Budget - City of Germantown
286
Germantown City of Excellence. Every Day. Budget Fiscal Year 2015 City of Germantown, Tennessee
-
Upload
khangminh22 -
Category
Documents
-
view
1 -
download
0
Transcript of Budget - City of Germantown

GermantownCity of
Excellence. Every Day.
BudgetFiscal Year 2015
City of Germantown, Tennessee

-
CITY OF GERMANTOWN
FISCAL YEAR 2015
BUDGET
July 1, 2014 – June 30, 2015

The Government Finance Officers Association of the United States and Canada (GFOA) presented a Distinguished Budget Presentation Award to the City of Germantown, Tennessee for its annual budget for the fiscal year beginning July 1, 2013. In order to receive this award, a governmental unit must publish a budget document that meets program criteria as a policy document, as an operations guide, as a financial plan and as a communication device. The award is valid for a period of one year only. We believe our current budget continues to conform to program requirements, and we are submitting it to GFOA to determine its eligibility for another award.


I
READER’S GUIDE The budget document is organized in 11 sections. Introduction. Separate letters from the Mayor and the City Administrator, transmitting the FY15 Budget document. General information about the City. The Board of Mayor and Aldermen’s Policy Agenda, listing major objectives. City Financial Policies, a guide in preparation and management of the Budget. Budget Summaries. An overview of the FY15 Budget. Total expenditure overview and summaries by major category and by cost center in six major operating funds: General, Utility, Germantown Athletic Club, Great Hall, Sanitation and Stormwater. Graphs/charts of revenues and expenditures, CIP projects, Infrastructure Replacement Program (IRP) lists, personnel staffing, special revenue funds, internal service funds and fiduciary funds. General Government. Operating budget for several departments including Administration, Finance, Procurement and General Services, Fleet Services, Economic Development. Specific cost centers and program description including overview, mission and FY15 objectives, performance measurements, budget category summary, personnel projections and category explanations. (Basic department and cost center information also found in other sections). Public Safety. Information about operation budgets for the Police Department, Automated Enforcement, Drug Asset Forfeiture, Federal Asset Forfeiture, Fire Department and Ambulance. Transportation and Environment. Operating Budget for all transportation and environment cost centers, including Public Services, State Street Aid, and Animal Control. Sanitation. Information for the operating budget for the Sanitation Fund, an enterprise fund, which incorporates the cost for both the collection and disposal of solid waste. Stormwater Management. Information for the operating budget for the Stormwater Management Fund, an enterprise fund. Community Services. Information about the operating budgets for Parks and Recreation, Library Services, Pickering Center, Cultural Arts and Germantown Municipal School Districts (GMSD). In addition, budgets are included for Germantown Athletic Club and the Great Hall & Conference Center, both enterprise funds. Utilities. Information about operating budgets for all utility cost centers, including Water Operations, Sewer Operations, Sewage Treatment and Utility Debt Service. Germantown Municipal School District. Information for the operating budget for the Germantown Municipal School District, a special revenue fund. Capital Improvements Program Summary. General overview of the CIP, divided in eight categories: General Government, Major Roads, Intersections/Other/Drainage, Parks, Germantown Athletic Club, Utilities, Great Hall & Conference Center, Stormwater and Recreation. (Complete listing of 2015 projects and five-year CIP projection in Budget Summary section). Revenues and Other Information. Specific information regarding revenue sources for General Fund and five enterprise funds. Significant accounting principles and policies followed by the City in the administration and development of the budget. Glossary of governmental budgeting and accounting terms.

II
TABLE OF CONTENTS INTRODUCTION PUBLIC SAFETY
Reader’s Guide………………………………...………. I Police………………………………………....................... 149 Table of Contents…………………..……..........……… II Automated Enforcement…..……………………………... 151 Mayor’s Letter…………………..……..………..…….... 1 Drug Asset Forfeiture……………………..……………… 153 City Administrator’s Letter.…..…….…………..…….... 2 Federal Asset Forfeiture……………………..…………... 155 Location Map……………………………...................… 16 Fire…………………………………………....................... 157 General Information and Statistical Data …...…….... 17 Ambulance………………………………...................... 161 Organization Chart……..….…………………...…….... 20 City Officials Roster……….…………………....…….... 21 TRANSPORTATION & ENVIRONMENT Philosophy Statement…………………………...……... 22 2013-2 Budget Ordinance..…………………..……….. 23 Public Services………….………………………………… 165 FY14 Policy Agenda and Performance Measurement………….……………………...…………
25
State Street Aid…………………………………….…… Animal Control…………………………………….………
169 171
Financial Policies………………….…………............... Condensed Budget Calendar…………………............
32 44
SANITATION
Sanitation Fund………………………………................. 175 BUDGET SUMMARIES
STORMWATER MANAGEMENT Total Expenditure Budget………………….….. ……… 46 General Fund Budget……………………….………….. 50 Stormwater Management Fund………………………... 177 Utility Fund Budget…………………………................. 54 Athletic Club Fund Budget………….…………………. 58 COMMUNITY SERVICES Great Hall Fund Budget……………………………….. 62 Sanitation Fund Budget…………………….………….. 66 Parks and Recreation……………………………………. 181 Stormwater Management Fund ………….…………… 68 Recreation………………………………………………… 185 Capital Projects Summary………………….………….. 70 Cultural Arts Projects…………………………………….. 187 Infrastructure Replacement Pickering Center………………………………………….. 189
Program Summary……………………..………….. 73 Library Services………………………………………….. 191 Discussion of General Fund Reserves…….…........... 77 The Farm ………………………………………………… 195 Budget Projection Summaries………………............... 79 Personnel and Staffing…………………………………. 103 GERMANTOWN MUNICIPAL SCHOOL DISTRICT… 197 GERMANTOWN ATHLETIC CLUB FUND…………… 199 GENERAL GOVERNMENT GREAT HALL FUND……………………………………. 211
Aldermen…………………………………….................. 107 UTILITIES Court……………………………………..………………. 109 Administration…………………………………………… 111 Utility Debt Service……………………………................. 217 Human Resources………………………….................. 115 Water Operations………………………………............... 219 Information Technology…………………..................... 119 Sewer Operations………………………………………… 223 Germantown Performing Arts Center….................. 123 Sewage Treatment……………………………………….. 225 Financial Services……………………….…………….. 125 Procurement……………………………………………. 129 CAPITAL IMPROVEMENTS PROGRAM……………… 227 Allocated Expenses……………………..…………….. 131 General Debt Service………………………………….. 133 REVENUES & OTHER INFORMATION Economic and Community Development…………… 135 Budget and Performance………………………………. 139 Revenues………………………………………................. 243 Facility Services……………………….……………….. 141 Significant Accounting Policies………………………….. 269 Fleet Services ……….………………………………… 145 Glossary of Terms……………...………………………… 274 City of Germantown Citizen Boards….…………………. 279

1
1930 South Germantown Road Germantown, Tennessee 38138-2815Phone (901) 757-7200 Fax (901) 757-7292 www.germantown-tn.gov
May 2014 Board of Mayor and Aldermen Financial Advisory Commission City of Germantown, Tennessee Although the annual budget development process culminates with three ordinance readings and a public hearing each May-June, the reality is that financial planning for the next fiscal year begins months earlier. It is driven by continuing recognition of the vision, goals and strategies embedded in the City’s Vision 2020 plan. It is directed by the Board of Mayor and Aldermen’s priorities expressed in the board’s annual mid-winter retreat. It is predicated on actions most appropriate to assure the economic, environmental and social sustainability of our community. In the period 2008-2013, city government aggressively controlled and even reduced the cost of public services as the economic recession and reappraisal negatively impacted revenues. Despite those continuing efforts, a combination of circumstances required a 44.5 cent property tax rate increase to adequately support the FY14 general fund and capital budgets and to provide sufficient revenues through FY18. The FY14 fiscal plan has worked. As staff prepared the FY15 budget, it did so in light of revenue trends and operational efficiencies that project the same property tax rate through FY19, six years instead of the five originally projected. The FY15 budget encompasses a wide range of services for safety and security, modest infrastructure improvement, fiscal soundness and sustaining the character of the community. It enables the addition of three school resource officers, thereby assigning one to every public education campus in the city, and expands the ambulance service by three paramedics. Aside from the half-cent optional sales tax revenues sufficient to meet the City’s statutory obligation to the Germantown Municipal School District, the general fund accommodates the annual payment to the Shelby County Schools (per the lawsuit settlement agreement with the City). In every department, division and line item, the FY15 budget reflects the Board’s thoughtful and diligent decisions about services and infrastructure investment, the Financial Advisory Commission’s thoughtful examination of revenue and expense projections, and the professional staff’s daily stewardship of citizen tax dollars. Because of the soundness of and adherence to conservative fiscal policies, the City continues merit the triple-A bond ratings of both Moody’s and Standard & Poor’s, established in FY94 and most recently affirmed during FY14.
Sharon Goldsworthy, Mayor

2
1930 South Germantown Road Germantown, Tennessee 38138-2815Phone (901) 757-7200 Fax (901) 757-7292 www.germantown-tn.gov
May 2014 Board of Mayor and Aldermen Financial Advisory Commission City of Germantown, Tennessee This letter transmits the Budget for the fiscal year beginning July 1, 2014. In setting the City’s annual financial and spending plan, the adoption of the Budget is the most significant action taken by the Board of Mayor and Aldermen each year. It authorizes the allocation of resources and establishes the direction for programs and services for our “triple-A” rated city for the coming year and the five-year planning period. THE FISCAL YEAR 2015 BUDGET The Board of Mayor and Aldermen, City administration and City staff have dealt with many difficult issues over the past five years, both during and after the recession. This new reality challenged us all to make fundamental shifts in our approach to managing resources and controlling costs. Today the City is in excellent financial health as evident by our triple-A bond rating and strong financial reserves and is poised to capitalize on improving the economy as it continues to take hold. The FY15 budget is balanced and total $120.1 million for all funds with the City’s general fund totaling $44.9 million. The balanced budget is the result of ongoing departmental cost control, efficiency measures city-wide, overall improvements to the economy in general and property tax adjustment approved last fiscal year. Against this backdrop the Administration has proposed a budget for FY15 that, in most instances, calls for an increase in general fund spending. The opportunity exists to fund some of the top priorities identified by the Board of Mayor and Aldermen during the strategic planning process and to reexamine previous spending cuts made during the recession in the areas of personnel, deferred maintenance and infrastructure replacement and capital improvements. Other areas of spending increases are centered on the establishment of our municipal school district including the settlement of the legal challenges to its creation. PUBLIC POLICY Adoption of the budget remains by far one of the most significant actions taken by the BMA each year. It authorizes the allocation of resources and establishes direction for programs and services for the coming year and during the five-year planning period. The annual budget represents the culmination of hours of analysis and hundreds of recommendations on how best to respond to needs of the community in accordance with resources available, established policies and sound administrative practices. The annual budget builds upon prior budgets, staff objectives and action plans, citizen feedback and the Germantown Vision 2020 Plan. Administration employs certain funding priorities in developing the annual budget. These funding priorities include a commitment to an operationally balanced budget, which includes the necessary supplies and tools to address the goals and objectives identified in Vision 2020; a fiscally balanced budget, with no use of one-time revenues to fund ongoing city operations; a programmatically balanced budget, which achieves parity between operations and support activities; full cost accounting and fee collection where possible and a commitment to funding capital projects based upon the City’s established financial policies. When structuring the budget document, one of the administration’s overarching goals is to produce a document that is user friendly and provides sufficient policy and financial information to give an accurate description of the City’s financial health and stability. The BMA realizes that sustainability requires a shift in orientation and how civic affairs are managed. The strategic vision and planning process focus on influencing the future rather than simply adapting to it by aligning organizational resources to bridge the gap between present conditions and the envisioned future.

Board of Mayor and Aldermen Financial Advisory Commission May 2014
3
Through the adoption of the Vision 2020 plan, a platform was developed for the City to transform the workforce into a high performing organization and implement best practices for service delivery. In the consideration and adoption of the City's annual budget, the administration routinely presents a balanced budget for the year under consideration in a five-year financial plan based upon various planning scenarios and financial assumptions. Administration addresses current and long-term financial obligations of the community through the following measures. FISCAL ACCOUNTABILITY Fiscal accountability is achieved through development and adoption of the annual budget and long-range financial plan. This action authorizes the allocation of resources and establishes direction for programs and services for the coming year and for the five-year planning period. The budget process and development begins with the annual Board of Mayor and Aldermen retreat when high priority items and policy decisions are included in budget deliberations. The actual development of the budget relies on the expertise and professionalism of a highly trained staff in cooperation with the 22-member Financial Advisory Commission (FAC), a volunteer commission appointed by the BMA. These appointed residents, with extensive experience in the financial sector, volunteer their time to work with City staff on every aspect of the budget and financial policies before recommending to the BMA the budget adoption and passage. Believing that a budget is more than simply a series of numbers, graphs and statistics, the City works hard to ensure that the document is easy to understand and that residents have a clear picture of how tax dollars are used. Prior to budget adoption, a budget in brief brochure is mailed to every resident. The document highlights key revenues, expenditures and capital projects and includes an invitation to attend the public hearing on the budget where residents can express concerns, raise specific issues or give support. Once adopted, the budget is placed on the City’s website. Throughout the fiscal year finance and Budget and Performance prepares and disseminates monthly financial reports to the city administrator, the BMA and every City department. The report provides information on key revenue and expenditures and highlights any variance requiring examination. Residents have access to this information via the City’s website. Fiscal accountability is also achieved each time the City enters the bond market to issue debt for capital projects. As stated in the profile, Germantown is one of only 97 cities with a Triple A bond rating from both Moody’s and Standard & Poors. Both agencies conduct an extensive review of the City’s finances and provide full disclosure to the bond buyer as to the fiscal health and stability of the City. These agencies last visited the City prior to a bond sale September 2013. Following the completion of an extensive surveillance report by Standard & Poors and Moody’s, the City was reaffirmed triple A by both agencies. At the end of each fiscal year the City conducts an annual audit. Records for every fund are audited by an independent audit firm that tests and reviews supporting evidences and financial statements. This independent audit has produced a clean unqualified opinion for the past 20 years on the overall fiscal health of the City. The audit report is presented to an audit commission consisting of Germantown residents for review prior to submission to the Board of Mayor and Aldermen. Since 1982 the City has received the GFOA award for excellence in financial reporting every year. The purpose of the award is to encourage local governments to go beyond the minimum requirements of generally accepted accounting principles and to prepare comprehensive financial reports that provide true transparency and full disclosure. The City also prepares and distributes to all residents a popular annual financial report (PAFR). The PAFR is prepared using information from the City’s audit and annual financial report and is presented in a format that is easily understood by the general public. The City has also received the GFOA award for excellence for the material presented in the PAFR for the past five years. A copy of the PAFR is available on the City’s website.

Board of Mayor and Aldermen Financial Advisory Commission May 2014
4
STRATEGIC PLANNING
Figure 1 Since the adoption of Vision 2020 in 2005, the BMA has conducted an annual retreat each January to test the validity and relevance of the vision and refocus goals and objectives. Beginning in 2011, the BMA and city administrator expanded the strategic planning model to include an additional retreat held in July. Participants in this process include the BMA and City staff. A professional facilitator ensures the process stays on track and helps build consensus. This annual strategic planning process ensures that the BMA and City staff stay focused on the vision, mission and core values of the organization. Results from the retreat are used to create focus area cabinet, departmental business plans, the annual Budget, five-year financial plan and five- year CIP. These plans are based on the triple bottom line (Economic, Environmental, and Social Sustainability) and are driven by key indicators with progress measured by the achievement of performance measures. Core competencies were established during the initial Vision 2020 process and are refined during the January retreat. Strategic challenges and opportunities are identified in one of five focus areas based on the BMA’s policy agenda. Vision 2020 is a long- range planning document based on annual goals, objectives and performance metrics designed to measure progress toward stated goals and key indicators. Leaders look to the future and a sustainable Germantown based on the triple bottom line. This approach is integrated throughout the strategic planning process. A systems approach is followed based on the understanding that systems are cyclical not linear. This approach takes a long term perspective with clear annual targets and indicators. It also provides for evaluation and feedback throughout the 12-month planning period to address unanticipated consequences, blind spots or variances. Through an understanding and analysis of this knowledge base, progress is measured toward the long range vision of sustainability and we are able to close the system loop and refocus strategic planning efforts each year during the retreat held in January and July. Figure 1 represents the critical steps involved in the strategic planning process.

Board of Mayor and Aldermen Financial Advisory Commission May 2014
5
The Vision 2020 strategic plan is defined by value based principles that describe the preferred future for the next eight years. Strategic planning culminating during the annual January retreat provides the BMA and City staff the opportunity to focus outcome based objectives over the next twelve months. This provides both the structure and context for knowledge integration, one of the City’s core competencies. It transforms the organization and creates opportunities for performance improvement. Knowledge generated through strategic planning and performance improvement model is the result of a collaborative effort citywide. This process, outlined in Figure 2 constitutes the basis for the City’s sustainable competitive advantage. ______________________________________________________________________________________________________ Figure 2 The Vision 2020 goals established by the Board of Mayor and Aldermen during the retreat forms the focus areas. Focus areas are designed to ensure that the policies and priorities identified by the Board are incorporated into the annual Budget and addressed during this fiscal year. A complete outline of the five focus areas, supporting policy agenda and performance measures follows this Budget transmittal letter. Vision 2020 goals identified by the Board of Mayor and Aldermen this year include the following: Public Safety
Safest city in southeast Effective emergency response Proactive approach to community safety Safe buildings and homes
Economic Development Germantown is the preferred place to live Enhanced residential neighborhoods Development and redevelopment consistent Connectivity and ease of movement
Quality of Life
Vibrant community Lifelong learning Parks, green spaces and natural areas
City Services and Finances
Financial sustainability Service excellence Services valued by customers

Board of Mayor and Aldermen Financial Advisory Commission May 2014
6
Services delivered in the most cost effective manner Civic involvement
Environmental Quality
Reduce energy consumption Pure water Waste reduction and resource recovery Stormwater pollution prevention Enhance natural resources management
A new tool that is being used in the strategic planning process to assess the community priorities is the Annual Citizen Survey. The twin measures of satisfaction and importance for city functions allows the construction of an improvement opportunity grid or priority chart. A priority chart graphically displays the city functions in terms of satisfaction and importance and helps set priorities for future initiatives to improve resident satisfaction. The chart below shows the value placed on each city function from the survey respondent perspective and shows the importance value along the horizontal axis and the satisfaction value along the vertical axis. City functions then fall into one of four quadrants based upon whether the value is above or below the average importance or satisfaction rating. For example, with regards to importance values, city functions on the right-hand side of the grid (quadrant 1 and 3) reflect values that are above average and those on the left-hand side (quadrants 2 and 4) are below average values.
Attributes in Quadrant 1 are considered by city functions to be above average in both satisfaction and importance levels. This indicates that the City is doing well in delivering these services and functions and is placing the right level of effort and priority on them. These City functions should be targets for continuous improvement: (1) Police Services (2) Fire and Medical Services (3) City Parks (4) Maintaining Streets
Board of Mayor and Aldermen Financial Advisory Commission May 2014
7
(5) Managing Traffic Flow City functions identified in Quadrant 3 are those with above average customer ratings in importance, but with below average ratings in satisfaction. The City should prioritize improvements on these functions and services. Efforts placed on these areas should contribute towards raising overall satisfaction levels. These areas include: (1) Attracting and keeping businesses in Germantown (2) Recycling and garbage collection (3) Zoning and land use City functions found in Quadrant 2 reflect areas in which the City is meeting or exceeding public satisfaction, but are not a high priority for survey respondents. The City may be placing too high of a priority or too many resources on these functions, and could redirect attention to the services and programs in Quadrant 3. There are only three functions in this quadrant: (1) Protecting our natural environment (2) Code enforcement (3) Support for neighborhoods Finally, service attributes contained in Quadrant 4 require no immediate action. Even though survey respondents rated these functions below average in satisfaction, they also rated them below average in importance. Therefore, the City should not consider the following functions as high improvement priorities: (1) Library services (2) Recreational programs and classes (3) Community events (4) Support for the arts in the community
REVENUE PROJECTIONS Concurrent with the adoption of the budget, the Board of Mayor and Aldermen adopts a property tax rate. The budget for FY15 has a property tax rate of $1.93. Property taxes generated in Germantown comprise about 60% of overall General Fund operating revenues. However, the uncertain economic times required an in-depth review of all revenue assumptions in formulating the budget. Additionally, a thorough expense review was conducted and included local issues of growth, new operating services, neighborhood preservation and quality of life.
The State Economy – The slow economic recovery continued to impact cities across the state during FY14. Rising gasoline prices are impacting Tennessee harder than most states because it relies so heavily on revenue from sales taxes of other consumer goods and services. The sales tax is elastic and more sensitive to economic shifts.
The Local Economy – Germantown tends to follow the dynamic fluctuations of the national economy. FY14 is
anticipated to meet budget and local sales are projected to increase in FY15 over FY14 estimate.
Hall Income Tax -- This tax is collected by the state as a tax on income from dividends and interest on out of state investments and allocated to the City at 3/8 of the amount collected from Germantown residents.

Board of Mayor and Aldermen Financial Advisory Commission May 2014
8
GENERAL FUND
REVENUES:
$ MILLIONS
0
10
20
30
40
50
FY11 FY12 FY13 FY14 FY15
Property Tax Local Sales TaxInvestment Income Federal and State RevenuesOther Revenues
5
10
15
20
25
FY11 FY12 FY13 FY14 FY15
Real Personal In Lieu Of PILOT
The General Fund revenues include property tax, local sales tax, investment income and other revenues. The property tax consistently remains one of the most stable sources of revenue in our community. Other revenue sources are subject to some degree of fluctuation in economic cycles, with the inclusion of a half cent sales tax increase, FY15 general fund revenues increased by 8.5% over FY14 estimate. The property tax rate of $1.93 per $100 assessed value, compared to $1.485 in FY13, accounts for the increase in property taxes shown in the graph.
The property tax rate for the City of Germantown is $1.93 per $100 of assessed valuation. In the FY15 budget, real, personal, in-lieu-of-property taxes and PILOT are projected to generate approximately $28.0 million, 60% of the total revenue budget for the City.
$ MILLIONS
$ MILLIONS LOCAL SALES TAXES
Local sales tax collections contribute 20% of the total revenue for the operations of the City. This category includes the local sales tax, the wholesale beer tax, the wholesale liquor tax, gross receipts business taxes and hotel/motel occupancy tax. This year’s sales tax includes a 0.005 increase that was approved by referendum in FY12. The FY15 Budget anticipates $9.5 million in local sales tax revenue.
0
5
10
15
FY11 FY12 FY13 FY14 FY15
Local Sales Tax Other Sources
PROPERTY TAXES

Board of Mayor and Aldermen Financial Advisory Commission May 2014
9
0.00
5.00
10.00
15.00
20.00
25.00
FY05 FY06 FY07 FY08 FY09 FY10 FY11 FY12 FY13 FY14 FY15
Sales Tax Interest Income
02468
FY11 FY12 FY13 FY14 FY15
State Revenues Grants
0
1
2
3
4
FY11 FY12 FY13 FY14 FY15
Fines Auto Registration Fees Licenses Other
SALES TAX REVENUE AND INTEREST INCOME AS % OF GENERAL FUND REVENUES
OTHER LOCAL REVENUE SOURCES
$ MILLIONS
PERCENT
Other local revenue sources generate approximately 7% of the overall revenue for the City. This category includes automobile registration fees, local cable franchise fees, city court fees and an assortment of other smaller fees collected by municipalities. Licenses and fees are a fairly stable source of revenue for the City. Revenues are budgeted at $3.4 million from fees.
STATE REVENUES AND GRANTS
State shared revenues and state and federal grants make up 13% of the total fund sources for the City. This area includes state allocations for income tax, sales tax, beer tax, liquor tax, and City street and transportation tax allocation. In Germantown, state shared revenues are projected to be $5.6 million in FY15. With the exception of the income and excise tax, state revenues are allocated on a per capita basis with Germantown’s population at 40,123 with a Special Census in 2012. This source of revenue fluctuates depending on the statewide economy and certified population counts.
$ MILLIONS
INTEREST INCOME Interest on the City’s investments contributes less than 1% of total revenues for the City of Germantown. The FY15 Budget projects income from investments at $54,400. Both the State of Tennessee and the City of Germantown have regulations regarding authorized investments. The level of interest income fluctuates depending on interest rates and amount of funds held in reserve.

Board of Mayor and Aldermen Financial Advisory Commission May 2014
10
More detailed information about each revenue category is provided under the “Revenues and Other Information” tab in the latter part of the document.
EXPENDITURES
The City’s fiscal year spending plan emphasizes a long-term goal of maintaining financial stability. All expenditures reflect the spending priorities established by the Board of Mayor and Aldermen and strict adherence to the financial policies that provide a framework for allocating resources. (The Board’s Policy Agenda for fiscal year 2015 and an overview of the Financial Policies as adopted by the Board of Mayor and Aldermen are provided following this section.)
02468
101214
FY11 FY12 FY13 FY14 FY15
Administration Finance Development General Services
012345
FY11 FY12 FY13 FY14 FY15
Public Services Animal Control
Total expenditures for Police and Fire Departments increased by $290,076 or 1.7% from the FY14 estimate. During the past five years, public safety costs have raised primarily due to the additional safety personnel and ancillary costs. FY15 shows an increase over FY14 estimate due primarily to infrastructure replacement and personnel additions in the Police department.
The category includes the Department of Public Services and Animal Control. Total FY15 expenditures for this category increased by $443,582 or 10.4% from the FY14 estimate. FY15 expenses are more than FY14 estimate due to infrastructure replacements for equipment and vehicles.
GENERAL GOVERNMENT EXPENDITURES
PUBLIC SAFETY EXPENDITURES
TRANSPORTATION AND ENVIRONMENT EXPENDITURES
$ MILLIONS
$ MILLIONS
General government includes the Departments of Aldermen, Administration, Economic & Community Development, Human Resources, Information Technology, Germantown Performing Arts Centre, General Services, Budget and Performance, City Court, Procurement, and Finance. FY15 expenditures for these functions increased by $1.74 million or 16% from the FY14 estimate. Budget and Performance moved to Administration in FY15.
$ MILLIONS
05
101520
FY11 FY12 FY13 FY14 FY15
Fire Police

Board of Mayor and Aldermen Financial Advisory Commission May 2014
11
The category includes the Parks and Recreation Department, Library Services, and Cultural Arts. The FY15 expenditures increased by $26,183 or less than 1% over the FY14 estimate. This increase is due to infrastructure replacements in FY15. In addition, the Farm Park was moved to a special revenue fund in FY15.
COMMUNITY SERVICES EXPENDITURES $ MILLIONS
00.5
11.5
22.5
33.5
FY11 FY12 FY13 FY14 FY15
Parks & Rec. Cultural Arts Library The Farm

Board of Mayor and Aldermen Financial Advisory Commission May 2014
12
SUMMARY OF FY15 APPROVED EXPENDITURE HIGHLIGHTS
Original Variance - % Variance % VarianceBudget Estimated Budget Est. FY14 Estimated BudgetFY14 FY14 FY15 Budget FY15 FY14 FY15
Operating Budget* 40,715 40,297 44,970 4,673 11.6% 10.4%Capital - - - - 0.0% 0.0% Total 40,715 40,297 44,970 4,673 11.6% 10.4%
TOTAL BUDGET - ALL FUNDS(in thousands)
Original Variance - % Variance % VarianceBudget Estimated Budget Est. FY14 Estimated BudgetFY14 FY14 FY15 Budget FY15 FY14 FY15
Operating Budget* 62,903 61,790 110,493 48,703 78.8% 44.1%Capital 8,407 5,799 9,654 3,855 66.5% 39.9% Total 71,310 67,589 120,147 52,558 77.8% 43.7%
Increase Percent Percent Inc.BY PROGRAM: (in thousands) of Total to Estimate Community Services 26$ 0.0% 0.9% General Debt Service (283) -0.5% -8.5% General Government 1,741 3.3% 16.1% Transportation & Environment 444 0.8% 10.4% Athletic Club 1,469 2.8% 41.0% Great Hall 53 0.1% 14.6% Other Programs 48,919 93.1% 458.9% Public Safety 290 0.6% 1.7% Sanitation 165 0.3% 4.7% Stormwater 212 0.4% 21.0% Utilities (479) -0.9% -5.0% TOTAL 52,558$ 100.0% 77.8%
BY CATEGORY: Personnel 37,892$ 72.1% 116.6% Debt Service (323) -0.7% -9.1% Contingencies - 0.0% 0.0% Communications 177 0.3% 37.8% Rents 197 0.4% 44.2% Contract Services 802 1.5% 17.6% Professional Fees 2,512 4.8% 74.6% Supplies 2,785 5.3% 106.3% Capital Outlay 1,839 3.5% 98.8% All Other Categories 6,678 12.8% 36.7% TOTAL 52,558$ 100.0% 77.8%
* Includes Capital Outlay and Infrastructure.

Board of Mayor and Aldermen Financial Advisory Commission May 2014
13
RESERVES: While the entire subsequent year’s balance sheets are not presented in this document, the most critical aspect of the City’s balance sheets – fund balance – is presented in the budget projection summaries in the following section. General Fund fund balance as of June 30, 2013 totaled $19.2 million. The underlying purpose and rationale for these reserves are described in the Financial Policies contained in this section of the document. Following a review of the Financial Policies with the Financial Advisory Commission and the Board of Mayor and Aldermen, the Financial Policies were updated as detailed in this section of the Budget. UTILITY FUND REVENUE AND EXPENSES: Proposed utility rates for FY15 increased 30%. This increase was recommended to keep the fund sustainable in future years.
2
4
6
8
10
FY11 FY12 FY13 FY14 FY15 FY16 FY17 FY18 FY19
Expenses Revenues
-10%
40%
90%
140%
FY11 FY12 FY13 FY14 FY15 FY16 FY17 FY18 FY19
Net Income Retained Earnings
The chart on the left graphically illustrates the revenue and expenditure trends over a 9-year planning period. Utility revenues and expenses reflect the fluctuation common to a Utility Fund.
Outstanding Utility Debt of $4.6 million at the start of FY15 is comprised of two bond issues. This chart displays Outstanding Utility Debt at the beginning of each fiscal year. In FY09 a bond issue totaling $5.0 million was issued to support the expansion of the Johnson Road Water Plant and water storage. The one bond issue in FY98, refunded in 2006, totaling $8.025 million was mainly to support the construction of a new water treatment plant. The five-year planning period includes a $1.5 million bond issuance in FY17.
The debt service coverage graph shows the ratio of operating income and retained earnings to debt service (the number of times operating income and retained earnings covers bonded debt service). Debt service coverage is the principal ratio used to assess utility debt capacity. As shown in the graph, the ratio for operating income coverage is fairly stable. FY15 and the projected plan period show a healthy fund. The retained earnings ratio illustrates the strong financial stability of the Utility Fund.
UTILITY FUND REVENUES OVER EXPENSES
OUTSTANDING UTILITY DEBT
UTILITY DEBT SERVICE COVERAGE
$ MILLIONS
$ MILLIONS
0123456789
FY11 FY12 FY13 FY14 FY15 FY16 FY17 FY18 FY19

Board of Mayor and Aldermen Financial Advisory Commission May 2014
14
Although the major rating agencies consider 2.4 an appropriate debt coverage ratio, Germantown’s strong financial foundations, coupled with its high levels of working capital maintained in the Utility Fund, provide additional protection against unexpected operating costs and declines in revenues between periodic rate adjustments.
FY15 CAPITAL BUDGET The FY15 Capital Budget totals $9,653,829. There is a $2.5 million transfer to capital projects from the General Fund in FY15. Those projects incorporated in the CIP are consistent with the Board of Mayor and Aldermen’s Policy Agenda and funding priorities. The FY15 CIP demonstrates a significant level of spending due mainly to the funding for several road and drainage improvement projects. Details on these and other CIP projects and their impact on operations in this Budget and future years are contained under the tab Capital Improvements Program. The following chart illustrates the impact of drawdown on General Fund reserves over the planning period for the CIP. DEBT ANALYSIS
In the State of Tennessee, there is no legal debt limit.
$-
$200
$400
$600
$800
$1,000
$1,200
FY12 FY13 FY14 FY15 FY16 FY17 FY18 FY19
Total Debt Warning Trend
The Outstanding General Obligation Debt chart depicts the level of indebtedness over an 8-year period. In FY10 $9.635 million of G.O. debt was issued. Of this amount, $6.0 million was new debt and $3.635 million was the refunding of Bond Series 2000 and 2002. In addition, in FY12 $6.025 million of G.O. debt and $3.5 million of new debt and $5.5 million in refunding in FY14 were issued. The five year planning period includes a bond issuance in FY19 of $2.6 million.
Rating agencies generally consider $1,000 per capita to be the upper limit for a triple-A rating. Even with the anticipated issuance of debt in the outer years, Germantown maintains a debt level below the upper limit.
OUTSTANDING G.O. DEBT
G.O. DEBT PER CAPITA
$ MILLIONS
$ PER CAPITA
10
20
30
40
FY12 FY13 FY14 FY15 FY16 FY17 FY18 FY19

Board of Mayor and Aldermen Financial Advisory Commission May 2014
15
GERMANTOWN ATHLETIC CLUB FUND The Germantown Athletic Club begins FY15 with a planned business development approach. Increased competition and an aging facility have resulted in a strong focus on membership retention. Streamlining programs and membership fees, enhancing marketing and communications, along with a “back to basics” approach of services, is planned to build membership and fiscal soundness. This business plan shows the financial improvement anticipated for the forecast period. In addition, the operations of the Great Hall & Conference Center were separated from the Germantown Athletic Club in FY10, thus allowing each facility to focus on its business objectives. GREAT HALL FUND In the FY10 Budget the Great Hall & Conference Center was separated from the Germantown Athletic Club Fund and a new enterprise fund was created for the Great Hall. This separation was done to better identify the profitability of operations for each of these funds. The Great Hall & Conference Center focuses on providing 8,000 square feet of rental facility space ideal to accommodate meetings, weddings and receptions. SANITATION FUND The FY15 Budget for the Sanitation Fund reflects costs of the fourth year of a five year contract with option to renew an additional five years for collection with Republic Services and landfill disposal with Waste Management. The revenue side includes a rate that remains the same as last year for solid waste collection in FY15. The contract includes backdoor household trash collection with curbside option, weekly recyclables collection with incentive program and unlimited resident generated yard debris collection and composing. STORMWATER MANAGEMENT FUND In the FY11 Budget a Stormwater Management Fund was created due to a federal mandate for municipalities to manage stormwater runoff. This fund provides citizens with improved health and safety, protection of property value, and cleaner and safer streets. SPECIAL THANKS: The FY15 Budget could not have been prepared without the combined efforts of staff, the Financial Advisory Commission, the Personnel Advisory Commission and the Board of Mayor and Aldermen. I want to express my appreciation to all of those who have worked to produce the FY15 Budget and Capital Improvements Program, and in particular, I want to thank the Office of Budget and Performance.
Sincerely, Patrick J. Lawton City Administrator

GENERAL INFORMATION AND STATISTICAL DATA
16
Germantown is located in southeast Shelby County. It is one of six municipalities adjacent to Memphis, Tennessee. GERMANTOWN’S EARLY HISTORY Germantown began in 1833 as the hamlet of Pea Ridge. In 1836 it was renamed Germantown, probably because the earliest settlers were of German heritage. By 1841, the City of Germantown was chartered. It met with a modest amount of prosperity when a plank road was built in 1849 and the railroad came through in 1852. It suffered setbacks in the 1860s when part of the City was destroyed during the Civil War and during the yellow fever epidemics of the 1870s. GERMANTOWN’S POPULATION PATH In 1960, the City had 1,101 residents. In the 1970s, Germantown began to grow rapidly and by 1980 the population had grown to 20,459. Today, the City’s population is 40,123 per 2012 Special Census. The City is primarily residential in character, but continues to expand in commercial businesses and professional services. GERMANTOWN DEMOGRAPHICS
Population 40,123* Education (persons 25 years of age or older)
Male 48.4% High School graduate or higher 98%Female 51.6% Bachelor's degree or higher 63%
Age Occupation
Under 5 years 4.9% Management, professional, and related occupations 60.8%5 to 19 years 21.2% Sales and office occupations 24.2%20 to 44 years 22.8% Service occupations 7.2%45 to 64 years 35.0% Production, transportation, and material moving occupations 5.1%65 years and older 16.1% Farming, fishing, and forestry occupations 2.7%
Race Other
White 88.1% Homeownership rate 89%Black or African American 3.6% Number of households 14,407 Asian 5.5% Median household income 113,535Hispanic or Latino 1.8% Median value of owner-occupied housing units 284,400Other 1.0% Per capita money income 54,229
Average family size 3.0
Unless otherwise indicated, statistics are from 2010 Federal Census. *Per 2012 certified Special Census

GENERAL INFORMATION AND STATISTICAL DATA
17
2013 PRINCIPLE PROPERTY TAXPAYERS
2013 PRINCIPAL EMPLOYERS
Percentageof Total City
TaxableAssessed Assessed
Taxpayer Value Rank Value
The Village at Germantown Inc. 12,777,160$ 1 0.86%VA Germantown LLC 8,310,400 2 0.56%FSP-Germantown LLC 6,939,480 3 0.47%Germantown Village Square Joint Venture 6,807,400 4 0.46%Vinyards Apartments Inc. 6,664,520 5 0.45%BIC-MTS Partners (PSO) 5,953,240 6 0.40%Taylor Sentor Crook, et. al 5,772,040 7 0.39%UT Medical Group 5,438,920 8 0.37%SWC Poplar FHI Partners LLC 5,428,520 9 0.37%LMP Wolf River LLC 4,913,880 10 0.33%
Totals 69,005,560$ 4.66%
Percentage of Total County
Employer Employees Rank Employment
Methodist Le Bonheur Hospital - Germantown 1,277 1 0.20%Shelby County School System - Germantown Schools 636 2 0.10%City of Germantown 377 3 0.03%Campbell Clinic 353 4 0.06%Orgill, Inc. 346 5 0.06%ThyssenKrupp Elevator Manufacturing, Inc. 244 6 0.06%Stern Cardiovascular 240 7 0.04%Villages of Germantown 225 8 0.04%Baptist Rehabiliation - Germantown 200 9 0.04%Kroger 103 10 0.02%
GENERAL INFORMATION AND STATISTICAL DATA
18
AMENITIES A total of 27 parks allow for a park within walking distance of every residence. The community has more than 700 acres of parkland. More than 11.4 miles of greenway links parkland and neighborhoods. Under the Germantown Municipal School District, a high school, one middle school and three elementary schools serve Germantown. The City also has three private and four specialty schools. The Community Library was constructed in 1996, the Regional History and Genealogy Center opened in FY07. The Germantown Performing Arts Centre (GPAC) is an acoustically-perfect 800-seat theater featuring top artists from around the world. The Germantown Athletic Club is an 118,000 square foot indoor athletic complex that opened in 1989 and expanded in 2003 to include two outdoor pools. The Great Hall & Conference Center is an 8,000 square feet rental facility space that is ideal to accommodate meetings, weddings and receptions. GERMANTOWN’S STATUS Germantown is one of a few cities in the nation possessing a triple-A bond rating from both Moody’s and Standard & Poor’s. It has the lowest crime rate for any city its size in the State of Tennessee and the police and fire departments have average emergency response time of five minutes. The parks and recreation department is nationally accredited. The Arbor Day Foundation has designed Germantown a “Tree City USA” for 23 consecutive years. GERMANTOWN’S GOVERNMENT The City of Germantown operates under a Mayor-Aldermanic form of government. The mayor and five aldermen are elected for four year terms and are part-time positions. The Board of Mayor and Aldermen is the legislative and policy-making body of the City. The mayor does not vote except to break a tie. By charter, the mayor is the chief administrative officer; however, oversight of day-to-day management is assigned to a professional city administrator, appointed by the mayor but subject to board approval. More than 200 citizens annually volunteer their time, expertise and energy in service on the City’s 20-plus advisory commissions and boards. Most appointments, made by the mayor and aldermen each December, are for one year terms; most groups meet monthly. Their responsibilities range from recommendations on City government matters and community interests to indentifying opportunities, challenges and solutions to conducting special activities. The commissions are Audit, Beautification, Design Review, Economic Development, Education, Environmental, Financial, Athletic Club, Great Hall, Historic, Industrial Development, Neighborhood Preservation, Parks and Recreation, Personnel, Planning, Public Safety Education, Retirement Plan Administration, Other Postemployment Benefits, Senior Citizens, and Telecommunications. The boards are Zoning Appeals, Industrial Development and Library.

GENERAL INFORMATION AND STATISTICAL DATA
19
CONTACT INFORMATION For further information, please contact: City of Germantown 1930 South Germantown Road Germantown, Tennessee 38138 901-757-7200 www.germantown-tn.gov
CITY OF GERMANTOWN, TENNESSEE MISCELLANEOUS STATISTICAL DATA
City Stats: Education (1) :Date Originally Chartered 1841 Number of Schools 5 (GMSD)Date of Incorporation 1903 Number of Students 5,441Form of Government Mayor-AldermanicArea 19.8 sq. milesMiles of Streets 206Number of Street Lights 5,095 Water System:
Number of Consumers 13,479Fire Protection: Miles of Water Main 208 Number of Stations 4 Well Capacity 25 million gallons per day Number of Regular Firefighters 71 Treatment Plant Capacity 24 million gallons per day Number of Volunteer Firefighters 25 Storage Capacity 7.875 million gallons Insurance Service Office Rating Class III Average Daily Consumption 7.500 million gallons
Peak Day Pumpage 15.120 million gallonsPolice Protection: Residential Rate in Force $8.78 for first 5,000 gallons (minimum) Number of Regular Police Officers 88 $2.15 per additional 1,000 Number of Reserve Police Officers 30 gallons up to 15,000 gallons
$2.47 per additional 1,000Recreation and Culture: gallons up to 50,000 gallons Number of Parks 27 $3.12 per 1,000 gallons thereafter Acreage 748 Number of Libraries 2 Sewer System:
(Germantown Community Number of Consumers 13,270Library and Genealogy Miles of Sewer Main 211Center) Treatment Provided by City of Memphis
Volumes 143,520 Residential Rate in Force $5.07 for first 2,000 gallons (minimum)$.90 per for third additional 1,000 gallons$1.99 per additional 1,000 gallons up to20,000 gallons$0.78 for 21st 1,000 gallons($5.07 minimum and $40.56 maximum)

ORGANIZATION CHART
20
CITY OF GERMANTOWN, TENNESSEE
Organization Chart
PHILOSOPHY STATEMENT
21
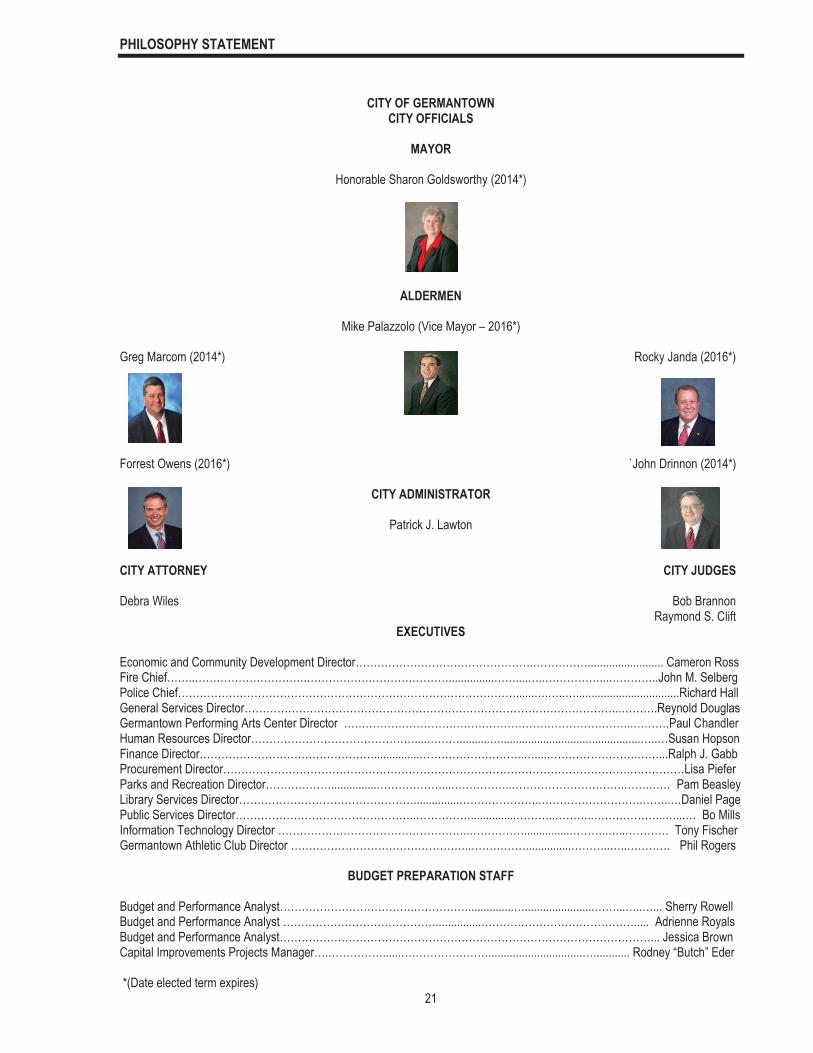
CITY OF GERMANTOWN CITY OFFICIALS
MAYOR
Honorable Sharon Goldsworthy (2014*)
ALDERMEN
Mike Palazzolo (Vice Mayor – 2016*) Greg Marcom (2014*)
Rocky Janda (2016*)
Forrest Owens (2016*)
`John Drinnon (2014*)
CITY ADMINISTRATOR
Patrick J. Lawton
CITY ATTORNEY
CITY JUDGES
Debra Wiles Bob Brannon
Raymond S. Clift EXECUTIVES
Economic and Community Development Director………………………………………….……………......................... Cameron Ross Fire Chief……..………………………….…………………………………...............……....…..……………...…………..John M. Selberg Police Chief…………………………………………………………………………………......….…..…..................................Richard Hall General Services Director…………………………………………………………………………………………..……….Reynold Douglas Germantown Performing Arts Center Director ……………………………………………………………………..……….Paul Chandler Human Resources Director………………………………………....………..........…..............................................…..…Susan Hopson Finance Director…………………………………………...............………………………..…....…………………….……...Ralph J. Gabb Procurement Director………………………………………………………………………………………………….……………Lisa Piefer Parks and Recreation Director………………...............………………...……………..………………………….…….…… Pam Beasley Library Services Director…………………………………………...............…………………..……………………….……..…Daniel Page Public Services Director…………………………………………..……………...............………..………..………………..…...… Bo Mills Information Technology Director ……………………………………………..……………...............………..…..………… Tony Fischer Germantown Athletic Club Director …………………………………………..……………...............………..…..………… Phil Rogers
BUDGET PREPARATION STAFF
Budget and Performance Analyst……………………………….……………...............….......................……...…..…... Sherry Rowell Budget and Performance Analyst ……………………………………...............……………………………………..... Adrienne Royals Budget and Performance Analyst…………………………………………………………………………………………... Jessica Brown Capital Improvements Projects Manager….……………......……………………...............................…............ Rodney “Butch” Eder *(Date elected term expires)

PHILOSOPHY STATEMENT
22
City of Germantown Core Values
We, the Germantown Managers and Employees,
Strive for S ERVICE Excellence
P RODUCE “A+” Results
Take the I NITIATIVE
Are R ESPONSIBLE
Are I NNOVATIVE
Practice T EAMWORK
The S.P.I.R.I.T. of Germantown

BOARD OF MAYOR AND ALDERMEN ORDINANCE – FY15
23
ORDINANCE NO. 2014 - 2
AN ORDINANCE TO ADOPT THE 2014- 2015 BUDGET WHEREAS, the City of Germantown desires to ordain its budget for the fiscal year July 1, 2014 through June 30, 2015; and WHEREAS, by charter, of the City of Germantown, the Board of Mayor and Aldermen is required to fix and determine an annual
budget setting forth all income and expenditures containing total revenues and available funds and total expended; prohibiting against exceeding appropriations and a line item financial plan;
BE IT ORDAINED by the City of Germantown, that its budget for the fiscal year July 1, 2014 through June 30, 2015, is the
following: SECTION 6-801 Revenues/Expenditures 6-802 Expenditure Appropriations 6-803 Expenditure of Donations and Grants 6-804 Line Item 6-805 Effective Date Section 6-801 Revenue/Expenditures
A. Total Revenues and Available Funds General Fund Revenues $47,638,767 Special Revenue Funds Revenues 48,209,259 Intergovernmental Revenues 3,398,100 Contributions - Utility Fund Revenues 8,800,609 Germantown Athletic Club Fund Revenues 4,070,372 Great Hall Fund Revenues 398,000 Sanitation Fund Revenues 3,528,900 Stormwater Management Fund Revenues 1,011,752
Decreases (Increases) in Fund Balances:
General Fund (2,668,967) Special Revenue Funds (82,772) Capital Projects Funds 4,205,200 Utility Fund 259,977 Internal Service Funds 20,000 Germantown Athletic Club Fund 983,536 Great Hall Fund 18,006 Sanitation Fund 148,009 Stormwater Management Fund 207,974 TOTAL
$120,146,722

BOARD OF MAYOR AND ALDERMEN ORDINANCE – FY15
24
B. Expenditures General Fund $44,969,800 Special Revenue Funds 48,126,487 Capital Projects Funds 7,603,300 Utility Fund 9,060,586 Internal Service Funds 20,000 Germantown Athletic Club Fund 5,053,908 Great Hall Fund 416,006 Sanitation Fund 3,676,909 Stormwater Management Fund 1,219,726 TOTAL
$120,146,722
Section 6-802 Expenditure Appropriations
No expenditure listed above may be exceeded without appropriate ordinance action to amend the budget, except as provided in the following section. Such action shall fully describe all changes to the budget and shall include the sources of revenue to finance the expenditure.
Section 6-803 Expenditure of Donations and Grants
In the event funds are donated or contributed to the City or the City receives grants, revenue projections and expenditure appropriations may be increased by resolution of the Board of Mayor and Aldermen to the extent of the amount of funds received.
Section 6-804 Line Item Financial Plan Required
A detailed line item financial plan shall be prepared in support of the budget. The financial plan shall be used as guidance and generally followed in implementing the budget.
Section 6-805 Effective Date
This Ordinance shall take effect July 1, 2014, the public welfare requiring it. First Reading: May 12, 2014 Second Reading: June 9, 2014June 11, 2012 Third Reading: June 23, 2014un s25, 2012 (To be added)
POLICY AGENDA AND PERFORMANCE MEASUREMENT – FY15
25
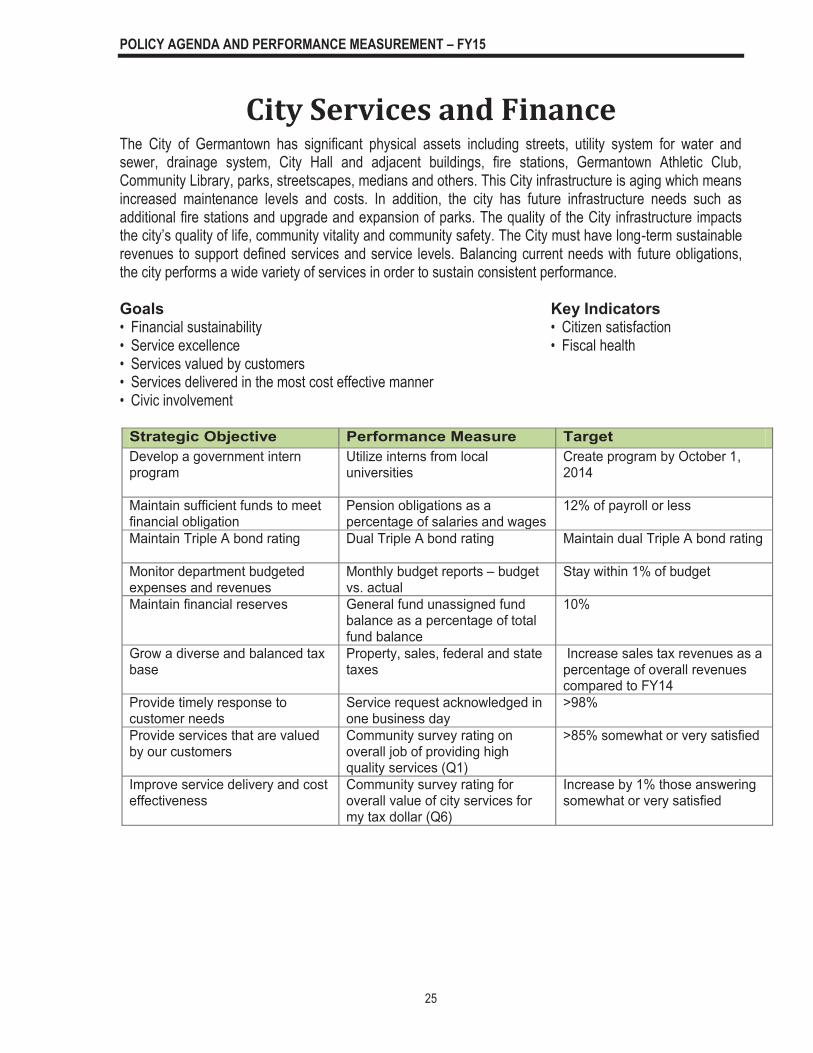
City Services and Finance The City of Germantown has significant physical assets including streets, utility system for water and sewer, drainage system, City Hall and adjacent buildings, fire stations, Germantown Athletic Club, Community Library, parks, streetscapes, medians and others. This City infrastructure is aging which means increased maintenance levels and costs. In addition, the city has future infrastructure needs such as additional fire stations and upgrade and expansion of parks. The quality of the City infrastructure impacts the city’s quality of life, community vitality and community safety. The City must have long-term sustainable revenues to support defined services and service levels. Balancing current needs with future obligations, the city performs a wide variety of services in order to sustain consistent performance. Goals Key Indicators • Financial sustainability • Citizen satisfaction • Service excellence • Fiscal health • Services valued by customers • Services delivered in the most cost effective manner • Civic involvement
Strategic Objective Performance Measure Target Develop a government intern program
Utilize interns from local universities
Create program by October 1, 2014
Maintain sufficient funds to meet financial obligation
Pension obligations as a percentage of salaries and wages
12% of payroll or less
Maintain Triple A bond rating Dual Triple A bond rating
Maintain dual Triple A bond rating
Monitor department budgeted expenses and revenues
Monthly budget reports – budget vs. actual
Stay within 1% of budget
Maintain financial reserves
General fund unassigned fund balance as a percentage of total fund balance
10%
Grow a diverse and balanced tax base
Property, sales, federal and state taxes
Increase sales tax revenues as a percentage of overall revenues compared to FY14
Provide timely response to customer needs
Service request acknowledged in one business day
>98%
Provide services that are valued by our customers
Community survey rating on overall job of providing high quality services (Q1)
>85% somewhat or very satisfied
Improve service delivery and cost effectiveness
Community survey rating for overall value of city services for my tax dollar (Q6)
Increase by 1% those answering somewhat or very satisfied

POLICY AGENDA AND PERFORMANCE MEASUREMENT – FY15
26
Public Safety Germantown residents enjoy a low crime rate and affordable homeowner and business insurance premiums due to the efforts of the police and fire departments. Both departments have excellent emergency response times and provide enhanced services in addition to traditional public safety services. The public safety plan focuses on sustaining Germantown as a safe community with an approach to public safety that incorporates essential emergency services tailored to the community’s risk. Goals Key Indicators • Safest city in southeast • Low crime rate • Proactive approach to community safety • Citizen satisfaction • Effective emergency response • Fire service index • Safe buildings and homes Strategic Objective Performance Measure Target Effective emergency police response
Police department emergency response time
< 4 minutes
Safest City in Tennessee Percentage of part-one crimes cleared
80% clearance
Fire Department response Fire department response time
First unit arrives on scene in 6.5 minutes or less 90% of the time
Effective emergency medical response
Cardiac arrest survival rate
> 30%
Fire safe commercial properties
Commercial inspection violations corrected within 90 days
> 90%

POLICY AGENDA AND PERFORMANCE MEASUREMENT – FY15
27
Economic Development Neighborhood preservation, development consistent with Germantown’s character and well maintained public infrastructure help define community vitality. The City strives to maintain the quality of existing residential and commercial areas through strong property maintenance codes and a dependable and well maintained system infrastructure. Value is placed also on new growth and development consistent with Germantown codes through the adherence to exemplary planning and design standards. Goals Key Indicators • Germantown is the preferred place to live • Home ownership • Enhanced residential neighborhoods • Citizen satisfaction • Development and redevelopment consistent • Property values • Connectivity and ease of movement • Infrastructure condition • Business vitality Strategic Objective Performance Measure Target Reposition Germantown within the regional economy
Constant Contact eNewsletter open rate
2% increase
Community engagement Business and Industry Summit attendance and satisfaction
1% increase in attendance 98% satisfaction rating
Create an enabling environment
Increase satisfaction with development approval process
90% satisfaction rating
Leverage assets to attract new investment
Reduction in office and retail vacancy rates
<11% vacancy rate

POLICY AGENDA AND PERFORMANCE MEASUREMENT – FY15
28
Environmental Quality The environmental quality plan is designed to provide a comprehensive approach to protect the natural resources of our community. The goals and objectives identified in the plan reflect the ideal future we strive to achieve. These include the implementation of energy conservation practices, reduction of solid and hazardous waste and the protection of the water supply. Many of these goals are the result of proactive planning practices and others are mandated by federal and state law. Goals Key Indicators • Reduce energy consumption • CO2 emissions • Pure water • Drinking water quality index • Waste reduction and resource recovery • Refuse reduction • Stormwater pollution prevention • Wolf River quality index • Enhance natural resources management Strategic Objective Performance Measure Target Reduce CO2 emissions
Reduce kilowatt usage 1% reduction compared to FY14
Reduce CO2 emissions
Fuel usage 1% reduction compared to FY14
Reduce CO2 emissions
Natural gas usage
1% reduction in cubic column feet usage compared to FY14
Meet or exceed state and federal drinking water standards
Continued water quality with no major violations
score 97% or above on state bi-annual water quality report
Monitor ground water quality and quantity
State of Tennessee drinking water standards
Quality meets or exceeds all PMCL and SMCL standards
Develop strategy for compliance with backflow prevention project
Reporting participation
Increase reporting participation compared to FY14 to greater than 60%
Sanitary sewer inspections and maintenance
Sewer main backups
Fewer sewer main line backups than reported in FY14
Develop strategy to increase residential recycling rate
Pounds of recyclables collected per household and residential participation rate
408 lbs per household per year (102/qtr) and 68% participation rate
Develop strategy to reduce volume of waste entering landfill
Tons of refuse collected per account
.97 tons per year (485 pounds per household per
Amend stormwater management ordinance
Reduction in pollutant loading 1% reduction compared to FY14

POLICY AGENDA AND PERFORMANCE MEASUREMENT – FY15
29
Quality of Life The foundation of a strong community exists in Germantown as a result of common community values and natural assets. Residents take ownership of the community and contribute time and resources to community betterment. The City’s top quality parks, preserved open spaces and natural areas provide a beautiful setting for residents to live, work, relax and play. A wide variety of leisure and cultural activities are available through Germantown Community Library Germantown Athletic club and the Germantown Performing Arts Centre. The ultimate goal is to add value to the lives of Germantown residents. Goals Key Indicators • Vibrant community • Resident participation • Lifelong learning • Community investment • Parks, green spaces and natural areas • Citizen satisfaction Strategic Objective Performance Measure Target Healthy initiative for residents Develop and implement Healthy
Germantown initiative Launch Healthy Germantown initiative by October 1, 2014
Develop in-house proposal and RFP documents for operation of Germantown Community Library
Complete financial analysis and design work system
Complete by February 1, 2015
Examine the need to expand GPAC
Assess feasibility of GPAC expansion
Consensus on plans by February 1, 2015
Examine the need to physically expand Germantown Community Library
Determine the demand for expansion
Consensus and conclusion by June 30, 2014
Develop plan and cost analysis for GAC renovations
Completion of design and architecture plans for Germantown Athletic Club improvements
Complete by October 1, 2014
Provide opportunities for businesses, organizations and residents to contribute resources
Sponsorship and in-kind donations
Increase contributed resources over FY14 by 2.5% which would generate $974,331 donated to the City of Germantown for FY15
Provide opportunities for stakeholders to contribute resources
Number of volunteer hours
Increase volunteers hours by 5% over FY14
Develop a process to benchmark Germantown Community Library with public libraries statewide
Evaluate the Library using typical public library measurements based on annual Tennessee Public Library Survey results
Rank in the top ten public libraries in Tennessee by HAPLR
Survey GPAC patrons to determine program satisfaction
Patron satisfaction with GPAC programs
85% of survey respondents satisfied with programs
Survey parks and recreation participants to determine satisfaction levels
Level of overall satisfaction reported by Parks and Recreation participants
90% or higher
Maintain the use of the parks, playgrounds, and athletic fields rating index
Community survey satisfaction rating for “maintenance of city parks and open spaces” (Q49)
93% of respondents report being somewhat or very satisfied

POLICY AGENDA AND PERFORMANCE MEASUREMENT – FY15
30
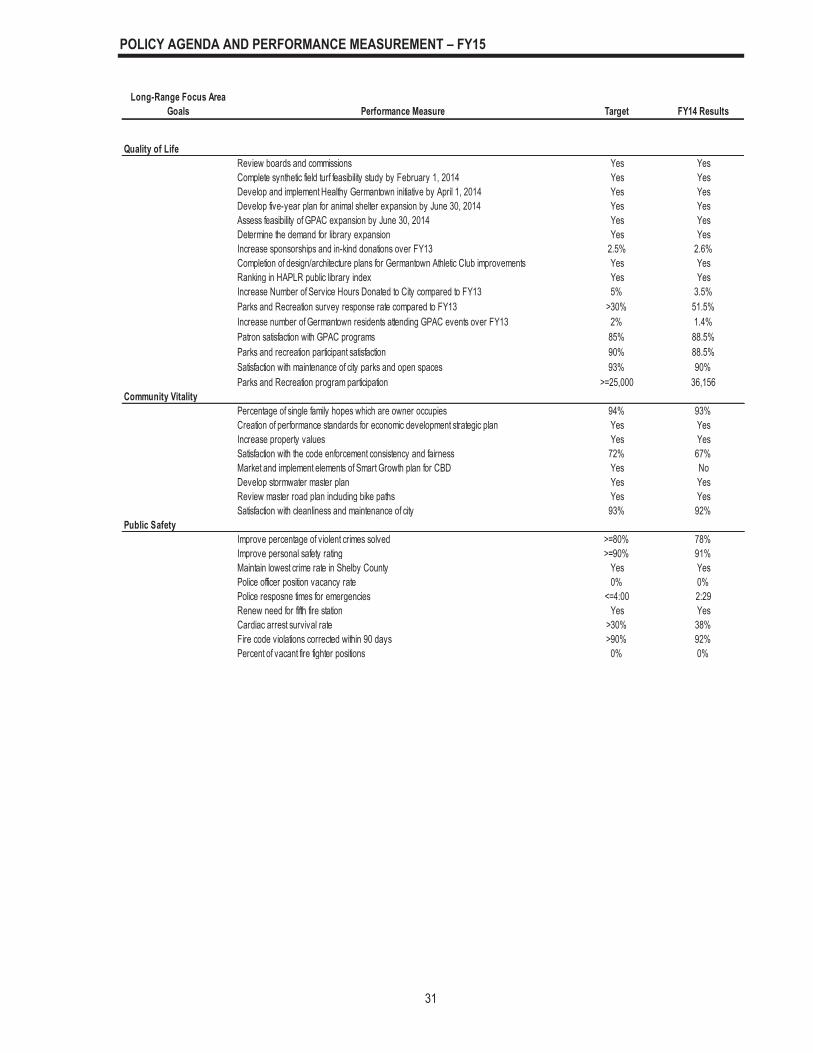
It is not enough to simply provide good customer service; the City of Germantown continually strives to improve overall value to its citizens. Business planning is a basic step to understanding how departments operate and provides a framework to examine alternatives to “business as usual”. Performance measures are the core of any results-based business planning and budgeting system. Thus, the City’s business planning process has a specific focus on performance measurement linking to the desired outcomes and performance measures in the City’s Strategic Plan. Departments monitor the need for change in performance measures as their operating environment evolves. Results-based business planning and budgeting is a process that directly connects resource allocations to specific measurable outcomes. Budgets are used to drive the progress and leverage accountability, rather than maintaining the status quo. This system provides policy makers with the tools they need to respond more effectively to what the community wants, as well as provide them with the political support that is needed to make tough choices. The City of Germantown’s performance management and strategic planning approach consists of identifying organizational strategies based on the Board of Mayor and Aldermen’s focus areas, then translating the strategy through Key Business Units. Performance measures are reviewed during the budget process to ensure that target goals are current with the BMA Policy Agenda. Changes were made to reflect each department’s evaluation of past service results and new program changes. Performance measures are reported quarterly along with a year-end report summarizing the fiscal year’s performance on an annual basis, which is distributed to elected officials and all levels of city management. These reports spotlight the level of service and allow for appropriate changes in staffing, funding allocations and delivery of service levels. In addition to these yearly reports, the City produces a PAFR to inform citizens about financial indicators and performance. Performance Measures are included in each department section. The chart below and on the following page lists the Focus Area performance measures for each of the BMA long-range goals. During FY10 the City contracted with ICMA (International City/County Management Association) to train our staff in developing meaningful performance measures that are used to benchmark with other comparable cities across the country.
Long-Range Focus Area Goals Performance Measure Target FY14 Results
PEG Funds received on a quarterly basis Increase IncreasedDevelop a government service fellows program Yes NoEstablish frame work for municipal school system Yes YesPension obligations as a percentage of salaries and wages <=12% 9%Maintain Triple A bond rating Yes YesBudget vs actual expenses and revenues 1% 1%Overall job of providing high quality services >85% 90%Increase satisfaction of value of city services for tax dollars paid 1% -4%
Reduce kilowatt usage compared to FY13 -1% 0.29%Reduce fuel usage compared to FY13 -1% 3.2%Reduce natural gas usage compared to FY13 -1% -12.96%State water quality report score >97% 99%Increase backflow reporting participation compared to FY13 >60% 65%Fewer sewer main back ups compared to FY13 <5 2Increase pounds of recyclables collected per household 408 lbs/year 367 lbs/yearReduce polluntant loading compared to FY13 -1% -1%
City Services and Finance
Environmental Quality
POLICY AGENDA AND PERFORMANCE MEASUREMENT – FY15
31
Long-Range Focus Area Goals Performance Measure Target FY14 Results
Review boards and commissions Yes YesComplete synthetic field turf feasibility study by February 1, 2014 Yes YesDevelop and implement Healthy Germantown initiative by April 1, 2014 Yes YesDevelop five-year plan for animal shelter expansion by June 30, 2014 Yes YesAssess feasibility of GPAC expansion by June 30, 2014 Yes YesDetermine the demand for library expansion Yes YesIncrease sponsorships and in-kind donations over FY13 2.5% 2.6%Completion of design/architecture plans for Germantown Athletic Club improvements Yes YesRanking in HAPLR public library index Yes YesIncrease Number of Service Hours Donated to City compared to FY13 5% 3.5%Parks and Recreation survey response rate compared to FY13 >30% 51.5%Increase number of Germantown residents attending GPAC events over FY13 2% 1.4%Patron satisfaction with GPAC programs 85% 88.5%Parks and recreation participant satisfaction 90% 88.5%Satisfaction with maintenance of city parks and open spaces 93% 90%Parks and Recreation program participation >=25,000 36,156
Percentage of single family hopes which are owner occupies 94% 93%Creation of performance standards for economic development strategic plan Yes YesIncrease property values Yes YesSatisfaction with the code enforcement consistency and fairness 72% 67%Market and implement elements of Smart Growth plan for CBD Yes NoDevelop stormwater master plan Yes YesReview master road plan including bike paths Yes YesSatisfaction with cleanliness and maintenance of city 93% 92%
Improve percentage of violent crimes solved >=80% 78%Improve personal safety rating >=90% 91%Maintain lowest crime rate in Shelby County Yes YesPolice officer position vacancy rate 0% 0%Police resposne times for emergencies <=4:00 2:29Renew need for fifth fire station Yes YesCardiac arrest survival rate >30% 38%Fire code violations corrected within 90 days >90% 92%Percent of vacant fire fighter positions 0% 0%
Public Safety
Community Vitality
Quality of Life

FINANCIAL POLICIES
32
By resolution of the Board of Mayor and Aldermen on June 28, 2004 the following policies were adopted to provide guidance to Administration in budgeting, long-range planning and financial management of the City’s operations designation for the General Fund fund balance.
I. Operating Budget
The operating budget will be based on the principle of financing current expenditures with current revenues or accumulated reserves. Operating expenditures will not be directly supported by debt or federal and state transfer proceeds. Expenditures shall include adequate funding for retirement systems and adequate maintenance and replacement of capital and operating assets. Budgeted expenditures shall reflect the City’s perceived needs and desires of the community based on current surveys and long-range planning. The budget will also be based on generally accepted accounting principles as promulgated by the Governmental Accounting Standards Board. The budget basis will conform to the accounting policies contained in the Comprehensive Annual Financial Report, Note 1 – Summary of Significant Accounting Policies. The form of the budget will include five-year projections of revenues and expenditures based on a program orientation, which includes measurement of performance, full cost absorption, adequate provisions for debt service and depreciation where applicable. The budget presentation will include analyses of cash flow, capital position and debt capacity. Semiannually, there will be a comprehensive review of the operations to date in comparison to the existing budget. Projections of remaining revenues and expenditures for the year will be made and reviewed by the City Administrator, Mayor, and the Financial Advisory Commission and appropriate adjustments will be recommended to the Board of Mayor and Aldermen.
II. Revenues
The operating budget will be developed with the objective of funding all well justified program goals, while avoiding major per capita tax increases. The City will strive to diversify the revenue base, reducing its dependency on property taxes and intergovernmental transfers. The City will maximize the availability of revenue proceeds through aggressive collection and investment policies and proper timing of cash disbursements. User fees will be developed and continually reviewed to ensure that they recover the cost of services that are not universal to all taxpayers. In Proprietary Funds, user fees will provide full coverage of direct and indirect costs including depreciation. In the Recreation Fund and the Pickering Center Fund, user fees will be maintained at a level to cover operating costs.
III. Fund Balance
General Fund: The operating budget will provide funding of commitments necessary to the continued financial health of the City. In compliance with generally accepted accounting principles, the following four areas are defined as Commitments of the General Fund fund balance in the City’s financial statements.
Emergencies and Catastrophes – provide funds to meet major, unforeseen, infrequent, catastrophic or emergency requirements, and are to be maintained at a level of $900,000. This amount also provides funding of a risk management program, whereby the City obtains insurance contracts for catastrophic losses, but maintains relatively high deductible or retention limits on operating equipment and maintains no insurance contracts on certain exposures. Infrastructure Replacement – commits the following year’s funding for the replacement, reconstruction or refurbishment of City assets consisting of, but not limited to, city buildings, parks, streets, curbs, and sidewalks and operating equipment on a pay-as-you-go basis.

FINANCIAL POLICIES
33
Tax Anticipation – supplements operating cash flows to avoid liquidity problems, which might necessitate the issuance of Tax Anticipation Notes. The funding commitment is to be maintained at a level of one-third of property tax revenues for the following year. Debt Service – establishes a funding commitment to meet total debt service requirements for the following year. Utility Fund: The operating budget will provide funding of certain reserves considered necessary to the continued financial health of the Utility Fund. These two reserves are reflected in the City’s annual budget as unrestricted net assets of the Utility Fund.
Operations – the unallocated cash balance in the Utility Fund will be maintained at a 90 day reserve level, not including debt service. This level was established to ensure reserves equal to three months of operating expenditures to meet cash flow requirements. Debt Service – the unallocated cash balance in the Utility Fund will maintain debt service coverage of two years of annual debt service.
IV. Capital Improvements Program
The Capital Improvements Program (CIP) will reflect a consensus of the perceived needs and desires of the community based on current surveys and long-range planning. The CIP will be cognizant of the financial impact on the applicable fiscal year and the City’s past, present and future goals. The CIP will generally address those capital projects used for the acquisition or construction of major capital facilities.
The City will update and adopt annually a six-year CIP, including the annual Capital Improvements Budget (CIB) and a five year projection of capital needs and expenditures which details the estimated cost, description and anticipated funding sources for capital projects. Projections may be made for future projects exceeding the six-year CIP timeframe. The plan will include costs that have been estimated including consideration for inflation. The inflation rate will be determined annually in the budget process and will be disclosed in the capital budget report.
The first year of the six-year CIP will be the basis of formal fiscal year appropriations during the annual budget process. As part of the annual budget process, the CIP will be evaluated and adjusted with changes in priorities. The Mayor and City Administrator will review the CIP quarterly and if new project needs arise during the year, a budget adjustment identifying both the funding sources and project appropriations must be presented to the Board of Mayor and Aldermen (BMA) for approval. The approval must occur before active progress is made on the planning, design, or construction of the project. Projects may be granted exceptions as to promptly resolve any dangers to the community.
Projects involving development contracts brought before the Board of Mayor and Aldermen for approval during the operating year will identify proposed sources of funding and impacts to CIP funding, in particular, the General Fund Operating Reserves.
Each capital project will have a “sunset provision” enforced at the end of the fiscal year, which can only be lifted by resolution adopted by the Board of Mayor and Aldermen. Projects will be monitored to ensure compliance with CIP Policy and Procedures. Projects will be entered into a timeline to produce a CIP schedule. Post-project evaluation reports will be used to determine the successfulness of a project. A contingency amount of $250,000 will be budgeted annually to meet minor, additional needs not specifically provided for in the current capital budget. The contingency amount is budgeted in the CIP Contingency Account. The Financial Advisory Commission and the Board of Mayor and Aldermen will review this fixed level of funding annually.
Evaluation Criteria In order for a project to be considered in the CIP, an application shall be submitted for evaluation. A CIP Committee will be developed to assist in the review of project applications. The CIP Committee will use the following criteria to evaluate each capital project:

FINANCIAL POLICIES
34
1. Conforms to the City’s Strategic Plan 2. Supports the BMA Policy as adopted in January of each year 3. Promotes safety and security 4. Requirements to meet federal or state mandates 5. Savings in operating, capital spending or energy consumption 6. Impacts to future operating costs 7. Enhances economic development or adds to the tax base 8. Availability of federal or state funding assistance 9. Deferring will have possible significant implications for the community 10. Maintains a current level of service 11. Relates to another high priority project or is a continuation of a project currently under way 12. Improves the quality of existing services to safety 13. Replaces or maintains a capital asset 14. Creates a disruption or inconvenience to citizens 15. Benefits a large amount of stakeholders 16. Carries risk or uncertainty 17. Protects or contributes to the history of the City
Financing The two basic approaches to funding capital projects are pay-as-you-go and pay-as-you-use. Pay-as-you-go means paying for the capital project out of current revenues at the time of expenditure. Pay-as-you-use means borrowing to finance the expenditure with debt service payments generated from revenues raised through the useful life of the project. The CIP will use a combination of these two financing methods. Capital projects are funded through bonds, reserves, grants, developer contributions and other governmental sources. The average maturity of general obligation bonds will be at or below 20 years. Pay-as-you-go financing for capital projects must account for at least 25% of capital plan funding. The City will maintain its physical assets at a level adequate to protect the City’s capital investment and to minimize future maintenance and replacement costs. The budget will provide for the adequate maintenance and the orderly replacement of capital plant and equipment from current revenues where possible. Future maintenance or replacement costs will be factored into future years CIP as a result of the entry of a new project. The Capital Improvements Program (CIP) will reflect a consensus of the perceived needs and desires of the community based on current surveys and long-range planning. The City will develop and maintain a CIP to control capital projects over a six-year planning period coordinated with the operating budget. The CIP will be designed to protect the City’s investments in capital and operating assets through timely and adequate maintenance and replacement of those assets. The Mayor and City Administrator will review the CIP quarterly and recommendations for amendments will be made to the Board of Mayor and Aldermen. Projects involving development contracts brought before the Board of Mayor and Aldermen for approval during the operating year will identify possible sources of funding and impacts to CIP funding, in particular, General Fund Operating Reserves. The CIP will monitor projects in progress to ensure timely completion or the substitution of alternative projects.
V. Debt Management and Investment Polices
Debt will be used to finance long-lived capital and operating assets within the constraints of maintaining or improving bond ratings and debt service quality. Debt management will provide for the protection of bond ratings, the maintenance of adequate debt service reserves, compliance with debt instrument provisions and appropriate disclosures to investors, underwriters and rating agencies. Investments of the City will be made and collateralized in accordance with Tennessee Code Annotated. Investment management will strive to maximize investment return on the City’s funds through pooling of funds where permitted, frequent market analysis; cash forecasting procedures and competitive bidding.

FINANCIAL POLICIES
35
A separate detailed investment policy “Policy Letter No. 27” has been revised and made current by the subcommittee of the citizen based Financial Advisory Commission for the city during calendar year 2004. The policy letter addresses in greater detail the administrative involvement into City investments. The policy defines appropriate criteria guidelines for the selection of financial institutions and investment instruments as authorized under Tennessee Code, staying mindful of cash flows and investment risk when matching length of maturities.
Types and Use of Debt
Uses of Debt
To ensure sustainability, City staff identifies new construction projects, infrastructure replacement or major asset acquisitions through its multi-year Capital Improvements Program (CIP). This process of long-term planning is performed in conjunction with the annual budget process and reflects the Board’s visions and goals for capital improvements to the City. Early identification of future capital needs allows the City more time to assess various financial alternatives and to plan the use of debt financing more effectively. The City will assess all financial alternatives for funding capital improvements, but initially, pay-as-you-go financing will be considered before issuing any debt. Pay-as-you-go financing may include: current revenues and unreserved fund balances; grants from federal, state and other sources; private sector or developer contributions; public/private partnerships; leasing payments. Once the City has determined the available "pay-as-you-go" funding, the City may consider debt to finance the balance of approved capital projects.
When debt financing is considered, the City’s policy is to issue debt for the acquisition or construction of major capital assets or infrastructure with a useful life of not less than ten (10) years. With the exception of unanticipated capital expenditures, the acquisitions or projects financed with debt will be well identified and analyzed in the CIP. Projects eligible for funding with debt include, but are not limited to, libraries, public streets and bridges, administrative facilities and equipment, public safety facilities and equipment, parks and recreational facilities, storm water drainage and treatment facilities and drinking water treatment and distribution facilities.
Under certain circumstances, the City’s financial interests will best be served by the prepayment or refinancing of existing debt. Because many factors could influence this decision, the City’s staff and advisors will periodically (at least annually) review all outstanding debt to determine refunding or prepayment opportunities. In general, refundings (or debt prepayments) will be considered if and when there is a net economic benefit from the transaction. Subject to a review of the transaction by the Tennessee Comptroller’s office (Division of Local Finance), targeted savings (net of all transaction costs) for advance refundings will be a net present value savings of a least four percent (4%) of the refunded debt. Notwithstanding the targeted savings, other factors will be considered on a case-by-case basis to determine if a refund, prepayment or other modification of existing debt is warranted or will be beneficial to the City. Types of Debt When the City’s determines that the use of debt is appropriate for funding, the form of the debt will be evaluated according to the criteria for various types of debt. The typical types of debt financing are listed in order as most commonly used by the City and are described herein: General Obligation Bonds. The City may issue general obligation bonds to finance approved capital projects that otherwise lack a dedicated revenue stream from operations. This long-term debt has the “full faith, credit and taxing power” of the City pledged to the repayment of the bonds and typically has the lowest interest cost for long-term capital. Generally, this debt will be issued for capital projects with a useful life of at least ten (10) years and a combined cost (for the funded projects) of at least three million dollars ($3,000,000). [Note: It is intended that any issuances of debt refunding bonds be combined with general obligation bonds (or revenue bonds, described below) in order to meet the targeted $3 million minimum issuance and to maximize the value of the issuance costs.] Revenue Bonds. The City may issue revenue bonds to finance approved capital projects (equipment and facilities) that have a useful life of at least ten (10) years and have a dedicated revenue stream as part of a separate enterprise fund (e.g., Utility Fund). It is fully intended that the debt will be repaid by the revenue

FINANCIAL POLICIES
36
generated by the enterprise fund. However, the revenue bonds may be issued with the City’s “full faith” backing as approved by the Board of Mayor and Aldermen based on economic and financial considerations. Special Assessment and Incremental Tax Revenue Bond. Specific to projects under the City’s Public Private Partnership Policy or other economic development initiative, the City may issue special assessment or incremental tax revenue bonds as part of the financing of the overall development project. Generally, these projects will be of significant size and scope encompassing major capital developments so that issued debt will be at least five million dollars ($5,000,000) with the useful lives of assets not less than twenty (20) years. It is intended and expected that any special assessment or incremental tax revenue bonds will be issued by a separate legal entity such as the Industrial Development Board (IDB) of the City of Germantown, Tennessee (a public benefit corporation chartered under Tennessee law) but will not be issued with the City’s “full faith” backing. Any bonds issued by the IDB will be subject to approval by the Board of Mayor and Aldermen, therefore it is intended that the IDB will be subject to the general guidelines and procedures included in this Debt Policy. Capital Outlay Notes. Under the provisions of T.C.A. Section 9-21-101 et seq., the City may issue capital outlay notes, a simpler and usually less expensive form of general obligation debt that is often structured as a loan from local banks. Subject to approval by an agency of the Tennessee Comptroller’s Office, this debt funding may be provided for approved capital equipment and projects with a useful life between three (3) and twelve (12) years and a total project cost of not more than three million dollars ($3,000,000). Other Financing Types. If it is determined in the best interest of the City after consulting with financial advisors, appropriate commissions or other stakeholders, and subject to required approvals by the City’s Board, the City may issue other forms of debt (including capital lease or installment financing). This section is not intended to circumvent the issuance process for other types of debt funding but merely recognizes that a simpler type of debt may be more cost effective under certain circumstances. Debt obligations of this type will not exceed two million dollars ($2,000,000) during a fiscal year with a maximum term not to exceed six (6) years. Debt Limits and Affordability Consistent with the stated objectives of this Debt Policy financial and economic indicators have been devised to reasonably measure the City’s debt capacity and establish maximum debt limits or limits of affordability. While recognizing the City’s need to access debt capital under a wide variety of obligations or changing circumstances, it is fully intended that the indicators of affordability provide measures that reflect the constantly changing dynamics of the population, the tax base and the economic environment. Likewise, it is intended that these measures are viewed and projected in conjunction with the City’s Capital Improvement Program in order to identify potential limitations or an unfavorable impact on future operations. The following benchmarks (financial or economic indicators) are devised to establish not only limits on the total debt but also the City’s ability to repay outstanding debt over future periods. These limits of affordability include:
1. Net Debt Service to General Fund Expenditures – a measure of the debt service as a percent of the
City’s total operating expense. A percent not to exceed: 12% Net Debt Service will include all debt service costs (principal and interest) related to general obligation or
other secured debt (but not including business enterprise debt with proven revenues) paid from the City’s general fund.
2. Direct Debt to Assessed Property Value – a measure of the debt liability to the City’s total assessed
values for property taxes. A percent not to exceed: 4% Direct Debt will include all general obligation debt and any business enterprise debt secured by the City’s
taxing authority. 3. Direct Debt Per Capita – a measure of debt liability to the City’s population.
FINANCIAL POLICIES
37
An amount not to exceed: $1,500 Direct Debt will include all general obligation debt and any business enterprise debt secured by the City’s
taxing authority. 4. Per Capita Debt to Per Capita Income – a measure of the debt liability for the City’s population as a
percent to their annual income. A percent not to exceed: 3% Per capita income from published sources and Direct Debt Per Capita calculated above.
Notwithstanding the measures established herein, this policy ultimately seeks to maintain the highest credit quality (triple-A) established by the national rating agencies due to easier access to capital and the lower overall cost for debt. Recognizing that these same measures are utilized by the rating agencies, the City’s policy will be adapted to ensure that its debt limits and measures of affordability do not exceed the levels necessary to maintain the highest quality rating for its debt.
This policy requires that these measures and limits of affordability be fully analyzed when evaluating the issuance of new or refunding debt in order to determine the financial impact of the additional debt on future periods. The analysis described herein will be made part of the information or presentations provided to the Financial Advisory Commission (FAC) and the Board of Mayor and Aldermen as outlined in this policy. Periodic monitoring and reporting of these debt measures will also be performed as part of the City’s annual budget preparation. During the annual budget process, the fiscal year budget information presented for review to the Financial Advisory Commission and the Board of Mayor and Aldermen will include the current and projected analysis of these debt measures. Debt Issuance Process Once the City determine that debt will be utilized to fund an approved capital project or acquisition, the Finance Director and City Treasurer will assemble the staff resources and service professionals needed to prepare, analyze, document and close the debt transaction. The type, complexity, and size of the debt to be issued will determine the staff requirements and service professionals required. The various considerations that must be addressed at the onset to ensure the proper planning and execution of the debt issuance process are discussed herein. Timing of the Transaction The City will determine the optimal timing for issuing or placing the debt based on the requirements identified in the CIP, the funding forecast developed in the budgeting process, and the actual cash flow projected for the construction or acquisition of the capital asset. Once the targeted debt issue date is determined, the City Treasurer will determine the necessary lead times to identify the type of debt to be issued, engage the appropriate professionals, analyze payment structure and estimated rates, and then schedule the various commission, public and Board presentations. Timing of the debt issuance will ultimately be determined by mandated public notice and necessary Board approvals. Sale Method or Placement Competitive Sale The City believes that the competitive sale process is the best tool for obtaining the lowest interest rates and terms for the issued debt. Therefore the City will always use the competitive sale process to sell its general obligation or revenue bonds (including capital outlay notes), except in situations where (1) existing disruptions in the national capital markets make it unlikely the City will receive at least three (3) reasonable bids for its bonds, or (2) the general obligation debt is in the form of a loan agreement through a federal or state sponsored loan program.
FINANCIAL POLICIES
38
Negotiated Sale Notwithstanding the strong preference for issuing debt using the competitive process, the City recognizes that some debt is best sold through negotiation. In such instances, the City shall assess the following circumstances or conditions when considering a negotiated sale: (1) express statutory authority; (2) a structure which may require a strong pre-marketing effort such as a complex transaction or new credit; (3) size of the issue; (4) market volatility; and (5) variable rate pricing. To ensure full transparency of any debt issuance, the use of the negotiated sale process will not reduce the analysis of the transaction by staff and professionals nor limit the public information and participation during the debt approval process. Private Placement For certain capital transactions, the City may elect to privately place the debt issued as part of the transaction (e.g. installment transactions or capital leases). Such placement will be acceptable if the method clearly demonstrates that such transaction will be in the best interest of the City due to cost savings or other favorable transaction terms.
Use of Professionals As part of the debt issuance process, the City will engage the services of knowledgeable professionals to analyze and advise City staff about optimizing the outcome of the transaction and clearing all the legal hurdles. Due to the infrequency of issuing new debt, the City will maintain its expertise in the credit markets by retaining professionals who stay well-informed about industry trends and about the City’s visions and finances. The Professional Services section this policy will more fully describe the details of the relationship with the professionals named herein. City Attorney The City Attorney will review, advise, and prepare debt-related documents on behalf of the City for simple borrowings that do not involve the public debt market. In the case of debt structures that directly access the public debt market, the City Attorney will provide support to staff and bond counsel about the City’s legal status and authority for issuing the debt. In addition, the City Attorney will provide an opinion that the debt was issued within the applicable debt limitations set by State law or the City’s charter, that the City has taken all steps necessary to authorize the sale and issuance or debt, and that the debt is a valid and binding obligation of the City (if applicable). Bond Counsel For all sales of debt in the public debt market, the City will engage a specialized bond counsel with specific experience in the issuance of municipal debt. The bond counsel will prepare all legal documents related to the issuance of the public debt including the legal documents necessary for the City to authorize the issuance of debt. In addition, the bond counsel must be fully competent to provide an unqualified opinion as to the tax-exempt or tax credit status of applicable debt issued and to prepare, review, or comment on all disclosure documents and regulatory forms or applications associated with the transaction. Financial Advisor For all debt transactions in excess of $1 million or for all sales of debt in the public debt market, the City will select a financial advisory firm to assist in the issuance and administration of the City’s debt. The firm selected to serve as financial advisor will provide objective advice and analysis, maintain the confidentiality (to the extent permitted by law) of the City’s financial plans and be free from any conflict of interest as defined in this Debt Policy and Tennessee statutes. Further, the City’s financial advisor will not underwrite or participate in any syndicates in the sale of the debt. Underwriters In a competitive sale of debt, the City and its financial/legal advisors will set the business and legal terms for the financing and then take public bids from qualified underwriters in a generally accepted auction setting. The firm (or syndicate) that submits the lowest true-interest-cost bid will be awarded the bonds and serve as underwriter (or senior manager of the syndicate). In the case of a negotiated sale of debt, the City will first select a firm to market its debt from a pool of qualified underwriters. The City’s appointment will be based upon a competitive evaluation of objective criteria, which may include the firm’s performance in the City’s past competitive sales of debt. The City’s selection of the underwriter
FINANCIAL POLICIES
39
will be subject to review and recommendation by the Financial Advisory Commission (FAC) and approval by the Board. Registration/Escrow Agent In the case of debt issued in the public debt market, the City will designate a bond registrar and paying agent (known at the “Registration Agent”) to maintain books and records necessary for the registration, record-keeping and transfer of bonds on behalf of the City. In addition, the Registration Agent will act as pay agent for the City and will be authorized to make all payments of principal, interest, and redemption premium, if any, with respect to the issued bonds. In the case of debt that is issued for the purpose of refunding currently outstanding bonds at the time of debt issue or in the near future, the City will designate an agent (known as the “Escrow Agent”) to hold funds in escrow for the express purpose of performing the refunding. The City and Escrow Agent will enter into an agreement (the “Escrow Agreement”) that authorizes the Escrow Agent to perform duties on behalf of the City with respect to the acquisition and payment for the refund bonds. Board Approval All debt financing that constitutes an obligation beyond one fiscal year will be presented for review by the FAC as described in this policy. At the completion of the FAC’s review of the proposed debt issuance, and with the FAC recommendation, the debt transaction will be presented to the Board for approval of the resolutions required to authorize the debt issuance. In the absence of a quorum of the FAC, the Finance Director may present the transaction directly to the Board for consideration. Compliance Reporting It is the City’s intent to provide a high level of transparency in all of its financial dealings, including debt management. Consistent with past practice, the City will issue on a timely basis and make widely available all financial reports including the annual budget, the Comprehensive Annual Financial Report (CAFR), the Popular Annual Financial Report (PAFR), and the Capital Improvements Program Report (CIP). In addition, as part of the issuance of debt in the public markets, the City covenants and agrees that it will comply with and carry out all of the provisions of the continuing disclosure certificate, which includes providing annual reports to national repositories and issuing material event notices in accordance with SEC Rule 15c2-12. Terms of the Debt Issue During the course of issuing debt, the City will endeavor to structure the terms and conditions of each debt transaction to achieve a low cost of capital and to preserve the City’s overall financial flexibility. Maintaining financial flexibility enables the City to readily access and restructure its financing at a low cost. (Likewise, the City can avoid financial distress in the face of negative shocks or readily fund capital investments when opportunities arise.) Adherence to the policies in this section is not intended to override the requirement that the City stay within the overall limits of the entire debt portfolio addressed in Debt Limits and Affordability. However, the policies herein will address the individual components of all financing that have the most immediate impact on the City’s credit rating and debt service payments. Maximum Maturity All capital improvements financed through the issuance of debt will be financed for a period not to exceed the useful life of the improvements, but in no event will the term of the debt financing exceed twenty (20) years. As part of this process to determine the maximum maturity of a debt issue, the City must consider the need to allocate the capital burden to upcoming generations (i.e. future fiscal periods) as opposed to funding from currently available sources. The City will measure the future financial impact of the financing’s debt service (principal and interest) by projecting the estimated percentage of the future budgets dedicated to total debt service. Analysis of the future debt capacity will be performed in order to assess the City’s commitment to a pay-as-you-go budget allocation for capital projects.

FINANCIAL POLICIES
40
Maturity Schedule Debt issuance will be planned to achieve relatively level debt service for each individual debt issue, while still matching debt service to the useful life of projects financed. The terms and life of each debt issue, including the detail of expected principal and interest payments, will be prominently disclosed when terms of the issued debt are published or otherwise made available to the public (through websites, e-mails, or other electronic means). The City will avoid the use of bullet or balloon maturities except in those rare instances where these maturities serve to make existing overall debt service level or match a specific income stream. Any deferral of principal payment or backloading must be explicitly disclosed and justified, including disclosure of the justification or recommendation made by the Financial Advisor for the principal deferral. Interest Rates To maintain a predictable level of debt service and to avoid future uncertainty, the City will issue debt that carries a fixed interest rate. Under certain limited conditions, the City may consider variable rate debt subject to additional analysis and recommendations by the Financial Advisor that the tradeoff between costs and risks is not unreasonable. Further, the City will employ cost effective measures (rate swaps, credit enhancements, etc.) to minimize risks associated with variable rate debt. If utilized, the total amount of variable rate debt issued will not exceed twenty-five percent (25%) of the City’s total outstanding debt at the time of issue. Bond Coupon Rate For most bond issuances, the City’s will set interest rates so that each bond maturity in a bond issue eligible for early redemption is priced between 95% and 110% of par. In certain market conditions, bonds issued with a deep discount may provide the City with a lower cost of borrowing. Subject to additional analysis and recommendations by the Financial Advisor, the City will assess the value and effect on any refinancing opportunities as a result of accepting lower-than-market coupons. Call Features In many cases, it is the City’s policy to include a call feature at a date no earlier than ten (10) years from the date of the original bond issuance. Subject to additional analysis and recommendations by the Financial Advisor, the City will assess the value of including a call option relative to the lower interest rate associated with non-callable bonds. Credit Enhancement Facilities Historically, the City has avoided the use of credit enhancement (insurance or letters of credit) because of its strong financial position and excellent standing with the national rating agencies. However, the City will consider the use of credit enhancements on a case-by-case basis, evaluating the economic benefit versus cost for each case. Only when clearly demonstrable savings can be shown shall an enhancement be considered. Issuance Cost As part of the Capital Improvements Program (CIP), the City regularly evaluates future capital project needs and the methods for financing them, including the use of debt financing. The City’s policy is to reasonably coordinate new bond issues to that multiple projects can be accommodated in a single borrowing to reduce issuance costs per dollar of debt issued. Total issuance costs will be evaluated and disclosed during all phases of the debt issue process. Professional Services The City will engage and utilize professional services as necessary to supplement the skills and expertise in the Financial Services Division or to meet regulatory requirements related to the issuance of debt. The selection or hiring of professionals will not be based on competitive bids but will be determined on the basis of recognized competence and integrity in their field of expertise. The Director of the Financial Services Division will determine the criteria for selecting professionals to be utilized in the debt issuance process. The selection criteria will include, but not be limited to, recognized professional expertise, depth of transaction experience, and the opportunity to bring current best industry practices to the City.

FINANCIAL POLICIES
41
Using the defined selection criteria, the Finance Director and Treasurer will interview eligible persons or groups and make specific recommendations to the Division Director for qualified professionals. The City Administrator will concur on all professionals selected by the Division Director.
All professionals engaged in the City’s process of issuing debt will affirm, acknowledge or disclose the following statements or information in an engagement letter, professional services agreement, or a separate writing provided as a matter of record to the City:
- The professional will clearly disclose all compensation and consideration received (or to be received) as related to services provided in the debt issuance process by the City and the lender or conduit issuer, if any. This includes “soft” costs or compensation in lieu of direct payments. - The professional will acknowledge receipt of this Debt Management Policy and will adhere to the standards and guidelines contained herein. - The professional will acknowledge receipt of and familiarity with the details of the “Code of Ethical Conduct for Officials of the City of Germantown” and the “Code of Ethical Conduct for City Employees of the City of Germantown.” - The professional will affirm that they have disclosed any existing client and business relationships as described in this Policy (Conflicts of Interest). Any exceptions, either by the professional or the City, to this Policy or other policies and procedures indicated above, must be clearly disclosed in the engagement letter, professional services agreement, or a separate writing. The City Administrator will determine if the exception requires removal of the professional from the debt transaction or if the exception requires any further disclosure. Specific to certain professionals are the following requirements: Legal Counsel. An engagement letter (or professional services agreement) will be required from each lawyer or law firm that represents or provides services to the City in a debt transaction. (This requirement does not apply to the City Attorney or to counsel not directly representing the City, such as underwriters’ counsel.) Financial Advisor. A professional services agreement or other form of written agreement (engagement letter) will be provided by each person or firm serving as financial advisor in a debt management role or in a debt transaction. In the sale of the City’s debt instruments, whether in a competitive or negotiated transaction, the financial advisor will not be permitted to bid on, privately place or underwrite an issue for which they have been providing advisory services. Underwriter. If the City engages an underwriter in a sale transaction, the underwriter will be required to clearly identify itself in writing (in its proposal, in its bid, or in its submitted promotional materials) as an underwriter and not as a financial advisor. This disclosure will occur at the earliest stages of the relationship with the debt issue. The underwriter will clarify that its primary role as a purchaser of securities in an arm’s-length commercial transaction has financial and other interests that differ from those of the City. Additionally, if the debt is offered in a publicly offered, negotiated sale, the underwriter will be required to provide pricing information (both as to interest rates and takedown per maturity) to the Financial Services Director in advance of the pricing of the debt. Conflicts of Interest The City of Germantown operates as a public trust, which is subject to scrutiny by and is accountable to its residents and members of the public. Consequently, a fiduciary duty exists between the City’s officers/employees and the public which carries with it a broad and unbending duty of loyalty and fidelity. Those officers and employees are responsible for administering the affairs of the City honestly and prudently. They will exercise the

FINANCIAL POLICIES
42
utmost good faith in all transactions involved in their duties, and they will not use their positions with the City or knowledge gained there from for their personal benefit. Separate from this Policy, the City’s officers (who include elected officials and members appointed to commission or boards) and all City employees are subject to strict Codes of Ethical Conduct. These Codes include very detailed standards that prohibit the officer or employee from knowingly engaging in activities that would lead to a conflict of interest with the City. By reference, the City’s existing Codes of Ethical Conduct as applicable to officer or employee conflicts of interest in debt transactions are applicable to the administration of this Policy. Likewise, all professionals involved in a debt transaction who have been hired or compensated by the City are required to disclose to the City any existing client and business relationships between and among the professionals to a transaction (including but not limited to financial advisor, swap advisor, bond counsel, swap counsel, trustee, paying agent, underwriter, counterparty, and remarketing agent), as well as conduit issuers, sponsoring organizations and program administrators. This written disclosure will include information reasonably sufficient to allow the City to appreciate the significance of the relationships. [NOTE: Professionals who become involved in the debt transaction as a result of a bid submitted in a widely and publicly advertised competitive sale conducted using an industry standard, electronic bidding platform are not subject to this disclosure. No disclosure is required that would violate any rule or regulation of professional conduct. However, subject to regulatory agency rules or industry guidelines, these same professionals are required to exercise due care and proper conduct in the debt transaction process.] Therefore, all parties to the debt transaction must be free from conflicts of interest that could adversely influence their judgment, objectivity or fiduciary duty on behalf of the City. Likewise, all parties must be aware that even the appearance of a conflict of interest can weaken or damage the public trust.
Basis of Budgeting
The City does not distinguish between Basis of Budgeting and Basis of Accounting, as reflected in the City’s Comprehensive Annual Financial Report (CAFR). The principles set forth as the Basis of Accounting are strictly observed in the budgetary process. The City budget is prepared on a modified accrual basis of accounting except for encumbrances. Unencumbered appropriations lapse at the end of each fiscal year, with encumbered appropriations being carried forward to the next year. The budgetary process for the City of Germantown begins in January with the Board of Mayor and Aldermen’s annual retreat where its policy agenda is set for the upcoming fiscal year. Early in January, a budget manual is distributed to all departments and divisions, which outlines the budget calendar, submission dates, performance measurement requirements and parameters for budget requests. Six months of actual data for the current fiscal year is given as a basis for departments to submit their estimates for the current fiscal year end. Departments are required to complete their budgetary requests for the new fiscal year and include justifications for any infrastructure, capital and program change requests. The Office of Budget and Performance staff works with departments in reviewing personnel needs. The city administration reviews all requests on the timeframe as identified in the annual budget calendar. All funds, capital programs, infrastructure replacement programs and staffing are presented to the City’s Financial Advisory Commission (FAC). The FAC is composed of citizens who volunteer to serve on the Commission on an annual basis and whose background is within the financial services discipline. The final component of the budgetary process is highlighted in a work session with the Board of Mayor and Aldermen. The Proposed Budget is then presented to the Board of Mayor and Aldermen for adoption through three readings, including a public hearing. Prior to the public hearing, a Budget In Brief brochure is mailed to all citizens. The brochure highlights the major capital and operating projects in the proposed Budget along with a letter from the Mayor. Budgetary Control Formal budgetary accounting is used as a management control for all funds of the City. Budgetary controls are exercised both at the departmental level, with the adoption of the budget, and at the line item level through accounting controls. Additionally, budgetary control is maintained at the program level by the individual departments, acting in conjunction with the Department of Finance and General Services. The latter has a Office of Budget & Performance to execute budgetary controls.

FINANCIAL POLICIES
43
Under provisions of the City's charter, the Board of Mayor and Aldermen annually enact by ordinance the operating budgets of the general, special revenue, capital projects, enterprise and internal service funds, which cannot exceed appropriation except by approval of the governing body. An annual budget for the capital projects is adopted by individual funds. The total budgets of these funds constitute legal spending limits, requiring ordinance amendment. Transfers within the funds are accomplished by resolution of the Board of Mayor and Aldermen to authorize expenditures of various grants received and to adjust the individual fund budgets as required within the total dollar limitations of the budget ordinance. The Mayor may approve transfers between categories within a cost center without the governing body's approval. The Board must approve other transfers or requests for additional funds. Thus, departmental or cost center appropriations comprise a legal spending limit for governmental fund types, except for capital projects funds for which the project length financial plans are adopted. The City disperses its capital projects fund monies to various projects, which may cause a deficit within the project. However, the City adopts a positive Capital Improvements Program where funds can be transferred within the fund with appropriate approval from the governing body. Supplemental appropriations were required during the year and the accompanying budgetary data has been revised for amendments authorized by resolution during the year. The basis of accounting applied to budgetary data presented is consistent with the appropriate basis of accounting for each fund type.
The Capital Projects Funds account for the receipt and disbursement of all resources used in the acquisition and construction of capital facilities where the construction period is expected to exceed one year, other than those financed entirely by Proprietary Fund Types. The primary funding sources are debt proceeds and General Fund transfers. The facilities constructed and assets acquired become a part of the City's fixed assets and are, therefore, recorded in the General Fixed Assets Account Group. The residual equity in Capital Projects Funds, if any, is returned to the General Fund upon completion of the project. The following funds are included in this grouping. The Major Roads Fund includes projects that create, widen or improve roads or intersections. In addition, this fund provides safe and reasonable access to the commercial developments while maintaining a reasonable level of service for traffic using the roadways. The Intersections & Other Fund includes additional intersections and signals for the city or the improvement of the existing ones. The major purpose of this fund is to provide safe and orderly movement of traffic. The Fire Fund contains major objective is to provide adequate fire protection to the city and to maintain the Class 3 insurance rating. The major projects in this fund include the construction of new fire stations, the remodeling or expansion of existing fire stations and major equipment purchases. The Parks Improvements Fund is needed to meet the intensified demand for additional parkland. In addition, growth and development of new parkland is needed to keep pace with the 2004 Plan for parks and recreation. The Drainage Projects Fund includes projects that will provide adequate water supply for existing and future population requirements. In addition, this fund consists of sewer projects, such as the provision of sanitary sewers, which are needed when properties are annexed into the City. The General Government Projects Fund includes miscellaneous projects needed to meet individual departmental demands. The major projects in this fund include the remodeling or expansion of City owned buildings as well as community use buildings and property.

44
FY15 BUDGET CALENDAR
January 1/10/14 Budget Material distributed to Departments
1/13/14 Board Meeting - Budget Calendar review and approval by the Board of Mayor and Aldermen February
2/03/14 Capital Improvements Program (CIP) applications due to CIP Manager 2/07/14 FY15 Budget materials (Revenues and Expenses) and Program Change Request Forms due to
Budget and Performance ( General Fund, Enterprise Funds, Internal Service Funds, Special Revenue Funds, Infrastructure Replacement Program)
2/18/14 Financial Advisory Commission – First Meeting: Introduction, BMA Retreat overview and Environmental Scan
2/20/14 Vehicle and equipment replacement schedule review with City Administrator 2/19-2/28/14 FY15 Budget review with departments
March
3/18/14 Financial Advisory Commission – Second Meeting: Review of FY15 Budget Enterprise Funds (Utility, Germantown Athletic Club, Great Hall, Stormwater and Sanitation)
April
4/01/14 Financial Advisory Commission – Third Meeting: Review of Capital Improvements Program and Infrastructure Replacement Program
4/02/14 Board of Mayor and Aldermen – work session on CIP 4/11/14 Proposed FY15 Budget and Capital Plan delivered to Department Directors for final comment and
review 4/15/14 Financial Advisory Commission – Fourth Meeting: Review of FY15 Special Revenue Funds 4/29/14 Financial Advisory Commission – Fifth Meeting: Review of FY15 General Fund Revenues and
General Fund Expenditures May
5/02/14 Proposed FY15 Budget delivered to Board of Mayor and Aldermen Budget in Brief prepared 5/02/14 Proposed FY15 Business Plans and FY15 Focus Area Cabinet Strategic Plans due to Budget and
Performance 5/07/14 Board of Mayor and Aldermen work session on FY15 Budget 5/12/14 Board Meeting - First Reading on FY15 Budget Ordinance 2014-2
Schedule meetings with Chamber, Homeowner Associations and Civic Clubs; Distribute Budget in Brief; Press Conference; Neighborhood News (Budget and Property Tax Rate)
5/16/14 Document printing RFP due to Purchasing
June
6/09/14 Board Meeting - Public Hearing on FY15 Budget; Second Reading on FY15 Budget Ordinance 2014-2
6/23/14 Board Meeting - Third and Final Reading on FY15 Budget Ordinance 2014-2
EXPLANATION OF BUDGET SUMMARIES FISCAL YEAR 2015
45
This section consists of summaries of the FY15 Budget by major category and by cost center in the six major operating funds: General, Utility, Germantown Athletic Club, Great Hall, Sanitation and Stormwater. It also contains pie charts of General Revenues and Expenditures, CIP Project Listings, Personnel Staffing Schedule, Special Revenue Funds, Internal Service Funds and Fiduciary Funds. TOTAL EXPENDITURE BUDGET – The schedule, which appears on the next two pages, summarizes revenues and expenditures for all fund types by category or nature of revenue and expenditure for FY15. It is compared to the estimated total for FY14. The significant totals are carried forward to the City Administrator’s transmittal letter in analyzing major changes in operating and capital expenditures. The impact to fund balance is also provided. Pie charts illustrate revenues and expenses by General Fund, Utility Fund, Germantown Athletic Club Fund, Great Hall Fund, Sanitation Fund, Stormwater Fund and Special Revenue Fund. GENERAL FUND – The summary of the General Fund Budget is on pages 50 and 51. The details of General and Special Revenues are found in the last section of the document. Expenditures are summarized by cost center and grouped by program. General Fund expenditures that include engineering, public services and information technology services are charged to the Utility Fund, which is reimbursed by the expense reimbursement line of the General Fund Budget Summary. Three years of history, including FY14 and five years of projections including FY15, are presented. The bottom line in this schedule is the ending fund balance for each of the fiscal years. A detail of the General Fund’s fund balance is outlined in this section under the heading Discussion of General Fund Reserves. The General Fund Summary reflects the carry forward resources from prior year revenues, which carries forward prior year expenditure obligations. This change accounts for the variance between ending and beginning fund balance figures. PIE CHARTS – Pie charts are presented for General Fund Revenues and Expenditures in order to demonstrate the proportional relationships of the General Fund Budget. Beneath the pie charts are comparative summaries of major categories of revenues and expenditures by program. Similar pie charts are presented for the Utility Fund, the Germantown Athletic Club and the Great Hall Fund. UTILITY FUND – GERMANTOWN ATHLETIC CLUB FUND – GREAT HALL FUND – SANITATION FUND – STORMWATER MANAGEMENT FUND – These Fund Summaries are presented in the same columnar format as the General Fund Summary. The summaries are designed to accomplish four objectives: 1) to provide a Net Operating Income amount; 2) to provide a projection of Working Capital; 3) to project Fund Equity; and 4) to project Total Net Assets. Revenues are detailed in the last section of this document. Operating Expenditures, including depreciation and interest on indebtedness, are subtracted from Total Revenues to arrive at Net Operating Income. Other adjustments to income, including depreciation and capital outlays, are added to or deducted from Net Operating Income to arrive at an estimation of cash flows. Working capital is defined as current assets less current liabilities at June 30 of each fiscal year. Components of fund equity at each of the fiscal year-ends are also described in these summaries. Contributed Capital in the Utility Fund does not include fees paid to the City by developers for infrastructure constructed by the City, but generally represents subdivision and project water and sewer lines installed by developers.
Governmental Proprietary Fiduciary General Fund General Utility Fund Enterprise Pension Fund Trust Fund Recreation Fund Special Germantown Athletic Club Fund Enterprise OPEB Fund
Cash Balance Fund Trust Fund Trust Fund State Street Aid Fund Special Great Hall Fund Enterprise
Automated Enforcement Special Santitation Fund Enterprise Drug Asset Forfeiture Special Stormwater Fund Enterprise Federal Asset Forfeiture Special Health Fund Internal Service Pickering Fund Special Fleet Services Internal Service Ambulance Fund Special Allocated Expenses Internal Service GMSD Fund Special Farm Park Fund Capital Improvements Fund
Special Capital
List of Major Funds
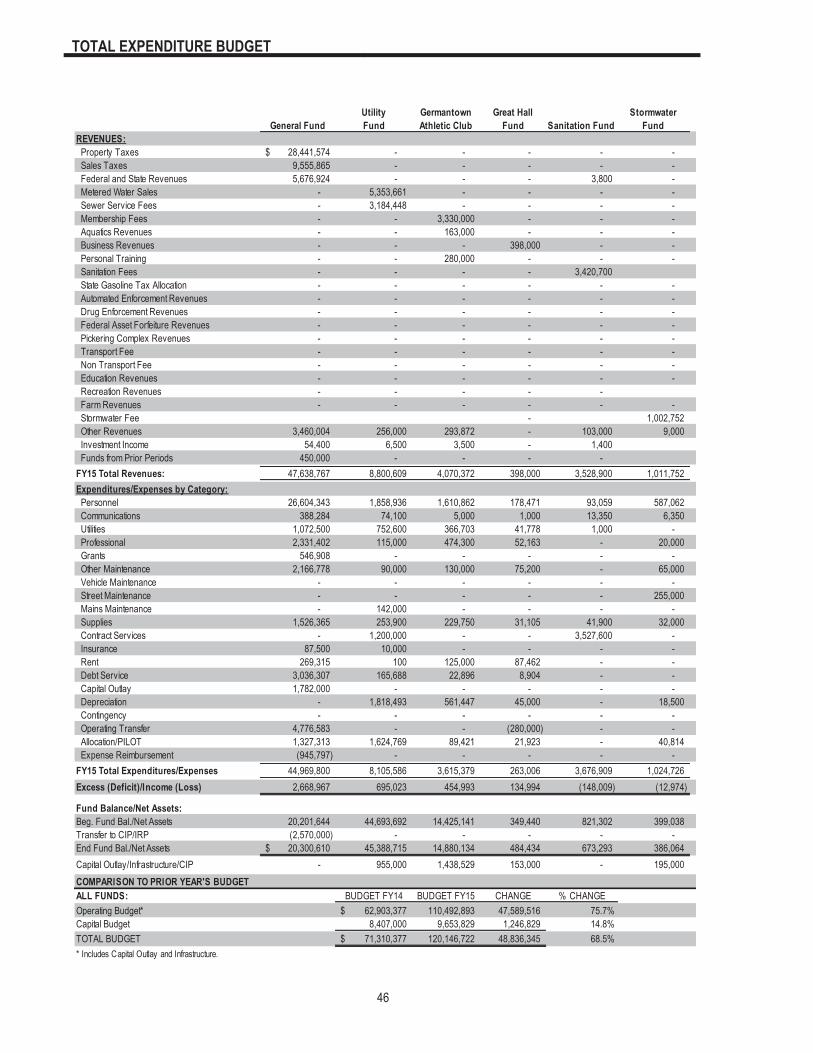
TOTAL EXPENDITURE BUDGET
46
General FundUtility Fund
Germantown Athletic Club
Great Hall Fund Sanitation Fund
Stormwater Fund
REVENUES: Property Taxes 28,441,574$ - - - - - Sales Taxes 9,555,865 - - - - - Federal and State Revenues 5,676,924 - - - 3,800 - Metered Water Sales - 5,353,661 - - - - Sewer Service Fees - 3,184,448 - - - - Membership Fees - - 3,330,000 - - - Aquatics Revenues - - 163,000 - - - Business Revenues - - - 398,000 - - Personal Training - - 280,000 - - - Sanitation Fees - - - - 3,420,700 State Gasoline Tax Allocation - - - - - - Automated Enforcement Revenues - - - - - - Drug Enforcement Revenues - - - - - - Federal Asset Forfeiture Revenues - - - - - - Pickering Complex Revenues - - - - - - Transport Fee - - - - - - Non Transport Fee - - - - - - Education Revenues - - - - - - Recreation Revenues - - - - - Farm Revenues - - - - - - Stormwater Fee - 1,002,752 Other Revenues 3,460,004 256,000 293,872 - 103,000 9,000 Investment Income 54,400 6,500 3,500 - 1,400 Funds from Prior Periods 450,000 - - - - FY15 Total Revenues: 47,638,767 8,800,609 4,070,372 398,000 3,528,900 1,011,752 Expenditures/Expenses by Category: Personnel 26,604,343 1,858,936 1,610,862 178,471 93,059 587,062 Communications 388,284 74,100 5,000 1,000 13,350 6,350 Utilities 1,072,500 752,600 366,703 41,778 1,000 - Professional 2,331,402 115,000 474,300 52,163 - 20,000 Grants 546,908 - - - - - Other Maintenance 2,166,778 90,000 130,000 75,200 - 65,000 Vehicle Maintenance - - - - - - Street Maintenance - - - - - 255,000 Mains Maintenance - 142,000 - - - - Supplies 1,526,365 253,900 229,750 31,105 41,900 32,000 Contract Services - 1,200,000 - - 3,527,600 - Insurance 87,500 10,000 - - - - Rent 269,315 100 125,000 87,462 - - Debt Service 3,036,307 165,688 22,896 8,904 - - Capital Outlay 1,782,000 - - - - - Depreciation - 1,818,493 561,447 45,000 - 18,500 Contingency - - - - - - Operating Transfer 4,776,583 - - (280,000) - - Allocation/PILOT 1,327,313 1,624,769 89,421 21,923 - 40,814 Expense Reimbursement (945,797) - - - - - FY15 Total Expenditures/Expenses 44,969,800 8,105,586 3,615,379 263,006 3,676,909 1,024,726 Excess (Deficit)/Income (Loss) 2,668,967 695,023 454,993 134,994 (148,009) (12,974)
Fund Balance/Net Assets:Beg. Fund Bal./Net Assets 20,201,644 44,693,692 14,425,141 349,440 821,302 399,038 Transfer to CIP/IRP (2,570,000) - - - - - End Fund Bal./Net Assets 20,300,610$ 45,388,715 14,880,134 484,434 673,293 386,064 Capital Outlay/Infrastructure/CIP - 955,000 1,438,529 153,000 - 195,000 COMPARISON TO PRIOR YEAR'S BUDGETALL FUNDS: BUDGET FY14 BUDGET FY15 CHANGE % CHANGEOperating Budget* 62,903,377$ 110,492,893 47,589,516 75.7%Capital Budget 8,407,000 9,653,829 1,246,829 14.8%TOTAL BUDGET 71,310,377$ 120,146,722 48,836,345 68.5%* Includes Capital Outlay and Infrastructure.

TOTAL EXPENDITURE BUDGET
47
Special Revenue
Veh. Maint./ Alloc.
Capital Projects Total FY15
Increase/ Decrease
Estimated FY14
Actual FY13
REVENUES: Property Taxes -$ - - 28,441,574 0.9% 28,183,189 22,895,489 Sales Taxes - - - 9,555,865 34.2% 7,121,648 7,063,632 Federal and State Revenues - - - 5,680,724 15.5% 4,916,813 6,070,654 Metered Water Sales - - - 5,353,661 30.0% 4,118,201 4,118,201 Sewer Service Fees - - - 3,184,448 30.0% 2,449,575 2,449,575 Membership Fees - - - 3,330,000 1.0% 3,296,000 3,191,099 Aquatics Revenues - - - 163,000 -1.7% 165,803 176,066 Business Revenues - - - 398,000 -7.3% 429,222 387,425 Personal Training - - - 280,000 15.2% 243,000 - Sanitation Fees - - - 3,420,700 0.3% 3,412,000 3,410,013 State Gasoline Tax Allocation 1,040,200 - - 1,040,200 0.3% 1,037,205 1,032,696 Automated Enforcement Revenues 58,800 - - 58,800 58700.0% 100 43,910 Drug Enforcement Revenues 350,000 - - 350,000 75.0% 200,000 114,774 Federal Asset Forfeiture Revenues 50,000 - - 50,000 0.0% 50,000 7,440 Pickering Complex Revenues 67,000 - - 67,000 3.9% 64,500 62,965 Transport Fee 835,936 - - 835,936 0.0% 762,474 - Non Transport Fee - - - - 0.0% - - Education Revenues 45,249,713 - - 45,249,713 0.0% 2,023,360 1,779,028 Recreation Revenues 521,910 - - 521,910 187.5% 181,541 197,140 Farm Revenues 35,700 35,700 0.0% - - Stormwater Fee 1,002,752 1.1% 992,270 994,936 Other Revenues - - - 4,121,876 9.8% 3,752,866 4,399,933 Investment Income - - - 65,800 -5.8% 69,817 103,951 Funds from Prior Periods - - - 450,000 - 450,000 - , ,FY15 Total Revenues: 48,209,259 - - 113,657,659 77.8% 63,919,584 58,754,125 Expenditures/Expenses by Category: Personnel 38,845,427 615,122 - 70,393,282 116.6% 32,501,008 31,668,533 Communications 156,685 2,000 - 646,769 37.8% 469,445 424,730 Utilities 1,872,405 12,365 - 4,119,351 34.8% 3,054,826 3,216,618 Professional 2,886,600 - - 5,879,465 74.6% 3,367,464 3,443,177 Grants 13,000 - - 559,908 70.7% 327,957 657,670 Other Maintenance 697,332 123,050 - 3,347,360 28.8% 2,599,619 2,265,018 Vehicle Maintenance - 118,480 - 118,480 -5.2% 125,000 116,886 Street Maintenance 1,850,000 - - 2,105,000 9.1% 1,930,000 1,722,382 Mains Maintenance - - - 142,000 2.9% 138,000 177,703 Supplies 3,146,961 143,550 - 5,405,531 106.3% 2,620,767 1,942,887 Contract Services 632,352 - - 5,359,952 17.6% 4,558,000 4,293,146 Insurance 18,000 616,619 - 732,119 0% 753,820 594,332 Rent 157,300 2,700 - 641,877 44.2% 445,019 353,740 Debt Service - - - 3,233,795 -9.1% 3,557,233 3,728,357 Capital Outlay 1,917,407 - - 3,699,407 98.8% 1,860,648 1,326,803 Depreciation - 36,110 - 2,479,550 4.0% 2,383,440 2,313,568 Contingency - - - - 0% - - Operating Transfer (4,496,583) - - - 0% - - Allocation 287,601 (1,669,996) - 1,721,845 18.4% 1,454,833 1,329,752 Expense Reimbursement - - - (945,797) -0.4% (949,557) (943,053) , ,FY15 Total Expenditures/Expenses 47,984,487 - - 109,639,893 79.2% 61,197,522 58,632,249 Excess (Deficit)/Income (Loss) 224,772 - -
Fund Balance/Retained Earnings:Beg. Fund Bal./Retained Earnings 953,634 35,192 - Transfer to CIP/IRP - - - End Fund Bal./Ret. Earnings 1,178,406$ 35,192 - Capital Outlay/Infrastructure/CIP 142,000 20,000 7,603,300 COMPARISON TO PRIOR YEAR'S BUDGETGENERAL FUND: BUDGET FY14 BUDGET FY15 CHANGE % CHANGEOperating Budget* 40,715,415$ 44,969,800 4,254,385 10.4%Capital Budget - - - 0.0%TOTAL BUDGET 40,715,415$ 44,969,800 4,254,385 10.4%* Includes Capital Outlay and Infrastructure.

TOTAL EXPENDITURE BUDGET
48

TOTAL EXPENDITURE BUDGET
49
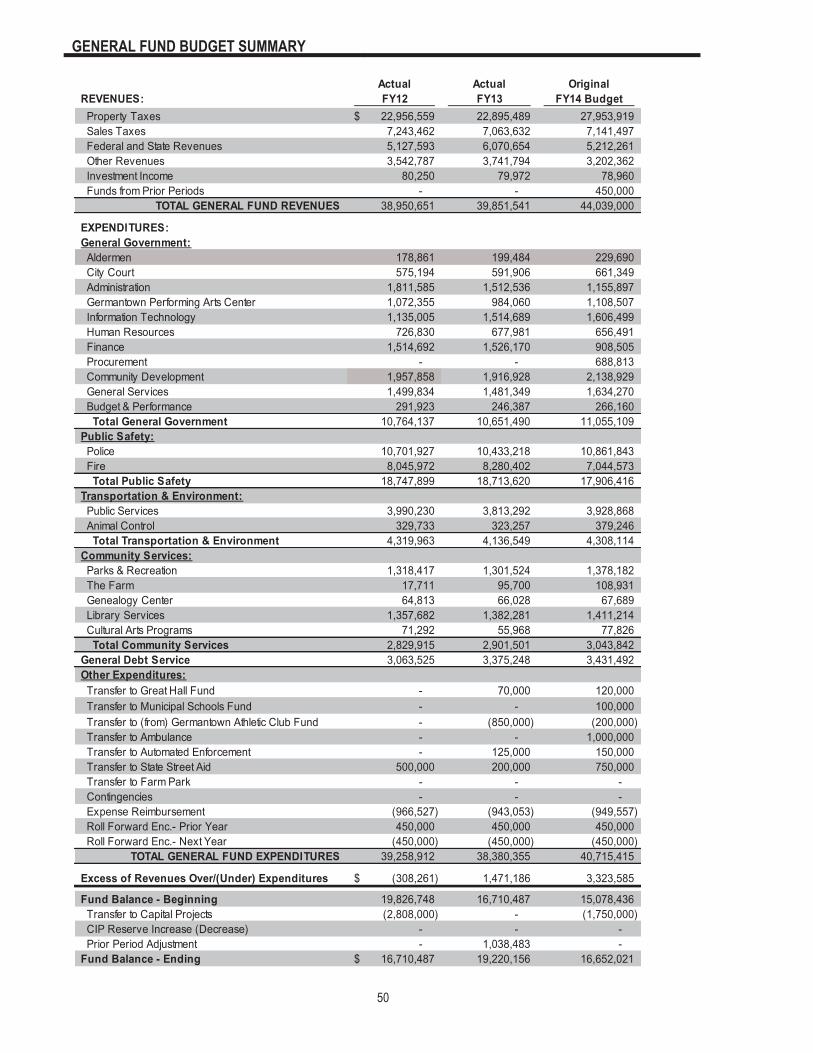
GENERAL FUND BUDGET SUMMARY
50
Actual Actual OriginalREVENUES: FY12 FY13 FY14 Budget Property Taxes 22,956,559$ 22,895,489 27,953,919 Sales Taxes 7,243,462 7,063,632 7,141,497 Federal and State Revenues 5,127,593 6,070,654 5,212,261 Other Revenues 3,542,787 3,741,794 3,202,362 Investment Income 80,250 79,972 78,960 Funds from Prior Periods - - 450,000
TOTAL GENERAL FUND REVENUES 38,950,651 39,851,541 44,039,000
EXPENDITURES:General Government: Aldermen 178,861 199,484 229,690 City Court 575,194 591,906 661,349 Administration 1,811,585 1,512,536 1,155,897 Germantown Performing Arts Center 1,072,355 984,060 1,108,507 Information Technology 1,135,005 1,514,689 1,606,499 Human Resources 726,830 677,981 656,491 Finance 1,514,692 1,526,170 908,505 Procurement - - 688,813 Community Development 1,957,858 1,916,928 2,138,929 General Services 1,499,834 1,481,349 1,634,270 Budget & Performance 291,923 246,387 266,160 Total General Government 10,764,137 10,651,490 11,055,109 Public Safety: Police 10,701,927 10,433,218 10,861,843 Fire 8,045,972 8,280,402 7,044,573 Total Public Safety 18,747,899 18,713,620 17,906,416 Transportation & Environment: Public Services 3,990,230 3,813,292 3,928,868 Animal Control 329,733 323,257 379,246 Total Transportation & Environment 4,319,963 4,136,549 4,308,114 Community Services: Parks & Recreation 1,318,417 1,301,524 1,378,182 The Farm 17,711 95,700 108,931 Genealogy Center 64,813 66,028 67,689 Library Services 1,357,682 1,382,281 1,411,214 Cultural Arts Programs 71,292 55,968 77,826 Total Community Services 2,829,915 2,901,501 3,043,842 General Debt Service 3,063,525 3,375,248 3,431,492 Other Expenditures: Transfer to Great Hall Fund - 70,000 120,000 Transfer to Municipal Schools Fund - - 100,000 Transfer to (from) Germantown Athletic Club Fund - (850,000) (200,000) Transfer to Ambulance - - 1,000,000 Transfer to Automated Enforcement - 125,000 150,000 Transfer to State Street Aid 500,000 200,000 750,000 Transfer to Farm Park - - - Contingencies - - - Expense Reimbursement (966,527) (943,053) (949,557) Roll Forward Enc.- Prior Year 450,000 450,000 450,000 Roll Forward Enc.- Next Year (450,000) (450,000) (450,000)
TOTAL GENERAL FUND EXPENDITURES 39,258,912 38,380,355 40,715,415
Excess of Revenues Over/(Under) Expenditures (308,261)$ 1,471,186 3,323,585
Fund Balance - Beginning 19,826,748 16,710,487 15,078,436 Transfer to Capital Projects (2,808,000) - (1,750,000) CIP Reserve Increase (Decrease) - - - Prior Period Adjustment - 1,038,483 - Fund Balance - Ending 16,710,487$ 19,220,156 16,652,021

GENERAL FUND BUDGET SUMMARY
51
Estimate Budget ProjectedFY14 FY15 FY16 FY17 FY18 FY1928,183,189$ 28,441,574 28,682,315 29,053,886 29,585,297 30,191,730
7,121,648 9,555,865 9,703,598 9,890,266 10,029,612 10,221,687 4,910,613 5,676,924 5,397,552 5,484,859 5,530,566 5,576,970 3,203,226 3,460,004 3,367,213 3,424,302 3,491,950 3,561,395
59,760 54,400 88,720 113,200 119,040 132,160 450,000 450,000 450,000 450,000 450,000 450,000
43,928,436 47,638,767 47,689,398 48,416,513 49,206,465 50,133,943
216,331 214,012 216,706 219,521 223,189 226,621 615,089 646,777 655,258 671,041 688,381 706,296
1,147,901 1,934,037 2,020,441 2,047,135 2,109,559 2,109,189 1,164,789 1,159,178 1,179,670 1,211,077 1,244,078 1,278,637 1,587,977 1,887,111 1,918,629 1,621,773 1,649,293 1,670,247
691,768 741,605 762,355 782,909 805,514 828,609 946,495 1,008,969 1,031,798 1,055,752 1,083,693 1,110,543 634,035 686,609 705,154 724,767 745,432 767,123
1,980,993 1,980,011 2,003,631 2,054,230 2,136,094 2,196,178 1,561,510 1,971,908 1,878,325 1,790,686 1,835,679 1,915,808
295,574 353,058 355,806 364,450 373,768 383,403 10,842,461 12,583,275 12,727,771 12,543,339 12,894,679 13,192,654
10,525,745 10,933,702 11,039,354 11,427,830 11,563,493 11,961,074 7,045,880 6,927,999 7,135,707 7,598,278 7,602,708 7,790,698
17,571,625 17,861,701 18,175,061 19,026,108 19,166,201 19,751,771
3,902,998 4,323,953 4,304,256 4,335,518 4,598,230 4,900,306 342,226 364,853 381,433 365,954 375,747 386,150
4,245,224 4,688,806 4,685,689 4,701,472 4,973,977 5,286,456
1,250,819 1,376,426 1,363,988 1,371,732 1,487,832 1,438,293 127,541 - - - - -
68,024 69,979 71,376 72,889 74,605 76,309 1,419,789 1,438,074 1,445,088 1,484,579 1,525,576 1,567,537
76,569 84,446 84,446 84,492 84,678 84,726 2,942,742 2,968,925 2,964,899 3,013,692 3,172,691 3,166,864 3,319,453 3,036,307 2,877,533 2,867,333 2,482,108 1,801,383
175,000 280,000 176,000 100,000 75,000 60,000 100,000 2,121,583 2,121,583 2,121,583 2,121,583 2,121,583
- - - - - - 1,000,000 500,000 500,000 500,000 500,000 400,000
150,000 75,000 50,000 50,000 50,000 50,000 900,000 1,650,000 1,500,000 1,500,000 1,500,000 1,500,000
- 150,000 159,000 162,000 100,000 100,000 - - - - - -
(949,557) (945,797) (966,536) (988,152) (1,010,315) (1,033,041) 450,000 450,000 450,000 450,000 450,000 450,000
(450,000) (450,000) (450,000) (450,000) (450,000) (450,000) 40,296,948 44,969,800 44,971,000 45,597,375 46,025,923 46,397,670
3,631,488$ 2,668,967 2,718,398 2,819,138 3,180,542 3,736,273
18,770,156 20,201,644 19,850,610 19,821,008 20,034,146 20,608,688 (1,750,000) (2,357,000) (2,114,000) (2,156,000) (2,156,000) (2,156,000)
- (213,000) (184,000) - - - - - - - - -
20,651,644$ 20,300,610 20,271,008 20,484,146 21,058,688 22,188,960
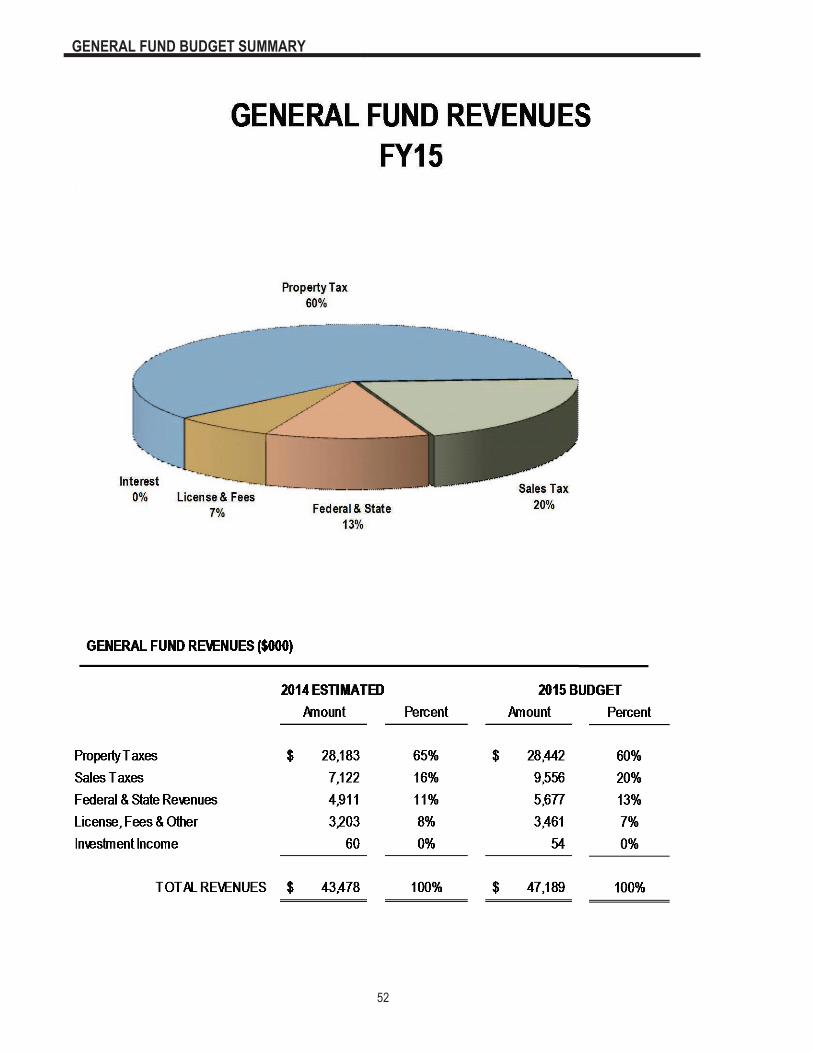
GENERAL FUND BUDGET SUMMARY
52
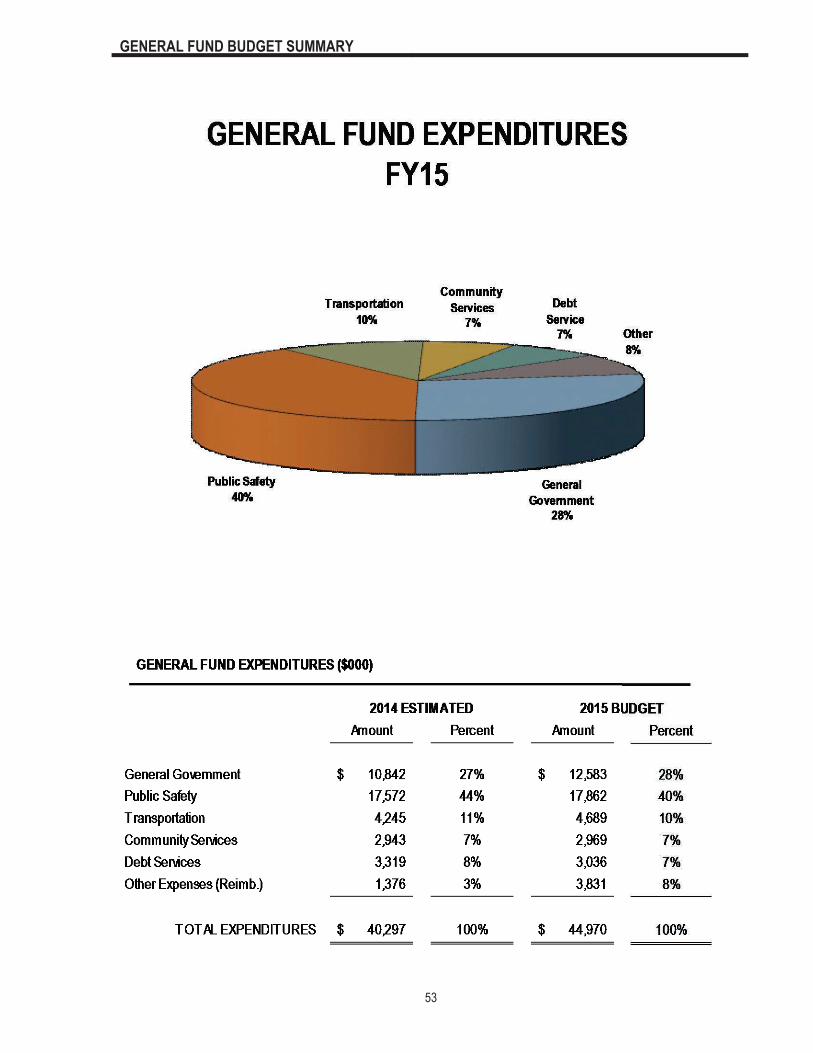
GENERAL FUND BUDGET SUMMARY
53

UTILITY FUND BUDGET SUMMARY
54
Actual Actual BudgetFY12 FY13 FY14
OPERATING REVENUES Metered Water Sales 4,568,200$ 4,118,201 4,760,000 Sewer Service Fees 2,664,844 2,449,575 2,700,000 Other Revenue 238,761 231,498 208,000
Total Operating Revenues 7,471,805 6,799,274 7,668,000 OPERATING EXPENSES Water 4,403,073 4,613,128 4,769,566 Sewer 1,534,342 1,606,335 1,644,435 Sewage Treatment 1,151,178 1,171,901 1,200,000
Total Operating Expenses 7,088,593 7,391,364 7,614,001 OPERATING INCOME 383,212 (592,090) 53,999
NONOPERATING REVENUES (EXPENSES) Contributions from Developers 116,797 86,243 145,000 Investment Income 12,185 13,786 18,200 Gain/loss on disposal of assets - - - Utility Debt Service (261,698) (310,669) (200,700) Net Non-Operating Revenues (Expenses) (132,716) (210,640) (37,500)
NET INCOME 250,496 (802,730) 16,499
Other Receipts Debt Proceeds - - - Depreciation 619,748 641,014 1,702,500 Total Other Receipts 619,748 641,014 1,702,500
Other Expenditures Bonds Payable 880,000 920,000 920,000 Major Construction 2,293,723 1,293,884 1,525,000 Infrastructure (Water & Sewer) 496,047 273,129 545,000 Total Other Expenditures 3,669,770 2,487,013 2,990,000
Working Capital - Beginning 7,071,196 4,154,873 2,017,730 Working Capital - Ending 4,154,873 1,419,901 601,729
Contributed Capital 17,833,462 17,833,462 17,833,462 Retained Earnings Reserved for: Emergencies 600,000 600,000 600,000 Contingencies 51,000 51,000 51,000 Capital Replacement 800,000 800,000 800,000 Total Reserved 1,451,000 1,451,000 1,451,000 Retained Earnings Unreserved 27,189,241 26,386,511 27,234,554
Retained Earnings at Beginning of Year 28,389,745 28,640,241 28,669,055 Retained Earnings at End of Year 28,640,241 27,837,511 28,685,554
Total Net Assets - Beginning 46,223,215 46,473,711 46,502,536 Total Net Assets - Ending 46,473,711$ 45,670,991 46,519,035
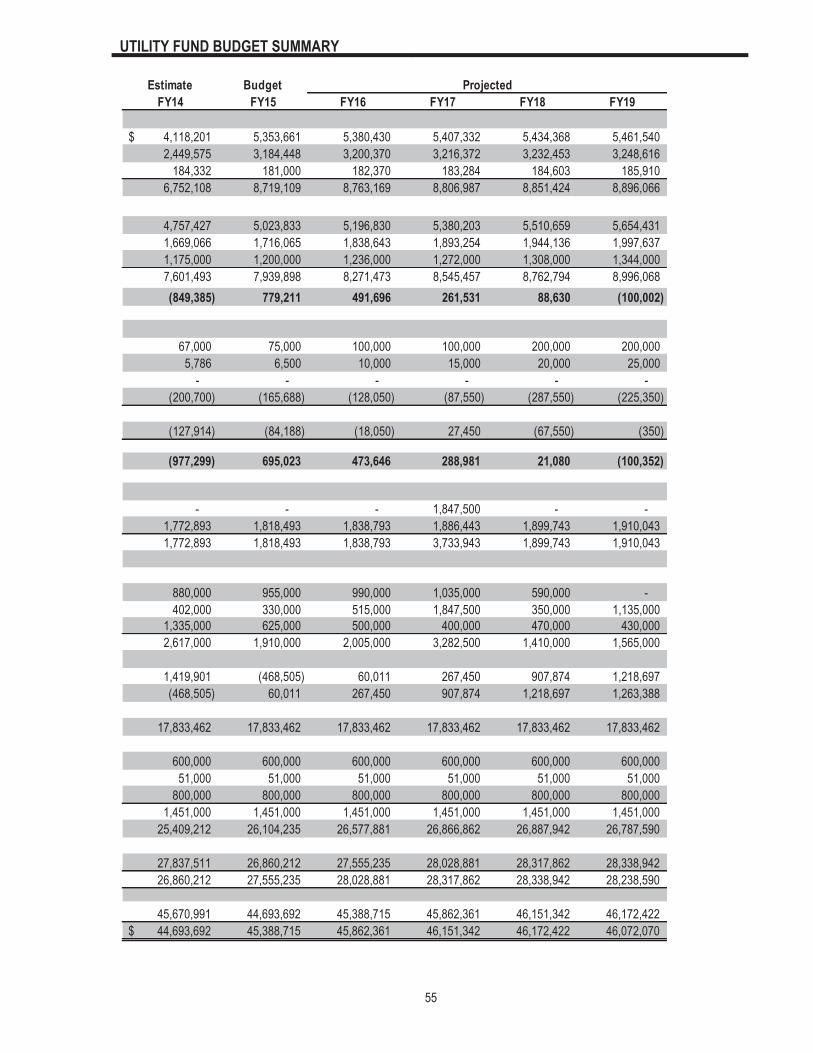
UTILITY FUND BUDGET SUMMARY
55
Estimate Budget ProjectedFY14 FY15 FY16 FY17 FY18 FY19
4,118,201$ 5,353,661 5,380,430 5,407,332 5,434,368 5,461,540 2,449,575 3,184,448 3,200,370 3,216,372 3,232,453 3,248,616
184,332 181,000 182,370 183,284 184,603 185,910 6,752,108 8,719,109 8,763,169 8,806,987 8,851,424 8,896,066
4,757,427 5,023,833 5,196,830 5,380,203 5,510,659 5,654,431 1,669,066 1,716,065 1,838,643 1,893,254 1,944,136 1,997,637 1,175,000 1,200,000 1,236,000 1,272,000 1,308,000 1,344,000 7,601,493 7,939,898 8,271,473 8,545,457 8,762,794 8,996,068 (849,385) 779,211 491,696 261,531 88,630 (100,002)
67,000 75,000 100,000 100,000 200,000 200,000 5,786 6,500 10,000 15,000 20,000 25,000
- - - - - - (200,700) (165,688) (128,050) (87,550) (287,550) (225,350)
(127,914) (84,188) (18,050) 27,450 (67,550) (350)
(977,299) 695,023 473,646 288,981 21,080 (100,352)
- - - 1,847,500 - - 1,772,893 1,818,493 1,838,793 1,886,443 1,899,743 1,910,043 1,772,893 1,818,493 1,838,793 3,733,943 1,899,743 1,910,043
880,000 955,000 990,000 1,035,000 590,000 - 402,000 330,000 515,000 1,847,500 350,000 1,135,000
1,335,000 625,000 500,000 400,000 470,000 430,000 2,617,000 1,910,000 2,005,000 3,282,500 1,410,000 1,565,000
1,419,901 (468,505) 60,011 267,450 907,874 1,218,697 (468,505) 60,011 267,450 907,874 1,218,697 1,263,388
17,833,462 17,833,462 17,833,462 17,833,462 17,833,462 17,833,462
600,000 600,000 600,000 600,000 600,000 600,000 51,000 51,000 51,000 51,000 51,000 51,000
800,000 800,000 800,000 800,000 800,000 800,000 1,451,000 1,451,000 1,451,000 1,451,000 1,451,000 1,451,000
25,409,212 26,104,235 26,577,881 26,866,862 26,887,942 26,787,590
27,837,511 26,860,212 27,555,235 28,028,881 28,317,862 28,338,942 26,860,212 27,555,235 28,028,881 28,317,862 28,338,942 28,238,590
45,670,991 44,693,692 45,388,715 45,862,361 46,151,342 46,172,422 44,693,692$ 45,388,715 45,862,361 46,151,342 46,172,422 46,072,070
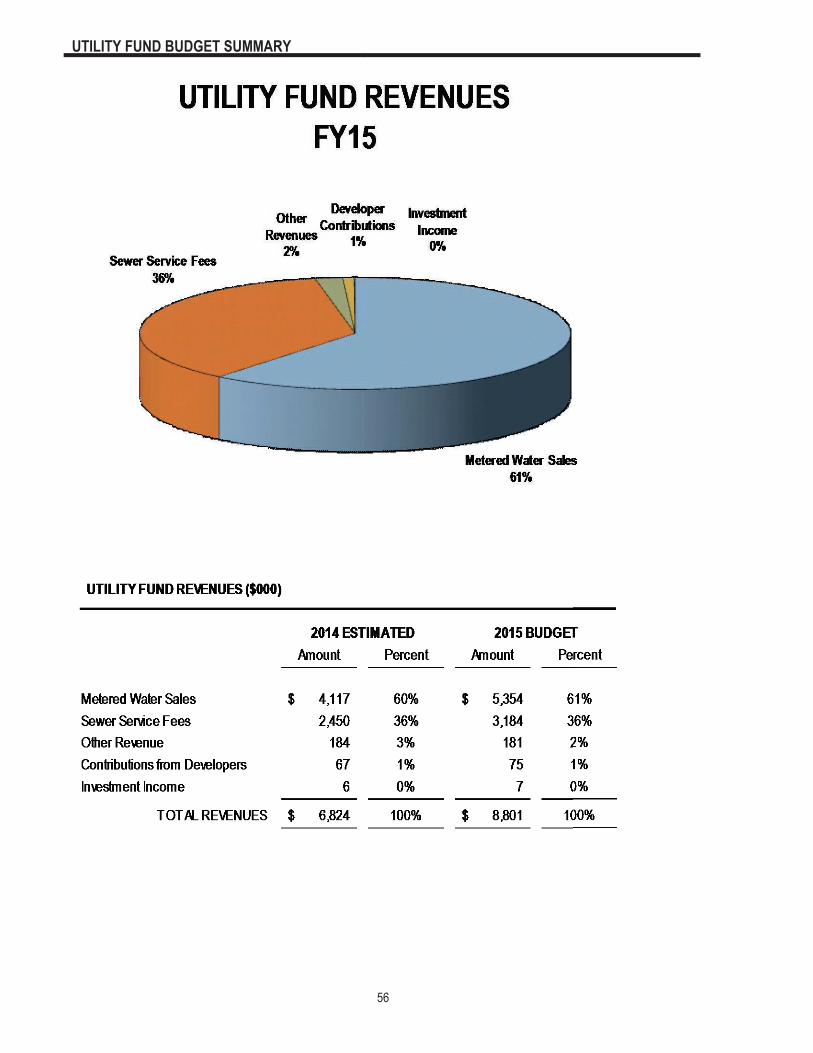
UTILITY FUND BUDGET SUMMARY
56

UTILITY FUND BUDGET SUMMARY
57

GERMANTOWN ATHLETIC CLUB FUND BUDGET SUMMARY
58
Actual Actual BudgetFY12 FY13 FY14
OPERATING REVENUES Membership Fees 2,998,150$ 3,191,099 3,087,000 Aquatics Revenues 160,691 176,066 160,500 Business Revenues 79,222 79,222 79,222 Personal Training Revenues 274,561 255,198 369,460 Other Revenues 197,291 200,051 181,040
TOTAL OPERATING REVENUES 3,709,915 3,901,636 3,877,222
OPERATING EXPENSES Recreation 2,706,222 2,357,315 2,679,881 Personal Training - 194,472 292,685 Aquatics 837,719 823,128 864,762
TOTAL OPERATING EXPENSES 3,543,941 3,374,915 3,837,328
OPERATING INCOME 165,974 526,721 39,894
NONOPERATING REVENUES (EXPENSES) Investment Income 3,130 6,009 6,650 Interest Payment (34,416) (30,557) (26,698) Contribution from (to) other funds - (850,000) (200,000) Total (31,286) (874,548) (220,048)
NET INCOME (LOSS) 134,688 (347,827) (180,154)
Other Receipts Depreciation 586,210 561,010 644,157 Total Other Receipts 586,210 561,010 644,157
Other Expenditures Debt Payable 125,000 125,000 125,000 Infrastructure 7,979 - - Other Assets 251,566 113,984 260,733 Total Other Expenditures 384,545 238,984 385,733
NET CHANGE IN WORKING CAPITAL 336,353 (25,801) 78,270
Working Capital - Beginning 1,005,788 1,342,141 1,107,053 Working Capital - Ending 1,342,141 1,316,340 1,185,323
Retained Earnings at Beginning of Year 2,874,444 3,009,132 2,280,279 Retained Earnings at End of Year 3,009,132 2,661,305 2,100,125
Total Net Assets-Beginning 13,969,707 14,104,395 13,375,542 Total Net Assets-Ending 14,104,395$ 13,756,568 13,195,388

GERMANTOWN ATHLETIC CLUB FUND BUDGET SUMMARY
59
Estimate Budget ProjectedFY14 FY15 FY16 FY17 FY18 FY19
3,296,000$ 3,342,000 3,378,740 3,547,310 3,586,436 3,626,132 165,803 163,000 165,445 167,927 170,446 173,002
79,222 79,222 79,222 79,222 79,222 79,222 243,000 280,000 192,600 202,230 212,342 222,959 195,158 202,650 308,370 314,159 320,328 326,735
3,979,183 4,066,872 4,124,377 4,310,848 4,368,773 4,428,050
2,230,304 2,451,848 2,549,610 2,633,103 2,695,509 2,759,962 235,287 291,136 295,905 304,306 313,115 322,218 821,109 849,499 861,701 878,467 896,166 914,368
3,286,700 3,592,483 3,707,215 3,815,877 3,904,790 3,996,548
692,483 474,389 417,162 494,971 463,983 431,502
2,788 3,500 3,500 3,500 3,500 3,500 (26,698) (22,896) (19,224) (15,624) (12,024) (8,496)
- - - - - - (23,910) (19,396) (15,724) (12,124) (8,524) (4,996)
668,573 454,993 401,438 482,847 455,459 426,506
524,900 561,447 616,700 641,700 641,700 641,700 524,900 561,447 616,700 641,700 641,700 641,700
125,000 125,000 125,000 125,000 125,000 125,000 - 1,420,529 1,000,000 1,000,000 - -
271,022 18,000 - - - - 396,022 1,563,529 1,125,000 1,125,000 125,000 125,000
797,451 (547,089) (106,862) (453) 972,159 943,206
1,316,340 2,113,791 1,566,702 1,459,840 1,459,387 2,431,545 2,113,791 1,566,702 1,459,840 1,459,387 2,431,545 3,374,751
2,661,305 3,329,878 3,784,871 4,186,309 4,669,156 5,124,614 3,329,878 3,784,871 4,186,309 4,669,156 5,124,614 5,551,120
13,756,568 14,425,141 14,880,134 15,281,572 15,764,419 16,219,877 14,425,141$ 14,880,134 15,281,572 15,764,419 16,219,877 16,646,383
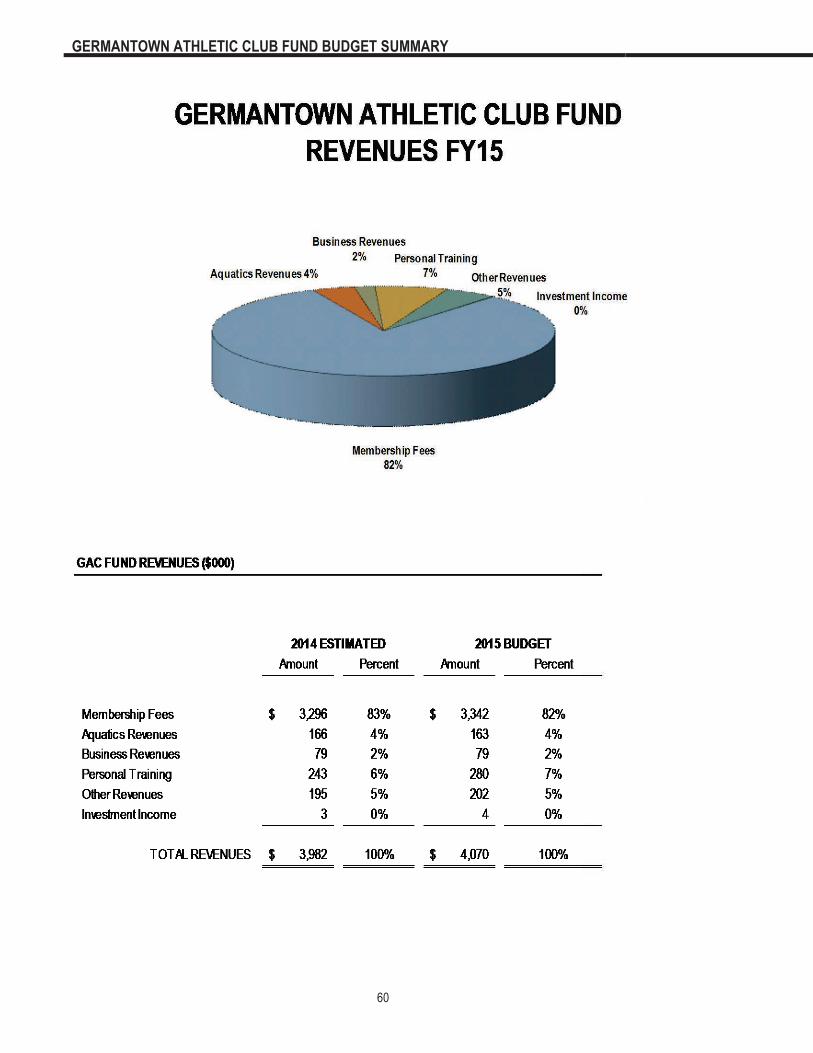
GERMANTOWN ATHLETIC CLUB FUND BUDGET SUMMARY
60

GERMANTOWN ATHLETIC CLUB FUND BUDGET SUMMARY
61

GREAT HALL FUND BUDGET SUMMARY
62
Actual Actual BudgetFY12 FY13 FY14
OPERATING REVENUES Rent - Taxable Business 132,253$ 164,231 164,500 Rent - Nontaxable Business 77,882 107,176 92,200 Other Revenue 30,781 33,920 43,400 Catering Revenue 2,054 2,876 5,578
TOTAL OPERATING REVENUES 242,970 308,203 305,678
OPERATING EXPENSES Communications 925 790 950 Allocations 54,539 34,001 22,071 Other Maint. 50,089 46,987 75,200 Personnel 163,519 137,145 171,674 Professional Fees 57,764 67,035 62,700 Insurance - 776 - Supplies 22,208 15,187 21,625 Utilities 39,342 39,727 41,928 Rent 85,759 84,236 85,222 Grants - - - Depreciation 17,835 43,351 52,221
TOTAL OPERATING EXPENSES 491,980 469,235 533,591
OPERATING INCOME (249,010) (161,032) (227,913)
NONOPERATING REVENUES (EXPENSES) Investment Income - 22 - Interest Payment (13,384) (11,883) (10,382) Contribution from other funds - 70,000 120,000 Total (13,384) 58,139 109,618
NET INCOME (LOSS) (262,394) (102,893) (118,295)
Other Receipts Depreciation 17,835 43,351 52,221 Total Other Receipts 17,835 43,351 52,221
Other Expenditures Debt Payable - - - Infrastructure 138,054 20,373 18,000 Other Assets - - - Total Other Expenditures 138,054 20,373 18,000
NET CHANGE IN WORKING CAPITAL (382,613) (79,915) (84,074)
Working Capital - Beginning 446,842 64,229 (141,763) Working Capital - Ending 64,229 (15,686) (225,837)
Retained Earnings at Beginning of Year 700,139 437,745 212,725 Retained Earnings at End of Year 437,745 334,852 94,430
Total Net Assets-Beginning 700,139 437,745 212,725 Total Net Assets-Ending 437,745$ 334,852 94,430

GREAT HALL FUND BUDGET SUMMARY
63
Estimate Budget ProjectedFY14 FY15 FY16 FY17 FY18 FY19
253,250$ 260,348 299,400 314,370 330,089 346,593 87,850 90,486 104,059 109,262 114,725 120,461
6,125 6,308 7,254 7,617 7,998 8,398 2,775 40,858 46,987 49,336 51,803 54,393
350,000 398,000 457,700 480,585 504,614 529,845
940 1,000 1,000 1,000 1,000 1,000 22,071 21,923 22,361 22,739 23,194 23,658 75,200 75,200 76,712 78,253 80,014 81,815
153,952 178,471 182,720 187,824 193,307 198,975 51,290 52,163 53,206 54,270 55,356 56,463
- - - - - - 22,625 31,105 31,791 32,184 32,632 33,090 41,730 41,778 42,405 43,253 44,118 45,001 87,222 87,462 87,462 87,628 87,817 88,010
- - - - - - 45,000 45,000 49,125 52,250 52,250 52,250
500,030 534,102 546,782 559,401 569,687 580,263
(150,030) (136,102) (89,082) (78,816) (65,073) (50,418)
- - - - - - (10,382) (8,904) (7,476) (6,076) (4,676) (3,304) 175,000 280,000 176,000 100,000 75,000 60,000 164,618 271,096 168,524 93,924 70,324 56,696
14,588 134,994 79,442 15,108 5,251 6,278
45,000 45,000 49,125 52,250 52,250 52,250 45,000 45,000 49,125 52,250 52,250 52,250
- - - - - - 18,000 150,000 125,000 - - -
9,710 3,000 - - - - 27,710 153,000 125,000 - - -
31,878 26,994 3,567 67,358 57,501 58,528
(15,686) 16,192 43,186 46,753 114,111 171,612 16,192 43,186 46,753 114,111 171,612 230,140
334,852 349,440 484,434 563,876 578,984 584,235 349,440 484,434 563,876 578,984 584,235 590,513
334,852 349,440 484,434 563,876 578,984 584,235 349,440$ 484,434 563,876 578,984 584,235 590,513

GREAT HALL FUND BUDGET SUMMARY
64
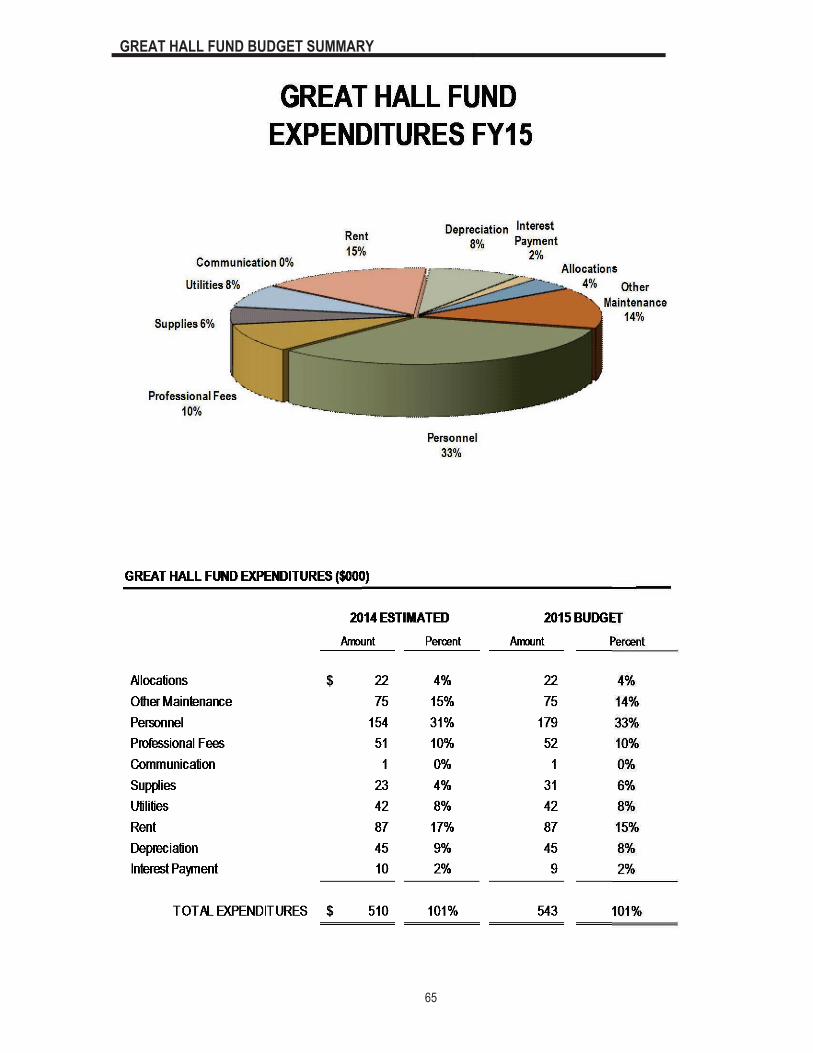
GREAT HALL FUND BUDGET SUMMARY
65
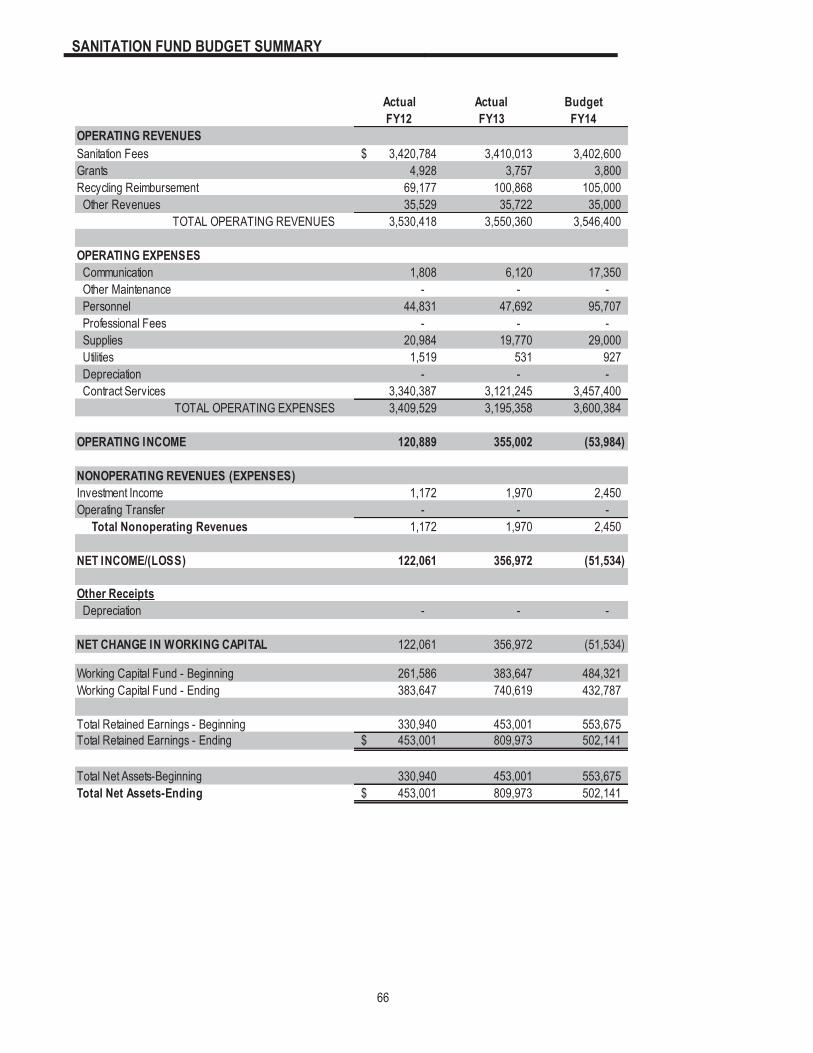
SANITATION FUND BUDGET SUMMARY
66
Actual Actual BudgetFY12 FY13 FY14
OPERATING REVENUESSanitation Fees 3,420,784$ 3,410,013 3,402,600 Grants 4,928 3,757 3,800 Recycling Reimbursement 69,177 100,868 105,000 Other Revenues 35,529 35,722 35,000
TOTAL OPERATING REVENUES 3,530,418 3,550,360 3,546,400
OPERATING EXPENSES Communication 1,808 6,120 17,350 Other Maintenance - - - Personnel 44,831 47,692 95,707 Professional Fees - - - Supplies 20,984 19,770 29,000 Utilities 1,519 531 927 Depreciation - - - Contract Services 3,340,387 3,121,245 3,457,400
TOTAL OPERATING EXPENSES 3,409,529 3,195,358 3,600,384
OPERATING INCOME 120,889 355,002 (53,984)
NONOPERATING REVENUES (EXPENSES)Investment Income 1,172 1,970 2,450 Operating Transfer - - - Total Nonoperating Revenues 1,172 1,970 2,450
NET INCOME/(LOSS) 122,061 356,972 (51,534)
Other Receipts Depreciation - - -
NET CHANGE IN WORKING CAPITAL 122,061 356,972 (51,534)
Working Capital Fund - Beginning 261,586 383,647 484,321 Working Capital Fund - Ending 383,647 740,619 432,787
Total Retained Earnings - Beginning 330,940 453,001 553,675 Total Retained Earnings - Ending 453,001$ 809,973 502,141
Total Net Assets-Beginning 330,940 453,001 553,675 Total Net Assets-Ending 453,001$ 809,973 502,141
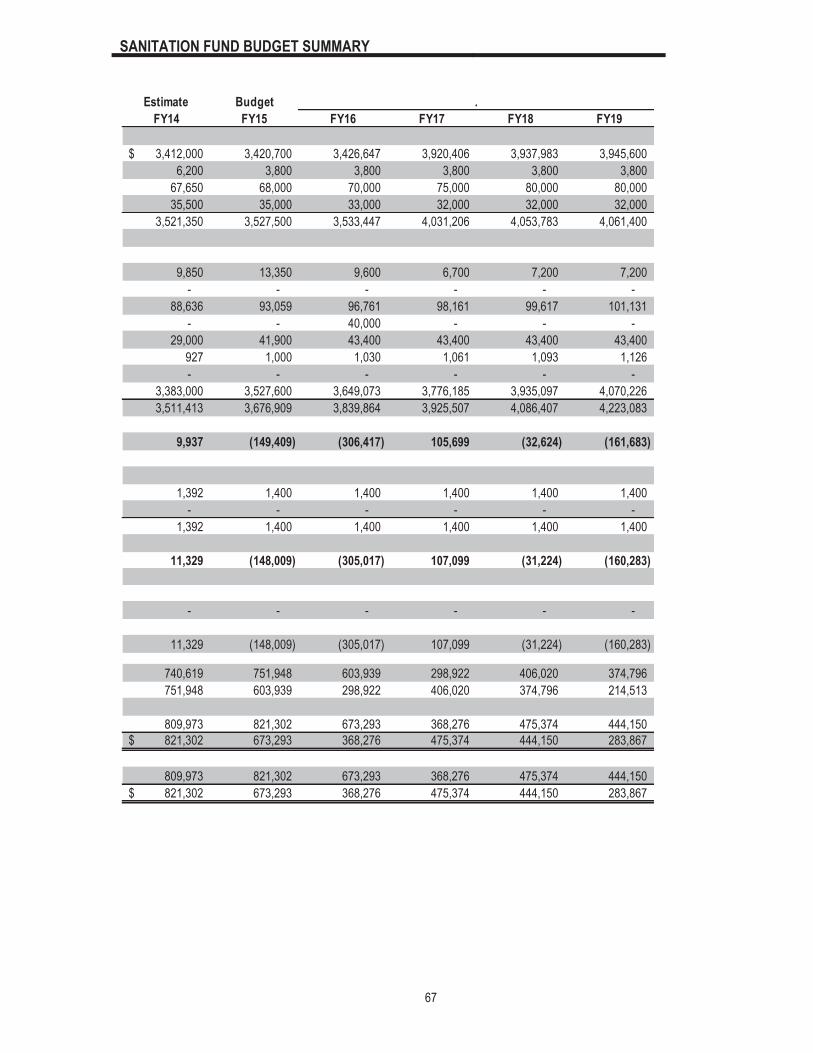
SANITATION FUND BUDGET SUMMARY
67
Estimate Budget .FY14 FY15 FY16 FY17 FY18 FY19
3,412,000$ 3,420,700 3,426,647 3,920,406 3,937,983 3,945,600 6,200 3,800 3,800 3,800 3,800 3,800
67,650 68,000 70,000 75,000 80,000 80,000 35,500 35,000 33,000 32,000 32,000 32,000
3,521,350 3,527,500 3,533,447 4,031,206 4,053,783 4,061,400
9,850 13,350 9,600 6,700 7,200 7,200 - - - - - -
88,636 93,059 96,761 98,161 99,617 101,131 - - 40,000 - - -
29,000 41,900 43,400 43,400 43,400 43,400 927 1,000 1,030 1,061 1,093 1,126 - - - - - -
3,383,000 3,527,600 3,649,073 3,776,185 3,935,097 4,070,226 3,511,413 3,676,909 3,839,864 3,925,507 4,086,407 4,223,083
9,937 (149,409) (306,417) 105,699 (32,624) (161,683)
1,392 1,400 1,400 1,400 1,400 1,400 - - - - - -
1,392 1,400 1,400 1,400 1,400 1,400
11,329 (148,009) (305,017) 107,099 (31,224) (160,283)
- - - - - -
11,329 (148,009) (305,017) 107,099 (31,224) (160,283)
740,619 751,948 603,939 298,922 406,020 374,796 751,948 603,939 298,922 406,020 374,796 214,513
809,973 821,302 673,293 368,276 475,374 444,150 821,302$ 673,293 368,276 475,374 444,150 283,867
809,973 821,302 673,293 368,276 475,374 444,150 821,302$ 673,293 368,276 475,374 444,150 283,867
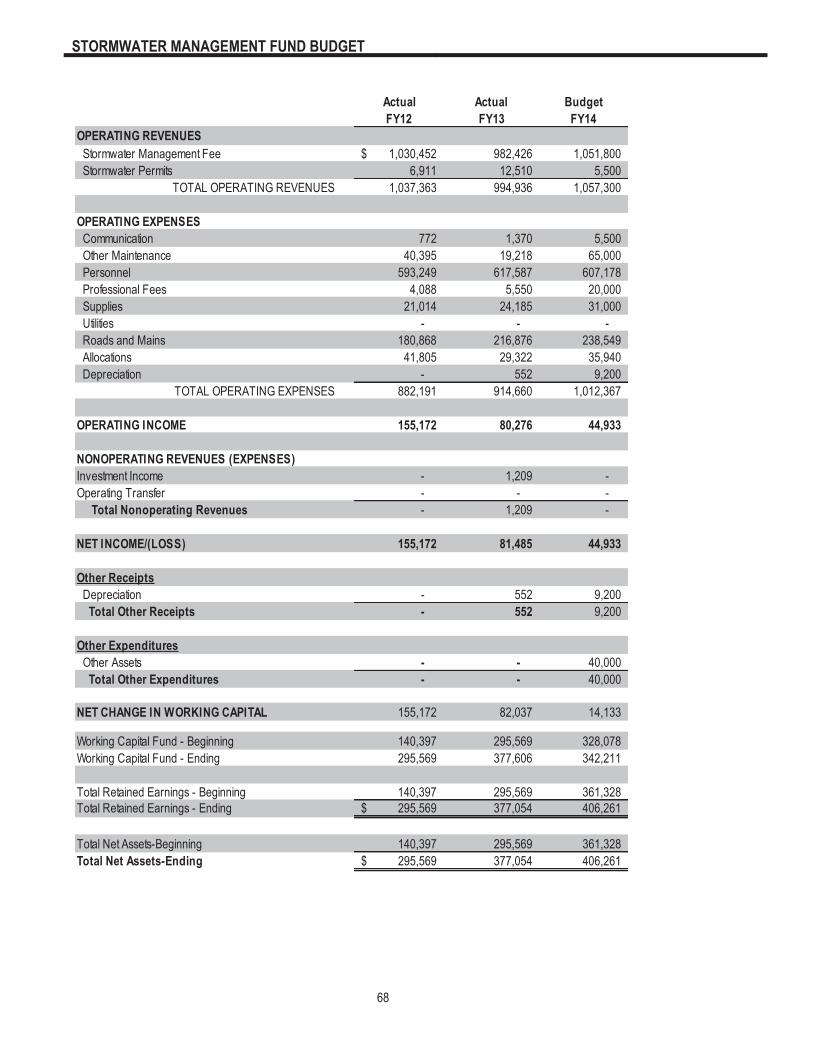
STORMWATER MANAGEMENT FUND BUDGET
68
Actual Actual BudgetFY12 FY13 FY14
OPERATING REVENUES Stormwater Management Fee 1,030,452$ 982,426 1,051,800 Stormwater Permits 6,911 12,510 5,500
TOTAL OPERATING REVENUES 1,037,363 994,936 1,057,300
OPERATING EXPENSES Communication 772 1,370 5,500 Other Maintenance 40,395 19,218 65,000 Personnel 593,249 617,587 607,178 Professional Fees 4,088 5,550 20,000 Supplies 21,014 24,185 31,000 Utilities - - - Roads and Mains 180,868 216,876 238,549 Allocations 41,805 29,322 35,940 Depreciation - 552 9,200
TOTAL OPERATING EXPENSES 882,191 914,660 1,012,367
OPERATING INCOME 155,172 80,276 44,933
NONOPERATING REVENUES (EXPENSES)Investment Income - 1,209 - Operating Transfer - - - Total Nonoperating Revenues - 1,209 -
NET INCOME/(LOSS) 155,172 81,485 44,933
Other Receipts Depreciation - 552 9,200 Total Other Receipts - 552 9,200
Other Expenditures Other Assets - - 40,000 Total Other Expenditures - - 40,000
NET CHANGE IN WORKING CAPITAL 155,172 82,037 14,133
Working Capital Fund - Beginning 140,397 295,569 328,078 Working Capital Fund - Ending 295,569 377,606 342,211
Total Retained Earnings - Beginning 140,397 295,569 361,328 Total Retained Earnings - Ending 295,569$ 377,054 406,261
Total Net Assets-Beginning 140,397 295,569 361,328 Total Net Assets-Ending 295,569$ 377,054 406,261
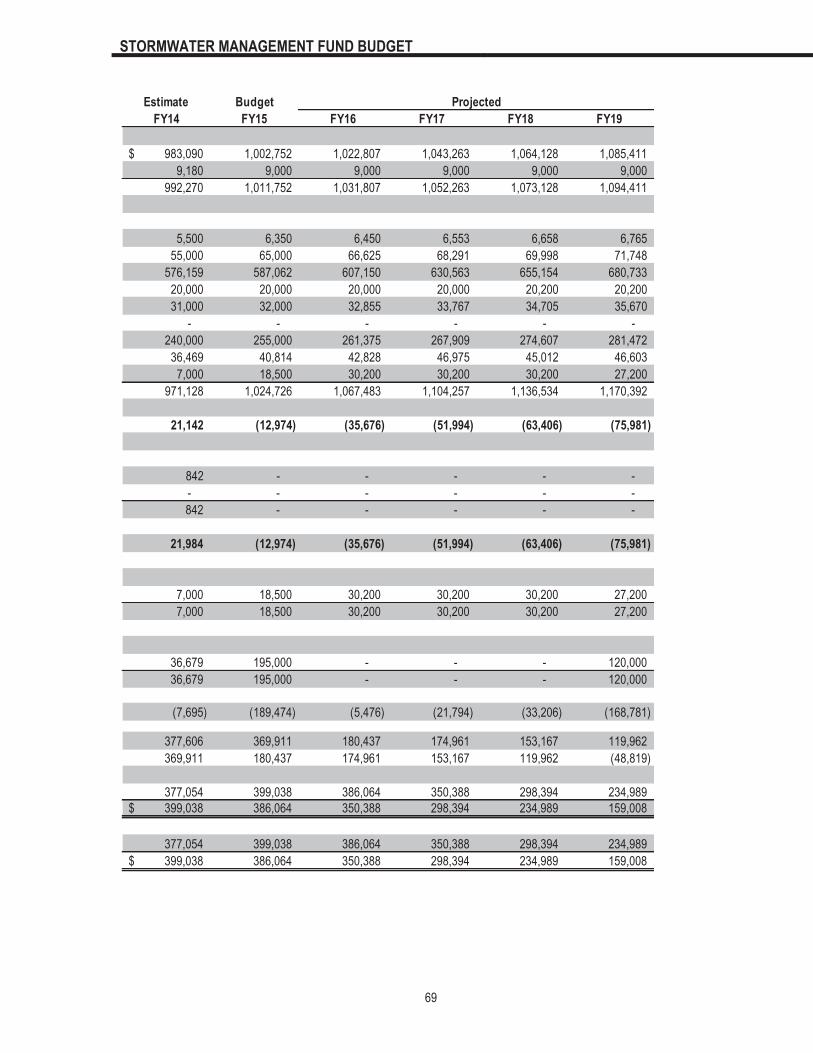
STORMWATER MANAGEMENT FUND BUDGET
69
Estimate Budget Projected
FY14 FY15 FY16 FY17 FY18 FY19
983,090$ 1,002,752 1,022,807 1,043,263 1,064,128 1,085,411 9,180 9,000 9,000 9,000 9,000 9,000
992,270 1,011,752 1,031,807 1,052,263 1,073,128 1,094,411
5,500 6,350 6,450 6,553 6,658 6,765 55,000 65,000 66,625 68,291 69,998 71,748
576,159 587,062 607,150 630,563 655,154 680,733 20,000 20,000 20,000 20,000 20,200 20,200 31,000 32,000 32,855 33,767 34,705 35,670
- - - - - - 240,000 255,000 261,375 267,909 274,607 281,472
36,469 40,814 42,828 46,975 45,012 46,603 7,000 18,500 30,200 30,200 30,200 27,200
971,128 1,024,726 1,067,483 1,104,257 1,136,534 1,170,392
21,142 (12,974) (35,676) (51,994) (63,406) (75,981)
842 - - - - - - - - - - - 842 - - - - -
21,984 (12,974) (35,676) (51,994) (63,406) (75,981)
7,000 18,500 30,200 30,200 30,200 27,200 7,000 18,500 30,200 30,200 30,200 27,200
36,679 195,000 - - - 120,000 36,679 195,000 - - - 120,000
(7,695) (189,474) (5,476) (21,794) (33,206) (168,781)
377,606 369,911 180,437 174,961 153,167 119,962 369,911 180,437 174,961 153,167 119,962 (48,819)
377,054 399,038 386,064 350,388 298,394 234,989 399,038$ 386,064 350,388 298,394 234,989 159,008
377,054 399,038 386,064 350,388 298,394 234,989 399,038$ 386,064 350,388 298,394 234,989 159,008

CAPITAL IMPROVEMENTS PROGRAM
70
The Capital Improvements Program (CIP) is a plan for capital expenditures over a fixed period of several years. The CIP identifies capital projects, the expected beginning and ending for each project, the funds to be expended each year and the method of financing projects. The six-year program is based on available fiscal resources and established community priorities. The CIP is updated annually as each year is lifted from the capital budget and included in the City's current year budget appropriations. The impact of the CIP to operations can be seen in the General Fund, the Germantown Athletic Club Fund, Great Hall & Conference Center, Stormwater, Recreation and Utility Fund summaries as transfers to CIP and Debt Service and in project detail found under the CIP tab.
The six-year CIP total has increased over last year's total. Approximately $6,115,000 in General Obligation (G.O.) and Revenue Bond funding is identified in the six-year planning period. The City's long-range strategic plan calls for funding of general government projects in the future through the use of G.O. debt.
Contributions from intergovernmental sources will total $10,398,100 during the next six years. The Board of Mayor and Aldermen and City Administration have worked closely with state officials to obtain funding for costly street and intersection improvements. The success of the Board’s efforts created valuable funding opportunities for other projects.
CIP IMPACT ON OPERATING BUDGET
CIP projects can affect the City's Operating Budget by increasing or decreasing expenditures and sometimes by increasing revenues. Projects that replace or rehabilitate existing facilities, like asphalt overlays, may decrease the cost of maintaining the system. Projects that build completely new infrastructure, such as a new park, will usually increase expenditures since more staff may be needed to operate and maintain the facility. A new facility, such as a recreation center, may increase the City's revenue by offering a new service that may generate new customers. The fiscal impact on general operations for each individual FY15 project is provided under the Capital Improvements Program tab.
General Government
14%
Major Roads 24%
Intersection & Drainage
11%
Parks26%
Utilities3%
Germantown Athletic Club
15%Contingency
3%
Great Hall 2% Recreation 1%Stormwater 1%
General Government
22%
Major Roads30%Intersection &
Drainage13%
Parks11%
Utilities8%
Germantown Athletic Club
10%
Contingency5%
Great Hall 1% Recreation 0%
Stormwater 0%
General Government 7,213$ Major Roads 10,003 Intersection & Drainage 4,294 Parks 3,551 Utilities 2,693 Germantown Athletic Club 3,421 Great Hall 275 Recreation 50 Stormwater 100 Contingency 1,500 TOTAL 33,099$
($000) 6-YEAR CIP
General Government 1,393$ Major Roads 2,340 Intersection & Drainage 1,069 Parks 2,551 Utilities 330 Germantown Athletic Club 1,421 Great Hall 150 Recreation 50 Stormwater 100 Contingency 250 TOTAL 9,654$
($000) FY15 CIP

CAPITAL IMPROVEMENTS PROGRAM
71
STATE &E X P E N D I T U R E S FUNDING SOURCES FEDERAL
(in thousands) FY14 TOTAL FY15 FY16 FY17 FY18 FY19 FY20 Reserves Grants Bonds Hall PROJECTSGENERAL GOVERNMENT: Animal Shelter Expansion 300 413 413 - - - - - - - - 413 - Redesign Corner of Gtown/Farmington - 250 250 - - - - - 250 - - - - Ambulance 528 - - - - - - - - - - - - GPAC Parking Lot - 250 250 - - - - - 250 - - - - Fire Engine F-148 - 660 - 660 - - - - - - - 660 - Dimmer System at GPAC - 315 315 - - - - - 15 - - 300 - IT/HR Space Reconfiguration - 165 165 - - - - - 50 - - 115 - Fleet Maintenance Shop - FF&E 309 - - - - - - - - - - - - Germantown Library - Roof 100 - - - - - - - - - - - - 100ft Platform Fire - 1,360 - - - 1,360 - - - - - 1,360 - GPAC Floor Restoration 183 - - - - - - - - - - - - Fire Station 1 Renovation 50 - - - - - - - - - - - - Fire Station 2 Replacement - 2,940 - - - 340 2,600 - - - 2,600 340 - Fire Engine F-156 - 860 - - - - 860 - - - - 860 -
Total General Government: 1,470 7,213 1,393 660 - 1,700 3,460 - 565 - 2,600 4,048 -
MAJOR ROADS: Gtown Rd Realignment - Design* 5 80 80 - - - - - 8 - - - 72 Gtown Rd Realignment - ROW* - 2,400 - 2,400 - - - - - - - 240 2,160 Gtown Rd Realignment - Constr* - 3,000 - - 3,000 - - - - - - 600 2,400 Germantown Road Streetscape - 88 - 88 - - - - - 70 - 18 - Wolf River Milling and Paving* 10 1,350 1,350 - - - - - - - - 270 1,080 Poplar Avenue Culvert - Phase II 768 - - - - - - - - - - - - Poplar Avenue Culvert - Phase III - 600 600 - - - - - - - - - 600 Poplar Avenue Culvert - Phase IV - 600 - 600 - - - - - - - - 600 McVay Rd Design 12 - - - - - - - - - - - - McVay Rd ROW - 310 310 - - - - - 62 - - - 248 McVay Rd Constr - 1,575 - 1,575 - - - - - - - 315 1,260 Wolf River Blvd. Closeout* 151 - - - - - - - - - - - -
Total Major Roads: 945 10,003 2,340 4,663 3,000 - - - 70 70 - 1,443 8,420 * State funding is included in totals.
INTERSECTIONS & OTHER: ITS Transportation System - - - - - - - - - - - - - Bicycle Facilities Program 10 40 25 15 - - - - - - - 40 - RR Crossing - West St./Poplar Pike - 30 30 - - - - - - - - - 30 School Zone Improvements - 54 54 - - - - - - - - 54 - Wolf River/Gtown Rd Impr- Design* 10 100 100 - - - - - - - - - 100 Wolf River/Gtown Rd Impr- ROW* - 510 - 510 - - - - - - - - 510 Decorative Street Signs - 50 50 - - - - - - - - 50 -
Total Intersections/Other: 20 784 259 525 - - - - - - - 144 640
DRAINAGE: Lateral D - Farmington Culvert Protection* 366 - - - - - - - - - - - - Annual Misc Drainage Imprv - 500 - 100 100 100 100 100 - - - 500 - Lateral D & E - Construction 871 - - - - - - - - - - - - Lateral D - Bank Stablization 373 - - - - - - - - - - - - Cameron Brown Ditch Imprv - 100 100 - - - - - - - - 100 - Grove Park Outfall Imprv - 100 100 - - - - - - - - 100 - Lateral G Flood Control - 6 2,000 - 1,000 1,000 - - - - - 2,000 - - English Meadow Drainage - Construction - 610 610 - - - - - - - - 610 - Lateral B (Miller Farms) Channel Eval - 200 - 200 - - - - - - - 200 -
Total Drainage: 1,616 3,510 810 1,300 1,100 100 100 100 - - 2,000 1,510 - * State funding is included in totals.
PARKS: Bobby Lanier Park - 951 951 - - - - - 743 208 - - - Germantown Station Lake Refurb 135 - - - - - - - - - - - - Farmington Park - Field Renovation 106 - - - - - - - - - - - - Wolf River Greenway - 1,600 1,600 - - - - - - - - 320 1,280 Greenway Phase VI - 500 - 500 - - - - - - - 500 - Field Turf - 500 - - 500 - - - - - - 500 -
Total Parks: 241 3,551 2,551 500 500 - - - 743 208 - 1,320 1,280
GERMANTOWN ATHLETIC CLUB FUND: GAC Renovation - 3,250 1,250 1,000 1,000 - - - 3,250 - - - - Renovation Design 257 - - - - - - - - - - - - Fitness & Weight Equip 9 171 171 - - - - - 171 - - - -
Total GAC Fund: 266 3,421 1,421 1,000 1,000 - - - 3,421 - - - -
* State funding is included in totals.
CITY OF GERMANTOWNCapital Improvements Program - 2014 to 2020

CAPITAL IMPROVEMENTS PROGRAM
72
STATE &E X P E N D I T U R E S FUNDING SOURCES FEDERAL
(in thousands) FY14 TOTAL FY15 FY16 FY17 FY18 FY19 FY20 Reserves Grants Bonds Hall PROJECTSGREAT HALL &CC: Patio Project - 150 150 - - - - - 150 - - - - Lobby Expansion - 125 - 125 - - - - 125 - - - -
Total GH Fund: - 275 150 125 - - - - 275 - - - -
RECREATION: Sports Lighting & Control Upgrades - 50 50 - - - - - 50 - - - -
Total Recreation Fund: - 50 50 - - - - - 50 - - - -
STORMWATER: Annual Misc Drainage Imprv - 100 100 - - - - - 100 - - - -
Total Stormwater Fund: - 100 100 - - - - - 100 - - - -
UTILITY FUND: Blue Grass Lift Station - Refurbishment 262 - - - - - - - - - - - - Biofilter 50 - - - - - - - - - - - - N Johnson Lift Station Rerouting - 225 225 - - - - - 225 - - - - Farm Park Sewer - 105 105 - - - - - 105 - - - - Lateral D Sewer Crossing Protection - 665 - 665 - - - - 665 - - - - Southern WTP Electrical Panel Upgrade - 183 - 183 - - - - 183 - - - - Southern Ave WTP Aeration Towers 929 - - - - - - - - - - - - Water Tower Replacement-Southern - 1,515 - - 1,515 - - - - - 1,515 - -
Total Utility Fund: 1,241 2,693 330 848 1,515 - - - 1,178 - 1,515 - -
CONTINGENCY: 1,500 250 250 250 250 250 250 250 - - 1,250 Total Contingency: - 1,500 250 250 250 250 250 250 250 - - 1,250 -
CIP SUMMARYGeneral Government 1,470 7,213 1,393 660 - 1,700 3,460 - Major Roads 945 10,003 2,340 4,663 3,000 - - - Intersec/Other/Drainage 1,636 4,294 1,069 1,825 1,100 100 100 100 Parks 241 3,551 2,551 500 500 - - - Utilities 1,241 2,693 330 848 1,515 - - - Germantown Athletic Club 266 3,421 1,421 1,000 1,000 - - - Great Hall - 275 150 125 - - - - Recreation - 50 50 - - - - - Stormwater - 100 100 - - - - - Contingency - 1,500 250 250 250 250 250 250
Total CIP: 5,799 33,099 9,654 9,871 7,365 2,050 3,810 350
FUNDING SUMMARY
Reserves: General 4,292 1,848 1,848 - - - - - Utility 1,241 1,178 330 848 - - - - Germantown Athletic Club 266 3,421 1,421 1,000 1,000 - - - Great Hall - 275 150 125 - - - - Recreation - 50 50 - - - - - Stormwater - 100 100 - - - - - State/Intergovernmental/Grant: 10,398 3,398 4,600 2,400 - - - Bonds: General - 4,600 - 1,000 1,000 - 2,600 - Utility - 1,515 - - 1,515 - - - Hall: General - 9,715 2,357 2,298 1,450 2,050 1,210 350
Total Funding: 5,799 33,099 9,654 9,871 7,365 2,050 3,810 350

INFRASTRUCTURE REPLACEMENT PROGRAM - 2015 to 2024
73
City of GermantownINFRASTRUCTURE REPLACEMENT PROGRAM DETAIL
(in thousands)AREA & TYPE OF Budget Estimate 10 YEARINFRASTRUCTURE FY14 FY14 FY15 FY16 FY17 FY18 FY19 FY20 FY21 FY22 FY23 FY24 TOTAL
GENERAL FUND:BUILDING IMPROVEMENTS:
FACIILITIES MANAGEMENT:Library Carpet - - - 75 - - - - - - - - 75Library Interior Paint - - - 60 - - - - - - - - 60HVAC Upgrade - Municipal Center - - 150 - - - - - - - - - 150FS3 Shower 25 25 - - - - - - - - - - 0Library-HVAC Cooling Tower - - 75 - - - - - - - - - 75Train Depot Refurbish - - 35 - - - - - - - - - 35Flooring - Municipal Center - - 60 - - - - - - - - - 60
TOTAL FACILITIES MAINT. 25 25 320 135 - - - - - - - - 455
TOTAL BUILDING IMPROVEMENTS 25 25 320 135 - - - - - - - - 455
OTHER EQUIPMENT:GPAC:Man Lift 10 10 - - - - - - - - - - -
TOTAL GPAC 10 10 - - - - - - - - - - - Parks:Outdoor Movie Projection Screen - - 20 - - - - - - - - - 20
TOTAL PARKS - - 20 - - - - - - - - - 20
FIRE:Power Hawk - - 16 - 18 - 20 - 38 - - - 92 Defibrillators 99 99 - - - - - - - - - - - Safety Rails - Training Building 15 15 - - - - - - - - - - - Hurst Tool - - 35 - - - - - - - - - 35 Fire Hose Replacement 27 27 40 30 - - - - - - - - 70 Thermal Imaging Detectors - - - 9 - 40 - - - - - - 49 Emergency Warning Siren Controller - - - - 246 130 - - - - - - 376
TOTAL FIRE 141 141 91 39 264 170 20 - 38 - - - 622 POLICE:Handguns - - 140 - - - - - - - - - 140 In-Car Video Systems - Police Vehicles 35 23 15 50 50 15 25 - - - - - 155
TOTAL POLICE 35 23 155 50 50 15 25 - - - - - 295
TOTAL OTHER EQUIPMENT 186 174 266 89 314 185 45 - 38 - - - 937
PUBLIC SERVICE AND GROUNDS:Turf Vac 30 21 - - - - - - - - - - - Z-Trak Mower (2) - - 35 - - - - - - - - - 35 Smitco Bunker Rake - - - - - 15 - - - - - - 15 Tarco Leaf Vac - - - - - . - - - - - - - Ingersoll Rand Roller - - 60 60 - - - - - - - - 120 Toro workman - - - - - - - - - 25 - - 25 Backhoe - - - - - - - - - 200 - - 200 Top Dresser - - 25 - - - - - - - - - 25 Grasshopper Mower - - - 16 16 - - - - - - - 32 Field Rake (2) - - 30 - - - - - - 20 - - 50 DXT Loader - - - - - - - 120 - - - - 120 Material Loader - - 85 - - - - - - - - - 85 Tractor - - - - - - 52 - - - - - 52
TOTAL MAINTENANCE EQUIPMENT 30 21 235 76 16 15 52 120 - 245 - - 759
FURNTURE:LIBRARY:Furniture - 16 - - - - - - - - - - -
TOTAL GPAC - 16 - - - - - - - - - - - TOTAL FURNITURE - 16 - - - - - - - - - - -
AUTOS AND TRUCKS:ADMINISTRATION:Charger - - - - - - - 30 - - - - 30
TOTAL ADMINISTRATION - - - - - - - 30 - - - - 30 ANIMAL CONTROL:Ford Ranger - - 25 - - - - - - - - - 25
TOTAL ANIMAL CONTROL - - 25 - - - - - - - - - 25 FACILITIES MANAGEMENT:Dodge 2500 w/ Service Body - - - - - - - - - - 35 - 35 Ford F-150 Pickup - - - - - - 30 - - - - - 30 Chevy S-10 - - - - - - - - 30 - - - 30
TOTAL FACILITIES MAINT. - - - - - - 30 - 30 - 35 - 95 DEVELOPMENT:Chevy S-10 - - - - - - - - - 25 - - 25 Ford Ranger - - 25 - - 25 25 - 30 - - - 105
TOTAL DEVELOPMENT - - 25 - - 25 25 - 30 25 - - 130 PUBLIC SERVICE AND GROUNDS:Dodge 2500 4x4 Pickup - - - - - - 35 - - - - - 35 Ford F-350 Pickup - - - - - 30 - - - - - - 30 Ford F-350 Extended Cab - - 45 - - - - - - - - - 45 Ford F-450 Dump Truck - - - - - 45 - - - - - - 45 Ford F-450 Service/Dump Body - - - - - 45 - - - - - - 45 Ford F-750 Flat Bed - - - - 75 - 75 - - - - - 150 Ford F-250 4x4 - - - - - 35 - - - - - - 35 Ford F-250 - - - - - - 120 - - - - - 120 GMC Dump Truck - - - - - - 120 - - - - - 120 Ford F-450 Crew Cab - - - - - 50 - - - - - - 50 Ford F-350 Crew Cab - - - - - 45 - - - - - - 45 Chevrolet 3500 Cab and Chassis - - - - - - 40 - - - - - 40 Sterling Dump Truck - - - 120 - - - - - - - - 120
TOTAL PUBLIC SVCS. - - 45 120 75 250 390 - - - - - 880

INFRASTRUCTURE REPLACEMENT PROGRAM - 2015 to 2024
74
City of GermantownINFRASTRUCTURE REPLACEMENT PROGRAM DETAIL
(in thousands)AREA & TYPE OF Budget Estimate 10 YEARINFRASTRUCTURE FY14 FY14 FY15 FY16 FY17 FY18 FY19 FY20 FY21 FY22 FY23 FY24 TOTAL
FIRE:Ford F-350 - - - - - - 45 45 - - - - 90 Impala - - - - 30 - - - - - - - 30 Ford Expedition - - - 40 40 - 40 - 50 - 40 - 210 Chevy Tahoe - - - - - - 40 - - - - - 40
TOTAL FIRE - - - 40 70 - 125 45 50 - 40 - 370 PARKS AND RECREATION:Dodge Dakota - - - 25 - - - - - - - - 25 Ford Explorer - - - - - - 25 - - - - - 25 Ford Escape - - - - 25 - - - - - - - 25
TOTAL PARKS AND REC. - - - 25 25 - 25 - - - - - 75 POLICE: - Police Fleet - Chevy Tahoes - (3) 288 271 108 - 108 36 72 36 320 160 80 - 920 Police Fleet - F-350 - - - - - - - - 45 - - - 45 Police Fleet - Ford Hybrid - - - - - - 30 30 - - - - 60 Police Fleet - Impala (2) - - 90 50 - 30 30 36 100 126 35 - 497 Police Fleet - Dodge Charger - - 36 - - - - - 80 - - - 116 Police Fleet - Ford Explorer - - - . 31 36 - - 30 - - - 97 Police Fleet - Ford Crown Vic - - 36 144 108 - 36 72 - - - - 396 Police Fleet - Chevrolet Malibu - - - - - 30 - - - - - - 30
TOTAL POLICE 288 271 270 194 247 132 168 174 575 286 115 - 2,161
TOTAL AUTOS & TRUCKS 288 271 365 379 417 407 763 249 685 311 190 - 3,766
COMPUTER EQUIPMENT:INFORMATION TECHNOLOGY:Plotter- Engineering - - 10 - - - - - - - - - 10 City Hall Server 11 21 - - - - - - - - - - - Main File Server - - 10 - - - - - - - - - 10 Network Switches - - 26 26 26 26 26 - - - - - 130 HVAC monitoring server upgrade - - 15 - - - - - - - - - 15 Toughbooks- (4) General Services - - 10 - - - - - - - - - 10 Computers 80 80 80 80 80 80 80 65 65 65 65 - 660
TOTAL I.T. 91 101 151 106 106 106 106 65 65 65 65 - 835
TOTAL COMPUTER EQUIPMENT 91 101 151 106 106 106 106 65 65 65 65 - 835
COMPUTER SOFTWARE:INFORMATION TECHNOLOGY:RecTrac Upgrade 13 13 - - - - - - - - - - - OneSolution - - 238 215 - - - - - - - - 453 Court Software - - - 100 - - - - - - - - 100 Compensation System - - 10 - - - - - - - - - 10 Vendor management system - - 15 1 1 1 1 1 - - - - 20
TOTAL I.T. 13 13 263 316 1 1 1 1 - - - - 583
TOTAL COMPUTER SOFTWARE 13 13 263 316 1 1 1 1 - - - - 583
OTHER ASSETS:PARKSYouth Fishing Lake 15 15 - - - - - - - - - - - Scoreboards - - 48 - 59 - - - - - - - 107 Dog Park Improvements - - 10 Trail Security Camera - Greenway 9 9 - - - - - - - - - - -
TOTAL PARKS 24 24 58 - 59 - - - - - - - 107 GPAC:
Fire Pump Control Panels - - 9 - - - - - - - - - 9 TOTAL GPAC - - 9 - - - - - - - - - 9
PUBLIC SERVICES:Pour in Place Playground at Cone - - 115 - - - - - - - - - 115 Greenbelt and Poplar Estate Walking Trails 26 26 - - - - - - - - - - - Volleyball Court Borders 13 8 - - - - - - - - - - - Tennis Court Refurbishment at Riverdale 18 18 - - - - - - - - - - - Split Rail Fencing 52 39 - - - - - - - - - - - Pour in Place Playground at Franklin 48 45 - - - - - - - - - - -
TOTAL PUBLIC SERVICES 157 136 115 - - - - - - - - - 115
TOTAL OTHER ASSETS 181 160 182 - 59 - - - - - - - 222
TOTAL GENERAL FUND 814 781 1,782 1,101 913 714 967 435 788 621 255 - 7,566
FEDERAL ASSET FORFEITURE:OTHER ASSETS:
Recording System - 18 - - - - - - - - - - 0 TOTAL FEDERAL ASSET FORFEITURE - 18 - - - - - - - - - - 0
DRUG FUND:AUTO & TRUCKS:
Chevy Tahoe - 73 - - - - - - - - - - - TOTAL DRUG FUND - 73 - - - - - - - - - - -
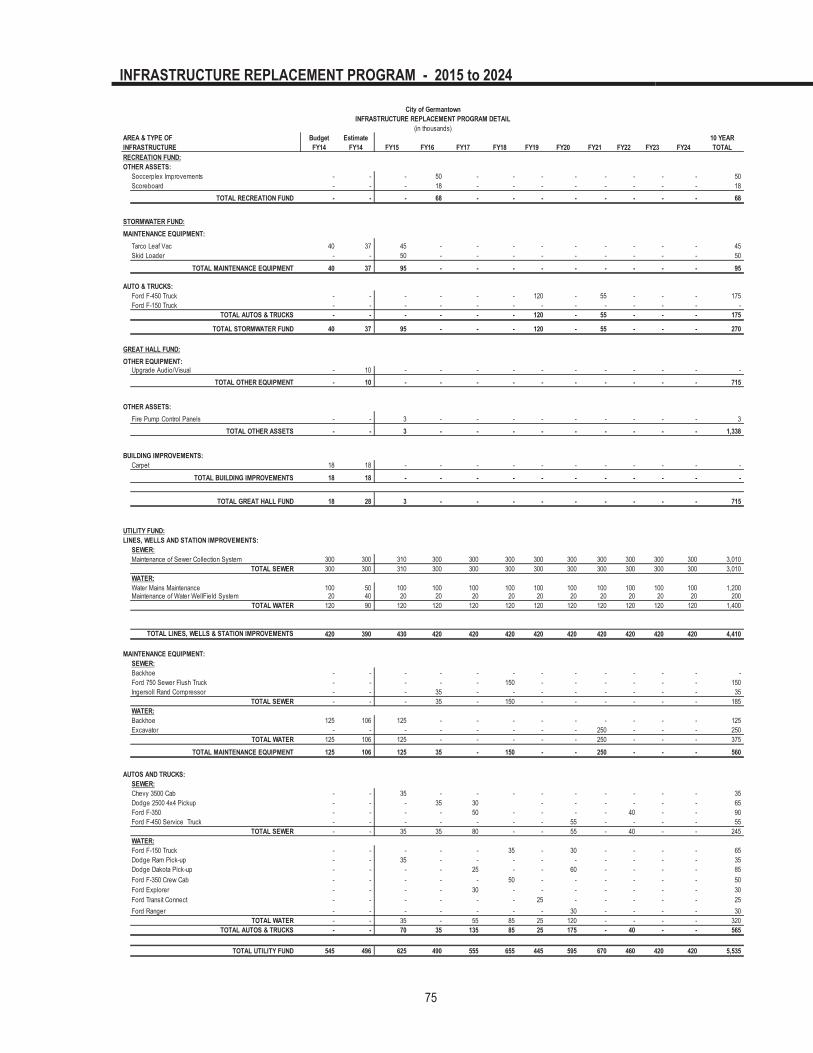
INFRASTRUCTURE REPLACEMENT PROGRAM - 2015 to 2024
75
City of GermantownINFRASTRUCTURE REPLACEMENT PROGRAM DETAIL
(in thousands)AREA & TYPE OF Budget Estimate 10 YEARINFRASTRUCTURE FY14 FY14 FY15 FY16 FY17 FY18 FY19 FY20 FY21 FY22 FY23 FY24 TOTALRECREATION FUND:OTHER ASSETS:
Soccerplex Improvements - - - 50 - - - - - - - - 50 Scoreboard - - - 18 - - - - - - - - 18
TOTAL RECREATION FUND - - - 68 - - - - - - - - 68
STORMWATER FUND:MAINTENANCE EQUIPMENT:
Tarco Leaf Vac 40 37 45 - - - - - - - - - 45 Skid Loader - - 50 - - - - - - - - - 50
TOTAL MAINTENANCE EQUIPMENT 40 37 95 - - - - - - - - - 95
AUTO & TRUCKS: Ford F-450 Truck - - - - - - 120 - 55 - - - 175 Ford F-150 Truck - - - - - - - - - - - - -
TOTAL AUTOS & TRUCKS - - - - - - 120 - 55 - - - 175
TOTAL STORMWATER FUND 40 37 95 - - - 120 - 55 - - - 270
GREAT HALL FUND:OTHER EQUIPMENT:
Upgrade Audio/Visual - 10 - - - - - - - - - - - TOTAL OTHER EQUIPMENT - 10 - - - - - - - - - - 715
OTHER ASSETS:Fire Pump Control Panels - - 3 - - - - - - - - - 3
TOTAL OTHER ASSETS - - 3 - - - - - - - - - 1,338
BUILDING IMPROVEMENTS: Carpet 18 18 - - - - - - - - - - -
TOTAL BUILDING IMPROVEMENTS 18 18 - - - - - - - - - - -
TOTAL GREAT HALL FUND 18 28 3 - - - - - - - - - 715
UTILITY FUND:LINES, WELLS AND STATION IMPROVEMENTS:
SEWER:Maintenance of Sewer Collection System 300 300 310 300 300 300 300 300 300 300 300 300 3,010
TOTAL SEWER 300 300 310 300 300 300 300 300 300 300 300 300 3,010 WATER:Water Mains Maintenance 100 50 100 100 100 100 100 100 100 100 100 100 1,200 Maintenance of Water WellField System 20 40 20 20 20 20 20 20 20 20 20 20 200
TOTAL WATER 120 90 120 120 120 120 120 120 120 120 120 120 1,400
TOTAL LINES, WELLS & STATION IMPROVEMENTS 420 390 430 420 420 420 420 420 420 420 420 420 4,410
MAINTENANCE EQUIPMENT:SEWER:Backhoe - - - - - - - - - - - - - Ford 750 Sewer Flush Truck - - - - - 150 - - - - - - 150 Ingersoll Rand Compressor - - - 35 - - - - - - - - 35
TOTAL SEWER - - - 35 - 150 - - - - - - 185 WATER:Backhoe 125 106 125 - - - - - - - - - 125 Excavator - - - - - - - - 250 - - - 250
TOTAL WATER 125 106 125 - - - - - 250 - - - 375
TOTAL MAINTENANCE EQUIPMENT 125 106 125 35 - 150 - - 250 - - - 560
AUTOS AND TRUCKS:SEWER:Chevy 3500 Cab - - 35 - - - - - - - - - 35 Dodge 2500 4x4 Pickup - - - 35 30 - - - - - - 65 Ford F-350 - - - - 50 - - - - 40 - - 90 Ford F-450 Service Truck - - - - - - - 55 - - - - 55
TOTAL SEWER - - 35 35 80 - - 55 - 40 - - 245 WATER:Ford F-150 Truck - - - - - 35 - 30 - - - - 65 Dodge Ram Pick-up - - 35 - - - - - - - - - 35 Dodge Dakota Pick-up - - - - 25 - - 60 - - - - 85 Ford F-350 Crew Cab - - - - - 50 - - - - - - 50 Ford Explorer - - - - 30 - - - - - - - 30 Ford Transit Connect - - - - - - 25 - - - - - 25 Ford Ranger - - - - - - - 30 - - - - 30
TOTAL WATER - - 35 - 55 85 25 120 - - - - 320 TOTAL AUTOS & TRUCKS - - 70 35 135 85 25 175 - 40 - - 565
TOTAL UTILITY FUND 545 496 625 490 555 655 445 595 670 460 420 420 5,535

INFRASTRUCTURE REPLACEMENT PROGRAM - 2015 to 2024
76
City of GermantownINFRASTRUCTURE REPLACEMENT PROGRAM DETAIL
(in thousands)AREA & TYPE OF Budget Estimate 10 YEARINFRASTRUCTURE FY14 FY14 FY15 FY16 FY17 FY18 FY19 FY20 FY21 FY22 FY23 FY24 TOTALGERMANTOWN ATHLETIC CLUB:OTHER ASSETS:
Fire Pump Control Panels - - 18 - - - - - - - - - 18 OTHER ASSETS: - - 18 - - - - - - - - - 18
COMPUTER EQUIPMENT:RECREATIONComputers - 5 - - - - - - - - - - -
TOTAL COMPUTER - 5 - - - - - - - - - - -
- - - - - - - - - - - - TOTAL G'TOWN ATHLETIC CLUB - 5 18 - - - - - - - - - -
GMSDFurniture - 258 - - - - - - - - - - -
TOTAL FURNITURE - 258 - - - - - - - - - - -
GMSDComputers - 648 - - - - - - - - - - -
TOTAL COMPUTER - 648 - - - - - - - - - - -
TOTAL GMSD - 906 - - - - - - - - - - - VEHICLE MAINTENANCE FUND:AUTOS AND TRUCKS:
Dodge 2500 Pick-up - 26 - - 30 - - - - - - - 30 Dodge Pick-up - - - - 30 - - - - - - - 30 Ford Fusion - - - - - - - 30 - 30 - - 60 Taurus - - - - - 30 - - - - - - 30 Ford Crown Vic - - - - - - - - - - 28 - 28
TOTAL AUTOS & TRUCKS - 26 - - 60 30 - 30 - 30 28 - 178
OTHER ASSETS:Fuel System- Station 2 - - 20 - - - - - 25 - - - 45
TOTAL OTHER ASSETS - - 20 - - - - - 25 - - - 45
TOTAL VEHICLE MAINT. FUND - 26 20 - 60 30 - 30 25 30 28 - 223
The FarmOTHER ASSETS:RTV/Furnishings - - 30 - - - - - - - - - 30
TOTAL OTHER ASSETS - - 30 - - - - - - - - - 30
TOTAL FARM - - 30 - - - - - - - - - 30
AmbulanceOTHER ASSETS:Defibrillators - 62 62 - - - - - - - - - 62
TOTAL OTHER ASSETS - 62 62 - - - - - - - - - 62
TOTAL AMBULANCE - 62 62 - - - - - - - - - 62
GRAND TOTAL - ALL FUNDS 1,417 2,432 2,635 1,659 1,528 1,399 1,532 1,060 1,538 1,111 703 420 14,487

DISCUSSION OF GENERAL FUND RESERVES
77
During the City's high growth period, excess revenues over expenditures were used for capital projects not funded by bond proceeds. In the past several years, General Fund reserves were used to fund a significant portion of the capital projects. Beginning in FY04, revenues from the Hall Income and Excise Tax were earmarked to fund capital projects due to the uncertainty of this revenue source for operational funding. The drawdown of reserves, including Hall, for the five-year planning period is as follows. FY14 FY15 FY16 FY17 FY18 FY19
CIP $ 1,750,000 2,570,000 2,298,000 2156,000 2,156,000 2,156,000
Actual Estimated Budget ProjectedFY13 FY14 FY15 FY16 FY17 FY18 FY19
Nonspendable 953,837$ 828,837 703,837 578,837 453,837 328,837 203,837 Restricted:Committed Emergencies & Catastrophe 900,000 900,000 900,000 900,000 900,000 900,000 900,000 Committed Capital Asset Repl. Infrastru 814,000 1,782,000 1,101,000 913,000 714,000 967,000 435,000 Committed Tax Anticipation 8,886,098 8,957,369 9,034,932 9,165,096 9,340,029 9,536,683 9,736,953 Committed General Debt 3,431,492 3,036,307 2,877,533 2,867,333 2,482,108 1,801,383 2,108,683
Assigned 1,358,669 1,378,371 1,403,776 1,419,041 1,208,364 1,374,018 1,792,279
Unassigned 2,876,060 3,768,760 4,279,532 4,427,701 5,385,808 6,150,767 7,012,208
Total Fund Balance 19,220,156 20,651,644 20,300,610 20,271,008 20,484,146 21,058,688 22,188,960
Operating Expenditures 38,380,355$ 40,296,948 44,969,800 44,971,000 45,597,375 46,025,923 46,397,670 Fund Balance as % of Expenditures 50% 51% 45% 45% 45% 46% 48%
The chart at the right illustrates the impact of the draw downs on the City’s General Fund fund balance:
FUND BALANCE % TOTAL EXPENDITURES
ANALYSIS OF FUND BALANCE
Percent
50% 51%
45% 45% 45% 46%48%
0%
10%
20%
30%
40%
50%
60%
FY13 FY14 FY15 FY16 FY17 FY18 FY19

78

GENERAL FUND BUDGET PROJECTION SUMMARY
79
The two charts below illustrate revenues and expenses for all major funds. The section following these charts consist of budget projection summaries of revenues and expenditures by major categories, along with fund balances as of June 30, for the fiscal years 2012-2019. The graphs illustrate 8 years of information. This data is provided for the General Fund, Utility Fund, Germantown Athletic Club Fund, Great Hall Fund, Sanitation Fund, Stormwater Management Fund, Special Revenue Funds, Internal Service Funds, Pension, OPEB, Health Fund and Cash Balance Funds. Following the budget projection summaries is a description of personnel costs with a comparison of staffing levels between FY14 and FY15.
$-$5,000
$10,000 $15,000 $20,000 $25,000 $30,000 $35,000 $40,000 $45,000 $50,000 $55,000
General Fund Utility Fund Germantown Athletic Club
Fund
Great Hall Fund
Sanitation Fund
Special Revenue
Funds
Stormwater Management
Fund
$ ThousandsALL FUNDSREVENUES
$-$5,000
$10,000 $15,000 $20,000 $25,000 $30,000 $35,000 $40,000 $45,000 $50,000 $55,000
General Fund Utility Fund Germantown Athletic Club
Fund
Great Hall Fund
Sanitation Fund
Special Revenue
Funds
Stormwater Management
Fund
$ Thousands ALL FUNDSEXPENSES
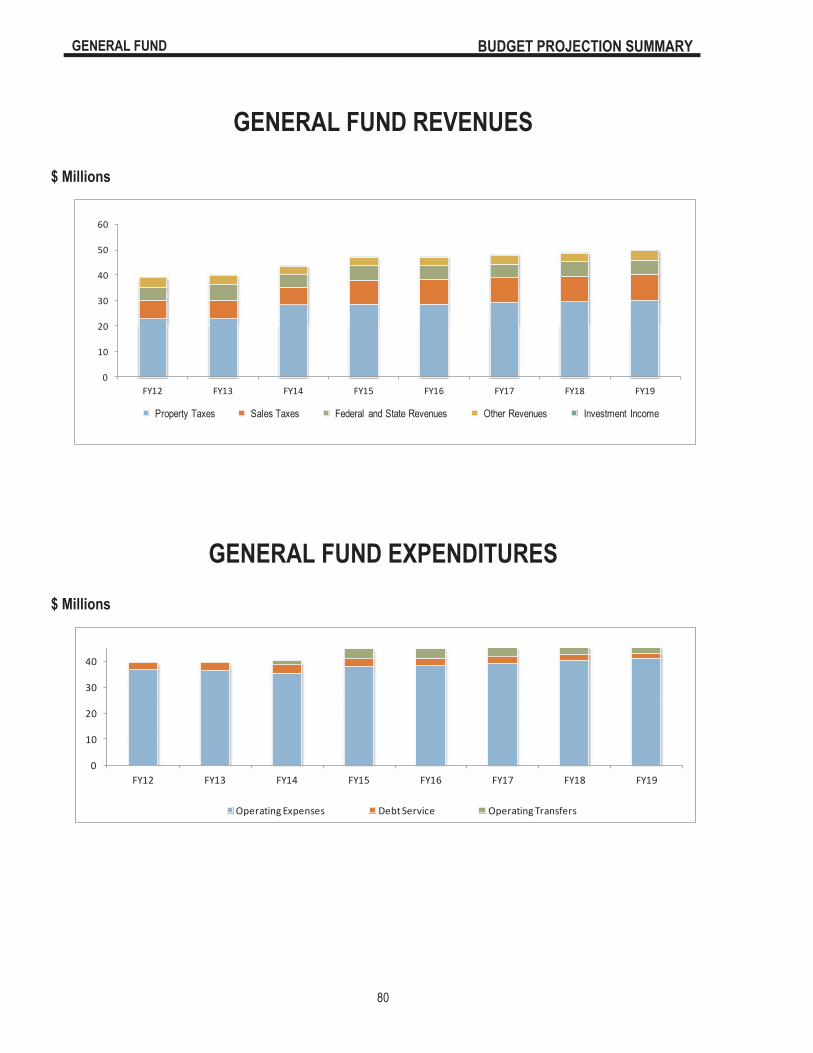
GENERAL FUND BUDGET PROJECTION SUMMARY
80
GENERAL FUND REVENUES
GENERAL FUND EXPENDITURES
0
10
20
30
40
50
60
FY12 FY13 FY14 FY15 FY16 FY17 FY18 FY19
Property Taxes Sales Taxes Federal and State Revenues Other Revenues Investment Income
0
10
20
30
40
FY12 FY13 FY14 FY15 FY16 FY17 FY18 FY19
Operating Expenses Debt Service Operating Transfers
$ Millions
$ Millions

GENERAL FUND BUDGET PROJECTION SUMMARY
81
($000) Actual Actual Budget Estimate Budget ProjectedFY12 FY13 FY14 FY14 FY15 FY16 FY17 FY18 FY19
GENERAL REVENUES:Auto Registration 609$ 657 595 595 607 899 917 935 954 Court Fines 498 501 412 417 445 740 756 773 790 Franchise Fees 0 0 - 0 - 581 599 617 635 Grants 11 26 11 11 11 250 250 250 250 Interest 3 3 3 3 3 54 63 74 92 Licenses 1,006 1,038 1,015 1,009 1,019 166 167 171 174 Other Income 1,309 1,580 1,344 1,325 1,522 1,016 1,036 1,042 1,048 Property Taxes 22,745 22,665 27,750 27,955 28,208 28,682 29,054 29,585 30,192 Sales Taxes 7,701 7,370 7,316 7,320 9,764 9,704 9,890 10,030 10,222 State Taxes 5,069 6,014 5,145 4,844 5,610 5,148 5,235 5,281 5,327 Fund From Prior - 1,038 450 450 450 450 450 450 450
REVENUE TOTAL 38,951 40,890 44,039 43,928 47,639 47,689 48,417 49,206 50,134
EXPENDITURE BY CATEGORY:Personnel 26,590 26,317 26,775 26,009 26,604 27,492 28,282 29,088 29,970 Communication 274 334 341 321 388 389 391 395 399 Prof. Fees 2,601 2,660 2,173 2,358 2,331 2,372 2,414 2,466 2,509 Other Maint. 1,769 1,886 2,014 2,040 2,167 2,197 2,229 2,271 2,308 Supplies 1,370 1,373 1,445 1,451 1,526 1,525 1,555 1,588 1,622 Insurance 114 64 82 75 88 86 86 86 86 Rent 62 63 116 116 269 269 269 270 270 Allocations 1,256 1,169 1,210 1,221 1,327 1,392 1,506 1,470 1,522 Capital Outlay 923 1,215 814 802 1,782 1,131 833 832 946 Road & Mains - - - - - - - - - Contingency - - - - - - - - - Grants 646 364 176 180 547 610 612 614 616 Debt Service 3,064 3,375 3,431 3,319 3,036 2,878 2,867 2,482 1,801 Operating Transfers 500 (455) 1,920 2,325 4,777 4,507 4,434 4,347 4,232 Sanitation - - - - - - - - - Expense Reimburs. (967) (943) (950) (950) (946) (967) (988) (1,010) (1,033) Roll Fwd. Enc. - Prior Yr. - - 450 450 450 450 450 450 450 Roll Fwd. Enc. - Next Yr. - - (450) (450) (450) (450) (450) (450) (450) Utilities 1,057 956 1,168 1,029 1,072 1,087 1,108 1,129 1,151
EXPENDITURE TOTAL 39,259 38,379 40,715 40,297 44,970 44,969 45,598 46,026 46,398
Excess (Deficit) (309) 2,511 3,324 3,631 2,670 2,719 2,819 3,180 3,736
FUND BALANCEBeginning 19,827 16,710 15,078 18,770 20,202 19,851 19,821 20,034 20,609 Transf. to CIP (2,808) - (1,750) (1,750) (2,357) (2,114) (2,156) (2,156) (2,156) Transf. to Infras. - - - - - - - - - CIP Res Inc (Dec) - - - - (213) (184) - - - Prior Period Adjustment - 1,038 - - - - - - -
Ending 16,710$ 20,259 16,652 20,652 20,301 20,272 20,484 21,058 22,189

UTILITY FUND BUDGET PROJECTION SUMMARY
82
UTILITY REVENUES
UTILITY EXPENDITURES
0
2
4
6
8
10
FY12 FY13 FY14 FY15 FY16 FY17 FY18 FY19
Water Sales Sewer Fees Other Developer Contributions
02468
10
FY12 FY13 FY14 FY15 FY16 FY17 FY18 FY19
Water Sewer Sewage Treatment Debt Service
$ Millions
$ Millions

UTILITY FUND BUDGET PROJECTION SUMMARY
83
($000) Actual Actual Budget Estimate Budget ProjectedFY12 FY13 FY14 FY14 FY15 FY16 FY17 FY18 FY19
REVENUES:
Allocations -$ 6 - - - - - - - Installation Charges 160 149 123 105 107 108 108 109 110 Interest 12 14 18 6 7 10 15 20 25 Contrib. Developers 117 86 145 67 75 100 100 200 200 Other Income 13 16 14 23 14 14 15 15 15 Sewer Fees 2,665 2,450 2,700 2,450 3,184 3,200 3,216 3,232 3,249 Water Sales 4,634 4,179 4,832 4,174 5,414 5,441 5,468 5,495 5,523
TOTAL REVENUES 7,601 6,899 7,831 6,825 8,801 8,873 8,922 9,071 9,121
EXPENSES BY CATEGORY:Allocations 1,076 1,133 1,078 1,080 1,140 1,292 1,360 1,400 1,456 Communication 70 65 74 70 74 76 78 80 81 Debt Service 262 311 201 201 166 128 88 288 225 Depreciation 1,645 1,678 1,703 1,773 1,818 1,839 1,886 1,900 1,910 Other Maintenance 67 84 90 105 90 96 98 101 104 Personnel 1,662 1,721 1,730 1,715 1,859 1,919 1,993 2,069 2,148 Professional Fees 68 103 111 105 115 115 115 116 116 Rents - 0 1 1 0 0 0 0 0 Insurance - 5 10 8 10 10 11 11 11 Mains Maintenance 124 178 141 138 142 146 150 154 158 Contract Services 1,151 1,172 1,200 1,175 1,200 1,236 1,272 1,308 1,344 Supplies 158 184 230 240 254 261 269 276 284 Utilities 691 682 753 689 753 779 795 810 827 PILOT 376 387 494 502 484 501 519 537 556
TOTAL EXPENSES 7,350 7,702 7,815 7,802 8,106 8,399 8,633 9,050 9,221
NET INCOME (LOSS) 251 (803) 16 (977) 695 474 289 21 (100)
RETAINED EARNINGS:
Beginning 28,389 28,640 28,670 27,837 26,860 27,555 28,029 28,318 28,339
Ending 28,640$ 27,837 28,686 26,860 27,555 28,029 28,318 28,339 28,239
Capital Outlay 2,790$ 1,567 2,070 1,737 955 1,015 2,248 820 1,565
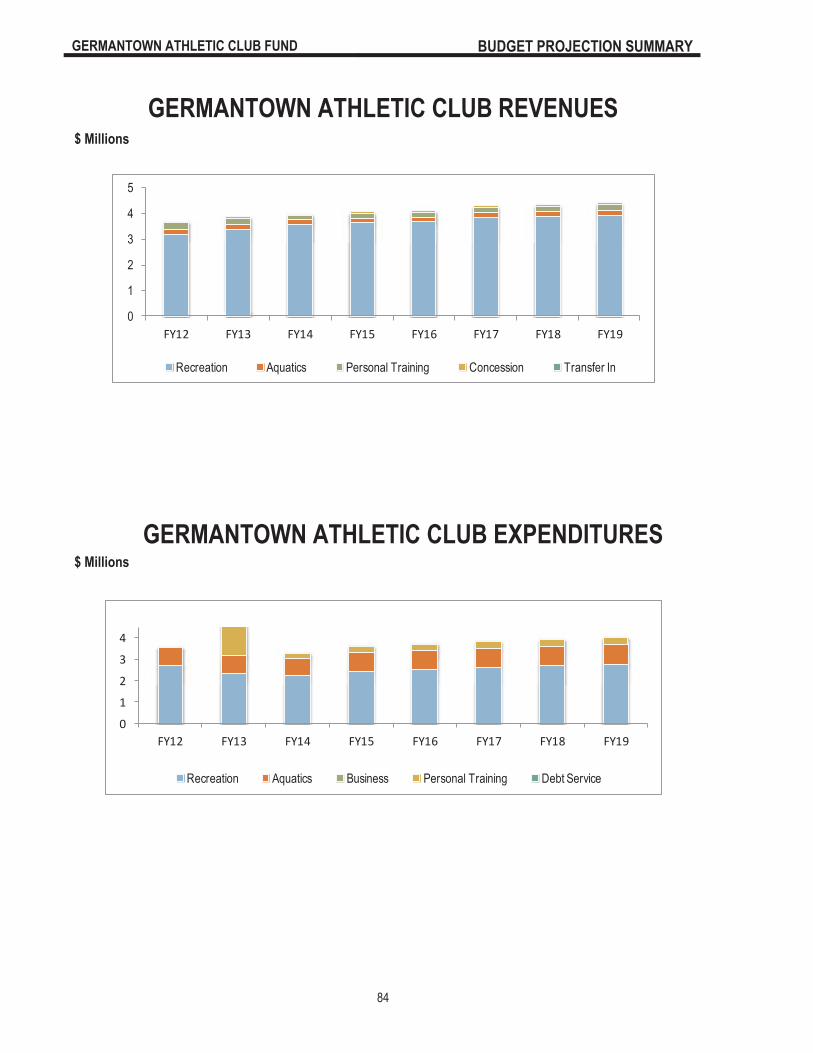
GERMANTOWN ATHLETIC CLUB FUND BUDGET PROJECTION SUMMARY
84
GERMANTOWN ATHLETIC CLUB REVENUES
GERMANTOWN ATHLETIC CLUB EXPENDITURES
0
1
2
3
4
5
FY12 FY13 FY14 FY15 FY16 FY17 FY18 FY19
Recreation Aquatics Personal Training Concession Transfer In
0
1
2
3
4
FY12 FY13 FY14 FY15 FY16 FY17 FY18 FY19
Recreation Aquatics Business Personal Training Debt Service
$ Millions
$ Millions

GERMANTOWN ATHLETIC CLUB FUND BUDGET PROJECTION SUMMARY
85
($000) Actual Actual Budget Estimated Budget ProjectedFY12 FY13 FY14 FY14 FY15 FY16 FY17 FY18 FY19
REVENUES:Centre Revenue 3,208$ 3,399 3,281 3,601 3,649 3,688 3,859 3,900 3,943 Aquatics Revenue 170 182 169 171 171 173 176 178 181 Personal Training 275 255 369 180 180 193 202 212 223 Concession Revenue 61 72 65 30 70 74 77 81 85 Transfer In - (850) (200) - - - - - -
TOTAL REVENUE 3,713 3,058 3,684 3,982 4,070 4,128 4,314 4,372 4,432
EXPENSES:Allocations 158 112 90 90 89 91 93 95 97 Communication 3 9 10 4 5 5 5 5 5 Debt Service 34 31 27 27 23 19 16 12 8 Other Maint. 106 108 132 102 130 133 135 138 141 Personnel 1,450 1,407 1,679 1,396 1,611 1,650 1,705 1,764 1,825 Professional Fees 543 458 538 432 474 481 491 501 511 Rents 181 181 183 182 125 128 130 133 136 Insurance - - - - - - - - - Supplies 182 202 202 204 230 227 231 236 241 Depreciation 586 561 644 525 561 617 642 642 642 Utilities 336 337 359 353 367 376 383 391 399
TOTAL EXPENSES 3,579 3,405 3,864 3,313 3,615 3,726 3,832 3,917 4,005
EXCESS (DEFICIT) 134 (348) (180) 669 455 401 483 455 427
RETAINED EARNINGS:Beginning 2,875 3,009 2,280 2,661 3,330 3,785 4,186 4,669 5,125
Ending 3,009$ 2,661 2,100 3,330 3,785 4,186 4,669 5,125 5,551
Capital Outlay 260$ 114 261 271 1,439 1,000 1,000 - -
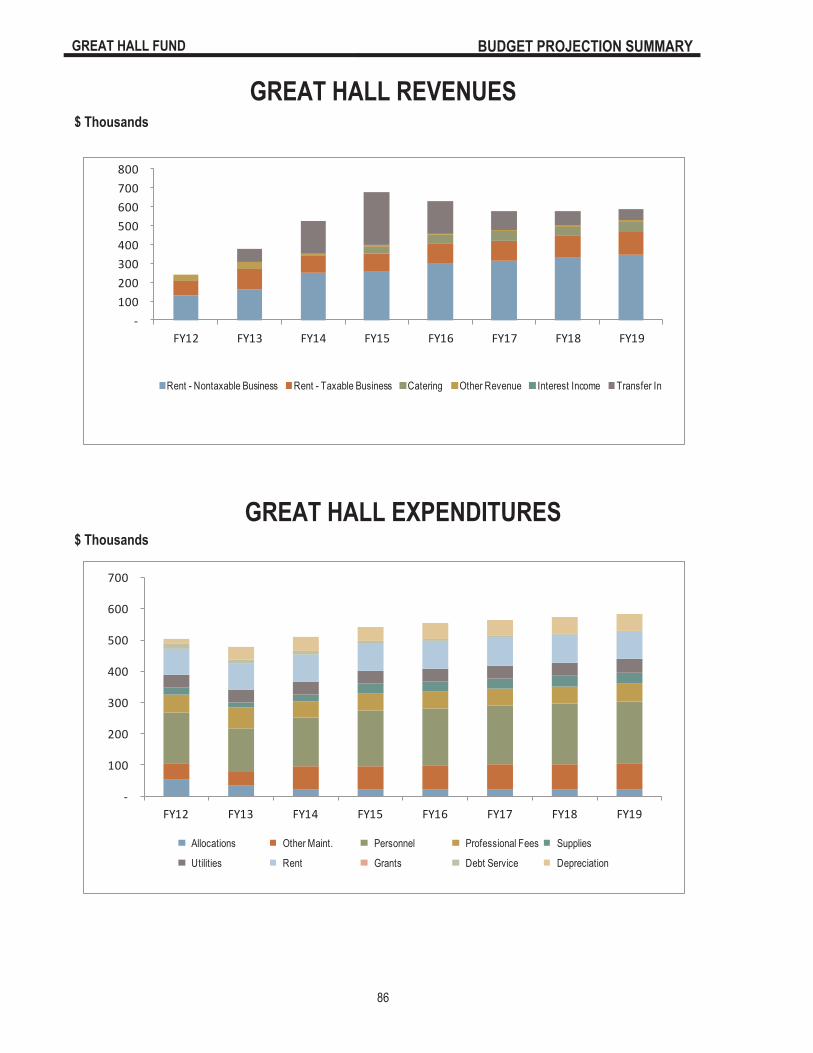
GREAT HALL FUND BUDGET PROJECTION SUMMARY
86
GREAT HALL REVENUES
GREAT HALL EXPENDITURES
-100 200 300 400 500 600 700 800
FY12 FY13 FY14 FY15 FY16 FY17 FY18 FY19
Rent - Nontaxable Business Rent - Taxable Business Catering Other Revenue Interest Income Transfer In
-
100
200
300
400
500
600
700
FY12 FY13 FY14 FY15 FY16 FY17 FY18 FY19
Allocations Other Maint. Personnel Professional Fees Supplies
Utilities Rent Grants Debt Service Depreciation
$ Thousands
$ Thousands

GREAT HALL FUND BUDGET PROJECTION SUMMARY
87
($000) Actual Actual Budget Estimated Budget ProjectedFY12 FY13 FY14 FY14 FY15 FY16 FY17 FY18 FY19
REVENUES:Business Revenue 243$ 308 306 350 398 458 481 505 530 Transfer In - 70 120 175 280 176 100 75 60
TOTAL REVENUE 243 378 426 525 678 634 581 580 590
EXPENSES:Allocations 55 34 22 22 22 22 23 23 24 Communication 1 1 1 1 1 1 1 1 1 Debt Service 13 12 10 10 9 7 6 5 3 Other Maint. 50 47 75 75 75 77 78 80 82 Personnel 164 137 172 155 179 183 188 193 199 Professional Fees 58 67 63 51 52 53 54 55 56 Rents 86 84 85 87 87 87 88 88 88 Supplies 22 15 22 23 31 32 32 33 33 Depreciation 18 43 52 45 45 49 52 52 52 Utilities 39 40 42 42 42 42 43 44 45
TOTAL EXPENSES 505 480 544 511 543 554 565 574 584
EXCESS (DEFICIT) (262) (102) (118) 14 135 79 15 5 6
RETAINED EARNINGS:Beginning 700 438 212 335 349 484 563 579 584
Ending 438$ 335 94 349 484 563 579 584 590
Capital Outlay 138$ 20 18 28 153 125 - - -

SANITATION FUND BUDGET PROJECTION SUMMARY
88
SANITATION REVENUES
SANITATION EXPENDITURES
012345
FY12 FY13 FY14 FY15 FY16 FY17 FY18 FY19
Fixed Service Fee
012345
FY12 FY13 FY14 FY15 FY16 FY17 FY18 FY19
Collection Landfill Administration
$ MILLIONS
$ MILLIONS

SANITATION FUND BUDGET PROJECTION SUMMARY
89
($000) Actual Actual Budget Estimated Budget ProjectedFY12 FY13 FY14 FY14 FY15 FY16 FY17 FY18 FY19
REVENUES: Fixed Service Fee 3,421$ 3,410 3,403 3,412 3,421 3,427 3,920 3,938 3,946 Other Revenues 111 142 146 111 108 108 112 117 117 Transfer In - - - - - - - - -
TOTAL REVENUES 3,532 3,552 3,549 3,523 3,529 3,535 4,033 4,055 4,063
EXPENSES BY CATEGORY:Communication 2 6 17 10 13 10 7 7 7 Personnel 45 48 96 89 93 97 98 100 101 Prof. Fees - - - - - 40 - - - Supplies 21 20 29 29 42 43 43 43 43 Contract Services 3,340 3,121 3,457 3,383 3,528 3,649 3,776 3,935 4,070 Utilities 2 1 1 1 1 1 1 1 1
TOTAL EXPENSES 3,410 3,195 3,600 3,511 3,677 3,840 3,926 4,086 4,223
EXCESS (DEFICIT) 122 357 (52) 11 (148) (305) 107 (31) (160)
RETAINED EARNINGS:Beginning 331 453 554 810 821 673 368 475 444
Ending 453$ 810 502 821 673 368 475 444 284
Capital Outlay -$ - - - - - - - -

STORMWATER MANAGEMENT FUND BUDGET PROJECTION SUMMARY
90
STORMWATER MANAGEMENT REVENUES
STORMWATER MANAGEMENT EXPENSES
0
1
2
FY12 FY13 FY14 FY15 FY16 FY17 FY18 FY19
Stormwater Fee Other Revenues
0
1
2
FY12 FY13 FY14 FY15 FY16 FY17 FY18 FY19
Communication Other Maintenance Personnel Professional Fees
Supplies Roads and Mains Depreciation Allocations
$ MILLIONS
$ MILLIONS

STORMWATER MANAGEMENT FUND BUDGET PROJECTION SUMMARY
91
($000) Actual Actual Budget Estimate Budget Projected
FY12 FY13 FY14 FY14 FY15 FY16 FY17 FY18 FY19
REVENUES: Stormwater Management Fee 1,030$ 995 1,052 983 1,003 1,023 1,043 1,064 1,085 Other Revenues 7 1 6 10 9 9 9 9 9 Transfer In - - - - - - - - -
TOTAL REVENUES 1,037 996 1,057 993 1,012 1,032 1,052 1,073 1,094
EXPENSES BY CATEGORY:Communication 1 1 6 6 6 6 7 7 7 Other Maintenance 40 19 65 55 65 67 68 70 72 Personnel 593 618 607 576 587 607 631 655 681 Prof. Fees 4 6 20 20 20 20 20 20 20 Supplies 21 24 31 31 32 33 34 35 36 Roads and Mains 181 217 239 240 255 261 268 275 281 Depreciation - 1 9 7 19 30 30 30 27 Allocations 42 29 36 36 41 43 47 45 47
TOTAL EXPENSES 882 915 1,012 971 1,025 1,067 1,104 1,137 1,170
EXCESS (DEFICIT) 155 81 45 22 (13) (36) (52) (63) (76)
RETAINED EARNINGS:Beginning 140 296 361 377 399 386 350 298 235
Ending 296$ 377 406 399 386 350 298 235 159
Capital Outlay -$ - 40 37 195 - - - 120

SPECIAL REVENUE FUNDS BUDGET PROJECTION SUMMARY
92
($000)STATE STREET AID
Actual Actual Budget Estimated Budget ProjectedFY12 FY13 FY14 FY14 FY15 FY16 FY17 FY18 FY19
REVENUES: State Street Aid 1,010$ 1,033 1,054 1,037 1,040 1,061 1,082 1,104 1,126 Other Revenue - - - - - - - - - Interest 3 2 4 0 - 5 6 7 8 Transfer In-Gen. Fund 500 200 750 900 1,650 1,500 1,500 1,500 1,500
TOTAL REVENUES 1,513 1,235 1,808 1,937 2,690 2,566 2,588 2,610 2,634
EXPENSES BY CATEGORY: Other Maintenance 55 64 250 200 200 200 200 200 200 Electricity & Gas 810 814 824 820 824 847 864 881 898 Str. Contract Maint. 984 1,136 460 1,040 1,300 1,100 1,100 1,100 1,100 City Str. Maint. 392 306 275 450 350 385 385 385 385
TOTAL EXPENSES 2,241 2,319 1,809 2,510 2,674 2,532 2,549 2,566 2,583
EXCESS (DEFICIT) (728) (1,085) (1) (573) 16 33 39 44 51
FUND BALANCE: Beginning of Year 2,420 1,692 438 607 34 51 84 124 167
Ending 1,692 607 437 34 51 84 124 167 219
($000)AUTOMATED ENFORCEMENT
Actual Actual Budget Estimated Budget ProjectedFY12 FY13 FY14 FY14 FY15 FY16 FY17 FY18 FY19
REVENUES: Red Lights 255$ 44 225 0 59 78 88 98 108 Transfer In-Gen. Fund - 125 150 150 75 50 50 50 50
TOTAL REVENUES 255 169 375 150 134 128 138 148 158
EXPENSES BY CATEGORY: Personnel 130 108 103 94 100 101 104 108 112 Materials & Supplies 2 2 8 0 7 8 8 8 8 Rent 113 23 175 - - - - - - Professional Fees - - - 32 - - - - - Other - Grants 19 - 23 23 13 13 13 13 13 Capital Outlay - - - - - - - - -
TOTAL EXPENSES 264 133 309 149 120 122 125 129 133
EXCESS (DEFICIT) (9) 36 66 1 14 7 13 19 25
FUND BALANCE: Beginning of Year 27 18 28 54 55 69 76 89 108
Ending 18 54 94 55 69 76 89 108 133

SPECIAL REVENUE FUNDS BUDGET PROJECTION SUMMARY
93
($000)DRUG ASSET FORFEITURE FUND
Actual Actual Budget Estimated Budget ProjectedFY12 FY13 FY14 FY14 FY15 FY16 FY17 FY18 FY19
REVENUES: Drug Enforcement 220$ 115 350 200 350 350 350 350 350 Interest - - - - - - - - -
TOTAL REVENUES 220 115 350 200 350 350 350 350 350
EXPENSES BY CATEGORY: Personnel 41 27 81 78 81 81 81 81 81 Communications - - 1 - 1 1 1 1 1 Professional Fees - - 24 - 24 24 24 24 24 Other Maintenance - - 5 - 5 5 5 5 5 Supplies 84 52 132 42 138 138 138 138 138 Utilities 2 2 2 5 6 6 6 6 6 Rents - - 1 - 1 1 1 1 1 Allocations - - - - - - - - - Capital Outlay 68 52 - 73 - - - - -
TOTAL EXPENSES 195 133 246 198 256 256 256 256 256
EXCESS (DEFICIT) 25 (18) 104 2 94 94 94 94 94
FUND BALANCE: Beginning 88 113 141 95 97 191 285 379 473
Ending 113 95 245 97 191 285 379 473 567
($000)PICKERING COMPLEX FUND
Actual Actual Budget Estimate Budget ProjectedFY12 FY13 FY14 FY14 FY15 FY16 FY17 FY18 FY19
REVENUES: Classes 19$ 19 18 25 25 25 25 25 25 Special Events 8 8 7 5 7 7 7 7 7 Rental 34 36 40 35 35 35 35 35 35 Transfer In-Gen. Fund - - - - - - - - -
TOTAL REVENUES 61 63 65 65 67 67 67 67 67
EXPENSES BY CATEGORY: Allocations 2 2 3 3 3 3 3 3 3 Utilities 8 8 10 10 10 11 11 11 11 Capital Outlay 90 17 - - - - - - - Professional Fees 16 18 21 25 21 25 25 25 25 Supplies 1 1 5 1 5 1 1 1 1
TOTAL EXPENSES 117 47 38 38 38 39 39 40 40
EXCESS (DEFICIT) (55) 16 27 26 29 28 28 27 27
FUND BALANCE: Beginning 193 138 118 153 179 208 237 265 292
Ending 138 153 145 179 208 237 265 292 320

SPECIAL REVENUE FUNDS BUDGET PROJECTION SUMMARY
94
($000)RECREATION FUND
Actual Actual Budget Estimate Budget ProjectedFY12 FY13 FY14 FY14 FY15 FY16 FY17 FY18 FY19
REVENUES: Basketball Fees 30$ 38 43 48 45 45 46 46 47 Softball Fees 35 33 40 38 37 38 38 38 39 Kickball Fees 2 2 2 2 4 4 4 4 4 Sports Camps 30 26 45 18 41 42 42 43 43 Tennis Classes 13 8 15 5 15 15 15 15 16 Basketball Sponsors 2 5 5 5 5 5 5 5 5 Soccer Fees (0) 13 - - - - - - - Baseball Fees 10 6 11 9 11 11 11 12 12 Croquet 1 1 1 1 1 1 1 1 1 Cheerleading 30 32 27 22 27 27 27 28 28 Competitive Soccer 0 - - - - - - - - Community Education 27 35 36 34 336 339 342 346 349
TOTAL REVENUES 180 197 225 182 522 527 533 538 543
EXPENSES BY CATEGORY: Personnel - - - - 168 173 179 185 192 Allocations 11 10 12 12 14 14 15 17 20 Professional Fees 119 109 134 108 150 150 150 152 152 Supplies 45 47 53 48 136 138 140 142 144 Capital Outlay 80 43 - - - - 50 - - Rents 1 2 4 3 3 3 3 3 3
TOTAL EXPENSES 256 211 203 170 471 478 537 499 510
EXCESS (DEFICIT) (76) (14) 22 12 51 49 (5) 39 33
FUND BALANCE: Beginning 244 168 149 154 166 218 266 262 301
Ending 168 154 171 166 218 266 262 301 334
Capital Outlay -$ - - - 50 - - - -
($000)FEDERAL ASSET FORFEITURE FUND
Actual Actual Budget Estimated Budget ProjectedFY12 FY13 FY14 FY14 FY15 FY16 FY17 FY18 FY19
REVENUES: Forfeiture Revenue 7$ 7 50 50 50 50 50 50 50
TOTAL REVENUES 7 7 50 50 50 50 50 50 50
EXPENSES BY CATEGORY: Personnel - - 20 20 20 20 20 20 20 Supplies 6 5 30 12 30 30 30 30 30 Capital Outlay - - - 18 - - - - -
TOTAL EXPENSES 6 5 50 50 50 50 50 50 50
EXCESS (DEFICIT) 1 2 - - - - - - -
FUND BALANCE: Beginning 3 4 3 6 6 6 6 6 6
Ending 4 6 3 6 6 6 6 6 6

SPECIAL REVENUE FUNDS BUDGET PROJECTION SUMMARY
95
($000)Ambulance Fund
Actual Actual Budget Estimated Budget ProjectedFY12 FY13 FY14 FY14 FY15 FY16 FY17 FY18 FY19
REVENUES: Transport Fee - - 704 762 836 886 939 996 1,055 Non Transport Fee - - 58 - - - - - - General Fund Transfer - - 1,000 1,000 500 500 500 500 400
TOTAL REVENUES - - 1,762 1,762 1,336 1,386 1,439 1,496 1,455
EXPENSES BY CATEGORY: Personnel - - 1,114 1,110 1,209 1,242 1,290 1,339 1,389 Communications - - 2 2 2 2 2 2 2 Professional Fees - - 63 50 54 54 56 58 60 Other Maintenance - - 1 1 1 1 1 1 1 Insurance - - 15 - 15 30 31 31 32 Supplies - - 103 103 75 63 72 67 68 Utilities - - 2 2 2 2 2 2 2 Rents - - 48 55 - - - - - Allocations - - 23 23 24 10 11 11 11 Capital Outlay - - 62 62 62 - - - - TOTAL EXPENSES - - 1,433 1,408 1,445 1,406 1,465 1,510 1,565
EXCESS (DEFICIT) - - 329 355 (109) (20) (26) (15) (110)
FUND BALANCE: Beginning - - - - 355 246 226 201 186
Ending - - 329 355 246 226 201 186 76

SPECIAL REVENUE FUNDS BUDGET PROJECTION SUMMARY
96
($000)Germantown Municipal School District Fund
Actual Actual Budget Estimated Budget Projected
FY12 FY13 FY14 FY14 FY15 FY16 FY17 FY18 FY19 REVENUES: BEP - - - - 22,115 22,336 22,559 22,898 23,241 ADA - - - - 18,693 18,880 19,068 19,354 19,645 Other Revenues - - - - 3,316 3,349 3,383 3,434 3,485 Nutrition - - - - 1,126 1,137 1,149 1,166 1,183 Sales Tax - 1,779 2,269 2,023 - - - - - General Fund Transfer - - 100 100 2,122 2,122 2,122 2,122 2,122
TOTAL REVENUES - 1,779 2,369 2,123 47,371 47,824 48,281 48,973 49,676
EXPENSES BY CATEGORY: Personnel - 554 1,306 665 37,198 37,570 37,946 38,319 38,695 Communications - 7 88 54 149 149 150 151 153 Professional Fees - 22 97 186 2,618 2,644 2,644 2,645 2,645 Other Maintenance - - 10 100 684 684 691 698 705 Insurance - 1 10 25 - - - - - Supplies - 0 161 401 2,735 2,748 2,767 2,786 2,806 Utilities - 369 129 95 1,021 1,027 1,035 1,042 1,050 Rents - - 4 0 144 145 147 148 150 Allocations - - 12 36 246 246 249 251 254 Grants - 294 125 125 - - - - - Capital Outlay - - 640 906 1,917 1,692 1,692 1,692 1,692 Contract Maintenance - - - - 629 629 635 641 648 TOTAL EXPENSES - 1,247 2,582 2,593 47,341 47,534 47,955 48,375 48,798
EXCESS (DEFICIT) - 532 (213) (470) 30 290 326 598 878
FUND BALANCE: Beginning - - 532 532 62 92 382 707 1,305
Ending - 532 319 62 92 382 707 1,305 2,184

SPECIAL REVENUE FUNDS BUDGET PROJECTION SUMMARY
97
($000)Farm Fund
Actual Actual Budget Estimated Budget ProjectedFY12 FY13 FY14 FY14 FY15 FY16 FY17 FY18 FY19
REVENUES: Donations - - - - 5 5 5 5 5 Membership Fee - - - - 17 20 20 20 20 Earned Income - - - - 10 10 10 10 10 Educational Fees - - - - 4 8 10 10 10 Rental Income - - - - - 30 50 50 50 General Fund Transfer - - - - 150 159 162 100 100
TOTAL REVENUES - - - - 186 232 257 195 195
EXPENSES BY CATEGORY: Personnel - - - - 70 73 94 97 100 Communications - - - - 5 5 5 5 5 Professional Fees - - - - 15 15 15 15 15 Other Maintenance - - - - 11 14 15 15 16 Insurance - - - - 3 3 3 3 3 Supplies - - - - 24 25 25 26 26 Utilities - - - - 10 12 12 12 13 Rents - - - - 10 10 10 10 10 Allocations - - - - - - - - - Capital Outlay - - - - 30 70 80 12 8 TOTAL EXPENSES - - - - 178 227 260 195 195
EXCESS (DEFICIT) - - - - 8 5 (3) (1) 0
FUND BALANCE: Beginning - - - - - 8 13 10 10
Ending - - - - 8 13 10 10 10

INTERNAL REVENUE FUNDS BUDGET PROJECTION SUMMARY
98
($000)FLEET SERVICES FUND
Actual Actual Budget Estimate Budget ProjectedFY12 FY13 FY14 FY14 FY15 FY16 FY17 FY18 FY19
REVENUES:
Transfers In 984$ 891 925 936 1,065 1,125 1,246 1,183 1,226
TOTAL REVENUES 984 891 925 936 1,065 1,125 1,246 1,183 1,226
EXPENSES BY CATEGORY: Allocations 10 11 12 12 12 11 12 12 13 Depreciation 30 31 34 34 36 40 45 55 60 Other Maintenance 223 237 234 247 242 389 479 379 390 Personnel 690 732 602 594 615 636 659 684 710 Communication 0 0 2 2 2 2 2 2 2 Rents 1 2 2 2 3 3 3 3 3 Supplies 20 17 31 36 144 32 33 34 35 Utilities 8 8 10 10 12 12 13 13 13 Vehicle Maint. - - - - - - - - -
TOTAL EXPENSES 984 1,038 926 936 1,065 1,125 1,246 1,183 1,226
EXCESS (DEFICIT) - (147) - - - - - - -
RETAINED EARNINGS: Beginning 35 35 26 (112) (112) (112) (112) (112) (112)
Ending 35 (112) 26 (112) (112) (112) (112) (112) (112)
Capital Outlay 18$ 65 - 26 20 - 50 90 -
($000)ALLOCATED EXPENSES
Actual Actual Budget Estimate Budget ProjectedFY12 FY13 FY14 FY14 FY15 FY16 FY17 FY18 FY19
REVENUES:
Transfers In 662$ 665 623 646 617 683 707 732 758
TOTAL REVENUES 662 665 623 646 617 683 707 732 758
EXPENSES BY CATEGORY: Insurance 662 518 623 646 617 683 707 732 758
TOTAL EXPENSES 662 518 623 646 617 683 707 732 758
EXCESS (DEFICIT) - 147 - - - - - - -
RETAINED EARNINGS: Beginning - - 147 147 147 147 147 147 147
Ending -$ 147 147 147 147 147 147 147 147

INTERNAL REVENUE FUNDS BUDGET PROJECTION SUMMARY
99
($000)HEALTH INSURANCE FUND
Actual Actual Budget Estimate Budget Projected FY12 FY13 FY14 FY14 FY15 FY16 FY17 FY18 FY19
REVENUES: Contributions 5,367$ 4,678 5,490 5,499 4,959 5,785 6,435 7,103 7,843 Transfer In - - - - - - - - -
TOTAL REVENUES 5,367 4,678 5,490 5,499 4,959 5,785 6,435 7,103 7,843
HEALTH PLAN EXPENSES: Health Claims 5,159 4,465 5,265 4,097 4,709 4,907 5,330 5,835 6,398 Dental Claims 194 213 225 323 250 225 236 247 260
TOTAL EXPENSES 5,353 4,678 5,490 4,420 4,959 5,132 5,566 6,082 6,657
EXCESS (DEFICIT) 14 (0) - 1,079 - 653 869 1,021 1,186
RETAINED EARNINGS: Beginning 499 513 1,236 512 1,591 1,591 2,244 3,113 4,134
Ending 513$ 512 1,236 1,591 1,591 2,244 3,113 4,134 5,321

TRUST FUNDS BUDGET PROJECTION SUMMARY
100
($000)OPEB FUND
Actual Actual Budget Estimate Budget Projected FY12 FY13 FY14 FY14 FY15 FY16 FY17 FY18 FY19
OPEB REVENUES: Contributions 1,073$ 1,601 920 913 920 1,661 1,728 1,797 1,869 Fair Value Appreciation (97) 366 300 10 150 156 162 169 175 Gain (Loss) (54) 80 80 60 300 312 324 337 351 Interest 59 59 76 60 60 62 65 67 70
TOTAL REVENUES 982 2,107 1,376 1,044 1,430 2,192 2,279 2,371 2,465
OPEB EXPENSES: Trustee Fees 6 20 14 17 1 1 1 1 1 Benefits 407 710 490 545 539 562 584 607 632 Stop Loss - (41) - - - - - - -
TOTAL EXPENSES 412 689 503 563 541 563 585 609 633
EXCESS (DEFICIT) 570 1,417 873 481 889 1,629 1,694 1,762 1,833
FUND BALANCE: Beginning 3,099 3,669 5,299 5,086 5,567 6,457 8,086 9,781 11,542
Ending 3,669$ 5,086 6,172 5,567 6,457 8,086 9,781 11,542 13,375
($000)CASH BALANCE
Actual Actual Budget Estimate Budget Projected FY12 FY13 FY14 FY14 FY15 FY16 FY17 FY18 FY19
CASH BALANCE REVENUES: Contributions -$ - 22 127 132 137 143 148 Fair Value Appreciation - - - - 8 8 8 8 9 Gain (Loss) - - - - 3 3 3 3 4 Interest - - - - 5 5 5 5 5
TOTAL REVENUES - - - 22 142 147 153 159 166
CASH BALANCE EXPENSES: Trustee Fees - - - - 7 7 8 8 8 Benefits - - - - - - - - -
TOTAL EXPENSES - - - - 8 7 8 8 8
EXCESS (DEFICIT) - - - 22 134 140 146 152 158
FUND BALANCE: Beginning - - - - 22 155 296 441 593
Ending -$ - - 22 155 296 441 593 751

TRUST FUNDS BUDGET PROJECTION SUMMARY
101
($000)PENSION FUND
Actual Actual Budget Estimate Budget Projected FY12 FY13 FY14 FY14 FY15 FY16 FY17 FY18 FY19
PENSION REVENUES: Contributions 3,049$ 3,075 2,918 2,918 2,274 3,042 3,042 3,042 3,042 Fair Value Appreciation (Depreciation) (2,073) 4,156 1,825 500 2,000 1,189 2,532 2,686 2,839 Realized Gain (Loss) 7 1,639 650 8,000 3,000 - - - - Interest 1,090 1,030 1,050 900 1,030 393 422 448 473
TOTAL REVENUES 2,073 9,900 6,443 12,318 8,304 4,624 5,996 6,176 6,354
PENSION EXPENSES: Trustee Fees 226 273 256 261 282 230 230 230 230 Benefits 2,261 2,382 2,485 2,485 1,594 1,655 1,738 1,738 1,825 TOTAL EXPENSES 2,486 2,655 2,741 2,746 1,876 1,885 1,968 1,968 2,055
EXCESS (DEFICIT) (413) 7,244 3,702 9,572 6,428 2,739 4,028 4,208 4,299
FUND BALANCE: Beginning 47,528 47,115 55,676 54,359 63,931 70,359 73,098 77,126 81,334
Ending 47,115$ 54,359 59,378 63,931 70,359 73,098 77,126 81,334 85,633

PERSONNEL AND STAFFING BUDGET PROJECTION SUMMARY
102
The following staffing schedule summarizes the employee component of the City. In each cost center section of the Budget, a Personnel Projection schedule lists five areas of personnel expense – exempt salaries, non-exempt wages, other compensation, fringe benefits and other personnel. Since the nature of these categories is generally common to all departments, these items will be described in this section.
Exempt Salaries and Non-Exempt Wages: Exempt salaries and non-exempt wages include the payroll cost for full-time and part-time positions classified under each category. There is a net effect of a 3% merit increase in the FY15 Budget. The total personnel budget increased over FY14 by $28,384,240, due largely to the GMSD Fund.
Other Compensation: Other compensation includes overtime wages, extra duty wages, housing allowance and per diem expenses. Overtime is self-explanatory. Extraordinary amounts and changes are described in certain cost center Budget Category Explanations. Extra duty wages account for the amounts paid to police and fire employees in lieu of holiday time off and for court appearances. Housing allowance has been discontinued, but is still paid to those who were grandfathered in before 1986. Per Diem covers City judges, prosecutors, Aldermen and the Mayor.
Fringe Benefits: Fringe Benefits include the City’s cost for FICA, medical, dental, life, long-term disability, retirement, OPEB, and Workers’ Compensation insurance. FICA, set by the federal law, is 7.65% of salary. Increases in the City’s health benefit costs necessitated a rate adjustment in the FY15 Budget. The new per employee annual contribution is $11,070 for both health and dental.
To maintain a competitive compensation package, the City added retiree’s medical benefits several years ago and continues to improve the retirement plan. The City has implemented an IRS Section 125 Plan to pay employee costs of retirement and medical benefits with pre-tax dollars.
The City also provides life insurance of three times salary at a cost of 15¢ per month per $1,000 of coverage. The City pays 72.3¢ per month per $100 of salary for long-term disability benefits. Workers’ Compensation is through the TML Risk Management Pool and varies by department based on the Pool’s assessment of potential risks.
Other Personnel: Other Personnel costs include education, staff functions, and unemployment. Employee education amounts and charges are described in the Budget Category Explanations in the various cost centers. Staff functions fund events such as employee holiday parties and awards programs. Unemployment funds payments to individuals receiving unemployment benefits.
-
100
200
300
400
Full-time Part-time
378.
42
389
42 Num
ber o
f Pos
itions
FY14 FY15
`
The number of full-time and part-time positions in the FY15 Budget shows change over the current fiscal year. The chart on the following page identifies the position changes; all associated with productivity improvement initiatives.

103
COMPARISON OF STAFFING BUDGET PROJECTION SUMMARY
FY13 Actual FY14 Actual FY15 Budget Incr/Full Part Full Part Full Part INC/ (Decr)Time Time Time Time Time Time (DECR) Salary Cost
(Full Time Equivalents-Non-Exempt/Exempt Employees)
GENERAL GOVERNMENT City Court 7.0 0.3 7.0 0.3 7.0 0.3 0.0 Administration* 5.0 0.5 4.0 1.0 5.0 1.1 1.1 81,209$ Human Resources 6.0 0.0 7.0 0.0 7.0 0.0 0.0 Information Technology 5.0 0.0 5.0 0.0 5.0 0.0 0.0 Finance 16.0 0.5 10.0 0.0 10.0 0.0 0.0 Procurement* 0.0 0.0 7.0 0.5 7.0 0.0 -0.5 (17,966)$ Economic and Community Development* 20.0 0.0 17.0 0.5 18.0 0.5 1.0 44,900$ Facilities Services* 12.0 0.0 13.0 0.5 14.0 0.0 0.5 17,966$ GPAC 9.0 4.5 10.0 1.5 10.0 1.5 0.0 Office of Budget and Performance 2.0 0.0 3.0 0.0 3.0 0.0 0.0PUBLIC SAFETY Police* 107.0 0.0 112.0 0.0 115.0 1.3 4.3 193,571$ Fire 70.0 1.0 66.0 1.0 66.0 1.0 0.0TRANSP. & ENVIRONMENT Public Services 38.5 1.0 38.5 1.0 38.5 1.0 0.0 Fleet Services 10.0 0.0 8.0 0.0 8.0 0.5 0.5 16,250$ Animal Control 5.0 0.0 4.0 0.5 4.0 0.5 0.0COMMUNITY SERVICES Parks & Recreation 6.5 4.5 5.5 5.5 5.5 6.0 0.5 20,000$ The Farm (General Fund)* 0.0 1.0 0.0 1.0 0.0 0.0 -1.0 (65,000)$ MUNICIPAL SCHOOLS FUND 5.0 1.3 0.0 1.3 n/a n/aAMBULANCE FUND* 0.0 0.0 13.0 0.0 16.0 0.0 3.0 54,439$ THE FARM (Special Revenue Fund)* 0.0 0.0 0.0 0.0 0.0 1.0 1.0 65,000$ GERMANTOWN ATHLETIC CLUB Recreation* 11.0 11.9 9.0 11.9 10.0 11.9 1.0 35,000$ Aquatics 2.0 13.5 2.0 13.5 2.0 13.5 0.0 Personal Training 1.0 1.0 1.0 1.0 1.0 1.0 0.0GREAT HALL 2.0 1.0 2.0 1.0 2.0 1.0 0.0UTILITIES Water* 20.0 0.0 20.0 0.0 21.0 0.0 1.0 85,000$ Sewer 6.0 0.0 6.0 0.0 6.0 0.0 0.0SANITATION 0.0 0.0 0.5 0.0 0.5 0.0 0.0STORMWATER 7.0 0.0 7.0 0.0 7.0 0.0 0.0 TOTAL 373.0 42.0 377.5 42.0 388.5 42.1 12.4 530,369$
* Analysis of Increase/(Decrease):
Administration Marketing & Communications Coordinator 1.0Grants Manager 0.1
Procurement Administrative Assistant (0.5)Economic Community Development Planner 1.0Facilities Services Administrative Assistant 0.5Police Police Officers (SRO) 1.0
Police Officers (SRO) 1.0Police Officers (SRO) 1.0School Crossing Guards 1.3
Fleet Services Inventory/Data Clerk 0.5Fire Paramedic Fire Fighter 1.0
Paramedic Fire Fighter 1.0Paramedic Fire Fighter 1.0
Parks & Recreation Inclusion Specialist 0.5The Farm (General Fund) Farm Workers (1.0)The Farm (Special Revenue Fund) Farm Workers 1.0GAC Recreation Child Care Coordinator 1.0Water Assistant Water Director 1.0

104

105
GENERAL GOVERNMENT FY15 BUDGET
The following section presents the operating budget for all General Government cost centers. Total operating expenditures for the four major categories within this classification are summarized below:
GENERAL GOVERNMENT EXPENDITURES
Category
Cost Centers Included
Administration
Administration Aldermen Budget and Performance Germantown Performing Arts Centre Information Technology Human Resources
Procurement Finance
Financial Services City Court
Development Economic and Community Development General Services Facility Services
Fleet Services
02468
101214
FY11 FY12 FY13 FY14 FY15
Administration Finance Development General Services
$ MILLIONS

106

107
GENERAL FUND
Mission To represent all the citizens of Germantown; to legally, ethically and morally uphold the duties and
responsibilities of the City of Germantown; and to support the City’s charter.
The legislative and policy making body of the City is the five Aldermen, elected for four-year overlapping terms. Their responsibility is representing the citizens of the community through the establishment of policies. These policies may take the form of resolutions or ordinances that establish the laws, proceedings and City service levels for the community. Compensation for their services is the major cost item in this activity. Also included are educational and meeting appropriations to provide for participation in the National League of Cities and the Tennessee Municipal League.
Budget Category Summary
Budget Payroll Summary Categories Personnel - $119,862 This category includes funding for the per diem of the City’s five Aldermen and their
related payroll expenditures. On January 1, 2009, the per diem increased to $1,000 for each Alderman per month as per Ordinance No. 2006-5.
Communications - $11,900 This category includes the Aldermen’s dues and subscriptions in the Tennessee Municipal League and the National League of Cities.
Actual Budget Estimated BudgetCATEGORY FY13 FY14 FY14 Amt. Chg. % Chg. FY15
Personnel 92,206$ 128,390 114,979 4,883 4.25% 119,862 Communication 11,143 10,800 10,702 1,198 11.19% 11,900 Professional Fees 69,458 40,000 44,250 (4,250) -9.60% 40,000 Supplies 26,677 50,500 46,400 (4,150) -8.94% 42,250
TOTAL 199,484$ 229,690 216,331 (2,319) -1.07% 214,012
FY13 FY14 FY15Actual Estimate Budget
Other Compensation 5.0 61,283 5.0 60,000 5.0 60,000
Fringe Benefits 30,923 54,979 59,862
DEPARTMENT TOTAL 5.0 92,206$ 5.0 114,979 5.0 119,862
Aldermen

108
GENERAL FUND
Professional Fees - $40,000 This category covers funding for lobbying services at the state level and miscellaneous consulting services. Supplies - $42,250 This category covers funding for the 2014 Aldermen and Mayor elections, Annual Commission Appreciation Reception, Principals’ Luncheon, and recognition items.
Performance Measures
Triple Bottom Line Focus Area: Social FY13 FY14 FY15Key Product/Service: Governance Goal Actual Goal Actual Goal
Measure: % of Commission Turnover Rate 25% 28% 25% 26% 25%
Aldermen

109
GENERAL FUND
Mission Provide for the orderly, efficient and responsive disposition of all clerical and administrative matters for
Municipal Court.
Under Finance, the Court Clerk’s Office creates and maintains all dockets and documents pertaining to Court; collects and accounts for all fines, costs, forfeitures, fees, bonds and taxes; reports and distributes funds to City, County and State agencies on a monthly basis; issues subpoenas and garnishments; documents warrants, jail sentencing logs and writs; transfers appeals and submits bindovers to the appropriate courts; schedules community service; maintains juvenile traffic school files; maintains the probation for juvenile offenders in the First Offenders Program and performs secretarial functions for prosecutors and judges.
Budget Category Summary
Budget Payroll Summary Categories Personnel - $589,910 This category funds salaries, wages, and benefits for a court clerk, deputy court clerks
and one intern. This category also includes necessary overtime. In addition, this category includes FICA, group insurance, retirement, OPEB, and workers’ compensation.
Additionally, included in this category are per diem expenses for judges who alternate 76 court sessions and prosecutors working weekly Wednesday night court sessions and bi-weekly Thursday night sessions. Besides holding court, judges are available 24 hours a day to sign warrants, set bonds or preside over non-scheduled court hearings. Prosecutors, in addition to attending court, receive phone calls in their private law offices regarding court related matters and require time to prepare for trials. Per diems are budgeted as follows: city judges at $2,500 per month each, the chief prosecutor at $1,500 per month and assistant prosecutors at $1,000 per month.
Actual Budget Estimated BudgetCATEGORY FY13 FY14 FY14 Amt. Chg. % Chg. FY15
Personnel 543,872$ 608,392 561,307 28,603 5.10% 589,910 Communication 1,871 1,800 2,500 - 0.00% 2,500 Professional Fees 9,204 13,500 13,500 - 0.00% 13,500 Supplies 11,631 6,600 7,269 831 11.43% 8,100 Rent 2,379 6,000 7,500 - 0.00% 7,500 Allocations 2,918 3,000 3,000 - 0.00% 3,000 Utilities 20,031 22,057 20,014 2,253 11.26% 22,267
TOTAL 591,906$ 661,349 615,090 31,687 5.15% 646,777
FY13 FY14 FY15Actual Estimate Budget
Exempt Salaries 1.0 68,000$ 1.0 60,642 1.0 62,320
Non-Exempt Wages 6.3 171,256 6.3 199,579 6.3 209,764
Other Compensation 6.0 145,640 6.0 135,000 6.0 138,000
Fringe Benefits 153,113 159,586 172,526
Other Personnel 5,863 6,500 7,300
DEPARTMENT TOTAL 7.3 543,872$ 7.3 561,307 7.3 589,910
Court
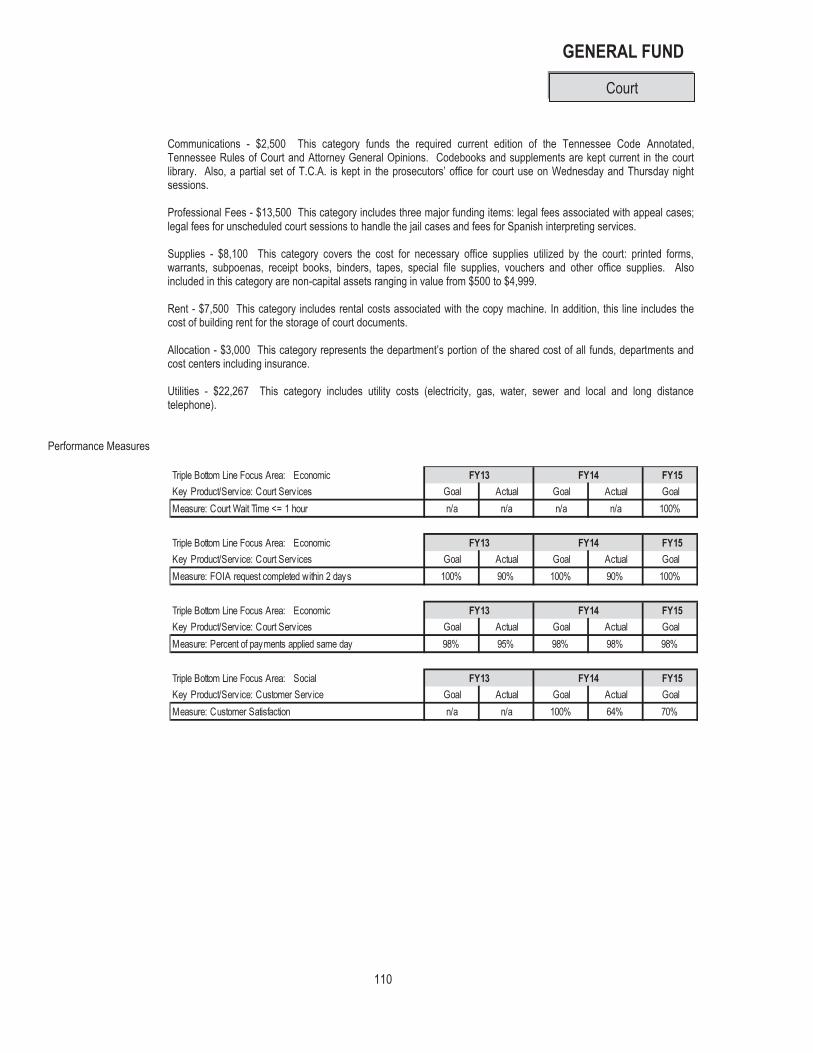
110
GENERAL FUND
Communications - $2,500 This category funds the required current edition of the Tennessee Code Annotated, Tennessee Rules of Court and Attorney General Opinions. Codebooks and supplements are kept current in the court library. Also, a partial set of T.C.A. is kept in the prosecutors’ office for court use on Wednesday and Thursday night sessions. Professional Fees - $13,500 This category includes three major funding items: legal fees associated with appeal cases; legal fees for unscheduled court sessions to handle the jail cases and fees for Spanish interpreting services. Supplies - $8,100 This category covers the cost for necessary office supplies utilized by the court: printed forms, warrants, subpoenas, receipt books, binders, tapes, special file supplies, vouchers and other office supplies. Also included in this category are non-capital assets ranging in value from $500 to $4,999. Rent - $7,500 This category includes rental costs associated with the copy machine. In addition, this line includes the cost of building rent for the storage of court documents. Allocation - $3,000 This category represents the department’s portion of the shared cost of all funds, departments and cost centers including insurance. Utilities - $22,267 This category includes utility costs (electricity, gas, water, sewer and local and long distance telephone).
Performance Measures
Triple Bottom Line Focus Area: Economic FY13 FY14 FY15Key Product/Serv ice: Court Serv ices Goal Actual Goal Actual GoalMeasure: Court Wait Time <= 1 hour n/a n/a n/a n/a 100%
Triple Bottom Line Focus Area: Economic FY13 FY14 FY15Key Product/Serv ice: Court Serv ices Goal Actual Goal Actual GoalMeasure: FOIA request completed within 2 days 100% 90% 100% 90% 100%
Triple Bottom Line Focus Area: Economic FY13 FY14 FY15Key Product/Serv ice: Court Serv ices Goal Actual Goal Actual GoalMeasure: Percent of payments applied same day 98% 95% 98% 98% 98%
Triple Bottom Line Focus Area: Social FY13 FY14 FY15Key Product/Serv ice: Customer Serv ice Goal Actual Goal Actual GoalMeasure: Customer Satisfaction n/a n/a 100% 64% 70%
Court

111
GENERAL FUND
Mission The Administration cost center represents the executive function of the City. The Mayor, as executive officer
of the City, is responsible for the establishment and implementation of citywide policies. Legal services are provided to the City on a contractual basis through a part-time city attorney and part-time attorneys assigned to the Planning Commission, the Board of Zoning Appeals and the Design Review Commission. In addition, Administration is responsible for overseeing the agreement with Germantown Community Television Foundation and Germantown Community Theater.
Administration staff is provided for numerous citizen advisory groups including the Education Commission, Senior Citizens’ Advisory Commission, Library Commission, and other special focus groups created during the year to assist the administration in clarifying policy initiatives for the Board of Mayor and Aldermen (BMA).
Budget Category Summary
Budget Payroll Summary
Actual Budget Estimated BudgetCATEGORY FY13 FY14 FY14 Amt. Chg. % Chg. FY15
Personnel 688,662$ 639,381 601,508 136,412 22.68% 737,920 Communication 133,739 103,050 103,514 29,636 28.63% 133,150 Professional Fees 312,549 222,000 247,658 125,342 50.61% 373,000 Other Maintenance 4,366 9,066 9,066 (4,251) -46.89% 4,815 Supplies 21,868 21,800 21,800 - 0.00% 21,800 Rent 1,731 4,175 4,175 144,000 3449.10% 148,175 Allocations 41,716 43,556 43,625 (3,825) -8.77% 39,800 Utilities 44,689 58,669 58,669 120 0.20% 58,789 Grants/Intergovernmental 263,216 54,200 57,886 358,702 619.67% 416,588
TOTAL 1,512,536$ 1,155,897 1,147,901 786,136 68.48% 1,934,037
FY13 FY14 FY15Actual Estimate Budget
Exempt Salaries 3.0 329,604$ 2.0 285,201 3.0 362,040
Non-Exempt Wages 2.5 127,250 3.0 137,980 3.1 178,273
Other Compensation 28,574 27,600 28,100
Fringe Benefits 202,025 147,987 165,635
Other Personnel 1,209 2,740 3,872
DEPARTMENT TOTAL 5.5 688,662$ 5.0 601,508 6.1 737,920
Administration

112
GENERAL FUND
Categories Personnel - $737,920 This category includes staffing funds for the mayor, city administrator, assistant to the city
administrator, executive assistant, marketing and communications coordinator, city clerk/recorder and part-time grants manager. Ordinance number 2006-5 adjusted the Mayor’s per diem effective January 1, 2009 from $1,000 a month to $2,000. Additionally, included is the monthly per diem for the city attorney and attorneys for the Planning Commission, Board of Zoning Appeals and the Design Review Commission. Communications - $133,150 This category includes publication of public meeting and hearing notices, various City receptions, membership and meeting costs for professional organizations such as the International City Manager’s Association and Tennessee City Manager’s Association. Professional Fees - $373,000 This category includes professional consulting related to team building, leadership training and legal services provided under contract by the city attorney. Other Maintenance - $4,815 This category funds maintenance for office equipment including facsimile equipment, tape recorders, copier and mobile radios used by the city administrator. Supplies - $21,800 This category includes supplies to fund special requisitions through the department, as well as general office supplies. Examples include audiotapes, report printing and binding and the City newsletter. Rent - $148,175 This category includes rental costs associated with the copy machine, Comcast monthly service fees and rental costs associated with the municipal school central office. Allocation - $39,800 This category represents the department’s portion of the shared cost of all funds, departments and cost centers including insurance. Utilities - $58,789 This category includes utility costs (electricity, gas, water, sewer and local and long distance telephone). Grants/Intergovernmental - $416,588 This category includes funds budgeted for the following organizations:
Shelby County Schools 355,453 Arts Alliance 40,000 Leadership Germantown 3,400 Senior Expo Rental 1,000 Business Expo Rental 1,000 Miscellaneous 15,735
Performance Measures
Triple Bottom Line Focus Area: Social FY13 FY14 FY15Key Product/Serv ice: Coordination (Governance) Goal Actual Goal Actual GoalMeasure: Completion of strategic objectives 80% 75% 80% 82% 90%
Triple Bottom Line Focus Area: Social FY13 FY14 FY15Key Product/Serv ice: Coordination (Governance) Goal Actual Goal Actual GoalMeasure: Completion of business plan objectives n/a n/a n/a 59% 90%
Triple Bottom Line Focus Area: Social FY13 FY14 FY15Key Product/Serv ice: Coordination (Governance) Goal Actual Goal Actual GoalMeasure: Turnaround time of Administration's rev iew within 3 business days 75% 79% 81% 90% 95%
Administration

113
GENERAL FUND
Triple Bottom Line Focus Area: Economic FY13 FY14 FY15Key Product/Serv ice: Coordination (Governance) Goal Actual Goal Actual GoalMeasure: Number of days to complete legal rev iew n/a n/a 50% 40% 50%
Triple Bottom Line Focus Area: Social FY13 FY14 FY15Key Product/Serv ice: Coordination (Governance) Goal Actual Goal Actual GoalMeasure: % of rework by department n/a n/a 10% 15% 10%
Triple Bottom Line Focus Area: Social FY13 FY14 FY15Key Product/Serv ice: Communication & Engagement Goal Actual Goal Actual GoalMeasure: Agenda accuracy by department n/a n/a 90% 92% 95%
Triple Bottom Line Focus Area: Social FY13 FY14 FY15Key Product/Serv ice: Communication & Engagement Goal Actual Goal Actual GoalMeasure: % requestor contacted within 1 business day n/a n/a n/a n/a 90%
Triple Bottom Line Focus Area: Social FY13 FY14 FY15Key Product/Serv ice: Communication & Engagement Goal Actual Goal Actual GoalMeasure: Timeliness of agenda posting online and board n/a n/a n/a 51% 95%
Administration

114

115
GENERAL FUND
Mission To design and administer programs that attract, retain, develop and motivate highly skilled employees who are
committed to the accomplishment of City goals, and provide professional and safe working conditions for all City employees.
The Human Resources Department posts job openings, conducts interviews, processes new employees, develops and formalizes personnel policies, conducts new employee orientation, sets the strategy for employee development, administers payroll and benefits and provides employee relations management.
Budget Category Summary
Budget Payroll Summary Categories Personnel - $665,316 This category includes sufficient funds to staff the following positions: human resources
director, human resources coordinator, payroll technician, compensation administrator, benefits administrator and two generalists.
Communications - $23,180 This category funds the City’s employee recognition program, subscriptions to professional organizations and training meetings and seminars.
Actual Budget Estimated BudgetCATEGORY FY13 FY14 FY14 Amt. Chg. % Chg. FY15
Personnel 570,834$ 575,913 588,543 76,773 13.04% 665,316 Communication 32,603 36,150 20,000 3,180 15.90% 23,180 Professional Fees 55,946 22,000 61,207 (34,207) -55.89% 27,000 Other Maintenance 151 300 300 - 0.00% 300 Supplies 5,612 9,000 9,500 3,100 32.63% 12,600 Rent 958 1,000 1,000 - 0.00% 1,000 Allocations 3,803 3,900 3,900 - 0.00% 3,900 Utilities 8,074 8,228 7,318 991 13.54% 8,309
TOTAL 677,981$ 656,491 691,768 49,837 7.20% 741,605
Expense Reimbursement (43,387)$ (46,138) (46,138) (5,974) 12.95% (52,112)
FY13 FY14 FY15Actual Estimate Budget
Exempt Salaries 4.0 318,679$ 5.0 329,696 5.0 392,862
Non-Exempt Wages 2.0 61,671 2.0 75,818 2.0 77,915
Other Compensation 10,220 600 600
Fringe Benefits 174,034 173,029 175,454
Other Personnel 6,230 9,400 18,485
DEPARTMENT TOTAL 6.0 570,834$ 7.0 588,543 7.0 665,316
Human Resources

116
GENERAL FUND
Professional Fees - $27,000 This category funds the cost of new employee physicals, expenses from employee training, background checks, the employee survey and the Federal Privacy Act requirements.
Other Maintenance - $300 This category includes funds for the maintenance of the department’s office equipment. Supplies - $12,600 This category includes funds for specialized supply requisitions and materials, and book printing.
Rent - $1,000 This category includes rental costs associated with the copy machine and offsite storage of personnel records. Allocation - $3,900 This category represents the department’s portion of the shared cost of all funds, departments and cost centers including insurance. Utilities - $8,309 This category includes utility costs (electricity, gas, water, sewer and local and long distance telephone).
Performance Measures
Triple Bottom Line Focus Area: Economic FY13 FY14 FY15 Key Product/Service: Workforce Management Goal Actual Goal Actual Goal
- Non-Public Safety, excluding IT 4.50% 2.00% 4.50% 4.50% 4.00%
- Public Safety 2.00% 1.00% 2.00% 3.00% 2.50%
Triple Bottom Line Focus Area: Social FY13 FY14 FY15Key Product/Service: Employee Development Goal Actual Goal Actual GoalMeasure: % of employees who successfully complete development plan n/a n/a n/a n/a 100%
Triple Bottom Line Focus Area: Social FY13 FY14 FY15Key Product/Service: Employee Training Goal Actual Goal Actual GoalMeasure: Training effectiveness 95% 90% 99% 94% 100%
Triple Bottom Line Focus Area: Economic FY13 FY14 FY15Key Product/Service: Benefits Administration Goal Actual Goal Actual GoalMeasure: # of ER v isits 35 33 30 31 23
Triple Bottom Line Focus Area: Economic FY13 FY14 FY15Key Product/Service: Benefits Administration Goal Actual Goal Actual GoalMeasure: Percentage of generic drugs filled 75% 75% 75% 79% 85%
Human Resources

117
GENERAL FUND
Triple Bottom Line Focus Area: Social FY13 FY14 FY15Key Product/Service: Customer Satisfaction Goal Actual Goal Actual GoalMeasure: Overall satisfaction with HR serv ices n/a n/a 95% 98% 95%
Triple Bottom Line Focus Area: Social FY13 FY14 FY15Key Product/Service: Job Analysis Goal Actual Goal Actual GoalMeasure: Manager satisfaction with job description completion by deadline n/a n/a n/a n/a 100%
Triple Bottom Line Focus Area: Social FY13 FY14 FY15Key Product/Service: On-boarding Goal Actual Goal Actual GoalMeasure: Onboarding satisfaction n/a n/a n/a n/a 80%
Triple Bottom Line Focus Area: Social FY13 FY14 FY15Key Product/Service: Recruitment Goal Actual Goal Actual GoalMeasure: Manager satisfaction with the quality of hire n/a n/a n/a n/a 100%
Triple Bottom Line Focus Area: Economic FY13 FY14 FY15Key Product/Service: Workers' compensation Goal Actual Goal Actual GoalMeasure: Number of days lost as a result of on the job injury 100 102 100 103 93
Human Resources

118

119
GENERAL FUND
Mission Provide employees and citizens with high-quality, cost-effective, timely and accurate information by
maintaining and supporting the information technology systems used by City employees.
Information Technology (IT) purchases, maintains, supports and enhances the City’s computer and technology related systems, including hardware, software, operating systems, telephones, voice and radio communications equipment and the local and wide area networks. The staff maintains the integrity of the computer systems. IT also serves as a technical consultant to the City. IT strives to integrate all of the City’s information systems, thus establishing an enterprise-wide system. Standardizing and streamlining City processes results in reduced risks and costs. In addition, Geographical Information Systems (GIS) are provided for all city departments. Staffing oversight is provided to the Telecommunication Commission.
Budget Category Summary
Budget Payroll Summary
Actual Budget Estimated BudgetCATEGORY FY13 FY14 FY14 Amt. Chg. % Chg. FY15
Personnel 551,837$ 534,699 531,394 2,533 0.48% 533,927 Communication 880 5,870 5,840 200 3.42% 6,040 Professional Fees 96,221 124,130 123,888 (48) -0.04% 123,840 Insurance 4,155 - - 2,000 100% 2,000 Other Maintenance 722,260 636,050 634,490 2,795 0.44% 637,285 Supplies 84,671 120,500 114,500 (21,000) -18.34% 93,500 Rent 1,846 2,000 2,000 1,200 60.00% 3,200 Allocations 2,653 3,000 3,000 3,519 117.30% 6,519 Capital Outlay - 104,000 114,000 300,000 263.16% 414,000 Utilities 50,166 76,250 58,865 7,935 13.48% 66,800
TOTAL 1,514,689$ 1,606,499 1,587,977 299,134 18.84% 1,887,111
Expense Reimbursement (58,863)$ (80,960) (80,960) (30) 0.04% (80,990)
FY13 FY14 FY15Actual Estimate Budget
Exempt Salaries 4.0 335,256$ 4.0 336,715 4.0 350,734
Non-Exempt Wages 1.0 40,768 1.0 43,173 1.0 44,367
Other Compensation 66 - -
Fringe Benefits 173,947 147,006 134,326
DEPARTMENT TOTAL 5.0 551,837$ 5.0 531,394 5.0 533,927
Information Technology

120
GENERAL FUND
Categories Personnel - $533,927 This category includes salaries, benefits and education expenses for the information technology
director, network/communication analysts, a technical services coordinator and computer support specialist. Communications - $6,040 This category includes publications and subscription costs for professional periodicals as well as funds for travel to local and national conferences and seminars. Professional Fees - $123,840 This category includes vendor support services, trouble shooting calls and disaster recovery for downed systems throughout the City. This line also funds e-commerce services. Other Maintenance - $637,285 This category includes maintenance charges for all computer equipment, and production of related equipment. Supplies - $93,500 This category includes all continuous forms. Also included in this category are non-capital assets ranging in value from $500 to $4,999.
Rent - $3,200 This category includes rental costs associated with the annual maintenance contract on one color copier. Allocation - $6,519 This category represents the department’s portion of the shared cost of all funds, departments and cost centers including insurance. Capital Outlay - $414,000 This category funds IRP projects, which includes the purchase of computers and software. Utilities - $66,800 This category includes utility costs (electricity, gas, water, sewer and local and long distance telephone).
Performance Measures
Triple Bottom Line Focus Area: Social FY13 FY14 FY15Key Product/Serv ice: Education Goal Estimate Goal Actual Goal
Measure: Customer request completed within one business day 90% 97% 90% 95% 95%
Triple Bottom Line Focus Area: Social FY13 FY14 FY15Key Product/Serv ice: Education Goal Estimate Goal Actual Goal
Measure: Customer satisfaction rating n/a n/a 80.00% 85.00% 90.00%
Triple Bottom Line Focus Area: Economic FY13 FY14 FY15 Key Product/Serv ice: Communications Goal Estimate Goal Actual Goal
Measure: Network System availability 99.90% 99.85% 99.90% 99.80% 99.90%
Triple Bottom Line Focus Area: Economic FY13 FY14 FY15 Key Product/Serv ice: Communications Goal Estimate Goal Actual Goal
Measure: Server System availability 99.90% 99.90% 99.90% 99.99% 99.90%
Information Technology

121
GENERAL FUND
Triple Bottom Line Focus Area: Economic FY13 FY14 FY15 Key Product/Serv ice: Communications Goal Estimate Goal Actual Goal
Measure: Telephony System availability 99.90% 99.90% 99.90% 99.85% 99.90%
Triple Bottom Line Focus Area: Economic FY13 FY14 FY15 Key Product/Serv ice: Communications Goal Estimate Goal Actual Goal
Measure: Public Safety System availability 100.00% 99.90% 100.00% 99.90% 100.00%
Triple Bottom Line Focus Area: Economic FY13 FY14 FY15 Key Product/Serv ice: Information Goal Estimate Goal Actual Goal
Measure: % or tracked IT assets within useful life n/a n/a 90% 82% 90%
Triple Bottom Line Focus Area: Social FY13 FY14 FY15 Key Product/Serv ice: Education Goal Estimate Goal Actual Goal
Measure: % employees attending 1 hour+ of IT training annually n/a n/a n/a n/a 60%
Triple Bottom Line Focus Area: Social FY13 FY14 FY15 Key Product/Serv ice: Education Goal Estimate Goal Actual Goal
Measure: % employees attending prov ided training upon hire n/a n/a n/a n/a 90%
Triple Bottom Line Focus Area: Economic FY13 FY14 FY15 Key Product/Serv ice: Education Goal Estimate Goal Actual Goal
Measure: % of time backups are successfully completed n/a n/a 99.5% 99.5% 99.5%
Information Technology

122

123
GENERAL FUND
Mission Foster quality performances and educational opportunities; encourage artistic expression and establish lasting
relationships between the community and all the arts.
The Germantown Performing Arts Centre (GPAC) provides a variety of performing and visual arts. GPAC opened on November 19, 1994, with a gala concert by the blues singer Ray Charles. Since then, GPAC has provided the community with performers such as Itzhak Perlman, Yo-Yo Ma, the New York City Opera, the Boston Pops, Dave Brubeck and the Alvin Ailey American Dance Theatre. Additionally, GPAC provides a diverse popular series, offering entertainers such as Bob Newhart, Emmylou Harris and the Capital Steps.
Youth education is important in GPAC’s mission and offers several programs offering performing art programs to youth. The Peanut Butter & Jam program consists of 20 classical music concerts for three to six-year-old children. The sessions are held on GPAC’s main stage and introduce the children to string, woodwind and brass instruments as well as basic classical composition. GPAC also offers instruction at string classes servicing over 150 area students, as well as a youth orchestra.
GPAC salaries and all other operating costs associated with the building, including debt service, are paid out of the General Fund. The artistic season at GPAC is the responsibility of the Germantown Performing Arts Centre Foundation Board. All ticket sales, sponsorships, grants and individual contributions support artist fees and ancillary costs such as marketing, public relations and accommodations through the Foundation.
Budget Category Summary
Budget Payroll Summary
Actual Budget Estimated BudgetCATEGORY FY13 FY14 FY14 Amt. Chg. % Chg. FY15
Personnel 812,439$ 918,437 876,435 (5,961) -0.68% 870,474 Communication 7,087 10,980 7,000 5,000 71.43% 12,000 Professional Fees - - 82,081 (82,081) -100.00% - Insurance 515 4,500 4,500 - 0.00% 4,500 Other Maintenance 14,859 10,800 4,000 48,000 1200.00% 52,000 Supplies 11,888 17,100 28,203 44,097 156.36% 72,300 Rent 1,466 3,500 3,500 - 0.00% 3,500 Allocations 22,923 23,964 24,031 648 2.70% 24,679 Capital Outlay - 10,000 25,814 (16,814) -65.14% 9,000 Utilities 112,883 109,225 109,225 1,500 1.37% 110,725
TOTAL 984,060$ 1,108,506 1,164,789 (5,611) -0.48% 1,159,178
FY13 FY14 FY15Actual Estimate Budget
Exempt Salaries 5.0 406,639$ 10.0 537,914 10.0 556,370
Non-Exempt Wages 8.5 192,863 1.5 111,344 1.5 73,875
Other Compensation 7,627 7,000 -
Fringe Benefits 203,048 214,177 234,228
Other Personnel 2,262 6,000 6,000
DEPARTMENT TOTAL 13.5 812,439$ 11.5 876,435 11.5 870,474
Germantown Performing Arts
Centre

124
GENERAL FUND
Categories Personnel - $870,474 This category contains sufficient funds to staff the department, including the executive director,
assistant to the director, facility services coordinators, GPAC development director, marketing and public relations manager, venue director, box office manager, assistant box office manager, education/business coordinator, and box office assistants.
Communications - $12,000 This category includes dues and subscriptions to professional journals and meetings. Insurance - $4,500 This category includes the department’s share of deductibles associated with workers’ compensation claims, and personal and private property claims. Also included in this category is the City’s deductible on all the City’s uninsured vehicle claims. Other Maintenance - $52,000 This category includes funding for technical contractual services and miscellaneous expenses. Supplies - $72,300 This category includes program printing for presentations, general office supplies, theatre supplies, ticket stock and in-house publications. Also included in this category are non-capital assets ranging in value from $500 to $4,999.
Rent - $3,500 This category includes rental costs associated with the copy machine. Allocation - $24,679 This category represents the department’s portion of the shared cost of all funds, departments and cost centers including insurance. Capital Outlay – $9,000 This category represents costs associated with fire pump control panels. Utilities - $110,725 This category includes utility costs (electricity, gas, water, sewer and local and long distance telephone).
Performance Measures
Triple Bottom Line Focus Area: Social FY13 FY14 FY15Key Product/Serv ice: Venue Management Goal Actual Goal Actual Goal
Measure: Venue user satisfaction n/a n/a 80% 85% 87%
Triple Bottom Line Focus Area: Economic FY13 FY14 FY15Key Product/Serv ice: Fundraising Goal Actual Goal Actual Goal
Measure: New donors 10% 15% 20% 15% 17%
Triple Bottom Line Focus Area: Economic FY13 FY14 FY15Key Product/Serv ice: Fundraising Goal Actual Goal Actual Goal
Measure: Retained donors 90% 85% 80% 77% 83%
Triple Bottom Line Focus Area: Economic FY13 FY14 FY15Key Product/Serv ice: Main Stage Performances Goal Actual Goal Actual Goal
Measure: performance ticket revenue projection by show 50% 50% 50% 55% 58%
Triple Bottom Line Focus Area: Social FY13 FY14 FY15Key Product/Serv ice: Educational programming Goal Actual Goal Actual Goal
Measure: Customer Satisfaction 75% 78% 80% 80% 83%
GPAC

125
GENERAL FUND
Mission To manage the financial affairs of the City through successful collection and disbursement of revenues and
expenditures; to accurately record and report all financial transactions while maintaining superior standards; to uphold the laws and ordinances of the City and State; to establish sound fiscal, and business policies and practices; and to maintain the triple-A credit ratings.
Financial Services includes three areas: Accounting, Treasury, and City Court. Financial Services manages all of the City’s fiscal affairs; supports the operating departments with accounting, financial reporting, and administrative services; manages all City investments; obtains debt financing for capital projects; collects taxes, utility billings and other revenues; financial reporting, and capital asset control; and conducts internal auditing of procedures and operations. In addition, the Financial Services area oversees the management of the City’s main reception and information center. Staffing oversight is provided to the Financial Advisory Commission, the Audit Commission, Retirement Plan Advisory Commission and Other Postemployment Benefits Commission.
Budget Category Summary
Budget Payroll Summary
Actual Budget Estimated BudgetCATEGORY FY13 FY14 FY14 Amt. Chg. % Chg. FY15
Personnel 1,139,395$ 649,842 687,237 29,986 4.36% 717,223 Communication 52,794 7,380 7,415 974 13.14% 8,389 Professional Fees 219,130 186,000 186,000 15,300 8.23% 201,300 Other Maintenance 2,021 500 500 800 160.00% 1,300 Supplies 35,910 14,200 14,741 12,079 81.94% 26,820 Rent 6,423 7,600 7,600 6,200 81.58% 13,800 Allocations 26,397 24,620 24,620 (3,120) -12.67% 21,500 Capital Outlay 20,484 - - - - - Utilities 23,616 18,363 18,382 255 1.39% 18,637
TOTAL 1,526,170$ 908,505 946,495 62,474 6.60% 1,008,969
Expense Reimbursement (170,205)$ (136,184)$ (136,184)$ (21,682) 15.92% (157,866)
FY13 FY14 FY15Actual Estimate Budget
Exempt Salaries 6.0 438,638$ 3.0 238,481 3.0 253,866
Non-Exempt Wages 10.5 335,583 7.0 229,700 7.0 243,363
Other Compensation 3,702 2,500 2,500
Fringe Benefits 357,408 206,154 210,392
Other Personnel 4,064 10,402 7,102
DEPARTMENT TOTAL 16.5 1,139,395$ 10.0 687,237 10.0 717,223
Finance
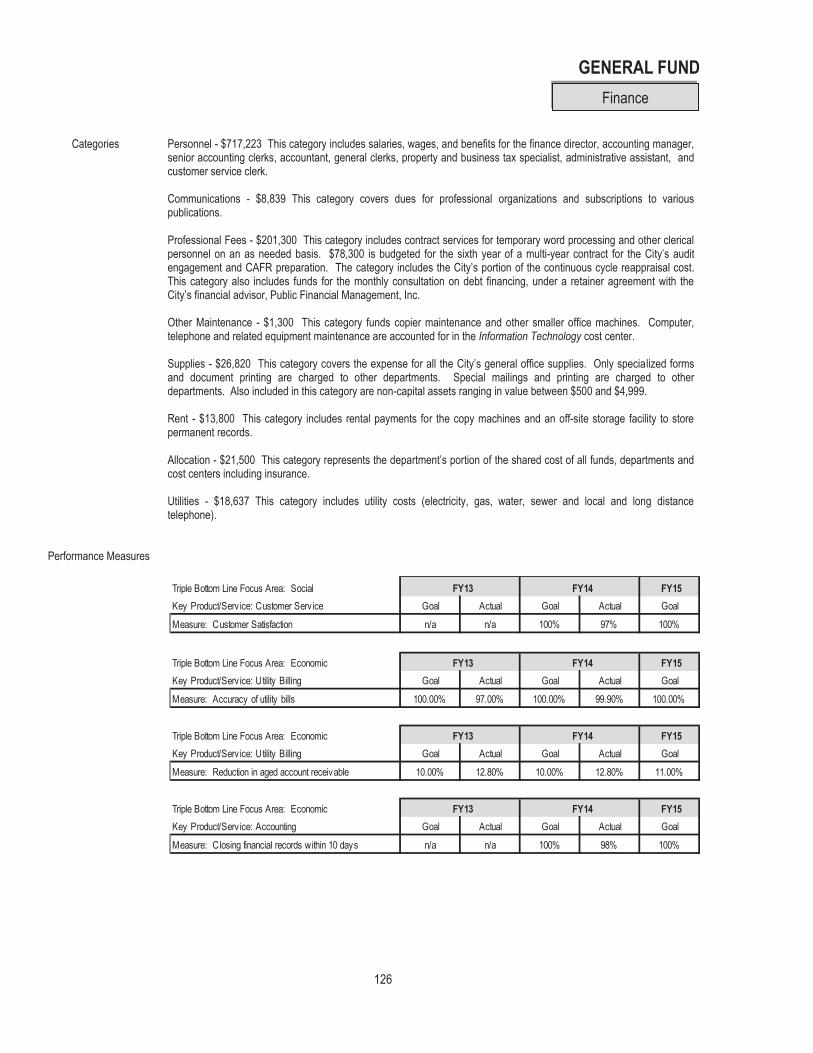
126
GENERAL FUND
Categories Personnel - $717,223 This category includes salaries, wages, and benefits for the finance director, accounting manager,
senior accounting clerks, accountant, general clerks, property and business tax specialist, administrative assistant, and customer service clerk.
Communications - $8,839 This category covers dues for professional organizations and subscriptions to various publications.
Professional Fees - $201,300 This category includes contract services for temporary word processing and other clerical personnel on an as needed basis. $78,300 is budgeted for the sixth year of a multi-year contract for the City’s audit engagement and CAFR preparation. The category includes the City’s portion of the continuous cycle reappraisal cost. This category also includes funds for the monthly consultation on debt financing, under a retainer agreement with the City’s financial advisor, Public Financial Management, Inc.
Other Maintenance - $1,300 This category funds copier maintenance and other smaller office machines. Computer, telephone and related equipment maintenance are accounted for in the Information Technology cost center. Supplies - $26,820 This category covers the expense for all the City’s general office supplies. Only specialized forms and document printing are charged to other departments. Special mailings and printing are charged to other departments. Also included in this category are non-capital assets ranging in value between $500 and $4,999.
Rent - $13,800 This category includes rental payments for the copy machines and an off-site storage facility to store permanent records. Allocation - $21,500 This category represents the department’s portion of the shared cost of all funds, departments and cost centers including insurance. Utilities - $18,637 This category includes utility costs (electricity, gas, water, sewer and local and long distance telephone).
Performance Measures
Triple Bottom Line Focus Area: Social FY13 FY14 FY15Key Product/Serv ice: Customer Serv ice Goal Actual Goal Actual Goal
Measure: Customer Satisfaction n/a n/a 100% 97% 100%
Triple Bottom Line Focus Area: Economic FY13 FY14 FY15Key Product/Serv ice: Utility Billing Goal Actual Goal Actual Goal
Measure: Accuracy of utility bills 100.00% 97.00% 100.00% 99.90% 100.00%
Triple Bottom Line Focus Area: Economic FY13 FY14 FY15Key Product/Serv ice: Utility Billing Goal Actual Goal Actual Goal
Measure: Reduction in aged account receivable 10.00% 12.80% 10.00% 12.80% 11.00%
Triple Bottom Line Focus Area: Economic FY13 FY14 FY15Key Product/Serv ice: Accounting Goal Actual Goal Actual Goal
Measure: Closing financial records within 10 days n/a n/a 100% 98% 100%
Finance

GENERAL FUND
127
Triple Bottom Line Focus Area: Economic FY13 FY14 FY15Key Product/Serv ice: Accounts Payable Goal Actual Goal Actual Goal
Measure: % of invoices paid within terms of contract 100% 85% 100% 87% 100%
Triple Bottom Line Focus Area: Economic FY13 FY14 FY15Key Product/Serv ice: Tax collection Goal Actual Goal Actual Goal
Measure: % of tax bills collected within ordinance and statute 100.0% 98.8% 100.0% 99.0% 100.0%
Triple Bottom Line Focus Area: Economic FY13 FY14 FY15Key Product/Serv ice: Accounting Goal Actual Goal Actual Goal
Measure: Accuracy of journal entries n/a n/a 100.0% 95.8% 100.0%
Finance

128
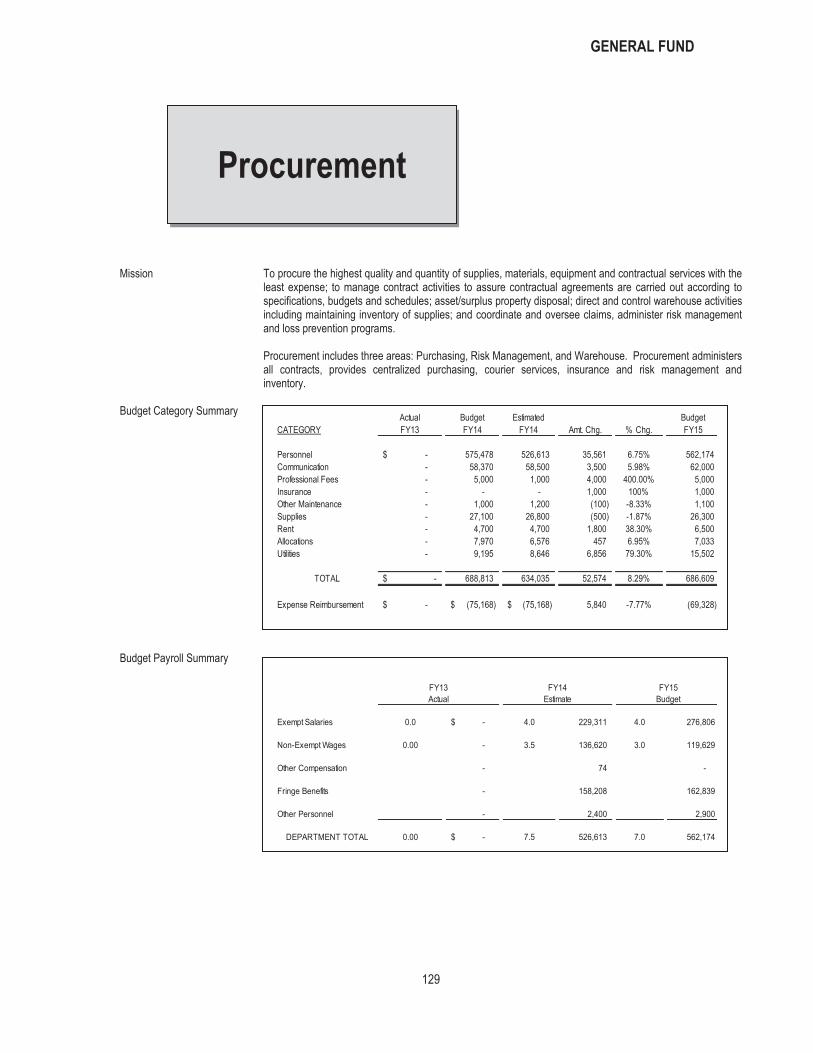
GENERAL FUND
129
Mission To procure the highest quality and quantity of supplies, materials, equipment and contractual services with the
least expense; to manage contract activities to assure contractual agreements are carried out according to specifications, budgets and schedules; asset/surplus property disposal; direct and control warehouse activities including maintaining inventory of supplies; and coordinate and oversee claims, administer risk management and loss prevention programs.
Procurement includes three areas: Purchasing, Risk Management, and Warehouse. Procurement administers all contracts, provides centralized purchasing, courier services, insurance and risk management and inventory.
Budget Category Summary Budget Payroll Summary
Procurement
Actual Budget Estimated BudgetCATEGORY FY13 FY14 FY14 Amt. Chg. % Chg. FY15
Personnel -$ 575,478 526,613 35,561 6.75% 562,174 Communication - 58,370 58,500 3,500 5.98% 62,000 Professional Fees - 5,000 1,000 4,000 400.00% 5,000 Insurance - - - 1,000 100% 1,000 Other Maintenance - 1,000 1,200 (100) -8.33% 1,100 Supplies - 27,100 26,800 (500) -1.87% 26,300 Rent - 4,700 4,700 1,800 38.30% 6,500 Allocations - 7,970 6,576 457 6.95% 7,033 Utilities - 9,195 8,646 6,856 79.30% 15,502
TOTAL -$ 688,813 634,035 52,574 8.29% 686,609
Expense Reimbursement -$ (75,168)$ (75,168)$ 5,840 -7.77% (69,328)
FY13 FY14 FY15Actual Estimate Budget
Exempt Salaries 0.0 -$ 4.0 229,311 4.0 276,806
Non-Exempt Wages 0.00 - 3.5 136,620 3.0 119,629
Other Compensation - 74 -
Fringe Benefits - 158,208 162,839
Other Personnel - 2,400 2,900
DEPARTMENT TOTAL 0.00 -$ 7.5 526,613 7.0 562,174

GENERAL FUND
130
Categories Personnel - $562,174 This category includes salaries, wages, and benefits for the procurement director, assistant
procurement director, warehouse supervisor, risk coordinator, procurement specialist, procurement coordinator and purchasing assistant.
Communications - $62,000 This category covers dues for professional organizations and subscriptions to various publications, the expenses of the City’s postage expense except Cultural Arts and Utilities, and publications of legal notices for bids.
Professional Fees - $5,000 This category includes costs associated with procurement card fees. Insurance - $1,000 This category includes Procurement’s share of deductibles associated with workers compensation claims and personal and private property claims.
Other Maintenance - $1,100 This category funds maintenance charges for postage and binder machines. Supplies - $26,300 This category covers the expense for general office supplies. Also included in this category are non-capital assets ranging in value between $500 and $4,999.
Rent - $6,500 This category includes rental payments for the copy machines and postage meter register. Allocation - $7,033 This category represents the department’s portion of the shared cost of all funds, departments and cost centers including insurance. Utilities - $15,502 This category includes utility costs (electricity, gas, water, sewer and local and long distance telephone).
Performance Measures
Triple Bottom Line Focus Area: Economic FY13 FY14 FY15 Key Product/Serv ice: Procurement of Goods/Serv ices Goal Actual Goal Actual GoalMeasure: Reduce percentage of PO's in non-paid/complete status 8% 9% 9% 9% 7%
Triple Bottom Line Focus Area: Economic FY13 FY14 FY15 Key Product/Serv ice: Inventory Goal Actual Goal Actual Goal
Measure: Inventory accuracy 40% 25% 40% 36% 50%
Triple Bottom Line Focus Area: Economic FY13 FY14 FY15 Key Product/Serv ice: Contracts Development Goal Actual Goal Actual GoalMeasure: Number of days to process non-standard contracts/agreements 14 15 14 14 7
Triple Bottom Line Focus Area: Economic FY13 FY14 FY15 Key Product/Serv ice: Risk Mitigation Goal Actual Goal Actual GoalMeasure: Number of non-deductible property /casualty claims processed 10 12 12 10 8
Procurement

INTERNAL SERVICE FUND
131
Mission This cost center was used in the past to distribute shared costs of telephone, gas and electric, radio
maintenance, gasoline, and uniform expenses to all funds, departments and cost centers. However, beginning in FY93, all shared costs, except insurance, were budgeted and tracked by each fund, department and cost center. This decision to decentralize budgeting and control was made in order to establish more accountability at the departmental level. Department managers receive, on a monthly basis, actual expenses for all of the above items, allowing for more cost control and better management of important resource dollars.
Insurance is the only shared cost that remains in this cost center. Since insurance-related costs are bid out in one contract, it was unrealistic to allocate this one remaining cost to each fund, department, and cost center.
Budget Category Summary
Categories Allocations – ($616,619) This category represents the allocation of the costs to individual funds,
departments and cost centers; thus this cost center has a net cost of zero.
Insurance - $616,619 This category includes: property insurance coverage ($224,000) that is on an All Risk form, vehicle insurance ($71,000), casualty or liability coverage ($246,619) designed to match minimum state tort limits, uninsured losses insurance ($10,000) to pay the deductibles for vehicle maintenance and administration, liability deductible ($15,000), and workers compensation deductible ($50,000).
Actual Budget Estimated BudgetCATEGORY FY13 FY14 FY14 Amt. Chg. % Chg. FY15
Allocations (665,327)$ (622,566) (645,755) 29,136 -4.51% (616,619) Insurance 522,782 622,566 645,755 (29,136) -4.51% 616,619
TOTAL (142,545)$ - - - - -
Allocated Expenses

132

GENERAL FUND
133
The General Debt Service cost center accounts for the principal and interest payments on: $5.6 million Series 2006 General Obligation bonds, $9.6 million Series 2009 General Obligation bonds and $6.0 million Series 2011 General Obligation bonds. In FY10 $9.635 million of G.O. debt was issued. Of this amount $6.0 million was new debt and $3.635 million was the refunding of Bond Series 2000 and 2002. In FY12 $6.025 million of G.O. debt was issued. In FY14 $9.070 million of G.O. debt was issued, of that amount $5.57 million was the refunding of Bond Series 2005. The General Fund revenues of the City fund this cost center. The long-range projections are based on the City’s Long-Range Strategic Plan approved by the BMA in each year’s CIP process. There are two projected future issues over the next five years totaling $2.6 million. The outstanding balance of General Obligation Debt at July 1, 2014 is $23,755,000. During the year, principal of $2,350,000 and interest of $684,807 will be paid. The balance of existing debt remaining at June 30, 2015 will be $21,405,000. Budget Category Summary
Categories Debt Service - $3,034,807 This category includes principal payments on the Series 2006 Bonds, the Series
2009 Bonds, the Series 2011 Bonds and the Series 2013 Bonds. Utility debt service is accounted for in a separate cost center in the Utility Fund.
Agency Fees - $1,500 This category covers fees paid to paying agents for the various bond issues.
Actual Budget Estimated BudgetCATEGORY FY13 FY14 FY14 Amt. Chg. % Chg. FY15
Debt Service 3,374,248$ 3,429,992 3,317,953 (283,146) -8.53% 3,034,807 Agency Fees 1,000 1,500 1,500 - 0.00% 1,500
TOTAL 3,375,248$ 3,431,492 3,319,453 (283,146) -8.53% 3,036,307
General Debt
Balance Principal Balance InterestSecurity 7/1/2014 Payment 6/30/2015 ExpenseExisting: Series 2006 Bonds 2,245,000$ 755,000 1,490,000 74,700 Series 2009 Bonds 6,900,000 480,000 6,420,000 252,074 Series 2011 Bonds 5,540,000 250,000 5,290,000 139,775 Series 2013 Bonds 9,070,000 865,000 8,205,000 218,258 Total FY14 Debt 23,755,000$ 2,350,000 21,405,000 684,807
Existing Existing Future FuturePrincipal Interest Principal Interest
FY15 -$ - - - FY16 2,250,000 626,033 - - FY17 2,300,000 565,833 - - FY18 1,970,000 510,608 - - FY19 1,335,000 464,883 - - Thereafter 13,320,000 2,667,192 2,655,000 457,350
Total Debt Service 21,175,000$ 4,834,547 2,655,000 457,350

134

135
GENERAL FUND
Mission To provide residents a strategically planned, well-designed, well-constructed community and to provide an
attractive community through public education and enforcement of the City’s various Codes and Ordinances.
This department, comprised of the Planning Division, Engineering Division and the Neighborhood Services Division, provides professional and technical services in the fields of civil engineering, traffic engineering, planning, land use and control, zoning and subdivision regulations, ordinances, construction inspection of public improvements, floodplain management, sign ordinance administration, code enforcement, neighborhood information, public relations and oversight of the Sanitation Fund.
This department provides staffing functions for the Planning Commission, Design Review Commission, Board of Zoning Appeals, Council of Neighborhood Associations (CONA), Telecommunications Commission, Youth Commission, Education Commission Economic Development Commission and the Environmental Commission.
Budget Category Summary
Budget Payroll Summary
Actual Budget Estimated BudgetCATEGORY FY13 FY14 FY14 Amt. Chg. % Chg. FY15
Personnel 1,650,561$ 1,679,080 1,494,854 8,873 0.59% 1,503,727 Communication 17,057 18,612 19,612 11,720 59.76% 31,332 Professional Fees 81,943 212,200 238,294 (57,004) -23.92% 181,290 Insurance 475 - 500 2,500 500.00% 3,000 Other Maintenance 40,264 72,000 72,000 (1,000) -1.39% 71,000 Supplies 23,255 32,715 31,215 10,025 32.12% 41,240 Rent 8,109 24,300 24,300 - 0.00% 24,300 Allocations 36,005 36,117 36,313 1,805 4.97% 38,118 Capital Outlay 3,192 - - 25,000 100% 25,000 Utilities 39,339 46,580 46,580 174 0.37% 46,754 Grants 16,728 17,325 17,325 (3,075) -17.75% 14,250
TOTAL 1,916,928$ 2,138,929 1,980,993 (982) -0.05% 1,980,011
Expense Reimbursement (80,690)$ (70,509) (70,509) (2,400) 3.40% (72,909)
FY13 FY14 FY15Actual Estimate Budget
Exempt Salaries 10.0 766,348$ 8.5 673,781 9.5 663,958
Non-Exempt Wages 10.0 368,340 9.0 403,078 9.0 426,824
Other Compensation - - -
Fringe Benefits 510,134 411,085 400,845
Other Personnel 5,739 6,910 12,100
DEPARTMENT TOTAL 20.0 1,650,561$ 17.5 1,494,854 18.5 1,503,727
Economic and Community
Development

136
GENERAL FUND
Categories Personnel - $1,503,727 This category includes salaries, wages, and benefits for the economic and community services
director, city engineer, assistant city engineer, plans manager, chief planner, planners, neighborhood services manager, neighborhood coordinator, community services coordinator, chief constructor inspector, senior construction inspectors, construction inspector, administrative assistant, sr. administrative assistant and senior code compliance officers. The personnel category also includes overtime wages for attendance of the administrative secretary and other non-supervisory personnel at Planning Commission, Design Review Commission, Board of Zoning Appeals meetings and employee education expenses.
Communications - $31,332 This category is comprised of items that enhance the department’s efficiency and effectiveness through continual contact with current issues and techniques, including dues and subscriptions to professional engineering societies, meetings and training sessions at one national and one regional or local professional seminar and the publication of commission meetings as required by State law. Professional Fees - $181,290 This category consists of funds to cover appraisal fees associated with capital projects. In addition, this category consists of funds to cover engineering surveys, design and traffic studies that arise during the year, but cannot be handled in-house due to time constraints or requirement of special skills. Also included are funds for special planning services or engineering services not allocated to specific capital improvements through the use of private consulting firms. Additionally, funds are provided for the National Pollution Discharge Elimination System program’s intergovernmental agreement with Shelby County. Funds are also included for economic development. Insurance - $3,000 This category includes ECD’s share of deductibles associated with workers compensation claims and personal and private property claims. Other Maintenance - $71,000 This category funds the maintenance of equipment not covered by maintenance contracts, including personal computers, color monitors, printers, lettering machine and digital cameras. Also included in this amount is the sign replacement and maintenance budget, which includes upgrading traffic signals. Supplies - $41,240 This category includes supplies unique to the department, (e.g. supplies for the printing of area maps and drawings and small tools for surveys and other projects). Also included in this category are non-capital assets ranging in value from $500 to $4,999. Rent - $24,300 This category includes rental costs associated with the department’s copy machine and color printer/copier. Allocation - $38,118 This category covers insurance and vehicle maintenance costs allocated to the department for its portion of the City’s shared expenses. Capital Outlay - $25,000 This category includes the funding necessary for the purchase of vehicles/equipment. Utilities - $46,754 This category includes utility costs (electricity, gas, water, sewer and local and long distance telephone). Grants - $14,250 This category includes funds budgeted for the following organizations:
Chamber Grant $12,750 Neighborhood Preservation Commission 1,500
Economic and Community Development

137
GENERAL FUND
Performance Measures
Triple Bottom Line Focus Area: Economic FY13 FY14 FY15Key Product/Serv ice: Construction Inspection Goal Actual Goal Actual Goal
Measure: % of construction projects with zero maintenance n/a n/a 90% 95% 100%
Triple Bottom Line Focus Area: Economic FY13 FY14 FY15Key Product/Serv ice: Economic development Goal Actual Goal Actual GoalMeasure: % of projects submitted according to standards n/a n/a n/a n/a 100%
Triple Bottom Line Focus Area: Economic FY13 FY14 FY15Measurement Type: Economic development Goal Actual Goal Actual Goal
Measure: % of completed project documentation prov ided to boards n/a n/a n/a n/a 95%
Triple Bottom Line Focus Area: Economic FY13 FY14 FY15Measurement Type: Economic development Goal Actual Goal Actual Goal
Measure: Increase number of units within small area plans n/a n/a n/a n/a 115.00
Triple Bottom Line Focus Area: Economic FY13 FY14 FY15Measurement Type: Economic development Goal Actual Goal Actual Goal
Measure: Increase square footage of space within small area plans n/a n/a n/a n/a 30000.00
Triple Bottom Line Focus Area: Social FY13 FY14 FY15Measurement Type: Code enforcement Goal Actual Goal Actual Goal
Measure: Average number of days for voluntary compliance 25.00 22.00 20.00 25.00 20.00
Triple Bottom Line Focus Area: Social FY13 FY14 FY15Measurement Type: Code enforcement Goal Actual Goal Actual Goal
Measure: Satisfaction with code enforcement 70% 70% 70% 67% 70%
Triple Bottom Line Focus Area: Social FY13 FY14 FY15Measurement Type: Code enforcement Goal Actual Goal Actual Goal
Measure: Satisfaction with code enforcement 70% 70% 70% 67% 70%
Economic and Community Development

138
GENERAL FUND
Triple Bottom Line Focus Area: Social FY13 FY14 FY15Measurement Type: Neighborhood serv ices Goal Actual Goal Actual Goal
Measure: Customer satisfaction with event planning/communication n/a n/a 95% 100% 95%
Triple Bottom Line Focus Area: Economic FY13 FY14 FY15Measurement Type: Civ il Engineering Goal Actual Goal Actual Goal
Measure: % of staff plans issued within given timeframe n/a n/a 90% 95% 90%
Triple Bottom Line Focus Area: Economic FY13 FY14 FY15Measurement Type: Project Management/Contract Administration Goal Actual Goal Actual Goal
Measure: % of CIP projects awarded within original budget n/a n/a 90% 84% 90%
Triple Bottom Line Focus Area: Economic FY13 FY14 FY15Measurement Type: Traffic Management Goal Actual Goal Actual Goal
Measure: % of signal issues addressed within 24 hours 80% 84% 85% 90% 90%
Economic and Community Development

139
GENERAL FUND
Mission To provide stronger linkage and greater emphasis on fiscal and policy analysis in strengthening the City’s ability to plan for the future; to ensure the City’s continued fiscal health through financial analysis and forecasting; and to serve as a research resource for city management.
Under Administration, Budget and Performance centralizes the linkage of policy and resources. The Board of Mayor and Aldermen’s Policy Agenda sets the tone, guide and direction for policy development, policy decisions and resource allocation. The division allows that agenda to directly relate and flow to resource allocation through the tools of performance management and budget. The division also serves as a resource for city management by providing independent policy and procedure analysis. As changes occur at the state and local levels, analysis is performed to assess the impact on the City of Germantown.
Budget and Performance‘s chief responsibility is developing, providing and monitoring the City’s annual operating and capital budgets. The division is also responsible for performance measurement and reporting, the City’s line item document, monthly and quarterly financial monitoring and reporting, fiscal forecasting and planning, financial analysis reports on projects, Capital Improvements Program tracking/reporting, policy analysis on programs and policy changes in addition to grant research and monitoring, and designing and conducting annual community surveys. The division also assists on budgetary expenditures, debt issuance, the City’s Annual Reports, and other financial operation issues.
Budget Category Summary
Budget Payroll Summary
Actual Budget Estimated BudgetCATEGORY FY13 FY14 FY14 Amt. Chg. % Chg. FY15
Personnel 226,623$ 245,635 270,145 25,682 9.51% 295,827 Communication 4,002 8,250 4,000 14,550 363.75% 18,550 Supplies 11,113 7,150 16,454 17,046 103.60% 33,500 Allocations 442 500 500 - 0.00% 500 Utilities 4,207 4,625 4,475 206 4.60% 4,681
TOTAL 246,387$ 266,160 295,574 57,484 19.45% 353,058
Expense Reimbursement (18,940)$ (16,627) (16,627) (2,520) 15.16% (19,147)
FY13 FY14 FY15Actual Estimate Budget
Exempt Salaries 2.0 154,363$ 3.0 189,129 3.0 207,282
Non-Exempt Wages 0.0 - 0.0 - 0.0 4,500
Other Compensation - - -
Fringe Benefits 71,753 79,566 74,073
Other Personnel 507 1,450 9,972
DEPARTMENT TOTAL 2.0 226,623$ 3.0 270,145 3.0 295,827
Budget and Performance

140
GENERAL FUND
Categories Personnel - $295,827 This category includes salaries, wages and benefits for sr. budget and performance analysts.
Communications - $18,550 This category is comprised of items that enhance the division’s efficiency and effectiveness through continual contact with current issues and techniques including dues and subscriptions to professional publications, meetings and training sessions at national, regional and local professional seminars. Supplies - $33,500 This category funds supplies unique to the division, including supplies for the printing of the City’s financial documents and the community and employee surveys.
Allocation - $500 This category represents the department’s portion of the shared cost of all funds, departments and cost centers including insurance. Utilities - $4,681 This category includes utility costs (electricity, gas, water, sewer and local and long distance telephone).
Performance Measures
Triple Bottom Line Focus Area: Economic Sustainability FY13 FY14 FY15 Key Product/Service: Coordination (Governance) Goal Actual Goal Actual GoalMeasure: number of budget adjustments per department 4 5 3 4 3
Budget & Performance
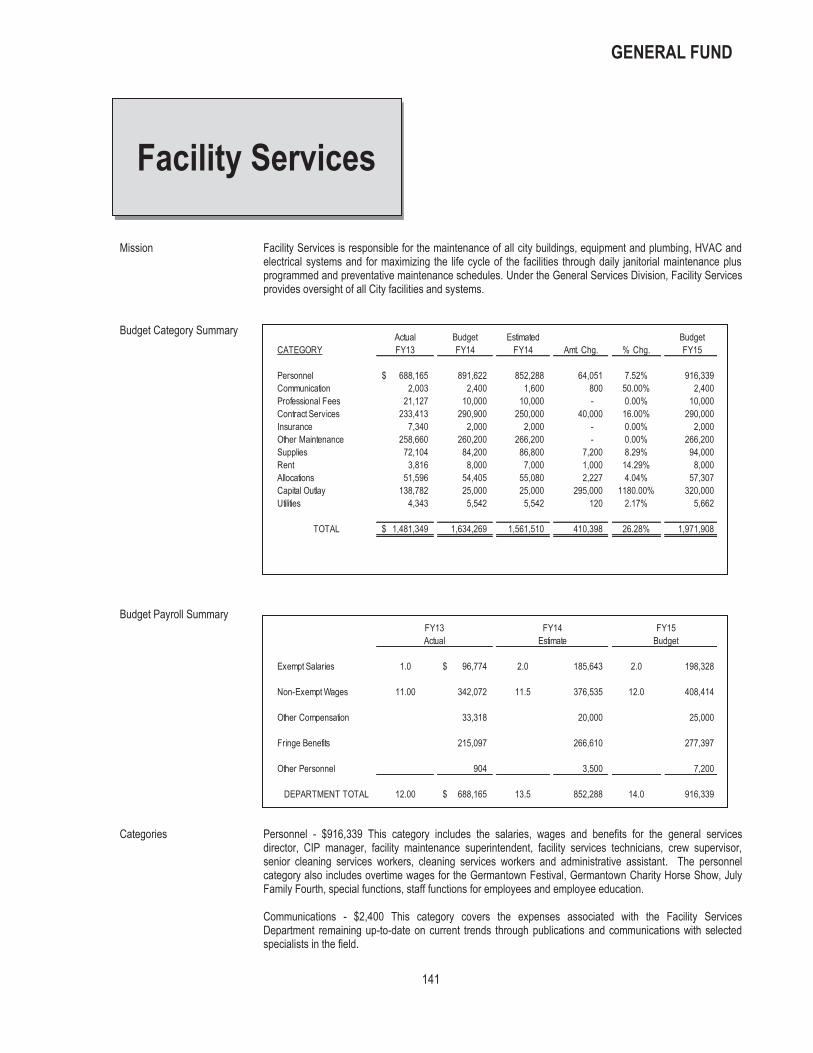
141
GENERAL FUND
Mission Facility Services is responsible for the maintenance of all city buildings, equipment and plumbing, HVAC and
electrical systems and for maximizing the life cycle of the facilities through daily janitorial maintenance plus programmed and preventative maintenance schedules. Under the General Services Division, Facility Services provides oversight of all City facilities and systems.
Budget Category Summary
Budget Payroll Summary
Categories Personnel - $916,339 This category includes the salaries, wages and benefits for the general services
director, CIP manager, facility maintenance superintendent, facility services technicians, crew supervisor, senior cleaning services workers, cleaning services workers and administrative assistant. The personnel category also includes overtime wages for the Germantown Festival, Germantown Charity Horse Show, July Family Fourth, special functions, staff functions for employees and employee education.
Communications - $2,400 This category covers the expenses associated with the Facility Services Department remaining up-to-date on current trends through publications and communications with selected specialists in the field.
Actual Budget Estimated BudgetCATEGORY FY13 FY14 FY14 Amt. Chg. % Chg. FY15
Personnel 688,165$ 891,622 852,288 64,051 7.52% 916,339 Communication 2,003 2,400 1,600 800 50.00% 2,400 Professional Fees 21,127 10,000 10,000 - 0.00% 10,000 Contract Services 233,413 290,900 250,000 40,000 16.00% 290,000 Insurance 7,340 2,000 2,000 - 0.00% 2,000 Other Maintenance 258,660 260,200 266,200 - 0.00% 266,200 Supplies 72,104 84,200 86,800 7,200 8.29% 94,000 Rent 3,816 8,000 7,000 1,000 14.29% 8,000 Allocations 51,596 54,405 55,080 2,227 4.04% 57,307 Capital Outlay 138,782 25,000 25,000 295,000 1180.00% 320,000 Utilities 4,343 5,542 5,542 120 2.17% 5,662
TOTAL 1,481,349$ 1,634,269 1,561,510 410,398 26.28% 1,971,908
FY13 FY14 FY15Actual Estimate Budget
Exempt Salaries 1.0 96,774$ 2.0 185,643 2.0 198,328
Non-Exempt Wages 11.00 342,072 11.5 376,535 12.0 408,414
Other Compensation 33,318 20,000 25,000
Fringe Benefits 215,097 266,610 277,397
Other Personnel 904 3,500 7,200
DEPARTMENT TOTAL 12.00 688,165$ 13.5 852,288 14.0 916,339
Facility Services

142
GENERAL FUND
Professional Fees - $10,000 This category provides funding for professional services for electrical, plumbing, mechanical and architectural. Contract Services - $290,000 This category covers the outside contract costs for the maintenance and repair of elevators, fire warning systems, fire protection systems, pest control and HVAC systems. This category also includes funding for an electrical contract and security alarm monitoring. Insurance - $2,000 This category includes the department’s share of deductibles associated with workers’ compensation claims. Other Maintenance - $266,200 This category funds maintenance for equipment used by Facility Services to service City buildings, maintenance parts and supplies for 33 City buildings (including 95 HVAC systems, 4 boilers, 28 air handler units and 177 electrical motors), 12 parks, 5 pavilions and related facilities. Supplies - $94,000 This category includes supplies used by staff to supply buildings including cleaning and paper supplies, gloves, hard hats, safety shoes and other miscellaneous supplies such as oxygen, potting soil and small tools used by staff. Also included in this category are non-capital assets ranging in value from $500 to $4,999. Rent - $8,000 This category includes rental costs associated with a lift truck and equipment pertaining to the repair and maintenance of City facilities not owned by the City. Allocation - $57,307 This line item contains Facility Services’ portion of the shared costs of all funds, departments, and cost centers, including insurance and vehicle maintenance. Capital Outlay - $320,000 This category provides funding for the following IRP projects: HVAC upgrade, Library HVAC, Train Depot Refurbishment and Municipal Center Flooring. Utilities - $5,662 This category includes utility costs (electricity, gas, water, sewer and local and long distance telephone).
Performance Measures
Triple Bottom Line Focus Area: Economic FY13 FY14 FY15Key Serv ice: Cleaning Serv ices Goal Actual Goal Actual Goal
Measure: Cleaning Efficiencies $1.58 $1.52 $1.58 $1.52 $1.33
Triple Bottom Line Focus Area: Social FY13 FY14 FY15Key Serv ice: Cleaning Serv ices Goal Actual Goal Actual Goal
Measure: Cleaning Serv ices satisfaction n/a n/a 90% 90% 95%
Triple Bottom Line Focus Area: Economic FY13 FY14 FY15Key Serv ice: Building Repairs Goal Actual Goal Actual GoalMeasure: Percent of general maintenance work orders completed 80% 85% 80% 97% 90%
Facility Services

143
GENERAL FUND
Triple Bottom Line Focus Area: Economic FY13 FY14 FY15Key Serv ice: Mechanical Repairs Goal Actual Goal Actual Goal
Measure: HVAC System Availability 90% 93% 90% 95% 97%
Triple Bottom Line Focus Area: Economic FY13 FY14 FY15Key Serv ice: Electrical Repairs Goal Actual Goal Actual Goal
Measure: Sports Lighting Availability 85% 85% 85% 86% 90%
Triple Bottom Line Focus Area: Economic FY13 FY14 FY15Key Serv ice: Capital Improvement Management Goal Actual Goal Actual Goal
Measure: Accuracy within Budget 90% 90% 90% 90% 95%
Facility Services

144

INTERNAL SERVICE FUND
145
Mission To provide a fleet management program for the City of Germantown, this includes acquisition, maintenance,
warehousing, safety and disposal of automobiles, trucks and equipment, plus supplies for fleet management.
Under the General Services Division, Fleet Services provides vehicle maintenance to city vehicles and various types of equipment (trucks, automobiles, fire trucks and engines, construction and street repair equipment and vehicles, emergency generators, etc.). Fleet Services also provides welding and fabrication services for all departments, fuel management, and equipment maintenance and safety training.
Budget Category Summary
Budget Payroll Summary
Actual Budget Estimated BudgetCATEGORY FY13 FY14 FY14 Amt. Chg. % Chg. FY15
Personnel 731,966$ 601,599 595,101 20,021 3.36% 615,122 Communication 258 1,630 1,630 370 22.70% 2,000 Professional Fees 111 120 120 (120) -100.00% - Other Maintenance 237,320 233,770 246,800 (5,270) -2.14% 241,530 Supplies 17,288 31,145 35,845 107,705 300.47% 143,550 Rent 1,683 1,700 1,700 1,000 58.82% 2,700 Allocations (881,147) (913,276) (924,508) (128,869) 13.94% (1,053,377) Depreciation 30,868 33,647 33,647 2,463 7.32% 36,110 Utilities 8,453 9,665 9,665 2,700 27.94% 12,365
TOTAL 146,800$ - - - - -
Capital Outlay 17,640$ 65,296 26,427 (6,427) -24.32% 20,000
FY13 FY14 FY15Actual Estimate Budget
Exempt Salaries 2.0 131,234$ 1.0 87,496 1.0 89,514
Non-Exempt Wages 8.0 337,629 7.0 321,000 7.5 346,023
Other Compensation 807 1,000 1,000
Fringe Benefits 258,705 182,201 174,680
Other Personnel 3,591 3,404 3,905
DEPARTMENT TOTAL 10.0 731,966$ 8.0 595,101 8.5 615,122
Fleet Services
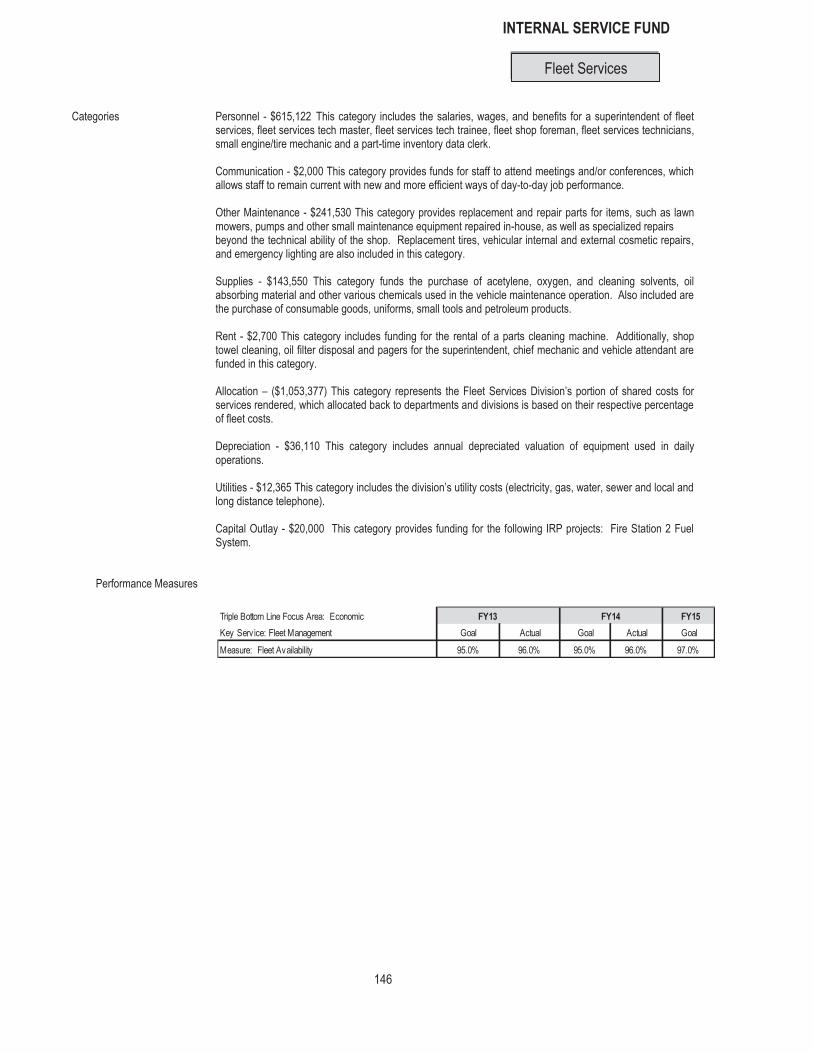
INTERNAL SERVICE FUND
146
Categories Personnel - $615,122 This category includes the salaries, wages, and benefits for a superintendent of fleet
services, fleet services tech master, fleet services tech trainee, fleet shop foreman, fleet services technicians, small engine/tire mechanic and a part-time inventory data clerk.
Communication - $2,000 This category provides funds for staff to attend meetings and/or conferences, which allows staff to remain current with new and more efficient ways of day-to-day job performance. Other Maintenance - $241,530 This category provides replacement and repair parts for items, such as lawn mowers, pumps and other small maintenance equipment repaired in-house, as well as specialized repairs beyond the technical ability of the shop. Replacement tires, vehicular internal and external cosmetic repairs, and emergency lighting are also included in this category. Supplies - $143,550 This category funds the purchase of acetylene, oxygen, and cleaning solvents, oil absorbing material and other various chemicals used in the vehicle maintenance operation. Also included are the purchase of consumable goods, uniforms, small tools and petroleum products. Rent - $2,700 This category includes funding for the rental of a parts cleaning machine. Additionally, shop towel cleaning, oil filter disposal and pagers for the superintendent, chief mechanic and vehicle attendant are funded in this category.
Allocation – ($1,053,377) This category represents the Fleet Services Division’s portion of shared costs for services rendered, which allocated back to departments and divisions is based on their respective percentage of fleet costs. Depreciation - $36,110 This category includes annual depreciated valuation of equipment used in daily operations. Utilities - $12,365 This category includes the division’s utility costs (electricity, gas, water, sewer and local and long distance telephone).
Capital Outlay - $20,000 This category provides funding for the following IRP projects: Fire Station 2 Fuel System.
Performance Measures
Triple Bottom Line Focus Area: Economic FY13 FY14 FY15Key Service: Fleet Management Goal Actual Goal Actual Goal
Measure: Fleet Availability 95.0% 96.0% 95.0% 96.0% 97.0%
Fleet Services

PUBLIC SAFETY FY 15 BUDGET
147
The following section presents the operating budget for the Police and Fire Departments. Total operating expenditures for each department are summarized below:
PUBLIC SAFETY EXPENDITURES
$ MILLIONS
05
101520
FY11 FY12 FY13 FY14 FY15
Fire Police Ambulance

148

149
SPECIAL REVENUE FUND
Mission The mission of the Germantown Police Department is to maintain a peaceful and orderly environment that
ensures the protection of life and property through equitable enforcement of laws, rapid response and community education.
Budget Category Summary
Budget Payroll Summary
Categories Personnel - $9,353,851 Salaries, wages, and benefits for the police chief, deputy chief, inspectors, captains,
lieutenants, public safety dispatcher/jailer supervisors, police officers, public safety dispatcher/jailers, administrative assistant, senior data entry clerk, police data technician, school crossing guards and a legal advisor are included in this item.
The Personnel category also includes overtime wages for extra hours as required and off-duty officers’ City level court appearances (two hours minimum); State level court appearances (three hours minimum); extra duty wages for 10 paid holidays for 100 police personnel who cannot be given the day off; FICA; group insurance; retirement; OPEB, workers’ compensation; and employee education.
Actual Budget Estimated BudgetCATEGORY FY13 FY14 FY14 Amt. Chg. % Chg. FY15
Personnel 8,874,167$ 9,439,382 9,132,050 221,801 2.43% 9,353,851 Communication 23,344 25,100 25,100 - 0.00% 25,100 Professional Fees 8,224 10,000 10,000 - 0.00% 10,000 Insurance 74,883 35,000 35,000 5,000 14.29% 40,000 Other Maintenance 1,885 6,000 6,000 - 0.00% 6,000 Supplies 415,854 523,452 524,849 12,100 2.31% 536,949 Rent 7,362 11,500 11,500 - 0.00% 11,500 Allocations 348,219 361,474 365,320 36,952 10.11% 402,272 Capital Outlay 558,266 323,000 293,900 131,100 44.61% 425,000 Utilities 116,473 121,635 116,630 1,100 0.94% 117,730 Grants 4,541 5,300 5,396 (96) -1.78% 5,300
TOTAL 10,433,218$ 10,861,843 10,525,745 407,957 3.88% 10,933,702
FY13 FY14 FY15Actual Estimate Budget
Exempt Salaries 11.0 939,993$ 12.0 1,010,786 12.0 1,035,449
Non-Exempt Wages 101.0 4,781,529 100.0 5,200,914 104.3 5,368,390
Other Compensation 299,681 310,370 299,000
Fringe Benefits 2,777,350 2,531,480 2,562,512
Other Personnel 75,614 78,500 88,500
DEPARTMENT TOTAL 112.0 8,874,167$ 112.0 9,132,050 116.3 9,353,851
Police

150
SPECIAL REVENUE FUND
Communications - $25,100 This category includes items that enhance the Police Department’s efficiency and effectiveness through continual contact with current issues and techniques including dues and subscriptions to law enforcement bulletins, Tennessee Code Annotated books and their supplements, meetings and training sessions at Tennessee and national police conferences. Professional Fees - $10,000 This category includes payments for legal and professional services. Insurance - $40,000 This category includes the department’s share of deductibles associated with workers’ compensation claims, and personal and private property claims. Also included in this category is the City’s deductible on all the City’s uninsured vehicle claims. Other Maintenance - $6,000 This item covers maintenance costs for office equipment and the jail security system. Supplies - $536,949 This category includes supplies the department requires to function on a daily basis, including printing report forms, traffic citations, daily activity reports, radio logs and other forms that had previously been available through the State. Also included are replacement uniforms and clothing for police personnel. Other required supplies include jail supplies (milk and meals for prisoners), training ammunition, cleaning supplies for the weapons, crime scene supplies, photo supplies, markings for vehicles, flashlight batteries, computer supplies and petroleum products. Also included in this category are non-capital assets ranging in value from $500 to $4,999. Rent - $11,500 This item includes the lease of the Smith & Wesson Identi-kit used as an investigative tool. In addition, lease payments for the copy machine are also included in this category. Allocation - $402,272 This line item contains the Police Department’s portion of the shared costs of all funds, departments, and cost centers, including insurance and vehicle maintenance. Capital Outlay - $425,000 This item includes the funding necessary to purchase police vehicles/related equipment and weapons. Utilities - $117,730 This category includes utility costs (electricity, gas, water, sewer and local and long distance telephone). Grants - $5,300 This category includes funding for the Public Safety Education Commission.
Performance Measures
Triple Bottom Line Focus Area: Social FY13 FY14 FY15Key Product/Serv ice: Respond to calls for serv ice Goal Actual Goal Actual Goal
Measure: Non-emergency response time 8.00 4.00 8.00 3.67 8.00
Social FY13 FY14 FY15Key Product/Serv ice: Customer serv ice Goal Actual Goal Actual GoalMeasure: Customer satisfaction rating n/a n/a n/a n/a 90%
Police

151
SPECIAL REVENUE FUND
Mission The expenditures in this cost center accounts for the leasing of the automated enforcement equipment from
American Traffic Solutions. Also included in the expenditures is funding for the Alive-At-25 and Driver Education programs.
Budget Category Summary
Categories Personnel - $99,624 This category includes 100% of one police officer and 25% of a court clerk’s personnel
costs to administer the automated enforcement program.
Supplies - $7,500 This category includes the cost of office supplies for the program and a printer.
Grants - $13,000 This category includes grants to support the Alive-At-25 and Driver Education programs.
Actual Budget Estimated BudgetCATEGORY FY13 FY14 FY14 Amt. Chg. % Chg. FY15
Personnel 108,470$ 103,195 94,422 5,202 5.51% 99,624 Professional Fees - - 32,000 (32,000) -100.00% - Supplies 2,000 7,500 50 7,450 14900.00% 7,500 Rent 22,075 175,000 - - - - Grants - 23,000 23,000 (10,000) -43.48% 13,000
TOTAL 132,545$ 308,695 149,472 (29,348) -19.63% 120,124
Automated Enforcement

152

153
SPECIAL REVENUE FUND
Mission The expenditures in this cost center account for the use of the City’s drug-related fines and confiscation.
State law requires these resources be used in drug law enforcement. Budget Category Summary
Categories Personnel - $81,000 This category includes overtime for police officers assigned to drug enforcement and the employee education costs for those same officers.
Communications - $1,000 This category includes funds to enhance the department’s efficiency and effectiveness through continual contact with current issues and techniques, which includes dues and subscriptions to industry associations and magazines.
Professional Fees - $24,000 This category includes the cost of providing High School Drug Tests.
Other Maintenance - $5,000 This category covers maintenance costs for office equipment and the jail security system.
Supplies - $138,000 This category includes expenditures associated with the Drug Fund dogs. This item also includes all Drug Fund expenditures associated with drug education, lab tests, the emergency storage facility and other supplies. Also included in this category are non-capital assets ranging in value from $500 to $4,999.
Rent - $750 This category covers the cost of rental of cellular telephones.
Utilities - $6,000 This category includes utility costs (electricity, gas, water, sewer and local and long distance telephone).
Drug Asset Forfeiture
Actual Budget Estimated BudgetCATEGORY FY13 FY14 FY14 Amt. Chg. % Chg. FY15
Personnel 26,777$ 81,000 77,660 3,340 4.30% 81,000 Communication - 1,000 - 1,000 100% 1,000 Professional Fees - 24,000 - 24,000 100% 24,000 Other Maintenance - 5,000 - 5,000 100% 5,000 Supplies 52,041 132,000 36,459 101,541 278.51% 138,000 Rent - 750 - 750 100% 750 Capital Outlay 52,138 - 79,000 (79,000) -100.00% - Utilities 2,264 2,000 5,400 600 11.11% 6,000
TOTAL 133,220$ 245,750 198,519 57,231 28.83% 255,750

154

SPECIAL REVENUE FUND
155
Mission The expenditures in this cost center account for the use of money obtained from asset forfeitures to be used
by the Police department. The federal government requires money seized from assets to be placed in a separate fund and then used by the Police department.
Budget Category Summary
Categories Personnel - $20,000 This category funds employee education for police officers involved in criminal
investigations. Police officers are sent to specialized police training schools.
Supplies - $30,000 This category includes expenditures associated with the Federal Asset Forfeiture Fund. In addition to office supplies, this fund provides funding for related supplies and non-cap assets needed by police officers involved in criminal investigations.
Actual Budget Estimated BudgetCATEGORY FY13 FY14 FY14 Amt. Chg. % Chg. FY15
Personnel -$ 20,000 20,000 - 0.00% 20,000 Supplies 5,498 30,000 12,000 18,000 150.00% 30,000 Capital Outlay - - 18,000 (18,000) -100.00% -
TOTAL 5,498$ 50,000 50,000 - 0.00% 50,000
Federal Asset Forfeiture

156

GENERAL FUND
157
Mission To provide timely and effective response to fire and medical emergencies for the protection of lives and
property in Germantown.
In addition to fire suppression, other services include: Emergency Medical Services (EMS), Special Operations and Rescue Techniques (SORT), Hazardous Materials Response Unit (HazMat), Public Fire Safety Education, Fire Inspections and Investigations, and Learning About Fire Safety (LAFS) Clown Troupe.
Budget Category Summary
Budget Payroll Summary
Categories Personnel - $6,102,283 Salaries, wages and benefits for a fire chief, assistant fire chief, deputy fire chief, battalion chiefs, administrative assistants, technical services/safety officer, fire lieutenants, apparatus drivers, fire fighters, fire marshal, assistant fire marshal, fire department instructor and reserve fire fighters. To maximize staffing, firefighters also serve a dual role as fire fighters and as paramedics.
Communications - $23,618 This category includes funds to enhance the department’s efficiency and effectiveness through continual contact with current issues and techniques, which includes dues and subscriptions to industry associations and magazines.
Actual Budget Estimated BudgetCATEGORY FY13 FY14 FY14 Amt. Chg. % Chg. FY15
Personnel 6,836,969$ 6,194,248 6,213,895 (111,612) -1.80% 6,102,283 Communication 26,198 23,318 23,318 300 1.29% 23,618 Professional Fees 485,932 7,500 7,500 4,000 53.33% 11,500 Contract Services 2,779 5,558 5,558 - 0.00% 5,558 Insurance 17,676 15,000 15,652 (652) -4.17% 15,000 Other Maintenance 34,002 40,000 38,500 1,700 4.42% 40,200 Supplies 331,288 202,800 194,800 6,450 3.31% 201,250 Rent 4,501 5,448 5,448 102 1.87% 5,550 Allocations 266,454 263,352 266,367 25,241 9.48% 291,608 Capital Outlay 143,402 141,000 141,000 (50,000) -35.46% 91,000 Utilities 131,201 146,349 133,842 6,590 4.92% 140,432
TOTAL 8,280,402$ 7,044,573 7,045,880 (117,881) -1.67% 6,927,999
FY13 FY14 FY15Actual Estimate Budget
Exempt Salaries 9.0 901,756$ 9.0 841,463 9.0 871,053
Non-Exempt Wages 62.0 3,506,194 58.0 3,407,501 58.0 3,342,211
Other Compensation 267,133 262,024 270,377
Fringe Benefits 2,111,782 1,651,307 1,561,042
Other Personnel 50,104 51,600 57,600
DEPARTMENT TOTAL 71.0 6,836,969$ 67.0 6,213,895 67.0 6,102,283
Fire

GENERAL FUND
158
Professional Fees - $11,500 Funds included are for fees to provide Hepatitis B vaccinations for new employees, medical coordinator fees and additional consulting fees. Contract Services - $5,558 Funds are included for a privatized to clean Fire Station #4. Insurance - $15,000 This category includes the department’s share of deductibles associated with workers’ compensation claims, and personal and private property claims. Also included in this category is the City’s deductible on all the City’s uninsured vehicle claims. Other Maintenance - $40,200 Funds in this category are for the maintenance of office equipment, computer equipment, fire fighting and personal protection equipment, EMS equipment and the installation and removal of radio equipment from vehicles and apparatus. Supplies - $201,250 This category includes supplies required for the daily operation of the department, including the printing of various forms and handout materials for public education programs. Also included are replacement uniforms and turnout clothing, chemical supplies for recharging fire extinguishers, EMS supplies, and small tools for fire fighting and fuel. Also included in this category are non-capital assets ranging in value from $500 to $4,999. Rent - $5,550 This category includes rental fees associated with the department’s copy machines. Allocation - $291,608 Funds in this category are for the department’s portion of shared insurance and vehicle maintenance costs. Capital Outlay - $91,000 This item includes the funding for IRP projects including a hurst tool, power hawk and fire hoses. Utilities - $140,432 This category includes utility costs (electricity, gas, water, sewer and local and long distance telephone).
Performance Measures
Triple Bottom Line Focus Area: Social FY13 FY14 FY15Key Serv ice: Fire Prevention Goal Actual Goal Actual Goal
Measure: Number of Civ ilian Injuries due to Fire 0 1.66 0 1.00 <=1
Triple Bottom Line Focus Area: Economic FY13 FY14 FY15Key Serv ice: Fire Prevention Goal Actual Goal Actual Goal
Measure: Percent of fire code v iolations corrected in 90 days 90.0% 90.0% 90.0% 92.0% 93.0%
Triple Bottom Line Focus Area: Social FY13 FY14 FY15Key Serv ice: Fire Prevention Goal Actual Goal Actual Goal
Measure: Perecent of Fires in which a cause is determined 90% 70% 90% 100% 99%
Fire

GENERAL FUND
159
Triple Bottom Line Focus Area: Social FY13 FY14 FY15Key Serv ice: Fire Suppression Goal Actual Goal Actual Goal
Measure: Post-Incident Survey Customer Satisfaction 98.0% 98.3% 90.0% 98.8% 99.0%
Triple Bottom Line Focus Area: Social FY13 FY14 FY15Key Serv ice: Fire Suppression Goal Actual Goal Actual Goal
Measure: Number of reported NFIRS fire serv ice injuries 0 4.75 0 5 4
Triple Bottom Line Focus Area: Economic FY13 FY14 FY15Key Serv ice: Fire Suppression Goal Actual Goal Actual Goal
Measure: Annual Fire Loss per $1 Million Appraised Value n/a n/a 370.00$ 249.00$ 225.00$
Fire

160

SPECIAL REVENUE FUND
161
Mission To provide timely and effective response medical emergencies for the protection of lives and property in
Germantown.
In addition, Emergency Medical Services (EMS)/Ambulance Transport provides advanced life support (ALS), first responder emergency medical services and ambulance transport service.
Budget Category Summary
Budget Payroll Summary
Ambulance
Actual Budget Estimated BudgetCATEGORY FY13 FY14 FY14 Amt. Chg. % Chg. FY15
Personnel -$ 1,114,428$ 1,109,993$ 98,789 8.90% 1,208,782$ Communication - 1,950 1,950 125 6.41% 2,075 Professional Fees - 63,431 50,000 4,275 8.55% 54,275 Insurance - 15,000 - 15,000 100% 15,000 Other Maintenance - 1,000 1,000 - 0.00% 1,000 Supplies - 102,539 102,967 (27,680) -26.88% 75,287 Rent - 48,000 55,000 (55,000) -100.00% - Allocations - 22,939 22,939 1,466 6.39% 24,405 Capital Outlay - 62,000 61,960 40 0.06% 62,000 Utilities - 2,000 1,800 200 11.11% 2,000
TOTAL -$ 1,433,287 1,407,609 37,215 2.64% 1,444,824
FY13 FY14 FY15Actual Estimate Budget
Exempt Salaries 0.0 -$ 1.0 79,761 1.0 78,270
Non-Exempt Wages 0.0 - 12.0 634,748 15.0 690,792
Other Compensation - 91,092 95,976
Fringe Benefits - 295,792 331,754
Other Personnel - 8,600 11,990
DEPARTMENT TOTAL 0.0 -$ 13.0 1,109,993 16.0 1,208,782

SPECIAL REVENUE FUND
162
Categories Personnel - $1,208,782 Salaries, wages and benefits for a EMS coordinator and firefighters also serve a dual role as fire
fighters and as paramedics.
Communications - $2,075 This category includes funds to enhance the department’s efficiency and effectiveness through continual contact with current issues and techniques, which includes dues and subscriptions to industry associations and magazines.
Professional Fees - $54,275 Funds the contract billing service used for revenue collection. Insurance - $15,000 This category includes the department’s share of deductibles associated with workers’ compensation claims, and personal and private property claims. Also included in this category is the City’s deductible on all the City’s uninsured vehicle claims. Other Maintenance - $1,000 Funds in this category are for the maintenance of office equipment, computer equipment, fire fighting and personal protection equipment, EMS equipment and the installation and removal of radio equipment from vehicles and apparatus. Supplies - $75,287 This category includes supplies required for the daily operation of the department, including the printing of various forms and handout materials for public education programs. Also included are replacement uniforms and turnout clothing, chemical supplies for recharging fire extinguishers, EMS supplies, and small tools and fuel. Also included in this category are non-capital assets ranging in value from $500 to $4,999. Allocation - $24,405 Funds in this category are for the department’s portion of shared insurance and vehicle maintenance costs. Capital Outlay - $62,000 This item includes the funding for IRP project for defibrillators. Utilities - $2,000 This category includes utility costs (electricity, gas, water, sewer and local and long distance telephone).
Performance Measures
Triple Bottom Line Focus Area: Economic FY13 FY14 FY15Key Serv ice: Emergency Medical Serv ice Goal Actual Goal Actual Goal
Measure: Ambulance Response Time n/a n/a 7:00 5:54 5:45
Triple Bottom Line Focus Area: Economic FY13 FY14 FY15Key Serv ice: Emergency Medical Serv ice Goal Actual Goal Actual Goal
Measure: Cardiac Arrest Surv ival 30% 66% 30% 33% 35%
Triple Bottom Line Focus Area: Economic FY13 FY14 FY15Key Serv ice: Emergency Medical Serv ice Goal Actual Goal Actual Goal
Measure: Cardiac Arrest Surv ival- VF/VT 30% 50% 30% 67% 70%
Ambulance

163
TRANSPORTATION AND ENVIRONMENT FY15 BUDGET
The following section presents the operating budget for all Transportation and Environment cost centers. Also presented in this section are the costs associated with the State Street Aid Fund and Fleet Services. Total operating expenditures for the two major fund categories within Transportation and Environment are summarized below:
012345
FY11 FY12 FY13 FY14 FY15
Public Services Animal Control
TRANSPORTATION & ENVIRONMENT EXPENDITURES
$ MILLIONS

164

165
GENERAL FUND
Mission To provide the citizens with safe streets and functioning drainage infrastructure. This is accomplished through an efficient and effective maintenance program, an aggressive planning process and prudent fiscal management.
The Public Services Department provides management oversight and administrative functions for the Utility Fund, State Street Aid, Animal Control and Street, Grounds, and Drainage Maintenance. Budgetary information for these areas can be found under separate headings within this budget document.
The State Street Aid Fund provides for maintenance and repairs of curbs and gutters, handicap access ramps, cross walks, more than 206 miles of roadways and seasonal maintenance and repair of 45 miles of concrete and earthen ditches. The Public Services Department also oversees for the Germantown Environmental Commission.
Budget Category Summary
Budget Payroll Summary
Actual Budget Estimated BudgetCATEGORY FY13 FY14 FY14 Amt. Chg. % Chg. FY15
Personnel 2,573,068$ 2,565,741 2,489,230 109,759 4.41% 2,598,989 Communication 3,162 4,000 2,950 1,050 35.59% 4,000 Professional Fees - 4,000 4,000 (4,000) -100.00% - Contract Services 449,366 530,000 600,000 43,520 7.25% 643,520 Insurance (51,787) 20,000 14,615 385 2.63% 15,000 Other Maintenance 97,422 122,500 119,500 3,000 2.51% 122,500 Supplies 135,702 154,000 149,250 5,250 3.52% 154,500 Rent 1,042 1,500 1,500 4,500 300.00% 6,000 Allocations 301,905 317,777 322,678 40,516 12.56% 363,194 Capital Outlay 282,933 187,000 178,170 216,830 121.70% 395,000 Utilities 20,479 22,350 21,105 145 0.69% 21,250
TOTAL 3,813,292$ 3,928,868 3,902,998 420,955 10.79% 4,323,953
Expense Reimbursement (412,832)$ (409,482) (409,482) (14,940) 3.65% (424,422)
FY13 FY14 FY15Actual Estimate Budget
Exempt Salaries 6.5 484,316$ 6.5 468,250 6.5 505,574
Non-Exempt Wages 33.0 1,160,361 33.0 1,201,808 33.0 1,272,398
Other Compensation 18,368 20,000 20,000
Fringe Benefits 908,627 797,172 797,017
Other Personnel 1,396 2,000 4,000
DEPARTMENT TOTAL 39.5 2,573,068$ 39.5 2,489,230 39.5 2,598,989
Public Services

166
GENERAL FUND
Categories Personnel - $2,598,989 This category includes salaries, wages and benefits for non-exempt and exempt employees, which includes the director of public services, assistant director of public services, superintendent of ground maintenance, superintendent of public works operations, contract administrator and the assistant superintendent of public works operations. Also included in this category is overtime for non-exempt employees, which include crew supervisors, heavy equipment operators, senior maintenance workers, maintenance workers, maintenance technicians and an office support technician. Additionally, funds are budgeted to provide job-related educational enrichment for employees, attendance at seminars, monthly safety and job-related training seminars and the purchase of necessary manuals.
Communications - $4,000 This category funds memberships and professional publications allowing staff to remain current with new and more efficient ways of day-to-day job performance.
Contract Services - $643,520 This category includes contract landscaping costs for grass cutting, herbicide, and maintenance.
Insurance - $15,000 This category includes the department’s share of deductibles associated with worker’s compensation claims and personal and private property claims. Also included in this category is the City’s deductible on all the City’s uninsured vehicle claims.
Other Maintenance - $122,500 This category includes materials and supplies necessary to make drainage, structural repairs and general improvements, as well as repairs to tools and equipment such as air hammers, welding machines and sump pumps. This category also includes the costs associated with park repair and maintenance. In addition, this category includes maintenance for forestry and parks equipment, landscaping turf, fencing, and repair of fire hydrants throughout the City. Supplies - $154,500 This category funds the purchase of office supplies, small tools used in day-to-day operations of maintenance activities and uniform service for all employees. This category provides the department with chemical supplies, small tools and miscellaneous supplies. Major expenses include fertilizer, weed control chemicals, athletic field marker and paint, and petroleum products. Also included in this category are non-capital assets ranging in value from $500 to $4,999.
Rent - $6,000 This category funds the rental of equipment, which is not owned by the City and cannot be acquired through our mutual use agreement with other municipalities.
Allocation - $363,194 This category represents the department’s portion of the insurance and vehicle maintenance. Capital Outlay - $395,000 This category funds the purchase of Z-trak mowers, Rand roller, top dresser, field rakes, and material loaders and improvements to various city grounds and parks. Utilities - $21,250 This category includes the department’s share of utility costs (electricity, gas, water, sewer and local and long distance telephone).
Public Services

167
GENERAL FUND
Performance Measures
Triple Bottom Line Focus Area: Social FY13 FY14 FY15Key Product/Service: Parks Maintenance Goal Actual Goal Actual Goal
Measure: Citizen satisfaction with park maintenance 91% 93% 92% 93% 94%
Triple Bottom Line Focus Area: Economic FY13 FY14 FY15Key Product/Service: Street Maintenance Goal Actual Goal Actual Goal
Measure: Satisfaction with city streets 75% 68% 75% 76% 80%
Public Services

168
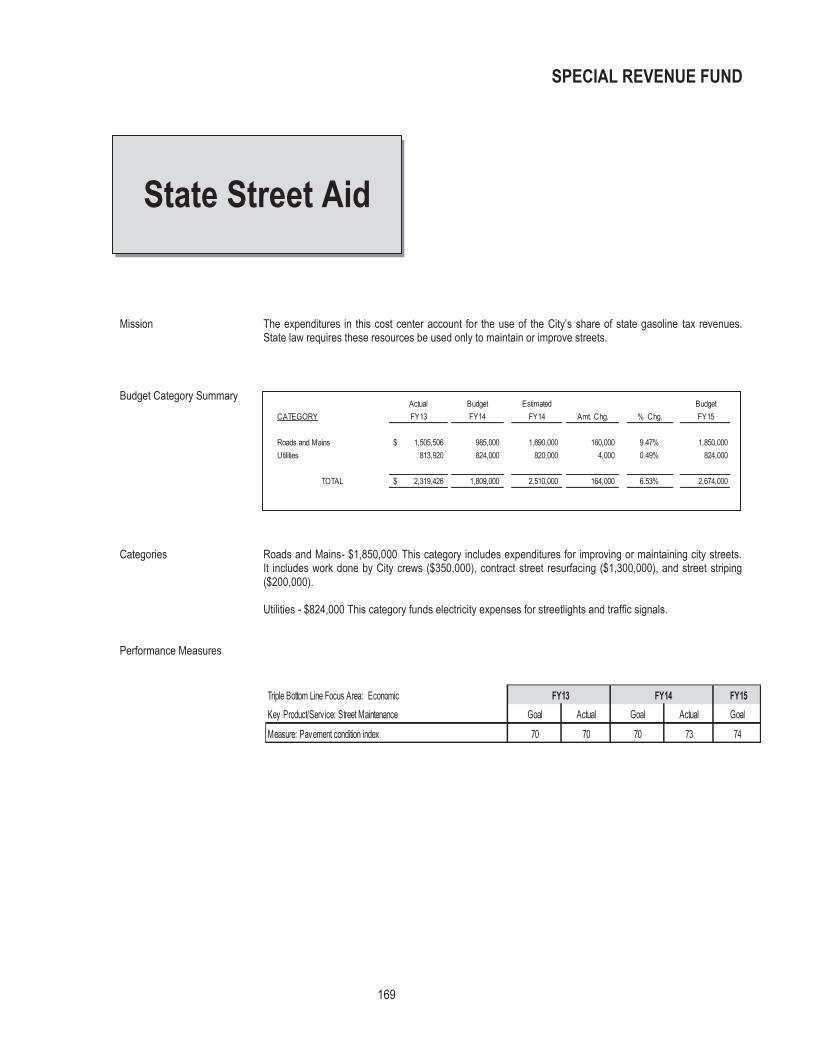
169
SPECIAL REVENUE FUND
Mission The expenditures in this cost center account for the use of the City’s share of state gasoline tax revenues.
State law requires these resources be used only to maintain or improve streets. Budget Category Summary
Categories Roads and Mains- $1,850,000 This category includes expenditures for improving or maintaining city streets.
It includes work done by City crews ($350,000), contract street resurfacing ($1,300,000), and street striping ($200,000).
Utilities - $824,000 This category funds electricity expenses for streetlights and traffic signals.
Performance Measures
Triple Bottom Line Focus Area: Economic FY13 FY14 FY15Key Product/Service: Street Maintenance Goal Actual Goal Actual Goal
Measure: Pavement condition index 70 70 70 73 74
Actual Budget Estimated BudgetCATEGORY FY13 FY14 FY14 Amt. Chg. % Chg. FY15
Roads and Mains 1,505,506$ 985,000 1,690,000 160,000 9.47% 1,850,000 Utilities 813,920 824,000 820,000 4,000 0.49% 824,000
TOTAL 2,319,426$ 1,809,000 2,510,000 164,000 6.53% 2,674,000
State Street Aid

170
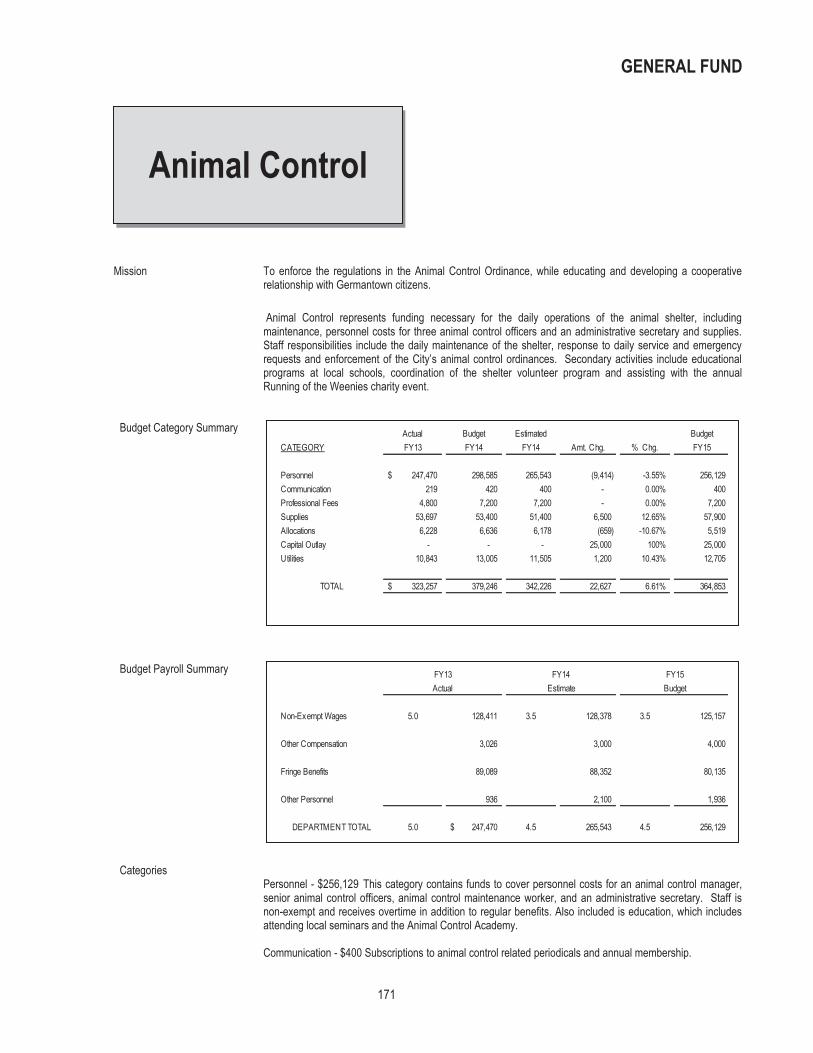
GENERAL FUND
171
Mission To enforce the regulations in the Animal Control Ordinance, while educating and developing a cooperative relationship with Germantown citizens.
Animal Control represents funding necessary for the daily operations of the animal shelter, including maintenance, personnel costs for three animal control officers and an administrative secretary and supplies. Staff responsibilities include the daily maintenance of the shelter, response to daily service and emergency requests and enforcement of the City’s animal control ordinances. Secondary activities include educational programs at local schools, coordination of the shelter volunteer program and assisting with the annual Running of the Weenies charity event.
Budget Category Summary
Budget Payroll Summary Categories
Personnel - $256,129 This category contains funds to cover personnel costs for an animal control manager, senior animal control officers, animal control maintenance worker, and an administrative secretary. Staff is non-exempt and receives overtime in addition to regular benefits. Also included is education, which includes attending local seminars and the Animal Control Academy.
Communication - $400 Subscriptions to animal control related periodicals and annual membership.
Actual Budget Estimated BudgetCATEGORY FY13 FY14 FY14 Amt. Chg. % Chg. FY15
Personnel 247,470$ 298,585 265,543 (9,414) -3.55% 256,129 Communication 219 420 400 - 0.00% 400 Professional Fees 4,800 7,200 7,200 - 0.00% 7,200 Supplies 53,697 53,400 51,400 6,500 12.65% 57,900 Allocations 6,228 6,636 6,178 (659) -10.67% 5,519 Capital Outlay - - - 25,000 100% 25,000 Utilities 10,843 13,005 11,505 1,200 10.43% 12,705
TOTAL 323,257$ 379,246 342,226 22,627 6.61% 364,853
FY13 FY14 FY15Actual Estimate Budget
Non-Exempt Wages 5.0 128,411 3.5 128,378 3.5 125,157
Other Compensation 3,026 3,000 4,000
Fringe Benefits 89,089 88,352 80,135
Other Personnel 936 2,100 1,936
DEPARTMENT TOTAL 5.0 247,470$ 4.5 265,543 4.5 256,129
Animal Control
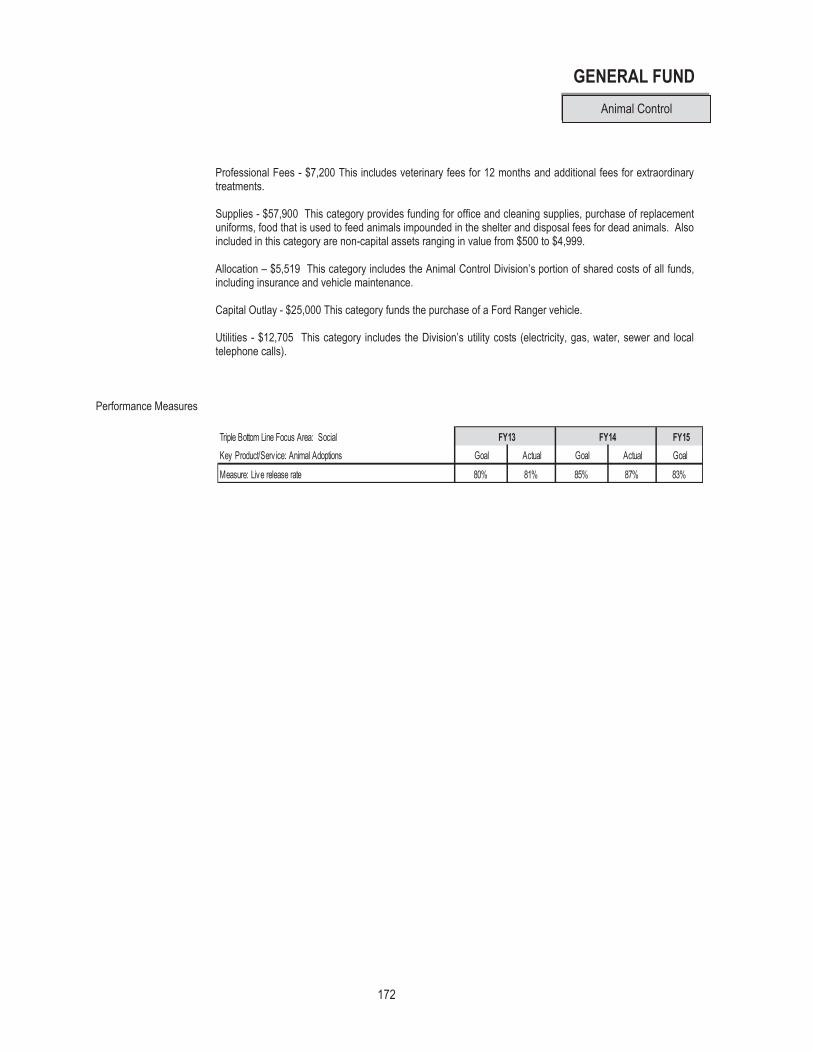
172
GENERAL FUND
Professional Fees - $7,200 This includes veterinary fees for 12 months and additional fees for extraordinary treatments. Supplies - $57,900 This category provides funding for office and cleaning supplies, purchase of replacement uniforms, food that is used to feed animals impounded in the shelter and disposal fees for dead animals. Also included in this category are non-capital assets ranging in value from $500 to $4,999.
Allocation – $5,519 This category includes the Animal Control Division’s portion of shared costs of all funds, including insurance and vehicle maintenance. Capital Outlay - $25,000 This category funds the purchase of a Ford Ranger vehicle. Utilities - $12,705 This category includes the Division’s utility costs (electricity, gas, water, sewer and local telephone calls).
Performance Measures
Triple Bottom Line Focus Area: Social FY13 FY14 FY15Key Product/Service: Animal Adoptions Goal Actual Goal Actual Goal
Measure: Live release rate 80% 81% 85% 87% 83%
Animal Control

173
SANITATION FY15 BUDGET
The following section presents the operating budget for the Sanitation Fund. Total operating expenditures for the fund are summarized below.
-101234
FY11 FY12 FY13 FY14 FY15
Landfill Fees Collection Fees Other Expenses
SANITATION EXPENDITURES
$ MILLIONS

174

175
SANITATION FUND
Mission To successfully collect and dispose of all solid waste through contracts with external vendor, and in conjunction with the Environmental Commission, to educate citizens about solid waste reduction activities such as recycling, grass cycling and composting.
The FY15 Sanitation Budget includes options for backdoor trash collection or curbside option, weekly recyclables collection and unlimited resident generated yard debris collection. This fund reflects the fourth year of a five year contract with option to renew for an additional five years with Republic Services for collection. The fee of residential collection for FY15 is calculated at $24.50 per single-family dwelling and $14.65 for multi-family.
In addition to the collection costs, the City is in the fourth year of a five-year contract with Waste Management with option to renew for three additional five year extensions with for disposal of residential waste in a permitted sanitation landfill. This fee is $31.70 per ton for FY15.
The cost for collection service alone is $3,138,800 with landfill fees projected to total $408,800 including savings from recycling. One goal of the Environmental Commission is to familiarize the public with the benefits of recycling.
Budget Category Summary
Budget Payroll Summary
Actual Budget Estimated BudgetCATEGORY FY13 FY14 FY14 Amt. Chg. % Chg. FY15
Personnel 47,692$ 95,707 88,636 4,423 5% 93,059 Communication 6,120 17,350 9,850 3,500 36% 13,350 Contract Services 3,121,245 3,457,400 3,383,000 144,600 4% 3,527,600 Supplies 19,770 29,000 29,000 12,900 44% 41,900 Utilities 531 927 927 73 8% 1,000
TOTAL 3,195,358$ 3,600,384$ 3,511,413 165,496 5% 3,676,909
FY13 FY14 FY15Actual Estimate Budget
Exempt Salaries 0.0 562$ 0.5 29,646 0.5 31,302
Non-Exempt Wages 0.0 31,591 0.3 30,836 0.3 33,576
Other Compensation - - -
Fringe Benefits 15,434 27,654 27,681
Other Personnel 105 500 500
DEPARTMENT TOTAL 0.0 47,692$ 0.8 88,636 0.8 93,059
Sanitation

176
SANITATION FUND
Categories Personnel - $93,059 This category contains funds to cover personnel costs for the sanitation
program.
Communications - $13,350 This category funds the City’s publications for semiannual Amnesty Days and the recycling/composting program. Also included in this category are funds for attending meetings, professional licenses and subscriptions to publications related to solid waste collection and disposal.
Contract Services - $3,527,600 This category reflects the cost for landfill charges ($408,800) and collection charges for one year ($3,138,800).
Supplies - $41,900 This category funds miscellaneous supplies unique to providing sanitation services and the City’s Amnesty Days and Recycling Program. Also, $15,000 is budgeted here for the Household Hazardous Waste Facility Fund.
Utilities - $1,000 This category includes Sanitation’s share of utility costs (electricity, gas, water, sewer and local and long distance telephone).
Performance Measures
Triple Bottom Line Focus Area: Environmental FY13 FY14 FY15Key Product/Serv ice: Solid waste collection Goal Actual Goal Actual GoalMeasure: Household missed serv ice requests 330 350 300 301 300
.Triple Bottom Line Focus Area: Environmental FY13 FY14 FY15Key Product/Serv ice: Solid waste collection Goal Actual Goal Actual GoalMeasure: Yard debris missed serv ice requests 527 402 300 392 225
Triple Bottom Line Focus Area: Environmental FY13 FY14 FY15Key Product/Serv ice: Solid waste collection Goal Actual Goal Actual GoalMeasure: Recycling missed serv ice requests 144 131 144 182 150
Triple Bottom Line Focus Area: Environmental FY13 FY14 FY15Key Product/Serv ice: Solid waste collection Goal Actual Goal Actual GoalMeasure: Recycling missed serv ice requests 140 134.2 144 131.050 144
Triple Bottom Line Focus Area: Environmental FY13 FY14 FY15Key Product/Serv ice: Solid waste collection Goal Actual Goal Actual GoalMeasure: Customer satisfaction 81% 80% 80% 77% 85%
Sanitation

177
STORMWATER MANAGEMENT FUND
Mission To provide for a safe and adequate drainage system to prevent flooding, meet future growth requirements,
and to insure our waterways meet water quality standards.
Budget Category Summary
Budget Payroll Summary
Actual Budget Estimated BudgetCATEGORY FY13 FY14 FY14 Amt. Chg. % Chg. FY15
Personnel 617,587$ 607,178 576,159 10,903 1.89% 587,062 Communication 1,370 5,500 5,500 850 15.45% 6,350 Professional Fees 5,550 20,000 20,000 - 0.00% 20,000 Other Maintenance 19,218 65,000 55,000 10,000 18.18% 65,000 Supplies 24,185 31,000 31,000 1,000 3.23% 32,000 Allocations 29,322 35,940 36,469 4,345 11.91% 40,814 Roads & Mains 216,876 238,549 240,000 15,000 6.25% 255,000
TOTAL 914,660$ 1,012,367 971,128 53,598 5.52% 1,024,726
Capital Outlay -$ 40,000 36,679 95,443 260.21% 195,000
FY13 FY14 FY15Actual Estimate Budget
Exempt Salaries 1.0 178,401$ 1.0 176,222 1.0 179,680
Non-Exempt Wages 6.3 235,917 6.0 222,811 6.0 229,254
Other Compensation 1,639 1,600 2,500
Fringe Benefits 200,501 173,526 173,428
Other Personnel 1,129 2,000 2,200
DEPARTMENT TOTAL 7.3 617,587$ 7.0 576,159 7.0 587,062
Stormwater Management
178
STORMWATER MANAGEMENT FUND
Categories Personnel - $587,062 This category contains funds to cover personnel costs for the stormwater
program including an engineer, crew supervisors, maintenance technicians, and senior maintenance worker.
Communications - $6,350 This category funds the air time on public radio to inform the public about the importance of stormwater management. In addition, this category funds professional licenses, dues to professional organizations and subscriptions to periodicals relevant to stormwater collection. Professional Fees - $20,000 This category funds professional engineering services that may be needed, which includes design work prior to replacement or construction of a stormwater project. Other Maintenance - $65,000 This category funds the permits needed in stormwater operations and the annual TDEC maintenance fee needed to hold discharge water. In addition, this category funds the quarterly testing and monitoring of outlets flowing into rivers. Necessary supplies are included in this category that is needed to maintain the City’s drainage system.
Supplies - $32,000 This category funds office supplies, uniforms and clothing and small tools that are unique to providing stormwater services. Also, included in this category are non-capital assets ranging in value from $500 to $4,999. Allocation – $40,814 This category includes the Stormwater’s portion of shared costs of all funds, including insurance and vehicle maintenance.
Roads and Mains - $255,000 This category funds the contract sweeping and asphalt resurfacing of the City’s roadway systems. In addition, this category funds the purchase of necessary supplies and equipment needed to maintain and overlay Germantown’s roadway system. Capital Outlay - $195,000 This category funds two IRP projects, a leaf vac and bobcat skid loader, and miscellaneous drainage improvements.
Stormwater Management

179
COMMUNITY SERVICES FY15 BUDGET
The following section presents the operating budget for Community Services. Total operating expenditures for the major General Fund categories within this classification are summarized below:
00.5
11.5
22.5
33.5
FY11 FY12 FY13 FY14 FY15
Parks & Rec. Cultural Arts Library The Farm
COMMUNITY SERVICES EXPENDITURES
$ MILLIONS

180

GENERAL FUND
181
Mission The Parks and Recreation Department provides recreational services, cultural arts, and coordination of
special events. In addition, staff provides management and oversight of the Pickering Center and Farm Park.
Recreational Services Recreational Services focuses on strengthening the community and creating quality recreation and leisure experiences. City recreational programs fulfill the recreational needs of the City’s youth, adult, senior and special needs populations. Staff manages the Recreation Fund, a special revenue fund for athletic activities.
Budget Category Summary
Budget Payroll Summary
Actual Budget Estimated BudgetCATEGORY FY13 FY14 FY14 Amt. Chg. % Chg. FY15
Personnel 760,405$ 762,367 738,833 38,358 5.19% 777,191 Communication 8,558 13,927 13,927 (102) -0.73% 13,825 Professional Fees 41,039 45,900 44,900 (500) -1.11% 44,400 Insurance 10,219 5,000 3,000 2,000 66.67% 5,000 Supplies 43,621 25,600 22,600 2,500 11.06% 25,100 Rent 9,185 10,196 10,196 1,500 14.71% 11,696 Allocations 33,710 35,442 35,672 1,992 5.58% 37,664 Capital Outlay 67,845 24,000 24,000 54,000 225.00% 78,000 Utilities 259,305 375,400 277,341 21,059 7.59% 298,400 Grants 67,637 80,350 80,350 4,800 5.97% 85,150
TOTAL 1,301,524$ 1,378,182 1,250,819 125,607 10.04% 1,376,426
FY13 FY14 FY15Actual Estimate Budget
Exempt Salaries 5.5 399,811$ 5.5 400,371 5.5 424,160
Non-Exempt Wages 5.5 151,151 5.5 170,497 5.5 190,655
Other Compensation 12 - -
Fringe Benefits 207,634 166,076 159,568
Other Personnel 1,797 1,889 2,808
DEPARTMENT TOTAL 11.0 760,405$ 11.0 738,833 11.0 777,191
Parks and Recreation

GENERAL FUND
182
Categories Personnel - $771,191 This category contains the salaries, wages and benefits for the director of
parks and recreation, superintendent of recreation, special events and marketing coordinator, recreation specialist, part-time senior adult program coordinator, part-time park rangers, playground leaders, part-time administrative assistant and partial cost for the community services division director. The personnel category also includes overtime wages for athletic tournaments, Germantown Festival, Germantown Charity Horse Show, Holiday Parade, July Family Fourth, Mayor’s Cup 5K Race and employee education for Parks and Recreation employees.
Communications - $13,825 This category includes funding for dues, subscriptions and meetings to assist the department in maintaining high proficiency and remaining up-to-date on current trends. Staff receives publications and attends meetings on various subjects related to parks and recreation.
Professional Fees - $44,400 This line category provides funding each year for a stipend to Becky Cloyes at Oaklawn Gardens, the Germantown Family Fourth Celebration and implementation of a marketing plan. Funding for the Parks and Recreation Department’s re-accreditation annual fee is also included. Insurance - $5,000 This category includes the department’s share of deductibles associated with workers’ compensation claims and personal and private property claims. Also included in this category is the City’s deductible on all the City’s uninsured vehicle claims.
Supplies - $25,100 This category provides the department with office, recreational supplies, as well as special clothing, small tools and miscellaneous supplies. Major expenses include baseball/softball supplies, playground supplies and small tools, park ranger first aid kits, trashcans and petroleum products. Also included in this category are non-capital assets ranging in value from $500 to $4,999. Rent - $11,696 This category includes rental fees for land and equipment. It also includes lease and taxes for Depot Park and Oaklawn Gardens.
Allocation - $37,664 This includes the Parks and Recreation Department’s portion of the shared costs of all internal funds, including insurance and vehicle maintenance. Capital Outlay - $78,000 This category provides funding for a scoreboards and dog park renovation. Utilities - $298,400 This category includes the department’s utility costs (electricity, gas, water, sewer and local and long distance telephone). Grants - $85,150 This category includes funding for City Beautification Commission, Historic Commission, Germantown Community Theatre, and Public Art Program.
Performance Measures
Triple Bottom Line Focus Area: Social FY13 FY14 FY15 Key Product/Serv ice: After school program Goal Actual Goal Actual Goal
Measure: Customer Satisfaction n/a n/a n/a n/a 90%
Triple Bottom Line Focus Area: Social FY13 FY14 FY15 Key Product/Serv ice: Facility rentals Goal Actual Goal Actual Goal
Measure: Customer Satisfaction n/a n/a n/a n/a 90%
Parks and Recreation

GENERAL FUND
183
Triple Bottom Line Focus Area: Social FY13 FY14 FY15 Key Product/Serv ice: Recreation, leisure and sports programs Goal Actual Goal Actual Goal
Measure: Overall satisfaction 90% 98% 90% 96% 97%
Triple Bottom Line Focus Area: Social FY13 FY14 FY15 Key Product/Serv ice: Park safety and security Goal Actual Goal Actual Goal
Measure: non-v iolent crime incidents in parks 10 12 10 16 12
Parks and Recreation

184
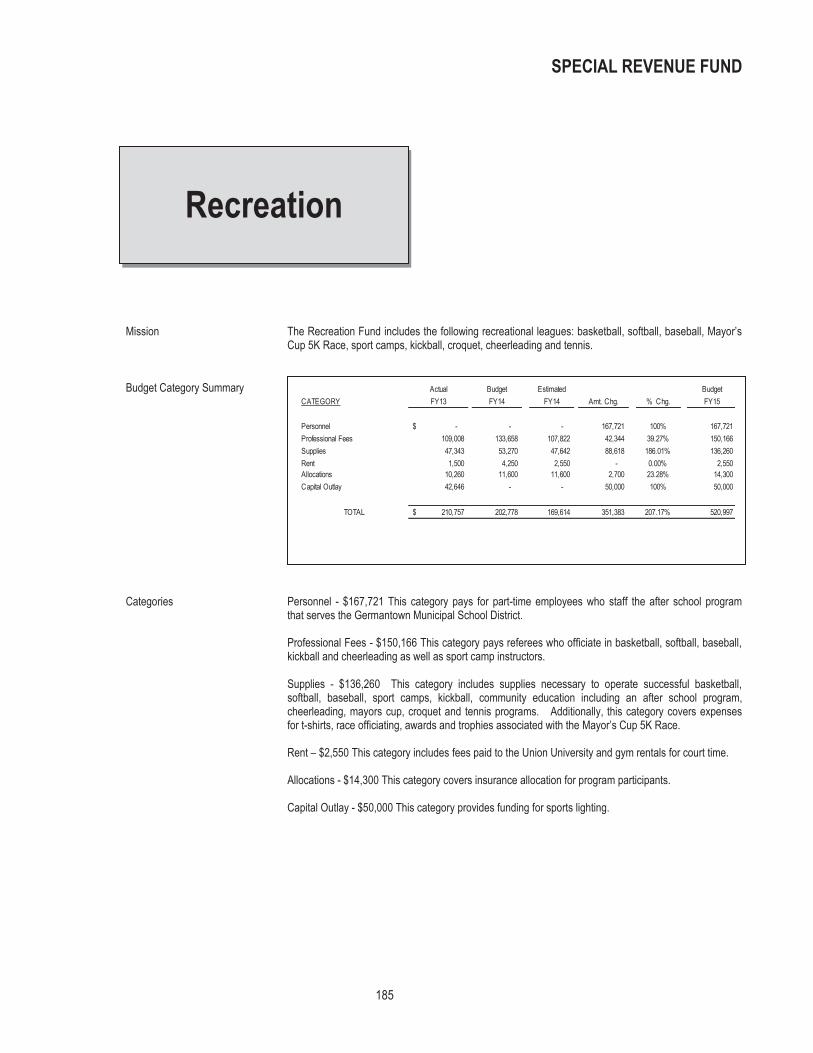
SPECIAL REVENUE FUND
185
Mission The Recreation Fund includes the following recreational leagues: basketball, softball, baseball, Mayor’s Cup 5K Race, sport camps, kickball, croquet, cheerleading and tennis.
Budget Category Summary
Categories Personnel - $167,721 This category pays for part-time employees who staff the after school program that serves the Germantown Municipal School District.
Professional Fees - $150,166 This category pays referees who officiate in basketball, softball, baseball, kickball and cheerleading as well as sport camp instructors.
Supplies - $136,260 This category includes supplies necessary to operate successful basketball, softball, baseball, sport camps, kickball, community education including an after school program, cheerleading, mayors cup, croquet and tennis programs. Additionally, this category covers expenses for t-shirts, race officiating, awards and trophies associated with the Mayor’s Cup 5K Race.
Rent – $2,550 This category includes fees paid to the Union University and gym rentals for court time.
Allocations - $14,300 This category covers insurance allocation for program participants. Capital Outlay - $50,000 This category provides funding for sports lighting.
Actual Budget Estimated BudgetCATEGORY FY13 FY14 FY14 Amt. Chg. % Chg. FY15
Personnel -$ - - 167,721 100% 167,721 Professional Fees 109,008 133,658 107,822 42,344 39.27% 150,166 Supplies 47,343 53,270 47,642 88,618 186.01% 136,260 Rent 1,500 4,250 2,550 - 0.00% 2,550 Allocations 10,260 11,600 11,600 2,700 23.28% 14,300 Capital Outlay 42,646 - - 50,000 100% 50,000
TOTAL 210,757$ 202,778 169,614 351,383 207.17% 520,997
Recreation

186

GENERAL FUND
187
Mission To sponsor numerous special events and projects throughout the year.
Budget Category Summary
Categories Professional Fees - $13,900 This category includes fees for instructors, entertainers, decorations, supplies,
equipment, trophies and fliers for a variety of programs planned throughout the year.
Supplies - $41,606 Included in this category are equipment, playground program and camp supplies, shirts, craft and art supplies and equipment. This category also includes funding for playground and camp trips and lunches for program participants. Rent- $3,320 This category includes the funds for rental space at the Germantown Athletic Club for programs and events. Grants- $25,620 This category includes the following: Senior Expo $13,720 Movers Program 8,050 Senior Advisory Commission 3,850
Actual Budget Estimated BudgetCATEGORY FY13 FY14 FY14 Amt. Chg. % Chg. FY15
Professional Fees 12,765 13,900 14,900 (1,000) -6.71% 13,900 Supplies 30,482 41,606 39,349 2,257 5.74% 41,606 Rent 914 3,320 3,320 - 0.00% 3,320 Grants 11,807 19,000 19,000 6,620 34.84% 25,620
TOTAL 55,968$ 77,826 76,569 7,877 10.29% 84,446
Cultural Arts

188

SPECIAL REVENUE FUND
189
The Pickering Complex includes the Pickering Community Center. The Pickering Community Center is utilized for cultural arts classes, senior programs and is also available for rental by individuals or organizations.
Budget Category Summary
Categories Professional Fees - $25,000 This category pays instructors for teaching classes at the Pickering Community Center. The instructor receives 70% of fees collected. This includes the senior programs that are held at the Pickering Community Center and funds for senior trips.
Supplies - $500 This category includes supplies used for the operation of the Pickering Community Center such as coffee, trash bags, keys, napkins and piano tuning. Also included are funds to purchase new coffee pots, chairs, cords and other supplies plus repairs.
Allocation - $2,600 This category includes shared costs of the City’s insurance expenses for the Pickering Community Center building. Utilities - $10,395 This category includes utility costs (electricity, gas, water, sewer and local and long distance telephone).
Actual Budget Estimated BudgetCATEGORY FY13 FY14 FY14 Amt. Chg. % Chg. FY15
Professional Fees 18,494$ 21,000 25,000 - 0.00% 25,000 Supplies 192 4,500 500 - 0.00% 500 Allocations 2,476 2,600 2,600 - 0.00% 2,600 Capital Outlay 17,115 - - - - - Utilities 8,139 10,275 10,275 120 1.17% 10,395
TOTAL 46,416$ 38,375 38,375 120 0.31% 38,495
Pickering Complex

190

GENERAL FUND
191
Library Services is responsible for the operations of the Germantown Community Library and the Germantown Community Library Regional History and Genealogy Center. The management and operations of the library are provided through a contract with Library Systems & Services, LLC. The Germantown Community Library provides reading material, educational activities, meeting space and a technology center.
Germantown Community Library Mission Germantown Community Library seeks to promote lifelong learning and a love of reading; to inform, enrich
and empower every patron served; to provide easy access to a wide variety of materials, services and programs; and to meet the personal, educational, cultural, and professional needs of the community.
Budget Category Summary
Categories Personnel - $3,000 This category funds the professional development and training of staff.
Communications - $9,900 This category funds marketing and notice publications, dues and subscriptions to TN Library Association, conferences and local travel within the Wolf River Consortium.
Professional Fees - $1,227,024 This category funds the contract services expenses of daily operations and management of the Germantown Community Library as well as credit card fees. Other Maintenance - $25,000 This category funds maintenance of OCLC and automation.
Supplies - $27,650 This category funds general supplies used in the operations of the Library. Rent - $14,500 This category funds costs associated with a copier machine.
Allocation - $23,200 This category includes the Germantown Community Library’s portion of insurance expenses. Utilities - $107,800 This category includes the department’s utility costs (electricity and gas, water, sewer, local and long distance telephone).
Library Services
Actual Budget Estimated BudgetCATEGORY FY13 FY14 FY14 Amt. Chg. % Chg. FY15
Personnel 920$ 2,000 2,000 1,000 50.00% 3,000 Communication 5,016 9,700 9,700 200 2.06% 9,900 Professional Fees 1,198,922 1,204,864 1,206,164 20,860 1.73% 1,227,024 Other Maintenance 18,564 23,000 23,000 2,000 8.70% 25,000 Supplies 30,199 27,250 35,025 (7,375) -21.06% 27,650 Rent 11,065 15,000 14,500 - 0.00% 14,500 Allocations 22,464 23,100 23,100 100 0.43% 23,200 Utilities 95,131 106,300 106,300 1,500 1.41% 107,800
TOTAL 1,382,281$ 1,411,214 1,419,789 18,285 1.29% 1,438,074

GENERAL FUND
192
Performance Measures
Triple Bottom Line Focus Area: Social FY13 FY14 FY15Key Product/Service: Library Services Goal Actual Goal Actual Goal
Measure: Usage of services 174,000 174,526 175,826 179,895 182,143
Library Services

GENERAL FUND
193
Germantown Regional History and Genealogy Center
Mission The Germantown Community Library Regional History and Genealogy Center’s mission is to preserve and
share across generations the wisdom, culture and history of the South.
Budget Category Summary
Categories Personnel - $200 This category funds professional development and training of staff.
Professional Fees - $42,448 This category funds the contract services expenses of daily operations and management of the Tennessee Genealogical Library as well as credit card fees.
Supplies - $9,000 This category includes the Tennessee Genealogical Library’s portion of insurance expenses. Rent - $774 This category funds the costs associated with a copier machine. Allocation - $1,500 This category includes the Tennessee Genealogical Library’s portion of insurance expenses. Utilities - $16,057 This category includes the department’s utility costs (electricity and gas, water, sewer, local and long distance telephone).
Actual Budget Estimated BudgetCATEGORY FY13 FY14 FY14 Amt. Chg. % Chg. FY15
Personnel 130$ 200 200 - 0.00% 200 Professional Fees 38,755 41,357 40,107 2,341 5.84% 42,448 Supplies 10,139 8,500 10,085 (1,085) -10.76% 9,000 Rent 376 500 500 274 54.80% 774 Allocations 1,415 1,500 1,500 - 0.00% 1,500 Utilities 15,213 15,632 15,632 425 2.72% 16,057
TOTAL 66,028$ 67,689 68,024 1,955 2.87% 69,979
Library Services

194
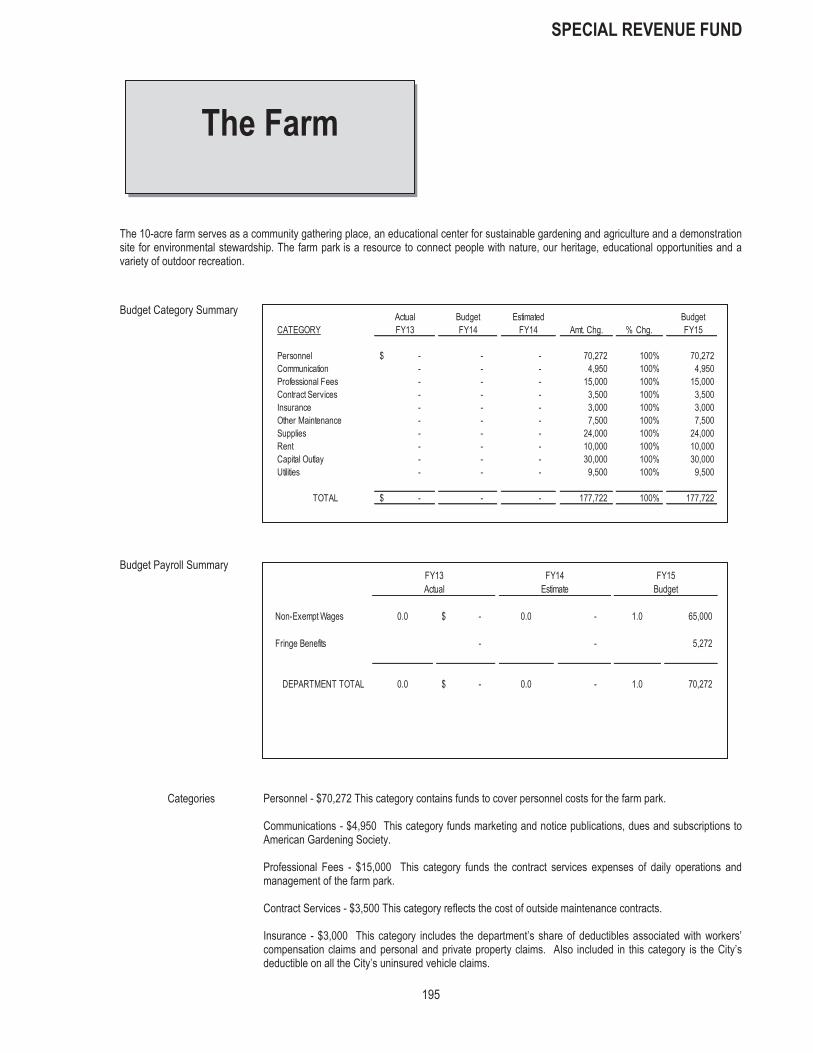
SPECIAL REVENUE FUND
195
The 10-acre farm serves as a community gathering place, an educational center for sustainable gardening and agriculture and a demonstration site for environmental stewardship. The farm park is a resource to connect people with nature, our heritage, educational opportunities and a variety of outdoor recreation.
Budget Category Summary
Budget Payroll Summary
Categories Personnel - $70,272 This category contains funds to cover personnel costs for the farm park.
Communications - $4,950 This category funds marketing and notice publications, dues and subscriptions to American Gardening Society.
Professional Fees - $15,000 This category funds the contract services expenses of daily operations and management of the farm park. Contract Services - $3,500 This category reflects the cost of outside maintenance contracts. Insurance - $3,000 This category includes the department’s share of deductibles associated with workers’ compensation claims and personal and private property claims. Also included in this category is the City’s deductible on all the City’s uninsured vehicle claims.
Actual Budget Estimated BudgetCATEGORY FY13 FY14 FY14 Amt. Chg. % Chg. FY15
Personnel -$ - - 70,272 100% 70,272 Communication - - - 4,950 100% 4,950 Professional Fees - - - 15,000 100% 15,000 Contract Services - - - 3,500 100% 3,500 Insurance - - - 3,000 100% 3,000 Other Maintenance - - - 7,500 100% 7,500 Supplies - - - 24,000 100% 24,000 Rent - - - 10,000 100% 10,000 Capital Outlay - - - 30,000 100% 30,000 Utilities - - - 9,500 100% 9,500
TOTAL -$ - - 177,722 100% 177,722
The Farm
FY13 FY14 FY15Actual Estimate Budget
Non-Exempt Wages 0.0 -$ 0.0 - 1.0 65,000
Fringe Benefits - - 5,272
DEPARTMENT TOTAL 0.0 -$ 0.0 - 1.0 70,272

SPECIAL REVENUE FUND
196
Other Maintenance - $7,500 This category includes materials and supplies necessary to make drainage, structural repairs and general improvements.
Supplies - $24,000 This category funds general supplies used in the operations of the farm. Rent - $10,000 This category funds costs associated with rental equipment used for seasonal work.
Capital Outlay - $30,000 This category funds the purchase of a RTV and furnishings for the farm. Utilities - $9,500 This category includes the department’s utility costs (electricity and gas, water, and sewer).
Performance Measures
Triple Bottom Line Focus Area: Economic FY13 FY14 FY15 Key Product/Serv ice: Programming Goal Actual Goal Actual Goal
Measure: Actual revenues meet or exceed budget N/A N/A N/A N/A 90%
Triple Bottom Line Focus Area: Social FY13 FY14 FY15 Key Product/Serv ice: Programming Goal Actual Goal Actual Goal
Measure: Program capacity N/A N/A N/A N/A 85%
The Farm

SPECIAL REVENUE FUND
197
With the passage of Ordinance 2013-7, the Germantown Municipal School District was established.
Budget Category Summary
Categories Personnel - $37,198,028 This category contains funds to cover personnel costs for the school system.
Communications - $148,660 This category funds marketing and notice publications, dues and subscriptions and election expenses.
Professional Fees - $2,618,159 This category funds the contract service expenses of daily operations and management for the school system. Contract Maintenance - $628,852 This category includes contractual maintenance expenses. Other Maintenance - $683,832 This category includes expenses associated with equipment maintenance.
Supplies - $2,735,414 This category funds general supplies used in the operations of municipal school startup. Rent - $144,000 This category funds costs associated with rental office space.
Allocation - $246,296 This category includes the Municipal Schools’ portion of insurance expenses.
Capital Outlay - $1,917,407 This category includes the purchase of capital and maintenance equipment and construction. Utilities - $1,020,510 This category includes utility costs (electricity and gas, water, and sewer).
Actual Budget Estimated BudgetCATEGORY FY13 FY14 FY14 Amt. Chg. % Chg. FY15
Personnel 553,894$ 1,306,453$ 665,301$ 36,532,727 5491.16% 37,198,028$ Communication 7,058 87,815 54,497 94,163 172.79% 148,660 Professional Fees 21,831 97,122 186,413 2,431,746 1304.49% 2,618,159 Contract Services - - - - 100% 628,852 Insurance 1,100 10,000 24,967 (24,967) -100.00% - Other Maintenance - 9,600 99,805 584,027 585.17% 683,832 Supplies 48 160,860 401,039 2,334,375 582.08% 2,735,414 Rent - 3,576 408 143,592 35194.12% 144,000 Allocations - 12,000 35,700 210,596 589.90% 246,296 Capital Outlay - 640,000 905,804 1,011,603 111.68% 1,917,407 Utilities 369,355 129,200 94,505 926,005 979.85% 1,020,510 Grants 293,741 125,000 125,000 (125,000) -100.00% -
TOTAL 1,247,027$ 2,581,626 2,593,439 44,118,867 1701.17% 47,341,158
Germantown Municipal School
District

198

GERMANTOWN ATHLETIC CLUB FY15 BUDGET
199
The Germantown Athletic Club is an enterprise fund in order to focus on net income and the ability of user fees to support operating expenses, which includes depreciation. The Germantown Athletic Club Fund consists of three cost centers – Recreation, Personal Training, and Aquatics. Debt service for the initial building was accounted for in the General Fund since it was originally contemplated that general revenues for the City would provide the funding. Capital debts for expansion expenditures are being accounted for in the Germantown Athletic Club Fund. The Germantown Athletic Club operates 106 hours each week and offers memberships and daily passes. The revenue system is designed to cover the operating expenses of the Athletic Club and the debt service for the Athletic Club’s expansion. Other non-operating expenses will be deducted from the operating income to determine net income. The Germantown Athletic Club includes a wide variety of functions and programming centered around the indoor 40 meter pool, outdoor zero depth pool, outdoor 25 meter recreation pool, fitness area, racquetball courts, 3 full court gymnasium, jogging track, meeting rooms, dance room, nursery and leisure areas. The Germantown Athletic Club offers a wide variety of classes and programs and adds new programs based on member needs.
GERMANTOWN ATHLETIC CLUB EXPENDITURES
$ MILLIONS

200

ENTERPRISE FUND
201
Mission To provide leisure and arts facilities and resources to Germantown Athletic Club members plus Germantown
citizens and others in the surrounding area while generating a balanced budget as an enterprise fund.
Budget Category Summary
Budget Payroll Summary Categories Personnel - $1,003,904 This category includes part of the salaries and benefits for the athletic club director,
assistant club director, business manager, child care programming coordinator, membership sales & services coordinator, administrative assistant, customer service representatives, custodial service supervisor, lead cleaning services worker, part-time concessions worker, part-time customer service representatives, part-time child care attendants, managers on duty and recreation leaders.
Actual Budget Estimated BudgetCATEGORY FY13 FY14 FY14 Amt. Chg. % Chg. FY15
Personnel 933,972$ 1,094,389 857,577 146,327 17.06% 1,003,904 Communication 9,287 10,000 4,000 1,000 25.00% 5,000 Professional Fees 282,945 365,168 298,100 42,100 14.12% 340,200 Other Maintenance 108,161 132,000 102,000 28,000 27.45% 130,000 Supplies 147,043 140,750 150,200 16,050 10.69% 166,250 Rent 181,014 183,000 181,500 (56,500) -31.13% 125,000 Allocations 91,141 62,342 62,342 (195) -0.31% 62,147 Depreciation 370,761 444,157 332,100 36,547 11.00% 368,647 Utilities 232,290 248,075 242,485 8,215 3.39% 250,700 Grants 701 - - - - -
TOTAL 2,357,315$ 2,679,881$ 2,230,304 221,544 9.93% 2,451,848
Capital Outlay 113,984$ 260,733 271,022 1,167,507 430.78% 1,438,529
FY13 FY14 FY15Actual Estimate Budget
Exempt Salaries 6.0 323,764$ 4.0 253,124 5.0 271,143
Non-Exempt Wages 16.9 381,213 16.9 402,190 16.9 509,286
Other Compensation 1,299 2,400 2,000
Fringe Benefits 225,896 200,763 215,475
Other Personnel 1,800 (900) 6,000
DEPARTMENT TOTAL 22.9 933,972$ 20.9 857,577 21.9 1,003,904
Germantown Athletic Club Recreation

ENTERPRISE FUND
202
Communication - $5,000 This category includes items that enhance the Germantown Athletic Club’s staff and programs through recreation and fitness publications, training meetings for staff and contact with specialized sources.
Professional Fees - $340,200 This category includes fees for professional services required for the cost center, including payment for class instructors. Group Exercise Instructors will receive $25-$30 per class and personal trainers will receive 70%-75% of the gross collected. In addition, this category includes a marketing effort to enhance membership of the Germantown Athletic Club and credit card fees. Other Maintenance - $130,000 This category funds expenses for part of the maintenance of fire extinguishers and control systems, elevator, sprinkler, pest control inspections and equipment maintenance as well as all items for general building maintenance. This category also includes contract and equipment and building maintenance items such as belts, replacement parts, etc.
Supplies - $166,250 This category includes office supplies for the Germantown Athletic Club, medical supplies, uniforms, small tools and cleaning supplies. Also included are recreational supplies needed to equip the Germantown Athletic Club such as basketballs, volleyballs, badminton equipment, table tennis equipment and air pumps. This category also includes camera equipment and supplies for producing membership cards and the purchase of small tools for building maintenance.
Rent - $125,000 This category provides rental of specialty and fitness equipment needed by the Germantown Athletic Club. Allocations- $62,147 This category includes the Germantown Athletic Club Recreation’s portion of insurance expenses. Depreciation - $368,647 This category includes the annual depreciated valuation of the Germantown Athletic Club facilities and equipment.
Utilities - $250,700 This line includes the Recreation’s share of utility expenses (electricity, gas, water, sewer and local and long distance telephone).
Performance Measures
Triple Bottom Line Focus Area: Social FY13 FY14 FY15 Key Product/Serv ice: Membership Goal Actual Goal Actual Goal
Measure: New member satisfaction n/a n/a 70% 73% 85%
Triple Bottom Line Focus Area: Social FY13 FY14 FY15 Key Product/Serv ice: Membership Goal Actual Goal Actual Goal
Measure: Member satisfaction of club cleanliness 75% 79% 75% 79% 84%
Triple Bottom Line Focus Area: Social FY13 FY14 FY15 Key Product/Serv ice: Membership Goal Actual Goal Actual Goal
Measure: Daily Walkthroughs Likard Scale n/a n/a n/a n/a 3.0
Triple Bottom Line Focus Area: Social FY13 FY14 FY15 Key Product/Serv ice: Membership Goal Actual Goal Actual GoalMeasure: E-mail Click Rate 10% 12% 12% 16% 21%
Athletic Club Recreation
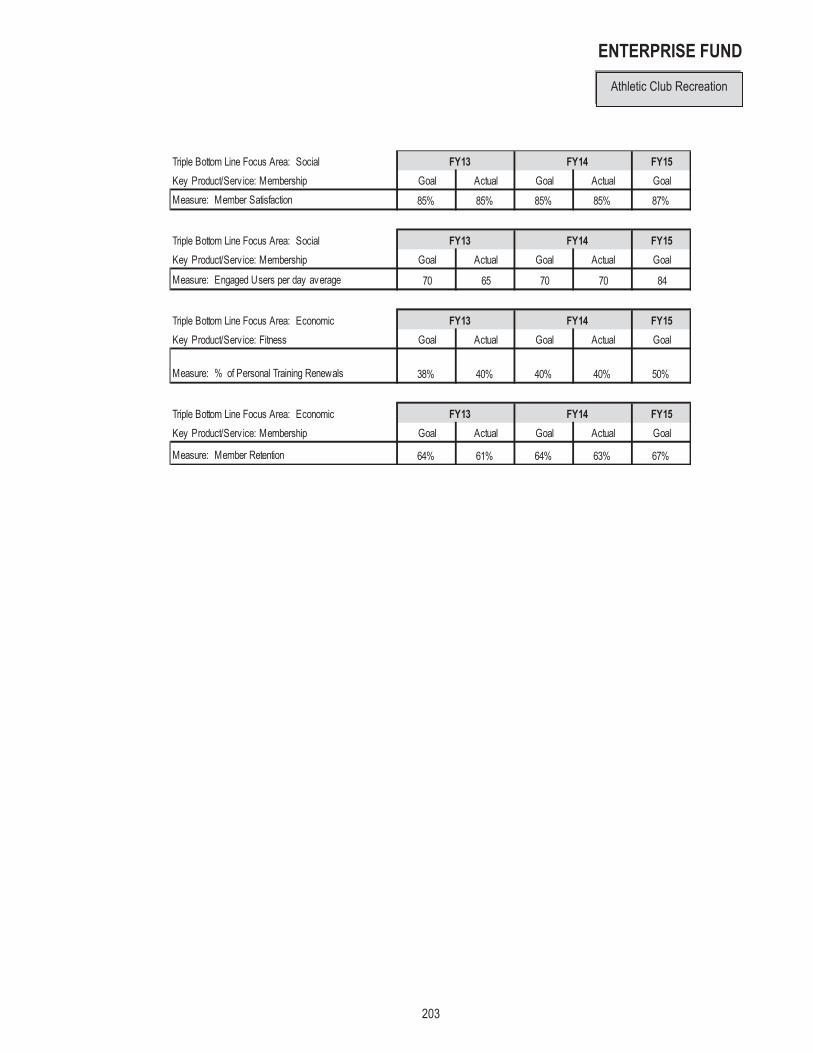
ENTERPRISE FUND
203
Triple Bottom Line Focus Area: Social FY13 FY14 FY15 Key Product/Serv ice: Membership Goal Actual Goal Actual GoalMeasure: Member Satisfaction 85% 85% 85% 85% 87%
Triple Bottom Line Focus Area: Social FY13 FY14 FY15 Key Product/Serv ice: Membership Goal Actual Goal Actual Goal
Measure: Engaged Users per day average 70 65 70 70 84
Triple Bottom Line Focus Area: Economic FY13 FY14 FY15 Key Product/Serv ice: Fitness Goal Actual Goal Actual Goal
Measure: % of Personal Training Renewals 38% 40% 40% 40% 50%
Triple Bottom Line Focus Area: Economic FY13 FY14 FY15 Key Product/Serv ice: Membership Goal Actual Goal Actual Goal
Measure: Member Retention 64% 61% 64% 63% 67%
Athletic Club Recreation

204

ENTERPRISE FUND
205
Mission To provide a safe and clean environment for quality aquatic leisure, instructional and fitness opportunities for
Germantown Athletic Club members and area citizens.
Budget Category Summary
Budget Payroll Summary Categories Personnel - $451,322 Represented in this category are the salaries and benefits for an aquatics coordinator,
head swim coach, seasonal aquatic supervisor, lifeguards, assistant swim coaches, water exercise instructors, and water safety instructors. The personnel category also includes employee education to train employees in specialized areas.
Actual Budget Estimated BudgetCATEGORY FY13 FY14 FY14 Amt. Chg. % Chg. FY15
Personnel 449,114$ 461,338 432,940 18,382 4.25% 451,322 Supplies 54,850 61,000 54,000 4,000 7.41% 58,000 Allocations 20,788 27,224 27,224 50 0.18% 27,274 Depreciation 190,249 200,000 192,800 - 0.00% 192,800 Utilities 108,127 115,200 114,145 5,958 5.22% 120,103
TOTAL 823,128$ 864,762 821,109 28,390 3.46% 849,499
FY13 FY14 FY15Actual Estimate Budget
Exempt Salaries 2.0 89,000$ 2.0 89,294 2.0 92,938
Non-Exempt Wages 13.5 281,433 13.5 275,405 13.5 290,000
Other Compensation - 682 - 1,000 - 1,000
Fringe Benefits - 77,999 - 67,241 - 64,884
DEPARTMENT TOTAL 15.5 449,114$ 15.5 432,940 15.5 451,322
Germantown Athletic Club
Aquatics

ENTERPRISE FUND
206
Supplies - $58,000 This line includes funds for chemicals for the swimming pool and cleaning supplies for the aquatic area. Equipment used in the aquatic area will include kickboards, hand paddles, teaching aids, recreation equipment and expenses for catered swim events and birthday parties. This category also includes uniforms for lifeguards and instructors and non-capital assets ranging in value from $500 to $4,999. Allocations- $27,274 This line includes the Athletic Club’s portion of insurance costs for the aquatic facilities. Depreciation - $192,800 Included in this category is the annual charge representing depreciated valuation of aquatic facilities and equipment.
Utilities - $120,103 This line includes the Aquatic’s share of utility expenses (electricity, gas, water, sewer and local and long distance telephone).
Performance Measures
Triple Bottom Line Focus Area: Economic FY13 FY14 FY15 Measurement Type: Productiv ity Goal Actual Goal Actual Goal
Measure: amount of increase in aquatics revenue (2% ) $163,904 $175,216 $163,904 $168,133 $163,000
Athletic Club Aquatics
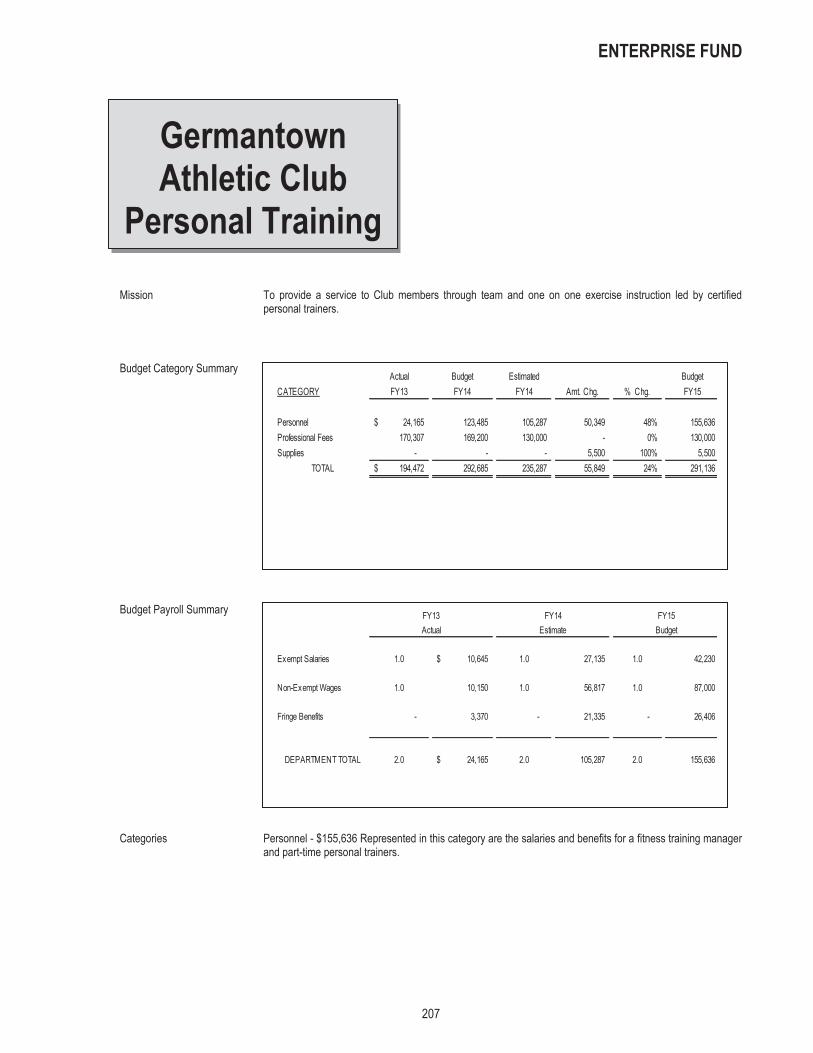
ENTERPRISE FUND
207
Mission To provide a service to Club members through team and one on one exercise instruction led by certified
personal trainers.
Budget Category Summary
Budget Payroll Summary Categories Personnel - $155,636 Represented in this category are the salaries and benefits for a fitness training manager
and part-time personal trainers.
Actual Budget Estimated BudgetCATEGORY FY13 FY14 FY14 Amt. Chg. % Chg. FY15
Personnel 24,165$ 123,485 105,287 50,349 48% 155,636 Professional Fees 170,307 169,200 130,000 - 0% 130,000 Supplies - - - 5,500 100% 5,500
TOTAL 194,472$ 292,685 235,287 55,849 24% 291,136
FY13 FY14 FY15Actual Estimate Budget
Exempt Salaries 1.0 10,645$ 1.0 27,135 1.0 42,230
Non-Exempt Wages 1.0 10,150 1.0 56,817 1.0 87,000
Fringe Benefits - 3,370 - 21,335 - 26,406
DEPARTMENT TOTAL 2.0 24,165$ 2.0 105,287 2.0 155,636
Germantown Athletic Club
Personal Training

ENTERPRISE FUND
208
Professional Fees - $130,000 This category includes fees for contracting personal trainers. Supplies - $5,500 This line includes funds for uniforms and clothing for personal trainers. In addition, other supplies are included here which includes miscellaneous fitness equipment attachments and accessories used in training, such as kettlebelts, ropes, bands medicine balls, etc.
Athletic Club Personal Training

ENTERPRISE FUND
209
The Germantown Athletic Club Debt Service cost center accounts for the interest portion on the $2.5 million General Fund Intergovernmental loan for the Germantown Athletic Club’s expansion project. Budget Category Summary
Categories Debt Service - $22,896 This category includes the interest portion of the $2.5 million General Fund
Intergovernmental loan for the Germantown Athletic Club’s expansion project.
Germantown Athletic Club Debt
Service
Actual Budget Estimated BudgetCATEGORY FY13 FY14 FY14 Amt. Chg. % Chg. FY15
Debt Service 30,557$ 26,698 26,698 (3,802) -14.24% 22,896
TOTAL 30,557$ 26,698 26,698 (3,802) -14.24% 22,896

210
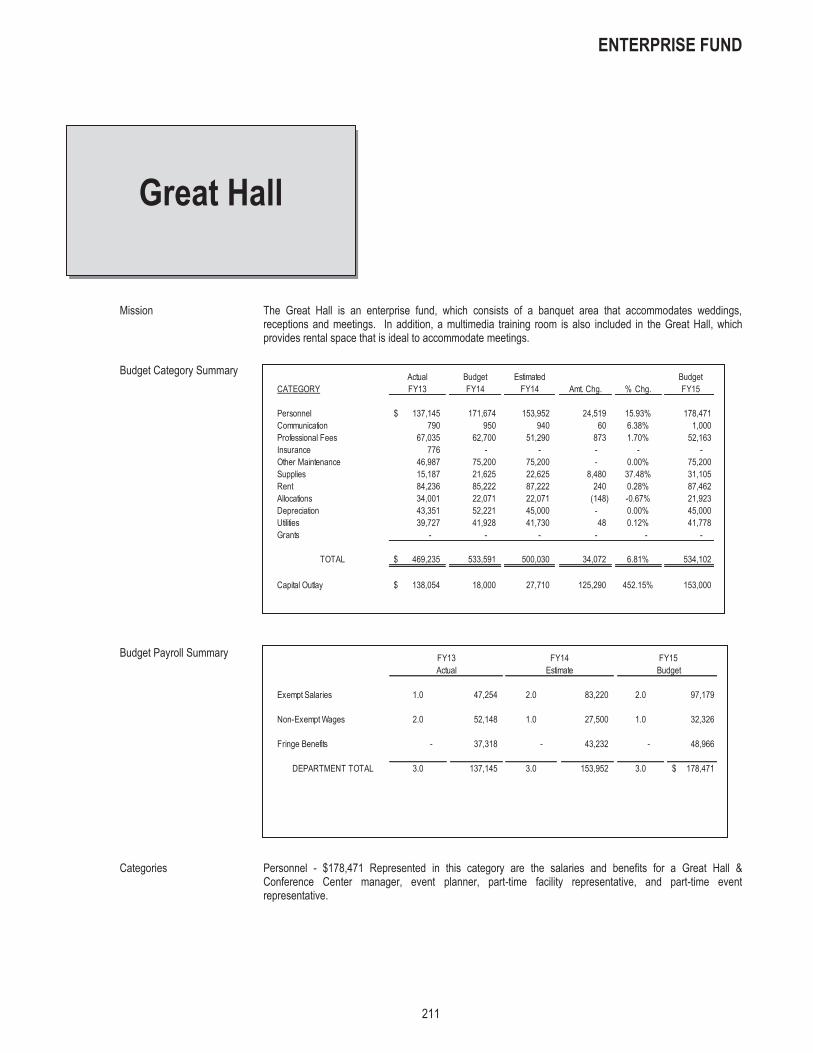
ENTERPRISE FUND
211
Mission The Great Hall is an enterprise fund, which consists of a banquet area that accommodates weddings, receptions and meetings. In addition, a multimedia training room is also included in the Great Hall, which provides rental space that is ideal to accommodate meetings.
Budget Category Summary
Budget Payroll Summary Categories Personnel - $178,471 Represented in this category are the salaries and benefits for a Great Hall &
Conference Center manager, event planner, part-time facility representative, and part-time event representative.
Actual Budget Estimated BudgetCATEGORY FY13 FY14 FY14 Amt. Chg. % Chg. FY15
Personnel 137,145$ 171,674 153,952 24,519 15.93% 178,471 Communication 790 950 940 60 6.38% 1,000 Professional Fees 67,035 62,700 51,290 873 1.70% 52,163 Insurance 776 - - - - - Other Maintenance 46,987 75,200 75,200 - 0.00% 75,200 Supplies 15,187 21,625 22,625 8,480 37.48% 31,105 Rent 84,236 85,222 87,222 240 0.28% 87,462 Allocations 34,001 22,071 22,071 (148) -0.67% 21,923 Depreciation 43,351 52,221 45,000 - 0.00% 45,000 Utilities 39,727 41,928 41,730 48 0.12% 41,778 Grants - - - - - -
TOTAL 469,235$ 533,591 500,030 34,072 6.81% 534,102
Capital Outlay 138,054$ 18,000 27,710 125,290 452.15% 153,000
FY13 FY14 FY15Actual Estimate Budget
Exempt Salaries 1.0 47,254 2.0 83,220 2.0 97,179
Non-Exempt Wages 2.0 52,148 1.0 27,500 1.0 32,326
Fringe Benefits - 37,318 - 43,232 - 48,966
DEPARTMENT TOTAL 3.0 137,145 3.0 153,952 3.0 178,471$
Great Hall

ENTERPRISE FUND
212
Communication - $1,000 This category includes job-related dues and subscriptions to assist the Great Hall & Conference Center in staying up-to-date with current trends in facility rentals.
Professional Fees - $52,163 This category includes marketing and advertising costs for the Great Hall & Conference Center. In addition, this category includes credit card fees.
Other Maintenance - $75,200 This category includes the maintenance cost associated with equipment used at the Great Hall. It also covers various materials and supplies needed in minor building repairs and janitorial service. In addition, this category includes funds for carpet cleaning and security monitoring. Supplies - $31,105 This line includes funds for the purchase of general office supplies, cleaning supplies, food supplies, and miscellaneous supplies. Rent- $87,462 This line includes the rental of a copy machine and the rental payments due to the Germantown Athletic Club for its portion of building depreciation. Allocations- $21,923 This line includes the Great Hall’s portion of insurance costs. Depreciation - $45,000 Included in this category is the annual charge representing depreciated valuation of the Great Hall & Conference Center. Utilities - $41,778 This line includes the Great Hall & Conference Center’s share of utility expenses (electricity, gas, water, sewer and local and long distance telephone). Capital Outlay - $153,000 This category includes the costs associated with the following IRP projects: patio remodel and fire pump control panels.
Performance Measures
Triple Bottom Line Focus Area: Social FY13 FY14 FY15Key Product/Serv ice: Meeting/Banquet Room Rental Goal Actual Goal Actual Goal
Measure: Overall Customer Satisfaction n/a n/a 98% 98% 99%
Triple Bottom Line Focus Area: Economic FY13 FY14 FY15Key Product/Serv ice: Meeting/Banquet Room Rental Goal Actual Goal Actual Goal
Measure: Total Revenue 224,200$ 308,225$ 305,678$ 354,197$ 398,000$
Great Hall
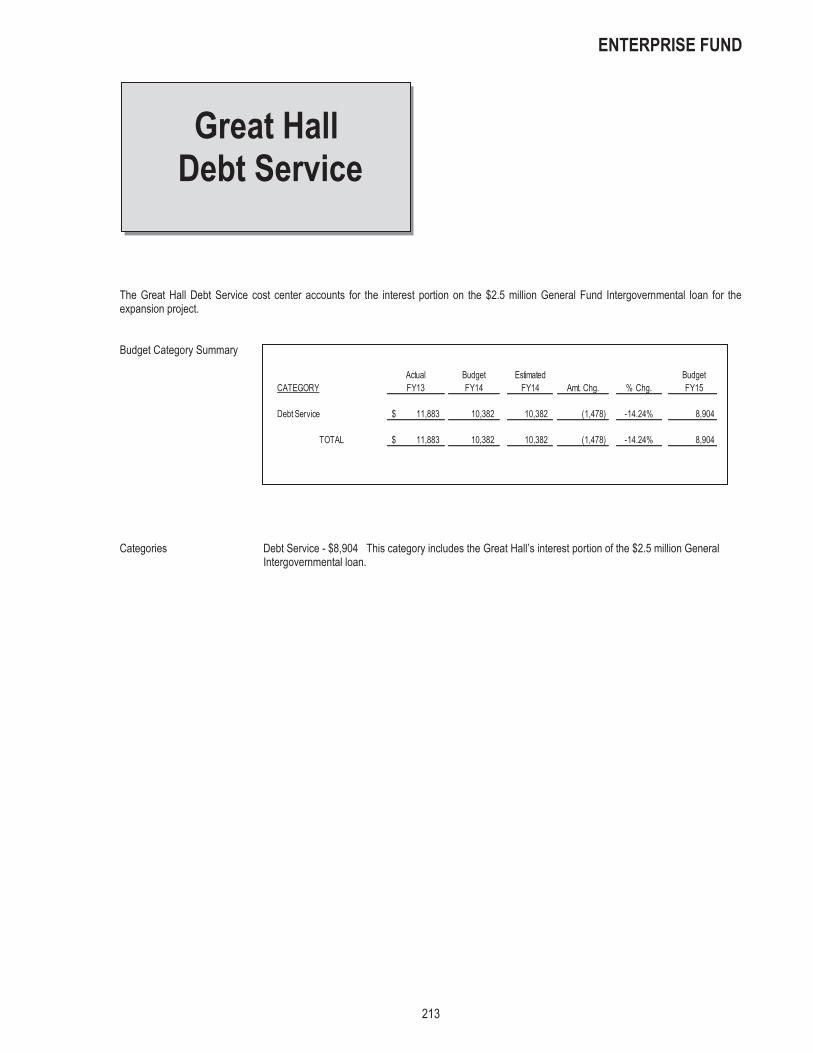
ENTERPRISE FUND
213
The Great Hall Debt Service cost center accounts for the interest portion on the $2.5 million General Fund Intergovernmental loan for the expansion project.
Budget Category Summary
Categories Debt Service - $8,904 This category includes the Great Hall’s interest portion of the $2.5 million General
Intergovernmental loan.
Actual Budget Estimated Budget
CATEGORY FY13 FY14 FY14 Amt. Chg. % Chg. FY15
Debt Service 11,883$ 10,382 10,382 (1,478) -14.24% 8,904
TOTAL 11,883$ 10,382 10,382 (1,478) -14.24% 8,904
Great Hall Debt Service

214

215
UTILITIES FY15 BUDGET
This section presents the operating budget for all Utility cost centers. Total operating expenses for Water Operations, Sewer Operations, Sewage Treatment and Utility Debt Service are summarized below.
UTILITY EXPENSES
$ MILLIONS

216

217
UTILITY DEBT SERVICE
The Utility Debt Service cost center accounts for the interest payments on the 2006 and 2008 Water Revenue Bonds. The City issued $5.0 million in Water Revenue Bonds Series 2008 in December 2008. This issue supported the plant expansion of the Johnson Road Water Plant, Johnson Road Reservoir, water wells, automated controls (SCADA), and sewer pipeline rehabilitation. The one bond issue in FY98, refunded in 2006, totaling $8.025 million was mainly to support the construction of a new water treatment plant. There is one future issuance projected in FY17 for $1.5 million. Outstanding principal of the Utility Fund at July 1, 2014 is $4,645,000. During the year, principal of $955,000 and interest of $165,438 will be paid. The principal balance at June 30, 2015, will be $3,690,000. Budget Category Summary
Categories Debt Service - $165,438 This category includes interest payments on the Series 2006 Water Revenue and
Tax Refunding Bonds and the Series 2008 Water and Sewer System Revenue and Tax Bonds. Agency Fees - $250 This category covers fees paid to paying agents for the various bond issues.
Actual Budget Estimated BudgetCATEGORY FY13 FY14 FY14 Amt. Chg. % Chg. FY15
Debt Service 310,419$ 200,450 200,450 (35,012) -17.47% 165,438 Agency Fees 250 250 250 - 0.00% 250
TOTAL 310,669$ 200,700 200,700 (35,012) -17.44% 165,688
Utility Debt
Balance Principal Balance Interest Security 7/1/2014 Payment 6/30/2015 Expense
Existing:2008 Water Revenue Bonds 2,725,000$ 505,000 2,220,000 97,638 2006 Water Revenue Bonds 1,920,000 450,000 1,470,000 67,800 Total FY14 Debt 4,645,000$ 955,000 3,690,000 165,438
Existing Existing Future FutureProposed: Principal Interest Principal InterestFY16 990,000$ 127,800 - - FY17 1,035,000 87,300 - - FY18 1,075,000 45,100 - - FY19 590,000 11,800 - - Thereafter - - - - Total Debt Service 3,690,000$ 272,000 - -

218

UTILITY FUND
219
Mission The Water Operations Division is part of the Utility Fund. This portion of the budget encompasses
expenditures required to produce and deliver water to utility customers. The assistant director of utilities oversees daily functions of both water and sewer operations.
Water Distribution Seven employees provide daily maintenance and repair needed to operate the system. These employees install meters, repair water service lines, main breaks, fire hydrants and maintain valves. They also perform minor new water construction and provide in-house utility locate duties for the Tennessee One-Call Service. An emergency call-out work force is provided for after hour calls. A standby operation, consisting of five water division employees, is an alternative to staffing two additional shifts. The staff successfully provides approximately 15,200 residential and 440 business customers with an uninterrupted supply of potable water, sufficient water pressure and adequate supply of water for fire protection; maintains 206 miles of water mains, 2,384 fire hydrants, 3,881 main line valves and 13,800 service lines with a minimum of down time; responds to main breaks, service line breaks and broken fire hydrants in a timely manner and educates customers about how to protect our most abundant natural resource, water.
Customer Services Four meter readers and their supervisor provide a variety of services including meter reading, turning services on and off, meter testing, meter change-outs and meter maintenance. The utility billing specialist prepares the water billing and assists customers regarding accounts. Staff strives to accurately read water meters, provides fair and timely assistance to each customer, and assists in maintaining a safe water system by protecting against utility theft; builds good working relationships with customers; prepares citizens for water emergencies that could occur in the home and contributes to each employee’s job enrichment.
Water Treatment Six employees are responsible for the quality and quantity of water produced, minor repairs to the water plant and repair and maintenance of various pieces of water production equipment. They also sample and analyze water from various points within the distribution system and administer a cross connection control inspection program as required by the Tennessee Department of Public Health. Staff provides safe water to customers, protects the integrity of well fields and builds a high level of customer confidence in product and operation.
Budget Category Summary
Actual Budget Estimated BudgetCATEGORY FY13 FY14 FY14 Amt. Chg. % Chg. FY15
Personnel 1,372,620$ 1,372,808 1,355,592 131,260 9.68% 1,486,852 Communication 65,356 73,500 69,700 3,800 5.45% 73,500 Professional Fees 103,131 110,500 104,768 10,232 9.77% 115,000 Insurance (2,730) 5,000 4,456 544 12.21% 5,000 Other Maintenance 79,254 85,000 100,000 (15,000) -15.00% 85,000 Supplies 163,777 202,000 211,000 14,875 7.05% 225,875 Rent - 1,000 1,000 (1,000) -100.00% - Allocations 740,611 715,995 717,490 38,332 5.34% 755,822 Roads & Mains 144,067 110,000 110,000 - 0.00% 110,000 Depreciation 1,036,773 1,046,760 1,097,267 32,000 2.92% 1,129,267 Utilities 666,822 735,600 673,325 62,275 9.25% 735,600 Pilot 243,447 311,403 312,829 (10,912) -3.49% 301,917
TOTAL 4,613,128$ 4,769,566 4,757,427 266,406 5.60% 5,023,833
Capital Outlay 254,843$ 1,445,000 1,206,000 397,752 32.98% 280,000
Water
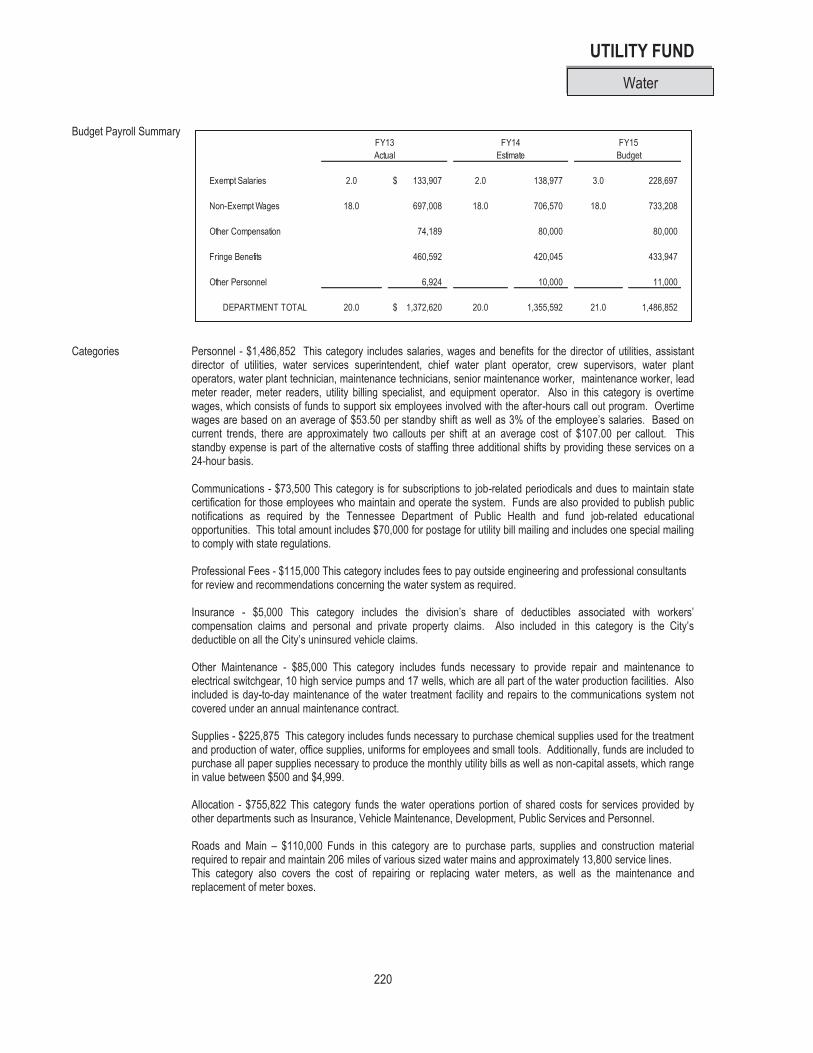
UTILITY FUND
220
Budget Payroll Summary
Categories Personnel - $1,486,852 This category includes salaries, wages and benefits for the director of utilities, assistant
director of utilities, water services superintendent, chief water plant operator, crew supervisors, water plant operators, water plant technician, maintenance technicians, senior maintenance worker, maintenance worker, lead meter reader, meter readers, utility billing specialist, and equipment operator. Also in this category is overtime wages, which consists of funds to support six employees involved with the after-hours call out program. Overtime wages are based on an average of $53.50 per standby shift as well as 3% of the employee’s salaries. Based on current trends, there are approximately two callouts per shift at an average cost of $107.00 per callout. This standby expense is part of the alternative costs of staffing three additional shifts by providing these services on a 24-hour basis.
Communications - $73,500 This category is for subscriptions to job-related periodicals and dues to maintain state certification for those employees who maintain and operate the system. Funds are also provided to publish public notifications as required by the Tennessee Department of Public Health and fund job-related educational opportunities. This total amount includes $70,000 for postage for utility bill mailing and includes one special mailing to comply with state regulations.
Professional Fees - $115,000 This category includes fees to pay outside engineering and professional consultants for review and recommendations concerning the water system as required.
Insurance - $5,000 This category includes the division’s share of deductibles associated with workers’ compensation claims and personal and private property claims. Also included in this category is the City’s deductible on all the City’s uninsured vehicle claims.
Other Maintenance - $85,000 This category includes funds necessary to provide repair and maintenance to electrical switchgear, 10 high service pumps and 17 wells, which are all part of the water production facilities. Also included is day-to-day maintenance of the water treatment facility and repairs to the communications system not covered under an annual maintenance contract.
Supplies - $225,875 This category includes funds necessary to purchase chemical supplies used for the treatment and production of water, office supplies, uniforms for employees and small tools. Additionally, funds are included to purchase all paper supplies necessary to produce the monthly utility bills as well as non-capital assets, which range in value between $500 and $4,999.
Allocation - $755,822 This category funds the water operations portion of shared costs for services provided by other departments such as Insurance, Vehicle Maintenance, Development, Public Services and Personnel.
Roads and Main – $110,000 Funds in this category are to purchase parts, supplies and construction material required to repair and maintain 206 miles of various sized water mains and approximately 13,800 service lines. This category also covers the cost of repairing or replacing water meters, as well as the maintenance and replacement of meter boxes.
FY13 FY14 FY15Actual Estimate Budget
Exempt Salaries 2.0 133,907$ 2.0 138,977 3.0 228,697
Non-Exempt Wages 18.0 697,008 18.0 706,570 18.0 733,208
Other Compensation 74,189 80,000 80,000
Fringe Benefits 460,592 420,045 433,947
Other Personnel 6,924 10,000 11,000
DEPARTMENT TOTAL 20.0 1,372,620$ 20.0 1,355,592 21.0 1,486,852
Water

UTILITY FUND
221
Depreciation - $1,129,267 This category includes the annual charge that represents the estimated monetary replacement expense as a result of aging and wear and tear of those assets that make up the Water Utility Fund. Water lines and appurtenances are depreciated on a 50-year basis with smaller equipment and machinery on a three to five-year basis.
Utilities - $735,600 This category includes utility costs (electricity, gas, water, sewer and local and long distance telephone). Pilot - $301,917 This category includes payments in lieu of taxes. Funds that are paid to offset costs incurred by the City for services provided to tax exempted properties. Capital Outlay - $280,000 This category includes the costs associated with the CIP and IRP projects of well field maintenance, water mains maintenance, pick up truck and a backhoe.
Performance Measures
Triple Bottom Line Focus Area: Social FY13 FY14 FY15 Key Product/Service: Potable water Goal Actual Goal Actual GoalMeasure: Water system availability 98% 96% 98% 98% 98%
Water

222

UTILITY FUND
223
Mission To successfully collect and transport sewage from the residential and commercial districts in Germantown to the Memphis outfall lines; to maintain all manholes, lift stations and lateral connections.
The Sewer Operations Division oversees the daily operations of the sanitary sewer system within the areas served by Germantown utilities, provides preventative maintenance to all sewer mains, lift stations, and laterals within the system, regularly cleans and flushes trouble areas and routinely flushes and cleans all lines through a systematic program. Video operations are incorporated into daily operations for inspection repairs, troubleshooting and assessment of future needs. Sewer operations also perform minor construction such as installation of sewer laterals and short sections of sewer main. There are over 206 miles of sewer mains and 23 lift pump stations throughout the city system.
A contract exists between the City of Memphis and Germantown, which was signed in FY03 providing for the treatment of Germantown’s sanitary sewage. It is Germantown’s responsibility to collect and deliver the sewage through its sanitary system to various points of connection within the Memphis system. Customers’ monthly fees are based on the amount of water consumed.
Budget Category Summary
Budget Payroll Summary
Actual Budget Estimated BudgetCATEGORY FY13 FY14 FY14 Amt. Chg. % Chg. FY15
Personnel 348,321$ 356,932 359,693 12,391 3.44% 372,084 Communication - 100 100 500 500.00% 600 Professional Fees - - - - - - Insurance 8,040 5,000 3,375 1,625 48.15% 5,000 Other Maintenance 4,798 5,000 5,000 - 0.00% 5,000 Supplies 20,301 27,800 29,300 (1,275) -4.35% 28,025 Rent 94 100 100 - 0.00% 100 Allocations 392,170 362,375 363,000 21,564 5.94% 384,564 Roads & Mains 33,636 31,000 28,000 4,000 14.29% 32,000 Depreciation 641,014 655,740 675,626 13,600 2.01% 689,226 Utilities 14,799 17,500 15,500 1,500 9.68% 17,000 PILOT 143,162 182,888 189,372 (6,906) -3.65% 182,466
TOTAL 1,606,335$ 1,644,435 1,669,066 46,999 2.82% 1,716,065
Capital Outlay 2$ 625,000 512,000 163,000 31.84% 675,000
FY13 FY14 FY15Actual Estimate Budget
Exempt Salaries 1.0 55,529$ 1.0 55,023 1.0 60,015
Non-Exempt Wages 5.0 146,498 5.0 164,869 5.0 173,179
Other Compensation 20,615 20,000 24,000
Fringe Benefits 124,877 119,301 114,390
Other Personnel 802 500 500
DEPARTMENT TOTAL 6.0 348,321$ 6.0 359,693 6.0 372,084
Sewer

UTILITY FUND
224
Categories Personnel – $372,084 This category includes salaries, wages and benefits for the superintendent of utilities, crew
supervisor, equipment operator, senior maintenance worker and maintenance workers. Overtime wages are included to cover expenditures associated with after hour sewer stoppages and maintenance requirements.
Communications - $600 Included in this category is the cost of job-related educational supplies and materials for six employees as well as registration fees for supervisory training seminars and Tennessee Department of Health certification requirements. Insurance - $5,000 This category includes the division’s share of deductibles associated with workers’ compensation claims and personal and private property claims. Also included in this category is the City’s deductible on all the City’s uninsured vehicle claims. Other Maintenance - $5,000 Funding in this category includes preventive maintenance and repair to the City’s video inspection equipment. Supplies - $28,025 This category funds the purchase of chemicals used in grease and odor control on lift stations, safety related items and uniform service for maintenance employees. In addition, petroleum products, small tools and non-capital assets, which range in value between $500 and $4,999, are budgeted here. Rent - $100 This category funds the rental of emergency generator, lighting or other types of equipment that may be needed as a result of a sewer lift station breakdown or other failures within the system. This allows us to obtain equipment that is not owned, but needed to make specific repairs. Allocation - $384,564 This category funds the water operations portion of shared costs for services provided by other departments such as Insurance, Fleet Service, Development, Public Services and Human Resources. Roads and Main –$ 32,000 This category funds the purchase of supplies and construction material required to make repairs and maintain the sanitary sewer main. Depreciation - $689,225 Funds in this category are for the annual depreciated valuation of equipment and sewer mains that make up the sanitary sewer system.
Utilities - $17,000 This category includes utility costs (electricity, gas, water, sewer and local and long distance telephone). PILOT - $182,466 This category includes payments in lieu of taxes. Funds that are paid to offset costs incurred by the City for services provided to tax exempted properties. Capital Outlay - $675,000 Funding in this category includes IRP projects for maintenance of the sewer collection system and pick up truck. In addition, one CIP project is included here for Farm Park Sewer.
Sewer

225
UTILITY FUND
Mission This cost center accounts for the payments to the City of Memphis for sewage treatment. Under the contract
amended in FY07, Germantown currently remits 34% of the current user fee to the City of Memphis for sewer treatment, which will continue through FY15. The rate was recalculated based on the formula set within the contract signed in FY03. This contract also requires that Germantown fund all new capital projects within its city’s limits.
Budget Category Summary
Categories Sewer Fees to Memphis - $ 1,200,000 Under contract, Germantown pays 34% of the monthly sewer fees to
the City of Memphis for treatment of sewage. Additionally, the contract signed in FY03 allowed the rate to be reviewed every two years, or when Memphis’ fees are changed. The rate was last reviewed in March 2013.
Actual Budget Estimated BudgetCATEGORY FY13 FY14 FY14 Amt. Chg. % Chg. FY15
Contract Services 1,171,901$ 1,200,000 1,175,000 25,000 2.13% 1,200,000
TOTAL 1,171,901$ 1,200,000 1,175,000 25,000 2.13% 1,200,000
Sewage Treatment

226

227
CAPITAL IMPROVEMENTS PROGRAM FY15 BUDGET
This section presents the capital budget for all Capital Improvements Programs. Total capital expenses for General Government, Major Roads, Intersection/Other/Drainage, Parks, Utility Fund, Germantown Athletic Club Fund, Great Hall Fund, Recreation Fund, Stormwater Fund and Contingency are summarized below.
0
2
4
6
8
10
12
FY15 FY16 FY17 FY18 FY19
GENERAL GOVERNMENT MAJOR ROADS INTERSECTIONS & OTHER
DRAINAGE PARKS GERMANTOWN ATHLETIC CLUB
GREAT HALL RECREATION STORMWATER
UTILITY FUND CONTINGENCY
CAPITAL IMPROVEMENTS PROJECT EXPENSES
$ MILLIONS

228
CAPITAL IMPROVEMENTS PROGRAM
The Capital Improvements Program (CIP) is divided into six major categories - General Government, Major Roads, Intersections/Other/Drainage, Parks, and Utilities. The Intersections/Other/Drainage category includes traffic signals, sidewalks and drainage projects. A comprehensive schedule of the FY15-19 CIP is contained in the Budget Summaries section of this document. The following is a brief summary of the funding sources identified in the CIP:
Bond Issues – Three General Obligation Bond (G.O.) and no Utility (Revenue) Bond issues are anticipated during the 6-year CIP.
General Reserves – (General Fund) – The CIP funding source described as General Fund Reserves is defined as the
portion of General Fund funding for capital projects through the provision of cash as a result of excess General Fund operating revenues over General Fund operating expenditures.
General Reserves – (Hall) – The CIP funding source described as General Fund Reserves – (Hall) is defined as a
revenue source from the Hall Income and Excise Tax to fund capital projects. Utility Fund – The Utility Fund accounts for water and sewer fees in connection with the operation of the City’s water
and sewer system. The proceeds of several bond issues and intergovernmental loans have been used specifically for the construction or acquisition of water and sewer systems and facilities.
Grants – Funding is available from various county, state and federal agencies, including Tennessee Department of Transportation (TDOT), Environmental Protection Agency (EPA), Federal Congestion Mitigation and Air Quality (CMAQ) and Department of Conservation.
State/Federal – Funding for these capital projects is the full responsibility of a federal or state agency. The City of
Germantown is only responsible for the coordination of the capital project due to it being within Germantown’s borders. These funds are not accounted for in the six category totals, since the City of Germantown will not appropriate the funding.
Development Contributions – This funding source is assumed to be available from developers in a specific area for a
specific project. It is anticipated that as property is developed, the developers will fund their fair share of the CIP project. The City may construct projects in an area prior to development. In such cases, only water lines and traffic signal reimbursements have been required from developers.
Contingency – This mechanism provides, on an annual basis, funding from which appropriations are made to meet
minor overruns in CIP projects. The amount for FY15 is fixed at $250,000 and is reviewed annually by both the Financial Advisory Commission and Board of Mayor and Aldermen.
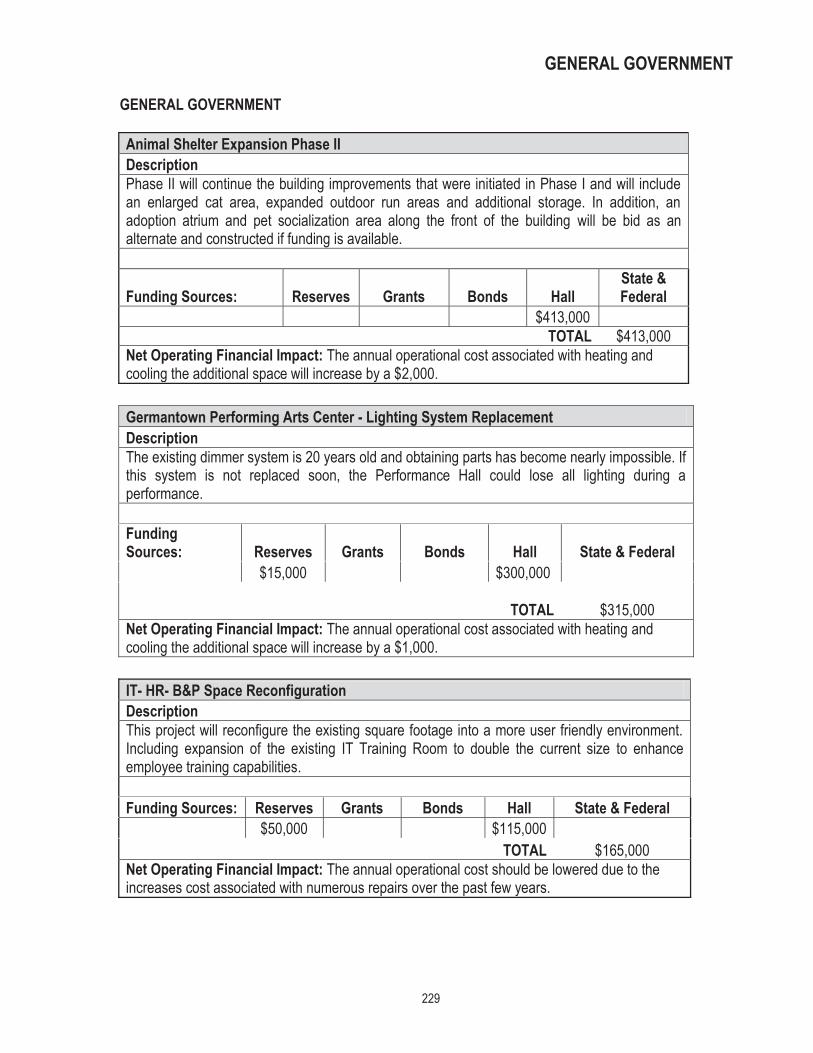
229
GENERAL GOVERNMENT
GENERAL GOVERNMENT Animal Shelter Expansion Phase II Description Phase II will continue the building improvements that were initiated in Phase I and will include an enlarged cat area, expanded outdoor run areas and additional storage. In addition, an adoption atrium and pet socialization area along the front of the building will be bid as an alternate and constructed if funding is available.
Funding Sources: Reserves Grants Bonds Hall State & Federal
$413,000 TOTAL $413,000
Net Operating Financial Impact: The annual operational cost associated with heating and cooling the additional space will increase by a $2,000.
Germantown Performing Arts Center - Lighting System Replacement Description The existing dimmer system is 20 years old and obtaining parts has become nearly impossible. If this system is not replaced soon, the Performance Hall could lose all lighting during a performance.
Funding Sources: Reserves Grants Bonds Hall State & Federal $15,000 $300,000
TOTAL $315,000
Net Operating Financial Impact: The annual operational cost associated with heating and cooling the additional space will increase by a $1,000.
IT- HR- B&P Space Reconfiguration Description This project will reconfigure the existing square footage into a more user friendly environment. Including expansion of the existing IT Training Room to double the current size to enhance employee training capabilities.
Funding Sources: Reserves Grants Bonds Hall State & Federal $50,000 $115,000
TOTAL $165,000 Net Operating Financial Impact: The annual operational cost should be lowered due to the increases cost associated with numerous repairs over the past few years.

230
GENERAL GOVERNMENT
GPAC Entrance Drive Improvements & Additional Parking Description Functional and aesthetic improvements to the Germantown Performing Arts Center entrance drive as well as additional parking.
Funding Sources: Reserves Grants Bonds Hall State & Federal $250,000
TOTAL $250,000 Net Operating Financial Impact: There are no additional operating expenses associated with this project.
Redesign N.E. East corner of the Farmington Blvd./Germantown Rd. Intersection Description Project includes the removal of the cedar tree, installation of flags and new signage for City Hall. In addition, the bank that runs along the Municipal Center parking lot that fronts Germantown Road will be cleaned- up and landscaped.
Funding Sources: Reserves Grants Bonds Hall State & Federal $250,000
TOTAL $250,000 Net Operating Financial Impact: There are no additional operating expenses associated with this project.
TOTAL GENERAL GOVERNMENT $ 1,393,000

231
MAJOR ROADS
MAJOR ROADS Wolf River Boulevard – Milling & Paving Description Project involves mill and overlay, pavement markings on Wolf River Boulevard between Germantown Road and Kimbrough Road and between Farmington Boulevard and the East City limits. Also includes signage and upgrading of HCR's to current ADA standards as needed and installation of new sidewalk to fill in the missing links along the north side eastward to Houston Middle School and from the Stern Clinic westward to the existing Greenway Trail.
Funding Sources: Reserves Grants Bonds Hall State & Federal $270,000 $1,080,000
TOTAL $1,350,000 Net Operating Financial Impact: There are no additional operating expenses associated with this project.
Germantown Road Realignment – Design Update Description Detailed design to meet TDOT requirements to align Germantown Road south of Poplar Avenue with West Street south of the railroad crossing. Project is a Smart Growth Planning Initiative to reduce traffic congestion in and through the Business District. ROW of acquisition is scheduled for FY17 with construction to follow shortly thereafter.
Funding Sources: Reserves Grants Bonds Hall State & Federal $8,000 $72,000
TOTAL $80,000 Net Operating Financial Impact: There are no additional operating expenses associated with this project.
Poplar Avenue Culvert Replacement Phase III Description Phase III of repair and/or replacement of damaged culverts under Poplar Avenue. Thirty-one of the forty-six need repair and seventeen of the thirty-one need to be excavated and completing replaced. Six culverts were replaced or repaired in Fiscal Year 2014.
Funding Sources: Reserves Grants Bonds Hall State & Federal $600,000
TOTAL $600,000 Net Operating Financial Impact: The upgrades to the drainage infrastructure will reduce the maintenance responsibility of the Public Services Dept. by approximately by $5,000.
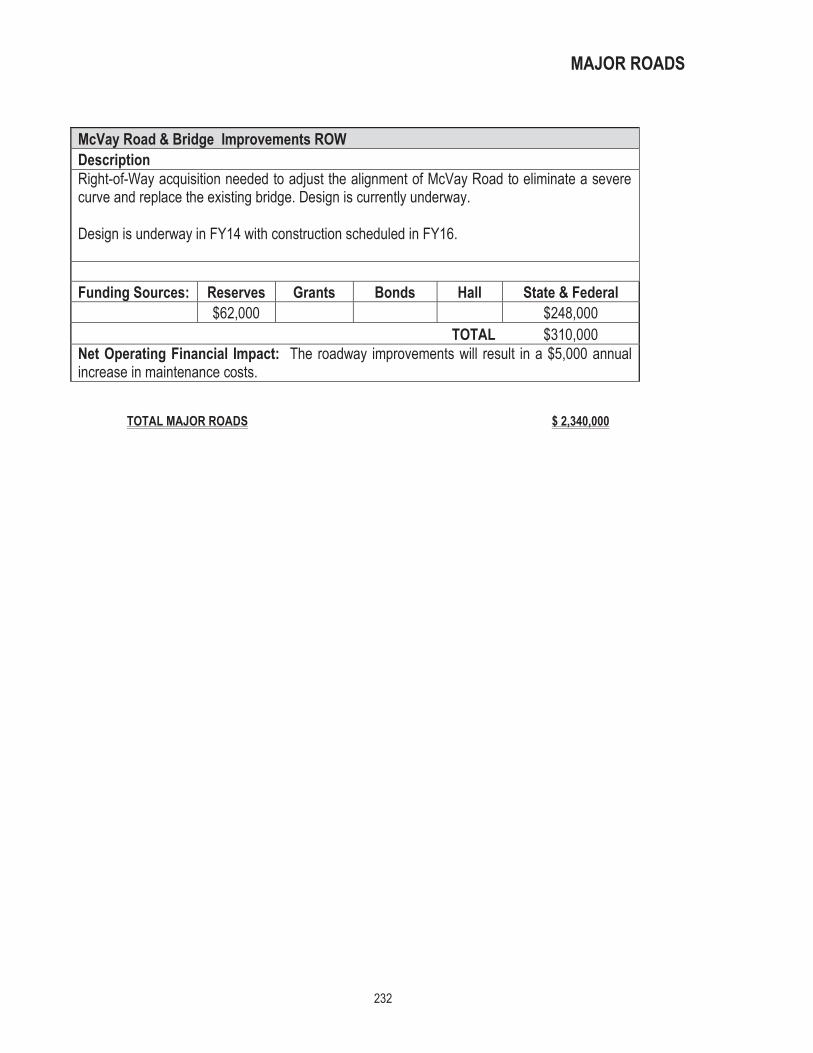
232
MAJOR ROADS
McVay Road & Bridge Improvements ROW Description Right-of-Way acquisition needed to adjust the alignment of McVay Road to eliminate a severe curve and replace the existing bridge. Design is currently underway. Design is underway in FY14 with construction scheduled in FY16.
Funding Sources: Reserves Grants Bonds Hall State & Federal $62,000 $248,000
TOTAL $310,000 Net Operating Financial Impact: The roadway improvements will result in a $5,000 annual increase in maintenance costs.
TOTAL MAJOR ROADS $ 2,340,000

233
INTERSECTIONS/OTHER
INTERSECTIONS & OTHER Wolf River Boulevard/ Germantown Road Intersection Improvements Design Description Design of traffic signal modifications and the addition of lanes:
SB Gtown – 4 thru lanes, double lefts to EB WRB NBGtown – 3 thru lanes, double lefts to WB WRB EB WRB – triple lefts to NB Gtown, 2 thru lanes WB WRB – 3 thru lanes, 1 dedicated turn to SB Gtown, dedicated right turn to
NB Gtown
Detailed design and environmental in FY14 – FY15; Right of Way acquisition in FY16
Funding Sources: Reserves Grants Bonds Hall State & Federal $100,000
TOTAL $100,000 Net Operating Financial Impact: There are no additional operating expenses associated with this project.
Railroad Crossing Improvements – West Street/Poplar Pike Description Installation of signage and battery backup to provide motorists with a safer crossing. TDOT to reimburse the City for 100% of the design and construction costs.
Funding Sources: Reserves Grants Bonds Hall State & Federal $30,000
TOTAL $30,000 Net Operating Financial Impact: There are no additional operating expenses associated with this project.

234
INTERSECTIONS/OTHER
Bicycle Facilities Program Description Restriping of existing bike lanes, striping of new bike lanes and new signage focusing on areas near public schools and the installation of bicycle racks at City facilities.
Funding Sources: Reserves Grants Bonds Hall State & Federal $25,000
TOTAL $25,000 Net Operating Financial Impact: There are no additional operating expenses associated with this project.
School Zone Improvements Description This project provides for the installation of crosswalks inside school zones, restriping the crosswalks, replacing the existing incandescent school flashers with LED flashers and replacing the existing school signage.
Funding Sources: Reserves Grants Bonds Hall State & Federal $54,000
TOTAL $54,000 Net Operating Financial Impact: There are no additional operating expenses associated with this project.
Decorative Street Signs Description Installation of decorative street signs and regulatory signs throughout various residential neighborhoods including Dogwood Trails (12 street /13 stop); Greenfields (11/10) and Duntreath East (23/23).
Funding Sources: Reserves Grants Bonds Hall State & Federal $50,000
TOTAL $50,000 Net Operating Financial Impact: There are no additional operating expenses associated with this project.
TOTAL INTERSECTION/OTHER $259,000

235
DRAINAGE
DRAINAGE
Cameron Brown Park Drainage Improvements Description This project will stabilize the severely eroded ditch bank erosion that is occurring on Cameron Brown Park Ditch as a result of head cutting on Lateral D. This section is located between the baseball fields, near the restroom facilities.
Funding Sources: Reserves Grants Bonds Hall State & Federal $100,000
TOTAL $100,000 Net Operating Financial Impact: Improvements will result in a $1,000 annual increase in maintenance costs.
Grove Park Lake Outfall Repair Description This project is for design and repair of the Grove Park Outfall. Severe bank erosion has resulted in the discharge pipe to be in danger of collapsing.
Funding Sources: Reserves Grants Bonds Hall State & Federal $100,000
TOTAL $100,000 Net Operating Financial Impact: There are no additional operating expenses associated with this project.
English Meadows Drainage Improvements Construction Phase I Description Phase I was completed in 1999 and improved the major drainage outlet system for the area. Phase II will improve two interior neighborhood systems within English Meadows. Improvements will primarily increase pipe sizes and add additional manholes and inlets.
Funding Sources: Reserves Grants Bonds Hall State & Federal $610,000
TOTAL $610,000 Net Operating Financial Impact: There are no additional operating expenses associated with this project.
TOTAL DRAINAGE $ 810,000

236
PARKS
PARKS Bobby Lanier Farm Park Phase II Description The scope of this project is to provide funding to complete the major infrastructure components of the master plan, construction of a new hay barn and provide construction oversight for the project. The design and construction documents were completed in 2013. Funding Sources: Reserves Grants Bonds Hall State & Federal $743,000 $208,000
TOTAL $951,000 Net Operating Financial Impact: The annual operational cost associated with utilities and maintenance of the additional space will increase $8,000.
Wolf River Boulevard Greenway Trail Description This project will increase the length of the greenway trail from the western trailhead to Cameron Brown Park. Funding is from the Wolf River Boulevard Extension project that was completed approximately $3,000,000 under the $25,000,000 budget the MPO allocated for the project. The city requested that the MPO not reallocate these funds and let the funds be used for project over-runs and design and construction of sections of the greenway trail. The MPO agreed provided that the funds are included in the current year CIP.
Funding Sources: Reserves Grants Bonds Hall State & Federal $320,000 $1,280,000
TOTAL $1,600,000 Net Operating Financial Impact: There are no additional operating expenses associated with this project.
TOTAL PARKS $ 2,551,000

237
GERMANTOWN ATHLETIC CLUB
GERMANTOWN ATHLETIC CLUB Germantown Athletic Club Expansion Construction Description The expansion of programming spaces, including functional training, expanded group programming and social areas. The social amenities are critical to serving the growing needs of the current members as well as attaining new members. Design is underway in FY14.
Funding Sources: Reserves Grants Bonds Hall State & Federal $1,250,000
TOTAL $1,250,000 Net Operating Financial Impact: The annual operational cost associated with electricity and maintenance will increase $5,000.
Germantown Athletic Club – Fitness Weight Equipment Purchase Description Purchasing outright, instead of the past practice of leasing strength equipment, will allow the Club to see a higher return on investment as we will be able to see years longer use and the ability to surplus the equipment ourselves when its life is up. Less frequent equipment change outs also means less disruption and downtime for the members.
Funding Sources: Reserves Grants Bonds Hall State & Federal $171,000
TOTAL $171,000 Net Operating Financial Impact: There are no additional operating expenses associated with this project.
TOTAL GERMANTOWN ATHLETIC CLUB $ 1,421,000

238
GREAT HALL/RECREATION
GREAT HALL Great Hall – Patio Construction Description Construction of a patio/garden area on the west end of the building outside of Room 1 to be used as a patio for weddings, receptions, cocktail parties and other events. This will enhance the appearance of the venue, improve competitiveness, create additional space to sell and grow revenues. Funding Sources: Reserves Grants Bonds Hall State & Federal $150,000
TOTAL $150,000 Net Operating Financial Impact: Improvements will result in a $1,000 annual increase in maintenance costs.
TOTAL GREAT HALL $ 150,000
RECREATION Sports Lighting & Control Upgrades - Municipal Park Tennis Center Description Continuation of the Sports Lighting & Control Program to remotely monitor and manage recreational facility lighting.
Funding Sources: Reserves Grants Bonds Hall State & Federal $50,000
TOTAL $50,000 Net Operating Financial Impact: There are no additional operating expenses associated with this project.
TOTAL RECREATION $ 50,000
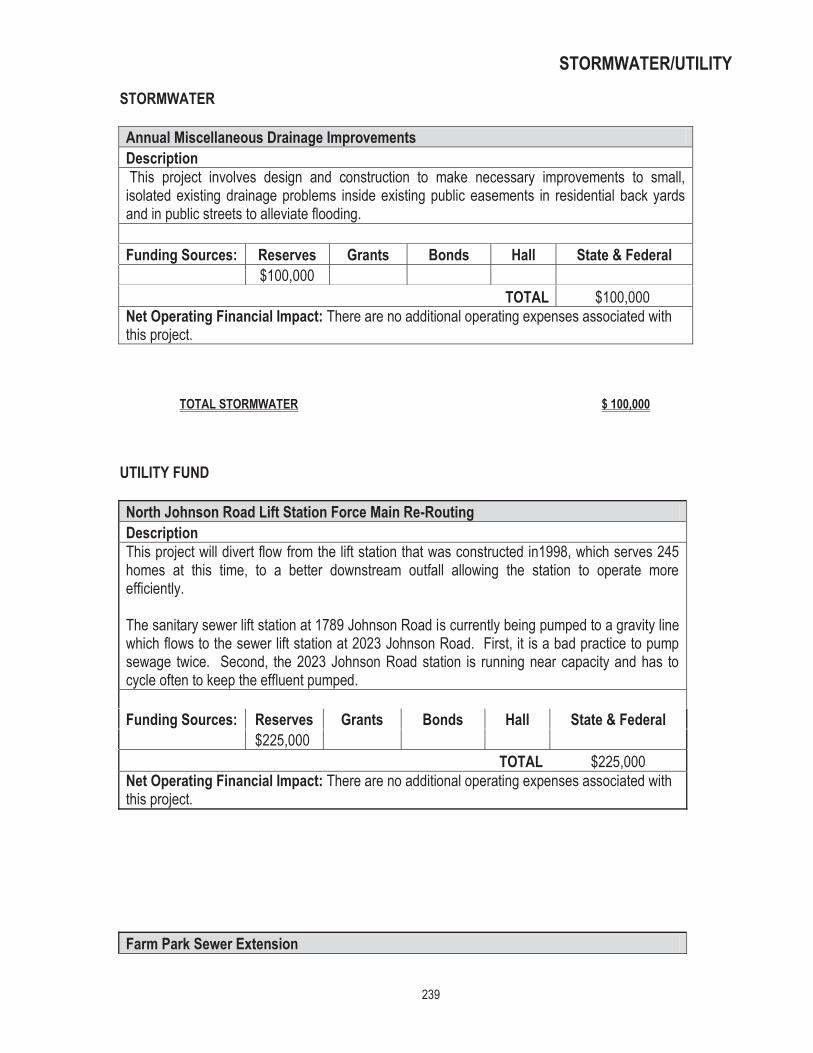
239
STORMWATER/UTILITY
STORMWATER Annual Miscellaneous Drainage Improvements Description This project involves design and construction to make necessary improvements to small, isolated existing drainage problems inside existing public easements in residential back yards and in public streets to alleviate flooding.
Funding Sources: Reserves Grants Bonds Hall State & Federal $100,000
TOTAL $100,000 Net Operating Financial Impact: There are no additional operating expenses associated with this project.
TOTAL STORMWATER
$ 100,000
UTILITY FUND North Johnson Road Lift Station Force Main Re-Routing Description This project will divert flow from the lift station that was constructed in1998, which serves 245 homes at this time, to a better downstream outfall allowing the station to operate more efficiently. The sanitary sewer lift station at 1789 Johnson Road is currently being pumped to a gravity line which flows to the sewer lift station at 2023 Johnson Road. First, it is a bad practice to pump sewage twice. Second, the 2023 Johnson Road station is running near capacity and has to cycle often to keep the effluent pumped.
Funding Sources: Reserves Grants Bonds Hall State & Federal $225,000
TOTAL $225,000 Net Operating Financial Impact: There are no additional operating expenses associated with this project.
Farm Park Sewer Extension
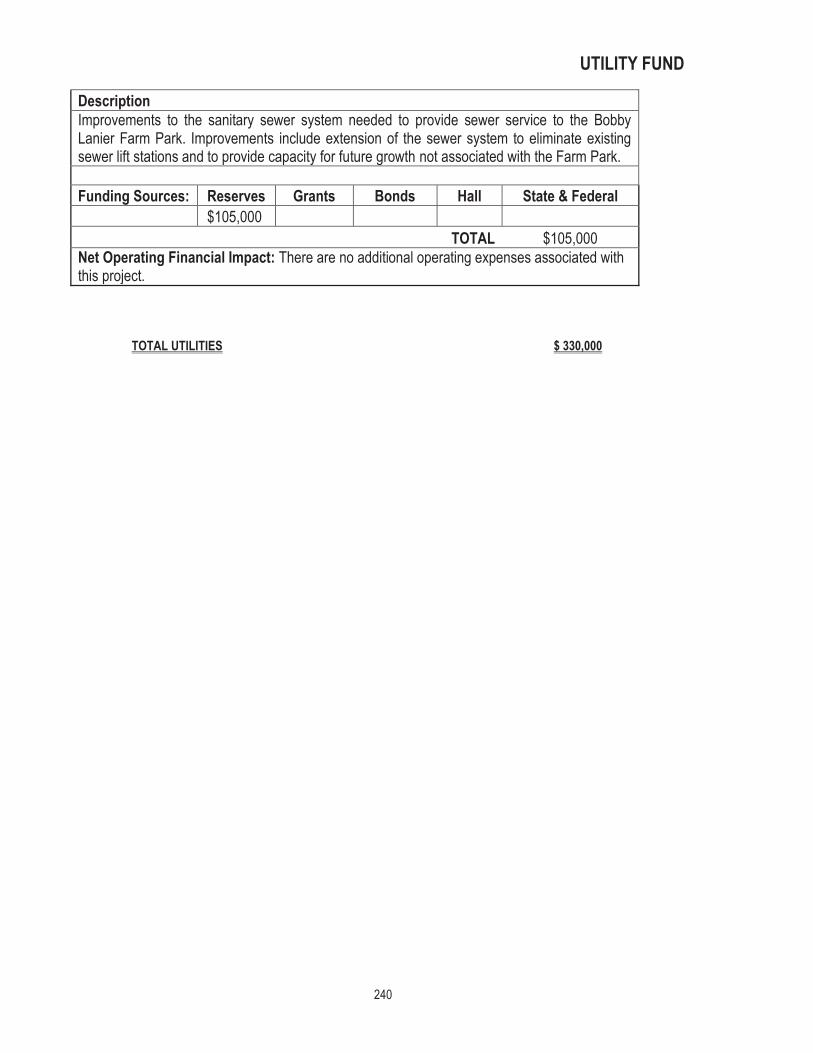
240
UTILITY FUND
Description Improvements to the sanitary sewer system needed to provide sewer service to the Bobby Lanier Farm Park. Improvements include extension of the sewer system to eliminate existing sewer lift stations and to provide capacity for future growth not associated with the Farm Park.
Funding Sources: Reserves Grants Bonds Hall State & Federal $105,000
TOTAL $105,000 Net Operating Financial Impact: There are no additional operating expenses associated with this project.
TOTAL UTILITIES
$ 330,000

241
CIP SUMMARY
CONTINGENCY $250,000
Funding: General Fund Reserves - $250,000 Description: This is a continuation of the City’s Financial Policy intended to help support higher bid cost estimates and to cover project cost overruns.
TOTAL CONTINGENCY $250,000
CIP SUMMARY General Government $ 1,393,000 Major Roads 2,340,000 Intersections/Other 259,000 Drainage 810,000 Parks 2,551,000 Athletic Club 1,421,000 Utility 330,000 Great Hall 150,000 Recreation 50,000 Stormwater 100,000 Contingency 250,000
TOTAL FY15 CAPITAL IMPROVEMENTS PROGRAM $ 9,654,000

242
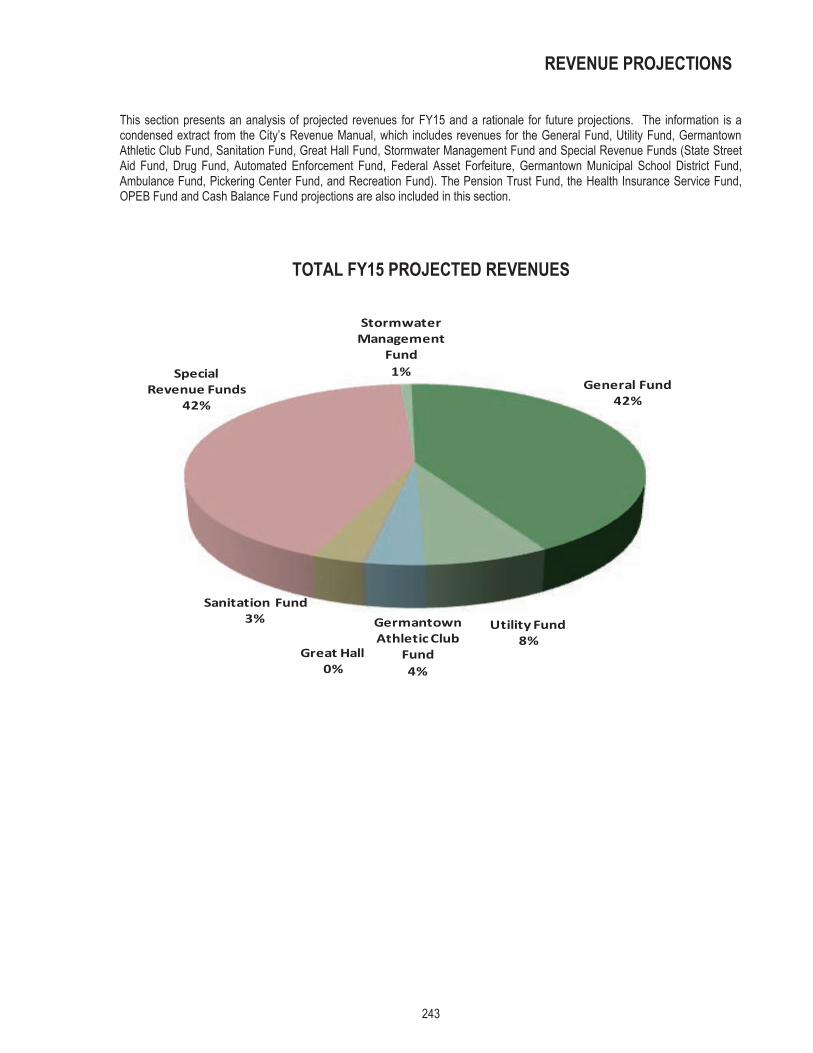
243
REVENUE PROJECTIONS
This section presents an analysis of projected revenues for FY15 and a rationale for future projections. The information is a condensed extract from the City’s Revenue Manual, which includes revenues for the General Fund, Utility Fund, Germantown Athletic Club Fund, Sanitation Fund, Great Hall Fund, Stormwater Management Fund and Special Revenue Funds (State Street Aid Fund, Drug Fund, Automated Enforcement Fund, Federal Asset Forfeiture, Germantown Municipal School District Fund, Ambulance Fund, Pickering Center Fund, and Recreation Fund). The Pension Trust Fund, the Health Insurance Service Fund, OPEB Fund and Cash Balance Fund projections are also included in this section.
TOTAL FY15 PROJECTED REVENUES
General Fund 42%
Utility Fund8%
Germantown Athletic Club
Fund4%
Great Hall0%
Sanitation Fund3%
Special Revenue Funds
42%
Stormwater Management
Fund1%

244
GENERAL FUND REVENUE PROJECTIONS
The five major components of General Fund revenues and projected trends are presented below. The other revenues component is analyzed and projected through a revenue model, which is based on the rationales contained in this section.
GENERAL FUND REVENUES
0
10
20
30
40
50
60
FY12 FY13 FY14 FY15 FY16 FY17 FY18 FY19
Property Taxes Sales Taxes Federal and State Revenues Other Revenues Investment Income
$ MILLIONS

245
GENERAL FUND
ACTUAL BUDGET BudgetACCT FY13 FY14 FY15
010-0000-311.10-00 Real Property Tax 21,028,279$ 26,123,058 26,378,541 010-0000-311.20-00 Personal Property Tax 666,337 535,235 765,000 010-0000-311.30-00 PILOT 386,609 494,291 484,683 010-0000-313.00-00 Penalties and Interest 125,793 130,889 130,000 010-0000-315.10-00 TVA 457,555 466,140 450,180 010-0000-315.20-00 MLG&W 230,916 204,306 233,170 010-0000-316.10-00 Local Option Sales Tax 5,216,535 5,400,000 7,800,000 010-0000-316.10-01 Contra - 20 year Annex Local Option Sales (39,764) (32,000) (41,000) 010-0000-317.10-00 Wholesale Beer Tax 388,405 414,256 411,828 010-0000-317.20-00 Wholesale Liquor Tax 268,317 261,111 217,155 010-0000-318.10-00 Gross Receipts Business Tax 573,252 501,734 561,000 010-0000-318.20-00 Business Tax Interest 126 677 100 010-0000-318.30-00 Business Tax Penalty 229 1,060 229 010-0000-319.10-00 Cable TV and Telecommunication 731,547 564,434 581,367 010-0000-319.20-00 Room Occupany Tax 656,522 594,660 606,553 010-0000-319.30-00 Telecommunications 1,925 - - 010-0000-321.10-00 Automobile Registration 899,670 876,027 881,062 010-0000-322.10-00 Retail Beer Licenses 6,302 7,500 7,500 010-0000-322.20-00 Retail Liquor Licenses 14,421 13,682 12,675 010-0000-324.10-00 Animal Registration Fees 75,654 79,500 79,500 010-0000-326.10-00 Fence and Sign Permits 6,500 3,800 3,800 010-0000-326.20-00 Building Permits 33,951 34,000 34,000 010-0000-326.40-00 Subdivision Engineering 25,570 10,900 10,900 010-0000-326.50-00 Zoning Application Fees 25,141 15,391 15,391 010-0000-331.90-00 Grants - Federal/State 236,710 250,000 200,000 010-0000-335.10-00 State Sales Tax Allocation 2,776,968 2,723,148 2,808,610 010-0000-335.20-00 State Income and Excise Tax (Hall) 2,877,005 2,072,799 2,500,000 010-0000-335.30-00 State Beer Tax Allocation 19,837 20,062 20,062 010-0000-335.40-00 State Liquor Tax Allocation 78,123 64,000 66,000 010-0000-335.90-00 City Street and Transportation Tax Allocation 82,011 82,252 82,252 010-0000-342.30-00 Fire Inspection Fees 9,350 - 5,325 010-0000-351.10-00 City Court Costs 349,391 268,456 300,000 010-0000-351.11-00 City Court Fines 141,983 143,170 140,000 010-0000-351.20-00 Other Court Revenue 318,402 276,420 300,000 010-0000-351.30-00 Animal Impoundment Fees 2,677 3,200 3,200 010-0000-353.01-00 Fines - Library 58,692 52,000 52,000 010-0000-361.10-00 Investment Income 34,852 39,200 20,000 010-0000-361.11-00 Loan Interest - Civic Centre 45,120 39,760 34,400 010-0000-362.00-00 Rental Revenue - WTF 323,502 318,082 336,259 010-0000-362.10-00 Rental Revenue - GPAC - 120,000 120,000 010-0000-362.20-00 Library Materials 23,225 23,000 23,000 010-0000-362.41-00 Parks - Taxable 6,790 7,500 7,500 010-0000-367.10-00 Friends of Library 8,933 10,000 10,000 010-0000-367.30-00 Senior Expo Revenue 15,475 13,000 20,000 010-0000-367.90-00 Playground Registrations Revenue 34,867 32,300 37,425 010-0000-368.01-00 Gain/Loss Sale of Assets - - - 010-0000-369.10-00 Other Revenue 576,532 300,000 449,100 010-0000-369.15-00 Surplus Equipment Sales - GovDeals 38,985 20,000 20,000 010-0000-369.20-00 Library - Printing & Misc. 10,391 10,000 10,000
TOTAL REVENUES 39,851,541$ 43,589,000 47,188,767

246
GENERAL FUND
Current Real Property Tax $26,378,541 Property taxes are assessed on January 1, prior to each fiscal year in which taxes are recorded. Residential property is assessed at 25% and commercial at 40% of the appraised value. The current projections are based on the tax rate of $1.93 per $100 of assessed value. Key assumptions are a growth of 70 housing units per year for the next four years that are valued at $450,000, a collection of 97% of taxes in the year assessed and a collection of 50% of all delinquent taxes each year. Current Personal Property $765,000 This rate is set by the same ordinance as real property. It represents a 30% assessment on personal property owned by commercial entities. This assessment is taxed at the same rate and handled in the same manner as the real estate assessment. Personal property taxes are erratic and difficult to evaluate when the assessment is made. Some growth is expected in this line item due to new office development now underway. Key assumptions are that 92% of assessments will be collected in the year assessed, and that 50% of delinquents will be collected each year. PILOT $484,683 A payment that a property owner, who is not subject to taxation, makes to compensate the City for services that the property owner receives that are normally financed through property taxes. Public utility property is assessed at 55% of its value. The current projection is based on the tax rate of $1.93 per $100 of assessed value. Penalties & Interest $130,000 After February 28, 5% penalty accrues immediately, the following month an additional penalty of 2% accrues and with each additional month 1% accrues to a maximum of a 10% penalty. Interest is charged at 1% each month until paid. TVA Payments in Lieu $450,180 T.C.A. 67-9-101 et. Seq. collects 5% of TVA gross sales. A total of 48% is allocated back to local governments with cities getting 30% of that on a per capita basis. Collected quarterly (October, January, April and June) as a direct deposit to the City’s Local Government Investment Pool (LGIP) account on the 20th of the month. The most recent federal census establishes a population of 40,123. This revenue has increased on average 2% per year for the last two years. Future projections are based on 2% per capita growth. MLGW Payments in Lieu $233,170 The 1987 Municipal Electric Systems Tax Equivalent Law established maximum in lieu of tax payments. It is the equivalent payment that would be made for MLGW plant and equipment in Germantown assessed at 55%. Payments are to be received in two equal installments in November and April for the MLGW fiscal year, which is the calendar year. This revenue has been erratic due to tax increases, rollback tax rates and changes to state law. Therefore, it is not easy to establish a predictable trend. Local Sales Taxes $7,800,000 Half of the 2.75% local tax on each purchase of merchandise made in Germantown is collected by the State and returned to Germantown. It is collected monthly approximately 65 days after the end of the tax month (i.e. 50% of October’s collections would be received in the first five days of January). A 2.375% commission fee is paid to the County. In addition, this revenue includes a $0.005 sales tax that was approved by referendum in 2012. Future projections of sales tax revenue are based on a 2% growth rate. Contra – 20 Year Annex Agreement $(41,000) Local sales tax collected from the tax on each purchase of merchandise within the annexed area are remitted to the City of Memphis. This remittance is based on the 20-year agreement signed between the City of Germantown and the City of Memphis upon annexation in 1999.

247
GENERAL FUND
Wholesale Beer Taxes $411,828 A 17% Wholesale Beer Tax is authorized by the State. It is collected from wholesalers based on their sales to retailers in the City and is collected monthly on about the 22nd directly from wholesalers. The revenue has increased steadily the last several years. Projections are based on a 1% annual growth. Wholesale Liquor Taxes $217,155 City Ordinance No. 1980-6. The State authorized a 5% inspection fee on the wholesale sale of alcoholic beverages in the City. It is collected from wholesalers based on sales to retail liquor stores in the City and is collected monthly. Projections are based on a 1% annual increase. Gross Receipts Business $561,000 Ordinance No. 1971-8. Authorized by Chapter 387 of the Public Acts of 1971. It is collected annually from retail sales and service businesses based on different percentages of the gross sales. Five due dates are spread throughout the year. The largest taxpayers are in the last quarter of the fiscal year. The tax base for the revenue is slightly different from local sales tax, but growth generally tracks that revenue. This revenue source is projected to increase at the same rate as local sales tax. Public Chapter 530 provides for the State of Tennessee to collect the business tax and remit this to the City. Business Tax Interest $100 Interest collected by the State of Tennessee on the gross receipts for late tax fillings. Penalty – Business $229 Penalties collected by the State of Tennessee on the gross receipts for late tax fillings. Cable TV Franchise Fee $581,367 Ordinance No. 1980-2. Authorizes the granting of a cable communication system franchise. The fees are collected quarterly. Projections are projected at a 3% increase. Hotel/Motel Occupancy Tax
$606,553
The City adopted, by ordinance, a Hotel/Motel Occupancy Tax in FY96. This tax is a privilege tax on transient occupancy (occupancy for a period of less the 30 days). Collections from the customer are remitted to the City by the 20th of each month for the preceding month. The rate originally adopted by the City was 3%. With the adoption of the FY98 Budget, this rate was established at 5% (the maximum rate available). Five hotel/motel facilities are now open and in full operation within the City’s boundaries. Projections are made at 2%. Automobile Registration $881,062 Ordinance No. 1980-9. The rate is $25 per automobile of which $1.25 covers a collection fee. Projections are based on the number of registered vehicles in FY14 plus an annual increase of 2.65 autos per living unit, times growth in living units projected at 15 per year. Retail Beer Licenses $7,500 A fee of $250 per application and $100 for each permit is collected annually. A total of 48 licenses are in effect now, and has no projected growth. Retail Liquor Licenses $12,675 Ordinance No. 1973-23. Privilege Tax Liquor by the Drink is based on a scale of $100 to $1,000, depending on the type of establishment or seating capacity. It is collected in January and February, except for new establishments, and is projected to continue at the current level.

248
GENERAL FUND
Animal Registration $79,500 Ordinance No. 1979-13. The license fee for any dog over six months of age, unneutered or unspayed, is $15.00. Neutered or spayed is $10.00 as set by the Resolution on Revenue. Throughout the year, veterinarians and the Animal Shelter collect this fee. Revenue from animal registration fees is leveling out due to the emphasis placed on spaying and neutering dogs. Fence & Sign Permits $3,800 Ordinance Sec. 14-8 and Sec. 6-108. The fees are $30 for temporary signs and $30 for residential fences. Commercial fences are $50. Building Permits $34,000 Under contract with Shelby County, permit fees are collected and a 25% of the basis fee is remitted to the City of Germantown generally in August, October, February and April. Non-residential fees are assessed per $1,000 of construction costs and rates vary between $1.50 and $4.00 depending upon the total value of construction. Residential construction and addition fees are assessed at $.05 per square foot. Subdivision Engineering $10,900 The current Subdivision Development Contract requires the payment of $500 per commercial development and $500 per residential development plus $80 per residential lot to cover inspection by the City. The projections are based on the level of new development required to achieve the real estate growth projected for real property taxes. Zoning Application Fee $15,391 Zoning application fees range from $600 to $3,600 depending on size and proposed use. Grants – Federal, State $200,000 Grants received from the State of Tennessee or the Federal Government. State Sales Tax Allocation $2,808,610 T.C.A. 67-6-103 (3) (A). The State allocates back to all municipalities slightly more than 4.5% of the 5.5% tax rate, based on population as of a certified census. Three special censuses can be conducted each decade and a census of annexed areas can be made each year. It is collected monthly and directly deposited to the LGIP on the 20th of each month. A 4% annual increase in per capita allocation is projected and the population is 40,123. The State budget cut the allocation to local municipalities by 7.5% in FY04. Half of the cut was restored in FY06 with full restoration in FY07.
State Income & Excise Tax $2,500,000 T.C.A. 67-2601. This tax is collected by the State as a tax on income from dividends and interest on certain investments and is allocated back to the City at 3/8 of the amount collected from Germantown taxpayers. It is collected in August and direct deposited to the LGIP. The allocation is affected by fluctuations in the growth in number of taxpayers and investment earnings. The State General Assembly cut this allocation by 33.3% in 2003 with the adoption of the FY04 Budget. In FY06, the state approved the restoration of this cut with half restored in FY06 and the balance in FY07.
State Beer Taxes Allocation $20,062
T.C.A. 57-5-201. A 10.05% allocation of the tax of $4.29 per barrel paid by manufacturers or distributors is made to municipalities and collected semiannually in October and April. It is a direct deposit to the LGIP on the 20th of each month. The projections are based on the same housing patterns as previously described and cut 9% in adoption of the State budget. In FY06, the state approved the restoration of this cut with half restored in FY06 and the balance in FY07.
249
GENERAL FUND
State Liquor Taxes Allocation $66,000 T.C.A. 57-4-301. This revenue is collected monthly and directly deposited to the LGIP on the 20th of the month. Projections are based on the same housing patterns as previously described and cut 9% in adoption of the State budget in FY04. In FY06, the state approved the restoration of this cut with half restored in FY06 and the balance in FY07. City Street & Transportation System $82,252 T.C.A. 67-3-904. State allocation is $0.01 per gallon for gasoline and other fuel in the state and is based on population. It is collected monthly and is directly deposited to the LGIP on the 20th of the month. Growth in this revenue is from the growth in housing as described earlier.
Fire Inspection Fees $5,325 This revenue includes fees obtained from fire inspection of new construction and annual inspection of existing construction. City Court Costs $300,000 This revenue is from Court Costs assessed in Municipal Court and is collected daily by the City Court clerk’s office. This revenue, like court fines, has been erratic and it will vary in direct proportion to court fines. Projections are based on a .7% annual growth factor. City Court Fines $140,000 Fines are assessed by Municipal Court and collected daily by the Court Clerk’s office. In the past, this revenue has been erratic. Approximately 15% of all fines assessed are deferred and only about half of the 15% deferrals are collected in the year assessed. Projections are based on a 3% annual growth factor. Court – Other Revenue $300,000 Other court revenue includes miscellaneous fees charged by City Court, including accident reports, bond filing, expungement, license clearance, returned check and warrant recall fees, returned check fees, warrant recall fees and offense reports. Animal Impoundment Fee $3,200 A charge of $35 (first time), $70 (second time), $90 (third or more times) impoundment fees and a $9 per day boarding fee is collected. The objective of Animal Control is to reduce the number of animals running loose. Projections are at current levels.
Fines - Library $52,000 Library fines are assessed as follows: $.10 per day per item for juvenile print and audio materials, $.20 per day per item for adult print and audio materials, $1.00 per day per item for adult/juvenile visual materials, and $1.00 per day per item for interlibrary loan materials. Investment Income $20,000 This revenue is from the investment of the pooled funds of the City, including all funds except enterprise, Drug Asset Forfeiture and fiduciary. Both gains and losses on sales of investment securities and interest earned on investments are included in this account. Projections are based on cash flows in the budget and an average investment rate of less than 1.0%. The LGIP account will be reduced to the minimum required to pay current bills, and all excess funds will be invested at the long-term rate. Loan Interest – Germantown Athletic Club $34,400 This revenue is the interest owed to the City by the Germantown Athletic Club annually on the loan of $2.5 million issued to the Germantown Athletic Club Fund in 2000.

250
GENERAL FUND
Rental Revenues - WTF $336,259 In addition to miscellaneous rental income, the City rents property under long-term contracts. There are several long-term contracts for wireless transmission facilities. Rental Revenues - GPAC $120,000 Revenue received from facility rentals at GPAC. Library Materials $23,000 Fees received for library materials. Some of the fees include: $1.00 for DVDs, $2.00 for book-on–tape/CD, $.50 for music CDs, $5.00 processing fee in addition to the cost for lost or damaged items, $2.00 processing fee for replacement of plastic magazine covers and $1.00 per library card replacement. Parks $7,500 Rental revenue received from the pavilions. Friends of Library $10,000 Money collected from the “Friends of the Library” on the sales of donated books. This money helps to support the Germantown Community Library. Senior Expo $20,000 Rental revenue received from booths at the annual Senior Expo at the Germantown Athletic Club. Playground Program $37,425 Program fees collected for the Summer Playground program. The “Summer Playground Program” is a partial day program (fee is $499/child). Other Revenues $449,100 This item increases and decreases from the sale of leased vehicles when the police fleet is replaced based on Vehicle Maintenance records and depreciation schedules. Other revenues collected are on routine items such as charges for copies of public records and donations. Surplus Equipment Sales - GovDeals $20,000 Monies collected from the disposition of surplus or confiscated items. Library – Printing & Misc. $10,000 The library charges $.20 per page for black and white copies and $1.00 per page for color copies.
TOTAL GENERAL FUND REVENUES $47,188,767

251
SPECIAL REVENUE FUNDS REVENUE PROJECTIONS
STATE STREET AID FUND
State Gasoline Tax Allocation $1,040,200 A population based allocation of the state $0.20 gasoline tax and $0.18 diesel fuel tax is accounted for in the separate State Street Aid Fund. A special petroleum tax of $0 .01 is also included. It is collected monthly and directly deposited to the LGIP on the 20th. These projections are based on the same housing growth as described for other state allocations. State collections have been erratic, and per capita collections are projected at the current rate of $25.93.
Transfer In- General Fund $1,650,000
Funds transferred from the General Fund to cover additional expenses.
AUTOMATED ENFORCEMENT FUND
Red Lights $58,800 This category includes fines captured on the automated enforcement cameras installed at Exeter/Poplar Avenue, Farmington/Poplar Avenue, and Kimbrough/Poplar Avenue. The fine for each violation is $50.00.
Actual Budget Estimated BudgetFY13 FY14 FY14 % Chg. FY15
State Gasoline Tax Allocation 1,032,696$ 1,054,031 1,037,205 0.29% 1,040,200 Investment Income 2,192 3,500 91 -100.00% - General Fund Transfer 200,000 750,000 900,000 83.33% 1,650,000
TOTAL REVENUES 1,234,888$ 1,807,531 1,937,296 38.86% 2,690,200
Actual Budget Estimated BudgetFY13 FY14 FY14 % Chg. FY15
Red Lights 43,910$ 225,000 100 58700.00% 58,800 General Fund Transfer 125,000 150,000 150,000 -50.00% 75,000
TOTAL REVENUES 168,910$ 375,000 150,100 -10.86% 133,800

252
SPECIAL REVENUE FUNDS REVENUE PROJECTIONS
DRUG ASSET FORFEITURE FUND
Drug Enforcement Revenues $350,000
Funds received from court fines and seizures.
PICKERING COMPLEX FUND
Classes $25,000 Included in this category are revenues received from cultural arts and senior classes offered in the Pickering Community Center. Instructors receive 70% of the revenue and the City receives 30%. Senior Events $7,000 Funds received for senior events, including special events, day trips, and commissions.
Other Revenue – Taxable $35,000 This category represents revenue that is taxable from the rental of the Pickering Complex.
Actual Budget Estimated BudgetFY13 FY14 FY14 % Chg. FY15
Drug Enforcement Revenues 220,399$ 350,000 300,000 16.67% 350,000
TOTAL REVENUES 220,399$ 350,000$ 300,000$ 16.67% 350,000
Actual Budget Estimated BudgetFY13 FY14 FY14 % Chg. FY15
Classes Revenues 19,267$ 18,000 25,000 0.00% 25,000 Senior Events Revenues 8,182 7,000 4,500 55.56% 7,000 Other Revenue - - - - - Other Revenue - Taxable 35,516 40,000 35,000 0.00% 35,000
TOTAL REVENUES 62,965$ 65,000 64,500 3.88% 67,000
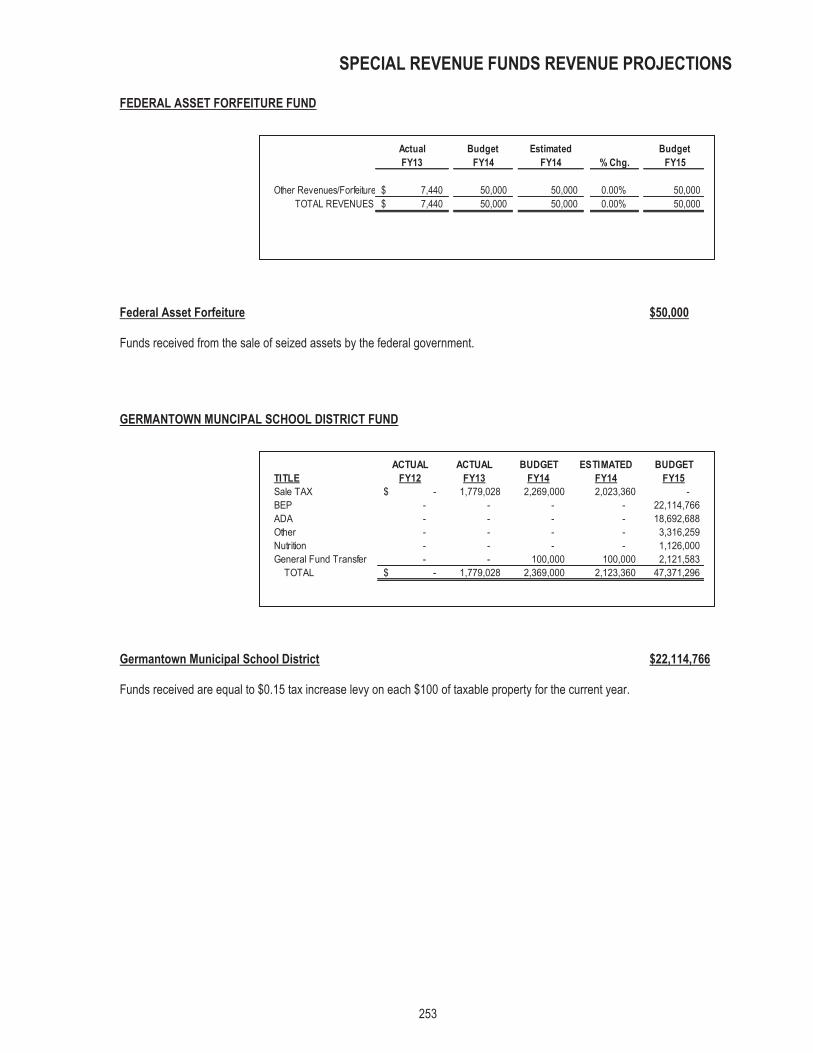
253
SPECIAL REVENUE FUNDS REVENUE PROJECTIONS
FEDERAL ASSET FORFEITURE FUND
Federal Asset Forfeiture $50,000
Funds received from the sale of seized assets by the federal government. GERMANTOWN MUNCIPAL SCHOOL DISTRICT FUND
Germantown Municipal School District $22,114,766
Funds received are equal to $0.15 tax increase levy on each $100 of taxable property for the current year.
Actual Budget Estimated BudgetFY13 FY14 FY14 % Chg. FY15
Other Revenues/Forfeiture 7,440$ 50,000 50,000 0.00% 50,000 TOTAL REVENUES 7,440$ 50,000 50,000 0.00% 50,000
ACTUAL ACTUAL BUDGET ESTIMATED BUDGETTITLE FY12 FY13 FY14 FY14 FY15Sale TAX -$ 1,779,028 2,269,000 2,023,360 - BEP - - - - 22,114,766 ADA - - - - 18,692,688 Other - - - - 3,316,259 Nutrition - - - - 1,126,000 General Fund Transfer - - 100,000 100,000 2,121,583 TOTAL -$ 1,779,028 2,369,000 2,123,360 47,371,296

SPECIAL REVENUE FUNDS REVENUE PROJECTIONS
254
AMBULANCE FUND
Transport Fee $ 835,936
Funds received for transporting patients to area hospitals.
Actual Budget Estimated BudgetFY13 FY14 FY14 Amt. Chg. % Chg. FY15
Transport Fees -$ 670,042 762,462 73,474 9.64% 835,936 Nontransport Fees - 58,354 - - - - Other Revenue - 34,066 12 (12) -100.00% - General Fund Transfer - 1,000,000 1,000,000 (500,000) -50.00% 500,000
TOTAL REVENUES -$ 1,762,462 1,762,474 (426,538) -24.20% 1,335,936

255
UTILITY FUND REVENUE PROJECTIONS
This section presents the projected Utility Fund revenues for FY15. An analysis chart of revenue components and projected trends through FY19 is presented below.
0
2
4
6
8
10
FY12 FY13 FY14 FY15 FY16 FY17 FY18 FY19
Water Sales Sewer Fees Other Revenues Developer Contributions
UTILITY REVENUES $ MILLIONS
Actual Budget Estimated BudgetFY13 FY14 FY14 % Chg. FY15
Metered Water Sales 4,118,201$ 4,760,000 4,118,201 30.00% 5,353,661 Forfeited Discounts 60,956 71,500 55,000 9.09% 60,000 Other Revenue 16,190 14,000 31,000 -16.13% 26,000 Developer Installation 16,820 5,000 5,000 0.00% 5,000 Water Connection Fees 70,911 75,000 55,000 9.09% 60,000 Sewer Connection Fees 49,200 30,000 36,000 -16.67% 30,000 Sewer Service Fees 2,449,575 2,700,000 2,449,575 30.00% 3,184,448
OPERATING REVENUES 6,781,853$ 7,655,500 6,749,776 29.18% 8,719,109
Investment Income 13,786$ 18,200 5,786 12.34% 6,500 Contributions from Developers 86,243 145,000 67,000 11.94% 75,000 Surplus Equip Sale - GovDeals 5,571 - - - - Credit Card Fees/Gain/Loss - - 2,332 -100.00% -
NONOPERATING REVENUES 105,600$ 163,200 75,118 8.50% 81,500

256
REVENUE ANALYSIS AND PROJECTIONS RATIONALE
Metered Water Sales $5,353,661 Residential charges are $8.73 for the first 5,000 gallons, $2.15 for each additional 1,000 gallons up to 15,000 gallons, $2.47 for each additional 1,000 gallons up to 50,000 gallons and $3.12 per 1,000 gallons thereafter. Commercial charges are $13.17 for the first 5,000 gallons, $3.42 for each additional 1,000 gallons up to 15,000 gallons, $3.90 for each additional 1,000 gallons up to 50,000 gallons and $4.88 per 1,000 gallons thereafter. These are net charges collected monthly by the City. The current rates became effective in FY15 and represented an average increase of 30%. Forfeited Discounts $60,000 By ordinance, when water and sewer bills are not paid within the ten-day discount period, the gross amount of the bill becomes due. On the average, this revenue is 3% of total water billings and is higher when water usage is greater. Other Revenues $26,000 This category includes all revenues not otherwise classified: reimbursement for repair, supplies and labor, fire hydrant usage permits and vendor compensation for sales tax of approximately $1,200 per year. This revenue source is projected to increase at 25% per year. Developer Installation $5,000 The City charges $300 per residential lot for water system expansion and for reimbursement of the City’s cost when an existing line originally installed by the City will serve the development. The recoveries for existing lines are currently a smaller projection than in previous years. Water Connection Fees $60,000 Charges in this category are $750 for residential (5/8-inch x ¾-inch meter) with higher scheduled charges for larger meters. Collected monthly, this revenue is also affected by lower growth rate. Sewer Connection Fees $30,000 Residential fees are $600 per lot. The commercial charges are based on the development’s frontage or acreage. This revenue is collected monthly and with the City installing the outfall lines, this revenue will accrue primarily to the City. Sewer Service Fee $3,184,448 This revenue is based on metered water service. Residential charges are $5.07 for the first 2,000 gallons, $.90 for an additional 1,000 gallons, $1.99 for each additional 1,000 gallons up to 20,000 gallons and $.78 for per 1,000 gallon thereafter with a maximum charge of $40.56. There is a nominal surcharge for restaurants. Commercial charges are $5.07 for the first 2,000 gallons, $.90 for an additional 1,000 gallons, $1.99 for each additional 1,000 gallons thereafter. These are net charges collected monthly by the City. The current rates became effective in FY15 and represented an average increase of 30%. Interest Income $6,500 Interest earned on investments and gains and losses on sales of securities are allocated to the Utility Fund based on the average daily balance of cash in the fund. These funds are invested in the LGIP at an average projected rate of 1.5%. Contributions from Developers $75,000 Assets received from private developers when the installation of water and sewer mains within the newly completed project is completed.
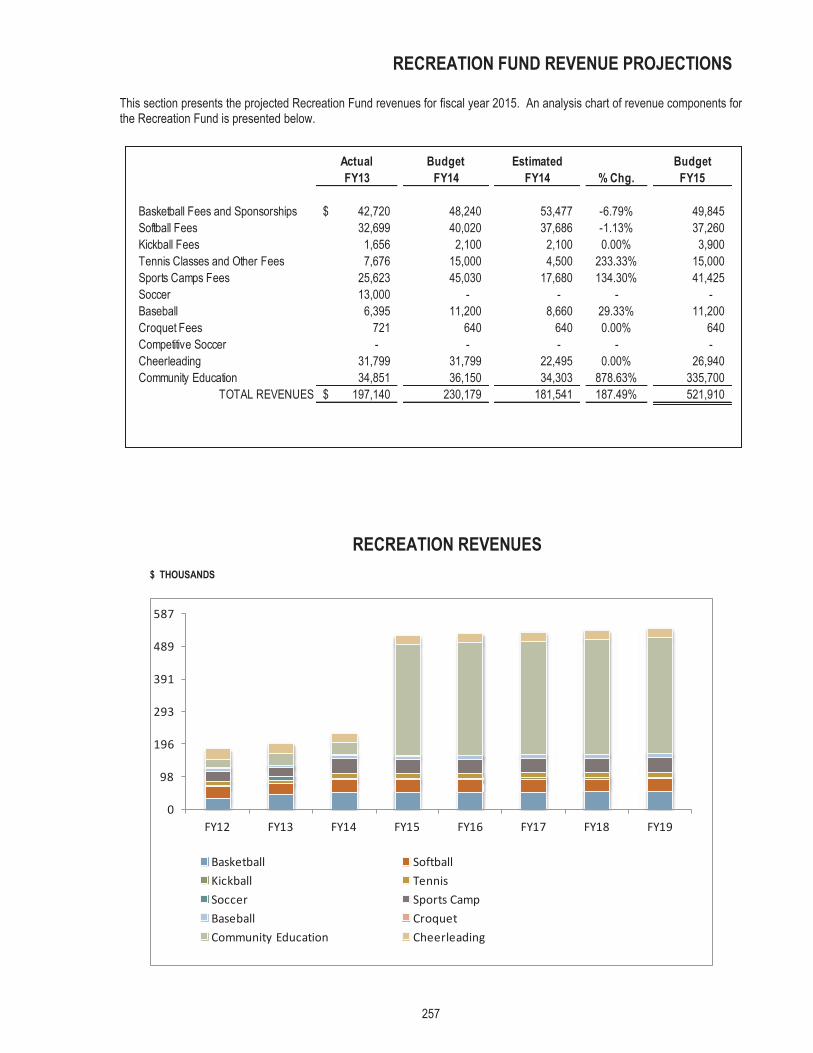
257
RECREATION FUND REVENUE PROJECTIONS
This section presents the projected Recreation Fund revenues for fiscal year 2015. An analysis chart of revenue components for the Recreation Fund is presented below.
0
98
196
293
391
489
587
FY12 FY13 FY14 FY15 FY16 FY17 FY18 FY19
Basketball SoftballKickball TennisSoccer Sports CampBaseball CroquetCommunity Education Cheerleading
RECREATION REVENUES $ THOUSANDS
Actual Budget Estimated BudgetFY13 FY14 FY14 % Chg. FY15
Basketball Fees and Sponsorships 42,720$ 48,240 53,477 -6.79% 49,845 Softball Fees 32,699 40,020 37,686 -1.13% 37,260 Kickball Fees 1,656 2,100 2,100 0.00% 3,900 Tennis Classes and Other Fees 7,676 15,000 4,500 233.33% 15,000 Sports Camps Fees 25,623 45,030 17,680 134.30% 41,425 Soccer 13,000 - - - - Baseball 6,395 11,200 8,660 29.33% 11,200 Croquet Fees 721 640 640 0.00% 640 Competitive Soccer - - - - - Cheerleading 31,799 31,799 22,495 0.00% 26,940 Community Education 34,851 36,150 34,303 878.63% 335,700
TOTAL REVENUES 197,140$ 230,179 181,541 187.49% 521,910

258
REVENUE ANALYSIS AND PROJECTIONS RATIONALE
Basketball Fees and Sponsors $49,845 Youth participant fees are $110 per player for residents and $154 for non-residents. The league is expecting over 350 youth participants, due to forming a high school age league and an increase in Challenger league. Softball Fees $37,260 This category includes adult softball teams with various divisions including men, women and coed. Eighty-seven teams are expected at a fee of $460 per team. Kickball Fees $3,900 Revenues are generated through seven expected Adult coed kickball teams participating in our league at a fee of $300 per team. Tennis Classes and Rentals $15,000 Revenues generated through leagues, lessons, and tournaments. Sports Camps $41,425 Revenues are generated through Sports Camps for Grizzlies Basketball ($125-150), Baseball ($150) and Lacrosse ($165). Baseball Fees $11,200 This category includes seven adult baseball teams at $1,600 per team. Croquet $640 Revenue generated through lessons, leagues, and tournaments, as well as court rentals. Cheerleading $26,940 Revenue generated through lessons, leagues, and tournaments, as well as court rentals. Community Education $335,700 Revenue for this account comes from educational courses and after school activities including a new after school care program with Germantown Municipal School District created in FY15.

259
GERMANTOWN ATHLETIC CLUB PROJECTIONS
This section presents the projected Germantown Athletic Club Fund revenues for FY15. The graph of revenue components and projected trends through FY19 is presented on the next page.
Actual Budget Estimated BudgetFY13 FY14 FY14 % Chg. FY15
Membership Fees 3,098,316$ 3,000,000 3,200,000 1.56% 3,250,000 Membership Application Fee 80,972 75,000 83,000 -3.61% 80,000 Daily Fees 11,811 12,000 13,000 -7.69% 12,000 Classes - Club Programs 59,784 47,000 56,000 7.14% 60,000 Classes - Contract Programs 27,504 27,190 30,000 -20.00% 24,000 Concessions - Recreation 71,765 65,000 70,000 0.00% 70,000 Rent - Taxable Recreation 4,408 3,000 7,500 6.67% 8,000 Rent - Nontaxable Business 79,222 79,222 79,222 0.00% 79,222 Rent - Nontaxable Recreation 9,389 7,000 9,500 0.00% 9,500 Non-Member Surcharge 7,367 8,000 5,000 60.00% 8,000 Other Revenues 1,911 2,000 1,500 0.00% 1,500 Nursery 395 350 250 -40.00% 150 Fitness Programs 140 - - - - Swim Team 94,261 80,000 90,000 -5.56% 85,000 Swimming Lessons 57,951 57,000 52,000 5.77% 55,000 Swim Meet Fees 20,036 17,500 18,303 -1.66% 18,000 Aquatics Rental 3,818 6,000 5,500 -9.09% 5,000 Personal Trainer 255,198 369,460 243,000 15.23% 280,000 Pro Shop 11,052 13,000 10,000 30.00% 13,000 Catered Events 6,100 8,000 5,500 45.45% 8,000
OPERATING REVENUES 3,901,400$ 3,876,722 3,979,275 2.19% 4,066,372
Investment Income 6,009$ 6,650 2,788 25.54% 3,500 Credit Card Over/Short 236 500 (92) -643.48% 500 Surplus Equip Sale - GovDeals - - - - -
NONOPERATING REVENUES 6,245$ 7,150$ 2,696$ 48.37% 4,000$

260
REVENUE ANALYSIS AND PROJECTIONS RATIONALE
$ MILLIONS
Membership Fees
$3,250,000
Membership fee revenues are based on an average annual membership of 5,840. The membership fee structure includes adult/couple/adult + 1/family/ youth (16 & 17)/senior (62+) and senior couple.
Membership Application Fees
$80,000
Membership application fee revenues are based on a $59-$99 nonrefundable, administrative, processing fee.
Daily Fees $12,000
Based on daily guest fees to residents and nonresidents for use of the Germantown Athletic Club.
Classes – Club Programs $60,000
Staff organized programs such as: group exercise special events, Gobble Wobble, Luau, kids programs, Father/daughter dance, dodge ball, etc.
Classes – Contract Programs $24,000
Taekwondo, Ballroom dancing, summer camps, winter camps.
Concessions - Recreation $70,000
Profits received from the sale of food/menu items at the Germantown Athletic Club concessions that include birthday parties.
Rent – Taxable Recreation $8,000
Revenue received for rental of GAC rooms.
Rent – Nontaxable Business $79,222
Revenue received from space rented/leased to the Great Hall for occupancy.
Rent – Nontaxable Recreation $9,500
Revenue received from gym or other room rentals.
0
1
2
3
4
5
FY12 FY13 FY14 FY15 FY16 FY17 FY18 FY19
Recreation Aquatics Personal Training Concession Transfer In
GERMANTOWN ATHLETIC CLUB OPERATING REVENUES

261
REVENUE ANALYSIS AND PROJECTIONS RATIONALE
Non-Member Surcharge $8,000 Revenue collected from non-member participation in programs. Other Revenues $1,500 This line includes revenue from food and drink machines at the Germantown Athletic Club, purchase of replacement ID and return check fees. Credit Card Short/Over $500 This account records cash overage and shortage. Nursery
$150
Income generated from kids klub and kids zones. Swim Team $85,000 Includes charges for participants in the Swim Team, Masters Swim Team and coaching clinic. Swimming Lessons $55,000 Includes charges for all regular and special swimming lessons. Swim Meet Fees $18,000 Revenues generated from hosting United States Swimming Meets and Memphis Swim Conference Meets. Aquatics Rental $5,000 Income generated from rentals of lanes and open swim for the indoor and outdoor pools. Personal Trainer $180,000 Revenue generated from personal training and pilates sessions. Club Training $100,000 Revenue generated from staff personal trainers. Pro Shop $13,000 Revenues from the sale of Germantown Athletic Club merchandise. Catered Events $8,000 Profits received from the sale of food/menu items for birthday parties. Investment Income $3,500 Interest earned on available cash from investments in the State of Tennessee LGIP account.

262
GREAT HALL PROJECTIONS
This section presents the projected Great Hall Fund revenues for FY15. Rent - Business
$350,834
Revenue received from the Great Hall rentals. These rentals include the multi-media room and Great Hall & Conference Center banquet rooms. Other Revenue $6,308 Revenue received from use of the dance floor, linens, pipe and drape easels, microphones. Catering -Taxable
$40,740
Profits received from the sale of food/menu items at the Great Hall & Conference Center. Catering –Nontaxable
$118
Food items sold to nontaxable organizations at the Great Hall & Conference Center.
Actual Budget Estimated BudgetFY13 FY14 FY14 % Chg. FY15
Rent - Business 271,407$ 256,700 341,100 2.85% 350,834 Other Revenues 33,920 43,400 6,125 2.99% 6,308 Catering-Taxable 2,635 5,200 2,660 1431.58% 40,740 Catering-Nontaxable 241 378 115 2.61% 118
OPERATING REVENUES 308,203$ 305,678 350,000 13.71% 398,000
Investment Income 22$ - - - - Credit Card Over/Short - - - - -
NONOPERATING REVENUES 22$ - - - -
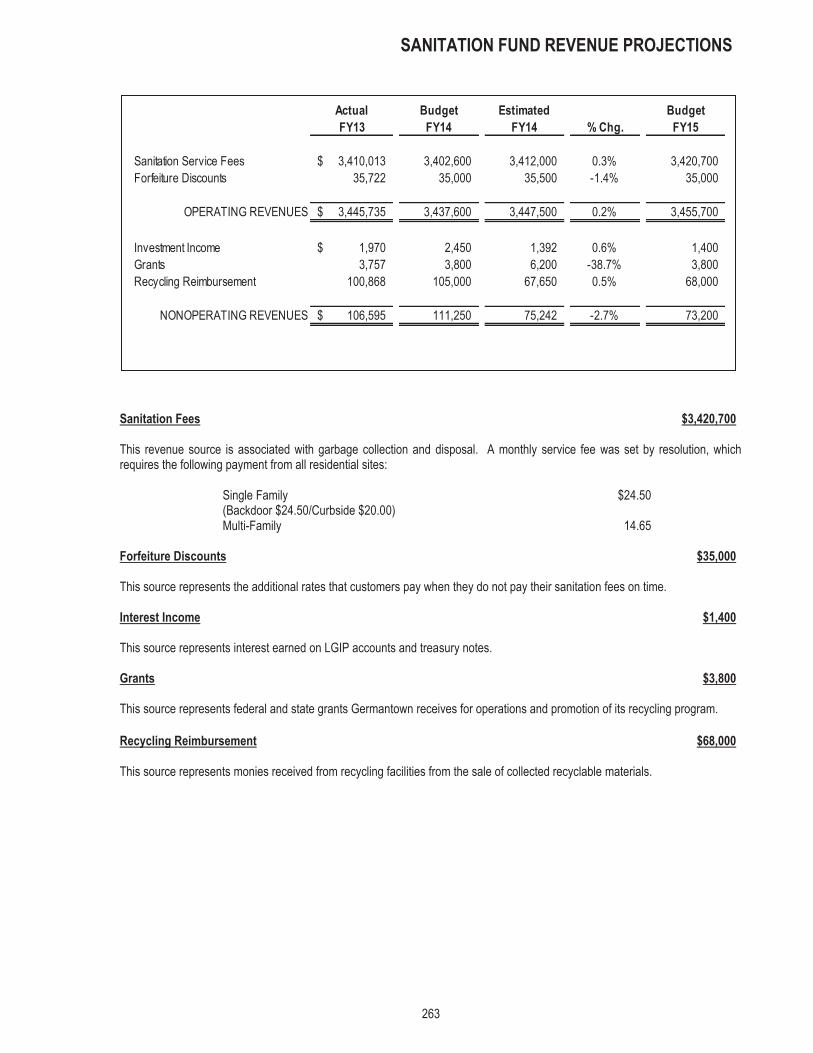
263
SANITATION FUND REVENUE PROJECTIONS
Sanitation Fees $3,420,700 This revenue source is associated with garbage collection and disposal. A monthly service fee was set by resolution, which requires the following payment from all residential sites:
Single Family (Backdoor $24.50/Curbside $20.00)
$24.50
Multi-Family 14.65 Forfeiture Discounts $35,000 This source represents the additional rates that customers pay when they do not pay their sanitation fees on time. Interest Income $1,400 This source represents interest earned on LGIP accounts and treasury notes. Grants $3,800 This source represents federal and state grants Germantown receives for operations and promotion of its recycling program. Recycling Reimbursement $68,000 This source represents monies received from recycling facilities from the sale of collected recyclable materials.
Actual Budget Estimated BudgetFY13 FY14 FY14 % Chg. FY15
Sanitation Service Fees 3,410,013$ 3,402,600 3,412,000 0.3% 3,420,700 Forfeiture Discounts 35,722 35,000 35,500 -1.4% 35,000
OPERATING REVENUES 3,445,735$ 3,437,600 3,447,500 0.2% 3,455,700
Investment Income 1,970$ 2,450 1,392 0.6% 1,400 Grants 3,757 3,800 6,200 -38.7% 3,800 Recycling Reimbursement 100,868 105,000 67,650 0.5% 68,000
NONOPERATING REVENUES 106,595$ 111,250 75,242 -2.7% 73,200

264
STORMWATER MANAGEMENT FUND REVENUE PROJECTIONS
This revenue source represents a set fee designated to cover the costs of the stormwater management program. The fee charged to residents and commercial properties is based on a gross area methodology.
This fee covers the cost of review for stormwater permit for new construction with homebuilders.
Stormwater Management Fee $1,002,752
Stormwater Permits $9,000
Actual Budget Estimated BudgetFY13 FY14 FY14 % Chg. FY15
Stormwater Management Fee 982,426$ 1,051,800 983,090 2.00% 1,002,752 Stormwater Permits 12,510 5,500 9,180 -1.96% 9,000
OPERATING REVENUES 994,936$ 1,057,300 992,270 1.96% 1,011,752
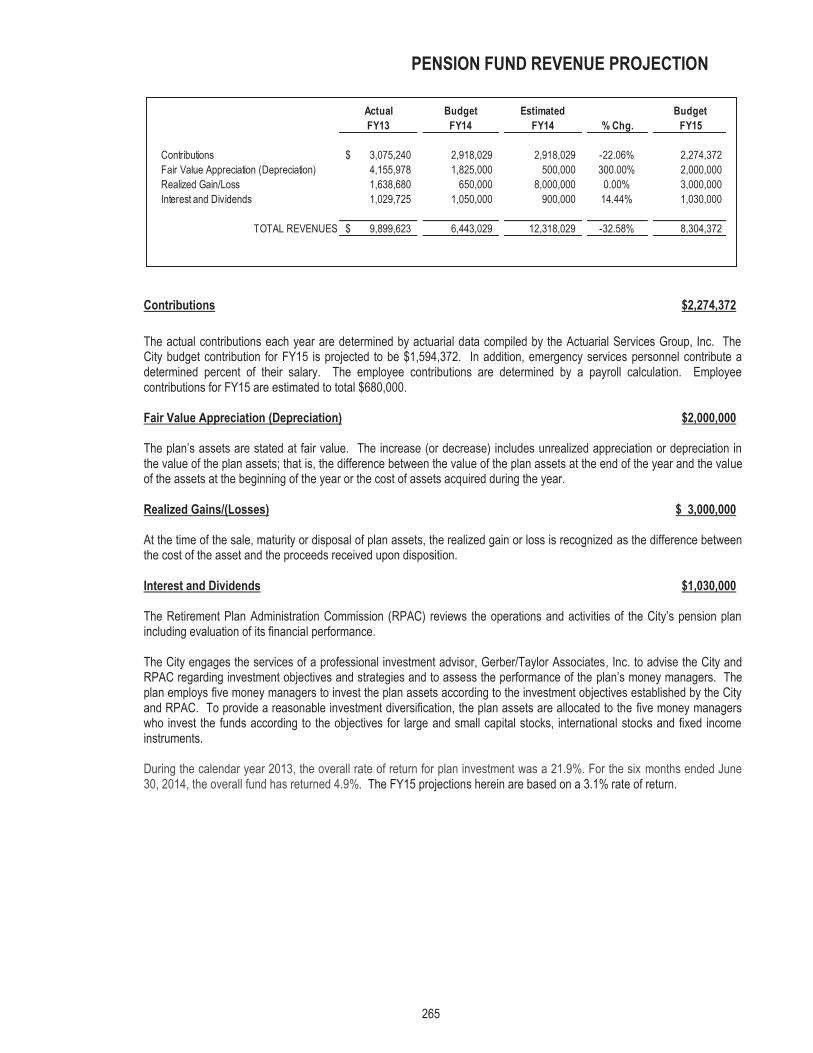
265
PENSION FUND REVENUE PROJECTIONNS
Contributions $2,274,372
The actual contributions each year are determined by actuarial data compiled by the Actuarial Services Group, Inc. The City budget contribution for FY15 is projected to be $1,594,372. In addition, emergency services personnel contribute a determined percent of their salary. The employee contributions are determined by a payroll calculation. Employee contributions for FY15 are estimated to total $680,000. Fair Value Appreciation (Depreciation) $2,000,000
The plan’s assets are stated at fair value. The increase (or decrease) includes unrealized appreciation or depreciation in the value of the plan assets; that is, the difference between the value of the plan assets at the end of the year and the value of the assets at the beginning of the year or the cost of assets acquired during the year. Realized Gains/(Losses) $ 3,000,000
At the time of the sale, maturity or disposal of plan assets, the realized gain or loss is recognized as the difference between the cost of the asset and the proceeds received upon disposition. Interest and Dividends $1,030,000
The Retirement Plan Administration Commission (RPAC) reviews the operations and activities of the City’s pension plan including evaluation of its financial performance. The City engages the services of a professional investment advisor, Gerber/Taylor Associates, Inc. to advise the City and RPAC regarding investment objectives and strategies and to assess the performance of the plan’s money managers. The plan employs five money managers to invest the plan assets according to the investment objectives established by the City and RPAC. To provide a reasonable investment diversification, the plan assets are allocated to the five money managers who invest the funds according to the objectives for large and small capital stocks, international stocks and fixed income instruments. During the calendar year 2013, the overall rate of return for plan investment was a 21.9%. For the six months ended June 30, 2014, the overall fund has returned 4.9%. The FY15 projections herein are based on a 3.1% rate of return.
Actual Budget Estimated BudgetFY13 FY14 FY14 % Chg. FY15
Contributions 3,075,240$ 2,918,029 2,918,029 -22.06% 2,274,372 Fair Value Appreciation (Depreciation) 4,155,978 1,825,000 500,000 300.00% 2,000,000 Realized Gain/Loss 1,638,680 650,000 8,000,000 0.00% 3,000,000 Interest and Dividends 1,029,725 1,050,000 900,000 14.44% 1,030,000
TOTAL REVENUES 9,899,623$ 6,443,029 12,318,029 -32.58% 8,304,372
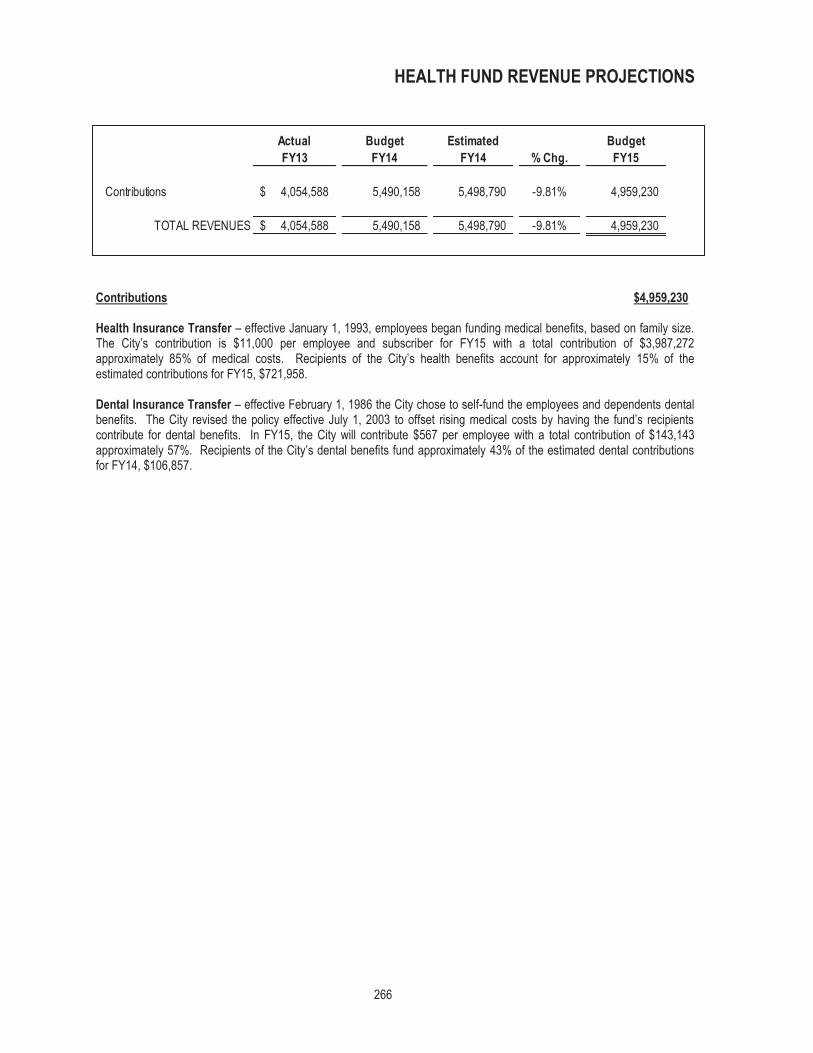
266
HEALTH FUND REVENUE PROJECTIONS
Contributions $4,959,230
Health Insurance Transfer – effective January 1, 1993, employees began funding medical benefits, based on family size. The City’s contribution is $11,000 per employee and subscriber for FY15 with a total contribution of $3,987,272 approximately 85% of medical costs. Recipients of the City’s health benefits account for approximately 15% of the estimated contributions for FY15, $721,958. Dental Insurance Transfer – effective February 1, 1986 the City chose to self-fund the employees and dependents dental benefits. The City revised the policy effective July 1, 2003 to offset rising medical costs by having the fund’s recipients contribute for dental benefits. In FY15, the City will contribute $567 per employee with a total contribution of $143,143 approximately 57%. Recipients of the City’s dental benefits fund approximately 43% of the estimated dental contributions for FY14, $106,857.
Actual Budget Estimated BudgetFY13 FY14 FY14 % Chg. FY15
Contributions 4,054,588$ 5,490,158 5,498,790 -9.81% 4,959,230
TOTAL REVENUES 4,054,588$ 5,490,158 5,498,790 -9.81% 4,959,230

267
OPEB FUND REVENUE PROJECTIONS
Contributions $920,357
Starting in FY09, the City began funding Other Post-employment Benefits (OPEB). This represents the City’s Annual Required Contribution (ARC) as determined actuarially and is required by the Governmental Accounting Standard Board Statement 45. In addition, retirees who participate in OPEB contribute monthly to the Fund. Fair Value Appreciation (Depreciation) $150,000
The plan’s assets are stated at fair value. The increase (or decrease) includes unrealized appreciation or depreciation in the value of the plan assets; that is, the difference between the value of the plan assets at the end of the year and the value of the assets at the beginning of the year or the cost of assets acquired during the year. Realized Gain/Loss $300,000
This is the actual gain/loss on the sale of mutual funds. Interest and Dividends $60,000
The Other Postemployment Benefits Commission (OPEBC) reviews the operations and activities of the City’s OPEB plan including evaluation of its financial performance. The City engages the services of a professional investment advisor, Gerber/Taylor Associates, Inc. to advise the City and OPEBC regarding investment objectives and strategies and to assess the performance of the plan’s money managers. The plan employs six money managers to invest the plan assets according to the investment objectives established by the City and OPEBC. To provide a reasonable investment diversification, the plan assets are allocated to the five money managers who invest the funds according to the objectives for large and small capital stocks, international stocks and fixed income instruments. During the calendar year end the overall rate of return for the plan investment was 20.8%. For the six months ended June 30, 2014 the overall fund has returned 4.9%. The FY15 projections herein are based on a 2.4% rate of return.
Actual Budget Estimated BudgetFY13 FY14 FY14 % Chg. FY15
Contributions 1,601,214$ 920,357 913,197 0.78% 920,357 Fair Value Appreciation 365,920 300,000 10,000 1400.00% 150,000 Realized Gain/Loss 80,192 80,000 60,000 0.00% 300,000 Interest and Dividends 59,462 76,000 60,000 0.00% 60,000
TOTAL REVENUES 2,106,788$ 1,376,357 1,043,197 37.11% 1,430,357

268
CASH BALANCE FUND REVENUE PROJECTIONS
Contributions $126,718
Contributions to the Cash Balance Fund have two components. The City employees hired after July 1, 2013 are required to contribute 5% of wages. The City matches the employee contribution at year end. Fair Value Appreciation (Depreciation) $7,513
The plan’s assets are stated at fair value. The increase (or decrease) includes unrealized appreciation or depreciation in the value of the plan assets; that is, the difference between the value of the plan assets at the end of the year and the value of the assets at the beginning of the year or the cost of assets acquired during the year. Realized Gain/(Losses) $3,013
At the time of the sale, maturity or disposal of plan assets, the realized gain or loss is recognized as the difference between the cost of the asset and the proceeds received upon disposition. Interest and Dividends $4,519
The Other Postemployment Benefits Commission (OPEBC) reviews the operations and activities of the City’s Cash Balance including evaluation of its financial performance. The City engages the services of a professional investment advisor, Gerber/Taylor Associates, Inc. to advise the City and RPAC regarding investment objectives and strategies and to assess the performance of the plan’s money managers. The FY15 projections herein are based on a 5% rate of return.
Actual Budget Estimated BudgetFY13 FY14 FY14 % Chg. FY15
Contributions -$ - 21,602 486.60% 126,718 Fair Value Appreciation (Depreciation) - - - 100% 7,531 Realized Gain/Loss - - - 100% 3,013 Interest and Dividends - - - 100% 4,519
TOTAL REVENUES -$ - 21,602 556.33% 141,781
269
SUMMARY OF SIGNIFICANT ACCOUNTING POLICIES
NOTE 1 from June 30, 2013 Comprehensive Annual Financial Report condensed: Reporting entity The City of Germantown, Tennessee (the "City") was chartered in 1841 and incorporated in 1903 under the provisions of Chapter 550 of the Private Acts of the General Assembly of the State of Tennessee. The City operates under a Board of Mayor and Aldermen form of government. The Executive Branch is organized into the following departments: Finance and General Services, Development, Community Services, Fire, Police, Human Resources, Germantown Athletic Club, and Germantown Performing Arts Centre. As required by accounting principles generally accepted in the United States of America, these financial statements present the government and its component units, entities for which the government is considered to be financially accountable. The City’s one component unit has a June 30 year-end and their separate financial statements are available as indicated below. The significant accounting policies followed by the component unit are generally the same as those followed by the primary government. Discretely Presented Component Unit: Germantown Performing Arts Center (GPAC) – GPAC has a cooperative agreement with the City to carry out a performing arts program that will foster and promote theatrical and musical performances to the community at the Germantown Performing Arts Center. GPAC is dependent upon the City for providing payroll, utilities, and other expenses as well as the building used by GPAC, which is owned by the City. In-kind contributions made to GPAC by the City during 2013 totaled $984,060. Upon termination of this agreement, the City shall receive all assets and assume all liabilities of GPAC. GPAC is a 501(c)3 organization with separately issued financial statements which may be obtained from the Germantown Performing Arts Center, 1801 Exeter Road, Germantown, Tennessee 38138, (901)757-7500. Government-wide and fund financial statements The government-wide financial statements (i.e., the statements of net assets and the statement of activities) are designed to provide readers with a broad overview of the City’s finances, in a manner similar to a private-sector business. For the most part, the effect of interfund activity has been removed from these statements. Governmental activities, which normally are supported by taxes and intergovernmental revenues, are reported separately from business-type activities, which rely to a significant extent on fees and charges for support. The statement of net position presents information on all of the City’s assets, liabilities, and deferred inflows of resources, with the differences presented as a net position. Net position is reported as one of three categories: net investment in capital assets; restricted; or unrestricted. Restricted net position is further classified as either net position restricted by enabling legislation or net position that is otherwise restricted. The statement of activities demonstrates the degree to which the direct expenses of a given function or segment are offset by program revenues. Direct expenses are those that are clearly identifiable with a specific function or segment. Program revenues include 1) charges to customers or applicants who purchase, use, or directly benefit from goods, services, or privileges provided by a given function or segment and 2) grants and contributions that are restricted to meeting the operational or capital requirements of a particular function or segment. Taxes and other items not properly included among program revenues are reported instead as general revenues. Separate financial statements are provided for governmental funds, proprietary funds, and fiduciary funds, even though the latter are excluded from the governmental-wide financial statements. Major individual governmental funds and major individual enterprise funds are reported as separate columns in the fund financial statements. The City has one component unit, the Germantown Performing Arts, for which the financial information is reported separately from the information presented for the primary government. Measurement focus, basis of accounting, and financial statement presentation The government-wide and fiduciary financial statements are reported using the economic resources measurement focus and the accrual basis of accounting, as are the proprietary fund statements. Revenues are recognized when earned and expenses are recognized at the time when liabilities are incurred, regardless of when the related cash transaction takes place. Nonexchange transactions, in which the City gives or receives value without directly receiving or giving equal value in exchange, include property taxes, grants and donations. On an accrual basis, revenue from property taxes is recognized in the fiscal year for which

270
SUMMARY OF SIGNIFICANT ACCOUNTING POLICIES
the taxes are levied. Revenue from grants and donations are recognized in the fiscal year in which all eligibility requirements have been satisfied. Government fund financial statements are reported using the current financial resources measurement focus and the modified accrual basis of accounting. Revenues are recognized as soon as they are both measurable and available. Revenues are considered to be available when they are collectible within the current period or soon enough thereafter to pay liabilities of the current period. For this purpose, the City considers revenues to be available if they are collected within 60 days of the end of the current fiscal period. Expenditures generally are recorded when a liability is incurred, as under accrual accounting. However, debt service expenditures, as well as expenditures related to compensated absences and claims and judgments, are recorded only when payment is due. Property taxes, franchise taxes, licenses, and interest associated with the current fiscal period are all considered to be susceptible to accrual and so have been recognized as revenues of the current fiscal period. Licenses and permits, fines and forfeitures, and miscellaneous revenues (except for investment earnings) are considered to be measurable and available only when cash is received by the City. The City reports the following major governmental funds:
The General Fund is the primary operating fund of the City and accounts for all financial resources of the general government not specifically provided for in other funds. Most of the essential governmental services such as police and fire protection, community services, and general administration are reported in the General Fund. The Capital Projects – Major Roads Fund accounts for the acquisition and construction of major roads. The primary funding source is bond proceeds and federal and state grants.
The City reports the following major proprietary funds:
The Utility Fund accounts for water and sewer fees in connection with the operation of the City's water and sewer system. The proceeds of several bond issues and intergovernmental loans have been used specifically for the construction or acquisition of water and sewer systems and facilities. Since it is the intention of the City to repay these bonds and loans through the operations of this fund, these obligations are classified as debt of this fund.
The Germantown Athletic Club Fund accounts for the operations of the Germantown Athletic Club, a recreation and cultural facility. The Athletic Club facility was financed through general obligation bonds and General Fund transfers. The City's intent is to operate the facility in a manner in which revenues cover operating expenses plus depreciation of the facility. However, the outstanding debt is to be paid by the General Fund and is therefore not carried as debt of the Germantown Athletic Club Fund. The General Fund made an advance to the Athletic Club facility for a 20-year term. The Sanitation Fund accounts for all expenditures and revenues associated with garbage collection and disposal.
Additionally, the City reports the following fund types:
Internal service funds account for health insurance and vehicle maintenance services provided to other departments or agencies of the government on a cost reimbursement basis. Fiduciary Fund Types include Pension and Other Employee Benefit Trust Funds and Agency Funds. The Pension and Other Employee Benefit Trust Funds and Agency Funds are used to account for assets held by the City in a trustee capacity or as an agent for individuals, private organizations and other governments. Pension and Other Employee Benefit Trust Funds are accounted for on the accrual basis. Agency Funds are custodial in nature (assets equal liabilities) and generally are accounted for on the cash basis, which approximates the modified accrual basis of accounting.
The Pension Fund, a pension and other employee benefit trust fund, is used to account for the accumulation of resources to be used to provide defined retirement benefits to all qualified employees upon retirement. The Other Post Employment Benefits Fund, a pension and other employee benefit trust fund, is used to account for the accumulation of resources to be used to provide health and dental benefits to all qualified retired employees.
271
SUMMARY OF SIGNIFICANT ACCOUNTING POLICIES
The Bail Deposit Fund, an agency fund, is used to account for bail funds deposited by persons awaiting trial in City Court. The fund is purely custodial and thus does not involve measurement of results of operation.
Private-sector standards of accounting and financial reporting issued prior to December 1, 1989, generally are followed in both the government-wide and proprietary fund financial statements to the extent that those standards do not conflict with or contradict guidance of the Governmental Accounting Standards Board. Governments also have the option of following subsequent private-sector guidance for their business-type activities and enterprise funds, subject to this same limitation. The City has elected not to follow subsequent private-sector guidance. As a general rule the effect of interfund activity has been eliminated from the government – wide financial statements. Amounts reported as program revenues include 1) charges to customers or applicants for goods, services, or privileges provided, 2) operating grants and contributions, and 3) capital grants and contributions. Internally dedicated resources are reported as general revenues rather than as program revenues. Likewise, general revenues include all taxes. Proprietary funds distinguish operating revenues and expenses from non-operating items. Operating revenues and expenses generally result from providing services and producing and delivering goods in connection with a proprietary fund’s principal ongoing operations. The principal operating revenues of the Utility Fund, Athletic Club Fund, Sanitation Fund, Great Hall Fund, and Stormwater Fund are charges to customers for sales and services. The Utility Fund also recognizes, as operating revenue, the portion of tap fees intended to recover the cost of connecting new customers to the system. Operating expenses for enterprise funds and internal service funds include the cost of sales and services, administrative expenses and depreciation on capital assets. All revenues and expenses not meeting this definition are reported as non-operating revenues and expenses. When an expenditure is incurred for purposes for which both restricted and unrestricted (committed, assigned, or unassigned) amounts are available, it is the policy of the City to generally consider restricted amounts to have been reduced first. When an expenditure is incurred for purposes for which amounts in any of the unrestricted fund balance classifications could be used, it is the policy of the City that committed amounts would be reduced first, followed by assigned amounts, and then unassigned amounts. In both instances, when a proposed expenditure is made with specific balances identified as the source of the funding, that specific fund balance will be used. The City has implemented GASB 54, Fund Balance Reporting and Governmental Fund Type Definitions. In the fund financial statements, governmental funds report the following classifications of fund balance:
Nonspendable – amounts that cannot be spent either because they are either in a (a)nonspendable form, including items not expected to be converted to cash, or (b) legally or contractually required to be maintained intact.
Restricted – amounts constrained to be used for a specific purpose as per external parties, constitutional provision, or enabling legislation.
Committed – amounts constrained to be used for specific purposes as per action by the Board of Mayor and Aldermen. Amounts classified as committed are not subject to legal enforceability like restricted resources; however, they cannot be used for any other purpose unless the Board removes or changes the commitment by taking the same action it employed to impose the commitment.
Assigned – amounts intended to be used by the City for specific purposes, but are neither restricted nor committed. The intent shall be expressed by the Board of Mayor and Aldermen or an official delegated the authority to assign by the Board of Mayor and Aldermen for a specific purpose in accordance with the policy established by the Board of Mayor and Aldermen. The nature of the actions necessary to remove or modify an assignment is not as rigid as required under a committed fund balance classification.
Unassigned – amounts available for any purpose in the General Fund.
272
SUMMARY OF SIGNIFICANT ACCOUNTING POLICIES
Assets, liabilities and fund equity 1. Deposits and investments The City considers all highly liquid investments with an original maturity of three months or less when purchased to be cash and cash equivalents. State statutes authorize the City to invest in obligations of the U.S. Treasury, commercial paper, corporate bonds, repurchase agreements, and the State Treasurer’s Investment Pool. Investments are stated at fair value. Cash equivalents held by the trustee of the Pension Fund and the Other Post Employment Benefits Fund are included in cash and cash equivalents. 2. Receivables and payables Activity between funds that are representative of lending/borrowing arrangements outstanding at the end of the fiscal year are referred to as either “due to/from other funds” (i.e., the current portion of interfund loans) or “advances to/from other funds” (i.e., the non-current portion of interfund loans). All other outstanding balances between funds are reported as “due to/from other funds.” Any residual balances outstanding between the governmental activities and business-type activities are reported in the government-wide financial statements as “internal balances.” Advances between funds, as reported in the fund financial statements, are offset by a fund balance reserve account in applicable governmental funds to indicate that they are not available for appropriation and are not expendable available financial resources. All trade and property taxes receivable are shown net of an allowance for uncollectibles. Taxes are due December 1 (levy date) and are considered delinquent after February 28 (lien date), at which time penalties and interest are assessed. 3. Inventories Inventories are valued at cost (first-in, first-out). Inventory in all funds consists of expendable supplies held for consumption. In the General Fund, the cost is recorded as an asset at the time individual inventory items are purchased. The reserve for inventories in the General Fund represents a portion of the fund balance that is applicable to future accounting periods. 4. Restricted assets Restricted assets in proprietary funds represent cash on deposit with paying agents primarily restricted for the principal and interest requirements of long-term debt. 5. Capital assets Capital assets, which include property, plant, equipment, and infrastructure assets (e.g., streets, bridges, sidewalks, and similar items), are reported in the applicable governmental or business-type activities columns in the government-wide financial statements. Such assets in excess of $5,000 are recorded at historical cost or estimated historical cost if purchased or constructed. Contributed capital assets are recorded at estimated fair market value at the date received. The costs of normal maintenance and repairs that do not add to the value of the asset or materially extend assets lives are not capitalized. Major outlays for capital assets and improvements are capitalized as projects are constructed. Property, plant and equipment of the primary government is depreciated using the straight-line method over the following estimated useful lives:
Buildings 25-50 years Improvements 10-60 years Infrastructure 50 years Machinery and equipment 3-15 years

273
SUMMARY OF SIGNIFICANT ACCOUNTING POLICIES
6. Compensated absences Compensated absences for accumulated unpaid vacation are accrued when incurred in all funds. Employees earn 10 or more days of vacation each year depending on length of service. The amount does not exceed the guidelines of the City Policy. A liability for these amounts is reported in governmental funds only if they have matured, for example, as a result of employee resignations and retirements. Compensated absences are paid out of the employee’s cost center. Accumulated unpaid overtime is also accrued when incurred in all funds. Sick leave is not accrued except at the governmental-wide presentation. 7. Post Employment Benefits In addition to providing pension benefits, the City provides health insurance coverage for current and future retirees and their spouses as described at Note 10. 8. Long-term obligations In the governmental-wide financial statements, and proprietary fund types in the fund financial statements, long-term debt and other long-term obligations are reported as liabilities in the applicable governmental activities, business-type activities, or proprietary fund type statement of net position. Bond premiums and discounts, as well as issuance costs, are deferred and amortized over the life of the bonds using the effective interest method. Bonds payable are reported net of the applicable bond premium or discount. Bond issuance costs are reported as deferred charges and amortized over the term of the related debt in the governmental activities and reported as a reduction of long-term debt in the proprietary funds. In governmental fund financial statements, bond premiums, discounts, and issuance costs are recognized in the current period. The face amount of the debt is reported as other financing sources. Premiums received on debt issuance are reported as other financing sources while discounts are reported as other financing uses. Issuance costs are reported as debt issuance expenditures. 9. Deferred inflows of resources In addition to liabilities, the statement of net position reports a separate section for deferred inflows of resources. This separate financial statement element, deferred inflows of resources, represents an increase to net position that applies to a future period and is not recognized as an inflow of resources (revenue) until that time. The City only has one type of item that qualifies for reporting in this category. The item is amounts in the governmental funds that were receivable and measurable at year-end but were not available to finance expenditures for the current year. This includes unavailable revenues from property taxes. 10. Fair Value Measurement Generally accepted accounting principles define fair value, establishes a framework for measuring fair value, and establishes a fair value hierarchy which prioritizes the inputs to valuation techniques. Fair value is defined as the price that would be received to sell an asset or paid to transfer a liability in an orderly transaction between market participants at the measurement date. The fair value hierarchy prioritizes the inputs to valuation techniques used to measure fair value into the following three broad levels:
Level 1 – Quoted prices in active markets for identical assets or liabilities the City has the ability to access. Level 2 – Inputs (other than quoted prices within level 1) that are observable for the asset or liability, either directly or
indirectly. Level 3 – Inputs which are unobservable for the asset or liability and rely on management’s own assumptions about the
assumptions that market participants would use in pricing the asset or liability.
For assets and liabilities that are measured at fair value on a recurring basis, this statement requires disclosure of information that enables financial statement users to assess the inputs used to develop those measurements. The only assets the City measures at fair value on a recurring basis are investments. See Note 4 for the required disclosure information.

274
GLOSSARY OF TERMS
Accrual Basis Adopted Budget Appraised Value Appropriation Balanced Budget BMA Bond(s) Budget Budget Appropriation Ordinance Budget Calendar Budget Document CAFR Capital Outlay Capital Projects CIP Contingency Fund
A method of accounting in which each item is entered as it is earned or incurred regardless of when actual payments are received or made. The budget approved by the BMA and enacted by budget appropriation ordinance, on or before June 30 of each year. The estimate of fair market value assigned to property by an appraiser or tax assessor. For tax assessment purposes such value is stated as of the last countywide reappraisal date. An authorization made by the BMA, which permits the City administrative staff to incur obligations against and to make expenditures of governmental resources. Appropriations are usually made for fixed amounts and are typically granted for a one-year period. A balanced budget occurs when the total sum of money a government collects in a year is equal to the amount it spends on goods, services, and debt interest/principal. Board of Mayor and Alderman. A certificate of debt (usually interest-barring or discounted) that is issued by a government or corporation in order to raise money. A plan of financial operations comprised of an estimate of expenditures for a fiscal year and the means of financing those expenditures (revenue estimates). The official enactment by the BMA establishing the legal authority for City administrative staff to obligate and expend funds. The schedule of key dates or milestones that the City follows in the calendar preparation and adoption of the budget. The official written statement prepared by the City’s staff that presents the budget to the BMA. Comprehensive Annual Financial Report. The purchase of items of significant value (more than $5,000) and having a useful life of several years, also referred to as fixed assets. Projects established to account for the cost of capital improvements. Typically a capital project encompasses a purchase of land and/or the construction of or improvements to a building or infrastructure. Capital Improvements Program. A budgetary reserve set aside for emergencies or unforeseen expenditures not otherwise budgeted.

275
GLOSSARY OF TERMS
An organizational budget and operating unit within a City department. Payment of interest and repayment of principal on City debt. A noncash expense that reduces the value of an asset as a result of wear and tear, age, or obsolescence. A management unit of closely associated City activities headed by a director or chief. The sum total of bonded debt issued by the City. A GFOA sponsored program award presented to a qualifying governmental unit that publishes a budget document that meets program criteria as a policy document, as an operations guide, as a financial plan and as a communications device. Emergency Medical Services. Emergency Medical Technician. A recorded expenditure commitment representing a contract to purchase goods or services. A type of proprietary fund used to account for the financing of goods or services to the public where all or most of the operating expenses involved are recovered in the form of user charges. This category includes the Germantown Centre Fund, the Great Hall Fund, the Utility Fund and the Sanitation Fund. The cost of goods received or services rendered whether payment for such goods and services has been made or not. Financial Advisory Commission – A citizen’s advisory committee made up of business executives and professionals from the community and one alderman. Financial Accounting Standards Board. Fiduciary funds account for assets held by the state in a trustee capacity or as an agent for individuals, private organizations, other governmental units and/or other funds. An accounting period extending from July 1 to the following June 30. A fiscal entity with a self-balancing set of accounts used to account for an activity(s) with common objectives. The cumulative excess of revenues over expenditures in a fund at a point in time. With certain limitations, a fund balance may be used to balance the subsequent year’s budget. Generally Accepted Accounting Principles are uniform standards and guidelines for financial accounting and reporting which govern the form and content of the basic financial statements of an entity.
Cost Center Debt Service Depreciation Department Direct Debt Distinguished Budget Presentation Award EMS EMT Encumbrance Enterprise Fund Expenditures FAC FASB Fiduciary Funds Fiscal Year (FY) Fund Fund Balance GAAP

276
GLOSSARY OF TERMS
The Governmental Accounting Standards Board, established in 1984 and comprised of five members, is the highest source of accounting and financial reporting guidance for state and local governments. The principal fund operating the City, it accounts for most of the financial resources of the government. General Fund revenues include property taxes, licenses and permits, local taxes, and other types of revenues. This fund usually includes most of the basic operating services, such as fire and police, finance, administration, parks and recreation and environmental services. When a government pledges its full faith and credit and unlimited taxing power for repayment of the bonds it issues. A GO Bond is typically used for long-term financing of capital projects and represents a written promise to pay to the bond purchaser a specified sum of money at a specified future date along with periodic interest paid at a specified interest percentage. Government Finance Officers Association of the United States and Canada. The underlying reason(s) for the provision of essential City services. Germantown Performing Arts Centre. Funds generally used to account for tax-supported activities. There are five different types of governmental funds: the general fund, special revenue funds, debt service fund, capital projects funds, and permanent funds. A contribution by a government or other organization to support a particular function. Grants may be classified as either categorical or block, depending upon the amount of discretion allowed the grantee. Amounts transferred from one fund to another. Revenue received from another government for general purposes or a special purpose. A type of proprietary fund used to account for the financing of goods or services provided by one City activity to other City activities on a cost-recovery basis. Infrastructure Replacement Program. Law Enforcement Assistance Administration, a grant or agency. An investment mechanism authorized by the 91st General Assembly, which enables all Tennessee municipalities, counties, school districts, utility districts or other local government units and political subdivisions to participate with the state in providing maximum opportunities for the investment of public funds. A budget summarizing the detailed categories of expenditures for goods and services the City intends to purchase during the fiscal year. Library Systems & Services, LLC. Governmental fund or enterprise fund reported as a separate column in the basic fund financial statements and subject to a separate opinion in the independent auditor’s report. The general fund is always a major fund. Otherwise, major funds are funds whose revenues, expenditures/expenses, assets, or liabilities (excluding extraordinary items) are at least 10 percent of corresponding totals for all governmental or enterprise funds and at least 5 percent of the aggregate amount for all governmental and enterprise funds for the same item.
GASB General Fund General Obligation (GO) Bonds GFOA Goal GPAC Governmental funds Grant Interfund Transfers Inter-governmental Revenue Internal Service IRP LEAA LGIP Line Item Budget LSSI Major fund

277
GLOSSARY OF TERMS Moody’s Investor Services, Inc. MSA Air Mask Objective MUNIES System Net Assets Objective PAFR Policy Agenda Program Change Proprietary Fund Proposed Budget Purchase Order Reserves Retained Earnings Revenue Risk Management RPAC SCAT
A recognized bond-rating agency. Mine Safety Appliance – used as a self-contained breathing apparatus. Municipal Impact Evaluation System. Total assets minus the total liabilities of an organization. A measurable statement of the actual results which a City activity expects to achieve in support of a stated goal. Popular annual financial reporting – Supplementary financial reporting designed to meet the special needs of interested parties who are either unable or willing to use the more detailed financial information provided in traditional comprehensive annual financial reports. The BMA’s long-range goals for the City of Germantown. Alteration or enhancement of current services or the provision of new services. A distinct business entity, which is responsible for its liabilities and entitled to its profits. The budget proposed by the city administrator to the BMA for adoption. A written legal document stating or confirming an offer to buy goods or services, which upon acceptance by a vendor becomes a contract. Its main function is to expedite and control buying by the City. An account used to indicate that a portion of a fund’s balance is legally restricted fro a specific purpose and is, therefore, not available for general appropriation. An equity account reflecting the accumulated earnings of an enterprise or internal service fund. A term used to represent actual or expected income to a specific fund. An organized attempt to protect a government’s assets against accidental loss in the most economical methods. The Retirement Plan Administrator Commission is a citizen advisory committee made up of three citizens, the Mayor, the city administrator, the finance director, and one alderman. Shelby County Automatic Tracking. This is the system used in Shelby County to track an individual through Shelby County Criminal Justice Center, which includes all warrants and local driving registration information.

278
GLOSSARY OF TERMS
SCBA Situs Standard & Poor’s Corp. Tax Levy Tax Rate TFIRS TGFOA TML TML Risk Management Pool Transmittal Letter TVA Un-encumbered Vision 2020
Self-contained breathing apparatus is a piece of firefighting equipment critical to the personal safety of the City’s Fire Department personnel. The allocation formula of State shared revenue based on the population of each local municipality as a percent of the State population. A recognized bond-rating agency. The total amount of tax that optimally should be collected based on tax rates and assessed values of personal and real properties. The level at which taxes are levied. The City of Germantown’s tax rate is $1.93 per $100 of assessed value for FY14. Tennessee Fire Incident Reporting System. Tennessee Government Finance Officers Association. Tennessee Municipal League - a voluntary, cooperative organization established by the cities and towns of the state for mutual assistance and improvement. Self-insurance pool formed in 1981 by the TML. A general discussion of the budget presented to the BMA by the City Administrator as a part of the budget document. The transmittal letter explains principal budget issues against the background of financial experience in recent years and presents recommendations made by the city administrator. Tennessee Valley Authority. The amount of an appropriation that is neither expended nor encumbered. It is essentially the amount of money still available for future purchases. Strategic plan for the City of Germantown formulated by the citizens and approved by the Board of Mayor and Aldermen

CITY OF GERMANTOWN CITIZEN BOARDS AND COMMISSIONS
279
The most important ingredient in creating and maintaining a quality environment for the community is the people. The City of Germantown is very fortunate to have caring and concerned citizens whom volunteer their time to serve on boards and commissions. There are 22 different groups of citizens who meet to discuss city business. They make suggestions to the Board of Mayor and Aldermen that shape the city’s future and they make decisions that set standards and goals for the community. The volunteers put much time, talent and hard work into the task at hand. Their continued commitment is the reason for the quality of life that is uniquely Germantown.
AUDIT COMMISSION
BEAUTIFICATION COMMISSION
BOARD OF ZONING APPEALS
DESIGN REVIEW COMMISSION
ECONOMIC DEVELOPMENT COMMISSION
EDUCATION COMMISSION
ENVIRONMENTAL COMMISSION
FINANCIAL ADVISORY COMMISSION
GERMANTOWN ATHLETIC CLUB COMMISSION
GREAT HALL ADVISORY COMMISSION
HISTORIC COMMISSION
INDUSTRIAL DEVELOPMENT BOARD
LIBRARY BOARD
NEIGHBORHOOD PRESERVATION COMMISSION
PARKS & RECREATION COMMISSION
PERSONNEL ADVISORY COMMISSION
PLANNING COMMISSION
PUBLIC SAFETY EDUCATION COMMISSION
RETIREMENT PLAN ADMINISTRATION COMMISSION
OTHER POST EMPLOYMENT BENEFIT COMMISSION
SENIOR CITIZENS ADVISORY COMMISSION

280