Budget - City of Rochester
553
City of Rochester, NY BUDGET 2009-2010 commitment unity hope
-
Upload
khangminh22 -
Category
Documents
-
view
0 -
download
0
Transcript of Budget - City of Rochester

City of Rochester, NY
Budget2009-2010
commitmentunityhope

City of Rochester VisionRochester will be the best mid-sized city in the U.S. in which to live,raise a family, visit and grow a business. Our city will be renowned for its safeneighborhoods, vibrant economy, educational excellence and customer service.
Our motivated employees take personal responsibility for serving our customers:residents, taxpayers, visitors and investors. We are guided by the following principles:
We conduct our professional duties with the utmost standards of ethics, transparency,professionalism and respect for our customers. Every action/decision is justifiable to ourcitizens. We always conduct ourselves “as if the world were watching.”
We deliver the highest quality, cost-efficient and most responsive services possibleto our customers. We judge our success on one basis: the extent to which we are thelocation of choice in our region to live, visit and conduct business.
We embrace our diverse internal teams and promote external partnerships withgovernmental, educational, business, nonprofit, neighborhood and faith-basedcommunity partners to the benefit of our customers.
We approach every work day with a sense of urgency and a desire to find innovativesolutions to our City’s challenges. Our motto is, “Oh yes, we can!”
City of Rochester Values and Guiding Principles
PERSONAL INTEGRITY
CUSTOMER FOCUS
COLLABORATION
“CAN DO” ATTITUDE
ACCOUNTABILITYWe set aggressive goals for customer satisfaction and continuously measure and reportpublicly on our progress in promptly meeting or exceeding expectations.
City of Rochester, NYRobert J. Duffy, Mayor
R


INTRODUCTION Table of Contents
Reader’s guide Glossary
Management Chart
i
CITY OFFICIALS
City Council Gladys Santiago (At-Large) President William F. Pritchard (At-Large) Vice President Carolee A. Conklin (At-Large) John F. Lightfoot (At-Large) Adam C. McFadden (South District) Dana K. Miller (At-Large) Carla M. Palumbo (Northwest District) Elaine G. Spaull (East District) Lovely A. Warren (Northeast District) Mayor Robert J. Duffy Deputy Mayor Patricia Malgieri Office of Management & Budget William J. Ansbrow Budget Director Budget Staff Sarah E. Boyce Alan Bredekamp Sharla D. Davenport Maria L. Fisher James Gillis Mary H. Kirkendale Jean Missler Kabutey Ocansey Josephus Tisdale Andrew Turner Suzanne P. Warren

BUDGET AT A GLANCE
ii
Amended ApprovedBudget Budget Dollar
2008-09 2009-10 Change
BUDGET $481,000,400 $452,153,500 -$28,846,900
PROPERTY TAX LEVY $162,872,900 $162,872,900 $0 (Before STAR)
TYPICAL HOMESTEAD BURDEN* Property Tax $1,382.31 $1,317.80 -$64.51 Service Charges $829.92 $829.92 $0.00 Subtotal $2,212.23 $2,147.72 -$64.51
TYPICAL NON-HOMESTEAD BURDEN** Property Tax $10,659.60 $10,929.57 $269.97 Local Works Charge $678.00 $678.00 $0.00Total $11,337.60 $11,607.57 $269.97
PROPERTY TAX RATES (PER $1,000)Homestead $20.57 $19.61 -$0.96Non-Homestead $40.67 $41.70 $1.03
TYPICAL HOMESTEAD SERVICE CHARGESWater $306.12 $306.12 $0.00Refuse $343.00 $343.00 $0.00Local Works $180.80 $180.80 $0.00
$829.92 $829.92 $0.00
*Based on a typical house assessed at $67,200 with 40' front footage and using 80,000 gallons of water annualy.**Based on a business assessed at $262,100 with 150' front footage.

INTRODUCTION Table of Contents
Reader’s guide Glossary
Management Chart
iii
TABLE OF CONTENTS Tab Page DEMOGRAPHIC PROFILE .............................................................................................. vii READER'S GUIDE .......................................................................................................... viii GLOSSARY ....................................................................................................................... x ORGANIZATION CHART ............................................................................................... xiii MAYOR'S MESSAGE CITY COUNCIL REPORT 1 SUMMARY .......................................................................................................................... Highlights ...................................................................................................................... 1−1 Summary of Revenue Changes .................................................................................... 1−3 Revenue Descriptions & Changes ................................................................................ 1−4 Revenue Estimates ..................................................................................................... 1−17 Property Tax Computation & Analysis ........................................................................ 1−22 Local Government Exemption Impact Report RP-495 ................................................ 1−31 Application of Revenue ............................................................................................... 1−33 Summary of Expenditure Changes ............................................................................. 1−37 Summary by Major Object of Expense ........................................................................ 1−39 Summary of 2008-09 Budget Amendments ................................................................ 1−41 Application of Related Expenditures & Revenues ....................................................... 1−48 Fund Summary ............................................................................................................ 1−49 2 MULTI-YEAR PROJECTION ........................................................................................ 2−1 3 CITY COUNCIL & CLERK ............................................................................................ 3−1 4 ADMINISTRATION Department Summary ................................................................................................... 4−1 Mayor's Office ............................................................................................................... 4−4 Neighborhood Service Centers ..................................................................................... 4−9 Office of Management & Budget ................................................................................. 4−12 Bureau of Human Resource Management .................................................................. 4−18 Bureau of Communications ......................................................................................... 4−23 Law Department .......................................................................................................... 4−30 5 INFORMATION TECHNOLOGY ................................................................................... 5−1

INTRODUCTION Table of Contents
Reader’s guide Glossary
Management Chart
iv
Tab Page 6 DEPARTMENT OF FINANCE Department Summary ....................................................................................................6−1 Director's Office ..............................................................................................................6−4 Bureau of Accounting .....................................................................................................6−8 Bureau of Treasury ......................................................................................................6−12 Bureau of Assessment .................................................................................................6−17 Bureau of Parking & Municipal Violations ....................................................................6−21 Bureau of Purchasing...................................................................................................6−25 7 DEPARTMENT OF NEIGHBORHOOD & BUSINESS DEVELOPMENT Department Summary ....................................................................................................7−1 Commissioner ................................................................................................................7−8 Business & Development .............................................................................................7−11 Planning & Zoning ........................................................................................................7−19 Neighborhood Preservation .........................................................................................7−25 Inspection & Compliance .............................................................................................7−29 8 DEPARTMENT OF COMMUNITY DEVELOPMENT Department Summary ....................................................................................................8−1 Office of the Commissioner ............................................................................................8−3 Bureau of Buildings & Zoning.........................................................................................8−6 Bureau of Housing & Project Development ....................................................................8−9 Bureau of Planning ......................................................................................................8−12 9 ECONOMIC DEVELOPMENT DEPARTMENT .............................................................9−1 10 DEPARTMENT OF ENVIRONMENTAL SERVICES Department Summary ..................................................................................................10−1 Office of the Commissioner ..........................................................................................10−7 Bureau of Architecture & Engineering ........................................................................10−11 Bureau of Operations & Parks Summary .................................................................................................................10−16 Director's Office .......................................................................................................10−20 Solid Waste Collections ..........................................................................................10−23 Special Services .....................................................................................................10−26 Building Services ....................................................................................................10−33 Equipment Services ................................................................................................10−36 Parks, Forestry & Municipal Sites ...........................................................................10−40 Bureau of Water Summary .................................................................................................................10−43 Director's Office .......................................................................................................10−46 Water Engineering ..................................................................................................10−49 Upland Operations .....................................................................................................10−52 Water Distribution ...................................................................................................10−55 Parking Meter Operations .......................................................................................10−58 Fixed Charges .........................................................................................................10−61

INTRODUCTION Table of Contents
Reader’s guide Glossary
Management Chart
v
Tab Page 11 EMERGENCY COMMUNICATIONS DEPARTMENT ................................................. 11−1 12 POLICE DEPARTMENT Department Summary ................................................................................................. 12−1 Office of the Chief ....................................................................................................... 12−6 Operations Summary ................................................................................................................ 12−11 Patrol ...................................................................................................................... 12−14 Investigations ......................................................................................................... 12−20 Administration ........................................................................................................... 12−25 13 FIRE DEPARTMENT Department Summary ................................................................................................. 13−1 Office of the Chief ....................................................................................................... 13−5 Operations ................................................................................................................... 13−9 Support ...................................................................................................................... 13−15 14 LIBRARY Department Summary ................................................................................................. 14−1 Central Library ............................................................................................................. 14−5 Community Library .................................................................................................... 14−11 15 DEPARTMENT OF RECREATION & YOUTH SERVICES Department Summary ................................................................................................. 15−1 Office of the Commissioner ......................................................................................... 15−5 Bureau of Recreation ................................................................................................ 15−11 Office of Special Services ......................................................................................... 15−20 Bureau of Youth Services ......................................................................................... 15−25 16 UNDISTRIBUTED EXPENSE Summary ..................................................................................................................... 16−1 Employee Benefits – Current ...................................................................................... 16−3 Employee Benefits – Non-Current .............................................................................. 16−7 General Risk Management ......................................................................................... 16−9 Other ......................................................................................................................... 16−11 17 CONTINGENCY .......................................................................................................... 17−1 18 CAPITAL EXPENSE SUMMARY Summary ..................................................................................................................... 18−1 Cash Capital ................................................................................................................ 18−4 Debt Service .............................................................................................................. 18−13 CIP Document Notes ................................................................................................ 18−17 [Capital Improvement Program ..................................................................................Insert]

INTRODUCTION Table of Contents
Reader’s guide Glossary
Management Chart
vi
Tab Page 19 PERSONNEL SUMMARY Introduction ..................................................................................................................19−1 Personnel Resources ...................................................................................................19−2 Employee Benefits .......................................................................................................19−6 Bargaining Units ...........................................................................................................19−7 Compensation ..............................................................................................................19−9 20 CITY SCHOOL DISTRICT SUMMARY ........................................................................21−1 INDEX

CITY OF ROCHESTER DEMOGRAPHIC PROFILE
vii
1980 1990 2000 2007 Total Population
241,741
231,636
219,773
204,112
Population by Race/Ethnicity
White, non-Hispanic 68% 59% 44% 42% Black, non-Hispanic 25% 31% 37% 38% Hispanic 5% 8% 13% 14% Other Race/Ethnicity 2% 2% 6% 6% Poverty Rate*
18%
24%
26%
29%
Median Family Income (adjusted for inflation to 2007 dollars)
$49,011
$46,276
$38,901
$35,368
Source: Census 1980, Census 1990, Census 2000, American Community Survey 2007 *Federal Poverty Level for a family of four in 2007 was $20,650 (Federal Register, Vol. 72, No. 15, January 24, 2007, pp. 3147–3148 ).
City of Rochester 2007 Population by Age Group
Age Category Total Percentage
Total 204,112 100%
Under 10 26,957 13%
10 to 14 15,317 8%
15-17 9,299 5%
18-24 28,568 14%
25-34 33,482 16%
35-44 27,593 14%
45-64 44,737 22%
65 or older 18,169 9%
Source: U.S. Census Bureau, American Community Survey, 2007

READER’S GUIDE
viii
Budget Process
This budget is for the City's 2009-10 fiscal year, which begins on July 1, 2009 and closes on June 30, 2010. The process and content requirements of the annual budget are stipulated in Section 3–9 of the City Charter. Consistent with these requirements, the Mayor prepares a proposed budget. Detailed budget requests are made by each department, reviewed and analyzed by the Bureau of Budget and Efficiency, modified as necessary, and approved by the Mayor. The Mayor's proposed budget is considered by the City Council, and at least one public hearing is scheduled. The City Council may adopt the budget as proposed by the Mayor or may modify it. If the City Council's action on the budget contains no additions, the budget is adopted without further action. Reductions to the proposed budget do not require the approval of the Mayor. If City Council's action includes any additions, the budget must be presented to the Mayor by June 20. The Mayor may accept or reject any additions. If the Mayor accepts the additions, the budget is adopted without further action. If the Mayor rejects any additions, he must inform the City Council of the items rejected with his reasons and return the budget to the Council by June 25. The City Council may then reconsider the budget and, by June 30, may revise its actions in conformity with the Mayor's objections or may, upon a two-thirds vote, override the Mayor's objections. If City Council does not, by June 30, adopt a budget according to these procedures, the budget as submitted by the Mayor plus any City Council additions not objected to by the Mayor will be the budget for the ensuing year.
Scope of the Budget The budget contains most of the ongoing operations of the City of Rochester. Certain programs are not included: City School District: A summary of the proposed City School District budget is included (Tab 17). The complete text of the School budget is included in a separate document. Federal Programs: The administrative costs and certain program expenses are included. However, most program expenditures from the Consolidated
Plan, Law Enforcement Block Grant (LEBG), and Enterprise Community Zone (ECZ) are not included. Appropriations from these programs are made during the year. Capital Programs: The budget includes two types of capital expenditures: Cash Capital, the direct outlay for capital purposes, and Debt Service, the repayment of principal and interest on previously authorized borrowing. Not included is the appropriation of the proceeds from note and bond sales that may occur during the year. These will be appropriated individually during the year, and their repayment will be included in future budgets as Debt Service. The Capital Improvement Program (CIP) section in the Budget document details all expected capital program expenditures for the upcoming year and each of the subsequent four years. Trust and Agency Funds: On occasion, the City receives income that is to be used for restricted purposes. An example is the income in the Fund for the City’s Future, which is restricted to the promotion of City tourism, living, and marketing. Such funds are not included in the budget; their use requires City Council appropriation during the year.
Budget Format – Organization The budget is organized into five presentations: 1. The Mayor's Message 2. City Council Report (in Approved Budget only) 3. Summary (Tab 1) 4. Departmental Sections (Tabs 2-15) 5. Informational Sections (Tabs 16-17 & Index) The departmental sections are indicated by white tabs with the name of each department.
Budget Format - Departmental Sections Each departmental section contains a Department Summary that includes Mission Statement, organization, fiscal goals and objectives, and financial data relating to the total department. Major changes from the prior year are highlighted. In addition, for each major function within a department, there are three detailed presentations: 1. Rochester By the Number presentation: Mission Statement presents why this unit exists. The

READER’S GUIDE
ix
organization of the unit. Vital Customers defines who are the primary recipients of this unit’s work. Critical Processes presents the critical processes this unit uses to carry out its mission. Key Performance Indicators measure how well objectives are being met. 2. Expenditures and Employee Years, which contains current and historical expenditure and personnel data. The expenditure data are presented in two ways — by major object (or type) of expense and by activity. 3. Personnel, which includes a calculation of employee years and a detailed listing of all full time position titles and pay brackets. The employee year calculations on this page produce the totals listed on the Expenditure and Employee Year pages. In the Undistributed Expenses (Tab 13), Contingency (Tab 14) and Capital (Tab 15) sections, no personnel data are provided, as no staff are assigned.
Budget Format Year-to-Year Comparisons The year-to-year comparison for each bureau or division calculates the increase or decrease in the budget and employee years for that unit. An analysis of the change in the budget is included. The total change is the sum of the change noted in each of six categories. The categories are: 1. Salary and Wage Adjustment, which accounts
for all routine changes in personnel compensation. This includes contract settlements, step and merit advancements, upgrades and downgrades of positions, and turnover that replaces higher compensated employees with lower compensated ones within the same pay brackets.
2. General Inflation, which accounts for increases
in the cost of goods and services attributed to inflation.
3. Chargebacks, which accounts for the year to
year change in charges for services provided to the activity by other units of City government. These services are duplicating, postage, motor equipment fuel and service, telephone service,
workers' compensation, water, refuse collection, and geographic information system.
4. Vacancy Allowance, which accounts for the year
to year change in the assumption of the vacancy allowance. This allowance is the difference between the actual expenditure requirements for personnel and that required if all positions were filled at all times.
5. Miscellaneous, which accounts for minor
changes not accounted for by any of the other categories.
6. Major Change, which accounts for significant
budget variances. If there are any major changes, a narrative explanation follows immediately.
7. Program Change, which explains any significant
changes in the operation or service delivery of the unit.
Basis of Accounting
The accounting policies of the City of Rochester conform to generally accepted accounting principles. The basis of accounting is the modified accrual method, in which revenues are recognized in the period in which they become available and measurable, and expenditures are recognized at the time a liability is incurred, except principal and interest on long-term debt and pension liability, which are recorded when due. The exception to this basis is for the Enterprise Funds that are on an accrual basis, in which revenues are recognized when earned, and expenditures are recognized when incurred. The accounts of the City are organized into various funds, each of which is considered a separate accounting entity. The operations of each fund are accounted for with a separate set of self-balancing accounts.

READER’S GUIDE
x
Glossary Activity The most basic level of presentation in the budget. Each major function is divided into activities, for which budgetary, personnel, and narrative information is provided. Adopted Budget The annual operating budget plan for the upcoming fiscal year approved by City Council according to the City Charter. Appropriation An authorization to expend funds for stated purposes. Assessed Value The value assigned for property tax purposes to each property within the City. Rochester utilizes a full value system; thus, it is the objective to assess all property at 100 percent of full market value. Assessed Value Tax Rate The amount of tax levied for each $1,000 of assessed valuation. Bond Anticipation Note A note that may be redeemed with the proceeds from the future sale of a serial bond. A note is a short term borrowing instrument, usually requiring repayment within one year of issuance. Budget Amendment A formal action by the City Council to adjust the budget after adoption. These amendments generally take two forms: the transfer of an appropriation from one departmental budget to another, or the appropriation of new sources of revenue to support a new expense. A budget amendment may, on occasion, reduce revenue and expense. Capital Improvement Program (CIP) The five-year spending plan for major improvements and construction projects. It provides detail by functional area, funding source, and year. Cash Capital The direct outlay for capital items, most typically equipment purchases, street improvements, and building renovations. The Cash Capital appropriation is a direct outlay because the City does not borrow for these expenditures. The Cash Capital appropriation is contained in the Capital Expense Summary.
Chargeback A charge from one department to another for services rendered, e.g., telephone service. Constitutional Debt Limit Limits on the amount of debt that a municipality can incur. Article VIII of the New York State Constitution imposes on Rochester a limit of 9 percent of the most recent five-year average of full valuation of taxable real estate for capital purposes. Constitutional Tax Limit Limits on the amount of money that a municipality can raise through real estate taxes. Article VIII of the New York State Constitution imposes on Rochester a limit of 2 percent of the most recent five-year average of full valuation of taxable real estate. Contingency A budgeted reserve fund for unforeseen or unmeasurable expenditures not otherwise budgeted. Debt Service The repayment of debt, including interest payments and installments on the principal. The debt service appropriation is contained in the Capital Expense Summary. Directly Applicable Revenue Revenues that are generated because of the efforts of an organizational unit for a given function. Employee Benefits The direct expenditures, other than salary and wages, associated with employee compensation. In the budget, the employee benefit appropriations are included in the Undistributed Expense budget, but are allocated for information purposes to each major function. These include retirement, Social Security, medical and dental, workers’ compensation, and life insurance benefits. All other employee compensation costs are included in the departmental budgets. Employee Years An approximation of employee resources stated as an equivalent number of full time positions. Each full time position is counted as one employee year, while overtime hours and part time, temporary, and seasonal positions are approximated as partial employee years. The vacancy allowance (see below) is also stated as an equivalent number of full time positions, and is subtracted in approximating net employee years for an activity.

READER’S GUIDE
xi
Enterprise Fund Enterprise funds are fiscal and accounting entities that account for certain services and programs that operate as separate businesses. Expenditures for these operations are supported by revenues generated by the activities (e.g., fees for service) or dedicated under law for those specific operations. This Budget includes the following Enterprise Funds: Water, War Memorial, Parking, Cemetery, Public Market, Refuse, and Local Works. Fund A fiscal and accounting entity with a self-balancing set of accounts recording cash and other financial resources, with related expenses and other obligations. The budget contains ten funds that are explained and accounted for in the Summary (Tab 1). Fund Balance In fund accounting, Fund Balance equals Assets minus Liabilities. General Fund The principal operating fund of the City, accounting for all financial resources not recorded in other funds. Homestead One of two classifications of property owners authorized for property taxation under the New York State law applicable to Rochester. The Homestead class includes all one, two, and three family residential real property, including dwellings used in part for non-residential purposes but used primarily for residential purposes. The other classification is the Non-Homestead class. Interfund Revenue Income generated through a transaction between or among funds. Interfund revenues are offset by expenses or obligations recorded in other funds. Intrafund Credit A transaction between or among appropriations within the same fund. In this budget, intrafund credits reflect chargebacks for services. The costs of these services (motor equipment, telephones, etc.) are included in the unit providing the service, and also the unit receiving the service. To offset this double recording of cost, the service provider unit records a credit (or reduction of expense) when the service charge is processed. Major Functions The subdivision of a departmental budget. Major functions are Bureaus, Divisions, Offices, or other organizational units.
Major Objects The basic types of expenses incurred by an organizational unit categorized as Personnel, Materials & Supplies, Services, and Other expenses. Morin-Ryan The sales tax distribution formula, which took effect in 1985-86, divides the first three percent of the local share of the sales tax. Non-Homestead One of two classifications of property owners authorized for property taxation under the New York State Law applicable to Rochester. The Non-Homestead class includes all properties other than one, two, and three family residential properties. The other classification is the Homestead class. Overtime Employee Years See Employee Years. Part Time, Temporary, Seasonal Used on the Personnel Summary page to show the approximation of Part Time, Temporary, and Seasonal employees in terms of Employee Years. Part Time employees work less than a regular work week schedule on a year round basis. Temporary employees work regular work week hours, but for a fixed duration (usually not to exceed eighteen months). Seasonal employees work at certain times during the year (e.g., during the Summer) on schedules determined by the nature of the jobs that they are performing. Property Tax Levy The total amount of property tax to be assessed on taxpayers. The property tax levy differs from property tax revenue in that the levy includes all amounts due, regardless of whether they are collected. Property Tax Rate The rate used to determine the property tax bill of individual taxpayers. The rate is expressed as a dollar amount to be charged for each $1,000 of assessed property value. A separate tax rate is applied to each of two classes of property owners, Homestead and Non-Homestead. Property Tax Reserve The portion of the property tax levy that is estimated to be uncollected during the fiscal year and remains uncollected after sixty days from the close of the fiscal year.

READER’S GUIDE
xii
Property Tax Revenue The amount of money raised by the property tax. Due to nonpayments, the actual collection is less than the total levy. Proposed Budget The budget plan for the upcoming fiscal year recommended by the Mayor to City Council for its formal approval. The budget is “proposed” until it is formally “approved” by City Council. Rochester by the Numbers (RBN) RBN is a philosophy of utilizing data to drive key organization objectives. It includes a management review process of critical indicators of success to the deployment of the City’s strategic objectives. This is to support the One City Vision Statement and Values and Guiding Principles. As appropriate, the budget document presents departmental, bureau, and activity Mission Statement. Vital Customers, Critical Processes, and Key Performance Indicators information used by RBN. Sales Tax A tax as a percentage of most retail sales is levied by New York State and Monroe County. The City receives a portion of the proceeds under agreements with Monroe County. Serial Bonds A long-term borrowing instrument that requires a series of repayments to be made over a multi-year period. The repayments made include principal installments and associated interest expense. Special Fund Special funds are fiscal and accounting entities that state law restricts for specific purposes. This Budget includes the following Special Funds: Animal Control and Library. STAR The New York State School Tax Relief Program providing homeowners relief from school property tax through two levels of exemptions. (See Summary, STAR section for details).
Vacancy Allowance The difference between actual expenditure requirements for personnel resources and that which would be required if all positions were filled at all times. The vacancy allowance accounts for position vacancies that occur as a result of routine employee turnover as well as those that may be deliberately maintained.

City
Co
un
cil
Pre
sid
en
tG
lad
ys S
an
tiag
o
Cou
ncil
Sta
ffW
illia
m F
. S
ulliv
anC
ity C
lerk
Da
nie
l Ka
rin
Ne
igh
bo
rho
od
&B
usin
ess
Dev
elop
men
tR
. C
arlo
s C
arba
llada
En
viro
nm
en
tal
Se
rvic
es
Pau
l M.
Hol
ahan
Man
agem
ent &
Bud
get
Will
iam
J.
Ans
brow
Fin
an
ceB
rian
L. R
oulin
Info
rmat
ion
Tec
hnol
ogy
Dav
id M
ayor
Dep
uty
May
orP
atric
ia M
algi
eri
Em
erge
ncy
Com
mun
icat
ions
John
M.
Mer
klin
ger
Fir
eJo
hn D
. C
aufie
ld
Re
cre
atio
n&
You
th S
ervi
ces
Cha
rles
D.
Rea
ves
*Lib
rary
Dire
ctor
is a
ppoi
nted
by
the
Libr
ary
Boa
rd o
f T
rust
ees
Lib
rary
*P
atric
ia M
. U
ttaro
Hum
an R
esou
rce
Man
agem
ent
Don
na T
urne
r
Ma
yor
Ro
be
rt J
. D
uff
y
Chi
ef o
f S
taff
G.
Jean
How
ard
Ass
ista
nt t
o M
ayor
Dar
ryl
Por
ter
Citi
zens
Of
The
City
Of
Roc
hest
er
Law
Tho
mas
S.
Ric
hard
sC
omm
unic
atio
nsG
ary
Wal
ker
Po
lice
Dav
id T
. M
oore
Offi
ce o
f P
ublic
Inte
grity
/Inte
rnal
Aud
itR
icha
rd C
. V
ega
Spe
cial
Pro
ject
sR
ich
ard
W.
Ha
nn
on

Robert J. DuffyMayor City Hall Room 307A, 30 Church Street
Rochester, New York 14614-1290 www.cityofrochester.gov
Phone: 585.428.7045 Fax: 585.428.6059 TTY: 585.428.6054 EEO/ADA Employer
May 15, 2009 TO THE COUNCIL:
Ladies and Gentlemen: RE: Funding Our Priorities Today I transmit to City Council the 2009-10 budget for the City of Rochester prepared in accordance with City Charter requirements. This proposed budget continues to fund our priorities: Public Safety, Education, Neighborhood and Business Development, and Customer Service. The 2009-10 budget estimate of $452,153,500 is $28,846,900 less than the 2008-09 amended City budget of $481,000,400. This 6% decrease in spending reflects the difficult, but necessary, choices we must make during this time of national economic crisis. Unlike other governmental entities we knew that this was the time to reduce spending and return money to our taxpayers to enable them to reinvest in their families and homes. Property Taxes and Burden I have previously said that I would not raise the property tax this year and I am holding to that promise by freezing the tax levy. Freezing the tax levy, combined with an annual required adjustment known as the “tax shift” between the homestead and non-homestead assessment class, results in a 4.7% reduction in the homestead tax rate that reduces the typical homeowner’s tax burden by $64.51. Unfortunately, this state-mandated tax shift and assessment changes also increases the non-homestead tax rate by 2.5% and increases the typical business burden by $269.97. The state mandated Maintenance of Effort (MOE) removes my ability to reduce the City School tax levy which accounts for 73% of the total tax levy. The City is left to fund such vital government services as police, fire, libraries, recreation centers, and city infrastructure with the remaining 27% of the tax levy. The proposed property tax rates for 2009-10 build upon our previous efforts to reduce property taxes. During my term we have leveraged new investments in the city that have led to increased City property values. This along with our reduced spending has enabled me to reduce the homestead and non-homestead tax rate by 6.6% and 6.9% respectively since becoming Mayor in 2006. 2005-06 Proposed 2009-10 Percent Tax Rate Tax Rate Difference Homestead $20.99 $19.61 -6.6% Non-Homestead $44.79 $41.70 -6.9% My Senior Management Team and I began the development of the 2009-10 Budget knowing it would be very challenging due to the economic crisis. Rochester is renowned for its sound fiscal practices and we were guided by them as we formulated this budget. Our decisions continue to be guided by good government and what is best for our customers and citizens.

Page 2 Early in the 2008-09 fiscal year we prepared the foundation for new revenue enhancements and cost savings by selling City tax liens and continuing our hiring freeze. This enabled us to avoid mid-year budget reductions as other revenues slipped that were sensitive to the economy. The seeds were sown early in 2008-09 including: we acted to reduce our future debt service; we are finalizing the purchase of the remaining portion of our street lighting system; we are actively planning for the sale of our watershed to ensure it is forever wild; and we have been looking for ways to control health care costs. We were prepared in the late fall of 2008 for the projected $31.9 million gap for 2009-10 driven by a 20% ($23.2 million) reduction in state aid. In April 2009, the projected gap grew to $35.1 million as our revenues sensitive to economic conditions slipped further. We knew we had to cut spending further and not back down on our pledge to taxpayers – to not raise taxes to bridge our gap. Voice of the Customer We expanded our effort to obtain input from our customers this year with the assistance of Dr. Andrew Turner, Chief of Customer Satisfaction and Performance Accountability. For the first time the City of Rochester initiated a formal process to obtain input from our employees, our City’s youth, our union leaders, and our faith community to go along with our taxpayers. Four Voice of the Customer (VOC) sessions – one in each city quadrant were held in fiscal year 2008-09. At these forums, the City demonstrated how citizen input was applied from the year before and presented items which the City will act on in 2009-10. Citizen input received from those sessions included: “ Continued push for consolidations, collaborations and efficiencies. “ Support for our increased police staffing levels and a desire for more citizen-police communication. “ An expectation that City employees should share the sacrifices made by residents. “ Senior City management should lead by example with a wage freeze. “ The City should strongly support home ownership and maintain an aggressive demolition program. “ The City should not make reductions that negatively impact our youth. “ People are generally not aware of the limited influence City Hall has on educational spending and
results, or of the City’s level of generosity to the City School District. “ The City should push for better use of technology. “ The City should be good stewards of the environment and conserve energy. “ The City should reduce overtime and eliminate City leasing of buildings and property. “ A mix of support, or acknowledgement, that this year is not the time to raise property taxes. “ The City should support new revenue other than raising property taxes. “ City management and unions should find win-win solutions.

Page 3 Later, I will share in detail how this input was incorporated into our decision making, but first I want to make clear that we have not decreased funding that would negatively impact our youth - the future of our City. We continue to fund our City School District at a level almost $50 million more than Buffalo which has a larger District. City after-school programs continue to be funded despite our community partners’ inability to further assist us at this time. There are no reductions in library branch or recreation service hours. We actually have expanded recreation hours where I believe they are most needed in our community. Now allow me to summarize how the City will close its projected $35.1 million gap. Closing the Gap and Funding New Initiatives In summary, the $35.1 million gap was closed by: $10.6 million – anticipated savings from health care and collective bargaining agreements $10.3 million – departmental efficiencies $2.1 million – departmental reductions $6.3 million – reduction from planned cash capital investments $3.0 million - anticipated revenue from the sale of property $1.3 million – no increased funding for management salaries and suspension of the
performance incentive until further notice $2.0 million - Use of Tax Relief Fund established from 2008-09 “spin-up” -$0.5 million - Net of other changes In addition another $3.2 million in a lower required contribution to the New York State Retirement System helped fund over $3 million in enhancements. We also were faced with having to fund over $400,000 in expenses related to the Rhinos Stadium, or risk having an empty stadium. A Labor/Management Committee has been working for months on a win-win solution to reduce the City’s health insurance costs. If this effort is unsuccessful, we will have to consider additional layoffs and other painful budget adjustments. We have further reduced the City’s full-time work force by an additional 53 positions. Our hiring freeze limited the number of layoffs to 38 full-time and 11 part-time employees. These numbers are expected to go down as individuals bid for job openings and more retirements are finalized. During my term as Mayor the total full-time workforce has declined by 4.8% (144) while the authorized number of sworn police officers has increased by 5% (36). I will now address in more detail the steps we took to close the gap and the actions we took to address our customers input aligned with our priorities. Given the size of the gap we had to close, this budget contains few new initiatives. Yet I commit to providing an even higher quality of services to our constituents. PUBLIC SAFETY Enhancements: “ Additional funding is provided for overt police surveillance cameras. There currently are 50 cameras
operational, 10 more will be installed in June 2009 and 40 more during in the fiscal year. I anticipate a total of 100 cameras will be fully operational by June 30, 2010.
“ Construction will begin this summer for a major renovation and expansion of the Hudson Avenue
Fire House.

Page 4 PUBLIC SAFETY (cont.) “ The Rochester Fire Department will install 3,600 smoke detectors and 1,400 carbon dioxide
detectors.
“ 3,219 street light fixtures will be replaced with more efficient fixtures that provide 112.8% more light and use 65% less energy.
“ Fire recruitment program will be expanded to increase diversity. “ County funding increases for 6 additional full-time and 4 additional part-time 911 operation positions. Reductions: “ Congresswoman Louise Slaughter secured $675,000 in funding that enables us to avoid immediate
police layoffs. However, the scheduled summer police recruit class is postponed due to budget constraints. Federal funding for an additional $1.9 million per year for three years has been requested. If we do not receive these funds up to 15 police officers could be laid off or additional budget reductions would be required in October 2009.
“ Funding for scheduled replacement of marked police cars will be reduced by at least 25%. “ The scheduled replacement of the Genesee Fire station is deferred for one year pending notification
of federal stimulus funding. Efficiencies: “ Total budgeted police overtime will be reduced 13.6%, while budgeted overtime for special events is
reduced by 23.4%. Anticipated total police overtime ($3,520,800) spending in 2009-10 will be 60% below the actual 2007-08 amount ($8,791,000).
“ Implementation of the Fire Department’s second phase of their reorganization converting to an
engine/truck service delivery model redeploys personnel and it is also anticipated to reduce overtime.
“ The Fire Department’s community outreach efforts will primarily be provided by sworn personnel in
neighborhood fire stations. “ Most police vehicles will be equipped with an automatic vehicle locator to enhance officer safety and
enable more efficient dispatching of vehicles. NEIGHBORHOOD AND BUSINESS DEVELOPMENT Enhancements: “ An additional $2 million of City demolition funding is provided to offset the anticipated decrease in
RESTORE NY funding. “ Major renovation of the Crossroads Garage is funded to support future development. “ Implementation of a quadrant based team model for enhanced service delivery and results. “ $1.4 million in capital funds are allocated to increase the development of market rate housing and
the construction of owner occupied homes.

Page 5 NEIGHBORHOOD AND BUSINESS DEVELOPMENT (cont.) “ $2 million in federal and local funding is identified to plan and design new infrastructure at the former
Midtown Plaza site. Reductions/Deferrals: “ Major renovation of Crossroads Park is deferred until market conditions are clarified. “ Additional renovations of Manhattan Square Park are deferred one year due to budget constraints. Efficiencies: “ The former Departments of Economic Development, Community Development and Neighborhood
Service Centers are consolidated into one department, saving $1.4 million annually. EDUCATION Public School Educational Excellence I suspect that we have yet to see the full impact of the ill-conceived state law known as the MOE. The State Education Department has still not developed the required form to oversee compliance. Our discussions with state education officials have given us increased concern there may be additional indirect consequences. Given our uncertainty, we have discontinued presentation of the Children’s Funding section. Our generosity to the District may be misconstrued and used against our financial position. I continue to be a strong advocate for supporting our youth, yet there continue to be forces that want to protect turf instead of focusing on our children and results. Enhancements: “ To significantly increase graduation rates and offset the loss of state Summer of Opportunity
funding, $400,000 from the 2008-09 Budget will be used to contract with the Hillside Work Scholarship Connection Program. This funding will increase the number of children in the program and enable the City to be a participating employer and leverage other funding.
“ The pilot literacy outreach effort that began in 2008-09 will be expanded due to the generous
donation of the Fenyvessy family. Beginning this summer the Highland, Charlotte and Wheatley branches will gain a literacy outreach component. The literacy outreach efforts continue at Arnett, Lincoln, Maplewood, Lyell and Sully branch libraries.
CUSTOMER SERVICE Enhancements: “ By providing summer jobs for youth, summer recreation service hours are extended 4 hours per day
at various recreation centers: – 9 a.m. to 9 p.m. instead of 9 a.m. to 5 p.m. at Norton Village; – 9 a.m. to 9 p.m. instead of 9 a.m. to 5 p.m. at Gardiner Recreation Center; – 9 a.m. to 9 p.m. instead of 9 a.m. to 5 p.m. at Marshall High School; – A youth anti-graffiti program is initiated based at North Street Recreation Center.

Page 6 CUSTOMER SERVICE (cont.) “ The expanded Hillside Work Scholarship program (150 jobs), combined with additional funding for
summer youth in recreation center (41 jobs) and new summer youth jobs in other City departments (18) more than offsets the loss of 200 summer youth jobs previously funded by the State (Summer of Opportunity). These new initiatives combined with existing youth summer employment programs result in a total of 615 city summer youth jobs available. I continue to call on federal and state officials to fund additional summer youth jobs. Even with the increase in spending in our New York State Budget, we have yet to receive any financial support for our Summer of Opportunity Program for our young citizens.
“ Weekend code enforcement service hours are added as a pilot in response to input from Voice of
the Customer sessions. “ An additional $75,000 is provided for the Rochester Music Festival to provide a free concert as part
of the celebration of our 175th anniversary. “ Four crews of seasonal PRIME workers are funded to pick up litter, again addressing input from the
voice of the customer. “ A pilot after-school program at the Lake Riley Lodge is initiated with user fees to offset the cost. “ City funds are provided to support an after school program at School #28 in partnership with the
Rochester Area Community Foundation. “ City personnel coordinate demolition of 100 vacant homes to enable benchmark comparison to
contracted demolition efforts. “ Seed funding of $10,000 is provided to support a fall 2009 Faith Based Initiative Conference. “ Funding provide for additional information technology positions to drive future efficiencies. “ A part-time investigator is added in the Office of Public Integrity to increase our responsiveness to
requests for action. Consolidation Budget Highlights: “ All parking related activities are consolidated into the Finance Department to drive future efficiencies
and improve customer service. Operations will be physically consolidated into office space at the South Avenue Parking Garage during the year.
“ The Department of Economic Development, Department of Community Development and
Neighborhood Service Centers are consolidated into one department and work components with similar core competencies are physically relocated and co-located.
“ Youth Services and the Office of Employment Opportunities will be consolidated and physically
moved into vacant office space at the former Sibley Building where the landlord has provided free rental space.
“ During the year the Street Lighting Unit will be relocated to City Hall from space currently shared
with Recreation staff at 400 Dewey Avenue to enable efficiencies with the Engineering Unit. “ Recreation administrative staff is consolidated into 400 Dewey Avenue to enable efficiencies.
Page 7 CUSTOMER SERVICE (cont.) “ The Office of Public Integrity moves from rented space into the Rundel Library by January 2010. “ The majority of code enforcement officers are consolidated into City Hall to receive daily direction
and improve consistency and customer service. Inspectors will be working in the quadrants after the morning briefing.
“ The Special Event Unit transferred to Communications during 2008-09 and will be physically co-
located during 2009-10. Efficiency Budget Highlights: “ $10.6 million in savings are anticipated from collective bargaining negotiations. “ The planned acquisition of the remaining portion of the City Street Lighting system decreases
operating expense by $1.8 million and capital expense by $1.1 million. “ Implementation of the tax lien sale program saves $826,000 annually. “ A standard temperature range for City buildings is set at 67 – 70 degrees for the cooler months and
we will also experiment with temperature controls during the warmer months. This standardization and other energy efficiencies will generate $165,000 in savings.
“ $1.3 million in savings anticipated due to freezing Senior Management salaries and eliminating the
planned cost of living adjustments for administrative, professional, and technical (APT) personnel. Outsourcing Highlights: “ The mowing of parks is contracted out for a savings of $77,600 annually. “ Small equipment repairs contracted out as an efficiency measure for an annual savings of $55,100. Capital Investment Deferrals and Budget Reduction Highlights: “ Rescheduling of next phase for Manhattan Square Park improvement defers $1,424,000. “ Deferral of major improvement to Crossroads Park pending additional planning defers $1,824,000. “ A new marking design for City vehicles and a reduction in the number of signs made saves $40,000. “ Support for the Puerto Rican Festival and High Falls Film Festival is reduced, $5,000 and $2,000
respectively due to budget constraints. “ Support for the Rochester Philharmonic concert series is reduced due to budget constraints, $7,000. “ Funding for Ribbin on the River is eliminated due to budget constraints, $20,000. “ Support for the Rochester International Jazz Festival is reduced due to budget constraints, $27,000.

Page 8 Self Supporting Enterprise Funds I am not recommending any fee increases for refuse, water or local works charges. Now is not the time to raise these fees given the state of our national and local economy. I anticipate that the City will sell our watershed to New York State in the coming months and ensure this land will be forever wild. Thus I am budgeting $2 million from the anticipated sale to balance the Water Fund. The Refuse Fund is balanced due to the multiyear refuse disposal agreement with Monroe County and the redesign of our collection routes. I am proposing that we balance the Local Works Fund with an appropriation of fund balance. I recognize we will likely have to make tough decisions in the future to balance these funds. As we celebrate the City’s 175th Anniversary, we are making every effort to continue to build upon the legacies of Mayor Ryan and Mayor Johnson. City property values continue to rise. The number of residents living downtown has doubled. We have reigned in overtime spending. Our services are accessed with one click (new City web site) or one call (311). We have streamlined our neighborhood and business development efforts by consolidating three departments into one. Crime is down, taxes are down and optimism is up. Summary I believe this budget will continue to plant additional seeds that will enable Rochester to grow and become the best mid-sized city in the United States. Every effort has been made to find efficiencies and avoid service reductions while not raising taxes. However, I suspect major efficiencies in the future will be hard to find unless we consider that the City and City School District be joined organizationally to eliminate costs and duplication of efforts to provide savings to our taxpayers. I know such a suggestion may spark controversy, we must not accept the status quo if we wish to continue to make our City attractive to our citizens and ensure our children have the opportunity for educational excellence. Our economy requires us to think differently and look for every possible opportunity to increase our services while reducing our costs – which is exactly what the private sector must do to survive. I plan to discuss this further with Rochester City School Superintendent, Jean-Claude Brizard, and Board President Malik Evans and have Voice of the Customer sessions in the upcoming months on this issue and others. I continue to believe mandate relief will play an important role in the City’s ability to control its costs. I support Governor Paterson’s call for pension reform and a new tier for new employees. I am proud of the fact that this budget does not place additional financial burden on our homeowners. My philosophy with this budget was to not place additional burden on our taxpayers during these dire economic times. I look forward to your careful review and commit to being responsive to questions that may arise during your review. Respectfully submitted, Robert J. Duffy Mayor


June 16, 2009
19
Transmitted herewith for your approval is legislation establishing $30,000 as maximum compensation for an agreement with The Corn Hill Waterfront & Navigation Foundation for a series of free cruises and production of a concert series at Corn Hill Landing. The cost of this agreement will be financed from the 2008-09 ($20,000) and 2009-10 ($10,000) Budgets of the Bureau of Communications. The series of eleven cruises on the Mary Jemison will focus on recent and visionary plans for development and preservation of the Genesee River Extension of the Erie Canal in the city. The series will take place during the City of Rochester’s 175th Anniversary Coming Home event in September and October 2009. The City’s contribution will leverage an additional $20,000 in matching funds from the Gleason Foundation. The River City Rhythms Concert Series will take place at Corn Hill Landing on five consecutive Friday evenings, beginning July 10. This series is a free, family-friendly outdoor music series which grew out of the 2007 “Friday Nights at the Landing” series produced by Corn Hill Navigation. Corn Hill Navigation will provide talent, vendors, and site management for the series. More than 7,500 attended this series in 2008. Corn Hill Navigation is a not-for-profit corporation whose mission is to improve and sustain the Erie Canal and adjoining Genesee River for current and future generations through awareness, education and enjoyment. Respectfully submitted, Robert J. Duffy Mayor Attachment No. AI-68 Ordinance No. 2009-183 (Int. No. 210) Establishing Maximum Compensation For An Agreement For
Cruises And Concerts BE IT ORDAINED, by the Council of the City of Rochester as follows: Section 1. The sum of $30,000, or so much thereof as may be necessary, is hereby established as the compensation to be paid for an agreement between the City and The Corn Hill Waterfront & Navigation Foundation for free cruises and a concert series at Corn Hill Landing. Of said amount, $20,000 shall be funded from the 2008-09 Budget of the Bureau of Communications and $10,000 shall be funded from the 2009-10 Budget of the Bureau of Communications. Section 2. This ordinance shall take effect immediately. Passed by the following vote: Ayes - President Santiago, Councilmembers Lightfoot, McFadden, Miller, Palumbo, Pritchard, Spaull, Warren - 8. Nays - None - 0. Councilmember Conklin abstained her vote because she serves on the Board of Directors of Corn Hill Navigation. TO THE COUNCIL Ladies and Gentlemen: Ordinance No. 2009-184, Ordinance No. 2009-185, Ordinance No. 2009-186 and Ordinance No. 2009-187

June 16, 2009
20
Re: Budget Amendments - $50,000 Transmitted herewith for your approval are amendments to the Proposed 2009-10 Budget that transfer $50,000 from the Contingency Account to various departments to enhance opportunities in four major areas: Youth Development, Citizen Support, Cultural Development, and Community Beautification. Funding will be provided for the following initiatives: Youth Development $20,000 CONEA Kid’s Fair - $4,500 to support a community fair in late August or early September to be run by CONEA. Of a total budget of approximately $9,000, the City’s contribution will go toward the purchase of school supplies, t-shirts and trophies. Courtside Scouting - $3,000 to provide a second year of funding for this important activity, which showcases the basketball talents of local youth to coaches from junior colleges as well as, NCAA Division II and III schools. The funds will pay for ads, t-shirts, referees, rental, and other miscellaneous expenses. High School Leadership Forum - $3,000 to Leadership Rochester to deliver a youth-training program that brings together 20 city and suburban youth to address issues that impact our community. The sessions will take place between September and May. Youth Fashion Show - $3,000 to support for the second year an annual pageant for youth ages 15 to 18. The event is in its seventh year of existence and serves 40 to 45 youth who, over four hours a week for six weeks, learn poise, stage presentation, and the elements of fashion in preparation for the fashion show. The three-hour event will be held in late summer, when the youth compete in four fashion categories before judges comprised of local leaders of the fashion industry. Tuck-Murphy Basketball Tournament - $2,500 to support this annual event that encourages sportsmanship and athletic competition. The event is organized by adult volunteers and held in City School District facilities. Pop Warner League Monroe County Cowboys - $2,000 to provide start-up support for this new entry in the Pop Warner league. Total budget requirements are estimated at $18,000 and fund-raising is expected to be complete prior to the start of the fall season. Slam High Poetry Program - $2,000 to support a poetry/spoken word development program for youth sponsored by Writers & Books. The participants hone their literary skills and compete locally and nationally in poetry contests. Citizen Support $10,500 Community Anti-Violence Program - $7,000 to the Gay Alliance of the Genesee Valley (GAGV) to launch a comprehensive outreach program so service providers and victims of violence can be informed about seeking and obtaining assistance that is needed. This effort is part of the larger anti-violence efforts of GAGV, which include direct services to victims. Senior Citizen Transportation - $2,000 to Baden Street Settlement House to expand their abilities to transport senior citizens to a variety of events that can enrich their lives. Lack of mobility is among the most serious problems facing many of our seniors, resulting in isolation and loss of interest in social activities. Refugee Sustainability Garden - $1,000 to support a collaborative effort undertaken by the Maplewood Neighborhood Association, Refugee Mission Group, Geyssens Nursery, Foodlink, Harris Seeds, Jefferson High School, and former Councilmember Robert J. Stevenson, to assist recently relocated Burmese refugees and enable them to engage in the agrarian practices that formed the core of their life style before relocation. The first garden has been planted at Geyssens on Mt. Read Blvd; a second garden is being planned for the former subway bed at Lexington Avenue.
June 16, 2009
21
Outreach for FIS in Beechwood - $500 to support a community gathering that will explain the goals of the Focused Investment Strategy (FIS) efforts and build community support for participation therein. As we move ahead with FIS, it will be critical to ensure that citizens are engaged and informed about projects and plans. Social events are among the most effective ways to accomplish such citizen participation. Cultural Development $10,500 Downtown Community Forum - $4,500 to present a series of interactive programs between July and December 2009 on topics of interest and concern to citizens in a nonpartisan, nonsectarian setting. Since 1985, DCF topics have sparked civic engagement by providing thought-provoking presenters who challenge Rochesterians to consider the real-time issues facing our community. Development of Regional Strategies for Arts Organizations - $3,000 to the Arts & Cultural Council of Greater Rochester to assist in their development of a regional strategy in support of the arts. As fiscal realities have reduced the resources available to arts groups, it is imperative that a broad look be undertaken as to how best to utilize the available resources and to ensure the survival of critical arts institutions throughout the community. North Winton Village Arts Festival - $2,000 to support this annual community festival that both embraces the arts and builds community throughout the neighborhood. Lyell Avenue Music Fest - $1,000 to support this important community event. For the past ten years, this festival has been organized by volunteers and requires an annual budget of approximately $10,000. The City provides further assistance to the Music Fest by closing the street to traffic during the event. Community Beautification $9,000 In recognition of the City’s 175th birthday, it is important to continue to make the City more physically attractive and to support those organizations that are committed to making Rochester a more pleasant place to live. To accomplish this, a total of $9,000 will be provided for Community Gardens, Banners, Lighting, and Signage. Those funds will be allocated to: North Winton Village ($2,000); Marketview Heights Collective Action ($1,500); Charlotte Community Association ($1,000); Park Avenue Revitalization Committee ($1,000); Sector 9 ($1,000); Sector 10 ($1,000); Sector 3 ($500); Upper Monroe Neighborhood Association ($500); Highland Neighbors ($500). Respectfully submitted, Gladys Santiago William F. Pritchard Carolee A. Conklin President Vice President Councilmember At-Large John F. Lightfoot Adam C. McFadden Dana K. Miller Councilmember Councilmember Councilmember At-Large South District At-Large Carla M. Palumbo Elaine M. Spaull Lovely A. Warren Councilmember Councilmember Councilmember Northwest District East District Northeast District Ordinance No. 2009-184 (Int. No. 234A) Amending The Proposed 2009-10 Budget Of The City Of Rochester
In Regard To Youth Development - $20,000 BE IT ORDAINED, by the Council of the City of Rochester as follows:

June 16, 2009
22
Section 1. The Proposed 2009-10 Budget of the City of Rochester is hereby amended by transferring $20,000 from the Contingency Account to the Department of Recreation and Youth Services for support of the following youth development activities: CONEA Kid’s Fair, $4,500; Courtside Scouting, $3,000; High School Leadership Forum, $3,000;
Mr. & Mrs. Trendsetter Fashion Show, $3,000; Tuck-Murphy Basketball Tournament, $2,500; Pop Warner League Monroe County Cowboys, $2,000; Slam High Poetry Program, $2,000.
Section 2. This ordinance shall take effect immediately. Passed unanimously. Ordinance No. 2009-185 (Int. No. 234B) Amending The Proposed 2009-10 Budget Of The City Of Rochester
In Regard To Citizen Support - $10,500 BE IT ORDAINED, by the Council of the City of Rochester as follows: Section 1. The Proposed 2009-10 Budget of the City of Rochester is hereby amended by transferring a total of $15,000 from the Contingency Account for Citizen Support programs as follows: $7,000 to the Police Department for development of a Community Anti-Violence Program by the
Gay Alliance of the Genesee Valley; $2,000 to the Department of Recreation & Youth Services for the Baden Street Senior Citizen
Transportation Program; $1,500 to the Department of Neighborhood & Business Development, of which $1,000 shall be for
the Refugee Sustainability Garden in Maplewood, and $500 for community outreach in Beechwood. Section 2. This ordinance shall take effect immediately. Passed unanimously. Ordinance No. 2009-186 (Int. No. 234C) Amending The Proposed 2009-10 Budget Of The City Of Rochester
In Regard To Cultural Development - $10,500 BE IT ORDAINED, by the Council of the City of Rochester as follows: Section 1. The Proposed 2009-10 Budget of the City of Rochester is hereby amended by transferring a total of $10,500 for Cultural Development programs from the Contingency Account as follows: $7,500 to the Department of Neighborhood & Business Development, of which $4,500 shall be for
the Downtown Community Forum lecture series, and $3,000 for the development of regional arts strategies by the Arts & Cultural Council of Greater Rochester;
$3,000 to the Administration - Communications, of which $2,000 shall be for the North Winton
Village Arts Festival, and $1,000 for the Lyell Avenue Music Fest.

June 16, 2009
23
Section 2. This ordinance shall take effect immediately. Passed by the following vote: Ayes - President Santiago, Councilmembers Conklin, Lightfoot, McFadden, Miller, Pritchard, Spaull, Warren - 8. Nays - None - 0. Councilmember Palumbo abstained her vote because she is a member of Board of Directors Arts and Cultural Council. Ordinance No. 2009-187 (Int. No. 234D) Amending The Proposed 2009-10 Budget Of The City Of Rochester
In Regard To Community Beautification - $9,000 BE IT ORDAINED, by the Council of the City of Rochester as follows: Section 1. The Proposed 2009-10 Budget of the City of Rochester is hereby amended by transferring a total of $9,000 for Community Beautification programs from the Contingency Account as follows: $8,000 to the Department of Neighborhood & Business Development, of which $2,000 shall be for
the North Winton Village gardens; $1,500 for the Marketview Heights Collective Action Project; $1,000 for the Charlotte Community Association beautification; $1,000 for Sector 9 beautification; $1,000 for Sector 10 beautification; $500 for Sector 3 beautification, $500 for Upper Monroe Neighborhood Association beautification, and $500 for the Highland Neighbors banners.
$1,000 to the Department of Environmental Services for the Park Avenue Revitalization
Committee’s holiday lighting program. Section 2. This ordinance shall take effect immediately. Passed unanimously. TO THE COUNCIL Ladies and Gentlemen: Resolution No. 2009-9 Re: Resolution of Budgetary Intent - Health Benefits Transmitted herewith for your approval is a resolution of budgetary intent regarding the possibility of providing additional health benefits to individuals being laid off from City employment. As you will recall, last June, City Council approved a budget amendment that provided an additional three months of coverage for health insurance to laid-off City employees. This was done in recognition of the substantial number of positions that were eliminated (70) and the number of layoffs that were anticipated (20). In the Proposed 2009-10 Budget, a net of 53 positions are eliminated and significant layoffs are again possible. As a result of Council’s amendment last year, the City has continued to extend the coverage for health benefits to nine months. In the current economic climate, it is quite possible that some of our former employees will not be able to find new jobs even in that extended period of time.

June 16, 2009
24
The City’s current fiscal circumstances do not allow us the luxury of funding an additional extension, despite our genuine concern for those whose positions have been eliminated for budgetary reasons. However, we would like to monitor the situation and revisit the issue during 2010. The proposed resolution requests that the Mayor report to City Council in January on the number of laid-off employees who are still utilizing the City’s health care coverage. At that time, Council can review the fiscal situation and make a determination if any additional extension of benefits is warranted and possible Respectfully submitted, Carolee A. Conklin, Chair Gladys Santiago Finance Committee President Resolution No. 2009-9 (Int. No. 234E) Resolution of Budgetary Intent - Health Benefits WHEREAS, the City of Rochester has provided health insurance benefits to its employees during the course of their employment, and WHEREAS, such benefits are of critical importance to ensuring the health and general welfare of our employees, and WHEREAS, current fiscal realities have required the elimination of many positions, a fact that will result in the loss of employment by numerous City staff, and WHEREAS, along with the loss of employment, the loss of associated health benefits would cause a substantial hardship for such laid-off employees and their families, and WHEREAS, the City has provided six months of health coverage to employees who are being laid off, and WHEREAS, in 2008, the City Council amended the budget to provide an additional three months of health insurance coverage in recognition of the difficult economic climate, and WHEREAS, the economic climate has not improved substantially; in fact, the unemployment rate has continued to increase to dire levels, and WHEREAS, while the City Council would like to further extend the health insurance coverage for laid-off City staff, current fiscal realities do not permit us to do so at this time. BE IT THEREFORE RESOLVED, by the Council of the City of Rochester as follows: Section 1. The Mayor is hereby requested to provide to City Council in January a report that shall include the number of City staff who were actually laid off as a result of the adoption of the 2009-10 Budget, as well as the number of those who are still using City-provided health insurance benefits as of that time. Section 2. The Mayor is also requested to provide to Council a recommendation that balances the scope of the need for continued health benefits for those laid-off City employees with the fiscal circumstances of the City at that time. Section 3. The City Council shall review the Mayor’s recommendation and the City’s fiscal circumstances at that time and shall determine whether any extension of health insurance benefits is warranted or possible.

June 16, 2009
25
Section 4. This resolution shall take effect immediately. Adopted unanimously. TO THE COUNCIL Ladies and Gentlemen: Ordinance No. 2009-188, Ordinance No. 2009-189, Local Improvement Ordinance No. 1609, Ordinance No. 2009-190, Ordinance No. 2009-191, Ordinance No. 2009-192 and Ordinance No. 2009-193 Re: 2009-10 Budget Transmitted herewith for your approval is legislation relating to the 2009-10 Budget. This legislation will: 1. Approve appropriations and establish revenue estimates for the City and City School District; 2. Authorize the tax levies required to finance appropriations for the City and City School District; 3. Authorize the budgets and related assessments for the Local Works program; 4. Confirm the assessments required for the following programs: a. Street mall maintenance b. Neighborhood parking lot operation c. Public Market snow removal and security services d. Street lighting and sidewalk districts e. South Avenue/Alexander Street Open Space District f. Downtown Special Services District (previously Downtown Guides) g. Downtown Enhancement District h. High Falls Improvement District i. Atlantic Avenue Improvement District j. St. Paul Street Streetscape k. Upper East Alexander Refuse 5. Authorize certain fee increases and Code changes. Details of the above actions related to the 2009-10 proposed budget of the City submitted to City Council on May 15, 2009 are summarized below: 1. Total appropriations of $1,151,556,717 allocated for the City and the School District: Proposed Amended Percent 2009-10 2008-09 $ Difference Difference City $ 452,153,500 $ 481,000,400 $ -28,846,900 -6.0 School 699,403,217 691,337,445 8,065,772 1.2 Total $1,151,556,717 $1,172,337,845 $ -20,781,128 -1.8 Total non-tax revenue distributed between the City and the District: Proposed Amended Percent 2009-10 2008-09 $ Difference Difference City $410,569,245 $ 439,635,010 $ -29,065,765 -6.6 School 586,258,217 578,787,945 7,470,272 1.3 Total $996,827,462 $1,018,422,955 $ -21,595,493 -2.1

June 16, 2009
26
2. Total tax levies of $162,872,900 for the City and City School District: Proposed Amended Percent 2009-10 2008-09 $ Difference Difference Tax Revenue $154,729,255 $153,914,890 $ 814,365 0.5 Tax Reserve 8,143,645 8,958,010 -814,365 -9.1 Tax Levy $162,872,900 $162,872,900 $ 0 0.0 3. Total appropriations for the Local Works fund of $17,347,500 and total assessments of $15,782,200: Proposed Amended Percent 2009-10 2008-09 $ Difference Difference Street Maintenance $ 3,802,255 $ 4,106,335 $ -304,080 -7.4 Sidewalk Repair 1,588,778 1,661,594 -72,816 -4.4 Roadway Plowing 8,129,833 7,846,138 283,695 3.6 Sidewalk Plowing 2,261,334 2,153,233 108,101 5.0 Total $15,782,200 $15,767,300 $ 14,900 0.1 4. The budgets for the various street malls and the Public Market were approved on February 17, 2009.
The budgets for the open space, lighting, Cascade and Norton Streetscapes, and High Falls Business District were approved on April 14, 2009. The budgets for the Downtown Enhancement District, Downtown Special Services District (previously known as Downtown Guides), East Avenue and Alexander Street Entertainment District, and parking lots were approved on May 12, 2009. The assessments required for the various programs consist of the following:
Proposed Amended Percent 2009-10 2008-09 $ Difference Difference Street Malls $ 81,285 $ 78,209 $ 3,076 3.9 Parking Lots 72,345 66,110 6,235 9.4 Public Market 36,276 36,159 117 0.3 Lighting and Sidewalks 39,557 40,699 -1,142 -2.8 Open Space Districts 6,500 6,500 0 0.0 Downtown Special Services 449,941 441,969 7,972 1.8 Downtown Enhancement 553,200 540,900 12,300 2.3 High Falls Improvement District 25,000 25,000 0 0.0 Atlantic Avenue Improvement 3,045 21,378 -18,333 -85.8 St. Paul Street Streetscape 20,649 20,649 0 0.0 Upper East/Alexander Refuse 17,930 0 17,930 100.0 5. The proposed additions to the tax roll consist of the following charges: Proposed Amended Percent 2009-10 2008-09 $ Difference Difference Delinquent Refuse $ 565,688 $ 562,598 $ 3,090 0.5 Delinquent Water 6,809,125 6,471,375 337,750 5.2 Code Enforcement 44,373 52,988 -8,615 -16.3 Supplemental and Omitted Taxes 176,818 175,756 1,062 0.6 Local Improvements 17,166 19,656 -2,490 -12.7 Encroachments 4,375 4,375 0 0.0 Rehabilitation/Demolition 264,732 220,731 44,001 19.9 Code Violations 1,191,568 929,801 261,767 28.2 Arnold Park

June 16, 2009
27
Monuments 7,055 7,055 0 0.0 6. Amending the City Code for proposed departmental fee and fine increases will result in incremental
revenues of approximately $473,300 to the following Departments: Neighborhood and Business Development $470,100 Bureau of Human Resource Management 3,200 $473,300 Respectfully submitted, Robert J. Duffy Mayor Ordinance No. 2009-188 (Int. No. 234, As Amended) Adoption Of The Budget Estimates For Municipal Purposes For The
2009-10 Fiscal Year, Appropriation Of Sums Set Forth Therein And Approving Commercial Refuse Fees
BE IT ORDAINED, by the Council of The City of Rochester as follows: Section 1. The budget estimate for municipal purposes for the fiscal year July 1, 2009 to June 30, 2010, providing for the expenditure of $452,153,500, is in all respects adopted, confirmed, fixed, and determined. Section 2. The sums of money designated in the budget estimate for municipal purposes for the fiscal year 2009-10 are hereby authorized to be expended and the sum of $452,153,500 is hereby appropriated for the current expenses of the departments and agencies; cash capital; debt service; and for the other purposes therein, in the manner provided by law, as listed below: City Council and Clerk $ 1,816,900 Administration [9,986,400] 9,989,400 Neighborhood and Business Development [13,899,400] 13,916,400 Environmental Services [79,614,500] 79,615,500 Finance 6,966,800 Information Technology 4,308,700 Law 1,867,000 Library 11,153,500 Recreation and Youth Services [12,295,000] 12,317,000 Emergency Communications 10,520,500 Police [76,058,800] 76,065,800 Fire 42,070,500 Undistributed Expenses 99,762,500 Contingency [10,152,800] 10,102,800 Cash Capital 39,151,000 Debt Service 32,529,200 Sub-total $452,153,500 Tax Reserve 2,188,645 Total $454,342,145 Section 3. The budget estimate of the current revenues and other receipts, other than real estate taxes and the School Tax Relief (STAR) funds, for municipal purposes for the fiscal year 2009-10 is hereby fixed and determined at $410,569,245 and said sum is appropriated for the purposes set forth in the budget estimate.

June 16, 2009
28
Section 4. The budget estimate for the fiscal year 2009-10 providing for the raising of taxation on real estate for municipal purposes of the sum of $43,772,900 is hereby adopted. Section 5. Pursuant to subsection 20-24B(1) of the Municipal Code, the Council hereby approves the fees for collection of commercial refuse and recyclables as proposed by the Mayor for fiscal year 2009-10. Section 6. This ordinance shall take effect on July 1, 2009. Bracketed material deleted; underlined material added. Passed unanimously. Ordinance No. 2009-189 (Int. No. 236) Levying Taxes For Municipal Purposes For The Fiscal Year
Commencing July 1, 2009 And Expiring June 30, 2010 BE IT ORDAINED, by the Council of The City of Rochester as follows: Section 1. The sum of $43,772,900, which sum is deemed by the Council sufficient with other revenues to produce from collection during the fiscal year commencing July 1, 2009 and expiring June 30, 2010 the amount required to meet the budget estimates for municipal purposes, is hereby levied on all taxable real property in the City of Rochester, as set forth in the assessment rolls, for the fiscal year commencing July 1, 2009 and expiring June 30, 2010. Section 2. The Director of Finance shall cause the taxes levied above to be inserted in the assessment rolls for the fiscal year commencing July 1, 2009 and expiring June 30, 2010. Section 3. This ordinance shall take effect on July 1, 2009. Passed unanimously. Local Improvement Ordinance No. 1609 (Int. No. 239) Local Improvement Ordinance - Street Cleaning, Street And
Sidewalk Snow Removal, And Hazardous Sidewalk Repair Commencing July 1, 2009 And Expiring June 30, 2010
BE IT ORDAINED, by the Council of The City of Rochester as follows: Section 1. The Council finds and declares (1) that it is in the public interest to provide street cleaning, snow removal services on the streets and sidewalks, and the repair of hazardous sidewalks in the City of Rochester during the fiscal year from July 1, 2009 to June 30, 2010; (2) that the provision of such service benefits the properties abutting on such streets and sidewalks, and (3) that the cost of providing such services should be borne by the benefitted properties according to the benefit received by such properties. Section 2. The Commissioner of Environmental Services shall cause the following improvements and work to be provided on streets, sidewalks and lots in the City of Rochester during the fiscal year July 1, 2009 to June 30, 2010:

June 16, 2009
29
A. The removal of snow from such sidewalks and the repair of such hazardous sidewalks as the Commissioner may direct.
B. The removal of snow and ice from the roadway of such streets as the Commissioner may
direct, including the use of sodium chloride, calcium chloride, and other chemicals or abrasives for the treatment of slippery or icy pavement as deemed necessary by the Commissioner.
C. The cleaning and/or flushing of such streets as the Commissioner may direct, including
hand-cleaning, tank flushing, mechanical sweeping, and the collection and removal of brush, leaves, and debris.
Section 3. Such work shall be done by competitive contract, or by the Department of Environmental Services, as the Commissioner of Environmental Services deems appropriate. Section 4. The cost of providing such street cleaning and street snow removal services for the 2009-10 fiscal year shall be assessed against all parcels of property that abut a street, reflecting the benefit to be derived by such parcels from such services. The cost of providing such sidewalk repair and snow removal services for the 2009-10 fiscal year shall be assessed against all parcels of property that abut a sidewalk, reflecting the benefit to be derived by such parcels from such services. Section 5. The amount assessed shall be allocated among all benefited parcels in direct proportion to each parcel's street or sidewalk footage, defined for purposes of this ordinance as the full footage of the parcel along the street or sidewalk upon which it fronts, plus one-third of the footage along any other abutting streets or sidewalks. The Council hereby determines that such street or sidewalk footage represents the relative amount of benefit received by each such parcel. Section 6. The total cost of such services to be assessed on July 1, 2009 shall be $15,782,200 consisting of $3,802,255 for street and lot maintenance, $1,588,778 for sidewalk repair, $8,129,833 for roadway snow removal and $2,261,334 for sidewalk snow removal services. Such total amount constitutes an estimate of the amount necessary to pay contractors to provide services and to cover the costs of providing services with City crews between July 1, 2009 and June 30, 2010, less any miscellaneous revenues estimated to be collected during the same period, plus a reasonable reserve for uncollected assessments. All assessments collected shall be paid into the Local Works Fund, and all costs incurred shall be paid from such fund. The amounts assessed herein are appropriated for that purpose. Section 7. The amount assessed on July 1, 2009 shall be billed on the tax bill and shall be due in one installment. Delinquent assessments collected more than 60 days into a fiscal year subsequent to the fiscal year billed shall be credited as revenue in the year collected and applied against costs in that fiscal year. Section 8. This ordinance shall take effect on July 1, 2009. Passed unanimously. Ordinance No. 2009-190 (Int. No. 240, As Amended) Amending The Municipal Code With Respect To Fees For Civil
Service Examinations BE IT ORDAINED, by the Council of the City of Rochester as follows: Section 1. Section 14-11 of the Municipal Code, Fee for civil service examinations, as amended, is hereby further amended by adding the following new sentence to the end thereof:

June 16, 2009
30
City employees [taking] applying for promotional examinations shall [be required to reimburse the City for the cost of the examination] pay a nonrefundable fee for both State and local examinations equivalent to the fee charged to the City by New York State for promotional examinations.
Section 2. This ordinance shall take effect immediately. Bracketed material deleted; underlined material added. Passed unanimously. Introductory No.’s 235, 237 and 238 were voted on after Resolution No. 2009-10 was adopted. TO THE COUNCIL Ladies and Gentlemen: Resolution No. 2009-10 Re: 2009-10 Debt Limit Transmitted herewith for your approval is legislation establishing the Debt Limit, and Debt Rollover and Debt Extension amounts for the 2009-10 Budget. 2009-10 Debt Limit The Debt Limit for tax supported borrowing is equal to the amount of principal on outstanding debt to be redeemed during the fiscal year for which the limit is established. The calculation excludes the redemption of principal on any borrowing approved as an exception to the Debt Limit and is further reduced by specific revenues attributable to bonded debt. The resulting Debt Limit for 2009-10 is $17,831,000. Attached is the 2009-10 Debt Authorization Plan, which calls for borrowing of $17,746,000 in tax supported funds. The Plan also includes an additional $9,639,000 supported by the City’s Enterprise Funds (Water and Local Works). Debt Rollover 2008-09 and 2007-08 The Debt Authorization Plans for the current and the two immediately prior fiscal years can remain open contingent upon the approval of the rollover amounts. This provides flexibility in the timing of authorizations which vary depending upon project timing, availability of supporting funds, and the participation of private sector partners. The rollover amounts equal the difference between the debt limit for any fiscal year and the sum of the authorizations made from the debt plan associated with that fiscal year. This sum may be further reduced by the amount of unauthorized items in the debt plan that are no longer necessary. The presentation of the rollover also includes any modifications made to the debt plan. Such rollovers do not result in authorizations exceeding the allowable authorization for any year. 2008-09: The Debt Limit for this year was $16,855,000. Of that amount, $8,196,000 has been authorized, leaving a balance of $8,659,000. Approval of a rollover in that amount is requested. The attached Debt Authorization Plan for 2008-09 itemizes projects remaining for that year and the details of the changes resulting from advanced funding. 2007-08: The Debt Limit for this year was $34,363,700. Of that amount, $24,445,700 has been authorized, leaving a balance of $9,918,000. Approval of a rollover in that amount is requested. The plan was modified to include advance funding for Midtown Plaza acquisition and relocation costs as well as funding for the Fast Ferry payment. The attached Debt Authorization Plan for 2007-08 itemizes projects remaining for that year. Time Limit Extensions for 2006-07 and 2005-06

June 16, 2009
31
Time limit extensions are requested when projects are delayed beyond two years by market forces, significant reprogramming of funds, or other circumstances that justify carrying these authorizations beyond their expected authorization dates. Approval of extensions does not result in exceeding the allowable authorization for any fiscal year but is required by City Council Resolution. Extensions acknowledge the importance of these items as well as the fact that future replacement funds are not likely to be available. One-year extensions are requested for the following items based on programming and timing: 2006-07 Project Purpose Amount R-1 Manhattan Square Park renovations $1,000,000 P-15 Dewey Avenue Fire House renovation 58,000 F-2 Hazardous Waste Remediation Brooks Landing 100,000 F-2 Hazardous Waste Remediation Emerson Street 462,000 F-2 Hazardous Waste Remediation contaminated sites within the city 142,000 G-8 Market Rate Downtown Development downtown development 230,000 G-8 Market Rate Housing Acquisition housing development 1,000,000 Total 2006-07 Extension $2,992,000 2005-06 Project Purpose Amount G-4 Parking Garage Improvements garage renovations $ 100,000 G-8 Historic Aqueduct Redevelopment Broad St. aqueduct renovation 387,000 G-8 Oak View Hill Development market rate housing infrastructure 865,000 T-9 Broad Street Subway Tunnel tunnel rehab - Brown to Exchange Sts. 934,000 F-2 Hazardous Waste Remediation contaminated sites within the city 30,000 G-7 Waterfront Planning & Acquisition Port development 1,400,000 Total 2005-06 Extensions $3,716,000 Each of these projects depends upon the partnership of developers and the cooperation of other governments. Like any business venture, delays are inevitable when financial or regulatory obstacles delay implementation. At the same time the City must continue to demonstrate its good faith by the continued availability of these authorizations. Respectfully submitted, Robert J. Duffy Mayor Attachment No. AI-69 Resolution No. 2009-10 (Int. No. 242) Resolution Approving The 2009-10 Debt Limit For General
Municipal Purposes WHEREAS, an important component of the City’s expense budget and tax levy is debt; and WHEREAS, the amount of debt outstanding is one of the major factors evaluated by credit agencies in the determination of bond ratings; and WHEREAS, control of the debt service expense and the amount of outstanding debt must necessarily be exercised through restrictions on bond and note authorizations; and WHEREAS, bond ratings influence the rate of interest which must be paid on indebtedness and therefore the amount of debt service.

June 16, 2009
32
NOW, THEREFORE, BE IT RESOLVED, by the Council of the City of Rochester, that it is the intent and policy of the City to limit the amount of bonds and notes authorized in fiscal year 2009-10 to $17,831,000 for general municipal purposes. BE IT FURTHER RESOLVED, unused authorizations from the debt limits for fiscal years 2007-08 and 2008-09 shall continue to be available, but no authorization included in the debt limit for a prior fiscal year, if not actually approved by the City Council, shall be carried-over and included in the limit for this fiscal year. By this resolution, the Council specifically approves inclusion for this fiscal year of unused authorizations from the debt limit for fiscal year 2006-07 relating to renovations to Manhattan Square Park, Dewey Avenue fire station, hazardous waste remediation at Brooks Landing, Emerson Street, and contaminated City sites, market rate downtown housing development and general market rate housing development, and for fiscal year 2005-06 relating to parking garage improvements, Historic Aqueduct Redevelopment, Oak View Hill Development, Broad Street Subway Tunnel, hazardous waste remediation, and waterfront planning and acquisition. BE IT FURTHER RESOLVED, that exceptions to this policy are to be approved only for projects and purposes which could not reasonably be foreseen and, if not approved, would result in an obvious public danger or economic loss; and for projects and purposes for which the debt issued therefor would be self-supporting. BE IT FURTHER RESOLVED, that to insure continued awareness of an adherence to this policy, each separate request for authorized debt shall be accompanied by a report in which the amount of debt actually authorized is compared to the amount of debt herein established as a limit. BE IT FURTHER RESOLVED, that the redemption of any debt issued as an exception to a debt limit shall be excluded from the calculation of subsequent debt limits. This resolution shall take effect immediately. Adopted unanimously. Ordinance No. 2009-191 (Int. No. 235) Adoption Of The Budget Estimates For School Purposes For The
Fiscal Year Commencing July 1, 2009 And Expiring June 30, 2010, And Appropriation Of Sums Set Forth Therein
BE IT ORDAINED, by the Council of The City of Rochester as follows: Section 1. The budget estimate for school purposes for the fiscal year July 1, 2009 to June 30, 2010, providing for the expenditure of $699,403,217, is in all respects adopted, confirmed, fixed, and determined. Section 2. The sums of money designated in the budget estimate for school purposes for the fiscal year 2009-10 are hereby authorized to be expended and the sum of $699,403,217 is hereby appropriated to the Board of Education for the following purposes: Operations $658,986,386 Cash Capital 15,027,738 Debt Service 25,389,093 Subtotal 699,403,217 Tax Reserve 5,955,000 Total $705,358,217

June 16, 2009
33
Section 3. The budget estimate of the current revenues and other receipts, other than real estate taxes, for school purposes for the fiscal year 2009-10 is hereby fixed and determined at $586,258,217 and said sum is appropriated for the purposes set forth in the budget estimate. Section 4. The budget estimate for the fiscal year 2009-10 providing for the raising of taxation on real estate for school purposes of the sum of $119,100,000 is hereby adopted. Section 5. This ordinance shall take effect on July 1, 2009. Passed by the following vote: Ayes - President Santiago, Councilmember Lightfoot, McFadden, Palumbo, Pritchard, Spaull - 6. Nays - Councilmembers Conklin, Miller, Warren - 3. Ordinance No. 2009-192 (Int. No. 237) Levying Taxes For School Purposes For The Fiscal Year
Commencing July 1, 2009 And Expiring June 30, 2010 BE IT ORDAINED, by the Council of The City of Rochester as follows: Section 1.The sum of $119,100,000, which sum is deemed by the Council sufficient with other revenues to produce from collection during the fiscal year commencing July 1, 2009 and expiring June 30, 2010 the amount required to meet the budget estimates for school purposes, is hereby levied on all taxable real property in the City of Rochester, as set forth in the assessment rolls, for the fiscal year commencing July 1, 2009 and expiring June 30, 2010. Section 2. The Director of Finance shall cause the taxes levied above to be inserted in the assessment rolls for the fiscal year commencing July 1, 2009 and expiring June 30, 2010. Section 3. This ordinance shall take effect on July 1, 2009. Passed unanimously. Ordinance No. 2009-193 (Int. No. 238) Confirming The Assessments, Amounts And Charges To Be
Inserted In The Annual Tax Rolls For The Fiscal Year Commencing July 1, 2009 And Expiring June 30, 2010
BE IT ORDAINED, by the Council of The City of Rochester as follows: Section 1. The following assessments, amounts and charges, and the allocation of said amounts against properties in the City, as set forth in roll or rolls on file in the City Clerk's Office, to be inserted into the annual tax rolls for the fiscal year commencing July 1, 2009 and expiring June 30, 2010 are hereby in all respects confirmed: Street and Lot Maintenance $3,802,255.00 Roadway Snow Removal 8,129,833.00 Sidewalk Snow Removal 2,261,334.00 Hazardous Sidewalk Repair 1,588,778.00 Delinquent Refuse 565,687.45

June 16, 2009
34
Delinquent Water Charges 6,809,124.50 Supplemental Taxes 175,740.13 Omitted Taxes 1,077.90 Street Malls 81,285.00 Arnold Park Monuments 7,055.29 Parking Lots 72,345.00 Code Enforcements 44,372.50 Code Violations 1,194,568.00 Local Improvements 17,165.40 Downtown Enhancement 553,200.00 Public Market Plowing 5,406.98 Public Market Security 30,868.42 Encroachment Fees 4,375.00 Rehabilitation Charges 254,736.61 Demolition 9,995.00 Downtown Special Services 449,941.00 Lyell Avenue Street Lights - District I 2,458.30 Lyell Avenue Street Lights - District II 2,385.98 Wilson Blvd. Street Lights 440.22 Blossom Road Lights 609.42 Monroe Avenue Lights I 7,017.16 Monroe Avenue Lights and Sidewalk II 9,495.08 Norton Street District 4,030.03 Cascade District 5,998.94 Lake Avenue Lights 3,507.19 High Falls Business Improvement District 25,000.00 South Avenue-Alexander Open Space 6,500.00 St. Paul Street Streetscape 20,649.38 St. Paul Street Lighting 445.85 Rundel Park Lighting 3,168.68 Atlantic Avenue Landscape 3,045.12 Upper East Alexander Refuse 17,930.00 Section 2. This ordinance shall take effect immediately. Passed unanimously. By Councilmember Warren June 16, 2009 To the Council: The Neighborhood & Community Development Committee recommends for Adoption the following entitled legislation:
Int. No. 211 - Authorizing The Sale Of Real Estate Int. No. 212 - Authorizing An Agreement For A Tenant Education Program Int. No. 213 - Authorizing Agreements For The Emergency Shelter Grant Program, As Amended Int. No. 214 - Approving A Lease For Office Space For The Swillburg Neighborhood Association Int. No. 241 - Authorizing An Agreement For A Healthy Heart Program Grant

HIGHLIGHTS 1–1
Increases
Revenue: Expense:
Tax levy is frozen Funding for demolitions
No increase to water rates is proposed Recreation center hours expanded
No increase to refuse rates is proposed Additional Summer jobs for youth
No increase to local works rates is proposed Expanded staff at 911 Center
The transfer from Premium and Interest Fund necessary to balance the budget increases by $1.2 million
Decreases
Revenue: Expense:
The Approved New York State Budget results in a 20% decrease for New York Aid and Incentives for Municipalities (AIM)
Anticipated savings in health care and collective bargaining
Anticipated sales tax revenue decreases $5.0 million due to the recession
Program eliminations or reductions in departmental sections
Interest earnings Departmental efficiencies
Elimination of Police recruit class

1–2 REVENUE SUMMARY SUMMARY OF REVENUECHANGES
General Fund 2009-10 revenue estimates are $342,122,200 or 8.8% less than the 2008-09 Budget. The 20% reduction in state aid ($23.2 million) approved by New York State is budgeted. The amount transferred from the Premium and Interest Fund required to balance the budget is $1.2 million more than the amount used in 2008-09. A transfer of $2 million from the Tax Relief Fund is budgeted. No growth in taxable sales is assumed for 2009-10 on a lower than anticipated base for 2008-09. No increase in the tax levy is recommended. Special Fund 2009-10 revenue estimates are $592,600 or 3.6% more than the 2008-09 Budget. Receipt of a capital grant of $500,000 from New York State is budgeted to fund improvements for the Rundel Library. Monroe County support for the Central Library remains constant at the 2009 level. Enterprise Fund 2009-10 revenue estimates are $3,662,400 or 4.1% more than the 2008-09 Budget. The appropriation of fund balance for the Refuse Fund and the Local Works Fund increases to fund capital expenditures.

REVENUE SUMMARY 1–3 SUMMARY OF REVENUE CHANGES
Amended 2008-09
Approved 2009-10 Change
Percent Change
GeneralTaxes
Property Tax (City & School) 130,556,200 129,839,600 -716,600 -0.5%Delinquent & Supplemental Taxes 4,081,300 3,719,500 -361,800 -8.9%In-Lieu-of-Tax Payments 9,415,400 9,472,300 56,900 0.6%Interest & Penalties 3,735,000 2,561,000 -1,174,000 -31.4%Sales Tax 129,100,000 124,100,000 -5,000,000 -3.9%Utilities Gross Receipts Tax 8,700,000 7,700,000 -1,000,000 -11.5%Mortgage Tax 1,800,000 1,621,000 -179,000 -9.9%
Taxes Total 287,387,900 279,013,400 -8,374,500 -2.9%Departmental Income 7,747,700 6,989,800 -757,900 -9.8%
Use of Money & Property 1,956,100 353,900 -1,602,200 -81.9%Fines & Forfeitures 4,688,900 4,068,100 -620,800 -13.2%Licenses & Permits 2,234,500 2,949,500 715,000 32.0%Sale of Property & Compensation for Loss 2,126,100 2,520,800 394,700 18.6%Miscellaneous 6,525,900 6,419,500 -106,400 -1.6%Intergovernmental – New York State 135,318,700 110,100,200 -25,218,500 -18.6%Intergovernmental – Federal 6,095,800 6,180,800 85,000 1.4%Intergovernmental – Other 17,310,500 17,052,100 -258,400 -1.5%Interfund Revenue & Transfers -96,168,000 -93,525,900 2,642,100 -2.7%
General Total 375,224,100 342,122,200 -33,101,900 -8.8%Animal 1,369,300 1,439,800 70,500 5.1%
Library 15,269,500 15,791,600 522,100 3.4%Water 36,348,200 35,925,900 -422,300 -1.2%War Memorial 3,050,700 2,802,200 -248,500 -8.1%Parking 5,234,700 5,875,500 640,800 12.2%Cemetery 2,267,200 3,469,800 1,202,600 53.0%Public Market 991,100 935,800 -55,300 -5.6%Refuse 25,249,100 26,443,200 1,194,100 4.7%Local Works 15,996,500 17,347,500 1,351,000 8.4%
Grand Total 481,000,400 452,153,500 -28,846,900 -6.0%

1–4 REVENUE SUMMARY DESCRIPTIONS & CHANGES
$0
$20
$40
$60
$80
$100
$120
$140
$160
$180
01 02 03 04 05 06 07 08 09 10
Mill
ion
s
Fiscal Year
PROPERTY TAX2000-2007 = ACTUAL, 2008 & 2009 = BUDGET
CITY TAX COLLECTIONS
Property Tax New York State General City Law authorizes Rochester to levy taxes on the value of real property. The assessed value of the property and the tax rate determine the amount of tax to be paid by a property owner. Taxes are billed annually, and quarterly installments are allowed for the first $6,200 owed on each parcel. Responsibility for collecting property taxes is vested in the Department of Finance, Bureau of Treasury. Property taxes are allocated to various funds as necessary to balance them. Beginning in 1994-95 City and School property tax collections are accounted for within the City Budget. Funding for the City School District is provided within the Interfund revenue section. Prior to 1994-95 the School District received property tax collections outside of the City Budget. Beginning in 1998-99 the STAR program enabled a decrease in the property tax billings with an equal offset in State aid. For detailed information on the calculation of property taxes, see the Property Tax Computation and Analysis section, which follows the Revenue Summary Section. Major Change Four major factors influence the amount of revenue generated by the property tax: 1. The Tax Base – The total assessed valuation of the City is the base on which revenues are generated. The assessed valuation increases by $27,195,201 from the 2008-09 level. A description of assessment changes is included in the Property Tax Computation and Analysis section. 2. The Revenue Requirement – The amount of property tax revenue required to finance City services is determined by the cost of the services provided and the availability of revenue sources other than the property tax. The following summarizes changes in expenses and revenues from the 2008-09 budget:
2008-09 2009-10 ChangeExpenses 481,000,400 452,153,500 -28,846,900 Non-Property Tax Revenue 341,312,800 311,063,700 -30,249,100
Property Tax Required (City & School) 139,687,600 141,089,800 1,402,200 Further specific changes in revenue receipts are detailed under the appropriate revenue headings that follow. Expense changes are described in the appropriate department budget section. 3. The Collection Rate – It is anticipated that 93.5 percent of the tax levy will be collected during 2009-10. In addition, anticipated collections for the first sixty days following the current year are accrued as 2008-09 receipts. This accrual is estimated to be 1.5 percent of the tax levy, bringing total collections to 95.0 percent. A Tax Reserve of 5.0 percent of the required property tax revenue is also levied to compensate for those taxes that will not be collected or accrued during 2009-10 and an amount for the settlement of assessment review proceedings. In accordance with Generally Accepted Accounting Principles, the tax reserve is not reflected in the budget. 4. STAR Program – In 1998-99 New York State enacted the School Tax Relief (STAR) Program, which provides two types of exemption for owner-occupied primary residences. The “Enhanced” program is for property owners 65 years of age or older, with incomes of less than $73,000. Approximately 4,800 property owners will benefit from this program in 2009-10. All other owner-occupied property owners are eligible for the “Basic” STAR program. Approximately 26,700 property owners will take advantage of the “Basic” program in 2009-10. This program is further defined in the Property Tax Computation and Analysis portion of the Revenue Summary section.

REVENUE SUMMARY 1–5 DESCRIPTIONS & CHANGES
$0
$1
$2
$3
$4
$5
$6
$7
$8
01 02 03 04 05 06 07 08 09 10
Mill
ions
Fiscal Year
DELINQUENT AND SUPPLEMENTAL TAXES 2001-2008 = ACTUAL, 2009 & 2010 = BUDGET
$0
$2
$4
$6
$8
$10
$12
$14
01 02 03 04 05 06 07 08 09 10
Mill
ions
Fiscal Year
IN-LIEU-OF-TAX PAYMENTS 2001-2008 = ACTUAL, 2009 & 2010 = BUDGET
Year-to-Year Comparison All Funds
2008-09 2009-10 Change139,687,600 141,089,800 1,402,200
General Fund
2008-09 2009-10 Change130,556,200 129,839,600 -716,600
Delinquent & Supplemental Taxes Revenue from property taxes levied but not collected or accrued in previous years is classified as delinquent taxes. After properties have been delinquent for one year, the City will hold a bulk sale of delinquent tax liens to a third party; uncollected balances are canceled when these actions are completed. When properties lose their tax exempt status through transfer of ownership, property owners receive a supplemental tax bill that includes both current and delinquent payments. When an assessment is inadvertently left off the tax roll, property owners are later notified and billed the following year as an omitted tax. Major Change Revenue from delinquent taxes decreases as a result of a successful 2008-09 tax lien sale. Year-to-Year Comparison
2008-09 2009-10 Change4,081,300 3,719,500 -361,800
In Lieu Of Tax Payments To facilitate construction of public housing units and encourage industrial development, various sections of New York State law authorize certain property owners to make payments as a substitute for property tax. Currently, such payments are authorized under four different statutes: 1. The Private Housing Finance Law applies to projects constructed with private resources to provide housing for low and moderate income families. Payments for such projects are generally calculated at a rate of 10% of sheltered rents. Sheltered rents are determined by subtracting that portion of rent needed for utility service from total rent payments. 2. The Public Housing Law authorizes payments in lieu of taxes for property owned by public housing agencies. Payments are calculated in the same manner as those covered under the Private Housing Finance Law.

1–6 REVENUE SUMMARY DESCRIPTIONS & CHANGES
$0
$1
$2
$3
$4
01 02 03 04 05 06 07 08 09 10
Mill
ion
s
Fiscal Year
INTEREST & PENALTIES2001-2008 = ACTUAL, 2009 & 2010 = BUDGET
$100
$105
$110
$115
$120
$125
$130
$135
01 02 03 04 05 06 07 08 09 10
Mill
ions
Fiscal Year
SALES TAX 2001-2008 = ACTUAL, 2009 & 2010 = BUDGET
3. The Urban Development Act provides tax exemptions for properties owned by the Urban Development Corporation (UDC). When such properties are leased, payments in lieu of taxes are negotiated. For housing projects, the sheltered rent formula is generally applied, while economic development projects pay based on the percent of floor space occupied or percent of operating revenues. 4. The General Municipal Law authorizes the County of Monroe Industrial Development Agency (COMIDA) to receive tax exemptions on properties owned. In lieu of tax payments are negotiated when such properties are leased. Generally, the payments are equal to the amount that would have been paid if the property were not owned by COMIDA. Currently sixty-nine COMIDA projects make payments in lieu of taxes. Fifty-four housing projects make shelter rent payments. The Department of Finance, Bureau of Accounting, administers these accounts. Major Change Revenues are anticipated to increase slightly due to an increase in shelter rent payments offset by a net transfer of $11.2 million in non-homestead assessed value from COMIDA to the tax roll. Year-to-Year Comparison
2008-09 2009-10 Change9,415,400 9,472,300 56,900
Interest & Penalties The City levies a finance charge of 1.5% per month on unpaid tax and fee balances. Penalty fees for unpaid taxes are added to subsequent tax bills and are collected in the same manner as property taxes. Major Change Reduction in delinquent tax balance as a result of successful 2008-09 tax lien sale reduces revenue from interest and penalties. Year-to-Year Comparison
2008-09 2009-10 Change3,735,000 2,561,000 -1,174,000
Sales Tax New York State Tax Law authorizes Monroe County to impose a tax on sales transactions in the County. A four percent tax (besides the four percent imposed by the State) is charged on most sales transactions except sales of food and home heating fuels. The local sales tax rate increased from 3 percent to 3.5 percent in September 1992 and to 4 percent in March 1993. Sales tax proceeds are collected by the State and distributed to the County every month. Under the current sales tax distribution formula the City receives 35.63 percent of total County collections generated from the 3 percent local share. The City’s initial share of the additional 1 percent, approximately 4.1%, began on December 1, 1993, and was suspended on November 30, 1994. During that period the City School District received approximately 3.7% of the additional percent directly from the County. The City resumed sharing the additional 1 percent on December 1, 1995. Beginning in December 1995 the City share of the additional 1 percent became 2.5%, and it increased annually for the

REVENUE SUMMARY 1–7 DESCRIPTIONS & CHANGES
$0
$2
$4
$6
$8
$10
$12
01 02 03 04 05 06 07 08 09 10
Mill
ion
s
Fiscal Year
UTILITIES GROSS RECEIPTS TAX 2001-2008 = ACTUAL, 2009 & 2010 = BUDGET
$0
$1
$2
$3
$4
01 02 03 04 05 06 07 08 09 10
Mill
ion
s
Fiscal Year
MORTGAGE TAX 2001-2008 = ACTUAL, 2009 & 2010 = BUDGET
next four years to 5%, 12%, 15.75% and 19.22%. The City share of the additional 1 percent decreased to 18.1% in January 2001 to reflect population changes identified in the 2000 Census. Major Change Taxable sales are anticipated to remain flat on a lower base than anticipated in 2008-09. Year-to-Year Comparison
2008-09 2009-10 Change129,100,000 124,100,000 -5,000,000
Utilities Gross Receipts Tax As provided by Section 20b of the General City Law, Rochester imposes a 3% tax on the gross income of utility company transactions in the City. Rochester Gas & Electric Corporation and Frontier Corporation pay approximately 85% of these taxes. Major Change Revenue decreases as a result of Rochester Gas & Electric miscalculation of payments for Energy Service Companies (ESCO’s). Year-to-Year Comparison
2008-09 2009-10 Change8,700,000 7,700,000 -1,000,000
Mortgage Tax New York State Tax Law authorizes the Monroe County Clerk to collect a tax on mortgage transactions in the County. A tax is charged on the transactions and distributed pursuant to Section 261 of the Tax Law. The City receives 50 percent of the amount collected, less an allowance for administrative expenses, on mortgage transactions within the City. Major Change Revenue from mortgage tax is anticipated to decrease due to a weak housing market. Year-to-Year Comparison
2008-09 2009-10 Change1,800,000 1,621,000 -179,000

1–8 REVENUE SUMMARY DESCRIPTIONS & CHANGES
$0
$1
$2
$3
$4
$5
$6
$7
$8
$9
01 02 03 04 05 06 07 08 09 10
Mill
ions
Fiscal Year
DEPARTMENTAL INCOME 2001-2008 = ACTUAL, 2009 & 2010 = BUDGET
$0
$1
$2
$3
$4
$5
01 02 03 04 05 06 07 08 09 10
Mill
ions
Fiscal Year
USE OF MONEY & PROPERTY 2001-2008 = ACTUAL, 2009 & 2010 = BUDGET
$0
$1
$2
$3
$4
$5
$6
01 02 03 04 05 06 07 08 09 10
Mill
ion
s
Fiscal Year
FINES & FORFEITURES 2001-2008 = ACTUAL, 2009 & 2010 = BUDGET
Departmental Income Revenues generated by departmental operations are classified as departmental income. Examples include fees collected at skating rinks, charges for processing at the Police photo lab, towing fees, foreclosure fees, and zoning application fees. The City Code authorizes these fees. The fees are calculated to cover all or part of the cost of specific services. Major Change Revenue from foreclosure fees is eliminated due to bulk tax lien sale $330,000; assessment and inspection services for the towns of Brighton and Gates cease eliminating reimbursements $170,400; subscription revenue from Emergency Training & Information Network (ETIN) is eliminated $78,000; towing fees decrease $70,000; reimbursements of demolition expense decreases $60,000; revenue from fire prevention permit fees decreases $29,000; sale of fuel to others reduces as a result of lower fuel costs $26,600; net of other changes is an increase of $6,100. Year-to-Year Comparison
2008-09 2009-10 Change7,747,700 6,989,800 -757,900
Use Of Money & Property The major revenue source in this category is from investment of cash. Under provisions of the New York State General Municipal Law, Rochester is authorized to invest funds in interest bearing commercial bank accounts until these funds are needed to meet payrolls or to pay bills. The second source of revenue in this category is from rental of City-owned property. Major Change Interest earnings are expected to decrease by $1,637,600; net of other changes is an increase of $35,400. Year-to-Year Comparison
2008-09 2009-10 Change1,956,100 353,900 -1,602,200
Fines & Forfeitures The revenue in this category consists of fines and penalties levied by the Criminal Branch of City Court, proceeds from parking tickets issued by the Police Department and other authorized agents, municipal code fines collected by the Parking & Municipal Violations Bureau, and a distribution of fines collected by New York State for traffic violations committed in the City

REVENUE SUMMARY 1–9 DESCRIPTIONS & CHANGES
$0
$1
$1
$2
$2
$3
$3
$4
01 02 03 04 05 06 07 08 09 10
Mill
ions
Fiscal Year
LICENSES & PERMITS 2001-2008 = ACTUAL, 2009 & 2010 = BUDGET
$0
$1
$2
$3
$4
01 02 03 04 05 06 07 08 09 10
Mill
ion
s
Fiscal Year
SALE OF PROPERTY & COMPENSATION FOR LOSS 2001-2008 = ACTUAL, 2009 & 2010 = BUDGET
Major Change Revenue is anticipated to decrease as a larger share of total revenue from parking tickets is allocated to the Parking Fund $482,500 and municipal code fine revenue is expected to decrease $310,400; partially offset by an increase in New York State moving violation fines $162,500; net of other changes is an increase of $9,600. Year-to-Year Comparison
2008-09 2009-10 Change4,688,900 4,068,100 -620,800
Licenses & Permits The Municipal Code authorizes the City to regulate various activities by issuing permits and licenses. This is done to protect public safety. Fees for permits and licenses are designed to fully or partially recover the administrative and enforcement costs of regulated activities. Most permits are issued by the Department of Community Development. Major Change Revenue increases due to proposed case management fee $286,100; increases in professional licenses due to the bi-annual schedule for licenses $190,800; proposed Certificate of Occupancy renewal fees $184,000; revenue from business and occupational licenses increases $76,300; the net of other changes is a decrease of $22,200. Year-to-Year Comparison
2008-09 2009-10 Change2,234,500 2,949,500 715,000
Sale Of Property & Compensation For Loss Revenue in this category comes from sale of real property, sale of excess materials, insurance recoveries, and the sale of unclaimed property. The sale of real property is the largest revenue source in this group. Major Change Revenue from the sale of real property increases $720,000 due to the proposed sale of a City facility offset by decreased receipts from auto auctions $230,000 and decreased sale of scrap $102,000; net of other changes is an increase of $6,700. Year-to-Year Comparison
2008-09 2009-10 Change2,126,100 2,520,800 394,700
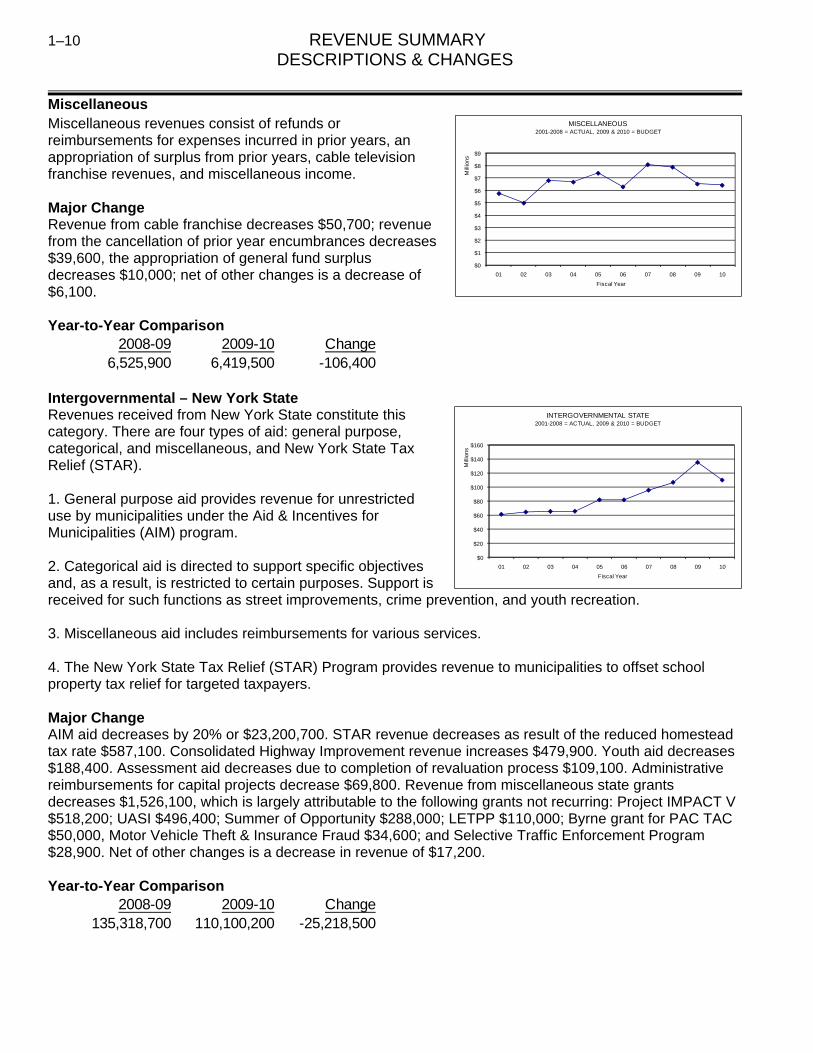
1–10 REVENUE SUMMARY DESCRIPTIONS & CHANGES
$0
$1
$2
$3
$4
$5
$6
$7
$8
$9
01 02 03 04 05 06 07 08 09 10
Mill
ions
Fiscal Year
MISCELLANEOUS 2001-2008 = ACTUAL, 2009 & 2010 = BUDGET
$0
$20
$40
$60
$80
$100
$120
$140
$160
01 02 03 04 05 06 07 08 09 10
Mill
ions
Fiscal Year
INTERGOVERNMENTAL STATE 2001-2008 = ACTUAL, 2009 & 2010 = BUDGET
Miscellaneous Miscellaneous revenues consist of refunds or reimbursements for expenses incurred in prior years, an appropriation of surplus from prior years, cable television franchise revenues, and miscellaneous income. Major Change Revenue from cable franchise decreases $50,700; revenue from the cancellation of prior year encumbrances decreases $39,600, the appropriation of general fund surplus decreases $10,000; net of other changes is a decrease of $6,100. Year-to-Year Comparison
2008-09 2009-10 Change6,525,900 6,419,500 -106,400
Intergovernmental – New York State Revenues received from New York State constitute this category. There are four types of aid: general purpose, categorical, and miscellaneous, and New York State Tax Relief (STAR). 1. General purpose aid provides revenue for unrestricted use by municipalities under the Aid & Incentives for Municipalities (AIM) program. 2. Categorical aid is directed to support specific objectives and, as a result, is restricted to certain purposes. Support is received for such functions as street improvements, crime prevention, and youth recreation. 3. Miscellaneous aid includes reimbursements for various services. 4. The New York State Tax Relief (STAR) Program provides revenue to municipalities to offset school property tax relief for targeted taxpayers. Major Change AIM aid decreases by 20% or $23,200,700. STAR revenue decreases as result of the reduced homestead tax rate $587,100. Consolidated Highway Improvement revenue increases $479,900. Youth aid decreases $188,400. Assessment aid decreases due to completion of revaluation process $109,100. Administrative reimbursements for capital projects decrease $69,800. Revenue from miscellaneous state grants decreases $1,526,100, which is largely attributable to the following grants not recurring: Project IMPACT V $518,200; UASI $496,400; Summer of Opportunity $288,000; LETPP $110,000; Byrne grant for PAC TAC $50,000, Motor Vehicle Theft & Insurance Fraud $34,600; and Selective Traffic Enforcement Program $28,900. Net of other changes is a decrease in revenue of $17,200. Year-to-Year Comparison
2008-09 2009-10 Change135,318,700 110,100,200 -25,218,500

REVENUE SUMMARY 1–11 DESCRIPTIONS & CHANGES
$0
$1
$2
$3
$4
$5
$6
$7
$8
$9
01 02 03 04 05 06 07 08 09 10
Mill
ions
Fiscal Year
INTERGOVERNMENTAL FEDERAL 2001-2008 = ACTUAL, 2009 & 2010 = BUDGET
$0
$4
$8
$12
$16
$20
01 02 03 04 05 06 07 08 09 10
Mill
ions
Fiscal Year
INTERGOVERNMENTAL OTHER 2001-2008 = ACTUAL, 2009 & 2010 = BUDGET
Intergovernmental – Federal The Federal Aid category includes reimbursements for the administration of federally funded programs. The program appropriations are approved by City Council separate from the City operating budget. The Community Development Block Grant (CDBG) Program is the largest such “off budget” fund . Major Change Grant from COPS MORE increases revenue $675,000. Revenue from miscellaneous grants decreases: Rochester Safe & Sound $423,700; Lead Hazard Program $73,300; COPS in Schools $70,500; and Metropolitan Medical Response System $25,000. Revenue from transportation grants increases $62,500. Revenue from block grant decreases $50,000. Net of other changes is a decrease in revenue of $10,000. Year-to-Year Comparison
2008-09 2009-10 Change6,095,800 6,180,800 85,000
Intergovernmental – Other Revenues received from governmental agencies other than the Federal and New York State levels constitute this category. Reimbursements for debt service from the Pure Waters Agency for sewers and from Monroe County for highways account for the majority of the revenues in this classification. Profits distributed by the Western Region Off-Track Betting (OTB) Corporation and Monroe County reimbursements for highway maintenance, public safety activities, and various other programs comprise the remaining intergovernmental revenues. Major Change There is a decrease of $435,000 for Traffic Shares as County funded capital projects decrease. County reimbursement for Emergency Communications increases $365,400. The following decreases occur: Lead Hazard Control grant $90,600; County LETPP $85,000; and Pure Waters Sewer Debt payments $41,600. Revenue increases for an after-school program $35,000. Net of other changes is a decrease of $6,600. Year-to-Year Comparison
2008-09 2009-10 Change17,310,500 17,052,100 -258,400

1–12 REVENUE SUMMARY DESCRIPTIONS & CHANGES
-$120
-$100
-$80
-$60
-$40
-$20
$0
01 02 03 04 05 06 07 08 09 10
Mill
ions
Fiscal Year
INTERFUND REVENUE 2001-2008 = ACTUAL, 2009 & 2010 = BUDGET
$0
$50,000
$100,000
$150,000
$200,000
$250,000
$300,000
$350,000
01 02 03 04 05 06 07 08 09 10
Fiscal Year
ANIMAL CONTROL 2001-2008 = ACTUAL, 2009 & 2010 = BUDGET
Interfund Revenues & Transfers Interfund transfers consist of three categories: 1. Reimbursements to the General Fund for services provided to other operating funds. In these cases, the cost of services (motor equipment, telephone, etc.) are included in the General Fund as well as the appropriate non-General Fund. The reimbursements offset the General Fund expense. Revenues in this group include transfers from the Library Fund and Enterprise Funds. 2. Reimbursements to the General Fund from funds that are not included in the operating budget. Revenues in these funds are generally restricted and can be transferred to the General Fund only to the extent that eligible expenses are identified. 3. Beginning in 1994-95, transfers to the City School District to fund educational expenditures in accordance with the City Charter. Major Change A transfer from the Tax Relief Fund is planned $2,000,000. The transfer from Premium and Interest needed to balance the budget increases $1,202,000. Revenue transferred from the Foreign Insurance Fund is eliminated $615,000. Transfer from Enterprise funds increases $409,200, due primarily to increased administrative chargebacks. Transfers from seized property funds decrease $189,000. Revenue from the HUD Asset Control Fund decreases $153,600. Net of other changes is a decrease of $11,500. Year-to-Year Comparison
2008-09 2009-10 Change-96,168,000 -93,525,900 2,642,100
Animal Control Fund Under Article 7 of the New York Agriculture and Markets Law, all expenditures and revenues associated with the licensing and impounding of animals must be recorded in a special fund. Accordingly, the Animal Control Fund includes revenues from the sale of dog licenses, fines for unlicensed dogs, and operating revenues from the Animal Control Center. Since the Animal Control Fund does not generate sufficient revenues to cover expenses, a portion of the property tax is allocated to this fund. Major Change Revenue from interest earnings decreases $14,900 due to lower rates. Revenue from fines and animal control center fees decrease $5,200. Dog license revenue increases $3,800. Property tax support increases $86,800 to balance the budget.

REVENUE SUMMARY 1–13 DESCRIPTIONS & CHANGES
$0
$2
$4
$6
$8
$10
$12
01 02 03 04 05 06 07 08 09 10
Mill
ions
Fiscal Year
LIBRARY 2001-2008 = ACTUAL, 2009 & 2010 = BUDGET
$0
$5
$10
$15
$20
$25
$30
$35
$40
01 02 03 04 05 06 07 08 09 10
Mill
ions
Fiscal Year
WATER 2001-2008 = ACTUAL, 2009 & 2010 = BUDGET
Year-to-Year Comparison 2008-09 2009-10 Change
Operating Revenue 305,200 288,900 -16,300 Property Tax 1,064,100 1,150,900 86,800
Total 1,369,300 1,439,800 70,500 Library Fund Section 259 of the New York State Education Law requires that all revenues generated from library operations be recorded in a special fund. Revenues associated with the operation of the Central Library and 10 branch libraries include Monroe County reimbursement for the Central Library, reimbursements from the Monroe County Library System (MCLS) for library material processing and inter-library loan services, State aid and grants, and miscellaneous income. These revenues are not sufficient to cover library costs; therefore, a portion of the property tax is allocated to this fund. Major Change State aid increases $512,600 as a result of a capital grant. An appropriation of fund balance does not recur $350,000. Revenue from Library charges decreases $269,500. Transfer from premium and interest increases $41,400. Miscellaneous revenue from grants decreases $31,200. Property tax support increases $618,800 to balance the budget. Year-to-Year Comparison
2008-09 2009-10 ChangeOperating Revenue 10,649,300 10,552,600 -96,700 Property Tax 4,620,200 5,239,000 618,800
Total 15,269,500 15,791,600 522,100 Water Fund This fund records the expenses and revenues of the Water enterprise, which provides potable water for domestic and commercial use and for fire protection purposes. Revenues are generated by metered water sales, sales to other municipalities, various service charges and wholesale water sales to the Monroe County Water Authority (MCWA). Most customers are billed quarterly, except for high volume users that are billed monthly. Major Change A one time sale of real property is planned $2,000,000. Metered water sales decreases $1,275,200 due to lower consumption. New York State grant for dam safety does not recur $1,000,000. Delinquent collections decrease as a result of 2008-09 tax lien sale $300,000. Transfer from premium and interest is budgeted $193,400. Revenue from MCWA reimbursements for capital projects decreases $190,900 due to the expiration of the exchange of water agreement. Revenue from service charges increases $97,500. Sale of water to MCWA and other municipalities increases revenue $56,300. Interest and penalties increase $55,200. Interest earnings decrease $40,200 due to lower rates. Net of other changes is a decrease of $18,400.

1–14 REVENUE SUMMARY DESCRIPTIONS & CHANGES
$0
$1
$2
$3
01 02 03 04 05 06 07 08 09 10
Mill
ions
Fiscal Year
WAR MEMORIAL 2001-2008 = ACTUAL, 2009 & 2010 = BUDGET
$0
$1
$2
$3
$4
$5
$6
$7
$8
01 02 03 04 05 06 07 08 09 10
Mill
ion
s
Fiscal Year
PARKING 2001-2008 = ACTUAL, 2009 & 2010 = BUDGET
Year-to-Year Comparison 2008-09 2009-10 Change
Operating Revenue 36,348,200 35,925,900 -422,300 War Memorial Fund This fund records the expenses and revenues from the Blue Cross Arena at the War Memorial. The Arena is operated by a private contractor from whom the City receives a ticket surcharge, a percent of concession receipts, and reimbursement for utility expenses. The City also receives funds from naming rights of the facility. A share of receipts from the City's portion of the Hotel/Motel Occupancy Tax is credited to this fund. Major Change Transfer from premium and interest increases $36,200. Operating revenues from the Blue Cross Arena decrease $15,300. Decrease in interest earnings $4,000 due to lower rates. Property tax support needed to balance the budget decreases $265,400 due to reduced operating costs. Year-to-Year Comparison
2008-09 2009-10 ChangeOperating Revenue 2,374,200 2,391,100 16,900 Property Tax 676,500 411,100 -265,400
Total 3,050,700 2,802,200 -248,500 Parking Fund Revenues in this fund are generated from nine downtown parking garages, sixteen surface lots, and on-street parking meters. Most facilities are operated by private contractors who pay a percentage of operating revenue to the City. The Cultural Center Commission reimburses the City for administrative expenses associated with the City's oversight of the East End Garage. Major Change A larger portion of parking ticket revenue is allocated to the Parking Fund $992,600 as cost centers are transferred from the General Fund. Revenue from parking ramps and lots decreases $707,700 due to the closure of Midtown Garage and the loss of parking spaces at Washington Square Garage. Transfer from premium and interest decreases $112,300. In-garage advertising revenue decreases $56,200. Parking meter revenue increases $50,000. Miscellaneous reimbursements decrease $50,000. Net of other changes decreases revenue $11,400. Property tax support for the Parking Fund increases $535,800. Year-to-Year Comparison
2008-09 2009-10 ChangeOperating Revenue 3,861,000 3,966,000 105,000 Property Tax 1,373,700 1,909,500 535,800
Total 5,234,700 5,875,500 640,800

REVENUE SUMMARY 1–15 DESCRIPTIONS & CHANGES
$0
$1
$2
$3
01 02 03 04 05 06 07 08 09 10
Mill
ions
Fiscal Year
CEMETERY 2001-2008 = ACTUAL, 2009 & 2010 = BUDGET
$0
$100,000
$200,000
$300,000
$400,000
$500,000
$600,000
$700,000
$800,000
$900,000
01 02 03 04 05 06 07 08 09 10
Fiscal Year
PUBLIC MARKET 2001-2008 = ACTUAL, 2009 & 2010 = BUDGET
$0
$5
$10
$15
$20
$25
$30
01 02 03 04 05 06 07 08 09 10
Mill
ions
Fiscal Year
REFUSE 2001-2008 = ACTUAL, 2009 & 2010 = BUDGET
Cemetery Fund The City owns and operates two cemeteries, Mt. Hope and Riverside. Revenues in the Cemetery Fund are received from the sale of single graves, lots, mausoleums, interments, burial service charges, crematory charges, and interest earned on funds set aside for perpetual care. Major Change Interest earnings decrease $124,500 due to lower rates. Service charges increase $51,400. Transfer from premium and interest increases $20,600. Net of other changes decreases revenue $1,000. Property tax support for the Cemetery fund increases $1,256,100. Year-to-Year Comparison
2008-09 2009-10 ChangeOperating Revenue 1,121,100 1,067,600 -53,500 Property Tax 1,146,100 2,402,200 1,256,100
Total 2,267,200 3,469,800 1,202,600 Public Market Fund A farmers' market, consisting of two open sheds and one enclosed shed, is owned and operated by the City. Rental of shed space occurs on an annual, semi-annual, or daily basis. Major Change Transfer from premium and interest increases $31,700. Revenue from market fees increases $27,100. Interest earnings decrease $800 due to lower rates. Property tax needed to balance the budget is reduced $113,300. Year-to-Year Comparison
2008-09 2009-10 ChangeOperating Revenue 740,300 798,300 58,000 Property Tax 250,800 137,500 -113,300
Total 991,100 935,800 -55,300 Refuse Fund Rochester's refuse collection and disposal costs are financed principally from the proceeds of user fees. Separate rates are charged for residential and commercial services. Residential fees are included with property tax bills, and commercial accounts receive separate quarterly bills.

1–16 REVENUE SUMMARY DESCRIPTIONS & CHANGES
$0
$2
$4
$6
$8
$10
$12
$14
$16
$18
$20
01 02 03 04 05 06 07 08 09 10
Mill
ion
s
Fiscal Year
LOCAL WORKS 2001-2008 = ACTUAL, 2009 & 2010 = BUDGET
Major Change Appropriation of fund balance is required $1,330,300 to fund capital purchases. Delinquent collections decrease as a result of 2008-09 tax lien sale $450,000. Sale of scrap increases $295,000. Commercial collections increase $164,000. Interest earnings decrease $140,100 due to lower rates. Net of other changes is a decrease of $5,100. Year-to-Year Comparison Row Labels 2008-09 2009-10 ChangeOperating Revenue 25,249,100 26,443,200 1,194,100 Local Works Fund Revenues to support street cleaning, snow and ice control services, and hazardous sidewalk replacement are derived from front footage assessments. These assessments are charged with the property tax bill. Other revenues include reimbursements from New York State for snow and ice control on highways and, if required, an appropriation from the Local Works fund balance. Major Change The appropriation of fund balance increases $1,717,000. Delinquent collections decrease as a result of 2008-09 tax lien sale $214,100. Interest earnings decrease $186,100 due to lower rates. Current collections increase $13,700. Miscellaneous income increases $13,000. Reimbursement for state snowplowing increases $7,500. Year-to-Year Comparison
2008-09 2009-10 ChangeOperating Revenue 15,996,500 17,347,500 1,351,000

REVENUE SUMMARY 1–17 REVENUE ESTIMATES
Actual2007-08
Estimated 2008-09
Budget 2008-09
Budget 2009-10
GeneralTaxes
Property Tax (City & School) 126,106,716 130,519,900 130,556,200 129,839,600 Delinquent & Supplemental Taxes 4,251,511 5,578,000 4,081,300 3,719,500 In-Lieu-of-Tax Payments 11,403,233 9,282,200 9,415,400 9,472,300 Interest & Penalties 3,741,199 4,820,800 3,735,000 2,561,000 Sales Tax 130,076,640 125,200,000 129,100,000 124,100,000 Utilities Gross Receipts Tax 9,367,413 6,700,000 8,700,000 7,700,000 Mortgage Tax 2,456,159 1,721,800 1,800,000 1,621,000
Taxes Total 287,402,871 283,822,700 287,387,900 279,013,400 Departmental Income
Police Fees 1,532,669 1,618,800 1,587,000 1,593,600 Fire Fees 732,240 697,000 718,600 613,400 Finance Fees 411,340 207,500 422,300 87,000 Repairs & Clean-up Fees 219,092 206,000 99,900 150,000 Recreation Fees 841,187 890,000 820,200 918,600 Zoning Fees 91,843 94,000 94,000 80,000 Charges for Service 2,233,857 2,530,000 2,723,300 2,295,000 Other Dept. Income 1,876,513 1,357,400 1,282,400 1,252,200
Departmental Income Total 7,938,741 7,600,700 7,747,700 6,989,800 Use of Money & Property
Interest Earnings 3,023,984 986,700 1,840,900 203,300 Rental of Real Property 118,298 115,200 115,200 150,600
Use of Money & Property Total 3,142,282 1,101,900 1,956,100 353,900 Fines & Forfeitures
City Court Fines 69,830 55,000 58,000 60,000 Moving Violations 898,915 850,000 900,000 1,062,500 Parking Violations 3,093,751 3,117,000 2,500,000 2,017,500 Municipal Code Fines 926,468 650,000 1,230,000 919,600 Miscellaneous 48,076 7,400 900 8,500
Fines & Forfeitures Total 5,037,040 4,679,400 4,688,900 4,068,100 Licenses & Permits
Business & Occupational Licenses 305,936 320,400 326,600 402,900 Bingo Licenses 12,279 16,000 12,000 21,500 Professional Licenses 255,918 43,500 47,100 237,900 Other Licenses 57,650 54,400 60,700 59,100 Building Permits 1,762,170 1,484,300 1,506,100 1,958,100 Street Opening Permits 287,089 267,400 282,000 270,000
Licenses & Permits Total 2,681,042 2,186,000 2,234,500 2,949,500 Sale of Property & Compensation for Loss
Sale of Scrap 366,979 300,000 250,000 148,000 Sale of Real Property 1,830,958 900,000 1,080,000 1,800,000 Sale of Unclaimed Property 528,779 461,500 641,100 412,800 Other Compensation for Loss 163,892 166,000 155,000 160,000
Sale of Property & Compensation for Loss Total 2,890,608 1,827,500 2,126,100 2,520,800

1–18 REVENUE SUMMARY REVENUE ESTIMATES
Actual2007-08
Estimated 2008-09
Budget 2008-09
Budget 2009-10
Miscellaneous Refund - Prior Year's Expense 437,693 150,000 154,100 148,000 General Fund Surplus 4,051,000 4,193,000 4,193,000 4,183,000 Cable TV Franchise Revenue 1,756,574 1,867,300 1,739,200 1,688,500 Miscellaneous 1,625,229 1,514,400 439,600 400,000
Miscellaneous Total 7,870,496 7,724,700 6,525,900 6,419,500 Intergovernmental – New York State
Aid & Incentives to Municipalities 86,247,303 115,415,700 115,415,700 92,215,000 STAR 14,677,047 14,223,400 14,227,300 13,640,200 Youth Aid 331,074 231,500 263,500 75,100 Consolidated Highway Improvements 2,647,884 3,036,800 2,647,900 3,127,800 Miscellaneous 2,961,145 3,968,400 2,764,300 1,042,100
Intergovernmental – New York State Total 106,864,453 136,875,800 135,318,700 110,100,200 Intergovernmental – Federal
Community Development Block Grant 3,943,615 4,123,900 4,113,900 4,063,900 Crime Bill 61,062 0 80,500 675,000 Homeland Security 5,674 73,300 73,300 0 Weed & Seed Grant 114,676 0 0 0 Transportation Grants 321,022 125,600 237,900 300,400 Federal Nutrition 422,228 454,500 408,700 476,000 Lead Programs 210,789 218,500 218,500 152,100 HUD-Emergency Shelter Grant 21,321 21,300 21,300 21,200 Metro. Medical Response 203,141 114,000 250,000 225,000 Substance Abuse Grant 100,890 100,000 100,000 100,000 Miscellaneous 373,962 701,200 591,700 167,200
Intergovernmental – Federal Total 5,778,380 5,932,300 6,095,800 6,180,800 Intergovernmental – Other
Off Track Betting 335,594 280,000 230,000 250,000 Pure Waters Agency Sewer Debt 568,828 462,000 462,000 420,400 Emergency Communications 12,352,341 13,226,000 13,226,000 13,591,400 Police Services-Firearms Instruction 111,350 55,700 55,700 55,700 Election Inspectors 271,165 213,200 303,900 283,900 Downtown Public Safety 300,000 300,000 300,000 300,000 Traffic Shares 221,667 700,000 976,000 541,000 STOP-DWI 121,433 91,300 91,300 91,300 Hotel/Motel Tax (Convention Center) 795,000 795,000 795,000 795,000 Miscellaneous 737,265 795,900 870,600 723,400
Intergovernmental – Other Total 15,814,643 16,919,100 17,310,500 17,052,100

REVENUE SUMMARY 1–19 REVENUE ESTIMATES
Actual2007-08
Estimated 2008-09
Budget 2008-09
Budget 2009-10
Interfund Revenue & TransfersCity School District -119,100,000 -119,100,000 -119,100,000 -119,100,000 Water Fund 4,678,500 4,593,100 4,593,100 4,593,100 Special & Enterprise Funds 10,092,200 10,630,100 11,116,200 11,525,400 Street Lighting Districts 39,698 40,000 37,400 35,000 Premium & Interest Fund 6,000,000 2,798,000 2,798,000 4,000,000 Foreign Insurance Fund 615,000 615,000 615,000 0 Cultural District 67,263 66,200 66,200 67,600 HUD Asset Control Fund 75,975 153,600 153,600 0 Downtown Enhancement District 707,521 540,900 540,900 553,200 Downtown Special Services District 467,127 499,700 499,700 513,400 Seized Property Fund 833,278 262,000 287,000 100,000 Care & Embellishment Fund 33,062 34,700 34,700 36,500 Tax Repayment Fund 1,762,000 1,762,300 1,762,300 1,787,900 Tax Relief Fund 0 0 0 2,000,000 Property Management Fund 125,983 100,000 77,900 12,000 Capital Funds 175,000 350,000 350,000 350,000
Interfund Revenue & Transfers Total -93,427,393 -96,654,400 -96,168,000 -93,525,900 General Total 351,993,163 372,015,700 375,224,100 342,122,200
AnimalAnimal Control Center Fees 200,550 199,900 200,600 198,400 Dog Licenses 33,189 29,700 29,700 33,500 Animal Fines 55,461 51,000 60,000 57,000 Interest Earnings 13,088 -1,300 14,900 0 Property Tax 1,008,900 1,090,000 1,064,100 1,150,900
Animal Total 1,311,188 1,369,300 1,369,300 1,439,800 Library
Library Charges 1,728,419 2,675,400 2,802,900 2,533,400 County Reimbursement 6,620,000 6,620,000 6,620,000 6,620,000 State Aid 1,330,536 966,200 828,200 1,340,800 Miscellaneous 0 31,200 31,200 0 Interest Earnings -100,199 -56,400 0 0 Trans. Premium & Interest 0 17,000 17,000 58,400 Appropriation of Fund Balance 0 350,000 350,000 0 Property Tax 4,784,000 4,666,100 4,620,200 5,239,000
Library Total 14,362,756 15,269,500 15,269,500 15,791,600

1–20 REVENUE SUMMARY REVENUE ESTIMATES
Actual2007-08
Estimated 2008-09
Budget 2008-09
Budget 2009-10
WaterMetered Water Sales 28,409,194 29,200,400 29,775,200 28,500,000 Upland Sales/MCWA 2,195,752 2,171,000 2,310,000 2,331,000 Other Municipalities 436,028 435,000 406,700 442,000 Delinquent Collections 1,128,819 1,533,000 1,050,000 750,000 Service Charges 170,218 270,200 202,500 300,000 Interest & Penalties 1,479,888 1,250,000 1,144,800 1,200,000 State Aid 0 1,000,000 1,000,000 0 Miscellaneous 240,880 202,700 198,300 196,400 Interest Earnings 148,228 84,100 53,300 13,100 Sale of Property & Compensation for Loss 0 0 0 2,000,000 Trans. Premium & Interest 212,700 0 0 193,400 MCWA Reimbursements 1,149,696 190,900 190,900 0 Refund Prior Years Expense 98,439 17,700 16,500 0
Water Total 35,669,842 36,355,000 36,348,200 35,925,900 War Memorial
Hotel/Motel Tax 905,000 905,000 905,000 905,000 War Memorial Revenue 1,460,139 1,290,800 1,464,500 1,449,200 Interest Earnings 7,411 100 4,700 700 Trans. Premium & Interest 0 0 0 36,200 Property Tax 759,000 854,800 676,500 411,100
War Memorial Total 3,131,550 3,050,700 3,050,700 2,802,200 Parking
Parking Ramps 1,908,796 1,869,000 2,214,000 1,557,800 Parking Lots 447,173 433,500 460,800 409,300 Meters 533,691 564,000 518,000 568,000 East End Garage 0 24,000 24,000 24,000 Miscellaneous 97,835 65,500 194,600 86,500 Parking Fines 232,556 260,000 260,000 1,252,600 Interest Earnings 104,046 17,000 11,600 2,100 Trans. Premium & Interest 421,400 178,000 178,000 65,700 Property Tax 1,831,000 1,823,700 1,373,700 1,909,500 Intergovernmental Federal 16,154 0 0 0
Parking Total 5,592,650 5,234,700 5,234,700 5,875,500

REVENUE SUMMARY 1–21 REVENUE ESTIMATES
Actual2007-08
Estimated 2008-09
Budget 2008-09
Budget 2009-10
CemeterySale of Lawn Crypts -2,430 5,300 4,000 7,800 Sale of Cemetery Lots 283,607 230,800 244,000 250,800 Service Charges 636,895 606,600 608,400 655,000 Miscellaneous 69,480 0 0 0 Mausoleum Sales 36,710 40,000 40,000 45,600 Sale of Foundations, Markers & Urns 100,537 65,000 83,000 69,600 Interest Earnings 328,965 85,000 141,700 18,200 Trans. Premium & Interest 0 0 0 20,600 Appropriation of Fund Balance 110,000 0 0 0 Property Tax 1,245,000 1,234,500 1,146,100 2,402,200
Cemetery Total 2,808,764 2,267,200 2,267,200 3,469,800 Public Market
Market Fees 601,346 641,800 696,200 723,300 Embellishment Fees 41,269 36,200 36,200 36,200 State Aid 39,944 0 0 0 Interest Earnings 426 100 900 100 Trans. Premium & Interest 0 7,000 7,000 38,700 Appropriation of Fund Balance 900 0 0 0 Property Tax 41,000 306,000 250,800 137,500
Public Market Total 724,885 991,100 991,100 935,800 Refuse
Current Collections 19,763,344 19,753,000 19,769,600 19,753,000 Commercial Charges 3,423,263 3,548,000 3,436,000 3,600,000 Delinquent Collections 1,734,979 2,311,000 1,750,000 1,300,000 Miscellaneous 192,307 47,100 15,000 26,500 Interest Earnings 312,581 130,000 166,700 26,600 Sale of Scrap 4,985 17,000 20,000 315,000 Appropriation of Fund Balance 2,131,000 91,800 91,800 1,422,100
Refuse Total 27,562,459 25,897,900 25,249,100 26,443,200 Local Works
Current Collections 14,027,875 14,500,000 14,569,000 14,582,700 Delinquent Collections 848,461 1,199,000 840,400 626,300 Miscellaneous 43,201 27,000 27,000 40,000 Interest Earnings 270,677 84,200 203,400 17,300 State Reimbursement-Snow & Ice Control 44,649 45,500 45,500 53,000 Appropriation of Fund Balance 576,900 311,200 311,200 2,028,200
Local Works Total 15,811,763 16,166,900 15,996,500 17,347,500 Total All Funds 458,969,021 478,618,000 481,000,400 452,153,500

1–22 REVENUE SUMMARY PROPERTY TAX COMPUTATION & ANALYSIS
The property tax is the single largest source of revenue to the City. The fundamental equation for the property tax is: (Tax Rate × Assessed Value) = Tax Levy. In Rochester, this fundamental equation is modified in two significant ways. First, according to Article 19 of the New York State Real Property Tax Law, Rochester’s levy is apportioned between Homestead and Non-Homestead classes of property. (Homestead properties, generally, are one, two, and three family residences. Non-Homestead properties are all others.) That is, separate tax rates for Homestead and Non-Homestead properties are applied to the separate assessment rolls for each class of property. The following display distinguishes the tax information for each class of property. The apportionment of the levy between the classes reflects the state mandated adjustment as calculated by the formula specified by Article 19. This adjustment occurs from year to year and is commonly called “the Shift”. Secondly, because the Rochester City School District is not permitted under law to levy a property tax, the City does so on behalf of the District for funding education purposes. The City also levies a property tax on its own behalf for funding municipal government purposes. While technically two separate tax levies (and, due to differing exemption provisions, based upon separate and unequal assessment rolls), the City and School property tax collections are accounted for within the City Budget as a combined total. The District receives its portion of the taxes collected and other revenue received by the City subject to a revenue sharing agreement between the City and the District. This distribution is displayed as an interfund transfer (“Negative Revenue”) elsewhere in the Revenue Summary. The following display shows the combination of the separate City and School tax rates and impacts in a consolidated presentation. It is this consolidated rate that is most commonly referred to in discussion of the “City property tax.” Detailed information on the calculation of each property tax follows. The 2009-10 STAR revenue of $13,640,200 is subtracted from tax levy prior to billing after the tax rate has been determined. Only eligible taxpayers receive the STAR benefit. Property Tax Rates & Burdens The assessed value for a typical single family residence (Homestead) is $67,200 in 2009-10. The assessed value for a typical commercial property (Non-Homestead) is $262,100 in 2009-10.
Percent2008-09 2009-10 Change Change
TAX RATE (per $1,000)Homestead Class- City 5.59 5.33 -0.26 -4.65%- School 14.98 14.28 -0.70 -4.67% Total 20.57 19.61 -0.96 -4.67%
Non-Homestead Class- City 10.93 11.21 0.28 2.56%- School 29.74 30.49 0.75 2.52% Total 40.67 41.70 1.03 2.53%
TAX BURDENSingle Family Residence- City $375.65 $358.18 -$17.47 -4.65%- School $1,006.66 $959.62 -$47.04 -4.67% Total $1,382.31 $1,317.80 -$64.51 -4.67%
Commercial Property- City $2,864.75 $2,938.14 $73.39 2.56%- School $7,794.85 $7,991.43 $196.58 2.52% Total $10,659.60 $10,929.57 $269.97 2.53%

REVENUE SUMMARY 1–23 PROPERTY TAX COMPUTATION & ANALYSIS
Computation Of City 2009-10 Property Tax Levy
Current Cash DebtOperations Capital Service Total
EXPENSEOperating 380,473,300 380,473,300Cash Capital 39,151,000 39,151,000Debt Service 32,529,200 32,529,200Tax Reserve 486,729 965,642 736,274 2,188,645Total 380,960,029 40,116,642 33,265,474 454,342,145
REVENUEOperating 371,225,445 371,225,445Cash Capital 20,803,800 20,803,800Debt Service 18,540,000 18,540,000Total 371,225,445 20,803,800 18,540,000 410,569,245
TOTAL TAX LEVY 9,734,584 19,312,842 14,725,474 43,772,900
Homestead (42.10904%)** 18,432,348Non-Homestead (57.89096%)** 25,340,552
ASSESSED VALUE 5,716,799,275Homestead 3,455,613,932Non-Homestead 2,261,185,343
TAX RATEHomestead 1.19 2.35 1.79 5.33Non-Homestead 2.49 4.95 3.77 11.21
*In accordance with the New York State Real Property Tax Law, the levy is apportioned between the Homestead and the Non-Homestead classes. The 2009-10 apportionment reflects the state
mandated adjustment as calculated by the formula specified by Article 19. The 2008-09 Homestead and Non-Homestead apportionment was 44.15962% and 55.84038% respectively.

1–24 REVENUE SUMMARY PROPERTY TAX COMPUTATION & ANALYSIS
Computation Of School 2009-10 Property Tax Levy Expenses and revenues related to the City School District are located within the School District Budget, not the City Budget. Exceptions are: (1.) the City’s $119.1 million dollar funding of the District (shown as a negative fund transfer in the City’s Revenue Summary) and (2.) the property tax collection estimate within the City Budget that represents collection of City and School taxes. The current revenue allocation displayed below reflects the $119.1 million dollars less anticipated receipt of School taxes. A portion of the debt service revenue allocation listed below is debt service that is treated as a current expense (i.e. Early Retirement Debt Service, and Revenue Anticipation Notes.
Current Cash DebtOperations Capital Service Total
EXPENSEOperating 76,549,744 76,549,744Cash Capital 15,959,283 15,959,283Debt Service 24,457,548 24,457,548Tax Reserve 4,028,934 839,962 1,086,104 5,955,000Total 80,578,678 16,799,245 25,543,652 122,921,575
REVENUEOperating 0 0 0 0Cash Capital 0Debt Service* 0 0 3,821,575 3,821,575Total 0 0 3,821,575 3,821,575
TOTAL TAX LEVY 80,578,678 16,799,245 21,722,077 119,100,000
Homestead (42.10904%)** 50,151,867Non-Homestead (57.89096%)** 68,948,133
ASSESSED VALUE 5,772,686,466Homestead 3,511,007,881Non-Homestead 2,261,678,585
TAX RATEHomestead 9.66 2.01 2.61 14.28Non-Homestead 20.63 4.30 5.56 30.49
*Revenues and debt exclusions are recorded here. Revenues related to City School District debt are located within the School District Budget not the City Budget.
**In accordance with the New York State Real Property Tax Law, the levy is apportioned between the Homestead and the Non-Homestead classes. The 2009-10 apportionment reflects the state mandated adjustment as calculated by the formula specified by Article 19. The 2008-09 Homestead and Non-Homestead apportionment was 44.15962% and 55.84038% respectively.

REVENUE SUMMARY 1–25 PROPERTY TAX COMPUTATION & ANALYSIS
Computation Of Property Tax Revenue For The General Fund City Property Tax Levy 43,772,900School Property Tax Levy 119,100,000
Total Property Tax Levy 162,872,900
Less: Allowance for Uncollectables (Tax Reserve) 8,143,645
Less: STAR Revenue 13,639,500
Combined City and School Property Tax Revenue 141,089,800
Distributions from the General Fund Property Tax Revenue to non-self supporting Special and Enterprise Funds:Animal Control Fund 1,150,900Library Fund 5,239,000War Memorial Fund 411,100Parking Fund 1,909,500Cemetery Fund 2,402,200Public Market Fund 137,500
Net General Fund Property Tax Revenue 129,839,600

1–26 REVENUE SUMMARY PROPERTY TAX COMPUTATION & ANALYSIS
STAR Beginning in 1998-99 New York State enacted the School Tax Relief Program (STAR) within section 425 of the Real Property Tax Law. The program provides an exemption from property taxes for owner-occupied primary residences. There are two types of STAR programs: The first, called Enhanced STAR, is for property owners 65 years of age or older, with incomes of less than $73,000. The second, called Basic STAR, is for all other home owners regardless of age or income. Eligible property owners for the 2009-10 program receive up to a $40,270 and $20,100 assessment exemption for the Enhanced program and Basic program, respectively. Both values are adjusted by the equalization rate. For large cities with fiscally dependent school districts, the enacting legislation assumed 67% of the combined tax rate to be for school purposes. For 2008-09 the maximum assessed value exemption for an eligible property owner under the Enhanced program was $38,060. For 2008-09 the maximum assessed value exemption for an eligible property owner under the Basic program was $20,100. The Board of Real Property Services may establish special equalization rates that may result in revised STAR exemption amounts if the determined STAR exemption is 5% or more different than the previous year’s exemptions. For 2009-10 the exemption under the Enhanced program is $40,270, and under the Basic program $20,100. These exemptions are applied against the combined City and School tax rate. Approximately 4,800 property owners will benefit from the Enhanced STAR program and 26,700 property owners for the Basic STAR program in 2009-10. The actual calculation of the dollar savings from the STAR exemption is determined subsequent to the determination of the City and School tax rates. The revenue from the STAR program is not counted in determining the tax rates. The process is as follows: First, the tax rates are determined. Second, eligible property owners receive a credit based upon the exemption. Third, the actual amount of the tax levy billed is reduced by the aggregate of the City and School exemption values applied against the City and School tax rates. Fourth, New York State reimburses the City for the reduced billing. The calculation of the 2009-10 STAR revenue to be reimbursed from the state is as follows:
AssessedValue Tax STAR
Exemption Rates Revenue
City:Homestead 679,106,378 5.33 3,619,637Non-Homestead 6,431,460 11.21 72,097
685,537,838 3,691,734
School:Homestead 689,260,464 14.28 9,842,639Non-Homestead 6,523,978 30.49 198,916
695,784,442 10,041,556
Total N/A N/A 13,733,289

REVENUE SUMMARY 1–27 PROPERTY TAX COMPUTATION & ANALYSIS
Assessed Value – Changes
The City's municipal taxable assessed valuation for property tax levies changes by:
2009-10 Assessed Value 5,716,799,2752008-09 Assessed Value 5,690,818,080Change 25,981,195
Percent Change 0.46%
The change in taxable assessment is substantially attributable to the following:
Non-Homestead Assessment:
Utility (Private) 46,591,438 Carestream (from COMIDA) 12,457,000
Railroad 2,772,256Declining BIE Schedules 1,761,635RES Exhibit Services (from COMIDA) 1,600,000Declining EDZ Schedules 1,201,858Price Rite - 1230 University Avenue 779,700Strathallan Hotel - 546 East Avenue 750,00025-45 & 55 Rutter Street (from COMIDA) 530,100Various Housing Projects -12,413,500Special Franchise -7,791,642153 & 169 Chestnut Street (to NYS) -7,125,000Kodak -3,321,100267 Monroe Avenue -1,986,800ESL Properties (to COMIDA) -1,590,000134 & 136 S. Fitzhugh Street (to COMIDA) -402,60010-22 E. Main Street -372,000
Non-Homestead Net other changes -7,779,891Subtotal 25,661,454
Homestead Assessment :Decrease in Veterans Exemption -1,509,942Homestead Net of other changes 1,829,683
Subtotal 319,741 Total Assessment Change 25,981,195

1–28 REVENUE SUMMARY PROPERTY TAX COMPUTATION & ANALYSIS
Assessed Valuation – Historic
Fiscal YearGeneral Municipal
PurposesVeterans
Exemption*Total School
PurposesChange from
Prior Year2009-10 5,716,799,275 55,887,191 5,772,686,466 25,086,9132008-09 5,690,818,080 56,781,473 5,747,599,553 596,119,5342007-08 5,135,078,243 54,377,249 5,189,455,492 37,975,4732006-07 5,094,593,315 56,886,704 5,151,480,019 33,815,7132005-06 5,057,647,759 60,016,547 5,117,664,306 11,857,2462004-05 5,042,827,983 62,979,077 5,105,807,060 370,473,1952003-04 4,674,520,611 60,813,254 4,735,333,865 -46,784,5222002-03 4,717,404,474 64,713,913 4,782,118,387 -7,369,4512001-02 4,722,309,412 67,178,426 4,789,487,838 -12,918,7112000-01 4,730,799,907 71,606,642 4,802,406,549 -241,838,994
*Subject to School Purposes but not General Municipal Purposes. Tax Collection Experience The following tables are all billings on the tax file. Items billed include: ad valorem taxes, residential refuse charges, local works charges, local improvements, property rehabilitation charges, municipal code fines, special assessment district charges, delinquent water charges, and supplemental and omitted taxes. A. Current Taxes
Fiscal Year Tax Billed July 1 Current Collections Percent of Levy Tax Balances June 30*2008-09 196,088,229 181,389,425 92.50 13,733,8202007-08 190,297,840 176,750,558 92.88 13,413,5042006-07 189,822,199 174,245,337 91.79 14,248,7242005-06 184,085,987 170,048,569 92.37 14,037,4182004-05 178,379,701 165,030,459 92.52 13,349,2412003-04 173,144,803 158,479,093 91.53 13,284,8802002-03 166,991,400 152,269,776 91.18 13,387,0762001-02 160,731,647 146,154,747 90.93 13,123,2452000-01 163,894,342 150,096,940 91.58 12,687,9061999-2000 168,683,315 155,680,276 92.29 12,264,332

REVENUE SUMMARY 1–29 PROPERTY TAX COMPUTATION & ANALYSIS
B. Delinquent Taxes
Fiscal YearDelinquent Tax
Balances July 1Delinquent Tax
Collections
Percent of Delinquent
Tax BalancesDelinquentTax
Balances June 30*Total Tax Balances
June 30**2008-09 28,448,291 12,380,746 43.52 8,118,305 21,852,1252007-08 25,881,808 10,593,675 40.93 14,792,228 28,205,7322006-07 24,102,157 10,328,437 42.85 11,633,085 25,881,8082005-06 23,003,805 9,682,226 42.09 10,064,739 24,102,1572004-05 22,968,443 10,310,008 44.89 9,654,565 23,003,8062003-04 23,506,991 9,739,204 41.43 9,683,583 22,968,4632002-03 22,905,693 9,949,240 43.44 10,119,915 23,506,9912001-02 21,911,683 9,951,536 45.42 9,782,447 22,905,6922000-01 21,405,580 10,065,294 47.02 9,223,775 21,911,6811999-2000 21,275,743 9,726,123 45.71 9,142,412 21,406,7441998-99 20,558,498 10,059,828 48.93 9,248,145 21,275,709
*Current and delinquent tax balances on June 30 reflect the beginning balances less collections and adjustments for cancellations.**Total tax balances equals the sum of current and delinquent balances as of June 30.
Constitutional Operating Tax Limit The State Constitution, Article VIII, Section 10, limits the maximum amount of real property taxes that can be raised for operating purposes. The limit is two percent of the five-year average of full valuation of taxable real property. The total taxable assessed valuation for school purposes is the assessed value used for this calculation. The limit pertains to cities of 125,000 or more inhabitants, except New York City, which has a limit of two and one-half percent. The levy subject to the limit is equal to the total tax levy (City and School) minus appropriations for debt service (with a few exceptions) and budgetary appropriations for which a period of probable usefulness has been determined by law (Cash Capital). The State Constitution also limits the maximum amount of real property taxes raised for debt service. This is described within the Capital section of the City Budget.
Equalization Full AssessedFiscal Year Assessed Value Ratio Valuation
2009-10 5,772,686,466 91.64 6,299,308,6712008-09 5,747,599,553 94.90 6,056,480,0352007-08 5,189,455,492 89.08 5,825,612,3622006-07 5,151,480,019 90.80 5,673,436,1442005-06 5,117,664,306 98.63 5,188,750,184
Five Year Total 29,043,587,396
Five Year Average 5,808,717,479Constitutional Percentage 2%Constitutional Limit 116,174,350

1–30 REVENUE SUMMARY PROPERTY TAX COMPUTATION & ANALYSIS
Constitutional Tax Limit & Margin – Historic The following table contains the historical tend of the City’s tax limit for operating purposes and the amount of the limit used. The amount of limit used is calculated by adding City and School operating levies and then subtracting Water Fund debt service. The tax margin is calculated by subtracting the amount used from the limit.
Fiscal Year Limit Amount Used Tax Margin2009-10 116,174,350 84,494,562 31,679,7882008-09 114,658,362 81,976,353 32,682,0092007-08 104,315,428 78,926,385 25,389,0432006-07 102,594,091 78,369,414 24,224,6772005-06 100,062,845 87,548,500 12,514,3452004-05 95,786,706 81,033,103 14,753,6032003-04 93,374,182 81,679,387 11,694,7952002-03 95,244,442 84,533,287 10,711,1552001-02 97,037,612 58,253,768 38,783,8442000-01 99,609,567 51,975,217 47,634,350
Constitutional Operating Tax Limit 2000-01 to 2009-10

REVENUE SUMMARY 1–31 PROPERTY TAX COMPUTATION & ANALYSIS
LOCAL GOVERNMENT EXEMPTION IMPACT REPORT
Date: May 15, 2009
Taxing Jurisdiction: City of Rochester
Fiscal Year Begining: 2008
Total equalized value in taxing jurisdiction: $ 7,996,741,664
Exemption Code
(Column A) Exemption Description (Column B)Statutory Authority
(Column C)
Number of Exemptions (Column D)
Total Equalized Value
(Column E)
Percentage of Value
Exempted (Column F)
13100 COUNTY OWNED (GENERALLY) RPTL 406(1) 41 168,441,050 2.11%13350 CITY OWNED (GENERALLY) RPTL 406(1) 3,758 473,624,950 5.92%18020 MUNICIPAL IND DEV AGENCY RPTL 412-a 114 243,413,700 3.04%25110 NONPROFIT ORGNZTN-RELIGIOUS RPTL 420-a 576 143,563,875 1.80%25120 NONPROFIT ORGNZTN-EDUCATIONAL RPTL 420-a 121 267,740,750 3.35%25130 NONPROFIT ORGNZTN-CHARITABLE RPTL 420-a 179 93,720,850 1.17%25210 NONPROFIT ORGNZTN-HOSPITAL RPTL 420-a 10 204,083,325 2.55%41836 ENHANCED STAR RPTL 425 4,887 147,566,494 1.85%41856 BASIC STAR RPTL 425 26,427 529,330,696 6.62%
ALL OTHER ALL OTHER VARIOUS 7,511 652,227,950 8.16%
Totals 43,624 $2,923,713,640.00 36.56%
Amount, if any, attributed to payments in lieu of taxes: $6,973,384.38(details contained on RP-495-PILOT)
(for local use only -- not to be filed with NYS Board of Real Property Services)
RP-495 (9/08)NYS BOARD OF REAL PROPERTY SERVICES
LOCAL GOVERNMENT EXEMPTION IMPACT REPORT
The exempt amounts do not take into consideration any payments for municipal services.

1–32 REVENUE SUMMARY PROPERTY TAX COMPUTATION & ANALYSIS
LOCAL GOVERNMENT EXEMPTION IMPACT REPORT
Date: May 15, 2009
Taxing Jurisdiction: City of Rochester
Fiscal Year Begining: 2008
Total equalized value in taxing jurisdiction: $ 7,996,741,664
Exemption Code
(Column A) Exemption Description (Column B)
Statutory Authority
(Column C)
Number of Exemptions (Column D)
Payments in Lieu of Taxes
(PILOTs) (Column E)
18020 MUNICIPAL INDUST DEVEL AGNCY RPTL 412-a 114 $6,973,384.38
Totals 114 $6,973,384.38
(for local use only -- not to be filed with NYS Board of Real Property Services)
RP-495 PILOT (9/08)
LOCAL GOVERNMENT EXEMPTION IMPACT REPORT

REVENUE SUMMARY 1–33 APPLICATION OF REVENUE
Beginning on the next page is an informational display of revenues for each major department or unit and the major category of revenue by fund. This display distributes revenues to the department to which they are most closely related. In this fashion, a sense of the overall revenue level for a given function can be approximated.

1–34 REVENUE SUMMARY APPLICATION OF REVENUE BY UNIT
A
pp
lie
d R
ev
en
ue
Cit
y C
ou
nc
il
& C
lerk
Ad
min
i-s
tra
tio
nL
aw
Info
rma
tio
n
Te
ch
no
log
yF
ina
nc
eN
eig
h, &
B
us
. D
ev
.
En
vir
on
-m
en
tal
Se
rvic
es
Em
erg
en
cy
Co
mm
un
i-c
ati
on
sP
oli
ceF
ire
Re
c. &
H
um
an
S
erv
ice
sL
ibra
ryU
nd
istr
i-b
ute
dD
eb
tT
ota
l A
pp
lie
dG
en
era
lO
the
r T
axe
s5
,21
9,2
005
,21
9,2
00D
epa
rtm
en
tal I
nc
ome
18,
800
14
3,2
000
1,0
00
77,
400
26
3,7
007
37
,200
200
3,2
93,6
00
1,2
07,
900
80
8,8
003
75,0
00
6,9
26
,800
Us
e o
f M
on
ey &
Pro
per
ty1
00,
000
11
5,4
003
5,2
002
50
,600
Fin
es &
Fo
rfe
iture
s2
,18
2,5
006
12,
100
1,2
65,0
00
4,0
59
,600
Lic
en
ses
& P
erm
its1
17,
900
88
,800
21,
500
2,2
27,
400
27
0,0
002
23,9
00
2,9
49
,500
Sa
le o
f P
rop
ert
y &
Co
mp
.1
10,
000
14
8,00
01
,80
5,1
005
0,0
004
07,7
00
2,5
20
,800
Mis
ce
llane
ous
30
0,0
001
68,
900
229
,00
06
97
,900
Inte
rgo
vern
me
ntal
Sta
te0
23
4,90
00
3,1
57
,500
370
,40
03
5,7
003
81,
500
4,1
80
,000
Inte
rgo
vern
me
ntal
Fe
dera
l1
24
,700
27
5,60
03
26,
700
3,5
29,
400
35
7,4
007
66,0
00
22
5,0
005
76,
000
6,1
80
,800
Inte
rgo
vern
me
ntal
Oth
er
28
3,90
06
88,
400
96
1,4
001
3,5
91,
400
447
,00
07
95,
000
16,7
67
,100
Inte
rfun
d R
eve
nue
44
1,60
01
,49
0,3
006
07,
100
2,0
46,
600
1,0
15,
700
11,1
73
,600
100
,00
00
36,
500
281
,70
01,
787
,90
018
,98
1,0
00G
en
era
l T
ota
l8
62,
200
2,1
47
,000
1,1
61,
600
1,0
00
5,1
37,
600
10
,25
7,2
0021
,92
6,3
001
3,5
91,
600
6,8
73,6
00
1,4
68,
600
2,6
33,
000
885
,70
01,
787
,90
068
,73
3,3
00A
nim
alD
epa
rtm
en
tal I
nc
ome
231
,90
02
31
,900
Fin
es &
Fo
rfe
iture
s57
,00
05
7,0
00A
nim
al T
ota
l2
88,9
00
28
8,9
00L
ibra
ryD
epa
rtm
en
tal I
nc
ome
2,5
33,
400
2,5
33
,400
Inte
rgo
vern
me
ntal
Sta
te1
,34
0,8
001
,34
0,8
00T
ran
s.
Pre
miu
m &
Inte
res
t5
8,4
005
8,4
00In
terg
ove
rnm
ent
al O
the
r6
,62
0,0
006
,62
0,0
00L
ibra
ry T
ota
l1
0,5
52,
600
10,5
52
,600
Lo
ca
l Wo
rks
Dep
art
me
nta
l In
com
e9
4,2
0015
,11
4,8
0015
,20
9,0
00U
se
of
Mo
ney
& P
rop
erty
17
,300
17
,300
Mis
ce
llane
ous
40
,000
40
,000
Inte
rgo
vern
me
ntal
Sta
te5
3,0
005
3,0
00A
ppr
op
riatio
n o
f F
und
Bal
an
ce
2,0
28
,200
2,0
28
,200
Lo
ca
l W
ork
s T
ota
l9
4,2
0017
,25
3,3
0017
,34
7,5
00W
ate
rD
epa
rtm
en
tal I
nc
ome
10
1,5
0033
,42
1,5
0033
,52
3,0
00U
se
of
Mo
ney
& P
rop
erty
13
,100
13
,100
Mis
ce
llane
ous
19
6,4
001
96
,400
Sa
le o
f P
rop
ert
y &
Co
mp
en
satio
n f
or L
os
s2
,00
0,0
002
,00
0,0
00T
ran
s.
Pre
miu
m &
Inte
res
t1
93
,400
19
3,4
00W
ate
r T
ota
l1
01
,500
35,8
24
,400
35,9
25
,900
Wa
r M
em
ori
alD
epa
rtm
en
tal I
nc
ome
1,4
49,
200
1,4
49
,200
Us
e o
f M
on
ey &
Pro
per
ty7
007
00T
ran
s.
Pre
miu
m &
Inte
res
t3
6,2
003
6,2
00In
terg
ove
rnm
ent
al O
the
r9
05,
000
90
5,0
00W
ar M
em
ori
al T
ota
l2
,39
1,1
002
,39
1,1
00P
ark
ing
Dep
art
me
nta
l In
com
e2
,55
9,1
002
,55
9,1
00U
se
of
Mo
ney
& P
rop
erty
2,1
002
,100
Fin
es &
Fo
rfe
iture
s1
,25
2,6
001
,25
2,6
00M
isc
ella
neo
us8
6,5
008
6,5
00T
ran
s.
Pre
miu
m &
Inte
res
t6
5,7
006
5,7
00P
ark
ing
To
tal
3,9
66,
000
3,9
66
,000
Ce
me
tery
Dep
art
me
nta
l In
com
e1
,02
8,8
001
,02
8,8
00U
se
of
Mo
ney
& P
rop
erty
18,
200
18
,200
Tra
ns
. P
rem
ium
& In
tere
st
20,
600
20
,600
Ce
me
tery
To
tal
1,0
67,
600
1,0
67
,600
Pu
blic
Ma
rke
tD
epa
rtm
en
tal I
nc
ome
75
9,5
007
59
,500
Us
e o
f M
on
ey &
Pro
per
ty1
001
00T
ran
s.
Pre
miu
m &
Inte
res
t3
8,7
003
8,7
00P
ub
lic M
ark
et
To
tal
79
8,3
007
98
,300
Re
fuse
Dep
art
me
nta
l In
com
e1
83
,700
24,7
84
,300
24,9
68
,000
Us
e o
f M
on
ey &
Pro
per
ty2
6,6
002
6,6
00M
isc
ella
neo
us2
6,5
002
6,5
00A
ppr
op
riatio
n o
f F
und
Bal
an
ce
1,4
22
,100
1,4
22
,100
Re
fus
e T
ota
l1
83
,700
26,2
59
,500
26,4
43
,200
To
tal
Ap
pli
ed
86
2,20
02
,52
6,4
001
,16
1,60
01
,00
09
,10
3,6
001
2,6
48,
300
101
,26
3,5
001
3,5
91,
600
7,1
62,5
00
1,4
68,
600
4,4
98,
900
10
,55
2,6
008
85,7
00
1,78
7,9
00
167
,51
4,4
00

EXPENDITURE SUMMARY 1–35 SUMMARY OF EXPENDITURE CHANGES
Expense Changes – Highlights The Mayor’s Proposed Budget of $452,153,500 decreases expenditures by $28,846,900 or 6.0% less than the 2008-09 Budget. Highlights of the changes that produce this variance are noted in the following display. Details of these and other expense changes are found in Tabs #3 through #17 of this document. MAJOR PROPOSED INCREASES
Additional Information Technology personnel to drive future efficiencies Additional Summer jobs for youth Recreation Center service hours increase Funding for demolitions Additional funding for 911 Operations positions
MAJOR PROPOSED DECREASES Decrease in debt service as a result of paying off the Fast Ferry debt Decrease in cash capital spending due to budget constraints Decrease in cash capital as allocation for acquisition of street lighting system does not recur Consolidation of Departments of Economic Development, Community Development and
Neighborhood Service Centers into one department Elimination of funding for Police recruit class Program eliminations or reductions in departmental sections
APROVED BUDGET City Council passed four ordinances amending the Mayor’s Proposed Budget, none of which were objected to by the Mayor. These amendments moved appropriations for:
Youth Development: for CONEA Kid's Fair; Courtside Scouting; High School Leadership Forum; Youth Fashion Show; Pop Warner League Monroe County Cowboys; Tuck-Murphy Basketball Tournament; and, Slam High Poetry Program from Contingency to Recreation & Youth Services
Citizen Support: Community Anti-Violence Program; Senior Citizen Transportation; Refugee Sustainability Garden; and, Outreach for FIS in Beechwood from Contingency to Neighborhood & Business Development, Police, and Recreation & Youth Services
Cultural Development: Downtown Community Forum; Development of Regional Strategies for Arts Organizations; North Winton Village Arts Festival; and, Lyell Avenue Music Fest from Contingency to Neighborhood & Business Development and Administration - Communications
Community Beautification: Community Gardens, Banners, Lighting, and Signage from Contingency to Neighborhood & Business Development and Environmental Services
These amendments did not change the total from the Mayor’s Proposed Budget. The changes made by City Council are detailed in the City Council Report section and in the impacted departmental sections starting with Tab #3. Change Detail
Salary & Wage VacancyAdjustment Inflation Chargebacks Allowance Miscellaneous Major Change Total
569,600 1,849,900 549,500 -376,900 75,600 -31,514,600 -28,846,900

1–36 EXPENNDITURE SUMMARY SUMMARY OF EXPENDITURE CHANGES
Year-to-Year Comparison
Budget Budget2008-09 2009-10 Variance Percent
City Council and Clerk 1,839,100 1,816,900 -22,200 -1.2 Administration: Mayor's Office 2,391,800 2,201,600 -190,200 -8.0 Neighborhood Service Centers 4,578,400 0 -4,578,400 -100.0 Management & Budget 2,422,600 2,349,700 -72,900 -3.0 Human Resource Management 2,465,100 2,536,700 71,600 2.9 Communications 2,119,600 2,901,400 781,800 36.9 Law 1,991,300 1,867,000 -124,300 -6.2 Information Technology 4,236,400 4,308,700 72,300 1.7 Finance 5,433,300 6,966,800 1,533,500 28.2 Neighborhood & Business Development 0 13,916,400 13,916,400 N/ACommunity Development 6,206,000 0 -6,206,000 -100.0 Economic Development 2,728,000 0 -2,728,000 -100.0 Environmental Services 83,308,100 79,615,500 -3,692,600 -4.4 Emergency Communications 10,355,800 10,520,500 164,700 1.6 Police 79,897,400 76,065,800 -3,831,600 -4.8 Fire 41,599,000 42,070,500 471,500 1.1 Library 11,225,600 11,153,500 -72,100 -0.6 Recreation & Youth Services. 16,977,800 12,317,000 -4,660,800 -27.5 Undistributed Expense 103,165,500 99,762,500 -3,403,000 -3.3 Contingency 7,442,300 10,102,800 2,660,500 35.7 Cash Capital 52,811,200 39,151,000 -13,660,200 -25.9 Debt Service 37,806,100 32,529,200 -5,276,900 -14.0
TOTAL 481,000,400 452,153,500 -28,846,900 -6.0

EXPENDITURE SUMMARY 1–37 SUMMARY BY DEPARTMENT
Actual2007-08
Estimated 2008-09
Budget 2008-09
Budget 2009-10
City Council and Clerk 1,714,630 1,728,900 1,839,100 1,816,900
Administration Mayor's Office 2,953,061 2,367,100 2,391,800 2,201,600 Neighborhood Service Centers 4,363,100 4,297,700 4,578,400 0 Management & Budget 1,765,337 1,933,500 2,422,600 2,349,700 Human Resource Management 2,123,482 2,274,800 2,465,100 2,536,700 Communications 982,485 2,044,900 2,119,600 2,901,400 Law Department 1,960,113 1,970,200 1,991,300 1,867,000
14,147,578 14,888,200 15,968,800 11,856,400
Information Technology 4,118,372 4,013,000 4,236,400 4,308,700
Finance Director's Office 478,235 523,200 531,100 458,500 Accounting 884,832 946,700 961,900 944,500 Treasury 1,672,600 1,760,400 1,905,200 1,746,600 Assessment 1,159,592 1,001,900 1,017,300 900,300 Parking & Municipal Violations 754,432 851,400 868,800 2,618,400 Purchasing 900,760 908,100 911,400 977,100 Less: Intrafund Credit 638,500 762,400 762,400 678,600
5,211,951 5,229,300 5,433,300 6,966,800
Neighborhood & Business DevelopmentCommissioner 0 0 0 1,161,900 Business & Housing Development 0 0 0 5,929,200 Planning & Zoning 0 0 0 1,863,600 Neighborhood Preservation 0 0 0 1,436,200 Inspection & Compliance 0 0 0 3,525,500
Total 0 0 0 13,916,400
Community Development Office of the Commissioner 430,893 530,700 549,500 0 Buildings & Zoning 2,516,328 2,525,900 2,617,000 0 Housing & Project Development 2,315,589 2,199,200 2,344,100 0 Planning 682,377 647,800 695,400 0
Total 5,945,187 5,903,600 6,206,000 0
Economic Development 2,369,565 2,684,600 2,728,000 0

1–38 EXPENDITURE SUMMARY SUMMARY BY DEPARTMENT
Actual2007-08
Estimated 2008-09
Budget 2008-09
Budget 2009-10
Environmental Services Office of the Commissioner 1,098,813 1,090,600 1,104,100 1,085,900 Architecture & Engineering 7,890,304 7,888,800 8,449,900 7,472,000 Operations & Parks 48,438,204 54,899,500 57,851,300 54,586,200 Water 21,205,703 23,009,800 22,627,400 22,377,900 Less: Intrafund Credit 5,346,200 6,051,300 6,724,600 5,906,500
73,286,824 80,837,400 83,308,100 79,615,500
Emergency Communications 9,595,252 10,348,400 10,355,800 10,520,500
Police 79,275,235 77,567,700 79,897,400 76,065,800
Fire 41,497,851 41,670,300 41,599,000 42,070,500
Library Central Library 7,595,547 7,882,900 8,094,100 7,961,000 Community Library 2,884,152 3,060,200 3,131,500 3,192,500
10,479,699 10,943,100 11,225,600 11,153,500
Recreation & Youth Services Office of the Commissioner 2,754,636 2,518,900 2,556,600 1,327,200 Recreation 8,463,903 8,708,900 8,697,200 8,232,700 Special Services 2,758,774 2,559,800 2,638,900 0 Youth Services 2,932,701 2,988,900 3,085,100 2,757,100
16,910,014 16,776,500 16,977,800 12,317,000
Undistributed 92,660,083 99,154,600 103,273,500 99,875,000 Less: Intrafund Credit 102,200 120,600 108,000 112,500
92,557,883 99,034,000 103,165,500 99,762,500
Contingency 0 7,442,300 7,442,300 10,102,800
CAPITAL Cash Capital 52,324,500 52,811,200 52,811,200 39,151,000 Debt Service 35,610,000 37,806,100 37,806,100 32,529,200
87,934,500 90,617,300 90,617,300 71,680,200
TOTAL 445,044,541 469,684,600 481,000,400 452,153,500

EXPENDITURE SUMMARY 1–39 SUMMARY BY MAJOR OBJECT
Actual2007-08
Estimated 2008-09
Budget 2008-09
Budget 2009-10
PERSONNEL EXPENSES City Council and Clerk 1,475,725 1,480,000 1,550,200 1,576,300 Administration 10,059,928 9,965,200 10,753,400 7,235,800 Law 1,697,403 1,793,800 1,789,900 1,662,000 Information Technology 3,229,664 2,903,200 3,022,600 3,152,300 Finance 4,461,473 4,622,300 4,627,300 5,257,500 Neighborhood & Business Development 0 0 0 9,309,700 Community Development 5,408,687 5,295,900 5,464,200 0 Economic Development 1,412,482 1,471,600 1,504,800 0 Environmental Services 32,118,896 33,233,300 34,140,500 33,390,600 Emergency Communications 8,478,792 9,140,500 8,967,600 9,223,200 Police 69,035,817 66,583,900 68,440,100 65,198,000 Fire 38,892,966 38,711,600 38,164,500 38,610,800 Library 7,813,231 7,997,700 8,270,200 8,126,800 Recreation & Youth Services 6,732,156 6,936,700 6,925,600 6,349,900 Undistributed 67,912,722 71,410,800 74,425,500 71,907,600
258,729,942 261,546,500 268,046,400 261,000,500
MATERIALS AND SUPPLIES City Council and Clerk 7,833 8,600 9,100 8,800 Administration 113,254 123,000 128,300 75,700 Law 43,035 32,900 32,900 36,600 Finance 142,337 109,300 118,100 123,400 Information Technology 44,108 41,800 98,100 101,100 Neighborhood & Business Development 0 0 0 139,700 Community Development 29,100 49,000 54,700 0 Economic Development 6,059 8,800 8,800 0 Environmental Services 9,304,642 9,771,700 11,030,700 11,170,700 Emergency Communications 144,244 196,900 249,900 172,000 Police 1,586,892 1,490,800 1,677,800 1,557,600 Fire 680,725 723,100 779,300 702,400 Library 933,495 945,300 942,500 947,500 Recreation & Youth Services 359,365 440,900 420,200 366,000
13,395,089 13,942,100 15,550,400 15,401,500

1–40 EXPENDITURE SUMMARY SUMMARY BY MAJOR OBJECT
Actual2007-08
Estimated 2008-09
Budget 2008-09
Budget 2009-10
SERVICES City Council and Clerk 231,072 240,300 279,800 231,800 Administration 2,014,283 2,829,800 3,095,800 2,677,900 Law 219,675 143,500 168,500 168,400 Information Technology 1,506,700 1,747,300 1,795,000 1,734,900 Finance 1,246,641 1,260,100 1,450,300 2,264,500 Neighborhood & Business Development 0 0 0 4,392,500 Community Development 507,400 558,700 687,100 0 Economic Development 951,024 1,204,200 1,214,400 0 Environmental Services 28,928,598 32,314,700 34,042,500 33,071,000 Emergency Communications 972,216 1,011,000 1,138,300 1,125,300 Police 8,652,526 9,493,000 9,779,500 9,310,200 Fire 1,924,160 2,235,600 2,655,200 2,757,300 Library 1,721,436 1,938,300 1,942,900 1,939,400 Recreation & Youth Services 9,754,491 9,314,500 9,489,300 5,532,900 Capital 39,400 39,400 39,400 39,400
58,669,622 64,330,400 67,778,000 65,245,500
OTHER Environmental Services 8,280,888 11,569,000 10,819,000 7,889,700 Neighborhood & Business Development 0 0 0 74,500 Library 11,537 61,800 70,000 139,800 Recreation & Youth Services 64,002 84,400 142,700 68,200 Undistributed 24,747,361 27,743,800 28,848,000 27,967,400 Contingency 0 7,442,300 7,442,300 10,102,800 Capital 87,895,100 90,577,900 90,577,900 71,640,800
120,998,888 137,479,200 137,899,900 117,883,200
LESS: INTRAFUND CREDITS 6,749,000 7,613,600 8,274,300 7,377,200
Total 445,044,541 469,684,600 481,000,400 452,153,500

EXPENDITURE SUMMARY 1–41 SUMMARY OF 2008-09 BUDGET AMENDMENTS
The adopted budget may, under certain circumstances, be amended by City Council. Upon written recommendation of the Mayor, City Council may transfer unencumbered balances from one department to another. The transfer is done by passage of an ordinance, which can amend multiple budgets. Examples of amendments are the transfer from Contingency to the departments for purposes of a wage settlement and the transfer of funds from a department with a surplus to one with a deficit. In addition, revenues from any source other than the property tax can be appropriated by City Council upon recommendation of the Mayor. Usually, this occurs upon receipt of a grant and entails increasing both expense and the offsetting revenue. The summaries that follow present 2008-09 Budget amendments by department and by individual ordinance, which indicates the appropriation of additional revenue.

1–42 EXPENDITURE SUMMARY SUMMARY OF 2008-09 BUDGET AMENDMENTS
Approved Budget
Amended Budget Change Ordinances
City Council & Clerk 1,771,900 1,839,100 67,200 2008-377 Administration: - Mayor's Office 2,286,300 2,391,800 105,500 2008-321, 2008-377 - Neighborhood Service Centers
4,547,800 4,578,400 30,600 2008-377, 2009-6, 2009-63
- Management & Budget 2,389,100 2,422,600 33,500 2008-377 - Human Resource Management
2,417,300 2,465,100 47,800 2008-377
- Communications 1,067,800 2,119,600 1,051,800 2008-377, 2009-57 - Law 1,929,600 1,991,300 61,700 2008-377 Information Technology 4,003,800 4,236,400 232,600 2008-377, 2008-400 Finance 5,364,500 5,433,300 68,800 2008-377 Community Development 6,032,200 6,206,000 173,800 2008-377, 2008-382 Economic Development 2,660,800 2,728,000 67,200 2008-377, 2009-53 Environmental Services 82,668,700 83,308,100 639,400 2008-299, 2008-377, 2008-386 Emergency Communications 10,337,200 10,355,800 18,600 2008-377 Police 78,734,000 79,897,400 1,163,400 2008-275, 2008-276, 2008-278,
2008-312, 2008-313, 2008-318, 2008-370, 2008-377, 2008-390, 2008-391, 2009-25, 2009-26, 20009-57, 2009-132
Fire 41,304,400 41,599,000 294,600 2008-273, 2008-377, 2008-390 Library 11,185,900 11,225,600 39,700 2008-377 Recreation & Youth Services 17,262,500 16,977,800 -284,700 2008-312, 2008-313, 2008-314,
2008-315, 2008-342, 2008-344, 2008-377, 2008-395, 2008-430, 2008-433, 2008-434, 2009-57, 2009-20, 2009-84, 2009-89, 2009-125, 2009-126, 2009-130
Undistributed 102,979,400 103,165,500 186,100 2008-312, 2008-377, 2008-434, 2009-89
Contingency 11,318,000 7,442,300 -3,875,700
2008-318, 2008-321, 2008-337, 2008-344, 2008-377, 2008-433, 2008-434, 2009-89, 2009-15, 2009-95, 2009-108
Cash Capital 50,039,800 52,811,200 2,771,400 2008-274, 2008-275, 2008-295, 2008-312, 2008-337, 2008-390, 2008-421, 2009-15, 2009-95, 2009-108
Debt Service 37,806,100 37,806,100 0 478,107,100 481,000,400 2,893,300

EXPENDITURE SUMMARY 1–43 SUMMARY OF 2008-09 BUDGET AMENDMENTS
Ordinance Purpose Amount Department
2008-273 Fire Prevention 73,000 * Fire
2008-274 Bomb Squad Training & Equipment 110,000 * Capital
2008-275 Homeland Security 75,000 Capital 10,000 Police 85,000 *
2008-276 PAC-TAC 50,000 * Police
2008-278 Appropriating Forfeiture Funds for the Greater Rochester Area Narcotics Team (GRANET)
175,000 * Police
2008-295 Computer equipment and software for Arnett,
Lincoln, Lyell, Maplewood, Sully, and Wheatley Branch Libraries
31,200 * Capital
2008-299 Graffiti Removal 80,000 * Environmental Services
2008-312 Gang Suppression 292,200 Capital
93,500 Police 31,000 Recreation & Youth Services 28,000 Undistributed 444,700 *
2008-313 Project IMPACT V 471,800 Police 46,400 Recreation & Youth Services 518,200 *
2008-314 Youth Voice, One Vision 40,000 * Recreation & Youth Services
2008-315 Clarissa Street Reunion 5,000 * Recreation & Youth Services
2008-318 Support services for victims of violence 50,000 Police -50,000 Contingency 0
2008-321 One City Connection volunteer website 25,000 Administration/Mayor's Office -25,000 Contingency 0
2008-337 Expanded parking at Public Market 203,000 Capital -203,000 Contingency 0

1–44 EXPENDITURE SUMMARY SUMMARY OF 2008-09 BUDGET AMENDMENTS
Ordinance Purpose Amount Department
2008-342 Rochester Re-Entry Program 70,700 * Recreation & Youth Services
2008-344 Expanded hours at recreation sites 91,000 Recreation & Youth Services 7,000 Undistributed -98,000 Contingency 0
2008-370 Appropriation of forfeiture funds 12,000 * Police
2008-377 PRIME Program 245,700 Environmental Services 16,900 Undistributed -60,800 Contingency -60,000 Recreation & Youth Services 141,800 * Surveillance camera system maintenance 127,300 Information Technology 76,000 Police 33,000 Undistributed -236,300 Contingency 0 Temporary cleaner position 14,200 Library -14,200 Contingency 0 Election Inspectors 48,100 * City Council & Clerk Wage & salary increases & performance awards
19,100 City Council and Clerk
Administration: 80,500 Mayor's Office 30,600 Neighborhood Service Centers 33,500 Management & Budget 47,800 Human Resource Management 26,800 Communications 61,700 Law 90,100 Information Technology 68,800 Finance 135,900 Community Development 60,200 Economic Development 301,600 Environmental Services 18,600 Emergency Communications 72,200 Police 50,400 Fire

EXPENDITURE SUMMARY 1–45 SUMMARY OF 2008-09 BUDGET AMENDMENTS
Ordinance Purpose Amount Department
25,500 Library 64,300 Recreation & Youth Services 90,800 Undistributed Expenses -1,278,400 Contingency 0
2008-382 City Living promotion 37,900 * Community Development
2008-386 Sebastian Park trees 12,100 * Environmental Services
2008-390 Urban Area Security Initiative Grant 310,600 Capital 170,900 Fire 14,900 Police 496,400 *
2008-391 COPS Secure Our School Grant Program 70,500 * Police
2008-395 Rochester HeLP (Healthy Lifestyle Project) 129,200 * Recreation & Youth Services
2008-400 Records Management Improvement Grant 15,200 * Information Technology
2008-421 Curb Replacement Project 42,400 * Capital
2008-430 Slater's Raiders for Peace Initiative 60,000 * Recreation & Youth Services
2008-433 Child care services 50,000 Recreation & Youth Services -50,000 Contingency 0
2008-434 Expanded hours at recreation sites 71,300 Recreation & Youth Services 5,200 Undistributed -76,500 Contingency 0
2009-6 Lead poisoning prevention 147,000 * Administration/Neighborhood Service Centers
2009-15 Marina market & feasibility study 310,000 Capital
-310,000 Contingency 0
2009-20 After School Program 25,000 * Recreation & Youth Services
2009-25 Selective Traffic Enforcement Program 27,800 * Police
2009-26 Motor Vehicle Theft & Insurance Fraud 14,700 * Police

1–46 EXPENDITURE SUMMARY SUMMARY OF 2008-09 BUDGET AMENDMENTS
Ordinance Purpose Amount Department
Prevention Program
2009-53 High Falls Centers repairs 7,000 * Economic Development
2009-57 Transfer of Office of Special Events 1,025,000 Administration/Communications -1,025,000 Recreation & Youth Services 0
2009-63 Repeal Ordinance No. 2009-6 -147,000 * Administration/Neighborhood Service Centers
2009-84 Elite Basketball League 10,000 * Recreation & Youth Services
2009-89 Continue expanded hours at recreation sites 71,300 Recreation & Youth Services
5,200 Undistributed -76,500 Contingency 0
2009-95 Additions to the street lighting system 972,000 Capital -972,000 Contingency 0
2009-108 Demolition Program 425,000 Capital -425,000 Contingency 0
2009-125 Northeast Bridges To Wellness Project 13,500 * Recreation & Youth Services
2009-126 Sports and fitness programs 10,000 * Recreation & Youth Services
2009-130 Adolescent Pregnancy Prevention Services Program
11,600 * Recreation & Youth Services
2009-132 Graffiti sensors 25,000 * Police
*Appropriation of additional revenue

EXPENDITURE SUMMARY 1–47 APPLICATION OF RELATED
EXPENDITURES & REVENUES
An informational display is provided on the next page which gives appropriations for each department or major subdivision, related expenditures, and revenues that are found elsewhere in the Budget. The City’s budgeting and accounting systems place employee benefits, capital items, and debt in separate departments for monitoring and control purposes. This display distributes those expenses to the department to which they are judged most closely related. In this fashion, a sense of the overall expense level for a given department can be approximated. Intrafund credits, where applicable, have been subtracted from the department’s budget to reflect net planned expenditures. The display also distributes revenue that is judged related to a department. The Application of Revenue section, pages 1-33 to 1-34, provides additional detail on the sources of this revenue. This applied revenue is subtracted from the total expenditures for the departments, yielding a net expense for each department. This net amount is funded by the property tax and other General Fund revenues that are not applied.

1–48 EXPENDITURE SUMMARY APPLICATION OF RELATED
EXPENDITURES & REVENUES
Cur
rent
Bal
ance
Req
uire
dE
xpen
seE
mpl
oyee
Cas
h D
ebt
Tota
lLe
ss D
irect
lyF
rom
Tax
es a
ndB
udge
tB
enef
itsC
apita
lS
ervi
ceE
xpen
ditu
res
App
licab
le R
even
ue G
ener
al R
even
ueC
ity C
ounc
il an
d C
lerk
1,81
6,90
0
817,
700
0
0
2,63
4,60
0
86
2,20
0
1,
772,
400
Adm
inis
trat
ion
9,98
9,40
0
3,74
1,90
0
857,
000
0
14
,588
,300
2,
526,
400
12
,061
,900
Law
1,86
7,00
0
862,
100
0
0
2,72
9,10
0
1,
161,
600
1,
567,
500
Info
rmat
ion
Tech
nolo
gy4,
308,
700
1,
609,
600
2,
910,
000
0
8,82
8,30
0
1,
000
8,
827,
300
Fin
ance
6,96
6,80
0
2,46
6,80
0
844,
000
0
10
,277
,600
9,
103,
600
1,
174,
000
Nei
ghbo
rhoo
d &
Bus
ines
s D
evel
opm
ent
13,9
16,4
00
4,75
0,30
0
5,19
9,00
0
8,93
9,60
0
32,8
05,3
00
12,6
48,3
00
20
,157
,000
Env
ironm
enta
l Ser
vice
s79
,615
,500
18
,470
,600
21,0
42,0
00
17,7
50,9
00
136,
879,
000
10
1,26
3,50
0
35,6
15,5
00
E
mer
genc
y C
omm
unic
atio
n10
,520
,500
4,
784,
200
11
5,00
0
0
15,4
19,7
00
13,5
91,6
00
1,
828,
100
Pol
ice
76,0
65,8
00
33,6
80,7
00
2,
181,
000
0
111,
927,
500
7,
162,
500
10
4,76
5,00
0
Fire
42,0
70,5
00
19,9
98,1
00
1,
886,
000
17
9,50
0
64
,134
,100
1,
468,
600
62
,665
,500
Libr
ary
11,1
53,5
00
2,75
1,60
0
1,23
5,00
0
321,
200
15,4
61,3
00
10,5
52,6
00
4,
908,
700
Rec
reat
ion
& Y
outh
Ser
vice
s12
,317
,000
3,
106,
200
2,
882,
000
3,
550,
000
21
,855
,200
4,
498,
900
17
,356
,300
Und
istr
ibut
ed*
2,72
2,70
0
0
0
0
2,
722,
700
885,
700
1,83
7,00
0
C
ontin
genc
y10
,102
,800
0
0
0
10,1
02,8
00
0
10,1
02,8
00
C
ash
Cap
ital
N/A
0
0
0
0
0
0
D
ebt
Ser
vice
**N
/A0
0
1,
788,
000
1,
788,
000
1,78
7,90
0
100
Tota
l97
,039
,800
39,1
51,0
00
32,5
29,2
00
452,
153,
500
16
7,51
4,40
0
284,
639,
100
*Oth
er e
xpen
ses
not
dist
ribut
ed.
**In
clud
es o
nly
expe
nditu
res
not
dist
ribut
ed t
o de
part
men
tal b
udge
ts.
N/A
- N
ot a
pplic
able
; al
l exp
endi
ture
s di
strib
uted
Net
of a
ll in
traf
und
char
geba
cks

FUND SUMMARY 1–49
FUND ACCOUNTING In accordance with generally accepted accounting principles, the City records financial transactions of its operations in various funds, each of which is a separate entity. Funds that do not generate sufficient revenues from operations are supported by property tax revenue. Following is a description of the funds and a table summarizing transactions in these funds during 2009-10. General Fund is Rochester's principal fund and includes all operations not contained in other funds. Animal Control Fund includes the operation of Animal Control. Under Article 7 of the Agriculture and Markets Law, licensing and impoundment fees, fines and penalties are deposited in this fund and are used solely for animal control purposes. Library Fund includes operations of the Central and Community libraries. Under Section 259 of the Education Law, all moneys received from taxes or other public sources for library purposes are to be maintained in a separate fund. Local Works Fund includes street cleaning, roadway plowing and salting, sidewalk plowing, and hazardous sidewalk replacement. Revenues are derived primarily from front footage charges to property owners for services rendered. Water Fund includes water production, treatment, and distribution. War Memorial Fund includes the Blue Cross Arena at the Rochester War Memorial operations. Parking Fund includes operations of Rochester's parking garages, lots, and meters. Cemetery Fund includes operations of Mt. Hope and Riverside Cemeteries. Public Market Fund includes the operations of Rochester's Public Markets. Refuse Fund includes refuse collection and disposal operations.
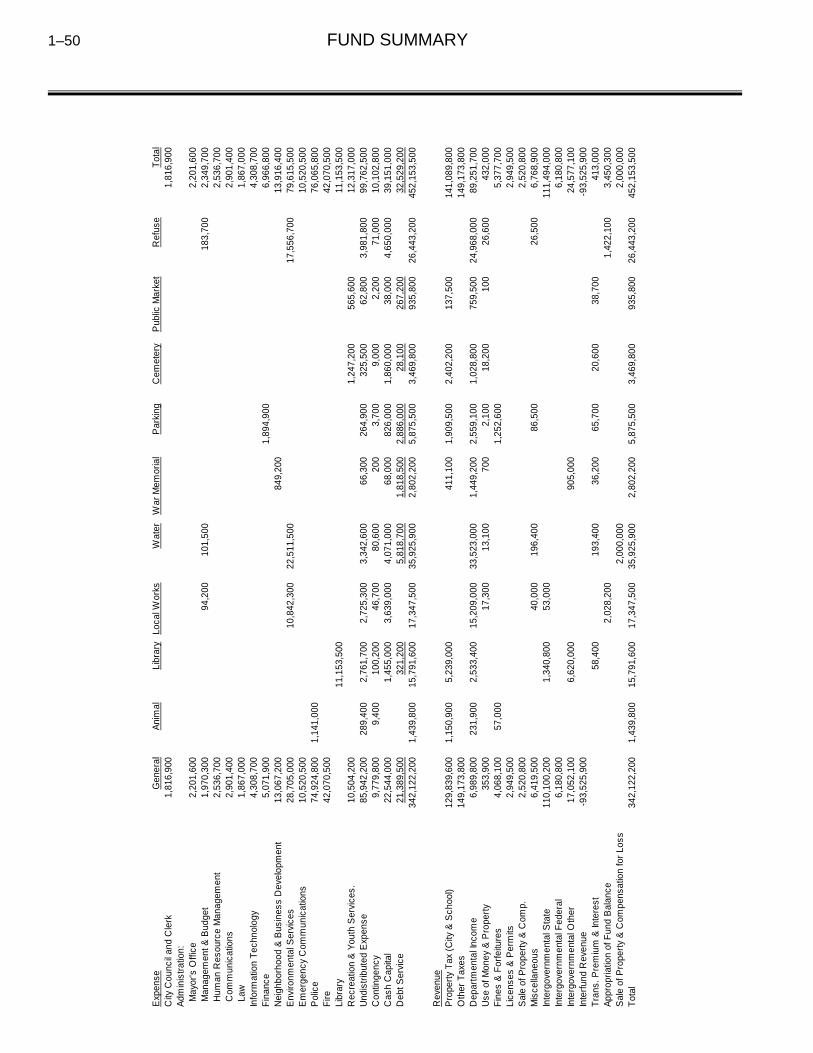
1–50 FUND SUMMARY
Exp
ense
Gen
eral
Ani
mal
Libr
ary
Loca
l Wor
ksW
ater
War
Mem
oria
lP
arki
ngC
emet
ery
Pub
lic M
arke
tR
efus
eT
otal
City
Cou
ncil
and
Cle
rk1,
816,
900
1,81
6,90
0A
dmin
istr
atio
n: M
ayor
's O
ffice
2,20
1,60
02,
201,
600
Man
agem
ent &
Bud
get
1,97
0,30
094
,200
101,
500
183,
700
2,34
9,70
0 H
uman
Res
ourc
e M
anag
emen
t2,
536,
700
2,53
6,70
0 C
omm
unic
atio
ns2,
901,
400
2,90
1,40
0 L
aw1,
867,
000
1,86
7,00
0In
form
atio
n T
echn
olog
y4,
308,
700
4,30
8,70
0F
inan
ce5,
071,
900
1,89
4,90
06,
966,
800
Nei
ghbo
rhoo
d &
Bus
ines
s D
evel
opm
ent
13,0
67,2
0084
9,20
013
,916
,400
Env
ironm
enta
l Ser
vice
s28
,705
,000
10,8
42,3
0022
,511
,500
17,5
56,7
0079
,615
,500
Em
erge
ncy
Com
mun
icat
ions
10,5
20,5
0010
,520
,500
Pol
ice
74,9
24,8
001,
141,
000
76,0
65,8
00F
ire42
,070
,500
42,0
70,5
00Li
brar
y11
,153
,500
11,1
53,5
00R
ecre
atio
n &
You
th S
ervi
ces.
10,5
04,2
001,
247,
200
565,
600
12,3
17,0
00U
ndis
trib
uted
Exp
ense
85,9
42,2
0028
9,40
02,
761,
700
2,72
5,30
03,
342,
600
66,3
0026
4,90
032
5,50
062
,800
3,98
1,80
099
,762
,500
Con
tinge
ncy
9,77
9,80
09,
400
100,
200
46,7
0080
,600
200
3,70
09,
000
2,20
071
,000
10,1
02,8
00C
ash
Cap
ital
22,5
44,0
001,
455,
000
3,63
9,00
04,
071,
000
68,0
0082
6,00
01,
860,
000
38,0
004,
650,
000
39,1
51,0
00D
ebt S
ervi
ce21
,389
,500
321,
200
5,81
8,70
01,
818,
500
2,88
6,00
028
,100
267,
200
32,5
29,2
0034
2,12
2,20
01,
439,
800
15,7
91,6
0017
,347
,500
35,9
25,9
002,
802,
200
5,87
5,50
03,
469,
800
935,
800
26,4
43,2
0045
2,15
3,50
0
Rev
enue
Pro
pert
y T
ax (
City
& S
choo
l)12
9,83
9,60
01,
150,
900
5,23
9,00
041
1,10
01,
909,
500
2,40
2,20
013
7,50
014
1,08
9,80
0O
ther
Tax
es14
9,17
3,80
014
9,17
3,80
0D
epar
tmen
tal I
ncom
e6,
989,
800
231,
900
2,53
3,40
015
,209
,000
33,5
23,0
001,
449,
200
2,55
9,10
01,
028,
800
759,
500
24,9
68,0
0089
,251
,700
Use
of M
oney
& P
rope
rty
353,
900
17,3
0013
,100
700
2,10
018
,200
100
26,6
0043
2,00
0F
ines
& F
orfe
iture
s4,
068,
100
57,0
001,
252,
600
5,37
7,70
0Li
cens
es &
Per
mits
2,94
9,50
02,
949,
500
Sal
e of
Pro
pert
y &
Com
p.2,
520,
800
2,52
0,80
0M
isce
llane
ous
6,41
9,50
040
,000
196,
400
86,5
0026
,500
6,76
8,90
0In
terg
over
nmen
tal S
tate
110,
100,
200
1,34
0,80
053
,000
111,
494,
000
Inte
rgov
ernm
enta
l Fed
eral
6,18
0,80
06,
180,
800
Inte
rgov
ernm
enta
l Oth
er17
,052
,100
6,62
0,00
090
5,00
024
,577
,100
Inte
rfun
d R
even
ue-9
3,52
5,90
0-9
3,52
5,90
0T
rans
. Pre
miu
m &
Inte
rest
58,4
0019
3,40
036
,200
65,7
0020
,600
38,7
0041
3,00
0A
ppro
pria
tion
of F
und
Bal
ance
2,02
8,20
01,
422,
100
3,45
0,30
0S
ale
of P
rope
rty
& C
ompe
nsat
ion
for
Loss
2,00
0,00
02,
000,
000
Tot
al34
2,12
2,20
01,
439,
800
15,7
91,6
0017
,347
,500
35,9
25,9
002,
802,
200
5,87
5,50
03,
469,
800
935,
800
26,4
43,2
0045
2,15
3,50
0

MULTI-YEAR PROJECTION 2–1
Introduction The multi-year projection is a forecast of revenues and expenditures for City purposes only. It does not include a forecast for the City School District. The multi-year projection is not a prediction of future events. Instead, the projection illustrates the City's fiscal condition over the next five years based on existing trends and specified assumptions. As indicated in forecast below, a gap for all funds of approximately $32.7 million is expected for 2010-11. This gap accumulates to $132.2 million in 2014-15. No expense or revenues are projected at this time from the possible installation of a red light camera system.
2009-10 2010-11 2011-12 2012-13 2013-14 2014-15
GENERAL FUND 0.0 27.8 54.1 70.3 95.9 116.5
ALL FUNDS 0.0 32.7 61.5 79.8 111.4 132.2
$0
$20
$40
$60
$80
$100
$120
$140
Mill
ions
($)
PROJECTED CITY GAPS

2–2 MULTI-YEAR PROJECTION MAJOR ASSUMPTIONS & TRENDS
Revenue Property Tax In recognition of the unusually high property tax burden that City taxpayers currently bear, and to stay competitive with other residential and commercial locations, the multi-year projection assumes a constant property tax level. Sales Tax A sales tax rate of 8.0% is assumed, with distributions according to current distribution formulas. The taxable sales growth rate assumed is 2.0 % per year for 2010-11 through 2014-15. City School District The City revenue allocation to the City School District is assumed constant at $119,100,000. Continuation of the City School District’s annual funding of school resource officers at $1.1 million is assumed and a $600,000 contribution to support the Hillside Work Scholarship Program. Intergovernmental The following actions are assumed of the Federal Government: Continuation of the Community Development Block Grant.
The following actions are assumed of the New York State Government: Aid and Incentives to Municipalities (AIM) total program funding is assumed to be constant for
2010-11 to 2014-15.
Continuation at current levels of categorical and miscellaneous aid programs that were included in the New York State 2009-10 budget (i.e. Consolidated Highway Improvement Program funds).
The following actions are assumed of Monroe County: Continued funding of the emergency communications system.
Continued funding of a portion of downtown police services.
Continued funding of election inspectors.
Fees and Enterprise Revenues The multi-year projection assumes no change in all major service charges (water, refuse collection, front foot assessment). No parking rate increase is assumed. Other Revenues The multi-year projection assumes the appropriation of $4.1 million General Fund surplus in 2010-11, and assumes zero thereafter.

MULTI-YEAR PROJECTION 2–3 MAJOR ASSUMPTIONS & TRENDS
Expense Inflation is responsible for the most significant pressure on projected expenditures. The Consumer Price Index (CPI) is projected to increase 3.50% in 2010-11 and 4.0% each year thereafter. The effects of inflation on the operating budget are direct and immediate, resulting in increased costs for employee wages and salaries, construction projects, materials, and other services. Cost increases based on expected inflation rates and current labor agreements are reflected in the multi-year expense projection. The multi-year projection assumes a constant level of services. Only programmatic and service changes currently known are recognized. The constant services approach does not take into account changes in the demand for service. Expenditure forecasts for Cash Capital and Debt Service are based on the City's 2010-2014 Capital Improvement Program.
Retirement expense reflects projections based on the most recent information for expected long term rates from the New York State Retirement System. Projections for active employee hospitalization and medical insurance assume 15% in 2010-11 and each year thereafter. Projections for retiree hospitalization and medical insurance assume 15% in 2010-11 and each year thereafter. A contribution of $1,000,000 to the insurance reserve is projected in 2010-11 and each year thereafter with an inflationary adjustment. The projected debt service reflects projects in the Capital Improvement Program.
0.00
1.00
2.00
3.00
4.00
5.00
3.0
3.5
2.6
3.3
1.4
2.8
3.5
4.0 4.0 4.04.0
MULTI-YEAR INFLATION RATES
Actual Projected

2–4 MULTI-YEAR PROJECTION MAJOR ASSUMPTIONS & TRENDS
Closing The Gap A funding gap is anticipated for each year of the projection. Since New York State Law requires that municipalities prepare balanced budgets, it is necessary that actions be taken to eliminate the gap. Actions are likely to be combinations of the revenue and expenditure options listed below. Revenue Options Because adjustments to existing taxes (except property taxes) have been included in the projection,
revenue options are limited to the following: Intergovernmental aid and grant increase.
New tax or user fees authorizations.
Property tax increase.
Service charge increase.
Expand use of Enterprise activities.
Expenditure Options Major expenditure options to eliminate the gap are to: Improve productivity – Through improved use of technological advances and innovative
management techniques, cost reductions can be realized without reducing service levels. Reduce service – If the options above are not sufficient to eliminate the funding gap, service
reductions or eliminations will be required. Consolidate services with other units of government.
Negotiate savings in collective bargaining agreements.
Invest in capital projects with a return on investment.
Relief from State mandates

CITY COUNCIL & CLERK 3–1
Purpose The City Council supports the City of Rochester’s One City Vision Statement and its Values and Guiding Principles and governs the City through the enactment of local laws, ordinances, and resolutions. It has nine members elected to overlapping four year terms, with four elected from districts and five from the City at-large. The President of City Council is elected by members of Council and presides over its meetings. The Office of the City Clerk supports the City of Rochester’s One City Vision Statement and its Values and Guiding Principles and maintains official records of the proceedings of the City Council. It issues several types of licenses and administers compensation of City election inspectors.
City Council
Council Staff City Clerk
Licensing
Elections

3–2 CITY COUNCIL & CLERK
Key Performance Indicators
Year-To-Year Comparison
Budget Budget PercentActivity 2008-09 2009-10 Change ChangeCity Council 1,008,800 999,100 -9,700 -1.0%Office of the City Clerk 350,900 362,200 11,300 3.2%Licensing 175,500 171,700 -3,800 -2.2%Elections 303,900 283,900 -20,000 -6.6%
Total 1,839,100 1,816,900 -22,200 -1.2%
Employee Years 27.2 26.7 -0.5 -1.8% Change Detail Salary & Wage General Vacancy
Adjustment Inflation Chargebacks Allowance Miscellaneous Major Change Total24,200 15,900 200 -20,000 16,500 -59,000 -22,200
Major Change Highlights Reduce professional services due to a new agreement for the City’s annual audit -37,300
Productivity improvements reduce expense -15,900
Two vacant part time positions convert to one full time position, resulting in savings -3,400
Reduce travel & training due to budget constraints -2,400
Actual 2007-08
Estimated 2008-09
Budget 2008-09
Budget 2009-10
Licenses processed: ● Dog 4,461 4,443 4,351 4,431 ● Marriage 1,327 1,343 1,419 1,343 ● Duplicate Marriage 1,385 1,415 1,394 1,449 ● Commissioner of Deeds 175 180 181 184 ● Business 1,706 1,784 1,828 1,800 ● Hack Plates 272 305 281 310 ● Taxicab drivers 498 540 522 545 ● Other taxicab 332 341 316 348 Domestic Partnerships 115 134 131 138 Alarm permits 8,740 8,809 8,755 8,874 Handicapped parking 3,817 3,719 3,754 3,772 Marriage ceremonies 439 463 431 470 Passports 276 282 370 300

CITY COUNCIL & CLERK 3–3
Organization City Council includes the members of the City Council and appropriations for Council research, support staff, and other related expenses. Office of the City Clerk prepares the agendas for City Council meetings, records the proceedings, and prints and distributes the minutes. It prints supplements and amendments to the City Code and Charter. It advertises public hearings and notifies the Secretary of State of changes in local laws. It also administers and audits the payroll for City election inspectors. Licensing receives applications and payments for licenses for businesses, occupations, marriages, dogs, passport applications, fire and burglar alarm permits, and handicapped parking permits. It prepares related reports for City, County, and State agencies. The Elections activity consists of salary and training expenses for election inspectors. Inspectors, who are directly supervised by the Monroe County Board of Elections, administer election laws and procedures at local polling places. They record, certify, and transmit election returns to the County Board of Elections.

3–4 CITY COUNCIL & CLERK EXPENDITURE SUMMARY
Actual Estimated Amended Approved2007-08 2008-09 2008-09 2009-10
Appropriation by Major ObjectPersonnel Expenses 1,475,725 1,480,000 1,550,200 1,576,300 Materials & Supplies 7,833 8,600 9,100 8,800 Services 231,072 240,300 279,800 231,800 Other 0 0 0 0
Total 1,714,630 1,728,900 1,839,100 1,816,900
Appropriation by ActivityCity Council 928,741 996,600 1,008,800 999,100 Office of the City Clerk 348,346 344,400 350,900 362,200 Licensing 166,378 174,700 175,500 171,700 Elections 271,165 213,200 303,900 283,900
Total 1,714,630 1,728,900 1,839,100 1,816,900
Employee Years by ActivityCity Council 8.3 8.4 8.2 8.2 Office of the City Clerk 4.4 4.4 4.4 4.4 Licensing 4.1 4.0 4.1 4.1 Elections 8.1 7.4 10.5 10.0
Total 24.9 24.2 27.2 26.7

CITY COUNCIL & CLERK 3–5 PERSONNEL SUMMARY
FULL TIME POSITIONS City
Cou
ncil
Offi
ce o
f the
C
ity C
lerk
Lice
nsin
g
Ele
ctio
ns
Budget ApprovedBr. Title 2008-09 2009-1036 Chief of Staff 1.0 1.0 1.031 City Clerk 1.0 1.0 1.028 Deputy City Clerk 1.0 1.0 1.026 Associate Legislative Analyst 1.0 1.0 1.024 Principal Legislative Communication Assistant 1.0 1.0 1.020 Senior Legislative Assistant 2.0 2.0 0.3 0.5 1.218 Secretary to Council 1.0 1.0 1.016 Legislative Assistant 1.0 1.0 1.011 Receptionist to City Council 1.0 1.0 0.5 0.59 Senior Legislative Clerk 1.0 1.0 1.07 Legislative Clerk 1.0 2.0 2.0
FX President-City Council (1) (1) (1)FX Vice President-City Council (1) (1) (1)FX Council Member (7) (7) (7)
( ) = not in totals
EMPLOYEE YEARSFull Time 12.0 13.0 4.8 4.0 4.2 0.0Overtime 0.0 0.0 0.0 0.0 0.0 0.0Part Time, Temporary, Seasonal 16.2 15.2 3.6 0.5 0.0 11.1Less: Vacancy Allowance 1.0 1.5 0.2 0.1 0.1 1.1 Total 27.2 26.7 8.2 4.4 4.1 10.0

ADMINISTRATION 4–1
Purpose Administration performs the City's executive and central support functions. These include managing City departments, implementing policies for affirmative action, resolving and preventing chronic quality of life, nuisance and disorder issues, preparing and administering the annual budget and capital programs, providing centralized personnel, civil service, and communications functions, distributing information, examining and evaluating City programs, and attending to the legal business of the City.
Mayor
Management & Budget
Human Resource Management Communications Law

4–2 ADMINISTRATION
Year-To-Year Comparison Budget Budget Percent
Main Functions 2008-09 2009-10 Change ChangeMayor's Office 2,391,800 2,201,600 -190,200 -8.0%Neighborhood Service Centers 4,578,400 0 -4,578,400 -100.0%Management & Budget 2,422,600 2,349,700 -72,900 -3.0%Human Resource Management 2,465,100 2,536,700 71,600 2.9%Communications 2,119,600 2,901,400 781,800 36.9%Law Department 1,991,300 1,867,000 -124,300 -6.2%
Total 15,968,800 11,856,400 -4,112,400 -25.8%
Employee Years 208.3 138.9 -69.4 -33.3% Change Detail Salary & Wage General Vacancy
Adjustment Inflation Chargebacks Allowance Miscellaneous Major Change Total-3,900 40,700 -7,100 34,000 13,700 -4,189,800 -4,112,400
Major Change Highlights As proposed by the Mayor:
All Neighborhood Service Center funds transfer to the newly created Department of Neighborhood and Business Development
-4,578,400
Remaining Special Events and High Falls laser show funding transfers from Department of Recreation & Youth Services
1,040,300
Three full time positions In Human Resource Management are eliminated as an efficiency measure
-112,500
Transfer the Office of Employment Opportunities from the Mayor’s Office to Recreation & Youth Services to better align functions
-90,400
Funding for MusicFest increases as part of Rochester's 175th Anniversary 75,000
Funds are added for the administration of Firefighter Exam 74,000
One position that supports RBN and process improvements transfers from the Mayor's Office to OMB
72,100
As amended by City Council:
Funds are transferred from Contingency to Communications for North Winton Village Arts Festival and Lyell Avenue Music Fest
3,000

ADMINISTRATION 4–3 EXPENDITURE SUMMARY
Actual Estimated Amended Approved2007-08 2008-09 2008-09 2009-10
Appropriation by Major ObjectPersonnel Expenses 11,757,331 11,759,000 12,543,300 8,897,800 Materials & Supplies 156,289 155,900 161,200 112,300 Services 2,233,958 2,973,300 3,264,300 2,846,300 Other 0 0 0 0
Total 14,147,578 14,888,200 15,968,800 11,856,400
Appropriation by ActivityMayor's Office 2,953,061 2,367,100 2,391,800 2,201,600 Neighborhood Service Centers 4,363,100 4,297,700 4,578,400 0 Management & Budget 1,765,337 1,933,500 2,422,600 2,349,700 Human Resource Management 2,123,482 2,274,800 2,465,100 2,536,700 Communications 982,485 2,044,900 2,119,600 2,901,400 Law Department 1,960,113 1,970,200 1,991,300 1,867,000
Total 14,147,578 14,888,200 15,968,800 11,856,400
Employee Years by ActivityMayor's Office 32.3 22.5 24.5 22.0 Neighborhood Service Centers 63.3 59.4 63.9 0.0 Management & Budget 44.1 39.1 43.7 40.7 Human Resource Management 38.1 39.0 39.0 36.7 Communications 13.6 13.9 13.7 18.1 Law Department 23.7 23.6 23.5 21.4
Total 215.1 197.5 208.3 138.9

4–4 ADMINISTRATION MAYOR’S OFFICE
Mission Statement Mayor’s Office Administration: To make Rochester the best mid-sized city in the U.S. in which to live, raise a family, visit and grow a business. Our city will be renowned for its safe neighborhoods, vibrant economy, educational excellence and customer service. Organization
Vital Customers Mayor’s Office Administration: Internal: City Council and City departments External: All who currently or potentially could live, work, visit, or do business in the City of
Rochester Critical Processes Mayor’s Office Administration: Oversight of all City departments Development of programs and policies Preparation of operating and capital budgets Continual improvement of performance of all City operations Management of City’s intergovernmental relations Coordination of federal stimulus process roll-out Representation of the City to all constituencies and monitoring of their satisfaction with our services
Mission Statement Office of Public Integrity (OPI): To support the City of Rochester’s One City Vision Statement and its Values and Guiding Principles by enhancing public confidence and trust in city government by making it more transparent, efficient, and accountable. The office is a means for city government to ensure all City employees are committed to integrity, ethical behavior, legal compliance, and accountability.
Mayor's Office
Public Integrity/Audit
& Review

ADMINISTRATION 4–5 MAYOR’S OFFICE
Vital Customers Office of Public Integrity (OPI): Internal: City of Rochester administration, departments, and employees External: All who currently or potentially could live, work, visit, or do business in the City of
Rochester Critical Processes Office of Public Integrity (OPI): Investigations—administrative and criminal Internal audits External audits if a relationship exists with the City Education of employees and constituents
The Mayor is the Chief Executive Officer of the City and is elected by the citizens to a four-year term. The Mayor is empowered to enforce City laws and ordinances, appoint and remove department heads, develop programs and policies, prepare the operating and capital budgets, and examine the performance of all City operations. The Mayor also is responsible for the City's intergovernmental relations and representation to all constituencies. 2009-10 Fiscal Goals & Objectives Objective Priorities Supported Projected
Completion
Promote literacy through increased programming at Branch Libraries
Education First Quarter
Oversee the development of a program to measure greenhouse emissions
Customer Service First Quarter
Fund additional summer jobs to support the Mayor’s Youth Advisory Council and City Youth
Customer Service First Quarter
Oversee the development of a program to support After School Alliance Initiative
Education First Quarter
Oversee the process to complete the management reorganization of all city parking assets
Customer Service Fourth Quarter
Conduct departmental audits and investigate allegations of impropriety among employees and vendors
Customer Service Ongoing

4–6 ADMINISTRATION MAYOR’S OFFICE
Key Performance Indicators
Actual2007-08
Estimated2008-09
Budget 2008-09
Budget2009-10
Office of Public Integrity (OPI)
Audits completed 20 20 19 20
Reviews and consultations completed 9 7 7 16
Payroll field checks completed 15 15 15 15
Investigations conducted by OPI involving financial loss
N/A 15 20 20
N/A – Not Applicable Year-To-Year Comparison
2008-09 2009-10 ChangeBudget 2,391,800 2,201,600 -190,200Employee Years 24.5 22.0 -2.5 Change Detail Salary & Wage General Vacancy
Adjustment Inflation Chargebacks Allowance Miscellaneous Major Change Total-38,300 13,000 -500 0 10,000 -174,400 -190,200
Major Changes Transfer the Office of Employment Opportunities from the Mayor’s Office to Recreation & Youth Services to better align functions
-90,400
Funding for a position transfers from the Law Department 80,000
Funding for a position to support Rochester by the Numbers transfers to the Office of Management and Budget
-72,100
A Staff Assistant position and a vacant position are eliminated as an efficiency measure -69,200
Travel and food allocations reduced as an economy measure -31,600
Funding for state lobbyist services is partially offset by a decrease in professional fees and the elimination of green team promotions
25,300
Funding for One City Connection website does not recur -25,000
A part time investigator position is added to the Office of Public integrity for increased investigative support
21,200
Funding for rent and utilities decreases for the planned relocation of the Office of Public Integrityinto Rundel Library
-12,600
Program Change The Manager of Employment Opportunities transfers to the Department of Recreation and Youth Services to help facilitate job opportunities for youth and adults at risk. Funding for professional fees for state lobbying services is added.

ADMINISTRATION 4–7 MAYOR’S OFFICE EXPENDITURE SUMMARY
Actual Estimated Amended Approved2007-08 2008-09 2008-09 2009-10
Appropriation by Major ObjectPersonnel Expenses 2,179,973 1,942,900 1,952,300 1,783,500 Materials & Supplies 17,997 13,800 13,800 13,800 Services 755,091 410,400 425,700 404,300 Other 0 0 0 0
Total 2,953,061 2,367,100 2,391,800 2,201,600
Appropriation by ActivityMayor's Office 1,561,835 1,823,100 1,855,800 1,665,000 Public Integrity/Audit & Review 485,972 544,000 536,000 536,600 Pathways to Peace 905,254 0 0 0
Total 2,953,061 2,367,100 2,391,800 2,201,600
Employee Years by ActivityMayor's Office 17.6 16.0 18.0 15.0 Public Integrity/Audit & Review 6.4 6.5 6.5 7.0 Pathways to Peace 8.3 0.0 0.0 0.0
Total 32.3 22.5 24.5 22.0

4–8 ADMINISTRATION MAYOR’S OFFICE
PERSONNEL SUMMARY
FULL TIME POSITIONS May
or's
Offi
ce
Pub
lic
Inte
grity
/ In
tern
al A
udit
Budget ApprovedBr. Title 2008-09 2009-10FX Mayor 1 1 1FX Deputy Mayor 1 1 136 Assistant to Mayor 1 1 136 Chief of Staff 1 1 135 Director of Special Projects 1 1 133 Director, Office of Public Integrity 1 1 132 Manager, Internal Audit 1 1 131 Manager of Employment Opportunities 1 0 029 Executive Staff Assistant IV 2 2 228 Principal Field Auditor 1 1 126 Associate Field Auditor 1 1 126 Executive Staff Assistant III 2 2 224 Sr. Administrative Analyst 1 1 123 Executive Staff Assistant II 1 1 123 Secretary to Mayor 1 1 122 Secretary to Deputy Mayor 1 1 120 Executive Assistant 1 1 119 Secretary to Chief of Staff 1 1 118 Secretary to Assistant to Mayor 1 1 118 Senior Field Auditor 1 1 115 Staff Support Assistant I 1 0 011 Receptionist to the Mayor 1 1 1
EMPLOYEE YEARSFull Time 24.0 22.0 16.0 6.0Overtime 0.0 0.0 0.0 0.0Part Time, Temporary, Seasonal 0.5 1.0 0.0 1.0Less: Vacancy Allowance 0.0 1.0 1.0 0.0 Total 24.5 22.0 15.0 7.0

ADMINISTRATION 4–9 NEIGHBORHOOD SERVICE CENTERS
Year-To-Year Comparison
2008-09 2009-10 ChangeBudget 4,578,400 0 -4,578,400Employee Years 63.9 0.0 -63.9 Change Detail Salary & Wage General Vacancy
Adjustment Inflation Chargebacks Allowance Miscellaneous Major Change Total0 0 0 0 0 -4,578,400 -4,578,400
Major Change All NSC funds transfer to the newly created Department of Neighborhood and Business Development
-4,578,400

4–10 ADMINISTRATION NEIGHBORHOOD SERVICE CENTERS
EXPENDITURE SUMMARY
Actual Estimated Amended Approved2007-08 2008-09 2008-09 2009-10
Appropriation by Major ObjectPersonnel Expenses 3,522,100 3,225,300 3,483,600 0 Materials & Supplies 59,200 55,100 55,100 0 Services 781,800 1,017,300 1,039,700 0 Other 0 0 0 0
Total 4,363,100 4,297,700 4,578,400 0
Appropriation by ActivityNeighborhood Service Center 4,363,100 4,297,700 4,578,400 0
Employee Years by ActivityNeighborhood Service Center 63.3 59.4 63.9 0.0
NSC Resource Allocation - DollarsNSC Allocation 4,363,100 4,297,700 4,578,400 0 Police Department NSC Allocation 1,531,000 1,423,600 1,848,600 0
Total NSC Allocation 5,894,100 5,721,300 6,427,000 0
NSC Resource Allocation - Employee YearsNSC Allocation 63.3 59.4 63.9 0.0 Police Department NSC Allocation 24.4 20.4 26.4 0.0
Total NSC Allocation 87.7 79.8 90.3 0.0

ADMINISTRATION 4–11 NEIGHBORHOOD SERVICE CENTERS
PERSONNEL SUMMARY
FULL TIME POSITIONS
Budget ApprovedBr. Title 2008-09 2009-1036 NSC Director 1 031 NSC Administrator 4 030 Manager of NSC Code Enforcement 1 024 Lead Paint Program Coordinator 1 021 Neigh. Conservation Officer 24 021 Neigh. Conservation Officer Bilingual 1 020 Executive Assistant 2 018 Neigh. Conservation Officer Trainee 1 017 NSC Property Conservation Inspector 7 017 NSC Property Conservation Inspector Bilingual 1 012 Customer Service Representative 5 011 Senior Service Assistant 1 0
9 Clerk II 1 09 Clerk II Bilingual 1 07 Clerk III 1 07 Clerk III with Typing 3 07 Clerk III with Typing Bilingual 2 03 Clerk Typist 1 0
EMPLOYEE YEARSFull Time 58.0 0.0Overtime 0.4 0.0Part Time, Temporary, Seasonal 6.5 0.0Less: Vacancy Allowance 1.0 0.0 Total 63.9 0.0
The following full time positions are included in the budget of the Police Department, Patrol Division but are assigned to NSC offices and are shown
here for reference only.
Br. Title 2008-09 2009-1094 Police Lieutenant 4 090 Police Officer 22 0
EMPLOYEE YEARSFull Time 26.0 0.0Overtime 0.4 0.0Part Time, Temporary, Seasonal 0.0 0.0Less: Vacancy Allowance 0.0 0.0 Total 26.4 0.0

4–12 ADMINISTRATION OFFICE OF MANAGEMENT & BUDGET
Mission Statement Management & Budget: To support the City of Rochester’s One City Vision Statement and its Values and Guiding Principles through the collection, analysis and evaluation of data and by providing information and preparing recommendations and plans for the needs and uses of City resources for its major customers with the goal of ensuring that limited resources are aligned with the issues of greatest importance. 311 Call Center: To support the City of Rochester’s One City Vision Statement and its Values and Guiding Principles by:
Being Accessible
The 311 Call Center provides our stakeholders with the highest level of customer service for fast and easy access to services and information provided by the City of Rochester.
Being Accountable
The 311 Call Center helps City departments improve their service delivery by enabling them to focus on their core competencies and the efficient management of their workforce.
Enabling Transparency The 311 Call Center provides insight to the City through data collection and management on ways to improve government services through accurate, timely and consistent analysis of service delivery performance.
Organization
Management & Budget
311/One Call To City Hall

ADMINISTRATION 4–13 OFFICE OF MANAGEMENT & BUDGET
Vital Customers Management & Budget: Internal: City of Rochester Administration; City of Rochester departments; City Council External: Those who currently, or could potentially, live, work, visit, or do business in the City of
Rochester 311 Call Center: Internal: City of Rochester departments External: Those who currently, or could potentially, live, work, visit, or do business in the City of
Rochester Critical Processes Management & Budget: Prepares and administers the City’s operating budget Prepares and administers the City’s capital budget Develops the City’s long-range fiscal plans Conducts studies of City departments to improve service delivery and cost effectiveness Sets standards of measurement and performance
311 Call Center: Retrieves up to date information to respond to inquiries Submits service requests to appropriate City departments Manages cases until resolution Reports on Call Center performance Reports on City departments’ performance and activity Trains service representatives to ensure they render appropriate service
2009-10 Fiscal Goals & Objectives Objective Priorities Supported Projected
Completion
Import customer information data into the Customer Relationship Management system
Customer Service First Quarter
Identify significant efficiency opportunities Customer Service First Quarter
Conduct a City-wide fee review Customer Service Third Quarter
Complete 311 Reorganization Project Customer Service Fourth Quarter
Create the “Office of Customer Dissatisfaction” to be managed by 311 Call Center
Customer Service Fourth Quarter
Continue to work with Information Technology to design and implement a new budget system as part of the Enterprise Resource Planning System
Customer Service Ongoing

4–14 ADMINISTRATION OFFICE OF MANAGEMENT & BUDGET
Objective Priorities Supported Projected
Completion
Continue to identify and pursue cost saving collaborative ventures with Monroe County, community agencies, and the Rochester City School District
Customer Service Ongoing
Support preparation of red light camera initiative Public Safety Ongoing
Key Performance Indicators Actual
2007-08Estimated
2008-09Budget
2008-09 Budget
2009-10
Management & Budget:
Total Property Tax levy ($000) 156,759 162,873 162,873 162,873
Budget funded through recurring revenue (%) 98.0 95.0 95.0 98.6
General Fund surplus ($000) 4,051 4,193 4,193 4,183
Budget growth (%) 2.5 5.9 5.9 -6.0
Refuse charge change (%) 1.5 0.0 0.0 0.0
Local works charge change (%) 6.3 3.0 3.0 0.0
Water rate change (%) 5.3 5.0 5.0 0.0
311 Call Center:
Total calls received 184,705* 331,000 331,000 504,000
Calls answered within 30 seconds (%) 89.0 90.0 90.0 90.0
Call abandon rate (%) 6.6 5.0 5.0 5.0
*January through June
Year-To-Year Comparison
2008-09 2009-10 ChangeBudget 2,422,600 2,349,700 -72,900Employee Years 43.7 40.7 -3.0 Change Detail Salary & Wage General Vacancy
Adjustment Inflation Chargebacks Allowance Miscellaneous Major Change Total200 0 -1,300 0 9,200 -81,000 -72,900

ADMINISTRATION 4–15 OFFICE OF MANAGEMENT & BUDGET
Major Change One position that supports RBN and process improvements transfers from the Mayor's Office to OMB
72,100
Revised staff plan results in personnel expense savings in 311 Call Center as an efficiency measure
-62,200
Overtime expense reduced due to revised scheduling of staff overtime in 311 Call Center as an efficiency measure
-47,000
Revised staff plan results in personnel expense savings in OMB as an efficiency measure -33,200
Funding for printing and advertising reduced in 311 Call Center due to budget constraints -13,300
Funding for training and meetings reduced in 311 Call Center due to budget constraints -10,000
Funds are added to professional fees in OMB for a Fall, 2009 faith-based conference 10,000
Funds are added for two Youth Worker, Part Time positions in 311 Call Center 2,600

4–16 ADMINISTRATION OFFICE OF MANAGEMENT & BUDGET
EXPENDITURE SUMMARY
Actual Estimated Amended Approved2007-08 2008-09 2008-09 2009-10
Appropriation by Major ObjectPersonnel Expenses 1,623,444 1,796,800 2,246,700 2,191,800 Materials & Supplies 12,954 20,500 23,700 23,700 Services 128,939 116,200 152,200 134,200 Other 0 0 0 0
Total 1,765,337 1,933,500 2,422,600 2,349,700
Appropriation by ActivityManagement & Budget Analysis 842,656 898,100 924,000 981,800 311/One Call To City Hall 922,681 1,035,400 1,498,600 1,367,900
Total 1,765,337 1,933,500 2,422,600 2,349,700
Employee Years by ActivityManagement & Budget Analysis 12.1 11.8 12.2 12.6 311/One Call To City Hall 32.0 27.3 31.5 28.1
Total 44.1 39.1 43.7 40.7

ADMINISTRATION 4–17 OFFICE OF MANAGEMENT & BUDGET PERSONNEL SUMMARY
FULL TIME POSITIONS Man
agem
ent
& B
udge
t A
naly
sis
311/
One
Cal
l T
o C
ity H
all
Budget ApprovedBr. Title 2008-09 2009-1036 Director 1.0 1.0 1.032 Assistant Director 1.0 1.0 1.031 Chief/Performance Accountability &
Customer Satisfaction1.0 1.0 1.0
29 311 Call Center Manager 0.0 1.0 1.029 Manager of Customer Satisfaction 1.0 0.029 Principal Staff Assistant 0.0 0.5 0.526 Associate Administrative Analyst 3.0 3.0 3.026 Process Improvement Specialist 0.0 1.0 1.025 Assistant 311 Center Manager Bilingual 1.0 1.0 1.024 Senior Administrative Analyst 1.0 1.0 1.020 Administrative Analyst 2.5 2.0 2.020 Knowledge Base Coordinator 0.0 1.0 1.020 Supervising Service Representative 1.0 1.0 1.018 Municipal Assistant 2.0 2.0 2.018 Secretary to Dir. of Budget & Efficiency 1.0 1.0 1.016 Management Trainee 1.0 1.0 1.016 Sr. Service Representative 2.0 1.0 1.016 Sr. Service Representative Bilingual 1.0 1.0 1.012 Service Representative 11.0 11.0 11.012 Service Representative Bilingual 4.0 3.0 3.0
7 Clerk III with Typing 1.0 1.0 1.0
EMPLOYEE YEARSFull Time 35.5 35.5 12.5 23.0Overtime 2.0 0.6 0.1 0.5Part Time, Temporary, Seasonal 6.2 4.6 0.0 4.6Less: Vacancy Allowance 0.0 0.0 0.0 0.0 Total 43.7 40.7 12.6 28.1

4–18 ADMINISTRATION HUMAN RESOURCE MANAGEMENT
Mission Statement To support the City of Rochester’s One City Vision Statement and its Values and Guiding Principles by supporting its customers in the achievement of recruiting, developing and retaining people with the proper competencies; creating a diverse, empowered, and motivated work environment; providing human resource consultancy, support and services; supporting a work climate that encourages and recognizes high performing work groups and individual performance; helping leaders create an environment where expectations are clear, documented, and communicated and where feedback is provided. Organization
Vital Customers External: Job applicants Internal: City of Rochester employees and retirees; City of Rochester departments
Critical Processes Maintain central personnel records and information requests from New York State Retirement
System, mortgage institutions, and other organizations Provide qualified employees through the administration of Civil Service exams and other
recruitment methods Administer collective bargaining agreements with City employee unions Support and assist departments in meeting their human resource needs and goals Develop and administer human resource policies and procedures Coordinate Employee Recognition Program Administer competitive compensation and benefits program Provide workforce development through training
2009-10 Fiscal Goals & Objectives Objective Priorities Supported Projected
Completion
Implement Phase II of the Pay for Performance Program
Customer Service First Quarter
Administration
Civil Service Labor Relations
Staffing ServicesBenefits
Administration
Training

ADMINISTRATION 4–19 HUMAN RESOURCE MANAGEMENT
Objective Priorities Supported Projected Completion
Continue to work with Information Technology to design and implement a new payroll/personnel system as part of the Enterprise Resource Planning System
Customer Service On-Going
Administer Fire Fighter Exam Public Safety Fourth Quarter
Negotiate Outstanding Collective Bargaining Agreements
Customer Service Ongoing
Continue City-wide comprehensive training program
Customer Service Ongoing
Continue process of supporting departmental reorganizations
Customer Service Ongoing
Key Performance Indicators Actual
2007-08Estimated
2008-09 Budget
2008-09Budget
2009-10
Affirmative Action Consultations held 60 65 65 65
Affirmative Action Investigations conducted 7 7 10 10
ADA accommodations processed 3 4 4 4
New Hires - % females 25 37 40 40
New Hires - % minority 36 37 38 38
Employees - % females 27 27 28 28
Employees - % minority 29 30 30 30
Employee Turnover 200 225 170 200
Provisional Positions at end of fiscal year 102 138
90 138
Provisionals added 87 116 75 100
Provisionals removed 52 70 60 70
Eligible lists established 120 98 90 90
Employment applications received - # 8,806 10,000 9,700 11,500
Employment applications received electronically (%)
56 65 60 68
Number of Full Time positions hired, promoted, transferred
390 400 400 350
Number of Non-Full Time positions hired, promoted, transferred
652 600 600 700
Grievances filed 68 50 100 60
Open Grievances, per 100 unionized employees
4.5 5.0 5.0 5.0
Grievances resolved pre-arbitration (%) 72 86 86 86
Personal injury accidents 315 280 290 311

4–20 ADMINISTRATION HUMAN RESOURCE MANAGEMENT
Actual2007-08
Estimated2008-09
Budget 2008-09
Budget2009-10
Personal injury accidents judged PESH recordable (%)
60 68 60 51
Non-uniformed motor vehicle accidents-Preventable
53 50 34 46
Non-uniformed motor vehicle accidents-Non-Preventable
52 60 49 55
Motor vehicle accidents judged preventable (%) 50 45 41 46
Training hours per employee N/A 20 N/A 25
Year-To-Year Comparison
2008-09 2009-10 ChangeBudget 2,465,100 2,536,700 71,600Employee Years 39.0 36.7 -2.3 Change Detail Salary & Wage General Vacancy
Adjustment Inflation Chargebacks Allowance Miscellaneous Major Change Total30,700 16,200 0 34,000 -5,100 -4,200 71,600
Major Change Three full time positions are eliminated as an efficiency measure -112,500
Funds are added for the administration of Firefighter Exam 74,000
A full time position is added to help coordinate departmental staffing concerns associated with the transition to a new Enterprise Resource Planning System
67,600
One time allocation for background checks for Police candidates decrease offset by a revamped hiring process initiative
-54,600
Funding is provided to extend recruitment efforts supporting policies and initiatives 30,000
Fees for state exams decrease -6,500
Travel and training reduces due to budget constraints -5,400
Funds are added for printing 4,800
Funding for cellular communications is eliminated as an efficiency measure -1,600
Program Change The Civil Service unit will administer a Fire Fighter Exam in the Spring of 2010. Professional services fees for Police background checks decreases as the Bureau of Human Resources seeks to revamp the entire hiring process. The Human Resources function for the Department of Recreation and Youth Services consolidates within the current staffing and funding levels.

ADMINISTRATION 4–21 HUMAN RESOURCE MANAGEMENT
EXPENDITURE SUMMARY
Actual Estimated Amended Approved2007-08 2008-09 2008-09 2009-10
Appropriation by Major Object Personnel Expenses 1,926,137 2,043,000 2,029,500 2,049,200 Materials & Supplies 13,500 16,800 18,900 18,400 Services 183,845 215,000 416,700 469,100 Other 0 0 0 0
Total 2,123,482 2,274,800 2,465,100 2,536,700
Appropriation by ActivityAdministration 682,801 748,200 908,800 856,200 Civil Service 494,361 475,700 510,800 589,600 Labor Relations 296,369 328,400 351,900 342,500 Staffing Services 208,033 227,600 230,900 243,900 Benefits Administration 225,132 202,800 196,400 188,500 Training 216,786 292,100 266,300 316,000
Total 2,123,482 2,274,800 2,465,100 2,536,700
Employee Years by ActivityAdministration 10.1 10.2 10.2 9.0 Civil Service 9.3 9.3 9.3 9.2 Labor Relations 3.9 3.5 3.5 3.5 Staffing Services 6.9 7.0 7.0 7.0 Benefits Administration 4.9 5.0 5.0 3.0 Training 3.0 4.0 4.0 5.0
Total 38.1 39.0 39.0 36.7

4–22 ADMINISTRATION HUMAN RESOURCE MANAGEMENT
PERSONNEL SUMMARY
FULL TIME POSITIONS Adm
inis
trat
ion
Civ
il S
ervi
ce
Labo
r R
elat
ions
Sta
ffing
S
ervi
ces
Ben
efits
A
dmin
istr
atio
n
Tra
inin
g &
S
afet
y U
nit
Budget ApprovedBr. Title 2008-09 2009-1036 Director of Human Resource Management 1 1 132 Assistant Director of Human Resource
Management1 0
32 Deputy Director of Human Resource Management 0 1 132 Manager of Labor Relations 1 1 126 Human Resource Coordinator 1 1 126 Labor Relations Specialist 1 1 126 Training & Safety Coordinator 1 1 125 Employee Safety Coordinator 1 1 124 Affirmative Action Officer 1 1 124 Senior Administrative Analyst 2 2 224 Senior Human Resource Consultant 3 4 1 1 1 121 Human Resource Consultant II 2 1 121 Human Resource Consultant II Bilingual 0 1 120 Senior Personnel Analyst 1 1 118 Human Resource Consultant I 3 3 1 218 Secretary to Director of Human Resource
Management1 1 1
16 Human Resource Assistant 2 2 1 114 Senior Human Resource Associate 1 012 Human Resource Associate 2 2 2
9 Clerk II with Typing 4 3 1 1 19 Clerk II with Typing Bilingual 1 1 17 Clerk III with Typing 6 5 1 1 2 1
EMPLOYEE YEARSFull Time 36.0 34.0 9.0 7.0 3.0 7.0 3.0 5.0Overtime 0.7 0.7 0.0 0.7 0.0 0.0 0.0 0.0Part Time, Temporary, Seasonal 2.3 2.0 0.0 1.5 0.5 0.0 0.0 0.0Less: Vacancy Allowance 0.0 0.0 0.0 0.0 0.0 0.0 0.0 0.0 Total 39.0 36.7 9.0 9.2 3.5 7.0 3.0 5.0

ADMINISTRATION 4–23 COMMUNICATIONS
Mission Statement Communications: To support the City of Rochester’s One City Vision and its Values and Guiding Principles and achieve the City Administration’s goals and objectives by providing information to the public about the City utilizing multiple communications platforms. Special Events: To support the City of Rochester’s One City Vision Statement and its Values and Guiding Principles by producing and supporting a diverse array of cultural programming designed to enhance a strong sense of community, attracting residents and visitors to downtown Rochester and promoting downtown as a safe and vibrant destination of choice for entertainment and the arts. Vital Customers Communications: Internal: City of Rochester departments External: The general public, specific target audiences and a variety of organizations
Special Events: Internal: City of Rochester departments External: People of all ages residing in or visiting the Greater Rochester Area, event sponsors,
community members who organize festivals, parades, special events, block parties and races, and professional producers of large events and concerts
Critical Processes Communications: Employs varied processes in delivery of information, graphics, photo, video and web services, as
well as in the provision of Freedom of Information Law services Provides marketing, communications and media relations planning and consultation
Special Events: Conceives, designs, plans logistics for, promotes, and produces events Processes permits and work orders for all events Develops corporate and community partners and sponsors for events Assists community members in the planning process of their events Contracts with and administers contracts with promoters to produce events Coordinates services of various City departments for events

4–24 ADMINISTRATION COMMUNICATIONS
2009-10 Fiscal Goals & Objectives Objective Priorities Supported Projected
Completion
Collaborate with City departments to develop new ways to produce public relations materials
Customer Service Ongoing
Drive phased improvements to City Web site
Customer Service Ongoing
Implement CRM system in Mayor’s Office and Communications
Customer Service Neighborhood & Business Development Education Public Safety
Ongoing
Implement 175th Anniversary plan to include community involvement
Customer Service Neighborhood & Business Development Education Public Safety
Ongoing
Conduct Customer Satisfaction Surveys Customer Service Neighborhood & Business Development Education Public Safety
Ongoing
Plan and deliver positive experiences to event attendees
Customer Service Neighborhood & Business Development Education Public Safety
Ongoing
Increase attendance and quality of cultural events downtown and city wide
Customer Service Neighborhood & Business Development Education Public Safety
Ongoing
Increase cash and in-kind sponsorship for City events
Customer Service Ongoing

ADMINISTRATION 4–25 COMMUNICATIONS
Key Performance Indicators Actual
2007-08Estimated
2008-09 Budget
2008-09Budget
2009-10
Communications:
Advertising/marketing/promotions projects 766 1,022 850 1,150
Photography/AV productions ** 700 N/A 700
Television/video program productions ** 500 N/A 500
Web site pages ** 300 N/A 300
Major promotional campaigns produced 31 33 35 40
FOIL applications processed 2,519 2,800 2,800 2,800
News releases written and distributed 567 545 550 550
News conferences conducted 142 150 150 150
Speeches and talking points prepared 426 376 300 300
Proclamations issued 133 100 80 100
Keys to the City issued 31 27 N/A 30
Photo/video training hours ** 30 N/A 30
Web site training hours ** 30 N/A 75
CRM training hours ** 60 N/A 160
Graphics training hours ** 20 N/A 30
Special Events:
Permit applications 432 465 455 480
Laser shows 46 36 40 46
Coordinated major events with City sponsorship
50 55 45 45
Total City-produced special events 32 34 33 37
Total professional services agreements 110 120 121 120
Attendance at City-produced concerts and events
155,000 165,000 162,000 162,000
In-kind services for City-produced events ($) 115,000 130,000 112,000 75,000
N/A - Not Applicable ** - Not Available

4–26 ADMINISTRATION COMMUNICATIONS
Year-To-Year Comparison
2008-09 2009-10 ChangeBudget 2,119,600 2,901,400 781,800Employee Years 13.7 18.1 4.4 Change Detail Salary & Wage General Vacancy
Adjustment Inflation Chargebacks Allowance Miscellaneous Major Change Total0 1,200 1,400 0 -400 779,600 781,800
Major Change
As proposed by the Mayor: As
Remaining Special Events and High Falls laser show funding transfers from Department of Recreation & Youth Services
1,040,300
Funding for MusicFest increases as part of Rochester's 175th Anniversary 75,000
Productivity enhancements -59,300
Police overtime for special events decreased as an efficiency measure -57,000
City ownership of laser modules instead of renting reduces expense -54,200
Support of Jazz Festival 2010 reduced due to budget constraints -27,000
Funding for printing and advertising reduced due to budget constraints -27,000
WDKX promotion contract ends -25,000
Cornhill Landing Concert series reduced from 6 events to 5 and funding reduces further based on actual expense
-22,000
Funding is added for rental of generators for temporary festival site and increased cost of sound, light, and staging of events
21,800
Funding for Rochester's 175th Anniversary Celebration ends -20,000
Funding for Ribbin' on the River eliminated due to budget constraints -20,000
Revised staff plan results in personnel expense savings as an efficiency measure -15,100
Support for Taste of Rochester is added 10,000
Party in the Park expense increases due to increased sponsorship 10,000
Funding for Firewater concept development eliminated -10,000
One time funding for Manhattan Square grand re-opening complete -7,500
Support for the RPO concert series reduced as an efficiency measure -7,000
Professional fees reduced due to budget constraints -5,000
Clarissa Street Reunion one time grant is complete -5,000
Support for the Puerto Rican Festival reduces due to budget constraints -5,000
Funding for Liberty Pole Lighting reduced due to budget constraints -5,000
Miscellaneous services expense decreases -4,700
Funding is added for two summer youth positions 2,600

ADMINISTRATION 4–27 COMMUNICATIONS
Major Change
Funding for training and meetings reduces due to budget constraints -2,600
Funding for High Falls Film Festival reduced due to budget constraints -2,000
Motor equipment chargeback reduces -1,500
Funding for office and miscellaneous supplies reduced due to budget constraints -1,200
As amended by City Council:
Funds are transferred from Contingency for North Winton Village Arts Festival and 3,000
Program Changes Communications assumes maintenance and oversight of the City web site. Special Events and responsibility for the High Falls laser shows transfer to the Communications Bureau from the Department of Recreation and Youth Services.

4–28 ADMINISTRATION COMMUNICATIONS
EXPENDITURE SUMMARY
Actual Estimated Amended Approved2007-08 2008-09 2008-09 2009-10
Appropriation by Major ObjectPersonnel Expenses 808,274 957,200 1,041,300 1,211,300 Materials & Supplies 9,603 16,800 16,800 19,800 Services 164,608 1,070,900 1,061,500 1,670,300 Other 0 0 0 0
Total 982,485 2,044,900 2,119,600 2,901,400
Appropriation by ActivityCommunications 982,485 2,044,900 2,119,600 2,901,400
Employee Years by ActivityCommunications 13.6 13.9 13.7 18.1

ADMINISTRATION 4–29 COMMUNICATIONS PERSONNEL SUMMARY
FULL TIME POSITIONS
Budget ApprovedBr. Title 2008-09 2009-1036 Director, Communications 1 132 Deputy Director of Communications 1 128 Communications Creative Coordinator 1 128 Director of Cultural Affairs 0 127 Assistant to Director - Communications 1 125 Communications Producer 1 125 Communications Relationship Analyst 0 125 New Media Editor 0 125 Outreach Coordinator 1 025 Web Content Writer/Editor 1 022 Special Events Coordinator 0 121 Photographer I 1 221 Sr. Graphic Designer 1 118 Communications Assistant 0 118 Graphic Designer 1 118 Secretary to Director - Communications 1 118 Senior Television Technician 1 018 Special Events Program Assistant Bilingual 0 116 Communications Aide 1 1
EMPLOYEE YEARSFull Time 13.0 17.0Overtime 0.0 1.0Part Time, Temporary, Seasonal 0.7 0.1Less: Vacancy Allowance 0.0 0.0 Total 13.7 18.1

4–30 ADMINISTRATION LAW DEPARTMENT
Mission Statement To support the City of Rochester’s One Vision Statement and its Values and Guiding Principles by contributing to make Rochester the best mid-size city in the United States. We provide cost effective services at the highest professional level to meet all of the City’s legal needs through its priorities of public safety, education, economic development and customer service.
2009-10 Fiscal Goals & Objectives Objective Priorities Supported Projected
Completion
Complete review and implement revised Entertainment and ABC licensed establishment Regulations
Public Safety First Quarter
Develop Legal Services model to serve newNeighborhood & Business Development Department
Customer Service Organizational Effectiveness
Third Quarter
Progress Midtown project including site planning, PAETEC, City and State development agreement, asbestos remediation and existing structure demolition
Neighborhood & Business Development Ongoing
Key Performance Indicators Actual
2007-08Estimated
2008-09Budget
2008-09 Budget
2009-10
Claims filed against City 409 375 350 375
Real estate closings 828 800 900 800
Contracts drafted 230 240 175 200
Quality-of-life and nuisance abatement inquiries, cases, contests & reviews
347 300 200 250
Year-To-Year Comparison
2008-09 2009-10 ChangeBudget 1,991,300 1,867,000 -124,300Employee Years 23.5 21.4 -2.1

ADMINISTRATION 4–31 LAW DEPARTMENT
Change Detail Salary & Wage General Vacancy
Adjustment Inflation Chargebacks Allowance Miscellaneous Major Change Total3,500 10,300 -6,700 0 0 -131,400 -124,300
Major Change Transfer funding for a position to Mayor’s Office -80,000
Eliminate one filled full time position as an efficiency measure due to tax lien sale -44,400
Reduce part time hours as an efficiency measure -7,000

4–32 ADMINISTRATION LAW DEPARTMENT
EXPENDITURE SUMMARY
Actual Estimated Amended Approved2007-08 2008-09 2008-09 2009-10
Appropriation by Major ObjectPersonnel Expenses 1,697,403 1,793,800 1,789,900 1,662,000 Materials & Supplies 43,035 32,900 32,900 36,600 Services 219,675 143,500 168,500 168,400 Other 0 0 0 0
Total 1,960,113 1,970,200 1,991,300 1,867,000
Appropriation by ActivityLegal Services 1,960,113 1,970,200 1,991,300 1,867,000
Employee Years by ActivityLegal Services 23.7 23.6 23.5 21.4

ADMINISTRATION 4–33 LAW DEPARTMENT
PERSONNEL SUMMARY
FULL TIME POSITIONS
Budget ApprovedBr. Title 2008-09 2009-1036 Corporation Counsel 1 134 Municipal Attorney IV 1 132 Municipal Attorney III 8 829 Municipal Attorney II 3 328 Manager of Contract Services 1 020 Assistant to Corporation Counsel 1 120 Legal Assistant./Claims Investigator 1 120 Legal Assistant./Real Estate 3 211 Senior Legal Secretary 3 3
9 Legal Secretary 1 1
EMPLOYEE YEARSFull Time 23.0 21.0Overtime 0.0 0.0Part Time, Temporary, Seasonal 0.5 0.4Less: Vacancy Allowance 0.0 0.0 Total 23.5 21.4

INFORMATION TECHNOLOGY DEPARTMENT 5–1
Mission Statement To support the City of Rochester’s One City Vision Statement and its Values and Guiding Principles through the delivery of information technology solutions and services to our customers which enables them to realize their strategies and objectives.
Administration & Compliance
Services
Public Safety Relationship
Public Services Relationship
Technical Infrastructure

5–2 INFORMATION TECHNOLOGY DEPARTMENT
Vital Customers Internal: City of Rochester Departments All who use public facing systems, such as the City’s web site and e-government process
Critical Processes Manage Enterprise Computing Security Manage Employee Computing Assets Manage Enterprise Systems Availability Manage Enterprise Systems Planning & Delivery Manage Contingency / Disaster Recovery Planning & Delivery
2009-10 Fiscal Goals & Objectives Objective Priorities Supported Projected
Completion
Administration & Compliance Services:
Establish Disaster Recovery for Mainframe Legacy Applications
Customer Service First Quarter
Develop comprehensive electronic file transfer to external customers
Customer Service Fourth Quarter
Business Process Re-engineering Complete Business Process Mapping
Customer Service Fourth Quarter
Public Safety Relationship:
Partner with Fire Department to deploy the Red NMX property inspection module
Public Safety First Quarter
Implement the Automatic Vehicle Locator System for RPD
Public Safety Second Quarter
Public Services Relationship:
Initiate Web Revitalization Project Phase III Customer Service First Quarter
Complete Phase III of 311 Project Automation of Environmental Services
Customer Service
Fourth Quarter
Technical Infrastructure Management:
AD/Exchange Project Implement City Wide Outlook Mail
Customer Service Second Quarter
Implement Integrated Document Management System for Code Violation Bureau
Customer Service Fourth Quarter
Develop Information Technology policies and procedures
Customer Service Fourth Quarter

INFORMATION TECHNOLOGY DEPARTMENT 5–3
Year-To-Year Comparison Budget Budget Percent
Bureau 2008-09 2009-10 Change ChangeAdministration & Compliance Services 1,181,300 1,284,800 103,500 8.8%Public Safety Relationship 510,500 543,800 33,300 6.5%Public Services Relationship 1,036,800 815,300 -221,500 -21.4%Technical Infrastructure Management 2,187,100 2,344,400 157,300 7.2%
Total 4,915,700 4,988,300 72,600 1.5%Less: Intrafund Credit 679,300 679,600 300 0.0%
Total 4,236,400 4,308,700 72,300 1.7%
Employee Years 43.6 47.6 4.0 9.2% Change Detail
Salary & Wage General VacancyAdjustment Inflation Chargebacks Allowance Miscellaneous Major Change Total
6,200 9,500 600 0 35,100 20,900 72,300 Major Change Four Process Developer positions are added to provide succession planning and drive future organizational efficiencies
197,200
One time savings in maintenance cost due to postponement of software purchase -155,200
Disaster Recovery programs implemented for mainframe and non mainframe 127,000
Infrastructure Manager position eliminated due to budget constraints -102,300
Expanded use of IT Interns 56,600
Personnel restructuring results in savings -47,300
One Application Analyst position converts to IT Transition Analyst results in savings -23,400
Productivity improvements -17,400
One time Records Management Grants complete -14,300
Funding added during the current year for a position to support the video surveillance system 0

5–4 INFORMATION TECHNOLOGY DEPARTMENT
Telephone Chargebacks Department/Bureau 2008-09 2009-10 Department/Bureau 2008-09 2009-10CITY COUNCIL & CLERK 10,000 10,500 ECONOMIC DEVELOPMENT Administration 8,400 0ADMINISTRATION Municipal Parking 2,500 0 Mayor’s Office 21,700 16,900 Total 10,900 Neighborhood Serv. Centers 49,800 0 Management & Budget 18,900 18,400 ENVIRONMENTAL SERVICES Human Resource Mgt. 18,500 18,000 Commissioner 6,800 6,300 Communications 9,600 11,800 Engineering 28,900 27,900 Law 9,900 10,000 Operations & Parks 58,600 61,100Total 128,400 75,100 Water 34,100 33,800 Total 128,400 129,100INFORMATION TECHNOLOGY 34,800 35,800 POLICE 218,700 217,600FINANCE Director's Office 2,200 2,400 FIRE 67,800 68,800 Accounting 7,800 7,500 Treasury 10,500 10,500 RECREATION & YOUTH SERVICES Assessment 8,700 8,400 Commissioner 5,900 9,300 Parking & Mun.Viol. 8,400 12,600 Recreation 27,900 29,200 Purchasing 4,600 4,200 Special Services 7,100 6,900Total 42,200 45,600 Youth Services 10,500 10,800 Total 51,400 56,200NEIGHBORHOOD AND BUSINESS DEVELOPMENT
0 96,300
COMMUNITY DEVELOPMENT Commissioner 4,000 0 Total Interfund 55,100 55,400 Buildings & Zoning 15,900 0 Total Intrafund 679,300 679,600 Housing & Project Dev. 13,800 0 CITY TOTAL 734,400 735,000 Planning 8,100 0 Total 41,800 0

INFORMATION TECHNOLOGY DEPARTMENT 5–5 EXPENDITURE SUMMARY
Actual Estimated Amended Approved2007-08 2008-09 2008-09 2009-10
Appropriation by Major ObjectPersonnel Expenses 3,229,664 2,903,200 3,022,600 3,152,300 Materials & Supplies 44,108 41,800 98,100 101,100 Services 1,506,700 1,747,300 1,795,000 1,734,900 Other 0 0 0 0
Total 4,780,472 4,692,300 4,915,700 4,988,300 Less Intrafund Credit* 662,100 679,300 679,300 679,600
Total 4,118,372 4,013,000 4,236,400 4,308,700
Appropriation by ActivityAdministration & Compliance Services 0 1,129,100 1,181,300 1,284,800 Public Safety Relationship 0 501,200 510,500 543,800 Public Services Relationship 0 957,000 1,036,800 815,300 Chief Information Officer 206,430 0 0 0 Relationship Management 719,263 0 0 0 Application Management 881,924 0 0 0 Technical Infrastructure 2,512,106 2,105,000 2,187,100 2,344,400 Compliance & Information Services 460,749 0 0 0
Total 4,780,472 4,692,300 4,915,700 4,988,300 Less Intrafund Credit* 662,100 679,300 679,300 679,600
Total 4,118,372 4,013,000 4,236,400 4,308,700
Employee Years by ActivityAdministration & Compliance Services 0.0 14.0 17.0 18.0 Public Safety Relationship 0.0 6.0 5.0 6.0 Public Services Relationship 0.0 11.0 11.0 10.0 Chief Information Officer 2.0 0.0 0.0 0.0 Relationship Management 11.0 0.0 0.0 0.0 Application Management 15.0 0.0 0.0 0.0 Technical Infrastructure 15.0 12.6 10.6 13.6 Compliance & Information Services 11.0 0.0 0.0 0.0
Total 54.0 43.6 43.6 47.6
*Reflects chargeback for telephone service.

5–6 INFORMATION TECHNOLOGY DEPARTMENT PERSONNEL SUMMARY
FULL TIME POSITIONS
Adm
in. &
C
ompl
ianc
e S
ervi
ces
Pub
lic S
afet
y R
elat
ions
hip
Pub
lic
Ser
vice
s R
elat
ions
hip
Tec
hnic
al
Infr
astr
uctu
re
Man
agem
ent
Budget ApprovedBr. Title 2008-09 2009-1036 Chief Information Officer 1 1 134 IT Infrastructure Manager 1 0 31 IT Compliance & Info. Services Manager 1 1 131 IT Relationship Manager 3 3 1 1 130 Information Engineer 0 1 1 30 Senior Network Analyst 1 1 130 Senior Server Analyst 1 1 129 Computer Systems Analyst 1 1 129 Database Administrator 1 0 29 Senior Application Analyst 0 2 1 127 Application Analyst 5 3 1 1 127 Application Engineer 1 0 27 Server Analyst 2 2 225 IT Transitions Analyst 0 1 1 25 Senior Application Developer 6 9 2 3 425 Senior Client Support Analyst 3 2 225 Webmaster 1 1 124 Records Management Coordinator 0 1 123 Client Support Analyst 0 3 323 Process Developer 0 4 3 123 Senior Computer Programmer 1 0 22 Asst. Records Mgmt. Coordinator 1 0 20 Computer Programmer 3 1 119 Senior IT Call Center Analyst 2 2 218 Secretary to CIO 1 1 112 Computer Operator 3 3 3
7 Data Entry Clerk 2 2 2
TotalEMPLOYEE YEARSFull Time 41.0 46.0 18.0 6.0 10.0 12.0Overtime 0.0 0.0 0.0 0.0 0.0 0.0Part Time, Temporary, Seasonal 2.6 1.6 0.0 0.0 0.0 1.6Less: Vacancy Allowance 0.0 0.0 0.0 0.0 0.0 0.0
Total 43.6 47.6 18.0 6.0 10.0 13.6

DEPARTMENT OF FINANCE 6–1
Mission Statement To support the City of Rochester’s One City Vision Statement and its Values and Guiding Principles by managing the City's financial affairs. We collect revenues, manage and invest cash, manage City debt, and control financial processing. Our responsibilities are to manage payroll, purchasing, and assessment operations; maintain financial records and reports; and enforce financial policies and standards.
Director's Office
Accounting Treasury
Assessment Parking & Municipal Violations
Purchasing

6-2 DEPARTMENT OF FINANCE
Highlights of the Department's 2009-10 Fiscal Goals & Objectives are presented below. Additional information for each bureau is included in the sections that follow.
Highlights Priorities Supported Projected Completion
Director:
Execute Bond Sale Customer Service First Quarter
Accounting:
Prepare REDCO Report Customer Service Third Quarter
Initiate Business Process Re-engineering Customer Service Fourth Quarter
Treasury:
Complete of tax lien sale Customer Service Second Quarter
Year-To-Year Comparison
Budget Budget PercentBureau 2008-09 2009-10 Change ChangeDirector's Office 531,100 458,500 -72,600 -13.7%Accounting 961,900 944,500 -17,400 -1.8%Treasury 1,905,200 1,746,600 -158,600 -8.3%Assessment 1,017,300 900,300 -117,000 -11.5%Parking & Municipal Violations 868,800 2,618,400 1,749,600 201.4%Purchasing 911,400 977,100 65,700 7.2%
Total 6,195,700 7,645,400 1,449,700 23.4% Less: Intrafund Credit 762,400 678,600 -83,800 -11.0%
Total 5,433,300 6,966,800 1,533,500 28.2%
Employee Years 94.4 107.0 12.6 13.3% Change Detail Salary & Wage General Vacancy
Adjustment Inflation Chargebacks Allowance Miscellaneous Major Change Total1,800 1,700 155,800 -99,200 -5,100 1,478,500 1,533,500
Major Change Highlights Transfer Parking Management function (garages & lots) from the Department of Economic Development
1,047,500
Transfer Parking Monitor function from the Rochester Police Department 378,200
Transfer Parking Meter function from the Department of Environmental Services 164,000
Tax Lien sale reduces postage expense -100,000
Director of Parking Management funded to enhance customer service and drive future efficiencies
84,700

DEPARTMENT OF FINANCE 6–3 EXPENDITURE SUMMARY
Actual Estimated Amended Approved2007-08 2008-09 2008-09 2009-10
Appropriation by Major ObjectPersonnel Expenses 4,461,473 4,622,300 4,627,300 5,257,500 Materials & Supplies 142,337 109,300 118,100 123,400 Services 1,246,641 1,260,100 1,450,300 2,264,500 Other 0 0 0 0
Total 5,850,451 5,991,700 6,195,700 7,645,400 Less: Intrafund Credit* 638,500 762,400 762,400 678,600
Total 5,211,951 5,229,300 5,433,300 6,966,800
Appropriation by ActivityDirector's Office 478,235 523,200 531,100 458,500 Accounting 884,832 946,700 961,900 944,500 Treasury 1,672,600 1,760,400 1,905,200 1,746,600 Assessment 1,159,592 1,001,900 1,017,300 900,300 Parking & Municipal Violations 754,432 851,400 868,800 2,618,400 Purchasing 900,760 908,100 911,400 977,100
Total 5,850,451 5,991,700 6,195,700 7,645,400 Less: Intrafund Credit* 638,500 762,400 762,400 678,600
Total 5,211,951 5,229,300 5,433,300 6,966,800
Employee Years by ActivityDirector's Office 5.2 5.2 5.2 3.6 Accounting 17.6 16.6 17.6 16.5 Treasury 23.8 23.8 23.8 22.1 Assessment 18.7 18.5 18.7 16.1 Parking & Municipal Violations 16.0 16.0 16.0 35.0 Purchasing 13.1 13.1 13.1 13.7
Total 94.4 93.2 94.4 107.0
*Reflects chargeback for postage and duplicating.

6–4 DEPARTMENT OF FINANCE DIRECTOR’S OFFICE
Mission Statement To support the City of Rochester’s One City Vision Statement and its Values and Guiding Principles by issuing and monitoring the City’s public debt and risk management. Vital Customers External: City of Rochester Contractors, City of Rochester Vendors Internal: City of Rochester Departments
Critical Processes Issue debt in compliance with State and SEC regulations and City Policy Provide central planning, programming, and development services to the bureaus of the
Department. 2009-10 Fiscal Goals & Objectives Objective Priorities Supported Projected
Completion
Execute Bond Sale Customer Service Fourth Quarter
Complete RFP for Deferred Compensation Plan Customer Service Second Quarter
Key Performance Indicators Actual
2007-08Estimated
2008-09Budget
2008-09 Budget
2009-10
Total Entity General Obligation Debt ($000) 360,636 372,337 372,336 390,572
Year-To-Year Comparison
2008-09 2009-10 Change Budget 531,100 458,500 -72,600Employee Years 5.2 3.6 -1.6 Change Detail Salary & Wage General Vacancy
Adjustment Inflation Chargebacks Allowance Miscellaneous Major Change Total0 500 -1,700 -20,000 -12,800 -38,600 -72,600

DEPARTMENT OF FINANCE 6–5 DIRECTOR’S OFFICE
Major Change
Transfer of Contract Administrator and Wage and Hour Investigator positions to Purchasing Bureau to promote efficiencies
-116,900
Additional outside Support for bond and note sales 50,000
Addition of on call support position to provide succession planning and drive future organizational efficiencies
35,000
Productivity improvements results in savings -9,100
Accounting title more appropriately aligned with current marketplace to assist in recruitment and retention of current and future candidates
2,400

6–6 DEPARTMENT OF FINANCE DIRECTOR’S OFFICE
EXPENDITURE SUMMARY
Actual Estimated Amended Approved2007-08 2008-09 2008-09 2009-10
Appropriation by Major ObjectPersonnel Expenses 330,534 347,100 345,900 234,400 Materials & Supplies 1,423 3,000 2,000 2,000 Services 146,278 173,100 183,200 222,100 Other 0 0 0 0
Total 478,235 523,200 531,100 458,500
Appropriation by ActivityDirector's Office 478,235 523,200 531,100 458,500
Employee Years by ActivityDirector's Office 5.2 5.2 5.2 3.6

DEPARTMENT OF FINANCE 6–7 DIRECTOR’S OFFICE
PERSONNEL SUMMARY
FULL TIME POSITIONS
Budget ApprovedBr. Title 2008-09 2009-1036 Director of Finance 1 124 Contract Administrator 1 020 Assistant to Director 1 117 Accountant 0 116 Wage & Hour Investigator 1 015 Accountant 1 0
EMPLOYEE YEARSFull Time 5.0 3.0Overtime 0.2 0.0Part Time, Temporary, Seasonal 0.0 0.6Less: Vacancy Allowance 0.0 0.0Total 5.2 3.6

6–8 DEPARTMENT OF FINANCE ACCOUNTING
Mission Statement To support the City of Rochester’s One City Vision Statement and its Values and Guiding Principles through the provision of reliable, timely and useful financial information and services that assures accountability to the public and provides support for decision making. Organization
Vital Customers External: City of Rochester citizens, City vendors, Grantors, Investment community Internal: City of Rochester Departments, City Council
Critical Processes Auditing and processing payrolls Auditing and processing vouchers Recording all financial transactions Producing financial reports Issuing paychecks to each employee and certain pensioners Maintaining general ledger and subsidiary records Reviewing grant budgets and monitors loan programs
2009-10 Fiscal Goals & Objectives Objective Priorities Supported Projected
Completion
Prepare Comprehensive Annual Financial Report for 2008-09 in accordance with national accounting standards for the public sector
Customer Service Second Quarter
Prepare REDCO Report Customer Service Third Quarter
Initiate Business Process Re-engineering Customer Service Fourth Quarter
Administration
Accounting Services
Accounts Payable/Data
InputPayroll Grant
Accounting

DEPARTMENT OF FINANCE 6–9 ACCOUNTING
Key Performance Indicators Actual
2007-08Estimated
2008-09 Budget
2008-09Budget
2009-10
Federal and New York State grants 167 150 130 150
Residential property improvement loans serviced
285 260 300 235
Economic Development loans serviced 108 115 110 115
In lieu of tax agreements 114 116 108 120
Year-To-Year Comparison
2008-09 2009-10 Change Budget 961,900 944,500 -17,400Employee Years 17.6 16.5 -1.1 Change Detail Salary & Wage General Vacancy
Adjustment Inflation Chargebacks Allowance Miscellaneous Major Change Total-800 0 -300 -800 0 -15,500 -17,400
Major Change Reduction in temporary and contract services results in savings -23,700
Accounting title more appropriately aligned with current marketplace to assist in recruitment and retention of current and future candidates
12,600
A clerical position is converted to On Call to promote efficiency -12,000
Part time Programmer Analyst converts to full time Assistant Payroll Systems to support Business Process Re-engineering
7,600

6–10 DEPARTMENT OF FINANCE ACCOUNTING
EXPENDITURE SUMMARY
Actual Estimated Amended Approved2007-08 2008-09 2008-09 2009-10
Appropriation by Major ObjectPersonnel Expenses 857,466 909,800 922,900 911,300 Materials & Supplies 3,344 4,400 4,800 4,800 Services 24,022 32,500 34,200 28,400 Other 0 0 0 0
Total 884,832 946,700 961,900 944,500
Appropriation by ActivityAdministration 194,548 221,900 237,500 227,800 Accounting Services 95,507 98,700 97,500 99,900 Accounts Payable/Data Input 91,164 78,800 144,900 131,300 Payroll 223,235 276,200 222,300 227,400 Grant Accounting 280,378 271,100 259,700 258,100
Total 884,832 946,700 961,900 944,500
Employee Years by ActivityAdministration 2.5 2.5 2.5 2.1 Accounting Services 2.0 2.0 2.0 2.0 Accounts Payable/Data Input 4.1 4.1 4.1 3.4 Payroll 4.0 4.0 4.0 4.0 Grant Accounting 5.0 4.0 5.0 5.0
Total 17.6 16.6 17.6 16.5

DEPARTMENT OF FINANCE 6–11 ACCOUNTING
PERSONNEL SUMMARY
FULL TIME POSITIONS Adm
inis
trat
ion
Acc
ount
ing
Ser
vice
s
Acc
ount
s P
ayab
le/D
ata
Inpu
t
Pay
roll
Gra
nt
Acc
ount
ing
Budget ApprovedBr. Title 2008-09 2009-1033 Director, Accounting 1 1 128 Assistant Director, Accounting 1 1 127 Payroll Systems Supervisor 1 1 126 Assistant Payroll Systems Supervisor 0 1 126 Principal Finance Officer 1 1 124 Associate Accountant 1 2 1 120 Senior Accountant 3 2 1 118 Payroll Auditor 1 1 117 Accountant 0 3 1 217 Payroll Technician 1 0 15 Accountant 3 0 15 Principal Account Clerk 1 1 1
9 Clerk II 1 1 19 Clerk II with Typing 2 1 1
EMPLOYEE YEARSFull Time 17.0 16.0 2.0 2.0 3.0 4.0 5.0Overtime 0.1 0.0 0.1 0.0 0.4 0.0 0.0Part Time, Temporary, Seasonal 0.5 0.5 0.0 0.0 0.0 0.0 0.0Less: Vacancy Allowance 0.0 0.0 0.0 0.0 0.0 0.0 0.0 Total 17.6 16.5 2.1 2.0 3.4 4.0 5.0

6–12 DEPARTMENT OF FINANCE TREASURY
Mission Statement To support the City of Rochester’s One City Vision Statement and its Values and Guiding Principles through the provision of quality customer service to the taxpayers of Rochester by safeguarding liquidity and yield as it relates to investment, collection and disbursement of taxpayer dollars while upholding the highest ethical standards. Organization
Vital Customers External: City of Rochester Taxpayers, City of Rochester Vendors Internal: City of Rochester Departments
Critical Processes Skilled, highly motivated, cross-trained employees manage specialized receivable, disbursement,
and investment systems. Use of reliable Information Systems (Tax receivable, ARLM, FIS, Insight). Adherence to Statutory regulations. Clear and consistent policy guidance. Invest City and City School District funds to generate interest income Maintain the City's cash ledger Process all interdepartmental and outgoing mail from City facilities
2009-10 Fiscal Goals & Objectives Objective Priorities Supported Projected
Completion
Complete tax lien sale Customer Service Second Quarter
Program Change Due to the Tax Lien sales fewer mass foreclosure mailings, direct calls to delinquent taxpayers, processing tax agreements, auctioning of property, creditor notification and owner letters, and title searches will occur. Tax collection rates and amounts will increase as a result of the Lien Sale. Key Performance Indicators
Administration
Cash Control Tax Accounting Mail & Messenger Service

DEPARTMENT OF FINANCE 6–13 TREASURY
Actual2007-08
Estimated 2008-09
Budget2008-09
Budget2009-10
Average daily cash ledger balance ($000) 353,600 340,000 312,400 346,800
Average daily invested cash bank balance ($000)
352,400 338,300 311,700 345,100
Average investment rate (%) 3.71 1.28 2.0 0.25
Tax accounts 62,858 63,000 63,005 63,000
Delinquent tax accounts 10,594 10,500 10,200 10,200
Foreclosure notices mailed 2,587 2,639 3,200 100
Percent of adjusted property tax balances collected – Current (%)
92.3 93.0 92.5 93.0
Percent of adjusted property tax balances collected – Delinquent (%)
43.5 61.7 48.1 52.3
Tax information 43,335 38,000 36,129 41,800
City initiated foreclosures 193 72 200 100
Properties redeemed before foreclosure 1,544 1,281 2,100 10
Year-To-Year Comparison
2008-09 2009-10 Change Budget 1,370,100 1,308,200 -61,900Employee Years 23.8 22.1 -1.7 Change Detail Salary & Wage General Vacancy
Adjustment Inflation Chargebacks Allowance Miscellaneous Major Change Total600 800 96,900 0 1,200 -161,400 -61,900
Major Change Tax Lien sale reduces postage expense -100,000
Eliminate vacant Resource Collector position as an efficiency due to Tax Lien sale -30,800
Advertising reduced as an efficiency measure due to Tax Lien sale -20,300
Reduction in operating expense as an efficiency due to Tax Lien sale -13,000
Accounting titles more appropriately aligned with current marketplace to assist in recruitment and retention of qualified individuals
9,000
Staff restructuring results in savings -6,300

6–14 DEPARTMENT OF FINANCE TREASURY
Postage Chargebacks Department/Bureau 2008-09 2009-10 Department/Bureau 2008-09 2009-10
CITY COUNCIL & CLERK
21,600 18,400 ECONOMIC DEVELOPMENT
Administration 9,100 0
ADMINISTRATION Municipal Parking 200 0
Mayor’s Office 7,500 4,800 Total 9,300 0
Neighborhood Serv. Centers
31,400 0
Management & Budget 2,300 1,200 ENVIRONMENTAL SERVICES
Human Resource Mgt. 22,700 26,500 Commissioner 20,800 1,000
Communications 21,800 5,600 Engineering 6,000 6,200
Law 13,300 7,100 Operations & Parks 7,800 7,100
Total 99,000 45,200 Water 120,200 122,000
Total 154,800 136,300
INFORMATION TECHNOLOGY
400 300
EMERGENCY COMMUNICATIONS
6,400 6,000
FINANCE
Director's Office 2,900 1,000 POLICE 79,800 62,800
Accounting 7,400 6,600
Treasury 88,900 89,100 FIRE 2,200 1,500
Assessment 35,500 21,100
Parking & Mun.Viol. 85,400 80,300 RECREATION & YOUTH SERVICES
Purchasing 13,900 13,100 Commissioner 3,900 900
Total 234,000 211,200 Recreation 13,200 11,000
Special Services 7,200 800
Neighborhood & Economic Dev.
0 73,100 Youth Services 4,200 2,700
Total 28,500 15,400
COMMUNITY DEVELOPMENT
Commissioner 4,100 0 Total Interfund 137,200 131,800
Buildings & Zoning 17,900 0 Total Intrafund 535,100 438,400
Housing & Project Dev.
13,600 0 CITY TOTAL 672,300 570,200
Planning 700 0
Total 36,300 0

DEPARTMENT OF FINANCE 6–15 TREASURY
EXPENDITURE SUMMARY
Actual Estimated Amended Approved2007-08 2008-09 2008-09 2009-10
Appropriation by Major ObjectPersonnel Expenses 1,027,283 1,068,200 1,081,000 1,054,700 Materials & Supplies 40,093 34,000 44,400 34,000 Services 605,224 658,200 779,800 657,900 Other 0 0 0 0
Total 1,672,600 1,760,400 1,905,200 1,746,600 Less: Intrafund Credit* 410,000 535,100 535,100 438,400
Total 1,262,600 1,225,300 1,370,100 1,308,200
Appropriation by ActivityAdministration 615,027 621,300 690,400 662,700 Cash Control 200,249 235,000 230,300 227,400 Tax Accounting 317,807 335,200 312,200 286,400 Mail and Messenger Service 539,517 568,900 672,300 570,100
Total 1,672,600 1,760,400 1,905,200 1,746,600 Less: Intrafund Credit* 410,000 535,100 535,100 438,400
Total 1,262,600 1,225,300 1,370,100 1,308,200
Employee Years by ActivityAdministration 7.1 7.1 7.1 7.0 Cash Control 6.5 6.5 6.5 6.1 Tax Accounting 8.1 8.1 8.1 7.0 Mail and Messenger Service 2.1 2.1 2.1 2.0
Total 23.8 23.8 23.8 22.1
*Reflects chargeback for postage

6–16 DEPARTMENT OF FINANCE TREASURY
PERSONNEL SUMMARY
FULL TIME POSITIONS Adm
inis
trat
ion
Cas
h C
ontr
ol
Tax
A
ccou
ntin
g
Mai
l &
Mes
seng
er
Ser
vice
Budget ApprovedBr. Title 2008-09 2009-1033 City Treasurer 1 1 130 Deputy Treasurer 1 1 124 Sr. Administrative Analyst 2 2 220 Senior Accountant 2 2 1 118 Head Cashier 1 1 117 Accountant 0 1 116 Administrative Assistant 1 1 115 Accountant 1 0 15 Principal Account Clerk 1 1 114 Junior Accountant 0 2 214 Mailroom Coordinator 1 1 114 Senior Resource Collector 1 1 113 Senior Cashier 0 1 113 Senior Cashier Bilingual 1 0 12 Junior Accountant 2 0 12 Resource Collector 2 1 1
9 Clerk II with Typing 2 2 27 Clerk III with Typing 2 2 26 Interdept. Messenger 1 1 15 Account Clerk 1 1 1
EMPLOYEE YEARSFull Time 23.0 22.0 7.0 6.0 7.0 2.0Overtime 0.8 0.3 0.0 0.2 0.1 0.0Part Time, Temporary, Seasonal 0.1 0.2 0.1 0.0 0.0 0.1Less: Vacancy Allowance 0.1 0.4 0.1 0.1 0.1 0.1 Total 23.8 22.1 7.0 6.1 7.0 2.0

DEPARTMENT OF FINANCE 6–17 ASSESSMENT
Mission Statement To support the City of Rochester’s One City Vision Statement and its Values and Guiding Principles by continually improving the accuracy and equity of the annual assessment roll used for the levy of City, School and County real property taxes; to increase the understanding of the assessment process; and to treat all owners fairly. Organization
Vital Customers External: Rochester property owners, legal and real estate professionals, business entities, World
Wide Web users Internal: City of Rochester Departments
Critical Processes Locate, identify, inventory, and record all real property Estimate every parcel’s full market value Defend proper values and correct errors Incorporate strategic technology to increase the long-term effectiveness and quality of community
service Process applications, complaints, and appeals to the Board of Assessment Review.
2009-10 Fiscal Goals & Objectives Objective Priorities Supported Projected
Completion
Comprehensive review of tax exempt properties
Customer Service Third Quarter
Key Performance Indicators Actual
2007-08Estimated
2008-09 Budget
2008-09Budget
2009-10
Reviews performed:
● Sales 756 1,250 3,500 3,500
● Inspection of building permits 4,569 4,600 6,000 6,000
● Exemptions (new and renewal) 12,967 13,000 14,000 14,000
Administration
Records Appraisal

6–18 DEPARTMENT OF FINANCE ASSESSMENT
Year-To-Year Comparison 2008-09 2009-10 Change
Budget 1,017,300 900,300 -117,000Employee Years 18.7 16.1 -2.6 Change Detail Salary & Wage General Vacancy
Adjustment Inflation Chargebacks Allowance Miscellaneous Major Change Total-1,700 0 -13,500 -33,400 500 -68,900 -117,000
Major Change Eliminate one secretary position as an efficiency measure -38,500
Eliminate one part time appraiser as an efficiency measure -21,600
Reduction in overtime drives efficiencies -6,000
Reduction in miscellaneous expenses as an efficiency measure -2,800

DEPARTMENT OF FINANCE 6–19 ASSESSMENT
EXPENDITURE SUMMARY
Actual Estimated Amended Approved2007-08 2008-09 2008-09 2009-10
Appropriation by Major ObjectPersonnel Expenses 1,014,049 941,100 950,300 849,300 Materials & Supplies 8,904 3,200 3,200 3,200 Services 136,639 57,600 63,800 47,800 Other 0 0 0 0
Total 1,159,592 1,001,900 1,017,300 900,300
Appropriation by ActivityAdministration 361,812 290,200 293,200 204,100 Records 238,756 168,600 171,700 169,400 Appraisal 559,024 543,100 552,400 526,800
Total 1,159,592 1,001,900 1,017,300 900,300
Employee Years by ActivityAdministration 3.1 3.1 3.1 2.0 Records 5.5 5.5 5.5 5.1 Appraisal 10.1 9.9 10.1 9.0
Total 18.7 18.5 18.7 16.1

6–20 DEPARTMENT OF FINANCE ASSESSMENT
PERSONNEL SUMMARY
FULL TIME POSITIONS Adm
inis
trat
ion
Rec
ords
App
rais
al
Budget ApprovedBr. Title 2008-09 2009-1033 Assessor 1 1 128 Deputy City Assessor 1 1 127 Commercial Appraiser 1 1 127 Supervising Real Property Appraiser 1 1 120 Real Property Appraiser 7 7 711 Clerk I 1 1 111 Secretary 1 0
7 Clerk III with Typing 3 3 3
EMPLOYEE YEARSFull Time 16.0 15.0 2.0 4.0 9.0Overtime 1.4 0.2 0.0 0.2 0.0Part Time, Temporary, Seasonal 1.3 0.9 0.0 0.9 0.0Less: Vacancy Allowance 0.0 0.0 0.0 0.0 0.0 Total 18.7 16.1 2.0 5.1 9.0

DEPARTMENT OF FINANCE 6–21 PARKING & MUNICIPAL VIOLATIONS
Mission Statement To support the City of Rochester’s One City Vision Statement and its Values and Guiding Principles by fairly adjudicating and respectfully collecting fines for Parking & Municipal tickets issued in the City of Rochester. Organization
Vital Customers External: Registered vehicle owners, City of Rochester property owners, Violators of Chapter 13A
of the City of Rochester Code, and all those who currently or potentially could live, visit, or do business in the City of Rochester and park.
Critical Processes Hearings at Parking & Municipal Violations Receipt of ticket payment by mail, internet, phone, in person Referral of unpaid housing tickets to property tax bills Referral of unpaid parking or municipal tickets to collection agencies Monitor contracts and revenue collection for City owned garages and surface lots Enforce on-street parking compliance Maintain and install on-street parking meters Perform meter revenue collection on a daily basis
2009-10 Fiscal Goals & Objectives Objective Priorities Supported Projected
Completion
Implement the most effective and cost efficient parking model for the City of Rochester
Customer Service Second Quarter
Administration
Parking & Municipal Violations Adjudication&
Enforcement
Parking Administrative Services
Meter Operations & Enforcement

6–22 DEPARTMENT OF FINANCE PARKING & MUNICIPAL VIOLATIONS
Key Performance Indicators Actual
2007-08Estimated
2008-09Budget
2008-09 Budget
2009-10
Tickets issued:
● Parking 112,159 95,000 102,663 98,500
● Dog code violations 1,912 1,950 2,000 2,050
● Housing and Municipal Code 4,570 4,100 6,000 6,100
Year-To-Year Comparison
2008-09 2009-10 Change Budget 868,800 2,618,400 1,749,600Employee Years 16.0 35.0 19.0 Change Detail Salary & Wage General Vacancy
Adjustment Inflation Chargebacks Allowance Miscellaneous Major Change Total500 400 88,500 -45,000 4,700 1,700,500 1,749,600
Major Change Transfer Parking Management from the Department of Economic Development 1,047,500
Transfer Parking Monitor function from the Rochester Police Department 378,200
Transfer Parking Meter function from the Department of Environmental Services 164,000
Director of Parking Management funded to enhance customer service and drive future efficiencies
84,700
A Municipal Assistant is added to supervise Meter & Enforcement Operations 45,200
Additional Management efficiencies are anticipated during the year -44,500
A clerical position is eliminated and an analytical position is added to enhance data driven decisions
25,400
Program Change The Administrative Services activity transfers from the Department of Economics Development. The Meter Operations and Enforcement activity transfers from the Department of Environment Services and the Rochester Police Department. Administrative Services coordinates the City’s On-and-Street Parking program. This includes monitoring contracts for the operation of city-owned and surface lots, capital expenditure planning and monitoring of revenue collection. This activity also oversees contractual operation of the East End garage on behalf of the Cultural Center Commission. Meter Operation and enforcement maintains the City’s on-street parking meters, installs new meters, and performs meter revenue collection on a daily basis. This activity also enforces on-street parking compliance by issuing parking tickets.

DEPARTMENT OF FINANCE 6–23 PARKING & MUNICIPAL VIOLATIONS
EXPENDITURE SUMMARY
Actual Estimated Amended Approved2007-08 2008-09 2008-09 2009-10
Appropriation by Major Object Personnel Expenses 586,476 697,000 664,100 1,477,400 Materials & Supplies 10,826 10,000 10,000 24,700 Services 157,130 144,400 194,700 1,116,300 Other 0 0 0 0
Total 754,432 851,400 868,800 2,618,400
Appropriation by ActivityAdministration 319,390 448,600 344,000 102,800 Parking/Municipal Violations Adjud. & Enforcement 435,042 402,800 524,800 723,500 Parking Administrative Services 0 0 0 1,226,800 Meter Operations/Parking Enforcement 0 0 0 565,300
Total 754,432 851,400 868,800 2,618,400
Employee Years by ActivityAdministration 3.3 3.3 3.3 1.7 Parking/Municipal Violations Adjud. & Enforcement 12.7 12.7 12.7 14.1 Parking Administrative Services 0.0 0.0 0.0 5.1 Meter Operations/Parking Enforcement 0.0 0.0 0.0 14.1
Total 16.0 16.0 16.0 35.0

6–24 DEPARTMENT OF FINANCE PARKING & MUNICIPAL VIOLATIONS
PERSONNEL SUMMARY
FULL TIME POSITIONS Adm
inis
trat
ion
PM
VB
Adj
ud.
&
Enf
orce
men
t
Par
king
A
dmin
istr
ativ
e S
ervi
ces
Met
er
Ops
/Par
king
E
nfor
cem
ent
Budget ApprovedBr. Title 2008-09 2009-1033 Director, Parking Management 0 1 131 Director, Adjudication & Enforcement 0 1 126 Asst. Director, Parking Violations 1 1 123 Municipal Parking Compliance Auditor 0 1 120 Administrative Analyst 0 1 120 Executive Assistant 1 1 118 Municipal Assistant 0 1 114 Parking Compliance Monitor 0 1 111 Secretary 1 1 110 Parking Meter Mechanic 0 1 110 Parking Monitor 0 9 9
9 Clerk II 1 1 19 Clerk II with Typing 0 1 0.5 0.57 Clerk III 7 6 67 Clerk III Bilingual 1 1 17 Clerk III with Typing 0 1 15 Account Clerk 1 1 13 Clerk Typist 1 0
EMPLOYEE YEARSFull Time 14.0 30.0 1.5 13.0 4.5 11.0Overtime 0.0 0.5 0.0 0.0 0.1 0.4Part Time, Temporary, Seasonal 2.1 4.5 0.2 1.1 0.5 2.7Less: Vacancy Allowance 0.1 0.0 0.0 0.0 0.0 0.0 Total 16.0 35.0 1.7 14.1 5.1 14.1

DEPARTMENT OF FINANCE 6–25 PURCHASING
Mission Statement To support the City of Rochester’s One City Vision Statement and its Values and Guiding Principles by obtaining products and services required by City of Rochester agencies at the best price while ensuring adherence to N.Y. State General Municipal Law and City Council Ordinances and regulations governing public purchasing. Organization
Vital Customers External: Vendors providing goods and services, Public works contractors Internal: City of Rochester Departments
Critical Processes Oversees fair and open bidding process to ensure compliance and award to low bidder Contract maintenance Auctioning of surplus equipment Issuance of purchase orders and call numbers Training department and bureau purchasing liaisons in purchasing law and practices General audit and review of encumbered funds Gather and monitor information from public contractors Gather information from vendors Liaison between vendors/contractors of City of Rochester Departments/Bureaus Review and approval of Minority and Women Business Enterprises Utilization plans Liaison between prime contractors and M/WBE subcontractors for City of Rochester projects Provide copying services to City Hall
Key Performance Indicators Actual
2007-08Estimated
2008-09 Budget
2008-09Budget
2009-10
Contracts awarded:
● Construction ($000) 27,460 26,790 28,030 38,570
● Construction M/WBE ($000) 2,368 2,464 3,392 3,587
● Supplies/services 610 700 700 600
Money recovered from sale of surplus property ($)
292,375 384,000 125,000 350,000
Purchase order turnaround time (days) 9.89 7.32 15.0 8.6
Purchasing
Duplicating Services

6–26 DEPARTMENT OF FINANCE PURCHASING
Year-To-Year Comparison
2008-09 2009-10 Change Budget 684,100 736,900 52,800Employee Years 13.1 13.7 0.6 Change Detail Salary & Wage General Vacancy
Adjustment Inflation Chargebacks Allowance Miscellaneous Major Change Total3,200 0 -14,100 0 1,300 62,400 52,800
Major Change Transfer of Contract Administrator and Wage and Hour Investigator positions from Director’s Office to promote efficiencies
116,900
Modify Purchaser staffing as an efficiency measure -23,500
Clerical efficiencies -29,100
Productivity improvements results in savings -1,900

DEPARTMENT OF FINANCE 6–27 PURCHASING
Duplicating Chargebacks Department/Bureau
2008-09 2009-10 Department/Bureau 2008-09 2009-10
CITY COUNCIL & CLERK
7,500 7,500 ECONOMIC DEVELOPMENT 9,800 0
ADMINISTRATION ENVIRONMENTAL SERVICES
Mayor’s Office 17,300 17,900 Commissioner 2,000 2,100
Neighborhood Serv. Centers
20,500 0 Engineering 13,900 14,100
Management & Budget 14,700 15,400 Operations & Parks 2,900 2,900
Human Resource Mgt. 24,500 25,200 Water 900 1,000
Communications 5,000 7,200 Total 19,700 19,000
Law 5,800 5,800
Total 87,800 71,500 EMERGENCY COMMUNICATIONS
2,000 2,000
INFORMATION TECHNOLOGY
600 600 RECREATION & YOUTH SERVICES
Commissioner 10,500 10,800
FINANCE Recreation 24,100 27,000
Director's Office 1,400 1,400 Youth Services 16,300 18,900
Accounting 2,500 2,500 Total 50,900 56,700
Treasury 4,500 4,500
Assessment 2,800 3,100
PMCVB 0 2,400
Purchasing 5,600 5,700 Total Interfund 3,900 4,400
Total 16,800 19,600 Total Intrafund 227,300 240,200
CITY TOTAL 231,200 244,600
Neighborhood & Business Dev.
0 66,600
COMMUNITY DEVELOPMENT
Commissioner 7,500 0
Buildings & Zoning 10,900 0
Housing & Project Dev 7,400 0
Planning 10,300 0
Total 36,100 0

6–28 DEPARTMENT OF FINANCE PURCHASING
EXPENDITURE SUMMARY
Actual Estimated Amended Approved2007-08 2008-09 2008-09 2009-10
Appropriation by Major ObjectPersonnel Expenses 645,665 659,100 663,100 730,400 Materials & Supplies 77,747 54,700 53,700 54,700 Services 177,348 194,300 194,600 192,000 Other 0 0 0 0
Total 900,760 908,100 911,400 977,100 Less: Intrafund Credit* 228,500 227,300 227,300 240,200
Total 672,260 680,800 684,100 736,900
Appropriation by ActivityPurchasing 655,452 668,400 680,200 744,100 Duplicating Services 245,308 239,700 231,200 233,000
Total 900,760 908,100 911,400 977,100 Less: Intrafund Credit* 228,500 227,300 227,300 240,200
Total 672,260 680,800 684,100 736,900
Employee Years by ActivityPurchasing 12.1 12.1 12.1 12.6 Duplicating Services 1.0 1.0 1.0 1.1
Total 13.1 13.1 13.1 13.7
*Reflects chargeback for duplicating

DEPARTMENT OF FINANCE 6–29 PURCHASING
PERSONNEL SUMMARY
FULL TIME POSITIONS
Pur
chas
ing
Dup
licat
ing
Ser
vice
s
Budget ApprovedBr. Title 2008-09 2009-1033 Purchasing Agent 1 1 124 Contract Administrator 0 1 124 Minority & Women Business Enterprise Officer 1 1 119 Purchaser 6 5 516 Wage & Hour Investigator 0 1 114 Coordinator Duplicating & Supplies 1 1 111 Secretary 1 1 110 Purchasing Control Clerk 1 1 1
7 Clerk III with Typing 2 1 1
EMPLOYEE YEARSFull Time 13.0 13.0 12.0 1.0Overtime 0.1 0.1 0.0 0.1Part Time, Temporary, Seasonal 0.0 0.6 0.6 0.0Less: Vacancy Allowance 0.0 0.0 0.0 0.0 Total 13.1 13.7 12.6 1.1

DEPARTMENT OF NEIGHBORHOOD & BUSINESS DEVELOPMENT 7–1
Mission Statement To support the City of Rochester’s One City Vision Statement and its Values and Guiding Principles, the Department of Neighborhood and Business Development will work to provide high quality housing, successful businesses of all sizes, and safe and attractive neighborhoods to retain our current customers and attract new ones. We will use a team-oriented approach with our residents, investors, and community partners to solve problems, address quality of life concerns, support our businesses, and enhance our neighborhoods. Organization
Administration
Business & Housing
Development
Planning & Zoning
Neighborhood Preservation
Inspection & Compliance

7–2 DEPARTMENT OF NEIGHBORHOOD & BUSINESS DEVELOPMENT
Highlights of the Department's 2009-10 Fiscal Goals & Objectives are presented below. Additional information for each bureau is included in the sections that follow.
Highlights Priorities Supported Projected Completion
Commissioner:
Implement re-organization of DCD/EDD/NSC into the Department of Neighborhood and Business Development to improve customer service and maximize efficiency
Customer Service Neighborhood & Business Development
First Quarter
Establish a quadrant based team model Customer Service Neighborhood & Business Development
First Quarter
Business & Housing Development:
Begin implementation of Five Year Action Plans for Focused Investment Strategy in four neighborhoods to leverage private investment and increase tax base
Neighborhood & Business Development Second Quarter
Execute next phase priorities of a Housing Plan: Affordable Housing Plan, Emergency Shelter, Transitional and Permanent Housing Plan, Attracting Middle Market Households and Reducing Poverty Concentration Plan
Neighborhood & Business Development Third Quarter
Monitor construction of the ESL headquarters and garage and welcome 300+ employees into the building
Neighborhood & Business Development Fourth Quarter
Planning & Zoning:
Expand research, analysis, and GIS services
Customer Service Ongoing
Implement Case Management System to facilitate review of development projects
Customer Service, Neighborhood & Business Development
Ongoing
Manage and coordinate Census “Complete Count” effort
Neighborhood & Business Development Customer Service
Fourth Quarter
Neighborhood Preservation:
Coordinate and implement four high functioning quadrant teams, bringing City services closer to the customer
Customer Service, Public Safety, Neighborhood & Business Development
First Quarter

DEPARTMENT OF NEIGHBORHOOD & BUSINESS DEVELOPMENT 7–3
Implement neighborhood related programs and activities and assist in research, planning, promotion and execution of various neighborhood projects
Customer Service Public Safety
Second QuarterOngoing
Inspection & Compliance:
Add Saturday code enforcement coverage as a pilot
Customer Service Neighborhood & Business Development
First Quarter
Enhance voluntary compliance rate by developing clear code enforcement strategies for all situations
Customer Service, Public Safety Neighborhood & Business Development
Second Quarter
Implement newly adopted code legislation (Landlord Registry and Inspection Warrant)
Customer Service Second Quarter
Transition to a cross-functionally trained inspection staff
Customer Service Fourth Quarter
Year-To-Year Comparison
Budget Budget PercentBureau 2008-09 2009-10 Change ChangeCommissioner 0 1,161,900 1,161,900 N/ABusiness & Housing Development 0 5,929,200 5,929,200 N/APlanning & Zoning 0 1,863,600 1,863,600 N/ANeighborhood Preservation 0 1,436,200 1,436,200 N/AInspection & Compliance 0 3,525,500 3,525,500 N/A
Total 0 13,916,400 13,916,400 N/A
Employee Years 0.0 154.5 154.5 N/A Change Detail Salary & Wage General Vacancy
Adjustment Inflation Chargebacks Allowance Miscellaneous Major Change Total-8,300 71,700 21,400 47,800 19,500 13,764,300 13,916,400

7–4 DEPARTMENT OF NEIGHBORHOOD & BUSINESS DEVELOPMENT
Major Change Highlights As proposed by the Mayor:
Transfer in from former Department of Community Development 6,206,000
Transfer in from former Bureau of Neighborhood Service Centers 4,578,400
Staff reductions and adjustments due to re-organization and budget constraints -2,128,700
Transfer in from former Economic Development Department 1,680,500
Transfer of Rochester Riverside Convention Center from Department of Recreation and Youth Services
1,526,100
Staff additions due to re-organization 1,102,100
Transfer of Blue Cross Arena at War Memorial administration from Department of Recreation and Youth Services
834,500
As amended by City Council:
Funds are transferred from Contingency for Development of Regional Strategies for Arts Organizations; Refugee Sustainability Garden; Downtown Community Forum; Outreach for FIS in Beechwood; and, Community Gardens, Banners, Lighting, and Signage
17,000

DEPARTMENT OF NEIGHBORHOOD & BUSINESS DEVELOPMENT 7–5 EXPENDITURE SUMMARY
Actual Estimated Amended Approved2007-08 2008-09 2008-09 2009-10
Appropriation by Major ObjectPersonnel Expenses 0 0 0 9,309,700 Materials & Supplies 0 0 0 139,700 Services 0 0 0 4,392,500 Other 0 0 0 74,500
Total 0 0 0 13,916,400
Appropriation by ActivityCommissioner 0 0 0 1,161,900 Business & Housing Development 0 0 0 5,929,200 Planning & Zoning 0 0 0 1,863,600 Neighborhood Preservation 0 0 0 1,436,200 Inspection & Compliance 0 0 0 3,525,500
Total 0 0 0 13,916,400
Employee Years by ActivityCommissioner 0.0 0.0 0.0 11.2 Business & Housing Development 0.0 0.0 0.0 44.7 Planning & Zoning 0.0 0.0 0.0 25.0 Neighborhood Preservation 0.0 0.0 0.0 21.1 Inspection & Compliance 0.0 0.0 0.0 52.5
Total 0.0 0.0 0.0 154.5
NBD Resource Allocation - DollarsNBD Allocation 0 0 0 13,916,400 Police Department NBD Allocation 0 0 0 1,559,800
Total NBD Allocation 0 0 0 15,476,200
NBD Resource Allocation - Employee YearsNBD Allocation 0.0 0.0 0.0 154.5 Police Department NBD Allocation 0.0 0.0 0.0 24.4
Total NBD Allocation 0.0 0.0 0.0 178.9

7–6 DEPARTMENT OF NEIGHBORHOOD & BUSINESS DEVELOPMENT OFFICE OF THE COMMISSIONER
Mission Statement To support the City of Rochester’s One City Vision Statement and its Values and Guiding Principles, the NBD Office of the Commissioner and its Division of Administration and Finance will provide budget and personnel management services, grant compliance, contracting, and monitoring and management support for the operating bureaus within the department. Organization
Vital Customers Internal: City of Rochester departments, NBD staff External: Federal and State government, skilled trades
Critical Processes Prepare departmental operating and CIP budgets Provide budgetary and financial reporting functions Prepare grant applications, monitor grant budgets, and coordinate audit visits Coordinate performance management and measurement programs Administer purchasing activities, personnel, payroll / timesheets Ensure adherence to grant compliance requirements for federal formula grant programs Manage the federal disbursement and information system Prepare and monitor professional services, sub-recipient and beneficiary agreements Coordinate portfolio management Monitor and maintain database of affordable homeownership and rental units Monitor use of funds for business recipients that create or retain jobs Conduct private code enforcement billing Coordinate City Council agenda process for departmental items Coordinate departmental web content, Freedom of Information Act requests, Enterprise Resource
Planning Administer licensing of skilled trades and elevator certification program
Commissioner
Administration & Finance

DEPARTMENT OF NEIGHBORHOOD & BUSINESS DEVELOPMENT 7–7 OFFICE OF THE COMMISSIONER
2009-10 Fiscal Goals & Objectives Objective Priorities Supported Projected
Completion
Implement re-organization of DCD/EDD/NSC into the Department of Neighborhood and Business Development to improve customer service and maximize efficiency
Customer Service Neighborhood & Business Development
First Quarter
Establish a quadrant based team model Customer Service, Neighborhood & Business Development
First Quarter
Review and revise business process for contract preparation and monitoring
Customer Service First Quarter
Review and revise business process for federal disbursement transactions
Customer Service Second Quarter
Prepare Consolidated Community Development Plan
Neighborhood & Business Development Third Quarter
Key Performance Indicators Actual
2007-08Estimated
2008-09 Budget
2008-09Budget
2009-10
INTERNAL OPERATIONS
Number of audit findings N/A N/A N/A 0
% payroll transactions not requiring correction
N/A N/A N/A 99
CUSTOMER PERSPECTIVE
% payments processed within 5 days N/A N/A N/A 95
% contracts prepared within 30 days
N/A N/A N/A 95
FINANCIAL/COST
State & federal grants ($ millions) N/A N/A N/A 20
% expenditures vary from estimate
N/A N/A N/A 1
LEARNING AND INNOVATION
Technical assistance trainings N/A N/A N/A 4
Average # of training hours per employee N/A N/A N/A 25
N/A - Not Applicable

7–8 DEPARTMENT OF NEIGHBORHOOD & BUSINESS DEVELOPMENT OFFICE OF THE COMMISSIONER
Yar-To-Year Comparison 2008-09 2009-10 Change
Budget 0 1,161,900 1,161,900Employee Years 0.0 11.2 11.2 Change Detail Salary & Wage General Vacancy
Adjustment Inflation Chargebacks Allowance Miscellaneous Major Change Total7,100 10,000 5,400 0 -1,600 1,141,000 1,161,900
Major Change As proposed by the Mayor:
Transfer from former Department of Community Development 519,700
Transfer from former Economic Development Department 474,000
Staff reductions due to re-organization and budget constraints -162,500
Funding for enhanced customer service and other expenses associated with re-organization 100,000
Development and implementation of strategic initiatives such as Quadrant Teams 76,200
Add two full-time positions to improve grant compliance and contract monitoring 73,400
Transfer from former Bureau of Neighborhood Service Centers 50,000
Increase in printing costs for development of quarterly community NBD newsletter 3,600
Productivity improvements result in savings -900
As amended by City Council:
Funds are transferred from Contingency for Development of Regional Strategies for Arts Organizations and Downtown Community Forum
7,500

DEPARTMENT OF NEIGHBORHOOD & BUSINESS DEVELOPMENT 7–9 OFFICE OF THE COMMISSIONER
EXPENDITURE SUMMARY
Actual Estimated Amended Approved2007-08 2008-09 2008-09 2009-10
Appropriation by Major ObjectPersonnel Expenses 0 0 0 676,500 Materials & Supplies 0 0 0 14,500 Services 0 0 0 470,900 Other 0 0 0 0
Total 0 0 0 1,161,900
Appropriation by Activity Commissioner 0 0 0 735,000 Administration & Finance 0 0 0 426,900
0 0 0 1,161,900
Employee Years by ActivityCommissioner 0.0 0.0 0.0 2.5 Administration & Finance 0.0 0.0 0.0 8.7
0.0 0.0 0.0 11.2

7–10 DEPARTMENT OF NEIGHBORHOOD & BUSINESS DEVELOPMENT OFFICE OF THE COMMISSIONER
PERSONNEL SUMMARY
FULL TIME POSITIONS
Com
mis
sion
er
Adm
inis
trat
ion
&
Fin
ance
Budget ApprovedBr. Title 2008-09 2009-1036 Commissioner 0.0 1.0 1.029 Principal Staff Assistant 0.0 1.0 1.026 Associate Administrative Analyst 0.0 1.0 1.020 Executive Assistant 0.0 1.0 1.018 Secretary to Commissioner 0.0 1.0 1.012 Project Assistant 0.0 3.0 3.0
9 Clerk II 0.0 1.0 1.07 Clerk III 0.0 1.0 1.0
EMPLOYEE YEARSFull Time 0.0 10.0 2.0 8.0Overtime 0.0 0.2 0.0 0.2Part Time, Temporary, Seasonal 0.0 1.0 0.5 0.5Less: Vacancy Allowance 0.0 0.0 0.0 0.0 Total 0.0 11.2 2.5 8.7

DEPARTMENT OF NEIGHBORHOOD & BUSINESS DEVELOPMENT 7–11 BUSINESS & HOUSING DEVELOPMENT
Mission Statement To support the City of Rochester’s One City Vision Statement and its Values and Guiding Principles, the Bureau of Business & Housing Development will create economic opportunity for residents and businesses to enhance the growth of our city. This will be accomplished through real estate development, neighborhood revitalization, business attraction, housing production and rehabilitation, and workforce development. Organization
Vital Customers Internal: City of Rochester departments External: Commercial/retail businesses; industrial businesses; developers/investors; property
buyers/owners; neighborhood groups; business associations; local amateur and professional sports teams; patrons of live sports, entertainment, and cultural activities.
Critical Processes Promote development of small and middle markets Promote residential development Purchase and sell real estate Manage housing programs Manage demolition program Collect revenue from Blue Cross Arena events
Administration
Business Development Real Estate
Housing and Programs Project Development

7–12 DEPARTMENT OF NEIGHBORHOOD & BUSINESS DEVELOPMENT BUSINESS & HOUSING DEVELOPMENT
2009-10 Fiscal Goals & Objectives Objective Priorities Supported Projected
Completion
Encourage home ownership through expansion of HOME Rochester, Home Buyer Assistance, Employer Assisted Housing Initiative programs and implementation of Neighborhood Stabilization Program funds
Neighborhood & Business Development First Quarter
Begin implementation of Five Year Action Plans for Focused Investment Strategy in four neighborhoods to leverage private investment and increase tax base
Neighborhood & Business Development Second Quarter
Identify developers for the Culver Road Armory, Gregory Street, Josh Lofton and Main/Plymouth development sites to maximize the City's return
Neighborhood & Business Development Second Quarter
Monitor renovation and/or construction of remaining projects funded under Rounds 2 & 3 of the Restore NY Program
Neighborhood & Business Development Second Quarter
Complete transition of ESG and HOPWA programs to the Division of Housing and Programs by implementing a RFP process consistent with the new Housing Policy and the ten year plan to end homelessness
Neighborhood & Business Development Second Quarter
Plan for consolidation of all Real Estate Services into the Division of Real Estate to eliminate the dispersed purchase, sale, leasing and management efforts
Customer Service Second Quarter
Complete renovation of the Hamilton and begin development of mixed income housing at Erie Harbor in place of the demolished Riverpark Commons low-rise building
Neighborhood & Business Development Third Quarter
Complete sale of Block F, 420 East Main Street, for development of residential and commercial uses.
Neighborhood & Business Development Third Quarter
Complete asbestos abatement project at 88 Elm Street, an 80,000 square feet office building behind Midtown Plaza
Neighborhood & Business Development Third Quarter
Execute next phase priorities of a Housing Plan: Affordable Housing Plan, Emergency Shelter, Transitional and Permanent Housing Plan, Attracting Middle Market Households and Reducing Poverty Concentration Plan
Neighborhood & Business Development Third Quarter
Begin site preparations at Valley Court for development of market rate housing
Neighborhood & Business Development Third Quarter

DEPARTMENT OF NEIGHBORHOOD & BUSINESS DEVELOPMENT 7–13 BUSINESS & HOUSING DEVELOPMENT
Objective Priorities Supported Projected Completion
Implement City-sponsored business training program for Hispanic business owners
Neighborhood & Business Development; Customer Service
Third Quarter
Monitor construction of the ESL headquarters and garage and welcome 300+ employees into the building
Neighborhood & Business Development Fourth Quarter
Continue redevelopment process for 12 acre Photec site with goal of having site ready for development in 2010-2011
Neighborhood & Business Development Fourth Quarter
Continue efforts to complete development of 14621 Industrial Park
Neighborhood & Business Development Fourth Quarter
Continue to redevelop current vacant sites on Kodak land for industrial use
Neighborhood & Business Development Fourth Quarter
Key Performance Indicators Actual
2007-08Estimated
2008-09 Budget
2008-09Budget
2009-10
INTERNAL OPERATIONS
Count of industrial businesses in city (manufacturing & wholesale) 1,800 1,925 1,950 1,950
Count of commercial businesses in city (retail & service) 4,800 5,000 5,000 5,100
Jobs created (projected) 1,749 540 852 830
Jobs retained 13,127 3,800 3,406 3,350
Business Associations supported 23 23 24 23
Vacant residential properties reoccupied/rehabilitated 274 85 260 61
New homes sold 8 10 14 9
Rental units developed 70 189 206 129
Residential properties demolished 156 160 190 200
Demolitions by private owner 88 100 100 100
Demolitions by City contract 156 160 200 200
Surplus City property:
Structures 220 145 400 40
Vacant lots 2,300 2,350 2,300 2,500
Tax foreclosures (City & County) 314 90 325 50
Properties sold 216 110 100 50
HUD & private owner occupant program properties sold 59 67 75 70
CUSTOMER PERSPECTIVE
Minority/Women's Business Enterprise financial 47 51 66 70

7–14 DEPARTMENT OF NEIGHBORHOOD & BUSINESS DEVELOPMENT BUSINESS & HOUSING DEVELOPMENT
Actual2007-08
Estimated 2008-09
Budget 2008-09
Budget2009-10
applications approved
Lead Hazard Reduction Grants awarded 223 205 200 215
Home ownership opportunities created 105 119 118 127
Residential properties receiving City rehabilitation assistance 619 482 790 690
Vacant properties (1- and 2-unit residential properties) 2,320 2,329 2,330 2,329
Blue Cross Arena events 132 141 140 101
Blue Cross Arena attendance per event 3,579 3,245 3,845 3,942
Rochester Riverside Convention Center conventions/trade shows
24 28 35 30
RRCC public shows 11 11 12 11
RRCC total attendance 278,845 281,500 300,000 282,000
Emergency Shelter Grant beneficiaries 12,500 12,500 12,500 12,500
Housing for Persons with AIDS households 145 156 140 140
FINANCIAL/COSTS
Total business investment ($ millions) 76.7 163.4 111.6 113.7
Empire Zone total investment ($ millions) 112.8 35.0 35.0 35.0
Lead Hazard Reduction Grant value ($ millions) 4.1 3.7 4.0 3.9
Housing investment funds leveraged ($ millions) 33.2 146.2 127.8 93.0
Property sales revenue ($ thousands) 1,831 949 1,000 1,800
Property rental revenue ($ thousands) 82.9 74.9 80 75
Blue Cross Arena concessions revenue (City share, $ thousands)
123 178 201 152
LEARNING AND INNOVATION
Average # of training hours per employee N/A N/A N/A 25
N/A - Not Applicable
Year-To-Year
2008-09 2009-10 ChangeBudget 0 5,929,200 5,929,200
Employee Years 0.0 44.7 44.7 Change Detail Salary & Wage General Vacancy
Adjustment Inflation Chargebacks Allowance Miscellaneous Major Change Total
-800 10,800 19,500 7,500 0 5,892,200 5,929,200

DEPARTMENT OF NEIGHBORHOOD & BUSINESS DEVELOPMENT 7–15 BUSINESS & HOUSING DEVELOPMENT
Major Changes Transfer from former Department of Community Development 2,378,500
Transfer of Rochester Riverside Convention Center from Department of Recreation and Youth Services
1,526,100
Transfer from former Economic Development Department 1,206,500
Transfer of Blue Cross Arena at War Memorial administration from Department of Recreation and Youth Services
834,500
Staff reductions and adjustments due to re-organization and budget constraints -655,400
Add two Senior Housing Program Specialists to develop new housing and homeless programs 135,300
Transfer of inter-fund credit as result of Parking function re-organization 115,000
Add Manager of Small Market Development to enhance neighborhood commercial development 80,000
Add Municipal Facilities Coordinator 73,100
Add Senior Community Housing Planner, Bilingual to enhance Focused Investment Strategy initiative
58,300
Add Legal Assistant/Real Estate to improve scheduling and increase efficiency of economic development and real estate transactions
58,300
Add Property Rehabilitation Specialist to improve monitoring of rehabilitation projects 55,100
Add Sr. Economic Development Specialist to strengthen neighborhood commercial programs 51,200
Professional fees do not recur -29,100
Increase in mileage expenses 6,900
Reduction in miscellaneous communications expense -2,100

7–16 DEPARTMENT OF NEIGHBORHOOD & BUSINESS DEVELOPMENT BUSINESS & HOUSING DEVELOPMENT
Operating cost for the Convention Center is estimated as follows:
Budget BudgetOperating Revenues 2008-09 2009-10 Building & equipment rental 1,126,000 1,052,500 Food & beverage service 4,608,500 4,648,700 Convention packages 290,000 290,000 Building services/miscellaneous 953,000 817,500
Total Revenues 6,977,500 6,808,700
Operating Expenses Personnel & fringe benefits 4,490,400 4,525,300 Materials & supplies 170,300 167,200 Utilities 447,000 424,800 Maintenance of building & equipment 289,900 302,600 Security & contract labor 283,400 270,600 Food & supplies 1,052,600 1,057,900 Convention packages 290,000 290,000 Facility improvement allocation 307,000 120,000 Other contractual services 1,204,200 1,176,400
Total Expenses 8,534,800 8,334,800
Operating Loss: 1,557,300 1,526,100 Hotel/Motel Tax 795,000 795,000
City Subsidy 762,300 731,100

DEPARTMENT OF NEIGHBORHOOD & BUSINESS DEVELOPMENT 7–17 BUSINESS & HOUSING DEVELOPMENT
EXPENDITURE SUMMARY
Actual Estimated Amended Approved2007-08 2008-09 2008-09 2009-10
Appropriation by Major ObjectPersonnel Expenses 0 0 0 2,934,500 Materials & Supplies 0 0 0 19,500 Services 0 0 0 2,900,700 Other 0 0 0 74,500
Total 0 0 0 5,929,200
Appropriation by ActivityAdministration 0 0 0 247,500 Business and Housing Development 0 0 0 1,144,800 Real Estate 0 0 0 726,400 Housing 0 0 0 592,700 Project Development 0 0 0 842,500 Rochester Riverside Convention Center 0 0 0 1,526,100 Blue Cross Arena at the Rochester War Memorial 0 0 0 849,200
0 0 0 5,929,200
Employee Years by ActivityAdministration 0.0 0.0 0.0 3.0 Business and Housing Development 0.0 0.0 0.0 11.9 Real Estate 0.0 0.0 0.0 7.9 Housing 0.0 0.0 0.0 8.9 Project Development 0.0 0.0 0.0 13.0
0.0 0.0 0.0 44.7

7–18 DEPARTMENT OF NEIGHBORHOOD & BUSINESS DEVELOPMENT BUSINESS & HOUSING DEVELOPMENT
PERSONNEL SUMMARY
FULL TIME POSITIONS
Adm
inis
trat
ion
Bus
ines
s D
evel
opm
ent
Rea
l Est
ate
Hou
sing
Pro
ject
D
evel
opm
ent
Budget ApprovedBr. Title 2008-09 2009-1035 Director of Development Services 0.0 1.0 1.030 Director of Real Estate 0.0 1.0 1.030 Manager of Business Development 0.0 1.0 1.030 Manager of Downtown Development 0.0 1.0 1.029 Principal Staff Assistant 0.0 1.0 1.028 Manager of Housing 0.0 1.0 1.028 Manager of Small Market Development 0.0 1.0 1.026 Associate Administrative Analyst 0.0 1.0 1.026 Associate Real Estate Specialist 0.0 1.0 1.026 Credit Manager 0.0 1.0 1.026 Economic Development Project Manager 0.0 3.0 3.026 Municipal Facilities Coordinator 0.0 1.0 1.026 Sr. Marketing Specialist 0.0 1.0 1.026 Sr. Marketing Specialist Bilingual 0.0 1.0 1.024 Sr. Community Housing Planner 0.0 4.0 3.0 1.024 Sr. Community Housing Planner Bilingual 0.0 1.0 1.024 Sr. Economic Development Specialist 0.0 3.0 2.0 1.024 Sr. Housing Program Specialist 0.0 2.0 2.024 Sr. Property Rehabilitation Specialist 0.0 2.0 2.024 Sr. Real Estate Specialist 0.0 1.0 1.021 Property Rehabilitation Specialist 0.0 4.0 4.020 Community Housing Planner 0.0 1.0 1.020 Executive Assistant 0.0 1.0 1.020 Legal Assistant/Real Estate 0.0 1.0 1.020 Real Estate Specialist 0.0 1.0 1.020 Real Estate Specialist Bilingual 0.0 1.0 1.013 Administrative Secretary 0.0 1.0 1.012 Project Assistant 0.0 1.0 1.012 Project Assistant Bilingual 0.0 1.0 1.011 Secretary 0.0 1.0 1.0
9 Clerk II 0.0 1.0 1.09 Clerk II/Typing 0.0 1.0 1.0
EMPLOYEE YEARSFull Time 0.0 44.0 2.0 12.0 8.0 9.0 13.0Overtime 0.0 0.1 0.0 0.0 0.0 0.0 0.1Part Time, Temporary, Seasonal 0.0 1.0 1.0 0.0 0.0 0.0 0.0Less: Vacancy Allowance 0.0 0.4 0.0 0.1 0.1 0.1 0.1 Total 0.0 44.7 3.0 11.9 7.9 8.9 13.0
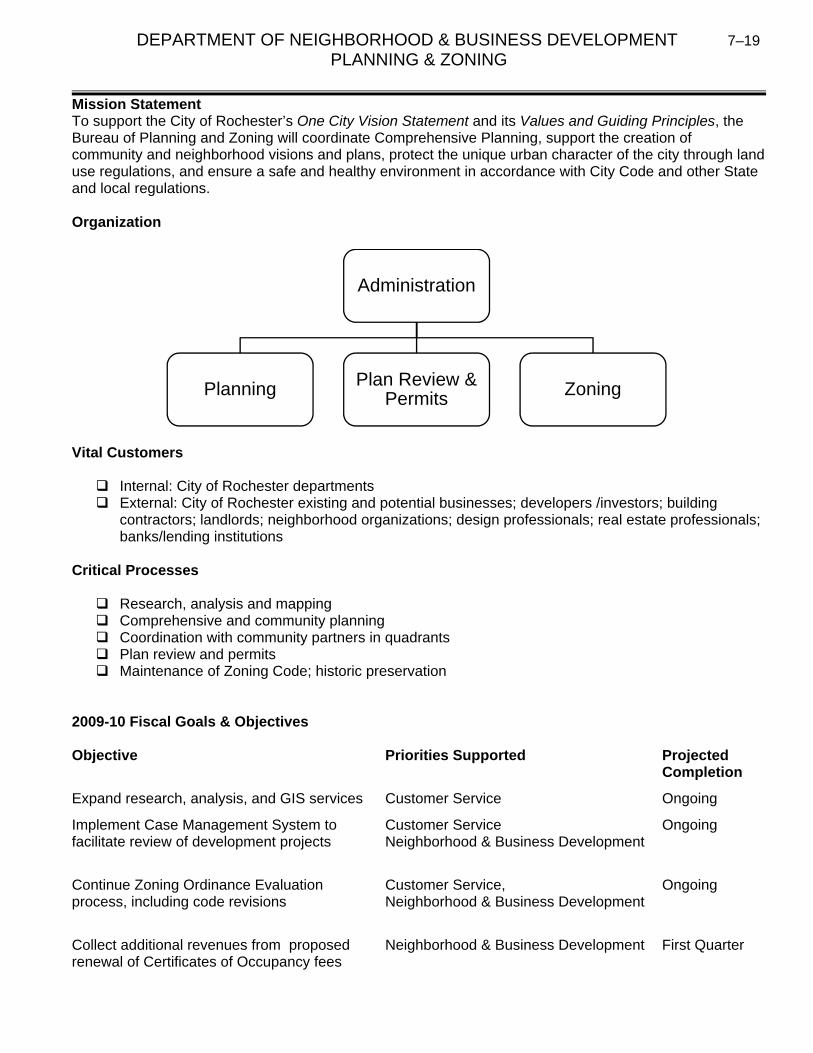
DEPARTMENT OF NEIGHBORHOOD & BUSINESS DEVELOPMENT 7–19 PLANNING & ZONING
Mission Statement To support the City of Rochester’s One City Vision Statement and its Values and Guiding Principles, the Bureau of Planning and Zoning will coordinate Comprehensive Planning, support the creation of community and neighborhood visions and plans, protect the unique urban character of the city through land use regulations, and ensure a safe and healthy environment in accordance with City Code and other State and local regulations. Organization
Vital Customers Internal: City of Rochester departments External: City of Rochester existing and potential businesses; developers /investors; building
contractors; landlords; neighborhood organizations; design professionals; real estate professionals; banks/lending institutions
Critical Processes Research, analysis and mapping Comprehensive and community planning Coordination with community partners in quadrants Plan review and permits Maintenance of Zoning Code; historic preservation
2009-10 Fiscal Goals & Objectives Objective Priorities Supported Projected
Completion
Expand research, analysis, and GIS services Customer Service Ongoing
Implement Case Management System to facilitate review of development projects
Customer Service Neighborhood & Business Development
Ongoing
Continue Zoning Ordinance Evaluation process, including code revisions
Customer Service, Neighborhood & Business Development
Ongoing
Collect additional revenues from proposed renewal of Certificates of Occupancy fees
Neighborhood & Business Development First Quarter
Administration
Planning Plan Review & Permits Zoning

7–20 DEPARTMENT OF NEIGHBORHOOD & BUSINESS DEVELOPMENT PLANNING & ZONING
Objective Priorities Supported Projected Completion
Collect additional revenues from proposed case management fee for non-compliant Notice & Order cases
Neighborhood & Business Development First Quarter
Complete evaluation of Zoning Ordinance and recommend applicable changes
Customer Service Neighborhood & Business Development
Second Quarter
Conduct Park Survey (50 yrs+ old) & prepare Preservation Plan
Customer Service
Third Quarter
Continue to streamline the approval process for new developments, including involvement of Planning, Zoning and Preservation Boards
Customer Service Neighborhood & Business Development
Third Quarter
Plan and implement the capability for on-line permitting
Customer Service Third Quarter
Manage and coordinate Census “Complete Count” effort
Customer Service Neighborhood & Business Development
Fourth Quarter
Conduct Center City Tourist/Visitor Circulation and Pedestrian Wayfinding Study
Customer Service Neighborhood & Business Development
Fourth Quarter
Conduct Rochester Bicycle Facilities Enhancement Plan
Customer Service Neighborhood & Business Development
Fourth Quarter
Key Performance Indicators Actual
2007-08Estimated
2008-09Budget
2008-09 Budget
2009-10
INTERNAL OPERATIONS
Data analysis requests 50 50 50 85
Mapping / data analysis requests 35 150 150 200
Design Reviews assisted 60 60 60 60
Specific Area Plans 4 4 4 10
Applications Reviewed by Zoning:
Business Permit/License 1,182 720 600 600
SEQR 150 150 150 150
Legal Use Reviews 950 1,000 250 250
Cert of Zoning Compliance reviewed 2,228 2,214 1,500 1,900
Planning Commission cases 140 151 90 130
Zoning Board of Appeals cases 78 83 100 80
Preservation Board cases 92 88 100 80
Project Review Committee meetings 20 20 30 30
Site Plan reviews 233 208 120 175
Admin Re-subdivision reviews 71 110 100 100

DEPARTMENT OF NEIGHBORHOOD & BUSINESS DEVELOPMENT 7–21 PLANNING & ZONING
Actual2007-08
Estimated 2008-09
Budget2008-09
Budget2009-10
Zoning N&O cases opened 116 116 150 100
Zoning inspections conducted 1,517 1,100 1,100 1,400
Building Permits issued 2,413 2,400 2,500 2,400
Electrical Permits issued 3,242 3,100 3,400 3,200
Plumbing Permits issued 2,084 2,300 2,200 2,100
Elevator Permits issued 17 28 30 30
C of O applications 1,913 1,556 1,556 4,000
CUSTOMER PERSPECTIVE
CZC's issued 1,789 1,714 1,500 1,650
Cert of Non-conformity issued 16 20 24 20
Cases resolved through Zoning App Process 194 200 150 180
Customer Service Information 22,000 22,000 22,000 21,000
COST/FINANCIAL
Value of construction/permits issued ($ millions) 172 160 130 140
Permit fees collected ($ thousands) 1,943 1,850 1,850 1,850
C of O Fees Collected ($ thousands) 78 70 70 264
Case Maintenance Fee collected ($ thousands) 0 0 0 286
LEARNING / INNOVATION
Average # of training hours per employee N/A N/A N/A 25
N/A - Not Applicable
Year-To-Year Comparison
2008-09 2009-10 ChangeBudget 0 1,863,600 1,863,600Employee Years 0.0 25.0 25.0 Change Detail Salary & Wage General Vacancy
Adjustment Inflation Chargebacks Allowance Miscellaneous Major Change Total-2,100 10,400 3,900 -33,500 0 1,884,900 1,863,600
Major Change Transfer from former Department of Community Development 2,424,400
Staff reductions and adjustments due to re-organization and budget constraints -777,200
Add one Manager of Zoning to improve supervision of this function under new structure 86,900

7–22 DEPARTMENT OF NEIGHBORHOOD & BUSINESS DEVELOPMENT PLANNING & ZONING
Add one Associate City Planner to improve alignment of supervisory functions 73,500
Add one Senior City Planner as part of re-organization of functions 66,200
Add one City Planner Research Analyst with GIS to enhance internal analytical capacity 40,400
Miscellaneous communication expenses do not recur -29,000
Decrease in professional fees -300

DEPARTMENT OF NEIGHBORHOOD & BUSINESS DEVELOPMENT 7–23 PLANNING & ZONING
EXPENDITURE SUMMARY
Actual Estimated Amended Approved2007-08 2008-09 2008-09 2009-10
Appropriation by Major ObjectPersonnel Expenses 0 0 0 1,646,600 Materials & Supplies 0 0 0 20,900 Services 0 0 0 196,100 Other 0 0 0 0
Total 0 0 0 1,863,600
Appropriation by ActivityAdministration 0 0 0 381,600 Planning 0 0 0 427,800 Plan Review & Permits 0 0 0 457,000 Zoning 0 0 0 597,200
Total 0 0 0 1,863,600
Employee Years by ActivityAdministration 0.0 0.0 0.0 4.0 Planning 0.0 0.0 0.0 6.0 Plan Review & Permits 0.0 0.0 0.0 7.0 Zoning 0.0 0.0 0.0 8.0
Total 0.0 0.0 0.0 25.0

7–24 DEPARTMENT OF NEIGHBORHOOD & BUSINESS DEVELOPMENT PLANNING & ZONING
PERSONNEL SUMMARY
FULL TIME POSITIONS Adm
inis
trat
ion
Pla
nnin
g
Pla
n R
evie
w
& P
erm
its
Zon
ing
Budget ApprovedBr. Title 2008-09 2009-1033 Director of Planning and Zoning 0.0 1.0 1.032 Director of Planning 0.0 1.0 1.031 Manager of Plan Review 0.0 1.0 1.030 Manager of Zoning 0.0 1.0 1.028 Permit Office Manager 0.0 1.0 1.026 Associate City Planner 0.0 1.0 1.024 Architect 0.0 1.0 1.024 Engineer, Mechanical 0.0 1.0 1.024 Preservation Planner 0.0 1.0 1.024 Senior City Planner 0.0 7.0 1.0 1.0 5.024 Sr. City Planner/Urban Design Specialist 0.0 1.0 1.021 Assistant Architect 0.0 1.0 1.020 City Planner/ Research Analyst with GIS 0.0 1.0 1.012 GIS Technician 0.0 1.0 1.011 Senior Service Assistant 0.0 1.0 1.0
9 Clerk II 0.0 3.0 1.0 1.0 1.06 Receptionist Typist Bilingual 0.0 1.0 1.0
EMPLOYEE YEARSFull Time 0.0 25.0 4.0 6.0 7.0 8.0Overtime 0.0 0.0 0.0 0.0 0.0 0.0Part Time, Temporary, Seasonal 0.0 0.0 0.0 0.0 0.0 0.0Less: Vacancy Allowance 0.0 0.0 0.0 0.0 0.0 0.0 Total 0.0 25.0 4.0 6.0 7.0 8.0

DEPARTMENT OF NEIGHBORHOOD & BUSINESS DEVELOPMENT 7–25 NEIGHBORHOOD PRESERVATION
Mission Statement To support the City of Rochester’s One City Vision Statement and its Values and Guiding Principles, the Bureau of Neighborhood Preservation will provide customer-focused services through personnel working from four quadrant Neighborhood Service Centers. The primary objective will be to improve quality of life issues and decrease the delivery of service time. Vital Customers Internal: City of Rochester departments External: City Residents; homeowners, business operators; neighborhood organizations
Critical Processes
Facilitate resolution of neighborhood complaints Provide technical assistance in community organizing Plan and implement special projects Monitor City-owned vacant structures to ensure security and determine demolition priority Reduce neighborhood nuisance activities Promote crime prevention activities
2009-10 Fiscal Goals & Objectives Objective Priorities Supported Projected
Completion
Coordinate and implement four high functioning quadrant teams, bringing City services closer to the customer
Customer Service Public Safety Neighborhood & Business Development
First Quarter
Develop a plan to address level one code compliance/enforcement (high grass/weeds, trash/debris, refuse/bulk removal, unlicensed vehicles, auto repair)
Customer Service Public Safety Neighborhood & Business Development
First Quarter
Enhance neighborhood Uplift programs in partnership with Rochester Police Department and Rochester City School District Truancy Program
Education Public Safety
First Quarter
Actively participate in neighborhood community planning with businesses and residents to develop strategies to market and leverage additional resources to improve the neighborhood business environment
Customer Service Neighborhood & Business Development
Second QuarterOngoing
Implement neighborhood related programs and activities and assist in research, planning, promotion and execution of various neighborhood projects
Customer Service Public Safety
Second QuarterOngoing

7–26 DEPARTMENT OF NEIGHBORHOOD & BUSINESS DEVELOPMENT NEIGHBORHOOD PRESERVATION
Objective Priorities Supported Projected Completion
Reduce neighborhood nuisance activities by increasing the number of warning meetings held, the number of referrals to landlord/tenant mediation and training programs, and more focused use of the decentralized Business Permit program
Customer Service Public Safety
Second QuarterOngoing
Key Performance Indicators Actual
2007-08Estimated
2008-09Budget
2008-09 Budget
2009-10INTERNAL OPERATIONS Get Tough Program: High grass/weeds cited 3,400 3,400 3,400 3,400 Trash/debris cited 1,100 1,100 1,100 1,100Enforcement Actions: Nuisance letters sent 200 200 200 200 Nuisance waiver letters sent 200 200 200 200 Nuisance waivers approved 15 15 15 20 CUSTOMER PERSPECTIVE Business Permits Issued 1,800 1,600 1,800 1,800Uplifts 50 50 50 55 LEARNING AND INNOVATION Average # of training hours per employee N/A N/A N/A 25 N/A - Not Applicable Year-To-Year Comparison
2008-09 2009-10 ChangeBudget 0 1,436,200 1,436,200Employee Years 0.0 21.1 21.1 Change Detail Salary & Wage General Vacancy
Adjustment Inflation Chargebacks Allowance Miscellaneous Major Change Total-4,600 17,500 0 21,000 200 1,402,100 1,436,200

DEPARTMENT OF NEIGHBORHOOD & BUSINESS DEVELOPMENT 7–27 NEIGHBORHOOD PRESERVATION
Major Change As proposed by the Mayor:
Transfer from former Bureau of Neighborhood Service Centers 1,888,700
Staff reductions and adjustments due to re-organization and budget constraints -318,300
Miscellaneous communication expenses do not recur -99,800
Budgeted expense for NW Neighborhood Service Center does not recur -78,000
Increase in food expenses for Uplift program volunteers 1,900
Productivity improvements result in savings -1,900
As amended by City Council:
Funds are transferred from Contingency for Refugee Sustainability Garden; Outreach for FIS in Beechwood; and, Community Gardens, Banners, Lighting, and Signage
9,500

7–28 DEPARTMENT OF NEIGHBORHOOD & BUSINESS DEVELOPMENT NEIGHBORHOOD PRESERVATION
PERSONNEL SUMMARY
Actual Estimated Amended Approved2007-08 2008-09 2008-09 2009-10
Appropriation by Major ObjectPersonnel Expenses 0 0 0 1,124,700 Materials & Supplies 0 0 0 37,200 Services 0 0 0 274,300 Other 0 0 0 0
Total 0 0 0 1,436,200
Neighborhood Preservation 0 0 0 1,436,200
Employee Years by Activity 21.1

DEPARTMENT OF NEIGHBORHOOD & BUSINESS DEVELOPMENT 7–29 NEIGHBORHOOD PRESERVATION
EXPENDITURE SUMMARY
FULL TIME POSITIONS
Budget ApprovedBr. Title 2008-09 2009-1031 Administrator 0.0 4.021 Code Enforcement Officer 0.0 4.012 Customer Service Representative 0.0 4.0
7 Clerk III Typing 0.0 1.07 Clerk III Typing Bilingual 0.0 2.0
EMPLOYEE YEARSFull Time 0.0 15.0Overtime 0.0 0.8Part Time, Temporary, Seasonal 0.0 5.7Less: Vacancy Allowance 0.0 0.4 Total 0.0 21.1
The following full time positions are included in the budget of the Police Department, Patrol Division but are assigned to NBD offices
and are shown here for reference only.
Br. Title 2008-09 2009-1094 Police Lieutenant 0 490 Police Officer 0 20
EMPLOYEE YEARSFull Time 0.0 24.0Overtime 0.0 0.4Part Time, Temporary, Seasonal 0.0 0.0Less: Vacancy Allowance 0.0 0.0 Total 0.0 24.4

7–30 DEPARTMENT OF NEIGHBORHOOD & BUSINESS DEVELOPMENT INSPECTION & COMPLIANCE
Mission Statement To support the City of Rochester’s One City Vision Statement and its Values and Guiding Principles, the Bureau of Inspection and Compliance will conduct inspection services in order that all buildings and properties in the City of Rochester are in compliance with local, county, state and national regulations. The team will do this in a timely and comprehensive customer-oriented and cost-effective manner. Organization
Vital Customers Internal: City of Rochester departments External: City residents, homeowners, business operators, contractors, licensed professionals,
neighborhood organizations, Monroe County Critical Processes Inspections for Certificates of Occupancy Building, electrical, plumbing, and elevator permit inspections Lead dust testing Issuance of tickets for non-compliance with City Codes Quality Housing Inspections for Monroe County Department of Social Services Monitor privately-owned vacant structures
Administration and Processing
Inspections
Eastside
Westside
Code Enforcement
Lead Program/
Quality Housing Inspections

DEPARTMENT OF NEIGHBORHOOD & BUSINESS DEVELOPMENT 7–31 INSPECTION & COMPLIANCE
2009-10 Fiscal Goals & Objectives Objective Priorities Supported Projected
Completion
Add Saturday code enforcement coverage as a pilot
Customer Service Neighborhood and Business Development
First Quarter
Amend Property Code to adopt a fee structure for the renewal of Certificates of Occupancy
Neighborhood and Business Development
First Quarter
Solicit customer feedback through implementation of customer satisfaction surveys
Customer Service Second Quarter
Implement newly adopted code legislation (Landlord Registry and Inspection Warrant)
Customer Service Second Quarter
Enhance efficiency of processing time by completing implementation of Share-Point Records Management system, eliminating paper case files
Customer Service Second Quarter
Primary Prevention of childhood lead poisoning program: conduct lead inspections in units referred by County Health Department, and monitor compliance
Customer Service Public Safety Education
Second Quarter
Enhance efficiency of permit processing by adding permit cases to Inspection System
Customer Service Second Quarter
Enhance voluntary compliance rate by developing clear code enforcement strategies for all situations
Customer Service Public Safety Neighborhood and Business Development
Second Quarter
Transition to a cross-functionally trained inspection staff
Customer Service Fourth Quarter
Key Performance Indicators Actual
2007-08Estimated
2008-09 Budget
2008-09Budget
2009-10
INTERNAL OPERATIONS
Certificates of Occupancy Issued 2,619 3,000 3,000 4,000
Certificates of Compliance Issued N/A N/A N/A 6,500
Units inspected for lead hazards 11,607 12,000 12,000 12,000
Units wipe tested 4,606 4,500 9,000 5,000
MCDSS QHI Inspections 6,204 6,400 6,500 6,400

7–32 DEPARTMENT OF NEIGHBORHOOD & BUSINESS DEVELOPMENT INSPECTION & COMPLIANCE
Actual2007-08
Estimated2008-09
Budget 2008-09
Budget2009-10
CUSTOMER PERSPECTIVE
C of O customer surveys sent 0 0 0 2,000
QHI customer surveys sent 0 0 0 2,000
Permit customer surveys sent 0 0 0 2,000
Vacant properties managed 2,850 2,850 2,850 2,850
Housing code tickets issued 1,341 1,500 1,500 1,500
FINANCIAL/COSTS
Average cases closed per month by inspector type:
CEO 47 50 50 50
Electrical 83 85 85 85
Plumbing 38 50 50 50
LEARNING AND INNOVATION
Average # of hours of training per staff N/A N/A N/A 25
N/A - Not Applicable
Year-To-Year Comparison
2008-09 2009-10 ChangeBudget 0 3,525,500 3,525,500Employee Years 0.0 52.5 52.5 Change Detail Salary & Wage General Vacancy
Adjustment Inflation Chargebacks Allowance Miscellaneous Major Change Total-7,900 23,000 -7,400 52,800 20,900 3,444,100 3,525,500
Major Change Transfer from former Bureau of Neighborhood Service Centers 2,639,700
Transfer from former Department of Community Development 883,400
Staff reductions and adjustments due to re-organization and budget constraints -215,300
Add two Code Compliance Coordinators to enhance technical supervision and consistency 160,400
Reduction in professional fees for lead wipe tests -149,700
Add two Property Conservation Inspectors as part of re-organization of inspection function 90,000
Increase in training for enhanced inspection capabilities 19,000
Increase in supply expenses for pen tablets 14,000
Increase in wearing apparel 1,400
Increase in printing costs 1,200

DEPARTMENT OF NEIGHBORHOOD & BUSINESS DEVELOPMENT 7–33 INSPECTION & COMPLIANCE
Actual Estimated Amended Approved
2007-08 2008-09 2008-09 2009-10Appropriation by Major ObjectPersonnel Expenses 0 0 0 2,927,400 Materials & Supplies 0 0 0 47,600 Services 0 0 0 550,500 Other 0 0 0 0
Total 0 0 0 3,525,500
Appropriation by ActivityAdministration & Inspections 0 0 0 3,102,600 Quality Housing Program 0 0 0 267,400 Primary Prevention Lead Program 0 0 0 155,500
Total 0 0 0 3,525,500
Employee Years by ActivityAdministration & Inspections 0.0 0.0 0.0 44.0 Quality Housing Program 0.0 0.0 0.0 6.0 Primary Prevention Lead Program 0.0 0.0 0.0 2.5
Total 0.0 0.0 0.0 52.5

7–34 DEPARTMENT OF NEIGHBORHOOD & BUSINESS DEVELOPMENT INSPECTION & COMPLIANCE
EXPENDITURE SUMMARY
FULL TIME POSITIONS
Adm
inis
trat
ion
&
Insp
ectio
ns
Qua
lity
Hou
sing
P
rogr
am
Prim
ary
Pre
vent
ion
Lead
Pro
gram
Budget ApprovedBr. Title 2008-09 2009-1033 Director of Inspection & Compliance 0.0 1.0 1.028 Code Compliance Coordinator 0.0 2.0 2.024 Code Enforcement Coordinator 0.0 1.0 1.024 Lead Paint Coordinator 0.0 1.0 0.8 0.221 Code Enforcement Officer 0.0 22.0 22.021 Code Enforcement Officer Bilingual 0.0 1.0 1.021 Electrical Inspector 0.0 3.0 3.021 Elevator Inspector 0.0 1.0 1.021 Plumbing Inspector 0.0 3.0 3.020 Executive Assistant 0.0 1.0 1.017 Property Conservation Inspector 0.0 9.0 3.0 4.0 2.017 Property Conservation Inspector Bilingual 0.0 1.0 1.011 Senior Service Assistant 0.0 1.0 1.0
9 Clerk II Bilingual 0.0 1.0 1.07 Clerk III 0.0 1.0 1.07 Clerk III Typing 0.0 2.0 2.03 Clerk Typist 0.0 1.0 1.0
EMPLOYEE YEARSFull Time 0.0 52.0 43.8 6.2 2.0Overtime 0.0 0.8 0.8 0.0 0.0Part Time, Temporary, Seasonal 0.0 1.0 0.5 0.0 0.5Less: Vacancy Allowance 0.0 1.3 1.1 0.2 0.0 Total 0.0 52.5 44.0 6.0 2.5

COMMUNITY DEVELOPMENT 8–1
Year-To-Year Comparison
Budget Budget PercentBureau 2008-09 2009-10 Change ChangeOffice of the Commissioner 549,500 0 -549,500 -100.0%Buildings & Zoning 2,617,000 0 -2,617,000 -100.0%Housing & Project Development 2,344,100 0 -2,344,100 -100.0%Planning 695,400 0 -695,400 -100.0%
Total 6,206,000 0 -6,206,000 -100.0%
Employee Years 90.8 0.0 -90.8 -100.0% Change Detail Salary & Wage General Vacancy
Adjustment Inflation Chargebacks Allowance Miscellaneous Major Change Total0 0 0 0 0 -6,206,000 -6,206,000
Major Change All Community Development Department funds transfer to the newly created Department of Neighborhood and Business Development
-6,206,000

8–2 COMMUNITY DEVELOPMENT EXPENDITURE SUMMARY
Actual Estimated Amended Approved2007-08 2008-09 2008-09 2009-10
Appropriation by Major ObjectPersonnel Expenses 5,408,687 5,295,900 5,464,200 0 Materials & Supplies 29,100 49,000 54,700 0 Services 507,400 558,700 687,100 0 Other 0 0 0 0
Total 5,945,187 5,903,600 6,206,000 0
Appropriation by ActivityOffice of the Commissioner 430,893 530,700 549,500 0 Buildings & Zoning 2,516,328 2,525,900 2,617,000 0 Housing & Project Development 2,315,589 2,199,200 2,344,100 0 Planning 682,377 647,800 695,400 0
Total 5,945,187 5,903,600 6,206,000 0
Employee Years by ActivityOffice of the Commissioner 7.0 7.0 7.2 0.0 Buildings & Zoning 40.1 38.5 38.5 0.0 Housing & Project Development 37.6 31.6 35.1 0.0 Planning 10.0 9.0 10.0 0.0
Total 94.7 86.1 90.8 0.0

DEPARTMENT OF COMMUNITY DEVELOPMENT 8–3 OFFICE OF THE COMMISSIONER Year-To-Year Comparison
2008-09 2009-10 ChangeBudget 549,500 0 -549,500Employee Years 7.2 0.0 -7.2 Change Detail Salary & Wage General Vacancy
Adjustment Inflation Chargebacks Allowance Miscellaneous Major Change Total
0 0 0 0 0 -549,500 -549,500 Major Change All funds transfer to the newly created Department of Neighborhood and Business Development -549,500

8–4 DEPARTMENT OF COMMUNITY DEVELOPMENT OFFICE OF THE COMMISSIONER
EXPENDITURE SUMMARY
Actual Estimated Amended Approved2007-08 2008-09 2008-09 2009-10
Appropriation by Major ObjectPersonnel Expenses 371,193 461,300 461,300 0 Materials & Supplies 2,600 3,900 6,900 0 Services 57,100 65,500 81,300 0 Other 0 0 0 0
Total 430,893 530,700 549,500 0
Appropriation by ActivityAdministration 226,593 346,100 366,900 0 Administrative Services 204,300 184,600 182,600 0
430,893 530,700 549,500 0
Employee Years by ActivityAdministration 3.0 3.0 3.0 0.0 Administrative Services 4.0 4.0 4.2 0.0
7.0 7.0 7.2 0.0

DEPARTMENT OF COMMUNITY DEVELOPMENT 8–5 OFFICE OF THE COMMISSIONER PERSONNEL SUMMARY
FULL TIME POSITIONS
Budget ApprovedBr. Title 2008-09 2009-1036 Commissioner 1.0 0.029 Principal Staff Assistant 1.0 0.024 Senior Administrative Analyst 1.0 0.018 Secretary to Commissioner 1.0 0.012 Project Assistant 1.0 0.0
9 Clerk II 1.0 0.07 Clerk III 1.0 0.0
EMPLOYEE YEARSFull Time 7.0 0.0Overtime 0.0 0.0Part Time, Temporary, Seasonal 0.2 0.0Less: Vacancy Allowance 0.0 0.0 Total 7.2 0.0

8–6 DEPARTMENT OF COMMUNITY DEVELOPMENT BUREAU OF BUILDINGS & ZONING
Year-To-Year Comparison
2008-09 2009-10 Change
Budget 2,617,000 0 -2,617,000Employee Years 38.5 0.0 -38.5 Change Detail Salary & Wage General Vacancy
Adjustment Inflation Chargebacks Allowance Miscellaneous Major Change Total
0 0 0 0 0 -2,617,000 -2,617,000 Major Change All funds transfer to the newly created Department of Neighborhood and Business Development -2,617,000

DEPARTMENT OF COMMUNITY DEVELOPMENT 8–7 BUREAU OF BUILDINGS & ZONING EXPENDITURE SUMMARY
Actual Estimated Amended Approved2007-08 2008-09 2008-09 2009-10
Appropriation by Major ObjectPersonnel Expenses 2,389,428 2,362,000 2,411,000 0 Materials & Supplies 14,200 21,500 24,200 0 Services 112,700 142,400 181,800 0 Other 0 0 0 0
Total 2,516,328 2,525,900 2,617,000 0
Appropriation by ActivityAdministration 195,128 143,700 237,100 0 Permits 274,200 239,800 271,200 0 Plan Review & Inspections 1,125,900 1,151,800 1,157,700 0 Zoning 921,100 990,600 951,000 0
Total 2,516,328 2,525,900 2,617,000 0
Employee Years by ActivityAdministration 1.0 0.5 0.5 0.0 Permits 5.8 4.7 4.7 0.0 Plan Review & Inspections 19.2 19.2 19.2 0.0 Zoning 14.1 14.1 14.1 0.0
Total 40.1 38.5 38.5 0.0

8–8 DEPARTMENT OF COMMUNITY DEVELOPMENT BUREAU OF BUILDINGS & ZONING
PERSONNEL SUMMARY
FULL TIME POSITIONS
Budget ApprovedBr. Title 2008-09 2009-1031 Director of Zoning 1.0 0.031 Mgr. of Plan Review & Building Inspections 1.0 0.029 Principal Staff Assistant 1.0 0.028 Permit Office Manager 1.0 0.028 Senior Engineer Mechanical 1.0 0.028 Supervising City Planner 1.0 0.024 Architect 1.0 0.024 Code Enforcement Coordinator 1.0 0.024 Engineer/Mechanical 1.0 0.024 Senior Administrative Analyst 1.0 0.024 Senior City Planner 5.0 0.024 Senior City Planner - Urban Design Specialist 1.0 0.024 Preservation Planner 1.0 0.021 Assistant Architect 1.0 0.021 Building Construction Inspector with Electrical 5.0 0.021 Electrical Inspector 3.0 0.021 Elevator Inspector 1.0 0.021 Neighborhood Conservation Officer 1.0 0.020 Plumbing Inspector 4.0 0.011 Senior Service Assistant 1.0 0.0
9 Clerk II 4.0 0.06 Receptionist Typist Bilingual 1.0 0.0
EMPLOYEE YEARSFull Time 38.0 0.0Overtime 0.3 0.0Part Time, Temporary, Seasonal 0.6 0.0Less: Vacancy Allowance 0.4 0.0 Total 38.5 0.0

DEPARTMENT OF COMMUNITY DEVELOPMENT 8–9 BUREAU OF HOUSING & PROJECT DEVELOPMENT
Year-To-Year Comparison 2008-09 2009-10 Change
Budget 2,344,100 0 -2,344,100Employee Years 35.1 0.0 -35.1 Change DetailSalary & Wage General Vacancy
Adjustment Inflation Chargebacks Allowance Miscellaneous Major Change Total0 0 0 0 0 -2,344,100 -2,344,100
Major Change All funds transfer to the newly created Department of Neighborhood and Business Development -2,344,100

8–10 DEPARTMENT OF COMMUNITY DEVELOPMENT BUREAU OF HOUSING & PROJECT DEVELOPOMENT
EXPENDITURE SUMMARY
Actual Estimated Amended Approved2007-08 2008-09 2008-09 2009-10
Appropriation by Major ObjectPersonnel Expenses 2,008,489 1,868,700 1,986,300 0 Materials & Supplies 7,500 16,800 16,800 0 Services 299,600 313,700 341,000 0 Other 0 0 0 0
Total 2,315,589 2,199,200 2,344,100 0
Appropriation by ActivityAdministration 191,289 230,100 258,500 0 Real Estate 680,500 683,100 725,200 0 Technical Services 681,600 514,300 600,400 0 Contract Services 339,300 307,700 302,900 0 Housing 422,900 464,000 457,100 0
Total 2,315,589 2,199,200 2,344,100 0
Employee Years by ActivityAdministration 2.0 2.0 2.0 0.0 Real Estate 6.9 8.3 8.3 0.0 Technical Services 14.9 9.5 11.0 0.0 Contract Services 7.9 6.9 7.9 0.0 Housing 5.9 4.9 5.9 0.0
Total 37.6 31.6 35.1 0.0

DEPARTMENT OF COMMUNITY DEVELOPMENT 8–11 BUREAU OF HOUSING & PROJECT DEVELOPOMENT
PERSONNEL SUMMARY
FULL TIME POSITIONS
Budget ApprovedBr. Title 2008-09 2009-1033 Director of Development Services 1 028 Director of Real Estate 1 028 Manager, Contract Services 1 028 Manager, Housing 1 028 Manager, Technical Services 1 026 Associate Administrative Analyst 1 026 Associate Real Estate Specialist 1 024 Senior Community Housing Planner 3 024 Senior Community Program Planner 2 024 Senior Property Rehab. Specialist 1 024 Senior Real Estate Specialist 1 021 Property Rehabilitation Specialist 4 020 Administrative Analyst 1 020 Building Construction Inspector 3 020 Community Housing Planner 3 020 Executive Assistant 1 020 Real Estate Specialist Bilingual 1 020 Real Estate Specialist 1 012 Project Assistant 1 012 Project Assistant Bilingual 1 011 Secretary 1 0
9 Clerk II with Typing 1 09 Clerk II with Typing Bilingual 1 07 Clerk III with Typing 2 0
EMPLOYEE YEARSFull Time 35.0 0.0Overtime 0.1 0.0Part Time, Temporary, Seasonal 0.4 0.0Less: Vacancy Allowance 0.4 0.0 Total 35.1 0.0

8–12 DEPARTMENT OF COMMUNITY DEVELOPMENT BUREAU OF PLANNING
Year-To-Year Comparison
2008-09 2009-10 ChangeBudget 695,400 0 -695,400Employee Years 10.0 0.0 -10.0 Change Detail
Salary & Wage General VacancyAdjustment Inflation Chargebacks Allowance Miscellaneous Major Change Total
0 0 0 0 0 -695,400 -695,400 Major Change All funds transfer to the newly created Department of Neighborhood and Business Development -695,400

DEPARTMENT OF COMMUNITY DEVELOPMENT 8–13 BUREAU OF PLANNING
EXPENDITURE SUMMARY
Actual Estimated Amended Approved2007-08 2008-09 2008-09 2009-10
Appropriation by Major ObjectPersonnel Expenses 639,577 603,900 605,600 0 Materials & Supplies 4,800 6,800 6,800 0 Services 38,000 37,100 83,000 0 Other 0 0 0 0
Total 682,377 647,800 695,400 0
Appropriation by ActivityAdministration 163,077 144,820 215,200 0 Comprehensive Planning 519,300 502,980 480,200 0
Total 682,377 647,800 695,400 0
Employee Years by ActivityAdministration 2.0 1.0 2.0 0.0 Comprehensive Planning 8.0 8.0 8.0 0.0
Total 10.0 9.0 10.0 0.0

8–14 DEPARTMENT OF COMMUNITY DEVELOPMENT BUREAU OF PLANNING PERSONNEL SUMMARY
FULL TIME POSITIONS
Budget ApprovedBr. Title 2008-09 2009-1032 Director of Planning 1 028 Supervising City Planner 1 026 Associate Community Program Planner 1 024 Senior City Planner 1 024 Sr. Community Program Planner Bilingual 1 020 Community Program Planner 1 018 Asst Community Program Planner 1 018 Jr. City Planner 1 012 GIS Technician 1 0
9 Clerk II with Typing 1 0
EMPLOYEE YEARSFull Time 10.0 0.0Overtime 0.1 0.0Part Time, Temporary, Seasonal 0.0 0.0Less: Vacancy Allowance 0.1 0.0 Total 10.0 0.0

ECONOMIC DEVELOPMENT 9–1
Year-To-Year Comparison
Budget Budget PercentBureau 2008-09 2009-10 Change ChangeAdministration 501,400 0 -501,400 -100.0%Industrial Development/High Technology/EZ 416,500 0 -416,500 -100.0%Neighborhood Commercial Development 325,400 0 -325,400 -100.0%Business Support & Development 437,200 0 -437,200 -100.0%Municipal Parking 1,047,500 0 -1,047,500 -100.0%
Total 2,728,000 0 -2,728,000 -100.0%
Employee Years 20.8 0.0 -20.8 -100.0% Change Detail Salary & Wage General Vacancy
Adjustment Inflation Chargebacks Allowance Miscellaneous Major Change Total
0 0 0 0 0 -2,728,000 -2,728,000 Major Change Municipal Parking transfers to Finance Department -1,047,500
Remainder of Economic Development Department transfers to the newly created Department of Neighborhood and Business Development
-1,680,500

9–2 ECONOMIC DEVELOPMENT EXPENDITURE SUMMARY
Actual Estimated Amended Approved2007-08 2008-09 2008-09 2009-10
Appropriation by Major ObjectPersonnel Expenses 1,412,482 1,471,600 1,504,800 0 Materials & Supplies 6,059 8,800 8,800 0 Services 951,024 1,204,200 1,214,400 0 Other 0 0 0 0
Total 2,369,565 2,684,600 2,728,000 0
Appropriation by ActivityAdministration 392,303 494,800 501,400 0 Industrial Dev./High Technology/EZ 405,539 417,900 416,500 0 Neighborhood Commercial Development 327,534 325,400 325,400 0 Business Support & Development 136,343 437,200 437,200 0 Municipal Parking 1,107,846 1,009,300 1,047,500 0
Total 2,369,565 2,684,600 2,728,000 0
Employee Years by ActivityAdministration 3.2 3.2 3.2 0.0 Industrial Dev./High Technology/EZ 6.0 6.0 6.0 0.0 Neighborhood Commercial Development 4.0 3.0 4.0 0.0 Business Support & Development 3.0 3.0 3.0 0.0 Municipal Parking 5.7 4.6 4.6 0.0
Total 21.9 19.8 20.8 0.0

ECONOMIC DEVELOPMENT 9–3 PERSONNEL SUMMARY
FULL TIME POSITIONS
Budget ApprovedBr. Title 2008-09 2009-1036 Commissioner 1 035 Deputy Commissioner 1 030 Manager of Business Development 1 030 Manager of Downtown Development 1 026 Associate Administrative Analyst 1 026 Associate Economic Develop Specialist 2 026 Economic Development Manager 1 026 Municipal Parking Coordinator 1 026 Senior Marketing Specialist 1 026 Senior Marketing Specialist Bilingual 1 024 Senior Economic Development Specialist 4 018 Secretary to Commissioner 1 018 Senior Field Auditor 1 014 Municipal Parking Compliance Monitor 1 011 Secretary 1 0
9 Clerk II with Typing 1 0
EMPLOYEE YEARSFull Time 20.0 0.0Overtime 0.0 0.0Part Time, Temporary, Seasonal 0.8 0.0Less: Vacancy Allowance 0.0 0.0 Total 20.8 0.0

DEPARTMENT OF ENVIRONMENTAL SERVICES 10–1
Mission Statement To support the City of Rochester’s One City Vision Statement and its Values and Guiding Principles by providing a safe, clean, and attractive community through efficient planning, design, and delivery of services that contribute to the highest possible quality of life within the City of Rochester.
Office of the Commissioner
Architecture &
Engineering
Operations & Parks
Director's Office
Solid Waste Collection
Special Services
Building Services
Equipment Services
Parks, Forestry & Open Spaces
Water
Director's Office
Engineering
Upland Operations
Distribution

10–2 DEPARTMENT OF ENVIRONMENTAL SERVICES
Highlights of the Department's 2009-10 Fiscal Goals & Objectives are presented below. Additional information for each bureau is included in the sections that follow.
Highlights Priorities Supported Projected Completion
Office of Commissioner:
Assume departmental project management responsibilities associated with implementation of new work order, asset management, and inventory control systems
Customer Service Organizational Effectiveness
First Quarter
Prepare and submit Port marina basin permit applications to New York State Department of Environmental Compliance (NYSDEC)
Customer Service Organizational Effectiveness
First Quarter
Initiate 1200 East Main Street cleanup Neighborhood & Business Development First Quarter
Prepare and submit City's Energy Efficiency & Conservation Strategy to US Department of Energy
Neighborhood & Business Development Second Quarter
Reservoir Compliance-continue to ensure reservoirs are in compliance with EPA regulations
Customer Service Organizational Effectiveness
Ongoing
Architecture & Engineering:
Implement 2009 Federal Economic Stimulus Package
Neighborhood & Business Development First Quarter
Complete purchase of street lighting system from RG&E
Customer Service Organizational Effectiveness
First Quarter
Begin design of Midtown Site Redevelopment Neighborhood & Business Development Second Quarter
Complete Rhino Soccer Stadium suite construction
Neighborhood & Business Development Second Quarter
Operations & Parks:
Establish city-wide centralized fleet purchasing policy and procedure
Customer Service Organizational Effectiveness
First Quarter
Implement enhanced equipment operator training program
Customer Service Organizational Effectiveness
Second Quarter
Design and implement equipment pools for heavy and small equipment
Customer Service Organizational Effectiveness
Second Quarter
Continue cooperative efforts with Monroe County for the design and construction of a new "green" fueling station
Customer Service Organizational Effectiveness
Fourth Quarter

DEPARTMENT OF ENVIRONMENTAL SERVICES 10–3
Highlights Priorities Supported Projected Completion
Water:
Finish design on Highland Reservoir Liner Improvements
Customer Service Organizational Effectiveness
Second Quarter
Complete negotiations with Monroe County Water Authority for new water sharing agreement
Customer Service Organizational Effectiveness
Second Quarter
Start construction on Highland Reservoir Liner Project
Customer Service Organizational Effectiveness
Third Quarter
Year-To-Year Comparison Budget Budget Percent
Bureau 2008-09 2009-10 Change ChangeOffice of the Commissioner 1,104,100 1,085,900 -18,200 -1.6%Architecture & Engineering 8,449,900 7,472,000 -977,900 -11.6%Operations & Parks 57,851,300 54,586,200 -3,265,100 -5.6%Water 22,627,400 22,377,900 -249,500 -1.1%
Total 90,032,700 85,522,000 -4,510,700 -5.0% Less: Intrafund Credit* 6,724,600 5,906,500 -818,100 -12.2%
83,308,100 79,615,500 -3,692,600 -4.4%
Employee Years 728.2 716.1 -12.1 -1.7%
*Reflects chargeback for motor equipment services. Change Detail Salary & Wage General Vacancy
Adjustment Inflation Chargebacks Allowance Miscellaneous Major Change Total1,900 996,000 462,100 0 -22,500 -5,130,100 -3,692,600
Major Change Highlights
As proposed by the Mayor:
In lieu of depreciation charge to fund capital purchases does not recur -2,563,100
Purchase of street lighting system results in savings -1,037,400
Net impact of personnel transactions -415,000
Reduce allowance for uncollectibles due to tax lien sale -360,000
Add funding for increase in facilities requiring services 350,000
Reduction in fuel pricing results in savings -327,500
Tipping fee reduction results in savings -182,500
Energy efficiencies results in savings -165,000

10–4 DEPARTMENT OF ENVIRONMENTAL SERVICES
Major Change Highlights
Parking Meter Operations transfers to Finance Department -164,000
Reduce funding for young adult work program -103,900
Add funding for demolition of city owned vacant housing 87,900
A one-time budget amendment for graffiti funding does not recur -80,000
Contract for lawn service as an efficiency measure -77,600
Productivity improvements results in savings -76,900
Contract for small equipment repair results in savings -55,100
As amended by City Council:
Funds are transferred from Contingency for Community Lighting 1,000

DEPARTMENT OF ENVIRONMENTAL SERVICES 10–5
Fund Summary
Bureau/Division General Local Works Water Refuse Total Commissioner 772,900 72,000 120,600 120,400 1,085,900 Architecture & Engineering 7,343,200 128,800 7,472,000 Operations & Parks:
Director's Office 223,600 152,300 255,500 631,400Solid Waste Collection 16,368,500 16,368,500Special Services 3,195,900 10,379,000 777,200 14,352,100Building Services 6,917,100 6,917,100Equipment Services 12,353,500 21,800 13,000 35,100 12,423,400Parks, Forestry & Open Spaces 3,805,300 88,400 3,893,700Operations Total 26,495,400 10,641,500 13,000 17,436,300 54,586,200 Water Fund Operating Units and Fixed Charges 22,377,900 22,377,900Water Total 22,377,900 22,377,900
Subtotal 34,611,500 10,842,300 22,511,500 17,556,700 85,522,000 Less Intrafund Credits:- Equipment Services 5,906,500 5,906,500
Net Total 28,705,000 10,842,300 22,511,500 17,556,700 79,615,500

10–6 DEPARTMENT OF ENVIRONMENTAL SERVICES
General36.1%
Local Works13.6%
Water28.3%
Refuse22.1%
Operating Budget By Fund

ENVIRONMENTAL SERVICES 10–7 EXPENDITURE SUMMARY
Actual Estimated Amended Approved2007-08 2008-09 2008-09 2009-10
Appropriation by Major ObjectPersonnel Expenses 32,118,896 33,233,300 34,140,500 33,390,600 Materials & Supplies 9,304,642 9,771,700 11,030,700 11,170,700 Services 28,928,598 32,314,700 34,042,500 33,071,000 Other 8,280,888 11,569,000 10,819,000 7,889,700
Total 78,633,024 86,888,700 90,032,700 85,522,000 Less: Intrafund Credit* 5,346,200 6,051,300 6,724,600 5,906,500
Total 73,286,824 80,837,400 83,308,100 79,615,500
Appropriation by ActivityOffice of the Commissioner 1,098,813 1,090,600 1,104,100 1,085,900 Architecture & Engineering 7,890,304 7,888,800 8,449,900 7,472,000 Operations & Parks 48,438,204 54,899,500 57,851,300 54,586,200 Water 21,205,703 23,009,800 22,627,400 22,377,900
Total 78,633,024 86,888,700 90,032,700 85,522,000 Less: Intrafund Credit* 5,346,200 6,051,300 6,724,600 5,906,500
Total 73,286,824 80,837,400 83,308,100 79,615,500
Employee Years by ActivityOffice of the Commissioner 14.3 13.6 14.0 14.2 Architecture & Engineering 60.6 62.4 66.5 64.2 Operations & Parks 475.9 496.0 503.5 498.2 Water 138.7 137.9 144.2 139.5
Total 689.5 709.9 728.2 716.1
*Reflects chargeback for motor equipment service.

10–8 DEPARTMENT OF ENVIRONMENTAL SERVICES OFFICE OF THE COMMISSIONER
Mission Statement Office of the Commissioner: To support the City of Rochester’s One City Vision Statement and its Values and Guiding Principles by assisting the Mayor and Commissioner in achieving their vision for the Department. This is accomplished by: Fostering a healthy exchange of dialogue between the Department and the City’s central service
agencies in order to secure the appropriate level of resources for the DES operating units so that they may carry out their essential missions, and attain stated goals and objectives;
Working in partnership with the DES operating units to improve customer service, and the efficiency and effectiveness of operations;
Improving the flow of communication throughout the Department and enhancing the Department’s capabilities to interact in a meaningful way with its customers.
Environmental Quality: To support the City of Rochester’s One City Vision Statement and its Values and Guiding Principles through the provision of efficient environmental investigation, cleanup, compliance and redevelopment services for the City of Rochester and the public. These services meet regulatory agency requirements, address environmental issues, maintain environmental compliance at City facilities and promote redevelopment and improved property valuations in order to protect, preserve and enhance the natural and built environment of the City of Rochester. Organization
Vital Customers Office of the Commissioner: Internal: City of Rochester Administration; City Senior Management Team; City of Rochester
Departments; City of Rochester Employees External: All who currently or potentially could live, work, visit, or do business in the City of
Rochester Environmental Quality: Internal: City of Rochester Departments External: All who currently or potentially could live, work, visit, or do business in the City of
Rochester; Community groups; Local, state and federal granting and regulatory agencies
Administration
Environmental Quality

DEPARTMENT OF ENVIRONMENTAL SERVICES 10–9 OFFICE OF THE COMMISSIONER
2009-10 Fiscal Goals & Objectives Objective Priorities Supported Projected
Completion
Assume departmental project management responsibilities associated with implementation of new work order, asset management, and inventory control systems
Customer Service Organizational Effectiveness
First Quarter
Prepare and submit Port marina basin permit applications to New York State Department of Environmental Compliance (NYSDEC)
Neighborhood & Business Development First Quarter
Initiate 1200 East Main Street cleanup Neighborhood & Business Development First Quarter
Prepare and submit City's Energy Efficiency & Conservation Strategy to US Department of Energy
Customer Service Organizational Effectiveness
Second Quarter
Complete City operations greenhouse gas emissions inventory
Customer Service Organizational Effectiveness
Second Quarter
Complete Photech site emergency demolition and interim cleanup actions
Neighborhood & Business Development Second Quarter
Develop project plan for participation in APWA Public Works Management Practices Self Assessment Program
Customer Service Organizational Effectiveness
Fourth Quarter
Complete 415 Orchard - 354 Whitney Street site remedy selection
Neighborhood & Business Development Fourth Quarter
Complete supplemental environmental impact statement for Marina Development Project
Neighborhood & Business Development Fourth Quarter
Reservoir Compliance-continue to ensure reservoirs are in compliance with EPA regulations
Customer Service Organizational Effectiveness
Ongoing
Continue succession planning efforts Customer Service Organizational Effectiveness
Ongoing

10–10 DEPARTMENT OF ENVIRONMENTAL SERVICES OFFICE OF THE COMMISSIONER
Key Performance Indicators Actual
2007-08Estimated
2008-09Budget
2008-09 Budget
2009-10
Spill responses completed 8 9 10 10
New York State cleanup agreements and orders
21 21 21 22
Cleanup cost per acre ($):
● Planned residential site reuse* N/A N/A 510,600 N/A
● Planned commercial/industrial reuse 163,100 71,300 332,100 400,300
Sites remediated* 2 4 4 3
Acres remediated 3.64 3.74 4 3.33
N/A - Not Applicable Restricted Residential-no single family homes
*2007-08 Actual: 151-191 Mt Hope Avenue, 877 West Broad Street 2008-09 Estimated: 399 Gregory Street, 1030 Jay St., 75 Wilton Terrace, 3-9 Trinidad Street 2008-09 Budget: 399 Gregory Street, 110 Colfax Street, 425-435 Mt Hope Avenue, 1200 East Main St. 2009-10 Budget: 110 Colfax Street, 425 – 435 Mt Hope Ave, 1200 East Main Street
Year-To-Year Comparison
2008-09 2009-10 ChangeBudget 1,104,100 1,085,900 -18,200Employee Years 14.0 14.2 0.2 Change Detail Salary & Wage General Vacancy
Adjustment Inflation Chargebacks Allowance Miscellaneous Major Change Total-2,100 1,000 -21,500 0 0 4,400 -18,200
Major Change Transfer of one full time position from Architecture & Engineering 39,900
Vacant part time administrative position is eliminated as an efficiency measure -23,700
Productivity improvements results in savings -11,800

DEPARTMENT OF ENVIRONMENTAL SERVICES 10–11 OFFICE OF THE COMMISSIONER EXPENDITURE SUMMARY
Actual Estimated Amended Approved2007-08 2008-09 2008-09 2009-10
Appropriation by Major ObjectPersonnel Expenses 997,940 968,000 980,800 994,900 Materials & Supplies 24,823 21,300 21,300 21,900 Services 76,050 101,300 102,000 69,100 Other 0 0 0 0
Total 1,098,813 1,090,600 1,104,100 1,085,900
Appropriation by ActivityAdministration 616,822 558,300 571,500 576,300 Environmental Quality 481,991 532,300 532,600 509,600
Total 1,098,813 1,090,600 1,104,100 1,085,900
Employee Years by ActivityAdministration 7.5 6.6 6.9 7.5 Environmental Quality 6.8 7.0 7.1 6.7
Total 14.3 13.6 14.0 14.2

10–12 DEPARTMENT OF ENVIRONMENTAL SERVICES OFFICE OF THE COMMISSIONER
PERSONNEL SUMMARY
FULL TIME POSITIONS Adm
inis
trat
ion
Env
ironm
enta
l Q
ualit
y
Budget ApprovedBr. Title 2008-09 2009-1036 Commissioner 1 1 132 Manager of Administrative Services 0 1 132 Manager of Environmental Quality 1 1 129 Principal Staff Assistant 1 027 Senior Environmental Specialist/Compliance 1 1 127 Senior Environmental Specialist/Remediation 1 1 126 Human Resource Coordinator 1 1 126 Process Improvement Specialist 0 1 123 Environmental Specialist/Remediation 1 1 121 Environmental Technician 1 1 120 Executive Assistant 1 1 118 Secretary to the Commissioner 1 1 1
7 Clerk III 0 1 17 Data Entry Clerk 1 1 16 Receptionist Typist 1 0
EMPLOYEE YEARSFull Time 12.0 13.0 7.0 6.0Overtime 0.1 0.0 0.0 0.0Part Time, Temporary, Seasonal 1.9 1.2 0.5 0.7Less: Vacancy Allowance 0.0 0.0 0.0 0.0 Total 14.0 14.2 7.5 6.7

DEPARTMENT OF ENVIRONMENTAL SERVICES 10–13 BUREAU OF ARCHITECTURE & ENGINEERING
Mission Statement To support the City of Rochester’s One City Vision Statement and its Values and Guiding Principles by focusing on customer service, efficiency, and excellence, the Bureau of Architecture and Engineering serves as the steward of the City’s infrastructure. The Bureau collaborates with community representatives, utilities, business owners, and other City Departments on public improvement projects that enhance quality of life and economic development opportunities in our neighborhoods. The Bureau uses in-house resources and manages consultants and contractors in order to perform design and construction services in the public realm related to streetscapes, street lighting, trails, bridges, and City owned buildings. Organization
Vital Customers Internal: City of Rochester Departments External: All who currently or potentially could live, work, visit, or do business in the City of
Rochester; Residents and businesses in surrounding region; Public and Private utilities Critical Processes Annual creation and implementation of the City-wide capital improvement program. Provide for public safety through regulation in the Right Of Way Stewardship of public infrastructure Surveying/mapping/monumentation to support land values and assessments
Administration
Development Construction
Maps & Surveys Permit Office
Street Design Architectural Services
Street Lighting

10–14 DEPARTMENT OF ENVIRONMENTAL SERVICES BUREAU OF ARCHITECTURE & ENGINEERING
2009-10 Fiscal Goals & Objectives: Objective Priorities Supported Projected
Completion
Implement 2009 Federal Economic Stimulus Package
Neighborhood & Business Development First Quarter
Begin construction of Crossroads Garage structural repairs
Neighborhood & Business Development First Quarter
Begin construction of Hudson Avenue firehouse renovation and expansion incorporating LEED certification standards
Public Safety First Quarter
Complete design of Manhattan Square Park Phase III
Neighborhood & Business Development First Quarter
Complete design of El Camino Trail Neighborhood & Business Development First Quarter
Begin construction of Broad Street Tunnel fill project
Neighborhood & Business Development First Quarter
Complete purchase of street lighting system from RG&E
Customer Service Organizational Effectiveness
First Quarter
Begin design of Midtown Site Redevelopment Neighborhood & Business Development Second Quarter
Complete Rhino Soccer Stadium suite construction
Neighborhood & Business Development Second Quarter
Complete design of Phase I Mt Hope Avenue improvements
Neighborhood & Business Development Second Quarter
Complete Brooks Avenue reconstruction Neighborhood & Business Development Second Quarter
Complete construction of South Avenue Firehouse renovations.
Public Safety
Second Quarter
Begin construction of University Avenue & ARTWALK II
Neighborhood & Business Development Third Quarter
Begin construction of Mt. Hope Avenue Phase I
Neighborhood & Business Development Third Quarter
Complete design of Riverside Cemetery Mausoleum/Chapel of Peace
Neighborhood & Business Development Third Quarter

DEPARTMENT OF ENVIRONMENTAL SERVICES 10–15 BUREAU OF ARCHITECTURE & ENGINEERING
Key Performance Indicators Actual
2007-08Estimated
2008-09 Budget
2008-09Budget
2009-10Development Projects designed ($000,000): ● In-house .20 .25 .24 .24● Consultants 6.20 13.28 8.22 9.81 Street Design Value of street improvement projects designed ($000,000):
● In-house 3.99 6.67 4.25 2.50● Consultants 5.74 6.62 8.75 4.80 Architectural Services Facilities in building renovation program 141 147 145 146Value of projects designed ($000,000): ● In-house 1.44 1.35 1.57 2.60● Consultant 6.00 8.00 5.0 5.50 Street Lighting City maintained lights 15,673 16,400 16,400 27,800RG&E maintained lights 11,867 11,400 11,400 0Calls for service 6,603 6,700 6,700 6,500 Year-To-Year Comparison
2008-09 2009-10 Change
Budget 8,449,900 7,472,000 -977,900Employee Years 66.5 64.2 -2.3 Change Detail Salary & Wage General Vacancy
Adjustment Inflation Chargebacks Allowance Miscellaneous Major Change Total-3,100 171,400 4,400 0 0 -1,150,600 -977,900
Major Change Purchase of street lighting system results in savings -1,037,400
Net impact of bureau personnel transactions as an efficiency measure -62,700
Transfer of one full time position to Office of the Commissioner’ -39,900
Productivity improvements results in savings
-10,600
Program Change Purchase remaining portion of street lighting system from Rochester Gas & Electric.

10–16 DEPARTMENT OF ENVIROMENTAL SERVICES BUREAU OF ARCHITECTURE & ENGINEERING
EXPENDITURE SUMMARY
Actual Estimated Amended Approved2007-08 2008-09 2008-09 2009-10
Appropriation by Major ObjectPersonnel Expenses 3,705,597 3,816,700 3,984,900 3,877,700 Materials & Supplies 219,644 216,100 216,100 404,100
3,965,063 3,856,000 4,248,900 3,190,200 Other 0 0 0 0
Total 7,890,304 7,888,800 8,449,900 7,472,000
Appropriation by ActivityAdministration 711,775 923,200 914,100 815,200 Development 286,429 290,300 323,900 436,800 Construction 421,297 469,600 507,600 460,300 Maps & Surveys 433,110 433,700 465,900 450,900 Permit Office 315,902 309,800 309,800 313,900 Street Design 815,034 796,200 878,600 847,700 Architectural Services 722,416 725,100 725,100 715,100 Street Lighting 4,184,341 3,940,900 4,324,900 3,432,100
Total 7,890,304 7,888,800 8,449,900 7,472,000
Employee Years by ActivityAdministration 6.1 6.3 6.3 5.9 Development 4.3 4.3 5.3 6.2 Construction 5.5 6.7 7.7 6.3 Maps & Surveys 8.2 8.0 9.0 8.2 Permit Office 5.4 5.9 5.9 5.9 Street Design 15.9 15.2 15.2 15.3 Architectural Services 10.1 10.8 11.9 11.0 Street Lighting 5.1 5.2 5.2 5.4
Total 60.6 62.4 66.5 64.2
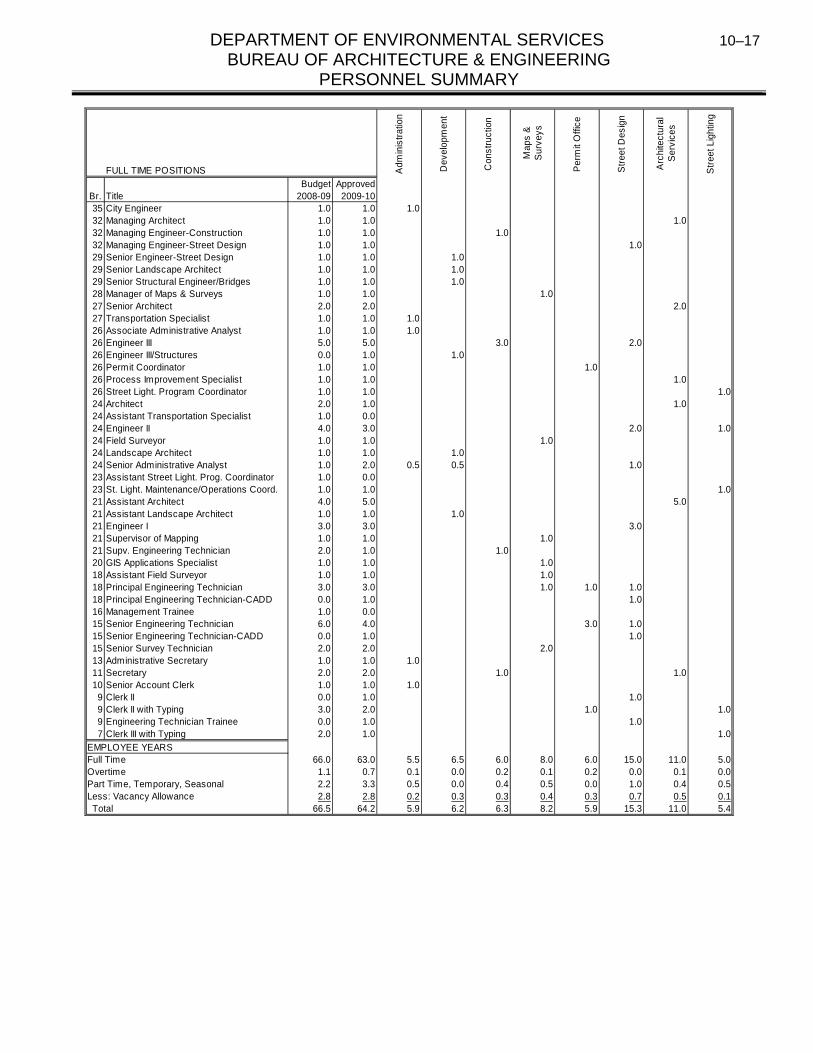
DEPARTMENT OF ENVIRONMENTAL SERVICES 10–17 BUREAU OF ARCHITECTURE & ENGINEERING
PERSONNEL SUMMARY
FULL TIME POSITIONS Adm
inis
trat
ion
Dev
elop
men
t
Con
stru
ctio
n
Map
s &
S
urve
ys
Per
mit
Offi
ce
Str
eet D
esig
n
Arc
hite
ctur
al
Ser
vice
s
Str
eet L
ight
ing
Budget ApprovedBr. Title 2008-09 2009-1035 City Engineer 1.0 1.0 1.032 Managing Architect 1.0 1.0 1.032 Managing Engineer-Construction 1.0 1.0 1.032 Managing Engineer-Street Design 1.0 1.0 1.029 Senior Engineer-Street Design 1.0 1.0 1.029 Senior Landscape Architect 1.0 1.0 1.029 Senior Structural Engineer/Bridges 1.0 1.0 1.028 Manager of Maps & Surveys 1.0 1.0 1.027 Senior Architect 2.0 2.0 2.027 Transportation Specialist 1.0 1.0 1.026 Associate Administrative Analyst 1.0 1.0 1.026 Engineer III 5.0 5.0 3.0 2.026 Engineer III/Structures 0.0 1.0 1.026 Permit Coordinator 1.0 1.0 1.026 Process Improvement Specialist 1.0 1.0 1.026 Street Light. Program Coordinator 1.0 1.0 1.024 Architect 2.0 1.0 1.024 Assistant Transportation Specialist 1.0 0.024 Engineer II 4.0 3.0 2.0 1.024 Field Surveyor 1.0 1.0 1.024 Landscape Architect 1.0 1.0 1.024 Senior Administrative Analyst 1.0 2.0 0.5 0.5 1.023 Assistant Street Light. Prog. Coordinator 1.0 0.023 St. Light. Maintenance/Operations Coord. 1.0 1.0 1.021 Assistant Architect 4.0 5.0 5.021 Assistant Landscape Architect 1.0 1.0 1.021 Engineer I 3.0 3.0 3.021 Supervisor of Mapping 1.0 1.0 1.021 Supv. Engineering Technician 2.0 1.0 1.020 GIS Applications Specialist 1.0 1.0 1.018 Assistant Field Surveyor 1.0 1.0 1.018 Principal Engineering Technician 3.0 3.0 1.0 1.0 1.018 Principal Engineering Technician-CADD 0.0 1.0 1.016 Management Trainee 1.0 0.015 Senior Engineering Technician 6.0 4.0 3.0 1.015 Senior Engineering Technician-CADD 0.0 1.0 1.015 Senior Survey Technician 2.0 2.0 2.013 Administrative Secretary 1.0 1.0 1.011 Secretary 2.0 2.0 1.0 1.010 Senior Account Clerk 1.0 1.0 1.0
9 Clerk II 0.0 1.0 1.09 Clerk II with Typing 3.0 2.0 1.0 1.09 Engineering Technician Trainee 0.0 1.0 1.07 Clerk III with Typing 2.0 1.0 1.0
EMPLOYEE YEARSFull Time 66.0 63.0 5.5 6.5 6.0 8.0 6.0 15.0 11.0 5.0Overtime 1.1 0.7 0.1 0.0 0.2 0.1 0.2 0.0 0.1 0.0Part Time, Temporary, Seasonal 2.2 3.3 0.5 0.0 0.4 0.5 0.0 1.0 0.4 0.5Less: Vacancy Allowance 2.8 2.8 0.2 0.3 0.3 0.4 0.3 0.7 0.5 0.1 Total 66.5 64.2 5.9 6.2 6.3 8.2 5.9 15.3 11.0 5.4

10–18 DEPARTMENT OF ENVIRONMENTAL SERVICES BUREAU OF OPERATIONS & PARKS
Mission Statement To support the City of Rochester’s One City Vision Statement and its Values and Guiding Principles by providing quality public works services through the maintenance of a clean, safe and vital environment for the greater Rochester community in order to improve the quality of life and contribute to a place where people choose to live and do business. Organization
Vital Customers Internal: City of Rochester Departments External: All who currently or potentially could live, work, visit, or do business in the City of
Rochester 2009-10 Fiscal Goals & Objectives Objective Priorities Supported Projected
Completion
Establish city-wide centralized fleet purchasing policy and procedure.
Customer Service Organizational Effectiveness
First Quarter
Implement standard temperature settings in City facilities
Customer Service Organizational Effectiveness
First Quarter
Complete rerouting of refuse and recycling routes
Customer Service Organizational Effectiveness
First Quarter
Design and implement equipment pools for heavy and small equipment.
Customer Service Organizational Effectiveness
Second Quarter
Director's Office
Solid Waste Collection
Special Services
Building Services
Equipment Services
Parks, Forestry & Open Spaces

DEPARTMENT OF ENVIRONMENTAL SERVICES 10–19 OPERATIONS & PARKS
Objective Priorities Supported Projected Completion
Implement enhanced equipment operator training program.
Customer Service Organizational Effectiveness
Second Quarter
Complete assessment of contract grass mowing operations
Customer Service Organizational Effectiveness
Second Quarter
Implement FASTER fleet management software upgrade
Customer Service Organizational Effectiveness
Second Quarter
Develop project plan to update Urban Forest Master Plan
Customer Service Organizational Effectiveness
Fourth Quarter
Complete requirements for Fleet Counselor Services Certification program
Customer Service Organizational Effectiveness
Fourth Quarter
Continue cooperative efforts with Monroe County for the design and construction of a new "green" fueling station.
Customer Service Organizational Effectiveness
Fourth Quarter
Work in conjunction with Information Technology staff to implement Automobile Vehicle Locator System in Operations
Customer Service Organizational Effectiveness
Fourth Quarter
Key Performance Indicators Actual
2007-08Estimated
2008-09 Budget
2008-09Budget
2009-10
Solid Waste
Residential refuse tons collected and disposed 95,325 95,800 97,064 97,063
Commercial refuse collected and disposed (tons)
13,933 14,500 17,634 17,434
Total recycling material collected (tons) 19,819 19,465 20,000 20,000
Stone chips in “Give Back” program (tons) 1,370 1,400 700 1,600
Total material recycled (tons) 21,189 20,865 20,700 21,600
Estimated disposal expense avoided, excluding stone chips ($)
950,100 922,400 978,000 967,400
Estimated net cost for recycling program 3,149,300 3,343,100 3,386,400 2,956,800
Special Services
Roadway plow runs 13 12 17 17
Sidewalk plow runs 12 11 15 15
Building Services
City building inventory 174 178 174 179
Buildings maintained (excludes foreclosed properties)
174 178 174 179

10–20 DEPARTMENT OF ENVIRONMENTAL SERVICES BUREAU OF OPERATIONS & PARKS
Actual2007-08
Estimated2008-09
Budget 2008-09
Budget2009-10
Equipment Services
Fuel purchased:
● Unleaded fuel (gallons) 786,034 743,300 760,200 800,000
● Diesel fuel (gallons) 514,600 523,150 543,000 525,000
Parks
Acres maintained 900 900 900 900
Ice rinks maintained 2 2 2 2
Year-To-Year Comparison 2008-09 2009-10 Change
Budget 51,126,700 48,679,700 -2,447,000Employee Years 503.5 498.2 -5.3 Change Detail Salary & Wage General Vacancy
Adjustment Inflation Chargebacks Allowance Miscellaneous Major Change Total16,500 620,200 308,700 0 -21,800 -3,370,600 -2,447,000
Major Change
As proposed by the Mayor:
In lieu of depreciation charge to fund capital purchases does not recur -2,563,100
Add funding in Building Services Division 350,000
Reduction in fuel pricing results in savings -327,500
Tipping fee reduction results in savings -182,500
Energy efficiencies results in savings -165,000
Net impact of Bureau personnel transactions -138,900
Reduce funding for young adult work program -103,900
Add funding for demolition of city owned vacant housing 87,900
A one-time budget amendment for graffiti funding does not recur -80,000
Contract for lawn service as an efficiency measure -77,600
Contract for small equipment repairs as an efficiency measure -55,100
Productivity improvements results in savings -54,500
Reinstitute Chip Seal Program 47,600
Transfer position to Finance Department -44,300
Net impact of personnel transactions with Bureau of Water -27,600
Funding for recycling study does not recur -25,000
Funding for one-time grant does not recur -12,100

DEPARTMENT OF ENVIRONMENTAL SERVICES 10–21 OPERATIONS & PARKS
Major Change
As amended by City Council:
Funds are transferred from Contingency for Community Lighting 1,000

10–22 DEPARTMENT OF ENVIRONMENTAL SERVICES OPERATIONS & PARKS
EXPENDITURE SUMMARY
Actual Estimated Amended Approved2007-08 2008-09 2008-09 2009-10
Appropriation by Major ObjectPersonnel Expenses 20,785,957 21,794,000 22,237,400 21,812,700 Materials & Supplies 7,804,013 8,104,700 9,363,700 9,244,900 Services 18,506,734 20,991,100 22,240,500 22,082,000 Other 1,341,500 4,009,700 4,009,700 1,446,600
Total 48,438,204 54,899,500 57,851,300 54,586,200 Less: Intrafund Credit* 5,346,200 6,051,300 6,724,600 5,906,500
Total 43,092,004 48,848,200 51,126,700 48,679,700
Appropriation by ActivityDirector's Office 1,853,184 2,030,600 2,132,400 631,400 Solid Waste Collection 15,176,038 18,568,700 18,963,000 16,368,500 Special Services 9,930,728 11,473,700 12,419,400 14,352,100 Street Maintenance 2,357,297 2,714,800 2,806,500 0 Building Services 5,980,306 6,668,600 6,511,000 6,917,100 Equipment Services 11,092,093 11,251,200 12,735,500 12,423,400 Parks, Forestry & Open Spaces 2,048,558 2,191,900 2,283,500 3,893,700
Total 48,438,204 54,899,500 57,851,300 54,586,200 Less: Intrafund Credit* 5,346,200 6,051,300 6,724,600 5,906,500
Total 43,092,004 48,848,200 51,126,700 48,679,700
Employee Years by ActivityDirector's Office 33.1 34.2 35.1 7.4 Solid Waste Collection 109.8 109.8 112.4 111.9 Special Services 102.9 117.2 114.8 148.0 Street Maintenance 35.3 36.7 36.7 0.0 Building Services 86.8 86.7 87.2 87.0 Equipment Services 71.6 74.2 78.1 79.2 Parks, Forestry & Open Spaces 36.4 37.2 39.2 64.7
Total 475.9 496.0 503.5 498.2
*Reflects chargeback for motor equipment.

DEPARTMENT OF ENVIRONMENTAL SERVICES 10–23 OPERATIONS & PARKS – DIRECTOR’S OFFICE
Year-To-Year Comparison 2008-09 2009-10 Change
Budget 2,132,400 631,400 -1,501,000Employee Years 35.1 7.4 -27.7 Change Detail Salary & Wage General Vacancy
Adjustment Inflation Chargebacks Allowance Miscellaneous Major Change Total6,000 3,900 18,200 0 0 -1,529,100 -1,501,000
Major Change Forestry transfers to Parks, Forestry & Open Spaces Division -969,900
Downtown District transfers to Parks, Forestry & Open Spaces Division -597,000
Add one full time technology position and position transfer from Solid Waste 115,000
A vacant full time position is eliminated as an efficiency measure -74,500
Productivity improvements results in savings -2,700
Program Change Forestry and Downtown District Activities transfer to Parks Forestry & Open Spaces Division

10–24 DEPARTMENT OF ENVIRONMENTAL SERVICES OPERATIONS & PARKS – DIRECTOR’S OFFICE
EXPENDITURE SUMMARY
Actual Estimated Amended Approved2007-08 2008-09 2008-09 2009-10
Appropriation by Major ObjectPersonnel Expenses 1,405,054 1,558,000 1,641,700 522,600 Materials & Supplies 107,573 111,800 111,800 10,500 Services 340,557 360,800 378,900 98,300 Other 0 0 0 0
Total 1,853,184 2,030,600 2,132,400 631,400
Appropriation by Activity Administration 414,333 524,300 565,500 631,400 Downtown District Services 558,249 604,000 597,000 0 Forestry 880,602 902,300 969,900 0
Total 1,853,184 2,030,600 2,132,400 631,400
Employee Years by ActivityAdministration 5.2 5.2 6.3 7.4 Downtown District Services 11.9 12.3 12.3 0.0 Forestry 16.0 16.7 16.5 0.0
Total 33.1 34.2 35.1 7.4

DEPARTMENT OF ENVIRONMENTAL SERVICES 10–25 OPERATIONS & PARKS – DIRECTOR’S OFFICE
PERSONNEL SUMMARY
FULL TIME POSITIONS
Budget ApprovedBr. Title 2008-09 2009-1035 Director of Operations 1.0 1.033 Deputy Director of Operations 1.0 1.032 Assistant Director of Operations 1.0 0.028 City Forester 1.0 0.026 Assoc. Administrative Analyst 1.0 1.024 Senior Administrative Analyst 0.0 1.023 Asst. Operations Superintendent 1.0 0.023 Technology Applications Specialist 0.0 1.019 Forestry Operations Supervisor 1.0 0.019 Operations Supervisor 0.5 0.017 Forestry Technician 4.0 0.016 Management Trainee 1.0 1.011 Secretary 1.0 1.0
7 Clerk III with Typing 1.0 0.065 Senior Forestry Worker 3.0 0.061 Forestry Worker 4.0 0.056 Grounds Equipment Operator 7.0 0.041 Operations Worker 1.0 0.0
EMPLOYEE YEARSFull Time 29.5 7.0Overtime 2.4 0.0Part Time, Temporary, Seasonal 3.8 0.4Less: Vacancy Allowance 0.6 0.0 Total 35.1 7.4

10–26 DEPARTMENT OF ENVIRONMENTAL SERVICES OPERATIONS & PARKS – SOLID WASTE COLLECTIONS DIVISION
Organization
Year-To-Year Comparison
2008-09 2009-10 ChangeBudget 18,963,000 16,368,500 -2,594,500Employee Years 112.4 111.9 -0.5 Change Detail Salary & Wage General Vacancy
Adjustment Inflation Chargebacks Allowance Miscellaneous Major Change Total-103,700 106,500 150,300 0 -4,600 -2,743,000 -2,594,500
Major Change In lieu of depreciation charge to fund capital purchases does not recur -2,563,100
Tipping fee reduction results in savings -182,500
Add resources for young adult work program 144,900
Transfer two employees to Equipment Services Division -72,200
Funding for recycling study does not recur -25,000
Transfer full time position to Director’s Office and add one full time technology position -21,300
A vacant part time position is eliminated as an efficiency measure -13,000
Productivity improvements results in savings -10,800
Program Change Implement litter collection program as a pilot project.
Administration
Residential Refuse Collection
Commercial Refuse Collection Recycling

DEPARTMENT OF ENVIRONMENTAL SERVICES 10–27 OPERATIONS & PARKS – SOLID WASTE COLLECTIONS DIVISION
EXPENDITURE SUMMARY
Actual Estimated Amended Approved2007-08 2008-09 2008-09 2009-10
Appropriation by Major ObjectPersonnel Expenses 5,600,309 5,780,900 5,723,800 5,652,900 Materials & Supplies 156,480 295,100 295,100 232,000 Services 9,419,249 9,929,600 10,381,000 10,483,600 Other 0 2,563,100 2,563,100 0
Total 15,176,038 18,568,700 18,963,000 16,368,500
Appropriation by ActivityAdministration 2,044,433 4,843,600 4,824,200 2,193,200 Residential Refuse Collection 9,103,688 9,790,600 10,081,200 10,191,400 Commercial Refuse Collection 1,974,729 2,291,900 2,393,700 2,418,200 Recycling 2,053,188 1,642,600 1,663,900 1,565,700
Total 15,176,038 18,568,700 18,963,000 16,368,500
Employee Years by ActivityAdministration 10.7 11.7 11.8 9.4 Residential Refuse Collection 58.3 60.9 62.6 65.2 Commercial Refuse Collection 11.7 16.8 16.9 17.3 Recycling 29.1 20.4 21.1 20.0
Total 109.8 109.8 112.4 111.9

10–28 DEPARTMENT OF ENVIRONMENTAL SERVICES OPERATIONS & PARKS – SOLID WASTE COLLECTIONS DIVISION
PERSONNEL SUMMARY
FULL TIME POSITIONS Adm
inis
trat
ion
Res
iden
tial
Ref
use
Col
lect
ion
Com
mer
cial
R
efus
e C
olle
ctio
n
Rec
yclin
g
Budget ApprovedBr. Title 2008-09 2009-1030 Refuse Operations Manager 1.0 1.0 1.025 Operations Superintendent 1.0 1.0 1.024 Senior Administrative Analyst 1.0 0.023 Asst. Operations Superintendent 4.0 4.0 3.0 1.023 Commercial Accounts Representative 1.0 1.0 1.023 Technology Applications Specialist 0.0 1.0 1.018 Municipal Assistant 1.0 1.0 1.016 Fleet Maintenance Technician 1.0 1.0 1.0
9 Clerk II 2.0 2.0 2.069 Environmental Services Operator I 85.0 85.0 53.0 15.0 17.069 Envir. Services Operator I - 6 Day 1.0 1.0 1.064 Dispatcher 1.5 1.5 1.559 Heavy Equipment Aide 2.0 0.0
EMPLOYEE YEARSFull Time 101.5 99.5 8.5 57.0 16.0 18.0Overtime 11.7 10.6 0.5 6.3 1.5 2.3Part Time, Temporary, Seasonal 0.8 3.3 0.5 2.8 0.0 0.0Less: Vacancy Allowance 1.6 1.5 0.1 0.9 0.2 0.3 Total 112.4 111.9 9.4 65.2 17.3 20.0

DEPARTMENT OF ENVIRONMENTAL SERVICES 10–29 OPERATIONS & PARKS – SPECIAL SERVICES DIVISION
Organization
Year-To-Year Comparison
2008-09 2009-10 ChangeBudget 12,419,400 14,352,100 1,932,700Employee Years 114.8 148.0 33.2 Change Detail Salary & Wage General Vacancy
Adjustment Inflation Chargebacks Allowance Miscellaneous Major Change Total24,800 268,000 -634,500 0 -1,000 2,275,400 1,932,700
Administration
Roadway Surface
Treatment
Special Projects
Service Truck Dispatch
Center City Cleaning
Lots & Yards Cleaning
Residential & Arterial
Sweeping
Work Orders & Civic Events
Leaf Collection
Snow & Ice Control

10–30 DEPARTMENT OF ENVIRONMENTAL SERVICES OPERATIONS & PARKS – SPECIAL SERVICES DIVISION
Major Change As proposed by the Mayor:
Consolidation of Street Maintenance Division 2,664,400
Reduce funding for young adult work program due to budget constraints -248,800
Transfer resources for landscaping work to Parks, Forestry & Open Spaces Division -110,800
Add funding for demolition of city owned vacant housing 87,900
A one-time budget amendment for graffiti funding does not recur -80,000
Transfer one full time and one part time position to Bureau of Water -70,600
Reinstitute Chip Seal Program 47,600
Add one full time technology position 46,000
Transfer position to Finance Department -44,300
Productivity improvements results in savings -17,000
As amended by City Council:
Funds are transferred from Contingency for Community Lighting 1,000
Program Change Consolidate Special Services Division and Street Maintenance Division. Chip Seal Program is reinstituted Coordinate demolition of city owned vacant housing as a pilot project. Funding for PRIME Program is reduced and combined with Litter Program in Solid Waste.

DEPARTMENT OF ENVIRONMENTAL SERVICES 10–31 OPERATIONS & PARKS – SPECIAL SERVICES DIVISION
EXPENDITURE SUMMARY
Actual Estimated Amended Approved2007-08 2008-09 2008-09 2009-10
Appropriation by Major ObjectPersonnel Expenses 4,161,520 4,742,500 4,863,500 6,023,200 Materials & Supplies 954,517 1,288,800 1,347,300 1,875,600 Services 4,814,691 5,442,400 6,208,600 6,453,300 Other 0 0 0 0
Total 9,930,728 11,473,700 12,419,400 14,352,100
Appropriation by ActivityAdministration 1,623,227 1,914,800 1,899,700 2,248,400 Roadway Surface Treatment 0 0 0 1,003,800 Special Projects 0 0 0 1,111,800 Service Truck 54,884 117,600 130,300 117,900 Dispatch 246,198 217,800 217,800 225,200 Center City Cleaning 277,474 384,300 391,400 263,600 Lots & Yards Cleaning 826,417 1,049,500 1,068,800 993,500 Residential & Arterial Sweeping 618,234 747,300 784,100 765,000 Work Orders & Civic Events 933,216 1,323,300 1,342,600 1,045,600 Leaf Collection 775,307 838,400 923,800 777,200 Snow & Ice Control 4,575,771 4,880,700 5,660,900 5,800,100
Total 9,930,728 11,473,700 12,419,400 14,352,100
Employee Years by ActivityAdministration 7.2 9.1 9.0 13.1 Roadway Surface Treatment 0.0 0.0 0.0 15.7 Special Projects 0.0 0.0 0.0 14.2 Service Truck 1.1 2.1 2.4 2.4 Dispatch 4.8 4.2 4.2 4.2 Center City Cleaning 7.5 8.0 8.1 6.3 Lots & Yards Cleaning 4.7 8.7 8.7 7.8 Residential & Arterial Sweeping 8.7 8.8 8.8 10.1 Work Orders & Civic Events 13.7 19.3 16.2 15.3 Leaf Collection 13.2 11.0 12.1 11.7 Snow & Ice Control 42.0 46.0 45.3 47.2
Total 102.9 117.2 114.8 148.0

10–32 DEPARTMENT OF ENVIRONMENTAL SERVICES OPERATIONS & PARKS – SPECIAL SERVICES DIVISION
PERSONNEL SUMMARY
FULL TIME POSITIONS Adm
inis
trat
ion
Roa
dway
S
urfa
ce
Tre
atm
ent
Spe
cial
P
roje
cts
Ser
vice
Tru
ck
Dis
patc
h
Cen
ter
City
C
lean
ing
Lots
& Y
ards
C
lean
ing
Res
iden
tial &
A
rter
ial
Sw
eepi
ng
Wor
k O
rder
s &
Civ
ic E
vent
s
Leaf
C
olle
ctio
n
Sno
w &
Ice
Con
trol
Budget ApprovedBr. Title 2008-09 2009-1030 Operations Manager 1.0 1.0 1.025 Operations Superintendent 1.0 2.0 2.024 Assistant to Operations Manager 0.0 1.0 1.023 Asst. Operations Superintendent 4.0 3.0 0.6 0.6 0.5 0.3 1.023 Asst. Operations Supt./Street Maint. 0.0 1.0 1.023 Technology Applications Specialist 0.0 1.0 1.019 Operations Supervisor 3.5 3.0 0.5 1.1 0.3 1.119 Op. Supervisor, St. Maintenance 0.8 2.0 1.3 0.718 Municipal Assistant 1.0 0.018 Principal Engineering Technician 0.0 1.0 1.016 Fleet Maintenance Technician 1.3 1.0 1.015 Senior Dispatcher 1.0 1.0 1.011 Clerk I 1.0 2.0 2.0
9 Clerk II Bilingual 1.0 1.0 1.065 Sr. Maintenance Mechanic Mason 0.0 1.0 0.4 0.665 Sr. Maintenance Mechanic Welder 0.0 1.0 1.064 Special Equipment Operator 1.1 4.0 2.0 1.0 1.064 Dispatcher 2.5 2.5 2.562 Senior Operations Worker 23.6 29.0 1.5 3.9 0.6 3.3 6.0 2.8 2.1 8.857 Construction Supply Handler 1.0 1.0 1.056 Grounds Equipment Operator 1.0 1.0 0.6 0.1 0.341 Operations Worker 31.5 45.0 8.0 5.5 1.0 4.6 2.7 2.2 5.2 2.2 13.6
EMPLOYEE YEARSFull Time 76.3 104.5 12.0 13.1 12.0 1.0 3.5 5.2 7.7 8.8 9.7 5.0 26.5Overtime 25.8 32.0 1.0 2.2 1.5 0.9 0.8 0.8 0.2 0.2 3.7 3.7 17.0Part Time, Temporary, Seasonal 14.6 14.6 0.4 1.0 1.2 0.5 0.0 0.4 0.1 1.3 2.2 3.1 4.4Less: Vacancy Allowance 1.9 3.1 0.3 0.6 0.5 0.0 0.1 0.1 0.2 0.2 0.3 0.1 0.7 Total 114.8 148.0 13.1 15.7 14.2 2.4 4.2 6.3 7.8 10.1 15.3 11.7 47.2

DEPARTMENT OF ENVIRONMENTAL SERVICES 10–33 OPERATIONS & PARKS – STREET MAINTENANCE DIVISION
Organization
Year-To-Year Comparison
2008-09 2009-10 ChangeBudget 2,806,500 0 -2,806,500Employee Years 36.7 0.0 -36.7 Change Detail Salary & Wage General Vacancy
Adjustment Inflation Chargebacks Allowance Miscellaneous Major Change Total0 0 0 0 0 -2,806,500 -2,806,500
Major Change Consolidation of Street Maintenance Division to Special Services Division -2,664,400
One vacant full time and one filled full time positions are eliminated as an efficiency measure -74,100
Transfer Sign Shop function to Equipment Services -68,000
Program Change Consolidate division with Special Services Division. Transfer Sign Shop function to Equipment Services.
Administration
Patching Chip Seal/Overlay
Utility Cuts Special Projects
Crack Sealing

10–34 DEPARTMENT OF ENVIRONMENTAL SERVICES OPERATIONS & PARKS –STREET MAINTENANCE DIVISION
EXPENDITURE SUMMARY
Actual Estimated Amended Approved2007-08 2008-09 2008-09 2009-10
Appropriation by Major ObjectPersonnel Expenses 1,474,331 1,492,300 1,496,800 0 Materials & Supplies 384,033 399,600 399,600 0 Services 498,933 822,900 910,100 0 Other 0 0 0 0
Total 2,357,297 2,714,800 2,806,500 0
Appropriation by ActivityAdministration 525,313 512,900 522,000 0 Patching 165,990 336,600 356,300 0 Chip Seal/Overlay 664,294 674,500 694,200 0 Utility Cuts 443,837 553,200 572,900 0 Special Projects 481,490 542,700 562,400 0 Crack Sealing 76,373 94,900 98,700 0
Total 2,357,297 2,714,800 2,806,500 0
Employee Years by ActivityAdministration 6.8 8.0 8.0 0.0 Patching 2.1 2.0 2.1 0.0 Chip Seal/Overlay 11.3 10.8 10.7 0.0 Utility Cuts 7.5 7.6 7.6 0.0 Special Projects 6.3 6.8 6.8 0.0 Crack Sealing 1.3 1.5 1.5 0.0
Total 35.3 36.7 36.7 0.0

DEPARTMENT OF ENVIRONMENTAL SERVICES 10–35 OPERATIONS & PARKS – STREET MAINTENANCE DIVISION
PERSONNEL SUMMARY
FULL TIME POSITIONS
Budget ApprovedBr. Title 2008-09 2009-1025 Operations Superintendent 1.0 0.023 Asst. Operations Supt./Street Maintenance 1.0 0.019 Operations Supervisor/Street Maintenance 1.2 0.018 Principal Engineering Technician 1.0 0.016 Fleet Maintenance Technician 0.7 0.016 Sign Maker 1.0 0.012 Assistant Sign Maker 1.0 0.011 Clerk I 1.0 0.0
9 Clerk II with Typing 1.0 0.065 Sr. Maintenance Mechanic Mason 1.0 0.065 Sr. Maintenance Mechanic Welder 1.0 0.064 Special Equipment Operator 2.9 0.062 Senior Operations Worker 5.4 0.041 Operations Worker 13.5 0.0
EMPLOYEE YEARSFull Time 32.7 0.0Overtime 3.6 0.0Part Time, Temporary, Seasonal 1.8 0.0Less: Vacancy Allowance 1.4 0.0 Total 36.7 0.0

10–36 DEPARTMENT OF ENVIRONMENTAL SERVICES OPERATIONS & PARKS – BUILDING SERVICES DIVISION
Organization
Year-To-Year Comparison
2008-09 2009-10 ChangeBudget 6,511,000 6,917,100 406,100Employee Years 87.2 87.0 -0.2 Change Detail Salary & Wage General Vacancy
Adjustment Inflation Chargebacks Allowance Miscellaneous Major Change Total76,000 123,200 38,100 0 1,900 166,900 406,100
Major Change Add resources for increase in facilities requiring services 350,000
Energy efficiencies results in savings -115,000
One vacant full time and two vacant part time positions eliminated as an efficiency measure -68,100
Program Change Standardize temperature range for city owned buildings.
Administration
Construction & Repair Building Operations Heating, Ventilating,
Air Conditioning

DEPARTMENT OF ENVIRONMENTAL SERVICES 10–37 OPERATIONS & PARKS –BUILDING SERVICES DIVISION
EXPENDITURE SUMMARY
Actual Estimated Amended Approved2007-08 2008-09 2008-09 2009-10
Appropriation by Major ObjectPersonnel Expenses 3,470,082 3,479,600 3,478,600 3,486,500 Materials & Supplies 718,652 759,300 759,300 774,400 Services 1,791,572 2,429,700 2,273,100 2,656,200 Other 0 0 0 0
Total 5,980,306 6,668,600 6,511,000 6,917,100
Appropriation by ActivityAdministration 490,064 538,700 509,200 550,500 Construction & Repair 1,679,672 1,647,800 1,640,400 1,690,100 Building Operations 2,856,824 3,495,600 3,379,000 3,644,400 Heating, Ventilating, Air Conditioning 953,746 986,500 982,400 1,032,100
Total 5,980,306 6,668,600 6,511,000 6,917,100
Employee Years by ActivityAdministration 6.2 5.2 5.2 5.2 Construction & Repair 27.1 23.2 23.9 23.9 Building Operations 40.8 44.7 44.5 44.4 Heating, Ventilating, Air Conditioning 12.7 13.6 13.6 13.5
Total 86.8 86.7 87.2 87.0

10–38 DEPARTMENT OF ENVIRONMENTAL SERVICES OPERATIONS & PARKS – BUILDING SERVICES DIVISION
PERSONNEL SUMMARY
FULL TIME POSITIONS Adm
inis
trat
ion
Con
stru
ctio
n &
Rep
air
Bui
ldin
g O
pera
tions
Hea
ting,
Ven
t. &
Air
Con
ditio
ning
Budget ApprovedBr. Title 2008-09 2009-10
30 Manager of Building Services 1 1 125 Superintendent HVAC 1 1 124 Superintendent of Construction & Repair 1 1 123 Superintendent Building Operations 2 2 221 Supervisor Carpentry Trades 1 1 121 Supervisor of Electrical Trades 1 1 121 Supervisor Structures & Equipment 1 1 118 Building Supervisor 1 1 118 Municipal Assistant 0 1 118 Senior Supervising Stock Clerk 1 1 116 Management Trainee 1 015 Building Maintenance Supervisor 1 1 111 Secretary 1 1 1
6 Stock Clerk 80 Hours 1 1 11 Cleaner 16 16 16
65 Sr. Maintenance Mechanic/Buildings 2 2 265 Sr. Maintenance Mechanic/Carpentry 5 5 565 Sr. Maintenance Mechanic/Electrical 1 1 165 Sr. Maintenance Mechanic/Mason 1 1 165 Sr. Maintenance Mechanic/Pipefitter 1 1 162 Senior Maintenance Mechanic 4 4 460 Maintenance Mechanic 7 7 757 Maintenance Worker 4 3 352 Building Maintenance Helper 5 5 5
152 Lead HVAC Engineer 2 2 2151 HVAC Engineer 3 3 3150 Assistant HVAC Engineer 7 7 7
EMPLOYEE YEARSFull Time 72.0 71.0 5.0 23.0 30.0 13.0Overtime 4.3 4.2 0.1 1.6 2.0 0.5Part Time, Temporary, Seasonal 13.7 14.6 0.3 0.2 13.6 0.5Less: Vacancy Allowance 2.8 2.8 0.2 0.9 1.2 0.5 Total 87.2 87.0 5.2 23.9 44.4 13.5

DEPARTMENT OF ENVIRONMENTAL SERVICES 10–39 OPERATIONS & PARKS –EQUIPMENT SERVICES DIVISION
Organization
Year-To-Year Comparison
2008-09 2009-10 ChangeBudget 6,010,900 6,516,900 506,000Employee Years 78.1 79.2 1.1 Change Detail Salary & Wage General Vacancy
Adjustment Inflation Chargebacks Allowance Miscellaneous Major Change Total11,800 83,600 766,300 0 -18,100 -337,600 506,000
Major Change Reduction in fuel price results in savings -327,500
Transfer two mechanic positions from Solid Waste Division 72,200
Eliminate two vacant full time positions as an efficiency measure -68,900
Transfer Sign Shop function from Street Maintenance Division 68,000
Contract small equipment repairs as an efficiency measure -55,100
Energy efficiencies results in savings -50,000
Transfer one mechanic position from Bureau of Water 43,000
Productivity improvements results in savings -19,300
Fleet Management
Repair Fueling Parts Equipment Maintenance

10–40 DEPARTMENT OF ENVIRONMENTAL SERVICES OPERATIONS & PARKS – EQUIPMENT SERVICES DIVISION
Chargebacks Department/Bureau 2008-09 2009-10 Department/Bureau 2008-09 2009-10CITY COUNCIL & CLERK 1,400 1,800 ENVIRONMENTAL SERVICES Commissioner 7,200 5,500ADMINISTRATION Architecture & Engineering 25,600 30,000 Mayor’s Office 8,600 7,600 Operations & Parks 7,214,200 6,649,900 Neighborhood Serv. Centers 200 0 Water 528,900 469,200 Management & Budget 5,100 200 Total 7,775,900 7,154,600 Communications 8,000 6,300 Human Resource Mgt. 8,600 5,600 EMERGENCY COMMUNICATIONS 8,100 6,500Total 30,500 19,700 POLICE 4,094,300 3,974,600INFORMATION TECHNOLOGY 6,600 7,800 FIRE 257,000 288,300FINANCE Treasury 6,000 12,300 LIBRARY Assessment 100 100 Central Library 14,400 1,500 Purchasing 900 600 Community Library 5,200 2,200 Parking 0 22,900 Total 19,600 3,700Total 7,000 35,900 RECREATION & YOUTH SERVICES COMMUNITY DEVELOPMENT 7,600 0 Commissioner 2,000 4,000 Recreation 90,600 41,800ECONOMIC DEVELOPMENT Special Services 120,000 105,000 Administration 3,200 0 Total 212,600 150,800 Municipal Parking 1,400 0 Total 4,600 0 Total Interfund 5,700,600 5,748,900 Total Intrafund 6,724,600 5,906,500NEIGHBORHOOD & BUSINESS DEVELOPMENT
0 11,700 CITY TOTAL 12,425,200 11,655,400

DEPARTMENT OF ENVIRONMENTAL SERVICES 10–41 OPERATIONS & PARKS – EQUIPMENT SERVICES DIVISION
EXPENDITURE SUMMARY
Actual Estimated Amended Approved2007-08 2008-09 2008-09 2009-10
Appropriation by Major ObjectPersonnel Expenses 3,311,657 3,367,900 3,603,000 3,618,100 Materials & Supplies 5,344,014 5,104,300 6,304,800 6,063,100 Services 1,094,922 1,332,400 1,381,100 1,295,600 Other 1,341,500 1,446,600 1,446,600 1,446,600
Total 11,092,093 11,251,200 12,735,500 12,423,400 Less: Intrafund Credit* 5,346,200 6,051,300 6,724,600 5,906,500
Total 5,745,893 5,199,900 6,010,900 6,516,900
Appropriation by ActivityFleet Management 2,124,595 2,444,800 2,603,400 2,481,500Repair 3,022,907 3,043,000 3,168,900 3,315,700 Fueling 3,719,029 3,526,800 4,727,300 4,363,900Parts 2,090,298 2,091,900 2,081,200 2,155,400 Equipment Maintenance 135,264 144,700 154,700 106,900
Total 11,092,093 11,251,200 12,735,500 12,423,400 Less: Intrafund Credit* 5,346,200 6,051,300 6,724,600 5,906,500
Total 5,745,893 5,199,900 6,010,900 6,516,900
Employee Years by ActivityFleet Management 5.5 6.5 7.1 7.4 Repair 53.7 55.0 58.1 61.8 Fueling 1.0 1.0 1.0 0.0 Parts 8.3 8.6 8.5 8.4 Equipment Maintenance 3.1 3.1 3.4 1.6
Total 71.6 74.2 78.1 79.2
*Reflects chargeback for motor equipment service.

10–42 DEPARTMENT OF ENVIRONMENTAL SERVICES OPERATIONS & PARKS – EQUIPMENT SERVICES DIVISION
PERSONNEL SUMMARY
FULL TIME POSITIONS
Fle
et
Man
agem
ent
Rep
air
Par
ts
Equ
ipm
ent
Mai
nten
ance
Budget ApprovedBr. Title 2008-09 2009-10
31 Fleet Service Manager 1.0 0.030 Fleet Manager 0.0 1.0 1.028 Asst. Fleet Service Manager 1.0 0.025 Fleet Maintenance Manager 2.0 0.025 Service Manager 0.0 1.0 1.024 Automotive Parts & Materials Manager 1.0 1.0 1.024 Operations Analyst 1.0 1.0 1.023 Assistant Fleet Maintenance Manager 3.0 0.023 Assistant Service Manager 0.0 4.0 4.023 Equipment Training Coordinator 1.0 1.0 1.023 Warranty Specialist 1.0 1.0 1.022 Equipment Analyst 0.0 1.0 1.021 Parts Supervisor 1.0 1.0 1.019 Mechanic Supervisor 2.0 2.0 2.0 19 Senior Equipment Mechanic 1.0 1.0 1.018 Equipment Trainer 0.0 1.0 1.017 Accountant 0.0 1.0 1.017 Heavy Mechanic I 3.0 1.0 1.017 Senior Auto Welder 0.0 1.0 1.016 Sign Maker 0.0 1.0 1.015 Accountant 1.0 0.015 Auto Welder 1.0 0.015 Heavy Mechanic II 20.0 17.0 17.014 Sr. Auto Maintenance Mechanic 15.0 13.0 13.014 Senior Auto Parts Clerk 2.0 2.0 2.013 Fleet Service Writer 2.0 2.0 2.011 Auto Parts Clerk 3.0 3.0 3.0
9 Clerk II with Typing 1.0 0.05 Account Clerk 0.0 1.0 1.0
70 Master Automotive Technician 0.0 3.0 3.070 Master Truck Technician 0.0 5.0 5.065 Auto Machinist 1.0 1.0 1.063 Equipment Mechanic 2.0 0.061 Tire Repairer 2.0 2.0 2.0 59 Heavy Equipment Aide 0.0 2.0 2.058 Auto Aide 1.0 1.0 1.057 Garage Attendant 1.0 0.0
EMPLOYEE YEARSFull Time 70.0 72.0 7.0 56.0 8.0 1.0Overtime 6.3 6.2 0.1 5.6 0.4 0.1Part Time, Temporary, Seasonal 2.7 1.9 0.3 1.0 0.1 0.5Less: Vacancy Allowance 0.9 0.9 0.0 0.8 0.1 0.0 Total 78.1 79.2 7.4 61.8 8.4 1.6

DEPARTMENT OF ENVIRONMENTAL SERVICES 10–43 OPERATIONS & PARKS – PARKS, FORESTRY & OPEN SPACES
Organization
Year-To-Year Comparison
2008-09 2009-10 ChangeBudget 2,283,500 3,893,700 1,610,200Employee Years 39.2 64.7 25.5 Change Detail Salary & Wage General Vacancy
Adjustment Inflation Chargebacks Allowance Miscellaneous Major Change Total1,600 35,000 -29,700 0 0 1,603,300 1,610,200
Major Change Transfer Forestry from Director’s Office 969,900
Transfer Downtown District from Director’s Office 597,000
Transfer resources for landscaping work from Special Services Division 110,800
Contract for lawn service results in savings -77,600
One full time management position for new division is added 68,900
A net reduction of one vacant full time position is eliminated as an efficiency measure -48,900
Funding for one time grant does not recur -12,100
Productivity improvements results in savings -4,700
Program Change Transfer Forestry and Downtown District from Director’s Office. Contract lawn mowing service is utilized.
Administration
Parks Operations
Downtown District Forestry Gateway &
Open Spaces

10–44 DEPARTMENT OF ENVIRONMENTAL SERVICES OPERATIONS & PARKS – PARKS, FORESTRY & OPEN SPACES
EXPENDITURE SUMMARY
Actual Estimated Amended Approved2007-08 2008-09 2008-09 2009-10
Appropriation by Major ObjectPersonnel Expenses 1,363,004 1,372,800 1,430,000 2,509,400 Materials & Supplies 138,744 145,800 145,800 289,300 Services 546,810 673,300 707,700 1,095,000 Other 0 0 0 0
Total 2,048,558 2,191,900 2,283,500 3,893,700
Appropriation by Activity Administration 0 0 0 134,000 Parks Operations 2,048,558 2,191,900 2,283,500 2,135,200 Downtown District 0 0 0 588,900 Forestry 0 0 0 947,200 Gateway & Open Spaces 0 0 0 88,400
Total 2,048,558 2,191,900 2,283,500 3,893,700
Employee Years by ActivityAdministration 0.0 0.0 0.0 1.9 Parks Operations 36.4 37.2 39.2 33.5 Downtown District 0.0 0.0 0.0 11.5 Forestry 0.0 0.0 0.0 16.5 Gateway & Open Spaces 0.0 0.0 0.0 1.3
Total 36.4 37.2 39.2 64.7

DEPARTMENT OF ENVIRONMENTAL SERVICES 10–45 OPERATIONS & PARKS – PARKS, FORESTRY & OPEN SPACES
PERSONNEL SUMMARY
FULL TIME POSITIONS Adm
inis
trat
ion
Par
ks
Ope
ratio
ns
Dow
ntow
n D
istr
ict
For
estr
y
Gat
eway
&
Ope
n S
pace
s
Budget ApprovedBr. Title 2008-09 2009-10
30 Operations Manager 0.0 1.0 1.025 City Forester 0.0 1.0 1.025 Operations Superintendent 1.0 1.0 1.023 Assistant Operations Superintendent 0.0 1.0 1.019 Forestry Operations Supervisor 0.0 1.0 1.019 Parks Operations Supervisor 3.0 3.0 3.018 Municipal Assistant 0.0 1.0 1.017 Forestry Technician 0.0 4.0 4.016 Management Trainee 1.0 0.0
7 Clerk III with Typing 0.0 1.0 1.066 Laborer 6 Day 1.0 1.0 1.065 Sr. Forestry Worker 0.0 3.0 3.065 Sr. Maintenance Mechanic/Pipefitter 1.0 0.064 Special Equipment Operator 0.0 1.0 1.062 Senior Maintenance Mechanic 1.0 1.0 1.061 Crew Chief 5.0 4.0 4.061 Forestry Worker 0.0 4.0 4.056 Ground Equipment Operator 17.0 23.0 16.0 7.041 Operations Worker 5.0 5.0 4.0 1.0
EMPLOYEE YEARSFull Time 35.0 56.0 2.0 31.0 9.0 14.0 0.0Overtime 1.5 4.1 0.0 1.6 1.5 1.0 0.0Part Time, Temporary, Seasonal 4.1 6.6 0.0 2.0 1.3 2.0 1.3Less: Vacancy Allowance 1.4 2.0 0.1 1.1 0.3 0.5 0.0 Total 39.2 64.7 1.9 33.5 11.5 16.5 1.3

10–46 DEPARTMENT OF ENVIRONMENTAL SERVICES BUREAU OF WATER Mission Statement To support the City of Rochester’s’ One City Vision Statement and its Values and Guiding Principles through the provision of an abundant supply of clean, palatable water to City residents and wholesale customers to provide reliable service at a modest price and to provide an adequate supply of water for fire protection services. Organization
Vital Customers Internal: City of Rochester Fire Department External: All who currently or potentially could live, work, visit, or do business in the City of
Rochester; Wholesale customers Critical Processes Protecting the watershed to keep the water supply as clean (free from contaminants) as possible. Filtering, disinfecting, and testing the potability of water before it is delivered to customers. Maintaining the distribution and storage systems in good condition to provide reliable, high quality
water. 2009-10 Fiscal Goals & Objectives Objective Priorities Supported Projected
Completion
Finish design on Highland Reservoir Liner improvements
Customer Service Organizational Effectiveness
Second Quarter
Complete negotiations with Monroe County Water Authority for new water sharing agreement.
Customer Service Organizational Effectiveness
Second Quarter
Conduit Modernization program-final design of pipe replacement/rehabilitation north of Rush Reservoir-South Clinton Avenue
Customer Service Organizational Effectiveness
Second Quarter
Start construction on Highland Reservoir Liner project
Customer Service Organizational Effectiveness
Third Quarter
Establish contract with New York DEC for watershed property maintenance from sale of watershed
Customer Service Organizational Effectiveness
Fourth Quarter
Director's Office
Water Engineering
Upland Operations Water Distribution Water Fixed
Charges

DEPARTMENT OF ENVIRONMENTAL SERVICES 10–47 BUREAU OF WATER
Key Performance Indicators Actual
2007-08Estimated
2008-09 Budget
2008-09Budget
2009-10
Engineering
In-house design projects value ($000) 3,822 4,299 4,254 3,116
In-house construction project value ($000) 3,560 2,850 5,650 3,264
Water Production & Treatment
Filtration plant production (millions gallons per day)
36.5 37 36.5 37
Water Distribution
Water service interruption measure 330 250 350 350
Lost water measure 27% 25% 23% 25%
Complaints received--Water related 4,669 4,400 4,600 4,600
Investigations performed 8,887 10,000 9,000 9,000
Year-To-Year Comparison
2008-09 2009-10 ChangeBudget 22,627,400 22,377,900 -249,500Employee Years 144.2 139.5 -4.7 Change Detail Salary & Wage General Vacancy
Adjustment Inflation Chargebacks Allowance Miscellaneous Major Change Total-9,400 203,400 170,500 0 -700 -613,300 -249,500
Major Change Reduce allowance for uncollectibles due to tax lien sale -360,000
Net impact of personnel transactions in Bureau -161,200
Parking Meter Operations transfers to Finance Department -119,700
Net impact of position transfers with Bureau of Operations & Parks 27,600

10–48 DEPARTMENT OF ENVIRONMENTAL SERVICES BUREAU OF WATER
EXPENDITURE SUMMARY
Actual Estimated Amended Approved2007-08 2008-09 2008-09 2009-10
Appropriation by Major ObjectPersonnel Expenses 6,629,402 6,654,600 6,937,400 6,705,300 Materials & Supplies 1,256,162 1,429,600 1,429,600 1,499,800 Services 6,380,751 7,366,300 7,451,100 7,729,700 Other 6,939,388 7,559,300 6,809,300 6,443,100
Total 21,205,703 23,009,800 22,627,400 22,377,900
Appropriation by ActivityDirector's Office 1,086,818 1,414,700 1,456,500 1,508,200 Water Engineering 1,059,518 1,065,800 1,059,500 1,068,100 Upland Operations 6,161,097 6,777,400 6,807,500 7,004,300 Water Distribution 4,196,322 4,420,000 4,712,600 4,475,000 Parking Meter Operations 182,760 110,300 119,700 0 Water Fixed Charges 8,519,188 9,221,600 8,471,600 8,322,300
Total 21,205,703 23,009,800 22,627,400 22,377,900
Employee Years by ActivityDirector's Office 10.5 12.1 12.3 15.0 Water Engineering 16.8 16.2 16.5 16.5 Upland Operations 37.4 38.1 38.5 38.8 Water Distribution 70.0 69.5 74.9 69.2 Parking Meter Operations 4.0 2.0 2.0 0.0
Total 138.7 137.9 144.2 139.5

DEPARTMENT OF ENVIRONMENTAL SERVICES 10–49 WATER – DIRECTOR’S OFFICE
Year-To-Year Comparison 2008-09 2009-10 Change
Budget 1,456,500 1,508,200 51,700Employee Years 12.3 15.0 2.7 Change Detail Salary & Wage General Vacancy
Adjustment Inflation Chargebacks Allowance Miscellaneous Major Change Total-12,500 20,400 -10,200 0 -40,600 94,600 51,700
Major Change Net impact of full time position transactions 67,000
Net impact of position transfer with Bureau of Operations & Parks 27,600

10–50 DEPARTMENT OF ENVIRONMENTAL SERVICES WATER – DIRECTOR’S OFFICE
EXPENDITURE SUMMARY
Actual Estimated Amended Approved2007-08 2008-09 2008-09 2009-10
Appropriation by Major ObjectPersonnel Expenses 642,508 760,800 767,200 808,700 Materials & Supplies 7,807 8,700 8,700 9,100 Services 436,503 645,200 680,600 690,400 Other 0 0 0 0
Total 1,086,818 1,414,700 1,456,500 1,508,200
Appropriation by ActivityDirector's Office 1,086,818 1,414,700 1,456,500 1,508,200
Employee Years by ActivityDirector's Office 10.5 12.1 12.3 15.0

DEPARTMENT OF ENVIRONMENTAL SERVICES 10–51 WATER – DIRECTOR’S OFFICE
PERSONNEL SUMMARY
FULL TIME POSITIONS
Budget ApprovedBr. Title 2008-09 2009-1035 Director of Water 1 126 Associate Administrative Analyst 1 125 Parts & Materials Manager 1 023 Parts & Materials Manager 0 123 Technology Applications Specialist 0 120 Executive Assistant 1 119 Water Materials Coordinator 1 018 Municipal Assistant 1 118 Senior Supervising Stock Clerk 0 116 Fleet Maintenance Technician 0 115 Heavy Mechanic II 1 013 Supervising Stock Clerk 1 1
9 Clerk II with Typing 1 165 Expediter 1 163 Water Maintenance Worker/Construction 0 157 Garage Attendant 1 1
EMPLOYEE YEARSFull Time 11.0 13.0Overtime 0.4 0.5Part Time, Temporary, Seasonal 0.9 1.5Less: Vacancy Allowance 0.0 0.0 Total 12.3 15.0

10–52 DEPARTMENT OF ENVIRONMENTAL SERVICES WATER – ENGINEERING DIVISION
Organization
Year-To-Year Comparison
2008-09 2009-10 ChangeBudget 1,059,500 1,068,100 8,600Employee Years 16.5 16.5 0.0 Change Detail Salary & Wage General Vacancy
Adjustment Inflation Chargebacks Allowance Miscellaneous Major Change Total5,800 4,500 -21,700 0 20,000 0 8,600
Design Engineering
Field Engineering Maps & Records

DEPARTMENT OF ENVIRONMENTAL SERVICES 10–53 WATER – ENGINEERING DIVISION
EXPENDITURE SUMMARY
Actual Estimated Amended Approved2007-08 2008-09 2008-09 2009-10
Appropriation by Major ObjectPersonnel Expenses 1,012,547 990,800 982,000 1,010,200 Materials & Supplies 14,325 20,000 20,000 20,700 Services 32,646 55,000 57,500 37,200 Other 0 0 0 0
Total 1,059,518 1,065,800 1,059,500 1,068,100
Appropriation by ActivityDesign Engineering 805,484 822,100 804,700 810,800 Field Engineering 196,602 182,800 189,100 190,900 Maps & Records 57,432 60,900 65,700 66,400
Total 1,059,518 1,065,800 1,059,500 1,068,100
Employee Years by ActivityDesign Engineering 11.9 11.5 11.6 11.5 Field Engineering 3.9 3.7 3.7 3.8 Maps & Records 1.0 1.0 1.2 1.2
Total 16.8 16.2 16.5 16.5
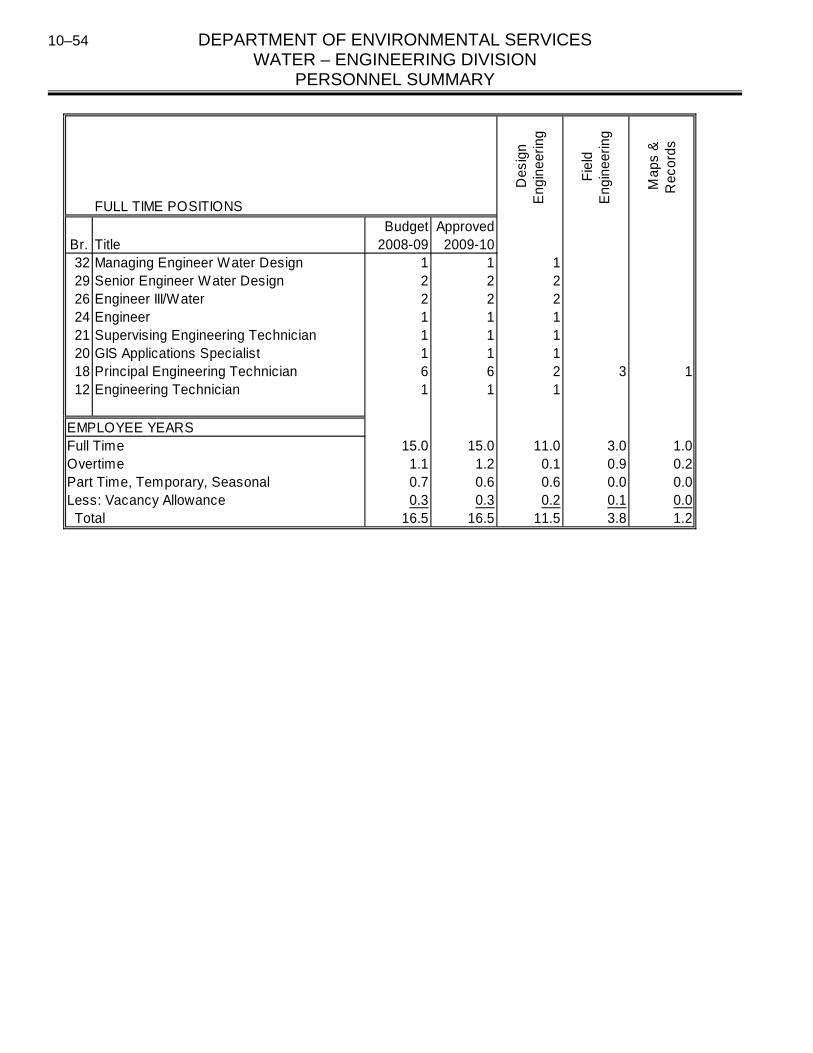
10–54 DEPARTMENT OF ENVIRONMENTAL SERVICES WATER – ENGINEERING DIVISION
PERSONNEL SUMMARY
FULL TIME POSITIONS
Des
ign
Eng
inee
ring
Fie
ld
Eng
inee
ring
Map
s &
R
ecor
ds
Budget ApprovedBr. Title 2008-09 2009-1032 Managing Engineer Water Design 1 1 129 Senior Engineer Water Design 2 2 226 Engineer III/Water 2 2 224 Engineer 1 1 121 Supervising Engineering Technician 1 1 120 GIS Applications Specialist 1 1 118 Principal Engineering Technician 6 6 2 3 112 Engineering Technician 1 1 1
EMPLOYEE YEARSFull Time 15.0 15.0 11.0 3.0 1.0Overtime 1.1 1.2 0.1 0.9 0.2Part Time, Temporary, Seasonal 0.7 0.6 0.6 0.0 0.0Less: Vacancy Allowance 0.3 0.3 0.2 0.1 0.0 Total 16.5 16.5 11.5 3.8 1.2

DEPARTMENT OF ENVIRONMENTAL SERVICES 10–55 WATER – UPLAND OPERATIONS DIVISION
Organization
Year-To-Year Comparison
2008-09 2009-10 ChangeBudget 6,807,500 7,004,300 196,800Employee Years 38.5 38.8 0.3 Change Detail Salary & Wage General Vacancy
Adjustment Inflation Chargebacks Allowance Miscellaneous Major Change Total7,500 128,700 40,700 0 19,900 0 196,800
Upland Operations
Supply & Maintenance
Water Production & Treatment
Taxes to Other Governments Purchase of Water

10–56 DEPARTMENT OF ENVIRONMENTAL SERVICES WATER – UPLAND OPERATIONS DIVISION
EXPENDITURE SUMMARY
Actual Estimated Amended Approved2007-08 2008-09 2008-09 2009-10
Appropriation by Major ObjectPersonnel Expenses 1,797,715 1,855,400 1,875,800 1,902,000 Materials & Supplies 907,539 961,600 961,600 1,017,000 Services 3,455,843 3,960,400 3,970,100 4,085,300Other 0 0 0 0
Total 6,161,097 6,777,400 6,807,500 7,004,300
Appropriation by ActivitySupply & Maintenance 833,355 1,018,200 1,056,000 1,079,400 Water Production & Treatment 2,673,168 2,805,900 2,798,200 2,892,500 Taxes to Other Governments 1,140,763 1,174,100 1,174,100 1,225,800 Purchase of Water 1,513,811 1,779,200 1,779,200 1,806,600
Total 6,161,097 6,777,400 6,807,500 7,004,300
Employee Years by ActivitySupply & Maintenance 11.4 12.3 12.7 12.7 Water Production & Treatment 26.0 25.8 25.8 26.1
37.4 38.1 38.5 38.8

DEPARTMENT OF ENVIRONMENTAL SERVICES 10–57 WATER – UPLAND OPERATIONS DIVISION
PERSONNEL SUMMARY
FULL TIME POSITIONS
Sup
ply
&
Mai
nten
ance
Wat
er
Pro
duct
ion
&
Tre
atm
ent
Budget ApprovedBr. Title 2008-09 2009-1032 Manager of Water Production 1 1 128 Assistant Manager of Water Production 0 1 126 Chief of Water Quality Operations 1 025 Automated Systems Control Specialist 1 1 125 Supt. of Water Plant Maintenance 1 1 125 Supt. of Water Supply Maintenance 1 1 123 Watershed Conservationist 1 1 121 Water Treatment Supervisor 1 1 120 Corrosion Technician 1 1 120 Master Electrician 1 1 120 Water Instrumentation Technician 1 1 120 Water Plant Mechanic 1 1 119 Water Quality Lab Technician 1 1 118 Senior Reservoir Operator 0 1 118 Senior Water Plant Operator 1 016 Water Plant Operator 6 6 615 Sr. Maint. Mech./Water Treatment 2 1 113 Administrative Secretary 1 1 165 Expediter 1 1 165 Sr. Maint. Mechanic/Instrumentation 0 1 165 Sr. Maint. Mechanic/Water Supply 3 3 363 Water Supply Maint. Worker/Constr. 5 4 461 Maint. Mechanic/Water Treatment 4 4 461 Water Maint. Worker/Water Treatment 0 1 1
EMPLOYEE YEARSFull Time 35.0 35.0 11.0 24.0Overtime 3.6 3.6 1.9 1.7Part Time, Temporary, Seasonal 0.6 0.9 0.0 0.9Less: Vacancy Allowance 0.7 0.7 0.2 0.5 Total 38.5 38.8 12.7 26.1

10–58 DEPARTMENT OF ENVIRONMENTAL SERVICES WATER –WATER DISTRIBUTION DIVISION
Organization
Year-To-Year Comparison
2008-09 2009-10 ChangeBudget 4,712,600 4,475,000 -237,600Employee Years 74.9 69.2 -5.7 Change Detail Salary & Wage General Vacancy
Adjustment Inflation Chargebacks Allowance Miscellaneous Major Change Total-10,200 49,800 -49,000 0 0 -228,200 -237,600
Major Change Eliminate four vacant positions and transfer one to Director’s Office as an efficiency measure -228,200
Administration
Dispatch Technical Support
Grid Repair Meter Service
Hydraulic Maintenance

DEPARTMENT OF ENVIRONMENTAL SERVICES 10–59 WATER –WATER DISTRIBUTION DIVISION
EXPENDITURE SUMMARY
Actual Estimated Amended Approved2007-08 2008-09 2008-09 2009-10
Appropriation by Major ObjectPersonnel Expenses 3,023,497 2,965,700 3,222,800 2,984,400 Materials & Supplies 323,482 434,000 434,000 453,000 Services 849,343 1,020,300 1,055,800 1,037,600 Other 0 0 0 0
Total 4,196,322 4,420,000 4,712,600 4,475,000
Appropriation by ActivityAdministration 533,625 605,100 648,500 612,100 Dispatch 289,219 250,600 279,600 285,200 Technical Support 332,174 371,400 459,500 371,400 Grid Repair 1,725,644 1,872,600 1,914,600 1,886,200 Meter Services 724,807 767,300 795,400 707,100 Hydraulic Maintenance 590,853 553,000 615,000 613,000
Total 4,196,322 4,420,000 4,712,600 4,475,000
Employee Years by ActivityAdministration 2.9 2.9 2.9 2.9 Dispatch 7.3 6.6 6.9 6.9 Technical Support 10.4 10.6 10.7 8.8 Grid Repair 18.5 19.0 23.1 21.2 Meter Service 15.7 15.8 16.5 14.6 Hydraulic Maintenance 15.2 14.6 14.8 14.8
Total 70.0 69.5 74.9 69.2

10–60 DEPARTMENT OF ENVIRONMENTAL SERVICES WATER – WATER DISTRIBUTION DIVISION
PERSONNEL SUMMARY
FULL TIME POSITIONS Adm
inis
trat
ion
Dis
patc
h
Tec
hnic
al
Sup
port
Grid
Rep
air
Met
er S
ervi
ce
Hyd
raul
ic
Mai
nten
ance
Budget ApprovedBr. Title 2008-09 2009-1032 Manager of Water Distribution 1 1 125 Superintendent of Water Distribution 1 1 123 Asst. Superintendent Water Distribution 4 4 2 1 121 Backflow Prevention Inspector 1 1 118 Supervising Dispatcher 1 1 118 Supervising Meter Services Technician 2 2 218 Supervising Water Distribution Technician 2 2 2
9 Clerk II 1 1 17 Clerk III with Typing 1 0
65 Sr. Maint. Mech./Water Grid 4 4 464 Water Distribution Technician 22 17 6 6 564 Dispatcher 5 5 563 Water Maintenance Worker/Construction 15 12 1262 Water Maintenance Worker 6 6 1 1 461 Meter Reader 4 4 459 Water Distribution Trainee 0 3 1 2
EMPLOYEE YEARSFull Time 70.0 64.0 3.0 6.0 8.0 19.0 14.0 14.0Overtime 5.1 5.4 0.0 1.0 1.0 2.0 0.9 0.5Part Time, Temporary, Seasonal 1.2 1.2 0.0 0.0 0.0 0.6 0.0 0.6Less: Vacancy Allowance 1.4 1.4 0.1 0.1 0.2 0.4 0.3 0.3 Total 74.9 69.2 2.9 6.9 8.8 21.2 14.6 14.8

DEPARTMENT OF ENVIRONMENTAL SERVICES 10–61 WATER –PARKING METER OPERATIONS
Year-To-Year Comparison 2008-09 2009-10 Change
Budget 119,700 0 -119,700Employee Years 2.0 0.0 -2.0 Change Detail Salary & Wage General Vacancy
Adjustment Inflation Chargebacks Allowance Miscellaneous Major Change Total0 0 0 0 0 -119,700 -119,700
Major Change Unit transfers to Finance Department -119,700

10–62 DEPARTMENT OF ENVIRONMENTAL SERVICES WATER – PARKING METER OPERATIONS
EXPENDITURE SUMMARY
Actual Estimated Amended Approved2007-08 2008-09 2008-09 2009-10
Appropriation by Major ObjectPersonnel Expenses 153,135 81,900 89,600 0 Materials & Supplies 3,009 5,300 5,300 0 Services 20,616 16,900 18,600 0 Other 6,000 6,200 6,200 0
Total 182,760 110,300 119,700 0
Appropriation by ActivityParking Meter Operations 182,760 110,300 119,700 0
Employee Years by ActivityParking Meter Operations 4.0 2.0 2.0 0.0

DEPARTMENT OF ENVIRONMENTAL SERVICES 10–63 WATER –PARKING METER OPERATIONS
PERSONNEL SUMMARY
FULL TIME POSITIONS
Budget ApprovedBr. Title 2008-09 2009-1018 Supervising Parking Meter Mechanic 1 010 Parking Meter Mechanic 1 0
EMPLOYEE YEARSFull Time 2.0 0.0Overtime 0.0 0.0Part Time, Temporary, Seasonal 0.0 0.0Less: Vacancy Allowance 0.0 0.0 Total 2.0 0.0

10–64 DEPARTMENT OF ENVIRONMENTAL SERVICES WATER – WATER FIXED CHARGES
Organization
This section includes operating expenditures for the water supply system that cannot be directly attributed to an operating budget . The allowance for uncollectibles is an estimate of the delinquent amount of water charges that are not paid within two years. The administrative chargeback is an interfund charge that reimburses the General Fund for general administrative services provided to the enterprise funds, based on an indirect cost allocation formula. The administrative chargeback to the Water Fund for 2009-10 represents 7.8 percent of total Water Fund expenses incurred in 2007-08. Contribution to the General Fund: the Water Fund makes a contribution to the General Fund as payment in lieu of taxes on the Water Fund capital plant and as a return on investment. Year-To-Year Comparison
2008-09 2009-10 ChangeBudget 8,471,600 8,322,300 -149,300 Change Detail Salary & Wage General Vacancy
Adjustment Inflation Chargebacks Allowance Miscellaneous Major Change Total0 0 210,700 0 0 -360,000 -149,300
Major Change Reduce allowance for uncollectibles due to tax lien sale -360,000
Water Fixed Charges
Allowance For Uncollectibles
Administrative Chargeback
Contribution To The General
Fund

DEPARTMENT OF ENVIRONMENTAL SERVICES 10–65 WATER – WATER FIXED CHARGES
EXPENDITURE SUMMARY
Actual Estimated Amended Approved2007-08 2008-09 2008-09 2009-10
Appropriation by Major ObjectPersonnel Expenses 0 0 0 0 Materials & Supplies 0 0 0 0 Services 1,585,800 1,668,500 1,668,500 1,879,200 Other 6,933,388 7,553,100 6,803,100 6,443,100
Total 8,519,188 9,221,600 8,471,600 8,322,300
Appropriation by ActivityAllowance for Uncollectibles 2,254,888 2,960,000 2,210,000 1,850,000 Administrative Chargeback 1,585,800 1,668,500 1,668,500 1,879,200 Contribution to the General Fund 4,678,500 4,593,100 4,593,100 4,593,100
Total 8,519,188 9,221,600 8,471,600 8,322,300

EMERGENCY COMMUNICATIONS DEPARTMENT 11–1 EXPENDITURE SUMMARY
Mission Statement To support the City of Rochester’s One City Vision Statement and its Values and Guiding Principles by serving as the vital link between the citizens and public safety agencies of the City of Rochester and the County of Monroe. We strive to collect and disseminate all requests for service in a prompt, courteous and efficient manner for all our customers. Through our actions, we help save lives, protect property and assist the public in its time of need.
Administration
Operations Facility Maintenance

11–2 EMERGENCY COMMUNICATIONS DEPARTMENT EXPENDITURE SUMMARY
Vital Customers External: City of Rochester and Monroe County residents, businesses, visitors, and travelers Internal: City of Rochester and Monroe County Police, Fire, and Emergency Medical Service
subscriber agencies Critical Processes Answer, collect information about, and document all calls to 9-1-1 Provide processed 9-1-1 call data and event documentation services for all police, fire, and
emergency medical service agencies in the City of Rochester and Monroe County Provide dispatch and communication services for participating agencies Provide primary and in-service training for personnel Prepares and monitors the budget Performs planning, personnel, purchasing and research functions Conducts facility maintenance
The City operates the 911 Center under contract with Monroe County. The County funds Administration and Operations activities while the City funds Facility Maintenance. The 911 Operating Practices Board (OPB), comprised of representatives from government, public safety, private sector, and citizens, provides advisory policy recommendations to the Center.
2009-10 Fiscal Goals & Objectives Objective Priorities Supported Projected
Completion
Complete building renovations in collaboration with DES - Architectural Services including Phase II of heat pump repair/replacement, parking lot gate replacement, and Uninterruptible Power Supply (UPS) replacement
Public Safety Fourth Quarter
Collaborate with neighboring counties to implement the Public Safety Interoperable Communications Grant program
Public Safety Fourth Quarter
Provide support to consultant to begin system design and configuration of new Computer Aided Dispatch (CAD), Jail Management System, Records Management System, and Mobile Data Terminal System
Public Safety 2011-12

EMERGENCY COMMUNICATIONS DEPARTMENT 11–3 EXPENDITURE SUMMARY
Key Performance Indicators Actual
2007-08Estimated
2008-09 Budget
2008-09Budget
2009-10
9-1-1 Calls received (excluding administrative calls)
1,092,231 1,097,000 1,127,000 1,115,000
Calls dispatched:
● Police (includes police-initiated) 1,058,295 1,034,000 1,014,000 1,069,000
● Fire 84,678 91,000 82,000 90,000
● Emergency medical service 102,624 108,000 98,000 111,000
● Total dispatched 1,245,597 1,233,000 1,194,000 1,270,000
Ring time (seconds) 6 5 6 6
Emergency Medical Dispatch Protocol Compliance
95.0% 95.0% 90.0% 90.0%
Caller complaints 247 240 178 200
Caller customer satisfaction (scale =1-4) 3.7 3.7 3.7 3.7
Operating cost per call $8.79 $9.43 $9.19 $9.44
Employee Training (hours) 12,148 12,000 12,000 12,000
Year-To-Year Comparison
Budget Budget PercentMain Functions 2008-09 2009-10 Change ChangeAdministration 702,700 703,900 1,200 0.2%Operations 9,432,900 9,609,000 176,100 1.9%Facility Maintenance 220,200 207,600 -12,600 -5.7% Total 10,355,800 10,520,500 164,700 1.6%
Employee Years 192.6 198.6 6.0 3.1% Change Detail Salary & Wage General Vacancy
Adjustment Inflation Chargebacks Allowance Miscellaneous Major Change Total1,800 34,000 -3,800 0 2,000 130,700 164,700
Major Change County budget funds six additional full time and four additional part time Operations positions 330,300
Miscellaneous equipment purchases decrease to correspond with approved County budget levels
-78,000
Overtime funding is reduced due to the addition of full time and part time staff -76,500
Productivity improvements result in savings -28,000
Funds for heat, light and power are reduced due to efficiencies from new HVAC system and controls implemented to regulate building temperatures
-17,100

11–4 EMERGENCY COMMUNICATIONS DEPARTMENT EXPENDITURE SUMMARY
Program Change Receipt of anonymous crime tip information via internet and text messaging will begin in 2009. Wireless devices installed in select police vehicles will be used to more efficiently dispatch vehicles to incidents. Facility temperatures will be more closely regulated: Winter – 67°- 70°, Summer – 70°-73°. Implementation of Public Safety Interoperable Communications Grant allows the opportunity to review surrounding county communications status and realize potential resource sharing prospects.

EMERGENCY COMMUNICATIONS DEPARTMENT 11–5 EXPENDITURE SUMMARY
Actual Estimated Amended Approved2007-08 2008-09 2008-09 2009-10
Appropriation by Major ObjectPersonnel Expenses 8,478,792 9,140,500 8,967,600 9,223,200 Materials & Supplies 144,244 196,900 249,900 172,000 Services 972,216 1,011,000 1,138,300 1,125,300 Other 0 0 0 0
Total 9,595,252 10,348,400 10,355,800 10,520,500
Appropriation by ActivityAdministration 611,867 660,000 702,700 703,900 Operations 8,775,117 9,481,500 9,432,900 9,609,000 Facility Maintenance 208,268 206,900 220,200 207,600
Total 9,595,252 10,348,400 10,355,800 10,520,500
Employee Years by ActivityAdministration 7.0 7.0 7.0 7.0 Operations 181.6 190.4 185.6 191.6
Total 188.6 197.4 192.6 198.6

11–6 EMERGENCY COMMUNICATIONS DEPARTMENT PERSONNEL SUMMARY
FULL TIME POSITIONS Adm
inis
trat
ion
Ope
ratio
ns
Budget ApprovedBr. Title 2008-09 2009-10
36 ECC Director 1 1 133 Deputy Director - ECC 1 1 127 911 Operations Manager 3 3 321 Shift Supervisor 12 13 13
200 ECC Trainer 1 1 1200 CAD Information System Specialist 1 1 1
20 Executive Assistant 1 1 1190 EMD Quality Improvement Coordinator II 2 2 2
18 Secretary to the Director 1 1 1170 Dispatcher II 27 26 26
16 Administrative Assistant 1 1 1150 Dispatcher I 71 73 73150 Dispatcher I Bilingual 0 4 4
12 Communications Research Assistant 1 1 1110 Telecommunicator 38 37 37110 Telecommunicator Bilingual 1 2 2
7 Clerk III with Typing 1 1 16 Research Technician 1 1 1
EMPLOYEE YEARSFull Time 164.0 170.0 7.0 163.0Overtime 20.2 18.2 0.0 18.2Part Time, Temporary, Seasonal 8.4 10.4 0.0 10.4Less: Vacancy Allowance 0.0 0.0 0.0 0.0 Total 192.6 198.6 7.0 191.6

POLICE DEPARTMENT 12–1
Mission Statement To support the City of Rochester’s One City Vision Statement and its Values and Guiding Principles by maintaining law and order through crime reduction, customer service and professionalism.
Office of the Chief
Operations
Patrol
Investigations
Administration

12–2 POLICE DEPARTMENT
Vital Customers Internal: City of Rochester Departments; RPD employees (sworn and non-sworn) External: Individuals who live, work, visit, or do business in the City of Rochester
Critical Processes Analysis of crime data and deployment of resources Collaboration with other law enforcement agencies at the local, state, and federal levels Community involvement and crime prevention initiatives
Highlights of the Department's 2009-10 Fiscal Goals & Objectives are presented below. Additional information for each bureau is included in the sections that follow. Highlights Priorities Supported Projected
Completion
Office of the Chief:
Implement strategies and tactics to achieve 20% reduction in homicides and violent crimes
Public Safety First Quarter
Complete implementation of the TIPS initiative (Trust, Information, Programs, Services), a community partnership to promote enhanced community relationships, improved intelligence acquisition, and crime prevention
Public Safety First Quarter
Operations:
Collaborate with Recreation & Youth Services to continue to improve implementation of the City Curfew and Truancy Initiative
Public Safety First Quarter
Implement Data Driven Approaches to Crime and Traffic Safety (DDACTS) in concert with National Highway Traffic Safety Association and the US Department of Justice
Public Safety First Quarter
Partner with Information Technology to expand and enhance the overt surveillance camera project by installing 50 additional cameras and implementing upgrades that allow for more effective use of the system
Public Safety Fourth Quarter
Administration:
Collaborate with Information Technology to install and implement the Automatic Vehicle Locator system
Public Safety Second Quarter
Pilot a non-traditional fuel-efficient police vehicle
Public Safety Third Quarter

POLICE DEPARTMENT 12–3
Year-To-Year Comparison
Budget Budget PercentBureaus 2008-09 2009-10 Change ChangeOffice of the Chief 5,773,900 4,711,300 -1,062,600 -18.4%Operations 58,142,400 56,537,800 -1,604,600 -2.8%Administration 15,981,100 14,816,700 -1,164,400 -7.3%
Total 79,897,400 76,065,800 -3,831,600 -4.8%
Employee Years 989.5 958.9 -30.6 -3.1% Change Detail Salary & Wage General Vacancy
Adjustment Inflation Chargebacks Allowance Miscellaneous Major Change Total-211,200 294,100 -88,600 -340,400 -10,700 -3,474,800 -3,831,600
Major Change Highlights As proposed by the Mayor:
Salary funding and miscellaneous costs to process recruit class are eliminated due to budget constraints
-1,369,700
Operation IMPACT V (Integrated Municipal Police Anti-Crime Teams) Grant funds expire -471,800
Nine full time and four part time parking enforcement positions and related expense transfer to Finance
-378,200
Net of grant funds expiration or reduction -235,000
Allocation for unreimbursed special events overtime reduced -200,000
Annual allocation for Greater Rochester Area Narcotics Enforcement Team (GRANET) ends -175,000
Two vacant administrative and one vacant clerical positions are eliminated due to budget constraints
-132,100
Funding for temporary clerical positions to assist with backlog of data entry expires -100,600
Three vacant full time Security Guard positions are eliminated due to budget constraints -79,800
Vacant Director of Research & Evaluation position is eliminated as an efficiency measure -74,800
Part time funding to conduct background investigations is eliminated -60,000
As amended by City Council:
Funds are transferred from Contingency for an Anti-Violence Community program 7,000

12–4 POLICE DEPARTMENT
Assignment of Authorized Positions
2000-01 to 2009-10 Office of the Chief & Administration Operations Department Total Year Sworn Non-Sworn Total Sworn Non-Sworn Total Sworn Non-Sworn Total2009-10 46 98.5 144.5 695 56 751 741 154.5 895.52008-09 46 88 134 695 83 778 741 171 9122007-08 64 121 185 677 52 729 741 173 9142006-07 65 95 160 661 56 717 726 151 8772005-06 63 103 166 642 58 700 705 161 8662004-05 61 104 165 645 59 704 706 163 8692003-04 68 117 185 639 49 688 707 166 8732002-03 65 110 175 643 55 698 708 165 8732001-02 64 115 179 644 57 701 708 172 8802000-01 69 111 180 638 57 695 707 168 875
Authorized Sworn Positions 2005-06 to 2009-10
Positions 2005-06 2006-07 2007-08 2008-09 2009-10Chief 1 1 1 1 1Executive Deputy Chief 0 0 0 1 1Deputy Chief 1 2 2 2 2Commander 3 3 3 3 3Captain 13 14 12 10 9Lieutenant 40 35 34 34 34Sergeant 88 88 88 88 88Police Officer (Investigator) 57 57 57 57 57Police Officer 502 526 544 545 546Total 705 726 741 741 741

POLICE DEPARTMENT 12–5 EXPENDITURE SUMMARY
Actual Estimated Amended Approved2007-08 2008-09 2008-09 2009-10
Appropriation by Major ObjectPersonnel Expenses 69,035,817 66,583,900 68,440,100 65,198,000 Materials & Supplies 1,586,892 1,490,800 1,677,800 1,557,600 Services 8,652,526 9,493,000 9,779,500 9,310,200 Other 0 0 0 0
Total 79,275,235 77,567,700 79,897,400 76,065,800
Appropriation by ActivityOffice of the Chief 5,540,042 5,786,500 5,773,900 4,711,300 Operations 57,260,479 55,107,400 58,142,400 56,537,800 Administration 16,474,714 16,673,800 15,981,100 14,816,700
Total 79,275,235 77,567,700 79,897,400 76,065,800
Employee Years by ActivityOffice of the Chief 37.5 38.0 37.2 30.1 Operations 790.2 777.6 819.8 797.9 Administration 154.6 151.8 132.5 130.9
Total 982.3 967.4 989.5 958.9
NBD Allocation - Dollars 1,531,000 1,423,600 1,848,600 1,559,800 NBD Allocation - Employee Years 24.4 20.4 26.4 24.4

12–6 POLICE DEPARTMENT OFFICE OF THE CHIEF
Mission Statement To support the City of Rochester’s One City Vision Statement and its Values and Guiding Principles by providing overall departmental management and planning. Organization
Critical Processes Chief’s Office Conducts strategic planning, policy development, public relations Liaison with community and other Federal , State, and local law enforcement agencies Conducts labor relations and development projects
Research & Evaluation Conducts research and management and statistical analysis Monitors compliance with state standards and national accreditation agencies Assists in conducting on-site evaluations Prepares department’s annual report Researches and writes grant applications and submits grant-related operational and financial
reports Serves as repository for all department and New York State reports Coordinates policy and procedure development for handling of emergencies Liaison to Monroe County Office of Emergency Preparedness Liaison to Bureau of Human Resource Management in administration of department’s health and
safety program Professional Standards Investigates complaints of police actions or misconduct Provides administrative review of fleet vehicle accident investigations Conducts other investigations as directed by the Chief of Police Provides staff support for civilian complaint review and internal disciplinary processes Maintains department’s official disciplinary records including administrative entries which involve
inquiries by a citizen or agency Includes individuals assigned to Long-Term Disability Unit
Communications Informs community and coordinates responses to inquiries from news media and public Supplies audio-visual and artwork assistance to production of promotional materials, annual
reports, training programs Recruits civilians to unpaid positions in the department Administers internship program
Chief's Office
Research & Evaluation
Professional Standards Communications Special Events

POLICE DEPARTMENT 12–7 OFFICE OF THE CHIEF
Special Events Coordinates all police activities at cultural and special events, including assessing logistical
requirements, traffic and crowd control plans, contingency plans, and coordination of all intra- and inter-departmental personnel
2009-10 Fiscal Goals & Objectives Objective Priorities Supported Projected
Completion
Implement strategies and tactics to achieve 20% reduction in homicides and violent crimes
Public Safety First Quarter
Complete implementation of the TIPS initiative (Trust, Information, Programs, Services), a community partnership to promote enhanced community relationships, improved intelligence acquisition, and crime prevention
Public Safety First Quarter
Design and execute a volunteer program to revitalize PAC-TAC
Public Safety First Quarter
Implement a Citizen Survey program, a proactive audit process to measure crime victims’ satisfaction with service, professionalism, proper documentation, and follow-up investigation
Public Safety Second Quarter
Key Performance Indicators Actual
2007-08Estimated
2008-09 Budget
2008-09Budget
2009-10
Research & Evaluation
Inspectional reports prepared 212 215 250 215
Grants administered 70 71 65 71
Professional Standards
Incident reviews completed 15 22 25 25
Civil suit investigations completed 62 65 74 65
Accident reports completed 154 162 144 162
Subject resistance reports reviewed 741 832 794 832
Year-To-Year Comparison
2008-09 2009-10 Change
Budget 5,773,900 4,711,300 -1,062,600Employee Years 37.2 30.1 -7.1

12–8 POLICE DEPARTMENT OFFICE OF THE CHIEF
Change Detail Salary & Wage General Vacancy
Adjustment Inflation Chargebacks Allowance Miscellaneous Major Change Total-29,600 15,800 14,700 1,500 3,600 -1,068,600 -1,062,600
Major Change As proposed by the Mayor:
Operation IMPACT V (Integrated Municipal Police Anti-Crime Teams) Grant funds expire -471,800
Allocation for unreimbursed special events overtime reduced -200,000
Funding for temporary clerical positions to assist with backlog of data entry expires -100,600
Two vacant administrative positions are eliminated due to budget constraints -98,000
A vacant Investigator position transfers to Patrol -77,100
Vacant Director of Research & Evaluation position is eliminated as an efficiency measure -74,800
A vacant clerical position was reclassified and transferred to Administration in 2008-09 -38,400
Management and administrative funding provided by Urban Area Security Initiative grant expires
-14,900
As amended by City Council:
Funds are transferred from Contingency for an Anti-Violence Community program 7,000
.

POLICE DEPARTMENT 12–9 OFFICE OF THE CHIEF EXPENDITURE SUMMARY
Actual Estimated Amended Approved2007-08 2008-09 2008-09 2009-10
Appropriation by Major ObjectPersonnel Expenses 4,057,568 4,093,800 4,078,000 3,248,400 Materials & Supplies 13,137 72,500 74,400 12,900 Services 1,469,337 1,620,200 1,621,500 1,450,000 Other 0 0 0 0
Total 5,540,042 5,786,500 5,773,900 4,711,300
Appropriation by ActivityChief's Office 2,608,229 2,560,200 2,721,400 2,527,300 Research & Evaluation 980,314 1,120,500 1,112,400 391,300 Professional Standards 1,722,660 1,737,900 760,600 816,200 Communications 0 141,200 169,600 166,500 Special Events 228,839 226,700 1,009,900 810,000
Total 5,540,042 5,786,500 5,773,900 4,711,300
Employee Years by ActivityChief's Office 12.2 9.0 13.0 11.0 Research & Evaluation 7.5 10.2 10.1 5.0 Professional Standards 15.8 14.3 9.1 9.1 Communications 0.0 2.5 3.0 3.0 Special Events 2.0 2.0 2.0 2.0
Total 37.5 38.0 37.2 30.1

12–10 POLICE DEPARTMENT OFFICE OF THE CHIEF
PERSONNEL SUMMARY
FULL TIME POSITIONS Chi
ef's
Offi
ce
Res
earc
h &
E
valu
atio
n
Pro
fess
iona
l S
tand
ards
Com
mun
i-ca
tions
Spe
cial
E
vent
s
Budget ApprovedBr. Title 2008-09 2009-10
98 Chief of Police 1 1 1197 Executive Deputy Chief 1 1 1
97 Deputy Chief of Police 2 2 294 Police Lieutenant 4 4 1 1 1 192 Police Sergeant 9 9 2 1 6
90B Police Officer (Investigator) 2 1 190 Police Officer 4 4 1 1 1 130 Director of Research & Evaluation 1 024 Grants Specialist 1 1 124 Police Program Grants Specialist 1 1 120 Executive Assistant 1 020 Police Steno 2 2 218 Police Artist 0 1 118 Secretary to the Chief 1 1 116 Management Trainee 1 015 Graphic Artist 1 015 Volunteer Coordinator 1 1 111 Secretary 1 0
7 Clerk III with Typing 1 1 1
EMPLOYEE YEARSFull Time 35.0 30.0 11.0 5.0 9.0 3.0 2.0Overtime 0.1 0.1 0.0 0.0 0.1 0.0 0.0Part Time, Temporary, Seasonal 2.4 0.2 0.0 0.2 0.0 0.0 0.0Less: Vacancy Allowance 0.3 0.2 0.0 0.2 0.0 0.0 0.0 Total 37.2 30.1 11.0 5.0 9.1 3.0 2.0

POLICE DEPARTMENT 12–11 OPERATIONS
Mission To support the City of Rochester’s One City Vision Statement and its Values and Guiding Principles by managing the Patrol Divisions East and West, Special Operations, Mounted Patrol, Youth Services, and Security units. Organization
2009-10 Fiscal Goals & Objectives Highlights Objective Priorities Supported Projected
Completion
Implement Data Driven Approaches to Crime and Traffic Safety (DDACTS) in concert with National Highway Traffic Safety Association and the US Department of Justice
Public Safety First Quarter
Collaborate with Rochester City School District to adjust crossing guard schedules to accommodate new busing schedules at no additional expense
Public Safety First Quarter
Partner with Information Technology to expand and enhance the overt surveillance camera project by installing 50 additional cameras and implementing upgrades that allow for more effective use of the system
Public Safety Fourth Quarter
Year-To-Year Comparison
2008-09 2009-10 ChangeBudget 58,142,400 56,537,800 -1,604,600Employee Years 819.8 797.9 -21.9 Change Detail Salary & Wage General Vacancy
Adjustment Inflation Chargebacks Allowance Miscellaneous Major Change Total-333,900 53,600 17,700 -334,500 -10,300 -997,200 -1,604,600
Operations
Patrol Investigations

12–12 POLICE DEPARTMENT OPERATIONS
Major Change Nine full time and four part time parking enforcement positions transfer to Finance -370,000
Annual allocation for Greater Rochester Area Narcotics Enforcement Team (GRANET) ends -175,000
Three paralegal positions transfer to Administration -126,900
Net of grant funds expiration or reduction -77,100
A vacant Investigator position transfers from the Office of the Chief 77,100
Three vacant full time Security Guard positions are eliminated due to budget constraints -79,800
COPS Secure Our Schools grant funding expires -70,500
Project Safe Neighborhood Grant funding ends -62,400
A vacant Captain position converts to a Police Officer -47,600
One time appropriation of forfeiture funds does not recur -40,000
One time Byrne Grant for Graffiti Sensors does not recur -25,000

POLICE DEPARTMENT 12–13 OPERATIONS EXPENDITURE SUMMARY
.
Actual Estimated Amended Approved2007-08 2008-09 2008-09 2009-10
Appropriation by Major ObjectPersonnel Expenses 55,238,179 52,891,800 55,828,800 54,465,700 Materials & Supplies 527,976 629,800 653,400 590,200 Services 1,494,324 1,585,800 1,660,200 1,481,900 Other 0 0 0 0
Total 57,260,479 55,107,400 58,142,400 56,537,800
Appropriation by ActivityPatrol 43,695,892 46,122,100 48,928,700 47,713,400 Investigations 13,564,587 8,985,300 9,213,700 8,824,400
Total 57,260,479 55,107,400 58,142,400 56,537,800
Employee Years by ActivityPatrol 605.4 658.1 698.2 680.2 Investigations 184.8 119.5 121.6 117.7
Total 790.2 777.6 819.8 797.9

12–14 POLICE DEPARTMENT OPERATIONS – PATROL
Organization
Critical Processes Patrol Protects life and property Protects constitutional guarantees of all people Conducts preventive patrol Conducts preliminary and follow-up investigation of reported offenses Reduces opportunities for commission of crime, resolution of conflict, identification of criminal
offenders and criminal activity, and apprehension of offenders Conducts periodic reviews of patrol and investigative activities, including use of “Crimestat” to
analyze crime patterns and response strategies Works with neighborhood Police-Citizen Interaction Committees (PCIC) to develop targeted crime
prevention and response programs Coordinates the police portion of the City’s four Neighborhood and Business Development (NBD)
quadrant teams Plans responses to unusual occurrences or emergency incidents
Special Operations Provides specialized field support services Tactical Unit provides directed patrol, crime-specific details, proactive investigative efforts, and
technical equipment for specific crime problems K-9 unit provides canine support services to building searches and in tracking, as well as in nitrate
and narcotic searches Mounted Patrol provides highly visible patrol and crowd control presence downtown, at special
events, and in the event of disturbance Traffic Enforcement Unit
o Enforces vehicle and parking regulations o Coordinates the School Traffic Officer program o Conducts alcohol-related enforcement counter measures and proactive traffic direction and
control throughout the city o Handles complaints or suggestions concerning traffic-engineering deficiencies and transmits
related data to Traffic Control Board Youth Services Unit
o Develops and implements programs along with School Resource Officers (SROs) to prevent and control juvenile delinquency
o Administers Department’s youth initiatives and serves as a liaison to Family Court and other social agencies
Administers Bomb Squad, Emergency Task Force, SCUBA squad, Crisis Negotiation Team, Mobile Field Force
Command
Patrol Division Special Operations Security

POLICE DEPARTMENT 12–15 OPERATIONS – PATROL
Security Provides guard service at key City facilities including City Hall, Department of Environmental
Services’ Operations Center and Bureau of Water, and during various City events Provides service at commercial and residential buildings acquired by City through foreclosure Mobile security patrol provides routine surveillance of City properties and secures firehouses and
libraries when necessary Monitors security alarms at City facilities and some Rochester City School District buildings
2009-10 Fiscal Goals & Objectives Objective Priorities Supported Projected
Completion
Collaborate with Recreation & Youth Services to continue to improve implementation of the City Curfew and Truancy Initiative
Public Safety First Quarter
Implement Data Driven Approaches to Crime and Traffic Safety (DDACTS) in concert with National Highway Traffic Safety Association and the US Department of Justice
Public Safety First Quarter
Collaborate with Rochester City School District to adjust crossing guard schedules to accommodate new busing schedules at no additional expense
Public Safety First Quarter
Key Performance Indicators Actual
2007-08Estimated
2008-09 Budget
2008-09Budget
2009-10
Eastside/Westside Patrol Divisions
Calls for service (all units):
● Priority I 211,513 214,838 219,200 218,275
● All other 253,755 223,310 212,700 223,300
● Total calls 465,268 438,148 431,900 441,575
Calls handled by means other than dispatch 13,208 12,638 12,900 12,650
Reported crimes:
● Part I - Violent 2,244 2,349 2,300 1,880
● Part I - Property 11,138 14,263 16,300 11,410
● Part II 17,525 19,904 21,900 19,900
● Total reported crimes 30,907 36,516 40,500 33,190
Motor vehicle accidents with injury 2,565 2,530 1,350 2,500
Investigations conducted:
● Field & Closed 17,857 18,016 22,500 18,000
● Office 14,754 21,316 16,500 21,300
Uniform traffic summonses issued 44,879 39,834 39,500 39,500
Parking citations issued 112,159 95,000 102,663 98,500

12–16 POLICE DEPARTMENT OPERATIONS – PATROL
Actual2007-08
Estimated2008-09
Budget 2008-09
Budget2009-10
Field information forms completed 8,568 10,294 13,000 11,000
Foot and bicycle patrol hours 9,525 19,292 26,900 20,300
Youth diverted 1,541 1,584 1,300 1,600
Juvenile Warrants served 343 332 370 300
Workload per officer:
● Calls for service 1,055 1,141 1,004 1,017
● Reported crimes (Parts I and II) 70 95 94 77
Average response time (call to arrival) for Priority I calls (minutes)
13:11 12:12 12:30 12:00
Average response time (call to arrival) for Priority II calls (minutes)
66:02 51:43 55:00 51:00
Percentage of crimes cleared (%) 48% 44% 49% 44%
Crimes cleared (#):
● Homicide 14 27 28 27
● Rape 60 31 105 30
● Robbery 339 189 500 200
● Aggravated Assault 597 573 1,300 600
● Burglary 278 189 430 200
● Larceny 990 984 2,200 1,000
● Motor Vehicle Theft 149 165 500 165
● Arson 26 22 45 23
Firearms seized 880 912 1,000 900
Juvenile arrests (under age 18) 3,154 2,936 2,200 2,900
Youth picked up under curfew 400 314 275 350
Students picked up under truancy 813 634 650 650
Security
Response to alarms 360 349 300 350
Referrals to ECD for safety issues 1,600 1,248 1,800 1,300
Referrals to NBD for violations/board-ups 403 451 275 450
Year-To-Year Comparison
2008-09 2009-10 ChangeBudget 48,928,700 47,713,400 -1,215,300Employee Years 698.2 680.2 -18.0 Change Detail

POLICE DEPARTMENT 12–17 OPERATIONS – PATROL
Salary & Wage General VacancyAdjustment Inflation Chargebacks Allowance Miscellaneous Major Change Total
-459,700 39,700 17,700 -342,300 -10,300 -460,400 -1,215,300 Major Change Nine full time and four part time parking enforcement positions transfer to Finance -370,000
A Police Commander transfers from Investigations 107,500
Three vacant full time Security Guard positions are eliminated due to budget constraints -79,800
A vacant Investigator position transfers from the Office of the Chief 77,100
COPS Secure Our Schools grant funding expires -70,500
A vacant Captain position converts to a Police Officer -47,600
Selective Traffic Enforcement Program (STEP) grant funds expire -20,400
One time Byrne Grant funding for PAC-TAC does not recur -20,000
Motor Vehicle Theft and Insurance Fraud Prevention grant funding reduces -14,700
DWI grant funding reduces -12,000
One time Law Enforcement Terrorism Protection Program grant funding expires -10,000
Program Change Use of two non-motorized trailers as mobile incident command/operations centers began in 2008-09. These trailers provide the ability for on-scene deployment in crisis situations in addition to serving as tactical operations centers on a routine basis. Staggered start times in 2009-10 for Rochester City School District elementary schools requires adjustments to City School Traffic Officer schedules. Civilian parking enforcement operations transfer to the Finance Department.
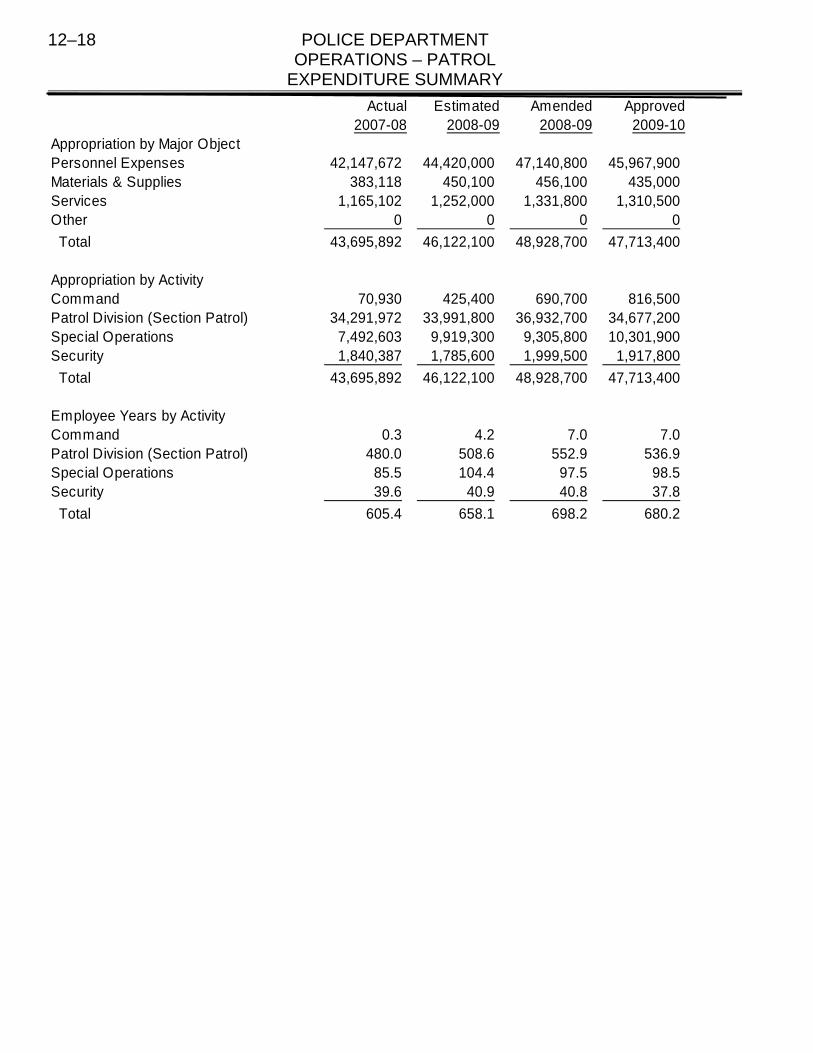
12–18 POLICE DEPARTMENT OPERATIONS – PATROL
EXPENDITURE SUMMARY
Actual Estimated Amended Approved2007-08 2008-09 2008-09 2009-10
Appropriation by Major ObjectPersonnel Expenses 42,147,672 44,420,000 47,140,800 45,967,900 Materials & Supplies 383,118 450,100 456,100 435,000 Services 1,165,102 1,252,000 1,331,800 1,310,500 Other 0 0 0 0
Total 43,695,892 46,122,100 48,928,700 47,713,400
Appropriation by ActivityCommand 70,930 425,400 690,700 816,500 Patrol Division (Section Patrol) 34,291,972 33,991,800 36,932,700 34,677,200 Special Operations 7,492,603 9,919,300 9,305,800 10,301,900 Security 1,840,387 1,785,600 1,999,500 1,917,800
Total 43,695,892 46,122,100 48,928,700 47,713,400
Employee Years by ActivityCommand 0.3 4.2 7.0 7.0 Patrol Division (Section Patrol) 480.0 508.6 552.9 536.9 Special Operations 85.5 104.4 97.5 98.5 Security 39.6 40.9 40.8 37.8
Total 605.4 658.1 698.2 680.2

POLICE DEPARTMENT 12–19 OPERATIONS – PATROL PERSONNEL SUMMARY
FULL TIME POSITIONS
Com
man
d
Pat
rol D
ivis
ion
Spe
cial
O
pera
tions
Sec
urity
Budget ApprovedBr. Title 2008-09 2009-1096 Police Commander 2 3 2 195 Police Captain 8 7 3 494 Police Lieutenant 25 25 22 392 Police Sergeant 59 59 1 49 9
90B Police Officer (Investigator) 33 34 33 190 Police Officer 478 479 399 8029 Chief of Security Operations 1 1 116 Supervising Security Guard 5 5 511 Secretary 1 1 110 Parking Monitor 9 0
9 Clerk II 1 1 17 Clerk III with Typing 2 2 2
52 Security Guard 29 26 26
EMPLOYEE YEARSFull Time 653.0 643.0 7.0 509.0 95.0 32.0Overtime 28.3 27.3 0.0 22.6 3.2 1.5Part Time, Temporary, Seasonal 18.2 16.2 0.0 10.8 0.3 5.1Less: Vacancy Allowance 1.3 6.3 0.0 5.5 0.0 0.8 Total 698.2 680.2 7.0 536.9 98.5 37.8
The following full time positions are included in the budget of the Police Department, Patrol Division but are assigned to NBD offices
and are shown here for reference only.
Budget ApprovedBr. Title 2008-09 2009-10
94 Police Lieutenant 4 490 Police Officer 22 20
EMPLOYEE YEARSFull Time 26.0 24.0Overtime 0.4 0.4Part Time, Temporary, Seasonal 0.0 0.0Less: Vacancy Allowance 0.0 0.0 Total 26.4 24.4

12–20 POLICE DEPARTMENT OPERATIONS – INVESTIGATIONS
Organization
Investigations Critical Processes Provides investigative support services necessary for effective operation of the department.
Central Investigations
Major Crimes Unit investigates all homicides, economic crime, and bank robbery, child abuse, arson, missing persons, and other assignments assigned by Central Investigations commanding officer
o Compiles and analyzes investigative data from field interview forms and reports in order to identify crime-specific strategies for patrol officers and investigators
License Investigation Unit investigates applicants for licenses issued by City of Rochester that require approval by Chief of Police
o Administers City’s alarm ordinance o Processes NYS Pistol Permit Applications
Technician’s Unit gathers and analyzes evidence from crime scenes o Collects, processes, preserves, analyzes physical evidence o Supervises Photo Lab, which processes photos for evidentiary and identification purposes
Special Investigations Section
Investigates illegal narcotics activities, illegal sale and distribution of liquor and tobacco, vice (organized prostitution, pornography, gambling), illegal weapons, trafficking, organized crime
Provides surveillance and intelligence services in support of investigations Work in joint task forces with Federal, State, and local law enforcement agencies Crime analysts review crime investigation reports, investigative action reports, and field interview
forms Crime analysts work with Monroe Crime Analysis Center to develop intelligence products that
improve ability to reduce Part I crime 2009-10 Fiscal Goals & Objectives Objective Priorities Supported Projected
Completion
Partner with Information Technology to expand and enhance the overt surveillance camera project by installing 50 additional cameras and implementing upgrades that allow for more effective use of the system
Public Safety Fourth Quarter
Command
Central Investigations
Special Investigations

POLICE DEPARTMENT 12–21 OPERATIONS – INVESTIGATIONS
Key Performance Indicators Actual
2007-08Estimated
2008-09 Budget
2008-09Budget
2009-10
Central Investigations
Arson Investigations conducted 278 332 372 330
Arrests - Child Abuse 41 70 64 70
SAFIS identifications 249 274 420 275
Special Investigations
Cases closed 1,113 1,374 910 1,200
Narcotics/Intelligence arrests 372 317 679 400
GRANET/FSU/VCT Arrests 165 280 157 200
Drugs seized:
● Cocaine (kilograms) 38.4 15.0 20.2 20.0
● Heroin (grams) 414.6 487.0 0.6 500.0
● Marijuana (kilograms) 1,088.0 492.0 880.0 500.00
Weapons seized:
● Handguns 114 61 121 60
● Shotguns and rifles 60 52 51 50
Vehicles seized 7 5 5 5
Year-To-Year Comparison
2008-09 2009-10 ChangeBudget 9,213,700 8,824,400 -389,300Employee Years 121.6 117.7 -3.9 Change Detail Salary & Wage General Vacancy
Adjustment Inflation Chargebacks Allowance Miscellaneous Major Change Total125,800 13,900 0 7,800 0 -536,800 -389,300
Major Change Annual allocation for Greater Rochester Area Narcotics Enforcement Team (GRANET) ends -175,000
Three paralegal positions transfer to Administration -126,900
A Police Commander transfers to Patrol – Special Operations -107,500
Project Safe Neighborhood Grant funding ends -62,400
One time appropriation of forfeiture funds does not recur -40,000
One time Byrne Grant for Graffiti Sensors does not recur -25,000

12–22 POLICE DEPARTMENT OPERATIONS – INVESTIGATIONS
EXPENDITURE SUMMARY
Actual Estimated Amended Approved2007-08 2008-09 2008-09 2009-10
Appropriation by Major ObjectPersonnel Expenses 13,090,507 8,471,800 8,688,000 8,497,800 Materials & Supplies 144,858 179,700 197,300 155,200 Services 329,222 333,800 328,400 171,400 Other 0 0 0 0
Total 13,564,587 8,985,300 9,213,700 8,824,400
Appropriation by ActivityCommand 278,766 443,600 425,000 296,900 Central Investigations 4,151,786 3,822,900 3,840,500 3,864,100 Special Investigations 5,310,238 4,718,800 4,948,200 4,663,400 Field Investigations 3,823,797 0 0 0
Total 13,564,587 8,985,300 9,213,700 8,824,400
Employee Years by ActivityCommand 3.0 2.8 1.0 1.0 Central Investigations 59.6 59.5 59.9 56.0 Special Investigations 67.9 57.2 60.7 60.7 Field Investigations 54.3 0.0 0.0 0.0
Total 184.8 119.5 121.6 117.7

POLICE DEPARTMENT 12–23 OPERATIONS – INVESTIGATIONS PERSONNEL SUMMARY
FULL TIME POSITIONS
Com
man
d
Cen
tral
In
vest
igat
ions
Spe
cial
In
vest
igat
ions
Budget ApprovedBr. Title 2008-09 2009-1096 Police Commander 1 095 Police Captain 2 2 1 194 Police Lieutenant 3 3 1 292 Police Sergeant 14 14 5 9
90B Police Officer (Investigator) 22 22 20 290 Police Officer 48 48 12 3627 Senior Crime Research Specialist 1 1 124 Crime Research Specialist 3 3 316 Police Evidence Technician 7 7 716 Supervisor Police Photo Lab 1 1 114 Police Paralegal 2 014 Police Paralegal Bilingual 1 011 Secretary 1 1 111 Senior Photo Lab Technician 1 1 1
9 Clerk II 4 4 3 17 Clerk III with Typing 2 2 2
EMPLOYEE YEARSFull Time 113.0 109.0 1.0 52.0 56.0Overtime 7.6 7.6 0.0 2.7 4.9Part Time, Temporary, Seasonal 1.5 1.5 0.0 1.5 0.0Less: Vacancy Allowance 0.5 0.4 0.0 0.2 0.2 Total 121.6 117.7 1.0 56.0 60.7

12–24 POLICE DEPARTMENT ADMINISTRATION
Mission To support the City of Rochester’s One City Vision Statement and its Values and Guiding Principles by providing administrative support services necessary to Department operations, and by overseeing the Officer Assistance Program that provides crisis intervention and stress counseling services to members and their families. Organization
Critical Processes Professional Development administers the department's training programs, including roll call,
recruit, civilian (pre-service) and in-service training. o Firearms Training Unit coordinates firearms training and maintains records on each
departmental weapon, and related inventory and firearms proficiency records. o In-Service Training Unit plans and develops training and special programs. o Recruitment and Field Training Unit coordinates recruit officers’ training and probationary
officers’ field training and performance evaluations, as well as selection and certification of Field Training Officers (FTOs) assigned to the Patrol Division.
o Coordinates, trains, and evaluates all newly appointed Sergeants and Lieutenants. o Background and Recruitment Unit actively works with the Bureau of Human Resource
Management to recruit new officers and conduct background research. Technical Services oversees resource and records management, contract vehicle towing,
coordination of fleet purchases, maintenance of fleet assets with the Department of Environmental Services, and inventory control of departmental fixed assets.
o Support Services includes the Property Clerk and Auto Pound, which receive evidentiary items, recovered property, and impounded vehicles.
o Quartermaster maintains and coordinates purchase and issuance of inventories of uniforms, equipment and supplies.
o Firearms Investigation Unit examines firearms coming into the custody of the department and conducts background investigations per federal law on all individuals requesting to purchase handguns within the city.
Administration
Professional Development
Technical Services
Family & Victims Services Personnel
Budget Animal Services

POLICE DEPARTMENT 12–25 ADMINISTRATION
o The Headquarters and Records Unit houses criminal and accident records, and conducts manual and automated record and warrant checks, using both local files and the statewide New York State Police Information Network (NYSPIN) system. Provides central duplication services, responds to walk-up complaints and
information requests, and issues copies of reports as legally required. Juvenile Records Unit is responsible for the privacy and security of juvenile records
which must be maintained separately from adult records. Warrant Unit administers the department’s arrest warrant service, entering notices
into regional, state and federal information systems. Court Liaison unit maintains contact with criminal and traffic courts for notification to
police officers and civilian employees to appear in court for required proceedings. Call Reduction Unit provides sworn personnel to handle calls referred from the 311
non-emergency response number and to take police reports over the phone. Identification Unit takes fingerprints and maintains manual and automated
photograph and fingerprint files. Paralegal Unit assists sworn personnel in the preparation of selected forms and
reports for Grand Jury packages, tracking felony cases submitted through the court system and reporting their disposition to the commanding officer, and reviewing Grand Jury referrals and juvenile petitions before delivery to Family Court.
Family & Victims Services provides direct public services through the Family Crisis Intervention Team (FACIT), which assists patrol officers responding to reported family disputes, and the Victim Assistance Unit (VAU), which counsels crime victims and assists them in dealing with the justice system.
o Coordinates the “Restorative Justice” project under the Juvenile Accountability Block Grant (JABG).
o Unit costs are partially underwritten by the New York State Crime Victims Board. Personnel provides personnel management, including job classification, hiring and promotion,
payroll, and record maintenance Budget provides central financial management for the department, including budget preparation,
purchasing, and contract administration. o Reviews all claims, requisitions, and contracts, and purchases central supplies and services.
Animal Services responds to animal-related complaints, impounds unleashed, surrendered, and stray pets, issues summonses for animal ordinance violations, and deals with injured or menacing animals.
o Makes available unclaimed dogs and cats for public adoption o Enforces laws against vicious animals o Provides housing and veterinary care for impounded animals after a specified holding period o Assists department in hazardous situations involving animals o Operates low-income spay/neuter program
2009-10 Fiscal Goals & Objectives Objective Priorities Supported Projected
Completion
Collaborate with Information Technology to install and implement the Automatic Vehicle Locator system
Public Safety Second Quarter
Pilot a non-traditional fuel-efficient police vehiclePublic Safety Third Quarter
Partner with Finance to transfer Auto Pound functions to Finance
Public Safety Fourth Quarter

12–26 POLICE DEPARTMENT ADMINISTRATION
Key Performance Indicators Actual
2007-08Estimated
2008-09Budget
2008-09 Budget
2009-10
Professional Development
Recruit training slots 80 88 100 0
Applicants for Police Officer exam 2,292 2,875 2,400 2,800
New officers trained:
● Academy 80 82 100 0
● Field Training 57 67 50 38
Technical Services
Property lots disposed 12,111 6,369 39,000 8,800
Vehicles disposed of:
● Sold at auction 1,592 1,213 2,100 1,200
● Sold for salvage 67 31 100 30
Average sale price (vehicles) 380 335 320 320
Family & Victims Services
FACIT responses 4,174 5,100 5,750 5,100
Victim assistance contacts 3,639 5,254 5,450 5,200
Animal Services
Service requests 14,766 12,472 14,000 13,500
Tickets issued 1,863 1,688 2,000 1,800
Year-To-Year Comparison
2008-09 2009-10 ChangeBudget 15,981,100 14,816,700 -1,164,400Employee Years 132.5 130.9 -1.6 Change Detail Salary & Wage General Vacancy
Adjustment Inflation Chargebacks Allowance Miscellaneous Major Change Total152,300 224,700 -121,000 -7,400 -4,000 -1,409,000 -1,164,400

POLICE DEPARTMENT 12–27 ADMINISTRATION
Major Change Salary funding for recruit class is eliminated due to budget constraints -1,203,700
Funding to process recruit class including psychological exams, weapons purchases, and other related costs are eliminated due to budget constraints
-166,000
Three paralegal positions transfer from Investigations 126,900
Part time funding to conduct background investigations is eliminated -60,000
Salary funding for temporary clerical positions in 2008-09 is eliminated -51,400
One time appropriation in support of Families and Friends of Murdered Children and Victims of Violence does not recur
-50,000
50% of an administrative position from the Office of Management & Budget funded 41,200
A vacant clerical position was reclassified and transferred from the Office of the Chief in 2008-09
38,400
A vacant Lot Attendant position is eliminated due to budget constraints -36,100
A vacant clerical position is eliminated due to budget constraints -34,100
Printing funding related to parking enforcement transfers to Finance -8,200
One time appropriation for training for surveillance camera maintenance expires -6,000
Program Change Recruitment activities are postponed indefinitely pending the announcement of the next police recruit class. The Police Overt Digital Surveillance System (PODSS) center, part of the Headquarters and Records Unit, is located in the Public Safety Building and is staffed 24 hours a day with the purpose of monitoring any activity that appears to be suspicious in nature. Within the PODSS center, trained personnel have access to police radios and Computer Aided Dispatch (CAD) terminals, allowing direct communication to police officers on the street. Property lots disposed of in 2008-09 assumed a large drug burn that did not occur.

12–28 POLICE DEPARTMENT ADMINISTRATION
EXPENDITURE SUMMARY
Actual Estimated Amended Approved2007-08 2008-09 2008-09 2009-10
Appropriation by Major ObjectPersonnel Expenses 9,740,070 9,598,300 8,533,300 7,483,900 Materials & Supplies 1,045,779 788,500 950,000 954,500 Services 5,688,865 6,287,000 6,497,800 6,378,300 Other 0 0 0 0
Total 16,474,714 16,673,800 15,981,100 14,816,700
Appropriation by ActivityProfessional Development 3,818,981 3,398,300 3,628,500 2,368,500 Technical Services 9,319,052 9,783,600 9,009,900 8,991,500 Family & Victim Services 714,274 770,100 779,400 740,100 Personnel 621,291 925,000 637,200 688,500 Budget 951,257 713,600 827,300 887,100 Animal Services 1,049,859 1,083,200 1,098,800 1,141,000
Total 16,474,714 16,673,800 15,981,100 14,816,700
Employee Years by ActivityProfessional Development 33.8 20.3 21.8 17.8 Technical Services 78.8 89.9 68.4 70.3 Family & Victim Services 13.2 13.1 13.7 13.7 Personnel 4.3 4.4 4.3 4.3 Budget 2.9 2.9 2.9 3.4 Animal Services 21.6 21.2 21.4 21.4
Total 154.6 151.8 132.5 130.9

POLICE DEPARTMENT 12–29 ADMINISTRATION
PERSONNEL SUMMARY
FULL TIME POSITIONS Pro
fess
iona
l D
evel
opm
ent
Tec
hnic
al
Ser
vice
s
Fam
ily &
V
ictim
S
ervi
ces
Per
sonn
el
Bud
get
Ani
mal
S
ervi
ces
Budget ApprovedBr. Title 2008-09 2009-1094 Police Lieutenant 2 2 1 192 Police Sergeant 6 6 3 390 Police Officer 15 15 5 1029 Principal Staff Assistant 0 0.5 0.526 Associate Administrative Analyst 1 1 126 Director of Animal Services 1 1 126 Manager of Police Property 1 1 124 Associate Personnel Analyst 1 1 124 Police Program Coordinator 0 1 120 Crisis Counseling Coordinator 1 020 Victim Services Coordinator 1 1 118 Counseling Specialist 5 5 518 Supervisor of Animal Control 1 1 116 Animal Shelter Manager 1 1 116 Fleet Maintenance Technician 1 1 116 Payroll Associate 1 1 116 Senior Property Clerk 2 2 214 Assistant Supervisor of Animal Control 1 1 114 Police Paralegal 0 2 114 Police Paralegal Bilingual 0 1 214 Victim Assistance Counselor 4 4 412 Animal Control Officer 7 7 711 Assistant Shelter Manager 1 1 111 Clerk I 1 1 111 Lead Police Information Clerk 3 3 311 Police Identification Technician Trick 4 4 411 Secretary 1 1 110 Sr. Finance Clerk 1 1 110 Veterinary Technician 1 1 1
9 Clerk II 2 2 1 19 Clerk II with Typing 6 4 1 39 Lot Attendant 6 5 59 Police Information Clerk 16 16 169 Property Clerk 4 4 47 Clerk III with Typing 6 9 6 1 27 Clerk III 1 06 Receptionist Typist 1 1 12 Animal Care Technician 5 5 5
EMPLOYEE YEARSFull Time 111.0 113.5 11.0 64.0 12.0 4.0 3.5 19.0Overtime 6.8 6.8 2.9 2.3 0.5 0.1 0.0 1.0Part Time, Temporary, Seasonal 16.5 12.5 4.2 4.7 1.5 0.3 0.0 1.8Less: Vacancy Allowance 1.8 1.9 0.3 0.7 0.3 0.1 0.1 0.4 Total 132.5 130.9 17.8 70.3 13.7 4.3 3.4 21.4

FIRE DEPARTMENT 13–1
Mission Statement To support the City of Rochester’s One City Vision Statement and its Values and Guiding Principles by providing professional services for life preservation, incident stabilization and property conservation. We protect life and property through fire suppression, emergency medical services, technical rescue, fire prevention, disaster preparedness and public education. The effective delivery of these services is achieved through a commitment to our employees and the community.
Office of the Fire Chief
Operations Support

13–2 FIRE DEPARTMENT
Vital Customers Internal: City of Rochester Administration; City Council External: All who live, work, visit, or do business in the City of Rochester; Rochester City School
District; Mutual Aid Program participants; Monroe County, West Brighton Fire District; RG&E; Kodak.
Critical Processes Training and appropriate staffing Education and fire prevention activities Fire suppression Medical response Equipment and supplies maintenance
Highlights of the Department's 2009-10 Fiscal Goals & Objectives are presented below. Additional information for each bureau is included in the sections that follow. Highlights Priorities Supported Projected
Completion
Office of the Fire Chief:
Implement phase 2 of a four-year transition to Engine/Truck service delivery model
Public Safety First Quarter
Develop and implement 2010 Recruitment Program for entry-level firefighters to increase minority representation in the department by 5% over the next four years
Public Safety Third Quarter
Operations:
Review and update the City’s Comprehensive Emergency Preparedness Plan
Public Safety Second Quarter
Support:
Partner with Information Technology to deploy the Red NMX property inspection module
Public Safety First Quarter
Year-To-Year Comparison
Budget Budget PercentBureaus 2008-09 2009-10 Change ChangeOffice of the Fire Chief 1,843,800 1,795,500 -48,300 -2.6%Operations 36,400,300 36,959,000 558,700 1.5%Support 3,354,900 3,316,000 -38,900 -1.2%
Total 41,599,000 42,070,500 471,500 1.1%
Employee Years 537.9 534.9 -3.0 -0.6%

FIRE DEPARTMENT 13–3
Change Detail Salary & Wage General Vacancy
Adjustment Inflation Chargebacks Allowance Miscellaneous Major Change Total577,800 192,200 32,700 0 -2,100 -329,100 471,500
Major Change Highlights Urban Area Security Initiative (UASI) grant funding expires -170,900
Reassignment of fire safety outreach efforts to neighborhood fire stations eliminates two full time community outreach positions, one vacant and one filled
-75,700
Assistance to Firefighters Grant funding expires -73,300
Part time salary funding for East High Trainee Program is reduced to reflect demand -60,900
Phase 2 of conversion to Fire Command’s preferred operational service delivery model requires reclassification of four firefighters to rank positions
50,200
A vacant administrative position is eliminated due to budget constraints -45,100
Funding for entry-level recruitment effort increases 34,600
Funding is provided for temporary off-site facility rental to conduct Candidate Physical Agility Test (CPAT)
10,000
Miscellaneous funding provided in recognition of volunteer efforts of Rochester Protectives, Inc.
2,000
Year Uniform Civilian Total Uniform Civilian Total Uniform Civilian Total2009-10 41 20 61 454 2 456 495 22 5172008-09 41 23 64 454 2 456 495 25 5202007-08 40 24 64 471 2 473 511 26 5372006-07 42 24 66 473 2 475 515 26 5412005-06 45 25 70 475 2 477 520 27 5472004-05 46 26 72 475 2 477 521 28 5492003-04 48 27 75 474 1 475 522 28 5502002-03 30 21 51 499 7 506 529 28 5572001-02 31 22 53 504 7 511 535 29 5642000-01 25 21 46 506 7 513 531 28 559
Assignment of Authorized Positions2000-01 to 2009-10
Office of the Chief & Support Operations Department

13–4 FIRE DEPARTMENT EXPENDITURE SUMMARY
Actual Estimated Amended Approved2007-08 2008-09 2008-09 2009-10
Appropriation by Major ObjectPersonnel Expenses 38,892,966 38,711,600 38,164,500 38,610,800 Materials & Supplies 680,725 723,100 779,300 702,400 Services 1,924,160 2,235,600 2,655,200 2,757,300 Other 0 0 0 0
Total 41,497,851 41,670,300 41,599,000 42,070,500
Appropriation by ActivityOffice of the Fire Chief 1,684,833 1,611,500 1,843,800 1,795,500 Operations 36,254,332 36,621,700 36,400,300 36,959,000 Support 3,558,686 3,437,100 3,354,900 3,316,000
Total 41,497,851 41,670,300 41,599,000 42,070,500
Employee Years by ActivityOffice of the Fire Chief 22.2 19.2 20.7 19.7 Operations 483.3 479.2 470.0 470.0 Support 50.2 48.2 47.2 45.2
Total 555.7 546.6 537.9 534.9

FIRE DEPARTMENT 13–5 OFFICE OF THE FIRE CHIEF
Mission Statement To support the City of Rochester’s One City Vision Statement and its Values and Guiding Principles, the Office of the Fire Chief manages the Fire Department; analyzes and evaluates operations and performance; carries out public relations; and coordinates payments to disabled firefighters. Organization
Critical Processes Manages personnel and establishes personnel standards, policies and work schedules Coordinates department’s annual budget request Controls general fiscal matters Analyzes operations and reporting systems Evaluates programs, and develops recommendations for modifying procedures Assists in implementing new methods and techniques Oversees information systems Acts as liaison with City’s Information Technology Department and Emergency Communications
Department Makes payments to disabled but not yet retired firefighters, as well as personnel on long-term sick
or injured status 2009-10 Fiscal Goals & Objectives Objective Priorities Supported Projected
Completion
Implement phase 2 of a four-year transition to Engine/Truck service delivery model
Public Safety First Quarter
Evaluate performance of uniformed medical services contract provider to initiate renewal procedure
Customer Service First Quarter
Begin preliminary planning for Genesee Street fire station replacement
Public Safety Second Quarter
Develop and implement 2010 Recruitment Program for entry-level firefighters to increase minority representation in the department by 5% over the next four years
Public Safety Third Quarter
Collaborate with Architectural Services to begin construction of renovation/addition to Hudson Avenue Fire Station
Public Safety Fourth Quarter
Chief's Office
Planning & Research Sick & Injured

13–6 FIRE DEPARTMENT OFFICE OF THE FIRE CHIEF
Key Performance Indicators Actual
2007-08Estimated
2008-09Budget
2008-09 Budget
2009-10
Service requests completed (Information/Technical assistance)
1,913 1,995 1,960 2,000
Year-To-Year Comparison
2008-09 2009-10 ChangeBudget 1,843,800 1,795,500 -48,300Employee Years 20.7 19.7 -1.0 Change Detail Salary & Wage General Vacancy
Adjustment Inflation Chargebacks Allowance Miscellaneous Major Change Total11,500 22,300 -300 0 0 -81,800 -48,300
Major Change Assistance to Firefighters Grant funding expires -73,300
A vacant administrative position is eliminated due to budget constraints -45,100
Funding for advertising of entry-level firefighter exam is provided 20,000
Professional fees increase to support a recruitment consultant 14,600
Miscellaneous funding provided in recognition of volunteer efforts of Rochester Protectives, Inc. 2,000

FIRE DEPARTMENT 13–7 OFFICE OF THE FIRE CHIEF EXPENDITURE SUMMARY
Actual Estimated Amended Approved2007-08 2008-09 2008-09 2009-10
Appropriation by Major ObjectPersonnel Expenses 1,415,534 1,351,700 1,461,900 1,428,300 Materials & Supplies 85,247 105,500 111,700 40,100 Services 184,052 154,300 270,200 327,100 Other 0 0 0 0
Total 1,684,833 1,611,500 1,843,800 1,795,500
Appropriation by ActivityChief's Office 1,056,504 941,000 971,700 976,100 Planning and Research 234,819 225,800 363,800 297,400 Sick & Injured 393,510 444,700 508,300 522,000
Total 1,684,833 1,611,500 1,843,800 1,795,500
Employee Years by ActivityChief's Office 13.7 10.7 10.6 10.6 Planning and Research 3.5 2.6 4.1 3.1 Sick & Injured 5.0 5.9 6.0 6.0
Total 22.2 19.2 20.7 19.7

13–8 FIRE DEPARTMENT OFFICE OF THE FIRE CHIEF
PERSONNEL SUMMARY
FULL TIME POSITIONS Chi
ef's
Offi
ce
Pla
nnin
g &
R
esea
rch
Sic
k &
Inju
red
Budget ApprovedBr. Title 2008-09 2009-1088 Fire Chief 1 1 187 Executive Deputy Fire Chief 1 1 184 Fire Captain 2 3 2 182 Fire Lieutenant 3 2 280 Firefighter 5 5 1 429 Principal Staff Assistant 1 1 124 Case Manager 1 1 120 Executive Assistant 1 1 118 Secretary to the Chief 1 1 116 Administrative Assistant 1 016 Payroll Associate 1 1 1
9 Clerk II 2 2 2
EMPLOYEE YEARSFull Time 20.0 19.0 10.0 3.0 6.0Overtime 0.6 0.6 0.5 0.1 0.0Part Time, Temporary, Seasonal 0.1 0.1 0.1 0.0 0.0Less: Vacancy Allowance 0.0 0.0 0.0 0.0 0.0 Total 20.7 19.7 10.6 3.1 6.0

FIRE DEPARTMENT 13–9 OPERATIONS
Mission Statement To support the City of Rochester’s One City Vision Statement and its Values and Guiding Principles; the Operations Bureau fights fires, provides emergency medical service, and responds to other emergency and non-emergency incidents. The Bureau remains prepared for this mission though training of recruits and ongoing training of firefighters and officers, through its Emergency Medical Services (EMS) Program, and through its Health & Safety compliance activities. Organization
Critical Processes Suppression Responds to fire incidents and performs rescues Controls hazardous materials that threaten public safety with a specialized Hazardous Materials
Response Team Trains as Certified First Responders and Emergency Medical Technicians Conducts code enforcement inspections Operates public education programs in cooperation with the Community Relations & Education Unit
(CREU)
Protectives Protectives, Inc. of Rochester, NY is volunteers that respond to fire alarms to safeguard and
salvage property using a City fire vehicle and other equipment. Training Provides initial training of recruits and ongoing training of firefighters and officers Conducts two days of in-service training annually for all fire companies Conducts annual service tests of firefighting apparatus Conducts Firefighter Trainee program in conjunction with Rochester City School District Through Special Operations, oversees six specialty teams: Hazardous Materials Response,
Confined Space Rescue, High Rise, Water Rescue, Extrication, and Heavy Rescue Develops and maintain Metropolitan Medical Response System program Oversees Emergency Training and Information Network (ETIN) which provides access for first
responders to a wide range of tools and information through the internet
Emergency Medical Service Coordinates Emergency Medical Services program, including training, certification, testing
o Emergency Medical Technician (EMT) o Certified First Responder (CFR) o Cardiopulmonary Resuscitation (CPR) o Continuing Medical Education (CME)
Purchases and maintain EMS equipment and supplies
Suppression
Protectives Training Emergency Medical Service Health & Safety

13–10 FIRE DEPARTMENT OPERATIONS
Health & Safety Ensures compliance with all Occupational and Safety Health Administration (OSHA) and other
regulations Inspects facilities, apparatus, and equipment for compliance with Federal, State, and local
safety regulations Provide oversight at the scene of emergency incidents Recommends changes in procedures to reduce the risk of injury to firefighting personnel
2009-10 Fiscal Goals & Objectives Objective Priorities Supported Projected
Completion
Implement next generation of the Emergency Training & Information Network (ETIN)
Public Safety First Quarter
Develop and evaluate options to reformat training at Public Safety Training Facility (PSTF)
Public Safety Second Quarter
Review and update the City’s Comprehensive Emergency Preparedness Plan
Public Safety Second Quarter
Monitor Ambulance Contract Accountability Public Safety Ongoing
Key Performance Indicators Actual
2007-08Estimated
2008-09Budget
2008-09 Budget
2009-10
Suppression
Incidents:
● Structure fire 666 670 650 670
● Other fire 778 800 850 810
● Emergency medical 15,129 15,200 14,800 15,550
● Other 12,190 13,130 10,500 13,425
● False alarm 3,297 3,600 3,500 3,750
● Total incidents 32,060 33,400 30,300 34,205
Fire safety inspections 4,048 3,400 3,500 4,000
Unit responses by fire station and unit:
● 272 Allen Street (Engine 13, Quint 8) 5,358 3,900 5,450 4,100
● 185 N. Chestnut St (Engine 17, Rescue 11) 3,996 4,500 4,110 4,500
● 1207 N. Clinton Ave (Quint 6, Midi 6) 5,152 5,600 5,300 5,750
● 1477 Dewey Ave (Engine 10, Truck 2)* 4,694 3,800 4,750 3,900
● 1051 Emerson St (Engine 3) 1,354 1,400 1,300 1,450
● 57 Gardiner Ave (Quint 5, Midi 5) 3,441 4,100 3,100 4,100
● 873 Genesee St (Engine 7) 2,181 2,400 2,300 2,400

FIRE DEPARTMENT 13–11 OPERATIONS
Actual2007-08
Estimated 2008-09
Budget2008-09
Budget2009-10
● 740 N Goodman St (Quint 7, Midi 7) 4,570 4,700 4,500 4,750
● 704 Hudson Ave (Engine 16) 3,683 3,900 3,650 3,900
● 4090 Lake Ave (Quint 1, Midi 1) 1,260 1,300 1,100 1,300
● 450 Lyell Ave (Engine 5) 2,885 2,900 2,750 3,000
● 315 Monroe Ave (Engine 1)* 4,549 4,800 4,500 4,100
● 1281 South Ave (Engine 8, Truck 7)* 2,676 2,700 2,700 3,000
● 977 University Ave (Truck 4)* 2,610 2,900 2,750 2,900
● 160 Wisconsin St (Engine 12) 1,540 1,600 1,400 1,700
● Battalion 1 1,043 1,135 1,200 1,200
● Battalion 2 1,303 1,345 1,400 1,400
● Battalion 3 931 975 1,000 1,000
● Total responses 53,226 53,955 53,260 54,450
*Equipment assignments subject to change pending completion of station construction and renovation projects.
Smoke detector installation 1,768 2,100 3,600 3,600
CO detector installations 408 565 1,400 1,400
Training
Recruits Trained 11 25 16 15
Uniformed personnel trained 564 551 495 450
Special Operations drills held 22 22 24 24
Emergency Medical Service
CPR certifications completed 43 35 50 50
Number of certified Emergency Medical Technicians (EMT)
426 428 435 431
Number of Certified First Responders (CFR) 64 54 60 52
Health & Safety
Civilian deaths due to fire 5 3 N/A 0
Firefighter injuries 131 120 N/A 125
N/A - Not Applicable Year-To-Year Comparison

13–12 FIRE DEPARTMENT OPERATIONS
2008-09 2009-10 ChangeBudget 36,400,300 36,959,000 558,700Employee Years 470.0 470.0 0.0 Change Detail Salary & Wage General Vacancy
Adjustment Inflation Chargebacks Allowance Miscellaneous Major Change Total543,500 155,900 33,000 0 -2,100 -171,600 558,700
Major Change Urban Area Security Initiative (UASI) grant funding expires -170,900
Part time salary funding for East High Trainee Program is reduced to reflect demand -60,900
Phase 2 of conversion to Fire Command’s preferred operational service delivery model requires reclassification of four firefighters to rank positions
50,200
Funding is provided for temporary off-site facility rental to conduct Candidate Physical Agility Test (CPAT)
10,000
Program Change Phase 2 of a four-year transition to an Engine/Truck service delivery model is implemented by the following restructuring:
One Quint/Midi station converts to Engine/Truck – 1281 South Avenue One Quint/Midi station converts to Engine – 315 Monroe Avenue One Quint/Midi station converts to Truck – 977 University Avenue
With this reorganization, the number of quint/midi stations will be reduced from seven to four; single engine stations will increase from six to seven; engine/truck stations will increase from two to three; and one truck station will be created. This reorganization will keep the current fifteen fire stations open.
Engine 16 and Battalion 1 are temporarily re-located from 704 Hudson Avenue due to construction. Engine 16 relocates to 1207 North Clinton Avenue and Battalion 1 relocates to 185 North Chestnut Street.

FIRE DEPARTMENT 13–13 OPERATIONS
PRSONNEL SUMMARY
Actual Estimated Amended Approved2007-08 2008-09 2008-09 2009-10
Appropriation by Major ObjectPersonnel Expenses 34,259,950 34,250,400 33,672,200 34,205,000 Materials & Supplies 326,349 339,000 400,600 383,800 Services 1,668,033 2,032,300 2,327,500 2,370,200 Other 0 0 0 0
Total 36,254,332 36,621,700 36,400,300 36,959,000
Appropriation by ActivitySuppression 33,995,445 34,200,800 33,698,000 34,489,900 Protectives 68,822 47,600 46,700 48,700 Training 1,506,600 1,696,700 1,950,600 1,702,600 Emergency Medical Service 186,472 185,300 190,400 191,400 Health & Safety 496,993 491,300 514,600 526,400
Total 36,254,332 36,621,700 36,400,300 36,959,000
Employee Years by ActivitySuppression 458.9 457.4 447.4 448.4 Protectives 0.4 0.0 0.0 0.0 Training 15.5 13.8 14.3 13.3 Emergency Medical Service 2.2 2.1 2.1 2.1 Health & Safety 6.3 5.9 6.2 6.2
Total 483.3 479.2 470.0 470.0

13–14 FIRE DEPARTMENT OPERATIONS
EXPENDITURE SUMMARY
FULL TIME POSITIONS Sup
pres
sion
Tra
inin
g
Em
erge
ncy
Med
ical
S
ervi
ce
Hea
lth &
S
afet
y
Budget ApprovedBr. Title 2008-09 2009-10
86 Deputy Fire Chief 6 6 4 1 185 Battalion Chief 15 15 14 184 Fire Captain 33 35 27 3 1 482 Fire Lieutenant 61 63 59 480 Firefighter 339 335 334 1
9 Clerk II with Typing 1 1 17 Clerk III with Typing 1 1 1
EMPLOYEE YEARSFull Time 456.0 456.0 438.0 10.0 2.0 6.0Overtime 8.0 8.0 7.4 0.3 0.1 0.2Part Time, Temporary, Seasonal 6.0 6.0 3.0 3.0 0.0 0.0Less: Vacancy Allowance 0.0 0.0 0.0 0.0 0.0 0.0 Total 470.0 470.0 448.4 13.3 2.1 6.2

FIRE DEPARTMENT 13–15 SUPPORT
Mission Statement To support the City of Rochester’s One City Vision Statement and its Values and Guiding Principles, Support maintains fire apparatus and equipment, Rochester’s radio fire alarm system, investigates all structure and other fires, and conducts code enforcement. Organization
Critical Processes Apparatus Maintenance Maintains fire apparatus, support vehicles, other motorized equipment Develops specifications for new apparatus and prepares for use Prepares surplus firefighting equipment for sale Maintains Airport fire apparatus
Hose and Supply Orders, maintains, stocks, and distributes equipment and materials to fire stations Performs general maintenance, testing, and routine repairs on fire tools and appliances Responds to major fires to deliver additional air bottles and make minor on-the-spot repairs
Fire Communications Maintains Rochester’s radio fire alarm system, including street alarm boxes for public use and
master boxes providing automatic transmission from alarm systems in city schools, hospitals, nursing homes, and industries.
Maintains central station receiver located in the Emergency Communications Center Programs digital communications equipment for the department Provides liaison with Monroe County Public Safety Communications
Fire Investigation Investigates all structure fires or other incident including vehicle, trash, and false calls Surveys fires scenes to determine ignition sequence and fire development Conducts interviews with witnesses and victims Arson Task Force interrogates suspects and pursues criminal charges Fire Related Youth Program investigates juvenile fire-setter incidents Perform educational interventions with juveniles and primary caregivers
Support
Apparatus Maintenance Hose & Supply
Hose & Supply Fire Communications
Fire Investigation Code Enforcement

13–16 FIRE DEPARTMENT SUPPORT
Code Enforcement Inspects residential, commercial, industrial, and institutional properties Seeks violations of the Fire Prevention Code liable to cause fire and endanger life and property In conjunction with Neighborhood and Business Development, reviews new construction plans to
ensure code compliance Inspects properties receiving Certificates of Occupancy and entertainment licenses Assists Neighborhood and Business Development quadrant teams in “Project Uplift” Issues permits for maintaining, storing, handling, and transporting hazardous materials; inspects
vehicles, buildings, and storage places to be used Maintains information file on structures that records inspections, permit issuance, fire prevention
measures Conducts educational programs through the Community Relations and Education Unit (CREU) to
develop public awareness of fire and fire safety 2009-10 Fiscal Goals & Objectives Objective Priorities Supported Projected
Completion
Partner with Information Technology to deploy the Red NMX property inspection module
Public Safety First Quarter
Provide mandated building Code Enforcement Officials (CEO) training
Public Safety Second Quarter
Establish cross-departmental committee to evaluate consolidating supervision for Apparatus Maintenance under Environmental Services, Equipment Services to drive accountability
Customer Service Third Quarter
Key Performance Indicators Actual
2007-08Estimated
2008-09Budget
2008-09 Budget
2009-10
Apparatus Maintenance
First line apparatus maintenance and repairs N/A N/A 1,760 1,700
Auto and miscellaneous repairs N/A N/A 1,370 1,370
Hose & Supply
Breathing apparatus returned to service 2,769 2,800 2,800 3,000
Turnout Gear returned to service 3,823 3,900 2,500 4,000
Fire Communications
Repairs completed 325 320 335 310

FIRE DEPARTMENT 13–17 SUPPORT
Actual2007-08
Estimated 2008-09
Budget2008-09
Budget2009-10
Code Enforcement
Permits issued 3,795 4,500 4,250 4,500
Property inspections conducted 9,138 8,910 8,850 9,000
Referrals to other City departments resulting from inspections
872 950 700 800
Fire Investigation
Initial fire investigations required 923 896 1,035 952
Arson or incendiary fires 267 280 230 260
Fires with undetermined cause 70 65 65 65
Vacant house fires 100 120 85 110
Juvenile fire-setter incidents 178 160 250 182
FOIL requests processed 234 318 250 250
Fire investigations closed 651 620 550 660
Preventable fire incidents 280 244 300 298
Juvenile contacts 314 350 400 385
Arrests:
● Adult 31 40 34 40
● Juvenile 23 35 30 35
Juvenile Diversions 12 20 N/A 20
Community Outreach
Fire Safety Presentations 214 160 425 285
Citizens Trained 9,816 10,000 21,000 10,000
N/A - Not Applicable

13–18 FIRE DEPARTMENT SUPPORT
Year-To-Year Comparison 2008-09 2009-10 Change
Budget 3,354,900 3,316,000 -38,900Employee Years 47.2 45.2 -2.0 Change Detail Salary & Wage General Vacancy
Adjustment Inflation Chargebacks Allowance Miscellaneous Major Change Total22,800 14,000 0 0 0 -75,700 -38,900
Major Change Reassignment of fire safety outreach efforts to neighborhood fire stations eliminates two full time community outreach positions, one vacant and one filled
-75,700
Program Change Delayed implementation of FASTER system prevents data collection on apparatus and auto repairs. Turn-out gear repairs increase as current inventory ages. Increased collaboration between departments causes referrals to other City departments to increase.

FIRE DEPARTMENT 13–19 SUPPORT
EXPENDITURE SUMMARY
Actual Estimated Amended Approved2007-08 2008-09 2008-09 2009-10
Appropriation by Major ObjectPersonnel Expenses 3,217,482 3,109,500 3,030,400 2,977,500 Materials & Supplies 269,129 278,600 267,000 278,500 Services 72,075 49,000 57,500 60,000 Other 0 0 0 0
Total 3,558,686 3,437,100 3,354,900 3,316,000
Appropriation by ActivityApparatus Maintenance 624,637 645,700 677,900 689,400 Hose and Supply 608,235 377,300 332,200 338,800 Fire Communications 93,444 99,400 102,300 103,300 Fire Investigation 873,186 808,400 758,500 755,600 Code Enforcement 1,359,184 1,506,300 1,484,000 1,428,900
Total 3,558,686 3,437,100 3,354,900 3,316,000
Employee Years by ActivityApparatus Maintenance 7.9 8.3 8.8 8.8 Hose and Supply 7.5 4.1 3.6 3.6 Fire Communications 1.4 1.3 1.4 1.4 Fire Investigation 14.0 12.2 11.4 11.4 Code Enforcement 19.4 22.3 22.0 20.0
Total 50.2 48.2 47.2 45.2

13–20 FIRE DEPARTMENT SUPPORT
PERSONNEL SUMMARY
FULL TIME POSITIONS
App
arat
us
Mai
nten
ance
Hos
e &
S
uppl
y
Fire
Com
mun
-ic
atio
ns
Fire
In
vest
igat
ion
Cod
e E
nfor
cem
ent
Budget ApprovedBr. Title 2008-09 2009-1086 Deputy Fire Chief 1 1 184 Fire Captain 2 1 182 Fire Lieutenant 3 4 1 1 280 Firefighter 23 23 2 9 1278 Fire Equipment Maint. Supervisor 1 1 175 Fire Communications Technician 1 1 173 Fire Apparatus Body Repairer 1 1 173 Senior Fire Equipment Mechanic 5 5 527 Supt. Fire Equipment Maintenance 1 1 116 Community Outreach Specialist Bilingual 1 012 Asst. Comm. Outreach Spec. Bilingual 1 0
9 Clerk II with Typing 3 3 1 29 Clerk II 0 1 17 Clerk III 1 0
EMPLOYEE YEARSFull Time 44.0 42.0 8.0 3.0 1.0 11.0 19.0Overtime 2.7 2.7 0.8 0.1 0.4 0.4 1.0Part Time, Temporary, Seasonal 0.5 0.5 0.0 0.5 0.0 0.0 0.0Less: Vacancy Allowance 0.0 0.0 0.0 0.0 0.0 0.0 0.0 Total 47.2 45.2 8.8 3.6 1.4 11.4 20.0

PUBLIC LIBRARY 14–1
Mission Statement To support the City of Rochester’s One City Vision Statement and its Values and Guiding Principles
by enriching the quality of life in Rochester and Monroe County by providing educational, recreational, aesthetic, and informational materials, services, and programs to help people follow their own lines of inquiry and enlightenment.
Through a partnership of public and private resources, the Library assists the City and County in meeting the needs of the community by operating the central and branch libraries, conducting outreach programs and providing services to member libraries of the Monroe County Library System.
In all its endeavors, the Library maintains and promotes the principles of intellectual freedom and equality of access.
Organization The Library consists of the Central Library, which includes Monroe County Library System support services, and Community Services, which includes the branch libraries. In accordance with New York State Education Law, the Library is governed by an eleven-member Board of Trustees. The Mayor appoints trustees, with the approval of City Council, for five-year terms.
Library Board
Office of the Library Director
Central Library
Community Library

14–2 PUBLIC LIBRARY
Vital Customers External: All users of library products, services, facilities; special populations;
institutions/agencies/organizations; funding bodies; businesses; other libraries. Critical Processes Our valued and culturally diverse staff provides convenient and reliable services and dynamic
collections that anticipate the needs of our community. Our attractive and inviting facilities enable us to meet the specific library service needs of
neighborhoods. We play a leadership role in facilitating independent learning in order to help people lead more
productive and fulfilling lives. Highlights of the Department's 2009-10 Fiscal Goals & Objectives are presented below. Additional information for each bureau is included in the sections that follow. Highlights Priorities Supported Projected
Completion
Central:
Reorganize the work processes of the Outreach Department
Customer Service First Quarter
Collaborate with the City’s Communications Bureau to develop new ways to produce promotional materials
Customer Service Second Quarter
Community:
Expand Literacy Outreach Program Customer Service First Quarter
Collaborate with the Department of Recreation and Youth Services on the opening of the Thomas P. Ryan Community Center
Customer Service First Quarter
Year-To-Year Comparison
Budget Budget PercentBureau 2008-09 2009-10 Change ChangeCentral Library 8,094,100 7,961,000 -133,100 -1.7%Community Library 3,131,500 3,192,500 61,000 1.9%
Total 11,225,600 11,153,500 -72,100 -0.6%
Employee Years 169.7 166.6 -3.1 -1.9% Change Detail Salary & Wage General Vacancy
Adjustment Inflation Chargebacks Allowance Miscellaneous Major Change Total169,700 34,900 -42,000 900 -500 -235,100 -72,100

PUBLIC LIBRARY 14–3
Major Change Highlights Budget constraints necessitated by Monroe County result in reduced personnel allocations at the Central Library
-221,900
Quadrant services model results in reduced personnel costs as an efficiency measure -52,200
Funding to enhance Literacy increase part time personnel cost at branch libraries 29,900
Security services decrease as an efficiency measure -20,200
Professional fees increase due to MCLS member agreement 17,000
Allotment for Central Library materials decrease due to budget constraints -16,000
Funding is included for maintenance fee for branch computers 14,300
Funding is included for increased office supplies at branch libraries 12,500

14–4 PUBLIC LIBRARY EXPENDITURE SUMMARY
Actual Estimated Amended Approved2007-08 2008-09 2008-09 2009-10
Appropriation by Major ObjectPersonnel Expenses 7,813,231 7,997,700 8,270,200 8,126,800 Materials & Supplies 933,495 945,300 942,500 947,500 Services 1,721,436 1,938,300 1,942,900 1,939,400 Other 11,537 61,800 70,000 139,800
Total 10,479,699 10,943,100 11,225,600 11,153,500
Appropriation by ActivityCentral Library 7,595,547 7,882,900 8,094,100 7,961,000 Community Library 2,884,152 3,060,200 3,131,500 3,192,500
Total 10,479,699 10,943,100 11,225,600 11,153,500
Employee Years by ActivityCentral Library 119.8 121.4 125.4 120.5 Community Library 40.9 43.3 44.3 46.1
Total 160.7 164.7 169.7 166.6

PUBLIC LIBRARY 14–5 CENTRAL LIBRARY
Organization
Critical Processes Provide personnel, financial management, consulting, public relations, promotions, graphics, and
duplicating services Provide support and outreach services to members of the Monroe County Library System Provide Internet service to libraries county-wide, the City of Rochester, and the County of Monroe
2009-10 Fiscal Goals & Objectives Objective Priorities Supported Projected
Completion
Reorganize the work processes of the Outreach Department
Customer Service First Quarter
Collaborate with City’s Communications Bureau to develop new ways to produce promotional materials
Customer Service Second Quarter
Develop specifications for new Shipping and Delivery Department Vehicles
Customer Service Fourth Quarter
Develop social networking tools on Website Customer Service Ongoing
Key Performance Indicators Actual
2007-08Estimated
2008-09 Budget
2008-09Budget
2009-10
Public Services
Users:
● Monday through Saturday 692,565 694,000 722,000 715,000
● Sunday 28,575 35,000 36,000 36,000
● Total Users 721,140 729,000 758,000 751,000
Users per service hour:
● Monday through Saturday 240 240 251 249
● Sunday 216 219 225 225
Circulation per service hour:
Administration
Public Services Technical & Support Services

14–6 PUBLIC LIBRARY CENTRAL LIBRARY
Actual2007-08
Estimated2008-09
Budget 2008-09
Budget2009-10
● Monday through Saturday 216 228 216 235
● Sunday 194 188 219 200
Reference assistance per service hour:
● Monday through Saturday 65 65 64 66
● Sunday 62 58 58 59
Reference transactions per capita
Internet sessions per service hour:
● Monday through Saturday 58 69 75 73
● Sunday 54 53 56 56
Average attendance per program:
● Monday through Saturday 30 35 22 39
● Sunday 26 13 11 15
Total circulation:
● Monday through Saturday 623,867 660,000 620,000 675,000
● Sunday 25,553 30,000 30,000 32,000
● Total 649,420 690,000 650,000 707,000
Technical & Support Services
● Registered borrowers 509,928 471,084 482,350 482,350
● Titles in database 940,585 960,585 980,000 980,000
● Items available for circulation (000) 2,894 2,949 3,096 3,096
● Items delivered (000) 7,847 7,968 8,088 8,088
Year-To-Year Comparison
2008-09 2009-10 ChangeBudget 8,094,100 7,961,000 -133,100Employee Years 125.4 120.5 -4.9 Change Detail Salary & Wage General Vacancy
Adjustment Inflation Chargebacks Allowance Miscellaneous Major Change Total111,300 20,000 -38,500 2,500 -500 -227,900 -133,100
Major Change

PUBLIC LIBRARY 14–7 CENTRAL LIBRARY
Budget constraints necessitated by Monroe County result in reduced personnel allocations at the Central Library
-221,900
Professional fees increase due to MCLS member agreement 17,000
Allotment for Library materials decrease due to budget constraints -16,000
Funding decreases to support training for new MCLS Web Page -10,100
Funding is included for increased building maintenance and repair 9,300
Funds are reduced for office supplies due to budget constraints -8,600
Funding is included for increased book scanner maintenance 5,300
Funds are reduced for tool and machine parts due to budget constraints -4,400
Funding is included for increased sound, light, and computer supplies 3,800
Lease payment for phone equipment does not recur -2,300
Program Change Information Center will be closed and work reallocated to subject departments. Outreach Department will be re-organized to use Central collection for recent publications.

14–8 PUBLIC LIBRARY CENTRAL LIBRARY
EXPENDITURE SUMMARY
Actual Estimated Amended Approved2007-08 2008-09 2008-09 2009-10
Appropriation by Major ObjectPersonnel Expenses 5,520,230 5,668,600 5,868,900 5,691,000 Materials & Supplies 877,207 892,200 895,900 877,500 Services 1,186,573 1,260,300 1,259,300 1,252,700 Other 11,537 61,800 70,000 139,800
Total 7,595,547 7,882,900 8,094,100 7,961,000
Appropriation by ActivityAdministration 2,072,665 2,219,700 2,221,200 2,220,800 Public Services 3,835,969 3,999,300 4,130,600 4,031,900 Technical & Support Services 1,686,913 1,663,900 1,742,300 1,708,300
Total 7,595,547 7,882,900 8,094,100 7,961,000
Employee Years by ActivityAdministration 26.9 26.8 26.8 27.8 Public Services 58.3 57.8 61.8 57.9 Technical & Support Services 34.6 36.8 36.8 34.8
Total 119.8 121.4 125.4 120.5

PUBLIC LIBRARY 14–9 CENTRAL LIBRARY PERSONNEL SUMMARY
FULL TIME POSITIONS Adm
inis
trat
ion
Pub
lic
Ser
vice
s
Tec
hnic
al &
S
uppo
rt
Ser
vice
s
Budget ApprovedBr. Title 2008-09 2009-1036 Library Director 1 1 131 Assistant Library Director III 2 2 1 126 Associate Administrative Analyst 1 1 124 Librarian IV 1 1 124 Assistant to the Library Director 1 1 124 Computer Operations Supervisor 1 1 123 Principal Graphic Designer 1 1 123 Supervisor Library Buildings 1 1 122 Librarian III 6 6 620 Administrative Analyst 1 1 119 Circulation Supervisor 1 1 120 Librarian II 12 10 8 219 Supervising Library Materials Handler 1 1 118 Computer Communications Technician 3 3 318 Directory Editor 1 1 118 Librarian I 15 16 1 13 218 Library Automation Specialist 2 2 218 Secretary to Library Director 1 1 116 Administrative Assistant 1 1 115 Supervisor Audio Visual Services 1 1 114 Library Assistant 4 4 1 314 Library Assistant Bilingual 1 014 Mailroom Coordinator 1 1 113 Library Automation Assistant 1 1 113 Sr. Maintenance Mechanic Buildings 1 1 111 Building Maintenance Foreman 1 1 111 Library Catalog Clerk I 1 011 Retrieval Room Coordinator 1 011 Secretary 2 2 1 1
9 Clerk II with Typing 2 2 1 19 Library Catalog Clerk II 1 1 18 Truck Driver 3 3 37 Clerk III 1 1 17 Clerk III with Typing 9 9 5 47 Maintenance Worker - Library 2 2 23 Materials Processor 3 3 32 Senior Library Page 6 6 1 4 11 Cleaner 3 3 3
57 Senior Security Guard 1 1 152 Security Guard 4 4 4
EMPLOYEE YEARSFull Time 102.0 98.0 24.0 45.0 29.0Overtime 1.7 1.7 0.3 1.0 0.4Part Time, Temporary, Seasonal 25.0 24.1 4.0 14.0 6.1Less: Vacancy Allowance 3.3 3.3 0.5 2.1 0.7 Total 125.4 120.5 27.8 57.9 34.8

14–10 PUBLIC LIBRARY COMMUNITY LIBRARY
Organization
Critical Processes Acquire materials, schedules and deploy personnel to branch libraries Maintain and repair branch libraries Provide convenient access to library services through:
● Loans of printed materials, audio tapes, compact discs, dvds, and video tapes ● Collections of popular interest for area residents ● Reference services with access to the resources of the Monroe County Library System ● Programs such as story hours, lectures, and artistic performances ● Referral services to community agencies ● Facilities for meetings and programs sponsored by non-library groups ● Access to the Internet and personal computing needs
2009-10 Fiscal Goals & Objectives Objective Priorities Supported Projected
Completion
Collaborate with the Department of Recreation and Youth Services on the opening of the Thomas P. Ryan Community Center
Customer Service Education
First Quarter
Expand Literacy Outreach Program Customer Service Education
First Quarter
Improve wireless access Customer Service Education
First Quarter
Refine Quadrant System for increased efficiencies and improved customer service
Customer Service Ongoing
Identify collaborative opportunities with the Department of Recreation and Youth Services
Customer Service Ongoing
Administration
Branch Libraries

PUBLIC LIBRARY 14–11 COMMUNITY LIBRARY Key Performance Indicators Actual
2007-08Estimated
2008-09 Budget
2008-09Budget
2009-10
Arnett
Internet sessions 26,765 25,625 25,000 26,000
Reference assistance per service hour 3 4 3 4
Average attendance per program 28 46 15 45
Circulation per service hour 19 20 21 22
Program attendance 3,115 4,832 1,700 5,000
Library materials circulated 38,462 41,280 42,000 44,000
Door count 86,678 82,498 98,000 87,000
Library card registrations 768 717 1,155 750
Charlotte
Internet sessions 12,031 12,985 13,000 13,000
Reference assistance per service hour 5 7 5 8
Average attendance per program 11 11 15 11
Circulation per service hour 50 49 52 57
Program attendance 1,303 1,498 2,000 1,500
Library materials circulated 100,630 113,150 104,000 115,000
Door count 79,533 86,145 89,000 87,000
Library card registrations 472 572 660 600
Highland
Internet sessions 18,416 19,126 16,600 19,200
Reference assistance per service hour 3 3 3 3
Average attendance per program 6 8 7 8
Circulation per service hour 49 48 48 48
Program attendance 1,811 3,855 1,100 3,900
Library materials circulated 89,751 91,532 86,000 92,000
Door count 77,312 79,757 77,000 80,000
Library card registrations 359 384 411 400

14–12 PUBLIC LIBRARY COMMUNITY LIBRARY
Lincoln
Internet sessions 23,668 22,979 23,000 24,000
Reference assistance per service hour 5 5 5 5
Average attendance per program 19 20 21 21
Circulation per service hour 32 31 32 32
Program attendance 10,630 11,681 8,500 11,700
Library materials circulated 64,018 62,541 64,000 64,000
Door count 108,619 105,175 112,000 109,000
Library card registrations 1,226 1,264 1,760 1,250
Lyell
Internet sessions 21,277 20,395 19,000 21,000
Reference assistance per service hour 3 3 3 3
Average attendance per program 16 18 18 18
Circulation per service hour 30 33 28 35
Program attendance 5,845 4,177 5,100 4,200
Library materials circulated 55,204 62,702 50,000 64,000
Door count 85,900 90,120 80,000 91,000
Library card registrations 748 816 745 820
Maplewood
Internet sessions 28,417 31,499 27,000 32,000
Reference assistance per service hour 4 5 4 5
Average attendance per program 32 41 16 34
Circulation per service hour 37 39 39 40
Program attendance 4,283 8,734 2,500 7,400
Library materials circulated 74,139 78,118 78,000 80,000
Door count 146,036 140,095 150,000 141,000
Library card registrations 863 1,006 910 1,000

PUBLIC LIBRARY 14–13 COMMUNITY LIBRARY Monroe
Internet sessions 22,194 20,716 25,000 21,000
Reference assistance per service hour 5 5 5 5
Average attendance per program 16 16 24 24
Circulation per service hour 60 63 59 63
Program attendance 1,633 1,180 2,400 2,400
Library materials circulated 120,622 126,268 119,000 127,000
Door count 96,540 94,852 100,600 95,000
Library card registrations 655 669 770 660
Sully
Internet sessions 16,262 15,498 17,000 17,850
Reference assistance per service hour 2 2 3 2
Average attendance per program 11 10 15 11
Circulation per service hour 15 17 15 19
Program attendance 2,625 2,814 2,500 2,900
Library materials circulated 27,511 32,038 27,000 35,000
Door count 59,035 60,901 58,000 70,000
Library card registrations 643 665 600 683
Wheatley
Internet sessions 15,850 18,606 20,000 23,000
Reference assistance per service hour 4 4 4 5
Average attendance per program 17 33 20 34
Circulation per service hour 10 10 12 12
Program attendance 3,803 8,093 4,500 8,200
Library materials circulated 19,352 22,641 25,000 25,000
Door count 65,720 75,939 70,000 82,000
Library card registrations 610 659 770 690

14–14 PUBLIC LIBRARY COMMUNITY LIBRARY
Winton
Internet sessions 18,086 20,915 20,000 21,000
Reference assistance per service hour 5 4 6 4
Average attendance per program 17 14 14 15
Circulation per service hour 86 86 88 99
Program attendance 1,658 1,508 2,100 1,600
Library materials circulated 174,309 199,841 178,000 200,000
Door count 106,324 124,826 115,000 125,000
Library card registrations 657 796 715 805
Total All Branches
Internet sessions 202,966 208,344 205,600 218,050
Reference assistance per service hour 39 42 41 45
Average attendance per program 16 20 165 20
Circulation per service hour 386 395 935 429
Program attendance 36,706 48,372 32,400 48,800
Library materials circulated 763,998 830,111 773,000 846,000
Door count 911,697 940,308 949,600 967,000
Library card registrations 7,001 7,548 8,556 7,658
Year-To-Year Comparison
2008-09 2009-10 ChangeBudget 3,131,500 3,192,500 61,000Employee Years 44.3 46.1 1.8 Change Detail Salary & Wage General Vacancy
Adjustment Inflation Chargebacks Allowance Miscellaneous Major Change Total58,400 14,900 -3,500 -1,600 0 -7,200 61,000
Major Change Quadrant service model results in reduced personnel costs as an efficiency measure -52,200
Funding to enhance Literacy increase part time personnel cost at branch libraries 29,900
Security services decrease as an efficiency measure -20,200
Funding included for maintenance fee for computers 14,300
Funding is included for increased office supplies 12,500
Funding increase for reading and cleaning supplies 8,500
Program Change Expand literacy Outreach program to Maplewood, Charlotte, and Highland branches.

PUBLIC LIBRARY 14–15 COMMUNITY LIBRARY EXPENDITURE SUMMARY
Actual Estimated Amended Approved2007-08 2008-09 2008-09 2009-10
Appropriation by Major ObjectPersonnel Expenses 2,293,001 2,329,100 2,401,300 2,435,800 Materials & Supplies 56,288 53,100 46,600 70,000 Services 534,863 678,000 683,600 686,700 Other 0 0 0 0
Total 2,884,152 3,060,200 3,131,500 3,192,500
Appropriation by ActivityAdministration 488,339 524,900 498,000 519,500 Branch Libraries 2,395,813 2,535,300 2,633,500 2,673,000
Total 2,884,152 3,060,200 3,131,500 3,192,500
Employee Years by ActivityAdministration 3.5 3.6 3.6 3.6 Branch Libraries 37.4 39.7 40.7 42.5
Total 40.9 43.3 44.3 46.1

14–16 PUBLIC LIBRARY COMMUNITY LIBRARY
PERSONNEL SUMMARY
FULL TIME POSITIONS Adm
inis
trat
ion
Bra
nch
Libr
arie
s
Budget ApprovedBr. Title 2008-09 2009-1031 Assistant Library Director III 1 1 124 Assistant to Library Director 1 024 Librarian IV 3 4 420 Librarian II 6 7 720 Youth Services Coordinator 1 1 118 Librarian I 6 5 518 Librarian I Bilingual 1 1 114 Library Assistant 2 1 113 Sr. Maintenance Mechanic Buildings 1 1 111 Secretary 1 1 1
1 Cleaner 0 1 1
EMPLOYEE YEARSFull Time 23.0 23.0 3.0 20.0Overtime 0.3 0.3 0.0 0.3Part Time, Temporary, Seasonal 21.5 23.2 0.7 22.5Less: Vacancy Allowance 0.5 0.4 0.1 0.3 Total 44.3 46.1 3.6 42.5

DEPARTMENT OF RECREATION & YOUTH SERVICES 15–1
Mission Statement The Department of Recreation and Youth Services supports the City of Rochester’s One City Vision Statement and its Values and Guiding Principles through the administration of programs, social activities and support services. The activities are carried out with a focus on customer service excellence.
Office of the Commissioner
Recreation Youth Services

15–2 DEPARTMENT OF RECREATION & YOUTH SERVICES
Vital Customers External: All who currently or potentially could live, visit or do business in the City of Rochester
Critical Processes Youth Services and Youth Employment Recreational Programs and Services Burial Assistance Market Services Facility Rentals
Highlights of the Department's 2009-10 Fiscal Goals & Objectives are presented below. Additional information for each bureau is included in the sections that follow. Highlights Priorities Supported Projected
Completion
Commissioner’s Office:
Develop and implement a program to support the Mayor’s After School Alliance initiative
Education Ongoing
Recreation:
Open the Thomas P. Ryan Community Center Customer Service First Quarter
Complete development of a request for proposal for the management of Riverside Cemetery
Customer Service Second Quarter
Partner with community agencies to pilot an enhancement to services at North St. Community Center
Customer Service Second Quarter
Youth Services:
Revise Parent Orientations into a workshop series on Youth Development
Education Second Quarter
Year-To-Year Comparison
Budget Budget PercentBureau 2008-09 2009-10 Change ChangeOffice of the Commissioner 2,556,600 1,327,200 -1,229,400 -48.1%Recreation 8,697,200 8,232,700 -464,500 -5.3%Special Services 2,638,900 0 -2,638,900 -100.0%Youth Services 3,085,100 2,757,100 -328,000 -10.6%
Total 16,977,800 12,317,000 -4,660,800 -27.5%
Employee Years 195.4 194.8 -0.6 -0.3% Change Detail Salary & Wage General Vacancy
Adjustment Inflation Chargebacks Allowance Miscellaneous Major Change Total9,600 159,200 18,200 0 29,700 -4,877,500 -4,660,800

DEPARTMENT OF RECREATION & YOUTH SERVICES 15–3
Major Change Highlights As proposed by the Mayor:
Transfer oversight of the Rochester Riverside Convention Center to the Department of Neighborhood and Business Development
-1,557,300
Transfer oversight of the Blue Cross Arena at the War Memorial to the Department of Neighborhood and Business Development
-834,500
Transfer remaining Special Events activity to Communications -811,800
The Summer of Opportunity grant is assumed to no longer be funded by the New York State Legislature -286,000
Transfer the remaining High Falls laser shows to Communications -228,500
The Healthy Lifestyle Project (HeLP) program grant in Recreation is complete -129,200
Three temporary full time recreation positions end -122,900
Summer youth employment is added at various recreation centers to offset the loss of the New York State Summer of Opportunity grant
122,600
Recreation staffing reconfigures as an efficiency measure -119,500
The Pathways To Peace Byrne Grant reduces as it nears completion, with two part time positions being eliminated at the end of the grant -99,400
The new After School in Parks Program (ASIPP) begins at Lake Riley Lodge, including the addition of one full time recreation position. This is a fee based program
91,000
Transfer the Office of Employment Opportunities from the Mayor’s Office to Youth Services to better align functions
90,400
Contractual recreation programs, such as African dance, Caddy program, Double Dutch program, Love 15 tennis, and Parks programs are eliminated and City staff assume responsibility
-87,400
As amended by City Council:
Funds are transferred from Contingency for CONEA Kid's Fair; Courtside Scouting; High School Leadership Forum; Youth Fashion Show; Pop Warner League Monroe County Cowboys; Tuck-Murphy Basketball Tournament; Slam High Poetry Program; and, Senior Citizen Transportation
22,000

15–4 DEPARTMENT OF RECREATION & YOUTH SERVICES EXPENDITURE SUMMARY
Actual Estimated Amended Approved2007-08 2008-09 2008-09 2009-10
Appropriation by Major ObjectPersonnel Expenses 6,732,156 6,936,700 6,925,600 6,349,900 Materials & Supplies 359,365 440,900 420,200 366,000 Services 9,754,491 9,314,500 9,489,300 5,532,900 Other 64,002 84,400 142,700 68,200
Total 16,910,014 16,776,500 16,977,800 12,317,000
Appropriation by ActivityOffice of the Commissioner 2,754,636 2,518,900 2,556,600 1,327,200 Recreation 8,463,903 8,708,900 8,697,200 8,232,700 Special Services 2,758,774 2,559,800 2,638,900 0 Youth Services 2,932,701 2,988,900 3,085,100 2,757,100
Total 16,910,014 16,776,500 16,977,800 12,317,000
Employee Years by ActivityOffice of the Commissioner 14.2 21.3 21.6 14.9 Recreation 186.1 167.1 164.0 167.0 Special Services 0.0 0.0 0.0 0.0 Youth Services 10.5 9.5 9.8 12.9
Total 210.8 197.9 195.4 194.8

DEPARTMENT OF RECREATION & YOUTH SERVICES 15–5 OFFICE OF THE COMMISSIONER
Mission Statement Commissioner’s Office: The Commissioner’s Office supports the City of Rochester’s One City Vision Statement and its Values and Guiding Principles through management policy and sets goals and performance standards. It coordinates the Department’s annual budget and capital planning processes; maintains fiscal operations and payroll matters; coordinates the purchasing of supplies; and manages the City Council submission process. Pathways to Peace: Pathways to Peace (PTP) supports the City of Rochester’s One City Vision Statement and its Values and Guiding Principles through a street level team of outreach workers channeling young city residents toward an array of community resources to prevent youth violence. This highly motivated team establishes essential linkages among service providers, participating youths and their families. PTP also monitors the young participants’ progress to ensure that these at-risk youth become productive citizens. Organization
Vital Customers Commissioner’s Office: Internal staff City Council Rochester City School District Community agencies City youth Mayor’s Youth Advisory Council (MYAC)
Pathways to Peace: Severely at-risk inner city youth Families of violent youth or in a crisis involving youth Community service providers The community at large
Commissioner's Office
Pathways To Peace

15–6 DEPARTMENT OF RECREATION & YOUTH SERVICES OFFICE OF THE COMMISSIONER Critical Processes Pathways to Peace: Targeted outreach Home visits Mediations and presentations Service linkages
2009-10 Fiscal Goals & Objectives Objective Priorities Supported Projected
Completion
Collaborate with the Rochester Police Department in supporting the curfew and truancy initiative
Public Safety First Quarter
Develop and implement a program to support the Mayor’s Youth Advisory Council
Education Ongoing
Develop and implement a program to support the Mayor’s After School Alliance initiative
Education Ongoing
Key Performance Indicators Actual
2007-08Estimated
2008-09Budget
2008-09 Budget
2009-10
Pathways to Peace
Client caseload 1,000 1,250 300 1,500
Anti-violence presentations 4,000 3,000 150 2,500
Client contacts 1,500 2,500 1,500 2,000
Juvenile violence incidents involvement 650 800 350 1,000
Year-To-Year Comparison
2008-09 2009-10 Change Budget 2,556,600 1,327,200 -1,229,400Employee Years 21.6 14.9 -6.7 Change Detail
Salary & Wage General VacancyAdjustment Inflation Chargebacks Allowance Miscellaneous Major Change Total
2,300 24,300 5,400 0 9,100 -1,270,500 -1,229,400

DEPARTMENT OF RECREATION & YOUTH SERVICES 15–7 OFFICE OF THE COMMISSIONER
Major Change As proposed by the Mayor:
Transfer remaining Special Events activity to Communications -811,800
The Byrne Grant reduces as it nears completion, with two part time positions being eliminated at the end of the grant
-99,400
Rochester Re-Entry grant is complete -70,700
Slater’s Raiders for Peace grant is complete -60,000
Consolidate the Human Resources function with the Bureau of Human Resource Management, resulting in the elimination of one full time position
-55,200
Project Integrated Municipal Police Anti-Crime Teams (IMPACT) V grant is complete -46,400
Reduce curfew advertising and professional services expenses based on historical experience -45,000
Transfer one full time clerical position to Youth Services -30,500
One half of an administrative position is eliminated as an efficiency measure -26,500
Transfer administrative charge from the Blue Cross Arena 18,600
Youth Violence Strike Force grant is complete -12,100
Rochester Safe and Sound grant reduces as it nears completion -10,000
Pathways to Peace overtime reduces due to budget constraints -9,400
Productivity improvements reduce expense -8,600
Travel and training expenses reduce due to budget constraints -2,500
The Courtside Scouting Service Program is complete -2,000
Pathways to Peace office supplies reduce due to budget constraints -1,000
As amended by City Council:
Funds are transferred from Contingency for Slam High Poetry Program 2,000

15–8 DEPARTMENT OF RECREATION & YOUTH SERVICES OFFICE OF THE COMMISSIONER EXPENDITURE SUMMARY
Actual Estimated Amended Approved2007-08 2008-09 2008-09 2009-10
Appropriation by Major ObjectPersonnel Expenses 790,713 1,118,700 1,135,100 791,600 Materials & Supplies 7,644 12,700 12,700 5,300 Services 1,956,279 1,387,500 1,408,800 530,300 Other 0 0 0 0
Total 2,754,636 2,518,900 2,556,600 1,327,200
Appropriation by ActivityCommissioner's Office 998,698 1,027,600 1,068,900 861,200 Special Events 1,755,938 806,300 811,800 0 Pathways to Peace 0 685,000 675,900 466,000
Total 2,754,636 2,518,900 2,556,600 1,327,200
Employee Years by ActivityCommissioner's Office 8.7 8.7 8.8 6.3 Special Events 5.5 5.6 5.6 0.0 Pathways to Peace 0.0 7.0 7.2 8.6
Total 14.2 21.3 21.6 14.9

DEPARTMENT OF RECREATION & YOUTH SERVICES 15–9 OFFICE OF THE COMMISSIONER
PERSONNEL SUMMARY
FULL TIME POSITIONS
Com
mis
-si
oner
's O
ffice
Pat
hway
s to
P
eace
Budget ApprovedBr. Title 2008-09 2009-10
36 Commissioner of Recreation & Youth Services
1.0 1.0 1.0
35 Deputy Commissioner of Recreation & Youth Services
1.0 1.0 1.0
28 Director of Cultural Affairs 1.0 0.028 Manager of Administrative Support 1.0 1.0 1.026 Youth Intervention Supervisor 1.0 1.0 1.021 Human Resource Consultant II Bilingual 1.0 0.021 Photographer I 1.0 0.021 Senior Communications Assistant 1.0 0.020 Administrative Analyst 0.5 0.020 Sr. Youth Intervention Specialist 1.0 1.0 1.018 Secretary to Commissioner 1.0 1.0 1.018 Special Events Program Assistant 1.0 0.018 Special Events Program Assistant Bilingual 1.0 0.018 Youth Intervention Specialist 3.0 3.0 3.018 Youth Intervention Specialist Bilingual 1.0 1.0 1.011 Secretary Bilingual 0.3 0.3 0.3
7 Clerk III with Typing 1.0 1.0 1.06 Receptionist Typist 1.0 1.0 1.06 Receptionist Typist Bilingual 1.0 0.0
EMPLOYEE YEARSFull Time 19.8 12.3 6.3 6.0Overtime 0.6 0.2 0.0 0.2Part Time, Temporary, Seasonal 1.2 2.4 0.0 2.4Less: Vacancy Allowance 0.0 0.0 0.0 0.0 Total 21.6 14.9 6.3 8.6

15–10 DEPARTMENT OF RECREATION & YOUTH SERVICES BUREAU OF RECREATION
Mission Statement The Bureau of Recreation supports the City of Rochester’s One City Vision Statement and its Values and Guiding Principles through providing quality leisure time programs and services to residents of all ages with an emphasis on youth. This is accomplished by utilizing a youth development philosophy with a focus on: competence, usefulness, belonging, and power of influence. The Bureau acts as stewards, interpreters and champions of our City’s recreational and horticultural resources including parks, playgrounds, green spaces and related facilities. It plans and implements capital improvement projects in parks, recreation facilities, and the Public Market. The Bureau also manages and operates the Rochester Public Market in a manner that: ensures its financial viability, fosters local economic development, promotes and sustains farmers and vendors, and
provides consumers with access to a fresh, nutritious food source. Cemeteries administers the City's two cemeteries: Mt. Hope, at 1133 Mt. Hope Avenue, and Riverside, at 2650 Lake Avenue. It provides customer service for all with an understanding and empathy for our client families while paying tribute to the past and creating a lasting legacy for the future by offering a full range of products and services to offset operational costs and build a substantial endowment.
Organization
Vital Customers Residents and visitors of all ages Vendors and customers at the Public Market Our client families Citizens of Rochester Mayor’s Youth Advisory Council (MYAC) All who have an interest in the history of the cemeteries or personal genealogy
Administration
Field Administration Recreation
Genesee Valley
Complex Athletics
Public Market Cemeteries

DEPARTMENT OF RECREATION & YOUTH SERVICES 15–11 BUREAU OF RECREATION
Critical Processes Employee Professional Development System (EPDS), including skill inventory Strengths-Weaknesses-Opportunities-Threats (SWOT) analysis conducted annually at each site
with all staff Town meetings held bi-annually to engage the public in service feedback Surveys conducted annually for youth who do not attend our centers and semi-annually with youth
who do attend The Public Market staff hold semi-annual meetings with vendors The Public Market staff conduct Rapid Market Assessments on a bi-annual basis Grounds and infrastructure maintenance and upkeep at the Cemeteries Quality, dignified burial services Accurate and thorough recordkeeping of burials Continual development of Cemetery sales programs and keeping abreast of market trends to
provide additional revenue sources 2009-10 Fiscal Goals & Objectives Objective Priorities Supported Projected
Completion
Complete parking lot expansion at the Public Market
Neighborhood & Business Development First Quarter
Open the Thomas P. Ryan Community Center Customer Service First Quarter
Reconfigure sales program at the Cemeteries Customer Service First Quarter
Partner with community agencies to pilot an enhancement to services at North St. Community Center
Customer Service Second Quarter
Expand environmental and green programming for youth and adults
Education Second Quarter
Complete the North Street Community Center renovation
Customer Service Second Quarter
Complete development of a request for proposal for the management of Riverside Cemetery
Customer Service Second Quarter
Key Performance Indicators Actual
2007-08Estimated
2008-09 Budget
2008-09Budget
2009-10
Recreation
Registrations:
● Adams/Gardiner 2,475 2,450 2,500 2,500
● Avenue D 2,718 2,620 2,600 2,600
● Campbell 1,524 1,550 1,600 1,500
● Carter/Norton Village 1,963 2,000 2,000 2,000
● Edgerton/Pierpont/Charlotte/LaGrange 3,357 2,694 1,900 2,700

15–12 DEPARTMENT OF RECREATION & YOUTH SERVICES BUREAU OF RECREATION
Actual2007-08
Estimated2008-09
Budget 2008-09
Budget2009-10
● Flint 2,895 3,450 3,000 3,000
● North Street 2,520 2,800 2,500 2,500
● South/Field/Cobbs Hill 2,382 2,600 1,800 2,400
● Thomas P. Ryan/Humboldt 2,417 3,000 1,700 2,700
● Total registrations 22,251 23,164 19,600 21,900
Attendance per year:
● Adams/Gardiner 31,351 37,000 37,000 33,000
● Avenue D 57,715 45,000 45,000 45,000
● Campbell 46,198 46,050 22,200 45,000
● Carter/Norton Village 40,024 40,000 40,000 40,000
● Edgerton/Pierpont/Charlotte/LaGrange 74,576 77,355 66,000 76,000
● Flint 89,011 73,500 57,500 70,000
● North Street 32,400 33,000 31,000 31,000
● South/Field/Cobbs Hill 52,751 51,000 34,600 51,000
● Thomas P. Ryan/Humboldt 53,385 35,000 12,800 50,000
● Total attendance 477,411 437,905 346,100 441,000
Genesee Valley Park Complex
Registrations - Special Events 868 850 875 850
Attendance per year:
● GVP Ice Rink 40,000 40,000 40,000 40,000
● GVP Pool 14,204 12,500 12,700 12,500
● Manhattan Square Ice Rink 10,000 16,230 19,500 20,000
Athletics
Adult softball games held 1,310 1,310 1,310 1,310
Aquatics attendance per year:
● Charlotte 70 400 400 0
● Douglass 0 700 700 700
● Durand Beach 62,000 75,000 60,000 80,000
● East 0 3,000 1,100 0
● Franklin 2,733 3,100 3,100 3,000
● Jefferson 3,335 3,600 3,600 0
● Madison 23 2,400 2,000 1,800
● Marshall 2,805 60 60 2,000

DEPARTMENT OF RECREATION & YOUTH SERVICES 15–13 BUREAU OF RECREATION
Actual2007-08
Estimated 2008-09
Budget2008-09
Budget2009-10
● Monroe 1,430 60 60 1,400
Public Market
Market days held 156 155 155 155
Special event days 34 32 33 33
Occupancy Rate (%):
● Shed A 100 100 100 100
● Shed C 100 100 100 100
● Winter Shed 100 100 100 100
Public market revenue ($) 682,985 685,100 740,300 759,500
Cemeteries
Cemetery services revenue generated ($) 3,225,103 1,032,700 1,192,000 1,067,600
Cemetery contracts written, by type:
Graves sold 473 432 430 430
Niches sold 41 32 50 70
Crypt spaces sold 17 21 25 25
Lawn crypt spaces sold 1 2 1 2
Markers sold 117 118 110 110
Cremation urns/vases - bronze 21 23 12 17
Year-To-Year Comparison
2008-09 2009-10 Change
Budget 8,697,200 8,232,700 -464,500Employee Years 164.0 167.0 3.0 Change Detail Salary & Wage General Vacancy
Adjustment Inflation Chargebacks Allowance Miscellaneous Major Change Total4,100 62,600 5,300 0 10,900 -547,400 -464,500
Major Change
As proposed by the Mayor:
The Healthy Lifestyle Project (HeLP) program grant is complete -129,200
Three temporary full time recreation positions end -122,900
Summer youth employment is added at various recreation centers to offset the loss of the Summer of Opportunity grant
122,600

15–14 DEPARTMENT OF RECREATION & YOUTH SERVICES BUREAU OF RECREATION
Major Change
Recreation staffing reconfigures as an efficiency measure -119,500
The new After School in Parks Program (ASIPP) begins at Lake Riley Lodge, including the addition of one full time recreation position. This is a fee based program
91,000
Contractual recreation programs, such as African dance, caddy program, Double Dutch program, Love 15 tennis, and Parks programs are eliminated and City staff assume responsibility
-87,400
Eliminate one administrative position due to budget constraints -66,500
The School #28 after school program continues with financial support from outside agencies 45,000
The new Thomas P. Ryan Community Center requires utility and water service 42,800
Productivity improvements reduce expense -40,700
The Youth Voice One Vision grant is complete -40,000
Eliminate one clerical position due to efficiencies -33,500
Reconfigure the Cemetery sales program, which eliminates 3 full time sales positions -30,800
Reduce seasonal grounds staff at the Cemeteries due to budget constraints -30,300
Facility rental for the temporary relocation of the former Webster Community Center is complete -25,000
Contractual security costs at the Public Market increase due to inflation 25,000
One time equipment maintenance expense is complete -25,000
Public Market advertising reduces due to budget constraints -21,900
The Adams St. Recreation Center pool closes for the Summer season due to Rochester City School District renovations -19,600
Equipment maintenance at the Cemeteries is not required due to outsourcing -19,500
A Cemetery management position reduces, resulting in savings -14,800
The Anthony Jordan Wellness Project is complete -13,500
The Greater Rochester Health Foundation grant for Summer Sports is complete -10,000
The one time grant for the Southeast Health Fair is complete -10,000
The one time grant for Elite Basketball is complete -10,000
Eliminate 12 Nextel telephones due to efficiencies -7,200
One time grant for the Future Boxing Club is complete -5,000
Office supplies reduce due to reduced staffing in the Cemetery Division -1,000
As amended by City Council:
Funds are transferred from Contingency for Courtside Scouting; Pop Warner League Monroe County Cowboys; Tuck-Murphy Basketball Tournament; and, Senior Citizen Transportation
9,500
Program Change The Aquatics unit will run Marshall and Monroe pools in 2009-10 in lieu of East and Jefferson due to Rochester City School District availability.

DEPARTMENT OF RECREATION & YOUTH SERVICES 15–15 BUREAU OF RECREATION EXPENDITURE SUMMARY
Actual Estimated Amended Approved2007-08 2008-09 2008-09 2009-10
Appropriation by Major ObjectPersonnel Expenses 5,334,208 5,202,300 5,129,000 4,876,400 Materials & Supplies 326,267 397,700 374,000 340,700 Services 2,803,428 3,099,000 3,182,600 3,004,000 Other 0 9,900 11,600 11,600
Total 8,463,903 8,708,900 8,697,200 8,232,700
Appropriation by ActivityAdministration 1,924,620 2,358,400 2,297,000 2,110,300 Field Administration 172,315 192,400 180,300 187,000 Recreation 3,469,044 3,278,600 3,315,500 3,136,800 Genesee Valley Complex 404,203 486,600 533,300 541,200 Athletics 533,295 532,000 556,000 534,300 Public Market 562,117 586,100 512,600 539,900 Cemeteries 1,398,309 1,274,800 1,302,500 1,183,200
Total 8,463,903 8,708,900 8,697,200 8,232,700
Employee Years by ActivityAdministration 21.1 17.2 19.0 21.3 Field Administration 2.3 3.3 3.0 3.0 Recreation 101.8 86.5 82.6 90.3 Genesee Valley Complex 12.0 13.4 13.0 13.0 Athletics 16.9 17.2 16.7 14.8 Public Market 4.4 4.6 4.3 4.3 Cemeteries 27.6 24.9 25.4 20.3
Total 186.1 167.1 164.0 167.0

15–16 DEPARTMENT OF RECREATION & YOUTH SERVICES BUREAU OF RECREATION
PERSONNEL SUMMARY
FULL TIME POSITIONS Adm
inis
trat
ion
Fie
ld
Adm
inis
trat
ion
Rec
reat
ion
Gen
esee
V
alle
y C
ompl
ex
Ath
letic
s
Pub
lic M
arke
t
Cem
eter
ies
Budget ApprovedBr. Title 2008-09 2009-10
33 Director/Recreation & Leisure Services 1.0 1.0 0.9 0.130 Asst. Mgr. of Parks & Recreation 0.0 1.0 0.7 0.328 Asst. Mgr. of Parks & Recreation 1.0 0.028 Cemetery Manager 1.0 0.025 Area Manager 1.0 1.0 1.025 Cemetery Manager 0.0 1.0 1.024 Program Development Specialist 2.0 1.0 1.023 Coordinator, Athletics & Aquatics 1.0 1.0 0.2 0.5 0.321 Recreation Center Director 6.0 6.0 6.020 Administrative Analyst 1.0 1.0 1.019 Cemetery Operations Supervisor 1.0 1.0 1.019 Senior Recreation Supervisor 2.0 2.0 2.018 Head Account Clerk 1.0 1.0 1.018 Supervisor of Markets 1.0 1.0 1.017 Horticulture Technician 1.0 1.0 1.016 Administrative Assistant 2.0 2.0 2.015 Recreation Supervisor 12.0 12.0 11.0 0.5 0.512 Cemetery Sales Counselor 3.0 0.0
9 Clerk II with Typing 1.0 1.0 1.09 Clerk II with Typing Bilingual 1.0 1.0 1.09 Pool Supervisor 1.0 1.0 1.09 Program Support Aide 1.0 1.0 1.09 Recreation Leader 24.0 21.0 21.09 Recreation Leader Bilingual 3.0 3.0 3.07 Clerk III with Typing 4.0 3.0 1.0 1.0 1.0
57 Cemetery Worker 3.0 3.0 3.057 Senior Security Guard 1.0 1.0 1.041 Parks Operations Worker 1.0 1.0 1.0
EMPLOYEE YEARSFull Time 77.0 69.0 10.8 2.0 44.0 1.0 0.8 2.4 8.0Overtime 1.6 1.6 0.1 0.0 0.6 0.0 0.0 0.4 0.5Part Time, Temporary, Seasonal 91.4 102.4 10.6 1.0 50.0 12.5 14.1 1.5 12.7Less: Vacancy Allowance 6.0 6.0 0.2 0.0 4.3 0.5 0.1 0.0 0.9 Total 164.0 167.0 21.3 3.0 90.3 13.0 14.8 4.3 20.3

DEPARTMENT OF RECREATION & YOUTH SERVICES 15–17 OFFICE OF SPECIAL SERVICES
Year-To-Year Comparison 2008-09 2009-10 Change
Budget 2,638,900 0 -2,638,900Employee Years 0.0 0.0 0.0 Change Detail Salary & Wage General Vacancy
Adjustment Inflation Chargebacks Allowance Miscellaneous Major Change Total0 0 0 0 0 -2,638,900 -2,638,900
Major Change Transfer oversight of the Rochester Riverside Convention Center to the Department of Neighborhood and Business Development
-1,557,300
Transfer oversight of the Blue Cross Arena at the War Memorial to the Department of Neighborhood and Business Development
-834,500
Transfer the remaining High Falls laser shows to Communications -228,500
Transfer Blue Cross Arena administrative charge to the Commissioner’s Office -18,600

15–18 DEPARTMENT OF RECREATION & YOUTH SERVICES OFFICE OF SPECIAL SERVICES
EXPENDITURE SUMMARY
Actual Estimated Amended Approved2007-08 2008-09 2008-09 2009-10
Appropriation by Major ObjectPersonnel Expenses 22,798 0 18,600 0 Materials & Supplies 4,000 1,500 2,000 0 Services 2,667,974 2,483,800 2,543,800 0 Other 64,002 74,500 74,500 0
Total 2,758,774 2,559,800 2,638,900 0
Appropriation by ActivityBlue Cross Arena at the Rochester War Memorial 799,043 774,000 853,100 0 Convention Center 1,290,600 1,557,300 1,557,300 0 High Falls Entertainment District 669,131 228,500 228,500 0
Total 2,758,774 2,559,800 2,638,900 0
Employee Years by ActivityBlue Cross Arena at the Rochester War Memorial 0.4 0.0 0.3 0.0
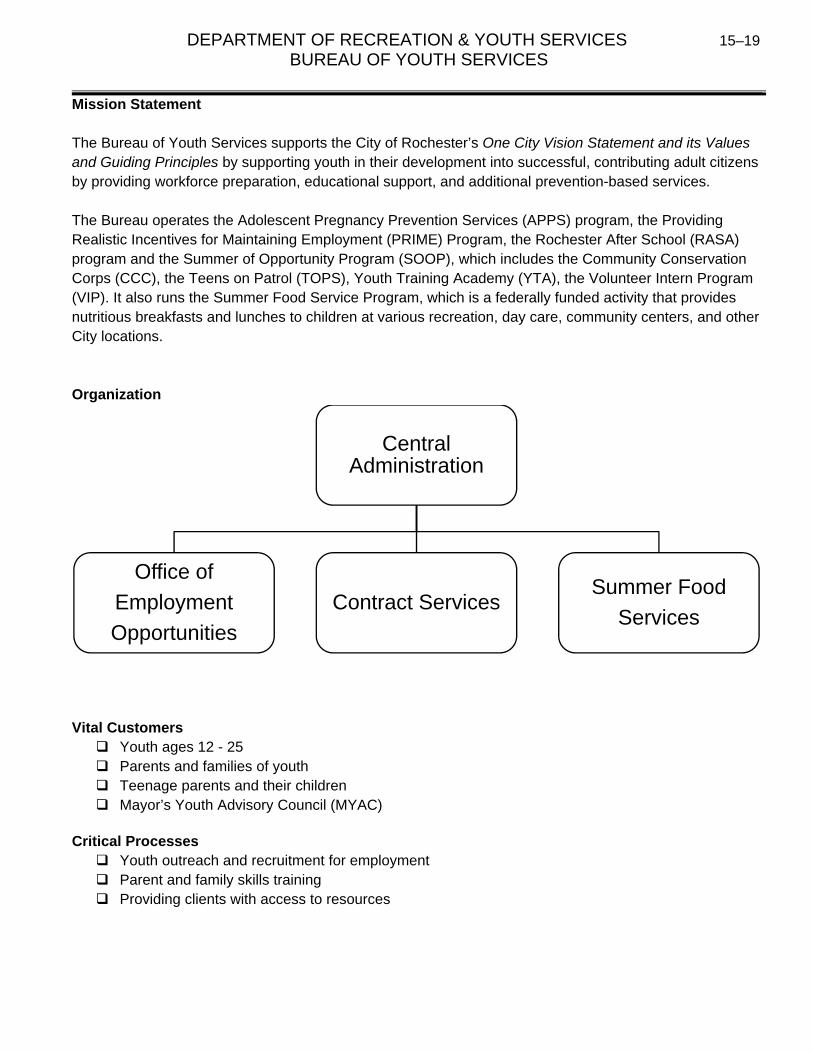
DEPARTMENT OF RECREATION & YOUTH SERVICES 15–19 BUREAU OF YOUTH SERVICES
Mission Statement The Bureau of Youth Services supports the City of Rochester’s One City Vision Statement and its Values and Guiding Principles by supporting youth in their development into successful, contributing adult citizens by providing workforce preparation, educational support, and additional prevention-based services. The Bureau operates the Adolescent Pregnancy Prevention Services (APPS) program, the Providing Realistic Incentives for Maintaining Employment (PRIME) Program, the Rochester After School (RASA) program and the Summer of Opportunity Program (SOOP), which includes the Community Conservation Corps (CCC), the Teens on Patrol (TOPS), Youth Training Academy (YTA), the Volunteer Intern Program (VIP). It also runs the Summer Food Service Program, which is a federally funded activity that provides nutritious breakfasts and lunches to children at various recreation, day care, community centers, and other City locations. Organization
Vital Customers Youth ages 12 - 25 Parents and families of youth Teenage parents and their children Mayor’s Youth Advisory Council (MYAC)
Critical Processes Youth outreach and recruitment for employment Parent and family skills training Providing clients with access to resources
Central Administration
Office of
Employment
Opportunities
Contract ServicesSummer Food
Services

15–20 DEPARTMENT OF RECREATION & YOUTH SERVICES BUREAU OF YOUTH SERVICES
2009-10 Fiscal Goals & Objectives Objective Priorities Supported Projected
Completion
Execute the Office of Employment Opportunities initiatives, in focused areas such as tool and die
Education Customer Service
First Quarter
Revise Parent Orientations into a workshop series on Youth Development
Education Second Quarter
Key Performance Indicators Actual
2007-08Estimated
2008-09Budget
2008-09 Budget
2009-10
Central Administration and Office of Employment Opportunities:
Applicants for Summer of Opportunity (ages 14 – 20 years)
1,084 978 1,000 1,500
Applicants for Youth Training Academy (YTA ) (ages 15 – 16 years)
25 25 75 50
Applicants for Volunteer Intern Program (VIP ) (ages 12 – 14 years)
0 20 15 40
Number of employers participating in Summer of Opportunity
62 42 80 45
Trainees in Summer of Opportunity 812 696 900 900
Number of students enrolled in YTA 15 19 60 40
Number of students enrolled in VIP 0 10 10 20
Number of youth placed in Summer of Opportunity
533 502 550 350
Number of parents attending workshops 763 959 N/A 1,000
Number of students completing YTA 15 19 55 40
Number of students completing VIP 0 10 10 20
Number of YTA students employed 9 12 40 30
Number of youth trained in the PRIME Initiative 24 195 30 200
Number of youth employed in the PRIME Initiative
19 155 20 150
Contract Services:
APPS allocation ($) 377,400 354,752 377,400 354,752
CDBG program allocation ($) 386,100 266,039 386,100 266,039
APPS participants 377 370 420 377
Hillside Work Scholarship participants 313 313 313 463

DEPARTMENT OF RECREATION & YOUTH SERVICES 15–21 BUREAU OF YOUTH SERVICES
Actual2007-08
Estimated 2008-09
Budget2008-09
Budget2009-10
CDBG participants 14,363 1,500 N/A 1,000
PRIME participants 0 150 20 200
APPS participants with no first or repeat pregnancies (%)
N/A 85% N/A 90%
PRIME participants finding full time employment
N/A 75 N/A 150
Special Projects:
New York State 21st Century - Phase 1 allocation ($)
407,660 N/A N/A N/A
New York State 21st Century - Phase 2 allocation ($)
896,038 N/A N/A N/A
New York State 21st Century - Phase 4 allocation ($)
N/A 847,771 N/A 847,771
Number of sites for RASA I 4 N/A N/A N/A
Number of sites for RASA II 5 N/A N/A N/A
Youth participants in RASA I 175 N/A N/A N/A
Youth participants in RASA II 300 N/A N/A N/A
Adult participants in RASA II 150 N/A N/A N/A
Youth participants in RASA-4 N/A 288 N/A 260
Adult participants in RASA-4 N/A N/A N/A 260
School attendance rates due to RASA-4 N/A 90% N/A 90%
Percentage of students increasing Math and/or English tests due to RASA programs
N/A N/A 0 65%
Summer Food Service:
Summer Food Program breakfast sites 58 60 56 56
Summer Food Program lunch sites 74 70 73 73
Summer Food Program breakfasts served 70,393 68,344 74,000 74,000
Summer Food Program lunches served 106,963 108,266 110,000 110,000
APPS - Adolescent Pregnancy Prevention Services VIP - Volunteer Intern Program
CDBG - Community Development Block Grant YTA - Youth Training Academy
RASA I - Rochester After School Academy Phase I N/A - Not Applicable
RASA II - Rochester After School Academy Phase II
RASA-4 - Rochester After School Academy Phase 4

15–22 DEPARTMENT OF RECREATION & YOUTH SERVICES BUREAU OF YOUTH SERVICES
Year-To-Year Comparison 2008-09 2009-10 Change
Budget 3,085,100 2,757,100 -328,000Employee Years 9.8 12.9 3.1 Change Detail Salary & Wage General Vacancy
Adjustment Inflation Chargebacks Allowance Miscellaneous Major Change Total3,200 72,300 7,500 0 9,700 -431,200 Error
Major Change As proposed by the Mayor: :
The Summer of Opportunity grant is assumed to no longer be funded by the New York State Legislature -286,000
Transfer the Office of Employment Opportunities from the Mayor’s Office to better align functions
90,400
Temporary full time position ends -51,900
PRIME stipends to be paid directly from the Community Development Block Grant -50,000
Rochester Area Community Foundation child care subsidy grant is complete -50,000
Productivity improvements reduce expense -46,800
New York State funding reduces for the Youth Bureau -42,900
Summer Food Program costs increase due to inflation 31,000
One time increase in Adolescent Pregnancy Prevention (APPS) grant is complete -11,600
Overtime reduces due to efficiencies -5,000
The Mr. & Mrs. Trendsetter Fashion Show program is complete -4,000
Reduce seasonal help for the Summer of Opportunity Program due to efficiencies -3,400
The one time expense of the Children's Festival is complete -1,000
The transfer of one full time clerical position from the Commissioner’s Office is offset by the elimination of another full time clerical position 0
As amended by City Council:
Funds are transferred from Contingency for CONEA Kid's Fair; High School Leadership Forum; and, Youth Fashion Show
10,500
Program Change A Manager of Employment Opportunities transfers from the Mayor’s Office to facilitate job opportunities for youth and young adults. The Emergency Shelter Grant (ESG) and the Housing for Persons with AIDS (HOPWA) grants transfer to Neighborhood and Business Development. The Bureau relocates from City Hall to the Sibley Building for space efficiencies. Additional funding provided to the Hillside Work Scholarship Program in the fourth quarter of 2008-09 will enhance the 2009-10 program. Loss of New York State funding for the Summer of Opportunity reduces Summer youth employment by 200 slots. Additional City funding is provided in Recreation (41), other City departments (18), and to the Hillside Work Scholarship Program (150) to offset this loss.

DEPARTMENT OF RECREATION & YOUTH SERVICES 15–23 BUREAU OF YOUTH SERVICES
EXPENDITURE SUMMARY
Actual Estimated Amended Approved2007-08 2008-09 2008-09 2009-10
Appropriation by Major ObjectPersonnel Expenses 584,437 615,700 642,900 681,900 Materials & Supplies 21,454 29,000 31,500 20,000 Services 2,326,810 2,344,200 2,354,100 1,998,600 Other 0 0 56,600 56,600
Total 2,932,701 2,988,900 3,085,100 2,757,100
Appropriation by ActivityCentral Administration 1,941,185 930,800 941,500 245,700 Office of Employment Opportunities 0 0 0 614,100 Contract Services 375,299 1,658,600 1,734,800 1,457,500 Special Projects 211,697 0 0 0 Summer Food Service 404,520 399,500 408,800 439,800
Total 2,932,701 2,988,900 3,085,100 2,757,100
Employee Years by ActivityCentral Administration 3.5 5.1 5.1 2.5 Office of Employment Opportunities 0.0 0.0 0.0 5.0 Contract Services 3.2 3.3 3.6 3.9 Special Projects 2.7 0.0 0.0 0.0 Summer Food Service 1.1 1.1 1.1 1.5
Total 10.5 9.5 9.8 12.9

15–24 DEPARTMENT OF RECREATION & YOUTH SERVICES BUREAU OF YOUTH SERVICES
PERSONNEL SUMMARY
FULL TIME POSITIONS Cen
tral
Adm
in-
istr
atio
n
Offi
ce o
f E
mpl
oym
ent
Opp
ortu
nitie
s
Con
trac
t S
ervi
ces
Sum
mer
Foo
d S
ervi
ce
Budget ApprovedBr. Title 2008-09 2009-10
33 Manager/Youth Services Planning 1.0 1.0 1.031 Manager/Office of Employment
Opportunities0.0 1.0 1.0
24 Senior Administrative Analyst 2.0 3.0 1.0 1.9 0.120 Senior Human Services Coordinator 1.0 1.0 1.016 Employment & Training Counselor 1.0 1.0 1.011 Secretary Bilingual 0.7 0.7 0.7
7 Clerk III with Typing 1.0 0.06 Receptionist Typist Bilingual 0.0 1.0 0.9 0.1
EMPLOYEE YEARSFull Time 6.7 8.7 2.7 2.0 3.8 0.2Overtime 0.1 0.0 0.0 0.0 0.0 0.0Part Time, Temporary, Seasonal 3.9 5.1 0.0 3.2 0.3 1.6Less: Vacancy Allowance 0.9 0.9 0.2 0.2 0.2 0.3 Total 9.8 12.9 2.5 5.0 3.9 1.5
`

UNDISTRIBUTED EXPENSES 16–1
Purpose The Undistributed Expenses budget records allocations associated with, but not included in, departmental budgets or those that cannot reasonably be distributed to departmental budgets. The program includes costs for both current and non-current employee benefits, general risk management, payments to other agencies, and other miscellaneous expenditures. Year-To-Year Comparison
Budget Budget PercentMain Functions 2008-09 2009-10 Change ChangeEmployee Benefits - Current 74,425,500 71,907,600 -2,517,900 -3.4%Employee Benefits - Non-Current 22,646,800 23,106,400 459,600 2.0%General Risk Management 1,584,300 2,138,300 554,000 35.0%Other 4,616,900 2,722,700 -1,894,200 -41.0%
103,273,500 99,875,000 -3,398,500 -3.3% Less: Intrafund Credit* 108,000 112,500 4,500 4.2%
Total 103,165,500 99,762,500 -3,403,000 -3.3%
*Reflects chargeback for Worker's Compensation costs. Major Change Highlights
Employee Benefits – Current decreases mainly due to anticipated lower retirement expense -2,517,900
Employee Benefits – Non-Current increases primarily due to retiree medical insurance rate increases
459,600
General Risk Management increases due to Insurance Reserve Contributions 554,000
Other decreases due to the completion of a one-time contribution made to the Tax Relief Fund less other adjustments
-1,894,200

16–2 UNDISTRIBUTED EXPENSES EXPENDITURE SUMMARY
Actual Estimated Amended Approved2007-08 2008-09 2008-09 2009-10
Appropriation by Major ObjectPersonnel Expenses 67,912,722 71,410,800 74,425,500 71,907,600 Materials & Supplies 0 0 0 0 Services 0 0 0 0 Other 24,747,361 27,743,800 28,848,000 27,967,400
92,660,083 99,154,600 103,273,500 99,875,000 Less: Intrafund Credit* 102,200 120,600 108,000 112,500
Total 92,557,883 99,034,000 103,165,500 99,762,500
Appropriation by ActivityEmployee Benefits - Current 67,912,722 71,410,800 74,425,500 71,907,600 Employee Benefits - Non-Current 20,083,719 21,376,500 22,646,800 23,106,400 General Risk Management 1,887,275 1,630,300 1,584,300 2,138,300 Other 2,776,367 4,737,000 4,616,900 2,722,700
92,660,083 99,154,600 103,273,500 99,875,000 Less: Intrafund Credit* 102,200 120,600 108,000 112,500
Total 92,557,883 99,034,000 103,165,500 99,762,500
*Reflects chargeback for Worker's Compensation costs.

UNDISTRIBUTED EXPENSES 16–3 EMPLOYEE BENEFITS – CURRENT
NEW YORK STATE RETIREMENT SYSTEM: the City makes annual payments to the New York State Retirement System, which in turn is responsible for making pension payments to eligible retirees. The New York State Comptroller oversees the System. The City participates in nine separate programs, four for civilians and five for uniformed employees. Each program provides a different level of benefits. Employees are eligible for participation in the various programs based on their employment period, which is called a tier. Tiers are: Tier Hire Date (by any qualified public employer) Non-Uniformed Employees Uniformed Employees 1 Before July 1973 Before July 1973 2 July 1973 to July 1976 After July 1973 3 July 1976 to September 1983 Does not apply 4 After September 1983 Does not apply The amount of the payment is the product of the estimated wage base times the contribution rates for each tier. The wage base is the estimate by the Comptroller of the wages and salaries earned during the period April 1, 2008 to March 31, 2009. The Comptroller determines the contribution rates. The bill also includes a reconciliation of under or over payment based on the prior year’s actual wages. Year-To-Year Comparison
2008-09 2009-10 ChangeBudget 24,368,000 21,165,100 -3,202,900 Major Change Savings due to lower retirement contribution rates -2,002,900
A credit is anticipated due to the wage base estimated by the Comptroller for the 2008-09 bill being higher than actual
-1,200,000
SOCIAL SECURITY: under the provision of Federal law, the City contributes to the Social Security Trust Fund 7.65 percent of the first $106,800, then 1.45 percent after that for salaries and wages earned by each eligible employee. Certain earnings and deductions are not subject to these rates, such as flexible spending and payments to disabled employees. Year-To-Year Comparison
2008-09 2009-10 Change
Budget 14,713,600 14,504,100 -209,500 Major Change Savings due to workforce reduction -209,500
HOSPITAL & MEDICAL INSURANCE: the City provides hospitalization and medical benefits through various programs. Agreements with the different labor unions determines specific coverage and the amount contributed by the City. Year-To-Year Comparison
2008-09 2009-10 ChangeBudget 24,292,700 24,593,700 301,000

16–4 UNDISTRIBUTED EMPLOYEE BENEFITS – CURRENT
Major Change Net of anticipated changes 673,600
Savings due to workforce reduction -372,600
CAFETERIA BENEFITS PLAN: the City provides a Cafeteria Benefits Plan for Administrative, Professional, and Technical employees and Confidential employees. Under the Plan, an employee is given a credit allocation; allocation decisions are made annually. The employee then allocates that credit toward various types of benefits and levels of coverage. Employees can choose among medical, dental, life, and disability insurances, and flexible spending accounts. The Plan is on a calendar year basis. Year-To-Year Comparison
2008-09 2009-10 ChangeBudget 5,239,700 5,531,000 291,300 Major Change An inflationary adjustment is made in the City’s contribution for the 2009 calendar plan year 393,000
Savings due to workforce reduction -101,700
WORKER’S COMPENSATION: under a self-insurance program, the City directly finances the costs of medical and compensation payments to employees injured on the job. A private insurance firm that is responsible for investigating claims, making payments, and estimating future reserve requirements administers the program. Year-To-Year Comparison
2008-09 2009-10 ChangeBudget 3,948,400 4,088,400 140,000 Less: Intrafund Credit 108,000 112,500 4,500
3,840,400 3,975,900 135,500 Major Change
2008-09 2009-10 ChangeCurrent Year Claims 264,400 261,300 -3,100 Administrative Charge 73,700 77,300 3,600 State Assessments 648,800 500,000 -148,800 Prior Years' Claims 2,961,500 3,249,800 288,300
Total 3,948,400 4,088,400 140,000 Less: Intrafund Credit 108,000 112,500 4,500
3,840,400 3,975,900 135,500

UNDISTRIBUTED EXPENSES 16–5 EMPLOYEE BENEFITS – CURRENT
Chargebacks – Current Year Claims Department/Bureau 2008-09 2009-10 Department/Bureau 2008-09 2009-10 NEIGHBORHOOD & BUSINESS DEVELOPMENT
0 1,000
COMMUNITY DEVELOPMENT 500 0 LIBRARY 700 2,200 ENVIRONMENTAL SERVICES RECREATION & YOUTH SERVICES Operations & Parks 147,000 155,000 Recreation 12,700 6,800 Water 70,000 45,000 Total 217,000 200,000 EMERGENCY COMMUNICATIONS
7,000 5,000 UNDISTRIBUTED 12,000 10,000
POLICE 14,000 35,800 Total Interfund 156,400 148,800 Total Intrafund 108,000 112,500FIRE 500 500 CITY TOTAL 264,400 261,300
DENTAL INSURANCE: this activity supports dental benefits provided to employees as provided in labor contracts. Year-To-Year Comparison
2008-09 2009-10 ChangeBudget 1,736,800 1,910,300 173,500 Major Change Higher contributions due to rate increases 191,900
Savings due to workforce reduction -18,400
LIFE INSURANCE: the City provides term life insurance for all full time employees. Year-To-Year Comparison
2008-09 2009-10 ChangeBudget 126,300 115,000 -11,300 Major Change Reduction based to projected need and workforce reduction -11,300

16–6 UNDISTRIBUTED EXPENSES EMPLOYEE BENEFITS – CURRENT
EXPENDITURE SUMMARY
Actual Estimated Amended Approved2007-08 2008-09 2008-09 2009-10
Appropriation by Major ObjectPersonnel Expenses 67,912,722 71,410,800 74,425,500 71,907,600 Materials & Supplies 0 0 0 0 Services 0 0 0 0 Other 0 0 0 0
67,912,722 71,410,800 74,425,500 71,907,600 Less: Intrafund Credit* 102,200 120,600 108,000 112,500
Total 67,810,522 71,290,200 74,317,500 71,795,100
Appropriation by ActivityNew York State Retirement 23,299,426 23,758,900 24,368,000 21,165,100 Social Security 13,843,345 13,962,600 14,713,600 14,504,100 Hospital and Medical 21,178,428 23,189,000 24,292,700 24,593,700 Cafeteria Benefits Plan 4,307,217 4,757,000 5,239,700 5,531,000 Worker's Compensation 3,655,566 4,069,200 3,948,400 4,088,400 Dental Insurance 1,528,871 1,563,000 1,736,800 1,910,300 Life Insurance 99,869 111,100 126,300 115,000
67,912,722 71,410,800 74,425,500 71,907,600 Less: Intrafund Credit* 102,200 120,600 108,000 112,500
Total 67,810,522 71,290,200 74,317,500 71,795,100
*Reflects chargeback for Worker's Compensation costs.

UNDISTRIBUTED EXPENSES 16–7 EMPLOYEE BENEFITS – NON-CURRENT
DISABLED/OLD PENSION: this activity includes the cost of pension payments to permanently disabled firefighters who are entitled to collect the difference between the amount they receive from the New York State Retirement System and their current pay for the bracket and step that they held with the Fire Department at the time they separated from City employment. This activity also includes the cost of a closed pension plan for surviving spouses of police officers and firefighters who retired before the City's participation in the New York State Retirement System Year-To-Year Comparison
2008-09 2009-10 ChangeBudget 2,309,200 2,128,000 -181,200 Major Change The number of disabled firefighters receiving the salary differential declines due to attainment of mandatory retirement age of 70
-181,200
HOSPITAL & MEDICAL INSURANCE: the City provides hospital and medical benefits to eligible retirees. Year-To-Year Comparison
2008-09 2009-10 ChangeBudget 19,153,300 19,794,100 640,800 Major Change Net of anticipated changes 640,800
DENTAL INSURANCE: coverage is provided to eligible firefighter retirees. Year-To-Year Comparison
2008-09 2009-10 ChangeBudget 123,000 123,000 0 Life Insurance: certain uniformed retirees are provided term life insurance benefits. Year-To-Year Comparison
2008-09 2009-10 ChangeBudget 44,500 44,500 0 UNEMPLOYMENT COMPENSATION: individuals terminated from City employment under qualifying circumstances are eligible for unemployment benefits according to Federal guidelines. Quarterly payments are made to New York State based on actual claim experience. Year-To-Year Comparison
2008-09 2009-10 ChangeBudget 1,016,800 1,016,800 0

16–8 UNDISTRIBUTED EXPENSES EMPLOYEE BENEFITS – NON-CURRENT
EXPENDITURE SUMMARY
Actual Estimated Amended Approved2007-08 2008-09 2008-09 2009-10
Appropriation by Major ObjectPersonnel Expenses 0 0 0 0 Materials & Supplies 0 0 0 0 Services 0 0 0 0 Other 20,083,719 21,376,500 22,646,800 23,106,400
Total 20,083,719 21,376,500 22,646,800 23,106,400
Appropriation by ActivityDisabled/Old Pension 2,265,216 2,128,000 2,309,200 2,128,000 Hospital and Medical - Retirees 17,385,160 18,711,300 19,153,300 19,794,100 Dental Insurance - Retirees 109,762 123,700 123,000 123,000 Life Insurance - Retirees 44,450 43,900 44,500 44,500 Unemployment Compensation 279,131 369,600 1,016,800 1,016,800
Total 20,083,719 21,376,500 22,646,800 23,106,400

UNDISTRIBUTED EXPENSES 16–9 GENERAL RISK MANAGEMENT
GENERAL INSURANCE: the City is self-insured for general and automobile liability. A private firm, which handles all claims, administers the total insurance program. Contributions to Insurance Reserve are a reimbursement of actual enterprise fund claims made in the prior fiscal year. Year-To-Year Comparison
2008-09 2009-10 ChangeBudget 1,484,300 2,038,300 554,000 Major Change Cost Components 2008-09 2009-10 ChangeAdministrative Charge 101,500 106,600 5,100 Insurance Premium - Major Claims 442,000 558,000 116,000 Contribution to the Insurance Reserve 940,800 1,373,700 432,900
1,484,300 2,038,300 554,000 JUDGMENTS AND CLAIMS: this account is used to pay the City's liability for minor judgment-based obligations that may occur outside of the normal tort litigation covered by the City's general insurance. Year-To-Year Comparison
2008-09 2009-10 ChangeBudget 100,000 100,000 0

16–10 UNDISTRIBUTED EXPENSES GENERAL RISK MANAGEMENT
EXPENDITURE SUMMARY
Actual Estimated Amended Approved2007-08 2008-09 2008-09 2009-10
Appropriation by Major ObjectPersonnel Expenses 0 0 0 0 Materials & Supplies 0 0 0 0 Services 0 0 0 0 Other 1,887,275 1,630,300 1,584,300 2,138,300
Total 1,887,275 1,630,300 1,584,300 2,138,300
Appropriation by ActivityGeneral Insurance 878,707 1,530,300 1,484,300 2,038,300 Judgments and Claims 1,008,568 100,000 100,000 100,000
Total 1,887,275 1,630,300 1,584,300 2,138,300

UNDISTRIBUTED EXPENSES 16–11 OTHER
PAYMENTS TO OTHER GOVERNMENTS: this activity provides for payments to other governments for charges and services. Monroe County Pure Waters Agency charges the City for waste water removal at City-owned properties. The charge is based on both assessed property value and water consumption. Taxes of certain city residents whose children attend suburban schools are remitted to those suburban school districts as required by State law. Payments are also made to Monroe County for services provided to City Court facilities. Year-To-Year Comparison
2008-09 2009-10 ChangeBudget 1,100,800 1,118,900 18,100 Major Change Pure Waters charges for soccer stadium 18,100
EMPLOYEE DEVELOPMENT: this activity provides for the development of City employees through various training programs and tuition reimbursement. Year-To-Year Comparison
2008-09 2009-10 ChangeBudget 525,000 525,000 0 CITY CHANNEL 12 OPERATION: this activity includes an agreement with WXXI-TV to operate City 12 as the government access channel providing programming to inform and entertain City residents. Year-To-Year Comparison
2008-09 2009-10 ChangeBudget 214,000 229,000 15,000 Major Change An inflationary adjustment is made 15,000
TIME BANK ACCRUAL: to comply with the Governmental Accounting Standards Board (GASB) standards, specific time banks are required to be accrued by the City. Vacation time and uniformed compensatory time earned, but not yet taken, are accrued as an expense. Year-To-Year Comparison
2008-09 2009-10 ChangeBudget 521,500 521,500 0 TITLE REPORTS: this activity includes agreements with companies that search titles of properties in foreclosure actions and issue title reports. Year-To-Year Comparison
2008-09 2009-10 ChangeBudget 240,000 50,000 -190,000

16–12 UNDISTRIBUTED EXPENSES OTHER
Major Change Tax lien sale reduces the need for searches -190,000
EFFICIENCY & EFFECTIVENESS INITIATIVES: this activity supports initiatives seeking greater efficiency and enhanced effectiveness in City operations Year-To-Year Comparison
2008-09 2009-10 ChangeBudget 500,000 500,000 0 TAX RELIEF FUND: this activity supports efforts to moderate future increases in property taxes. Year-To-Year Comparison
2008-09 2009-10 ChangeBudget 2,000,000 0 -2,000,000 Major Change A one-time contribution made in 2008-09 is completed -2,000,000
MOTOR EQUIPMENT BENEFITS CREDIT: this credit to Undistributed represents the estimated benefits costs for active and retired employees in the Department of Environmental Services, Equipment Services Division. These costs are allocated to this Division so that these costs are part of the operational expense of the unit and the full costs can be recovered by the motor equipment chargeback. Year-To-Year Comparison
2008-09 2009-10 ChangeBudget -1,446,600 -1,446,600 0 MISCELLANEOUS: this activity reserves funds for various expenditures that do not pertain to a specific department, such as the employee bus pass subsidy, flexible spending, safe driver awards, employee assistance program, medical services, and child care referral services. Also included are the Leadership Rochester Program, and annual memberships in Public Technologies, Inc. and International Sister Cities. Year-To-Year Comparison
2008-09 2009-10 ChangeBudget 962,200 1,224,900 262,700 Major Change Funding added for Employer Assisted Housing Incentive payments 200,000
Net of other changes 62,700

UNDISTRIBUTED EXPENSES 16–13 OTHER
Actual Estimated Amended Approved2007-08 2008-09 2008-09 2009-10
Appropriation by Major ObjectPersonnel Expenses 0 0 0 0 Materials & Supplies 0 0 0 0 Services 0 0 0 0 Other 2,776,367 4,737,000 4,616,900 2,722,700
Total 2,776,367 4,737,000 4,616,900 2,722,700
Appropriation by ActivityPayments to Other Governments 871,200 1,116,700 1,100,800 1,118,900 Employee Development 208,512 525,000 525,000 525,000 CIty Channel 12 Operation 200,000 214,000 214,000 229,000 Time Bank Accrual 97,119 521,500 521,500 521,500 Title Reports 240,000 0 240,000 50,000 Efficiency & Effectiveness Initiatives 976,535 500,000 500,000 500,000 Tax Relief Fund 0 2,000,000 2,000,000 0 Motor Equipment Benefits Credit -1,341,500 -1,446,600 -1,446,600 -1,446,600 Miscellaneous 1,524,501 1,306,400 962,200 1,224,900
Total 2,776,367 4,737,000 4,616,900 2,722,700

CONTINGENCY 17–1
Contingency provides funds for difficult to project or otherwise unforeseen expenditures. The City Council specifically authorizes each expenditure through a budget transfer to the department incurring the expense. Year-To-Year Comparison
Percent2008-09 2009-10 Change Change
Budget 7,442,300 10,102,800 2,660,500 35.7% Major Change Highlights As proposed by the Mayor:
Allocation is made for difficult to project or unforeseen expenditures, including the incremental cost of pending labor agreements
2,710,500
As amended by City Council:
Funds were transferred from Contingency to: -50,000
Administration – Communications for Lyell Avenue Music Fest and North Winton Village Arts Festival
Neighborhood & Business Development for Development of Regional Strategies for Arts Organizations; Refugee Sustainability Garden; Downtown Community Forum; Outreach for FIS in Beechwood; and, Community Gardens, Banners, Lighting, and Signage
Environmental Services for Community Lighting
Police for a Community Anti-Violence Program
Recreation & Youth Services for CONEA Kid's Fair; Courtside Scouting; High School Leadership Forum; Youth Fashion Show; Pop Warner League Monroe County Cowboys; Tuck-Murphy Basketball Tournament; Slam High Poetry Program; and, Senior Citizen Transportation

17–2 CONTINGENCY EXPENDITURE SUMMARY
Actual Estimated Amended Approved2007-08 2008-09 2008-09 2009-10
Appropriation by Major ObjectPersonnel Expenses 0 0 0 0 Materials & Supplies 0 0 0 0 Services 0 0 0 0 Other 0 7,442,300 7,442,300 10,102,800
Total 0 7,442,300 7,442,300 10,102,800
Appropriation by ActivityGeneral Contingency* 0 7,442,300 7,442,300 10,102,800
*Reflects remaining contingency after amendments. The original 2007-08 Contingency was $10,614,800; the original 2008-09 was $11,318,000.

CAPITAL EXPENSE 18–1
The Capital Expense budget finances the construction or reconstruction of facilities and services, the acquisition and replacement of vehicles and equipment, and certain other projects and improvements that provide benefits over a multi-year period. To be included in this budget, a project or item must be consistent with the definition of “capital object or purpose” included in Section 11 of New York State Local Finance Law. The financing of these capital projects may occur principally through two means. First, a direct appropriation may be made; this type of appropriation is included in the Cash Capital section. Second, funds for the project may be obtained through the issuance of bonds and notes, two forms of borrowing. The subsequent repayment of these borrowed funds and the related interest costs are called “debt service”. Appropriations for these expenses are included in the Debt Service section. To plan for capital expenditures over a period of years and to ensure that equipment replacement and building renovations are made when economically feasible and needed, a Capital Improvement Program (CIP) is prepared anticipating capital investments and their proposed sources of funding for a five year period. The CIP is included in this section as a separate document. The first year's program in each five-year CIP provides the basis for the Cash Capital appropriation and the annual Debt Authorization Plan. Year-To-Year Comparison
Budget Budget PercentCategory 2008-09 2009-10 Change ChangeCash Capital 52,811,200 39,151,000 -13,660,200 -25.9%Debt Service 37,806,100 32,529,200 -5,276,900 -14.0%
Total 90,617,300 71,680,200 -18,937,100 -20.9% Major Change Highlights CASH CAPITAL
New Projects:
Home Ownership Program 800,000
Focused Investment 500,000
Business Process Services 350,000
Disaster Recovery System 350,000
Rundel Mechanical System Replacement 220,000
Emergency Training Information Network Phase II 150,000
Sanborn Maps 150,000
Monroe Branch Library Improvements 135,000
CVMF Fuel System Upgrade 100,000
Granite Memorials in Cemetery 100,000
Riverside Convention Center – Overhead Door 100,000
Genesee Valley Park Master Plan design 60,000
Changes in Existing Projects from 2008-09:
Funding decreases for Street Lighting Improvements -4,475,000
Funding increases for Motor Equipment in the Solid Waste Division, as planned 3,612,000

18–2 CAPITAL EXPENSE
Funding decreases for Acquisition and Development in the Department of Economic Development
-2,067,800
Funding increases for Demolition due to funding changes to the Restore New York Program 2,000,000
Funding deferred for Fire House Replacement and Major Renovations -1,721,000
Funding increases for Mausoleum Building #3 1,130,000
Funding decreases for Asphalt Milling, Resurfacing and Curb Replacement -1,094,000
Funding decreases for Fire Facilities Building Rehabilitation -880,000
Funding increases for Market Rate Housing Acquisition 879,000
Funding increases for Enterprise Resource Planning System, as planned 850,000
Funding decreases for Broad Street East/Chestnut Street/Court Street project -785,000
Funding decreases for city-wide Office Automation, as planned -631,000
Funding increases for CVMF Building Roof Replacement 347,000
Funding increases for Motor Equipment in the Bureau of Operations & Parks, as planned 435,000
Funding decreases for Fire Fighting Apparatus as scheduled -399,000
Funding decreases for Acquisition and Development in Administration -365,000
Funding increases for general Rehabilitation in the Department of Recreation and Youth Services
215,000
Funding increases for Midtown Development 196,000
Funding increases for Cars, Vans and Utility Vehicles in the Fire Department 191,000
Funding increases for Conduit Streambed and Bank Erosion Control, as planned 150,000
Projects or Project Elements that will not recur:
One time allocation for Land Acquisition and Site Preparation -3,000,000
Funding for City Hall Exterior Renovations is complete -1,800,000
One time funding for Police Equipment and hybrid Vehicles complete -1,736,000
Funding for Hazardous Waste at Elm Street is complete -1,500,000
Funding for Clinton/Baden Recreation Center is complete -1,000,000
One time allocation for Monroe County Crime Lab -1,000,000
Funding for City Hall Electrical Upgrades is complete -350,000
Funding for Lyell Avenue Firehouse is complete -200,000
One time allocation for River Street Extension -263,000
Funding for CVMF Building 100 – HVAC Improvements is complete -175,000
Funding for Genesee Valley Park Pool Roof is complete -171,000
Funding for Fire House HVAC Improvements is complete -165,000
Funding decreases for Parking Lot Test Wells at Emergency Communications Facilities -150,000
Funding for Content Management System is complete -125,000
Funding for Gardiner Recreation Center is complete -125,000
Funding for Recreation Building Security Enhancements is complete -125,000

CAPITAL EXPENSE 18–3
One time allocation for Capron Street/South Avenue Reconstruction -111,000
DEBT SERVICE
Expenditures increase in accordance with debt repayment schedules -5,276,900

18–4 CAPITAL EXPENSE
Actual Estimated Amended Approved2007-08 2008-09 2008-09 2009-10
Appropriation by Major ObjectPersonnel Expenses 0 0 0 0 Materials & Supplies 0 0 0 0 Services 39,400 39,400 39,400 39,400 Other 87,895,100 90,577,900 90,577,900 71,640,800
Total 87,934,500 90,617,300 90,617,300 71,680,200
Appropriation by ActivityCash Capital 52,324,500 52,811,200 52,811,200 39,151,000 Debt Service 35,610,000 37,806,100 37,806,100 32,529,200
Total 87,934,500 90,617,300 90,617,300 71,680,200

CAPITAL EXPENSE 18–5 CASH CAPITAL
TRANSPORTATION The Transportation category includes the following ongoing infrastructure rehabilitation programs: ● Arterial Improvements ● Asphalt Milling, Resurfacing and Curb Replacement ● Residential Street Rehabilitation ● Residential Street Treatment ● Hazardous Sidewalk Program ● Street Planning and Design ● Bridge Improvement Program ● Bridge Reconstruction and Rehabilitation Funding in this category includes utility work done together with street improvement projects. Year-To-Year Comparison
2008-09 2009-10 ChangeBudget 5,695,400 4,969,000 -726,400 Major Change
Projects Impacted by Federal Funds:
Asphalt Milling, Resurfacing and Curb Replacement -1,094,000
University Avenue & Artwalk II 320,000
New Projects:
Acquisition of Railroad Bridge and Land for Trails 145,000
Pavement Program 10,000
Inner Loop/Sidewalk 3,000
Changes in Existing Projects from 2008-09:
Funding decreases for Broad Street East/Chestnut Street/Court Street project -785,000
Funding decreases for Waring Road project, as planned -139,000
Funding increases for Ridgeway Road project, as planned 72,000
Funding decreases for Mt. Hope Avenue Phase I as Cash Capital is reassigned to Debt -60,000
One time allocation for Curb Replacement -42,400
Funding decreases for Culver Road project, as planned -30,000
Funding decreases for Lake Avenue project -23,000
Funding decreases for Winton Road North -3,000
Purchasing Power Parity Increments:
Residential Street Rehabilitation 744,000
Hazardous Sidewalk and Sidewalk Ramp Installation Programs 66,000
Annual Bridge Maintenance 51,000
Street Treatment and Traffic Control 33,000
Street Lighting 6,000

18–6 CAPITAL EXPENSE CASH CAPITAL
WATER SYSTEM The Water System category encompasses both the supply and distribution systems, which provide safe and reliable sources of water to the City. Improvements funded in this category include the cleaning and lining of water mains; replacement of hydrants, valves and meters; and conduit and watershed improvements. Year-To-Year Comparison
2008-09 2009-10 ChangeBudget 2,847,000 3,253,000 406,000 Major Change
Changes in Existing Projects from 2008-09:
Funding increases for Conduit Streambed and Bank Erosion Control, as planned 150,000
Funding increases for Lead and Galvanized Service 115,000
Funding decreases for Small Equipment, as planned -99,000
Funding increases for Contamination Prevention Hydrant Locks 96,000
Funding increases for Water Main Cleaning and Lining, as planned 62,000
Funding increases for Filtration Plant and Related Renovations 52,000
Funding increases for Hydrant and Valve Replacement, as planned 49,000
Funding decreases for Chemical Tank Replacement, as planned -46,000
Funding increases for Water Security, as planned 31,000
Funding decreases for Water Meter Replacement, as planned -19,000
Funding increases for Reservoir Bypass, as planned 13,000
Purchasing Power Parity Increments:
Conduit Valve & Vault Rehabilitation 2,000
PUBLIC SAFETY The Public Safety category finances the replacement program for equipment used by the Police, Fire, and Emergency Communications units. Year-To-Year Comparison
2008-09 2009-10 ChangeBudget 13,952,800 3,984,000 -9,968,800 Major Change
New Projects:
Funding increases for Police Facilities 139,000
Changes in Existing Projects from 2008-09:
Funding decreases for Street Lighting Improvements -4,475,000
Funding deferred for Fire House Replacement and Major Renovations -1,721,000
Funding decreases for Fire Fighting Apparatus as planned -399,000

CAPITAL EXPENSE 18–7 CASH CAPITAL
Major Change
Funding increases for Cars, Vans and Utility Vehicles in the Fire Department 191,000
Funding decreases for SCBA Replacement -50,000
Funding decreases for Small Equipment in Emergency Communications Department -35,000
Funding increases for Parking Gate Replacement at Emergency Communications Facilities 30,000
Funding increases for Loading Dock Installations at Emergency Communications Facilities 25,000
Funding increases for Emergency Communications Vehicles 25,000
Funding decreases for Turnout Gear -17,000
Funding increases for Small Equipment in the Fire Department 15,000
Funding increases for Emergency Generators at Fire Houses 10,000
Project or Project Elements that will not recur:
One time funding for Police Vehicles and Hybrid Vehicles is complete -1,736,000
One time allocation for Street Lighting System -972,000
One time grant for Urban Area Security Initiative Grant -310,600
One time grant for Gang Suppression -292,200
Funding decreases for Parking Lot Test Wells at Emergency Communications Facilities -150,000
One time grant for Bomb Squad Training and Equipment -110,000
One time grant for Homeland Security -75,000
Funding decreases for Illuminated Building Sign Replacement at Emergency Communications Facilities
-15,000
Funding decreases for Cooling Tower Door and Louver Replacement at Emergency Communications Facilities
-15,000
Funding decreases for Emergency Training Information Network -15,000
Funding for Floor replacement at Emergency Communications Facilities -10,000
Funding for Storage Room Shelving at Emergency Communications Facilities -10,000
Purchasing Power Parity Increments:
Street Lighting 3,000
Project Uplift 1,000
RECREATIONS & CULTURE Recreation & Culture category includes equipment replacement and facility improvements for parks, cemeteries, recreation centers, and the Community Library. Year-To-Year Comparison
2008-09 2009-10 ChangeBudget 2,534,200 3,347,000 812,800

18–8 CAPITAL EXPENSE CASH CAPITAL
Major Change
New Projects:
Granite Memorials in Cemetery 100,000
Riverside Convention Center – Overhead Door 75,000
Genesee Valley Park Master Plan design 60,000
Changes in Existing Projects from 2008-09:
Funding increases for Mausoleum Building #3 1,130,000
Funding deferred for Manhattan Square Park -409,000
Funding increases for General Rehabilitation in the Department of Recreation and Youth Services
215,000
Funding decreases for Tennis and Basketball Replacement -150,000
Funding increases for Traditional Materials at Branch Libraries 104,000
Funding decreases for Small Equipment -96,000
Funding decreases for Vehicle Purchases -40,000
Funding increases for Riverside Cemetery Roadway Improvements 53,000
Funding decreases for Lighting Courts and Fields -25,000
Funding increases for maintenance at the Cemeteries 10,000
Funding increases for maintenance at the Public Market 7,000
Funding increases for Trails 5,000
Projects or Project Elements that will not recur:
One time allocation for Public Market Lot expansion -203,000
One time grant for Library Renovations -31,200
Funding decreases for Maplewood Park Trail Equipment -6,000
Purchasing Power Parity Increments:
High Falls District 10,000
Rundel Library 2,000
War Memorial Standard Allocation 2,000
GENERAL CITY DEVELOPMENT General City Development (projects to preserve and enhance the employment and tax base of the City) are included in this category. Year-To-Year Comparison
2008-09 2009-10 Change
Budget 10,220,800 7,312,000 -2,908,800

CAPITAL EXPENSE 18–9 CASH CAPITAL
Major Change
New Projects:
Home Ownership Program 800,000
Focused Investment 500,000
Changes in Existing Projects from 2008-09:
Funding decreases for Acquisition and Development in the Department of Economic Development
-2,067,800
Funding increases for Demolitions due to funding changes to the Restore New York Program 2,000,000
Funding increases for Market Rate Housing Acquisition 879,000
Funding decreases for Acquisition and development in Administration -365,000
Funding increases for Midtown Development 196,000
Funding increase for Transient Marina Facilities 174,000
Funding increases for Terminal Facility 100,000
Funding increases for Municipal Garage Equipment, as planned 75,000
Funding decreases for Port Infrastructure Roads -55,000
Projects or Project Elements that will not recur:
One time allocation for Land Acquisition and Site Preparation -3,000,000
One time allocation for Monroe County Crime Lab -1,000,000
One time allocation for Demolition Program -425,000
One time allocation for Marina Market and Feasibility Study -310,000
One time allocation for River Street Extension -263,000
One time allocation for Capron Street/South Avenue Reconstruction -111,000
One time allocation for Downtown Infrastructure Improvements -40,000
Purchasing Power Parity Increments:
Downtown Streetscape 4,000
FACILITIES & EQUIPMENT Facilities & Equipment provides for municipal facilities to be maintained through annual renovation programs for roofs, windows, electrical and mechanical systems, safety features, fuel stations, parking areas, and general structures. Specific improvements are scheduled in each program; in addition, separate allocations are provided for unique facilities. The General Equipment subcategory consists of the ongoing replacement programs for general office equipment, non−motorized field equipment, and information processing systems. The Motor Equipment subcategory provides funds for the scheduled replacement of heavy and light motor equipment and sedans for Administration, Finance, Community Development, Economic Development, and Environmental Services. Motor Equipment for Recreation and Youth Services and Community Library and Police, Fire, and Emergency Communications are funded in the Recreation/Culture and Public Safety categories, respectively.

18–10 CAPITAL EXPENSE CASH CAPITAL
Year-To-Year Comparison 2008-09 2009-10 Change
Budget 17,561,000 16,286,000 -1,275,000 Major Change
New Projects:
Business Process Services 350,000
Disaster Recovery 350,000
Rundel Mechanical System Replacement 220,000
Sanborn Maps 200,000
Emergency Training Information Network Phase II 150,000
Monroe Branch Library Renovations 135,000
CVMF Fuel System Upgrade 100,000
Communications Web Revitalization 100,000
Fire Department Office Furnishing 100,000
Communications Designer Suite 80,000
Police Shot Spotter 40,000
Emergency Communications Small equipment 35,000
Changes in Existing Projects from 2008-09:
Funding increases for Motor Equipment in the Solid Waste Collection Division, as planned 3,612,000
Funding decreases for Fire Facilities Building Rehabilitation -880,000
Funding increases for Enterprise Resource Planning System, as planned 850,000
Funding decreases for city-wide Office Automation, as planned -631,000
Funding increases for CVMF Building 347,000
Funding increases for Motor Equipment in the Bureau of Operations & Parks, as planned 435,000
Funding decreases for City Hall Repairs -400,000
Funding decreases for Hazardous Waste Remediation at the Port of Rochester -160,000
Funding decreases for Police Video Surveillance Cameras -150,000
Funding increases for Rundel Library Renovations 150,000
Funding increases for Hazardous Waste Remediation, as planned 137,000
Funding decreases for North Street Recreation Center as Cash Capital is reassigned to Debt -135,000
Funding decreases for Motor Equipment in the Water Bureau, as planned -72,000
Funding increases for Lagan Application 70,000
Funding decreases for Database Management and GIS -37,000
Funding decreases for General Rehabilitation of non-public safety City facilities -30,000
Funding decreases for Lift Replacement at the Central Vehicle Maintenance Facility -30,000
Funding increases for Forestry Tree Maintenance Programs, as planned 22,000
Funding increases for Small Equipment in the Department of Environmental Services 8,000

CAPITAL EXPENSE 18–11 CASH CAPITAL
Major Change
Funding increases for the standard maintenance allocation for the Department of Environmental Services on Mt. Read Boulevard
6,000
Funding increases for maintenance of the Public Safety Building, as planned 5,000
Funding increases for Finance Department Office Furnishing 4,000
Funding decreases for Economic Development Office Furnishing -2,000
Projects or Project Elements that will not recur:
Funding for City Hall Exterior Renovations is complete -1,800,000
Funding for Hazardous Waste Remediation at Elm Street is complete -1,500,000
Funding for Clinton/Baden Recreation Center is complete -1,000,000
Funding for City Hall Electrical Upgrades is complete -350,000
Funding for Lyell Avenue Firehouse is complete -200,000
Funding for CVMF Building 100 – HVAC Improvements is complete -175,000
Funding for Genesee Valley Park Pool roof is complete -171,000
Funding for Fire Houses HVAC Improvements is complete -165,000
Funding for Content Management System is complete -125,000
Funding for Gardiner Recreation Center is complete -125,000
Funding for Recreation Building Security Enhancements is complete -125,000
Funding for Blue Cross Arena improvements is complete -105,000
Funding for Genesee Valley Park Ice Rink structural repairs is complete -100,000
Funding for Public Market Winter Shed improvements is complete -100,000
Funding for Security Improvements is complete -100,000
Funding for Hazardous Waste Remediation at Driving Park is complete -80,000
Funding for Parking Meters Motor Equipment is complete -21,000
Funding decreases for Motor Equipment in Engineering -18,000
Funding for Treasury Interactive Voice Response System is complete -5,000
Purchasing Power Parity Increments:
Duplicating Equipment 8,000
Standard allocation for routine maintenance at City Hall 2,000
Standard allocation for routine maintenance at the Colfax Street Refuse Garage 1,000

18–12 CAPITAL EXPENSE CASH CAPITAL
EXPENDITURE SUMMARY
Actual Estimated Amended Approved2007-08 2008-09 2008-09 2009-10
Appropriation by Major ObjectPersonnel Expenses 0 0 0 0 Materials & Supplies 0 0 0 0 Services 0 0 0 0 Other 52,324,500 52,811,200 52,811,200 39,151,000
Total 52,324,500 52,811,200 52,811,200 39,151,000
Appropriation by ActivityTransportation 5,995,000 5,695,400 5,695,400 4,969,000 Water System 3,186,000 2,847,000 2,847,000 3,253,000 Public Safety 8,042,000 13,952,800 13,952,800 3,984,000 Recreation & Culture 3,190,000 2,534,200 2,534,200 3,347,000 General City Development 12,177,700 10,220,800 10,220,800 7,312,000 Facilities & Equipment 19,733,800 17,561,000 17,561,000 16,286,000
Total 52,324,500 52,811,200 52,811,200 39,151,000

CAPITAL EXPENSE 18–13 DEBT SERVICE
Principal payments consist of annual installment payments on long−term borrowing (Serial Bonds), Tax Repayment Fund, short−term borrowing (Bond Anticipation Notes) and Ferry debt. Year-To-Year Comparison
Budget Budget2008-09 2009-10 Change
Serial Bonds & Tax Repayment Fund 28,891,900 22,249,900 -6,642,000 Bond Anticipation Notes 100,000 3,975,900 3,875,900
Total 28,991,900 26,225,800 -2,766,100 Interest Payment consists of annual payments of interest on long−term borrowing (Serial Bonds), Tax Repayment Fund, short−term borrowing (Bond Anticipation Notes) and Ferry debt. Year-To-Year Comparison
Budget Budget2008-09 2009-10 Change
Serial Bonds & Tax Repayment Fund 7,022,800 5,302,300 -1,720,500 Bond Anticipation Notes 1,791,400 1,001,100 -790,300
Total 8,814,200 6,303,400 -2,510,800 The following table illustrates the actual rates on borrowing contracted by the City during 2008-09. Rates vary with the type of borrowing, size of the issue, and general market conditions. Date Type of Issue Interest Rate August, 2008 Bond Anticipation Note 2.75 February, 2009 Bond Anticipation Note 1.50

18–14 CAPITAL EXPENSE DEBT SERVICE
Statement of Indebtedness - June 30, 2009
Category Bonds Notes TotalGeneral 99,844,000 47,573,550 147,417,550Sewer* 3,481,500 1,167,500 4,649,000Water 32,214,500 7,324,225 39,538,725School 116,050,555 83,014,725 199,065,280
251,590,555 139,080,000 390,670,555
Less:Items not subject to Constitutional Limit:-Sewer (partial) 470,000-Water 39,538,725Constitutional Debt 350,661,830Constitutional Debt Limit 522,784,573(equal to 9% of the most recent five year average full assessed value)Debt Contracting Margin 172,122,743
*$710,000 to be reimbursed by Monroe County Pure Waters

CAPITAL EXPENSE 18–15 DEBT SERVICE
Bond Debt to Maturities (Principal, All funds) As of June 30, 2009
Fiscal Year City School Total
2009-10 $ 20,625,000 $ 9,856,393 $ 30,481,393 2010-11 17,800,000 9,129,393 26,929,393 2011-12 15,185,000 9,104,370 24,289,370 2012-13 13,000,000 8,486,400 21,486,400 2013-14 11,005,000 8,275,000 19,280,000 2014-15 8,585,000 8,428,000 17,013,000 2015-16 7,875,000 8,505,000 16,380,000 2016-17 6,360,000 8,164,000 14,524,000 2017-18 5,425,000 7,996,000 13,421,000 2018-19 5,080,000 8,074,000 13,154,000 2019-20 4,795,000 7,627,000 12,422,000 2020-21 4,090,000 6,815,000 10,905,000 2021-22 2,775,000 5,430,000 8,205,000 2022-23 2,480,000 4,265,000 6,745,000 2023-24 2,175,000 3,295,000 5,470,000 2024-25 2,145,000 1,895,000 4,040,000 2025-26 1,655,000 590,000 2,245,000 2026-27 1,530,000 115,000 1,645,000 2027-28 805,000 805,000 2028-29 625,000 625,000 2029-30 675,000 675,000 2030-31 680,000 680,000 2031-32 170,000 170,000
Total $ 135,540,000 $ 116,050,555 $ 251,590,555

18–16 CAPITAL EXPENSE DEBT SERVICE
EXPENDITURE SUMMARY
Actual Estimated Amended Approved2007-08 2008-09 2008-09 2009-10
Appropriation by Major ObjectPersonnel Expenses 0 0 0 0 Materials & Supplies 0 0 0 0 Services 39,400 39,400 39,400 39,400 Other 35,570,600 37,766,700 37,766,700 32,489,800
Total 35,610,000 37,806,100 37,806,100 32,529,200
Appropriation by ActivityPrincipal Payment 23,378,300 26,457,100 26,457,100 24,601,000 Interest Payment 12,231,700 11,349,000 11,349,000 7,928,200
Total 35,610,000 37,806,100 37,806,100 32,529,200

Capital Improvement Program
2009-10 City of Rochester, New York July 1, 2009

CITY OFFICIALS City Council Gladys Santiago (At-Large) President William F. Pritchard Vice President Carolee A. Conklin (At-Large) John F. Lightfoot (At-Large) Adam C. McFadden (South District) Dana K. Miller (At-Large) Carla M. Palumbo (Northwest District) Elaine G. Spaull (East District) Lovely A. Warren (Northeast District) Mayor Robert J. Duffy Deputy Mayor Patricia Malgieri Bureau of Budget & Efficiency William J. Ansbrow, Director of Budget & Efficiency Staff Kabutey Ocansey, Budget Analyst

TABLE OF CONTENTS
Financial Summary Section Introduction i Summary by Funding Source A Summary by Category B Summary by Department C Tax Rates Capital and Debt D Program by Category Transportation 1 Water System 2 Public Safety 3 Recreation and Culture 4 General City Development 5 Facilities and Equipment 6


Priorities Applied to CIP:
1. Contractual obligations New York State Power Authority, Riverside Convention Center
2. Projects with immediate impact on public safety Fire Fighting Apparatus, Fire House Replacement, Video Surveillance Cameras
3. Projects in their construction year Broad Street, Reservoir LTS Compliance
4. Investments with significant return particularly with regards to tax base Hazardous Waste Remediation, Port of Rochester, Midtown Development, Acquisitions, Home Ownership
5. Projects leveraging funding from other governments Demolitions, University Avenue & Artwalk II, Mt. Hope, East Henrietta Road
6. Projects with short term operating pay backs Mausoleum, Street Lighting, IT Office Automation/ERP, Green Fuel Station
7. Projects with significant public profile Rundel Library Renovations
8. Others (priority projects of Mayor and City Council) Recreation Facilities Rehabilitation

2009-10 TO 2013-14 Capital Improvement Program
INTRODUCTION
CAPITAL EXPENDITURES
The Capital Improvement Program (CIP) is a financing plan for the construction or reconstruction of facilities and services, the acquisition and replacement of vehicles and equipment, and certain other projects and improvements that provide benefits over a multi-year period. To be included in the capital program, a project or item must be consistent with the definition of >capital object or purpose= included in Section 11 of the New York State Local Finance Law. The financing of capital projects may occur through three means. First, a direct appropriation may be made; this type of appropriation is known as >cash capital=. Second, funds for projects may be obtained through the issuance of bonds and notes, two forms of debt. The subsequent repayment of this debt and related interest costs is called >debt service=. Funding for repayment of debt is included in the Debt Service allocation of the annual operating budget. Third, full or partial funding for some objects is obtained from outside agencies.
CIP DOCUMENT
This document represents a five-year capital investment program organized in three parts. The first part is a financial summary overview of the recommended program. Categories, funding sources and Departments are summarized in this section. The second part presents the project detail organized by six functional program types: Transportation, Water System, Public Safety, Recreation and Culture, General City Development and Facilities and Equipment. Each of these types is divided into Categories (e.g. G-7 Port of Rochester). Categories may contain one or more programs (e.g. G-7 Port of Rochester, Transient Marina Facilities). Each category type is prefaced by a narrative description, a listing of new programs, and program changes. Each program is described along with its cost and funding source for each year of the plan. The third part contains appendices listing funding, program and departmental detail.
i

SUMMARY BY FUNDING SOURCE (000s)
2009-10 2010-11 2011-12 2012-13 2013-14 Total
2010-14
CAPITAL IMPROVEMENT PROGRAM
2,125 1,900 2,288 2,045 2,052CDBG 10,410
541 597 1,170 344 1,074Monroe County Traffic 3,726
23,987 32,896 19,596 10,982 14,726Federal 102,187
11,766 16,305 24,834 12,793 11,215General Debt 76,913
1,230 3,945 350 0 0Library Debt 5,525
259 0 0 0 0Local Works Debt 259
960 980 1,000 1,000 1,200Monroe County 5,140
2,049 0 250 0 0New York State 2,299
4,022 840 840 3,340 840Parking Debt 9,882
0 4,000 0 0 0Private 4,000
728 1,722 3,387 450 1,127Pure Waters 7,414
9,380 8,687 11,327 8,826 6,325Water Debt 44,545
22,003 25,361 27,213 26,477 30,043General Cash Capital 131,097
1,860 285 570 596 638Cemetery Cash Capital 3,949
1,455 1,547 1,045 907 938Library Cash Capital 5,892
3,639 3,655 4,411 3,841 5,153Local Works Cash Capital 20,699
826 1,021 1,176 826 826Parking Cash Capital 4,675
38 540 2,542 44 46Public Market Cash Capital 3,210
4,650 3,235 650 961 771Refuse Cash Capital 10,267
4,071 4,230 3,752 4,117 6,474Water Cash Capital 22,644
68 70 903 50 50War Memorial Cash Capital 1,141
95,657 111,816Grand Total 107,304 77,599 83,498 475,874
A - 1

Category Summary 2010-11 2011-12 2012-13 2013-14
2010-14
CAPITAL IMPROVEMENT PROGRAM TOTAL2009-10
Facilities and Equipment
General Cash Capital 8,937 8,345 7,010 6,971 7,428 38,691
General Debt 4,820 3,003 900 3,079 900 12,702
Library Cash Capital 855 850 220 220 220 2,365
Library Debt 1,230 3,945 350 0 0 5,525
Local Works Cash Capital 1,209 1,143 1,815 518 1,721 6,406
Local Works Debt 259 0 0 0 0 259
New York State 0 0 250 0 0 250
Parking Cash Capital 20 215 20 20 20 295
Refuse Cash Capital 4,650 3,235 650 961 771 10,267
War Memorial Cash Capital 0 0 831 0 0 831
Water Cash Capital 615 703 484 561 482 2,845
22,595 21,439 12,530 12,330 11,542Facilities and Equipment Total 80,436
General City Development
CDBG 1,359 1,275 1,276 1,277 1,278 6,465
Federal 10,667 26,200 12,400 0 9,000 58,267
General Cash Capital 6,256 4,974 5,296 5,753 5,536 27,815
General Debt 1,290 4,223 7,700 4,650 100 17,963
Monroe County Traffic 50 408 733 0 0 1,191
New York State 1,765 0 0 0 0 1,765
Parking Cash Capital 806 806 1,156 806 806 4,380
Parking Debt 4,022 840 840 3,340 840 9,882
Private 0 4,000 0 0 0 4,000
Pure Waters 400 1,335 2,460 0 0 4,195
Water Cash Capital 200 0 0 0 0 200
Water Debt 0 595 1,070 0 0 1,665
26,815 44,656 32,931 15,826 17,560General City Development Total 137,788
B - 1

2009-10 2010-11 2011-12 2012-13 2013-14Category Summary 2010-14 CIP TOTAL
Public Safety
CDBG 50 50 50 50 50 250
Federal 0 2,146 0 0 0 2,146
General Cash Capital 3,984 5,614 7,220 5,495 4,935 27,248
General Debt 330 2,214 3,600 0 0 6,144
4,364 10,024 10,870 5,545 4,985Public Safety Total 35,788
Recreation and Culture
CDBG 490 105 250 0 0 845
Cemetery Cash Capital 1,860 285 570 596 638 3,949
Federal 79 33 545 252 0 909
General Cash Capital 781 1,142 1,629 1,805 5,761 11,118
General Debt 0 2,500 1,500 0 0 4,000
Library Cash Capital 600 697 825 687 718 3,527
Public Market Cash Capital 38 540 2,542 44 46 3,210
War Memorial Cash Capital 68 70 72 50 50 310
3,916 5,372 7,933 3,434 7,213Recreation and Culture Total 27,868
Transportation
CDBG 226 470 712 718 724 2,850
Federal 13,241 3,572 5,676 9,725 4,572 36,786
General Cash Capital 2,045 5,286 6,058 6,453 6,383 26,225
General Debt 5,326 4,365 11,134 5,064 10,215 36,104
Local Works Cash Capital 2,430 2,512 2,596 3,323 3,432 14,293
Monroe County 960 980 1,000 1,000 1,200 5,140
Monroe County Traffic 491 189 437 344 1,074 2,535
New York State 284 0 0 0 0 284
Pure Waters 328 387 927 450 1,127 3,219
Water Cash Capital 3 65 10 264 186 528
Water Debt 2,244 824 2,857 1,339 3,189 10,453
27,578 18,650 31,407 28,680 32,102Transportation Total 138,417
B - 2

2009-10 2010-11 2011-12 2012-13 2013-14Category Summary 2010-14 CIP TOTAL
Water System
Federal 0 945 975 1,005 1,154 4,079
Water Cash Capital 3,253 3,462 3,258 3,292 5,806 19,071
Water Debt 7,136 7,268 7,400 7,487 3,136 32,427
10,389 11,675 11,633 11,784 10,096Water System Total 55,577
95,657 111,816 107,304 77,599 83,498Grand Total 475,874
B - 3

Department Summary 2009-10 2010-11 2011-12 2012-13 2013-14
2010-14
CAPITAL IMPROVEMENT PROGRAM TOTAL
Administration
General Cash Capital 857 22 22 226 226 1,353
857 22 22 226 226Administration Total 1,353
Emergency Communications Department
General Cash Capital 115 70 35 70 35 325
General Debt 330 0 0 0 0 330
445 70 35 70 35Emergency Communications Total 655
Environmental Services
CDBG 500 745 988 995 1,002 4,230
Federal 21,637 30,730 19,371 10,982 14,726 97,446
General Cash Capital 7,921 10,491 11,433 12,120 11,019 52,984
General Debt 10,605 10,291 16,734 9,614 11,115 58,359
Library Cash Capital 220 220 220 220 220 1,100
Local Works Cash Capital 3,639 3,655 4,411 3,841 5,153 20,699
Local Works Debt 259 0 0 0 0 259
Monroe County 960 980 1,000 1,000 1,200 5,140
Monroe County Traffic 541 597 1,170 344 1,074 3,726
New York State 1,649 0 0 0 0 1,649
Parking Cash Capital 0 195 250 0 0 445
Pure Waters 728 1,722 3,387 450 1,127 7,414
Refuse Cash Capital 4,650 3,235 650 961 771 10,267
Water Cash Capital 4,071 4,230 3,752 4,117 6,474 22,644
Water Debt 9,380 8,687 11,327 8,826 6,325 44,545
66,760 75,778 74,693 53,470 60,206Environmental Services Total 330,907
C - 1

2009-10 2010-11 2011-12 2012-13 2013-14Department Summary 2010-14 CIP
TOTAL
Finance
General Cash Capital 38 71 30 41 41 221
Parking Cash Capital 806 806 906 806 806 4,130
Parking Debt 440 840 840 840 840 3,800
1,284 1,717 1,776 1,687 1,687Finance Total 8,151
Fire
CDBG 50 50 50 50 50 250
Federal 0 2,146 0 0 0 2,146
General Cash Capital 1,886 2,753 4,289 2,359 1,794 13,081
General Debt 370 1,854 0 0 0 2,224
2,306 6,803 4,339 2,409 1,844Fire Total 17,701
Information Technology
General Cash Capital 2,910 3,050 2,500 2,500 2,500 13,460
2,910 3,050 2,500 2,500 2,500Information Technology Total 13,460
Library
Library Cash Capital 1,100 1,327 825 687 718 4,657
Library Debt 1,230 3,945 350 0 0 5,525
New York State 0 0 250 0 0 250
2,330 5,272 1,425 687 718Library Total 10,432
Neighborhood Business Development
CDBG 1,085 1,000 1,000 1,000 1,000 5,085
Federal 2,350 0 0 0 0 2,350
General Cash Capital 5,179 4,540 4,540 5,000 5,000 24,259
General Debt 0 1,000 3,000 1,000 100 5,100
New York State 400 0 0 0 0 400
Parking Cash Capital 20 20 20 20 20 100
Parking Debt 3,582 0 0 2,500 0 6,082
Private 0 4,000 0 0 0 4,000
12,616 10,560 8,560 9,520 6,120Neighborhood Business Total 47,376
C - 2

2009-10 2010-11 2011-12 2012-13 2013-14Department Summary 2010-14 CIP
TOTAL
Police
General Cash Capital 2,181 3,470 3,040 3,109 3,113 14,913
General Debt 0 360 3,600 0 0 3,960
2,181 3,830 6,640 3,109 3,113Police Total 18,873
Recreation & Youth Services
CDBG 490 105 250 0 0 845
Cemetery Cash Capital 1,860 285 570 596 638 3,949
Federal 0 20 225 0 0 245
General Cash Capital 916 894 1,324 1,052 6,315 10,501
General Debt 461 2,800 1,500 2,179 0 6,940
Library Cash Capital 135 0 0 0 0 135
Public Market Cash Capital 38 540 2,542 44 46 3,210
War Memorial Cash Capital 68 70 903 50 50 1,141
3,968 4,714 7,314 3,921 7,049Recreation & Youth Services Total 26,966
95,657 111,816 107,304 77,599 83,498Grand Total 475,874
C - 3

2009-10 2010-11 2011-12 2012-13 2013-14 TotalExpense ($000)
Existing Debt 32,529.2 32,868.6 28,536.8 25,448.3 21,479.9 140,862.8New Program 995.8 4,417.6 8,557.2 12,633.6 26,604.2
32,529.2 33,864.4 32,954.4 34,005.5 34,113.5 167,467.0
Revenue ($000)Premium and Interest Fund 3,000.0 3,000.0 3,000.0 3,000.0 3,000.0 15,000.0 Monroe County Pure Waters 420.4 1,722.0 3,387.0 450.0 1,127.0 7,106.4 Sale Unclaimed Property 412.8 641.1 641.1 641.1 641.1 2,977.2 Fed. Transportation Reimb. 300.4 208.4 208.4 208.4 208.4 1,134.0 Sale of Real Property 1,800.0 1,800.0 Tax Repayment Fund 1,787.9 809.1 2,597.0 Enterprise Funds 10,818.5 11,343.0 12,031.5 12,503.9 12,903.3 59,600.2
18,540.0 17,723.6 19,268.0 16,803.4 17,879.8 90,214.8
Tax Revenue Required ($000) 13,989.2 16,140.8 13,686.4 17,202.1 16,233.7 77,252.2Tax Reserve 736.3 849.5 720.3 905.4 854.4 7,382.0Tax Levy Required ($000) 14,725.5 16,990.3 14,406.7 18,107.5 17,088.1 84,634.2
Tax Rate per $1,000 Assessed ValueHomestead 1.79 2.17 1.75 2.21 2.08Non-Homestead 3.77 4.35 3.69 4.64 4.38
2009-10 2010-11 2011-12 2012-13 2013-14 Total
Expense ($000)General Cash Capital 22,544.0 25,361.0 27,213.0 26,477.0 30,043.0 131,638.0 Library Cash Capital 1,455.0 1,547.0 1,045.0 907.0 938.0 5,892.0 Local Works Cash Capital 3,639.0 3,655.0 4,411.0 3,841.0 5,153.0 20,699.0 Water Cash Capital 4,071.0 4,230.0 3,752.0 4,117.0 6,474.0 22,644.0 War Memorial Cash Capital 68.0 70.0 903.0 50.0 50.0 1,141.0 Parking Cash Capital 826.0 1,021.0 1,176.0 826.0 826.0 4,675.0 Public Market Cash Capital 38.0 540.0 2,542.0 44.0 771.0 3,935.0 Cemetery Cash Capital 1,860.0 285.0 570.0 596.0 638.0 3,949.0 Refuse Cash Capital 4,650.0 3,235.0 650.0 961.0 771.0 10,267.0
39,151.0 39,944.0 42,262.0 37,819.0 45,664.0 204,840.0
Revenue ($000)Monroe County Traffic Shares 541.0 597.0 1,170.0 344.0 1,074.0 3,726.0 CHIPS 3,127.8 3,127.8 3,127.8 3,127.8 3,127.8 15,639.0 Sale of Scrap 148.0 148.0 148.0 148.0 148.0 740.0 Street Opening Permits 270.0 274.7 280.2 285.8 291.5 1,402.2 Compensation for Loss 110.0 110.0 110.0 110.0 110.0 550.0 Enterprise Funds 16,607.0 14,583.0 15,049.0 11,342.0 15,621.0 73,202.0
20,803.8 18,840.5 19,885.0 15,357.6 20,372.3 95,259.2
Tax Revenue Required ($000) 18,347.2 21,103.5 22,377.0 22,461.4 25,291.7 109,580.8 Tax Reserve 965.6 1,110.7 1,177.7 1,182.2 1,331.1 5,767.4
Tax Levy Required ($000) 19,312.8 22,214.2 23,554.7 23,643.6 26,622.8 115,348.2
Tax Rate per $1,000 Assessed ValueHomestead 2.35 2.71 2.87 2.88 3.24Non-Homestead 4.95 5.69 6.03 6.05 6.82
TAX RATES FOR DEBT SERVICE
TAX RATES FOR CASH CAPITAL
D-1

2009-10 TO 2013-14 CAPITAL IMPROVEMENT PROGRAM
1–i
TRANSPORTATION The City maintains 537 centerline miles of streets. Preservation of the City's transportation network is achieved through reconstruction and rehabilitation of streets, bridges, sidewalks and curbs.
New Programs T-2 City Funded Arterials
Mt. Hope Avenue Phase I ROW from Elmwood Avenue to Rossiter Street is added. Mt. Hope Avenue Phase II Village District is added. East Henrietta Road from Mt. Hope to City line is added due to available Federal Aid. Emerson Street from Mt. Read Avenue to City Line is added with construction in 2013-14.
Program Changes T-1 County Funded Arterials
Goodman Street (Bay Street to Clifford) is omitted, as Monroe County Funding is reduced. Genesee Street (Genesee Park Blvd to Brooks Avenue) is omitted, as Monroe County Funding is
reduced. T-2 City Funded Arterials
Broad Street East/Chestnut Street/Court Street begins in 2009-10 due to synergy with Manhattan Park renovations & ESL construction
Lake Avenue (Merrill Street to 600' South Burley Road) delayed two years to 2012-13. Mt. Hope Avenue Phase II from (Canal/South City Line Rossiter Street) delayed one year to
2012-13. Waring Road (Culver Road to Norton Street) delayed three years to 2012-13. Winton Road North (Blossom Road to Corwin Road) delayed one year to 2010-11. Westfield Street (Brooks Avenue to Chili Avenue) delayed two years to 2011-12.

2009-10 TO 2013-14
Capital Improvement Program TRANSPORTATION
T-1 County Assisted Arterial Improvements
South Avenue
Funding Source 2009-10 2010-11 2011-12 2012-13 2013-14
(Elmwood Ave. to Bellevue Dr.) Elmwood Avenue (Mt. Hope to South Avenue)
TOTAL
Street reconstruction, new curbing, sidewalks, water main and services, hydrants, receiving basins, street light and tree planting.
General Cash Capital 0 0 0 0 242 242
General Debt 0 0 0 0 1,158 1,158
Monroe County 0 132 1,000 1,000 1,200 3,332
Water Cash Capital 0 0 0 119 119 238
Water Debt 0 0 0 0 1,151 1,151
0 132 1,000 1,119 3,870 6,121
Culver Road
Funding Source 2009-10 2010-11 2011-12 2012-13 2013-14
Atlantic Avenue to Garson Avenue; Laurelton to Clifford
TOTAL
Street reconstruction, new curbing, sidewalks, water main and services, hydrants, receiving basins, street light and tree planting.
General Cash Capital 0 27 0 0 0 27
General Debt 0 1,085 0 0 0 1,085
Monroe County 960 848 0 0 0 1,808
Water Debt 1,056 0 0 0 0 1,056
2,016 1,960 0 0 0 3,976
T-10 Street Lighting
Street Lighting
Funding Source 2009-10 2010-11 2011-12 2012-13 2013-14 TOTAL
In conjunction with street improvement projects
General Cash Capital 209 215 222 228 235 1,109
209 215 222 228 235 1,109
1 - 1

2009-10 TO 2013-14TRANSPORTATIONCapital Improvement Program
T-2 City Funded Arterials
Broad Street East/Chestnut Street/Court Street
Funding Source 2009-10 2010-11 2011-12 2012-13 2013-14 TOTAL
Street reconstruction, new curbing, sidewalks, water main and services, hydrants, receiving basins, street light and tree planting.
General Debt 833 0 0 0 0 833
Monroe County Traffic 12 0 0 0 0 12
Water Debt 40 0 0 0 0 40
885 0 0 0 0 885
East Henrietta Road
Funding Source 2009-10 2010-11 2011-12 2012-13 2013-14
Mt. Hope Avenue to City Line
TOTAL
Street reconstruction, new curbing, sidewalks, water main and services, hydrants, receiving basins, street lighting and tree planting. *Funds appropriated by City Council during FY 2008-09.
Federal 1,820 0 0 0 0 1,820
1,820 0 0 0 0 1,820
Emerson Street
Funding Source 2009-10 2010-11 2011-12 2012-13 2013-14
Mt Read Boulevard to Curlew Street
TOTAL
Street reconstruction, new curbing, sidewalks, water main and services, hydrants, receiving basins, street lighting and tree planting.
General Cash Capital 0 0 0 227 26 253
General Debt 0 0 0 0 2,000 2,000
Monroe County Traffic 0 0 0 19 160 179
Water Cash Capital 0 0 0 65 0 65
Water Debt 0 0 0 0 600 600
0 0 0 311 2,786 3,097
1 - 2

2009-10 TO 2013-14TRANSPORTATIONCapital Improvement Program
Future Street Planning & Projects
Funding Source 2009-10 2010-11 2011-12 2012-13 2013-14 TOTAL
Staff time for design and construction of City Arterials. The specific projects are not yet designated.
General Cash Capital 200 200 200 200 234 1,034
General Debt 0 0 0 0 5,000 5,000
Monroe County Traffic 0 0 0 0 20 20
Water Cash Capital 0 0 0 0 67 67
200 200 200 200 5,321 6,121
Genesee Park Boulevard
Funding Source 2009-10 2010-11 2011-12 2012-13 2013-14
Brooks Avenue to Genesee Street
TOTAL
Street reconstruction, new curbing, sidewalks, water main and services, hydrants, receiving basins, street lighting and tree planting.
General Cash Capital 0 382 41 0 0 423
General Debt 0 0 3,493 0 0 3,493
Monroe County Traffic 0 4 32 0 0 36
Pure Waters 0 0 200 0 0 200
Water Cash Capital 0 38 0 0 0 38
Water Debt 0 0 371 0 0 371
0 424 4,137 0 0 4,561
1 - 3

2009-10 TO 2013-14TRANSPORTATIONCapital Improvement Program
Lake Avenue
Funding Source 2009-10 2010-11 2011-12 2012-13 2013-14
Merrill Street to 600' South of Burley Road
TOTAL
Street reconstruction, new curbing, sidewalks, water main and services, hydrants, receiving basins, street light and tree planting.
Federal 120 0 0 6,099 0 6,219
General Cash Capital 6 0 0 15 0 21
General Debt 0 0 0 1,091 0 1,091
Monroe County Traffic 0 0 0 67 0 67
New York State 23 0 0 0 0 23
Pure Waters 0 0 0 52 0 52
Water Cash Capital 1 0 0 0 0 1
Water Debt 0 0 0 312 0 312
150 0 0 7,636 0 7,786
Mt. Hope Avenue - Phase I ROW (Elmwood Ave - Rossiter St.)
Funding Source 2009-10 2010-11 2011-12 2012-13 2013-14 TOTAL
Street reconstruction, land acquisition, new curbing, sidewalks, water main and services, hydrants, receiving basins, street light and tree planting.
General Debt 900 0 0 0 0 900
900 0 0 0 0 900
Mt. Hope Avenue - Phase II Village District
Funding Source 2009-10 2010-11 2011-12 2012-13 2013-14 TOTAL
General Debt 880 0 0 0 0 880
880 0 0 0 0 880
1 - 4

2009-10 TO 2013-14TRANSPORTATIONCapital Improvement Program
Mt. Hope Avenue Phase II (Canal/South City Line to Rossiter Street)
Funding Source 2009-10 2010-11 2011-12 2012-13 2013-14
East Henrietta Road (South Avenue to Mt. Hope Avenue)
TOTAL
Street reconstruction, new curbing, sidewalks, water main and services, hydrants, receiving basins, street light and tree planting.
Federal 0 0 0 0 4,150 4,150
General Cash Capital 0 0 0 402 54 456
Monroe County Traffic 0 0 0 48 725 773
New York State 0 0 0 0 0 0
Pure Waters 0 0 0 0 746 746
Water Cash Capital 0 0 0 70 0 70
Water Debt 400 0 0 0 534 934
400 0 0 520 6,209 7,129
Waring Road
Funding Source 2009-10 2010-11 2011-12 2012-13 2013-14
Culver Road to Norton Street
TOTAL
Street reconstruction, new curbing, sidewalks, water main and services, hydrants, receiving basins, street light and tree planting.
Federal 0 0 0 237 422 659
General Cash Capital 0 6 0 46 105 157
Monroe County Traffic 0 0 0 3 0 3
Water Cash Capital 0 0 0 10 0 10
Water Debt 0 0 0 0 10 10
0 6 0 296 537 839
1 - 5

2009-10 TO 2013-14TRANSPORTATIONCapital Improvement Program
Winton Road North
Funding Source 2009-10 2010-11 2011-12 2012-13 2013-14
Blossom Road to Corwin Road
TOTAL
Street reconstruction, new curbing, sidewalks, water main and services, hydrants, receiving basins, street lighting and tree planting.
Federal 0 132 303 3,389 0 3,824
General Cash Capital 0 23 76 0 0 99
General Debt 0 0 0 620 0 620
Monroe County Traffic 0 2 0 42 0 44
Pure Waters 0 0 0 27 0 27
Water Cash Capital 0 8 0 0 0 8
Water Debt 0 0 0 158 0 158
0 165 379 4,236 0 4,780
Seneca Avenue
Funding Source 2009-10 2010-11 2011-12 2012-13 2013-14
Norton Street to Ridge Road East
TOTAL
Street reconstruction, new curbing, sidewalks, water main and services, hydrants, receiving basins, street light and tree planting.
General Cash Capital 0 224 24 0 0 248
General Debt 0 0 2,053 0 0 2,053
Monroe County Traffic 0 21 184 0 0 205
Pure Waters 0 0 123 0 0 123
Water Cash Capital 0 18 0 0 0 18
Water Debt 0 0 177 0 0 177
0 263 2,561 0 0 2,824
1 - 6

2009-10 TO 2013-14TRANSPORTATIONCapital Improvement Program
University Avenue & Artwalk II
Funding Source 2009-10 2010-11 2011-12 2012-13 2013-14
Union Street to Goodman Street
TOTAL
Street reconstruction, new curbing, sidewalks, water main and services, hydrants, receiving basins, street light and tree planting.
Federal 3,839 0 0 0 0 3,839
Monroe County Traffic 320 0 0 0 0 320
New York State 250 0 0 0 0 250
4,409 0 0 0 0 4,409
Westfield Street
Funding Source 2009-10 2010-11 2011-12 2012-13 2013-14
Brooks Avenue to Chili Avenue
TOTAL
Street reconstruction, new curbing, sidewalks, water main and services, hydrants, receiving basins, street light and tree planting.
General Cash Capital 0 0 24 0 0 24
General Debt 0 0 2,199 0 0 2,199
Pure Waters 0 0 137 0 0 137
Water Debt 0 0 91 0 0 91
0 0 2,451 0 0 2,451
Ridgeway Avenue
Funding Source 2009-10 2010-11 2011-12 2012-13 2013-14
Ramona Street to Minder Street
TOTAL
Street reconstruction, new curbing, sidewalks, water main and services, hydrants, receiving basins, street lighting and tree planting.
Federal 328 1,511 3,489 0 0 5,328
General Cash Capital 98 0 126 0 0 224
General Debt 0 0 1,148 0 0 1,148
Monroe County Traffic 0 0 51 0 0 51
New York State 0 0 0 0 0 0
Pure Waters 0 0 51 0 0 51
Water Debt 0 0 1,375 0 0 1,375
426 1,511 6,240 0 0 8,177
1 - 7

2009-10 TO 2013-14TRANSPORTATIONCapital Improvement Program
T-3 Asphalt Milling, Resurfacing and Curb Replacement
Milling & Resurfacing Program
Funding Source 2009-10 2010-11 2011-12 2012-13 2013-14 TOTAL
Milling and Resurfacing, and micro-paving of streets including curb replacement, water and receiving basin improvements and traffic markings.*Federal funds appropriated by City Council during FY 2008-09.
Federal 2,641 0 0 0 0 2,641
General Cash Capital 0 3,409 3,512 3,581 3,688 14,190
General Debt 0 318 328 338 348 1,332
Monroe County Traffic 109 112 115 119 122 577
Pure Waters 0 55 56 58 59 228
Water Debt 0 55 56 58 59 228
2,750 3,949 4,067 4,154 4,276 19,196
Pavement Program
Funding Source 2009-10 2010-11 2011-12 2012-13 2013-14 TOTAL
Pavement maintenance program for milling and resurfacing to extend the life of streets.
Federal 1,535 1,337 1,884 0 0 4,756
General Debt 347 277 389 0 0 1,013
Monroe County Traffic 8 6 10 0 0 24
Pure Waters 42 37 56 0 0 135
Water Cash Capital 2 1 10 0 0 13
Water Debt 6 5 0 0 0 11
1,940 1,663 2,349 0 0 5,952
1 - 8

2009-10 TO 2013-14TRANSPORTATIONCapital Improvement Program
T-4 Residential Street Rehabilitation
Neighborhood Right-of-Way Improvements
Funding Source 2009-10 2010-11 2011-12 2012-13 2013-14 TOTAL
Improvements of the rights-of-way in CDBG eligible locations including the upgrade of road surfaces, curbing, tree lawns and catch basins.
CDBG 226 205 197 203 209 1,040
226 205 197 203 209 1,040
Residential Street Rehabilitation
Funding Source 2009-10 2010-11 2011-12 2012-13 2013-14 TOTAL
Street reconstruction and rehabilitation, new curbs, sidewalks, water, receiving basins, street lighting improvements, and tree planting for residential streets.
CDBG 0 265 515 515 515 1,810
General Cash Capital 743 0 1,000 1,000 1,000 3,743
General Debt 1,766 2,685 1,524 1,615 1,709 9,299
Monroe County Traffic 42 44 45 46 47 224
Pure Waters 286 295 304 313 322 1,520
Water Debt 742 764 787 811 835 3,939
3,579 4,053 4,175 4,300 4,428 20,535
T-5 Street Treatment
Street Treatment and Traffic Control
Funding Source 2009-10 2010-11 2011-12 2012-13 2013-14 TOTAL
Maintenance of residential, collector, and arterial streets, as well as the conduct of the neighborhood traffic control program. This includes Chip & Seal Materials, arterial/collector crack fill, and asphalt overlay materials for spot treatment.
General Cash Capital 300 300 300 300 300 1,500
Local Works Cash Capital 813 846 880 915 952 4,406
1,113 1,146 1,180 1,215 1,252 5,906
1 - 9

2009-10 TO 2013-14TRANSPORTATIONCapital Improvement Program
T-6 Hazardous Sidewalk Program
Hazardous Sidewalk Remediation
Funding Source 2009-10 2010-11 2011-12 2012-13 2013-14
Standard Allocation
TOTAL
Replacing hazardous sidewalks throughout the City. Other sidewalk work is performed in conjunction with a number of the street programs referenced in this document. *Federal funds appropriated by City Council during FY 2008-09.
Federal 300 0 0 0 0 300
Local Works Cash Capital 1,370 1,411 1,454 2,138 2,202 8,575
1,670 1,411 1,454 2,138 2,202 8,875
Inner Loop/Sidewalks
Funding Source 2009-10 2010-11 2011-12 2012-13 2013-14 TOTAL
Federal 57 592 0 0 0 649
General Cash Capital 3 125 0 0 0 128
New York State 11 0 0 0 0 11
71 717 0 0 0 788
Sidewalk Ramp Installation
Funding Source 2009-10 2010-11 2011-12 2012-13 2013-14
Standard Allocation
TOTAL
Reconstruction of sidewalk ramps on residential streets at high priority locations.
Local Works Cash Capital 247 255 262 270 278 1,312
247 255 262 270 278 1,312
T-8 Bridge Improvement Program
Bridges - Standard Allocation
Funding Source 2009-10 2010-11 2011-12 2012-13 2013-14 TOTAL
Repairing, painting and cleaning of selected bridges. *Federal funds appropriated by City Council during FY 2008-09.
Federal 2,001 0 0 0 0 2,001
General Cash Capital 341 375 413 454 499 2,082
2,342 375 413 454 499 4,083
1 - 10

2009-10 TO 2013-14TRANSPORTATIONCapital Improvement Program
T-9 Bridge Reconstruction and Rehabilitation
Erie-Lackawanna RR Bridge
Funding Source 2009-10 2010-11 2011-12 2012-13 2013-14 TOTAL
Conversion into a pedestrian bridge connecting Genesee Riverway Trail on both sides of the river with the University of Rochester Campus.
Federal 600 0 0 0 0 600
General Debt 600 0 0 0 0 600
1,200 0 0 0 0 1,200
Railroad Underpass Improvements
Funding Source 2009-10 2010-11 2011-12 2012-13 2013-14 TOTAL
Cleaning, painting, lighting upgrades, pedestrian and vehicular safety improvements, concrete repairs, leakages/drainage improvements, and landscaping upgrades.
General Cash Capital 145 0 120 0 0 265
General Debt 0 0 0 1,400 0 1,400
145 0 120 1,400 0 1,665
1 - 11

Summary of Funding by Program: Transportation2009-10 2010-11 2011-12 2012-13 2013-14 Total
T-1 County Assisted Arterial Improvements
General Cash Capital 0 27 0 0 242 269
General Debt 0 1,085 0 0 1,158 2,243
Monroe County 960 980 1,000 1,000 1,200 5,140
Water Cash Capital 0 0 0 119 119 238
Water Debt 1,056 0 0 0 1,151 2,207
2,016 2,092 1,000 1,119 3,870 10,097
T-10 Street Lighting
General Cash Capital 209 215 222 228 235 1,109
209 215 222 228 235 1,109
T-2 City Funded Arterials
Federal 6,107 1,643 3,792 9,725 4,572 25,839
General Cash Capital 304 835 491 956 419 3,005
General Debt 2,613 0 8,893 1,711 7,000 20,217
Monroe County Traffic 332 27 267 179 905 1,710
New York State 273 0 0 0 0 273
Pure Waters 0 0 511 79 746 1,336
Water Cash Capital 1 64 0 145 67 277
Water Debt 440 0 2,014 470 1,144 4,068
10,070 2,569 5,968 3,265 4,853 56,725
1 - 12

2009-10 2010-11 2011-12 2012-13 2013-14 Total
T-3 Asphalt Milling, Resurfacing and Curb Replacement
Federal 4,176 1,337 1,884 0 0 7,397
General Cash Capital 0 3,409 3,512 3,581 3,688 14,190
General Debt 347 595 717 338 348 2,345
Monroe County Traffic 117 118 125 119 122 601
Pure Waters 42 92 112 58 59 363
Water Cash Capital 2 1 10 0 0 13
Water Debt 6 60 56 58 59 239
4,690 5,612 6,416 4,154 4,276 25,148
T-4 Residential Street Rehabilitation
CDBG 226 470 712 718 724 2,850
General Cash Capital 743 0 1,000 1,000 1,000 3,743
General Debt 1,766 2,685 1,524 1,615 1,709 9,299
Monroe County Traffic 42 44 45 46 47 224
Pure Waters 286 295 304 313 322 1,520
Water Debt 742 764 787 811 835 3,939
3,805 4,258 4,372 4,503 4,637 21,575
T-5 Street Treatment
General Cash Capital 300 300 300 300 300 1,500
Local Works Cash Cap 813 846 880 915 952 4,406
1,113 1,146 1,180 1,215 1,252 5,906
T-6 Hazardous Sidewalk Program
Federal 357 592 0 0 0 949
General Cash Capital 3 125 0 0 0 128
Local Works Cash Cap 1,617 1,666 1,716 2,408 2,480 9,887
New York State 11 0 0 0 0 11
1,988 2,383 1,716 2,408 2,480 10,975
1 - 13

2009-10 2010-11 2011-12 2012-13 2013-14 Total
T-8 Bridge Improvement Program
Federal 2,001 0 0 0 0 2,001
General Cash Capital 341 375 413 454 499 2,082
2,342 375 413 454 499 4,083
T-9 Bridge Reconstruction and Rehabilitation
Federal 600 0 0 0 0 600
General Cash Capital 145 0 120 0 0 265
General Debt 600 0 0 1,400 0 2,000
1,345 0 120 1,400 0 2,865
1 - 14

TRANSPORTATION TOTALS
2009-10 2010-2011 2011-12 2012-13 2013-14 Total
724226 470 712 718CDBG 2,850
4,57213,241 3,572 5,676 9,725Federal 36,786
6,3832,045 5,286 6,058 6,519General Cash Capital 26,291
10,2155,326 4,365 11,134 5,064General Debt 36,104
3,4322,430 2,512 2,596 3,323Local Works Cash Capital 14,293
1,200960 980 1,000 1,000Monroe County 5,140
1,074491 189 437 344Monroe County Traffic 2,535
0284 0 0 0New York State 284
1,127328 387 927 450Pure Waters 3,219
1863 65 10 264Water Cash Capital 528
3,1892,244 824 2,857 1,339Water Debt 10,453
27,578 18,650 31,407 28,746 32,102 138,483
1 - 15

2009-10 TO 2013-14 CAPITAL IMPROVEMENT PROGRAM
2–i
WATER SYSTEM The Water System category includes projects designed to provide a safe source of water to its users. Additional water distribution system improvements are made in conjunction with the street projects in the Transportation and General City Development categories.
Program Changes A number of items previously aggregated are presented in detail in an effort to
emphasize individual projects, particularly with regard to maintenance of structures and major equipment.
There are no major changes to ongoing system infrastructure maintenance. The programs for infrastructure support continue at planned levels. Bridges and River Crossings is added beginning 2013-14. SCADA System is added beginning 2012-13. Filtration Plant Filter Underdrain Joint Rehabilitation is added beginning 2013-14. Upland Bridge Rehabilitation is added beginning 2013-14. Cobb's Hill Fountain Replacement is omitted.

2009-10 TO 2013-14
Capital Improvement Program WATER SYSTEM
W-1 Water Main Extension and Improvements
Bridges and River Crossings
Funding Source 2009-10 2010-11 2011-12 2012-13 2013-14 TOTAL
Rehabilitate bridges over Genesee River.
Water Cash Capital 0 0 0 0 550 550
0 0 0 0 550 550
Water Main, Extension & Improvement Program
Funding Source 2009-10 2010-11 2011-12 2012-13 2013-14 TOTAL
Replacement of deteriorated water mains.
Water Debt 1,136 1,168 1,200 1,236 1,285 6,025
1,136 1,168 1,200 1,236 1,285 6,025
W-11 Water Security
Reservoir Bypass
Funding Source 2009-10 2010-11 2011-12 2012-13 2013-14 TOTAL
Improve routing of supply and management of reservoirs
Water Cash Capital 13 100 131 0 0 244
13 100 131 0 0 244
Water Security
Funding Source 2009-10 2010-11 2011-12 2012-13 2013-14 TOTAL
Securing Water facilities by facility upgrade and access control.
Water Cash Capital 131 80 82 75 78 446
131 80 82 75 78 446
2 - 1

2009-10 TO 2013-14WATER SYSTEMCapital Improvement Program
W-2 Water Main Cleaning & Lining
Water Main Cleaning & Lining
Funding Source 2009-10 2010-11 2011-12 2012-13 2013-14 TOTAL
Cleaning of water mains and installation of mortar lining to restore pipe capacity and slow deterioration.
Water Cash Capital 1,616 1,836 1,714 1,765 1,836 8,767
1,616 1,836 1,714 1,765 1,836 8,767
W-3 Hydrant and Valve Replacement Program
Hydrant & Valve Replacement Program
Funding Source 2009-10 2010-11 2011-12 2012-13 2013-14 TOTAL
Replacement of hydrants and valves. Hydrants needing replacement are identified through annual inspection by the Fire Department.
Water Cash Capital 559 576 597 618 643 2,993
559 576 597 618 643 2,993
W-4 Water Meter Maintenance Program
Water Meter Replacement Program
Funding Source 2009-10 2010-11 2011-12 2012-13 2013-14 TOTAL
Replacement and modernization of water meters.
Water Cash Capital 362 370 380 391 407 1,910
362 370 380 391 407 1,910
W-5 General System Improvement
Contamination Prevention Hydrant Locks
Funding Source 2009-10 2010-11 2011-12 2012-13 2013-14 TOTAL
Protects against tampering with Fire Hydrants contributing to fire suppression and water system safety.
Water Cash Capital 105 105 107 109 113 539
105 105 107 109 113 539
2 - 2

2009-10 TO 2013-14WATER SYSTEMCapital Improvement Program
Distribution System Vault Rehabilitation
Funding Source 2009-10 2010-11 2011-12 2012-13 2013-14 TOTAL
Water Cash Capital 0 0 0 0 280 280
0 0 0 0 280 280
Lead and Galvanized Service Program
Funding Source 2009-10 2010-11 2011-12 2012-13 2013-14 TOTAL
Replace lead lined iron pipe and galvanized services with lead goosenecks.
Federal 0 945 975 1,005 1,154 4,079
Water Cash Capital 115 115 115 115 115 575
115 1,060 1,090 1,120 1,269 4,654
W-6 Reservoir, Conduit and Watershed Improvements
Conduit Modernization Program
Funding Source 2009-10 2010-11 2011-12 2012-13 2013-14 TOTAL
Modernization of the City's Water supply conduit system.
Water Cash Capital 0 0 0 0 0 0
Water Debt 1,500 1,600 1,700 1,751 1,851 8,402
1,500 1,600 1,700 1,751 1,851 8,402
Conduit Streambed & Bank Erosion Control
Funding Source 2009-10 2010-11 2011-12 2012-13 2013-14 TOTAL
Shoring up of banks and related actions to preserve the watershed.
Water Cash Capital 150 0 0 0 0 150
150 0 0 0 0 150
2 - 3

2009-10 TO 2013-14WATER SYSTEMCapital Improvement Program
Conduit Valve & Vault Rehabilitation
Funding Source 2009-10 2010-11 2011-12 2012-13 2013-14 TOTAL
Funding to support the repair and replacement of valves and vaults.
Water Cash Capital 74 75 76 77 80 382
74 75 76 77 80 382
Reservoir LTS Compliance
Funding Source 2009-10 2010-11 2011-12 2012-13 2013-14 TOTAL
Long Term Enhanced Surface Water Treatment enhancements.
Water Debt 4,500 4,500 4,500 4,500 0 18,000
4,500 4,500 4,500 4,500 0 18,000
Upland Bridge Rehabilitation
Funding Source 2009-10 2010-11 2011-12 2012-13 2013-14 TOTAL
Water Cash Capital 0 0 0 0 312 312
0 0 0 0 312 312
W-8 Holly System
Diesel Engine Replacement
Funding Source 2009-10 2010-11 2011-12 2012-13 2013-14 TOTAL
Water Cash Capital 0 150 0 0 0 150
0 150 0 0 0 150
Interior Painting
Funding Source 2009-10 2010-11 2011-12 2012-13 2013-14 TOTAL
Water Cash Capital 0 0 0 0 63 63
0 0 0 0 63 63
2 - 4

2009-10 TO 2013-14WATER SYSTEMCapital Improvement Program
W-9 Filtration Plant Complex
Filtration Plant and Related Renovations
Funding Source 2009-10 2010-11 2011-12 2012-13 2013-14 TOTAL
Improvements to the sites, structures and systems comprising the filtration complex. Funding provides for backwash improvement and mixer replacement. General repair is included as is the installation of sidewalks.
Water Cash Capital 93 19 19 16 230 377
93 19 19 16 230 377
Filtration Plant Filter Underdrain Joint Rehabilitation
Funding Source 2009-10 2010-11 2011-12 2012-13 2013-14 TOTAL
Water Cash Capital 0 0 0 0 135 135
0 0 0 0 135 135
Filtration Plant Roof Replacement
Funding Source 2009-10 2010-11 2011-12 2012-13 2013-14 TOTAL
Water Cash Capital 0 0 0 0 430 430
0 0 0 0 430 430
SCADA System
Funding Source 2009-10 2010-11 2011-12 2012-13 2013-14 TOTAL
Water Cash Capital 0 0 0 91 292 383
0 0 0 91 292 383
Small Equipment
Funding Source 2009-10 2010-11 2011-12 2012-13 2013-14 TOTAL
Improvements to the sites, structures and systems comprising the filtration complex. Funding provides for backwash improvement and mixer replacement. General repair is included as is the installation of sidewalks.
Water Cash Capital 35 36 37 35 242 385
35 36 37 35 242 385
2 - 5

Summary of Funding by Program: Water System2009-10 2010-11 2011-12 2012-13 2013-14 Total
W-1 Water Main Extension and Improvements
Water Cash Capital 0 0 0 0 550 550
Water Debt 1,136 1,168 1,200 1,236 1,285 6,025
1,136 1,168 1,200 1,236 1,835 6,575
W-11 Water Security
Water Cash Capital 144 180 213 75 78 690
144 180 213 75 78 690
W-2 Water Main Cleaning & Lining
Water Cash Capital 1,616 1,836 1,714 1,765 1,836 8,767
1,616 1,836 1,714 1,765 1,836 8,767
W-3 Hydrant and Valve Replacement Program
Water Cash Capital 559 576 597 618 643 2,993
559 576 597 618 643 2,993
W-4 Water Meter Maintenance Program
Water Cash Capital 362 370 380 391 407 1,910
362 370 380 391 407 1,910
W-5 General System Improvement
Federal 0 945 975 1,005 1,154 4,079
Water Cash Capital 220 220 222 224 508 1,394
220 1,165 1,197 1,229 1,662 5,473
2 - 6

2009-10 2010-11 2011-12 2012-13 2013-14 Total
W-6 Reservoir, Conduit and Watershed Improvements
Water Cash Capital 224 75 76 77 392 844
Water Debt 6,000 6,100 6,200 6,251 1,851 26,402
6,224 6,175 6,276 6,328 2,243 27,246
W-8 Holly System
Water Cash Capital 0 150 0 0 63 213
0 150 0 0 63 213
W-9 Filtration Plant Complex
Water Cash Capital 128 55 56 142 1,329 1,710
128 55 56 142 1,329 1,710
WATER SYSTEM TOTALS
2009-10 2010-11 2011-12 2012-13 2013-14 Total
1,1540 945 975 1,005Federal 4,079
5,8063,253 3,462 3,258 3,292Water Cash Capital 19,071
3,1367,136 7,268 7,400 7,487Water Debt 32,427
10,389 11,675 11,633 11,784 10,096 55,577
2 - 7

2009-10 TO 2013-14 CAPITAL IMPROVEMENT PROGRAM
3–i
PUBLIC SAFETY The Public Safety category contains projects that improve the ability of Fire, Police and Emergency Communications Departments to carry out their mission of protecting the public. Equipment replacement is a major component of this category.
Program Changes P-11 Small Equipment – Fire Emergency Training Information Network is consolidated into the Information
Technology Program.
P-35 Emergency Communications Facilities Funds are allocated for HVAC Improvements. Transformer House Safety Fence Replacement is omitted. Window Blind Replacement is delayed one year. Restroom Partition Replacement is delayed one year.
P-43 Public Safety Facility Improvements Design of a permanent facility for Westside operations is moved up to 2010-11 in
conjunction with the Bull's Head Development.

2009-10 TO 2013-14
Capital Improvement Program PUBLIC SAFETY
P-10 Apparatus Replacement Program - Fire
Fire Fighting Apparatus
Funding Source 2009-10 2010-11 2011-12 2012-13 2013-14 TOTAL
Scheduled replacement of fire fighting apparatus.
General Cash Capital 365 1,532 2,779 929 975 6,580
365 1,532 2,779 929 975 6,580
P-11 Small Equipment - Fire
Communications Equipment - RFD
Funding Source 2009-10 2010-11 2011-12 2012-13 2013-14 TOTAL
Routine replacement of radio receivers, mobile and portable radios, digital pagers, and transmitters.
General Cash Capital 35 63 63 63 63 287
35 63 63 63 63 287
SCBA Replacement
Funding Source 2009-10 2010-11 2011-12 2012-13 2013-14 TOTAL
Scheduled replacement and new purchase of small fire suppression equipment.
General Cash Capital 0 383 496 417 70 1,366
0 383 496 417 70 1,366
Small Equipment - RFD
Funding Source 2009-10 2010-11 2011-12 2012-13 2013-14 TOTAL
Scheduled replacement and new purchase of small fire suppression equipment as well as smoke dectectors.
CDBG 50 50 50 50 50 250
General Cash Capital 332 336 346 357 368 1,739
382 386 396 407 418 1,989
3 - 1

2009-10 TO 2013-14PUBLIC SAFETYCapital Improvement Program
Turnout Gear
Funding Source 2009-10 2010-11 2011-12 2012-13 2013-14 TOTAL
An allocation for the provision of fire fighting apparel and related apparatus.
General Cash Capital 163 163 98 110 175 709
163 163 98 110 175 709
P-12 Motor Equipment - Fire
Cars, Vans, Utility Vehicles - RFD
Funding Source 2009-10 2010-11 2011-12 2012-13 2013-14 TOTAL
Scheduled replacement of Fire Department sedans and station wagons.
General Cash Capital 191 56 83 59 43 432
191 56 83 59 43 432
P-15 Fire Facilities
Emergency Generators - Fire Houses
Funding Source 2009-10 2010-11 2011-12 2012-13 2013-14 TOTAL
Supplies power for communications, utilities and automatic doors in case of an outage on the public grid.
General Cash Capital 90 120 324 324 0 858
90 120 324 324 0 858
Fire House Replacement and Major Renovation
Funding Source 2009-10 2010-11 2011-12 2012-13 2013-14 TOTAL
Federal 0 2,146 0 0 0 2,146
General Cash Capital 460 0 0 0 0 460
General Debt 0 1,854 0 0 0 1,854
460 4,000 0 0 0 4,460
3 - 2

2009-10 TO 2013-14PUBLIC SAFETYCapital Improvement Program
P-20 Motor Equipment - Police
Police Vehicles
Funding Source 2009-10 2010-11 2011-12 2012-13 2013-14 TOTAL
Scheduled replacement of marked vehicles supporting patrol and investigation activities.
General Cash Capital 1,442 2,200 2,300 2,500 2,500 10,942
1,442 2,200 2,300 2,500 2,500 10,942
P-21 Small Equipment - Police
Standard Allocation
Funding Source 2009-10 2010-11 2011-12 2012-13 2013-14 TOTAL
General Cash Capital 190 190 190 190 190 950
190 190 190 190 190 950
P-32 Motor Equipment - Emergency Communications Department
Emergency Communication Vehicles
Funding Source 2009-10 2010-11 2011-12 2012-13 2013-14 TOTAL
Scheduled replacement of vehicles.
General Cash Capital 25 0 0 0 0 25
25 0 0 0 0 25
P-35 Emergency Communications Facilities
HVAC Improvements
Funding Source 2009-10 2010-11 2011-12 2012-13 2013-14 TOTAL
General Debt 330 0 0 0 0 330
330 0 0 0 0 330
3 - 3

2009-10 TO 2013-14PUBLIC SAFETYCapital Improvement Program
Loading Dock Installation
Funding Source 2009-10 2010-11 2011-12 2012-13 2013-14 TOTAL
General Cash Capital 25 0 0 0 0 25
25 0 0 0 0 25
Parking Lot Gate Replacement
Funding Source 2009-10 2010-11 2011-12 2012-13 2013-14 TOTAL
General Cash Capital 30 0 0 0 0 30
30 0 0 0 0 30
Restroom Partition Replacement
Funding Source 2009-10 2010-11 2011-12 2012-13 2013-14 TOTAL
General Cash Capital 0 30 0 0 0 30
0 30 0 0 0 30
Window Blind Replacement
Funding Source 2009-10 2010-11 2011-12 2012-13 2013-14 TOTAL
General Cash Capital 0 5 0 0 0 5
0 5 0 0 0 5
P-42 Street Lighting
Project Uplift
Funding Source 2009-10 2010-11 2011-12 2012-13 2013-14 TOTAL
Enhanced street lighting where improvements will add to the public safety.
General Cash Capital 66 67 68 70 72 343
66 67 68 70 72 343
3 - 4

2009-10 TO 2013-14PUBLIC SAFETYCapital Improvement Program
Street Lighting - Standard Allocation
Funding Source 2009-10 2010-11 2011-12 2012-13 2013-14 TOTAL
Replacement, upgrade and improvement of poles and luminaries.
General Cash Capital 106 109 113 116 119 563
106 109 113 116 119 563
Street Lighting Improvements
Funding Source 2009-10 2010-11 2011-12 2012-13 2013-14 TOTAL
General Cash Capital 325 325 325 325 325 1,625
325 325 325 325 325 1,625
P-43 Public Safety Facility Improvements
Police Facilities
Funding Source 2009-10 2010-11 2011-12 2012-13 2013-14 TOTAL
Structural repairs.
General Cash Capital 139 35 35 35 35 279
139 35 35 35 35 279
Police Patrol Headquarters
Funding Source 2009-10 2010-11 2011-12 2012-13 2013-14 TOTAL
Construction of Westside Police Patrol Headquarters. Preliminary study underway to determine cost.
General Debt 0 360 3,600 0 0 3,960
0 360 3,600 0 0 3,960
3 - 5

Summary of Funding by Program: Public Safety2009-10 2010-11 2011-12 2012-13 2013-14 Total
P-10 Apparatus Replacement Program - Fire
General Cash Capital 365 1,532 2,779 929 975 6,580
365 1,532 2,779 929 975 6,580
P-11 Small Equipment - Fire
CDBG 50 50 50 50 50 250
General Cash Capital 530 945 1,003 947 676 4,101
580 995 1,053 997 726 4,351
P-12 Motor Equipment - Fire
General Cash Capital 191 56 83 59 43 432
191 56 83 59 43 432
P-15 Fire Facilities
Federal 0 2,146 0 0 0 2,146
General Cash Capital 550 120 324 324 0 1,318
General Debt 0 1,854 0 0 0 1,854
550 4,120 324 324 0 5,318
P-20 Motor Equipment - Police
General Cash Capital 1,442 2,200 2,300 2,500 2,500 10,942
1,442 2,200 2,300 2,500 2,500 10,942
P-21 Small Equipment - Police
General Cash Capital 190 190 190 190 190 950
190 190 190 190 190 950
3 - 6

2009-10 2010-11 2011-12 2012-13 2013-14 Total
P-32 Motor Equipment - Emergency Communications Department
General Cash Capital 25 0 0 0 0 25
25 0 0 0 0 25
P-35 Emergency Communications Facilities
General Cash Capital 55 35 0 0 0 90
General Debt 330 0 0 0 0 330
385 35 0 0 0 420
P-42 Street Lighting
General Cash Capital 497 501 506 511 516 2,531
497 501 506 511 516 2,531
P-43 Public Safety Facility Improvements
General Cash Capital 139 35 35 35 35 279
General Debt 0 360 3,600 0 0 3,960
139 395 3,635 35 35 4,239
PUBLIC SAFETY TOTALS
2009-10 2010-11 2011-12 2012-13 2013-14 Total
5050 50 50 50CDBG 250
00 2,146 0 0Federal 2,146
4,9353,984 5,614 7,220 5,495General Cash Capital 27,248
0330 2,214 3,600 0General Debt 6,144
4,364 10,024 10,870 5,545 4,985 35,788
3 - 7

2009-10 TO 2013-14 CAPITAL IMPROVEMENT PROGRAM
4–i
RECREATION & CULTURE The Recreation and Culture category contains projects that promote the preservation an enhancement of recreational and cultural opportunities in the community.
New Programs R-1 General Rehabilitation Provision for a Genesee Valley Park Master Plan is scheduled for 2009-10. Provision for Granite Memorial sales commences in 2009-10. Provision for Public Market Winter Shed is scheduled for 2010-11. Provision for renovations at Rochester Riverside Convention Center commences in
2009-10. Provision for Susan B. Anthony Pedestrian repairs commences in 2009-10.
Program Changes
R-1 General Rehabilitation
Lighting Courts & Fields is delayed until 2010-11. Edgerton Park Community Center renovations is delayed until 2010-11. Tennis/Basketball Replacement is delayed until 2010-11.

2009-10 TO 2013-14
Capital Improvement Program RECREATION and CULTURE
R-1 General Rehabilitation
Aquatics Plan
Funding Source 2009-10 2010-11 2011-12 2012-13 2013-14 TOTAL
Implementation of aquatics program city wide.
CDBG 200 105 250 0 0 555
200 105 250 0 0 555
Arts Installation and Enhancements
Funding Source 2009-10 2010-11 2011-12 2012-13 2013-14 TOTAL
General Cash Capital 0 245 225 250 250 970
0 245 225 250 250 970
Bicycle Enhancements
Funding Source 2009-10 2010-11 2011-12 2012-13 2013-14 TOTAL
Design and construction of on-street bike lanes.
Federal 0 20 225 0 0 245
General Cash Capital 0 5 56 0 0 61
0 25 281 0 0 306
Cemeteries Standard Allocation
Funding Source 2009-10 2010-11 2011-12 2012-13 2013-14 TOTAL
Routine repair, replacement and renovation of facilities, systems, and structures.
Cemetery Cash Capital 25 30 30 35 35 155
25 30 30 35 35 155
4 - 1

2009-10 TO 2013-14RECREATION and CULTURECapital Improvement Program
DRYS General Rehabilitation
Funding Source 2009-10 2010-11 2011-12 2012-13 2013-14 TOTAL
Rehabilitation, renovation, repair and replacement of recreation and parks facilites and attendant systems, fixtures and grounds.
General Cash Capital 415 295 545 545 500 2,300
415 295 545 545 500 2,300
Edgerton Park Community Center
Funding Source 2009-10 2010-11 2011-12 2012-13 2013-14 TOTAL
Rehabilitation, renovation, repair and replacement of recreation and parks facilities and attendant systems, fixtures and grounds.
General Debt 0 500 500 0 0 1,000
0 500 500 0 0 1,000
Fence Replacement
Funding Source 2009-10 2010-11 2011-12 2012-13 2013-14 TOTAL
Routine repair, replacement and renovation of facilities, systems, and structures.
Cemetery Cash Capital 50 50 55 60 60 275
50 50 55 60 60 275
Genesee Valley Park Master Plan
Funding Source 2009-10 2010-11 2011-12 2012-13 2013-14 TOTAL
Master planning for Genesee Valley Park West. Concept includes a new water sports facility with five boat bays; space for instruction, meetings, offices, and boat storage.
Federal 60 0 0 0 0 60
General Cash Capital 60 0 0 0 0 60
120 0 0 0 0 120
Granite Memorials
Funding Source 2009-10 2010-11 2011-12 2012-13 2013-14 TOTAL
Cemetery Cash Capital 100 100 100 100 100 500
100 100 100 100 100 500
4 - 2

2009-10 TO 2013-14RECREATION and CULTURECapital Improvement Program
High Falls District
Funding Source 2009-10 2010-11 2011-12 2012-13 2013-14 TOTAL
Standard Allocation.
General Cash Capital 55 57 59 61 63 295
55 57 59 61 63 295
High Falls District ROW
Funding Source 2009-10 2010-11 2011-12 2012-13 2013-14 TOTAL
Replacement of public furnishings.
General Cash Capital 55 57 59 61 63 295
55 57 59 61 63 295
Lighting Courts & Fields
Funding Source 2009-10 2010-11 2011-12 2012-13 2013-14 TOTAL
Strategic lighting of tennis and baseball facilities.
General Cash Capital 0 200 200 200 0 600
0 200 200 200 0 600
Manhattan Square Park
Funding Source 2009-10 2010-11 2011-12 2012-13 2013-14 TOTAL
Allocations are for rehabilitation of the Chestnut Plaza area, main entrance from Strong Museum, lawn area by Court Street, and berm area adjacent to Woodbury.
General Cash Capital 91 0 0 0 0 91
General Debt 0 2,000 1,000 0 0 3,000
91 2,000 1,000 0 0 3,091
Mausoleum Building #3
Funding Source 2009-10 2010-11 2011-12 2012-13 2013-14 TOTAL
New structure.
Cemetery Cash Capital 1,580 0 0 0 0 1,580
1,580 0 0 0 0 1,580
4 - 3

2009-10 TO 2013-14RECREATION and CULTURECapital Improvement Program
Public Market Standard Allocation
Funding Source 2009-10 2010-11 2011-12 2012-13 2013-14 TOTAL
Routine repair, replacement and renovation of facilities, systems, and structures.
Public Market Cash Capital 38 40 42 44 46 210
38 40 42 44 46 210
Public Market Winter Shed
Funding Source 2009-10 2010-11 2011-12 2012-13 2013-14 TOTAL
Renovation.
Public Market Cash Capital 0 500 2,500 0 0 3,000
0 500 2,500 0 0 3,000
Riverside Convention Center - Ballroom Renovation
Funding Source 2009-10 2010-11 2011-12 2012-13 2013-14 TOTAL
General Cash Capital 0 0 0 0 250 250
0 0 0 0 250 250
Riverside Convention Center - Exhibit Hall Renovations
Funding Source 2009-10 2010-11 2011-12 2012-13 2013-14 TOTAL
Major interior renovation.
General Cash Capital 0 0 0 0 4,500 4,500
0 0 0 0 4,500 4,500
Riverside Convention Center - Food Service Equipment
Funding Source 2009-10 2010-11 2011-12 2012-13 2013-14 TOTAL
General Cash Capital 0 0 200 0 0 200
0 0 200 0 0 200
4 - 4

2009-10 TO 2013-14RECREATION and CULTURECapital Improvement Program
Riverside Convention Center - Overhead Door
Funding Source 2009-10 2010-11 2011-12 2012-13 2013-14 TOTAL
General Cash Capital 75 0 0 0 0 75
75 0 0 0 0 75
Roadway Improvements
Funding Source 2009-10 2010-11 2011-12 2012-13 2013-14 TOTAL
Maintenance of roadways, crack sealing, patching and curbing.
Cemetery Cash Capital 60 60 65 70 75 330
60 60 65 70 75 330
Susan B. Anthony Pedestrian Access
Funding Source 2009-10 2010-11 2011-12 2012-13 2013-14 TOTAL
Design and construction of new mid-block lighted walkway connecting W. Main Street sidewalk with Troup Street Park.
CDBG 290 0 0 0 0 290
290 0 0 0 0 290
Tennis/Basketball Replacement
Funding Source 2009-10 2010-11 2011-12 2012-13 2013-14 TOTAL
At facilities city wide.
General Cash Capital 0 250 175 150 100 675
0 250 175 150 100 675
Trails
Funding Source 2009-10 2010-11 2011-12 2012-13 2013-14 TOTAL
Neighborhood trail connections
Federal 19 13 320 252 0 604
General Cash Capital 5 3 80 503 0 591
24 16 400 755 0 1,195
4 - 5

2009-10 TO 2013-14RECREATION and CULTURECapital Improvement Program
War Memorial Standard Allocation
Funding Source 2009-10 2010-11 2011-12 2012-13 2013-14 TOTAL
Improvements, repairs, rehabilitation and renovation of the War Memorial and its building system components.
War Memorial Cash Capital 68 70 72 50 50 310
68 70 72 50 50 310
R-2 Small Equipment Program
Standard Allocation
Funding Source 2009-10 2010-11 2011-12 2012-13 2013-14 TOTAL
Replacement and purchase of small equipment for the War Memorial, cemeteries, recreation centers and parks.
Cemetery Cash Capital 45 45 45 45 50 230
General Cash Capital 25 30 30 35 35 155
70 75 75 80 85 385
R-5 Motor Equipment
Recreation and Youth Services Vehicles
Funding Source 2009-10 2010-11 2011-12 2012-13 2013-14 TOTAL
Scheduled replacement of motor equipment for the Department of Recreation and Youth Services.
Cemetery Cash Capital 0 0 275 286 318 879
0 0 275 286 318 879
4 - 6

2009-10 TO 2013-14RECREATION and CULTURECapital Improvement Program
R-6 Library Materials and Equipment
Library Materials Traditional Formats
Funding Source 2009-10 2010-11 2011-12 2012-13 2013-14 TOTAL
Replacement of worn and obsolete materials and purchase of new materials and small equipment for branch libraries.
Library Cash Capital 510 536 563 591 620 2,820
510 536 563 591 620 2,820
R-7 Library Facilities
Computer Replacements
Funding Source 2009-10 2010-11 2011-12 2012-13 2013-14 TOTAL
Provision for cyclical replacement of computers.
Library Cash Capital 0 69 143 0 0 212
0 69 143 0 0 212
Furniture and Equipment for Branches
Funding Source 2009-10 2010-11 2011-12 2012-13 2013-14 TOTAL
Standard allocation.
Library Cash Capital 20 20 20 20 20 100
20 20 20 20 20 100
Rundel Library
Funding Source 2009-10 2010-11 2011-12 2012-13 2013-14 TOTAL
Standard allocation.
Library Cash Capital 70 72 74 76 78 370
70 72 74 76 78 370
4 - 7

2009-10 TO 2013-14RECREATION and CULTURECapital Improvement Program
R-9 Library Motor Equipment
Standard Allocation
Funding Source 2009-10 2010-11 2011-12 2012-13 2013-14 TOTAL
Replacement of motor equipment for the Rochester Public Library.
Library Cash Capital 0 0 25 0 0 25
0 0 25 0 0 25
4 - 8

Summary of Funding by Program: Recreation and Culture2009-10 2010-11 2011-12 2012-13 2013-14 Total
R-1 General Rehabilitation
CDBG 490 370 765 515 515 2,655
Cemetery Cash Capital 1,815 240 250 265 270 2,840
Federal 79 33 545 252 0 909
General Cash Capital 756 1,112 1,599 1,770 5,726 10,963
General Debt 0 2,500 1,500 0 0 4,000
Public Market Cash Capital 38 540 2,542 44 46 3,210
War Memorial Cash Capital 68 70 72 50 50 310
3,246 4,865 7,273 2,896 6,607 24,887
R-2 Small Equipment Program
Cemetery Cash Capital 45 45 45 45 50 230
General Cash Capital 25 30 30 35 35 155
70 75 75 80 85 385
R-5 Motor Equipment
Cemetery Cash Capital 0 0 275 286 318 879
0 0 275 286 318 879
R-6 Library Materials and Equipment
Library Cash Capital 510 536 563 591 620 2,820
510 536 563 591 620 2,820
R-7 Library Facilities
Library Cash Capital 90 161 237 96 98 682
90 161 237 96 98 682
4 - 9

2009-10 2010-11 2011-12 2012-13 2013-14 Total
R-9 Library Motor Equipment
Library Cash Capital 0 0 25 0 0 25
0 0 25 0 0 25
RECREATION AND CULTURE TOTALS
2009-10 2010-11 2011-12 2012-13 2013-14 Total
515490 370 765 515CDBG 2,655
6381,860 285 570 596Cemetery Cash Capital 3,949
079 33 545 252Federal 909
5,761781 1,142 1,629 1,805General Cash Capital 11,118
00 2,500 1,500 0General Debt 4,000
718600 697 825 687Library Cash Capital 3,527
4638 540 2,542 44Public Market Cash Capital 3,210
5068 70 72 50War Memorial Cash Capital 310
3,916 5,637 8,448 3,949 7,728 29,678
4 - 10

2009-10 TO 2013-14 CAPITAL IMPROVEMENT PROGRAM
5–i
GENERAL CITY DEVELOPMENT The General City Development Category consists of projects to preserve and enhance the employment, economy, and tax base of the City, including: neighborhood physical improvements, infrastructure to support industrial and commercial development, and the development of parking facilities.
PORT OF ROCHESTER This project involves the ongoing development of Rochester's Port area as outlined by the City's Port Manager. Components of this program include a Marina, and Garage as well as port access roads, river channel dredging, the provision of boat slips, the rehabilitation of the former station in the immediate vicinity, and the acquisition of property from CSX. Several revisions reflect changes in sequences and scheduling of related projects: North Dock River Wall is rescheduled for 2013-14. Transient Marina Facilities Phase II is added beginning 2012-13.
New Programs G-4 Garage Elevator Program Funds are included for repairs in 2011-12.
G-4 Garage Maintenance Program Funds are included for repairs in 2009-10.
G-8 Crossroads Park Rehabilitation Funds are delayed in order to be better coordinated with comprehensive redevelopment.
G-8 Focused Investment Funds are included in support of this initiative in 2009-10.
G-8 Home Ownership Program Funds are included in support of this initiative in 2009-10.
G-8 Green Fuel Station Funds are included in support of this project in 2009-10.

2009-10 TO 2013-14
Capital Improvement Program GENERAL CITY DEVELOPMENT
G-3 Land Acquisition and Demolition
Acquisition/Administration
Funding Source 2009-10 2010-11 2011-12 2012-13 2013-14 TOTAL
Support construction of County Maintenance Building at the Port of Rochester to enable creation of development site.
General Cash Capital 135 0 0 0 0 135
135 0 0 0 0 135
Acquisition/Economic Development
Funding Source 2009-10 2010-11 2011-12 2012-13 2013-14 TOTAL
This is to purchase land for development or other purposes.
General Cash Capital 0 1,000 1,000 1,000 1,000 4,000
0 1,000 1,000 1,000 1,000 4,000
Demolition/Community Development
Funding Source 2009-10 2010-11 2011-12 2012-13 2013-14 TOTAL
This supports demolition of buildings that are untenable, unneeded or to enable reuse of the parcel.
General Cash Capital 3,000 3,000 3,000 3,000 3,000 15,000
New York State 400 0 0 0 0 400
3,400 3,000 3,000 3,000 3,000 15,400
G-4 Municipal Garage Renovations
Garage Elevator Program
Funding Source 2009-10 2010-11 2011-12 2012-13 2013-14 TOTAL
Comprehensive elevator repair program.
Parking Cash Capital 0 0 250 0 0 250
0 0 250 0 0 250
5 - 1

2009-10 TO 2013-14GENERAL CITY DEVELOPMENT
Capital Improvement Program
Garage Improvements
Funding Source 2009-10 2010-11 2011-12 2012-13 2013-14 TOTAL
Repairs, replacements and renovations at ramp garages.
Parking Cash Capital 500 500 500 500 500 2,500
500 500 500 500 500 2,500
Garage Maintenance Program
Funding Source 2009-10 2010-11 2011-12 2012-13 2013-14 TOTAL
Maintenance and repair.
Parking Debt 440 840 840 840 840 3,800
440 840 840 840 840 3,800
G-6 Parking Meters and Garage Equipment
Garage Equipment
Funding Source 2009-10 2010-11 2011-12 2012-13 2013-14 TOTAL
Repair and installation of curbside meter an miscellaneous equipment in ramp garages.
Parking Cash Capital 200 200 200 200 200 1,000
200 200 200 200 200 1,000
Parking Meters
Funding Source 2009-10 2010-11 2011-12 2012-13 2013-14 TOTAL
Repair and installation of curbside meter an miscellaneous equipment in ramp garages.
Parking Cash Capital 106 106 206 106 106 630
106 106 206 106 106 630
5 - 2

2009-10 TO 2013-14GENERAL CITY DEVELOPMENT
Capital Improvement Program
G-7 Port of Rochester
Charlotte Lighthouse Promenade
Funding Source 2009-10 2010-11 2011-12 2012-13 2013-14 TOTAL
Design and construction of mid-block lighted walkway.
General Debt 53 150 0 0 0 203
New York State 150 0 0 0 0 150
203 150 0 0 0 353
Harbor Management Plan
Funding Source 2009-10 2010-11 2011-12 2012-13 2013-14 TOTAL
Improve functionality and operation of the Port of Rochester and Genesee River Harbor.
New York State 150 0 0 0 0 150
150 0 0 0 0 150
North Dock River Wall
Funding Source 2009-10 2010-11 2011-12 2012-13 2013-14 TOTAL
General Cash Capital 0 0 0 0 150 150
0 0 0 0 150 150
Port Infrastructure Roads
Funding Source 2009-10 2010-11 2011-12 2012-13 2013-14 TOTAL
General Cash Capital 45 20 45 20 45 175
45 20 45 20 45 175
Riverfront Development III
Funding Source 2009-10 2010-11 2011-12 2012-13 2013-14 TOTAL
East side boat launch parking lot south of Petten street, removal of County boat launch, and boat launch north of Petten Street.
General Cash Capital 0 0 500 36 0 536
General Debt 0 0 0 2,750 0 2,750
0 0 500 2,786 0 3,286
5 - 3

2009-10 TO 2013-14GENERAL CITY DEVELOPMENT
Capital Improvement Program
Terminal Facility
Funding Source 2009-10 2010-11 2011-12 2012-13 2013-14 TOTAL
Retro-fitting of building.
General Cash Capital 150 0 0 0 0 150
150 0 0 0 0 150
Transient Marina Facilities Phase I
Funding Source 2009-10 2010-11 2011-12 2012-13 2013-14 TOTAL
Excavation, dredging, quay wall construction, utility connections, floating dock slips and mounting devices.
Federal 0 2,200 12,400 0 0 14,600
General Cash Capital 227 200 0 0 0 427
General Debt 737 0 0 0 0 737
964 2,400 2,400 0 0 15,764
Transient Marina Facilities Phase II
Funding Source 2009-10 2010-11 2011-12 2012-13 2013-14 TOTAL
Construction.
Federal 0 0 0 0 9,000 9,000
General Cash Capital 0 0 0 360 0 360
0 0 0 360 9,000 9,360
G-8 Special Projects
Aqueduct Project
Funding Source 2009-10 2010-11 2011-12 2012-13 2013-14 TOTAL
Center City Walkway Extension, Feasibility of the Erie Canal Aqueduct Phase I Rewatering, and design of Erie Harbor Park.
Federal 5,667 18,000 0 0 0 23,667
New York State 665 0 0 0 0 665
6,332 18,000 0 0 0 24,332
5 - 4

2009-10 TO 2013-14GENERAL CITY DEVELOPMENT
Capital Improvement Program
Bull's Head
Funding Source 2009-10 2010-11 2011-12 2012-13 2013-14 TOTAL
Commercial development.
General Debt 0 0 2,000 0 0 2,000
Private 0 4,000 0 0 0 4,000
0 4,000 2,000 0 0 6,000
Crossroad Garage Rehabilitation
Funding Source 2009-10 2010-11 2011-12 2012-13 2013-14 TOTAL
Major renovation of the parking facility
Parking Debt 3,582 0 0 2,500 0 6,082
3,582 0 0 2,500 0 6,082
Crossroads Park Rehabilitation
Funding Source 2009-10 2010-11 2011-12 2012-13 2013-14 TOTAL
General Debt 0 0 0 500 0 500
0 0 0 500 0 500
Downtown Streetscape
Funding Source 2009-10 2010-11 2011-12 2012-13 2013-14 TOTAL
Trees, grates, benches, pavement, lights, etc.
General Cash Capital 120 125 129 133 137 644
120 125 129 133 137 644
Durand Eastman Beach Improvements
Funding Source 2009-10 2010-11 2011-12 2012-13 2013-14 TOTAL
Water Quality improvements and bathhouse construction.
Federal 750 6,000 0 0 0 6,750
750 6,000 0 0 0 6,750
5 - 5

2009-10 TO 2013-14GENERAL CITY DEVELOPMENT
Capital Improvement Program
Erie Harbor Enhancements
Funding Source 2009-10 2010-11 2011-12 2012-13 2013-14 TOTAL
Design and construction of enhanced pedestrian access.
New York State 400 0 0 0 0 400
400 0 0 0 0 400
Focused Investment
Funding Source 2009-10 2010-11 2011-12 2012-13 2013-14 TOTAL
Neighborhood stabilization and improvement. *Portion of Federal funds appropriated by City Council during FY 2008-09.
CDBG 1,017 1,000 1,000 1,000 1,000 5,017
General Cash Capital 500 0 0 0 0 500
1,517 1,000 1,000 1,000 1,000 5,517
Goodman/Main Street Intersection
Funding Source 2009-10 2010-11 2011-12 2012-13 2013-14 TOTAL
Reconfigure lane uses, intersection geometry and traffic calming techniques to make intersection more pedestrain friendly.
General Cash Capital 0 44 0 0 0 44
General Debt 0 443 0 0 0 443
Monroe County Traffic 0 13 0 0 0 13
0 500 0 0 0 500
Green Fuel Station
Funding Source 2009-10 2010-11 2011-12 2012-13 2013-14 TOTAL
General Debt 500 0 0 0 0 500
500 0 0 0 0 500
5 - 6

2009-10 TO 2013-14GENERAL CITY DEVELOPMENT
Capital Improvement Program
Home Ownership Program
Funding Source 2009-10 2010-11 2011-12 2012-13 2013-14 TOTAL
Closing cost/downpayment assistance for homebuyers. *CDBG funds anticipated to be appropriated by City Council during FY 2008-09.
CDBG 68 0 0 0 0 68
General Cash Capital 800 0 0 0 0 800
General Debt 0 1,000 1,000 1,000 100 3,100
868 1,000 1,000 1,000 100 3,968
Jefferson Avenue
Funding Source 2009-10 2010-11 2011-12 2012-13 2013-14 TOTAL
Street reconstruction, new curbing, sidewalks, water main and services, hydrants, receiving basins, street lighting and tree planting. *Funds anticipated to be appropriated by City Council during FY 2008-09.
Federal 950 0 0 0 0 950
950 0 0 0 0 950
La Avenida
Funding Source 2009-10 2010-11 2011-12 2012-13 2013-14 TOTAL
Streetscape improvements, including sidewalk, crosswalk and lighting improvements. *Funds appropriated by City Council during FY 2008-09.
Federal 1,100 0 0 0 0 1,100
1,100 0 0 0 0 1,100
Market Rate Housing Acquisition and Support
Funding Source 2009-10 2010-11 2011-12 2012-13 2013-14 TOTAL
The support and development of market rate housing city wide.
General Cash Capital 879 540 540 1,000 1,000 3,959
879 540 540 1,000 1,000 3,959
5 - 7

2009-10 TO 2013-14GENERAL CITY DEVELOPMENT
Capital Improvement Program
Neighborhood Streetscapes
Funding Source 2009-10 2010-11 2011-12 2012-13 2013-14 TOTAL
Streetscape improvements including public safety initiatives in eligible neighborhoods.
CDBG 274 275 276 277 278 1,380
274 275 276 277 278 1,380
NYS Canal Corporation
Funding Source 2009-10 2010-11 2011-12 2012-13 2013-14 TOTAL
Repayment to NYS Canal Corporation for river front access to Corn Hill Landing.
General Cash Capital 0 0 0 204 204 408
0 0 0 204 204 408
Riverfront Access Improvements
Funding Source 2009-10 2010-11 2011-12 2012-13 2013-14 TOTAL
Public walkway along RG&E abandoned Front Street property.
General Debt 0 0 0 400 0 400
0 0 0 400 0 400
South Clinton Avenue/Mt Hope Avenue
Funding Source 2009-10 2010-11 2011-12 2012-13 2013-14 TOTAL
Public Improvements. *Funds appropriated by City Council during FY 2008-09.
Federal 1,250 0 0 0 0 1,250
1,250 0 0 0 0 1,250
5 - 8

2009-10 TO 2013-14GENERAL CITY DEVELOPMENT
Capital Improvement Program
G-9 Midtown Development
Midtown Redevelopment III
Funding Source 2009-10 2010-11 2011-12 2012-13 2013-14 TOTAL
New interconnecting roads and public utilities to support the redevelopment of the Midtown site including reconstruction of the sidewalk and pedestrian facilities along E. Main St., S. Clinton Av. & E. Broad St.
Federal 950 0 0 0 0 950
General Cash Capital 400 45 82 0 0 527
General Debt 0 2,630 4,700 0 0 7,330
Monroe County Traffic 50 395 733 0 0 1,178
Pure Waters 400 1,335 2,460 0 0 4,195
Water Cash Capital 200 0 0 0 0 200
Water Debt 0 595 1,070 0 0 1,665
2,000 5,000 9,045 0 0 16,045
5 - 9

Summary of Funding by Program: General Development2009-10 2010-11 2011-12 2012-13 2013-14 Total
G-3 Land Acquisition and Demolition
General Cash Capital 3,135 4,000 4,000 4,000 4,000 19,135
New York State 400 0 0 0 0 400
3,535 4,000 4,000 4,000 4,000 19,535
G-4 Municipal Garage Renovations
Parking Cash Capital 500 500 750 500 500 2,750
Parking Debt 440 840 840 840 840 3,800
940 1,340 1,590 1,340 1,340 6,550
G-6 Parking Meters and Garage Equipment
Parking Cash Capital 306 306 406 306 306 1,630
306 306 406 306 306 1,630
G-7 Port of Rochester
Federal 0 2,200 12,400 0 9,000 23,600
General Cash Capital 422 220 545 416 195 1,798
General Debt 790 150 0 2,750 0 3,690
New York State 300 0 0 0 0 300
1,512 2,570 2,945 3,166 9,195 29,388
5 - 10

G-8 Special Projects
CDBG 1,359 1,275 1,276 1,277 1,278 6,465
Federal 9,717 24,000 0 0 0 33,717
General Cash Capital 2,299 709 669 1,337 1,341 6,355
General Debt 500 1,443 3,000 1,900 100 6,943
Monroe County Traffic 0 13 0 0 0 13
New York State 1,065 0 0 0 0 1,065
Parking Debt 3,582 0 0 2,500 0 6,082
Private 0 4,000 0 0 0 4,000
18,522 31,440 4,945 7,014 2,719 64,640
G-9 Midtown Development
Federal 950 0 0 0 0 950
General Cash Capital 400 45 82 0 0 527
General Debt 0 2,630 4,700 0 0 7,330
Monroe County Traffic 50 395 733 0 0 1,178
Pure Waters 400 1,335 2,460 0 0 4,195
Water Cash Capital 200 0 0 0 0 200
Water Debt 0 595 1,070 0 0 1,665
2,000 5,000 9,045 0 0 16,045
5 - 11

GENERAL DEVELOPMENT TOTALS
2009-10 2010-11 2011-12 2012-13 2013-14 Total
1,2781,359 1,275 1,276 1,277CDBG 6,465
9,00010,667 26,200 12,400 0Federal 58,267
5,5366,256 4,974 5,296 5,753General Cash Capital 27,815
1001,290 4,223 7,700 4,650General Debt 17,963
050 408 733 0Monroe County Traffic 1,191
01,765 0 0 0New York State 1,765
806806 806 1,156 806Parking Cash Capital 4,380
8404,022 840 840 3,340Parking Debt 9,882
00 4,000 0 0Private 4,000
0400 1,335 2,460 0Pure Waters 4,195
0200 0 0 0Water Cash Capital 200
00 595 1,070 0Water Debt 1,665
26,815 44,656 32,931 15,826 17,560 137,788
5 - 12

2009-10 TO 2013-14 CAPITAL IMPROVEMENT PROGRAM
6–i
FACILITIES & EQUIPMENT The Facilities and Equipment category includes projects to preserve City-owned facilities and equipment as well as to improve automated information systems.
New Programs F-1 Building Renovation Program A number of building improvements are funded in 2009-10, including compressor
replacement at Genesee Valley Park Ice Rink. F-11 City School Partnership Funding is provided for Flint Street Recreation Center in 2009-10.
F-33 Information Technology Applications Funding is provided to expand and improve the performance of our networks, invest in
ad hoc initiatives with direct impact on the operating budget.
Program Changes F-2 Hazardous Waste Remediation Funding for Seneca Avenue is provided in 2009-10.
F-9 Upkeep of City Owned Property Funding for this initiative is omitted, as funds are in the Building Renovations Program.

2009-10 TO 2013-14
Capital Improvement Program FACILITIES AND EQUIPMENT
F-1 Building Renovation Program
Asbestos Management
Funding Source 2009-10 2010-11 2011-12 2012-13 2013-14 TOTAL
Implementation of the Asbestos Management Study.
General Cash Capital 80 80 80 80 80 400
80 80 80 80 80 400
Blue Cross Arena
Funding Source 2009-10 2010-11 2011-12 2012-13 2013-14 TOTAL
Mechanical and Electrical Improvements.
War Memorial Cash Capit 0 0 831 0 0 831
0 0 831 0 0 831
City Hall
Funding Source 2009-10 2010-11 2011-12 2012-13 2013-14 TOTAL
Chiller replacement.
General Debt 275 0 0 0 0 275
275 0 0 0 0 275
City Hall - Building B Elevator
Funding Source 2009-10 2010-11 2011-12 2012-13 2013-14 TOTAL
General Debt 0 250 0 0 0 250
0 250 0 0 0 250
City Hall Annual Allocation
Funding Source 2009-10 2010-11 2011-12 2012-13 2013-14 TOTAL
Repairs and replacements of building systems and components.
General Cash Capital 79 81 83 85 88 416
79 81 83 85 88 416
6 - 1

2009-10 TO 2013-14FACILITIES AND EQUIPMENTCapital Improvement Program
Clinton Pavilion
Funding Source 2009-10 2010-11 2011-12 2012-13 2013-14 TOTAL
Roof replacement.
General Debt 235 0 0 0 0 235
235 0 0 0 0 235
Colfax Street Facility
Funding Source 2009-10 2010-11 2011-12 2012-13 2013-14 TOTAL
Maintenance and repair of the Refuse Enterprise facility on Colfax Street.
Refuse Cash Capital 49 51 53 55 57 265
49 51 53 55 57 265
Cortland Street Tunnel
Funding Source 2009-10 2010-11 2011-12 2012-13 2013-14 TOTAL
Rehabilitation of tunnel in Center City serving Midtown Plaza.
General Debt 824 1,278 0 0 0 2,102
824 1,278 0 0 0 2,102
Court Street Garage
Funding Source 2009-10 2010-11 2011-12 2012-13 2013-14 TOTAL
Lighting improvements.
Parking Cash Capital 0 195 0 0 0 195
0 195 0 0 0 195
CVMF - Fuel System Upgrade
Funding Source 2009-10 2010-11 2011-12 2012-13 2013-14 TOTAL
General Cash Capital 33 0 0 0 0 33
Local Works Cash Capital 34 0 0 0 0 34
Refuse Cash Capital 33 0 0 0 0 33
100 0 0 0 0 100
6 - 2

2009-10 TO 2013-14FACILITIES AND EQUIPMENTCapital Improvement Program
CVMF Building
Funding Source 2009-10 2010-11 2011-12 2012-13 2013-14 TOTAL
Roof replacement.
General Cash Capital 258 0 0 0 0 258
Local Works Debt 259 0 0 0 0 259
Refuse Cash Capital 259 0 0 0 0 259
776 0 0 0 0 776
CVMF Lift Replacement
Funding Source 2009-10 2010-11 2011-12 2012-13 2013-14 TOTAL
Systematic replacement of various lifts at the Central Vehicles Maintenance Facility
General Cash Capital 35 35 40 40 40 190
Local Works Cash Capital 35 35 40 40 40 190
Refuse Cash Capital 35 35 40 40 40 190
Water Cash Capital 10 10 10 10 10 50
115 115 130 130 130 620
DES Mt. Read Facilities
Funding Source 2009-10 2010-11 2011-12 2012-13 2013-14 TOTAL
Provides an annual allocation for the upkeep of the Operations Center, Central Vehicle Maintenance Facility and the salt shed.
General Cash Capital 83 83 85 88 90 429
Local Works Cash Capital 52 52 54 56 58 272
Refuse Cash Capital 52 52 54 56 58 272
187 187 193 200 206 973
Emerson Firehouse
Funding Source 2009-10 2010-11 2011-12 2012-13 2013-14 TOTAL
Routine repair, replacement and renovation of facilities, systems, and structures.
General Debt 190 0 0 0 0 190
190 0 0 0 0 190
6 - 3

2009-10 TO 2013-14FACILITIES AND EQUIPMENTCapital Improvement Program
General Rehabilitation
Funding Source 2009-10 2010-11 2011-12 2012-13 2013-14 TOTAL
Renovation, rehabilitation, repair, and replacement of buildings systems, city architectural staff, and components at City facilities as prioritized in an annual review.
General Cash Capital 320 320 320 320 320 1,600
320 320 320 320 320 1,600
Genesee Firehouse
Funding Source 2009-10 2010-11 2011-12 2012-13 2013-14 TOTAL
Structural repairs.
General Debt 85 0 0 0 0 85
85 0 0 0 0 85
Genesee Valley Park Ice Rink
Funding Source 2009-10 2010-11 2011-12 2012-13 2013-14 TOTAL
Compressor replacement.
General Debt 725 0 0 0 0 725
725 0 0 0 0 725
High Falls Mounted Patrol
Funding Source 2009-10 2010-11 2011-12 2012-13 2013-14 TOTAL
Re-pointing and coating of lower wall.
General Debt 220 0 0 0 0 220
220 0 0 0 0 220
Lake Avenue Firehouse
Funding Source 2009-10 2010-11 2011-12 2012-13 2013-14 TOTAL
Routine repair, replacement and renovation of facilities, systems, and structures.
General Debt 180 0 0 0 0 180
180 0 0 0 0 180
6 - 4

2009-10 TO 2013-14FACILITIES AND EQUIPMENTCapital Improvement Program
Monroe Branch Library
Funding Source 2009-10 2010-11 2011-12 2012-13 2013-14 TOTAL
Masonary and Interior repairs.
Library Cash Capital 135 0 0 0 0 135
135 0 0 0 0 135
New York State Power Authority
Funding Source 2009-10 2010-11 2011-12 2012-13 2013-14 TOTAL
Payments to the New York Power Authority for cooperative major improvements to selected HVAC and electrical systems.
General Cash Capital 291 291 291 291 300 1,464
291 291 291 291 300 1,464
North Street Recreation Center
Funding Source 2009-10 2010-11 2011-12 2012-13 2013-14 TOTAL
Roof replacement.
General Debt 150 0 0 0 0 150
150 0 0 0 0 150
Public Safety Building Standard Allocation
Funding Source 2009-10 2010-11 2011-12 2012-13 2013-14 TOTAL
Repairs and replacements of building systems and components.
General Cash Capital 120 130 130 134 138 652
120 130 130 134 138 652
Rundel - Mechanical System Replacement
Funding Source 2009-10 2010-11 2011-12 2012-13 2013-14 TOTAL
Partnering with NYPA to replace chiller condenser.
Library Cash Capital 220 220 220 220 220 1,100
220 220 220 220 220 1,100
6 - 5

2009-10 TO 2013-14FACILITIES AND EQUIPMENTCapital Improvement Program
Rundel Library Front Door Replacement
Funding Source 2009-10 2010-11 2011-12 2012-13 2013-14 TOTAL
Structural and building repairs.
Library Cash Capital 0 100 0 0 0 100
0 100 0 0 0 100
Rundel Library Renovations
Funding Source 2009-10 2010-11 2011-12 2012-13 2013-14 TOTAL
Structural and building repairs.
Library Cash Capital 500 500 0 0 0 1,000
Library Debt 1,230 3,945 0 0 0 5,175
1,730 4,445 0 0 0 6,175
South Avenue Sidewalk Enhancements - Rundel Library
Funding Source 2009-10 2010-11 2011-12 2012-13 2013-14 TOTAL
Replace hazardous sidewalks.
Library Cash Capital 0 30 0 0 0 30
Library Debt 0 0 350 0 0 350
New York State 0 0 250 0 0 250
0 30 600 0 0 630
F-11 City School Partnership
Adams Street Recreation Center
Funding Source 2009-10 2010-11 2011-12 2012-13 2013-14 TOTAL
Facilities renovation and repair.
General Debt 0 0 0 1,578 0 1,578
0 0 0 1,578 0 1,578
6 - 6

2009-10 TO 2013-14FACILITIES AND EQUIPMENTCapital Improvement Program
Clinton/Baden Recreation Center
Funding Source 2009-10 2010-11 2011-12 2012-13 2013-14 TOTAL
Facilities renovation and repair.
General Cash Capital 0 0 0 0 804 804
0 0 0 0 804 804
Flint Street Recreation Center
Funding Source 2009-10 2010-11 2011-12 2012-13 2013-14 TOTAL
Facilities renovation and repair.
General Debt 311 300 0 0 0 611
311 300 0 0 0 611
South Avenue Recreation Center
Funding Source 2009-10 2010-11 2011-12 2012-13 2013-14 TOTAL
Facilities renovation and repair.
General Debt 0 0 0 601 0 601
0 0 0 601 0 601
F-2 Hazardous Waste Remediation
Investigation and Remediation
Funding Source 2009-10 2010-11 2011-12 2012-13 2013-14 TOTAL
Funding for the investigation, remediation of contaminated sites within the City's jurisdiction, and city environmental staff.
General Cash Capital 845 562 622 799 617 3,445
General Debt 0 900 900 900 900 3,600
845 1,462 1,522 1,699 1,517 7,045
Investigation and Remediation - Andrews Street
Funding Source 2009-10 2010-11 2011-12 2012-13 2013-14 TOTAL
General Debt 1,000 0 0 0 0 1,000
1,000 0 0 0 0 1,000
6 - 7

2009-10 TO 2013-14FACILITIES AND EQUIPMENTCapital Improvement Program
Investigation and Remediation - Fire Academy
Funding Source 2009-10 2010-11 2011-12 2012-13 2013-14 TOTAL
General Debt 75 275 0 0 0 350
75 275 0 0 0 350
Investigation and Remediation - Port of Rochester
Funding Source 2009-10 2010-11 2011-12 2012-13 2013-14 TOTAL
Funding for design and investigation of contaminated sites at the Port of Rochester.
General Cash Capital 0 500 0 0 0 500
0 500 0 0 0 500
Investigation and Remediation - Seneca
Funding Source 2009-10 2010-11 2011-12 2012-13 2013-14 TOTAL
General Debt 550 0 0 0 0 550
550 0 0 0 0 550
F-3 Information Technology Infrastructure
Office Automation
Funding Source 2009-10 2010-11 2011-12 2012-13 2013-14 TOTAL
New and replacement installations of personal computers and terminals.
General Cash Capital 500 500 500 500 500 2,500
500 500 500 500 500 2,500
F-33 Information Technology Applications
311 - Lagen Licenses
Funding Source 2009-10 2010-11 2011-12 2012-13 2013-14 TOTAL
General Cash Capital 80 0 0 0 0 80
80 0 0 0 0 80
6 - 8

2009-10 TO 2013-14FACILITIES AND EQUIPMENTCapital Improvement Program
Communications - Designer Suite
Funding Source 2009-10 2010-11 2011-12 2012-13 2013-14 TOTAL
Manage internal and external website content.
General Cash Capital 80 0 0 0 0 80
80 0 0 0 0 80
Communications - Web Revitalization
Funding Source 2009-10 2010-11 2011-12 2012-13 2013-14 TOTAL
General Cash Capital 150 50 0 0 0 200
150 50 0 0 0 200
Database Management and GIS
Funding Source 2009-10 2010-11 2011-12 2012-13 2013-14 TOTAL
Creates map of water grid with access to system features, placement and service history.
Water Cash Capital 14 14 14 26 24 92
14 14 14 26 24 92
Management System
Funding Source 2009-10 2010-11 2011-12 2012-13 2013-14 TOTAL
General Cash Capital 2,100 2,500 2,000 2,000 2,000 10,600
2,100 2,500 2,000 2,000 2,000 10,600
NBD - Sanborn Maps
Funding Source 2009-10 2010-11 2011-12 2012-13 2013-14 TOTAL
General Cash Capital 200 0 0 0 0 200
200 0 0 0 0 200
6 - 9

2009-10 TO 2013-14FACILITIES AND EQUIPMENTCapital Improvement Program
Police - Records Management System
Funding Source 2009-10 2010-11 2011-12 2012-13 2013-14 TOTAL
Upgrades centralized computer operation.
General Cash Capital 0 665 135 0 0 800
0 665 135 0 0 800
Police - Shot Spotter
Funding Source 2009-10 2010-11 2011-12 2012-13 2013-14 TOTAL
General Cash Capital 40 0 0 0 0 40
40 0 0 0 0 40
Police - Video Surveillance Cameras
Funding Source 2009-10 2010-11 2011-12 2012-13 2013-14 TOTAL
Address high problem areas.
General Cash Capital 250 250 250 250 250 1,250
250 250 250 250 250 1,250
RFD - ETIN Phase II
Funding Source 2009-10 2010-11 2011-12 2012-13 2013-14 TOTAL
General Cash Capital 150 0 0 0 0 150
150 0 0 0 0 150
TIS - Business Process Services
Funding Source 2009-10 2010-11 2011-12 2012-13 2013-14 TOTAL
General Cash Capital 350 0 0 0 0 350
350 0 0 0 0 350
TIS - Disaster Recovery
Funding Source 2009-10 2010-11 2011-12 2012-13 2013-14 TOTAL
General Cash Capital 350 0 0 0 0 350
350 0 0 0 0 350
6 - 10

2009-10 TO 2013-14FACILITIES AND EQUIPMENTCapital Improvement Program
F-4 Office Equipment
Administration
Funding Source 2009-10 2010-11 2011-12 2012-13 2013-14 TOTAL
Routine replacement of office furnishings.
General Cash Capital 12 12 12 12 12 60
12 12 12 12 12 60
Communications - Video Equipment
Funding Source 2009-10 2010-11 2011-12 2012-13 2013-14 TOTAL
Appropriation of annual grant from Time-Warner.
General Cash Capital 5 5 5 5 5 25
5 5 5 5 5 25
Environmental Services
Funding Source 2009-10 2010-11 2011-12 2012-13 2013-14 TOTAL
Routine replacement of office furnishings.
General Cash Capital 12 12 12 13 13 62
Local Works Cash Capital 4 4 4 5 5 22
Refuse Cash Capital 4 4 4 5 5 22
20 20 20 23 23 106
Environmental Services/Water Bureau
Funding Source 2009-10 2010-11 2011-12 2012-13 2013-14 TOTAL
Routine replacement of office furnishings.
Water Cash Capital 12 12 12 13 14 63
12 12 12 13 14 63
6 - 11

2009-10 TO 2013-14FACILITIES AND EQUIPMENTCapital Improvement Program
Finance
Funding Source 2009-10 2010-11 2011-12 2012-13 2013-14 TOTAL
Routine replacement of office furnishings.
General Cash Capital 6 6 6 6 6 30
6 6 6 6 6 30
Fire Department
Funding Source 2009-10 2010-11 2011-12 2012-13 2013-14 TOTAL
Routine replacement of fire houses furnishing.
General Cash Capital 100 100 100 100 100 500
100 100 100 100 100 500
Human Resources
Funding Source 2009-10 2010-11 2011-12 2012-13 2013-14 TOTAL
General Cash Capital 5 5 5 5 5 25
5 5 5 5 5 25
Recreation and Youth Services
Funding Source 2009-10 2010-11 2011-12 2012-13 2013-14 TOTAL
Routine replacement of office furnishings.
General Cash Capital 12 12 12 12 12 60
12 12 12 12 12 60
F-5 Duplicating Equipment
Duplicating Equipment - Standard Allocation
Funding Source 2009-10 2010-11 2011-12 2012-13 2013-14 TOTAL
Regular replacement of central and some distributed duplicating equipment.
General Cash Capital 32 65 24 35 35 191
32 65 24 35 35 191
6 - 12

2009-10 TO 2013-14FACILITIES AND EQUIPMENTCapital Improvement Program
F-6 Small Equipment
Emergency Communications
Funding Source 2009-10 2010-11 2011-12 2012-13 2013-14 TOTAL
General Cash Capital 35 35 35 70 35 210
35 35 35 70 35 210
Environmental Services
Funding Source 2009-10 2010-11 2011-12 2012-13 2013-14 TOTAL
Local Works Cash Capital 17 17 17 17 18 86
Refuse Cash Capital 187 193 199 205 211 995
Water Cash Capital 47 47 48 48 50 240
251 257 264 270 279 1,321
Environmental Services - Small Equipment
Funding Source 2009-10 2010-11 2011-12 2012-13 2013-14 TOTAL
General Cash Capital 71 54 55 56 57 293
71 54 55 56 57 293
Neigborhood Business Development
Funding Source 2009-10 2010-11 2011-12 2012-13 2013-14 TOTAL
Parking Cash Capital 20 20 20 20 20 100
20 20 20 20 20 100
F-7 Motor Equipment
Motor Equipment - DES Commissioner
Funding Source 2009-10 2010-11 2011-12 2012-13 2013-14 TOTAL
Standard allocation.
General Cash Capital 0 0 21 22 0 43
0 0 21 22 0 43
6 - 13

2009-10 TO 2013-14FACILITIES AND EQUIPMENTCapital Improvement Program
Motor Equipment - Refuse Collection
Funding Source 2009-10 2010-11 2011-12 2012-13 2013-14 TOTAL
This provides for scheduled replacement Refuse Packers, Recycling Truck and utility vehicles used in support of Refuse Collection.
Refuse Cash Capital 4,031 2,900 300 600 400 8,231
4,031 2,900 300 600 400 8,231
Motor Equipment - Water Bureau
Funding Source 2009-10 2010-11 2011-12 2012-13 2013-14 TOTAL
Standard allocation.
Water Cash Capital 532 620 400 464 384 2,400
532 620 400 464 384 2,400
Motor Equipment- DES Operations
Funding Source 2009-10 2010-11 2011-12 2012-13 2013-14 TOTAL
Standard allocation.
General Cash Capital 1,601 1,327 1,507 1,348 1,200 6,983
Local Works Cash Capital 1,067 1,035 1,700 400 1,600 5,802
2,668 2,362 3,207 1,748 2,800 12,785
F-8 Tree Maintenance
Forestry Tree Maintenance Program
Funding Source 2009-10 2010-11 2011-12 2012-13 2013-14 TOTAL
Planting and upkeep of City trees.
General Cash Capital 652 665 680 700 721 3,418
652 665 680 700 721 3,418
6 - 14

Summary of Funding by Program: Facilities and Equipment
2009-10 2010-11 2011-12 2012-13 2013-14 Total
F-1 Building Renovation Program
General Cash Capital 1,299 1,020 1,029 1,038 1,056 5,442
General Debt 2,884 1,528 0 0 0 4,412
Library Cash Capital 855 850 220 220 220 2,365
Library Debt 1,230 3,945 350 0 0 5,525
Local Works Cash Capital 121 87 94 96 98 496
Local Works Debt 259 0 0 0 0 259
New York State 0 0 250 0 0 250
Parking Cash Capital 0 195 0 0 0 195
Refuse Cash Capital 428 138 147 151 155 1,019
War Memorial Cash Capital 0 0 831 0 0 831
Water Cash Capital 10 10 10 10 10 50
7,086 7,773 2,931 1,515 1,539 20,844
F-11 City School Partnership
General Cash Capital 0 0 0 0 804 804
General Debt 311 300 0 2,179 0 2,790
311 300 0 2,179 804 3,594
F-2 Hazardous Waste Remediation
General Cash Capital 845 1,062 622 799 617 3,945
General Debt 1,625 1,175 900 900 900 5,500
2,470 2,237 1,522 1,699 1,517 9,445
F-3 Information Technology Infrastructure
General Cash Capital 500 500 500 500 500 2,500
500 500 500 500 500 2,500
6 - 15

2009-10 2010-11 2011-12 2012-13 2013-14 Total
F-33 Information Technology Applications
General Cash Capital 3,750 3,465 2,385 2,250 2,250 14,100
Water Cash Capital 14 14 14 26 24 92
3,764 3,479 2,399 2,276 2,274 14,192
F-4 Office Equipment
General Cash Capital 152 152 152 153 153 762
Local Works Cash Capital 4 4 4 5 5 22
Refuse Cash Capital 4 4 4 5 5 22
Water Cash Capital 12 12 12 13 14 63
172 172 172 176 177 869
F-5 Duplicating Equipment
General Cash Capital 32 65 24 35 35 191
32 65 24 35 35 191
F-6 Small Equipment
General Cash Capital 106 89 90 126 92 503
Local Works Cash Capital 17 17 17 17 18 86
Parking Cash Capital 20 20 20 20 20 100
Refuse Cash Capital 187 193 199 205 211 995
Water Cash Capital 47 47 48 48 50 240
377 366 374 416 391 1,924
F-7 Motor Equipment
General Cash Capital 1,601 1,327 1,528 1,370 1,200 7,026
Local Works Cash Capital 1,067 1,035 1,700 400 1,600 5,802
Refuse Cash Capital 4,031 2,900 300 600 400 8,231
Water Cash Capital 532 620 400 464 384 2,400
7,231 5,882 3,928 2,834 3,584 23,459
6 - 16

2009-10 2010-11 2011-12 2012-13 2013-14 Total
F-8 Tree Maintenance
General Cash Capital 652 665 680 700 721 3,418
652 665 680 700 721 3,418
FACILITIES AND EQUIPMENT TOTALS
2009-10 2010-11 2011-12 2012-13 2013-14 Total
7,4288,937 8,345 7,010 6,971General Cash Capital 38,691
9004,820 3,003 900 3,079General Debt 12,702
220855 850 220 220Library Cash Capital 2,365
01,230 3,945 350 0Library Debt 5,525
1,7211,209 1,143 1,815 518Local Works Cash Capital 6,406
0259 0 0 0Local Works Debt 259
00 0 250 0New York State 250
2020 215 20 20Parking Cash Capital 295
7714,650 3,235 650 961Refuse Cash Capital 10,267
00 0 831 0War Memorial Cash Capital 831
482615 703 484 561Water Cash Capital 2,845
22,595 21,439 12,530 12,330 11,542 80,436
6 - 17

PERSONNEL SUMMARY 19–1
The Budget records personnel resources in a number of ways. First, individuals may be employed in either full time, part time, temporary, or seasonal capacities. A full time employee works a standard work week on a year round basis. The number of hours per week may vary depending on unit assignment and the nature of the job. Part time employees also work on a year round basis, but for less than the standard work week. Temporary employees work standard work weeks, but for a fixed period, usually not more than eighteen months. Seasonal employees work hours that are determined by the jobs to which they are assigned, usually for short periods, e.g., the Summer. While most of the City's personnel resources are allocated to full time positions, use of part time, temporary, and seasonal positions provides an efficient and flexible means of meeting peak work load requirements. These other than full time positions are aggregated in some Budget presentations. Secondly, all full time positions are recorded in the Budget by job titles. In every unit with assigned personnel, a display indicates the job titles assigned to that unit and the number of full time positions authorized for each title. All job titles are assigned to pay brackets that represent the compensation range for the position. The salary and wage schedules at the back of this section present the range for each bracket. Overtime, the practice of extending work beyond the regular work week hours, is also explicitly accounted for in the Budget. Carefully managed overtime provides a flexible extension of the City's experienced workforce. Finally, the Budget accounts for a Vacancy Factor, the difference between the allocation actually required for personnel compensation and that which would be required if every position were filled at all times. Some number of positions are always unfilled at a given moment. Vacancy factors differ among units, based on the size of the unit and the turnover rates experienced by various elements of the work force.
Personnel resources are approximated in “Employee Years”. Each full time position represents one Employee Year regardless of actual assigned hours, which vary. Part time, temporary, and seasonal positions are expressed as fractions of a full time Employee Year based on the numbers of hours to be worked in relation to the hours to be worked by a full time equivalent position or by salary averaging; fractions are to one decimal place, i.e., one-tenth of an Employee Year. Overtime and vacancy factors are similarly approximated. The Employee Year allocations are approximated by adding that unit of measure for all full time, part time, temporary, seasonal, and overtime assistance and subtracting the vacancy allowance, as in the following example: Employee Years Full Time Positions 21.0 Overtime 1.7 Part Time, Temporary, and Seasonal 2.3 LESS: Vacancy Allowance 1.1 23.9 Some presentations in the Budget show the assignment of fractional full time positions (e.g., 1.5 full time positions) to reflect sharing of positions among various activities and the corresponding allocation of costs to each activity. This practice is common in the Department of Environmental Services, Bureau of Operations & Parks. Here workload requirements change throughout the year (e.g., from Leaf Collection in the Fall to Snow and Ice Control in the Winter) and is found elsewhere as well. Summing these partial assignments from two or more activities will result in an accounting of 100% of the full time employees, as in the following example: Title Activities Crew Chief Lots & Yards 1.2 Work Orders 0.6 Leaf Collection 0.3 Snow & Ice Control 0.9 Total Authorized 3.0

19–2 PERSONNEL SUMMARY PERSONNEL RESOURCES
Total Employee Years Budget 2006-07
Budget 2007-08
Budget 2008-09
Budget 2009-10
City Council and Clerk 27.2 27.2 27.2 26.7
AdministrationMayor's Office 31.2 32.3 24.5 22.0Neighborhood Service Centers 69.3 67.3 63.9 0.0Office of Management & Budget 10.7 43.1 43.7 40.7Human Resource Management 37.1 38.1 39.0 36.7Communications 12.5 14.5 13.7 18.1Law 23.5 23.5 23.5 21.4
184.3 218.8 208.3 138.9
Information Technology 0.0 54.0 43.6 47.6
FinanceDirector's Office 8.4 5.4 5.2 3.6Accounting 18.0 17.6 17.6 16.5Treasury 24.2 23.9 23.8 22.1Assessment 19.0 20.4 18.7 16.1Parking Violations & Adjudication 16.7 17.0 16.0 35.0Purchasing 13.1 13.1 13.1 13.7InformationSystems 39.2 0.0 0.0 0.0
138.6 97.4 94.4 107.0
Neighborhood & Business DevelopmentCommissioner 0.0 0.0 0.0 11.2Business & Development 0.0 0.0 0.0 44.7Planning & Zoning 0.0 0.0 0.0 25.0Neighborhood Preservation 0.0 0.0 0.0 21.1Inspection & Compliance 0.0 0.0 0.0 52.5
0.0 0.0 0.0 154.5
Community DevelopmentCommissioner 7.5 7.0 7.2 0.0Neighborhood Initiatives 5.1 0.0 0.0 0.0Buildings and Zoning 41.9 40.1 38.5 0.0Housing & Project Development 38.0 37.6 35.1 0.0Planning 4.1 10.0 10.0 0.0
96.6 94.7 90.8 0.0
Economic Development 22.8 21.9 20.8 0.0
Environmental ServicesCommissioner 62.5 14.8 14.0 14.2Architecture & Engineering 67.7 67.8 66.5 64.2Operations & Parks 459.6 508.4 503.5 498.2Water 146.4 147.7 144.2 139.5
736.2 738.7 728.2 716.1

PERSONNEL SUMMARY 19–3 PERSONNEL RESOURCES
Total Employee Years Budget
2006-07Budget
2007-08Budget
2008-09Budget
2009-10Emergency Communications 187.6 192.6 192.6 198.6
Police 923.8 984.1 989.5 958.9
Fire 562.5 554.2 537.9 534.9
LibraryCentral Library 128.6 129.0 125.4 120.5Community Library 44.3 43.9 44.3 46.1
172.9 172.9 169.7 166.6
Recreation & Youth ServicesCommissioner 16.3 14.4 21.3 14.9Recreation 218.9 147.0 139.8 167.0Special Services 26.3 27.7 25.7 0.0Youth Services 15.9 10.2 9.8 12.9
277.4 199.3 196.6 194.8
Total 3,329.9 3,355.8 3,299.6 3,142.6
0.0 1,000.0 2,000.0 3,000.0 4,000.0
2000-01
2001-02
2002-03
2003-04
2004-05
2005-06
2006-07
2007-08
2008-09
2009-10
3,502.8
3,557.1
3,472.2
3,406.5
3,354.6
3,343.4
3,329.9
3,355.8
3,299.6
3,142.6
EMPLOYEE YEARS

19–4 PERSONNEL SUMMARY PERSONNEL RESOURCES
Total Full Time Positions Budget 2006-07
Budget 2007-08
Budget 2008-09
Budget 2009-10
City Council and Clerk 12.0 12.0 12.0 13.0
AdministrationMayor's Office 29.0 30.0 24.0 22.0Neighborhood Service Centers 65.0 62.0 58.0 0.0Office of Management & Budget 10.5 37.5 35.5 35.5Human Resource Management 35.0 36.0 36.0 34.0Communications 11.0 13.0 13.0 17.0Law 23.0 23.0 23.0 21.0
173.5 201.5 189.5 129.5
Information Technology 0.0 54.0 41.0 46.0
FinanceDirector's Office 8.0 5.0 5.0 3.0Accounting 18.0 17.0 17.0 16.0Treasury 23.0 23.0 23.0 22.0Assessment 17.0 17.0 16.0 15.0Parking Violations & Adjudication 16.0 16.0 14.0 30.0Purchasing 13.0 13.0 13.0 13.0Information Systems 39.0 0.0 0.0 0.0
134.0 91.0 88.0 99.0
Neighborhood & Business DevelopmentCommissioner 0.0 0.0 0.0 10.0Business & Development 0.0 0.0 0.0 44.0Planning & Zoning 0.0 0.0 0.0 25.0Neighborhood Preservation 0.0 0.0 0.0 15.0Inspection & Compliance 0.0 0.0 0.0 52.0
0.0 0.0 0.0 146.0
Community DevelopmentCommissioner 7.0 6.5 7.0 0.0Neighborhood Initiatives 5.0 0.0 0.0 0.0Buildings and Zoning 41.5 39.5 38.0 0.0Housing & Project Development 38.0 38.0 35.0 0.0Planning 4.0 10.0 10.0 0.0
95.5 94.0 90.0 0.0
Economic Development 22.5 21.0 20.0 0.0
Environmental ServicesCommissioner 57.0 13.0 12.0 13.0Architecture & Engineering 67.0 67.0 66.0 63.0Operations & Parks 388.5 424.0 417.0 410.0Water 134.0 136.0 133.0 127.0
646.5 640.0 628.0 613.0

PERSONNEL SUMMARY 19–5 PERSONNEL RESOURCES
Total Full Time Positions Budget
2006-07Budget
2007-08Budget
2008-09Budget
2009-10Emergency Communications 164.0 164.0 164.0 170.0
Police 877.0 914.0 912.0 895.5
Fire 541.0 537.0 520.0 517.0
LibraryCentral Library 102.0 102.0 102.0 98.0Community Library 27.0 25.0 23.0 23.0
129.0 127.0 125.0 121.0
Recreation & Youth ServicesCommissioner 15.2 13.5 19.8 12.3Recreation 122.0 74.0 77.0 69.0Special Services 16.8 12.3 0.0 0.0Youth Services 14.0 7.7 6.7 8.7
168.0 107.5 103.5 90.0
Total 2,963.0 2,963.0 2,893.0 2,840.0
0.0 500.0 1,000.0 1,500.0 2,000.0 2,500.0 3,000.0 3,500.0
2000-01
2001-02
2002-03
2003-04
2004-05
2005-06
2006-07
2007-08
2008-09
2009-10
3,121
3,151
3,100
3,054
3,003
2,984
2,963
2,963
2,893
2,840
FULL TIME EMPLOYEES

19–6 PERSONNEL SUMMARY EMPLOYEE BENEFITS
Department AmountCity Council and Clerk 817,700 Administration 3,741,900 Law 862,100 Information Technology 1,609,600 Finance 2,466,800 Neighborhood & Business Development 4,750,300 Environmental Services 18,470,600 Emergency Communications 4,784,200 Police 33,680,700 Fire 19,998,100 Library 2,751,600 Recreation & Youth Services. 3,106,200
97,039,800
Employment Benefit Distribution
In addition to wage and salary compensation, employees are provided with various fringe benefits as provided by law, collective bargaining agreements, and administrative determination. The City's budgeting and accounting systems place the allocations for these benefits in a separate department for monitoring and control purposes. Details on these allocations are found in the Undistributed Expenses section of the Budget (Tab 13). The following table distributes fringe benefits to appropriate units:

PERSONNEL SUMMARY 19–7 BARGAINING UNITS
Portions of the City's workforce are represented by the following labor organizations:
American Federation of State, County and Municipal Employees, Local 1635 and 1635P, Full and Part Time Units
Rochester Police Locust Club, Inc. International Association of Firefighters, Local 1071, Uniformed and Non-Uniformed Units International Union of Operating Engineers, Local 832-S Civil Service Employees Association, Rochester Public Library Part Time Employees Unit, Local
828 In accordance with collective bargaining agreements, employees in the following positions are granted full release time from their regularly scheduled work, with full pay and benefits to perform union duties. These positions and associated salary and benefits are reflected in the appropriate departmental and Undistributed Expenses budgets, and are presented here for informational purposes only. Salary plus Benefits
AFSCME Local 1635 2008-09 2009-10
Neighborhood & Business Development
● Code Enforcement Officer 0 94,000
Administration – Neighborhood Service Centers
● Neighborhood Conservation Officer 91,100 0
Department of Environmental Services
● Environmental Services Operator - 6 Day 94,900 97,800
● Environmental Services Operator 85,000 88,000
Department of Recreation & Youth Services
● Receptionist-Typist 65,100 68,400
Rochester Police Locust Club, Inc.
Police Department
● Police Officer 115,900 119,000
● Police Officer 115,900 119,000
International Association of Firefighters, Local 1071
Fire Department
● Captain 125,500 128,200
Total 693,400 714,400

19–8 PERSONNEL SUMMARY BARGAINING UNITS
Effective Dates of Current or Most Recent Agreements
Labor Organization Agreement Dates
AFSCME Local 1635 Full Time July 1, 2005 to June 30, 2009
AFSCME Local 1635 Part Time July 1, 2007 to June 30, 2011
Rochester Police Locust Club, Inc. July 1, 2005 to June 30, 2008
International Association of Firefighters, Local 1071, Uniformed July 1, 2003 to June 30, 2008
International Association of Firefighters, Local 1071, Non-Uniformed July 1, 2005 to June 30, 2009
International Union of Operating Engineers, Local 832-S July 1, 2006 to June 30, 2010
Civil Service Employees Association, Local 828, Rochester Public Library Part Time Employees Unit
July 1, 2005 to June 30, 2009

PERSONNEL SUMMARY 19–9 SALARY SCHEDULES
July 1, 2009 By virtue of the authority vested in me by law, I, Robert J. Duffy, Mayor of the City of Rochester, New York, do hereby create, effective July 1, 2009, all positions set forth in this Budget to be in existence for the fiscal year 2009-10 at the salary and wage brackets indicated for said positions. The salary and wage bracket amounts shall be as set forth herein, except as modified by collective bargaining agreements or further directive of this office. All positions in existence prior to July 1, 2009, which are not set forth in this Budget shall be abolished effective July 1, 2009, except for positions otherwise prescribed by law.
Robert J. Duffy Mayor

19–10 PERSONNEL SUMMARY SALARY SCHEDULES
Management Salaried PersonnelEffective July 1, 2008
Bracket Step A Step B Step C Step D Step E Step F Step G Step H Step I Step J Step K Step L Step M Step N
22 47,113 48,126 49,161 50,218 51,297 52,400 53,527 54,677 55,853 57,054 58,281 59,533 60,814 62,12223 49,160 50,217 51,298 52,399 53,527 54,677 55,853 57,054 58,280 59,533 60,814 62,121 63,456 64,82024 51,296 52,398 53,526 54,676 55,852 57,052 58,279 59,532 60,812 62,120 63,455 64,819 66,213 67,63725 53,527 54,677 55,854 57,054 58,281 59,534 60,814 62,122 63,457 64,822 66,215 67,638 69,093 70,57826 55,855 57,056 58,282 59,535 60,816 62,123 63,458 64,823 66,216 67,640 69,094 70,580 72,098 73,64827 58,280 59,533 60,813 62,121 63,456 64,820 66,214 67,637 69,091 70,577 72,095 73,645 75,228 76,84528 60,674 61,979 63,310 64,672 66,062 67,483 68,934 70,416 71,930 73,477 75,056 76,670 78,318 80,00229 63,146 64,503 65,890 67,306 68,754 70,232 71,742 73,284 74,860 76,470 78,114 79,793 81,508 83,26030 65,874 67,290 68,737 70,215 71,725 73,267 74,842 76,451 78,095 79,774 81,489 83,241 85,031 86,85931 68,571 70,046 71,553 73,090 74,661 76,267 77,907 79,582 81,293 83,040 84,825 86,649 88,513 90,41632 71,386 72,920 74,488 76,089 77,725 79,396 81,104 82,847 84,628 86,448 88,306 90,205 92,144 94,12533 74,321 75,919 77,552 79,219 80,922 82,662 84,439 86,255 88,109 90,004 91,939 93,916 95,935 97,99834 77,387 79,051 80,750 82,487 84,260 86,072 87,922 89,813 91,743 93,716 95,731 97,789 99,891 102,03935 80,580 82,313 84,082 85,890 87,736 89,623 91,550 93,518 95,529 97,583 99,681 101,824 104,013 106,24936 91,765 93,738 95,754 97,813 99,916 102,064 104,258 106,500 108,790 111,130 113,519 115,960 118,45386 102,323 104,881 107,503 110,190 112,945 114,000 117,42087 104,881 107,503 110,190 112,945 115,000 118,45088 90,113 91,948 93,824 95,740 97,694 99,690 101,718 103,798 105,916 108,081 110,283 113,592 117,000 120,51096 102,323 104,881 107,503 110,190 112,945 114,000 117,42097 104,881 107,503 110,190 112,945 115,000 118,45098 90,113 91,948 93,824 95,740 97,694 99,690 101,718 103,798 105,916 108,081 110,283 113,592 117,000 120,510
197 105,793 108,437 111,148 113,927 116,000 119,480
CITY OF ROCHESTER SALARY SCHEDULE

PERSONNEL SUMMARY 19–11 SALARY SCHEDULES
CITY OF ROCHESTER SALARY SCHEDULE
Bracket Step A Step B Step C Step D Step E Step F Step G Step H Step I
1 23,779 24,514 25,272 26,075 26,880 27,568 28,128 28,639 29,2852 24,384 25,138 25,916 26,740 27,568 28,128 28,639 29,285 30,0143 24,876 25,645 26,438 27,288 28,128 28,639 29,285 30,014 30,7904 25,328 26,111 26,918 27,781 28,639 29,285 30,014 30,790 31,4755 25,897 26,699 27,524 28,403 29,285 30,014 30,790 31,475 32,3356 26,545 27,366 28,213 29,116 30,014 30,790 31,475 32,335 33,1467 27,237 28,080 28,948 29,866 30,790 31,475 32,335 33,146 34,0508 27,837 28,698 29,586 30,531 31,475 32,335 33,146 34,050 35,0359 28,602 29,487 30,399 31,366 32,335 33,146 34,050 35,035 36,109
10 29,317 30,223 31,159 32,155 33,146 34,050 35,035 36,109 37,23011 30,116 31,047 32,007 33,029 34,050 35,035 36,109 37,230 38,38912 30,991 31,950 32,938 33,984 35,035 36,109 37,230 38,389 39,72413 31,941 32,929 33,947 35,028 36,109 37,230 38,389 39,724 40,92014 32,932 33,950 34,999 36,109 37,230 38,389 39,724 40,920 42,29815 33,956 35,007 36,089 37,241 38,389 39,724 40,920 42,298 43,58516 35,130 36,217 37,336 38,531 39,724 40,920 42,298 43,585 45,09317 36,193 37,314 38,467 39,692 40,920 42,298 43,585 45,093 46,89818 37,409 38,565 39,758 41,028 42,298 43,585 45,093 46,898 48,82619 38,546 39,737 40,965 42,277 43,585 45,093 46,898 48,826 50,79920 39,882 41,115 42,386 43,740 45,093 46,898 48,826 50,799 52,86721 41,475 42,757 44,080 45,487 46,898 48,826 50,799 52,867 55,059
110 25,606 32,007 33,029 34,050 35,035 36,109 37,230 38,389 39,540150 28,871 36,089 37,241 38,389 39,724 40,920 42,298 43,585 44,894170 30,774 38,467 39,692 40,920 42,298 43,585 45,093 46,898 48,307180 31,806 39,758 41,028 42,298 43,585 45,093 46,898 48,826 50,291190 32,772 40,965 42,277 43,585 45,093 46,898 48,826 50,799 52,322200 33,909 42,386 43,740 45,093 46,898 48,826 50,799 52,867 54,451
Non-Management Salaried PersonnelEffective July 1, 2008

19–12 PERSONNEL SUMMARY SALARY SCHEDULES
CITY OF ROCHESTER SALARY SCHEDULE
Hourly Rates:
Bracket Step A Step B Step C Step D Step E Step F Step G Step H Step I
40 13.78 14.20 14.64 15.15 15.60 15.94 16.30 16.75 17.1941 14.23 14.68 15.13 15.60 16.07 16.44 17.05 17.23 17.8642 14.76 15.22 15.69 16.21 16.76 17.19 17.58 18.19 18.6451 12.03 12.40 12.78 13.13 13.51 13.79 14.04 14.24 14.5052 12.20 12.58 12.97 13.39 13.79 14.04 14.24 14.50 14.8453 12.37 12.75 13.14 13.59 14.04 14.24 14.50 14.84 15.1754 12.61 13.00 13.40 13.81 14.24 14.50 14.84 15.17 15.5155 12.82 13.21 13.63 14.09 14.50 14.84 15.17 15.51 15.8756 13.11 13.51 13.93 14.46 14.84 15.17 15.51 15.87 16.1457 13.42 13.83 14.26 14.75 15.17 15.51 15.87 16.14 16.7558 13.70 14.12 14.55 15.04 15.51 15.87 16.14 16.75 17.0559 14.03 14.47 14.91 15.36 15.87 16.14 16.75 17.05 17.5560 14.28 14.72 15.17 15.66 16.14 16.75 17.05 17.55 17.9461 14.75 15.21 15.68 16.20 16.75 17.05 17.55 17.94 18.5662 15.09 15.55 16.04 16.50 17.05 17.55 17.94 18.56 19.0663 15.50 15.99 16.48 17.05 17.55 17.94 18.56 19.06 19.6164 15.89 16.39 16.89 17.45 17.94 18.56 19.06 19.61 20.1965 16.44 16.94 17.46 18.00 18.56 19.06 19.61 20.19 20.8066 13.24 13.65 14.08 14.49 14.94 15.87
Daily Rates:
BracketStep A Step B Step C Step D Step E Step F Step G Step H
68 115.34 118.90 122.5869 139.35 143.65 148.10 157.54 166.97 176.43 181.67 186.9270 148.20 152.78 157.38 162.68 167.63 173.43
Weekly and Hourly PersonnelEffective July 1, 2008

PERSONNEL SUMMARY 19–13 SALARY SCHEDULES
Bracket Step 1 Step 2 Step 3 Step 4 Step 5 Step A Step B
90 34,977 43,151 50,760 58,197 61,077 65,457 69,43592 65,957 69,93594 74,585 79,08295 84,160 89,235
Bracket Entry Step 1A Step 1B Step 2 Step 3 Step 4
80 34,428 38,452 42,474 49,965 57,285 60,12182 65,596 68,83984 74,173 77,84285 83,697 87,838
Bracket Step A Step B Step C Step D Step E Step F Step G Step H Step I Step J
73 37,711 38,876 40,330 41,772 43,237 44,691 46,144 47,598 49,051 50,50575 39,596 40,820 42,397 43,971 45,547 47,120 48,698 50,274 51,849 53,42578 42,427 43,740 46,081 48,422 50,763 53,105 55,446 57,787 60,128 62,469
CITY OF ROCHESTER SALARY SCHEDULE
Effective July 1, 2007
Effective July 1, 2008
Uniformed Police PersonnelEffective January 1, 2008
Non-Uniformed Fire Personnel
Uniformed Fire Personnel

19–14 PERSONNEL SUMMARY SALARY SCHEDULES
Title Amount
Elected and Appointed OfficalsPresident of the Council* 41,560Council Member* 31,560Mayor* 131,525Deputy Mayor 125,000
Examining Board MembersExaminer-Chair** 1,250Examiner Plumber 1,250Clerk to the Board 1,250Examiner-Vice Chair** 1,250Examiner-Secretary** 1,250Examiner-Stationary 1,250Examiner-Electrician 1,000
*These salaries are fixed by local legislation on a calendar year basis; amounts shown represent calendar 2009.Currently, Mayor Duffy and Councilmembers Conklin, Miller and Pritchard have declined to accept the 2009cost of living adjustment and are receiving $127,694 and $30,641 respectively.
**These positions are not compensated if filled by a City or RG&E employee.
Fixed Salary RatesEffective July 1, 2009 or as otherwise noted

PERSONNEL SUMMARY 19–15 SALARY SCHEDULES
TITLE Bracket Step A Step B Step C Step D Step E Step FAdministrative Assistant N165 18.43 19.00 19.63 20.24 20.64 21.05Bookmobile Operator N095 15.01 15.47 15.97 16.47 16.80 17.14Class 5 Truck Driver N085 14.64 15.09 15.57 16.06 16.38 16.71Cleaner Library N015 12.47 12.86 13.27 13.70 13.96 14.23Clerk II Library N095 15.01 15.47 15.97 16.47 16.80 17.14Clerk III with Typing Library N075 14.29 14.73 15.19 15.67 15.99 16.30Clerk Typist Library N035 13.06 13.46 13.87 14.32 14.62 14.90Graphic Assistant N145 17.28 17.81 18.41 18.97 19.35 19.75Librarian I N165 18.43 19.00 19.63 20.24 20.64 21.05Librarian II N195 20.23 20.86 21.52 22.20 22.65 23.10Library Assistant N145 17.28 17.81 18.41 18.97 19.35 19.75Maintenanace Worker N575 13.97 14.40 14.85 15.32 15.79 16.11Retrieval Room Aide N304 7.70 7.94 8.20 8.47 8.63 8.81Security Guard Library N015 12.47 12.86 13.27 13.70 13.96 14.23Shipping Aide N402 7.57 7.79 8.01 8.19 8.35 8.52Sr. Retrieval Room Aide N305 12.46 12.85 13.23 13.67 13.93 14.20Stock Clerk P/T Library N065 13.92 14.35 14.80 15.31 15.59 15.90Youth Services Assistant N075 14.29 14.73 15.19 15.67 15.99 16.30Youth Services Coordinator N145 17.28 17.81 18.41 18.97 19.35 19.75
TITLE BRACKET Step A Step B Step C Step D Step E
Administrative Analyst N200 21.91 22.59 23.29 24.02 24.77Animal Care Technician P028 11.72 12.08 12.45 12.85 13.25Auto Aide P758 13.70 14.12 14.55 15.04 15.51Cemetery Worker P757 13.42 13.83 14.26 14.75 15.17Cleaner P701 11.43 11.79 12.15 12.55 12.93Clerk II N790 15.72 16.20 16.70 17.23 17.77Clerk III with Typing N770 14.97 15.43 15.90 16.42 16.92Clerk Typist N730 13.67 14.09 14.53 15.00 15.45Code Enforcement Inspector P761 14.75 15.21 15.68 16.20 16.75Communications Aide N716 19.30 19.90 20.51 21.18 21.83Counseling Specialist N718 20.55 21.19 21.85 22.56 23.24Dispatcher I OEC N715 13.88 17.35 17.91 18.46 19.54Ground Equipment Operator P756 12.48 12.85 13.24 13.77 14.24Interdepartmental Messenger N706 14.58 15.04 15.50 16.01 16.49Neighborhood Conservation Officer P721 19.94 20.55 21.19 21.87 22.56Neighbor Conservation Officer Trainee P718 17.98 18.54 19.12 19.72 20.34Office Automation Specialist N717 19.89 20.50 21.14 21.81 22.47Parking Monitor P710 14.10 14.53 14.98 15.46 15.93Police Evidence Technician N716 19.30 19.90 20.51 21.18 21.83Principal Engineering Technician N718 20.55 21.19 21.85 22.55 23.24Project Assistant N712 17.03 17.56 18.10 18.67 19.25Property Conservation Inspector P717 17.40 17.94 18.49 19.09 19.67Receptionist Typist N760 14.58 15.04 15.50 16.01 16.49Secretary N711 16.55 17.06 17.58 18.15 18.73Security Guard P752 12.20 12.58 12.97 13.39 13.78Service Representative N712 17.03 17.56 18.10 18.67 19.25Victim Assistance Counselor N714 18.10 18.65 19.23 19.85 20.46
CSEA Library Part TimeEffective July 1, 2008
AFSCME PART TIMEEffective July 1, 2008

19–16 PERSONNEL SUMMARY SALARY SCHEDULES
Part time, Temporary, and Seasonal PersonnelEffective July 1, 2008
Bracket Title Step A Step B Step C Step D Step E Step FN160 Administrative Assistant 19.30 19.90 20.51 21.18 21.83 24.77N130 Administrative Secretary 17.55 18.09 18.64 19.24 19.84N308 Architectural Intern Seas 11.94 13.35P462 Assistant Exam Supervisor 10.91P840 Assistant Pool Manager 12.73 13.15 13.49P459 Assistant Summer Program Coordinator 10.03P417 Assistant Supervisor of Markets 14.27 14.75 15.17P588 Auto Aide 13.70 14.12N316 Bingo Inspector 14.26P528 Building Maintenance Helper 12.20 12.58 12.97 13.39 13.79P365 Car Pool Coordinator 14.90P350 Clerical Aide 11.30N030 Clerk IV 13.67 14.09 14.53 15.00 15.45N030 Clerk Typist 13.67 14.09 14.53 15.00 15.45P618 Code Enforcement Inspector 14.75 15.21 15.68 16.20 16.75P456 College Junior Intern 7.90N140 Coordinator Duplicating and Supply 18.10 18.65 19.23 19.85 20.46P360 Crew Chief Seasonal 14.34P461 Day Camp Supervisor 11.65P648 Dispatcher 15.89 16.39 16.89 17.45 17.94N308 Engineering Intern Seas 11.94 13.35P358 Exam Proctor 8.40 8.96 9.53P460 Exam Supervisor 13.44N200 Executive Assistant 21.91 22.59 23.29 24.02 24.77P354 Firefighter Trainee 7.36 7.88 16.58P618 Forestry Worker 14.75 15.21 15.68 16.20 16.75N180 Graphic Designer 20.55 21.19 21.85 22.55 23.24P451 Grounds Worker 8.63N210 Human Resource Consultant II (C)/OC 22.78 23.49 24.22 25.00 25.96P456 Laborer 7.90P441 Lead Stage Hand 17.03N200 Legal Assistant Col/FC/Bankruptcy 21.91 22.59 23.29 24.02 24.77N160 Legislative Aide 19.30 19.90 20.51 21.18 21.83N070 Legislative Clerk 14.97 15.43 15.90 16.42 16.92P825 Lifeguard 8.99 9.33 9.73P835 Lifeguard Captain 11.65 11.99 12.40

PERSONNEL SUMMARY 19–17 SALARY SCHEDULES
Part time, Temporary, and Seasonal PersonnelEffective July 1, 2008
Bracket Title Step A Step B Step C Step D Step E Step FP830 Lifeguard Lieutenant 10.32 10.66 11.07P608 Maintenance Mechanic 14.28 14.72 15.17P578 Maintenance Worker 13.42 13.83 14.26 14.75 15.17P418 Operations Worker 14.23 14.68 15.13 15.60 16.07P418 Parks Operations Worker 14.23 14.68 15.13 15.60 16.07N170 Payroll Technician 19.89 20.50 21.14 21.81 22.47P449 Playground Supervisor 9.33P457 Pool Attendant 9.90P128 Project Assistant 14.90 15.36P447 Public Safety Aide 8.83P815 Recreation Assistant 8.31 8.60 8.86P820 Recreation Clerical Aide 8.10 8.32 8.59N300 Recreation Leader OC 15.72 16.20 16.70 17.23 17.77P448 Rink Aide 7.99P446 Rink Manager 11.75P459 School Traffic Officer 10.03P458 School Traffic Officer II 11.67N110 Secretary OC 16.55 17.06 17.58 18.15 18.73N180 Secretary to Commissioner OC 20.55 21.19 21.85 22.55 23.24N180 Secretary to Deputy Mayor OC 20.55 21.19 21.85 22.55 23.24N100 Service Representative 16.11 16.60 17.12 17.66 18.21N180 Sr Field Auditor 20.55 21.19 21.85 22.55 23.24D065 Sr Maintenance Mechanic/Mason 16.44 16.94 17.46 18.00 18.56 19.06D062 Sr Operations Worker 15.09 15.55 16.04 16.50 17.05 17.55N200 Sr Personnel Analyst 21.91 22.59 23.29 24.02 24.77P364 Sr. Rigger 28.57P440 Sr. Stagehand 14.14P454 Summer Program Clerk 9.47P338 Summer Program Coordinator 16.84P359 Vending Inspector 13.38P598 Water Maintenance Worker 14.03 14.47 14.91P453 Watershed Quality Aide 9.14 10.18N180 Youth Intervention Specialist 20.55 21.19 21.85 22.55 23.24N400 Youth Worker 7.36

Rochester Board of Education 131 West Broad Street
Rochester, New York 14614
(585) 262-8525 • Fax: (585) 262-8381 www.rcsdk12.org/boe
Board of Education President Malik Evans Vice President Van Henri White Members Thomas Brennan Melisza Campos Cynthia Elliott Willa Powell Allen Williams Superintendent of Schools Jean-Claude Brizard
May 12, 2009 The Honorable Robert J. Duffy Mayor, City of Rochester City Hall 30 Church Street Rochester, New York 14614 Dear Mayor Duffy: On May 7, 2009, the Rochester Board of Education adopted a school district budget of $699,482,694 for school year 2009-2010. This represents an increase of 1.2% from the final, amended budget for 2008-2009. The budget for 2009-2010 is a major step forward in bringing rigor, alignment, transparency, and horizontal equity to our system. Funding is aligned with four key areas that support our citywide priority of creating post-scholastic-ready students:
1) Improved literacy at all grades. 2) Improved math competency. 3) Increased graduation rates. 4) A safer, more secure school environment for all students and staff.
Most importantly, the budget is aligned with our core values:
Achievement – It allows schools greater control over resources to support the achievement of their students.
Equity – Funding is allocated equitably across schools based on student and school need.
Accountability – Our budget can be easily understood by the average citizen, not just CPAs.
Tying Dollars To Student Need In what were often grueling budget sessions, we were pushed to prioritize spending and asked ourselves repeatedly, “Does this investment support our most important priority…the needs of our students?” While we must become even more rigorous in this process, we are well on our way to aligning dollars to our bottom-line: raising student achievement.
Section 1 Page 3
Introduction and Overview 2009-10 Budget

This budget represents a first step in redesigning our financial system to align dollars with the priorities of our schools based on the educational needs of their students. A school-based, student-weighted funding formula ensures that we are using finite budget dollars in ways that will best improve teaching and learning for our students. This “extreme budget makeover,” as some have called it, is about changing the way we operate and introducing new behaviors into a system traditionally resistant to change. It helps counter some of the spending behaviors that frustrate parents and taxpayers while helping ensure that funds are most effectively used to provide a quality education to our students. Addressing the Structural Deficit Further, this budget controls expenditures to begin to close a longstanding $50 million plus structural deficit. Across-the-board staff cuts are a continuation of those we made at Central Office in 2008 when we eliminated or returned to schools more than 130 positions. It is the start of a multi-year plan to “right size” the district to a point at which we are living within our means. The allocation of staff is being done through an updated staffing formula designed to meet the specific needs of schools. While some classrooms will see minimal increases in class sizes, we still have one of the best student-teacher ratios in New York and the nation. Our investment in teacher quality and the equitable distribution of effective teachers provides the necessary complement to improve student achievement levels. Greater Transparency Our budget this year is more transparent than ever, addressing a longstanding concern of City Council and the public. Whereas in the past the budget was central department driven, it is now school centered. It provides a snapshot of every school that includes budget data as well as student demographics, key academic indicators, and student/staff ratios. Each parent can see what resources are coming into his or her child’s school and how those dollars are helping every student improve a full grade level each year. There is no more mystery about school funding. The 2009-2010 budget is a first step in the equitable distribution of limited resources based on the needs of students. It demonstrates that sound business and financial decisions are not counter to achieving a world-class education system. In future years, you will see greater transparency and school leaders will continue to have greater control of their resources while being held accountable for results in the area that drives all that we do: student achievement.
Sincerely,
Malik Evans Jean-Claude Brizard President, Board of Education Superintendent of Schools xc: Rochester Board of Education Rochester City Council
2Section 1 Page 4
Introduction and Overview 2009-10 Budget

Section 1 Page 5
Introduction and Overview 2009-10 Budget

dIstrIct-wIde summary Budget
Budget SummaryRevenue and Expenditures ChartsAssumptions and PrioritiesRevenue Summary and AnalysisExpenditure Summary and AnalysisPosition SummaryExplanation of Changes to BudgetMulti-Year Projection

THIS PAGE INTENTIONALLY LEFT BLANK
Section 3 Page 2
District-Wide Summary Budget 2009-10 Budget

2007-08 2008-09 2009-10 $ VarianceRevenue Category Actual Amended Proposed Fav/(Unfav)
GENERAL FUND
State Recurring State Aid 386,207,231 423,362,036 428,879,846 5,517,810 Building Aid 14,666,088 20,013,947 20,011,548 (2,399)
Other State Revenues 1,205,700 1,000,000 250,000 (750,000) Prior Year State Aid Adjustments 718,940 171,590 (2,226,262) (2,397,852)
Total - New York State Revenue 402,797,959 444,547,573 446,915,132 2,367,559 City 119,100,000 119,100,000 119,100,000 - Federal Medicaid 4,426,311 2,000,000 2,000,000 - Local - Other 10,559,011 10,874,076 8,423,484 (2,450,592) Appropriated Fund Balance for General Fund - 5,733,807 2,128,941 (3,604,866)
Total - GENERAL FUND Revenue 536,883,281 582,255,456 578,567,557 (3,687,899)
GRANT & SPECIAL AID FUNDS
State Sources 26,858,930 30,527,309 29,256,020 (1,271,289) Federal Sources 52,697,695 60,235,966 72,009,895 11,773,929 Local Sources 2,660,426 3,354,423 2,780,745 (573,678)
Total - GRANT & SPECIAL AID FUND Revenue 82,217,051 94,117,698 104,046,660 9,928,962
SCHOOL FOOD SERVICE FUND Revenue 14,620,109 14,964,291 16,789,000 1,824,709
GRAND TOTAL REVENUE - ALL FUNDS 633,720,441 691,337,445 699,403,217 8,065,772
2007-08 2008-09 2009-10 $ VarianceExpenditure Category Actual Amended Proposed Fav/(Unfav)
Salary Compensation 309,529,656 330,861,550 339,325,235 (8,463,685) Other Compensation 15,076,646 17,656,352 16,446,122 1,210,231 Employee Benefits 113,667,224 128,458,230 133,051,426 (4,593,196)
Total Compensation and Benefits 438,273,526 476,976,132 488,822,783 (11,846,651) Fixed Obligations With Variability 80,921,739 87,095,360 83,536,292 3,559,068 Debt Service 29,064,443 26,304,378 25,389,093 915,285 Cash Capital Outlays 12,674,102 13,859,633 15,027,738 (1,168,105) Facilities and Related 40,668,140 43,288,521 42,698,362 590,159 Technology 806,273 1,101,352 1,811,870 (710,518) All Other Variable Expenses 44,169,869 42,712,068 42,117,080 594,989
Total Non Compensation 208,304,566 214,361,313 210,580,434 3,780,878 Sub Total 646,578,092 691,337,445 699,403,217 (8,065,772)
Fund Balance Reserve - - - - Grand Total Expenditures 646,578,092 691,337,445 699,403,217 (8,065,772)
BUDGET SUMMARY
Revenue Summary
Expenditure Summary
Section 3 Page 3
District-Wide Summary Budget 2009-10 Budget

City Aid$119,100,000
17.03%
Medicaid$2,000,000
0.29%Other
$8,423,484 1.20%
State Aid $446,915,132
63.90%
Grants $104,046,660
14.88%
Fund Balance $2,128,941
0.30%
Food Service $16,789,000
2.40%
Revenue Summary - All Funds
Technology $1,811,870
0.26%
Cash Capital $15,027,738
2.15%
Facilities $42,698,362
6.10%
Compensation $355,771,357
50.87%Variable Expenses $42,117,080
6.02%
Debt Service$25,389,093
3.63%
Fixed obligations $83,536,292
11.94%
Benefits$133,051,426
19.02%
Expenditure Summary
$699,403,217
$699,403,217
Section 3 Page 4
District-Wide Summary Budget 2009-10 Budget

ASSUMPTIONS AND PRIORITIES: FACTORS RELATED TO THE BALANCING OF THE 2009-10 BUDGET Developing a balanced budget for 2009-10 has been a great challenge for the District this year. With the continual decline of the financial market, the instability of the Federal and State revenues, the downturn in the local economy and declining enrollment numbers, RCSD has been faced with the task of reducing staff and programs in order to obtain a balanced budget. We have continued the work identified by the Superintendent last year and have chosen the fiscally prudent path to take this opportunity to “right size” the District rather than draw from our already dwindling fund balance. At the same time, the District has started a multi-year project of a financial redesign to enable Principals and schools to strategically manage resources in support of their academic improvement plans. To begin the budget process, a series of planning assumptions were made. Some were short term, such as assumed revenue amounts for the year. Others were part of a longer term horizon like reduction of the structural deficit over a three-year period. Some of the key assumptions are provided below. The objective was to build as conservative a plan as possible, not relying on “soft” revenue or “possible” savings. As additional information becomes available, some of the planning assumptions will prove to be accurate while others will require additional modifications to the plan. Budget amendments will be presented as we continue to refine the budget and execute our plan. REVENUE State Funding – Deficit Reduction – Federal Stabilization The start of the budget process for this year was delayed, not only to establish changes necessary as part of the first year of the redesign, but also in hopes that the Governor would give some indication of the reduction to education. This information did come in December with a significant projected revenue reduction. As of the presentation of the draft budget, we still did not know the final impact on Districts within New York State. The Governor’s Deficit Reduction Assessment (DRA) was reinstated with the acceptance of the Federal Stabilization package of $13.4M which is part of the Federal government’s American Recovery and Reinvestment Act (ARRA). Further guidelines for the accountability of the use of funds will be given to us at a later date. The State has been forewarned that this funding is for one year. This funding will flow through the State from the Federal government. Federal Stimulus Funds – Title I and IDEA During the planning process, the Federal government announced the possibility of various economic stimulus packages that would give relief to education. The decision by the District, as well as the intent of the package, is to use stimulus dollars for temporary or one-time issues to avoid dependency upon funds. The 2009 ARRA describes funding for schools flowing from three separate areas. The area that will flow directly to the District has been established as Federal funds through Title I and IDEA. This funding will flow to Districts in the next two years. Although the exact details are not clear at this time, RCSD will receive approximately $15.4M through this portion of the package. It is important to understand that the proposed Federal stimulus funds will only be for two years, running through 2010-11. Funds are to be used for short-term investments with the potential for long-term benefits. School districts were cautioned to be careful and avoid expenditures they may not be able to sustain once the recovery funds are spent. Guidelines have been given for both the Title I and the IDEA portions of the package. The District will need to track and account for the spending of these funds to comply with Federal regulations.
Section 3 Page 5
District-Wide Summary Budget 2009-10 Budget

The last flow of funding will be available through tax credit bonds for new construction and Qualified Zone Academy bonds for renovation and modernization. Under this funding, the 100 largest, poorest school districts are guaranteed part of 40% of their state’s bond allocation. A provision also states that up to an additional 25 school districts may receive priority status. Due to the inability to project the amount, no provision was made to include it in the 2009-10 Budget at this time. _ Structural Deficit As projected in earlier years, RCSD has a structural deficit of approximately $50M. Although steps have been taken this year to reduce the deficit, it will take additional time to “right size” our programs and supporting structure. This process was started during the 2008-09 budget year and will continue through the 2010-11 fiscal year. The stimulus package is being used to support this deficit. Ongoing and unrestricted resources can not continue to cover the cost increases in areas such as continuous salary increases, rising costs of employee benefits (especially health), contractual requirements, fuel, utilities, inflation and any new initiatives. The reduction in revenues will not allow the District to fully fund its priorities and will cause reductions in our educational programs. Declining Enrollment Another factor that was taken into consideration during the restructuring of our budget was the decline in District enrollment. We have experienced this decline for several years and have projected a continual decrease in the number of children attending District schools. This will continue to have a negative impact on further State funding and will cause corresponding reductions in school staffing. The reduction in school staffing was started in the 2009-10 budget projection. The projected decrease in teachers and other staff for 2009-10 is approximately 230 positions which relates to approximately $17M. Unappropriated Fund Balance It was the intent of the Superintendent not to use the unappropriated fund balance to support the structural deficit. Instead, if possible, restructuring over the next three years will be necessary for reducing the deficit. Restructuring aligns with the initiative to “right-size” the District. Budget decisions would be made with the intent to work with the long-term objective of school-based budgeting. The 2008-09 General Fund beginning balance of $47,843,997 reflects the ending balance of the 2007-08 fiscal year. The majority of this balance is committed to specific purposes such as: workers compensation reserves, insurance reserves, OPEB and the Employment Preparation Education (EPE) audit reimbursement. The balance that is available to support on going programs is $12,481,425. Maintaining an adequate ending balance is required by State law. The allowable unappropriated amount is a reserve of 4% of the coming year’s general fund which is $23.1M. EXPENDITURES In addition to the decline in State funding, the District is required to pay the reimbursement of EPE funds. In prior years, the District requested a waiver for the repayment of the $2.1M EPE reimbursement. A decision was made to not request the waiver for this year due to the economic climate in State government. This amount will be paid from our appropriated fund balance. It is the intent of the District to continue most of the 2008-09 programs plus approved changes for 2009-10. The assumption was made that compensation increases, for which negotiations have not been completed, will continue at the stated rate.
Section 3 Page 6
District-Wide Summary Budget 2009-10 Budget
Alignment of expenditures to support the four goals of improving ELA scores, Math scores, graduation rates and school safety has been provided for in the budget: Textbook Adoption for Math: $1,205,000 Restructuring of Schools #14, #58, Franklin, and East High Schools: More than $620,000 District-wide Dashboard and assessment tools: $500,000 Increased work placement and interventions by Hillside: $1,200,000 School Safety-Behavior management and X-ray equipment: More than $200,000 Short Term Fiscal Issues Health Insurance negotiations: The District continues to look at cost savings for District
health care plans. Progress is being made to change from community rating to experience rating. Changes will mitigate rising insurance costs.
Transportation costs: Earlier in 2008-09, an RFP was successfully completed for the transportation of our children. This savings has been recognized in our 2009-10 proposed budget.
Interest Revenue: Reduction is due to declining market conditions. _ Long Term Fiscal Issues Collective Bargaining: The District is in negotiations with three of our five bargaining
units. The Rochester Teachers Association and Association of Supervisors and Administrators of Rochester contracts expire on June 30, 2009. Negotiations continue with Rochester Association of Paraprofessionals which expired on June 30, 2008.
Future funding will depend on the recovery of our economic system. Continual reductions will be passed to Districts if the State continues its structural deficit. The impact will have a negative affect on the growth of our programs.
Some programs, which are currently supported fully or partially by Special Aid or grants, will be underfunded and become reliant upon general funds.
Decreased funding will lead to slightly increased class size, which remains at or below contract and state averages.
The Special Education program analysis is complete. A multi-year program redesign and improvement process has started.
Reimbursement rates in some State and Federal reimbursements are lagging behind actual cost increases.
The cost of textbooks and other instructional supplies continue to increase. Fuel and utilities costs continue to rise at rates higher than expected. Double digit increases in employee benefits is anticipated.
The Budget is balanced and targeted to the needs of our students and allows for the continued support of the goals of the District and the policies of the Board of Education. We still face many challenges, both at the State level and within the District itself. New academic initiatives, academic program flexibility and the collective bargaining process will need to be addressed as revenue sources are confirmed. This budget is the first glimpse at a fundamental change in the strategic management and resourcing of our schools. It addresses tough fiscal realities while continuing to resource critical education needs. Sincerely, Deputy Superintendent of Administration
Section 3 Page 7
District-Wide Summary Budget 2009-10 Budget

2007-08 2008-09 2009-10 $ VarianceRevenue Category Actual Amended Budget Proposed Budget Fav/(Unfav)
GENERAL FUND
>>>>> STATE <<<<<
Foundation Aid 320,835,447 351,317,169 337,900,112 (13,417,057)
NYS Stabilization Stimulus Funding - - 13,417,057 13,417,057
Special Services Aid 6,692,278 9,708,675 9,958,293 249,618
Special Education - Public High Cost Aid 3,311,884 2,530,723 2,424,447 (106,276)
Special Education - Private Excess Cost Aid 8,813,281 9,516,830 9,449,447 (67,383)
Transportation Aid 41,284,527 44,622,526 48,280,159 3,657,633
Computer Hardware Aid 769,747 786,052 787,823 1,771
Textbook Aid 2,002,883 2,246,761 2,205,575 (41,186)
Software Aid 559,249 559,279 559,279 -
Library Aid 233,331 209,057 209,057 -
Charter School Transitional Aid 1,704,604 1,864,964 3,688,597 1,823,633
Subtotal - Recurring State Aid 386,207,231 423,362,036 428,879,846 5,517,810
>>>>> Building Aid <<<<<
Building Aid 14,666,088 20,013,947 20,011,548 (2,399)
Subtotal - Building Aid 14,666,088 20,013,947 20,011,548 (2,399)
>>>>> State - Other State Revenues <<<<<NYS Legislative Grant 80,700 - 250,000 250,000 After School Program Aid 1,125,000 1,000,000 - (1,000,000)
Subtotal - Other State Revenues 1,205,700 1,000,000 250,000 (750,000)
>>>>> State Aid Adjustments <<<<<Prior Year Aid Advance - Bond Bank 1,479,000 1,479,000 1,479,000 - Prior Year Aid - $20M Spin Up Loan Payment (667,000) (667,000) (667,000) - Non-Recurring Prior Year Aid Adjustments 852,567 203,126 - (203,126) Local Share Deduction for Certain Students (945,627) (843,536) (909,321) (65,785)
Prior Year Aid Adjustment - EPE - - (2,128,941) (2,128,941)
Subtotal - Prior Year State Aid Adjustments 718,940 171,590 (2,226,262) (2,397,852)
Total - New York State Revenue 402,797,959 444,547,573 446,915,132 2,367,559
>>>>> CITY <<<<<
City of Rochester Aid 119,100,000 119,100,000 119,100,000 -
Total - City 119,100,000 119,100,000 119,100,000 -
>>>>> Other Revenue Sources <<<<<
Federal - Medicaid 4,426,311 2,000,000 2,000,000 -
Subtotal - Other Revenue Sources 4,426,311 2,000,000 2,000,000 -
>>>>> Local - Other <<<<<
Indirect Costs 2,322,353 2,239,231 2,531,811 292,580
Nonresident Tuition 692,627 700,000 700,000 -
Health Services Revenue 735,326 650,000 650,000 -
Rental and Use of Buildings 130,122 150,000 150,000 -
Sale of Obsolete Equipment 4,997 25,000 25,000 -
Prior Years Refunds 1,172,819 650,000 650,000 -
E-Rate Revenue 993,932 3,979,816 1,736,644 (2,243,172)
Student and Other Fees 132,138 75,000 75,000 -
Earnings - Capital Fund Investments 1,197,726 525,000 525,000 -
Earnings - General Fund Investments 2,994,731 1,700,000 1,200,000 (500,000) Miscellaneous Revenue 182,240 180,029 180,029 -
Total - Local Other 10,559,011 10,874,076 8,423,484 (2,450,592)
Appropriated Fund Balance for General Fund - 5,733,807 2,128,941 (3,604,866)
GENERAL FUND Revenue 536,883,281 582,255,456 578,567,557 (3,687,899)
REVENUE SUMMARY
Section 3 Page 8
District-Wide Summary Budget 2009-10 Budget
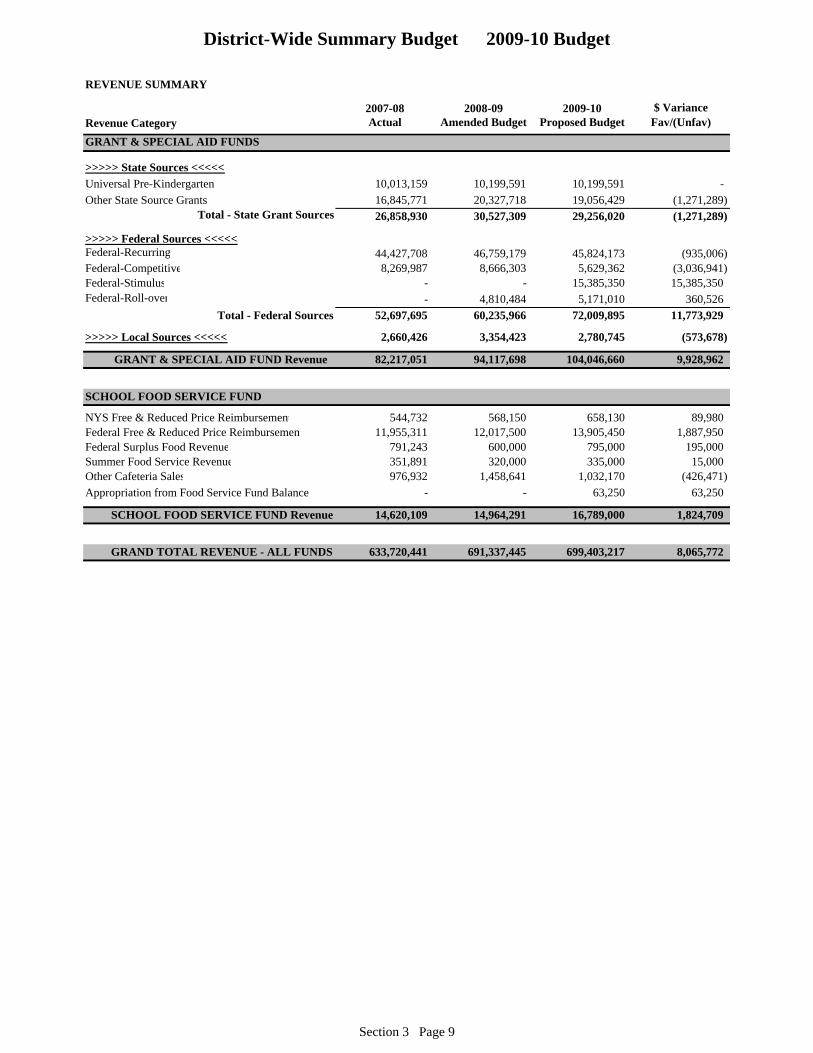
2007-08 2008-09 2009-10 $ VarianceRevenue Category Actual Amended Budget Proposed Budget Fav/(Unfav)
REVENUE SUMMARY
GRANT & SPECIAL AID FUNDS
>>>>> State Sources <<<<<
Universal Pre-Kindergarten 10,013,159 10,199,591 10,199,591 -
Other State Source Grants 16,845,771 20,327,718 19,056,429 (1,271,289) Total - State Grant Sources 26,858,930 30,527,309 29,256,020 (1,271,289)
>>>>> Federal Sources <<<<<Federal-Recurring 44,427,708 46,759,179 45,824,173 (935,006) Federal-Competitive 8,269,987 8,666,303 5,629,362 (3,036,941) Federal-Stimulus - - 15,385,350 15,385,350 Federal-Roll-over - 4,810,484 5,171,010 360,526
Total - Federal Sources 52,697,695 60,235,966 72,009,895 11,773,929
>>>>> Local Sources <<<<< 2,660,426 3,354,423 2,780,745 (573,678)
GRANT & SPECIAL AID FUND Revenue 82,217,051 94,117,698 104,046,660 9,928,962
SCHOOL FOOD SERVICE FUND
NYS Free & Reduced Price Reimbursement 544,732 568,150 658,130 89,980 Federal Free & Reduced Price Reimbursement 11,955,311 12,017,500 13,905,450 1,887,950 Federal Surplus Food Revenue 791,243 600,000 795,000 195,000 Summer Food Service Revenue 351,891 320,000 335,000 15,000 Other Cafeteria Sales 976,932 1,458,641 1,032,170 (426,471)
Appropriation from Food Service Fund Balance - - 63,250 63,250
SCHOOL FOOD SERVICE FUND Revenue 14,620,109 14,964,291 16,789,000 1,824,709
GRAND TOTAL REVENUE - ALL FUNDS 633,720,441 691,337,445 699,403,217 8,065,772
Section 3 Page 9
District-Wide Summary Budget 2009-10 Budget

STATE AID TO EDUCATION General Fund State Aid shown below is based on the aid projections included in the adopted 2009-10 New York State Budget. FOUNDATION AID $337,900,112 Foundation Aid is unrestricted aid to support the District’s general operations such as salaries, benefits, utilities and other operating costs. Beginning in 2007-08, NYS combined a number of separate aid categories into Foundation Aid. These aid categories included: Public Excess Cost, Sound Basic Education, Extraordinary Needs, Limited English Proficiency and several categorical grants. STATE STABILIZATION STIMULUS $13,417,057 New York State is using one-time federal funding to offset the Deficit Reduction Assessment that was included in the Governor’s Budget Proposal. This funding will only be available in the 2009-10 fiscal year. SPECIAL SERVICES AID $9,958,293 This aid supports certain occupational, marketing and business programs, in grades 10-12 and for approved data processing expenses pursuant to Regulations of the Commissioner. SPECIAL EDUCATION – PUBLIC HIGH COST AID $2,424,447 Public High Cost Aid is provided for students with disabilities placed in a special education program by the Committee on Special Education (CSE) in public settings in the Rochester City School District and at BOCES. This aid is based upon approved costs, attendance and level of service. SPECIAL EDUCATION – PRIVATE EXCESS COST AID $9,449,447 Excess Cost Aid is provided for students with disabilities placed in a special education program by the Committee on Special Education (CSE) in private settings such as St. Joseph’s Villa and Crestwood Children’s Center. This aid is based upon approved costs, attendance and level of service. TRANSPORTATION AID $48,280,159 This aid provides up to 90% of the District's approved transportation expenses. Non-allowable expenses include: the transportation of non-handicapped pupils who live 1 1/2 miles or less from the school attended, and transportation for extra activities such as field trips, athletic trips, etc. HARDWARE AND TECHNOLOGY AID $787,823 Computer Hardware and Technology Equipment Aid provides funding for the purchase and lease of micro and/or mini computer equipment; technology equipment; repair of equipment for instructional purposes; and training and staff development for instructional purposes. SOFTWARE, TEXTBOOK AID AND LIBRARY MATERIALS $2,973,911 This aid provides funding for the purchase of computer software, textbooks and library material. The amount of aid is based on a per-pupil dollar amount.
Section 3 Page 10
District-Wide Summary Budget 2009-10 Budget

CHARTER SCHOOL TRANSITIONAL AID $3,688,597
This aid partially offsets the cost of tuition that the District must provide for students attending Charter Schools. BUILDING AID $20,011,548
This aid supports expenses associated with the construction of new buildings, additions, and alterations or modifications of existing buildings. Building aid is provided for projects which have received prior approval from the State Education Department. OTHER STATE REVENUES 250,000
This category represents state funding that the local delegation in Albany has secured for the district. STATE AID ADJUSTMENTS ($2,226,262)
This category represents adjustments for prior year aid monies owed to the District, contingency for prior year aid claims owed to the State, and revenue to offset the District’s debt service under the State’s Prior Year Claims Financing Program. This category also contains aid deductions for certain resident student placements, including incarcerated youth detention centers, intermediate residential treatment programs, and State supported schools for the Blind and Deaf. The State assumes 100% of the tuition costs for these placements. GRAND TOTAL STATE $446,915,132 REVENUES FROM CITY $119,100,000
The City of Rochester funding includes the State funded STAR program. MEDICAID REVENUE $2,000,000
The District receives partial reimbursement under Medicaid for support services provided to Medicaid eligible students with disabilities. The District receives 25% of the approved billable amount per service. The State recoups 75% of all federal Medicaid monies received by the District. OTHER LOCAL REVENUES INDIRECT COSTS $2,531,811
Many grant-funded programs provide revenue to offset overhead costs, which the District incurs in the operation of grants. Overhead costs include supervision, accounting costs, etc. NON-RESIDENT TUITION FROM OTHER DISTRICTS $700,000 The District provides tutoring and other education services to non-resident students on a tuition/fee basis. The largest portion of these revenues is for tutoring services provided to non-resident students at several agencies in the area. HEALTH SERVICES REVENUE $650,000
The District provides health services to non-resident students attending private/parochial schools located within the district boundaries per NYS regulations. The District bills these costs back to the student’s home districts.
Section 3 Page 11
District-Wide Summary Budget 2009-10 Budget

RENTAL AND USE OF BUILDINGS $150,000 This represents the fees charged to various groups for the use of buildings in accordance with District policy. SALES OF OBSOLETE EQUIPMENT $25,000 This is revenue from sales of obsolete equipment and vehicles, in accordance with District policy. PRIOR YEARS REFUNDS $2,386,644 This revenue is derived from several sources including federal E-Rate monies, BOCES refunds and refunds of prior year expense from vendors. STUDENT AND OTHER FEES $75,000 This revenue is earned through fees charged for Adult Education, rental of musical instruments and other miscellaneous fees. EARNINGS - CAPITAL FUND INVESTMENTS $525,000 This revenue is earned primarily through two sources: Interest earned on authorized capital funds which have not yet been expended, and any unused capital fund authorizations. EARNINGS - GENERAL FUND INVESTMENTS $1,200,000 This revenue from investments is earned by the District's cash management program. PREMIUM – RAN $0 This represents the premium associated with the issuance of a Revenue Anticipation Note (RAN). The District does not anticipate issuing a RAN in 2009-10. MISCELLANEOUS REVENUE $180,029 This represents revenues that do not fit in any other categories and are non-recurring. TOTAL LOCAL REVENUES $8,423,484 APPROPRIATIONS FROM FUND BALANCE $2,128,941 An Appropriation from Fund Balance represents the use of accumulated financial surplus that resulted from prior years' activity. GRAND TOTAL GENERAL FUND REVENUE $578,567,557
Section 3 Page 12
District-Wide Summary Budget 2009-10 Budget

Grant Title2008-09
Amended2009-2010
Budget$ Change
Fav/(Unfav)
>>>>>STATE SOURCES<<<<<ARSIP-APPRENTICESHIP TRAINING 85,527 85,000 (527)ELL BILINGUAL SUPPLEMENTARY 25,000 0 (25,000)EMPLOYMENT PREPARATION EDUCATION 2,763,994 2,763,994 0EXTENDED SCHOOL DAY/SCHOOL VIO 691,993 691,993 0FAMILIES NATURALIZATION (FANS) 12,000 12,000 0FEASIBILITY STUDY INSURANCE 84,000 0 (84,000)INCARCERATED YOUTH 2,000,087 2,277,514 277,427LEARNING TECHNOLOGY 299,526 0 (299,526)MEDICAID GRANT 41,000 0 (41,000)MENTOR TEACHER INTERNSHIP PROG 325,000 0 (325,000)ROCHESTER SCHOOL LIBRARY SYSTEMS 96,929 77,543 (19,386)ROCHESTER TEACHER CENTER 579,000 579,000 0SCH LIBRARY SYS AID 4 AUTOMATION 9,693 7,754 (1,939)SCHOOL HEALTH SERVICES 6,292,705 6,292,705 0SCHOOL LIBRARY SYS SUPPLEMENTAL 47,950 0 (47,950)SCHOOLS UNDER REGISTRATION REVIEW (SURR) 200,022 0 (200,022)SUMMER PROGRAM SPECIAL ED. 4,512,050 4,768,926 256,876TEACHERS OF TOMORROW 1,985,680 1,500,000 (485,680)UNIVERSAL PRE-K 10,199,591 10,199,591 0WEP-WELFARE EDCATION PROGRAM 275,562 0 (275,562)
SUBTOTAL - STATE 30,527,309 29,256,020 (1,271,289)
GRANT REVENUE
Section 3 Page 13
District-Wide Summary Budget 2009-10 Budget
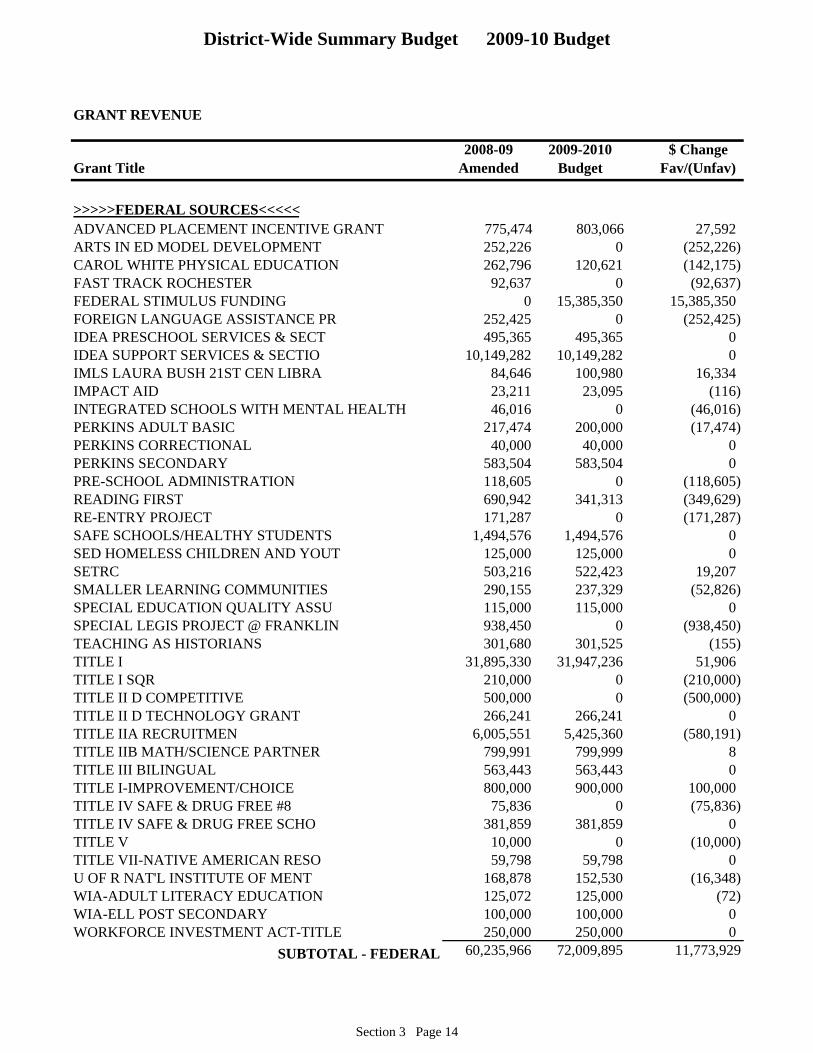
Grant Title2008-09
Amended2009-2010
Budget$ Change
Fav/(Unfav)
GRANT REVENUE
>>>>>FEDERAL SOURCES<<<<<ADVANCED PLACEMENT INCENTIVE GRANT 775,474 803,066 27,592ARTS IN ED MODEL DEVELOPMENT 252,226 0 (252,226)CAROL WHITE PHYSICAL EDUCATION 262,796 120,621 (142,175)FAST TRACK ROCHESTER 92,637 0 (92,637)FEDERAL STIMULUS FUNDING 0 15,385,350 15,385,350FOREIGN LANGUAGE ASSISTANCE PR 252,425 0 (252,425)IDEA PRESCHOOL SERVICES & SECT 495,365 495,365 0IDEA SUPPORT SERVICES & SECTIO 10,149,282 10,149,282 0IMLS LAURA BUSH 21ST CEN LIBRA 84,646 100,980 16,334IMPACT AID 23,211 23,095 (116)INTEGRATED SCHOOLS WITH MENTAL HEALTH 46,016 0 (46,016)PERKINS ADULT BASIC 217,474 200,000 (17,474)PERKINS CORRECTIONAL 40,000 40,000 0PERKINS SECONDARY 583,504 583,504 0PRE-SCHOOL ADMINISTRATION 118,605 0 (118,605)READING FIRST 690,942 341,313 (349,629)RE-ENTRY PROJECT 171,287 0 (171,287)SAFE SCHOOLS/HEALTHY STUDENTS 1,494,576 1,494,576 0SED HOMELESS CHILDREN AND YOUT 125,000 125,000 0SETRC 503,216 522,423 19,207SMALLER LEARNING COMMUNITIES 290,155 237,329 (52,826)SPECIAL EDUCATION QUALITY ASSU 115,000 115,000 0SPECIAL LEGIS PROJECT @ FRANKLIN 938,450 0 (938,450)TEACHING AS HISTORIANS 301,680 301,525 (155)TITLE I 31,895,330 31,947,236 51,906TITLE I SQR 210,000 0 (210,000)TITLE II D COMPETITIVE 500,000 0 (500,000)TITLE II D TECHNOLOGY GRANT 266,241 266,241 0TITLE IIA RECRUITMEN 6,005,551 5,425,360 (580,191)TITLE IIB MATH/SCIENCE PARTNER 799,991 799,999 8TITLE III BILINGUAL 563,443 563,443 0TITLE I-IMPROVEMENT/CHOICE 800,000 900,000 100,000TITLE IV SAFE & DRUG FREE #8 75,836 0 (75,836)TITLE IV SAFE & DRUG FREE SCHO 381,859 381,859 0TITLE V 10,000 0 (10,000)TITLE VII-NATIVE AMERICAN RESO 59,798 59,798 0U OF R NAT'L INSTITUTE OF MENT 168,878 152,530 (16,348)WIA-ADULT LITERACY EDUCATION 125,072 125,000 (72)WIA-ELL POST SECONDARY 100,000 100,000 0WORKFORCE INVESTMENT ACT-TITLE 250,000 250,000 0
SUBTOTAL - FEDERAL 60,235,966 72,009,895 11,773,929
Section 3 Page 14
District-Wide Summary Budget 2009-10 Budget

Grant Title2008-09
Amended2009-2010
Budget$ Change
Fav/(Unfav)
GRANT REVENUE
>>>>>LOCAL SOURCES<<<<<CFC CUBAN HAITIAN ENTRANTS 30,000 27,544 (2,456)COHESIVE LEADERSHIP GRANT 135,000 0 (135,000)COMMUNITY PRE-SCHOOL RELATED S 468,088 468,088 0CONSUMER CREDIT COUNSELING SVC - STUDENT INT 2,207 0 (2,207)DANCING WITH THE STARS 5,800 0 (5,800)ESL STUDENT INTERN 11,616 11,616 0EXPEDITIONARY LEARNING #58 63,500 62,905 (595)FOOD SECURITY 30,457 0 (30,457)GGP - STUDENTS WRITE FOR COMM SVC 15,045 0 (15,045)GOOD GRADE PAY - SUMMER LAW PREP 18,112 0 (18,112)GROUP WORKCAMP 35,000 0 (35,000)GREATER ROCHESTER HEALTH FITNESS STATIONS 10,000 0 (10,000)HEALTH CARE YOUTH APPRENTICESH 162,000 162,000 0HOSPITALITY & LODGING CAREER @ JEFFERSON 24,548 0 (24,548)MONROE COUNTY CAREERS 466,000 466,000 0MONROE COUNTY TRANSITION SERV 95,000 0 (95,000)NAZARETH TEACHERS AS LEARNERS 10,000 0 (10,000)PLAY IT SMART 16,667 0 (16,667)PRE-SCHOOL ADMINISTRATION/COUNTY 250,450 369,055 118,605PRE-SCHOOL INTEGRATED/HANDICAPPED 902,268 902,268 0REEP 131,232 0 (131,232)SCHOOL #9 & #12 / UNITED WAY 157,700 52,658 (105,042)SPECIAL EDUCATION/ITINERANT TE 132,611 132,611 0SUMMER LAW PREP (CITY OF ROCHESTER) 20,154 0 (20,154)THE PRIMARY PROJECT 128,620 99,000 (29,620)TOSHIBA AMERICA FOUNDATION 518 0 (518)VIRTUAL ENTERPRISE 27,000 27,000 0WATER MARSHALL 4,830 0 (4,830)
SUBTOTAL - LOCAL 3,354,423 2,780,745 (573,678)
TOTAL - GRANT REVENUE 94,117,698 104,046,660 9,928,962
Section 3 Page 15
District-Wide Summary Budget 2009-10 Budget

STATE GRANT REVENUES
UNIVERSAL PRE-KINDERGARTEN $10,199,591 This grant supports the District’s efforts to provide environments and experiences in socialization, early literacy and motor skill development to all eligible four-year old children, including those with disabilities and children whose home language is other than English. It also provides aid for the education of three and four-year-old children from disadvantaged environments and supports the pre-kindergarten program at various District sites. SCHOOL HEALTH SERVICES $6,292,705 This grant provides reimbursement to the District for the cost of providing nursing services. SUMMER PROGRAM $4,768,926 State aid supports the District’s Special Education programs during the months of July and August. EMPLOYMENT PREPARATION EDUCATION AID $2,763,994 This aid supports employment preparation programs such as: adult education, GED preparation, ESOL and career education for pupils age 21 and older. INCARCERATED YOUTH $2,277,514 This aid provides funding for instructional services to resident students in the Monroe County Jail. TEACHERS OF TOMORROW $1,500,000 State grant funds are used to support the recruitment, development and retention of teachers in subject shortage areas. EXTENDED SCHOOL DAY/SCHOOL VIOLENCE PREVENTION (ESD/SVP) $691,993 This grant provides resources to ensure that students receive social-emotional skills training and support services that are proven to prevent violent behavior. Schools also use the funding to implement character education and bullying prevention strategies to maintain a safe and supportive learning environment. ROCHESTER TEACHER CENTER $579,000 This allocation enables the Teacher Center to continue providing high quality professional development programs and services that assist teachers and schools in their efforts to implement the State’s Learning Standards and improve student performance. OTHER STATE GRANT REVENUES $182,297 STATE GRANT REVENUE $29,256,020
Section 3 Page 16
District-Wide Summary Budget 2009-10 Budget

FEDERAL GRANT REVENUE CONSOLIDATED APPLICATION (TITLE I, IIA, IID, III, IV) $38,584,139 The NYSED consolidated application includes five grants that are bundled together for the application process but fund distinctly different programs. The Title I Basic grant supports academic intervention programs, supplemental educational services, and support services for economically disadvantaged children - especially those enrolled in schools cited by the State Education Department as schools in need of improvement. Titles II - IV provide for the recruitment and training of teachers and administrators; the infusion of technology into instruction; bilingual, LEP and ELL education; and health and safety programs. The grants are Federal flow through dollars administered by the New York State Education Department and include: Title I Basic Improving Academic Achievement for the Disadvantaged Title IIA Teacher/Principal Recruitment and Training Title IID Enhancing Education Through Technology Title III Bilingual, LEP, ELL Programs Title IV Safe and Drug Free Schools and Communities FEDERAL STIMULUS FUNDING $15,385,350 The Federal Government is providing additional funding over the next two years through Title I and IDEA legislation to assist schools under the American Recovery and Reinvestment Act of 2009 (ARRA). CHILDREN WITH IDENTIFIED EDUCATIONAL DISABILITIES $10,759,647 These grants provide a variety of supplemental aid to students with disabilities ages 3 to 21. Among the largest grants are the IDEA Section 611 and Section 619 grants. IDEA grants are based upon a State-approved count of District resident handicapped students. These Pre-school and School-Age grants are designed to help defray the additional costs to the District for educating handicapped students. Funding is also intended to ensure compliance with State mandates and guidelines. These grants also support instructional positions including special education teachers, paraprofessionals, supplies, materials, and purchased services.
SPECIAL EDUCATION TRAINING AND RESOURCE CENTER (SETRC) $522,423 The Special Education Training Resource Center provides training and information to staff involved in educating children with handicapping conditions, and responds to individual instructional needs of children. These objectives are accomplished through in-service training, information dissemination, awareness workshops, etc. READING FIRST $341,313 This grant uses scientifically-based reading research to implement effective professional development, improve instruction, and modify teaching practices to ensure that all children will read independently and well by the end of the third grade.
Section 3 Page 17
District-Wide Summary Budget 2009-10 Budget

WORKFORCE PREPARATION/CAREER AND TECHNICAL EDUCATION $1,258,504 Workforce Preparation activities are designed for moving all students to higher levels of academic and work standards by developing the skills necessary for success in the workplace, post-secondary education, technical training and lifelong learning, including obtaining employability skills documented by the Certificate of Employability and other industry-recognized credentials. Career and Technical Education provide learning experiences where students become aware of a broad spectrum of careers and develop skills that are applicable and necessary to personal and career roles. Successful programs will prepare students for employment in specific career areas or post-secondary study and for life as productive members of society. Federal grants that support Workforce Preparation and Career and Technical Education include the Workforce Investment Act and Perkins IV Career and Technical Education.
SCHOOL IMPROVEMENT $900,000 LEAs that have Title I schools in need of improvement identified receive an allocation based upon the number of schools in each category as follows: Schools in Need of Improvement (SINI) Year 1 and Year 2 Corrective Action Schools (CA) Year 1 and Year 2 Restructured Schools Year 1, Year 2, Year 3 and Year 4 of Implementation MATH AND SCIENCE PARTNERSHIP TITLE IIB $799,999 This competitive grant provides resources for professional development in Math with partners at the University of Rochester and Mid-West Regional School Support Center of NYS in order to better evaluate the effectiveness of math instruction within RCSD. OTHER FEDERAL GRANT REVENUE $3,458,520 GRAND TOTAL FEDERAL GRANT REVENUE $72,009,895 LOCAL REVENUES PRESCHOOL SPECIAL EDUCATION - SECTION 441 $1,872,022 Section 4410 provides resources for Preschool Special Education programs and services. Pre School Integrated/Handicapped Community Pre-School Related Services Special Education/Itinerant Teachers (S.E.I.T.) CPSE Administration OTHER LOCAL GRANT REVENUE $908,723 GRAND TOTAL LOCAL GRANT REVENUES $2,780,745 GRAND TOTAL - ALL GRANTS $104,046,660
Section 3 Page 18
District-Wide Summary Budget 2009-10 Budget

2007-2008 2008-2009 2009-2010 Var Bud vs Amend
Actual Amended Proposed Fav/(Unfav)
EXPENDITURES BY ACCOUNT
Salary CompensationTeachers' Salaries 194,507,794 207,069,382 210,267,912 (3,198,530) Civil Service Salaries 58,970,489 61,953,391 66,201,875 (4,248,484) Administrator's Salaries 27,411,162 29,084,275 30,387,574 (1,303,299) Hourly Teachers 14,412,738 17,434,872 15,395,056 2,039,816 Teaching Assistants 3,274,367 3,876,102 4,308,531 (432,429) Paraprofessionals Salary 10,953,105 11,443,528 12,764,287 (1,320,759)
Sub Total Salary Compensation 309,529,656 330,861,550 339,325,235 (8,463,685) Other CompensationSubstitute Teacher Cost 9,382,705 11,480,834 11,247,075 233,759 Overtime Non-Instructional Sal 3,736,649 3,865,319 2,772,036 1,093,284 Teachers In Service 1,957,293 2,310,199 2,427,011 (116,812)
Sub Total Other Compensation 15,076,646 17,656,352 16,446,122 1,210,231 Total Salary and Other Compensation 324,606,302 348,517,902 355,771,357 (7,253,455)
Employee Benefits 113,667,224 128,458,230 133,051,426 (4,593,196) Total Compensation and Benefits 438,273,526 476,976,132 488,822,783 (11,846,651)
Fixed Obligations With VariabilitySpecial Education Tuition 28,097,204 26,388,242 26,487,900 (99,658) Contract Transportation 41,993,353 45,899,012 40,014,711 5,884,301 Charter School Tuition 9,662,024 13,312,457 15,477,032 (2,164,575) Health Service Other Districts 519,824 599,000 575,000 24,000 Insurance Non-employee 649,335 896,649 981,649 (85,000)
Sub Total Fixed Obligations 80,921,739 87,095,360 83,536,292 3,559,068 Debt Service
Sub Total Debt Service 29,064,443 26,304,378 25,389,093 915,285 Cash Capital OutlaysCash Capital Expense 6,440,510 6,973,066 10,115,000 (3,141,934) Textbooks 2,843,721 2,823,438 2,415,997 407,441 Equipment Other Than Buses 782,722 1,176,170 1,126,193 49,977 Equipment Buses 680,947 914,780 - 914,780 Computer Hardware - Instructional 1,042,608 964,785 717,625 247,160 Computer Hardware - Non Instructional 523,000 475,185 396,991 78,194 Library Books 360,594 532,209 255,932 276,277
Sub Total Cash Capital Outlays 12,674,102 13,859,633 15,027,738 (1,168,105)
Expenditure Summary (All Funds)
Section 3 Page 19
District-Wide Summary Budget 2009-10 Budget

2007-2008 2008-2009 2009-2010 Var Bud vs Amend
Actual Amended Proposed Fav/(Unfav)
Expenditure Summary (All Funds)
Facilities and RelatedUtilities 12,557,431 12,967,449 12,215,127 752,322 Instructional Supplies 7,261,396 6,779,671 7,083,224 (303,553) Equip Service Contr & Repair 3,972,134 4,292,322 3,953,507 338,815 Facilities Service Contracts 2,031,484 2,315,413 1,758,418 556,995 Rentals 2,970,846 4,122,775 4,130,670 (7,895) Maintenance Repair Supplies 1,147,014 1,155,908 1,019,414 136,494 Postage Printing & Advertising 1,452,871 1,521,910 1,451,080 70,830 Auto Supplies 1,085,922 1,023,378 1,041,502 (18,124) Supplies and Materials 7,230,842 7,877,840 8,978,267 (1,100,427) Custodial Supplies 496,535 584,327 545,797 38,530 Office Supplies 461,665 647,528 521,355 126,173
Sub Total Facilities and Related 40,668,140 43,288,521 42,698,362 590,159 TechnologyComputer Software - Instructional 658,244 709,546 938,910 (229,364) Computer Software - Non Instructional 148,029 391,806 872,960 (481,154)
Subtotal Technology 806,273 1,101,352 1,811,870 (710,518) All Other Variable ExpensesMiscellaneous Services 1,900,201 2,580,820 1,937,972 642,848 Professional & Technical Serv 18,192,324 26,754,220 27,206,949 (452,729) Agency Clerical 1,878,131 1,725,599 1,155,415 570,184 Judgments and Claims 14,218,612 900,000 1,000,000 (100,000) Grant Disallowances (213,091) 1,300,000 1,380,000 (80,000) Departmental Credits (2,368,491) (2,363,488) (2,095,984) (267,504) Indirect Costs Grants 2,321,283 2,702,981 3,197,366 (494,385) BOCES Services 6,568,557 6,853,955 6,767,959 85,996 Professional Development 1,672,343 2,257,981 1,567,403 690,578
Subtotal of All Other Variable Expenses 44,169,869 42,712,068 42,117,080 594,989 Total Non Compensation 208,304,566 214,361,313 210,580,434 3,780,878
Sub Total 646,578,092 691,337,445 699,403,217 (8,065,772) Fund Balance Reserve - - - -
Grand Total 646,578,092 691,337,445 699,403,217 (8,065,772)
Section 3 Page 20
District-Wide Summary Budget 2009-10 Budget

2007 - 2008 2008 - 2009 2009 - 2010
Var Bud vs Amend
Actual Amended Proposed Fav/(Unfav)
POSITIONS BY ACCOUNT
Salary CompensationTeachers' Salaries 3,641.21 3,765.98 3,566.87 199.11Civil Service Salaries 1,630.95 1,656.04 1,632.10 23.94Administrator's Salaries 287.00 306.00 301.50 4.50Teaching Assistants 146.50 180.00 175.00 5.00Paraprofessionals Salary 568.20 564.20 566.45 (2.25)Hourly Teachers 0.00 0.00 0.00 0.00
Total Salary Compensation 6,273.86 6,472.22 6,241.92 230.30Other CompensationSubstitute Teacher Cost 0.00 0.00 0.00 0.00Overtime Non-Instructional Sal 0.00 0.00 0.00 0.00Teachers In Service 0.00 0.00 0.00 0.00
Total Other Compensation 0.00 0.00 0.00 0.00Total Salary and Other Compensation 6,273.86 6,472.22 6,241.92 230.30
Employee BenefitsCatastrophic Illness-C.S. 4.69 9.08 9.08 0.00Catastrophic Illness-Tch. 4.00 6.00 6.00 0.00Paid Illness Leave-C.S. 2.00 1.00 1.00 0.00Paid Illness Leave-T.P. 6.00 4.00 4.00 0.00
Employee Benefits Total 16.69 20.08 20.08 0.00Grand Total 6,290.55 6,492.30 6,262.00 230.30
Position Summary
Section 3 Page 21
District-Wide Summary Budget 2009-10 Budget

Explanation of Changes to the Budget The proposed 2009-10 Rochester City School District Budget increases to $699.4M from the 2008-2009 Amended Budget of $691.3M. This represents an increase of $8.1M or 1.2%. The overall budget increase was supported largely by short-term State and Federal Stimulus funding. The 2009-10 Budget was balanced by a significant reduction in staffing along with district-wide operating budget reductions. The District projects Salary and Other Compensation costs to increase to $355.8M in 2009-10 from $348.5M in 2008-09. This represents an increase of $7.3M or 2.1%. Contractual salary increases that average 3.9% were offset by a reduction of 230.3 FTEs along with savings from district-wide Substitute Teacher and Overtime cost reductions. Costs for Employee Benefits continue to rise. Overall, benefit costs increase to $133.1M in 2009-10 from $128.5M in 2008-09. This represents an increase of $4.6M or 3.6%. The overall benefit increase is relatively modest due to anticipated Health Insurance cost savings related to the District’s move from a community-rated plan to an experience-rated plan. Additional benefit cost savings are expected due to employer contribution rate reductions in the Teachers’ and Employees’ Retirement Systems. Fixed Obligations with Variability, which includes Contract Transportation and Charter School Tuition, will decrease by $3.6M to $83.5M in 2009-10. Contract Transportation decreases by $5.9M as a result of cost savings from re-bidding the transportation vendor contracts and adjusting elementary school starting times to make more efficient use of the bus fleet. This reduction is offset by Charter School Tuition, which shows a $2.2M increase to $15.5M. The increase is attributable to projected enrollment growth of 200 students at the existing schools as the 2009-10 tuition rate has been frozen by the State of New York. The remaining budgets in this category will increase by a total of $0.1M. The Debt Service budget will decrease by $0.9M to $25.4M to reflect changes in the District’s long-term debt schedule. This reduction is due largely to reduced interest payments on existing Bonds and Bond Anticipation Notes. The District anticipates Cash Capital Outlays will increase by $1.2M to $15.0M in 2009-10. A $3.1 million increase in Cash Capital funding for Central Kitchen improvement and computer system upgrades will be offset by reductions in the remaining categories due to the district-wide operating budget reductions effort. The balance of the District’s 2009-10 Budget shows a decrease of $0.5M. Once again, almost all of the remaining budget categories experienced reductions as part of the district-wide operating budget reductions effort to balance the budget.
Section 3 Page 22
District-Wide Summary Budget 2009-10 Budget

Multi-Year Projection OVERVIEW:
The multi-year projection represents a forecast of the District’s revenue and expenditures for the next three fiscal years. The projections shown allow the District to begin the planning process to solve for anticipated deficits in future years.
Given the State’s fiscal situation, the projected revenues in this analysis anticipate that Foundation Aid will not increase in the next few years. In addition, the one-time New York State Stabilization Stimulus funding will not continue, resulting in a $13.4 million aid reduction in 2010-11. The projected $5 million reduction in 2010-11 Other State Revenue is due to a lower Transportation Department cost structure, which will result in a corresponding decrease in Transportation Aid. Finally, 2011-12 Grant revenue will decrease by $15.4 million, which is when the two-year Federal Stimulus funding will end.
ASSUMPTIONS:
Based on historical trend analysis and contractual commitments, the District utilizes the following annual rates of increase to develop the projections:
Assumptions Projected 2010-2011
Projected 2011-2012
Projected 2012-2013
Revenues: State Aid Foundation Aid Increase 0.00% 0.00% 0.00%New York State Stabilization Stimulus -$13,417,057 0.00% 0.00%State Aid Revenue - Other Increase -$5,000,000 3.00% 3.00%City of Rochester Revenue Increase 0.00% 0.00% 0.00%All Other General Fund Revenue Increase 0.00% 0.00% 0.00%Appropriated Fund Balance $2,128,941 $2,128,941 $2,128,941 Grant and Special Aid Fund Increase 0.00% -$15,385,350 0.00%Food Services Revenue Increase 2.00% 2.00% 2.00%Expenditures: Teacher Salary Increase 4.39% 4.39% 4.39%Civil Service Salary Increase 3.95% 3.95% 3.95%Administrative Salary Increase 3.95% 3.95% 3.95%Hourly Teachers Salary Increase 4.00% 4.00% 4.00%Teaching Assistants Salary Increase 3.95% 3.95% 3.95%Paraprofessionals Salary Increase 3.95% 3.95% 3.95%Other Compensation Annual Rate Increase 2.00% 2.00% 2.00%Benefits Increase 10.50% 10.50% 10.50%Employee Retirement System % of Payroll 10.60% 10.60% 10.60%Teachers Retirement System % of Payroll 10.20% 10.20% 10.20%Charter Schools tuition increase per student 5.00% 5.00% 5.00%New Charter School students each year 70 70 70 Transportation Contracts incl. impact of Charters 3.50% 3.50% 3.50%Special Education (Tuition) 4.00% 4.00% 4.00%Cash Capital per Year $6,115,000 $6,115,000 $6,115,000 Utilities 7.00% 7.00% 7.00%BOCES Services (SPED Tuition & Nurses) 4.00% 4.00% 4.00%CPI 3.50% 3.50% 3.50%No FTE staffing changes No Facilities Modernization impact
Section 3 Page 23
District-Wide Summary Budget 2009-10 Budget

Multi-Year Projection
Projected RCSD Deficit
500
600
700
800
900
Proposed2009-2010
Projected2010-2011
Projected2011-2012
Projected2012-2013
Mill
ions
Total Revenue Grand Total Expenditures
Structural Deficit
Surplus/(Deficit): 0 ($59.0M) ($107.7M) ($143.3M)
CLOSING THE DEFICIT: The District projects a deficit situation in future years due to declining revenues and rising expenses based on the assumptions listed on the previous page. New York State law mandates that the District maintain a balanced budget. Revenue The Rochester City School District is a fiscally dependent school district and therefore cannot levy taxes. The District can impact revenue in the following ways: Lobbying state government officials to continue funding proposed Foundation Aid increases Lobbying federal government officials to continue Stimulus Aid Lobbying local government officials to continue their support of the District’s needs Searching for and securing additional grant funding Expenses The District continues to focus on automating operations, partnering with other government entities and businesses and cost-cutting initiatives.
Section 3 Page 24
District-Wide Summary Budget 2009-10 Budget

Multi-Year Projection
Proposed 2009-2010
Projected 2010-2011
Projected 2011-2012
Projected 2012-2013
Revenue:
New York State Foundation Aid
337,900,112
337,900,112
337,900,112
337,900,112
State Stabilization Stimulus
13,417,057
- -
-
New York State Aid - Other
75,586,415
70,586,415
72,704,007
74,885,128
New York State Building Aid
20,011,548
20,011,548
20,011,548
20,011,548
City of Rochester
119,100,000
119,100,000
119,100,000
119,100,000
Federal-Medicaid
2,000,000
2,000,000
2,000,000
2,000,000
Other Local
8,423,484
8,423,484
8,423,484
8,423,484
Appropriated Fund Balance
2,128,941
2,128,941
2,128,941
2,128,941
Grant and Special Aid Fund
104,046,660
104,046,660 88,661,310
88,661,310
Food Services
16,789,000
17,124,780
17,467,276
17,816,621
Total Revenue
699,403,217
681,321,940
668,396,678
670,927,144
Compensation 355,771,357
370,436,503
385,715,431
401,634,053
Employee Benefits 133,051,426
156,231,047
170,263,455
185,672,310
Total Compensation and Benefits 488,822,783
526,667,550
555,978,885
587,306,362
Fixed Obligations with Variability 83,536,292
87,693,964
92,028,863
96,548,695
Debt Service 25,389,093
25,389,093
25,389,093
25,389,093
Cash Capital Outlays 15,027,738
11,959,237
12,040,411
12,124,425
Facilities and Related 42,698,361
44,475,760
46,345,294
48,312,285
Technology 1,811,870
1,811,870
1,811,870
1,811,870
Other Variable Expenses 42,117,080
42,314,439
42,520,059
42,734,284
Total Non Compensation 210,580,434
213,644,363
220,135,590
226,920,651
Grand Total Expenditures 699,403,217
740,311,913
776,114,475
814,227,013
Total Surplus/(Deficit) -
(58,989,973)
(107,717,797)
(143,299,869)
Section 3 Page 25
District-Wide Summary Budget 2009-10 Budget

THIS PAGE INTENTIONALLY LEFT BLANK
Section 3 Page 26
District-Wide Summary Budget 2009-10 Budget

INDEX–1
Departmental activities and selected subject categories are presented here; for department and bureau references, see Table of Contents. Department Abbreviations: Admin. - Administration Council/Clerk - City Council and Clerk DCD - Community Development DES - Environmental Services ECD - Emergency Communications Department EDD - Economic Development Department DRYS - Recreation & Youth Services 311/One Call to City Hall
See Management & Budget Accounting
(Finance), 6-9 Administration
(EDD), 9-1 (Police), 12-24
Administrative Chargebacks Duplicating, 6-26 Motor Equipment, 10-40 Postage, 6-13 Telephone, 5-5 Water, 10-64 Workers Compensation, 16-5
Affirmative Action 4-1, 4-21
Application of Revenue 1-33
Architecture & Engineering (DES), 10-13
Assessment (Finance), 6-16
Budget Amendments, 2008-09 1-41
Buildings & Zoning (DCD), 8-6
Business & Housing Development (NBD), 7-11 Capital Improvement Program
See Capital Expense Cash Capital
18-5
Cash Capital (Capital Expense), 17-4
Central (Library), 14-5
Chief's Office (Fire), 13-5 (Police), 12-6
City Council & Clerk (Council/Clerk), 3-1
City School District 20-1
Commissioner's Office (DCD), 8-3 (DES), 10-8 (DRYS), 15-5 (NBD), 7-6
Communications (Admin.), 4-25
Community (Library), 14-10
Contingency (Contingency),17-1
Debt Service 18-13
Debt Services (Capital Expense), 18-13
Demographic Profile viii Director's Office
(Finance), 6-4 Emergency Communications
(ECD), 11-1

INDEX–2
Employment Benefits-Current (Undistributed), 16-3
Employment Benefits-Non-Current (Undistributed), 16-7
Equipment & Facilities See Capital Expense
Expenditure Changes - Summary 1-37
Fire Personnel Summary 13-3
General Risk Management (Undistributed), 16-9
Glossary x
Housing & Project Development (DCD), 8-9
Human Resource Management (Admin.), 4-19
Information Technology (IT), 5-1
Inspection & Compliance (NBD), 7-29 Law Department
(Admin.), 4-32 Legal Services
See Law Department Local Government Exemption Impact Report RP495 1-31 Management & Budget
(Admin.), 4-13 Mayor's Office
(Admin.), 4-4 Multi-Year Projection
2-1 Neighborhood Preservation (NBD), 7-25 Neighborhood Service Centers
(Admin.), 4-10 Operations
(Police), 12-11 (Fire), 13-9
Operations & Parks-Building Services (DES), 10-36
Operations & Parks-Director's Office (DES), 10-23
Operations & Parks-Equipment Services (DES), 10-39
Operations & Parks-Parks, Forestry & Open Spaces
(DES), 10-43 Operations & Parks-Solid Waste Collection
(DES), 10-26 Operations & Parks-Special Services
(DES), 10-29 Operations & Parks-Street Maintenance
(DES), 10-33 Operations-Investigations
(Police), 12-20 Operations-Patrol
(Police), 12-14 Other
(Undistributed), 16-11 Organization Chart xiii Parking & Municipal Violations
(Finance), 6-20 Planning
(DCD), 8-12 Planning & Zoning (NBD), 7-19 Police Personnel Summary
12-4 Position Summary
19-5 Property Tax
1-4 Property Tax (computation)
1-22 Purchasing
(Finance), 6-24 Reader's Guide
viii Recreation
(DRYS), 15-10 Revenue Changes - Summary
1-3 Sales Tax
1-6 School Tax Relief Program (STAR)
1-26 Special Services
(DRYS), 15-17

INDEX–3
STAR Program See School Tax Relief Program (STAR)
State Aid 1-10
Support (Fire), 13-15
Treasury (Finance), 6-11
War Memorial See Blue Cross Arena at the War Memorial
Water-Director's Office (DES), 10-49
Water-Engineering (DES), 10-52
Water-Parking Meter Operations (DES), 10-61
Water-Upland Operations (DES), 10-55
Water-Water Distribution (DES), 10-58
Water-Water Fixed Charges (DES), 10-64
Youth Services (DRYS), 15-19