2021 proposed budget book.pdf - Oklahoma City - EMBARK
562
-
Upload
khangminh22 -
Category
Documents
-
view
0 -
download
0
Transcript of 2021 proposed budget book.pdf - Oklahoma City - EMBARK


Table of Contents
Table of Contents
i
Introduction Mission and Vision Statements .................................................................................................... A-1 Mayor, Council Members, and Ward Boundaries ........................................................................ A-2 Reader’s Guide ............................................................................................................................. A-4 Message from the City Manager .................................................................................................. A-5 Council Priorities and Key Results .............................................................................................. A-12 Leading for Results and the Budget Process .............................................................................. A-16 Budget Development Process .................................................................................................... A-19 Overview of Oklahoma City ........................................................................................................ A-21
Oklahoma City in the News ........................................................................................... A-24 Metropolitan Area Demographics and Economic Data ................................................ A-25 Major Metropolitan Area Employers ............................................................................ A-26 Quality of Life ................................................................................................................ A-27 Transportation ............................................................................................................... A-28 Development Activity .................................................................................................... A-29
Organizational Chart .................................................................................................................. A-30
Financial Summaries Consolidated Budget Overview .................................................................................................... B-1 Revenues ...................................................................................................................................... B-2
Revenue Summary .......................................................................................................... B-2 Operating Funds .............................................................................................................. B-3 Non-Operating Funds .................................................................................................... B-11 Revenue Detail Table .................................................................................................... B-15
Expenditures ............................................................................................................................... B-27 Expenditure Summary ................................................................................................... B-27 Budgeted Positions by Department .............................................................................. B-30 General Fund Summary ................................................................................................. B-31 Expenditure Summary Table ......................................................................................... B-33
Departmental Budgets Reader’s Guide to Department Budgets ...................................................................................... C-1
Airports ............................................................................................................................ C-3 City Auditor ................................................................................................................... C-11 City Clerk ....................................................................................................................... C-17 City Manager ................................................................................................................. C-25 Development Services ................................................................................................... C-33 Finance .......................................................................................................................... C-43 Fire ................................................................................................................................. C-53 General Services ............................................................................................................ C-63 Human Resources .......................................................................................................... C-71 Information Technology ................................................................................................ C-79 Mayor and City Council ................................................................................................ C-91 Municipal Counselor ..................................................................................................... C-97 Municipal Court ........................................................................................................... C-105

ii
Non-Departmental ..................................................................................................... C-113 Parks and Recreation ................................................................................................... C-117 Planning ....................................................................................................................... C-129 Police ........................................................................................................................... C-137 Public Transportation and Parking .............................................................................. C-147 Public Works ................................................................................................................ C-157 Utilities ........................................................................................................................ C-169 Zoo ............................................................................................................................... C-181
Fund Summaries Overview of Fund Summaries ...................................................................................................... D-1 Budget and Fund Structure .......................................................................................................... D-2 Fund and Related Trust Descriptions ........................................................................................... D-3 Changes in Fund Balance .............................................................................................................. D-4 Fund by Department and Service Category ................................................................................. D-5 Airports Fund ................................................................................................................... D-6 Asset Forfeiture Fund ...................................................................................................... D-7 Better Streets, Safer City Sales Tax Fund ........................................................................ D-8 Better Streets, Safer City Use Tax Fund ........................................................................... D-9 Capital Improvement Projects Fund ............................................................................. D-11 City and Schools Capital Projects Use Tax Fund ............................................................ D-15 Court Administration and Training Fund ....................................................................... D-17 Debt Service Fund ......................................................................................................... D-19 Emergency Management Fund ..................................................................................... D-20 Fire Sales Tax Fund ....................................................................................................... D-21 General Fund ................................................................................................................. D-22 Grants Management Fund ............................................................................................ D-28 Hotel Motel Tax Special Revenue Fund ......................................................................... D-32 Impact Fee Fund ............................................................................................................ D-33 Internal Service Fund..................................................................................................... D-34 Medical Service Program Fund...................................................................................... D-36 Metropolitan Area Projects Sales Tax Fund .................................................................. D-37 MAPS Operations Fund ................................................................................................. D-38 MAPS 3 Sales Tax Fund .................................................................................................. D-40 MAPS 3 Use Tax Fund .................................................................................................... D-41 MAPS 4 Program Fund .................................................................................................. D-44 MAPS 4 Use Tax Fund .................................................................................................... D-45 Oklahoma City Improvement and Special Services Assessment District Fund ............. D-47 Oklahoma City Metropolitan Area Public Schools Sales Tax Fund ................................ D-48 Oklahoma City Tax Increment Financing (TIF) Fund...................................................... D-49 Police and Fire Capital Equipment Sales Tax Fund ........................................................ D-50 Police Sales Tax Fund (Police Services, Facilities or Equipment Tax Fund) .................. D-52 Solid Waste Management Fund .................................................................................... D-53 Special Purpose Fund .................................................................................................... D-54 Sports Facilities Sales Tax Fund ..................................................................................... D-57
Table of Contents
iii
Sports Facilities Use Tax Fund ....................................................................................... D-58 Stormwater Drainage Utility Fund ................................................................................ D-59 Street and Alley Fund .................................................................................................... D-60 Transportation and Parking Fund .................................................................................. D-61 Water and Wastewater Fund ........................................................................................ D-63 Zoo Sales Tax Fund ........................................................................................................ D-65
Capital Program and Budget Capital Improvement Budget ........................................................................................................ E-1 Capital Improvement Funding ....................................................................................................... E-2 Impact of Capital Projects ............................................................................................................ E-3 Capital Expenditures Summary ..................................................................................................... E-4 Capital Budget by Department ...................................................................................................... E-5 Airports ............................................................................................................................. E-7 Bond-Other ..................................................................................................................... E-17 City Manager .................................................................................................................. E-18 City Manager (MAPS 3) .................................................................................................. E-20 Fire .................................................................................................................................. E-22 General Services ............................................................................................................. E-23 Non-Departmental ......................................................................................................... E-26 Parks and Recreation ...................................................................................................... E-27 Police .............................................................................................................................. E-33 Public Trans and Parking…………………………………………………………………………………………...E-35 Public Works ................................................................................................................... E-38 Solid Waste ..................................................................................................................... E-50 Wastewater .................................................................................................................... E-51 Water .............................................................................................................................. E-55 Zoo .................................................................................................................................. E-60 Overview of Bond and Debt Service ............................................................................................ E-62 Debt Service Budget .................................................................................................................... E-63 Remaining Bond Authorization Issuance Plan ............................................................................. E-64
Appendix Overview of Budget Guidelines and Control ................................................................................ F-1 Overview of Financial Policies and Practices ................................................................................. F-5 Statement of Compliance with Budgeting and Financial Planning Policies ................................ F-19 Table of Compliance with Reserve Policy .................................................................................... F-20 Glossary ....................................................................................................................................... F-21
Performance Data Performance Management Readers Guide .................................................................................. G-1 Airports ............................................................................................................................ G-3 City Auditor ................................................................................................................... G-11 City Clerk ....................................................................................................................... G-13 City Manager ................................................................................................................. G-18 Development Services ................................................................................................... G-30 Finance .......................................................................................................................... G-38 Fire ................................................................................................................................. G-45
iv
General Services ............................................................................................................ G-52 Information Technology ................................................................................................ G-59 Municipal Counselor...................................................................................................... G-69 Municipal Court ............................................................................................................. G-74 Parks and Recreation ..................................................................................................... G-79 Personnel/HR ................................................................................................................ G-90 Planning ......................................................................................................................... G-99 Police ........................................................................................................................... G-108 Public Transportation and Parking .............................................................................. G-117 Public Works ................................................................................................................ G-126 Utilities ........................................................................................................................ G-137

Introduction
A-1
Mission and Vision Statements
Mission Statement
The mission of the City of Oklahoma City is to provide exceptional service to residents and visitors. We do this by ensuring the safety of the public, delivering quality services, and maintaining infrastructure to support the growth of the city.
Vision Statement
Oklahoma City seeks to further progress as a vibrant, diverse, safe, unified and welcoming community.
Recently, a committee of diverse, enthusiastic and committed City employees, representing virtually every department and work group in the organization, was convened to update the City’s vision and mission statements. Many of the participants are included in the photo below taken on the day City Council adopted a resolution for the updated vision and mission. We thank them for their efforts.
Table of Contents

Mayor, City Council and Ward Boundaries
Introduction
A-2
James Griener Ward 1
Larry McAtee Ward 3
David Greenwell Ward 5
JoBeth Hamon Ward 6
James Cooper Ward 2
Mark K. Stonecipher Ward 8
Table of Contents

Introduction
A-3
Todd Stone Ward 4
Nikki Nice Ward 7
David Holt Mayor
Table of Contents

Reader’s Guide
Introduction
A-4
The City of Oklahoma City is required by State law to adopt a budget on an annual basis. The City is also required to show three consecutive years of revenue and expenditure data. To comply with this law, the annual budget book reports the actual revenues and expenditures for the most recent completed fiscal year, the adopted budget including amendments for the prior fiscal year and the proposed budget. The annual budget governs City programs and finances for the fiscal year beginning July 1, and ending June 30. This document contains six sections, separated by divider pages and a second volume that contains detailed performance information. Major divider pages denote the content of each section. These sections are further segmented into sub-components. For example, the Departmental Budgets section has a divider page. The departments themselves are then presented in alphabetical order. The following briefly describes the contents of each section of this year’s Annual Budget book:
• The Introduction contains the City Manager’s transmittal letter to the Mayor and City Council.
This letter summarizes the adopted budget, links the budget process to City goals and objectives and highlights significant functional changes from the prior year. This section also includes information about how the budget document is organized, vital statistics about the City, performance information, and an organizational chart.
• The Financial Summaries section includes an overview of the City’s current and anticipated economic condition and provides revenue and expenditure information by fund and category.
• The Departmental Summaries section contains information about responsibilities and budget for each of the departments. At the beginning of this section, there is a Reader’s Guide to explain the format used in the department budgets. Departments are listed alphabetically.
• The Fund Summaries section contains summaries of the adopted budget for each City fund. State Law requires the City to adopt the annual budget by fund or purpose and the City has chosen to budget by fund. A fund, for budgetary purposes, is an accounting entity used for segregating revenues and expenditures for specific purposes.
• The Capital Budget section highlights information pertaining to the City’s Capital Improvement Plan and Debt Service. In general, projects or items are included in this section if they have a usable life of three years or more and cost in excess of $50,000. Past and future Bond and Debt Service requirements are also described in this section.
• The Appendix contains budget guidelines and controls that describe the legal and policy requirements associated with budget development and implementation. This section also includes the required statement of compliance with the City’s financial policies and practices and a glossary of terms utilized in this document.
• The Performance Supplement provides an in-depth look at the major issues being faced by departments, their strategies for dealing with those issues and the strategic results they are tracking on each issue. In addition, the supplement provides a listing of all performance measures for each department.
The Annual Budget Book is published online at www.okc.gov. Final Adopted Budget Books are available on a limited basis and copies can be requested from the Office of Management and Budget at (405) 297-2257.
Table of Contents

Message From the City Manager
A-5
Introduction
The Honorable Mayor and City Council:
The Fiscal Year 2020-2021 (FY21) budget has been quite a challenge. The COVID-19 pandemic changed the economic outlook significantly and forced us to start a second budget process just as we were wrapping up the original budget process. Departments moved quickly to develop proposals to reduce their FY21 budgets even further. Department directors stepped up with proposals that will save money while maintaining core services and minimizing decreases in service levels. Difficult choices were made to reduce costs while minimizing the number of employees affected by the cut. The FY21 budget totals $1.66 billion, an increase of $70.3 million (4.4%) over the FY20 amended budget. While there are many increases and decreases in the various City funds, the biggest single factor in the budget’s growth is the $114.3 million in reimbursements available through the Coronavirus Aid, Relief, and Economic Security (CARES) Act that is added in the Grants Management Fund. Without the CARES Act we would have seen a decrease in our overall budget in many funds. Some of the notable declines include General Fund (down 5.2%); Hotel/Motel Tax Fund (down 43.0%); and the Fire, Police and Zoo Sales Tax Funds (each down at least 6%). The budget includes funding for 4,701 full-time positions, which is a decrease of 168 positions (3.5%) from the FY20 total. Of that total, 1 management, 21 firefighter positions and 34 police officer positions are frozen. Frozen positions are not funded, but they are being maintained to show the City’s commitment to funding them as revenues improve. A global recession and the collapse of oil prices will weigh heavy on Oklahoma City residents, which will affect our revenues in the coming year. Likewise, uncertainty about when a vaccine will be widely available makes it difficult to predict how quickly the economy will recover. Each of these concerns affect our largest revenue source – sales tax. As in past years, the City has worked with Dr. Russell Evans to develop our sales tax estimate for FY21. Dr. Evans is the Executive Director of the Steven Agee Economic Research and Policy Institute and Associate Professor of Economics at Oklahoma City University. His outlook is for sales tax to be down between 5.9% and 6.5% in FY21. To put that in context, the worst annual decline in sales tax for Oklahoma City during the 1980’s was negative 4.7% in FY87. The largest annual decline the City has seen in the last 40 years was negative 7.3% in FY10 during the Great Recession. The City budget is built using a forecast of a 5% decline in sales tax in FY21. While this is more optimistic than Dr. Evans’ forecast, we felt the high level of uncertainty about the future state of the economy allows for some latitude as we project forward. It should be noted that the focus on controlling expenses will continue into FY21 to ensure we keep expenses in line with revenues. The current hiring freeze will be extended into FY21 and we will be judicious in capital spending and other
Table of Contents

Message From the City Manager
Introduction
A-6
areas where we have more flexibility to rein in spending as needed. In addition, the City is in the enviable position of having strong operating reserves in the General Fund should revenue fall below our projections. A full discussion of our various revenue sources can be found in the Revenue Summary section of the budget book on page B-2. MAPS 4 FY21 marks the first full year of MAPS 4 revenue collections as collections began on April 1, 2020. This once cent General Fund sales tax will be collected in the non-operating portion of the General Fund and transferred to the MAPS 4 Program Fund where the various projects will be funded. This year the citizen advisory board and subcommittees will be constituted. They will begin to work with consultants and our MAPS Office to develop the implementation plan for the 16 projects that address neighborhood and human needs and provide for quality of life and job-creating initiatives. For FY21, the budget is $120.6 million. The MAPS program is cash funded with no debt. The implementation plan guides the order and sequencing of projects based on the balance being built up in the fund to “pay as you go.” As Mayor Holt said recently, “It is always a good time to invest in ourselves, but MAPS 4 turned out to be remarkably well-timed. It gives me a lot of optimism for our city’s future.” Better Streets, Safer City Collections ended March 31, 2020 for the temporary once cent Better Streets, Safer City sales tax. The tax was projected to bring in $240 million, but collections totaled over $254 million. The Community and Neighborhood Enhancement Advisory Board, which is the citizen advisory board for the tax, will recommend to Council how to direct the excess collections. Work will continue in FY21 with a budget of $200.1 million for projects that have already begun and those that have been identified by the citizen advisory board. MAPS 3 Approved by voters in 2009, MAPS 3 is a $777 million capital improvement program. MAPS 3 has funded construction of the Oklahoma City Streetcar, Riversports Rapids whitewater facility and rowing infrastructure on the Oklahoma River, the Bennett Event Center at the Oklahoma State Fairgrounds, Scissortail Park, four Senior Health and Wellness Centers and trails and sidewalks throughout the City. The cover of the budget book is a picture from the opening weekend of Scissortail Park last year, which has provided an engaging green space just south of downtown. The new MAPS 3 convention center will open in FY21 and plans for the next two Senior Health and Wellness Centers and the lower portion of Scissortail Park are underway. Total revenue in the MAPS 3 fund exceeded estimates and the MAPS 3 Citizens Advisory Board recommended the Council allocate funds from the surplus to several projects. In FY21, the remaining funds and interest earnings are budgeted for a total of $183.5 million. Major Budget Changes With the dramatic declines in sales tax at the end of FY20 and projections for further declines in FY21, significant reductions were required from departments. I will address some of the most significant reductions here, but more detail on the changes in each department can be found in Section C of the budget book.
Table of Contents

Message From the City Manager
A-7
Introduction
City Manager’s Office – The MAPS Office cut three vacant positions to align staffing with the workload during the early phases of MAPS 4. The Executive Assistant to the City Manager position is cut and the Chief Innovation Officer position is frozen. Frozen positions do not have funding for salary, but the position is retained to indicate it is a priority when revenues improve. The Print Shop lost a full-time employee in the Public Information Office. Additionally, the Economic Development program’s two staff were transferred to the Finance Department. Development Services – A 10% reduction in staff led to cuts of 20 positions across the department. Animal Welfare is cutting three new positions that were added as overage positions last year but were never filled and a supervisory position to oversee them. These positions were created to increase service levels by assigning officers to different parts of the city and extend our capacity to work evenings. Existing officers will still respond to priority one calls after hours as we have done in the past, so the community will not experience any reduction in existing service levels due to this cut. In the Development Center, two vacant Plans Examiner and a Code Tech position are being cut; however, capacity may be offset by efficiencies gained from Online Plan Review once fully implemented. Two other positions in Code Administration and Permits are being cut. Existing personnel are expected to be able to absorb their workload due to a reduced demand for customer service from instituting the Online Business Licensing program. Two vacant inspector positions are being cut. Although this may cause the time to perform building and electrical inspections to slow, the overall impact may be minimized with the new ability to conduct video inspection and re-inspection. Code Enforcement is cutting two positions in Abandoned Buildings and two in Nuisance Abatement and combining the Abandoned Buildings Program into the Nuisance Abatement Program. All proactive property maintenance functions of the Abandoned Buildings Program will continue as a component of the overall program rather than a stand-alone effort. Public safety response billing, which is one of the primary functions of the Abandoned Buildings program, has been largely automated for greater efficiency and will now fall under the larger billing processes of Nuisance Abatement. Finally, Code Inspections is cutting five vacant inspector positions, which will require the department to focus resources on working complaints and decrease proactive code enforcement efforts. Finance – Cuts in Accounting (3 positions), Revenue Management (1 position), Purchasing and Payment Processing (1 position), Financial Planning and Management (1 position) and Risk Management (1 position) along with the addition of Economic Development (2 positions) result in a net reduction of five positions (5.4%). Fire – The Fire Department is taking several steps to control costs in FY21. First is freezing 21 firefighter positions that were added to staff Fire Station 38 that is under construction. The station will not be completed before July 1, 2021, so funding for those positions was eliminated from the budget. Funding must be restored in order to staff Fire Station 38 when it is complete. Another cost saving strategy is to limit the amount of call-back overtime used by the Department to maintain minimum staffing of all apparatus. To accomplish this, the Department will temporarily take select apparatus out of service. The Fire Department will also bring the cleaning of Personal Protective Equipment (PPE) in house to meet National Fire Protection Association (NFPA) standards. The department can provide the service for about the same cost as the contract in the current year and anticipates saving $66,000 per year thereafter.
Table of Contents

Message From the City Manager
Introduction
A-8
General Services – The Building Maintenance, Repair and Enhancement Program loses four positions – two Plumbers, one Building Maintenance Mechanic II and a Building Heat and Air Technician. The Vehicle and Equipment Maintenance Program cuts a Master Mechanic. The reduction of the Mechanic and a cut in the contractor for operation of the parts counter will result in reduced hours of the Vehicle Maintenance shop from 14 hours (5 am to 7 pm) to 11 hours per weekday (6 am to 5pm). Municipal Courts – A reduction of nine positions and significant line item reductions are proposed. The most noticeable impact will be a reduction in the hours the front counter is open to take payments. Hours will change from 7 am to 7 pm seven days a week to 7:30 am to 5:30 pm weekdays. Parks and Recreation – A total of thirteen positions were eliminated in the Parks and Recreation Department. Grounds Management, the Department’s largest line of business, cut nine positions. These reductions will result in reducing the frequency of mowing City parks from every two weeks to every three or four weeks. The Natural Resources Line of Business loses a position and part-time funding, while the Administration Line of Business loses two positions. In addition, the Parks Department has identified two aging community centers, Douglass and Sellers, as redundant and inefficient to serve, and recommends closing them. Douglass community center has an annual attendance of only around a hundred people and provides a redundancy in service to nearby Pitts Park community center. The building has structural concerns and will be demolished when the new Willa D. Johnson Recreation Center opens in 2022. Sellers, which is near Southern Oaks and Taylor community centers, creates another redundancy in service. Its attendance is comprised primarily from two programs, which will be moved to Southern Oaks. With the closure of these two facilities, a full-time position and part-time staff in the Recreation, Health and Wellness Line of Business can be eliminated. Police – The reduction faced by Police and Fire was smaller than General Fund Departments, at 3.3%. Despite this, the reductions they are implementing are significant. Thirty-four officer positions will be frozen in FY21. Again, frozen positions are not funded, but remain in the budget with the expectation they will be restored when funding is available. On the civilian side, Police cut twelve positions. Two positions in the Administration Line of Business, a Systems Analyst II and Systems Analyst III will impact the Department’s ability to integrate Police systems and implement newer technology. In the Public Safety Support Line of Business five Report Clerk positions were cut. This is expected to delay report review and validation. In the Investigations Line of Business, the reduction of three positions, a Property Crime Specialist, a Senior Crime Analyst and an Administrative Support Technician will reduce the civilian support available to investigators. Two other administrative support positions are deleted in the Operations and Public Safety Support lines of business. Public Transportation and Parking – Funding from the CARES Act for transit agencies will make up for a $9 million reduction in General Fund support for public transportation without affecting service levels. The more significant impact on public transit operations has been the service modifications necessary to operate safely during a pandemic, such as limiting the number of seats available on buses. During this difficult year, funding is eliminated for the Oklahoma River Ferry Cruises and for Spokies bike share program with the assumption that the services will be restored in future years as revenue improves. The Off-Street Parking Program has been significantly impacted by the reduced
Table of Contents

Message From the City Manager
A-9
Introduction
number of business and event-related parkers due to the coronavirus. Two positions have been reduced to reflect lower activity in various programs. Public Works – Public Works reduced staffing by 4.5%, which is 19 positions. Streets, Traffic and Drainage Maintenance represents 57% of the employees in the department and 14 positions were deleted, leaving 228 in the line of business. Fortunately, all of the positions being deleted will be vacant on July 1, so the reduction in service should be minimal compared to current levels, as will the impact on employees. The other five reductions are spread between the Administration, Engineering, Project Management and Storm Water Quality Lines of Business. Utilities – The Utilities Department has experienced a five-fold increase in the number of residential customers who are eligible to have their water shutoff. While many of these residents can arrange for payment plans or make up their late bills once they are back to work, there will be many customers who can’t catch up. Between business and residential customers, this could be almost $1.7 million. Lower demand for Utility services due to the global recession and its impact on the oil and gas industry could result in over $8 million in reduced revenue for the Utility. In response to these revenue shortfalls, the Utilities Department has proposed cutting 20 vacant positions in nearly every line of business. In addition, the Department will delay capital improvement projects and scheduled replacement of some equipment to keep revenues and expenditures in balance. Efficiency Improvements While departments have had to make many reductions, there are several efforts to improve efficiency to mitigate the impact of the cuts. The Development Services Department is implementing a Remote Video Inspection Program. This lets contractors communicate with inspectors to complete certain types of inspections via Skype, eliminating travel to the construction site. This will help offset reductions in building-related inspectors. Through support from the IT Department, the Development Center has instituted an Online Business License Process. All functions can now be completed electronically online, eliminating the exchange of paper forms. As part of this software upgrade, mass mailings to contact customers about the need to renew their business licenses can be done through an automated electronic process. This gains efficiencies in time previously spent to prepare the mailings and reduces the costs for paper and postage.
Multiple departments are working together to implement an Electronic Plan Review Process. This process will help streamline and automate the plan review process that touches Development Services, Fire, Planning, Public Works and Utilities. With the reduction in hours at the Courts front counter, two Municipal Court staff are being transferred to the newly renamed Compliance and Enforcement Services Line of Business. They will proactively contact defendants with warrants to help resolve barriers to handling their court case.
Table of Contents

Message From the City Manager
Introduction
A-10
Creation of a business service center on the first floor of the James D. Couch Municipal Building will consolidate counter services for several departments. This will serve customers more efficiently and minimize public access within the building to help limit COVID-19 exposure and improve building security. Council Strategic Priorities The City Council developed the current strategic priorities in the fall of 2017. These priorities provide guidance for department business plans and budget preparation. The City Council’s Strategic Priorities are:
Promote safe, secure, and thriving neighborhoods Develop a transportation system that works for all residents Maintain strong financial management Enhance recreational opportunities and community wellness Encourage a robust local economy Uphold high standards for all city services Continue to pursue social and criminal justice initiatives
We were unable to bolster our efforts in these areas because of the reduced revenue available, however, we did work to limit reductions in these priority areas. The full descriptions of these priorities and the results used to monitor progress in each area are discussed on page A-11. Our annual resident survey is one of the ways we measure how well we are serving residents. We are conducting the survey again this year in July, just as these reductions are taking effect. The survey, along with our internal performance management process, helps track how we are doing at delivering services. We work every day to meet the expectations of our residents and businesses to make Oklahoma City a great place to live, work and play. In the coming year our staff will be working to maintain our high resident satisfaction ratings, even with reduced staff. Compliance with Budgeting and Financial Planning Policies The City Council has adopted policies to guide financial planning and budget decisions. A summary of these policies can be found on online at https://www.okc.gov/departments/finance/policies and a table addressing policy compliance is on page B-41. Conclusion FY21 will be a challenging year as we face the new reality of life during a pandemic and deal with a severe contraction in the oil and gas industry. The investments Oklahoma City residents have made in themselves will be critical to the recovery from this economic downturn. Improvements made through the MAPS program and now MAPS 4 along with improved infrastructure due to the Better Streets Safer City program, will make Oklahoma City an attractive place to live, work and play for many years to come.
Table of Contents

Message From the City Manager
A-11
Introduction
The new MAPS 3 Convention Center and the Omni Convention Center Hotel will open this fiscal year. As business travel rebounds, Oklahoma City will be an attractive location for meetings trade shows and conferences. The First Americans Museum is also slated to open late in FY21, bringing a new world-class museum to our city that promotes awareness and understanding of the cultural diversity, authentic history and contributions of the 39 First American Tribal Nations in Oklahoma today.
I want to thank City employees for their unwavering commitment to public service during the pandemic. Each time we are faced with uncertainty, they stand tall and help solve problems head on. Despite these tough times, they continue to find ways to improve the services we offer the public. I’m constantly amazed by the work they do to keep Oklahoma City moving forward and appreciate their willingness to dedicate their lives and expertise to serving others. I look forward to working together to meet the opportunities and challenges of the coming year. Respectfully submitted, Craig Freeman
Table of Contents

Council Priorities and Key Results
Introduction
A-12
In October of 2017, the Oklahoma City Council met to identify the major issues confronting the City over the next two to five years. They reviewed and updated previously established Council Priorities and the progress indicators or key results that the City should achieve in order to successfully address the identified issues. The following are the Council Priorities and Progress Indicators adopted by the City Council and the departments which most directly align with those priorities and progress indicators.
Promote safe, secure, and thriving neighborhoods Neighborhoods are the building blocks of a great city and residents expect safe neighborhoods that provide a high quality of life. We will continue to promote strong and safe neighborhoods by providing public safety services, effective code enforcement, and
support for neighborhood revitalization efforts. We will work with our partners to support education initiatives that encourage strong neighborhood schools.
Preamble Our priorities are grounded in the lessons of the City’s history and the values of inclusive-ness, mutual respect and self-reliance that are the hallmarks of our future. We will be re-sponsive to our residents’ needs as we address these priorities and continue to deliver what we promise. Our focus is to improve the quality of life for every Oklahoma City resident.
PROGRESS INDICATORS
PRIMARY DEPARTMENTFY19 Actual
FY20
Estimate
FY20
Target
FY21
Target
Police % of person crimes cleared by arrest,
prosecution or other means61% 51% 70% 70%
% of property crimes cleared by arrest,
prosecution or other means29% 25% 30% 30%
% of residents who report they feel safe 50% 50% 55% 55%
% of Life Threatening calls (Priority 1)
responded to within 9 minutes 30 seconds
from the time a 911 call is answered until
officer arrival
73% 73% 80% 80%
Fire % of emergency incidents responded to within
7 minutes 65% 66% 70% 70%
EMSA % of EMSA/Police Call Taker incidents
dispatched in 2 minutes62% 63% 70% 70%
Planning % of residents who are satisfied with the
overall quality of their neighborhood64% 64% 65% 65%
Development Services % of property maintenance and code violations
resolved voluntarily63% 64% 75% 65%
Table of Contents
Introduction
A-13
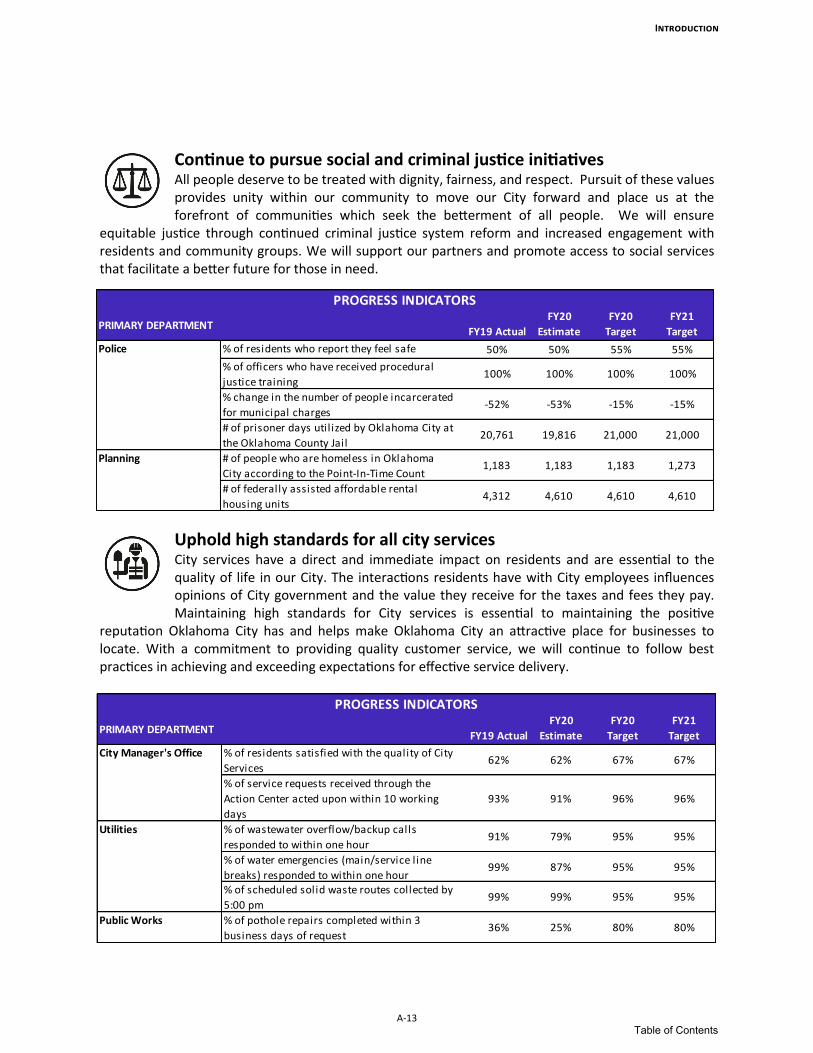
Continue to pursue social and criminal justice initiatives All people deserve to be treated with dignity, fairness, and respect. Pursuit of these values provides unity within our community to move our City forward and place us at the forefront of communities which seek the betterment of all people. We will ensure
equitable justice through continued criminal justice system reform and increased engagement with residents and community groups. We will support our partners and promote access to social services that facilitate a better future for those in need.
Uphold high standards for all city services City services have a direct and immediate impact on residents and are essential to the quality of life in our City. The interactions residents have with City employees influences opinions of City government and the value they receive for the taxes and fees they pay. Maintaining high standards for City services is essential to maintaining the positive
reputation Oklahoma City has and helps make Oklahoma City an attractive place for businesses to locate. With a commitment to providing quality customer service, we will continue to follow best practices in achieving and exceeding expectations for effective service delivery.
PROGRESS INDICATORS
PRIMARY DEPARTMENTFY19 Actual
FY20
Estimate
FY20
Target
FY21
Target
% of residents satisfied with the quality of City
Services62% 62% 67% 67%
% of service requests received through the
Action Center acted upon within 10 working
days
93% 91% 96% 96%
% of wastewater overflow/backup calls
responded to within one hour91% 79% 95% 95%
% of water emergencies (main/service line
breaks) responded to within one hour99% 87% 95% 95%
% of scheduled solid waste routes collected by
5:00 pm99% 99% 95% 95%
Public Works % of pothole repairs completed within 3
business days of request36% 25% 80% 80%
Utilities
City Manager's Office
PROGRESS INDICATORS
PRIMARY DEPARTMENTFY19 Actual
FY20
Estimate
FY20
Target
FY21
Target
% of residents who report they feel safe 50% 50% 55% 55%
% of officers who have received procedural
justice training100% 100% 100% 100%
% change in the number of people incarcerated
for municipal charges-52% -53% -15% -15%
# of prisoner days util ized by Oklahoma City at
the Oklahoma County Jail20,761 19,816 21,000 21,000
# of people who are homeless in Oklahoma
City according to the Point-In-Time Count1,183 1,183 1,183 1,273
# of federally assisted affordable rental
housing units4,312 4,610 4,610 4,610
Planning
Police
Table of Contents
A-14
Introduction
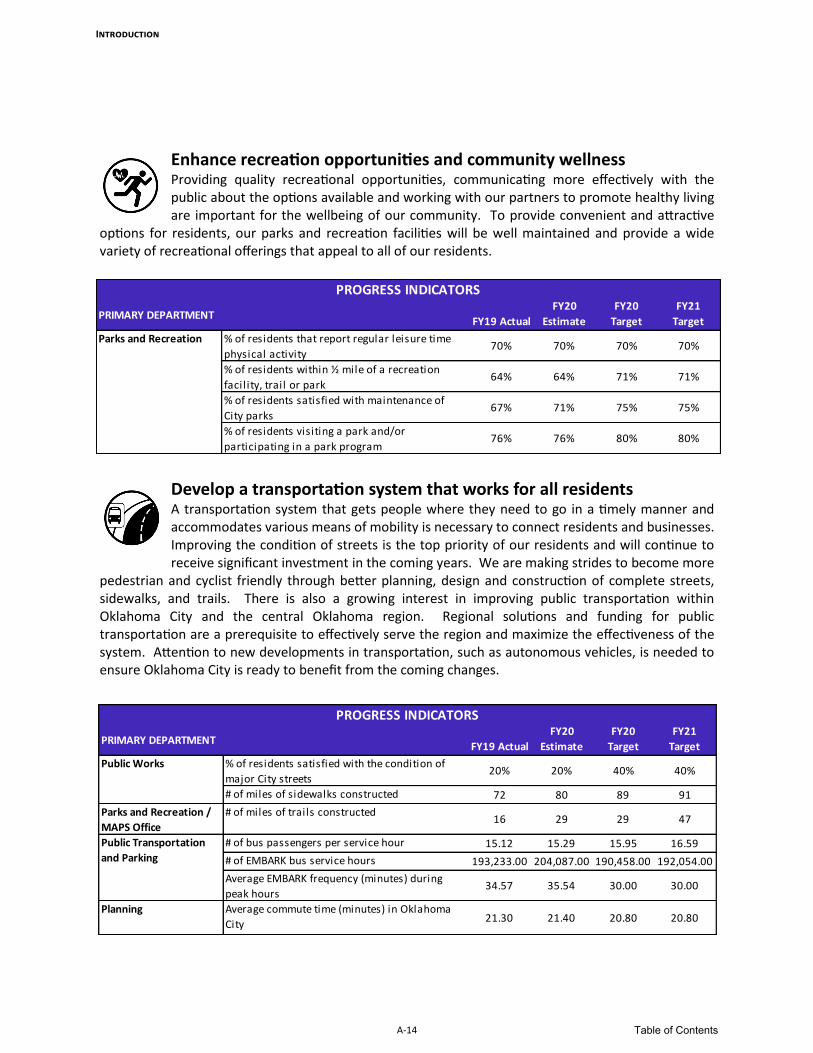
Enhance recreation opportunities and community wellness Providing quality recreational opportunities, communicating more effectively with the public about the options available and working with our partners to promote healthy living are important for the wellbeing of our community. To provide convenient and attractive
options for residents, our parks and recreation facilities will be well maintained and provide a wide variety of recreational offerings that appeal to all of our residents.
Develop a transportation system that works for all residents A transportation system that gets people where they need to go in a timely manner and accommodates various means of mobility is necessary to connect residents and businesses. Improving the condition of streets is the top priority of our residents and will continue to receive significant investment in the coming years. We are making strides to become more
pedestrian and cyclist friendly through better planning, design and construction of complete streets, sidewalks, and trails. There is also a growing interest in improving public transportation within Oklahoma City and the central Oklahoma region. Regional solutions and funding for public transportation are a prerequisite to effectively serve the region and maximize the effectiveness of the system. Attention to new developments in transportation, such as autonomous vehicles, is needed to ensure Oklahoma City is ready to benefit from the coming changes.
PROGRESS INDICATORS
PRIMARY DEPARTMENTFY19 Actual
FY20
Estimate
FY20
Target
FY21
Target
% of residents that report regular leisure time
physical activity70% 70% 70% 70%
% of residents within ½ mile of a recreation
facility, trail or park64% 64% 71% 71%
% of residents satisfied with maintenance of
City parks67% 71% 75% 75%
% of residents visiting a park and/or
participating in a park program76% 76% 80% 80%
Parks and Recreation
PROGRESS INDICATORS
PRIMARY DEPARTMENTFY19 Actual
FY20
Estimate
FY20
Target
FY21
Target
Public Works % of residents satisfied with the condition of
major City streets20% 20% 40% 40%
# of miles of sidewalks constructed 72 80 89 91
Parks and Recreation /
MAPS Office
# of miles of trails constructed16 29 29 47
# of bus passengers per service hour 15.12 15.29 15.95 16.59
# of EMBARK bus service hours 193,233.00 204,087.00 190,458.00 192,054.00
Average EMBARK frequency (minutes) during
peak hours34.57 35.54 30.00 30.00
Planning Average commute time (minutes) in Oklahoma
City21.30 21.40 20.80 20.80
Public Transportation
and Parking
Table of Contents

Introduction
A-15
Maintain strong financial management
Prudent financial leadership will allow us to continue to meet resident needs and maintain resident confidence as we uphold our commitment to manage cost growth within available revenues. Expanding the revenue base through greater diversification of revenue sources
will help the City meet the needs of our residents as the City grows. We expect sound financial leadership from elected, appointed and professional City staff.
Encourage a robust local economy A strong economy that supports job creation and improves the local tax base is fundamental to our growth. To make Oklahoma City an attractive option for current and future residents and businesses, we will encourage a high quality of life for residents and promote a pro-business environment that makes it clear we value the contribution of a
strong business community. We recognize the need to foster innovation and embrace technological advances to move our City forward.
PROGRESS INDICATORS
PRIMARY DEPARTMENTFY19 Actual
FY20
Estimate
FY20
Target
FY21
Target
Bond Rating AAA/Aaa AAA/Aaa AAA/Aaa AAA/Aaa
% of General Fund budget maintained in
unbudgeted reserve21.66% 22.58% 20.00% 20.00%
% of General Fund revenue from sales tax 55% 74% 56% 56%
Finance
PROGRESS INDICATORS
PRIMARY DEPARTMENTFY19 Actual
FY20
Estimate
FY20
Target
FY21
Target
Finance # of people employed 666,083 667,487 664,751 672,063
Average weekly earnings 884 906 911 933
Airports # of enplanements at Will Rogers World
Airport 2,203,565 2,281,979 2,248,195 2,293,159
Table of Contents

Leading for Results and the Budget Process
A-16
Introduction
Leading for Results (LFR) is the “way we do business.” What this means is that the City uses a performance management system for all City departments linking department operations to a strategic business plan. The strategic business plan is organized into programs with each program having an established budget and family of performance measures. The performance measures are used to set department goals and measure progress in achieving those goals using the resources allocated to programs. The entire process is focused on the benefit received by the customer (residents). Leading for Results provides better information to decision makers, which in turn helps them determine how to allocate resources. The Leading for Results performance management system includes planning, employee performance, budgeting, data collecting, reporting, evaluating, and decision-making. The Strategic Business Plan contains the information needed to perform these functions and provides a concise overview of departmental operations. The graph below illustrates the performance management process. As the arrows indicate, each step is critical and flows into the next, which creates a continuous cycle.
Delivering What We Promise
Table of Contents

Introduction
A-17
Planning for Results: Focuses the department on long-term strategic (2-5 years) goals and operational results by building a Strategic Business Plan. Department business plans are summarized in each department section of the budget book and are available at www.okc.gov.
The strategic portion of the plan: Begins with an assessment of the future where departments identify the biggest challenges impacting them and their customers over the next 2-5 years. These challenges are then refined into Issue Statements which help the department clearly communicate what the trend is that they are facing and the consequences of the trend if not addressed. Once the Issue is clearly stated, departments develop Strategic Results which are typically stretch goals that, if achieved, will demonstrate the department’s ability to respond to the challenges they identified as Issue Statements. Strategic Results are specific, measurable, and describe what the customer will experience.
The operational portion of the plan: Organizes the services each department provides around results for customers. Similar services are grouped into programs and each program has a “Family of Measures.” Similar programs are organized into lines of business. This organization serves as the structure for the City’s Performance Based Program Budget. All programs engaged in delivering and reporting performance are structurally aligned to Strategic Business Plans.
Employee / Contractor Performance Management: Links the organization’s goals and performance measures to executive, employee, and contractor performance plans so that work unit efforts can be aligned to the organization’s strategic and operational results.
Budgeting for Results: Structures the budget around programs and lines of business and the results generated for customers, integrating results and cost information to improve resource allocation decisions by both departments and policymakers.
Performance Data Collection: Provides the means by which Oklahoma City can accurately capture and review performance information to assist in decision-making and focusing on performance and results.
Reporting Results: Provides clear, concise performance reports on the results being achieved for the community, policymakers, and employees, thus demonstrating accountability for the investments citizens make in their government.
The LFR Performance Management System
Table of Contents

A-18
Introduction
Evaluating Results: Compels a thoughtful examination of performance data to highlight opportunities for service level improvements and improved customer experiences.
Decision-Making for Results: Deploys performance data at all levels to ensure that decision makers (policy level, enterprise, strategic, and operational) can make more informed decisions, resulting in improved customer experiences and continued confidence by citizens in government.
Leading for Results and the Budget Process: The budget addresses step three in the Leading for Results process. Each department reports performance data for a family of measures which are included in the performance data volume of this document.
Key Terms in the Leading for Results Process • Issue Statements: (Issues): Identify the critical trends that will impact the department and
customer over the next 2-5 years • Strategic Results: 2-5 year goals that, if achieved, demonstrate how the department is
proactively responding to issues • Strategy: The actions a department plans to take to achieve a strategic result. • Line of Business: A collection of programs in a department with similar purposes. • Program: The smallest section of a department organized around services provided and
results customers receive. • Family of Measures: The set of performance measures for an individual program. A primary
focus being on the Result measures (or outcomes) that demonstrate the benefit the customer receives from the program. The remainder of the Family of Measures includes Output, Demand, and Efficiency measures.
Table of Contents

Introduction
A-19
FY 2021 Budget Development Process
How this Budget was Prepared This budget is the result of a yearlong strategic and financial planning process. In addition to the budget itself, this process generates a capital improvement plan and budget for the three trusts for which the Mayor and City Council serve as trustees. The timeline on the next page describes the schedule and the major actions taken. The planning process began with the update of department strategic business plans that form the base for performance-based budget planning. At the same time, preliminary revenue and expenditure estimates were made to guide budget development.
Departmental Budget Submissions The budget documents were distributed to all departments in December with instructions for preparing their budgets. Departments submitted their budgets to the Office of Management and Budget and included in these submissions any requests for additional resources.
City Manager’s Review During February and March, the Office of Management and Budget analyzed the proposed budgets submitted by the departments. Recommendations were discussed with the departments and the City Manager’s Office made decisions regarding proposed changes to the budgets. Depending on the current financial climate, the changes may be to add new services and enhance existing services or to make reductions necessary to balance revenues and expenses. After the budget review process, revenue projections were revisited using the nine months of actual data that was then available. As revenue and expenditure projections were fine-tuned, final decisions were made regarding the City Manager’s recommended budget. The result was the submission of the proposed budget to the City Council.
Office of Management and Budget Staff
Doug Dowler Budget Director [email protected]
Jeff Mosher Management & Budget Specialist
Lindsey McNabb Management & Budget Specialist
Ian Hutcheson Management & Budget Analyst
Latisha Jackson Management & Budget Analyst
Daniel Dorgan Management & Budget Analyst Erika Vandersypen
Management & Budget Specialist
Lori Hird Management & Budget Specialist
Nichole Stover Management & Budget Analyst
Jeniphur King Management & Budget Analyst
Table of Contents

A-20
Introduction
Budget Calendar For Fiscal Year 2021
Sep –Nov 2019 Departments update strategic business plans for FY21 in the Leading for Results process November 2019 OMB begins process of estimating FY21 revenues. November 2019 OMB prepares Human Resources cost worksheets and budget preparation reports. December 2019 City Manager establishes budget targets. January 2020 OMB conducts budget training classes and distributes operating budget instructions. February 2020 OMB hosts the City Council Budget Workshop. The Five Year Forecast is presented to Council. Departments submit operating budget and capital requests to OMB. OMB begins review of departmental budget requests. March 2020 Assistant City Managers review departmental budget requests. OMB forwards budget recommendations to the City Manager. April 2020 OMB estimates a sharp decline in projected revenue due to COVID-19. Departments submit budget cuts to meet new revenue targets. May-Jun 2020 City Manager reviews budget submissions. Annual budget introduced on May 26. City Council holds public hearings and considers the proposed budget on May 26, June 2 and June 9. City Council adopts the budget on June 16. OMB files adopted Annual Budget with State Auditor and Inspector by June 30. July 2020 FY 2021 Adopted Annual Budget becomes effective July 1.
Table of Contents

Overview of Oklahoma City
Introduction
A-21
The City of Oklahoma City is the capital of the State of Oklahoma and is the second largest municipality by land area in the United States, with a total area of 620.4 square miles. The city’s 2019 population was estimated at just over 650,000 and the metropolitan statistical area’s (MSA) population was estimated at nearly 1.4 million. The population of the MSA has grown 11.4% since 2010, almost twice as quickly as the country as a whole.
Oklahoma City continues to grow as a regional economic hub, boasting a $70.5 billion MSA economy in 2019. With an unemployment rate of 2.9% in January 2020, the area has one of the ten lowest jobless rates in the nation among large metro areas. The city offers one of the lowest costs of living for a major American city at around 15% lower than the national average. Property values have increased 20% over the past five years, while overall housing costs are around 44% lower than the U.S average. Oklahoma City has been a transportation and commercial center in Oklahoma since before statehood in 1907. During the famous Oklahoma Land Run of 1889, the city was settled in a single day when nearly 10,000 pioneers staked out territory in what is now Oklahoma City. With the combination of settlers and the large number of Native American nations in the area, many of whom were transplanted from their homes further east , Oklahoma City has developed a unique and complex cultural identity. Incorporated in 1890, the City of Oklahoma City has had a Council-Manager form of government since 1927. In 2018, voters elected David Holt as their next mayor. Mayor Holt heads a Council of eight members, each elected by ward. In addition to ongoing efforts to improve the quality of life in Oklahoma City, recent initiatives have focused a commitment to public safety, neighborhoods, criminal and social justice, financial management, economic growth, recreational services, and transportation.
Table of Contents
Introduction
A-22
Historically, Oklahoma City’s economic base has been closely tied to the energy and agricultural mar-kets. Today, the city’s economic base is more diversified and is seeing growth in the health and tech-nology industries, while remaining a regional center for education and government. The largest em-ployers in the MSA include the State of Oklahoma, The City of Oklahoma City, Tinker Air Force Base, and the University of Oklahoma. Companies with headquarters in Oklahoma City include American Fidelity Assurance Company, BancFirst, Chesapeake Energy, Continental Resources, Devon Energy, Hobby Lobby Stores, Love’s Travel Stops & Country Stores, OG&E Energy, MidFirst Bank, Paycom and Sonic Corporation. Vital among the City’s assets are ample water supplies and its central location. Interstate highways I-35 North/South, I-40 East/West and I-44 converge in Oklahoma City and provide transportation links to the rest of the nation. The new I-40 Crosstown Expressway relocation, which opened in 2013, al-lows faster travel by incorporating 10 lanes of traffic. These ground transportation routes, together with Will Rogers World Airport, make the City a regional transportation hub.
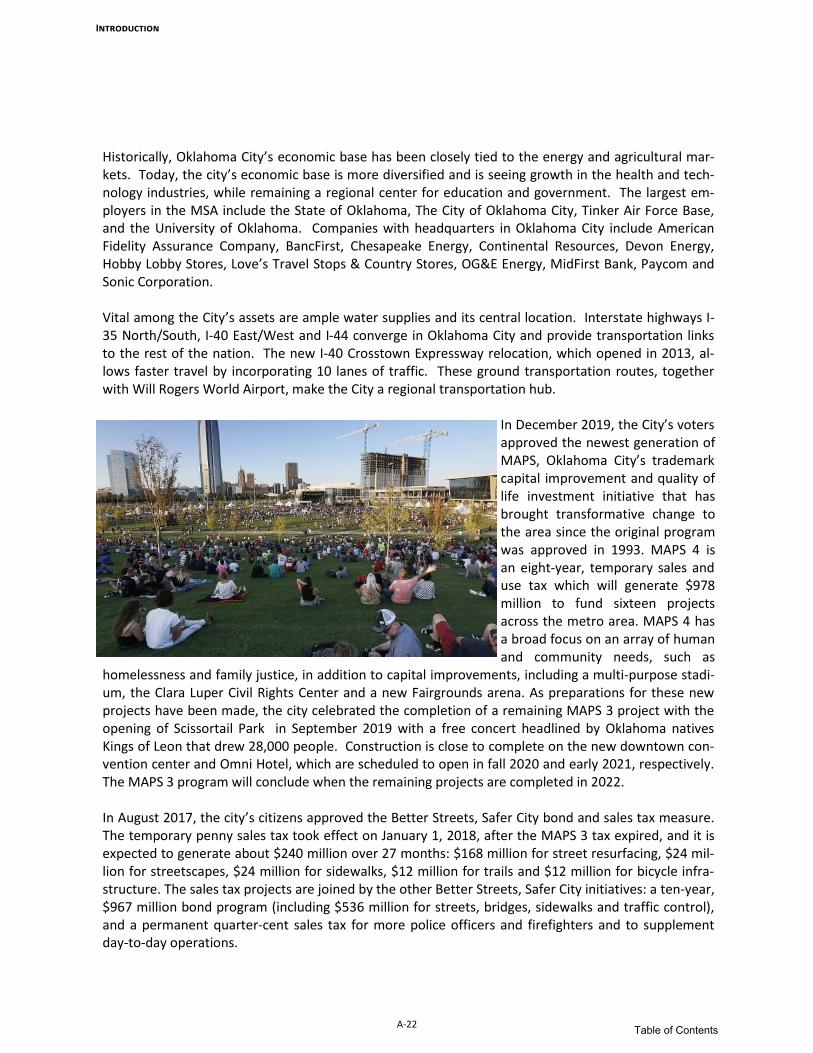
In December 2019, the City’s voters approved the newest generation of MAPS, Oklahoma City’s trademark capital improvement and quality of life investment initiative that has brought transformative change to the area since the original program was approved in 1993. MAPS 4 is an eight-year, temporary sales and use tax which will generate $978 million to fund sixteen projects across the metro area. MAPS 4 has a broad focus on an array of human and community needs, such as
homelessness and family justice, in addition to capital improvements, including a multi-purpose stadi-um, the Clara Luper Civil Rights Center and a new Fairgrounds arena. As preparations for these new projects have been made, the city celebrated the completion of a remaining MAPS 3 project with the opening of Scissortail Park in September 2019 with a free concert headlined by Oklahoma natives Kings of Leon that drew 28,000 people. Construction is close to complete on the new downtown con-vention center and Omni Hotel, which are scheduled to open in fall 2020 and early 2021, respectively. The MAPS 3 program will conclude when the remaining projects are completed in 2022. In August 2017, the city’s citizens approved the Better Streets, Safer City bond and sales tax measure. The temporary penny sales tax took effect on January 1, 2018, after the MAPS 3 tax expired, and it is expected to generate about $240 million over 27 months: $168 million for street resurfacing, $24 mil-lion for streetscapes, $24 million for sidewalks, $12 million for trails and $12 million for bicycle infra-structure. The sales tax projects are joined by the other Better Streets, Safer City initiatives: a ten-year, $967 million bond program (including $536 million for streets, bridges, sidewalks and traffic control), and a permanent quarter-cent sales tax for more police officers and firefighters and to supplement day-to-day operations.
Table of Contents

Introduction
A-23
Performing arts groups such as the Oklahoma City Philharmonic, Lyric Theater, and Ballet Oklahoma contribute to the City’s cultural environment. The new facility for the Oklahoma Contemporary art museum was completed in 2020, beginning a new chapter for the institution founded in 1989. Other popular attractions include the National Cowboy and Western Heritage Museum, the Oklahoma City Museum of Art, the Oklahoma City National Memorial, the Oklahoma History Center and the National Softball Hall of Fame.
Since 2008, the city has been the home of the National Basketball Association’s Oklahoma City Thunder, who perform in the 18,203-seat Chesapeake Energy Arena. Since moving to Oklahoma City, the franchise has been one of the most competitive teams in the league, and has fielded some of the world’s brightest talents. The City has been the site of numerous Big XII championships in collegiate sports and has hosted the opening rounds of the NCAA basketball tournament, the Wrestling Championships and the Women’s College World Series. The USL Championship professional men’s soccer team Energy FC is one of the founding clubs of the league’s Western Conference and plays in the historic Taft Stadium. In May 2016, the $45.3 million RIVERSPORT OKC center opened to provide whitewater rafting and kayaking on an 11-acre facility adjacent to the Oklahoma River. The Center features world-class rapids for elite athletes as well as recreational opportunities for families. The City was designated as the U. S. Olympics Training Site for canoes, kayaks and rowing in July 2009 and hosted the U.S. Olympic trials in 2016. The Oklahoma River is the only river to receive this coveted designation. In January 2016, the City entered into an agreement with the State of Oklahoma and the Chickasaw Nation to complete the First Americans Museum (FAM) along the Oklahoma River. The Center will provide 85 acres of park space with walking trails and interpretive art, and will serve as a venue for native performers and educational exhibits. The FAM’s opening is planned for spring 2021. With a quintessentially American history and a future with an undeniable energy, the city and its people are characterized by a sense of determination and optimism that will guarantee the best is yet to come for Oklahoma City.
Table of Contents

Oklahoma City in the News
A-24
Introduction
OKC now the 25th-largest metro in the U.S. June, 2020 - U.S. Census Bureau In the most recent annual population estimates released. OKCPS produces top two high schools in Oklahoma April, 2020 - U.S. News & World Report According to U.S. News & World Report, the top two high schools in Oklahoma are products of the Oklahoma City Public Schools District, Classen SAS and Harding Prep. Both schools also ranked in the top 100 in the country. In total, eight out of the top 10 high schools in the state are located in the Oklahoma City MSA. OKC earns AAA bond rating for tenth year in a row April, 2020 - Moody's/S&P Moody’s Investors Service awarded Oklahoma City a AAA Bond rating for the tenth-consecutive year. S&P Global Ratings also affirmed the City’s top-notch bond rating. Freelancers should look to OKC February, 2020 - Fundera With our stable housing market and low cost of living, it should be no surprise OKC made Fundera.com's "Best 15 U.S. Cities for Freelancers" list. The metro's impressive job-growth rate and self-employment stats also contributed to the high ranking. OKC among Reader's Digest 'best American cities for live music' February, 2020 - Reader's Digest No, it's not just you: there really are a lot more opportunities to see great live music in OKC these days. We've talked a lot about OKC's emergence as a live music destination on this and some of our sister sites, and recently, other outlets have begun to take notice. Another example is Reader's Digest, who last month named OKC among their "Best American Cities for Live Music (Besides Nashville)." Oklahoma City ranked No. 1 place for startups to expand February, 2020 - Zillow Zillow ranked Oklahoma City No. 1 out of 42 large metro areas nationwide for tech companies and start-ups to expand. The study focused on these five factors: housing affordability, market ‘“hotness,” demographics & labor, tech availability and livability. OKC named to Travel+Leisure's Top 50 Destinations in 2020 December, 2019 - Travel+Leisure OKC is just one of seven destinations across the U.S. included in the 2020 list. OKC ranks No. 5 for veterans October 23, 2019 - Veterans United OKC ranks as the No. 5 place in the U.S. to live for veterans according to website VeteransUnited.com. OKC is home to more than 42,000 veterans. Oklahoma City’s resident satisfaction ratings among the best in U.S. October 23, 2019 - OKC.gov According to this year's Citizen Survey, nearly nine out of 10 residents think Oklahoma City is an “excellent” or “good” place to live. The national average for large American cities (population 250,000+) is about half.
Table of Contents

Metro Area Demographic and Economic Data
Introduction
A-25
Metro Area Demographic and Economic Data
$0
$10,000
$20,000
$30,000
$40,000
$50,000
$60,000
2010 2011 2012 2013 2014 2015 2016 2017 2018
Oklahoma City Per Capita Income
0.0%1.0%2.0%3.0%4.0%5.0%6.0%7.0%
2010 2011 2012 2013 2014 2015 2016 2017 2018 2019 2020
Oklahoma City Unemployment Rate
520,000540,000560,000580,000600,000620,000640,000660,000680,000
2009 2010 2011 2012 2013 2014 2015 2016 2017 2018 2019
Oklahoma City Population
Table of Contents

Major Metropolitan Area Employers
A-26
Introduction
Source: Economic Development Division of the Greater Oklahoma City Chamber — September 2019.
Company Name # Employees Sector
State of Oklahoma 47,300 Government
Tinker Air Force Base 24,000 Military
University of Oklahoma - Norman 12,700 Higher Education
FAA Mike Monroney Aeronautical Center 7,000 Aerospace
INTEGRIS Health 6,000 Health Care
Hobby Lobby Stores Inc 5,100 Wholesale & Retail
University of Oklahoma Health Sciences Center 5,000 Higher Education
City of Oklahoma City 4,700 Government
Mercy Hospital 4,500 Health Care
OGE Energy Corp 3,400 Utility
OU Medical Center 3,300 Health Care
SSM Health Care of Oklahoma, Inc. 3,000 Health Care
University of Central Oklahoma 3,000 Higher Education
The Boeing Company 3,000 Aerospace
Norman Regional Hospital 2,950 Health Care
AT&T 2,700 Telecommunications
Devon Energy Corp 2,500 Oil & Gas
Paycom 2,500 Technology
Sonic Corp 2,460 Wholesale & Retail
Oklahoma City Community College 2,100 Higher Education
Midfirst Bank 2,000 Finance
Dell 1,950 Sales & Business Services
Chesapeake Energy Corp 1,800 Oil & Gas
UPS 1,800 Transportation
Love's Travel Stops & Country Stores 1,800 Retail
BancFirst 1,700 Finance
Hertz Corporation 1,700 Rental Services
Enable Midstream 1,600 Oil & Gas
American Fidelity 1,400 Finance/Insurance
Cox Communications 1,400 Telecommunications
Farmers Insurance Group 1,300 Customer Service
Great Plains Coca-Cola Bottling Company 1,300 Beverage Distribution
Johnson Controls 1,200 Manufacturing
Bank of Oklahoma 1,100 Finance
Continental Resources 1,080 Oil & Gas
Dolese Bros. Co. 1,000 Manufacturing
INTEGRIS-Deaconess Hospital 1,000 Health Care
Table of Contents

Quality of Life
Introduction
A-27
The 15-acre Myriad Botanical Gardens is a natural escape in the heart of downtown Oklahoma City, offering vibrant gardens, playgrounds, splash fountains, the Great Lawn, an off-leash dog park and walking and jogging paths. Nestled at the center is the Crystal Bridge Conservatory with a cascading waterfall and tropical and desert plantings within. From sporting and special events at the Bricktown Ballpark, Chesapeake Energy Arena and Cox Convention Center, to theatre and ballet at the Civic Center Music Hall, Oklahoma City has something for everyone. The 12,000-seat Chickasaw Bricktown Ballpark includes shops, luxury suites, and a year-round sports theme restaurant. The Chesapeake Energy Arena , home of the Oklahoma City Thunder, is a 586,000-square-foot state-of-the-art entertainment facility that hosts major concerts as well as sporting and special events. Just steps away from Bricktown, the Cox Convention Center is a 150,000-square-foot event space with arena seating for 16,000. Offering the best of Broadway, theatre, ballet, chorus and orchestra, the Civic Center Music Hall brings world-class entertainment to Oklahoma City. More than just a park, the Scissortail Park will be place for play, culture, wander, celebration and inspiration for everyone. Extending from the core of downtown Oklahoma City to the shore of the Oklahoma River, this 70-acre urban oasis will encompass a café, sports facilities, picnic grove, nature trails, and a tranquil lake with boathouse and paddle boat and board rentals. Inspired by Oklahoma’s state bird, the scissor-tailed flycatcher, the 380-foot-long Skydance Bridge will connect the north section of the park to the south section. Hop on the Oklahoma City Streetcar to explore the diverse and historic districts, and experience the new-found adrenaline reflected by a gleaming downtown. Discover the many restaurants and entertainment venues from the Bricktown Canal and Water Taxi. Take a horse-driven carriage ride to a swanky hotel, gaze in awe at the world’s tallest Chihuly glass tower in the Oklahoma City Museum of Art, or climb to the top of one of the region’s tallest rock climbing walls. An abundant amount of recreation activities, a robust economy, low unemployment rate and an average commute time of 21 minutes, as well as ranking high in housing, healthcare and environmental quality all contribute to the great quality of life Oklahoma offers. As one of the best places for young adults to thrive, this creative and progressive city is buzzing with life.
Table of Contents

Transportation
A-28
Introduction
As a major transportation hub in the south-central United States, Oklahoma City is served by Interstate Highways 35, 40 and 44. The City is headquarters for several motor freight companies with terminals for many others. Major carriers provide interstate passenger bus service and Burlington Northern, Union Pacific and Santa Fe railroads provide freight service. In addition, Amtrak’s Heartland Flyer offers convenient and affordable daily rail service between Oklahoma City and Fort Worth, Texas. Oklahoma City operates three municipal airports. Will Rogers World Airport (WRWA) supports and enhances Oklahoma City economic growth and development through continued improvements to facilities and services. WRWA is served by six major airlines offering non-stop service to 30 airports from Seattle to New York. In early 2019, construction began on a $61.9 million terminal expansion at WRWA, which will include a new east concourse and four new gates. In addition to commercial and cargo service at WRWA, Wiley Post and Clarence E. Page are general aviation airports. Wiley Post is also designated as a reliever airport for WRWA.
EMBARK is Oklahoma City’s municipal transit service, which provides bus routes citywide, and, since 2018, streetcar service to the downtown area. The Oklahoma City Streetcar is a $131 million project that was funded through the MAPS 3 temporary sales tax. Seven cars serve 22 stops in two loops; the Downtown Loop serves all stops seven days a week, while the Bricktown Loop operates on Fridays, Saturdays and Sundays and serves nine stops.
In addition to ride hailing services that have changed the way Americans think about automobile transportation, the addition of motorized scooters to Oklahoma City’s streets has given residents and visitors further freedom over transportation options. Last year, the City adopted a municipal code to address the emergence of motorized scooters and to guarantee that Oklahoma City’s streets continue to be safe for all travelers. With a growing population of 1.42 million covering 6,359 square miles, local governments in the Oklahoma City MSA are adopting an increasingly regional approach to transportation. In February 2019, the cities of Norman, Edmond, Moore, Midwest City , Del City and Oklahoma City agreed to form a regional transit authority to better coordinate their efforts to promote safe, reliable and efficient transportation. In an industry that is quickly transforming to serve greater numbers of people in ways that are more demand-based and sustainable, change is the only constant in the future of transportation for Oklahoma City.
Table of Contents
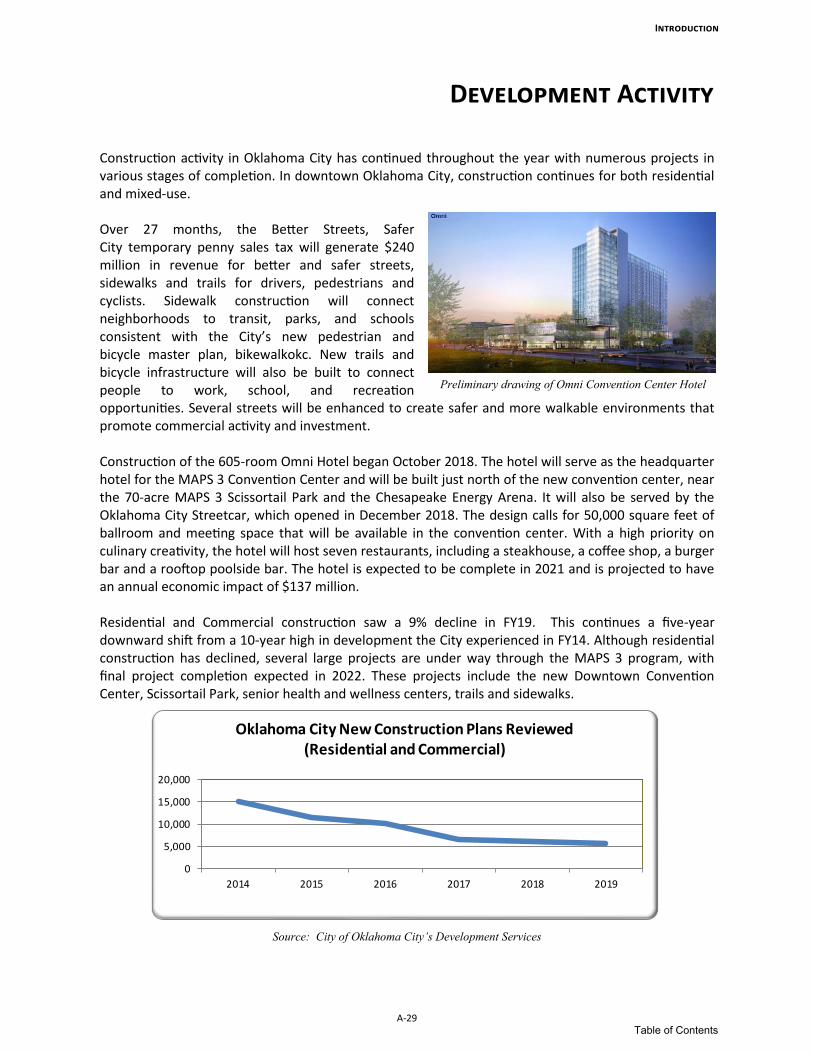
Development Activity
Introduction
A-29
Construction activity in Oklahoma City has continued throughout the year with numerous projects in various stages of completion. In downtown Oklahoma City, construction continues for both residential and mixed-use. Over 27 months, the Better Streets, Safer City temporary penny sales tax will generate $240 million in revenue for better and safer streets, sidewalks and trails for drivers, pedestrians and cyclists. Sidewalk construction will connect neighborhoods to transit, parks, and schools consistent with the City’s new pedestrian and bicycle master plan, bikewalkokc. New trails and bicycle infrastructure will also be built to connect people to work, school, and recreation opportunities. Several streets will be enhanced to create safer and more walkable environments that promote commercial activity and investment. Construction of the 605-room Omni Hotel began October 2018. The hotel will serve as the headquarter hotel for the MAPS 3 Convention Center and will be built just north of the new convention center, near the 70-acre MAPS 3 Scissortail Park and the Chesapeake Energy Arena. It will also be served by the Oklahoma City Streetcar, which opened in December 2018. The design calls for 50,000 square feet of ballroom and meeting space that will be available in the convention center. With a high priority on culinary creativity, the hotel will host seven restaurants, including a steakhouse, a coffee shop, a burger bar and a rooftop poolside bar. The hotel is expected to be complete in 2021 and is projected to have an annual economic impact of $137 million. Residential and Commercial construction saw a 9% decline in FY19. This continues a five-year downward shift from a 10-year high in development the City experienced in FY14. Although residential construction has declined, several large projects are under way through the MAPS 3 program, with final project completion expected in 2022. These projects include the new Downtown Convention Center, Scissortail Park, senior health and wellness centers, trails and sidewalks.
Source: City of Oklahoma City’s Development Services
Preliminary drawing of Omni Convention Center Hotel
0
5,000
10,000
15,000
20,000
2014 2015 2016 2017 2018 2019
Oklahoma City New Construction Plans Reviewed(Residential and Commercial)
Table of Contents

A-30
Introduction
Organization Chart
Authorities and Trusts
Mayor and City Council
Boards and Commissions
City Auditor Municipal Counselor
City Manager Municipal Judges Office of Mayor and City Council
Community Enhancement
Policy and Executive
Leadership
Communications
Municipal Court
City Clerk Airports Development Services
Finance
Administration
Fire
Commercial Aviation
General Aviation
Maintenance
Official City Records
Court Case and Enforcement
Facility Operations
Municipal Judicial Service
Animal Welfare
Code Enforcement
Development Center
Accounting and Financial Reporting
Financial Planning and Mgmt
Purchasing and Payment Processing
Fire Prevention
Operational Services
Information Technology
Human Resources
Parks and Recreation
General Services
Police Public Transportation and Parking
Public Works Utilities
Engineering
Customer Service
Line Maintenance
Wastewater Quality
Water Quality
Solid Waste
Fleet Management
Facility Asset Management
Field Services
Engineering
Storm Water Quality
Streets, Traffic and Drainage
Maintenance
Traffic Management
Public Transportation
Parking
Operations
Investigations
Public Safety Support
Current Planning and Urban Design
Plan Development and Implementation
Labor and Empl. Relations
Benefits
Occupational Health
Natural Resources
Grounds Management
Recreation, Health and Wellness
Tech App Support
Technology Enhancement
Public Safety Support
Technology Infrastructure
Public—Private Partnership
Operations
Administration Administration Administration Administration Administration
Administration Administration Administration Administration
Planning
Administration Administration Administration Administration Administration
Community Development
Property Mgmt and Development
Probation Services
Subdivision and Zoning
Revenue Management
Support Services
Risk Management
Project Management
Fleet Services
Southeast Water Supply
Customer Support
Table of Contents
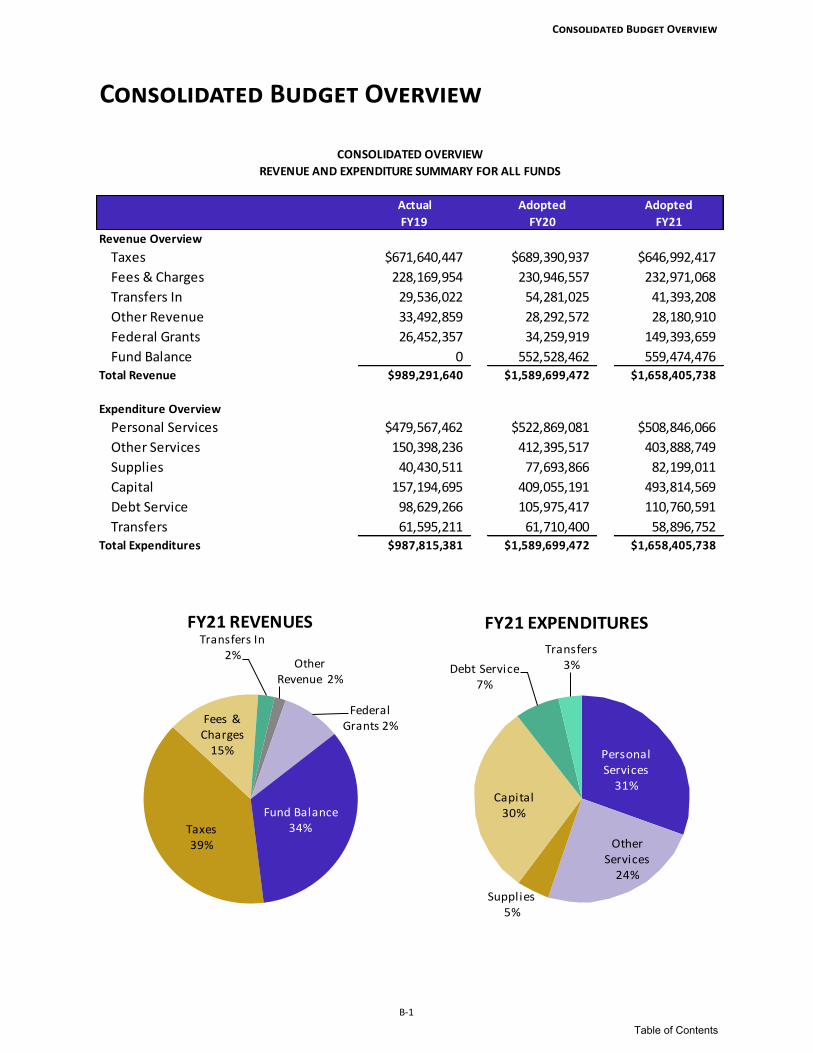
Consolidated Budget Overview
B-1
Consolidated Budget Overview
CONSOLIDATED OVERVIEW
REVENUE AND EXPENDITURE SUMMARY FOR ALL FUNDS
Actual Adopted Adopted
FY19 FY20 FY21
Revenue Overview
Taxes $671,640,447 $689,390,937 $646,992,417
Fees & Charges 228,169,954 230,946,557 232,971,068
Transfers In 29,536,022 54,281,025 41,393,208
Other Revenue 33,492,859 28,292,572 28,180,910
Federal Grants 26,452,357 34,259,919 149,393,659
Fund Balance 0 552,528,462 559,474,476Total Revenue $989,291,640 $1,589,699,472 $1,658,405,738
Expenditure Overview
Personal Services $479,567,462 $522,869,081 $508,846,066
Other Services 150,398,236 412,395,517 403,888,749
Supplies 40,430,511 77,693,866 82,199,011
Capital 157,194,695 409,055,191 493,814,569
Debt Service 98,629,266 105,975,417 110,760,591
Transfers 61,595,211 61,710,400 58,896,752Total Expenditures $987,815,381 $1,589,699,472 $1,658,405,738
Personal Services
31%
Other Services
24%
Supplies5%
Capital30%
Debt Service7%
Transfers3%
FY21 EXPENDITURES
Taxes39%
Fees & Charges
15%
Transfers In2%
Other Revenue 2%
Federal Grants 2%
Fund Balance34%
FY21 REVENUES
Table of Contents

Revenues
B-2
When revenue is dedicated to a particular purpose, the City has generally chosen to establish a separate fund to ensure that all of the dedicated revenue is spent for its intended purpose. The City derives revenue from a myriad of sources. Some revenues are dedicated to specific purposes, such as the MAPS 4 Sales Tax or the tariff on phone service dedicated to the E-911 service. Other revenues are not dedicated to a particular program or service and are deposited in the City’s General Fund. A fund is an accounting method for segregating revenues and expenditures for a specific purpose. Revenues
Non-Operating Funds
General Operating Fund
Enterprise Funds Special Revenue Funds
Capital Improvements
Other
• Court Administration and Training Fund
• Emergency Management Fund
• Fire Sales Tax
Fund
• Hotel/Motel Tax Fund*
• MAPS Operations
Fund*
• MAPS 3 Use Tax Fund*
• MAPS 4 Use Tax
Fund*
• Medical Service (Ambulance) Program Fund
• OCMAPS Sales Tax Fund*
• Police Sales Tax Fund*
• Zoo Sales Tax
Fund
• Airports Fund
• Solid Waste
Management Fund
• Stormwater Drainage Utility Fund*
• Public
Transportation and Parking Cash Fund
• Water/Wastewater Fund
• Better Streets, Safer City Sales Tax Fund
• Better Streets, Safer City
Use Tax Fund
• Capital Improvement Projects Fund
• City and Schools
Capital Projects Use Tax Fund
• Hotel/Motel Tax Fund*
• Impact Fees Fund
• MAPS Operations Fund*
• MAPS Sales Tax Fund
• MAPS 3 Sales Tax Fund
• MAPS 3 Use Tax Fund*
• MAPS 4 Program Fund
• MAPS 4 Use Tax Fund*
• OCMAPS Sales Tax Fund*
• OKC Tax Increment
Financing Fund
• Police Sales Tax Fund*
• Police/Fire Capital
Equipment Sales Tax Fund
• Sports Facilities Sales Tax Fund
• Sports Facilities Use
Tax Fund
• Stormwater Drainage Utility Fund*
• Street and Alley Fund
• Asset Forfeiture Fund
• Debt Service Fund
• Grants Management
Fund
• OKC Improvement and Special Assessment District Fund
• Special Purpose Fund
• General Fund—MAPS 4
Operating Funds
• General Fund
• Internal Service
Funds
* These funds have both an operating and non-operating component
Revenue Summary
Table of Contents

Operating Funds
Revenues
B-3
Before beginning the discussion of revenues, it should be noted that all projected growth rates for FY21 were based on estimated year end totals for FY20. The City classifies its funds as either operating or non-operating. The distinction is that some funds and, in some cases, portions of funds directly support operations; and other funds provide for capital improvements or are so limited in their purpose that they do not support daily operations. This allows decision-makers to segregate operating costs from the total cost for the organization so that significant changes in capital funding are not misinterpreted as a significant change in operational costs. An example of this is dedicated sales taxes. In recent years, the citizens of Oklahoma City have approved several limited-term dedicated sales taxes to fund capital improvements. With the MAPS 4 Sales Tax beginning on April 1, 2020, there will be significant increases in the revenue of those funds which are being used for capital improvements. Because of this distinction, the portion of the Sales Tax used for capital improvements was classified as non-operating and the small portion used to fund the MAPS 4 Project Office was classified as operating. The Operating Funds category includes three major types of funds: General Operating Funds, Special Revenue Funds and Enterprise Funds, all of which will be discussed further; however, the bulk of the discussion focuses on the General Fund, the City’s largest fund at $457 million or 28% of the FY21 budget.
GENERAL FUND Due to the COVID-19 pandemic, an economic recession is projected in FY21 resulting in overall growth of –5% in the General Fund. The General Fund has hundreds of individual revenue sources ranging from daily fishing permits to building permits to sales tax. Similar sources are grouped into categories as shown in the chart. The narrative on the following pages examines each of the major revenue categories in the General Fund and the short term factors that influenced the revenue projections. Also highlighted in the narrative and the table on page B-4 are the top 10 individual revenue sources that, when combined, account for 83% of the FY21 General Fund budget. As the pie chart at right, and the table at the top of the next page indicate, the largest single source of revenue in the General Fund is Sales Tax. As such, the most time and effort is dedicated to forecasting this revenue source.
Misc. Revenue
1%
Fines 3% Franchise Fees 9%
Other Fees17%
Other Taxes17%
Sales Tax 54%
General Fund Revenue by Source
Operating Funds 47%
Non-Operating
Funds
53%
Total City Revenues
Table of Contents

Revenues
B-4
GENERAL FUND - TAXES The largest category of revenue in the General Fund is taxes at $317.6 million or 69.6%. Within the taxes category, all revenue sources are authorized by the state and collected by the Oklahoma Tax Commission.
Sales Tax Sales Tax is the largest single revenue source for the General Fund and the City. Sales tax is applied to most retail transactions, as provided by state law, and is collected by local vendors who then remit the revenue to the Oklahoma Tax Commission. The City maintains agreements with the Oklahoma Tax Commission for administration and enforcement services associated with sales and use taxes. The City levies a total of 4.125% in sales tax. Combined with the state levy of 4.5%, the total state and municipal sales tax rate charged within corporate Oklahoma City limits is 8.625%. The City’s 4.125% sales tax levy is divided between various funds as authorized by voters as shown in the graphic below. The General Fund receives the largest portion of sales tax at 2.250% and is where the City’s day-to-day operations are funded. MAPS 4 is a 8-year temporary one-cent sales tax in effect through March 31, 2028. It is projected to generate a total of $978 million dedicated to funding a
variety of 16 different capital projects such as parks, youth centers, a mental health and family justice center, transit system improvements, sidewalks, and a new multi-purpose stadium, among other projects. The Public Safety Sales Tax is a permanent 0.750% sales tax split evenly between Police and Fire. The Zoo Sales Tax is a permanent 0.125% (1/8 cent) sales tax that can only be used for capital improvements and operations at the zoo. This section will focus on the 2.250% authorized for
1
1
1
1
0.000%
0.500%
1.000%
1.500%
2.000%
2.500%
Oklahoma City Sales Tax Rate
4.125%
0.750%Publ ic Safety Sales Tax Fund
0.125%Zoo Sales Tax Fund
1.000%MAPS 4 SalesTax Fund
2.250% General Fund
General Fund
Top 10 General Fund Revenue Sources % of GF
Sales Tax $240,723,459 53%
Use Tax $63,822,181 14%
OG&E Franchise Fee $19,748,198 4%
Fire Wage Adjustment $12,249,416 3%
Police Wage Adjustment $9,405,200 2%
Court Costs $8,350,732 2%
Bond Fund Engineering, Legal, Other Services $6,219,072 1%
Building Permits $5,809,224 1%
Cox Cable Franchise Fee $5,734,824 1%
Traffic Fines $5,354,450 1%
83%
Top 10 Revenue Sources
83%
17%
All Other Revenue Sources
Table of Contents

Revenues
B-5
general operations, while the dedicated sales taxes that account for the remaining 1.875% will be discussed in the Special Revenue Operating Funds section of this chapter. Projecting sales tax has always been challenging since it is complicated by many local and national factors. For example, the world is currently experiencing a pandemic known as COVID-19 which is greatly affecting economies on all levels including our local economy. The uncertainty of the length and breadth of this pandemic has made projecting sales tax receipts very challenging. Through careful analysis, the City has developed the FY21 budget based upon a –5% growth rate in sales tax as compared to projected FY20 year end collections. Sales Tax collections are projected to be $240.7 million and account for 53% of the General Fund’s FY21 budget.
GENERAL FUND - OTHER TAXES Use Tax Use Tax is levied on goods that are bought in other states and then imported to Oklahoma for use. This tax is applied in lieu of sales tax because the goods were originally bought outside the state. As more people are making purchases online, Use Tax is growing at a higher rate than Sales Tax. Use Tax collections have averaged an 8.1% growth rate and Sales Tax has averaged 2.75% growth over the past 10 years. The Use Tax rate is 4.125% of the purchase price and is budgeted at $63.8 million or 14% of the General Fund budget for FY21. Together, Sales and Use Tax make up 67% of the General Fund operating budget which shows how much the City relies on tax revenues. Excise Tax In FY05, state law changed the taxation of tobacco products and exempted them from sales tax, but implemented an excise tax designed to make it more expensive to purchase tobacco products on a per unit basis. Municipalities receive a portion of the excise tax from the state. Revenue is projected to be $4.6 million, which is less than 1% of the General Fund revenue budget.
2.4% -1.3% 4.4% 3.4%6.9%
6.0% 3.9% 1.3%-7.2%
12.2%5.6%
4.3% 2.7% 2.9% -1.9% -3.1%
10.6%
11.3% 2.4%
-8.2%
$0
$50,000,000
$100,000,000
$150,000,000
$200,000,000
$250,000,000
$300,000,000
FY02 FY03 FY04 FY05 FY06 FY07 FY08 FY09 FY10 FY11 FY12 FY13 FY14 FY15 FY16 FY17 FY18 FY19 FY20* FY21*
Oklahoma City Sales Tax Collections
*Sales Tax Collection Projections
Table of Contents
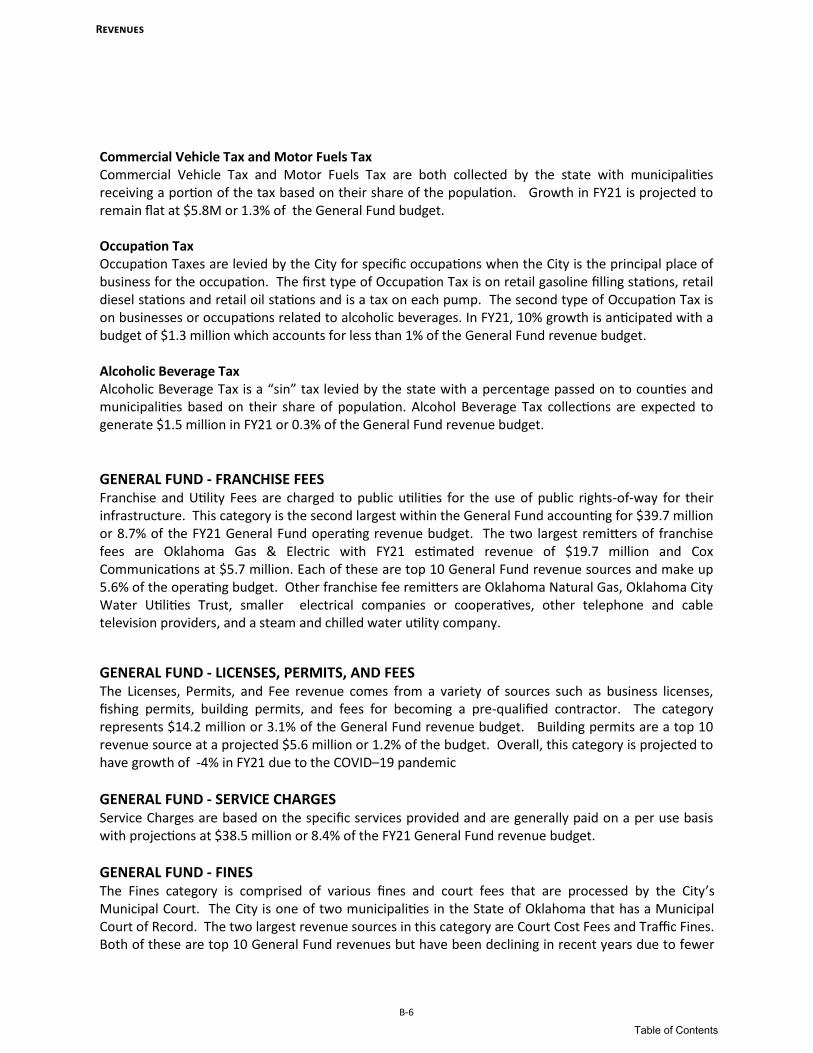
Revenues
B-6
Commercial Vehicle Tax and Motor Fuels Tax Commercial Vehicle Tax and Motor Fuels Tax are both collected by the state with municipalities receiving a portion of the tax based on their share of the population. Growth in FY21 is projected to remain flat at $5.8M or 1.3% of the General Fund budget. Occupation Tax Occupation Taxes are levied by the City for specific occupations when the City is the principal place of business for the occupation. The first type of Occupation Tax is on retail gasoline filling stations, retail diesel stations and retail oil stations and is a tax on each pump. The second type of Occupation Tax is on businesses or occupations related to alcoholic beverages. In FY21, 10% growth is anticipated with a budget of $1.3 million which accounts for less than 1% of the General Fund revenue budget. Alcoholic Beverage Tax Alcoholic Beverage Tax is a “sin” tax levied by the state with a percentage passed on to counties and municipalities based on their share of population. Alcohol Beverage Tax collections are expected to generate $1.5 million in FY21 or 0.3% of the General Fund revenue budget.
GENERAL FUND - FRANCHISE FEES Franchise and Utility Fees are charged to public utilities for the use of public rights-of-way for their infrastructure. This category is the second largest within the General Fund accounting for $39.7 million or 8.7% of the FY21 General Fund operating revenue budget. The two largest remitters of franchise fees are Oklahoma Gas & Electric with FY21 estimated revenue of $19.7 million and Cox Communications at $5.7 million. Each of these are top 10 General Fund revenue sources and make up 5.6% of the operating budget. Other franchise fee remitters are Oklahoma Natural Gas, Oklahoma City Water Utilities Trust, smaller electrical companies or cooperatives, other telephone and cable television providers, and a steam and chilled water utility company.
GENERAL FUND - LICENSES, PERMITS, AND FEES The Licenses, Permits, and Fee revenue comes from a variety of sources such as business licenses, fishing permits, building permits, and fees for becoming a pre-qualified contractor. The category represents $14.2 million or 3.1% of the General Fund revenue budget. Building permits are a top 10 revenue source at a projected $5.6 million or 1.2% of the budget. Overall, this category is projected to have growth of -4% in FY21 due to the COVID–19 pandemic
GENERAL FUND - SERVICE CHARGES Service Charges are based on the specific services provided and are generally paid on a per use basis with projections at $38.5 million or 8.4% of the FY21 General Fund revenue budget.
GENERAL FUND - FINES The Fines category is comprised of various fines and court fees that are processed by the City’s Municipal Court. The City is one of two municipalities in the State of Oklahoma that has a Municipal Court of Record. The two largest revenue sources in this category are Court Cost Fees and Traffic Fines. Both of these are top 10 General Fund revenues but have been declining in recent years due to fewer
Table of Contents

Revenues
B-7
cases being filed with the court and implementation of criminal justice reform. Court cost fees are projected at $8 million or –4% growth under the FY20 budget and Traffic Fines are projected at $5.3 million or –13% below the FY20 budget. The Fines category is $16.7 million or 3.7% of the General Fund revenue budget.
GENERAL FUND - OTHER This includes the smaller categories of revenue including Administrative Charges, Other Revenue, Transfers and Fund Balance and comprises $29.6 million or 6.5% of the FY21 budget. Administrative Charges Administrative Charges are $23.9 million or 5.2% of the FY21 General Fund revenue budget and are assessed to other city funds and entities for administrative services such as accounting, personnel, payroll, audit, and other functions provided by General Fund departments. Other Revenue Other Revenue includes the smaller sources such as interest, rebates, and royalties. The category is projected to have collections of $5.6 million in FY21 or 1.2% of the General Fund revenue budget. Transfers Transfers are payments made to the General Fund from other city funds. The category can vary greatly from year to year depending on the status of projects. In FY21, the Transfers category is projected to be $58K which is an decrease of 96% from FY20 year-end due to a transfer from courts capital improvement program to reimburse the General Fund that will not reoccur. In total, the Transfers category is 0.01% of the General Fund revenue budget. Fund Balance No fund balance is budgeted in FY21.
GENERAL FUND HISTORICAL REVENUE SHORTFALL OR SURPLUS The chart below illustrates the differences between General Fund revenue projections and revenues actually received each fiscal year. Significant continued variances in actual collections from projected amounts, whether it be shortfall or surplus, can be reason for concern. Either scenario could indicate a changing economy or inaccurate forecasting techniques. Additionally, credit rating organizations use this indicator to review the quality of financial management in a local government since variances between budget and actual results are considered indicative of management’s financial planning capabilities. In February 2020, for the tenth year in a row, the City earned the highest bond ratings possible from two of the nation’s most respected financial rating services. The City received a AAA rating from Standard & Poor’s and a Aaa rating from Moody’s Investor Service. The average absolute value variance over the past 11 years was 3.3% which is outside the City’s stated goal of having revenues within 2% of projections. Over the last five years, the absolute value variance average improved to 2.6%. In FY10, actual revenue was 6% less than projected due to the recession. In FY11 and FY12, Oklahoma rebounded stronger than expected with variances of 10% and 6%. In FY13, FY14, and FY15 revenue was within 1.0% of projections. In FY16, a contraction in the energy sector contributed to revenue collections missing projection by almost 4% and a prolonged weakened local economy that reflected inventory adjustments accounted for a shortfall of 2% in FY17. Back to back revenue declines are rare and the last time it occurred was more than 30 years ago. In FY18,
Table of Contents

Revenues
B-8
revenues exceeded projections by 3.7% as the City once again recovered from an economic downtown stronger than projected. In FY19, General Fund revenue collections exceeded budget by 2.6% due to strong growth in Use Tax collections from online sales remitters and merchant wholesalers. In mid FY20, the world experienced the COVID-19 pandemic which severely affected sales tax collections and offset earlier year growth and the City is projected to end the year at –2.1%. The City continues to work with Dr. Russell Evans and Oklahoma City University to refine forecast estimates and consistently
project collections within 2% of budget. Keeping the variance to a minimum means services have not been unnecessarily reduced because of a perceived shortage in revenue that did not occur, or that new services were established that could not be maintained because revenues failed to meet projections.
*FY20 Estimate
INTERNAL SERVICE FUNDS Internal Service Funds are in departments that provide services to most other city departments. They generate revenue by charging departments for those services. The majority of the charges assessed to departments are set at the beginning of each year based on past usage. The two exceptions are for fuel and postage which are charged to departments based on current usage and current prices. The other internal service funds are Information Technology, Risk Management which is in the Finance Department, the Print Shop which is in the City Manager’s Office, and Fleet Services which is in the General Services Department. Internal service funds have a FY21 budget of $51.8 million, which is a 4.2% decrease compared to the FY20 adopted budget. Major changes to each internal service fund are summarized in the department section of the budget book. Internal Service funds combined are 3.1% of FY21’s $1.66 billion budget.
3.18% 3.58%
2.96%
0%
1%
2%
3%
4%
5%
6%
7%
8%
9%
10%
11%
FY10 FY11 FY12 FY13 FY14 FY15 FY16 FY17 FY18 FY19 FY20*
Avg BudgetAccuracy
Target
% Difference
Table of Contents

Revenues
B-9
SPECIAL REVENUE OPERATING FUNDS Special Revenue Funds have a revenue source or sources that are dedicated to a specific purpose. Police, Fire and Zoo Sales Tax Funds The Police, Fire and Zoo Sales Tax Funds are supported by dedicated portions of the City’s sales tax collections. In each of these funds, the forecast for sales tax revenue growth is –5%; this is the same rate of growth as projected for base sales tax in the General Fund. MAPS 3 Use Tax Fund The MAPS 3 Use Tax Fund was supported by a temporary 1% Use Tax adopted after the MAPS 3 Sales Tax was approved. The Use Tax expired December 31, 2017. Through FY18, a portion of the MAPS 3 Use Tax was budgeted for public safety capital funding, which is included in the non-operating section. The remaining fund balance will be used to support administration and oversight of the MAPS 3 projects and is budgeted in the operating fund. The FY21 budget is $4.4million, a 6.8% decline from FY20. The fund balance is projected to fund the administration and oversight through FY21 when most MAPS 3 projects will have been completed or nearing completion. Court Administration and Training Fund The Court Administration and Training Fund is made up of revenue from state mandated fees that the City is allowed to retain to train Court, Police, and Legal staff. The Court Administration and Training Fund budget is one of the smallest operating fund budgets at $0.2 million in FY21. Emergency Management Fund The Emergency Management Fund supports the E-911 system for Oklahoma City and is budgeted at $9.2 million in FY21, which is flat growth from the FY20 adopted budget. The fund is supported by tariffs on both cell phone and traditional telephone lines that are assessed on each user. Even with the addition of cell phone tariff revenue, the General Fund is still expected to support E-911 operations through a transfer of $2.9 million in FY21. Hotel/Motel Tax Fund The Hotel/Motel Tax Fund FY21 budget is $14.2million and is supported by a 5.5% hotel occupancy tax. This fund is divided between operating activities ($7.8 million) dedicated to the promotion of special events, convention and tourism development and non-operating activities ($6.4 million) dedicated to capital projects at the State Fairgrounds. Overall revenue from the Hotel/Motel Tax fund is projected have –42% growth when compared to FY20 adopted budget due to the COVID-19 pandemic. The MAPS 4 Use Tax Program Operating Fund is supported by a temporary 1% Use Tax adopted after the MAPS 4 Program Fund was approved. It has both an operating and non-operating component and will primarily be used to fund the City’s operating cost of administering the MAPS 4 projects, public safety capital improvement projects and equipment costs and capital costs associated with City-owned facilities. The MAPS 4 Use Tax Operating Fund is budgeted at $1.5 million in FY21.
Table of Contents

Revenues
B-10
Medical Service Program Fund The Medical Service Program Fund was created in FY10. This fund handles revenue and expenses associated with the Medical Service Program adopted by the City Council on December 8, 2008, which makes it possible for households to pay $3.65 per month on their City utility bill in exchange for EMSACare benefits from the Emergency Medical Services Authority (EMSA). The FY21 budget of $8.7 million is up 24% compared to FY20 as the program expects to purchase a new headquarters building in FY21. Program fees are expected to generate $7.1 million in FY21 with fund balance and interest earnings funding the remaining budget. Metropolitan Area Projects (MAPS) Operations Fund The Metropolitan Area Projects (MAPS) Operations Fund was originally funded by a dedicated Use Tax during the same period of the MAPS Sales Tax. The fund was established to provide for the maintenance, capital replacement, and operations of the MAPS projects. Over the last few years, the General Fund has gradually assumed the operating expenses for the MAPS projects allowing for the remaining fund balance of $2.0 million to be transferred to the non-operating fund for capital maintenance in FY21. Oklahoma City Metropolitan Area Public Schools (OCMAPS) Sales Tax Fund The Oklahoma City Metropolitan Area Public Schools (OCMAPS) Sales Tax Fund was originally funded by a 1% sales tax dedicated to supporting capital projects at public schools that serve kids in Oklahoma City. The Sales Tax expired on December 31, 2008. While the tax was in effect, a reserve was established to continue to fund project management and oversight of remaining projects. The operating fund continues to receive small reallocations of sales tax collections and minimal interest earnings that are transferred each year to the non-operating fund for capital maintenance on the original OCMAPS projects. ENTERPRISE FUNDS Enterprise Funds are supported by the revenue generated by operations in their specific areas. Enterprise Funds have been established for operations at the Airports, Solid Waste Management, Stormwater Drainage Utility, Public Transportation and Parking, and Water and Wastewater Utilities. With the exception of Stormwater Drainage Utility, all of these funds have a public trust that oversees operations and receives all revenues. Revenues in each of the enterprise funds may be growing at a different rate than growth reflected in the City funds and each trust’s revenue budget is individually based on customer rates and expected usage. The trusts generally make capital investments directly and the transfer to city funds support operations. The one Enterprise Fund that is not supported by a trust is the Stormwater Drainage Utility. All revenue for stormwater drainage activities comes from a fee on all water utility bills based on the size of the water line. The Stormwater Drainage Utility Fund is the only Enterprise Fund to also have a capital component in the non-operating funds section.
Table of Contents
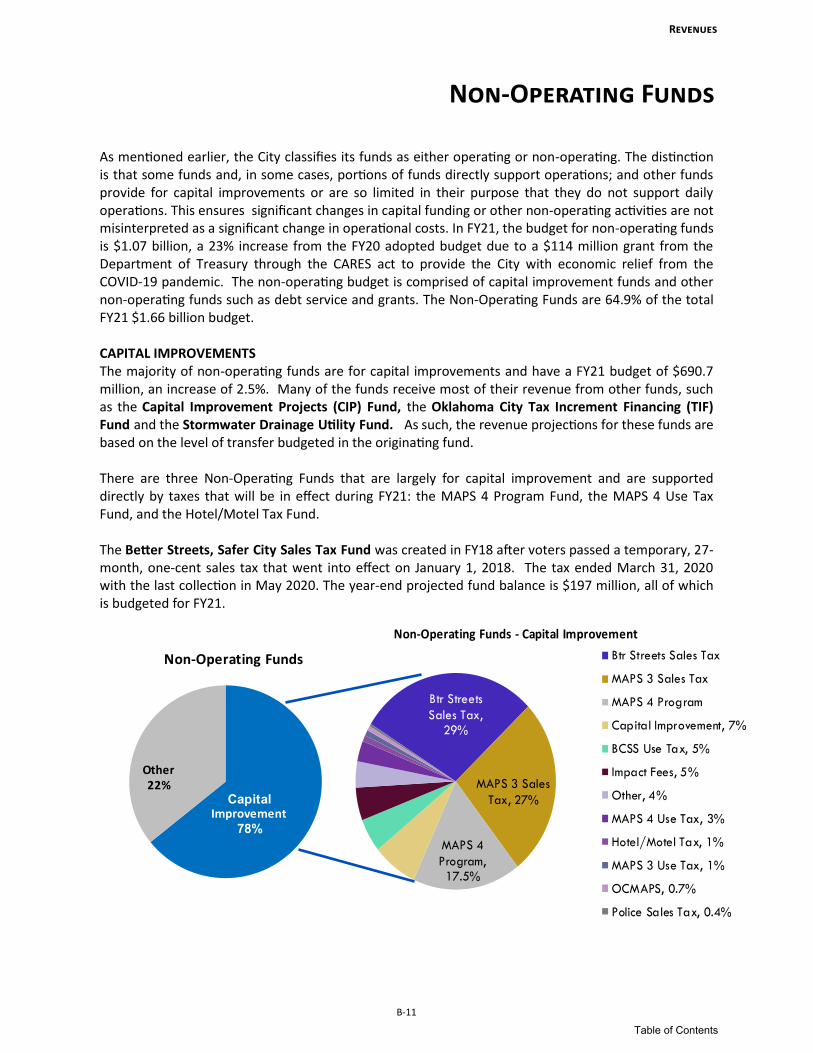
Non-Operating Funds
Revenues
B-11
As mentioned earlier, the City classifies its funds as either operating or non-operating. The distinction is that some funds and, in some cases, portions of funds directly support operations; and other funds provide for capital improvements or are so limited in their purpose that they do not support daily operations. This ensures significant changes in capital funding or other non-operating activities are not misinterpreted as a significant change in operational costs. In FY21, the budget for non-operating funds is $1.07 billion, a 23% increase from the FY20 adopted budget due to a $114 million grant from the Department of Treasury through the CARES act to provide the City with economic relief from the COVID-19 pandemic. The non-operating budget is comprised of capital improvement funds and other non-operating funds such as debt service and grants. The Non-Operating Funds are 64.9% of the total FY21 $1.66 billion budget. CAPITAL IMPROVEMENTS The majority of non-operating funds are for capital improvements and have a FY21 budget of $690.7 million, an increase of 2.5%. Many of the funds receive most of their revenue from other funds, such as the Capital Improvement Projects (CIP) Fund, the Oklahoma City Tax Increment Financing (TIF) Fund and the Stormwater Drainage Utility Fund. As such, the revenue projections for these funds are based on the level of transfer budgeted in the originating fund. There are three Non-Operating Funds that are largely for capital improvement and are supported directly by taxes that will be in effect during FY21: the MAPS 4 Program Fund, the MAPS 4 Use Tax Fund, and the Hotel/Motel Tax Fund. The Better Streets, Safer City Sales Tax Fund was created in FY18 after voters passed a temporary, 27-month, one-cent sales tax that went into effect on January 1, 2018. The tax ended March 31, 2020 with the last collection in May 2020. The year-end projected fund balance is $197 million, all of which is budgeted for FY21.
Btr Streets
Sales Tax, 29%
MAPS 3 Sales
Tax, 27%
MAPS 4
Program, 17.5%
Non-Operating Funds - Capital Improvement
Btr Streets Sales Tax
MAPS 3 Sales Tax
MAPS 4 Program
Capital Improvement, 7%
BCSS Use Tax, 5%
Impact Fees, 5%
Other, 4%
MAPS 4 Use Tax, 3%
Hotel/Motel Tax, 1%
MAPS 3 Use Tax, 1%
OCMAPS, 0.7%
Police Sales Tax, 0.4%
Other22%
Non-Operating Funds
Capital Improvement
78%
Table of Contents

Revenues
B-12
The Better Streets, Safer City Use Tax Fund was established at the same time as the Sales Tax Fund and was a temporary, 27-month, one-cent Use Tax that ended on March 31, 2020. The tax is primarily used to fund public safety fleet and equipment replacements. The year-end projected fund balance is $34.3 million, all of which is budgeted for FY21. The MAPS 4 Program Fund is a non-operating fund that was established after voters passed the MAPS 4 Sales Tax in December 2019 and became effective on April 1, 2020. It is an 8-year one-cent sales tax that extended the current 4.125% sales tax rate after Better Streets, Safer City expired. The revenues will initially be deposited in the General Fund and then transferred to the MAPS 4 Program Non-Operating Fund to be used for 16 distinct capital projects. The FY21 budget of $120.6 million is comprised of a General Fund transfer of $107 million and $13.6 million from fund balance. The MAPS 4 Use Tax Program Non-Operating Fund was established at the same time as the MAPS 4 Program Fund and is also a temporary, 8-year one-cent Use Tax that will primarily be used to fund the City’s operating cost of administering the MAPS 4 projects, public safety capital improvement projects and equipment costs and capital costs associated with City-owned facilities. The MAPS 4 Use Tax Fund is expected to collect $20.4 million in FY21. The Impact Fee Fund was established in 2017 to collect fees from developers related to new construction. The fees are then used by the City for capital improvements to infrastructure to serve the same service area as the new construction. The FY21 budget is $33.8 million, which is an increase of 57% over the FY20 adopted budget. The increase is largely accumulated fund balance. The MAPS 3 Sales Tax Fund is a non-operating fund and was created after voters passed the MAPS 3 initiative on December 8, 2009. The one percent sales tax went into effect on April 1, 2010 and expired December 31, 2017. The tax will fund eight distinct capital projects. The FY21 budget is $178 million and is primarily made up of fund balance and will be used for several of the capital projects that are in design or have begun construction, including the largest project, a new convention center that is expected to open later this year. The MAPS 3 Use Tax Non-Operating Fund is used for capital replacement. The FY21 non-operating budget, comprised of fund balance and interest, is $5.8 million, a decline of 221% from the FY20 adopted budget. The remaining balance will be transferred to the MAPS 3 operating fund for operations or used for public safety capital. When the non-operating fund is exhausted, those public safety capital expenses will be transitioned to the Better Streets, Safer City Use Tax Fund. The Hotel/Motel Tax Fund supports three distinct purposes: convention and tourism development, promotions for specific events, and capital improvements at the Fairgrounds. It is this last capital portion of the Hotel/Motel Tax that is classified as non-operating. Revenue in FY21 for the non-operating portion of the Hotel/Motel Tax matches the growth rate for the operating portion and is expected to grow at –42% in FY21 due to the COVID-19 pandemic, with a budget of $6.4M.
Table of Contents
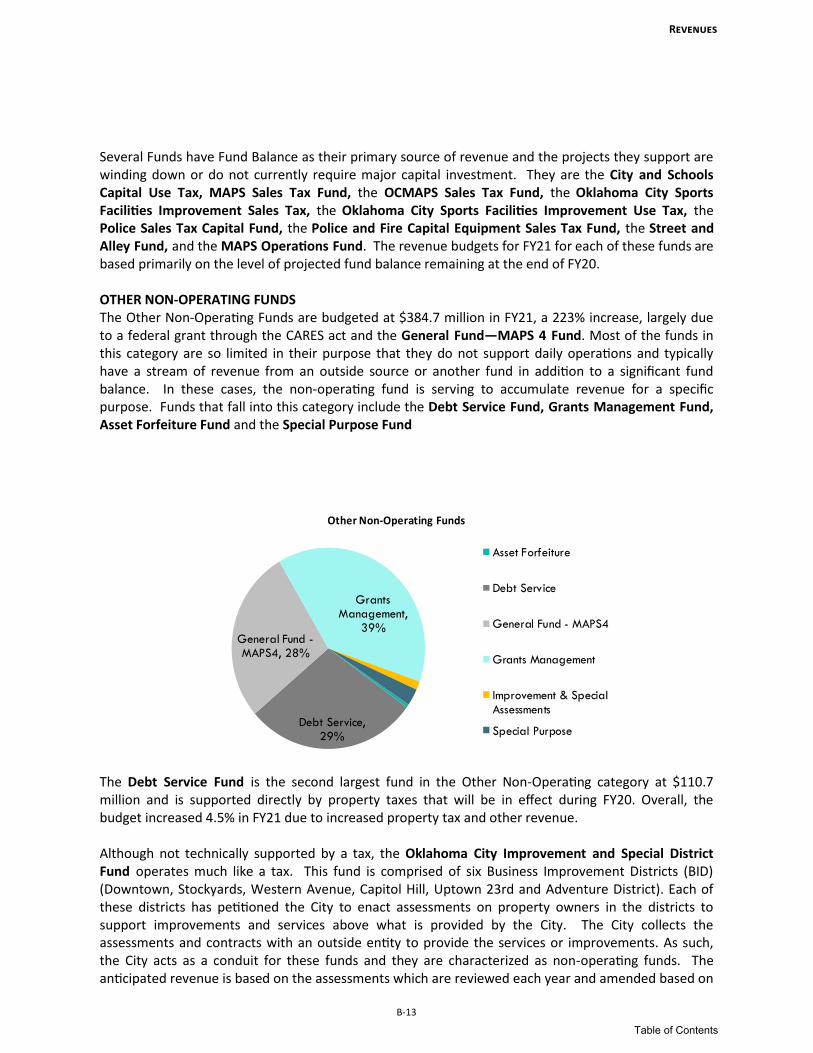
Revenues
B-13
Several Funds have Fund Balance as their primary source of revenue and the projects they support are winding down or do not currently require major capital investment. They are the City and Schools Capital Use Tax, MAPS Sales Tax Fund, the OCMAPS Sales Tax Fund, the Oklahoma City Sports Facilities Improvement Sales Tax, the Oklahoma City Sports Facilities Improvement Use Tax, the Police Sales Tax Capital Fund, the Police and Fire Capital Equipment Sales Tax Fund, the Street and Alley Fund, and the MAPS Operations Fund. The revenue budgets for FY21 for each of these funds are based primarily on the level of projected fund balance remaining at the end of FY20. OTHER NON-OPERATING FUNDS The Other Non-Operating Funds are budgeted at $384.7 million in FY21, a 223% increase, largely due to a federal grant through the CARES act and the General Fund—MAPS 4 Fund. Most of the funds in this category are so limited in their purpose that they do not support daily operations and typically have a stream of revenue from an outside source or another fund in addition to a significant fund balance. In these cases, the non-operating fund is serving to accumulate revenue for a specific purpose. Funds that fall into this category include the Debt Service Fund, Grants Management Fund, Asset Forfeiture Fund and the Special Purpose Fund The Debt Service Fund is the second largest fund in the Other Non-Operating category at $110.7 million and is supported directly by property taxes that will be in effect during FY20. Overall, the budget increased 4.5% in FY21 due to increased property tax and other revenue. Although not technically supported by a tax, the Oklahoma City Improvement and Special District Fund operates much like a tax. This fund is comprised of six Business Improvement Districts (BID) (Downtown, Stockyards, Western Avenue, Capitol Hill, Uptown 23rd and Adventure District). Each of these districts has petitioned the City to enact assessments on property owners in the districts to support improvements and services above what is provided by the City. The City collects the assessments and contracts with an outside entity to provide the services or improvements. As such, the City acts as a conduit for these funds and they are characterized as non-operating funds. The anticipated revenue is based on the assessments which are reviewed each year and amended based on
Debt Service, 29%
General Fund -MAPS4, 28%
Grants Management,
39%
Other Non-Operating Funds
Asset Forfeiture
Debt Service
General Fund - MAPS4
Grants Management
Improvement & SpecialAssessments
Special Purpose
Table of Contents

Revenues
B-14
needs. The FY21 budget of $5.2 million is a 29% increase due to a projected increase in spending of money collected within the districts and the creation of the new Uptown 23rd St BID. Grant Funds are included in the budget book to provide a more accurate picture of the City’s financial situation and to comply with the requirements of the Municipal Budget Act. The amounts shown as revenue in these funds are estimates of grant awards based on the best judgment of the departments that utilize grants funding. Grant Funds are classified as non-operating funds because the activities supported by grants would typically not be provided without the grant funding. The FY21 budget is increasing 436% at $149.3 million due to a $114 million grant from the Department of Treasury through the CARES act to provide economic relief from the COVID-19 pandemic. The Special Purpose Fund is used primarily for donations to the City. The FY21 budget is $10.4 million, a decrease of 11% due to a reduction in budgeted fund balance. The General Fund—MAPS 4 Fund is a non-operating fund that was established in the General Fund after voters passed the MAPS 4 Sales Tax in December 2019 and became effective on April 1, 2020. It is an 8-year one-cent sales tax that extended the current 4.125% sales tax rate after Better Streets, Safer City expired. Revenues will initially be deposited in the General Fund and then transferred to the MAPS Program Fund to be used for capital projects. The Fund is expected to generate $978M over the eight years and will be used for 16 capital projects such as a new family justice center, youth centers, senior wellness centers, a multi-purpose stadium, transit system improvements, a freedom center, among other projects. The fund has a FY21 budget of $107 million or 28% of Other Non-Operating Funds.
Table of Contents

Revenue Detail Table
B-15
Revenues
Actual Adopted Adopted
FY19 FY20 FY21
General Operating Funds
General Fund
Taxes
Sales Tax $256,271,645 $262,266,708 $240,723,459
Use Tax 60,466,886 63,492,414 63,822,181
Other Taxes 4,132,977 4,234,821 4,402,571
Commercial Vehicle Tax 4,566,167 4,592,800 4,627,063
Motor Fuels Tax 1,182,163 1,215,957 1,195,629
Occupational Tax 1,318,770 1,218,000 1,346,651
Alcoholic Beverage Tax 1,280,790 1,155,144 1,539,747Total Taxes $329,219,397 $338,175,844 $317,657,301
Franchise/Utility Fees
Oklahoma Natural Gas $5,599,148 $5,597,915 $5,270,161 Oklahoma Gas & Electric 20,141,736 20,862,466 19,748,198
Caddo Electric Coop. 192,978 180,068 226,869
Oklahoma Electric Coop. 1,347,910 1,366,132 1,361,172
Tri-Gen 373,977 345,994 380,059
AT&T 252,055 220,980 195,191
AT&T Video 1,150,303 1,004,363 1,161,768
Cox Cable 5,996,387 5,801,786 5,734,824
Cox Fibernet 165,591 0 0
Other Telephone 86,470 114,103 107,395
Util ity Fees - Water 2,640,109 3,011,554 2,599,001
Util ity Fees - Wastewater 1,705,746 2,003,183 1,833,558
Util ity Fee - Solid Waste 1,100,152 1,168,585 1,130,605
Total Franchise/Utility Fees $40,752,562 $41,677,129 $39,748,801
Licenses, Permits, and Fees
Abandoned Building Registration $22,073 $34,352 $43,566
Fire Prevention Permits 189,895 322,407 207,099
Alarm Permits 616,852 751,378 590,546
Police Alarm Fees 534,598 828,067 284,146
Oil & Gas Well Inspections 332,750 359,240 287,247
General Licenses 551,369 436,555 1,137,910
Building Permits 5,805,712 5,747,150 5,809,224
Electrical Wiring Permits 1,404,246 1,394,146 1,450,833
Plumbing Permits 1,589,718 1,663,937 1,714,020
Boiler & Elevator Permits 241,497 266,710 249,848
Offsite Wagering Fee 34,191 27,646 30,695
Pre-Qualification Application Fee 162,095 217,305 269,825
Refrig. & Forced Air Permits 1,082,560 1,062,364 1,094,834
Sidewalk & Paving Fees 347,845 412,625 543,319
Work Zone Permits 28,400 27,156 31,996
Other Fees 103,713 40,290 44,259
Hunting and Fishing Permits 184,121 169,063 196,261
Table of Contents

Revenues
B-16
Actual Adopted Adopted
FY19 FY20 FY21
Vending Stamps 175,363 165,911 142,709
Garage Sale Permits 99,229 95,647 86,811
Total Licenses, Permits, & Fees $13,506,225 $14,021,949 $14,215,148
Administrative Charges
Airport Administrative Payments $760,060 $965,588 $1,093,261
Airport Police Payments 3,270,618 3,603,108 3,486,887
Water/Wastewater Admin Payments 6,113,259 6,138,774 6,317,416
Drainage Util ity Administrative Payment 1,056,128 1,107,959 1,174,964
Solid Waste Mgmt. Admin Payments 819,463 817,325 860,947
Convention & Tourism Admin Payments 337,095 429,713 473,578
Zoo Administrative Payments 266,200 292,820 300,000
Golf Administrative Payments 67,513 59,291 70,578
Other Administrative Payments 116,241 99,711 125,574
MAPS3 Administrative Payments 1,017,224 910,762 907,539
Better Streets Administrative Payments 0 276,032 430,223
Risk Management Administrative Payments 733,644 734,829 681,332
Public Transportation Administrative Pmts. 961,205 1,075,072 1,216,245
Parking Administrative Payments 155,728 408,537 198,712
IT Administrative Payments 1,501,171 1,435,064 1,517,618
Print Shop Administrative Payments 107,397 153,455 141,860
Fleet Services Admin Payments 64,361 64,966 60,594
Banking Fee Payments 203,111 140,000 140,000
Nuisance Abatement Payments 578,865 655,311 612,203
Econ Dev,TIF Engineering, Legal, Other Svcs 442,331 538,504 564,666
Civic Center Payments 41,380 0 0
Mowing, Liter, and Landscaping Adm Payments 1,709,366 3,700,000 1,361,740
Pavement Maintenance Payments 1,763,000 0 2,200,000
Total Administrative Charges $22,085,360 $23,606,821 $23,935,937
Other Service Charges
Bond Fund Engineering, Legal, Other Services $7,680,233 $5,150,000 $6,219,072
Animal Shelter Fees 301,662 312,391 320,249
Engineering Fees 2,481,009 2,282,305 2,263,466
Planning Fees 734,088 701,594 831,345
Fire Service Recovery 28,000 28,000 28,000
Fire Wage Adjustment Reimbursement 12,113,760 12,312,425 12,249,416
Police Wage Adjustment Reimbursement 9,301,042 9,459,160 9,405,200
Police Fees 2,612,360 2,163,575 2,484,454
Parking Meters 1,423,445 1,473,491 1,473,491
Reimbursement - Grants 0 275,281 179,574
Refunds and Reimbursements - Operating 1,096,613 693,236 1,659,471
Mowing Services - OCRRA 60,393 0 0
Damage to City Property 67,597 110,127 125,839
Recreation Fees 1,317,476 1,848,472 1,312,892
Total Other Service Charges $39,217,678 $36,810,057 $38,552,469
Table of Contents

Revenues
B-17
Actual Adopted Adopted
FY19 FY20 FY21
Fines
Traffic Fines $6,282,860 $6,163,596 $5,354,450
Parking Fines 1,511,905 1,660,413 1,299,594
Court Fees 9,412,125 9,253,034 8,705,448
Court of Record, Jury Division 1,048,883 976,420 781,101
Criminal Court 323,576 295,757 317,470
Jail Cost Recovery Program 259,056 258,187 175,184
Other Fines 14,800 17,222 9,502
Juvenile Fines 147,472 148,456 104,841
Total Fines $19,000,677 $18,773,085 $16,747,590
Other Revenue
Leases $2,373,801 $2,907,368 $2,512,770
Sale of City Property 106,276 28,424 23,523
Check Service Charge 820 540 598
Royalties 109,759 106,192 124,645
Miscellaneous 1,589,820 1,307,352 1,294,362
Wrecker Service Payments 0 0 0
Operating Interest 2,223,885 2,531,700 1,639,560
Total Other Revenue $6,404,361 $6,881,576 $5,595,458
Transfers
Transfers from OCPPA - DAS $150,000 $0 $0
Transfers - Miscellaneous 1,795,865 2,000,431 58,684
Total Transfers $1,945,865 $2,000,431 $58,684
Fund Balance $0 $1,594,455 $0
Total General Fund - Operating** $472,132,126 $483,541,347 $456,511,388
Internal Service Funds** Interest $283,374 $30,000 $56,204
Information Technology 25,733,968 28,061,366 27,905,330
Risk Management 14,607,542 13,145,295 12,942,188 Print Shop 824,213 1,012,012 933,288
Fleet Services 8,617,802 9,647,630 8,314,491
Other 325,131 519,595 390,795
Transfers 0 (185,000) (228,500)
Fund Balance 0 1,863,069 1,537,617
Total Internal Service Funds $50,392,030 $54,093,967 $51,851,413
Total General Operating Funds $522,524,155 $537,635,314 $508,362,801
Table of Contents

Revenues
B-18
Actual Adopted Adopted
FY19 FY20 FY21
Special Revenue Funds
Court Administration & Training Fund
Fees $177,635 $181,817 $185,765
Fines 1,202 0 471
Interest 1,713 2,660 2,032
Fund Balance 0 50,059 38,732
Total Court Administration & Training Fund $180,549 $234,536 $227,000
Emergency Management Fund
Tariffs $5,926,996 $5,873,700 $6,113,890
Interest 27,844 29,602 35,084
Transfers 2,550,000 3,019,867 2,895,939
Fund Balance 0 273,961 200,000
Total Emergency Management Fund $8,504,840 $9,197,130 $9,244,913
Fire Sales Tax Fund
Sales Tax $42,722,904 $43,711,118 $40,120,576
Interest 347,963 400,560 421,036
Other 154,312 13,677 13,677
Service Charges 23,660 0 0
Fund Balance 0 5,227,929 3,002,100
Total Fire Sales Tax Fund $43,248,839 $49,353,284 $43,557,389
Hotel/Motel Tax Fund**
Hotel/Motel Tax $7,153,284 $7,098,430 $4,316,770
Interest 74,833 77,378 73,746
Transfers 5,687,113 5,667,027 3,453,416
Fund Balance 0 931,236 0
Total Hotel/Motel Tax Fund $12,915,229 $13,774,071 $7,843,932
MAPS Operations Fund**
Use Tax $0 $0 $0
Interest 47,814 5,000 0
Other 58 0 0
Transfers (547,986) (2,032,165) 0
Fund Balance 0 2,146,758 0
Total MAPS Operations Fund ($500,115) $119,593 $0
MAPS 3 Use Tax Fund**
Use Tax ($773) $0 $0
Interest 217,792 80,000 80,000
Service Charges 92,318 0 0
Transfers 0 0 0
Fund Balance 0 4,638,462 4,320,119
Total MAPS 3 Use Tax Fund $309,337 $4,718,462 $4,400,119
Table of Contents

Revenues
B-19
Actual Adopted Adopted
FY19 FY20 FY21
MAPS 4 Use Tax Fund**
Use Tax $0 $0 $0
Interest 0 0 0
Service Charges 0 0 0
Transfers 0 0 1,500,000
Fund Balance 0 0 0
Total MAPS 4 Use Tax Fund $0 $0 $1,500,000
Medical Service Program Fund
Medical Service Program Fee $6,904,002 $6,872,385 $7,098,377
Interest 158,716 173,477 100,000
Other 3,300 0 0
Fund Balance 0 0 1,527,983
Total Medical Service Program Fund $7,066,019 $7,045,862 $8,726,360
OCMAPS Sales Tax Fund**
City/Schools Sales Tax $0 $0 $0
Interest 517 500 0
Other 9,986 0 0
Transfers 0 (26,431) 0
Fund Balance 0 25,931 0
Total OCMAPS Sales Tax Fund $10,503 $0 $0
Police Sales Tax Fund**
Sales Tax $42,722,904 $43,711,118 $40,120,576
Interest 354,166 395,664 464,807
Other 3,944 0 0
Service Charges 141,041 0 0
Transfers 0 (2,520,000) 0
Fund Balance 0 3,871,459 1,821,457
Total Police Sales Tax Fund $43,222,055 $45,458,241 $42,406,840
Zoo Sales Tax Fund
Sales Tax $14,240,968 $14,570,373 $13,346,522
Interest 3,829 0 3,829
Fund Balance 0 291,407 301,798
Total Zoo Sales Tax Fund $14,244,798 $14,861,780 $13,652,149
Total Special Revenue Funds $129,202,055 $144,762,959 $131,558,702
Table of Contents

Revenues
B-20
Actual Adopted Adopted
FY19 FY20 FY21
Enterprise Funds
Airports Fund
Transfer from Airport Trust (OCAT) $17,848,123 $19,941,667 $20,090,873
Interest 20,593 19,077 28,830
Other 106,044 50,374 153,354
Fund Balance 0 457,557 0
Total Airports Fund $17,974,760 $20,468,675 $20,273,057
Solid Waste Management Fund
Interest $38,522 $46,482 $50,862
Transfers 9,000,000 10,081,192 10,095,047
Fund Balance 0 1,001,021 1,000,000
Total Solid Waste Management Fund $9,038,522 $11,128,695 $11,145,909
Stormwater Drainage Utility Fund**
Fees $17,818,772 $18,022,200 $18,953,204
Interest 342,497 384,498 298,768
Other 0 0 0
Permits 124,280 127,251 109,399
Reimbursements 255,766 255,766 255,766
Service Charges 45,143 43,975 47,312
Transfers 0 (4,000,001) (4,000,000)
Fund Balance 0 4,537,136 3,399,186
Total Stormwater Drainage Utility Fund $18,586,458 $19,370,825 $19,063,635
Transportation and Parking Fund
Other $14,898 $19,039 $13,494
Interest 10,228 0 0
Service Charges 462,214 631,605 347,753
Transfers 2,926,070 3,889,306 4,141,164
Fund Balance 0 52,878 0
Total Transportation and Parking Fund $3,413,410 $4,592,828 $4,502,411
Water/Wastewater Fund
Interest $311,522 $367,085 $365,858
Transfers 80,800,000 95,475,866 95,255,941
Fund Balance 0 1,298,249 800,000
Total Water/Wastewater Fund $81,111,522 $97,141,200 $96,421,799
Total Enterprise Funds $130,124,673 $152,702,223 $151,406,811
Subtotal Operating Funds $781,850,882 $835,100,496 $791,328,314
Less Operating Interfund Transfers (1) (93,195,405) (98,663,146) (96,026,940)
Total Operating Funds $688,655,477 $736,437,350 $695,301,374
Table of Contents

Revenues
B-21
Actual Adopted Adopted
FY19 FY20 FY21
Non-Operating Funds
Non-Operating Capital Improvements
Better Streets, Safer City Sales Tax Fund
Sales Tax $113,651,743 $104,028,439 $0
Interest 1,953,264 1,487,513 3,051,975
Fund Balance 0 102,048,569 197,082,947
Total Better Streets, Safer City Sales Tax Fund $115,605,007 $207,564,521 $200,134,922
Better Streets, Safer City Use Tax Fund
Use Tax $19,350,227 $18,110,850 $0
Interest 336,196 187,500 294,172
Fund Balance 0 22,727,377 34,366,413
Total Better Streets, Safer City Use Tax Fund $19,686,423 $41,025,727 $34,660,585
Capital Improvement Projects Fund
Interest $685,004 $318,000 $0
Other 367,025 0 0
Service Charges 189,395 0 0
Transfers 26,856,555 17,705,220 5,850,000
Fund Balance 0 31,706,333 44,358,915
Total Capital Improvement Projects Fund $28,097,979 $49,729,553 $50,208,915
City and Schools Capital Projects Use Tax Fund
Use Tax $0 $0 $0
Interest 68,599 20,142 54,879
Other 211,936 0 0
Transfers 194,919 0 0
Fund Balance 0 3,307,925 3,831,697
Total City and Schools Cap. Projects Use Tax Fund $475,454 $3,328,067 $3,886,576
Hotel/Motel Tax Fund**
Hotel/Motel Tax $8,583,522 $9,038,118 $5,180,123
Interest 84,593 96,289 104,496
Transfers 2,120,437 2,038,100 0
Fund Balance 0 0 1,100,000
Total Hotel/Motel Tax Fund $10,788,551 $11,172,507 $6,384,619
Impact Fees Fund
Impact Fees $8,056,087 $7,843,663 $10,639,594
Interest 278,034 36,059 154,572
Fund Balance 0 13,551,748 23,031,898
Total Impact Fees Fund $8,334,122 $21,431,470 $33,826,064
Table of Contents

Revenues
B-22
Actual Adopted Adopted
FY19 FY20 FY21
Internal Service Funds**
Interest $0 $0 $0
Transfers 0 185,000 228,500
Fund Balance 0 0 370,861
Total Internal Service Funds $0 $185,000 $599,361
MAPS Operations Fund**
Use Tax $0 $0 $0
Interest 63,729 85,000 30,674
Transfers 732,986 2,032,165 0
Fund Balance 0 3,315,242 5,115,659
Total MAPS Operations Fund $796,715 $5,432,407 $5,146,333
MAPS Sales Tax Fund
Sales Tax $0 $0 $0
Interest 5,029 1,738 5,029
Other 3,469 3,000 3,554
Fund Balance 0 247,139 186,022
Total MAPS Sales Tax Fund $8,498 $251,877 $194,605
MAPS 3 Sales Tax Fund
Sales Tax $258,655 $0 $0
Interest 6,800,558 4,779,744 4,779,744
Service Charges 32,019 0 0
Fund Balance 0 305,206,006 178,682,900
Total MAPS 3 Sales Tax Fund $7,091,233 $309,985,750 $183,462,644
MAPS 3 Use Tax Fund**
Use Tax $0 $0 $0
Interest 294,207 182,725 250,076
Other 2,303 0 0
Transfers 0 0 0
Fund Balance 0 12,839,365 5,628,180
Total MAPS 3 Use Tax Fund $296,510 $13,022,090 $5,878,256
MAPS 4 Program Fund
Interest $0 $0 $36,000
Transfers 0 13,569,828 106,988,204
Fund Balance 0 0 13,569,828
Total MAPS 4 Program Fund $0 $13,569,828 $120,594,032
Table of Contents
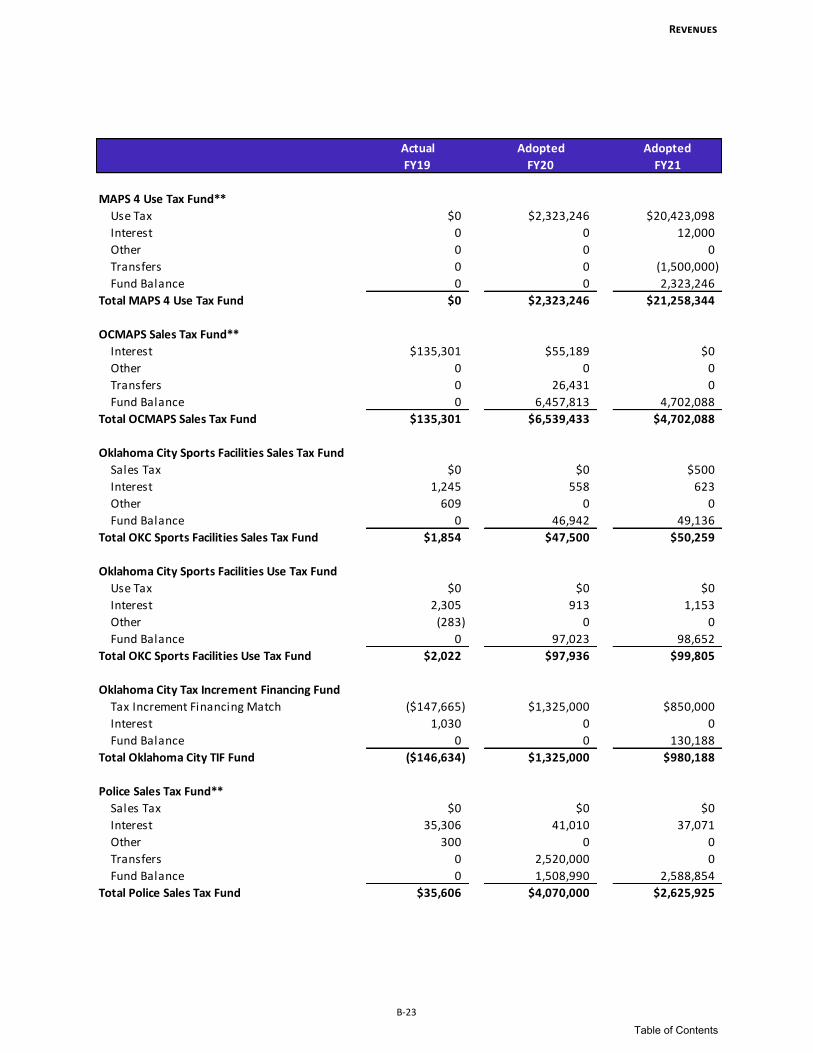
Revenues
B-23
Actual Adopted Adopted
FY19 FY20 FY21
MAPS 4 Use Tax Fund**
Use Tax $0 $2,323,246 $20,423,098
Interest 0 0 12,000
Other 0 0 0
Transfers 0 0 (1,500,000)
Fund Balance 0 0 2,323,246
Total MAPS 4 Use Tax Fund $0 $2,323,246 $21,258,344
OCMAPS Sales Tax Fund**
Interest $135,301 $55,189 $0
Other 0 0 0
Transfers 0 26,431 0
Fund Balance 0 6,457,813 4,702,088
Total OCMAPS Sales Tax Fund $135,301 $6,539,433 $4,702,088
Oklahoma City Sports Facilities Sales Tax Fund
Sales Tax $0 $0 $500
Interest 1,245 558 623
Other 609 0 0
Fund Balance 0 46,942 49,136
Total OKC Sports Facilities Sales Tax Fund $1,854 $47,500 $50,259
Oklahoma City Sports Facilities Use Tax Fund
Use Tax $0 $0 $0
Interest 2,305 913 1,153
Other (283) 0 0
Fund Balance 0 97,023 98,652
Total OKC Sports Facilities Use Tax Fund $2,022 $97,936 $99,805
Oklahoma City Tax Increment Financing Fund
Tax Increment Financing Match ($147,665) $1,325,000 $850,000
Interest 1,030 0 0
Fund Balance 0 0 130,188
Total Oklahoma City TIF Fund ($146,634) $1,325,000 $980,188
Police Sales Tax Fund**
Sales Tax $0 $0 $0
Interest 35,306 41,010 37,071
Other 300 0 0
Transfers 0 2,520,000 0
Fund Balance 0 1,508,990 2,588,854
Total Police Sales Tax Fund $35,606 $4,070,000 $2,625,925
Table of Contents
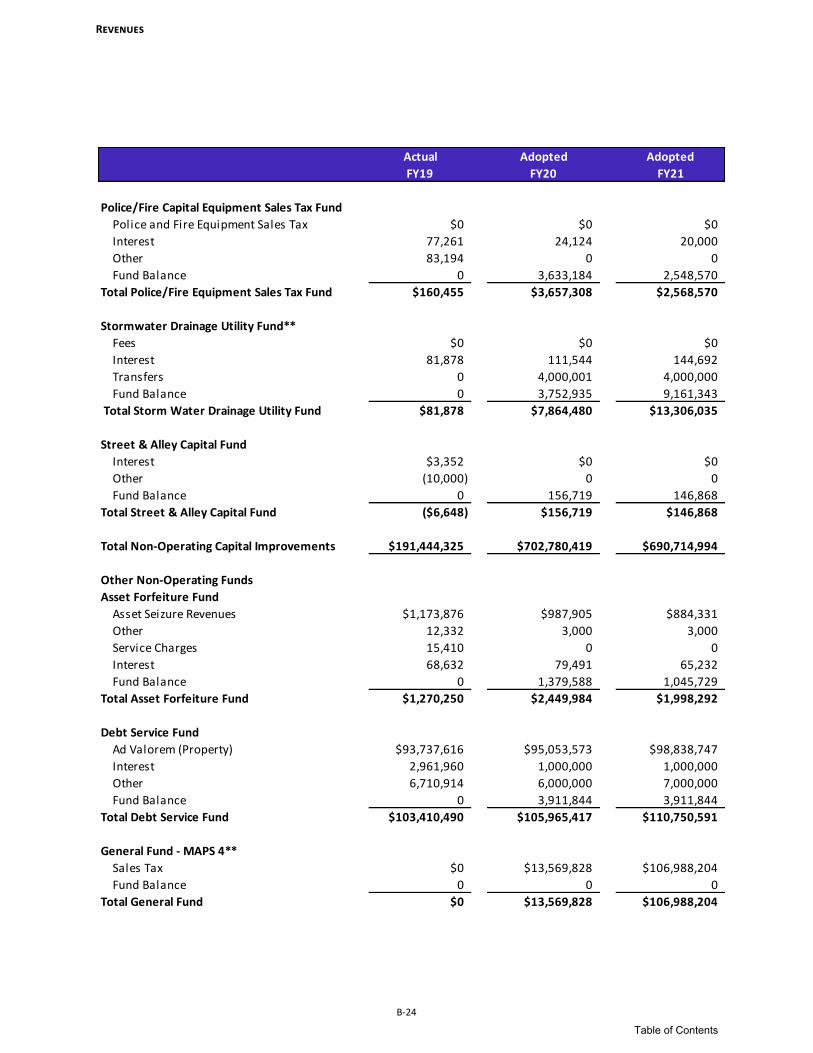
Revenues
B-24
Actual Adopted Adopted
FY19 FY20 FY21
Police/Fire Capital Equipment Sales Tax Fund
Police and Fire Equipment Sales Tax $0 $0 $0
Interest 77,261 24,124 20,000
Other 83,194 0 0
Fund Balance 0 3,633,184 2,548,570
Total Police/Fire Equipment Sales Tax Fund $160,455 $3,657,308 $2,568,570
Stormwater Drainage Utility Fund**
Fees $0 $0 $0
Interest 81,878 111,544 144,692
Transfers 0 4,000,001 4,000,000
Fund Balance 0 3,752,935 9,161,343
Total Storm Water Drainage Utility Fund $81,878 $7,864,480 $13,306,035
Street & Alley Capital Fund
Interest $3,352 $0 $0
Other (10,000) 0 0
Fund Balance 0 156,719 146,868
Total Street & Alley Capital Fund ($6,648) $156,719 $146,868
Total Non-Operating Capital Improvements $191,444,325 $702,780,419 $690,714,994
Other Non-Operating Funds
Asset Forfeiture Fund
Asset Seizure Revenues $1,173,876 $987,905 $884,331
Other 12,332 3,000 3,000
Service Charges 15,410 0 0
Interest 68,632 79,491 65,232
Fund Balance 0 1,379,588 1,045,729
Total Asset Forfeiture Fund $1,270,250 $2,449,984 $1,998,292
Debt Service Fund
Ad Valorem (Property) $93,737,616 $95,053,573 $98,838,747
Interest 2,961,960 1,000,000 1,000,000
Other 6,710,914 6,000,000 7,000,000
Fund Balance 0 3,911,844 3,911,844
Total Debt Service Fund $103,410,490 $105,965,417 $110,750,591
General Fund - MAPS 4**
Sales Tax $0 $13,569,828 $106,988,204
Fund Balance 0 0 0
Total General Fund $0 $13,569,828 $106,988,204
Table of Contents

Revenues
B-25
Actual Adopted Adopted
FY19 FY20 FY21
Grants Management Fund
Grant Awards $26,452,357 $34,259,919 $149,393,659
Total Grants Management Fund $26,452,357 $34,259,919 $149,393,659
OKC Improvement & Special Assessment Dist.
Assessments $3,253,903 $4,043,341 $5,252,985
Interest 39,296 27,700 11,100
Service Charges 3,002 6,003 2,872
Transfers 0 0 0
Fund Balance 0 0 0
Total OKC Improv. & Spcl Assess. Districts Fund $3,296,201 $4,077,044 $5,266,957
Special Purpose Fund
Donations $501,814 $263,481 $362,245
Fees 254,662 242,237 347,876
Interest 301,969 178,703 320,211
Other 1,024,918 1,500,000 556,247
Service Charges 61,830 47,270 320,562
Transfers 2,302,000 1,000,000 1,000,000
Fund Balance 0 8,372,153 7,493,646
Total Special Purpose Fund $4,447,194 $11,603,844 $10,400,787
Total Other Non-Operating Funds $138,876,492 $171,926,036 $384,798,490
Total Non-Operating Funds $330,320,816 $874,706,455 $1,075,513,484
Subtotal All Funds $1,018,976,294 $1,611,143,805 $1,770,814,858
Less Interfund Transfers (2) (29,684,654) (21,444,333) (112,409,120)
Total All Funds $989,291,640 $1,589,699,472 $1,658,405,738
*Includes transfers between the operating and non-operating portions of a fund.
** Fund contains both Operating and Non-Operating activities
Table of Contents

Revenues
B-26
Actual Adopted Adopted
FY19 FY20 FY21
(1) Transfers between Operating Funds
Gen Fund Transfer to Emerg Mgmt $2,550,000 $3,019,867 $2,895,939
Gen Fund to Transit Fund via COTPA 2,861,879 3,416,847 3,557,538
Gen Fund to City and Schools Use Tax Fund 0 0 0
Various Funds to Internal Service Fund 49,783,525 51,866,303 50,095,297
Fire Sales Tax to General Fund 12,113,760 12,312,425 12,249,416
Police Sales Tax to General Fund 9,301,042 9,459,160 9,405,199
Grants to General Fund 0 275,281 179,574
Gen Fund to Parking Cash Fund 239,848 538,935 588,867
Special Purpose to MAPS 3 Fund 0 0 0
Various Non-Operating Pmts to Gen Fund 1,738,331 1,941,747 769,764
Various Funds Admin Pmts to Gen Fund 14,607,021 15,832,581 16,285,346
Total $93,195,405 $98,663,146 $96,026,940
(2) Transfers to Non-Operating Funds
Gen Fund Transfer to MAPS 4 Prog Fund $0 $13,569,828 $107,365,950
Various to CIP Fund 27,626,803 7,416,850 4,910,000
Various Miscellaneous Transfers 2,000 0 0
Various Funds to Special Purpose 0 362 362
Various Funds to Grant Fund 2,055,852 457,293 132,808
Total $29,684,654 $21,444,333 $112,409,120
Table of Contents

B-27
Expenditures
Expenditure Summary
The Oklahoma Municipal Budget Act guides municipalities in the preparation of their budgets and mandates certain requirements in presenting the budget. The City of Oklahoma City diligently follows these requirements. Some of the requirements seem commonplace because we have been following these guidelines for years. For example, the budget contains actual revenues and expenses for the prior fiscal year, the revenue and expenditure budget for the current year, and estimated revenue and expenditures for the coming year. Another requirement is that all expenditures be “departmentalized” within each fund. The budget is also divided between operating and non-operating expenditures. This division helps take out the significant fluctuations in capital and non-operating expenses that occur as a result of projects such as the MAPS 3 program. Most of the discussions about the budget focus on the operating portion of the budget because it allows for better year-to-year comparisons. The operating budget totals $695,301,374.
Expenditure Categories One requirement of the Municipal Budget Act that drives the organization of the budget is that expenditures be classified into the following categories: Personal Services, Supplies, Other Services, Capital, Debt Service, and Transfers. As shown in the chart below, Personal Services is the largest portion of the City’s operating expenditures accounting for 72% of the total operating budget. Expenses like salaries, taxes, retirement benefits, and insurance make up the majority of operating costs because City services are labor-intensive and closely tied to the employees who carry out the various functions of the City. The second largest area of operating expenditures is Other Services at 14% of the operating budget. These expenses include contracts for service, utilities and chargebacks for internal services (Information Technology, Fleet Services, Print Shop, and Risk Management). Other Services is also the category where contingency is budgeted in each fund, as well as payments from City funds to City trusts such as the General Fund payment to the Central Oklahoma Transportation and Parking Authority. Supplies, at 5% of the operating budget, make up a relatively small percentage of the total and include items as varied as paper and pencils to asphalt and ammunition. Capital outlay makes up an even smaller percentage of the operating budget at less than 1% of the total. Most of the capital expenses of the City are reflected in the
Personal Services 72%
Supplies 5%
Other Services14%
Capital 1%
Transfers 8%
Operating Expenditures by Category
Table of Contents

B-28
Expenditures
non-operating portion of the budget. For purposes of the graph, debt service expenses related to General Obligation (GO) bond issuance costs are included in the capital category. Within the operating expenditure budget, the only debt service expenses are the fees paid related to the issuance of GO bonds. The Transfers category makes up 8% of the budget and includes transfers from operating funds to non-operating funds and City Trusts. One significant transfer is from the General Fund to the Capital Improvement Fund. Although the Municipal Budget Act classifies this expenditure as a transfer, the end result is capital investment.
Expenditures By Function Another way of looking at the City’s budget is to consider the service or function being provided. There are four broad areas of service provided by the City. The first are the General Government functions. These include the City Manager’s Office, the Office of Mayor and Council, the Municipal Counselor’s Office, the City Auditor’s Office, the City Clerk’s Office, Finance, Human Resources, and General Services; and make up approximately 11% of the City’s operating expenditures. The next function of city government is Public Safety which includes Police, Fire, Animal Welfare and Municipal Courts. This function comprises 51% of the operating expenditure budget. Public Services function includes Airports, Public Works, Development Services, Planning, Public Transportation and Parking, and Utilities. These departments total 30% of the operating expenditure budget. The Culture and Recreation function includes Parks and Recreation, the Zoo Sales Tax Fund, OCMAPS, MAPS 3 and the Hotel/Motel Tax Special Revenue Fund; and makes up 8% of the operating expenditure budget. The General Fund contains the Non-Departmental function, which organizes various citywide expenses and certain transfers that do not fit within another City department. These expenses were included in each of the four categories where the expense could easily be categorized. For example, the funding for audits of the City’s finances was classified as a General Government expense, while the subsidy for the Chesapeake Energy Arena and Cox Center operations was classified as a Cultural expense. The expenses in Non-Departmental that could not be directly attributed to a single category, such as the retiree health insurance subsidy, were allocated to each category proportionally so the full operating budget is allocated to specific functions.
General Government
11%
Public Safety51%
Public Services30%
Culture & Recreation 8%
Operating Expenditures by Function
Table of Contents

B-29
Expenditures
Budgeted Positions The FY21 Budget contains authorization for 4,757 positions throughout the City. This is a decrease of 112 positions from the FY20 adopted budget. In in addition to the decrease of 112 positions, 56 positions were frozen, meaning the positions still exist but funding is frozen for the FY21 budget year. The table on the following page shows the changes on a department-by-department basis. The City’s workforce is comprised of five basic groups. The American Federation of State, County, and Municipal Employees (AFSCME) represent the general pay plan or non-management employees of the City. This is the largest group at 1,338 positions. The Fraternal Order of Police (FOP) represents all sworn positions within the Police Department. The adopted budget includes 1,235 FOP positions. The International Association of Firefighters (IAFF) represents all of the uniformed positions within the Fire Department. The adopted budget contains 999 uniformed Fire positions. Management includes employees on the Management, Auditors, and Legal pay plans. Each pay plan includes administrative support, professional, and managerial positions. In addition, those employees who report directly to the City Manager are included as Management. This group totals 1,178 positions in the adopted budget. The executive category includes only positions that report directly to City Council: the City Manager, City Attorney, City Auditor and four Municipal Judges.
Mgmt. 1,177
Executive 7
IAFF 999FOP 1,235
AFSCME 1,339
Positions by Category
4,5294,580
4,804 4,8694,757
0
1,000
2,000
3,000
4,000
5,000
FY17 Adopted FY18 Adopted FY19 Adopted FY20 Adopted FY21 Adopted
Budgeted Positions History
Table of Contents

B-30
Expenditures
Budgeted Positions by Department
FY19 FY20 FY21
Department Adopted Adopted Adopted Change %
Airports 127.00 130.00 130.00 0.00 0.0%
City Auditor 8.00 7.00 7.00 0.00 0.0%
City Clerk 9.00 9.00 9.00 0.00 0.0%
City Manager 50.00 52.00 45.40 (6.60) (12.7%)
Development Services 192.00 197.00 177.00 (20.00) (10.2%)
Finance 85.00 88.00 83.00 (5.00) (5.7%)
Fire 1,000.14 1,015.15 1,032.45 17.30 1.7%
Fire Grants 28.86 18.85 4.55 (14.30) (75.9%)
General Services 71.00 71.00 66.00 (5.00) (7.0%)
Human Resources 27.00 29.00 29.00 0.00 0.0%
Information Technology 111.00 111.00 112.00 1.00 0.9%
Mayor and Council 6.00 7.00 6.60 (0.40) (5.7%)
Municipal Counselor 55.00 56.00 54.00 (2.00) (3.6%)
Municipal Court 67.00 67.00 58.00 (9.00) (13.4%)
Parks and Recreation 165.00 178.00 165.00 (13.00) (7.3%)
Planning 27.83 27.93 26.93 (1.00) (3.6%)
Planning Grants 19.17 19.07 18.07 (1.00) (5.2%)
Police 1,524.00 1,539.00 1,527.00 (12.00) (0.8%)
Police Grants 0.00 0.00 0.00 0.00 N/A
Public Transportation and Parking 35.00 36.00 34.00 (2.00) (5.6%)
Public Works 409.00 418.00 399.00 (19.00) (4.5%)
Utilities 787.00 793.00 773.00 (20.00) (2.5%)
Subtotal 4,804.00 4,869.00 4,757.00 (112.00) (2.3%)
Positions Frozen in FY21
City Manager 0.00 0.00 (1.00) (1.00) N/A
Fire 0.00 0.00 (21.00) (21.00) N/A
Police 0.00 0.00 (34.00) (34.00) N/A
Total Frozen Positions 0.00 0.00 (56.00) (56.00) N/A
Total 4,804.00 4,869.00 4,701.00 (168.00) (3.5%)
Table of Contents

B-31
Expenditures
The General Fund The General Fund is the largest fund within the City budget and makes up $456,511,388 of the City’s total operating budget. The General Fund serves as the mechanism from which many of the core services of the City are primarily funded. The General Fund also has the most flexibility on how funds can be spent. The special revenue and enterprise funds, mostly operating funds, have specific purposes required for the expenditure of those funds. Within the General Fund, however, there is more latitude to direct the spending priorities of the City. Using the same functions that were defined before, the focus on Public Safety is even more pronounced in the General Fund as approximately 66.2% of the total budget is expended in this area. Public Services is the second largest area of spending at 15.5%. However, its share of the General Fund is significantly smaller than in the operating budget because a large portion of Public Service funding comes from Enterprise Funds (such as Airports and Utilities). General Government makes up 8.5% of the General Fund because general government functions, such as Finance and Human Resources, do not have a funding source outside the General Fund.
Culture and Recreation at 9.9% is a smaller portion of the General Fund than of the operating budget, as a whole, because major revenue sources for Culture and Recreation, such as MAPS 3, the Zoo Sales Tax and the Hotel/Motel Tax, are outside the General Fund. A comparison of the General Fund Budget at the department level provides a useful comparison of how priorities are allocated and how the costs for providing services are changing relative to the other departments. The next page provides a breakdown of the General Fund budget by department.
Public Safety66.2%
General Government
8.5%
Public Services15.5%
Culture & Recreation
9.9%
General Fund Expenditures by Function
Table of Contents

B-32
Expenditures
General Fund Budget by Department
Actual Adopted Adopted
FY19 FY20 FY21
General Fund Expenses
City Auditor $1,125,065 $1,254,507 $1,241,116
City Clerk 1,061,975 1,088,938 1,118,014
City Manager 3,779,749 3,666,576 3,079,447
Development Services 18,749,761 19,968,327 18,335,567
Finance 8,133,061 9,099,916 8,916,045
Fire 102,107,086 106,922,333 108,428,499
General Services 5,254,315 5,212,806 4,858,164
Human Resources 3,485,791 3,711,168 3,614,809
Mayor & Council 1,069,544 1,175,891 1,159,250
Municipal Counselor 7,470,493 7,514,930 7,089,258
Municipal Court 7,878,068 8,855,152 8,022,534
Non-Departmental Operating 62,657,685 68,172,907 59,784,174
Parks & Recreation 26,054,789 29,036,043 27,805,941
Planning 3,946,810 4,500,543 3,897,050
Police 148,446,811 154,800,485 152,262,308
Public Transportation and Parking 22,124,121 23,665,143 14,308,586
Public Works 29,521,876 34,895,682 32,590,626
Total Expenses $452,866,998 $483,541,347 $456,511,388
Table of Contents

B-33
Expenditures
Expenditure Summary Table
Actual Adopted Adopted
FY19 FY20 FY21
Operating Funds
General Operating Funds
General Fund* $452,866,998 $483,541,347 $456,511,388
Internal Service Fund* 50,483,839 54,093,967 51,851,413
Total General Operating Funds $503,350,837 $537,635,314 $508,362,801
Special Revenue Funds
Court Admin. and Training Fund $188,433 $234,536 $227,000
Emergency Management Fund 8,347,722 9,197,130 9,244,913
Fire Sales Tax Fund 41,202,984 49,353,284 43,557,389
Hotel/Motel Tax Fund* 13,279,023 13,774,071 7,843,932
MAPS Operations Fund* 274,894 119,593 0
MAPS 3 Use Tax Fund* 3,421,087 4,718,462 4,400,119
MAPS 4 Use Tax Fund* 0 0 1,500,000
Medical Service Program Fund 4,736,177 7,045,862 8,726,360
Police Sales Tax Fund* 41,357,386 45,458,241 42,406,840
Zoo Sales Tax Fund 14,244,798 14,861,780 13,652,149
Total Special Revenue Funds $127,052,503 $144,762,959 $131,558,702
Enterprise Funds
Airports Fund $17,339,871 $20,468,675 $20,273,057
Solid Waste Management Fund 9,230,758 11,128,695 11,145,909
Stormwater Drainage Utility Fund* 15,370,982 19,370,825 19,063,635
Public Trans. and Parking Fund 3,670,337 4,592,828 4,502,411
Water/Wastewater Fund 80,894,261 97,141,200 96,421,799
Total Enterprise Funds $126,506,209 $152,702,223 $151,406,811
Subtotal Operating Funds $756,909,549 $835,100,496 $791,328,314
Less Interfund Transfers (1) (93,195,405) (98,663,146) (96,026,940)
Total Operating Funds $663,714,145 $736,437,350 $695,301,374
Table of Contents

B-34
Expenditures
Actual Adopted Adopted
FY19 FY20 FY21
Non-Operating Funds
Capital Improvement Funds
Better Streets, Safer City Sales Tax Fund $32,325,426 $207,564,521 $200,134,922
Better Streets, Safer City Use Tax Fund 2,253,236 41,025,727 34,660,585
Capital Improvement Projects Fund 22,764,768 49,729,553 50,208,915
City and Sch Cap Proj Use Tax Fund 4,116 3,328,067 3,886,576
Hotel/Motel Tax Fund* 10,739,175 11,172,507 6,384,619
Impact Fees Fund 1,422,589 21,431,470 33,826,064
Internal Service Funds* 0 185,000 599,361
MAPS Operations Fund* 79,408 5,432,407 5,146,333
MAPS Sales Tax Fund 30,955 251,877 194,605
MAPS 3 Sales Tax Fund 144,809,990 309,985,750 183,462,644
MAPS 3 Use Tax Fund* 5,645,689 13,022,090 5,878,256
MAPS 4 Program Fund 0 13,569,828 120,594,032
MAPS 4 Use Tax Fund* 0 2,323,246 21,258,344
OCMAPS Sales Tax Fund 1,370,170 6,539,433 4,702,088
OKC Sports Facilities Sales Tax Fund 20,578 47,500 50,259
OKC Sports Facilities Use Tax Fund 78,496 97,936 99,805
OKC Tax Increment Financing Fund 0 1,325,000 980,188
Police Sales Tax Fund* 337,077 4,070,000 2,625,925
Police/Fire Cap Equip Sales Tax Fund 435,272 3,657,308 2,568,570
Stormwater Drainage Utility Fund* 480,389 7,864,480 13,306,035
Street and Alley Fund 16,255 156,719 146,868
Total Capital Improvement Funds $222,813,589 $702,780,419 $690,714,994
Other Non-Operating Funds
Asset Forfeiture Fund $1,422,751 $2,449,984 $1,998,292
Debt Service Fund 98,624,181 105,965,417 110,750,591
General Fund - MAPS 4* 0 13,569,828 106,988,204
Grants Management Fund 26,368,965 34,259,919 149,393,659
OKC Improv. and Special Assess Dist. 2,839,843 4,077,044 5,266,957
Special Purpose Fund 1,716,562 11,603,844 10,400,787
Total Other Non-Operating Funds $130,972,302 $171,926,036 $384,798,490
Total Non-Operating Funds $353,785,891 $874,706,455 $1,075,513,484
Subtotal All Funds $1,017,500,036 $1,611,143,805 $1,770,814,858
Less Interfund Transfers (2) (29,684,654) (21,444,333) (112,409,120)
Total All Funds $987,815,381 $1,589,699,472 $1,658,405,738
* Indicates the Fund has both an Operating and Non-Operating component
Table of Contents

B-35
Expenditures
Actual Adopted Adopted
FY19 FY20 FY21
(1) Transfers between Operating Funds
Gen Fund Transfer to Emerg Mgmt $2,550,000 $3,019,867 $2,895,939
Gen Fund to Transit Fund via COTPA 2,861,879 3,416,847 3,557,538
Various Funds to Internal Service Fund 49,783,525 51,866,303 50,095,297
Fire Sales Tax to General Fund 12,113,760 12,312,425 12,249,416
Grants Funds to General Fund 0 275,281 179,574
General Fund to Parking Cash Fund 239,848 538,935 588,867
Various Funds Pmts to Gen Fund 1,738,331 1,941,747 769,764
Police Sales Tax to General Fund 9,301,042 9,459,160 9,405,199
Various Funds Admin Pmts to Gen Fund 14,607,021 15,832,581 16,285,346
Total $93,195,405 $98,663,146 $96,026,940
(2) Transfers to Non-Operating Funds
Gen Fund Transfer to MAPS 4 Prog Fund $0 $13,569,828 $107,365,950
Various to CIP Fund 27,626,803 7,416,850 4,910,000
Various Miscellaneous Transfers 2,000 0 0
Various Funds to Special Purpose 0 362 362
Various Funds to Grant Funds 2,055,852 457,293 132,808
Total $29,684,654 $21,444,333 $112,409,120
Table of Contents

B-36
Expenditures
Table of Contents

Reader’s Guide to Department Budgets
C-1
Departmental Budgets
The Reader’s Guide to Department Budgets on the following pages offers a step-by-step guide for understanding the Budget Presentation. All departments follow the Leading For Results budget model. The graphics and text in this section are designed to assist the reader in understanding the department budget format.
Department Name
Organizational Chart This graphic represents the department’s structure with Lines of Business being identified by boxes. Programs within the Line of Business are listed below the box and bulleted for easy identification. Within each department is an Administrative Line of Business represented by the box containing the department name. The Executive Leadership Program within the Administrative Line of Business is standard across all City departments. The departments have the option of adding additional programs to the Administrative Line of Business such as Human Resources, Public Information, and Safety and Risk Management. Occasionally, a department will remove a non-applicable Program from the Administrative Line of Business or add a Program unique to their department.
Mission Statement Each department develops a Mission Statement to clearly communicate the purpose of the department. The Mission Statement includes the results the department will achieve for its customers, the future direction of the department, and its commitment to public service.
Department Budget, Overview and Position History The Department Budget shows the budget by Line of Business to include any non-operating components of the budget, such as capital spending. The Department Overview is a quick snap shot of the current budget, how it changed since last fiscal year and any significant changes. The Position History is a five-year look at the number of positions in this department.
Major Budget Changes This is a summary of the department’s major budget changes such as position changes, equipment purchases, or significant increases in fuel or utilities.
Table of Contents

Departmental Budgets
C-2
Department Expenditures The first table lists the department’s expenditures by Line of Business or purpose and the second table lists the expenditures by funding source.
Department Positions The first table lists the department’s positions by Line of Business or purpose and the second table lists the positions by funding source.
Lines of Business The detail for each Line of Business is included in the department’s budget with the Purpose Statement for that particular Line of Business. Purpose Statements follow the same guideline as the department’s Mission Statement and are designed to clearly communicate the purpose of the Line of Business including the results that will be achieved for customers.
Program Positions and Budget Program Positions and Budget shown in the last table provides the number of positions and operating budget by Program for each department’s Line of Business section.
Table of Contents
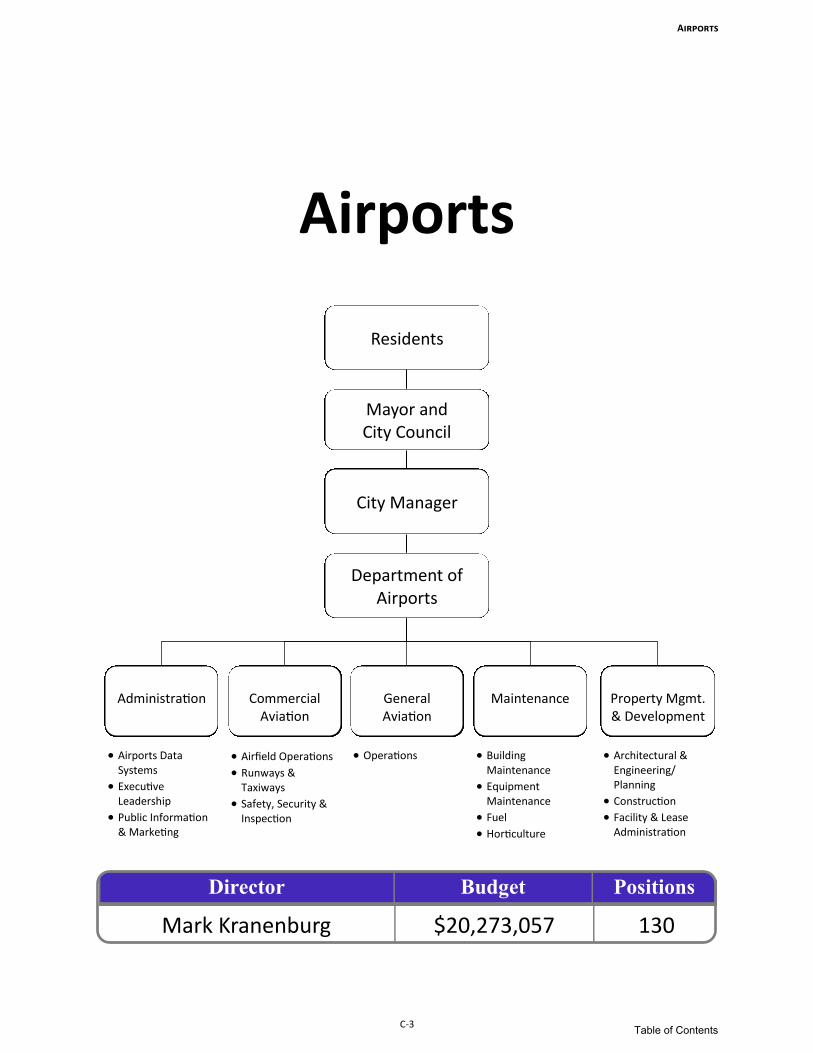
Airports
C-3
Airports
Property Mgmt. & Development
• Architectural & Engineering/Planning
• Construction
• Facility & Lease Administration
Maintenance
• Building Maintenance
• Equipment Maintenance
• Fuel
• Horticulture
General Aviation
• Operations
Residents
Mayor and City Council
City Manager
Department of Airports
Mark Kranenburg $20,273,057 130
Director Budget Positions
• Airports Data Systems
• Executive Leadership
• Public Information & Marketing
Administration
Commercial Aviation
• Airfield Operations
• Runways & Taxiways
• Safety, Security & Inspection
Table of Contents

Department Introduction
Airports
C-4
Mission Statement The mission of the Airports Department is to provide management, operations, and development of the City’s three airports to tenants, users, and the general public so they can have a safe and efficient air transportation system.
Department Budget
Department overview The Airports Department has a total budget of $20,273,057, which is an increase of 1.31%. There are 130 positions authorized in the FY21 budget, which is the same number of positions as of FY20.
Position history
To review performance information,
please see the performance data report or visit our website: www.okc.gov/performancedata.
Department Facts • The Department operates
three airports: Will Rogers World Airport (WRWA), Wiley Post Airport (WPA), and Clarence E. Page Airport (CEP).
• In 2018 WRWA provided
service to a record breaking 4.34 million passengers.
• WRWA’s two longest
runways are 9,800 feet each, each runway is the equivalent of 27 football fields end-to-end.
• About 170 flights per day
arrive and depart from WPA, the vast majority of which are local and transient
31%
29%
4%
25%
11%
$20,273,057
Administration
Commercial Aviation
General Aviation
Maintenance
Property Mgmt. andDevelopment
120 120127 130 130
FY17 FY18 FY19 FY20 FY21
Table of Contents

Major Budget Changes
Airports
C-5
Department of Airports Major Budget Changes Amount Positions
1. Changes in personnel related costs such as salaries, merit,
retirement, health insurance and other benefits
$189,060 -
Table of Contents

Expenditures
Airports
C-6
Summary of FY19 FY20 FY21 Percent
Expenditures by Purpose Actual Adopted Budget Adopted Budget Change
Operating Expenditures
Administration $5,190,594 $5,996,516 $6,172,374 2.93%
Commercial Aviation 5,333,775 6,009,423 5,900,861 -1.81%
General Aviation 760,118 860,950 880,000 2.21%
Maintenance 4,073,382 5,439,170 5,097,990 -6.27%
Property Mgmt. and Development 1,982,002 2,162,616 2,221,832 2.74%
Total Operating Expenditures $17,339,871 $20,468,675 $20,273,057 -0.96%
Summary of FY19 FY20 FY21 Percent
Expenditures by Funding Source Actual Adopted Budget Adopted Budget Change
Airport Cash Fund $17,339,871 $20,468,675 $20,273,057 -0.96%
Total All Funds $17,339,871 $20,468,675 $20,273,057 -0.96%
Table of Contents

Positions
Airports
C-7
Summary of FY19 FY20 FY21 Percent
Positions by Purpose Actual Adopted Budget Adopted Budget Change
Administration 24.00 25.00 25.00 0.00%
Commercial Aviation 24.00 25.00 25.00 0.00%
General Aviation 10.00 10.00 10.00 0.00%
Maintenance 49.00 50.00 50.00 0.00%
Property Mgmt. and Development 20.00 20.00 20.00 0.00%
Department Total 127.00 130.00 130.00 0.00%
Summary of FY19 FY20 FY21 Percent
Positions by Funding Source Actual Adopted Budget Adopted Budget Change
Airport Cash Fund 127.00 130.00 130.00 0.00%
Department Total 127.00 130.00 130.00 0.00%
Table of Contents

Airports Lines of Business
Airports
C-8
Administration • The Airport Data Systems Program provides technology services to department employees, airport
tenants, and the general public so they can have a safe reliable and informed airport experience. • The Executive Leadership Program provides planning, management, administrative, and reporting
services to department employees and City leaders so they can achieve strategic goals and key results.
• The Public Information and Marketing Program provides the users, tenants and employees of the
airport effective communication, promotions, advertising, and air service development so they can have the best overall airport experience.
Administration Positions and Budget
Commercial Aviation
• The Airfield Operations Program provides airfield inspections and emergency response services to
the flying public, airport users and tenants so they can have a safe and secure airfield environment that meets or exceeds federal requirements.
• The Runways and Taxiways Program at Will Rogers World Airport provides runway and taxiway
maintenance services to aircraft operators so they can have safe ground movement. • The Safety, Security and Inspection Program provides secured area management, security
oversight and information dissemination services to airport employees, tenants, contractors, vendors, and the traveling public so they can have access to a secure airport environment.
Adopted Actual Adopted Adopted Adopted Adopted
Program Positions Expenses Positions Budget Positions Budget
Airport Data Systems 0.00 $0 0.00 $0 0.00 $0
Executive Leadership 21.95 4,955,689 22.95 5,759,745 22.95 5,928,731
Public Information and
Marketing2.05 234,905 2.05 236,771 2.05 243,643
Line of Business Total 24.00 $5,190,594 25.00 $5,996,516 25.00 $6,172,374
*The Airport Data Systems Program was added during the FY20 Strategic Bus iness Plan Update
FY19 FY20 FY21
Table of Contents

Airports
C-9
Commercial Aviation Positions and Budget
General Aviation • The Operations Program at Wiley Post Airport and Clarence E. Page Airport provides maintenance,
safety inspections, and reporting services to tenants, users and the general public so they can have a safe airport operating environment.
General Aviation Positions and Budget
Maintenance • The Building Maintenance Program provides maintenance on airport buildings and facility
maintenance on leased facilities to airport tenants and users so they can experience a clean, safe, comfortable and operational work and travel environment.
• The Equipment Maintenance Program provides vehicle and equipment preventive maintenance
and repair services to airport contractors, and airport employees so they can have operable equipment needed to perform their duties in a timely manner.
• The Fuel Program provides fuel storage services to aircraft refueling tenants, and City and
contractor personnel so they can have quality fuel and fuel services. • The Horticulture Program at Will Rogers World Airport provides maintenance of grounds,
landscaping, center medians, and right-of-ways to citizens and visitors so they can experience a safe, clean, aesthetically pleasing environment.
Adopted Actual Adopted Adopted Adopted Adopted
Program Positions Expenses Positions Budget Positions Budget
Airfield Operations 8.00 $741,443 8.00 $769,731 8.00 $757,497
Runways and Taxiways 13.00 1,071,274 14.00 1,389,992 14.00 1,401,837
Safety, Security, and Inspections 3.00 3,521,059 3.00 3,849,700 3.00 3,741,527
Line of Business Total 24.00 $5,333,775 25.00 $6,009,423 25.00 $5,900,861
FY21FY20FY19
Adopted Actual Adopted Adopted Adopted Adopted
Program Positions Expenses Positions Budget Positions Budget
Operations 10.00 $760,118 10.00 $860,950 10.00 $880,000
Line of Business Total 10.00 $760,118 10.00 $860,950 10.00 $880,000
FY19 FY20 FY21
Table of Contents

Airports
C-10
Maintenance Positions and Budget
Property Management and Development • The Architectural and Engineering/Planning Program provides technical analysis, space planning,
long-term capital planning, project management, and maintenance support to other airport divisions so they can have the engineering and planning resources that they need within the specified time frame.
• The Construction Program provides capital improvement construction services to tenants and
other Airport divisions so they can have the buildings, facilities and infrastructure necessary to meet their needs within budget and time constraints.
• The Facility and Lease Administration Program provides facility accommodations, economic
development support, leasing and permitting services to tenants and other users so the airport can generate revenue for operations and users can have the facilities necessary to meet their needs.
Property Management and Development Positions and Budget
Adopted Actual Adopted Adopted Adopted Adopted
Program Positions Expenses Positions Budget Positions Budget
Building Maintenance 18.00 $1,477,414 19.00 $1,752,214 19.00 $1,820,825
Equipment Maintenance 8.00 882,128 8.00 1,829,244 8.00 1,393,735
Fuel 7.00 777,320 7.00 734,946 7.00 729,792
Horticulture 16.00 936,520 16.00 1,122,766 16.00 1,153,638
Line of Business Total 49.00 $4,073,382 50.00 $5,439,170 50.00 $5,097,990
FY19 FY20 FY21
Adopted Actual Adopted Adopted Adopted Adopted
Program Positions Expenses Positions Budget Positions Budget
Architectural and
Engineering/Planning6.00 $651,645 6.00 $701,194 6.00 $723,344
Construction 8.00 781,667 8.00 884,950 8.00 906,666
Facility and Lease Administration 6.00 548,690 6.00 576,472 6.00 591,822
Line of Business Total 20.00 $1,982,002 20.00 $2,162,616 20.00 $2,221,832
FY19 FY20 FY21
Table of Contents

City Auditor
C-11
• Audit Services • Ethics Assurance
City Auditor
Ethics Assurance
Residents
Mayor and City Council
City Auditor
Jim Williamson $1,241,116 7
Audit Services
Director Budget Positions
Table of Contents

Department Introduction
City Auditor
C-12
Mission Statement The mission of the Office of the City Auditor is to provide independent audit, investigative and advisory services to City Council, appointed officials and executive managers so they can make better-informed policy and operational decisions on behalf of residents.
Department Budget
Department Overview The Office of the City Auditor (OCA) has a FY21 budget of $1,241,116, a decrease of 1.07%. Seven positions are authorized in the FY21 budget. There has been no change in positions from FY20 to FY21.
Position history
To review performance information, please see the attached supplemental performance report or visit our website: www.okc.gov/performancedata.
Department Facts
• The OCA is audited every three years to ensure compliance with Generally Accepted Government Auditing Standards.
• The OCA develops and
operates by a triennial Audit Plan based on a citywide risk assessment.
• So far in FY20, the OCA has
completed four audit reports, and completed eight reports in FY19. All reports are available on the Department’s official City website
6%
90%
4%
$1,241,116
Administration
Audit Services
Ethics Assurance
8
9
8
7 7
FY17 FY18 FY19 FY20 FY21
Table of Contents
Major Budget Changes
City Auditor
C-13
City Auditor Major Budget Changes Amount Positions
1. Changes in personnel related costs such as salaries, merit,
retirement, health insurance, and other benefits
$22,224 -
Table of Contents

Expenditures
City Auditor
C-14
Summary of FY19 FY20 FY21 Percent
Expenditures by Funding Source Actual Adopted Budget Adopted Budget Change
General Fund $1,125,065 $1,254,507 $1,241,116 -1.07%
Total All Funds $1,125,065 $1,254,507 $1,241,116 -1.07%
Summary of FY19 FY20 FY21 Percent
Expenditures by Purpose Actual Adopted Budget Adopted Budget Change
Operating Expenditures
Administration $78,099 $76,655 $71,477 -6.75%
Audit Services 992,287 1,125,641 1,116,010 -0.86%
Ethics Assurance 54,679 52,211 53,629 2.72%
Total Operating Expenditures $1,125,065 $1,254,507 $1,241,116 -1.07%
Table of Contents
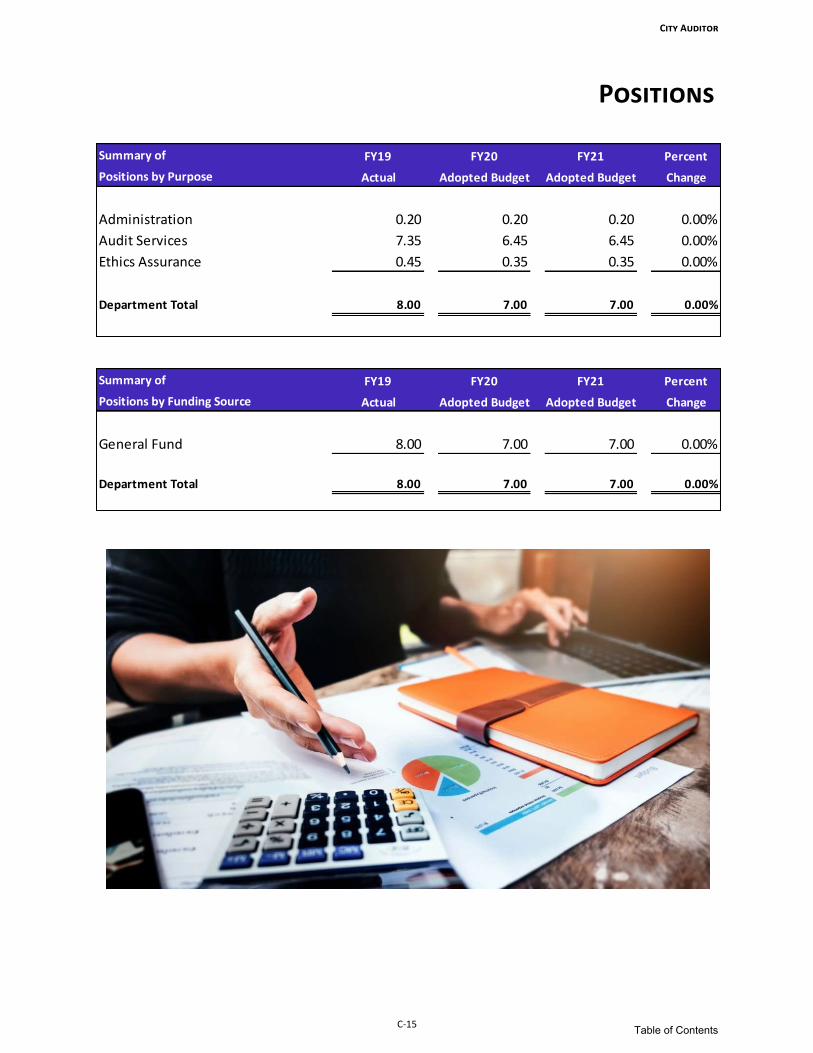
Positions
City Auditor
C-15
Summary of FY19 FY20 FY21 Percent
Positions by Purpose Actual Adopted Budget Adopted Budget Change
Administration 0.20 0.20 0.20 0.00%
Audit Services 7.35 6.45 6.45 0.00%
Ethics Assurance 0.45 0.35 0.35 0.00%
Department Total 8.00 7.00 7.00 0.00%
Summary of FY19 FY20 FY21 Percent
Positions by Funding Source Actual Adopted Budget Adopted Budget Change
General Fund 8.00 7.00 7.00 0.00%
Department Total 8.00 7.00 7.00 0.00%
Table of Contents

City Auditor Lines of Business
City Auditor
C-16
Administration
• The Executive Leadership Program provides planning, management, administrative and reporting services to department employees and City leaders so they can achieve strategic goals and key results.
Administration Positions and Budget
Audit Services
• The Audit Services Program provides scheduled (proactive) and unscheduled (responsive) audit, investigative, and advisory services to City Council and other City decision makers so they can have timely and useful information to address policy and operational opportunities and/or deficiencies.
Audit Services Positions and Budget
Ethics Assurance
• The Ethics Assurance Program provides ethics reporting and advisory services to City decision makers so they can detect and quickly address all reported cases of fraud, waste, abuse and significant policy violations.
Ethics Assurance Positions and Budget
Adopted Actual Adopted Adopted Adopted Adopted
Program Positions Expenses Positions Budget Positions Budget
Ethics Assurance 0.45 $54,679 0.35 $52,211 0.35 $53,629
Line of Business Total 0.45 $54,679 0.35 $52,211 0.35 $53,629
FY19 FY20 FY21
Adopted Actual Adopted Adopted Adopted Adopted
Program Positions Expenses Positions Budget Positions Budget
Executive Leadership 0.20 $78,099 0.20 $76,655 0.20 $71,477
Line of Business Total 0.20 $78,099 0.20 $76,655 0.20 $71,477
FY19 FY20 FY21
Adopted Actual Adopted Adopted Adopted Adopted
Program Positions Expenses Positions Budget Positions Budget
Audit Services 7.35 $992,287 6.45 $1,125,641 6.45 $1,116,010
Line of Business Total 7.35 $992,287 6.45 $1,125,641 6.45 $1,116,010
FY19 FY20 FY21
Table of Contents

City Clerk
C-17
• Bid Management
• City Clerk’s Information
• Council Agenda Management
• Election Management
• Records Management
City Clerk
Official City Records
Residents
Mayor and City Council
City Manager
City Clerk
Frances Kersey $1,169,831 9
Director Budget Positions
Table of Contents

Department Introduction
City Clerk
C-18
Mission Statement The mission of the Office of the City Clerk is to provide management of Council and Trust agendas, official records, and coordination of bidding and election services to City officials, departments and the public so they can receive information to successfully accomplish their goals.
Department budget
Department overview The Office of the City Clerk has a total budget of $1,169,831, which is an increase of 0.78%. There are nine positions authorized in the FY21 budget, an increase of zero positions over the FY20 budget.
Position history
To review performance information, please see the performance data report or visit our website: www.okc.gov/performancedata.
Department Facts • The Office of the City Clerk is
responsible for preserving and maintaining over 435,807 records dating as far back as 1890.
• The Office of the City Clerk
received an estimated 4,000 record requests in FY19.
20%
80%
$1,169,831
Administration
Official CityRecords
8 8
9 9 9
FY17 FY18 FY19 FY20 FY21
Table of Contents

Major Budget Changes
City Clerk
C-19
The Office of the City Clerk Major Budget Changes Amount Positions
1. Changes in personnel related costs such as salaries, merit,
retirement, health insurance, and other benefits.
$28,444
Table of Contents

Expenditures
City Clerk
C-20
Summary of FY19 FY20 FY21 Percent
Expenditures by Funding Source Actual Adopted Budget Adopted Budget Change
General Fund $1,061,976 $1,088,938 $1,118,014 2.67%
Capital Improvement Projects 0 71,819 51,817 -27.85%
Special Purpose Fund 71,163 0 0 N/A
Total All Funds $1,133,139 $1,160,757 $1,169,831 0.78%
Summary of FY19 FY20 FY21 Percent
Expenditures by Purpose Actual Adopted Budget Adopted Budget Change
Operating Expenditures
Administration $229,334 $209,416 $221,013 5.54%
Official City Records 832,642 879,522 897,001 1.99%
Total Operating Expenditures $1,061,976 $1,088,938 $1,118,014 2.67%
Non-Operating Expenditures $71,163 $71,819 $51,817 -27.85%
Department Total $1,133,139 $1,160,757 $1,169,831 0.78%
Table of Contents
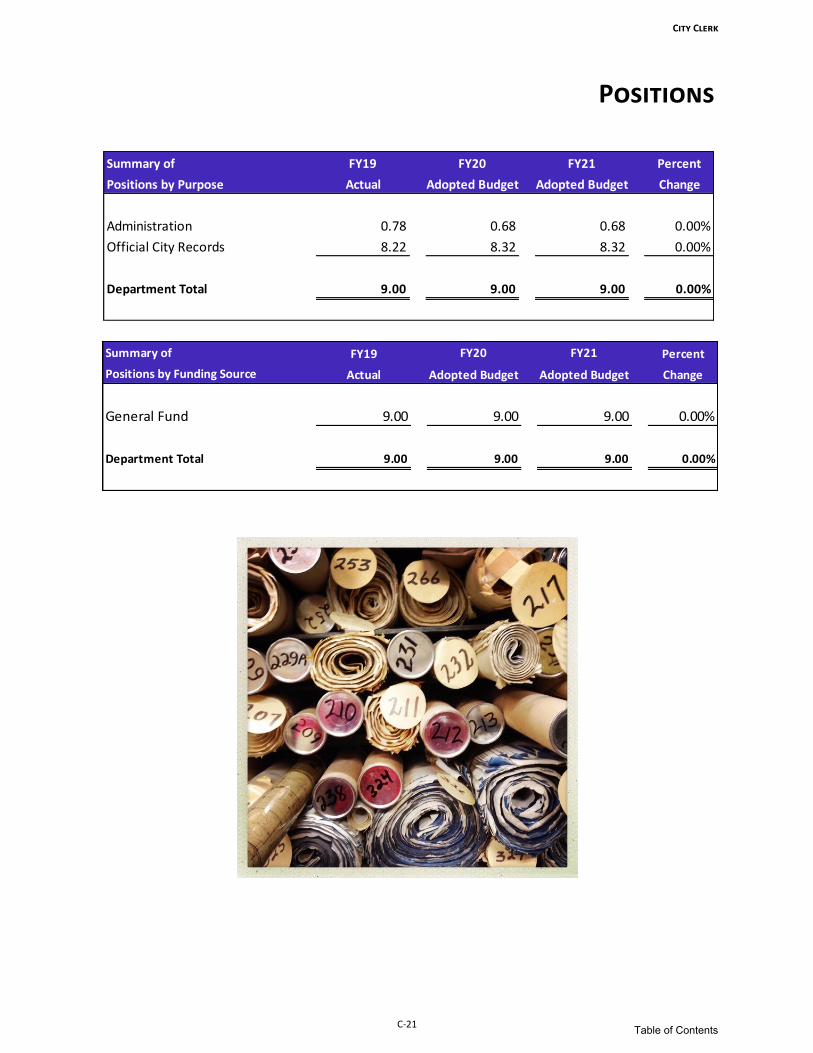
Positions
City Clerk
C-21
Summary of FY19 FY20 FY21 Percent
Positions by Purpose Actual Adopted Budget Adopted Budget Change
Administration 0.78 0.68 0.68 0.00%
Official City Records 8.22 8.32 8.32 0.00%
Department Total 9.00 9.00 9.00 0.00%
Summary of FY19 FY20 FY21 Percent
Positions by Funding Source Actual Adopted Budget Adopted Budget Change
General Fund 9.00 9.00 9.00 0.00%
Department Total 9.00 9.00 9.00 0.00%
Table of Contents

City Clerk Lines of Business
City Clerk
C-22
Administration • The Executive Leadership Program provides planning, management, administrative and reporting
services to department employees and City leaders so they can achieve strategic goals and key results.
Administration Positions and Budget
FY19 FY20 FY21
Adopted Actual Adopted Adopted Adopted Adopted
Program Positions Expenses Positions Budget Positions Budget
Executive Leadership 0.78 $229,334 0.68 $209,416 0.68 $221,013
Line of Business Total 0.78 $229,334 0.68 $209,416 0.68 $221,013
Table of Contents

City Clerk
C-23
Official City Records
• The Bid Management Program provides bid information, receipt, verification and training services to the City and its Trusts so they receive qualified bids to award contracts for City programs and projects.
• City Clerk’s Information Program manages receipt of official notices, processes legal documents,
provides open records request responses, publication and notification services to The City of Oklahoma City, City departments and the public so they can receive and access official information requested in a timely manner.
• Council Agenda Management Program provides agenda oversight and coordination services to The City and its Trusts so they can conduct official business and ensure the confidence and trust of the residents of Oklahoma City.
• Election Management Program increases governmental transparency by providing public access to
information on election reporting and provide education to candidates and City Officials so they can comply with City and State election laws.
• Records Management Program provides public record preservation and storage, advisory and
regulatory compliance services to City departments, Trusts and the public so they have convenient access to records.
Official City Records Positions and Budget
FY19 FY20 FY21
Adopted Actual Adopted Adopted Adopted Adopted
Program Positions Expenses Positions Budget Positions Budget
Bid Management 1.57 $107,137 1.49 $120,280 1.49 $123,036
City Clerk's Information 3.23 372,008 3.38 384,439 3.38 392,877
Council Agenda Management 1.97 202,013 2.00 225,368 2.00 231,569
Election Management 0.00 785 0.00 212 0.00 212
Records Management 1.45 150,699 1.45 149,223 1.45 149,307
Line of Business Total 8.22 $832,642 8.32 $879,522 8.32 $897,001
Table of Contents

City Clerk
C-24
Table of Contents

City Manager
C-25
City Manager
Communications
• Employee Communication
• Print and Mail Services
• Public Information
• Event and Tourism Development
• MAPS
• City Manager’s Office
• Legislative
• Office of the City Council
• Office of the Mayor
Policy and Executive Leadership
Community Enhancement
Residents
Mayor and City Council
City Manager
Craig Freeman $325,482,071 45.4
Director Budget Positions
Table of Contents

Department Introduction
City Manager
C-26
Mission Statement The mission of the City Manager’s Office* is to provide leadership, management, information, and policy implementation to: • Elected officials so they can make informed decisions; • City departments so they can efficiently and effectively deliver services; and • Residents so they can live, work, and play in a community known for its high quality of life. *For functional purposes, the Mayor, City Council, and City Manager Offices share a strategic plan. For budget purposes, they will remain separate entities.
Department Budget
Department Overview The City Manager’s Office has a total FY21 budget of $325,482,071, a decrease of 7.35% from FY20. There are 45.4 authorized positions, an increase of 6.6 positions from FY20. On December 10, 2019, the voters of Oklahoma City approved a general purpose temporary sales tax in support of the MAPS 4 Program.
Position History To review performance information, please see the performance data report or visit our website: www.okc.gov/performancedata.
Department Facts
• The City adopted a Council-Manager form of city government in 1927.
• The City Manager serves
as the Chief Administrative Officer of the City and supervises nearly all branches of its government.
• The final MAPS 3 projects
are scheduled to be completed in FY23.
• Nearly 60% of citizens are
satisfied with the availability of information about City programs and services.
4348 50 52
45
FY17 FY18 FY19 FY20 FY21
97%
$325,482,071
Administrative
CommunityEnhancement
Policy and ExecutiveLeadership
Public Informationand Marketing
Non Operating
Table of Contents

Major Budget Changes
City Manager
C-27
Amount Positions
1. Removes two Construction Project Manager positions in MAPS to meet
budget target
($159,432) (2.00)
2. Removes an Engineering Projects Manager position in MAPS to meet
budget target
($152,158) (1.00)
3. Changes in personnel related costs such as salaries, merit, retirement,
health insurance, and other benefits
($139,885) -
4. Moves the Economic Development Program and associated personnel to
the Finance Department
($138,607) (2.00)
5. Freezes the Chief Innovation Officer position in the City Manager's Office
to meet budget target
($138,607) -
6. Removes a vacant Executive Assistant to the City Manager position in
Executive Leadership to meet budget target
($75,205) (1.00)
7. Removes a Production Technician position in the Print Shop to meet
budget target
($57,981) (1.00)
City Manager Department Major Budget Changes
Table of Contents

Expenditures
City Manager
C-28
Summary of FY19 FY20 FY21 Percent
Expenditures by Purpose Actual Adopted Budget Adopted Budget Change
Operating Expenditures
Administrative $164,271 $228,182 $141,830 -37.84%
Community Enhancement 4,103,979 5,376,026 6,026,033 12.09%
Policy and Executive Leadership 1,661,214 1,435,810 1,468,521 2.28%
Communications 2,077,888 2,542,032 2,647,331 4.14%
Total Operating Expenditures $8,007,353 $9,582,050 $10,283,715 7.32%
Non-Operating Expenditures
Capital Expenditures 147,468,017 341,712,460 315,198,356 -7.76%
Total Non-Operating Expenditures $147,468,017 $341,712,460 $315,198,356 -7.76%
Department Total $155,475,370 $351,294,510 $325,482,071 -7.35%
Summary of FY19 FY20 FY21 Percent
Expenditures by Funding Source Actual Adopted Budget Adopted Budget Change
General Fund $3,779,749 $3,666,576 $3,079,447 -16.01%
Capital Improvement Projects Fund 622,556 4,986,831 2,537,982 -49.11%
MAPS 4 Use Tax Fund - Operating 0 0 1,500,000 N/A
MAPS 4 Use Tax Fund - Non-Operating 0 2,323,246 0 -100.00%
MAPS 4 Program Fund 0 13,569,828 120,594,032 788.69%
MAPS 3 Sales Tax Fund 144,809,990 309,985,750 183,462,644 -40.82%
MAPS 3 Use Tax Fund 3,421,087 4,718,462 4,400,119 -6.75%
MAPS Sales Tax Fund 30,955 251,877 194,605 -22.74%
OCMAPS Sales Tax Fund - Non-Operating 1,370,170 6,539,433 4,702,088 -28.10%
OKC Tax Increment Financing Fund 0 1,325,000 980,188 -26.02%
Police & Fire Capital Sales Tax Fund 435,272 2,466,543 2,388,773 -3.15%
Print Shop Internal Service Fund -
Operating 806,517 1,012,012 933,288 -7.78%
Print Shop Internal Service Fund - Capital 0 185,000 370,861 100.47%
Special Purpose Fund 100,000 118,516 187,980 58.61%
Sports Facilities Sales Tax Fund 20,578 47,500 50,259 5.81%
Sports Facilities Use Tax Fund 78,496 97,936 99,805 1.91%
Total All Funds $155,475,370 $351,294,510 $325,482,071 -7.35%
Table of Contents

Positions
City Manager
C-29
Artist rendering of the new MAPS 3 Downtown Convention Center, scheduled to open in fall 2020
Summary of FY19 FY20 FY21 Percent
Positions by Purpose Actual Adopted Budget Adopted Budget Change
Administrative 1.30 1.30 0.70 -46.15%
Community Enhancement 28.70 28.70 22.70 -20.91%
Policy and Executive Leadership 6.00 7.00 8.00 14.29%
Communications 14.00 15.00 14.00 -6.67%
Department Total 50.00 52.00 45.40 -12.69%
Summary of FY19 FY20 FY21 Percent
Positions by Funding Source Actual Adopted Budget Adopted Budget Change
General Fund 21.55 23.55 20.95 -11.04%
Print Shop Internal Service Fund 3.45 3.45 2.45 -28.99%
OCMAPS Sales Tax Fund - Operating 0.00 0.00 0.00 N/A
MAPS 3 Use Tax Fund 25.00 25.00 22.00 -12.00%
Department Total 50.00 52.00 45.40 -12.69%
Table of Contents

City Manager Lines of Business
City Manager
C-30
Administration • The Executive Leadership Program provides planning, management, administrative and reporting
services to department employees and City leaders so they can achieve strategic goals and key results.
Administration Positions and Budget
Community Enhancement • The Event and Tourism Development Program provides diverse opportunities for conventions,
sports, tourism, and entertainment in City-owned facilities so the local economy can prosper and residents and visitors can experience an improved quality of life.
• The MAPS Program provides community enhancement projects to residents and visitors so they
can enjoy an improved quality of life.
Community Enhancement Positions and Budget
FY19 FY20 FY21
Adopted Actual Adopted Adopted Adopted Adopted
Program Positions Expenses Positions Budget Positions Budget
Executive Leadership 1.30 $164,271 1.30 $228,182 0.70 $141,830
Line of Business Total 1.30 $164,271 1.30 $228,182 0.70 $141,830
FY19 FY20 FY21
Adopted Actual Adopted Adopted Adopted Adopted
Program Positions Expenses Positions Budget Positions Budget
Community Development# 1.30 $191,301 1.30 $197,987 0.00 $0
Economic Development* 1.60 340,595 1.60 313,580 0.00 0
Event and Tourism Development 0.80 150,996 0.80 145,997 0.70 125,914
MAPS 25.00 3,421,087 25.00 4,718,462 22.00 5,900,119
Line of Business Total 28.70 $4,103,979 28.70 $5,376,026 22.70 $6,026,033
#Incorporated in Event and Tourism Development
*Program moved to Finance Department
Table of Contents

City Manager
C-31
Policy and Executive Leadership • The City Manager’s Office Program provides leadership, management, and information services to
the community so they can experience a high degree of satisfaction with City services, to the Mayor and Council so they can make informed decisions, and to City staff so they can achieve strategic results.
• The Legislative Program provides information and recommendations to Mayor and Council so they
can make informed decisions to influence federal and state legislation, and rules and regulations that affect Oklahoma City.
Policy and Executive Leadership Positions and Budget
Communications The Employee Communication Program provides information and recognition services to employees so they can be informed, understand expected performance, and feel valued by the organization. The Print and Mail Services Program provides printing and mail distribution services to City departments so they can print and distribute documents in a cost effective manner that meets expectations for accuracy, quality, and timeliness. The Public Information Program provides information services, in partnership with City departments, to the public so they can access, understand, and use City services.
Communications Positions and Budget
FY19 FY20 FY21
Adopted Actual Adopted Adopted Adopted Adopted
Program Positions Expenses Positions Budget Positions Budget
City Manager's Office 5.40 $1,510,882 6.40 $1,318,544 7.40 $1,359,537
Legislative 0.60 150,333 0.60 117,266 0.60 108,984
Line of Business Total 6.00 $1,661,214 7.00 $1,435,810 8.00 $1,468,521
FY19 FY20 FY21
Adopted Actual Adopted Adopted Adopted Adopted
Program Positions Expenses Positions Budget Positions Budget
Employee Communication 1.10 $184,881 1.10 $178,125 1.10 $173,700
Print and Mail Services 3.45 806,517 3.45 1,197,012 2.45 1,304,149
Public Information 9.45 1,086,491 10.45 1,166,895 10.45 1,169,482
Line of Business Total 14.00 $2,077,889 15.00 $2,542,032 14.00 $2,647,331
Table of Contents

City Manager
C-32
Table of Contents

Development Services
C-33
Development Services
• Animal Control
• Animal Shelter
• Community Outreach
• Veterinary Services
• Subdivision & Zoning
• Construction Inspections
• Permits & Licensing
• Plan Review
• Abandoned Buildings
• Code Inspections
• Nuisance Abatement
Residents
Mayor and City Council
City Manager
Development Services
Director Budget Positions
Bob Tener $20,416,508 177
Animal Welfare Code Enforcement Development
Center Subdivision &
Zoning
Table of Contents

Department Introduction
Development Services
C-34
Mission Statement The mission of the Development Services Department is to provide animal welfare, code enforcement, construction permitting and inspections, licensing, and development application review services to the development community and general public so they can receive timely development decisions and live in a clean, safe and stable City.
Department Budget
Department Overview The Development Services Department has a total budget of $20,416,508 which is a decrease of 6.49%. There are 177 positions authorized in the FY21 budget, a decrease of 20 positions.
Position History
To review additional performance information, please see the attached supplemental performance report or visit our website: www.okc.gov/performancedata.
189 182192 197
177
FY17 FY18 FY 19 FY 20 FY 21
Department Facts • There were over 15,900 live
releases from the Animal Shelter in FY19.
• There were over 24,000 code
violations in FY19. • Development Center processed
over 14,600 plan review applications in FY19.
14%
23%
16%
35%
3%
9%
Administration
Animal Welfare
Code Enforcement
Development Center
Subdivision and
Zoning
Other Non-Operating
Expenditures
$20,416,508
Table of Contents

Major Budget Changes
Development Services
C-35
Development Services Department Major Budget Changes Amount Positions
1. Changes in personnel related costs such as salaries, merit, retirement,
health insurance, and other benefits
$125,436 -
2. Deletes four Code Inspector I's and one Unit Operations Leader from
the Code Inspections Program
($294,990) (5.00)
3. Deletes three Animal Welfare Officer II's and one Unit Operations
Supervisor from the Animal Control Program
($273,987) (4.00)
4. Deletes one Code Technician and two Plans Examiners from the Plan
Review Program
($281,780) (3.00)
5. Deletes one Administrative Specialist and one Code Inspector I from
the Abandoned Buildings Program
($191,986) (2.00)
6. Deletes one Building Inspector I and one Electrical Inspector I from the
Constructions Inspections Program
($220,491) (2.00)
7. Deletes one Office Assistant and one Neighborhood Support
Representative from the Nuisance Abatement Program
($142,598) (2.00)
8. Deletes one Subdivision & Zoning Tech II from the Subdivision & Zoning
Program
($106,164) (1.00)
9. Deletes one Records Control Clerk from the Permits & Licensing
Program
($54,137) (1.00)
10. Reduces line items in various programs ($163,303) -
Table of Contents

Expenditures
Development Services
C-36
Summary of FY 19 FY 20 FY 21 Percent
Expenditures by Funding Source Actual Adopted Budget Adopted Budget Change
General Fund $18,749,761 $19,968,327 $18,335,567 -8.18%
Capital Improvement Projects Fund 8,524 254,342 246,378 -3.13%
Grants Management Fund 1,551 150,000 219,006 46.00%
Special Purpose Fund 210,480 1,555,587 1,615,557 3.86%
Total All Funds $18,970,316 $21,928,256 $20,416,508 -6.89%
Summary of FY 19 FY 20 FY 21 Percent
Expenditures by Purpose Actual Adopted Budget Adopted Budget Change
Operating Expenditures
Administration $2,697,816 $2,672,250 $2,825,906 5.75%
Animal Welfare 4,538,695 4,937,596 4,603,174 -6.77%
Code Enforcement 3,623,275 4,074,807 3,184,660 -21.85%
Development Center 7,039,118 7,465,707 6,991,700 -6.35%
Subdivision and Zoning 850,857 817,967 730,127 -10.74%
Total Operating Expenditures $18,749,761 $19,968,327 $18,335,567 -8.18%
Non-Operating Expenditures
Capital Expenditures $8,524 $254,342 $246,378 -3.13%
Other Non-Operating Expenditures 212,031 1,705,587 1,834,563 7.56%
Total Non-Operating Expenditures $220,555 $1,959,929 $2,080,941 6.17%
Department Total $18,970,316 $21,928,256 $20,416,508 -6.89%
Table of Contents

Positions
Development Services
C-37
Summary of FY 19 FY 20 FY 21 Percent
Positions by Purpose Actual Adopted Budget Adopted Budget Change
Administration 4.00 4.00 4.00 0.00%
Animal Welfare 51.00 56.00 52.00 -7.14%
Code Enforcement 45.00 45.00 36.00 -20.00%
Development Center 85.00 85.00 79.00 -7.06%
Subdivision and Zoning 7.00 7.00 6.00 -14.29%
Department Total 192.00 197.00 177.00 -10.15%
Table of Contents

Development Services
C-38
Summary of FY 19 FY 20 FY 21 Percent
Positions by Funding Source Actual Adopted Budget Adopted Budget Change
General Fund 192.00 197.00 177.00 -10.15%
Department Total 192.00 197.00 177.00 -10.15%
Table of Contents

Development Services Lines of Business
Development Services
C-39
Administration • The Executive Leadership Program provides planning, management, administrative and reporting
services to department employees and City leaders so they can achieve strategic goals and key results.
Administration Positions and Budget
Adopted Actual Adopted Adopted Adopted Adopted
Program Positions Expenses Positions Budget Positions Budget
Executive Leadership 4.00 $2,697,816 4.00 $2,672,250 4.00 $2,825,906
Line of Business Total 4.00 $2,697,816 4.00 $2,672,250 4.00 $2,825,906
FY 19 FY 20 FY 21
Table of Contents
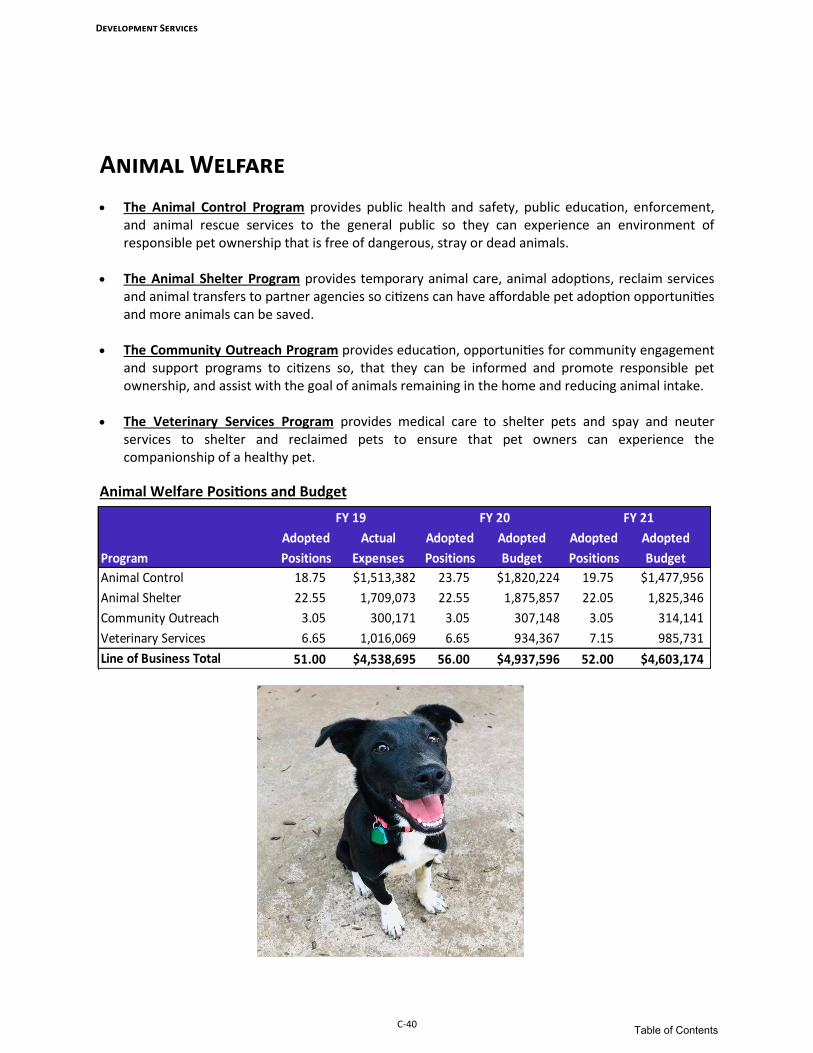
Development Services
C-40
Animal Welfare • The Animal Control Program provides public health and safety, public education, enforcement,
and animal rescue services to the general public so they can experience an environment of responsible pet ownership that is free of dangerous, stray or dead animals.
• The Animal Shelter Program provides temporary animal care, animal adoptions, reclaim services
and animal transfers to partner agencies so citizens can have affordable pet adoption opportunities and more animals can be saved.
• The Community Outreach Program provides education, opportunities for community engagement
and support programs to citizens so, that they can be informed and promote responsible pet ownership, and assist with the goal of animals remaining in the home and reducing animal intake.
• The Veterinary Services Program provides medical care to shelter pets and spay and neuter
services to shelter and reclaimed pets to ensure that pet owners can experience the companionship of a healthy pet.
Animal Welfare Positions and Budget
FY 19 FY 20 FY 21
Adopted Actual Adopted Adopted Adopted Adopted
Program Positions Expenses Positions Budget Positions Budget
Animal Control 18.75 $1,513,382 23.75 $1,820,224 19.75 $1,477,956
Animal Shelter 22.55 1,709,073 22.55 1,875,857 22.05 1,825,346
Community Outreach 3.05 300,171 3.05 307,148 3.05 314,141
Veterinary Services 6.65 1,016,069 6.65 934,367 7.15 985,731
Line of Business Total 51.00 $4,538,695 56.00 $4,937,596 52.00 $4,603,174
Table of Contents

Development Services
C-41
Code Enforcement
• The Abandoned Buildings Program provides exterior property maintenance inspections and
abandoned building reviews for the community and property owners so they can live in more attractive and safe neighborhoods.
• The Code Inspections Program provides inspection services (proactive and complaint response) to
citizens and the business community so they can experience an environment that is free of code violations.
• The Nuisance Abatement Program provides nuisance abatement services to the community and
property owners so they can live in cleaner and safe neighborhoods.
Code Enforcement Positions and Budget
FY 19 FY 20 FY 21
Adopted Actual Adopted Adopted Adopted Adopted
Program Positions Expenses Positions Budget Positions Budget
Abandoned Buildings 12.00 $850,404 12.00 $989,175 9.00 $706,745
Code Inspections 24.50 1,980,845 24.50 2,219,843 20.50 1,864,301
Nuisance Abatement 8.50 792,026 8.50 865,789 6.50 613,614
Line of Business Total 45.00 $3,623,275 45.00 $4,074,807 36.00 $3,184,660
Table of Contents

Development Services
C-42
Development Center
• The Construction Inspections Program provides construction related code inspections to the development community and the public so they can build safe commercial and residential structures in a timely manner.
• The Permits and Licensing Program provides construction permits, inspection processing, and
licenses to the development community, the public, and inspectors so they can conduct their construction or business related activities in a timely manner.
• The Plan Review Program provides construction plan review to the development community and
the public so they can develop and build code-compliant structures in a timely manner.
Development Center Positions and Budget
Subdivision and Zoning • The Subdivision and Zoning Program processes development applications and provides
consultation to developers, applicants, and residents so they can receive timely zoning and subdivision approvals and information.
Subdivision and Zoning Positions and Budget
FY 19 FY 20 FY 21
Adopted Actual Adopted Adopted Adopted Adopted
Program Positions Expenses Positions Budget Positions Budget
Construction Inspections 46.50 $3,737,193 46.50 $4,041,874 44.50 $3,973,660
Permits and Licensing 18.50 1,306,551 18.50 1,450,624 17.50 1,359,332
Plan Review 20.00 1,995,374 20.00 1,973,209 17.00 1,658,708
Line of Business Total 85.00 $7,039,118 85.00 $7,465,707 79.00 $6,991,700
FY 19 FY 20 FY 21
Adopted Actual Adopted Adopted Adopted Adopted
Program Positions Expenses Positions Budget Positions Budget
Subdivision and Zoning 7.00 $850,857 7.00 $817,967 6.00 $730,127
Line of Business Total 7.00 $850,857 7.00 $817,967 6.00 $730,127
Table of Contents

Finance
C-43
Finance
Financial Planning and Management
Purchasing and Payment
Processing
Accounting and Financial Reporting
Revenue Management
• Accounting Systems
• Financial Reporting
• Payroll
• Payment Processing
• Purchasing
• Revenue Enforcement
• Treasury
• Insurance
• Workplace Safety and Workers’ Compensation
• Energy Management
• Management and Budget
• Performance Management
Risk Management
Residents
Mayor and City Council
City Manager
Finance
Brent Bryant $22,396,184 83
Director Budget Positions
• Executive Leadership
• Debt Management
• Economic Development
Administration
Table of Contents

Department Introduction
Finance
C-44
Mission Statement The mission of the Finance Department is to provide financial planning, management, and information services to City departments, elected officials and the public so they can make informed decisions and have confidence in the City’s financial stewardship. Department Budget
Department Overview The Finance Department has a total budget of $22,396,184, which is a decrease of 1.12% from prior year. There are 83 positions authorized in the FY21 budget, which is a decrease of five positions from the FY20 budget.
Position history To review performance information, please see the performance data report or visit our website: www.okc.gov/performancedata.
Department Facts • The City of Oklahoma
City earned AAA ratings, the highest rating to receive from both S&P and Moody’s, for the seventh year in a row.
• The Finance Department conducts financial management, budgeting, expending, investing, and reporting for a budget over $1.66 billion.
• On average, over 7,500 vendor payments are processed per month.
11%
13%
6%
7%
7%
56%
$22,396,184
Administration
Accounting &Financial Reporting
Financial Planning &Management
Purchasing &Payment Processing
RevenueManagement
Risk Management
85 85 8588
83
FY17 FY18 FY19 FY20 FY21
Table of Contents

Major Budget Changes
Finance
C-45
Finance Major Budget Changes Amount Positions
1. Changes in personnel related costs such as salaries, merit, retirement,
health insurance, and other benefits
$102,198 -
2. Moves the Economic Development Program and associated staff from
the City Manager's Office
$246,784 2.00
3. Deletes one Controller and two Municipal Accountant II's in the
Accounting Services Program
($340,643) (3.00)
4. Deletes one Management Specialist in the Treasury Program ($112,809) (1.00)
5. Deletes one Administrative Support Technician in the Procurement
Program
($80,288) (1.00)
6. Deletes one Management and Budget Analyst in the Management and
Budget Program
($78,696) (1.00)
7. Deletes one Claims Analyst from the Workers Compensation Program ($76,703) (1.00)
Table of Contents

Expenditures
Finance
C-46
Summary of FY19 FY20 FY21 Percent
Expenditures by Purpose Actual Adopted Budget Adopted Budget Change
Operating Expenditures
Administration $1,716,277 $1,926,451 $2,422,127 25.73%
Accounting & Financial Reporting 2,702,444 3,209,269 2,887,141 -10.04%
Financial Planning & Management 1,488,712 1,574,199 1,242,170 -21.09%
Purchasing & Payment Processing 1,508,709 1,598,205 1,593,119 -0.32%
Revenue Management 1,450,563 1,526,621 1,452,820 -4.83%
Risk Management 13,629,854 12,499,147 12,375,741 -0.99%
Total Operating Expenditures $22,496,559 $22,333,892 $21,973,118 -1.62%
Non-Operating Expenditures
Grants Management Fund ($144) $0 $0 N/A
Capital Expenditures 31,003 316,224 423,066 33.79%
Total Non-Operating Expenditures $30,858 $316,224 $423,066 33.79%
Department Total $22,527,417 $22,650,116 $22,396,184 -1.12%
Summary of FY19 FY20 FY21 Percent
Expenditures by Funding Source Actual Adopted Budget Adopted Budget Change
General Fund $8,133,060 $9,099,916 $8,916,045 -2.02%
Capital Improvement Projects Fund 31,003 316,224 423,066 33.79%
Grants Management Fund (144) 0 0 N/A
Risk Mgmt. Internal Service Fund 14,363,498 13,233,976 13,057,073 -1.34%
Total All Funds $22,527,417 $22,650,116 $22,396,184 -1.12%
Table of Contents

Positions
Finance
C-47
Summary of FY19 FY20 FY21 Percent
Positions by Purpose Actual Adopted Budget Adopted Budget Change
Administration 2.50 2.50 7.00 180.00%
Accounting & Financial Reporting 29.00 30.00 27.00 -10.00%
Financial Planning & Management 13.50 14.50 11.00 -24.14%
Purchasing and Payment Processing 17.00 18.00 17.00 -5.56%
Revenue Management 11.00 11.00 10.00 -9.09%
Risk Management 12.00 12.00 11.00 -8.33%
Department Total 85.00 88.00 83.00 -5.68%
Summary of FY19 FY20 FY21 Percent
Positions by Funding Source Actual Adopted Budget Adopted Budget Change
General Fund 73.00 76.00 72.00 -5.26%
Risk Mgmt. Internal Service Fund 12.00 12.00 11.00 -8.33%
Department Total 85.00 88.00 83.00 -5.68%
Table of Contents

Finance Lines of Business
Finance
C-48
Administration
• The Executive Leadership Program provides planning, management, administrative and reporting services to department employees and City leaders so they can achieve strategic goals and key results.
• The Debt Management Program provides financing and debt compliance services to City
departments, City leadership, and the public so they can effectively and efficiently fund capital projects.
• The Economic Development Program provides business attraction and expansion services to the
business community so the residents can benefit from the creation of jobs paying the Oklahoma City Metropolitan Statistical Area (MSA) average wage or greater.
Administration Positions and Budget
Accounting and Financial Reporting • The Accounting Systems Program provides systems infrastructure to City departments and public
trusts so they can accurately record transactions and access reliable information. • The Financial Reporting Program provides timely and accurate accounting, reporting and financial
guidance services to City departments, City leadership, public trusts, investors and regulatory agencies, and the public so they can make well informed decisions.
• The Payroll Program provides payroll services to employees, vendors and City departments so they
can receive timely and accurate compensation and information.
Accounting and Financial Reporting Positions and Budget
FY19 FY20 FY21
Adopted Actual Adopted Adopted Adopted Adopted
Program Positions Expenses Positions Budget Positions Budget
Accounting Systems 4.25 $451,434 4.75 $471,529 3.50 $365,752
Financial Reporting 18.75 1,842,483 19.75 2,276,928 18.00 2,052,521
Payroll 6.00 408,527 5.50 460,812 5.50 468,868
Line of Business Total 29.00 $2,702,444 30.00 $3,209,269 27.00 $2,887,141
FY19 FY20 FY21
Adopted Actual Adopted Adopted Adopted Adopted
Program Positions Expenses Positions Budget Positions Budget
Executive Leadership 2.50 $1,716,277 2.50 $1,926,451 2.50 $1,893,959
Debt Management* 0.00 0 0.00 0 2.50 281,384
Economic Development** 0.00 0 0.00 0 2.00 246,784
Line of Business Total 2.50 $1,716,277 2.50 $1,926,451 7.00 $2,422,127
*Moved from the Financial Planning & Management Line of Business in FY21.
**Moved from the City Manager's Office in FY21.
Table of Contents

Finance
C-49
Financial Planning and Management • The Energy Management Program provides comprehensive utility bill management services and
technical and financial support for energy efficiency projects to City departments and City leadership so they can effectively manage their resources, reduce energy consumption and implement practices that are sustainable.
• The Management and Budget Program provides financial planning, reporting and management
services to City departments, City leadership, and the public so they can make informed decisions that promote financial stability.
• The Performance Management Program provides strategic business planning and reporting
services to City departments, City leadership, and the public so they can make informed decisions about City operations.
Financial Planning and Management Positions and Budget
FY19 FY20 FY21
Adopted Actual Adopted Adopted Adopted Adopted
Program Positions Expenses Positions Budget Positions Budget
Debt Management* 1.50 $208,924 2.50 $295,336 0.00 $0
Energy Management 2.00 216,261 2.00 232,520 2.00 256,110
Management and Budget 6.60 743,544 6.60 694,991 6.20 678,900
Performance Management 3.40 319,983 3.40 351,352 2.80 307,160
Line of Business Total 13.50 $1,488,712 14.50 $1,574,199 11.00 $1,242,170
*Moved to the Administration Line of Business in FY21.
Table of Contents
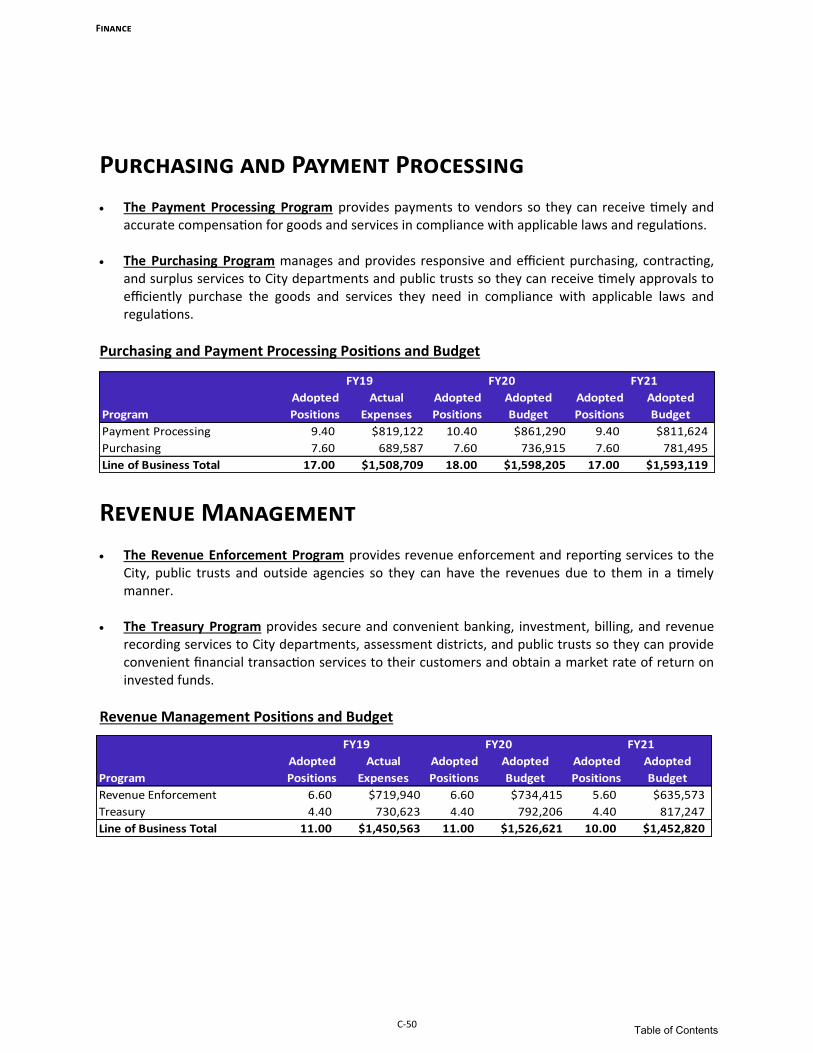
Finance
C-50
Purchasing and Payment Processing • The Payment Processing Program provides payments to vendors so they can receive timely and
accurate compensation for goods and services in compliance with applicable laws and regulations. • The Purchasing Program manages and provides responsive and efficient purchasing, contracting,
and surplus services to City departments and public trusts so they can receive timely approvals to efficiently purchase the goods and services they need in compliance with applicable laws and regulations.
Purchasing and Payment Processing Positions and Budget
Revenue Management • The Revenue Enforcement Program provides revenue enforcement and reporting services to the
City, public trusts and outside agencies so they can have the revenues due to them in a timely manner.
• The Treasury Program provides secure and convenient banking, investment, billing, and revenue
recording services to City departments, assessment districts, and public trusts so they can provide convenient financial transaction services to their customers and obtain a market rate of return on invested funds.
Revenue Management Positions and Budget
FY19 FY20 FY21
Adopted Actual Adopted Adopted Adopted Adopted
Program Positions Expenses Positions Budget Positions Budget
Payment Processing 9.40 $819,122 10.40 $861,290 9.40 $811,624
Purchasing 7.60 689,587 7.60 736,915 7.60 781,495
Line of Business Total 17.00 $1,508,709 18.00 $1,598,205 17.00 $1,593,119
FY19 FY20 FY21
Adopted Actual Adopted Adopted Adopted Adopted
Program Positions Expenses Positions Budget Positions Budget
Revenue Enforcement 6.60 $719,940 6.60 $734,415 5.60 $635,573
Treasury 4.40 730,623 4.40 792,206 4.40 817,247
Line of Business Total 11.00 $1,450,563 11.00 $1,526,621 10.00 $1,452,820
Table of Contents

Finance
C-51
Risk Management • The Insurance Program provides property and casualty insurance administration services to City
departments and public trusts so they can be protected against extreme financial and operational losses.
• The Workplace Safety and Workers’ Compensation Program provides incident/injury prevention
and claims management services to City departments, public trusts and their employees so they can reduce workplace injuries and related costs.
Risk Management Positions and Budget
FY19 FY20 FY21
Adopted Actual Adopted Adopted Adopted Adopted
Program Positions Expenses Positions Budget Positions Budget
Insurance 1.40 $2,792,846 1.40 $3,331,183 0.40 $3,290,439
Workplace Safety and Workers'
Compensation10.60 10,837,009 10.60 9,167,964 10.60 9,085,302
Line of Business Total 12.00 $13,629,854 12.00 $12,499,147 11.00 $12,375,741
Table of Contents

Finance
C-52
Table of Contents

Fire
C-53
Fire Chief Budget Positions
Fire
Fire Prevention Services
Support Services
Operational Services
• Fire Investigations
• Fire Prevention Inspection and Code Compliance
• Public Safety Education Services
• Fire Dispatch
• Fire Logistics and Facilities Maintenance
• Emergency Medical Services
• Fire Suppression Operations
Residents
Mayor and City Council
City Manager
Office of the Fire Chief
Richard Kelley $158,721,265 1,037
Administration
• Executive Leadership
• Public Relations and Marketing
Fire Chief Budget Positions
Table of Contents
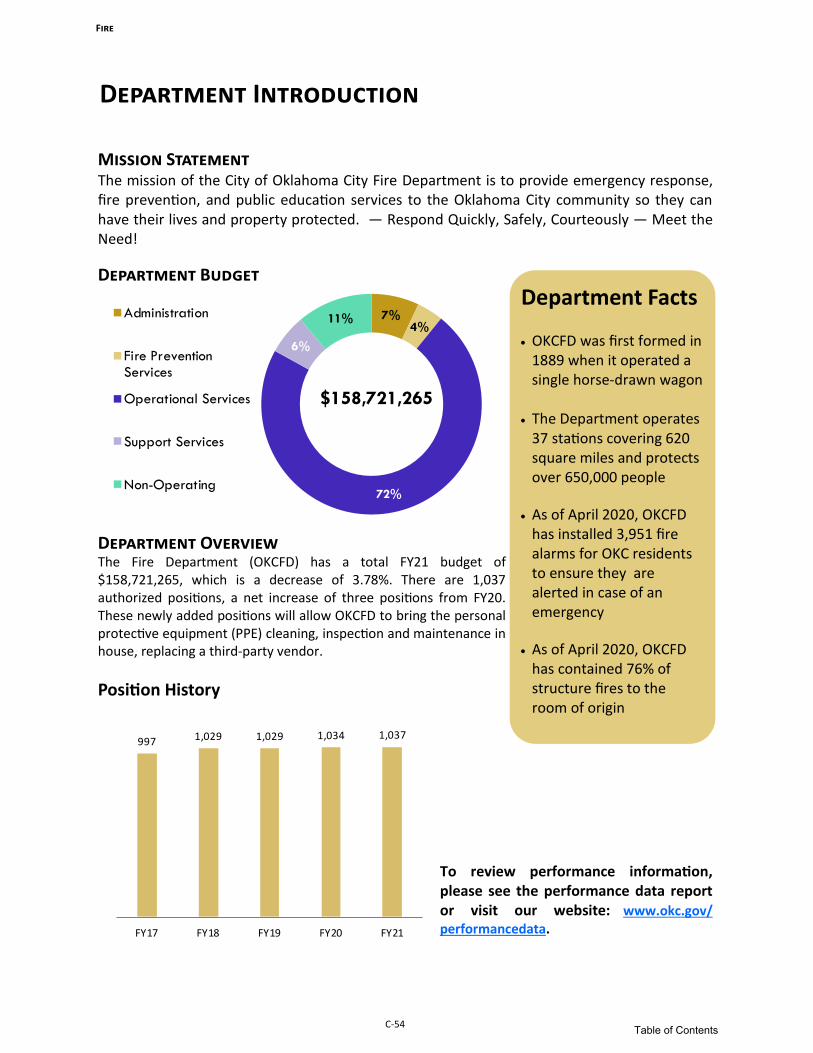
Department Introduction
Fire
C-54
Mission Statement The mission of the City of Oklahoma City Fire Department is to provide emergency response, fire prevention, and public education services to the Oklahoma City community so they can have their lives and property protected. — Respond Quickly, Safely, Courteously — Meet the Need!
Department Budget
Department Overview The Fire Department (OKCFD) has a total FY21 budget of $158,721,265, which is a decrease of 3.78%. There are 1,037 authorized positions, a net increase of three positions from FY20. These newly added positions will allow OKCFD to bring the personal protective equipment (PPE) cleaning, inspection and maintenance in house, replacing a third-party vendor.
Position History
To review performance information, please see the performance data report or visit our website: www.okc.gov/performancedata.
Department Facts • OKCFD was first formed in
1889 when it operated a single horse-drawn wagon
• The Department operates
37 stations covering 620 square miles and protects over 650,000 people
• As of April 2020, OKCFD has installed 3,951 fire alarms for OKC residents to ensure they are alerted in case of an emergency
• As of April 2020, OKCFD has contained 76% of structure fires to the room of origin
7%4%
72%
6%
11%
$158,721,265
Administration
Fire PreventionServices
Operational Services
Support Services
Non-Operating
997 1,029 1,029 1,034 1,037
FY17 FY18 FY19 FY20 FY21
Table of Contents

Major Budget Changes
Fire
C-55
Fire Department Major Budget Changes Amount Positions
1. Changes in personnel related costs such as salaries, merit,
retirement, health insurance, and other benefits$2,574,331 -
2. Reduces PPE cleaning funding by replacing the current third-party
vendor with two new Equipment Technicians and one new
Equipment Technician II and necessary equipment
($9,636) 3.00
3. Reduces salary expense to freeze 21 budgeted positions due to
Fire Station 38 construction delays($1,853,575) -
5. Reduces Construction in Progress in the Fire Sales Tax Fund,
resulting in less support for bond projects($1,500,000) -
6. Reduces Contingency budget in the Fire Sales Tax Fund ($1,500,000) -
7. Reduces Equipment expenses in the Fire Sales Tax Fund because
of reduced need for defibrillator replacement next year($620,000) -
8. Reduces overtime costs through reduced call back overtime by
taking some apparatus out of service during lower risk times($984,560) -
Table of Contents
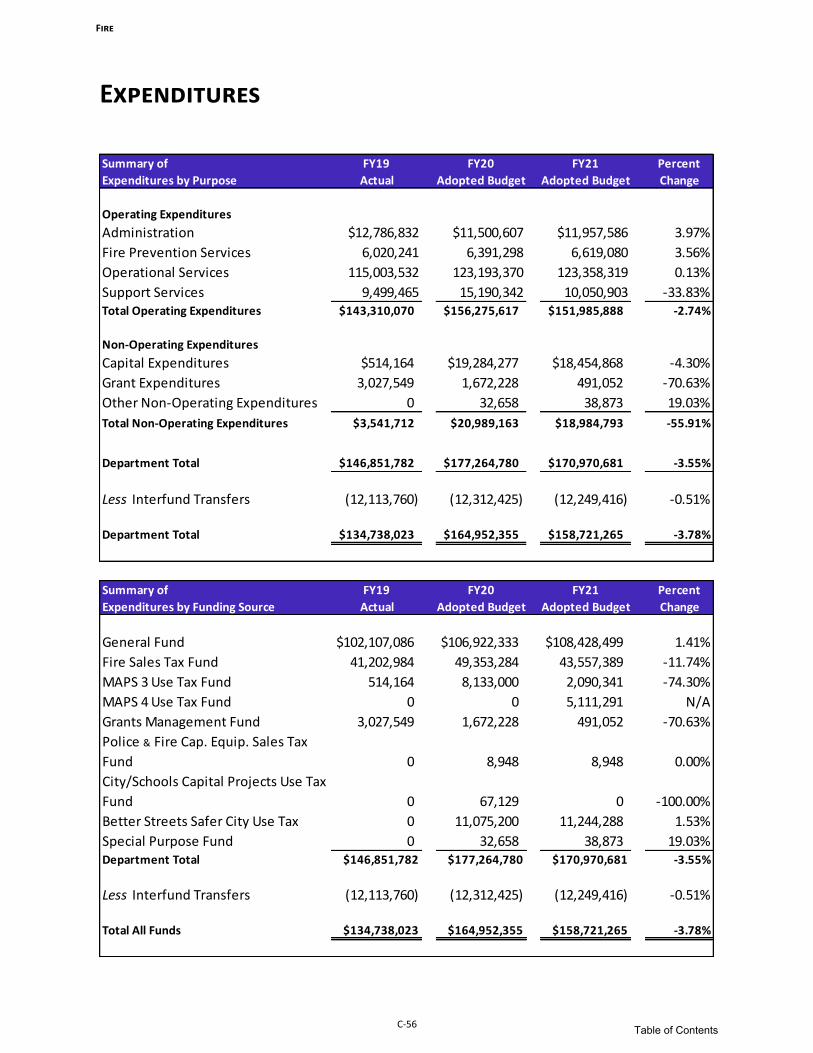
Expenditures
Fire
C-56
Summary of FY19 FY20 FY21 Percent
Expenditures by Purpose Actual Adopted Budget Adopted Budget Change
Operating Expenditures
Administration $12,786,832 $11,500,607 $11,957,586 3.97%
Fire Prevention Services 6,020,241 6,391,298 6,619,080 3.56%
Operational Services 115,003,532 123,193,370 123,358,319 0.13%
Support Services 9,499,465 15,190,342 10,050,903 -33.83%Total Operating Expenditures $143,310,070 $156,275,617 $151,985,888 -2.74%
Non-Operating Expenditures
Capital Expenditures $514,164 $19,284,277 $18,454,868 -4.30%
Grant Expenditures 3,027,549 1,672,228 491,052 -70.63%
Other Non-Operating Expenditures 0 32,658 38,873 19.03%
Total Non-Operating Expenditures $3,541,712 $20,989,163 $18,984,793 -55.91%
Department Total $146,851,782 $177,264,780 $170,970,681 -3.55%
Less Interfund Transfers (12,113,760) (12,312,425) (12,249,416) -0.51%
Department Total $134,738,023 $164,952,355 $158,721,265 -3.78%
Summary of FY19 FY20 FY21 Percent
Expenditures by Funding Source Actual Adopted Budget Adopted Budget Change
General Fund $102,107,086 $106,922,333 $108,428,499 1.41%
Fire Sales Tax Fund 41,202,984 49,353,284 43,557,389 -11.74%
MAPS 3 Use Tax Fund 514,164 8,133,000 2,090,341 -74.30%
MAPS 4 Use Tax Fund 0 0 5,111,291 N/A
Grants Management Fund 3,027,549 1,672,228 491,052 -70.63%
Police & Fire Cap. Equip. Sales Tax
Fund 0 8,948 8,948 0.00%
City/Schools Capital Projects Use Tax
Fund 0 67,129 0 -100.00%
Better Streets Safer City Use Tax 0 11,075,200 11,244,288 1.53%
Special Purpose Fund 0 32,658 38,873 19.03%Department Total $146,851,782 $177,264,780 $170,970,681 -3.55%
Less Interfund Transfers (12,113,760) (12,312,425) (12,249,416) -0.51%
Total All Funds $134,738,023 $164,952,355 $158,721,265 -3.78%
Table of Contents

Positions
Fire
C-57
Summary of FY19 FY20 FY21 Percent
Positions by Purpose Actual Adopted Budget Adopted Budget Change
Administration 43.05 36.05 36.05 0.00%
Fire Prevention Services 41.20 44.20 44.20 0.00%
Operational Services 911.85 920.85 920.85 0.00%
Support Services 32.90 32.90 35.90 9.12%
Department Total 1,029.00 1,034.00 1,037.00 0.29%
Summary of FY19 FY20 FY21 Percent
Positions by Funding Source Actual Adopted Budget Adopted Budget Change
General Fund 792.14 806.15 820.45 1.77%
Grants Management Fund 28.86 18.85 4.55 -75.86%
Fire Sales Tax Fund 208.00 209.00 212.00 1.44%
Department Total 1,029.00 1,034.00 1,037.00 0.29%
Table of Contents

Fire Lines of Business
Fire
C-58
Administration • The Executive Leadership Program provides planning, management, administrative and reporting
services to department employees and City leaders, so they can achieve strategic goals and key results.
• The Public Relations and Marketing Program provides informational, educational and promotional
services to residents, the media, the business community and departmental personnel, so they will be aware of Fire Department programs, activities, and emergency service delivery.
Administration Positions and Budget
Adopted Actual Adopted Adopted Adopted AdoptedProgram Positions Expenses Positions Budget Positions Budget
Executive Leadership 43.05 $12,786,832 36.05 $11,490,607 36.05 $11,947,586
Public Relations and Marketing 0.00 0 0.00 10,000 0.00 10,000
Line of Business Total 43.05 $12,786,832 36.05 $11,500,607 36.05 $11,957,586
FY19 FY20 FY21
Table of Contents

Fire
C-59
Fire Prevention Services
• The Fire Investigations Program provides investigation services to prosecutors, property owners,
and property insurers so they can receive fire cause determinations that allow them to receive (or provide) appropriate compensation and prosecute alleged arsonists.
• The Fire Code Compliance Program provides specialized inspections, testing and consultation
services to the residents of Oklahoma City, property and business owners, and industry professionals so they can be compliant with safety codes and ordinances.
• The Public Safety Education Services Program provides community risk reduction activities to the
community of Oklahoma City so they can prevent and better prepare for emergencies to have a reduced risk of loss from fire, injury, or illness.
Fire Prevention Services Positions and Budget
Adopted Actual Adopted Adopted Adopted Adopted
Program Positions Expenses Positions Budget Positions Budget
Fire Investigations 13.75 $2,056,991 14.15 $2,208,846 14.15 $2,249,400
Fire Code Compliance 17.55 2,551,473 19.75 2,676,789 19.75 2,844,148
Public Safety Education Services 9.90 1,411,778 10.30 1,505,663 10.30 1,525,532
Line of Business Total 41.20 $6,020,241 44.20 $6,391,298 44.20 $6,619,080
FY19 FY20 FY21
Table of Contents

Fire
C-60
Operational Services
• The Emergency Medical Services Program provides response to life threatening emergencies and medical assistance services to residents and visitors of Oklahoma City, so they can receive immediate medical assessment and treatment that will improve, resolve, or stabilize their condition.
• The Fire Suppression Operations Program provides fire protection and emergency response
services to our residents, so they can realize minimized property loss, reduced injuries and fatalities.
Operational Services Positions and Budget
Adopted Actual Adopted Adopted Adopted Adopted
Program Positions Expenses Positions Budget Positions Budget
Emergency Medical Services 627.46 $78,362,362 635.50 $84,902,320 635.50 $85,391,848
Fire Suppression Operations 284.39 36,478,841 285.35 38,290,700 285.35 37,966,471
Operations Training * 0.00 162,329 0.00 350 0.00 0
Line of Business Total 911.85 $115,003,532 920.85 $123,193,370 920.85 $123,358,319
* Removed by Department in FY19 Strategic Business Plan update, budget reallocated to other programs.
FY21FY19 FY20
Table of Contents

Fire
C-61
Support Services
• The Fire Dispatch Program provides coordinated response services to residents and visitors in need, so they can receive immediate and appropriate emergency and non-emergency assistance.
• The Fire Logistics and Facilities Maintenance Program provides fleet, equipment and facilities services to the Oklahoma City Fire Department, so it can have safe and reliable facilities and equipment to respond.
Support Services Positions and Budget
Adopted Actual Adopted Adopted Adopted Adopted
Program Positions Expenses Positions Budget Positions Budget
Fire Dispatch 15.65 $2,183,178 15.65 $2,279,492 15.65 $2,441,655
Fire Logistics and Facilities
Maintenance17.25 7,316,287 17.25 12,910,850 20.25 7,609,248
Line of Business Total 32.90 $9,499,465 32.90 $15,190,342 35.90 $10,050,903
FY19 FY20 FY21
Table of Contents

Fire
C-62 Table of Contents
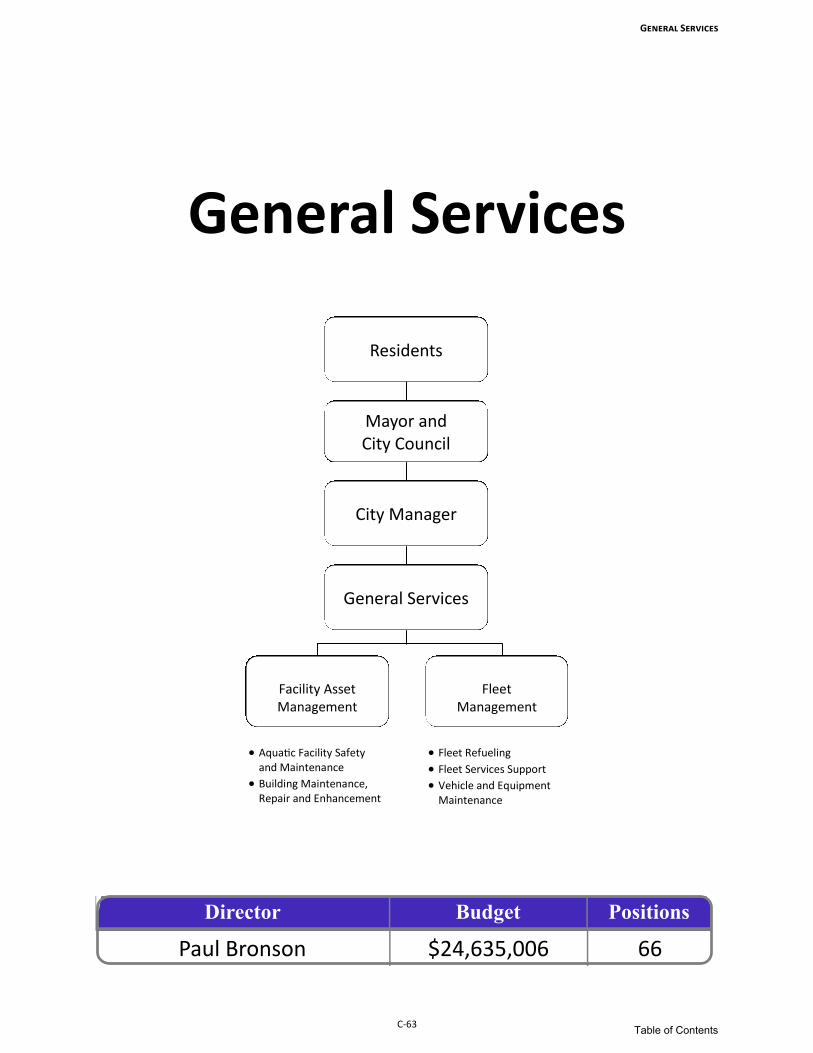
General Services
C-63
General Services
Facility Asset Management
• Aquatic Facility Safety and Maintenance
• Building Maintenance, Repair and Enhancement
Fleet Management
• Fleet Refueling
• Fleet Services Support
• Vehicle and Equipment Maintenance
Residents
Mayor and City Council
City Manager
General Services
Director Budget Positions
Paul Bronson $24,635,006 66
Table of Contents

Department Introduction
General Services
C-64
Mission Statement The mission of the General Services Department is to provide fleet and facility asset management services to all City departments so they can successfully accomplish their missions.
Department Budget
Department Overview The General Services Department has a total budget of $24,635,006, which is a decrease of 15.06%.
There are 66 positions authorized in the FY21 budget. The pie chart above provides a breakdown of the
FY21 budget by Line of Business. The Department is the City’s point of contact for all American with
Disabilities Act (ADA) guidance, inquiries, and compliance questions. Since FY 2017 the ADA
Coordinator has responded to over 550 ADA-related inquiries and complaints annually.
Position History
To review additional performance information, please see the attached supplemental performance report or visit our website: www.okc.gov/performancedata.
Department Facts • The General Services
Department performs approximately 9,200 vehicle workorders per year consisting of over 25,000 individual jobs performed .
• The General Services Department performs over 2,700 preventative maintenance jobs at city facilities.
70 6871 71
66
FY17 FY18 FY19 FY20 FY21
10%
30%
60%
$24,635,006
Administration
Facility AssetManagement
Fleet Management
Table of Contents

Major Budget Changes
General Services
C-65
General Services Department Major Budget Changes Amount Positions
1. Deletes one Plumber in the Building Maintenance, Repair and
Enhancement Program
(69,570) (1.00)
2. Deletes one Building Maint Mech II in the Building Maintenance, Repair
and Enhancement Program
(61,447) (1.00)
3. Deletes one Plumber in the Building Maintenance, Repair and
Enhancement Program
(85,908) (1.00)
4. Deletes one Building Heat & Air Tech in the Building Maintenance, Repair
and Enhancement Program
(79,268) (1.00)
5. Deletes a Master Mechanic in the Vehicle and Equipment Maintenance
Program
(63,430) (1.00)
Table of Contents

Expenditures
General Services
C-66
Summary of FY19 FY20 FY21 Percent
Expenditures by Purpose Actual Adopted Budget Adopted Budget Change
Operating Expenditures
Administration $1,919,931 $2,130,673 $1,336,505 -37.27%
Facility Asset Management 4,491,264 4,469,284 3,978,517 -10.98%
Fleet Management 7,835,709 9,195,287 7,857,633 -14.55%
Total Operating Expenditures $14,246,904 $15,795,244 $13,172,655 -16.60%
Non-Operating Expenditures
Capital Expenditures $4,410,464 $13,134,355 $11,390,358 -13.28%
Other Non-Operating Expenditures 32,516 71,993 71,993 0.00%
Total Non-Operating Expenditures $4,442,980 $13,206,348 $11,462,351 -13.21%
Department Total $18,689,883 $29,001,592 $24,635,006 -15.06%
Summary of FY19 FY20 FY21 Percent
Expenditures by Funding Source Actual Adopted Budget Adopted Budget Change
General Fund $5,254,315 $5,212,806 $4,858,164 -6.80%
Fleet Services Internal Services Fund 8,992,590 10,582,438 8,314,491 -21.43%
Capital Improvement Projects Fund 4,410,464 13,134,355 11,390,358 -13.28%
Grants Management Fund 32,516 71,993 71,993 0.00%
Total All Funds $18,689,885 $29,001,592 $24,635,006 -15.06%
Table of Contents

Positions
General Services
C-67
Summary of FY19 FY20 FY21 Percent
Positions by Purpose Actual Adopted Budget Adopted Budget Change
Administration 3.40 3.40 4.77 40.29%
Facility Asset Management 36.40 36.40 32.33 -11.18%
Fleet Management 31.20 31.20 28.90 -7.37%
Department Total 71.00 71.00 66.00 -7.04%
Summary of FY19 FY20 FY21 Percent
Positions by Funding Source Actual Adopted Budget Adopted Budget Change
General Fund 39.00 39.00 36.27 -7.00%
Fleet Services Internal Services Fund 32.00 32.00 29.73 -7.09%
Department Total 71.00 71.00 66.00 -7.04%
Table of Contents

General Services Lines of Business
General Services
C-68
Administration
• The Executive Leadership Program provides planning, management, administrative and reporting
services to department employees and City leaders so they can achieve strategic goals and key results.
Administration Positions and Budget
FY19 FY20 FY21
Adopted Actual Adopted Adopted Adopted Adopted
Program Positions Expenses Positions Budget Positions Budget
Executive Leadership 3.40 $1,919,931 3.40 $2,130,673 4.77 $1,336,505
Line of Business Total 3.40 $1,919,931 3.40 $2,130,673 4.77 $1,336,505
Table of Contents

General Services
C-69
Facility Asset Management
• The Aquatic Facility Safety and Maintenance Program provides aquatic facility maintenance and
repair services to the Parks and Recreation Department so their customers can enjoy a safe place to play.
• The Building Maintenance, Repair and Enhancement Program provides code compliant facility
maintenance and enhancements services to City departments so they can work in well-maintained facilities.
Facility Asset Management Positions and Budget
FY19 FY20 FY21
Adopted Actual Adopted Adopted Adopted Adopted
Program Positions Expenses Positions Budget Positions Budget
Aquatic Facility Safety and
Maintenance 4.55 $394,832 4.55 $416,372 4.28 $394,408
Building Maintenance, Repair and
Enhancement31.85 4,096,433 31.85 4,052,912 28.05 3,584,109
Line of Business Total 36.40 $4,491,264 36.40 $4,469,284 32.33 $3,978,517
Table of Contents

General Services
C-70
Fleet Management • The Fleet Refueling Program provides fuel, fueling sites, and fueling services to City departments
so they have fuel resources needed to operate their vehicles and equipment. • The Fleet Services Support Program provides vehicle and equipment advice, replacement, rentals,
and disposal services to City departments so transportation needs are fully met. • The Vehicle and Equipment Maintenance Program provides vehicle and equipment preventive
maintenance and repair services to City departments so they can have the vehicles and equipment they need to do their job.
Fleet Management Positions and Budget
FY19 FY20 FY21
Adopted Actual Adopted Adopted Adopted Adopted
Program Positions Expenses Positions Budget Positions Budget
Fleet Refueling 4.70 $3,648,601 4.70 $4,781,635 4.60 $3,731,068
Fleet Services Support 2.80 467,821 2.80 480,176 2.70 451,175
Vehicle and Equipment
Maintenance23.70 3,719,287 23.70 3,933,476 21.60 3,675,390
Line of Business Total 31.20 $7,835,709 31.20 $9,195,287 28.90 $7,857,633
Table of Contents

HUMAN RESOURCES
C-71
Human Resources
• Occupational Health • Labor Relations
• Policy Compliance
• Classification and Compensation
• Employment
• Human Resources Information Systems
• Organizational Training and Development
• Employee Medical Center
• Health and Welfare
• Retirement Savings
Benefits Labor and Employee
Relations Occupational Health Operations
Residents
Mayor and City Council
City Manager
Human Resources
Aimee Maddera $3,614,809 29
Director Budget Positions
Table of Contents

Department Introduction
HUMAN RESOURCES
C-72
Mission Statement The mission of the Personnel Services Department is to provide employment, health and welfare, and employee relations and development services to the City and its employees so they can have the resources needed to successfully deliver services and accomplish their professional goals.
Department Budget
Department Overview The Personnel Department has a total budget of $3,614,809 which is a decrease of 10.99%. There are 29 positions authorized in the FY21 budget, no change in positions from the FY20 budget. Position History
To review additional performance information, please see the attached supplemental performance report or visit our website: www.okc.gov/performancedata.
Department Facts • An average of 17,142
applications are processed and 362 selection processes are conducted per year.
• An average of 32,682 personnel transactions are processed per year.
• There are over 11,959 active employees, retirees and dependents who participate in the City’s health and welfare plans.
• OKC Occupational Health Center performed 4,108 physical examinations last year.
14%
14%
16%
14%
42%
$3,614,809
Administration
Benefits
Labor and EmployeeRelations
Occupational Health
Operations
2624
2729 29
FY17 FY18 FY19 FY20 FY21
Table of Contents

Major Budget Changes
HUMAN RESOURCES
C-73
Aimee Maddera was hired as the new Human Resources Director in March 2020
Human Resources Major Budget Changes Amount Positions
1. Changes in personnel related costs, such as salaries, merit, retirement,
health insurance other benefits($95,589) -
2. Adds an enhancement to the NeoGov system to streamline the
onboarding process for new hires$42,178 -
3. Adds an Electronic Records Management system for the Occupational
Health Clinic to begin digitizing records$20,000 -
Table of Contents

Expenditures
HUMAN RESOURCES
C-74
Summary of FY19 FY20 FY21 Percent
Expenditures by Purpose Actual Adopted Budget Adopted Budget Change
Operating Expenditures
Administration $686,572 $595,940 $502,871 -15.62%
Benefits 422,524 470,087 527,092 12.13%
Labor and Employee Relations 546,999 487,313 563,632 15.66%
Occupational Health 485,921 479,665 502,872 4.84%
Operations 1,343,774 1,678,163 1,518,342 -9.52%
Total Operating Expenditures $3,485,791 $3,711,168 $3,614,809 -2.60%
Non-Operating Expenditures
Capital Expenditures 0 350,000 0 -100.00%
Total Non-Operating Expenditures $0 $350,000 $0 -100.00%
Department Total $3,485,791 $4,061,168 $3,614,809 -10.99%
Summary of FY19 FY20 FY21 Percent
Expenditures by Funding Source Actual Adopted Budget Adopted Budget Change
General Fund $3,485,791 $3,711,168 $3,614,809 -2.60%
Capital Improvement Projects Fund 0 350,000 0 -100.00%
Total All Funds $3,485,791 $4,061,168 $3,614,809 -10.99%
Table of Contents

Positions
HUMAN RESOURCES
C-75
Summary of FY19 FY20 FY21 Percent
Positions by Purpose Actual Adopted Budget Adopted Budget Change
Administration 2.10 2.35 2.35 0.00%
Benefits 4.95 4.95 4.95 0.00%
Labor and Employee Relations 4.25 4.25 5.25 23.53%
Occupational Health 1.95 1.95 1.95 0.00%
Operations 13.75 15.50 14.50 -6.45%
Department Total 27.00 29.00 29.00 0.00%
Summary of FY19 FY20 FY21 Percent
Positions by Funding Source Actual Adopted Budget Adopted Budget Change
General Fund 27.00 29.00 29.00 0.00%
Department Total 27.00 29.00 29.00 0.00%
Table of Contents

HUMAN RESOURCES Lines of Business
HUMAN RESOURCES
C-76
Administration
• The Executive Leadership Program provides planning, management, administrative and reporting services to department employees and City leaders so they can achieve strategic goals and key results.
Administration Positions and Budget
benefits
• The Employee Medical Center Program reduces health plan costs and provides quality health and wellness services to eligible employees, eligible retirees, and their eligible dependents so they can experience overall improved health.
• The Health and Welfare Benefits Program provides insurance and benefit-related services to
employees and retirees so they can have access to comprehensive health and welfare services. • The Retirement Savings Program provides retirement planning and investment education services
to active and retired City employees so they can plan for their financial future beyond employment.
Benefits Positions and Budget
FY19 FY20 FY21 Adopted Actual Adopted Adopted Adopted Adopted
Program Position Expenses Positions Budget Positions Budget
Executive Leadership 2.10 $686,572 2.35 $595,940 2.35 $502,871
Line of Business Total 2.10 $686,572 2.35 $595,940 2.35 $502,871
FY19 FY20 FY21
Adopted Actual Adopted Adopted Adopted Adopted
Program Position Expenses Positions Budget Positions Budget
Employee Medical Center * 0.00 $0 0.00 $0 0.00 $0
Health and Welfare Benefits 4.90 416,601 4.90 460,906 4.90 516,515
Retirement Savings 0.05 5,923 0.05 9,181 0.05 10,577
Line of Business Total 4.95 $422,524 4.95 $470,087 4.95 $527,092
* Cost associated with the Employee Medical Center is budgeted in Oklahoma City Municipal Facilities Authority.
Table of Contents

HUMAN RESOURCES
C-77
Labor and Employee Relations
• The Labor Relations Program provides union contract administration, negotiation services, and consultations to City departments and employees so they can maintain positive working relationships.
• The Policy Compliance Program provides policy development, interpretation and compliance
services to City departments so they can conduct business in a fair and consistent manner and within the scope of established City policies.
Labor and Employee Relations Positions and Budget
Occupational Health
• The Occupational Health Program provides post job-offer and incumbent medical evaluations for City departments so they can employ and maintain a safe and healthy workforce.
Occupational Health Positions and Budget
FY19 FY20 FY21
Adopted Actual Adopted Adopted Adopted Adopted
Program Position Expenses Positions Budget Positions Budget
Labor Relations 2.90 $331,733 2.90 $293,921 3.40 $333,076
Policy Compliance 1.35 215,266 1.35 193,392 1.85 230,556
Line of Business Total 4.25 $546,999 4.25 $487,313 5.25 $563,632
FY19 FY20 FY21
Adopted Actual Adopted Adopted Adopted Adopted
Program Position Expenses Positions Budget Positions Budget
Occupational Health 1.95 $485,921 1.95 $479,665 1.95 $502,872
Line of Business Total 1.95 $485,921 1.95 $479,665 1.95 $502,872
Table of Contents

HUMAN RESOURCES
C-78
Operations
• The Classification and Compensation Program provides job analysis and salary administration services to City departments so they can have accurate job classifications and descriptions, and organizational and pay structure for recruiting and retaining a qualified workforce.
• The Employment Program provides recruitment, screening, selection, placement, and consulting
services to applicants, employees and City departments so a qualified and diverse workforce can be hired and retained.
• The Human Resources Information Systems Program provides personnel records management,
systems administration, information and reporting services to City departments so they can have accurate and timely information needed to make personnel-related decisions.
• Organizational Training and Development Program promotes a culture of excellence and improve employee engagement and productivity by providing quality training programs to City employees so they can be effective in their current positions and prepared for future advancement.
Operations Positions and Budget
FY19 FY20 FY21
Adopted Actual Adopted Adopted Adopted Adopted
Program Position Expenses Positions Budget Positions Budget
Classification and
Compensation4.30 $484,869 4.40 $461,038 4.40 $409,543
Employment 5.15 481,295 5.55 660,975 4.80 525,250
HR Information Services 4.30 377,610 4.30 417,819 4.30 432,758
Organizational Training and
Development0.00 0 1.25 138,331 1.00 150,791
Line of Business Total 13.75 $1,343,774 15.50 $1,678,163 14.50 $1,518,342
Table of Contents

Information Technology
C-79
Information Technology
Customer Support
Technology Enhancement
Technology Application
Support
Technology Infrastructure
Public Safety Support
• Departmental Systems
• Enterprise Business Applications
• Geographic Information Systems
• Data Management
• Software Development
• Project Management
• Communications
• Configuration Management
• Network
• Security
• Servers
• Public Safety Applications Support
• Public Safety Communications Support
• Customer Support
Residents
Mayor and City Council
City Manager
Information Technology
Schad Meldrum $37,355,219 112
Director Budget Positions
Table of Contents

Department Introduction
Information Technology
C-80
Mission Statement The mission of the Information Technology (IT) Department is to provide business solutions and technological services to City Departments so they can better serve the Oklahoma City community.
Department Budget
Department Overview The Information Technology Department has a total budget of $37,355,219, which is a decrease of 0.95%. There are 112 positions authorized in the FY21 budget, an increase of 1 position from the FY20 budget.
Positions History To review additional performance information, please see the attached supplemental performance report or visit our website: www.okc.gov/performancedata.
Department Facts • The IT Department
supports nearly 12,000 network connections and 7,000 telephones.
• The Department has
developed and supports 165 custom IT applications.
• The IT Department receives
about 35,000 total Work Requests annually
102 100
111 111 112
FY17 FY18 FY19 FY20 FY21
9%2%
25%
13%5%
25%
21%
$37,355,219
Administration
Customer Support
Public Safety Support
TechnologyApplication Support
Technology
Enhancement
Technology
Infrastructure
Capital Expenditures
Table of Contents

Major Budget Changes
Information Technology
C-81
Information Technology Department Major Budget Changes Amount Positions
1. Increases to contracts and agreements for software and services
used Citywide
$967,135 -
2. Changes in personnel related costs such as salaries, merit,
retirement, health insurance, and other benefits
$186,689 -
3. Reductions to services, supplies and transfer budget line items to
meet budget target
($733,372) -
4. Deletes Programmer/Analyst position in GIS ($110,555) (1.00)
5. Adds Management Specialist position in Executive Leadership $84,415 1.00
6. Adds Information Security Specialist position in Technology
Infrastructure
$99,013 1.00
7. Deletes Applications Support Tech I position in Technology
Customer Support
($78,800) (1.00)
8. Adds Systems Analyst I position in the Technology Applications
Support
$84,415 1.00
Table of Contents

Expenditures
Information Technology
C-82
Summary of FY19 FY20 FY21 Percent
Expenditures by Purpose Actual Adopted Budget Adopted Budget Change
Operating Expenditures
Administration $3,507,643 $3,478,480 $3,280,991 -5.68%
Customer Support 845,108 910,846 839,646 -7.82%
Public Safety Support 7,733,416 8,936,207 9,268,681 3.72%
Technology Application Support 4,407,380 4,609,163 4,797,374 4.08%
Technology Enhancement 1,473,689 1,890,044 1,771,449 -6.27%
Technology Infrastructure 8,353,998 9,602,801 9,588,420 -0.15%Total Operating Expenditures $26,321,234 $29,427,541 $29,546,561 0.40%
Non-Operating Expenditures
Capital Expenditures $1,409,687 $8,284,629 $7,808,658 -5.75%Total Non-Operating Expenditures $1,409,687 $8,284,629 $7,808,658 -5.75%
Department Total $27,730,921 $37,712,170 $37,355,219 -0.95%
Summary of FY19 FY20 FY21 Percent
Expenditures by Funding Source Actual Adopted Budget Adopted Budget Change
IT Internal Service Fund - Operating $26,321,236 $29,265,541 $29,546,561 0.96%
IT Internal Service Fund - Capital 0 0 228,500 N/A
Better Streets Safer City Use Tax Fund 0 4,740,000 272,029 -94.26%
Capital Improvement Projects Fund 885,061 3,543,048 2,503,705 -29.33%
City/Schools Cap Proj. Use Tax Fund 4,116 581 2,816,700 484702.07%
Police/Fire Sales Tax Fund 0 162,000 0 -100.00%
MAPS 3 Use Tax Fund 520,509 1,000 0 -100.00%
MAPS 4 Use Tax Fund 0 0 1,987,724 N/A
Total All Funds $27,730,923 $37,712,170 $37,355,219 -0.95%
Table of Contents

Positions
Information Technology
C-83
Summary of FY19 FY20 FY21 Percent
Positions by Funding Source Actual Adopted Budget Adopted Budget Change
IT Internal Service Fund 111.00 111.00 112.00 0.90%
Department Total 111.00 111.00 112.00 0.90%
Summary of FY19 FY20 FY21 Percent
Positions by Purpose Actual Adopted Budget Adopted Budget Change
Administration 7.00 7.00 9.00 28.57%
Customer Support 6.25 6.25 5.25 -16.00%
Public Safety Support 28.00 30.00 30.00 0.00%
Technology Application Support 21.50 22.00 22.00 0.00%
Technology Enhancement 14.25 14.95 13.95 -6.69%
Technology Infrastructure 34.00 30.80 31.80 3.25%
Department Total 111.00 111.00 112.00 0.90%
Table of Contents

Information Technology Lines of Business
Information Technology
C-84
Administration • The Executive Leadership Program provides planning, management, administrative and reporting
services to department employees and City leaders so they can achieve strategic goals and key results.
Administration Positions and Budget
FY19 FY20 FY21
Adopted Actual Adopted Adopted Adopted Adopted
Program Positions Expenses Positions Budget Positions Budget
Executive Leadership 7.00 $3,507,643 7.00 $3,478,480 9.00 $3,280,991
Line of Business Total 7.00 $3,507,643 7.00 $3,478,480 9.00 $3,280,991
Table of Contents

Information Technology
C-85
Customer Support • The Customer Support Program provides centralized technology support services to City
employees so they can have a single point of contact for their service needs and receive rapid restoration of normal services.
Customer Support Positions and Budget
FY19 FY20 FY21
Adopted Actual Adopted Adopted Adopted Adopted
Program Positions Expenses Positions Budget Positions Budget
Customer Support 6.25 $845,108 6.25 $910,846 5.25 $839,646
Line of Business Total 6.25 $845,108 6.25 $910,846 5.25 $839,646
Table of Contents

Information Technology
C-86
Public Safety Support • The Public Safety Applications Support Program provides technology-based support and
emergency planning services to City public safety providers so they can have the systems and information required to successfully perform their job.
• The Public Safety Communications Support Program provides radio, voice, and mobile computing
system services and Public Safety Communication Center facility support services to City and regional users so they can reliably communicate with others.
Public Safety Support Positions and Budget
FY19 FY20 FY21
Adopted Actual Adopted Adopted Adopted Adopted
Program Positions Expenses Positions Budget Positions Budget
Public Safety Applications
Support 8.25 $1,985,003 7.80 $1,941,995 7.80 $2,313,041
Public Safety Communications
Support 19.75 5,748,413 22.20 6,994,212 22.20 6,955,640
Line of Business Total 28.00 $7,733,416 30.00 $8,936,207 30.00 $9,268,681
Table of Contents

Information Technology
C-87
Technology Application Support • The Departmental Systems Program provides system analysis, implementation and support
services to City departments so they can utilize technology to deliver services to their customers. • The Enterprise Business Applications Program provides analysis, support, security, and system
maintenance services to financial, personnel, and utility billing application users so they can effectively perform their business activities and receive accurate and timely information.
• The Geographic Information Systems (GIS) Program provides spatial data, analysis, and
technology services to City departments so they can receive the spatial information needed to make informed decisions to meet their business goals.
Technology Application Support Positions and Budget
FY19 FY20 FY21
Adopted Actual Adopted Adopted Adopted Adopted
Program Positions Expenses Positions Budget Positions Budget
Departmental Systems 7.25 $1,411,547 7.25 $1,697,516 7.25 $1,819,297
Enterprise Business
Applications 10.25 1,810,130 9.25 2,210,346 9.25 2,292,479
Geographic Information
Systems 4.00 1,185,703 5.50 701,301 5.50 685,598
Line of Business Total 21.50 $4,407,380 22.00 $4,609,163 22.00 $4,797,374
Table of Contents

Information Technology
C-88
Technology Enhancement • The Data Management Program provides data storage, analysis, reporting, training, and support
to City departments so they can conveniently access the information they need to make informed and timely decisions.
• The Software Development Program provides application integration and custom applications to
users so they can have software solutions that meet their unique business goals. • The Project Management Program provides technology needs analysis and project administration
services to City executives, project sponsors, and stakeholders so they can complete technology projects that meet their business goals.
Technology Enhancement Positions and Budget
FY19 FY20 FY21
Adopted Actual Adopted Adopted Adopted Adopted
Program Positions Expenses Positions Budget Positions Budget
Data Management 5.00 $611,735 6.20 $817,663 6.20 $780,340
Software Development 6.00 408,328 4.50 462,464 4.50 521,130
Project Management 3.25 453,626 4.25 609,917 3.25 469,979
Line of Business Total 14.25 $1,473,689 14.95 $1,890,044 13.95 $1,771,449
Table of Contents

Information Technology
C-89
Technology Infrastructure • Communications Program provides telecommunications and e-mail services to City employees so
they can have secure and reliable communication tools to provide services to citizens and other City departments.
• The Configuration Management Program provides centralized management systems and standard
configuration services to City employees so they can most efficiently support and maintain information technology applications and systems.
• The Network Program provides device connectivity to City employees and users of the City’s
systems so they can have secure and reliable communications. • The Security Program provides technology risk management, access governance, compliance
review, and operational security services to City employees and users of City systems so they can conduct their business with confidentiality, integrity, and availability of technology systems.
• The Server Program provides enterprise-level infrastructure that is redundant and secure to City
departments so they can reliably store, process, and retrieve information through City applications.
Technology Infrastructure Positions and Budget
FY19 FY20 FY21
Adopted Actual Adopted Adopted Adopted Adopted
Program Positions Expenses Positions Budget Positions Budget
Communications 5.30 $2,275,028 4.70 $2,142,216 4.70 $1,988,266
Configuration Management 3.25 1,898,709 3.70 2,808,365 3.70 2,864,517
Network 9.35 1,729,641 8.20 1,923,339 9.20 2,005,386
Security 7.35 1,226,524 6.00 1,381,760 6.00 1,207,730
Servers 8.75 1,224,097 8.20 1,347,121 8.20 1,522,521
Line of Business Total 34.00 $8,353,998 30.80 $9,602,801 31.80 $9,588,420
Table of Contents

Information Technology
C-90 Table of Contents

Mayor and City Council
C-91
Mayor and City Council David Holt, Mayor
James Greiner, City Council Ward 1 James Cooper, City Council Ward 2 Larry McAtee, City Council Ward 3 Todd Stone, City Council Ward 4
David Greenwell, City Council Ward 5 JoBeth Hamon, City Council Ward 6
Nikki Nice, City Council Ward 7 Mark K. Stonecipher, City Council Ward 8
Residents
City Council
Mayor
Office of the Mayor
City Manager Office of the City Council
Table of Contents

Council Strategic Priorities
Mayor and City Council
C-92
City Council has established Strategic Priorities for addressing critical issues facing the City over the next two to five years. These priorities provide guidance for the organization as the budget is developed. Every other year these priorities are reviewed and previously established Council Priorities and the progress indicators or key results that the City should achieve to address the identified issues are updated. The following are the Council Priorities adopted by the City Council in 2016; more detail can be found beginning on page A-10. Our priorities are grounded in the lessons of the City’s history and the values of inclusiveness, mutual respect and self-reliance that are the hallmarks of our future. We will be responsive to our residents’ needs as we address these priorities and continue to deliver what we promise. Our focus is to improve the quality of life for every Oklahoma City resident.
Continue to pursue social and criminal justice initiatives
Uphold high standards for all City services
Encourage a robust local economy
Enhance recreation opportunities and community wellness
Maintain Strong Financial Management
Develop a transportation system that works for all residents
Promote safe, secure, and thriving neighborhoods
Table of Contents

Major Budget Changes
Mayor and City Council
C-93
Office of the Mayor and City Council Major Budget Changes Amount Positions
1. Changes in personnel related costs such as salaries, merit,
retirement, health insurance, and other benefits
$67,143 -
Table of Contents

Expenditures
Mayor and City Council
C-94
Summary of FY19 FY20 FY21 Percent
Expenditures by Purpose Actual Adopted Budget Adopted Budget Change
Operating Expenditures
Office of the Mayor $392,105 $434,106 $389,653 -10.24%
Office of the City Council 677,439 741,785 769,597 3.75%Total Operating Expenditures $1,069,544 $1,175,891 $1,159,250 -1.42%
Non-Operating Expenditures
Capital Expenditures $0 $10,500 $10,500 0.00%
Total Non-Operating Expenditures $0 $10,500 $10,500 0.00%
Department Total $1,069,544 $1,186,391 $1,169,750 -1.40%
Summary of FY19 FY20 FY21 Percent
Expenditures by Funding Source Actual Adopted Budget Adopted Budget Change
General Fund $1,069,544 $1,175,891 $1,159,250 -1.42%
Capital Improvement Projects Fund 0 10,500 10,500 0.00%
Total All Funds $1,069,544 $1,186,391 $1,169,750 -1.40%
Table of Contents

Positions
Mayor and City Council
C-95
Summary of FY19 FY20 FY21 Percent
Positions by Purpose Actual Adopted Budget Adopted Budget Change
Office of the Mayor 2.00 3.00 2.60 -13.33%Office of the City Council 4.00 4.00 4.00 0.00%
Department Total 6.00 7.00 6.60 -5.71%
Summary of FY19 FY20 FY21 Percent
Positions by Funding Source Actual Adopted Budget Adopted Budget Change
General Fund 6.00 7.00 6.60 -5.71%
Department Total 6.00 7.00 6.60 -5.71%
Table of Contents

Mayor and City Council Lines of Business
Mayor and City Council
C-96
Office of the Mayor
• The Office of the Mayor Program provides information and support to the Mayor so he can sustain public support for Mayor and Council priorities, guide policymaking for the Mayor and Council, provide oversight to City services on behalf of the people of Oklahoma City, make appointments to City boards and commissions, enhance the external perception of Oklahoma City and provide outreach services to the community so they can experience a high degree of satisfaction with City services.
Office of the Mayor Positions and Budget
Office of the City Council
• The Office of the City Council Program provides accurate and timely information to Council for the adoption of City policies, and provides coordination, research, and administrative/constituency services to Council, and supports the development and implementation of Council priorities, and community programs that enhance the quality of life for residents.
Office of the City Council Positions and Budget
FY19 FY20 FY21
Adopted Actual Adopted Adopted Adopted Adopted
Program Positions Expenses Positions Budget Positions Budget
Office of the Mayor 2.00 $392,105 3.00 $434,106 2.60 $389,653
Line of Business Total 2.00 $392,105 3.00 $434,106 2.60 $389,653
FY19 FY20 FY21
Adopted Actual Adopted Adopted Adopted Adopted
Program Positions Expenses Positions Budget Positions Budget
Office of the City Council 4.00 $677,439 4.00 $741,785 4.00 $769,597
Line of Business Total 4.00 $677,439 4.00 $741,785 4.00 $769,597
Table of Contents

Municipal Counselor
C-97
Municipal Counselor
Civil Litigation
Labor and Employment
Law
Criminal Justice
Land Use and Economic
Development
Trusts, Utilities and
Finance
• Police and Courts
Legal Services
• Prosecution Legal
Services
• Labor Litigation Legal Services
• Labor Relations Legal Services
• Economic Development
Legal Services
• Land Use Legal
Services
• Trusts, Utilities and Finance Legal Services
Deputy Municipal Counselor
• Civil Litigation Legal Services
Deputy Municipal Counselor
Administration
• Executive Leadership
Mayor and City Council
Municipal Counselor
Residents
Kenneth Jordan $7,110,242 54
Municipal Counselor Budget Positions
Deputy Municipal Counselor
Table of Contents

Department Introduction
Municipal Counselor
C-98
Mission Statement The mission of the Municipal Counselor is to provide legal consultations, representations, and document services to the City, its public trusts, and their officers, appointees, and employees so they can lawfully and effectively conduct business and implement policies.
Department Budget
Department Overview The Office of the Municipal Counselor has a total budget of $7,110,242 which is a decrease of 5.52%. There are 54 positions authorized in the FY21 budget, a decrease of 2 positions.
Positions History
To review additional performance information, please see the attached supplemental performance report or visit our website: www.okc.gov/performancedata.
35%
10%26%
6%
16%
7%
$7,110,242
Administration
Civil Litigation
Criminal Justice
Labor andEmployment Law
Land Use andEconomic Development
Trusts, Utilities andFinance
55 55 55 5654
FY17 FY18 FY19 FY20 FY21
Department Facts • Each year the Municipal
Counselor’s Office handles approximately 370 civil cases, 150,000+ criminal citations, 600 claims, 190 collections and multiple other department requested projects, such as drafting contracts or legal opinions.
• The Municipal Counselor’s
Office serves as legal counsel to all departments and trusts in the City and consistently maintains positive satisfaction responses when conducting monthly client satisfaction reviews.
Table of Contents

Major Budget Changes
Municipal Counselor
C-99
Municipal Counselor Department Major Budget Changes Amount Positions
1. Deletes an Assistant Municipal Counselor III in the Executive
Leadership Program
($195,194) (1.00)
2. Deletes a Legal Secretary II in the Executive Leadership Program ($105,006) (1.00)
Table of Contents

Expenditures
Municipal Counselor
C-100
Summary of FY19 FY20 FY21 Percent
Expenditures by Purpose Actual Adopted Budget Adopted Budget Change
Operating Expenditures
Administration $2,506,085 $2,463,208 $2,517,070 2.19%
Civil Litigation 1,072,933 1,122,707 686,396 -38.86%
Criminal Justice 1,758,274 1,799,373 1,877,716 4.35%
Labor and Employment Law 514,003 505,953 412,880 -18.40%
Land Use and Economic Development 934,497 937,636 1,131,833 20.71%
Trusts, Utilities and Finance 690,841 696,053 475,363 -31.71%Total Operating Expenditures $7,476,634 $7,524,930 $7,101,258 -5.63%
Non-Operating Expenditures
Capital Expenditures $0 $525 $8,984 1611.24%Total Non-Operating Expenditures $0 $525 $8,984 1611.24%
Department Total $7,476,634 $7,525,455 $7,110,242 -5.52%
Summary of FY19 FY20 FY21 Percent
Expenditures by Funding Source Actual Adopted Budget Adopted Budget Change
General Fund $7,340,305 $7,387,898 $6,962,689 -5.76%
Capital Improvement Projects Fund 0 525 8,984 1611.24%
Court Administration & Training Fund 6,141 10,000 12,000 20.00%
Juvenile Justice Fund 130,188 127,032 126,569 -0.36%
Total All Funds $7,476,634 $7,525,455 $7,110,242 -5.52%
Table of Contents

Positions
Municipal Counselor
C-101
Summary of FY19 FY20 FY21 Percent
Positions by Purpose Actual Adopted Budget Adopted Budget Change
Administration 14.03 14.16 16.36 15.54%
Civil Litigation 7.90 8.90 5.80 -34.83%
Criminal Justice 16.62 15.49 15.49 0.00%
Labor and Employment Law 3.45 3.45 2.45 -28.99%
Land Use and Economic Development 5.51 5.51 6.90 25.23%
Trusts, Utilities, and Finance 7.49 8.49 7.00 -17.55%
Department Total 55.00 56.00 54.00 -3.57%
Summary of FY19 FY20 FY21 Percent
Positions by Funding Source Actual Adopted Budget Adopted Budget Change
General Fund 50.05 50.05 48.05 -4.00%
Airports Cash Fund 2.00 3.00 3.00 0.00%
Juvenile Justice Fund 0.75 0.75 0.75 0.00%
Police Sales Tax Fund 1.20 1.20 1.20 0.00%
Water and Wastewater Funds 1.00 1.00 1.00 0.00%
Department Total 55.00 56.00 54.00 -3.57%
Table of Contents

Municipal Counselor Lines of Business
Municipal Counselor
C-102
Administration
• The Executive Leadership Program provides planning, management, administrative and reporting
services to department employees and City leaders so they can achieve strategic goals and key results.
Administration Positions and Budget
Civil Litigation • The Civil Litigation Legal Services Program provides advice, consultations and legal representation
services to the City, its public trusts, and their officials and employees so they can avoid or limit liability.
Civil Litigation Positions and Budget
FY20 FY21
Adopted Actual Adopted Adopted Adopted Adopted
Program Positions Expenses Positions Budget Positions Budget
Executive Leadership 14.03 $2,506,085 14.16 $2,463,208 16.36 $2,517,070
Line of Business Total 14.03 $2,506,085 14.16 $2,463,208 16.36 $2,517,070
FY19
Adopted Actual Adopted Adopted Adopted Adopted
Program Positions Expenses Positions Budget Positions Budget
Civil Litigation Legal Services 7.90 $1,072,933 8.90 $1,122,707 5.80 $686,396
Line of Business Total 7.90 $1,072,933 8.90 $1,122,707 5.80 $686,396
Table of Contents

Municipal Counselor
C-103
Criminal Justice • The Police and Courts Legal Services Program provides legal consultations, representations and
document services to the police and court administration departments so they can receive prompt, clear and direct legal guidance in order to lawfully conduct their business.
• The Prosecution Legal Services Program provides municipal ordinance prosecution services to the
City of Oklahoma City so it can have a just and efficient resolution of criminal complaints.
Criminal Justice Positions and Budget
Labor and Employment Law • The Labor Litigation Legal Services Program provides civil representation services to City Council
members and City supervisors so they can resolve disputes and reduce legal liability associated with labor management issues.
• The Labor Relations Legal Services Program provides general counsel, legal consultations,
administrative representations and document services to City Council members and City management so they can increase their awareness and understanding of labor issues to better plan and better manage their employees in a timely manner.
Labor and Employment Law Positions and Budget
Adopted Actual Adopted Adopted Adopted Adopted
Program Positions Expenses Positions Budget Positions Budget
Police and Courts Legal Services 1.45 $2,969 1.20 $1,717 1.20 $1,717
Prosecution Legal Services 15.17 1,755,305 14.29 1,797,656 14.29 1,875,999
Line of Business Total 16.62 $1,758,274 15.49 $1,799,373 15.49 $1,877,716
Adopted Actual Adopted Adopted Adopted Adopted
Program Positions Expenses Positions Budget Positions Budget
Labor Litigation Legal Services 1.55 $233,205 1.55 $228,859 1.15 $192,836
Labor Relations Legal Services 1.90 280,798 1.90 277,094 1.30 220,044
Line of Business Total 3.45 $514,003 3.45 $505,953 2.45 $412,880
Table of Contents
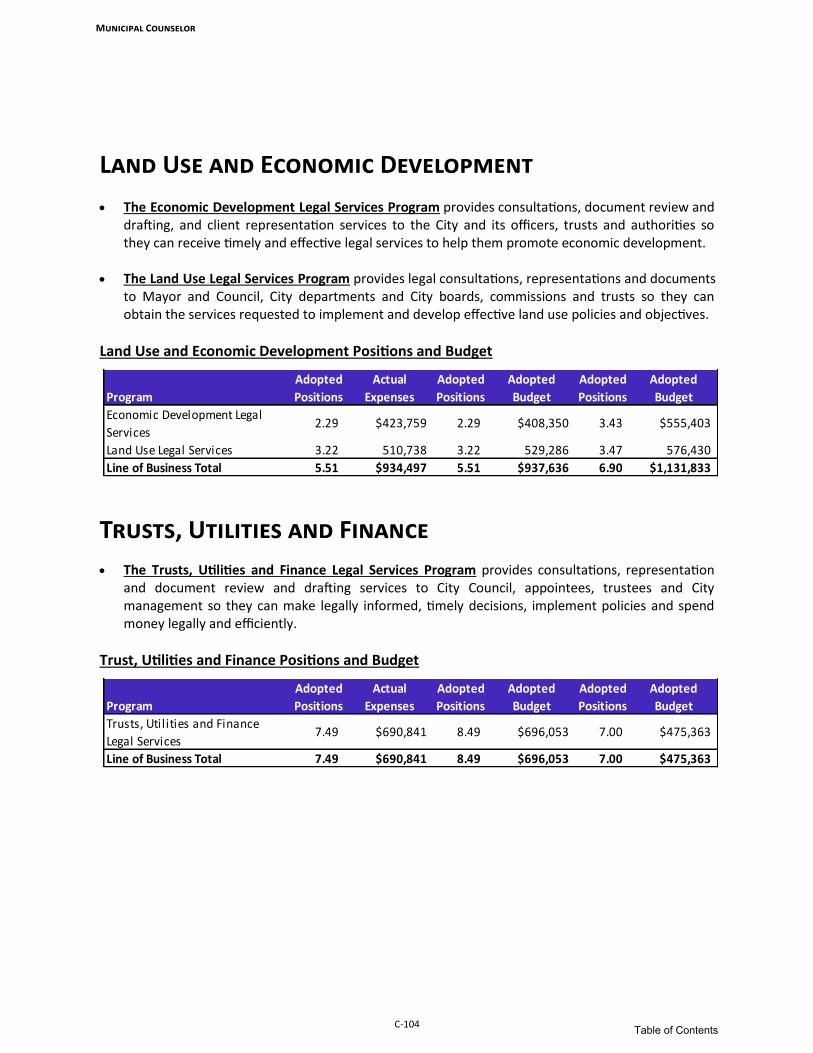
Municipal Counselor
C-104
Land Use and Economic Development • The Economic Development Legal Services Program provides consultations, document review and
drafting, and client representation services to the City and its officers, trusts and authorities so they can receive timely and effective legal services to help them promote economic development.
• The Land Use Legal Services Program provides legal consultations, representations and documents
to Mayor and Council, City departments and City boards, commissions and trusts so they can obtain the services requested to implement and develop effective land use policies and objectives.
Land Use and Economic Development Positions and Budget
Trusts, Utilities and Finance
• The Trusts, Utilities and Finance Legal Services Program provides consultations, representation and document review and drafting services to City Council, appointees, trustees and City management so they can make legally informed, timely decisions, implement policies and spend money legally and efficiently.
Trust, Utilities and Finance Positions and Budget
Adopted Actual Adopted Adopted Adopted Adopted
Program Positions Expenses Positions Budget Positions Budget
Economic Development Legal
Services 2.29 $423,759 2.29 $408,350 3.43 $555,403
Land Use Legal Services 3.22 510,738 3.22 529,286 3.47 576,430
Line of Business Total 5.51 $934,497 5.51 $937,636 6.90 $1,131,833
Adopted Actual Adopted Adopted Adopted Adopted
Program Positions Expenses Positions Budget Positions Budget
Trusts, Utilities and Finance
Legal Services7.49 $690,841 8.49 $696,053 7.00 $475,363
Line of Business Total 7.49 $690,841 8.49 $696,053 7.00 $475,363
Table of Contents

Municipal Court
C-105
Municipal Court
• Court Case Support
• Court Enforcement and Investigations
• Court Financial Processing
• Probation Services • Municipal Judicial Services
• Municipal Court Facility Operations
LaShawn Thompson $9,016,383 58
City Council Municipal Judges
City Manager
Municipal Court
Court Case and Enforcement
Facility Operations
Municipal Judicial Services
Probation Services
Director Budget Positions
Table of Contents

Department Introduction
Municipal Court
C-106
Mission Statement The mission of the Municipal Court is to ensure procedural justice to court patrons affected by a violation of Oklahoma City ordinances, so they can be assured of fairness, transparency, and impartiality in the timely disposition of all cases.
Department Budget
Department Overview The Municipal Court has a total budget of $9,016,383 which is a decrease of 23.44%. The reduction is due in large part to a decrease in capital expenditures. There are 58 positions authorized in the FY21 budget, which is a reduction of nine positions from the FY20 budget.
Position History
To review additional performance information, please see the attached supplemental performance report or visit our website: www.okc.gov/departments/finance/performance-data.
20%
45%
8%
6%
10%
11%
$9,016,383
Administration
Court Case andEnforcement
Facility Operations
Municipal JudicialServices
Probation Services
Capital Expenditures
79
64 67 67
58
FY17 FY18 FY19 FY20 FY21
Department Facts
• In FY20, 181,535 citations were processed by Municipal Court.
• The FY20 Municipal Court
Customer Satisfaction Survey results indicate that 84% of people who completed the survey were satisfied with their court experience and 91% were satisfied that they “were treated with courtesy and respect by court staff.”
Table of Contents
Major Budget Changes
Municipal Court
C-107
PHOTO: SIMON HURST
Municipal Court Major Budget Changes Amount Positions
1. Changes in personnel related costs such as salaries, merit,
retirement, health insurance, and other benefits
$221,379 -
2. Deletes an Administrative Support Tech, a Senior Customer
Service Rep and a Court Officer
($247,971) (3.00)
3. Deletes two Court Officers in Court Services ($154,420) (2.00)
4. Reduces in Court Case Support for professional services, training
and collection expenses
($100,824)
5. Deletes one Municipal Court Reporter and reduces line items for
training and professional services contracts in Courts
Administration
($145,288) (1.00)
6. Deletes three custodial services related positions in the Court
Facility Operations Program
($181,000) (3.00)
Table of Contents

Expenditures
Municipal Court
C-108
Summary of FY19 FY20 FY21 Percent
Expenditures by Purpose Actual Adopted Budget Proposed Budget Change
Operating Expenditures
Administration $1,969,722 $1,872,363 $1,835,677 -1.96%
Court Case and Enforcement 3,926,255 4,634,235 4,014,706 -13.37%
Facility Operations 683,418 887,785 741,325 -16.50%
Municipal Judicial Services 526,384 576,220 569,648 -1.14%
Probation Services 776,136 891,549 868,178 -2.62%Total Operating Expenditures $7,881,915 $8,862,152 $8,029,534 -9.40%
Non-Operating Expenditures
Capital Expenditures $2,049,648 $2,915,409 $986,849 -66.15%Total Non-Operating Expenditures $2,049,648 $2,915,409 $986,849 -66.15%
Department Total $9,931,563 $11,777,561 $9,016,383 -23.44%
Summary of FY19 FY20 FY21 Percent
Expenditures by Funding Source Actual Adopted Budget Proposed Budget Change
General Fund $7,072,684 $7,940,879 $7,139,684 -10.09%
Capital Improvement Projects Fund 1,852,467 2,645,409 778,879 -70.56%
CLEET Court Administration Fund 0 0 0 N/A
CLEET Court Administration Training 3,849 7,000 7,000 0.00%
Juvenile Justice Fund 805,383 914,273 882,850 -3.44%
MAPS 3 Use Tax Fund 197,181 270,000 207,970 -22.97%
MAPS 4 Use Tax Fund 0 0 N/A
Total All Funds $9,931,564 $11,777,561 $9,016,383 -23.44%
Table of Contents

Positions
Municipal Court
C-109
PHOTO: SIMON HURST
Summary of FY19 FY20 FY21 Percent
Positions by Purpose Actual Adopted Budget Adopted Budget Change
Administration 4.40 4.40 4.40 0.00%
Court Case and Enforcement 46.40 46.40 39.60 -14.66%
Facility Operations 2.20 2.20 0.00 -100.00%
Municipal Judicial Services 4.00 4.00 4.00 0.00%
Probation Services 10.00 10.00 10.00 0.00%
Department Total 67.00 67.00 58.00 -13.43%
Summary of FY19 FY20 FY21 Percent
Positions by Funding Source Actual Adopted Budget Adopted Budget Change
General Fund 58.00 58.00 49.00 -15.52%
Juvenile Justice Fund 9.00 9.00 9.00 0.00%
Department Total 67.00 67.00 58.00 -13.43%
Table of Contents

Municipal Court Lines of Business
Municipal Court
C-110
Administration
• The Executive Leadership Program provides planning, management, administrative and reporting services to department employees and City leaders so they can achieve strategic goals and key results.
• Community Outreach Program provides community outreach, case information and resolution services to individuals and community partners so they can make an informed decision regarding a
case.
Administration Positions and Budget
Court Case and Enforcement
• The Court Case Support Program provides scheduling, case processing and information services to Enforcement Agencies, Officers of the Court and Justice-Involved Individuals so they can experience accurate and timely adjudication of cases.
• The Court Enforcement and Investigations Program provides warrant investigative services to the
Municipal Court and Oklahoma City Police Department Court Detail Unit so it can clear warrants on cases.
• The Court Financial Processing Program provides case information and financial payment
processing services to court customers so they can receive an accurate disposition of their court case.
Court Case and Enforcement Positions and Budget
Adopted Actual Adopted Adopted Proposed Proposed
Program Positions Expenses Positions Budget Positions Budget
Executive Leadership 4.40 $1,969,722 4.40 $1,822,363 4.40 $1,835,677
Community Outreach* 0.00 0.00 0.00 $50,000 0.00 0
Line of Business Total 4.40 $1,969,722 4.40 $1,872,363 4.40 $1,835,677
*New program proposed in FY20
FY19 FY20 FY21
`
Adopted Actual Adopted Adopted Proposed Proposed
Program Positions Expenses Positions Budget Positions Budget
Court Case Support 27.35 $2,660,241 27.35 $3,202,043 25.35 $2,925,154
Court Enforcement and
Investigations4.15 317,979 4.15 347,785 4.45 339,449
Court Financial Processing 14.90 948,034 14.90 1,084,407 9.80 750,103
Line of Business Total 46.40 $3,926,254 46.40 $4,634,235 39.60 $4,014,706
FY19 FY20 FY21
Table of Contents

Municipal Court
C-111
Facility Operations
• The Municipal Court Facility Operations Program provides facility maintenance, technical support,
employee training, safety compliance and security services to court staff and individuals entering the Court facility so they can conduct business and experience a safe and secure environment.
Facility Operations Positions and Budget
Municipal Judicial Services
• The Municipal Judicial Services Program provides Judicial Decisions and court procedure guidance to citizens of Oklahoma City and court patrons so they can receive a fair and just hearing or experience in accordance with the Oklahoma City Municipal Code, State and Federal laws.
Municipal Judicial Services Positions and Budget
Adopted Actual Adopted Adopted Proposed Proposed
Program Positions Expenses Positions Budget Positions Budget
Courthouse Security* 0.00 $111,010 0.00 $125,000 0.00 $106,077
Municipal Court Facility Ops 2.20 572,408 2.20 762,785 0.00 635,248
Line of Business Total 2.20 $683,418 2.20 $887,785 0.00 $741,325
*Positions were moved to Police, but Courts stil l has a budget and the program in this Line of Business
FY19 FY20 FY21
`
Adopted Actual Adopted Adopted Proposed Proposed
Program Positions Expenses Positions Budget Positions Budget
Municipal Judicial Services 4.00 $526,384 4.00 $576,220 4.00 $569,648
Line of Business Total 4.00 $526,384 4.00 $576,220 4.00 $569,648
FY19 FY20 FY21
Table of Contents

Municipal Court
C-112
Probation Services
• The Probation Services Program provides referral and supervision services to offenders so they
can successfully complete their court ordered requirements within the established period of time and reduce recidivism.
Probation Services Positions and Budget
PHOTO: SIMON HURST
Adopted Actual Adopted Adopted Proposed Proposed
Program Positions Expenses Positions Budget Positions Budget
Probation Services 11.10 $776,136 10.00 $891,549 10.00 $868,178
Line of Business Total 11.10 $776,136 10.00 $891,549 10.00 $868,178
FY19 FY20 FY21
Table of Contents

Non-Departmental
C-113
City Manager
Non-Departmental Administered by the Office of Management and Budget
Non-Departmental
Department Mission The mission of Non-Departmental is to aggregate citywide funding needs that are not identified with any one department.
City Council
Contingency Funds
Convention and Visitors Bureau
General Expenses
Subsidies and Transfers
• MAPS 3 Reserve for Future Capital Costs
• Capital Improvements
• Chesapeake Arena and Cox Center Operations
• Retiree Health Insurance
• Contractual Services
• Economic Development
• Miscellaneous Professional Service Contracts
• Utilities and Rent
• Contracted Service Funded by Hotel/Motel Tax
Table of Contents

Major Budget Changes
Non-Departmental
C-114
Amount Positions
1. Adds new budget in General Fund - Non-Operating to transfer to
the new MAPS4 Program Fund$106,988,204 -
2. Removes Salary Reserve held for potential cost of living
increases to meet budget reduction targets($5,180,000) -
3. Reduces transfer to Capital Improvement Projects fund to meet
budget reduction targets($1,500,000) -
4. Increases the subsidy for the management of the Chesapeake
Energy Arena and Cox Convention Center due to lost revenue
and increased cleaning expenses due to COVID-19
$2,435,198 -
5. Increases the subsidy for the management of the new MAPS 3
Convention Center set to open in January 2021$405,815 -
6. Increases utilities at the new MAPS 3 Convention Center $1,071,250 -
7. Reduces contingency to meet budget reduction targets ($2,040,900) -
8. Reduces transfer to Oklahoma City Public Employee Benefits
Trust to match pay as you go cost estimate($1,248,495) -
Non-Departmental's Major Budget Changes
Table of Contents
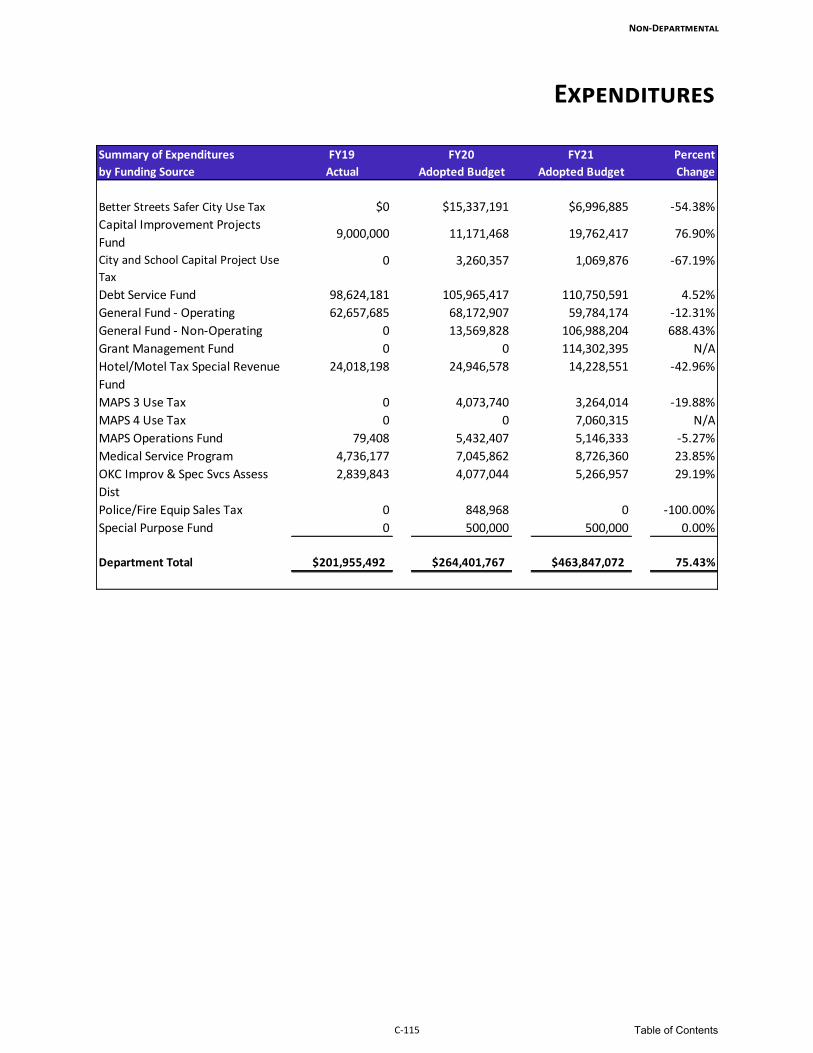
Expenditures
Non-Departmental
C-115
Summary of Expenditures FY19 FY20 FY21 Percent
by Funding Source Actual Adopted Budget Adopted Budget Change
Better Streets Safer City Use Tax $0 $15,337,191 $6,996,885 -54.38%
Capital Improvement Projects
Fund9,000,000 11,171,468 19,762,417 76.90%
City and School Capital Project Use
Tax
0 3,260,357 1,069,876 -67.19%
Debt Service Fund 98,624,181 105,965,417 110,750,591 4.52%
General Fund - Operating 62,657,685 68,172,907 59,784,174 -12.31%
General Fund - Non-Operating 0 13,569,828 106,988,204 688.43%
Grant Management Fund 0 0 114,302,395 N/A
Hotel/Motel Tax Special Revenue
Fund
24,018,198 24,946,578 14,228,551 -42.96%
MAPS 3 Use Tax 0 4,073,740 3,264,014 -19.88%
MAPS 4 Use Tax 0 0 7,060,315 N/A
MAPS Operations Fund 79,408 5,432,407 5,146,333 -5.27%
Medical Service Program 4,736,177 7,045,862 8,726,360 23.85%
OKC Improv & Spec Svcs Assess
Dist
2,839,843 4,077,044 5,266,957 29.19%
Police/Fire Equip Sales Tax 0 848,968 0 -100.00%
Special Purpose Fund 0 500,000 500,000 0.00%
Department Total $201,955,492 $264,401,767 $463,847,072 75.43%
Table of Contents

Responsibilities
Non-Departmental
C-116
Summary of Departmental Responsibilities Non-Departmental is a budgeting mechanism for identifying and funding programs that are City-wide in nature. Non-Departmental also funds miscellaneous projects that reflect Council Policy. Included under this mechanism are such expenses as:
• Utilities • Economic Development Resources • Contingency Reserves • Retiree Health Subsidy
No direct services are provided to citizens and no staff positions are assigned to this department.
Table of Contents

Parks and Recreation
C-117
Parks and Recreation
• Community Partnership
• Trust and Foundation Support
• Aquatics
• Athletics, Health and Wellness
• General Recreation
• Bricktown Canal and Field Horticulture
• Fisheries Management
• Martin Park Nature Center
• Will Rogers Gardens
• Equipment Repair
• Grounds Maintenance
• Park Events
• Parks Athletic Fields
• Traffic Hazard Abatement
• Urban Forestry Services
Grounds Management
Natural Resources
Public-Private Partnership
Recreation, Health and Wellness
Residents
Mayor and City Council
City Manager
Parks and Recreation
Director Budget Positions
Douglas Kupper $36,052,475 165
Table of Contents

Department Introduction
Parks and Recreation
C-118
Mission Statement The mission of OKC Parks is to provide cultural, social and recreational experiences to our community so they can have the opportunity to cultivate wellness and enjoy a healthy lifestyle.
Department Budget
Department Overview The Parks and Recreation Department has a total budget of $36,052,475, which is a decrease of 2.99%.
There are 165 positions authorized in the FY21 budget, a decrease of 13 positions. The pie chart above
provides a breakdown of the FY21 budget by Line of Business. Also included below is a graph showing
the number of authorized positions over the last five years.
Position History
To review additional performance information, please see the attached supplemental performance report or visit our website: www.okc.gov/performancedata.
Department Facts • The Recreation Division
hosts about 1,200 classes per year.
• The Grounds Management Division mows about 40,000 acres of parks and public grounds per year.
• 5.7% of the City’s land area is parkland.
185
165 165178
165
FY17 FY18 FY19 FY20 FY21
14%
25%
8%13%
10%
13%
17%
$36,052,475
Administration
Grounds Management
Natural Resources
Public - PrivatePartnership
Recreation, Health andWellness
Capital Expenditures
Other Non-OperatingExpenditures
Table of Contents

Major Budget Changes
Parks and Recreation
C-119
Parks and Recreation Department's Major Budget Changes Amount Positions
1. Changes in personnel related costs such as salaries, merit, retirement,
health insurance, and other benefits
$208,411 -
2. Closes Douglass and Sellers recreation centers, deletes one Custodian
position, and reduces Part-time & Temporary wages and other expense
line items
($173,872) (1.00)
3. Deletes five Grounds Maintenance Operator I's, one Grounds
Maintenance Operator II, one Tree Trimmer, one Crew Chief, and one
Construction Equipment Operator I position in the Grounds
Maintenance Division
($446,617) (9.00)
4. Deletes one Grounds Maintenance Operator I position and reduces Part-
time & Temporary wages in the Natural Resources Division
($152,125) (1.00)
5. Deletes one Customer Support and one Database Technician position in
the Administration Division
($115,914) (2.00)
Table of Contents
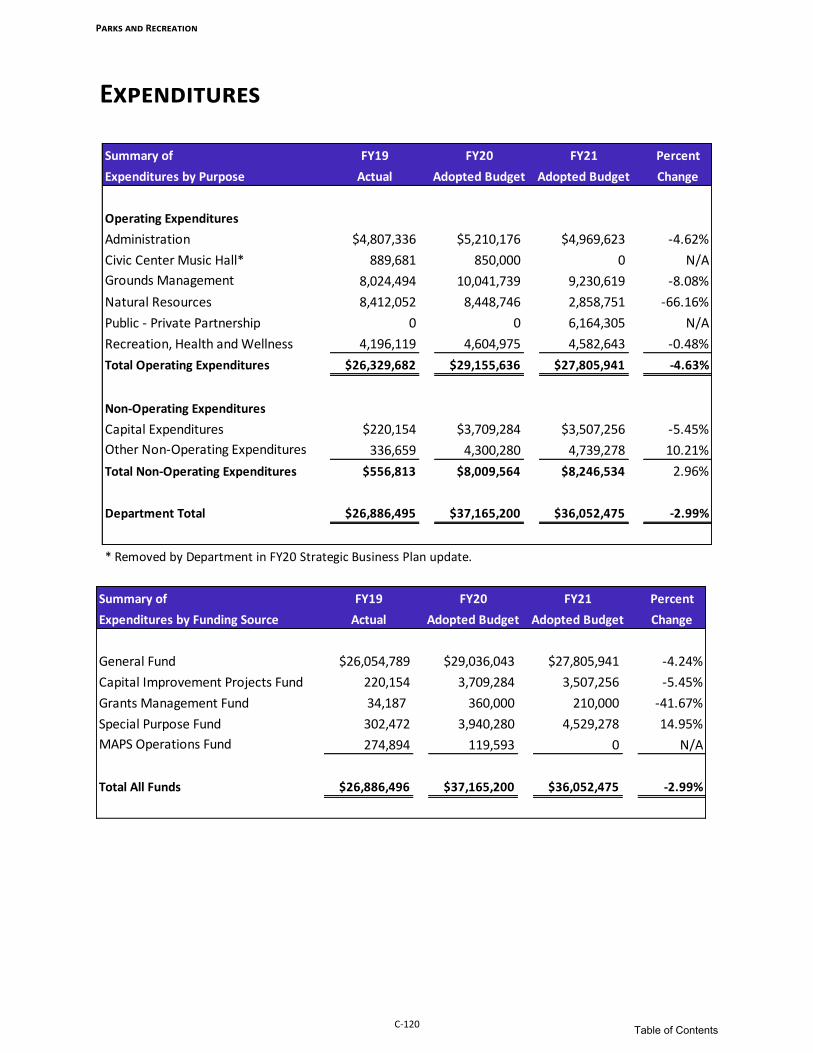
Expenditures
Parks and Recreation
C-120
Summary of FY19 FY20 FY21 Percent
Expenditures by Purpose Actual Adopted Budget Adopted Budget Change
Operating Expenditures
Administration $4,807,336 $5,210,176 $4,969,623 -4.62%
Civic Center Music Hall* 889,681 850,000 0 N/A
Grounds Management 8,024,494 10,041,739 9,230,619 -8.08%
Natural Resources 8,412,052 8,448,746 2,858,751 -66.16%
Public - Private Partnership 0 0 6,164,305 N/A
Recreation, Health and Wellness 4,196,119 4,604,975 4,582,643 -0.48%
Total Operating Expenditures $26,329,682 $29,155,636 $27,805,941 -4.63%
Non-Operating Expenditures
Capital Expenditures $220,154 $3,709,284 $3,507,256 -5.45%
Other Non-Operating Expenditures 336,659 4,300,280 4,739,278 10.21%
Total Non-Operating Expenditures $556,813 $8,009,564 $8,246,534 2.96%
Department Total $26,886,495 $37,165,200 $36,052,475 -2.99%
* Removed by Department in FY20 Strategic Business Plan update.
Summary of FY19 FY20 FY21 Percent
Expenditures by Funding Source Actual Adopted Budget Adopted Budget Change
General Fund $26,054,789 $29,036,043 $27,805,941 -4.24%
Capital Improvement Projects Fund 220,154 3,709,284 3,507,256 -5.45%
Grants Management Fund 34,187 360,000 210,000 -41.67%
Special Purpose Fund 302,472 3,940,280 4,529,278 14.95%
MAPS Operations Fund 274,894 119,593 0 N/A
Total All Funds $26,886,496 $37,165,200 $36,052,475 -2.99%
Table of Contents

Positions
Parks and Recreation
C-121
Summary of FY19 FY20 FY21 Percent
Positions by Purpose Actual Adopted Budget Adopted Budget Change
Administration 22.00 20.00 18.00 -10.00%
Civic Center Music Hall* 0.00 0.00 0.00 N/A
Grounds Management 96.00 99.00 90.00 -9.09%
Natural Resources 24.00 29.00 28.00 -3.45%
Public - Private Partnership 0.00 0.00 0.00 N/A
Recreation, Health and Wellness 23.00 30.00 29.00 -3.33%
Department Total 165.00 178.00 165.00 -7.30%
* Removed by Department in FY20 Strategic Business Plan update.
Summary of FY19 FY20 FY21 Percent
Positions by Funding Source Actual Adopted Budget Adopted Budget Change
General Fund 165.00 178.00 165.00 -7.30%
Department Total 165.00 178.00 165.00 -7.30%
Table of Contents

Parks and Recreation Lines of Business
Parks and Recreation
C-122
Administration • The Executive Leadership Program provides planning, management, administrative and reporting
services to department employees and City leaders so they can achieve strategic goals and key results.
Administration Positions and Budget
FY19 FY20 FY21
Adopted Actual Adopted Adopted Adopted Adopted
Program Positions Expenses Positions Budget Positions Budget
Executive Leadership 22.00 $4,807,336 20.00 $5,210,176 18.00 $4,969,623
Line of Business Total 22.00 $4,807,336 20.00 $5,210,176 18.00 $4,969,623
Table of Contents

Parks and Recreation
C-123
Civic Center Music Hall
• In FY 2019, the City entered an agreement with the Civic Center Foundation for the operations of
the Civic Center Music Hall.
Civic Center Positions and Budget
FY19 FY20 FY21
Adopted Actual Adopted Adopted Adopted Adopted
Program Positions Expenses Positions Budget Positions Budget
Box Office* 0.00 $0 0.00 $0 0.00 $0
Performance Support* 0.00 889,612 0.00 850,000 0.00 0
Private Event & Business Services* 0.00 69 0.00 0 0.00 0
Line of Business Total 0.00 $889,681 0.00 $850,000 0.00 $0
*In FY19 the Operations were outsourced to the Civic Center Foundation and in FY21 the budget was moved to the
new Public-Private Partnership line of business
Table of Contents
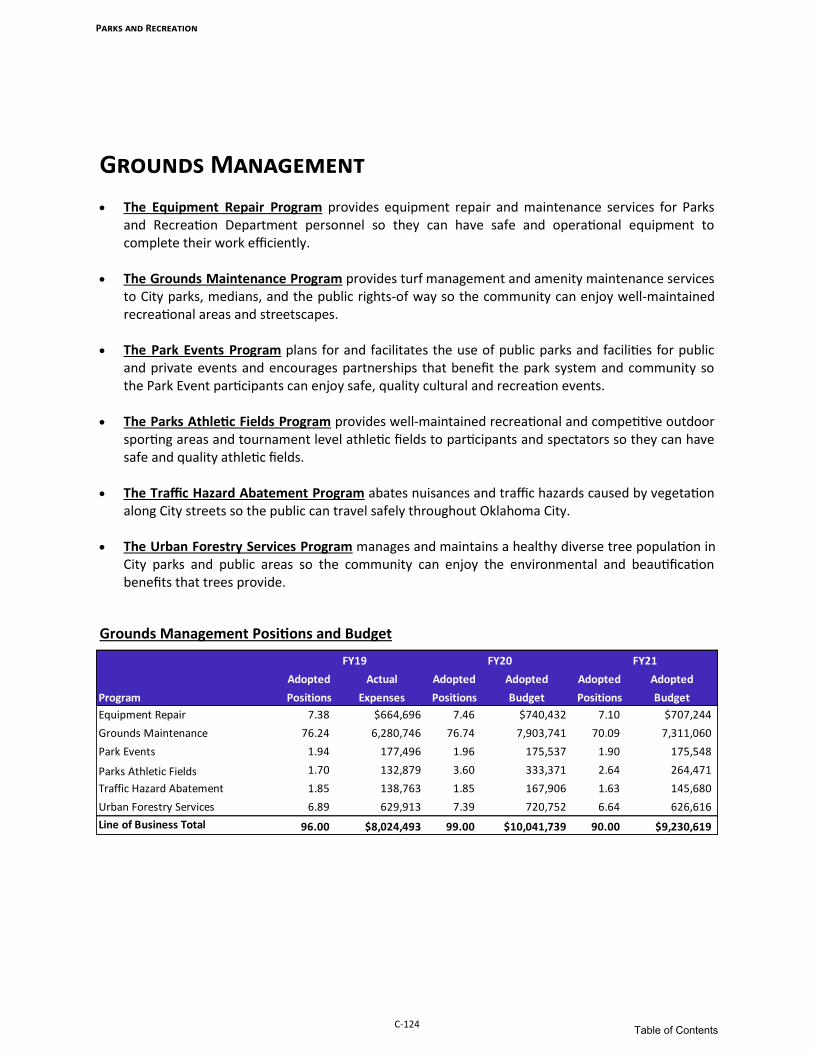
Parks and Recreation
C-124
Grounds Management
• The Equipment Repair Program provides equipment repair and maintenance services for Parks
and Recreation Department personnel so they can have safe and operational equipment to complete their work efficiently.
• The Grounds Maintenance Program provides turf management and amenity maintenance services
to City parks, medians, and the public rights-of way so the community can enjoy well-maintained recreational areas and streetscapes.
• The Park Events Program plans for and facilitates the use of public parks and facilities for public
and private events and encourages partnerships that benefit the park system and community so the Park Event participants can enjoy safe, quality cultural and recreation events.
• The Parks Athletic Fields Program provides well-maintained recreational and competitive outdoor
sporting areas and tournament level athletic fields to participants and spectators so they can have safe and quality athletic fields.
• The Traffic Hazard Abatement Program abates nuisances and traffic hazards caused by vegetation
along City streets so the public can travel safely throughout Oklahoma City. • The Urban Forestry Services Program manages and maintains a healthy diverse tree population in
City parks and public areas so the community can enjoy the environmental and beautification benefits that trees provide.
Grounds Management Positions and Budget
FY19 FY20 FY21
Adopted Actual Adopted Adopted Adopted Adopted
Program Positions Expenses Positions Budget Positions Budget
Equipment Repair 7.38 $664,696 7.46 $740,432 7.10 $707,244
Grounds Maintenance 76.24 6,280,746 76.74 7,903,741 70.09 7,311,060
Park Events 1.94 177,496 1.96 175,537 1.90 175,548
Parks Athletic Fields 1.70 132,879 3.60 333,371 2.64 264,471
Traffic Hazard Abatement 1.85 138,763 1.85 167,906 1.63 145,680
Urban Forestry Services 6.89 629,913 7.39 720,752 6.64 626,616
Line of Business Total 96.00 $8,024,493 99.00 $10,041,739 90.00 $9,230,619
Table of Contents

Parks and Recreation
C-125
Natural Resources
• The Bricktown Canal and Field Horticulture Program provides maintenance and enhancements of
landscaping in public areas, parks, medians, and City street rights-of-way, so the public can enjoy attractive, well-maintained landscapes.
• The Fisheries Management Program provides recreational sport fishing opportunities and
education to anglers so they can fish for well-stocked and healthy fish populations within a major urban area.
• The Martin Park Nature Center Program provides a variety of nature experiences, environmental
education programs and recreational services to the public so they can enjoy a well maintained and accessible nature park within Oklahoma City.
• The Will Rogers Gardens Program provides a well-maintained and managed horticulture
education center and private event rental facility to the public so they can experience decorative landscapes, specialty gardens, conservatory, arboretum and attend educational gardening programs for an enhanced quality of life.
Natural Resources Positions and Budget
FY19 FY20 FY21
Adopted Actual Adopted Adopted Adopted Adopted
Program Positions Expenses Positions Budget Positions Budget
Bricktown Canal and Field
Horticulture14.25 $2,539,168 18.50 $1,930,220 17.50 $1,579,836
Fisheries Management 1.25 188,830 1.50 213,506 1.50 214,288
Martin Park Nature Center 2.25 267,743 2.50 336,315 2.50 310,573
Myriad Botanical Gardens Support* 0.00 4,631,546 0.00 5,223,450 0.00 0
Will Rogers Gardens 6.25 784,765 6.50 745,255 6.50 754,054
Line of Business Total 24.00 $8,412,052 29.00 $8,448,746 28.00 $2,858,751* In FY21, the Myriad Botanical Gardens Support program was moved to the Trust and Foundation Support program in the
Public - Private Partnership line of business
Table of Contents

Parks and Recreation
C-126
Public-Private Partnership • The Community Partnership Program facilitates public-private partnerships that leverage the
expertise, skills, and resources of volunteers, civic foundations, neighborhood groups, school districts, universities, and businesses who wish to contribute to the quality and improvement of the public park system so the community can enjoy an enhanced quality of life.
• The Trust and Foundation Support Program provides support and maintenance oversight of
the City-owned facilities and parks managed by various foundations and trusts so the public can enjoy the use of intensely programmed, safe, and well-maintained parks and facilities.
Public-Private Partnership Positions and Budget
FY19 FY20 FY21
Adopted Actual Adopted Adopted Adopted Adopted
Program Positions Expenses Positions Budget Positions Budget
Community Partnership 0.00 $0 0.00 $0 0.00 $63,930
Trust and Foundation Support 0.00 0 0.00 0 0.00 6,100,375
Line of Business Total 0.00 $0 0.00 $0 0.00 $6,164,305
Table of Contents

Parks and Recreation
C-127
Recreation, Health and Wellness
• Aquatics Program provides wellness and educational aquatic opportunities to the public so they
can participate in aquatic activities and enjoy safe aquatic facilities. • The Athletic, Health and Wellness Program provides quality and safe activities to the public so
they can experience an enhanced quality of life. • The General Recreation Program provides a vast array of health, wellness and recreational services
to the public so they can enjoy a variety of safe and educational recreation opportunities that reflect the needs and interests of the community.
Recreation, Health and Wellness Positions and Budget
FY19 FY20 FY21
Adopted Actual Adopted Adopted Adopted Adopted
Program Positions Expenses Positions Budget Positions Budget
Aquatics 0.00 $39,161 0.00 $0 3.50 $1,278,997
Athletics, Health, and Wellness 0.00 29,962 0.00 0 8.00 612,223
General Recreation 23.00 4,126,997 30.00 4,604,975 17.50 2,691,423
Line of Business Total 23.00 $4,196,120 30.00 $4,604,975 29.00 $4,582,643
Table of Contents

Parks and Recreation
C-128
Table of Contents

Planning
C-129
Planning
Residents
Mayor and City Council
City Manager
Planning
Community Development
Current Planning and Urban Design
Plan Development and Implementation
• Community Development
• Homelessness Services
• Comprehensive Planning
• Neighborhood and Commercial District Revitalization
• Transportation Planning
• Current Planning
• Urban Design and Community Appearance
Geoffrey Butler $32,557,010 45
Administration
• Arts and Cultural Affairs
• Executive Leadership
• Grants and Financial Management
• Office of Sustainability
Director Budget Positions
Table of Contents

Department Introduction
Planning
C-130
Mission Statement The mission of the Planning Department is to guide the city’s growth and development so that current and future Oklahoma City residents and businesses can thrive in a vibrant and sustainable city.
Department Budget
department overview The Planning Department has a total budget of $32,557,010 which is an increase of 11.50%. There are 45 positions authorized in the FY21 budget, which is a decrease of two from FY20.
Position history
To review performance information, please see the attached supplemental performance report or visit our website: www.okc.gov/performancedata.
Department Facts The Planning Department staffs 10 committees and commissions: • Arts Commission
• Citizens Committee for Community Development
• Community and Neighborhood Enhancement Advisory Board
• Bricktown Urban Design Committee
• Stockyards Urban Design Committee
• Riverfront Design Committee
• Downtown Design Review Committee
• Planning Commission
• Historic Preservation Commission
47 47 47 4745
FY17 FY18 FY19 FY20 FY21
4%
89%
3%3%1%
$32,557,010
Administration
CommunityDevelopment
Current Planningand Urban Design
Plan Developmentand Implementation
Non-Operating
Table of Contents

Major Budget Changes
Planning
C-131
Amount Positions
1. Changes in personnel related costs such as salaries, merit, retirement,
health insurance, and other benefits
$125,696
-
2. Deletes two vacant positions, and moves one Program Planner underfill
to a Senior Planner.
($216,080) (2.00)
Planning Department's Major Budget Changes
Table of Contents

Expenditures
Planning
C-132
Summary of FY19 FY20 FY21 Percent
Expenditures by Funding Source Actual Adopted Budget Adopted Budget Change
General Fund $3,946,810 $4,500,543 $3,897,050 -13.41%
Grants Management Fund 16,338,337 24,806,406 28,365,052 14.35%
Special Purpose Fund 32,210 362,073 294,908 -18.55%
Total All Funds $20,317,357 $29,669,022 $32,557,010 9.73%
Summary of FY19 FY20 FY21 Percent
Expenditures by Purpose Actual Adopted Budget Adopted Budget Change
Operating Expenditures
Administration $1,331,579 $1,623,610 $1,243,337 -23.42%
Community Development 514,780 607,399 603,694 -0.61%
Current Planning and Urban Design 989,911 1,059,832 943,489 -10.98%
Plan Development and Implementation 1,110,541 1,209,702 1,106,530 -8.53%
Total Operating Expenditures $3,946,810 $4,500,543 $3,897,050 -13.41%
Non-Operating Grants Expenditures
Administration $3,750 $0 $0 N/A
Community Development 16,271,869 24,747,081 28,335,768 14.50%
Plan Development and Implementation 62,718 59,325 29,284 -50.64%
Total Grant Expenditures $16,338,337 $24,806,406 $28,365,052 14.35%
Non-Operating Special Purpose Expenditures
Arts & Cultural Affairs $32,210 $135,957 $141,955 4.41%
Mayor's Round Table 0 126,116 126,280 0.13%
Other 0 100,000 26,673 -73.33%
Total Special Purpose Expenditures $32,210 $362,073 $294,908 -18.55%
Department Total $20,317,357 $29,669,022 $32,557,010 9.73%
Table of Contents

Positions
Planning
C-133
Summary of FY19 FY20 FY21 Percent
Positions by Funding Source Actual Adopted Budget Adopted Budget Change
General Fund 27.83 27.93 26.93 -3.58%
Grants Management Fund 19.17 19.07 18.07 -5.24%
Department Total 47.00 47.00 45.00 -4.26%
Summary of FY19 FY20 FY21 Percent
Positions by Purpose Actual Adopted Budget Adopted Budget Change
Administration 7.97 7.97 7.97 0.00%
Community Development 20.17 20.07 18.17 -9.47%
Current Planning and Urban Design 10.00 10.00 9.00 -10.00%
Plan Development and Implementation 8.86 8.96 9.86 10.04%
Department Total 47.00 47.00 45.00 -4.26%
Table of Contents

Planning Lines of Business
Planning
C-134
Administration • The Arts and Cultural Affairs Program expands the community’s arts and cultural opportunities so
the community can experience direct economic, social, physical, and educational enrichment. • The Executive Leadership Program provides planning, management, administrative and reporting
services to department employees and City leaders so they can achieve strategic goals and key results.
• The Grant and Financial Management Program provides program and fiscal administration
services to The City, granting organizations, and funding recipients so they can receive and/or disburse grant and loan funds in compliance with relevant rules and regulations.
• The Office of Sustainability provides planning and outreach services to City departments and Oklahoma City residents, businesses and visitors so they can integrate sustainability into decision making for improved economic, environmental, and social health.
Administration Positions and Budget
Adopted Actual Adopted Adopted Adopted Adopted
Program Positions Expenses Positions Budget Positions Budget
Arts & Cultural Affairs 2.47 $246,594 2.47 $244,988 2.47 $245,793
Executive Leadership 3.50 894,107 3.50 1,175,885 3.50 786,915
Grant & Financial Management 0.00 0 0.00 0 0.00 0
Office of Sustainability 2.00 194,628 2.00 202,737 2.00 210,629
Line of Business Total 7.97 $1,335,329 7.97 $1,623,610 7.97 $1,243,337
FY21FY19 FY20
Table of Contents

Planning
C-135
Community Development
• The Community Development Program Neighborhood provides needed resources principally for
low– and moderate-income persons so they can have decent housing, a suitable living environ-ment, and expanded economic opportunities.
• The Homelessness Services Program provides stable housing, employment opportunities, and sup-
portive services to people who are homeless or those at risk of homelessness so they can increase their income and obtain or remain in permanent housing.
Community Development Positions and Budget
Current Planning and Urban Design • The Current Planning Program implements the Comprehensive Plan by providing development
consultations, evaluating development proposals, and recommending policies and regulations to decision makers and the community so they can make informed decisions regarding growth and development.
• The Urban Design and Community Appearance Program provides design ordinance implementa-
tion, evaluation, and advice services, and historic preservation services to residents, property own-ers, and developers so they can experience a vibrant, attractive community and realize improved property values.
Current Planning and Urban Design Positions and Budget
Adopted Actual Adopted Adopted Adopted Adopted
Program Positions Expenses Positions Budget Positions Budget
Community Development 17.02 $9,552,114 16.72 $18,323,749 16.17 $21,970,679
Homelessness Services 3.15 7,234,534 3.35 7,030,731 2.00 6,968,783
Line of Business Total 20.17 $16,786,648 20.07 $25,354,480 18.17 $28,939,462
FY19 FY20 FY21
Adopted Actual Adopted Adopted Adopted Adopted
Program Positions Expenses Positions Budget Positions Budget
Current Planning 3.70 $316,926 3.70 $384,359 3.70 $369,241
Urban Design & Comm App 6.30 672,985 6.30 675,473 5.30 574,248
Line of Business Total 10.00 $989,911 10.00 $1,059,832 9.00 $943,489
FY19 FY20 FY21
Table of Contents

Planning
C-136
Plan Development and implementation • The Comprehensive Planning Program provides plans, studies and recommendations to policy
makers, the development sector, partner organizations, and the community so they can implement the Comprehensive Plan.
• The Neighborhood and Commercial District Revitalization Program provides revitalization support
services to residents, community stakeholders, and business and property owners so they can create and maintain successful, unique, and vibrant neighborhoods and urban places.
• The Transportation Planning Program provides transportation plans, studies, and
recommendations to policy makers, the development sector, and partner organizations so they can promote and facilitate better planning, design and construction of complete streets, sidewalks, and trails to become a more pedestrian and cyclist friendly community and increase various means of mobility.
Planning Development and Implementation Positions and Budget
Adopted Actual Adopted Adopted Adopted Adopted
Program Positions Expenses Positions Budget Positions Budget
Comprehensive Planning 3.58 $340,535 3.58 $409,259 3.08 $294,969
Neighborhood and Commercial
District Revitalization5.28 832,724 5.38 859,768 4.78 840,845
Transportation Planning* 0.00 0 0.00 0 2.00 0
Line of Business Total 8.86 $1,173,259 8.96 $1,269,027 9.86 $1,135,814
*The Transportation Planning Program was added as part of the 2019 Strategic Business Plan
FY19 FY20 FY21
Table of Contents

Police
C-137
Police
• Investigations
• Investigations Support
• Special Investigations
Residents
Mayor and City Council
City Manager
Office of the Chief of Police
Investigations Administration Public Safety
Support
• Executive Leadership
• Emergency Management
• Human Resources
• Professional Standards
• Public Information
• 911 Communications
• Inmate Processing / Incarceration Alternatives
• Permit Services
• Records Management
• Training
Wade Gourley $226,051,993 1,527
Police Chief Budget Positions
Operations
• Court Enforcement and Investigations
• Courthouse Security
• Crime Prevention and Awareness
• Patrol
• Traffic Safety
• Youth Services
Table of Contents

Department Introduction
Police
C-138
Mission Statement The mission of the Oklahoma City Police Department is to deliver exceptional police services to our community with integrity, compassion, accountability, respect and equity.
Department budget
Department overview The Police Department has a total budget of $226,051,993, which is an increase of 3.45%. There are 1,527 positions authorized in the FY21 budget, a decrease of 12 positions over the FY20 budget.
Position history
To review performance information, please see the attached supplemental performance report or visit our website: www.okc.gov/departments/finance/performance-data.
Department Facts • In 2020, the Oklahoma City
Police Department (OKCPD) implemented a specialized unit, comprised of patrol officers, detectives and crime analysts, focused specifically on quick response and investigating violent crime.
• In 2020, the OKCPD adopted the following core values:
Integrity Compassion Accountability Respect Equity • In 2019, the OKCPD
participated in 650 community events with a total attendance of 82,776
10%
18%
49%
9%
14%
$226,051,993
Administration
Investigations
Operations
Public Safety Support
Non-Operating
1,4471,522 1,524 1,539 1,527
FY17 FY18 FY19 FY20 FY21
Table of Contents

Major Budget Changes
Police
C-139
Police Major Budget Changes Amount Positions
1. Changes in personnel related costs, such as salaries, merit,
retirement, health insurance, and other benefits$2,136,865 -
2. Reduces salary expense by holding 34 Police Officer positions vacant ($3,113,235) -
3. Reduces various line items, such as Materials, Services, Maintenance,
Contingencies, etc.
($1,779,894)-
4. Reduces various line items in the Police Recruit Project ($600,000) -
5. Deletes five Police Report Clerks in the Records Management and
Inmate Processing Programs($282,060) (5.00)
6. Deletes an Administrative Support Technician, a Senior Crime Analyst
and a Property Crime Specialist in various Investigation Programs($231,236) (3.00)
7. Deletes an Office Clerk and contingency funding in the 911
Communications Program($143,943) (1.00)
8. Deletes a Systems Analyst III and a Systems Analyst II in the Executive
Leadership Program($138,517) (2.00)
9. Deletes an Office Assistant in the Uniform Support Unit ($74,785) (1.00)
10. Increases Capital funding to cover construction and remodeling costs $800,000 -
Table of Contents

Expenditures
Police
C-140
Summary of FY19 FY20 FY21 Percent
Expenditures by Purpose Actual Adopted Budget Adopted Budget Change
Operating Expenditures
Administration $22,623,682 $23,030,722 $22,830,764 -0.87%
Investigations 39,658,456 40,313,372 40,228,717 -0.21%
Operations 112,381,336 120,681,707 116,542,836 -3.43%
Public Safety Support 23,666,889 25,647,591 24,519,744 -4.40%
Total Operating Expenditures $198,330,363 $209,673,392 $204,122,061 -2.65%
Non-Operating Expenditures
Administration $69,172 $108,559 $101,470 -6.53%
Investigations 977,105 1,705,315 1,753,498 2.83%
Operations 238,451 572,110 79,324 -86.13%
Public Safety Support 138,023 64,000 64,000 0.00%
Capital Expenditures 7,004,149 14,894,478 26,595,045 78.56%
Other Non-Operating 1,734,424 4,013,424 5,677,733 41.47%
Total Non-Operating Expenditures $10,161,324 $21,357,886 $34,271,070 60.46%
Total Department $208,491,687 $231,031,278 $238,393,131 3.19%
Less Transfers to City Funds ($11,917,042) ($12,519,027) ($12,341,138) -1.42%
Total Department $196,574,645 $218,512,251 $226,051,993 3.45%
Summary of FY19 FY20 FY21 Percent
Expenditures by Funding Source Actual Adopted Budget Adopted Budget Change
General Fund $148,446,811 $154,800,485 $152,262,308 -1.64%
Asset Forfeiture Fund 1,422,751 2,449,984 1,998,292 -18.44%
Better Streets Safer City Use Tax Fund 2,253,236 9,873,336 16,147,383 63.55%
Capital Improvements Projects Fund 0 235,943 235,943 0.00%
City and Schs Capital Use Tax Fund 0 0 0 N/A
Court Admin and Training Fund 178,444 217,536 208,000 -4.38%
Emergency Management Fund 8,347,722 9,197,130 9,244,913 0.52%
Grants Management Fund 1,715,424 3,937,926 5,614,461 42.57%
MAPS 3 Use Tax 4,413,835 544,350 315,931 -41.96%
MAPS 4 Use Tax 0 0 7,099,014 N/A
Police Sales Tax Fund 41,694,463 49,528,241 45,032,765 -9.08%
Police and Fire Equip Sales Tax Fund 0 170,849 170,849 0.00%
Special Purpose Fund 19,000 75,498 63,272 -16.19%
Total Department $208,491,687 $231,031,278 $238,393,131 3.19%
Less Interfund Transfers ($11,917,042) ($12,519,027) ($12,341,138) -1.42%
Total All Funds $196,574,645 $218,512,251 $226,051,993 3.45%
Table of Contents

Positions
Police
C-141
Summary of FY19 FY20 FY21 Percent
Positions by Funding Source Actual Adopted Budget Adopted Budget Change
General Fund 1,193.75 1,202.75 1,193.75 -0.75%
Emergency Management Fund 82.25 82.25 81.25 -1.22%
Grants Management Fund 0.00 0.00 0.00 N/A
Police Sales Tax Fund 248.00 254.00 252.00 -0.79%
Total Department 1,524.00 1,539.00 1,527.00 -0.78%
Summary of FY19 FY20 FY21 Percent
Positions by Purpose Actual Adopted Budget Adopted Budget Change
Administration 83.05 85.05 83.10 -2.29%
Investigations 299.40 306.40 303.40 -0.98%
Operations 948.95 951.55 949.80 -0.18%
Public Safety Support 192.60 196.00 190.70 -2.70%
Total Department 1,524.00 1,539.00 1,527.00 -0.78%
Table of Contents

Police Lines of Business
Police
C-142
Administration
• The Executive Leadership Program provides planning, management, administrative and reporting
services to department employees and City leaders so they can achieve strategic goals and key results.
• The Emergency Management Program provides prevention, protection, mitigation, preparedness,
response and recovery services to emergency responders and the community so they can improve community resilience and effectively respond to and recover from emergencies and disasters.
• The Human Resources Program provides employee support services and strategic and intentional
recruiting efforts to department personnel so they can receive timely and accurate performance assessment, compensation, and benefits as well as address diversity and staffing goals.
• The Professional Standards Program provides internal criminal and administrative investigative
services to the Chief of Police and Command Staff so they can make informed decisions regarding employee conduct.
• The Public Information Program provides media and open record response services to the public
so they can be aware of Police Department programs, activities, and cases being investigated.
Administration Positions and Budget
FY19 FY20 FY21
Adopted Actual Adopted Adopted Adopted Adopted
Program Positions Expenses Positions Budget Positions Budget
Executive Leadership 46.85 $17,696,262 48.85 $18,520,379 47.35 $18,295,250
Emergency Management 4.10 649,422 4.10 636,375 4.10 652,293
Human Resources 14.00 1,741,828 14.00 1,475,153 13.75 1,476,766
Professional Standards 9.90 1,475,670 9.90 1,395,678 9.90 1,407,914
Public Information 8.20 1,060,500 8.20 1,003,137 8.00 998,541
Line of Business Total 83.05 $22,623,682 85.05 $23,030,722 83.10 $22,830,764
Table of Contents

Police
C-143
Investigations
• The Investigations Program provides investigative services to crime victims and prosecutors so they can achieve successful prosecution of criminal offenders.
• The Investigations Support Program provides investigative and technical support services to
investigators so they can receive accurate and timely information to resolve criminal investigations. • The Special Investigations Program provides investigative services, intelligence assistance and
crime data analysis to executive staff, divisions and other agencies so they can achieve successful prosecution of criminal offenders.
Investigations Positions and Budget
FY19 FY20 FY21
Adopted Actual Adopted Adopted Adopted Adopted
Program Positions Expenses Positions Budget Positions Budget
Investigations 143.35 $20,059,715 143.35 $19,719,219 143.35 $19,815,744
Investigations Support 76.55 8,775,777 79.55 9,386,385 79.55 9,279,384
Special Investigations 79.50 10,822,964 83.50 11,207,768 80.50 11,133,589
Line of Business Total 299.40 $39,658,456 306.40 $40,313,372 303.40 $40,228,717
Table of Contents

Police
C-144
Operations
• The Court Enforcement and Investigations Program provides warrant enforcement for the Municipal Court’s delinquent cases, along with delivery of in custody prisoners scheduled to appear before a magistrate.
• The Courthouse Security Program provides screening, protection and security services to Court
staff and all individuals conducting business with the Court ensuring a safe and secure environment.
• The Crime Prevention and Awareness Program provides training and education to the community
so they can be informed and involved in crime prevention. • The Patrol Program provides first responder law enforcement services to the residents and visitors
of Oklahoma City so they can experience a prompt and professional response and have a feeling of safety and security in the community.
• The Traffic Safety Program provides education, investigation, and enforcement services to the
motoring and pedestrian public so they can safely travel throughout the community. • The Youth Services Program provides security, education and mentoring services to the youth of
Oklahoma City so they can attend safe schools and learn to avoid criminal activity and victimization.
Operations Positions and Budget
FY19 FY20 FY21
Adopted Actual Adopted Adopted Adopted Adopted
Program Positions Expenses Positions Budget Positions Budget
Court Enforcement and
Investigations4.50 $494,295 4.50 $570,318 4.50 $597,901
Courthouse Security 4.50 349,660 4.50 526,692 4.50 559,852
Crime Prevention and Awareness 8.20 1,206,651 8.20 1,115,792 8.20 1,128,510
Patrol 774.00 90,799,175 773.00 98,035,937 773.65 93,859,397
Traffic Safety 122.90 14,114,654 126.50 15,220,901 125.10 15,230,616
Youth Services 34.85 5,416,901 34.85 5,212,067 33.85 5,166,560
Line of Business Total 948.95 $112,381,336 951.55 $120,681,707 949.80 $116,542,836
Table of Contents

Police
C-145
Public Safety Support
• The 911 Communications Program provides emergency response, dispatch and emergency notification services to anyone needing City services so they can receive a proper service response and a timely dispatch.
• The Inmate Processing/Incarceration Alternatives Program provides arrestee intake, detention,
incarceration alternatives, and release services to criminal justice agencies so they can have accurate management of inmate processing.
• The Permit Services Program provides identification and permit management services to City
employees and residents required to obtain permits so they can be in compliance with City policy or ordinance.
• The Records Management Program provides information to maintain, validate, and dissemination
services to law enforcement, other government agencies, and the public so they can obtain accurate and timely information needed to investigate and document public safety incidents.
• The Training Program provides basic and continuing education services to public safety personnel
so they can receive and maintain the knowledge and skills needed to provide public safety services.
Public Safety Support Positions and Budget
FY19 FY20 FY21
Adopted Actual Adopted Adopted Adopted Adopted
Program Positions Expenses Positions Budget Positions Budget
911 Communications 84.30 $11,094,742 85.70 $12,471,115 84.70 $12,412,164
Inmate Processing /
Incarceration Alternatives13.45 2,648,300 13.45 2,944,605 12.45 2,532,396
Permit Services 5.15 426,588 4.15 901,846 4.15 895,781
Records Management 77.95 6,010,501 80.95 6,904,005 76.95 6,739,606
Training 11.75 3,486,758 11.75 2,426,020 12.45 1,939,797
Line of Business Total 192.60 $23,666,889 196.00 $25,647,591 190.70 $24,519,744
Table of Contents

Police
C-146
Table of Contents

Public Transportation and Parking
C-147
Public Transportation
Parking Public
Transportation
• Municipal Off Street Parking
• On-Street Parking Meter
• Bus Operations
• Bus Stop Management
• EMBARK Plus Paratransit
• EMBARK Norman
• Facilities Management
• Fleet Management
• Mobility Management
• Oklahoma River Cruises
• Spokies Bike Share
• Streetcar
Residents
Mayor and City Council
City Manager
Public Transportation and Parking
Director Budget Positions
Jason Ferbrache $15,563,655 34
Administration
• Executive Leadership
• Customer Relations
• Safety, Security, and Training
Table of Contents

Department Introduction
Public Transportation and Parking
C-148
Mission Statement The mission of the Public Transportation and Parking Department is to provide dependable multimodal public transportation and downtown Oklahoma City parking services to the residents and visitors of the greater Oklahoma City metropolitan area so they can experience friendly, convenient, safe and affordable transit and parking services.
Department Budget
Department Overview The Public Transportation and Parking Department has a total budget of $15,563,655, which is a decrease of 36.28%. There are 34 City positions authorized in the FY21 budget, which is an decrease of two position from the FY20 budget.
Position history
To review performance information, please see the performance data report or visit our website: www.okc.gov/performancedata.
Department Facts • In FY19, over 3 million
passenger trips were provided through the EMBARK family of transit services
• The City of Oklahoma
City has 5,172 off-street parking spaces available
• In February 2020, the
OKC streetcar surpassed 500,000 cumulative passenger trips since opening for service in December of 2018.
31%
5%63%
1%
$15,563,655
Administration
Parking
Public Transportation
Non-Operating
34 32 35 36 34
234217 217 220
282
FY17 FY18 FY19 FY20 FY21
City Employees COTPA Employees
Table of Contents

Major Budget Changes
Public Transportation and Parking
C-149
Public Transportation & Parking Department Major Budget Changes Amount Positions
1. Adds an Assistant Director of Administration to provide executive
level expertise and direct support to non-operations managers
and the Administrative Service Manager.
$141,731 1.0
2. Adds a Trust Specialist to assist with increased administrative
support services for the Regional Transit Authority$89,617 1.0
3. Deletes a vacant Senior Planner position funded by grants. ($86,150) (1.0)
4. Reduces General Fund Subsidy to support Public Transportation
bus operations, and will be offset by Federal Cares Act funding to
allow the continuation of normal service supported by a same
service level bus operations budget.
($9,000,000) -
5. Deletes a customer service representative supporting EMBARK
bus service and OKC Streetcar.($53,481) (1.0)
6. Temporarily suspends Spokies bike share operations for at least
the next fiscal year while maintaining equipment and bikes in
storage for future relaunch of service.
($103,325) -
7. Suspends Oklahoma River Cruises operation for the next fiscal
year while maintaining the equipment for future relaunch of
services and cuts a Unit Operations Supervisor over the Spokies
and River programs.
($570,291) (1.0)
8. Deletes an Administrative Coordinator to align with Off Street
Parking revenue projections.(92,106) (1.0)
Table of Contents

Expenditures
Public Transportation and Parking
C-150
These summaries only detail administrative expenditures in the General Fund, Public Transportation Cash Fund and the Parking Cash Fund, which are The City of Oklahoma City funds. The entire operating budget for Public Transportation and Parking is contained in the Central Oklahoma Transportation and Parking Authority (COTPA) budget and is presented separately to its Board of Trustees. COTPA’s adopted budget for FY20 was $46.7 million and the proposed FY21 budget is $43.8 million.
Summary of FY19 FY20 FY21 Percent
Expenditures by Purpose Actual Adopted Budget Adopted Budget Change
Operating Expenditures
Administration $5,284,191 $5,279,156 $4,882,021 -7.52%
Parking 568,316 962,633 751,689 -21.91%
Public Transportation 16,840,223 18,060,400 9,806,370 -45.70%Total Operating Expenditures $22,692,730 $24,302,189 $15,440,080 -36.47%
Non-Operating Expenditures
Capital Expenditures $0 $123,575 $123,575 0.00%Total Non-Operating Expenditures $0 $123,575 $123,575 0.00%
Department Total $22,692,730 $24,425,764 $15,563,655 -36.28%
Summary of FY19 FY20 FY21 Percent
Expenditures by Funding Source Actual Adopted Budget Adopted Budget Change
General Fund $22,124,121 $23,665,143 $14,308,586 -39.54%
Parking Fund 808,458 1,175,981 944,873 -19.65%
Public Transportation Fund 2,861,879 3,416,847 3,557,538 4.12%
Cap. Improvement Projects Fund 0 123,575 123,575 0.00%Department Total $25,794,458 $28,381,546 $18,934,572 -33.29%
Less Interfund Transfers (3,101,727) (3,955,782) (3,370,917) -14.79%
Total All Funds $22,692,731 $24,425,764 $15,563,655 -36.28%
Table of Contents

Positions
Public Transportation and Parking
C-151
These summaries only detail positions in the General Fund, Public Transportation Cash Fund and the Parking Cash Fund, which are The City of Oklahoma City funds. The total position count for Public Transportation and Parking includes Central Oklahoma Transportation and Parking Authority (COTPA) employees whose wages and benefits cost are supported directly by the trust. Total positions for Public Transportation and Parking are 316, which includes 282 positions budgeted in COTPA and 34 positions budgeted in City funds.
Summary of FY19 FY20 FY21 Percent
Positions by Purpose Actual Adopted Budget Adopted Budget Change
Administration 25.95 24.80 25.93 4.56%
Parking 4.55 5.00 4.00 -20.00%
Public Transportation 4.50 6.20 4.07 -34.35%
Department Total 35.00 36.00 34.00 -5.56%
Summary of FY19 FY20 FY21 Percent
Positions by Funding Source Actual Adopted Budget Adopted Budget Change
Parking Fund 6.25 6.25 5.30 -15.20%
Public Transportation Fund 28.75 29.75 28.70 -3.53%
Department Total 35.00 36.00 34.00 -5.56%
Table of Contents
Public Transportation and Parking Lines of Business
Public Transportation and Parking
C-152
Administration • The Executive Leadership Program provides planning, management, administrative and reporting
services to department employees and City leaders so they can achieve strategic goals and key results.
• The Customer Relations Program maintains and fosters relationships in the community including
customers, businesses, agencies and others through continuous engagement, education activities, and world-class customer care.
• The Safety, Security and Training Program provides ongoing Safety Management System (SMS)
support and guidance to all Transit and Parking employees and customers so they can have a safe environment to think safe, work safe, and live safe.
Administration Positions and Budget
Adopted Actual Adopted Adopted Adopted Adopted
Program Positions Expenses Positions Budget Positions Budget
Executive Leadership 13.95 $3,545,994 14.00 $3,618,242 16.58 $3,491,871
Customer Relations 11.00 907,917 10.00 960,133 8.60 637,258
Safety, Security, and Training 1.00 830,280 0.80 700,781 0.75 752,892
Line of Business Total 25.95 $5,284,191 24.80 $5,279,156 25.93 $4,882,021
FY19 FY20 FY21
Table of Contents

Public Transportation and Parking
C-153
Parking
• The Municipal Off-Street Parking Program provides monthly, daily, hourly, and event parking
services to downtown area residents, workers, and visitors so they can park their vehicles in an environment that is safe, convenient, secure, customer-friendly, and well-maintained.
• The On-Street Parking Meter Program provides parking meter revenue collection, installation, and
maintenance services to the City for residents, visitors, and businesses so they can have convenient and reliable metered parking.
Parking Positions and Budget
Adopted Actual Adopted Adopted Adopted Adopted
Program Positions Expenses Positions Budget Positions Budget
Municipal Off-Street Parking 1.75 $157,794 1.95 $213,870 1.35 $162,822
On-Street Parking Meter 2.80 410,523 3.05 748,763 2.65 588,867
Line of Business Total 4.55 $568,317 5.00 $962,633 4.00 $751,689
FY19 FY20 FY21
Table of Contents

Public Transportation and Parking
C-154
Public Transportation • The Bus Operations Program provides bus transportation to residents and visitors in the greater
Oklahoma City metropolitan area so they can travel in a convenient, affordable, safe, customer-friendly environment.
• The Bus Stop Management Program provides bus stop maintenance and enhancement for
residents and visitors of the greater Oklahoma City metropolitan area so they can experience safe, accessible and convenient bus stops.
• The EMBARK Plus Paratransit Program provides paratransit services, to eligible individuals with a
disability who are unable to use regular fixed-route service independently so they can have safe, reliable, and customer-friendly transportation to access employment, health care, nutritional programs, recreation and other destinations that are within the service area.
• The Embark Norman Program provides fixed-route bus and ADA paratransit transportation to the
residents and visitors in the Norman area so they can travel in a convenient, affordable, safe, and customer-friendly environment. This service is made possible through an intergovernmental agreement between EMBARK and the City of Norman.
• The Facilities Management Program provides facility and grounds maintenance and repair services
for residents, visitors, and employees so they can conduct their business in a safe environment that is accessible, clean, and comfortable.
• The Fleet Management Program provides vehicle maintenance and repair services for customers
that utilize the transit system so they can receive transportation services in a safe, clean, comfortable and dependable vehicle.
• The Mobility Management Transportation Program provides a variety of contracted, reservation-
based transportation services to qualified residents with limited options in the greater Oklahoma City metropolitan area so they can have access to essential services.
• The Oklahoma River Cruises Program provides river transportation services to residents and
visitors in the greater Oklahoma City area so they can travel along the Oklahoma River in a safe, customer-friendly environment.
• The Spokies Bike Share Program provides an alternate transit option for residents and visitors of
Oklahoma City so they can use bicycles that provide health benefits and contribute to a cleaner environment.
• The Streetcar Program provides a downtown public streetcar system for Oklahoma City residents,
businesses and visitors so they can travel in a convenient, affordable, safe, and customer-friendly environment.
Table of Contents

Public Transportation and Parking
C-155
Public Transportation Positions and Budget
Adopted Actual Adopted Adopted Adopted Adopted
Program Positions Expenses Positions Budget Positions Budget
Bus Operations 0.50 $5,966,760 0.50 $6,412,482 0.47 $76,775
EMBARK Norman* 0.00 0 0.00 0 0.00 0
EMBARK Plus Paratransit 0.50 1,065,735 0.50 1,123,960 0.50 61,455
Facilities Management 0.00 1,027,374 0.00 1,072,076 0.40 916,136
Fleet Management 1.00 3,752,139 1.00 3,993,368 0.60 3,570,381
Mobility Management 0.50 113,894 0.50 118,336 0.50 251,514
Oklahoma River Cruises 0.50 750,302 0.50 753,622 0.00 184,598
Spokies Bike Share 0.50 123,738 0.50 127,059 0.00 25,000
Streetcar 1.00 4,040,281 2.70 4,459,497 1.60 4,720,511
Line of Business Total 4.50 $16,840,223 6.20 $18,060,400 4.07 $9,806,370
*All expenses related to the Embark Norman program are funded in full by the City of Norman
FY19 FY20 FY21
Table of Contents

Public Transportation and Parking
C-156
Table of Contents

Public Works
C-157
Public Works
Field Services Project
Management Storm Water
Quality Street, Traffic, &
Drainage Traffic
Management Engineering
• Bridge and Drainage Engineering
• Engineering Technical Review
• Paving Engineering
• Construction Inspection
• Construction Quality Control
• Survey
• Contract Administration
• Facilities Project Management
• Infrastructure Project Management
• Environmental Water Quality
• Household Hazardous Waste Collection
• Storm Water Permitting
• Public Outreach
• Drainage
• Streets
• Traffic Operations
• Traffic and Transportation Services
• Traffic Engineering
Residents
Mayor and City Council
City Manager
Public Works
Director Budget Positions
Eric J. Wenger, P.E. $310,986,824 399
Table of Contents

Department Introduction
Public Works
C-158
Mission Statement The mission of the Public Works Department is to provide infrastructure construction and maintenance, private construction review and inspection, and emergency first response services to the public so they can live, work and play in a safe environment.
Department Budget
Department Overview The Public Works Department has a total budget of $310,986,824, which is an increase of 0.73%. There are 399 positions authorized in the FY21 budget, an increase of nine positions. Among the most significant changes, is the $4,883,529 increase in capital expenditures.
Position History
Department Facts • The Streets, Traffic, and
Drainage Maintenance Division maintains over 3,500 miles of public streets with 765 signalized intersections and over 50,000 traffic signs throughout the City.
• The Field Services Division performs over 25,000 construction inspections every year.
386409 409 418
399
FY17 FY18 FY19 FY20 FY21
3%
9%
82%
$310,986,824
Administration
Engineering
Field Services
Project Management
Storm Water Quality
Streets, Traffic &Drainage Maint.Traffic Management
Non-OperatingExpenditures
To review additional performance information, please see the attached supplemental per-formance report or visit our website: www.okc.gov/performancedata.
Table of Contents

Major Budget Changes
Public Works
C-159
Public Works Department Major Budget Changes Amount Positions
1. Reduces Roadway Materials in the Streets Program ($156,359)
2. Deletes an Emergency Management Specialist in the Streets Program ($160,078) (1.00)
3. Adds a Database Technician to the Streets Program $54,289 1.00
4. Deletes a Financial Specialist in the Streets program ($103,920) (1.00)
5. Deletes a Construction Project Coordinator in the Infrastructure Project
Management Program
($91,420) (1.00)
6. Deletes two Heavy Truck Drivers from the Streets Program ($132,059) (2.00)
7. Deletes three Crew Worker II from the Streets Program ($164,975) (3.00)
8. Deletes an Office Coordinator in the Storm Water Quality Program ($60,077) (1.00)
9. Deletes a Concrete Finisher in the Streets Program ($59,559) (1.00)
10. Deletes two Construction Inspectors I from the Field Service Program ($122,894) (2.00)
11. Deletes a Crew Chief from the Streets Program ($57,669) (1.00)
12. Deletes a Construction Project Manager from the Facilities Project
Management Program
($94,294) (1.00)
13. Deletes a Construction Equipment Operator I from the Streets Program ($55,967) (1.00)
14. Deletes a Construction Equipment Operator II from the Streets Program ($57,669) (1.00)
15. Deletes two Traffic Maintenance Workers from the Streets Program ($130,204) (2.00)
16. Deletes a Traffic Crew Chief from the Streets Program ($65,820) (1.00)
17. Deletes a Field Operations Supervisor in the Streets Program ($106,078) (1.00)
Table of Contents

Expenditures
Public Works
C-160
Summary of FY19 FY20 FY21 Percent
Expenditures by Purpose Actual Adopted Budget Adopted Budget Change
Operating Expenditures
Administration $7,774,338 $9,032,388 $8,827,015 -2.27%
Engineering 3,941,709 4,433,869 4,487,072 1.20%
Field Services 4,277,193 4,463,059 4,279,256 -4.12%
Project Management 3,552,831 3,797,730 3,668,278 -3.41%
Storm Water Quality 2,910,131 3,540,329 3,476,971 -1.79%
Streets, Traffic & Drainage Maint. 20,996,509 27,254,887 25,309,247 -7.14%
Traffic Management 1,440,148 1,744,245 1,606,422 -7.90%
Total Operating Expenditures $44,892,859 $54,266,507 $51,654,261 -4.81%
Capital Expenditures $38,556,609 $17,197,429 $22,080,958 28.40%
Other Non-Operating Expenditures 7,623,371 237,276,589 237,251,605 -0.01%
Department Total $91,072,838 $308,740,525 $310,986,824 0.73%
Less Interfund Transfers ($1,880,787) ($27,000) $0 -100.00%
Department Total $89,192,051 $308,713,525 $310,986,824 0.74%
Summary of FY19 FY20 FY21 Percent
Expenditures by Funding Source Actual Adopted Budget Adopted Budget Change
General Fund $29,521,876 $34,895,682 $32,590,626 -6.61%
Street & Alley Fund 16,255 156,719 146,868 -6.29%
Storm Water Drainage Utility Fund 15,851,370 27,235,305 32,369,670 18.85%
Grants Management Fund 5,219,546 3,261,366 119,700 -96.33%
Capital Improvement Projects Fund 5,734,539 9,176,230 8,628,055 -5.97%
Special Purpose Fund 981,236 5,019,232 3,170,919 -36.82%
Better Streets, Safer City Sales Tax Fund 32,325,426 207,564,521 200,134,922 -3.58%
Impact Fee Fund 1,422,589 21,431,470 33,826,064 57.83%
Total All Funding Sources $91,072,838 $308,740,525 $310,986,824 0.73%
Less Interfund Transfers ($1,880,787) ($27,000) $0 -100.00%
Grand Total All Funds $89,192,051 $308,713,525 $310,986,824 0.74%
Table of Contents

Positions
Public Works
C-161
Summary of FY19 FY20 FY21 Percent
Positions by Funding Source Actual Adopted Budget Adopted Budget Change
General Fund 272.35 276.05 257.75 -6.63%
Storm Water Drainage Utility Fund 136.65 141.95 141.25 -0.49%
Department Total 409.00 418.00 399.00 -4.55%
Summary of FY19 FY20 FY21 Percent
Positions by Purpose Actual Adopted Budget Adopted Budget Change
Administration 20.00 23.00 22.00 -4.35%
Engineering 24.00 27.00 26.00 -3.70%
Field Services 50.00 50.00 48.00 -4.00%
Project Management 31.00 32.00 31.00 -3.13%
Storm Water Quality 28.00 29.00 29.00 0.00%
Streets, Traffic & Drainage Maint. 241.00 242.00 228.00 -5.79%
Traffic Management 15.00 15.00 15.00 0.00%
Department Total 409.00 418.00 399.00 -4.55%
Table of Contents

Public works Lines of Business
Public works
C-162
Administration • The Executive Leadership Program provides planning, management, administrative and reporting
services to department employees and City leaders so they can achieve strategic goals and key results.
Administration Positions and Budget
FY19 FY20 FY21
Adopted Actual Adopted Adopted Adopted Adopted
Program Positions Expenses Positions Budget Positions Budget
Executive Leadership 20.00 $7,774,338 23.00 $9,032,388 22.00 $8,827,015
Line of Business Total 20.00 $7,774,338 23.00 $9,032,388 22.00 $8,827,015
Table of Contents

Public Works
C-163
Engineering
• The Drainage Engineering Program provides federal and local drainage compliance and
engineering services to City staff, government agencies, the public and the development community so they can be protected from potential flooding and ensure compliance with all regulations.
• The Engineering Technical Review Program provides plan and document review and approval
services to the development and consulting community, government agencies, and the public so they can proceed with construction projects in a timely manner.
• The Paving Engineering Program provides street and sidewalk design and construction services to
City staff so they can construct safe and comfortable roadways for public travel.
Engineering Positions and Budget
FY19 FY20 FY21
Adopted Actual Adopted Adopted Adopted Adopted
Program Positions Expenses Positions Budget Positions Budget
Drainage Engineering 5.00 $751,959 7.25 $779,827 7.50 $826,818
Engineering Technical Review 8.00 680,804 8.35 807,730 8.25 838,464
Paving Engineering 11.00 2,508,946 11.40 2,846,312 10.25 2,821,790
Line of Business Total 24.00 $3,941,709 27.00 $4,433,869 26.00 $4,487,072
Table of Contents

Public Works
C-164
Field Services
• The Construction Inspection and Construction Quality Control Program provides plan review,
materials testing, inspections, and reporting to City Staff and the development community so they can provide residents with infrastructure built and maintained in a timely manner and in accordance with recognized construction standards.
• The Survey Program provides survey services to City staff, consultants and surveyors so they can
have the survey data required to identify historic and current field conditions in a timely manner.
Field Services Positions and Budget
FY19 FY20 FY21
Adopted Actual Adopted Adopted Adopted Adopted
Program Positions Expenses Positions Budget Positions Budget
Construction Inspection and
Construction Quality Control45.90 $3,966,186 45.90 $4,121,353 43.90 $3,927,302
Survey 4.10 311,007 4.10 341,706 4.10 351,954
Line of Business Total 50.00 $4,277,193 50.00 $4,463,059 48.00 $4,279,256
Table of Contents

Public Works
C-165
Project Management
• The Contract Administration Program provides architectural and engineering contract services,
contractor prequalification, and specification management for City departments so they can have completed projects that meet expectations and requirements.
• The Facilities Project Management Program provides architectural project design and construction
oversight services to City departments and the public so they can have improved public facilities completed on time and within program budget.
• The Infrastructure Project Management Program provides engineering project design and
construction oversight services to City departments and the public so they can have improved public infrastructure projects completed on time and within program budget.
Project Management Positions and Budget
FY19 FY20 FY21
Adopted Actual Adopted Adopted Adopted Adopted
Program Positions Expenses Positions Budget Positions Budget
Contract Administration 5.00 $498,150 5.00 $550,602 6.00 $630,869
Facilities Project Management 11.00 1,312,246 12.00 1,779,091 11.00 1,687,117
Infrastructure Project
Management*13.00 1,586,071 13.00 1,297,477 14.00 1,342,714
Property Research and Land
Acquisition*2.00 157,856 2.00 170,560 0.00 7,578
Line of Business Total 31.00 $3,554,323 32.00 $3,797,730 31.00 $3,668,278*In its most recent Business Plan update, the department merged its Property Research and Land Acquisition
program into Infastructure Project Management
Table of Contents

Public Works
C-166
Storm Water Quality • The Environmental Water Quality Program provides environmental water quality health
assessments and technical services to residents, businesses and government agencies so they can realize a reduction of pollution in community waterways and comply with the Clean Water Act.
• The Household Hazardous Waste Collection Program provides awareness, reuse, recycling and
disposal services to the residents of Oklahoma City and participating municipalities so they can reduce their household hazardous waste and dispose of it in an environmentally safe manner.
• The Public Outreach Program provides public education and training services to increase
environmental awareness through workshops, school programs, public events, and volunteer programs so the public is informed about the City’s Storm Water Quality Program.
• The Storm Water Permitting Program provides training, inspections and enforcement to developers, contractors, facility owner/operators and the public so they can prevent pollution of community waterways.
Storm Water Quality Positions and Budget
FY19 FY20 FY21
Adopted Actual Adopted Adopted Adopted Adopted
Program Positions Expenses Positions Budget Positions Budget
Environmental Water Quality 6.10 $578,817 6.20 $807,061 6.20 $790,151
Household Hazardous Waste
Collection7.10 988,304 7.20 1,162,864 7.20 1,116,648
Public Outreach 1.00 118,778 1.00 115,972 1.00 108,299
Storm Water Permitting 13.80 1,224,232 14.60 1,454,432 14.60 1,461,873
Line of Business Total 28.00 $2,910,131 29.00 $3,540,329 29.00 $3,476,971
Table of Contents

Public Works
C-167
Streets, Traffic, and Drainage Maintenance • The Drainage Program provides construction, infrastructure maintenance, and river support
services to the residents and patrons so they can have reliable stormwater runoff control and use of the Oklahoma River Corridor as a unique quality of life venue.
• The Streets Program provides roadway repair and reconstruction services to the public so they can
travel safely and comfortably throughout the City. • The Traffic Operations Program provides traffic control and maintenance services to the public so
they can travel safely and efficiently throughout the City.
Streets, Traffic, and Drainage Maintenance Positions and Budget
FY19 FY20 FY21
Adopted Actual Adopted Adopted Adopted Adopted
Program Positions Expenses Positions Budget Positions Budget
Drainage 92.10 $8,005,377 93.15 $9,960,437 92.45 $9,586,580
Streets 105.00 9,656,627 108.50 12,816,582 99.50 11,782,642
Traffic Operations 43.90 3,331,339 40.35 4,477,868 36.05 3,940,025
Line of Business Total 241.00 $20,996,509 242.00 $27,254,887 228.00 $25,309,247
Table of Contents

Public Works
C-168
Traffic Management
• The Traffic Engineering Program provides engineering services for the design, review, inspection
and planning of traffic infrastructure to City staff and the development community so that the public can travel safely and efficiently on City streets.
• The Traffic and Transportation Services Program provides work zone permits, work zone
inspections and traffic safety recommendations to the development community so they can safely operate in the right of way.
Traffic Management Positions and Budget
FY19 FY20 FY21
Adopted Actual Adopted Adopted Adopted Adopted
Program Positions Expenses Positions Budget Positions Budget
Traffic and Transportation 5.65 639,155 5.65 898,174 5.65 746,431
Traffic Engineering 9.35 800,993 9.35 846,071 9.35 859,991
Line of Business Total 15.00 $1,440,148 15.00 $1,744,245 15.00 $1,606,422
Table of Contents

Utilities
C-169
Utilities
Customer Service
Line Maintenance
Solid Waste Southeast
Water Supply Engineering
Wastewater Quality
Director Budget Positions
Chris Browning $107,567,708 773
Residents
Mayor and City Council
City Manager
Utilities Administration
• Customer Service / Billing
• Field Support
• Design
• Infrastructure Records
• Private Development
• Meter Maintenance
• Wastewater Line Maintenance
• Water Line Maintenance
• Bulk Waste Collection
• Environmental Clean-Up
• Solid Waste Collection
• Lift Stations
• Pre-Treatment
• Property Maintenance
• Pumping Station Maintenance
• Water Treatment
Fleet Services
• Fleet Services
Water Quality
• Pumping Station Maintenance
Table of Contents

Department Introduction
Utilities
C-170
Mission Statement The mission of the Utilities Department is to provide water, wastewater, and solid waste services to metro area residents, businesses, and other communities so they can enjoy public health protection through safe drinking water and environmentally safe waste disposal.
Department Budget
Department overview The Utilities Department has a total budget of $107,567,708, which is a decrease of 0.65%. There are 773 positions authorized in the FY21 budget, a decrease of 20 positions over the FY20 budget.
Position History
To review performance information, please see the attached supplemental performance report or visit our website: www.okc.gov/performancedata
Department Facts • The Utilities Department
operates on rate-payer funds, that is money received when utility bills are paid.
• Serves 1.4 million people
drinking water. • Treated 34.3 billion gallons of
water and 27.8 billion gallons of wastewater.
• Sold 2.4 billion gallons of
reuse water. • Over 17,200 tons of waste
was diverted from landfills in FY19.
774 787 787 793 773
FY17 FY18 FY19 FY20 FY21
23%
12%
3%2%
21%
9%
1%3%
26%
$107,567,708
Administration
Customer Service
Engineering
Fleet Services
Line Maintenance
Solid Waste
Southeast WaterSupplyWastewater Quality
Table of Contents

Department Introduction
C-171
Utilities
Utilities Department Major Budget Changes Amount Positions
1. Changes in personnel related costs such as salaries, merit, retirement,
health insurance, and other benefits$1,890,178
2. Deletes contractual and commodity budget for the decommissioned
Overholser Water Treatment Plant($1,388,572)
3. Deletes 2 Crew Supervisors, 2 Collection and Distribution Operators,
and a Water Service Tech in the Line Maintenance Division ($307,664) (5.00)
4. Deletes a Civil Engineer II, Engineering Aide I, and Systems Analyst I in
the Engineering Division ($286,285) (3.00)
5. Deletes a Water Quality Technician, a Facility and Plant Mechanic II,
and a Electronic Tech I in the Water Quality Division($236,565) (3.00)
6. Deletes 2 Refuse Collector IIIs and a Community Relations Coordinator
in the Solid Waste Division($204,625) (3.00)
7. Deletes an Environmental Unit Supervisor and a Facility and Plant
Mechanic I in the Wastewater Quality Division($154,408) (2.00)
8. Deletes an Alternative Fuels Mechanic and a Master Mechanic in the
Fleet Services Division($124,877) (2.00)
9. Deletes a Database Technician in the Customer Services Division and an
Inventory Technician in the Administration Division($105,406) (2.00)
10. Increases parts and supplies in the Line Maintenance Division $800,000
11. Increases Operating Reserves in the Water and Wastewater Line of
Business$219,000
12. Increases Uniform budget in all Divisions $105,305
13. Increases the contracted services in the Southeast Water Supply
Division $100,000
Table of Contents

Expenditures
Utilities
C-172
Summary of FY19 FY20 FY21 Percent
Expenditures by Purpose Actual Adopted Budget Adopted Budget Change
Operating Expenditures
Administration $20,328,685 $24,083,591 $24,490,710 1.69%
Customer Service 10,215,876 12,389,893 12,619,131 1.85%
Engineering 2,717,958 3,175,597 2,889,620 -9.01%
Fleet Services 2,697,195 3,226,179 2,571,265 -20.30%
Line Maintenance 20,039,159 21,535,941 23,239,351 7.91%
Solid Waste 7,880,099 9,741,621 9,704,915 -0.38%
Southeast Water Supply 0 0 780,606 N/A
Wastewater Quality 2,804,153 3,391,582 3,198,310 -5.70%
Water Quality 23,441,892 30,725,491 28,073,800 -8.63%
Total Operating Expenditure $90,125,019 $108,269,895 $107,567,708 -0.65%
Department Total $90,125,019 $108,269,895 $107,567,708 -0.65%
Summary of FY19 FY20 FY21 Percent
Expenditures by Funding Source Actual Adopted Budget Adopted Budget Change
Wastewater Fund $26,206,919 $31,370,377 $31,068,064 -0.96%
Water Fund 54,687,342 65,770,823 65,353,735 -0.63%
Solid Waste Mgmt Fund 9,230,758 11,128,695 11,145,909 0.15%
Total All Funds $90,125,019 $108,269,895 $107,567,708 -0.65%
Table of Contents

Positions
Utilities
C-173
Summary of FY19 FY20 FY21 Percent
Positions by Purpose Actual Adopted Budget Adopted Budget Change
Administration 73.00 75.00 71.00 -5.33%
Customer Service 151.00 154.00 156.00 1.30%
Engineering 31.00 30.00 26.00 -13.33%
Fleet Services 24.00 24.00 22.00 -8.33%
Line Maintenance 235.00 232.00 227.00 -2.16%
Solid Waste 110.00 110.00 107.00 -2.73%
Southeast Water Supply 0.00 0.00 5.00 N/A
Wastewater Quality 27.50 29.50 27.50 -6.78%
Water Quality 135.50 138.50 131.50 -5.05%
Department Total 787.00 793.00 773.00 -2.52%
Summary of FY19 FY20 FY21 Percent
Positions by Funding Source Actual Adopted Budget Adopted Budget Change
Wastewater Fund 279.05 281.00 262.05 -6.74%
Water Fund 397.95 402.00 403.95 0.49%
Solid Waste Mgmt Fund 110.00 110.00 107.00 -2.73%
Department Total 787.00 793.00 773.00 -2.52%
Table of Contents

Utilities Lines of Business
Utilities
C-174
Administration • The Administration Program provides planning, management, administrative and reporting
services to department employees and City leaders so they can achieve strategic goals and key results.
Administration Positions and Budget
Customer Service
• The Customer Service/Billing Program provides account, billing, and customer issue resolution services to Utility customers so they can receive correct account information, accurate billing, and prompt issue resolution.
• The Field Support Program provides water service response, inspection, and enforcement services
to metro area residents, businesses, other communities, as well as internal customers so they can receive a prompt and accurate resolution of water billing discrepancies and customer requests.
• The Meter Reading Program provides water reading services to metro area residents, businesses,
and other communities so they can receive timely, accurate measurements of their water use.
Customer Service Positions and Budget
FY19 FY20 FY21
Adopted Actual Adopted Adopted Adopted Adopted
Program Positions Expenses Positions Budget Positions Budget
Administration 73.00 $20,328,685 75.00 $24,083,591 71.00 $24,490,710
Line of Business Total 73.00 $20,328,685 75.00 $24,083,591 71.00 $24,490,710
FY19 FY20 FY21
Adopted Actual Adopted Adopted Adopted Adopted
Program Positions Expenses Positions Budget Positions Budget
Customer Service/Billing 81.52 $5,609,021 80.52 $6,991,301 83.52 $7,236,187
Field Support 35.24 2,662,215 35.24 2,910,121 71.24 5,211,314
Meter Reading 34.24 1,944,640 38.24 2,488,471 1.24 171,630
Line of Business Total 151.00 $10,215,876 154.00 $12,389,893 156.00 $12,619,131
Table of Contents

Utilities
C-175
Engineering • The Engineering Management Program provides water and wastewater improvement design,
review, and project management services to individuals, businesses, and communities so they can have funded capital improvement projects completed in a timely manner.
• The Infrastructure Records Program provides water and wastewater information and record
services to individuals, contractors, developers, consultants, City departments, and other governmental agencies, so they can receive the requested information in a timely manner.
• The Private Development Program provides water and wastewater plan review services to
developers and residents so they can receive timely information to most effectively implement private improvements to the utility system.
Engineering Positions and Budget
Fleet Services
• The Fleet Services Program provides fleet services for Utilities Department employees, so they have safe and reliable vehicles and equipment.
Fleet Services Positions and Budget
FY19 FY20 FY21
Adopted Actual Adopted Adopted Adopted Adopted
Program Positions Expenses Positions Budget Positions Budget
Engineering Management 18.32 $1,740,315 17.32 $2,044,993 14.32 $1,756,349
Infrastructure Records 4.34 410,613 4.34 402,605 3.34 344,924
Private Development 8.34 567,030 8.34 727,999 8.34 788,347
Line of Business Total 31.00 $2,717,958 30.00 $3,175,597 26.00 $2,889,620
FY19 FY20 FY21
Adopted Actual Adopted Adopted Adopted Adopted
Program Positions Expenses Positions Budget Positions Budget
Fleet Services 24.00 $2,697,195 24.00 $3,226,179 22.00 $2,571,265
Line of Business Total 24.00 $2,697,195 24.00 $3,226,179 22.00 $2,571,265
Table of Contents

Utilities
C-176
Line Maintenance • The Meter Maintenance Program provides water meter maintenance services for accurate meter
reading and safe operations. • The Wastewater Line Maintenance Program provides sanitary sewer line operation and
maintenance services to Utility customers so they can have uninterrupted sanitary sewer service. • The Water Line Maintenance Program provides operations and maintenance to the distribution
system for Utility customers so they have water with minimal disruption in service.
Line Maintenance Positions and Budget
FY19 FY20 FY21
Adopted Actual Adopted Adopted Adopted Adopted
Program Positions Expenses Positions Budget Positions Budget
Meter Maintenance 32.00 2,244,657 32.00 $2,924,701 32.00 $2,870,227Wastewater Line Maintenance 101.50 8,204,643 100.50 9,654,703 89.00 9,583,641Water Line Maintenance 101.50 9,589,858 99.50 8,956,537 106.00 10,785,483
Line of Business Total 235.00 $20,039,159 232.00 $21,535,941 227.00 $23,239,351
Table of Contents

Utilities
C-177
Solid Waste
• The Bulk Waste Collection Program provides bulk solid waste removal services to Oklahoma City
residents so they can have their bulk waste disposed of in a satisfactory manner. • The Environmental Clean-Up Program provides litter and illegal dumping removal services to
Oklahoma City residents and visitors so they can enjoy a clean, healthy environment. • The Solid Waste Collection Program provides solid waste removal, transport and disposal services
to Oklahoma City residents and businesses so they can have their refuse collected and disposed of in a satisfactory and environmentally safe manner on a weekly basis.
Solid Waste Positions and Budget
Southeast Water Supply
• Pumping Station Maintenance provides adequate supply to customers throughout the water
transportation system.
Southeast Water Supply Positions and Budget
FY19 FY20 FY21
Adopted Actual Adopted Adopted Adopted Adopted
Program Positions Expenses Positions Budget Positions Budget
Bulk Waste Collection 33.50 $1,953,077 32.50 $2,336,470 30.50 $2,251,323
Environmental Clean-Up 8.50 567,742 8.50 623,994 8.50 602,562
Solid Waste Collection 68.00 5,359,280 69.00 6,781,157 68.00 6,851,030
Line of Business Total 110.00 $7,880,099 110.00 $9,741,621 107.00 $9,704,915
FY19 FY20 FY21
Adopted Actual Adopted Adopted Adopted Adopted
Program Positions Expenses Positions Budget Positions Budget
Pumping Station Maintenance 0.00 $0 0.00 $0 5.00 $780,606
Line of Business Total 0.00 $0 0.00 $0 5.00 $780,606
Table of Contents

Utilities
C-178
Wastewater Quality • The Lift Station Program provides properly operating and maintained wastewater lift stations to
ensure system reliability. • The Pre-Treatment Program provides permitting, monitoring, and information services to
commercial and industrial users so they can discharge their treated waste into the sanitary sewer system in an environmentally safe manner.
• The Wastewater Treatment Program provides contract monitoring for outsourced treatment plant
operations and biosolids disposal services provided to City residents, businesses and other communities so they can have environmentally safe wastewater disposal.
Wastewater Quality Positions and Budget
FY19 FY20 FY21
Adopted Actual Adopted Adopted Adopted Adopted
Program Positions Expenses Positions Budget Positions Budget
Lift Station 14.50 $1,313,981 14.50 $1,589,457 13.50 $1,449,778Pre-treatment 8.00 979,074 10.00 1,179,544 10.00 1,193,591Wastewater Treatment 5.00 511,099 5.00 622,581 4.00 554,941
Line of Business Total 27.50 $2,804,153 29.50 $3,391,582 27.50 $3,198,310
Table of Contents

Utilities
C-179
Water Quality
• The Property Maintenance Program provides lake property and facility maintenance services to
City treatment plants and property users so they receive timely responses to their maintenance requests.
• The Water Treatment Program provides potable water services to customers so they can receive a
safe, continuous supply of water.
Water Quality Positions and Budget
FY19 FY20 FY21
Adopted Actual Adopted Adopted Adopted Adopted
Program Positions Expenses Positions Budget Positions Budget
Property Maintenance 45.00 $4,003,536 41.00 $4,087,245 42.00 $4,115,026Water Treatment 90.50 19,438,356 97.50 26,638,246 89.50 23,958,774
Line of Business Total 135.50 $23,441,892 138.50 $30,725,491 131.50 $28,073,800
Table of Contents

Utilities
C-180
Table of Contents

Zoo
C-181
Animal Care and Management
• Birds • Carnivores • Marine Mammals • Pachyderms • Primates • Reptiles and Amphibians • Veterinary/
Records/Commissary
PR/Marketing
• Admissions • Concessions/
Retail • Marketing • Public Relations • Rides/Attractions
Facilities and Grounds
• Horticulture and Grounds
• Housekeeping • Maintenance • Safety & Security
Business Services, Human Resources
& Finance
• Finance • Human Resources • IT
Zoo
Residents
Mayor and City Council
Oklahoma City Zoological Trust
Oklahoma City Zoo
Executive Director / CEO Budget
Dwight Lawson $13,652,149
Education
• Camps • Education • Family Programs • Outreach • Pre-School
Table of Contents

Department Introduction
Zoo
C-182
The Oklahoma City Zoo budget is managed and positions are funded through the Oklahoma City Zoological Trust. In 1990, City voters approved a 1/8-cent sales tax levy for the limited purpose of funding the Oklahoma City Zoo. The City of Oklahoma City as beneficiary, is the governing authority of the Oklahoma City Zoological Park. The Trust reviews all major financial expenditures; sets policy for the Zoo based on the study of recommendations from the Zoo's professional staff; and employs the Zoo's Executive Director/CEO. The Trust oversees all major building projects, exhibits and public events. The Trust's members assist in community and government relations and serve as advocates for the Zoo on issues affecting property and programs.
Department Facts • In February 2020 a new 9,000
square foot facility for the Zoo’s four Galapagos tortoises opened which features both an indoor and outdoor habitat.
• The Sanctuary Asia habitat
opened in September 2018 and features new species such as tanuki, cassowaries, Burmese Black Mountain tortoises and a troop of Francois’ langurs.
Table of Contents

Expenditures
Zoo
C-183
Summary of FY19 FY20 FY21 Percent
Expenditures by Funding Source Actual Adopted Budget Proposed Budget Change
Zoo Sales Tax Fund $14,244,798 $14,861,780 $13,652,149 -8.14%
Fund Total $14,244,798 $14,861,780 $13,652,149 -8.14%
Table of Contents

Zoo
C-184
Table of Contents
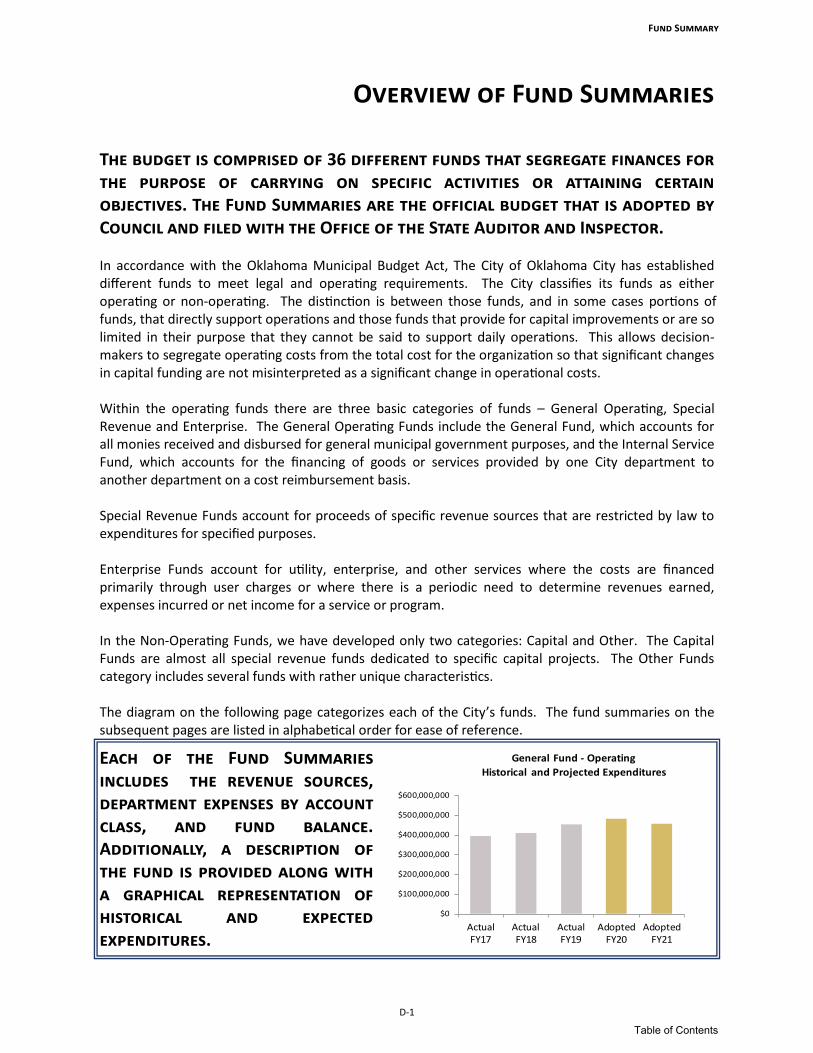
Overview of Fund Summaries
Fund Summary
D-1
The budget is comprised of 36 different funds that segregate finances for the purpose of carrying on specific activities or attaining certain objectives. The Fund Summaries are the official budget that is adopted by Council and filed with the Office of the State Auditor and Inspector. In accordance with the Oklahoma Municipal Budget Act, The City of Oklahoma City has established different funds to meet legal and operating requirements. The City classifies its funds as either operating or non-operating. The distinction is between those funds, and in some cases portions of funds, that directly support operations and those funds that provide for capital improvements or are so limited in their purpose that they cannot be said to support daily operations. This allows decision-makers to segregate operating costs from the total cost for the organization so that significant changes in capital funding are not misinterpreted as a significant change in operational costs. Within the operating funds there are three basic categories of funds – General Operating, Special Revenue and Enterprise. The General Operating Funds include the General Fund, which accounts for all monies received and disbursed for general municipal government purposes, and the Internal Service Fund, which accounts for the financing of goods or services provided by one City department to another department on a cost reimbursement basis. Special Revenue Funds account for proceeds of specific revenue sources that are restricted by law to expenditures for specified purposes. Enterprise Funds account for utility, enterprise, and other services where the costs are financed primarily through user charges or where there is a periodic need to determine revenues earned, expenses incurred or net income for a service or program. In the Non-Operating Funds, we have developed only two categories: Capital and Other. The Capital Funds are almost all special revenue funds dedicated to specific capital projects. The Other Funds category includes several funds with rather unique characteristics. The diagram on the following page categorizes each of the City’s funds. The fund summaries on the subsequent pages are listed in alphabetical order for ease of reference.
Each of the Fund Summaries includes the revenue sources, department expenses by account class, and fund balance. Additionally, a description of the fund is provided along with a graphical representation of historical and expected expenditures.
$0
$100,000,000
$200,000,000
$300,000,000
$400,000,000
$500,000,000
$600,000,000
ActualFY17
ActualFY18
ActualFY19
AdoptedFY20
AdoptedFY21
General Fund - Operating
Historical and Projected Expenditures
Table of Contents

Budget and Fund Structure
Fund Summary
D-2
City Budget
Operating Funds
Capital
Improvements
• Better Streets Safer City Sales Tax Fund
• Better Streets Safer City Use Tax Fund
• Capital Improvement Projects Fund
• City and Schools Capital Projects Use Tax Fund
• Hotel/Motel Tax Fund*
• Impact Fees Fund • MAPS 3 Sales Tax Fund
• MAPS 3 Use Tax Fund*
• MAPS 4 Program Fund • MAPS 4 Use Tax Fund*
• MAPS Operations Fund*
• MAPS Sales Tax Fund
• OKC Tax Increment Fi-nancing Fund
• Police Sales Tax Fund* • Police/Fire Capital Equip-
ment Sales Tax Fund • Sports Facilities Sales Tax
Fund • Sports Facilities Use Tax
Fund • Stormwater Drainage
Utility Fund*
• Street and Alley Fund
• Asset Forfeiture Fund • Debt Service Fund
• Grants Management Fund
• OKC Improvement and Special Assess District Fund
• Special Purpose Fund
Non-Operating
Funds
General Operating Funds
• General Fund • Internal Service Funds
Other
Trusts**
• Central Oklahoma Transportation and Parking Authority (COTPA)
• McGee Creek Authority (MCA) • Oklahoma City Airports Trust (OCAT)
• Oklahoma City Economic Development Trust (OCEDT)
• Oklahoma City Environmental Assistance Trust (OCEAT)
• Oklahoma City Municipal Facilities Authority (OCMFA)
• Oklahoma City Other Post Employment Benefits Trust (OPEBT)
• Oklahoma City Public Property Authority (OCPPA)
• Oklahoma City Riverfront Redevelopment Authority (OCRRA)
• Oklahoma City Water Utilities Trust (OCWUT)
• Oklahoma City Zoological Trust (OCZT)
• Various Bond Funds
Enterprise Funds
Special Revenue
Funds
• Court Administration and Training Fund
• Emergency Management Fund
• Fire Sales Tax Fund
• Hotel/Motel Tax Fund* • MAPS Operations Fund*
• MAPS 3 Use Tax Fund*
• Medical Services Program Fund
• OCMAPS Sales Tax Fund • Police Sales Tax Fund*
• Zoo Sales Tax Fund
• Airports Fund • Solid Waste Manage-
ment Cash Fund • Stormwater Drainage
Utility Fund*
• Transportation and Parking Fund
• Water/Wastewater Fund
*Indicates the Fund has both an Operating and Non-Operating Component **Trusts develop their budgets independently and are not part of this document. However, they have been listed for informational purposes. Boxes represent fund categories used to organize fund type.
Table of Contents
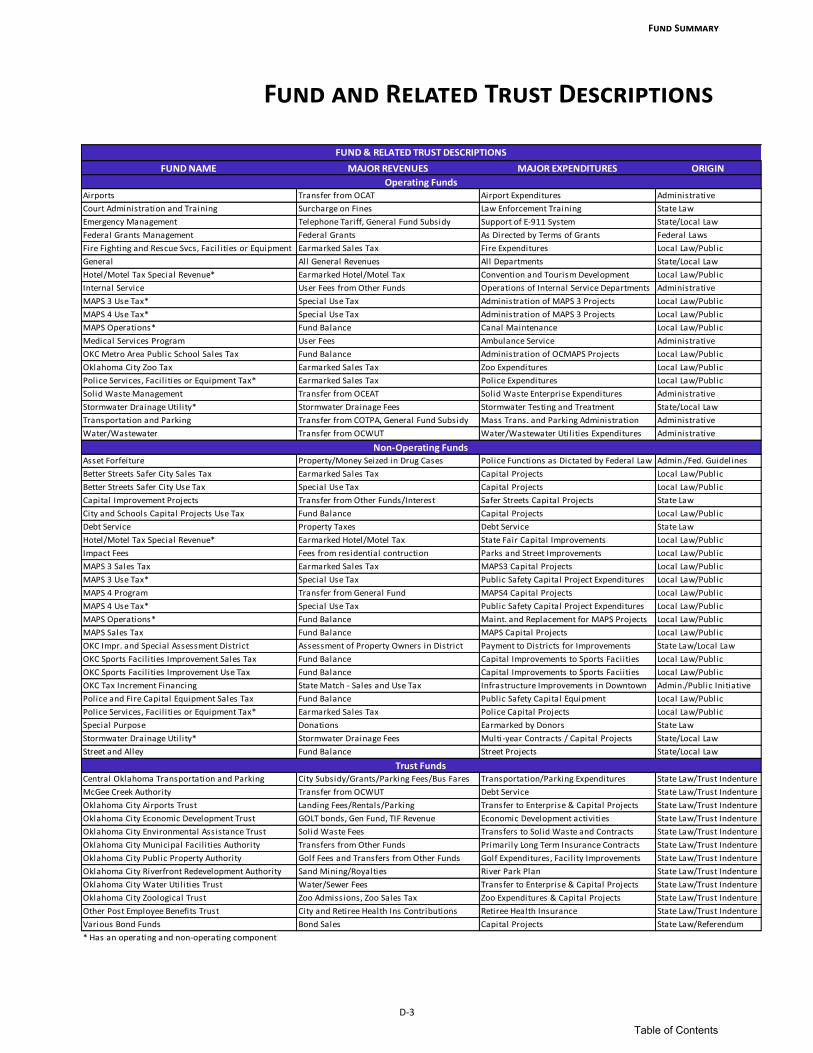
Fund and Related Trust Descriptions
Fund Summary
D-3
FUND NAME MAJOR REVENUES MAJOR EXPENDITURES ORIGIN
Airports Transfer from OCAT Airport Expenditures Administrative
Court Administration and Training Surcharge on Fines Law Enforcement Training State Law
Emergency Management Telephone Tariff, General Fund Subsidy Support of E-911 System State/Local Law
Federal Grants Management Federal Grants As Directed by Terms of Grants Federal Laws
Fire Fighting and Rescue Svcs, Facil ities or Equipment Earmarked Sales Tax Fire Expenditures Local Law/Public
InitiativeGeneral All General Revenues All Departments State/Local Law
Hotel/Motel Tax Special Revenue* Earmarked Hotel/Motel Tax Convention and Tourism Development Local Law/Public
InitiativeInternal Service User Fees from Other Funds Operations of Internal Service Departments Administrative
MAPS 3 Use Tax* Special Use Tax Administration of MAPS 3 Projects Local Law/Public
InitiativeMAPS 4 Use Tax* Special Use Tax Administration of MAPS 3 Projects Local Law/Public
InitiativeMAPS Operations* Fund Balance Canal Maintenance Local Law/Public
InitiativeMedical Services Program User Fees Ambulance Service Administrative
OKC Metro Area Public School Sales Tax Fund Balance Administration of OCMAPS Projects Local Law/Public
InitiativeOklahoma City Zoo Tax Earmarked Sales Tax Zoo Expenditures Local Law/Public
InitiativePolice Services, Facil ities or Equipment Tax* Earmarked Sales Tax Police Expenditures Local Law/Public
InitiativeSolid Waste Management Transfer from OCEAT Solid Waste Enterprise Expenditures Administrative
Stormwater Drainage Util ity* Stormwater Drainage Fees Stormwater Testing and Treatment State/Local Law
Transportation and Parking Transfer from COTPA, General Fund Subsidy Mass Trans. and Parking Administration Administrative
Water/Wastewater Transfer from OCWUT Water/Wastewater Util ities Expenditures Administrative
Asset Forfeiture Property/Money Seized in Drug Cases Police Functions as Dictated by Federal Law Admin./Fed. Guidelines
Better Streets Safer City Sales Tax Earmarked Sales Tax Capital Projects Local Law/Public
InitiativeBetter Streets Safer City Use Tax Special Use Tax Capital Projects Local Law/Public
InitiativeCapital Improvement Projects Transfer from Other Funds/Interest Safer Streets Capital Projects State Law
City and Schools Capital Projects Use Tax Fund Balance Capital Projects Local Law/Public
InitiativeDebt Service Property Taxes Debt Service State Law
Hotel/Motel Tax Special Revenue* Earmarked Hotel/Motel Tax State Fair Capital Improvements Local Law/Public
InitiativeImpact Fees Fees from residential contruction Parks and Street Improvements Local Law/Public
InitiativeMAPS 3 Sales Tax Earmarked Sales Tax MAPS3 Capital Projects Local Law/Public
InitiativeMAPS 3 Use Tax* Special Use Tax Public Safety Capital Project Expenditures Local Law/Public
InitiativeMAPS 4 Program Transfer from General Fund MAPS4 Capital Projects Local Law/Public
InitiativeMAPS 4 Use Tax* Special Use Tax Public Safety Capital Project Expenditures Local Law/Public
InitiativeMAPS Operations* Fund Balance Maint. and Replacement for MAPS Projects Local Law/Public
InitiativeMAPS Sales Tax Fund Balance MAPS Capital Projects Local Law/Public
InitiativeOKC Impr. and Special Assessment District Assessment of Property Owners in District Payment to Districts for Improvements State Law/Local Law
OKC Sports Facil ities Improvement Sales Tax Fund Balance Capital Improvements to Sports Faciities Local Law/Public
InitiativeOKC Sports Facil ities Improvement Use Tax Fund Balance Capital Improvements to Sports Faciities Local Law/Public
InitiativeOKC Tax Increment Financing State Match - Sales and Use Tax Infrastructure Improvements in Downtown
area
Admin./Public Initiative
Police and Fire Capital Equipment Sales Tax Fund Balance Public Safety Capital Equipment Local Law/Public
InitiativePolice Services, Facil ities or Equipment Tax* Earmarked Sales Tax Police Capital Projects Local Law/Public
InitiativeSpecial Purpose Donations Earmarked by Donors State Law
Stormwater Drainage Util ity* Stormwater Drainage Fees Multi-year Contracts / Capital Projects State/Local Law
Street and Alley Fund Balance Street Projects State/Local Law
Central Oklahoma Transportation and Parking
Authority
City Subsidy/Grants/Parking Fees/Bus Fares Transportation/Parking Expenditures State Law/Trust Indenture
McGee Creek Authority Transfer from OCWUT Debt Service State Law/Trust Indenture
Oklahoma City Airports Trust Landing Fees/Rentals/Parking Transfer to Enterprise & Capital Projects State Law/Trust Indenture
Oklahoma City Economic Development Trust GOLT bonds, Gen Fund, TIF Revenue Economic Development activities State Law/Trust Indenture
Oklahoma City Environmental Assistance Trust Solid Waste Fees Transfers to Solid Waste and Contracts State Law/Trust Indenture
Oklahoma City Municipal Facil ities Authority Transfers from Other Funds Primarily Long Term Insurance Contracts State Law/Trust Indenture
Oklahoma City Public Property Authority Golf Fees and Transfers from Other Funds Golf Expenditures, Facil ity Improvements State Law/Trust Indenture
Oklahoma City Riverfront Redevelopment Authority Sand Mining/Royalties River Park Plan State Law/Trust Indenture
Oklahoma City Water Util ities Trust Water/Sewer Fees Transfer to Enterprise & Capital Projects State Law/Trust Indenture
Oklahoma City Zoological Trust Zoo Admissions, Zoo Sales Tax Zoo Expenditures & Capital Projects State Law/Trust Indenture
Other Post Employee Benefits Trust City and Retiree Health Ins Contributions Retiree Health Insurance State Law/Trust Indenture
Various Bond Funds Bond Sales Capital Projects State Law/Referendum
* Has an operating and non-operating component
Operating Funds
Non-Operating Funds
Trust Funds
FUND & RELATED TRUST DESCRIPTIONS
Table of Contents

Changes in Fund Balance
D-4
Fund Summary
Estimated Estimated
Beginning Budgeted Budgeted Ending
Fund Balance Revenues* Expenditures Balance $ Change % Change
Airports Fund $1,547,947 $20,273,057 $20,273,057 $1,547,947 $0 0.00% (e)
Asset Forfeiture Fund 2,187,586 952,563 1,998,292 1,141,857 (1,045,729) -47.80% (b)
Better Streets Safer City Sales Tax Fund 197,082,947 3,051,975 200,134,922 0 (197,082,947) -100.00% (d)
Better Streets Safer City Use Tax Fund 34,366,413 294,172 34,660,585 0 (34,366,413) -100.00% (d)
Capital Improvement Projects Fund 44,358,915 5,850,000 50,208,915 0 (44,358,915) -100.00% (b)
City and Sch Cap Proj Use Tax Fund 3,991,301 54,879 3,886,576 159,604 (3,831,697) -96.00% (d)
Court Administration and Training Fund 81,061 188,268 227,000 42,329 (38,732) -47.78% (c)
Debt Service Fund 113,515,236 106,838,747 104,232,104 116,121,879 2,606,643 2.30% (c)
Emergency Management Fund 665,085 9,044,913 9,244,913 465,085 (200,000) -30.07% (c)
Fire Sales Tax Fund 12,742,724 40,555,289 43,557,389 9,740,624 (3,002,100) -23.56% (c)
General Fund 103,320,637 563,499,592 563,499,592 103,320,637 0 0.00% (a)
Grants Management Fund N/A 149,393,659 149,393,659 N/A N/A N/A (g)
Hotel/Motel Tax Fund 5,214,745 13,128,551 14,228,551 4,114,745 (1,100,000) -21.09% (c)
Impact Fee Fund 23,031,898 10,794,166 33,826,064 0 (23,031,898) -100.00% (b)
Internal Service Fund 8,493,910 50,542,296 52,450,774 6,585,432 (1,908,478) -22.47% (a)
Medical Services Program Fund 9,831,807 7,198,377 8,726,360 8,303,824 (1,527,983) -15.54% (c)
Metropolitan Area Projects Tax Fund 372,044 8,583 194,605 186,022 (186,022) -50.00% (d)
MAPS Operations Fund 5,115,659 30,674 5,146,333 0 (5,115,659) -100.00% (b)
MAPS 3 Sales Tax Fund 178,682,900 4,779,744 183,462,644 0 (178,682,900) -100.00% (d,f)
MAPS 3 Use Tax Fund 28,421,539 330,076 10,278,375 18,473,240 (9,948,299) -35.00% (d,f)
MAPS 4 Program Fund 13,569,828 107,024,204 120,594,032 0 (13,569,828) -100.00% (d,f)
MAPS 4 Use Tax Fund 2,323,246 20,435,098 22,758,344 0 (2,323,246) -100.00% (d,f)
OCMAPS Sales Tax Fund 4,702,088 0 4,702,088 0 (4,702,088) -100.00% (d)
OKC Imprv & Spcl Srvcs Assess Dist Fund 30,801 5,266,957 5,266,957 30,801 0 0.00% (c)
Oklahoma City TIF Fund 130,188 850,000 980,188 0 (130,188) -100.00% (c)
Police and Fire Cap Equip Sales Tax Fund 5,097,140 20,000 2,568,570 2,548,570 (2,548,570) -50.00% (d)
Police Sales Tax Fund 14,617,988 40,622,454 45,032,765 10,207,677 (4,410,311) -30.17% (c)
Solid Waste Management Fund 1,000,000 10,145,909 11,145,909 0 (1,000,000) -100.00% (e)
Special Purpose Fund 7,493,646 2,907,141 10,400,787 0 (7,493,646) -100.00% (c)
Sports Facilities Sales Tax Fund 49,136 1,123 50,259 0 (49,136) -100.00% (d)
Sports Facilities Use Tax Fund 98,652 1,153 99,805 0 (98,652) -100.00% (d)
Stormwater Drainage Utility Fund 36,914,880 19,809,141 32,369,670 24,354,351 (12,560,529) -34.03% (f)
Street and Alley Fund 156,719 0 146,868 9,851 (146,868) -93.71% (b)
Transportation and Parking Fund 0 4,502,411 4,502,411 0 0 N/A (e)Water and Wastewater Fund 800,000 95,621,799 96,421,799 0 (800,000) -100.00% (e)
Zoo Sales Tax Fund 0 13,350,351 13,652,149 (301,798) (301,798) N/A (h)
(a) Use of fund balance is budgeted for one time uses. Unbudgeted fund balance remains within acceptable range per policy.
(b) The primary expenditures of this fund are capital in nature and the intent is to spend all funds for these purposes.
(c) This is a limited purpose fund. All fund balance is budgeted in compliance with the limited purpose.
(d) This is a limited purpose, limited term fund. This fund will terminate when the purpose is fulfilled.
(e) This is an enterprise fund supported by operating transfers from a City trust. Enterprise reserves are held in the Trust.
(f) Reserves in this fund were or are being accumulated for significant capital projects that are now underway.
(h) The Zoo budgets 2% more expenses than revenue in order to provide budget authority for revenue exceeding estimate.
*Budgeted Revenues exclude use of fund balance
(g) Due to the fact that most grant funds operate on a reimbursement basis, fund balance projections do not produce an
adequate picture of financial health and are not included.
Table of Contents

Fund By Department and Service Category
Fund Summary
D-5
City Auditors Office
City Clerks Office
City Managers Office
Finance
General Services
Information Technology
Mayor And Council
Municipal Counselors Office
Non-Departmental
Personnel
Fire
Municipal Court
Police
Airports
Development Services
Planning
Public Trans and Parking
Public Works
Util it ies
Parks and Recreation
Zoo Sales Tax
Airp
orts
Fu
nd
●
As
se
t Fo
rfeitu
re F
un
d
●
Be
tter S
tree
ts S
afe
r City S
ale
s Ta
x Fu
nd
●
Be
tter S
tree
ts S
afe
r City U
se
Tax F
un
d●
Ca
pita
l Imp
rove
me
nt P
roje
cts
Fu
nd
●
●●
●●
●●
●●
●●
●●
●●
●●
●
City a
nd
Sc
h C
ap
Pro
j Us
e Ta
x Fu
nd
●●
●●
Co
urt A
dm
inis
tratio
n a
nd
Train
ing
Fu
nd
●●
●
De
bt S
ervic
e F
un
d●
Em
erg
en
cy M
an
ag
em
en
t Fu
nd
●
Fire
Sa
les
Tax F
un
d●
Ge
ne
ral F
un
d●
●●
●●
●●
●●
●●
●●
●●
●●
Gra
nts
Ma
na
ge
me
nt F
un
d●
●●
●●
●●
●●
●
Ho
tel/
Mo
tel Ta
x Fu
nd
●
Imp
ac
t Fe
es
Fu
nd
●●
Inte
rna
l Se
rvice
Fu
nd
●●
●●
MA
PS
3 S
ale
s Ta
x Fu
nd
●
MA
PS
3 U
se
Tax F
un
d●
●●
●
MA
PS
4 P
rog
ram
Fu
nd
●
MA
PS
4 U
se
Tax F
un
d●
●●
●
MA
PS
Op
era
tion
s F
un
d●
●
Me
dic
al S
ervic
es
Pro
gra
m F
un
d●
Me
trop
olita
n A
rea
Pro
jec
ts Ta
x Fu
nd
●
OK
C Im
pro
vem
en
t an
d S
pe
cia
l Svc
s F
un
d●
OK
C S
ch
oo
ls M
AP
S S
ale
s Ta
x Fu
nd
●
Ok
lah
om
a C
ity TIF F
un
d●
Po
lice
an
d F
ire C
ap
Eq
uip
Sa
les
Tax F
un
d
●●
●●
Po
lice
Sa
les
Tax F
un
d●
So
lid W
as
te M
an
ag
em
en
t Ca
sh
Fu
nd
●
Sp
ec
ial P
urp
os
e F
un
d
●●
●●
●●
●●
●
Sp
orts
Fa
cilitie
s S
ale
s Ta
x Fu
nd
●
Sp
orts
Fa
cilitie
s U
se
Tax F
un
d●
Sto
rmw
ate
r Dra
ina
ge
Utility F
un
d●
Stre
et a
nd
Alle
y Fu
nd
●
Tran
sp
orta
tion
an
d P
ark
ing
Fu
nd
●
Cu
lture
& R
ec
Pu
blic S
ervice
Pu
blic S
afe
tyG
en
era
l Go
vern
me
nt
Table of Contents

Airports Fund
D-6
Fund Summary
The Airports Fund was established in the FY89 budget. State statutes provide for the establishment of enterprise funds to account for each utility, enterprise, or service other than those operated as a department of the General Fund, where the costs are financed primarily through user charges or where a periodic need exists to determine revenues earned, expenses incurred, or net income for a service or program. Funding for the operation of the Airports Fund comes from monthly transfers from the Oklahoma City Airport Trust. The Trust was created as a Public Trust on April 1, 1956 pursuant to Title 60 of the Oklahoma Statutes, Section 176, on behalf of the City of Oklahoma City. The purpose of the Trust is to provide a means of financing and administering the construction of airports and air navigation facilities of the City. The provisions of the trust agreement provide that the Trust will lease, or otherwise manage, the related property and improvements financed by the Trust. The Trust will receive all revenues generated from related properties to repay revenue bonds or other debt instruments incurred by the Trust plus costs and expenses incidental to the management, operation, maintenance, and conservation of the Trust.
Actual Adopted Adopted
FY19 FY20 FY21
Revenues
Transfer from Airport Trust $17,848,123 $19,941,667 $20,090,873
Interest 20,593 19,077 28,830
Other 106,044 50,374 153,354
Fund Balance 0 457,557 0
Total Revenues $17,974,760 $20,468,675 $20,273,057
Expenditures - Airports
Personal Services $11,030,442 $12,221,872 $12,486,397
Other Services & Charges 5,692,597 6,587,354 6,584,728
Supplies 460,430 701,932 701,932
Capital Outlay 156,402 957,517 500,000
Transfers 0 0 0
Total Expenditures $17,339,871 $20,468,675 $20,273,057
Use of Fund Balance
Beginning Fund Balance $743,333 $1,378,222 $1,547,947
Additions/(Reductions) to Fund Balance 634,888 169,725 * 0 **
Ending Fund Balance $1,378,222 $1,547,947 * $1,547,947 **
* Estimated.
** Assumes budgeted revenues and expenditures.
$0
$5,000,000
$10,000,000
$15,000,000
$20,000,000
$25,000,000
ActualFY17
ActualFY18
ActualFY19
AdoptedFY20
AdoptedFY21
Airports Fund
Historical and Projected Expenditures
Table of Contents

Fund Summary
D-7
The Federal Asset Forfeiture Fund was established in FY85 within the Oklahoma City Municipal Facilities Authority (OCMFA) with the passage of Federal Law allowing the Federal Government to forfeit property obtained through illegal activity. It was established by City Ordinance allowing The City of Oklahoma City to accept federally forfeited property. In FY94, the fund was moved from the OCMFA to the City budget. The Asset Forfeiture Fund consists of three sub funds: Federal Asset Forfeiture, State Asset Forfeiture and Treasury Asset Forfeiture. In compliance with the Comprehensive Crime Control Act of 1984, all Federal funds will be utilized for law enforcement purposes only.
Asset Forfeiture Fund
Actual Adopted Adopted
FY19 FY20 FY21
Revenues
Asset Seizure Revenues $1,173,876 $987,905 $884,331
Other Revenue 12,332 3,000 3,000
Service Charges 15,410 0 0
Interest 68,632 79,491 65,232
Fund Balance 0 1,379,588 1,045,729
Total Revenues $1,270,250 $2,449,984 $1,998,292
Expenditures - Police
Personal Services $24,019 $81,470 $81,470
Other Services & Charges 616,667 767,505 874,215
Supplies 712,065 1,331,009 772,607
Capital Outlay 0 200,000 200,000
Transfers 70,000 70,000 70,000
Total Expenditures $1,422,751 $2,449,984 $1,998,292
Use of Fund BalanceBeginning Fund Balance $3,060,952 $2,908,451 $2,187,586
Additions/(Reductions) to Fund Balance (152,501) (720,865) * (1,045,729) **
Ending Fund Balance $2,908,451 $2,187,586 * $1,141,857 **
* Estimated.
** Assumes budgeted revenues and expenditures.
$0
$500,000
$1,000,000
$1,500,000
$2,000,000
$2,500,000
$3,000,000
ActualFY17
ActualFY18
ActualFY19
AdoptedFY20
AdoptedFY21
Asset Forfeiture Fund
Historical and Projected Expenditures
Table of Contents

Better Streets, Safer City Sales Tax Fund
D-8
Fund Summary
On September 12, 2017, the Oklahoma City voters approved on a temporary tax increase known as Better Streets, Safer City. This 27-month continuation of the expired MAPS 3 penny sales tax will generate $240 million for street resurfacing, streetscapes, trails, sidewalks, and bicycle infrastructure. The initiative includes $168 million for street resurfacing, $24 million for streetscapes, $24 million for sidewalks, $12 million for trails, $12 million for bicycle infrastructure. The debt-free projects will create smooth and safe streets for drivers, on-street amenities for recreational and commuting cyclists, and streetscapes and trails that protect pedestrians and cyclists and enhance opportunities for economic development.
$0
$50,000,000
$100,000,000
$150,000,000
$200,000,000
$250,000,000
ActualFY17
ActualFY18
ActualFY19
AdoptedFY20
AdoptedFY21
Better Streets, Safer City Sales Tax Fund
Historical and Projected Expenditures
Actual Adopted Adopted
FY19 FY20 FY21
Revenues
Capital Improvements Sales Tax $113,651,743 $104,028,439 $0
Interest 1,953,264 1,487,513 3,051,975
Other 0 0 0
Fund Balance 0 102,048,569 197,082,947
Total Revenues $115,605,007 $207,564,521 $200,134,922
Expenditures
Public Works
Personal Services $0 $0 $0
Other Services & Charges 32,303,369 206,834,271 99,129,071
Supplies 10,058 0 200
Capital Outlay 12,000 730,250 101,005,651
Transfers 0 0 0
Total Expenditures $32,325,426 $207,564,521 $200,134,922
Use of Fund Balance
Beginning Fund Balance $37,708,773 $120,988,353 $197,082,947
Additions/(Reductions) to Fund Balance 83,279,581 76,094,594 * (197,082,947) **
Ending Fund Balance $120,988,353 $197,082,947 * $0 **
* Estimated.
** Assumes budgeted revenues and expenditures.
Table of Contents

Better Streets, Safer City Use Tax Fund
D-9
Fund Summary
Actual Adopted Adopted
FY19 FY20 FY21
Revenues
Capital Improvement Use Tax $19,350,227 $18,110,850 $0
Interest 336,196 187,500 294,172
Other 0 0 0
Fund Balance 0 22,727,377 34,366,413
Total Revenues $19,686,423 $41,025,727 $34,660,585
Expenditures
Fire
Personal Services $0 $0 $0
Other Services & Charges 0 0 0
Supplies 0 270,000 412,562
Capital Outlay 0 10,805,200 10,831,726
Transfers 0 0 0
Department Total $0 $11,075,200 $11,244,288
Information Technology
Personal Services $0 $0 $0
Other Services & Charges 0 0 0
Supplies 0 4,740,000 272,029
Capital Outlay 0 0 0
Transfers 0 0 0
Department Total $0 $4,740,000 $272,029
Non-Departmental
Personal Services $0 $0 $0
Other Services & Charges 0 0 0
Supplies 0 11,301,141 6,996,885
Capital Outlay 0 4,036,050 0
Transfers 0 0 0
Department Total $0 $15,337,191 $6,996,885
Table of Contents

Fund Summary
D-10
On September 12, 2017, the Oklahoma City voters approved a temporary tax increase known as Better Streets, Safer City. The use tax collected as part of this 27-month increase will be used for capital improvements. Among the capital improvements funded are police and fire vehicles, information systems, mobile data systems, a Citywide radio communication system, City public safety computer-aided dispatch systems, a communications network to support mobile data systems, improvements in the public emergency warning system and police helicopters.
Actual Adopted Adopted
FY19 FY20 FY21
Police
Personal Services $0 $0 $0
Other Services & Charges 639 60,580 32,695
Supplies 1,010,081 8,117,782 16,114,688
Capital Outlay 1,242,516 1,694,974 0
Transfers 0 0 0
Department Total $2,253,236 $9,873,336 $16,147,383
All Departments
Personal Services $0 $0 $0
Other Services & Charges 639 60,580 32,695
Supplies 1,010,081 24,428,923 23,796,164
Capital Outlay 1,242,516 16,536,224 10,831,726
Transfers 0 0 0
Department Total $2,253,236 $41,025,727 $34,660,585
Use of Fund Balance
Beginning Fund Balance $5,554,392 $22,987,579 $34,366,413
Additions/(Reductions) to Fund Balance 17,433,187 11,378,834 * (34,366,413) **
Ending Fund Balance $22,987,579 $34,366,413 * $0 **
* Estimated.
** Assumes budgeted revenues and expenditures.
$0
$5,000,000
$10,000,000
$15,000,000
$20,000,000
$25,000,000
$30,000,000
$35,000,000
$40,000,000
$45,000,000
ActualFY17
ActualFY18
ActualFY19
AdoptedFY20
AdoptedFY21
Better Streets, Safer City Use Tax Fund
Historical and Projected Expenditures
Table of Contents

Fund Summary
D-11
Capital Improvement Projects Fund
Actual Adopted Adopted
FY19 FY20 FY21
Revenues
Interest $685,004 $318,000 $0
Other 367,025 0 0
Reimbursements 0 0 0
Service Charges 189,395 0 0
Transfers 26,856,555 17,705,220 5,850,000
Fund Balance 0 31,706,333 44,358,915
Total Revenues $28,097,979 $49,729,553 $50,208,915
Expenditures
City Clerk
Personal Services 0 $0 $0
Other Services & Charges 0 2,089 2,089
Supplies 0 5,664 30,663
Capital Outlay 0 64,066 19,065
Transfers 0 0 0
Department Total $0 $71,819 $51,817
City Manager's Office
Personal Services $0 $0 $0
Other Services & Charges 324,489 1,843,380 1,305,930
Supplies 104,899 12,324 6,463
Capital Outlay 193,168 3,131,127 1,225,589
Transfers 0 0 0
Department Total $622,556 $4,986,831 $2,537,982
Development Services
Personal Services $0 $0 $0
Other Services & Charges 8,524 43,440 35,476
Supplies 0 110,902 110,902
Capital Outlay 0 100,000 100,000
Transfers 0 0 0
Department Total $8,524 $254,342 $246,378
Finance
Personal Services $0 $0 $0
Other Services & Charges 31,003 254,431 361,271
Supplies 0 61,793 61,795
Capital Outlay 0 0 0
Transfers 0 0 0
Department Total $31,003 $316,224 $423,066
Table of Contents

Fund Summary
D-12
Actual Adopted Adopted
FY19 FY20 FY21
General Services
Personal Services $0 $0 $0
Other Services & Charges 927,101 2,942,242 4,565,716
Supplies 1,970,141 6,231,252 5,063,763
Capital Outlay 1,513,222 3,958,811 1,758,829
Transfers 0 2,050 2,050
Department Total $4,410,464 $13,134,355 $11,390,358
Human Resources
Personal Services $0 $0 $0
Other Services & Charges 0 350,000 0
Supplies 0 0 0
Capital Outlay 0 0 0
Transfers 0 0 0
Department Total $0 $350,000 $0
Information Technology
Personal Services $0 $0 $0
Other Services & Charges 137,408 1,210,160 1,051,688
Supplies 345,298 1,134,337 726,408
Capital Outlay 312,355 1,171,661 675,609
Transfers 90,000 26,890 50,000
Department Total $885,061 $3,543,048 $2,503,705
Mayor and Council
Personal Services $0 $0 $0
Other Services & Charges 0 0 0
Supplies 0 10,500 10,500
Capital Outlay 0 0 0
Transfers 0 0 0
Department Total $0 $10,500 $10,500
Municipal Court
Personal Services $0 $0 $0
Other Services & Charges 0 694,547 0
Supplies 0 1,300 1,300
Capital Outlay 115,700 7,815 7,815
Transfers 1,736,767 1,941,747 769,764
Department Total $1,852,467 $2,645,409 $778,879
Table of Contents

Fund Summary
D-13
Actual Adopted Adopted
FY19 FY20 FY21
Municipal Counselor's Office
Personal Services $0 $0 $0
Other Services & Charges 0 0 0
Supplies 0 525 8,984
Capital Outlay 0 0 0
Transfers 0 0 0
Department Total $0 $525 $8,984
Non-Departmental
Personal Services $0 $0 $0
Other Services & Charges 9,000,000 3,043,423 1,273,085
Supplies 0 1,406 42,560
Capital Outlay 0 8,114,139 15,434,272
Transfers 0 12,500 3,012,500
Department Total $9,000,000 $11,171,468 $19,762,417
Parks and Recreation
Personal Services $0 $0 $0
Other Services & Charges 163,595 1,871,421 206,327
Supplies 41,990 288,911 709,123
Capital Outlay 14,569 1,548,952 2,591,806
Transfers 0 0 0
Department Total $220,154 $3,709,284 $3,507,256
Police
Personal Services $0 $0 $0
Other Services & Charges 0 0 0
Supplies 0 0 0
Capital Outlay 0 235,943 235,943
Transfers 0 0 0
Department Total $0 $235,943 $235,943
Public Transportation and Parking
Personal Services $0 $0 $0
Other Services & Charges 0 16,425 16,425
Supplies 0 40,690 40,690
Capital Outlay 0 66,460 66,460
Transfers 0 0 0
Department Total $0 $123,575 $123,575
Public Works
Personal Services $0 $0 $0
Other Services & Charges 5,620,659 7,980,641 5,151,405
Supplies 107,674 189,242 817,313
Capital Outlay 6,206 1,006,347 2,659,337
Transfers 0 0 0
Department Total $5,734,539 $9,176,230 $8,628,055
Table of Contents

Fund Summary
D-14
NOTES: (a) Capital projects are lengthy in nature and difficult to predict completion. For this reason, the budget is based on the assumption that the outstanding encumbrances used as of February 2019 will remain to the end of the fiscal year. If encumbrances are actually expended by the end of the year, the budget will be overstated. Purchases and encumbrances in the budget year are made on a cash basis. In 1975, the State of Oklahoma passed legislation noted in Title 11 § 17-109.11 authorizing cities to create a fund to account for financial resources to be used for the acquisition or construction of major capital facilities (other than those financed by proprietary funds and trust funds). The revenue sources of the Capital Improvement Projects Fund may be the proceeds of the sale of assets, interest income, grants from agencies or other governmental units and transfers from other funds. The Fund’s major financial resources are interest earnings and a transfer from the General Fund.
Actual Adopted Adopted
FY19 FY20 FY21
All Departments
Personal Services $0 $0 $0
Other Services & Charges 16,212,779 20,252,199 13,969,412
Supplies 2,570,002 8,088,846 7,630,464
Capital Outlay 2,155,220 19,405,321 24,774,725
Transfers 1,826,767 1,983,187 3,834,314
Total Expenditures $22,764,768 $49,729,553 $50,208,915
Use of Fund Balance
Beginning Fund Balance $30,760,221 $36,093,432 $44,358,915
Additions/(Reductions) to Fund Balance 5,333,211 8,265,483 * (44,358,915) **
Ending Fund Balance $36,093,432 $44,358,915 * $0 **
* Estimated.
** Assumes budgeted revenues and expenditures.
$0
$10,000,000
$20,000,000
$30,000,000
$40,000,000
$50,000,000
$60,000,000
ActualFY17
ActualFY18
ActualFY19
AdoptedFY20
AdoptedFY21
Capital Improvement Projects Fund
Historical and Projected Expenditures
Table of Contents

Fund Summary
D-15
City and Schools Capital Project Use Tax Fund
Actual Adopted Adopted
FY19 FY20 FY21
Revenues
Use Tax $0 $0 $0
Interest 68,599 20,142 54,879
Other 211,936 0 0
Transfers 194,919 0 0
Fund Balance 0 3,307,925 3,831,697
Total Revenues $475,454 $3,328,067 $3,886,576
Expenditures
Fire
Personal Services $0 $0 $0
Other Services & Charges 0 13,345 0
Supplies 0 53,784 0
Capital Outlay 0 0 0
Department Total $0 $67,129 $0
Information Technology
Personal Services $0 $0 $0
Other Services & Charges 0 0 0
Supplies 4,116 581 2,816,700
Capital Outlay 0 0 0
Department Total $4,116 $581 $2,816,700
Non-Departmental
Personal Services $0 $0 $0
Other Services & Charges 0 0 0
Supplies 0 0 0
Capital Outlay 0 3,260,357 1,069,876
Total Expenditures $0 $3,260,357 $1,069,876
Police
Personal Services $0 $0 $0
Other Services & Charges 0 0 0
Supplies 0 0 0
Capital Outlay 0 0 0
Department Total $0 $0 $0
Table of Contents
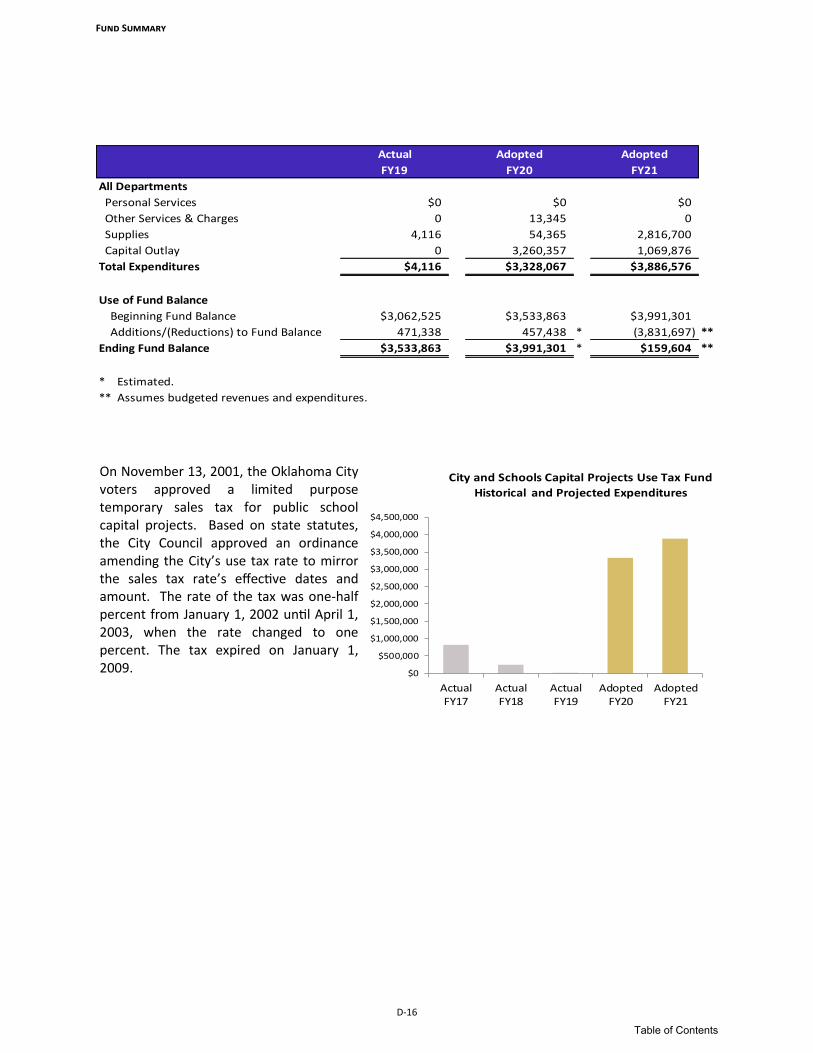
Fund Summary
D-16
On November 13, 2001, the Oklahoma City voters approved a limited purpose temporary sales tax for public school capital projects. Based on state statutes, the City Council approved an ordinance amending the City’s use tax rate to mirror the sales tax rate’s effective dates and amount. The rate of the tax was one-half percent from January 1, 2002 until April 1, 2003, when the rate changed to one percent. The tax expired on January 1, 2009.
Actual Adopted Adopted
FY19 FY20 FY21
All Departments
Personal Services $0 $0 $0
Other Services & Charges 0 13,345 0
Supplies 4,116 54,365 2,816,700
Capital Outlay 0 3,260,357 1,069,876
Total Expenditures $4,116 $3,328,067 $3,886,576
Use of Fund Balance
Beginning Fund Balance $3,062,525 $3,533,863 $3,991,301
Additions/(Reductions) to Fund Balance 471,338 457,438 * (3,831,697) **
Ending Fund Balance $3,533,863 $3,991,301 * $159,604 **
* Estimated.
** Assumes budgeted revenues and expenditures.
$0
$500,000
$1,000,000
$1,500,000
$2,000,000
$2,500,000
$3,000,000
$3,500,000
$4,000,000
$4,500,000
ActualFY17
ActualFY18
ActualFY19
AdoptedFY20
AdoptedFY21
City and Schools Capital Projects Use Tax Fund
Historical and Projected Expenditures
Table of Contents

Court Administration and Training Fund
Fund Summary
D-17
Actual Adopted Adopted
FY19 FY20 FY21
Revenues
Fees $177,635 $181,817 $185,765
Fines 1,202 0 471
Interest 1,713 2,660 2,032
Fund Balance 0 50,059 38,732
Total Revenues $180,549 $234,536 $227,000
Expenditures
Municipal Court
Personal Services $0 $0 $0
Other Services & Charges 3,849 7,000 7,000
Supplies 0 0 0
Capital Outlay 0 0 0
Transfers 0 0 0
Department Total $3,849 $7,000 $7,000
Municipal Counselor
Personal Services $0 $0 $0
Other Services & Charges 6,141 10,000 12,000
Supplies 0 0 0
Capital Outlay 0 0 0
Transfers 0 0 0
Department Total $6,141 $10,000 $12,000
Police
Personal Services $0 $0 $0
Other Services & Charges 142,546 155,573 153,000
Supplies 35,897 61,963 55,000
Capital Outlay 0 0 0
Transfers 0 0 0
Department Total $178,444 $217,536 $208,000
Table of Contents

Fund Summary
D-18
The Court Administration and Training Fund was created in 1986 to fund law enforcement training through state mandated fees collected by the Oklahoma City Municipal Court. As of November 1, 2017, state law requires that a $30 fee be collected on each case that is not a parking, stopping or standing violation and which is punishable by a fine of $10 or greater. This fee is in addition to any fines, costs or fees already associated with the case. The $30 fee consists of $10 for the Council on Law Enforcement Education and Training (CLEET), $10 for
the statewide Automated Fingerprint Identification System (AFIS) and $10 for the statewide Forensic Improvement Program. Oklahoma City, because it operates its own law enforcement academy, retains $2 of each CLEET fee collected in addition to a small administrative fee.
$0
$500,000
$1,000,000
$1,500,000
$2,000,000
$2,500,000
$3,000,000
$3,500,000
$4,000,000
ActualFY17
ActualFY18
ActualFY19
AdoptedFY20
AdoptedFY21
Court Administration and Training Fund
Historical and Projected Expenditures
Actual Adopted Adopted
FY19 FY20 FY21
All Departments
Personal Services $0 $0 $0
Other Services & Charges 152,536 172,573 172,000
Supplies 35,897 61,963 55,000
Capital Outlay 0 0 0
Transfers 0 0 0
Total Expenditures $188,433 $234,536 $227,000
Use of Fund Balance
Beginning Fund Balance $83,463 $75,579 $81,061
Additions/(Reductions) to Fund Balance (7,884) 5,482 * (38,732) **
Ending Fund Balance $75,579 $81,061 * $42,329 **
* Estimated.
** Assumes budgeted revenues and expenditures.
Table of Contents

Fund Summary
D-19
Under Section 26, Article 10 of the State Constitution, the City of Oklahoma City is authorized to establish a Debt Service Fund. The General Obligation Debt Services Fund accounts for all expenditures for principal, interest and agency fees on all of the City's general obligation debt and judgments. Revenues in the General Obligation Debt Service Fund include ad valorem taxes and interest on reserves. By law, appropriations in the Debt Service Fund may not be reduced below the minimums required to make debt service payments. The final debt service budget (statement of required funding) is prepared and submitted to required authorities at the end of August, after the preceding fiscal year accounting is closed. The adopted budget is an estimate based on partial year results.
Debt Service Fund
Actual Adopted Adopted
FY19 FY20 FY21
Revenues
Ad Valorem (Property Tax) $93,737,616 $95,053,573 $98,838,747
Interest 2,961,960 1,000,000 1,000,000
Other 6,710,914 6,000,000 7,000,000
Fund Balance 0 3,911,844 3,911,844
Total Revenues $103,410,490 $105,965,417 $110,750,591
Expenditures - Non-Departmental
Judgments $4,262,085 $5,974,000 $3,365,948
Judgment Interest 217,033 221,000 214,645
Fiscal Agency Fees 299,500 400,000 600,000
Bond Retirement 61,365,000 64,660,123 65,925,000
Interest on Bonds 32,480,563 34,710,294 34,126,511
Reserve For Future Debt Service Payments 0 0 6,518,487
Total Expenditures $98,624,181 $105,965,417 $110,750,591
Use of Fund Balance
Beginning Fund Balance $112,640,770 $117,427,080 $113,515,236
Additions/(Reductions) to Fund Balance 4,786,309 (3,911,844) * 2,606,643 **
Ending Fund Balance $117,427,080 $113,515,236 * $116,121,879 **
* Estimated.
** Assumes budgeted revenues and expenditures.
$0
$20,000,000
$40,000,000
$60,000,000
$80,000,000
$100,000,000
$120,000,000
ActualFY17
ActualFY18
ActualFY19
AdoptedFY20
AdoptedFY21
Debt Service Fund
Historical and Projected Expenditures
Table of Contents

Fund Summary
D-20
The Emergency Management Fund was established in FY90 to fund operations for the 911 emergency telephone and dispatch system, and the disaster preparedness and warning programs. The budget combines a subsidy from the General Fund, projected revenues from a charge to households and businesses accessing the system through their community or cell phone service, and fund balance and interest earned by the fund.
Emergency Management Fund
Actual Adopted Adopted
FY19 FY20 FY21
Revenues
Tariffs $5,926,996 $5,873,700 $6,113,890
Interest 27,844 29,602 35,084
Transfers 2,550,000 3,019,867 2,895,939
Fund Balance 0 273,961 200,000
Total Revenues $8,504,840 $9,197,130 $9,244,913
Expenditures - Police
Personal Services $6,428,193 $6,677,159 $6,864,296
Other Services & Charges 1,916,918 2,512,902 2,373,548
Supplies 2,611 7,069 7,069
Capital Outlay 0 0 0
Transfers 0 0 0
Total Expenditures $8,347,722 $9,197,130 $9,244,913
Use of Fund Balance
Beginning Fund Balance $723,226 $880,344 $665,085
Additions/(Reductions) to Fund Balance 157,118 (215,259) * (200,000) **
Ending Fund Balance $880,344 $665,085 * $465,085 **
* Estimated.
** Assumes budgeted revenues and expenditures.
$7,800,000
$8,000,000
$8,200,000
$8,400,000
$8,600,000
$8,800,000
$9,000,000
$9,200,000
$9,400,000
ActualFY17
ActualFY18
ActualFY19
AdoptedFY20
AdoptedFY21
Emergency Management Fund
Historical and Projected Expenditures
Table of Contents

Fire Sales Tax Fund (Fire fighting and Fire Rescue Services, Facilities or Equipment Tax Fund)
Fund Summary
D-21
The Fire Fighting and Fire Rescue Services, Facilities or Equipment Tax Fund was established in FY90. Funding is provided through a dedicated three-quarter-cent sales tax approved by City voters to fund new or improved public safety services. The Fund receives one-half of the revenues collected through the special sales tax. Each year the City Council adopts a resolution specifying the specific projects and funding levels in the Fire Fighting and Fire Rescue Services, Facilities or Equipment Tax Fund.
Actual Adopted Adopted
FY19 FY20 FY21
Revenues
Special Sales Tax $42,722,904 $43,711,118 $40,120,576
Interest 347,963 400,560 421,036
Other 154,312 13,677 13,677
Service Charges 23,660 0 0
Fund Balance 0 5,227,929 3,002,100
Total Revenues $43,248,839 $49,353,284 $43,557,389
Expenditures - Fire
Personal Services $35,992,742 $38,062,058 $38,170,302
Other Services & Charges 2,088,726 3,938,450 2,117,087
Supplies 3,108,042 4,103,176 2,270,000
Capital Outlay 13,474 3,249,600 1,000,000
Transfers 0 0 0
Total Expenditures $41,202,984 $49,353,284 $43,557,389
Use of Fund Balance
Beginning Fund Balance $13,484,380 $15,530,235 $12,742,724
Additions/(Reductions) to Fund Balance 2,045,855 (2,787,511) * (3,002,100) **
Ending Fund Balance $15,530,235 $12,742,724 * $9,740,624 **
* Estimated.
** Assumes budgeted revenues and expenditures.
$0
$10,000,000
$20,000,000
$30,000,000
$40,000,000
$50,000,000
$60,000,000
ActualFY17
ActualFY18
ActualFY19
AdoptedFY20
AdoptedFY21
Fire Sales Tax Fund
Historical and Projected Expenditures
Table of Contents

Fund Summary
D-22
General Fund
Actual Adopted Adopted
FY19 FY20 FY21
Revenues - Operating
Taxes $329,219,397 $338,175,844 $317,657,301
Franchise Fees 40,752,562 41,677,129 39,748,801
Licenses & Permits 13,506,225 14,021,949 14,215,148
Service Charges 61,303,038 60,416,878 62,488,406
Fines 19,000,677 18,773,085 16,747,590
Transfers 1,945,865 2,000,431 58,684
Other Revenue 6,404,361 8,476,031 5,595,458
Total Revenues - Operating $472,132,126 $483,541,347 $456,511,388
Revenues - Non-Operating
Taxes $0 $13,569,828 $106,988,204
Total Revenues - Non-Operating $0 $13,569,828 $106,988,204
Total Revenues $472,132,126 $497,111,175 $563,499,592
Expenditures - Operating
City Auditor's Office
Personal Services $1,052,779 $1,100,677 $1,122,901
Other Services & Charges 59,081 144,080 108,465
Supplies 13,205 9,750 9,750
Capital Outlay 0 0 0
Transfers 0 0 0
Department Total $1,125,065 $1,254,507 $1,241,116
City Clerk
Personal Services $778,385 $872,658 $901,102
Other Services & Charges 224,661 211,228 211,860
Supplies 13,929 5,052 5,052
Capital Outlay 0 0 0
Transfers 45,000 0 0
Department Total $1,061,975 $1,088,938 $1,118,014
City Manager's Office
Personal Services $3,289,335 $3,254,857 $2,791,506
Other Services & Charges 459,434 380,537 260,016
Supplies 30,980 31,182 27,925
Capital Outlay 0 0 0
Transfers 0 0 0
Department Total $3,779,749 $3,666,576 $3,079,447
Table of Contents

Fund Summary
D-23
Actual Adopted Adopted
FY19 FY20 FY21
Development Services
Personal Services $15,083,481 $16,210,489 $14,741,133
Other Services & Charges 2,911,111 3,031,706 2,903,148
Supplies 755,169 726,132 691,286
Capital Outlay 0 0 0
Transfers 0 0 0
Department Total $18,749,761 $19,968,327 $18,335,567
Finance
Personal Services $6,645,478 $7,429,619 $7,196,619
Other Services & Charges 1,311,260 1,567,756 1,603,666
Supplies 76,323 102,541 115,760
Capital Outlay 0 0 0
Transfers 100,000 0 0
Department Total $8,133,061 $9,099,916 $8,916,045
Fire
Personal Services $93,261,257 $98,551,177 $100,165,286
Other Services & Charges 6,560,076 7,087,068 7,150,978
Supplies 1,280,457 1,164,088 992,235
Capital Outlay 0 0 0
Transfers 1,005,296 120,000 120,000
Department Total $102,107,086 $106,922,333 $108,428,499
General Services
Personal Services $3,363,117 $3,501,049 $3,306,703
Other Services & Charges 1,351,021 1,505,293 1,412,603
Supplies 540,177 206,464 138,858
Capital Outlay 0 0 0
Transfers 0 0 0
Department Total $5,254,315 $5,212,806 $4,858,164
Human Resources
Personal Services $3,039,083 $3,135,075 $3,011,423
Other Services & Charges 431,252 560,569 576,114
Supplies 15,456 15,524 27,272
Capital Outlay 0 0 0
Transfers 0 0 0
Department Total $3,485,791 $3,711,168 $3,614,809
Table of Contents

Fund Summary
D-24
Actual Adopted Adopted
FY19 FY20 FY21
Juvenile Justice - Municipal Court
Personal Services $721,881 $763,684 $765,261
Other Services & Charges 83,493 143,189 114,958
Supplies 9 7,400 2,631
Capital Outlay 0 0 0
Transfers 0 0 0
Department Total $805,383 $914,273 $882,850
Juvenile Justice - Municipal Counselor
Personal Services $126,518 $124,250 $123,787
Other Services & Charges 0 0 0
Supplies 3,670 2,782 2,782
Capital Outlay 0 0 0
Transfers 0 0 0
Department Total $130,188 $127,032 $126,569
Mayor and Council
Personal Services $981,410 $1,028,817 $1,054,468
Other Services & Charges 82,438 135,842 94,362
Supplies 5,695 11,232 10,420
Capital Outlay 0 0 0
Transfers 0 0 0
Department Total $1,069,544 $1,175,891 $1,159,250
Municipal Court
Personal Services $4,194,490 $4,662,178 $4,075,343
Other Services & Charges 2,765,944 2,965,444 2,869,569
Supplies 112,250 212,657 194,772
Capital Outlay 0 0 0
Transfers 0 100,600 0
Department Total $7,072,684 $7,940,879 $7,139,684
Municipal Counselor's Office
Personal Services $6,522,114 $6,661,756 $6,390,570
Other Services & Charges 668,323 605,113 455,408
Supplies 149,869 121,029 116,711
Capital Outlay 0 0 0
Transfers 0 0 0
Department Total $7,340,305 $7,387,898 $6,962,689
Table of Contents

Fund Summary
D-25
Actual Adopted Adopted
FY19 FY20 FY21
Non-Departmental
Personal Services $18,596,755 $26,866,987 $18,056,995
Other Services & Charges 11,291,351 23,742,746 22,999,740
Supplies 8,305 7,500 7,500
Capital Outlay 0 0 0
Debt Service 5,085 10,000 10,000
Transfers 32,756,189 17,545,674 18,709,939 Department Total $62,657,685 $68,172,907 $59,784,174
Parks and Recreation
Personal Services $11,962,822 $14,497,491 $13,708,074
Other Services & Charges 9,526,819 12,234,621 11,024,144
Supplies 1,635,284 1,917,660 1,837,452
Capital Outlay 20,994 0 0
Transfers 2,908,870 386,271 1,236,271
Department Total $26,054,789 $29,036,043 $27,805,941
Planning
Personal Services $2,724,486 $2,990,856 $2,819,472
Other Services & Charges 1,204,224 1,490,885 1,063,376
Supplies 18,100 18,802 14,202
Capital Outlay 0 0 0
Transfers 0 0 0
Department Total $3,946,810 $4,500,543 $3,897,050
Police
Personal Services $127,747,342 $132,214,081 $130,341,865
Other Services & Charges 16,993,865 18,455,950 17,776,053
Supplies 759,604 810,587 778,451
Capital Outlay 0 0 0
Transfers 2,946,000 3,319,867 3,365,939
Department Total $148,446,811 $154,800,485 $152,262,308
Public Transportation and Parking
Other Services & Charges $21,884,273 $23,126,208 $13,719,719
Transfers 239,848 538,935 588,867
Department Total $22,124,121 $23,665,143 $14,308,586
Public Works
Personal Services $19,616,463 $22,448,027 $21,360,316
Other Services & Charges 5,523,652 7,523,967 6,946,374
Supplies 2,500,974 4,896,688 4,283,936
Capital Outlay 0 0 0
Transfers 1,880,787 27,000 0
Department Total $29,521,876 $34,895,682 $32,590,626
Table of Contents

Fund Summary
D-26
Actual Adopted Adopted
FY19 FY20 FY21
All Departments - Operating
Personal Services $319,707,197 $346,313,728 $331,932,824
Other Services & Charges 83,332,279 104,912,202 91,290,553
Supplies 7,919,455 10,267,070 9,256,995
Capital Outlay 20,994 0 0
Debt Service 5,085 10,000 10,000
Transfers 41,881,989 22,038,347 24,021,016
Total Operating Expenditures $452,866,998 $483,541,347 $456,511,388
Expenditures - Non-Operating
Non-Departmental - MAPS 4 (Non-Operating)
Personal Services $0 $0 $0
Other Services & Charges 0 0 0
Supplies 0 0 0
Capital Outlay 0 0 0
Transfers 0 13,569,828 106,988,204
Department Total $0 $13,569,828 $106,988,204
All Departments - Non-Operating
Personal Services $0 $0 $0
Other Services & Charges 0 0 0
Supplies 0 0 0
Capital Outlay 0 0 0
Debt Service 0 0 0
Transfers 0 13,569,828 106,988,204
Total Operating Expenditures $0 $13,569,828 $106,988,204
Total All Departments Operating and Non-Operating
Personal Services $319,707,197 $346,313,728 $331,932,824
Other Services & Charges 83,332,279 104,912,202 91,290,553
Supplies 7,919,455 10,267,070 9,256,995
Capital Outlay 20,994 0 0
Debt Service 5,085 10,000 10,000
Transfers 41,881,989 35,608,175 131,009,220
Total General Fund Expenditures $452,866,998 $497,111,175 $563,499,592
Use of Fund Balance
Beginning Fund Balance $84,878,259 $104,143,386 $103,320,637
Additions/(Reductions) to Fund Balance 19,265,127 (822,749) * 0 **
Ending Fund Balance $104,143,386 $103,320,637 * $103,320,637 **
* Estimated.
** Assumes budgeted revenues and expenditures.
Table of Contents
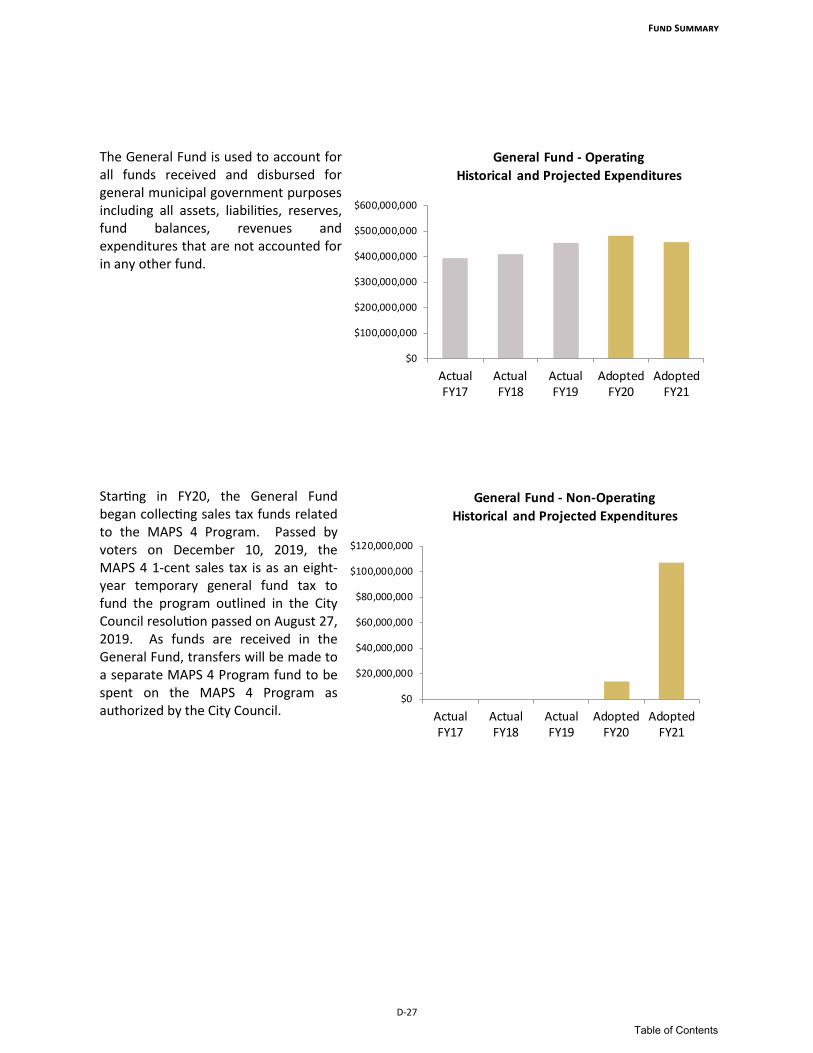
Fund Summary
D-27
The General Fund is used to account for all funds received and disbursed for general municipal government purposes including all assets, liabilities, reserves, fund balances, revenues and expenditures that are not accounted for in any other fund. Starting in FY20, the General Fund began collecting sales tax funds related to the MAPS 4 Program. Passed by voters on December 10, 2019, the MAPS 4 1-cent sales tax is as an eight-year temporary general fund tax to fund the program outlined in the City Council resolution passed on August 27, 2019. As funds are received in the General Fund, transfers will be made to a separate MAPS 4 Program fund to be spent on the MAPS 4 Program as authorized by the City Council.
$0
$100,000,000
$200,000,000
$300,000,000
$400,000,000
$500,000,000
$600,000,000
ActualFY17
ActualFY18
ActualFY19
AdoptedFY20
AdoptedFY21
General Fund - Operating
Historical and Projected Expenditures
$0
$20,000,000
$40,000,000
$60,000,000
$80,000,000
$100,000,000
$120,000,000
ActualFY17
ActualFY18
ActualFY19
AdoptedFY20
AdoptedFY21
General Fund - Non-Operating
Historical and Projected Expenditures
Table of Contents

Fund Summary
D-28
Grants Management Fund
Actual Adopted Adopted
FY19 FY20 FY21
Revenues
Department of Energy $3,750 $0 $0
Department of Homeland Security 3,010,914 1,612,403 491,052
Department of Housing and Urban Development 14,976,565 23,925,906 27,112,854
Department of Interior 62,718 22,312 29,284
Department of Justice 696,008 2,308,247 3,950,552
Department of Transportation 443,029 1,028,385 1,141,276
Department of the Treasury 0 0 114,302,395
Environmental Protection Agency 412,897 881,000 1,198,379
Federal Railroad Administration 4,962,698 3,000,000 0
Other - Misc Grants, Loan Repayments, Etc. 922,661 150,000 219,006
State and Local Grants 961,117 1,331,666 948,861
Total Revenues (a) $26,452,357 $34,259,919 $149,393,659
Table of Contents

Fund Summary
D-29
Actual Adopted Adopted
FY19 FY20 FY21
Expenditures
Development Services
Personal Services $0 $150,000 $219,006
Other Services & Charges (13) 0 0
Supplies 0 0 0
Capital Outlay 0 0 0
Transfers 1,564 0 0
Department Total $1,551 $150,000 $219,006
Finance
Personal Services ($144) $0 $0
Other Services & Charges 0 0 0
Supplies 0 0 0
Capital Outlay 0 0 0
Transfers 0 0 0
Department Total ($144) $0 $0
Fire
Personal Services $2,932,873 $1,612,403 $413,890
Other Services & Charges 68,633 59,825 77,162
Supplies 26,042 0 0
Capital Outlay 0 0 0
Transfers 0 0 0
Department Total $3,027,549 $1,672,228 $491,052
General Services
Personal Services $0 $0 $0
Other Services & Charges 0 0 0
Supplies 0 0 0
Capital Outlay 32,516 71,993 71,993
Transfers 0 0 0
Department Total $32,516 $71,993 $71,993
Non-Departmental
Personal Services $0 $0 $0
Other Services & Charges 0 0 114,302,395
Supplies 0 0 0
Capital Outlay 0 0 0
Transfers 0 0 0
Department Total $0 $0 $114,302,395
Table of Contents

Fund Summary
D-30
Actual Adopted Adopted
FY19 FY20 FY21
Parks
Personal Services $0 $0 $0
Other Services & Charges 34,187 0 0
Supplies 0 0 0
Capital Outlay 0 360,000 210,000
Transfers 0 0 0
Department Total $34,187 $360,000 $210,000
Planning
Personal Services $1,672,774 $1,927,853 $2,297,014
Other Services & Charges 13,885,290 22,847,183 26,036,668
Supplies 11,443 31,370 31,370
Capital Outlay 768,829 0 0
Transfers 0 0 0
Department Total $16,338,337 $24,806,406 $28,365,052
Police
Personal Services $1,325,164 $2,213,002 $2,838,208
Other Services & Charges 254,279 651,315 471,867
Supplies 91,762 1,073,609 1,648,851
Capital Outlay 44,220 0 655,535
Transfers 0 0 0
Department Total $1,715,424 $3,937,926 $5,614,461
Public Works
Personal Services $134,988 $119,700 $119,700
Other Services & Charges 0 0 0
Supplies 0 0 0
Capital Outlay 5,084,558 3,141,666 0
Transfers 0 0 0
Department Total $5,219,546 $3,261,366 $119,700
All Departments
Personal Services $6,065,655 $6,022,958 $5,887,818
Other Services & Charges 14,242,376 23,558,323 140,888,092
Supplies 129,247 1,104,979 1,680,221
Capital Outlay 5,930,123 3,573,659 937,528
Transfers 1,564 0 0
Total Expenditures $26,368,965 $34,259,919 $149,393,659
NOTES: Use of Fund Balance
Due to the nature of grant funds, fund balance projections do not provide an adequate picture of
financial health and are not included.
(a) Budgeted revenue include balances from prior year grant awards and anticipated new grant awards.
Table of Contents

Fund Summary
D-31
The Grants Management Fund was established in order to provide the City with a means of budgeting and accounting for grant awards. Although shown in the same manner as other City funds, the Grants Management Fund generally follows federal, rather than state or local law for budgeting and spending. The information presented in this budget is an estimate of federal grant activity and does not restrict actual grant expenditures. Grant expenditures are governed by individual grant requirements.
$0
$20,000,000
$40,000,000
$60,000,000
$80,000,000
$100,000,000
$120,000,000
$140,000,000
$160,000,000
ActualFY17
ActualFY18
ActualFY19
AdoptedFY20
AdoptedFY21
Grants Management Fund
Historical and Projected Expenditures
Table of Contents

Fund Summary
D-32
Hotel/Motel Tax Special Revenue Fund
On December 14, 2004, the Oklahoma City voters approved a 5.5% hotel occupancy tax. The tax rate went into effect on January 1, 2005 and Ordinance No. 22,538 provides for three specific uses. Four-elevenths or 2% is dedicated to encouraging, promoting, and fostering convention and tourism development of the City. Six-elevenths or 3% is dedicated to funding improvements to the Oklahoma City Fairgrounds. The final one-eleventh or 0.5% is dedicated to sponsoring or
promoting events recommended by the Oklahoma City Convention and Visitors Commission. The Hotel/Motel Tax Special Revenue Fund was established by Budget Amendment in FY05 to account for all monies from the tax.
Actual Adopted Adopted
FY19 FY20 FY21
Revenues
Hotel/Motel Tax $15,736,805 $16,136,549 $9,496,893
Interest 159,426 173,667 178,242
Other 0 0 0
Transfers 7,807,549 7,705,126 3,453,416
Fund Balance 0 931,236 1,100,000
Total Revenues $23,703,780 $24,946,578 $14,228,551
Expenditures - Non-Departmental
Personal Services $0 $0 $0
Other Services & Charges 7,775,780 8,329,713 4,648,831
Supplies 0 0 0
Capital Outlay 0 0 0
Transfers 16,242,418 16,616,865 9,579,720
Total Expenditures $24,018,198 $24,946,578 $14,228,551
Use of Fund Balance
Beginning Fund Balance $6,544,549 $6,230,131 $5,214,745
Additions/(Reductions) to Fund Balance (314,418) (1,015,386) * (1,100,000) **
Ending Fund Balance $6,230,131 $5,214,745 * $4,114,745 **
* Estimated.
** Assumes budgeted revenues and expenditures.
$0
$5,000,000
$10,000,000
$15,000,000
$20,000,000
$25,000,000
$30,000,000
ActualFY17
ActualFY18
ActualFY19
AdoptedFY20
AdoptedFY21
Hotel/Motel Special Revenue Fund
Historical and Projected Expenditures
Table of Contents

Fund Summary
D-33
Impact Fee Fund
In 2017, the Streets and Parks System Development Impact Fee Fund was established through City ordinance to collect and expend development fees related to new construction. Fee revenue received through the building permitting process is utilized for capital improvements to infrastructure in parks and streets within the same service area as the new construction.
Actual Adopted Adopted
FY19 FY20 FY21
Revenues
Impact Fees $8,056,087 $7,843,663 $10,639,594
Interest 278,034 36,059 154,572
Fund Balance 0 13,551,748 23,031,898
Total Revenues $8,334,122 $21,431,470 $33,826,064
Expenditures - Public Works
Personal Services $0 $0 $0
Other Services & Charges 605,589 17,081,912 21,951,450
Supplies 0 969,023 0
Capital Outlay 817,000 3,380,535 11,874,614
Transfers 0 0 0
Department Total $1,422,589 $21,431,470 $33,826,064
Use of Fund Balance
Beginning Fund Balance $9,059,516 $15,971,048 $23,031,898
Additions/(Reductions) to Fund Balance 6,911,533 7,060,850 * (23,031,898) **
Ending Fund Balance $15,971,048 $23,031,898 * $0 **
* Estimated.
** Assumes budgeted revenues and expenditures.
$0
$5,000,000
$10,000,000
$15,000,000
$20,000,000
$25,000,000
$30,000,000
$35,000,000
$40,000,000
ActualFY17
ActualFY18
ActualFY19
AdoptedFY20
AdoptedFY21
Impact Fee Fund
Historical and Projected Expenditures
Table of Contents

Fund Summary
D-34
Internal Service Fund
Actual Adopted Adopted
FY19 FY20 FY21
Revenues
Interest $283,374 $30,000 $56,204
Information Technology Chargebacks 25,733,968 28,061,366 27,905,330
Risk Management Chargebacks 14,607,542 13,145,295 12,942,188
Print Shop Chargebacks 824,213 1,012,012 933,288
Fleet Services Chargebacks 8,617,802 9,647,630 8,314,491
Licenses, Permits and Fees 0 0 0
Other 325,131 519,595 390,795
Services 0 0 0
Fund Balance 0 1,863,069 1,908,478
Total Revenues $50,392,030 $54,278,967 $52,450,774
Expenditures
City Manager's Office - Print Shop
Personal Services $263,999 $284,617 $228,788
Other Services & Charges 454,940 605,914 756,919
Supplies 87,578 86,481 270,944
Capital Outlay 0 220,000 47,498
Transfers 0 0 0
Department Total $806,517 $1,197,012 $1,304,149
Finance - Risk Management
Personal Services $919,058 $1,184,417 $1,095,765
Other Services & Charges 787,884 840,271 786,774
Supplies 10,582 24,629 24,629
Capital Outlay 0 0 0
Transfers 12,645,975 11,184,659 11,149,905
Department Total $14,363,498 $13,233,976 $13,057,073
General Services - Fleet Services
Personal Services $2,351,830 $2,608,679 $2,515,161
Other Services & Charges 1,153,056 1,461,474 1,265,637
Supplies 4,587,704 5,586,185 4,533,693
Capital Outlay 0 176,100 0
Transfers 900,000 750,000 0
Department Total $8,992,590 $10,582,438 $8,314,491
Information Technology
Personal Services $11,531,659 $12,457,049 $12,718,847
Other Services & Charges 4,572,859 5,736,608 6,624,264
Supplies 410,860 469,829 334,374
Capital Outlay 0 0 228,500
Transfers 9,805,856 10,602,055 9,869,076
Department Total $26,321,234 $29,265,541 $29,775,061
Table of Contents

Fund Summary
D-35
Internal Service Funds were established to finance and account for services and commodities furnished by one City department to other City departments on a cost reimbursement basis. Since the services and commodities are supplied exclusively within the City government, they are separate from those services that are rendered to the public in general and/or accounted for in other City Funds. Details of the services provided may be found under the following department headings presented in this budget: Information Technology, City Manager’s Office
- Public Information and Marketing (Print Shop), Finance (Risk Management), and General Services (Fleet Services).
Actual Adopted Adopted
FY19 FY20 FY21
All Departments
Personal Services $15,066,546 $16,534,762 $16,558,561
Other Services & Charges 6,968,739 8,644,267 9,433,594
Supplies 5,096,723 6,167,124 5,163,640
Capital Outlay 0 396,100 275,998
Transfers 23,351,831 22,536,714 21,018,981
Total Expenditures $50,483,839 $54,278,967 $52,450,774
Use of Fund Balance
Beginning Fund Balance $8,310,532 $8,218,723 $8,493,910
Additions/(Reductions) to Fund Balance (91,809) 275,187 * (1,908,478) **
Ending Fund Balance $8,218,723 $8,493,910 * $6,585,432 **
* Estimated.
** Assumes budgeted revenues and expenditures.
$42,000,000
$44,000,000
$46,000,000
$48,000,000
$50,000,000
$52,000,000
$54,000,000
$56,000,000
ActualFY17
ActualFY18
ActualFY19
AdoptedFY20
AdoptedFY21
Internal Service Fund
Historical and Projected Expenditures
Table of Contents

Fund Summary
D-36
Medical Service Program Fund
Actual Adopted Adopted
FY19 FY20 FY21
Revenues
Medical Service Program Fee $6,904,002 $6,872,385 $7,098,377
Interest 158,716 173,477 100,000
Other 3,300 0 0
Fund Balance 0 0 1,527,983
Total Revenues $7,066,019 $7,045,862 $8,726,360
Expenditures - Non-Departmental
Personal Services $0 $0 $0
Other Services & Charges 4,477,367 7,045,862 5,126,360
Supplies 1,436 0 0
Capital Outlay 257,374 0 3,600,000
Transfers 0 0 0
Total Expenditures $4,736,177 $7,045,862 $8,726,360
Use of Fund Balance
Beginning Fund Balance $5,779,785 $8,109,626 $9,831,807
Additions/(Reductions) to Fund Balance 2,329,842 1,722,181 * (1,527,983) **
Ending Fund Balance $8,109,626 $9,831,807 * $8,303,824 **
* Estimated.
** Assumes budgeted revenues and expenditures.
The Medical Service Program Fund was created in the FY10 budget for a new ambulance fee as part of the Medical Service Program enacted by the City Council on December 8, 2008. The program took effect on October 1, 2009. The Fund receives the $3.65 monthly fee paid by households enrolled in the program for coverage under the Emergency Medical Services Authority (EMSA) TotalCare program. The fund is used to pay EMSA for coverage, as well as, the administrative costs of the Utilities Department for operating the billing and customer service aspects of the program.
$0
$1,000,000
$2,000,000
$3,000,000
$4,000,000
$5,000,000
$6,000,000
$7,000,000
$8,000,000
$9,000,000
$10,000,000
ActualFY17
ActualFY18
ActualFY19
AdoptedFY20
AdoptedFY21
Medical Service Program Fund
Historical and Projected Expenditures
Table of Contents

Fund Summary
D-37
Metropolitan Area Projects (MAPS) Sales Tax
Actual Adopted Adopted
FY19 FY20 FY21
Revenues
Sales Tax $0 $0 $0
Interest 5,029 1,738 5,029
Other 3,469 3,000 3,554
Fund Balance 0 247,139 186,022
Total Revenues $8,498 $251,877 $194,605
Expenditures - City Manager's Office
Personal Services $0 $0 $0
Other Services & Charges 30,955 104,495 180,422
Supplies 0 0 0
Capital Outlay 0 147,382 14,183
Transfers 0 0 0
Total Expenditures $30,955 $251,877 $194,605
Use of Fund Balance
Beginning Fund Balance $241,042 $218,584 $372,044
Additions/(Reductions) to Fund Balance (22,457) 153,460 * (186,022) **
Ending Fund Balance $218,584 $372,044 * $186,022 **
* Estimated.
** Assumes budgeted revenues and expenditures.
The Oklahoma City voters approved an ordinance amending the City sales tax code on December 14, 1993. This ordinance levied an additional limited term sales tax of one percent for the term of five years, beginning January 1, 1994 and ending January 1, 1999. The Oklahoma City voters extended this tax on December 8, 1998, adding six months to the life of the tax, which expired June 30, 1999. The ordinance established a limited purpose tax fund to be expended only for specified projects, including improvements to the North Canadian River; a
metropolitan learning center; a baseball park; improvement of the Myriad Convention Center; improvement of the Civic Center Music Hall; improvement of the Oklahoma City Fairgrounds; an indoor sports/convention facility; all or part of a transportation system between Interstate 40 and Meridian Avenue and downtown Oklahoma City; site acquisition, site preparation, site improvements, infrastructure, parking facilities, personal property, engineering fees, architectural fees, and legal fees related to the main projects; payment of principal and interest on and the costs of issuance of notes or obligations in support of the main projects; payment of senior citizens tax refunds; and related administrative costs.
$0
$50,000
$100,000
$150,000
$200,000
$250,000
$300,000
$350,000
ActualFY17
ActualFY18
ActualFY19
AdoptedFY20
AdoptedFY21
MAPS Sales Tax Fund
Historical and Projected Expenditures
Table of Contents

Fund Summary
D-38
MAPS Operations Fund
Actual Adopted Adopted
FY19 FY20 FY21
Revenues
Use Tax $0 $0 $0
Interest 111,542 90,000 30,674
Other 58 0 0
Transfers 185,000 0 0
Fund Balance 0 5,462,000 5,115,659
Total Revenues $296,600 $5,552,000 $5,146,333
Expenditures
Parks and Recreation
Personal Services $244,336 $0 $0
Other Services & Charges 29,472 4,752 0
Supplies 1,086 4,236 0
Capital Outlay 0 110,605 0
Transfers 0 0 0
Department Total $274,894 $119,593 $0
Non-Departmental
Personal Services $0 $0 $0
Other Services & Charges 58,971 289,575 443,003
Supplies 20,437 61,032 40,299
Capital Outlay 0 5,081,799 4,663,031
Transfers 0 1 0
Department Total $79,408 $5,432,407 $5,146,333
All Departments
Personal Services $244,336 $0 $0
Other Services & Charges 88,442 294,327 443,003
Supplies 21,523 65,268 40,299
Capital Outlay 0 5,192,404 4,663,031
Transfers 0 1 0
Total Expenditures $354,301 $5,552,000 $5,146,333
Use of Fund Balance
Beginning Fund Balance $5,277,226 $5,219,525 $5,115,659
Additions/(Reductions) to Fund Balance (57,702) (103,866) * (5,115,659) **
Ending Fund Balance $5,219,525 $5,115,659 * $0 **
* Estimated.
** Assumes budgeted revenues and expenditures.
Table of Contents

Fund Summary
D-39
The MAPS Operations Fund was originally funded by the MAPS Use Tax, which was separate from the MAPS Sales Tax. The MAPS Use Tax was enacted by the City Council and was in effect for five-and-a-half years, while the MAPS Sales Tax was in effect. The tax provided for a levy of one percent on the sale of tangible personal property not subject to sales tax from January 1, 1994 through June 30, 1999. Funds collected from the additional levy were accounted for separately and are to be used for operating, maintaining, and
replacing capital as needed on any or all of the nine major MAPS projects. The MAPS Operations Fund budget reflects only the funding for adopted expenditures.
$0
$1,000,000
$2,000,000
$3,000,000
$4,000,000
$5,000,000
$6,000,000
ActualFY17
ActualFY18
ActualFY19
AdoptedFY20
AdoptedFY21
MAPS Operations Fund
Historical and Projected Expenditures
Table of Contents

Fund Summary
D-40
The Oklahoma City voters approved a one-cent sales tax for MAPS 3 on December 8, 2009. The tax began April 1, 2010 and lasted for seven years and nine months. The initiative contained a diverse list of eight projects including: the new 70-acre Scissortail Park linking the core of downtown with the Oklahoma River; the new Oklahoma City Streetcar system; a new downtown convention center and Omni Hotel; sidewalks for major streets and near facilities used by the public; 57 miles of new public bicycling and walking trails throughout the City; improvements to
the Oklahoma River, including the RIVERSPORT OKC whitewater rafting and kayaking facility and other upgrades which have earned the river a designation as a U.S. Olympics Training Site; state-of-the-art Health and Wellness Centers designed for senior citizens; and improvements to the Oklahoma State Fairgrounds.
MAPS 3 Sales Tax Fund
Actual Adopted Adopted
FY19 FY20 FY21
Revenues
Sales Tax $258,655 $0 $0
Interest 6,800,558 4,779,744 4,779,744
Service Charges 32,019 0 0
Transfers 0 0 0
Fund Balance 0 305,206,006 178,682,900
Total Revenues $7,091,233 $309,985,750 $183,462,644
Expenditures - City Manager's Office
Personal Services $0 $0 $0
Other Services & Charges 124,521 90,482 100,898
Supplies 277,154 559,355 704,107
Capital Outlay 143,367,750 308,905,148 182,524,469
Transfers 1,040,566 430,765 133,170
Total Expenditures $144,809,990 $309,985,750 $183,462,644
Use of Fund Balance
Beginning Fund Balance $392,681,476 $254,962,719 $178,682,900
Additions/(Reductions) to Fund Balance (137,718,757) (76,279,819) * (178,682,900) **
Ending Fund Balance $254,962,719 $178,682,900 * $0 **
* Estimated.
** Assumes budgeted revenues and expenditures.
$0
$50,000,000
$100,000,000
$150,000,000
$200,000,000
$250,000,000
$300,000,000
$350,000,000
ActualFY17
ActualFY18
ActualFY19
AdoptedFY20
AdoptedFY21
MAPS 3 Sales Tax Fund
Historical and Projected Expenditures
Table of Contents

Fund Summary
D-41
MAPS 3 Use Tax Fund
Actual Adopted Adopted
FY19 FY20 FY21
Revenues
Use Tax ($773) $0 $0
Interest 511,999 262,725 330,076
Service Charges 92,318 0 0
Transfers 0 0 0
Fund Balance 0 17,477,827 9,948,299
Other 2,303 0 0
Total Revenues $605,847 $17,740,552 $10,278,375
Expenditures
City Manager's Office
Personal Services $2,172,086 $2,776,336 $2,454,400
Other Services & Charges 1,227,172 1,421,774 1,418,477
Supplies 11,839 101,610 108,500
Capital Outlay 0 418,742 418,742
Transfers 9,990 0 0
Department Total $3,421,087 $4,718,462 $4,400,119
Fire Department
Personal Services $0 $0 $0
Other Services & Charges 7,670 3,000 1,500
Supplies 332,034 130,000 227,959
Capital Outlay 174,460 8,000,000 1,860,882
Transfers 0 0 0
Department Total $514,164 $8,133,000 $2,090,341
Information Technology
Personal Services $0 $0 $0
Other Services & Charges 0 0 0
Supplies 520,509 1,000 0
Capital Outlay 0 0 0
Transfers 0 0 0
Department Total $520,509 $1,000 $0
Municipal Courts
Personal Services $0 $0 $0
Other Services & Charges 0 65,000 8,327
Supplies 0 0 0
Capital Outlay 197,181 205,000 199,643
Transfers 0 0 0
Department Total $197,181 $270,000 $207,970
Table of Contents

Fund Summary
D-42
Actual Adopted Adopted
FY19 FY20 FY21
Non-Departmental
Personal Services $0 $0 $0
Other Services & Charges 0 0 0
Supplies 0 0 0
Capital Outlay 0 4,073,740 3,264,014
Transfers 0 0 0
Department Total $0 $4,073,740 $3,264,014
Police Department
Personal Services $0 $0 $0
Other Services & Charges 13,375 42,350 6,537
Supplies 4,400,461 312,000 120,250
Capital Outlay 0 190,000 189,144
Transfers 0 0 0
Department Total $4,413,835 $544,350 $315,931
All Departments
Personal Services $2,172,086 $2,776,336 $2,454,400
Other Services & Charges 1,248,216 1,532,124 1,434,841
Supplies 5,264,842 544,610 456,709
Capital Outlay 371,641 12,887,482 5,932,425
Transfers 9,990 0 0
Total Expenditures $9,066,776 $17,740,552 $10,278,375
Use of Fund Balance
Beginning Fund Balance $29,501,800 $21,040,870 $28,421,539
Additions/(Reductions) to Fund Balance (8,460,929) 7,380,669 * (9,948,299) **
Ending Fund Balance $21,040,870 $28,421,539 * $18,473,240 **
* Estimated.
** Assumes budgeted revenues and expenditures.
Table of Contents

Fund Summary
D-43
Following the approval of the one-cent MAPS 3 Sales Tax by City voters on December 8, 2009, the City Council approved an ordinance based on state statute that amended the City’s use tax rate to be equal to the sales tax rate. The MAPS 3 Use Tax will be in effect for the same seven years and nine months as the MAPS 3 Sales Tax. The Use Tax will pay for the cost of the management and oversight of the MAPS 3 construction projects. In addition, the Use Tax was used to support enhanced public safety by providing funding for Police and Fire uniform positions that would
otherwise have been cut from the General Fund in the FY11 budget. In FY13, a non-operating component was included in the MAPS 3 Use Tax Fund providing a reserve for future capital funding.
$0
$2,000,000
$4,000,000
$6,000,000
$8,000,000
$10,000,000
$12,000,000
$14,000,000
$16,000,000
$18,000,000
$20,000,000
ActualFY17
ActualFY18
ActualFY19
AdoptedFY20
AdoptedFY21
MAPS 3 Use Tax Fund
Historical and Projected Expenditures
Table of Contents

Fund Summary
D-44
On December 10, 2019, the Oklahoma City voters approved a one-cent sales tax for MAPS 4 Program. The temporary general fund tax will begin on April 1, 2020 and will last for eight years, generating an estimated $978 million. The City will begin collecting revenue from the sales tax in May 2020. The initiative contains a broad array of sixteen projects addressing a variety of human and community needs including: enhancements to City parks; four new youth centers; a new senior wellness center and assistance
to low-income seniors; three new mental health and addiction support centers; a family justice center; transit improvements, sidewalks, bike lanes, trails and streetlights; support for residents experiencing homelessness; maintenance and enhancements to Chesapeake Energy Arena and related facilities; an animal shelter; a new Fairgrounds Coliseum; a diversion hub for low-level criminal offenders; investments in the northeast Oklahoma City Innovation District; the renovation of the Freedom Center and a new Clara Luper Civil Rights Center; citywide beautification projects; and a new multipurpose
MAPS 4 Program Fund
Actual Adopted Adopted
FY19 FY20 FY21
Revenues
Interest $0 $0 $36,000
Transfers 0 13,569,828 106,988,204
Fund Balance 0 0 13,569,828
Total Revenues $0 $13,569,828 $120,594,032
Expenditures - City Manager's Office
Personal Services $0 $0 $0
Other Services & Charges 0 0 0
Supplies 0 0 0
Capital Outlay 0 13,569,828 120,594,032
Transfers 0 0 0
Total Expenditures $0 $13,569,828 $120,594,032
Use of Fund Balance
Beginning Fund Balance $0 $0 $13,569,828
Additions/(Reductions) to Fund Balance 0 13,569,828 * (13,569,828)
Ending Fund Balance $0 $13,569,828 * $0
* Estimated.
** Assumes budgeted revenues and expenditures.
$0
$20,000,000
$40,000,000
$60,000,000
$80,000,000
$100,000,000
$120,000,000
$140,000,000
ActualFY17
ActualFY18
ActualFY19
AdoptedFY20
AdoptedFY21
MAPS 4 Program Fund
Historical and Projected Expenditures
Table of Contents

Fund Summary
D-45
MAPS 4 Use Tax Fund
Actual Adopted Adopted
FY19 FY20 FY21
Revenues
Use Tax $0 $2,323,246 $20,423,098
Interest 0 0 12,000
Service Charges 0 0 0
Transfers 0 0 0
Fund Balance 0 0 2,323,246
Other 0 0 0
Total Revenues $0 $2,323,246 $22,758,344
Expenditures
City Manager's Office
Personal Services $0 $0 $0
Other Services & Charges 0 2,323,246 1,500,000
Supplies 0 0 0
Capital Outlay 0 0 0
Transfers 0 0 0
Department Total $0 $2,323,246 $1,500,000
Fire Department
Personal Services $0 $0 $0
Other Services & Charges 0 0 0
Supplies 0 0 0
Capital Outlay 0 0 5,111,291
Transfers 0 0 0
Department Total $0 $0 $5,111,291
Information Technology
Personal Services $0 $0 $0
Other Services & Charges 0 0 0
Supplies 0 0 1,987,724
Capital Outlay 0 0 0
Transfers 0 0 0
Department Total $0 $0 $1,987,724
Table of Contents

Fund Summary
D-46
Following the approval of the one-cent sales tax for the MAPS 4 Program by the Oklahoma City voters on December 10, 2020, the City Council approved an ordinance based on state statute that amended the City’s use tax rate to be equal to the sales tax rate. The MAPS 4 Use Tax will be in effect for the same eight year period as the corresponding sales tax. The MAPS 4 Use Tax will pay for the cost of the management and oversight of the MAPS 4 projects. In addition, the Use Tax will include a non-operating component to support public safety capital and other City capital
improvements.
Actual Adopted Adopted
FY19 FY20 FY21
Non-Departmental
Personal Services $0 $0 $0
Other Services & Charges 0 0 0
Supplies 0 0 0
Capital Outlay 0 0 7,060,315
Transfers 0 0 0
Department Total $0 $0 $7,060,315
Police Department
Personal Services $0 $0 $0
Other Services & Charges 0 0 0
Supplies 0 0 7,099,014
Capital Outlay 0 0 0
Transfers 0 0 0
Department Total $0 $0 $7,099,014
All Departments
Personal Services $0 $0 $0
Other Services & Charges 0 2,323,246 1,500,000
Supplies 0 0 9,086,738
Capital Outlay 0 0 12,171,606
Transfers 0 0 0
Total Expenditures $0 $2,323,246 $22,758,344
Use of Fund Balance
Beginning Fund Balance $0 $0 $2,323,246
Additions/(Reductions) to Fund Balance 0 2,323,246 * (2,323,246) **
Ending Fund Balance $0 $2,323,246 * $0 **
* Estimated.
** Assumes budgeted revenues and expenditures.
$0
$5,000,000
$10,000,000
$15,000,000
$20,000,000
$25,000,000
ActualFY17
ActualFY18
ActualFY19
AdoptedFY20
AdoptedFY21
MAPS 4 Use Tax Fund
Historical and Projected Expenditures
Table of Contents
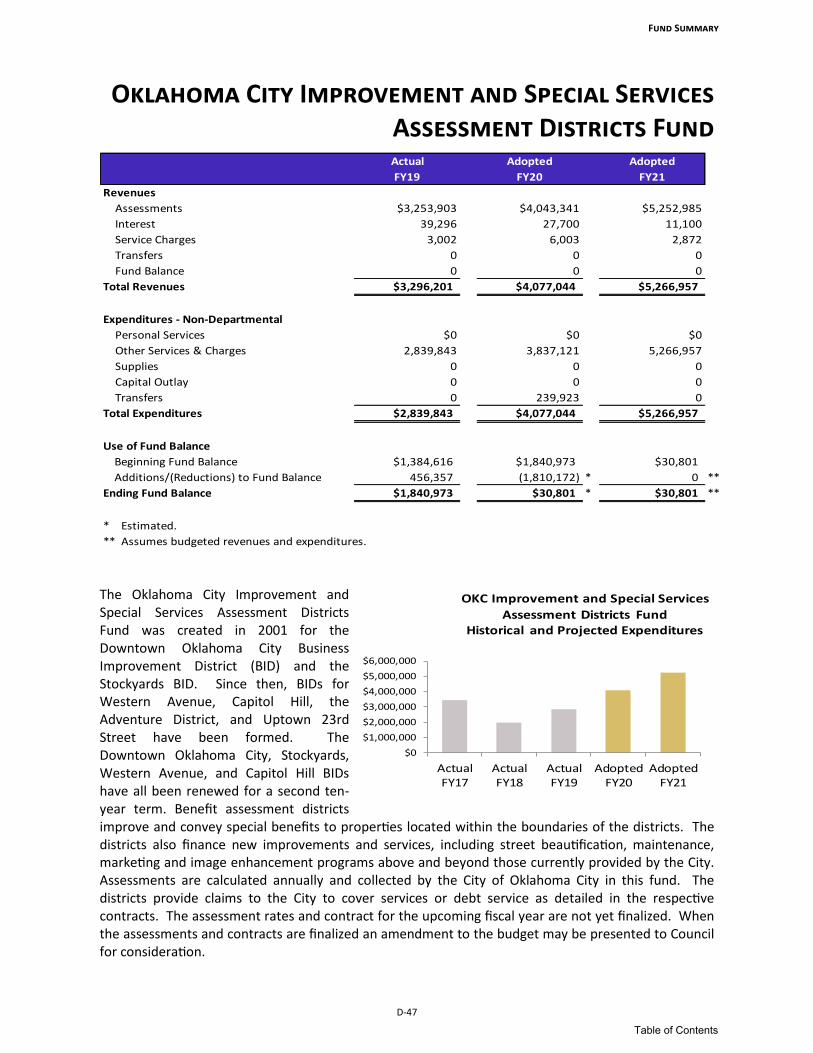
Fund Summary
D-47
Oklahoma City Improvement and Special Services Assessment Districts Fund
The Oklahoma City Improvement and Special Services Assessment Districts Fund was created in 2001 for the Downtown Oklahoma City Business Improvement District (BID) and the Stockyards BID. Since then, BIDs for Western Avenue, Capitol Hill, the Adventure District, and Uptown 23rd Street have been formed. The Downtown Oklahoma City, Stockyards, Western Avenue, and Capitol Hill BIDs have all been renewed for a second ten-year term. Benefit assessment districts improve and convey special benefits to properties located within the boundaries of the districts. The districts also finance new improvements and services, including street beautification, maintenance, marketing and image enhancement programs above and beyond those currently provided by the City. Assessments are calculated annually and collected by the City of Oklahoma City in this fund. The districts provide claims to the City to cover services or debt service as detailed in the respective contracts. The assessment rates and contract for the upcoming fiscal year are not yet finalized. When the assessments and contracts are finalized an amendment to the budget may be presented to Council for consideration.
Actual Adopted Adopted
FY19 FY20 FY21
Revenues
Assessments $3,253,903 $4,043,341 $5,252,985
Interest 39,296 27,700 11,100
Service Charges 3,002 6,003 2,872
Transfers 0 0 0
Fund Balance 0 0 0
Total Revenues $3,296,201 $4,077,044 $5,266,957
Expenditures - Non-Departmental
Personal Services $0 $0 $0
Other Services & Charges 2,839,843 3,837,121 5,266,957
Supplies 0 0 0
Capital Outlay 0 0 0
Transfers 0 239,923 0
Total Expenditures $2,839,843 $4,077,044 $5,266,957
Use of Fund Balance
Beginning Fund Balance $1,384,616 $1,840,973 $30,801
Additions/(Reductions) to Fund Balance 456,357 (1,810,172) * 0 **
Ending Fund Balance $1,840,973 $30,801 * $30,801 **
* Estimated.
** Assumes budgeted revenues and expenditures.
$0
$1,000,000
$2,000,000
$3,000,000
$4,000,000
$5,000,000
$6,000,000
ActualFY17
ActualFY18
ActualFY19
AdoptedFY20
AdoptedFY21
OKC Improvement and Special Services
Assessment Districts FundHistorical and Projected Expenditures
Table of Contents

Fund Summary
D-48
On November 13, 2001, Oklahoma City voters approved a limited term, limited purpose sales tax to be earmarked for certain public school capital projects. The rate of the tax was one-half percent from January 1, 2002 until April 1, 2003 when the rate changed to one percent. The tax expired on January 1, 2009. The OCMAPS trust was dissolved in FY18 and the remaining funds will be used to complete existing projects.
Oklahoma City Metropolitan Area Public Schools Sales Tax Fund
Actual Adopted Adopted
FY19 FY20 FY21
Revenues
City/Schools Sales Tax $0 $0 $0
Interest 135,818 55,689 0
Other 9,986 0 0
Service Charges 0 0 0
Transfers 0 0 0
Fund Balance 0 6,483,744 4,702,088
Total Revenues $145,804 $6,539,433 $4,702,088
Expenditures - City Manager's Office
Personal Services $0 $0 $0
Other Services & Charges 23,734 2,000,000 100,000
Supplies 0 0 0
Capital Outlay 1,346,435 4,539,433 4,602,088
Transfers 0 0 0
Total Expenditures $1,370,170 $6,539,433 $4,702,088
Use of Fund Balance
Beginning Fund Balance $6,833,473 $5,609,107 $4,702,088
Additions/(Reductions) to Fund Balance (1,224,366) (907,019) * (4,702,088) **
Ending Fund Balance $5,609,107 $4,702,088 * $0 **
* Estimated.
** Assumes budgeted revenues and expenditures.
$0
$1,000,000
$2,000,000
$3,000,000
$4,000,000
$5,000,000
$6,000,000
$7,000,000
ActualFY17
ActualFY18
ActualFY19
AdoptedFY20
AdoptedFY21
OKC Metropolitan Area Public Schools Sales
Tax FundHistorical and Projected Expenditures
Table of Contents

Fund Summary
D-49
As part of the creation of some TIF districts, the State of Oklahoma committed to match sales and use tax derived from improvement efforts in the respective areas. This dedicated fund is restricted for economic development purposes associated with these TIF districts and is currently used to fund tax anticipation debt repayment in the Oklahoma City Economic Development Trust.
Oklahoma City Tax Increment Financing (TIF) Fund
Actual Adopted Adopted
FY19 FY20 FY21
Revenues
Tax Increment Financing Match ($147,665) $1,325,000 $850,000
Interest 1,030 0 0
Fund Balance 0 0 130,188
Total Revenues ($146,634) $1,325,000 $980,188
Expenditures - City Manager's Office
Personal Services $0 $0 $0
Other Services & Charges 0 1,325,000 980,188
Supplies 0 0 0
Capital Outlay 0 0 0
Transfers 0 0 0
Reserve for Future Capital Costs 0 0 0
Total Expenditures $0 $1,325,000 $980,188
Use of Fund Balance
Beginning Fund Balance $146,634 $0 $130,188
Additions/(Reductions) to Fund Balance (146,634) 130,188 * (130,188) **
Ending Fund Balance $0 $130,188 * $0 **
* Estimated.
** Assumes budgeted revenues and expenditures.
$0
$200,000
$400,000
$600,000
$800,000
$1,000,000
$1,200,000
$1,400,000
ActualFY17
ActualFY18
ActualFY19
AdoptedFY20
AdoptedFY21
Oklahoma City Tax Increment Financing (TIF) Fund
Historical and Projected Expenditures
Table of Contents

Fund Summary
D-50
Police and Fire Capital Equipment Sales Tax Fund
Actual Adopted Adopted
FY19 FY20 FY21
Revenues
Police and Fire Equipment Sales Tax $0 $0 $0
Interest 77,261 24,124 20,000
Other 83,194 0 0
Fund Balance 0 3,633,184 2,548,570
Total Revenues $160,455 $3,657,308 $2,568,570
Expenditures
City Manager's Office
Personal Services $0 $0 $0
Other Services & Charges 349,931 1,198,631 1,194,691
Supplies 22,341 78,610 343,201
Capital Outlay 63,000 1,189,302 850,881
Transfers 0 0 0
Department Total $435,272 $2,466,543 $2,388,773
Fire
Personal Services $0 $0 $0
Other Services & Charges 0 1,937 1,937
Supplies 0 0 0
Capital Outlay 0 7,011 7,011
Transfers 0 0 0
Department Total $0 $8,948 $8,948
Information Technology
Personal Services $0 $0 $0
Other Services & Charges 0 162,000 0
Supplies 0 0 0
Capital Outlay 0 0 0
Transfers 0 0 0
Department Total $0 $162,000 $0
Non-Department
Personal Services $0 $0 $0
Other Services & Charges 0 0 0
Supplies 0 0 0
Capital Outlay 0 848,968 0
Transfers 0 0 0
Department Total $0 $848,968 $0
Table of Contents

Fund Summary
D-51
The Police and Fire Capital Equipment Sales Tax Fund was established in FY01. Funding was provided through a 32-month one-half cent sales tax approved by City voters on March 14, 2000 for police and fire capital equipment projects beginning July 1, 2000 and ending March 1, 2003. Among the capital improvements funded are police and fire vehicles, information systems, mobile data systems, a Citywide radio communication system, City public safety computer-aided dispatch systems, a communications network to support mobile data systems, improvements in the public emergency warning system and police helicopters.
$0
$500,000
$1,000,000
$1,500,000
$2,000,000
$2,500,000
$3,000,000
$3,500,000
$4,000,000
ActualFY17
ActualFY18
ActualFY19
AdoptedFY20
AdoptedFY21
Police and Fire Capital Equipment Sales Tax Fund
Historical and Projected Expenditures
Actual Adopted Adopted
FY19 FY20 FY21
Police
Personal Services $0 $0 $0
Other Services & Charges 0 0 0
Supplies 0 3,484 3,484
Capital Outlay 0 167,365 167,365
Transfers 0 0 0
Department Total $0 $170,849 $170,849
All Departments
Personal Services $0 $0 $0
Other Services & Charges 349,931 1,362,568 1,196,628
Supplies 22,341 82,094 346,685
Capital Outlay 63,000 2,212,646 1,025,257
Transfers 0 0 0
Total Expenditures $435,272 $3,657,308 $2,568,570
Use of Fund Balance
Beginning Fund Balance $3,680,616 $3,405,799 $5,097,140
Additions/(Reductions) to Fund Balance (274,817) 1,691,341 * (2,548,570) **
Ending Fund Balance $3,405,799 $5,097,140 * $2,548,570 **
* Estimated.
** Assumes budgeted revenues and expenditures.
Table of Contents

Fund Summary
D-52
The Police Services, Facilities or Equipment Tax Fund was established in FY90. Funding is provided through a dedicated three-quarter-cent sales tax approved by City voters to fund new or improved public safety services. The Fund receives one-half of revenues collected through the special sales tax. Each year the City Council adopts a resolution specifying the specific projects and funding levels in the Police Services, Facilities or Equipment Tax Fund.
Police Sales Tax Fund (Police Services, Facilities or Equipment Tax Fund)
Actual Adopted Adopted
FY19 FY20 FY21
Revenues
Special Sales Tax $42,722,904 $43,711,118 $40,120,576
Interest 389,471 436,674 501,878
Other 4,244 0 0
Service Charges 141,041 0 0
Transfers 0 0 0
Fund Balance 0 5,380,449 4,410,311
Total Revenues $43,257,661 $49,528,241 $45,032,765
Expenditures - Police
Personal Services $36,421,142 $38,124,917 $38,135,483
Other Services & Charges 2,869,688 5,016,591 4,630,292
Supplies 2,403,633 3,291,345 1,235,094
Capital Outlay 0 3,095,388 1,031,896
Transfers 0 0 0
Total Expenditures $41,694,463 $49,528,241 $45,032,765
Use of Fund Balance
Beginning Fund Balance $15,545,739 $17,108,937 $14,617,988
Additions/(Reductions) to Fund Balance 1,563,198 (2,490,949) * (4,410,311) **
Ending Fund Balance $17,108,937 $14,617,988 * $10,207,677 **
* Estimated.
** Assumes budgeted revenues and expenditures.
$0
$10,000,000
$20,000,000
$30,000,000
$40,000,000
$50,000,000
$60,000,000
ActualFY17
ActualFY18
ActualFY19
AdoptedFY20
AdoptedFY21
Police Services, Facilities or Equipment Tax Fund
Historical and Projected Expenditures
Table of Contents

Fund Summary
D-53
The Solid Waste Management Fund, formerly the Sanitation Fund, was established to track the revenues and expenditures of refuse collection activities. Revenues are first collected by the Oklahoma City Environmental Assistance Trust (OCEAT) and then transferred monthly to the Solid Waste Management Fund for operations. The Solid Waste Management Division was moved from the Public Works Department to the Water and Wastewater Utilities Department as part
of the FY98 budget. The Division functions as an enterprise fund responsible for the supervision, coordination and control of various work activities that contribute to the health, welfare and beautification of the community through a high level of refuse collection services.
Solid Waste Management Fund
Actual Adopted Adopted
FY19 FY20 FY21
Revenues
Interest $38,522 $46,482 $50,862
Transfers 9,000,000 10,081,192 10,095,047
Fund Balance 0 1,001,021 1,000,000
Total Revenues $9,038,522 $11,128,695 $11,145,909
Expenditures - Utilities
Personal Services $7,711,159 $9,108,975 $9,057,630
Other Services & Charges 1,421,747 1,832,199 1,886,119
Supplies 97,852 187,521 202,160
Capital Outlay 0 0 0
Transfers 0 0 0
Total Expenditures $9,230,758 $11,128,695 $11,145,909
Use of Fund Balance
Beginning Fund Balance $1,460,871 $1,268,635 $1,000,000
Additions/(Reductions) to Fund Balance (192,236) (268,635) * (1,000,000) **
Ending Fund Balance $1,268,635 $1,000,000 * $0 **
* Estimated.
** Assumes budgeted revenues and expenditures.
$0
$2,000,000
$4,000,000
$6,000,000
$8,000,000
$10,000,000
$12,000,000
ActualFY17
ActualFY18
ActualFY19
AdoptedFY20
AdoptedFY21
Solid Waste Management Fund
Historical and Projected Expenditures
Table of Contents
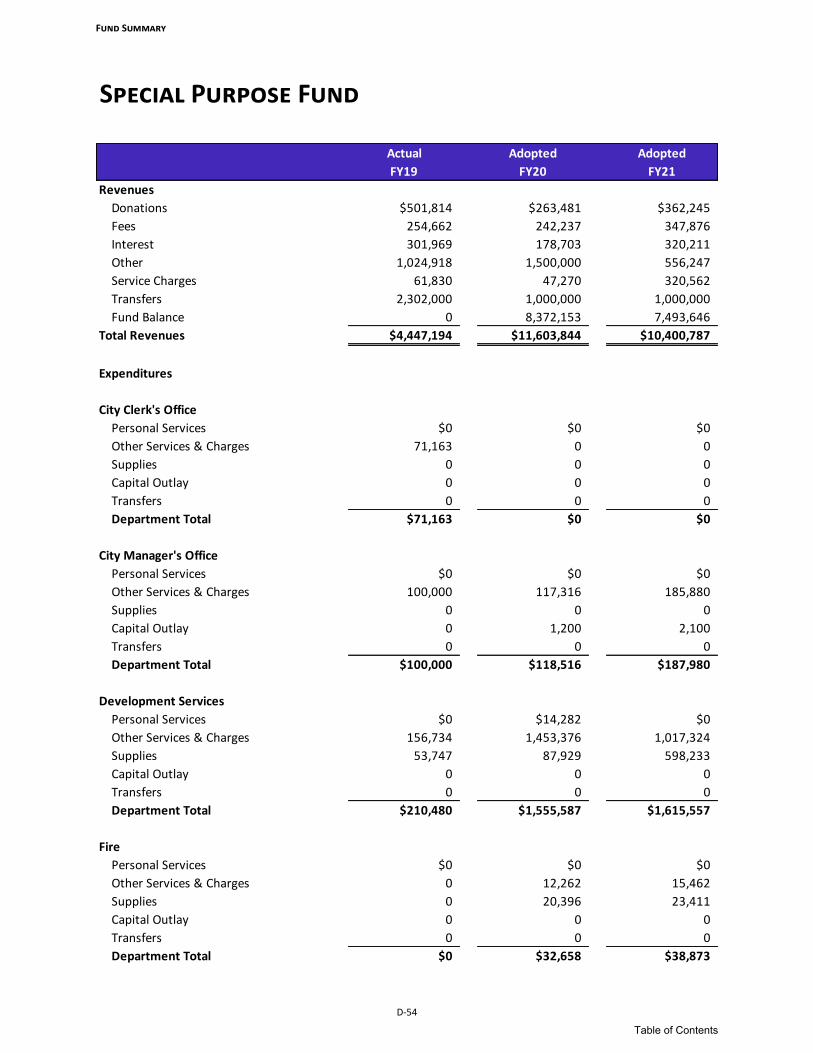
Fund Summary
D-54
Special Purpose Fund
Actual Adopted Adopted
FY19 FY20 FY21
Revenues
Donations $501,814 $263,481 $362,245
Fees 254,662 242,237 347,876
Interest 301,969 178,703 320,211
Other 1,024,918 1,500,000 556,247
Service Charges 61,830 47,270 320,562
Transfers 2,302,000 1,000,000 1,000,000
Fund Balance 0 8,372,153 7,493,646
Total Revenues $4,447,194 $11,603,844 $10,400,787
Expenditures
City Clerk's Office
Personal Services $0 $0 $0
Other Services & Charges 71,163 0 0
Supplies 0 0 0
Capital Outlay 0 0 0
Transfers 0 0 0
Department Total $71,163 $0 $0
City Manager's Office
Personal Services $0 $0 $0
Other Services & Charges 100,000 117,316 185,880
Supplies 0 0 0
Capital Outlay 0 1,200 2,100
Transfers 0 0 0
Department Total $100,000 $118,516 $187,980
Development Services
Personal Services $0 $14,282 $0
Other Services & Charges 156,734 1,453,376 1,017,324
Supplies 53,747 87,929 598,233
Capital Outlay 0 0 0
Transfers 0 0 0
Department Total $210,480 $1,555,587 $1,615,557
Fire
Personal Services $0 $0 $0
Other Services & Charges 0 12,262 15,462
Supplies 0 20,396 23,411
Capital Outlay 0 0 0
Transfers 0 0 0
Department Total $0 $32,658 $38,873
Table of Contents

Fund Summary
D-55
Actual Adopted Adopted
FY19 FY20 FY21
Non-Departmental
Personal Services $0 $0 $0
Other Services & Charges 0 500,000 500,000
Supplies 0 0 0
Capital Outlay 0 0 0
Transfers 0 0 0
Department Total $0 $500,000 $500,000
Parks and Recreation
Personal Services $0 $0 $0
Other Services & Charges 63,600 867,074 2,054,065
Supplies 42,724 550,710 987,232
Capital Outlay 196,148 2,522,496 1,487,981
Transfers 0 0 0
Department Total $302,472 $3,940,280 $4,529,278
Planning
Personal Services $0 $0 $0
Other Services & Charges 7,210 248,851 287,426
Supplies 25,000 0 0
Capital Outlay 0 113,222 7,482
Transfers 0 0 0
Department Total $32,210 $362,073 $294,908
Police
Personal Services $0 $0 $0
Other Services & Charges 19,000 65,151 37,542
Supplies 0 10,347 25,730
Capital Outlay 0 0 0
Transfers 0 0 0
Department Total $19,000 $75,498 $63,272
Public Works
Personal Services $0 $0 $0
Other Services & Charges 107,835 1,620,424 188,599
Supplies 0 0 0
Capital Outlay 873,401 3,398,808 2,982,320
Transfers 0 0 0
Department Total $981,236 $5,019,232 $3,170,919
Table of Contents

Fund Summary
D-56
The Special Purpose Fund is used primarily for donations to the City of Oklahoma City or for other designated uses. The expenditures are made from specific accounts designated for each special purpose. Typical expenditures of the fund are projects relating to improvements by neighborhood associations, recreation improvements, renovations in parks, improvements at the animal shelter, and projects relating to fire safety.
$0
$2,000,000
$4,000,000
$6,000,000
$8,000,000
$10,000,000
$12,000,000
$14,000,000
ActualFY17
ActualFY18
ActualFY19
AdoptedFY20
AdoptedFY21
Special Purpose Fund
Historical and Projected Expenditures
Actual Adopted Adopted
FY19 FY20 FY21
All Departments
Personal Services $0 $14,282 $0
Other Services & Charges 525,541 4,884,454 4,286,298
Supplies 121,471 669,382 1,634,606
Capital Outlay 1,069,549 6,035,726 4,479,883
Transfers 0 0 0
Total Expenditures $1,716,562 $11,603,844 $10,400,787
Use of Fund Balance
Beginning Fund Balance $5,750,638 $8,481,270 $7,493,646
Additions/(Reductions) to Fund Balance 2,730,632 (987,624) * (7,493,646) **
Ending Fund Balance $8,481,270 $7,493,646 * $0 **
* Estimated.
** Assumes budgeted revenues and expenditures.
Table of Contents

Fund Summary
D-57
The Oklahoma City Sports Facilities Improvement Sales Tax Fund, established in FY08 pursuant to voter approval on March 4, 2008, is a limited term, limited purpose sales tax earmarked for certain capital improvements relating to the City’s sports arena and the construction of the professional basketball team practice facility. Funding was provided through a one percent temporary sales tax that began on January 1, 2009 and expired on March 31, 2010.
Sports Facilities Sales Tax Fund (Oklahoma City Sports Facilities Improvement Sales Tax Fund)
Actual Adopted Adopted
FY19 FY20 FY21
Revenues
Sports Facilities Sales Tax $0 $0 $500
Interest 1,245 558 623
Other 609 0 0
Fund Balance 0 46,942 49,136
Total Revenues $1,854 $47,500 $50,259
Expenditures - City Manager's Office
Personal Services $0 $0 $0
Other Services & Charges 20,578 26,029 28,788
Supplies 0 21,471 21,471
Capital Outlay 0 0 0
Transfers 0 0 0
Total Expenditures $20,578 $47,500 $50,259
Use of Fund Balance
Beginning Fund Balance $66,332 $47,608 $49,136
Additions/(Reductions) to Fund Balance (18,724) 1,528 * (49,136) **
Ending Fund Balance $47,608 $49,136 * $0 **
* Estimated.
** Assumes budgeted revenues and expenditures.
$0
$50,000
$100,000
$150,000
$200,000
$250,000
$300,000
$350,000
ActualFY17
ActualFY18
ActualFY19
AdoptedFY20
AdoptedFY21
Sports Facilities Sales Tax Fund
Historical and Projected Expenditures
Table of Contents

Fund Summary
D-58
The Oklahoma City Sports Facilities Use Tax is the companion use tax to the one-cent Oklahoma City Sports Facilities Sales Tax. The tax provides a levy of one percent on the sale of tangible personal property not subject to sales tax from January 1, 2009 through March 21, 2010. The City Council has expressed its intent to use this fund for expenses related to the Oklahoma City Sports Facilities Sales Tax Fund and the funding of other City capital projects as specified by a resolution of the City Council.
Sports Facilities Use Tax Fund (Oklahoma City Sports Facilities Improvement Use Tax Fund)
Actual Adopted Adopted
FY19 FY20 FY21
Revenues
Sports Facilities Use Tax $0 $0 $0
Interest 2,305 913 1,153
Other (283) 0 0
Fund Balance 0 97,023 98,652
Total Revenues $2,022 $97,936 $99,805
Expenditures - City Manager's Office
Personal Services $0 $0 $0
Other Services & Charges 19,976 97,936 99,805
Supplies 58,520 0 0
Capital Outlay 0 0 0
Transfers 0 0 0
Department Total $78,496 $97,936 $99,805
Use of Fund Balance
Beginning Fund Balance $174,452 $97,978 $98,652
Additions/(Reductions) to Fund Balance (76,474) 674 * (98,652) **
Ending Fund Balance $97,978 $98,652 * $0 **
* Estimated.
** Assumes budgeted revenues and expenditures.
$0
$50,000
$100,000
$150,000
$200,000
$250,000
$300,000
$350,000
$400,000
ActualFY17
ActualFY18
ActualFY19
AdoptedFY20
AdoptedFY21
Sports Facilities Use Tax Fund
Historical and Projected Expenditures
Table of Contents

Fund Summary
D-59
The Stormwater Drainage Utility Fund was established by Council on June 13, 1995 to address federal mandates governing National Pollution Discharge Elimination System (NPDES) programs and is responsible for planning and implementing strategies for improving the quality of storm and other runoff waters. The Stormwater Drainage Utility fund is an enterprise fund with operating revenues generated from a drainage fee. Fees are billed monthly along with water, wastewater, and solid waste fees.
Stormwater Drainage Utility Fund
Actual Adopted Adopted
FY19 FY20 FY21
Revenues
Fees $17,818,772 $18,022,200 $18,953,204
Interest 424,375 496,042 443,460
Other 0 0 0
Permits 124,280 127,251 109,399
Reimbursements 255,766 255,766 255,766
Service Charges 45,143 43,975 47,312
Transfers 0 0 0
Fund Balance 0 8,290,071 12,560,529
Total Revenues $18,668,336 $27,235,305 $32,369,670
Expenditures - Public Works
Personal Services $9,473,216 $10,991,849 $11,040,430
Other Services & Charges 4,950,358 13,951,308 19,362,819
Supplies 1,072,788 1,666,772 1,405,804
Capital Outlay 355,008 625,376 560,617
Transfers 0 0 0
Total Expenditures $15,851,371 $27,235,305 $32,369,670
Use of Fund Balance
Beginning Fund Balance $17,854,938 $20,671,903 $36,914,880
Additions/(Reductions) to Fund Balance 2,816,966 16,242,977 * (12,560,529) **
Ending Fund Balance $20,671,903 $36,914,880 * $24,354,351 **
* Estimated.
** Assumes budgeted revenues and expenditures.
$0
$5,000,000
$10,000,000
$15,000,000
$20,000,000
$25,000,000
$30,000,000
$35,000,000
ActualFY17
ActualFY18
ActualFY19
AdoptedFY20
AdoptedFY21
Stormwater Drainage Utility Fund
Historical and Projected Expenditures
Table of Contents

Fund Summary
D-60
The Street and Alley Fund provides for street resurfacing and major repairs on City streets that are in addition to those projects funded through General Obligation Bonds. Fund Balance provides the funding for these projects.
Street and Alley Fund
Actual Adopted Adopted
FY19 FY20 FY21
Revenues
Interest $3,352 $0 $0
Other (10,000) 0 0
Fund Balance 0 156,719 146,868
Total Revenues ($6,648) $156,719 $146,868
Expenditures - Public Works
Personal Services $0 $0 $0
Other Services & Charges 46 1,899 1,899
Supplies 0 5 5
Capital Outlay 16,209 154,815 144,964
Transfers 0 0 0
Total Expenditures $16,255 $156,719 $146,868
Use of Fund Balance
Beginning Fund Balance $167,701 $144,799 $156,719
Additions/(Reductions) to Fund Balance (22,903) 11,920 * (146,868) **
Ending Fund Balance $144,799 $156,719 * $9,851 **
* Estimated.
** Assumes budgeted revenues and expenditures.
$0
$50,000
$100,000
$150,000
$200,000
$250,000
ActualFY17
ActualFY18
ActualFY19
AdoptedFY20
AdoptedFY21
Street and Alley Fund
Historical and Projected Expenditures
Table of Contents

Fund Summary
D-61
Transportation and Parking Fund
Actual Adopted Adopted
FY19 FY20 FY21
Revenues
Interest $14,898 $19,039 $13,494
Other 10,228 0 0
Service Charges 462,214 631,605 347,753
Transfers 2,926,070 3,889,306 4,141,164
Fund Balance 0 52,878 0
Total Revenues $3,413,410 $4,592,828 $4,502,411
Expenditures
Parking
Personal Services $502,129 $563,198 $496,638
Other Services & Charges 250,154 533,215 416,835
Supplies 56,176 79,568 31,400
Capital Outlay 0 0 0
Transfers 0 0 0
Department Total $808,458 $1,175,981 $944,873
Public Transportation
Personal Services $2,701,961 $3,095,122 $3,206,815
Other Services & Charges 159,918 321,725 350,723
Supplies 0 0 0
Capital Outlay 0 0 0
Transfers 0 0 0
Department Total $2,861,879 $3,416,847 $3,557,538
All Departments
Personal Services $3,204,089 $3,658,320 $3,703,453
Other Services & Charges 410,072 854,940 767,558
Supplies 56,176 79,568 31,400
Capital Outlay 0 0 0
Transfers 0 0 0
Total Expenditures $3,670,337 $4,592,828 $4,502,411
Use of Fund Balance
Beginning Fund Balance $321,982 $65,055 $0
Additions/(Reductions) to Fund Balance (256,927) (65,055) * 0 **
Ending Fund Balance $65,055 $0 * $0 **
* Estimated.
** Assumes budgeted revenues and expenditures.
Table of Contents

Fund Summary
D-62
The Transportation and Parking Fund was established by Council action in September 1989. The Fund was established as a direct result of the reorganization of the Central Oklahoma Transportation and Parking Authority, in which administrative functions became part of the City organization. The reorganization also separated Public Transportation and Parking Services into two distinct operations identified separately. The Central Oklahoma Transportation and Parking Authority (COTPA) was created in
1966 as a Public Trust pursuant to Title 60 of the Oklahoma Statutes, Section 176. The purpose of COTPA is to provide a means of financing municipal public transportation services and functions. The trust indenture provides that COTPA will acquire and operate transportation service and equipment, receive all revenue generated from these services, pay the debt service requirements on the revenue bonds issued by COTPA, pay all operating expenses, and finance future improvements. The trust does not have the power to levy taxes.
$0
$500,000
$1,000,000
$1,500,000
$2,000,000
$2,500,000
$3,000,000
$3,500,000
$4,000,000
$4,500,000
$5,000,000
ActualFY17
ActualFY18
ActualFY19
AdoptedFY20
AdoptedFY21
Transportation and Parking Fund
Historical and Projected Expenditures
Table of Contents

Fund Summary
D-63
Water and Wastewater Fund
Actual Adopted Adopted
FY19 FY20 FY21
Revenues
Interest $311,522 $367,085 $365,858
Other 15 0 0
Service charges 0 0 0
Transfers 80,800,000 95,475,866 95,255,941
Fund Balance 0 1,298,249 800,000
Total Revenues $81,111,537 $97,141,200 $96,421,799
Expenditures
Water
Personal Services $28,892,181 $31,669,240 $32,435,720
Other Services & Charges 17,369,573 22,902,426 22,323,096
Supplies 8,425,589 11,199,157 10,594,919
Capital Outlay 0 0 0
Transfers 0 0 0
Departmental Total $54,687,342 $65,770,823 $65,353,735
Wastewater
Personal Services $18,549,261 $22,382,740 $21,691,897
Other Services & Charges 6,109,198 6,945,798 7,338,145
Supplies 1,548,460 2,041,839 2,038,022
Capital Outlay 0 0 0
Transfers 0 0 0
Departmental Total $26,206,919 $31,370,377 $31,068,064
All Departments
Personal Services $47,441,442 $54,051,980 $54,127,617
Other Services & Charges 23,478,771 29,848,224 29,661,241
Supplies 9,974,048 13,240,996 12,632,941
Capital Outlay 0 0 0
Transfers 0 0 0
Total Expenditures $80,894,261 $97,141,200 $96,421,799
Use of Fund Balance
Beginning Fund Balance $2,912,803 $3,130,079 $800,000
Additions/(Reductions) to Fund Balance 217,276 (2,330,079) * (800,000) **
Ending Fund Balance $3,130,079 $800,000 * $0 **
* Estimated.
** Assumes budgeted revenues and expenditures.
Table of Contents
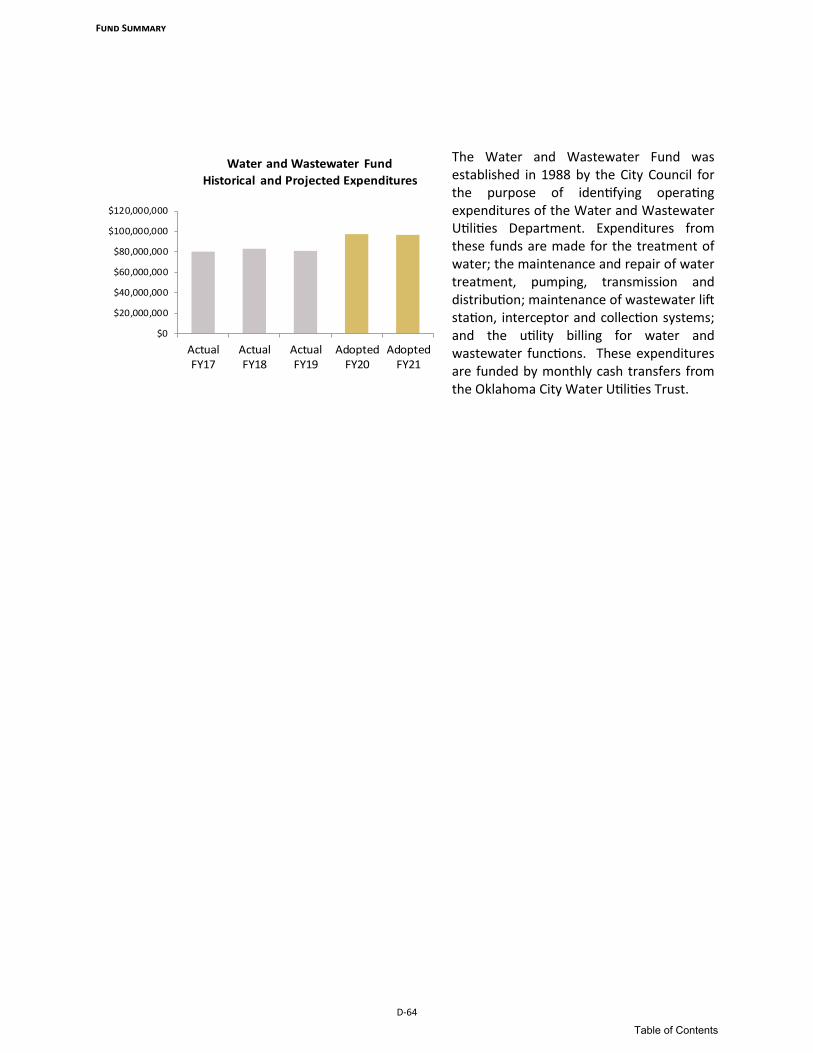
Fund Summary
D-64
The Water and Wastewater Fund was established in 1988 by the City Council for the purpose of identifying operating expenditures of the Water and Wastewater Utilities Department. Expenditures from these funds are made for the treatment of water; the maintenance and repair of water treatment, pumping, transmission and distribution; maintenance of wastewater lift station, interceptor and collection systems; and the utility billing for water and wastewater functions. These expenditures are funded by monthly cash transfers from the Oklahoma City Water Utilities Trust.
$0
$20,000,000
$40,000,000
$60,000,000
$80,000,000
$100,000,000
$120,000,000
ActualFY17
ActualFY18
ActualFY19
AdoptedFY20
AdoptedFY21
Water and Wastewater Fund
Historical and Projected Expenditures
Table of Contents

Fund Summary
D-65
On July 17, 1990, the Oklahoma City voters approved a one-eighth cent sales tax levy for the limited purpose of funding the Oklahoma City Zoo. The Oklahoma City Zoo Sales Tax Fund was created to collect all revenues pursuant to the Zoo tax levy. The ordinance provides that Zoo Sales Tax funds will only be used for the establishment, maintenance, replacement, and expansion of zoological parks, gardens, and entertainment facilities; the acquisition, maintenance, and replacement of real property, personal property, and buildings; the operational expenses, education
research and program expenses, conservation program expenses, and all other expenses deemed necessary or advisable by the Oklahoma City Zoological Trust in connection with the operation of the Oklahoma City Zoo. The Oklahoma City Zoological Trust is a public trust of which the City of Oklahoma City is the sole beneficiary. The Trust operates the Oklahoma City Zoo under a lease and operating agreement with the City.
Zoo Sales Tax Fund
Actual Adopted Adopted
FY19 FY20 FY21
Revenues
Zoo Sales Tax Revenue $14,240,968 $14,570,373 $13,346,522
Interest 3,829 0 3,829
Fund Balance 0 291,407 301,798
Total Revenues $14,244,798 $14,861,780 $13,652,149
Expenditures - Zoo
Personal Services $0 $0 $0
Other Services & Charges 0 0 0
Supplies 0 0 0
Capital Outlay 0 0 0
Transfers 14,244,798 14,861,780 13,652,149
Total Expenditures $14,244,798 $14,861,780 $13,652,149
Use of Fund Balance
Beginning Fund Balance $0 $0 $0
Additions/(Reductions) to Fund Balance 0 0 * (301,798) **
Ending Fund Balance $0 $0 * ($301,798) **
* Estimated** Assumes budgeted revenues and expenditures
$12,000,000
$12,500,000
$13,000,000
$13,500,000
$14,000,000
$14,500,000
$15,000,000
$15,500,000
ActualFY17
ActualFY18
ActualFY19
AdoptedFY20
AdoptedFY21
Zoo Sales Tax Fund
Historical and Projected Expenditures
Table of Contents

Fund Summary
D-66
Table of Contents

Capital Improvement
E-1
Capital Improvement Budget
The Capital Improvement budget is separate from the city’s operating budget approved by the city council. The provided capital budget is a listing of fy21 amounts budgeted and funding sources of each planned project. The planned capital expenditures represents the cost of new construction, renovation, acquisition or capital maintenance of City infrastructure, facilities, or other capital investments, to ensure the continuation of service, enhance operations and promote economic development. a five-year Capital Improvement plan is prepared bi-annually to identify projects across the City which improve municipal services, strengthen infrastructure, enhance culture and recreation, and promote the economic development and growth of the City. The five-year CIP plan is available to the public and published online at https://www.okc.gov/departments/finance/financial-and-budget-reports/budget-and-tax-reports.
Table of Contents

Capital Improvement Funding
Capital Improvement
E-2
The FY21 Capital Improvement Budget includes capital expenditures funded through various sources. Capital projects funded by General Obligation Bonds and Public Trusts are included in this section to provide a comprehensive capital position. Capital budgets for these two sources are not approved through the normal budget process. City voters approve General Obligation Bond propositions providing authorization for bond funded capital projects. Public trusts’ capital budgets are approved by the trustees.
Capital Funding
Operating Funds
Trust Funds
General Obligation Bond
Funds
Non-Operating
Funds
Grant Management
Funds
• Airports Fund
• General Fund
• Fire Sales Tax
Fund
• Asset Forfeiture Fund
• Better Streets, Safer City
Sales Tax Fund
• Better Streets, Safer City
Use Tax Fund
• Capital Improvement
Projects Fund
• City and Schools Capital
Use Tax Fund
• MAPS Fund
• MAPS 3 Sales Tax Fund
• MAPS 3 Use Tax Fund
• MAPS 4 Program Fund
• MAPS 4 Use Tax Fund
• Police and Fire
Equipment
Sales Tax Fund
• Police Sales Tax Fund
• Special Purpose
Funds
• Sports Facilities
Sales Tax Fund
• Sports Facilities Use
Tax Fund
• Stormwater Drainage
Utility Fund
• Central Oklahoma
Parking and
Transportation
Authority
• Oklahoma City
Airports Trust
• Oklahoma City
Economic
Development
Trust
• Oklahoma City
Environmental
Authority Trust
• Oklahoma City
Municipal
Facilities Authority
• Oklahoma City
Public Property
Authority
• Oklahoma City
Water Utilities
Trust
• Oklahoma City
Zoological Trust
• 2007 General
Obligation Bonds
• 2017 General
Obligation Bonds
• Police Grants
• Public Works
Grants
• Trust Grants
Table of Contents

E-3
Capital Improvement
impact of Capital Projects on the Operating Budget The City recognizes that capital projects have an impact on the operating budget in two distinct ways and has taken appropriate steps to address those impacts. The first impact occurs during the design and construction phase of capital projects. As projects are being undertaken, City staff has numerous design, management, construction and oversight responsibilities. For example, implementation of the General Obligation Bond Programs have required significant resources, particularly within the Public Works Department, due to the extensive design and project management requirements of these programs. Where feasible, the costs of project management are charged to the associated projects by the department providing those services. The second and primary impact of capital projects on the operating budget is the ongoing maintenance and operations requirements that continue after a project is completed. As part of the operating and capital budget development process, departments are asked to identify costs associated with the maintenance and operation of capital projects that are to be completed in the coming fiscal year and future fiscal year impacts. The City’s capital planning process includes the estimate of future operating and maintenance costs resulting from proposed capital improvements. Capital improvements that replace existing City assets generally reduce maintenance and operating costs in the near term. As the assets age, maintenance and operating costs will increase, but generally do not exceed the cost of operating and maintaining the assets they are replacing. For new capital projects, which increase City assets, Departments are required to provide estimates of future operating and maintenance costs to assist in the decision making for operating budgets and to allow for consideration of the feasibility of the projects.
Airports4.6%
Culture and Recreation29.2%
Public Works*25.9%
Public Safety6.3%
General Government
4.5%
Public Education0.4%
Public Transportation and Parking
1.0%
Utilities28.1%
FY21 Capital Budget by Function
$1,301,612,132**
*Publ ic Works includes s treets, bridges, drainage and traffic projects
** Estimated Capital Expenditures as of June 16, 2020
Table of Contents

Capital Expenditures Summary
Capital Improvement
E-4
Actual Adopted Planned
FY19 FY20 FY21
Operating Funds
Airports Fund $156,402 $500,000 $500,000
General Fund 20,994 0 0
Internal Service Fund 0 35,000 30,700
Medical Service Program Fund 257,374 0 3,600,000
Stormwater Drainage Fund 355,008 480,898 480,898
Total Operating Funds $789,778 $1,015,898 $4,611,598
Non-Operating Funds
Asset Forfeiture Funds $0 $200,000 $200,000
Capital Improvements Projects Fund 2,155,220 39,340,583 50,208,915
Impact Fee Fund 817,000 21,431,470 33,826,064
Internal Service Capital Fund 0 185,000 245,298
Special Purpose Funds 1,069,549 6,535,726 4,479,883
Stormwater Drainage Capital Fund 0 1,650,000 1,650,000
Street and Alley Capital Fund 16,209 154,815 144,964
Total Non-Operating Funds $4,057,978 $69,497,594 $90,755,124
Trust Funds *
Central OK Trans. and Parking Auth. (COTPA) $4,796,341 $31,757,726 1,771,855
OKC Airport Trust (OCAT) 30,983,063 77,314,378 50,095,725
OKC Environmental Assistance Trust (OCEAT) 3,360,027 3,484,000 3,665,000
OKC Economic Development Trust (OCEDT) 1,551,180 0 0
OKC Metro Area Projects Trust (OCMAPS) 0 0 0
OKC Municipal Facilities Authority (OCMFA) 583,220 6,808,526 3,526,645
OKC Public Property Authority (OCPPA) 2,132,025 14,966,998 9,435,114
OKC Water Util ities Trust (OCWUT) 130,992,033 387,730,000 361,490,000
OKC Zoological Trust (OCZT) 3,971,619 7,964,000 8,910,038
Total Trust Funds $178,369,508 $530,025,628 $438,894,377
Special Tax Funds
Special Tax Funds $146,416,816 $593,883,601 $587,534,775
Total Special Tax Funds $146,416,816 $593,883,601 $587,534,775
General Obligation Bond Funds
General Obligation Bond Funds $64,949,864 $140,049,000 $168,599,344
Total General Obligation Bond Funds $64,949,864 $140,049,000 $168,599,344
Grant Management Funds
Grant Management Funds $5,930,123 $8,494,437 $11,216,914
Total Grant Management Funds $5,930,123 $8,494,437 $11,216,914
Total Capital Expenditures ** $400,514,067 $1,342,966,158 $1,301,612,132
* Not included in the City's adopted budget
** Estimated Capital Expenditures as of June 16, 2020
Table of Contents
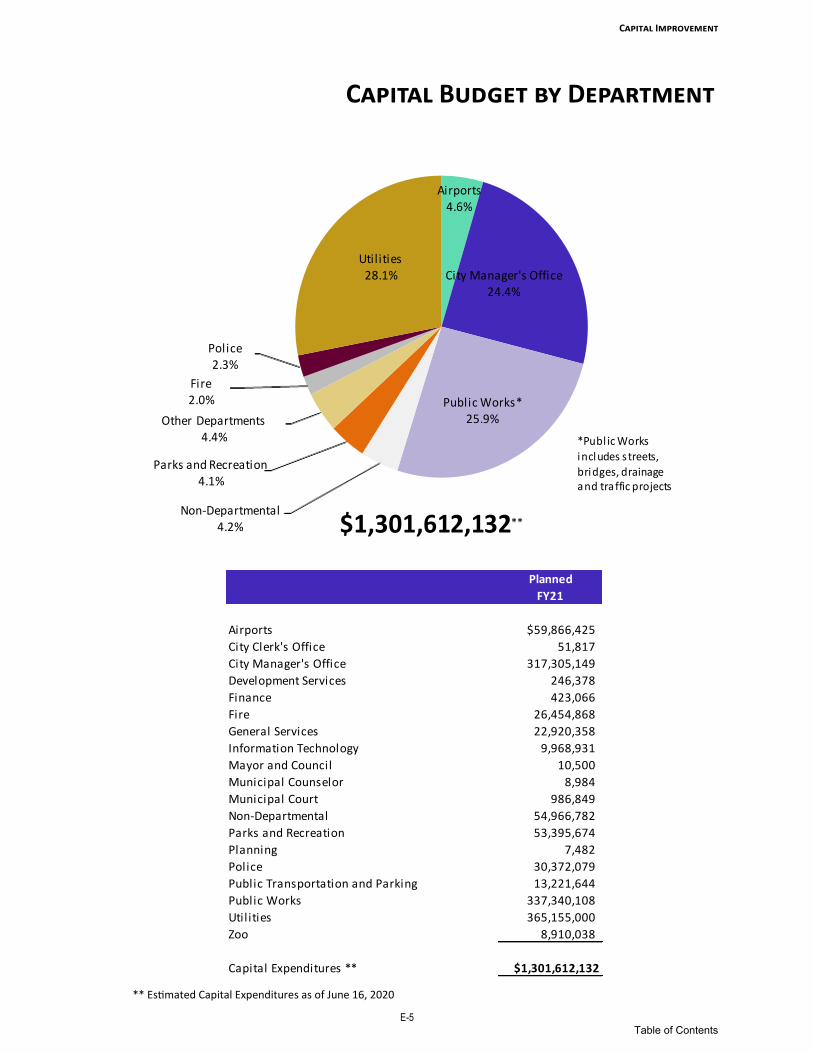
Capital Budget by Department
Capital Improvement
E-5
Airports4.6%
City Manager's Office24.4%
Public Works*25.9%
Non-Departmental4.2%
Parks and Recreation4.1%
Other Departments4.4%
Fire2.0%
Police2.3%
Utilities 28.1%
$1,301,612,132**
*Publ ic Works
includes s treets,
bridges, drainage and traffic projects
Planned
FY21
Airports $59,866,425
City Clerk's Office 51,817
City Manager's Office 317,305,149
Development Services 246,378
Finance 423,066
Fire 26,454,868
General Services 22,920,358
Information Technology 9,968,931
Mayor and Council 10,500
Municipal Counselor 8,984
Municipal Court 986,849
Non-Departmental 54,966,782
Parks and Recreation 53,395,674
Planning 7,482
Police 30,372,079
Public Transportation and Parking 13,221,644
Public Works 337,340,108
Util ities 365,155,000
Zoo 8,910,038
Capital Expenditures ** $1,301,612,132
** Estimated Capital Expenditures as of June 16, 2020
Table of Contents

Capital Improvement
E-6
Table of Contents

AIRPORTS CAPITAL PROGRAM
AIRPORTS
ARFF ACCESS ROAD PAVEMENT REPL - 7100 Terminal Drive, Oklahoma City 73159 (Ward 3)
Will Rogers World Airport - Remove and replace pavement connecting AAR Apron and Terminal Apron south of ARFF building. Estimated annual operating cost is $0.
FY21 Cost
Oklahoma City Airport Trust $516,600
Project Total $516,600
CEPA RECONSTRUCT FBO APRON - 2300 Cimmaron Road, Yukon, OK 73099 (Ward 3)
Clarence E. Page Airport- Reconstruction OCAT owned portion of FBO Apron. Estimated annual operating cost is $0.
FY21 Cost
Other Grants $5,544
Oklahoma City Airport Trust $526
Project Total $6,070
ELECTRIC CARTS FOR PASSENGER - 7100 Terminal Drive, Oklahoma City, OK 73159 (Ward 3)
Will Rogers World Airport - Four 8-passenger electric carts, including two wheelchair accessible carts to be used in the WRWA terminal concourse. Estimated annual operating cost is $0.
FY21 Cost
Oklahoma City Airport Trust $56,000
Project Total $56,000
ENVIRONMENTAL REMEDIATION - 6500 South MacArthur Blvd., Oklahoma City, OK 73169 (Ward 3)
Mike Monroney Aeronautical Center - This will be used when its necessary to remediate buildings or areas before projects. Estimated annual operating cost is $0.
FY21 Cost
Oklahoma City Airport Trust $125,000
Project Total $125,000
GARAGE EXTERIOR PAINTING STUDY - 7100 Terminal Drive, Oklahoma City, OK 73159 (Ward 3)
Will Rogers World Airport - Analysis and engineering for painting of all Parking Garages B and C. Estimated annual operating cost is $0.
FY21 Cost
Oklahoma City Airport Trust $250,000
Project Total $250,000
Table of Contents

AIRPORTS CAPITAL PROGRAM
MECHANICAL IMPROVEMENTS - 7100 Terminal Drive, Oklahoma City, OK 73159 (Ward 3)
Will Roger World Airport - Emergency repairs. Estimated annual operating cost is $0.
FY21 Cost
Oklahoma City Airport Trust $100,000
Project Total $100,000
MECHANICAL SYSTEMS REPAIR - 6500 South MacArthur Blvd., Oklahoma City, OK 73169 (Ward 3)
Mike Monroney Aeronautical Center - This will be used when its necessary to repair or maintain mechanical HVAC systems due to failures before a full project can begin. Estimated annual operating cost is $0.
FY21 Cost
Oklahoma City Airport Trust $125,000
Project Total $125,000
MEDIUM VOLTAGE SYSTEMS - 6500 South MacArthur Blvd., Oklahoma City, OK 73169 (Ward 3)
Mike Monroney Aeronautical Center - This will be used when its necessary to repair or maintain medium voltage systems due to failures before a full project can begin. Estimated annual operating cost is $0.
FY21 Cost
Oklahoma City Airport Trust $125,000
Project Total $125,000
MMAC HANGAR 8 & 9 ELECTRICAL - 6500 South MacArthur Blvd., Oklahoma City, OK 73169 (Ward 3)
Mike Monroney Aeronautical Center - Replace main switch gear, electrical distribution system, and 400 hz aircraft charging system. Estimated annual operating cost is $0.
FY21 Cost
Oklahoma City Airport Trust $438,254
Project Total $438,254
MMAC HANGAR 8 BOILER AND HEAT - 6500 South MacArthur Blvd., Oklahoma City, OK 73169 (Ward 3)
Mike Monroney Aeronautical Center - Replace boilers, air handling units (AHUs), unit heaters, and heating distribution system. Estimated annual operating cost is $0.
FY21 Cost
Oklahoma City Airport Trust $500,000
Project Total $500,000
Table of Contents
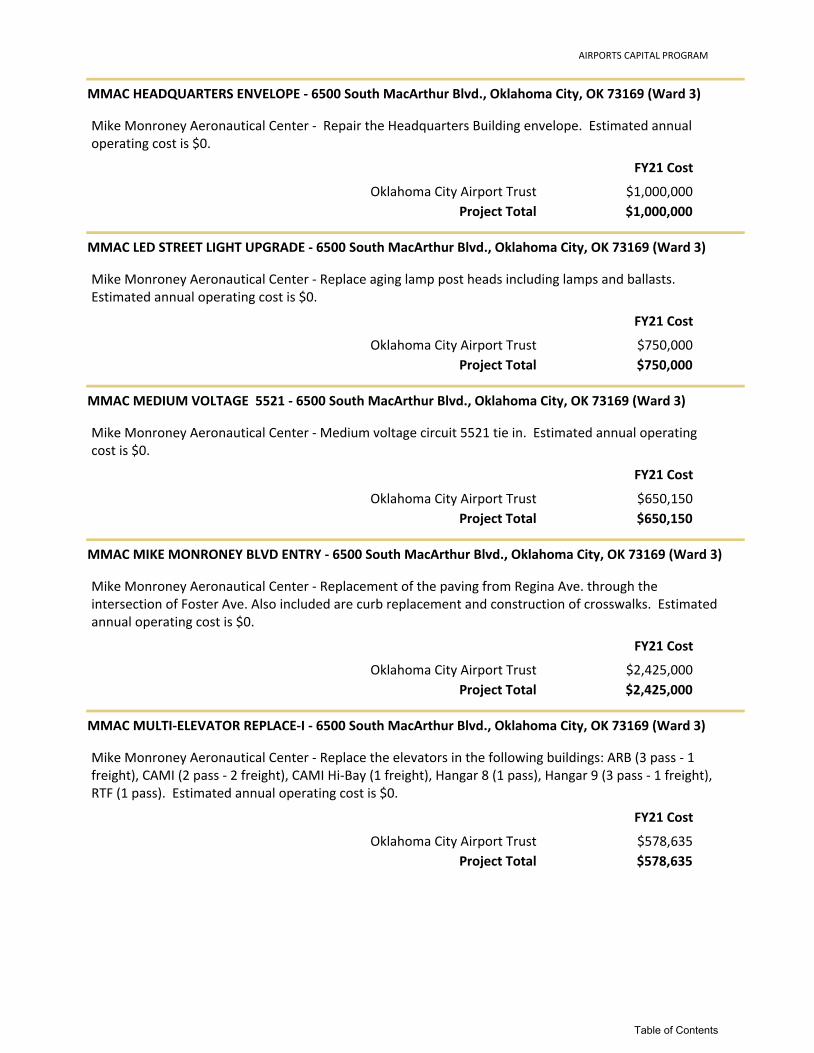
AIRPORTS CAPITAL PROGRAM
MMAC HEADQUARTERS ENVELOPE - 6500 South MacArthur Blvd., Oklahoma City, OK 73169 (Ward 3)
Mike Monroney Aeronautical Center - Repair the Headquarters Building envelope. Estimated annual operating cost is $0.
FY21 Cost
Oklahoma City Airport Trust $1,000,000
Project Total $1,000,000
MMAC LED STREET LIGHT UPGRADE - 6500 South MacArthur Blvd., Oklahoma City, OK 73169 (Ward 3)
Mike Monroney Aeronautical Center - Replace aging lamp post heads including lamps and ballasts. Estimated annual operating cost is $0.
FY21 Cost
Oklahoma City Airport Trust $750,000
Project Total $750,000
MMAC MEDIUM VOLTAGE 5521 - 6500 South MacArthur Blvd., Oklahoma City, OK 73169 (Ward 3)
Mike Monroney Aeronautical Center - Medium voltage circuit 5521 tie in. Estimated annual operating cost is $0.
FY21 Cost
Oklahoma City Airport Trust $650,150
Project Total $650,150
MMAC MIKE MONRONEY BLVD ENTRY - 6500 South MacArthur Blvd., Oklahoma City, OK 73169 (Ward 3)
Mike Monroney Aeronautical Center - Replacement of the paving from Regina Ave. through the intersection of Foster Ave. Also included are curb replacement and construction of crosswalks. Estimated annual operating cost is $0.
FY21 Cost
Oklahoma City Airport Trust $2,425,000
Project Total $2,425,000
MMAC MULTI-ELEVATOR REPLACE-I - 6500 South MacArthur Blvd., Oklahoma City, OK 73169 (Ward 3)
Mike Monroney Aeronautical Center - Replace the elevators in the following buildings: ARB (3 pass - 1 freight), CAMI (2 pass - 2 freight), CAMI Hi-Bay (1 freight), Hangar 8 (1 pass), Hangar 9 (3 pass - 1 freight), RTF (1 pass). Estimated annual operating cost is $0.
FY21 Cost
Oklahoma City Airport Trust $578,635
Project Total $578,635
Table of Contents

AIRPORTS CAPITAL PROGRAM
MMAC SLAB MONITOR AND REPLACE - 6500 South MacArthur Blvd., Oklahoma City, OK 73169 (Ward 3)
Mike Monroney Aeronautical Center - Replacement of pavement slabs around the Flight Standards Building, Air Navigation Facility 1, Air Traffic Building and Aviation Records Building ramps. Estimated annual operating cost is $0.
FY21 Cost
Oklahoma City Airport Trust $250,000
Project Total $250,000
MMAC STREETS AND PARKING - 6500 South MacArthur Blvd., Oklahoma City, OK 73169 (Ward 3)
Mike Monroney Aeronautical Center - Streets and parking reconstruction as identified in the FY 12 Annual Inspection. Estimated annual operating cost is $0.
FY21 Cost
Oklahoma City Airport Trust $800,000
Project Total $800,000
NATURAL GAS SYSTEM REPAIR - 6500 South MacArthur Blvd., Oklahoma City, OK 73169 (Ward 3)
Mike Monroney Aeronautical Center - This will be used when its necessary to repair or maintain the natural gas master meter system due to failures before a full project can begin. Estimated annual operating cost is $0.
FY21 Cost
Oklahoma City Airport Trust $100,000
Project Total $100,000
OLD FIRE STATION UPPER ROOF - 7100 Terminal Drive, Oklahoma City, OK 73159 (Ward 3)
Will Rogers World Airport - Replace the upper and lower roof on the Old Fire Station. Estimated annual operating cost is $0.
FY21 Cost
Oklahoma City Airport Trust $400,000
Project Total $400,000
OTHER CCTV HARDWARE/SOFTWARE - 7100 Terminal Drive, Oklahoma City, OK 73159 (Ward 3)
Will Rogers World Airport - Other CCTV hardware and software, to be broken out and coded to specific projects/cost centers. Estimated annual operating cost is $0.
FY21 Cost
Oklahoma City Airport Trust $150,000
Project Total $150,000
Table of Contents

AIRPORTS CAPITAL PROGRAM
PAVEMENT REPLACEMENT REHAB - 7100 Terminal Drive, Oklahoma City, OK 73159 (Ward 3)
Will Rogers World Airport - Funding for unexpected pavement repair or replacement project. Estimated annual operating cost is $0.
FY21 Cost
Oklahoma City Airport Trust $500,000
Project Total $500,000
Replace 22 Yr Old Dozier - 7100 Terminal Drive, Oklahoma City, OK 73159 (Ward 3)
Will Rogers World Airport - Replace equipment that's becoming less dependable, costly to maintain and obsolete parts Estimated annual operating cost is $10,000.
FY21 Cost
Oklahoma City Airport Trust $310,000
Project Total $310,000
ROOF IMPROVEMENTS - 7100 Terminal Drive, Oklahoma City, OK 73159 (Ward 3)
Will Rogers World Airport - Funding for unexpected roof project. Estimated annual operating cost is $0.
FY21 Cost
Oklahoma City Airport Trust $1,500,000
Project Total $1,500,000
ROOF REPAIR AND MAINTENANCE - 6500 South MacArthur Blvd., Oklahoma City, OK 73169 (Ward 3)
Mike Monroney Aeronautical Center - This will be used when its necessary to repair or maintain roofs due to damage before a full project can begin. Estimated annual operating cost is $0.
FY21 Cost
Oklahoma City Airport Trust $250,000
Project Total $250,000
TERMINAL EXPANSION PHASE III - 7100 Terminal Drive, Oklahoma City, OK 73159 (Ward 3)
Will Rogers World Airport - Terminal Expansion (PFC building), Apron (AIP), and PBBs (AIP). Estimated annual operating cost is $100,001.
FY21 Cost
Oklahoma City Airport Trust $527,020
PAX\Customer Facility Charges $21,292,539
Project Total $21,819,559
Table of Contents

AIRPORTS CAPITAL PROGRAM
UPPER LEVEL DECK STRUCTURE - 7100 Terminal Drive, Oklahoma City, OK 73159 (Ward 3)
Will Rogers World Airport - Phase 1--Demolish Soffit on the underside of the deck; Phase 2--A&E to determine structural repairs and finished product; Phase 3--Repair structure and provide finish for underside of deck. Estimated annual operating cost is $0.
FY21 Cost
Other Grants $3,367,877
Oklahoma City Airport Trust $1,089,903
Project Total $4,457,780
WIDEN RWW 17R/35L TO 100' - 5915 Phillip Rhoads Ave., Bethany, OK 73008 (Ward 1)
Wiley Post Airport - Widen Runway 17R/35L from 75' to 100' and reconstruct asphalt section of runways. Install new lights in cans previously installed. Estimated annual operating cost is $0.
FY21 Cost
Oklahoma City Airport Trust $111,125
Project Total $111,125
WPA GULFSTREAM DEMO - 5915 Phillip Rhoads Ave., Bethany, OK 73008 (Ward 3)
Wiley Post Airport - WPA Gulfstream demolition. Estimated annual operating cost is $1,491,600.
FY21 Cost
Oklahoma City Airport Trust $749,112
Project Total $749,112
WPA Hangar 10 Roof - 5915 Phillip Rhoads Ave., Bethany, OK 73008 (Ward 1)
Wiley Post Airport - Recoating of the Hangar 10 roof. Estimated annual operating cost is $0.
FY21 Cost
Oklahoma City Airport Trust $10,000
Project Total $10,000
WPA Hangar 3 and 6 Roof - 5915 Phillip Rhoads Ave., Bethany, OK 73008 (Ward 1)
Wiley Post Airport - Recoating of Hangar 6 and replacement of Hangar 3. Estimated annual operating cost is $0.
FY21 Cost
Oklahoma City Airport Trust $290,000
Project Total $290,000
Table of Contents

AIRPORTS CAPITAL PROGRAM
WPA HGR 11 MIDDLE & HIGH ROOF - 5915 Phillip Rhoads Ave., Bethany, OK 73008 (Ward 1)
Wiley Post Airport - Re-Roof High Roof and Adjacent Equipment Room (middle roof). Estimated annual operating cost is $0.
FY21 Cost
Oklahoma City Airport Trust $380,000
Project Total $380,000
WPA MECHANICAL AND PLUMBING - 5915 Phillip Rhoads Ave, Bethany, OK 73008 (Ward 1)
Wiley Post Airport - Upgrade and/or evaluate HVAC systems and plumbing infrastructure. Estimated annual operating cost is $0.
FY21 Cost
Oklahoma City Airport Trust $835,000
Project Total $835,000
WPA RW 13-31 REHABILITATION - 5915 Phillip Rhoads Ave., Bethany, OK 73008 (Ward 1)
Wiley Post Airport - Install new oversized base and conduit system with new LED edge lights, new cable and constant current regulator. Install new LED mandatory signs and new LED mandatory runway exit signs on RWY 13/31. Estimated annual operating cost is $0.
FY21 Cost
Other Grants $74,272
Oklahoma City Airport Trust $27,368
Project Total $101,640
WPA Terminal FAA Build Rehab - 5915 Phillip Rhoads Ave., Bethany, OK 73008 (Ward 1)
Wiley Post Airport - Terminal FAA Building Electrical Rehab, Replacement of electrical equipment, including transformers, cutoff switches, circuit panels and wiring as needed. Estimated annual operating cost is $0.
FY21 Cost
Oklahoma City Airport Trust $60,000
Project Total $60,000
WPA Terminal Roof Replacement - 5915 Phillip Rhoads Ave., Bethany, OK 73008 (Ward 1)
Wiley Post Airport - Replace the roof over the Terminal and Restaurant Estimated annual operating cost is $0.
FY21 Cost
Oklahoma City Airport Trust $40,000
Project Total $40,000
Table of Contents

AIRPORTS CAPITAL PROGRAM
WRWA RUNWAY 13-31 REHAB - 7100 Terminal Drive, Oklahoma City, OK 73159 (Ward 3)
Will Rogers World Airport - Rehabilitate the asphalt pavement through a mill and overlay of the complete surface, base and subgrade repairs as necessary, and new marking and grooving. Estimated annual operating cost is $0.
FY21 Cost
Other Grants $879,551
Oklahoma City Airport Trust $220,419
Project Total $1,099,970
WRWA BAGGAGE CLAIM UNITS - 7100 Terminal Drive, Oklahoma City, OK 73159 (Ward 3)
Will Rogers World Airport - Replace six baggage claim units. Estimated annual operating cost is $50,000.
FY21 Cost
Oklahoma City Airport Trust $500,000
Project Total $500,000
WRWA FIDSAND ENGAGE IMPROVE - 7100 Terminal Drive, Oklahoma City, OK 73159 (Ward 3)
Will Rogers World Airport - Flight information display system (FIDS) and Engage hardware replacement of aging Legacy hardware and software. Estimated annual operating cost is $40,000.
FY21 Cost
Oklahoma City Airport Trust $50,000
Project Total $50,000
WRWA Garage B and C - Repairs - 7100 Terminal Drive, Oklahoma City, OK 73159 (Ward 3)
Will Rogers World Airport - Garage B and C - Review/Repair Waterproofing and Structural Repairs. Estimated annual operating cost is $2,430,000.
FY21 Cost
Oklahoma City Airport Trust $300,000
Project Total $300,000
WRWA MAINTENANCE AND MULTI-BAY - 7100 Terminal Drive, Oklahoma City, OK 73159 (Ward 3)
Will Rogers World Airport - Plan and design a new 2 or 3 bay maintenance facility at the south maintenance yard large enough to accommodate the new CNG 35-foot CONRAC busses, ARFF vehicles, and snow removal equipment. Estimated annual operating cost is $0.
FY21 Cost
Oklahoma City Airport Trust $2,000,000
Project Total $2,000,000
Table of Contents

AIRPORTS CAPITAL PROGRAM
WRWA NETWORK INFRASTRUCTURE - 7100 Terminal Drive, Oklahoma City, OK 73159 (Ward 3)
Will Rogers World Airport - Multi-year project to replace failing, end of life network equipment for new hardware with 10-year life expectancy. Estimated annual operating cost is $10,000.
FY21 Cost
Oklahoma City Airport Trust $100,000
Project Total $100,000
WRWA SHUTTLE BUSES - 7100 Terminal Drive, Oklahoma City, OK 73159 (Ward 3)
Will Rogers World Airport - Purchase of replacement buses. Estimated annual operating cost is $0.
FY21 Cost
Oklahoma City Airport Trust $190,000
Project Total $190,000
WRWA SNOW REMOVAL EQUIPMENT - 7100 Terminal Drive, Oklahoma City, OK 73159 (Ward 3)
Will Rogers World Airport - Replace equipment that's becoming less dependable, costly to maintain and obsolete parts. Estimated annual operating cost is $10,000.
FY21 Cost
Other Grants $1,449,000
Oklahoma City Airport Trust $161,000
Project Total $1,610,000
WRWA STATION 2 RENOVATION - 7100 Terminal Drive, Oklahoma City, OK 73159 (Ward 3)
Will Rogers World Airport - Remove and upgrade the two existing elevators, and add a two-large machine room less elevator. Also replace the HVAC equipment and roof, upgrade lighting, and other upgrades to the enclosure for water tightness. Estimated annual operating cost is $0.
FY21 Cost
Oklahoma City Airport Trust $4,922,600
Project Total $4,922,600
WRWA TERMINAL ACCESS ROAD - 7100 Terminal Drive, Oklahoma City, OK 73159 (Ward 3)
Will Rogers World Airport - Rehabilitate the terminal entrance and exit road along with adjacent intersecting roads. Estimated annual operating cost is $0.
FY21 Cost
Other Grants $3,500,000
Oklahoma City Airport Trust $1,425,000
Project Total $4,925,000
Table of Contents
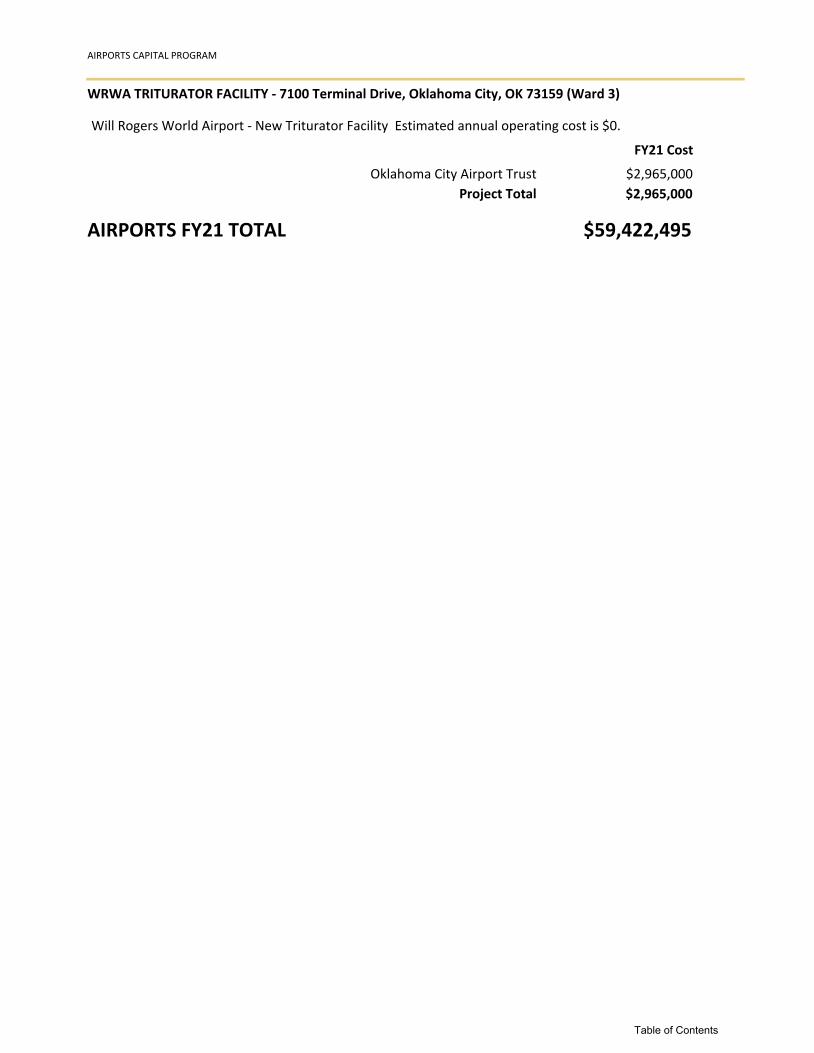
AIRPORTS CAPITAL PROGRAM
WRWA TRITURATOR FACILITY - 7100 Terminal Drive, Oklahoma City, OK 73159 (Ward 3)
Will Rogers World Airport - New Triturator Facility Estimated annual operating cost is $0.
FY21 Cost
Oklahoma City Airport Trust $2,965,000
Project Total $2,965,000
$59,422,495AIRPORTS FY21 TOTAL
Table of Contents

BOND-OTHER CAPITAL PROGRAM
BOND-OTHER
Downtown Buildings CNTRL_ULSTA - 201 North Walker Ave. Oklahoma City, OK 73102 (Ward 6)
Control project for unlisted bond funds related to Downtown City buildings. Estimated annual operating cost is $0.
FY21 Cost
2017 G.O. Bonds $350,000
Project Total $350,000
Libraries CNTRL_ULSTA - To be determined (N/A)
Libraries Unlisted Control Account Estimated annual operating cost is $0.
FY21 Cost
2017 G.O. Bonds $250,000
Project Total $250,000
$600,000BOND-OTHER FY21 TOTAL
Table of Contents

CITY MANAGER CAPITAL PROGRAM
CITY MANAGER
Ballpark Improvements - 2 S Mickey Mantle Drive (Ward 7)
Various repairs and improvements that are needed at the Ballpark. Estimated annual operating cost is $0.
FY21 Cost
OKC Public Property Authority $1,400,000
Project Total $1,400,000
Ballpark Maintenance - 2 S Mickey Mantle Drive (Ward 7)
Capital expenditures for scheduled capital maintenance at ballpark. Estimated annual operating cost is $0.
FY21 Cost
OKC Public Property Authority $1,460,000
Project Total $1,460,000
COX Center Projects - 1 Myriad Gardens (Ward 6)
Capital maintenance to the facility and various improvements at the Cox Convention Center to enhance the visitor experience at the arena. Estimated annual operating cost is $0.
FY21 Cost
OKC Public Property Authority $450,000
Project Total $450,000
Downtown Arena Improvements - 100 W Reno Ave. (Ward 7)
Repair, renovate, remodel, improve, equip, and furnish the City‘s Downtown Arena. Estimated annual operating cost is $0.
FY21 Cost
2017 G.O. Bonds $4,000,000
Project Total $4,000,000
Parking Lots and Resurfacing - Oklahoma State Fairgrounds (Citywide)
Improvements to various Fairgrounds' parking areas in support of activities conducted at the facilities. Estimated annual operating cost is $0.
FY21 Cost
Capital Improvement Fund $300,000
Project Total $300,000
Table of Contents

CITY MANAGER CAPITAL PROGRAM
Softball Hall of Fame - 2801 NE 50th Street (Ward 7)
Phase IV of USA Softball Hall of Fame including various improvements the stadium; such as a new media center, ticket booths, press box, concourse and restrooms. Estimated annual operating cost is $0.
FY21 Cost
2017 G.O. Bonds $3,000,000
Project Total $3,000,000
$10,610,000CITY MANAGER FY21 TOTAL
Table of Contents

CITY MANAGER - (MAPS 3) CAPITAL PROGRAM
CITY MANAGER - (MAPS 3)
MAPS 3 Convention Center - Downtown Oklahoma City (Ward 6)
Land acquisition and construction of the new MAPS 3 Downtown Convention Center. Estimated annual operating cost is $0.
FY21 Cost
MAPS3 Sales Tax $14,033,614
Project Total $14,033,614
MAPS 3 Downtown Public Park - Downtown Oklahoma City (Ward 6)
Land acquisition and construction of the new MAPS 3 Downtown Public Park. Estimated annual operating cost is $1,200,000.
FY21 Cost
MAPS3 Sales Tax $14,110,557
Project Total $14,110,557
MAPS 3 Oklahoma River - Along the Oklahoma River (Ward 7)
Improvements at the Oklahoma River including upgrades to the rowing and paddling venue and the construction of a new Whitewater Rapids facility. Estimated annual operating cost is $0.
FY21 Cost
MAPS3 Sales Tax $4,662,442
Project Total $4,662,442
MAPS 3 Senior Health/Wellness - Citywide
Construction of Senior Health and Wellness Centers. Estimated annual operating cost is $0.
FY21 Cost
MAPS3 Sales Tax $19,235,719
Project Total $19,235,719
MAPS 3 Sidewalks - Citywide
Construction of new MAPS 3 Sidewalk projects. Estimated annual operating cost is $0.
FY21 Cost
MAPS3 Sales Tax $1,115,425
Project Total $1,115,425
Table of Contents

CITY MANAGER - (MAPS 3) CAPITAL PROGRAM
MAPS 3 Trails - Citywide
Proposed construction of new trails including: the I-44 West Trail, the West River/Lake Overholser Trail, the Lake Draper Trail, and the Airport Trail. Estimated annual operating cost is $100,000.
FY21 Cost
MAPS3 Sales Tax $2,956,493
Project Total $2,956,493
$56,114,250CITY MANAGER - (MAPS 3) FY21 TOTAL
Table of Contents

FIRE CAPITAL PROGRAM
FIRE
Fire Apparatus Replacement - (N/A)
Fire apparatus replacement plan. Fire apparatus is comprised of all the emergency vehicles responding from fire stations including command vehicles. Estimated annual operating cost is $0.
FY21 Cost
Btr Streets Safer City Use Tax $4,800,000
Project Total $4,800,000
Fire CNTRL_ULSTA - Unlisted Control Account - Fire (N/A)
Fire Control Account-Unlisted Estimated annual operating cost is $0.
FY21 Cost
2017 G.O. Bonds $200,000
Project Total $200,000
Fire Passenger Vehicles - (N/A)
Replacement of fire support vehicles. Estimated annual operating cost is $0.
FY21 Cost
Btr Streets Safer City Use Tax $230,000
Project Total $230,000
Fire Training Center - In the vicinity of I-240 and S Air Depot (Ward 4)
Construct a new training center, new fire stations, and repair, renovate, remodel, replace, improve, furnish, equipment and technology improvements of Fire facilities. Estimated annual operating cost is $0.
FY21 Cost
2017 G.O. Bonds $2,500,000
Project Total $2,500,000
$7,730,000FIRE FY21 TOTAL
Table of Contents

GENERAL SERVICES CAPITAL PROGRAM
GENERAL SERVICES
ADA Compliance Program - Citywide
ADA program to assist in bringing City facilities into compliance. Estimated annual operating cost is $0.
FY21 Cost
Capital Improvement Fund $150,000
Project Total $150,000
AMAG Hardware Replacement - (N/A)
AMAG - hardware replacement including locks, card and various maintenance items. Estimated annual operating cost is $0.
FY21 Cost
Capital Improvement Fund $75,000
Project Total $75,000
City Buildings Downtown Campus - City buildings - Downtown Campus (Ward 6)
Repair, renovate, furnish, equip and improve City buildings and facilities within the Civic Center Complex. Estimated annual operating cost is $0.
FY21 Cost
2017 G.O. Bonds $3,980,000
Project Total $3,980,000
Citywide Carpet Replacement - Various City facilities (Ward 6)
Replace aged carpet that reaches the manufacturer's life cycle and documented wear percentage in the Downtown campus buildings, select CMF buildings, and SW Oklahoma City Library (approximately three departments per year). Estimated annual operating cost is $0.
FY21 Cost
Capital Improvement Fund $50,000
Project Total $50,000
Citywide Facilities Reserve - Citywide
Reserve funding for Capital Maintenance. Estimated annual operating cost is $0.
FY21 Cost
Capital Improvement Fund $500,000
Project Total $500,000
Table of Contents

GENERAL SERVICES CAPITAL PROGRAM
Citywide Fire Alarm Panel Rplc - (Citywide)
Replace the fire alarm panels at various City buildings. Estimated annual operating cost is $0.
FY21 Cost
Capital Improvement Fund $300,000
Project Total $300,000
Citywide Fleet Replacement - (N/A)
Replacement of highway and non-highway equipment in the general fleet used by Animal Welfare, Development Services, Municipal Court, Parks, Public Transportation and Parking, and Public Works. Estimated annual operating cost is $0.
FY21 Cost
Capital Improvement Fund $3,300,000
Project Total $3,300,000
Citywide Roofing - Citywide
Roof repairs and/or replacement as identified for various facilities citywide. Estimated annual operating cost is $0.
FY21 Cost
Capital Improvement Fund $70,000
Project Total $70,000
Citywide Waterproofing - (Citywide)
Waterproof exterior walls of City buildings Estimated annual operating cost is $0.
FY21 Cost
Capital Improvement Fund $150,000
Project Total $150,000
CMF Complex CNTRL_ULSTA - 3738 SW 15th Street (Ward 3)
Control project for unlisted bond funds related to the Central Maintenance Facility. Estimated annual operating cost is $0.
FY21 Cost
2017 G.O. Bonds $200,000
Project Total $200,000
Table of Contents

GENERAL SERVICES CAPITAL PROGRAM
CMF Painting - 3738 SW 15th Street (Ward 3)
Paint exterior of CMF building including Field Services, Street Maintenance, Training Center, Radio Shop, Fleet Maintenance and Truck Wash. Estimated annual operating cost is $0.
FY21 Cost
Capital Improvement Fund $175,000
Project Total $175,000
$8,950,000GENERAL SERVICES FY21 TOTAL
Table of Contents

NON-DEPARTMENTAL CAPITAL PROGRAM
NON-DEPARTMENTAL
EMSA Building - (N/A)
EMSA Building Purchase Estimated annual operating cost is $0.
FY21 Cost
Other Unspecified $3,600,000
Project Total $3,600,000
$3,600,000NON-DEPARTMENTAL FY21 TOTAL
Table of Contents

PARKS AND RECREATION CAPITAL PROGRAM
PARKS AND RECREATION
CCMH Interior Improvements - 201 N Walker Ave (Ward 6)
Civic Center Music Hall - Repair, renovate, furnish, equip and improvements to include Main Lobby, Freede Theatre and facility tuck pointing. Estimated annual operating cost is $0.
FY21 Cost
2017 G.O. Bonds $7,190,000
Project Total $7,190,000
Crown Heights Park - 600 NW 38th Street (Ward 2)
Install, upgrade, repair, and/or renovate park walks and path improvements and related design and/or landscaping. Estimated annual operating cost is $0.
FY21 Cost
2007 G.O. Bonds $400,000
Project Total $400,000
Deep Fork Greenway Trail - (Ward 7)
Construction of a new trail along the Deep Fork creek in Northeast Oklahoma City. Estimated annual operating cost is $0.
FY21 Cost
2007 G.O. Bonds $1,000,000
Project Total $1,000,000
Dolphin Wharton Park - 301 NE 63rd Street (Ward 7)
Improve parks by acquiring/installing/repairing and/or replacing playground equipment/spraygrounds and/or facilities which may include related design and landscaping. Estimated annual operating cost is $0.
FY21 Cost
2007 G.O. Bonds $171,500
Project Total $171,500
E. M. Sellers Park - 8301 S Villa Avenue (Ward 5)
Install/upgrade/repair and/or renovate park paving/parking lots and related design and/or landscaping. Estimated annual operating cost is $0.
FY21 Cost
2007 G.O. Bonds $200,000
Project Total $200,000
Table of Contents

PARKS AND RECREATION CAPITAL PROGRAM
Earlywine Golf Clubhouse - 11600 S Portland Avenue (Ward 5)
Acquisition, construction, expansion, renovation, repair, relocation, or improvements to new and existing City golf courses, clubhouses, maintenance facilities, practice facilities, or tournament facilities. Estimated annual operating cost is $0.
FY21 Cost
2017 G.O. Bonds $5,450,000
Project Total $5,450,000
James Stewart Golf Clubhouse - 824 Frederick Douglass Ave (Ward 7)
Acquisition, construction, expansion, renovation, repair, relocation, or improvements to new and existing City golf courses, clubhouses, maintenance facilities, practice facilities, or tournament facilities. Estimated annual operating cost is $0.
FY21 Cost
2017 G.O. Bonds $5,500,000
Project Total $5,500,000
Lafayette Mike Dover Park - 4601 S Walker Avenue (Ward 4)
Improve parks by acquiring/installing/repairing and/or replacing playground equipment/spraygrounds and/or facilities which may include related design and landscaping. Estimated annual operating cost is $0.
FY21 Cost
2007 G.O. Bonds $155,000
Project Total $155,000
MG Air Handling Units - 301 West Reno (Ward 6)
Myriad Botanical Gardens - Replacement/repairs air handling units in the Crystal Bridge. Estimated annual operating cost is $0.
FY21 Cost
Capital Improvement Fund $150,000
Project Total $150,000
Myriad Gardens Capital Fund - 301 W Reno Avenue (Ward 6)
Capital maintenance projects at Myriad Gardens facilities. Estimated annual operating cost is $0.
FY21 Cost
Capital Improvement Fund $215,000
Project Total $215,000
Table of Contents

PARKS AND RECREATION CAPITAL PROGRAM
Neighborhood Parks - New neighborhood parks in Wards 3, 4 and 8 (Citywide)
Acquisition, construction, expansion, equipping and improvement of new City parks, parkland, recreational facilities, or trails. Estimated annual operating cost is $0.
FY21 Cost
2017 G.O. Bonds $5,500,000
Project Total $5,500,000
New Park Northeast OKC - Northeast area of Oklahoma City (Ward 7)
Land acquisition and development of a new local, neighborhood park in NE OKC. Location TBD. Estimated annual operating cost is $0.
FY21 Cost
2007 G.O. Bonds $441,000
Project Total $441,000
North Highland Park - 301 NW 81st Street (Ward 7)
Install/upgrade/repair and/or renovate park walks and path improvements and related design and/or landscaping. Estimated annual operating cost is $0.
FY21 Cost
2007 G.O. Bonds $85,000
Project Total $85,000
North Rotary - North Oklahoma City Rotary Park - 5708 N Tulsa Avenue (Ward 2)
Install/upgrade/repair and/or renovate park walks and path improvements and related design and/or landscaping. Estimated annual operating cost is $0.
FY21 Cost
2007 G.O. Bonds $260,000
Project Total $260,000
North Rotary Park - 5708 N Tulsa Avenue (Ward 2)
Improve parks by acquiring/installing/repairing and/or replacing playground equipment/spraygrounds and/or facilities which may include related design and landscaping. Estimated annual operating cost is $0.
FY21 Cost
2007 G.O. Bonds $150,000
Project Total $150,000
Table of Contents

PARKS AND RECREATION CAPITAL PROGRAM
Northeast Park - 1300 NE 33rd Street (Ward 7)
Improve existing community centers/gyms/party houses/picnic shelters or pavilions/recreational facilities by designing & improving HVAC/roofs/parking lots/windows/restrooms/locker rooms/structural/ acoustical/landscaping/accessibility or other repairs. Estimated annual operating cost is $0.
FY21 Cost
2007 G.O. Bonds $500,000
Project Total $500,000
NW Oklahoma City Park - New park in NW Oklahoma City (Ward 8)
Acquisition, construction, expansion, equipping and improvement of new City parks, parkland, recreational facilities, or trails. Estimated annual operating cost is $0.
FY21 Cost
2017 G.O. Bonds $3,000,000
Project Total $3,000,000
Oklahoma River Greenway Trail - (Ward 7)
Construction of a new trail on Oklahoma River. Estimated annual operating cost is $0.
FY21 Cost
2007 G.O. Bonds $2,000,000
Project Total $2,000,000
Parks and Rec Fac CNTRL_ULSTA - (N/A)
Control project for unlisted bond funds related to the Parks and Recreation Facilities. Estimated annual operating cost is $0.
FY21 Cost
2017 G.O. Bonds $1,000,000
Project Total $1,000,000
Pat Murphy Park - 4551 W Hefner Road (Ward 8)
Install/upgrade/repair and/or renovate park walks and path improvements and related design and/or landscaping. Estimated annual operating cost is $0.
FY21 Cost
2007 G.O. Bonds $205,000
Project Total $205,000
Table of Contents

PARKS AND RECREATION CAPITAL PROGRAM
South Rotary Park - 1800 Westwood Blvd (Ward 5)
Install/upgrade/repair and/or renovate park walks and path improvements and related design and/or landscaping. Estimated annual operating cost is $0.
FY21 Cost
2007 G.O. Bonds $235,000
Project Total $235,000
Southern Oaks Park - 6818 S Walker Avenue (Ward 5)
Improve existing community centers/gyms/party houses/picnic shelters or pavilions/recreational facilities by designing & improving HVAC/roofs/parking lots/windows/restrooms/locker rooms/structural/ acoustical/landscaping/accessibility or other repairs. Estimated annual operating cost is $0.
FY21 Cost
2007 G.O. Bonds $400,000
Project Total $400,000
Syl Goldman Park - 5333 S Independence Avenue (Ward 3)
Install/upgrade/repair and/or renovate park walks and path improvements and related design and/or landscaping. Estimated annual operating cost is $0.
FY21 Cost
2007 G.O. Bonds $335,000
Project Total $335,000
Taylor Park - 1115 SW 70th Street (Ward 5)
Improve existing community centers/gyms/party houses/picnic shelters or pavilions/recreational facilities by designing & improving HVAC/roofs/parking lots/windows/restrooms/locker rooms/structural/ acoustical/landscaping/accessibility or other repairs. Estimated annual operating cost is $0.
FY21 Cost
2007 G.O. Bonds $205,000
Project Total $205,000
Trail wayfinding and signage - Throughout the Trail system (Citywide)
Acquisition, construction, expansion, renovation, repair, relocation, or improvements to new and/or existing City trails. Estimated annual operating cost is $0.
FY21 Cost
2017 G.O. Bonds $1,700,000
Project Total $1,700,000
Table of Contents

PARKS AND RECREATION CAPITAL PROGRAM
Wiley Post Park - 2021 S Robinson Avenue (Ward 4)
Improve parklands by installing, providing, improving playgrounds, athletic, picnic, and aquatic facilities, trails, water features, horticulture, nature observation, landscaping, lighting, equipment, furniture and maintenance facilities. Estimated annual operating cost is $0.
FY21 Cost
2007 G.O. Bonds $3,600,000
Project Total $3,600,000
Will Rogers Park - 3400 NW 36th Street (Ward 3)
Acquisition, construction, expansion, equipping and improvement of new City parks, parkland, recreational facilities, or trails. Estimated annual operating cost is $0.
FY21 Cost
2017 G.O. Bonds $2,000,000
Project Total $2,000,000
Willa D. Johnson Rec Center - 900 N Frederick Douglass Avenue (Ward 7)
Acquisition, construction, expansion, equipping and improvement of new City parks, parkland, recreational facilities, or trails. Estimated annual operating cost is $0.
FY21 Cost
2017 G.O. Bonds $5,000,000
Project Total $5,000,000
Woodson Park - 3401 S May Avenue (Ward 3)
Improve parks by acquiring/installing/repairing and/or replacing playground equipment/spraygrounds and/or facilities which may include related design and landscaping. Estimated annual operating cost is $0.
FY21 Cost
2007 G.O. Bonds $270,000
Project Total $270,000
Zach D. Taylor Park - 633 NW 52nd Street (Ward 2)
Install/upgrade/repair and/or renovate park paving/parking lots and related design and/or landscaping. Estimated annual operating cost is $0.
FY21 Cost
2007 G.O. Bonds $95,000
Project Total $95,000
$47,412,500PARKS AND RECREATION FY21 TOTAL
Table of Contents

POLICE CAPITAL PROGRAM
POLICE
Headquarters/Courts Complex - 219 E Main St, Oklahoma City, OK 73104 (Ward 6)
Original projects to build a new Police Headquarters and Courts Complex have been completed. Remaining projects are to demolish old buildings and to construct a parking lot on the original sites. Estimated annual operating cost is $0.
FY21 Cost
2007 G.O. Bonds $1,600,000
2017 G.O. Bonds $348,959
Police Sales Tax Fund $1,600,000
Project Total $3,548,959
Helicopter Refurbishments - (N/A)
Refurbishment of police helicopter equipment. Estimated annual operating cost is $0.
FY21 Cost
Btr Streets Safer City Use Tax $1,180,000
Project Total $1,180,000
Patrol Vehicles - (N/A)
Scheduled replacement of Police patrol sedans, sport utility vehicles, boats, motorcycles and bicycles. Project also includes the addition of Patrol vehicles as new Police Officers are added to the department. Estimated annual operating cost is $0.
FY21 Cost
Btr Streets Safer City Use Tax $7,172,884
Project Total $7,172,884
Police Aviation Facility - In the vicinity of SW 54th Street and Portland Avenue (Ward 3)
Construct a police aviation facility with hanger for aircraft storage and maintenance to be located at the Southwest Police Briefing Station. Estimated annual operating cost is $0.
FY21 Cost
2017 G.O. Bonds $3,400,000
Project Total $3,400,000
Police Building Improvements - Citywide
Improvement to existing police facilities including construction, equipment, furnishings, installation or A&E services. This could include enhancements to equipment and infrastructure critical to efficient operations. Estimated annual operating cost is $0.
FY21 Cost
Police Sales Tax Fund $150,000
Project Total $150,000
Table of Contents

POLICE CAPITAL PROGRAM
Police CNTRL_ULSTA - Citywide
2017 Control account for unlisted Police GOB funds. Estimated annual operating cost is $0.
FY21 Cost
2017 G.O. Bonds $350,000
Project Total $350,000
Police Training Center - Location to be determined. (Ward 4)
MB-1473-Construct a new Police/Fire training center (Phase 1, Building Construction and Parking and Phase 2, Site Ammenities) Estimated annual operating cost is $0.
FY21 Cost
2017 G.O. Bonds $2,500,000
Project Total $2,500,000
Renovation of 616 Colcord Dr. - 616 Colcord Drive (Ward 6)
Renovations for this project include the first-floor expansion and remodel of the existing CSI Offices, Laboratory, and Firearms/Ballistics Laboratory. Estimated annual operating cost is $0.
FY21 Cost
Police Sales Tax Fund $554,000
Project Total $554,000
Special Investigations Vehicle - (N/A)
Purchase of undercover vehicles for the Special Investigations Division. Estimated annual operating cost is $0.
FY21 Cost
State Asset Forfeiture Funds $200,000
Project Total $200,000
Unmarked Vehicles Police - (N/A)
Scheduled replacement of unmarked Police vehicles. Estimated annual operating cost is $0.
FY21 Cost
Btr Streets Safer City Use Tax $793,763
Project Total $793,763
$19,849,606POLICE FY21 TOTAL
Table of Contents

PUBLIC TRANS AND PARKING CAPITAL PROGRAM
PUBLIC TRANS AND PARKING
Bus Rapid Transit - Northwest Expressway and Meridian Avenue to the Downtown Transit Center (Citywide)
Northwest Corridor Bus Rapid Transit. Estimated annual operating cost is $0.
FY21 Cost
2017 G.O. Bonds $4,000,000
Other Grants $154,960
Other Unspecified $819,840
Project Total $4,974,800
Bus Replacement - Citywide
Replace aging buses utilized beyond their useful lives. Estimated annual operating cost is $0.
FY21 Cost
2017 G.O. Bonds $3,880,000
Project Total $3,880,000
Bus Shelters - Citywide
Bus shelters (12 annually). Estimated annual operating cost is $0.
FY21 Cost
Cntrl OK Trans and Prkng Auth $21,500
Other Grants $86,000
Project Total $107,500
Bus Stop Improvements - Citywide (N/A)
Acquisition of public transit buses, bus stop improvements, and construction, repair, improvement and acquisition of transit facilities, equipment and materials. Estimated annual operating cost is $0.
FY21 Cost
2017 G.O. Bonds $250,000
Project Total $250,000
Equipment Replacement - 2000 S May Avenue (Ward 6)
Purchase of maintenance equipment. Estimated annual operating cost is $10,000.
FY21 Cost
Cntrl OK Trans and Prkng Auth $5,000
Other Grants $20,000
Project Total $25,000
Table of Contents

PUBLIC TRANS AND PARKING CAPITAL PROGRAM
Paratransit Vans - Citywide
Replacement of 25 paratransit vehicles from FY 2019 through FY 2023. Estimated annual operating cost is $0.
FY21 Cost
Cntrl OK Trans and Prkng Auth $131,515
Other Grants $745,254
Project Total $876,769
Parking Garage Improvements - Downtown (Ward 6)
Repairs and improvements to all garages including revenue collection equipment Estimated annual operating cost is $0.
FY21 Cost
Cntrl OK Trans and Prkng Auth $500,000
Project Total $500,000
Security at COTPA Facilities - Citywide
Provide access control, lighting, outside cameras and perimeter fencing at COTPA facilities. Estimated annual operating cost is $1,000.
FY21 Cost
Cntrl OK Trans and Prkng Auth $17,000
Other Grants $68,000
Project Total $85,000
Service Vehicle Replacement - Citywide
Replacement of service vehicles. Estimated annual operating cost is $0.
FY21 Cost
Cntrl OK Trans and Prkng Auth $32,000
Other Grants $92,000
Project Total $124,000
Technology Infrastructure - 2000 S May Ave (Ward 6)
Technology infrastructure. Fiber Installations at S. May, additional cameras at Transit Center along with interactive trip planning kiosk, stand up Reno mini-hub technology. Also includes computers, software and upgrading software. Estimated annual operating cost is $0.
FY21 Cost
Cntrl OK Trans and Prkng Auth $200,000
Other Grants $800,000
Project Total $1,000,000
Table of Contents

PUBLIC TRANS AND PARKING CAPITAL PROGRAM
Transit Center Improvements - 420 NW 5th Street (Ward 6)
Facilities improvements. Estimated annual operating cost is $0.
FY21 Cost
Cntrl OK Trans and Prkng Auth $50,000
Project Total $50,000
Transit CNTRL_ULSTA - (Citywide)
Control project for unlisted bond funds related to Transit. Estimated annual operating cost is $0.
FY21 Cost
2017 G.O. Bonds $250,000
Project Total $250,000
$12,123,069PUBLIC TRANS AND PARKING FY21 TOTAL
Table of Contents

PUBLIC WORKS - BRIDGES CAPITAL PROGRAM
PUBLIC WORKS - BRIDGES
Bridge CNTRL_ULSTA - (N/A)
Control project for unlisted bond funds related to the Bridges. Estimated annual operating cost is $0.
FY21 Cost
2017 G.O. Bonds $295,000
Project Total $295,000
NW 10th St, W Reno Ave - 0.5 Miles west of NW 10th St and N Council Rd (Ward 1)
Replacement, construction, reconstruction, rehabilitation, repair, or improvement of bridges, may include appurtenances, AE, ROW, utility relocation, drainage, lighting, or approach improvements. Estimated annual operating cost is $0.
FY21 Cost
2017 G.O. Bonds $3,300,000
Project Total $3,300,000
S Council, W Reno Ave - 0.6 Miles south of W Reno and Council (Ward 3)
Replacement, construction, reconstruction, rehabilitation, repair, or improvement of bridges, may include appurtenances, AE, ROW, utility relocation, drainage, lighting, or approach improvements. Estimated annual operating cost is $0.
FY21 Cost
2017 G.O. Bonds $3,850,000
Project Total $3,850,000
$7,445,000PUBLIC WORKS - BRIDGES FY21 TOTAL
Table of Contents

PUBLIC WORKS - DRAINAGE CAPITAL PROGRAM
PUBLIC WORKS - DRAINAGE
Belle Isle Park Detention Pond - 2525 NW 62nd Street (Ward 2)
Drainage, channel and water quality improvements, mapping and equipment, may include stormwater detention facilities, real property acquisition, construction and related activities, landscaping, or technology improvements. Estimated annual operating cost is $0.
FY21 Cost
2017 G.O. Bonds $1,050,000
Project Total $1,050,000
Drainage Cntrl Sys CNTRL_ULSTA - (Citywide)
Control project for unlisted bond funds related to Drainage. Estimated annual operating cost is $0.
FY21 Cost
2017 G.O. Bonds $350,000
Project Total $350,000
DRAINAGE STUDIES - Citywide
Drainage Studies Citywide Estimated annual operating cost is $0.
FY21 Cost
Stormwater Drainage Utility $150,000
Project Total $150,000
Hog Creek Lake Thunderbird - SE 29th Street to SE 149th Street and South Post Road to South Peebly Road (Ward 4)
Drainage, channel and water quality improvements, mapping and equipment, may include stormwater detention facilities, real property acquisition, construction and related activities, landscaping, or technology improvements. Estimated annual operating cost is $0.
FY21 Cost
2017 G.O. Bonds $2,400,000
Project Total $2,400,000
Mapping Data Systems Programs - (N/A)
Drainage, channel and water quality improvements, mapping and equipment, may include stormwater detention facilities, real property acquisition, construction and related activities, landscaping, or technology improvements. Estimated annual operating cost is $0.
FY21 Cost
2017 G.O. Bonds $500,000
Project Total $500,000
Table of Contents

PUBLIC WORKS - DRAINAGE CAPITAL PROGRAM
NW 56, Western NW 55, Western - NW 56th and Western Avenue (Ward 2)
Drainage, channel and water quality improvements, mapping and equipment, may include stormwater detention facilities, real property acquisition, construction and related activities, landscaping, or technology improvements. Estimated annual operating cost is $0.
FY21 Cost
2017 G.O. Bonds $1,655,000
Project Total $1,655,000
NW 90 and County Line - In The Vicinity Of W Wilshire Blvd and W Britton Rd Off County Line Rd; NW 90th St and N County Line Rd (Ward 1)
Drainage, channel and water quality improvements, mapping and equipment, may include stormwater detention facilities, real property acquisition, construction and related activities, landscaping, or technology improvements. Estimated annual operating cost is $0.
FY21 Cost
2017 G.O. Bonds $675,000
Project Total $675,000
OK Rivr Sedimnt. Basn Dredging - Oklahoma River (North Canadian River) from South Eastern to South Meridian Avenue (Ward 6)
Project is to dredge the Oklahoma River Sediment basin to remove large amounts of sediment deposits that are caused by strong flows of water. Estimated annual operating cost is $0.
FY21 Cost
Stormwater Drainage Utility $1,500,000
Project Total $1,500,000
West Elm Creek Lake Thndrbrd - SE 29th Street to SE 149th Street and South Post Road to South Peebly Road (Ward 4)
Drainage, channel and water quality improvements, mapping and equipment, may include stormwater detention facilities, real property acquisition, construction and related activities, landscaping, or technology improvements. Estimated annual operating cost is $0.
FY21 Cost
2017 G.O. Bonds $2,000,000
Project Total $2,000,000
$10,280,000PUBLIC WORKS - DRAINAGE FY21 TOTAL
Table of Contents

PUBLIC WORKS - STREETS CAPITAL PROGRAM
PUBLIC WORKS - STREETS
2007 GOB Unlisted Control Acct - (Citywide)
Control project for unlisted bond funds related to the purpose of constructing, reconstructing, improving, and repairing streets. Estimated annual operating cost is $0.
FY21 Cost
2007 G.O. Bonds $3,000,000
Project Total $3,000,000
Bike_Walker/Shartel, 16/19 St - Britton to SW 104th along Walker and Shartel; Council to I-35 along 16th and 19th (Ward 6)
Street enhancements, may include reconstruction, construction, repair, resurfacing, or improvements of streets, pedestrian safety improvements, bicycle lanes, striping, markings, or pedestrian amenities Estimated annual operating cost is $0.
FY21 Cost
2017 G.O. Bonds $2,850,000
Project Total $2,850,000
Britton, Piedmont to N Mustang - W Britton Rd from Piedmont Rd (Hwy 4) to N Mustang Rd (Ward 1)
Reconstruction, construction, repair, resurfacing, or improvements of street, may include AE, signals, signs, markings, devices, conduit, lighting, drainage, intersection imprv, ROW, utilities, sidewalks, furniture, landscaping, or irrigation sys. Estimated annual operating cost is $0.
FY21 Cost
2017 G.O. Bonds $555,000
Project Total $555,000
Bryant, SE 89 to SE 104 - Bryant Avenue from SE 89th St to SE 104th St (Ward 4)
Reconstruction, construction, repair, resurfacing, or improvements of street, may include AE, signals, signs, markings, devices, conduit, lighting, drainage, intersection imprv, ROW, utilities, sidewalks, furniture, landscaping, or irrigation sys. Estimated annual operating cost is $0.
FY21 Cost
2017 G.O. Bonds $540,000
Project Total $540,000
BSSC Sales Tax Control Acct - (Citywide)
Control project for the Better Streets, Safer City Program. Estimated annual operating cost is $0.
FY21 Cost
Better Streets Safer City Tax $68,000,000
Project Total $68,000,000
Table of Contents

PUBLIC WORKS - STREETS CAPITAL PROGRAM
Cemetery,Czech Hall,Reno,NW10 - Area bound by N Cemetery Rd, N Czech Hall Rd, W Reno Ave, NW 10 (Ward 3)
Resurfacing, repair, rehabilitation or improvement of the streets in areas bounded by listed streets, may include AE, signals, signs, markings, devices, conduit, lighting, drainage, intersection improvements, ROW, utilities, or sidewalks. Estimated annual operating cost is $0.
FY21 Cost
2017 G.O. Bonds $3,050,000
Project Total $3,050,000
EB Reno, N Meridian-Portland - East bound on W Reno Ave from N Meridian Ave to N Portland Ave (Ward 3)
Reconstruction, construction, repair, resurfacing, or improvements of street, may include AE, signals, signs, markings, devices, conduit, lighting, drainage, intersection imprv, ROW, utilities, sidewalks, furniture, landscaping, or irrigation sys. Estimated annual operating cost is $0.
FY21 Cost
2017 G.O. Bonds $550,000
Project Total $550,000
Gemstone Acres Addition - In the vicinity of SW 44 and Cemetary Rd (Ward 3)
Resurfacing, repair, rehabilitation or improvement of the streets in areas bounded by listed streets, may include AE, signals, signs, markings, devices, conduit, lighting, drainage, intersection improvements, ROW, utilities, or sidewalks. Estimated annual operating cost is $0.
FY21 Cost
2017 G.O. Bonds $555,000
Project Total $555,000
Kelley, Britton to Hefner - Kelley Ave from Britton Rd to Hefner Rd (Ward 7)
Widening and improving the listed streets which may include related A&E/signals/signs/markings/devices/conduit & improvements/lighting/drainage/intersection improvements/ROW/utilities/sidewalks &/or landscaping & irrigation systems. Estimated annual operating cost is $0.
FY21 Cost
2007 G.O. Bonds $1,500,000
Project Total $1,500,000
Kelley, Wilshire to Britton - Kelley Avenue from Wilshire Boulevard to Britton Road (Ward 7)
Widening and improving the listed streets which may include related A&E/signals/signs/markings/devices/conduit & improvements/lighting/drainage/intersection improvements/ROW/utilities/sidewalks &/or landscaping & irrigation systems. Estimated annual operating cost is $0.
FY21 Cost
2007 G.O. Bonds $1,500,000
Project Total $1,500,000
Table of Contents

PUBLIC WORKS - STREETS CAPITAL PROGRAM
Linwood Blvd, NW 6 and Western - Intersection at Linwood Boulevard, NW 6th Street and Western (Ward 6)
Street enhancements, may include reconstruction, construction, repair, resurfacing, or improvements of streets, pedestrian safety improvements, bicycle lanes, striping, markings, or pedestrian amenities Estimated annual operating cost is $0.
FY21 Cost
2017 G.O. Bonds $165,000
Project Total $165,000
MacArthur, NW 150 to NW 164 - MacArthur Boulevard from NW 150th Street to NW 164th (Ward 8)
Widening and improving the listed streets which may include related A&E/signals/signs/markings/devices/conduit & improvements/lighting/drainage/intersection improvements/ROW/utilities/sidewalks &/or landscaping & irrigation systems. Estimated annual operating cost is $0.
FY21 Cost
2007 G.O. Bonds $1,500,000
Project Total $1,500,000
MacArthur, Wilshire to Britton - N MacArthur Blvd from W Wilshire Blvd to W Britton Rd (Ward 1)
Reconstruction, construction, repair, resurfacing, or improvements of street, may include AE, signals, signs, markings, devices, conduit, lighting, drainage, intersection imprv, ROW, utilities, sidewalks, furniture, landscaping, or irrigation sys. Estimated annual operating cost is $0.
FY21 Cost
2017 G.O. Bonds $1,345,000
Project Total $1,345,000
Morgan, SW 44 to SW 29 - Morgan Road from SW 44th Street to SW 29th Street (Ward 3)
Widening and improving the listed streets which may include related A&E/signals/signs/markings/devices/conduit & improvements/lighting/drainage/intersection improvements/ROW/utilities/sidewalks &/or landscaping & irrigation systems. Estimated annual operating cost is $0.
FY21 Cost
2007 G.O. Bonds $1,000,000
Project Total $1,000,000
N MacArthr, W Hefner to NW 122 - N MacArthur Blvd from W Hefner Rd to NW 122nd St (Ward 8)
Reconstruction, construction, repair, resurfacing, or improvements of street, may include AE, signals, signs, markings, devices, conduit, lighting, drainage, intersection imprv, ROW, utilities, sidewalks, furniture, landscaping, or irrigation sys. Estimated annual operating cost is $0.
FY21 Cost
2017 G.O. Bonds $1,320,000
Project Total $1,320,000
Table of Contents

PUBLIC WORKS - STREETS CAPITAL PROGRAM
N May, NW 63 - N May Ave from N Grand Blvd to NW 47th St and NW 63rd St from N Warren Ave to N Villa Ave (Ward 1)
Sidewalk improvements, may include reconstruction, construction, repair, resurfacing, or improvements of sidewalks, AE, signals, signs, lighting, landscaping, or pedestrian amenities. Estimated annual operating cost is $0.
FY21 Cost
2017 G.O. Bonds $2,140,000
Project Total $2,140,000
NE 10, NE 23, MLK, I-35 - Area bound by NE 10th St, NE 23rd St, MLK, and I-35 (Ward 7)
Resurfacing, repair, rehabilitation or improvement of the streets in areas bounded by listed streets, may include AE, signals, signs, markings, devices, conduit, lighting, drainage, intersection improvements, ROW, utilities, or sidewalks. Estimated annual operating cost is $0.
FY21 Cost
2017 G.O. Bonds $6,100,000
Project Total $6,100,000
NE 63, Midwest to Douglas - NE 63rd St from N Midwest Blvd to N Douglas Blvd (Ward 7)
Reconstruction, construction, repair, resurfacing, or improvements of street, may include AE, signals, signs, markings, devices, conduit, lighting, drainage, intersection imprv, ROW, utilities, sidewalks, furniture, landscaping, or irrigation sys. Estimated annual operating cost is $0.
FY21 Cost
2017 G.O. Bonds $550,000
Project Total $550,000
NW 23, Western to Broadway - NW 23rd St from Western Ave to Broadway Ave (Ward 2)
Street enhancements, may include reconstruction, construction, repair, resurfacing, or improvements of streets, pedestrian safety improvements, bicycle lanes, striping, markings, or pedestrian amenities Estimated annual operating cost is $0.
FY21 Cost
2017 G.O. Bonds $3,300,000
Project Total $3,300,000
NW 36, Penn to Western - NW 36th St from N Pennsylvania Ave to N Western Ave (Ward 2)
Reconstruction, construction, repair, resurfacing, or improvements of street, may include AE, signals, signs, markings, devices, conduit, lighting, drainage, intersection imprv, ROW, utilities, sidewalks, furniture, landscaping, or irrigation sys. Estimated annual operating cost is $0.
FY21 Cost
2017 G.O. Bonds $1,335,000
Project Total $1,335,000
Table of Contents
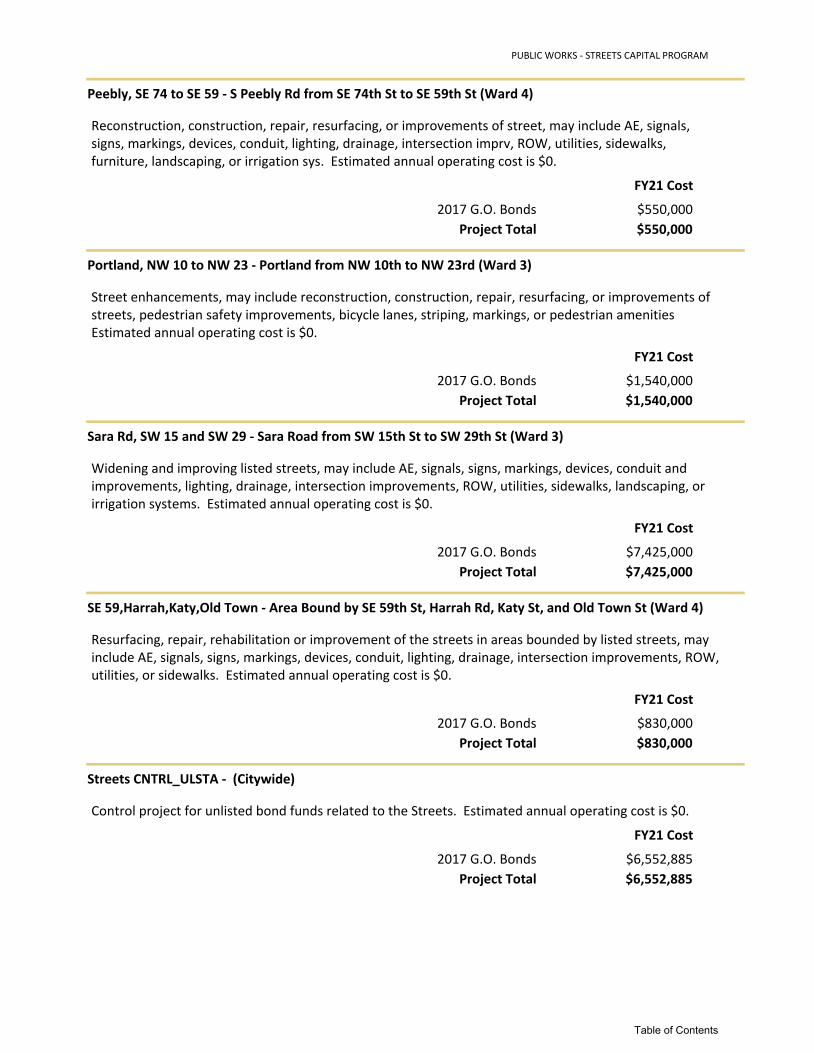
PUBLIC WORKS - STREETS CAPITAL PROGRAM
Peebly, SE 74 to SE 59 - S Peebly Rd from SE 74th St to SE 59th St (Ward 4)
Reconstruction, construction, repair, resurfacing, or improvements of street, may include AE, signals, signs, markings, devices, conduit, lighting, drainage, intersection imprv, ROW, utilities, sidewalks, furniture, landscaping, or irrigation sys. Estimated annual operating cost is $0.
FY21 Cost
2017 G.O. Bonds $550,000
Project Total $550,000
Portland, NW 10 to NW 23 - Portland from NW 10th to NW 23rd (Ward 3)
Street enhancements, may include reconstruction, construction, repair, resurfacing, or improvements of streets, pedestrian safety improvements, bicycle lanes, striping, markings, or pedestrian amenities Estimated annual operating cost is $0.
FY21 Cost
2017 G.O. Bonds $1,540,000
Project Total $1,540,000
Sara Rd, SW 15 and SW 29 - Sara Road from SW 15th St to SW 29th St (Ward 3)
Widening and improving listed streets, may include AE, signals, signs, markings, devices, conduit and improvements, lighting, drainage, intersection improvements, ROW, utilities, sidewalks, landscaping, or irrigation systems. Estimated annual operating cost is $0.
FY21 Cost
2017 G.O. Bonds $7,425,000
Project Total $7,425,000
SE 59,Harrah,Katy,Old Town - Area Bound by SE 59th St, Harrah Rd, Katy St, and Old Town St (Ward 4)
Resurfacing, repair, rehabilitation or improvement of the streets in areas bounded by listed streets, may include AE, signals, signs, markings, devices, conduit, lighting, drainage, intersection improvements, ROW, utilities, or sidewalks. Estimated annual operating cost is $0.
FY21 Cost
2017 G.O. Bonds $830,000
Project Total $830,000
Streets CNTRL_ULSTA - (Citywide)
Control project for unlisted bond funds related to the Streets. Estimated annual operating cost is $0.
FY21 Cost
2017 G.O. Bonds $6,552,885
Project Total $6,552,885
Table of Contents

PUBLIC WORKS - STREETS CAPITAL PROGRAM
SW 25, Walker to Western - SW 25th St from Walker Avenue to Western Avenue (Ward 4)
Reconstruction, construction, repair, resurfacing, or improvements of street, may include AE, signals, signs, markings, devices, conduit, lighting, drainage, intersection imprv, ROW, utilities, sidewalks, furniture, landscaping, or irrigation sys. Estimated annual operating cost is $0.
FY21 Cost
2017 G.O. Bonds $270,000
Project Total $270,000
SW 29, Robinson toWestern - SW 29th St from Robinson to Western (Ward 6)
Street enhancements, may include reconstruction, construction, repair, resurfacing, or improvements of streets, pedestrian safety improvements, bicycle lanes, striping, markings, or pedestrian amenities Estimated annual operating cost is $0.
FY21 Cost
2017 G.O. Bonds $3,300,000
Project Total $3,300,000
SW 29, Western to Penn - SW 29th St from Western to Pennsylvania (Ward 6)
Street enhancements, may include reconstruction, construction, repair, resurfacing, or improvements of streets, pedestrian safety improvements, bicycle lanes, striping, markings, or pedestrian amenities Estimated annual operating cost is $0.
FY21 Cost
2017 G.O. Bonds $3,300,000
Project Total $3,300,000
SW 59, County Line to Hwy 152 - SW 59th St from County Line Rd to Hwy 152 (Ward 3)
Widening and improving listed streets, may include AE, signals, signs, markings, devices, conduit and improvements, lighting, drainage, intersection improvements, ROW, utilities, sidewalks, landscaping, or irrigation systems. Estimated annual operating cost is $0.
FY21 Cost
2017 G.O. Bonds $4,400,000
Project Total $4,400,000
SW 59, Penn to Western - SW 59th St from S Pennsylvania Ave to S Western Ave (N/A)
Reconstruction, construction, repair, resurfacing, or improvements of street, may include AE, signals, signs, markings, devices, conduit, lighting, drainage, intersection imprv, ROW, utilities, sidewalks, furniture, landscaping, or irrigation sys. Estimated annual operating cost is $0.
FY21 Cost
2017 G.O. Bonds $1,320,000
Project Total $1,320,000
Table of Contents

PUBLIC WORKS - STREETS CAPITAL PROGRAM
SW 89, Western to Santa Fe - SW 89th St from S Western Ave to S Santa Fe Ave (Ward 5)
Reconstruction, construction, repair, resurfacing, or improvements of street, may include AE, signals, signs, markings, devices, conduit, lighting, drainage, intersection imprv, ROW, utilities, sidewalks, furniture, landscaping, or irrigation sys. Estimated annual operating cost is $0.
FY21 Cost
2017 G.O. Bonds $1,320,000
Project Total $1,320,000
Turtle Lake Additions - In the vicinity of SE 149th St and Sooner Rd (Ward 4)
Resurfacing, repair, rehabilitation or improvement of the streets in areas bounded by listed streets, may include AE, signals, signs, markings, devices, conduit, lighting, drainage, intersection improvements, ROW, utilities, or sidewalks. Estimated annual operating cost is $0.
FY21 Cost
2017 G.O. Bonds $1,110,000
Project Total $1,110,000
W Main and N Western - Main and Western (Ward 6)
Street enhancements, may include reconstruction, construction, repair, resurfacing, or improvements of streets, pedestrian safety improvements, bicycle lanes, striping, markings, or pedestrian amenities Estimated annual operating cost is $0.
FY21 Cost
2017 G.O. Bonds $825,000
Project Total $825,000
W Reno, N Portland-Meridian - West bound on Reno Ave from N Portland to N Meridian Ave (Ward 3)
Reconstruction, construction, repair, resurfacing, or improvements of street, may include AE, signals, signs, markings, devices, conduit, lighting, drainage, intersection imprv, ROW, utilities, sidewalks, furniture, landscaping, or irrigation sys. Estimated annual operating cost is $0.
FY21 Cost
2017 G.O. Bonds $555,000
Project Total $555,000
W Reno, N Western to Penn - W Reno Ave from N Western Ave to N Pennsylvania Ave (Ward 6)
Reconstruction, construction, repair, resurfacing, or improvements of street, may include AE, signals, signs, markings, devices, conduit, lighting, drainage, intersection imprv, ROW, utilities, sidewalks, furniture, landscaping, or irrigation sys. Estimated annual operating cost is $0.
FY21 Cost
2017 G.O. Bonds $1,335,000
Project Total $1,335,000
Table of Contents

PUBLIC WORKS - STREETS CAPITAL PROGRAM
Western, NW 14 to I-40 - Western Ave from NW 14th to I-40 (Ward 6)
Street enhancements, may include reconstruction, construction, repair, resurfacing, or improvements of streets, pedestrian safety improvements, bicycle lanes, striping, markings, or pedestrian amenities Estimated annual operating cost is $0.
FY21 Cost
2017 G.O. Bonds $1,485,000
Project Total $1,485,000
$136,972,885PUBLIC WORKS - STREETS FY21 TOTAL
Table of Contents

PUBLIC WORKS - TRAFFIC CAPITAL PROGRAM
PUBLIC WORKS - TRAFFIC
Independence and NW Expressway - N Independence Avenue and NW Expressway (Ward 2)
Installation, acquisition of new, improvement, replacement or repair of existing traffic signals, signs, equipment, and devices, may include AE, ROW, utility relocation, conduit installation, drainage, intersection improvements, or lighting. Estimated annual operating cost is $0.
FY21 Cost
2017 G.O. Bonds $930,000
Project Total $930,000
Penn, NW 10 and Virginia - Intersection of N Pennsylvania Ave, NW 10th St and Virginia Ave (Ward 6)
Installation, acquisition of new, improvement, replacement or repair of existing traffic signals, signs, equipment, and devices, may include AE, ROW, utility relocation, conduit installation, drainage, intersection improvements, or lighting. Estimated annual operating cost is $0.
FY21 Cost
2017 G.O. Bonds $2,000,000
Project Total $2,000,000
S Sooner and Embers Dr, SE 48 - S Sooner Road at Embers Drive and SE 48 St (Ward 7)
Installation, acquisition of new, improvement, replacement or repair of existing traffic signals, signs, equipment, and devices, may include AE, ROW, utility relocation, conduit installation, drainage, intersection improvements, or lighting. Estimated annual operating cost is $0.
FY21 Cost
2017 G.O. Bonds $1,215,000
Project Total $1,215,000
Traffic Cntrl Sys CNTRL_ULSTA - (Citywide)
Control project for unlisted bond funds related to the Traffic control systems. Estimated annual operating cost is $0.
FY21 Cost
2017 G.O. Bonds $300,000
Project Total $300,000
$4,445,000PUBLIC WORKS - TRAFFIC FY21 TOTAL
Table of Contents

SOLID WASTE MANAGEMENT CAPITAL PROGRAM
SOLID WASTE MANAGEMENT
Cart Purchases - (N/A)
Replacement of recycling and collection carts and the addition of carts for expanded service. Estimated annual operating cost is $0.
FY21 Cost
OKC Environmental Asst Trust $1,205,000
Project Total $1,205,000
Mobile Equipment - (N/A)
Replacement of pick-up trucks, refuse trucks, side loaders, and other mobile equipment. Estimated annual operating cost is $0.
FY21 Cost
OKC Environmental Asst Trust $2,460,000
Project Total $2,460,000
$3,665,000SOLID WASTE MANAGEMENT FY21 TOTAL
Table of Contents

WASTEWATER CAPITAL PROGRAM
WASTEWATER
420 Office Space Modifications - 420 W. Main or 5th Street and Pennsylvania (Ward 6)
Modifications to office space at 420 W Main Street to accommodate current and future staffing requirements. Estimated annual operating cost is $0.
FY21 Cost
OKC Water Utilities Trust $520,000
Project Total $520,000
Capital Plan Program Mgt - (Citywide)
The program management portion of the contract is to perform the program management services for the Capital Improvement Plan that incorporate developing, reporting, scheduling, coordination with internal and external agencies, and quarterly updates. Estimated annual operating cost is $0.
FY21 Cost
OKC Water Utilities Trust $5,270,000
Project Total $5,270,000
Chisholm Creek WWTP R & R - 22000 N. Western Avenue (Ward 8)
The funds in this category provide for plant upgrades to improve, replace, and renew existing facilities as necessary to continue reliable and regulatory compliant operation. Estimated annual operating cost is $0.
FY21 Cost
OKC Water Utilities Trust $2,470,000
Project Total $2,470,000
Citywide Sanitary Sewer R & R - Citywide
To provide for renewal and/or replacement of deficient sanitary sewer lines. Estimated annual operating cost is $0.
FY21 Cost
OKC Water Utilities Trust $13,390,000
Project Total $13,390,000
Condition Assessment - Citywide
This program will assess the condition of collection system assets to determine which assets require replacement or rehabilitation. Estimated annual operating cost is $0.
FY21 Cost
OKC Water Utilities Trust $4,890,000
Project Total $4,890,000
Table of Contents

WASTEWATER CAPITAL PROGRAM
Customer Service Division - Citywide
Replaces meters and meter pits. Estimated annual operating cost is $0.
FY21 Cost
OKC Water Utilities Trust $2,630,000
Project Total $2,630,000
Emergency Projects - Citywide
Wastewater related emergency projects. Estimated annual operating cost is $0.
FY21 Cost
OKC Water Utilities Trust $620,000
Project Total $620,000
Equipment Replacement - (N/A)
Mobile equipment replacement. Estimated annual operating cost is $0.
FY21 Cost
OKC Water Utilities Trust $1,290,000
Project Total $1,290,000
Flow Metering Isolation - Citywide
This program will be used to measure wastewater flows within specific basins to identify areas of high inflow and infiltration in order to determine and prioritize abatement projects. Estimated annual operating cost is $0.
FY21 Cost
OKC Water Utilities Trust $1,550,000
Project Total $1,550,000
Gen WWTP & Collection Sys Imp. - Citywide
Collection system and treatment plant modifications and upgrades to meet increasing demands and regulatory requirements. Estimated annual operating cost is $0.
FY21 Cost
OKC Water Utilities Trust $5,150,000
Project Total $5,150,000
Table of Contents

WASTEWATER CAPITAL PROGRAM
I/I Abatement - Citywide
This program will further investigate the cause of inflow and infiltration and install the required capital improvements necessary to prevent them from entering the collection system. Estimated annual operating cost is $0.
FY21 Cost
OKC Water Utilities Trust $1,550,000
Project Total $1,550,000
Lift Station R & R - Citywide
Lift station renewals and/or replacements. Estimated annual operating cost is $0.
FY21 Cost
OKC Water Utilities Trust $50,000
Project Total $50,000
N Canadian WWT R & R - 12800 N. Anderson Road (Ward 7)
The funds in this category provide for plant upgrades to improve, replace, and renew existing facilities as necessary to continue reliable and regulatory compliant operation. Estimated annual operating cost is $0.
FY21 Cost
OKC Water Utilities Trust $2,060,000
Project Total $2,060,000
Policy B and B-1 Projects - Citywide
Policy B or B-1 may be used if a development is located within a sewer shed where the potential for additional growth will require proposed wastewater mains to be upsized to meet future development. Estimated annual operating cost is $0.
FY21 Cost
OKC Water Utilities Trust $2,740,000
Project Total $2,740,000
Public Works Reimbursements - Citywide
Public Works Reimbursement Projects. Estimated annual operating cost is $0.
FY21 Cost
OKC Water Utilities Trust $310,000
Project Total $310,000
Table of Contents

WASTEWATER CAPITAL PROGRAM
Relocation for Road Projects - Citywide
Relocations of sewer roadway improvement projects. Estimated annual operating cost is $0.
FY21 Cost
OKC Water Utilities Trust $1,040,000
Project Total $1,040,000
South Canadian Expansion - 15924 S. May Avenue (Ward 5)
South Canadian Wastewater Treatment Plant expansion. Estimated annual operating cost is $0.
FY21 Cost
OKC Water Utilities Trust $113,320,000
Project Total $113,320,000
System upgrades to Draper Resv - Westside of Stanley Draper Reservoir (Ward 4)
Sewer system upgrades to provide more reliable collection of wastewater flows along the westside of the Stanley Draper Reservoir. Estimated annual operating cost is $0.
FY21 Cost
OKC Water Utilities Trust $3,090,000
Project Total $3,090,000
Technology Upgrades - (N/A)
Technology Upgrades. Estimated annual operating cost is $0.
FY21 Cost
OKC Water Utilities Trust $4,120,000
Project Total $4,120,000
$166,060,000WASTEWATER FY21 TOTAL
Table of Contents

WATER CAPITAL PROGRAM
WATER
Capital Plan Program Mgt - (Citywide)
The program management portion of the contract is to perform the program management services for the Capital Improvement Plan that incorporate developing, reporting, scheduling, coordination with internal and external agencies, and quarterly updates. Estimated annual operating cost is $0.
FY21 Cost
OKC Water Utilities Trust $2,060,000
Project Total $2,060,000
Citywide Water Main R & R - Citywide
Water main renewals and replacements. Estimated annual operating cost is $0.
FY21 Cost
OKC Water Utilities Trust $2,060,000
Project Total $2,060,000
Customer Service Division Proj - Citywide
Replaces water meters and meter pits. Estimated annual operating cost is $0.
FY21 Cost
OKC Water Utilities Trust $4,690,000
Project Total $4,690,000
Draper 72" Replace from WTP - Citywide
In-depth condition assessment of 72-inch transmission main from the Draper water treatment plant. Estimated annual operating cost is $0.
FY21 Cost
OKC Water Utilities Trust $3,090,000
Project Total $3,090,000
Draper Plant R & R - 13700 S. Douglas Boulevard (Ward 4)
Draper Plant renewal and replacement. Estimated annual operating cost is $0.
FY21 Cost
OKC Water Utilities Trust $1,030,000
Project Total $1,030,000
Table of Contents

WATER CAPITAL PROGRAM
Draper WTP Upgrades - 13700 S. Douglas Boulevard (Ward 4)
Improvements to the Draper Water Treatment Plant. Estimated annual operating cost is $0.
FY21 Cost
OKC Water Utilities Trust $2,060,000
Project Total $2,060,000
Draper/Hefner Interconnection - Citywide
Transmission and booster station improvements to interconnect the Draper and Hefner service areas. Estimated annual operating cost is $0.
FY21 Cost
OKC Water Utilities Trust $16,800,000
Project Total $16,800,000
Emergency Projects - Citywide
Water related emergency projects. The department deals with a number of emergencies during the operation of raw water supply and potable water distribution. Funds are allocated every fiscal year to pay for these emergencies. Estimated annual operating cost is $0.
FY21 Cost
OKC Water Utilities Trust $820,000
Project Total $820,000
Equipment Replacement - (N/A)
Mobile equipment replacement. Estimated annual operating cost is $0.
FY21 Cost
OKC Water Utilities Trust $1,370,000
Project Total $1,370,000
Existing Atoka Pipeline - Lake Atoka to Lake Stanley Draper (Citywide)
Maintenance and repair of the existing raw water pipeline. Estimated annual operating cost is $0.
FY21 Cost
OKC Water Utilities Trust $260,000
Project Total $260,000
Ext Atoka Pipeline Stat Upgrd - Macomb Pump Station for the existing Atoka pipeline (Citywide)
Upgrades to the balancing tanks for the existing pump stations and new surge facility for the Macomb Pump Station for the existing Atoka pipeline. Estimated annual operating cost is $0.
FY21 Cost
OKC Water Utilities Trust $5,310,000
Project Total $5,310,000
Table of Contents

WATER CAPITAL PROGRAM
Hefner Plant R & R - 3827 W. Hefner Road (Ward 8)
Hefner water treatment plant renewal and replacement. Estimated annual operating cost is $0.
FY21 Cost
OKC Water Utilities Trust $1,030,000
Project Total $1,030,000
Hefner WTP Upgrades - 3827 W. Hefner Road (Ward 8)
Improvements to the Hefner Water Treatment Plant to meet regulatory requirement and maintain reliable operation. Estimated annual operating cost is $0.
FY21 Cost
OKC Water Utilities Trust $52,550,000
Project Total $52,550,000
Laboratory Improvements - Citywide
Laboratory Improvements Estimated annual operating cost is $0.
FY21 Cost
OKC Water Utilities Trust $110,000
Project Total $110,000
Lake management projects - Citywide
The City owns and operates Lake Draper, Lake Hefner, Lake Overholser, and Lake Atoka. Many of the functional and structural components of the reservoir require capital funds to do major repairs and or upgrades. Estimated annual operating cost is $0.
FY21 Cost
OKC Water Utilities Trust $4,120,000
Project Total $4,120,000
Overholser Plant R & R - 601 N. Pennsylvania (Ward 6)
Overholser Plant renewals and/or replacement. Estimated annual operating cost is $0.
FY21 Cost
OKC Water Utilities Trust $150,000
Project Total $150,000
Table of Contents

WATER CAPITAL PROGRAM
Policy A and A-1 Projects - Citywide
Policy A and A-1 may be used if a development is located within a service area where the potential for additional growth will require proposed water mains to be upsized to meet future development. Estimated annual operating cost is $0.
FY21 Cost
OKC Water Utilities Trust $100,000
Project Total $100,000
Public Works Reimbursements - Citywide
Public Works reimbursement projects. Estimated annual operating cost is $0.
FY21 Cost
OKC Water Utilities Trust $320,000
Project Total $320,000
Raw Water 2nd Atoka Pipeline - Lake Atoka to Lake Stanley Draper (Citywide)
Construction of a second raw water pipeline from Lake Atoka to Lake Stanley Draper. Estimated annual operating cost is $0.
FY21 Cost
OKC Water Utilities Trust $88,190,000
Project Total $88,190,000
Relocation for Road Projects - Citywide
Relocation of water roadway improvement projects. Estimated annual operating cost is $0.
FY21 Cost
OKC Water Utilities Trust $780,000
Project Total $780,000
Reservoir Maintenance - Citywide
The City owns and operates Lake Draper, Lake Hefner, Lake Overholser, and Lake Atoka. Many of the functional and structural components of the reservoir require capital funds to do major repairs. Estimated annual operating cost is $0.
FY21 Cost
OKC Water Utilities Trust $1,060,000
Project Total $1,060,000
Table of Contents
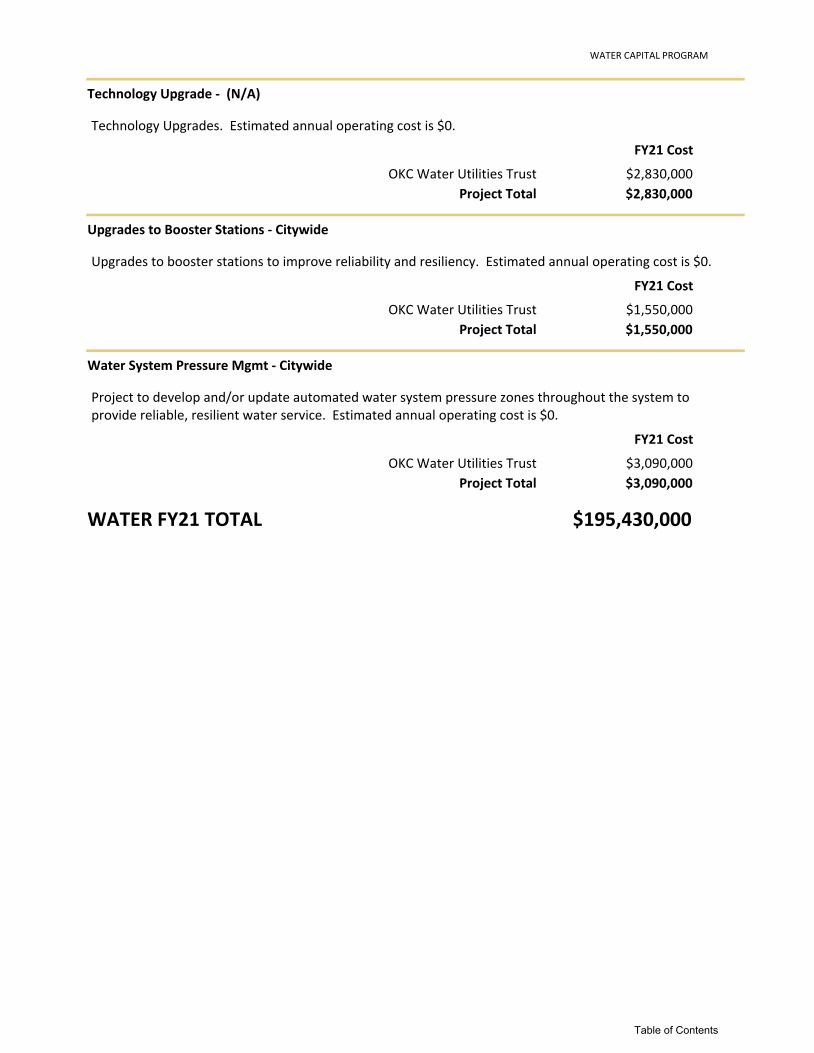
WATER CAPITAL PROGRAM
Technology Upgrade - (N/A)
Technology Upgrades. Estimated annual operating cost is $0.
FY21 Cost
OKC Water Utilities Trust $2,830,000
Project Total $2,830,000
Upgrades to Booster Stations - Citywide
Upgrades to booster stations to improve reliability and resiliency. Estimated annual operating cost is $0.
FY21 Cost
OKC Water Utilities Trust $1,550,000
Project Total $1,550,000
Water System Pressure Mgmt - Citywide
Project to develop and/or update automated water system pressure zones throughout the system to provide reliable, resilient water service. Estimated annual operating cost is $0.
FY21 Cost
OKC Water Utilities Trust $3,090,000
Project Total $3,090,000
$195,430,000WATER FY21 TOTAL
Table of Contents

ZOO CAPITAL PROGRAM
ZOO
Administration Building - 2101 NE 50th Street (Ward 6)
Construction of new exhibit at the Oklahoma City Zoo. Estimated annual operating cost is $0.
FY21 Cost
Oklahoma City Zoo Trust $1,741,442
Project Total $1,741,442
Africa Exhibit - 2101 NE 50th Street (Ward 6)
Construction of new exhibit at the Oklahoma City Zoo. Estimated annual operating cost is $0.
FY21 Cost
Oklahoma City Zoo Trust $4,143,750
Project Total $4,143,750
Cheetah/Wild Dog Exhibit - 2101 NE 50th Street (Ward 6)
Construction of new exhibit at the Oklahoma City Zoo. Estimated annual operating cost is $0.
FY21 Cost
Oklahoma City Zoo Trust $2,110,525
Project Total $2,110,525
Condor/Azalea Garden Exhibit - 2101 NE 50th Street (Ward 6)
Construction of new exhibit at the Oklahoma City Zoo. Estimated annual operating cost is $0.
FY21 Cost
Oklahoma City Zoo Trust $201,046
Project Total $201,046
HVAC Replacement - 2101 NE 50th Street (Ward 6)
HVAC replacement at the Oklahoma City Zoo. Estimated annual operating cost is $0.
FY21 Cost
Oklahoma City Zoo Trust $210,000
Project Total $210,000
Lake Park Site and Utilities - 2101 NE 50th Street (Ward 6)
Capital maintenance for the Lake Park site and utilities at the Oklahoma City Zoo. Estimated annual operating cost is $0.
FY21 Cost
Oklahoma City Zoo Trust $328,500
Project Total $328,500
Table of Contents

ZOO CAPITAL PROGRAM
Roof Replacement - 2101 NE 50th Street (Ward 6)
Roof replacement at the Oklahoma City Zoo. Estimated annual operating cost is $0.
FY21 Cost
Oklahoma City Zoo Trust $100,000
Project Total $100,000
$8,835,263ZOO FY21 TOTAL
Table of Contents

Overview of Bonds and Debt Service
E-62
Bonds and Debt Service
Major capital improvements such as streets, drainage, facilities, and major equipment are often financed by bonds. This funding mechanism allows payment for infrastructure improvements to be made over multiple years, usually over the life of the improvement.
General Obligation Bonds (GO Bonds) are issued only upon voter approval. Voters must be informed of the purpose of the bonds and review a list of bond projects to be funded.
Each year, the City repays a portion of the remaining principal on GO Bonds it has issued, along with interest on the remaining balance. Together these payments are called Debt Service. The ad valorem tax (property tax) is the primary revenue source used for repaying GO Bonds. The Debt Service Fund is totally independent of the City’s operating funds, using a different source of revenue. Because of this independence, debt service costs do not affect current or future operations.
State law does not place a cap on the amount of debt the City can incur through our General Obligation Bonds, but does limit the amount of debt on General Obligation Limited Tax (GOLT) Bonds to $5 per $1,000 assessed. Revenue bonds for water, sewer, airport and parking projects, backed by user fees, have been issued by various trusts established by the City. The City is the legal beneficiary of these trusts.
General Obligation Bonds are backed by the full faith and credit of the City, meaning the City must levy ad valorem taxes sufficient to pay the annual principal and interest payments. By State law, cities may only use ad valorem taxes to support the Debt Service Fund. The Mayor and City Council of Oklahoma City follow an informal policy of keeping the ad valorem tax rate for debt service at or near $16 per $1,000 dollars of net assessed value.
In addition to paying the principal and interest on General Obligation Bonds issued by the City, the Debt Service Fund also pays certain legal judgments against the City. The Debt Service budget is adopted and filed with the County Excise Board, which establishes property tax rates once the results from the previous year are finalized. The City’s adopted budget will be amended during the fiscal year to address any differences that exist between the adopted budget and the final budget approved by the County Excise Board.
The City has retired approximately $61.42 million in General Obligation bonded debt and has issued $111.48 million in FY20, which will leave the total General Obligation Bond indebtedness at the end of FY20 at approximately $919.26 million. This equates to $1,372 per capita estimated for FY20 compared to $1,310 per capita at the end of FY19.
Since 2009, Standard & Poor's and Moody’s Investor Service have rated Oklahoma City’s General Obligation debt at the highest levels, AAA and Aaa respectively, for the City's General Obligation Bonds. Oklahoma City’s expanding economic base, ongoing downtown redevelopment, conservative financial management, and moderate debt contributed to the City’s high rating. This high rating means lower interest rates enabling the City to spend a larger portion of the funds on major capital projects.
AAA The City of Oklahoma City’s General Ob-ligation bonds are rated “AAA” by Standard & Poor’s and “Aaa” by Moody’s Investor Service, the highest rating available.
Table of Contents

Debt Service Budget
Bonds and Debt Service
E-63
Actual Adopted Adopted
FY19 FY20 FY21
Revenues
Ad Valorem (Property Tax) $93,737,616 $95,053,573 $98,838,747
Interest 2,961,960 1,000,000 1,000,000
Other 6,710,914 6,000,000 7,000,000
Fund Balance 0 3,911,844 3,911,844
Total Revenues $103,410,490 $105,965,417 $110,750,591
Expenditures - Non-Departmental
Judgments $4,262,085 $5,974,000 $3,365,948
Judgment Interest 217,033 221,000 214,645
Fiscal Agency Fees 299,500 400,000 600,000
Bond Retirement 61,365,000 64,660,123 65,925,000
Interest on Bonds 32,480,563 34,710,294 34,126,511
Reserve For Future Debt Service Payments 0 0 6,518,487
Total Expenditures $98,624,181 $105,965,417 $110,750,591
Use of Fund Balance
Beginning Fund Balance $112,640,770 $117,427,080 $113,515,236
Additions/(Reductions) to Fund Balance 4,786,309 (3,911,844) * 2,606,643 **
Ending Fund Balance $117,427,080 $113,515,236 * $116,121,879 **
* Estimated.
** Assumes budgeted revenues and expenditures.
Table of Contents
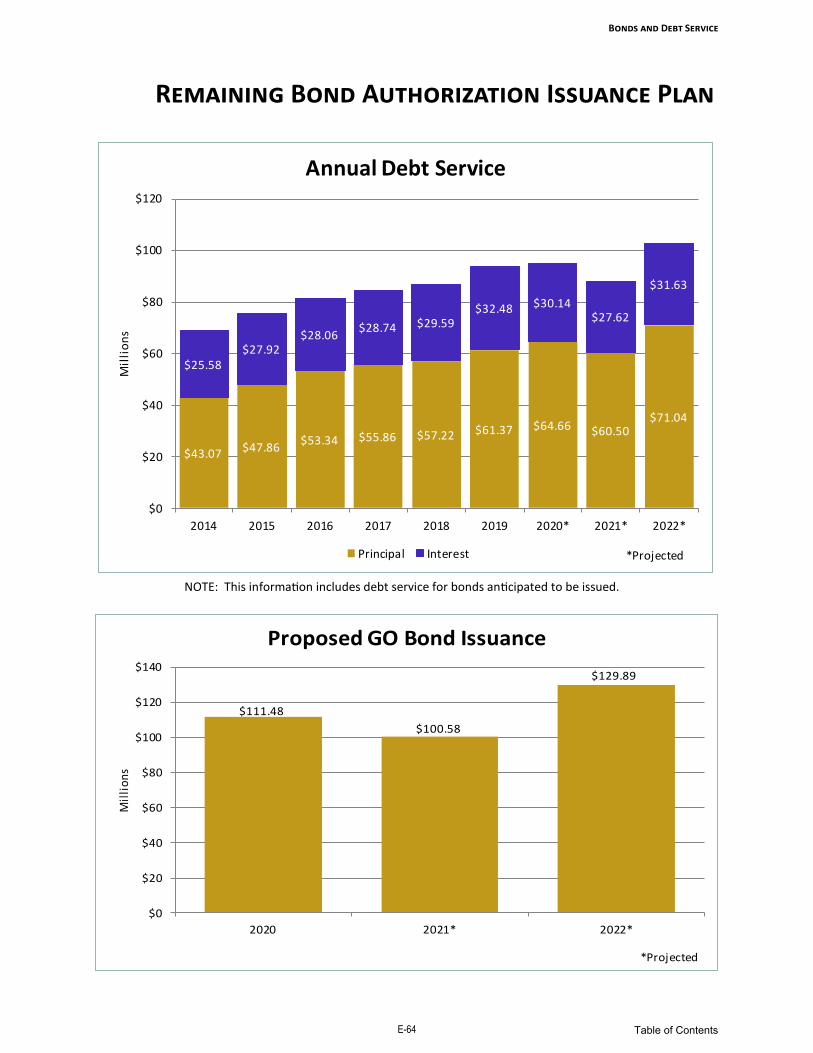
Remaining Bond Authorization Issuance Plan
Bonds and Debt Service
E-64
NOTE: This information includes debt service for bonds anticipated to be issued.
$43.07 $47.86 $53.34 $55.86 $57.22 $61.37 $64.66 $60.50
$71.04
$25.58 $27.92
$28.06 $28.74 $29.59
$32.48 $30.14 $27.62
$31.63
$0
$20
$40
$60
$80
$100
$120
2014 2015 2016 2017 2018 2019 2020* 2021* 2022*
Mil
lio
ns
Annual Debt Service
Principal Interest *Projected
$111.48
$100.58
$129.89
$0
$20
$40
$60
$80
$100
$120
$140
2020 2021* 2022*
Mil
lio
ns
Proposed GO Bond Issuance
*Projected
Table of Contents

Bonds and Debt Service
E-65
NOTE: This information includes tax rates for anticipated bond issues. Although there is no limit in Oklahoma State Law, the Mayor and City Council of Oklahoma City follow an informal policy of keeping the mill levy/ad valorem tax rate at or near $16 per $1,000 dollars of net assessed value.
$16.00 $15.99 $15.62
$14.81
$15.26 $15.51 $15.41 $16.28 $16.04
$0.00
$2.00
$4.00
$6.00
$8.00
$10.00
$12.00
$14.00
$16.00
$18.00
2014 2015 2016 2017 2018 2019 2020 2021* 2022*
Property Tax Ratea
*ProjectedaPer $1,000 of Assessed Value
Table of Contents

Bonds and Debt Service
E-66 Table of Contents

Overview of Budget Guidelines and Control
Appendix
F-1
The Budget Guidelines and Control Section describes Oklahoma City’s financial planning and
budgeting practices, including State laws that affect budgeting, how the budget may change during the fiscal year, and the major financial
policies and practices of the City.
Table of Contents

Legislative Requirements
Appendix
F-2
Oklahoma State Law allows for two methods of budgeting. The City of Oklahoma City has chosen the fund and department method and these are the requirements:
1. A budget that discloses the complete financial position and condition of the City must be prepared and sub-mitted to the Mayor and City Council at least thirty days prior to the beginning of the fiscal year. 2. The budget must contain a summary, a message from the City Manager and a description of important budget features. Actual revenues and expenditures for the immediate prior fiscal year must be included along with the budgeted revenues and expenditures for the current year and estimated revenues and expenditures for the up-coming fiscal year. 3. The estimate of revenues and expenditures must be accounted for by fund and account. The budget of ex-penditures for each fund may not exceed the estimated revenues. No more than 10 percent of the total budget for any fund may be budgeted for miscellaneous purposes (e.g., contingencies and reserves). 4. No later than fifteen days prior to the beginning of the budget year, the Council must hold a public hearing on the proposed budget. The date, time and place of the hearing, along with a summary of the budget, must be published in a newspaper of general circulation no less than five days before the hearing. The proposed budget is available to the public at this time. 5. After the hearing and at least seven days prior to the beginning of the budget year, Council must adopt the budget. 6. The adopted budget must be filed with the State Auditor and Inspector and the City Clerk. The adopted budg-et becomes effective on the first day of the fiscal year. 7. No expenditures or encumbrances may exceed 90 percent of the appropriation for any fund until revenues, including the prior fiscal year’s fund balance, in an amount equal to at least 90 percent of the appropriation for the fund are collected. 8. General obligation operating debt and deficit spending are prohibited. Oklahoma City’s debt service require-ments are, therefore, budgeted in a Debt Service Fund. Revenue bonds may be issued by Trusts and Authorities, while voter approved general obligation bond issues may be used to finance specific capital projects. 9. The Municipal Budget Act also allows cities to transfer funds between departments and/or between expendi-ture categories (i.e., Capital Outlay to Personal Services, Supplies to Capital Outlay, etc.). Since these transfers represent a deviation from the adopted budget, the City Manager reports these transfers to the City Council as an informational item. This practice keeps the governing body informed of necessary operational changes as the adopted budget is implemented. 10. Trusts that have been created to benefit the City are required to submit budgets, financial reports and relat-ed materials to the Mayor and City Council.
Table of Contents

Levels of Budgetary Control
Appendix
F-3
The budget is adopted by the Mayor and City Council by fund, department and expenditure classification. The following are the definitions for each classification: Personal Services are the costs of personnel, such as compensating City employees for salaries, wages, and employee bene-fits (social security, retirement, and insurance), the cost of health insurance for retired employees, and other personnel relat-ed costs such as uniform allowance. Other Services and Charges are for expenditures for services (e.g., advertising, repairs, postage), contractual arrangements, and any other expenditures that are not applicable to the other classifications. Supplies and Materials are items used to provide City services such as fuel, parts, and office supplies. Capital Outlay is the purchase, construction or improvement of machinery and equipment, furniture, land, buildings, and similar assets. Capital outlay items have a useful life of over one year and a cost of $50,000 or more. Definitions differ for grant and certain special revenue funds. Transfers are payments to other funds or trusts related to the City. Some transfers are general fund subsidies to other City funds. Debt Service is the payment of principal and interest on bonds that financed the purchase or construction of City facilities such as roads, buildings, and water supply systems. Actual expenditures are charged to more detailed accounts. For example, the supplies and materials classification contains distinct object accounts for fuel, office supplies, computer supplies and other commodities. Departments have the flexibility to shift funds between accounts within the same classification (e.g., from the fuel account to the office supplies account) or between organizational divisions in the same classification (e.g., from the Fire Department/Administration Division’s personal service classification to the Fire Department / Fire Suppression Division’s personal service classification). A department cannot exceed the adopted budget for any classification without either a budget amendment or an appropri-ately approved budget transfer. Budget Transfers Transfers are more common than budget amendments and must be approved by the department (or, if funds are transferred from one department to another, by both departments), the Office of Management and Budget, the Finance Director, and in some cases, the City Manager. Transfers are reported quarterly to the Mayor and City Council for informational purposes. Budget Amendments The Oklahoma Municipal Budget Act permits the City Council to amend the City’s annual adopted budget. The budget may be amended for supplemental appropriations up to the amount of any additional revenues that are available due to: 1. Revenues received from unanticipated sources; 2. Revenues from anticipated sources in excess of unbudgeted estimates; or 3. Unanticipated, unencumbered cash balances on hand at the end of the previous fiscal year in excess of budgeted esti-mates. The Oklahoma Municipal Budget Act also allows the City Council to take action, as it deems necessary, to amend the budget if it appears that projected revenues will be insufficient to meet appropriations. The budget amendment must be adopted at a City Council meeting and filed with the City Clerk and the State Auditor and Inspector. In the event of a budget amendment, Oklahoma City incorporates the same public notice and public hearing prac-tices used in the adoption of the original budget.
Table of Contents

Accounting Basis
Appendix
F-4
The City of Oklahoma City’s budget is best characterized as being developed on a modified cash and expenditures/encumbrances basis. The operating budget is an estimate of revenues and expenditures for one fiscal year. Only revenues expected to be received in cash during the year or soon thereafter are included in revenue estimates, as well as any fund balance that will be used for one-time expenditures during the coming year. Only amounts that will be spent or encumbered (under contract) by the end of the fiscal year are budgeted as expenditures. This is in conformance with the Oklahoma Municipal Budget Act that does not allow the City to incur operating fund obligations for more than one fiscal year. Annual financial reports are prepared under the modified accrual and accrual basis of accounting, as required by Generally Accepted Accounting Principles (GAAP). The annual financial report also compares actual revenues and expenditures on the budgetary basis to the budget so that budget performance can be measured. The City of Oklahoma City’s budgetary basis of accounting differs from the basis of accounting required by GAAP for preparing the City’s Comprehensive Annual Financial Report (CAFR). The major differences between the budgetary basis of accounting and the basis of accounting required by GAAP are listed in the following paragraphs. A reconciliation of the budgetary basis and GAAP basis fund balances is provided each year in the CAFR. 1. For budgetary purposes, only revenues expected to be received in cash during the year or soon thereafter are included in revenue estimates along with unreserved fund balance expected to be used during the coming year. For GAAP purposes, governmental fund type revenues are recognized when they are both “measurable and available” according to the modified accrual basis of accounting. Proprietary fund type revenues are recognized when earned according to the accrual basis of accounting. 2. For budgetary purposes, only amounts that will be spent or encumbered (under contract) by the end of the fiscal year are budgeted as expenditures. For GAAP purposes, governmental and proprietary fund type expenditures are recorded when incurred according to the modified accrual and accrual basis of accounting. Encumbered amounts are commonly treated as expenditures for budgetary purposes, while encumbrances are never treated as expenditures for GAAP purposes. 3. Transactions, such as transfers, classified as “other financing sources (or uses)” in the CAFR for GAAP purposes are classified as revenues and expenditures for budgetary purposes. 4. All City public trust revenues and expenses are incorporated for GAAP purposes but only included in budgetary revenues and expenses to the extent that transfers are budgeted from or to a City fund by the public trust.
Table of Contents

Overview of Financial Policies and Practices
Appendix
F-5
The financial policies and practices de-scribed in this section address:
Budgeting and Financial
Planning
Capital Planning
Revenue
Investments
Debt Management
Procurement
Accounting and Auditing
This section describes the major policies and practices that guide Oklahoma City’s financial planning and management. Policies are shaped by state law and established by the Mayor and City Council. Practices are determined by City management and, while often ratified by the Mayor and City Council in annual budgeting and other major decisions, have not been adopted as policies.
Table of Contents

Budgeting and Financial Planning Policies
F-6
Appendix
A Resolution Adopting Budgeting and Financial Planning Policies, adopted by the City Council March 27, 2018, requires that the City Manager prepare and submit the proposed budget in accordance with the following policies. A statement of compliance and table can be found on pages F19-F20. 1. Balanced Budget. Under Title 11, Oklahoma statutes, Section 17-206, the budget of expenditures for a fund
may not exceed the estimated revenues, including budgeted fund balance, for the fund. 2. Municipal Budget Act. The City of Oklahoma City originally chose to begin using and complying with the
Municipal Budget Act (Title 11 Sections 17-201 through 17-218) on December 18, 1979 (Item VIII. B.) for its budget process. The City will continue to follow the provisions and requirements of the Municipal Budget Act in its annual budgeting process.
3. Borrowing for Operations. The City will not borrow from any external source to fund ongoing operations. 4. Fund Balance. Fund Balance should not be budgeted as revenue to support ongoing operations in the
annual budget. Fund Balance may be budgeted to fund one-time expenditures such as capital projects. Fund balance may be drawn upon for cash flow needs, and may be used as revenue without amending the budget if other revenue sources in total fall short of the estimate used in the adopted budget.
5. Reserves. To provide cash flow, to meet unexpected needs, and to minimize the disruption caused by
decreases in revenues over the course of a fiscal year, City operating funds should maintain two types of reserves: contingency and operating reserve.
a. Contingency. Each City fund should include an appropriation adequate to fund a contingency account of
a targeted amount of two percent of the fund’s budgeted expenditures. As needs arise, appropriations may be transferred from the contingency account within legal and procedural limitations on transfers. The Municipal Budget Act specifies that no more than ten percent of the total budget may be budgeted for miscellaneous purposes. This account would count as a miscellaneous purpose under the Municipal Budget Act because what it will be used for cannot be known.
b. Operating Reserve. Operating reserve is the fund balance carried forward into the next fiscal year that is
not budgeted. Each city fund will maintain an operating reserve, although the requirements for operating reserve differ depending on the type of fund.
i. General Fund: The General Fund shall maintain operating reserves at the beginning of each fiscal
year in the amount of no less than fourteen percent and no more than twenty percent of the total General Fund budget for that fiscal year. This equates to maintaining approximately two months of expenditures in operating reserves. The Government Finance Officers Association (GFOA) recommends a minimum of two months’ worth of expenditures be maintained in operating reserve. General Fund operating reserves should be counter cyclical; reserve requirements are higher when the financial condition of the City is better so that operating reserves may be drawn down should the financial condition worsen. If the operating reserve falls outside of the fourteen to twenty percent range, the City Manager will recommend appropriate action to address the situation. Should operating reserve fall below the minimum level it will be the goal of the City to restore the operating reserve back to the minimum level within two years. Should the operating reserve exceed the recommended maximum level the City Manager may recommend it be used to fund one-time expenditures, such as capital projects.
Table of Contents

Appendix
F-7
ii. Other Funds: Any fund that supports personnel or other ongoing operating expenditures shall maintain operating reserves at a target level of five to twenty percent of the total budgeted expenditures of the fund for the ensuing fiscal year. For the purposes of this section, “budgeted expenditures” means total budgeted expenditures and budgeted transfers to other funds for the ensuing fiscal year for a fund. City enterprise funds that are fully supported by a trust of the City, such as the Oklahoma City Water Utilities Trust, Oklahoma City Airports Trust or the Oklahoma City Environmental Assistance Trust, are excepted from this operating reserve requirement. Funds that are fully supported by a trust will follow the trust policy for operating reserve requirements.
c. Reporting requirements: The City Manager shall notify the Mayor and Council of reserve and contingency levels for all funds in the proposed budget.
6. Performance-based Budget. The City Manager shall develop and present a budget that includes meaningful
measures of the performance of City government in meeting its various service demands. Such measures should be tied to individual programs, address specific services or functions and should measure the effectiveness and efficiency of services delivered rather than only the workload generated. Historical performance measures data and performance targets for the coming fiscal year shall be transmitted to the Mayor and City Council along with the proposed budget. The same information should be published in the Annual Budget Book. The City Manager shall take into account the validity of the measures and the ability of departments to meet the expected level of performance in allocating funds in the proposed budget.
7. Scope of Budget. The annual budget shall estimate revenues and make appropriations for spending on all
city, state, and federal funds estimated to be available to the City during the fiscal year. a. Several funds within the budget have differing controls over them than the adopted budget. These are
Grant Funds, the Debt Service Fund and the Bond Fund. While appropriations for these funds are contained in the annual budget, they are controlled by different sources than the annual budget.
i. The annual budget will contain an estimate of revenues and expenditures in the federal, state and
private grant funds; however, the control on those funds is at the individual grant level, not at the broader fund level.
ii. The Debt Service Fund, also referred to as the Sinking Fund, will be included in the annual budget,
however, it is the County Excise Board which approves the final Debt Service budget. The Finance Department will amend the annual budget to bring it in line with the final budget approved by the County Excise Boards for the counties in which Oklahoma City is located; however, it is that budget and state law which governs the Debt Service Fund budget.
8. Annual Budget Book. In addition to the annual budget adopted by the City Council, the City shall make
available an Annual Budget Book on the City’s website. This book shall include such additional information as may be useful to citizens, including information on programs, performance and staffing levels.
9. Appropriations for Fiscal Year.
a. Level of control. The annual budget shall be filed with the State Auditor and Inspector as required by Title 11 Oklahoma Statutes, Section 17-209, to the level of specificity required by Title 11 Oklahoma Statutes, Section 17-213. The annual budget shall make appropriations specific to the fund, department and general character of expenditure. Funds may be encumbered in accordance with Title 62 Oklahoma Statutes, Section 310.2 and the City Charter and Code, provided that the unencumbered unexpended balance of the appropriation as a whole is not exceeded.
Table of Contents

Appendix
F-8
b. Transfers. The Oklahoma Municipal Budget Act (Oklahoma Statutes Title 11, section 17-201 et. seq) provides for certain transfers of unexpended and unencumbered appropriations by the chief executive officer or designee as authorized by the governing body. In order to streamline the process and decrease delays in processing, the following procedure is put in place:
i. The City Manager may authorize transfers of any unexpended and unencumbered appropriation or
any portion thereof from one account class (categories of budget as described in the Municipal Budget Act) to another within the same department or from one department to another within the same fund (except that no appropriation for debt service or other appropriation required by law or ordinance may be reduced below the minimum required).
ii. The City Manager may designate the Assistant City Managers to authorize transfers.
iii. The Finance Director may authorize transfers between account classes within any department
within the same fund. iv. The City Manager will inform the Council of all transfers through regular City Manager reports on
adjustments to the budget by transfers. c. Lapsed appropriations. The fiscal year ends on June 30th. State law, under Title 62 of Oklahoma
Statutes Section 310.4, provides a 90 day period from June 30th to September 30th where claims for payment for goods or services ordered in the previous fiscal year can be made against appropriations from the prior fiscal year. After that time, no further claims can be made against prior year appropriations.
10. Budget Amendments. The annual budget shall be amended in accordance with Title 11 Oklahoma Statutes, Section 17-216. a. The governing body may amend the budget to make supplemental appropriations to any fund up to the
amount of additional revenues which are available for current expenditures for the fund due to:
i. Revenues received or to be received from sources not anticipated in the budget for that year;
ii. Revenues received or to be received from anticipated sources but in excess of the budget estimates therefor; or
iii. Unexpended and unencumbered fund balances on hand at the end of the preceding fiscal year
which had not been anticipated or appropriated in the budget. Any appropriation authorizing the creating an indebtedness shall be governed by the applicable provisions of Article 10 of the Oklahoma Constitution.
Table of Contents

Appendix
F-9
b. If at any time during the budget year it appears probable that revenues available will be insufficient to meet the amount appropriated, or that due to unforeseen emergencies there is temporarily insufficient money in a particular fund to meet the requirements of appropriation for the fund, the governing body shall take action as it deems necessary. For that purpose, it may amend the budget to reduce one or more appropriations or it may amend the budget to transfer money from one fund to another fund, but no appropriation for debt service may be reduced and no appropriation may be reduced by more than the amount of the unencumbered and unexpended balance thereof. No transfer shall be made from the debt service fund to any other fund except as may be permitted by the terms of the bond issue or applicable law.
c. A budget amendment as provided in this section authorizing supplemental appropriations or a decrease
in the total appropriation of funds shall be adopted at a meeting of the governing body and filed with the municipal clerk and the State Auditor and Inspector.
Any resolution amending the budget of any fund to recognize and appropriate fund balance shall state the reason for the amendment and the estimated impact upon reserve levels.
11. Long-Term Planning. The City Manager shall, at least, every other year prepare and transmit to the Mayor
and City Council a forecast of City revenues and expenditures for the ensuing five years, and the major financial policy issues likely to be addressed in that five-year period.
12. Decentralization. The City Manager shall make every effort to involve departments in the preparation of the
proposed budget and to give managers maximum legal flexibility in encumbering and expending funds once the budget is adopted. See e.g., Title 62 Oklahoma Statutes, Section 310.2.
13. Capital Expenditure. Capital expenditure is the cost of new construction, renovation, acquisition or capital
maintenance of City infrastructure, facilities, or other capital investments, to ensure the continuation of service, enhance operations and promote economic development. The City will make efforts to fund capital expenditures through an increase in General Fund spending and commitment of “non-recurring” revenue sources. As a target, the City will work to budget 1-3% of the General Fund for capital expenditures.
14. Capital Planning. Every other year, the City Manager shall submit a five-year capital improvement plan to the Mayor and City Council. This plan shall seek to assure the adequate condition and sustainability of the City’s infrastructure, facilities, and capital investments. The Plan should also address the City Council’s priorities, federal and state mandates, and be in compliance with the City’s current comprehensive plan.
15. Arbitrage Compliance. To comply with federal regulations on interest earnings on tax-exempt bonds the
City shall annually project payments to the federal government for arbitrage penalties, rebates and other payments for the next five years. Funds that owe arbitrage penalties will pay their own costs each year.
16. Cost Allocation Plan. The City Manager shall annually prepare and distribute a cost allocation plan. This plan
should allocate the costs of the various administrative departments among all departments offering direct service to the public. The plan should conform to all requirements of federal funding agencies regarding such plans. The plan should be as simple as possible while maintaining equity. In preparing the cost allocation plan, the City Manager shall solicit input from both the administrative departments whose costs are allocated and the direct service departments to which costs are allocated. The City Manager may determine which allocated costs are paid from one department or fund to another based on ability to pay, but shall maintain equitable treatment of all departments or funds.
Table of Contents

Appendix
F-10
17. Interest and Investment Income. Interest and investment income earned by each fund shall be deposited in the same fund. All interest and investment income shall have the same purpose as that of the fund.
18. Revenues. The City must be sensitive to the balance between the need for services and the City's ability to support those services.
a. Mix of Revenues. The City should strive to maintain a diversified mix of revenues in order to balance
the sources of revenue amongst taxpayers and to provide ongoing stability and predictability. The City will strive to keep a total revenue mix that encourages growth, and keeps Oklahoma City economically competitive and a city of choice for people to live and do business.
b. Charges for Services. As much as is reasonably possible, City services that provide direct benefit
should be supported by fees and charges in order to provide maximum flexibility in use of general City taxes to meet the cost of services of broader public benefit. Fees should recover full costs, including all direct costs, capital costs, department overhead, and Citywide overhead. Departments that impose fees or service charges should prepare and periodically update cost-of-service studies for such services.
19. Retirement Contributions. The City shall provide its share of contributions to the City's Police and Fire retirement systems in accordance with the state statutes establishing each system. Consistent with §40-62(b) of the Municipal Code, the City shall provide the actuarially determined contribution for all employees covered by the Oklahoma City Employee Retirement System (OCERS) to maintain a fully funded position, as determined in the annual report from the OCERS actuary, up to a maximum of ten percent.
Table of Contents

Capital Planning
Appendix
F-11
Oklahoma City’s capital planning process is governed by ordinances and resolutions adopted by the City Council. The capital planning policies are summarized below: 1. The Capital Improvement Plan (CIP) covers five years and is prepared every two years.
2. The CIP identifies projects and includes estimated capital cost, operating cost impact, justification, relationship to adopted plans and policies, and proposed sources of funding.
3. Project evaluation criteria are established by the City Manager.
4. The CIP is sent to applicable boards, trusts, authorities and commissions for review and comment prior to its adoption. Comments and recommendations need not be incorporated in the plan.
5. The City Council adopts the CIP after at least one public hearing with adequate notice to citizens of hearing time and place.
6. The CIP may be amended by the City Council. Amendments may change the priority for a project, change the proposed commencement year, or increase the estimated cost.
7. Projects may be added to the CIP by the City Council after recommendation by the City Manager, review by appropriate boards, trusts, authorities and commissions, and a public hearing.
The City Manager provides the City Council periodic progress reports on the status of capital improvement projects.
Table of Contents

Revenue
Appendix
F-12
Oklahoma City’s authority for generating revenue is limited by state law. Specific user fees are set by the City Council, while municipal taxes require voter approval.
Revenue Policies Summarized 1. The City sales tax rate is currently established at 4.125%. Of this amount, the General Fund receives 2.25%, the Public
Safety Sales Tax Fund receives 0.75%, divided equally between the Police and Fire Departments, the Oklahoma City Zoo receives 0.125%, and 1.00% is dedicated to Better Streets Safer City.
2. The hotel tax collection rate is established at 5.5% of gross receipts of all room rentals at the sales value of the room. Collections are dedicated to promoting convention and tourism and to capital improvements at the fairgrounds.
3. Occupational taxes and utility taxes and fees are established at various rates.
4. User fees are established and revised by the City Council. The City Code includes a general schedule of fees which is updated by ordinance each time fees change.
5. Fees, penalties, and assessments for late payment are authorized by the various provisions establishing fees and taxes.
Revenue Practices 1. Revenues are estimated annually.
2. Efforts are made to diversify revenues.
3. User charges are reviewed periodically and recommendations to increase or decrease charges are based on the following:
a. The history of charge levels, including how long present charges have been in place.
b. For charges that defray all or part of the cost of delivering a service, how revenues compare to costs.
c. How City charges compare to those of surrounding and comparable cities.
d. The potential impact on the City, the local economy and on individuals and firms who will pay the charge.
4. Increases to user charges are to be implemented incrementally whenever possible. Sales, use and hotel tax revenues are monitored and reported to the City Manager, the Mayor and City Council each month. Total City revenues are monitored, analyzed and reported to the City Manager monthly and to the Mayor and City Council quarterly.
Table of Contents

Investment
F-13
Appendix
The City Treasurer follows three major prioritized objectives in investing the City’s funds: safety, liquidity and return on investments. The City Council approved a revised and updated investment policy effective August 1, 2017. The City’s investment policy incorporates City Charter, Municipal Code and statutory requirements and recognizes standards promulgated by the Govern-ment Finance Officers Association and the Association of Public Treasurers of the United States and Canada. In accordance with this policy, the City Treasurer follows three major prioritized objectives in investing the City’s funds: safety, liquidity and return on investments. Safety. Safety of principal is the foremost objective of the City’s investment program. Investments of the City shall be under-taken in a manner that seeks to ensure the preservation of capital of the portfolio. This objective will be to minimize credit risk and interest rate risk. Liquidity. The City’s investment portfolio shall at all times be sufficiently liquid to enable the City to meet all operating cash flow needs that are reasonably anticipated. This will be accomplished by structuring the portfolio so that securities mature concurrent with cash needs to meet anticipated demands. Return on Investments. The City’s investment portfolio shall be designed with the objective of attaining a market rate of re-turn throughout budgetary and economic cycles, taking into account the City’s investment risk constraints, liquidity needs and cash flow characteristics of the portfolio. Return shall be subordinate to safety and liquidity. The Charter of Oklahoma City Article IV, § 13, provides for the investment of municipal funds in the custody of the City Treas-urer upon the direction of the Council and only in such securities as are provided by the Constitution and the laws of the State of Oklahoma for the investment of the municipal funds. The statutes that bear on the investment of municipal funds are 62 O.S. Supp. 2000 § 348.1; 62 O.S. Supp. 2000 §§ 348.3 and 62 O.S. Supp. 2000 §§ 517.1 et seq. The City Manager is authorized to appoint Assistant City Treasurers to assist with the function of the City Treasurer and perform the duties of City Treasurer in absence or incapacity as specified in the Oklahoma City Municipal Code, § 2-232 (2002). In accordance with these provi-sions, the City Treasurer and Assistant City Treasurers will authorize all purchases, sales and trades of investments in accord-ance with the scope, objectives and covenants of the policy including those recommended by any independent professional investment consultants hired by the City. The City Treasury personnel involved in the investment process shall act responsibly as custodians of public funds. The City Treasurer shall be responsible for all transactions undertaken and shall establish a system of controls and procedures to regulate the activities of assistants and any independent professional investment con-sultants. The City Treasury personnel who have authority to invest public funds, make wire transfers, or who have signatory authority for depository accounts are required to be bonded in accordance with the Oklahoma City Municipal Code, § 2-233 (2002). The City Treasurer and a designee of the City Manager’s Office will review all investment transactions. The City currently invests in short-term U.S. Treasury securities, callable and non-callable agencies, collateralized or insured certificates of deposit, collateralized savings accounts, money market funds repurchase agreements and prime commercial paper. Repurchase agreements are fully collateralized by U.S. Treasury securities and agencies under a master repurchase agreement. The City’s basic investment strategy is to structure the investment portfolio to meet various cash flow needs and attain a mar-ket-average rate of return. Through historical experience, the Treasurer has documented the on-going cash flow needs of the City (e.g. bi-weekly payroll, vendor payments, debt service payments, and capital project requirements). In most instances, investment maturities are laddered to cover specific, known cash flow requirements throughout the year, such as debt service payments and capital improvement program expenditures. Short term investments, including money market funds, high balance savings accounts and prime commercial paper are maintained for liquidity.
Table of Contents

Appendix
F-14
This portfolio strategy allows the City to meet liquidity requirements and provides the City reasonable rates of return under various market conditions. The portfolio is structured within the maturity and type limitations described below.
Maturity Limitations Percentage of Total Invested Principle
Investment Type Limitations Percentage of Total Invested Principal
*Includes SLGS The investment policy also has additional provisions pertaining to the following:
• Standard of care
• Ethics and conflict of interest
• Authorized depository institutions/financial dealers
• Collateralization
• Safekeeping and custody
• Delivery versus payment
• Internal controls
• Investment committee
• Investment procedures
• Record keeping and reporting
• Interest earnings
• Competitive selection of investments
• Performance standards
• Bond fund proceeds
• Policy adoption
• Advance refunding escrows
MAXIMUM % MINIMUM %
0-1 Year 100% 5%-25%
1-3 Years 90% 0%
3-5 Years 90% 0%
MAXIMUM % MINIMUM %
Repurchase agreements 100% 0%
U.S. Treasury Securities* 100% 0%
Certificates of deposit 50% 0%
Money market funds 100% 0%
Savings account 100% 0%
U.S. non-callable agencies securities 100% 0%
U.S. callable agencies securities 20% 0%
Prime commercial paper 7.5% 0%
Direct City debt obligation and judgments 5% 0%
Table of Contents
Debt Management
F-15
Appendix
The issuance of debt is controlled by the relevant provisions of the Oklahoma State Constitution, Oklahoma State Statutes, Oklahoma City Charter, Oklahoma City Municipal Code, Oklahoma City Debt Management Policy and other rules and regulations promogulated by various regulatory and government agencies such as the Securities and Exchange Commission and the Internal Revenue Service.
The City and the public trusts, of which the City is a beneficiary, issue the following types of bonds: General Obligation Bonds. The City may issue general obligation bonds that have been approved by a majority of the voters,
voting in an election, for the purpose of approving various municipal improvements. These bonds are sold at a competitive public sale, backed by the full faith and credit of the City, and retired by an annual ad valorem property tax levy. The City strives to issue general obligation bonds in amounts designed to keep the ten year average ad valorem tax rate at or near 16 mills.
2. Revenue Bonds. The City has created a number of trusts to finance City services that have issued revenue bonds to acquire assets or construct improvements. The debt of these trusts does not constitute debt of the City and is payable solely from the resources of the trusts.
The City’s capital funding and debt management practices are designed, as follows: 1. To maintain a balanced relationship between issuing debt and pay-as-you-go financing.
2. To use debt only for capital projects that cannot be financed from current revenues.
3. To schedule maturities of debt so as not to exceed the expected useful life of the capital project or asset(s) financed.
4. To maintain and improve current bond ratings so that borrowing costs are minimized and access to credit is preserved. Good communication with bond rating agencies will be maintained and the City will follow a policy of full disclosure on official bond statements.
5. To actively monitor its investment practices to ensure maximum returns on its invested bond proceeds while complying with Federal arbitrage requirements.
6. To comply with all continuing disclosure obligations and reporting of material events as required by the Securities and Exchange Commission Rule 15c2-12.
Table of Contents

Procurement
F-16
Appendix
The City Council has adopted the following purchasing policies: 1. Comply with all pertinent state and local legal requirements governing purchasing.
2. Act to purchase for the City the highest quality in supplies and contractual services at the least expense consistent with prevailing economic conditions, while establishing and maintaining a reputation of fairness and integrity.
3. Endeavor to obtain as full and open competition as possible on all purchases and sales, and to competitively bid all formal contracts without undue restrictions and with open competition.
4. Provide a fair and equal opportunity to all vendors.
5. Maximize the possibilities of buying in large quantities, so as to take full advantage of discounts.
6. Strive to process all payments due vendors promptly and without unnecessary delay.
7. Obtain the greatest possible revenue from the disposal of surplus or obsolete materials and equipment.
8. Conduct the entire process of public purchasing in an open, impartial and ethical manner. In this regard, this policy prohibits the acceptance of gratuities, gifts or other favors that might raise questions concerning the impartiality of the process.
9. Maintain accountability through a system of checks and balances, stringent accounting and budget controls and periodic reports to supervising officials.
10. Keep abreast of current developments in the field of purchasing, pricing, market conditions and new product development, and to secure for the City the benefits of any research done in the field of purchasing.
11. The City Manager, with the assistance of the Municipal Counselor and City Auditor, has issued a City of Oklahoma City Purchasing Policies and Procedures Manual to all departments based on the formal policies established by the City Council.
12. The City Manager shall amend the manual as required by changes in pertinent law, ordinances or operating procedures.
Table of Contents

Accounting and Auditing
F-17
Appendix
Financial Reporting 1. The City’s approach to financial reporting and disclosure is comprehensive, open and accessible. The objective of
financial reporting activities is to provide interested parties with accurate, timely and understandable information concerning the City’s financial operations and results.
2. The City has a comprehensive accounting information system. Interim financial statements provide City management, the Mayor and City Council with regular financial analyses. The City’s accounting and financial reporting comply with Generally Accepted Accounting Principles (GAAP).
3. The City produces a Comprehensive Annual Financial Report (CAFR) for the City and the Oklahoma City Employee Retirement System and annual reports for major public trusts, in accordance with state and federal law. This reporting attempts to meet or exceed industry standards (established by the Governmental Accounting Standards Board) for financial reporting. The CAFR encompasses the City and related public trusts, associations, foundations, etc. as determined to comprise the City’s reporting entity and over which the City exercises accountability and serves as the City’s primary external reporting document.
4. The City also produces financial reports meeting regulatory requirements for secondary market disclosure, as determined by the Securities and Exchange Commission and other financial documents required to maintain the City’s regulatory compliance.
Internal Controls 1. The City’s internal control environment is designed to safeguard City assets and provide reliable financial records.
Reasonable assurances are provided through implementation of the following internal controls.
a. Transactions are executed in accordance with City Council and/or management’s general or specific authorization.
b. Transactions are recorded as necessary to permit preparation of financial statements in conformity with GAAP or other criteria applicable to such statements and/or to maintain accountability for assets.
c. Access to assets is permitted only in accordance with the City Council and/or management’s authorization.
d. The recorded accountability for assets is compared with the existing assets at reasonable intervals and appropriate action is taken with respect to any differences.
2. The City’s internal controls are reviewed annually as a part of the independent audit and in compliance with federal and state regulations. Internal controls are also routinely reviewed by internal auditors. The City implements cost effective management and internal control recommendations.
Table of Contents

F-18
Appendix
Auditing 1. By City Council resolution, the Audit Committee Charter was established as a standing committee of the City Council.
2. The Audit Committee reviews matters relating to internal and external auditing and the City’s system of internal controls. The Audit Committee promotes cooperation among auditors and management, preserves the independence of the auditing function and ensures that appropriate action is taken on audit findings.
3. The City Charter and Oklahoma Statutes require an annual independent audit. Statutes also require annual audits of active public trusts. The City and its public trusts comply with audit requirements.
4. The City’s independent auditor is competitively selected based on technical qualifications to obtain qualified audit services at the lowest cost to the City.
5. By City Council resolution, public trusts of which the City is the beneficiary are encouraged to use the independent auditor competitively selected by the City. The City complies with the Single Audit Act which requires that a comprehensive audit of federal funds be conducted in conjunction with the City’s annual financial audit associated with the CAFR.
6. The City Auditor is appointed by the Mayor and City Council. The position of City Auditor is established by the City Charter and the office has been confirmed and established by ordinance as the Auditing Department. The Auditing Department and the City Auditor are a part of the Division of Public Affairs whose duties and responsibilities as established by the City Charter or related ordinance include, but are not limited, to the following:
a. determine whether management has established and complied with procedures and practices to ensure that:
City operations are being conducted efficiently and effectively, in a manner consistent with the intended objectives of the governing body and in compliance with applicable laws and regulations; resources, including funds, contractual rights, property and personnel, are adequately safeguarded; and financial and management records and reports disclose fairly, accurately and completely all information that is required by law, that is necessary to assess the City's financial position and that is necessary to understand and evaluate the results of operations.
b. evaluate and report on the adequacy and effectiveness of the internal control structure established and utilized over the payment of municipal funds;
c. attend bid openings and verify the correctness, completeness and accuracy of bids received; and
d. receive and file annually property inventories.
7. The Office of the City Auditor develops an audit plan which is submitted for the review and approval of Mayor and Council. The Comprehensive Audit Plan is a detailed work program that allocates the professional hours available among specified audit engagements.
8. Policies and procedures adopted by resolution of Mayor and Council direct that the operations of the Office of the City Auditor shall be conducted in accordance with government auditing standards.
Table of Contents
Statement of Compliance with Budgeting and Financial Planning Policies
F-19
Appendix
A Resolution adopting Budgeting and Financial Planning Policies, adopt-ed by the City Council March 27th, 2018 requires that the City Manager prepare and submit the proposed budget in accordance with the policies specified by the resolution and that the proposed budget include a state-ment of the extent to which it complies with those policies.
Summary of Budget Requirements 1. Scope of Budget. This budget complies with the policy requiring that all City funds be budgeted.
2. Appropriations for Fiscal Year. The budget complies with policy requirements regarding level of budgetary control and appropriations lapsing at the end of the fiscal year.
3. Financial Forecast. Information from the five-year financial forecast, required at least every two years, was last present-ed to Council in February.
4. Decentralization. This budget was prepared with department involvement as required by the policy.
5. Performance-based Budget. This budget includes measures of performance and has considered them when allocating funds, as required by the policy.
6. Operating Reserves. The policy requires each City fund to maintain two types of reserves: fund balance and contingency.
• Contingency. Each City fund should include an appropriation adequate to fund a contingency account of a targeted amount of 2% of the fund’s budgeted expenditures. Refer to the Table of Compliance for contingency levels for each operating fund.
• Fund Balance. Fund Balance is an unbudgeted reserve which may be drawn upon for cash flow needs, and may be used as revenue without amending the budget if other revenue sources in total fall short of the estimate used in the adopted budget. The policy states that Fund Balance should not be used to fund on-going operations and this budg-et meets this requirement.
• General Fund. The General Fund shall maintain reserves at the beginning of each fiscal year in the amount of no less than fourteen percent and no more than twenty percent of the total General Fund budget for that fiscal year. This equates to maintaining approximately two months of expenditures in operating reserves. For the purposes of this section, “budgeted expenditures” means total budgeted General Fund expenditures and budgeted transfers to oth-er funds for the ensuing fiscal year.
• Other Funds. Any fund that is not partially funded through transfers from the General Fund and supports personnel or other ongoing operating expenditures shall maintain reserves at a target level of five to twenty percent of the total budgeted expenditures of the fund for the ensuing fiscal year. City enterprise funds that are fully supported by a trust of the City are excepted from this operating reserve requirement. Funds that are fully supported by a trust will follow the trust policy for operating reserve requirements.
7. Borrowing for Operations. This budget will not require any fund to borrow for ongoing operations.
8. Balanced Budget. The budget is balanced in accordance with the Municipal Budget Act. Estimated revenues, including budgeted fund balance, meet or exceed anticipated expenditures.
9. Capital Expenditures. City policy is that non-recurring revenue be used for capital and one-time expenses. As a target, the City works to budget 1-3% of the General Fund for capital expenditures.
10. Cost Allocation Plan. A cost allocation plan was prepared, distributed to departments, and used as the basis for deter-mining Administrative Service Chargebacks as required by policy.
11. Interest and Investment Income. Interest and investment income earned by each fund shall be deposited in the same fund.
12. Budget Amendments. If budget amendments are necessary, they will be conducted as required by policy.
Table of Contents

Table of Compliance with Reserve Policy
F-20
Appendix
Operating Only FY21 FY21 Contingency Projected Fund Bal.
Adopted Budgeted as a % Unbudgeted as a %
Budget Contingency of Budget Fund Balance of Budget
(a) (b) (c) (d)
(e) General Fund $456,511,388 $6,800,851 1.49% $103,320,637 22.63%
(g) Asset Forfeiture Fund $1,998,292 434,325 21.73% $1,141,857 57.14%
Court Admin. and Training Fund 227,000 6,400 2.82% 26,029 11.47%
(e,g) Fire Sales Tax Fund 43,557,389 515,000 1.18% 9,740,624 22.36%
(e,f,g) Hotel/Motel Tax Fund 7,843,932 0 0.00% 4,114,745 52.46%
(e) MAPS 3 Use Tax 4,400,119 0 0.00% 0 0.00%
MAPS 4 Use Tax 1,500,000 500,000 33.33% 0 0.00%
(e,g) Medical Service Program Fund 8,726,360 141,000 1.62% 8,303,824 95.16%
(g) Police Sales Tax Fund 42,406,840 860,479 2.03% 10,207,677 24.07%
(g) Stormwater Drainage Fund 19,063,635 600,000 3.15% 11,792,171 61.86%
(f,i) Zoo Sales Tax Fund 13,652,149 0 0.00% 0 0.00%
Funds Supported by the General Fund or Other Entities (h)
(i) Airports $20,273,057 $336,882 1.66% $1,547,947 7.64%
Emergency Management Fund 9,244,913 200,000 2.16% 665,085 7.19%
Internal Service Fund 51,851,413 844,918 1.63% 7,014,974 13.53%
(i) Transportaion and Parking Fund 4,502,411 150,767 3.35% 0 0.00%
(i) Solid Waste Mgmt. Fund 11,145,909 300,000 2.69% 0 0.00%
(i) Water Fund 65,353,735 1,260,000 1.93% 0 0.00%
(i) Wastewater Fund 31,068,064 630,000 2.03% 0 0.00%
NOTES:
(a)
(b)
(c)
(d)
(e)
(f)
(g)
(h)
(i)
The budgeted contingency includes only operating contingencies.
The City's Financial Policies set a target of 2% for budgeted contingency.
The City's Financial Policies set an 14-20% target for unbudgeted fund balance in the General Fund and 5 to 20% in
other funds.
The Projected Unbudgeted Fund Balance figures were calculated using estimates developed at the time the budget
was presented to the City Council
These funds can rely on the General Fund or other entities for some or all of their funding and, therefore, do not
have the same fund balance requirements as other funds.
All expenditures managed in these funds are expended on behalf of trusts. City enterprise funds that are fully
supported by a trust of the City are excepted from the unbudgeted fund balance requirement.
These funds are dedicated for use by other entities; contingency is included in the receiving entity's budget.
These funds carry a high unbudgeted fund balance as a reserve for future projects.
Contingency is below target levels of 2% because of a management decision to lower contingency in order to
maximize availability of funds for departmental programs.
Table of Contents

Glossary
Appendix
F-21
Account – An entity for recording specific revenues or expenditures, or for grouping related or similar classes of revenues and expenditures and recording them within a fund or department. Account Class – A category of expenditures used in the budget and based on the Municipal Budget Act. Specifically, Personal Services, Other Services and Charges, Materials and Supplies, Capital Outlay, Debt Service and Transfers. Account Code – An expenditure or revenue account number such as office supplies or rental of equipment. This is synonymous with line item. Accrual Basis of Accounting – The accrual basis of accounting recognizes revenues, when earned, and expenses, when incurred, as opposed to recognizing revenues when received and expenses when paid. The accrual basis of accounting is used in proprietary fund types and the pension trust fund. ADA – Americans with Disabilities Act. Enacted in 1990 and amended in 2008 as a wide-ranging civil rights law that prohibits discrimination based on disability. In regard to public entities, the act also mandates compliance with specific physical and procedural access regulations to all service and programs offered. Administrative Services Charge – An internal charge to departments for central services provided by General Fund departments. Adopted Budget – A plan of financial operation, legally adopted by the City Council, providing an estimate of expenditures for a given fiscal year and a proposed means of financing them. The legal requirements for adopting a budget are set forth in the Oklahoma State Statutes (Title 11 Sections 17-201 - 17-216, known as the Municipal Budget Act). Ad Valorem Tax – A tax based on the value of real property, most commonly real estate. The City can only use this revenue source to pay General Obligation Bond debt and pay judgments against the City. A/E or A&E – Architect and engineering services. AFSCME – American Federation of State, County and Municipal Employees. This bargaining unit represents non-uniform and non-management City employees. Agenda – A list or outline of items to be considered or performed by the governing body. Allocation – Part of a lump-sum appropriation designated for expenditure by specific organizational units and/or for special purposes, activities or objects. Appropriated Fund Balance – Any fund balance appropriated for a fund for the budget year. Appropriation – An authorization to expend or encumber revenues and fund balance of a fund. Arbitrage – A requirement that if the investment earnings on tax-exempt bond proceeds exceed the interest paid on the bond issue, then the excess earnings above the interest paid on the bonds must be forwarded to the U.S. Treasury. ARRA – American Recovery and Reinvestment Act. Enacted in 2009, an economic stimulus package enacted by the 111th U.S. Congress in February 2009 to create jobs and promote investment and consumer spending. Balanced Budget – A budget developed wherein estimated revenues, including budgeted fund balance, meets or exceeds budgeted expenditures. Base Budget – An estimate of the funding available for existing programs as established by the Office of Management and Budget for each department at the beginning of a budget cycle.
Table of Contents

Appendix
F-22
BEDI – Brownfield Economic Development Initiative. An economic development grant program designed to assist cities with the redevelopment of abandoned and underused industrial and commercial facilities impacted by environmental contamination. Better Streets, Safer City – On Sept. 12, 2017, Oklahoma City voters approved 13 bond propositions and two sales tax initiatives known as the Better Streets, Safer City projects. The 10-year, $967 million bond package invests in streets, police and fire facilities, parks and other basic needs. A permanent 1/4 cent sales tax was passed that provided funding for 129 more police officers and 57 more firefighters with an annual $26 million boost for public safety and other day-to-day operations. It's the first increase in the permanent general operations sales tax rate since 1976. The final initiative is a temporary, 27-month one cent sales tax will generate $240 million for street resurfacing, streetscapes, trails, sidewalks and bicycle infrastructure. BID – Business Improvement District. A public/private sector partnership in which property and business owners of a defined area elect to make a collective contribution to the maintenance, development, and marketing of their commercial district. This is accomplished through an additional assessment against each property in the Business Improvement District. Bond Rating – A bond rating performs the isolated function of credit risk evaluation. While many factors go into the investment decision-making process, the bond rating is often the single most important factor affecting the interest cost on bonds. Budget – A plan of financial operations for a fiscal year, including an estimate of proposed expenditures for given purposes and the proposed means for financing them. Budget Summary – A tabular listing of revenues by source and expenditures by fund and by department within each fund for the budget year. Budget Year – The fiscal year for which a budget is prepared or being prepared. Budgetary Basis – The basis of accounting used for the purpose of budgeting. The City uses a modified cash and expenditures basis. This means that revenues are not recognized until they are received, and expenditures are recognized when they are incurred or committed not when the funds are actually spent. Budgeted Fund Balance – The amount of the carryover or Fund Balance from the prior year that is projected to be used to fund expenditures in the budget. Budgeted Fund Balance is counted as revenue for budget purposes. Budgeted Reserve – See Contingency. CAFR – Comprehensive Annual Financial Report. The City prepares this annual report which provides the public with an accurate picture of current financial conditions. CALEA – Commission on Accreditation for Law Enforcement Agencies. Created in 1979, a program for establishing a body of standards for law enforcement professionals and administering an accreditation process. Capital Budget – A one-year plan for financing a program of long-term work projects for the physical development of the City. The capital budget is usually enacted as part of the complete annual budget, which includes other operating and capital outlay and is based on a Capital Improvement Program. Capital Improvement Program (CIP) – A five-year plan for financing long-term work projects for the physical development of the City which identifies each project, the expected beginning and ending date, annual cost and proposed method of financing each project. Capital Outlay – Expenditures of at least $50,000 that result either in the acquisition of fixed assets or property, durable for longer than one year. Capital Project – A project to acquire, develop, improve, or maintain City infrastructure, facilities, and/or capital assets (long-term investments held for a period of more than one year) CCTV – Closed Circuit Television. CCTV is a video camera and TV monitoring system primarily used for surveillance and security.
Table of Contents

Appendix
F-23
CDBG – Community Development Block Grant. The CDBG is a program of the U.S. Department of Housing and Urban Development. CDBG grants fund local community development through affordable housing, anti-poverty programs and infrastructure development. National priorities include activities that benefit citizens with low to moderate income, prevent or eliminate slums or blight, and other community development activities that address an urgent threat to health or safety. These grants may be used for real estate acquisition, relocation, demolition, rehabilitation of housing and commercial buildings, construction of public facilities, improvements to water and sewer facilities, streets, neighborhood centers, the conversion of school buildings, as well as for public services, such as economic development and job creation/retention. CEPA – Clarence E. Page Airport. This general aviation airport is home to small aircraft and aviation-related enterprises. CHAPPS – Cops Helping Alleviate Police Problems. Developed in 1983, CHAPPS offers support to the Oklahoma City Police Department employees and their families without cost or obligation by responding to “critical incidents” that may overwhelm a person’s emotional coping mechanisms. Chargeback – A charge to departments receiving services from another City department. See Internal Service Fund. Chief Executive Officer – The mayor of an aldermanic city or a strong-mayor-council city, the mayor of a town, or the city manager or chief administrative officer as it may be defined by applicable law, charter or ordinance. CLEET – Council on Law Enforcement, Education and Training. Established in 1963, CLEET supports Oklahoma law enforcement by enhancing public safety, providing education and training, promoting professionalism and enhancing competency within the ranks of Oklahoma law enforcement. CWA – Clean Water Act. Enacted in 1972, the Act establishes the basic structure for regulating discharges of pollutants into the waters of the United States and regulating quality standards for surface waters. C-MOM – Capacity Assurance, Management, Operation and Maintenance Programs. C-MOM is an approach presented by the Environmental Protection Agency to manage wastewater facilities. The plan includes using an information-based approach to setting priorities, evaluating capacity for all parts of the system, developing a strategic approach to preventative maintenance, and conducting periodic program audits to identify deficiencies and potential problems. CNG – Compressed Natural Gas. CNG is a fossil fuel and clean burning alternative to gasoline, diesel and propane. COBRA – Consolidated Omnibus Budget Reconciliation Act. Enacted in 1985, a portion of the Act sets forth requirements for employers and employees with regard to health insurance after leaving employment. Contingency – An amount designated in the budget of a specific fund for use in unforeseen circumstances. COTPA – Central Oklahoma Transportation and Parking Authority. Established in 1966, COTPA provides public transit services in the City and, through contracts, in many suburban areas and also operates downtown parking garages. Core to Shore – A planning process to focus on development between the downtown core south to the shore of the Oklahoma River. The Core to Shore zone covers approximately 1,375 acres impacted by the I-40 realignment. Current year – The year in which the budget is prepared and adopted, or the fiscal year immediately preceding the budget year. Debt Service – The amount owed for principal and interest of bonds and other debt instruments according to a predetermined payment schedule. Dedicated Revenues – Income that is restricted by law to fund specific purposes. Deficit – The excess of a fund's current liabilities and encumbrances over its current financial assets as reflected by its books of account. Demand Measure – A specific type of performance measure used in the City’s Leading for Results process referring to the number of total units of service expected to be requested or required.
Table of Contents

Appendix
F-24
Department – A functional unit within a fund which carries on a specific activity, such as a fire department or a police department within a general fund. Division – See “Line of Business.” DOE – Department of Energy. The federal agency whose mission is to advance energy technology and promote related innovation in the United States. DOJ – Department of Justice. The federal agency responsible for criminal investigation and law enforcement. EEOC – Equal Employment Opportunity Commission. The federal agency tasked with ending employment discrimination in the United States. Efficiency Measure – A specific type of performance measure used in the City’s Leading for Results process measuring cost or expenditure per Output or Result. EMSA – Emergency Medical Services Authority. EMSA is a trust of the Tulsa and Oklahoma City governments. As an arm of local government, EMSA puts out bids for a private ambulance service to provide emergency and non-emergency medical services and dispatching in the Oklahoma City area. Encumbrances – Obligations in the form of purchase orders, contracts, or salary commitments that are charged to an appropriation and for which a part of the appropriation is reserved. Encumbrances are eliminated when paid or when an actual liability is set up. Enterprise Fund – Funds where the costs are financed primarily through user charges. EPA – Environmental Protection Agency. The agency of the federal government charged with protecting human health and with safeguarding the natural environment (air, water, and land). Estimated Revenue – The amount of revenues estimated to be received during the budget year in each fund for which a budget is prepared. Excise Tax – Taxes paid when purchases are made on specific goods or activities and often included in the price of the product or service. An example would be taxes on tobacco. Expenditures – The total outflow of funds represented by: (a) supplies, materials and services received for current operations; (b) payments in the form of goods or services received; (c) equipment and other assets received; (d) payment for servicing debts including interest or principal; and (e) transfers to other funds. FAA – Federal Aviation Administration. The federal agency responsible for the regulation of civil aviation and overseeing the
development of air traffic control.
FEMA – Federal Emergency Management Agency. An agency of the United States Department of Homeland Security established to coordinate the response to disaster that has occurred in the United States and overwhelms the resources of local and state authorities. Fiscal Year (FY) – The annual period for reporting fiscal operations which begins and ends on dates as the Legislature provides or as provided by law. The City’s fiscal year is July 1 to June 30. Fixed Assets – Assets with a useful life in excess of one year and an initial cost equal to or exceeding $50,000 Classifications include land, buildings, machinery, furniture, equipment, and construction in progress. FLSA – Fair Labor Standards Act. Enacted in 1938, a federal law that established the national minimum wage, guaranteed time and-a-half for overtime for certain jobs, and other employment laws.
Table of Contents

Appendix
F-25
FMLA – Family and Medical Leave Act. Enacted in 1993, this federal labor law allows an employee to take unpaid leave due to illness or to care for a sick family member. FOP – Fraternal Order of Police. This bargaining unit represents sworn law enforcement officers. Franchise Tax – A gross receipts tax assessed on public utilities granted a franchise by the voters for use of City rights of way. Fund – An independent fiscal and accounting entity with a self-balancing set of accounts to record cash and other financial resources, together with all liabilities, which are segregated for the purpose of carrying on specific activities or attaining certain objectives. Fund Balance – The excess of a fund's current financial assets over its current liabilities and encumbrances, as reflected by its books of account. Generally Accepted Accounting Principles (GAAP) – The standard framework of guidelines for financial accounting which sets forth the standards conventions, and rules accountants follow in recording and summarizing transactions and preparing of financial statements and annual reports. General Fund – A fund used to account for all monies received and disbursed for general municipal government purposes including all assets, liabilities, reserves, fund balances, revenues, and expenditures that are not accounted for in any other fund. GIS – Geographical Information System. GIS integrates hardware, software, and data for capturing, managing, analyzing, editing and sharing and displaying all forms of geographically referenced information and can be integrated into any enterprise information system framework. GO Bond – General Obligation Bond. GO Bonds are issued by The City of Oklahoma City to finance major capital improvements and infrastructure projects. GO bonds require a vote of the citizens and they are repaid over time with real property (ad valorem) taxes. GOLT Bond – General Obligation Limited Tax Bond. GOLT Bonds are issued by The City of Oklahoma City for economic development to provide funding for the City’s Strategic Investment Program. GOLT bonds require a vote of the citizens and they are repaid over time with real property (ad valorem) taxes. Governing Body – The city council of a city, the board of trustees of a town, or the legislative body of a municipality as it may be defined by applicable law or charter provision. Grant – A contribution by an organization (most often the federal government) to support a particular function. GRAVE – Gun Resistance and Violence Education. An educational awareness program sponsored by the Oklahoma City Police. HIDTA – High Intensity Drug Trafficking Area. Established in 1990, a drug-prohibition enforcement program that identifies certain areas for increased law enforcement activity. Hiring Freeze – A temporary restriction on hiring in order to achieve financial savings. HOME – Home Investment Partnership Program. HOME is the largest Federal block grant to state and local governments designed exclusively to create affordable housing for low-income households. Each year it allocates approximately $2 billion among the states for hundreds of localities nationwide. HOPWA – Housing Opportunities for People with AIDS. This HUD program addresses the specific needs of persons living with HIV/AIDS and their families. It makes grants to local communities, states, and nonprofit organizations for projects that benefit those individuals. HP – Historic Preservation is the theory and practice of creatively maintaining the historic built environment and controlling the landscape component of which it is an integral part.
Table of Contents

Appendix
F-26
HUD – U.S. Department of Housing and Urban Development. HUD is a Cabinet department of the United States government founded in 1965 to develop and execute policy on housing and cities. It has largely scaled back its urban development function and now focuses primarily on housing. IAFF – International Association of Fire Fighters. This bargaining unit represents professional firefighters. ICMA – International City/County Management Association. Founded in 1914, ICMA is an organization for local government leaders and managers. Their mission is to create excellence in local government by advocating and developing the professional management of local government worldwide. Immediate Prior Fiscal Year – The year preceding the current year. IMPACT – Initiating Multiple Police Actions Against Criminal Targets. This is a Police Department program administered through the briefing stations that focuses on reducing crime. Infrastructure – The main physical foundation of the City including roads, utilities, water mains, streets, and bridges. Internal Service Fund – A fund established to finance and account for services and commodities furnished by one department to another department on a cost reimbursement basis. See Chargeback. ISTEA – Intermodal Surface Transportation Efficiency Act. Enacted in 1991, a federal law that allows for the distribution of funds for highway, mass transportation, trails, and other transportation purposes. Oklahoma City uses ISTEA funds for highway improvement projects and for a network of trails around the City. Issue Statement – Identifies the critical trends that will impact the department and its customers over the next two to five years. LARA – Lake Atoka Reservation Association. Lake Atoka is 100 miles southeast of Oklahoma City. In 1959, the City constructed the reservoir to supply water to Lake Draper through a 60-inch pipeline. LARA was created by The City of Oklahoma City, the Oklahoma City Water Utilities Trust, and the City of Atoka in 1974 to administer use of the Reservation, its resources, and facilities. The eight members are the Mayors of Oklahoma City and City of Atoka, the Manager of Oklahoma City, the Chairman of the Oklahoma City Water Utilities Trust (OCWUT), one appointee from Oklahoma City, and three citizens of Atoka County who are appointed by the City of Atoka. Levy – To impose ad valorem taxes or the total amount of ad valorem taxes for a purpose or entity. LFR – See “Leading for Results.” Leading for Results – The strategic planning process used by all City departments to develop strategic business plans, the performance-based program budget and related performance measures to document the results achieved by departmental programs. Line Item – An account for recording specific revenues or expenditures within a fund or department. Line of Business – A set of programs within a department sharing a common purpose that produce results for citizens. Lines of Business represent broad result areas and are the second highest level of organization in the City. A Department is typically comprised of several Lines of Business. This terminology is used in the Leading for Results process and is comparable to a Division within a Department. Listed Project – A capital improvement project listed for funding in a specific bond issuance statement. Maintenance and Operations Expenditures (M & O’s) – Costs of services and supplies needed for a service, program or department. Under Oklahoma's Municipal Budget Act, these are budgeted and accounted for under two distinct classes: “other services and charges” and “materials and supplies.”
Table of Contents
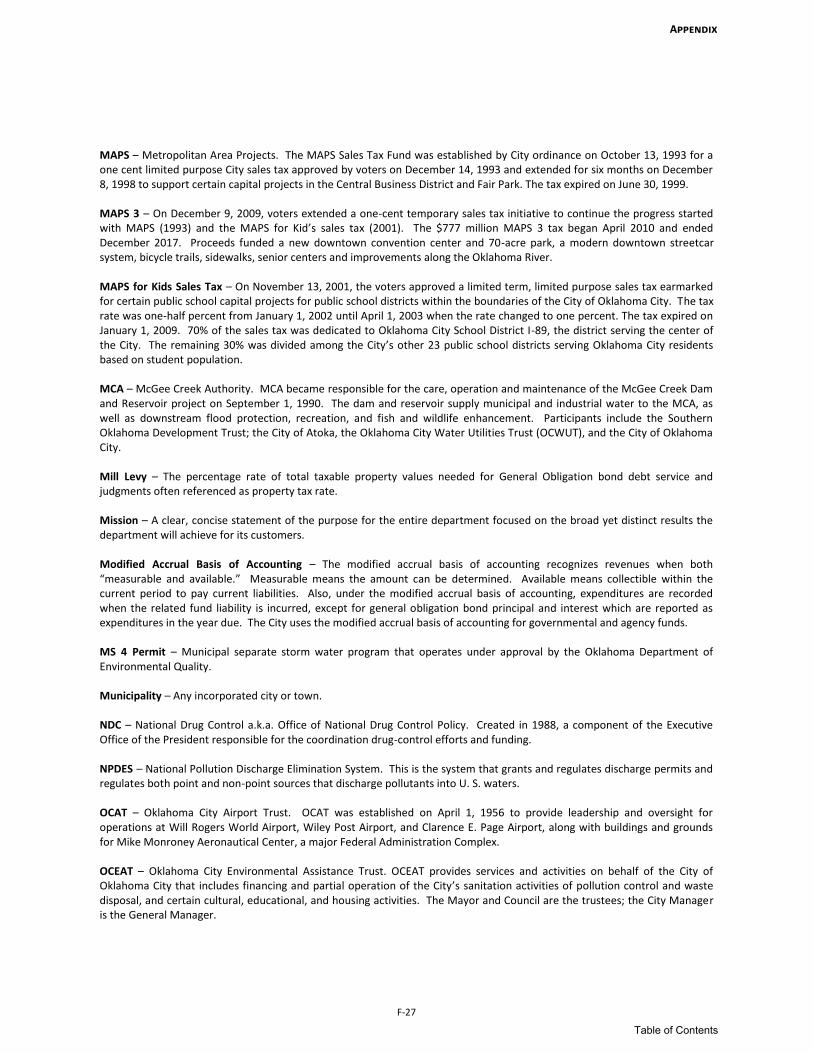
Appendix
F-27
MAPS – Metropolitan Area Projects. The MAPS Sales Tax Fund was established by City ordinance on October 13, 1993 for a one cent limited purpose City sales tax approved by voters on December 14, 1993 and extended for six months on December 8, 1998 to support certain capital projects in the Central Business District and Fair Park. The tax expired on June 30, 1999. MAPS 3 – On December 9, 2009, voters extended a one-cent temporary sales tax initiative to continue the progress started with MAPS (1993) and the MAPS for Kid’s sales tax (2001). The $777 million MAPS 3 tax began April 2010 and ended December 2017. Proceeds funded a new downtown convention center and 70-acre park, a modern downtown streetcar system, bicycle trails, sidewalks, senior centers and improvements along the Oklahoma River. MAPS for Kids Sales Tax – On November 13, 2001, the voters approved a limited term, limited purpose sales tax earmarked for certain public school capital projects for public school districts within the boundaries of the City of Oklahoma City. The tax rate was one-half percent from January 1, 2002 until April 1, 2003 when the rate changed to one percent. The tax expired on January 1, 2009. 70% of the sales tax was dedicated to Oklahoma City School District I-89, the district serving the center of the City. The remaining 30% was divided among the City’s other 23 public school districts serving Oklahoma City residents based on student population. MCA – McGee Creek Authority. MCA became responsible for the care, operation and maintenance of the McGee Creek Dam and Reservoir project on September 1, 1990. The dam and reservoir supply municipal and industrial water to the MCA, as well as downstream flood protection, recreation, and fish and wildlife enhancement. Participants include the Southern Oklahoma Development Trust; the City of Atoka, the Oklahoma City Water Utilities Trust (OCWUT), and the City of Oklahoma City. Mill Levy – The percentage rate of total taxable property values needed for General Obligation bond debt service and judgments often referenced as property tax rate. Mission – A clear, concise statement of the purpose for the entire department focused on the broad yet distinct results the department will achieve for its customers. Modified Accrual Basis of Accounting – The modified accrual basis of accounting recognizes revenues when both “measurable and available.” Measurable means the amount can be determined. Available means collectible within the current period to pay current liabilities. Also, under the modified accrual basis of accounting, expenditures are recorded when the related fund liability is incurred, except for general obligation bond principal and interest which are reported as expenditures in the year due. The City uses the modified accrual basis of accounting for governmental and agency funds. MS 4 Permit – Municipal separate storm water program that operates under approval by the Oklahoma Department of Environmental Quality. Municipality – Any incorporated city or town. NDC – National Drug Control a.k.a. Office of National Drug Control Policy. Created in 1988, a component of the Executive Office of the President responsible for the coordination drug-control efforts and funding. NPDES – National Pollution Discharge Elimination System. This is the system that grants and regulates discharge permits and regulates both point and non-point sources that discharge pollutants into U. S. waters. OCAT – Oklahoma City Airport Trust. OCAT was established on April 1, 1956 to provide leadership and oversight for operations at Will Rogers World Airport, Wiley Post Airport, and Clarence E. Page Airport, along with buildings and grounds for Mike Monroney Aeronautical Center, a major Federal Administration Complex. OCEAT – Oklahoma City Environmental Assistance Trust. OCEAT provides services and activities on behalf of the City of Oklahoma City that includes financing and partial operation of the City’s sanitation activities of pollution control and waste disposal, and certain cultural, educational, and housing activities. The Mayor and Council are the trustees; the City Manager is the General Manager.
Table of Contents

Appendix
F-28
OCEDT – Oklahoma City Economic Development Trust. OCEDT was established October 9, 2007 to facilitate, enable, operate, manage, market, administer, and finance all forms of economic or community development projects within or near the City of Oklahoma City by providing loans, grants, and other incentives to further job creation and private investment. OCERS – Oklahoma City Employee Retirement System. OCERS provides retirement benefits and disability allowances for virtually all full-time, civilian employees of the City and public trusts included in the City’s reporting entity. Assets are held separately from the City and may be used only for the payment of member benefits. OCMAPS – Oklahoma City Metropolitan Area Public Schools Trust. The OCMAPS Trust is the governing body responsible for the MAPS for Kids sales tax funds and management of its construction projects. The trust is authorized to purchase public school sites and improve public school sites; erect, purchase or demolish school buildings; furnish, equip, or repair public school buildings and purchase school transportation equipment. OCMFA – Oklahoma City Municipal Facilities Authority. OCMFA was established on November 16, 1976 to provides services on behalf of the City that include financing, partial operation, and capital purchases for administration of the City’s risk management activities, water and wastewater assets, information technology, capital leasing and other general government activities. The Mayor and Council serve as the Authority’s trustees and the City Manager serves as the General Manager. OCPPA – Oklahoma City Public Property Authority. OCPPA was established in 1961 to provide services on behalf of the City that include the financing and operating of five municipal golf courses, the Oklahoma City Fairgrounds, Cox Business Services Convention Center, Ford Center Arena, Civic Center Music Hall, and other City buildings. The Mayor and Council serve as OCPPA trustees and the City Manager is the General Manager. OCRA – Oklahoma City Redevelopment Authority. OCRA was established to conserve, develop, and redevelop the central business district. OCRRA – Oklahoma City Riverfront Redevelopment Authority. OCRRA was established to develop, finance, and maintain the property adjacent to the Oklahoma River. OCWUT – Oklahoma City Water Utilities Trust. OCWUT was established in 1960 to oversee the construction of the Atoka Reservoir and its Pipeline Project. OCWUT provides utility customers with outstanding quality water and wastewater services. OCZT – Oklahoma City Zoological Trust. OCZT was created on January 7, 1975 to develop, maintain, operate and manage the Oklahoma City Zoo. Trustees include the Mayor, the City Manager, one Council Member and six other members recommended by the Oklahoma Zoological Society. ODOC – Oklahoma Department of Commerce. ODOC is the primary economic development arm of the state government. ODOT – Oklahoma Department of Transportation. ODOT is the state department in charge of maintaining public roadways in Oklahoma. OESC – Oklahoma Employment Security Commission. OESC is the state’s employment services agency. OMB – Office of Management and Budget. OMB prepares, coordinates and monitors the City’s operating and capital budgets and develops an annual revenue forecast, month-by-month revenue and expenditure targets, and five-year revenue and expenditure projections. OPEBT – Oklahoma City Post-Employment Benefits Trust. OPEBT provides post-employment health insurance benefits for substantially all full-time, civilian employees of the City and public trusts included in the City’s reporting entity. Assets are held separate from the City and may only be used to pay member benefits. Operating Reserve – That portion of the fund balance which has not been appropriated in a budget year. Other Services and Charges – An account class for expenditures for services (e.g., advertising, repairs, postage) and other expenditures that do not fit in the remaining classifications.
Table of Contents

Appendix
F-29
Output Measure – A specific type of performance measure used in the City’s Leading for Results process referring to the amount produced or workload. Performance Based Budgeting – Structures the budget around allocating resources to programs and the results expected from each program. The results from each program are conveyed through performance measures. Performance Measures – Specific quantitative measures of work performed within an activity or program (e.g., total miles of streets cleaned) or specific quantitative measures of results obtained under a program or activity (e.g., reduced vandalism due to street lighting program). Personal Services – The account class containing the costs of personnel such as salaries, wages and employee benefits (social security, retirement and insurance), costs for travel, and training reimbursements. Program – Identifies the third highest level in the formal City organization in which a specific activity is carried out. A program is characterized by a grouping of related activities and services for a common objective. In the Leading for Results format, programs replaced sections and multiple programs comprise a Line of Business. Project 180 – A massive renovation project of more than 180 acres in downtown Oklahoma City. The three-year, $140 million initiative includes the redesign of downtown streets, sidewalks, parks and plazas to improve appearance and make the central core more pedestrian friendly. Proposed Budget – A plan of financial operation, proposed by the City Manager to the City Council, providing an estimate of expenditures for a given fiscal year and a means to finance them. Proprietary Fund Accounting – Accounting used for government operations that are financed and operated in a manner similar to business enterprises and for which preparation of an income statement is desirable. Reserve for Prior Year Encumbrances – An amount budgeted as revenue to provide budget authority for items encumbered in one year which will not be received and paid for until a future year. Result Measure – A specific type of performance measure used in the City’s Leading for Results process measuring the degree to which the customer experiences the desired impact or benefit. Revenue Estimate – A formal estimate of how much income will be earned from a specific revenue source for some future period, typically, a future fiscal year. Revenue sources can include taxes, intergovernmental grants, and fees for services, fines and permits. RFP – Request for Proposal. This is an invitation for consultants, suppliers and other companies to submit a formal offer to provide a specific product or service. The Proposals are then reviewed and scored on a set of criteria to select a vendor or vendors to negotiate a contract to provide the product or service. Right-of-Way (ROW) – A passageway reserved or granted over land for purposes of transportation or maintenance of existing services. SCADA – Supervisory Control and Data Acquisition system. This is a large-scale, distributed measurement and control system that provides for monitoring, control and alarming of complete and/or remote sites. Section – Identifies the third highest level in the formal City organization in which a specific activity is carried out. With the implementation of Leading for Results, a section was reorganized into a Program. Previously, a Division may have consisted of several sections. See Program. SID – Special Improvement District. A public/private sector partnership in which property and business owners in a defined area elect to make a collective contribution to the maintenance, development and marketing of their commercial district. This is accomplished through an additional assessment against each property in the Special Improvement District. Special Purpose Funds – Funds dedicated for a specific purpose, such as a fund established to receive donations to support parks and recreation activities.
Table of Contents

Glossary
Appendix
F-30
Special Revenue Funds – Funds used to account for receipts from revenue sources that have been earmarked for specific activities and related expenditures. Strategic Result – Two to five-year goals that, if achieved, demonstrate how departments are responding to issues. Strategy – A tactic accomplished by departments operationally that contributes to achieving Strategic Result goals. Supplies – The account class that includes articles and items which are consumed or materially altered when used by operating activities, such as office supplies, maintenance parts and small tools, and minor equipment. TANF – Temporary Assistance for Needy Families. This program provides cash assistance to indigent American families with dependent children through the United States Department of Health and Human Services. It is the government program commonly known as “welfare.” TIF – Tax Increment Financing. TIF captures the future tax benefits of real estate improvements in a designated area to pay the present cost of those improvements. It is designed to channel funding, or tax increment, toward improvements in blighted or underdeveloped areas where development would not otherwise occur. TOC – Total Organic Carbon. The amount of carbon bound in organic compounds, often used as an indicator of water quality. Transfer – An account class that includes payments from one City fund to another or to a related trust. Trust – A public trust created by a municipality to issue obligations and enter into financing for the benefit of the municipality. TSA – Transportation Security Administration. The federal agency in charge of security standards for passenger and freight transportation in the United States. Unbudgeted Reserve – The amount of fund balance that is not budgeted and available for cash flow purposes. Use Tax – A consumption tax assessed on products/services used or stored by a resident of the assessing state but purchased outside the state and where a sales tax was not paid on the purchase. USDOC – United States Department of Commerce. The Cabinet department of the United States government concerned with promoting economic growth, technology, entrepreneurship and business development, environmental stewardship and statistical research and analysis. Vacancy Discount – Projected salary savings from personnel turnover. The discount is budgeted as a percentage of the budgeted salary, insurance and retirement for departments in funds with significant Personal Services expenses. In FY16, the discount is 2.0% of combined salary, insurance and retirement for civilian positions, and 1.5% for uniform Police and Fire positions. Vision – The guiding beliefs of Oklahoma City that serve as a basis for all strategic business planning. Weed and Seed – A neighborhood specific crime prevention strategy led by the U.S. Department of Justice, The City of Oklahoma City, various law enforcement and government agencies, non-profit groups, and community residents, who are committed to preventing, reducing and controlling crime and delivering programs and services for community residents. WIA – Workforce Investment Act. The WIA is a United States federal law passed August 7, 1998 to replace the Job Training Partnership Act and certain other Federal job training laws with new workforce investment systems. WPA – Wiley Post Airport. WPA is a reliever airport for Will Rogers World Airport, serving both business and corporate air travelers. WRWA – Will Rogers World Airport. WRWA is the commercial airport for the City of Oklahoma City with over 3.9 million boarding passengers each year.
Table of Contents

Performance Data G-1
Performance Management—Leading For Results
Reader’s Guide In this section, long-term issues and program performance measures are provided for each department. The long-term issues are highlighted in blue and appear at the beginning of each department section.
Long-Term Issues includes issue statements, strategies and strategic results for each department. The issue statements describe the critical trends expected to impact the department and their customers over the next two to five years. The strategies summarize the department’s operational plans to ensure the achievement of strategic results. Strategic results are goals that go beyond current practice and status quo to measure the impact on the aligned issue statement.
Performance Measures are included for each program. Measures are structured so that each program has a full family of measures to report not only the customer experience or satisfaction but also the workload of the program, the demand on the program, and the efficiency or cost of providing services. Required for each program are result measures to illustrate the outcome each program delivers to customers and output measures to provide an idea of the workload of each program. Many programs also include demand measures where there may be a gap between demand and output, illustrating a need for additional resources, and efficiency measures which help show cost over time for a program with a narrowly focused service delivery area.
Legend The key symbol indicates a key measure. These measures align directly with the purpose of the program and best measure the impact on the program’s customers.
Measure aligns with council priority to promote safe, secure, and thriving neighborhoods.
Measure aligns with council priority to develop a transportation system that works for all residents.
Measure aligns with council priority to maintain strong financial management.
Measure aligns with council priority to enhance recreational opportunities and community wellness.
Measure aligns with council priority to encourage a robust local economy.
Measure aligns with council priority to uphold high standards for all city services.
Measure aligns with council priority to continue to pursue social and criminal justice initiatives.
More information about Oklahoma City Council Priorities can be found beginning on page A-12 of the FY21 Budget Book.
Table of Contents

Performance Data G-2
Performance Management—Leading For Results
Leading for Results (LFR) is the “way we do business.” What this means is that the City uses a performance management system for all City departments linking department operations to a strategic business plan. The strategic business plan is organized into programs with each program having an established budget and family of performance measures. The performance measures are used to set department goals and measure progress in achieving those goals using the resources allocated to programs. The entire process is focused on the benefit received by the customer (residents). Leading for Results provides better information to decision makers, which in turn helps them determine how to allocate resources. The Leading for Results performance management system includes planning, employee performance, budgeting, data collecting, reporting, evaluating, and decision-making. The Strategic Business Plan contains the information needed to perform these functions and provides a concise overview of departmental operations. The graph below illustrates the performance management process. As the arrows indicate, each step is critical and flows into the next, which creates a continuous cycle.
Leading for Results equips departments with the ability to develop strategic or department-wide Issue Statements and Strategic Results as well as the ability to focus operationally on individual performance measures. The strategic portion of the process begins with an assessment of the future where departments identify the biggest challenges impacting them and their customers over the next two to five years. These challenges are then refined into Issue Statements which help the department clearly communicate what the trend is that they are facing and the consequences of the trend if not addressed. With the Issue Statements clearly identified, departments develop Strategic Results which are typically stretch goals that, if achieved, demonstrate the department’s ability to respond to the challenges they identified as Issue Statements. Departments will also develop Strategies which are the operational tactics that will be used to achieve Strategic Results. Issue Statements, Strategic Results, and Strategies can be reviewed at the beginning of each department section. The operational portion of the process organizes the services each department provides into programs and performance measures.
Delivering What We Promise
Table of Contents

AirportsFY21 TargetFY20 ProjectionFY19 Actual FY20 TargetFY18 Actual
Long-Term Issue - Unstable Revenue Passenger Growth and Facility DemandsThe unstable nature of some revenue sources, passenger growth and facility demands, long-term property leases that lag current market rates, and continued increases in the cost of providing services, if not addressed, will result in:
A decrease in the quality of service
Deferred maintenance
A lack of funding for capital improvement projects
Strategies to address the Long-Term IssueRates for new/renewed leases will be based on benchmarking of the airport industry, and appraisals to determine market value rates.
Analyze rates structures with funding required to support airport infrastructure.
As provided for in the food, beverage and retail concession agreements, airport staff will do periodic reviews of goods/services provided, and an inspection of the books and records.
Review parking revenue reports quarterly.
Strategic Result(s) to measure annual progress on Long-Term IssueIncrease and stabilize airport revenue in order to finance operations and capital needs as evidenced by:
Maintain all new/renewed leases at market rate and/or include rates sufficient to fund airport provided infrastructure.
Maintain food, beverage and retail concession revenue growth of at least 2% per year.
Maintain parking revenue growth per transaction of at least 2% per year.
100% 100%100%1 100%% of new/renewed leases at market rate and/or rates sufficient to fund airport provided infrastructure
100%
2% 2%0%2 4%% increase in Food, beverage, and retail concession revenues per boarding passenger
6%
2% 2%0%3 4%% change in parking revenue per transaction per year 2%
FY21 Budget Performance Data G-3
Table of Contents
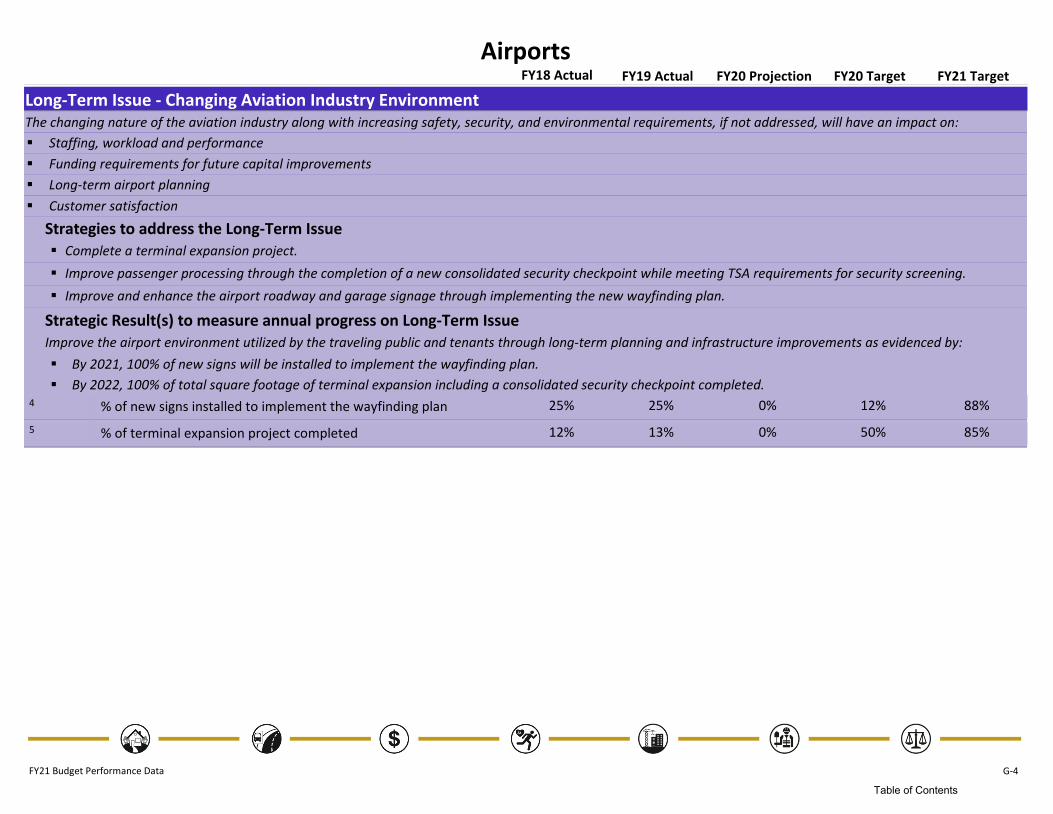
AirportsFY21 TargetFY20 ProjectionFY19 Actual FY20 TargetFY18 Actual
Long-Term Issue - Changing Aviation Industry EnvironmentThe changing nature of the aviation industry along with increasing safety, security, and environmental requirements, if not addressed, will have an impact on:
Staffing, workload and performance
Funding requirements for future capital improvements
Long-term airport planning
Customer satisfaction
Strategies to address the Long-Term IssueComplete a terminal expansion project.
Improve passenger processing through the completion of a new consolidated security checkpoint while meeting TSA requirements for security screening.
Improve and enhance the airport roadway and garage signage through implementing the new wayfinding plan.
Strategic Result(s) to measure annual progress on Long-Term IssueImprove the airport environment utilized by the traveling public and tenants through long-term planning and infrastructure improvements as evidenced by:
By 2021, 100% of new signs will be installed to implement the wayfinding plan.
By 2022, 100% of total square footage of terminal expansion including a consolidated security checkpoint completed.
12% 88%0%4 25%% of new signs installed to implement the wayfinding plan 25%
50% 85%0%5 13%% of terminal expansion project completed 12%
FY21 Budget Performance Data G-4
Table of Contents

AirportsFY21 TargetFY20 ProjectionFY19 Actual FY20 TargetFY18 Actual
Long-Term Issue - Air Service DevelopmentThe growth in Oklahoma City’s population and business activity has resulted in an increased demand for additional air service that, if not addressed could result in:
Missed revenues
Missed economic development, tourism, and convention business opportunities
Decreased customer satisfaction
Strategies to address the Long-Term IssueConduct annual airline rate-based analysis for cost recovery of operations and maintenance (O&M) expenses.
Attend air service conferences and perform target market presentations to specific airlines.
Review passenger trends and forecasts, the FAA Terminal Area Forecast, community activities, local business climate, and economic climate.
Strategic Result(s) to measure annual progress on Long-Term IssueContinue efforts to attract air service in Oklahoma City as evidenced by:
Limit growth in airport cost to airlines per boarding passenger to no more than 5% per year.
Staff will accomplish a minimum of three marketing presentations to airlines per year.
Achieve a 2% increase in boarding passengers each year.
5% 5%-23%6 -23%% increase in the airport cost to the airline per boarding passenger
5%
10 10107 8# of marketing presentations to air carriers each year 12
2% 2%0%8 6%% change in boarding passengers 10%
FY21 Budget Performance Data G-5
Table of Contents
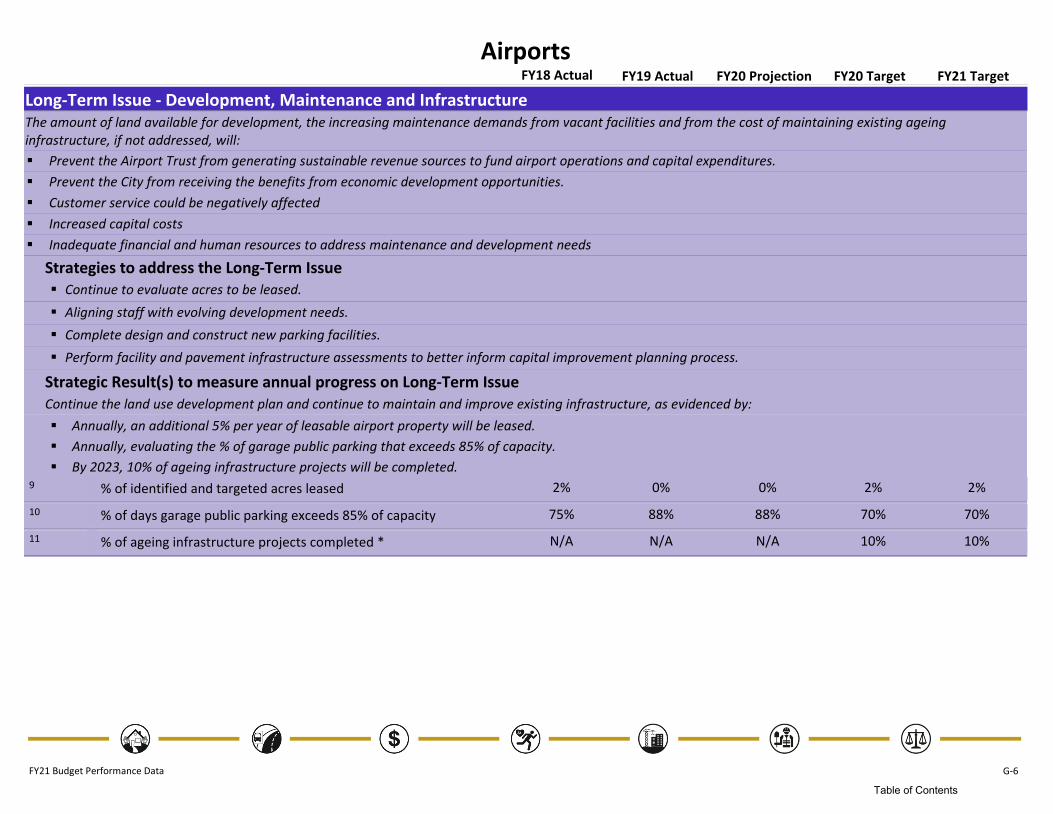
AirportsFY21 TargetFY20 ProjectionFY19 Actual FY20 TargetFY18 Actual
Long-Term Issue - Development, Maintenance and InfrastructureThe amount of land available for development, the increasing maintenance demands from vacant facilities and from the cost of maintaining existing ageing infrastructure, if not addressed, will:
Prevent the Airport Trust from generating sustainable revenue sources to fund airport operations and capital expenditures.
Prevent the City from receiving the benefits from economic development opportunities.
Customer service could be negatively affected
Increased capital costs
Inadequate financial and human resources to address maintenance and development needs
Strategies to address the Long-Term IssueContinue to evaluate acres to be leased.
Aligning staff with evolving development needs.
Complete design and construct new parking facilities.
Perform facility and pavement infrastructure assessments to better inform capital improvement planning process.
Strategic Result(s) to measure annual progress on Long-Term IssueContinue the land use development plan and continue to maintain and improve existing infrastructure, as evidenced by:
Annually, an additional 5% per year of leasable airport property will be leased.
Annually, evaluating the % of garage public parking that exceeds 85% of capacity.
By 2023, 10% of ageing infrastructure projects will be completed.
2% 2%0%9 0%% of identified and targeted acres leased 2%
70% 70%88%10 88%% of days garage public parking exceeds 85% of capacity 75%
10% 10%N/A11 N/A% of ageing infrastructure projects completed * N/A
FY21 Budget Performance Data G-6
Table of Contents

AirportsFY21 TargetFY20 ProjectionFY19 Actual FY20 TargetFY18 Actual
Long-Term Issue - Facility and Lease AdministrationThe increasing demand for Facility and Leasing services due to the continuing emphasis on economic development, growth in the Airport terminal, changes in Federal regulations, and the lack of technological resources, as well as a reduced ability to respond to requests due to lack of personnel will result in:
Delays in preparing contracts and agreements
Delays in responding to open records requests
Potential deterioriation and loss of public records
Potential loss of economic development dollars due to slow processing time
Strategies to address the Long-Term IssueRefine and maximize use of technology to streamline processes for staff and customers.
Archive records in a digital format to make them more easily accessible.
Strategic Result(s) to measure annual progress on Long-Term IssueAirport customers will benefit from enhanced accessibility of Airport records as evidenced by:
By Fiscal Year 2022, 95% of all Facility and Leasing records will be digitized and easily accessible.
Annually, 90% of agreements and renewals will be completed in a timely manner.
95% 95%N/A12 N/A% of Facility and Leasing records digitized and easily accessible * N/A
90% 90%N/A13 N/A% of agreements/contracts approved on time * N/A
Administrative - Airport Data Systems75% 75%N/A14 N/A% of incidents resolved within four operational hours * N/A
Administrative - Executive Leadership75% 75%24%15 59%% of key measures and strategic results achieved 67%
5% 5%-23%16 -23%% increase in the airport cost to the airline per boarding passenger
5%
90% 90%96%17 96%% of full-time equivalent employees without an on the job injury (OJI) in the current fiscal year
98%
12% 88%0%18 25%% of new signs installed to implement the wayfinding plan 25%
95% 95%89%19 81%% of performance evaluations completed by the review date 76%
50% 85%0%20 13%% of terminal expansion project completed 12%
FY21 Budget Performance Data G-7
Table of Contents

AirportsFY21 TargetFY20 ProjectionFY19 Actual FY20 TargetFY18 Actual
Administrative - Executive Leadership95% 95%58%21 73%% of terminations submitted to the Personnel Department
within 3 days of the termination date
63%
0.07 0.07N/A22 N/AInjury/Illness Incident Rate * N/A
500 500N/A23 N/A# of employees receiving safety training * N/A
2,248,195 2,293,1592,061,15324 2,203,565# of enplanements N/A
130 13012025 118# of full-time employees supported 113
20,011,118 20,273,05717,312,41426 17,121,614Dollar amount of operating expenditures managed 16,939,892
Administrative - Public Information and Marketing18% 18%29%27 29%% of airlines that have increased or improved air service 50%
98% 98%100%28 100%% of citizen complaints responded to within 24 hours 100%
27 272829 28# of airports served by non-stop flights from Will Rogers World Airport
30
10 10N/A30 8# of marketing presentations to air carriers each year 12
Commercial Aviation - Airfield Operations90% 90%82%31 86%% of daily inspection items resolved within 30 days 77%
275 27523232 289# of aircraft diversions per month 206
Commercial Aviation - Runways and Taxiways10% 10%29%33 25%% of days per month that the airport has a runway closed 31%
96% 96%100%34 99%% of airport certification work orders completed within 3 business days of identifying deficiency
100%
Commercial Aviation - Safety, Security and Inspection97% 97%87%35 86%% of days with zero security incidents 92%
90% 90%83%36 78%% of airport identification badges renewed on time 79%
General Aviation - Operations72% 70%71%37 74%% of itinerant takeoffs and landings at Wiley Post Airport 71%
FY21 Budget Performance Data G-8
Table of Contents

AirportsFY21 TargetFY20 ProjectionFY19 Actual FY20 TargetFY18 Actual
General Aviation - Operations41% 8%23%38 2%% of days the airport has a runway closed 4%
Maintenance - Building Maintenance95% 95%91%39 90%% of airport operating hours where major mechanical systems
are functioning
91%
95% 95%99%40 98%% of critical building maintenance calls resolved within 2 days 99%
90% 90%108%41 99%% of moving walkways, elevators, and escalators that are functioning
99%
Maintenance - Equipment Maintenance10% 10%N/A42 N/A% of repairs that are outsourced * N/A
90% 90%N/A43 59%% of preventative maintenance work orders completed on time 71%
Maintenance - Fuel95% 95%100%44 95%% of tenant aircraft refueling vehicles with no deficiencies found 100%
Maintenance - Horticulture90% 90%80%45 68%% of landscape maintained according to schedule 62%
87% 87%72%46 77%% of publc grounds mowed according to schedule 56%
7,422 7,4227,15247 7,423# of public grounds acres mowed 7,162
3,547,773 3,547,7733,385,29748 3,547,773# of square-feet of beds maintained 3,547,775
Property Management and Development - Architectural and Engineering/Planning50% 50%N/A49 N/A% of contracts approved within 150 calendar days from
advertising the project *
N/A
5% 5%39%50 104%% of total project consultant cost as a result of amendments 0%
Property Management and Development - Construction80% 80%58%51 87%% of construction projects that do not exceed 5% of original
contract amount
80%
5% 5%6%52 -1%% of total project construction cost as a result of change orders and amendments
1%
FY21 Budget Performance Data G-9
Table of Contents

AirportsFY21 TargetFY20 ProjectionFY19 Actual FY20 TargetFY18 Actual
Property Management and Development - Facility and Lease Administration90% 90%N/A53 N/A% of agreements/contracts approved on time * N/A
2% 2%0%54 6%% change in boarding passengers 10%
2% 2%0%55 4%% change in parking revenue per transaction per year 2%
2% 2%0%56 4%% increase in Food, beverage, and retail concession revenues per boarding passenger
6%
70% 70%74%57 88%% of days garage public parking exceeds 85% of capacity 75%
95% 95%N/A58 N/A% of Facility and Leasing records digitized and easily accessible * N/A
2% 2%0%59 0%% of identified and targeted acres leased 2%
475 47547960 473# of agreements 452
246.00 246.00230.4561 230.45# of leasable acres identified and targeted 246.18
FY21 Budget Performance Data G-10
Table of Contents

City Auditor's OfficeFY21 TargetFY20 ProjectionFY19 Actual FY20 TargetFY18 Actual
Long-Term Issue - AccountabilityThe continuing expectations for government accountability as evidenced by more extensive accounting and auditing regulations, City Council Strategic Priorities and the Leading for Results program, if not addressed, will result in:
Loss of public trust and confidence
Diminished ability to provide new revenue sources for infrastructure and public services
Decreased employee confidence in City leaders and managers
The lack of an ethical culture throughout the City leading to an increased risk of fraud, waste, abuse, and significant policy violations
Strategies to address the Long-Term IssueIdentify important programs and operations for inclusion in the Audit Plan through a triennial citywide risk assessment.
Plan and deliver audit services using a risk-based approach to ensure audit scope and objectives are defined clearly and focused on important issues or concerns.
Respond to requests for advisory services and investigate potentially unethical or fraudulent acts in a professional, sensitive manner.
Undergo a triennial peer review to ensure audit services are provided in accordance with generally accepted government auditing standards.
Communicate with audit clients throughout service delivery to ensure a complete and accurate understanding of conditions, facts, and circumstances.
Provide professional opinions and recommendations for improving City programs through published reports.
Provide Hotline information to employees through presentations, posters, brochures, intranet and direct mailings.
Strategic Result(s) to measure annual progress on Long-Term IssueAnnually, City Council and other City decision makers will continue to benefit from objective, timely and useful audit information as evidenced each year by:
At least 90% of City Council and other City decision makers will rate audit services as “good” or “excellent”
At least 95% of audit recommendations will be accepted by management
90% 90%100%1 100%% of City Council and other City decision makers rating audit services as "good" or "excellent"
100%
95% 95%100%2 100%% of audit recommendations accepted by management 98%
Strategic Result(s) to measure annual progress on Long-Term IssueThrough 2024, management, and employees will benefit from timely review of reports of fraud, waste, abuse, and significant policy violations as evidenced by:
At least 90% of actionable allegations will be assessed and assigned for investigation within seven days of reporting.
90% 90%95%3 100%% of actionable allegations assessed and assigned for investigation within seven days of reporting
92%
FY21 Budget Performance Data G-11
Table of Contents

City Auditor's OfficeFY21 TargetFY20 ProjectionFY19 Actual FY20 TargetFY18 Actual
Long-Term Issue - Complex Information SystemsThe continuing reliance on complex information systems combined with rapid technology advancement creates a need for knowledge and expertise to assess controls over information systems that support critical operational and financial activities, which, if not addressed will lead to:
Increased risks relating to system security, availability and integrity
Programs failing to meet objectives
Undetected violations of laws, regulations and policies
Strategies to address the Long-Term IssueContract with an information technology expert to perform a citywide information systems risk assessment.
The risk assessment will be used to select future contracted information technology audits.
Strategic Result(s) to measure annual progress on Long-Term IssueNo results have been identified for this Issue
Administrative - Executive Leadership75% 75%100%5 40%% of key measures and strategic results achieved 40%
100% 100%97%6 97%% of full-time equivalent employees without an on the job injury (OJI) in the current fiscal year
100%
95% 95%53%7 67%% of performance evaluations completed by the review date 83%
95% 95%N/A8 N/A% of terminations submitted to the Personnel Department by termination date
N/A
7 779 7# of full-time employees supported 7
1,254,507 1,241,1161,074,43810 1,111,974Dollar amount of operating expenditures managed 1,039,556
Audit Services - Audit Services95% 95%100%11 100%% of audit recommendations accepted by management 98%
90% 90%100%12 100%% of City Council and other City decision makers rating audit services as "good" or "excellent"
100%
80% 80%71%13 50%% of audit services completed within deadlines 38%
73% 73%85%14 84%% of available time on direct services 83%
FY21 Budget Performance Data G-12
Table of Contents

City Auditor's OfficeFY21 TargetFY20 ProjectionFY19 Actual FY20 TargetFY18 Actual
Audit Services - Audit Services9,600.00 9,600.0010,611.0015 10,215.00# of direct service hours provided 10,157.00
Ethics Assurance - Ethics Assurance90% 90%95%16 100%% of actionable allegations assessed and assigned for
investigation within seven days of reporting
92%
60 603817 55# of allegation dispositions provided 56
FY21 Budget Performance Data G-13
Table of Contents
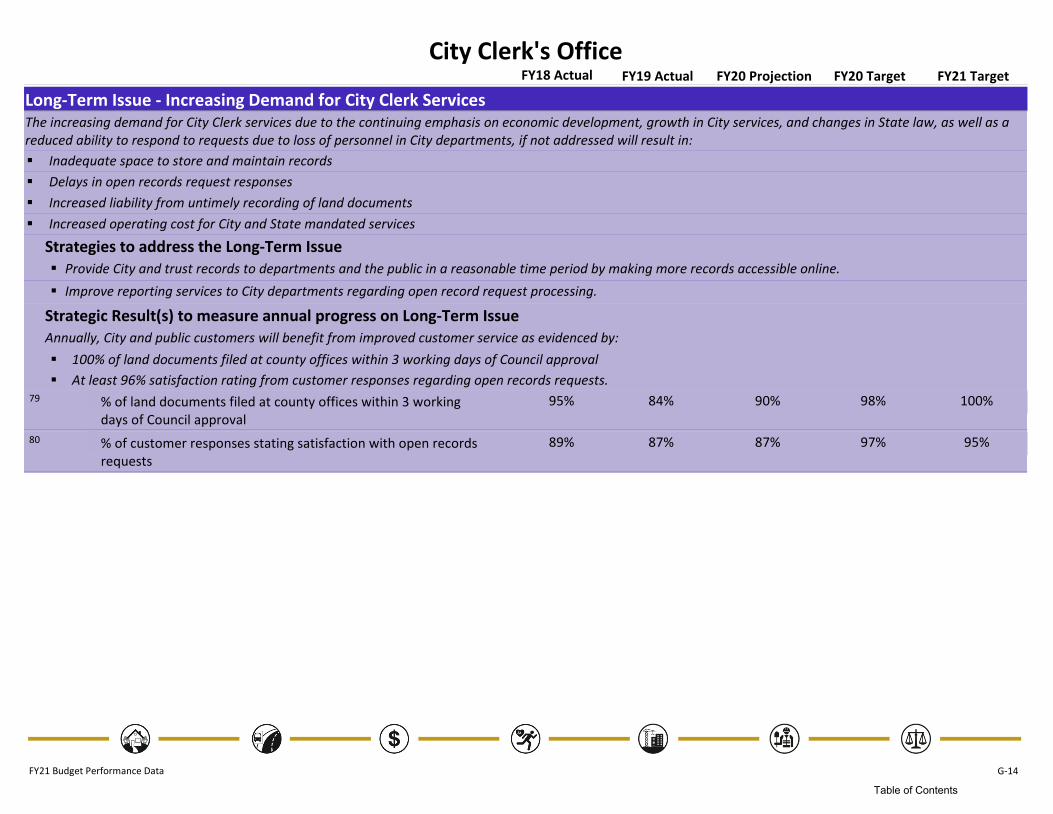
City Clerk's OfficeFY21 TargetFY20 ProjectionFY19 Actual FY20 TargetFY18 Actual
Long-Term Issue - Increasing Demand for City Clerk ServicesThe increasing demand for City Clerk services due to the continuing emphasis on economic development, growth in City services, and changes in State law, as well as a reduced ability to respond to requests due to loss of personnel in City departments, if not addressed will result in:
Inadequate space to store and maintain records
Delays in open records request responses
Increased liability from untimely recording of land documents
Increased operating cost for City and State mandated services
Strategies to address the Long-Term IssueProvide City and trust records to departments and the public in a reasonable time period by making more records accessible online.
Improve reporting services to City departments regarding open record request processing.
Strategic Result(s) to measure annual progress on Long-Term IssueAnnually, City and public customers will benefit from improved customer service as evidenced by:
100% of land documents filed at county offices within 3 working days of Council approval
At least 96% satisfaction rating from customer responses regarding open records requests.
98% 100%90%79 84%% of land documents filed at county offices within 3 working days of Council approval
95%
97% 95%87%80 87%% of customer responses stating satisfaction with open records requests
89%
FY21 Budget Performance Data G-14
Table of Contents

City Clerk's OfficeFY21 TargetFY20 ProjectionFY19 Actual FY20 TargetFY18 Actual
Long-Term Issue - Accessibility of InformationThe increasing demand for online information, coupled with the lack of technological resources to simplify access to information services, if not addressed, will result in:
Lack of transparency
Delays in responding to open records requests
Limited records available online
Strategies to address the Long-Term IssuePublish all public records maintained in the Office of the City Clerk online.
Strategic Result(s) to measure annual progress on Long-Term IssueBy 2020, City and public customers will benefit from enhanced accessibility of official City records as evidenced by:
100% of ordinances will be available online
77% of City staff managed trust, board, commission, and committee meeting records will be accessible online
100% 0%141%81 28%% of ordinances available online 117%
71% 100%N/A82 N/A% of City staff managed trust, board, commission, and committee meeting records online
71%
Long-Term Issue - Maintenance and Preservation of Public RecordsThe continued inefficient use of space and resources as a result of decentralized records management, if not addressed, will result in deterioration and loss of public records, and a loss of public trust.
Strategies to address the Long-Term IssueProvide information to the city departments so they can efficiently comply with record retention policy.
Strategic Result(s) to measure annual progress on Long-Term IssueThe City and related trusts will benefit from a centralized records program as evidenced by:
Annually, train 100 staff from City departments on records management policies and procedures
100 100N/A83 N/A# of staff from City departments trained on records management policies and procedures
N/A
Administrative - Executive Leadership75% 75%33%84 9%% of key measures and strategic results achieved 67%
89% 89%99%85 97%% of full-time equivalent (FTE) employees without an on the job injury (OJI) in the current fiscal year
100%
FY21 Budget Performance Data G-15
Table of Contents

City Clerk's OfficeFY21 TargetFY20 ProjectionFY19 Actual FY20 TargetFY18 Actual
Administrative - Executive Leadership95% 95%79%86 100%% of performance evaluations completed by the review date 88%
95% 95%N/A87 N/A% of terminations submitted to the Personnel Department within 3 days of the termination date
N/A
9 9988 9# of full-time employees supported 8
1,088,938 1,118,0141,096,88589 1,016,387Dollar amount of operating expenditures managed 902,091
Official Records - Bid Management98% 98%96%90 94%% of construction bids received that are qualified bids 94%
61% 50%18%91 33%% of users trained annually 24%
350 35022692 260# of bidding documents reviewed and released 196
600 50041193 443# of construction bid receipts processed 481
375 35025794 352# of goods and services bid receipts processed 280
310 25035695 420# of proposal/qualification receipts processed 294
115 1174396 78# of users trained 56
Official Records - City Clerk's Information95% 95%87%97 91%% of City Clerk records requests completed within 8 business
hours of request
91%
90% 90%80%98 61%% of requests for records and information maintained in other City departments completed within 7 business days
78%
97% 95%84%99 87%% of customer responses stating satisfaction with open records requests
89%
90% 90%72%100 89%% of requests for Development Center records completed within 14 business days
N/A
90% 90%N/A101 54%% of requests for records requiring legal review completed within 30 business days
N/A
1,350 1,3001,239102 1,238# of meeting notices & agendas posted in accordance with State Law
1,262
FY21 Budget Performance Data G-16
Table of Contents

City Clerk's OfficeFY21 TargetFY20 ProjectionFY19 Actual FY20 TargetFY18 Actual
Official Records - City Clerk's Information3,200 3,2003,677103 3,066# of request responses provided for external records maintained
in other City Departments
4,569
500 500304104 393# of request responses provided for internal City Clerk records 499
1,350 1,3001,242105 1,247# of meeting notices and agendas requested to be posted 1,265
3,700 3,7004,584106 4,057# of record requests received 5,068
Official Records - Council Agenda Management71% 100%N/A107 N/A% of City staff managed trust, board, commission, and
committee meeting records online
71%
85% 85%78%108 81%% of agenda items submitted correctly 81%
600 600875109 723# of agenda items corrected 708
4,000 4,0003,921110 3,760# of agenda items reviewed 3,771
75 10054111 86# of users trained 34
Official Records - Election95% 94%93%112 97%% of conflict of interest forms filed in a timely manner 97%
222 224195113 202# of conflict of interest forms filed 206
18 1818114 18# of gift disclosure forms filed 16
2 22115 2# of proclamations and election results issued 2
222 224224116 238# of conflict of interest forms distributed for filing 231
Official Records - Records Management100% 100%N/A117 N/A% of departments audited to determine centralized records
management needs
N/A
98% 100%96%118 84%% of land documents filed at county offices within 3 working days of Council approval
95%
100% 0%172%119 28%% of ordinances available online 117%
1,781 02,599120 2,200# of City Clerk historic ordinances indexed online 3,453
6,000 6,0005,345121 5,364# of records added to the City Clerk's record storage 5,251
FY21 Budget Performance Data G-17
Table of Contents

City Clerk's OfficeFY21 TargetFY20 ProjectionFY19 Actual FY20 TargetFY18 Actual
Official Records - Records Management449,000 449,000435,807122 435,807# of records maintained in the City Clerk's record storage 430,556
100 100N/A123 N/A# of staff from City departments trained on records management policies and procedures
N/A
FY21 Budget Performance Data G-18
Table of Contents

City Manager's OfficeFY21 TargetFY20 ProjectionFY19 Actual FY20 TargetFY18 Actual
Long-Term Issue - Promote Safe, Secure and Thriving NeighborhoodsThe increasing need to satisfy resident expectations for safe, vibrant, and diverse neighborhoods, if not addressed, will result in:
Greater loss of life and property
Population migration to other cities
Decreased resident confidence
Widening gap between code enforcement requests and response
Neighborhoods and businesses being developed in outlying areas with inadequate infrastructure
Inability to meet the demand for infrastructure
Inefficient delivery of core services
Strategies to address the Long-Term IssueContinue the use of overtime programs in the Police Department to address high crime areas, traffic enforcement and increased presence in entertainment districts.
Continue to improve Intelligence-Led policing.
Continue the planning and construction of new fire stations authorized as General Obligation Bond projects.
Monitor the health indices related to cardiac outcomes.
Monitor the number of times the availability of EMSA resources is at level zero.
Promote inner-city residential and business development and redevelopment through the use of incentives, design review consultations and coordination with other City agencies and the development community.
Strategically concentrate neighborhood revitalization efforts in the Strong Neighborhoods Initiative area to reverse neighborhood decline early and leverage private investment.
Stabilize at risk neighborhoods through the Strong Neighborhood Initiative to make neighborhoods more attractive for single family residential development.
Implement the Neighborhood Stabilization Program to purchase and rehabilitate foreclosed single-family bank owned properties for the benefit of low/moderate/medium income families.
Reduce the number of abandoned buildings by increasing the number of property maintenance citations
FY21 Budget Performance Data G-19
Table of Contents

City Manager's OfficeFY21 TargetFY20 ProjectionFY19 Actual FY20 TargetFY18 Actual
Long-Term Issue - Promote Safe, Secure and Thriving Neighborhoods
Strategic Result(s) to measure annual progress on Long-Term IssueProgress on this issue will be measured by results from other sources as listed below:
By 2018, 55% or more residents citywide will report they feel safe.
By 2018, 80% or more of Police life threatening calls (Priority 1) will be responded to within 9 minutes 30 seconds from the time a 911 call is answered to officer arrival.
By 2018, 5% reduction in aggravated assaults citywide.
Annually, the citizens of Oklahoma City, even anticipating growth in outlying areas, will receive emergency responses within 7 minutes 70% of the time in order to protect lives, assess and treat medical emergencies, and limit damage to property and the environment.
Annually, 100% of rezoning decisions by Council will be consistent with the Comprehensive Plan.
Annually, 65% of residents surveyed will be satisfied with the overall quality of their neighborhood
Annually, 80% of designated proactive area properties will be proactively inspected at least once per month.
Annually, 95% of service requests received through the Action Center acted upon within 10 working days.
55% 55%50%124 50%% of residents reporting they feel safe 48%
80% 80%74%125 73%% of Police life threatening calls (priority 1) responded to within 9 minutes and 30 seconds from the time a 911 call is answered to officer arrival
73%
5% 5%5%126 19%% reduction in aggravated assaults citywide -2%
70% 70%65%127 65%% of emergencies responded to within 7 minutes 65%
100% 100%96%128 96%% of rezoning decisions by Council that are consistent with the Comprehensive Plan
97%
65% 65%64%129 64%% of residents satisfied with the overall quality of their neighborhood
63%
90% 90%88%130 83%% of designated proactive area properties inspected at least once per month
89%
96% 96%93%131 93%% of service requests acted upon within 10 working days 96%
FY21 Budget Performance Data G-20
Table of Contents

City Manager's OfficeFY21 TargetFY20 ProjectionFY19 Actual FY20 TargetFY18 Actual
Long-Term Issue - Encourage a strong local economyAn increase in ecommerce, demand for more quality jobs in diverse industries, and continued decline in public education performance, if not addressed, will result in:
Residents moving to suburban areas to pursue better education opportunities
Lack of job growth in Oklahoma City
Decline in availability in quality of City services
Decline in quality of life
Missed opportunities for residents to experience professional growth
Missed opportunities to attract new businesses
Strategies to address the Long-Term IssueContinued partnerships with the Alliance for Economic Development, Greater Oklahoma City Chamber of Commerce and other economic development partners to recruit diverse businesses to Oklahoma City to help grow the City’s job base and develop revenue to keep pace with resident expectations.
Maintain relationships with Myriad Gardens Foundation, MAPS Park Foundation, Downtown Oklahoma City, Inc. to enhance and promote local quality of life aspects for corporate recruitments.
Educate the public regarding the benefits of shopping local.
Work to improve performance of the Oklahoma City Public Schools through the Joint Education Task Force and the Oklahoma City Public Schools Compact.
Pursue legislative changes to expand the sales tax base.
Strategic Result(s) to measure annual progress on Long-Term IssueProgress on this issue will be measured by results from other sources as listed below:
By 2020, satisfaction with the City being a good place to work will be above 75%
By 2020, satisfaction with the City being a good place to raise children will be above 75%
By 2020, 16,000 jobs will be created
By 2020, 35% of new jobs created will pay above the Oklahoma City MSA average wage
By 2020, the OKC MSA average annual income will increase by 8%
75% 75%74%132 74%% of residents who feel the City is a good place to work 71%
75% 75%69%133 69%% of residents who feel the City is a good place to raise children 69%
2,500 2,5001,760134 1,760# of jobs created 9,496
35% 35%46%135 46%% of new jobs paying above the Oklahoma City MSA average wage
53%
FY21 Budget Performance Data G-21
Table of Contents

City Manager's OfficeFY21 TargetFY20 ProjectionFY19 Actual FY20 TargetFY18 Actual
Long-Term Issue - Encourage a strong local economy
2% 2%4%136 4%% change in the OKC MSA average annual income N/A
Long-Term Issue - Financial ManagementThe continuing challenge to maintain diversified and adequate revenues to support expenses for City operations and the need to preserve resident confidence for voter approved initiatives, if not addressed, will result in:
Diminished capacity to provide core services and address community needs
Inability to meet new, increased, or changing resident expectations
Difficulty in securing financing for city projects and services
Strategies to address the Long-Term IssueWork with the Greater Oklahoma City Chamber and other economic development partners in the community to help grow the City’s job base and develop revenue to keep pace with resident expectations.
Address the increasing need to find innovative solutions to provide efficient public service delivery by working to create regional partnerships in the metro area.
Continue to support and explore ways to diversify City revenue sources.
Continue to support the Marketplace Fairness Act.
Strategic Result(s) to measure annual progress on Long-Term IssueProgress on this issue will be measured by results from other sources as listed below:
The City will maintain the highest ratings for G.O. Bonds.
Personnel related expenses will remain at or below 70% of total operating expenses.-
General Fund unbudgeted reserves will be maintained in the range of 8-15% of the General Fund budget.
By 2020, the percentage of General Fund revenue from sales tax will be below 50% due to greater diversification of revenue sources
AAA / Aaa AAA / AaaAAA / Aaa137 AAA / AaaGeneral Obligation Bond Ratings AAA / Aaa
70% 70%70%138 70%% of total operating expenses for payroll expenses 70%
17% 17%21%139 28%% of general fund budget maintained in unbudgeted reserve 19%
56% 56%58%140 55%% of General Fund revenue from Sales Tax 54%
FY21 Budget Performance Data G-22
Table of Contents

City Manager's OfficeFY21 TargetFY20 ProjectionFY19 Actual FY20 TargetFY18 Actual
Long-Term Issue - Transportation SystemContinued deterioration of many City streets coupled with increasing expectations from residents to provide a better public transportation system and more alternative mobility options such as sidewalks, bike lanes and trails, if not addressed, will result in:
Resident dissatisfaction with the condition of city streets
Mobility options for residents that lag other cities
Inability to promote and develop the city center
Negative environmental impacts
Limitations in the growth of the economy
Strategies to address the Long-Term IssueEducate the public in the benefits of regional public transportation so they will be responsive to efforts to provide a funding source.
Establish impact fees for transportation.
Continue to provide efficient street maintenance and new construction to improve the overall condition of city streets.
Implement the recommendations of the Nelson Nygaard study to add transit services.
Strategic Result(s) to measure annual progress on Long-Term IssueProgress on this issue will be measured by results from other sources as listed below:
By 2018, 40% of residents will be satisfied with the condition the City’s arterial streets.
By 2020, 40% of residents will be satisfied with the City’s public transportation system.
By 2019, Bus passengers per service hour will be at or above 20.
By 2020, 260 miles of new trails, sidewalks and bike lanes will be constructed.
40% 40%20%141 20%% of citizens satisfied with the condition of the City's arterial streets
18%
40% 40%20%142 20%% of residents satisfied with the City's public transportation system
25%
14.60 15.2914.76143 14.82# of passengers per weekday service hour 16.66
N/A N/AN/A144 N/A# of miles of new trails, sidewalks and bike lanes constructed N/A
FY21 Budget Performance Data G-23
Table of Contents

City Manager's OfficeFY21 TargetFY20 ProjectionFY19 Actual FY20 TargetFY18 Actual
Long-Term Issue - Recreation and Community WellnessThe ongoing need to maintain and improve recreational opportunities for residents along with consistently low rankings nationally in the areas of health and wellness, if not addressed, will result in:
Decreased resident satisfaction with parks and recreation opportunities
Increasing obesity and other public health issues
Strategies to address the Long-Term IssueContinue to construct sidewalks and trails city wide
Addressing recreational needs for changes in demographics and demands
Support efforts to increase after-school recreation programs
Improve park maintenance
Strategic Result(s) to measure annual progress on Long-Term IssueProgress on this issue will be measured by results from other sources as listed below:
By 2024, 65% of residents will live within ½ mile of a recreation facility, trail, or park.
By 2020, 70% of residents will report regular leisure time physical activity.
By 2020, 75% of residents satisfied with the maintenance of City parks.
By 2020, 35% of residents that report using an Oklahoma City park or attending a park program more than 10 times per year.
Improvement in the next City County Health Department average wellness score, indicated by a 1.5% change.
71% 71%57%145 64%% of citizens within a half mile of a recreation facility, trail or park
65%
70% 70%70%146 70%% of residents reporting regular leisure time physical activity 39%
75% 75%74%147 74%% of residents who feel the City is a good place to work 71%
35% 35%24%148 24%% of residents attending a park or park program more than 10 times per year
25%
3% 3%N/A149 N/A% change in Wellness Score in the 20% of zip codes with the lowest scores (updated every 3 years)
-2%
FY21 Budget Performance Data G-24
Table of Contents

City Manager's OfficeFY21 TargetFY20 ProjectionFY19 Actual FY20 TargetFY18 Actual
Long-Term Issue - Uphold high standards for all City servicesHigher customer expectations for quality City services, combined with a growing and increasingly diversified population, if not addressed will result in:
Decreased resident satisfaction
Dampening of private investment in economic development
Eroding voter support for future initiatives
Strategies to address the Long-Term IssueContinue to do resident survey.
Support departmental efforts to pursue accreditation and adopt best practices.
Support opportunities for employee development.
Strategic Result(s) to measure annual progress on Long-Term IssueProgress on this issue will be measured by results from other sources as listed below:
By 2020, 70% of residents will be satisfied with the quality of services provided by the City
By 2020, 65% of residents will be satisfied with the quality of customer service from City employees
By 2020, 80% of residents surveyed will feel the City is heading in the right direction
75% 75%62%150 62%% of residents surveyed who report they are satisfied with City services
57%
65% 65%69%151 69%% of residents satisfied with the quality of customer service from City employees
67%
85% 85%72%152 72%% of residents who are satisfied the City is heading in the right direction
67%
FY21 Budget Performance Data G-25
Table of Contents
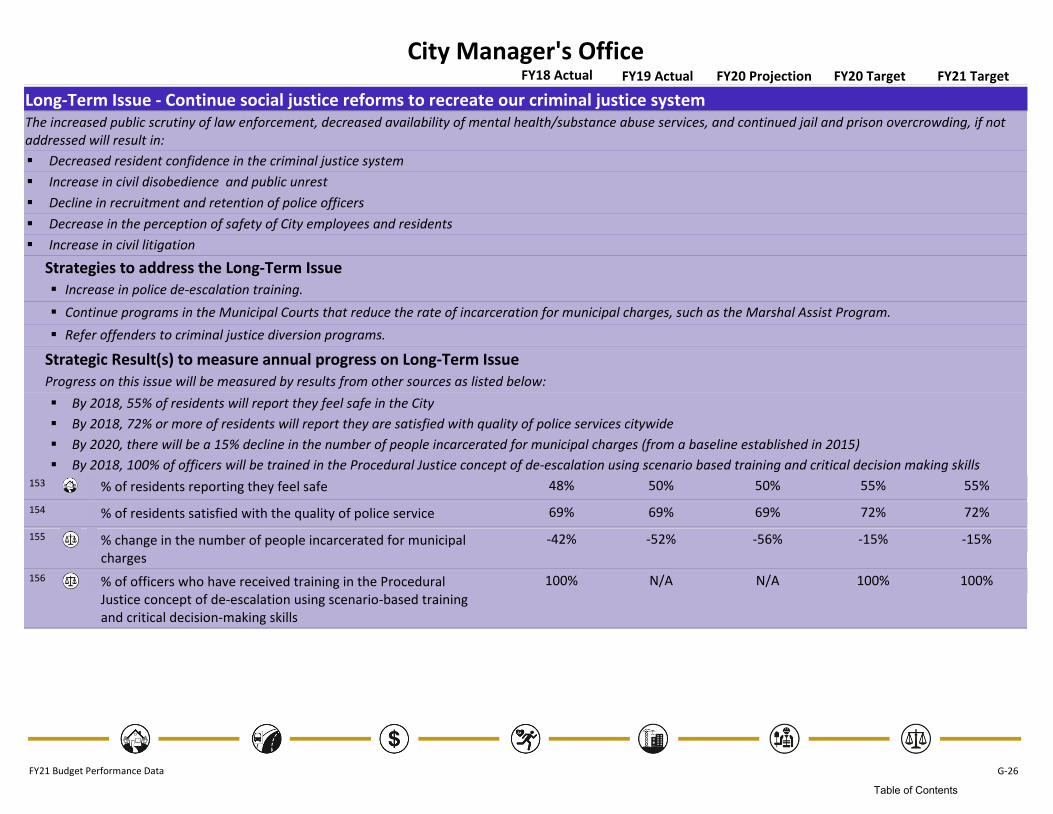
City Manager's OfficeFY21 TargetFY20 ProjectionFY19 Actual FY20 TargetFY18 Actual
Long-Term Issue - Continue social justice reforms to recreate our criminal justice systemThe increased public scrutiny of law enforcement, decreased availability of mental health/substance abuse services, and continued jail and prison overcrowding, if not addressed will result in:
Decreased resident confidence in the criminal justice system
Increase in civil disobedience and public unrest
Decline in recruitment and retention of police officers
Decrease in the perception of safety of City employees and residents
Increase in civil litigation
Strategies to address the Long-Term IssueIncrease in police de-escalation training.
Continue programs in the Municipal Courts that reduce the rate of incarceration for municipal charges, such as the Marshal Assist Program.
Refer offenders to criminal justice diversion programs.
Strategic Result(s) to measure annual progress on Long-Term IssueProgress on this issue will be measured by results from other sources as listed below:
By 2018, 55% of residents will report they feel safe in the City
By 2018, 72% or more of residents will report they are satisfied with quality of police services citywide
By 2020, there will be a 15% decline in the number of people incarcerated for municipal charges (from a baseline established in 2015)
By 2018, 100% of officers will be trained in the Procedural Justice concept of de-escalation using scenario based training and critical decision making skills
55% 55%50%153 50%% of residents reporting they feel safe 48%
72% 72%69%154 69%% of residents satisfied with the quality of police service 69%
-15% -15%-56%155 -52%% change in the number of people incarcerated for municipal charges
-42%
100% 100%N/A156 N/A% of officers who have received training in the Procedural Justice concept of de-escalation using scenario-based training and critical decision-making skills
100%
FY21 Budget Performance Data G-26
Table of Contents
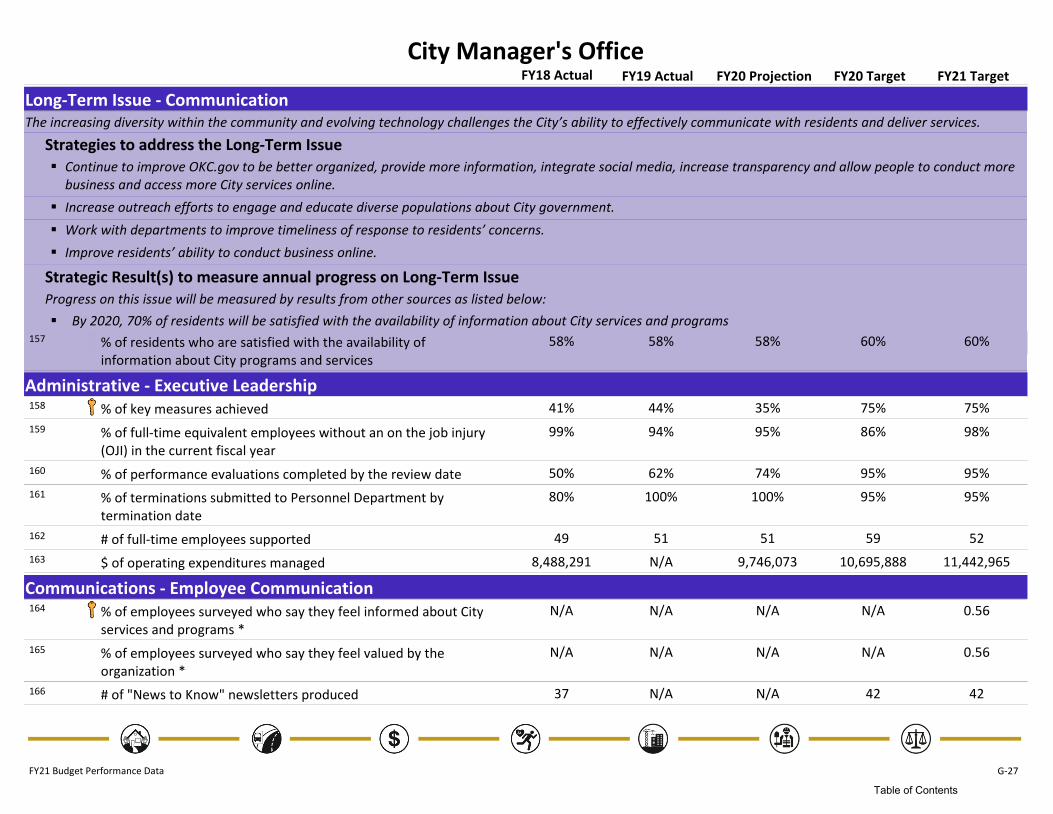
City Manager's OfficeFY21 TargetFY20 ProjectionFY19 Actual FY20 TargetFY18 Actual
Long-Term Issue - CommunicationThe increasing diversity within the community and evolving technology challenges the City’s ability to effectively communicate with residents and deliver services.
Strategies to address the Long-Term IssueContinue to improve OKC.gov to be better organized, provide more information, integrate social media, increase transparency and allow people to conduct more business and access more City services online.
Increase outreach efforts to engage and educate diverse populations about City government.
Work with departments to improve timeliness of response to residents’ concerns.
Improve residents’ ability to conduct business online.
Strategic Result(s) to measure annual progress on Long-Term IssueProgress on this issue will be measured by results from other sources as listed below:
By 2020, 70% of residents will be satisfied with the availability of information about City services and programs
60% 60%58%157 58%% of residents who are satisfied with the availability of information about City programs and services
58%
Administrative - Executive Leadership75% 75%35%158 44%% of key measures achieved 41%
86% 98%95%159 94%% of full-time equivalent employees without an on the job injury (OJI) in the current fiscal year
99%
95% 95%74%160 62%% of performance evaluations completed by the review date 50%
95% 95%100%161 100%% of terminations submitted to Personnel Department by termination date
80%
59 5251162 51# of full-time employees supported 49
10,695,888 11,442,9659,746,073163 N/A$ of operating expenditures managed 8,488,291
Communications - Employee CommunicationN/A 0.56N/A164 N/A% of employees surveyed who say they feel informed about City
services and programs *
N/A
N/A 0.56N/A165 N/A% of employees surveyed who say they feel valued by the organization *
N/A
42 42N/A166 N/A# of "News to Know" newsletters produced 37
FY21 Budget Performance Data G-27
Table of Contents

City Manager's OfficeFY21 TargetFY20 ProjectionFY19 Actual FY20 TargetFY18 Actual
Communications - Employee Communication4 4N/A167 5# of employee events held 6
13 1315168 15# of employee special communication projects managed 15
100 100N/A169 125# of Facebook posts on City of OKC Employees page N/A
5,239 5,2395,122170 5,122# of full and part-time City employees N/A
Communications - Print and Mail Services98% 98%98%171 98%% of employees who report being satisfied with print and mail
services
97%
100% 100%100%172 99%% of print jobs delivered within the agreed upon deadline 100%
6,100,000 6,100,000N/A173 5,328,967# of impressions produced 6,104,855
385,000 385,000409,350174 405,882# of US mail pieces stamped 385,039
Communications - Public Information60% 60%58%175 58%% of residents who are satisfied with the availability of
information about City programs and services
58%
96% 96%93%176 93%% of service requests acted upon within 10 working days 96%
650 650706177 728# of media contacts provided 683
85 85N/A178 98# of new video segments produced 64
2,500 2,500N/A179 2,559# of social media interactions 2,940
500 500448180 500# of special event permits processed 477
2,000 2,000N/A181 2,341# of web pages updated 1,882
Community Enhancement - Event and Tourism Development458.56 458.56420.81182 N/A$ of combined direct spending generated per square foot of
privately operated City event facilities
454.72
N/A N/AN/A183 N/A% of customers who report they are satisfied with the quality of events in Oklahoma City *
N/A
N/A N/AN/A184 N/A% of patrons satisfied with the quality of City event facilities * N/A
FY21 Budget Performance Data G-28
Table of Contents

City Manager's OfficeFY21 TargetFY20 ProjectionFY19 Actual FY20 TargetFY18 Actual
Community Enhancement - Event and Tourism DevelopmentN/A N/AN/A185 N/A% of event presenters who say they expect to return to City
event facilities in the future *
N/A
N/A N/AN/A186 N/A# of attendees for events hosted in Oklahoma City * N/A
N/A N/AN/A187 N/A# of events hosted in Oklahoma City * N/A
376,250 376,250312,947188 372,116# of hotel room nights generated by Convention and Visitors Bureau
408,104
N/A N/AN/A189 N/A# of tourism contracts negotiated/administered ** 35,578,294
Community Enhancement - MAPS 363% 63%38%190 38%% of MAPS 3 program completed N/A
N/A N/AN/A191 N/A% of MAPS 4 implementation plan developed * N/A
80% 80%66%192 66%% of residents who are satisfied with the quality of life in the City 63%
N/A N/A655,041,371.00193 570,010,942.00$ expended on MAPS 3 projects to date N/A
Policy and Executive Leadership - City Manager’s Office75% 75%62%194 62%% of residents surveyed who report they are satisfied with City
services
57%
85% 85%72%195 72%% of residents who are satisfied the City is heading in the right direction
67%
89% 89%80%196 93%% of City Council who are satisfied with the quality of information they are provided to establish policies, priorities and strategic goals
87%
75% 75%85%197 85%% of management accepted City Auditor audit recommendations implemented within the specified time
73%
75% 75%52%198 52%% of Strategic Results identified in LFR Strategic Business Plans achieved
52%
112 112151199 129# of City Manager reports provided 145
3,751 3,7513,988200 3,799# of Council agenda items approved 3,771
FY21 Budget Performance Data G-29
Table of Contents
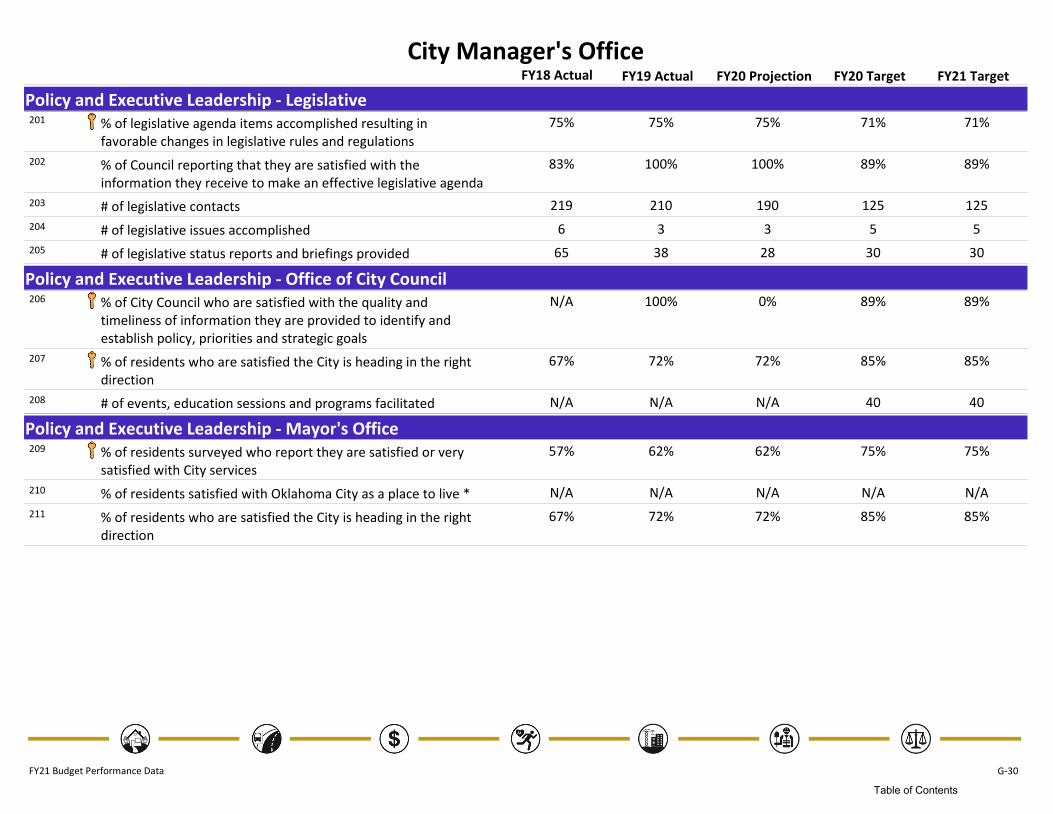
City Manager's OfficeFY21 TargetFY20 ProjectionFY19 Actual FY20 TargetFY18 Actual
Policy and Executive Leadership - Legislative71% 71%75%201 75%% of legislative agenda items accomplished resulting in
favorable changes in legislative rules and regulations
75%
89% 89%100%202 100%% of Council reporting that they are satisfied with the information they receive to make an effective legislative agenda
83%
125 125190203 210# of legislative contacts 219
5 53204 3# of legislative issues accomplished 6
30 3028205 38# of legislative status reports and briefings provided 65
Policy and Executive Leadership - Office of City Council89% 89%0%206 100%% of City Council who are satisfied with the quality and
timeliness of information they are provided to identify and establish policy, priorities and strategic goals
N/A
85% 85%72%207 72%% of residents who are satisfied the City is heading in the right direction
67%
40 40N/A208 N/A# of events, education sessions and programs facilitated N/A
Policy and Executive Leadership - Mayor's Office75% 75%62%209 62%% of residents surveyed who report they are satisfied or very
satisfied with City services
57%
N/A N/AN/A210 N/A% of residents satisfied with Oklahoma City as a place to live * N/A
85% 85%72%211 72%% of residents who are satisfied the City is heading in the right direction
67%
FY21 Budget Performance Data G-30
Table of Contents

Development ServicesFY21 TargetFY20 ProjectionFY19 Actual FY20 TargetFY18 Actual
Long-Term Issue - Code Enforcement/Construction Inspection PrioritiesThe growing demand and continued expansion of code enforcement and construction inspection programs, if not addressed, will have a negative impact on customer and citizen satisfaction.
Strategies to address the Long-Term IssueThe Code Enforcement Line of Business will monitor its inspection assignment priorities to ensure a timely response and proactive service delivery targets are met.
The code enforcement and construction inspection programs will pursue new technologies to improve efficiencies.
Strategic Result(s) to measure annual progress on Long-Term IssueBy 2022, Development Services will provide effective code enforcement services as evidenced by maintaining at least 50% citizen satisfaction with Code Enforcement.
39% 39%38%212 38%% of citizens satisfied with code enforcement 38%
Long-Term Issue - Live Release RateThe demand for an improved animal live release rate without an increased commitment of community resources and community participation will result in higher euthanasia rates and lower citizen satisfaction.
Strategies to address the Long-Term IssueThe Animal Welfare Line of Business will continue to coordinate with partner agencies to promote programs and internal services that improve the live release rate of shelter pets and increase pet adoptions and placements.
Strategic Result(s) to measure annual progress on Long-Term IssueBy 2022, Animal Welfare will provide improved services and coordination as evidenced by achieving at least an 80% live release rate of shelter pets.
90% 90%84%213 84%% of live releases N/A
FY21 Budget Performance Data G-31
Table of Contents

Development ServicesFY21 TargetFY20 ProjectionFY19 Actual FY20 TargetFY18 Actual
Long-Term Issue - Development Application Review The increasing complexity of development, if not adequately addressed, will cause increased costs and time delays in the development application review process and reduced customer satisfaction.
Strategies to address the Long-Term IssueThe Subdivision and Zoning Line of Business will utilize the Accela automated development process tracking system to decrease processing and review time for development applications.
Strategic Result(s) to measure annual progress on Long-Term IssueBy 2022, Development Services customers will experience a more timely and efficient development review process as evidenced by:
At least 90% of applicants proposing a new preliminary plat will receive a development application decision within 60 days of submission.
At least 90% of applicants will receive a rezoning development application decision within 120 days of application submission.
98% 98%100%214 100%% of applicants proposing a new preliminary plat that receive a development application decision within 60 days of submission
100%
98% 98%100%215 100%% of applicants that receive a rezoning development application decision within 120 days of application submission
100%
Long-Term Issue - Development Process CoordinationLack of inter and intra-departmental coordination in the development process impacted by the inability to implement and maintain technology in a timely manner will continue to cause delays in processing development applications and the issuance of construction permits, licenses, and certificates of occupancy.
Strategies to address the Long-Term IssueThe Development Services Department will utilize Accela and monthly Construction Inspection reports to track and review response data to identify opportunities for greater efficiency in plan review, permit issuance, and inspections.
The Development Center Line of Business will pursue new technologies to improve efficiencies.
Strategic Result(s) to measure annual progress on Long-Term IssueBy 2022, the Development Services Department will improve the timeliness of reviews and inspections, and customer service, as follows:
Complete 90% of initial review of commercial new construction plans within 15 working days of submission.
Complete 90% of initial review of commercial remodel plans within ten working days of submission.
Complete 95% of construction inspections within one working day of request.
At least 70% of phone calls will be answered within 4 minutes.
90% 90%23%216 16%% of commercial new construction plans initial code review completed within 15 working days
64%
FY21 Budget Performance Data G-32
Table of Contents

Development ServicesFY21 TargetFY20 ProjectionFY19 Actual FY20 TargetFY18 Actual
Long-Term Issue - Development Process Coordination
90% 90%35%217 23%% of commercial remodel construction plans initial code review completed within 10 working days
56%
100% 100%112%218 109%% of single family residential new construction plans reviewed within one working day of submission
100%
70% 70%55%219 44%% of phone calls answered within four minutes 29%
Long-Term Issue - Animal Control ServicesThe growing demand for animal control services and programs to help citizens be responsible pet owners, if not addressed, will result in, increased response times, an inability to respond to requests for service, lower citizen satisfaction, and continued challenges with animal control issues in the community.
Strategies to address the Long-Term IssueThe Animal Welfare Line of Business will utilize proactive programs, public education and information services, and coordinate with partner agencies to decrease the amount of animal control calls received.
Animal Welfare Line of Business will pursue new technologies to improve efficiencies.
Strategic Result(s) to measure annual progress on Long-Term IssueBy 2022, in order to provide quality services to our customers Animal Welfare will:
Provide an initial response to services requested within two business hours for Priority one calls 90% of the time
52% 52%25%220 24%% of Animal Welfare Priority one calls receiving initial response within two business hours
26%
Administrative - Executive Leadership75% 75%47%221 56%% of key measures and strategic results achieved 69%
85% 94%96%222 95%% of full-time equivalent (FTE) employees without an on the job (OJI) in the current fiscal year
94%
95% 95%87%223 84%% of performance evaluations completed by the review date 73%
95% 95%77%224 91%% of terminations submitted to the Personnel Department within three days of the termination date
90%
197 177183225 182# of full-time employees supported 169
19,871,313 18,335,56717,885,041226 18,400,662Dollar amount of operating expenditures managed 16,666,156
FY21 Budget Performance Data G-33
Table of Contents

Development ServicesFY21 TargetFY20 ProjectionFY19 Actual FY20 TargetFY18 Actual
Animal Welfare - Animal Control56% 56%37%227 32%% of Animal Welfare Calls responded to within specified time
frames
N/A
52% 52%29%228 24%% of Animal Welfare Priority one calls receiving initial response within two business hours
26%
45% 45%28%229 27%% of Animal Welfare Priority three calls receiving initial response by the next business day
19%
70% 70%63%230 54%% of Animal Welfare Priority two calls receiving initial response within the same business day
40%
20,000 20,00017,063231 16,177# of Animal Welfare service call responses provided 12,769
2,500 2,5002,875232 2,515# of cruelty cases worked 2,301
80 8064233 93# of dangerous animal cases worked 77
10 1021234 10# of menacing animal cases worked N/A
24,000 24,00026,305235 26,102# of animal welfare service calls received 23,050
75.84 75.8458.98236 56.73Expenditure per animal welfare service call provided 58.23
Animal Welfare - Animal Shelter90% 90%78%237 84%% of live releases N/A
22,000 22,00021,910238 22,428# of live animals sheltered 21,821
17,600 17,60015,380239 15,984# of live releases 17,198
24,500 24,50023,635240 24,120# of animal intakes logged 23,437
Animal Welfare - Community Outreach90% 90%91%241 95%% of requested spay/neuter provided 76%
1,750 1,7501,443242 1,634# of animal adoptions resulting from an outreach event 1,771
5,000 5,0008,942243 5,176# of animals in foster care 3,603
1,500 1,5001,508244 1,509# of community cats transferred 1,456
1,100 1,100713245 948# of pet food bank customers served 1,126
4,500 4,5004,665246 4,705# of public spay/neuter performed 4,639
FY21 Budget Performance Data G-34
Table of Contents

Development ServicesFY21 TargetFY20 ProjectionFY19 Actual FY20 TargetFY18 Actual
Animal Welfare - Community Outreach130,000 130,000198,736247 123,832# of volunteer hours 59,442
5,000 5,0005,125248 4,942# of public spay/neuter requested 6,080
Animal Welfare - Veterinary Services25% 25%28%249 25%% of animals spayed/neutered 23%
18% 18%24%250 23%% of live animals logged treated for illness or injury 20%
7,000 7,0007,796251 6,915# of animals receiving microchips N/A
5,500 5,5006,089252 5,637# of animals spayed/neutered 5,056
4,000 4,0005,183253 5,156# of animals treated for illness or injury 4,311
3,000 3,0004,336254 3,000# of euthanasias performed 4,246
22,000 22,00021,720255 22,582# of live animals logged 21,821
Code Enforcement - Abandoned Buildings75% 65%64%256 63%% of property maintenance violations resolved voluntarily 65%
85% 70%72%257 84%% of abandoned buildings/property maintenance complaint initial inspections completed within four days
84%
6.00 6.005.56258 5.56Average number of property maintenance inspections per violation
N/A
100 110129259 115# of abandoned buildings where maintenance violations are resolved
109
400 400471260 425# of abandoned property notices issued 362
3,000 2,8002,954261 2,974# of proactive property maintenance notices issued 3,076
200 240296262 254# of properties declared abandoned by City Council 244
3,460 3,0003,104263 3,378# of property maintenance notices issued 3,543
4,200 4,0003,559264 4,149# of property maintenance complaints received 4,008
Code Enforcement - Code Inspections90% 90%96%265 83%% of designated proactive area properties inspected at least
once per month
89%
FY21 Budget Performance Data G-35
Table of Contents

Development ServicesFY21 TargetFY20 ProjectionFY19 Actual FY20 TargetFY18 Actual
Code Enforcement - Code Inspections82% 70%44%266 62%% of total complaint-based inspections (non-abandoned
building/property maintenance) completed within four days
78%
36,000 30,80018,243267 29,814# of complaint-based inspections (non-abandoned building/property maintenance) completed within four days
34,646
49,405 49,40552,433268 45,481# of proactive properties inspected monthly 49,072
90,000.00 82,000.0080,869.33269 N/ATotal # of Inspections Performed * N/A
43,900 44,00041,116270 48,256# of code complaints (non-abandoned building/property maintenance) received
44,289
54,892 54,89254,892271 54,892# of properties in pro-active inspection areas 54,892
Code Enforcement - Nuisance Abatement60% 90%90%272 65%% of code violations resolved voluntarily 61%
39% 39%38%273 38%% of citizens satisfied with code enforcement 38%
80% 80%N/A274 N/A% of weeds/grass and junk/debris complaints abated within 45 days from date of complaint
N/A
26.00 25.0024.63275 25.63Average # of days from official notification to contractor order issued for weeds/grass and junk/debris complaints
N/A
10,000 9,0008,511276 7,374# of abatement actions completed 7,374
12,000 9,0006,538277 9,416# of abatement notices issued 8,291
25,000 20,00019,360278 21,126# of violations identified and parking citations issued. 22,289
Development Center - Construction Inspections92% 90%85%279 94%% of construction related inspections completed within one
working day of request
89%
80% 80%77%280 78%% of quality control reviews that do not require correction 83%
105,000 110,000118,582281 106,221# of construction related inspections completed 104,054
1,200 1,200910282 1,124# of oil and gas inspections completed 1,073
900 9001,287283 975# of quality control reviews completed 889
FY21 Budget Performance Data G-36
Table of Contents

Development ServicesFY21 TargetFY20 ProjectionFY19 Actual FY20 TargetFY18 Actual
Development Center - Permits and Licensing100% 100%100%284 100%% of construction related permits issued within one working day
of request
100%
70% 70%57%285 44%% of phone calls answered within four minutes 29%
60,000 60,00061,023286 53,728# of construction permits issued 53,290
26,000 26,00019,348287 21,089# of licenses and residential sale permits issued 24,912
21,000 21,00022,174288 21,226# of walk in customers assisted 22,076
Development Center - Plan Review90% 90%50%289 16%% of commercial new construction plans initial code review
completed within 15 working days
64%
90% 90%27%290 23%% of commercial remodel construction plans initial code review completed within 10 working days
56%
69% 69%163%291 67%% of commercial permits issued within three months 70%
67% 23%62%292 62%% of development community surveyed responding as satisfied with the plan review process
51%
100% 100%101%293 109%% of single family residential new construction plans reviewed within one working day of submission
100%
11.00 11.0012.88294 12.18Average # of working days in permit process for City permit review
11.74
49.50 49.5042.53295 37.03Average # of working days in permit process for developer response
49.06
1,150 1,150871296 1,117# of commercial new construction plans reviewed 1,131
1,000 1,0001,704297 1,166# of commercial remodel construction plans reviewed 905
60 2526298 38# of oil and gas applications reviewed 34
2,900 2,9003,739299 2,916# of one and two family residential new construction plans reviewed
2,883
FY21 Budget Performance Data G-37
Table of Contents

Development ServicesFY21 TargetFY20 ProjectionFY19 Actual FY20 TargetFY18 Actual
Subdivision and Zoning - Subdivision and Zoning98% 98%100%300 100%% of applicants that receive a rezoning development application
decision within 120 days of application submission
100%
98% 98%100%301 100%% of applicants proposing a new preliminary plat that receive a development application decision within 60 days of submission
100%
48 4850302 50Average # of days for applicants proposing a new subdivision to receive a development application decision
48
350 350335303 314# of zoning and subdivision applications processed 315
FY21 Budget Performance Data G-38
Table of Contents

FinanceFY21 TargetFY20 ProjectionFY19 Actual FY20 TargetFY18 Actual
Long-Term Issue - Financial Management and InformationIncreasing customer needs for timely information, financial management services and higher levels of accountability and transparency if not addressed may result in increased costs, reduced city services, difficulty in maintaining compliance with laws and regulations, lost revenue, and reduced credibility with customers and stakeholders.
Strategies to address the Long-Term IssueProvide more proactive communication, such as newsletters and training.
Work with customers in departments to identify their financial information and service needs and develop the resources and services identified.
Clarify and improve financial policies and ensure they are easily accessible and effectively communicated to departments.
Refine and maximize use of technology to streamline processes for staff and customers.
Focus on staff development and morale through succession planning and internal training.
Develop transparency plan to provide the public with easily accessible financial information.
Strategic Result(s) to measure annual progress on Long-Term IssueAnnually, 93% of customers will report they are satisfied with the financial services received to manage operations.
90% 90%89%304 89%% of customers reporting they are satisfied with the financial services received to manage their operations
91%
Strategic Result(s) to measure annual progress on Long-Term IssueAnnually, 95% of customers will report they are satisfied with financial information and reports.
90% 92%92%305 92%% of customers reporting they are satisfied with financial information and reports
93%
FY21 Budget Performance Data G-39
Table of Contents

FinanceFY21 TargetFY20 ProjectionFY19 Actual FY20 TargetFY18 Actual
Long-Term Issue - Sustainable Financial ModelIncreasing costs, limited revenue raising flexibility, growing future liabilities, and higher demands for City services if not addressed will result in increased use of debt, increasingly unsustainable levels of service, and a focus on immediate needs at the expense of long-term goals.
Strategies to address the Long-Term IssueContributions for the Employee Retirement System will be budgeted at the Actuarial Determined Contribution (ADC) rate.
Develop a funding plan for maintenance, operating, and capital replacement of MAPS and bond projects.
Develop a funding plan for public safety and transit fleet replacement.
Continue funding and cost management to address the long-term liability of retiree health insurance (OPEB).
Prepare and manage the General Fund budget to maintain appropriate reserve levels and control personnel cost levels.
Pursue legislative changes to expand the sales tax base, provide revenue diversification and use of property tax.
Strategic Result(s) to measure annual progress on Long-Term IssueThe City will maintain the ratings on G.O. bonds at the highest level.
AAA / Aaa AAA / AaaAAA / Aaa306 AAA / AaaGeneral Obligation Bond Ratings AAA / Aaa
Strategic Result(s) to measure annual progress on Long-Term IssueAnnually, personnel related costs will remain at or below 70% of total operating costs.
70.00% 70.00%69.64%307 70.28%% of total operating expenses for payroll expenses 70.25%
Strategic Result(s) to measure annual progress on Long-Term IssueAnnually, General Fund unbudgeted reserves will be maintained in the range of 14-20% of General Fund budget.
20.00% 20.00%20.63%308 21.66%% of general fund budget maintained in unbudgeted reserve 18.58%
Strategic Result(s) to measure annual progress on Long-Term IssueBy 2023, long-term liabilities will be funded at the following levels:
100% for Employee Retirement System (ERS)
20% for retiree health insurance, also known as Other Post Employment Benefits (OPEB)
100% 100%100%309 104%% of Employee Retirement System (ERS) liability funded 105%
12.22% 13.31%13.21%310 12.10%% of Other Post Employment Benefits (OPEB) liability funded 8.58%
FY21 Budget Performance Data G-40
Table of Contents

FinanceFY21 TargetFY20 ProjectionFY19 Actual FY20 TargetFY18 Actual
Long-Term Issue - Sustainable Financial Model
Strategic Result(s) to measure annual progress on Long-Term IssueBy 2023, property insurance reserves will be funded at two times the deductible.
2.00 2.001.60311 1.60# of deductibles funded by property insurance reserves 1.74
Strategic Result(s) to measure annual progress on Long-Term IssueBy 2023, the percentage of General Fund revenue from sales tax will be below 50% due to greater diversification of revenue sources.
56% 56%58%312 55%% of General Fund revenue from Sales Tax 54%
Long-Term Issue - SafetyA continued need to promote a workplace safety culture within the City, if not addressed, will result in a high risk of employee injuries and reduced resources available to provide City services.
Strategies to address the Long-Term IssueContinue to provide useful and accurate Workers’ Compensation and On the Job Injury (OJI) reports to Departments and assist in analyzing their workplace injury experience.
Provide safety consultation services to Departments.
Train managers in the essential elements of an Occupational Safety Program.
Coordinate safety training for all City employees, employing both internal and external resources.
Maintain a City-wide Safety Advisory Committee to make recommendations for improving the City’s safety culture.
Continue proactive claims management services.
Implement a safety recognition program.
Implement a city-wide return to work program.
Ensure every department has an injury/illness prevention plan.
Strategic Result(s) to measure annual progress on Long-Term IssueBy 2023, a culture of safety will be reflected by:
The City injury rate will be at or below 7 injuries per 100 employees.
100% of employees will receive quarterly safety training.
8.00 8.008.41313 8.41# of injuries per 100 employees 9.18
100% 100%N/A314 N/A% of employees that receive quarterly safety training N/A
FY21 Budget Performance Data G-41
Table of Contents

FinanceFY21 TargetFY20 ProjectionFY19 Actual FY20 TargetFY18 Actual
Administrative - Executive Leadership75% 75%75%315 79%% of key measures and strategic results achieved 78%
90% 92%92%316 92%% of customers reporting they are satisfied with financial information and reports
93%
90% 90%89%317 89%% of customers reporting they are satisfied with the financial services received to manage their operations
91%
88% 101%96%318 96%% of full-time equivalent employees without an on the job injury (OJI) in the current fiscal year
96%
95% 95%86%319 78%% of performance evaluations completed by the review date 73%
95% 95%100%320 100%% of terminations submitted to the Personnel Department within 3 days of the termination date
100%
88 8380321 79# of full-time employees supported 76
22,320,511 21,973,11818,297,395322 20,988,564Dollar amount of operating expenditures managed 15,237,055
Accounting and Financial Reporting - Accounting Systems96.50% 98.41%97.56%323 97.05%% of accounting system support requests resolved within 3
working days
96.24%
97.22% 100.00%96.41%324 98.61%% of total capital assets that are in balance 93.98%
1,848 1,7501,785325 1,853# of accounting system support requests resolved 1,907
1,800 1,7651,794326 1,864# of accounting system support requests received 1,914
Accounting and Financial Reporting - Financial Reporting95.61% 100.00%90.92%327 95.64%% of financial reports issued on time 95.00%
100.00% 100.00%99.68%328 99.34%% of bank reconciliations completed on time 97.75%
90% 92%87%329 87%% of customers who report they are satisfied with the financial information available to make decisions
81%
2,040 2,0001,978330 1,963# of bank reconciliations completed 1,999
218 192219331 263# of financial reports issued 228
FY21 Budget Performance Data G-42
Table of Contents
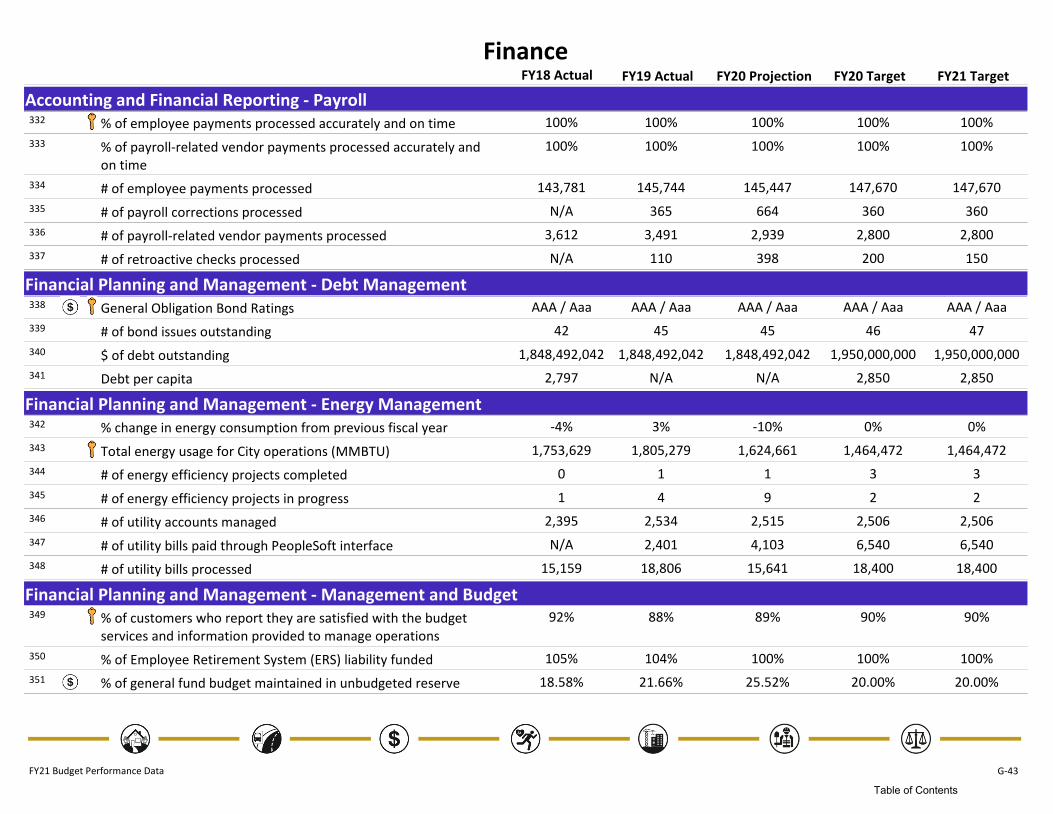
FinanceFY21 TargetFY20 ProjectionFY19 Actual FY20 TargetFY18 Actual
Accounting and Financial Reporting - Payroll100% 100%100%332 100%% of employee payments processed accurately and on time 100%
100% 100%100%333 100%% of payroll-related vendor payments processed accurately and on time
100%
147,670 147,670145,447334 145,744# of employee payments processed 143,781
360 360664335 365# of payroll corrections processed N/A
2,800 2,8002,939336 3,491# of payroll-related vendor payments processed 3,612
200 150398337 110# of retroactive checks processed N/A
Financial Planning and Management - Debt ManagementAAA / Aaa AAA / AaaAAA / Aaa338 AAA / AaaGeneral Obligation Bond Ratings AAA / Aaa
46 4745339 45# of bond issues outstanding 42
1,950,000,000 1,950,000,0001,848,492,042340 1,848,492,042$ of debt outstanding 1,848,492,042
2,850 2,850N/A341 N/ADebt per capita 2,797
Financial Planning and Management - Energy Management0% 0%-10%342 3%% change in energy consumption from previous fiscal year -4%
1,464,472 1,464,4721,624,661343 1,805,279Total energy usage for City operations (MMBTU) 1,753,629
3 31344 1# of energy efficiency projects completed 0
2 29345 4# of energy efficiency projects in progress 1
2,506 2,5062,515346 2,534# of utility accounts managed 2,395
6,540 6,5404,103347 2,401# of utility bills paid through PeopleSoft interface N/A
18,400 18,40015,641348 18,806# of utility bills processed 15,159
Financial Planning and Management - Management and Budget90% 90%89%349 88%% of customers who report they are satisfied with the budget
services and information provided to manage operations
92%
100% 100%100%350 104%% of Employee Retirement System (ERS) liability funded 105%
20.00% 20.00%25.52%351 21.66%% of general fund budget maintained in unbudgeted reserve 18.58%
FY21 Budget Performance Data G-43
Table of Contents
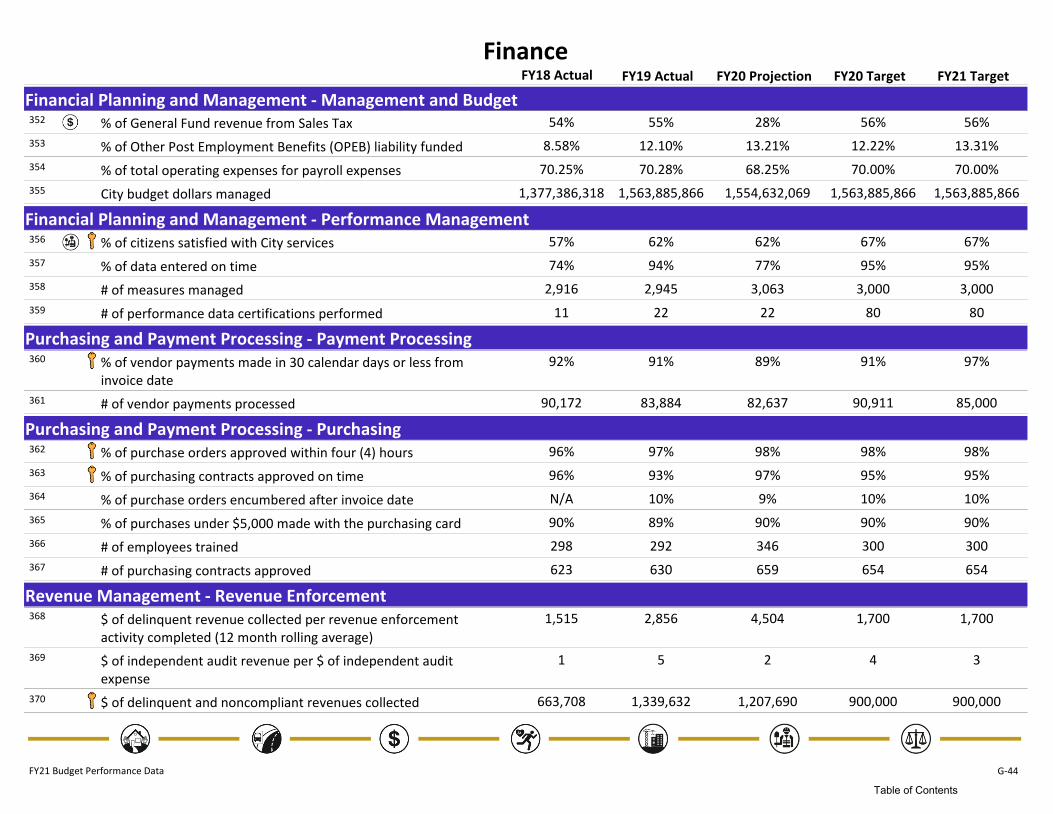
FinanceFY21 TargetFY20 ProjectionFY19 Actual FY20 TargetFY18 Actual
Financial Planning and Management - Management and Budget56% 56%28%352 55%% of General Fund revenue from Sales Tax 54%
12.22% 13.31%13.21%353 12.10%% of Other Post Employment Benefits (OPEB) liability funded 8.58%
70.00% 70.00%68.25%354 70.28%% of total operating expenses for payroll expenses 70.25%
1,563,885,866 1,563,885,8661,554,632,069355 1,563,885,866City budget dollars managed 1,377,386,318
Financial Planning and Management - Performance Management67% 67%62%356 62%% of citizens satisfied with City services 57%
95% 95%77%357 94%% of data entered on time 74%
3,000 3,0003,063358 2,945# of measures managed 2,916
80 8022359 22# of performance data certifications performed 11
Purchasing and Payment Processing - Payment Processing91% 97%89%360 91%% of vendor payments made in 30 calendar days or less from
invoice date
92%
90,911 85,00082,637361 83,884# of vendor payments processed 90,172
Purchasing and Payment Processing - Purchasing98% 98%98%362 97%% of purchase orders approved within four (4) hours 96%
95% 95%97%363 93%% of purchasing contracts approved on time 96%
10% 10%9%364 10%% of purchase orders encumbered after invoice date N/A
90% 90%90%365 89%% of purchases under $5,000 made with the purchasing card 90%
300 300346366 292# of employees trained 298
654 654659367 630# of purchasing contracts approved 623
Revenue Management - Revenue Enforcement1,700 1,7004,504368 2,856$ of delinquent revenue collected per revenue enforcement
activity completed (12 month rolling average)
1,515
4 32369 5$ of independent audit revenue per $ of independent audit expense
1
900,000 900,0001,207,690370 1,339,632$ of delinquent and noncompliant revenues collected 663,708
FY21 Budget Performance Data G-44
Table of Contents
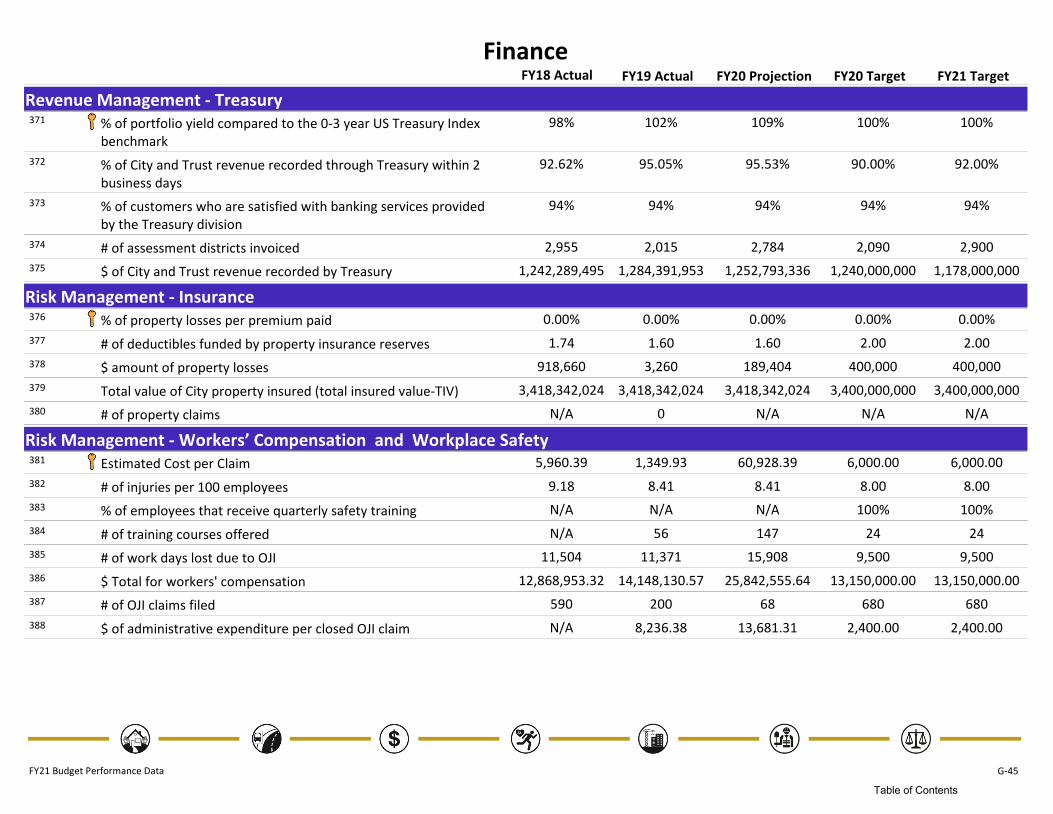
FinanceFY21 TargetFY20 ProjectionFY19 Actual FY20 TargetFY18 Actual
Revenue Management - Treasury100% 100%109%371 102%% of portfolio yield compared to the 0-3 year US Treasury Index
benchmark
98%
90.00% 92.00%95.53%372 95.05%% of City and Trust revenue recorded through Treasury within 2 business days
92.62%
94% 94%94%373 94%% of customers who are satisfied with banking services provided by the Treasury division
94%
2,090 2,9002,784374 2,015# of assessment districts invoiced 2,955
1,240,000,000 1,178,000,0001,252,793,336375 1,284,391,953$ of City and Trust revenue recorded by Treasury 1,242,289,495
Risk Management - Insurance0.00% 0.00%0.00%376 0.00%% of property losses per premium paid 0.00%
2.00 2.001.60377 1.60# of deductibles funded by property insurance reserves 1.74
400,000 400,000189,404378 3,260$ amount of property losses 918,660
3,400,000,000 3,400,000,0003,418,342,024379 3,418,342,024Total value of City property insured (total insured value-TIV) 3,418,342,024
N/A N/AN/A380 0# of property claims N/A
Risk Management - Workers’ Compensation and Workplace Safety6,000.00 6,000.0060,928.39381 1,349.93Estimated Cost per Claim 5,960.39
8.00 8.008.41382 8.41# of injuries per 100 employees 9.18
100% 100%N/A383 N/A% of employees that receive quarterly safety training N/A
24 24147384 56# of training courses offered N/A
9,500 9,50015,908385 11,371# of work days lost due to OJI 11,504
13,150,000.00 13,150,000.0025,842,555.64386 14,148,130.57$ Total for workers' compensation 12,868,953.32
680 68068387 200# of OJI claims filed 590
2,400.00 2,400.0013,681.31388 8,236.38$ of administrative expenditure per closed OJI claim N/A
FY21 Budget Performance Data G-45
Table of Contents

FireFY21 TargetFY20 ProjectionFY19 Actual FY20 TargetFY18 Actual
Long-Term Issue - Life Safety – Property LossThe lack of awareness and application of personal safety and health measures by residents, if not addressed, will result in fire fatalities, illness, injuries and property loss.
Strategies to address the Long-Term IssueConduct community risk reduction activities where a safety survey, home smoke alarms, healthcare needs, and safety messages or drills are provided.
Increase improved life safety knowledge through safety education sessions.
Distribute long life smoke alarms in targeted high fire risk areas.
Provide online pre-inspection checklists and provide regular inspections.
Provide CPR training to Oklahoma City employees and residents.
Strategic Result(s) to measure annual progress on Long-Term IssueAnnually, the structure fire fatality rate in Oklahoma City will be at or below the national average (1.05 per 100,000 residents based on the latest available data from the National Fire Protection Association (NFPA).
1.03 1.032.20389 2.39# of structure fire fatalities per 100,000 residents 3.21
Strategic Result(s) to measure annual progress on Long-Term IssueAnnually, Oklahoma City will achieve a cardiac arrest resuscitation rate of 33%.
29% 29%38%390 37%% of cardiac arrest patients receiving resuscitative efforts where return of spontaneous circulation is achieved
38%
Strategic Result(s) to measure annual progress on Long-Term IssueAnnually, the community of Oklahoma City will benefit from comprehensive fire and life safety and prevention education, as evidenced by:
100% of elementary public schools in Oklahoma City limits participating in Community Risk Reduction activities.
40,000 community risk reduction activities involving the community of Oklahoma City.
100% 100%26%391 26%% of elementary public schools in Oklahoma City limits participating in Community Risk Reduction activities
93%
40,000 40,00038,936392 39,155# of Fire Department Community Risk Reduction activities 37,393
FY21 Budget Performance Data G-46
Table of Contents

FireFY21 TargetFY20 ProjectionFY19 Actual FY20 TargetFY18 Actual
Long-Term Issue - Increased Service DemandThe growing demand on Fire Department services and resources caused by population growth, development, and changing demographics, coupled with an increasing role in EMS delivery, if not addressed, will result in:
Increased response times leading to property loss
Deterioration of patient condition
Increasing delays in delivering other services
Hazardous Materials
Technical rescue
Water rescue
High angle rescue
Trench Rescue
Confined space rescue
Structural collapse rescue
Wildland urban interface
Agency assist
Strategies to address the Long-Term IssueContinue to review and upgrade the Advanced Life Support Program (ALS) to meet City Council directives.
Concentrate recruitment and training efforts on increasing Oklahoma City Fire Department paramedics.
Continue the planning and construction of new fire stations authorized as General Obligation Bond projects.
Continue the implementation and training for enhanced communications and data systems.
Continue integration with EMSA including the periodic analysis of the Medical Priority Dispatch System (MPDS) to ensure appropriate allocation of our EMS resources.
Continue to work with local, state and federal organizations to assist and provide monitoring and detection for our residents and responders at large venues and National security events.
Collaborate with other City Departments to implement plans that are conducive for emergency responses to include faster routes and areas free of permanent obstructions.
Collaborate with local educational institution, Medical Director, local law enforcement, state and federal organizations, and medical transport agencies to increase educational opportunities.
FY21 Budget Performance Data G-47
Table of Contents

FireFY21 TargetFY20 ProjectionFY19 Actual FY20 TargetFY18 Actual
Long-Term Issue - Increased Service Demand
Strategic Result(s) to measure annual progress on Long-Term IssueAnnually, the residents of Oklahoma City, even anticipating growth in outlying areas, will receive emergency responses within 7 minutes 70% of the time in order to protect lives, assess and treat medical emergencies, and limit damage to property and the environment.
70% 70%65%393 65%% of emergency incidents responded to within 7 minutes 65%
Long-Term Issue - Aging Facilities and Fleet ReplacementA lack of capital funding for Fire Department facilities and fleet replacement past 2021, if not addressed, will result in increased facility and fleet maintenance costs and a diversion of resources from direct services to the public.
Strategies to address the Long-Term IssueContinue the planning and construction of new fire stations authorized as General Obligation Bond projects.
Complete facility repairs funded by General Obligation Bonds and Fire Sales Tax Fund.
Work with City leadership to identify a funding source for Fleet replacement.
Use MA+ Engineering facility assessment to prioritize building improvements throughout the Fire Department and identify a funding source.
Strategic Result(s) to measure annual progress on Long-Term IssueBy 2021, 100% of annual fleet replacement needs will have an identified funding source.
N/A N/A0%394 0%% of annual fleet replacement needs with an identified funding source
N/A
Strategic Result(s) to measure annual progress on Long-Term IssueBy 2021, 100% of annual facility improvement needs will have an identified funding source.
N/A N/AN/A395 N/A% of annual facility improvement needs with an identified funding source
N/A
Administrative - Executive Leadership75% 75%42%396 26%% of key measures and strategic results achieved 18%
45% 45%42%397 42%% of Fire Department applicants that are female and/or minority 36%
95% 95%95%398 95%% of full-time equivalent employees without an on the job injury (OJI) in the current fiscal year
95%
100% 100%91%399 92%% of performance evaluations completed by the review date 77%
FY21 Budget Performance Data G-48
Table of Contents
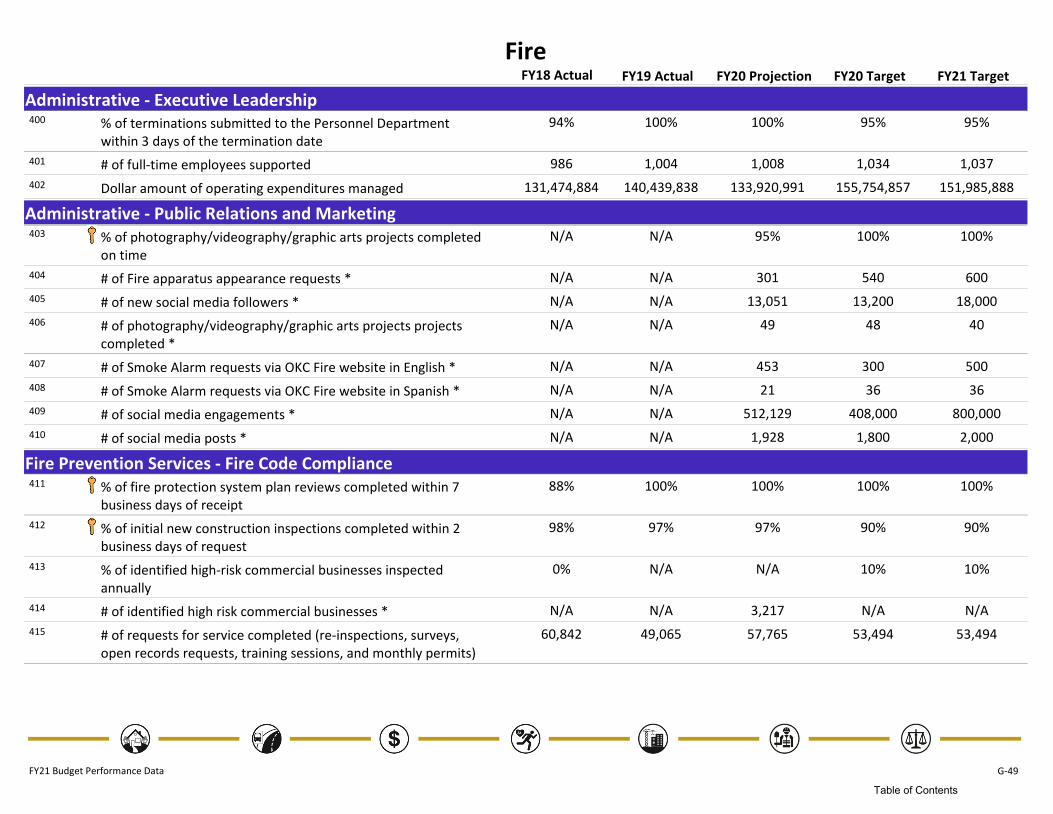
FireFY21 TargetFY20 ProjectionFY19 Actual FY20 TargetFY18 Actual
Administrative - Executive Leadership95% 95%100%400 100%% of terminations submitted to the Personnel Department
within 3 days of the termination date
94%
1,034 1,0371,008401 1,004# of full-time employees supported 986
155,754,857 151,985,888133,920,991402 140,439,838Dollar amount of operating expenditures managed 131,474,884
Administrative - Public Relations and Marketing100% 100%95%403 N/A% of photography/videography/graphic arts projects completed
on time
N/A
540 600301404 N/A# of Fire apparatus appearance requests * N/A
13,200 18,00013,051405 N/A# of new social media followers * N/A
48 4049406 N/A# of photography/videography/graphic arts projects projects completed *
N/A
300 500453407 N/A# of Smoke Alarm requests via OKC Fire website in English * N/A
36 3621408 N/A# of Smoke Alarm requests via OKC Fire website in Spanish * N/A
408,000 800,000512,129409 N/A# of social media engagements * N/A
1,800 2,0001,928410 N/A# of social media posts * N/A
Fire Prevention Services - Fire Code Compliance100% 100%100%411 100%% of fire protection system plan reviews completed within 7
business days of receipt
88%
90% 90%97%412 97%% of initial new construction inspections completed within 2 business days of request
98%
10% 10%N/A413 N/A% of identified high-risk commercial businesses inspected annually
0%
N/A N/A3,217414 N/A# of identified high risk commercial businesses * N/A
53,494 53,49457,765415 49,065# of requests for service completed (re-inspections, surveys, open records requests, training sessions, and monthly permits)
60,842
FY21 Budget Performance Data G-49
Table of Contents

FireFY21 TargetFY20 ProjectionFY19 Actual FY20 TargetFY18 Actual
Fire Prevention Services - Fire Investigations35% 63%29%416 37%% of incendiary (set fire) fire investigations referred to the
district attorney for prosecution of arson
N/A
68% 56%65%417 61%% of fire investigations resulting in a cause determination of accidental, incendiary, or natural
65%
126 200268418 208# of fire investigations conducted 229
126 7094419 63# of investigations resulting in a cause determination of incendiary
67
50 3010420 20# of juveniles referred to the Operation Safe Fire Program 12
Fire Prevention Services - Public Safety Education Services100% 100%26%421 26%% of elementary public schools in Oklahoma City limits
participating in Community Risk Reduction activities
93%
0% 0%N/A422 N/A% of youth referred to Fire Prevention Services that have previously attended Operation Fire Safe
N/A
36,000 36,00034,627423 20,086# of Fire Department public safety education participants served 23,455
6,824 6,824N/A424 N/A# of elementary students in the Oklahoma City limits participating in Community Risk Reduction activities
7,276
30 5019425 N/A# of Health and Safety Sessions provided 83
3,500 3,500N/A426 1,598# of hours spent on Community Risk Reduction requests for service
4,645
6,500 6,5005,777427 8,047# of smoke alarms distributed to residents 6,511
Operational Services - Emergency Medical Services29% 29%33%428 37%% of cardiac arrest patients receiving resuscitative efforts where
return of spontaneous circulation is achieved
38%
70% 70%61%429 62%% of Fire Department emergency medical responses provided within 5 minutes or less from being dispatched to arrival
61%
85% 85%88%430 87%% of Fire Department emergency medical responses provided with Advanced Life Support (ALS) staff and equipment
87%
FY21 Budget Performance Data G-50
Table of Contents

FireFY21 TargetFY20 ProjectionFY19 Actual FY20 TargetFY18 Actual
Operational Services - Emergency Medical Services95% 95%100%431 100%% of Fire Department emergency medical responses where
treatment is indicated and condition is improved or stabilized
100%
28% N/AN/A432 N/A% of time Fire apparatus arrives on scene prior to EMSA * N/A
55,579 55,57956,152433 52,188# of Fire Department emergency medical responses 52,924
48,157 48,15743,410434 41,205# of Fire Department emergency medical responses where treatment is provided
N/A
64,919 64,91966,356435 61,234# of Fire Department emergency medical calls dispatched 61,788
Operational Services - Fire Suppression Operations1.03 1.031.41436 2.39# of structure fire fatalities per 100,000 residents 3.21
70% 70%68%437 68%% of structure fire incident responses within 5 minutes or less from being dispatched to arrival
N/A
70% 70%65%438 65%% of emergency incidents responded to within 7 minutes 65%
70% 70%55%439 56%% of other fire incident responses within 5 minutes or less from being dispatched
N/A
65% 65%76%440 71%% of structure fires contained to the room of origin 63%
40,000 40,00037,725441 39,155# of Fire Department Community Risk Reduction activities 37,393
2.00 2.00N/A442 N/A# of Fire Department daily training hours per Operations position 3.04
3,100 3,1003,472443 2,581# of fire incident responses provided 2,926
1,800 1,8002,261444 1,469# of other fire incident responses provided N/A
3,000 3,000567445 900# of people assisted by the Fire Department Community Service Liaison
1,661
800 800959446 1,129# of special operations responses provided by the Fire Department
905
1,000 1,0001,184447 1,097# of structure fire incident responses provided N/A
Support Services - Fire Dispatch90% 90%92%448 88%% of incidents dispatched within 60 seconds of receipt at Fire
Dispatch
83%
FY21 Budget Performance Data G-51
Table of Contents

FireFY21 TargetFY20 ProjectionFY19 Actual FY20 TargetFY18 Actual
Support Services - Fire Dispatch100% 100%97%449 98%% of 911 telephone calls answered within 15 seconds or less
from transfer to Fire Dispatch
97%
78,400 78,40080,787450 74,411# of incidents dispatched to the Fire Department 75,089
17,600 17,60019,761451 17,157# of 911 telephone calls received 17,006
Support Services - Fire Logistics and Facilities Maintenance90% 90%N/A452 81%% of Priority 1 facility work orders completed within 24 hours 90%
90% 90%92%453 92%% of time the fire apparatus is available for use (not down for maintenance)
92%
70% 70%96%454 60%% of fleet direct labor hours realized N/A
12% 8%5%455 4%% of repairs outsourced 6%
70% 80%83%456 93%% of total maintenance hours that are scheduled 65%
9,800 9,8007,743457 8,245# of fleet direct labor hours realized 6,495
160 160N/A458 112# of Priority 1 Fire Department facility work orders completed 158
144 144N/A459 91# of Priority 1 Fire Department facility work orders completed within 24 hours
142
FY21 Budget Performance Data G-52
Table of Contents

General ServicesFY21 TargetFY20 ProjectionFY19 Actual FY20 TargetFY18 Actual
Long-Term Issue - Maintenance of City AssetsThe continued need for coordinated planning for the maintenance of City assets, if not addressed, will result in:
Increased capital and operating cost.
Delays in response times to maintenance requests.
Unsafe facilities, leading to increased risk of injury or illness to citizens and city employees.
Continued duplication of efforts.
Missed opportunities to identify conservation initiatives.
Strategies to address the Long-Term IssueSchedule elective repairs found during preventive maintenance inspections based on customer’s priority of need.
Assign staff to preventive maintenance work orders in a timely manner to promote completions by due date.
Increase shop priority on equipment approaching promised return date.
Assign staff to facility work orders in a timely manner and work closely with requesting agencies regarding material acquisition to complete services within designated completion time.
Strive to provide exceptional customer service through SharePoint notification communication with customers as work requests / work orders are completed.
Meet annually with Fleet Services’ customer groups to discuss their issues and concerns.
Strategic Result(s) to measure annual progress on Long-Term IssueBy 2020, General Services’ customer departments will benefit from having a coordinated building and equipment assets maintenance, repair and service plan as evidenced by:
At least 60% of all vehicle/equipment work orders that are preventative maintenance.
At least 88% of all preventive maintenance facility work orders will be completed when due in order to decrease capital costs and avoid costly unexpected repairs.
55% 53%50%460 51%% of all vehicle/equipment work orders that are preventitive maintenance
52%
95% 95%98%461 96%% of preventive maintenance work orders completed on schedule
103%
FY21 Budget Performance Data G-53
Table of Contents

General ServicesFY21 TargetFY20 ProjectionFY19 Actual FY20 TargetFY18 Actual
Long-Term Issue - Maintenance of City Assets
Strategic Result(s) to measure annual progress on Long-Term IssueBy 2020, City departments will benefit from improved customer service as evidenced by:
At least 90% of vehicle repairs completed within the stated completion time.
At least 80% of unscheduled facility repair work orders completed on time.
At least 80% of customers surveyed will be satisfied with Building Management services.
At least 95% of customers surveyed will be satisfied with Fleet Services.
93% 92%97%462 98%% of vehicle/equipment work orders completed by the stated completion time
95%
55% 50%44%463 52%% of unscheduled facility repair work orders completed on time 54%
70% 80%85%464 85%% of customers satisfied with Building Management 62%
90% 82%85%465 85%% of customers satisfied with Fleet Services 74%
FY21 Budget Performance Data G-54
Table of Contents

General ServicesFY21 TargetFY20 ProjectionFY19 Actual FY20 TargetFY18 Actual
Long-Term Issue - Skilled Labor ShortageThe growing shortage of skilled laborers, if not addressed, will result in:
Additional outsourcing at an increase in cost to customers.
Diminished service levels to customers.
Limited facility and fleet management service options.
Strategies to address the Long-Term IssueProvide staff training and support to improve skills needed to complete facility repair requests.
Work with vocational technology and educational institutions to find employees
Work with the personnel department to establish apprenticeship programs within the skilled trades
Strategic Result(s) to measure annual progress on Long-Term IssueBy 2020 Oklahoma City Departments will benefit from a skilled General Services Department workforce, as evidenced by:
100% of vehicle mechanics with ASE Master Level Certification.
Maintain Fleet Services staffing levels at 210 vehicle equivalents per mechanic (industry standard is 200 vehicle equivalates per mechanic).
Maintain a minimum Building Maintenance staff ratio of 63,250 square feet per employee (industry standard is 55,000 square feet per maintenance staff employee).
Less than 25% of vehicle repairs will be outsourced.
88% 87%64%466 66%% of vehicle mechanics with ASE Master Level Certification 82%
259 290327467 334# of vehicle equivalents per mechanic 320
79,730 93,61285,608468 88,938Square footage maintained per Building Maintenance Employee 82,870
7% 4%5%469 5%% of outsourced vehicle repairs 2%
FY21 Budget Performance Data G-55
Table of Contents

General ServicesFY21 TargetFY20 ProjectionFY19 Actual FY20 TargetFY18 Actual
Long-Term Issue - Capital Repair and ReplacementThe continued inadequate capital repair and replacement of the City’s facilities and equipment assets, if not addressed, will result in:
Increased demand for building and fleet maintenance services.
Increased maintenance, operational and capital costs for the City.
Negative public image of the City.
Poor customer morale.
Increased risk for injury for citizens and employees.
Unscheduled service interruptions.
Strategies to address the Long-Term IssueProvide a detailed estimate Facility and Fleet capital needs to the Finance Department annually.
Meet annually with department and division heads to determine their vehicle/equipment replacement needs.
Provide project development and estimating services, building assessments and reports and provide advice on facility issues.
Strategic Result(s) to measure annual progress on Long-Term IssueBy 2020, City decision makers will benefit from having expert advice and information needed to make fleet and facility decisions as evidenced by:
100% of department managers will say they received the information needed to make Fleet decisions.
100% of department managers will say they received the information needed to make Facility decisions.
100% 81%100%470 100%% of department managers satisfied with information needed to make fleet decisions
13%
80% 80%100%471 100%% of department managers that say they receive the information needed to make Facility decisions
100%
Administrative - Executive Leadership75% 75%65%472 47%% of key measures and strategic results achieved 58%
100% 100%100%473 100%% of ADA compliance issues responded to within 5 working days 100%
96% 98%97%474 97%% of full-time equivalent employees without an on the job injury (OJI) in the current fiscal year
96%
96% 94%82%475 81%% of performance evaluations completed by the review date 78%
1% 100%100%476 100%% of terminations submitted to the Personnel Department within 3 days of the termination date
100%
FY21 Budget Performance Data G-56
Table of Contents

General ServicesFY21 TargetFY20 ProjectionFY19 Actual FY20 TargetFY18 Actual
Administrative - Executive Leadership500 420591477 575# of ADA issues responded to within 5 working days 555
71 6668478 66# of full-time employees supported 62
15,542,573 13,172,65514,268,904479 13,078,766Dollar amount of operating expenditures managed 12,693,006
500 420591480 575# of ADA compliance issues received and tracked 555
Facility Asset Management - Aquatic and Recreational Facility Safety98% 98%N/A481 N/A% of operating days aquatic facilities are available for use 99%
90% 95%97%482 97%% of water quality tests passed N/A
23 2323483 23# of aquatic facilities supported 23
35 3539484 29# of aquatic facility installations/repairs completed 26
300 300N/A485 N/A# of spray ground inspections 314
800 850742486 857# of water quality tests performed by General Services 761
Facility Asset Management - Building Maintenance, Repair, and Enhancement81% 80%85%487 85%% of customers surveyed who express overall satisfaction with
maintenance of their facilities
78%
45% 41%44%488 39%% of work orders that are unscheduled 35%
70% 80%85%489 85%% of customers satisfied with Building Management 62%
80% 85%83%490 83%% of customers surveyed who express overall satisfaction with enhancements of their facilities
71%
70% 70%64%491 64%% of customers surveyed who express overall satisfaction with the cleanliness of facilities
59%
98% 98%98%492 98%% of facility repair requests received that are non-callbacks 99%
95% 95%88%493 96%% of preventive maintenance work orders completed on schedule
103%
55% 50%43%494 52%% of unscheduled facility repair work orders completed on time 54%
79,730 93,61281,433495 88,938Square footage maintained per Building Maintenance Employee 82,870
50 4027496 60# of enhancements completed 58
FY21 Budget Performance Data G-57
Table of Contents

General ServicesFY21 TargetFY20 ProjectionFY19 Actual FY20 TargetFY18 Actual
Facility Asset Management - Building Maintenance, Repair, and Enhancement1,852 2,2002,289497 2,199# of preventive maintenance work orders completed 2,572
17 1516498 20# of resource conservation measures completed 13
5,000 5,0005,549499 2,489# of square feet of graffiti removed 9,767
750 750750500 751# of unscheduled facility work orders completed 729
67 4539501 81# of enhancements requested 95
1,949 2,3152,610502 2,300# of preventive maintenance work orders scheduled for completion
2,506
1,650 1,6502,066503 1,554# of unscheduled repair work orders requested 1,428
5.62 1.591.44504 1.50$ expenditure per square foot of City facilities maintained 1.51
Fleet Management - Fleet Refueling100% 100%100%505 101%% of fueling transactions completed without assistance 100%
26,400 31,22435,351506 133,380# of fueling transactions completed 124,617
1,700,000 1,871,0161,840,970507 1,804,996# of gallons of fuel purchased 1,651,539
Fleet Management - Fleet Services Support85% 85%117%508 124%% of budgeted vehicle/equipment purchased 71%
20% 25%26%509 28%% of underutilized units in the general fleet 27%
90% 82%85%510 85%% of customers satisfied with Fleet Services 74%
100% 81%100%511 100%% of department managers satisfied with information needed to make fleet decisions
13%
85 8591512 97# of new vehicles/equipment issued 55
374 269274513 333# of underutilized units 392
3 00514 1# of vehicles/equipment specifications provided 63
4,300,000 3,915,0003,915,000515 3,915,000$ amount of vehicles/equipment funded for replacement 3,915,000
6,042,000 6,042,0008,562,939516 8,562,939$ amount of vehicles/equipment identified for replacement 8,562,939
FY21 Budget Performance Data G-58
Table of Contents
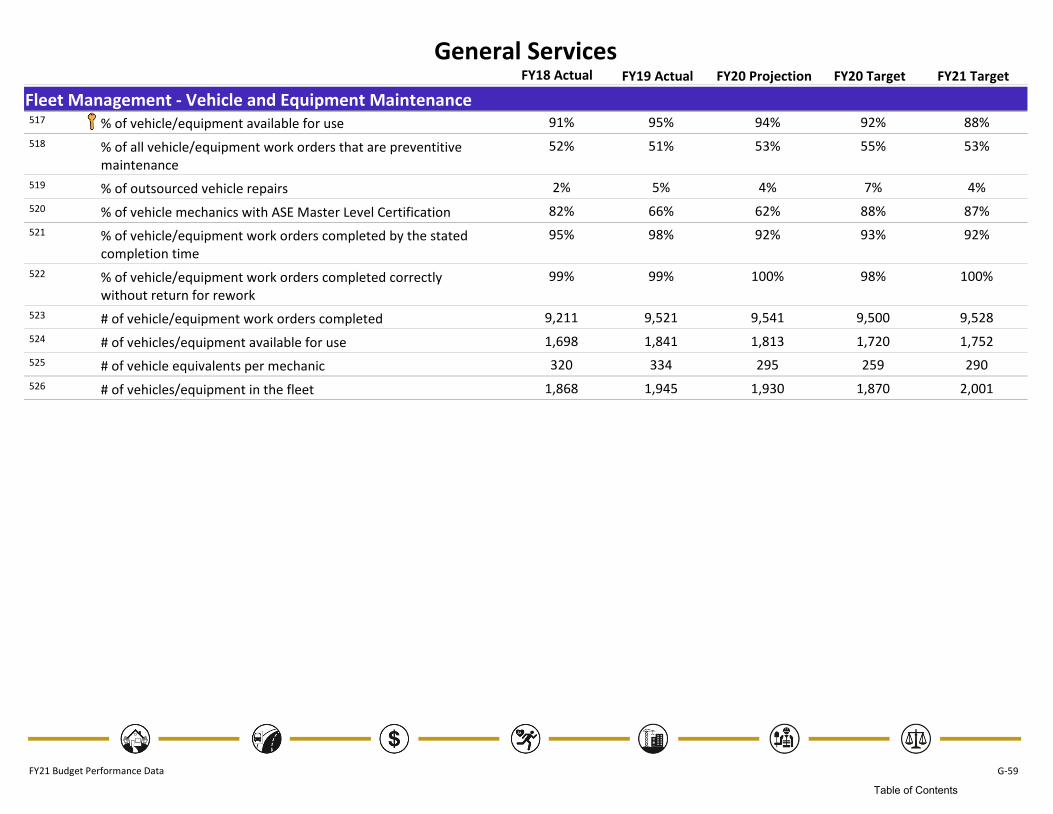
General ServicesFY21 TargetFY20 ProjectionFY19 Actual FY20 TargetFY18 Actual
Fleet Management - Vehicle and Equipment Maintenance92% 88%94%517 95%% of vehicle/equipment available for use 91%
55% 53%53%518 51%% of all vehicle/equipment work orders that are preventitive maintenance
52%
7% 4%4%519 5%% of outsourced vehicle repairs 2%
88% 87%62%520 66%% of vehicle mechanics with ASE Master Level Certification 82%
93% 92%92%521 98%% of vehicle/equipment work orders completed by the stated completion time
95%
98% 100%100%522 99%% of vehicle/equipment work orders completed correctly without return for rework
99%
9,500 9,5289,541523 9,521# of vehicle/equipment work orders completed 9,211
1,720 1,7521,813524 1,841# of vehicles/equipment available for use 1,698
259 290295525 334# of vehicle equivalents per mechanic 320
1,870 2,0011,930526 1,945# of vehicles/equipment in the fleet 1,868
FY21 Budget Performance Data G-59
Table of Contents

Information TechnologyFY21 TargetFY20 ProjectionFY19 Actual FY20 TargetFY18 Actual
Long-Term Issue - System Security and Data IntegrityThe increasing number and sophistication of security threats to the City’s information technology systems, if not addressed, could result in:
Loss of system integrity
Loss of data confidentiality
Decreased ability for the organization to provide services
Financial instability
Exposure of employees and citizens to identity theft
Erosion of citizen confidence
Liability caused by data breach or interruption of service
Strategies to address the Long-Term IssueThe IT Department will utilize the Center for Internet Security CIS Critical Security Controls for Effective Cyber Defense (CIS Controls - www.cisecurity.org) to prioritize City security projects and operational efforts,
Cyber security threats will be closely monitored in collaboration through active membership in the MS-ISAC (Multi State Information Sharing & Analysis Center - msisac.cisecurity.org)
The IT Department will continue to conduct periodic vulnerability and penetration assessments and the results will drive the implementation of new security projects.
The IT Department will pro-actively conduct user security awareness training based on industry best practices.
Strategic Result(s) to measure annual progress on Long-Term IssueBetter than 90% success rate for user security awareness training annually.
90% 96%N/A527 N/A% success rate for user security awareness testing * N/A
Strategic Result(s) to measure annual progress on Long-Term IssueAt least 95% of business system configurations will match the approved configuration standard annually.
97% 97%94%528 94%% of business system configurations that match the approved configuration security standard
N/A
Strategic Result(s) to measure annual progress on Long-Term IssueThe City will meet or exceed 85% compliance with the recommended Critical Security Controls (CSC) standard annually.
90% 95%94%529 94%% compliance with the recommended Critical Security Controls (CSC)
89%
FY21 Budget Performance Data G-60
Table of Contents

Information TechnologyFY21 TargetFY20 ProjectionFY19 Actual FY20 TargetFY18 Actual
Long-Term Issue - Growing Demand for TechnologyThe increasing backlog of projects and service requests for new and expanded technology, if not addressed, could result in:
Excessive delay in technology projects which will impact City department strategies
Inability to implement new technology services in a timely manner
Increased security vulnerability risk
Customer dissatisfaction with overall technology capabilities and support
Increased decentralization of new technology selection, implementation and support:
Decreased standardization of technology
Increased inefficiency in the organization
Failure to comply with Federal and legal mandates
Underutilization of technology investments
Strategies to address the Long-Term IssueThe IT Department will conduct technology Strategic Alignment (SA) meetings biannually with customer department directors and stakeholders to validate organizational priorities and align new project investments with final direction from the City Manager and Assistant City Managers.
The IT Department will continue to balance staff resource allocations to most effectively meet new technology initiatives which provide an increased efficiency and improved quality of service from customer departments to citizens, while still meeting support expectations for existing systems.
The IT Department will continue to use project prioritization criteria to ensure that projects required for legal mandates, to mitigate a security risk, or necessary for City operations, efficiency, and quality of service to citizens are executed first.
Strategic Result(s) to measure annual progress on Long-Term IssueAt least 75% of all incidents will be resolved within four operational hours annually.
75% 75%80%530 79%% of incidents resolved within four operational hours by the IT Department
70%
Strategic Result(s) to measure annual progress on Long-Term IssueAt least 95% of IT Departmental Contacts survey respondents will report that the Information Technology Department effectively meets their technology service expectations annually.
90% 90%100%531 100%% of IT Departmental Contacts who report that the Information Technology Department resources effectively meets their technology service expectations
100%
FY21 Budget Performance Data G-61
Table of Contents

Information TechnologyFY21 TargetFY20 ProjectionFY19 Actual FY20 TargetFY18 Actual
Long-Term Issue - Growing Demand for Technology
Strategic Result(s) to measure annual progress on Long-Term IssueAt least 75% of programs where delivery capacity meets or exceeds project demand by 2021.
86% 86%50%532 50%% of programs where delivery capacity meets or exceeds project demand
N/A
Long-Term Issue - Advanced Skill SetsThe increasing implementation of systems utilizing advanced technologies creates a growing gap between required and available skills to configure and support these technologies, if not addressed, could result in:
Increased security risks, including identity theft and data integrity
Increased disruption to critical City services
Underutilized technology investments
Failure to effectively support critical City systems
Inability to recruit and retain qualified technology staff
Increased cost and inefficiency due to reliance on third party support
Strategies to address the Long-Term IssueThe IT Department will continue to budget for critical training requirements to effectively support City systems.
The IT Department will maximize training efficiency using available online and local resources where possible for IT staff.
Identify recommended end user training opportunities and communicate to department contacts.
Strategic Result(s) to measure annual progress on Long-Term IssueAt least 90% of critical or required IT staff training requests completed annually.
90% 90%100%533 100%% of critical or required IT staff training requests completed annually
N/A
Administrative - Executive Leadership75% 75%40%534 68%% of key measures and strategic results achieved 64%
90% 90%100%535 100%% of critical or required IT staff training requests completed annually
N/A
95% 94%98%536 97%% of full-time equivalent employees without an on the job injury (OJI) in the current fiscal year
100%
FY21 Budget Performance Data G-62
Table of Contents

Information TechnologyFY21 TargetFY20 ProjectionFY19 Actual FY20 TargetFY18 Actual
Administrative - Executive Leadership90% 90%100%537 100%% of IT Departmental Contacts who report that the Information
Technology Department resources effectively meets their technology service expectations
100%
95% 95%62%538 43%% of performance evaluations completed by the review date 56%
86% 86%50%539 50%% of programs where delivery capacity meets or exceeds project demand
N/A
95% 95%96%540 91%% of terminations submitted to the Personnel Department within 3 days of the termination date
100%
111 112104541 104# of full-time employees supported 100
29,348,747 29,546,56126,743,268542 22,537,954Dollar amount of operating expenditures managed 21,809,170
Customer Support - Customer Support95% 95%96%543 96%% of customers responding to the IT Work Request Feedback
survey who are satisfied with the overall quality of services delivered by the IT Department
95%
75% 75%72%544 79%% of incidents resolved within four operational hours by the IT Department
70%
95% 95%97%545 98%% of customers responding to the IT Work Request feedback survey who are satisfied with the overall quality of service delivered by the IT Customer Support Program
N/A
75% 75%81%546 N/A% of incidents resolved within four operational hours by the Customer Support Program
N/A
5,500 5,5005,876547 6,396# of IT Customer Support work requests completed 5,491
5,500 5,5006,012548 6,744# of IT Customer Support work requests received 5,551
9 96549 6# of requested IT Customer Support projects in backlog 10
Public Safety Support - Public Safety Applications Support95% 95%50%550 133%% of customers responding to the IT Work Request Feedback
survey who are satisfied with the overall quality of services delivered by the IT Public Safety Applications Support Program
88%
FY21 Budget Performance Data G-63
Table of Contents

Information TechnologyFY21 TargetFY20 ProjectionFY19 Actual FY20 TargetFY18 Actual
Public Safety Support - Public Safety Applications Support75% 75%36%551 53%% of incidents resolved within four operational hours by the
Public Safety Applications Support program
50%
375 375392552 722# of public safety system work requests completed 381
370 370397553 712# of public safety system work requests received 413
12 1237554 14# of requested Public Safety Application projects in backlog 14
Public Safety Support - Public Safety Communications Support95% 95%N/A555 N/A% of customers responding to the IT Work Request Feedback
survey who are satisfied with the overall quality of services delivered by the IT Public Safety Communication Support program
98%
95% 98%97%556 98%% of CCTV cameras operational 98%
95% 95%100%557 100%% of customers responding to an internal departmental survey who are satisfied with the response to critical Public Safety Communications Center (PSCC) work requests
100%
88% 88%89%558 86%% of incidents resolved within 24 operational hours by the Public Safety Communications Support program
82%
75% 75%89%559 86%% of incidents resolved within four operational hours by the Public Safety Communications Support program
75%
96 9669560 41# of non-Oklahoma City Police Department vehicles outfitted 55
225 225N/A561 N/A# of Oklahoma City Police Department vehicles outfitted 162
8,500 8,5008,438562 8,422# of Public Safety communication devices supported 8,381
1,800 1,8001,325563 1,213# of Public Safety Communications Support work requests received
1,374
1,600 1,6001,507564 1,179# of Public Safety Communications work requests completed 1,380
5 57565 12# of requested Public Safety Communications Support projects in backlog
15
803.79 803.79797.00566 673.86$ expenditure per Public Safety communication device supported
702.76
FY21 Budget Performance Data G-64
Table of Contents
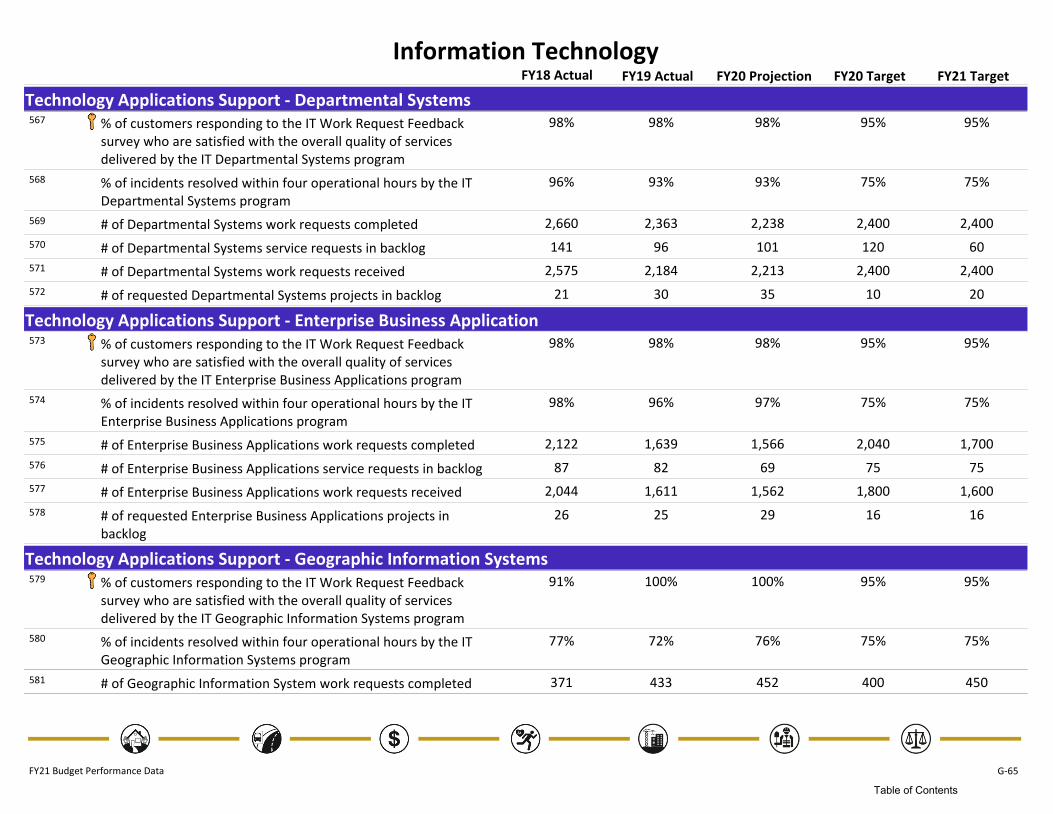
Information TechnologyFY21 TargetFY20 ProjectionFY19 Actual FY20 TargetFY18 Actual
Technology Applications Support - Departmental Systems95% 95%98%567 98%% of customers responding to the IT Work Request Feedback
survey who are satisfied with the overall quality of services delivered by the IT Departmental Systems program
98%
75% 75%93%568 93%% of incidents resolved within four operational hours by the IT Departmental Systems program
96%
2,400 2,4002,238569 2,363# of Departmental Systems work requests completed 2,660
120 60101570 96# of Departmental Systems service requests in backlog 141
2,400 2,4002,213571 2,184# of Departmental Systems work requests received 2,575
10 2035572 30# of requested Departmental Systems projects in backlog 21
Technology Applications Support - Enterprise Business Application95% 95%98%573 98%% of customers responding to the IT Work Request Feedback
survey who are satisfied with the overall quality of services delivered by the IT Enterprise Business Applications program
98%
75% 75%97%574 96%% of incidents resolved within four operational hours by the IT Enterprise Business Applications program
98%
2,040 1,7001,566575 1,639# of Enterprise Business Applications work requests completed 2,122
75 7569576 82# of Enterprise Business Applications service requests in backlog 87
1,800 1,6001,562577 1,611# of Enterprise Business Applications work requests received 2,044
16 1629578 25# of requested Enterprise Business Applications projects in backlog
26
Technology Applications Support - Geographic Information Systems95% 95%100%579 100%% of customers responding to the IT Work Request Feedback
survey who are satisfied with the overall quality of services delivered by the IT Geographic Information Systems program
91%
75% 75%76%580 72%% of incidents resolved within four operational hours by the IT Geographic Information Systems program
77%
400 450452581 433# of Geographic Information System work requests completed 371
FY21 Budget Performance Data G-65
Table of Contents

Information TechnologyFY21 TargetFY20 ProjectionFY19 Actual FY20 TargetFY18 Actual
Technology Applications Support - Geographic Information Systems30 5044582 53# of Geographic Information System service requests in backlog 61
400 450478583 427# of Geographic Information System work requests received 381
25 2021584 27# of requested Geographic Information System projects in backlog
25
Technology Enhancements - Data Management95% 95%94%585 89%% of customers responding to the IT Work Request Feedback
survey who are satisfied with the overall quality of services delivered by Data Management
N/A
90% 90%N/A586 N/A% compliance with recommended data governance controls N/A
75% 75%78%587 53%% of incidents resolved within four operational hours by the Data Management program
56%
380 380425588 398# of databases supported 370
240 240213589 338# of IT Data Management program work requests completed 335
75 75116590 103# of Data Management service requests in backlog 61
240 240236591 334# of IT Data Management program work requests received 318
24 2470592 58# of requested Data Management projects in backlog 57
Technology Enhancements - Project Management90% 90%85%593 88%% of surveyed technology project stakeholders reporting that
implemented technology meets identified business goals
100%
100% 100%30%594 71%% of recommended formal business analyses completed for new technology projects
100%
90% 90%94%595 95%% of technology project stakeholders rating the quality of services delivered by the Project Management Program as good or excellent
100%
10 1018596 16# of Project Management projects completed 12
36 3638597 44# of requested Project Management projects in backlog 39
FY21 Budget Performance Data G-66
Table of Contents

Information TechnologyFY21 TargetFY20 ProjectionFY19 Actual FY20 TargetFY18 Actual
Technology Enhancements - Software Development 90% 90%100%598 100%% of customers responding to the IT Work Request Feedback
survey who are satisfied with the overall quality of services delivered by Software Development
100%
75% 75%87%599 92%% of incidents resolved within four operational hours by the Software Development program
86%
35 137165600 41# of custom IT applications supported 43
600 8001,046601 80# of IT Software Development work requests completed 161
100 100347602 80# of IT Software Development service requests in backlog 95
600 1,0001,396603 82# of IT Software Development work requests received 162
20 25028604 32# of requested IT Software Development projects in backlog 34
Technology Infrastructure - Communications95% 95%N/A605 99%% of customers responding to the Work Request Feedback
survey who report that they are satisfied with the overall quality of services delivered by the IT Communications program
98%
75% 75%72%606 58%% of incidents resolved within four operational hours by the Communications program
50%
5,500 5,5005,561607 5,527# of email accounts supported 5,454
1,200 2,0002,676608 2,037# of IT Communication work requests completed 1,442
5,800 5,8006,995609 5,672# of telephones lines supported 5,786
1,250 2,0002,571610 2,030# of IT Communications program work requests received 1,407
15 1510611 8# of requested Communications projects in backlog 8
189.58 189.58158.79612 202.77$ expenditure per telephone and email accounts supported 171.31
Technology Infrastructure - Configuration Management95% 95%90%613 87%% of client devices meeting current configuration standards 84%
75% 75%68%614 69%% of incidents resolved within four operational hours by Configuration Management program
28%
200 200146615 N/A# of Configuration Management work requests completed N/A
FY21 Budget Performance Data G-67
Table of Contents
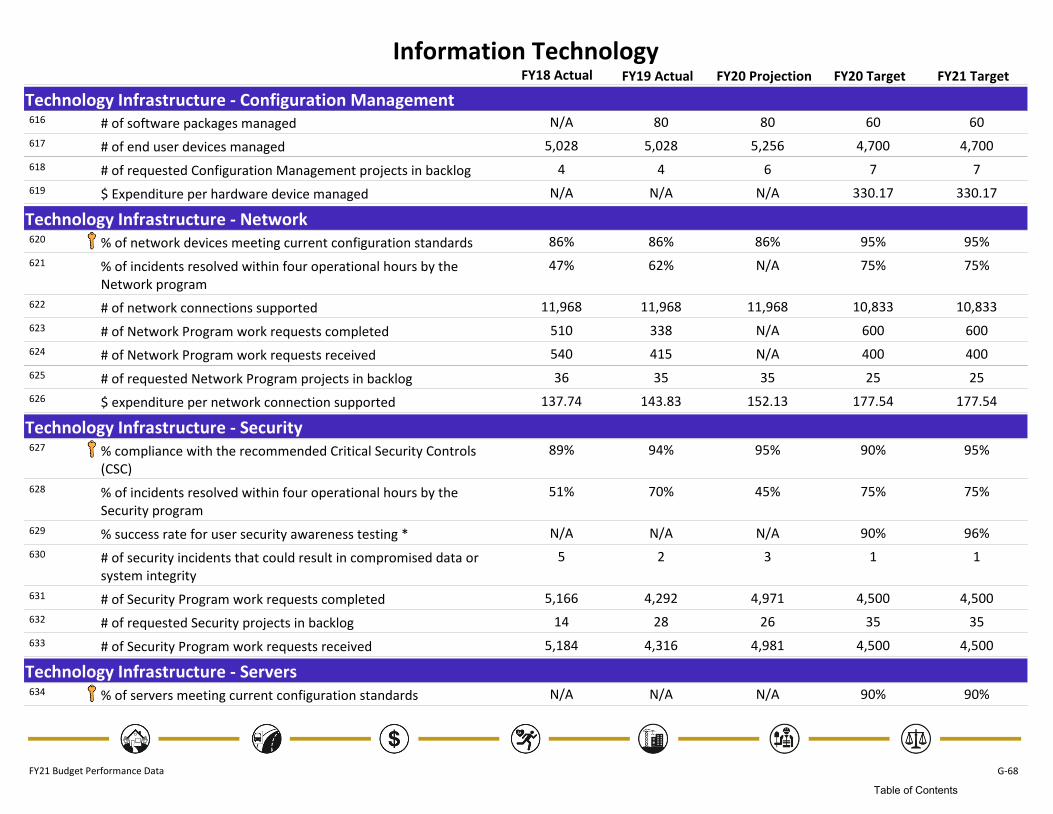
Information TechnologyFY21 TargetFY20 ProjectionFY19 Actual FY20 TargetFY18 Actual
Technology Infrastructure - Configuration Management60 6080616 80# of software packages managed N/A
4,700 4,7005,256617 5,028# of end user devices managed 5,028
7 76618 4# of requested Configuration Management projects in backlog 4
330.17 330.17N/A619 N/A$ Expenditure per hardware device managed N/A
Technology Infrastructure - Network95% 95%86%620 86%% of network devices meeting current configuration standards 86%
75% 75%N/A621 62%% of incidents resolved within four operational hours by the Network program
47%
10,833 10,83311,968622 11,968# of network connections supported 11,968
600 600N/A623 338# of Network Program work requests completed 510
400 400N/A624 415# of Network Program work requests received 540
25 2535625 35# of requested Network Program projects in backlog 36
177.54 177.54152.13626 143.83$ expenditure per network connection supported 137.74
Technology Infrastructure - Security90% 95%95%627 94%% compliance with the recommended Critical Security Controls
(CSC)
89%
75% 75%45%628 70%% of incidents resolved within four operational hours by the Security program
51%
90% 96%N/A629 N/A% success rate for user security awareness testing * N/A
1 13630 2# of security incidents that could result in compromised data or system integrity
5
4,500 4,5004,971631 4,292# of Security Program work requests completed 5,166
35 3526632 28# of requested Security projects in backlog 14
4,500 4,5004,981633 4,316# of Security Program work requests received 5,184
Technology Infrastructure - Servers90% 90%N/A634 N/A% of servers meeting current configuration standards N/A
FY21 Budget Performance Data G-68
Table of Contents

Information TechnologyFY21 TargetFY20 ProjectionFY19 Actual FY20 TargetFY18 Actual
Technology Infrastructure - Servers75% 75%70%635 70%% of incidents resolved within four operational hours by Servers
program
55%
300 3001,615636 1,601# of server work requests completed 1,400
900 900913637 988# of servers supported 935
3,100 3,1003,141638 3,141# of total server storage space managed (Terabytes) 3,141
8 814639 20# of requested Server projects in backlog 15
300 3001,629640 1,586# of server work requests received 1,495
FY21 Budget Performance Data G-69
Table of Contents

Municipal Counselor's OfficeFY21 TargetFY20 ProjectionFY19 Actual FY20 TargetFY18 Actual
Long-Term Issue - Early Contact and CommunicationA continuing lack of early contact and communication by some City clients with the Municipal Counselor’s Office concerning some City projects, if not adequately addressed, may result in:
Delays in client projects and policy implementation
Lack of direction and clarity for the client
Duplication of efforts by legal staff causing delays on other client projects
Increased liability exposure
Diminished client satisfaction
Strategies to address the Long-Term IssueThe Municipal Counselor’s Office will endeavor to contact clients on a monthly basis or more often, as necessary, in addition to the regular attorney-client communications on a routine basis.
Strategic Result(s) to measure annual progress on Long-Term IssueThe City and its Public Trusts will benefit from regular communication with Legal staff and from a workforce trained in areas of the law relevant to their work as evidenced by:
At least 97% of Department Heads will be provided monthly communications to help identify legal issues relating to their work, annually through 2019
100% 100%100%641 100%% of Department Heads receiving monthly communications from the Municipal Counselor's Office
100%
FY21 Budget Performance Data G-70
Table of Contents

Municipal Counselor's OfficeFY21 TargetFY20 ProjectionFY19 Actual FY20 TargetFY18 Actual
Long-Term Issue - Faster Responses to Legal IssuesThe growing demand for faster responses to complex legal issues involving new and amended laws, City economic development projects, new City programs, bond issues, open records requests and increasing litigation and labor union activity combined with limited resources, training and technology, if not adequately addressed, will result in:
Delays in client projects and policy implementation
Lack of direction and clarity for the client
Duplication of efforts by legal staff causing delays on other client projects
Increased liability exposure
Diminished client satisfaction
Strategies to address the Long-Term IssueA client survey is distributed each year for eight of the eleven programs in the Municipal Counselor’s Office.
Strategic Result(s) to measure annual progress on Long-Term IssueThe City, its Public Trusts and their officers, appointees and employees will benefit from timely and effective legal service, as evidenced by:
At least 90% of responding clients surveyed will be satisfied with the timeliness, effectiveness, and overall provision of legal services, annually through 2019
90% 90%98%642 99%% of responding clients surveyed satisfied with the timeliness, effectiveness and overall provision of legal services
99%
Administrative - Executive Leadership100% 100%100%643 100%% of Department Heads receiving monthly communications
from the Municipal Counselor's Office
100%
75% 75%82%644 80%% of key measures and strategic results achieved 80%
98% 102%98%645 99%% of full-time equivalent employees without an on the job injury (OJI) in the current fiscal year
99%
95% 95%98%646 91%% of performance evaluations completed by the review date 97%
90% 90%98%647 99%% of responding clients surveyed satisfied with the timeliness, effectiveness and overall provision of legal services
99%
95% 95%100%648 100%% of terminations submitted to the Personnel Department within 3 days of the termination date
100%
56 5455649 54# of full-time employees supported 52
7,430,445 7,101,2586,679,822650 7,137,248Dollar amount of operating expenditures managed 6,286,140
FY21 Budget Performance Data G-71
Table of Contents

Municipal Counselor's OfficeFY21 TargetFY20 ProjectionFY19 Actual FY20 TargetFY18 Actual
Civil Litigation - Civil Litigation Legal Services90% 90%98%651 100%% of responding clients satisfied with the timeliness,
effectiveness and overall provision of Civil Litigation legal services
100%
38,000 38,000N/A652 N/A# of legal services provided by Civil Litigation attorneys N/A
29.54 29.54N/A653 N/A$ expenditure per Civil Litigation legal service provided N/A
Criminal Justice - Police and Courts Legal Services90% 90%95%654 97%% of responding clients satisfied with the timeliness,
effectiveness and overall provision of Police and Courts legal services
351%
8,500 12,00014,572655 10,922# of Police and Courts legal services provided 10,069
8,500 12,00014,572656 10,922# of Police and Court legal services requested 10,069
4.95 3.510.00657 0.27$ expenditure per Police and Courts legal service provided 4.07
Criminal Justice - Prosecution Legal Services99% 99%98%658 99%% of Municipal Court Jury Division charges filed or declined
within 45 days of bond posting
99%
0 0137,701659 135,741# of cases not tried resolved by guilty or no contest plea 136,110
0 0297660 344# of cases tried that result in guilty verdict 306
0 0163,253661 156,671# of charges filed N/A
0 0171,717662 171,686# of charges reviewed N/A
1,400.00 1,400.001,018.44663 1,079.00# of hours in court for docket appearances 1,375.00
154,691 0167,647664 164,985# of prosecutions resolved 169,773
0 0167,315665 164,631# of cases resolved without trial N/A
0 0334666 377# of cases tried N/A
0 0171,717667 171,686# of charges presented for review N/A
11.62 11.6210.64668 10.55$ expenditure per prosecution resolved 9.86
FY21 Budget Performance Data G-72
Table of Contents

Municipal Counselor's OfficeFY21 TargetFY20 ProjectionFY19 Actual FY20 TargetFY18 Actual
Labor and Employment Law - Labor Litigation Legal Services90% 90%100%669 99%% of responding clients satisfied with the timeliness,
effectiveness and overall provision of Labor Litigation legal services
99%
12,800 12,80010,817670 11,882# of Labor Litigation legal services provided 15,008
12,800 12,800N/A671 11,882# of Labor Litigation legal services requested 15,004
17.88 17.8820.20672 19.46$ expenditure per Labor Litigation legal service provided 14.55
Labor and Employment Law - Labor Relations Legal Services90% 90%100%673 99%% of responding clients satisfied with the timeliness,
effectiveness and overall provision of Labor Relations legal services
99%
12,800 12,80018,903674 17,636# of Labor Relations legal services provided 12,283
12,800 12,80017,211675 17,327# of Labor Relations legal services requested 11,785
21.65 21.6513.61676 15.79$ expenditure per Labor Relations legal service provided 21.65
Land Use and Economic Development - Economic Development Legal Services Program90% 90%95%677 98%% of responding clients satisfied with the timeliness,
effectiveness and overall provision of Economic Development legal services
98%
11,000 11,00024,092678 14,793# of Economic Development legal services provided 14,501
11,000 11,00024,144679 14,863# of Economic Development legal services requested 14,564
37.12 37.1219.94680 28.42$ expenditure per Economic Development legal service provided 24.83
Land Use and Economic Development - Land Use Legal Services90% 90%717%681 100%% of responding clients satisfied with the timeliness,
effectiveness and overall provision of Land Use legal services
100%
23,620 23,62022,926682 24,242# of Land Use legal services provided 23,812
23,620 23,62022,926683 23,827# of Land Use legal services requested 23,757
22.41 22.4123.52684 20.88$ expenditure per Land Use legal service provided 20.74
FY21 Budget Performance Data G-73
Table of Contents

Municipal Counselor's OfficeFY21 TargetFY20 ProjectionFY19 Actual FY20 TargetFY18 Actual
Trusts, Utilities and Finance - Trusts, Utilities and Finance Legal Services90% 90%100%685 99%% of responding clients satisfied with the timeliness,
effectiveness and overall provision of Trusts, Utilities and Finance legal services
99%
33,431 33,43133,577686 34,126# of Trust, Utilities and Finance legal services provided 33,968
33,431 33,43133,577687 34,126# of Trusts, Utilities and Finance legal services requested 33,968
14.32 14.3212.45688 13.86$ expenditure per Trusts, Utilities and Finance legal service provided
14.36
FY21 Budget Performance Data G-74
Table of Contents

Municipal CourtFY21 TargetFY20 ProjectionFY19 Actual FY20 TargetFY18 Actual
Long-Term Issue - Skilled WorkforceThe increasing difficulty to recruit, develop and retain an adequately compensated, skilled and well trained workforce due to reduction in workforce, technology changes and staff changes, if not adequately addressed, will result in:
Delays in court transactions
Dissatisfied court patrons
Increased liability
Strategies to address the Long-Term IssueContinue to work with the Personnel Department regarding employee recruitment.
Develop a comprehensive court focused training program.
Implement a succession plan
Strategic Result(s) to measure annual progress on Long-Term IssueAnnually, 95% of court cases audited will reflect that the Court records were updated accurately.
100% 100%97%689 99%% of court cases audited that reflect the Municipal Courts records management system was updated accurately
99%
Strategic Result(s) to measure annual progress on Long-Term IssueAnnually, 95% of court patrons will be satisfied with their court experience.
95% 95%84%690 84%% court patrons satisfied with their experience 80%
FY21 Budget Performance Data G-75
Table of Contents

Municipal CourtFY21 TargetFY20 ProjectionFY19 Actual FY20 TargetFY18 Actual
Long-Term Issue - Technology ServicesThe increase in court patron expectations for court information and electronic services, combined with the reliance on automated systems, if not adequately addressed, will result in:
Lost opportunities for increased efficiency
Decreased levels of customer satisfaction with court services
Disruption in court services and processes
Strategies to address the Long-Term IssueContinue improving information systems to enable the Municipal Court to expand the services that it provides to court patrons.
Continue working with the Information Technology Department and vendors to increase the number of electronic transactions.
Identify new software or technology solution to implement electronic filing.
Strategic Result(s) to measure annual progress on Long-Term IssueBy 2023, 50% of designated court functions will be available electronically.
56% 67%36%691 36%% of court functions available online 29%
Long-Term Issue - Juvenile Service ResourcesThe increasing complexity of juvenile cases combined with limited resources for juveniles, if not adequately addressed, will result in:
Increase in juvenile crime rates
Increase in school drop-out rates
Increase in controlled dangerous substance use among juveniles
Increase in probation workloads
Strategies to address the Long-Term IssueContinue to identify juvenile referral sources.
Explore additional funding resources for mental health and substance abuse treatment.
Strategic Result(s) to measure annual progress on Long-Term IssueBy 2020, 95% of the juvenile offenders referred to probation services will successfully complete probation within established period of time.
94% 91%96%692 96%% of juvenile offenders successfully completing probation within established period of time
94%
FY21 Budget Performance Data G-76
Table of Contents

Municipal CourtFY21 TargetFY20 ProjectionFY19 Actual FY20 TargetFY18 Actual
Long-Term Issue - Court Safety and SecurityThere is a heightened public expectation for secured court facilities, if not adequately addressed, will result in:
Diminished court visitors' perception of courts as a safe place to conduct business
Increased fear for personal safety
Increased risk of incidents resulting in personal injury to court visitors or employees
Strategies to address the Long-Term IssueContinue monitoring and assessing the security needs of the Municipal Court to ensure the safety of court visitors and employees.
Monitor court facility security issues to identify necessary security improvements.
Implement a Safety and Security committee.
Strategic Result(s) to measure annual progress on Long-Term IssueAnnually, 100% of days per year the court facility will be maintained without security incident.
100% 100%100%693 100%% of days per year the court facility will be maintained without security incident
100%
Strategic Result(s) to measure annual progress on Long-Term IssueAnnually, 85% of visitors will report feeling safe while conducting business at Municipal Court.
N/A 95%N/A694 N/A% of visitors will report feeling safe while conducting business at Municipal Court *
N/A
Administrative - Executive Leadership56% 67%36%695 36%% of court functions available online 29%
75% 75%82%696 73%% of key measures and strategic results achieved 73%
99% 114%98%697 98%% of full-time equivalent employees without an on the job injury (OJI) in the current fiscal year
100%
95% 95%31%698 33%% of performance evaluations completed by the review date 36%
95% 95%100%699 100%% of terminations submitted to the Personnel Department within three days of the termination date
71%
67 5865700 65# of full-time employees supported 63
8,861,785 8,029,5346,821,374701 7,206,402Dollar amount of operating expenditures managed 9,668,485
FY21 Budget Performance Data G-77
Table of Contents

Municipal CourtFY21 TargetFY20 ProjectionFY19 Actual FY20 TargetFY18 Actual
Administrative - Community OutreachN/A N/A76%702 N/A% of Municipal Court cases referred to community outreach
program that are disposed *
N/A
N/A N/A13,284703 N/A# of cases processed for jail release * N/A
24 2433704 26# of community outreach events conducted 32
3,000 3,0002,788705 N/A# of cases referred to the community outreach program * N/A
Court Case and Enforcement - Court Case Support100% 100%99%706 99%% of court cases audited that reflect the Municipal Courts
records management system was updated accurately
99%
95% 95%84%707 84%% court patrons satisfied with their experience 80%
190,000 189,700180,481708 176,724# of cases disposed 181,535
180 220531709 298# of days until disposal on average 248
130,000 135,400145,350710 134,145# of cases filed 137,796
Court Case and Enforcement - Court Enforcement and Investigations75% 75%93%711 86%% of total warrants cleared 82%
37,500 37,50041,177712 39,665# of total warrants cleared 41,369
10,000 2,0001,549713 2,605# of warrants cleared by Enforcement Services 4,787
50,000 50,00044,430714 46,153# of warrants issued 50,701
Court Case and Enforcement - Court Financial Processing100% 100%100%715 100%% of payments processed and posted to proper case 100%
63% 66%66%716 64%% of court payment transactions processed electronically 61%
85,000 85,00084,118717 83,842# of court payment transactions processed - Electronically 83,843
50,000 44,00043,875718 46,898# of court payment transactions processed - In Person 54,002
Facility Operations - Courthouse Security38.31 38.3132.34719 32.66$ expenditure per security hour provided 30.46
FY21 Budget Performance Data G-78
Table of Contents

Municipal CourtFY21 TargetFY20 ProjectionFY19 Actual FY20 TargetFY18 Actual
Facility Operations - Municipal Court Facility Operations100% 100%100%720 100%% of days per year the court facility will be maintained without
security incident
100%
355.00 355.00354.91721 355.00# of days without a security incident 355.00
355 355355722 355# of days court facility is open 355
Municipal Judicial Services - Municipal Judicial Services95% 95%94%723 94%% of court participants (defense attorneys, enforcement
personnel, and jurors) satisfied with judicial services
98%
110,000 100,65079,585724 90,428# of hearings provided 105,596
5.24 5.737.05725 5.77$ expense per hearing provided 4.92
Probation Services - Probation Services95% 95%114%726 97%% of adult offenders completing probation without further
involvement with the OKC Municipal Court within a two-year period
94%
87% 90%88%727 89%% of adult offenders successfully completing supervised probation within established period of time
87%
94% 91%97%728 96%% of juvenile offenders successfully completing probation within established period of time
94%
550 540425729 488# of adult offenders successfully completing supervised probation within a specified time frame
671
750 617569730 739# of juvenile offenders successfully completing probation within a specified time frame
849
FY21 Budget Performance Data G-79
Table of Contents

Parks and RecreationFY21 TargetFY20 ProjectionFY19 Actual FY20 TargetFY18 Actual
Long-Term Issue - Leisure TrendsSignificant changes in demographics and community growth patterns combined with increased leisure alternatives and changes in recreational preferences will continue to cause requests for new and different facilities, programs and attractions.
Strategies to address the Long-Term IssueThe department will identify new and different facilities and programs desired by citizens through user surveys, citizen surveys and public comment at meetings and forums. The department will also consult with industry experts and parks and recreation departments in peer cities regarding trends in parks and recreation facilities and programs.
Strategic Result(s) to measure annual progress on Long-Term IssueBy 2020, Parks and Recreation Department will develop new facilities and programs and adapt existing resources as evidenced by:
70% or more of citizens reporting they are satisfied with the quality of parks and recreation programs and facilities
80% or more of citizens reporting they are satisfied with their Civic Center Music Hall experience.
65% 65%62%731 61%% of citizens satisfied with Parks and Recreation Department ¹ 58%
70% 70%73%732 69%% of citizens reporting they are satisfied with their Civic Center Music Hall experience
66%
(footnote: Target represents 12% increase over 2017 survey results.)[1]
Long-Term Issue - Public ExpectationsIncreasing public expectations for quality and diverse programs without a corresponding reallocation or increase of resources will result in a decrease in community participation and support.
Strategies to address the Long-Term IssueThe department will provide quality and diversified programming to meet changing public expectations by continuously examining existing programs to determine if any should be eliminated or modified due to lack of participation, and by focusing departmental resources on improving the quality of programs which are shown to have potential for high participation and/or public benefit.
Strategic Result(s) to measure annual progress on Long-Term IssueBy 2020, Parks and Recreation Department will maximize the overall use of parks and participation in park programs as evidenced by:
85% or more of citizens reporting they have visited an OKC park or participated in an OKC park program.
Attendance at Civic Center events will exceed 750,000 people annually.
80% 80%73%733 76%% of citizens visiting a park and/or participating in a park program ¹
78%
1,216,893 1,216,893N/A734 N/A# of people attending Civic Center events annually N/A
FY21 Budget Performance Data G-80
Table of Contents

Parks and RecreationFY21 TargetFY20 ProjectionFY19 Actual FY20 TargetFY18 Actual
Long-Term Issue - Public Expectations(footnote: Target represents 8% increase over 2017 survey results.)[1]
Long-Term Issue - Capital Improvement MaintenanceThe addition of new or upgraded parks, facilities, streetscapes and beautification projects without a corresponding reallocation or increase of resources will result in reduced citizen confidence in the City to successfully implement and maintain such capital improvements.
Strategies to address the Long-Term IssueThe department will increase maintenance efficiency through effective use of resources such as:
Review plans and request adequate funding for future capital projects to ensure sustainable maintenance plans; and
Partner with neighborhood groups, businesses, and volunteer groups such as OKC Beautiful to provide litter pick up, maintenance and beautification projects : and
Partner with Civic foundations, school districts, universities, and businesses to leverage their expertise, skills, and resources to improve our parkland, facilities, and programs.
Strategic Result(s) to measure annual progress on Long-Term IssueBy 2020, Citizens observing parkland and public spaces will experience an attractive leisure environment as evidenced by increasing satisfaction with maintenance of:
Parks and facilities to 80%
Walking and Biking Trails to 60%
Streetscapes to 60%
75% 75%71%735 67%% of residents surveyed who are satisfied with the maintenance of city parks
67%
60% 65%61%736 60%% of respondents from the residents' survey who are satisfied with city multi-purpose trails
56%
60% 60%42%737 42%% of residents satisfied with the condition of landscaping in medians and City street right-of-ways
48%
FY21 Budget Performance Data G-81
Table of Contents
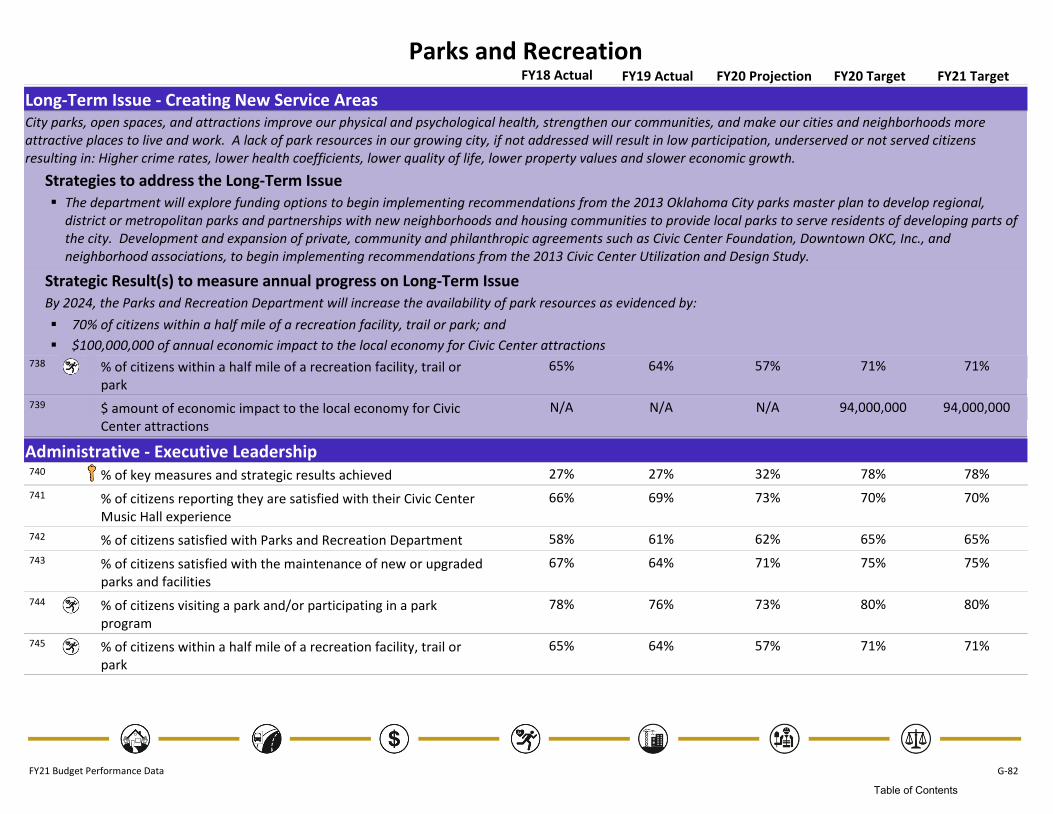
Parks and RecreationFY21 TargetFY20 ProjectionFY19 Actual FY20 TargetFY18 Actual
Long-Term Issue - Creating New Service AreasCity parks, open spaces, and attractions improve our physical and psychological health, strengthen our communities, and make our cities and neighborhoods more attractive places to live and work. A lack of park resources in our growing city, if not addressed will result in low participation, underserved or not served citizens resulting in: Higher crime rates, lower health coefficients, lower quality of life, lower property values and slower economic growth.
Strategies to address the Long-Term IssueThe department will explore funding options to begin implementing recommendations from the 2013 Oklahoma City parks master plan to develop regional, district or metropolitan parks and partnerships with new neighborhoods and housing communities to provide local parks to serve residents of developing parts of the city. Development and expansion of private, community and philanthropic agreements such as Civic Center Foundation, Downtown OKC, Inc., and neighborhood associations, to begin implementing recommendations from the 2013 Civic Center Utilization and Design Study.
Strategic Result(s) to measure annual progress on Long-Term IssueBy 2024, the Parks and Recreation Department will increase the availability of park resources as evidenced by:
70% of citizens within a half mile of a recreation facility, trail or park; and
$100,000,000 of annual economic impact to the local economy for Civic Center attractions
71% 71%57%738 64%% of citizens within a half mile of a recreation facility, trail or park
65%
94,000,000 94,000,000N/A739 N/A$ amount of economic impact to the local economy for Civic Center attractions
N/A
Administrative - Executive Leadership78% 78%32%740 27%% of key measures and strategic results achieved 27%
70% 70%73%741 69%% of citizens reporting they are satisfied with their Civic Center Music Hall experience
66%
65% 65%62%742 61%% of citizens satisfied with Parks and Recreation Department 58%
75% 75%71%743 64%% of citizens satisfied with the maintenance of new or upgraded parks and facilities
67%
80% 80%73%744 76%% of citizens visiting a park and/or participating in a park program
78%
71% 71%57%745 64%% of citizens within a half mile of a recreation facility, trail or park
65%
FY21 Budget Performance Data G-82
Table of Contents

Parks and RecreationFY21 TargetFY20 ProjectionFY19 Actual FY20 TargetFY18 Actual
Administrative - Executive Leadership84% 90%88%746 91%% of full-time equivalent (FTE) employees without an on the job
injury (OJI) in the current fiscal year
94%
95% 95%84%747 70%% of performance evaluations completed by the review date 75%
95% 95%25%748 67%% of terminations submitted to the Personnel Department within 3 days of the termination date
72%
178 165144749 149# of full-time employees supported 151
28,928,073 27,805,94118,188,693750 17,279,754Dollar amount of operating expenditures managed 20,820,016
Civic Center Music Hall - Box Office94% 94%N/A751 N/A% of customers surveyed who are satisfied with box office
services
N/A
140% 140%N/A752 N/A% of box office expenses supported by box office revenues N/A
N/A N/AN/A753 N/A% of seats sold at all venues N/A
34% 34%N/A754 N/A% of tickets sold by the web N/A
N/A N/A26,709755 26,709# of available seats (capacity) 26,709
13,670 13,670N/A756 N/A# of calls answered N/A
305,182 305,182N/A757 N/A# of tickets sold by all points of sale N/A
2.48 2.48N/A758 N/A$ expenditure per ticket sold N/A
Civic Center Music Hall - Performance Support208% 208%N/A759 N/A% of performance expenses supported by performance revenues N/A
75% 75%N/A760 N/AUtilization rate of performance facilities N/A
390,715 390,715N/A761 N/A# of guests attending performances N/A
1,175 1,175N/A762 N/A# of Performance event days rented N/A
34,000.00 34,000.00N/A763 N/A# of volunteer hours N/A
94,000,000 94,000,000N/A764 N/A$ amount of economic impact to the local economy for Civic Center attractions
N/A
1,832 1,832N/A765 N/A# of Performance Event days requested N/A
FY21 Budget Performance Data G-83
Table of Contents

Parks and RecreationFY21 TargetFY20 ProjectionFY19 Actual FY20 TargetFY18 Actual
Civic Center Music Hall - Performance Support723.40 723.40N/A766 N/A$ expenditure per Performance support event day rented N/A
Civic Center Music Hall - Private Event and Business Services94% 94%N/A767 N/A% of customers surveyed who are satisfied with facilities and
services
N/A
1,216,893 1,216,893N/A768 N/A# of people attending Civic Center events annually N/A
120% 120%N/A769 N/A% of private event expenses supported by private event revenues
N/A
26% 26%N/A770 N/AUtilization rate of Private Event and Business Services facilities N/A
826,178 826,178N/A771 N/A# of guests attending Private Events N/A
352 352N/A772 N/A# of Private event weekend days rented (Friday, Saturday, Sunday)
N/A
452 452N/A773 N/A# of total private event days rented N/A
304,000.00 304,000.00N/A774 N/APrivate Event Revenue N/A
1,808 1,808N/A775 N/A# of Private Event days requested N/A
1,408 1,408N/A776 N/A# of Private Event weekend days requested (Friday, Saturday, Sunday)
N/A
Grounds Management - Forestry Services2 20777 0% increase in estimated economic impact N/A
250 225407778 216# of tree maintenance work orders completed 213
26,193 32,15038,114779 38,114$ Economic impact of new tree planting N/A
1,680 1,6801,866780 1,866$ Environmental impact of new tree planting N/A
Grounds Management - Grounds Maintenance100% 22%N/A781 94%% of parks mowed within two weeks 77%
75% 75%71%782 67%% of residents surveyed who are satisfied with the maintenance of city parks
67%
98% 98%N/A783 98%% of equipment in service 98%
FY21 Budget Performance Data G-84
Table of Contents

Parks and RecreationFY21 TargetFY20 ProjectionFY19 Actual FY20 TargetFY18 Actual
Grounds Management - Grounds Maintenance950 950160784 661# of equipment repairs completed 805
N/A N/AN/A785 N/A# of Park or amenity rentals supported * N/A
36,785.00 27,497.4341,436.25786 38,867.45# of public ground acres mowed 28,047.81
N/A N/AN/A787 N/A% of equipment repairs completed within 5 business days once parts received *
N/A
75 100154788 209# of requests received for mowing 81
Grounds Management - Hazard Abatement100% 100%97%789 99%% of identified traffic hazards abated within 3 working days 100%
200 200128790 121# identified traffic hazards abated 93
375 375511791 296# of potential traffic hazard inspections requested 379
Grounds Management - Parks Athletic Fields & Amenities85% 85%N/A792 N/A% of athletic fields meeting competition standards * N/A
60% 65%61%793 60%% of respondents from the residents' survey who are satisfied with city multi-purpose trails
56%
2,865.00 2,865.002,912.40794 2,922.00# of playground inspections 2,642.00
1,382.00 1,382.001,836.32795 1,827.30# of trail miles inspected and maintained 1,155.30
85 85N/A796 N/A# of athletic fields maintained to competition standards * N/A
Grounds Management - Special Events85% 85%91%797 97%% of park event participants surveyed who are satisfied with
their permitted event's facilities and services
91%
200 300224798 N/A# of permits issued 220
450 500311799 N/A# of permits requested 371
Natural Resources - Canal/Field Horticulture50 50N/A800 N/A% of residents satisfied with the condition of the Bricktown
Canal and landscaping
N/A
800 800632801 1,001# of new trees planted 625
FY21 Budget Performance Data G-85
Table of Contents

Parks and RecreationFY21 TargetFY20 ProjectionFY19 Actual FY20 TargetFY18 Actual
Natural Resources - Canal/Field Horticulture685,923 428,793700,000802 700,000# of square feet of landscaped areas maintained 685,823
Natural Resources - Fisheries Management100% 100%98%803 100%% of fishing class participants surveyed who are satisfied 100%
100% 100%100%804 100%% of sampled fishing waters with fair or better fishing based on established Oklahoma Department of Wildlife Conservation standards
67%
500,000 500,000393,771805 410,993# of fish stocked 551,100
1,100 1,1001,028806 809# of fishing education program attendees 1,193
7,530 7,53022,590807 7,530# of surface acres of fishing waters managed 7,530
20 2016808 15# of fishing education programs scheduled 20
0.43 0.430.59809 0.46$ expenditure per fish stocked 0.34
Natural Resources - Martin Nature Park100% 100%100%810 98%% of customers surveyed who are satisifed with the nature park,
trail access, and educational opportunities
73%
8,000 8,0002,134811 2,624# of Martin Nature Park nature programs participants 6,063
575,000 160,000150,714812 88,502# of nature park visitors 105,471
325 325102813 N/A# of nature programs conducted 201
250 250200814 228# of nature programs requested 248
Natural Resources - Myriad Botanical Gardens Support4,125,556.00 4,125,556.00N/A815 N/A$ of Myriad Garden Expenses 3,993,162.00
Natural Resources - Will Rogers Gardens100% 100%N/A816 N/A% of Will Rogers Gardens rental survey respondents who are
satisfied with their rental experience
N/A
100% 100%100%817 100%% of Will Rogers Gardens' class program participants surveyed who were satisfied with their education programs
100%
1,500 1,5002,200818 3,079# of Will Rogers Gardens' program participants 1,243
FY21 Budget Performance Data G-86
Table of Contents

Parks and RecreationFY21 TargetFY20 ProjectionFY19 Actual FY20 TargetFY18 Actual
Public - Private Partnership - Community PartnershipN/A N/AN/A819 N/A% increase in the value of partneships * N/A
90,000% 100,000%N/A820 N/A% of increase in the value of volunteer hours * N/A
N/A N/AN/A821 N/Aincrease in the value of partnerships * N/A
90,000 100,000N/A822 N/A# of annul volunteer hours * N/A
85 85N/A823 N/A# of partnerships * N/A
4,300,000 4,400,000N/A824 N/A$ of volunteer value * N/A
N/A N/AN/A825 N/A$ value of donations * N/A
Public - Private Partnership - Trust and Foundation SupportN/A N/AN/A826 N/A% of Civic Center Music Hall preventative maintenance reports
received on time *
N/A
N/A N/AN/A827 N/A% of golf participants satisfied with the quality and condition of municipal golf courses *
N/A
94% 94%N/A828 N/A% of guests satisfied with the quality and maintenance of the Civic Center's performance facilities.
N/A
N/A N/AN/A829 N/A% of Myriad Gardens preventative maintenance reports received on time *
N/A
N/A N/AN/A830 N/A% of Riversport guests satisfied with the quality and maintenance of the Riversport facilties and services *
N/A
N/A N/AN/A831 N/A% of Scissortail Park guests satisfied with the quality of maintenance of park facilities and services *
N/A
N/A N/AN/A832 N/A% of Scissortail Park preventative maintenance reports received on time *
N/A
N/A N/AN/A833 N/A% of Myriad Botanical Gardens guests satisfied with the quality of maintenance of garden facilities and services *
N/A
N/A N/AN/A834 N/A% of Riversport Park preventative maintenance reports received on time *
N/A
FY21 Budget Performance Data G-87
Table of Contents

Parks and RecreationFY21 TargetFY20 ProjectionFY19 Actual FY20 TargetFY18 Actual
Public - Private Partnership - Trust and Foundation SupportN/A N/AN/A835 N/A# of Civic Center Music Hall preventative maintenance reports
received on time *
N/A
N/A N/AN/A836 N/A# of Civic Center Music Hall preventative maintenance reports received total *
N/A
N/A N/AN/A837 N/A# of golf participants at the municipal golf course total * N/A
N/A N/AN/A838 N/A# of golf participants satisfied with the quality and condition of municipal golf courses *
N/A
N/A N/AN/A839 N/A# of Myriad Gardens preventative maintenance reports received on time *
N/A
N/A N/AN/A840 N/A# of Myriad Gardens preventative maintenance reports received total *
N/A
N/A N/AN/A841 N/A# of Riversport guests satisfied with the quality and maintenance of the Riversport facilties and services *
N/A
N/A N/AN/A842 N/A# of Riversport Park preventative maintenance reports received on time *
N/A
N/A N/AN/A843 N/A# of Scissortail Park guests satisfied with the quality of maintenance of park facilities and services *
N/A
N/A N/AN/A844 N/A# of Scissortail Park preventative maintenance reports received on time *
N/A
N/A N/AN/A845 N/A# of Scissortail Park preventative maintenance reports received total *
N/A
N/A N/AN/A846 N/A# of guests attending private Civic Center Music Hall events. * N/A
N/A N/AN/A847 N/A# of guests visiting Scissortail Park guests in total * N/A
N/A N/AN/A848 N/A# of participants and municipal golf courses * N/A
N/A N/AN/A849 N/A# of participants at Riversport * N/A
N/A N/AN/A850 N/A# of Riversport Park preventative maintenance reports received total *
N/A
FY21 Budget Performance Data G-88
Table of Contents
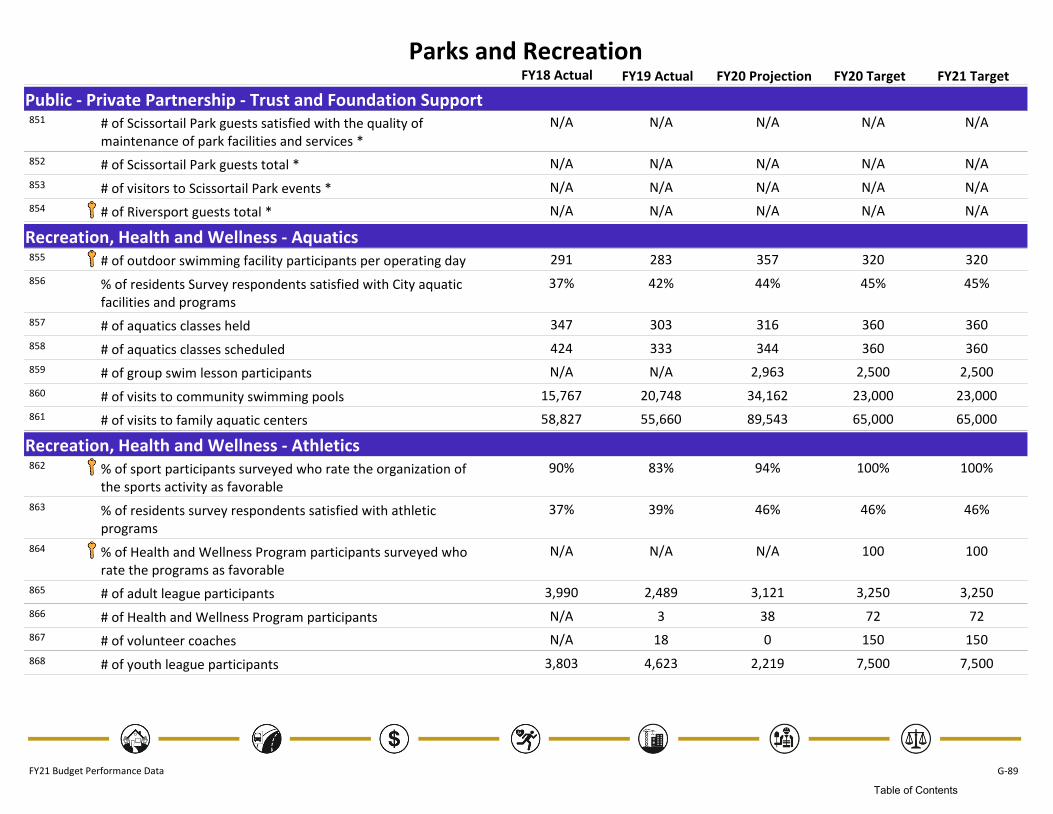
Parks and RecreationFY21 TargetFY20 ProjectionFY19 Actual FY20 TargetFY18 Actual
Public - Private Partnership - Trust and Foundation SupportN/A N/AN/A851 N/A# of Scissortail Park guests satisfied with the quality of
maintenance of park facilities and services *
N/A
N/A N/AN/A852 N/A# of Scissortail Park guests total * N/A
N/A N/AN/A853 N/A# of visitors to Scissortail Park events * N/A
N/A N/AN/A854 N/A# of Riversport guests total * N/A
Recreation, Health and Wellness - Aquatics320 320357855 283# of outdoor swimming facility participants per operating day 291
45% 45%44%856 42%% of residents Survey respondents satisfied with City aquatic facilities and programs
37%
360 360316857 303# of aquatics classes held 347
360 360344858 333# of aquatics classes scheduled 424
2,500 2,5002,963859 N/A# of group swim lesson participants N/A
23,000 23,00034,162860 20,748# of visits to community swimming pools 15,767
65,000 65,00089,543861 55,660# of visits to family aquatic centers 58,827
Recreation, Health and Wellness - Athletics100% 100%94%862 83%% of sport participants surveyed who rate the organization of
the sports activity as favorable
90%
46% 46%46%863 39%% of residents survey respondents satisfied with athletic programs
37%
100 100N/A864 N/A% of Health and Wellness Program participants surveyed who rate the programs as favorable
N/A
3,250 3,2503,121865 2,489# of adult league participants 3,990
72 7238866 3# of Health and Wellness Program participants N/A
150 1500867 18# of volunteer coaches N/A
7,500 7,5002,219868 4,623# of youth league participants 3,803
FY21 Budget Performance Data G-89
Table of Contents

Parks and RecreationFY21 TargetFY20 ProjectionFY19 Actual FY20 TargetFY18 Actual
Recreation, Health and Wellness - General Recreation373.47 373.47284.54869 218.38# of Recreation Center participants per operating day 362.67
138 13880870 122# of senior center participants per operating day 132
50% 50%49%871 47%% of resident Survey respondents that are satisfied with City recreation centers
41%
88% 88%63%872 85%% of scheduled classes held 81%
96% 96%100%873 99%% of senior participants surveyed who are satisfied with the overall quality of classes and events
92%
105,000 105,00038,042874 44,839# of recreation center class participants 89,333
1,300 1,300592875 719# of recreation center classes held 1,121
1,500 1,5001,232876 933# of recreation center classes scheduled 1,480
11,500 11,5008,231877 11,046# of senior class participants (class enrollment) 11,343
FY21 Budget Performance Data G-90
Table of Contents

PersonnelFY21 TargetFY20 ProjectionFY19 Actual FY20 TargetFY18 Actual
Long-Term Issue - Skilled, Diverse WorkforceThe increasing challenge to recruit, develop and retain a skilled and diverse workforce, coupled with changing job complexity and evolving job requirements, if not addressed, will result in:
A reduction in the quality and speed of City services
Increased exposure to litigation
Loss of critical operational knowledge
Increased turnover
Increased time and cost for on-the-job training
Decreased resident confidence
Decreased government efficiency
Strategies to address the Long-Term IssueDevelop and implement a comprehensive recruitment strategy to reach diverse audiences, such as: participate in career fairs; establish relationships with universities, community-based organizations, and career technology centers; and identify existing opportunities that can be leveraged for the purpose of promoting City career opportunities.
Conduct a comprehensive classification and compensation study.
Plan and conduct a systematic review of classification descriptions to ensure they accurately describe the duties, responsibilities, job requirements, physical requirements, and working conditions of the positions.
Plan and conduct a systematic review of written tests, job simulation tests, and assessments to ensure candidates’ skill sets match job requirements.
Plan and conduct a systematic review of performance evaluations to ensure alignment with classification descriptions.
Recommend departments provide new employees with copies of their job descriptions and performance evaluation forms upon first reporting to the job site and discuss the responsibilities and performance expectations, to better ensure success and retention.
Continue to meet with Department Directors to disseminate departmental workforce demographics and discuss strategies to address any issues.
Assess departmental training needs in the areas of recruitment, employment, classification, compensation, and performance evaluation, and develop and offer training (i.e., classroom training, Lunch and Learn training sessions, online informational PowerPoint presentations, etc.) based on identified needs.
Enhance career development services provided to employees (i.e., career counseling, resume creation, interview preparation, etc.).
FY21 Budget Performance Data G-91
Table of Contents

PersonnelFY21 TargetFY20 ProjectionFY19 Actual FY20 TargetFY18 Actual
Long-Term Issue - Skilled, Diverse Workforce
Strategic Result(s) to measure annual progress on Long-Term IssueBy 2025, City departments will benefit from a skilled and diverse workforce, as evidenced by:
City staff will reflect the ethnic diversity of the community in at least 71% of the seven ethnic categories for the overall available workforce.
60% of City job categories will reflect the gender/ethnic diversity of the available workforce within the community, based on current census data.
At least 80% of new full-time City employees will continue City employment for at least 12 months beyond the date of hire.
100% of job descriptions including responsibilities, duties, requirements, and working conditions necessary to perform essential job functions will be analyzed and current within three years of prior approval date.
100% of written tests, job simulation tests, and assessments will be analyzed and validated within three years of prior approval date.
57% 57%57%878 57%City staff will reflect the ethnic diversity of the community in at least 60% of the seven ethnic categories for the overall available workforce
57%
44% 44%43%879 43%% of City job categories that reflect the gender/ethnic diversity of the available workforce within the community, based on current census data
43%
74% 74%83%880 83%% of full-time non-uniformed City employees who continue City employment for at least 12 months beyond the date of hire
72%
70% 60%54%881 54%% of job descriptions developed or updated 36%
40% 40%20%882 20%% of written tests and job simulation tests developed or updated 39%
FY21 Budget Performance Data G-92
Table of Contents

PersonnelFY21 TargetFY20 ProjectionFY19 Actual FY20 TargetFY18 Actual
Long-Term Issue - Health and Welfare Benefits CostThe increasing costs of providing comprehensive health and welfare benefits, if not addressed, will result in:
Reduced funding for other city services
Reduced employee and retiree benefits
Exorbitant Premiums
Strategies to address the Long-Term IssueMaintain an on-site employee and retiree health and wellness center.
Develop an Employee Wellness Program.
Encourage plan participants diagnosed with one or more of the top 10 chronic medical conditions to participate in disease management programs.
Continue to identify and implement cost-saving health plan changes for employees and retirees.
Continue to provide educational programs and information to address overall health and wellness.
Strategic Result(s) to measure annual progress on Long-Term IssueAnnually through 2025, the percentage change in the medical premium for active employee plan members will remain at or below the City providers’ average percentage premium change for Oklahoma clients.
9.02% 9.02%5.21%883 5.21%% change in the annual medical premium costs for active employee plan members as compared to the City providers’ average medical premium change for Oklahoma clients
8.51%
Strategic Result(s) to measure annual progress on Long-Term IssueBy 2025, 50% of eligible participants will be utilizing the medical center as reported by the employee medical center provider.
25% 25%23%884 22%% eligible participants utilizing the medical center as reported by the employee medical center provider.
19%
FY21 Budget Performance Data G-93
Table of Contents

PersonnelFY21 TargetFY20 ProjectionFY19 Actual FY20 TargetFY18 Actual
Long-Term Issue - Occupational Health IssueAn increased demand for occupational health services combined with state and federal regulatory requirements and evolving job functions, if not addressed, will result in:
Delays in conducting post job-offer medical evaluations
Delays in conducting department-directed and/or regulatory medical exams
Increased risk to employee health and safety
Decreased customer satisfaction
Strategies to address the Long-Term IssueWork in coordination with OCFD and Labor Relations to enforce the NFPA standards by making the exam mandatory for uniformed employees.
Periodically contact all City departments to determine if any new medical or regulatory needs have been identified.
Work with Risk Management to address any medical-related safety issues identified.
Coordinate with Classification and Compensation program staff to update physical requirements into applicable job descriptions.
Actively search for a City owned property that has appropriately sized operating space for an Occupational Health Clinic.
Strategic Result(s) to measure annual progress on Long-Term IssueBy 2022, City departments will benefit from a safer and healthier workforce, as evidenced by:
100% of the Fire Department’s uniformed workforce will be medically evaluated annually according to the NFPA standards.
100% of occupational health and regulatory medical needs identified annually by City Departments will result in scheduled evaluations.
100% of City Departments will report that the quality and timeliness of services provided by the Occupational Health Clinic are satisfactory.
85% 85%78%885 78%% of the Fire Department's uniformed workforce will be medically evaluated annually according to NFPA standards
83%
100% 100%N/A886 N/A% of occupational health and regulatory medical needs identified annually by City Departments that result in scheduled evaluations
100%
100% 100%91%887 91%% of City Departments satisfied with the quality and timeliness of services provided by the Occupational Health Clinic
96%
Administrative - Executive Leadership75% 75%26%888 45%% of key measures and strategic results achieved 58%
86% 86%97%889 96%% of full-time equivalent employees without an on the job injury (OJI) in the current fiscal year
100%
FY21 Budget Performance Data G-94
Table of Contents

PersonnelFY21 TargetFY20 ProjectionFY19 Actual FY20 TargetFY18 Actual
Administrative - Executive Leadership95% 95%100%890 100%% of performance evaluations completed by the review date 100%
95% 95%100%891 100%% of terminations submitted to the Personnel Department within 3 days of the termination date
100%
29 2925892 25# of full-time employees supported 24
3,711,168 3,614,8093,187,609893 3,415,581Dollar amount of operating expenditures managed 2,882,004
Benefits - Employee Medical Clinic25% 25%23%894 22%% eligible participants utilizing the medical center as reported by
the employee medical center provider.
19%
3,000 3,0002,750895 2,653# of eligible participants utilizing the medical center 2,242
12,000 12,00011,927896 11,875# of eligible participants 11,704
455.07 455.07N/A897 N/A$ program expenditure per eligible participant enrolled utilizing the medical center
N/A
Benefits - Health and Welfare Benefits9.02% 9.02%5.21%898 5.21%% change in the annual medical premium costs for active
employee plan members as compared to the City providers’ average medical premium change for Oklahoma clients
8.51%
3,317 3,3173,467899 3,389# of City and Trust participants enrolled in a medical insurance plan
3,340
3,960 3,9604,155900 3,153# of consultations provided 10,500
3,756 3,756N/A901 3,664# of City and Trust participant eligible for medical insurance 3,619
138.95 138.95134.53902 121.74$ program expenditure per enrolled plan member N/A
Benefits - Retirement Savings64% 64%59%903 64%% of eligible employees participating in the 457 Deferred
Compensation Plan
64%
8 811904 10# of savings plan/investment education sessions provided 7
2,973 2,9733,053905 2,953# of employees participating in the 457 Deferred Compenation Plan
2,899
FY21 Budget Performance Data G-95
Table of Contents

PersonnelFY21 TargetFY20 ProjectionFY19 Actual FY20 TargetFY18 Actual
Benefits - Retirement Savings4,644 4,6445,192906 4,638# of employees eligible to participate in the 457 Deferred
Compensation Plan
4,540
Labor and Employee Relations - Labor Relations100% 94%100%907 100%% of grievances resolved without arbitration 97%
3 31908 1# of grievances resolved with arbitration 2
50 4734909 50# of grievances resolved without arbitration 66
181 175154910 174# of predetermination meetings attended 205
55 5036911 44# of grievances filed 71
Labor and Employee Relations - Policy Compliance24% 33%43%912 23%% of all personnel-related policy violation complaints that are
substantiated
20%
52% 67%73%913 54%% of investigation reports provided within 90 days of initiating the investigation
45%
550 550420914 413# of City employees attending policy training sessions 603
21 3048915 26# of policy compliance investigation reports provided 20
30 3027916 33# of policy training sessions provided 40
3 32917 2# of other policy violation complaints received 2
15 2558918 23# of sexual harassment/discrimination complaints received 16
Occupational Health - Occupational Health100% 100%100%919 100%% of employment candidate (non-uniform) referrals who are
examined within 2 business days of the exam request date
100%
100% 100%N/A920 N/A% of occupational health and regulatory medical needs identified annually by City Departments that result in scheduled evaluations
100%
100% 100%91%921 91%% of City Departments satisfied with the quality and timeliness of services provided by the Occupational Health Clinic
96%
FY21 Budget Performance Data G-96
Table of Contents

PersonnelFY21 TargetFY20 ProjectionFY19 Actual FY20 TargetFY18 Actual
Occupational Health - Occupational Health85% 85%78%922 78%% of the Fire Department's uniformed workforce will be
medically evaluated annually according to NFPA standards
83%
2,500 2,5001,841923 2,158# of medical consultations provided 1,218
4,200 4,2004,112924 4,108# of physical examinations provided 3,510
2,500 2,5001,829925 2,158# of medical consultations requested 1,218
4,200 4,2004,112926 4,108# of physical examinations requested 3,510
Operations - Classification and Compensation100% 100%100%927 100%% of classification audits completed in 60 days or less from
receipt of completed job content questionnaires
66%
80% 80%55%928 55%% of customers surveyed that are satisfied with the quality and timeliness of classification and compensation services provided
N/A
100% 100%100%929 100%% of compensation reviews completed within 30 days or less from receipt of salary survey results
50%
74% 74%89%930 83%% of full-time non-uniformed City employees who continue City employment for at least 12 months beyond the date of hire
72%
70% 60%45%931 54%% of job descriptions developed or updated 36%
28 2955932 55# of classification audits completed 35
10 109933 9# of compensation reviews completed 8
150 15086934 104# of job descriptions developed or updated 65
28 2943935 39# of classification audits requested 31
10 107936 7# of compensation reviews requested N/A
215 249192937 192# of job descriptions identified to be developed or updated 180
Operations - Employment80% 80%64%938 64%% of customers surveyed that are satisfied with the quality and
timeliness of employment services provided
N/A
87% 85%55%939 86%% of final candidate referrals sent to hiring supervisors within 45 calendar days of the close of the vacancy announcement
N/A
FY21 Budget Performance Data G-97
Table of Contents

PersonnelFY21 TargetFY20 ProjectionFY19 Actual FY20 TargetFY18 Actual
Operations - Employment80% 82%76%940 79%% of newly hired employees (non-uniform) who remain
employed with the City past their probationary period
83%
5% 5%0%941 0%% of City Departments that reflect the gender/ethnic diversity of the available workforce within the community, based on current census data
0%
44% 44%43%942 43%% of City job categories that reflect the gender/ethnic diversity of the available workforce within the community, based on current census data
43%
80% 80%50%943 50%% of customers surveyed that are satisfied with the effectiveness of recruitment and selection processes in attracting qualified candidates
N/A
57% 57%57%944 57%City staff will reflect the ethnic diversity of the community in at least 60% of the seven ethnic categories for the overall available workforce
57%
18,500 17,00021,290945 19,018# of applications processed 15,337
135.00 114.00144.86946 143.42# of final candidate referrals N/A
500 450548947 587# of full-time, non-uniformed positions filled 492
400 344460948 442# of selection procedures conducted 378
40 4034949 34# of written tests and job simulation tests developed or updated 65
475 452549950 599# of requests received to fill full-time, non-uniformed positions 535
100 100166951 166# of written tests and job simulation tests requiring development or update
166
Operations - Human Resources Information Services80% 80%79%952 79%% of customers surveyed that are satisfied with the quality and
timeliness of personnel related information provided by Human Resources Information Systems (HRIS)
N/A
98% 98%100%953 100%% of employee termination transactions processed within 7 calendar days of receipt
N/A
FY21 Budget Performance Data G-98
Table of Contents

PersonnelFY21 TargetFY20 ProjectionFY19 Actual FY20 TargetFY18 Actual
Operations - Human Resources Information Services31,982 31,98222,039954 35,651# of non-terminated personnel transactions completed N/A
686 686675955 624# of termination transaction requests processed within 7 calendar days of receipt
642
Operations - Organization Training and Development86% 90%N/A956 N/A% of participants surveyed that are satisfied with training and
development courses
N/A
0% 100%525%957 N/A% of training and development courses provided based on needs identified by training assessments conducted
N/A
100% 100%100%958 N/A% of training needs assessments completed N/A
80 1,040323959 N/A# of participants trained N/A
0 4821960 N/A# of training and development courses offered N/A
3 44961 N/A# of training needs assessments conducted N/A
11 484962 N/A# of training and development courses requested N/A
3 44963 N/A# of training needs assessments requested N/A
FY21 Budget Performance Data G-99
Table of Contents

PlanningFY21 TargetFY20 ProjectionFY19 Actual FY20 TargetFY18 Actual
Long-Term Issue - Community DevelopmentPoverty, homelessness, lack of quality affordable housing, concerns about the quality of education, decreasing community involvement in neighborhood schools, and declining community vitality, if not adequately addressed, will result in:
Increased crime and decreased perception of public safety;
Continued decline in public health;
Reduced ability to meet demand for public services;
Decreased property values and neighborhood decline;
Reduced ability to attract economic development;
Reduced ability to improve education outcomes;
Increased cost burden for low and moderate-income households; and
Decreased satisfaction in community appearance.
Strategies to address the Long-Term IssueStabilize neighborhoods through the Strong Neighborhoods Initiative.
Strengthen at-risk neighborhoods through the use of community development and social services programs.
Strengthen relationships with partners, including the Public School Districts and the Oklahoma Department of Mental Health and Substance Abuse Services, to develop programs and strategies targeted to the specific needs of the community.
Enhance community appearance through improving design and development regulations and facilitating public art projects.
Seek additional partners and resources to increase permanent supportive housing and emergency shelters for homeless families and individuals.
Concentrate community development resources in target revitalization areas for economic development, housing activities and public facilities for low and moderate-income populations.
Strategic Result(s) to measure annual progress on Long-Term IssueAnnually, the Planning Department will address homelessness and concerns about community vitality as evidenced by:
85% of people who are homeless who remain in permanent housing for more than six months.
The percent of residents that say they are satisfied or very satisfied with the appearance of the city is above the national average, as reported by the annual Citizen Survey.
The percent of residents that say they are satisfied or very satisfied with their feeling of safety is above the national average, as reported by the annual Citizen Survey.
100% 95%93%964 93%% of people who are homeless who remain in permanent housing for more than six months
95%
FY21 Budget Performance Data G-100
Table of Contents

PlanningFY21 TargetFY20 ProjectionFY19 Actual FY20 TargetFY18 Actual
Long-Term Issue - Community Development
53% 55%56%965 N/A% of residents that say they are satisfied or very satisfied with the appearance of the city
N/A
58% 52%52%966 N/A% of residents that say they are satisfied or very satisfied with their feeling of safety
N/A
FY21 Budget Performance Data G-101
Table of Contents

PlanningFY21 TargetFY20 ProjectionFY19 Actual FY20 TargetFY18 Actual
Long-Term Issue - Urban RevitalizationIf not addressed, older districts and neighborhoods will continue to experience increased vulnerability and decline, as evidenced by:
A lack of quality, affordable central city neighborhoods driving population to outlying areas with better public education;
Higher costs to the City to provide services for residents and businesses;
The inability to generate optimal tax revenue to pay for essential City services;
Continued deterioration of aging commercial districts and neighborhoods;
Inadequate number of quality, affordable residential products;
Underutilization of existing properties and infrastructure;
A lack of transportation options; and
Lost opportunities for economic development.
Strategies to address the Long-Term IssueGuide the allocation of resources including grant funds and capital expenditures as stated in planokc.
Focus Planning Department capacity and technical assistance on revitalization areas.
Strengthen capacity of commercial districts to deliver more meaningful social, economic, and aesthetic results through the Commercial District Revitalization Program.
Strategically concentrate neighborhood revitalization efforts in the Strong Neighborhoods Initiative areas to reverse decline and leverage private investment and support.
Strategic Result(s) to measure annual progress on Long-Term IssueAnnually, the Planning Department will influence revitalization and redevelopment within the urbanized areas of the city as evidenced by:
100% of participating Commercial District Revitalization Program districts will maintain or increase total property value.
65% of citizens surveyed will be satisfied with each attribute in response to the following question: Please rate your satisfaction with the following attributes of your neighborhood: - Safety - Appearance - Property Maintenance - Sense of Community - Amenities (parks, sidewalks, street trees) - Overall Quality
100% 100%83%967 83%% of commercial properties in each Commercial District in the CDRP that have maintained or increased in market value from one year to the next according to the Oklahoma County Assessor
N/A
65% 61%62%968 57%% of citizens satisfied with neighborhood attributes 59%
FY21 Budget Performance Data G-102
Table of Contents

PlanningFY21 TargetFY20 ProjectionFY19 Actual FY20 TargetFY18 Actual
Long-Term Issue - Sustainable GrowthFailure to guide the city’s growth in a way that promotes quality of life, efficient service provision, and human, environmental, and economic health will result in:
Increased costs to provide public services;
Lower level of City services;
Diminished neighborhood stability and durability;
Exacerbation of public health issues;
Continued stress on capacity of public schools to improve educational outcomes;
Reduced functionality of the multi-modal transportation system and capacity to support it;
Reduction in quality, accessibility, and availability of natural resources (air, water, natural areas);
Increased number of vacant, abandoned and dilapidated buildings and properties;
Diminished options for access to community services and employment opportunities;
Increased infrastructure construction and maintenance costs for taxpayers;
Failure to meet federal air quality standards will impact federal funding, efficiency of transportation infrastructure projects, and the ability to support new or expanding industry;
Diminished attractiveness for economic development;
Increased economic and social disparity; and
Diminished ability to meet community demand for quality of life services and amenities.
Strategies to address the Long-Term IssueImplement Comprehensive Plan (planokc);
Develop, adopt and implement the Sustainability Plan.
Establish a full-time Urban Forester position to: develop and manage an Urban Forestry Management and Reforestation Plan; utilize grants, leverage community resources, and form public/private partnerships to assist with tree planting, care, and maintenance; and provide internal assistance in coordinating any type of emergency service that impacts trees in the event of an ice storm, tornado, wildfires, or any other natural disaster.
Develop policies, strategies, and incentives to increase the variety of housing types and affordability.
Promote inner-city development and redevelopment through the use of incentives, design review consultations and coordination with other City agencies and the development community.
Modify codes, regulations and policies to ensure consistency with the comprehensive plan (planokc).
Promote the implementation of a multi-modal transportation system.
FY21 Budget Performance Data G-103
Table of Contents

PlanningFY21 TargetFY20 ProjectionFY19 Actual FY20 TargetFY18 Actual
Long-Term Issue - Sustainable Growth
Strategic Result(s) to measure annual progress on Long-Term IssueThe Planning Department will use planokc to guide the city’s growth in a way that promotes quality of life, efficiency of service provision, and human, environmental, and economic health as evidenced by:
Annually, 20% of development/redevelopment will be in the inner-loop annually.
Annually, 100% of rezoning decisions by Council will be consistent with the Comprehensive Plan.
Increase the percentage of commute trips made by walking, bicycling, or public transportation from 2.13% to 2.16% by 2024.
18% 21%23%969 23%% of new development and redevelopment that occurs in the inner-loop
13%
100% 100%96%970 96%% of rezoning decisions by City Council that are consistent with the comprehensive plan
97%
2.14% 2.15%2.32%971 N/A% of commute trips made by walking, bicycling, or public transportation
N/A
FY21 Budget Performance Data G-104
Table of Contents

PlanningFY21 TargetFY20 ProjectionFY19 Actual FY20 TargetFY18 Actual
Long-Term Issue - Effective Collaboration and Coordination Inadequate coordination between all City departments and partner agencies in the development and implementation of the City’s projects, plans, policies and goals, if not addressed, will result in:
Inefficient use of City resources;
Inefficient and unsustainable growth;
Poor execution of City policies, plans and Council priorities; and
Increased project costs, delays and diminished citizen confidence.
Strategies to address the Long-Term IssueBuild and maintain a strong relationships with Public School Districts, Association of Central Oklahoma Governments, Local Art Agencies, City Departments, and others.
Identify and recruit interested and involved stakeholders to participate on planning and implementation teams.
Establish and solidify agreements committing resources and staff with departments to assist with implementing initiatives that have cross-departmental issues.
Strategic Result(s) to measure annual progress on Long-Term IssueThe Planning Department will help facilitate better participation and support from other City departments, school systems and other agencies as evidenced by:
100% of affected departments will participate in planning initiatives where cross-departmental issues have been identified.
100% 100%100%972 100%% of affected departments will participate in planning initiatives where cross-departmental issues have been identified
100%
Administrative - Executive Leadership78% 78%44%973 47%% of key measures and strategic results achieved 60%
94% 98%98%974 98%% of full-time equivalent employees without an on the job injury (OJI) in the current fiscal year
99%
95% 95%92%975 86%% of performance evaluations completed by the review date 88%
53% 55%56%976 N/A% of residents that say they are satisfied or very satisfied with the appearance of the city
N/A
58% 52%52%977 N/A% of residents that say they are satisfied or very satisfied with their feeling of safety
N/A
95% 95%100%978 100%% of terminations submitted to the Personnel Department within 3 days of the termination date
67%
47 4544979 44# of full-time employees supported 42
FY21 Budget Performance Data G-105
Table of Contents
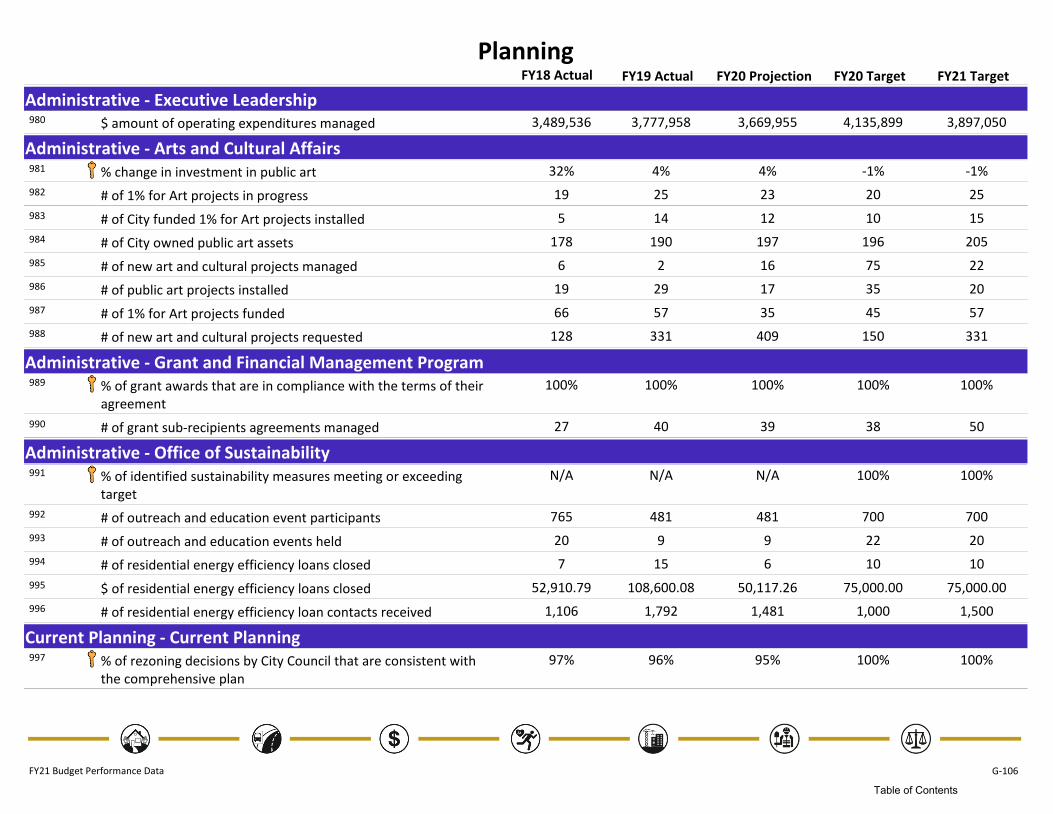
PlanningFY21 TargetFY20 ProjectionFY19 Actual FY20 TargetFY18 Actual
Administrative - Executive Leadership4,135,899 3,897,0503,669,955980 3,777,958$ amount of operating expenditures managed 3,489,536
Administrative - Arts and Cultural Affairs-1% -1%4%981 4%% change in investment in public art 32%
20 2523982 25# of 1% for Art projects in progress 19
10 1512983 14# of City funded 1% for Art projects installed 5
196 205197984 190# of City owned public art assets 178
75 2216985 2# of new art and cultural projects managed 6
35 2017986 29# of public art projects installed 19
45 5735987 57# of 1% for Art projects funded 66
150 331409988 331# of new art and cultural projects requested 128
Administrative - Grant and Financial Management Program100% 100%100%989 100%% of grant awards that are in compliance with the terms of their
agreement
100%
38 5039990 40# of grant sub-recipients agreements managed 27
Administrative - Office of Sustainability100% 100%N/A991 N/A% of identified sustainability measures meeting or exceeding
target
N/A
700 700481992 481# of outreach and education event participants 765
22 209993 9# of outreach and education events held 20
10 106994 15# of residential energy efficiency loans closed 7
75,000.00 75,000.0050,117.26995 108,600.08$ of residential energy efficiency loans closed 52,910.79
1,000 1,5001,481996 1,792# of residential energy efficiency loan contacts received 1,106
Current Planning - Current Planning100% 100%95%997 96%% of rezoning decisions by City Council that are consistent with
the comprehensive plan
97%
FY21 Budget Performance Data G-106
Table of Contents

PlanningFY21 TargetFY20 ProjectionFY19 Actual FY20 TargetFY18 Actual
Current Planning - Current Planning100% 100%100%998 100%% of affected departments will participate in planning initiatives
where cross-departmental issues have been identified
100%
100 10086999 94# of board of adjustment applications reviewed N/A
12 24341000 17# of preliminary plats reviewed by staff 18
160 2002561001 198# of rezoning applications reviewed by staff 145
Current Planning - Urban Design and Community Appearance65% 65%67%1002 65%% of citizens surveyed who say they are satisfied or very
satisfied with the appearance of the community
62%
7% 6%6%1003 6%% of change in property values within all Design Districts 6%
750 6386621004 669# of applications reviewed in design districts 772
2 231005 0# of Historic Landmark Designations approved 1
5 781006 4# of National Register Nominations reviewed 5
Housing and Community Development - Community Development2.50 2.752.251007 2.25$ value of non-City investment per $ value of City investment 2.08
65% 61%62%1008 57%% of citizens satisfied with neighborhood attributes 59%
40 30321009 21# of down payment assistances provided 40
200 2002141010 176# of housing rehabilitations completed 293
300 2501801011 205# of housing units assisted or built through all program services 397
12 1011012 6# of new housing units constructed 9
70% 70%70%1013 68%% of residents that describe their perceptions of safety and security in their neighborhoods as safe or very safe in the City’s annual Citizen Survey
N/A
60% 60%61%1014 59%% of residents that say they are satisfied or very satisfied with property maintenance in their neighborhoods in the City’s annual Citizen Survey
N/A
FY21 Budget Performance Data G-107
Table of Contents

PlanningFY21 TargetFY20 ProjectionFY19 Actual FY20 TargetFY18 Actual
Housing and Community Development - Homelessness Services100% 95%93%1015 93%% of people who are homeless who remain in permanent
housing for more than six months
95%
650 7007351016 735# of People who were formerly homeless housed through the Continuum of Care Program
702
1,183 1,5731,2731017 1,273# of people who are homeless in Oklahoma City according to the Point in Time Count
1,183
Plan Development and Implementation - Comprehensive Planning18% 21%19%1018 23%% of new development and redevelopment that occurs in the
inner-loop
13%
77% 76%76%1019 76%% Comprehensive plan policies in progress or completed 62%
239 2362361020 236# of Comprehensive Plan policies in progress or completed each year
193
21,000,000 21,000,00023,320,3191021 22,872,359# of square feet of development city wide 24,202,402
Plan Development and Implementation - Neighborhood and Commercial District Revitalization 100% 100%83%1022 83%% of commercial properties in each Commercial District in the
CDRP that have maintained or increased in market value from one year to the next according to the Oklahoma County Assessor
N/A
7% 7%11%1023 11%% change in new construction and building remodels in CDRP, TIF, and BIDs
-25%
5% 5%-3%1024 -3%% change in new construction and building remodels in Strong Neighborhoods Initiative (SNI) Neighborhoods
N/A
140 1361131025 146# of events sponsored by the Districts in the CDRP Program 197
Plan Development and Implementation - Transportation Planning2.14% 2.15%2.32%1026 N/A% of commute trips made by walking, bicycling, or public
transportation
N/A
10 17N/A1027 N/A# of miles bicycle facilities built N/A
20 72221028 N/A# of miles of sidewalk built N/A
FY21 Budget Performance Data G-108
Table of Contents

PoliceFY21 TargetFY20 ProjectionFY19 Actual FY20 TargetFY18 Actual
Long-Term Issue - Greater Need for Police Presence and ServicesThe growing demand for police presence and services coupled with the increasing scope and complexity of police services, if not adequately addressed, will result in:
Slower police response times
Increasing crime rate and reduced percentage of crimes solved
Decreased resident satisfaction with police services and feelings of community safety
Decreased traffic enforcement resulting in increased number of collisions
Strategies to address the Long-Term IssueContinue the use of overtime programs to address high crime areas to improve the public perception and foster trust.
Increase traffic enforcement citywide.
Increase personnel in Investigations, Operations and community based programs.
Build strategic relationships with local and national public and private partners.
Strategic Result(s) to measure annual progress on Long-Term IssueBy 2021, police presence and services will adequately increase while maintaining the level of core services citywide, as evidenced by:
55% or more of citizens citywide report they feel safe.
72% or more of residents will be satisfied with quality of police services citywide.
80% or more of life threatening calls (Priority 1) will be responded to within 9 minutes 30 seconds from the time a 911 call is answered to officer arrival.
Property crime clearance rate equal to or above the national average of comparable cities, 17.6%.
Violent crime clearance rate equal to or above the national average of comparable cities, 45.5%.
55% or more of residents will feel safe in the Downtown area.
55% 55%50%1 50%% of residents citywide reporting they feel safe ¹ 48%
72% 72%69%2 69%% of residents reporting they are satisfied with the quality of police services citywide ¹
69%
80% 80%74%3 73%% of Life Threatening calls (Priority 1) responded to within 9 minutes 30 seconds from the time a 911 call is answered until officer arrival
73%
30% 30%25%4 28%% of property crimes cleared by arrest, prosecution or other means ²
29%
70% 70%54%5 59%% of person crimes cleared by arrest, prosecution or other means ²
69%
FY21 Budget Performance Data G-109
Table of Contents

PoliceFY21 TargetFY20 ProjectionFY19 Actual FY20 TargetFY18 Actual
Long-Term Issue - Greater Need for Police Presence and Services55% 55%43%6 43%% of residents reporting they feel safe in the Downtown area ¹ 42%
Based on the Resident Survey Results. This measure includes the categories of safe and very safe or satisfied and very satisfied.[1]
Based on 2018 statistics from the latest available data published by the FBI.[2]
Long-Term Issue - Violent CrimeA continued trend of violent crime, if not adequately addressed, will result in:
Increased assaults and homicides
Increased gang violence
Increased demand on public services
Decreased feeling of public safety
Strategies to address the Long-Term IssueImprove public perception and foster trust by increasing community engagement along with police presence, and enforcement in strategic areas using various overtime initiatives and grant programs.
Continue efforts to reduce crime through community based programs, social outreach opportunities, increased crime analysis, and public and private partnerships.
Continue recruitment, hiring and training of new officers to fill vacancies.
Continue Safe Streets Task Force Program with FBI.
Strategic Result(s) to measure annual progress on Long-Term IssueAnnually, the Police Department will address the rise in violent crime and gang violence by:
Aggravated assaults per 100,000 residents in Oklahoma City equal to or below comparable cities nationwide.
Reducing the number of gang-related deadly weapon assaults by 5% compared to previous year.
392.13 392.13394.917 394.91# of aggravated assaults per 100,000 residents 424.53
5% 5%-65%8 -5%% reduction in the number of gang-related deadly weapon assaults
47%
FY21 Budget Performance Data G-110
Table of Contents

PoliceFY21 TargetFY20 ProjectionFY19 Actual FY20 TargetFY18 Actual
Long-Term Issue - Procedural JusticeProcedural justice is defined as the idea of fairness in the processes that resolve disputes and allocate resources. It is a philosophy and practice which promotes positive organizational change, builds police legitimacy in the community, and enhances officer safety. The continuing need to implement and promote procedural justice, if not addressed, will result in:
Negative public perception
Decreased ability to recruit candidates
Decreased resident satisfaction, confidence, and cooperation
Decreased actual or perception of unfair and inequitable policing services
Strategies to address the Long-Term IssueContinue to review and revise policies and procedures.
Continue to participate in community outreach through community programs and partnerships.
Continue to reinforce de-escalation training and practices to officers through recruit and in-service training.
Continue to manage and evaluate the Body Worn Camera program.
Strategic Result(s) to measure annual progress on Long-Term IssueBy 2021, 72% or more residents will be satisfied with the quality of police services citywide.
72% 72%69%9 69%% of residents reporting they are satisfied with the quality of police services citywide
69%
Strategic Result(s) to measure annual progress on Long-Term IssueBy 2022, 100% of all captains and lieutenants will receive Leadership Development training.
100% 100%100%10 100%% of Lieutenants and Captains who have been provided Leadership Development Training each year
N/A
Administrative - Executive Leadership75% 75%26%11 44%% of key measures and strategic results achieved 52%
90% 90%96%12 95%% of full-time equivalent employees without an on the job injury (OJI) in the current fiscal year
96%
10% 10%8%13 8%% of underutilized vehicles in the fleet 9%
1,539 1,5271,46514 1,426# of full-time employees supported 1,372
208,355,295 204,122,061204,629,85315 197,528,596Dollar amount of operating expenditures managed 181,776,538
FY21 Budget Performance Data G-111
Table of Contents

PoliceFY21 TargetFY20 ProjectionFY19 Actual FY20 TargetFY18 Actual
Administrative - Emergency Management100% 100%50%16 100%% of Federal and State required all hazard emergency or disaster
plans reviewed and updated
100%
80.00 80.00132.3217 159.40# of people contacted per presentation or event 124.59
4 4718 5# of exercises conducted 4
30 30719 50# of public education and outreach presentations, events or opportunities
44
2,400 2,40089020 7,970# of residents contacted through public education and outreach presentations, events or opportunities
5,482
24 243621 31# of responder training courses coordinated or conducted. 26
24 241422 32# of responses to significant events, emergencies or disasters 24
Administrative - Human Resources60% 60%53%23 73%% of applications received from minority applicants 56%
95% 95%85%24 81%% of performance evaluations completed by the review date 76%
95% 95%64%25 64%% of terminations submitted to the Personnel Department within 3 days of the termination date
55%
20 155826 58# of minority recruits hired 24
2,000 2,0002,44727 2,595# of applications for sworn positions received by department 2,349
1,543 1,5431,56928 1,572# of full-time and part-time employees 1,519
Administrative - Professional Standards67% 67%82%29 91%% of administrative investigations completed within six months 82%
30 301430 35# of administrative investigations 39
6 6031 0# of criminal investigations 2
Administrative - Public Information31,111 16,00017,26632 16,192# of views per social media post 6,120
6,320 8,0009,62733 9,734# of media requests responded to 9,788
750 7501,24634 2,013# of resident requests responded to 1,304
FY21 Budget Performance Data G-112
Table of Contents

PoliceFY21 TargetFY20 ProjectionFY19 Actual FY20 TargetFY18 Actual
Administrative - Public Information900 1,2002,18535 1,991# of social media posts 4,341
400 40072536 549# of written news releases produced through the PIO 281
Investigations - Investigations70% 70%54%37 59%% of person crimes cleared by arrest, prosecution or other
means
69%
30% 30%25%38 28%% of property crimes cleared by arrest, prosecution or other means
29%
33,000 33,00042,94939 25,309# of investigations conducted (all investigations including Municipal Court charges as well as State and Federal Court charges)
30,815
70,000 70,00060,27940 57,057# of incidents routed for review 64,251
Investigations - Investigations Support100% 100%53%41 39%% of peer reviewed validated crime lab results delivered within
time standards- Fingerprint within 30 days- Controlled substance within 30 days- DNA within 90 days- Firearm examinations comp
42%
48,000 48,00042,91942 46,360# of crime lab tests conducted 27,099
800 80070343 762# of firearms entered into the National Integrated Ballistic Information Network
758
Investigations - Special Investigations12.23 12.2320.4644 13.73# of drive-by shootings per 100,000 residents 12.24
14.90 14.903.2245 2.98# of gang-related deadly weapon assaults per 100,000 residents 2.91
550.00 550.00476.5846 571.32# of Special Projects’ illicit drug cases presented for prosecution per 100,000 residents
510.70
128% 128%120%47 194%% of graffiti crimes cleared by arrest, prosecution, or other means
132%
FY21 Budget Performance Data G-113
Table of Contents

PoliceFY21 TargetFY20 ProjectionFY19 Actual FY20 TargetFY18 Actual
Investigations - Special Investigations5% 5%-15%48 -5%% reduction in the number of gang-related deadly weapon
assaults
47%
750 7001,01949 749# of computer, digital, electronic and other media device forensic examinations completed
704
400 40036450 399# of criminal nuisance abatement cases 449
215 21520851 154# of graffiti investigations conducted by Special Investigations 246
275 27525052 298# of graffitti crimes cleared by arrest, prosecution, or other means
324
750 80085253 848# of computer, digital and electronic and other media device forensic examinations requested
744
100 15021054 148# of graffiti investigation requests reported by Special Investigations
98
Operations - Court Enforcement and Investigations 20% 20%19%55 13%% of total warrants cleared of total received N/A
6,000 6,0008,34356 1,825# of warrants cleared by officers N/A
30,000 30,00044,43057 14,020# of warrants received by officers N/A
Operations - Courthouse Security0 0058 0# of security breaches N/A
3,263 3,2633,30959 3,263# of security hours provided 3,315
3,000 3,0003,89860 2,038# of service responses 354
Operations - Crime Prevention and Awareness98% 98%97%61 100%% of crime prevention and awareness training participants who
report they received important/useful information
100%
8,000 8,0007,15862 8,542# of crime prevention and awareness participants trained 8,227
Operations - Patrol392.13 392.13394.9163 394.91# of aggravated assaults per 100,000 residents 424.53
FY21 Budget Performance Data G-114
Table of Contents

PoliceFY21 TargetFY20 ProjectionFY19 Actual FY20 TargetFY18 Actual
Operations - Patrol80% 80%73%64 73%% of Life Threatening calls (Priority 1) responded to within 9
minutes 30 seconds from the time a 911 call is answered until officer arrival
73%
55% 55%50%65 50%% of residents citywide reporting they feel safe 48%
72% 72%69%66 69%% of residents reporting they are satisfied with the quality of police services citywide
69%
80% 85%82%67 83%% of officers that achieve the minimum performance standards per hour for their patrol shift and division
82%
55% 55%43%68 43%% of residents reporting they feel safe in the Downtown area 42%
380,000 380,000435,39969 408,798# of calls for service answered 379,287
1,500.00 1,500.001,180.9570 1,306.70# of helicopter hours flown 1,504.80
280,000.00 280,000.00310,653.7671 283,504.00# of hours of time on call provided 272,702.00
75,000 75,00068,96172 61,922# of self-initiated contacts provided 74,236
22,000.00 22,000.0012,899.6873 13,314.65# of special event security hours provided 20,177.25
150 15041974 393# of specialized unit responses provided 145
Operations - Traffic Safety25.07 24.0024.5075 23.76# of traffic collisions per 1,000 residents of Oklahoma City 22.91
58% 60%58%76 58%% of residents that are satisfied with traffic enforcement 58%
183.84 183.84170.9077 162.54# of traffic contacts per 1,000 residents of Oklahoma City 172.21
0.12 0.120.1278 0.12# of traffic fatalities per 1,000 residents of Oklahoma City 0.12
15,000 15,00016,41679 15,918# of traffic collision investigations completed 14,962
110,000 112,000114,50080 108,904# of traffic contacts made 112,456
Operations - Youth Services4.68 4.684.6181 5.45# of crimes reported to School Resource Officers in schools per
1,000 students
5.25
50% 50%57%82 51%% decrease in truancy rate of students served by truancy officers 49%
FY21 Budget Performance Data G-115
Table of Contents

PoliceFY21 TargetFY20 ProjectionFY19 Actual FY20 TargetFY18 Actual
Operations - Youth Services10,000 10,00010,45483 14,189# of youths served in education programs 12,708
8,000 8,0006,59584 8,287# of students served by truancy officers 8,441
1,200 1,2001,58685 1,124# of youths processed through Community Intervention Center. 1,025
60 6019486 253# of youths served by the Juvenile Intervention Program 300
10,000 10,0007,46687 17,817# of youths served by the Police Athletic Program 11,070
13,250 13,25017,33188 13,085# of students in OKCPS/OCPD secondary schools per year 13,654
Public Safety Support - 911 Communications90% 90%96%89 95%% of 911 calls answered within 10 seconds 94%
85% 85%80%90 86%% of life threatening (Priority 1) calls dispatched within 2 minutes 30 seconds
82%
1,100,000 1,100,0001,098,38491 1,047,079# of calls serviced 1,028,354
Public Safety Support - Inmate Processing/Incarceration Alternative-15% -15%-55%92 -52%% change in the number of people incarcerated for municipal
charges
-42%
100% 100%100%93 99%% of all arrestees booked into the jail, by any law enforcement agency, who are accurately identified at the time of booking/intake
99%
18,000 17,00016,32694 16,626# of arrestees processed 19,125
3,600 3,6003,83395 3,849# of Detox admissions provided 3,406
21,000 17,00014,67396 20,761# of inmate days utilized by Oklahoma City at the Oklahoma County Jail
22,136
Public Safety Support - Permit Services46% 46%26%97 27%% of alarm responses with alarm permits 29%
96% 96%98%98 98%% of total alarm responses that are false alarms 98%
41,500 41,50033,01799 33,625# of all permits processed 36,374
FY21 Budget Performance Data G-116
Table of Contents

PoliceFY21 TargetFY20 ProjectionFY19 Actual FY20 TargetFY18 Actual
Public Safety Support - Records Management100% 100%100%100 N/A% of reports validated within 24 hours * N/A
144,000 144,000145,725101 N/A# of reports validated * N/A
Public Safety Support - Training75% 75%69%102 79%% of officers who rate advanced training as high or very high in
supporting the knowledge and skills needed to provide public safety services
61%
100% 100%100%103 100%% of Lieutenants and Captains who have been provided Leadership Development Training each year
N/A
60 6056104 56# of recruits that graduate from the Police Academy 26
2,000 2,0002,777105 3,639# of training hours provided 3,117
FY21 Budget Performance Data G-117
Table of Contents

Public Transportation and ParkingFY21 TargetFY20 ProjectionFY19 Actual FY20 TargetFY18 Actual
Long-Term Issue - ServiceThe continuing demand to enhance transportation and parking services, if not addressed, will result in:
Erosion of ridership and parking customers
Less workers connecting to jobs
Loss of transit service and degraded on-time performance
Strategies to address the Long-Term IssueComplete equipment and facility preventative maintenance work on schedule
Expand commitment to recruiting, retaining, and developing our workforce
Modernize practices and maximize technology to improve the customer experience
Educate our community about EMBARK services and develop community partners
Strategic Result(s) to measure annual progress on Long-Term IssueBy 2024, public transportation and parking customers will benefit from enhanced services as evidenced by:
% Public Transit service hours lost will be at or below 1%
8% or less employee vacancy rate
At least 80% of customers will be satisfied with EMBARK services
EMBARK on-time performance will be 85% of EMBARK bus trips will be on-time
EMBARK on-time performance will be 95% of EMBARK Plus paratransit pick-ups will be on-time
EMBARK on-time performance will be 95% of OKC Streetcar trips will be on-time
0% of EMBARK Plus paratransit trips will be denied due to capacity constraints
Parking complaints per 1,000 transactions will be at or below 1%
EMBARK will provide at least 13,000 public transit trips per day
8% 8%0%1134 N/AAnnual vacancy rate * N/A
78% 78%74%1135 74%% of public transportation customers surveyed rating service as satisfactory
74%
75% 75%69%1136 69%% of on-time bus departures 66%
93.00% 93.00%93.31%1137 94.40%% of EMBARK Plus paratransit pick-ups on time 94.72%
96% 96%96%1138 N/A% of on-time streetcar departures * N/A
FY21 Budget Performance Data G-118
Table of Contents
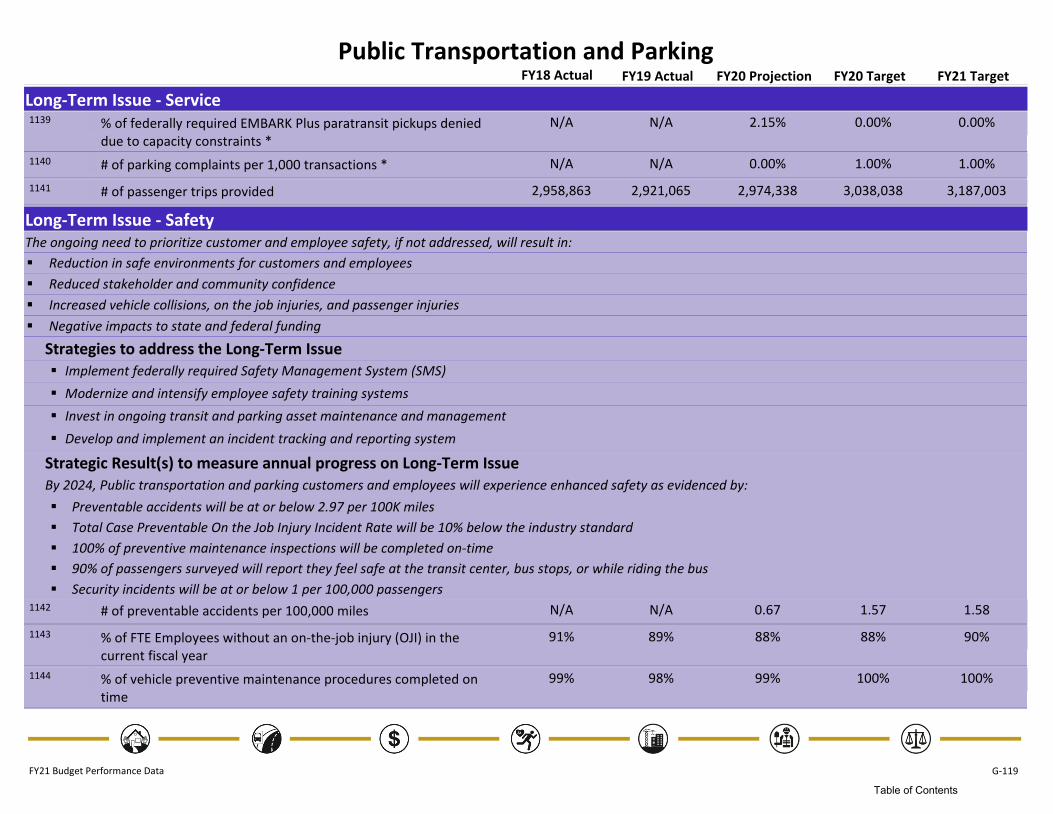
Public Transportation and ParkingFY21 TargetFY20 ProjectionFY19 Actual FY20 TargetFY18 Actual
Long-Term Issue - Service
0.00% 0.00%2.15%1139 N/A% of federally required EMBARK Plus paratransit pickups denied due to capacity constraints *
N/A
1.00% 1.00%0.00%1140 N/A# of parking complaints per 1,000 transactions * N/A
3,038,038 3,187,0032,974,3381141 2,921,065# of passenger trips provided 2,958,863
Long-Term Issue - SafetyThe ongoing need to prioritize customer and employee safety, if not addressed, will result in:
Reduction in safe environments for customers and employees
Reduced stakeholder and community confidence
Increased vehicle collisions, on the job injuries, and passenger injuries
Negative impacts to state and federal funding
Strategies to address the Long-Term IssueImplement federally required Safety Management System (SMS)
Modernize and intensify employee safety training systems
Invest in ongoing transit and parking asset maintenance and management
Develop and implement an incident tracking and reporting system
Strategic Result(s) to measure annual progress on Long-Term IssueBy 2024, Public transportation and parking customers and employees will experience enhanced safety as evidenced by:
Preventable accidents will be at or below 2.97 per 100K miles
Total Case Preventable On the Job Injury Incident Rate will be 10% below the industry standard
100% of preventive maintenance inspections will be completed on-time
90% of passengers surveyed will report they feel safe at the transit center, bus stops, or while riding the bus
Security incidents will be at or below 1 per 100,000 passengers
1.57 1.580.671142 N/A# of preventable accidents per 100,000 miles N/A
88% 90%88%1143 89%% of FTE Employees without an on-the-job injury (OJI) in the current fiscal year
91%
100% 100%99%1144 98%% of vehicle preventive maintenance procedures completed on time
99%
FY21 Budget Performance Data G-119
Table of Contents

Public Transportation and ParkingFY21 TargetFY20 ProjectionFY19 Actual FY20 TargetFY18 Actual
Long-Term Issue - Safety
75% 75%72%1145 72%% of passengers surveyed will report they feel safe at the transit center, bus stops, or while riding the bus
71%
0.0500 0.05000.00001146 0.0000# of security incidents per 100,000 passengers 0.0338
Long-Term Issue - GrowthA lack of dedicated funding sources for public transit and awareness of transportation and parking services needed to meet the demands of a growing city, if not addressed will result in:
Missed opportunities to attract new customers
Declining community confidence and trust
Difficulty in attracting private sector talent and employees to Oklahoma City from other states
Decreased economic development, expansion, and partnerships
Strategies to address the Long-Term IssueImplement private sector employee transit pass program
Affect change in the municipal code to support Transit Oriented Development and land use strategies
Update and implement long-range and short-range transit and parking plans
Promote technology-based customer centric programs, improve ADA eligibility process and establish a travel training program
Continued coordination with state, local and federal partners regarding transit funding
Launch pilot program to manage private parking assets
Strategic Result(s) to measure annual progress on Long-Term IssueBy 2024, Public Transportation and Parking services will promote sustainable growth as evidenced by:
5% Increase in operations expense recovered through fare revenue
10% decline in bus transfers
Construction and launch of NW Bus Rapid Transit route
Construction and opening of new hotel/convention center parking garage
25% increase of available public parking through management of private parking assets
1.00% 1.00%0.00%1147 N/A% increase in available public parking through management of private parking assets *
N/A
FY21 Budget Performance Data G-120
Table of Contents

Public Transportation and ParkingFY21 TargetFY20 ProjectionFY19 Actual FY20 TargetFY18 Actual
Administrative - Executive Leadership75% 75%33%1148 21%% of key measures and strategic results achieved 50%
63% 63%62%1149 52%% of newly hired employees who retain employment with EMBARK for more than 24 months
44%
95% 80%39%1150 11%% of performance evaluations completed by the review date 30%
95% 95%100%1151 97%% of terminations submitted to the Personnel Department within 3 days of the termination date
98%
18% 21%21%1152 24%Annual Turnover Rate of Employees 20%
264 3003001153 258# of full-time employees supported 227
8% 8%N/A1154 N/AAnnual vacancy rate * N/A
41,025,586 41,025,58637,798,5841155 37,664,210Dollar amount of operating expenditures managed 30,087,320
Administrative - Customer Relations100% 100%0%1156 N/A% of business along the streetcar route contacted each month * N/A
87% 90%89%1157 90%% of customer calls answered in 30 seconds 88%
77% 77%67%1158 74%% of customer inquiries, requiring staff research and review, responded to within 5 business days
67%
115,000 80,00074,6651159 71,806# of customer calls answered 78,444
1,344 1,3441,3801160 1,003# of customer inquiries, requiring staff research and review, responded to within 5 business days
781
115,000 80,00078,5431161 75,079# of customer calls received 81,695
1,300 1,3002,0561162 1,354# of customer inquiries received requiring staff research and review
1,173
Administrative - Safety, Security, and Training88% 90%91%1163 89%% of FTE Employees without an on-the-job injury (OJI) in the
current fiscal year
91%
1.57 1.581.441164 N/A# of preventable accidents per 100,000 miles N/A
0.0500 0.05000.04201165 0.0000# of security incidents per 100,000 passengers 0.0338
FY21 Budget Performance Data G-121
Table of Contents

Public Transportation and ParkingFY21 TargetFY20 ProjectionFY19 Actual FY20 TargetFY18 Actual
Administrative - Safety, Security, and Training100% 100%N/A1166 N/A% of employees who have completed required training * N/A
90% 90%100%1167 N/A% of new employees who have passed the CDL test * N/A
75% 75%72%1168 72%% of passengers surveyed will report they feel safe at the transit center, bus stops, or while riding the bus
71%
100% 100%11%1169 N/A% of total non-preventable vehicle accident claims collected on * N/A
100% 100%100%1170 N/A% of total vehicle accident files completed within 10 days * N/A
25 25151171 N/A# of OJI’s per 200,000 hours worked * N/A
15 15151172 N/A# of non-collision passenger injury claims substantiated per 100,000 passengers *
N/A
Parking - Municipal Off Street Parking0% 0%78%1173 N/A% of time operational equipment is working (uptime) * N/A
1.00% 1.00%0.27%1174 N/A# of parking complaints per 1,000 transactions * N/A
100% 70%69%1175 77%% of monthly vehicle spaces occupied 92%
2,501,904 2,501,9042,501,9001176 N/A# of hours of parking purchased * N/A
335,000 356,180294,6221177 367,690# of parking customers served 335,383
2,841,000 2,349,2442,031,6841178 2,399,293# of parking transactions completed 3,074,147
900 9009421179 780# of preventative off-street work orders completed 668
5,476,800 6,588,2105,230,7391180 N/A$ total revenue from parking transactions * N/A
1.00% 1.00%0.00%1181 N/A% increase in available public parking through management of private parking assets *
N/A
Parking - On-Street Parking Meter100% 100%100%1182 100%% of time operational equipment is working (uptime) 100%
1.00% 1.00%0.27%1183 N/A# of parking complaints per 1,000 transactions * N/A
1,345 1,3451,4071184 N/A# of metered on-street parking spaces available * N/A
200 2001801185 280# of on-street work orders completed 633
173 2051801186 N/A# of parking meters * N/A
FY21 Budget Performance Data G-122
Table of Contents

Public Transportation and ParkingFY21 TargetFY20 ProjectionFY19 Actual FY20 TargetFY18 Actual
Parking - On-Street Parking Meter585,363 675,008586,7401187 N/A# total parking transactions * N/A
Public Transportation - Bus Operations8,323 8,7328,2511188 N/A# of bus passengers per day * N/A
15.00 15.5414.811189 N/A# of bus passengers per service hour * N/A
75% 75%67%1190 69%% of on-time bus departures 66%
78% 78%74%1191 74%% of public transportation customers surveyed rating service as satisfactory
74%
3,038,038 3,187,0033,024,2651192 2,921,065# of passenger trips provided 2,958,863
202,533 205,093204,2551193 N/A# of service hours provided * N/A
Public Transportation - Bus Stop Management37% 37%33%1194 33%% of bus stops that are ADA compliant 31%
14% 14%13%1195 N/A% of bus stops with a shelter * N/A
75% 75%66%1196 66%% of customers satisfied with cleanliness of bus stops 63%
100% 100%95%1197 100%% of bus stop repair work orders completed on time 96%
25 25401198 29# of bus shelters constructed 6
40 40211199 16# of bus stops made ADA compliant 32
Public Transportation - EMBARK Norman19.16 12.7016.541200 N/A# of Norman bus passengers per service hour * N/A
75% 75%N/A1201 N/A% of Norman public transportation customers surveyed rating service as satisfactory *
N/A
75% 75%N/A1202 N/A% of on-time Norman fixed route bus departures * N/A
95% 95%N/A1203 N/A% of on-time Norman paratransit pick-ups * N/A
326,858 326,858282,6931204 N/A# of Norman fixed route passenger trips provided * N/A
16,421 16,42113,2961205 N/A# of Norman paratransit trips provided * N/A
FY21 Budget Performance Data G-123
Table of Contents

Public Transportation and ParkingFY21 TargetFY20 ProjectionFY19 Actual FY20 TargetFY18 Actual
Public Transportation - EMBARK Plus Paratransit92% 92%N/A1206 N/A% of EMBARK Plus customers surveyed rating the services
provided as satisfactory or very satisfactory
N/A
98.00% 98.00%78.14%1207 88.81%% of total EMBARK Plus customer trip requests completed 96.66%
93.00% 93.00%89.04%1208 94.40%% of EMBARK Plus paratransit pick-ups on time 94.72%
0.00% 0.00%2.19%1209 N/A% of federally required EMBARK Plus paratransit pickups denied due to capacity constraints *
N/A
55,000 65,00057,0601210 56,388# of EMBARK Plus trips provided 53,155
68,000 80,00075,0431211 71,340# of EMBARK Plus trips requested 67,137
Public Transportation - Facilities Management85% 85%77%1212 77%% of customers satisfied with cleanliness of Transit Center 73%
100% 100%100%1213 N/A% of facility preventive maintenance procedures completed on-time *
N/A
450 901081214 826# of preventative maintenance procedures completed 483
500 4504031215 N/A# of scheduled facility service requests completed * N/A
500 7007421216 835# of unscheduled facility service requests completed 814
Public Transportation - Fleet Management75% 75%66%1217 66%% of customers satisfied with cleanliness of buses 66%
85% 85%82%1218 85%% of fixed-route fleet available 85%
100% 100%100%1219 98%% of vehicle preventive maintenance procedures completed on time
99%
67,000.00 70,000.0078,347.051220 N/A# of miles driven between service interruptions * N/A
4,000 4,1004,8231221 4,206# of vehicle repair work orders completed 3,734
Public Transportation - MOBILITY MANAGEMENT98% 100%100%1222 100%% of senior transportation customers rating services as
satisfactory
100%
350.00 350.00405.651223 N/A# of passengers per day utilizing mobility management services N/A
FY21 Budget Performance Data G-124
Table of Contents

Public Transportation and ParkingFY21 TargetFY20 ProjectionFY19 Actual FY20 TargetFY18 Actual
Public Transportation - MOBILITY MANAGEMENT34,500 45,00057,4121224 53,145# of bus passes distributed to homeless or low-income
individuals
38,256
45,000 50,00044,1151225 N/A# of senior transportation trips provided N/A
2,320 2,32058,1911226 N/A# of Social Service Agency Trips Provided * N/A
Public Transportation - Oklahoma River Cruises6.50 0.008.521227 6.17# of passengers per River Cruise service hour 9.85
96% 96%98%1228 100%% of river cruise customers rating service as satisfactory 100%
10% 100%34%1229 N/A% of scheduled river cruise service hours lost 15%
5,275 05,3461230 3,633# of river cruise passengers transported 8,870
803.90 0.00627.541231 N/A# of river cruise service hours provided 901.10
Public Transportation - Spokies Bike Share1,153 03611232 837# of Spokies trips per bike per day 1,054
0.00% 0.00%88.06%1233 97.14%% of Bikes available for use 94.12%
13,835 04,3261234 10,041# of Bike trips 12,643
0 0591235 68# of Bikes available for use 48
Public Transportation - STREETCAR1,036.65 1,036.65937.351236 N/A# of streetcar passengers per day * N/A
14.00 14.0013.971237 N/A# of streetcar passengers per service hour * N/A
96% 96%95%1238 N/A% of on-time streetcar departures * N/A
85% 85%80%1239 N/A% of surveyed customers who are satisfied with the quality of their service *
N/A
13.00 13.0014.111240 N/AAverage frequency for streetcar * N/A
60,000 60,00028,5491241 N/A# of miles between streetcar service interruptions * N/A
378,378 378,378343,5801242 N/A# of streetcar passenger trips provided * N/A
FY21 Budget Performance Data G-125
Table of Contents

Public WorksFY21 TargetFY20 ProjectionFY19 Actual FY20 TargetFY18 Actual
Long-Term Issue - Condition of StreetsIncreasing difficulty to address resident expectations of the quality of city streets, if not addressed with additional maintenance and reconstruction, will result in further dissatisfaction and lack of resident confidence.
Strategies to address the Long-Term IssueContinue to provide efficient management that combines routine maintenance, street resurfacing, and new construction to improve overall condition of city streets.
Continue unit price contracts for resurfacing and base repair for efficient delivery of projects.
Identify and secure a dedicated funding source for the maintenance of street infrastructure.
Strategic Result(s) to measure annual progress on Long-Term IssueAnnually, the Public Works Department will improve the timeliness of infrastructure repairs, as follows:
Complete 80% of pothole repairs within 3 business days.
Complete 80% of permanent utility cut repairs within 10 business days of receipt from line maintenance.
80% 80%N/A1243 N/A% of arterial pothole repairs completed within 3 calendar days of work order issued
60%
80% 91%52%1244 54%% of utility cut repairs completed within 14 calander days of receipt from line maintenance
N/A
Strategic Result(s) to measure annual progress on Long-Term IssueAnnually, the Public Works Department will:
Complete 77 miles of resurfacing and widening
Expend $46 million for resurfacing and widening projects
80% of arterial street resurfacing projects will be completed within 4 weeks
77.00 72.00104.331245 110.62# of miles resurfaced and widened annually N/A
46,000,000 95,000,00094,942,6011246 94,942,601$ expended on resurfacing and widening 57,309,413
80% 80%25%1247 48%% of arterial street resurfacing projects completed within 4 weeks
N/A
Strategic Result(s) to measure annual progress on Long-Term IssueBy 2023, resident satisfaction with the condition of arterial streets will meet or exceed 40%
40% 40%20%1248 20%% of citizens satisfied with the condition of arterial streets 18%
FY21 Budget Performance Data G-126
Table of Contents

Public WorksFY21 TargetFY20 ProjectionFY19 Actual FY20 TargetFY18 Actual
Long-Term Issue - Condition of Streets
Strategic Result(s) to measure annual progress on Long-Term IssueBy 2023, resident satisfaction with the condition of residential streets will meet or exceed 50%
50% 50%30%1249 30%% of citizens satisfied with condition of residential streets 28%
Strategic Result(s) to measure annual progress on Long-Term IssueBy 2023, the average of all city streets will have a Pavement Condition Index (PCI) rating of 70 or above
68 68681250 67Citywide average PCI 66
Strategic Result(s) to measure annual progress on Long-Term IssueBy 2023, 60% of arterial streets with a Pavement Condition Index (PCI) rating of 70 or above
52% 52%41%1251 40%% of arterial streets with a Pavement Condition Index (PCI) rating of 70 or above
32%
Strategic Result(s) to measure annual progress on Long-Term IssueBy 2023, 65% of residential streets with a Pavement Condition Index (PCI) rating of 70 or above
63% 63%64%1252 63%% of residential streets with a Pavement Condition Index (PCI) rating of 70 or above
62%
Long-Term Issue - Capital Project DeliveryThe increasing number of projects and continuing priority to expedite project construction if not addressed will result in failure to deliver projects on time and on budget.
Strategies to address the Long-Term IssueDevelop and maintain categorized budget worksheets, for sales tax and future bond projects to ensure delivery within available funds.
Ensure consistent delivery and construction of projects using increased consulting services to supplement city project management staff.
Utilize work order contracting on street resurfacing projects to reduce the number of total bids and expedite construction.
Limit construction contract revisions through improved plan reviews, successful management of change orders and amendments, and expediting final acceptance of completed projects.
Strategic Result(s) to measure annual progress on Long-Term IssueBy April 2021, all listed 2007 bond issue projects will be completed or under construction.
100% 100%73%1253 73%% of listed 2007 projects completed or under construction 65%
FY21 Budget Performance Data G-127
Table of Contents

Public WorksFY21 TargetFY20 ProjectionFY19 Actual FY20 TargetFY18 Actual
Long-Term Issue - Capital Project Delivery
Strategic Result(s) to measure annual progress on Long-Term IssueBy December 2022, $300 million of the $967 million 2017 bond issue will be awarded or completed.
114,949,750 114,949,75071,525,0001254 71,525,000Total $ of 2017 GO bond projects awarded or completed N/A
Strategic Result(s) to measure annual progress on Long-Term IssueBy December 2022, all sales tax street resurfacing projects will be completed or under construction.
50% 50%65%1255 47%% of sales tax street resurfacing projects completed or under construction
9%
Strategic Result(s) to measure annual progress on Long-Term IssueAnnually, the department will continue to improve timeliness and budgeting for project delivery as evidenced by:
75% of facilities projects will be substantially completed on time.
75% of facilities construction projects will not exceed 7% in cost increases following award of contract.
75% of infrastructure construction projects will be substantially completed on time.
75% of infrastructure construction projects will not exceed 7% in cost increases following award of contract.
75% 75%92%1256 83%% of facilities projects substantially completed on time 40%
75% 75%81%1257 70%% of facilities construction projects not exceeding 7% in cost increases following award of contract
76%
77% 77%50%1258 50%% of infrastructure construction projects substantially completed on time
58%
70% 70%85%1259 74%% of infrastructure construction projects not exceeding 7% in cost increases following award of contract
68%
FY21 Budget Performance Data G-128
Table of Contents

Public WorksFY21 TargetFY20 ProjectionFY19 Actual FY20 TargetFY18 Actual
Long-Term Issue - Condition of Drainage InfrastructureRecent increases in the number of severe storm events coupled with limited resources to provide maintenance and new drainage construction, if not addressed, will result in a higher number of flooded structures, property damage, and citizen complaints.
Strategies to address the Long-Term IssueContinue to provide a drainage program that combines inlet maintenance, rural road drainage maintenance, unimproved channel maintenance, and improved channel maintenance to the overall condition of city drainage infrastructure.
Develop new City basin drainage studies to better monitor the effects of urbanized development on the City’s drainage systems to prioritize projects and address citizen complaints.
Complete an improved and updated Drainage Criteria Manual, to guide drainage design consultants on City standards and procedures.
Revise the Drainage Ordinance to increase requirements and standards for newly constructed drainage infrastructure.
Provide necessary staff, crews, and project resources to expedite response to drainage concerns.
Improve Community Rating System to further lower flood insurance rates to residents.
Strategic Result(s) to measure annual progress on Long-Term IssueThe Public Works Department will:
By 2020, Complete 90% of drainage repairs within 30 calendar days
Achieve a FEMA community rating system of 6 by 2020.
50% of the City’s drainage basin studies will be completed by 2023.
90% 90%84%1260 85%% of drainage repairs completed within 30 calendar days 90%
6 681261 8FEMA Community Rating ¹ 8
8% 8%0%1262 0%% of the City's drainage basin studies completed N/A
The Community Rating System (CRS) is a voluntary system used by the Federal Emergency Management System (FEMA) that recognizes and encourages community floodplain management activities that exceed minimum National Flood Insurance Program (NFIP) standards. CRS participation allows for discounts on flood insurance premiums ranging from 5% to 45%. Depending upon the level of activity, communities are assigned to one of ten classes, with Class 1 offering to highest discount for policy holders.
[1]
FY21 Budget Performance Data G-129
Table of Contents

Public WorksFY21 TargetFY20 ProjectionFY19 Actual FY20 TargetFY18 Actual
Long-Term Issue - Inspection ServicesAn increasing number of projects in the right of way from both the development community and public investment, if not addressed, will result in increased traffic impact.
Strategies to address the Long-Term IssueIncrease the timeliness of scheduled inspections to ensure contractor compliance and expedite construction. Establish a staffing level to allow for proactive work zone inspections to reduce the number of days roadways are closed.
Strategic Result(s) to measure annual progress on Long-Term IssueBy 2022, 60% of field inspections will be completed daily
50% 50%37%1263 37%% of field inspections completed daily N/A
Strategic Result(s) to measure annual progress on Long-Term IssueBy 2022, 50% of active work zones will receive a compliance inspection
40% 40%13%1264 13%% of active work zones receiving a compliance inspection 11%
Administrative - Executive Leadership75% 75%34%1265 27%% of key measures and strategic results achieved 39%
82% 86%92%1266 93%% of full-time equivalent employees without an on the job injury (OJI) in the current fiscal year
97%
95% 95%59%1267 64%% of performance evaluations completed by the review date 65%
95% 95%86%1268 95%% of terminations submitted to the Personnel Department within 3 days of the termination date
88%
10% 10%24%1269 26%% of underutilized vehicles (excluding heavy equipment) in the Public Works Fleet
22%
418 3993691270 362# of full-time employees supported 338
53,315,940 51,654,26145,794,7861271 43,957,619Dollar amount of operating expenditures managed 40,751,415
Engineering - Drainage Engineering80% 80%56%1272 45%% of property owner drainage inquiry reviews and responses
completed within 30 calendar days
59%
100% 100%100%1273 100%% of bridges that are open to traffic 100%
FY21 Budget Performance Data G-130
Table of Contents

Public WorksFY21 TargetFY20 ProjectionFY19 Actual FY20 TargetFY18 Actual
Engineering - Drainage Engineering91% 91%91%1274 90%% of bridges that have an acceptable rating 90%
8% 8%0%1275 0%% of the City's drainage basin studies completed N/A
400 4002801276 339# of drainage inquiry responses 196
6 681277 8FEMA Community Rating 8
Engineering - Engineering Technical Review85% 85%87%1278 74%% of customers that receive four (4) week initial document
review response including drainage, paving and ADA compliance
74%
60% 60%26%1279 31%% of infastructure and site plan reviews requiring more than one review
N/A
1,000 1,0007151280 1,030# of infrastructure and site plans reviewed 862
1,200 1,2001,0941281 N/A# of revocable permits reviewed * N/A
200 2001191282 107# of work orders issued for private development 165
1,000 1,0007611283 1,094# of infrastructure and site plans submitted for review 1,061
Engineering - Paving Engineering52% 52%41%1284 40%% of arterial streets with a Pavement Condition Index (PCI)
rating of 70 or above
32%
63% 63%64%1285 63%% of residential streets with a Pavement Condition Index (PCI) rating of 70 or above
62%
80% 80%0%1286 48%% of arterial street resurfacing projects completed within 4 weeks
N/A
50% 50%65%1287 47%% of sales tax street resurfacing projects completed or under construction
9%
15.00 4.00N/A1288 11.60# of miles of new arterial street sidewalk constructed 7.00
20.00 14.00N/A1289 9.51# of miles of new residential sidewalk constructed 28.00
4.00 2.003.181290 3.07# of miles of street widened 4.87
73.00 70.00147.701291 107.55# of miles of streets resurfaced 47.00
FY21 Budget Performance Data G-131
Table of Contents

Public WorksFY21 TargetFY20 ProjectionFY19 Actual FY20 TargetFY18 Actual
Engineering - Paving Engineering7.50 3.000.001292 0.56# of miles of streetscapes/enhancements 0.00
77.00 72.00150.881293 110.62# of miles resurfaced and widened annually N/A
46,000,000 95,000,00094,942,6011294 94,942,601$ expended on resurfacing and widening 57,309,413
Field Services - Construction Inspection and Construction Quality ControlN/A N/AN/A1295 N/A% of active construction projects receiving a site visit daily * N/A
95% 95%97%1296 97%% of right of way inspections completed within one day of request
97%
50% 50%40%1297 37%% of field inspections completed daily N/A
30,000 30,00027,9041298 28,224# of inspections completed 27,518
400,000,000 400,000,000472,702,1941299 580,108,690Estimated value of work inspected 378,360,899
600 6005731300 645# of new projects received 633
500 5005341301 542# of total active projects 493
Field Services - Survey95% 95%98%1302 97%% of surveys delivered by the proposed date of completion 97%
100% 100%100%1303 100%% of survey proposals provided within 3 business days of survey request
100%
150 1501431304 153# of surveys completed 152
Project Management - Contract Administration50% 50%46%1305 34%% of consulting contracts approved within 150 calendar days
from advertising the project
49%
15.00 15.008.821306 9.17# of days that project contracts are in negotiation N/A
70% 70%33%1307 N/A% of contract amendments completed within 45 calendar days 46%
100% 100%0%1308 0%% of new pre-qualified contractors receiving field evaluations during the application process
N/A
N/A N/AN/A1309 N/A% of pre-qualification applications reviewed and approved in 60 calendar days *
N/A
FY21 Budget Performance Data G-132
Table of Contents

Public WorksFY21 TargetFY20 ProjectionFY19 Actual FY20 TargetFY18 Actual
Project Management - Contract Administration50 50371310 N/A# of consulting contract amendments approved 54
60 60651311 70# of consulting contracts approved 43
250 2502731312 231# of contractor pre-qualifications approved 245
70 70411313 60# of consulting contracts managed 68
Project Management - Facilities Project Management75% 75%88%1314 70%% of facilities construction projects not exceeding 7% in cost
increases following award of contract
76%
75% 75%89%1315 83%% of facilities projects substantially completed on time 40%
75% 75%90%1316 83%% of facilities projects achieving final acceptance within 90 calendar days of substantial completion
58%
45,000,000 45,000,00068,214,2591317 33,994,447Dollar value of facilities construction projects awarded 42,768,469
90 901581318 117# of facilities construction projects awarded 47
50 50771319 63# of work orders issued N/A
145 1451511320 133# of facilitiy projects in progress 129
Project Management - Infrastructure Project Management70% 70%74%1321 74%% of infrastructure construction projects not exceeding 7% in
cost increases following award of contract
68%
77% 77%N/A1322 50%% of infrastructure construction projects substantially completed on time
58%
62% 62%41%1323 48%% of infrastructure projects achieving final acceptance within 90 calendar days of substantial completion
49%
100% 100%81%1324 73%% of listed 2007 projects completed or under construction 65%
200 2001751325 222# of infrastructure construction projects awarded 30
100,000,000 100,000,000111,129,3821326 95,339,534Dollar value of infrastructure construction projects awarded 53,824,596
200 1501471327 204# of infrastructure construction projects in process 145
FY21 Budget Performance Data G-133
Table of Contents

Public WorksFY21 TargetFY20 ProjectionFY19 Actual FY20 TargetFY18 Actual
Storm Water Quality - Environmental Water Quality95% 78%88%1328 88%% of storm water stations where water test results indicate no
follow up is needed
89%
164 2001861329 225# of dry weather sites monitored 436
11,000 11,0008,9081330 17,351# of pounds of floatable debris collected from creeks within the city
18,398
Storm Water Quality - Household Hazardous Waste Collection65% 65%62%1331 55%% of households that are aware of OKC household hazardous
waste collection services
54%
660,000.00 576,000.00585,786.941332 768,380.00Pounds of household hazardous waste collected 648,766.00
227,000 237,000272,7801333 272,780# of pounds of household hazardous waste reused and recycled 529,432
9,000 9,0009,9811334 10,380# of residents utilizing household waste services 9,722
Storm Water Quality - Public Outreach11% 11%7%1335 7%% of elementary schools in Oklahoma City contacted that
participate in the Storm Water Quality program
9%
24 2481336 20# of school visits 19
2,500 2,5006501337 3,088# of student contacts 1,991
875 8758821338 814# of total participants in volunteer programs 651
3,500,000 4,000,0006,385,6621339 5,532,508# of total public outreach contacts 3,676,618
Storm Water Quality - Stormwater Permitting50% 50%51%1340 52%% of active construction and land disturbance permitted sites
receiving a monthly inspection
57%
N/A N/A68%1341 N/A% of active industrial permitted sites receiving required inspections *
N/A
99% 99%99%1342 98%% of construction and industrial inspections in compliance with storm water pollution prevention plan requirements
99%
N/A N/A82%1343 N/A% of industrial inspections completed on time monthly * N/A
FY21 Budget Performance Data G-134
Table of Contents

Public WorksFY21 TargetFY20 ProjectionFY19 Actual FY20 TargetFY18 Actual
Storm Water Quality - Stormwater Permitting120 120831344 132# of construction and land disturbance site enforcement actions
issued
98
8,500 8,5009,2121345 8,884# of construction and land disturbance site inspections conducted
9,058
12 12251346 26# of industrial site enforcement actions issued 12
700 1,1901,2111347 869# of industrial site inspections conducted 841
Streets, Traffic & Drainage Maintenance - Drainage90% 90%71%1348 85%% of drainage repairs completed within 30 calendar days 90%
2,000 2,5002,5961349 2,441# of drainage repairs completed 1,177
225.00 225.00195.931350 318.31# of tons of debris removed from the Oklahoma River 130.80
Streets, Traffic & Drainage Maintenance - Streets80% 80%N/A1351 N/A% of arterial pothole repairs completed within 3 calendar days
of work order issued
60%
80% 91%58%1352 54%% of utility cut repairs completed within 14 calander days of receipt from line maintenance
N/A
50% 50%30%1353 30%% of citizens satisfied with condition of residential streets 28%
40% 40%20%1354 20%% of citizens satisfied with the condition of arterial streets 18%
60,000 60,00054,5441355 66,452# of potholes repaired 53,798
400 3501621356 235# of utility cut repairs 828
Streets, Traffic & Drainage Maintenance - Traffic Operations80% 80%70%1357 83%% of priority traffic signal calls responded to within 30 minutes 71%
80% 80%88%1358 64%% of traffic sign work orders completed within 7 days 79%
3,000 3,0002,9551359 3,016# of traffic sign installation and repairs completed 1,993
5,000 6,5006,8991360 9,009# of traffic signal repairs completed 4,228
FY21 Budget Performance Data G-135
Table of Contents

Public WorksFY21 TargetFY20 ProjectionFY19 Actual FY20 TargetFY18 Actual
Traffic Management - Traffic and Transportation Services100% 100%100%1361 100%% of work zone permits issued within one business days of
application
100%
80% 80%83%1362 75%% of work zones inspected in compliance 77%
40% 40%13%1363 13%% of active work zones receiving a compliance inspection 11%
4,600 4,6005,4381364 4,940# of active work zones 3,978
1,840 1,8407161365 626# of active work zones receiving compliance inspection 421
7,200 7,2008,5911366 7,512# of work zone compliance inspections 5,053
4,600 4,6004,1751367 3,473# of work zone permit requests processed 4,295
Traffic Management - Traffic Engineering50% 50%35%1368 37%% of citizens satisfied with the flow of traffic and ease of getting
around the City as indicated by the citizen's survey
35%
100% 100%100%1369 100%% of field studies completed within 14 days 100%
100% 100%100%1370 100%% of traffic engineering plan reviews receiving intial response within 3 business days
100%
1,000 1,0005891371 882# of field studies completed 1,120
475 4755341372 520# of traffic construction design plans reviewed 398
120 1202581373 136# of traffic modifications that increased safety (monthly avg) 107
1,300 1,3003,2261374 1,628# of traffic service requests completed 1,282
FY21 Budget Performance Data G-136
Table of Contents
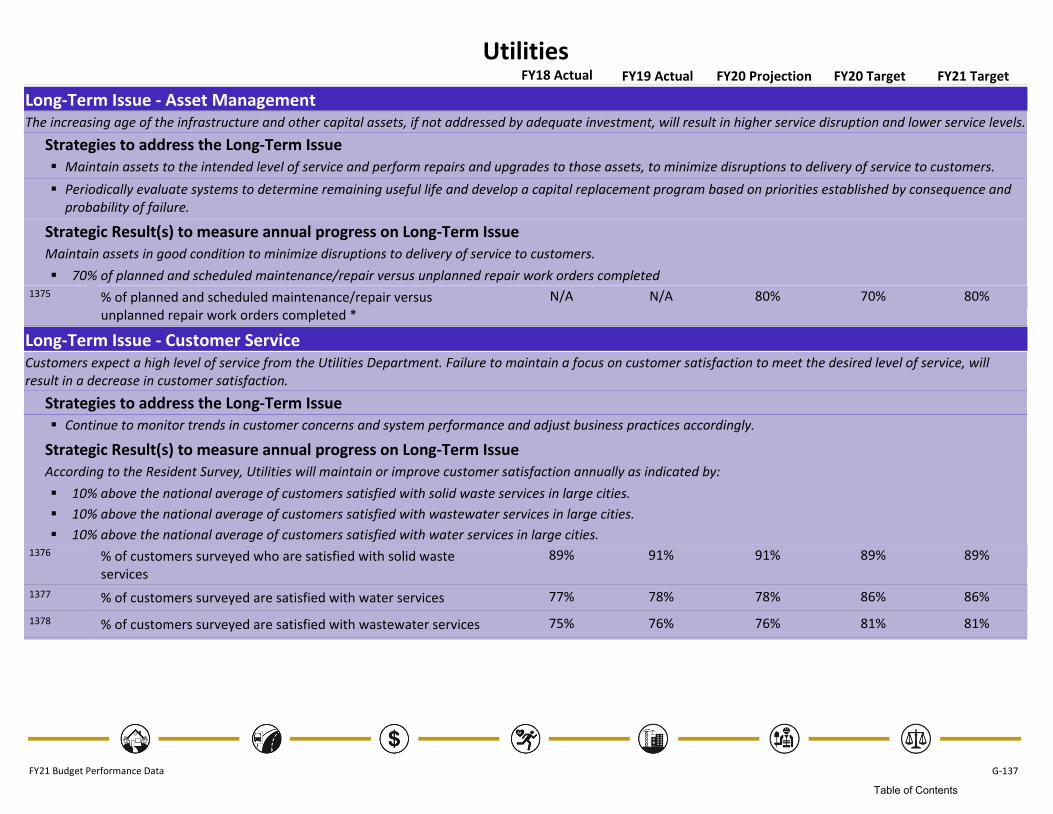
UtilitiesFY21 TargetFY20 ProjectionFY19 Actual FY20 TargetFY18 Actual
Long-Term Issue - Asset ManagementThe increasing age of the infrastructure and other capital assets, if not addressed by adequate investment, will result in higher service disruption and lower service levels.
Strategies to address the Long-Term IssueMaintain assets to the intended level of service and perform repairs and upgrades to those assets, to minimize disruptions to delivery of service to customers.
Periodically evaluate systems to determine remaining useful life and develop a capital replacement program based on priorities established by consequence and probability of failure.
Strategic Result(s) to measure annual progress on Long-Term IssueMaintain assets in good condition to minimize disruptions to delivery of service to customers.
70% of planned and scheduled maintenance/repair versus unplanned repair work orders completed
70% 80%80%1375 N/A% of planned and scheduled maintenance/repair versus unplanned repair work orders completed *
N/A
Long-Term Issue - Customer ServiceCustomers expect a high level of service from the Utilities Department. Failure to maintain a focus on customer satisfaction to meet the desired level of service, will result in a decrease in customer satisfaction.
Strategies to address the Long-Term IssueContinue to monitor trends in customer concerns and system performance and adjust business practices accordingly.
Strategic Result(s) to measure annual progress on Long-Term IssueAccording to the Resident Survey, Utilities will maintain or improve customer satisfaction annually as indicated by:
10% above the national average of customers satisfied with solid waste services in large cities.
10% above the national average of customers satisfied with wastewater services in large cities.
10% above the national average of customers satisfied with water services in large cities.
89% 89%91%1376 91%% of customers surveyed who are satisfied with solid waste services
89%
86% 86%78%1377 78%% of customers surveyed are satisfied with water services 77%
81% 81%76%1378 76%% of customers surveyed are satisfied with wastewater services 75%
FY21 Budget Performance Data G-137
Table of Contents

UtilitiesFY21 TargetFY20 ProjectionFY19 Actual FY20 TargetFY18 Actual
Long-Term Issue - Workforce Stability and DevelopmentThe increasing number of retirements and difficulty in recruiting and retaining qualified employees, if not addressed, will impair Utilities' ability to maintain and improve service reliability.
Strategies to address the Long-Term IssueContinue to pursue training strategies to broaden employees’ workplace skills.
Continue the workforce succession plan to achieve career progression and meet job requirements.
Strategic Result(s) to measure annual progress on Long-Term IssueEnsure a qualified workforce for delivering customer service as indicated by:
100% of supervisors will be on track to complete Utilities University supervisory core classes in three years.
100% of mid-management employees will be Lean Green Belt certified by 2022.
100% 100%90%1379 90%% of supervisors on track to complete Utilities University supervisory core classes in three years
100%
100% 100%64%1380 N/A% of mid-management employees Lean Green Belt certified * N/A
Long-Term Issue - Maintain Strong Financial ManagementIncreased customer and regulatory demands along with increased construction, equipment, and operational costs can exceed annual revenue requirements to support programs which, if not addressed, will result in a decrease in services and customer satisfaction.
Strategies to address the Long-Term IssueContinue to evaluate the Cost of Service and make rate adjustment recommendations to OCWUT, OCEAT and City Council accordingly.
Strategic Result(s) to measure annual progress on Long-Term IssueProtect the customers’ investment in Utilities by maintaining strong financial management as demonstrated by:
OCWUT will maintain bond ratings of AAA from Standard & Poor’s and Aaa from Moody’s Investors Service.
OCEAT will maintain its bond rating of AAA from Standard & Poor’s.
AAA / Aaa AAA / AaaAAA / Aaa1381 AAA / AaaOCWUT will maintain bond ratings of AAA from Standard & Poor's and Aaa from Moody's Investor's Service
AAA / Aaa
AAA AAAAAA1382 AAAOCEAT will maintain its bond rating of AAA from Standard & Poor's
AAA
FY21 Budget Performance Data G-138
Table of Contents

UtilitiesFY21 TargetFY20 ProjectionFY19 Actual FY20 TargetFY18 Actual
Long-Term Issue - Environmental StewardshipThe reduced availability of future natural resources and commodities, if not addressed, will result in the inability to meet service expectations of our customers.
Strategies to address the Long-Term IssueContinue to pursue conservation of resources in the best economic interest of our customers.
Improve participation rate in recycle program to extend life of landfill.
Strategic Result(s) to measure annual progress on Long-Term IssueUtilities will maintain and improve its environmental stewardship as evidenced by:
Reduce annual water loss to less than 10% by 2022.
Increase recycle tonnage to 27,000 by 2021.
N/A 0.1217N/A1383 N/AN/A
18,000.00 16,500.0016,230.701384 17,207.51# of tons recycled 7,348.98
Administrative - Administration75% 75%63%1385 67%% of key measures and strategic results achieved 77%
90% 92%94%1386 94%% of full-time equivalent employees without an on the job injury (OJI) in the current fiscal year
97%
100% 100%64%1387 N/A% of mid-management employees Lean Green Belt certified * N/A
95% 95%60%1388 56%% of performance evaluations completed by the review date 59%
100% 100%90%1389 90%% of supervisors on track to complete Utilities University supervisory core classes in three years
100%
95% 95%85%1390 82%% of terminations submitted to the Personnel Department within three days of the termination date
63%
793 7737191391 723# of full-time employees supported 698
107,770,625 107,567,70889,306,9321392 88,481,272Dollar amount of operating expenditures managed 95,343,981
Customer Service - Customer Service/Billing90% 85%83%1393 86%% of utility customer calls answered within 30 seconds of first
ring
89%
95% 95%98%1394 95%% of billing discrepancies resolved within five business days 98%
FY21 Budget Performance Data G-139
Table of Contents

UtilitiesFY21 TargetFY20 ProjectionFY19 Actual FY20 TargetFY18 Actual
Customer Service - Customer Service/Billing486,148 365,222441,3011395 N/A# of utility customer service calls 489,089
Customer Service - Field Support99% 99%100%1396 N/A% of accurate meter reads N/A
85% 89%88%1397 87%% of service requests completed as scheduled 85%
90% 95%100%1398 100%% of bills issued within two business days of meter read 66%
2,600,000 2,858,7342,839,5031399 N/A# of meter readings * N/A
2,400,000 2,436,0002,291,5061400 N/A# of routine bills issued N/A
296,400 245,000284,9611401 228,141# of service requests 302,309
Engineering - ENGINEERING MANAGEMENT90% 90%93%1402 79%% of Inter-Departmental projects reviewed within five business
days
73%
90% 90%75%1403 80%% of projects completing construction within the contract time 70%
10% 10%11%1404 N/A% of wastewater collection system assessed N/A
24 24281405 20# of construction projects outstanding 27
80 801181406 81# of Inter-Departmental projects presented for review 55
Engineering - Infrastructure Records90% 90%87%1407 95%% of water and wastewater record requests completed within
30 minutes
87%
5,000 5,0005,8491408 7,403# of water and wastewater record requests 5,258
Engineering - Private Development95% 95%100%1409 99%% of water and wastewater private development plans
reviewed within ten business days of receipt
84%
700 7009131410 714# of water and wastewater private development plans received 643
Fleet Services - Fleet Services70% 75%80%1411 N/A% of planned and scheduled maintenance/repair versus
unplanned repair work orders completed *
N/A
FY21 Budget Performance Data G-140
Table of Contents

UtilitiesFY21 TargetFY20 ProjectionFY19 Actual FY20 TargetFY18 Actual
Fleet Services - Fleet Services95% 95%97%1412 98%% of scheduled vehicle and equipment preventative
maintenance inspections completed within 24 hours
93%
85% 85%84%1413 N/A% of Utilities fleet vehicles utilized * N/A
95% 95%96%1414 96%% of Utilities vehicles and equipment available for use 97%
380 3673001415 305# of standard Utilities fleet vehicles 366
N/A 9,500N/A1416 N/A# of Utilities vehicle and equipment maintenance and repairs * N/A
7,030 8,0008,5611417 8,088# of Utilities vehicle and equipment preventative maintenance inspections
6,661
7,400 8,0008,8261418 8,294# of vehicle and equipment preventative maintenance tasks required
7,158
Line Maintenance - UTILITIES METER MAINTENANCE100% 100%51%1419 N/A% of required Utility locates completed on time * N/A
100% 100%104%1420 N/A% of scheduled, aging meters replaced 107%
18,000 18,00017,8601421 N/A# of meters scheduled for replacement 18,017
59,426 59,42660,3291422 N/A# of Utility locate requests received * N/A
Line Maintenance - Wastewater Line Maintenance70% 70%59%1423 N/A% of planned and scheduled maintenance/repair versus
unplanned repair work orders completed *
N/A
95% 95%79%1424 N/A% of wastewater overflow/backup calls responded to within one hour
N/A
2,820 2,8202,9681425 N/A# of wastewater overflow/backup calls * N/A
9,246 9,2469,0071426 N/A# of work orders * N/A
Line Maintenance - Water Line Maintenance70% 70%82%1427 N/A% of planned and scheduled maintenance/repair versus
unplanned repair work orders completed *
N/A
95% 95%88%1428 99%% of water emergencies (main/service line breaks) responded to within one hour
96%
FY21 Budget Performance Data G-141
Table of Contents

UtilitiesFY21 TargetFY20 ProjectionFY19 Actual FY20 TargetFY18 Actual
Line Maintenance - Water Line Maintenance90% 90%85%1429 N/A% of inoperable public fire hydrants repaired within five
business days
82%
90% 90%90%1430 94%% of water leaks repaired within five business days 79%
300 3002541431 N/A# of inoperable fire hydrants reported N/A
298,438 298,541298,3551432 N/A# of public fire hydrants in system * N/A
2,310 2,3102,3131433 N/A# of water leaks * N/A
8,029 8,0297,9011434 N/A# of work orders * N/A
3,889 3,8893,9521435 N/A# water emergencies * N/A
Solid Waste - Bulk Waste Collections100% 99%100%1436 N/A% of bulk waste collected on schedule * N/A
84% 84%84%1437 82%% of customers reporting satisfactory bulk waste service 81%
95% 95%82%1438 72%% of customer requests for missed bulk waste resolved in two business days
84%
2,500,000 2,515,9322,491,7871439 N/A# of customers receiving bulk waste service * N/A
3,198 3,5003,1551440 N/A# of customers requests for missed bulk waste collection * N/A
Solid Waste - Environmental Clean-Up52% 50%64%1441 67%% of litter collection routes completed on schedule 76%
1,320 1,3201,3201442 N/A# of litter routes * N/A
Solid Waste - Solid Waste Collection95% 95%99%1443 99%% of scheduled solid waste routes collected by 5:00 pm 100%
95% 95%93%1444 94%% of customer requests for missed cart collections resolved in one business day
87%
89% 89%91%1445 91%% of customers surveyed who are satisfied with solid waste services
89%
95% 95%96%1446 99%% of solid waste collection carts delivered, repaired or replaced within three business days of request
98%
FY21 Budget Performance Data G-142
Table of Contents

UtilitiesFY21 TargetFY20 ProjectionFY19 Actual FY20 TargetFY18 Actual
Solid Waste - Solid Waste Collection7% 6%6%1447 6%% of trash recycled 3%
4,000 4,6544,5511448 N/A# of customer requests for missed cart collection * N/A
43,508 48,00034,4161449 N/A# of service requests for solid waste collection carts delivered, repaired or replaced *
N/A
210,199 213,605210,1051450 N/A# of solid waste customers * N/A
1,131 1,1251,1291451 N/A# of solid waste routes scheduled * N/A
Wastewater Quality - Lift Station Maintenance70% 80%79%1452 N/A% of planned and scheduled maintenance/repair versus
unplanned repair work orders completed *
N/A
330 2,9001,5511453 N/A# of work orders 247
Wastewater Quality - Pretreatment95% 95%94%1454 99%% of commercial customers in compliance with pre-treatment
program
98%
95% 95%99%1455 99%% of industrial customers in compliance with pre-treatment program
99%
394 3943921456 N/A# of commercial customers monitored * N/A
1,618 1,6001,7031457 N/A# of industrial customers monitored * N/A
Wastewater Quality - Wastewater Treatment70% 80%95%1458 N/A% of planned and scheduled maintenance/repair versus
unplanned repair work orders completed
94%
21,570 21,50019,4871459 N/A# of work orders * N/A
Water Quality - Property Maintenance95% 95%100%1460 100%% of property maintenance requests by citizens responded to
within three business days of receipt
100%
100 100681461 N/A# of property maintenance requests 158
FY21 Budget Performance Data G-143
Table of Contents

UtilitiesFY21 TargetFY20 ProjectionFY19 Actual FY20 TargetFY18 Actual
Water Quality - Pumping Station Maintenance70% 80%92%1462 N/A% of planned and scheduled maintenance/repair versus
unplanned repair work orders completed *
N/A
100 1801811463 N/A# of work orders * N/A
Water Quality - Water Treatment70% 80%85%1464 N/A% of planned and scheduled maintenance/repair versus
unplanned repair work orders completed *
N/A
100% 100%100%1465 100%% of water quality tests meeting primary drinking water standards
100%
100% 100%99%1466 N/A% of water quality tests meeting secondary drinking water standards
102%
35.00 35.0036.821467 32.35# of billion gallons of water treated 35.37
23,850 23,85023,9131468 N/A# of required primary drinking water tests * N/A
970 9709471469 N/A# of scheduled secondary drinking water tests 41,195
1,250 1,2501,1731470 N/A# of work orders 1,072
80% 80%85%1471 N/A% of planned and scheduled versus corrective maintenance work orders completed
84%
FY21 Budget Performance Data G-144
Table of Contents