03664-9780939934591-en-book.pdf - IMF eLibrary
139
-
Upload
khangminh22 -
Category
Documents
-
view
1 -
download
0
Transcript of 03664-9780939934591-en-book.pdf - IMF eLibrary


©International Monetary Fund. Not for Redistribution
Occasional Papers of the International Monetary Fund*
2. Economic Stabilization and Growth in Portugal, by Hans 0. Schmitt. 1981.
5. Trade Policy Developments in Industrial Countries, by S.J. Anjaria, z. lqbal, L.L. Perez, and
W.S. Tseng. 1981.
6. The Multilateral System of Payments: Keynes. Convertibility, and the International Monetary
Fund's A11icles of Agreement, by Joseph Gold. 1981.
7. International Capital Markets: Recent Developments and Short-Term Prospects, 1981, by a Staff
Team Headed by Richard C. Williams, with G.G. Johnson. 1981.
8. Taxation in Sub-Saharan Africa. Part I: Tax Policy and Administration in Sub-Saharan Africa, by
Carlos A. Aguirre. PeterS. Griffith, and M. Zi.ihti.i Yi.icelik. Part ll: A Statistical Evaluation of
Taxation in Sub-Saharan Africa, by Vito Tanzi. 1981.
9. World Economic Outlook: A Survey by the Staff of the International Monetary Fund. 1982.
I 0. International Comparisons of Government Expenditure. by Alan A. Tait and Peter S. Helier.
1982.
I I. Payments Arrangements and the Expansion of Trade in Eastern and Southern Africa, by
Shailendra J. Anjaria, Sena Eken, and John F. Laker. 1982.
12. Effects of Slowdown in Industrial Countries on Growth in Non-Oil Developing Countries, by
Morris Goldstein and Mohsin S. Khan. 1982.
13. Currency Convertibility in the Economic Community of West African States, by John B.
McLenaghan, Saleh M. Nsouli. and Klaus-Walter Riechel. 1982.
14. International Capital Markets: Developments and Prospects, 1982, by a Staff Team Headed by
Richard C. Williams, with G.G. Johnson. 1982.
15. Hungary: An Economic Survey, by a Staff Team Headed by Patrick de Fontenay. 19�2.
16. Developments in international Trade Policy, by S.J. Anjaria, Z. lqbal. N. Kirmani, and
L.L. Perez. 1982.
17. Aspects of the International Banking Safety Net, by G.G. Johnson, with Richard K. Abrams.
1983.
18. Oil Exporters' Economic Development in an Interdependent World, by Jahangir Amuzegar. 1983.
19. The European Monetary System: The Experience, 1979-82, by Horst Ungerer, with Owen Evans
and Peter N yberg. 1983.
20. Alternatives to the Central Bank in the Developing World. by Charles Collyns. 1983.
22. Interest Rate Policies in Developing Countries: A Study by the Research Department of the
International Monetary Fund. 1983.
23. International Capital Markets: Developments and Prospects, 1983. by Richard Williarns, Peter
Keller, John Lipsky, and Donald Mathieson. 1983.
*Numbers I. 3, 4, and 2 I of I he Occasional Paper series are out of print.
(Conrinued on inside back cover)

©International Monetary Fund. Not for Redistribution
Occasional Paper No. 43
International Capital Markets
Developments and Prospects
By Maxwell Watson, Donald Mathieson,
Russell Kincaid, and Eliot Kalter
International Monetary Fund
Washington, D.C. February 1986

©International Monetary Fund. Not for Redistribution
c 1986 International Monetary Fund
International Standard Serial Number: lSSN 0251-6365
International Standard Book Number: ISBN 0-939934-59-0
Price: US$7.50 (US$4.50 to university libraries, faculty members,
and students)
Address orders to:
External Relations Department, Attention Publications International Monetary Fund, Washington, D.C. 20431

©International Monetary Fund. Not for Redistribution
Contents
Prefatory Note
I.
rr.
m.
Overview of Developments and Key Issues Economic and Financial Environment International Banking Activity
Bank Lending to Developing Countries Bonds and Issuance Facilities Issues Concerning the Markets
Liberalization and Innovation Integration of Markets and Redistribution of Risk Some Implications of Recent Changes
The Debt Situation Developments in Techniques for Restructuring and
Concerted Lending Banks' Lending Behavior
Prospects Trends in Private Capital Flows U.S. Debt Initiative Medium-Term Outlook
Structural Changes in the Financial Markets Factors Contributing to Change in Financial Markets
Inflation and Increased Uncertainty Changing Patterns of Payments Imbalances, Savings, and
Investment Flows Liberalization
Development of Market Instruments Securitization Swaps, Options, and Futures
Changes in the Supervision of Financial Markets Capital Adequacy Interaction of Capital Adequacy Regulation and Market
Innovation Reserves for Loan Losses Liquidity Functional versus Institutional Supervision
International Banking Activity Measurement of International Banking Flows Overview of Bank Lending and Deposit Taking Industrial Countries as International Borrowers and Depositors
of Funds Developing Countries as International Borrowers and
Depositors of Funds Regional Developments
Lending Behavior of Banks by Ownership and Size Developments in Banks' Claims Relative to Capital Terms of Bank Lending
Page ix
1
20
34
Ill

©International Monetary Fund. Not for Redistribution
CONTENTS
Page
IV. Recent Trends in Bank Debt Restructuring 50 General Amounts and Terms Multiyear Restructurings and Enhanced Surveillance
Multiyear Restructuring Agreements Enhanced Surveillance
New Financing Agreements Other Current Developments
Currency Redenomination On-lending and Re-lending Loan Swaps and Sales
V. International Bond and Note Markets and Other Flows 58
Bond Market Trends Developments in 1984 and 1985
Overview Interest Rate Developments International Bond Issuance. Currency Composition and Market Share Types of Bonds Foreign Bond Markets Eurobond Markets Maturities Developing Country Access
International Issuance Facilities Foreign Direct Investment and Official Flows
APPENDICES
I. Measurement of International Banking Flows 73
Coverage Measurement Issues
Exchange Rate Adjustment Accuracy of Reports
u. The Institute of International Finance, Inc. 76
Ill. Domestic Savings, Foreign Savings, and Investment 77
Domestic and Foreign Savings Domestic Savings Foreign Savings
Investment Note to Appendix I l l
IV. Technical Note on Interest Rate and Currency Swaps 82 Interest Rate Swap Currency Swaps
V. Glossary of Selected Terms 84
VI. Statistical Tables 86
IV
©International Monetary Fund. Not for Redistribution
Contents
TABLES Page
Section I. I. International Lending and Selected Economic Indicators 3 11. 2. Selected Changes in Regulations Governing Financial
Markets in Japan and the United States 23 3. Capital-Asset Ratios of Banks in Selected Industrial
Countries, 1977-84 28 Ill. 4. Total Cross-Border Bank Lending and Deposit Taking,
1982-First Half of 1985 35 5 . International Borrowing Operations in ECUs, 1983-First
Half of 1985 37 6. New Publicized Long-Term External Bank Credit
Commitments to Developing Countries, 1979-First Half of 1985 38
7. Total Cross-Border Bank Lending to and Deposit-Taking from Developing Countries, 1983-84 40
8. International Assets, Liabilities, and Net Position of Banks by Nationality of Ownership 42
9. Change in Bank Claims on Developing Countries, 1982-First Half of 1985 43
10. Change in Claims of U.S . Banks on Developing Countries, 1982-First Half of 1985 44
1 1 . Short-Term Claims in Percent of Outstanding Bank Claims, 1979-First Half of 1985 48
IV. 12. Terms of Selected Bank Debt Restructurings and Bank Financial Packages, 1983-September 1985 52
V. 13. Real Return on Bond Holdings, 1976-83 59 14. Measures of Real Size of Bond Market, 1976-84 60 15 . Developments in International Bond Markets, 1980-First
Half of 1985 60 16. Nominal and Real Interest Rates, 1979-84 62 17. Gross International Bond Issues and Placements, 1979-
June 1985 63 18. International Bond Issues and Placements by Currency of
Denomination, 1979-June 1985 64 19. Developing Country Gross Issues and Placements in
International Markets, 1979-First Half of 1985 68 20. International Facility by Type of Use, 1982-85 70 2 1 . International Facility by Borrower, 1982-85 70 22. Capital-Importing Developing Countries: Financing of
Current Account Deficit and Reserve Accumulation, 1977-84 7 1
Appendix
VI. 23. Cross-Border Interbank Lending and Deposit Taking, 1982-First Half of 1985 86
24. International Bank Lending to Nonbanks and Deposit Taking from Nonbanks, 1982-First Half of 1985 88
25. Total Cross-Border Bank Lending to and Deposit Taking from Developing Countries, 1982-First Half of 1985 89
26. Cross-Border Interbank Lending to and Deposit Taking from Developing Countries, 1982-First Half of 1985 90
27. Cross-Border Interbank Lending to and Deposit Taking from Nonbanks in Developing Countries, 1982-First Half of 1985 91
V

©International Monetary Fund. Not for Redistribution
CONTENTS
VI
Page 28. Cross-Country Comparison of Components of External
Assets and Liabilities, End-December 1984 92 29. Long-Term International Bank Credit Commitments, 1979-
First Half of 1985 94 30. New Long-Term External Bank Credit Commitments by
Country of Destination, 1979-First Half of 1985 96 3 1 . Long-Term International Bank Credit Commitments, 1979-
First Half of 1 985 98 32. External Assets of BIS Reporting Banks by Maturity and
Undisbursed Credit Commitments, December 1980-June 1985 99
33. Undisbursed Credit Commitments in Percent of Outstanding Bank Claims, 1979-June 1985 101
34. Assets and Capital of U.S. Banks, 1977-First Half of 1985 101 35. Commercial Banks Ranked by Assets 102 36. Chronology of Bank Debt Restructurings and Bank
Financial Packages, 1978-85 103 37. Amounts of Medium- and Long-Term Bank Debt
Restructured, 1983-85 l04 38. Short-Term Debt RoUed Over or Converted Into Medium-
Term Loans, 1983-85 104 39. Concerted Lending: Commitments and Disbursements,
1983-85 105 40. Terms and Conditions of Bank Debt Restructurings and
Bank Financial Packages, 1978-85 106 4 1 . World Bank Cofinancing of B-Loans by Fiscal Year of
Signing 121 42. International Bonds, by Type, 1981-84 123 43. Maturity Profile of International Bonds, 1981-84 123 44. Interest Rates on International Markets, December 1983-
Second Quarter 1985 124 45. Inflation, Interest Rate, and Exchange Rate Experience of
Selected Financial Market Countries, 1970-84 125
CHARTS
Section
I.
Ill. V .
I. Growth Rate of International Bank Claims, 1976-84 2. Bond Issues and Long-Term Commitments of Credits and
Facilities to Capital-Importing Developing Countries, 1981-First Half of 1985
3. Terms of International Bank Lending Commitments, 1976-First Half of 1985
4. Selected Balance Sheet Data for U.S. Banks, 1977-84 5. Concentration of Cross-Border Bank Claims, 1976-84 6. Domestic Money Market Rates, January 1983 to June 1985 7. "Domestic Long-Term Interest Rates, January 1983 to June
1985 8. Interest Rate Developments, January 1981 to June 1985 9. Developments in International Bond Markets, 1981-84
10. Yield Differentials on Deutsche Mark-Denominated Public Bonds Issued by Nonresidents, 1982-85
I J. Eurodollar and U.S. Commercial Paper Interest Rates, January 1983 to September 1985
2
5
6 14 47 61
61 62 65
70
70

©International Monetary Fund. Not for Redistribution
Page
Appendices
Ill. 12. Gross Domestic Savings, 1967-84 13. Fiscal Imbalances, 1967-84 14. Foreign Capital FJows, 1967-84 15. Gross Capital Formation, 1967-84
The following symbols have been used throughout thi!> paper:
to indicate that data are not available;
to indicate that the figure is zero or less than half the final digit shown. or that the item does not exist;
between years or months (e.g., 1 979-81 or January-June) to indicate the
years or months covered, including the beginning and ending years or months;
between years (e.g., 1980/81) to indicate a crop or fiscal (financial) year .
.. Billion'· means a thousand million.
Minor discrepancies between constituent figures anti totab are due to rounding.
78 79 80 80
Contents
VII

©International Monetary Fund. Not for Redistribution
'f'hispage infenfionalfy left hfank

©International Monetary Fund. Not for Redistribution
Prefatory Note
This study was prepared in the International Capital Markets Division of the Exchange and Trade Relations Department of the international Monetary Fund under the direction of C. Maxwell Watson, Division Chief, with G. RusseU Kincaid, Assistant Division Chief. Coauthors of the study are Donald Mathieson, Division Chief in the Research Department, and Eliot Kalter of the Exchange and Trade Relations Department.
Background for the study was provided in part by informal discussions with commercial banks, monetary and bank supervisory authorities, and the staffs of the Bank for International Settlements, the European Community, and the Organization for Economic Cooperation and Development. These discussions took place at various times during June to September 1985 in Amsterdam, Basle, Berlin, Bern, Brussels, Frankfurt, London, Luxembourg, New York, Ottawa, Paris, Singapore, Tokyo, Toronto, Washington, and Zurich. In addition to the authors, other Fund staff members took part in some of the discussions: LaWTence OeMilner and Charles Collyns of the Western Hemisphere Department participated in discussions in Canada and in the United States, respectively. Sena Eken of the Fund's Office in Europe participated in meetings in Brussels and Paris.
Other Fund staff members made significant contributions to the preparation of this study. They include Klaus P. RegJing, Bruno de Schaetzen, Caroline Atkinson, and R. Barry Johnston, all of the International Capital Markets Division. Staff of the Bureau of Statistics, particularly Peter L. Joycc and Cyrille Brian<;on, developed and compiled the data based on the Fund's International Banking Statistics. Research assistance was provided by Can T. Demir. The authors are also grateful to the editor, Maxi ne Stough, of the External Relations Department.
Similar studies have been prepared in recent years, and last year's study was published in August 1984 as Occasional Paper No. 3 1 . The present study was completed in December 1985 and reflects developments up to that time. Related issues concerning bank debt restructurings are reviewed in detail in Recent Developments in External Debl Reslruc/uring, published in October 1985 as Occasional Paper No. 40.
The paper has benefited from comments by staff in other departments of the Fund and by members of the Executive Board. However, opinions expressed are those of the authors and do not necessarily represent the view of other staff members or of Executive Directors.
It should be noted that the term "country" used in this document does not in all cases refer to a territorial entity that is a state as understood by international Jaw and practice. The term also covers some territorial entities that are not states but for which statistical data are maintained and provided internationally on a separate and independent basis.
IX

©International Monetary Fund. Not for Redistribution
'f'hispage infenfionalfy left hfank

©International Monetary Fund. Not for Redistribution
I Overview of Developments and Key Issues
This paper provides a description and analysis of recent developments in international capital markets and an assessment of the prospects for private financing flows. Particular attention is focused on recent trends in liberalization and innovation in international financial markets, including relevant changes in supervision, and on developments in the debt situation, especiaUy the prospects for flows to developing countries.
An overview of developments in international financial markets, together with a general assessment of current issues and prospects for market flows, is given in this section. There is special emphasis on the factors influencing flows to developing countries and the recent U.S. initiative to promote these flows. Section U examines the recent structural changes in major financial markets, including relevant developments in bank supervisory practices. A detailed description and analysis of developments in international bank lending is provided in Section ill. Recent trends in bank debt restructuring, including the development of multiyear restructurings and banks' monitoring procedures, are reviewed in Section IV. Developments in other financial flows, including the issuance of international bonds and short-term notes, are presented in Section V. The appendices contain some additional background information on issues related to measurement and coverage in international banking statistics; the activities of the Institute of International Finance; developments in tbe pattern of savings and investment flows; technical information on interest rate and currency swaps; and a glossary of terms.
As with previous papers, the scope of this paper is limited mainly to the analysis of financing flows through international capital markets. It does not address in detail questions related to concessional assistance, the flow of resources through the multilateral development institutions, or the role of the Fund in providing financial assistance in support of adjustment programs of member countries. Nor does it djscuss mediumterm issues affecting the world economy. A discussion of the principal findings that have emerged from the studies in the Fund setting out broad scenarios of how the world economy could evolve over the period
through the end of this decade is contained in the 1985 World Economic Outlook.'
Economic and Financial Environment
The growth and pattern of international financial flows during 1984-85 have primarily reflected an expansion of financing needs in industrial countries. The combined current account deficits of these countries expanded sharply, from $40 billion in 1982 to $108 billion in 1984, while the aggregate current account deficits of developing countries declined from $133 billion to $78 billion during that period. These trends continued in 1985. As a resuJt of these developments, total net lending through international capital markets rose substantially during 1984-85. Total net lending through international banks and bond markets increased by $68 billion in t 984 to $252 billion (Table 1) , after two years of declining activity. Cross-border bank lending in 1984 recovered to its 1 982 level, and net issues of international bonds rose to a record volume. A further increase in activity occurred in the first half of 1 985.
The sharp increase in the U .S. current account deficit (from $3 billion in 1982 to $93 billion in 1984) more than accounted for the rise in the current account deficits of industrial countries. For 1985, the identified current account deficits of industrial countries are estimated to reach $141 billion, with the U.S. current account deficit expected to increase to $123 billion. The recent distribution of current account imbalances has been one key factor in the shift of international financing flows toward securities market transactions, in contrast with the rapid growth in bank intermediation that occurred before 1982.
The current pattern of investment and savings is characterized by increased deficits among borrowers whose high credit stanrung afforded them considerable access to securities markets, and by higher surpluses among savers who invested directly in such instru-
1 International Monetary Fund, World Economic Outlook. Octo· ber 1985: Revised Projections by the Staff of the International Monetary Fund (Washington: International Monetary Fund, October 1985).

©International Monetary Fund. Not for Redistribution
I • OVERVIEW OF DEVELOPMENTS AND KEY ISSUES
ments. The financing requirements of the U .S. fiscal deficit were partly satisfied by large foreign purchases of U .S. Government securities. Nonfinancial companies in the United States borrowed more heavily in international capital markets. In Japan and Europe, nonfinancial corporations have used higher profits associated with economic recovery to strengthen their balance sheets by rebuilding financial assets and reducing their net indebtedness to banks.
Capital-importing developing countries have engaged in strong adjustment efforts associated with tight external financing constraints. Their current account deficit declined sharply from $60 billion in 1983 to $38 billion in 1984. Latest Fund staff estimates put their current account deficits at $44 billion in 1985. Nondebt-creating flows plus net disbursement from official sources averaged about $5 I billion during 1984-85. As a result, the current account deficits of these countries were more than covered by financing from sources other than international capital markets.
Current account imbalances of many developing
Chart 1. Growth Rate of International Bank Claims, 1976-84
(In percent)
30 CLAIMS ON ALL COUNTRIES
0�--�--�----�--�----�--�----�---J
40 CLAIMS ON DEVELOPING COUNTRIES
20
10
�9�7�6--�1�97=7--�1�97�8���9�79���9�W�--�19�M1���9�8�2--�1�98�3��1�9� Sources: Bank for international Settlements, International Bank·
i111: Stllli.wics and Annual Report: International Monetary Fund. l11tematia11al Fi11ancial Statistics: and Fund staff estimates.
' The�e data do not net out interbank redepositing.
2
country groups were reduced to levels not recorded since the 1960s. The associated drop in foreign capital flows has been most evident for those developing countries which have relied on external borrowing from commercial banks (i.e., market borrowers) or its principal subgroup (i.e., major borrowers). The current account deficits of the market borrowers, which averaged 3 percent of gross domestic product (GDP) during 1973-82, declined to less than I percent in 1984-the lowest ratio since 1967. In contrast, the official borrowers continued to run current account deficits equivalent to approximately 6 percent of GDP in I 984-close to the average level of their deficits during 1973-82.
International Banking Activity
lnternationaJ banks' overall cross-border lending 2 grew by 7 percent in 1984, reaching $192 billion.3 This growth was entirely due to greater activity among industrial countries, as lending to developing countries slowed further (Chart 1). In the first half of 1985, overall bank lending slowed to $72 billion from $98 billion during the same period in 1984. Bank lending to industrial countries rose to $ 1 1 6 billion during 1984, after having declined during the previous two years. With relatively limited lending opportunities to nonbanks in industrial countries, increased bank lending was more than accounted for by greater interbank lending. which jumped by $33 billion to $110 billion during 1984. However, bank lending to these countries declined somewhat during the first half of 1985 to $56 billion compared with $65 billion during the comparable period in 1984.
The rate of growth in interbank claims on industrial countries accelerated to 8 percent in 1984, in contrast with a further slowing to 3 percent in lending to nonbanks. Moreover, interbank lending continued at a strong pace in the first half of 1985. Growth in interbank lending occurred despite several factors
:Total cross-border lending by banks is measured as the �um of cross-border interbank accounts by residence of borrowing bank and of international bank credits to nonbanks by residence of borrower. corrected for change!. attributed to exchange rate movements. In interpreting the flows thus derived. it is necessary to bear in mind that the Fund's International Banking Statistics �eries follows a balance of payments approach to recording credit flows. and is thus based on the geographical location of banks rather than on their nationality. As a result. activity within a money market center-e.g., lending by a British bank in London to local branches of U .S. banks-is not captured. On the other hand. lending by a U.S. bank to its own branches in Europe or the Far East will11how up in the data as a cross-border flow. Thus. the review of recent developments that follows does not reflect interbank lending within the major ccnters. nor does it net out redepositing between banks when recording flows across borders. Because all references in this paper are to cross-border flows. the term '"cross-border" i� hereafter omitted.
l Based on a stock of claims of $2.6 trillion at the end of 1983.

©International Monetary Fund. Not for Redistribution
Table l . International Lending and Selected Economic Indicators, 1979-85
(ln billions of U .S. dollars; or in percent)
International lending through banks and bond markets
Total 1 IMF based BIS based (gross) BIS based (net of redepositing)
Bond issues (net) 2 Bank lending I
IMF based Growth rate
BlS based (gross) Growth rate
BIS based (net of redepositing) Growth rate
International lending to developing countries 3
Bond issues • Bank lending 1
IMF based Growth rate
BIS based Growth rate
World economic developments
Total of identified current account deficits '
Industrial countries Of which:
Seven largest Developing countries
Overall current account balance of capital-importing developing countries
Reserve accumulation of capitalimporting developing countries • (accumulation + l
Growth rate in value of world trade
Growth rate of real GNP of industrial countries
lnflat ion rate of industrial countries (GNP deflators)
Interest rates (six-month Eurodollar deposit rate)
1979
370 229 148
23
347 27
206 23
125 23
3
59 23 49 24
98 29
12 69
-61
22.0
26.3
3.5
7.9
11.9
1980
414 260 179
19
395 24
241 22
160 24
2
85 27 56 22
151 59
31 92
-77
19.0
21.5
2.0
9.1
13.9
1981
434 295 195
30
404 20
265 20
165 20
4
87 22 53 17
175 41
16 134
-113
-3.0
-0.6
1.7
8.7
16.7
Economic and Financial Environment
1982
236 230 145
50
186 8
180 12 95 10
5
51 1 1 34 10
172 40
17 133
-104
-18.0
-6.3
0.4
7.2
13.6
1983
184 150 130 45
139 5
105 6
85 8
3
38 7
26 7
150 50
37 100
-60
9.0
-2.3
2.5
4.8
9.9
1984 1985
252 185 155 60
192 7
125 6
95 8
5
16 3
1 1 2
186 108
96 78
-38
18.0
6.4
4.5
4.1
11.3
Estimates
223 141
130 82
- 44
4.0
1.8
2.8
3.2
8.5
Sources: Bank for International Settlements (BIS); Organization for Economic Cooperation and Development; International Monetary Fund, lmernationa/ Financial Statistics; World Economic Outlook August 1985: A Revised Study by the Staff of the International Monetary Fund: and Fund staff estimates.
1 IMF based data on cross-border lending by banks are derived from the Fund's International Banking Statistics (rBS) (cross-border interbank accounts by residence of borrowing bank plus international bank credits to nonbanks by residence of borrower), excluding changes attributed to exchange rate movements. BIS based data are derived from quarterly statistics contained in the BIS's International Banking Developments; the figures shown are adjusted for the effects of exchange rate movements. Differences between the IMF data and the BIS data are mainly accounted for by the different coverages. The BIS data are derived from geographical analyses provided by banks in the BIS reporting area. The IMF data derive cross-border interbank positions from the regular money and banking data supplied by member countries, while the IMF analysis of transactions with non banks is based on data from geographical breakdowns provided by the BIS reporting countries and additional banking centers. Both IBS and BIS series are not fully comparable over time. owing to expanding coverage.
2 Net of redemption and of double counting due to bank purchases of bonds. 3 Excludes the seven offshore centers, which are the Bahamas, Bahrain, the Cayman Islands, Hong Kong, the Netherlands Antilles,
Panama, and Singapore. • Unadjusted for redemptions and double counting due to bank purchases of bonds. <Goods. services, and private transfers. • Based on balance of payments definitions.
3

©International Monetary Fund. Not for Redistribution
I • OVERVIEW OF DEVELOPMENTS AND KEY ISSUES
which have been operating to slow interbank lendingincluding notably higher capital asset ratio requirements for U .S. banks; issuance of medium-term bonds by banks to lengthen the maturity of their funding positions; use of futures contracts rather than interbank positions for interest rate matching; and some disintermediation as nonbanks have increasingly issued debt instruments, often backed by commercial bank stand-bys, directly to other nonbanks.
A number of developments appear to explain the growth in interbank activity. A large proportion of the growth in interbank claims represents an increase in claims between banks and their related offices abroad (i.e., intrabank claims). On occasion, local funding problems of these related offices have led to greater lending to them by their parent institutions. Since the increase in interbank lending was almost entirely directed-in roughly equal amounts-to countries with major securities markets (Japan, the United Kingdom, and the United States), a part of this activity may reflect funding of trading portfolios of securities held by bank offices in those markets. Moreover, activity may have increased at times of foreign exchange volatility, as banks co�ered foreign exchange positions in the deposit market. Lastly, the possibility was raised by some banks that a degree of tiering in the interbank market might have caused some recycling of deposits received by highly regarded banks.
Bank Lending to Developing Countries
Measures of bank lending to developing countries are subject to considerable uncertainties. Data in this paper have been corrected for identified misrecording of lending during 1983-84 and the first half of 1985. Following these adjustments, it is estimated that the resulting data on international banking activity reflect a net underrecording of flows to developing countries. 4
• Lending is measured as the change in bank claims adjusted for exchange rate fluctuations. Overcounting of bank claims in certain developing countries may occur when loan claims on nonbanks are transferred to banks (i.e., the central bank). Such transfers should result in an increase in interbank claims offset by a decline in claims on nonbanks. However, international banks that report their claims on banks and nonbanks may not properly reclassify their claims on nonbanks, which would result in overcounting of those claims and an overestimation of lending. On the other hand, data on bank claims have been reduced, owing to loan charge-offs, sales of banks' claims to nonbanks, and the exercise of official guarantees. Thus, recorded new lending could be underestimated. (According to an estimate by the staff of the Board of Governors of the U .S. Federal Reserve System, U.S. banks' lending to non-OPEC developing countries may have been understated by $31/2 billion during 1983-84, or by JY2 percent. Similar estimates are currently being developed for other key financial centers.) Another source of undercounting is that banks' holdings of securities have been underrecorded because some major banking centers exclude securities from the geographical analysis of their banks' positions.
4
A further examination of measurement issues is contained in Appendix I.
The growth in bank claims on developing countries5 slowed to 3 percent during 1984 ($16 billion) from a rate of 7 percent in 1983 ($38 billion). Furthermore, bank lending to these countries dropped to $ 1 billion during the first half of 1985 compared with $4 billion during the same period in the previous year. The sharp decline in bank lending to developing countries was associated with lower current account deficits of those countries, which were more than covered by nondebtcreating flows and net flows from official creditors. Banks remained reluctant to lend to many developing countries-especially those experiencing payments difficulties and to those countries with whom banks had large exposures. Nearly 60 percent of bank lending to developing countries during 1984 and the first half of 1985 was in the form of concerted lending.6 Disbursements under concerted lending packages totaled $10.2 billion in 1984, of which Brazil and Mexico accounted for $9.4 billion.
In the Western Hemisphere (excluding the offshore centers of the Bahamas, the Cayman Islands, the Netherlands Antilles, and Panama), international banks increased their claims on developing countries in 1984 by $7.3 billion, or 3 percent. This increase was less than disbursements under concerted lending packages because some banks reduced their claims on certain countries in the region, principaUy Argentina and
Venezuela. Banks' claims on devel.oping countries in the Western Hemisphere declined by $0.8 billion in the first half of 1985.
Outside the Western Hemisphere, a number of developing countries continued to have access to spontaneous lending. Indeed, for certain countries, access to bank credits improved in 1984. Bank claims on developing countries in Europe grew by 4 percent ($2.9 billion) in 1984, while lending to developing countries and territories in Asia (excluding Hong Kong and Singapore) rose by 6 percent ($5.8 billion). l n Africa, bank claims on developing countries increased in 1984 by 2 percent ($0.7 billion). Bank claims on countries in the Middle East contracted by $ 1 . 1 billion in 1984. In the first half of 1985, bank lending to developing countries in Asia and Europe continued to increase, rising by $1.9 billion and $2.9 billion, respectively, while banks' claims on developing countries in the Middle East and Africa contracted, declining by $2.7 billion and $0.4 billion, respectively.
Developments in new bank credit commitments to developing countries provide some indications of re
s AIJ references to developing countries exclude the major offshore banking centers (the Bahamas, Bahrain, the Cayman Islands, Hong Kong, the Netherlands Antilles, Panama, and Singapore).
6 Concerted lending (or "new money") refers to equiproportional increases in exposure coordinated by a bank advisory committee.

©International Monetary Fund. Not for Redistribution
Chart 2. Bond Issues ar.d Long-Term Commitments of Credits and Facilities to CapitaJ-lmporting Developing Countries, 1981-First Half of 1985
(In billions of U .S. dollars)
0 FaciUtit>s 0 Sp01r1aneous lending • Concerted lending • Bonds 80 CAPITAI..-IMPORT!NG DEVELOPING COUNTRIES
60
40
20
0
40
30
20
10
0
20 ASIA
15
10
5 0
10 EUROPE
5
6 AFRICA
4 Lr=======-,
2
Source: Organization for Economic Cooperation and Development. Financial Statistics Monthly.
1 Includes a facility arranged fo� Mexico. 2 First half annualized.
international Banking Activity
cent capital market conditions for these borrowers (Chart 2).7 New publicized long-term bank commitments to developing countries declined in 1984 to $31 billion from $35 billion in 1 983. All regional groupings of developing countries recorded virtually unchanged or lower bank commitments in 1984, with countries in Africa and the Middle East reporting the greatest percentage reductions. New commitments to developing countries slowed further to $9 billion in the first half of 1985, compared with $ 1 8 billion in the first half of 1984. In the Western Hemisphere, new bank commitments to developing countries during the first half of 1985 dropped to $2.4 billion-virtually all was concerted lending-while there were almost no bank commitments to developing countries in the Middle East.
Meanwhile, bank commitments to developing countries in Europe in the first half of 1985 reached $2.3 billion-double the level for the same period in 1984. Centrally planned economies, excluding Fund member countries, experienced a sharp increase in bank credit commitments in 1984 and the first half of 1985. During that period, these commitments reached an average annual level of $2.5 billion in contrast to the average annual commitment level of $0.4 billion during 1982-83.
Included in these commitment data for 1984 and the first half of 1985 are concerted lending packages on which nine Fund members reached agreements (at least in principle) with their bank creditors. In 1984, firm long-term commitments for concerted lending to these countries totaled $16.2 billion, or about half of new long-term commitments to developing countries in that year, which was up from about 40 percent in 1983. During the first half of 1985, five countries obtained firm commitments for concerted lending amounting to $2.3 billion, or about one quarter of new external commitments during that period. During 1984 and the first half of 1985, nearly all new bank commitments to developing countries that had recently restructured their debt (i.e., a number of countries in the Western Hemisphere, Cote d'Ivoire, and the Philippines) consisted of concerted lending.
Tbe maturity of outstanding bank debt of countries outside the reporting area of the Bank for International Settlements (BIS) lengthened during 1983 and 1984, reflecting the restructuring of medium-term loans and
7 This analysis is based on data published by the Organization for Economic Cooperation and Development (OECD). The OECD data, however, understate gross bank commitments to developing countries because they do not include commitments corresponding to the restructuring of long-term maturities. These data are also not directly comparable to the data on lending previously referred to in the text, as OECD data are on a commitments basis and cover only new bank credils that are publicized and that have an original maturity of more than one year.
5

©International Monetary Fund. Not for Redistribution
l • OVERVIEW OF DEVELOPMENTS AND KEY ISSUES
a deliberate effort by some borrowers with access to spontaneous medium-term bank credits to improve the maturity structure of their bank debt. The OECD data on the maturity of new long-term bank credit commitments indicate that average maturities for industrial countries remained basically unchanged in 1984, while maturities for developing countries-especially nonoil developing countries-lengthened. During the first half of 1985, the average maturity of new commitments to developing countries shortened (Chart 3).
Spreads on long-term bank credits declined sharply in 1 984 and early 1985, as banks competed heavily for creditworthy borrowers both against each other and with other segments of the international capital market, and as spontaneous bank credit commitments to developing countries increasingly were limited to the most creditworthy. As a result of these developments, the gap between the spreads applied to various groups of borrowers, which had widened during 1982-83, narrowed sharply in 1984 and the first half of 1985 (Chart 3). For developing countries with spontaneous access to bank credits, the difference between their average spread and the spreads for industrial countries was the least since 1980.
Data on the ownership of international bank claims recently compiled by the BIS throw some light on the role of different national groups of banks in lending. 8 While these statistics are not adjusted for the effect of exchange rate movements, nevertheless they provide valuable insight into the relative importance of different groups of banks in lending to nonbanks, other banks, and their own related offices. Broadly, more than half of the increase in international assets of banks in industrial countries during 1984 and two thirds of total interbank activity were accounted for by an increase in claims of banks on their own related offices, an activity that was almost totally due to Japanese and U:S. banks. The increase in assets between unrelated banks was more than fully accounted for by Japanese banks. Lending to nonbanks by Japanese banks also more than accounted for the total increase in such lending. Thus, Japanese banks were overwhelmingly the dominant source of lending to other banks and nonbanks. By contrast, U.K. and U.S. banks reduced their claims on other banks and nonbanks.
Bonds and Issuance Facilities
New issuance activity in international bond markets expanded to record levels during 1984-85. Issues of international bonds reached $ 1 10 billion in 1984, con-
8 The Nationality Structure of International Bank Market and the Role of Interbank Operations, Bank for International Settlements, May 1985. The analysis based on ownership of assets includes crossborder claims in all currencies and foreign currency claims on local residents.
6
Chart 3. Terms on International Bank Lending Commitments, 1976-First Half of 1985
Pcrccnr
30 AVERAGE INTEREST RA iES
20
10
Percenl 2 AVERAGE SPREADS 1
' .... , .... _ .......... ----
U.S. prime rate
De1•eloping coumrics
-................ Jnd.ustritzl t:omrtries O L_ __ L_ __ L_ __ L_ __ L_ __ L_ __ �--�--��
v��------------�--------------------------, 1 0 AVERAGEMATURITIES1
lndusrrial counrries 8
6 All comttriu
4 L_ __ L_ __ �--�--�--�--������� 1976 1977 1978 1979 1980 1 98 1 1982 1983 1984 19851
Sources: Organization for Economk Cooperation and Development, Financial Statistics Mot111J/y; Federal Reserve Bulletin for Prime Rate; and International Monetary Fund, International Financial Statistics.
1 New publicized long-term international bank credit commitments.
2 First half only.
sisting of $82 billion in Eurobonds and $28 billion in foreign bonds. Lending through bond markets (bond issues net of redemptions) also reached the unprecedented amount of $84 billion in 1984. In the first half of 1985, net issues rose further to an annualized amount of $ 1 1 9 billion. Recently, international bonds and issuance facilities have increasingly become a substitute for syndicated loans-at least for those borrowers viewed as the best credit risks.
The importance of floating rate notes continued to grow in 1984; 34 percent of new bond issues were in the form of floating rate notes compared with 25 percent in 1983. Industrial country borrowers and international organizations together accounted for 95 percent of total international bond issues during 1984 and the first half of 1985. New issues by developing countries kept pace with the overall expansion in the bond market during this period as their share remained constant, albeit at a low level (5 percent). Total issues by developing countries rose to $5.3 billion in 1984 from

©International Monetary Fund. Not for Redistribution
$3.3 billion in the previous year. During the first half of I 985, developing countries issued bonds amounting to $4.9 billion. Five developing countries (Greece, Korea, Malaysia, South Africa, and Thailand) accounted for over two thirds of the issues during 1984 and the first half of 1985.
These developments in the bond market can be attributed to several factors. First, surpluses have arisen in countries and financial sectors, with a preference for investment in securities, directly or through nonbank intermediaries. Meanwhile, deficits have arisen in sectors, many of whose borrowers enjoy sufficient creditworthiness to tap nonbank savings directly to meet their financing requirements. Certain sovereign and corporate borrowers among the industrial countries have been able to raise funds more cheaply in the bond market than in the bank credit market and, in some cases, have been tapping the bond market in order to refinance outstanding bank credits.
Second, bond purchasers have also been encouraged by continued low rates of inflation in industrial countries and, in certain markets, by a steeply upward sloping yield curve. Real yields have been sufficiently high to attract investors, while for many borrowers, the cost of these real interest rates has been offset by the advantages of restructuring their balance sheets.
The third factor behind developments in the bond market is that activity of banks in the securities markets has continued to grow. The traditional distinction between the bank credit and bond markets has become less relevant as banks have become major purchasers and issuers of bonds. Banks purchased about $24 billion in international bonds in 1984, or 29 percent of new issues; within the floating rate note market, banks played an even larger role-buying half of the new issues. Banks have increased their bond portfolio as part of a general trend toward "securitization" of their balance sheets. In addition, banks have also been under pressure from their supervisors to increase their capital asset ratios. Banks have been the largest single issuer of floating rate notes, using the funds to increase their capital base and improve their liquidity position.
Factors related to those discussed above have influenced the growth of an international market in shortterm paper. Banks have attempted to maintain business relations with those clients who wish to enter the evolving short-term international securities market by providing international back-up facilities for issuance of such notes which is one element of banks' offbalance sheet activities. Under such facilities, a group of banks stands ready, over the medium term, to purchase the borrower's short-term notes that cannot be placed in the market on certain agreed terms. Reflecting their high creditworthiness, the most active
Market Issues
users of these facilities have been sovereign borrowers, including a few developing countries, and high-quaLity corporations, especially from the United States. The amounts committed under such facilities (excluding merger-related stand-bys) jumped to $29 billion in 1984 from $10 billion in 1983. Activity in these facilities during the first half of 1985 increased to an annualized rate of $40 billion.
To some degree, the appetite of financial institutions for securities may have been influenced by factors which may not be entirely sustainable. Some financial institutions have preferred negotiable instruments to book claims, in the belief that negotiability would, of itself, increase liquidity. The steep upward sloping yield curve in U .S. dollar assets, together with declining interest rates, has enabled banks to purchase floating rate notes and other securities at a profit by funding at very short term. Also, the privileged servicing of the modest volume of outstanding bonds for countries engaged in debt restructuring may have encouraged a belief that such instruments were inherently much less risky, even if they were to account for a significant proportion of a country's total debt. Finally, banks have raised capital to reassure market or supervisory concerns about their soundness by issuing floating rate notes which, in some cases, have been held by other banks. Although considered as part of capital by the issuing bank, these floating rate notes have tended to be viewed as a money market instrument by the purchasing bank and not as an equity instrument.
Finally, the growth in securities activity has been stimulated by liberalization and innovation in financial markets. Financial liberalization measures were announced in a number of major financial centers. In addition, the growth of currency and interest rate swaps has increased the ability of market participants to arbitrage differences in financial market conditions, especially in medium-term maturities. Such transactions were estimated at $80 billion in 1984-triple the level in 1983. Swaps have also been used by some borrowers to avoid saturating a market with debt issues in their name. Banks have been major participants in interest rate swaps. They have issued fixed interest rate bonds with an associated interest rate swap in order to secure long-term funds at variable interest rates which were below the London lnterbank Offered Rate (LIBOR). During 1984 and early 1985, these developments tended to integrate international financial markets more closely.
Issues Concerning the Markets
The last three years have been marked by farreaching changes in international financial markets.
7
©International Monetary Fund. Not for Redistribution
I • OVERVIEW OF DEVELOPMENTS AND KEY ISSUES
Developments in two areas are of particular importance. First, the structure of financial markets has been changed by liberalization and by the spread of innovative financing techniques. Second, new issues have arisen concerning resolution of the debt-servicing difficulties of developing countries.
Liberalization and Innovation
Banks' recent experience with problem loans-both domestic and international-was one factor leading them to develop new techniques of risk management, impeUed by market and supervisory concerns about a deterioration in their balance sheets. The debtservicing difficulties of developing countries have therefore contributed to an acceleration in the pace of change in financial markets. Banks and supervisors indicated that these market developments responded to other fundamental sources of change also. An overview of these influences is provided below and is foHowed by an assessment of the key elements in the present wave of change in capital markets. This section concludes with an appraisal of the risks inherent in such rapid changes in market instruments and structure.
Sources of Change
Developments in macroeconomic policies and in the world economic environment during the 1970s and early 1980s have strongly influenced the structure of financial markets. In particular, high and variable rates of inflation and sharply fluctuating interest rates contributed to the development of floating rate instruments. Large fiscal deficits in some industrial countries increased the availability of risk-free liquid assets, reinforcing pressure on banks to pay market interest rates on deposits.
When a sustained attack on inflation was initiated in the late 1970s, the attendant increase in real interest rates and decline in output caused the creditworthiness of many borrowers to deteriorate sharply. The emergence of widespread external payments difficulties among developing countries and problem loans to various sectors in industrial economies combined to weaken the balance sheets of many banks. As a result of these developments, banks' funding costs rose relative to the borrowing costs faced by the most creditworthy sovereign and corporate borrowers. These borrowers therefore found that they could issue paper on international markets at costs considerably below those associated with obtaining bank loans. As the share of credit flows attributable to issuance of debt instruments rose, competition between securities houses and banks intensified. This heightened competition has
8
contributed to the wave of innovation in financial markets.
In response to a deterioration in their balance sheets, many banks have sought to increase capital asset ratios. Where banks' stocks were not highly regarded, capital has been raised through the issue of equityrelated instruments, or floating rate notes. Intense competition has limited banks' ability to increase profits by higher spreads on lending. Banks have therefore sought to cut costs and also to develop new business activities. A further reaction has been to slow balance sheet growth, and to emphasize activities that have high rates of return relative to their capital weighting. Commercial banks have, therefore, engaged in a rapid expansion of off-balance sheet business, such as securities business, swap transactions, standby credits, and trading in financial futures and options, all of which frequently have not been included in risk categories used for official capital adequacy measurements.
The interaction between innovation and liberalization in financial markets is complex. In some cases, changes in the pattern of financial flows, financial innovations, and competition in and between markets have provided the impetus for liberalization. In some countries, supervisors have cited the desire to reduce risk concentrations and improve the quality of earnings in the banking industry as a reason for diversifying bank activities. At the same time, a generally favorable attitude toward freer trade in financial services, matched by a domestic concern to foster efficiency and competition, has led to greater liberalization in a number of major financial centers. Thus, the current wave of change in financial markets reflects a confluence of factors: macroeconomic changes, changes in the banking industry and in public policy on competition in financial services. Although the pressures for liberalization and innovation have varied among the major financial centers, it would appear that these pressures have been less intense in countries where inflation has remained relatively low, and where ceilings on interest rates or restrictions on the financial activities and geographical location have not slowed the response of financial institutions to changing conditions.
Integration of Markets and Redistribution of Risk
The developments described above have been reflected in a multitude of changes in financial markets. In essence, however, a single process is occurring. Barriers between financial portfolios are being lowered and financial risks are being repackaged and distributed into different portfolios. A key aspect of this risk repackaging is that financial claims are becoming

©International Monetary Fund. Not for Redistribution
tradable to enhance their liquidity and facilitate their placement in different portfolios.
Liberalization measures and swaps have reduced market segmentation both domestically and internationally. Domestic deregulation has encouraged the lowering of barriers, especially between the banks and securities companies, as a means to stimulate efficiency in the financial services sector. In those countries where banks and securities companies have been separated by law or custom, restrictions on competition have been eased. In some countries, restrictions on bank participation in stock exchange activity have been lifted or are under review. Banks have also been allowed to compete more keenly for savings by offering deposits at market interest rates, and by a relaxation of restrictions on products or limits on geographical establishment. Market participants have been allowed to issue instruments that previously were not permitted such as floating rate notes and zero coupon bonds.
Measures to liberalize international access to capital markets in major financial centers have contributed to the integration of portfolios that has taken place. Exchange controls have been removed in some major financial centers in recent years, permitting residents access to foreign currency investments. Restrictions on access by foreign borrowers to national markets, and on their ability to borrow in national currencies, have been eased. Withholding taxes on interest payments to nonresidents have been lifted in several countries. Moreover, competition has been enhanced as countries have liberalized rights of establishmentespecially for foreign banks-in banking and securities markets.
In parallel to these official initiatives, a variety of technical innovations in the market has also resulted in greater integration of markets. The emergence of interest rate and currency swaps on a large scale represents an innovation comparable in importance to the evolution of floating rate instruments. Swaps integrate international capital markets by allowing access to portfolios in a financial market independent of the borrower's currency or interest rate preferences, because the borrower can simultaneously undertake swaps to modify these aspects of the transactions. Participants in a swap transaction, however, expose themselves to the risk that their counterpart may not honor the contract. The extent of the associated credit risk depends on intervening currency and interest rate movements. There exists an extremely wide range of estimates for such credit risk among banks.
At the same time that portfolios have been opened up, securities houses and banks have been developing other new financial instruments to facilitate risk management in financial markets to enhance the liquidity of financial claims. Thus, currency and interest rate
Market Issues
options and futures, as well as ECU-denominated assets, permit banks and nonbanks to hedge their exposure.
Marketability of banks' assets has also been increased, a process that has been termed "securitization." Examples are the substitution of floating rate notes for syndicated lending, the introduction of transferability into international credits, and packaging of existing assets for resale (e.g., mortgages, car loans, and other receivables). Banks are selling high quality assets to other investors for a one-time income gain, while freeing up capital to deploy elsewhere. "Securitization" has also been driven by a decline in the ability of some banks to intermediate credit profitably. owing to their diminished market rating relative to prime nonbank borrowers. These borrowers have recognized the opportunity to tap directly nonbank portfolios by issuing bonds and short-term negotiable instruments that compete directly with bank deposits. In an effort to retain business relationships, banks have competed to provide medium-term stand-by facilities for the issuance of such short-term instruments. Many banks also purchase this paper for their own portfolios, compensating for the low yield by "cheap" funding through swaps, by carrying paper on an interest rate mismatch basis, or by costing such transactions as part of an overall relationship with the borrower.
Some Implications of Recent Changes
The changes described above constitute a major structural development in international capital markets. Liberalization measures in a number of major financial market countries have reduced the barriers to competition among domestic and foreign banks and increased access to bond markets. At the same time, recent innovations in instruments have provided market participants with new opportunities to tap nonbank savings directly and to hedge against risks associated with volatile interest rates or currencies. These developments should generally result in capital markets that are more closely integrated and more efficient. They also have the potential to allocate financial resources more effectively, both domestically and internationally, distributing risks to portfolios better placed to evaluate, diversify, and manage those risks.
Many of the new instruments have significantly altered the sharing of risks associated with exchange rate and interest rate variability and changed the roles of various financial institutions in intermediating flows between ultimate lenders and borrowers. To the extent that these innovations are used judiciously to improve the risk-adjusted return on the assets of financial intermediaries, they can strengthen the process of intermediation. Financial futures and options can off-
9

©International Monetary Fund. Not for Redistribution
l • OVERVIEW OF DEVELOPMENTS AND KEY ISSUES
set--or at least redistribute-the risks that arise in volatile financial conditions. Diversification into feeearning business which does not appear on banks' balance sheets permits them to strengthen their earnings and capital position. The liquidity of banks may be greatly enhanced by improving the marketability of existing loans and by securing medium-term floating rate funding by issuing securities directly or through swaps at advantageous interest rates.
Notwithstanding these potential efficiency gains. the recent changes pose considerable challenges to supervisory and monetary authorities. They raise issues concerning the nature of the evolving capital marketsin particular, questions regarding transparency, credit analysis, and effective distribution of risk. These issues are discussed below.
The transparency of financial markets has been lessened considerably in recent years, because markets have developed in areas where statistical coverage is as yet very weak. New instruments are affecting credit appraisal by complicating the interpretation of balance sheets. lnsofar as an institution's position in swaps and financial futures is not disclosed, it may be very difficult to gauge accurately the degree of risk to which the institution is actually exposed. The reduced transparency makes it more difficult to perform credit analysis on borrowers and to evaluate conditions in financial markets.
These problems highlight the importance of the continuing efforts by monetary institutions, including the Fund, to improve coverage of financial market activity, especially with regard to holdings of securities and off-balance sheet transactions such as swaps and issuance facilities. Moreover, publication by more countries of their banks' consolidated international claims, including the geographical distribution and the corresponding capital data, would permit a greater understanding of developments in international bank lending, especially to developing countries.
Credit analysis by financial institutions is crucial to an effectively functioning financial system. While new hedging instruments and the sale of debt instruments directly to nonbank investors reduce the apparent concentration of risk in certain portfolios, risks may, in some cases, be acquired by investors who do not fully understand the nature of these risks, or cannot readily absorb losses that may be associated with them. In the case of recent innovations such as swaps and international issuance facilities, supervisors and some market participants have expressed concern that the pricing of these instruments may not always fulJy reflect their credit risks. The intensification of competitive pressures in international financial markets, partially stemming from liberalization, may lead to underpricing of risk taking by market participants.
1 0
Adverse effects on individual institutions could, of course, arise where credit assessment is not adequately performed or credit risk not adequately rewarded. Moreover, as risks are unbundled and repackaged, the adequacy of risk management systems-and the division of credit assessment between different partiesmay be a source of difficulty. In particular, transactors may not rely on their own credit assessment, but on the credit assessment performed by selling or agency institutions and/or the marketability of the asset. Moreover, as claims are converted to negotiable forms, the liquidity of such instruments may, at times, be overestimated. The stability of financial markets will reflect not only the marketability of claims and dispersion of risks, but whether the risks have been transferred to parties who are weU placed to evaluate and manage these risks.
The spread of deposit-like liabilities and credit-like assets, widely dispersed among bank and nonbank institutions, may raise new issues for the authorities in providing Liquidity support in case of emergent strains. The capacity for �bsorbing shock of new market structures and of liquidity arrangements is not yet fully tested. At the same time, the need to protect the payments system from the repercussions of disruptions in other segments of financial markets has not diminished. Such protection is imperative, but it carries with it a need for vigilance against a weakening of market discipline on financial institutions. Such weakening could be caused by the perception of explicit or, equally important, implicit guarantees on deposits or other financial institution liabilities. Coordinated prudential supervision of financial institutions can reduce this problem of "moral hazard" and diminish potential budgetary costs of providing needed protection to the payments system.
Issues concerning the structure of supervision arise as financial intermediaries branch into new types of activity. As the distinction between commercial banks and other financial institutions blurs, business can more easily shift between these institutions. Thus, as banks increasingly hold marketable assets, supervisory practices that apply to securities houses-including frequent marking of tradable assets to market value and full disclosure of valuations-may become more appropriate. Conversely, to the extent that securities houses engage in transactions-including interest rate and currency swaps-with a considerable credit risk component. it may be important to ensure that their credit evaluation process is well developed. Changes in the range of activities that financial institutions engage in, as well as the risk characteristics of assets in their portfolios, may require supervisors to reevaluate capital adequacy considerations. For example, as banks repackage and sell attractive assets, or

©International Monetary Fund. Not for Redistribution
extend stand-bys to a new class of customers, they may also increase the risk inherent in their portfolios. Whether a functional or institutional approach to supervision is adopted, detailed knowledge of financial institutions and markets and the links between them will be crucial to detect problems and to respond quickly and effectively.
The changes in financial markets discussed in this paper have led to a major strengthening of financial supervision, including concerted efforts by bank supervisors to improve the adequacy of bank capital and liquidity. Together with market pressures, these supervisory initiatives have resulted in a substantial increase in the capital and reserves of many banks, aJthough it must be noted that banks' exposure to offbalance sheet risks has also increased . Supervisory authorities have warned banks that new financing techniques and instruments should be subject to close management control and that concerted reviews by supervisory and monetary authorities are under way. Many banks have also responded to concerns about their liquidity by extending the maturity of their funding and by increasing the proportion of their deposits taken from retail sources and other depositors with whom they have a continuing relationship. On the asset side, many banks have viewed more critically the liquidity of their interbank claims, and acknowledged that some holdings of short-term negotiable securities, including government notes, can provide a cushion of primary liquidity, especially in times of strains i.n the market. Continuing coordinated efforts by supervisory and monetary authorities may be necessary to underpin the stability of financial markets, especially during this transitional period.
Monetary authorities are engaged also in a study to assess the macroeconomic implications of recent changes in financial markets. There are questions whether financial innovations may seriously complicate the definition of monetary aggregates and modify the nature of the transmission mechanism. Keener competition, reduced market segmentation, and new technology have increased the speed at which financial markets adjust, while rising protectionism and structural rigidities have hampered the ability of goods and labor markets to adjust. A greater divergence in adjustment speeds could produce increased volatility of exchange rates and interest rates. Heightened international integration of financial markets may also imply that the impact of policies can spread more widely and more quickly through the international community. To the extent that these concerns appear warranted, increased importance would be attached to enhancing the effectiveness of the Fund's surveillance in order
Market Issues
to promote greater harmony between economic policies, to improve resource allocation, and to foster orderly conditions in financial markets.
The Debt Situation
A number of important developments in the international debt situation have occurred over the last several years. Techniques of restructuring debt and securing new financing have evolved further. At the same time, bank attitudes toward lending to developing countries have changed regarding both concerted financing and spontaneous flows.
Developments in Techniques for Restructuring and Concerted Lending
A key development in 1984-85 has been the adoption by bank creditors of a medium-term perspective in certain debt restructurings. Multiyear restructuring agreements (MYRAs) were developed to smooth debt amortization profiles and, by providing a clear planning horizon, to facilitate the return to international capital markets of countries that bad demonstrated significant domestic and external adjustment. In 1984 and the first three quarters of 1985, banks negotiated such MYRAs with Ecuador, Mexico, Venezuela, and Yugoslavia.
The practice of enhanced surveillance is seen as a means for the Fund to promote the normalization of creditor/debtor relations in connection with MYRAs. Enhanced surveillance comprises three separate elements: a quantified financial program prepared by the country's authorities, which presents a comprehensive description of their major macroeconomic objectives along with consistent domestic policies; additional Fund staff visits to the country and supplemental Fund staff reports which would be discussed by the Fund's Executive Board; and the release of these Fund staff reports by the member to its creditor banks. Enhanced surveillance is not a substitute for normal stand-by or extended arrangements, nor is it designed to transform the Fund into a credit-rating agency for commercial banks. For these reasons, enhanced surveillance would be employed essentially to help promote MYRAs, although not all MYRAs might be associated with enhanced surveillance. The appropriate duration of this procedure would be about the length of a MYRA' s cousolidation period. To avoid the risk of the Fund providing on/off indications to banks, Fund staff would take no active part in the negotiation or in design of trigger mechanisms, although at the request of a member, the Fund staff could provide purely technical advice.
Discussions between banks and countries are under
I I

©International Monetary Fund. Not for Redistribution
I • OVERVIEW OF DEVELOPMENTS AND KEY ISSUES
way on MYRAs for countries that would not meet the criteria for enhanced surveillance because they have not established an adequate record of adjustment. In such cases, member countries and bank creditors may agree on a multi year restructuring to avoid the burdens and uncertainties imposed by multiple annual restructurings. In order to maintain a close link between debt relief and the implementation of adjustment policies, bank creclitors may make only subperiods within the consolidation period eligible for restructuring. This approach, known as a serial MYRA, facilitates a periodic review of economic policies and prospects. However, it is important that these periodic reviews be the responsibility of creditors.
The past year has seen a number of developments in the assembling of new financing packages. The value of commitments for concerted lending during 1985 has been substantially less than the levels of 1983
and 1984. In all cases except Colombia's, during 1984-85, bank creditors linked their disb4rsements of concerted lending to purchases under a Fund program. Involvement of the World Bank has increased through cofinancing operations, including the guarantee of a portion of a concerted lending package. Banks have indicated that they see an advantage in cofinancing with the World Bank, because by associating their lending with effective sector policies and productive projects, they potentially reduce their risk.
Another development has been some adaptation of restructuring and concerted lending techniques designed to preserve traditional business ties to the debtor country. In some restructuring agreements, banks have been permitted to on-lend a portion of the domestic currency counterpart of the rescheduled debt to the private sector. In addition, some recent concerted lending packages have included an option to lend in the form of trade- or project: related loans. In contrast, however, there are cases where banks have pressed for guarantees by the debtor country government on existing loans to the private sector, thereby adding to the debt burden of the public sector. Other developments in restructuring techniques, including redenominations, are discussed in Section 11 of this paper.
While progress has been made in resolving debtservicing difficulties, there appears to have been a lessening of banks' cohesion in responding to new requests for restructuring and concerted lending. Cohesion has declined as banks' underlying business interests in debtor countries have moved in different directions and as banks have also made greater provisions for loan losses, or have written off in their own books small claims on debtor countries. This process has occurred at varying paces, depending on the nationality, exposure, and size of banks. Therefore, bank attitudes toward new financing packages have become
1 2
more diverse, which has made the already arduous task of assembling the critical mass necessary for concerted lending even more difficult. The weakening of bank cohesion (which has affected restructuring as well as concerted lending) has been greatest for countries that do not pose a direct systemic risk to the international banking community.
Bank advisory committees, partly in an effort to maintain cohesion, have sought a larger commitment of official resources in new money packages. Some banks have indicated that cofinancing of project and sectoral loans with the World Bank may induce greater bank cohesion because the World Bank's appraisal of project and sectoral policies, together with its financial involvement, reduces risk. A crucial issue may be to ensure that additional commitments of official resources effectively catalyze bank financing, rather than substitute for such lending.
Banks have also been evaluating their options for dealing with cases of protracted debt difficulties. In a very few countries with slim prospects of restoring a more normal debtor-creditor relationship in the near term, banks have agreed to cap or rescheduJe interest for a portion of interest payments, at least with regard to medium-term financing. In such cases, the debt burden of countries has increased substantially. However, banks have not agreed to forgive debt, presumably because of concern about reactions of other domestic or international borrowers to such concessions.
Banks' Lending Behavior
A major issue in the present phase of the debt situation is how to catalyze a resumption of significant spontaneous private flows to developing countries that are pursuing policies to correct imbalances in their economies so that they can resume sustainable growth. In this connection, it is important to assess the implications of recent developments in bank lending. This is not an easy task, however, since data-particularly on the behavior of national groups of banks-are very limited. The trends that do emerge are complex.
The data suggest that some groups of banks may wish to restrain their exposure to many developing countries, including, but not limited to, those that have recently restructured their external debt. Notwithstanding the return of Turkey to international capital markets and some spontaneous trade finance for Brazil and Mexico, it is notable that spontaneous lending has been slow to revive for countries that have recently restructured their debt. The reluctance of banks to resume spontaneous lending has been associated with uncertainties concerning those countries' policies and the external economic environment . Moreover, some

©International Monetary Fund. Not for Redistribution
banks have also cut back or strictly limited their exposure to countries that have not restructured their debt. Such actions may reflect banks' assessment of countries' economic policies and prospects, but may also reflect, in some cases, a more general reticence toward lending to developing countries. In particular, many banks with small exposures may not wish to continue general purpose lending to many developing countries at the present time.
At the same time, banks have continued to lend on very competitive terms to various countries outside the industrial group, including some developing countries in Asia and Europe. Certain centrally planned economies have regained substantial access to international capital markets in 1984 and 1985 after a period of constrained access. In some cases, banks' willingness to lend to countries reflects their assessment of economic policies being pursued, but this is not the case in all instances.
The distribution and terms of bank lending to developing countries in 1984-85 raise some concerns. Banks undertaking substantial loans on very fine terms to certain countries have, on occasion, paid inadequate attention to the implementation of appropriate adjustment policies. At the same time, some banks have indicated an unwiJiingness to lend to countries pursuing adjustment programs. The absence of spontaneous lending to such countries renders the task of economic policy reform more difficult and may impair the quality of banks' existing claims on those countries.
In light of these developments in spontaneous lending to developing countries, attention has focused on the lending pattern of different groups of banks. Analysis of international lending to countries by nationality of banks is limited by the lack of consolidated claims data, especially for banks in the Federal Republic of Germany and Japan. For Germany, data on a fully consolidated basis with a geographical distribution have recently been published, but available statistics as yet cover claims on only some countries and only for end-1984. For Japan, no official data on the geographical distribution of bank claims on developing countries are published.
Available information for the United States suggests that consolidated claims of U .S. banks on developing countries declined by $4 billion in 1984, or by about 2 percent. Increases in claims on countries in the Western Hemisphere, which were largely related to disbursements under concerted lending packages, were more than offset by the withdrawal of funds in all other regions, especially in Asia. These trends intensified during the 12 months to end-June 1985. U.S. bank claims on developing countries were lowered by $8 billion or by 5 percent. During this period, U.S. banks began to reduce their claims on developing
Market Issues
countries in the Western Hemisphere. All size categories of U .S. banks reduced their claims on developing countries as a group, with regional banks reducing their claims most sharply (by 8 percent). Consolidated external claims of U .K.-registered banks on developing countries also declined in 1984 and the first half of 1985, although this development is difficult to interpret in the absence of exchange rate-adjusted data. An increase in claims on developing countries in the Western Hemisphere was more than offset by a decline in claims on developing countries in all other regions.
Similar concerns arise in connection with bank debt restructuring. To secure necessary net financing from banks, the restructuring process has often included agreements to maintain existing short-term exposure with concerted lending packages. Exchange rate adjusted claims data, however, suggest that disbursements under concerted lending packages between 1983 and the first half of 1985 were greater than the increase in bank claims on certain countries with concerted lending packages. Although write-offs and risk transfers may account for a portion of this difference, analysis of available data indicates that some banks may have, nevertheless, succeeded in reducing their exposure. These leakages may diminish the effectiveness of the present restructuring process and weaken bank cohesion.
The developments described above raise the question of whether some groups of banks may be attempting to hold constant or reduce their overall exposure to many developing countries. In considering the question, it is important to note that holdings of floating rate notes are excluded from the lending data available for some groups of banks. This exclusion may result in underrecording of bank flows to developing countries that issue floating rate notes because banks are holders of a high proportion of the floating rate notes issued by these countries. Also, judging by the overall rise in claims on Asia, it appears clear that national groups of banks for which data are not separately available have continued to expand their business with countries in that region. Discussions with banks suggest that Japanese banks, in particular, have expanded their lending to Asia during the period under review.
Key factors relevant to the supply of bank lending to developing countries are believed to be the exposure of banks relative to their capital and total assets. Banks have significantly reduced their claims relative to capital, in considerable part by increasing their capital and reserves. For U.S. banks, claims on developing countries have returned to the 1977 level in relation to capital and reserves (Chart 4). Nevertheless, the claims on major borrowers of some individual banks remain large relative to capital. A similar comparison for non-U.S. banks is not possible, since
1 3

©International Monetary Fund. Not for Redistribution
I • OVERVIEW OF DEVELOPMENTS AND KEY ISSUES
reserves against these banks' claims have been substantial and are not generally disclosed. Such reserves are believed to have increased further in 1984, although the appreciation of the U.S. dollar has inflated claims (which are denominated largely in U.S. dollars) on developing countries relative to these banks' capital (which is largely denominated in domestic currency).
Banks are also seeking to reduce gradually the proportion of their loan portfolios (as well as the proportion of their capital) that is extended to developing countries, partly in light of market concerns arising from high disclosed exposure. However, the slower growth of bank assets in many countries may mean that the process of diluting asset concentration may continue over a number of years. For non-U.S. dollar-based banks, a decline in the U.S. dollar would speed up dilution of both capital and assets.
Banks' concern about their exposure has recently increased on account of developments in key debtor countries and greater uncertainty about the world economic outlook. (For some banks, these concerns are compounded by continuing weaknesses in their domestic loan portfolios.) Banks' concern about countries' commitment to adjustment policies has led them to review ways of limiting increases in their risk exposure to a considerable number of developing countries, whether by avoiding new loans or by pressing for preferred status (e.g., by obtaining guarantees from creditor government agencies or multilateral institutions, and governments of debtor countries). Indeed, data recently published jointly by the BIS and OECD suggest that there was an increase in the level of bank claims guaranteed by export-credit agencies in 1984, particularly for developing countries in Africa, Asia, and the Middle East. This would imply that the true risk-adjusted exposure of banks increased by less than overall lending data indicate.9
Therefore, there has been a growing interest among banks in forms of legal security, preferential payments arrangements, and guarantees of the debtor country. It would be a concern if the search for such protection were to divert attention from the fundamental need for economic evaluation. Other banks seem to be looking for ways to strengthen economic evaluation and are emphasizing a need to integrate country risk assessment more fully into their lending decisions. In this regard, information supplied by the Institute of International Finance (IIF) is increasingly being used by banks. Information on the activities of the IIF is contained in Appendix II.
In this environment, an issue that has attracted
9 Bank for International Settlements and Organization for Economic Cooperation and Development, Statistics on External Indebtedness: Bank and Trade-Related Nonbank External Claims on Individual Borrowing Countries and Territories at End-December 1984.
1 4
Chart 4. Selected Balance Sheet Data for U.S. Banks, 1977-84
(In percent)
30 GROWJ'H RATES
20 Claims on developing coumries
.,.,.,..,- --- -............ , .......... 10 Capital Total assets
----..... ..... 0 �-----------------------------------'�-��-�-�
-I O L---��---L _____ L_I __ �I ____ _L ____ �•�--�
? CAPITAL AS A PERCENTAGE OF TOTAL ASSETS
6
All banks
5
Nine money ce/Jier banks
4 L_ __ �-----L----�--��---L----�--�
80 CAPITAL AS A PERCENTAGE OF CLAIMS ON DEVELOPING COUNTRIES
6ot=-------
4or--------Nine money cemer banks
Source: Federal Financial institutions Examination Council, Country Exposure Lending Survey.
renewed attention is the impact of banking supervision on international lending. Bank supervisors have been engaged, over the past several years, in a coordinated effort to strengthen their banks' balance sheets by increasing capital asset ratios and by accumulating larger reserves against potential loan losses. Capitalasset ratios of banks in most major industrial countries have improved significantly as a result.
Efforts to strengthen banks' balance sheets may have moderated bank lending to some degree. Bank supervisors have, however, weighed the advantages of reinforcing the soundness of the international financial system against the disadvantages created by an overly rapid transition. Bank supervisors have acted in a judicious manner by accommodating the impact of concerted lending on banks' balance sheets.
Supervisory authorities in some countries have also shown flexibility in the treatment of trade finance, when regularly serviced, as regards mandatory provisioning requirements. Nevertheless, a potential problem exists concerning the dynamic impact of provisioning on spontaneous lending, especially trade finance, for developing countries that have undertaken

©International Monetary Fund. Not for Redistribution
adjustment policies. In some cases, provisioning requirements for developing countries are set on all exposures to a group of developing countries comprising those countries that have restructured in recent years. Such a practice could create a strong disincentive for the emergence of spontaneous lending, including trade finance, because provisioning renders marginal increases in exposure unprofitable.
This potential problem has been acknowledged although other factors, such as economic policies in debtor countries, also influence banks' decisions to lend. Supervisory authorities in several countries are reviewing the possible impact of mandatory provisioning on the availability of new finance to developing countries pursuing adjustment policies.
A number of implications for future lending can be drawn from banks' attitudes toward developing countries. First, while a certain number of developing countries remain highly regarded, banks still are very concerned about their exposure to many of the othersparticularly those that have restructured their debt. Banks recognize that appropriate macroeconomic and microeconomic policies in debtor countries remain the key to reducing the risk inherent in their claims. Consequently, they have maintained a linkage between their financing and assessment by the Fund of countries' macroeconomic policies. In addition, they are pressing for greater World Bank involvement in improving the supply response of countries' economies and in providing direct financial support.
Banks have reduced their exposure to some countries through a variety of approaches, including a substantial buildup of reserves in some cases. This process has proceeded at very different paces for banks of different nationalities, size, and exposure. The number of banks committed to medium-term lending to developing countries has decreased. These factors have further diminished the cohesion of bank creditor groups. Banks are, however, considerably more forthcoming as regards increasing short-term trade financing and, to a limited degree, project financing; they are seeking to shift the composition of their claims toward such financing. Banks expect trade finance to be serviced in a timely way, and it offers synergies with domestic business. For many developing countries, trade and project lending may thus account for the core of spontaneous bank financing during the period ahead.
Prospects
Fund staff projections in the World Economic Outlook for 1985 indicated that the scale and distribution of international financial flows in the near term would be strongly influenced by historically large current account imbalances in the industrial countries and
Prospects
small current account deficits in many developing countries. This pattern of current account imbalances suggests continuation of both a high level of international capital flows among the industrial countries and rather limited net flows between the industrial and developing countries.
Under the conditions outlined in the World Economic Outlook, especially regarding exchange rates and interest rates, it is expected that new issues of international bonds, essentially by industrial country borrowers, will continue to be buoyant both in absolute terms and relative to bank lending. Buoyancy in bond markets is expected to continue for several other reasons. Many of the recent structural changes have enhanced access to international capital markets. Liberalization-whether of access or of instruments--continues in a number of major financial centers. Financial surpluses and deficits will persist in countries and in sectors for which securities transactions provide a major channel for finance.
Commercial banks, in turn, will likely extend further the process of "securitization." Financial innovations are expected to play an increasingly important part in credit activity, enhancing the marketability of risks and carrying further the process of matching instruments to portfolio preferences. These new developments have the potential to enhance the efficiency and stability of financial markets. However, as discussed earlier, coordinated efforts by supervisory and monetary authorities will be crucial to enhance the transparency of these developments and ensure that their inherent risks are adequately managed.
Under the policies and global conditions set out in the World Economic Outlook, the net financing flows to capital-importing developing countries are projected to continue at a low level in 1986. A high proportion of these flows are projected to be provided by sources other than private creditors. Net external borrowing for capital-importing developing countries is projected to decline to about $31 billion during 1986, of which $22 billion would be financed by long-term borrowing from official creditors.
Trends in Private Capital Flows
Banks have indicated that the availability of spontaneous financing for many developing countries may remain limited. Banks also indicated that willingness to provide such financing depends closely on policy implementation in borrowing countries and global economic conditions. To preserve or regain access to spontaneous flows, many developing countries, including countries that have not recently restructured their external debt, may thus in effect have little room
15

©International Monetary Fund. Not for Redistribution
I • OVERVIEW OF DEVELOPMENTS AND KEY ISSUES
for maneuver in framing their economic policies. Trade and project lending by banks is expected to
represent the core of spontaneous lending to most developing countries, reflecting among other factors its link with the export activities of banks' customers in industrial countries. Even with adequate trade and project lending, the limited availability of general purpose funds may imply that adverse domestic or external developments affecting individual countries would require further coordinated balance of payments support.
Collaboration between the Fund and the World Bank will be crucial to promote appropriate macroeconomic and microeconomic policies, which will favor more effective investment and can be supported by external capital flows. The World Bank can play an important role in facilitating the resumption of bank lending through its involvement in project and sector policies. Export credit agencies also can play an important role, because extension of export cover to countries that are implementing appropriate economic policies can help these countries maintain or regain access to commercial financing.
The composition of capital flows to developing countries is expected to continue to reflect a higher share of foreign direct investment and official transfers. Greater foreign direct investment would also facilitate the growth and adjustment process. Such equity investment can bring with it new technology and provide greater protection than do borrowed resources against sudden changes in international costs of funds. Direct investment flows may grow only at a moderate pace, however, reflecting restrictions in developing countries on direct foreign investment and protectionism in industrial countries. Establishment of the Multilateral Investment Guarantee Agency (MIGA) can contribute to fostering greater private direct investment by reducing noneconomic risks. For many .lower income countries, flows from official sources, adapted to their economic situation, wilJ continue to dominate flows from international capital markets.
As a result of differences in the implementation of adjustment programs, as well as differences in the impact of external developments, there has been a divergence in the economic performance and prospects of debtor countries. Reflecting this divergence, restructuring techniques have continued to evolve. MYRAs with enhanced surveillance have been developed to contribute to the process of restoring countries' access to spontaneous financing. At the other end of the spectrum, banks have rescheduled interest payments on long-term credits to very few countries judged to have little or no prospect of regaining access to financing other than trade credits.
Cohesion and burden sharing among creditors are
16
likely to be difficult issues in the period ahead. The task of mustering concerted financing has become more difficult, because of a diminished sense of urgency among creditors, and because the passage of time has caused some divergence in banks' longer-term business interests. In the months ahead, bank creditors are likely to review carefully the ways of providing debt relief, while keeping new techniques attuned to individual debtor countries' prospects for access to different types of finance. Recent developments in adapting financing instruments flexibly to the situations of countries, and to the differing financial circumstances of banks, may need to be further extended.
A central task in the period ahead will concern the need to catalyze adequate financial flows. This process will depend upon several factors, including the quality of policies in member countries and the close involvement of various sources of finance. Pressures will likely continue for concerted lending packages to include a larger share of official resources or guarantees. Banks are aware, however, that official support alone is not sufficient to serve the financing needs of debtor countries. Rather, it is important that bank lending, together with that from official sources, be geared to support adjustment policies in developing countries that lead to sustainable growth.
U.S. Debt Initiative
Recognizing these difficult problems, Secretary of the U.S. Treasury, James A. Baker Ill , in his address to the 1985 Annual Meetings of the Fund and World Bank, proposed a "Program for Sustained Growth" to strengthen the international debt strategy. This initiative was welcomed by finance ministers in other countries who had voiced similar concerns. Secretary Baker proposed a three-point plan that would build upon the flexible, case-by-case debt strategy developed in the past three years. This initiative is aimed primarily at stimulating the process of growth and adjustment in heavily indebted developing countries and encouraging new financing flows from both official and private sources to reinforce this process. The proposals illustrate the need for financing to countries implementing appropriate economic policies. The main lines of the U.S. initiative are set out below.
The first element in the U .S. proposal is the adoption by principal debtor countries of comprehensive macroeconomic and structural policies to promote growth, balance of payments adjustments, and a reduction in inflation. In addition to the continued application of macroeconomic policies, the proposal envisages increased emphasis on medium- and long-term supplyside policies to promote growth, savings, and invest-

©International Monetary Fund. Not for Redistribution
ment. The initiative recommends that the Fund, in close cooperation with the World Bank and other multilateral development banks, give greater attention in debtor countries to structural and institutional measures such as tax reform, market-oriented pricing, the reduction of tabor market rigidities, and the opening of economies to foreign trade and investment.
The second element is a continued central role for the Fund in conjunction with increased and more effective lending by multilateral development banks. The proposal supports the role that has been played by the Fund in encouraging policy changes and catalyzing capital flows to debtor countries, and envisages a continued important role for the Fund in both respects. In this connection, it was noted that the development by the Fund of new techniques, such as "enhanced surveillance," could be useful in certain cases in generating additional financing to support further progress in borrowing countries.
The adoption by debtor countries of economic reforms would also be supported by an increase in structural and sectoral loans from the World Bank and other multilateral development banks. The United States has suggested that annual disbursements from the World Bank and Inter-American Development Bank to principal debtor countries could increase by about 50 percent from the current level of nearly $6 billion in support of structural policy changes in debtor countries. If the principal debtors implement growth-oriented reforms, if commercial banks provide adequate increases in net new lending, and if increased demand for quality World Bank lending demonstrates the need for increased capital resources, the United States would be prepared to look seriously at the timing and scope of a general capital increase for the World Bank. The United States also proposed that the Inter-American Development Bank should strengthen its lending policies to give more effective support to growth-oriented structural reform and, on this basis, introduce a program of targeted nonproject lending.
The World Bank role in stimulating private lending to developing countries would be enhanced under the U.S. proposal, with strong support for an expansion in the Bank's cofinancing operations. ln addition, the proposal anticipates that the operations of both the recently negotiated Multilateral Investment Guarantee Agency (MIGA) and of the International Finance Corporation will assist in attracting nondebt capital flows to member countries.
The third element is increased financing from private sources in support of comprehensive adjustment programs. The U .S. initiative is aimed at overcoming the increasing reluctance among banks to participate in new money packages and debt restructuring, and at reversing the sharp decline in net new bank lending to
The U.S. Debt Initiative
debtor countries noted previously. It called for a public commitment from the banking community to provide net new lending of $20 billion to a group of heavily indebted, middle-income developing countries over the period 1986-88, provided that sound economic policies are put into place. U.S. officials have indicated that this $20 billion would represent an increase on the order of 2 Y2-3 percent a year in total commercial bank claims on the group of countries. No entitlements or predetermined ceilings for bank lending were intended by the suggested percentage increase in banks' exposure to these countries. Rather, commercial bank financing would be tailored, on a case-by-case basis, to the financial requirements of individual member countries.
A list of 1 5 such countries was put forward by the U.S. Treasury. This list was not intended to exclude any country from gaining access to bank lending; some countries may not need net new bank lending, while other countries may be added to the list. In addition to the provision of net new loans to the group of 1 5 countries, banks would be asked to continue to provide net new loans to countries now receiving adequate bank financing on a spontaneous basis, provided that these countries maintain sound policies, and to consider lending to other developing countries experiencing debt-servicing problems that require relatively small amounts of commercial bank financing under agreed adjustment programs.
A variety of techniques for generating the new bank lending could be considered in order to achieve as broad a participation by banks as is feasible. A diversification of instruments available to banks, particularly for banks with small exposures, might eventually be developed. The Secretary of the Treasury has invited the banking community to develop possible arrangements to ensure that an adequate flow of new financing is obtained.
The U.S. initiative also stresses that other sources of external finance, including foreign equity investment, private sector borrowing, and repatriation of domestic capital, must be encouraged. This should be facilitated by the implementation of sound economic policies to stimulate growth and investment, and would also be encouraged by the expansion of the role of multilateral institutions described above. In particular, policy measures must succeed in reversing capital flight if foreign financing is to increase. The U .S. Treasury Secretary also laid emphasis on the importance of enhancing foreign direct investment. He noted that it is not debt-creating, that it may have a compounding effect on growth, as well as bringing new technology and innovation into recipient countries, and that this may help to retain capital in the developing country.
1 7

©International Monetary Fund. Not for Redistribution
I • OVERVIEW OF DEVELOPMENTS AND KEY ISSUES
In recent discussions by the Executive Boards of the International Monetary Fund and the World Bank, as stated in a press release December 2, 1985, broad support was expressed for this debt initiative. A. W. Clausen, President of the World Bank, and J. de Larosiere, Managing Director of the IMF, expressed their strong support for the initiative, and stated that it should be translated into positive and concrete actions as soon as possible.
The IMF and the World Bank stated that they were ready and willing to play their parts, in close coiJaboration, in the implementation of the initiative and to that end would cooperate fully and constructively with their memberships, and with all parties in these concerted efforts to deal with debt problems and establish the basis for sustained economic growth.
The U .S. debt initiative has also been welcomed by the international banking community. In messages received by the Managing Director of the Fund and the President of the World Bank, banks from the major financial centers-accounting for an overwhelming majority of bank claims on heavily indebted, middleincome countries-have indicated their willingness to play their part in implementing the strategy on a caseby-case basis, and in collaboration with all other relevant parties-including debtor and creditor governments and the international institutions. In the United States, banks accounting for more than 95 percent of U .S. bank claims on the heavily indebted, middle-income countries have indicated their support. ln the aggregate, indications of support have been received from banks in financial centers that account for more than 90 percent of total loan exposure to these countries.
Medium-Term Outlook
The medium-term outlook for coping with the debtservicing problems of developing countries remains difficult. The global economic environment has become less favorable. Output growth of industrial countries has slowed, while protectionist pressures have continued on the rise. Moreover, export earnings of developing countries have been reduced by a decline in prices for primary commodities. Finally, spontaneous bank lending to developing countries has slowed further and is likely to remain very limited, while the pattern of such lending may be subject to sharp swings owing to changes in banks' perceptions of creditworthiness. With such challenges, a coordinated response by governments of developing and industrial countries, multilateral development banks, and commercial banks is needed to strengthen the international debt strategy.
18
Developing countries need to institute policies that would allow them to achieve external adjustment and growth. Such a strategy rests on policies that maintain a set of incentives for exporting, foster domestic savings, and encourage private investment. Prudent monetary and fiscal policies are necessary to create an environment of financial stability which facilitates the operation of supply-oriented policies. Essential components of this strategy for growth and adjustment are real exchange rates and real interest rates which provide adequate incentives for the production of tradable goods and the generation of domestic savings. Growth-oriented adjustment policies in debtor countries will also assist in restoring confidence in their economies and, hence, also contribute to deterring capital flight and attracting foreign equity investment.
Industrial countries also bear a significant responsibility to undertake policies that improve the world economic environment faced by developing countries. Several policy actions by industrialized countries would be required to achieve durable noninflationary growth. The public sector's claims on available world savings should be reduced by cutting structural budget deficits and public spending where these are excessive. Such action would contribute to a lowering of international interest rates. The rise of protectionism also needs to be strongly resisted, on the part of both industrial and developing countries. Industrial countries could stimulate the flow of financing to developing countries by applying export credit cover policies in a manner that recognizes more quickly countries' adjustment efforts, while bank supervisors could continue to show flexibility in order that bank flows are not unduly impeded, and that the quality of adjustment policies is taken into account.
Multilateral development institutions can play an increasingly important role-through their lending, their expertise on investment strategies, and their advice on long-term structural reform-in implementing the international debt strategy. Cofinancing operations with the World Bank and other institutions would aid in this process by encouraging increased project and sectoral financing. However, guarantees to banks by governments or the World Bank would only transfer risks from the private banking system to the public sector. There is a need for bank creditors to add to the financing pool made available to developing countries by official sources. In this regard, a major role of the multilateral development institutions could be to reinforce banks' confidence in the mediumterm advisability of lending to developing countries and to aid in greater total lending to these countries.
Commercial banks, by demonstrating responsibility and flexibility where effective adjustment efforts are

©International Monetary Fund. Not for Redistribution
under way, can protect the quality of their existing claims on developing countries and contribute to further progress in restoring sustainable growth. Recent improvements in banks' balance sheets place banks in a better position to lend to countries undertaking appropriate policies. Trade finance and project lending are of particular importance in supporting exports, investment, and growth and would safeguard the security of past bank investments. However, caution must be taken so that the present tendency toward trade and project financing by commercial banks does not divert attention away from the need to disburse balance of payments financing in those cases where this type of financing would be appropriate.
The U.S. Debt Initiative
Considerable progress has been achieved in handJing debt-servicing difficulties and reducing systemic risks. A coordinated effort by all parties involved-debtor and creditor governments, multilateral agencies, and commercial banks-is needed to build upon this progress. With the experience that the Fund has acquired in these matters, and in close cooperation with the World Bank, the Fund will be able to assist developing countries in designing appropriate adjustment strategies and mobilizing financial support. Through its surveillance responsibilities, the Fund will be able to work with its membershjp to improve the global economic environment on which the adjustment effort of developing countries is conditioned.
19
©International Monetary Fund. Not for Redistribution
11 Structural Changes in the Financial Markets
In recent years, the structure of major international financial markets has been fundamentally altered by the development of new instruments, more intense competition, and significant changes in official regulations governing the banking and securities markets. While the principal instrument of medium-term international finance in the 1970s was the syndicated bank loan, alternative instruments such as floating rate notes, interest rate and exchange rate swaps, and international issuance facilities developed rapidly during the 1980s, substituting, in a number of cases, for syndicated lending.
Many of the new financial instruments initially were designed in response to tax or regulatory factors. However, the more enduring innovations have significantly altered the sharing of risks between borrowers and lenders, more closely integrated market conditions among the major countries, and strongly affected the roles of various financial intermediaries in channeling the flows of savings and investment between countries. The rapid pace of innovation represents a fundamental response to uncertainties in the international economy, experience of the debt crisis, and changes in official policies relating to bank supervision and financial markets. The changes in official policies relating to financial markets, in turn, have been undertaken in response to changes in economic conditions affecting domestic and foreign financial markets. These policy changes also reflect a desire to increase efficiency and competition in financial markets.
One factor that has contributed to the rapid pace of change has been the development of new computer and telecommunications technologies. While these technological changes would not, by themselves, have fundamentally altered the financial markets without accompanying changes in the economic environment and official regulations, new technology has increased the ability of financial institutions to manage more complex and sophisticated operations in an increasingly integrated global market.
This section examines some of the key sources of change that arise from macroeconomic conditions and from official policies aimed at liberalizing financial markets. It also discusses the nature of a number of new instruments in international markets. Finally,
20
recent developments m market supervision are reviewed.
Factors Contributing to Change in Financial Markets
Inflation and Increased Uncertainty
The sharp acceleration of inflation during the 1970s in countries with major financial markets was a major factor leading to changes in financial instruments and regulations. The regulatory and institutional structures of major financial market countries in the 1960s and early 1970s reflected, to an important degree, a long experience of relatively low inflation rates and stable interest rates. 10 Relatively low inflation contributed to interest rate stability and helped create a willingness on the part of savers to hold long-term, fixed interest rate assets. In addition, there emerged a number of financial institutions holding relatively illiquid, longterm, fixed interest rate loans that were financed by issuing relatively liquid, short-term, fixed interest rate liabilities.
Rising inflation resulted in low or negative real interest rates on many financial assets and reduced capital values of those assets. Although the acceleration in inflation was not uniform among major industrial countries, the average inflation rates in the 1970s were generally twice those observed in the 1960s.11 For holders of long-term, fixed interest rate securities during the 1960s, the higher levels of inflation and the accompanying increases in interest rates produced
1° For example, inflation (as measured by the consumer price index) in the United States averaged only slightly more than 2 percent per annum during the 1950s and 1960s; and, in the United Kingdom, inflation was typicaUy between 3 percent and 4 percent during this period. In the Federal Republic of Germany, the rate of inflation rose only slightly from an average annual rate of 2 percent in the 1950s to 2.5 percent in the 1960s: whereas in Japan, inflation was usually between 4 percent and 5.5 percent during this period.
11 l n the United States, inflation during the 1970s averaged nearly 8 percent per annum versus 3 percent in the 1960s. In the United Kingdom. the annual average rate of inflation in the 1970s was nearly 14 percent in comparison with an average of 4 percent in the 1960s. ln the Federal Republic of Germany, the rate of inflation equaled 5 percent in the 1970s versus 2.5 percent in the 1960s. In Japan, inflation during the 1970s averaged 9 percent per annum versus less than 6 percent in the 1960s.

©International Monetary Fund. Not for Redistribution
large capital losses and low (and often significantly negative) real returns on their portfolio holdings. This experience created a preference on the part of investors for instruments carrying variable interest rates or with relatively short maturities. While inflation slowed during the early 1980s, average inflation rates during 1980-84 were still higher than in the 1960s (except in the case of Japan).
Changes in financial markets were also stimulated by the emergence of more volatile macroeconomic conditions in the international economy during the 1970s and early 1980s. In addition to high and variable inflation rates and interest rates, this period witnessed the emergence of considerable exchange rate variability, sharp swings in economic activity, and substantial movements in relative prices of commodities. Moreover, macroeconomic policies generally placed less emphasis on stabilizjng exchange rates or interest rates than in the past.
Sharp changes in economic conditions increased the uncertainty regarding real yields on financial instruments. As a result of increased uncertainty, lenders became reluctant to provide long-term, fixed interest rate funds, except in exchange for high real rates of return. To respond to changes in perceived risks, the issuers of securities and deposit liabilities attempted to alter the characteristics of financial instruments to enhance their liquidity and to make their future capital value more certain. This process has included the emergence of floating rate notes, interest rate and exchange rate swaps, and financial futures and option markets.
Changing Patterns of Payments Imbalances, Savings, and Investment Flows
The types of instruments used in international financial markets have been strongly influenced by the changing patterns of payments imbalances and the implied redistribution of savings and investment flows across countries and regions. During the 1970s, the need to finance the current account imbalances associated with the sharp movements in energy and commodity prices led to a significant expansion in international bank lending and the emergence of the syndicated bank loan as a principal vehicle of international finance.
For those developing countries which relied heavily on credit from commercial sources (the market borrowers), foreign capital inflows, measured relative to GDP, increased by nearly one half between 1967-72 and 1973-82. These inflows added the equivalent of 12 percent of domestic savings to total savings. Foreign capital inflows also represented an important compo-
Factors of Change
nent of total funds available to finance investment for those developing countries which have been heavily dependent on credits from official sources (official borrowers). During 1967-84, the inflows received by this group represented an average 6 percent of their GDP, and 5 1 percent of their domestic savings. In contrast, while individual industrial countries at times experienced large capital inflows or outflows during the 1960s and 1970s, the imbalances for the group as a whole varied between surpluses or deficits that were equivalent to less than I percent of their combined incomes or 3 percent of their domestic savings. Appendix ill contains a more detailed discussion of the evolution of savings, investment, and foreign capital inflows during 1967-84.
In the period following the emergence of external payments difficulties for many developing countries in the early 1980s, there were sharp changes in the pattern of payments imbalances. Reflecting both the adjustment efforts of developing countries and a reluctance of commercial lenders to increase their exposure to countries with external payments difficulties, net capital flows and current account deficits declined sharply. The current account deficit of the developing countries in aggregate declined from $100 billion in 1982 to $42 billion in 1984.
At the same time, the current account position of the industrial countries switched from a small surplus in 1982 ($3 billion) to a sizable deficit ($35 billion) in 1984. Moreover, the current account imbalances of individual industrial countries increased significantly, with the U.S. current account deficit reaching $93 billion in 1984 and the Japanese surplus amounting to $36 billion. International capital movements thus increasingly represented flows between industrial countries, as opposed to flows between industrial and developing countries. At the same time, the issuance and purchase of securities (principally between entities in industrial countries) gradually displaced syndicated bank lending as a primary vehicle of international finance.
The decline of foreign capital flows to developing countries has sharply reduced the contribution of external savings to the financing of investment in these countries. For the market borrowers, the average ratio of foreign capital inflows to GDP during 1983-84 was below that experienced in the late 1960s and early 1970s. As a result, foreign capital inflows were equivalent to less than 7 percent of domestic savings during 1983 and 1984, whereas they had represented over 1 2 percent of the groups' domestic savings in the late 1960s. In contrast, the capital inflows that have been received by the official borrowers have remained more stable and helped to sustain the level of investment for this group. Since the ratios of domestic savings to
2 1

©International Monetary Fund. Not for Redistribution
11 • STRUCTURAL CHANGES IN THE FINANCIAL MARKETS
GDP in many developing countries remained unchanged over the period 1967-84, reduced capital inflows have been accompanied by generally lower ratios of investment to income.
Liberalization
While many recent changes in reguJations governing financial markets have been undertaken i n response to the pressures created by macroeconomic developments, there have also been efforts in some countries to introduce additional competition into domestic financial systems in order to promote efficiency and to increase international access to domestic financial markets. In addition, the growing scale of Eurocurrency operations has led to competitive pressures in both domestic and international financial markets, permitted certain restrictions on domestic financial transactions to be bypassed, and allowed arbitrage of financing conditions across major financial markets.
The pressures for regulatory change affecting banking activity were often most evident when market interest rates rose relative to ceiling interest rates on bank deposit liabilities. Since interest rate ceilings on bank deposits were adjusted slowly to increases in market interest rates, there were at times significant outflows of funds from depository institutions subject to these interest rate ceilings into securities, including government paper, and deposits in nonbank institutions which were not subject to interest rate ceilings. Disintermediation was also encouraged by the need to finance large fiscal deficits in a number of countries with major financial markets. To finance these deficits, the authorities often issued debt with shorter average maturity, offered higher yields, and removed restrictions on the types of investors that could purchase short- and long-term government securities. Government debt carrying market-related yields provided attractive alternatives to banks' deposits that had their interest rates fixed due to ceilings.
In most instances, changes in official policies have encompassed the relaxation of barriers separating the activities of different types of institutions, extensions of the geographkal domain of existing institutions, the relaxation of interest rate ceilings, reductions in barriers to entry into the domestic financial system by both foreign and domestic institutions, the abolition or relaxation of exchange controls, and elimination of quantitative credit ceilings. Typically, new regulatory policies have been introduced gradually in order to allow the various sectors of the financial system sufficient time to adjust to the new financial market environment as well as to changing macroeconomic conditions.
22
Access to major financial markets has been improved by removal of capital controls, changes in regulations governing the taxation and issuance of bonds, the continuing expansion of the Eurocurrency markets, and changes in regulations governing access to both domestic and international markets. Table 2 provides some examples of the types of changes in regulations governing securities and banking markets that have occurred i n recent years in Japan and the United States. Changes in Japanese regulations have broadened the array of instruments that can be used in securities markets and enlarged the access of both domestic and foreign borrowers to these markets, while increasing the role played by foreign financial institutions. In the United States, there has been a gradual removal of ceilings on domestic interest rates for bank deposits, a redefinition of the activities that various financial intermediaries can undertake, and a lessening of geographical restrictions on activities of banks.
Substantial changes have taken place in many other countries during the 1980s. In the United Kingdom. the authorities abolished exchange controls, removed restraints on the growth of bank liabilities (the Supplementary Special Deposit Scheme), and announced plans to liberalize the ownership of stock exchange firms with regard to both domestic and foreign institutions. In the Federal Republic of Germany, the authorities recently liberalized the types of securities that can be issued, allowing floating rate notes, zero coupon bonds, and swap-related issues. Also, it was recently announced that arrangements would be made to permit the issue of OM certificates of deposit by commercial banks. Foreign-owned institutions are now permitted to act as lead managers for foreign deutsche mark issues. In the Netherlands, a package of deregulation measures was announced in November 1985 that allows, among other things, the introduction of floating rate notes, certificates of deposit, and commercial paper. In addition, bond issues can now be brought to market without waiting in queue and foreignowned institutions are now permitted to act as lead managers in issuing securities.
In addition, withholding taxes on interest payments on domestic bonds held by foreigners have been removed in a number of countries including the United States, Japan, and the Federal Republic of Germany. There has been a removal of restrictions on the establishment of futures and options markets for financial assets, foreign exchange, and equities. Unlisted securities markets have been encouraged in several countries, to facilitate the raising of equity by smalland medium-sized enterprises.
The increasingly important role of foreign banks in the domestic markets of the major industrial countries is another aspect of growing integration-and corn-

©International Monetary Fund. Not for Redistribution
Factors of Change
Table 2. Selected Changes in Regulations Governing Financial Markets in Japan and the United States
Japan
September 1982 It was announced that the rules governing the issuance of yen-denominated obligations by nonresidents would be liberalized effective January 1983. The rule of one issue per quarter for a foreign corporate borrower was abolished, and private companies could compete for a place in the new issue queue on the same basis as supranational organizations and sovereign borrowers. All AAA-rated companies can issue on the market.
February 1983 Ministry of Finance lifted its ban on the sale of zero coupon bonds in Japan but some conditions were placed on purchases of such bonds by Japanese investors.
December 1983 Financial institutions were allowed to set up subsidiaries dealing exclusively in consumer lending.
January 1984 The minimum size of COs was reduced from ¥ 500 million to ¥ 300 million. Effective April l , 1984 (i) the ceiling on overseas borrowing in the form of government-guaranteed bonds by public corporations and government-affiliated agencies was raised by one-half; (ii) the required credit rating for foreign governments and official agencies who wish to borrow for the first time in the domestic yen market was lowered from AAA to AA; and (iii) the waiting period between two offerings by the same borrower was abolished.
April 1984 Guidelines on the issue of Euro-yen bonds issued by residents were eased, allowing some 120 Japanese firms to issue convertible Euro-yen bonds and some 30 firms to issue straight Euro-yen bonds. Guidelines on overseas lending by Japanese banks were discontinued.
May 1984 The Ministry of Finance decontrolled exchange swaps in connection with the issuance of foreign currency bonds by residents. and of yen bonds by nonresidents. Nonresidents were excluded from the 20 percent withholding tax on interest paid on government bond issues in foreign currency. The final communique of the Working Group on Yen/Dollar Exchange Rates and the U .S. Secretary of the Treasury was published. lt included a commitment by the Japanese authorities to create a framework for a yen-denominated bankers' accep tance market and abolish, as of June I , 1984. swap limits on spot foreign exchange position of banks. Furthermore. it authorized foreign companies to issue Euro-yen bonds under the criteria established for the use of samurai bonds. The criteria were to be relaxed further beginning in April 1985. The communique also contained a commitment from the Japanese Government to allow foreign financial entities to lead manage Euro-yen bond issues; to permit the issue of short-term Euro-yen denominated certificates of deposit; and to liberalize short-term Euro-yen loans to residents.
June 1984 The Ministry of Finance relaxed "Gensaki'. trading to include bonds denominated in foreign currencies which are listed on foreign stock exchanges. Banks were permitted to deal in secondary market issues of government and municipal bonds with maturities of up to two years. Short-term Euro-yen loans to Japanese residents were allowed.
Japan (concluded) September 1984 Three foreign banks were invited to submit ap
plications for licenses to deal in secondary market issues of public bonds under the same rules applying to Japanese banks.
December 1984 Overseas branches of Japanese banks and foreign banks were allowed to issue abroad negotiable Euro-yen certificates of deposits with maturities of up to six months; nonresident borrowers were allowed to issue unsecured Euro-yen bonds under the same rules which govern foreign yen bond issues in Japan; and six additional foreign banks were authorized to sell Japanese government bonds over the counter. A concrete plan to create a yen-denominated Bankers' Acceptance Market was announced.
March 1985 The Ministry of Finance announced that from June 1985. banks and securities houses would be authorized to offer revolving loan facilities (up to ¥ 2 billion) by using public bonds as collateral, and that brokering licenses would be granted to banks for trading in the bond futures market which would begin operations in October 1985.
April 1985 All banks were permitted to sell new types of large denomination deposit instruments with market-determined interest rates. Minimum size of COs was lowered (to ¥ 100 million) and minimum maturity was shortened from three months to one month. Nonresident lenders and Japanese banks' overseas branches were allowed to extend medium- and long-term Euro-yen loans, with a maturity of one year or more, to nonresidents and to overseas subsidiaries of Japanese corporations. The withholding tax on nonresidents' earnings on Euro-yen bonds issued by Japanese residents was abolished.
June 1985 It was confirmed that floating rate notes issued by nonresidents would be allowed on the Euroyen market. The yen-denominated Bankers· Acceptance Market became operative. Nine foreign banks were allowed to participate in trust banking business in Japan, thus permitting them to participate in the management of corporate pension funds.
July 1985 It was also announced that foreign securities firms would be allowed membership on the Tokyo Stock Exchange before the end of the year.
October 1985 Interest rates on large time deposits were liberalized.
United States
March 1980 Depository Institution Deregulation and Monetary Control Act became law. lt authorized negotiable orders of withdrawal (NOW) accounts on a nationwide basis from December 3 1 . 1980 and extended reserve requirements to banks and other depository institutions that were not part of the Federal Reserve System. Furthermore, the law allowed savings and loan associations to invest 20 percent of their assets in consumer loans, commercial papers. and debt securities; allowed mutual savings banks to make business loans and accept business deposits; and created the Depository Institutions Deregulation Committee (DlDC). charging it with responsibility to eliminate gradually interest rate ceilings on deposit accounts.
23

©International Monetary Fund. Not for Redistribution
ll • STRUCTURAL CHANGES IN THE FINANCIAL MARKETS
Table 2 (concluded). Selected Changes in Regulations Governing Financial Markets in Japan and the United States
United States (concluded) December 1982 Following instructions given by the Garn-St Ger
main Depository Institutions Act. the DfDC authorized money market deposit accounts (MMDA) with a minimum balance of $2,500 (subsequently changed to $1,000 after January I , 1985, and zero after January I , 1986) and with no interest rate ceiling. Depositors were allowed up to six transfers per month. Effective January 5, 1983, the DIDC allowed depository institutions to offer the Super-NOW account that had unregulated interest rates and unlimited transfers but with minimum balance requirements. Savings and loan associations were allowed to increase the proponion of their assets in the form of commercial loans.
June 1983 The DIDC decided to eliminate all remaining interest rate ceilings on new time deposits of over $2.500 and longer maturity than 3 1 days opened after October I , 1983. The Federal Reserve set a 5 percent capital/asset ratio requirement for larger banks.
Source: Official data.
petition--of financial markets. While foreign banks have traditionally provided financial services in the host country for exporters from their home countries, these banks are now attempting to establish positions in domestic retail banking markets by establishing branch networks or by purchasing domestic banks.
Development of Market Instruments
ParaUel with the changes in official regulations, a variety of new instruments has developed in response to macroeconomic changes as well as existing and new regulations. Most of these instruments both redistribute risk in the markets and foster greater integration, whether by blurring the distinctions between banking activity and the securities markets, or by allowing borrowers to access markets in new ways.
Securitization
Floating rate notes have become an important instrument because they have been able to satisfy certain needs of both lenders and borrowers during periods of high and variable interest rates, unstable macroeconomic conditions, and uncertainty about the future trends in interest rates and inflation. In particular, floating rate notes fundamentally alter the sharing of the risks associated with interest rate variability between the borrower and the lender. With floating rate notes the borrower bears the costs of higher interest rates or obtains the benefit of lower yields. Borrowers have been willing to bear this additional risk in order to obtain longer maturities than are typicaUy available through the issuance of fixed interest rate bonds.
24
October 1983 The DIDC decided that the remaining requirement of a balance of $2.500 on deposit accounts should be phased out by January I , 1986.
July 1984 The Deficit Reduction Act repealed the 30 percent withholding tax on interest paid to foreign residents on qualified U.S. obligations issued after July 18. 1984.
September 1984 The Department of Treasury banned direct or indirect sales to nonresidents of U.S. Government-backed security issues in bearer form.
November 1984 About 9,300 state-chartered banks regulated by the Federal Deposit Insurance Corporation were permitted to enter the securities business.
January 1985 The Department of Treasury announced that a separate trading of registered interest and principal of securities (STRIPS) programs would be available first for its long-term notes and bonds and later for all old and new eligible securities in circulation.
Although the first Eurocurrency floating rate notes were issued in the early 1970s, it was not until recently, when banks began to use floating rate notes for liquidity management and as a means of adding to their capital , that the volume of these instruments expanded to a significant level. During 1979-8 1 , for example, Eurodollar floating rate notes represented 1 2 percent of all new international bond issues, but this proportion grew to 34 percent in 1984. Commercial banks have been both major purchasers and issuers of floating rate notes. Many non-U .S. banks often found Eurodollar floating rate notes the least expensive means of securing medium-term U.S. dollar funding for their medium-term floating interest rate syndicated loans in U.S. doUars. In addition, subordinated floating rate notes were at times used as a source of bank capital, where this was permitted by the authorities.
Many corporate and sovereign borrowers found it less expensive to issue floating rate notes (or fixed interest rate bonds) than to obtain syndicated bank loans. This change in the relative cost of borrowing through bank loans and securities reflected, in part, the perception that the creditworthiness of many banks had declined in view of the difficulties that many of their borrowers were having in servicing their bank loans. As a result, the ratings of a number of leading banks were reduced relative to some of their sovereign and corporate clients. This factor, in addition to the costs of loan intermediation, helped keep the cost of syndicated loans for many creditworthy borrowers above the costs they experienced by directly issuing notes or other securities. In many cases, banks were able to hold floating rate notes without incurring the full liquidity and capital costs associated with direct

©International Monetary Fund. Not for Redistribution
loans, owing to privileged regulatory treatment of securities.
Floating rate notes typify a more general tendency, called "securitization," to increase the marketability of banks' assets which traditionaiJy have been held to maturity. Also, a large number of recent syndicated loans have incorporated contractual features allowing them to be transferred, usually in the form of transferable loan certificates. Of course, regulators and many banks point out that the negotiability of an asset does not ensure that it is salable at close to par value. Ease and value of resale can be affected by the evolving creditworthiness of the borrower, as weiJ as by interest and exchange rate fluctuations.
From the point of view of the borrower, syndicated loans are more flexible than the issuance of floating rate notes in a number of respects. The borrower can draw on the funds available through a syndicated loan at any time during the loan period, can often change the interest rate basis (e.g., from the three- to the sixmonth LIBOR), can prepay the loan, and can sometimes even select the currency in which to receive the loan. In contrast, with a floating rate note, the borrower receives all funds at the time of issuance, the interest rate basis is typically fixed for the life of the note, which can generally not be prepaid, and these notes are denominated in a single currency. However, lenders find floating rate notes much more attractive since they typically have greater liquidity than part.icipations in a syndicated loan.
In a number of respects, note issuance facilities (NlFs) and other backup credit facilities that have recently developed are an attempt to combine some of the characteristics of the traditional syndicated loan with those of a floating rate note. The note issuance facility consists of an arrangement whereby an underwriting syndicate commits itself for severaJ years (sometimes as long as ten years) to purchase the borrower's notes of one- to twelve-month maturity with a fixed spread (the "cap rate") above a benchmark interest rate. When the borrower activates the facility, notes are sold through bidding by tender or through negotiation to banks and other institutions that then place the notes with investors or add them to their investment portfolios. The cost to the borrower of such sales is usually below the "cap rate."
The underwriting banks are required to take up only those notes that cannot be sold below the "cap rate," although the underwriters can-and do-acquire the notes voluntarily also. About 25 percent of all note issuance facilities are not underwritten or are only partially underwritten. Approximately three quarters of the underwritten note issuance facilities operate with a tender panel while the rest are placed by a single bank. The average maturity of the facility is
Market instruments
seven to ten years, whereas the notes that are issued typically have matUiities of one, three, or six months.
The development of such facilities is characteristic of the type of innovation that arises through the application in a new setting of a financing technique well-established in one financial market. The shortterm . . committed" bank credit line or stand-by credit has been a common feature of domestic financial markets in many industrial countries. The type of international issuance facility that has recently grown so rapidly differs from domestic stand-by arrangements primarily in being explicitly medium-term. It seeks to protect the underwriters by covenants analogous to those used in medium-term syndicated credits rather than by periodic renewal, as in domestic stand-bys.
These facilities have generally been arranged for highly regarded borrowers from the major industrial countries, including large banks and international institutions. They can potentiaJly be used for a variety of purposes. While a fully drawn facility could be used in place of a syndicated loan to raise cash, very few facilities have been arranged in this manner. During 1984 and the first half of 1985, only a relatively modest proportion of the notes that could be issued under the existing facilities have actually been issued, especially in the case of facilities for corporations. Note issuance facilities arranged for corporations have thus far been used primarily as a replacement for a bank stand-by. Note issuance facilities may, however, serve as the basis for the issuance of Eurocurrency commercial paper. Note issuance facilities are still undergoing rapid evolution. This is evident most recently in the development of multiple-option funding facilities (MOFFs) which allow the borrower either to sell Eurocurrency notes in different currencies or to obtain short-term bank advances .
The yields on the notes issued under these facilities have typically been below LIBOR but above the yields on alternative money market instruments (e.g., Eurocurrency deposits of comparable maturity). Notwithstanding this favorable interest rate differential, nonbanks' holdings of Euronotes are believed to remain very modest at this time. The principal non bank purchasers have been corporations, insurance companies, investment trusts, and central banks.
Thus, the development of a true Eurocommercial paper market for corporate and sovereign borrowers is still at an embryonic stage. The future development of note issuance facilities will be crucially dependent on the willingness of nonbank investors to purchase the short-term notes which are issued under these facilities. One element necessary for many nonbank corporations to invest in such paper on a large scale may be widespread rating of such paper by established credit-rating agencies.
25
©International Monetary Fund. Not for Redistribution
11 • STRUCTURAL CHANGES IN THE FINANCIAL MARKETS
Swaps, Options, and Futures
Another new instrument, which emerged in significant volume only in the early 1980s, has been the medium-term swap. Swap transactions have been used both to arbitrage differences in borrowing costs across major financial markets and to reallocate the interest and exchange rate risks implicit in medium-term financial transactions. 12 Given the extensive interest rate and exchange rate movements that have occurred since 1973, institutions have sought means to impose control over and to minimize their borrowing costs; to cover long-term commitments in foreign currencies; and to be able to use fully worldwide intracompany liquidity, both in convertible and blocked currencies. The thinness or absence of forward foreign exchange markets for cross-currency financial transactions with maturities beyond one or two years has meant that medium-term transactions could not be fully hedged using traditional foreign exchange markets. However, the existence of the medium-term swap market has itself now stimulated and facilitated development of the forward exchange markets at similar maturities.
Both securities houses and commercial banks have expanded their swap activities at a rapid pace. Since 1981, interest rate and exchange rate swap transactions
have grown at a rapid rate, reaching an estimated $80 billion in 1984. Over the last few years, swap
���kets have undergone extensive change. During the mtttal development of the swap markets, swaps typically had a value of between $10 million and $ 1 50 million, with a maturity from three to ten years. By 1984, in contrast, maturities were generally between one and twelve years, with amounts ranging from $5 million to $500 million. Swaps are now also being used by corporations, banks, insurance companies, savings and l�an associations, governments, and multilateral agenctes. Currently, a very substantial proportion of new bond issuance in international markets is undertaken as part of a swap transaction. There are approximately three times as many interest rate swaps as currency swaps.
In swap transactions, financial intermediaries may play the role of a broker, bringing together two parties that undertake the actual swap, or may stand between the parties. In the latter instance, the financial intermediary assumes the credit risk that either of the parties may fail to perform, which could result in unintended losses or profits, depending on intervening currency and interest rate movements. Estimates by market participants ranged widely as to the proportion of face value of a swap which might be considered as representing the credit risk. These estimates varied in
'2 Appendix IV explains the mechanics of an interest rate and currency swap.
26
particular in the case of medium-term interest rate and currency swaps, where the currencies concerned have varied �ateri�Uy in the past (e.g., interest and currency swaps mvolvmg U .S. dollars against deutsche marks or Swiss francs). The very fine margins obtained through swaps reflect the fact that some institutions view their swap transactions as having relatively low credit risk.
As the outstanding volume of swaps increased, a so-ca�ed secondary market developed. Existing swaps ar
_e said to be "traded" when the swap is terminated,
wtth payment of a negotiated fee by one original
�o�nterparty to the other original counterparty; when tt ts reversed through an offsetting swap with a new counterparty; or when one side of the swap is assigned by an original participant to a third party. In the second and third of these cases, the credit risk is not extinguished and may be increased because new counterparties are introduced in the chain of transactions. Swaps h�ve thus not yet reached the status of finely tradable mstruments. Moreover, it is not clear that actual trading of swaps is completely risk-free. To reduce such risks, many corporations refuse to deal with counterparties whose credit ratings are inferior to their own rating.
For corporate borrowers, swaps have also been a means of obtaining medium-term fixed interest rate credits. Among other factors, the financing of large fiscal imbalances in a number of major countries has to some degree stimulated corporate borrowers with less than the very best credit ratings to seek access to medium- and long-term capital market funds outside the traditional fixed-rate market. Swap transactions have
_allowed these corporations to issue floating rate
debt m markets where their name has a scarcity value, and then to enter into a swap transaction in which they agree to service the fixed interest rate debt of anothe� entity (often a bank). The other entity agrees to servtce the corporation's floating rate debt. These swaps allow the corporation to obtain the equivalent of fixed interest rate debt at a cost that is lower than could often be obtained through direct fixed interest rate ?ond issues. (Appendix IV provides an example of thts type of transaction.)
Early in the development of the market, some nonU.S. doUar-based banks were able to obtain indirectly medium-term, floating interest rate U.S. dollar finance at rates substantially below LlBOR, by issuing fixed interest rate, non-U .S. dollar foreign and Eurobonds, and by swapping the proceeds for U.S. dollars. As the market has developed, the initial large savings in borrowing costs that could be obtained through these swaps were eroded by competitive pressures.
A further area of innovation has been the rapid expansion of currency and interest rate options and

©International Monetary Fund. Not for Redistribution
futures. These markets permit banks and corporations to hedge their exposure to financial risks. The expansion of such activity may involve banks both as an agent for other parties and as principals-and if as principals, they may be trading on their own account, or taking positions to limit the interest and exchange rate exposure arising through other assets and liabilities.
The use of financial futures by banks for their own account has increased sharply. Interest rate futures, for example, offer banks an alternative route to hedge mismatches between interest rates applicable to their assets and liabilities. This avoids an increase in interbank positions to match such exposure, thus economizing on the capital required for the banks' business.
Changes in the Supervision of Financial Markets
The growth in banks' off-balance sheet business, the "securitization" of loan claims, and the growing integration of different financial markets and market segments have raised new and complex issues for supervisory agencies. These changes have occurred at a time when the quality of many banks' assets was still affected by the external payments problems of certain developing countries, and in some cases by debt-servicing difficulties of borrowers in the energy, agricultural, shipping, and real estate sectors of industrial countries.
These developments have posed substantial challenges to supervisors. They have also demonstrated the importance of steps taken over the past ten years to develop international coordination of bank supervision under the auspices of the Cooke Committee13 and of regional supervisory groups. With the growing integration of different types of financial markets, the need for close coordination between banking supervisors and regulators of other financial intermediaries has also been demonstrated.
There has been a continuing need to strike a balance between the common concern of bank managements and supervisors to strengthen individual institutions rapidly and a concern that such actions could-by their cumulative effect in restricting flows of new funds to debtor countries-jeopardize the immediate stability of the financial system and thus prove self-defeating. Supervisors' sensitivity to this dilemma is illustrated by their acceptance of increases in banks' exposure to countries experiencing payments difficulties that have occurred under internationally concerted "new money" packages. Some current issues of relevance
oJ The Cooke Committee is formally known as The Group ofTen Committee on Banking Regulations and Supervisory Practices. 1t meets under the auspices of the Bank for International Settlements.
Changes in Supervision of Financial Markets
in this area are touched on in the discussion below of banks' reserves for loan losses.
Capital Adequacy
Bank supervisors have continued their coordinated efforts to halt and reverse the decline in capital adequacy levels that had been evident in the late 1970s in many national groups of banks. Published capital ratios in a number of industrial countries have risen as a result of supervisory and market pressures (Table 3). The need to persist in this endeavor has been underscored by recent experience of some supervisors. This experience has indicated that adequate capital is essential to allow banks to withstand significant losses arising from their lending and other activities, and to limit the potential liabilities of public agencies in the event of the failure of an institution.
In the United States, strong impetus for the strengthening of capital asset ratios was given by the passage of the International Lending Supervision Act of 1983. Recently, Federal agencies adopted new capital adequacy standards involving a minimum ratio of 5.5 percent for primary capital and 6 percent for total capital to banks' assets, increasing the minimum capital requirements for larger banks. At a hearing before the Senate Banking Committee in September 1985, the Chairman of the Federal Reserve Board indicated that, in his view, an increase to 9 percent in the ratio of total capital to assets for commercial banks was "attractive in concept and worthy of study." The possibility of a 9 percent total capital ratio had been raised previously by the Chairman of the Federal Deposit Insurance Corporation. Market estimates indkate that the total (as opposed to primary) capital ratio of the holding companies for the U .S. money center banks was equivalent to 8.5 percent in June 1985, up from 7.8 percent at end-1984. The comparable picture for a wider group of 35 banks gives very similar results.
The internationally coordinated effort to strengthen capital asset ratios has itself influenced the forms in which bar.ks are taking on business. In particular, the application of a simple capital asset ratio may give banks incentives both to conduct business "off-balance sheet" and to invest less on low-yielding, high quality assets. Thus pressure has developed in favor of the more sophisticated risk-weighted capital ratios typically applied in many European countries. The interaction between capital adequacy regulation and innovative market responses is discussed in more detail in the following subsection.
A further area of change is increased vigilance by supervisors over the quality of banks' capital. Authorities have expressed concern about the role subordinated debt can play in bank capital. ln particular,
27

©International Monetary Fund. Not for Redistribution
ll • STRUCTURAL CHANGES IN THE FINANCIAL MARKETS
they have questioned the ability of such debt capital to absorb recurrent losses, and to back assets except in the event of liquidation. In the Federal Republic of Germany, for example, subordinated debt has not been included in the capital base. In many other countries, such debt has been viewed as only "secondary" capital, subject to limitations on the degree to which it can be included in prudential capital measures. Supervisory concern about the role of subordinated debt as capital has increased, as many banks have become holders, as well as issuers of substantial quantities of such debt. Thus, capital available to the banking system is to some degree being double-counted, and the capacity of such instruments to serve as capital may be perceived differently by issuers and holders.
Limits on the ability of banks to issue straight equity capital, particularly in cases where a bank's stock is poorly regarded by the market or where the bank is under government ownership, have thus led banks to issue instruments that fall between the traditional categories of loan and stock. These securities-with titles such as "participation certificates"-typically offer investors a somewhat higher return than bonds, but can (directly or by concession) bear part of the burden of lower profits or eventual losses.
As regards the international coordination of supervision, the consensus among bank supervisors on the need to supervise the international activities of banks on a worldwide consolidated basis has been implemented more fuiJy. The authorities in Japan have
Table 3. Capital-Asset Ratios of Banks in Selected Industrial Countries, 1977-841 (ln percent)
Canada 1 France • Germany, Federal Republic of 5 Japan � Luxembourg 1 Netherlands � Switzerland 9
Largest 5 banks All banks
United Kingdom Largest 4 banks 10 All banks 11
United States Nine money center banks 12 Next 15 banks r2 All reporting banks 12.u
1977
3.40
3.41 5.28
4.41
6.09 5.59
7.14 5.20
4.95 5.72 5.70
1978 1979 1980 1981
3.27 3.16 2.98 3.463 2.29 2.62 2.40 2.20 3.32 3.31 3.27 3.26 5 . 1 2 5.13 5.28 5.25
3.52 3.45 3.86 4.29 4.20 4.33
6.20 6. 1 1 6.18 5.78 5.68 5.63 5.66 5.36
7.53 7.18 6.85 6.39 5.20 5 . 1 0 5.00 4.47
4.73 4.51 4.52 4.62 5.42 5.37 5.51 5.21 5.53 5.29 5.35 5.38
Sources: Fund staff calculations based on data from official sources, as indicated in footnotes.
1982 1983 1984
3.65 4.06 4.43 2.07 1 .96 1 .94 3.31 3.34 3.38 5.03 5.22 5. !5
3.50 3.59 3.83 4.60 4.68 4.72
5.58 5.44 5.29 5.25 5.16 5.05
6.28 6.59 6.20 4.14 4.35 4.47
4.93 5.41 6.12 5.34 5.69 6.63 5.60 5.94 6.53
1 Aggregate figures such as the ones in this table must be interpreted with caution. Differences across national groups of banks (share of the interbanking activities in the total assets. provisioning practices. definition of the capital) make cross-country comparisons less appropriate than developments over time within a single country, which however can be affected by changes in regulations or practices year after year.
2 Ratio of equity plus accumulated appropriations for losses (beginning with 1981, appropriations for contingencies) to total assets (Bank of Canada Review).
3 The changeover to consolidated reporting from November I , 1981 had the statistical effect of increasing the aggregate capital-asset ratio by about 7 percent.
• Ratio of capital, reserves, and general provisions, to total assets. Data exclude cooperative and mutual banks. This ratio is not the official one (ratio of risk coverage), which includes loan capital and subordinate loans in the numerator and balances the denominator with regard to the quality of the assets, and which provides the groundwork for the control of the banking activities by the Commission Bancaire. (Commission de Controle des Banques, Rapport).
5 Ratio of capital including published reserves to total assets (Deutsche Bundesbank, Monthly Report). • Ratio of reserves for possible loan �osses, specified reserves, share capital, legal reserves plus surplus and profits and losses for the term
to total assets (Bank of Japan, Economics Statistics Monthly). 7 Ratio of capital resources (share capital, reserves excluding current year profits, general provisions, and eligible subordinated loans) to
total payables. Eligible subordinated loans are subject to prior authorization by the Institut Monetaire Luxembourgeois and may not exceed 50 percent of a bank's share capital and reserves. Data in the table are compiled on a nonconsolidated basis, and as a weighted average of all banks (excluding foreign bank branches). An arithmetic mean for 1984 would show a ratio of 6.98 percent. Inclusion of current year profits in banks' capital resources would result in a weighted average of 4.03 percent for 1984. Provisions for country risks, which are excluded from capital resources, have been considerably increased in the last four years, with a tripling of the level of provisions between 1982 and 1984.
8 Ratio of capital, disclosed free reserves, and subordinated loans to total assets. Eligible liabilities of business members of the agricultural credit institutions are not included (De Nederlandsche Bank N. V., Annual Report).
9 Ratio of capital plus reserves to total assets (Swiss National Bank, Monthly Report). 10 Ratio of share capital and reserves, plus minority interests and loan capital, to total assets (Bank of England). 1 1 Ratio of capital and other funds (sterling and other currency liabilities) to total assets (Bank of England). Note that these figures include
U.K. branches of foreign banks, which normally have little capital in the United Kingdom. '2 Ratio of total capital (includes equity, subordinated debentures, and reserves for loan losses) to total assets. n Reporting banks are all banks which report their country exposure for publication in the Country Exposure Lendinf( Survey. Federal
Financial Institutions Examination Council.
28

©International Monetary Fund. Not for Redistribution
moved to a consolidated monitoring procedure and, in the Federal Republic of Germany, legislation mandating consolidated supervision of banks has come into force. Considerable progress has also been made in agreeing on common techniques to monitor the capital adequacy of banks in different countries, based on alternative definitions of banks' capital and assets, including risk-weighted capital ratios. Work on coordinated monitoring of capital ratios has been pursued by the Cooke Committee. Moreover, the European Commission (EC) has proposed to the representative organizations of the banking industry in each member state the harmonization of capital adequacy monitoring. The EC is currently engaged in trial calculations of capital ratios, or "observation ratios."
The treatment of country risk in observation ratios of the kinds used by the Cooke Committee and the EC, respectively, was discussed in a recent speech by H.J. MueUer, Executive Director of the Netherlands Bank.14 "Both systems apply relatively simple weighting, which essentially distinguishes between four broad categories of assets: claims on (a) governments, (b) banks, (c) private sector, and (d) contingent items. Apart from some minor differences with respect to the relative weighting of the various assets, a more fundamental problem needs, however, to be resolved: how to reflect cross-border risk in risk-weighted capital ratios. In the EC calculation, claims on governments and banks are split into two groups, namely, industrialized and nonindustrialized countries (based on IMF definitions) in order to reflect, through a different weighting, the element of country risk. It is to be hoped that the Basle Supervisors Committee will recommend the same kind of approach of incorporating a country-risk factor into its capital adequacy ratio. Although the inclusion of an element of country risk may raise conceptual and political difficulties, this aspect cannot be overlooked nowadays."
Interaction of Capital Adequacy Regulation and Market Innovation
Given the competitive and innovative nature of financial markets, official actions to increase the capital cover of bank-intermediated flows inevitably have met with responses from financial market participants to minimize the incidence of these costs. Thus, a key aspect of financial market activity in 1 984-85 has been the remolding of capital market business to reduce or eliminate the costs of intermediation. Supervisory actions were not, however, the only factor influencing
•• The speech was given at the Conference on Banking Control and Supervision, hosted by the Arab Bankers Association in London May 7-8, 1985.
Changes in Supervision of Financial Markets
this trend. Another important factor was the deterioration in the credit rating of some banks that has taken place in recent years. This deterioration has been indicated by a downgrading of bank liabilities by rating agencies and, on occasion, by widening differentials in short-term funding rates at times of market concern. Consequently, in the longer run, the improvement in banks' financial positions sought by supervisors would help enhance banks' abilities to raise funds cheaply and to intermediate domestic and international credit flows effectively.
A few examples may illustrate bow banks have restructured their business in response to supervisory influences on capital adequacy and related market pressures. First, there has been a very rapid growth in types of banking business that-in many countriesare not recorded on banks' balance sheets or are not captured in capital adequacy requirements. Thus, bank stand-by arrangements which back issues of negotiable securities by ooobanks have expanded substantially. Activity in financial futures markets has presented an important alternative to "on-balance sheet" interbank activity for matching interest rate positions. Credits have been granted in the form of negotiable instruments (such as floating rate notes), in part, because in some supervisory schemes listed securities receive privileged treatment in measurement of capital or liquidity adequacy.
In the United States, revisions to guidelines regarding capital adequacy issued in 1985 included reference to off-balance sheet banking: "The Federal Reserve will also take into account the sale of loans or other assets with recourse and the volume and nature of all off-balance sheet risk. Particularly close attention will be directed to risks associated with stand-by letters of credit and participation in joint venture activities. The Federal Reserve will review the relationship of all onand off-balance sheet risks to capital and will require those institutions with high or inordinate levels of risk to hold additional primary capital. In addition, the Federal Reserve will continue to review the need for more explicit procedures for factoring on- and offbalance sheet risks into the assessment of capital adequacy.'' One estimate of the effect of incorporating stand-by letters of credit indicates that the primary capital ratio for 1 2 money center banks would decrease from 6.3 percent to 5.6 percent.15
In April 1985, the Bank of England instituted a comprehensive review of off-balance sheet risks for banks in the United Kingdom, although without a presumption that all types of such business would necessarily be included in prudential ratios. The first
15 "Implications of the Federal Reserve's Proposed Capital GuideLines," a Bond Market Research publication by Salomon Brothers, lnc., September 12, 1985.
29
©International Monetary Fund. Not for Redistribution
li • STRUCTURAL CHANGES IN THE FINANCIAL MARKETS
stage of this review was essentially fact-finding, involving consultation with banks, banking associations, and licensed deposit takers, as weU as other interested parties, including auditors. The second stage will be a set of recommendations on the treatment of off-balance sheet risks for the purposes of assessing capital adequacy and liquidity management and control.
Pending completion of this study, and in response to the increase in banks' contingent commitments from revolving underwriting facilities and other note issuance facilities, the Bank of England has announced that such commitments must be given a 0.5 weighting in U.K. banks' capital adequacy ratios. This weighting also applies to guarantees and a number of other contingent liabilities. It is anticipated that the Japanese authorities will take action along similar lines, involving a weight of 0.3 for underwriting commitments. Similar measures are being studied or implemented i n other countries also.
Therefore, market developments have led to an evolution in supervisory approaches to capital adequacy, perhaps especially in countries where a simple gearing ratio (capital to total assets) has traditionally been applied. The need for capitaJ adequacy measures to capture differing degrees of risk attached to various instruments has heightened interest in the more flexible "risk assets" ratio approach to assessing capital adequacy. Under the risk assets approach, which is prevalent in European countries, different capital
weightings are applied to various types of claims and reflect broadly the degree of bank risk. Both i n the United States and Japan, supervisory agencies have indicated that the risk asset approach is under active study.
As indicated above in connection with cross-border risk, defining risk weightings for capital adequacy purposes and modifying them over time to reflect market developments is not a simple task. A coordinated study among supervisors in the Cooke Committee is currently under way to assess the regulatory implications of different types of off-balance sheet business, including notably their treatment for capital adequacy purposes. Meanwhile, supervisors in the key financial market countries have strongly warned banks that supervision is in the process of being extended to off-balance sheet activities, and that these activities may be included formally in capital adequacy requirements.
Reserves for Loan Losses
Closely linked with the assessment of banks' capital adequacy is the valuation of banks' assets. While
30
current profits are a first protection against losses, banks also need adequate reserves to withstand potential losses, including those arising from cross-border exposure. Pressure on banks to establish adequate reserves is clearly manifest i n market reactions as well as supervisory responses.
Provisioning practices on cross-border exposure are complex and-notwithstanding the pursuit of common supervisory objectives-the detail of practices in different countries differs to a very considerable degree. While increasing their general capital and reserves, banks i n many countries have also reserved (or "provisioned") against exposure to individual debtor countries. Alternatively, in a number of countries, banks have taken a "basket" approach to constitution of reserves, setting aside reserves against a portion of their exposure to a group of countries-typically those that have recently experienced payments difficulties. Variants on this latter technique are applied, for example, in Canada, France, Japan, and Switzerland. This approach reflects a view that transfer risk is inherent in all such loans, but that it is inappropriately captured by specific provisioning against individual debtor countries.
The degree of supervisors' involvement in the process of establishing reserves against transfer risks varies considerably from country to country. In some countries (for example, Canada, Switzerland , and the United States), supervisors are involved in setting mandatory provisioning levels, although these are, in effect, minimum provisioning levels, and some banks build up their loan loss reserves beyond such levels. I n many other countries, supervisors' involvement is primarily based on assessment of individual banks' actions, as reviewed by external auditors, when measured against prudent valuations made by other institutions. A further variation is that the scale of reserves held available to meet losses (and transfers to or from such reserves) need not be disclosed in some countries.
The degree of provisioning differs widely from country to country and from bank to bank. While minimum provisioning standards are mandatory in some countries, these countries are not necessarily those where provisioning is most sizable. Key factors influencing provisions are the scale of a bank's exposure, the availability of current profits, and the possibility of securing tax deductibility. In general terms, banks in continental Europe can offset provisions for unrealized losses against current taxes to a considerable degree. At the other end of the spectrum are banks in Japan and the United States where, beyond certain specified levels, banks can only reduce their tax burden when actual loan losses are experienced. Tax deductibility, however, is not within bank supervisors' direct control.
As a broad generalization, it is not uncommon for

©International Monetary Fund. Not for Redistribution
banks in continental European countries to have earmarkeo reserves against exposure to countries that have experienced payments difficulties, on a scale that could absorb losses equivalent to one fifth or more of their exposure to such countries. Banks in industrial countries elsewhere may generally have a lower level of reserves earmarked against such potential losses. However, such a comparison is of limited usefulness. Banks' ultimate ability to absorb losses is not mainly a function of average national provisioning percentages. ll depends on the relationship between a variety of factors. These include the scale and distribution of any bank's exposure, after allowing for reserves earmarked against such exposure; the underlying earnings stream of the bank from other, unrelated activities; the concurrent loss experience on other types of lending or off-balance sheet activity; the total capital and available resources of the bank (including resources represented by assets carried below market value); and the liquidity available to the bank to withstand sudden market reactions. The diversity of such factors-within, as weiJ as between, countriesis considerable.
The difference in banks' exposure and ability to absorb losses is one element that has weakened cohesion among banks providing financial support for countries in payments difficulties. However, there is no immediate prospect of convergence i n key factors influencing such ability, whether technical factors, such as the tax deductibility of reserves, or the longerrun relationship between individual banks' available profits and the scale of their exposure. Moreover, banks' attitudes to such financing may be strongly influenced by their longer-term business interests in individual countries.
A subject of particular interest at the present time is the influence of provisioning practices on banks' willingness to resume spontaneous lending to countries that have restructured their external debt. In this regard, the distinction between mandatory and nonmandatory provisioning is relevant, but the impact of either system on individual institutions can vary. For example, under either system a bank which has high provisions relative to other banks, or relative to mandatory levels, might feel comfortable with a modest increase in exposure to a country whose external position is improving. The bank might feel that the type and scale of exposure strengthened its existing claims. In addition, it might judge that adequate reserves were already established, or alternatively desire additional tax savings gained from new reserves, if its profits and tax regime permitted. At the other extreme, a bank with sizable exposure, low provisioning, weak profitability, and limited tax advantages on further provisions would likely seek to avoid any increase in
Changes in Supervision of Financial Markets
exposure--even through instruments that were serviced regularly such as trade financing. Under such circumstances, mandatory minimum provisioning levels, if they existed, would be only one aspect of its concern.
However, one identifiable concern relates to the impact at the margin of mandatory provisions on exposure to a group ("basket") of countries. Specifically, any increase in exposure to one country in the basket results i n a need to increase provisions. The dynamics of this process imply that, for example, a spontaneous increase in trade financing, which has been regularly serviced, to a country whose economic prospects have improved, would result in the same provisioning requirement as a new medium-term loan to a country whose economic policies and prospects have worsened sharply . Supervisors in those countries where a basket approach is adopted are sensitive to the possibility that such arrangements have the potential to operate in a counterproductive manner, and in several cases are reviewing this problem.
As indicated above, banks and supervisors suggest that supervisory rules, like immediate tax considerations, are only one factor influencing banks' willingness to lend. In general, these regulatory factors may well be subordinate to banks' perceptions of their longer run business interests. While attention to potential regulatory obstacles is an important concern, neither banks nor regulators believe that growth in spontaneous lending can be stimulated primarily by finetuning of microprudential instruments.
Liquidity
A substantive reappraisal of liquidity management in banks' international business has been under way i n recent years. Four main factors have caused this reappraisal: problems in the interbank market encountered with banks from certain developing countries; funding difficulties experienced by a number of industrial country banks, and the official response to these difficulties; a decline in the interbank business of some major banks as part of an effort to restrain their balance sheet growth relative to capital; and the rapid growth in certain instruments (notably, floating rate notes and stand-by credits) whose liquidity characteristics have yet to be fully tested. Banks and supervisors have begun to subject liquidity adequacy to a fundamental review of the kind undertaken for capital adequacy since 1977.
Problems encountered by developing countries in the interbank market since 1982 were a factor leading to reappraisal of the role of interbank placements i n banks' liquidity management. A main reaction to these problems was a more critical appraisal of the purposes
3 1

©International Monetary Fund. Not for Redistribution
11 • STRUCTURAL CHANGES IN THE FINANCIAL MARKETS
for which banks were tapping the interbank market. Concern developed, and has persisted, that banks should not use short-term interbank funding as a principal source of medium-term lending to their home countries. From 1982, spontaneous access to the international interbank market has been curtailed for banks from developing countries that have restructured their debt. A substantial proportion of these banks' interbank borrowings has been consolidated under "maintenance of exposure" facilities. In Brazil and Mexico, in particular, interbank facilities amounting to $1 I billion have been consolidated since 1982. Traderelated and interbank borrowings often other countries have also been consolidated, and the total short-term bank debt rolled over or converted into medium-term loans since 1982 stood at $38 billion at the end of 1985. Over time, a natural increase in trade-related lending may allow such maintenance of exposure arrangements to be dispensed with.
Funding difficulties experienced by a number of banks in industrial countries have also influenced liquidity management substantially. One conclusion drawn by market participants from recent experiences in the United States, the United Kingdom, and Canada is that monetary authorities remain highly sensitive to the dangers of contagion that could arise if an institution of significant size were unable to meet its commitments in the wholesale money markets. Taken alone, this conclusion would certainly raise serious concerns about the "moral hazard'' posed by national authorities' willingness to provide liquidity support, especially while uninsured deposits are being withdrawn.
Other responses to these incidents may run counter to that concern. Funding problems or serious losses in commercial banks have prompted authorities in different countries to tighten supervisory procedures significantly during the past ten years. In a number of instances, this has involved closer collaboration with bank auditors and increased coordination with supervisors in other countries. Banks have also been influenced directly by events in the interbank market, and have sought to strengthen and safeguard their own liquidity positions. Several techniques have been employed to lengthen the "survival period" during which a bank could withstand strains in international wholesale markets. On the funding side, banks have raised medium-term funds through interest rate swaps, diversified wholesale funding sources, increased the proportion of "relationship" deposits, and-in the case of U .S. banks-broadened their retail deposit base.
On the asset side, banks have focused on the liquidity of various categories of assets. Interbank placements with other banks have been examined much more closely to assess their true liquidity in times of stress.
32
More conservative institutions indicate that they see merit also in holding some prime quality, short-term negotiable paper, including government debt, in currencies that match their wholesale liabilities. The desire for greater asset liquidity has also been one of the factors leading to the "securitization" of bank assets. Certainly, in a legal sense, or for some regulatory ratios, an increase in liquidity results from "securitization." However, supervisors have indicated a concern that the effective liquidity of these instruments may be overestimated in some cases. On the other hand, banks' liquidity position may deteriorate quickly if they are required to provide funds to borrowers under stand-bys or international issuance facilities.
For some banks, including notably U .S. banks, the effort to improve liquidity has had to be weighed against a desire to restrain balance sheet growth due to market and regulatory pressures for higher capital ratios. Indeed, one of the factors leading supervisors to favor risk-asset ratios for capital adequacy purposes has been the desire to ensure that capital adequacy requirements were not met by measures that could weaken a bank's liquidity position. The interaction of capital and liquidity supervision has attracted increased attention recently and is likely to be a key area of interest in the period ahead.
Functional Versus Institutional Supervision
The lowering of barriers in financial markets has advanced to varying degrees in different countries, but there is a clear tendency for financial institutions to develop a full spectrum of financial products. Thus, in some markets, banks now compete directly with securities houses, mortgage institutions, insurance companies, and even "nonfinancial" companies in different markets for financial products. A striking development of the past two years has been the recognition that supervision practices should be adopted to suit the more integrated financial markets.
Traditional forms of regulation of the financial services industry in many industrial countries have been based on restrictions to entry into various types of business, and limitations on product competition between different sectors of the industry. In many ways, this practice has facilitated the supervision of institutions, and allowed supervisors to have detailed knowledge of the management and activities of individual institutions whose business was, to a degree, homogeneous. Such compartmentalization persists to a degree in some countries, such as the United States and Japan, where deposit taking and securities underwriting are separated. Nonetheless, even in these coun-

©International Monetary Fund. Not for Redistribution
tries, commercial banks and secunttes houses have considerably greater freedom for competition in their respective business areas outside the national territory.
In the United Kingdom there was a clear demarcation between stock exchange members and other financial institutions. The past year has seen the formation of links between banks and stock exchange members with the intention of combining the roles of issuing house, agent broker, market maker, and investment manager in a single institution. Investment business will be subject to common standards for entry, with much emphasis on disclosure and transparency. A key task of the new securities authority will be to devise rules to control conflicts of interest. The issue of avoiding conflict of interest in an evolving financial structure has also been addressed in Canada, where a discussion paper on the future structure of parts of the financial services industry was issued early in 1985.
Efforts are under way in a number of countries to study and enhance the coordination between supervisors of different types of financial intermediaries. While this issue has arisen with regard to various aspects of supervision, it has been clearest in the areas of capital adequacy. For example, both banks and securities companies carry inventories of securities and enter into medium-term currency and interest rate swaps. To raise the capital costs associated with banks' involvement in such activities may simply displace business to other financial institutions.
In countries where integration of the financial services sector is proceeding rapidly, regulatory authorities have been studying the merits of supervising financial companies on a "functional," rather than an "institutional" basis. Under a functional approach, a given activity would be subject to the same supervisory regime regardless of the type of financial institution undertaking the activity. For example, the same prudential rules would apply to both banks' and to securities houses' inventories of marketable securities (including frequent marking to market, full disclosure, and reguJar turnover of portfolio holdings). To facilitate
Changes in Supervision of Financial Markets
supervision, different market activities might be confined within identified departments of a company, or companies within a group.
In this connection, supervisory attention has come to focus also on safeguards to contain any problems of confidence within singJe parts of a financial company, avoiding contagion to the remainder of the company or group and to the rest of the system. Component parts of financial conglomerates can be separately capitalized, and the Bank of EngJand's discussion document relating to primary dealers in the gilt-edged market proposed that these should be backed by dedicated capital. The Canadian discussion paper emphasizes the barriers within a financial conglomerate. These are not simple issues, however, as was noted in a speech by the Deputy Governor of the Bank of England in November 1984: "There is, however, a potential tension between the desire to isolate marketmaking risks, and the well-established principle that parent banks have a moral obligation to stand behind their subsidiaries to cover losses, even when they exceed their limited Liability in law. The involvement of a bank in a group which contains a market-maker is therefore likely to have implications for the assessment of its own capital adequacy." 16
The functional approach to supervision has attracted attention because it creates a regulatory "level playing field," but it does not offer a simple solution. In practice, it may prove unrealistic to supervise one segment of the business of a financial company--or even of a group of companies-without knowledge about other parts. Experience has demonstrated that, in an industry where confidence plays a crucial role, problems in one part of a financial business can spread quickly to affect the position of other units. Thus, close coordination between regulatory authoritiesdomestically and internationally-is likely to remain of paramount importance.
16 Speech by C.W. McMahon, Deputy Governor. Bank of England, to the Euromoney Conference in Sydney, Australia, November 27, 1984.
33

©International Monetary Fund. Not for Redistribution
Ill International Banking Activity
Measurement of International Banking Flows
The quantity and quality of statistics on international bank lending have improved substantially in recent years. However, with the spread of liberalization and innovation in the international capital markets, the range of financing techniques available to market participants has expanded greatly. These developments, together with the international debt crisis, have contributed to making banks' financial operations increasingly complex. These factors are affecting not only the way in which markets function, but also the ability of statisticians to measure and interpret the transactions that are taking place.
The description of international banking activity presented in this section is based on data from a number of sources in order to provide as comprehen
sive an analysis of underlying patterns as possible. Appendix I describes the coverage issues involved, with particular emphasis on differences inherent in data that are drawn from different sources or that represent banking activity on different bases (e.g., residential, consolidated, or by nationality of ownership). However, Table 1 and Chart l illustrate the similarity in trends in international banking activity in recent years, as shown by the Fund's International Banking Statistics and the quarterly data published by the BIS in lntemational Banking Developments.
Appendix 1 also addresses current measurement problems. These problems result, essentially, from the fact that bank lending flows are derived from changes in stock data (banks' claims). Changes in these stocks are caused not only by new lending and amortization but by exchange rate movements, write-offs of debt, calling of guarantees, and classification problems (including inconsistent reporting by debtors and creditors). Moreover, banks' purchases of securities have not been fully included in the geographical analysis of banks' claims in many countries.
The description of banking activity in this section is based on data that have been corrected for these problems whenever possible, and in particular for exchange rate changes and identified inconsistencies in reporting of data by debtor and creditor sources.
34
Revisions to take account of reporting problems were made to lending data for 12 countries, principally affecting lending to countries in the Western Hemisphere. The downward revision in lending to developing countries as a result of correcting identified reporting problems amounted to about $10 billion in 1983 and $1 .5 billion in 1984, mainly owing to changes for Brazil and Mexico.
Overview of Bank Lending and Deposit Taking
Banks' overall lending increased by $192 billion in 1984, compared with $ 1 39 billion in 1 983 (Table 4); this corresponded to a rate of growth of 7 percent, up from 5 percent in 1983. However, international bank lending activity was still considerably below that during the early part of the decade. The slight pick-up in activity in 1984 was due to interbank lending, which amounted to $152 biiJion in 1984, compared with $102 billion in 1 983 (Table 23). This corresponded to a rate of growth in interbank lending of 8 percent in 1984, up from 6 percent in 1983. ln the first half of 1985, overalJ bank lending activity decreased to $72 billion in comparison with $98 billion in the same period a year earlier. Furthermore, lending to non banks declined to about 1 3 percent of total lending from over 2 1 percent in the first half of 1984 (Table 24).
Bank lending to industrial countries rose from $92 billion in 1983 to $ 1 1 6 billion in 1984, although it declined to $56 billion in the first half of 1 985 (Table 4). A high proportion of bank lending to industrial countries took the form of interbank Hows. Claims on developing countries (excluding seven offshore centers) grew by only $16 billion in 1984 (3 percent) compared with $38 billion in 1983 (7 percent). In the first half of 1985, bank claims on this group of countries increased by only $ 1 billion, compared with an increase of $4 billion in the first half of 1984.
Total deposit taking from both banks and nonbanks increased from $161 billion in 1983 to $192 billion in 1984. However, deposit taking declined to $72 billion in the first half of 1985 in comparison with $1 14 billion in the first half of 1984. Growth of deposits of the industrial countries increased from $88 billion in 1983

©International Monetary Fund. Not for Redistribution
Overview of Bank Lending and Deposit Taking
Table 4. Total Cross-Border Bank Lending and Deposit Taking, 1982-First Half of 1985 1
(ln billions of U .S. dollars)
1984 1985 1st 2nd t st
1982 1983 1984 half half half
Lending to 2 186 139 192 98 94 72 Industrial countries 123 92 1 16 65 51 56
Of which: United States 61 38 35 28 7 12 Japan 10 /9 9 10 9
Developing countries 3 5 1 38 16 4 12 I Offshore centers • 25 7 29 1 1 19 7 Other transactors ' - 1 6 7 7 5 Unallocated (nonbanks) • - 1 2 - 4 24 18 6 2 Memorandum items Capital-importing developing countries J.7 38 18 4 12 4 Major borrowers s 13 9 3 6 I Non-oil developing countries J.Y 41 3 1 1 9 4 1 3 4
Deposit taking from '0 188 161 192 114 78 72 Industrial countries 150 88 133 79 54 57
Of wlticlt: United States 107 32 11 29 -18 - I Japan 15 12 4 8 8
Developing countries 3 4 29 23 1 3 1 1 3 Offshore centers • 25 26 19 12 6 4 Other transactors 1 4 10 3 2 2 Unallocated (nonbanks) 6 6 8 14 10 4 6 Memorandum items Capital-importing developing countries 3•7 38 27 15 12 3 Major borrowers 8 12 17 6 11 Non-oil developing countries J.• 17 32 23 14 9
Change in net claims on " -2 -22 -16 16 Industrial countries -26 4 - 16 - 13 -3 - I
Of whiclt: United States -46 6 23 - 2 25 13 Japan -5 7 5 2 I
Developing countries J 47 9 - 8 - 8 I -2 Offshore centers • - 19 1 1 - 2 12 3 Other transactors ' - 5 - 4 4 4 3 Unallocated (nonbanks) - 18 - 1 2 10 8 3 -4 Memorandum items Capital-importing developing countries J.7 - 1 1 - 10 I I Major borrowers s I - 8 - 3 -5 I Non-oil developing countries 3·9 24 - 1 - 5 - 8 4 4
Note: Owing to rounding, components may not add. Sources: International Monetary Fund. 1mernational Financial Statistics (IFS); and Fund staff estimates. 1 Data on lending and deposit taking are derived from stock data on the reporting countries· liabilities and assets, excluding changes
attributed to exchange rate movements. 2 As measured by differences in the outstanding liabilities of borrowing countries defined as cross-border interbank accounts by residence
of borrowing bank plus international bank credits to nonbanks by residence of borrower. J Excluding offshore centers. • Consisting of the Bahamas, Bahrain. Cayman Islands. Hong Kong. the Netherlands Antilles. Panama, and Singapore. ' Transactors included in IFS measures for the world, to enhance global symmetry, but excluded from IFS measures for .. All Countries."
The data comprise changes in identified cross-border bank accounts of centrally planned economies (excluding Fund members), and of international organizations.
• Calculated as the difference between the amount that countries report as their banks' positions with nonresident banks in their monetary statistics and the amounts that banks in major financial centers report as their positions with nonbanks in each country.
7 Consisting of all developing countries except the eight Middle Eastern oil exporters (Islamic Republic of Iran. Iraq, Kuwait, Libyan Arab Jamahiriya. Oman, Qatar, Saudi Arabia, and the United Arab Emirates) for which external debt statistics are not available or are small in relation to external assets.
8 Consisting of Argentina, Brazil, Indonesia, Korea, Mexico, the Philippines, and Venezuela. 9 Consisting of all developing countries except the eight Middle Eastern oil exporters (listed in footnote 7 above). Algeria, Indonesia,
Nigelia, and Venezuela. 10 As measured by differences in the outstanding assets of depositing countries, defined as cross-border interbank accounts by residence
of lending bank plus international bank deposits of nonbanks by residence of depositor. 11 Lending to, minus deposit taking from.
35

©International Monetary Fund. Not for Redistribution
Ill • INTERNATIONAL BANKING ACTrVITY
to $133 billion in 1984, despite a sharp drop in deposit taking from the United States from $32 billion in 1983 to $ 1 1 billion in 1984-this deposit taking fell back to $57 billion in the first half of 1985 with banks' liabilities to the United States actually declining by $I billion. There was a leveling off of the increase in developing countries' deposits with the international banking system. Deposits from developing countries increased by $23 billion in 1 984, compared with $29 billion in 1983, but rose by only $3 billion in the first half of 1985. While depositing by these countries in 1984 reflected to a greater extent than in 1983 increases in official reserves, this pattern was not continued in the first half of 1985.
Industrial Countries as International Borrowers and Depositors of Funds
The growth of bank lending to industrial countries rose to 7 percent in 1984 from 6 percent in 1983. Growth in interbank claims on industrial countries was somewhat faster than the total, whereas there was a slowing to 3 percent in lending to nonbanks (from 5 percent in 1983). The major destination of bank lending was the United States, with flows amounting to $35 billion. Lending totaled almost $30 billion to the United Kingdom, $19 billion to Japan, $12 billion to Belgium-Luxembourg, and $7 billion to France. Nonbanks in the United States took in $ 1 1 billion of bank lending, while the rest of the industrial countries, in aggregate, experienced a decline in claims on their nonbanks of over $4 billion, of which $3 billion represented a decljne in claims on nonbanks in Japan (Table 24). Industrial countries' recourse to bank lending slowed somewhat in the first half of 1985 to $56 billion (in comparison with $65 biiJion in the first half of 1984), most ofwhich took the form ofinterbank lending.
The slowdown of bank lending to nonbanks in industrial countries in 1984 and the first half of 1985 may be attributable to three factors: the strong liquidity position of nonbanks in a number of industrial countries; the preference on the part ofnonbanks for bonds rather than bank finance, reflecting the lower cost of issuing various types of securities versus the cost of bank finance; and banks' preference for fee-earningrather than asset-creating-business.
The growth in interbank Lending occurred despite some factors which have operated to slow interbank activity. These factors include the impact of higher capital asset ratio requirements on 0 .S. banks and efforts to raise capital asset ratios in many of the industrial countries; the greater use that banks are making of other instruments (such as futures, options, and swaps) for managing interest and exchange rate
36
exposures; and a more critical attitude to the liquidity of interbank deposits.
However, in other ways the liberalization of financial markets may have added to interbank activity. Bank head offices in some major financial centers may have been transferring funds to their branches and subsidiaries abroad to fund larger trading portfolios of securities associated with the liberalization of security markets in the countries where the branches or subsidiaries operate. A significant proportion of interbank lending appears to reflect the increasing integration of the Japanese market into the international financial system, including the effect that relaxation of limits has had on Japanese banks' funding through swaps. Also, the relatively high level of interbank lending could be related to dealings in the foreign exchange market, which has witnessed large fluctuations. Banks' covering of forward exchange operations in the spot market can result in an increase in interbank positions when the banks deposit the purchased currencies in banks abroad.
In addition, the rapid growth of the ECU market has contributed to interbank lending. Borrowing denominated in ECU has risen from less than 2 percent of total international borrowing in 1983, to almost 5 percent in the first half of 1985 (Table 5). Because banks' ECU assets exceed their nonbank ECU deposits, banks have borrowed component currencies of the ECU on a large scale in the interbank market. Alternatively, they have used foreign exchange transactions to generate ECU funds. lnterbank activity was also required, insofar as ECU borrowing and depositing by nonbanks occurred in different countries.
FinaiJy, interbank lending has reflected the particularly strong ability of U .S. and Swiss banks to attract deposits from nonbanks that exceeded their loans to nonbanks. Moreover, some tiering in the interbank market may have led to an increased recycling of deposits received by highly regarded banks, in addition to flows reflecting the difficulties of a major international bank.
Developments in new long-term external bank credit commitments17 provide some indication of recent capital market conditions to different borrowers. Total
17 This analysis is based on OECD data on long-term external bank credit commitments. These cover new publicized mediumand long-term bank loans-including not only syndicated loans, but also "club" deals and single bank loans-signed or completed in a certain period, which have an original maturity of more than one year. They are not directly comparable to the data on lending previously referred to in the text, both because the amounts committed are not necessarily disbursed during the period, and because they relate to gross commitments and do not take account of amortization. These data nevertheless provide a useful indication about trends in the international banking markets. OECD data on long-term external bank commitments and other bank facilities are provided in Table 29.

©International Monetary Fund. Not for Redistribution
Table 5. International Borrowing Operations in ECUs, 1983-First Half of 1985
(In billions of ECUs)
1st half
1983 1984 1985
By instrument Bonds 2.49 3.92 4.95
Of which: Floating rate notes 0.57 0.71 Syndicated loans 0.72 2.16 2.66 Other facilities 0.26
Total 3.21 6.08 7.87
By borrower l!aly 0.94 1 .68 2.70 France 0.60 0.57 0.80 EEC institutions 0.62 1.00 0.47 Other EEC countries 0.23 0.48 1.24 Other borrowers 0.82 2.35 2.66
Total 3.21 6.08 7.87
Memorandum item: ECU as a percent of total
borrowing 1 1.7 2.5 4.9
Source: Organization for Economic Cooperation and Development. Financial Market Trends.
1 At constant (end-1983) exchange rates.
commitments amounted to about $67 biiJion in 1984, or about the same amount as in 1983, and about $58 billion at an annual rate in the first half of 1985. New commitments to industrial countries rose slightly to $30 biJJion in 1984 from $28 billion in 1983. But they remained considerably below the 1982 level of $52 billion, again reflecting borrowers' reliance on the security markets to obtain external financing. New commitments to industrial countries picked up to an annual rate of about $33 billion in the first half of 1985 (Tables 29 and 30).
Depositing by industrial countries increased significantly from $88 billion in 1983 to $133 billion in 1 984 (Table 4). lnterbank deposits rose from $62 biiJion in 1 983 to $121 billion in 1 984, while bank deposit taking from nonbanks in the industrial countries feiJ from $26 billion in 1983 to $12 billion in 1984. Industrial countries' depositing abroad moderated in the first half of 1985. amounting to $57 billion in comparison with $79 billion in the first half of 1984.
Industrial countries as a group made net deposits of $16 billion in new funds in 1984, after taking a net of $4 billion in new funds in 1 983. IS Within the industrial group, the United States was a net user of international funds, with a net inflow of $23 billion. This contrasts with its historical role as the major supplier of funds. Net financing from the international banking system
18 However, recent global developments in ftows of net funds should be treated with caution, particularly in view of the sizable net inflows in 1984 recorded for offshore centers and appearing as unallocated.
Developing Countries as Lnternational Borrowers and Depositors
amounted to more than one quarter of the U.S. current account deficit in 1984. Interestingly, the United Kingdom and Japan were also net takers of funds, drawing $10 billion and $7 billion, respectively. The Japanese net financing from the international banking system occurred at a time that it recorded a current account surplus of$36 billion. This net financing reflects, among other factors, investment by Japanese residents in international bond markets. In contrast, Switzerland (including trustee accounts) was a net placer of funds in the amount of almost $28 billion in 1984. Industrial countries were net depositors of funds in the first half of 1985, with a net outflow of less than $ 1 billion. The United States continued to be a net taker of funds, with a total of $ 1 3 billion.
Developing Countries as International Borrowers and Depositors of Funds
Overview
Bank lending to developing countries continued to slow in 1984, increasing by only $16 biiJion, compared with $38 billion in 1983. This increase corresponded to a growth of bank claims of 3 percent in 1 984, in comparison with 7 percent in 1983. Bank lending to nonbanks in developing countries declined from $22 billion in 1983 to $5 billion in 1984. The growth in bank claims on developing countries continued to decelerate in the first half of 1985, with bank lending totaling only $ 1 biUion in comparison with $4 billion in the first half of 1984.
The sharp decline in bank lending to developing countries was associated with those countries' lower current account deficits in 1 984-85 and a reluctance on the part of international banks to lend to many developing countries--especially those experiencing payments difficulties. About 60 percent of the growth in banks' claims on developing countries in 1984 took the form of concerted lending to Latin American countries in conjunction with bank debt restructurings and Fund-supported programs. Disbursements under concerted lending packages totaled over $10.2 billion in 1984, with Brazil and Mexico accounting for almost $9.5 billion of this amount.
The combined deficit of capital-importing developing countries (i.e., all developing countries except the eight major oil exporters in the Middle East region) fell from $60 billion in 1983 to $38 billion in 1984-a deficit equivalent to about 7 percent of their exports of goods and services-the lowest figure since 1967. The financing requirement in 1 984 was covbred by nondebt-creating flows (grants and direct investment) and by long-term borrowing from official creditors. The improved external financial position of the devel-
37

©International Monetary Fund. Not for Redistribution
Il l • INTERNATIONAL BANKING ACTIVITY
Table 6. New Publicized Long-Term External Bank Credit Commitments to Developing Countries, 1979-First Half of 1985
(In billions of U.S. dollars)
1984 1985
1st 2nd 1st
1979 I 1980 I 1981 1982 1983 1984 2 half half 2 hal f )
Developing countries 50.9 38.3 48.1 44.6 34.9 31.0 18.0 13.0 9.3
Capital-importing 49.8 37.8 47.0 42.6 32.6 29.9 17.6 12.3 8.7
Africa 4.8 2.6 4.1 2.7 2.7 0.5 0.3 0.2 1 . 1
Spolllaneous lending • 4.8 2.6 4.1 2.7 2.7 0.5 0.3 0.2 /.0 Concerted lending • 0.1
Asia 1 1 .0 9.2 12.8 12.6 10.4 10.2 4.6 5.6 2.9
Spontaneous lending • 1/.0 9.2 /2.8 12.6 10.4 9.3 4.6 4.7 2.9 Concerted lending • 0.9 0.9
Europe 7.8 4.9 4.7 3.7 3.5 3.4 1.2 2.2 2.3
Spomaneous lending • 7.8 4.9 4.7 3.7 2.9 3.4 1.2 2.2 2.3 Concerted lending • 0.6
Middle East 0.2 0.7 0.2 0.6 0.7 0.4 0.1 0.3
Western Hemisphere 26.0 20.4 25.2 23.0 15.3 15.4 1 1 .4 4.0 2.4
Spontaneous lending • 26.0 20.4 25.2 23.0 2.0 0.6 0.3 0.3 0.2 Concerted lending • 13.3 ) 14.8 l l . l 3.7 2.2
Sources: Organization for Economic Cooperation and Development, Financial Statistics Monthly: and Fund staff estimates. 1 Includes only Eurocrcdit commitments. ! Includes agreements in principle with Argentina and the Philippines. and excludes the short-term trade deposit facility for Argentina of
$0.5 billion. ) Includes agreements in principle with Chile and Colombia. • Concerted lending refers to bank credit commitments obtained during 1983-85 and coordinated by a bank advisory committee (i.e . .
Argentina, Brazil, Chile, Colombia, Ecuador, Cote d'lvoire, Mexico, Panama, Peru, the Philippines, Uruguay. and Yugoslavia). 5 Excludes the extension of a bridging loan of $1.3 billion to Argentina.
oping countries allowed them to accumulate $22 billion in reserves in 1984, foJlowing an accumulation of $10 billion in 1983.
Bank lending to most developing countries in Asia and Europe has remained spontaneous, though, in some cases, more Limited in volume. Some countries, again particularly in Asia and Europe, were able to make greater recourse to the securities market, notably issues of floating rate notes and, to a lesser degree, note issuance facilities. Some countries in Eastern Europe were able to regain substantial access to syndicated lending in 1984, following a period when their access to spontaneous financing was limited. However, for most developing countries, access to spontaneous medium-term bank financing was even more limited in 1984 than in the previous year.
Almost two thirds of bank lending to developing countries in 1984 took place through the interbank market, compared with one third during 1982-83. This higher share was related, in part, to the transfer of claims on nonbanks to the monetary authorities in the context of debt restructurings.
New bank commitments to developing countries declined to $31 billion in 1984, from $35 billion in 1983, and $45 billion in 1982 (Table 6 and Chart 2). Spontaneous commitments continued to fall, a decline which was only partly offset by concerted loans. Spontaneous
38
commitments fell from an average of$45 billion during 1979-82, to $21 billion in 1983, and to $15 billion in 1984 (Table 6). Concerted commitments, mostly to a limited number of Latin American countries, totaled $14 billion in 1983 and $16.2 billion19 in 1984. All regional groupings of developing countries recorded virtually unchanged, or lower bank commitments in 1984, with countries in Mrica and the Middle East reporting the greatest reductions. There was a large increase in new commitments to some non-Fund member countries with centrally planned economies, notably the Union of Soviet Socialist Republics and the German Democratic Republic, in 1984, but new commitments remained small in absolute terms.
New bank credit commitments to developing countries slowed further to $9 billion in the first half of 1985, compared with $18 billion in the first half of 1984. Commitments to developing countries in the Western Hemisphere dropped to $2.4 billion-virtually all was concerted lending. In contrast, bank credit commitments to developing countries in Europe rose to $2.3 billion, compared with $ 1 .2 billion in the first half of 1984. Credit commitments to countries in Africa rose in the first half of 1985, reflecting mainly a large bank commitment to South Africa. New commitments
19 Excluding a new short-term trade deposit facility for Argentina of $0.5 biLHon.

©International Monetary Fund. Not for Redistribution
to non-Fund member countries with centrally planned economies continued to rise and, on an annual basis, were 25 percent higher than during 1984.
Data supplied by the BJS sheds light on undisbursed credit commitments of countries in the BIS reporting area to developing countries (Tables 32 and 33). These unused lines of credit declined from almost $82 billion at the end of 1981, to $75 billion at the end of 1983, to $68 billion at the end of 1984, and to $66 billion as of June 1985. The $9 billion decline in unused lines of credit to developing countries during 1984 and the first half of 1985 was mostly accounted for by a $6.4 billion cutback to Western Hemisphere countries; in contrast, developing countries i n Europe saw a slight increase in their unused credit lines. (In light of changes in coverage in this data, direct comparisons between endyear figures from 1982 to the first half of 1985 should be interpreted with caution.)
Deposit taking of the international banking system from the developing countries was $23 billion in 1984, or $6 billion less than in 1983. Interbank deposits of developing countries rose by $19 billion in 1984, compared with $5 billion in 1983, reflecting an accumulation of gross official reserves by many of the countries in the group, while deposit taking from nonbanks in developing countries declined from $23 billion in 1983 to $4 billion in 1984, in part as a result of decreased capital flight from developing countries. Banks' liabilities to these countries increased in the first half of 1985 by $3 billion, in comparison with $13 billion in the first half of 1984. Overall, developing countries contributed a net flow of funds to banks in the rest of the world of $2 billion in the first half of 1985 and $8 billion in 1984, following net inflows to developing countries of $47 billion and $9 billion in 1982 and 1983, respectively.
Regional Deve1opments
Growth in international bank claims on the developing countries in the Western Hemisphere (excluding the offshore centers of the Bahamas, the Cayman Islands, the Netherlands Antilles, and Panama) declined from about $16 billion in 1 983 (6 percent) to about $7.5 billion (3 percent) in 1984 (Table 7). Bank claims on these countries declined by $0.8 billion in the first half of 1985 compared with lending of $ 1 .7 billion in the first six months of 1984. lnterbank lending declined from almost $12 billion in 1983 to about $7 billion in 1984 (Table 26), while bank lending to nonbanks fell from just over $4 billion in 1983 to $0.5 billion in 1984 (Table 27). In the first half of 1985, interbank claims in these countries declined by over $1 billion while claims on nonbanks rose by $0.5 billion.
Developing Countries as International Borrowers and Depositors
In 1984, total bank lending to developing countries i n the Western Hemisphere was less than disbursements under concerted lending packages because some banks reduced their claims on certain countries. In most countries where international banks agreed to provide new money as part of debt restructuring packages, overall lending was larger than the concerted loans disbursed. Banks' claims on Brazil and Chile rose by $7.4 billion and $ 1 .2 billion, respectively, compared with concerted lending of $6.5 billion and $0.8 billion, respectively. However, international bank claims on Mexico rose by $1 .5 biJJion, despite concerted bank lending of almost $3 billion. Banks also reduced their claims by $1 .7 billion on Argentina and by $2.2 billion on Venezuela.
Countries in the Western Hemisphere were able to increase their deposits with international banks by nearly $17 billion in 1984, about the same amount as in 1983. Deposits fell by $0.5 billion during the first half of 1985 (Table 25). Monetary authorities largely accounted for an increase of $12 billion of interbank deposits, mostly from Brazil and Mexico, while the increase in international deposits of nonbanks of $5 billion was principally from BraziJ, Mexico, and Venezuela. On a net basis, countries in this region supplied almost $9 billion to international banks in 1984, with Mexico and Venezuela accounting for over 80 percent of this. Developing countries in the Western Hemisphere were net suppliers of funds on a small scale in the first half of 1985.
International banks increased their claims on countries in Asia (excluding Hong Kong and Singapore) by $5.8 billion in 1984 (6 percent increase in bank claims) compared with $8.4 billion in 1 983 (9.5 percent). This slowdown in bank lending may reflect the smaller net financing requirement of the region and increased borrowing on the international bond and floating rate note markets.2o (Asian country borrowers accounted for 60 percent of bond issues by developing countries in 1984.) In the first half of 1985, international banks' claims on developing countries in Asia increased by $ 1 .9 billion, unchanged from the same period a year earlier.
In 1984, Korea increased its liabilities to international banks by $3.6 billion. China increased its external liabilities by $ 1 billion. The Philippines continued to face major debt-servicing difficulties, and a tentative agreement on concerted lending of $925 million was finalized only in 1985. Total bank claims on the Philippines increased by $0.1 billion in 1984.
Asian countries deposited about $6 billion in 1984,
20 Lending to Asian countries may be particularly affected by an underrecording of lending. owing to the exclusion of floating rate notes from the geographic analysis of bank claims in many countries. Bond issues by developing countries are discussed in Section V.
39

©International Monetary Fund. Not for Redistribution
1 1 1 • INTERNATIONAL BANKING ACTIV.ITY
after having deposited $1 I billion in 1983. lndonesia increased its deposits by $ 1 .6 billion. while the international banks took in $ 1 . 1 billion in deposits from Korea, of which $0.9 billion were interbank transactions. Banks' liabilities to countries in Asia increased by $1 billion in the first half of 1985 in comparison with an increase of almost $7 billion in the same period a year earlier. Asian countries supplied not less than
$0.4 billion of funds to the rest of the world in 1984, in comparison with $2.8 billion in 1983, but became a net taker of funds ($1 billion) in the first half of 1985.
International banks' claims on countries in Europe increased by $2.9 billion in 1984 (4 percent) or about the same as in 1 983 ($3 billion or by 5 percent). In 1984, banks' total claims increased by $ 1 .4 billion on Turkey, $0.9 biHion on Yugoslavia, $1 .4 billion on
Table 7. Total Cross-Border Bank Lending to and Deposit Taking from Developing Countries, 1983-84 1•2
(In billions of U.S. dollars)
Lending J Deposit Taking • 1983 1984 1983 1984
Africa 7.3 0.7 1 .8 -0.5 Of which:
Algeria 0.2 0.7 -0.5 -0.4 Cote d'Ivoire 0.1 -0.3 0.1 Liberia - 0 . 1 1 . 5 0.4 0.3 Nigeria 1.3 -0.4 -0.1 0.4 South Africa 3.0 1.5 0.8 -2.5
Asia 8.4 5.8 1 1 .2 6.2 Of which:
China 0.8 1.0 3.6 0.3 India 0.9 0.1 0.9 0.3 lndonesia 2.8 0.3 2.1 1.6 Korea 2.2 3.6 -0.4 1.1 Malaysia 1.8 1.4 0 . 1 -0.2 Philippines - 1.3 0.1 - 1 .2 0.2 Thailand 0.5 0.9 -0.2 -0.1
Europe 3.1 2.9 2.4 4.7 Of which:
Greece 0.9 1.4 -0.1 0.4 Hungary 0.9 0.2 0.5 0.8 Portugal 0.6 -0.1 0.4 0.6 Romania -0.6 -0.6 0.2 0.3 Turkey 0.5 1.4 1.2 Yugoslavia 0.7 0.9 0.5 1 . 1
Middle East 3.3 - 1 . 1 -3.0 -3.6 Of which:
Egypt 0.4 0.6 1 . 6 -0.5 Israel -0.4 -0.7 -0.5 - 1 .0 Kuwait 0.1 -0.5 -0.9 -0.3 United Arab Emirates - 1 .2 -0.3 2.0
Western Hemisphere 15.8 7.3 16.2 16.6 Of which:
Argentina 2.2 - 1 .7 -0.4 -0.2 Brazil 5.6 7.4 5.1 6.8 Chile 0.3 1.2 0.8 0.1 Colombia 0.6 0.3 -0.2 Ecuador 1.0 0.6 0.6 Mexico 2.9 1.5 5.3 4.9 Peru 0.3 0 . 1 0.2 0.5 Venezuela - 1 . 1 -2.2 2.5 2.2
Total 37.9 15.7 28.5 23.4
Note: Owing to rounding, components may not add. Sources: international Monetary Fund, International Financial Statistics: and Fund staff estimates. 1 In general, data on lending and deposit taking are derived from stock data on the reporting countries' liabilities and assets, excluding
changes attributed to exchange rate movements. 2 Excluding offshore centers. 3 As measured by duferences in the outstanding liabiJities of borrowing countries defined as cross-border interbank accounts by residence
of borrowing bank plus international bank credits to non banks by residence of borrower. • As measured by differences in the outstanding assets of depositing countries, defined as cross-border interbank accounts by residence of
lending bank plus international bank deposits of non banks by residence of depositor.
40

©International Monetary Fund. Not for Redistribution
Greece, and $0.2 billion on Hungary, but declined by $0.6 billion on Romania. In the first half of 1985, bank claims on countries in Europe increased by $2.9 billion with Hungary, Turkey, and Yugoslavia accounting for a large proportion of the lending.
In other regions, international banks increased their claims on countries in Africa by $0.7 billion in 1984 ( l percent) compared with an increase of over $7 billion in 1983 ( 1 1 percent). In 1984, banks' recorded claims increased by $1.5 billion on Liberia (reflecting loans related to shipping activity), and $0.7 billion on Algeria, but declined by $ 1 .5 billion on South Africa, $0.4 billion on Nigeria, and $0.3 billion on Cote d'Ivoire. International banks decreased their total claims on countries in the Middle East (excluding Bahrain) by over $ 1 billion ( l percent) compared with an increase of over $3 billion in 1983 (3 percent). Banks decreased their total claims on countries in both Africa and the Middle East in the first half of 1 985.
Seven offshore banking centers, comprising the Bahamas, Bahrain, the Cayman Islands, Hong Kong, the Netherlands Antilles, Panama, and Singapore, are treated separately from other developing countries and territories in this report. Lending to offshore centers picked up significantly to over $29 billion in 1984, compared with $7 billion in 1983. Interbank lending accounted for $27 billion in 1984 and $6 billion in 1983. The rebound in lending to offshore centers was more than accounted for by the increase of bank claims on Singapore, the Cayman Islands, and Hong Kong of $16 billion, $12 billion, and $7 billion, respectively. In contrast, deposit taking from offshore centers is recorded as having declined from $27 billion in 1983 to $19 billion in 1984. Thus, the offshore centers are shown as net takers of funds in the amount of $ 1 1 billion in 1984, while they were net placers of $ 1 9 billion in 1983. During the first half of 1985, offshore centers were net takers of $3 billion.
Lending Behavior of Banks by Ownership and Size
As described above, the BIS has developed data on the international activity of banks classified by nationality of ownership , rather than by the location of banking offices (Table 8). At the end of 1983, the earliest date for which data exist, the reporting banks' international claims totaled $2,136 billion. By end-1984, these claims had increased by almost $47 billion (2.2 percent) in current dollar terms. The BIS has estimated, however, that the dollar's appreciation against other currencies in 1984 reduced the current dollar value of banks' total assets in other currencies by almost $65 billion. Expressed in exchange rate adjusted terms, therefore, the reporting banks' inter-
Lending Behavior of Banks by Ownership and Size
national books grew by some $ 1 1 0 billion.21 The $65 biUion valuation effect cannot be allocated across individual banking nationalities. 22
The statistics, while not adjusted for the effect of exchange rate movements, provide insight into the relative importance of different groups of banks in lending to non banks, other banks, and their own related offices. The most important nationality groups are U .S. banks with a share of 28 percent of total reported assets and Japanese banks with a share of nearly 24 percent. The increase of almost $47 billion in 1984 in total claims of aiJ reporting countries was more than accounted for by Japanese banks. This compares with a decline of some $ 1 7 billion, or 2.6 percent, in the international claims of U.S. banks. The increase in total claims of all reporting countries reflected , in large part, an increase of interbank activity, which was $41 billion, or almost 90 percent of the total.
Broadly, more than half of the increase in international assets of banks in industrial countries during 1984 and two thirds of total interbank activity was accounted for by an increase in claims of banks on their own related offices, which was dominated by Japanese and U . S . banks. The increase in assets between unrelated banks was more than fuJiy accounted for by Japanese banks. Japanese banks also recorded the largest change in liabilities to unrelated banks. Lending to nonbanks by Japanese banks also more than accounted for the total increase in such lending and Japanese banks were also the largest net providers of funds to nonbanks. U.S. banks reduced their claims on other banks by about 3 percent and on nonbanks by over 2 percent. The scale of Japanese banking activity is evidenced by the fact that 8 Japanese banks are among the world's 20 largest , ranked by assets (Table 35).
The BIS also compiles information that incorporates, where available, measures of banks' assets on a consolidated basis for countries within the reporting area vis-a-vis countries outside the reporting area. A summary of these data, together with the components for U.K. and U.S. banks, is provided in Table 9. These data extend to the activities of bank affiliates located outside the reporting area; also, the figures include not only the claims of such affiliates, but also their local lending in nonlocal currency. However, several countries, including Japan, do not yet publish information
z• The Nationality Strucwre of tlze lntemmiona/ Banking Market and the Role of lnterbank Operations, Bank for International Settlements, May 10, 1985.
n lt may be assumed that this effect, which on average amounted to about 3 percent of total assets, had a relatively greater weight in the case of the European and, to a lesser degree, Japanese banks. Thh is because the share of assets denominated in currencies other than the U .S. dollar is probably higher than for banks in the United States and Canada.
4 1

©International Monetary Fund. Not for Redistribution
ni • INTERNATIONAL BANKING ACTIVITY
Table 8. International Assets, Liabilities, and Net Position of Banks by Nationality of Ownership
(In billions of U .S. dollars)
Of which, to
Total Claims Related Offices Other Banks Nonbanks
Country Change Change Change Change of Parent Dec. during Dec. during Dec. during Dec. during Bank 1984 1984 1984 1984 1984 1984 1984 1984
Total 2,183.0 46.7 505.3 25.8 939.9 14.7 702.7 7.4 Of which:
Canada 88.9 -0.4 21.0 - 1 .4 31.5 2.3 35.5 - 1 .2 France 197.1 6.8 24.2 0.2 112.1 7.7 55.6 -0.8
Germany. Federal Republic of 142.1 - 1 .8 1 1 . 1 0.6 72.7 2.8 56.9 -5.2
Italy 88.2 8.1 2.9 0.6 60.8 4.1 24.0 3.6 Japan 513.7 63.0 136.2 16.5 218.6 25.0 153.5 20.9
Switzerland 75.3 - 1.5 1 1 .7 - 1 .3 37.2 0.9 20.4 United Kingdom 161.4 -9.5 19.6 0.7 73.8 -8.0 63.3 - 1 .8 United States 614.5 - 16.5 241.9 7.7 193.4 -20.0 176.1 -4.3
Of which, on
Total Liabilities Related Offices Other Banks Nonbanks
Country Change Change Change Change of Parent Dec. during Dec. during Dec. during Dec. during Bank 1984 1984 1984 1984 1984 1984 1984 1984
Total 2,088.4 70.4 504.5 34.1 93.5 - 13.4 421.8 43.3 Of which:
Canada 98.0 1.5 12.3 0.2 37.4 -4.5 38.6 4.5 France 189.1 5.1 29.2 1 . 5 123.5 1.2 21.1 1.2
Germany, Federal Republic of 128.3 -2.8 17.6 3.7 70.6 - 1 1 . 7 27.5 3.6
Italy 87.6 9.5 4.2 -0.4 73.2 7.0 6.0 0.8 Japan 493.2 8 1 . 5 137.7 23.8 256.4 36.6 40.1 10.1
Switzerland 68.3 2.3 25.2 -0.2 10.7 -4.7 19.9 6.3 United Kingdom 164.7 - 10.8 19.5 0.9 78.0 -8.3 43.7 -2.9 United States 559.0 -8.4 222.9 8.6 122.9 - 16.9 147.0 12.8
Of which, on/to
Net Claims/ Related Offices Other Banks Nonbanks Net Liabilities
Country Change Change Change Change of Parent Dec. in net Dec. in net Dec. in net Dec. in net Bank 1984 position 1984 pOsition 1984 position 1984 position
Total 94.6 -23.7 0.8 -8.3 4.4 28.1 280.9 -35.9 Of which:
Canada -9.1 - 1.9 8.7 - 1 .6 -5.9 6.8 - 3 . 1 - 5.7 France 8.0 1.7 -5.0 - 1 .3 - 1 1.4 6.5 34.5 -2.0
Germany. Federal Republic of 13.8 1.0 -6.5 - 3 . 1 2 . 1 14.5 29.4 -8.8
ltaly 0.6 - 1 .4 - 1 .3 1 .0 - 12.4 -2.9 18.0 2.8 Japan 20.5 - 18.5 - 1 . 5 -7.3 - 37.8 - 1 1.6 113.4 10.8
Switzerland 7.0 -3.8 - 13.5 - 1 . 1 26.5 5.6 0.5 - 6.3 United Kingdom -3.3 1.3 0.1 -0.2 -4.2 0.3 19.6 1 . 1 United States 55.5 -8.1 19.0 -0.9 70.5 -3.0 29.1 - 17.1
Source: Bank for International Settlements, The Nationality Stmcture of the International Banking Market and the Role of lnterbank Operations.
42

©International Monetary Fund. Not for Redistribution
Lending Behavior of Banks by Ownership and Size
Table 9. Change in Bank Claims on Developing Countries, 1982-First Half of 1985 1 (In billions of U .S. dollars and in percent)
12 months to 1982 1983 1984 June 1985
Billions Billions Billions Billions ofU.S. Growth of U.S. Growth of U.S. Growth of U.S. Growth dollars rate dollars rate dollars rate dollars rate
Developing countries BIS semiannual 39.3 10.0 26.0 6.0 4.7 1 .0 6.0 1 . 3 U .S. claims data 1 1 .5 8.2 6.2 4.1 -3.5 -2.2 -8.0 -5.1 U.K. claims data 6.4 1 1 .2 2.3 3.7 -0.9 - 1 .4 - 1 .9 -2.9
Capital-importing developing countries
BIS semiannual 38.2 10.2 2 1 . 7 5.3 4.7 1 . 1 6.8 1.6 U.S. claims data 1 1 .6 8.5 5.7 3.9 -2.7 - 1 .8 -7.3 -4.8 U.K. claims data 6.2 1 1 .7 2.0 3.3 - 0 . 1 -0.2 - 1 .2 -2.0
Africa BIS semiannual 5.5 10.8 3 . 1 5.5 - 1 .0 - 1 .7 - 1.2 -2.0 U .S. claims data 1 . 3 12.4 1 .0 8.5 -0.8 -6.0 - 1.9 - 15 . 1 U.K. claims data 2.9 3 1 . 1 0.5 4 . 1 -0.2 -2.0 - I . I -9.0
Asia BIS semiannual 10.4 17.1 8.7 12.2 3.8 4.7 4.8 5.9 U.S. claims data 3.8 14.2 1.4 4.5 -3.0 -9.5 -2.7 -9.0 U.K. claims data 1.4 16.5 0.4 3.6 -0.3 -3.0 -0.7 -6.5
Indonesia BIS semiannual 2.7 37.5 1.5 15.2 1 . 1 9.3 0.1 0.8 U.S. claims data 0.6 24.2 0.6 19.9 -0.2 -5.0 -0.6 - 15.3 U.K. claims data 0.5 63.6 0.3 26.0 2 . 1 -0.2 -12.8
Korea BIS semiannual 3.3 16.6 1.9 8.2 0.3 1 . 2 1.9 7.5 U.S. claims data 2.1 24.1 0.5 4.1 - 1 . 5 - 1 3.3 - 1. 1 - 10.0 U.K. claims data 0.3 10.8 -0.2 -7.4 - 0 . 1 -2.5 -0.2 -7.9
Philippines BIS semiannual 2.4 23.5 0.6 4.8 - 1 .4 - 10.1 0.1 0.8 U .S. claims data 0.4 6.9 0.3 5.5 -0.6 - 10.0 -0.2 - 3 . 1 U.K. claims data 0.2 1 1 .7 0.1 4.2 - 0.2 -9.6 - 0 . 1 -4.8
Europe BlS semiannual -0.3 -0.7 1 . 6 3.5 -0.6 - 1 .2 1.6 3.3 U.S. claims data -0.8 -7.0 0.9 9.5 -0.4 -3.6 - 1 .3 - 12.2 U.K. claims data -0.2 -2.7 0.2 3.2 -0.2 - 2 . 5 - 0 . 1 - 1.9
Middle East BlS semiannual 3.5 19.7 0.7 3.3 -0.7 -4.5 -0.7 -4.6 U.S. claims data 0.3 8.1 0.3 8.5 -0.4 -9.0 -0.4 - 10.9 U.K. claims data 0.5 32.0 -0.2 - 1 1 . 2 -0.2 - 1 3.3 -0.2 -8.5
Western Hemisphere BlS semiannual 1 9 . 1 9.6 7.7 3.5 3.2 1.4 2.2 1.0 U .S. claims data 6.9 8.2 2 . 1 2.3 1.8 1.9 -0.9 - 1.0 U.K. claims data 1 .6 6.1 1 . 1 3.9 0.8 2.8 0.9 3.0
Argentina BIS semiannual 0.9 3.6 0.2 0.8 - 1.5 -5.6 0.4 1.6 U .S. claims data -0.2 -2.0 0.3 3.3 -0.5 -6.3 -0.3 -3.2 U.K. claims data -0.3 - 7.8 0.1 2.8 - 0 . 1 - 1. 3 - 0 . 1 - 1 .6
Brazil BIS semiannual 8.0 15.2 1 . 7 2.8 4.8 7.9 2.4 3.7 U.S. claims data 3.6 21.5 0.2 1 . 1 3.2 15.6 0.7 3.1 U.K. claims data 1 . 2 .18.2 0.7 8.5 0.7 8.5 0.5 5.4
Mexico BIS semiannual 5.8 10.2 5.5 8.7 1 .6 2.3 0.4 0.6 U.S. claims data 2.9 13.4 2.0 8.0 0.2 0.7 -0.8 -3.0 U.K. claims data 0.2 3 . 1 0.3 3.8 0.1 1 . 1 0.1 1.4
Venezuela BIS semiannual 1 . 3 5.0 -0.3 - I . I -0.9 - 3 . 3 -0.3 - 1 . 1 U.S. claims data 1 . 1 10.5 -0.3 -2.8 -0.4 -4.0 -0.7 - 6.3 U.K. claims data -0.1 -4.3 - 0.2 -5.4 -0.1 -4.2 0.1 1.8
Note: Owing to rounding. components may not add. Sources: Bank for International Settlements, The Maturity Distribution of lntemational Bank Lending: Federal Financial Institutions
Examination Council, Country Exposure Lending Survey: and Bank of England, Bank of England Quarterly Bulletin. 1 These data are not adjusted for the impact of exchange rate movements. and are based on consolidated reports of banks.
43

©International Monetary Fund. Not for Redistribution
I l l • INTERNATIONAL BANKING ACTIVITY
for their banks on a consolidated basis, and the reporting area for the data was expanded in 1984, making interpretation of the flow data difficult.23
The United States publishes data for its banks on a consolidated basis by geographical destination (Table 10). After increasing by 8 percent in 1982, the
!l These data are not corrected for exchange rate changes. Coverage of the BIS semiannual data was substantially broadened during the course of 1984, as additional countries began to report on a consolidated basis. lt appears that changes in claims on developing countries were largely unrelated to the broadening of the statistical coverage. On that basis, and before exchange rate adjustment, the reporting banks' claims on the developing countries rose by less than 0.5 percent in 1984, after increasing by over 6 percent and 10 percent in 1982 and 1983, respectively. To give a broad indication of the effect of exchange rate changes, it is estimated that, after adjustment, the growth in claims on all developing countries in 1984 would amount to $13 biJJion. or 2.8 percent (a rate of growth broadly comparable to that shown by the IBS data).
consolidated claims of U.S. banks on developing countries increased by 4 percent in 1983 and declined by over 2 percent in 1 984. In 1984, U .S. banks' claims decreased in aggregate by $3 billion ( 10 percent) on developing countries in Asia. The decline in U .S. banks' claims was particularly large in Korea ($1.5 billion) and the Philippines ($0.6 billion). The only material increases in U.S. banks' claims occurred in China ($0.2 billion) and Thailand ($0. 1 billion). With regard to developing countries in the Western Hemisphere, U.S. banks' claims increased in aggregate by $ 1 .8 billion ( 1 .9 percent) in 1984. The largest increase in banks' claims was to Brazil ($3.2 billion), while U .S. banks' claims to Argentina declined ($0.5 billion), as they also did to Venezuela ($0.4 billion). Further, U.S. banks' claims declined to developing countries in Europe by 3.6 percent, and to Africa by 6 percent.
Table 10. Change in Claims of U.S. Banks on Developing Countries, 1982-First Half of 1985 1
(In billions of U .S. dollars; and in percent)
12 months to 1982 1983 1984 June 1985
Billions Billions Billions Billions of U.S. Growth of U.S. Growth of U.S. Growth ofU.S. Growth dollars rate dollars rate dollars rate dollars rate
Developing countries All banks 1 1 .5 8.2 6.2 4.1 -3.5 -2.2 -8.0 -5.1
Nine banks 7.1 8.0 3.9 4.1 - 1 .4 - 1 .4 -5. 1 -5.1 Fifteen banks 2.9 1 1 . 5 2.1 7.5 0.2 0.6 -0.6 -2.2 Others 1 .5 5.7 0.2 0.7 -2.3 -8.0 -2.3 -8.2
Capital-importing developing countries
All banks 1 1 . 6 8.5 5.7 3.9 -2.7 - 1.8 -7.3 -4.8 Nine banks 7.3 8.7 3.3 3.6 -0.8 -0.8 -4.8 -4.9 Fifteen banks 2.8 1 1 .4 2.2 8.1 0.3 0.9 -0.4 - 1.3 Others 1.4 5.4 0.2 0.8 -2.2 -7.7 - 2.2 -7.9
Africa All banks 1 . 3 12.4 1.0 8.5 -0.8 -6.0 - 1 .9 - 15 . 1
Nine banks 0.7 8 . 1 0.9 10.2 -0.8 -8.1 - I . I - 12.4 Fifteen banks 0.5 34.5 0.3 15.4 0.2 1 1 . 9 -0.4 - 17.3 Others 0.2 17.2 - 0 . 1 -4.7 -0.2 - 17.1 -0.4 -29.1
Asia All banks 3.8 14.2 1.4 4.5 -3.0 -9.5 -2.7 -9.0
Nine banks 2.7 14.8 0.3 1.3 - 2.0 -9.3 - 1.9 -9.3 Fifteen banks 0.4 8.4 0.5 8.2 0.6 -0.5 Others 0.6 20.9 0.6 17.0 - 1.1 -25.6 -0.8 -26.1
Indonesia All banks 0.6 24.2 0.6 19.9 -0.2 -5.0 -0.6 - 15.3
Nine banks 0.5 26.9 0.5 21.0 -0.3 -8.8 -0.5 - 1 7.5 Fifteen banks 10.9 7.5 0 . 1 30.1 -3.5 Others 12.2 32.6 - 14.8 2.9
Korea All banks 2.1 24.1 0.5 4.1 - 1.5 - 13.3 - 1 . 1 - 10.0
Nine banks 1.5 26.4 -0.5 -6.8 - 1.0 - 15.5 -0.3 -4.5 Fifteen banks 0.4 18.9 0.5 20.5 0.4 -0.2 -8.8 Others 0.3 22.0 0.5 28.5 -0.5 - 24.0 -0.6 -27.8
Philippines All banks 0.4 6.9 0.3 5.5 -0.6 - 10.0 - 0 2 - 3 . 1
Nine banks 0.2 6.3 0.1 1 . 3 -0.2 -4.4 -0.1 -3.5 Fifteen banks 1.7 2.7 - 0 . 1 -4. 6 0.9 Others 0.1 22.8 0.2 36.3 -0.4 -42.7 -8.3
44

©International Monetary Fund. Not for Redistribution
Table 10 also shows the U.S. banks' claims by geographical destination according to the size of the bank. The middle-size U.S. banks recorded some expansion in lending to developing countries, increasing their claims by about I percent in 1984, but the nine money center banks (the nine largest banks) decreased their claims by 1 percent in 1984. The regional banks (those ranked below the 24 largest) have been withdrawing from international lending, increasing their claims on developing countries by nearly 1 percent in 1983 and decreasing their claims by 8 percent in 1984.
ln the 1 2 months to June 1985, U .S . bank claims on developing countries declined by $8 billion (about 5 percent). U .S. banks reduced their claims on developing countries in aJJ regions, with the largest decline
Lending Behavior of Banks by Ownership and Size
for countries in Mrica ( 1 5 percent) and with substantial declines for countries in Europe ( 12 percent), in the Middle East ( 1 1 percent), and in Asia (9 percent). All size categories of U.S. banks reduced their claims on developing countries, with declines of almost 8 percent for the regional banks; 5 percent for the 9 money center banks; and 2 percent for the middle-size banks.
Estimates prepared by staff of the Board of Governors of the Federal Reserve System indicate that U .S. banks' lending to non-OPEC developing countries may have been understated by $3lf2 billion (approximately 3 Y2 percent) during 1983-84. This is roughly equivalent to the absolute decline in claims on developing countries recorded in 1984 alone; thus. the declining trend in U.S. claims is slowed but not reversed by such corrections.
Table 10 (concluded). Change in Claims of U.S. Banks on Developing Countries, 1982-First Half of 1985 1
(In biiJjons of U.S. dollars; and in percent)
1 2 months to 1982 1983 1984 June 1985
Billions Billions Billions BiUions of U.S. Growth of U.S. Growth of U.S. Growth of U.S. Growth dollars rate dollars rate dollars rate dollars rate
Europe All banks -0.8 -7.5 0.9 9.5 -0.4 -3.6 - 1 .3 - 12.2
Nine banks -0.3 -4.6 0.8 12.8 -0.4 -4.9 - 1 .3 - 1 6.5
Fifteen banks -0.1 -7.3 0.1 5.7 0 . 1 6.1 0.1 3.6
Others -0.3 -20.4 -3.5 -0.1 -7.6 -0.1 -5.5
Middle East All banks 0.3 8 . 1 0.3 8.5 -0.4 -9.0 - 0.4 - 10.9
Nine banks 0.1 6.0 0.2 8.6 -0.2 -7.8 - 0 . .1 -5.6
Fifteen banks 0.1 19.8 0.1 19.7 -0.9 - 0 . 1 -20.0
Others 0.1 7.5 1.5 -0.2 - 18.8 - 0 . 1 - 19.0
Western Hemisphere All banks 6.9 8.2 2.1 2.3 1 .8 1.9 -0.9 - 1.0
Nine banks 4.1 8.5 l . l 2 . 1 2.5 4.7 -0.3 -0.4
Fifteen banks 1.9 12.1 1.3 7.3 -0.1 -0.6 0.1 0.5
Others 0.8 4.2 -0.3 - 1 .4 -0.6 -3.0 -0.8 -3.9
Argentina All banks -0.2 -2.0 0.3 3.3 -0.5 -6.2 -0.3 -3.2
Nine banks -0.1 - 1 .7 0.2 4.5 -0.3 -4.6 0.3
Fifteen banks 0 . 1 6.0 0.2 8.4 -0.1 -6.1 -0.1 -4.5
OLhers -0.2 - 12.7 -0.1 - 8.4 -0.2 - 13.6 -0.2 - 17.3
Brazil All banks 3.6 21.5 0.2 1.1 3.2 15.6 0.7 3 . 1
Nine banks 2.7 25.0 2.5 18.8 0.6 4.1
Fifteen banks 0.9 30.7 0.4 10.3 0.4 10.0 0.9
Others 0.1 1 .5 -0.2 -5.8 0.3 9.4 1 .2
Mexico All banks 2.9 13.4 2.0 8.0 0.2 0.7 -0.8 -3.0
Nine banks 1.3 1 1 . 1 1.3 9.8 0.6 4.0 -0.4 -2.9
Fifteen banks 0.8 18.7 0.2 4.0 -0.2 0.2 3.8
Others 0.8 14.1 0.5 7.7 -0.4 -5.3 -0.6 -8.5
Venezuela All banks 1 . 1 10.5 -0.3 -2.8 - 0.4 -4.0 -0.7 -6.3
Nine banks 0.8 11 .3 -0.2 -2.2 -0.2 -2.6 -0.3 -4.5
Fifteen banks 0.3 18.8 1.3 -0.1 -5.3 -0.2 -8.5
Others - 1 .4 -0.2 - 10.6 -0.1 -8.9 -0.2 - 12.4
Note: Owing to rounding, components may not add. Source: Federal Financial Institutions Examination Council, Country Exposure Lending Survey. ' These data are based on consolidated reports of banks.
45

©International Monetary Fund. Not for Redistribution
Ill • INTERNATIONAL BANKING ACTIVITY
The only other country within the BIS reporting area that publishes consolidated data by geographical destination on a basis that permits analysis of flows according to a Fund country classification is the United Kingdom (Table 9). There was also an overall decline in U.K. banks' claims on developing countries in 1984. This decline amounted to $0.9 biiJion, or 1 .4 percent, although claims of U.K. banks rose by 2.8 percent on developing countries in the Western Hemisphere ($0.8 billion). The decline against countries in Asia and Europe may, in part, reflect underrecording, owing to banks' holdings of floating rate notes issued by developing countries' borrowers, as well as the fact that exchange rate adjustments cannot be made to take account of the non-U .S. dollar lending of U.K. banks.
In the 12 months to June 1985, U.K. banks' claims on developing countries declined by $1 .9 billion, or 2.9 percent, although claims of U.K. banks continued to rise by 2.9 percent on developing countries in the Western Hemisphere.
Developments in Banks' Claims Relative to Capital
For the United States, available data permit a detailed analysis of developments in banks' balance sheets (Chart 4 and Table 34). Between 1977 and 1 98 1 , U . S . banks' capital ratios deteriorated from 5. 7 percent to 5.4 percent. During this period, claims on developing countries grew, on average, by about 5 percent a year more rapidly than nominal GDP, and increased, as a proportion of total claims, from 9.2 percent to 10.7 percent. Bank capital grew at about the same rate as nominal GDP.
Between 1982 and 1984, U.S. banks' capital to total claims rose from 5.6 percent to 6.5 percent and continued to rise to 6.8 percent in the first half of 1985. This improvement in U.S. banks' capital ratios reflected both a rapid growth in capital and also a marked slowdown in the growth of total assets. Increases in capital were substantial during 1982 to the first half of 1985, especiaJJy in tight of lower inflation. Total assets grew relatively slowly during this period. U.S. banks' external claims on developing countries declined, as a proportion of their total claims, to 9.6 percent in the first half of 1985, but this was still somewhat higher than in 1977. It is noteworthy that U.S. banks reduced their lending to developing countries at a considerably more rapid pace than they reduced their total lending in 1983, and claims on these countries were reduced in 1984 and the first half of 1985.
It is not feasible to prepare a general analysis of banking developments in other industrial countries with the same degree of detail or internal consistency
46
as for the United States, because comprehensive information is not generally available on banks' consolidated exposure to developing countries or the corresponding bank capital. Moreover, national accounting regulations differ markedly, as do prudential guidelines on capital and on the valuation of assets; exposure of non-U .S. banks is overstated to the extent that undisclosed provisions have been made.
While developments among countries have varied markedly, the capital ratios of industrial country banks generaiJy deteriorated during the late 1970s. Subsequently, for many of these countries, there was a rise in capital/asset ratios. For the industrial countries as a group, the bank capital ratio appears to have returned in 1984 to the 1977 level, although this was not the case for each country within the group. The strengthening of the aggregate capital ratio during this period reflected a significant increase in capital. In countries other than the United States, bank capital is largely denominated in local currency, while foreign assets tend to be denominated in U.S. doUars, and the sizable appreciation of the U .S. dollar in recent years retarded efforts to increase aggregate capital ratios. Similarly, the depreciation of the U .S. dollar in the first half of 1 985 will have aided these countries' banks in strengthening their capital ratios, while allowing room for further increases in banks' claims.
While the true claims of industrial country banks on developing countries is not known, some general trends can be seen (Chart 5). As a percentage of banks' total assets, banks' international claims have risen significantly since the mid-1970s. More than 30 percent of banks' assets are now accounted for by external claims. Some 23 percent of international claims are claims on developing countries, although the proportion has been falling, especially for developing countries other than the seven major borrowers. The recent decline in claims on developing countries as a proportion of international claims is only partly accounted for by developments in U.S. banks' claims. Moreover, the claims of European banks, in particular, has probably been reduced further by provisioning. Even before allowance for provisioning, it appears that claims on developing countries probably do not now account for a greater proportion of banks' international claims than in the mid-1970s.24 However, within this aggregate, the share accounted for by major borrowers has risen to a modest extent.
While projections of future lending must be considered cautiously, the projections of bank lending to developing countries contained in the World Economic Outlook's medium-term scenarios are consistent with
Z4 After allowing for breaks in statistical series, reflecting wider coverage.

©International Monetary Fund. Not for Redistribution
Terms of Bank Lending
Chart S. Concentration of Cross-Border Bank Claims, 1976-84
(In percent)
35
30
25
20
SHARE OF INTERNATIONAL CLAJMS IN TOTAL CLAIMS OF BANKS
l l
10
SHARE OF CLAIMS ON DEVELOPING COUNTRIES AND SEVEN MAJOR BORROWERS IN BANKS" INTERNATIONAL CLAIMS
Devc/ofling coumries tRigltt sroleJ
7 major l>nrrowers (Left,,·coltt)
24
\ 23
Sources: Bank for International Settlements . lntemational Banking Developments: International Monetary Fund, International Fintmcial Statistics; and Fund staff estimates.
1 Owing to a change in the coverage of the BIS reporting area, there is a break in the series.
a reduction in the ratio of claims on these countries to the aggregate capital of banks in industrial countries, a process which is already under way. Lending by private creditors was projected to rise by about 2 percent in 1986 and more rapidly during 1987-90. The ratio of banks' claims to capital could thus return to the level prevailing before the increase Ln lending to developing countries that occurred during the late 1970s and early 1980s, provided that bank capital continues to increase somewhat more rapidly than nominal GDP and that exchange rate developments are as projected. For non-U .S. banks, developments in the U .S. dollar exchange rate will have an important impact on the speed at which their claims relative to capital is reduced, although this will be offset to the extent that currency redenomination of U .S. dollardenominated claims takes place.
Terms of Bank Lending
The BIS semiannual series show that the maturity of outstanding bank debt of most of the countries outside the BIS reporting area lengthened considerably in J 984, after a gradual lengthening in the previous years. A slight reversal of this lengthening occurred in the first half of 1985 but was mainly attributable to the smaller industrial countries. This development is
evidenced by the reduced share of short-term debt in total debt outstanding (Table 1 1 ),25 and marks a significant departure from the tendency toward a general increase in short-term indebtedness that prevailed through mid-1982. In some instances, the declining
25 Because there are changes in the coverage of the BIS. direct comparisons between 1983 and 1984 should be interpreted with caution.
47

©International Monetary Fund. Not for Redistribution
Ill • INTERNATIONAL BANKING ACTIVITY
proportion of short-term debt reflects the impact of bank debt restructuring arrangements, whereby sizable proportions of short-term debt have been converted into long-term debt. In Mexico, the share of shortterm debt declined from a peak of almost 49 percent at the end of 1981 to 24.1 percent at the end of 1984, before increasing slightly to 25.9 percent at the end of June 1985. In Brazil, the share of short-term debt declined from almost 35 percent at the end of 1981 to 25.1 percent at the end of 1984 (although it increased somewhat to 26.7 percent at the end of June 1985).
This trend also reflected a deliberate effort by some developing countries, which continued to have access to spontaneous bank credits, to improve their external position by lengthening the maturity of their debt. This was the case in Korea, where the share of short-term debt declined from over 62 percent at the end of 1980 to 50 percent at the end of 1 984 and 47.6 percent at the end of 1985. In stiU other instances, this trend may have resulted from a withdrawal of short-term loans and deposits by creditor banks.
The OECD data covering the maturity of new longterm bank credit commitments indicate that the average final maturity of new long-term bank credit commitments has lengthened slightly (Chart 3). The length-
ening of maturities affected mostly concerted lending and, more generaUy, lending to developing countries.
Reference rates26 in 1984 were, on average, about 1-1 !14 percentage points higher than in 1983 but declined significantly in the first half of 1985. As regards weighted average spreads over reference rates on new publicized medium-term bank credit commitments, such lending margins declined to 0.93 percent in 1984, compared with 1 . 1 5 percent in 1983. Average spreads remained above the levels experienced during 1979-82, but below those of 1974-78 (Table 3 1 ). Developments in 1984, however, reflected limited access for developing countries and increased competition for loans to highly regarded borrowers. As discussed in Section IV, margins for countries gaining external finance through concerted lending have also declined. The differential in the average spread between OECD and developing country borrowers, which had nearly doubled to I 05 basis points in 1983, declined to 89 basis points in 1984. Furthermore, tbjs average differential declined to 27 basis points in the second half of 1984 and the first half of 1985, when the spread to developing countries was cut signjficantly.
26 Primarily comprising LIBOR, U.S. prime rate. and interest rate on certificates of deposit.
Table 1 1 . Short-Term Claims in Percent of Outstanding Bank Claims, 1979-First Half of 1985 1 Dec. Dec. Dec. Dec. Dec. Dec. June 1979 1980 1981 1982 1983 2 1984 � 1985
All countries 44.0 45.5 47.1 46.7 44.3 41.8 42.4
Industrial countries (other than Group of 41.4 43.0 44.0 43.7 42.9 44.9 46.7 Ten, Switzerland, Austria, Denmark, and Ireland)
Developing countries 44.9 46.9 48.1 48.1 45.3 41.4 41.8
Capital-importing 43.4 45.4 46.4 46.4 43.1 39.2 39.9
Africa 28.4 28.8 34.6 38.1 40.0 42.2 40.3
Asia 52.8 55.4 54.1 51.7 48.7 46.3 46.4 Of which: Indonesia 39.7 4 1 .3 41.7 38.4 39.0 41.9 41.3 Korea 55.8 62.3 57.8 59.9 56.4 50.0 47.6 Philippines 52.7 58.1 56.9 59.5 52.9 53.2 58.3
Europe 37.6 36.2 34.4 32.4 33.3 33.3 33.9
Middle East 76.3 78.0 78.7 78.4 69.7 68.9 68.5
Western Hemisphere 43.6 46.4 46.9 46.6 42.2 35.2 36.8 Of which: Argentina 51.5 52.3 46.8 54.1 52.6 55.3 57.1 Brazil 29.3 35.5 34.7 34.9 27.9 25.1 26.7 Mexico 34.6 44.2 48.7 47.5 42.4 24.1 25.9 Venezuela 6 1 . 1 58.9 61.5 57.5 59.1 65.2 65.8
Centrally planned economies 3 41.0 38.4 43.1 39.2 38.1 38.9 40.1
Source: Bank for international Settlements, The Maturity Distribution of International Bank Lending. 1 Short-term claims are defined in this table as having a remaining maturity of one year or less. ' Coverage of the series changes at end-1983 and end-1984. ' Excluding Fund member countries.
48
©International Monetary Fund. Not for Redistribution
The general decline in margins for borrowers with access to international markets and the decline in the average differential between industrial and developing countries reflects the fairly high liquidity of the financial markets and competitive pressures resulting from the increasing share of financing achieved through issuance of bonds or short-term notes. It is noteworthy that a market has developed in which banks are willing to extend long-term international credit on a spontaneous basis, mainly to those countries that also have access to the securities market where margins were very low during this period.
Concerning the currency distribution of syndicated loans, there was a continuation of the trend toward lessening the predominance of the U.S. dollar in 1984. The share of U .S. dollar in total borrowing declined below 75 percent in 1984, compared with 92 percent in 1981. This decUne was broadly matched by the
Terms of Bank Lending
growing importance of the ECU, pound sterling, and yen, which increased their combined share from 2 percent in 1981 to almost 19 percent in 1984; the yen accounted for 60 percent of the increase. This reflects the internationalization ofthe yen and the liberalization of the Japanese financial markets, as well as the large proportion of bank lending by Japanese banks.
The pound sterling continued to increase its share of the market in 1984, although the bulk of borrowing operations was confined to U . K. enterprises. The use of the ECU expanded more rapidly than any other monetary unit except the yen, with loan completions exceeding the equivalent of$1.6 billion compared with $0.6 billion in 1983. Italian and Spanish entities remained the most frequent national borrowers to use ECUs on the loan market, but the Union of Soviet Socialist Republics and Hungary also accessed funds in ECU in 1984.
49

©International Monetary Fund. Not for Redistribution
IV Recent Trends in Bank Debt Restructuring
General
Successful restructuring of countries' bank debt has continued to demand intensive coordination among banks, governments, the Fund, and other multilateral agencies on the financial requirements associated with adjustment programs, and continuous liaison by the coordinating banks with aJI creditor banks to secure agreement on the restructuring packages. Almost all restructurings have been linked to a Fund-supported adjustment program. A detailed discussion of current trends in bank debt restructuring is contained in Recent Developments in External Debt Restructuring.21 This section summarizes key points from that study, and updates the statistics and description of developments.
While the basic approach to solving debt-servicing problems has been maintained from the outset of the debt problem, more recently, creditors have been willing to enter into longer-term arrangements with a number of countries. To this end, debtor countries and banks have negotiated MYRAs. However, for some countries engaged in debt-restructuring negotiations, the process has been complex and slow, especially where agreement on new financing has been sought. In some cases, final agreements have yet to be signed, despite prolonged negotiations.
The type of debt included in bank debt has reflected a number of factors. One major consideration has been a concern to achieve equitable burden-sharing among banks, which has involved securing agreement from all of a country's creditor banks. Another important consideration has been to minimize the potential danger to restructuring countries' prospects of regaining access to international capital markets. Therefore, interest payments on bank debt have been excluded from reschedulings in almost all cases, although banks have been willing, in some cases, to reduce the interest rate on existing loans; formal restructuring of trade credits and interbank deposits has been avoided whenever feasible; and bonds and floating rate notes owned by nonbanks generaJly have been excluded from restruc-
27 International Monetary Fund, Recenl Developmenls in External Debt Restructuring, Occasional Paper No. 40 (Washington, October 1985).
50
turing, in part, because their holders have not normaJJy been known.
A further concern has been burden-sharing among bank and official creditors; thus, agreements with bank creditors, at times, were made contingent on comparable debt relief from official creditors. Official creditors, for their part, conditioned further debt relief on debtor countries seeking debt restructuring by banks on comparable terms. With one exception, each instance of official rescheduling during the past two years has been preceded or followed by parallel discussions on bank debt restructuring. In the single exception, there was no medium-term debt to banks. Banks, on the other band, have restructured debt for some countries that did not seek a multilateral rescheduling from official creditors.
In addition to restructuring debt owed or guaranteed by the debtor government, a number of debtor countries encouraged the restructuring of nonguaranteed private debt in order to regularize the private sector's relations with creditors, and to secure additional balance of payments relief. In several of such cases, governments introduced preferential exchange rate schemes, and sometimes special domestic credit arrangements to induce the private sector to reschedule its debts. Also, interest payments on rescheduled debts were sometimes given priority under an exchange allocation system. In some cases, banks have pressed countries' authorities to assume or mitigate the commercial risk of their loans to the private sector.
Amounts and Terms In 1984, restructuring agreements were reached (at
least in principle) by 17 countries, compared with 14 countries in 1983, and an average of 6 countries a year during 1 980-82. During 1985, 8 countries signed restructuring agreements. The amounts of debt restructured in agreements signed or agreed in principle, excluding short-term debt rolled over, are estimated to have been $98 billion in 1984, about three times the amount in 1983, and $ 1 3 bitlion during 1985.28 The
28 Excluding three MYRAs agreed in principle, the amount of bank debt restructured in 1984 would have been somewhat below the 1983 figure.

©International Monetary Fund. Not for Redistribution
amount rescheduled in 1984 was equivalent to almost 20 percent of the stock of bank debt of developing countries compared with 6 percent in 1983.
Under arrangements concluded in the context of all bank debt restructurings, an estimated $38 billion of short-term debt was rolled over or converted into medium-term debt in 1984-36 percent more than in 1983. These arrangements affected trade-related, interbank, and money market facilities in 12 countries. During 1985, the covered amount increased only slightly, as banks raised facilities in only two countries-Costa Rica and Panama. Details on amounts of debt restructured, rollover arrangements, and concerted lending are contained in Tables 36-40.
Between September 1984 and June 1985, banks signed or reached agreement in principle on MYRAs with Mexico, Venezuela, Ecuador, the Dominican Republic, Jamaica, and Yugoslavia (Table 12). These agreements cover $75 billion of principal repayments due between 1983 and 1990. Preliminary agreement was also reached on a MYRA with Yugoslavia. For the countries involved, the MYRAs provided considerably longer consolidation periods and maturities of up to 14 years, compared with 10 years in typical recent debt restructurings. Spreads in some cases were fixed at 7/s percent to 1 Y4 percent over LIBOR, significantly below the spreads in other recent debt restructurings, and rescheduHng fees were waived.
Recent agreements with other countries that had previously undertaken debt restructurings and are implementing economic adjustment programs show a narrowing of spreads, and a lengthening of grace periods and maturities, compared with earlier agreements. This trend has been clearest in the case of MYRAs, but a number of other recent agreements show spreads of 13/4 percent or less over LIBORconsiderably lower than was generally the case in the first year after widespread payments difficulties emerged in late 1982. In the case of Chile, for example, the interest rate in the 1983 rescheduling arrangement was 2-2 Ys percent over LIB OR, while the 1985 arrangement includes a spread of J3/s percent over LIBOR. In addition, in certain cases, creditor banks have been willing to alter the schedule for interest payments (e.g., semiannual instead of quarterly payments).
Maturities of restructurings, other than MYRAs, have recently ranged up to 10 or 12 years, compared with typical maturities during 1982-83 of up to 8 years. For example, the maturity of Chile's debt in the 1983 rescheduling was 8 years, while the recently signed 1985 arrangement calls for a 12-year maturity. Grace periods , too, have been lengthened, from typically 3 years during 1982-83, to more recently as long as 5 years. While these terms are still less favorable than the average terms recorded for all new publicized long-
Multiyear Restructurings and Enhanced Surveillance
term international bank credit commitments to developing countries, the differences have narrowed.
Where no improvement in economic performance has been apparent, or where the country has been unable to fulfill the terms of an existing restructuring agreement, banks on occasion entered into deferment agreements that have been periodically renewed. For some countries that experienced extremely protracted payments difficulties, banks have also been prepared to stretch out repayment terms over a relatively long period and, in a very few cases, have rescheduled or formally deferred a portion of interest payments (notably in Nicaragua and Sudan). However, in such cases, there has been no provision of new mediumterm financing by banks, and banks have considered that there was little prospect of an early return by the countries to normal access to capital markets.
Multiyear Restructurings and Enhanced Surveillance
Multiyear Restructuring Agreements
The most significant new development in bank debt restructurings during 1984-85 was the adoption by bank creditors of a medium-term perspective for debt restructuring through the negotiation of MYRAs with certain countries. In all cases, MYRAs have been seen to provide a clearer planning horizon for bank creditors, as well as the government.
In several cases, MYRAs were intended to facilitate an early return by debtor countries to more normal access to capital markets, that is, to move away from a concerted approach to new lending and to re-establish independent decision making by market participants. In such cases, banks sought economic monitoring procedures for the period when countries would no longer be using Fund resources. In this context, the concept of enhanced surveillance by the Fund was developed (enhanced surveillance is discussed further in the following subsection).
MYRAs have also been agreed or discussed with countries that would not meet the criteria for enhanced surveillance, mainly because they have not established an adequate record of adjustment. l n certain such cases, member countries and bank creditors have agreed on a multiyear restructuring to avoid the burdens and uncertainties imposed by multiple annual restructurings.
In order to maintain a close link between debt relief and the implementation of adjustment policies, bank creditors have in some cases made only subperiods within the consolidation period of a MYRA eligible for unconditional restructuring. The restructuring for later years in the consolidation period depends on
5 1

©International Monetary Fund. Not for Redistribution
IV • RECENT TRENDS TN BANK DEBT RESTRUCTURING
Table 12. Terms of Selected Bank Debt Restructurings and Bank Financial Packages, 1983-September 1985
Country
Argentina
Brazil
Chile
Costa Rica
Dominican Republic
Ecuador
Jamaica
Mexico
Philippines
Venezuela
Yugoslavia
Year of Agree-
ment
1983 1985 1985
1983 1983 1984 1984
1983 1983 1984 1985 1985
1983 1985
1983
1985
1983 1983 1984 1984
1984 1985
1983 1983 1984 1985
1984 1984
1984
1983 1983 1984 1985
Type of Debt Restructured
New financing Restructuring New financing
Restructured New financing Restructuring New financing
New financing Restructuring New financing Restructuring 4 New financing
Restructuring Restructuring
Restructuring
Restructuring 6
Restructuring New financing Restructuring 6 New financing
Restructuring Restructuring
Restructuring New financing New financing Restructuring •
Restructuring New financing
Restructuring 6
Restructuring New financing Restructuring Restructuring •
Sources: Restructuring agreements: and press reports. 1 First principal payment due 30 months after rescheduling.
Grace Period (ln years)
3 3 3
2'/2 I 2'/z 5 5
4 4 5 6
31/. 3
3
I Yz 3 2
2 3 1
4 3 5Vz 0 to 1
4 to 5 5
3 3 4 5
Interest Rate Maturity (I o percent spread
(ln years) . over LIBOR-U.S. Prime)
41/� 2'1·-2'h 10 to 12 1%-1% 10 1%-1 v. 8 2V..-2 2 8 2'/s-P/s J 9 2-13/. 9 2-Jl/.
7 2Y·-2Ys 8 2'/s-2 9 1%-1 Yz 12 1 :Ys 10 1%- I V.
6'12 to 7 '12 2'1 ...... 2'/s 10 I:Ys-P/s s
5 2'1•-2'/s
13 Pis
7 2'1 ..... 2'/s 6 2:Ys-2Y. 12 1% 10 1%
5 2Yz 10 1%
8 11/s-1 :y. 6 21/.-2'/s 10 I Yz-1 Ys 14 'la in 1985-86
lYsin 1987-91 I V. in 1992-98
10 1% 9 Jl/.
12\/z I V•
6 11/s-1 :y. 6 1'/s-P/. 7 1%-l 'lz 1 1 I Vs
1 The spreads over LIBORIU .S. prime rate are 2'/s percent/Pis percent for amounts on deposit with the Central Bank or-as generally acceptable maximums-for loans to public sector borrowers with officiaJ guarantee, Petrobras, and Companhia Vale do Rico Doce (CVRD): 21/. percent/2 percent as the generally acceptable maximums for public sector borrowers without officiaJ guarantee. private sector borrowers with development bank guarantee and for commercial and investment banks under Resolution 63; 21/2 percent/21/. percent as generally acceptable maximums for private sector borrowers.
J The Central Bank stands ready to borrow the committed funds at either 2'/s percent over LIBOR or I Vs percent over U.S. prime rate. For loans to other borrowers, the spreads agreed must be acceptable to the Central Bank, which indicated the following maximums for spreads over LIBOR/U.S. prime rate to be generaJly acceptable: public sector borrowers with officiaJ guarantee as well as Petrobras and CVRD--211.! percent/!'!.! percent; public sector borrowers without official guarantee, private sector borrowers with development bank guarantee. and Resolution 63 loans to commercial and investment banks-2'1. percent/2 percent; private sector borrowers. including multinationals-2'h percent/2'/z percent. Brazil is also prepared to pay a 0.5 percent commitment fee on undisbursed commitments, payable quarterly in arrears. and a 1.5 percent flat faciHty fee on amounts disbursed. payable at the time of disbursement.
• Agreement in principle of restructuring of public and private debt due in 1985-87. s 15/8 percent over ''domestic reference rate." equal to: U.S. dollar certificate of deposit rate adjusted to reserves and insurance; or a
comparable yield for loans denominated m other currencies. 6 Multiyear debt restructuring agreement. 1 The repayment schedule is 4 quarterly payments of$1 million starting October 15, 1988 with the remainder to be paid in 25 equal quarterly
installments.
52

©International Monetary Fund. Not for Redistribution
certain conditions being met with regard to economic performance and monitoring arrangements. This approach, known as a serial MYRA, facilitates a periodic review of economic policies and prospects.
In September 1984, Mexico became the first case for which a MYRA was agreed in principle. Maturities of $48.7 billion falling due during 1985-90 (of which $3.2 billion are doiJar-denominated debts to foreign branches of Mexican banks) were rescheduled, and the repayment period was lengthened from 8 years to 14 years. ending in 1998. Margins were set at Vs percent over LIBOR for 1985-86, I Ys percent over LIBOR for I 987-91 , and I Y4 percent for 1992-98. Under the arrangements requested by the Mexican authorities, when Mexico is no longer drawing upon Fund resources, the Fund will conduct semiannual consultations under Article IV of the Fund's Articles of Agreement-a procedure termed enhanced surveillance. These Fund staff reports will be made available by Mexico to creditor banks. Enhanced surveillance will continue through 1990 or 1994 (depending upon the date of final repayment of Mexico's 1983 new money package).
During the period of the arrangements, creditor banks party to the restructuring agreement can call an event of default if they determine that the implementation of Mexico's financial program is materially incompatible with the country's sound and sustained economic growth or incompatible with a viable external payments position consistent with a continuing ability to service external debt. An event of default could also occur if the consultation and reporting procedures were not carried out as described, or if the average level of certain foreign liabilities falls below the level specified in the restructuring agreement.
In addition, three years of the Mexican consolidation period (1985-87) have been "carved out" for a block restructuring; there is specific provision for the possibility that creditor banks may discontinue the restructuring beyond that point if they decide that Mexico's policies are inadequate.29 In the event that Mexico's economic situation or prospects deteriorate to the point that it would be unable to meet its financing requirements through normal market channels, it has agreed to seek financing from other sources, which may include a request to use Fund resources.
2'1 The rescheduling agreement provides that a majority of banks having more than 55 percent of the original commitments under the 1983 new money package is required to arrest the rescheduling. but that banks having 33 percent of the commitments may trigger a vote on this i�sue. On the one hand, the provision for a minimum initiating group of votes protects the debtor country from disruptive actions by individual creditor banks. At the same time. the reference to 33 percent of the commitments ha� been interpreted as an indication that the bank advisory committee (which held approximately one third of the votes) might continue to perform some sort of monitoring role.
Multiyear Restructurings and Enhanced Surveillance
In the case of Venezuela, the period of final repayment for maturities of $21.2 billion due during 1983-88 was set at 12 Y2 years from the date of agreement in principle (September 1984), and the margin was set at 1 Ys percent over LIBOR. The arrangements for monitoring Venezuela's economy parallel closely those adopted for Mexico. However, Venezuela's initial adjustment effort was undertaken without a request to use Fund resources. Consequently, enhanced surveillance by the Fund commenced with the first review of Venezuela's policies during the midyear Article IV consultation in May 1985. It is to extend until the restructured debt is amortized in 1997.
The Venezuelan MYRA restructures a complete block of maturities falling due during 1983-88. Thus, there is no specific provision for a date on which banks may vote to discontinue the restructuring. At any time, however, two thirds of the banks (determined by weight of exposure) may call an event of default if "in their reasonable judgment, the results of Venezuela's economic program are or will be materially incompatible with a viable external payments position consistent with continuing debt service." In addition, should operating reserves of the Central Bank fall below $2 billion, an event of default would occur.
For Ecuador, maturities were restructured of $4.3 million due during 1985-89. For maturities not previously restructured, final repayment was set for 1996, with a grace period of three years and an interest rate of I ¥s percent over LIBOR or the floating domestic rate. Final repayment for previously restructured maturities was set for 1995, with a grace period of two years and an interest rate of ISfs percent over LIBOR. The commercial banks' arrangements with Ecuador for monitoring its economy are similar to those concluded with Mexico, although Ecuador is required to be under stand-by arrangements through both 1985 and 1986.
Enhanced surveillance of Ecuador would begin in 1987 and run for ten years to the final amortization payment of the restructured debt. After 1986, the restructuring is "serial," insofar as there is explicit provision for a majority of banks to halt the restructuring in any year, if Ecuador's financial program is judged inadequate by the banks, or if its external situation or prospects deteriorate. This provision is in addition to the events of default, which could end the restructuring at any time if, based on the comments and conclusions expressed in the annual and mid-year consultation reports, the majority of lenders determine either that the implementation of Ecuador's economic and financial program is or would be materially incompatible with a viable external payments position consistent with a continuing ability to service external debt, or that there has been a deterioration in Ecuador's
53

©International Monetary Fund. Not for Redistribution
IV • RECENT TRENDS IN BANK DEBT RESTRUCTURING
economic position. An event of default could also occur if the consultation and reporting procedures were not implemented in the manner described.
In the case of Yugoslavia, the preliminary agreement with bank creditors covers restructuring of maturities of $3.6 billion falling due in 1985-88, with repayment in equaJ installments over the seven years 1990-96, which implies a grace period of 3-5 years and a spread of 1 Ys percent. The draft agreement is based in part on an understanding that the Fund would be asked to agree to undertake enhanced Article IV consultations from the expiration of the present stand-by arrangement in May 1986 through 1991. In addition to the monitoring of economic performance under enhanced surveillance, the authorities have agreed to an objective indicator mechanism that would trigger discussions between themselves and their creditors. This is totally separate from the Article IV surveillance. Thus, it is understood that the triggers may go off although policies are on track and, conversely, that policies may be off track although none of the triggers have gone off. The major purpose of the trigger mechanism is to shorten the time Jag between implementation of remedial action, if needed, and the diagnosis of such a need, and to facilitate the assessment of the situation by the banks.
For the Dominican Republic, maturities of$707 million falling due during 1985-89 wiiJ be restructured. In the agreement in principle signed in May 1985, final repayment was set for 1997, with a grace period of three years and with an interest rate of J3/s percent over LIBOR. The arrangements for monitoring the Dominican Republic's economy included that, initially, the 1985 IMF agreement must be in effect and all drawings that could have been made under this agreement must have been made, and that in subsequent years, an understanding that monitoring arrangements acceptable to banks would be in place. In addition, the agreement stipulates that failure to have arranged a medium- or long-term World Bank export-oriented sector loan or other similar World Bank financial assistance acceptable to banks before 1988 could constitute an event of default.
With Jamaica , an agreement with the commercial bank's steering committee was reached in September 1985 to restructure amortization payments falling due during 1985-87 and also 1987-89. Amortization payments of $195 million faJling due between April 1985 and March 1987 will be restructured with a grace period of 3 years, final repayment after 10 years, and a margin of J1/s percent over LIBOR. The restructuring covers all principal payments due during the period of the Fund stand-by arrangement under consideration. Included among the conditions governing the restructuring are that "the IMF stand-by or other such
54
arrangement covering the fiscal year shall have received IMF Board approval" and that "aU disbursements scheduled to have been made at such date under the current IMF program shall have been drawn in full." Jamaica and the commercial banks also agreed to consolidate the maturities of April 1987 to March 1989 into a single loan, thereby setting up an administrative mechanism for a subsequent restructuring.
Arrangements between debtor countries and creditors in the early MYRAs thus provide for several different forms of monitoring by creditors. In general, creditors can halt the restructuring process when they conclude that the implementation of a debtor's financial and economic program is insufficient. Clauses in the agreement indicate what would happen in the event that the country's economic situation deteriorates, or in other events of concern to the banks. A key feature of each agreement is the provision governing whether, or to what degree, the restructuring is a "block" or a ·'serial" restructuring-that is, how strong a presumption is created that restructuring of maturities falling due in the later years of the consolidation period will depend on satisfactory economic performance and policies.
Monitoring procedures, where enhanced surveillance rather than a Fund-supported program is in place, range from judgmental assessments of the sustainability of the debtor country's policies to the monitoring of certain variables in relation to agreed trigger values for these variables. ln principle, the design of trigger mechanisms and the establishment of monitoring procedures is a matter of agreement between the debtor country and its creditors. The Fund staff will not negotiate, design, or assess trigger mechanisms, so as not to dilute banks' responsibility in the monitoring process. But the Fund could provide technical assistance to the member country if requested by the member. The function of triggers would be to initiate discussions between creditor banks and the debtor countries. However, triggers should not be seen as simple on/off switches for determining the appropriateness of continued restructuring or new lending. Creditors will need to be full and active participants in the process of monitoring and assessing the policies of debtor countries and the progress achieved in their implementation, and take full responsibility for their lending decisions.
Enhanced Surveillance
The procedure of enhanced surveillance was developed to assist in the process of restoring normal market relations between bank creditors and debtor countries in connection with negotiation of a MYRA. In these circumstances, enhanced surveillance by the Fund was

©International Monetary Fund. Not for Redistribution
seen as a way for the Fund to help in the normalization of market relations. The key objectives were to improve the country's capacity to design, implement, and monitor economic policies and to provide information about those policies to creditors; to support banks' risk evaluation through timely and comprehensive information and through the Fund's forwardlooking assessment of domestic policies; and to foster a shift in responsibility for lending decisions back to commercial banks by avoiding on/off financing indications from the Fund.
Under enhanced surveillance, the annual Article IV consultation report wiU review and appraise the adequacy of a quantified financial program prepared by the country's authorities, commenting specifically on the internal consistency of its objectives and targets, and addressing their compatibility wiith sustained growth and the attainment of a viable external payments position. Interim consultations will address the progress achieved in implementing the financial program and evaluate the country's economic performance on the same basis as annual consultations. Both annual and mid-year reports will be transmitted to creditor banks by the member country. While the Fund staff will assess the country's program and review actual developments, the creditor banks will need to weigh that information, together with other available information, before arriving at a judgment about the economic performance of the country and before making their financing decisions.
The tenninology and certain techniques of enhanced surveillance are very similar to those of surveillance. Under enhanced surveillance, however, the activities of the Fund extend beyond the normal implementation of its responsibilities under Article IV. Three separate elements together comprise enhanced surveillance: a quantified financial program prepared by the country's authorities, presenting a comprehensive description of the major macroeconomic objectives and the policies to be followed in their achievement; supplemental Fund staff visits to the country and supplemental Fund staff reports and discussions of these reports by the Fund Executive Board; and the release of Fund staff reports by the member to banks.
Some of these elements represent a further strengthening of improvements already introduced in the implementation of the Fund's traditional surveillance function. The release of Fund staff reports to private creditors, however, is clearly exceptional. Enhanced surveillance has been conceived as an exceptional and temporary adaptation of Fund procedures and practices, in response to equally exceptional circumstances. Enhanced surveillance is not intended to become a substitute for stand-by and extended arrangements.
New Financing Agreements
Experience gained in early cases of enhanced surveillance has allowed the identification of broad criteria to apply in deciding whether the Fund should accept requests for enhanced surveillance. The first criterion is that the initiative to request enhanced surveillance must rest with the member, which must be convinced that enhanced surveillance procedures are suited to its circumstances. Second, the member must have already achieved a good record of adjustment. A third criterion is that it should support a MYRA that is needed to normalize a member's market relations and to facilitate a return to spontaneous financing. Fourth, the member must be in a position to present an adequate quantified policy program in the framework of consultations with the Fund staff, which are part of the procedure of enhanced surveillance. With respect to the length of the Fund's involvement, it would seem appropriate to limit the enhanced surveillance procedure to about the consolidation period of a MYRA or, at most, a little beyond the consolidation period.
New Financing Agreements
In 1984, five member countries that were engaged in debt restructuring and adjustment programs reached agreements with banks on new financing agreements. Three of these were firm concerted lending commitments, totaling $ 1 1 . 1 billion, while two other countries reached agreements in principle on concerted lending commitments totaling $5.1 billion. This compares with concerted lending commitments involving eight countries in 1983 for $13.9 biUion. During the first three quarters of 1985, concerted lendjng commjtments of six countries amounted to $2.3 billion. While concerted lending to countries in the Western Hemisphere accounted for more than 90 percent of total new bank commitments to this area during I 983-84, new bank commitments to Asian countries other than the Philippines continued to be on an entirely spontaneous basis.
AU concerted bank lending during 1984-85 took place with the encouragement of the Fund and, except for Colombia, was Unked to purchases under a Fund program. Nonobservance of performance criteria under a Fund program usuaUy delayed disbursements under new money packages until such time as the country's drawing rights under the Fund arrangement were restored. Colombia is a special case, insofar as banks tied their financial package to endorsement by the Fund Executive Board of Colombia's adjustment program. Use of Fund resources was not involved, however.
Banks have expressed interest in greater involvement of the World Bank in new financing arrangements. The increased involvement of the World Bank is
55

©International Monetary Fund. Not for Redistribution
IV • RECENT TRENDS IN BANK DEBT RESTRUCTURING
viewed as reducing the risk by associating commercial bank lending with sound projects and sector policies. In specific cases, direct financial protection of a portion of bank claims has also been sought through cofinancing operations involving a portion of concerted lending.
The World Bank's cofinancing program for private banks aims to foster capital flows to developing countries, and to improve the terms of commercial lending, by providing lenders with greater assurance through their association with investments supported by the World Bank. This "B-loan program" was introduced in early 1 983. Unlike the earlier cofinancing program, which involved parallel loans to the country, this program enables the World Bank to participate in the cofinancing loans syndicated by the commercial banks in three possible ways. The World Bank can participate directly in, or guarantee, the later maturities of a loan. It can also take a contingent obligation in respect of a fixed repayment installment loan to compensate eolenders for any rise in a floating market interest rate above an initially scheduled level. Since introduction of the program in 1 983, cofinancings through B-loans have involved about $ 1 .6 billion in commercial bank credits, based on about $340 million of World Bank involvement, including the Uruguay operation currently in progress. Most of these operations took place on a spontaneous basis (i.e., outside the framework of concerted arrangements to close the ex ante financing gap of countries engaged in negotiating a debt restructuring). Details of recent World Bank cofinancing arrangements are provided in Table 4 1 .
A s regards cofinancing as a part of new money packages, Chile signed an agreement with commercial banks in November 1985 on a new loan of $785 million and a World Bank cofinancing of $300 million, also to be funded by commercial banks. Of the $300 million in cofinancing, up to $150 million will be guaranteed by the World Bank. The World Bank commitment was made contingent upon the commercial banks' participation in the new money package, while the disbursement of the new loan from the commercial banks is tied to Chile's purchases from the Fund and drawings under the World Bank's structural adjustment loan in 1985-86. Uruguay also has requested a World Bank guarantee to cover part of a $45 million syndicated loan from commercial banks which is needed to close Uruguay's 1986 financing gap. Commercial banks have made conclusion of a MYRA for Uruguay contingent upon the closing of the 1986 financing gap.
In the case of Colombia, the $ 1 billion financing package, signed in December 1985, does not involve cofinancing. However, the fourth disbursement of the bank package is tied to the World Bank confirming that Colombia will have access to the second tranche of the Trade Policy Loan during 1986. AJI disburse-
56
ments require a communication from the Fund to the Colombian authorities indicating that Colombia has complied with its quantitative economic program.
Other Current Developments
In addition to the MYRAs and enhanced surveillance, a number of other developments have occurred in bank debt restructurings and new money packages during 1984-85. The three principal developments were currency redenominations, on-lending, and loan swaps and sales.
Currency Redenomination
Under several recent restructuring agreements with several countries (including Argentina, Mexico, the Philippines, and Venezuela), banks have been permitted, at their option, to redenominate existing loans into their domestic currencies or the ECU. The period for such conversions has varied, extending in one case to four years. Between 50 and 100 percent of the shares of existing loans not denominated in banks' home currency have been eligible for redenominations, with an additional effective ceiling in the case of Venezuela that limits conversions to about one seventh of the total debt restructured.
Such redenomination may reduce funding risks for non-U.S. dollar-based banks and would reduce the effect of future exchange rate movements on the banks' claims relative to domestic currency capital, albeit at a U.S. dollar exchange rate which some banks view as unfavorable. For the debtor country, the benefits from currency diversification are difficult to predict, because possible savings on interest payments could be in part offset by the opportunity cost of benefiting from any further depreciation of the U.S. dollar.
Information on the amounts actually redenominated or likely to be redenominated is limited. Banks do not need to elect to redenominate their loans before the restructuring agreement is signed, or for a specified period thereafter. The agreement between Argentina and the banks envisages that almost a quarter of the debt restructured is eligible for redenomination, but there are no indications yet to what extent banks intend to exercise their option. ln the case of Mexico, about half of the restructured debt is covered by the currency denomination option; of this portion, a maximum of 50 percent is eligible for redenomination. It is expected that only a modest proportion of Mexico's total debt will eventually be converted.
In the case of the Philippines, the currency composition of the first tranche of new bank money

©International Monetary Fund. Not for Redistribution
indicates a continuing strong preference for the U.S. doliar, with a share of 70 percent, but also a considerable interest in yen (18 percent) and ECU (5Y2
percent) denomination. The Venezuelan authorities have indicated that they expected that many Japanese banks and German banks could eventualJ y elect to redenominate their loans into their home currencies, and that the overall ceiling of $3 billion could be reached.
On-lending and Re-lending
A second development in some recent financial packages has been a preference on the part of banks to extend fresh funds in the form of (or convertible into) trade- or project-related loans to the private sector or to parastatals, instead of purely financial credits to the central government ("on-lending"). Arrangements have also been made to allow some existing debt to be converted into this form ("re-lending"). This enables banks to maintain business relationships in the developing country and to support the export activities of their customers. A number of recent restructurings or new money packages (including those with Argentina, Brazil, Chile, Venezuela, and the Philippines) all include specific provisions for onlending or re-lending.
In the case of Argentina, for example, the $3.7 billion medium-term loan agreement signed in principle in 1984 foresees that one third of each lender's disbursement to the Central Bank will be available for on-lending to borrowers from Argentina's public sector. SpecificaJiy, 28 percent will be available for onlending either to public sector borrowers with a government guarantee or to private sector borrowers without a government guarantee, while a further 5
percent, subject to certain conditions, will be available to private sector borrowers without being guaranteed. Moreover, an additional $0.5 billion of new funds made available to Argentina were in the form of a shortterm trade deposit facility.
In the case of Brazil, the 1983 and 1984 restructuring agreements and the interim arrangement for 1 985
specify that lenders may re-lend to private and public sector borrowers those amounts falling due during the life of the restructuring agreements; in addition, new money provided under the 1983 and 1984 concerted lending arrangements can be on-lent on similar terms. Chile's $785 million new money facility signed in 1985
allows re-lending of up to $80 million to the private sector and to certain designated public sector entities, and the 1985 rescheduling provides for the partial onlending to the private sector of certain rescheduled maturities of the private sector deposited with the Central Bank up to a ceiling of $120 million.
Other Current Developments
The $925 million credit signed by the Philippines and banks in May 1985 includes a re-lending option which specifies that banks that wish to on-lend have to apply for Central Bank approval which has to take a decision on such applications within 30 days. The Venezuelan MYRA, signed in principle in 1984, contains provisions for a re-lending facility if amortization payments are made over and above the agreed repayment schedule. In such cases, banks have the right to lend to those borrowers and/or sectors that will be designated semiannually by the government or for which individual approval is granted.
Loan Swaps and Sales
Banks in various countries have engaged in swaps or outright sales of loan claims, to even out the distribution of their portfolios, to regroup their claims on countries with which they expect to have continuing business interests, or to reduce their overall exposure. There have been isolated instances of banks undertaking swaps on a large scale. Generally, however, individual swaps and sales are believed to be of very small amounts (substantially less than $5 million).
The U .S. Institute of Certified Public Accountants has provided guidance on the valuation of asset swaps. This . guidance indicates that such swaps are to be viewed as the sale of two loans. When such sales are made, the fair market value of the loans must be established, and any loss that arises for each selling bank must be recognized in its income statement. There is a presumption that sales of developing country debt instruments in the context of asset swaps would involve a recognition of loss, although this does not necessarily carry implications for valuation of a bank's other loan claims on that country. Nonetheless, banks do express concern that swapping assets on any significant scale, or selling sizable claims on developing country borrowers, could at some stage result in regulatory insistence that their holdings of such claims be marked to a lower value. These concerns are strongest among banks which have not earmarked significant reserves against claims on the countries concerned.
A few banks have specialized in arranging loan swaps. These banks apparently find customers mainly among small- and medium-sized banks. In some cases, the "market-making bank" purchases small participations outright, at a discount, and sells them to concerns with an ongoing investment program in the debtor country. According to reports, discounts range from I 0 percent to 90 percent, reflecting the economic situation of the debtor country, banks' existing specific provisions, and-to a lesser degree-the size of the claim.
57

©International Monetary Fund. Not for Redistribution
V International Bond and Note Markets and Other Flows
One of the most important recent changes in the structure of international financial markets has been the displacement of the syndicated bank loan as a principal instrument of international finance by a wide range of bonds and other marketable securities. Between 1981 and 1 984, international bonds,3o net of redemptions and double counting due to bank purchases of bonds issues, rose from $30 billion to $60 biHion. As a result, the proportion of the sum of net international bank loans and net bond issuance, accounted for by net bond issuance, rose from 7 percent to 24 percent.
This expansion of bond market activity stands in sharp contrast to the stagnant level of activity in the late 1970s and represents a response to lower inflation and improvements in other macroeconomic condjtions, bigh real returns on bond holdings, the development of new types of financial instruments, and reductions in regulatory restrictions on bond issuance in certain major markets. This section first considers the general factors leading to the sharp growth of bond issuance during the past five years and then reviews specific developments in international bond markets in 1984 and the first half of 1985.
Bond Market Trends
The record level of bond issuance during 1981-84 represents a sharp recovery from an almost decadelong decline in bond market activity, especially during the late 1970s.31 Although the nominal level of net bond issuance remained at approximately $30 billion
JO International bonds consist of foreign and Eurocurrency bonds. Foreign bonds are issued by a borrower who is of a nationality different from the country in which the bonds are issued. Such issues are underwritten and sold by a group of banks of the market country and are denominated in that country's currency. In contrast, Eurocurrency bonds are those underwritten and sold in various national markets simultaneously usually through international syndicates of banks.
)I The earlier stages of this recovery were discussed extensively in International Capital Markets: Developments and Prospects, 1983, Occasional Paper No. 23 (Washington: International Monetary Fund, July 1983), pp. 4� and International Capital Markets: Developments and Prospects. 1984, Occasional Paper No. 3 1 (Washington: Loternational Monetary Fund, August 1984), pp. 45-49.
58
during 1976-80, the real value of these net issues fell to $20 billion in 1980 (a 3 1 percent decline from the real value in 1976). Moreover, net bond issues declined from the equivalent of 3.2 percent of world imports in 1976 to only 1 .5 percent in 1980. At the same time, a growing level of international syndicated bank credits reduced the ratio of international net bond issuance to international bank lending from 42 percent in 1976 to only 18 percent in 1980.
A number of factors combined to reduce the attractiveness of long-term fixed-interest rate bonds as an instrument of international finance. These factors included high inflation, increased exchange rate and interest rate variability, and the substantial capital losses experienced on fixed interest rate securities, as interest rates rose (Table 13). Borrowers found that they could attract purchasers to the bond markets only by offering high real yields and by changing the maturities and risk-sharing characteristics of the instruments used in bond markets. In a number of major financial markets, real yields rose sharply during 1979-80 and remained at historically high levels throughout the early 1980s. In addition, bond maturities were shortened with the average maturity of Eurodollar bonds declining from a range of 12-15 years in the early 1 970s to 7-10 years in the late 1970s.
The recovery of bond market activity began in late 1981 as short-term interest rates started to decline from post-World War 1 1 peaks in many industrial countries. As discussed in Section 1 1 , this recovery has encompassed record volumes of new issues, an extended period of high real returns on bonds, and a gradual lengthening of bond maturities. Declining interest rates and the slowing of inflation in a number of industrial countries created a situation where investors were able to obtain high real rates of return. Borrowers were willing to pay these high real rates in order to reduce their reliance on short-term debt and because of their ability to issue callable debt which helped ensure that they would not be locked into permanently high real borrowing costs, if future interest rates should decline.
The extent of the recovery in bond issuance activity during 1981-84 is indicated in Table 14. Net bond

©International Monetary Fund. Not for Redistribution
issues have risen from $28 billion in 1980 to $84 billion in 1984 (an average annual rate of growth of32 percent), and the real value of net bond issues has risen from $20 billion (in 1975 prices) in 1980 to $47 billion in 1984. The recovery of bond market activity in the early 1980s has now more than offset the bond market decline of the late 1970s. This recovery has been based
Table 13. Real Return on Bond Holdings, 1976-831
(ln percent per annum)
Purchased in December of : 1976 1977 1978
Bond Market Trends
on an environment characterized by relatively low inflation in countries with major financial markets, declining nominal interest rates, high real bond yields, but considerable interest rate and exchange rate variability.
Issuance activity on international bond markets during 1984 and the first half of 1985 suggests a
1979 1980 1981 1982 1983
U.S. Investor Holding a U.S. Dollar Eurobond
Sold in Dec. of: 1977 0.48 1978 -2.QO -5.18 1979 -4.65 - 8.23 - 13.42 1980 - 4.97 -7.22 -9.91 -8.55 1981 -3.41 - 5.38 -6.72 -5.00 -3.09 1982 - 1 .05 -2.13 - 2.28 1 .22 6.27 17.27 1983 0.40 -0.20 0.28 3.95 8.56 16.05 14.00
1984 1.34 0.93 1.57 5.01 9.29 14.86 12.67 10.51
U . S . Investor Holding a Deutsche Mark Eurobond Sold in Dec. of:
1977 27.12 1978 20.38 10.80 1979 1 1 .94 2.68 - 5.95 1980 1.59 - 5.80 - 13.65 -23.61 1981 - 1 .42 -7.54 - 1 1 .82 - 16.10 - 1 1.30 1982 -0.99 - 5.69 -9.28 - 10.23 -4.41 3.71 1983 - 1 .80 -5.46 -8.07 -9.24 -5.44 -2.29 -7.72 1984 -2.42 -5.35 -7.36 -8.14 -5.37 - 3.28 -6.06 -4.05
German Investor Holding a Deutsche Mark Eurobond
Sold in Dec. of: 1977 18.40 1978 1 1 .00 3 . 1 0 1979 5.51 - 1 .47 -6.89 1980 2.66 - 2.59 -6.38 -7.40 1981 2.57 - 2.23 -3.19 -2.01 3.59
1982 3.60 -0.15 - 1 .56 1 .46 6.65 10.33
1983 4.26 1.20 0.44 2.27 6.48 8.32 6.03
1984 4.72 2. l l 1.68 3.63 7.25 8.94 8.09 10.41
German Investor Holding a U.S. Dollar Eurobond Sold in Dec. of:
1977 -6.42 1978 -8.40 - 1 1 .77 1979 -8.72 - I 1 .52 - 14.29 1980 -4.17 -4.17 - 1 .89 10.85 1981 0.15 0.59 3.97 13.71 13.18 1982 3.52 4.79 8.88 18.71 19.92 24.76 1983 7.52 9.59 14.74 25.09 26.47 30.74 30.98 1984 1 1 . 1 5 13.64 19.28 29.81 3 1 .33 34.46 32.87 27.17
Sources: Orion Royal Bank. Ltd., The Orion Royal Guide ro rite lnrernarional Capiral Markers CEuromoney Publications Limited, London, 1982); the Organization for Economic Cooperation and Development; and the International Monetary Fund, Internarional Financial Statisrics.
' In calculating the real rates of return in this table, the following assumptions were made: ( I ) The bond is assumed to be purchased in December of the year at the top of the table. (2) All interest on the bond is paid on December 3 1 of each year and the initial coupon rate of interest is taken as equal to the prevailing market interest rate. (3) Principal is repaid only at maturity. (4) Bonds are sold in December of the year given at the side of the table at a price which ensures that the bond yields a return to maturity equal to the prevailing (December) interest rate. (5) All coupon interest received is assumed to be continuously reinvested in three-month Eurocurrency deposits (at the prevailing Eurocurrency deposit rate) in the same currency as the interest rate payments and bonds are denominated. (6) ln calculating the real return on bonds not denominated in the domestic currency. the accumulated interest income and bond sale proceeds are converted at the prevailing exchange rate, and any exchange gain or loss is included in the calculation of the real return. (7) The real return is calculated using the consumer price index in the investors' home countries. (8) The bonds are those issued by private corporations.
59

©International Monetary Fund. Not for Redistribution
V • INTERNATIONAL BOND AND NOTE MARKETS AND OTHER FLOWS
Table 14. Measures of Real Size of Bond Market, 1976-84
1976 1977 1978 1979 1980 1981 1982 1983 1984
Billions of U.S. dollars
Bond issues (net) 1 30 3 1 30 32 28 36 58 59 84
Billions of U.S. dollars at 1975 prices
Bond issues deflated by U.S. GNP deflator 30 28 25 25 20 23 35 34 47
Percent
Bond issues as ratio to world imports in U.S. dollars 3.2 2.9 2.4 2.2 1 .5 1.9 3.2 3.4 4.1
Bond issues as ratio to international bank lending (net) 2 42.3 45.6 33.3 26.4 17.5 25.2 60.4 105.4 107.1
Sources: International Monetary Fund; Orion Royal Bank, Ltd. (London); and Bank for International Settlements. ' New international bond issues less redemptions and repurchases, but including bank purchases of bonds. 2 International bank lending equals external lending by banks in the BIS reporting area, net of interbank redepositing.
Table 15. Developments in International Bond Markets, 1980-First Half of 1985
1985 1st
1980 1981 1982 1983 1984 half I
Billions of U.S. dollars
Bond market lending (net of redemptions) 2 28 36 58 59 84 1 19
Of which: purchases by banks 9 2 6 11 24 42 By category of borrower
Industrial countries 20 26 46 47 70 98 Developing countries 2 3 3 2 4 7 Other (i.ncludi.ng international
organizations) 6 7 9 1 1 10 14
Percent
By currency of denomination U.S. dollar 43 63 64 57 64 67 Deutsche mark 22 5 7 9 6 6 Swiss franc 20 16 1 5 1 8 12 8 Japanese yen 5 6 5 5 6 6 Other 10 10 9 1 1 12 13
Share purchased by banks 32 6 10 19 29 35
Percent per annum
Interest rate developments Eurodollar deposits 1 14.6 16.8 13.2 9.7 10.8 8.6 Dollar Eurobonds • 12.6 14.4 15.0 12.6 12.7 I 1.7 Deutsche mark international bonds • 8.9 10.1 8.9 7.9 7.9 7.6
Sources: Organization for Economic Cooperation and Development. Financial Statistics Monthly: International Monetary Fund, lmernational Financial Statistics; and Fund staff estimates.
1 On an annualized basis. 2 This series is net of redcmptions but is not adjusted for double counting due to bank purchases of bonds. 1 Three-month deposits. • Bonds with remaining maturity of 7-15 years.
60
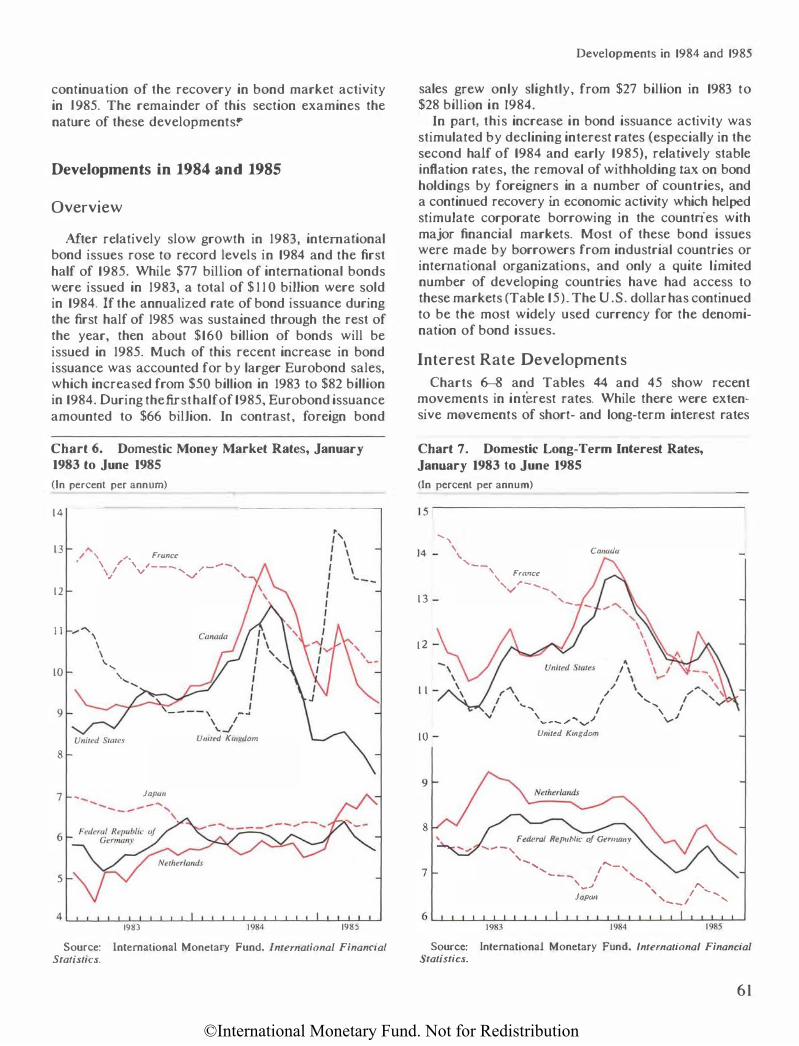
©International Monetary Fund. Not for Redistribution
continuation of the recovery in bond market activity in J 985. The remainder of this section examines the nature of these developments�
Developments in 1984 and 1985
Overview
Mter relatively slow growth in 1983, international bond issues rose to record levels in 1984 and the first half of 1985. While $77 billion of international bonds were issued in 1983, a total of $ 1 1 0 billion were sold in 1984. If the annualized rate of bond issuance during the first half of 1985 was sustained through the rest of the year, then about $160 billion of bonds will be issued in 1985. Much of this recent increase in bond issuance was accounted for by larger Eurobond sales, which increased from $50 billion in 1983 to $82 billion in 1984. During the first half of 1985, Eurobond issuance amounted to $66 billion. In contrast, foreign bond
Chart 6. Domestic Money Market Rates, January 1983 to June 1985
(In percent per annum)
14
13
12
1 1
10
9
8
7
6
5
4
" / ' \ /'·, \ I France
/--- , -""-, "
.... ---\ ' ' \. .... ' ....
v 'v '-
.....
Uni1ed Kingdom
Japan
1983 1984 1985 Source: International Monetary Fund, International Financial
Statistics.
Developments in 1984 and 1985
sales grew only slightly, from $27 billion in 1983 to $28 billion in 1984.
In part, this increase in bond issuance activity was stimulated by declining interest rates (especially in the second half of 1984 and early 1985), relatively stable inflation rates, the removal of withholding tax on bond holdings by foreigners in a number of countries, and a continued recovery in economic activity which helped stimulate corporate borrowing in the countries with major financial markets. Most of these bond issues were made by borrowers from industrial countries or international organizations, and only a quite limited number of developing countries have had access to these markets (Table 15). The U .S. dollar has continued to be the most widely used currency for the denomination of bond issues.
Interest Rate Developments
Charts 6-8 and Tables 44 and 45 show recent movements in interest rates. While there were extensive movements of short- and long-term interest rates
Chart 7. Domestic Long-Term Interest Rates,
January 1983 to June 1985
(In percent per annum)
1 5 .---------------------------------------�
14
13
12
1 1
10
9
8
7
..... , \
\. , _ _
Canada
', Frcmce
'...;'-............ ' ,_
" "
I \ / ' / ' I ' '--.. -. I
\ I \ J '"" ......... , ..... v.l Y Unittd Kingdom
Fecleral Republic of Germany .......... -, ,..._
'.... /'-, --- I ', ,_.., ' " Japa11
' , I ...... ...... , _ _ ,
Source: International Monetary Fund, lntemational Financial Statistics.
61
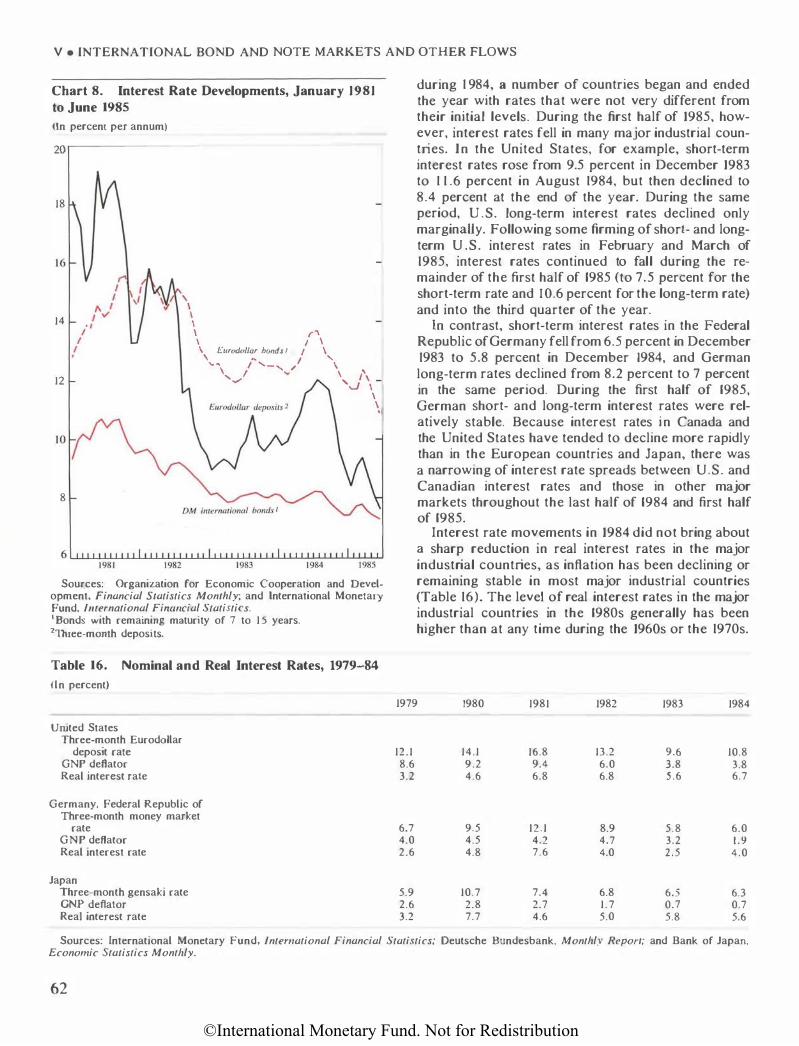
©International Monetary Fund. Not for Redistribution
V • INTERNATIONAL BOND AND NOTE MARKETS AND OTHER FLOWS
Chart 8. Interest Rate Developments, January 1981 to June 1985
(In percent per annum)
20
18
14
' I I \ \ ,� I I \ \ Eurodollar bo11ds I 1 \ \ .. I '
-. � I '-, / \ 12 ' .... ..,/ \ i\ 'J \ \ \ .
8
1981 Sources: Organization for Economic Cooperation and Devel
opment, Financial Statistics Monthly; and International Monetary Fund, Imernational Fimmcial Statistics. 1 Bonds with remaining maturity of 7 to 15 years. 2Three-month deposits.
Table 16. Nominal and Real Interest Rates, 1979-84
(ln percent)
United States Three-month Eurodollar
deposit rate GNP dellator Real interest rale
Germany. Federal Republic of Three-month money market
rate GNP deftator Real interest rate
Japan Three-month gensaki rate GNP deflalor Real interest rate
during 1 984, a number of countries began and ended the year with rates that were not very different from their initial levels. During the first half of 1985, however, interest rates fell in many major industrial countries. In the United States, for example, short-term interest rates rose from 9.5 percent in December 1983 to 1 1 .6 percent in August 1984, but then declined to 8.4 percent at the end of the year. During the same period, U .S. long-term interest rates declined only marginally. Following some firming of short- and longterm U .S. interest rates in February and March of 1985, interest rates continued to fall during the remainder of the first half of 1985 (to 7.5 percent for the short-term rate and I 0.6 percent for the long-term rate) and into the third quarter of the year.
In contrast, short-term interest rates in the Federal Republic of Germany fell from 6.5 percent in December 1983 to 5.8 percent in December 1984, and German long-term rates declined from 8.2 percent to 7 percent in the same period. During the first half of 1985, German short- and long-term interest rates were relatively stable. Because interest rates in Canada and the United States have tended to decline more rapidly than in the European countries and Japan, there was a narrowing of interest rate spreads between U .S. and Canadian interest rates and those in other major markets throughout the last half of 1984 and first half of 1985.
Interest rate movements in 1984 did not bring about a sharp reduction in real interest rates in the major industrial countries, as inflation has been declining or remaining stable in most major industrial countries (Table 16). The level of real interest rates in the major industrial countries in the 1980s generally has been higher than at any time during the 1960s or the 1970s.
1979 1980 1981 1982 1983 1984
12.1 8.6 3.2
6.7 4.0 2.6
5.9 2.6 3.2
14.1 9.2 4.6
9.5 4.5 4.8
10.7 2.8 7.7
16.8 9.4 6.8
12.1 4.2 7.6
7.4 2.7 4.6
13.2 6.0 6.8
8.9 4.7 4.0
6.8 1 .7 5.0
9.6 3.8 5.6
5.8 3.2 2.5
6.5 0.7 5.8
10.8 3.8 6.7
6.0 1.9 4.0
6.3 0.7 5.6
Sources: International Monetary Fund, International Financial Statistics: Deutsche Bundesbank, Monthly Report; and Bank of Japan, Economic Statistics Monthly.
62

©International Monetary Fund. Not for Redistribution
Developments in 1984 and 1985
Table 17. Gross International Bond Issues and Placements, 1979-June 1985 '
(In millions of U .S. dollars)
January to 1979 1980 1981 1982 1983 1984 June 1985
Foreign bonds 20,308 17,924 20,514 25,199 27,050 27,801 13,068 Industrial countries 13,421 1 1 .339 14.129 16,854 18,693 18,299 7,745 Developing countries 1,431 746 1,212 726 893 1,618 840 CentraJJy planned economies 1 43 International organizations 5.259 5,714 5.030 7.461 7,269 7,580 4,430 Other 154 125 143 158 195 304 53
Eurobonds 18,691 20,394 31,324 50,329 50,098 81,717 66,038 Industrial countries 14,212 17,206 25.210 42,816 41,015 73.145 56,989 Developing countries 1,885 1 .403 3.215 3,970 2,382 3,646 4,095 Centrally planned economies 1 30 55 International organizations 2.220 1.710 2,486 3.280 6,074 4,218 4,598 Other 344 75 358 263 627 708 356
International bonds 38,999 38,318 51,838 75,528 77,148 109,518 79,106 Industrial countries 27,633 28.545 39,339 59,670 59,708 91 ,444 64,734 Developing countries 3,316 2.149 4.427 4,696 3,275 5.264 4,935 Centrally planned economies 1 73 55 International organizations 7,479 7.424 7.516 10.741 13,343 I 1 ,798 9,028 Other 498 200 501 421 822 1.012 409
Source: Organization for Economic Cooperation and Development, Financial SI(Jtistics Monthly. 'Excludes special issues by development institutions placed directly with governments or central banks and, from October 1984, issues
targeted specifically to foreigners. 1Excluding Fund member countries.
Moreover, the dispersion of real yields across the major industrial countries has been lower than in many earlier periods, particularly during 1980-8 1 .
The persistence of high real interest rates has been attributed to the following factors: expectations of higher inflation in the future; the existence of risk premiums required to compensate asset holders for uncertainty about future inflation rates; the impact of large current and prospective budget deficits on the balance between the supply and demand for loanable funds; the impact of financial deregulation; and the stance of monetary policy. During the first half of 1985, the continuing decline in interest rates helped to lower real interest in most major industrial countries and reduced the spread of real yields between the United States and other major financial markets.
International Bond Issuance
After growing at an annual rate of 26 percent during 1980-83, the total issuance of foreign and Eurobonds expanded by 42 percent in 1984 and continued to increase at that rate during the first half of 1985 (Table 17). This expansion has primarily reflected growth in the issuance ofEurobonds rather than foreign bonds. While foreign bonds grew from $27. J biJiion in 1983 to only $27.8 billion in 1984, Eurobonds increased by 63 percent (from $50. I billion in 1983 to $81.7 billion in 1984).
The volume of international bonds issued by indus-
trial country entities grew from $59.7 billion in I 983 to $91.4 billion in 1984, with their issuance of Eurobonds expanding sharply and foreign bond issues declining. U.S. residents borrowed $25 billion on the international bond markets in I 984, three times more than in 1983. Most of this borrowing ($19.5 billion) involved the issuance of Eurobonds, but the subsidiaries of U .S. corporations raised substantial funds on the bond markets in the FederaJ Republic of Germany, Switzerland, and the United Kingdom. The second largest group of borrowers were Japanese corporations and banks, which raised $17 billion and $3.8 billion, respectively, on international bond markets. French entities obtained $8.5 billion from these markets, with French banks accounting for $4.3 billion of these issues. Swedish borrowers raised $6.4 billion, with government borrowing accounting for $4.6 billion of the total increase. This rapid growth of bond issuance raised the share of industrial countries in total international bond issues from 77 percent in 1983, to 83 percent in 1 984, and 82 percent in the first half of 1985.
Although the bond issues of developing countries rose from 4 percent to 5 percent of international bond issues between 1983 and 1 984, the issuance of such bonds was highly concentrated. Korea, MaJaysia, and South Mrica issued about $ 1 billion each, together representing more than 60 percent of the developing country issues. Moreover, some bond issues by developing countries appear to have substituted for medium-term bank credits, because few of these bonds
63

©In
tern
atio
nal M
onet
ary
Fund
. Not
for R
edis
tribu
tion
<
• z
-l
m
"'
z
>
j
0
Ta
ble
18
. In
tern
ati
on
al
Bo
nd
Iss
ues
an
d P
lace
men
ts b
y C
urr
ency
of
Den
om
ina
tio
n,
197
9-
Jun
e 19
85
z
>
(I
n m
illio
ns
of
U .S
. d
olla
rs:
and
in
perc
ent )
r
197
9
1980
19
81
198
2
198
3
198
4
Jan
.-Ju
ne
19
85
tc
0
S
hare
of
S
ha
re o
f S
hare
of
S
ha
re o
f S
hare
of
Sha
re o
f S
ha
re o
f z
0
A
mo
unt
tota
l A
mo
unt
tota
l A
mo
unt
tota
l A
mo
un
t to
tal
Am
ou
nt
tota
l A
mo
un
t to
tal
Am
ou
nt
tota
l >
U.S
. do
llar
14.7
24
3
7.8
16
.35
8
42
.7
32
.617
6
3.0
4
8,2
53
6
3.9
4
3,9
40
5
7.0
6
9,6
28
z
6
3.5
5
2,9
92
67
.0
0
Eu
rob
ond
s /0
,36
0
/3,6
49
2
5.7
61
42
.22
8
39
,20
5
65
,33
4
50
,83
7
z
Fo
reig
n b
ond
s 4
.364
2
.709
6
,85
6
6,0
25
4
,73
5
4.2
94
2
,15
5
0
Deu
tsc
he
ma
rk
8.5
71
22
.0
8.4
08
2
1.9
2
.59
2
5.0
5
.36
2
7.1
6
.660
8
.6
6,74
3 6
.2
4.4
77
5
.7
-3
Eur
ob
ond
s 5
,88
/ 3
,45
7
1,3
96
3
,25
3
4.0
42
4
,32
4
3,6
75
m
�
F
ore
ign
bond
s 2
.69
0
4.9
51
1.1
96
2
,10
9
2,6
18
2,4
19
80
2
>
Sw
iss
fran
c 9
.718
2
4.9
7
,47
0
19.5
8
,118
15
.7
11,
32
5
15.0
13
,500
17
.5
13.1
20
12
.0
5,9
86
7
.6
"'
Eu
rob
ond
s ;:r:
:: F
ore
ign
bond
s 9
.718
7
.47
0
8.1
18
11
.32
5
13.5
00
13.1
20
5
,986
[T]
-3
Ja
pa
ne
se y
en
2.8
55
7
.3
1.8
44
4
.9
3,1
32
6
.0
3.9
15
5.2
4
,08
4 5
.3
6.06
3
5.5
4
,85
6
6.1
Vl
E
uro
bo
nds
/84
30
/ 4
10
59
8
23
3
1.1
90
1.8
66
>
Fo
reig
n bo
nds
2.6
71
1,5
43
2
,72
2
3,3
17
3
,85
1 4
,87
3
2,9
90
z
Net
herl
and
s gu
ilder
4
70
l.
2
874
2.3
9
29
1.8
1.
47
4
2.0
1,
681
2.2
1.
84
6
1.7
769
1.
0
0
Eur
ob
ond
s 3
08
5
49
4
90
618
74
8
98
6
38
7
0
Fo
reig
n b
ond
s 16
2
32
5
43
9
85
4
933
86
0
38
2
-3
::I;
Po
und
ster
ling
2
91
0.7
1.
152
3
.0
1,4
46
2
.8
1.9
75
2
.6
3.0
12
3.9
5
.614
5
.1
2.6
23
3
.3
[T]
Eur
ob
ond
s 2
91
974
5
35
84
6
2,1
53
3
,96
5
2,4
66
"'
F
ore
ign
bo
nds
177
9
11
1,1
29
8
59
/
,64
9
157
'"!j
r-
Fre
nc
h f
ran
c 5
71
1.5
1,
142
3
.0
602
1.2
2
21
0.3
18
8
0.2
2
1 64
6
0.8
0
E
uro
bo
nds
37
4
882
513
3
43
�
F
ore
ign
bo
nds
197
2
60
8
9
22
1 188
2
1 3
03
(/}
O
the
r cu
rren
cie
s 1.
799
4
.6
1.0
70
2.7
2
.37
3
4.6
3
.005
4
.0
4.0
83
5
.3
6.5
83
6
.0
6.7
77
8
.5
Eur
obo
nds
1,2
94
5
82
2
,219
2
.78
6
3,7
17
6,0
18
6,4
64
Fo
reig
n b
ond
s 5
05
4
88
/84
2
19
366
5
65
2
93
To
tal
38
.999
100
.0
38
.318
100
.0
51,
83
8
100.0
7
5.5
28
100
.0
77
.14
8
100.0
109
,618
100
.0
79.1
06
100.0
Eu
rob
ond
s 18
,69
1 2
0.3
94
3
1.3
24
5
0,3
29
5
0,0
98
8
1.8
17
66
,03
8
Fo
reig
n b
ond
s 2
0.3
08
1
7.9
24
2
0,5
14
25
.19
9
27
.05
0
27
.80
1 /3
,068
So
urc
e:
Org
aniz
ati
on
for
E
co
no
mic
Co
op
era
tio
n a
nd
De
ve
lop
men
t. F
inan
cia
l S
tati
stic
s M
om
hly
.

©International Monetary Fund. Not for Redistribution
were placed outside the banking system. l n the first half of 1985, bond issues by developing countries represented 6 percent of total issues.
The bond issues of international organizations declined from $13.3 billion in 1983 to $ 1 1.8 billion in 1984. While the issuance of international bonds by the World Bank expanded from $4.3 biJJion in 1983 to $5.2 billion in 1984, other regional institutions significantly reduced their issuance. For example, the European Community (EC) issued only $300 million of international bonds in 1984, compared with $3 billion in 1983. As a result of the decline in their issuance activity, international organizations accounted for only 1 1 percent of total international bonds in 1984 and in the first half of 1985, as opposed to 17 percent in 1983.
In 1984, international bond issues, net of redemptions, amounted to $84 billion or 42 percent above net issues in 1983. These net flows went mainly to the industrial countries and international organizations. The net flows to developing countries have remained relatively unchanged during the past five years.
Currency Composition and Market Share
Because the U.S. dollar is the primary currency of denomination in the Eurobond markets, the sharp surge in Eurobond issues relative to those in foreign bond markets had a pronounced effect on the currency composition of international bonds in 1984 and in early 1985. Although the share of international bonds denominated in the U .S. dollar had declined to 57 percent in 1983 (Table 18), the share rose to 64 percent in 1984, matching the previous peak share established in 1982. This higher share reflected the fact that Eurobonds denominated in U .S. dollars have increased by 67 percent between 1 983 and 1984, and that they represented 80 percent of aJI Eurobonds issued in 1984. In the first half of 1985, moreover, the share of U.S. dollar-denominated bonds rose to 67 percent of all international bonds. In contrast, the shares of international bonds denominated in deutsche marks, Swiss francs, and Netherlands guilders all declined in 1984 and the first half of 1 985.
Types of Bonds
The implications of recent bond market developments for the types of instruments used in international bond markets is illustrated in Chart 9 and Table 42. While straight debt issues represented 76 percent of all international bond issues in 1982, this proportion declined to 52 percent in 1984. In contrast, the share of floating rate notes has expanded from 20 percent to 34 percent in the same period. At the same time, use
Developments in 1984 and 1985
Chart 9. Developments in International Bond
Markets, 1981-84
(In billions of U.S. dollars)
140 ISSUES AND PLACEMENTS BY TYPE OF INVESTMENT
120 lUTAL BONDS � Convertible bonds
F/(}(Jting rau note.r 100 01htr
Slraig/11 debl
80
60
l40 ISSUES AND PLACEMENTS BY CURRENCY OF DENOMINATION AND COUNTRY OF ISSUE
120 EUROBONDS FOREICN BONOS
lOO Deu/Sche mark Fed. Rep. of Germany = US. dollar 8 United States
01hu Swirzerlatul Japan
80 Othu
60
I
Sources: Organization for Economic Cooperation and Development, Financial Swtistics Monthly; and International Monetary Fund, International Financial Statistics.
of convertible international bonds rose from 3 percent to 10 percent of total bond issues.
In addition to a growing volume of floating rate notes, the average size of individual issues and average maturity has increased noticeably in recent years; and the secondary market for floating rate notes has gained both in terms of volume and participants. As discussed in Section II, floating rate notes have served as an attractive alternative to fixed rate bonds during periods when volatile interest rate movements discouraged lenders from committing their funds long term at fixed interest rates. Moreover, holders of floating rate notes have generally earned high returns in the period since the late 1970s. For example, investors in Eurodollar floating rate notes earned an annual average rate of return of 13.6 percent during 1979-84, which compares favorably with 12.8 percent on three-month Eurodollar deposits or 10.9 percent on three-month U .S. Treasury bills.
Commercial banks also became majonpurchasers of floating rate notes, especially those issued by the best credit risk, in order to improve the quality of their
65

©International Monetary Fund. Not for Redistribution
V • INTERNATIONAL BOND AND NOTE MARKETS AND OTHER FLOWS
balance sheets. They have been willing to accept a lower spread on floating rate notes than on loans in order to obtain what they regard as a more liquid and safer security and to maintain business ties with prime borrowers. In addition, U.S. savings and loan associations acquired floating rate notes to offset their money market deposits; and Japanese banks, until recently, may have purchased Eurodollar floating rate notes because these securities fell outside certain domestic regulatory guidelines applied to mediumterm loans.
Sovereign borrowers and commercial banks have been the major issuers of floating rate notes. Concerns about the quality of banks' portfolios raised their funding costs in the 1980s, enabling those sovereign borrowers regarded as good credit risks to obtain funds from international bond markets at a lower cost and with longer maturity than were available by borrowing from banks. Bank issuance of floating rate notes has reflected attempts to secure longer-term funding, especially with regard to U.S. dollar funding from nonU .S. banks. In addition, where allowed by the supervisory authorities (e.g·. , in the United Kingdom and the United States), banks have also made extensive use of subordinated debentures as a means of raising capital funds.
Bond market activity has also been affected by the growing use of swaps. ln 1984, interest rate and exchange rates swaps have been estimated to have reached $65 billion and $12-15 billion, respectively, amounting to a total volume three times greater than in 1983. Such transactions are a part of a continuing arbitrage of financial market conditions in different national and international financial markets, and they reflect the differing ability of borrowers to access the various markets.
Foreign Bond Markets
Although the Eurodollar bond market has expanded at a rapid rate in recent years, sales of foreign bonds denominated in U.S. dollars (colloquially known as "Yankee bonds") continued the decline first evident in 1981. In part, this reflected the efforts of international organizations, such as the World Bank, to lower their borrowing costs by relying less heavily on U.S. capital markets. Canadian entities, in particular public agencies, also reduced their issuance of U .S. dollar bonds from $2.5 billion in 1983 to $700 miiJion in 1984. As a result, the share of "Yankee bonds" in total foreign bonds fell from 18 percent in 1983 to between 1 5 and 16 percent in 1984 and the first half of 1985.
While the value of Swiss franc foreign bonds rose in 1984, an approximately 1 9 percent depreciation of the Swiss franc relative to the U .S. dollar resulted in
66
a small decline in the U .S. dollar value of these issues (from $13.5 billion in 1983 to $ 1 3 . 1 billion in 1984). Swiss franc issues, nonetheless, continue to represent the largest share of total foreign bonds ( 1 5 percent in 1984). As in 1983, Japanese firms were the most important issuers in this market, accounting for 44 percent of all issues. The activities of Japanese corporations were particularly evident in the convertible bond market where their issues of Swiss franc convertibles increased to nearly $3.8 billion in 1984 from $3.5 billion in 1983. Swiss franc issues by U .S. banks and corporations decJjned slightly from $ 1 .3 billion in 1983 to $1 .2 billion in 1984. Moreover, Swiss franc bond issues have often been associated with currency or interest rate swaps, especially as they relate to the Japanese yen. In the first half of 1985, the Swiss franc value of foreign bond issues was about 47 percent below that for the corresponding period in 1984.
Foreign bonds denominated in deutsche marks declined slightly from $2.6 billion in 1983 to $2.4 billion in 1984. Despite a rise in the deutsche mark value of foreign bonds (from DM 6.6 billion in 1983 to DM 7 billion in 1984), the U.S. dollar value of these issues declined in 1984 as the deutsche mark depreciated relative to the U.S. dollar. International organizations accounted for a significant share of foreign bonds issued in the Federal Republic of Germany. Japanese corporations were also particularly active in the public issuance market for convertibles and warrant attached bonds. Issue activity was especially heavy in the latter part of 1984 when secondary market yields on foreign deutsche mark bonds fell from 8.2 percent in July to 7.2 percent in January 1985. During late January and early February 1985, however, yields began to rise sharply when the deutsche mark came under pressure in the foreign exchange market. The capital markets subcommittee, therefore, closed the foreign deutsche mark market to new borrowing for three weeks ending in early March.
In May 1985, the authorities implemented a number of changes in regulations pertaining to the issuance of foreign bonds (and Eurobonds) in the Federal Republic of Germany. Since May 1 , foreign bonds can take the form of floating rate notes and zero coupon issues. In addition, such bonds can be used as part of a swap transaction. Moreover, the capital markets subcommittee had its last regular meeting on April 12 . Banks that are lead managers now inform the Bundesbank at the beginning of the month of the size and form of the new issues which they plan to bring to the market. Foreign deutsche mark-denominated bond issues may now be lead-managed by foreign banks incorporated in the Federal Republic of Germany.
Total issue volume in the deutsche mark market

©International Monetary Fund. Not for Redistribution
during the first half of 1 985 nearly doubled the volume during the first half of 1984. Two floating rate notes were sold in early May, including a DM 1 .5 billion issue by Sweden. In addition, there was a floating rate note issue of DM 500 million for Ireland and a swaprelated floating rate note ofDM 250 million by a French bank. Two zero coupon bond issues with a nominal value of DM 1 . 1 billion were also marketed. Malaysia sold a DM 100 million bond issue with a coupon of 7'1z percent on a ten-year maturity; and The Bank of China raised OM 150 million through a bond issue with a coupon of 7 percent and a seven-year maturity.
Foreign bond issues in the Japanese yen rose from $3.9 billion in 1983 to $4.9 billion in 1984 (a 27 percent increase). In the period since 1980, the volume of these issues has more than tripled. Borrowers from all major industrial countries, some East European countries, international organizations, and developing countries obtained funds by the issuing of either public (Samurai) bonds or by private placements.
While industrial country borrowers tend to dominate in most other markets, international institutions accounted for approximately 30 and 38 percent of foreign bond issues in the Japanese market in 1984 and early 1985, respectively, and developing countries represented approximately 25 percent of issues. China was the largest developing country borrower in early 1985, but Malaysia and Korea also raised substantial amounts.
Low and stable interest rates on Japanese markets have helped to attract borrowers, while the yen's relative stability against the U .S. dollar helped to make these bonds attractive for investors. During 1984 and 1985, the Japanese authorities also undertook a series of measures designed to liberalize the foreign bond market, including a reduction in the required credit rating for foreign governments and official agencies borrowing on the Japanese market from AAA to AA, and further to A.
Activity in other.foreign bond markets in 1984 was generally little changed from that in 1983, although foreign bond issues denominated in the pound sterling rose from $0.9 billion in 1983 to $ 1 .6 billion in 1984.
Although the Swiss market has continued to account for the largest portion of total foreign bond issues, its share declined from 50 percent in 1983 to 47 percent in 1984, and 46 percent in the first half of 1985. The rapid increase in issuance activity in the Japanese foreign bond markets gave that market the second largest share ( 18 percent in 1984 and 23 percent in the first half of 1985). Activity in the foreign bond markets in the United States had the third largest share ( 1 5 percent in 1984 and 16 percent in the first half of 1985). Foreign bonds issued in the Federal Republic of Germany represented 9 percent of total foreign bonds in 1984 and 6 percent in the first half of 1985.
Developments in 1984 and 1985
Eurobond Markets
During the past five years, Eurobond issues have expanded at an average annual rate of 34 percent, and the growth was even more rapid in 1 984, at 63 percent. In the first half of 1985, Eurobond issues expanded at a rate which would imply a 61 percent growth for 1985. The issuance of Eurobonds denominated in all currencies expanded, but bonds denominated in the U.S. dollar continue to account for 80 percent of all Eurobond issues and approximately two thirds of all international bond issues.
For the second successive year, the volume of U.S. dollar Eurobonds issued in 1984-floating rate notes, straight bonds, and convertible bonds-exceeded by over $10 billion the total issues of U.S. domestic corporate bonds. Throughout this period, interest rate and exchange rate developments strongly affected the level of activity in the Eurodollar markets. As Eurobond yields rose from 12 percent in January and February 1 984 to nearly 1 4 percent in July, issue volume fell from an annual rate of $65 bimon to $50 billion. When U.S. money market rates began to decline in the early fall and the U .S. dollar showed strength on foreign exchange markets, however, there was a sharp increase in issuance activity (to an annual rate of $90 billion in the August-Oecember period). This increase in Eurodollar bond market activity was also stimulated by the repeal by the United States of its 30 percent withholding tax on interest payments to foreign holders of U.S . bonds and by legal changes which made it possible for U.S. corporations to issue directly debt obligations on the Eurodollar market in bearer form.
One important aspect of the rapid expansion in Eurodollar issues has been the growing importance of floating rate notes relative to straight debt issues. Although straight debt issues expanded from $17.2 bilLion in 1983 to $25.4 billion in 1984, their share of Eurodollar bond issues fell from 44 percent in 1983 to 39 percent in 1984. In contrast, floating rate notes accounted for 50 percent of all Eurodollar bond issues in 1984; their issuance increased from $17.9 billion in 1983 to $32.8 billion.
The deutsche mark represented the second most heavily used currency of denomination in the Eurobond markets. Issues of Euro-deutsche mark bonds rose from $4 billion in 1983 to $4.3 billion in 1984. However, the share of Euro-deutsche mark bonds in total Eurobonds feU to 5.3 percent, the lowest share since 1981. The share of deutsche mark-denominated bonds in the first half of 1985 amounted to 5.6 percent of total Eurobonds. As noted earlier, however, the lib-
67

©International Monetary Fund. Not for Redistribution
V • fNTERNATIONAL BOND AND NOTE MARKETS AND OTHER FLOWS
eralization of German bond markets that occurred in May 1985 has had a significant impact on the recent volume of international bonds denominated in deutsche marks.
The third most heavily used currency of denomination in 1984 in the Eurobond markets was the pound sterling, which was used for 4.8 percent of Eurobond issues. Euro-sterling bond issues increased from $2.2 billion in 1983 to $4 billion in 1 984. Nearly a quarter of these issues were made by borrowers from the United Kingdom, although entities from the United States, France, and Canada were also active. Despite the issuance of $2.5 billion Euro-sterling bonds in the
first half of 1985, the share of sterling issues in total Eurobond issues fell to 4 percent.
Although Eurobonds denominated in ECUs were first issued in 198 1 , these issues reached $2.9 billion in 1984 and constituted 3.6 percent of all Eurobond issues. In the first half of 1985, moreover, there were $3.2 billion of ECU issues, which made the ECU the third most heavily used currency of denomination. The ECU bond has been used by a variety of borrowers, including EEC official institutions, sovereign borrowers in the European monetary system (such as France, Italy, and Ireland), international organizations (such as the World Bank), and European, Japanese,
Table 19. Developing Country Gross Issues and Placements in International Markets, 1979-First Half of 1985 1
(In millions of U.S. dollars)
1985 1st
1979 1980 1981 1982 1983 1984 half
AJgeria 182.8 500.0 Argentina 4 16.6 163.9 195.3 Bahrain 30.0 100.0 150.0 Bermuda 60.0 Brazil 735.6 3 16.2 60.8 100.9 Chile 83.5 82.2 30.0 China 44.5 20.5 81.7 246.5 Colombia 55.0 20.0 35.0 15.0 Costa Rica 109.3 Cote d'lvoire 14.3 Egypt 65.0 40.0 50.0 Gabon 33.2 Greece 30.0 50.0 41.6 200.8 464.1 Haiti 8.0 Hong Kong 123.8 71.7 62.8 185.6 Hungary 50.0 20.0 40.5 195.5 India 30.0 281.7 185.0 60.0 297.6 180.0 Indonesia 62.7 45.8 96.5 363.1 365.7 50.0 Israel 200.0 130.0 117.0 1 10.0 135.0 Korea 43.6 47.8 322.8 141.7 546.8 1,056.0 758.6 Kuwait 25.0 1 10.0 50.0 Malaysia 152.4 816.8 884.6 I ,141.2 893 . 1 Mexico 363.0 353.5 2,344.1 1,602.5 Morocco 21.8 23.2 Panama 1 10.7 25.0 21.0 20.0 Papua New Guinea 20.6 Peru 25.0 Philippines 176.2 66.8 68.5 30.0 Portugal 30.0 20.0 183.3 76.2 389.4 177.0 Saudi Arabia 14.7 200.0 Singapore 25.0 55.6 125.0 70.0 South Africa 243.6 36.5 92.0 314.1 532.5 1,013.9 691.6 Sri Lanka 1 1 .3 Thailand 176.2 45.9 98.7 62.5 253.5 283.3 540.6 Trinidad and Tobago 50.0 107.4 28.6 Tunisia 60.0 20.3 United Arab Emirates 25.0 Venezuela 173.6 1 3 1 . 5 290.8 35.0 Yugoslavia 96.3 37.2 Other 29.7 54.9 79.4 145.6 39.8 21.0 19.1 --
Total 3,316.0 2,149.0 4,427.0 4,696.0 3,275.0 5,264.0 4,935.0
Source: Organization for Economic Cooperation and Development, Financial Statistics Monthly. 1 Foreign bonds and Eurobonds.
68

©International Monetary Fund. Not for Redistribution
and (to a more limited extent) U.S. banks. Banks have often increased their issuance of ECU bonds to fund their growing holdings of ECU-denominated assets. Investors have been attracted to the ECU in part by a relatively high nominal yield and by the fact that the ECU underlying basket of currencies does not include the U .S. dollar. In addition, some European investors have been affected by the more favorable treatment that ECU-denominated bonds have received under exchange regulations and capital controls in some European countries.
The liberalization of the Euro-yen bond market in 1984-85 was discussed in Section II of this paper. Notably, it included easing of the guidelines on eligible resident and nonresident issuers, permission to make swap-related issues, and abolition of the withholding tax for nonresident purchasers of Japanese corporate issues.
There was a sharp distinction between the issuance activity in the Euro-yen bond market before and after the financial market liberalization which took place in late 1984. The pace of Euro-yen issues has accelerated sharply in the wake of these liberalization measures. Euro-yen bond issues rose from only $0.2 billion in 1983 to $ 1 . 2 billion in 1984, with $464 million of these issues in December 1984 alone. This market continued to expand to $ 1 .9 billion in the first half of 1985. Recently, foreign borrowers have also issued ECUand U .S. dollar-denominated instruments on the Japanese market.
Maturities
There has been considerable diversity of maturities across the international bond markets on the basis of currency of denomination in the period since 1981. In the U .S. dollar market, there has been a general decline in the proportions of short-term (0-5 years) and medium-term (6-10 years) maturities and an increase in the proportion of long-term (over 10 years) bonds. In part, this reflects the growing importance of floating rate note issues, whose maturities are currently much longer than those typically available through the fixed interest rate markets. In contrast, in the markets for borrowings in Japanese yen, pound sterling, and Netherlands guilder, there has been a shift from longerterm bonds to medium-term issues (Table 43).
Developing Country Access
Most developing countries currently have very limited access to international bond markets. Although bond issues by developing countries rose from $3.3 billion in 1983 to $5.3 billion in 1984, the share of developing country bonds in total bonds fel l from 9 percent in 1981 to 5 percent in 1984 (Table 19). Only
International Issuance Facilities
those developing countries regarded as the best credit risks have been able to access these markets. The four largest developing country issuers typically accounted for 67 percent to 80 percent of all developing country issues in each of the years between 1982 and 1984. In the first half of 1985, six developing countries (Algeria, China, Greece, Korea, Malaysia, and Thailand) accounted for approximately 70 percent of all developing country issues.
These limitations on entry into international bond markets have persisted despite the continued servicing of principal and interest on outstanding bonds by almost all developing countries. This servicing record has, nonetheless, had a strong impact on the differentials between yields on developed and developing country bonds in the secondary markets for bonds denominated in deutsche marks (Chart 10). Although the differentials between the yields on developed and developing country bonds had reached levels ranging from 6 to 10 percentage points in the period following the emergence of the external payment difficulties for many developing countries, they declined to less than 2 percentage points by the beginning of 1985. A similar pattern of yield differentials has also been found for U .S. dollar-denominated bonds.32
International Issuance Facilities
The rapid increase in the volume of international issuance facilities is one of the key changes that have taken place recently in international markets. Longterm international bank facility commitments (excluding those that were merger-related) amounted to almost $29 billion in 1 984, in comparison with less than $10 billion in 1983 and $5.5 billion in 1982. In the first half of 1985, these commitments proceeded at an annual rate of $40 billion (Table 20). The central feature of these arrangements is the rapid development of an international market in short-term securities. Back-up facilities for Euronotes and commercial paper rose from less than $4 billion in 1983 to $12 billion in 1984 and $22 billion in the first half of 1985 (at an annual rate).
The market for such facilities is in a phase of rapid evolution. Increasingly complex financial packages are being created, as reflected in the increase in the volume of "multiple component facilities" from $7.7 billion in 1984 to $ 1 1 .3 billion, at an annual rate, in the first half of 1985. These facilities allowed the issuance of Euronotes or use of short-term bank advances by corn-
n See D. Folkerts-Landau, "The Changing Role of international Bank Lending in Development Finance," Staff Papers, International Monetary Fund (Washington, March 1985), Vol. 32, No. 2, pp. 317-363.
69
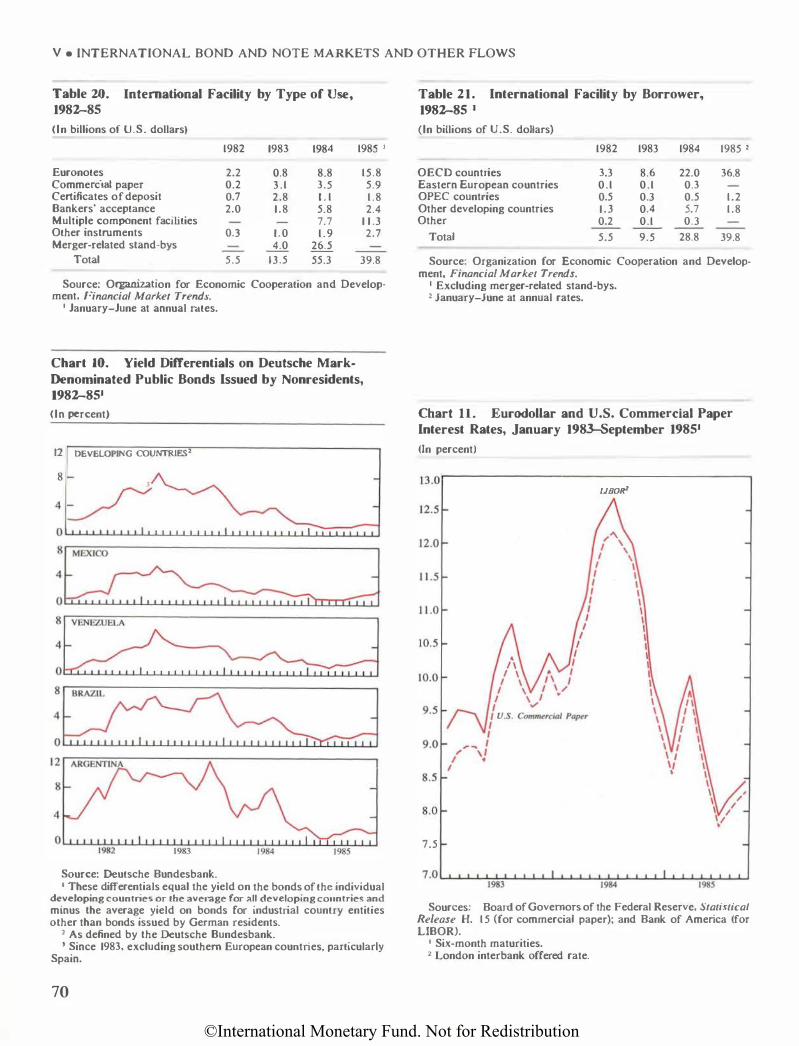
©International Monetary Fund. Not for Redistribution
V • INTERNATIONAL BOND AND NOTE MARKETS AND OTHER FLOWS
Table 20. International Facility by Type of Use, 1982-85
(In billions of U.S. dollars)
1982 1983 1984 1985 I
Euronotes 2.2 0.8 8.8 15.8 Commercial paper 0.2 3.1 3.5 5.9 Ceniticates of deposit 0.7 2.8 1 . 1 1 .8 Bankers' acceptance 2.0 1.8 5.8 2.4 Multiple component facilities 7.7 1 1 .3 Other instruments 0.3 1.0 1.9 2.7 Merger-related stand-bys 4.0 26.5
Total 5.5 13.5 55.3 39.8
Source: Organization for Economic Cooperation and Development, Financial Market Trends.
1 January-June at annual rates.
Chart 10. Yield Differentials on Deutsche Mark
Denominated Public Bonds Issued by Nonresidents, 1982-851
(In percent)
12 DEVELOPING COUNTR1ES2
8
4�
Source: Deutsche Bundesbank. 1 These differentials equal the yield on the bonds of the individual
developing countries or the average for all developing countries and minus the average yield on bonds for industrial country entities other than bonds issued by German residents.
1 As defined by the Deutsche Bundesbank. ' Since 1983, excluding southern European countries, particularly
Spain.
70
Table 21. International Facility by Borrower, 1982-85 I (In billions of U .S. dollars)
1982 1983 1984 1985 l
OECD countries 3.3 8.6 22.0 36.8 Eastern European countries 0.1 0.1 0.3 OPEC countries 0.5 0.3 0.5 1.2 Other developing countries 1 .3 0.4 5.7 1.8 Other 0.2 0.1 0.3
Total 5.5 9.5 28.8 39.8
Source: Organization for Economic Cooperation and Development, Financial Market Trends.
1 Excluding merger-related stand-bys. 2 January-June at annual rates.
Chart 11. Eurodollar and U.S. Commercial Paper Interest Rates, January 1983--September 19851
(In percent)
IJ.or----------------------. UBO�
7.5
Sources: Board of Governors of the Federal Reserve. Statistical Release H. 15 (for commercial paper); and Bank of America (for LlBOR).
1 Six-month maturities. 2 London interbank offered rate.

©International Monetary Fund. Not for Redistribution
petitive bidding, against a range of funding bases and currencies. In contrast, the volume of other facilities of a more traditional nature (e.g., bankers' acceptances) has not increased substantially during the period.
As im.licated in Table 2 1 , most borrowers using these facilities have come from within the OECD area. Highly regarded U .S. corporations used such facilities to back up commercial paper programs or the issuance of Euronotes. In addition, there was a strong demand for such facilities by corporations which had not previously borrowed extensively in international markets. Official borrowers using these facilities have included Indonesia, Oman, Portugal, and Sweden. The users of international facilities have thus been governments and governmental agencies, corporations, bank holding companies, and banks of countries with a generally high credit standing. Although financial institutions were the principal users of note issuance facilities (to obtain stand-by funds) during 1983, nonbank corporations and governments were the most active participants in these markets during 1984 and the first eight months of 1985. During 1984, corporations and governments each accounted for roughly 40 percent of announced note issuance facilities, while during January to August 1985, corporations became the most active users of these facilities, arranging nearly 70 percent of new facilities.
International Issuance Facilities
Borrowers using such facilities have paid relatively low fees and have generally obtained funds at a lower cost than that associated with either syndicated loans or floating rate notes. The size of the potential differential in borrowing costs can be illustrated by the spread between the yields on U .S. commercial paper and LIBOR (Chart 1 I) . Despite relatively low fees, many banks have been active participants in the underwriting of note issuance facilities. As in the case of floating rate notes, a high proportion of the shortterm notes is held by bank portfolios. Nonetheless, leading arrangers of these facilities report an increasing market for notes outside the banking system. Holders reportedly include insurance companies, investment trusts, corporations, and central banks.
While the market for back-up facilities is in a phase of rapid growth, the use of these facilities is believed to have been below that of other forms of financial commitments. For many borrowers, back-up facilities may not actually involve any drawdown of funds. Data are not available concerning the issuance of notes under these facilities, but it is estimated that private sector borrowers have, by mid-1985, made issues amounting to 10-20 percent of facilities. In contrast, sovereign borrowers have tended to use these facilities as a substitute for syndicated loans, and have issued notes equivalent to a substantial proportion of their facilities.
Table 22. Capital-Importing Developing Countries: Financing of Current Account Deficit and Reserve Accumulation, 1977-84
(In billions of U .S. dollars)
1977 1978 1979 1980 1981 1982 1983 1984
Market borrowers
Current account deficit 19.5 32.8 30.3 36.5 72.7 74.7 29.4 7.2
Reserve accumulation 6.1 10.6 18.2 17.4 -2.7 -25.1 4.0 18.5
Financing 25.6 43.4 48.5 53.9 70.0 49.6 33.4 25.7
Direct investment 4.5 6.4 7.8 7.4 1 1 .3 10.6 7.4 7.7 Official transfers 0.8 1 . 0 1 . 2 1 . 3 1 . 8 1 . 9 2.2 2 . 1 Long-term borrowing from
official creditors. net 5.4 6.5 5 . 1 7.5 8.4 8.0 14.4 12.3 Other net external borrowing 22.2 36.1 4 1 . 6 56.9 79.2 50.1 10.3 9.0 Other sources I - 7 . 3 - 6 . 6 - 7 . 2 - 19.2 - 30.7 - 2 1 . 0 -0.9 -5.4
Official borrowers
Current account deficit 8.4 1 1 .0 12.1 16.0 19.0 17.6 15.7 16.3 Reserve accumulation 1.9 0.7 0.8 0.5 -0.2 - 1 .0 0.8 -0.9
Financing 10.3 11.7 12.9 16.5 18.8 16.6 16.5 15.4 Direct investment 0.7 0.6 0.6 0.2 0.9 0.5 0.4 0.4
Official transfers 4.2 3.9 6.1 7.0 7.4 7.2 6.5 6.2 Long-term borrowing from
official creditors, net 2.8 3.8 6.3 8.5 9.7 9.0 7.4 7.3 Other net external. borrowing 2.9 2.5 0.9 0.5 - 1 .4 -2.1 1.7 1 .9
Other sources 1 - 0.3 0.9 - 1 .0 0.3 2.2 2.0 0.5 0.6
Source: International Monetary Fund. World Economic Outlook, October /985: Revised Projections by the Staff of the International Monetary Fund.
1 Includes errors and omissions.
71

©International Monetary Fund. Not for Redistribution
V • INTERNATIONAL BOND AND NOTE MARKETS AND OTHER FLOWS
Foreign Direct Investment and Official Flows
As a result of the sharp slowdown in the growth of international bank lending to developing countries and this group's Umited access to international bond markets, foreign direct investment and official flows have come to play an increasing role in financing of current account deficits and reserve accumulation of developing countries. This trend is shown in Table 22 along with the financing requirements of two major groups of capital-importing countries, the market borrowers, and the official borrowers.
For the market borrowers, the sum of their current account deficits and reserve accumulations during 1973-84 reached a peak of $70 billion in 1 98 1 , but has declined to $26 biJHon in 1984 despite extensive reserve accumulation. While other net external borrowing accounted for 1 13 percent of the financing requirement of 1981, this type of borrowing accounted for only 3 1 and 3 5 percent of the borrowing requirements in 1983 and 1984, respectively. In contrast, direct foreign investment flows represented only 14 percent of the borrowing requirement in 1980, but subsequently increased to 30 percent in 1984. Nonetheless, such
72
investment flows have fallen in absolute amount from $ 1 1 billion in 198 J to less than $8 billion in 1984.
The position of the official borrowers has been significantly different from that of the market borrowers. Other net external borrowings accounted for the largest proportion of the sum of current account deficits and reserve accumulations when they represented 28 percent in 1977. However, there has been a net repayment of these borrowings in 1981 and 1982. Foreign direct investment flows have also represented only a small proportion of the financing requirement for this group of countries. l n contrast, official transfers and lending have represented at least 84 percent of their financing requirement since 1 979.
While the World Economic Outlook, October 1985, projects a recovery of foreign direct investment in 1985-86 (from $10 billion in 1984 to $12 billion in 1 986 for all capital-importing countries), official lending and transfers to this group are anticipated to fall from $40 billion in 1984 to $38 billion by 1986. This will encompass an increase in official transfers from $14 billion in 1984 to $17 billion in 1986 but a decline in official lending from $26 billion to $22 billion in the same period.

©International Monetary Fund. Not for Redistribution
Appendix I Measurement of International Banking Flows
The quantity and quality of statistics on international banking have improved substantially in recent years. In particular, the Fund introduced new tables on international banking statistics (IBS) in the January 1984 issue of International Financial Statistics (IFS), and expanded the coverage further in early 1985. The IBS series is a source of comprehensive data on a country's gross liabilities to, and claims on, nonresident banks as well as on its banks' liabilities to, and claims on, nonresident nonbanks.
This series is also used in deriving measures of banking flows on which the discussion of international banking activity in this paper is largely based. However, flow data derived from stock data need to be interpreted cautiously. Changes in banks' external positions do not necessarily measure transactions, and the quality of the stock data depends heavily on the accuracy, completeness, and currentness of information supplied by national authorities. Hence, this appendix briefly reviews the coverage of the IBS series and other sources of international banking statistics used in this paper and discusses statistical issues affecting the measurement of international banking flows.
Coverage
The IBS data are drawn in part from data on banks' external positions included in the regular money and banking returns of Fund members for publication in IFS and in part from confidential reports which give a geographic analysis of the external accounts of deposit banks in a number of international banking centers. Information provided in the money and banking returns of Fund members is used to derive the series on interbank liabilities and claims,33 interbank credits to nonbanks by residence of lending bank, and bank deposits of nonbanks by residence of borrowing bank.
33 Lnterbank accounts of nonmembers of the Fund are derived from the geographic analysis of banks' external accounts supplied by reporting international banking centers.
Detailed reports on the geographic distribution of the external assets and liabilities of deposit banks in 32 international banking centers are made available to the Fund. These reports, although individually highly confidential, are aggregated across reporting centers to produce the tables on bank credit to nonbanks by residence of borrower; and bank deposits of nonbanks by residence of lender. The world totals, however, are equal to the "all country" totals in the tables on bank credit to nonbanks by residence of lending bank; and on bank deposits of oonbanks by residence of borrowing bank, respectively. 34 International banking centers whose detailed geographic reports are currently used include nearly all industrial countries, as well as the major offshore banking centers, and some developing countries that play a major role in international banking.
The IBS series also provides an extensive data base for a comprehensive analysis of international bank lending and deposit taking flows by country of residence. As these data are on a residency basis from the point of view of both the reporting and reported country, they are conceptually close to the balance of payments data on both monetary and nonmonetary capital movements. Data on bank lending and deposit taking flows are derived from stock data detailed above. Separate estimates are generated for lending flows to banks, deposit taking from banks, lending flows to nonbanks, and deposit taking from nonbanks. Lending flows to banks are measured by changes in stock figures on the interbank accounts by residence of
34 Conceptually, at the world level, totals should be the same in each pair of tables since they represent opposite ends of the same transactions. However, banks in only 32 international banking centers report their positions with nonbanks in individual countries, compared with more than a hundred countries report.ing their positions with nonbanks as a whole in their monetary statistics. Differences between the world totals and the sum of the country (and area) components. in the tables derived mainly from the detailed geographic analysis, are shown under allocated items, which are expected to be reduced over time as the reports of an increasing number of international banking centers are made available to the Fund and the quality of these reports improves. The area residuals reflect both the extent to which reporting banks identify positions by area but not by individual country, and reporting banks' positions with countries not specifically listed.
73

©International Monetary Fund. Not for Redistribution
APPENDIX I • MEASUREMENT OF INTERNATIONAL BANKING FLOWS
borrowing bank. and those to nonbanks by changes in the stock figures on international bank credits to nonbanks by residence of borrower. Deposit taking flows from banks are measured by the changes in stock figures on the interbank accounts by residence of lending bank and those from nonbanks by the changes in stock figures on international bank deposits by nonbanks by residence of deposit. The changes in stock figures for individual countries are adjusted for changes attributable to exchange rate movements.
The other major source of international banking statistics is the BIS, which has long published quarterly data on the geographic distribution of the external accounts of banks in BIS reporting countries. The BIS recently enlarged its reporting area to take in the geographic distribution of the external accounts of banks in 25 countries, including nearly all the industrial countries and offshore banking centers. In addition to stock and flow figures, the BIS derives a measure of "net international bank credit" by excluding estimates of redepositing among reporting banks. One explanation for differences between the Fund and BIS series is that, for data on the interbank market, the Fund uses information on the external positions of the banking systems of over 140 Fund members, whereas the BIS uses data derived from the geographic analysis mentioned above. Secondly, the Fund has more international banking centers in its reporting system than the BIS. Thirdly. the Fund makes estimatf!S of the positions. with reported countries' nonbanks, of banks in centers not providing a bank/nonbank breakdown as a classification of the geographic distribution.
In addition, the BIS publishes semiannual data entitled "The Maturity Distribution of International Bank Credits." These series have been compiled on a consolidated basis since the end of 1984.35 Hence, for banks with head offices in the reporting area, coverage extends to the activities of their affiliates located outside the reporting area, and the data include not only the cross-border claims for such affiliates, but also their local lending in non-local currency. The main value of this report is to provide information on the maturity distribution of the reporting banks' external positions and on undisbursed commitments to individual countries. Also, these data permit comparison of banks' consolidated claims published by some countries with total claims by the reporting group, although changes in the coverage of the data make comparison over time difficult.
Recently, the BIS published data on banks· nation-
Js Bank claims captured in these reports are smaller than those in the BIS quarterly reports because a smaller number of countries provides information for the 'lemiannual reports. The reports do not provide information on liabilities or positions with banks and non banks.
74
ality of ownership. The new reports encompass the international activities of bank offices in 14 countries plus the cross-border operations of the branches of U .S. banks in some offshore banking centers. These data allow an analysis of changes in the positions of banks in each of these countries with their own related offices abroad, with other banks, and with noobanks, but do not provide a geographic analysis. The data are not adjusted for exchange rate changes.
Measurement Issues
This section discusses measurement issues arising first from the derivation of international banking flows from the IBS series, and second from the accuracy of the reports the Fund receives.
Exchange Rate Adjustment
Figures on international bank lending to, and deposit taking from, banks and nonbanks in individual countries arc calculated by taking changes in the IBS series adjusted for variations in exchange rates. The adjustment of the stock figures is necessary because, in an environment of floating exchange rates, some of the changes in the external positions of banks result from the variations in exchange rates used to convert external positions denominated in several currencies into U .S. dollars. The adjustment process is based on the overall currency composition of the external positions of banks in 1 8 major international banking centers in relation to banks and nonbanks in individual countries.36 This currency distribution is assumed to represent the currency distribution of the external positions of banks and nonbanks in the reported countries with aJJ nonresident banks. The flow data are calculated as follows: external positions, reported to the Fund in U .S. dollars, are converted back into their original currencies using the currency distribution and exchange rates prevailing on the dates to which the reports refer. The changes in these positions are then caJculated and converted back into U.S. dollars using period average exchange rates. Finally, the flow figures are obtained by aggregating changes (expressed in U .S. dollar terms) across currencies of denomination. 37
Flow figures derived from stock data must be interpreted carefully. The assumptions made in estimating flows from stocks (particularly with regard to the currency composition of stocks) are necessarily approximations. In addition, banks' external positions can vary because of reclassification of some items,
ll> The Fund receives these figures from the BIS. l7 The BLS uses the end-of-period exchange rates to adjust the
stock data, in effect assuming that changes in deposit banks' position) occur at the end of each period. In contrast. the Fund's Balance of Payments Manual assumes that such changes are evenly distributed over the period.
©International Monetary Fund. Not for Redistribution
rather than because of transactions between debtor and creditor. For instance, creditor banks may reduce their reported external claims when they make provisions or write-offs on international loans. The same can be said when banks sell their claims to nonbank investors or transfer some of their claims to guaranteeing agencies for value. Also, renegotiation and rescheduling of external debt can give rise to variations in banks' external positions which, when combined with other transactions, are difficult to interpret.
Accuracy of Reports
A second set of measurement issues is related to the accuracy of the reports the Fund uses in compiling the IBS series. This is especially important because the IBS series is compiled using two main sources of data and inaccurate reports can result in overestimation or underestimation when two series are combined. The comprehensiveness of the reports has also become an increasingly important issue because the greatly expanded range of financing techniques available today is unevenly captured in the existing statistical collection system.
To analyze international bank lending to individual countries, the IBS series on interbank accounts by residence of borrower is combined with the series on international bank credit to nonbanks by residence of borrower. The first series is derived from the interbank positions in the monetary statistics that countries report to the Fund. The second series is calculated from the reports of major banking centers on the positions of their banks with banks and nonbanks in individual countries. Obviously, any misclassification between banks and nonbanks either in the monetary statistics or in the reports of major banking centers can result in either overestimation or underestimation.
Misclassification may occur either because the data are improperly reported or because the Fund staff makes its own estimates when a bank/nonbank breakdown is not available in either the monetary statistics or the reports of some international banking centers. In the past few years, some misclassifications have resulted following negotiated debt reorganization that have involved the assumption by the country's banking system (generally the central bank) of the external debt of nonbanks. In that case, the monetary statistics will generally report an increase in the external liabil-
Measurement Issues
ities of the banking system to internationa.l banks; but this increase will not always be matched by a reduction in the claims on nonbanks reported by international banking centers.
Overestimation of bank lending may also occur because of the practice of recording payments arrears as part of the external liabiJities of the monetary authorities. If these arrears are related to the external debt of non banks, it is likely that they will be accounted for twice in the IBS series since international banks will also report them in their claims on nonbanks, to the extent that they consider the nonbanks to remain the legal debtors. To help remove double counting, interbank positions reported by major international banking centers with individual countries are compared with interbank positions reported in the monetary statistics of these individual countries.
The comprehensiveyess of international banking statistics is also affected by the increasing use of securities to meet international financial needs, as discussed earlier in this paper. The proliferation of these financing techniques has caused statistical problems. First, the recording of banks' investment portfolios and banks' issuances of securities differs among banking centers. In general, holdings and issuances of external securities by banks are properly recorded in the monetary statistics (with a few major exceptions) and, hence, in the four IBS tables derived from these data. However, securities are not systematically reported in the geographic analysis of the external positions of banks in 32 international banking centers. To the extent that such instruments represent positions with nonbanks, and that they are reported in the monetary statistics, they will be reported as unallocated items in the two IBS tables derived from the reports of major banking centers. Second, the underwriting of instruments recorded off the banks' balance sheets, such as note issuance facilities, is not reported in the external positions of banks and, hence, the IBS series does not record the amount of international financing supported by banks' medium-term commitments.
Data used in this paper incorporate adjustments made to the IBS series to correct for some of the above-mentioned measurement issues. Revisions to estimated lending flows to 12 developing countries resulted in a downward adjustment of total crossborder lending to these countries of approximately $10 billion in 1983 and $ 1 .5 billion in 1984.
75
©International Monetary Fund. Not for Redistribution
Appendix II The Institute of International Finance, Inc.
Since its establishment January 1 , 1983, The Institute of International Finance (IlF) has increased its membership to 196. While most members are commercial banks, a number of official export credit agencies have joined as associate members in the past year, as have some multinational corporations. The IIF's member banks account for about 80 percent of global lending to developing countries.
A primary objective of the Institute is to improve the timeliness and quality of information on sovereign borrowers available to banks and other international lenders. During the past year, the IIF expanded the database that it provides on-line to members. The database now includes approximately 150 series for more than 30 countries, and is being progressively expanded to cover a total of 40-50 developing countries which have significant outstanding borrowings from commercial banks. Information is provided on fiscal policy, domestic economic performance, and the external sector, including estimates of liabilities to main creditor groups.
The IIF also prepared full reports on 33 countries. Staff have visited more than 20 countries, including Mexico, Argentina, Venezuela, Chile, Colombia, Ecuador, Peru, Korea, Indonesia, the Philippines, Malaysia, Egypt, Morocco, Cote d'Ivoire, Turkey, and Hungary. Informal visits have been paid to Greece and Nigeria. Missions normally include both IIF staff and representatives of commercial banks.
In addition to its work on specific countries, the IIF has undertaken a number of general, policy-oriented initiatives. The institutional focus of this work is the IIF's Working Party on the Future of International Lending, which comprises 50 participants. In 1984, the Working Party created four specialized committees to study the restructuring process; legal and regulatory matters; technical issues, in particular the currency composition of lending; and new initiatives in international lending by private banks and the public sector, as well as obstacles to development of long-term solutions to financing LDC development. The main conclusions of the committees' reports, made public in September 1984, included an endorsement of techniques designed to foster an early return to voluntary lending, multi year reschedulings, provision of currency options, and exclusion of trade financing from reschedulings.
76
In the second half of 1984, the Working Party set up two study groups, both of which involve regulators, officials from multilateral agencies, lawyers, and accountants as well as bank representatives. The primary objective of the first study group-the Task Force on the Regulatory, Accounting, and Tax Treatment of Cross-Border Lending-is to conduct a study to clarify the implications of different national policies, procedures, and practices in the main creditor countries for cross-border lending. A main objective is to find potential ways to overcome some distortions and impediments to international bank lending resulting from such differences. Initially, the North American and European members of the Task Force met separately in Washington and London. Another meeting, which brought together accountants, bankers, and regulators from Europe, Japan, and North America, was held in November 1985 in Washington. The second study group, the Study Group on Insurance and Guarantees, is examining possible mechanisms to insure bank loans or portfolios and spread international risk. It has met several times in Washington and London.
In addition to the Working Party, the Institute has set up an Economic Advisory Committee, composed of the chief international economists of some 20 member banks, to advise the Institute on all aspects of its country economic work, as well as to provide a forum to discuss matters which go beyond the analysis of individual debtor countries, such as alternative scenarios for the world economy and their implications for the resolution of the debt problem. As part of the general services which the Institute provides for its members·, the IIF publishes two surveys on a regular basis: a "Survey of Debt Restructurings by Banks" and a "Survey of Official Reschedulings and Balance of Payments Support . "
Prior to tbe Spring 1985 meetings of the IMF Interim Committee and the World Bank!IMF Development Committee, which focused on the debt problem, the IIF's Board met to approve a letter to the Chairman of the Interim Committee from the IIF Managing Director, Andre de Lattre. The letter highlighted some issues essential for a sound development of the banks' role in providing finance to developing countries and was accompanied by a memorandum on factors affecting the future of international lending.

©International Monetary Fund. Not for Redistribution
Appendix Ill Domestic Savings, Foreign Savings, and Investment
This appendix examines the relative sizes of domestic and foreign savings and their contributions to lhe financing of domestic investment during 1967-84. The exercise covers the groups of industrial countries and the capital-importing developing countries. The capital-importing developing countries are further divided into market borrowers, including the major borrowers, and official borrowers. Because consistent data on domestic savings, foreign savings, fiscal imbalances, and investment are not available for all countries over the period 1967-84, this analysis is based on a sample composed of 18 industrial countries and 50 developing countries.38
There are a number of insights concerning the international pattern of savings and investment flows which are evident in developments during 1967-84. First, while individual industrial countries have at times experienced large capital inflows or outflows, the capital account imbalances for the group as a whole have varied between surpluses or deficits equivalent to less than I percent of their combined incomes or 3 percent of domestic savings. However, during 1983-84, some industrial countries experienced relatively large current account deficits (e.g., the U.S. deficit equaled $93 billion in 1984) and surpluses (e.g., Japan had a surplus of $36 billion in 1984), which made these countries significant users of foreign savings or suppliers of domestic savings to the rest of the world.
Second, although the major developing country groups received foreign capital inflows throughout the period, the size of these inflows relative to domestic savings or GDP varied sharply over time and across
311 The note at the end of this appendix lists the countries that are included from each country group. Additional discussions of the relationships between capital flows, domestic savings, and investment can be found in World Economic Outlook, April 1985: A Survey by the Staff of the lmernational Monetary Fund (Washington: International Monetary Fund, April 1985), pp. 63-67 and the World Development Report, 1985 (Washington: World Bank, 1985), pp. 43-70. The country classifications used in this appendix are defined in the World Economic Outlook. The market borrowers consist of those countries that obtained at least two thirds of their external borrowings between 1978 and 1982 from commercial creditors. The major borrowers are a subgroup of the market borrowers and are composed of the seven countries with the largest outstanding external indebtedness. Finally, official borrowers comprise those countries, excluding China and India, that obtained two thirds or more of their external borrowings between 1978 and 1982 from official creditors.
groups. For the market borrowers and major borrowers, the average ratio of foreign capital inflows to GDP increased by nearly one-half between 1967-72 and 1973-82, but then declined during 1983-84 to an average value below that of the late 1960s and early 1970s. As a result, foreign savings were equivalent to 8 percent of the groups' domestic savings in the late 1960s, over 1 2 percent in the late 1 970s, and less than 7 percent during 1983-84. In contrast, since 1967 foreign savings have represented an important component of total funds available to finance investment for official borrowers. The ratio of capital inflows to GDP averaged over 6 percent during this period and these inflows equaled, on average, nearly 5 1 percent of domestic savings.
Third, while the ratios of domestic savings to income have shown considerable variability during 1967-84, the industrial countries, market borrowers, and major borrowers showed little net change in their savings ratios over the entire period. In contrast, the ratio of domestic savings to GDP for official borrowers declined significantly.
Fourth, a significant part of the variation in domestic savings ratios has been associated with changes in the fiscal positions of central governments. For the market borrowers and major borrowers, this was in part evident in both the decline in domestic savings ratios as fiscal deficits grew during 1980-82 and the recovery of savings during 1983-84 as fiscal deficits declined.
Finally, the behavior of the ratios of investment to income has varied sharply across country groups. The investment ratios for the market borrowers and major borrowers first rose significantly between 1967 and 1975. By 1983 and 1984, however, they had declined to levels not very different from those prevailing in the late 1960s. In contrast, the investment ratios for the industrial countries and the official borrowers have been somewhat more stable.
Domestic and Foreign Savings
Since the late 1960s, foreign capital flows have often played an important role in financing investment and fiscal imbalances in both developed and developing countries. Naturally, the roles of foreign and domestic
77

©International Monetary Fund. Not for Redistribution
APPENDIX ill • DOMESTIC SAVINGS, FOREIGN SAVINGS, AND INVESTMENTS
savings can be compared only if the two concepts are defined on a comparable basis. Since the usual measures of domestic savings-gross national or gross domestic savings-are broadly defined, net foreign savings (which could involve dissavings) must also be measured in a similar manner. A broad measure of a country's use of foreign savings is given by its current account deficit, which represents the real transfer of resources that is financed by the rest of the world's net accumulation of the country's liabilities.39.40
While total domestic savings is typically measured as gross domestic product (GDP) less the sum of private and public sector consumption, its behavior can often be most usefully examined in terms of the differences between private and public sector savings. There are, however, no consistent data on overall fiscal deficits for aU countries covering the period from 1967 to 1984. Even where fiscal data are available for this period, they generally represent the position of only the central government and do not incorporate the imbalances of local or provincial governments, or state enterprises. The scope of this problem varies from country to country and is often especially significant for countries with large state enterprise systems. Nevertheless, a rough division between domestic savings of the private and public sectors can be obtained by defining public sector use of total savings to equal the fiscal imbalance of the central governments.
Domestic Savings
AJthough foreign savings often reached significant levels for many countries during 1967-84. domestic savings was the most important and stable source of
39 The financing of such a deficit could involve a reduction in the country's assets, as well as an increase in foreign liabilities. This measure of the use of foreign savings does not rule out the possibility that these funds may be used to acquire external assets in the future. As wiiJ be discussed, the measure of the current account balance used in this paper is that of goods, services, and private transfers. An alternative definition would include official transfers.
40 Although the current account balance is a broad indicator of a country's use of foreign savings, it is not traditionally measured on the same national income basis as gross domestic savings or gross domestic investment. Studies of the relationships between savings, investment, and current account balances have therefore used a variety of methods to ensure consistency between the three concepts. One approach has been to treat gross savings as a residual obtained by adding gross domestic fixed investments, changes in inventories, and the current account balances (see A. Penati and M. Dooley, "Current Account Imbalances and Capital Formation in Industrial Countries, 1949-81," Staff Papers, International Monetary Fund (Washington, March 1984), Vol. 3 1 , No. I , pp. 1-24). Alternatively, the current account balances have been calculated as a residual (see J. Sachs, "The Current Account and Macroeconomic Adjustment in the 1970s," Brookings Papers on Economic Activity I, The Brookings Institution (Washington) 1981, pp. 201-68). Gross domestic investment could also potentially be the residual component. In this appendix, however, the actual data for all three concepts are represented in the charts.
78
financing for domestic investment for all country groups. Industrial countries had the most stable ratios of domestic savings to GDP during 1967-84; their ratio remained within the range of 20 percent to 24 percent during that period (Chart 12).41 This group's savings ratio declined from 24 percent in 1973 to 20 percent in 1982, before recovering somewhat during 1983 and 1984. As a result, the savings ratio for the industrial countries in 1984 was only about I percentage point below that prevailing in the late 1960s.
Savings ratios of capital-importing developing countries exhibited more diverse behavior. The average ratio of domestic savings to GDP for the market borrowers and the major borrowers rose sharply during the 1 970s and then declined significantly in the early 1980s. For the market borrowers, the domestic savings ratio rose from 22 percent in 1967 to approximately
•• For a listing of the countries and territories included in each group, see the note at the end of this appendix. The group savings ratio equals the savings ratio for individual countries weighted by the average U.S. dollar value of their respective GDPs over the preceding three years.
Chart 12. Gross Domestic Savings, 1967-84
(As percentage of GDP)
30 .-------------------------------------�
26
24
20
18
16
14
12
10
' ' \ \ - -.....
\ _.,.,. ' ""'- '-. .... !IUlttstrial coumries \ ; \ /
, _ _ /
Sources: World Bank; and Fund staff esumates.

©International Monetary Fund. Not for Redistribution
26 percent during 1976-80 but then fell back to roughly 24 percent in 1983 and 1984. The major borrowers had a domestic savings ratio of 22 percent in the late 1960s that rose to approximately 25 percent by 1977 but declined to 23 percent in 1984. It is too early to tell whether these recent declines in the domestic savings ratios of the market borrowers and the major borrowers represent a new trend or merely a temporary downturn from the past upward trend.
These variations in domestic savings rates for the groups of market borrowers and major borrowers have at times been strongly influenced by changes in central government fiscal imbalances and thus by the level of public sector savings. As indicated in Chart 13, the fiscal deficits of the central governments of the market bonowers and major borrowers increased sharply relative to GDP between 1980 and 1982, reaching roughly 5 percent of GDP in 1982. During 1983 and 1984, however, net dissaving by the central government declined to 3 percent of GDP for the market borrowers and 2 percent for the major borrowers.
The domestic savings ratio of the official borrowers deteriorated sharply between 1967 and 1984. Their domestic savings ratio was 16 percent of GDP in 1967, and it reached a peak of 19 percent in 1969. However, since 1969, the domestic savings ratio has declined nearly continuously, reaching a level between 9 and 10 percent in 1981. Since 1981, there has been little movement in the ratio. The deterioration in the domestic savings performance of these countries reflected both relatively large fiscal imbalances and adverse domestic and external developments which reduced private savings. Although the size of these fiscal deficits relative to GDP declined in the late 1970s, they still averaged nearly 5Y2 percent of GDP in 1984. This lower level of domestic savings was, to a considerable degree, offset by larger foreign capital inflows (principally from official sources).
Foreign Savings
The capital flows recorded by industrial countries have been considerably larger in absolute terms than capital flows of developing countries. Nevertheless, the importance of foreign savings-as indicated by their size relative to GDP-generally has been much greater for developing countries than for industrial countries. In Chart 14, the ratio of the external current account balance42 (with sign reversed) to GDP is used to measure the relative scale of foreign capital inflows. A positive value of this ratio represents a net inflow of foreign savings, whereas a negative value represents a placement of domestic savings in foreign markets.
42 The current account balance is that on goods, services, and private transfers.
Domestic and Foreign Savings
Chart 13. Fiscal Imbalances, 1967-841
(As percentage of GOP)
2
Sources: World Bank: and Fund staff estimates. 1 A deficit is indicated by a negative value.
While the current account imbalances of the industrial countries have been at times quite large, the ratio of these imbalances to their income has generally been small. These flows (typically an outflow) represented less than 3 percent of this group's domestic savings and less than I percent of their combined incomes. However, the combined current account imbalance of $35 biiUon in 1984 was the second largest since 1973, exceeded only by that in 1980 ($39 billion). Moreover, a distinction must be made between the positions of individual countries and the group as a whole. As noted before, some industrial countries have at times run relatively large current account deficits or surpluses and have therefore been significant users of foreign savings or suppliers of domestic savings to the rest of the world.
For developing countries, foreign saving� have often represented a significant addition to domestic savings. The importance of these foreign inflows can be measured relative to both GDP and gross domestic savings. Net foreign capital inflows to the capital-importing
79

©International Monetary Fund. Not for Redistribution
APPENDIX III • DOMESTIC SAVINGS, FOREIGN SAVINGS, AND INVESTMENT
developing countries amounted on average to nearly 3 percent of their GDP and 14 percent of domestic savings during 1967-84. Even in 1983 and 1984 when current account deficits declined sharply, foreign savings was equivalent to l l percent of gross domestic savings. However, there was a considerable divergence between the experiences of different developing country groups. During 1967-82, the market borrowers bad an average current account deficit of 3 percent of their combined GDPs. Viewed somewhat differently, foreign savings averaged nearly 1 3 percent of gross domestic savings during 1967-81 apd amounted to nearly 23 percent in 1 982. However, this capital inflow had fallen to less than 1 percent of GDP in 1 984, and these flows added only the equivalent of 3 percent to available domestic savings.
The major borrowers' reliance on foreign savings averaged 3 percent of their GDP during 1967-81 , but reached 5 percent of their combined GDPs in 1982. Reflecting the adjustment efforts of these countries
Chart 14. Foreign Capital Flows, 1967-841
(As percentage of GDP)
14
1 2
1 0
ltulustrial countri�.f
- 2
Sources: World Bank; and Fund staff estimates. 1 Foreign capital inflows are measured by the size of the current
account deficit (with sign reversed). A larger, positive value in this chart impHes a larger current account deficit and a larger capital inflow. The current account balance is that on goods. services, and private transfers.
80
and the limited availability of external capital, this group recorded a balanced current account position in 1984.
The official borrowers have experienced relatively large foreign capital inflows since 1967. In the late 1960s, foreign capital inflows represented approximately 4 percent of GDP. These inflows rose to 1 3 percent of GDP in 1975 and remained at nearly 7 percent of GDP during 1982 to 1984. Given the deterioration in this group's domestic savings ratio (Chart 12), official lending and transfers have played a vital role in maintaining investment. While foreign inflows bad equated 24 percent of domestic savings of the official borrowers in the late 1960s, this proportion reached 58 percent in the late 1970s and 7 1 percent in the 1980s.
Investment
While the ratios of gross capital formation to GDP that prevailed in 1983 and 1984 were not very different from those evident in the late 1960s (Chart 15), there has been considerable diversity of experience both between the groups of industrial and developing countries and within the groups of developing countries during the 1970s and early 1980s. The evolution of the
Chart 15. Gross Capital Formation, 1967-84
(As percentage of GDP)
32.---------------------------------------�
Sources: World Bank; and Fund staff estimates.

©International Monetary Fund. Not for Redistribution
industrial countries' domestic savings and investment ratios has been quite similar, since the average net supply of savings to the rest of the world by industrial countries represented only a small proportion of their domestic savings or income. In contrast, the large reliance on foreign savings by developing countries during 1973-82 often aUowed consumption and investment to expand simultaneously. When this occurred during certain periods in the 1970s, investment ratios rose more rapidly than savings ratios.
The behavior of the ratios of gross capital formation to GDP for different groups of developing countries in the period since 1967 is given in Chart 4. For the market borrowers and major borrowers, the domestic investment ratio rose erratically from the late 1960s until the mid- 1970s. This rise in the investment ratios was supported by an increase in both domestic savings
Investment
ratios (Chart 12) and foreign savings ratios (Chart 14). During the late 1970s, in contrast, the investment ratios for these country groups began to decline, while domestic savings ratios stabilized or declined slightly. Associated with these developments was a fall in foreign capital inflows. The decline in the investment ratio accelerated in the early 1980s as there were reductions in the flows of domestic savings and net foreign capital inflows relative to GDP. For the market borrowers, the investment ratio fell from 26 percent in 198J to 2 1 percent in 1984; and, for the major borrowers, the ratio declined from 24 to 19 percent during the same period. As already discussed, this faU in the ratios of investment to GDP for the developing countries was somewhat cushioned by a recovery of domestic savings in 1984, which reflected reduced central government fiscal imbalances.
Note to Appendix Ill
The countries and territories included in the major country groups of the World Economic Outlook are listed below. Countries and territories for which there are savings, investment, capital flows, and fiscal imbalance data for the period between 1967 and 1984 are denoted by an asterisk.
lndusrrial Coumries
Australia* Canada* France* Iceland Japan* New Zealand* Sweden* United Kingdom*
Austria* Denmark* Germany, Ireland" Luxembourg Norway Switzerland* United States*
Belgium* Finland* Fed. Rep. of* Italy Netherlands* Spain*
Marke1 Borrowers
Algeria* Bolivia* Cote d'lvoire* Hong Kong Mexico* Paraguay South Africa* Uruguay*
Antigua and Brazil* Cyprus Hungary* Nigeria* Peru* Suriname Venezuela*
Barbuda Chile Ecuador Indonesia* Panama* Philippines* Trinjdad and Yugoslavia*
Argentina* Colombia* Gabon Korea* Papua New Portugal* Tobago
Bahamas Congo Greece* Malaysia* Guinea Singapore*
Major Borrowers
Argentina* Brazil* Indonesia* Korea* Mexico* Philippines* Venezuela*
Official Borrowers
Afghanistan Central El Salvador* Guinea- Madagascar Nicaragua* Somalia Uganda
Bahrain African Equatorial Bissau Malawi Pakistan* St. Lucia VietNam
Bangladesh Rep. Guinea Guyana Maldives Rwanda St. Vincent Western Samoa
Bhutan Chad Fiji* Honduras* Mali Sao Tome and Sudan Yemen Arab Rep.
Burkina Faso Comoros Gambia. The Jamaica* Malta* Principe Swaziland Yemen, People's
Burma Djibouti Ghana Jordan Mauritania Senegal Syrian Arab Rep. Dem. Rep. of
Burundi* Dominica Grenada Lao People's Nepal Seychelles Tanzania Za"ire*
Cape Verde Dominican Guatemala* Dem. Rep. Netherlands Sierra Leone Togo Zambia*
Rep. Guinea Liberia Antilles
8 1

©International Monetary Fund. Not for Redistribution
Appendix IV
Technical Note on Interest Rate and Currency Swaps
Interest Rate Swap
The typical interest rate swap is designed to arbitrage the different abilities of two borrowers (counterparties) to gain access to the fixed and floating interest rate markets. One counterparty generally has access to floating interest rate debt at relatively attractive rates but wants instead to secure fixed interest rate funds. The other counterparty has good access to the fixed interest rate markets but would prefer to have floating interest rate debt.
For example, the counterparty issuing fixed interest rate debt may be an AAA-rated corporation; while the counterparty supplying floating interest rate debt is an A-rated corporation (Figure 1). The AAA corporation may be able to issue a fixed interest rate bond carrying a 12 percent yield, whereas the A corporation would
FIGURE I
INTEREST RATE SWAP
AAA Corporation
Aoating Interest Rate UBOR + •;.. % Fi:otcd Interest Rate 12%
1314 %
A Corporation
LIBOR + v,% 14%
Interest Rate Differential
V.% 2%
AAA Corporation A Corporation
82
Pays 12% on bond
Fixed rate outilow Fixed rate inOow Floating rate ourOow Aoating rate inOow
Net cost Ahemative cost
Saving
LIBOR+ V> %
l Pays LIBOR + Y2 %
AAA Corporation 12%
13\4 % LIBOR + V> %
LIBOR - .Y.. % LIBOR + V. %
1%
to bank
A Corporation (13\4 %)
LIBOR + Y2% (LIBOR + Y2 %)
1 3 14 % 14%
Y.%
have to pay 14 percent (an interest rate differential of 2 percent). In contrast, the AAA corporation may be able to borrow in the floating interest rate market at the London Interbank Offered Rate (LIBOR) plus Y4 percent, whereas the A corporation could obtain a loan at LIBOR plus !12 percent (an interest rate differential of minus Y4 percent). The combined interest rate differential (2 percent minus !14 percent = 13/4 percent) represents the potential arbitrage gain that the corporations could share through a swap of obligations. The A corporation would be interested in undertakjng
FIGURE 2
CURRENCY SWAP
Initial transaction
OM
Company I
$
Agreed annual interest payment
Company I
Actual OM interest to bond holders
OM agreed interest
$ agreed interest
Tran;;action at linal maturity
Company I
OM principal to bond holders
D M orward contact
S forward contact
Company 2
Company 2
Actual S to bond holders
Company 2
S pnnctpal to bond holders

©International Monetary Fund. Not for Redistribution
a swap if it can obtain fixed interest rate funding at less than 14 percent, whereas the AAA corporation would engage in the swap only if it obtains floating interest rate funds at less than LIBOR plus Y4 percent.
Exactly how the differential is shared between the two corporations is determined by negotiations. One possibility would be for the swap to be arranged so that the A corporation obtains fixed interest rate funds at 1 3 Y4 percent, whereas the AAA corporation would obtain floating rate funding at LIBOR minus % percent. The cumulative benefit for both counterparties equals the initial J3/4 percent interest rate differential. To achieve this situation, the A corporation would agree to service not only the 1 2 percent cost of the AAA corporation's fixed interest rate debt but also to pay I Y4 percent towards the cost of servicing the LIBOR plus 1/2 percent floating interest rate debt that it had raised.
Currency Swaps
Currency Swaps
A typical currency swap is illustrated in Figure 2. In this situation, Company I has an outstanding deutsche mark bond which it is wiUing to swap into an equivalent U .S. dollar liability. Assume Company 2 plans to issue new fixed interest rate U .S. dollar bonds (a market in which it has access to credit at relatively good terms) and to swap the proceeds into deutsche marks (a market where it does not have very good access to credit at a relatively attractive cost). Initially, Company 1 would sell deutsche marks to Company 2 in exchange for U .S. dollars. Over the life of the swap arrangement, the two companies would then agree to provide the amounts of U .S. dollars or deutsche marks needed to service the other party's servicing payments. At the end of the swap period, the two companies would reverse the initial transaction at a prearranged exchange rate.
83

©International Monetary Fund. Not for Redistribution
Appendix V Glossary of Selected Terms
Agreement in principle-the stage of the restructuring or new money package process when the advisory committee banks seek approval by other creditor banks of a draft agreement negotiated with the restructuring country.
Bank advisory committees-also called coordinating committees, a limited number of banks designated by the authorities of a country to act on behalf of and as a liaison group with all bank creditors. Once an agreement is reached with the advisory committee it is then submitted for approval to all participating banks. Typically, membership of advisory committees is determined on the basis of banks' exposure and to secure a regional balance. The bank with the largest exposure usually heads the committee, while member banks often act as regional coordinators.
Club deal-a bank loan which does not require syndication and which is offered and funded by a small group of banks acting in concert.
Cofinancing-loans to developing countries made by commercial banks or other lending institutions in association with the World Bank and other multilateral development banks.
Concerted bank lending-refers to equiproportional increases in bank exposure, coordinated by a bank advisory committee. There has generally been a close linkage between disbursements of concerted bank lending to a country and performance under a Fundsupported adjustment program.
Consolidation period-the period in which amortization payments to be rescheduled or refinanced under the terms of a restructuring agreement have fallen or will fall due.
Counterparty-the party on the other side of a transaction, e.g., a swap transaction is undertaken between two agents with each being the counterparty of the other.
84
Critical mass-a mtrumum amount of bank commitments to a new money package giving reasonable assurance to Fund management that the financing assumptions of an adjustment program are realistic and that the program can be submitted to the Fund Executive Board for approval.
Current maturities-principal and interest payments falling due within the consolidation period.
Cutoff date-the date before which debt must have been incurred in order for its amortization payment to be eligible for restructuring.
Debt refinancing--either a rollover of maturing debt obligations or the conversion of existing or future debtservice payments into a new medium-term loan.
Debt rescheduling-formal deferment of debt-service payments with new maturities applying to the deferred amounts.
Economic subcommittee-subcommittee of a bank advisory committee appointed to evaluate economic prospects of a restructuring country.
Effective rescheduling proportion-the proportion of total payments eligible for restructuring that are rescheduled or otherwise deferred until after the end of the consolidation period.
Events of default-any event which allows creditor banks to declare the outstanding principal , as well as all accrued interest, due and payable on demand.
Floating rate notes-unsecured notes paying interest at rates varying with the yield on a reference interest rate such as LIBOR.
Late interest charges-additional interest charges that may be levied as a result of obligations being overdue beyond a specified period.

©International Monetary Fund. Not for Redistribution
LIBOR-London lnterbank Offered Rate. The rate at which banks in London place Eurocun·encies with each other. It is frequently used in international loans as a reference rate.
Maturity period-the grace period plus the repayment period.
Moratorium-an official declaration or decree by a government postponing aU or certain types of maturing debt for a given period.
Multiyear restructuring agreement (M YRA)-restructuring agreement where the consolidation period covers more than two years beyond the date of the signing of the agreement. These arrangements aim principaUy at eliminating a hump in scheduled amortization which may prevent a return to normal market access. In the context of MYRAs, banks have sought special monitoring procedures to seek to ensure that adequate financial policies would be followed once the restructuring country no longer is using Fund resources. As part of these special monitoring procedures some restructuring countries have requested that the Fund enhance its Article IV consultations.
Onlending-redesignation of credits originally granted to a government or central bank for general balance of payment purposes as loans to parastatals or private sector borrowers.
Previously rescheduled debt-debt service obligations arising from previous debt reschedulings.
Redenomination clause-a clause which, in the context of a debt restructuring agreement, allows banks to redenominate their loans in their home currency. The agreement normally specifies the amount. timing, and currency eligibility of such redenomination as well as the applicable reference interest rates.
Glossary
Securilization-the process in which banks' assets become more marketable through, for example, the substitution of floating rate notes for syndicated lending, the introduction of transferability into international credits. and the packaging of existing assets for resale.
Serial MYRA-agreement where subperiods within the consolidation period of a multi year restructuring agreement (MYRA) are made eligible for restructuring based on periodic reviews of economic performance and prospects. The restructuring for later years in the consolidation period depends on certain conditions being met with regard to economic performance and monitoring arrangements.
Signed agreement-the stage of the restructuring or new money process when creditor banks sign the agreement in principle reached between the advisory committee banks and the restructuring country. Signing the agreement makes it legally effective provided all preconditions contained in the agreement are met.
Standstill-an agreement between bank creditors and a government on a temporary deferment of amortization payments on long-term debt and on a freezing or rollover of short-term debt. Its principal objectives are to prevent a deterioration of the payments situation during the restructuring negotiation period and to preclude an uneven reduction in debt to some banks.
Syndication-the process by which a loan, arranged by one group of banks (i.e., the "lead banks"), is funded by being sold to another group of banks.
Trade deposit facility-facility under which participating creditor banks make foreign exchange deposits at the central bank of the restructuring country. These deposits then may be withdrawn by these banks to finance specified foreign trade transactions with the restructuring country.
85

©International Monetary Fund. Not for Redistribution
Appendix VI
Statistical Tables
Table 23. Cross-Border Interbank Lending and Deposit Taking, 1982-First Half of 1985 1 (In billions of U .S. dollars)
1st 1982 1983 1984 half
Lending to 2 lOS 102 152 77 Industrial countries 73 77 1 10 62
Of which: United States 46 39 24 23 Japan 8 22 10
Developing countries J 16 16 1 1 5 Offshore centers • 18 6 27 1 1 Other transactors s -2 3 5 - I
Memorandum items Capital-importing developing countries M 17 12 5 Major borrowers 7 9 7 3 Non-oil developing countries u 15 1 5 12 5
Deposit taking from • 125 97 152 83 industrial countries 1 13 62 1 2 1 67
Of which: United States 81 16 17 25 Japan 15 11 4
Developing countries l - 9 5 19 7 Offshore centcrs 4 17 22 10 9 Other transactors .s 3 8 2
Memorandum items Capital-importing developing countries J.6 1 3 20 10 Major borrowers 7 4 14 5 Non-oil developing countries 3·8 2 1 0 17 9
86
1984 1985
2nd 1st half half
75 63 48 53
I 8 12 10
6 16 6
6 4
7 I 4 - I 7 I
70 60 54 57
-8 I 7 8
12 - 3 I 4 2 2
10 - 2 9 -2 8 -5

©International Monetary Fund. Not for Redistribution
Statistical Tables
Table 23 (concludetl). Cross-Border Interbank Lending and Deposit Ta.king, 1982-First Half of 1985 1 (ln billions of U .S. dollars)
Change in net claims on 10 Industrial countries
Of which: United States Japan
Developing countries 3 Offshore centers � Other transactors 5 Memorandum items Capital-importing developing countries 3·6 Major borrowers 1 Non-oil developing countries J.s Net errors and omissions 11
Note: Owing to rounding, components may not add.
1982
-20
-40
-35
25 I
- 5
13 20
1983
5 15
23 - 7
10 - 16
-4
4 5 5
- 5
1st 1984 half
-6 - 1 1 - 4
7 -2 11 6
- 9 - 2 17 2
3 - I
- 7 - 5 - 6 - 2 - 5 - 4
6
Sources: International Monetary Fund, International Financial Statistics (IFS); and Fund staff estimates.
1984 2nd half
5 - 6
9 5
- 7 15 3
- 3 -5 - I - 5
1985 1st
half
3 -4
7 2 3 2 2
4
7 3
' Data on lending and deposit taking are derived from stock data on the reporting countries' liabilities and assets, excluding changes attributed to exchange rate movements.
2 As measured by differences in the outstanding liabilities of borrowing countries, defined as cross-border interbank accounts by residence of borrowing bank.
3 Excluding offshore centers. • Consisting of the Bahamas, Bahrain, the Cayman Islands, Hong Kong, the Netherlands Antilles, Panama. and Singapore. 5 Transactors included in IFS measures for the world, to enhance global symmetry, but excluded from IFS measures for "All Countries."
The data comprise changes in the accounts of the Bank for lnternational Settlements with banks other than central banks; and changes in identified cross-border interbank accounts of centrally planned economies (excluding Fund members).
6 Consisting of all developing countries except the eight Middle Eastern oil exporters (Islamic Republic of Iran, Iraq, Kuwait, Libyan Arab Jamahiriya, Oman. Qatar, Saudi Arabia, and the United Arab Emirates) for which external debt statistics are either not available or are small in relation to external assets.
1 Consisting of Argentina, Brazil. Indonesia, Korea, Mexico, the Philippines, and Venezuela. 8 Consisting of all developing countries except the eight Middle Eastern oil exporters (Listed in footnote 6), Algeria, Indonesia, Nigeria,
and Venezuela. 9 As measured by differences in the outstanding assets of depositing countries, defined as cross-border interbank accounts by residence of
lending banks. 10 Lending to, minus deposit taking from. 1 1 Calculated as the difference between global measures of cross-border interbank lending and deposit taking.
87

©International Monetary Fund. Not for Redistribution
APPENDIX VI • STATISTICAL TABLES
Table 24. International Bank Lending to Nonbanks and Deposit Taking from Nonbanks, 1982-First Half of 1985 1 (In billions of U.S. dollars)
Lending to ' Industrial countries
Of which: United States Japan
Developing countries 1 Offshore centers • Other transactors � Unidentified borrowers 6 Memorandum items Capital-importing developing countries 3•7 Major borrowers 8 Non-oil developing countries 1·9
Deposit taking from •o Industrial countries
Of which United States Japan
Developing countries 1 Offshore centers • Other transactors � Unidentified depositors � Memorandum items Capital-importing developing countries 3•7 Major borrowers 8 Non-oil developing countries 1·9
Change in net claims on 11 Industrial countries
Of which: United Slates Japan
Developing countries ' Offshore centers • Other transactors s Unidentified (net) 0 Memorandum items Capital-importing developing countries 3•7 Major borrowers s Non-oil developing countries 3·�
Note: Owing to rounding, components may not add.
1982
80 5 1
14
35 7 I
- 12
26
63 37
26
13 8 I 6
15
17 14
-12
22 - I
- 18
12
I st 1983 1984 half
37 40 21 1 5 7 3
- I 1 1 5 2 -3 - I
22 5 - I 2 2 2 I
-4 24 18
20 4 - I 4 2
16 7
64 39 3 1 26 12 12
16 -6 4 I
23 4 6 5 9 3 2 8 14 10
24 6 6 8 3 I
22 5 5
-27 I - 10 - 1 1 - 5 - 9
- 1 7 16 2 -4 -I
- l l - 6 - 3 - 6 - 3
I - 12 1 1 8
- 4 - 3 - 7 - 4 - I - 2 - 6 I - 6
Sources: International Monetary Fund. International Financial Statistics (IFS); and Fund staff estimates.
1984
2nd half
1 9 3
6 -2
6 3 I 6
5 2 6
8
-10 I
- I 5
4
2 2 I
1 1 3
16 -3
7 - 3
I 3
4 I 6
1985
1st half
9 4
4 - I
I I I 2
I 2 2
12
-2
6
6
6 2 5
-3 4
6 -I - 5
I I
-4
-4 I
- 2
1 Data on lending and deposit taking are derived from stock data on the reporting countries' liabilities and assets, excluding changes attributed to exchange rate movements.
1 As measured by differences in the outstanding liabilities of borrowing countries, defined as cross-border bank cred.its to nonbanks by residence of borrower.
1 Excluding offshore centers. • Consisting of the Bahamas, Bahrain, the Cayman Islands, Hong Kong, the Netherlands Antilles, Panama. and Singapore. ' Transactors included in IFS measures for the world, to enhance global symmetry, but excluded from IFS measures for ''All Countries."
The data comprise changes in the accounts of international organizations (other than the Bank for International Settlements) with banks; and changes in identified cross-border bank accounts of nonbanks in centrally planned economies (excluding Fund members).
• Calculated as the difference between the amount that countries report as their banks' positions with nonresident banks in their monetary statistics and the amounts that banks in major financial centers report as their positions with nonbanks in each country.
7 Consisting of all developing countries except the eight Middle Eastern oil exporters (Islamic Republic of Iran, Iraq, Kuwait, Libyan Arab Jamahiriya. Oman. Qatar, Saudi Arabia, and the United Arab Emirates) for which external debt statistics are either not available or are smaU in relation to external assets.
8 Consisting of Argentina, Brazil, Indonesia, Korea, Mexico, the Philippines. and Venezuela. • Consisting of all developing countries except the eight Middle Eastern oil exporters (listed in footnote 7). Algeria. Indonesia, Nigeria,
and Venezuela. 10 As measured by differences in the outstanding assets of depositing countries defined as international bank deposits by nonbanks by
residence of depositor. 1 1 Lending to, minus deposit taking from.
88

©International Monetary Fund. Not for Redistribution
Statistical Tables
Table 25. Total Cross-Border Bank Lending to and Deposit Taking from Developing Countries,
1982--First Half of 1985 1 (In billions of U.S. dollars)
Lending to 2 Offshore centers > Developing countries •
Africa Asia Europe Middle East Western Hemisphere
Deposit taking from 5 Offshore centers 1 Developing countries •
Africa Asia Europe Middle East Western Hemisphere
Change in net claims on 6 Offshore centers 1 Developing countries •
Africa Asia Europe Middle East Western Hemisphere
1982
75.8 24.7 5 1 . 1
28.7
24.8 3.9
47.1
-0.1 47.2
Note: Owing to rounding, components may not add.
1983
45.3
7.4 37.9
7.3
8.4
3.1
3.3
15.8
55.0
26.5 28.5
1.8
/1.2
2.4
-3.0
16.2
-9.7
- 19.1 9.4 5.5
-2.8
0.7
6.3
-0.4
tst 1984 half
45.0 15.0
29.3 10.8 15.7 4.1
0.7 0.6
5.8 1.9
2.9 1.0
- / . I -0.9
7.3 /.7
42.1 24.9
18.7 12.4 23.4 12.5
-0.5 -0.1
6.2 6.8
4.7 0.9
-3.6 -2.1
/6.6 7.0
2.9 -9.9
10.6 - 1 .6 - 7.7 -8.3
1.2 0.7
-0.4 -4.9
- 1 . 7 0.1
2.5 1.2
- 9.3 -5.3
Sources: International Monetary Fund, International Financial Statistics; and Fund staff estimates.
1984
2nd half
30.0
18.5 11 .5
0.1
3.9
2.0
-0.2
5.6
17.2
6.3 10.9
-0.4
-0.6
3.8
-1.5
9.6
12.8
12.2 0.6 0.5
4.5
-1.8
1.3
-4.0
1 Data on lending and deposit taking are derived from stock data on the reporting countries' Liabilities and assets. excluding changes attributed to exchange rate movements.
2 As measured by differences in the outstanding liabilities of borrowing countries, defined as cross-border interbank accounts by residence of borrowing bank plus international bank credits to nonbanks by residence of borrower.
1 Consisting of the Bahamas, Bahrain. the Cayman Islands. Hong Kong, the Netherlands Antilles, Panama. and Singapore. • Excluding offshore centers.
1985
1st half
7.9
6.9 0.8
-0.4
/.9
2.9
-2.7
-0.8
7.1 4.2
2.9 3.0
0.9
0.5
-1.0
-0.5
0.8
2.7 -2.0 -3.4
1.0
2.4
-1.7
-0.3
s As measured by differences in the outstanding assets of depositing countries, defined as cross-border interbank accounts by residence of lending bank plus international bank deposits of non banks by residence of depositor.
• Lending to, minus deposit taking from.
89

©International Monetary Fund. Not for Redistribution
APPENDIX VI • STATISTICAL TABLES
Table 26. Cross-Border lnterbank Lending to and Deposit Taking from Developing Countries, 1982-First Half of 1985 1 (In billions of U .S . dollars)
1984
1st 2nd 1982 1983 1984 half half
Lending to 1 34.6 21.3 37.4 15.7 21.7
Offshore centers 3 18.1 5.8 26.9 10.9 16.0 Developing countries • 16.4 15.5 10.5 4.8 5.7
Africa I .5 I .6 0.5 1.1 Asia 2.0 2.3 I .6 0.7 Europe 0.5 /.4 0.2 1.2 Middle Ecm -0.2 -1.6 -0.5 -1.1 Western Hemisphere 11.7 6.8 3.0 3.8
Deposit taking from • 8.5 26.9 29.2 15.9 13.3
Offshore centers 3 17.2 21.5 10.1 9.0 1 . 1 Developing countries 4 -8.7 5.4 19.1 6.9 12.4
Africa 0.4 -0.3 -0.1 -0.2 Asia 8.0 7.0 5.2 1.8 Europe /.5 4.1 0.7 3.4 Middle East -7.0 -3.5 -4.3 -0.8 Western Hemisphere 2.6 11.8 5.4 6.4
Change in net claims on • 26.1 -5.6 8.2 -0.2 8.4
Offshore centers l 1.0 - 1 5.7 16.9 2.0 14.9 Developing countries • 25. 1 10.1 - 8.6 -2.2 -6.5
Africa 1.1 1.9 0.6 1.3 Asia -6.0 -4.7 -3.6 - 1 . 1 Europe -1.0 -2.7 -0.5 -2.2 Middle East 6.8 1.9 3.8 -1.9 Western Hemisphere 9.1 -5.0 -2.4 -2.6
Note: Owing to rounding, components may not add. Sources: International Monetary Fund, International Financial Statistics; and Fund staff estimates. 1 Data on lending and deposit taking are derived from stock data on the reporting countries' liabilities and assets, excluding changes
allributed to exchange rate movements. 2 As measured by differences in the outstanding liabilities of borrowing countries, defined as cross-border interbank accounts by
residence of borrowing bank. 3 Consisting of the Bahamas, Bahrain, the Cayman Islands, Hong Kong, the Netherlands Antilles, Panama, and Singapore. • Excluding offshore centers.
1985
1st half
6.3
5.8 0.3
1.2 2.3
- / .8 -1.3
0.9
3.8 -2.9
1.8 0.5
-0.3 - 1 . 7 -3.2
5.4
2.0 3.2
-1.8 0.7 2.6
-0.1 1.9
5 As measured by differences in the outstanding assets of depositing countries. defined as cross-border interbank accounts by residence of lending banks.
6 Lending to, minus deposit taking from.
90

©International Monetary Fund. Not for Redistribution
Statistical Tables
Table 27. Cross-Border Interbank Lending to and Deposit Taking from Non banks in Developing Countries, 1982-First Half of 1985 1 (In billions of U.S. dollars)
Lending to 2 Offshore centers 3 Developing countries •
Africa Asia Europe Middle East Western Hemisphere
Deposit taking from 5 Offshore centers 3 Developing countries •
Africa Asia Europe Middle East Western Hemisphere
Change in net claims on 6 Offshore centers 3 Developing countries •
Africa Asia Europe Middle Easr Western Hemisphere
1982
41.2
6.5 34.7
20.2
7.6 12.6
21.0
- I . I 22.1
Note: Owing to rounding, components may not add.
1983
24.0
1.6 22.4 5.8 6.4 2.6 3.5 4.1
28.1
5.0 23.1
1 .4 3.1 0.9 4.2
13.6
-4.1
-3.4 -0.7
4.4 3.3 1.7
-0.7 -9.5
1st 1984 half
7.4 -0.8
2.4 -0.1 5.0 -0.7
-0.9 0.1 3.5 0.3 1.5 0.7 0.4 -0.5 0.5 - 1 .3
12.9 9.0
8.6 3.4 4.3 5.7
-0.3 -0.1 -0.7 1.7
0.6 0.2 2.3
4.8 1.6
-5.5 -9.8
-6.2 -3.5 0.6 -6.4
-0.7 0.1 4.2 -1.4 0.9 0.5 0.4 -2.7
-4.3 -2.9
Sources: International Monetary Fund, lmemational Financial Statistics: and Fund staff estimates.
1984
2nd half
8.2
2.5 5.7
-1.0 3.2 0.8 0.9 1.8
3.9
5.2 - 1 .3 -0.2 -2.4
0.4 -2.3
3.2
4.3
-2.7 7.0
-0.8 5.6 0.4 3.2
- 1 .4
1 Data on lending and deposit taking are derived from stock data on the reporting countries' liabilities and assets, excluding changes attributed to exchange rate movements.
1985
1st half
1.7
1.1 0.6
-0.4 0.7 0.6
-0.9 0.5
6.0
0.4 5.7 1.3 0.3 0.8 0.7 2.6
-4.4
0.7 -5.1 - /.6
0.4 -0.2 -1.6 -2.1
' As measured by differences in the outstanding liabilities of borrowing countries, defined as cross-border interbank credits to nonbanks by residence of borrower.
3 Consisting of the Bahamas, Bahrain, the Cayman Islands, Hong Kong, the Netherlands Antilles, Panama, and Singapore. • Excluding offshore centers. 5 As measured by differences in the outstanding assets of depositing countries, defined as international bank deposits of nonbanks by
residence of depositor. 6 Lending to, minus deposit taking from.
9 1

©In
tern
atio
nal M
onet
ary
Fund
. Not
for R
edis
tribu
tion
\0
>
N
"0
"0
[l]
z
0
><
Ta
ble
28.
Cro
ss-C
ou
ntr
y C
om
pa
riso
n o
f C
om
po
nen
ts o
f E
xternal
Asse
ts a
nd
Lia
bil
itie
s, E
nd
-Decem
ber
19
84
<
(In
bil
lio
ns
of
U .S
. d
oll
ars
) • en
C
ross
-Bo
rde
r In
tern
ati
on
al
Cro
ss-B
ord
er
Lnte
rna
lio
na
l T
ota
l E
xte
rna
l N
et
Ex
tern
al
-l
>
lnte
rba
nk
B
an
k C
red
its
To
tal
Ex
tern
al
lnte
rba
nk
B
an
k D
ep
osi
ts
Ass
ets
of
Lia
bil
itie
s j
A
cc
ou
nts
by
to
No
nb
an
ks
Lia
bil
itie
s o
f A
cco
un
ts b
y
of
No
nb
an
ks
Ba
nk
s a
nd
o
f B
an
ks
an
d
en
Re
sid
enc
e o
f b
y R
esi
de
nce
B
an
ks
and
No
n-
Re
sid
en
ce o
f by
R
esi
de
nce
N
on
ba
nk
s N
on
ba
nk
s _,
B
orr
ow
ing
Ba
nk
o
f B
orr
ow
er
ba
nk
s to
Ba
nk
s L
en
din
g B
an
k
of
Depo
sito
r w
ith
Ba
nk
s to
Ba
nk
s ()
>
In
du
stri
al
cou
ntr
ies
I ,31
2. 7
27
9.9
1,
59
2.6
1,
315
.4
29
8.5
1,
613
.9
-2
1.3
r
M
ajo
r in
du
stri
al
cou
ntr
ies
1,02
9.7
17
3.5
1,
203
.1
969.
3 22
7.6
1,
196
.9
6.2
_,
O
the
r in
du
stri
al
cou
ntr
ies
283.
0
106.5
38
9.5
34
6.1
71.
0
417
.1
-27
.6
>
1:1:1
Cen
tral
ly p
lann
ed e
cono
mies
3
2.6
8
.6
41.
1 19
.8
0.6
20
.3
20
.8
r- [l]
Cz
ec
ho
slo
va
kia
1.
9
0.6
2.
4
1.0
1.
0
1.4
CIJ
G
erm
an
De
mo
crati
c R
epu
bli
c 7
.0
1.4
8
.3
4.5
0
.1
4.6
3.
7
Po
lan
d
8.0
2.
4
10.3
1.
4
0.2
1.
6
8.7
U
.S.S
.R.
13.1
3.
6
16.7
11
.2
0.2
11
.3
5.4
O
ther
2.
6
0.6
3.
4
1.7
0
.1
1.8
1.
6
Dev
elop
ing
coun
tries
6
24.5
3
63
.2
98
7.7
6
02
.9
219
.1
82
1.9
16
5.8
O
ffsh
ore
ce
nte
rs
388.
3 33
.4
42
1.7
364
.0
58.9
4
22.9
-
1.2
Ca
pit
al-
imp
ort
ing
de
ve
lop
ing
c
ou
ntr
ies
219
.7
312
.0
53
1.7
15
9.4
12
3.8
28
3.2
248
.5
Afr
ica
11
.6
46.2
57
.8
7.9
13
.1
21.
0
36.8
C
olt' d
' ho
ire
0.1
2.
0
2.1
0
.1
0.3
0.5
1.6
Liber
ia
9.8
9.8
3.
8 3.
8 6.
0
Mor
occo
0
.5
3.6
4.1
0
.1
0.5
0.6
3.5
Nig
eria
0.
3 7.
0 7.
3 1.
7
1.2
2
.9
4.4
Sout
h Af
rica
]J
8.
5 9.
8
0.6
1.
0
1.7
8./
O
ther
9.
4 15
.3
24.7
5.
4 6.
3 11
.5
/3.2
A
sia
4
5.5
55
.0
100.4
66
.0
11.9
77
.9
22.5
C
hina
3
.6
1.4
5.
0
14.4
0.
3 14
.7
-9
.7
Indi
a 2.
6 2.
6 4.
3 1.
4
5.7
-
3.1
In
done
sia
0.9
12
.5
13.4
9.
2 0.
5 9.
8
3.6
Kor
ea
22.1
12
.1
34.2
8
.1
0.4
8.
6 25
.6
Ma/
a,·si
a 2.
3
9.1
1/.4
3
.2
1.3
4.6
6.
8
Phi
lippi
nes
8.5
6.5
15.0
2.
2 1 .
I 3.
3 11
.7
Thai
land
2.
0
4.5
6.6
1.6
0.
3 1.
9
4.7
O
ther
6
.1
63
12.2
23
.0
6.6
29.3
-
17.1
E
uro
pe
37
.4
24.6
6
2.1
16
.2
11.0
27
.2
34.9
G
reec
e 1.
2
6.0
7.
3 2.
3 -1.
7 7.
1 0
.2
Hun
gary
7.
7 1.
4
9.1
2.2
2.2
6.9
Por
tuga
l 0
.1
9.2
9.2
2.3
2.6
4.
9 43
R
oman
ia
6.8
0
.9
7.6
1.1
1.1
6.5
Tur
key
9.6
2.3
12.0
3.
3 1.
8
5.1
6.
9 Yu
gosl
a•·ia
12
.0
3.2
15
.2
3.3
0.3
3.6
11.6
O
ther
1.
6
1.7
1.
7
1.6
3
.2
-1.
5 M
idd
le E
ast
15
.7
8.6
24
.3
21.
9
21.
5 4
3.4
-
19.1
E
gyp
t 8
.5
3.1
11
.6
9.1
1.4
1/.6
Is
rael
3
.8
1.3
6.1
7.
2 1.
6 9.
8 -
3.7
S
vria
2
.1
0.2
2.3
0.4
1.0
1.
4
0.9
O
ther
1.
3
3.0
4.
3 5.
2 15
.5
20.6
-
16.3

©In
tern
atio
nal M
onet
ary
Fund
. Not
for R
edis
tribu
tion
We
ste
rn H
emis
ph
ere
109
.5
177
.6
28
7.1
4
7.4
6
6.3
11
3.7
17
3.4
A
rgel
lfina
7.
0
17.6
24
.6
1.5
7.
6 9.
1 15
.5
Bra
zil
41.
2
52.2
93
.5
13.9
8
.2
22.1
71
.4
Chi
le
10.0
6.
7 /6
.6
3.0
1.
9
4.9
11.7
C
olom
bia
lJ
5.3
7.6
15
1.4
3
.9
3.7
M
exi
co
33.6
56
.8
90.4
7.
6 14
.3
21.
9 68
.5
Nic
arag
ua
1.8
0
.6
2.4
05
0.1
0.6
1.
8
Per
tt 0
.7
-1.0
4
.7
1.8
1.4
3.2
1.5
Ven
e::.ue
la
3.0
20
.2
23.3
8.
8 11
.7
20.5
2.
8 0
1her
9.
9 14
.2
24.0
8.
8 18
.7
27.5
-
3.5
Un
aiJ
oca
ted
an
d i
nte
rna
tio
na
l or
gani
zatio
ns
32
.6
84
.8
117
.4
27
.2
126
.4
153
.6
-3
6.2
Of
wlr
iclz:
In
tern
atio
nal
orga
niza
tions
32
.6
6.9
39.5
27
.2
6.2
33.4
6
.1
Total
2
,002
.3
736.5
2
,73
8.8
1
,965
.2
644.6
2
,609
.7
129
.1
Me
mo
ra
nd
um
ife
ms:
(D
ata
ex
clu
de
off
sho
re c
ente
rs)
No
n-o
il d
evel
op
ing
co
un
trie
s 2
11.
0
26
4.6
4
75
.6
138
.2
108
.6
24
6.8
2
28
.8
Oil
ex
poni
ng
dev
elop
ing
coun
trie
s 25
.2
65
.2
90.3
100
.7
51
.5
152
.2
-6
1.9
So
urc
e:
Inte
rna
tio
na
l M
on
eta
ry F
und,
lm
ernat
iona
l F
inar
rcia
l Sra
tisf
ics.

©In
tern
atio
nal M
onet
ary
Fund
. Not
for R
edis
tribu
tion
Ta
ble
29
. L
on
g-T
erm
In
tern
ati
on
al
Ba
nk
Cre
dit
Co
mm
itm
ents
, 19
79-
Firs
t H
alf o
f 19
85
(In
bil
lio
ns
of
U.S
. d
oU
ars
)
J979 I
J9
80 I
19
81
198
2 19
83
198
4!
Lo
ng
-ter
m e
xte
rnal c
red
it c
om
mit
men
ts
Ind
ust
ria
l c
ou
ntr
ies
24
.1
39.3
4
4.8
5
1.6
27
.9
29.9
S
el'e
n la
rges
t 1
2.9
2
3.4
2
7.8
3
1.2
1
5.0
1
8.2
Oth
er
11
.2
15
.9
17
.0
20
.4
12
.9
11
.7
Dev
elo
pin
g c
ou
ntr
ies
50.9
38
.3
48
.1
44.6
34
.9
31.
0
Ca
pit
al-
imp
ort
ing
49
.8
37.8
4
7.0
4
2.6
32
.6
29.9
A
fric
a 4
.8
2.6
4
.1
2.7
2
.7
0.5
Asi
a 1
/.0
9
.2
12.8
1
2.6
1
0.4
1
0.2
Eur
ope
7.8
4
.9
4.7
3
.7
3.5
3
.4
Mid
dle
Eas
t 0
.2
0.7
0
.2
0.6
0
.7
0.4
Wes
tern
Hem
isph
ere
26
.0
20
.4
25
.2
23
.0
15
.3
15
.4
Cen
tra
lly
pla
nn
ed e
con
om
ies•
3.
6
1.7
0
.7
0.:!
0
.5
2.2
In
tern
ati
on
al
orga
niz
ati
on
s a
nd
un
aU
oc
ate
d
0.4
0
.7
1.0
1.
8
3.9
3
.5
Tot
al
79
.1
79.9
94
.6
98
.2
67.2
66
.6
Oth
er i
nte
rna
tio
na
l lo
ng
-ter
m b
an
k f
acil
itie
s
Ind
ust
rial
co
un
trie
s 4
6.5
3
.1
12.4
47
.8
Se1
•en
larg
est
45
.9
1.4
1
0.6
3
3.9
Oth
er
0.6
1
.7
/.8
1
3.9
Dev
elo
pin
g c
ou
ntr
ies
6.5
2
.1
1.0
6
.9
Ca
pit
al-
imp
ort
ing
6
.5
2.1
0
.9
6.6
A
fric
a 0
.1
0.2
Asi
a 0
.2
0.5
0
.4
1.5
Eur
ope
0.4
0
.3
0.7
Mid
dle
Eas
t 0
.2
Wes
tern
Hem
isph
ere
6.2
1
.2
4.3
Cen
tra
lly
pla
nn
ed e
co
no
mie
s •
Inte
rna
tio
na
l o
rgan
iza
tio
ns
an
d u
na
lloca
ted
0
.1
0.2
0
.1
0.6
Total
5
.3.1
5
.4
13.5
5
5.3
198
4
1st
2n
d
ha
lf
ha
lf!
12.5
5
.4
7.1
18.0
17
.6
0.3
4.6
1.2
0.1
1/
.4
0.7
2
.2
33
.4
31.
5 2
8.8
2.6
0.8
0
.6
0.3
0.4
17.5
1
2.8
4.6
13.0
12
.3
0.2
5.6
2.2
0.3
4.0
1.5
1.
2
33
.2
16.3
5
.0
11
.2
6.2
5
.9
0.2
1 .I
0
.3
4.3
198
5
1st
ha
lf 1
16.4
1
2.6
3.8
9.3
8
.7
1.1
2.9
2.3
2.4
1.6
1.
6
28.9
17.3
1
2.5
4.8
2.1
1.
9
1.3
0.5
0.6
0
.6
32
.3
23.0
20
.0
>
"'0
"'0
m
z
2
X
<

©In
tern
atio
nal M
onet
ary
Fund
. Not
for R
edis
tribu
tion
Ind
ust
ria
l co
un
trie
s S
e1•e
n /a
rge.s
t O
ther
D
evel
op
ing
co
unt
ries
C
ap
ita
l-im
port
ing
A
fric
a A
sia
E
uro
pe
Mid
dle
Ea
st
Wes
tern
Hem
isp
her
e C
entr
aU
y p
lan
ned
eco
no
mie
s •
Inte
rna
tio
na
l o
rga
niz
ati
on
s a
nd
un
allo
ca
ted
To
tal
Mem
ora
nd
um
ite
m:
Oth
er i
nte
rna
tio
na
l lo
ng
-ter
m
ba
nk
fa
cili
ties
, ex
clu
din
g m
erg
er
rela
ted
fac
ilit
ies
No
te:
Ow
ing
to
ro
un
ding
, co
mp
on
ents
ma
y n
ot
ad
d. 2
4.1
39
.3
12
.9
23
.4
11
.2
15.9
50
.9
38
.3
49
.8
37
.8
4.8
2
.6
11
.0
9.0
7.8
4
.9
0.2
0
.7
26
.0
20
.4
3.6
1.
7
0.4
0
.7
7!U
7
9.9
To
tal
inte
rna
tio
na
l co
mm
itm
ents
91.
3
54
.6
40
.2
77
.6
73.6
3
2.6
2
5.5
5
2.1
17.6
2
2.1
1
4.7
2
5.5
54
.6
46
.8
35
.9
37
.9
53
.5
44
.8
33
.5
36
.5
4.2
2
.7
2.7
0
.7
13
.0
13
.1
10
.8
11
.7
4.7
4
./
3.8
4
.2
0.2
0
.6
0.8
0
.4
3/
.3
24
.2
15
.3
19
.7
0.7
0
.2
0.5
2
.2
1.1
2
.0
4.0
4
.1
147
.7
103
.6
80.7
12
1.8
5.4
9
.5
28.9
So
urc
es:
Org
aniza
tio
n f
or
Eco
no
mic
Co
ope
rati
on
an
d D
evel
op
me
nt.
Fin
anc
ial
Sta
tist
ics
Mon
thly
; a
nd
Fu
nd
sta
ff e
stim
ate
s.
' In
clu
de
s o
nly
Eu
rocr
edit
co
mm
itm
en
ts.
43
.9
33
.7
34
.2
17.9
9.7
1
5.8
18.8
19
.1
18.3
18
.2
0.3
0
.4
4.9
6
.7
1.6
2
.6
0.1
0
.3
11
.4
8.3
0.7
1
.5
2.3
1.
8
65
.7
56
.2
5.9
2
3.0
2 In
clu
des
ag
reem
ents
in
pri
nci
ple
with
Arg
enti
na
an
d t
he
Phil
ipp
ine
s, a
nd
ex
clu
de
s th
e s
ho
rt-t
erm
tra
de
de
po
sit f
acil
ity
fo
r A
rgen
tin
a o
f $
0.5
bil
lio
n.
3 In
clu
de
s ag
reem
ents
in
pri
nci
ple
wit
h C
hil
e a
nd
Co
lom
bia
. •
Ex
clu
des
Fu
nd
mem
ber
co
un
tries
.
33.
7 2
5.1
8.6
I 1.
4
10.6
1.1
4.3
2.8
2.4
1.6
2.2
48.9
20
.0

©International Monetary Fund. Not for Redistribution
APPENDIX VI • STATISTICAL TABLES
Table 30. New Long-Term External Bank Credit Commitments by Country of Destination, 1979-First Half of 1985
(In billions of U.S. dollars)
1984 1985 3 1st I Sl
1979 I 1980 I 1981 1982 1983 1984 2 half half
Industrial countries 24.1 39.3 44.8 51.6 27.9 29.9 12.5 16.4
Australia 0.7 1.7 3.9 5.9 2.7 2.4 1.6 0.2 Belgium 1.0 3 . 1 0.5 2.0 0.1 0.9 0.9 0.2 Canada 0.9 6.4 5 . 1 7.0 2.1 2.7 0.2 4.8 Denmark 1.2 1 .6 1.6 1.6 2.2 0.7 0.2 France 2.8 1 .9 0.6 6.6 1.5 2.0 0.6 0.3 Italy 3.4 6.5 6.4 5.3 2.8 4.7 1.3 3.7 Spain 3.7 4.5 4.8 2.0 2.7 3.5 1.9 1.4 Sweden 1.5 1.3 2.5 2.0 2.6 0.4 0.3 0.4 United Kingdom 2.0 1 .7 2.6 2.2 0.9 3.3 1.5 2.0 United States 3.7 6.4 12.9 10.0 7.3 5.3 1 .8 1 .8 Other 3.2 4.0 3.9 7.0 3.0 4.0 2.2 1.6
Centrally planned economies 3.6 1.7 0.7 0.2 0.5 2.2 0.7 1.6
Czechoslovakia 0.5 0.5 0. 1 German Democratic RepubHc 0.7 0.4 0.5 0.1 0.4 0.7 0.1 0.6 Poland 0.9 0.7 0.3 U.S.S.R. 0.3 0.1 0.1 0.9 0.5 0.9 Other 1.4 0.2 0.3 0.1 0.1
Developing countries 50.9 38.3 48.1 44.6 34.9 31.0 18.0 9.3
Capital-importing developing countries 49.8 37.8 47.0 42.6 32.6 29.9 17.6 8.7
Africa 4.8 2.6 4. 1 2.7 2.7 0.5 0.3 1 . 1 Cote d'Jvoire 0.2 0.4 0.6 0.5 0.1 Morocco 0.6 0.5 0.6 0.2 0.1 Nigeria 1.2 0.7 2.0 0.4 0.2 South Africa 0.1 0.4 0.3 1.0 0.2 0.2 0.2 Other 2.7 0.7 0.6 0.6 2.2 0.3 0.1 1.0
Asia 1 1 .0 9.2 12.8 12.6 10.4 10.2 4.6 2.9 China 3.1 0.4 0.5 0.3 0.1 0.2 0.1 0.1 India 0.1 0.1 1.0 0.4 0.7 0.6 0.1 Indonesia 0.7 1.0 1.1 1.1 2.0 1.6 0.9 Korea 2.7 2.0 3.2 3.6 3.5 3.7 1.6 2.3 Malaysia 0.2 1.1 1.5 2.4 1.4 1.0 0.9 0.2 Philippines 1.8 1.3 0.9 1 . 1 0.6 0.9 Thailand 0.3 0.9 0.8 0.3 0.4 0.8 0.1 Other 2.1 2.5 3.8 3.4 1.7 1.4 0.9 0.3
Europe 7.8 4.9 4.7 3.7 3.5 3.4 1.2 2.3 Greece 0.9 1.2 1.0 0.9 1.2 1.1 0.5 0.6 Hungary 1.0 0.6 0.6 0.3 0.5 0.8 0.1 0.5 Portugal 0.8 0.7 1.7 1.5 I .0 1.0 0.3 0.6 Turkey 3.2 0.3 0.3 0.4 0.3 0.6 Yugoslavia 1.7 1.8 1.0 0.5 0.6 Other 0.3 0.6 0.4 0.2 0.1
Middle East 0.2 0.7 0.2 0.6 0.7 0.4 0.1 Egypt 0.2 0.4 0.1 Jordan 0.1 0.2 0.2 0.3 0.3 0.1 Other 0.1 0.3 0.2 0.2
96
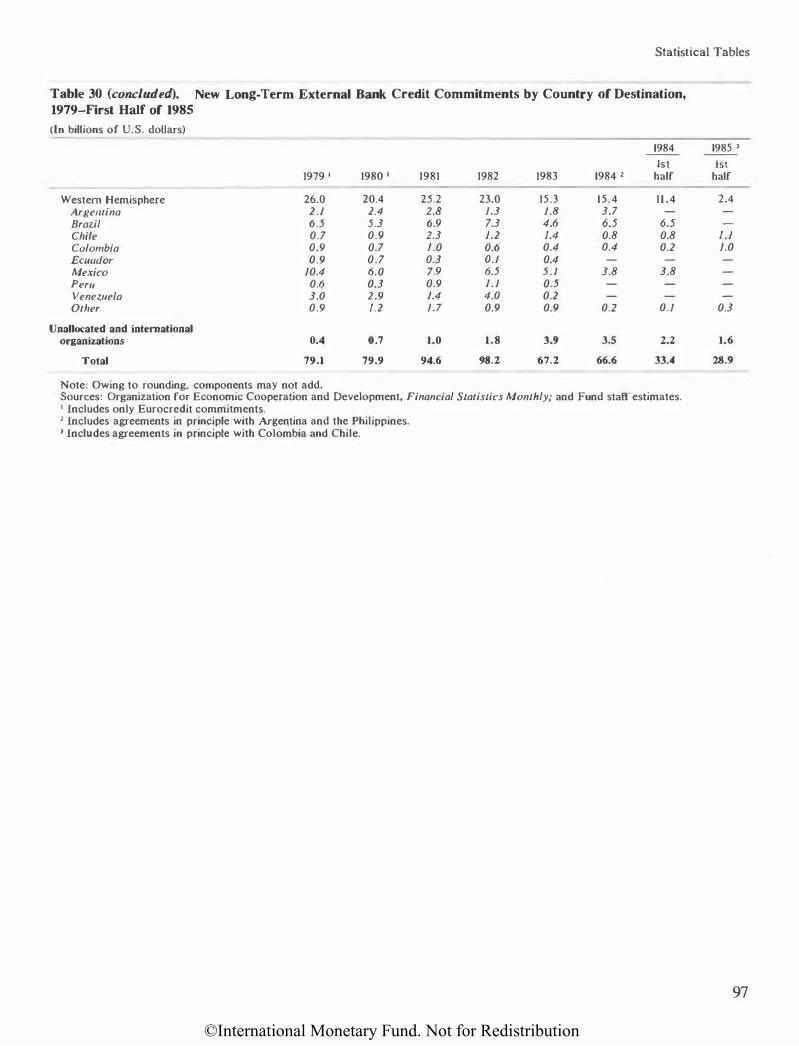
©International Monetary Fund. Not for Redistribution
Statistical Tables
Table 30 (concluded). New Long-Term External Bank Credit Commitments by Country of Destination, 1979-First Half of 1985
(In billions of U.S. doUars)
1984
1st 1979 I 1980 I 1981 1982 1983 1984 2 half
Western Hemisphere 26.0 20.4 25.2 23.0 15.3 15.4 11.4 Argefllina 2.1 2.4 2.8 1.3 1.8 3.7
Brazil 6.5 5.3 6.9 7.3 4.6 6.5 6.5 Chile 0.7 0.9 2.3 1.2 1.4 0.8 0.8
Colombia 0.9 0.7 1.0 0.6 0.4 0.4 0.2
Ecuador 0.9 0.7 0.3 0.1 0.4
Mexico 10.4 6.0 7.9 6.5 5.1 3.8 3.8
Peru 0.6 0.3 0.9 I .I 0.5
Venezuela 3.0 2.9 1.4 4.0 0.2
Other 0.9 1.2 I .7 0.9 0.9 0.2 0.1
Unallocated and international organizations 0.4 0.7 1.0 1.8 3.9 3.5 2.2
Total 79.1 79.9 94.6 98.2 67.2 66.6 33.4
Note: Owing to rounding, components may not add. Sources: Organization for Economic Cooperation and Development, Financial Statistics Mon1hly; and Fund staff estimates. 1 Includes only Eurocredit commitments. 2 Includes agreements in principle with Argentina and the Philippines. ) Includes agreements in principle with Colombia and Chile.
1985 )
1st half
2.4
1.1
1.0
0.3
1.6
28.9
97

©In
tern
atio
nal M
onet
ary
Fund
. Not
for R
edis
tribu
tion
\0
Ta
ble
31.
T
erm
s o
n N
ew Pu
bli
cized
Lo
ng
-Ter
m I
nte
rna
tio
na
l B
ank
Cre
dit
Co
mm
itm
ents
, 19
79-
Fir
st H
alf
of
198
5
�
00
"0
"0
(In
perc
ent.
unl
ess
oth
erw
ise
ind
icat
ed)
cri
z
1984
19
85
0
I st
2nd
1s
t ><
19
79
1980
19
81
1982
19
83
1984
I
half
h
alf
I half
2 <
•
Six
-mo
nth
Eur
odo
llar
{/)
in
terb
ank
rate
(av
erag
e)
11.90
13
.91
16.6
9
13.60
9.
92
11.2
9 11
.25
11.3
3 9.
03
....,
>
U.S
. p
rim
e ra
te (a
vera
ge}
12
.66
15.2
6
18.8
7 14
.86
10
.79
12
.13
11
.69
12.5
6
10.4
8
....,
Ave
rage
ma
turi
ty (
in y
ears
/mo
nth
s)
818
719
718
7n
7/3
719
815
7/4
m
en
....,
OE
CD
co
untr
ies
8/11
8/
0 71
8 8/
3 71
8 7/
4 71
8 7/
4 m
- n
C
entra
lly p
lann
ed e
cono
mie
s 8/
0 6
17
5n
4/9
415
5111
5/
5 612
6
110
)>
O
il ex
port
ing
coun
trie
s 8/0
7/
3 7/
9 61
0 m
7n
7/
6 71
8 7/
6 r
O
ther
dev
elo
ping
co
unt
ries
818
7/
8 71
9 710
71
0 8/
11
9n
7/1
0
812
....,
)>
Ave
rage
sp
read
0.
79
0.74
0
.80
0
.77
1.15
0
.93
1.23
0
.60
0.5
1 cc
O
EC
D c
oun
trie
s 0
.62
0.5
9 0
.58
0
.56
0
.65
0.5
5 0
.68
0.4
8 0
.42
r
m
Cen
tral
ly p
lann
ed e
cono
mie
s 0
.70
0
.88
0
.62
1.0
3 1.
18
0.8
8 0
.72
0.94
0
.55
{/)
Oi.l
exp
ort
ing
cou
ntri
es
1.05
0
.77
0.7
9
0.9
4
0.8
5 0
.76
0
.71
0.8
0
0.6
3 O
lher
dev
elo
ping
co
unt
ries
0.
85
0.9
1 1.
04
1.14
1.
70
1.4
4
1.60
0
.64
0.6
9
So
urce
s:
Org
aniz
atio
n fo
r E
cono
mic
Co
ope
ratio
n an
d D
evel
op
men
t (O
EC
D),
Fin
an
cia
l Ma
rket
T
ren
ds;
In
tern
atio
nal
Mo
neta
ry
Fu
nd
. In
tern
ati
on
al
Fin
an
cia
l S
tati
stic
s (f
or
Eu
rod
olla
r ra
te);
Fed
era
l R
ese
rve
Bu
llet
in (
for
prim
e ra
te);
and
unpu
blis
hed
dat
a fr
om t
he O
EC
D (
for
det
ails
on
mat
uri
ties
).
1 D
oes
no
t in
clud
e te
rms
of
agree
men
ts i
n p
rinc
iple
wit
h A
rgen
tina
and
the
Ph
ilip
pine
s.
2 Do
es n
ot
incl
ude
term
s o
f agr
eem
ents
in
princ
iple
with
Ch
ile
and
Co
lom
bia
.

©In
tern
atio
nal M
onet
ary
Fund
. Not
for R
edis
tribu
tion
Ta
ble
32
. E
xter
na
l A
sset
s of
BIS
Repo
rtin
g B
an
ks
by
Ma
turi
ty a
nd
Un
dis
bu
rsed
Cre
dit
Co
mm
itm
ents
, Dec
emb
er 1
98
0-
Jun
e 19
85
(I
n b
illio
ns
of
U.S
. d
oll
ars
)
D«:tm
ber
1980
lkct
mbe
r 198
1 lk
ctm
ber
I�
Dttem
ber
1983
I lk
cem
ber
1984 1
Ju
ne
19&5
Ex
tern
al A
sset
s l/
nd
1>·
Ext
ernal A
sstl s
li
ndos
-E.<
tem
al A
sstts
L
ndos
-E.'
lem
al A
SS<I
S U
ndis
-E
xtern
al A
sstls
U
nd�<
-E
xte
rnal
ASS
<tS
Und
as-
bur
std
b
urs<
d bu
.,<
d burstd
bursed
bu
rsed
l>p
to
and
n
edn
Up
to a
nd
cred
11
Up
10
and
cred
u U
p to
and
cre
dit
U
p to
an
d
cred
it
Up
to
and
cred
it mc
ludm
g corn
mu-
oncl
udmg
C'om:mi l·
incl
udin
g
com
mit
-in
clud
ing
com
mit
-inc
ludin
g
co
mm
it-
inc
ludi
ng
co
mrrul-
Total
one
)'ea
T rnr
nts.
To
tal
OM �
·e.ar
men
ts
To
tal
�)e
ar
men1
s T
ota
l one
)e
ar
mea
ts
To
tal
one
�ear
me
nts
Tot
al
one
)'ta
r �
nb
Cla
ims
on
: In
du
strial
co
untr
ies
out
sid
e th
e B
IS
rep
or
ting
are
a 5
0.5
2
1.7
1
5.7
5
7.5
2
5.3
18
.3
67
.3
29
.4
20
.1
72
.1
30.9
2
2.0
8
0.8
36
.3
21
.7
82
.2
38
.4
24
.9
Au
s1ra
lia
7
.3
2.6
5
.2
9.8
4
.0
6.9
15
.0
5.2
9
.0
18.2
6
.4
8.8
2
3.0
9
.4
9.6
2
2.9
9
.0
10.5
Fin
lan
d
7.0
3
.9
2.1
7
.4
4.1
2
.6
9.0
5
.1
2.0
9
.4
5.5
2
.6
11.
3
6.9
1.
4
12.
1 7
.5
1.6
No
rwa
y
10.8
3
.7
2.6
10
.6
3.9
2
.9
11
.3
5. 1
3
.4
10.7
4
.6
4.0
1
1.3
5
.4
3.9
12
.3
6.8
4
.6
Sp
ain
19
.7
8.0
3
.8
23
.1
9.3
4
.1
24
.6
10.1
2
.8
26
.9
11.
0
3.4
2
7.
1 1
1.0
3
.2
25
.9
11.3
4
.4
01h
er
5.7
3
.5
2.0
6
.6
4.0
1
.8
7.4
3
.9
2.9
6
.9
3.4
3
.2
8.1
3
.6
3.6
9
.0
3.8
3
.8
De\·e
lop
ing
co
unt
ries
3
39
.9
159
.5
79
.2
39
3.9
18
9.4
8
1.5
4
33
.2
208
.4
78
.9
45
7.7
2
()7
.5
74
.8
46
2.4
1
91
.6
67
.8
46
5.7
19
4.8
66
.3
Cap
ital
-im
portin
g
cou
ntr
ies
319
.4
14
5.0
7
4.3
3
73
.8
173
.4
75
.9
41
2.0
1
91
.1
62
.2
43
1.4
18
5.9
6
7.7
4
36.1
1
71
.1
60.1
4
40
.6
175
.7
60.3
Afr
ica
45
.5
13.1
13
.2
50
.9
17.6
13
.3
56
.4
21.
5
13.5
6
0.5
2
4.2
13
.3
59
.5
25
.1
11
.7
58
.5
23
.6
10.0
Cot
e d
'ho
ire
3.0
1
.0
0.4
3
.2
0.9
0
.5
3.4
0
.9
0.4
3
.1
0.8
0
.2
2.7
0
.6
0.1
2
.7
0.5
0
.2
Mor
occo
3
.5
0.7
0
.3
3.7
1
.2
0.5
3
.9
1.0
0
.4
3.9
1
.1
0.2
3
.8
1.2
0
.3
4.0
1
.3
0.2
Nig
eria
4.5
/
A
2.4
6
.0
2.0
3
.6
8.5
3
.1
3.9
1
0.0
2
.7
2.6
8
.9
2.6
1
.9
9.0
3
.0
1.3
Sou
th A
fric
a 7
.2
2.5
3
.1
11
2
6.0
3
.4
14
.3
8.7
3
.5
18
.4
11
.8
3.6
1
8.9
/
2.8
3
.5
17
.2
11
.3
2.5
Zai
re
1.2
0
.3
0.1
/
.1
0.3
0
.1
0.9
0
.3
0.1
0
.7
0.2
0
.7
0.3
0
./
0.7
0
.3
0.1
Oth
er
26
.1
7.2
6
.9
25
.7
7.2
5
.2
25
.4
7.5
6
2
24
.4
7.6
6
.7
24
.5
7.6
5
.8
24
.9
7.2
5
.7
Asi
a
51
.6
28
.6
19.8
60
.8
32
.9
22
.7
71.
2
36
.8
19.5
8
0.9
3
9.4
2
1.4
8
4.7
3
9.2
2
1.3
8
6.0
3
9.9
2
2.7
C
hina
2
.6
0.9
4
.0
2.3
]
./
5.0
1.
3
0.6
3
.1
2.2
1
.4
3.2
3
.5
2.4
3
.4
3.2
2
.2
3.1
Indi
a 1
.0
0.5
0
.9
1.3
0
.7
2.0
2
.3
1.1
/
.8
2.6
/
.1
2.1
3
.4
1.3
2
.5
3.8
13
2
.7
Ind
ones
ia
6.3
2
.6
2.2
7
.2
3.0
2
.6
9.9
3
.8
2.2
1
1.8
4
.6
3.2
/
2.9
5
.4
3.6
1
2.6
5
.2
4.6
Kor
ea
16
.7
/0
.4
4.3
1
9.9
1
1.5
4
.1
23
.2
/3
.9
3.9
2
5.7
14
.5
4.4
2
6.0
1
3.0
4
.4
27
.3
/3
.0
5.0
Mal
aysi
a 2
.7
/.0
/
A
-1.4
1
.4
1.3
6.6
1
.6
1.3
8
.7
2.1
1
.6
10
.6
2.4
1
.8
10
.0
1.9
2
.0
Phi
lipp
ines
9
.3
5.4
2
.4
10
.2
5.8
2
.8
/2
.6
7.5
2
.4
/3.8
7
.3
1.6
1
2.4
6
.6
1.0
1
2.7
7
.4
0.9
Tlra
ilan
d
4.0
2
.4
1.3
5
.1
3.1
1
.3
4.9
2
.8
1.6
5
.8
3.5
1
.4
6.5
3
.5
/.4
6
.8
3.8
1.5
O
ther
9
.0
5.4
3
.3
10.4
6
.3
3.6
/0
.4
5.5
3
.2
10.3
4
.9
3.9
9
.4
4.6
3
.2
9.6
5
.1
2.9
Eu
rope
4
3.1
15
.6
8.6
4
5.7
15
.7
6.8
4
5.4
14
.7
5.8
4
8.3
16
. 1
4.8
4
7.7
15
.9
5.6
5
0.1
17
.0
6.1
Gre
ece
8.4
3
.2
3.0
9
.7
3.6
2
.6
10.0
3
.3
22
/
1.8
3
.8
2.1
1
2.3
4
.0
2.0
1
2.9
4
.0
1.8
Hun
gary
8
.0
3.4
0
.7
7.7
3
.1
0.4
6
.8
2.2
0
.5
7.0
3
.2
03
6
.8
2.7
0
.6
7.3
2.8
0
.7
Por
lllga/
5
.6
2.1
/
.2
7.7
3
.0
1.5
10
.0
3.8
1
.2
10
.8
4.0
0
.8
10
.8
3.5
/
./
I J.J
3
.6
1.2
Rom
ania
5
.8
2.5
1
./
5.1
1
.8
0.5
4
.2
1.7
0
.4
3.9
0
.9
0.2
3
.1
0.7
0
.2
3.0
0
.8
02
Turk
ey
4.4
/3
0
.6
4.2
1
.0
0.5
4
.0
1.0
0
.5
4.4
1
.2
0.6
4
.6
1.9
1
.0
5.4
2
.5
1.5
Yugo
slal
'ia
10
.4
2.9
2
.0
10
.7
3.0
1
.3
9.8
2
.6
0.7
9
.8
2.7
0
.5
9.3
2
.6
0.5
9
.5
2.9
0
.5
Oth
er
0.5
0
.2
0.2
0
.6
0.2
0
.6
0.1
0
.3
0.6
0
3
0.3
0
.8
0.5
0
.2
0.9
0
.4
0.2
C/l
§:
�- r;
· 2:.
. -:l
I»
er
\0
0
\0
"'

©In
tern
atio
nal M
onet
ary
Fund
. Not
for R
edis
tribu
tion
>
0
Ta
ble
32
(con
clud
ed).
Ex
tern
al
Ass
ets
of B
IS R
eport
ing
Ban
ks b
y M
atu
rity
and
Un
disb
urs
ed C
red
it C
om
mit
men
ts,
Dec
emb
er 1
98
0-Ju
ne
198
5
"'0
0
"'0
(In
billi
on
s of
U .S
. do
llars
) rn
z
De
cem
ber
1980
Oec<
m�
r 198
1 D<ce
m�
r 19
82
Dece
m�
� 198
3 1
D<cem
�r
1984 2
Ju
ne 198
5 0
-
E�t
emal As
sets
Und
is-
EJt
tern
al A
»et
s U
ndi.s-
Ex
tern
al A
sset
s U
nd
os·
E<te
mal A
»et
s U
ndis
-�
tem
al As
sets
Und
is-
Ex
ternal
A..
et>
Un
dis
-><
b
ursc:
d
bursed
bu
rsed
bursed
b
urs
c:d
bursc:d
<
U
p t
o and
cr
edit
Up
to
and
c
redit
Up
to
an
d
cred
tt U
p to
an
d
cred
it U
p to
and
cred11
Up
to
and
a
cdit
in
clu
din
g
com
mit
� inc
lud
ing
co
mmit
-in
clu
ding
co
mm
it-
includ
ing
c
ommi
t-mc
lud
ing
co
mm
it-
includ
ing
com
mit
-•
To
lal
one y
ear
mcn
ts
To
lal
one
)ea
T m
ents
T
ola
l o
ne )
·ear
ments
T
ota
l OO
C' )tar
m
ents
Total
o
ne
year
m
�nts
T
ota
l o
ne y
ear
m
t'nts
en
--l
>
M
idd
le E
ast
15.0
11
.7
3.1
17
.8
14.0
3.
2 2
1.3
16.7
3
.5
15.5
10
.8
3.6
14
.8
10.2
3
.3
14.6
10
.0
3.2
--l
-
Eg
ypt
3.3
2
.0
1.5
4
.4
3.0
1.
5
4.9
3
.2
1.8
5
_6
3]
2
.0
5.8
3
.6
1.8
6
.0
3.6
2
.0
en
--l
Jsra
e{
4.8
3
.4
0.5
6
.0
4.3
0
.6
6.7
4
.4
0.5
6
.4
4.4
0
]
5.3
3
.7
0.5
5
.4
3.7
0
.6
-O
ther
6
.9
6.3
/.
1 6
.9
6_7
1.
1 9
.7
9.1
1.
2
3.5
2
]
0.9
3
]
2.9
1.
0
3.2
2
.7
0.6
()
>
W
este
rn
r
--l
Hem
isph
ere
164.2
7
6.1
29
.5
198.
6
93.
2 30
.0
217
.7
101.
5
19.9
22
6.2
9
5.4
24
.6
229
.4
80.7
18
.2
23
1.3
8
5.1
18
.2
>
Arg
enti
na
/9
.9
10.4
4
.0
24
.8
Jl.6
3
.9
25
.7
/3.9
/.
9
26
.8
14./
1
.7
25
.3
/4.0
1.
9
26
.1
14.9
1.
9
to
Bra
zil
45
]
16.2
6
.4
52
.5
/8.2
6
.1
60.5
2
1.1
5
.3
60.6
16
.9
5.0
6
5.4
16
.4
3.7
66
.6
/7.8
4
.4
r
trl
Chi
le
7.3
2
.9
/.6
10
.5
4.2
1.
8
1/.6
4
.6
1.0
12
.5
4.6
/
2
13.2
3
_7
0.7
13
.4
3.9
0
.6
(/)
Co
fom
bia
4
.6
2.5
1.
7
5.4
2
.6
1.6
6
.3
2.9
1.
2
6.8
3
2
0.8
6
.5
2.6
0
.9
6.2
2
.6
1.0
E
cua
do
r 3
.9
1.8
1.
0
4.5
2
.3
0.9
4
.5
2.5
0
.5
4.8
2
.3
0.5
4
.7
/]
0.3
4
.9
/..8
0
.4
Mex
ico
4
2.5
18
.8
6_7
5
7.1
2
7.8
7.
3 6
2.9
2
9.9
3
.7
69
.3
29
.4
8.6
7
0.9
17
.1
3.5
7
0_7
18
.3
2.6
P
eru
4
./
2.4
lJ
4
.4
2]
1.
4
5.4
3
.2
1.1
5
.1
2.3
0
.8
4.8
2
.1
0.7
4
.7
2.3
0
.8
Ve
ne
zue
la
24
.3
14.3
3
.7
26
.2
16.1
3
.2
27
.5
15.8
2
.4
27
.6
16.3
0
.9
26
.7
17.4
0
.9
26
.6
17.5
0
.9
Oth
er
11.9
6
.8
3.2
/3
.2
7.7
3
.8
/3.3
7
.6
2.8
/2
]
6.3
4
./
1/.9
5
]
5.6
12
./
6.0
5
.6
Cen
tral
ly pla
nned
ec
onom
ies
48
.4
18.6
8
.0
50
.1
21.
6
6.3
43
.6
17
.1
6.4
4
0.9
15
.6
6.5
3
8.3
1
4.9
4
.5
41
.2
16.5
5
.3
Cze
cho
slo
vakia
3
.5
1.5
0
.3
3.3
1.
3 0
.2
2.8
0
.9
0.3
2.
7
0.9
0
.2
2.4
0
.8
0.4
2.
5 0
.9
0.4
G
erm
an De
mo
crat
ic
Rep
ub
lic
9.9
3
.8
1.5
10
.7
4.6
1.
7
8.9
3
.5
1.2
8.4
3
.3
0.8
8.
4
3.7
1.
1 8
.8
4.0
1.
4
Po
lan
d
16.2
5
.4
3.9
15
.2
5.5
1.8
13.9
4
.6
0.7
10
.9
2.7
0
.3
8.7
2
.1
0.3
8
.6
1.8
0
.4
U.S
.S.R
. 13
.4
5.6
1.
7
16.3
8
.2
2.0
14
.6
6.6
3.
9
15.6
7
.0
4.8
15
.8
6.6
1.
9
18.1
8
.2
2.4
O
ther
5.
4
2.3
0.6
4
.6
2.0
0
.6
3.4
1.
5
0.3
3
.3
1.1
0
.4
3.0
1.
7
0.8
3.
2
1.6
0.
7
Total
4
38.
8 199
.8
102
.9
50
1.4
2
36
.2
106.1
54
4.1
25
4.9
9
4.7
5
70
.8
25
4.0
10
3.2
5
81.
5
24
2.8
94
.0
58
9.1
2
49
.7
96.5
Not
�: U
p to
June
1984 tM
reporti
ng a
rea
for
th
ese
data
inc
lud
es b
ran
ches
of
U.S
. ba
nk
s and
the
aflihate
s in
off
shore
�po
ning c
ente
rs o
f ba
nks
in
oth
er co
untries
. Tbe
December
1984 d
ata are
on a
wo
rldw
ide
consolid
ated
basis
for
all
repo
rtin
g cou
ntr
ies.
Th
is se
ries
is
on
ly
avai
lab
le s
em
ian
nuaUy
and bas
longer J
ags t
han
tM
dat
a p
rc..,
nted
in
qua
ner
ly pu
bli<:atio
o.s of tM
Ban
k fo
r In
tern
ational �
ulcme
nts on
iot.e
matio
nal c
ap;ta
l m
arke
ts d
cv�t
opm
ents
.
So
u�e:
Ba
nk
fo
r In
ternati
on
al
�ul
em
ents
. Tlr
r Mat
uri�·
Dis
trib
urio
n of
lnr
tma
tion
af
Ba
nk u
ndin
g.
1 Due to
a c.
hange
in
the c
ove
rage
and
partia
l co
nso
lida
tio
n o
f tM
r�porti
ng
area.
1983
figures
should n
ot
� d
irec
tly compare
d to
1982.
1 F
igure
s ar
e based
on
fully
col
lSObdat
ed re
port
s o
r ba
nks.
and s
ho
uld
110t
� d
i.realy
com
pared t
o 198
3.

©International Monetary Fund. Not for Redistribution
Statistical Tables
Table 33. Undisbursed Credit Commitments in Percent of Outstanding Bank Claims, 1979-June 1985
Dec. Dec. Dec. Dec. 1979 1980 1981 1982
All countries 24.7 23.4 2.1.0 17.2
Industrial countries (other than Group of Ten, Switzerland, Austria, Denmark, and Ireland) 22.0 3 1 . 1 3 .1 .8 29.9
Developing countries 25.9 23.3 20.7 18.2 Capital-importing 26.0 23.3 20.3 15.1
Africa 29.4 29.0 26.1 23.9
Asia 44.8 38.4 37.3 27.4 Of which:
Indonesia 36.2 34.9 36.1 22.2 Korea 33.3 25.8 20.6 16.8 PhiJjppines 39.2 25.8 27.5 19.1
Europe 19.7 20.0 14.9 12.8
Mjddle East 25.9 20.7 18.0 16.4
Western Hemisphere 20.6 18.0 15.1 9.1 Of which:
Argentina 21.6 20.1 15.7 7.4 Brazil 17.4 14.0 1 1 .6 8.8 Mexico 19.7 15.8 12.8 5.9 Venezuela 19.7 15.2 12.2 8.7
Centrally planned economies 1 18.9 16.5 12.6 14.7
Source: Bank for International Settlements, The Maturity Distribution of International Bank Lending. 1 Coverage of the series changes at end-1983 and end-1984. 2 Excluding Fund member countries.
Table 34. Assets and Capital of U.S. Banks, 1977-First Half of 1985
1977 1978 1979 1980 1981 1982
Billions of U.S. dollars
External claims on developing countries' 66.3 75.1 84.7 102.5 124.7 140.0
Total assets 717.1 823.6 941.3 1,066.3 1, 164.5 1 ,261.0 Capital 40.9 45.5 49.7 56.9 62.7 70.6
Percent
Memorandum items: Capital to total assets 5.7 5.5 5.3 5.3 5.4 5.6 External claims on
developing countries to total assets 9.2 9. 1 9.0 9.6 10.7 1 1. 1
Capital to external claims on developing countries 61.7 60.6 58.7 55.5 50.3 50.4
Dec. Dec. 1983 I 1984 I
17.6 16.2
30.5 26.4
16.3 14.7 15.7 13.8
22.0 19.7
26.5 25.2
27.1 27.9 17.1 16.9 1 1 .6 8.1
9.9 1 1.7
23.2 22.3
10.9 7.9
6.3 7.5 8.3 5.7
12.4 4.9 3.3 3.4
15.9 11.8
1983 1984
143.9 140.7 1,336.0 1 ,413.0
79.3 92.2
5.9 6.5
10.8 10.0
55.1 65.5
June 1985
16.4
30.3
14.2 13.7
17.1
26.4
36.5 18.3 7.1
12.2
21.9
7.9
7.3 6.6 3.7 3.4
12.9
1985 !si half
139.0 1 ,444.0
98.8
6.8
9.6
7 1 . 1
Sources: Federal Financial Institutions Examination Council, Country Exposure Lending Survey: and International Monetary Fund, International Financial Statistics.
1 The data presented in this table are on an exposure basis, i.e., they are adjusted for guarantees and other risk transfers.
101

©International Monetary Fund. Not for Redistribution
APPENDIX VI • STATISTICAL TABLES
Table 35. Commercial Banks Ranked by Assets
Bank and Head Office
Citicorp, New York Dai-lchi Kangyo Bank, Tokyo Fuji Bank, Tokyo Bank America Corporation, San Francisco Mitsubishi Bank, Tokyo
Sumitomo Bank, Osaka Banque National de Paris, Paris Sanwa Bank, Osaka Credit Agricole, Paris Credit Lyonnais. Paris Societe Generale, Paris
Barclays. London Norinchukin Bank, Tokyo National Westminster Bank, London Industrial Bank of Japan, Tokyo Chase Manhattan, New York
Tokai Bank, Nagoya Deutsche Bank, Frankfun Manufacturers Hanover Corporation, New York Midland Bank. London
Assets' at End-December 1984
(In billions of U .S. dollars)
142.7 1 19.1 1 15.1 1 13.7 110.7
107.6 99.0 96.5 92.4 90.5 87.1
85.2 83.1 82.7 81.7 81.6
76.1 73.4 73.1 71.1
Source: Financial Times Business Information Limited, The Banker (London, July 1985), p. 1 Assets less contra accounts.
102
Rank
1984 1983
I I 2 3 3 4 4 2 5 7
6 5 7 6 8 9 9 10
10 1 1 1 1 13
12 8 13 17 14 12 15 18 16 16
17 22 18 14 19 23 20 15
133.

©International Monetary Fund. Not for Redistribution
Statistical Tables
Table 36. Chronology of Bank Debt Restructurings and Bank Financial Packages, 1978-85
1978
Peru-June Jamaica-September Peru-December
1979
Jamaica-April Turkey-June z Turkey-August 2
1980
Peru-January Togo-March Zaire-April
Agreement reached 1
(By year and monrh of agreemenr)
1982 (co11tinued) Liberia-December Romania-December
1983
Zaire-January (temporary deferment) BraziJ-February ! Malawi-March Sudan-April (modification of 1981
agreement) Romania-June
Chile-July 2 Guyana-July (temporary deferment) Nigeria-July
1984 (conti11ued) Nicaragua-February Peru-February 3 Senegal-February Niger-March Mexico-April (new financing only)
Sudan-April (modification of 1981 agreement)
Yugoslavia-May Jamaica-June
Zaire-June (temporary deferment) Mexico-September 3 Philippines-October l.).s Madagascar-October Bolivia-August, December (temporary
deferments) Nicaragua-December
Peru-July 2 Uruguay-July
Chile-November (temporary deferment)
1981
Bolivia-April Jamaica-June 2 Madagascar-July, November
Turkey-August Nicaragua-December Sudan-December
1982
Honduras-January Nicaragua-March Sudan-March Turkey-March Guyana-June (temporary deferment) Madagascar-October
1983
Liberia
Mexico-August z Costa Rica-September 1 Dominican Republic-September 3 Madagascar-September • Nigeria-September Yugoslavia-September 2 Ecuador-October 2 Togo-October
1984
Brazil-January z Sierra Leone-January Guyana-January, July (temporary
deferments)
Under negotiation (By year of approach to banks)
1984
People's Republic of Mozambique Peru
Note: .. Restructuring" covers rescheduling and also cenain refinancings. Sources: Restructuring agreements; and Fund staff estimates.
Honduras-December ) Uruguay-December (deferment) Zambia-December 3 1985
Cote d'lvoire-March Costa Rica-May Dominican Republic-May 3 Senegal-May Zalre-May (deferment) Argentina-August 1 Morocco-September 6 Jamaica-September Yugoslavia-September 3 Panama-October Chile-November Uruguay-November (deferment) Venezuela-November Ecuador-December
1985
Morocco Nicaragua 7 Sudan
1 Agreement either signed or reached in principle. See Glossary in Appendix V for definitions of the two terms. 2 The restructuring agreement includes new financing. 3 Agreed in principle or tentative agreement with bank's steering or advisory committee. • The agreement was officially signed in October 1984. 5 The agreement in principle covers 1985 and 1986 maturities. 6 The agreement covers 1983 and 1984 maturities. ' Refers to amount previously restructured during 1980-82.
103

©International Monetary Fund. Not for Redistribution
APPENDIX VI • STATISTICAL TABLES
Table 37. Amounts of Medium- and Long-Term Bank Debt Restructured, 1983-85
(ln billions of U .S. dollars)
1983 1984 1985
Argentina 13.400 I Bolivia (0.309) 2 Brazil 4.452 4.846 (46.500) l Chile Costa Rica
C6te d'lvoire Dominican Republic Ecuador Guyana Honduras
Jamaica Liberia Madagascar Malawi Mexico
Morocco Mozambique Nicaragua Niger Nigeria
Panama Peru Philippines Romania Senegal
Sierra Leone Sudan Togo Uruguay
Venezuela Yugoslavia Zaire Zambia
Total
2.169 0.709
0.500 1.835
(0.024) 2
0.057 18.800
1 .935
0.380
0.567
0.790 9 0.084 0.216
0.950 (0.058) 2
33.444 11
4.260 1.6 (0.071) 2 0.368 4 0.164
0.195
48.700 6·8
0.145 0.026
0.460 . 2.188 1.9
0.078
0.025 0.838 IO
(0.104) 2 21 .2031•6
1.250 (0.064) 2 0.073 .
98.219 12
6.007 4 0.440 4 0.501 0.787 1.6.7
0 . 1 95 6 (0.035) s
(0.950) 2
0.548 4 ( 1 .400) s (0.120) s
0.602
0.020
(0.234) 2
3.600 •·6 (0.061) 2
12.700 I}
Note: Figures in parentheses are not included in the totals. Sources: Restructuring agreements; and Fund staff estimates. 1 Agreement in principle, signed in 1985. 2 Deferment agreement. 3 Multiyear rescheduling under negotiation in 1985, but no longer
in process. • Agreement in principle. 5 In process, or requested by the national authorities. • Multi year rescheduling agreement (MYRA). 1 Consists of MYRA for maturities of $707 million falling due in
1985-89 and rescheduling of $79.8 million of arrears at end-1984. 8 Agreement in principle: final agreements were signed in 1984
and 1985 and consist of $5 billion in the form of the syndicated credit raised in 1983, $20.1 billion of public medium- and long-term debt not previously rescheduled falling due during 1985-90; $5.8 billion in the form of public medium- and long-term debt previously rescheduled falling due in 1987. and of $17.8 billion in the form of public medium- and long-term debt previously rescheduled falling due during 1988-90.
" Including rescheduling of $1,213 million in medium- and longterm public debt, $159 million in medium- and long-term private financial sector debt and $816 million medium- and long-term corporate.
10 Modification of 1981 agreement. 1 1 Excluding $391 million in deferments. 12 Excluding $239 million in deferments. 13 Excluding $48,055 million of debt rescheduling that was under
negotiation and $1 ,245 million in deferments.
104
Table 38. Short-Term Debt Rolled Over or Converted Into Medium-Term Loans, 1983-85
(In billions of U .S. dollars)
Argentina Trade credit and deposit
facility Stand-by money market
facility Trade credit maintenance
facility
Brazil Interbank exposure Trade-related
Chile Trade-related Nootrade-related
Costa Rica New revolving trade facility Increase in revolving trade
facility
Ecuador Trade-related credits
Madagascar Short-term debt
Mexico lnterbank exposure
Morocco Short-term debt
Panama Money-market facility Trade-related facilities
Peru Short-term working capital Short-term trade-related credit
lines
Philippines Short-term debt of:
Public sector Private financial sector Corporate sector
Revolving trade facility
Uruguay Nontrade-related credits Treasury notes outstanding
Yugoslavia Revolving trade facility Nontrade-related facility
Total
1983
6.000 9.800
1.700 1 . 160
0.202
0.700
5.200
1.200
0.800
0.359 1
0.084
0.600 0.200
28.049
1984
0.500
1.400
1.200 I
6.000 9.800
1.700 J . J60 I
0.202 I
0.700
0 . 1 1 7 I
5.200
0.750
0.965
0.800
1.432 l.l 1.516 l.l 0.417 1.2
2.944 l.l
0.359 1 0.128
0.600 0.200
38.090
1985
0.500
1 .400
1 . 200 I
6.000 9.800
I . 700 1.2 1 . 160 I
0.202 2
0.075 '
0.700
0 . 1 1 7 I
5.200
0.750
0.133 0.084
0.965
0.800
1 .432 1•2
1.516 l.l 0.417 1,2 2.944 1·2
0.359 1
0.171
0.600 0.200
38.425
Sources: Restructuring agreements: and Fund staff estimates. 1 Converted into medium-term debt. 2 Agreement in principle with Steering Committee.

©International Monetary Fund. Not for Redistribution
Table 39. Concerted Lending: Commitments and Disbursements, 1983-851
(ln millions of U.S. dollars)
1983 1984
Commitments Disbursements Commitments Disbursements
Argentina Medium-term loan I ,500 500 3,7002 Trade deposit facility 5()()2
Brazil Medium-term loan 4,400 4,400 6,500 6,500
Chile Medium-term loan J ,300 .I ,300 780 780 Cofinancing arrangement
with the World Bank
Colombia Medium-term loan
Costa Rica Medium-term loan
Cote d'Ivoire Medium-term loan
Ecuador Medium-term loan 431 431
Mexico Medium-term loan 5,000 5,000 3,800 2,850
Panama Medium-term loan
Peru Medium-term loan 450 250 100
Philippines Medium-term loan 9252
Uruguay Medium-term loan 240 240
Yugoslavia Medium-term loan 600 600
Total 13,921 12,721 16,205 10,230
Sources: Restructuring agreements; and Fund staff estimates. ' These data exclude bridging loans. 1 Agreed in principle with Steering Committee. ' Fifty percent guaranteed by the World Bank.
Statistical Tables
1985
Commitments Disbursements
I, 700 500
785 520
300 194)
1,000
75
104 104
950
60
400
2,324 4,368
105
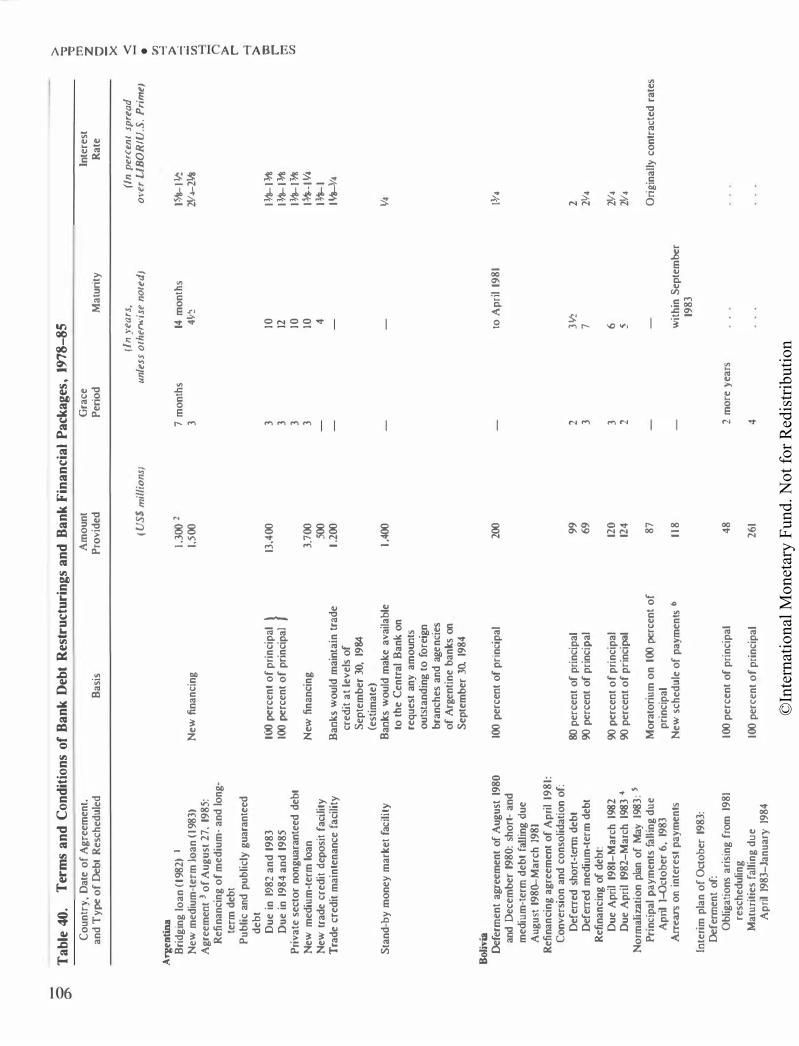
©In
tern
atio
nal M
onet
ary
Fund
. Not
for R
edis
tribu
tion
0
Ta
ble
40.
Ter
ms
an
d C
on
dit
ion
s o
f B
an
k D
ebt
Res
tru
ctu
rin
gs
an
d B
an
k F
ina
nc
ial
Pa
cka
ges
, 197
8-
85
>
0'1
.,
.,
Co
untr
y. D
ate
of
Agr
eem
ent.
A
mo
unt
Gra
ce
Inte
rest
rn
z
an
d T
ype
of
Debt
Res
ched
uled
B
asis
P
rovi
ded
Peri
od
Mai
Urity
R
ate
Q
X
(In
ye
ars
, (I
n p
erce
m s
pre
ad
<
(U
S$
mil
lio
ns)
u
nle
ss o
1herw
ise
n0
1ed
) o
ver
LIB
OR
IU.S
. P
rim
e)
• {/)
Argen
tina
....J
>:
Bri
dgin
g lo
an (
1982
) I
1,30
0 2
7 m
ont
hs
14 m
ont
hs
J5,.t..JJ,.2
::
::! N
ew m
ediu
m-t
erm
lo
an (
1983
) N
ew fi
nan
cing
1,
500
3 4'1.
! 21
f.._21ti
{/)
A
gree
men
t 3
of
Aug
ust
27,
19
85:
..
..J
Ref
inan
cin
g o
f m
ediu
m-
and
lon
g-n
te
rm d
ebt
>
r
Pu
bli
c an
d p
ublic
ly g
uara
ntee
d -l
d
ebt
>
Du
e in
198
2 a
nd
19
83
100 pe
rcen
t o
f p
rin
cip
al }
13.4
00
3 10
1�
1�
c::l
Du
e in
19
84
an
d 1
985
100
perc
ent
of
prin
cipa
l 3
12
1�1�
r
rn
P
riv
ate
sect
or
non
guar
ante
ed d
ebt
3 10
1�
m
{/)
New
med
ium
-ter
m lo
an
New
fin
anci
ng
3.700
3
10
1.ltt-l
\4
New
tra
de c
red
it d
epo
sit
facil
ity
500
4
1�
1 T
rade
cre
dit
mai
nte
nan
ce f
aci
lity
Ban
ks w
oul
d m
aint
ain
tra
de
1,200
llt8-Y
4 cr
edit
at
lev
els
of
Sep
tem
ber
30,
19
84
(est
imat
e)
Sta
nd-b
y m
one
y m
arke
t fa
cili
ty
Ban
ks w
oul
d m
ake
avai
lab
le
1,400
v�
to
the
Cen
tral
Ban
k on
re
que
st a
ny a
mo
unts
o
utst
andi
ng t
o f
ore
ign
bra
nch
es a
nd a
gen
cies
of
Arg
enti
ne b
anks
on
Sep
tem
ber
30,
1984
Bolivia
De
ferm
ent
agree
men
t of
Aug
ust
1980
100
per
cent
of
pri
ncip
al
200
to A
pri
l 19
81
l¥4
and
Dec
emb
er 1
980
: sh
ort
-an
d
med
ium
-ter
m d
ebt
fallin
g d
ue
Aug
ust
19
8�M
arch
19
81
Ref
inan
cing
agr
eem
ent
of A
pri
l 19
81:
C
onv
ersi
on
and
co
nso
lidat
ion
of:
D
eferr
ed s
hort
-term
deb
t 80
per
cen
t of
pri
ncip
al
99
2 3
'1.!
2 D
eferr
ed m
ediu
m-t
erm
deb
t 90
per
cent
of
prin
cip
al
69
3 7
2V4
Refi
nan
cing
of
deb
t: D
ue A
pril
1981
-M
arch
198
2 90
per
cent
of
pri
ncip
al
120
3
6
2lf4
D
ue A
pri
l 19
82-
Mar
ch 1
983
4 90
per
cent
of
prin
cipa
l 12
4
2 5
2lf4
N
orm
alizatio
n pl
an o
f M
ay
1983:
5
Pri
ncip
al p
aym
ents
fa
lling
du
e M
ora
tori
um
on
100
perc
ent
of
87
Ori
gina
lly c
ont
ract
ed r
ates
A
pril
!-O
cto
ber
6,
1983
p
rinc
ipal
Ar
rears on
inte
rest
pay
men
ts
New
sch
edu
le o
f pa
ymen
ts 6
11
8
wit
hin
Sep
tem
ber
1983
In
teri
m p
lan
of
Oct
ob
er 1
983
: De
ferm
ent
of:
Ob
ligat
ions
ari
sing
fro
m
1981
100
per
cent
of
pri
ncip
al
48
2 m
ore
yea
rs
resc
hedu
ling
Mat
uri
ties
fal
ling
du
e 100
per
cen
t o
f p
rinc
ipal
26
1 4
Ap
ril
1983
-Ja
nua
ry 1
984

©In
tern
atio
nal M
onet
ary
Fund
. Not
for R
edis
tribu
tion
- 0
........)
Bra
zil
Agr
eem
ent
of
Feb
ruar
y 2:5
, 19
83:
Res
ched
ulin
g of
: M
ediu
m-
and
lo
ng-t
erm
d
ebt
due
in
198
3 S
hon
-ter
m d
ebt
(198
3)
New
loan
co
mm
itm
ents
(19
83)
Agr
eem
ent
of J
anua
ry 2
7, 1
984
: R
esch
edul
ing
of:
Med
ium
-an
d lo
ng-t
erm
deb
t du
e in
198
4
Sho
n-t
erm
deb
t (1
984)
New
loa
n co
mm
itm
ent
(198
4)
Req
uest
ed b
y th
e au
tho
riti
es
(Dec
emb
er 1
984)
: R
esch
edul
ing
of
pub
lic a
nd p
riva
te
sect
or
debt
due
in 1
985-9
1
{ 100 percent
of
prin
cipa
l
100 pe
rcen
t ro
llove
r in
198
3
New
fin
anci
ng
100 p
erce
nt o
f pr
inci
pal
100 pe
rcen
t ro
llove
r
New
fina
ncin
g
Pri
ncip
al
Sour
ces:
Res
truct
urin
g agr
eem
ents
; pr
ess
repo
rts;
and
Fun
d st
aff c
alcu
lati
ons
.
4,45
2
15,8
00
(tra
de·
rela
ted
) 4 ,
4 00
4,846
IO
15,80
0 (t
rade
-rel
ated
) 6,
500
46,5
00
5 5 up
to 8
11
8 8 9 9 16
2l+
J�8
2V4-
28
I An
agr
eem
ent
in p
rinc
iple
to
res
ched
ule
arrears a
t th
e en
d o
f 19
82 a
nd
pub
lic d
ebt
falli
ng d
ue
in
1983
was
rea
ched
in
Jan
uary
198
3, b
ut t
he
new
go
vernm
ent
requ
este
d a
rene
goti
atio
n of
thi
s agr
eem
ent.
2
The
cum
ulat
ive
loan
dis
bur
sem
ents
cou
ld n
ever
ex
ceed
SI.
! bi
llio
n pe
r an
num
. 3
The
agr
eem
ent
also
pro
vid
ed t
hat:
the $
750
mill
ion
out
stan
ding
un
der
the
19
82 b
rid
ge l
oan
wo
uld
be
repa
id i
n e
arly
198
5 o
n th
e da
te of
the
first
borr
ow
ing
und
er t
he n
ew l
oan
; A
rgen
tina
wo
uld
pay
at
leas
t S7
:50 m
illi
on
befo
re t
he e
nd o
f 198
4 to
red
uce
inte
rest
arrears o
n A
rgen
tine
pub
lic s
ecto
r in
debt
edne
ss; i
nter
est
arre
ars
on
pub
lic s
ecto
r in
debt
edne
ss w
oul
d
be b
roug
ht c
urre
nt d
urin
g th
e f
irst
half
of
1985
; and
tha
t fo
reig
n ex
chan
ge w
oul
d be
mad
e av
aila
ble
to p
riva
te s
ecto
r bo
rro
wer
s so
tha
t in
tere
st o
n A
rgen
tine
pri
vate
sec
tor
indeb
ted
ness
ca
n be
bro
ught
cu
rren
t d
uri
ng t
he f
irst
half
of
1985.
4
Bo
livia
mad
e pa
ymen
ts o
f to
perc
ent
of t
he a
mo
unt
to be
co
nso
lidat
ed u
nti
l ea
rly
Sept
embe
r 19
82. S
inc
e th
en,
no
mo
re p
aym
ents
wer
e m
ade
an
d t
he r
efina
ncin
g agr
eem
ent
on
the
A
pr
il 19
82-
Mar
ch 1
983
maturiti
es d
id n
ot
take
eff
ect.
s
The
agr
eem
ent
wou
ld be
fina
lized
, su
bjec
t to
: p
aym
ent
of i
nter
est
arrears a
cco
rdin
g to
the
sch
edul
e ag
reed
on
in
Mar
ch:
the
pay
men
t of
th
e ex
isti
ng a
rrea
rs o
n t
he
10 pe
rcen
t of
pri
ncip
al d
ue o
n th
e b
asis
of
the
198
1 agr
eem
ent;
and
the
rea
chin
g o
f an
agr
eem
ent
wit
h th
e F
und
. Si
nce
Bo
livia
was
una
ble
to m
ake
the
final p
aym
ent
of $
30 m
illio
n in
inte
rest
arr
ears
by
Sep
tem
ber
198
3 as
agr
eed
, an
int
erim
ag
reem
ent
was
rea
ched
wit
h th
e b
ank
s in
wh
ich
Bo
livia
mad
e a
goo
d f
aith
dep
osi
t o
f S3
mill
ion
and
agr
eed
to r
epay
$30
mill
ion
in m
ont
hly
inst
allm
ents
of
$7.:5
mill
ion
each
betw
een
Oct
obe
r 19
83 a
nd J
anua
ry 1
984.
In
retu
rn t
he b
anks
agr
eed
to
exte
nd t
he s
tand
still
agr
eem
ent
on r
epay
men
ts a
nd
reg
ular
mat
urit
ies
falling d
ue
after
Ap
ril
I,
1983
wit
hout
pena
lty
pay
men
ts u
ntil
Jan
uar
y 3
1, 1
984
. A
fter
the
exp
irat
ion
of
the
inte
rim
pla
n,
Bol
ivia
mad
e tw
o m
ore
pay
men
ts o
f $7
.5 m
illio
n ea
ch i
n F
ebru
ary
and
Mar
ch
1984.
On
May
30,
19
84,
the
Bo
livia
n G
ove
rnmen
t an
noun
ced
a te
mpo
rary
sus
pen
sio
n o
f al
l fore
ign
deb
t p
aym
ent
to p
riva
te b
anks
. O
n N
ove
mb
er 2
, 19
84,
the
Go
vern
men
t re
new
ed B
oliv
ia's
req
uest
for
a c
ont
ractu
al a
rran
gem
ent
to po
stpo
ne al
l deb
t se
rvic
e to
banks u
ntil
the
end
of 1
985.
6
On
arr
ears
as
of
June
5,
1983
, S28
mill
ion
of
arrears o
n in
tere
st p
aym
ents
wer
e pa
id b
y A
pril
5, 1
983
. The
rem
aind
er w
as
div
ided
int
o fi
ve
mo
nthl
y pa
ymen
ts.
7 F
irst
pri
ncip
al p
aym
ent
due
30
mo
nths
aft
er r
esch
edu
ling.
8
The
spre
ads
ove
r L
ffiO
RIU
.S.
pri
me
rate
are
2MI
perc
ent/
J1111 pe
rcen
t fo
r am
oun
ts o
n d
epo
sit
wit
h th
e C
entr
al
Ban
k or
-as
gene
rally
acc
epta
ble
maximums-
-for
lo
ans
to p
ublic
se
cto
r bo
rro
wer
s w
ith o
ffici
al gu
aran
tee,
Pet
robr
as, a
nd C
om
pao
hia
Val
e do
Ric
o Doc
e (C
VR
D);
2V4
perc
ent/
2 pe
rcen
t as
the
gen
erally
acc
epta
ble
maximums
for
pub
lic s
ecto
r bo
rro
wer
s w
itho
ut o
fficia
l gua
rant
ee,
priv
ate
sect
or
borr
ow
ers
with
dev
elo
pmen
t bank
guarante
e an
d fo
r co
mm
erci
al a
nd i
nves
tmen
t ba
nks
unde
r R
eso
luti
on
63;
211.!
perc
ent/
2V4
perc
ent
as g
ener
ally
ac
cept
able
max
imum
s fo
r pr
ivat
e se
cto
r bo
rro
wer
s.
9 T
he C
entr
al B
ank
stan
ds r
eady
to
bo
rro
w t
he c
om
mitt
ed fu
nds
at e
ithe
r 2MI
perc
ent
ove
r L
IBO
R o
r J111!
per
cent
ove
r U
.S.
prim
e r
ate
. F
or
loan
s to
oth
er bo
rro
wer
s. t
he
spre
ads
agree
d m
ust
be a
ccep
tabl
e to
the
Cen
tral
Ban
k,
whi
ch i
ndic
ated
th
e fo
llow
ing
max
imum
s fo
r sp
read
s ov
er L
IBO
R/U.S
. pri
me
rate
to
be g
ener
ally
acc
epta
ble
: pu
blic
sec
tor
borr
ow
ers
wit
h o
ffici
al g
uara
ntee
as
wel
l as
Pet
robr
as a
nd C
VR
D-
2MI
perc
ent/
!� pe
rce
nt;
pub
lic s
ecto
r bo
rro
wer
s w
itho
ut o
ffici
al g
uara
ntee
, pr
ivat
e sec
tor
bor
row
ers
wit
h de
velo
pmen
t bank
guaran
tee
, an
d R
eso
luti
on
63 l
oan
s to
co
mm
ercia
l an
d i
nves
tmen
t banks-2
V4 pe
rcen
t/2
perc
ent:
pri
vate
sec
tor
borr
ow
ers,
inc
ludi
ng m
ulti
nati
ona
ls. -
2'n pe
rcen
t/2Y'l
perc
ent.
Bra
zil
is al
so p
repa
red
to p
ay
a 0
.5 pe
rcen
t co
mm
itm
ent
fee
on u
ndis
bur
sed
co
mm
itm
ents
, pa
yabl
e q
uar
terl
y in
arrears
, an
d a
1.5
perc
ent
fiat
fac
ilit
y fe
e on
amo
unts
dis
burs
ed,
pay
able
at
the
tim
e of
d.is
burs
em
eot.
10
Lat
est
esti
mat
e o
f am
oun
t su
bjec
t to
res
ched
ulin
g. T
otal
may
be l
ow
er,
as s
om
e of
Bra
zil
's d
ebt
to b
anks
and
sup
plie
rs m
ay be
eligi
ble
for
resc
hedu
ling
thro
ugh
Par
is C
lub
. A
d
efiniti
ve a
ccou
ntin
g o
f P
aris
Clu
b re
sche
du
ling
wil
l be
av
aila
ble
upon
ter
min
atio
n of
bila
tera
l ag
reem
ents
. ln
ad
dit
ion,
tra
de fi
nan
cing
was
mai
ntai
ned
at a
ppro
xim
atel
y S9
.8 b
illio
n and
io
terba
nk
expo
sure
was
res
tore
d to
S6 b
illio
n.
11 C
erta
in p
aym
ents
are t
o be
mad
e du
ring
198
5-93
for
amo
unts
fal
ling
due
dur
ing
that
peri
od
.

©In
tern
atio
nal M
onet
ary
Fund
. Not
for R
edis
tribu
tion
0
00
Ta
ble
40
(co
ntinu
ed}.
Ter
ms
an
d C
on
dit
ion
s o
f B
an
k D
ebt
Re
stru
ctu
rin
gs
an
d B
an
k F
ina
nci
al
Pa
cka
ges
, 19
78-8
5
Co
unt
ry,
Dat
e o
f A
gree
men
t,
and
Ty
pe o
f D
ebt
Res
ched
ule
d
Chile
Ag
reem
ent
of J
uly
28,
198
3:
New
loan
agre
ed i
n pr
inci
ple
Res
ched
ulin
g o
f m
ediu
m-t
erm
d
ebt
du
e:
In 1
983
ln
198
4
Ro
llo
ver
of
tra
de-
rela
ted
sh
ort
-ter
m d
ebt
Ag
reem
ent
of J
anu
ary
25,
19
84:
Sh
ort
-ter
m n
on
trad
e-re
late
d d
ebt
con
vert
ed t
o m
ediu
m-t
erm
deb
t A
gre
emen
t o
f Ju
ne
14,
1984
: N
ew
lo
an
Ag
reem
ent
of N
ove
mbe
r 26
, 19
84:
Co
nti
nu
atio
n o
f ro
llo
ver
of
sho
rt-
term
tra
de-
rela
ted l
ine
of c
redit
u
nti
l Ju
ne 3
0,
1985
A
gree
men
! o
f N
ov
embe
r I,
19
85:
R
estr
uctu
rin
g of
pu
bli
c an
d p
riva
te d
ebt
due
in
19
85-8
7 N
ew m
ediu
m-t
erm
lo
an
Wo
rld
Ban
k c
ofi
nanc
ing
E
xten
sio
n o
f sh
ort
-ter
m t
rade
-re
late
d fa
cilit
y u
ntil
1990
Co
lom
bia
A
gree
men
t o
f De
cem
ber
19
85:
New
lo
an
Cos
ta Ri
ca
Agr
eem
ent
of
Sep
tem
ber
10
, 19
83
(am
end
men
t agr
eed
in
pri
ncip
le i
n
Janu
ary
19
85):
Pri
nci
pal
in
arr
ears
pri
or
to 1
983
Pri
nci
pal
fal
lin
g d
ue i
n 1
983
Pri
ncip
al fa
llin
g d
ue
in 1
984
C
ertifi
cate
s o
f d
eposi
t: IS
Fa
llin
g d
ue
pri
or
to 1
983
Fal
ling
du
e in
198
4 N
ew r
evo
lvin
g f
acil
ity
16
Am
oun
t G
race
B
asi
s P
rovi
ded
P
eriod
M
atur
ity
fin
ye
ars
, (U
S$
mil
lio
ns}
u
nle
ss o
the
rwis
e n
ote
d}
New
fin
an
cin
g
1,300
4
7
100 pe
rcen
t o
f p
rin
cip
al
1.15
0
4
8
100 p
erce
nt o
f p
rinc
ipal
1.
019
4
8
100
perc.e
nt
roll
ove
r u
ntil
1,700
D
ecem
ber
19
84
100 p
erce
nt o
f p
rinc
ipa
l 1,
160
4
8
Ne
w f
inan
cing
78
0
5 9
1,700
6
mo
nth
s
100 p
erce
nt o
f p
rinc
ipal
6
,007
6
12
New
fin
anci
ng
785
5 10
N
ew fi
nan
cing
300
13
IOlfz
12
100 p
erce
nt
roUo
ver
1,700
New
fina
ncin
g
1 ,00
0 8
1fz
971fz
per
cen
t 36
3 3V
4 7
1fz
97'12
perc
ent
110
3V
4 7
1fz
100 p
erce
nt
136
3V
4 6
1fz
100 p
<«<o
l of
pri
odp
al �
• }
4
8
inte
rest
acc
rued
pri
or
to
1983
100
perc
ent
of
pri
ncip
al
100
5 8
R
evo
lvin
g c
red
it e
qui
vale
nt
202
2 3
to S
O pe
rcen
t o
f in
tere
st
pay
men
ts a
ctu
ally
pai
d i
n
1983
>
"'0
"'0
Inte
rest
r:rl
z
R
ate
0
- ><
(In
pe
rce
nt
spre
ad
<
o
ve
r L
JBO
RIU
.S. P
rim
e)
- • tl.l
�
>
2V4-
2M!
:J
tl.l
-l
()
2Yi-
-2
>
2Yi--
2 r
l'n
-l
>
to
r
trl
21-1
1 tl.l
l¥4
-llfz
Ori
gin
ally
co
ntra
cted
rat
es
1� 12
l�lV
4 I�
IV4
I�IM!
14
!Ill f
or fi
rst
4 y
ears,
and I
� th
erea
fter
2V4-
2Itil
2V4-
2t,.k
2Y4-
2t,.k
J.¥4
-JS;t

©In
tern
atio
nal M
onet
ary
Fund
. Not
for R
edis
tribu
tion
Agr
eem
ent
of
Ma
y 1
98
5:
Incr
ease
in
revo
lvin
g fa
cili
ty
New
fin
an
cin
g
75
1\12
6
1¥
.... 15
�
ori
gin
all
y a
gree
d in
S
epte
mbe
r 19
83
Res
ched
ulin
g o
f pri
nci
pa
l fa
lling
100
per
cen
t 44()
3
10
IS..t-J5
�17
d
ue
in 1
985
an
d 1
986
Co
te d
'lvo
ire
Agr
eem
ent
of
Ma
rch
I,
198
5:
Pu
blic
an
d p
ub
licl
y g
uara
ntee
d m
ediu
m-
and
lo
ng-t
erm
deb
t:
Du
e De
cem
ber
1983
100
per
cen
t o
f pri
nci
pa
l 280
2
7
J1..t-
JS�
an
d 1
984
D
ue
198
5 90
perc
ent
of
pri
nci
pal
22
1 3
8
J 1..t-
IS�
N
ew l
oan
104
3
7
J1..t-
JS�
Dominican
Rep
obu
c A
gree
men
t of
Dec
embe
r 2
1, 1
98
3:
Len
ers
of
cred
it o
uts
tan
din
g o
n
No
vem
ber
30,
198
2, a
nd
in
a
rrea
rs a
t th
at
da
te
Cen
tra
l B
an
k a
ccep
tan
ces
Pu
bli
c an
d pri
vat
e d
ebt
i.n ar
rears
95
perc
ent
500
5 2V
4-2�
a
s o
f N
ov
embe
r 30
, 19
83
Pub
lic
an
d p
riv
ate
deb
t fal
ling due
be
twee
n D
ecem
ber
I, 19
82-
Dece
mbe
r 3
1, 1
983
Agr
eem
ent
in p
rin
cip
le w
ith
Ste
erin
g
Co
mm
itte
e (M
ay 1
98
5):
Res
ched
uJin
g o
f p
ub
lic
an
d p
riv
ate
d
ebt
In a
rrea
rs a
s o
f D
ecem
ber
31.
19
84
100 p
erce
nt
80
3 13
l¥1!
D
ue i
n 1
985
-89
100
per
cen
t 70
7 3
13
m
Ecuad
or
Agr
eem
ent
of O
cto
ber
1983
: R
efin
anci
ng
of
pri
vate
deb
t fa
llin
g
100 p
erce
nt
of
pri
nci
pal
940
7 2V
+-2�
d
ue in
19
83
Ref
inan
cing
of
pu
blic
deb
t fa
llin
g
90 p
erc
ent
of
pri
nci
pa
l 89
5 (i
ncl
udin
g
6
2V+
-2�
d
ue
in 1
98
3 (e
ffec
tiv
e 58
0 in
sh
ort
-De
cem
ber
31,
19
83)
18
term
deb
t)
New
lo
an
N
ew f
inanc
ing
43
1 l'
h
6
2l.
.t-2V>I
Tra
de c
red
it
100 p
erce
nt
roUo
ver
unti
l 700
Jlh
-1�
De
cem
ber
198
4
12 T
hes
e ra
tes
will
als
o a
pply
to
th
e o
utst
andi
ng p
art
s o
f th
e 19
83 a
nd
19
84 a
gree
men
ts.
1 3 S
!50 m
illio
n o
f th
e la
ter
ma
turi
ties
car
ries
a g
uar
ante
e fr
om t
he
Wo
rld
Ba
nk
for
wh
ich
it w
ill
char
ge c
om
mer
cial
ba
nk
s a
fee
ran
ging
fro
m
I� pe
rcen
t to
I Y•
perc
ent.
14
Th
ere
is a
lso
a f
acili
ty f
ee o
f�
per
cen
t pe
r y
ear.
IS
Ref
ers
to t
ho
se c
ertifi
cate
s w
hic
h w
ere
issu
ed b
y th
e C
entr
al B
ank
aga
inst
ex
isti
ng
arr
ears
of
the
priv
ate
sec
tor
(mai
nly
wit
h re
gard
to
im
port
s) a
nd w
hic
h w
ere
held
by
the
fo
reig
n co
mm
erci
al b
an
ks.
16
The
banks a
greed
to
pro
vide
Co
sta
Ric
a w
ith
a r
evo
lvin
g t
rade
-rel
ated
cre
dit
fac
ilit
y e
qui
va
len
t to
50
per
cen
t of
inte
rest
pa
ym
ents
act
ually
pa
id in
19
83,
wh
ich
wer
e ei
ther
in a
rrea
rs
or h
ad a
ccru
ed i
n 19
83.
17
I�
perc
ent
ov
er
.. d
om
esti
c re
fere
nce
rate
," e
qua
l to
: U
.S.
dolla
r CID
rate
adj
ust
ed t
o r
eser
ves
and
in
sura
nce
; o
r a
co
mp
arab
le y
ield
for
lo
ans
den
om
ina
ted
in
oth
er c
urre
nci
es.
1 8 P
aym
ents
of
100 pe
rcen
t o
f th
e m
atur
itie
s fa
llin
g d
ue
wer
e de
ferr
ed u
nti
l De
cem
ber
31,
19
84
, w
hen
90 pe
rcen
t o
f th
e a
mo
unt
wa
s re
fin
ance
d.
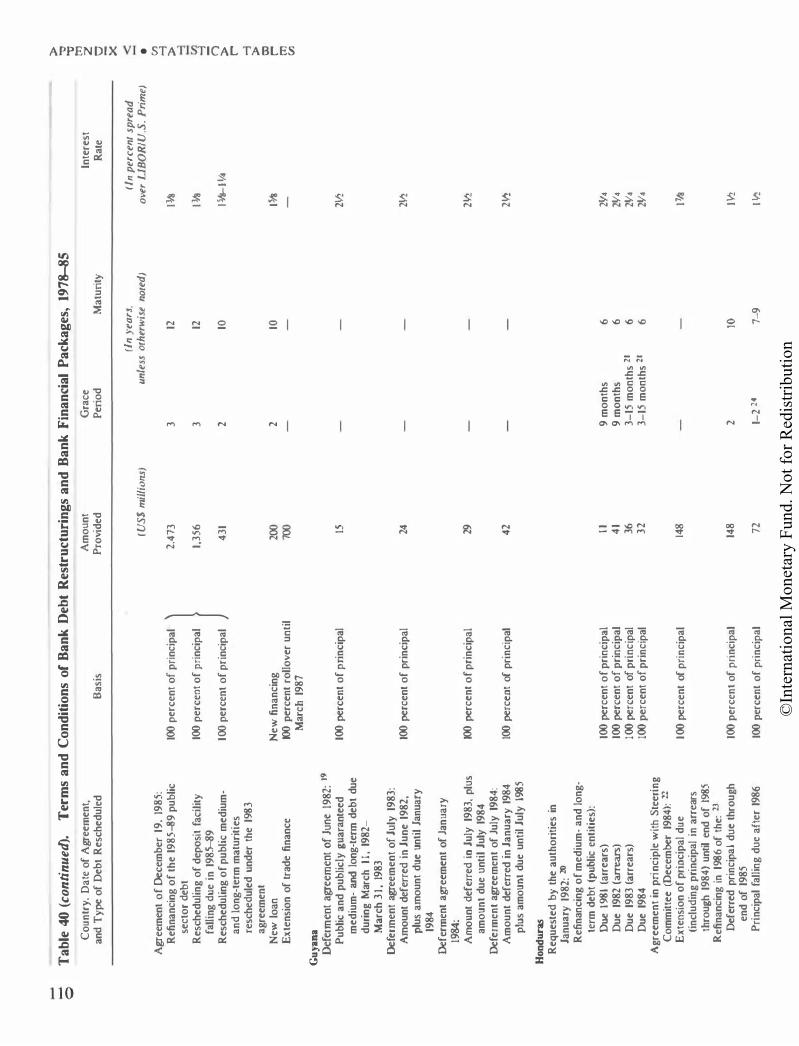
©In
tern
atio
nal M
onet
ary
Fund
. Not
for R
edis
tribu
tion
0
Ta
ble
40 (
conti
nued)
. T
erm
s a
nd
Co
nd
itio
ns
of
Ba
nk
Deb
t R
est
ruc
turi
ng
s a
nd
Ba
nk
Fin
an
cia
l P
ack
ag
es,
197
8-85
Co
un
try
. D
ate
of
Agr
eem
ent.
an
d T
ype
of
Deb
t R
esch
edu
led
Agr
eem
ent
of
Dece
mb
er 1
9,
1985
: R
efin
an
cin
g o
f th
e 1
985
-89
pu
blic
se
cto
r d
ebt
Res
ched
ulin
g o
f d
epo
sit
faci
lity
fa
llin
g d
ue
in 1
98S�
9 R
esch
edu
lin
g o
f p
ub
lic
med
ium
-a
nd
lo
ng
-ter
m m
atu
riti
es
resc
hed
ule
d u
nd
er t
he
1983
ag
reem
ent
New
lo
an
E
xte
nsi
on
of
trad
e fi
na
nce
Guy
ana
Def
erm
ent
agree
men
t of
Ju
ne
1982
: 19
Pu
blic
an
d p
ub
licly
gu
aran
teed
m
ed
ium
-and
long
-ter
m d
ebt
du
e d
uri
ng
Mar
ch
11,
1982
-M
arc
h 3
1, 1
983
Defe
rme
nt
agree
me
nt
of
July
198
3:
Am
ou
nt
def
erre
d i
n J
un
e 1
982,
p
lus
am
ou
nt
du
e u
nti
l Ja
nu
ary
19
84
Defe
rmen
t a
gree
men
t o
f Ja
nu
ary
1984
: A
mo
un
t d
efer
red
in
July
198
3, p
lus
amo
un
t d
ue
un
til
July
198
4
Defe
rmen
t agr
eem
ent
of
July
198
4:
Am
ou
nt
def
erre
d i
n J
an
ua
ry 1
984
plu
s a
mo
un
t d
ue
un
til
July
198
5
Hon
duras
Req
ues
ted
by
th
e a
uth
ori
ties
in
Ja
nu
ary
198
2: 20
R
efin
anci
ng
of
me
diu
m-
an
d l
on
g-
term
deb
t (p
ub
lic e
nti
tie
s):
Due
1981
(arr
ears
) D
ue
1982
(ar
rears) D
ue
1983
(a
rrea
rs)
Du
e 19
84
Ag
ree
me
nt
in p
rin
cip
le w
ith
Ste
erin
g
Co
mm
itte
e (D
ecem
ber
1984
): 22
E
xte
nsio
n o
f p
rin
cip
al
du
e
(in
clu
din
g p
rin
cip
al
in a
rrea
rs
thro
ug
h 1
984)
unt
il en
d o
f 198
5 R
efin
an
cin
g i
n
1986
of
the:
13
Def
erre
d p
rin
cip
al
du
e th
rou
gh
en
d o
f 19
85
Pri
nci
pal
fal
lin
g d
ue
aft
er
1986
Am
ou
nt
Ba
sis
Pro
vid
ed
(US
$ m
illi
ons
)
100 p
erce
nt
of
pri
nci
pa
l
} 2,
473
100 p
erc
ent
of
pri
nci
pa
l 1,
356
100 p
erce
nt
of
pri
nci
pa
l 4
31
Ne
w fi
na
nci
ng
200
100
per
cen
t ro
Uo
ver
un
til
700
Mar
ch 1
987
100 pe
rcen
t o
f p
rin
cip
al
15
100 pe
rcen
t o
f p
rin
cip
al
24
100 pe
rcen
t o
f p
rin
cip
al
29
100 pe
rcen
t of
pri
nci
pal
42
100 pe
rcen
t o
f p
rin
cip
al
11
100 pe
rcen
t o
f p
rin
cip
al
41
100 pe
rcen
t of
pri
nci
pal
36
100
pe
rcen
t o
f p
rin
cip
al
32
100 pe
rcen
t of
pri
nci
pa
l 148
100 p
erc
ent
of
pri
nci
pa
l 14
8
100 p
erce
nt
of
pri
nci
pa
l 72
Gra
ce
Peri
od
M
atu
rity
(in
yea
rs.
un
less
oth
erw
ise
nor
ed)
3 3 2 2 9 m
on
ths
9 m
on
ths
3-15
mo
nth
s 21
3-
15 m
on
ths
21
2 1-2
24
12
12
10
10 6 6 6 6 10
7-9
>
"0
"'0
Inte
rest
m
z
R
ate
S2
><
(In
per
cen
t sp
rea
d
<
ove
r L
JBO
RIU
.S.
Pri
me)
•
r.
.n -i
I M!
>
-i
I M!
r.
.n j
()
J51
11-J V4
>
r
...,
>
cc
I�
r
("Il
r..n
21/l
21/l
21/l
21/l
2lf4
2V4
2V4
2V4
I�
Jll.!
Jtn
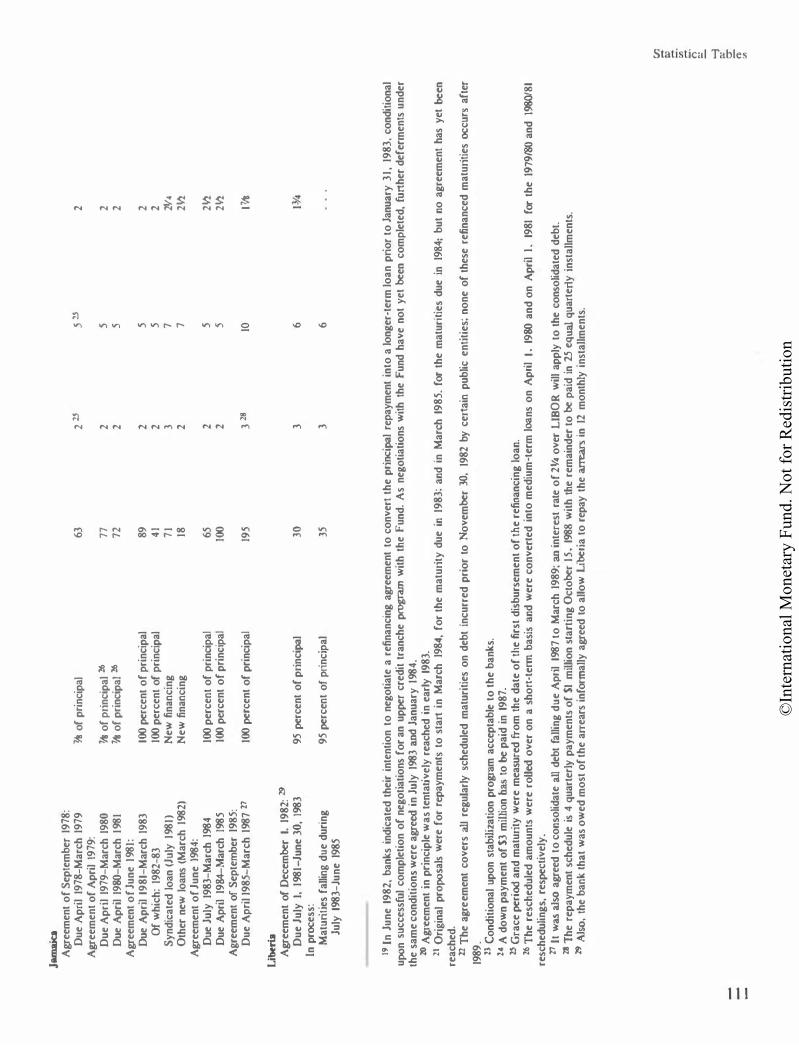
©In
tern
atio
nal M
onet
ary
Fund
. Not
for R
edis
tribu
tion
- - ....
Jamaica
Agr
eem
ent
of
Sep
tem
ber
1978
: D
ue A
pri
l 19
78-M
arch
197
9 A
gree
men
t o
f A
pril
1979
: D
ue A
pri
l 19
79-M
arch
198
0 D
ue A
pril
1980
-Mar
ch 1
981
Agr
eem
ent
of J
une
198
1:
Due
Ap
ril
198
1-M
arch
198
3 Of
whi
ch:
1982
-83
Syn
dica
ted
loan
(Ju
ly 1
981)
O
ther
new
lo
ans
(Mar
ch 1
982)
A
gree
men
t o
f Ju
ne 1
984:
D
ue J
uly
198
3-M
arch
198
4 D
ue A
pril
1984-
-Mar
ch 1
985
Agr
eem
ent
of S
epte
mbe
r 19
85:
Due
Apr
il 19
85-
Mar
ch 1
987
27
Libe
ria
Agr
eem
ent
of D
ecem
ber
I, 19
82: 29
D
ue
July
I,
1981-
June
30
, 198
3 ln
proc
ess:
M
aturi
ties
fal
ling
due
dur
ing
July
198
3-Ju
ne
1985
7111 o
f pr
inci
pal
� o
f pr
inci
pal
Z6
� o
f pr
inci
pal
Z6
100 pe
rcen
t o
f pr
inci
pal
100 p
erce
nt o
f pr
inci
pal
New
fina
ncin
g N
ew fi
nanc
ing
100 p
erce
nt o
f pr
inci
pal
100 p
erce
nt o
f pr
inci
pal
100 pe
rcen
t o
f pr
inci
pal
95 pe
rcen
t o
f pr
inci
pal
95 pe
rcen
t of
pri
ncip
al
63
225
5
25
2
77
2 5
2 72
2
5 2
89
2 5
2 4
1 2
5 2
71
3 7
2V4
18
2 7
2Vl
65
2 5
2Vl
100
2
5
2Vl
195
328
10
J1AI
30
3 6
35
3 6
19 I
n J
une
1982
, ba
nks
indi
cate
d th
eir
inte
ntio
n to
neg
otia
te a
refi
nanc
ing
agree
men
t to
co
nver
t th
e pr
incipa
l re
paym
ent
into
a lo
nger
-ter
m lo
an p
rior
to
Jan
uary
31,
19
83,
cond
itio
nal
upon
succ
essfu
l co
mpl
etio
n o
f ne
goti
atio
ns f
or
an u
pper
cred
it t
ranc
he p
rogram w
ith
the
Fun
d. A
s ne
goti
atio
ns w
ith t
he F
und
have
no
t ye
t be
en c
om
plet
ed,
furt
her
defe
rmen
ts u
nder
th
e sa
me
cond
itio
ns w
ere
agreed
in
Ju
ly 1
983
and J
anua
ry 1
984.
20
Agr
eem
ent
in p
rinc
iple
wa
s te
ntat
ivel
y re
ache
d in
ear
ly 1
983.
21
Ori
gina
l pr
opo
sals
wer
e fo
r re
paym
ents
to
sta
rt i
n M
arch
19
84,
for
the
mat
urit
y du
e in
19
83:
and
in M
arch
19
85.
for
the
mat
urit
ies
due
in
1984
; bu
t no
agr
eem
ent
has
yet
been
re
ache
d.
22 T
he a
gre
emen
t co
vers
all r
egul
arly
sch
edul
ed m
atur
itie
s o
n de
bt i
ncur
red
prio
r to
No
vem
ber
30,
1982
by
cert
ain
publ
ic e
ntit
ies:
no
ne o
f th
ese
refin
ance
d m
atur
itie
s oc
curs
aft
er
1989
. 23
Co
ndit
iona
l up
on s
tabil.i
zatio
n pr
ogra
m a
ccep
tabl
e to
th
e ba
nks.
24
A d
ow
n pa
ymen
t o
f S3
mill
ion
has t
o be
pai
d in
198
7.
2S G
race
peri
od a
nd m
atur
ity
wer
e m
easu
red
fro
m t
he d
ate
of
th.e
firs
t di
sbur
sem
ent
of
the
refin
anci
ng lo
an.
26 T
he r
esch
edul
ed a
mo
unts
wer
e ro
Ued o
ver
on
a sh
ort
-term
bas
is a
nd w
ere
conv
erte
d in
to m
ediu
m-t
erm
loans
on
Ap
ril
I, 1
980 a
nd o
n A
pril
L
1981
for
the
19
79/80
and
1980/
81
resc
hedu
lings
, re
spect
ivel
y.
27 l
t was
also
agr
eed
to c
ons
olid
ate
all d
ebt
falli
ng d
ue
Apr
il 1
987
to M
arch
198
9; an
inte
rest
rat
e o
f 2
V4 o
ver
LLB
OR
will
app
ly t
o t
he c
ons
olid
ated
deb
t.
28 T
he r
epay
men
t sc
hedu
le i
s 4
qua
rter
ly p
aym
ents
of
SI m
iUio
n st
arti
ng O
cto
ber
15,
1988
wit
h th
e re
mai
nder
to
be p
aid
in 25
equal
qua
rterl
y in
stal
lmen
ts.
29 Al
so,
the
bank
that
was
ow
ed m
ost
of
the
arrea
rs i
nfor
mal
ly a
gree
d to
allo
w L
iberi
a to
rep
ay t
he ar
rears in 1
2 m
ont
hly
inst
allm
ents
.
en
g
�
c;·
::::..
.,
�
2:
n
"'

©In
tern
atio
nal M
onet
ary
Fund
. Not
for R
edis
tribu
tion
Ta
ble
40 (
conti
nued)
. T
erm
s a
nd
Co
nd
itio
ns
of
Ba
nk
De
bt
Res
tru
ctu
rin
gs
an
d B
an
k F
ina
nci
al
Pa
cka
ges
, 19
78-8
5
>
N
""
""
Co
un
try
, D
ate
of
Agr
eem
en
t,
Am
ou
nt
Gra
ce
Inte
rest
tT1
z
a
nd
Ty
pe o
f De
bt
Res
ched
ule
d
Ba
sis
Pro
vid
ed
Per
iod
M
atu
rity
R
ate
0
- ><
(In
yea
rs,
(In
pe
rce
nt
spre
ad
<
(U
S$
mil
lio
ns)
u
nle
ss o
ther
wis
e n
ote
d)
OIJe
r L
JBO
RIU
.S.
Pri
me}
- •
Madag
ascar
tn
-i
Ag
reem
ent
of
July
-N
ov
embe
r 19
81:
>
R
esch
edu
lin
g o
f a
rre
ars
on
100 pe
rcen
t o
f p
rin
cip
al
147
30
3Vl
lVl
:j
o
ver
dra
fts
tn
Ag
reem
ent
of
Oct
ob
er 2
5, 1
984
: 31
j
("')
G
lob
al r
estr
uc
turi
ng
of
ou
tsta
nd
ing
>
p
ub
lic
deb
t 32
r
Of
wh
ich
: in
arr
ears
..
..., M
ediu
m-t
erm
18
2V
l 8
2
>
to
Sh
ort
-ter
m
52
2V2
6
I :Y4
r
Of
wh
ich
: fu
iUre
mat
uri
ties
m
M
ediu
m-t
erm
60
2V
2 8
2
tn
Sh
ort
-ter
m
65
2V2
6
I:Y4
Malawi
A
gree
men
t o
f M
arc
h 6
, 19
83:
Me
diu
m-
an
d l
ong
-ter
m d
eb
t D
ue
Se
pte
mb
er
1982
-85
perc
en
t o
f p
rin
cip
al
28
3 6
V2
J1tt
Au
gu
st 1
983
Du
e S
epte
mbe
r 19
83-
85 pe
rcen
t o
f p
rin
cip
al
29
3 6V
2 nt
A
ug
ust
198
4
Mexico
A
gree
men
t o
f A
ug
ust
27
, 19
83:
33
Res
ched
ulin
g o
f p
ub
lic s
ecto
r 100
perc
ent
of
pri
nci
pa
J 18
,800
4
8
l�l¥
4 sh
ort
-, m
ed
ium
-, a
nd
lo
ng
-ter
m
deb
t 34
du
e A
ug
ust
23,
198
2-D
ecem
ber
31,
19
84
Sy
nd
ica
ted l
oan
35
Ne
w fi
nan
cin
g
5,00
0 3
6
2114
-21;1!
S
ettl
emen
t o
f in
tere
st i
n ar
rear
s o
n
1,36
7 1-
�
pri
va
te s
ecto
r's
deb
t 36
A
gree
men
t o
f A
pri
l 19
84
: N
ew
lo
an
Ne
w fi
nan
cin
g
3.800
5
V2
10
l\-2-
11;1!
A
gree
men
t o
f M
arc
h 2
9, 1
985
: R
esc
hed
uli
ng
of
pu
bli
c m
ediu
m-
and
lo
ng
-ter
m d
ebt
pre
vio
usl
y
resc
hed
ule
d
Du
e in
19
87
100 pe
rcen
t o
f p
rin
cip
aJ
5,800
14
.18
{ �in
198
5-86
D
ue
from
19
88 t
o 1
990
100 pe
rcen
t o
f p
rin
cip
aJ
17,80
0 14
38
11;1! in
198
7-9
1 11
;1! i
n 1
992-
98
Res
ched
uli
ng
of
1983
100
per
cent
of
pri
nci
pa
l 5,
000
5 10
l\-
2-11;1!
sy
nd
icat
ed l
oan
37
Agr
eem
ent
of
Au
gu
st 2
9. 1
985
: 38
R
esch
edu
lin
g o
f p
ub
lic
100 pe
rcen
t o
f p
rin
cip
aJ
20,1
00
14 38
{ �in
198
5-86
m
ediu
m-
and
lo
ng
-ter
m d
ebt
11;1! in
198
7-9
1 n
ot
pre
vio
usl
y r
esch
edu
led
I�
in
1992-
98
faJl
ing
du
e fr
om
19
85 t
o
1990

©In
tern
atio
nal M
onet
ary
Fund
. Not
for R
edis
tribu
tion
Defe
rmen
t agr
eem
ent
of-
Octo
ber
I,
1985
F
irst
pri
ncip
al p
aym
ent
und
er t
he
$5 b
illio
n ag
reem
ent
as a
men
ded
M
arch
29,
19
85
Mor
occo
A
gree
men
t o
f S
epte
mbe
r 19
85:
M
ediu
m-
an
d lo
ng-t
erm
deb
t d
ue
Sep
tem
ber
9,
1983
-D
ecem
ber
31,
19
83
Med
ium
-an
d l
ong
-ter
m d
ebt
du
e in
1984
Ro
llove
r of
sho
rt-t
erm
deb
t R
equ
este
d b
y th
e au
tho
riti
es
Res
ched
ulin
g o
f p
ub
lic
deb
t d
ue
in 1
985-86
Peop
le's
Rep
ubli
c of
Moza
mb
iqu
e P
reli
min
ary
dis
cuss
ion
s o
n b
ank
deb
t (F
ebru
ary
1985
)
100 pe
rcen
t o
f p
rin
cip
al
100 p
erce
nt
of
pri
nci
pal
}
90 pe
rcen
t o
f p
rin
cip
al
950
548
750
790
1,400
30 I
ncl
ud
es a
bout
$50
mil
lion
of a
rrea
rs o
n o
verd
rafts
resc
hed
uled
on
sim
ilar
term
s in
lat
e 198
0.
3 7
1¥
4
3 7
lt T
he
agre
emen
t is
sub
ject
to
Mad
agas
car'
s b
eing
cur
rent
on
inte
rest
pay
men
ts.
Th
e ag
reem
ent a
lso
en
vis
ages
th
e p
rov
isio
n of
a r
evo
lvin
g tra
de f
acil
ity
, fo
r a
n a
mo
unt
equi
val
ent
to
the
pri
nci
pal
pay
men
ts f
allin
g d
ue in
19
83 (
$12
mil
lion)
or
a o
ne-y
ear
grace
peri
od o
n th
at a
mo
unt.
32
Ba
sed
on
ou
tsta
nd
ing
deb
t, in
clud
ing
sho
rt-t
erm
deb
t, a
s o
f D
ecem
ber
31,
198
2, and
incl
udin
g p
aym
ents
arr
ears
on
both
sho
rt-
and
med
ium
-ter
m d
ebt.
In
clu
des
a s
peci
al a
gree
men
t fo
r th
e re
sch
edu
ling
of
Air
Mad
agasca
r d
ebt,
sec
ured
by
airc
raf
t. B
Agr
eem
ent
too
k e
ffec
t w
ith
dis
bu
rsem
ent
of
a n
ew l
oa
n in
Mar
ch 1
983
. l4
Fo
r th
e p
urpo
se o
f th
e r
esch
edul
ing
, M
exic
o's
pub
lic s
ecto
r d
ebt
(sh
ort
-, m
ediu
m-,
an
d l
ong
-ter
m)
excl
ud
es:
loan
s m
ade,
guarante
ed,
insu
red
, o
r su
bsi
diz
ed b
y o
ffici
al a
genc
ies
in
the
cred
ito
r co
untr
ies;
pu
blic
ly i
ssu
ed bo
nd
s, p
riva
te p
lace
men
ts (
incl
ud
ing
Japa
nes
e ye
n-den
om
inat
ed r
egist
ered
pri
vate
pla
cem
ents
) an
d fl
oat
ing
rate
cer
tifi
cate
s o
f d
eposi
t and
no
tes
(in
clu
din
g fl
oat
ing
rate
no
tes)
; d
ebt
to o
ffici
al
mu
ltila
tera
l en
titi
es;
forw
ard
exc
hang
e an
d p
recio
us m
etal
co
ntr
acts
; spo
t an
d l
ease
ob
ligat
ions
in
respe
ct o
f m
ova
ble
pro
pert
y, s
hort
-ter
m
impo
rt-a
nd
expo
rt-r
elat
ed t
rade
cre
dit
s; io
terb
ank
ob
ligat
ions
(in
clu
din
g p
lace
men
ts)
of t
he
fore
ign a
genc
ies
and
bra
nche
s of
Mex
ican
ba
nk
s, e
xclu
din
g g
uara
ntee
s o
n in
terb
ank
pla
cem
ents
; fi
nan
cin
g s
ecu
red
by
legal
ly r
eco
gniz
ed s
ecur
ity
in
tere
st i
n s
hip
s, a
ircr
aft,
and
dri
llin
g r
igs;
and
the
Cen
tral
Ban
k's
ob
ligat
ions
ari
sin
g f
rom
th
e ar
ran
gem
ents
to
liq
uid
ate
inte
rest
pay
men
ts
in a
rrea
rs.
15 T
he
$5 b
illio
n l
oan
was
rai
sed
in
th
e fo
rm o
f a
med
ium
-ter
m i
nter
nati
ona
l sy
nd
icat
ed c
red
it i
n w
hich
ban
ks
par
tici
pa
ted
on
the
bas
is o
f th
eir
pro
rat
a ex
po
sure
to M
exic
o a
s of
A
ugus
t 2
3, 1
982
. T
he l
oan
doc
um
ent
incl
ud
ed a
sp
ecif
ic r
efer
ence
to
a w
ritt
en e
xpla
nati
on
and
confi
rmat
ion
from
th
e F
und
Man
aging
Dir
ecto
r w
ith
res
pect
to
$2-
2.5
bill
ion
in
financia
l as
sist
ance
to
be o
bta
ined
fro
m o
ffici
al c
red
ito
rs (
oth
er t
han
the F
un
d),
a r
equ
irem
ent
to p
rovi
de
info
rmat
ion
about
the
im
ple
men
tati
on
of
the
fina
ncia
l p
rogr
am,
a r
eque
st o
n th
e p
art
of
the
lend
ing
synd
icat
e no
t to
obj
ect
to t
he
fina
l re
stru
ctur
ing
pri
nci
ple
s o
f th
e co
ntem
pla
ted
res
ched
ulin
g o
pera
tio
n,
the
cust
om
ary
cro
ss-d
efau
lt c
lau
se,
a s
pec
ifica
tio
n of
ev
ents
of
defa
ult
s (i
ncl
ud
ing
the
fai
lure
of
Mex
ico
to
co
mp
ly w
ith
the
perf
orm
ance
cri
teri
a a
gree
d w
ith
the
Fun
d in
co
nnec
tio
n w
ith
the
thre
e-y
ear
exte
nd
ed ar
rangemen
t, a
nd n
on
mem
bers
hip
), and
the
imp
lem
enta
tio
n o
f th
e p
ropo
sed
·mec
han
ism
to
elim
inat
e th
e in
tere
st a
rrea
rs o
n t
he
pri
va
te s
ecto
r d
ebt.
ln
ad
dit
ion
, iot
erb
ank
expo
sure
wa
s re
sto
red
an
d w
ou
ld be
mai
nta
ined
th
roug
h th
e en
d o
f 19
86 a
t $5
.2 b
illio
n.
36 S
pecifi
call
y,
Mex
ican
pri
vate
borr
ow
ers
ow
ing
inte
rest
on
fore
ign b
ank
deb
ts p
ayab
le i
n f
ore
ign c
urr
ency
an
d o
utst
and
ing
pri
or
to S
epte
mbe
r 1,
198
2 co
uld
use
the
pro
ced
ures
p
ropo
sed
by
the
Mex
ican
aut
hori
ties
to
set
tle
inte
rest
pa
ym
ents
due
in
the
per
iod
fro
m A
ug
ust
1, 1
982
to J
anua
ry 3
1, 1
9S
3. S
ettl
emen
t ha
d to
be m
ade
by
depo
siti
ng
the
lo
cal
curr
ency
eq
uiv
alen
t o
f th
e am
oun
t o
f in
tere
st d
ue i
n fo
reig
n cu
rren
cy,
at t
he c
ont
rolle
d e
xch
ang
e ra
te o
f th
e d
ate
at w
hich
the
depo
sit
was c
on
stit
uted
. S
pec
ial
fore
ign
curr
ency
depo
sits
wer
e b
eing
ope
ned
by t
he f
ore
ign
lend
ers
wit
h th
e B
ank
of
Mex
ico
, an
d th
e am
oun
ts o
f in
tere
st o
wed
wer
e b
eing
cre
dit
ed t
o t
hes
e ac
cou
nts
. T
en p
erce
nt o
f th
e o
utst
and
ing
bala
nce
in t
hese
ac
coun
ts w
as
pai
d t
o c
red
ito
rs o
n J
anu
ary
31,
19
83,
wh
ile
the
rem
aind
er h
ad t
o be
sett
led
su
bje
ct t
o t
he
avai
lab
ility
of
fore
ign
exch
ang
e. A
s o
f M
arc
h 7
, 198
4, a
ll o
utst
and
ing
arrears
w
ere
elim
ina
ted
. 37
$1.
2 b
illio
n o
f th
e $5
bill
ion
syn
dic
ated
lo
an w
as
to b
e p
rep
aid
in
1985
an
d t
he
bal
ance
res
tru
ctu
red
to
mat
ch t
he
rep
aym
ent
sch
edu
le o
n t
he
1984
$3.
8 b
illio
n n
ew m
on
ey l
oa
n.
Ho
wev
er.
on
ly $
250
mil
lion
was p
rep
aid
in
19
85 a
nd t
he a
uth
ori
ties
hav
e ag
reed
wit
h th
e b
an
ks
to t
he
post
pon
emen
t o
f th
e re
mai
nin
g $
950
mill
ion
. 38
Th
ere
are
no
res
ched
ulin
g f
ees
an
d.
und
er c
ertai
n c
on
dit
ion
s, b
ank
s are
allo
wed
to
sw
itch
the
ir lo
an
s f
rom
do
llars
to
ho
me
cou
ntr
y c
urr
enci
es. R
esch
edu
ling
of
pre
vio
usly
res
ched
ule
d
deb
t fa
lling
due
fro
m
1987
to
1990
is
con
dit
ion
al u
po
n t
he
ach
ieve
men
t o
f M
exic
o's
ow
n ec
ono
mic
tar
gets
to
be
mo
nito
red
on
the
ba
sis
of
enha
nced
Art
icle
IV
co
nsu
ltat
ion
s w
ith
the
F
und
begi
nnin
g in
19
86.
Mat
uri
ties
sho
wn
rel
ate
to t
he
dat
e o
f th
e agr
eem
ent
in p
rin
cip
le.

©In
tern
atio
nal M
onet
ary
Fund
. Not
for R
edis
tribu
tion
Ta
ble
40 (
conti
nued)
. T
erm
s a
nd
Co
nd
itio
ns
of
Ba
nk
De
bt
Res
tru
ctu
rin
gs
an
d B
an
k F
ina
nc
ial
Pa
cka
ges
, 197
8-85
>
�
..,
"'0
C
ou
ntr
y.
Da
te o
f A
gree
men
t,
Am
oun
t G
race
In
tere
st
trJ
z
an
d T
ype
of
Deb
t R
esch
edu
led
B
asis
P
rovi
ded
P
eriod
M
atur
ity
Rat
e 0
..
... X
(l
rr \'
tars
, (I
n pe
rcen
t sp
read
<
I U
S$
m if/
ions
) un
less
oth
erwi
se n
ote
d)
ove
r L
IBO
RIU
.S.
Pri
meJ
•
N
icaragua
en
Agr
eem
ent
of
Dec
emb
er 1
98
0:
-l
>
Arr
ears
on
inte
rest
or
du
e up
to
7
5 p
erce
nt o
f ar
rear
s an
d 90
5
¥._
1 \14.
bu
t w
ith
def
erre
d
-l
Dec
embe
r 19
80 3
9 am
oun
t d
ue
inte
rest
pay
men
t ..
... en
p
rovi
sio
n a
nd
in
tere
st
-l
Arr
ears
on
prin
cip
al a
s o
f 100
per
cen
t o
f ar
rears on
252
5 11
re
cap
ture
cla
use
40
()
>
Dec
embe
r 19
79
40
pri
nci
pal
r
D
ue
aft
er D
ecem
ber
1979
100
per
cent
of
pri
ncip
al
240
5 12
..
..; >
A
gree
men
t o
f D
ecem
ber
1981
tD
r
(d
ebt
of
nat
ion
aliz
ed b
anks
}: tn
A
ccu
mu
late
d a
rrea
rs
90 p
erce
nt
of
inte
rest
and
) 19
2 5
10
l ¥._
1 \1 4,
bu
t de
ferr
ed
en
pri
ncip
al
inte
rest
pay
men
t P
rinc
ipal
due
aft
er S
epte
mb
er 1
981
100 pe
rcen
t o
f pr
inci
pal
5
10
pro
visi
on
and
re
cap
ture
cla
use
40
Agr
eem
ent
of
Mar
ch 1
982
(d
ebt
of
nat
ion
aliz
ed e
nte
rpri
ses
and
of
pri
vate
en
terp
rise
s):
} A
ccu
mu
late
d a
rrea
rs
90 pe
rcen
t o
f in
tere
st a
nd
10
¥._1 1!
4, b
ut w
ith
def
erre
d p
rin
cip
al
inte
rest
pay
men
t pr
ov
isio
n and
re
capt
ure
clau
se 40
Du
e af
ter
Mar
ch 1
982
100
per
cen
t o
f p
rin
cip
al
100
5 10
A
gree
men
t o
f F
ebru
ary
1984
: R
esch
edu
ling
of
pri
nci
pal
an
d
95
-100
perc
ent o
f p
rin
cip
al
145
8 4
1 I \
1+--J3
-4
inte
rest
du
e Ju
ly 1
983
-Ju
ne
1984
(p
revi
ou
sly
resc
hed
ule
d i
n 1
980-412)
Ln
pro
cess
of
nego
tiat
ion:
P
rinc
ipal
an
d i
nter
est
due
95-
100 p
erce
nt o
f p
rinc
ipal
12
0
July
198
4-Ju
ne
1985
(p
revi
ous
ly r
esch
edu
led
in
1980-
-82)
Nige
r A
gree
men
t o
f M
arch
9.
198
4:
Res
ched
ulin
g o
f m
ediu
m-t
erm
d
ebt:
D
ue
Oct
obe
r 19
83-
90 p
erce
nt o
f p
rin
cip
al
12
Jll.!
1Yz
Ori
gin
ally
co
ntr
acte
d ra
te
Sep
tem
ber
1984
+
2 p
erce
nt
Due O
cto
ber
1984
-90
per
cent
of
pri
nci
pal
15
3'1
2 m
O
rigi
nally
co
ntr
acte
d r
ate
Sep
tem
ber
1985
+
2 p
erce
nt
Nig
eria
A
gre
emen
t o
f Ju
ly 1
983
: Ar
rears as
of
end-
Mar
ch 1
983
100 pe
rcen
t o
f ar
rears o
n 1.
350
5
\ll m
ont
hs
3 1'12-
-Ht
le
tter
s of
cre
dit
Ag
reem
ent
of
Sep
tem
ber
198
3:
Arr
ears
as
of
end
-Ju
ly 1
98
3 100
per
cen
t o
f ar
rear
s o
n
585
311.!
mo
nths
25
/ 6
I 11.!-
PA!
lett
ers
of c
red
it

©In
tern
atio
nal M
onet
ary
Fund
. Not
for R
edis
tribu
tion
Panama
Agr
eem
ent
of
Oct
obe
r 19
85:
P
ublic
sec
tor
deb
t D
ue i
n 1
985
D
ue i
n 1
986
N
ew loa
n
Ro
llove
r o
f sh
ort
-ter
m
cred
it l
ines
Per
u 43
A
gree
men
t o
f Ju
ne 1
978
: D
ue
du
rin
g s
eco
nd s
emes
ter
of
197
8 A
gree
men
t of
Dec
embe
r 19
78:
Due
in
19
79
· D
ue i
n 1
980
D
ue i
n J
anua
ry 1
979
as
per
June
19
78 a
gree
men
t A
gree
men
t o
f Ja
nuar
y 19
80:
45
Due
in
1980
A
gree
men
t of
Jul
y 19
83:
Med
ium
-and
long
-ter
m m
atur
itie
s fa
llin
g d
ue be
twee
n M
arch
7,
1983
and M
arch
7,
1984
B
ridg
e lo
an
New
lo
an
Sho
rt-t
erm
cre
dit
lines
out
stan
ding
as
of
Mar
ch 7
, 19
83
Agr
eem
ent
in
prin
cipl
e o
f F
ebru
ary
1984
: 47
M
ediu
m-
and
long
-ter
m m
atur
itie
s fa
iJing
due
betw
een
Mar
ch 7
, 19
84 a
nd J
une
30,
1985
Sh
ort-
term
wo
rkin
g ca
pita
l o
uts
tan
ding
on
Mar
ch 6
, 19
84
Lo
an c
ove
ring
the
un
disb
urse
d po
rtio
n o
f th
e 19
83 n
ew lo
an
Sho
rt-t
erm
tra
de-r
elat
ed c
redi
t lin
es c
om
mit
ted
as o
f M
arch
6,
1984
Pri
ncip
al
Pri
ncip
al
New
fina
ncin
g P
rinc
ipa
l
Ro
llove
r o
f 100
perc
ent
of
prin
cip
al
90 p
erce
nt o
f pr
inci
pal
} 90
perc
ent
of
prin
cipa
l 50
perc
ent
of
amo
unt
rolle
d o
ver
90 pe
rcen
t of
pri
ncip
al
100 pe
rcen
t
New
fin
anci
ng
I 00 p
erce
nt o
f pr
inci
pal
100 pe
rcen
t
100 pe
rcen
t
New
fin
anci
ng
100 pe
rcen
t
225
377
60
190
186
44
340
44
380
200
450
2,00
0 46
460
965
200
800
3lfl42
3lfl
42
3 2 2 2 3 3 5 5 3
12
12 9
Du
e Ja
nuar
y 3,
6
5 1 5 8 8 I 9
9
8
1979
Ro
llove
r
PAl
P/4
Jl/4
2lf4
PIS-
I V•
1�18-
1 v.
2lf4
�+
1\12
perc
ent
acce
ptan
c.e c
om
mis
sio
n
39 O
n sh
ort
-an
d m
ediu
m-t
erm
deb
t. B
anks
agr
eed
to r
ecal
cula
te t
he i
nter
est
due
but
unpa
id a
t a
spre
ad o
f \12
perc
enta
ge p
oin
t ab
ove
the
act
ual
LIB
OR
du
rin
g t
he r
elev
ant
peri
od
, ra
ther
than
at
the
hig
her
sp
read
s spe
cified
in
the
ori
gina
l co
ntra
cts.
40
All f
our
cate
gori
es o
f de
bt a
re s
ubje
ct t
o in
tere
st a
ccru
al a
t a
spre
ad o
f I
perc
ent
abo
ve L
lBO
R be
twee
n D
ecem
ber
15
. 19
80 a
nd D
ecem
ber
14.
1983
; o
f I�
perc
ent
betw
een
Dece
mbe
r 15
, 19
83 a
nd D
ecem
ber
14,
1986
; o
f 1\1
2 p
erce
nt be
twee
n D
ecem
ber
15.
1986
and
Dece
mbe
r 14
, 1990
; an
d o
f J¥4
perc
ent
betw
een
Dec
embe
r 15
, 1990
and
Dece
mbe
r 14
, 199
2.
Ho
wev
er.
actu
al p
aym
ents
of
inte
rest
can b
e li
mit
ed t
o 7
perc
ent
a ye
ar f
or t
he
agree
men
t o
f 19
80,
an
d t
o 6
per
cent
for
th
e ag
reem
ents
of
198
1 an
d 19
82. A
ny
exc
ess
of
accr
ued
int
eres
t w
ill
be
adde
d to
a d
eferr
ed i
nter
est
paym
ent
pool
whi
ch w
ill b
e re
pai
d w
hene
ver
the
accru
ed i
nter
est
rate
pay
men
ts a
re l
ess
than
7 pe
rcen
t pe
r an
num
. o
r, i
f th
is d
oes
not
exha
ust
the
poo
l b
y De
cem
ber
15,
198
5. t
he
bal
ance
will
be a
mo
rtiz
ed b
etw
een
1986
and
1990
wit
h 10
per
cent
due
in
each
of
1986
and
19
87.
and
the
res
t du
ring
the
rem
aini
ng t
hree
yea
rs.
The
agre
emen
t al
so c
ont
ain
s an
int
eres
t re
capt
ure
clau
se.
If N
icaragua f
ulli
lls aiJ
the
ter
ms
of
the
cont
ract
, th
e in
tere
st r
ate
spre
ad w
oul
d be
red
uced
by
Yll p
erce
ntag
e p
oin
t fo
r ev
ery
$2
0 m
illio
n o
f pr
inci
pal
repa
id a
fte
r 19
85 f
or u
p to
I p
erce
ntag
e p
oin
t.
• • B
ack.J
oad
ed i
n th
e la
st y
ears
. 42
At
the
end
of
the
grac
e pe
riod
, th
e re
pay
men
t sc
hedu
le p
rov
ides
for
rep
aym
ents
of
I pe
rcen
t o
f th
e to
taJ p
er q
uart
er d
urin
g th
e fir
st y
ear,
I tn
perc
ent
per
quar
ter
duri
ng t
he
seco
nd
year
, an
d eq
ual
qua
rter
ly i
nsta
lJmen
ts o
f th
e re
mai
nder
the
reaf
ter.
43
All r
esch
edul
ing
agre
emen
ts c
ove
r o
nly
pub
lic s
ecto
r o
blig
atio
ns.
Ban
k lo
ans
wit
h cr
edit
or
coun
try
gua
rant
ees
wer
e in
clud
ed i
n th
e P
aris
Clu
b agr
eem
ent.
rat
her
than
in
the
ban
k re
sche
du
ling
s.
44 U
nder
th
e 19
78 a
nd
19
80 b
ank
resc
hed
ulin
gs,
amo
un
ts w
ere
init
ially
ro
lled
ov
er o
n a
sho
rt-t
erm
bas
is t
o b
e co
nso
lidat
ed i
nto
a m
ediu
m-t
erm
lo
an a
t a
specifi
ed d
ate
earl
y in
the
fo
llow
ing
year.
45
ln J
anua
ry 1
980,
Per
u pr
epai
d th
e 19
79 b
ank
resc
hedu
ling
and
the
term
s o
f th
e 19
80 r
esch
edul
ing
wer
e re
nego
tiat
ed.
46 S
1.2
billi
on
of
wo
rkin
g cap
itaJ a
nd
S800 m
illio
n o
f tr
ade
rela
ted-
lin
es.
47 S
ign
ing
of
the
agree
men
t h
as be
en d
elay
ed i
nte
r al
ia b
y P
eru'
s no
npay
men
t of
int
eres
t si
nce
Jul
y 19
84.

©In
tern
atio
nal M
onet
ary
Fund
. Not
for R
edis
tribu
tion
Te
rms
an
d C
on
dit
ion
s o
f B
an
k D
eb
t R
estr
uct
uri
ngs
an
d B
an
k F
ina
nc
ial
Pa
cka
ges
, 197
8-85
>
0"1
T
ab
le 40
(co
ntinu
ed).
"'0
"'0
Co
un
try,
Dat
e o
f A
gre
emen
t,
Am
ou
nt
Gra
ce
lnte
rest
rrJ
z
an
d T
ype o
f D
ebt
Res
ched
ule
d
Bas
is
Pro
vid
ed
Per
iod
Mat
uri
ty
Rat
e 0
(/n
ye
ars
, (I
n p
erc
en
t sp
rea
d
x
(US
$ m
illi
ons
) u
nle
ss o
ther
wis
e no
ted
) o
ver
LIB
OR/
U.S
. P
rim
e)
<
Phili
pp
ines
•
Cll
Agr
eem
ent
of
Ma
y 2
0,
198
5:
-3
Res
ched
ulin
g o
f p
ub
lic a
nd
;>
pu
blic
ly g
uara
ntee
d d
ebt:
-3
-
Du
e b
etw
een
Oct
obe
r 17
, 198
3 100
perc
ent
of p
rin
cip
al
566
j4S
10
4S
1.5A!
Cll
j
an
d D
ecem
ber
31.
19
85
()
Du
e in
198
6 100
per
cen
t of
pri
ncip
al
647
j4S
10
4S
1.5A!
)>
Sb
on
-ter
m d
ebt
1,4
32
4
4
Less
tha
n 2
r
Res
ched
ulin
g o
f p
riva
te fi
nan
cial
..
., >
se
cto
r d
ebt.
med
ium
-and
C:J
lo
ng
-ter
m:
r
Du
e be
twee
n O
cto
ber
J 7
, 19
83
I 00 pe
rcen
t o
f p
rin
cip
al
105
j48
10
48
I�Jt
(T1
Cll
an
d De
cem
ber
31,
19
85
Du
e in
19
86
100 pe
rcen
t o
f pr
inci
pal
54
j48
10
48
(SJt
Sho
n-t
erm
deb
t 1.
516
4
4
L
ess
tha
n 2
R
esch
edu
ling
of
corp
ora
te d
ebt,
m
ediu
m-
and
lo
ng-t
erm
: D
ue b
etw
een
Oct
ob
er 1
7,
1983
100
perc
ent
of
pri
nci
pal
53
1 a
nd
Dece
mbe
r 3
1 , 1
985
Du
e in
19
86
100 p
erce
nt o
f pr
inci
pal
235
Sb
on
-ter
m d
ebt
417
N
ew m
ediu
m-t
erm
lo
an
New
mo
ney
9
25
5 9
1¥
+-Jl.lt
R
evo
lvin
g s
ho
n-t
erm
tra
de f
acili
ty
Tra
de-r
elat
ed o
uts
tan
din
g a
nd
2,94
4 R
evo
lvin
g p
er
1'14
cent
ral
ban
k o
ver
draf
ts a
s an
num
o
f O
cto
ber
17
, 19
83
Romania
A
gree
men
t o
f De
cem
ber
7,
1982
:
) A
rrea
rs o
n t
he
198
1 de
bt
80 pe
rcen
t o
f su
ch d
ebt
3 611
1 l¥
4 o
blig
atio
ns
obl
igat
ions
D
ue i
n 19
82 o
n al
l deb
ts (
incl
ud
ing
80
perc
ent
of
pri
nci
pal
1,
598
3 611
1 IV
• sh
on
-ter
m)
Agr
eem
ent
of
June
20
, 19
83:
Med
ium
-an
d l
ong
-ter
m d
ebt
du
e }
10 p
erce
nt o
f p
rin
cip
al
81
Jllz
1111
P/
4 in
19
83
60 p
erce
nt o
f p
rin
cip
al
486
3Yi
6111
J3/4
Seneg
al
Agre
emen
t o
f F
ebru
ary
1984
: D
ue b
etw
een
May
l,
198
1 an
d 100
per
cent
of
pri
nci
pal
) 78
3
7 2
Jun
e 30
, 19
82
(inc
ludi
ng
arre
ars)
D
ue b
etw
een
July
I,
1982
and
100
per
cent
of
prin
cipa
l Ju
ne
30.
198
4
Agr
eem
ent
of
Ma
y 1
985
: D
ue b
etw
een
Ju
ly 1
. 19
84 a
nd
80
perc
ent
of
prin
cipa
l 49
20
3
7 2
Jun
e 30
, 198
6
Sie
rra
Leone
Ag
reem
ent
of
Jan
ua
ry 1
984:
P
rinc
ipal
arrears
100
perc
ent
25
2 7
l¥4

©In
tern
atio
nal M
onet
ary
Fund
. Not
for R
edis
tribu
tion
Sud
an
Agr
eem
ent
of
Dec
emb
er 1
981:
A
rrea
rs o
n p
rin
cip
al
as o
f en
d-1
979
A
rrea
rs o
n i
nter
est
du
e:
Per
iod J
anua
ry-
June
198
0
Per
iod
Ju
ly 1
980
--A
pri
l 19
82
Exc
ess
bala
nces
on
Nos
tro
acco
unts
ove
r en
d-19
79 l
evel
M
odi
ficat
ion
of
Dec
embe
r 19
81
agre
emen
t (M
arch
19
82)
Arr
ears
of
inte
rest
as o
f en
d-1
979
A
rrea
rs o
n i
nter
est
du
e Ja
nuar
yJu
ne
1980
E
xces
s b
ala
nce
on
No
stro
a
cco
un
ts o
ver
en
d-1
979
lev
el
Mod
ifica
tion
of
Dece
mbe
r 19
81
agree
men
t (A
pril
1983
) P
rin
cip
al a
nd i
nter
est
Mod
ifica
tion
of
Dece
mb
er 1
98
1 agr
eem
ent
(Ap
ril
1984
) P
rin
cip
al and
inte
rest
A
gree
men
t in
pri
nci
ple
w
ith
Ste
erin
g C
om
mit
tee
on
mod
ifica
tio
n of
D
ecem
ber
198
1 a
gree
men
t (S
epte
mbe
r 19
85)
Res
truc
tur
ing
of
debt
Tog
o
ou
tsta
nd
ing
con
sist
ing
of
Tra
nch
e A
; de
bt o
rig
ina
lly
du
e o
r in
arrears a
s o
f D
ecem
ber
31,
19
81
Tra
nch
e B
; in
tere
st c
apit
alized
si
nce
19
82
Agr
eem
ent
of M
arch
19
80:
Arrears
as o
f en
d o
f 19
79
Inte
rest
Pri
nci
pal
D
ue i
n 1
980
on a
num
ber
of
spec
ific
loan
s A
gree
men
t o
f O
cto
ber
198
3:
Arr
ears
as
of
end
of
198
2 D
ue i
n 1
98
3 an
d 19
84 o
n m
ediu
m
an
d lo
ng
-ter
m p
ub
lic
and
p
ub
licly
guarante
ed l
oa
ns
} 100 p
erce
nt
60 pe
rcen
t 100
per
cent
40
perc
ent
40 pe
rcen
t
60 pe
rcen
t
100 p
erce
nt
100 p
erce
nt
Princ
ipal
an
d ca
pit
aliza
tio
n
of
inte
rest
ab
ov
e $
32 m
illio
n
per
year
}
100 pe
rcen
t o
f ar
rear
s
100 pe
rcen
t of
pri
nci
pa
l
lOO p
erce
nt
of a
rrea
rs
100 p
erce
nt o
f p
rin
cip
al
383
115
55
790
838
683
262 8
17
44
58
26
4 8 T
en y
ears
fro
m L
be
earl
ier
of
sig
nin
g d
ate
or
Dec
emb
er 3
1, 1
98
4; w
ilb
fiv
e ye
ars
of
gra
ce.
4 9 T
he r
emai
nin
g 2
0 pe
rcen
t is
to
be
paid
in
eig
ht
equ
al
qu
art
erly
in
sta
llmen
ts s
tart
ing
in 1
98
5.
3 7 3
5 m
ont
hs
9 m
ont
hs
2 6
5
3 7
3 7
Set
tlem
ent
to b
e m
ade
in 1
980
in
3 e
qua
l in
stal
lmen
ts
6 m
on
ths
I IVz
3
Vz
Jl/4
P/4
IV4
Origi
nal r
ates
mai
ntai
ned
How
ever
, sp
read
s o
n E
uro
loan
red
uced
to
IVz
O
riginal
rat
es m
aint
ain
ed
Origi
nal r
ates
mai
ntai
ned
2 2

©In
tern
atio
nal M
onet
ary
Fund
. Not
for R
edis
tribu
tion
- - 00
Ta
ble
40 (
con
tin
ued).
Ter
ms
an
d C
on
dit
ion
s o
f B
an
k De
bt
Re
stru
ctu
rin
gs
an
d B
an
k F
ina
nc
ial
Pa
cka
ges
, 19
78-8
5
Co
untr
y, D
ate
of
Agr
eem
ent,
an
d T
ype o
f De
bt
Res
ched
uled
Tur
key
Eur
ocu
rren
cy l
oan
of
Jun
e 19
79
jO
Agr
eem
ent
of
Jun
e 19
79
: B
anke
rs'
cred
its
Agr
eem
ent
of
Aug
ust
197
9:
Co
nven
ible
Tur
kish
lir
a d
eposi
ts 5
2 A
gree
men
t o
f A
ugus
t 19
81:
T
hir
d-pa
ny
reim
bur
sem
ent
clai
ms
Agr
eem
ent
of
Mar
ch 1
98
2:
Impr
ov
e th
e m
atur
ity
profile
of
the
Aug
ust
197
9 r
esc
hedul
ing
agr
eem
ent
Uru
guay
A
gree
men
t o
f Ju
Jy 2
9,
198
3:
New
med
ium
-ter
m l
oan
S
hort
-ter
m n
ont
rade
-rel
ated
cre
dits
M
ediu
m-t
erm
mat
urit
ies
falli
ng d
ue
in 1
983
Med
ium
-ter
m m
atur
itie
s fa
lling
due
in
19
84
De
ferm
ent
agree
men
t o
f N
ove
mb
er 1
985
: P
ublic
sec
tor
deb
t du
e in
19
85
Venezue
la
Agr
eem
ent
of
No
vem
ber
198
5:
Res
ched
ulin
g o
f m
ediu
m-a
nd
long
-te
rm d
ebt
falli
ng d
ue d
urin
g
198
3-
88
Yug
osla
via
Agr
eem
ent
of S
epte
mb
er 1
98
3:
Refi
nanc
ing
of:
M
ediu
m-t
erm
to
ans
due
in 1
98
3
Sho
rt-t
erm
deb
t N
ont
rade
-rel
ate
d cr
edit
s R
evo
lvin
g t
rade
fac
ilit
y N
ew l
oan
A
gree
men
t o
f M
ay
16,
198
4:
57
Refi
nanc
ing
of:
M
ediu
m-
an
d l
ong-
term
m
aturi
ties
fal
ling
due
in
19
84
A
gree
men
t w
ith S
teer
ing
Co
mm
itte
e {S
epte
mb
er 1
985)
: R
efina
ncin
g o
f m
ediu
m-
and
long
-ter
m d
ebt
falli
ng
due
in 1
985-86
du
e in
19
87
-88
Bas
is
New
fin
anci
ng (
net
)
100 pe
rcen
t o
f pr
inci
pal
100 pe
rcen
t o
f pr
inci
pal
100 p
erce
nt o
f pr
inci
pal
100 pe
rcen
t of
pri
ncip
al
90 pe
rcen
t of
pri
ncip
al
90 pe
rcen
t of
pri
ncip
al
90 p
erce
nt o
f p
rin
cip
al
Pri
ncip
al
Pri
ncip
al
100 pe
rcen
t of
pri
ncip
al
Ro
lled
ove
r {t
hro
ugh
Jan
uary
19
85
)
New
fin
anci
ng
lOO pe
rcen
t o
f pri
ncip
al
100 p
erce
nt o
f pr
inci
pal
100 p
erce
nt o
f pr
inci
pal
Am
oun
t Pr
ovi
ded
(US
$ m
illi
on
s)
407
429
51
2,2
69
S2
100 S3
240
35
9
105
Ill
234
21,
203
950
200
600
600
1,25
0
2,3
00
1,3
00
Gra
ce
Per
iod
Mat
uri
ty
tin
ye
ars
, u
nle
ss o
the
rwi
se
no
ted
)
3
7
3
7
3
7
3
2S4
3
ss
2
6
2
6
2
6
2
6
13-m
ont
h ex
tens
ion
12\12
56
3
6
2
2
2
2
3
6
4
7
4
10\12
3
9
\12
>
"0
"0
Inte
rest
t'I'l
z
R
ate
Q
X
(in
pe
rce
nr
spre
ad
<
o
ver
LJJJ
ORJ
U.S
. P
rim
e)
•
en
l¥4
-3
>
I:Y4
-3
- en
-3
I:Y4
n
>
11h
r
-3
>
l:Y
4 t:l:l
r
t'I'l
en
2V4
-2�
2
V4--2
�
2V4
-2�
2V
4-2
�
Ori
ginally
co
ntra
cted
rat
es
I�
J1..t-J31
4
1�11
/1 P..t-
11/1
17.-t-l
lfl
l�JI
I.15&
I�
I�

©In
tern
atio
nal M
onet
ary
Fund
. Not
for R
edis
tribu
tion
Zaire 59
A
gree
men
t o
f A
pri
l 1980
: A
rrea
rs o
n p
rinc
ipal
as
of
end
of
1979
P
rin
cip
al p
aym
ents
due
aft
er e
nd
of
l979
D
efer
men
t ag
reem
ent
of
Janu
ary
1983
: 60
Def
erm
ent
agre
em
ent
of
Jun
e 19
84:
61
Def
erm
ent
agre
emen
t o
f M
ay 1
985
: 61
Zam
bia
Agr
eem
ent
in p
rinc
iple
w
ith
Stee
ring
Co
mm
itte
e (De
cem
ber
198
4):
Refi
nanc
ing
of
med
ium
-an
d lo
ng
term
pub
lic a
nd p
ublic
ly
guar
ante
ed u
nsec
ured
deb
t in
ar
rear
s as
of
Feb
ruar
y 28
. 19
83
Du
e M
arch
I.
1983
-F
ebru
ary
29.
1984
Due
Mar
ch I
. 19
84-
Feb
ruar
y 28
, 19
85
Due
Mar
ch I
, 19
85-
Dece
mb
er 3
1, 1
985
64
76 p
erce
nt o
f pr
inci
pal
100 p
erce
nt o
f pr
inci
pal
Pri
ncip
al
Princ
ipal
Pr
inci
pal
100 p
erce
nt o
f p
rinc
ipal
100 pe
rcen
t of
pri
ncip
al
100 pe
rcen
t o
f pr
inci
pal
90 pe
rcen
t o
f pr
inci
pal
287
115 58
64
61
16
26
21 11
5 5 2 3
10
10 1 63
4 5 6
P..t f
or fi
rst
5 ye
ars.
2
ther
eaft
er
J7.-t f
or fir
st 5
yea
rs,
2 th
erea
fter
O
rigi
nally
co
ntra
cted
rat
e
Ori
gina
lly c
ont
ract
ed r
ate
Ori
gina
lly c
ont
ract
ed r
ate
2V4
50 T
he d
isb
urse
men
t w
as t
o be
bas
ed o
n le
tter
-()f-
cred
it fi
nanc
ing
for
impo
rts.
Oth
er c
ond
itio
ns f
or
the
first
dis
bur
sem
ent
(50 pe
rcen
t) in
clud
ed m
akin
g th
e fi
rst
purc
hase
und
er I
MF
st
and-
by
arra
ngem
ent
and
the
sign
ing
of
the
agre
emen
t o
n c
onv
ertib
le T
urki
sh l
ira
depo
sits
. F
or t
he s
econ
d an
d th
ird
disb
urse
men
ts (
25 p
erce
nt e
ach
), o
ther
co
ndit
ions
incl
uded
mak
ing
the
purc
hase
s un
der
the
IMF
sta
nd-b
y arr
ange
men
t sc
hedu
led
for
No
vem
ber
19
79 a
nd M
arch
198
0,
and
the
impl
emen
tati
on
of p
rogr
ams
for
thir
d-pa
rty
reim
bur
sem
ent
clai
ms
and
arrears
on
nong
uara
ntee
d d
ebts
. SI
All
pre
vio
usly
ro
lled
ove
r.
Sl H
old
ers
we
re a
llow
ed t
o s
v.it
ch c
urre
ncy
of
den
om
inat
ion
, wit
h Lia
bili
ty b
eing
sw
itche
d fr
om
co
mm
erci
al b
anks
to t
he C
entr
al B
ank
. The
am
oun
t in
clu
des
S2
billi
on r
olle
d o
ver
pri
or
to J
un
e 30
, 19
79; a
nd $0
.2 b
illio
n du
e in
sec
ond
half
of
1979
. S3
The
am
oun
t re
sche
dule
d is
equ
ival
ent
to th
e su
m o
f o
bliga
tio
ns r
esch
edul
ed i
n Ju
ne
and
Aug
ust
1979
, in
clud
ing
a n
ew s
yndi
cate
d cr
edit
exte
nded
at
that
tim
e.
54 T
he y
ears
sho
wn
rep
rese
nt t
he e
xten
sio
n to
the
grace
peri
od a
nd m
aturi
ty gra
nted
und
er t
he o
riginal
res
ched
ulin
g ar
range
men
t.
ss In
Mar
ch
1983
. w
ith t
he e
ndo
rsem
ent
of
the
Ste
erin
g C
om
mit
tee.
Ven
ezue
la d
ecla
red
a de
ferr
al o
n pr
inci
pal
pa�·m
ents
of
exte
rnal p
ublic
sec
tor
deb
t ow
ed t
o f
orei
gn c
om
mer
cial
ba
nk
s. T
he a
mo
unt
of s
.hort
-ter
m d
ebt
inv
olv
ed w
as a
bout
$8.
5 b
illio
n. T
he d
efer
ral
was
ext
ende
d un
til
Oct
ob
er I
, 19
83.
It w
as t
wic
e fu
rthe
r ex
tend
ed,
first
unti
l Ja
nuary
31,
198
4, a
nd
then
unt
il A
pril
30,
1984
. T
he r
esch
edul
ing
agre
emen
t is
co
ndit
iona
l on
a s
olu
tio
n to
the
arr
ears
on
the
priv
ate
sect
or
deb
t. 56
Mat
uri
ty s
how
n re
late
s to
the
dat
e o
f th
e ag
reem
ent
in p
rin
cip
le.
Pay
men
ts a
re t
o be
mad
e in
equ
al a
mo
un
ts;
how
ever
, Ven
ezue
la w
ill m
ake
an i
niti
al p
aym
ent o
f $1
50 m
illio
n du
ring
th
e se
cond
qua
rter
and
fu
rthe
r de
bt
serv
ice
paym
ent
for
1985
wil
l to
tal
$5.
15 b
illio
n w
ith
regu
lar
paym
ent
not
to e
xcee
d $5
bill
ion
a ye
ar th
erea
fter
. 57
Co
ndit
ion
al u
pon
refi
nanc
ing
of $
700 m
illio
n in
offi
cial
ly g
uara
ntee
d lo
ans.
58
The
agr
eem
ent
pro
vid
es f
or
a I V4
per
cent
red
ucti
on
of
inte
rest
on
the
deb
t re
sche
dule
d in
198
3 an
d 19
84.
59 B
ank
deb
t re
fina
ncin
g agr
eem
ent
cove
rs o
nly
syn
dica
ted
loan
s (a
nd
oth
er fl
oat
ing
rate
lo
ans)
wit
hout
cre
dito
r co
untr
y guaran
tee
. 60
Un
der
thi
s ag
reem
ent
Zaire
wou
ld m
ake
mo
nth
ly p
aym
ents
of
SS m
iUio
n t
o t
he L
ond
on
Clu
b b
anks
. T
his
amou
nt i
s to
be i
ncre
ased
to
$6 m
illio
n if
U .S
. pr
od
ucer
pri
ces
for
copp
er
rise
abo
ve
the
thre
sho
ld p
rice
of
$0.7
5 pe
r po
und.
61
Un
der
thi
s ag
reem
ent
Zai
re w
ould
mak
e m
onth
ly p
aym
ents
of
$2 m
illio
n in
the
first
sem
este
r o
f 19
84,
of $
5 m
illio
n in
the
thi
rd q
uar
ter,
of
$7 m
illio
n in
the
fou
r:th
qu
arte
r, and
of
S4 m
iUio
n in
the
firs
t qu
arte
r of
198
5.
62 U
nder
the
agr
eem
ent,
Zai
re w
ould
m
ake
mo
nth
ly p
aym
ents
to
the
Lo
ndon
Clu
b b
ank
s am
ou
nti
ng
to
$4.
5 m
illio
n fo
r th
e pe
rio
d o
f M
ay 1
985
to De
cem
ber
198
5, i
ncre
asin
g to
$6
mill
ion
for
the
first
fou
r m
ont
hs o
f 19
86.
The
agr
eem
ent
speci
fies
that
mo
nthl
y pa
ymen
ts a
re t
o b
e re
vis
ed b
y $0
.5 m
illio
n if
the
co
pper
pric
e (a
s qu
oted
for
Lo
ndo
n in
iF
S)
exce
eds
$0.66
per
poun
d, b
y SI
mill
ion
if th
e pri
ce e
xcee
ds
$0.7
per
po
und
, and
by
$1.
5 m
illio
n if
it e
xcee
ds $
0.7
4 p
er po
un
d.
6 3 Ar
rears a
s o
f F
ebru
ary 28
, 198
3, a
re t
o be
pai
d in
12
equa
l m
ont
hly
inst
allm
ents
sta
rtin
g fr
om J
anu
ary
15,
1985
. 64
The
rem
aini
ng 1
0 pe
rcen
t am
oun
ting
to
Sl.
2 m
illio
n ar
e to
be
paid
off
in t
wo
equ
al i
nsta
llmen
ts in
Ju
ne
and
Dece
mb
er 1
985.
n
CJ

©In
tern
atio
nal M
onet
ary
Fund
. Not
for R
edis
tribu
tion
N
0
Ta
ble
40 (
con
clud
ed).
Ter
ms
an
d C
on
dit
ion
s o
f B
an
k D
ebt
Res
tru
ctu
rin
gs
an
d B
an
k F
ina
nci
al
Pa
cka
ges
, 197
8-85
Co
unt
ry,
Dat
e o
f A
gree
men
t,
Am
oun
t G
ra.ce
an
d T
ype o
f De
bt R
esch
edu
led
B
asi
s P
rovi
ded
Per
iod
Mat
uri
ty
(ln
vea
rs.
(US
$ m
illi
on
s)
un
less
oth
erw
ise
no
ted
)
Mem
oran
du
m i
tem
s:
No
n-F
und
mem
ber
s C
uba
Ag
reem
ent
of D
ecem
ber
30,
19
83:
Res
ched
uli
ng
of
med
ium
-ter
m
100 p
erce
nt
of p
rin
cip
al
128
2 51
!2
deb
t du
e be
twee
n
Sep
tem
ber
I,
1982
and
D
ecem
ber
31.
1984
R
ollo
ver
of
sho
rt-t
erm
cre
dit
65
490
Agr
eem
ent
with
Ste
erin
g C
om
mit
tee (
July
19
85):
R
esch
edu
lin
g o
f m
ediu
m-t
erm
100
per
cen
t o
f pr
inci
pal
85
6
10
d
ebt
du
e in
19
85
Ro
llov
er o
f sh
ort
-ter
m
cred
it 6
7 37
3
Po
lan
d
Agr
eem
ent
of A
pri
l 198
2: 69
M
ediu
m-t
erm
deb
t d
ue
95 p
erce
nt
of
pri
ncip
al
1,95
7 4
7
Mar
ch 2
6,
198
1-D
ecem
ber
19
81
Agr
eem
ent
of
No
vem
ber
19
82:
10
Med
ium
-ter
m d
ebt
du
e in
9
5 pe
rcen
t o
f p
rin
cip
al
2,22
5
4
71!2
19
82,
incl
ud
ing
arr
ears
on
un
resc
hed
uled
mat
uri
ties
d
ue
in 1
98
1 A
gree
men
t o
f N
ov
embe
r 198
3: 7
1 M
ediu
m-t
erm
deb
t d
ue d
uri
ng
95
per
cen
t o
f p
rin
cip
al
1,19
2 4
1!2
9
1983
A
gree
men
t of
Ju
ly 1
984:
Med
ium
-an
d lo
ng-t
erm
deb
t 95
per
cent
of
pri
nci
pal
1,
382
5 10
d
ue
in 1
984
-87
New
tra
de
cred
its
n
New
fina
nci
ng
33
5 5
6 5 A
ll li
nes
of c
red
it w
ith
Ban
co N
acio
nal
de
Cu
ba
wer
e sc
hed
ule
d t
o r
emai
n at
th
e le
vel
of
Feb
ruar
y 28
, 19
83 u
nti
l S
epte
mb
er 3
0.
1984
. 66
A r
efin
anci
ng
fee
of
� pe
rcen
t a
lso
app
lie
s.
67 T
hese
cre
dit
lin
es
are t
o be
ren
ewed
for
th
e y
ear
bet
wee
n S
epte
mbe
r 30
, 19
85 a
nd S
epte
mb
er 3
0, 1
986
. 68
A f
acili
ty f
ee o
f \.1
1 perc
ent
also
ap
pli
es.
Inte
rest
R
ate
(In
per
cen
t sp
read
o
ver
L/B
OR
JU.S
. P
rim
e)
2V4
IV4
IYi 66
·�68
l¥4
1¥4-
lYi
]1;8
l¥4
1518
69 T
he a
gree
men
t, w
hich
co
ver
s rna
turi
ties
due
du
ring
Mar
ch 2
6,
198
1 an
d De
cem
ber
31,
19
81,
was
ef
fect
ive
May
10
. 19
82.
Sh
ort
-ter
m fac
ilit
ies
and
inte
rban
k d
epo
sits
wer
e spe
cifi
call
y ex
clu
ded
. 70
A s
ix-m
on
th t
rade
cre
dit
, re
volv
ing
up
to
thr
ee y
ears
, w
as
exte
nded
un
der
sep
arat
e ag
reem
ent:
the
am
ou
nt o
f th
e cr
edit
eq
uiv
alen
t to
50
perc
ent
of
the
$1.
1 b
illi
on
in in
tere
st d
ue.
71
A s
ix-m
on
th t
rade
cre
dit
, rev
olv
ing
up
to
th
ree
year
s, w
as
exte
nded
un
der
sep
arat
e ag
reem
ent.
72
In
19
85 t
he s
hort
-ter
m c
red
it f
acili
ty w
as r
olle
d o
ver
, an
d f
urth
er tr
ade
cred
its,
rev
olv
ing
ever
y s
ix m
on
ths
for
up t
o b
etw
een
4 a
nd
5 y
ears
, ar
e to
be e
xte
nded
.
>
.,
.,
m
z
0
X
:5
•
en
�
>
�
- en
�
n
>
r'
�
>
trl
r
m
en

©In
tern
atio
nal M
onet
ary
Fund
. Not
for R
edis
tribu
tion
Ta
ble
41.
W
orl
d B
an
k C
ofi
na
nci
ng
of
B-L
oa
ns
by
Fis
cal
Yea
r of
Sig
nin
g
([n
millio
ns
of
U.S
. d
ollars
)
Gra
ce P
erio
d/
!BR
D F
ee o
n
To
tal
Co
mm
erci
al
Gua
rant
ee
Pro
ject
IB
RD
IB
RD
F
inal
an
d! o
r
Boa
rd D
ate
Co
st
Am
oun
r A
mo
unt
Co
mm
er-
Mat
urit
y/O
vera
ll
Co
ntig
ent
Fis
cal
of P
roje
ct
(as
in
in
cial
T
ota
l S
ign
ing
Fin
al M
atu
rity
In
tere
st R
ates
O
bli
gati
on
Yea
r C
oun
try
P
roje
ct
App
rova
l R
evis
ed)
A-Lo
an
B-L
oan
A
mo
unt
Am
ou
nt
Curr
ency
D
ate
(yea
rs)
(per
ann
um)
(per
annum
)
198
4 T
hai
lan
d
Tel
eco
mm
unic
atio
ns
Sep
t. 1
2.
197
&
307
.0
90.0
&
.51
25
.5
34.0
¥
S
ept.
22
. 51
14.5
116
.5
Lo
ng
-ter
m
1983
pr
ime
rate
(L
TP
R}
+ 0
.3%
fixed
Tel
eco
mm
unic
atio
ns
May
31,
198
2 4
94.3
14
2.1
L
TP
R
+ 0
.1%
va
riab
le
Hu
ngary
Ag
ricu
ltur
e Ju
ne 1
4,
19&
3 3
13.6
13
0.4
30
.01
170
.0
200.0
U
S$
Sep
t. 2
5,
31618
3
or 6
mo
nth
19
83
LlB
OR
+
1.2
5%
or
U.S
. P
rim
e +
lo/o'
Ind
ustr
y Ju
ne
14,
1983
309
.6
109.0
9
.01
61.0
70
.0
¥
Oct.
27,
3n/9
LT
PR
+ 0
.4%
19
83
fixed
; L
TP
R
+
0.3
% r
evis
ed
ever
y 6
mo
nth
s
Bra
zil
Min
ing
A
ug
. 10
. 19
&2
4
,926
.6
304.5
7.
72
52.3
60
.0'
DM
Ju
ne
5,
519
.571
10
1.87
5%
1984
g
uara
ntee
fe
e
Co
lom
bia
E
nerg
y
Mar
ch 2
9, 1
98
4 1,
602.
0 17
0.0
} 25.
01
150
.0
175.
0
US
$ Ju
ne 2
7.
418
110
L
IBO
R +
19
84
1.6
25%
or
U.S
. P
rim
e +
1.5o/o'
3.8
1 2
1.2
25
.0
¥
Jun
e 27
, 4
1819
.5
LT
PR
+ 0
.4%
19
84
fixed
fiscal 1
984 T
ota1
No.
or
B-loans
: 6
84.0
480
.0
564.0
1985
H
ung
ary
In
du
stry
M
arch
27
. 19
84
319
.0
110
0) 35.0
1 35
0.0
38
5.0
u
ss
July
19
. 4
/8110
3
or
6 m
ont
h
1984
U
BO
R +
1.
125
%o
r U
.S.
(/J ....
Pri
me
+
�
0.7
5o/o'
�
-c:;
· P
etro
leum
M
arch
27.
198
4 5
19.7
90
.0
13.3
1 &
8.7
10
2.0
¥
Ju
ly 2
5.
5/10
112
LT
PR
+ 0
.2%
�
1984
fi
xed
: LT
PR
+
--3
I»
...... 0
.1%
var
iab
le
0"
N
0
-"'

©In
tern
atio
nal M
onet
ary
Fund
. Not
for R
edis
tribu
tion
Wo
rld
Ba
nk
Co
fin
an
cin
g o
f B
-Lo
an
s b
y F
iscal Y
ear
of
Sig
nin
g
>
N
Ta
ble
41
(co
ncl
ud
ed).
"tt
N
.,
(In
mil
lio
ns o
f U
.S.
do
llar
s)
tr1
z
Grac
e Pe
riod/
ffiR
D F
ee oo
0
T
ota
l C
om
mer
cia
l G
uara
nte
e x
P
roJe
ct
LBR
D
LBR
D
Fmal
and!
or
<
Board D
ate
Co
st
Am
ou
nt
Am
oun
t C
om
mer
-·
Ma
turi
tyiO
vcr
all
C
on
tig
cnt
•
Fis
cal
of
Project
(as
in
in
cia
l T
ota
l S
igning
Fina
l M
atu
rity
In
tere
st R
ate
s Ob
liga
tion
en
Y
ear
Co
un
t I'}
Pro
ject
A
pp
rova
l R
e,i
scd
l A
-Lo
an
B-L
oa
n
Am
ou
nt
Am
ou
nt
Cu
rren
cy
Dat
e (y
ears
) (pe
r a
nn
um
) (pe
r a
nn
um
) -l
>
:j
A
gri
cult
ure
A
pri
l 2
, 19
85
32
5.2
�·} 36
.01
264.0
300
.0
uss
Ju
ne
11.
5
/8110
L
IBO
R +
en
19
85
0.6
5%
-l
Ch
emic
als
A
pri
12
. 19
85
311
.5
73
.0
()
>
r
Tra
nsp
on
ati
oo
M
ay
28
. 19
85
215
.5
75.0
14
.01
106.0
12
0.0
¥
Ju
ne
19,
611
0112
L
TP
R
+ 0
.2%
-l
19
85
fixed
; L
TP
R
>
va
ria
ble
: l
TP
R
c:;
r'
+ 0
.1%
se
mi-
tr1
fixed
en
Par
agua
y
Ag
ricu
hu
re
Jan
. 3
. 198
4
111.
1 25
.0
3.8
� 15
.0
15.0
u
ss
Mar
ch 22
. 5
/101
10
0.5
%
3.3
3 198
5
gu
ara
ntee
fee
0.1
25%
con
tin
gen
t
ob
ligati
on
fee
fisa
l 198
5 T
otal
No.
or B-1oans
: 5
98
.3'
823
.7
922
.0
1986
Co
te
Tra
nspon
ati
oo
Ju
ne
13.
1985
230
.7
110
.0
8.0
1 32
.0
40.0
u
ss
Sep
t. 1
9.
3/8
110
.5
(EC
U l
ote
rban
k
d"l
vo
ire
1985
Off
ered
Ra
te
FF
o
r F
renc
h
Fra
nc M
one
y
Ma
rket
E
CU
R
ate
or
LIB
OR
)+
1.7
5% o
r U
.S.
Pri
me
+
1.3
75
%
Ch
ile
T
rans
pon
atio
n Ju
ne 20
. 19
85
65
6.0
14
0.0
15
0.2
! 300
.0
300.0
u
ss
No
v.
I.
10.5
/12
/12
L
JBO
R
+
1.12
5% f
or
1985
1.
62
5%
or
yea
rs I
to
6.
Pri
me
+
1.25
% t
her
e-1.
125%
a
fte
r
f'tscal
1984-86 T
otal N
o. o
rB-l
oan
s: 1
3
340.3
' 1,
63
5.7
1,
82
6.0
Sour.-c
: lnl
ema
uonal
Bank for
ReconstruciJOD and
o.�cl
op
ment
' T
) � of
co6
nancmg
(di
rect
contnl>uti
on)
. ! T
y� o
f co
6na
ncm�
(part.al
guarantee
).
l T
)� o
f co6nan<J
ng (
coot,
�nl
obbgauon
l.
• Cocuaran
tee
f..Oil
l)
<T
otal
amou
nt"
the
sum
of tbe
Wo
rld
Banl.. amou
nu §b
o,.·
n a
p�ns
t lnd
l\,du
alloa
ns.
e\<'C
pl
"'h
ere
Wor
td B
ank amoun
u are
guarante
es o
r c
on
tirlgen
t ob
hgau
ons
'" respec
t o
f c:ornm
erc.
al a
mount
s.
• �
lugl
lcr of
U .S
. Pn
me
or 91kla
) ce
rulia
tt o
r depos
it ra
tes.
'
�co
mmerc
ial
banks g
uannte
ed o
nl)
60 pe
rcen
t of the
lOth
msta
llment
(d
ue a
fter
9.5
>ears
!.

©International Monetary Fund. Not for Redistribution
Table 42. International Bonds, by Type, 1981-84
(In percent of total)
1981 1982 1983 1984
International bonds Straight 66 76 64 52 Floating rate notes 22 20 25 34 Convertibles 9 3 10 10 Zero coupon 3 I I 4
Swiss franc bonds Foreign straight and floating
rate notes 85 87 74 72 Foreign convertibles 15 13 26 28
Sources: Organization for Economic Cooperation and Development, Financial Market Trends; and Salomon Brothers, Inc . . International Bond and Money Market Performance.
Table 43. Maturity Profile of International Bonds, 1981-84
(In percent)
Currency of 0-5 Years
Denomination 1981 1982 1983 1984 1981
U.S. dollar 25 20 14 20 54
Canadian dollar 35 21 17 24 58
Deutsche mark 12 1 1 12 13 82
Japanese yen 0 2 0 2 24
Pound sterJjng 41 32 17 15 2
Swiss franc 32 36 41 44 64 Netherlands guilder 37 39 30 34 35
6-10 Years
1982 1983
59 60 79 80 81 83
69 76 27 40 50 54 48 54
Source: Salomon Brothers, Inc., International Bond and Money Market Performance.
Statistical Tables
Over 10 Years
1984 1981 1982 1983 1984
37 21 21 26 42
60 7 0 3 16 8 1 6 8 5 6 75 76 29 24 23 42 57 41 42 42 52 4 4 5 4
.49 28 13 5 17
123

©International Monetary Fund. Not for Redistribution
APPENDIX Vl • STATISTICAL TABLES
Table 44. Interest Rates on International Markets, December 1983-Second Quarter 1985
(In percent)
1983 1984 1985 Dec. First Second Third Fourth First Second
quarter quarter quarter quarter quarter quarter
Eurocurrency markets 1 U.S. dollars in London 10.14 10.08 1 1 .40 1 1 .88 9.78 8.98 8.19 Sterling in London 9.41 9.25 6.10 1 1 . 18 10.16 12.% 12.62 Swiss francs in London 4.37 3.60 2.51 4.88 5.09 5.54 5.25 Deutsche marks in London 6.27 5.86 3.87 5.67 5.74 6.02 5.68 Netherlands guilders in
London 6.28 6.07 4.09 6.36 6.02 6.69 6.83 French francs in London 13.25 14.76 8.71 1 1 .68 1 1 . 1 7 10.97 10.45 Japanese yen in London 6.65 6.38 4. 19 6.35 6.34 6.39 6.31
International bond markets 1 Dollar-denominated bonds: 1
4- to 7-year maturity 12.24 12.45 13.17 13.22 12.54 12.00 1 1 . 18 7- to 15-year maturity 12.49 12.38 13.23 13.26 12.25 1 1.95 1 1 .47
Deutsche mark-denominated bonds: 3
3- to 7-year maturity 8.30 7.90 7.93 8.07 7.43 7.63 7.37 7- to 15-year maturity 8.20 7.93 8.07 8.17 7.60 7.73 7.47
Netherlands guilder-denominated notes:
3 or more years maturity 8.31 8.13 8.09 8.12 7.45 7.54 7.37
French franc-denominated bonds:
3- to 7-year maturity 13.19 13.03 13.16 12.65 1 1 .70 1 1 .52 1 1 .74
Source: Organization for Economic Cooperation and Development, Financial Statistics Monthly. 1 Three-month deposits. 2 Secondary market yields. ) Average of yields on bonds of international organizations, public sector, and private corporations.
124

©International Monetary Fund. Not for Redistribution
Statistical Tables
Table 45. Inflation, Interest Rate, and Exchange Rate Experience of Selected Financial Market Countries, 1970-84
(In percent)
1970-75 1976-80 1981-84
Standard Standard Standard Mean Deviation Mean Deviation Mean Deviation
United States Rate of inflation as measured by the rate
of change in: Consumer price i'ndex 6.6 2.9 8.9 3.3 6.0 3.1 GNP deflator 6.4 2.1 7.3 1.7 5.8 2.8
Nominal treasury bill interest rate 5.9 1.5 7.8 2.9 10.7 2.4 Nominal long-term treasury bond interest rate 7. 1 0.9 8.9 1.5 12.6 1.0 Real treasury bill rate 1 -0.4 0.5 4.7 Real treasury bond rate 1 0.6 1.6 6.5
United Kingdom Rate of inflation as measured by the rate
of change in: Consumer price index 12.1 6.9 14.4 3.8 7.5 3.4 GDP deflator 12.4 7.8 14.8 3.2 5.9 4.8
Rate of change of exchange rate ($/£) - 1 . 2 3.2 1.6 12.8 - 12.9 0.8 Nominal treasury bill interest rate 8.2 2.5 I 1 . 1 3 . 1 10.8 1.7 Nominal treasury bond interest rate 1 1 .2 2.7 13.3 0.8 12.3 1.9 Real treasury biiJ rate 1 3.5 -3.2 4.7 Real treasury bond rate 1 -0.8 - 1 . 3 6.1
Germany, Federal Republlc of Rate of inflation as measured by the
rate of change in: Consumer price index 5.7 1 .3 4.0 1.0 4.7 1.8 GNP deflator 6.7 0.9 4.0 0.4 3.5 1.2
Rate of change of exchange rate (OM/$) -7.5 4.7 -5.7 6.4 12.1 8.6 Nominal call money rate 7 . 1 2.5 5.3 2.3 7.7 2.8 Nominal public authorities' bond yield 8.7 1.0 7.1 1 . 1 8.8 1.2 Real call money rate 1 0.4 1.3 4.1 Real public bond yield 1 1.9 3.1 5.1
Japan Rate of inflation as measured by the
rate of change in: Consumer price index 1 1 .0 7.2 6.6 2.7 2.9 1 .4 GNP deflator 9.7 5.9 4.4 1.7 1 . 3 1.2
Rate of change of exchange rate (¥/$) -2.9 7.7 -4.7 10.9 1.4 7.9 Nominal call money rate 8.3 2.9 6.8 2.5 6.7 0.6 Nominal government bond yield 7.8 1 . 1 7.8 1.2 7.7 0.8 Real call money rate 1 - I . I 2.3 5.4 Real government bond yield 1 - 1.5 3.3 6.4
Switzerland Rate of inflation as measured by the
rate of change in: Consumer price index 7.0 2.1 2.3 1.4 4.5 1.8
Rate of change of exchange rate (Sw F/$) -8.2 6.1 -7.8 10.4 9.0 6.8 Nominal government bond yield 5.9 0.8 4.1 0.8 4.9 0.5 Real government bond yield 1 - 1 .0 1.8 0.4
Source: Lmernational Monetary Fund, International Financial Swtistics. 1 The average real interest rate (r) is derived from the corresponding average nominal interest rate (i) and average rate of inflation (p) via + r = (I + i)/( I + p). in all countries except Switzerland. p is the average rate of change in the GNP or GDP det1ator. For Switzerland.
p equals the average rate of change in the consumer price index.
125

©International Monetary Fund. Not for Redistribution
'f'hispage infenfionalfy left hfank

©International Monetary Fund. Not for Redistribution
Occasional Papers of the International Monetary Fund
(Continued from inside ji-ont cover)
24. Government Employment and Pay: Some international Comparisons, by Peter S. Helier and
AI an A. Tait. 1983. Revised 1984.
25. Recent Multilateral Debt Restructurings with Official and Bank Creditors, by a Staff Team
Headed by E. Brau and R.C. Williams, with P.M. Keller and M. Nowak. 1983.
26. The Fund, Commercial Banks, and Member Countries, by Paul Mentre. 1 984.
27. World Economic Outlook: A Survey by the Staff of the International Monetary Fund. 1 984.
28. Exchange Rate Volatility and World Trade: A Study by the Research Department of the
International Monetary Fund. 1984.
29. Issues in the Assessment of the Exchange Rates of Industrial Countries: A Study by the Research
Department of the international Monetary Fund. 1 984
30. The Exchange Rate System-Lessons of the Past and Options for the Future: A Study by the
Research Department of the International Monetary Fund. 1984
3 1 . international Capital Markets: Developments and Prospects. 1 984, by Maxwell Watson, Peter
Keller, and Donald Mathieson. 1 984.
32. World Economic Outlook, September 1984: Revised Projections by the Staff of the International
Monetary Fund. 1984.
33. Foreign Private Investment in Developing Countries: A Study by the Research Department of the
International Monetary Fund. 1985.
34. Adjustment Programs in Africa: The Recent Experience, by Justin B. Zulu and Saleh M. Nsouli.
1985.
35. The West African Monetary Union: An Analytical Review, by Rattan J. Bhatia. 1985.
36. Formulation of Exchange Rate Policies in Adjustment Programs, by a Staff Team Headed by
G.G. Johnson. 1985.
37. Export Credit Cover Policies and Payments Difficulties, by Eduard H. Brau and Chanpen
Puckahtikom. 1985.
38. Trade Policy Issues and Developments, by Shailendra J. Anjaria, Naheed Kirmani, and Arne B.
Petersen. 1985.
39. A Case of Successful Adjustment: Korea's Experience During 1 980-84, by Bijan B. Aghevli and
Jorge Marquez-Ruarte. 1985.
40. Recent Developments in External Debt Restructuring, by K. Burke Dillon, C. Maxwell Watson,
G. Russell Kincaid, and Chanpen Puckahtikom. 1985.
4 1 . Fund-Supported Adjustment Programs and Economic Growth. by Mohsin S. Khan and Malcolm
D. Knight. 1985.
42. Global Effects of Fund-Supported Adjustment Programs, by Morris Goldstein. 1 986.
43. International Capital Markets: Developments and Prospects, by Maxwell Watson, Donald
Mathieson, Russell Kincaid, and Eliot Kalter. 1986.
International Monetary Fund, Washington. D.C. 20431. U.S.A. Telephone number 202 623-7430
Cable address: lntcrfund