International Capital Markets - IMF eLibrary
218
-
Upload
khangminh22 -
Category
Documents
-
view
5 -
download
0
Transcript of International Capital Markets - IMF eLibrary

©International Monetary Fund. Not for Redistribution
WORLD ECONOMIC AND FINANCIAL SURVEYS
International Capital Markets Developments, Prospects,
and Key Policy Issues
By a Staff Team led by
Charles Adams, Donald J. Mathieson, and Garry Schinasi
INTERNATIONAL MONETARY FUND Washington, DC September 1999
©International Monetary Fund. Not for Redistribution
© 1999 International Monetary Fund
Production: IMF Graphics Section Figures: Theodore F. Peters. Jr.
Typeseuing: Choon Lee
ISBN 1-55775-852-2 ISSN 0258-7440
Price: US$36.00 (US$25.00 to full-time faculty members and
students at universities and colleges)
Please send orders to: International Monetary Fund, Publication Services
700 19th Street, N.W., Washington, D.C. 20431, U.S.A. Tel.: (202) 623-7430 Telefax: (202) 623-720 I
E-mail: [email protected] Internet: http://www.imf.org
recycled paper
©International Monetary Fund. Not for Redistribution
Contents
Page
Preface ix
List of Abbreviations xi
I. Introduction and Overview 1
II. Developments, Trends, and Issues in the Mature Financial Markets 4 The Mature Market Turbulence and Its Aftermath 4 Developments in Money and Credit Markets Since the Turbulence 13 Developments in the Major Foreign Exchange Markets Since the Turbulence 16 Developments in the Major Equity Markets Since November 1998 19 Developments in Derivatives Markets 21 Developmems in the Major Banking Systems 26 Risks and Vulnerabilities 31 References 35
ill. Emerging Markets: The Contraction in External Financing and Its Impact on Financial Systems 37
Financial Market Developments 38 Private Capital Flows to Emerging Markets and Developments in the Bond,
Equity, and Syndicated Loan Markets 51 Developments in Emerging Market Banking Systems 59 References 65
IV. Managing Global Finance: Private and Public Policy Challenges Raised by Last Fall's Mature Market Turbulence 66
Recurring Features of Turbulence and Crisis: Importance of Lines of Defense Against Systemic Problems
Environment in Which Financial Excesses Accumulated and Created the Potential for Systemic Problems
Private and Public Policy Issues and Challenges Proposals for Reform Remaining Challenges Overall Assessment and Conclusion Appendix I. Off-Balance-Sheet Leverage Appendix 2. Impact of HLis on Small and Medium-Sized Markets References
V. Emerging Markets: Nonstandard Responses to External Pressure
67
68 73 77 79 82 84 88 90
and the Role of the Major Credit Rating Agencies in Financial Markets 92
Nonstandard Policy lnterventions in Emerging Markets 92 The Role of the Major Credit Rating Agencies in Global Financial Markets I 0 I References 114
iii
©International Monetary Fund. Not for Redistribution
VI. Summary and Conclusions
Mature Markets Emerging Markets
CONTENTS
Private and Public Policy Challenges Raised by Highly Leveraged Institutions and Activities
Emerging Markets and the International Financial System
Annexes
116
116 117
117 120
I. Progress with European Monetary Integration 123
Money Market Integration and EMU Financial Infrastructure J 23 Outlook for Pan-European Capital Markets 131 Banking System Consolidation and Restructuring 132 Financial Supervision, Regulation, and Crisis Management 134 References 135
II. Banking System Developments and Corporate Sector Restructuring in Japan 136
Overview of Banking System Issues 136 Main Policy Developments in Banking 140 Remaining Challenges 144 Financial Reorganization and Corporate Restructuring 145 Approaching a Crossroad 146 Directions for Change 14 7 Prospects and Risks 152 References 154
ID. Developments in Emerging Market Banking Systems 155
Asia 155 Latin America 162 Central Europe 165 References J 68
IV. Proposals for Improved Risk Management, Transparency, and Regulatory and Supervisory Reforms 170
Proposals to Strengthen Risk Management and Internal Control Systems 172 Disclosure and Market Discipline 175 Highly Leveraged Institutions 176 Supervision of Financial Conglomerates and International
Accounting Standards 178 References 179
V. Credit Ratings and the Recent Crises 180 Factors in Sovereign Ratings and Empirical Studies of Determinants 180 Review of Ratings During the Crises 186 Evaluating Rating Agencies: By What Criteria? 192 Survey of Credit Rating Agencies 196 References 198
VI. Use of Ratings in the Regulatory Process 200
References 204
Boxes
Chapters
2. I . The April 1998 BIS Survey of Foreign Exchange and OTC Derivatives Markets
iv
18

©International Monetary Fund. Not for Redistribution
Contents
2.2. Interest Rates and Implied Dividend Growth in G-7 Stock Markets 2.3. Ongoing Reforms in the U.S. Equity Market Infrastructure 2.4. Implications of the Y2K Problem for the Major Financial Systems 3.1. Russia: The Feeding Frenzy 3.2. The Activity of Highly Leveraged Institutions in Pacific Rim
Currencies in 1998 3.3. The Decline in Liquidity in Emerging Market Bonds and
Foreign Exchange 3.4. The Collapse of GITIC 3.5. The Nondeliverable Forward Market 3.6. Issues Involving the Possible Restructuring of Eurobonds 3.7. Is the Bond Market Becoming More Discriminating? 3.8. Private Contingent Credit Lines 4.1. Proposed Revisions to the Basel Accord on Capital Adequacy 5.1. The Mechanics of a "Double Play"
Annexes
A2. 1. Stock Market Reaction to Recent Restructuring Announcements in Japan
A3.1. Corporate Debt Restructuring in Asia A3.2. Hybrid Instruments in Asian Bank Recapitalization A3.3. Deposit Insurance: Issues for Emerging Markets A5.1. Standard & Poor's Issuer Ratings A5.2. Moody's Issuer Ratings A5.3. Criteria for Eligible External Credit Assessment Institutions
Tables
Chapters
2.1. Major Industrial Countries: Outstanding Amounts of Private
28 32 34 41
45
47 48 49 50 57 61 80 94
148 158 161 166 181 183 196
Sector Domestic Debt Securities 8 2.2. Announced International Syndicated Credit Facilities by Nationality
of Borrowers 16 2.3. Outstanding Amounts of International Debt Securities 17 2.4. Outstanding Amounts and Net Issues of International Debt Securities
by Currency of Issue 17 2.5. Currency Composition of Notional Principal Value of Outstanding
Interest Rate and Currency Swaps 22 2.6. Markets for Selected Derivative Financial Instruments:
Notional Principal Amounts Outstanding 23 2.7. Notional Value of Outstanding Interest Rate and Currency Swaps
ofiSDA Members 24 2.8. New Interest Rate and Currency Swaps 25 2.9. Annual Turnover in Derivative Financial Instruments Traded on
Organized Exchanges Worldwide 26 2.10. Claims of Banks in BIS-Reporting Countries on Selected
Emerging Markets as of December 1998 27 3.1. Net Private Capital Flows to Emerging Markets, 1990-98 52 3.2. Changes in Bank Exposures to Emerging Markets 54 3.3. Gross Private Market Financing to Emerging Markets, by Region,
Financing Type. and Borrower Type 55 3.4. Selected Emerging Markets: Banking System External and
Domestic Liquidity Conditions 62 4.1. Leverage Ratios in Basic Derivative Instruments 85 4.2. Global Risk Positions and Approximate Gross Leverage Ratios in
OTC Derivatives Markets by Type of Risk Instrument 87 5.1. Local Credit Rating Agencies 103
v
©International Monetary Fund. Not for Redistribution
CONTENTS
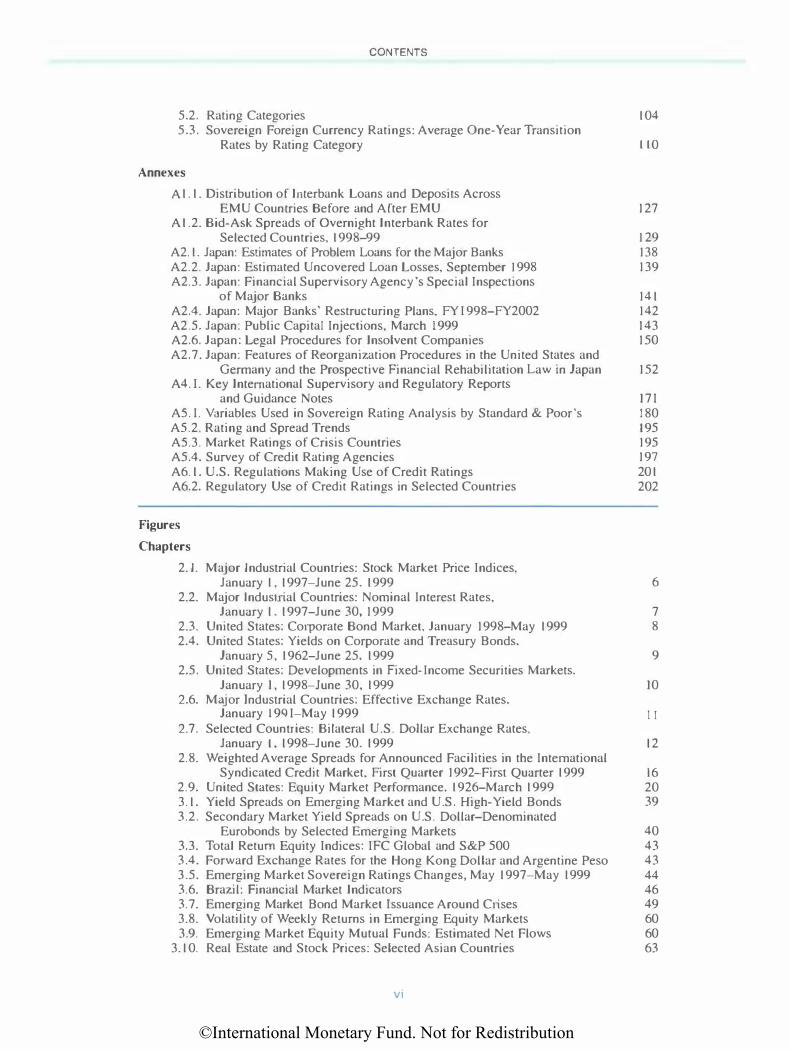
5.2. Rating Categories 104 5.3. Sovereign Foreign Currency Ratings: Average One-Year Transition
Annexes
Rates by Rating Category I I 0
A 1.1. Distribution of Interbank Loans and Deposits Across EMU Countries Before and After EMU 127
A 1.2. Bid-Ask Spreads of Overnight Interbank Rates for Selected Countries, 1998-99 J 29
A2.1. Japan: Estimates of Problem Loans for the Major Banks 138 A2.2. Japan: Estimated Uncovered Loan Losses, September J 998 139 A2.3. Japan: Financial Supervisory Agency's Special Inspections
of Major Banks 141 A2.4. Japan: Major Banks' Restructuring Plans, FYI 998-FY2002 142 A2.5. Japan: Public Capital Injections. March 1999 143 A2.6. Japan: Legal Procedures for Insolvent Companies 150 A2.7. Japan: Features of Reorganization Procedures in the United States and
Germany and the Prospective Financial Rehabilitation Law in Japan 152 A4. I. Key International Supervisory and Regu Ia tory Reports
and Guidance Notes I 7 I AS. I. Variables Used in Sovereign Rating Analysis by Standard & Poor's 180 A5.2. Rating and Spread Trends 195 AS .3. Market Ratings of Crisis Countries 195 A5.4. Survey of Credit Rating Agencies 197 A6.1. U.S. Regulations Making Use of Credit Ratings 201 A6.2. Regulatory Use of Credit Ratings in Selected Countries 202
Figures
Chapters
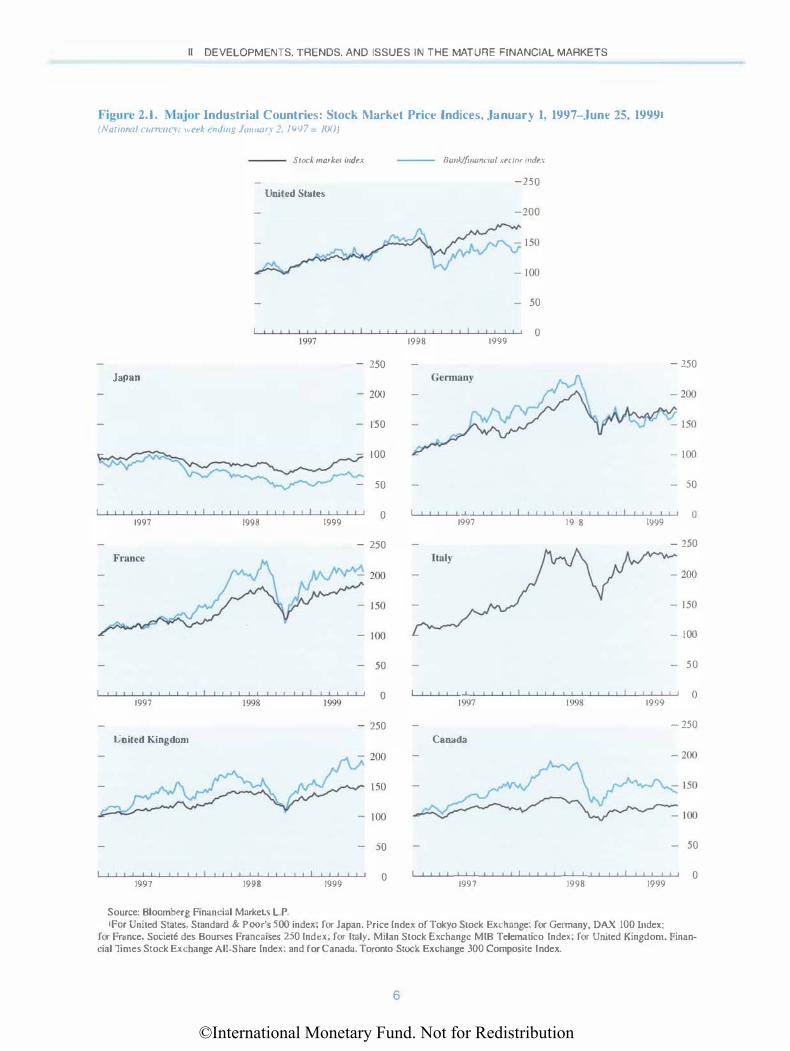
2. I. Major Industrial Countries: Stock Market Price Indices, January 1 ,1997-June 25. 1999 6
2.2. Major lndustrial Countries: Nominal Interest Rates. January 1. 1997-June 30, 1999 7
2.3. United States: Corporate Bond Market, January 1998-May 1999 8 2.4. United States: Yields on Corporate and Treasury Bonds.
January 5, 1962-June 25, 1999 9 2.5. United States: Developments in Fixed-Income Securities Markets.
January I, 1998-June 30, 1999 I 0 2.6. Major Industrial Countries: Effective Exchange Rates.
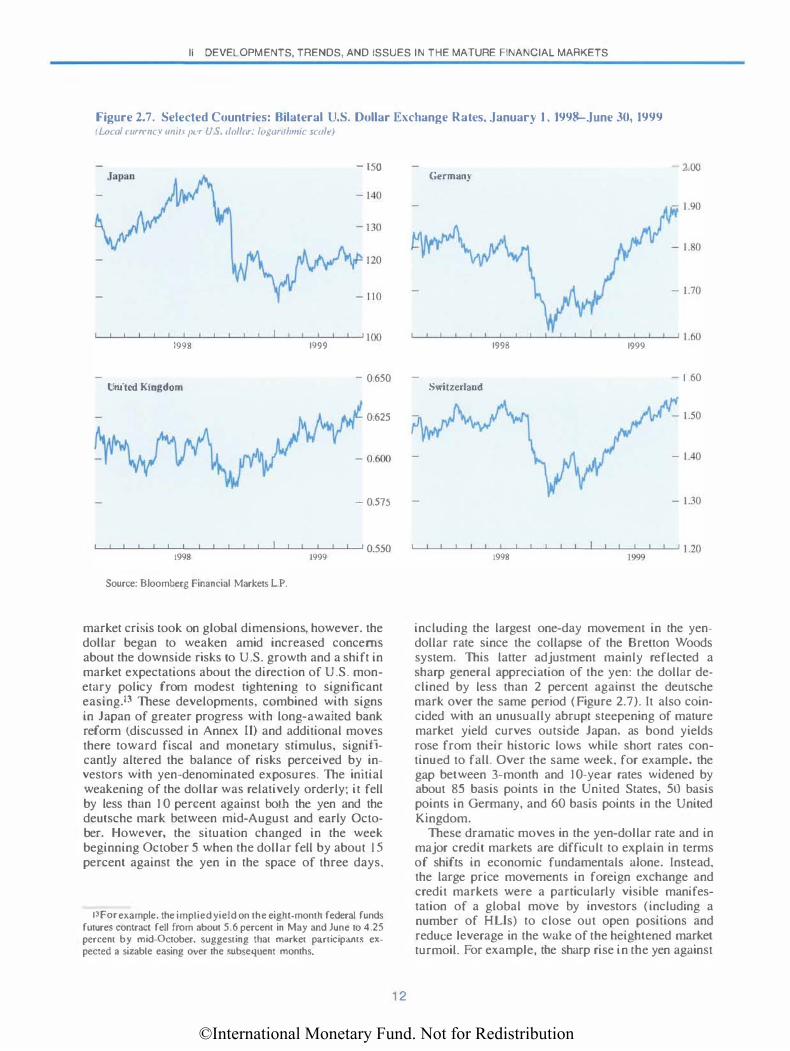
January L9QI-May 1999 II 2.7. Selected Countries: Bilateral U.S. Dollar Exchange Rates,
January I, 1998-June 30, 1999 12 2.8. Weighted Average Spreads for Announced Facilities in the International
Syndicated Credit Market, First Quarter 1992-First Quarter 1999 J 6 2.9. United States: Equity Market Performance. 1926-March 1999 20 3.1. Yield Spreads on Emerging Market and U.S. High-Yield Bonds 39 3.2. Secondary Market Yield Spreads on U.S. Dollar-Denominated
Eurobonds by Selected Emerging Markets 40 3.3. Total Return Equity Indices: IFC Global and S&P 500 43 3.4. Forward Exchange Rates for the Hong Kong Dollar and Argentine Peso 43 3.5. Emerging Market Sovereign Ratings Changes, May 1997-May 1999 44 3.6. Brazil: Financial Market Indicators 46 3. 7. Emerging Market Bond Market lssuance Around Crises 49 3.8. Volatility of Weekly Returns in Emerging Equity Markets 60 3.9. Emerging Market Equity Mutual Funds: Estimated Net Flows 60
3.1 0. Real Estate and Stock Prices: Selected Asian Countries 63
vi

©International Monetary Fund. Not for Redistribution
Contents
4.1. United States: Top 25 Commercial Banks-National Amount of Derivatives, Equity Capital. and The Gross Ot'f-Balance-Sheet Leverage Ratio, Founh Quarters 1995-Fourth Quaner 1998
5.1. Stock Market Indices: Hong Kong Hang Seng and Dow Jones 86
Industrial Average 5.2. Selected Stock Market Indices
93 95 99 5.3. Malaysia: Portfolio Investment Flows
5.4. Overnight Interest Rates. Foreign Exchange Rates. and Stock Market lndices
5.5. Emerging Markets: Number of Sovereign Ratings by Category 5.6. Moody"s-Rated Default Count by Industry and Trend
100 107 108
5.7. Five-, Ten-, Fifteen-, and Twenty-Year Average Cumulative Default Rates, 1970-98 108
109 109
5.8. Fifteen-Year Cumulative Default Rates and Volatilities, 1920-98 5.9. Average Credit Ratings in Emerging Market Countries
Annexes
AI.!. ECB: Interest Rates and Standing Facilities, January 4-June 11. 1999 125 A 1.2. Distribution of Cross-Border Payments in EMU Between EBA
and TARGET, January-May 1999 126 A 1.3. Overnight Rates on Unsecured Interbank Funds in the Euro Area,
January 4-June 10,1999 128 A l .4. France and Spain: Overnight Repo Rates, January 4, June 11. 1999 130 A2.l. Japan: Banking System Strains. 1997-99 137 A2.2. Japan: Major Banks' Profits, 1988-99 138 A2.3. Japan: Postal Saving Deposits. 1987-98 140 A5.1. Emerging Markets: Sovereign Ratings and Fundamentals 185 A5.2. Rating Actions by Moody's and Standard & Poor's,
and Changes in Yield Spreads: Argentina 186 A5.3. Rating Actions by Moody's and Standard & Poor's,
and Changes in Yield Spreads: Brazil 187 A5.4. Rating Actions by Moody's and Standard & Poor's.
and Changes in Yield Spreads: Hungary 187 A5.5. Rating Actions by Moody's and Standard & Poor's.
and Changes in Yield Spreads: Indonesia 188 A5.6. Rating Actions by Moody's and Standard & Poor's,
and Changes in Yield Spreads: Korea 188 A5.7. Rating Actions by Moody's and Standard & Poor's,
and Changes in Yield Spreads: Malaysia 189 A5.8. Raling Action!> by Moody's and Standard & Poor's.
and Changes in Yield Spreads: Mexico 189 A5.9. Rating Actions by Moody's and Standard & Poor's.
and Changes in Yield Spreads: Poland 190 AS. J 0. Rating Actions by Moody's and Standard & Poor's,
and Changes in Yield Spreads: Russia 190 AS. J L Rating Actions by Moody's and Standard & Poor's.
and Changes in Yield Spread: Thailands 191 A5.l2. Rating Actions by Moody's and Standard & Poor's.
and Changes in Yield Spreads: Turkey 191 A5.13. Average Cumulative 15-Year Default Rates for Corporate Issuers 193 A5.14. Rating Stability 194
vii

©International Monetary Fund. Not for Redistribution
CONTENTS
The following symbols have been used throughout this volume:
to indicate that data are not available:
to indicate that the figure is zero or less than half the final digit shown, or that the item does not exist;
between years or months (for example, 1997-98 or January-June) to indicate the years or months covered. including the beginning and ending years or months:
between years (for example, 1997/98) to indicate a fiscal or financial year.
"Billion" means a thousand million: "trillion" means a thousand billion.
"Basis points" refer to hundredths of I percentage point (for example. 25 basis points are equivalent to !4 of I percentage point).
"n.a." means not applicable.
Minor discrepancies between constituent figures and totals are due to rounding.
As used in this volume the term "country" does not in all cases refer to a territorial entity that is a state as understood by international law and practice. As used here, the term also covers some territorial entities that are not states but for which statistical data are maintained on a separate and independent basis.
viii
©International Monetary Fund. Not for Redistribution
Preface
The International Capital Markets report is an integral element of the TMF's surveillance of developments in international financial markets. The lMF has published the International Capital Markets report annually since 1980. The report draws, in pan, on a series of infom1al discussions with commercial and investment banks, securities firms, stock and futures exchanges, regulatory and monetary authorities, credit rating agencies, and the staffs of the Bank for International Settlements, the Commission of the European Union, and the International Swaps and Derivatives Association. The discussions leading up to the present report took place in Argentina, Belgium, China, France, Germany, Hong Kong SAR, Hungary, Italy, Japan, Malaysia, Mexico, Poland, Singapore. Switzerland, Turkey, the United Kingdom, and the United States, in early 1999. The report reflects information available up to the end of June 1999.
The International Capital Markets report is prepared in the Research Department. The lnrernacional Capital Markets project is directed by Charles Adams, Assistant Director, together with Donald Mathieson. Chief of the Emerging Markets Studies Division, and Garry Schinasi. Chief of the Capital Markets and Financial Studies Division. Coauthors of the report from the Research Department are Peter Breuer, Bank.im Chadha, Nada Choueiri, Burkhard Drees, Anne Jansen, Charles Kramer, Subir LalJ, William Lee. Joaquim Levy, Alessandro Prati, Anthony Richards, Jorge Roldos, Todd Smith (Visiting Scholar), Subramanian Sriram, Amadou Sy, Peter Tran, and Caroline Van Rijckeghem. Contributors from other departments are Martin Cerisola, Western Hemisphere Deparonent; Cern Karacadag, Monetary and Exchange Affairs Department; and James Morsink, Asia and Pacific Department. Celia Bums, Sheila Kinsella. Rosalind Oliver, Ramanjeet Singh, and Adriana Vohden provided expert word processing assistance. Marina Primorac of the External Relations Department edited the manuscript and coordinated production of the publication.
The study has benefited from comments and suggestions from staff in other IMF departments, as well as from Executive Directors following their discussions of the lmernational Capital Markets reporr on July 29, 1999. However. the analysis and policy considerations are those of the contributing staff and should not be attributed to Executive Directors, their national authorities, or the IMF.
ix

©International Monetary Fund. Not for Redistribution
This page intentionally left blank

©International Monetary Fund. Not for Redistribution
List of Abbreviations
BIS BNL CAPM CAPS CCBM DJ1A DCR EAF EBA ECB EFIL EMU EONIA ERM EU FBA FESCO FOBAPROA FOMC FRC FSA G-7 G-10 GITIC HKMA HLl lAS lASC IFC llF INDRA IOSCO IPAB ISO ISDA ITIC JGB KAMCO LIB OR LTCM MRO NCB NDF NRSRO occ OTC PCA PNS
Bank for International Settlements Banca Nazionale del Lavoro Capital Asset Pricing Model CapitaJ Augmented Prefen·ed Securities correspondent central banking model Dow Jones Industrial Average Duff & Phelps Credit Rating Agency Euro Access Frankfurt European Bankers' Association European Central Bank Exchange Fund Investment Limited Economic and Monetary Union curo overnight index average exchange rare mechanism European Union Federation of Bankers' Associations Forum of European Securities Commissions Fondo Bancario de Protecci6n aJ Ahorro Federal Open Market Committee Financial Reconstruction Committee Financial Supervisory Agency Group of Seven Group of Ten Guangdong International Trust and Investment Corporation Hong Kong Monetary Authority highly leveraged institution International Accounting Standard International Accounting Standards Committee International Finance Corporation Institute of International Finance Indonesia Debt Restructuring Agency International Organization of Securities Commissions lnstituto de Protecci6n del Ahorro Bancario Investment Services Directive International Swaps and Derivatives Associatior international trust and investment corporation Japanese government bonds Korea Management Corporation London interbank offered rate Long-Term Capital Management main refinancing operations national central bank nondeliverable forward Nationally Recognized Statistical Rating Organization Office of the Comptroller of the Currency over-the-counter prompt corrective action Paris Net Settlement
xi
©International Monetary Fund. Not for Redistribution
ROE RTGS S&P's SAR SODS SEC SLIPS TARGET TffiOR VaR Y2K
LIST OF ABBREVIATIONS
return on equity real-time gross settlement Standard & Poor's Special Administrative Region Special Data Dissemination Standard Securities and Exchange Commission Stapled Limited interest Preferred Securities Trans-European Automated Real-Time Gross Settlement Express Transfer Tokyo interbank borrowed rate value at risk Year 2000
xii
©International Monetary Fund. Not for Redistribution
I Introduction and Overview
The period since last year's International Capital Markets report has witnessed some of the most
severe financial market turbulence in the postwar period. The effects of the Asian financial crisis were initially felt mainly within the region, and the negative spillovers to other emerging markets and to most of the advanced countries outside the region were short li ved.• Indeed, through mid-1998 other emerging markets, including in Latin America and Europe, generally maintained access to international capital markets at relatively favorable terms, and some of the Asian crisis countries saw a pickup in inflows.2 At the same time, equity markets in most of the advanced countries continued to record strong gains-reaching record valuations; levels of leverage in advanced countries' financial systems remained high; and confidence was generally strong.
During 1998. however, the situation began to deteriorate as weakening commodity prices, deeper-thanexpected output declines in the Asian cnsts economies, and continued difficulties in Japan conspired to produce an increasingly negative perception of the global outlook. Russia's decision in August to unilaterally restructure its domestic debt and allow the ruble to depreciate triggered a far-reaching reassessment of risk. Reflecting the associated portfolio rebalancing and deleveraging, credit and liquidity spreads in key mature markets widened sharply-more than reversing the compression over the preceding several years; liquidity almost dried up in some of the deepest capital markets in the world following the nearcollapse of the hedge fund Long-Term Capital Management (LTCM); and the dollar-yen exchange rate experienced its largest one-day movement since the collapse of the Bretton Woods system. The effects of the turbulence on the emerging markets were dra-
1The term ·•emerging markets'' as used in this report is substantially broader than that used in other comexts and includes the IMFs World Economic Our look classifications of '"developing countries:· ··countries in transition." and the advanced economies of Hong Kong Special Administrative Region (SAR) of China. Israel, Korea. Singapore. and Taiwan Province of China.
lHcrc, and in what follows, Korea. Malaysia, the Philippines. Thailand. and Indonesia are characterized as the Asian crisis economies. ln view of the large number of Asian countries seriously affected by the regional turmoil, the identification of crisis countries is necessarily somewhat arbitrary.
matic: spreads on external debt widened sharply, international lending effectively dried up, and the more vuLnerabLe economies in Latin America began to be brought into the crisis.
TimeLy action by a number of central banks and the international conu1mnity were successful in staving off the risk of a global crisis, and financial markets in the advanced countries began to stabilize toward the end of 1998. Moreover, even though sentiment began to deteriorate again early this year when Brazil gave up its defense of its currency after several months of pressure, the spillovers to other countries were surprisingly short lived and the negative effects on Brazil less than had been feared. These muted responses were pivotal in avoiding another round of international fmancial turmoil. In the event, the economk climate began to improve as it became clear that growth in the U.S. economy remained surprisingLy robust, Japan began to take important measures to stabilize its economy and address its banking sector problems, and the Asian crisis economies showed signs of recovery. Notwithstanding these favorable developments, conditions in financial markets remain fragile, as evidenced by continued high levels of volatility, high spreads on emerging market external debt. and capital flows to the emerging markets that are running well below the rates during the boom years.
The turbulence over the last few years has raised questions about the market dynamics of the "new·• increasingly integrated and securitized international capital markets, including the boom-bust swings in international capital flows, the speed and severity with which disturbances spill over across countries, and the market dynamics (magnification effects) associated with high levels of leverage. Recent International Capital Markets reports and World Economic Outlooks have extensively covered many of these issues. which are also being considered in the context of the lMF Executive Board's work program. Following a review and assessment of recent developments in capital market and banking systems, this year's International Capital Markets report addresses a number of specific features of international capital market dynam.ics, including the systemic and other issues posed by highly leveraged institutions and activities; the nonstandard policy responses some emerging markets have taken when faced with extreme external pres-
©International Monetary Fund. Not for Redistribution
I INTRODUCTION AND OVERVIEW
sures; and the perfonnance of the major credit rating agencies during the recent financial crises.
Chapter 11 provides a comprehensive assessment of recent developments and trends in the mature financial markets and identifies key risks and uncertainties in the outlook. Beyond the turbulence in international capital markets, the mature financial markets were innuenced significantly over the last year by continued sharp differences in macroeconomic performance and policies across the major advanced countries, notably the continued strong performance of the U.S. economy vis-a-vis Europe and Japan; spillovers from problems in t11e emerging markets, especially to banking systems; and the global shift toward a low-inflation environment. On the structural side, important factors have i�cluded the further progress toward European financial integration with the successful launch of the euro, Japan's initiation of a program to address its financial sector problems, and stepped-up mergers and acquisitions within and between major banking systems. Notwithstanding the recent improved global situation, there are a number of risks related to the sustainability of current configuration of asset prices, especially in the United States. potential vulnerabilities in the major banking systems of the advanced countries, and the possibility of increased uncertainty in the lead-up to the Y2K (Year 2000) transition.
Chapter TTl reviews and assesses recent developments in the emerging markets with particular focus on how they have been affected by the global turbulence. After declining in 1997 for the first time this decade. private market financing for the emerging markets fell dramatically in 1998, with much of the decline in the latter half of the year in the wake of the international turbulence. With the notable exception of foreign direct investment, all categories of private inflows fell sharply with significant further retrenchments in bank lending. Many regions shared in the cutbacks. with the Asian crisis countries becoming net capital exporters as they began to build up reserves following sharp declines during the crisis. In response to the tightening and cutback of external financing, emerging markets adopted a number of innovative approaches to accessing international capital markets, but generally only the highest quality borrowers have been successful, in some instances supported by official guarantees. Not surprisingly, the tight external financing conditions have placed strains on emerging markets, with effects varying according to underlying vulnerabilities, including dependence on short-term external funding, the strength of banking and corporate sectors, and progress in improving financial sector resilience. Notwithstanding a rally in emerging markets early this year, external financing for many emerging market borrowers remains weak.
In tile immediate aftermath of last year's turbulence in international financial markets, the World Economic Outlook and lmernational CapitaL Markets: In-
2
rerim Assessment3 identified several weaknesses in private risk management, bank supervision, and financial markets surveillance that had been intended to provide key lines of defense against systemic risk. Subsequently, in the wake of the LTCM episode, recommendations have been made by both official and private groups in a number of countries to address these weaknesses. Against the background of deepseated and ongoing changes in global financial markets. Chapter IV considers a number of conjunctural factors, such as abundant global liquidity and the search for yield in competitive financial sectors, that may have contributed to unsustainable levels of leverage in key financial centers, as well as the factors underlying the market dynamics set in train by the increase in risk aversion following the Russian crisis. High and unchecked levels of leverage have not only raised important systemic issues but bave also been a source of concern for a number of countries that believe their markets have been pushed around by the large and concentrated positions taken by a number of highly leveraged institutions (HLis). An appendix to Chapter IV addresses the impact of HUson small and medium-sized countries.
The evolving role of emerging markets in the new financial system is discussed in Chapter V. A number of emerging markets have recently responded to extreme financial pressures through relatively nonstandard approaches, taking into account developments in the instruments used-and high leverage employedby some international investors. wcluded among these nonstandard approaches have been the interventions last year by the Hong Kong Monetary Authority (HKMA) in domestic equity and derivative markets to deal with concerns about a "double play" by highly leveraged speculators. the adoption by Malaysia of controls on capital outflows to provide greater domestic monetary independence and effectively close down the offshore market in its currency, and interventions by Brazil in its external debt market.
As capital markets become a major source of funding, major credit rating agencies have been assuming an increasingly important role in providing standardized assessments of the credit risks associated with emerging market investments. Although the major credit rating agencies identified weaknesses in the financial systems of a number of Asian countries before the crisis, the maintenance of investment-grade ratings for many countries and the subsequent sharp downgrades during the crisis have been seen by some observers as imparting a pro-cyclical element, exacerbating herding behavior before the crisis and contributing to the massive turnaround in capital flows.
·11nternational Monetary Fund, World Economic· Owlook and fmemarimwl Capiwl Markets: fmerim Asse.wnent (Washington, December 1998).

©International Monetary Fund. Not for Redistribution
Introduction and Overview
Against this background, the report reviews in Chapter V the credit rating experience during the Asian crisis and considers steps the major rating agencies are taking to address weaknesses revealed by the episode. The recent Basel Committee proposals to base banks' capital risk weights on external credit ratings add
3
impottance to rating agencies' cun·em efforts to strengthen the rating process, and could help dampen the boom-bust cycles in international capital flows, lock in some of the recent shift away from bank lending and toward portfolio flows, and facilitate a better pricing of risk.
©International Monetary Fund. Not for Redistribution
II Developments, Trends, and Issues in the Mature Financial Markets
During the last twelve months, mature markets have experienced severe turbulence.! Following
the crisis in Russia and amid news of difficulties at a major hedge fund (LTCM), these markets experienced volatility of a magnitude rarely seen; credit and liquidity spreads rose sharply in U.S. money and credit markets, major equity markets declined significantly, and the yen underwent the sharpest one-day adjustment against the dollar since the collapse of the Bretton Woods system.2 Mature markets rebounded fairly quickly, though U.S. credit spreads remain somewhat above precrisis levels. As the turbulence subsided, mature markets came to be predominantly influenced by domestic and regional conditions, against the background of a variety of important structural and conjunctural developments. The onset of European Economic and Monetary Union (EMU), the economic and financial difficulties in Japan, low and declining inflation, and the divergence of economic conditions and policies among the major countries have also importantly influenced financial markets. On balance, by end-June 1999, short-term interest rates were generally lower. long-term rates were mixed, equity prices were higher, and the dollar was mixed against the other major currencies compared with a year earlier.
The Mature Market Thrbulence and Its Aftermath3
Ru n-Up to tbe Mature Market ThrbuJence
Until July 1998, the mature financial markets in the United States and Europe were generally buoyant, extending a period of several years during which spreads on a wide range of instruments narrowed and the price of credit risk was increasingly compressed (a process that was little affected by the Asian
'This seclion focuses principally on developments during the period June 1998 to June 1999. The data cutoff is June 30, 1999.
2ln particular. the dollar declined against the yen by 7.7 percent; as noted in Chapter m, emerging market liquidity also dried up during the period.
3The description of the turbulence in this section updates Chapter lll in international Monetary Fund (1998b).
4
crisis).4 Government bond yields conrinued to decline, while equity prices recorded further strong gains-especially in continental Europe, where markets surged in a number of countries by 45-65 percent over end-1997 levels. Contributing to this buoyancy were very subdued inflation, solid domestic demand growth in most countries, and increased confidence i11 a successful launch of EMU. In addition, the mature financial markets were bolstered by a "flight to quality'' as investors shifted funds away from Asia and some other emerging markets. Despite these generally favorable developments, there were some signs of a weakening in sentiment in the months leading up to July 1 998. Major stock market indices in the United States and the United Kingdom continued to advance, but the gains were increasingly narrowly based, and market indices for "small cap" stocks (which had underperformed "large cap" stocks for some time) began to weaken. Also. yield spreads on below-investment-grade bonds in the United States began to widen by about 90 basis points from their historic lows of about 240 basis points in mid-1997 prior to the Asian crisis, probably owing to concerns about the advanced state of the business cycle and rising risks of an economic slowdown, and the effects of the Asian crisis on corporate eamings.5 ln other countries, the equity market weakened in Japan, where domestic economic conditions continued to worsen, and also came under downward pressure in countries with strong u·ade links to Asia or heavy reliance on commodity exports (notably, Australia, Canada, New Zealand, and Norway); exchange rates weakened in a number of these countries as well.
In June and July, credit spreads widened further, and the boom in U.S. and European equity markets stalled. Spreads on lower-quality U.S. corporate bonds, which averaged about 300 basis points during the early 1990s, crept up from a low of about 250
4See Chapter IV in International Monetary Fund ( 1998a). 5Th is widening coincided with a general weakening in U.S. cor
porate earnings growth and an increase in the number of domestic corporate credit rating downgrades relative to upgrades. Salomon Smith Barney's announcement on July 6 that it planned to close its U.S. bond-arbitrage unit appeared to reduce liquidity in the U.S. bond markets. which may have contributed to the rise in spreads in JuJy and tbe increase in volatility Jater io the year.
©International Monetary Fund. Not for Redistribution
The Mature Market Turbulence and Its Aftermath
basis points around the end of April to about 320 basis points in July.6 Spreads on investment-grade bonds widened more modesdy. Equity markets in d1e United States and Europe generally peaked in midJuly. While it is difficult to identify a particular event that triggered the subsequent correction, several factors may have Jed investors to reassess the sustainability of historically high equity market valuations and compressed credit spreads. First, the negative effects of the Asian crisis on output growth and corporate earnings were becoming more visible, particularly in the United States. In addition, it was increasi�ngly apparent that the contraction in the Asian emerging market economies was much deeper than initially expected, and that prospects for early recovery in Japan had diminished. Signs that the situation was deteriorating in Russia also contributed to concerns that the emerging market crisis might spread beyond Asia. Bank stocks were hit particularly hard, in part unwinding earlier sharp gains bur also reflecting concerns about bank exposures to emerging markets (Figure 2.1).
Mature Market Thrbulence
The situation deteriorated sharply in d1e second half of August as the devaluation and unilateral debt restructuring by Russia sparked a period of turmoil in mature markets that is virtually without precedent in the absence of a major inflationary or economic shock. Neither Russia's relative importance in the world economy nor the size of bank exposures to Russia can fully explain the magnitude of the market movements that followed.? The crisis in Russia sparked a broad-based reassessment and repricing of risk, especially regarding emerging market investments, and a large-scale portfolio rebalancing across a range of global financial markets. ln subsequent weeks, conditions in many of the mature financial markets deteriorated sharply, increasing the pressures on financial institutions, including LTCM. The equity market sell-off intensified, largely wiping out the gains recorded earlier in the year. In the United States, equity markets bottomed out in late August, roughly 20 percent below their highs, while European markets continued to decline through the fust half of October. falling on average by about 35 percent. At the same time, the decline in government bond yields accelerated, taking yields to their lowest levels since at least the mid-1 960s and in some cases si�nce World
6Some market analysts have suggested that the adverse effect of widening credit spreads on balance sheets may have reduced market participants' willingness to roll over exposures to Russia once problems began to appear.
7ln 1998, Russia accounted for roughly I percent of world GOP and 1.2 percent of world trade: bank claims on Russia accounted for less than I percent of BIS reporting banks' total claims.
5
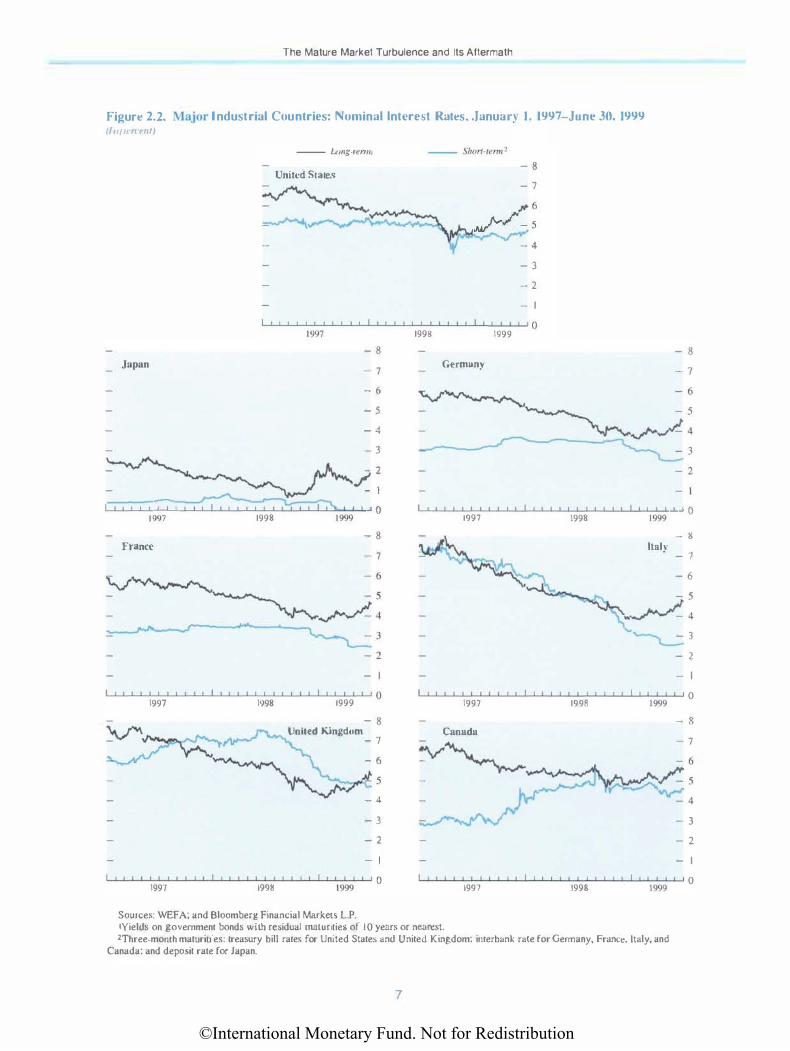
War II, as investors increasingly sought to shift funds into the safest and most liquid assets (Figure 2.2). In the six-week period between mid-August and early October, for example, government bond yields fell by about 70 basis points in Germany, 110 basis points in the United Kingdom, and 120 basis points in the United States, implying price gains in the range of 6-1 1 percent (equivalent to about 50 to 100 percent at an annual rate) for the benchmark 7- to 10-year bonds. Elsewhere in Europe, yield spreads over German rates widened to their highest levels of the year within the euro area (among both core and peripheral countries), and even more dramatically outside the prospective euro area, with spreads for Denmark and Sweden widening by 30-40 basis points in less than a month.
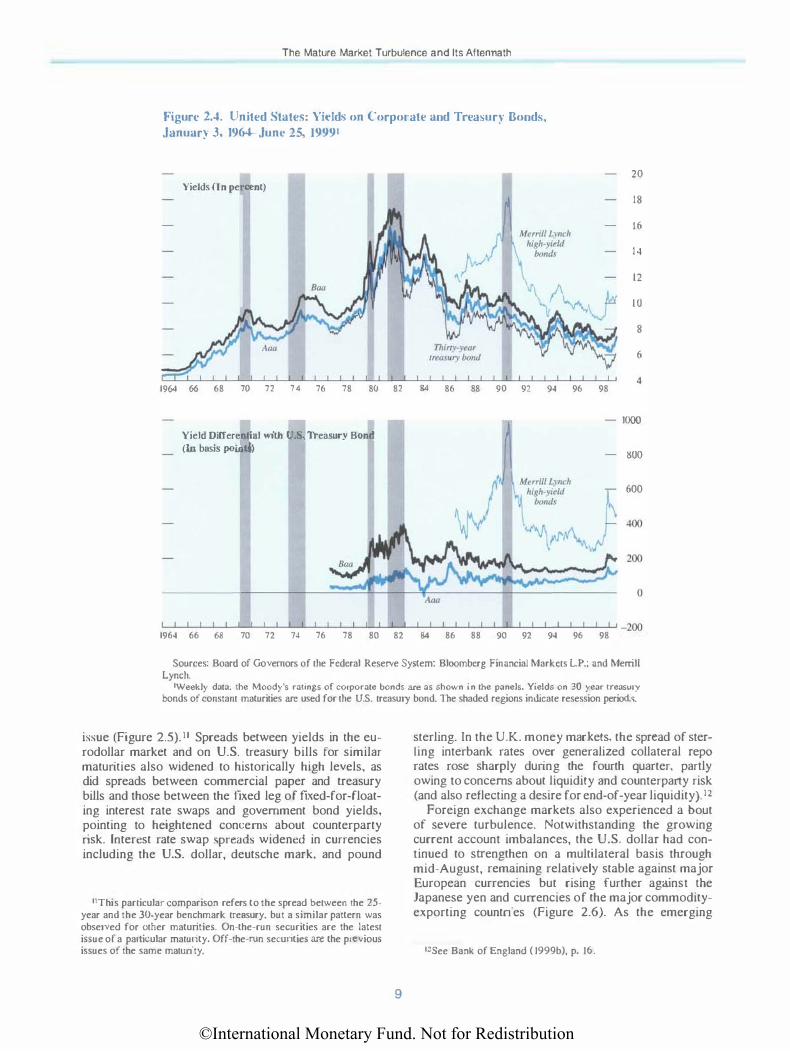
Corporate bond spreads widened more sharply starting in the second half of August, and in some instances, new debt issuance dropped off markedly (Figure 2.3; Table 2.1). Comprehensive data are most readily available for the United States, where the corporate bond market is relatively large and well developed (Figure 2.4). Yield spreads over U.S. treasury bonds for below-investment-grade bonds widened from about 375 basis points immediately before the Russian debt restructuring to almost 600 basis points by mid-October, the highest level since the collapse of the U.S. junk bond market at the beginning of the 1990s. For the most part, the rise in spreads on highergrade credits reflected the fall in treasury bond yields rather than a rise in actual borrowing costs. However, below investment grade, the spread widening was also associated with a sharp increase in nominal yields, and the spread of below-investment-grade bonds over investment-grade bonds widened substantially (a similar increase in credit differentiation was observed i n the commercial paper market). The volume of U.S. high-yield bonds issued in October fell to about $2 billion, compared with a monthly average of roughly $ 1 5 billion in the second quarter (a substantial though less pronounced drop-off was observed in the issuance of U.S. investment-grade bonds). Corporate bond spreads also appear to have widened in some European markets, though time-series data on these spreads are much more limited. For example, spreads on AA euro sterling bonds over U.K. gilts widened from about 90 basis points to 130 basis points during the same period.s There were also reports that highyield corporate bond issuance slowed sharply in continental Europe.
Starting in August. the deteriorating conditions in long-term fixed income markets gave rise to concerns that a widespread "credit crunch" might materialize in the United States. In the event, firms in large measure
81ndividual U.K. corporate bond spreads also widened significantly during the third quarter. See Bank of England (1998), p. 6.
©International Monetary Fund. Not for Redistribution
II DEVELOPMENTS. TRENDS. AND ISSUES IN THE MATURE FINANCIAL MARKETS
Figure 2.1. M ajor Industrial Countries: Stock l\Jarket Price lndice'i, .January 1, 1997-.lunc 25. 19991 (Narumol CIIIH'III'\', m·d oulm� lunlllln ::, /'i'li = /110}
Srock market index
United State�>
I I I 1997
- 250 Japan
- 200
150
100
50
I (I 0 1999
t ' ( I I I 1997 1998
- 250
50
I t I I I I I I I 1997 1 998 1 999
0
- 250 liniled Kingdom
50
I I I I I I I I I 1997 1998 1999
0
Source: Bloomberg Financial Markets L.P.
' I I 1998
Bank/fmannal sector mde.<
I I I 1997
I I I 1997
Dmada
I I I 1997
-250
-200
50
I I I 0 1999
I I I 1998
I I I 1998
I I I 1998
- 250
50
I I I I I u 1999
- 250
100
50
I I I I I 0 1999
- 250
50
I I I I 0 1999
1For United States, Standard & Poor's 500 index: for Japan. Price Index of Tokyo Stock Exchange; for Germany, DAX 100 Index: for France, Societ� des Bou rses Francaises 250 Index; for Italy. Milan Stock Exchange MIB Telemalico Index; for United Kingdom. Financial Times Stock Exchange All-Share Index: and for Canada, Toronto Stock Exchange 300 Composite Index.
6
©International Monetary Fund. Not for Redistribution
The Mature Market Turbulence and Its Aftermath
Figur� 2.2. :\ lajor I ndustrial Countries: Nominal lntere'>t Rat�s • .JanuaQ 1. 1997-.Junc 30. 1999 (/IIJti'IH'/11)
Japan
!'I"! a I ;---;:I 1997
France
I I I I l 1997
-- Ltmg-rt�nnl - 8
Unlted State.�
� -- 7
- y � ; 6
��-"""-;-� L .. .t--/- 5 - � � - 4
f I I I I 1997
I I I I I I I I 1998
I I I 1998
t I I I
- 8
- 7
- 6 - 5 - 4
- 3
- 2 ..( I I I 0
- 8
- 7
- I
I f I I I 0 1999
- 8
I I I 1998
Germany
I I I I ! 1997
I I I I I 1997
Canada
- 3
- 2
- I
I I I I I 0 1999
I I I 1998
I I I 1998
- 8
- 7
\�� I I 0
- 8 ltaly
- 7
- 6
- 3 ..___
- 2
- I
\�9 t I 0
- 8
� � United Kingdom - ��� ---.'"'-- - 7
� � ._ \ - 6 - ��� 5 v� - 7
= ��: I 1
- 4
- 3
- 2
- I
I I I I I 0 1999
I I I I I I 1997 1998
Sources: WEFA; and Bloomberg Financial Markets LP.
�� 3
I I I I I 1997
I I I 1998
2
- I
\�9 I I 0
1Yields on govemmen1 bonds with residual mmurities of 10 years or nearest. 2Three-momh maturities: treasury bill ra1es for United States and United Kingdom: inlerbank rale for Germany. France. haly. and
Canada: and deposit rate for Japan.
7

©International Monetary Fund. Not for Redistribution
II DEVELOPMENTS, TRENDS, AND ISSUES IN THE MATURE FINANCIAL MARKETS
Figure 2.3. United States: Corporate Bond l\1a1·ket. .January l99s-Ma)' 1999
- 1.8
- 1.6
- 1.4
- 1.2
1.0
0.8
0.6
0.4
0.2
1999 0
6
5
4
3
2
1999 0
Sources: Board of Governors of lhe Federal Reserve System: and Bloomberg Financial MarJcets L.P.
'Spreads against yields on 30-year U.S. government bonds.
were able to avoid financing difficulties by substituting other sources of finance for corporate bonds during the disruption.9 In August and September, some
9See Board of Governors of lhe Federal Reserve System ( 1999a).
firms issued commercial paper to delay issuance of corporate bonds. Others took out bank loans, or drew on credit lines, notwithstanding some tightening of credit standards by banks (some firms drew on credit lines that had been extended and priced during more tranquil periods).
In September and early October, indications of heightened concern about liquidity and counterparty risk emerged in some of the world's deepest financial markets. A key development was the news of difficulties in, and ultimately the near-failure of, a U.S. hedge fund-LTCM-which had large highly leveraged and complex positions across a broad range of markets, including over-the-counter (OTC) derivatives markets, and substantial links with a range of U.S. and European financial institutions. Although a private rescue of LTCM, organized with the help of the New York Federal Reserve Bank, was announced on September 23, the market reverberations intensified in the ensuing weeks as previous positions were unwound and as concerns increased about the extent to which other financial institutions might be in trouble or face a need to unload assets into illiquid markets at distressed prices.
In response to these developments and the rapid deleveraging, market volatility increased sharply, and there were some significant departures from normal pricing relationships an1ong different asset classes.IO In the U.S. treasury market, for example, the spread between the yield on "on-the-run" and "off-the-run" treasuries widened from less than 10 basis points to about 15 basis points in the wake of the Russian debt restructuring, and to a peak of over 35 basis points in mid-October, suggesting that investors were placing an unusually large premium on the liquidity of the "on-the-run"
'OWhile lhe observed movementS in market prices suggest problems of reduced l.iquidity and perhaps broader disruption of normal market functioning, reports of such problems remain largely anecdotal.
Table 2. 1 . 1\lajor Industrial Countries: Oul�tanding Amounts of Private Sector Domestic Debt Sccurities1 (In In/Iron\ of U.S. dol/an)
1998
1993 1994 1995 1996 1997 1998 Ql Q2 Q3 Q4 United States 3,418.2 3,651.0 4,072.3 4,605.6 5.218.1 5.946.0 5,486.4 5,656.7 5.802.3 5,946.0 Japan 1.325.6 1,497.3 1,529.7 1,468.5 1,316.6 1.434.1 1,298.6 1.192.0 1,211.7 1.434.1 Germany 738.5 867.2 1,033.5 1,030.5 961.1 1 . 137.5 956.7 997.4 1,126.7 1,137.5 France 541.2 572.4 605.3 567.7 471.8 484.2 453.6 444.3 488.9 484.2 Italy 300.0 325.4 356.5 411.6 348.9 363.8 333.5 339.9 361.9 363.8 United Kingdom 134.2 170.2 187.3 261.0 31 1.9 388.3 336.9 347.5 372.1 388.3 Canada 45.7 45.8 50.5 63.8 77.2 82.7 79.8 82.8 81.0 82.7
Total 6,503.4 7,129.3 7.835.1 8.408.7 8,705.6 9,836.6 8.945.5 9,060.6 9,444.6 9,836.6
Source: Bank for International Settlements. 'Debt securities issued in domestic currency by residentS of the counuy indicated. Includes short-term paper (e.g., commercial paper).
8
©International Monetary Fund. Not for Redistribution
The Mature Market Turbulence and Its Aftennath
Figure 2.4. United States: Yield-, on Corporate and Treasury Bonds. January 3. 1964-Junc 25, 1999•
20 Yields (In percent)
18
16
14
12
10
8
6
4 1964 66 68 70 72 74 76 78 80 82 84 86 88 90 92 94 96 98
Yield OiiJerentinl wilh (J.S. Treasury Bond (In basis poind)
1000
800
600
400
I I I I I I I I I I I I I I I I I I I t I I I I I I I I I I I I I It -2()(} 1964 66 68 70 72 74 76 78 80 82 84 86 88 90 92 94 96 98
Sources: Board of Governors of the Federal Reserve System: Bloomberg Financial Markets L.P.: and Merrill Lynch.
•weekly data; the Moody's ratings of corporate bonds are as shown in the panels. Yields on 30 year treasury bonds of constant maturities arc used for the U.S. treasury bond. The shaded regions indicate resession periods.
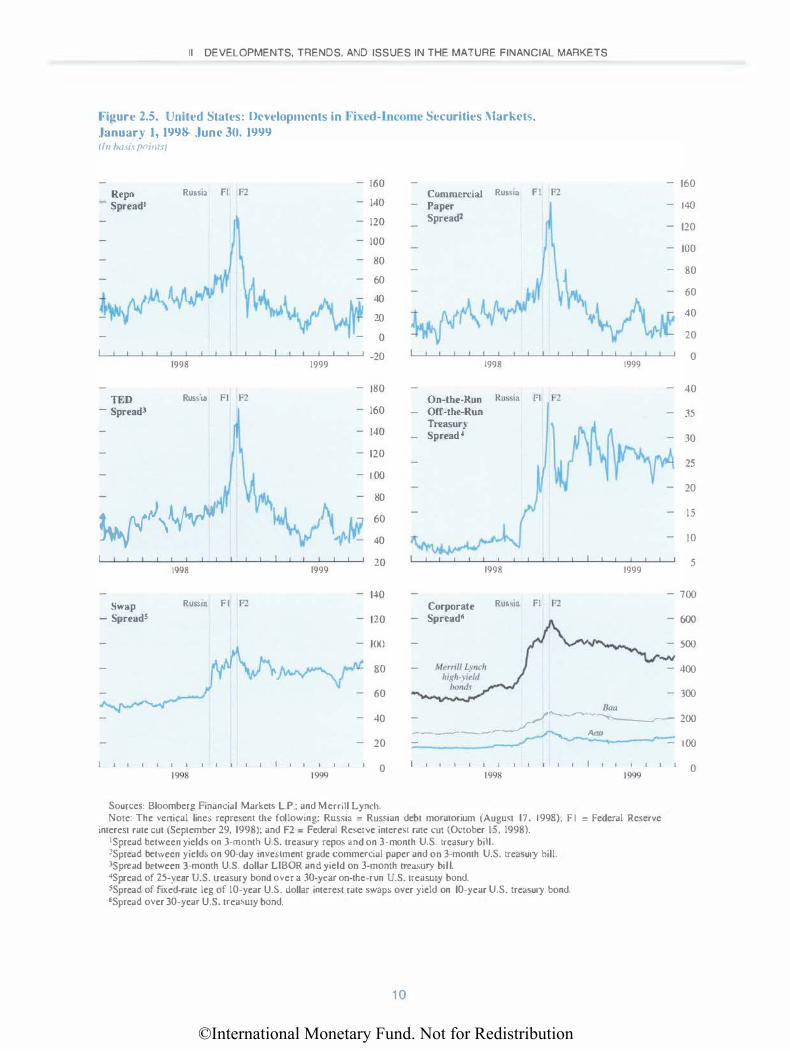
issue (Figure 2.5). 11 Spreads between yields in the eurodollar market and on U.S. treasury bills for similar maturities also widened to historically high levels, as did spreads between commercial paper and treasury bills and those between the fixed leg of fixed-for-floating interest rate swaps and government bond yields, pointing to heightened concerns about counterparty risk. Interest rate swap spreads widened in currencies including the U.S. dollar, deutsche mark, and pound
11Th is particular comparison refers to the spread between the 25-year and the 30-year benchmark treasury. but a similar pattern was observed for other maturities. On-the-run securities are the latest issue of a particular maturity. Off-the-run securities are the previous issues of the same maturity.
9
sterling. In the U.K. money markets, the spread of sterLing interbank rates over generalized collateral repo rates rose sharply during the fourth quarter, partly owing to concerns about liquidity and counterparty risk (and also reflecting a desire for end-of-year liquidity). t2
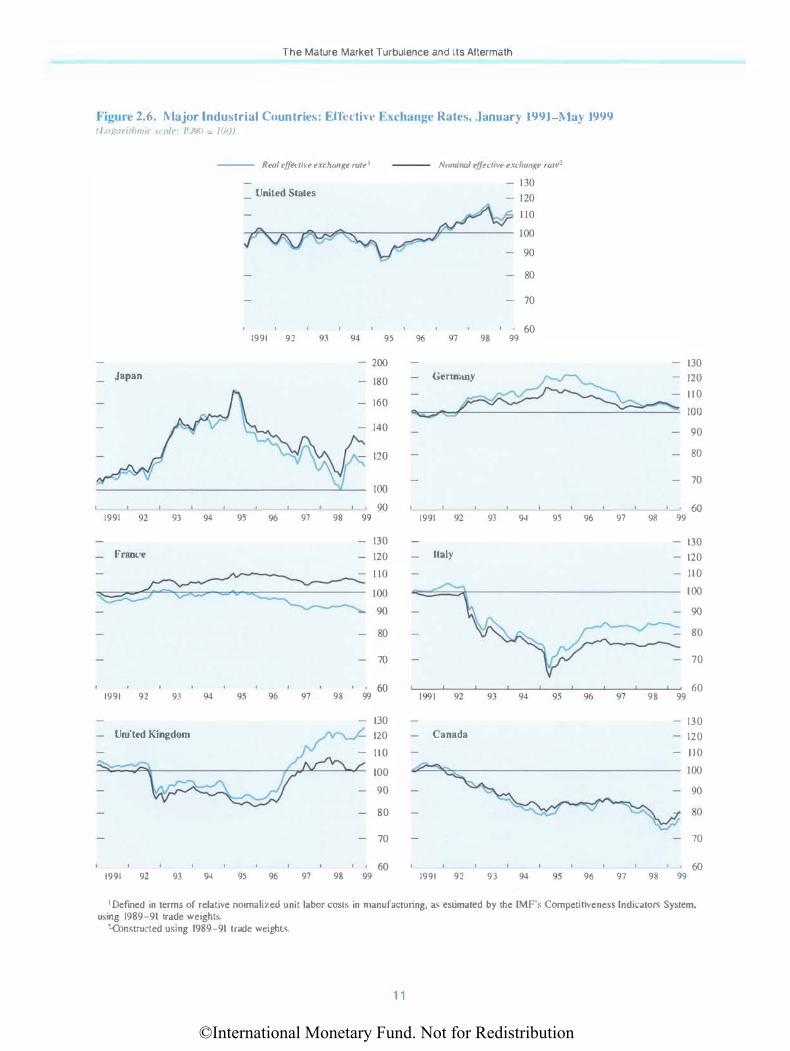
Foreign exchange markets also experienced a bout of severe turbulence. Notwithstanding the growing current account imbalances, the U.S. dollar had continued to strengthen on a multilateral basis through mid-August, remaining relatively stable against major European currencies but rising further against the Japanese yen and cunencies of the major commodityexporting countries (Figure 2.6). As the emerging
12See Bank of England ( 1999b}, p. 16.
©International Monetary Fund. Not for Redistribution
II DEVELOPMENTS, TRENDS, AND ISSUES IN THE MATURE FINANCIAL MARKETS
Figure 2.5. United States: ncvelopmcnts in Fixed- Income Securities :\Iarkcb.,
.January 1, 1998-junc 30. 1999 (/n hu\1.\ poum I
160 Repo Ru•sia Fl F2 Commercial Ru••in Fl F2
- Spread1 140 Paper
120 Spreadl
100
80
��\.!\� 60
�w 40 �AHvJ 20
0
1998 1999 -20
1998 1999
180 TED Russia F1 F2 On-the-Run Rus�a F1 F2
- SpreadJ 160 Off-the-Run
140 Treasury Spread A
120
1 00
�\� 80 �;\.�t 60
40 '{ t� � ...
1998 1999 20
1998 1999
140 Swap Ru&sin F1 F2 Corporate Ru�sia Fl F2
- Spreads 120 Spread�
l()(l ....,.,
�-- 80
60 Baa
160
140
120
100
80
60
40
20
0
40
35
30
25
20
15
10
5
700
600
500
400
300
40 /-------' �-....-----.....r- 200 ----------_/ Aaa
20
1998 1999 0
1998 1999
Sources: Bloomberg Financial Markets L.P.; and Merrill Lynch. Note: The venical lines represent the following: Russia = Russian debt moratorium (August 17. 1998); F l = Federal Reserve
interest rate cut (September 29, 1998); and F2 = Federal Reserve interest rate cut (October IS, 1998). 'Spread between yields on 3-month U.S. treasury repos and on 3-month U.S. treasury bill. 2Spread between yields on 90-day investment grade commercial paper and on 3-month U.S. treasury bill. 3Spread between 3-month U.S. dollar LIBOR and yield on 3-month treasury bill. 4Spread of 25-yeat U.S. treasury bond over a 30-ycat on-the-run U.S. treasury bond. SSpread of fixed-rate leg of 1 0-year U.S. dollar interest rate swaps over yield on 10-year U.S. treasury bond. 6Spread over 30-year U.S. treasury bond.
1 0
100
0
©International Monetary Fund. Not for Redistribution
The Mature Market Turbulence and Its Aftermath
Figure 2.6. 1\lajor Industrial Countries: Ell'cctin' Exchange Rates, .January 1991-:\-lay 1999 f I o�arirlmuc ,mft·. /1)90 � /()f/J
Japan
1991 92
France
1991 92
93
93
United Kingdom
94
94
--- Real cffectiv� exchange mte 1
95
95
United States
1991 92
96
96
97
97
93
98
98
94 95
- 200
180
160
140
120
100
90 99
99
130
120
80
70
60
130
120
110
96
-
Nominal effectil-•e e.tdrunge raJt•1
80
70
60 97 98 99
Gennany
_;::
_
"'"'"""' �
1991 92 93 94 95 96 97 98 99
Italy
98 99
Canada
130
120
1 1 0
100
90
80
70
60
130
120
110
100
90
80
70
60
130
120
1 1 0
100
90
80 ��: 70 70
60 60 1991 92 93 94 95 96 97 98 99 1991 92 93 9� 95 96 97 98 99
I Defined in terms of relative normali7.ed unit labor cosL� in manufacturing, as esumated by the IMF's Competitiveness Indicato rs System. using 1989-91 tr.lde weights.
zconstructed using 1989-91 trade weights.
1 1
©International Monetary Fund. Not for Redistribution
II DEVELOPMENTS, TRENDS, AND ISSUES IN THE MATURE FINANCIAL MARKETS
Figure 2.7. Selected Countries: Bilateral U.S. Dollar Exchange Rates, January 1 , 1998-June 30, 1999 (Local current)' uniH pt·r U.S. tlollllr: logarahmic w·llll'/
- ISO
1998 1999
- 0.650 United Kingdom
0.625
- 0.575
L--L....l-'-'----'-----'-----'---'---'---'---'---'---'--'---'---'---'-_J 0.550 t998 t999
Source: Bloomberg Financial Markets L.P.
market crisis took on global dimensions, however. the dollar began to weaken amid increased concerns about the downside risks to U.S. growth and a shift in market expectations about the direction of U.S. monetary policy from modest tightening to significant easing.l3 These developments, combined with signs in Japan of greater progress witJ1 long-awaited bank reform (discussed in Annex U) and additional moves there toward fiscal and monetary stimulus, signiticantJy altered the balance of risks perceived by investors with yen-denominated exposures. The initial weakening of the dollar was relatively orderly: it fell by less than 10 percent against both the yen and the deutsche mark between mid-August and early October. However, the situation changed in the week beginning October 5 when the dollar fell by about J 5 percent against ilie yen in the space of three days,
13For example, the implied yield on the eight·monrh federal funds futures contract fell from about 5.6 percent in May and June to 4.25 percent by mid-October. suggesting that market participams expected a sizable easing over the subsequent months.
1 2
Germany - 2.00
1998 1999
- 1 .60 Switzerland
t998 1999
including the largest one-day movemem in the yendollar rate since the collapse of the Bretton Woods system. This latter adjustment mainly reflected a sharp general appreciation of the yen: the dollar declined by less than 2 percent against the deutsche mark over the same period (Figure 2.7). It also coincided with an unusually abrupt steepening of mature market yield curves outside Japan. as bond yields rose from their historic lows while short rates continued to fall. Over the same week, for example, the gap between 3-month and 10-year rates widened by about 85 basis points in the United States, 50 basis points in Germany, and 60 basis points in the United Kingdom.
These dramatic moves in the yen-dollar rate and in major credit markets are difficult to explain in terms of shifts in economic fundamentals alone. Instead, the large price movements in foreign exchange and credit markets were a particularly visible manifestation of a global move by investors (including a number of HLis) to close out open positions and reduce leverage in the wake of the heightened market turmoil. For example, the sharp rise in the yen against
©International Monetary Fund. Not for Redistribution
Developments In Money and Credit Markets Since the Turbulence
the dollar appears to have reflected a large-scale unwinding of yen-denominated exposures-the "yen carry trade"-the effects of which were amplified by technical factors linked to stop-loss orders and dynamic hedging strategies. 14 Also, as securities prices fell, market participants with leveraged securities positions sold those and other securities to meet margin calls on those positions, adding to the decline in prices. The decline in prices and rise in market volatility also led arbitrageurs and market makers in the securities markets to cut positions and inventories and withdraw from market making, reducing liquidity in securities markets and exacerbating the decline in prices. ln this environmelll, signs that pressures were building on LTCM, an important market maker and provider of liquidity in securities markets. and considerable uncertainty about how much an unwinding of positions by LTCM and similar institutions might contribute to selling pressure-fed concerns that the cycle of price declines and deleveraging might accelerate. IS
In response to these developments, the U.S. Federal Reserve Board began to cut interest rates starting in late September. An initial cut of \14 of 1 percentage point in the target federal funds rate was announced following the Federal Open Market Committee (FOMC) meeting on September 29 but failed to have a significant effect in calming markets; spreads continued to widen, equity markets fell further. and volatility continued to increase. Against this background, the Federal Reserve followed up on October 15 with V4 of 1 percentage point cuts in both the federal funds target and the discount rate, a move that proved to be the key policy action that stemmed and ultimately helped reverse the deteriorating trend in market sentiment. The easing-coming so soon after the first rate cut and outside a regular FOMC meeting (the first such move since April 1 994)-sent a clear signal that the U.S. monetary authorities were prepared to move aggressively if needed to ensure the normal functioning of financial markets. Elsewhere, the Bank of Japan reduced the guideliJle for the uncollateralized call rate by about 25 basis points to 1,4 percent on September 9, and official interest rates have been reduced since late September in Australia, Canada, and Europe. Furthermore, EMU central banks indicated that central bank rates might converge at the levels prevailing in core countries. While these moves were motivated primarily by domestic considerations, they have also played a helpful role from a global perspective by contributing to the broad easing of monetary conditions in the industrial countries.
'4See Box 3.1 in Lntemational Monetary Fund ( 1998b) for a discussion of !he yen carry trade.
15See the discussion in Chapter IV.
1 3
Starting i n mid-October after rhe Federal Reserve's second cut in interest rates, some calm began to return to money and credit markets. Money market spreads declined quickly to precrisis levels, while credit spreads declined more slowly and remained somewhat above precrisis levels, probably reflecting the deleveraging (a return to the highly compressed credit spreads that prevailed before the Russian crisis was probably neither likely nor desirable).l6 Except for low-grade credits, actual borrowing costs in mature markets did not appear to have increased significantly during the episode and may even have declined for many borrowers during the latter part of 1 998. Issuance of long-term debt began to recover, though in November surveys suggested that banks were tightening lending conditions and there were signs of a renewed rise in short-term spreads. The Federal Reserve cut both the federal funds target and the discount rate by Y4 of I percentage point at the FOMC meeting on November 17, noting that although financial market conditions had settled down materially since mid-October, unusual strains remained. Shortterm spreads subsequently declined. The calming effect of the rate cuts suggested that the turbulence stemmed primarily from a sudden and sharp increase in pressures on (broadly defined) liquidity, including securities market liquidity, triggered by a reassessment of risk.
De,·elopments in l\loney and Credit Markets Since the Turbulence
From November 1 998, as the turbulence waned, U.S., European, and Japanese money and credit markets were predominantly influenced again by domestic and regional conditions, including continued strong growth in the United States, the EMU process in Europe, and weak economic growth, financial system difficulties, and policy responses in Japan.
Toward the end of 1998, as the effects of the turbulence waned and the flight to quality reversed, U.S. fixed-income markets turned their attention to the mounting pressures on Brazil. Market participants hedged or unloaded exposures well in advance, and in the event, the realignment and floating of the real during January l3-15 had little effect on long-term credit spreads or short-term money market spreads.J7
It became increasingly clear in early 1 999 that although credit risk had been repriced and credit dHferentiation had increased as a result of the tur-
16The spread between off-the-run and on-the-run 30-year U.S. treasury bonds also remained above levels auained prior 10 the crisis, probably reflecting deleveraging and a decreased appetite for arbitrage.
17For a detailed discussion of the events surrounding the floating of the real. see International Monetary Fund ( 1999). pp. �9.
©International Monetary Fund. Not for Redistribution
II DEVELOPMENTS, TRENDS, AND ISSUES IN THE MATURE FINANCIAL MARKETS
bulence, access of most U.S. firms to credit had not been permanently reduced.18 Spreads of highyield and Baa-rated bonds over Aaa-rated bonds remained wide, though tiering (differentiation of credit risks) in the commercial paper market decreased. U.S. corporate bond spreads against U.S. treasuries and dolJar swap spreads remained above precrisis levels; risk also appeared to have been repriced in deutsche mark and sterling swaps and U.K. corporate bonds.19 Despite the repricing of risk in U.S. markets, issuance of commercial paper and corporate bonds resumed apace, and bank lending expanded at rates similar to early 1998 (though there were some indications that terms of bank lending remained tighter than before the turbulence, and highyield issuance was less buoyant than in the first half of 1998).20
At the same time, economic data pointed to continued strong growth in d1e United States. and fixedincome yields began to reflect concerns that monetary policy might need to be tightened to contain the risk of inflation, particularly in view of the easing that had taken place during the second half of 1998. Between end-December 1998 and mid-May 1999, longtenn interest rates rose strongly; indkators of the expected stance of monetary policy, such as the slope of the yield curve and the federal funds futures rate, increased as welJ. The FOMC adopted a tightening bias at its May L8 meeting, and yields subsequently rose further in anticipation that the FOMC would tighten policy following its end-June meetings. By mid-June L 999, the yield on the 30-year treasury bond had risen by about 100 basis points from its end-1998 level to just above 6 percent, and the federal fund futures rate implied about 60 basis points of tightening over the second half of 1 999. On June 30, as had been widely anticipated, the FOMC raised the target for the federal funds rate by 25 basis points to 5 percent, and also removed its bias toward tightening; long-term treasury yields declined, and stocks rallied.21
European money and credit markets continued to be influenced by the convergence in euro-area policies and the planned introduction of the euro. The convergence in euro-area interest rates was only temporarily interrupted during the turbulence. Following the turbulence, the trend decline in euro-area government bond yields resumed. Spreads of euro-area govern-
IBA rise in default rates on speculative-grade debt in 1998 also contributed to the repricing of credit risk.
•�See Bank of England ( 1 999b, 1999c). 211LTCM had returned to profitability by this time. and outper
formed some other high-profile hedge funds in the first 4uarter of 1999.
Zlln contrast. spot short-tenn rates were relatively liule changed over the first half of 1999, outside a decline in treasury bill rates through April and a subsequent rebound (which gave rise tO a temporary widening of money-market spreads).
1 4
menl bonds against comparable German bond yields narrowed, even briefly turning negative for Italy. Short-term interest rates converged as well. and were closely aligned wid1in the euro area by the end of the year.
The introduction of the curo was successful and smoother than some had expected. In January 1999, some minor "teething troubles•· were experienced in the Trans-European Automated Real-Time Gross Settlement Express Transfer System (TARGET) payments system, as banks adapted to the new system. but were quickly resolved. There was also some volatility in overnight interest rates in the first few months of 1999, and the euro overnight index average (EONTA) declined to below the ECB's refinancing rate in March. as banks adapted to the new arrangements for monetary policy operations.22 Overall, by May 1999, European money markets were transferring funds across countries and institutions with reasonable efficiency, as financial systems and institutions that had excess liquidity were able to supply it to those that needed liquidity. However, some features of the euro financial infrastructure continued to limit recourse to cross-border transactions, including swaps and repos. These features, in some cases deriving from the EMU financial structure, included differences in market structure (such as the extent of bilateral interbank credit lines), national differences in infrastructure (such as payments and security settlement systems). and nationaJ differences in policies (tax, legal. and regulatory environments, including differences in the legal treatment of repo operations).
Following the launch of EMU, euro-area government bond spreads against Germany were broadly stable until the second quarter, when government bond rates rose amid rising U.S. bond rates. Spreads for Spain, Portugal, and Italy widened amid signs of divergent economic conditions within the euro area and concerns about the relaxation of Italy's deficit target. Apart from such considerations, remaining spreads have reflected a variety of factors, including differences in liquidity, perceived credir risk, trading conventions. and market infrastructure (including clearing and settlement systems) among countries.23
The September 1998 lnrernarional Capital Markets report identified a number of remaining challenges for EMU authorities in the areas of financial crisis prevention and management, especially in light
22Thesc developments and associated structural issues (including payment and securities seulemen1 syMems) are described in more detail in Annex I.
23Thcsc factors also dctem1ined lhe composition of the euro-nrea benchmark yield curve. which market participants viewed as composed of German securities at the long end and French and German securities m the short end.
©International Monetary Fund. Not for Redistribution
Developments in Money and Credit Markets Since the Turbulence
of Lhe ongoing integration of European money and financial markets and banking system consolidation and restructuring. Since the publication of that report, there has been important progress toward meeting those challenges. including intensified efforts to enhance coordination and cooperation among European Union (EU) supervisors and regulators. First, the Banking Supervision Committee of the EuJ·opean Central Bank (ECB) supports the Eurosystem decision-making bodies in their supervisory tasks, and serves as a fomm for the exchange of views on supervisory policies and practices that are not directly related to the tasks of the Eurosystem. Second. a discussion is ongoing on a possible further strengthening of multilateral cooperation and information sharing among supervisors. Moreover, the Banking Supervision Committee is focusing on the issue of cooperation between the Eurosystem and supervisory authorities in payment systems oversight. Third, a Commission Communication on an Action Plan for Financial Services was endorsed by the European Council in Cologne in June 1 999. A key element of Lhis action plan concems the need to ensure that the EU supervisory and regulaLOry framework is appropriate for a single financial market. Concrete actions and an indkative timetable for implementation have been identified, and the Commission will pursue the plan with input from a high level group of representatives of finance ministers. This group has already served as a forum for the exchange of views on. inter alia, the issue of consoUdated versus sectoral supervision, the appropriate relationship between central banks and supervisory authorities, the need for intensified cooperation among supervisory organizations, and the possible future need for some form of European-level supervision. Fourth, in February 1999, members of the Forum of European Securities Commissions signed a multilateral European memorandum of understanding on surveillance of securities activities.
In the area of crisis management, there has been agreement within the Eurosystem on responsibilities for emergency liquidity assistance. In the event of a liquidity problem involving an otherwise solvent institution, the provision of emergency liquidity assistance would be the responsibility and decision of the relevant national central bank. If and when this liquidity assistance might be large enough to have a monetary policy impact, it would entail consultation with the ECB and might also require a decision by the ESCB about whether such liquidity assistance should be provided. Jn this context, emergency liquidity assistance is defined as liquidity provided to an illiquid but not insolvent institution to contain any potential systemic risk or contagion if this were perceived to be a possibility. Regarding cases of solvency problems, ministers of finance. the European Commission, and the ECB have jointly begun
1 5
to assess whether the current instruments and responsibilities would need to be adjusted for the EMU environment.
Japanese money and credit markets have been influenced by important policy measures to address banking system weakness and continuing macroeconomic difficulties, and by Lhe acceleration of corporate restructuring efforts. Against Lhis background, money and credit markets in Japan have increasingly diverged from intemationa1 markets during the period under review.
Concerted efforts by the Bank of Japan to maintain monetary and financial stability caused short-term interest rates to decline sharply; overnight rates declined to virtually zero. In the second half of 1998, the overnight call rate fell steeply to about 25 basis pointS as domestic economic activity slowed and Lhe Bank of Japan eased monetary policy. (Some international banks were reportedly quoting negative yenLlBOR (London interbank offered rate) rates in November 1998.) The Bank of Japan eased further in February J 999, ru1d announced that it would "encourage the uncollateralized overnight caiJ rate to move as low as possible." The overnight call rate subsequently declined to 3 basis points, essentially zero net of brokerage fees. The low rate of remuneration on call money led to a shift of funds from call money to bank deposits, and the call money market contracted sharply.24 Liquidity pressures eased considerably, as onshore funding spreads declined and the Japan premium fell steeply to around zero.l5
During the period under review. supply and demand shifts in the Japanese government bond (JGB) market gave rise to considerable volatility in JGB yields. A strong increase in demand drove yields on I 0-year JGBs from about 160 basis points at end-June to about 80 basis points in mid-November, amid repatriation of funds and heightened concerns about the domestic economic situation and problems in the banking system. Subsequent concems that expansionary fiscal policy would strongly boost the supply of JGBs and that support of the market by the Trust Fund Bureau might be cut back sharply contributed to a sharp rebound in JGB yields, which reached about 225 basis points in December. Later. suggestions (and in March 1999, official confirmation) that the Trust Fund Bureau would continue to buy JGBs, and injections of public capital into the major banks, contributed to a subsequent decline in yields and
Z41nsurancc companies have been particularly active in this shift
of funds from overnight call money to bank deposits. Insurance companies. investment trusts. and regional banks are the most important supplie rs of funds to the uncollateralized call market. City banks. foreign banks. and regional banks are important borrowers of
funds. 2:Yfhe Japan premium is the premium over LIBOR that Japanese
banks pay compared with other imernational banks.
©International Monetary Fund. Not for Redistribution
II DEVELOPMENTS, TRENDS, AND ISSUES IN THE MATURE FINANCIAL MARKETS
Table 2.2. Announced International Slndicated Credit Facilities by Nationality of Borr(mers ( ln lullillll\ of U.S. dol/an)
1992 1993 1994 1995 1996
All countries 194.0 279.4 477.1 697.8 900.9
Industrial countries 159.6 242.6 422.0 608.3 795.8 Of which:
United States 114.8 194.3 3 12.4 399.0 551.9 Japan 0.8 0.6 2.5 4.7 Germany 0.3 0.9 1.2 13.5 France 1.4 5.2 6.8 18.1 Italy 3.2 2.0 5.3 15.1 United Kingdom 18.3 12.9 28.4 56.3 Canada 4.4 7.3 15.0 22.6
Source: Bank for International Settlements.
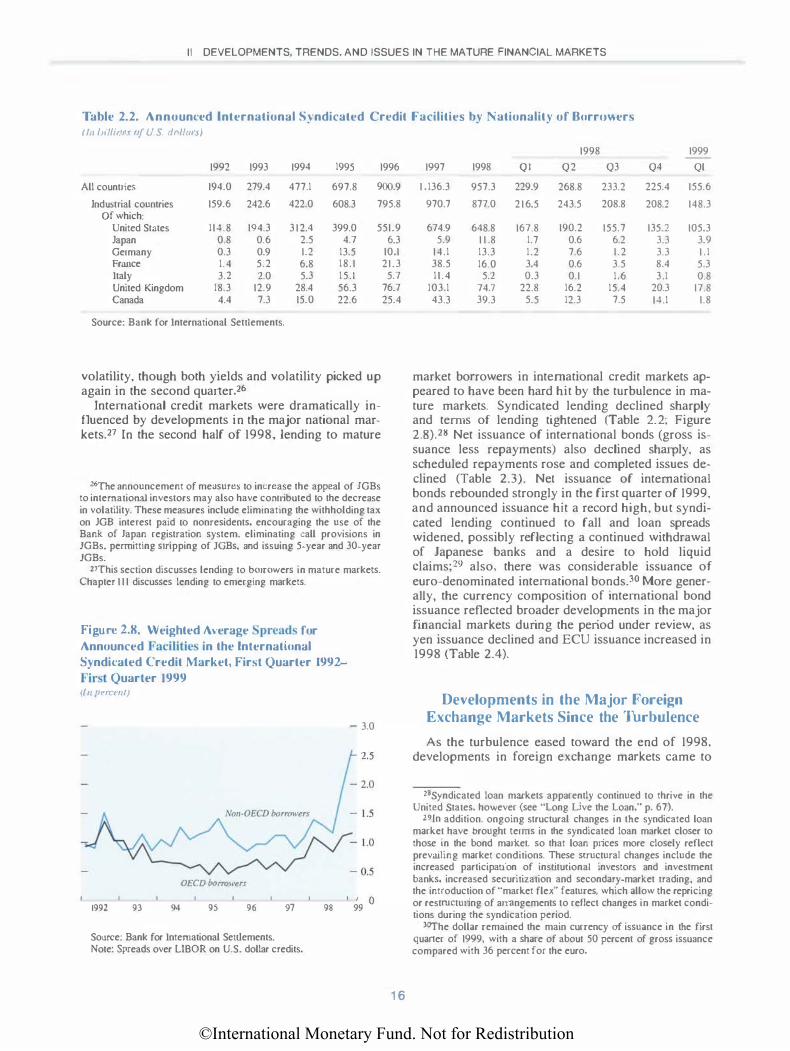
volatility, though both yields and volatility picked up again in the second quarter.26
International credit markets were dramatically influenced by developments in the major national markets.27 ln the second half of 1998, lending to mature
26The announcement of measures to increase the appeal of JGBs to internatiortal investors may also have contributed to the decrease in volatility. These measures include eliminating the withholding tax on JGB interest paid to nonresidents, encouraging the use of the Bank of Japan registration system, eliminating call provisions in JGBs, pern1itting stripping of JOBs, and issuing 5-year and 30-year JGBs.
Z7This section discusses lending to borrowers in mature markets. Chapter 1 1 1 discusses lending to emerging markets.
Figure 2.8. Weighted Average Spreads for Announced Facilities in the International Syndicated Credit Market, First Quarter 1992-First Quarter 1999 (In pcrant)
- 3.0
6.3 10.1 21.3
5.7 76.7 25.4
1998 1999
1997 1998 Ql Q2 Q3 Q4 Ql
1 .136.3 957.3 229.9 268.8 233.2 225.4 155.6
970.7 877.0 216.5 243.5 208.8 208.2 148.3
674.9 648.8 167.8 190.2 155.7 135.2 105.3 5.9 1 1 .8 1.7 0.6 6.2 3.3 3.9
14.1 13.3 1.2 7.6 1.2 3.3 1 . 1 38.5 16.0 3.4 0.6 3.5 8.4 5.3 11.4 5.2 0.3 0.1 1.6 3.1 0.8
103.1 74.7 22.8 16.2 15.4 20.3 17.8 43.3 39.3 5.5 12.3 7.5 14.1 1.8
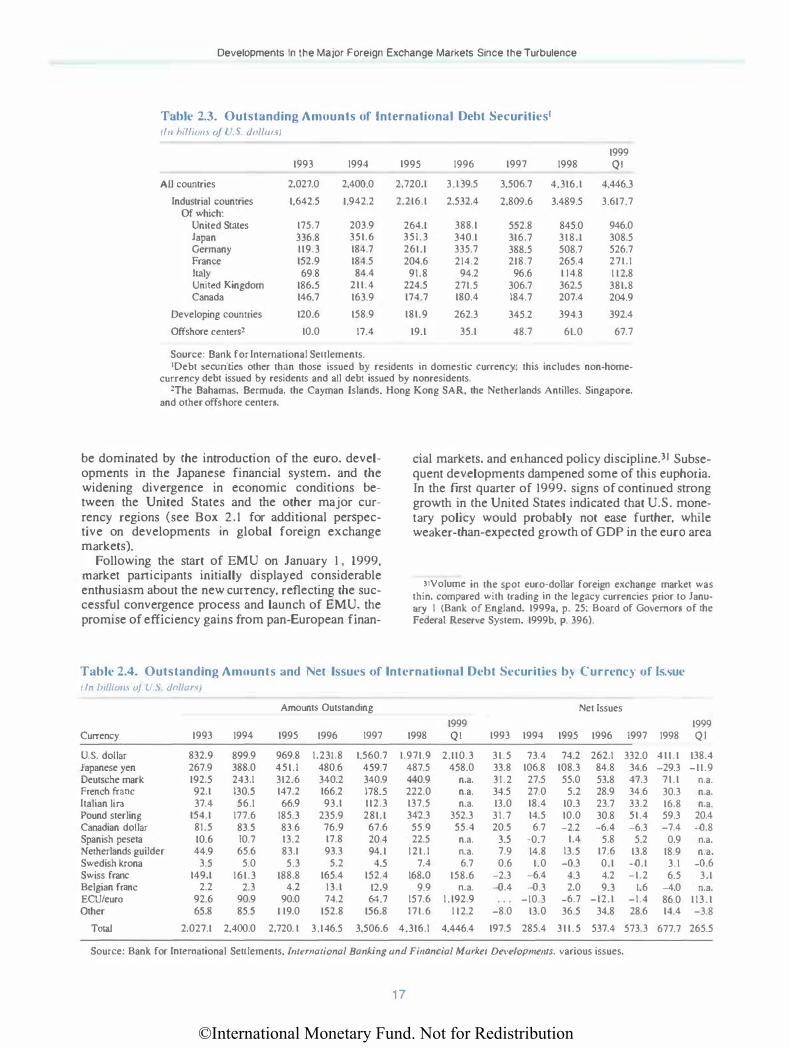
market borrowers in international credit markets appeared to have been hard hit by the turbulence in mature markets. Syndicated lending declined sharply and terms of lending tightened (Table 2.2; Figure 2.8).28 Net issuance of international bonds (gross issuance less repayments) also declined sharply, as scheduled repayments rose and completed issues declined (Table 2.3). Net issuance of international bonds rebounded strongly in the first quarter of 1999, and announced issuance hit a record high, but syndicated lending continued to fall and loan spreads widened, possibly reflecting a continued withdrawal of Japanese banks and a desire to hold liquid claims;29 also, there was considerable issuance of euro-denominated international bonds.30 More generaJiy, the currency composition of international bond issuance reflected broader developments in the major financial markets during the period under review, as yen issuance declined and ECU issuance increased in 1998 (Table 2.4).
Developments in the Major Foreign Exchange Markets Since the Thrbulence
As the turbulence eased toward the end of 1998, 2.5 developments in foreign exchange markets came to
OECD borrowuJ
1992 93 94 95 96 97
Source: Bank for International Settlements. Note: Spreads over LffiOR on U.S. dollar credits.
98 99 °
1 6
28Syndicated loan markets apparently continued to thrive in the United States, however (see "Long Live the Loan." p. 67).
29in addition. ongoing structural changes in the syndicated loan market have brought terms in the syndicated loan market closer to those in the bond market, so that loan prices more closely reflect prevailing market cond.itions. These structural changes include the increased participation of institutional investors and investment banks. increased securitization and secondary-market trading, and the introduction of "market flex'' features, which allow the repricing or restructuring of arrangements to reflect changes in market conditions during the syndication period.
:laThe dollar remained the main currency of issuance in the ftrst quaner of 1999, with a share of about 50 percent of gross issuance compared with 36 percent for the euro.
©International Monetary Fund. Not for Redistribution
Developments In the Major Foreign Exchange Markets Since the Turbulence
Table 2.3. Outstanding Amounts of international Debt Securities• 1111 11111wm oj { .. s. dollm.,J
1999 1993 1994 1995 1996 1997 1998 QJ
All countries 2,027.0 2,400.0 2,720.1 3,139.5 3,506.7 4.316.1 4,446.3
Industrial countries 1,642.5 1,942.2 2,216.1 2,532.4 2.809.6 3,489.5 3.617.7 Of which:
United States 175.7 203.9 264.1 388.1 552.8 845.0 946.0 Japan 336.8 351.6 351.3 340.1 316.7 318.1 308.5 Germany 119.3 184.7 261.1 335.7 388.5 508.7 526.7 France 152.9 184.5 204.6 214.2 218.7 265.4 271.1 Italy 69.8 84.4 91.8 94.2 96.6 1 14.8 1 12.8 United Kingdom 186.5 211.4 224.5 271.5 306.7 362.5 381.8 Canada 146.7 163.9 174.7 180.4 184.7 207.4 204.9
Developing countries 120.6 158.9 181.9 262.3 345.2 394.3 392.4
Offshore cemers2 10.0 17.4 19.1 35.1 48.7 61.0 67.7
Source: Bank for International Seulements. 'Debt securities other than those issued by residents in domestic currency: this includes non-home-
currency debt issued by residents and all debt issued by nonresidents. �The Bahamas. Bermuda, the Cayman Islands, Hong Kong SAR, the Netherlands Antilles. Singapore.
and other offshore centers.
be dominated by the introduction of the euro. developments in the Japanese financial system, and the widening divergence in economic conditions between the United States and the other major currency regions (see Box 2.1 for additional perspective on developments in global foreign exchange markets).
Following the start of EMU on January 1 , 1999, market participants initially displayed considerable enthusiasm about the new currency, reflecting the successful convergence process and launch of EMU, the promise of efficiency gains from pan-European finan-
cial markets, and enhanced policy discipline) I Subsequent developments dampened some of this euphoria. In the ftrst quarter of 1999. signs of continued strong growth in the United States indicated that U.S. monetary policy would probably not ease further, while weaker-than-expected growth of GOP in the euro area
31Volume in the spot euro-dollar foreign exchange market was thin. compared with trading in the legacy currencies prior to January 1 (Bank of England, 1999a, p. 25: Board of Governors of the Federal Reserve System, 1999b, p. 396).
Table 2.4. Outstanding Amounts and Net Issues of International Debt Securities b� Currenc) of Issue 1 In lnlliml' of L . .\. dol/an}
AmountS Outstanding Net Issues
1999 1999 Currency 1993 1994 1995 1996 1997 1998 Ql 1993 1994 1995 1996 1997 1998 Ql
U.S. dollar 832.9 899.9 969.8 1.231.8 1.560.7 1.971.9 2,110.3 31.5 73.4 74.2 262.1 332.0 411.1 138.4 1 apanese yen 267.9 388.0 451.1 480.6 459.7 487.5 458.0 33.8 106.8 108.3 84.8 34.6 -29.3 -11.9 Deutsche mark 192.5 243.1 312.6 340.2 340.9 440.9 n.a. 31.2 27.5 55.0 53.8 47.3 71.1 n.a. French franc 92.1 130.5 147.2 166.2 178.5 222.0 n.a. 34.5 27.0 5.2 28.9 34.6 30.3 n.a. Italian lira 37.4 56.1 66.9 93.1 112.3 137.5 n.a. 13.0 18.4 10.3 23.7 33.2 16.8 n.a. Pound sterling 154.1 177.6 185.3 235.9 281.1 342.3 352.3 31.7 14.5 10.0 30.8 51.4 59.3 20.4 Canadian dollar 81.5 83.5 83.6 76.9 67.6 55.9 55.4 20.5 6.7 -2.2 -6.4 -6.3 -7.4 -0.8 Spanish peseta 10.6 10.7 13.2 17.8 20.4 22.5 n.a. 3.5 -0.7 1.4 5.8 5.2 0.9 n.a. Netherlands guilder 44.9 65.6 83.1 93.3 94.1 121.1 n.a. 7.9 14.8 13.5 17.6 13.8 18.9 n.a. Swedish krona 3.5 5.0 5.3 5.2 4.5 7.4 6.7 0.6 1.0 -0.3 0.1 -0.1 3.1 -0.6 Swiss franc 149.1 161.3 188.8 165.4 152.4 168.0 158.6 -2.3 -6.4 4.3 4.2 -1.2 6.5 3.1 Belgian franc 2.2 2.3 4.2 13.1 12.9 9.9 n.a. -0.4 -0.3 2.0 9.3 1.6 -4.0 n.a. ECU/euro 92.6 90.9 90.0 74.2 64.7 157.6 1 ,192.9 -10.3 -6.7 -12.1 -1.4 86.0 113.1 Other 65.8 85.5 1 19.0 152.8 156.8 171.6 1 12.2 -8.0 13.0 36.5 34.8 28.6 14.4 -3.8
Total 2.027.1 2.400.0 2,720. 1 3.146.5 3.506.6 4.316.1 4.446.4 197.5 285.4 311.5 537.4 573.3 677.7 265.5
Source: Bank for International Setllements. lnremarional Banking and Fi11ancial Marker Developmems. various issues.
1 7
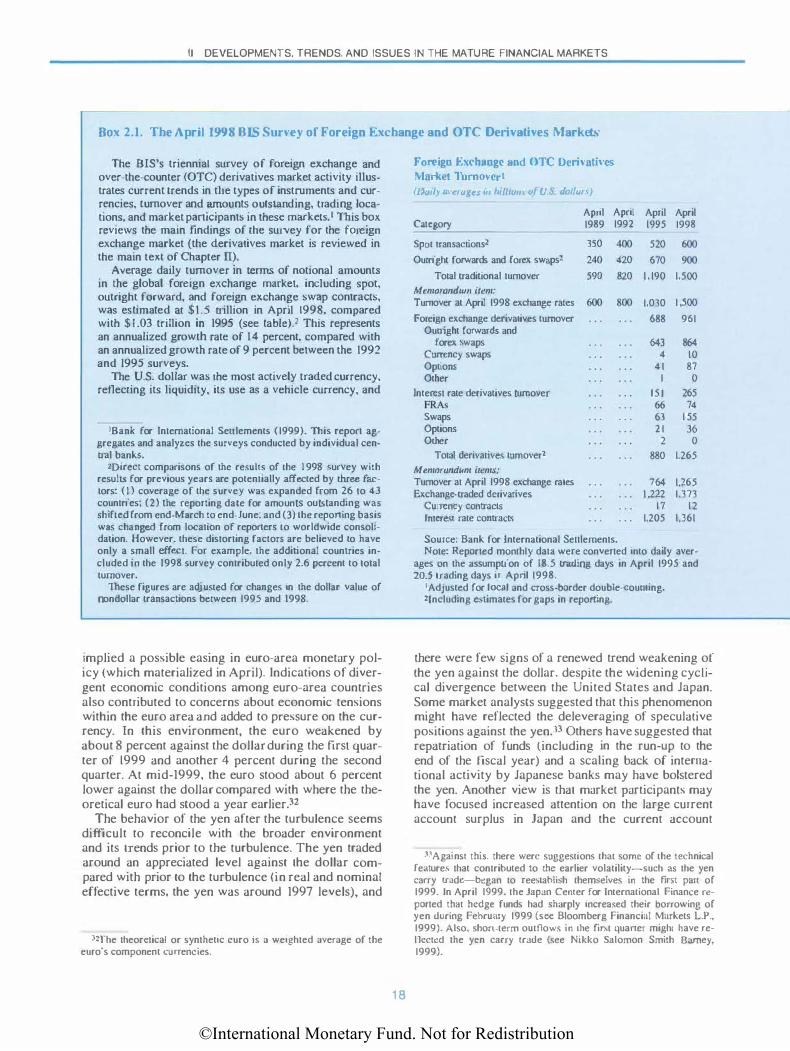
©International Monetary Fund. Not for Redistribution
II DEVELOPMENTS. TRENDS. AND ISSUES IN THE MATURE FINANCIAL MARKETS
nox 2.1. The April 1998 BIS Sun·ey of Foreign Exchange and OTC Derivathes Markcl'i
The SIS's triennial survey of foreign exchange and over-the-counter (OTC) derivatives market activity illustrates current trends in t.he types of instruments and currencies, turnover and amounts outstanding, trading locations, and market participants in these markets. I This box reviews the main findings of the survey for the foreign exchange market (the derivatives market is reviewed in the main text of Chapter ll).
Average daily turnover in terms of notional amounts in the global foreign exchange market, including spot, outright forward, and foreign exchange swap contracts, was estimated at $1.5 trillion in April 1998, compared with $ 1 .03 trillion in 1995 (see table).2 This represents an annualized growth rate of 14 percent, compared with an annualized growth rate of 9 percent between the 1992 and 1995 surveys.
The U.S. dollar was the most actively traded currency, reflecting its liquidity, its use as a vehicle currency, and
'Bank for International Seulements ( 1999). This report aggregates and analyzes the surveys conducted by individual cenual banks.
2Direct comparisons of the results of the I 998 survey with resuhs for previous years are potentially affected by three factors: (1) coverage of the survey was expanded from 26 to 43 countries: (2) the reporting date for amounts outstanding was shifted from end-March to end-June: and (3) the reporting basis was changed from location of reporters to worldwide consolidation. However. these distorting factors are believed to have only a small effect. For example, the additional countries included in the 1998 survey contributed only 2.6 percent to total turnover.
These figures are adjusted for changes in the dollar value of nondollar transactions between 1995 and 1998.
implied a possible easing in euro-area monetary policy (whkh materialized in April). Indications of divergent economic conditions among euro-area countries aJso contributed to concerns about economic tensions within the euro area and added to pressure on the currency. In this environment, the euro weakened by about 8 percent against the dollar during the ftrsl quarter of 1999 and another 4 percent during the second quarter. At mid-1999, the euro stood about 6 percent lower against the dollar compared with where the theoretical euro had stood a year earlier.32
The behavior of the yen after the turbulence seems difficult to reconcile with the broader environment and its trends prior to the turbulence. The yen traded around an appreciated level against the dollar compared with prior to the turbulence (in real and nominal effective terms, the yen was around 1997 levels), and
32'fhe theoretical or synthetic curo i� a weighted average of the euro's component currencies.
1 8
Foreign Exchang� and OTC Dcrh·ath·cs Market Thmovcrt (J>mh· U\'t'mges 111 hillwn.� c•J U.-5 (/ol/un·J
April April April April Category 1989 1992 1995 1998
Spot transactionsl 350 400 520 600 Outright forwards and forex swaps2 240 420 670 900
Total traditional turnover 590 820 1 . 190 1,500 Memorandum item: Turnover at April 1998 exchange rates 600 800 1,030 1,500
Foreign exchange derivatives turnover 688 961 Ounigbt forwards and
forex swaps 643 864 Currency swaps 4 10 Options 4 1 87 Otber I 0
Interest rate derivatives turnover lSI 265 FRAs 66 74 Swaps 63 155 Options 2 1 36 Other 2 0
Total derivatives tumover2 880 1.265 Memorandum items: Turnover at April 1998 exchange rates 764 1,265 Exchange-traded derivatives 1,222 1,373
Currency contr.lcts 17 12 I merest rate contracts 1.205 1,361
Source: Bank for International Settlements. Note: Reported monthly data were converted into daily aver
ages on the assumption of 18.5 trading days in April 1995 and 20.5 trading days iJJ April 1998.
1 Adjusted for local and cross-border double-counting. 2fncluding estimates for gaps in reponing.
there were few signs of a renewed trend weakening of the yen against the dollar, despite the widening cycucal divergence between the United States and Japan. Some market analysts suggested that this phenomenon might have reflected the deleveraging of speculative positions against the yen.33 Others have suggested that repatriation of funds (including in the run-up to the end of the fiscal year) and a scaJing back of internationaJ activity by Japanese banks may have bolstered the yen. Another view is that market participants may have focused increased attention on the large current account surplus in Japan and the current account
"Against this, there were suggestions that some of the technical fe;uures that contributed to the earlier volatility-such as the yen carry trade-began to ree�tablish themselves in the tim part of 1999. In April 1999, the Japan Center for International Finance reported thai hedge funds had sharply increased their borrowing of yen during February 1999 (see Bloomberg Financial Markets L.P., 1999). Also, short-term outnows in 1he fi rst quaner might have re-11ecicd the yen carry trade (see Nikko Salomon Smith Barney, 1999).
©International Monetary Fund. Not for Redistribution
Developments in the Major Equity Markets Since November 1998
its predominance in trade-related transactions. The dollar was involved in 87 percent of all foreign exchange transactions.J The second and third most traded currencies were the deutsche mark and Japanese yen, which contributed 30 percent and 21 percent to total turnover, respectively. While the share of the dollar increased by 4 percent, the share of the mark and yen decreased by 7 percent and 3 percent, respectively. The currency pairs formed by these three currencies together accounted for 40 percent of turnover in all currency pairs worldwide.4 Bven the third most actively traded currency pair. the U.S. dollar-British pound, represented only 8 percent of total global foreign exchange activity. Emerging market currencies contributed less than 15 percent to total daily turnover.
The global foreign exchange business is concentrated in four centers, which together account for 64 percent of total reported turnover: the United Kingdom (32 percent), the United States ( 1 8 percent), Japan (8 percent), and Singapore (7 percent). A larger share of U.S. dollar turnover (32 percent) and deutsche mark turnover (34 percent) is conducted in the United Kingdom than in
3Since every foreign exchange transaction involves 1wo currencies. the contributions of all currencies 10 total turnover sum to 200 percent. For example. suppose there are two spot currency transactions: an exchange of $15 for yen. and an exchange of $5 for euros. ln this ellample, the dollar is involved on one side of all currency transactions, and the yen and euro are each involved on one side of half of all transactions. The dollar contributed I 00 percent to turnover, the yen contributed 75 percent. and the euro contributed 25 percent.
•currency pairs sum 10 100 percent.
deficit in the United States, which are consistent with an appreciation in the yen against the dollar over the medium tenn. Most recently, some positive economic data released in June might have contributed to further upward pressure on the yen (which was followed by some official intervention).
Developments in the Major Equil) Markels Since November 1998
Although the major equity markets staged impressive recoveries from the depths of the turbulence in October 1998. on balance. some markets performed much more strongly than others during the 12 months ending June 1 999. In local currency tem1s, U.S. stocks have risen by about 20 percent since end-June 1 998; broad indexes of European stocks have risen by about 5-10 percent (though some country indexes have fallen); Japanese stocks have risen by about 10 percent (and have been unusually volatile over the inter-
1 9
either the United States ( 1 8 percent) or Germany (10 percent).
The share of outright forwards and foreign exchange swaps in total foreign exchange market turnover rose from 40 percem in 1989 to 60 percent in 1998. Nevertheless, among currency pairs not involving the U.S. dollar, spot transactions still dominate the business (70 percent of turnover).
The foreign exchange market is dominated by dealers, and is becoming increasingly automated and concentrated. Most trades (73 percent) take place among reporting dealers. Nonfinancial customers account for 20 to 30 percent of turnover in the smaller markets, and even less in larger markcts.s Business among dealers is mostly (59 percent) across borders, whereas transactions with nonfinancial customers are mostly (68 percent) domestic. The foreign exchange market is also increasingly automated. For example, in the United Kingdom, the share conducted over electronic braking systems increased from 5 percent in 1995 to I I percent in 1998. ln the United States, this share more than tripled from I 0 percent to 33 percent during the same period. Consolidation in the financial industry contributed to growing market concentration in the foreign exchange business. The share of the top 10 dealers rose from 44 percent to 50 percent in the United Kingdom, and from 48 percent to 5 1 percent in the United States. Smaller markets tended to have higher levels of concentration.
sA market is defined here as total foreign exchange turnover i n a country.
vening 1 2 months). Gains during 1999 have been attributed to various factors, including in the United States, a surprisingly robust pace of economic growth, which has raised hopes for sustained growth in corporate earnings: in Europe. structural changes in equity markets and prospects that corporate consolidation and restructuring will boost corporate earnings; and in Japan. suggestions that recent measures improved the sentiment of foreign investors toward Japanese equities.
In March 1999, the long-running debate over the high valuation level of the U.S. equity market intensified as the Dow Jones Industrial Average (DJlA) crossed the I 0000 mark (Figure 2.9).34 This strength is remarkable in view of the recent rise in long-term U.S. interest rates, which implies an associated rise in im-
34Federal Reserve Chairman Greenspan's speech contairung the often-noted reference to "irrational exuberance" was given in December 1996, when the DJlA wa� around 6400 (see Greenspan. 1996).
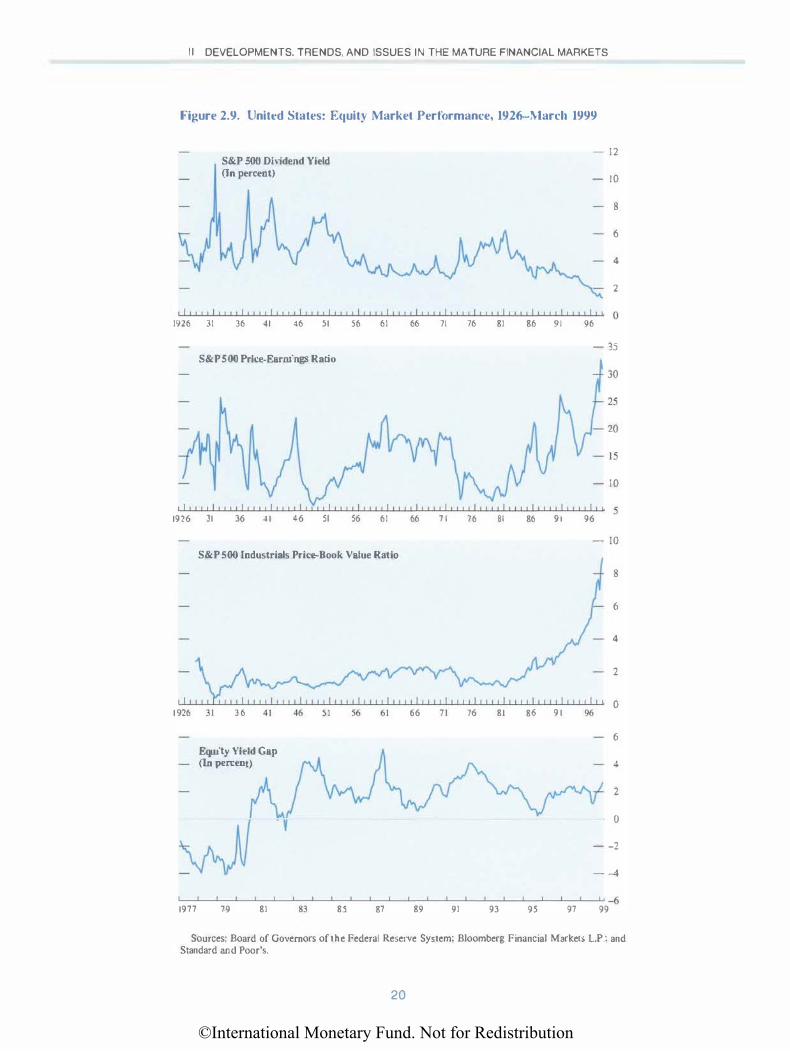
©International Monetary Fund. Not for Redistribution
I I DEVELOPMENTS, TRENDS, AND ISSUES IN THE MATURE FINANCIAL MARKETS
Figure 2.9. United States: Equity Market Performance, 1926-;\larch 1999
S&P 500 Dividend Yield (In percent)
- 12
- 10
8
6
4
2
, '',,, '',, ,,, , , , 1,,,, 1,,., 1,,,, '',,, 1,,,, r,,,, 1,,,, r,,, ,, , , , , '',,, ,, , , , 1,, 0 1926 31 36 41 46 51 56 61 66 71 76 81 86 91 96
- 35 S&P 500 Price-Earnings Ratio
30
25
20
- 10
I I I I I I I I I ! I I II I " II I ' I II I I I II I I I I I I J I I I I ' I I I II I I I I I I I I II I I I I I I I I I I I II I I I I I 5 1926 31 36 41 46 51 56 61 66 7 1 76 81 86 91 96
- LO S&P 500 Industrials Price-Book Value Ratio
8
6
4
2
1926 3 1 3 6 41 46 51 56 61 66 71 76 81 86 9 1 96 0
6
Equity Yield Gap (In percent) 4
2
0
- -2
- -4
-6 1977 79 81 83 85 87 89 91 93 95 97 99
Sources: Board of Governors of the Federal Reserve System; Bloomberg Financial Markeb L.P.; and Standard and Poor's.
20
©International Monetary Fund. Not for Redistribution
Developments in Derivatives Markets
plied dividend growth or fall in the equity risk premium to justify current dividend yields (see Box 2.2). The mature phase of the business cycle suggests that growth in corporate earnings wiJJ slow, while a decline in the equity risk premium seems difficult to reconcile with the evident repricing of credit risk in fixed-income markets. Accordingly, concerns about the risk of a correction in equity markets have increased since mid-1998. Nevertheless, observers have suggested a variety of factors that might rationalize some of the recent rise in equity prices. These include broader household participation in the stock market through institutional investors; the increased number of funded pension plans; the strong performance of the U.S. economy, including low inflation and robust productivity growth; and (until 1999) the decline in long-term interest rates.35
On balance, these considerations have given rise to concerns about a correction and its possible repercussions. A correction in the U.S. equity market could affect the risk appetite and financial condition of major financial institutions {particularly HLJs), which could adversely affect conditions in fixed-income markets in the United States and conditions in financial markets outside the United States {though reforms have bolstered the U.S. equity market infrastructure; see Box 2.3). It could also adversely affect economic activity in the United States, including through its effect on household wealth and corporate balance sheets, with knock-on effects to global trade and growth.36
In Europe, a trend decline in long-term interest rates has worked to support equity valuations over a period of increased uncertainty about the prospects for dividends. A simple calculation of expected dividend growth implied by the dividend yields for major European markets suggests that such expectations have become less optimistic or stayed the same since mid-1998 (see Box 2.2). Over the medium term, the performance of European equity markets might be supported by structural trends in European equity markets and in the European corporate sector. These include the privatization of major public enterprises; merger and acquisition activity; deeper and more unified European equity markets; an increasing number of defined-contribution pension plans; improved corporate control; and equity buybacks.37 In the near term, however, prospects are clouded by uncertainties about the pace of recovery in Europe.
JSSee Greenspan ( 1999a). J6Scc International Monetary Fund (1999). pp. 61-62. Also, a
number of U.S. corporations have issued debt and bought back equity in order to raise return on equity (consistent with a view by firn1s that the equity premium was too large); a stock market correction could put substantial pressure on such firms.
37For example. the German government recently took steps to clarify the tax treatment of equity buybacks (see "European Share Buy-Back Market Poised to Explode," p. 68).
2 1
The Japanese stock market has been affected mainly by developments in the domestic financial system and concerns about the burden of the corporate-debt overhang and weak economic performance. Between mid-November 1998 and end-February 1999, a period when U.S. and European stocks posted strong gains, the Nikkei was volatile but ended the period virtually unchanged. ln the first two weeks of March, the Nikkei abruptly rose by about 12 percent, as the Japanese authorities' efforts to stabilize the financial system and stem the economic decline contributed to an improvement in the sentiment of foreign institutional investors toward the Japanese stock market (which also coincided with a brief rise in the yen against the dollar).38 Overseas institutional investors reportedly raised benchmark weights on Japanese stocks (often from underweighted positions), bolstering foreign inflows. The pronounced rally in Japanese stock prices lost momentum in April, however, perhaps reflecting concerns that more fundamental measures were needed to put the Japanese economy and financial system on a path to recovery, and concerns that unloading of cross-shareholdings might depress stock prices. In June, stock prices rebounded following the release of favorable economic data.
Developments in Derivatives Markets
Developments in derivatives markets continued to reflect a number of ongoing trends (Tables 2.5-2.9).39 These trends, including rapid growth, the increasing dominance of the OTC segment compared with the exchange-traded segment, and the preponderance of ·'plain vanHla" derivatives, are clearly illustrated by the most recent Bank for International Settlements (BIS) triennial survey of foreign exchange and derivatives markets (see Box 2 . 1 for discussion of the foreign exchange segment of the survey). The survey covers traditional foreign exchange derivatives (outright forwards and swaps); more sophisticated foreign exchange derivatives (options, currency swaps, and others); and interest rate products.40 lt conveys a sense of market size as measured by notional amounts and gross market value of derivatives outstanding, and activity as measured by average daily turnover of notional amounts.
Notional amounts omstanding in derivatives markets are related to market risk exposure. From the end
38See Annex II. Suggestions that corporate restructuring wa� accelerating have also recently contributed to positive sentiment about stock prices.
J9See, for example, International Monetary Fund ( 1996). 40The survey is limited to OTC derivatives. but makes compar
isons to data on exchange-traded derivatives that the B IS collects in other surveys.
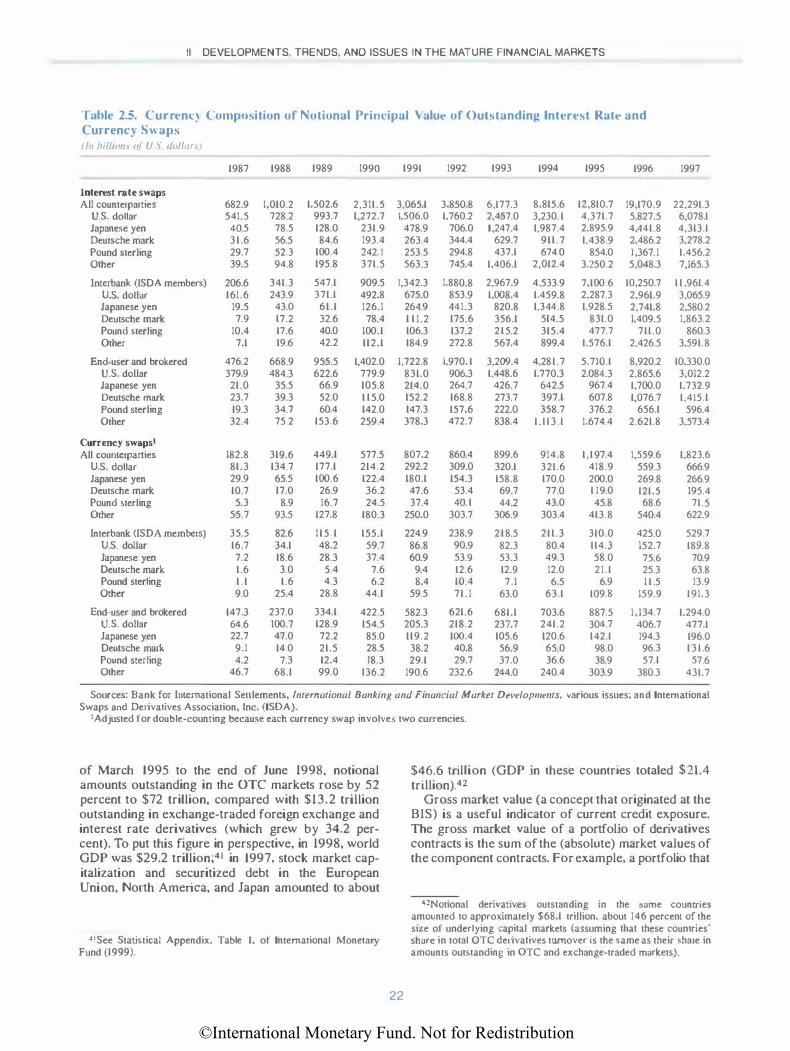
©International Monetary Fund. Not for Redistribution
II DEVELOPMENTS, TRENDS, AND ISSUES IN THE MATURE FINANCIAL MARKETS
Table 2.5. Curren<:) Compusition of Notional Principal Value of Outstanding Interest Rate and Currency Swaps tin hi/lion< o/ L .. \. t!nl/anl
Interest rate swaps All counterparties
U.S. dollar Japanese yen Deutsche mark Pound sterling Other
Interbank (lSD A members) U.S. dollar Japanese yen Deutsche mark Pound sterling Other
End-user and brokered U.S. dollar Japanese yen Deutsche mark Pound sterling Other
Currency swaps I All counterpanies
U.S. dollar Japanese yen Deutsche mark Pound sterling Other
Interbank (ISDA members) U.S. dollar Japanese yen Deutsche mark Pound sterling Other
End-user and brokered U.S. dollar Japanese yen Deutsche mark Pound sterling Other
1987
682.9 541.5
40.5 31.6 29.7 39.5
206.6 161.6
19.5 7.9
10.4 7.1
476.2 379.9
21.0 23.7 19.3
32.4
182.8 81.3 29.9 10.7
5.3 55.7
35.5 16.7
7.2 1.6 1 . 1 9.0
147.3 64.6 22.7
9.1 4.2
46.7
1988
1,010.2 728.2
78.5 56.5 52.3 94.8
341.3 243.9
43.0 17.2 17.6 19.6
668.9 484.3
35.5 39.3 34.7 75.2
319.6 134.7
65.5 17.0
8.9 93.5
82.6 34.1 18.6 3.0 1.6
25.4
237.0 100.7 47.0 14.0 7.3
68.1
1989
1,502.6 993.7 128.0 84.6
100.4 195.8
547.1 371.1
61.1 32.6 40.0 42.2
955.5 622.6
66.9 52.0 60.4
153.6
449.1 177.1 100.6
26.9 16.7
127.8
115.1 48.2 28.3
5.4 4.3
28.8
334.1 128.9
72.2 21.5 12.4
99.0
1990
2,311.5 1,272.7
231.9 193.4 242. 1 371.5
909.5 492.8 126.1
78.4 100.1 112.1
1,402.0 779.9 105.8 1 15.0 142.0
259.4
577.5 214.2 122.4 36.2 24.5
180.3
155.1 59.7 37.4
7.6 6.2
44.1
422.5 154.5
85.0 28.5 18.3
136.2
1991
3,065.1 1,506.0
478.9 263.4 253.5 5633
1,342.3 675.0 264.9 1 1 1.2 106.3 184.9
1.722.8 831.0 214.0 152.2 147.3
378.3
807.2 292.2 180.1
47.6 37.4
250.0
224.9 86.8 60.9
9.4 8.4
59.5
582.3 205.3 119.2
38.2 29.1
190.6
1992
3,850.8 1,760.2
706.0 344.4 294.8 745.4
1,880.8 853.9 441.3 175.6 137.2
272.8
1,970. 1 906.3 264.7 168.8 157.6 472.7
860.4 309.0 154.3
53.4 40. 1
303.7
238.9 90.9 53.9 12.6 10.4 71.1
621.6 218.2 100.4
40.8 29.7
232.6
1993
6,177.3 2,457.0 I ,247.4
629.7 437.1
1,406.1
2,967.9 1,008.4
820.8 356.1 2 15.2 567.4
3,209.4 1.448.6
426.7 273.7 222.0 838.4
899.6 320.1 158.8
69.7 44.2
306.9
2 18.5 82.3 53.3 12.9 7.1
63.0
681.1 237.7 105.6 56.9 37.0
244.0
1994
8,815.6 3,230. 1 1,987.4
911.7 674.0
2,012.4
4.533.9 1,459.8 1,344.8
514.5 315.4 899.4
4.281.7 1,770.3
642.5 397.1 358.7
1.113.1
914.8 321.6 170.0 77.0 43.0
303.4
211.3 80.4 49.3 12.0 6.5
63.1
703.6 241.2 120.6 65.0 36.6
240.4
1995
12.810.7 4,371.7 2.895.9 1.438.9
854.0 3.250.2
7,100.6 2,287.3 1,928.5
831.0 477.7
1.576.1
5,710.1 2.084.3
967.4 607.8 376.2
1,674.4
1,197.4 418.9 200.0 1 19.0 45.8
413.8
310.0 114.3 58.0 21.1
6.9 109.8
887.5 304.7 142.1
98.0 38.9
303.9
1996
19,170.9 5,827.5 4,441.8 2,486.2 I ,367.1
5,048.3
10,250.7 2,961.9 2,741.8 1.409.5
711.0 2.426.5
8,920.2 2.865.6 1,700.0 1,076.7
656.1 2.621.8
1,559.6 559.3 269.8 121.5
68.6 540.4
425.0 152.7
75.6 25.3 1 1 .5
159.9
1,134.7 406.7 194.3 96.3 57.1
380.3
1997
22,291.3 6,078.1 4,313.1 3,278.2 1,456.2 7,165.3
1 1 .961.4 3,065.9 2,580.2 1.863.2
860.3 3.591.8
10,330.0 3.012.2 1.732.9 1,415.1
596.4 3,573.4
1,823.6 666.9 266.9 195.4
71.5 622.9
529.7 189.8
70.9 63.8 13.9
191.3
1.294.0 477.1 196.0 131.6
57.6 431.7
Sources: Bank for International Senlements, International Banking and Financial Market Developments, various issues; and International Swaps and Derivatives Association, Inc. (ISDA).
I Adjusted for double-counting because each currency swap involves two currencies.
of March 1995 to the end of June 1998, notional amounts outstanding in the OTC markets rose by 52 percent to $72 trillion, compared with $13.2 trillion outstanding in exchange-traded foreign exchange and interest rate derivatives (which grew by 34.2 percent). To put this figure in perspective, in 1998, world GOP was $29.2 trillion;4' in 1997, stock market capitaJization and securitized debt in the European Union, North America, and Japan amounted to about
41See Statistical Appendix. Table I, of International Monetary Fund (1999).
22
$46.6 trillion (GOP in these countries totaled $21.4 trillion).42
Gross market value (a concept that originated at the BIS) is a useful indicator of current credit exposure. The gross market value of a portfolio of derivatives contracts is the sum of the (absolute) market values of the component contracts. For example, a portfolio that
42Notional derivatives outstanding in the same countries amounted to approximately $68.1 trillion, about 146 percent of the size of underlying capital markets (assuming that these countries' share in total OTC derivatives turnover is the same as their share in amounts outstanding in OTC and exchange-traded markets).
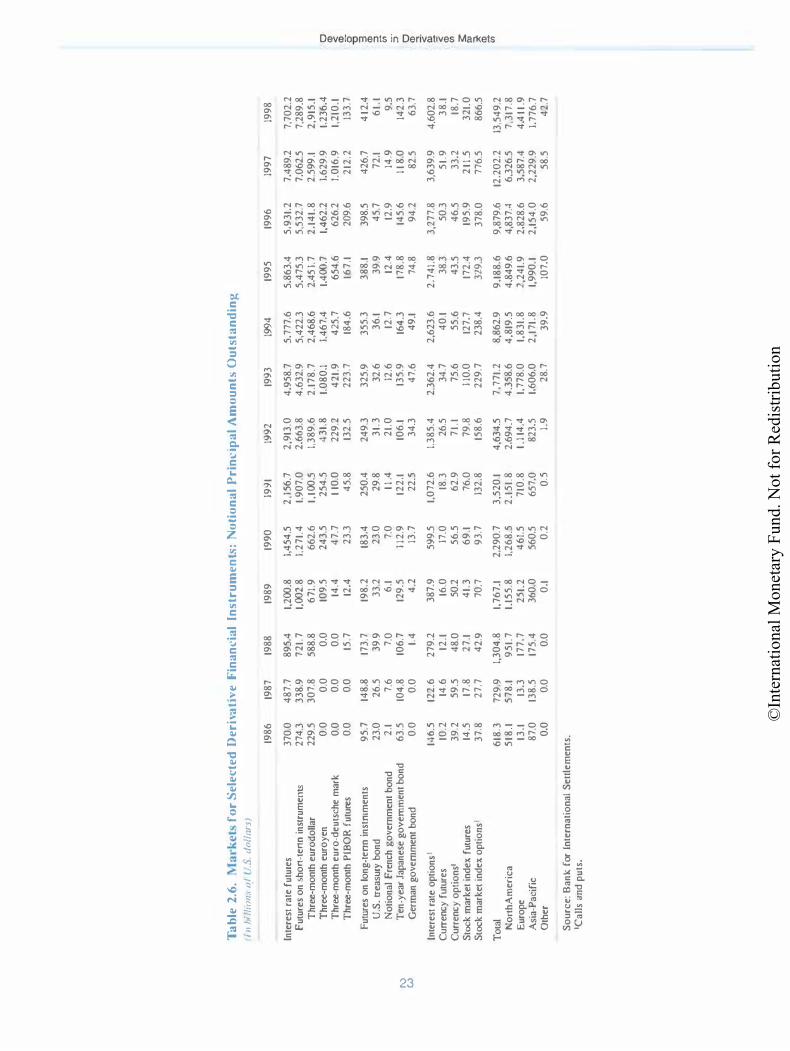
©In
tern
atio
nal M
onet
ary
Fund
. Not
for R
edis
tribu
tion
Ta
ble
2.6
. M
ark
ets
for
Sel
ecte
d D
erh
ath
e F
ina
nc
ial
Inst
rum
ents
: N
oti
on
al
Pri
nc
ipa
l Am
ou
nts
Ou
tsta
nd
inJ!.
(I
n htll
um., o
t l . �
-""
"'
"·'I
198
6
198
7
198
8
198
9
199
0
199
1 19
92
19
93
1994
19
95
19
96
19
97
19
98
Inte
rest
rat
e fu
ture
s 37
0.0
4
87
.7
89
5.4
1,
200
.8
1,4
54
.5
2,1
56.7
2
,913
.0
4.9
58
.7
5.7
77
.6
5.8
63
.4
5,9
31.
2
7.4
89
.2
7.7
02
.2
Fut
ures
on
sho
n-t
enn
inst
rum
ents
27
4.3
3
38
.9
72
1.7
1,
002
.8
1.2
71.
4
1.9
07
.0
2,6
63
.8
4,6
32
.9
5,4
22
.3
5.4
75
.3
5,5
32
.7
7,0
62.
5 7
,28
9.8
T
hree
-mo
nth
euro
do
llar
229
.5
30
7.8
5
88
.8
67
1.9
6
62.
6
1,100
.5
1,3
89
.6
2.1
78
.7
2,4
68.
6
2,4
51.
7
2.1
41.
8
2.5
99
.1
2,9
15.1
T
hree
-mo
nth
euro
yen
0
.0
0.0
0
.0
109
.5
24
3.5
2
54
.5
43
1.8
1.
08
0.1
1.
46
7.4
1.
400
.7
1.4
62
.2
1.6
29
.9
1,2
36
.4
0
Thr
ee-m
ont
h eu
ro-d
euts
che
mar
k 0
.0
0.0
0
.0
14.4
4
7.7
1
10.0
2
29
.2
42
1.9
4
25
.7
65
4.6
6
26
.2
1.0
16.9
1,
210
.1
CD <
CD
Thr
ee-m
ont
h P
I.BO
R f
uture
s 0
.0
0.0
15
.7
12.4
2
3.3
4
5.8
13
2.5
2
23
.7
184
.6
167
.1
20
9.6
2
12.2
13
3.7
0
"0
F
utur
es o
n lo
ng-t
enn
inst
rum
ents
9
5.7
14
8.8
17
3.7
19
8.2
18
3.4
2
50
.4
24
9.3
3
25
.9
35
5.3
3
88
.1
398.
5 4
26.7
4
12.4
3 CD
U.S
. tr
easu
ry b
ond
23
.0
26
.5
39
.9
33
.2
23
.0
29
.8
31.
3
32.6
3
6.1
3
9.9
4
5.7
7
2.1
6
1.1
::> N
otio
nal
Fre
nch
go
vern
men
t bo
nd
2.1
7
.6
7.0
6
.1
7.0
11
.4
21.
0
12.6
12
.7
12.4
12
.9
14.9
9
.5
r;
:;
1\)
Ten
-yea
r Ja
pane
se g
ov
ernm
ent b
ond
6
3.5
10
4.8
10
6.7
12
9.5
11
2.9
12
2.1
10
6.1
13
5.9
16
4.3
17
8.8
14
5.6
11
8.0
14
2.3
0
(.
..) G
erm
an g
ove
rnm
ent
bond
0
.0
0.0
1.
4
4.2
13
.7
22
.5
34
.3
47
.6
49
.1
74.8
9
4.2
8
2.5
6
3.7
CD
::J.
I mer
est
rate
opt
ions
I 14
6.5
12
2.6
38
7.9
59
9.5
1,
07
2.6
1,
38
5.4
2
.36
2.4
2
,62
3.6
<
2
79
.2
2,7
41.
8
3,2
77
.8
3,6
39
.9
4.6
02.
8 OJ
Curr
ency
fut
ures
10
.2
14.6
12
.1
16.0
17
.0
18.3
26
.5
34.7
4
0.1
3
8.3
5
0.3
5
1.9
3
8.1
� CD
C
urre
ncy
opt
ions
' 3
9.2
5
9.5
4
8.0
50
.2
56
.5
62
.9
71.
1 7
5.6
5
5.6
4
3.5
46
.5
33
.2
18.7
CJ)
Stoc
k m
arke
t ind
ex f
utur
es
14.5
17
.8
27
.1
41.
3
69
.1
76
.0
79
.8
110
.0
127
.7
172
.4
195
.9
211
.5
32
1.0
�
OJ
S
tock
mar
ket i
ndex
opt
ions
' 3
7.8
2
7.7
4
2.9
70
.7
93
.7
132
.8
158
.6
22
9.7
2
38
.4
329
.3
37
8.0
7
76
.5
86
6.5
�
CD
T
ota
l 6
18.3
7
29
.9
1,3
04
.8
1.7
67
.1
2,2
90
.7
3,5
20
.1
4,6
34.5
7
,77
1.2
8,
862.
9
9.1
88
.6
9,8
79
.6
12,2
02
.2
13,5
49
.2
r;
No
nhA
mer
ica
518
.1
57
8.1
9
51.
7
1.15
5.8
1.
26
8.5
2
.15
1.8
2.
69
4.7
4
.35
8.6
4
,819
.5
4,8
49
.6
4,8
37.4
6
.326
.5
7,3
17.8
E
urop
e 13
.1
13.3
17
7.7
2
51.
2
46
1.5
7
10.8
1.
114
.4
1.7
78
.0
1,8
31.
8
2,2
41.
9
2,8
28
.6
3,5
87
.4
4.4
11.9
A
sia-
Pac
ific
8
7.0
13
8.5
17
5.4
36
0.0
56
0.5
6
57.0
8
23
.5
1.6
06
.0
2,1
71.
8
1,9
90
.1
2,1
54
.0
2,2
29
.9
1.7
76
.7
Oth
er
0.0
0
.0
0.0
0
.1
0.2
0
.5
1.9
2
8.7
3
9.9
10
7.0
5
9.6
5
8.5
4
2.7
So
urce
: Ban
k f
or I
nter
nati
ona
l S
ettl
emen
ts.
1Cal
ls a
nd p
uts
.
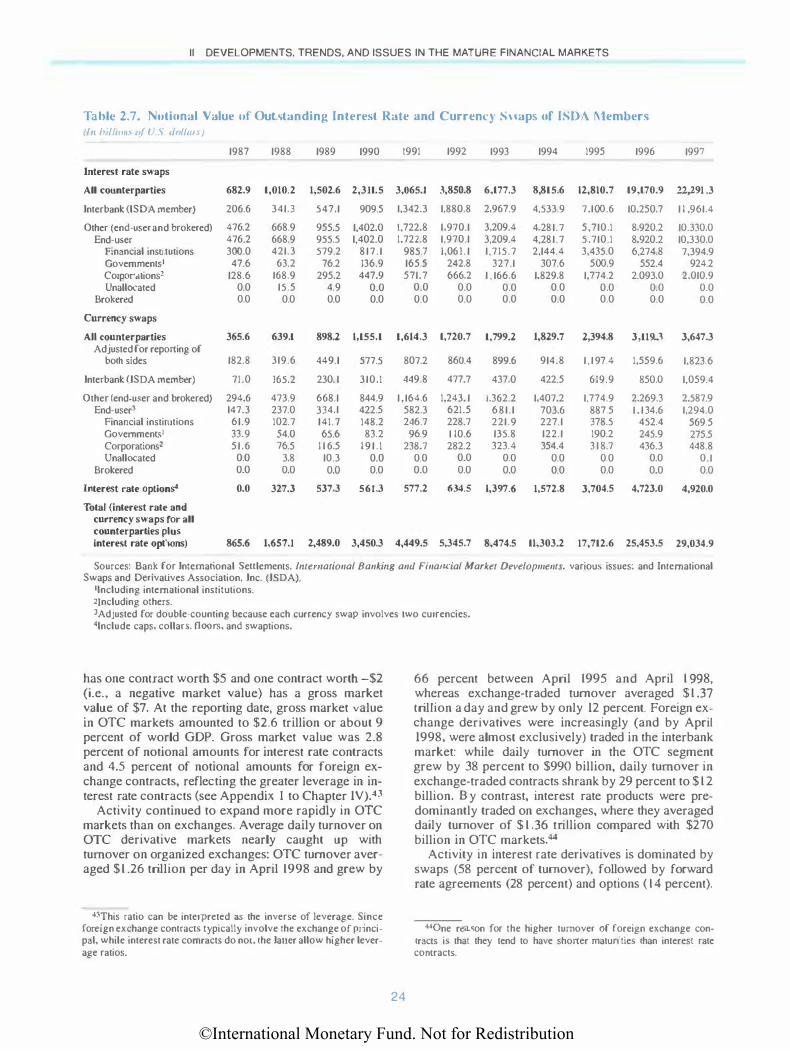
©International Monetary Fund. Not for Redistribution
II DEVELOPMENTS, TRENDS, AND ISSUES IN THE MATURE FINANCIAL MARKETS
Table 2.7. Nutional Value of Outstanding Interest Rate and Curren<') S\\aps of ISOA t\Jembers (/u /111/wll\ of l .. \. dolltll ')
1987 1988 1989 1990 1991 1992 1993 1994 1995 1996 1997
Interest rate swaps
All counterparties 682.9 1,010.2 1,502.6 2,3ll.5 3,065.1 3,850.8 6,177.3 8,815.6 12,810.7 19,170.9 22,291 .3
Interbank (lSDA member) 206.6 341.3 547.1 909.5 1,342.3 1,880.8 2.967.9 4,533.9 7,100.6 10.250.7 1 1 ,961.4
Other (end-user and brokered) 476.2 668.9 955.5 1.402.0 1.722.8 1,970.1 3,209.4 4,281.7 5,710.1 8.920.2 10.330.0 End-user 476.2 668.9 955.5 1,402.0 1.722.8 1,970.1 3,209.4 4,281.7 5,710.1 8.920.2 10,330.0
Financial institutions 300.0 421.3 579.2 817.1 985.7 1,061. 1 1,715.7 2,144.4 3,435.0 6,274.8 7,394.9 Govemments1 47.6 63.2 76.2 136.9 165.5 242.8 327.1 307.6 500.9 552.4 924.2 Corporarions2 128.6 168.9 295.2 447.9 571.7 666.2 1 , 166.6 1.829.8 1,774.2 2.093.0 2.010.9 Unallocated 0.0 15.5 4.9 0.0 0.0 0.0 0.0 0.0 0.0 0.0 0.0
Brokered 0.0 0.0 0.0 0.0 0.0 0.0 0.0 0.0 0.0 0.0 0.0
Currency swaps
All counterparties 365.6 639.1 898.2 1,155.1 1,614.3 1,720.7 1,799.2 1,829.7 2,394.8 3,119.3 3,647.3 Adjusted for reponing of
both sides 182.8 319.6 449.1 577.5 807.2 860.4 899.6 914.8 1 , 197.4 1,559.6 1,823.6
Interbank (ISDA member) 71.0 165.2 230. 1 310.1 449.8 477.7 437.0 422.5 619.9 850.0 1,059.4
Other (end-user and broke red) 294.6 473.9 668.1 844.9 1,164.6 1,243. 1 1.362.2 1.407.2 1,774.9 2.269.3 2.587.9 End-user3 147.3 237.0 334.1 422.5 582.3 621.5 681.1 703.6 887.5 1 . 1 34.6 1,294.0
Financial instirutions 61.9 102.7 141.7 148.2 246.7 228.7 221.9 227.1 378.5 452.4 569.5 GovemmenL�• 33.9 54.0 65.6 83.2 96.9 1 10.6 135.8 122.1 190.2 245.9 275.5 Corporationsl 51.6 76.5 1 1 6.5 191 . 1 238.7 282.2 323.4 354.4 3 1 8.7 436.3 448.8 Unallocated 0.0 3.8 10.3 0.0 0.0 0.0 0.0 0.0 0.0 0.0 0.1
Brokered 0.0 0.0 0.0 0.0 0.0 0.0 0.0 0.0 0.0 0.0 0.0
loterest rate options4 0.0 327.3 537.3 561.3 577.2 634.5 1,397.6 1,572.8 3,704.5 4,723.0 4,920.0
Total (interest rate and currency swaps for all counterparties plus interest rate options) 865.6 1,657.1 2,489.0 3,450.3 4,449.5 5,345.7 8,474.5 11,303.2 17,712.6 25,453.5 29,034.9
Sources: Bank for International Seulements, International Banking and Financial Market Developments, various issues: and International Swaps and Derivatives Association, Inc. (ISDA).
1lncluding international institutions. 2Including others. 3Adjusted for double-counting because each currency swap involves rwo currencies. 4lnclude caps, collars, floors, and swaptions.
has one contract worth $5 and one contract worth -$2 (i.e., a negative market value) bas a gross market value of $7. At the reporting date, gross market value in OTC markets amounted to $2.6 trillion or about 9 percent of world GOP. Gross market value was 2.8 percent of notional amounts for interest rate contracts and 4.5 percent of notional amounts for foreign exchange contracts, reflecting the greater leverage in interest rate contracts (see Appendix I to Chapter 1Y).43
Activity continued to expand more rapidly in OTC markets than on exchanges. Average daily turnover on OTC derivative markets nearly caught up with turnover on organized exchanges: OTC turnover averaged $1 .26 trillion per day in April 1998 and grew by
•3This ratio can be interpreted as the inverse of leverage. Since foreign exchange contracts typically involve the exchange of principal, while interest rate comracts do nor, the Iauer allow higher leverage ratios.
24
66 percent between April 1995 and April 1 998, whereas exchange-traded turnover averaged $1 .37 trillion a day and grew by only 12 percent. Foreign exchange derivatives were increasingly (and by ApriJ 1998, were almost exclusively) traded in the interbank market: while daily turnover in the OTC segment grew by 38 percent to $990 billion, daily turnover in exchange-traded contracts shrank by 29 percent to $ 1 2 billion. B y contrast, interest rate products were predominantly traded on exchanges, where they averaged daily turnover of $ 1 .36 trillion compared with $270 billion in OTC markets.44
Activity in interest rate derivatives is dominated by swaps (58 percent of turnover), followed by forward rate agreements (28 percent) and options ( 14 percent).
4-IQne reason for the higher turnover of foreign exchange contracts is that they tend to have shoner maturities than interest rate comracts.
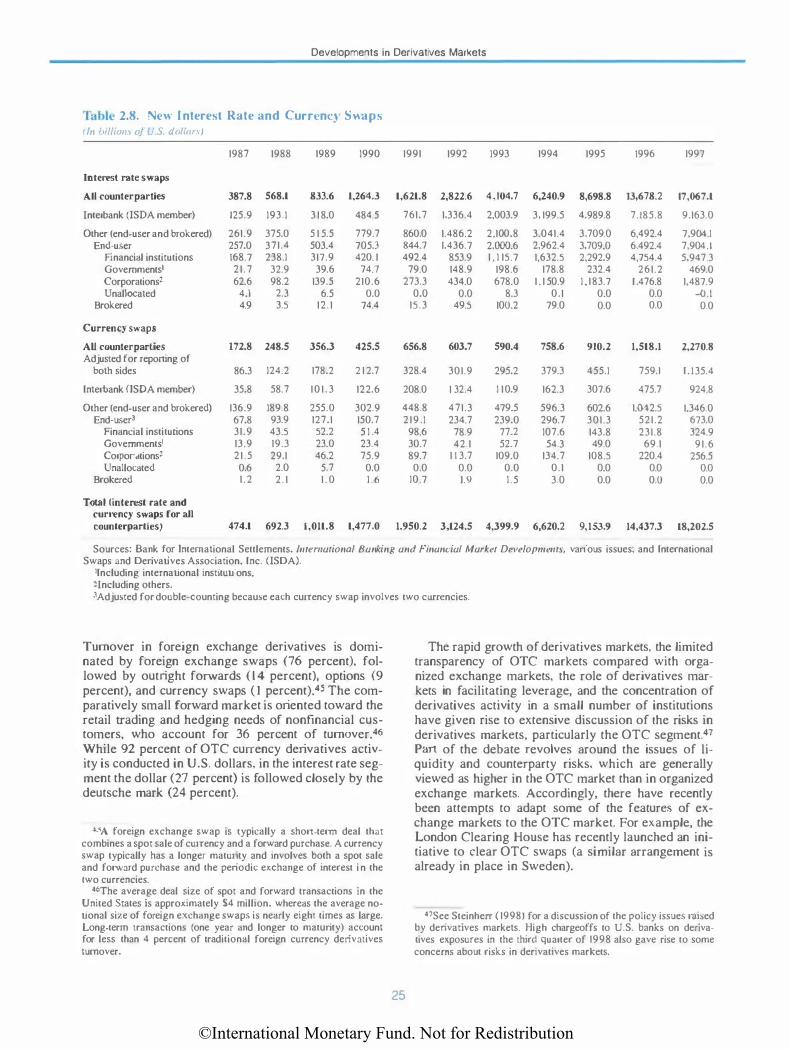
©International Monetary Fund. Not for Redistribution
Developments in Derivatives Marl<ets
Table 2.8. t\ew I nterest Rate and Curn:nq S\\aps r In />1!/wm oj L \. do/1.1n I
1987 1988 1989 1990 1991 1992 1993 1994 1995 1996 1997
Interest rate swaps
All counterparties 387.8 568.1 833.6 1,264.3 1,621.8 2,822.6 4,104.7 6,240.9 8,698.8 13,678.2 17,067.1
Interbank (lSDA member) 125.9 193.1 318.0 484.5 761.7 1.336.4 2.003.9 3, 199.5 4,989.8 7.185.8 9.163.0
Other (end-user and brokered) 261.9 375.0 5 1 5.5 779.7 860.0 1.486.2 2.100.8 3,041.4 3,709.0 6,492.4 7,904.1 End-user 257.0 371.4 503.4 705.3 844.7 1.436.7 2.000.6 2,962.4 3.709.0 6,492.4 7,904.1
Financial institutions 168.7 238.1 317.9 420. 1 492.4 853.9 1 , 1 15.7 1,632.5 2,292.9 4,754.4 5,947.3 Governments' 21.7 32.9 39.6 74.7 79.0 148.9 198.6 178.8 232.4 261.2 469.0 Corporations2 62.6 98.2 139.5 210.6 273.3 434.0 678.0 1 . 1 50.9 1,183.7 I ,476.8 1,487.9 Unallocated 4.1 2.3 6.5 0.0 0.0 0.0 8.3 0.1 0.0 0.0 -0.1
Brokered 4.9 3.5 12.1 74.4 15.3 49.5 100.2 79.0 0.0 0.0 0.0
Currency swaps
AU counterparties 172.8 248.5 356.3 425.5 656.8 603.7 590.4 758.6 910.2 1,518.1 2,270.8 Adjusted for reponing of
both sides 86.3 124.2 178.2 2 1 2.7 328.4 301.9 295.2 379.3 455.1 759.1 I. I 35.4
Interbank (ISDA member) 35.8 58.7 101.3 122.6 208.0 1 32.4 1 10.9 162.3 307.6 475.7 924.8
Other (end-user and brokered) 136.9 189.8 255.0 302.9 448.8 471.3 479.5 596.3 602.6 1.042.5 1.346.0 End-user3 67.8 93.9 127.1 150.7 219.1 234.7 239.0 296.7 301.3 521.2 673.0
Financial institutions 31.9 43.5 52.2 5 1 .4 98.6 78.9 77.2 107.6 143.8 231.8 324.9 Governments1 13.9 19.3 23.0 23.4 30.7 42.1 52.7 54.3 49.0 69.1 91.6 Corporations2 21.5 29.1 46.2 75.9 89.7 1 1 3.7 109.0 134.7 108.5 220.4 256.5 Unallocated 0.6 2.0 5.7 0.0 0.0 0.0 0.0 0.1 0.0 0.0 0.0
Brokered 1.2 2.1 1.0 1.6 10.7 J.\) 1.5 3.0 0.0 0.0 0.0
Total (interest rate and currency swaps for aU counterparties) 474.1 692.3 1,011.8 1,477.0 1,950.2 3,124.5 4,399.9 6,620.2 9,153.9 14,437.3 18,202.5
Sources: Bank for International Settlements. lmernational Banking and Financial Market Developmems. various issues: and International Swaps and Derivatives Association. Inc. (lSDA).
'Including international institutions. 2Including others. 3Adjusted for double-counting because each currency swap involves two currencies.
Turnover in foreign exchange derivatives is dominated by foreign exchange swaps (76 percent), followed by outright forwards (14 percent), options (9 percent), and currency swaps (I percent).45 The comparatively small forward market is oriented toward the retail trading and hedging needs of nonfinancial customers, who account for 36 percent of turnover.46 While 92 percent of OTC currency derivatives activity is conducted in U.S. dollars, in the interest rate segment the dollar (27 percent) is followed closely by the deutsche mark (24 percent).
4SA foreign exchange swap is 1ypically a short-term deal that combines a spot sale of currency and a forward purchase. A currency swap typically has a longer maturity and involves both a spot sale and forward purchase and the periodic exchange of interest i n the rwo currencies.
46The average deal size of spot and forward transactions in the United States is approximately $4 million, whereas the average notional size of foreign exchange swaps is nearly eigh1 times as large. Long-term transactions (one year and longer to maturity) account for less than 4 percent of traditional foreign currency derivatives tumover.
25
The rapid growth of derivatives markets, the limited transparency of OTC markets compared with organized exchange markets, the role of derivatives markets in facilitating leverage, and the concentration of derivatives activity in a small number of institutions have given rise to extensive discussion of the risks in derivatives markets, particularly the OTC segment.47 Part of the debate revolves around the issues of liquidity and counterparty risks, which are generally viewed as higher in the OTC market than in organized exchange markets. Accordingly, there have recently been attempts to adapt some of the features of exchange markets to the OTC market. For example, the London Clearing House has recently launched an initiative to clear OTC swaps (a similar arrangement is already in place in Sweden).
47See Steinherr ( 1998) for a discussion of the policy issues raised by derivatives markets. High chargeoffs to U.S. banks on derivatives exposures in the third quarter of 1998 also gave rise to some concerns about risks in derivatives markets.
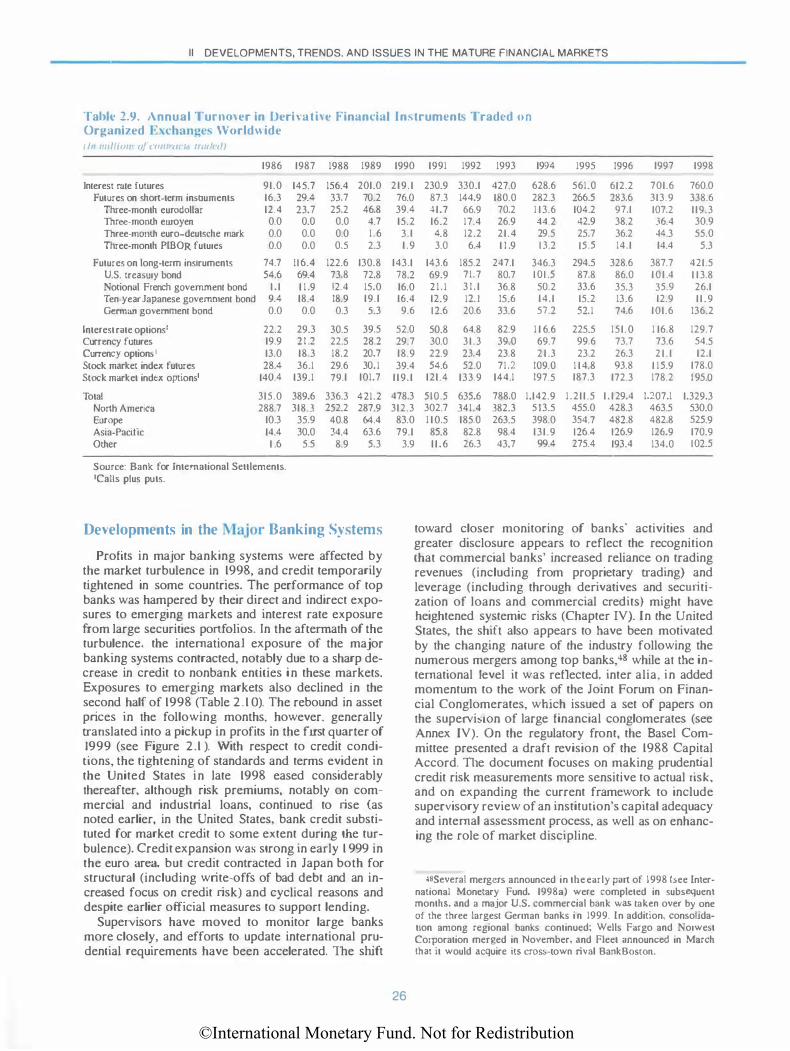
©International Monetary Fund. Not for Redistribution
II DEVELOPMENTS, TRENDS, AND ISSUES IN THE MATURE FINANCIAL MARKETS
Tabl� 2.9. Annual Turnmer in I>eri,athe Financial In�truments Trad�d un Organiled Exchanges Worldwide I l11 mi//ioll1 oj c·omrm 11 tlllti< dl
Interest mte futures Futures on shon-term instruments
Three-month eurodollar Three-month euroyen Three-month euro-deutsche mark Three-month PffiOR futures
Futures on long-term instruments U.S. treasury bond Notional French government bond Ten-year Japanese government bond German government bond
Interest rate options1 Currency future� Currency options I Stock market index futures Stock market index options•
Total Nonh America Europe Asia· Pacific Other
1986
91.0 16.3 12.4 0.0 0.0 0.0
74.7 54.6
1.1 9.4 0.0
22.2 19.9 13.0 28.4
140.4
315.0 288.7
10.3 14.4 1 .6
Source: Bank for International Settlements. 'Calls plus puts.
1987 1988 1989
145.7 156.4 201.0 29.4 33.7 70.2 23.7 25.2 46.8
0.0 0.0 4.7 0.0 0.0 1.6 0.0 0.5 2.3
116.4 122.6 130.8 69.4 73.8 72.8 1 1 .9 12.4 15.0 18.4 18.9 19.1 0.0 0.3 5.3
29.3 30.5 39.5 21 .2 22.5 28.2 18.3 18.2 20.7 36.1 29.6 30.1
139.1 79.1 101.7
389.6 336.3 421.2 318.3 252.2 287.9
35.9 40.8 64.4 30.0 34.4 63.6
5.5 8.9 5.3
Developments in the Major Banking Systems
Profits in major banking systems were affected by the market turbulence in 1998, and credjt temporarily tightened in some countries. The performance of top banks was hampered by their direct and indirect exposures to emerging markets and interest rate exposure from large securities portfolios. In the aftermath of the turbulence, the international exposure of the major banking systems contracted, notably due to a sharp decrease in credit to nonbank entities in these markets. Exposures to emerging markets also declined jn the second half of 1998 (Table 2. 1 0). The rebound in asset prices in the following months, however, generally translated into a pickup in profits jn the first quarter of 1999 (see Figure 2.1 ). With respect to credit condi
tions, the tightening of standards and terms evident in the United States in late 1998 eased considerably thereafter, although risk premjums, notably on commercial and industrial loans, continued to rise (as noted earlier, in the United States, bank credit substituted for market credit tO some extent during the turbulence). Credit expansion was strong in early 1 999 in the euro area, but credjt contracted in Japan both for structural (including write-offs of bad debt and an increased focus on credit risk) and cyclical reasons and despite earlier official measures to support lending.
Supervisors have moved to morutor large banks more closely, and efforts to update international prudential requirements have been accelerated. The shlft
1990 1991 1992 1993 1994 1995 1996 1997 1998
219.1 230.9 330.1 427.0 628.6 561.0 612.2 701.6 760.0 76.0 87.3 144.9 180.0 282.3 266.5 283.6 313.9 338.6 39.4 41.7 66.9 70.2 1 13.6 104.2 97.1 107.2 119.3 15.2 16.2 17.4 26.9 44.2 42.9 38.2 36.4 30.9 3.1 4.8 12.2 21.4 29.5 25.7 36.2 44.3 55.0 1.9 3.0 6A 1 1 .9 13.2 15.5 14.1 14.4 5.3
143.1 143.6 185.2 247.1 346.3 294.5 328.6 387.7 421.5 78.2 69.9 71.7 80.7 101.5 87.8 86.0 101.4 1 13.8 16.0 21.1 31 . 1 36.8 50.2 33.6 35.3 35.9 26.1 16.4 12.9 12.1 15.6 14.1 15.2 13.6 12.9 11.9 9.6 12.6 20.6 33.6 57.2 52.1 74.6 101.6 136.2
52.0 50.8 64.8 82.9 1 1 6.6 225.5 151.0 1 16.8 129.7 29.7 30.0 31.3 39.0 69.7 99.6 73.7 73.6 54.5 18.9 22.9 23.4 23.8 21.3 23.2 26.3 21.1 12.1 39.4 54.6 52.0 71.2 109.0 1 14.8 93.8 1 15.9 178.0
119.1 121.4 133.9 144.1 197.5 187.3 172.3 178.2 195.0
478.3 510.5 635.6 788.0 1.142.9 1.211.5 1.129.4 1,207.1 1.329.3 312.3 302.7 341.4 382.3 513.5 455.0 428.3 463.5 530.0
83.0 1 10.5 185.0 263.5 398.0 354.7 482.8 482.8 525.9 79.1 85.8 82.8 98.4 131.9 126.4 126.9 126.9 170.9
3.9 11.6 26.3 43.7 99.4 275.4 193.4 134.0 102.5
26
toward closer monitoring of banks' activities and greater djsclosure appears to reflect the recognition that commercial banks' increased reliance on trading revenues (including from proprietary trading) and leverage (including through derivatives and secmitization of loans and commercial credits) might have heightened systemic risks (Chapter TV). In the Uruted States, the shift also appears to have been motivated by the changing nature of the industry following the numerous mergers among top banks,48 whlle at the international level it was reflected, inter alia, in added momentum to the work of the Joint Forum on Financial Conglomerates, wruch issued a set of papers on the supervisiOn of large financial conglomerates (see Annex IV). On the regulatory front, the Basel Committee presented a draft revision of the 1988 Capital Accord. The document focuses on making prudential credit risk measurements more sensitive to actual risk, and on expanding the current framework to include supervisory review of an institution's capital adequacy and internal assessment process, as well as on enhancing the role of market discipline.
48SeveraJ mergers announced in the early pan of J 998 (see International Monetary Fund. 1998a} were completed in subsequent months, and a major U.S. commercial bank wa� taken over by one of the three largest German banks i n 1999. In addition, consoHdation among regional banks continued; Wells Fargo and Norwest Corporation merged in November, and Fleet announced in March that it would acquire its cross-town rival BankBosron.
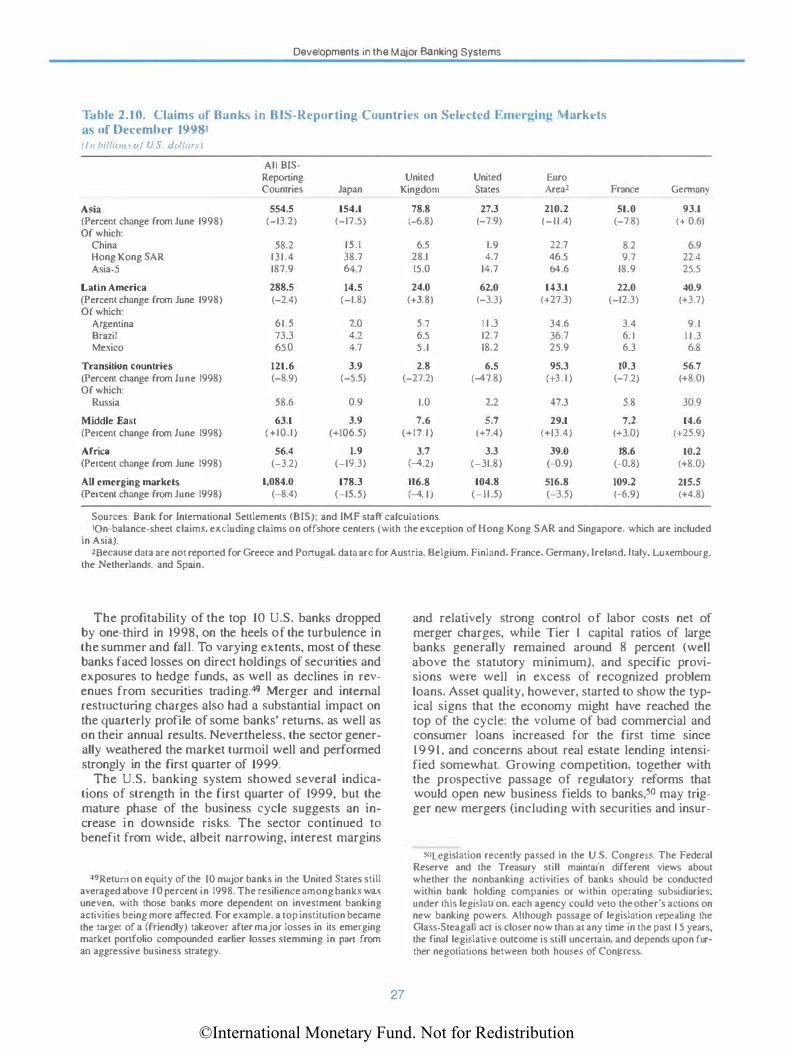
©International Monetary Fund. Not for Redistribution
Developments in the Major Banking Systems
Table 2.1 0. Claims uf Banks in B IS-Reporting Countries on Selcch.·d Emerging 1\ larkcts as of December 19981 (In billllll _, o/ L .S. dull an 1
All BIS-Reponing United United Euro Countries Japan Kingdom States Areal France Germany
Asia 554.5 154.1 78.8 27.3 210.2 51.0 93.1 (Percem change from June 1998) (-13.2) (-17.5) (-6.8) (-7.9) (-11.4) (-7.8) (+ 0.6) Of which:
China 58.2 15.1 6.5 1.9 22.7 8.2 6.9 Hong Kong SAR 131.4 38.7 28.1 4.7 46.5 9.7 22.4 Asia-5 187.9 64.7 15.0 14.7 64.6 18.9 25.5
Latin America 288.5 14.5 24.0 62.0 143.1 22.0 40.9 (Percem change from June 1998) (-2.4) (-1.8) (+3.8) (-3.3) (+27.3) (-12.3) (+3.7) Of which:
Argentina 61.5 2.0 5.7 1 1 .3 34.6 3.4 9.1 Brazil 73.3 4.2 6.5 12.7 36.7 6. 1 1 1 .3 Mexico 65.0 4.7 5.1 18.2 25.9 6.3 6.8
Transition countries 121.6 3.9 2.8 6.5 95.3 10.3 56.7 (Percent change from June 1998) (-8.9) (-5.5) (-27.2) (-47.8) (+3 . 1 ) (-7 .2) (+8.0) Of which:
Russia 58.6 0.9 1.0 2.2 47.3 5.8 30.9
Middle East 63.1 3.9 7.6 5.7 29.1 7.2 14.6 (Percem change from June 1998) (+10.1) (+106.5) (+17. 1) (+7.4) (+13.4) (+3.0) (+25.9)
Africa 56.4 1.9 3.7 3.3 39.0 18.6 10.2 (Percem change from June 1998) (-3.2) (-19.3) (-4.2) (-31.8) (-0.9) (-0.8) (+8.0)
AJJ emerging markets 1,084.0 178.3 IJ6.8 104.8 516.8 109.2 215.5 (Percent change from June 1998) (-8.4) (-15.5) (-4. 1) (-11.5) (-3.5) (-6.9) (+4.8)
Sources: Bank for International Settlements (BIS); and JMF staff calculations. 10n-balance-sheet claims. excluding claims on offshore centers (with the exception of Hong Kong SAR and Singapore, which are included
in Asia). ZBecause data are not reponed for Greece and Portugal. data arc for Austria. Belgium. Finland. France, Germany, Ireland. haly, Luxembourg,
the Netherlands. and Spain.
The profitability of the top 10 U.S. banks dropped by one-third in 1998, on the heels of the turbulence in the summer and fall. To varying extents, most of these banks faced losses on direct holdings of securities and exposures to hedge funds, as weJJ as declines in revenues from securities trad.ing.49 Merger and internal restructuring charges also had a substantial impact on the quarterly proflle of some banks' returns, as well as on their annual results. Nevertheless, the sector generally weathered the market turmoil well and performed strongly in the first quarter of 1999.
The U.S. banking system showed several indications of strength in the first quarter of 1999, but the mature phase of the business cycle suggests an increase in downside risks. The sector continued to benefit from wide, albeit narrowing, interest margins
�9Retum on equity of the I 0 major banks in the United States still averaged above 1 0 percent in 1998. The resilience among banks was uneven, with those banks more dependent on investment banking activities being more affected. For example. a top institution became the target of a (friendly) takeover after major losses in its emerging market ponfolio compounded earlier losses stemming in pan from an aggressive business strategy.
27
and relatively strong control of labor costs net of merger charges, while Tier 1 capital ratios of large banks generally remained around 8 percent (well above the statutory minimum), and specific provisions were well in excess of recognized problem loans. Asset quality, however, started to show the typical signs that the economy might have reached the top of the cycle: the volume of bad commercial and consumer loans increased for the first time since 1991 , and concerns about real estate lending intensified somewhat. Growing competition, together with the prospective passage of regulatory reforms that would open new business fields to banks,so may trigger new mergers (includjng with securities and insur-
SOLegislation recently passed in the U.S. Congress. The Federal Reserve and the Treasury still maintain different views about whether the nonbanking activities of banks should be conducted within bank holding companies or within operating sub&idiaries: under this legislation. each agency could veto the other's actions on new banking powers. Although passage of legislation repealing the Glass-Steagall act is closer now than at any time in the past 1 5 years. the final legislative outcome is still uncenain, and depends upon further negotiations between both houses of Congress.
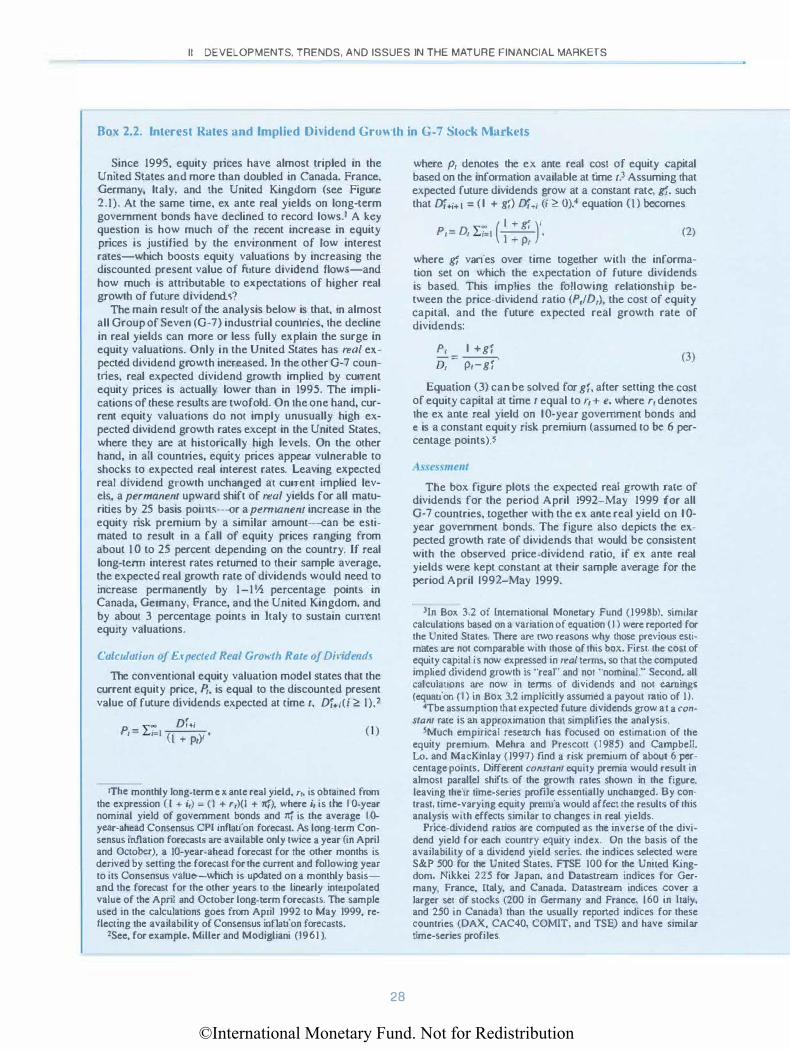
©International Monetary Fund. Not for Redistribution
II DEVELOPMENTS, TRENDS, AND ISSUES IN THE MATURE FINANCIAL MARKETS
Box 2.2. Interest Rates and Implied Dhidend Growth in G-7 Stock Markets
Since 1995, equity prices have almost tripled in the United States and more than doubled in Canada, France, Germany, Italy, and the United Kingdom (see Figure 2.1). At the same time, ex ante real yields on long-term government bonds have declined to record lows.' A key question is how much of the recent increase in equity prices is justified by the environment of low interest rates-which boosts equity valuations by increasing the discounted present value of future dividend flows-and how much is attributable to expectations of higher real growth of future dividends?
The main result of the analysis below is that, in almost all Group of Seven (G-7) industrial countries, the decline in real yields can more or less fully explain the surge in equity valuations. Only in the United States has real expected dividend growth increased. In the other G-7 countries, real expected dividend growth implied by current equity prices is actually lower than in 1995. The implications of these results are twofold. On the one hand, current equity valuations do not imply unusually high expected dividend growth rates except in the United States, where they are at historically high levels. On the other hand, in all countries, equity prices appear vulnerable to shocks to expected real interest rates. Leaving expected real dividend growth unchanged at current implied levels, a permanent upward shift of real yields for all maturities by 25 basis points--or a pemwnenr increase in the equity risk premium by a similar amount--can be estimated to result in a fall of equity prices ranging from about 1 0 to 25 percent depending on the country. If real long-term interest rates returned to their sample average, the expected real growth rate of dividends would need to increase permanently by 1-1 Yz percentage points in Canada, Germany, France, and the United Kingdom, and by about 3 percentage points in Italy to sustain current equity valuations.
(alclllatiun af Expected Real Gmwth Rate of Di1·idends
The conventional equity valuation model states that the current equity price, �. is equal to the discounted present value of future dividends expected at time 1, D1+1(i 2:. 1),2
�.. Df+l P, = ki=l (I + p,)' , (I)
1The monthly long-term ex ante real yield, r, is obtained from the expression ( I + i,) = (I + r.)(! + nf). where i, is the I 0-year nominal yield of government bonds and � is the average I 0-year-ahead Consensus CPI inflation forecast. As long-term Consensus inflation forecasts are available only twice a year (in April and October), a 10-year-ahead forecast for the other months is derived by setting the forecast for the current and following year to its Consensus value-which is updated on a monthly basisand the forecast for the other years to the linearly interpolated value of the April and October long-term forecastS. The sample used in the calculations goes from April 1992 to May 1999, reflecting the availability of Consensus inflation forecasts.
2See, for example, Miller and Modigliani (1961 ).
28
where p1 denotes the ex ante real cost of equity capital based on the information available at time t.3 Assuming that expected future dividends grow at a constant rate, g�. such that D1+i+ 1 = (I + gf) D1+, (i 2:. 0).4 equation (I) becomes
� - ( 1 + gf )i P, = D, k i;l 1+j),'" . (2)
where gr varies over time together wit11 the information set on which the expectation of future dividends is based. This implies the following relationship between the price-dividend ratio (P,!D,), the cost of equity capital, and the future expected real growth rate of dividends:
P, I +gf
D, =
p,-gf. (3)
Equation (3) can be solved for gf, after setting the cost of equity capital at time r equal to r, + e. where r, denotes the ex ante real yield on I 0-year government bonds and e is a constant equity risk premium (assumed to be 6 percentage points).S
The box figure plots the expected real growth rate of dividends for the period April 1992-May 1999 for all G-7 countries, together with the ex ante real yield on I 0-year government bonds. The figure also depicts the expected growth rate of dividends that would be consistent with the observed price-dividend ratio, if ex ante real yields were kept constant at their sample average for the period April 1992-May 1999.
lin Box 3.2 of Lnlemational Monetary Fund (1998b). similar calculations based on a variation of equation ( l ) were reponed for the United States. There are two reasons why those previous estimates are not comparable with those of this box. First, the cost of equity capital is now expressed in real terms, so that the computed implied dividend growth is "real" and not "nominal.'' Second, all calculations are now in terms of dividends and not earnings (equation ( I ) in Box 3.2 implicitly assumed a payout ratio of 1).
4Tbe assumption that expected future dividends grow at a constant rate is an approximarion that simplifies the analysis.
SMuch empirical research has focused on estimation of the equity premium. Mehra and Prescott (1985) and Campbell, Lo, and MacKin lay ( 1997) find a risk premium of aboul 6 percentage points. Different constant equity premia would result in almost parallel shifts of the growth rates shown in the figure. leaving their time-series profile essentially unchanged. By contrast, time-varying equity premia would affect the result<; of this analysis with effects similar to changes in real yields.
Price-dividend ratios are computed as the inverse of the dividend yield for each country equity index. On the basis of the availability of a dividend yield series. the indices selected we.re S&P 500 for the United States. FTSE 100 for the United Kingdom, Nikkei 225 for Japan. and Datastream indices for Germany, France, Italy. and Canada. Oatastream indices cover a larger se1 of stocks (200 in Germany and France, 160 in Italy. and 250 in Canada) than the usually reponed indices for these countries (DAX, CAC40, COMIT, and TSE) and have similar time-series profiles.

©International Monetary Fund. Not for Redistribution
Developments in the Major Banking Systems
Major Industrial Countries: Expected Long-Term Growth of Real DiYidends and Ex Ante Real Yields, \pril 19lJ2-J\lay 19lJ9
-- Expected r<!al dividmd growth -- E.tpected r<!al dividend growth (with real yieltl.r m .mmple avemgt>)
£x Illite real ltmg·t�mr yield.r
Japan
. ·· ··
1992 93
France
··· ·· ,..,
.·
94
···· .. ·
United States
- · .. · ··.
1992 93
···' ..
94
.. � .... ······· ........ ··· ... .. .
95 96 97
····.·· ····· ......
·.
95 - 13
- I I
9
3
3 ... .. .
1992 93 94
United Kingdom
1992 93 94
95
95
96 97
·.·.
96 97
Sources: Datastream; and !MF staff estimates.
98 99 - 13
- I I
9
7
5
3 . . .
98 99 -1
· ...... ·.· ·
96 97 98
Germany
- 13
- I I
99
9
7
5
3
-I
- 1 3
- I I
9
7
···· . .... . . . ······· .
...... .. . ·· '• ···
· ··. ·· · ····.
5
3 · .. .. � .. .. · ...
�,99�2��93��9�4��9=5��9�6�-9�7��9�8�-799- l
\ . : •• ' l
'.: .
.' ''
\: ·. · .. · .. ····
· ··. ; ·.'. · ..
- 13
········ .. , ·····
9
7
5
3
�199�2��93�--794��9�5�--9�6�--�97��9�8��99 I Canada
- . .
29
• . .. . ·····. ·
......
·
... · ...... ·····.·.
� . ..... . ··· ..... .
- 13
- I I
9
7
5
..
·. •• · - 3
©International Monetary Fund. Not for Redistribution
II DEVELOPMENTS, TRENDS, AND ISSUES IN THE MATURE FINANCIAL MARKETS
Box 2.2 (crmc/ud£•d)
The expected growth rate of dividends obtained by keeping ex ante real yields constant at their �ample average follows a marked upward trend in all G-7 counlries. This suggests that, if a constant real cost of equity capital were used to discount future dividend flows. CUJTent equity valuations would imply expectations of record growth rates of future dividends for the period 1992-99.6 Th1s conclusion changes when the current low real yield environment is taken into accoum. Only in the Uniled States is the expected real growth rate of dividends based on current real yields close to historical highs. [n the other G-7 countries, current equity valuations appear consistent with dividend growth expectatiOn\ that are well below past peaks and suggest that the recent �urge in equity prices could largely be explained by lower real yields. Conversely, if the real yields reverted to their sample average. the expected growth rate of future dividends would have to increal>e considerably to support current valuations.
�several studies have recently pointed out, however. Jllat equation (I) can track equity price' and pred1c1 futun: return:. relbonably well only with ltmt'-l'atYillg mterest rates
once analysts' earning� forecasts are taken into account (see, for example. Lee, Myers. and Swami nathan. 1999).
ance firms), although the accompanying merger and acquisition charges could become a heavy burden to banks as the economy slows.
Bank performance in Canada was also affected by volatility i n trading activities, but return on equity remained above 15 percent for most banks. pointing to the soundness of the sector. Growth prospects could, however, be dampened by Canada's susceptibility to the economic cycle in the Western Hemisphere, and by banks' limited diversification into other markets. Further consolidation in the domestic market appeared unlikely after regulators blocked two large mergers.
Banks in the United Kingdom that operate mainly in the domestic market had another good year; those banks with a large share of business in Asia, however, faced a decline in profitability (albeit from a high level). Interest margins on domestic operations remained mainly in the 2-3 percent range, and labor costs were well contained. Several factors may put downward pressure on earnings growth in the period ahead. Domestic competition is intensifying, particularly from nonbank financial institutions. Loan losses have already edged up, and the economic slowdown wiiJ put further pressure on loan quality (though recent strong profi tability will mitigate the effect<; of a slowdown). Despite recent improvements in risk management, greater reliance on high-margin loans to in-
30
dividuaJs51 has raised the cyclical sensitivity of bank income. Prospects for overseas earnings will hinge on the recovery of emerging market economies, notably Hong Kong SAR.
Profitability in most continental European banking systems recently improved as banks have been able to increase noninterest income (though return on equity (ROE) generally remained below 10 percent). Noninterest income was boosted by fees and commissions from a shift of customers into alternative savings products, as well as trading income. Despite some write-offs for emerging market exposures, aggregate 1 998 results were favorable in the larger European countries.52 The aggregate operational income of the four top banks in Germany rose by 14 percent in 1998. following the recovery of asset prices in the last quarter of the year; income from trading accounts increased by 50 percent. Major banks in France enjoyed a second year of improved results (net income for the four largest banks rose by 14 percent), also in large part owing to increased income from trading and a rise in the value of their holdings in nonfinancial corporations in the wake of strong stock-market gains, and despite substantial provisions for emerging market risks. The aggregate return on equity of Italian banks rose from 2.7 percent in 1996--97 to 7.8 percent in 1998. That improvement was underpinned by a 60 percent increase in revenues from fees and other services, and an 1 8 percent increase in profits from securities trading in 1998.
Low interest margins, large branch networks. and overstaffing continue to burden continental European banks' proti.tability. While mergers could help reduce capacity and might raise interest margins, strict labor laws and political considerations still limit the rate at which overstaffing can be addressed. Mergers and acquisitions have accelerated: several major banks have attempted to take over domestic rivals, in what some have characterized as a "quest for national champions," and numerous European banks have taken minority interests in institutions in other euro-area countries (Annex I). As cross-border mergers pick up, European banks will benefit from geographic diversification. The top insurance companies on the European continent (based in Germany, France, and Italy) have continued to play a prominent role in the uniJication of those financial systems. 53
SIConsumer loan� have grown by 15-20 percent a year since 1997. S2Banks were quick to increase provisions in the aftermath of the
crises in Asia and Russia. notably in France and Germany (Italian banks had �mall exposures). Also, trade credit by large French and German commercial banks to Russia wa.� largely secured or guaranteed by the respective governments; the exposure of other German banks. notably Landesbanken, varied significantly, and were in some cases considerable in relation to the equity base and earnings capacity.
Slltaly and France also made funher progress toward overhauling their savings bank systems. while similar steps continued to lag in Germany.
©International Monetary Fund. Not for Redistribution
Risks and Vulnerabilities
European banks continued to strive to raise their capitalization in recognition of the increased risks owing to their larger securities portfolios, as well as the desire to make strategic acquisitions domestically and abroad. For instance, large commercial German banks are stiJJ estimated to have sizeable hidden reserves (e.g., 3 percent of assets for one bank), in part because of strength in stock prices in recent years. However, two major banks chose to raise over €6 bilLion (about 20 percent of existing shareholder liquidity) in outside capital to finance actual or prospective acquisitions abroad. In France, the relatively weak capitalization of major commercial banks remains a handicap. which could be progressively attenuated by further consolidation of net profits and further rationalization of the French banking structure. In Italy, the capitalization of large banks has improved in recent years. notably in connection with foreign investment and privatization. Nonetheless, considering the banking system as whole, the relatively high stock of problem loans (nonperforming and doubtful loans account for l l .9 percent of total loans) appears to remain a source of weakness for some banks as reflected, inter alia. in the significantly negative free capital of some of these banks. 54
All major banks in Japan posted losses in fiscal year 1998, owing mainly to large loan loss provisions and charge-offs totaling ¥10 trillion (equivalent to about $80 billion).55 Net interest revenues were broadly unchanged, and fee income was stagnant. Gains from trading and investment, however, rose by 37 percent, reflecting the volati}jty of exchange rates and bond yields. Operating costs declined by 2 percent. Several aspects of asset quality were subject to reevaluation, reflecting new disclosure rules and greater recognition of problem loans under the aegis of the Financial Revitalization Laws. 56 At the end of the fiscal year, claims on problem borrowers under the disclosure rules established by those laws were estimated at ¥28 tri!Hon (8.8 percent of total loans), against total reserves of¥ 16.7 trillion. Major banks' capital was boosted by public capital injections (¥7.5 trillion) and the inclusion of deferred tax assets (¥7 .I trillion), which together accounted for more than half of Tier 1 capital.
Several measures helped stabilize the Japanese banking system, but prospects wiU remain uncertain until the problems of low core profitability and excess capacity are decisively addressed. The passage of laws providing a framework for dealing with problem
54 Free capital-a mea�ure of ability to cushion further losses-i> prudential capital less expected losses on recognized problem loans. fixed investment, and shareholdings.
��Difficulties in the nonfinancial sector, which have largely persisted. were discussed in International Monetary Fund ( 1998a), Chapter V.
S6See Annex n for a discussion of this and other structural and policy issues relating to the Japanese financial system.
31
banks and the provision of ample liquidity by the Bank of Japan were key ingredients to that stabilization. reflected inter alia in the decline of the Japan premium in interbank markets. Both the establishment of an independent Financial Supervisory Agency and the creation of a high-level Financial Reconstruction Committee (FRC). whose chief holds a cabinet-level position, have resulted in important strides toward the reorganization of the sector. 57 The restructuring plans presented by major banks to the FRC, however. by themselves might be insufficient to restore core profitability, and loan disposal remains too slow. Also, incipient corporate restructuring suggests that banks may face years of low credit demand and asset writedowns in connection with corporate financial reorganizations.5ll
Risks and Vulnerabilities
Looking ahead. there are some risks to and vulnerabilities in the U.S. equity market, the major currency markets, and the major banking systems. Lack of comprehensive information about the degree and extent of leverage in the major financial systems, which could amplify and propagate shocks in these markets, complicates an assessment of the risks. There are also risks associated with the Y2K computer problem.
The remarkably high level of valuations in the U.S. equity market, reached after a nearly unprecedented period of gains, poses a risk in global financial markets. 59 Three factors have supported past gains in the U.S. equity market: a decline in long-term U.S. interest rates through the end of 1998; robust growth in corporate profits over much of the past few years; and strong inflows of funds.60 The decline in interest rates has reversed, and rates may rise further in the period ahead. Looking ahead, growth in corporate profits is likely to slow eventually as economic activity moderates to a more sustainable pace. Finally, mutual-fund
�7Two major banks were nationali7ed in 1998. In 1999, the government has begun to intervene in regional banks. taking over some and ordering others to increase capi tal. It also has established criteria for capital injections into regional banks, including requiring banks to achieve sufficient capital adequacy after the capital injection (with an 8 percent ratio as a desirable target).
58 A:. noted in International Monetary Fund ( 1 998a), there are also problems in the insurance sector. Although a framework to deal with these problems has been put in place. including a privately financed insurance scheme backed by a government guarantee until 200 l . these problems have not been fully addressed.
'9Federal Reserve Chairman Alan Greenspan recently stated that "the breadth of technological advance and its application ha> engendered a major upward revaluation of business assets, both real and intangible. That revaluation has induced a spectacular rise in equity prices that to many has reached well beyond the justifiable." (See Greenspan, 1999b).
fiJA competing explanation for the rise in stock prices-a decline in the e(juity risk premium-is difficult to reconcile with the apparent repricing of risk in the fixed-income market.
©International Monetary Fund. Not for Redistribution
II DEVELOPMENTS, TRENDS, AND ISSUES IN THE MATURE FINANCIAL MARKETS
Box 1.3. Ongoing Reforms in the U.S. Equity Market lnfraslructure
Concerns about the sustainability of current equity market valuations in the United States have renewed interest in the ability of the current U.S. equity market infrastructure to withstand the effects of a sudden and sustained correction in equity prices. such as the one experienced during the October 1987 market crash. Postcrash episodes of market sell-offs, such as occurred in October 1997, suggest that structural and regulatory changes have significantly improved the ability of equity market participants to withstand the strains associated with massive market sell-offs.t
lrltat nas Leumed from the 1987 Markel Crash?
The reports that examined the 1987 crash emphasized several deficiencies in the infrastructure that led to the market collapse.< For example, the Brady report suggested that the interrelationship of market mechanisms (particularly portfolio trading strategies, and clearing and settlement) was largely responsible for the clisconnection of cash and futures markets and problems in handling transactions. and that the major systemic risk was the threat posed to the clearing and settlement mechanisms. The report recommended unifying clearing and settlement procedures for stocks, index futures, and stock options. Other reports also emphasized the role of a reassessment of fundamental factors (such as corporate earnings potential and risk premia) in driving the sell-off, and recommended specific reforms, such as cross-
'See international Monetary Fund ( J 998a). Box 4.1 . 2See, among others. U.S. President's Task Force on Market
Mechanisms ( 1988), U.S. Securities and Exchange Commission (1988), and the U.S. President's Working Group on Financial Markets (1988).
inflows have slowed in 1999 compared with a year earlier, partly reflecting a shift to direct stock ownership. The weakening of these supporting factors implies an increased vulnerability of U.S. equity prices to shocks, including a sharper-tJ1an-expected tightening of monetary policy, weaker-than-expected growth in earnings, and a worsening of investor sentiment.
Although a correction in the U.S. market might have domestic origins, it could well have international consequences. According to some estimates, a correction in the range of 15 to 20 percent would have a manageable domestic economic impact, though a sharp slow-
61See International Monetary Fund ( 1999), p. 22. Some have also suggested that a stock-market correction could put pressure on U.S. firms that have employed debt-financed equity buybacks to raise return on equity. Also, see Starr-McCluer ( 1998) for an analysis of the wealth effect in the United S tates. The macroeconomic effects of a correction (including effects on the value of the dollar) could also give rise to international spillovers.
32
margining and guaranteeing agreements, to help ease the severe imbalances in financing needs and increased demand for creclit and liquiclity created by the need to transfer funds across entities during the margin settlement process. A key recommendation was to ensure that market participants maintain adequate levels of capitaJ and abstain from withdrawing during periods of massive se!J-offs. ln examining market leverage and volatility, some reports acknowledged that margin requirements did not cover alJ the risks from price movements, but no unified view emerged on whether these needed to be raised.3 The reports agreed that, to reduce processing time and potential default risks, the settlement of all transactions had to be done in book-entry form, reduced to three days, and paid in same-day funds. The reports saw a need to enhance the operational capacity of broker-dealers, specialists, and self-regulatory organizations, as the ma�sive sell-off had clearly overwhelmed the capacity to process trading operations.
�ri/QI Ha.\ Bee11 Done Since the 1987 Harke/ Cra�h?
Refonns since 1987 have attempted to improve coordination, mitigate deficiencies in the operational capacity
3The Brady report suggested that margin requirements had to be made consistent between stock index futures, options, and cash stock markets, while the report by the Working Group on Financial MarkeL� concluded that margins for stocks. stock index futures. and options should remain different, and that the benefits of raising them were ambiguous. The report by the Securities and Exchange Commission (SEC) recommended examining equity haircuts for proprietary trading firms. since most of the failures and financial difficulties during the crash involved this type of firms.
down in domestic demand cannot be ruled out.61 Also, measures taken since the 1987 crash have strengthened the infrastructure of the U.S. equity markets (see Box 2.3). Uncertainties about the extent of leverage in the global financial system complicate a broader assessment of the risks, however.62 As the turbulence demonstrated, leverage can magnify small initial disturbances and propagate them across markets in an unpredictable fashion, as margin calls can give rise to adjustments across a range of assets in portfolios. lf there is substantial leverage in the system, then a correction in the U.S. equity market could give rise to corrections in financial markets outside the United States, which could
62Some anecdotal evidence suggests that in the early pan of 1999. hedge fund activity picked up and lenders relaxed terms of credit to HLis. including by reducing or waiving initial margins.
63In October 1997. turbulence in the Hong Kong SAR equity market appeared to spill over to the U.S. equity market (sec Box 4.1 in International Monetary Fund. 1998a).
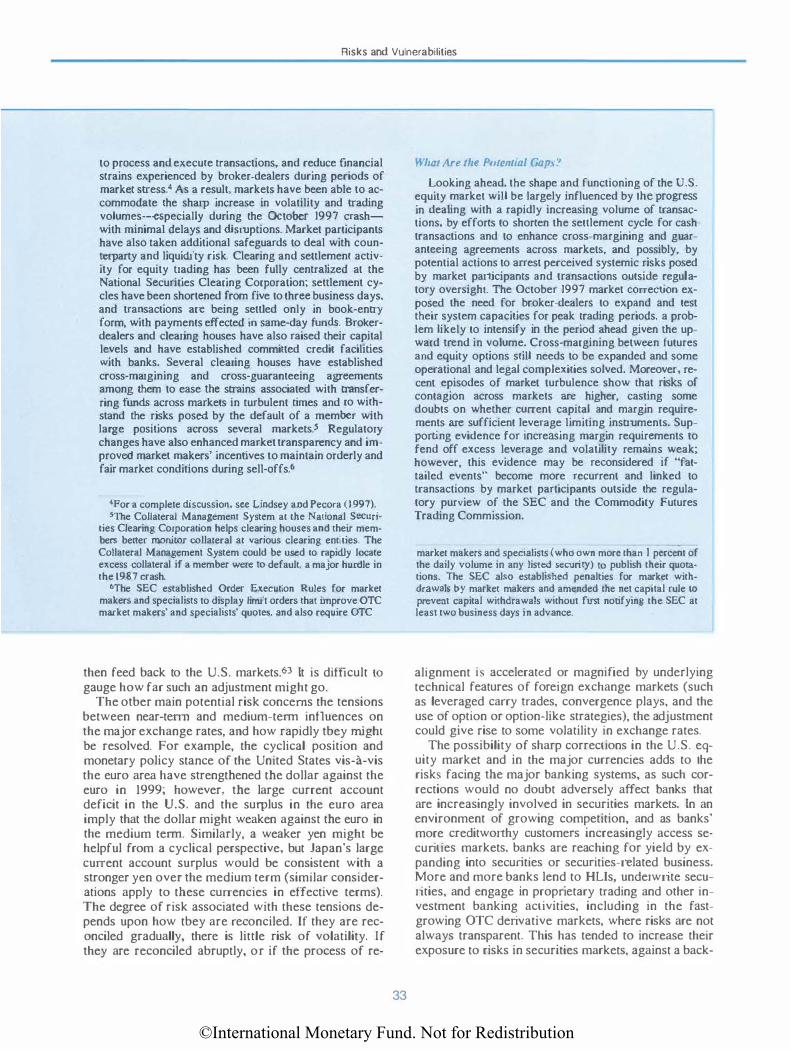
©International Monetary Fund. Not for Redistribution
Risks and Vulnerabilities
to process and execute transactions, and reduce financial strains experienced by broker-dealers during periods of market stress.4 As a result, markets have been able to accommodate the sharp increase in volatility and trading volumes-especially during the October 1997 crashwith minimal delays and disruptions. Market participants have also taken additional safeguards to deal with counterparty and liquidity risk. Clearing and settlement activity for equity trading has been fully centralized at the National Securities Clearing Corporation; settlement cycles have been shortened from five to three business days, and transactions are being settled only in book-entry form, with payments effected in same-day funds. Brokerdealers and clearing houses have also raised their capital levels and have established committed credit facilities with banks. Several clearing houses have established cross-margining and cross-guaranteeing agreements among them to ease the strains associated with transferring funds across markets in turbulent times and ro withstand the risks posed by the default of a member with large positions across several markets.S Regulatory changes have also enhanced market transparency and improved market makers' incentives to maintain orderly and fair market conditions during sell-offs.6
4For a complete discussion. see Lindsey and Pecora (1997). Yfhe Collateral Managemem System at the National Securi
ties Clearing Corporation helps clearing houses and their members beuer monitor collateral at various clearing entities. The Collateral Management System could be used to rapiclly locate eJO:cess collateral if a member were to default, a major hurdle in the 1987 crash.
6The SEC established Order Execution Rules for market makers and specialists to display limit orders that improve OTC market makers' and specialists' quotes, and also require OTC
then feed back to the U.S. markets.63 It is difficult to gauge how far such an adjustment might go.
The otber main potential risk concerns the tensions between near-tenn and medium-term influences on the major exchange rates, and how rapidly tbey might be resolved. For example, the cyclical position and monetary policy stance of the United States vis-a-vis the euro area have strengthened the dollar against the euro in 1999; however, the large current account deficit in the U.S. and the surplus in the euro area imply that the dollar might weaken against the euro in the medium term. Similarly, a weaker yen might be helpful from a cyclical perspective, but Japan's large current account surplus would be consistent with a stronger yen over the medium term (similar considerations apply to tbese currencies in effective terms). The degree of risk associated with these tensions depends upon how tbey are reconciled. U they are reconciled gradually, there is little risk of volatility. If they are reconciled abruptly, or if the process of re-
33
�Hwr Are the f>(l(eutial Gapx '!
Looking ahead, the shape and functioning of the U.S. equity market will be largely influenced by the progress in dealing with a rapidly increasing volume of transactions, by efforts to shorten the settlement cycle for cash transactions and to enhance cross-margining and guaranteeing agreements across markets, and possibly, by potential actions to arrest perceived systemic risks posed by market participants and transactions outside regulatory oversight. The October 1997 market correction exposed the need for broker-dealers to expand and test their system capacities for peak trading periods, a problem likely to intensify in the period ahead given the upward trend in volume. Cross-margining between futures and equity options still needs to be expanded and some operational and legal complexities solved. Moreover, recent episodes of market turbulence show that risks of contagion across markets are higher, casting some doubts on whether current capital and margin requirements are sufficient leverage limiting instruments. Supporting evidence for increasing margin requirements to fend off excess leverage and volatility remains weak; however, this evidence may be reconsidered if "fattailed events" become more recurrent and linked to transactions by market participants outside the regulatory purview of the SEC and the Commodity Futures Trading Commission.
market makers and specialists (who own more than 1 percent of the daily volume in any listed security) to publish their quotations. The SEC also established penalties for market withdrawals by market makers and amended the net capital rule to prevent capital withdrawals without first notifying the SEC at least two business days in advance.
alignment is accelerated or magnified by underlying technical features of foreign exchange markets (such as leveraged carry trades, convergence plays, and the use of option or option-like strategies), the adjustment could give rise to some volatility in exchange rates.
The possibility of sharp corrections in the U.S. equity market and in the major currencies adds to the risks facing tbe major banking systems, as such corrections would no doubt adversely affect banks that are increasingly involved in securities markets. In an environment of growing competition, and as banks' more creditworthy customers increasingly access securities markets, banks are reaching for yield by expanding into securities or securities-related business. More and more banks lend to HLis, underwrite securities, and engage in proprietary trading and other investment banking activities, including in the fastgrowing OTC derivative markets, where risks are not always transparent. This has tended to increase their exposure to risks in securities markets, against a back-
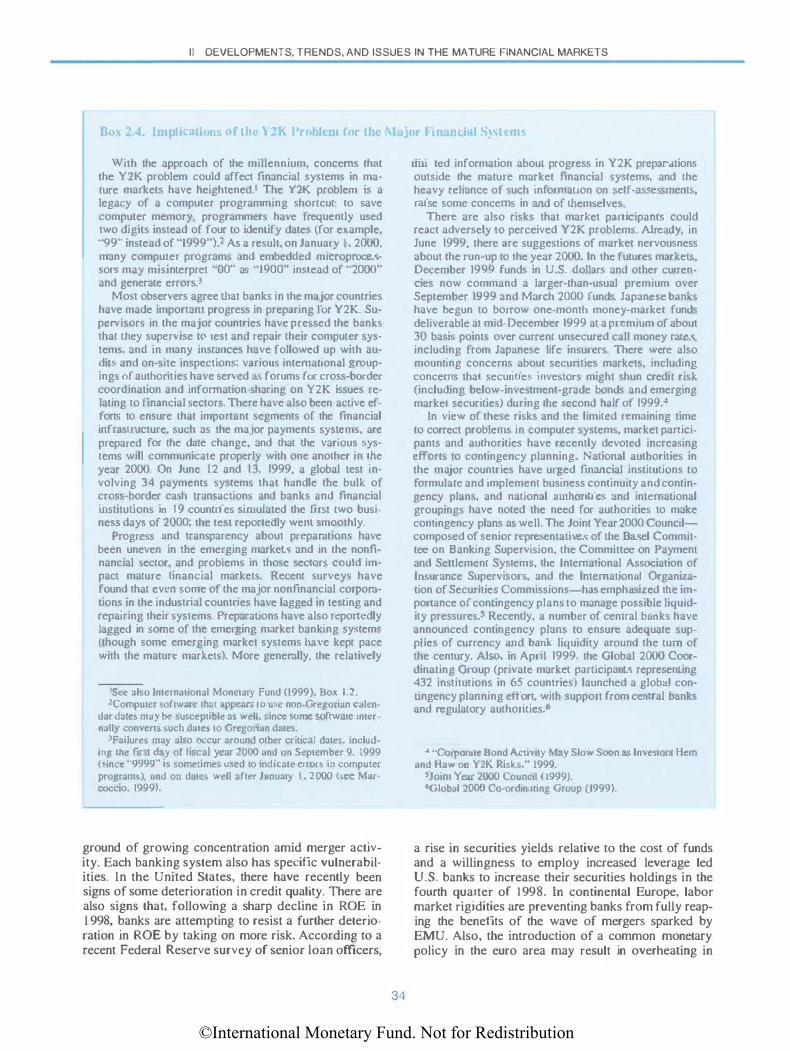
©International Monetary Fund. Not for Redistribution
II DEVELOPMENTS, TRENDS, AND ISSUES IN THE MATURE FINANCIAL MARKETS
Box 2.4. Implications of the \ 2K PrCiblem for the \h:lJOr I in m:i.ll S\stun.,
With the approach of the millennium, concerns thtit the Y2K problem could affect financial systems in mature markets have heightened. I The Y2K problem is a legacy of a computer programming shortcut: to save computer memory, programmers have frequently used two digits instead of four to identify dates {for example, "99'' instead of "1999").2 As a result, on January 1 , 2000. many computer programs and embedded microprocessors may misinterpret "00" as "1900" instead of ''2000'' and generate errors.3
Most observers agree that banks in the major countries have made important progress in preparing lor Y2K. Supervisors in the major countries have pressed the bank.<> that they supervise t(.' test and repair their computer systems, and in many instilllces have followed up with audits and on-site inspections; various international groupings of authorities have served as forums for cross-border coordination and information-sharing on Y2K issues relating to financial sectors. There have also been active efforts to ensure that important segments of the financial infrastructure, such as the major payments systems, are prepared for the date change, and that the various systems \\ill communicate properly with one ano1her in the year 2000. On June 12 and 13, 1999, a global test involving 34 payments systems that handle the bulk of cross-border cash transactions and banks and financial institutions in 1 9 countries sin1ulated the first two busines� days of 2000; the test reportedly wem �moothly.
Progress and transparency about preparations have been uneven in the emerging markets and in the nonfinancial sector, and problems in those sector� could impact mature financial markets. Recent surveys have found that even some of the major nonfinancial corpomtions in the industrial countries have lagged in testing and repairing their systems. Preparations have also rcponcdly Jagged in �orne of the emerging market banking syMem� (though some emerging market systems have kept pace with the mature markets). More genemlly, the relatively
1See also International Monetary Fund (1999). Box l.2. 2Computer software that nppean; 10 use non-Gregoriun calen
dar date.� m:l) be sut>ceptible as well, sin� some software antt:r· nally convert� such date� to Gregorian dates.
JFailures may also occur around olher critical dates, tncluding t.he lirst day of li�cal year 2000 and on September 9. 1999 (since "9999" is sometimes u�ed to tndtcate errors an computer programs), nnd on dnt<!s well after January I , 2000 (see Marcoccio. 1999).
ground of growing concentration amid merger activity. Each banking system also has specific vulnerabilities. In the United States, there have recently been signs of some deterioration in credit quality. There are also signs that, following a sharp decline in ROE in l 998, banks are attempting to resist a further deterioration in ROE by taking on more risk. According to a recent FederaJ Reserve survey of senior loan officers,
34
limi ted information about progress in Y2K prepar.uions outside the mature market financial systems, and the heavy reliance of such information on self-assessments, raise some concerns in Md of themselves.
There are also risks that market participants could react adversely to perceived Y2K problems. Already, in June 1999, there are suggestions of market nervousness about the run-up to the year 2000. ln the futures marke�. December 1999 funds in U.S. dollars and other currencies now command a larger-than-usual premium over September 1999 and March 2000 funds. Japanese banks have begun to borrow one-month money-market funds deliverable at mid-December 1999 at a premium of about 30 basis point� over current unsecured call money rates, including from Japanese life insurers. There wl!re also mounting concerns about securiues markets, including concerns that securiues mve!>tors might shun credit risk (including below-investment-grade bonds and emerging market securities) during the second half of 1999."
In view of these risks and the limited remaining time to correct problems in computer systems, market participants and authorities have recently devoted increasing effort!> to contingency planning. National authorities in the maJOr countries have urged finMcial institutions to formulate and implement business continuity and contingency plans, and national authorities and international groupings have noted the need for authorities to make contingency plans as well. The Joint Year 2000 Councilcomposed of senior representatives of the Ba�el Committee on Banking Supervision, the Committee on Payment and Settlement Systems, lhe International Association of Insurance Supervisors, and the lntemationul Organization of Securities Commissions-has empha�i.!:ed the importance of contingency plans to manage possible liquidity pressures.s Recently, a number of central bunks have announced contingency plans to ensure adequate supplies of currency Md bank liquidity around the tum of the century. Also. in April 1999. the Global 2000 Coordinating Group (private market participilllts representing 432 institutions in 65 countries) launched a global contingency planning effort, with support from central banks and regulatory authorities."
� "Corpomte Bond Activity May Slow Soon as Investors Hem and Haw on Y2K Risks," 1999.
�Joant Year 2000 Council ( 1999). 6Qiobal 2000 Co-ordinating Group ( 1999).
a rise in securities yields relative to the cost of funds and a willingness to employ increased leverage led U.S. banks to increase their securities holdings in the fourth quarter of 1 998. In continental Europe, labor market rigidities are preventing banks from fully reaping the benetits of the wave of mergers sparked by EMU. Also, the introduction of a common monetary policy in the euro area may result in overheating in
©International Monetary Fund. Not for Redistribution
References
some of the relatively smaller economies. In these economies, special attention is needed to prevent credit growth from leading to a deterioration of credit standards and portfolio quality and, more generally, to excessive risk-taking. In Japan, although much has been done to stabilize the financial system, the challenge of restoring its long-term viability has not yet been fully addressed. In the meantime, the major banks remain weak, and face years of low profitability owing to weak credit demand and continued writedowns of assets. In these circumstances, banks in these countries may be vulnerable to shocks, including shocks to capital markets, a deterioration of crerut quality stemming from weaker-than-expected economic activity, and (in view of the still-considerable exposures) renewed turbulence in emerging markets.
Banks and other financial institutions also face risks from the Y2K computer problem (see Box 2.4). These include both technical risks-the risk of operational fru lures-and the risks of an adverse shlft in market behavior. The risks of operational frulures within banks may be minimal in view of the considerable pressure from supervisors and the substantial progress that has been reported. However, nonbank counterparties and borrowers are probably less prepared, particularly in countries where authorities have not actively encouraged the private sector to prepare. Banks could face substantial credit losses if a major borrower or counterparty became bankrupt, and could face a Iiqwruty squeeze if operational problems led to delays in payments.
Liquidity squeezes could also arise from an adverse change in market behavior in reaction to Y2K risks, even in those markets where adequate technical preparations have been implemented. In reaction to a perceived increase in risks (rational or not), households may withdraw cash, or shift funds to banks that are viewed as safest; banks could withdraw riskier credits and seek to hold only the safest and most liquid assets through the end of 1999 (with the effect that, e.g., smaller fmancial institutions and emerging market borrowers might have difficulty obtaining funding through the year-end); and securities markets might experience a "flight to liquidity" similar to the episode during the turbulence.64 Central banks in the major countries are well aware of these risks and of the need to be watchful in the run-up to the year-end for signs of tensions in their markets and institutions; some have also announced explicit contingency plans to manage liquidity risks related to Y2K.65
64As early as March 1998, December 1999 eurodollars commanded a significant premium compared with September 1999 or March 2000 eurodollars. A similar rise in tum-of-the-year premia was also evident in the other major currencies.
65For example. in May 1999 the Federal Reserve proposed the creation of a special facility (the Century Date Change Special Liquidity Facility) that would lend to depository institutions on special terms around the tum of the year.
35
References
Bank of England, I 998, Inflation Report (London. November). ---, 1999a, Practical Issues Arising From the Euro
(June). ---, l999b, Quarterly Bulletin (London, February). ---, 1999c, Quarterly Bulletin (London, May). Bank for International Settlements. 1999, Central Bank Sur
vey of Foreign Exchange and Derivatives Market Activity 1998 (Ba�el, May).
---, lntemational Banking and Financial Market Developmems, various issues.
Bloomberg Financial Markets L.P.. I 999, ''Hedge Fund Investment in Yen Recovers in February" (Tokyo, April 3).
Board of Governors of the Federal Reserve System. I 999a, Monetary Policy Report to the Congress (HumphreyHawkins Report) (Washington, February).
---, 1999b, "Treasury and Federal Reserve Foreign Exchange Operations," Federal Reserve Bulletin (Washington, June).
Campbell. John Y., Andrew W. Lo, and A. Craig MaclGnlay, 1997, The Econometrics of Financial Markets (Princeton. New Jersey: Princeton University Press).
"Corporate Bond Activity May Slow Soon as Investors Hem and Haw on Y2K Risks," 1999, Wall Street Joumal (June 15).
"European Share Buy-Back Market Poised to Explode," I 998, lntemational Financing Review (December 12).
Global 2000 Co-ordinating Group, 1999. Year 2000 Risk Mitigation & Contingency Planning Program (Zurich: Union Bank of Switzerland. April 20).
Greenspan, Alan, I 996, "The Challenge of Central Banking in a Democratic Society," remarks at the American Enterprise rnstitute, Washjngton, December 5.
---, J999a, "State of the Economy," testimony before the U.S. House of Representatives. January 20.
---. 1999b. "The American Economy in a World Contexl.," remarks at the 35th Annual Conference on Bank Strucrure and Competition of the Federal Reserve Bank of Chicago, Chicago, lllinois, May 6.
International Monetary Fund, 1996. /memational Capital Markets: Developments. Prospects, and Key Policy Issues, World Economic and Financial Surveys (Washington, September).
---, 1998a, lntemational Capital Markets: Developments, Prospects, and Key Policy Issues, World Economic and Financial Surveys (Washington, September).
---, 1998b, World Economic Outlook and lntemational Capital Markets: Imerim AssessmenT, World Economic and Financial Surveys (Washington, December).
---, 1999, World Economic Owlook, May 1999: A Survey by the Staff of the lntemational Monetary Fund, World Economic and Financial Surveys (Washjngton).
Joint Year 2000 Council, I 999, Planning by Financial Market Awhorities for Year 2000 Contingencies (Basel: Bank for International Settlements, February).
Lee, Charles M.C., James Myers, and Bha�karan Swaminathan, 1999. "What Is the Intrinsic Value of the Dow?" Journal of Finance (forthcoming).
Lindsey. Richard R., and Anthony P. Pecora, 1997, Ten Years After: Regulatory Developments in che Securities

©International Monetary Fund. Not for Redistribution
II DEVELOPMENTS, TRENDS, AND ISSUES IN THE MATURE FINANCIAL MARKETS
Markets Since the 1987 Market Break (Washington: U.S. Securities and Exchange Commission).
·'Long Live the Loan," 1999, The Economist (June 12). p. 67. Marcoccio, Lou, 1999. "Year 2000 International State of
Readiness,'' testimony before the U.S. Senate Special Commiuee on the Year 2000 Technology Problem, Washington, March 5.
Mehra, Rajnish. and Edward C. Prescott, 1985, "The Equity Premium: A Puzzle," Journal of Monetary Economics, Vol. 15 (March), pp. 145-6 1 .
Miller, Merton H., and Franco Modigliani, 1961, "Dividend Policy, Growth, and the Valuation of Shares,'' Journal of Business (October), pp. 41 1-33.
Nikko Salomon Smith Barney, 1999, "Digging Deeper into Capital Flows," Economic and Market Analysis: Japan-Issues and Prospects (Tokyo, May 20).
36
Starr-McCiuer, Martha, 1998, "Stock Market Wealth and Consumer Spending,'' Finance and Economics Discussion Series No. 1998-20 (Washington: Board of Governors of the Federal Reserve System, April).
Steinherr, Alfred, 1998. Derivatives: The Wild Beast of Finance (New York: Wiley).
United States, Presidential Task Force on Market Mechanisms. 1988, Report of the Presidemial Task Force on Market Mechanisms (Washington: U.S. Government Printing Office. January).
United States, President's Working Group on Financial Markets, 1988, /nterim Report of the Working Group on Financial Markets: Submiued to the President of the United States (Wa�hington, May).
U.S. Securities and Exchange Commission. 1988, The October 1987 Market Break (Washington, February).
©International Monetary Fund. Not for Redistribution
III Emerging Markets: T he Contraction in External Financing and Its Impact on Financial Systems
The turmoil that began as the ··Asian crisis" in 1997 spread far more widely in 1998 as the pattern of
rolling crises continued. After the substantial turmoil experienced in late 1997, the outlook for emerging markets appeared to improve in early l 998 and suggested that the crisis might perhaps be contained in Asia. However, pressures reemerged and were reflected in a slowing of gross capital flows, a rise in bond yield spreads, and a fall in equity prices. The situation worsened following the devaluation and unilateral domestic debt restructuring in Russia. Fears that similar defaults could occur in other emerging markets resulted in a full-blown emerging market crisis, exacerbated by the turmoil in the mature markets around the near-failure of LTCM. In Latin America, pressures on the Brazilian real intensified and culminated in the devaluation in January 1999. However, the devaluation did not have major or long-Lived effects on other emerging markets, reflecting the deleveraging that had occurred in late 1998 and the growing expectation that an exchange rate adjustment would eventually be necessary in Brazil.
There was a recovery in emerging markets in the first half of 1999 following the Brazilian devaluation. By mid-1999, the pressures on emerging markets appeared to have lessened somewhat, and market access for the higher-rated emerging market borrowers had improved from the anemic levels of the second half of 1998. Nonetheless, yield spreads remain high, international markets remain closed for many corporates, and the weakness in May of expectations regarding U.S. interest rate increases illustrates the sensitivity of emerging market asset prices to developments in the mature markets. Further, trading volumes in emerging market bonds and foreign exchange are now much lower than prior to the crisis, as leverage has been cut back and many investors have retreated from the market, leaving both a smaller pool of "dedicated" emerging market investors and fewer "crossover" investors. There have also been cutbacks in the number of market makers, and price volatility and bid-ask spreads have increased relative to their levels prior to the Asian crisis.
The crises seen in Asia, Russia, and Brazil were both causes and symptoms of a reassessment of risk in emerging markets. The Large capital inflows into emerging markets in the 1990s were predicated on, and helped to strengthen, the perception that emerging
37
markets represented a near-mainstream asset class that was suitable for many investors. By early 1997, this perception had resulted in yield spreads on emerging market bonds that were unreasonably low. As weaknesses in emerging markets were revealed, yield spreads increased, and net flows to emerging markets slowed and then reversed. To some extent, this reassessment of risk in emerging markets is appropriate. It remains to be seen, however, how much yield spreads will fall from current levels and how much flows will pick up from their current low rate.
The spillover effects associated with the recent emerging market crises are larger and more complex than those seen in earlier periods of turmoi I. I In part, this contagion was the result of common external shocks, wake-up calls about common domestic weaknesses, and macroeconomic linkages. But financial linkages have proven stronger and more complex than in earlier periods, and they have increased the rapidity with which shocks are reflected in asset prices. Moreover, the portfolio decisions of market makers and large global players, including those that operate with a high degree of leverage, have often played a key role in determining short-term movements in asset prices. By contrast, the role of traditional "fundamentals" in short-term price movements sometimes appears quite modest. As an example. while the falls in asset prices in the turmoil of August and September of 1998 certainly reflected a reassessment of credit and other risks, this initial impact was magnified substantially by the subsequent drying up of market liquidity.
The continued turmoil in emerging markets has resulted in some noteworthy changes in investor and issuer behavior. As investors' appetites for emerging market assets have fallen, they have shown a clear preference for assets with reduced credit risk and enhanced liquidjty. As a result, the proportion of emerging market bonds sold without credjt ratings was far lower in early 1999 than it had been in 1997. Further, the average credit qualjty of new rated bonds is now substantially higher, as more issuers have sought to enhance the credit quality of their bonds through asset backing and as investors have shown a preference for sovereign over private sector issuers. In thjs context, Japan's New
1 See also IMF ( 1999a) for a funher discussion of financial contagion.

©International Monetary Fund. Not for Redistribution
Ill EMERGING MARKETS: EXTERNAL FINANCING CONTRACTION AND IMPACT ON FINANCIAL SYSTEMS
Miyazawa fnitiative, which provides guarantees for bonds issued by Asian emerging markets, will be helpful in facilitating market access. The difficult market conditions of the last year have also encouraged innovation in issuance polky. Emerging market borrowers have looked for new ways to make their issues attractive, by attaching warrants and other "sweeteners" and enhancing the liquidity of their issues by reopening existing issues and issuing securities with stepdown coupons that wiU later become fungible with existing issues. In addition, the reluctance of banks to weigh down their balance sheets with low-yielding syndicated loans means the terms and conditions in this sector are becoming more like those in the bond market.
The losses experienced on emerging market assets in 1998 were reflected in a further sharp contraction in private market financing for emerging markets. Balance of payments data suggest that private net capital inflows fell in 1998 to levels not seen since L990, while gross private market financing flows fell back to the levels of 1994-95. Most types of inflows fell, although foreign direct investment remained fairly stable. International banks continued their withdrawal of funds from emerging markets, imposing severe strains on domestic banking systems.
The turbulence in global markets imposed severe pressures on most systemically important emerging market banking systems, but most systems outside Asia weathered the consequences of capital outflows reasonably well. Many Asian and Latin American banks experienced substantial cuts in international interbank credit lines and losses in international repo lines, but their deposit bases proved resilient to the turbulence in the second half of 1998-in many cases aided by extensive government guarantees. In most countries, banks magnified the transmission of the external liquidity squeeze to local capital markets and the real economy, as they scrambled to restore the liquidity of their balance sheets, shifting funds away from the corporate sector and into government securities. ln addition to the losses on their securities portfolios, banks were hit by increased delinquencies in their loan portfolios owing to a deteriorated operating environment. While most banks in emerging Asia remained focused on restructuring their bad loans and restoring their capital bases, the largest banking systems in Latin America have shown an enhanced ability to withstand the external liquidity squeeze. The healthiest banking systems in emerging Europe have continued to attract sizable capital flows and to expand credit to a fledging corporate sector, as competition grows and foreign banks contribute to a more stable and efficient financial environment.
Despite the resiJjence of most emerging market banking systems to the recent bouts of market turbulence, some risks remain. The lack of progress in corporate debt restructuring in Asia represents one of the key risks to the strengthening of banks' balance sheets
38
in the region, and may require additional rounds of bank recapitalization. [n Latin America. the pronounced slowdown in economic activity has not yet been fully reflected in banks' balance sheets. Moreover, the banks' conservative behavior toward lending-combined with the corporate sector's loss of access to international capital markets-has continued to squeeze the small and medium-sized enterprises, which have all but lost access to private credit, particularly in Argentina and Mexico. Smaller and weaker banks in some countries are facing the double strain of a deteriorated environment and competition from foreign banks, and are likely to have to exit the market. While the authorities have so far managed the failures of weaker banks with no adverse effects upon the rest of the systems, market participants view the likely acceleration of the consolidation process in a weak econorruc environment as a source of concern. In Poland and Hungary, the rapid growth in foreign currency loans to generally unhedged corporales is a potential risk, but this is counterbalanced by the stability offered by high foreign ownership and the ongoing improvements in supervision and regulation prior to EU accession. Jn Turkey, analysts remain concerned about banks' foreign currency mismatches, the concentration of intragroup lending and guarantees, and the health of some weak institutions.
Financial Market Developments
E'olution of the Crisis Through 1998 and Early 1999
In the early part of 1998, it appeared that the emerging markets were beginning to recover from the Asian crisis, and from the October 1997 turmoiJ in Hong Kong SAR and other equity markets. A modest recovery in Asia-where Korea and Thailand saw increases of over 60 percent in U.S. dollar terms in equity prices in the firsr quarter2-suggested that the crisis might perhaps be stopped from spreading beyond Asia. This raLly reflected the improving outlook in Korea, which-after substantial downgrades in late 1997-was upgraded by two of the major rating agencies in February 1998 as the external debt restructuring and IMF-supported program bolstered confidence. Indonesia was a notable exception to the improving outlook, with the rupiah remaining extremely weak against a background of economic policy weaknesses and continuing civil unrest that eventually saw the resignation of President Suharto in May.
The nascent recovery came to a halt in May and the outlook began to worsen through the middle of the year. While the worsening situation in Russia was an
2AII references to equity price developments in emerging markeiS in this chapter refer. unless otherwise noted, to the percentage return in the International Finance Corporation's investable indices in U.S. dollar tenns.
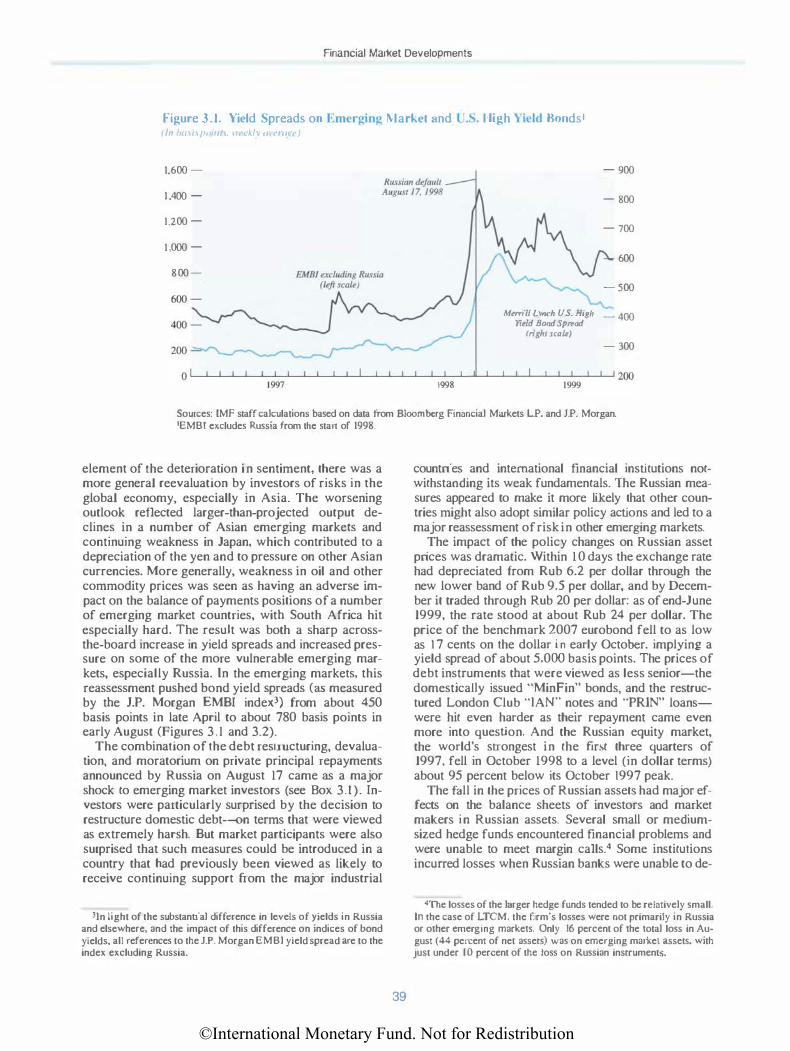
©International Monetary Fund. Not for Redistribution
Rnancial Market Developments
Figure 3.1. \'icld Spreads on Emerging \larl..ct �nd l' .S. lligh \'iclcl Bonds I f/n />ri.\Hf!Ortlll, llld/\ tll ll"l" I
1,600 -
1,400 -
1,200 -
1,000 -
800-
1 997 1998
- 900
- 800
- 700
600
- 500
..... M�rrill Lym:lt U.S. High _ 400
Yi�ld Bond Sp"od (right scale)
- 300
1 999
Sources: LMF staff calculations based on data from Bloomberg Rnaocial Markets L.P. and J.P. Morgan. 'EMBT excludes Russia from the stan of 1998.
element of the deterioration i n sentiment, there was a more general reevaluation by investors of risks in the global economy, especially in Asia. The worsening outlook reflected larger-than-projected output declines in a number of Asian emerging markers and continuing weakness in Japan, which contributed to a depreciation of the yen and to pressure on other Asian currencies. More generally, weakness in oil and other commodity prices was seen as having an adverse impact on the balance of payments positions of a number of emerging market countries, with South Africa hit especially hard. The result was both a sharp acrossthe-board increase in yield spreads and increased pressure on some of the more vulnerable emerging markets, especially Russia. In the emerging markets, this reassessment pushed bond yield spreads (as measured by the J.P. Morgan EMBI index3) from about 450 basis points in late April to about 780 basis points in early August (Figures 3.1 and 3.2).
The combination of the debt restructuring, devaluation, and moratorium on private principal repayments announced by Russia on August 17 came as a major shock to emerging market investors (see Box 3.1). Investors were particularly surprised by the decision to restructure domestic debt-on terms that were viewed as extremely harsh. But market participants were also surprised that such measures could be introduced in a country that bad previously been viewed as likely to receive continuing support from the major industrial
lin light of the substantial difference in levels of yields in Russia and elsewhere, and the impact of this difference on indices of bond yields. all references to the J.P. Morgan EMBl yield spread are to the index excluding Russia.
39
countries and international financial instHutions notwithstanding its weak fundamentals. The Russian measures appeared to make it more likely that other countries might also adopt similar policy actions and led to a major reassessment of risk in other emerging markets.
The impact of the policy changes on Russian asset prices was dramatic. Within 10 days the exchange rate had depreciated from Rub 6.2 per dollar through the new lower band of Rub 9.5 per dollar, and by December it traded through Rub 20 per doJlar: as of end-June 1999, the rate stood at about Rub 24 per dollar. The price of the benchmark 2007 eurobond fell to as low as J 7 cents on the dollar i n early October. implying a yield spread of about 5.000 basis points. The prices of debt instruments that were viewed as less senior-the domesticaJiy issued "MinFin" bonds, and the restructured London Club "JAN" notes and "PRIN" loanswere hit even harder as their repayment came even more into question. And the Russian equity market, the world's strongest in the ftrst three quarters of 1997, fell in October 1998 to a level (in dollar terms) about 95 percent below its October 1997 peak.
The fall in the prices of Russian assets had major effects on the balance sheets of investors and market makers in Russian assets. Several small or mediumsized hedge funds encountered financial problems and were unable to meet margin calls.4 Some institutions incurred losses when Russian banks were unable to de-
4The losses of the larger hedge funds tended to be relatively small. ln the case of LTCM, the firm's losses were oot primarily in Russia or other emerging markets. Only 16 percent of the total loss in Au· gust (44 percent of net assets) was on emerging market assets. with just under I 0 percent of the loss on Russian instruments.

©International Monetary Fund. Not for Redistribution
Ill EMERGING MARKETS: EXTERNAL FINANCING CONTRACTION AND IMPACT ON FINANCIAL SYSTEMS
Figure 3.2. Secondan \Jark.ct Yield Spread-; on U .S. Dollar- Denmninatcd Eurobonds b) Selected !�merging :\ larkct-; 1 I /11 btl\i' f'<liut.d
Latin America
Mexico
1994 1995 1996
350 -Europe
250 -
ISO -
50 1994 1995 1996
Asia
Source: Bloomberg Financial Markets L.P.
1997
1997
-2.500
Bra:,il -2,000
500
0 1998 1999
-8,000
-7,000 � Rt4siJJ t h.�\::: :::
4,000
3,000
2,000
1998 1999 0
- 2,500
lndon�sia
'Latin America: Republic of Argentina bond due 12/3, Umtcd Mexican States bond due 9/2, and Republic of Brazil bond due 11/1. Europe: National Bank of Hungary bond due 4/3, Republic of Turkey bond due 5/2. and Ministry of Finance of Russia bond due 1 1/1 . Asia: People's Republic of China bond due 1 1/3, Republic of Indonesia bond due 8/6. Republic of Philippines bond due 10/16. and Korea Developmenl Band bond due 11/3.
liver on forward contracts on the ruble, or when Westem banks refused to deliver, claiming that the policy actions of the Russian government constituted a form of force majeure. As losses on holdings of Russian securities were revealed and market volatility increased, many leveraged investors began to face much higher
40
margin calls from their creditor banks. Further, risk management systems in many investment banks require higher asset price volatility to be supported by higher capital charges against trading activity or reductions in trading positions in assets whose perceived riskiness has increased. In many cases, the decision
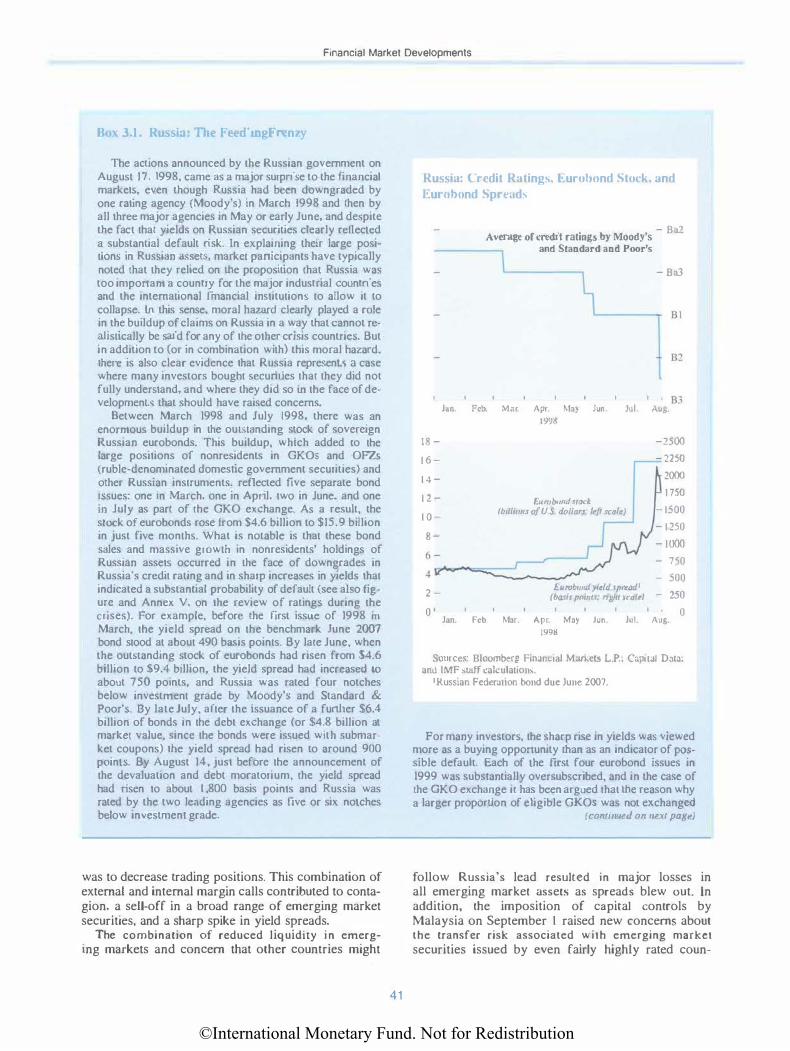
©International Monetary Fund. Not for Redistribution
Financial Market Developments
Box 3.1 . Russia: The I eeding Frenzy
The actions announced by the Russian government on August 17. 1998, came as a major surpri�e to the financial markets, even though Russia had been downgraded by one rating agency (Moody's) in March 1998 and then by all three major agencies in May or early June. and de!>pite the fact that yields on Russian securities clearly reflected a substantial default risk. ln explaining thetr large position� in Russian a-,set!., market panicipants have typically noted that they relied on the proposition that Russia was too imponam a country for the major industrial countries and the international fmancial institution� to allow it to collapse. ln this sense, moral hazard clearly played a role in the buildup of claims on Russia in a way that cannot realistically be said for any of the other crisis countries. But in addition to (or in combination with) this moral hazard. there is also clear evidence that Russia represent!> a case where many investors bought secunues that they did not fully understand, and where they did so in the face of developments that should have raised concerns.
Between March 1998 and July 1998, there was an enormous buildup in the outstanding stock of sovereign Russian eurobonds. This buildup. whtch added to the large positions of nonresidents in GKOs and OFZs (ruble-denominated domestic government securities) and other Russian instruments. reflected five separate bond issues: one in March, one in April, two in June, and one Ill July as part of the GKO exchange. As a result, the stock of eurobonds rose from $4.6 billion to $15.9 billion in just five months. What is notable is that these bond sales and massive growth in nonresidents' holdings of Russian asset<; occurred in the face of downgrades in Russia's credit rating and in sharp increases in yields that indicated a substantial probability of default (sec also figure and Annex V, on the review of ratings during the crises). For example, before the first issue of 1998 m March, the yield spread on the benchmark June 2007 bond stood at about 490 basis point<;. By late June, when the out�tanding stock of eurobonds had risen from $4.6 billion to $9.4 billion, the yield spread had increased LO about 750 points, and Russia was rated four notches below investment grade by Moody'� and Standard & Poor's. By late July, after the 1ssuance of a funher $6.4 billion of bonds in the debt exchange (or $4.8 billion at market value, since the bonds were is!>ued with submarket coupons) the yield spread had risen to around 900 points. By August 14, just before the announcement of the devaluation and debt moratorium, the yield spread had risen to about I ,800 basis points and Russia was rated by the two leading agencies as five or six notches below investment grade.
was to decrease trading positions. This combination of external and internal margin calls contributed to contagion, a sell-off in a broad range of emerging market securities, and a sharp spike in yield spreads.
The combination of reduced liquidHy in emerging markets and concern that other countries might
41
Russia: Credit Ratings, l�urohond Stock, and Euruhnnd Sprcnd"
18 -
1 6 -
1 4 -
1 2 -
1 0 -
8 -
6 -
4
2 -
0
- Ba2 Average of credit ratings by Moody's and Standard and Poor's
- Ba3
B3 Jiln Feb. Mor Apr May Jun Jul -\ug.
Jan.
1998
-2500
, ___ ,«. n :: fb•llirm.r af U.S Jollar.r; lt!ft .rc<1/�) - 1500
- 1 250
- 1000 - 750
- 500 Euroboml y• tld sprtad1
(ba.ri.r p<>imr: right uat.•J - 2.50
Feb. Mar. Apr May Jun Jul Aug. 0
1998
Sources: Bloomberg Financ1al Market� L.P .• Cap1tal 0<�1<1. and IMF Maff calculation�
• Russ1an Federauon bond due June 2007.
For many investor<;, the sharp rise in yields wru; viewed more as a buying opponunity than as an indicator of possible default. Each of the first four eurobond issues in 1999 was substantially oversubscribed, and in the case of the GKO exchange it has been argued Lhat the reason why a larger proportion of eligible GKOs was not exchanged
( co11tinued on lli!.Xt page)
follow Russia's lead resulted in major losses in all emerging market assets as spreads blew out. In addition, the imposition of capital controls by Malaysia on September 1 raised new concerns about the transfer risk associated with emerging market securities issued by even fairly highly rated coun-
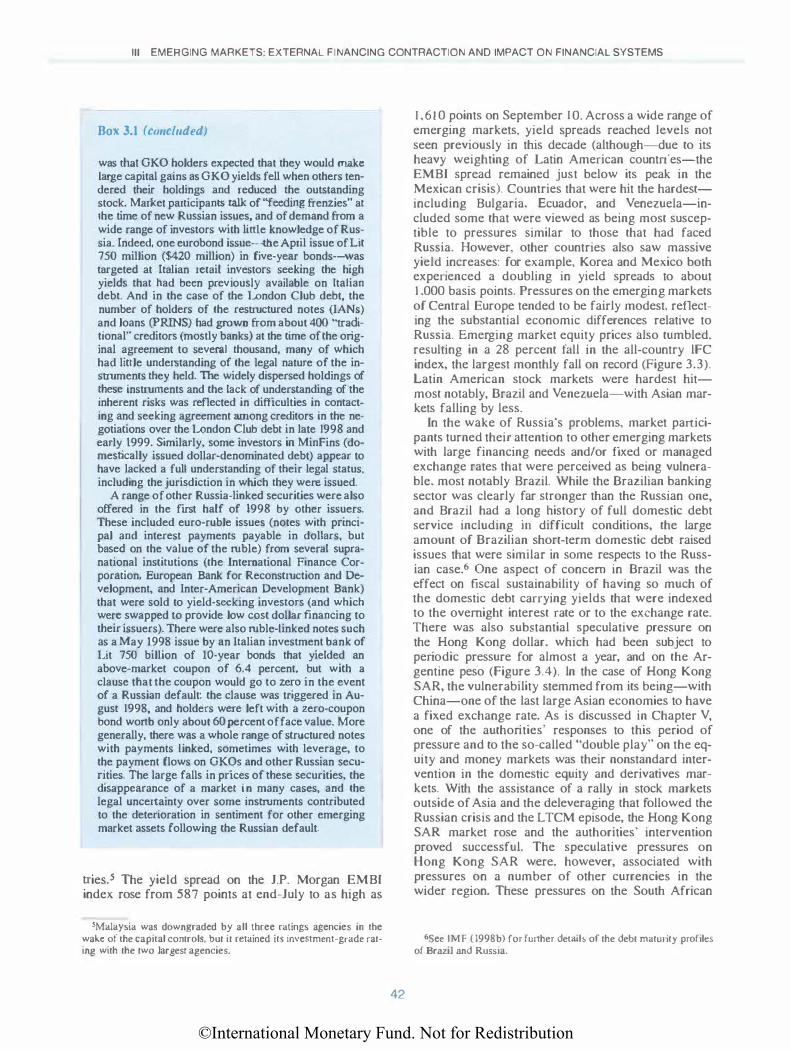
©International Monetary Fund. Not for Redistribution
Ill EMERGING MARKETS: EXTERNAL FINANCING CONTRACTION AND IMPACT ON FINANCIAL SYSTEMS
Box 3.1 (concluded)
was that GKO holders expected that they would make Large capital gains as GKO yields fell when others tendered their holdings and reduced the outstanding stock. Market participants talk of "feeding frenzies" at the time of new Russian issues, and of demand from a wide range of investors with little knowledge of Russia. Indeed. one eurobond issue-the April issue of Lit 750 million ($420 million) in five-year bonds-was targeted at Italian retail investors seeking the high yields that bad been previously available on ltatian debt. And in the case of the London Club debt, the number of holders of the restructured notes (IANs) and loans (PRINS) had grown from about 400 "traditional" creditors (mostly banks) at the time of the original agreement to severa.l thousand, many of which had little understanding of the legal nature of the instruments they held. The widely dispersed holdings of these instruments and the lack of understanding of the inherent risks was reflected in difficulties in contacting and seeking agreement among creditors in the negotiations over the London Club debt in late 1998 and early 1999. Similarly, some investors in Minfins (domestically issued dollar-denominated debt) appear to have lacked a full understanding of their legal status, including the jurisdiction in which they were issued.
A range of other Russia-linked securities were also offered in the first half of 1998 by other issuers. These included euro-ruble issues (notes with principal and interest payments payable in dollars, but based on the value of the ruble) from several supranational institutions (the International Finance Corporation, European Bank for Reconstruction and Development, and Inter-American Development Bank) that were sold to yield-seeking investors (and which were swapped to provide low cost dollar financing to their issuers). There were also ruble-Linked notes such as a May 1998 issue by an Italian investment bank of Lit 750 billion of 10-year bonds that yielded an above-market coupon of 6.4 percent, but with a clause that the coupon would go to zero in the event of a Russian default: the clause was triggered in August 1998, and holders were left with a zero-coupon bond wonb only about 60 percent of face value. More generally, there was a whole range of structured notes with payments Linked, sometimes with leverage, to the payment flows on GKOs and other Russian securities. The large falls in prices of these securities, the disappearance of a market in many cases, and the legal uncertainty over some instruments contributed to the deterioration in sentiment for other emerging market assets following the Russian default.
tries.s The yield spread on the J.P. Morgan EMBf index rose from 587 points at end-July to as high as
5Malaysia was downgraded by all three ratings agencies in the wake of the capital controls, but it retained its investment-grade rating with the two largest agencies.
42
I ,610 points on September I 0. Across a wide range of emerging markets. yield spreads reached levels not seen previously in this decade (although-due to its heavy weighting of Latin American countries-the EMBI spread remained just below its peak in the Mexican crisis). Countries that were hit the hardestincluding Bulgaria, Ecuador, and Venezuela-included some that were viewed as being most susceptible to pressures similar to those that had faced Russia. However, other countries also saw massive yield increases: for example, Korea and Mexico both experienced a doubling in yield spreads to about 1 .000 basis points. Pressures on the emerging markets of Central Europe tended to be fairly modest, reflecting the substantial economic differences relative to Russia. Emerging market equity prices also tumbled. resulting in a 28 percent fall in the all-country lFC index, the largest monthly fall on record (Figure 3.3). Latin American stock markets were hardest hitmost notably, Brazil and Venezuela-with Asian markets falling by less.
In the wake of Russia's problems, market participants turned thei1· attention to other emerging markets with large financing needs and/or fixed or managed exchange rates that were perceived as being vulnerable, most notably Brazil. While the Brazilian banking sector was clearly far stronger than the Russian one, and Brazil had a long b.istory of full domestic debt service including in difficult conditions, the large amount of Brazilian short-term domestic debt raised issues that were similar in some respects to the Russian case.6 One aspect of concern in Brazil was the effect on fiscal sustainability of having so much of the domestic debt carrying yields that were indexed to the overnight interest rate or to the exchange rate. There was also substantial speculative pressure on the Hong Kong dollar, which had been subject to periodic pressure for almost a year, and on the Argentine peso (Figure 3.4). ln the case of Hong Kong SAR, the vulnerability stemmed from its being-with China-one of the last large Asian economies to have a fixed exchange rate. As is discussed in Chapter V, one of the authorities' responses to this period of pressure and to the so-called "double play" on the equity and money markets was their nonstandard intervention in the domestic equity and derivatives markets. With the assistance of a rally in stock markets outside of Asia and the deleveraging that followed the Russian crisis and the LTCM episode, the Hong Kong SAR market rose and the authorities' intervention proved successful. The speculative pressures on Hong Kong SAR were. however, associated with pressures on a number of other currencies in the wider region. These pressures on the South African
6See IMF ( 1998b) for further details of the debt maturity profiles of Brazil and Russia.
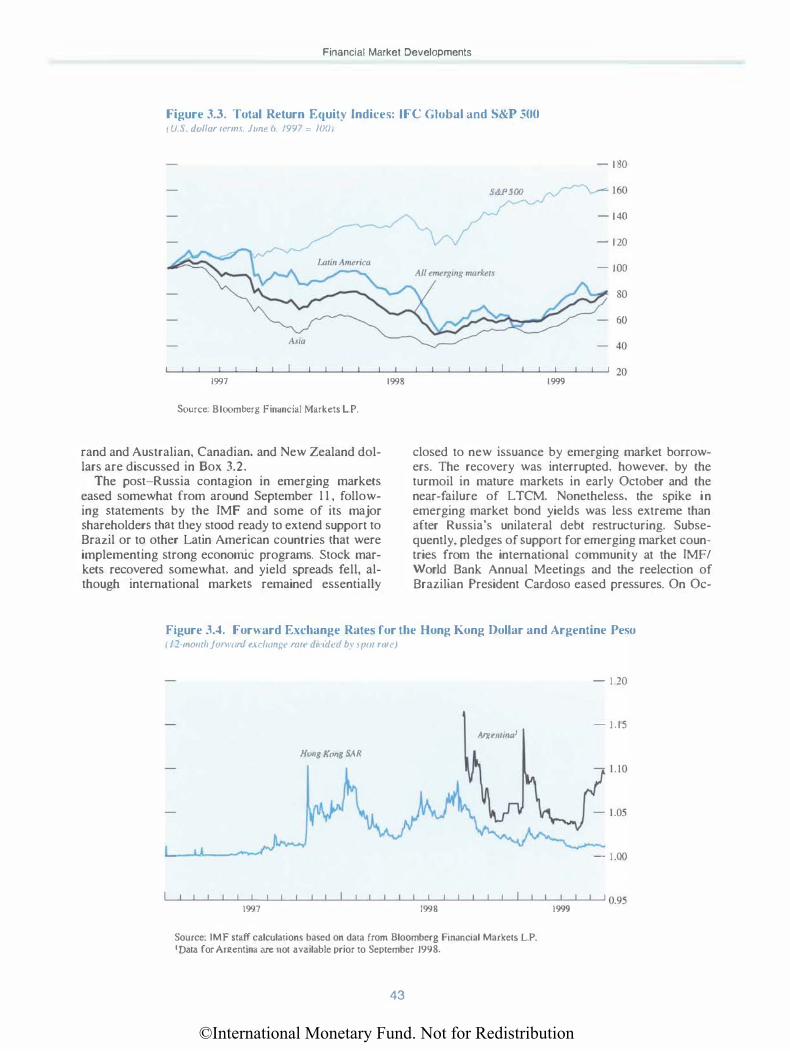
©International Monetary Fund. Not for Redistribution
Financial Market Developments
Figure 3.3. Total Return Equit) Indices: lFC Global and S&P .500 I L' .. �. dollar rerm.1. June 6. 1'197 = /00)
1997
Source: Bloomberg Financial Markets L.P.
rand and Australian, Canadian, and New Zealand dollars are discussed in Box 3.2.
The post-Russia contagion in emerging markets eased somewhat from around September l l , following statements by the IMF and some of its major shareholders that they stood ready to extend support to Brazil or to other Latin American countries that were implementing strong economic programs. Stock markets recovered somewhat, and yield spreads fell, although international markets remained essentially
1998
S&PS(J()
- 1 80
� 160
- 140
- 120
- 100
80
60
40
1999
closed to new issuance by emerging market borrowers. The recovery was interrupted, however, by the turmoil in mature markets in early October and the near-failure of LTCM. Nonetheless, the spike in emerging market bond yields was less extreme than after Russia's unilateral debt restructuring. Subsequently, pledges of support for emerging market countries from the international community at the IMF/ World Bank Annual Meetings and the reelection of Brazilian President Cardoso eased pressures. On Oc-
Figure JA. Forward Exchange Rates for the Hong Kong Dollar and Argentine Peso 1 1 2-momh jonwml exclwiiJ.:< ran dll'lth·d "' \fUll rill< 1
- 1.20
- 1 . 1 5 Argtlltmo1
Hong Kong SAR
- 1.00
L-L-L-L-L-����������L-L-L-L-��·������L-L-L-L-L-�·�·��• o.9s 1997 1998 1999
Source: 1MF staff calculations based on data from Bloomberg Financial Markets L.P. I Data for ArJ;tentina are not available prior to September 1998.
43
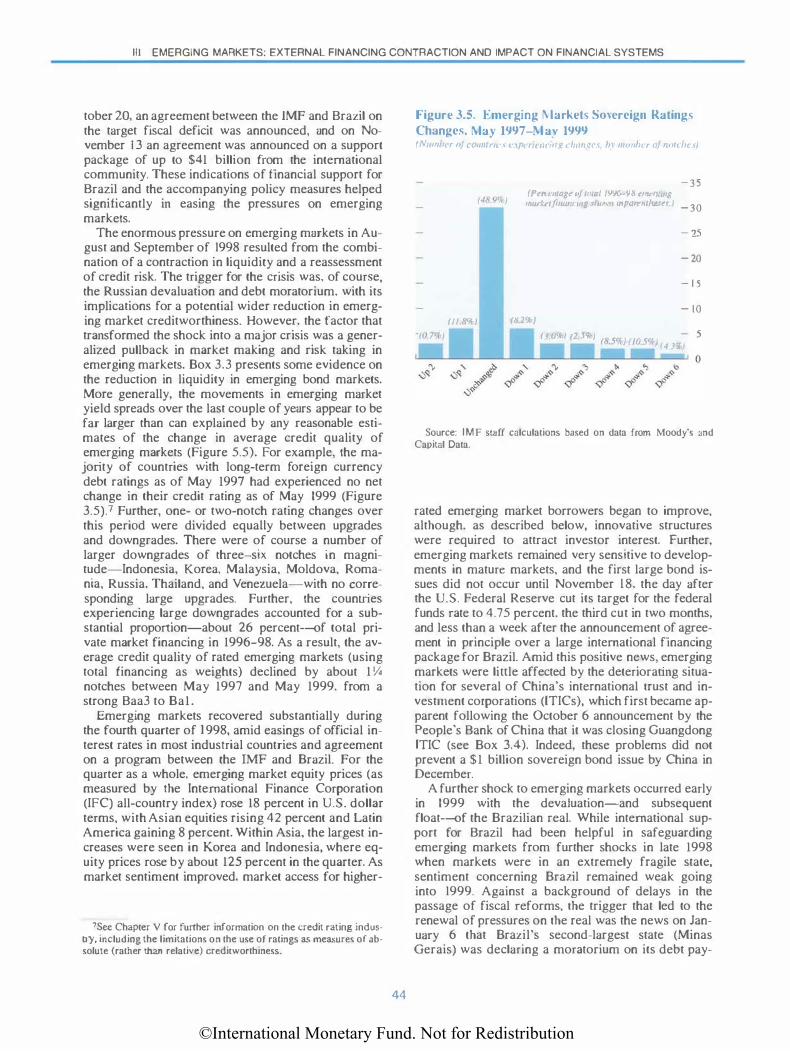
©International Monetary Fund. Not for Redistribution
Ill EMERGING MARKETS: EXTERNAL FINANCING CONTRACTION AND IMPACT ON FINANCIAL SYSTEMS
tober 20, an agreement between the JMF and Brazil on the target fiscal deficit was announced, and on November 13 an agreement was announced on a support package of up to $41 billion from the international community. These indications of financial support for Brazil and the accompanying policy measures helped significantly in easing the pressures on emerging markets.
The enormous pressure on emerging markets in August and September of 1998 resulted from the combination of a contraction in liquidity and a reassessment of credit risk. The trigger for the crisis was, of course. the Russian devaluation and debt moratorium. with its implications for a potential wider reduction in emerging market creditworthiness. However, the factor that transformed the shock into a major crisis was a generalized pullback in market making and risk taking in emerging markets. Box 3.3 presents some evidence on the reduction in liquidity in emerging bond markets. More generally, the movements in emerging market yield spreads over the last couple of years appear to be far larger than can explained by any reasonable estimates of the change in average credit quality of emerging markets (Figure 5.5). For example, the majority of countries with long-term foreign currency debt ratings as of May 1997 had experienced no net change in their credit rating as of May 1999 (Figure 3.5).7 Further, one- or two-notch rating changes over this period were divided equaJiy between upgrades and downgrades. There were of course a number of larger downgrades of three-six notches in magnitude-Indonesia, Korea, Malaysia, Moldova, Romania, Russia, Thailand, and Venezuela-with no corresponding large upgrades. Further, the countries experiencing large downgrades accounted for a substantial proportion-about 26 percent-of total private market financing in 1996-98. As a result, the average credit quality of rated emerging markets (using total financing as weights) declined by about 1 V.S notches between May 1997 and May 1999. from a strong Baa3 to Ba 1.
Emerging markets recovered substantially during the fourth quarter of J 998, amid easings of official interest rates in most industrial countries and agreement on a program between the IMF and Brazil. For the quarter as a whole. emerging market equity prices (as measured by the International Finance Corporation (IFC) all-country index) rose 18 percent in U.S. dollar terms, with Asian equities rising 42 percent and Latin America gaining 8 percent. Within Asia, the largest increases were seen in Korea and Indonesia, where equity prices rose by about 125 percent in the quarter. As market sentiment improved, market access for higher-
'See Chapter V for further information on the credit rating industry. including the limitations on the use or ratings as measures of absolute (rather than relative) creditworthiness.
44
Figure 3.5. Emerging 1\larl..eb Smcrcign Rating-. Changcc;, l\lay 1'197-1\la)· 1999 f ,\'umht 1 oj collllffl('.\ ('.\fl( 1/( 111 1111! t hclllf:t' h� lllflllh( 1 of Ill'/' IW.\)
I Pen t·magr of ltlta/ /W6-98 mu'l}llll� marlt.d.ntwJumg rlitmn mpan:mltt·s�1.
11 1.8<:< I (IJ1%)
-35
-30
25
- 20
- I S
- 10
5 13.0%1 11.5�} 185"' i 10' «• ' . . , I .. nr J 14.3'•
Source: IMF staff calculations based on data from Moody"s and Capital Data.
rated emerging market borrowers began to improve, although. as described below, innovative structures were required to attract investor interest. Further, emerging markets remained very sensitive to developments in mature markets, and the first large bond issues did not occur until November J 8, the day after the U.S. Federal Reserve cut its target for the federal funds rate to 4.75 percent, the third cut in two months, and less than a week after the announcement of agreement in principle over a large international financing package for Brazil. Amid this positive news, emerging markets were linle affected by the deteriorating situation for several of China's international trust and investment corporations (ITICs), which first became apparent following the October 6 announcement by the People's Bank of China that it was closing Guangdong !TIC (see Box 3.4). Indeed, these problems did not prevent a $1 billion sovereign bond issue by China in December.
A further shock to emerging markets occurred early in 1999 with the devaluation-and subsequent float-of the Brazilian real. While international support for Brazil had been helpful in safeguarding emerging markets from further shocks in late 1998 when markets were in an extremely fragile state, sentiment concerning Brazil remained weak going into 1999. Against a background of delays in the passage of fiscal reforms, the trigger that led to the renewal of pressures on the real was the news on January 6 that Brazil's second-largest state (Minas Gerais) was declaring a moratorium on its debt pay-
©International Monetary Fund. Not for Redistribution
Financial Market Developments
Box 3.2. The Activity of Highly Levera�ed lnslitutions in Pacific Rim Currencies in 1998
The speculative pressures experienced in Hong Kong SAR in 1998 (see also Chapter V) were also felt in other countries that saw substantial speculative activity by hedge funds and other leveraged players. Other currencies experiencing large hedge fund trading at various stages in 1998 included the AusLralian dollar, the New Zealand dollar, and the South African rand, in additionas is discussed in Chapter ll-to the Japanese yen.
Short hedge fund positions were buHt up in the period leading up to mid-1998 against currencies that were seen as "surrogates" for the less liquid Asian emerging currencies. ln addition to views on commodity prices and on the vulnerability of some countries, positions against some of the targeted countries reflected the desire to take shon positions against certain Asian emerging markets. However, reflecting the thinness of the foreign exchange markets in most of emerging Asia in the wake of the Asian crisis, il was impossible to put in place large short positions on these currencies. Leveraged investors therefore put positions on the more liquid currencies in the region, including the Australian dollar, the Hong Kong dollar, the New Zealand dollar, and the Singapore dollar, with the absence of any capital controls facilitating the establishment of short positions on the ftrst three currencies. Hedge funds were also seen at times taking short positions against the Canadian dollar and the South African rand.
Discussions with market participants suggest that speculative positions in some of these currencies in mid-1998 were quite large and highly concentrated, with unconfirmed estimates suggesting that total positions of more than S percent of annual GDP may have occurred against some count:ries. Of course, given the relative magnitudes of foreign exchange trading and GDP, even a position thls large in terms of GDP may represent less than one day's average tOtal (i.e., spot, forward, and swap) turnover in the foreign exchange market. In terrns of client business (i.e., excluding interbank dea.ling), the positions would seem substantially larger, and may represent several days of normal turnover. I In this light. the
lA comparison with final client turnover may be more relevant. since this may give a beuer indication of a market's ability to digest a given position without a large price impact.
ments to the federal government. Pressures built up rapidly, and following several days of large capital outflows, the exchange rate band was adjusted on January 13 to allow a devaluation from R$1.21 to R$1.32 per dollar. However, pressures continued, and on January 1 5 the free float of the real was announced. The exchange rate depreciated steadily, reaching a low of R$2.15 per dollar at the start of March, a depreciation of 43 percent from its previous fixed rate. Subsequently, however, the real has appreciated, and traded at end-June at about R$1.75 per dollar (Figure 3.6).
45
total speculative positions pUL in place in some of these markets might well have been quite large relative to the size of the markets.
When the Japanese yen jumped on OcLOber 7 on the reversal of the yen carry Lrade, hedge funds and ot:her large players were seen covering short positions in several currencies including the AusLralian dollar, New Zealand dollar, and South African rand. These currencies saw rapid appreciations of 4-5 percent, while the Canadian and Singapore dollars each appreciated by about 2 percent. As occurred in some other markets, these players found that positions that were built up gradually to avoid moving prices could not be unwound quickly without causing large price movements. lndeed, one-week price movement<; of 16, 10, and 7 percent were seen in the Japanese. New Zealand, and AusLraJian currencies, respectively. These represent the largest oneweek moves in these currencies in the current floating rate era (since 1971 for Japan, 1983 for AustraJia. and 1985 for New Zealand). In hindsight, the players in
volved do not appear to have given sufficient consideration to the consequences if all those with similar positions tried to quickly unwind them. It is notable that the markets that saw the largest movements because of hedge funds and other similar players in this period were not necessarily the smallest and least liquid. but included the third (Japanese) and eighth (Auslralian) most-traded currencies in the world.
Concerns about market integrity have been raised in connection with the activity of hedge funds in some of these countries. It has been suggested that hedge funds lack the longer-terrn relationships that banks have with these markets and are more likely to engage in destabilizing trading and practices. lt has been suggested that, in several cases, hedge funds were seen to be trading in ways that were designed to destabilize markets and to be spreading information about their positions designed to scare other investors into following their lead. It is clear that several hedge funds took similar positions around the same time, although it is unlikely that the question of whether or not there was exphcit collusion will ever be satisfactorily resolved (see Chapter V).
A surprising feature of the market reaction to the Brazilian devaluation was the limited negative impact on Brazilian assets and the limited spillovers elsewhere in tbe region. For example, Brazilian stock prices (in domestic currency terms) fell 31 percent between January 6 and January 14, before surging on the float of the real on January 15, and by January 20, the stock market had more than recovered its losses in domestic currency terms. And, after initially falling about 23 percent (its yield spread increasing by 440 basis points), the price of the benchmark Brazilian eurobond had fully recovered its losses by mid-Febru-
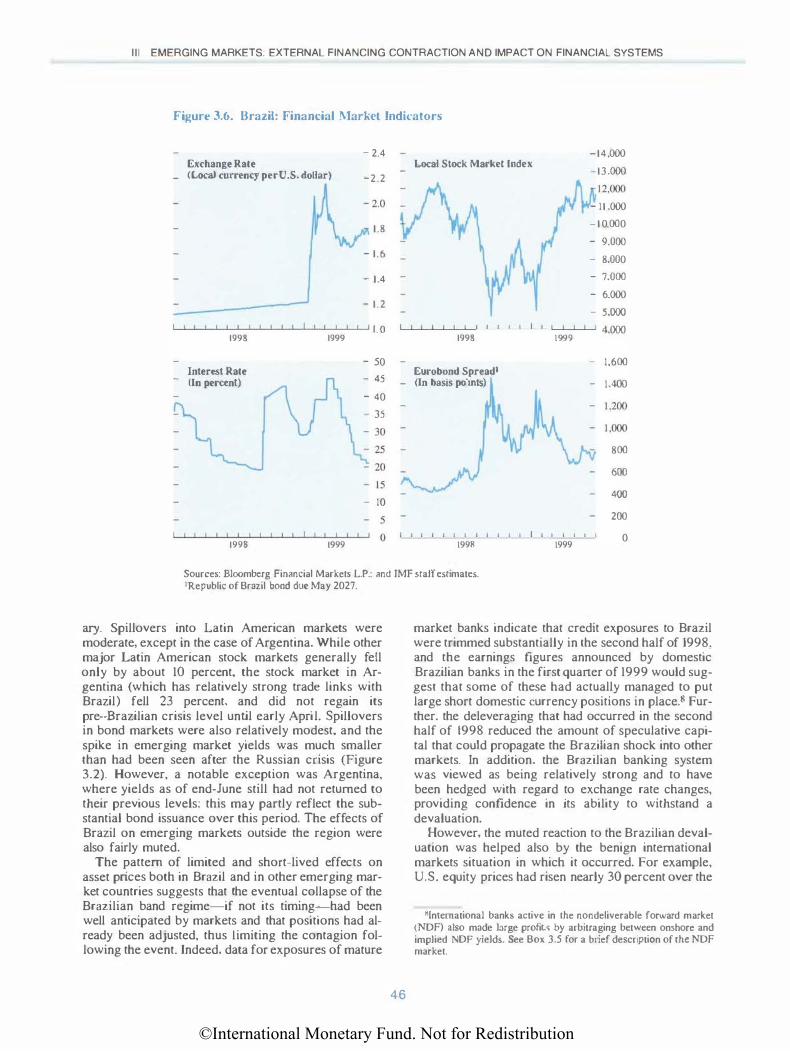
©International Monetary Fund. Not for Redistribution
Ill EMERGING MARKETS: EXTERNAL FINANCING CONTRACTION AND IMPACT ON FINANCIAL SYSTEMS
Figure 3.6. Brazil: Financial 1\larkct lndkators
Exchange Rate (Local currency per U.S. dollar)
I I I I I 1998
Interest Rate - (In percent)
I I 1999
- 2.4
-2.2
1.8
- 1.6
- 1.4
- 1.2
I I I I.Q
- 50 - 45 - 40 - 35 - 30
- IS - 10 - 5
���_L��I_LI�I-L_L��_L�I_L!�t_LI�I Q 1998 1999
I I
I I
Local Stock Market lodex
I I I 1998
Eurobond Spread' (In basis points)
I I I 1998
I I I I 1999
-14,000 -13.000
�12,000 - 11 ,000 - 1 0,000 - 9.000 - 8.000 - 7.000 - 6.000 - 5,000
I 4,000
-
-
1,600
1.400
800
600
400
I I l I I 200
0 1999
Sources: Bloomberg Financial Markers L.P.: and IMF staff estimates. I Republic of Brazil bond due May 2027.
ary. Spillovers into Latin American markets were moderate, except in the case of Argentina. While other major Latin American stock markets generally fell only by about 10 percent, the stock market in Argentina (which has relatively strong trade links with Brazil) fell 23 percent, and did not regain its pre-Brazilian crisis level until early April. Spillovers in bond markets were also relatively modest, and the spike in emerging market yields was much smaller than had been seen after the Russian crisis (Figure 3.2). However, a notable exception was Argentina, where yields as of end-June still had not returned to their previous levels: this may partly reflect the substantial bond issuance over this period. The effects of Brazil on emerging markets outside the region were also fairly muted.
The pattern of limited and short-lived effects on asset prices both in Brazil and in other emerging market countries suggests that the eventual collapse of the Brazilian band regime-if not its timing-had been well anticipated by markets and that positions had already been adjusted, thus Limiting the contagion following the event. Indeed, data for exposures of mature
46
market banks indicate that credit exposures to Brazil were trimmed substantially in the second half of 1998, and the earnings figures announced by domestic Brazilian banks in the first quarter of 1999 would suggest that some of these had actually managed to put large short domestic currency positions in place. a Further, the deleveraging that had occurred in the second half of 1998 reduced the amount of speculative capital that could propagate the Brazilian shock into other markets. In addition, the Brazilian banking system was viewed as being relatively strong and to have been hedged with regard to exchange rate changes, providing confidence in its ability to withstand a devaluation.
However, the muted reaction to the Brazilian devaluation was helped also by the benign international markets situation in which it occurred. For example, U.S. equity prices had risen nearly 30 percent over the
��"International banks active in the nondeliverable forward marker (NDF) also made large profirs by arbitraging between onshore and implied NDF yields. See Box 3.5 for a brief description of the NDF marker.

©International Monetary Fund. Not for Redistribution
Financial Market Developments
Box 3.J. The Decline in Liquidit} in Emerging Market Bond� and Foreign Exchange
In the wake of the Russian unilateral debt restructuring and the near-failure of LTCM, there has been a sharp cutback in the willingness of market participants to take positions in emerging market assets. Many hedge funds and proprietary trading desks either have chosen to reduce their activity in emerging markets or have been forced to do so by the reduction of credit lines. In addition, "crossover" players (investors who speciaJize in investment grade instruments from mature markets, but who are aJso able to hold positions in emerging market securiries) also have a sharply reduced appetite for emerging market assets. Several investment banks have closed down their emerging market trading desks, while most of the others that continue to operate have reduced the capital devoted to this activity and therefore now take smaJJer positions in emerging market assets.
This trend is confirmed by data showing a sharp fall in trading turnover. Data from a survey by the Emerging Markets Trading Association suggest a sharp fall in trading in the third and fourth quarters of 1998, with the turnover of responding firms in the first quarter of 1999 down around 66 percent from its peak level in the fourth quarter of 1997. While a part of this decline is due to falls in the prices of emerging market instruments (and perhaps also to changes in survey coverage), it is clear that there has been a sharp pullback in trading and marketmaking in emerging market instruments. Market participants report an even larger fall in the repo market for emerging market securities. repos having been used to finance the purchases of many investors. Market participants reported gains in turnover in the second quarter in both bond trading and repo activity, bUl volumes remained far below earlier peaks.
The reduction in liquidity and the greater day-to-day price volatility has shown up in larger bid-ask spreads in emerging market instruments. Data for bid-ask spreads for emerging market bonds (measured as the monthly average of the daily median spread for some benchmark bonds) are shown in the figure. The data suggest that bidask spreads in emerging markets were at their lowest in September 1997, around the time that price volatility in emerging market bonds and yield spreads on emerging market bonds and U.S. high-yield debt also touched their lows. Bid-ask spreads peaked in September 1998 in the post-Russian turmoil at levels eight or nine times their levels a year earlier. While they have since declinedwith a hiccup around the Brazilian devaluation-bid-ask
preceding three-month period, and global interest rates were low. Furthermore, one rating agency had placed Korea under review for possible upgrade i n December 1998, while the other two major agencies actually upgraded Korea less than two weeks after the Brazilian devaluation. Malaysia and Thailand were also upgraded around this period.
As a result of the overall favorable global environment, strengthening oil prices, and improving macro-
47
Bid-A-.k Spreads in Emerging Bond \larkcts ( I I /'1 /Y'( /II "' '"""' f'l'i<c 'I
1994
- 2.0 Average bid·ask sprr:ads - 1.8 for /7 Brady uruf
Eurobond instrummts - 1.6 - 1 .4 - 1.2
Average bid·ask sprr:ads for 9 Brady instrumems
-0.4
-0.2
95 96 97 98 99 0
Source: Staff calculations based on data from J.P. Morgan.
spreads in mid 1999 remained about three times higher than the levels of September 1997.
The decline in liquidity has aJso shown up io a smaller number of firms that are active in the primary issuance of emerging market securities. As a result of the reduced competition and the higher price volatility in emerging market assets, fees paid by issuers have increased.
There has been a substantial reduction recently in liqujdity in some sectors of the foreign exchange market. There has been a sharp decline in the volume of trading in Asian and European emerging market currencies, with the withdrawaJ of many market makers. In centraJ Europe, the nondeliverable forward market-which exists mainly for position taking-has been especially hard hit, with a much smaller contraction in onshore spot markets. However, in the case of the crisis-affected countries, liquidity has recovered somewhat from the thin levels in the midst of the crisis. For example, in May 1999 bid-ask spreads in Thailand, Indonesia, and Brazil had fallen by between 60 and 90 percent from their levels during the respective crises. Nonetheless, spreads remain much higher than the levels that prevailed under the previous managed exchange rate regimes.
economic conditions in a number of key emerging markets, markets rallied in February-April, and the issuance drought following the Brazilian shock was relatively brief (Figure 3.7). In the first six months of 1999, emerging equity markets (as measured by the IFC Investable Index) rose by 37 percent. with the Asian index rising 52 percent and the Latin American index rising 3 I percent. Korea, Indonesia, and Russia showed some of the largest rises, each rising by more
©International Monetary Fund. Not for Redistribution
Ill EMERGING MARKETS: EXTERNAL FINANCING CONTRACTION AND IMPACT ON FINANCIAL SYSTEMS
Ro\: J.4. Tht1 < ' ollapst• of G IT<'
Concerns over the financial condition of China's international trust and inveslment corporations (ITLC�>) came to a head in October 1998 with the closure of Guangdong ITIC (GITIC) by the People':. Bank of China for failing to meet its debt obligations. GlTlC. which was declared bankrupt in January 1999, had total liabilities of about $4.7 billion. about half of which bad not been registered. Press reports in April 1999 indicated that creditors could expect to receive back only around 17 percent of the face value of their claims. About $3.9 billion of liabilities were external. and the authorities have announced that the claims of external creditors will be treated in a similar fashion to domestic creditors. Foreign creditors have complained. however. about the lack of transparency and of creditor consultation in the liquidation process.
Over 200 lTlCs were established over the last two decades by cenrraJ and regional governments. These companies played an important role in tem1s of raising funds (mainly in foreign markets in the case of about 20 large lTICs), making loans and investments (including in property development), and conducting securities open\tions. Their growth occurred with limited supervision and under substantial pressure for policy-related lending from their owners. The resulting weaknesses in governance have been exacerbated by the weak health of the state enterprise sector.
The closure of GTTJC has provided a clear indication that creditors of ITICs may not be able to rely on government support. The precise degree of support for ITlCs from their owners bad long been uncertain. although many provincial governments provided letters of support for foreign loans but not explicit guarantees. For their part. the national authorities had issued several statements in recent years warning investors that unautho-
than 60 percent. Emerging market bonds also rallied modestly, with the J.P. Morgan EMBI yield spread (excluding Russia) falling from 1 ,020 basis points to 9 1 5 basis points. This recovery reflected the improving fundamemals in many countries-especially in Asia, where several countries have had rating upgrades-and a perception that the markdown on emerging market assets in the wake of the Russian crisis had been larger than was justified in the wake of the relatively modest reduction in the creditworthiness of most emerging markets.
The recovery in emerging markets has also been supported by favorable developments in Brazil (Figure 3.6). Market participants responded favorably to the nomination and confinnation of Arminio Fraga as Governor of the central bank. The announcement of a strengthened IMF-supported arrangement in March also helped sentiment, as did favorable macroeconomic developments, including resilient output data and a smaller-than-expected impact on inflation. While
48
rized external borrowings would not be guaranteed by the cemral government. In the case of GITIC, it was owned by the Guangdong provincial government and had in the past received capital support from its owner. This support-in addition to its location in a prosperous region that benefited from its proximity to Hong Kong SAR-was one factor behind GITIC still having an inve�tment-grade credit rating by one agency (BBB- from Standard & Poor's) at the time of it� closure. However, the other major agency (Moody's) had downgraded GITIC and some other ITICs to sub-investment-grade two months prior to its closure, citing their deteriorating financial health and the weakened ability of their provincial owners to provide support.
The closure and bankruptcy of GITIC has prompted a reduction in foreign banks' exposure to China and an increasing differentiation between sovereign and nonsovereign entities. Several other !TICs have encountered liquidity pressures in recent months. including Guangzhou TTIC, which is �eeking to restructure its debts to banks in the face of attempts to force the company i11to bankltlptcy. Total ITlC external debt (including GITIC) is estimated by the authoritie$ at $12 billion-but analyst�; estimate it could reach over $20 billion w1th the mclusion of unregistered external claims and guarantees. Only one maJOr ITIC (the central government-controlled China ITIC) retains an investment-grade rating.
U>oking ahead. it is expected that there will be substantial consolidation of the ITIC sector. The People's Bank of China hal> announced that the number of ITICs will be substantially reduced through mergers and restructuring, and a reduction in the �cope of their operalions. Further. !TIC:; have been required since late 1998 to separate their securities and trust operations, in an attempt to increaJ<e the transparency of their operations.
official interest rates were initially increased only slowly, the overnight interest rate was increased to about 45 percent in early March. helping to stabilize the real. As market participants gained confidence in monetary policy, the real strengthened substantially, allowing overnight interest rates to be eased to about 21 percent by late June. At end-June. equity prices in dollar terms were about 20 percent above their predevaluation levels and about 65 percent above their lows during the crisis. Benchmark bond yields had also fallen significantly. As a result of these favorable trends, Braz.il was able to return to the eurobond market in April, raising $2 billion in cash and a further $1 billion in a conversion of Brady securities into conventional eurobonds. However, at a yield spread of 675 basis points on five-year bonds, the cost of funds was far higher than an earlier five-year issue in May 1996 that had canied a spread of only 265 basis points.
Bond markets appear to have been largely unaffected by developments in early 1999 with regard to

©International Monetary Fund. Not for Redistribution
Financial Market Developments
Box 3.5. The Nondeliver.tble ForY.ard �'larket
A notable feature in emerging market foreign exchange markets in recent years has been the prominence of nondeliverable forward (NO F) markets for certain currencies. NDF contracts are similar to outright currency forward contracts in that they fix the future price of a currency between two counterparties. However, unlike traditional forward contracts, which involve the simultaneous exchange, at a predetermined date in the future, of the agreed amounts in the two currencies, delivery on NDF contracts is always in the same currency-usually the U.S. dollar-and in a typical exchange involves settling the difference between the implied exchange rate on the contract and the prevailing spot rate on the maturity date of the contract. NDF contracts are similar to currency futures contracts except that they are traded over the counter and not on organized exchanges, and the payoff on an NDF contract can be replicated exactly using an outright forward contract.
The structure of the NDF contract is designed for two counterparties to take positions on the future value of a currency without requiring delivery of that currency, usually done to avoid capital and exchange controls that pre-
the possible restructuring of some sovereign eurobonds (Box 3.6). Although market participants expressed concern about the Paris Club's decision to ask Pakistan to reschedule its private sector obligations
i ncluding eurobonds and floating rate notes-in a comparable manner to the restructuring of debt owed
Figure 3.7. Emerging J\larJ..et Bond l\hnket Issuance Around Crises• llll l>llitllll\ oj I .\. dol/an. 11 ,.,-�.�, dtllll. c , 111.-r, t! tftrn •n·• 1.. llwnng
cl1·t�rugc J
- 3.6
-2.0
1.6
- 0.4
0 -5-4 -3 -2 -1 0 I 2 3 4 5 6 7 8 9 10 II 12 13 14 15
Weeks Relative co CriSIS Week (Week 0)
Source: Staff calculacions based on data from Capilal Dma. 'Data prior ro Russian default exclude the July 1998 Russian
debt exchange.
49
vent delivery of the domestic currency in fulfillment of a typical forward contract. NDF markets are therefore typically offshore. I As a result, whereas the forward rate on a typical forward contract reflects the interest rate differential between the onshore domestic inte.rest rate and the dollar interest rate, the implied forward rate on an NDF contract reflects the interest rate differential between the offshore interest rate and the dollar interest rate. Arbitraging the onshore and offshore interest rate differential, which can deviate substantially, is a profitable marketmaking activity, but can typically only be done by international banks with local affiliates. However, arbitrage is often not perfect, and hence wide differentials between onshore and implied offshore NDF yields are seen, particularly in times of market volatility.
'In the case of the Philippines, an onshore NDF market has ex.isted where sertlemenr is in pesos. Jndeed, similar markets with settlement in domestic currency ex.isred in many industrial counuies in the 1970s and 1980s prior to the removal of exchange controls.
to official creditors, the impact on the debt of other emerging markets appears to have been limited to a few other lower-rated credits. The possibility of restructuring was seen to be relevant only for a few other countries-including Ukraine and Romaniawith substantial principal repayments due in 1999.9 Nonetheless, in conjunction with the turbulence of the second half of 1998, indications in early 1999 that
payments on sovereign eurobonds might not always be met on schedule have helped to ensure that "investors have become newly acquainted with the notion of credit risk for countries as well as companies and banks" (Moody's, 1 999).
The rally in emerging markets slowed in May amid indications that the U.S. Federal Reserve might raise official interest rates in response to an increase i n inflationary pressures. Emerging market bond and equity markets both peaked around May 10 and then drifted down over the rest of the month. While some country-specific factors-such as the political uncertainty in Russia after the removal of the Primakov government-were at work, the decline in emerging market asset prices mostly reflected developments in the mature markets, including expectations of higher short-term interest rates in the United States. increases
9Jn the case of Romania. repayments were evcmually made on schedule in May and June on two imemational bonds. In the case of Ukraine. credirors agreed in late June 10 exrend the grace period on a structured rare maturing in early June. to enable further negoriations on a possible res1rucruring.

©International Monetary Fund. Not for Redistribution
Ill EMERGING MARKETS: EXTERNAL FINANCING CONTRACTION AND IMPACT ON FINANCIAL SYSTEMS
Box 3.6. I ue<; lnvolvin the Possible Restntduring of Eurobonds
There has recently been substantial discusl>ion about the possibility that countries with debt servicing problems may need to rel;tructure sovereign curobonds and that countries issuing new eurobonds might change the legal structure of bond contracts lO provide for facilitated restructuring if that should prove necessary in the furure.t This discussion follows me decision by the Paris Club to a�k Pakistan to reschedule its private sector obligations-including eurobonds and floating rate notes-in a comparable manner to the re!.lructuting of debt owed LO official creditors.
Although some market participants have complained that seeking rescheduling of eurobonds is a change in the "rules of the game," most have accepted that the move w� probably inevitable in extreme cru;es. given the recent substantial increases io the issuance of government bonds by emerging market countries. especially by countries rated below investment grade. For example. in the case of Pakistan. the majority of eurobonds were issued at ratings of 82 or below. while in the case of Ukrainewhere restructuring& have already occurred-some of the instrumems were issued even before the country had received a 82 rating.
It is clear that there is a tradeoff for countries that approach creditors for a restructuring between immediate cash Oow beoefiL� and possibly reduced subsequent ac-
1See. for example, IMF ( !999b}; lnsutute of International Finance (1999 ); Emergtng Markets Trnders Association (1999); and Standard & Poor\ (1999).
in bond yields or credit yield spreads in some countries, and some weakness in commodity prices. Argentina was one of the most affected countries, with market participants concerned about the impact of higher interest rates on an already weak economy, due to the loss of competitiveness from the Brazilian devaluation. Nonetheless, the pressure on the peso (as measured by the 12-month forward exchange rate) was substantially less than around the Russian and Brazilian crises. Further, as mature equity markets recovered in June, pressures on emerging markets eased, and there were no major movements in emerging market asset prices when the U.S. Federal Reserve announced a 0.25 percent increase in its target for the federal funds rate on June 30.
At the end of June, yield spreads on all major emerging countries had fallen to levels substantiaJiy below their peaks after the crises in Russia and Brazil. But there were substantial differences across countries. Yield spreads on some of the mid-rated countries-for example, Argentina, BraziJ, and Turkey-remained above their pre-Russian crisis levels, due either to domestic developments or be-
50
cess to capital market�. As a result. there is widespread agreement in both the official and private sector!> that any restructuring of eurobonds should be done on a case-bycase basis and that debtors and creditors should work collaboratively to resolve problems on a voluntary basi� for example. via exchange offers.
Looking forward. it may be useful tO have more nexible bond contracts that facilitate restructurings should they become necessary. Currently, most outstanding curobonds arc "American-sryle" hond�. which do not include contractual provisions allowing qualified maJorities to modify the terms of a bond and to impose these mouificauons on minority holders.z Further. in the event of default the bonds provide few conrractual limitations on the ability of individual bondholders to initiate and benefit from legal action on their claims. Given that ownership of eurobonds is generally spread widely. resrructuring under these terms may be diffi" cult and could lead to litigation, loss of value, and perhaps even loss of access for other borrower;,. This could be exacerbated if "vulture funds"-investOI'$ that are skilled m extracting payments from troubled borrowers-were to increase their presence in emerging markets.
In light of the potential problems with ext sting bonds. there have been several suggestions over the last few years that future eurobond issues adopt .. 8rinsh-style"
2See Pet� and Rahman <1999). pp. 61-62, for mformauon on the governing law for outManding bonds.
cause the Russian crisis has highlighted their vulnerability to global shocks. And even in some of the more highly rated countries-for example, Hungary and China-yield spreads have not really fallen back to their pre-Russian crisis levels, due in the latter case to new weaknesses revealed in the problems of the JTICs. Spreads on most other countries in Asia have fallen back below their pre-Russian crisis levels, although they remain well above the pre-Asian crisis levels. Finally, spreads for one country-Mexico-have fallen back nearly to the levels prior to the entire emerging market crisis, largely reflecting the stability imparted by its proximity and links to the United States and the buffering role of its flexible exchange rate.
Looking ahead, one aspect of concern arising out of the losses of the last two years is the damage that has been done to earHer perceptions that emerging markets had become a mainstream asset class. ln the middJe of the decade, emerging market bonds and equities had begun to establish themselves as a legitimate asset class for many investors, with high expected returns and favorable portfolio characteristics (such as low

©International Monetary Fund. Not for Redistribution
Private Capital Flows to Emerging Markets and Developments in the Bond, Equity, and Syndicated Loan Markets
legal terms.� Bonds issued under these terms comam "collective action clauses" that allow for: • collective represemation---clauses that provide proce
dures for bondholders to organize and designate a represen tative to negotiate on their behalf with the debtor;
• qualified majority voting--clauses that enable changes LO be made in the terms of a bond contmct without the unanimous consent of bondholders, and thus prevem a small number of dissident bondholders from blocking an agreement beneficial to the majority; and
• sharing among bondholders--clauses requtring bondholders to share the proceeds of litigation against a debtor with all other creditors, thus reducing the incentive for individual creditors to rake independent legal action against the debtor. Discussions with market participants indicate a fairly
limited knowledge of the legal sLructure of bonds that they purcbase.4 Nonetheless, some market participants argue that facilitating restructuring will make it more likely to occur, and that this will outweigh any possible
'See, for example, the Rcy Report (G-10, 1996): and lMF (1999b)
�sec also the results of a survey of bond m:uket participant' in G-10 (1996). p. 3 1 . The survey indicate� that hond market participants were not generally awnre of the typical $i7e of the majoriry required to agree to a rescheduling of curobonds in ca�s (British-style bonds) where the document allowed this. The survey also notes that there were cenain types of market participants that were indifferent to the legal structure of bond issues. saying they were not long-term holden; of such securities and expected 10 sell securiues well before renegotiation became an issue.
correlations with mature market returns). Many investors that came into emerging markets have fled the market and may not return quickly. The emerging market investor base is now reduced, with a smaiJer pool of "dedicated" money and fewer "crossover" investors (those specializing in mature market investments but able also to invest in emerging markets). Further, the experience of the last two years may have made the remaining crossover investors more opportunistic in their willingness to hold emerging market assets. As a result, emerging markets will remain unusually susceptible to ongoing shocks. Global shocks such as larger-than-expected increases in U.S. interest rates, falls in mature market equity prices, renewed weakness in commodity prices, or set-backs in Japan would undoubtedly have a negative impact on emerging markets. lndications of Y2K problems in emerging market economies or in the trading of emerging market instruments could also affect the outlook, as could indications that reduced access of Latin American corporates to international markets is leading to greater-than-expected difficulties in servicing external debt.
51
benefit to bondholders from a higher recovery rate in the event of restructuring. However, there seem]; to be no evidence in current market prices to suggest that Britishstyle bonds carry higher yields than U.S.-style bonds.s Thus. it seems unlikely that a shift to British-style bonds per se will result m market acces:. being cunailed or yield spread:; being increased substantially. If market acces� were mdeed to worsen, it is more likely that tht� would be a more general result of the problems of some !>Overeign borrowers having resulted in a greater focus on credit risk by market participants.
After some initial negative reaction to official suggestions for changes to bond contracL� an new issues, market participants appear to be more open to :.uch changes. The initial reaction may have in part reflected concerns that all bonds-rather than just new issues-would be subject to such changes. The proposed clauses are seen by many as potentially helpful in facilitating resLructuring and in preserving value that could be lost in the event of a holdout by a small number of creditors. Nonetheless. some market participants remain wary of such instruments. and some emerging market countries may be reluctant to be at the vanguard of a concened shift to British-style issuance, so it will be important for the larger mature market countries to lead this shift.
�See also Petru. and Rahman ( 1999. pp. 69-70), who 'ho" that the market prices of different bonds 1ssued under U.S. and Briush law by three sovereigns (Kankhstan, the Ph1lippmes, and Turkey) suggest-if anything-a higher valuation for Briush -�tyle bonds.
Private Capital Flows to Emerging Markets and Developments in the Bond, E<1uity. and
Syndicated Loan Markets
Net Private Capital flows to Emerging l\larkeh
Balance of payments data show a further sharp fall in net private capital flows to emerging markets in 1998, to the lowest level this decade. While data for 1998 are still preliminary for many countries, current estimates suggest that total net private capital flows in 1998 were about $60 billion. a level about 55 percent below the I 997 figure and about 70 percent below the peak level of L996 (Table 3. L). The sharpness of the recent fall is illustrated by the fact that private flows in 1998 are estimated at levels not seen since 1990 (in dollar terms) or 1989 (as a ratio to emerging market GDP). Further, the level of capital markets activity seen in the first half of J 999 suggests that any pickup this year will be fairly modest.
The financing pressures that in 1997 bad mainly affected the crisis-affected Asian countries spread more widely in 1998. Regions that appeared to benefit in

©International Monetary Fund. Not for Redistribution
Ill EMERGING MARKETS: EXTERNAL FINANCING CONTRACTION AND IMPACT ON FINANCIAL SYSTEMS
Table 3. 1 . Net Private Capital Flow'i to Emcr·ging l\ larkcls, I 990-98 ( /11 l>illir>ll\ nj l' \. do/1111 \)
1990 1991 1992 1993 1994 1995 1996 1997 1998
Emerging markets Total net private capital inflows I 47.7 123.8 119.3 181.9 152.8 193.3 212.1 149.2 64.3
Net foreign direct investment 18.4 31.3 35.5 56.8 82.6 96.7 1 1 5.0 140.0 13 1.0
Net portfolio investment 17.4 36.9 5 1 . 1 1 1 3.6 105.6 41.2 80.8 66.8 36.7
Bank loans and other 1 1 .9 55.6 32.7 1 1 . 5 -35.5 55.4 16.3 -57.6 -103.5
Africa Total net private capital inflows 4.4 8.9 6.9 8.7 4.8 6.8 7.6 16.3 10.3
Net foreign direct investment 1.2 2.0 1.7 1.9 3.4 4.2 5.5 7.6 6.8 Net ponfolio investment -1.5 -1.5 -0.6 1.0 0.8 1.5 -0.2 2.9 3.5
Bank loans and other 4.7 8.4 5.8 5.8 0.7 1.2 2.3 5.8 0.0
Asia To tal net private capital inflows 19.6 34.1 17.9 57.3 66.4 95.1 100.5 3.2 -55.1
Net foreign direct investment 9.3 14.4 14.8 33.0 45.3 49.8 55.1 62.6 50.0
Net portfolio invesunem -2.7 1.4 7.8 21.0 9.4 10.9 12.6 0.9 -15.4
Bank loans and other 13.0 18.4 �.7 3.3 1 1 . 7 34.4 32.8 -60.3 -89 7
Five affected Asian countriesl Total net private capital inflows 24.2 26.8 26.6 31.9 33.2 62.5 62.4 -19.7 -46.2
Net foreign direct investment 6.0 6.1 6.3 6.7 6.5 8.7 9.5 12.1 4.9
Net portfolio investment 0.3 3.4 5.3 16.5 8.3 17.0 20.0 12.6 -6.5
Bank loans and other 17.9 17.3 15.0 8.7 18.4 36.9 32.9 �.5 �.5
Europe Total net private capital inflows 0.0 -16.3 7.6 26.0 16.1 48.1 25.2 35.3 17.5
Net foreign direct investment 0.5 3.2 5.1 6.7 6.0 13.9 13.4 16.6 18.2
Net ponfolio investment 0.5 0.4 2.3 12.4 22.5 18.9 24.8 20.5 4.8
Bank loans and other -1.1 -19.9 0.3 7.0 -12.3 1 5.2 - 13.0 -1.8 -5.4
Russia Total net private capital inflows -5.0 -10.2 0.7 5.9 2.1 15.1 -2.6 1.0 -14.7
Net foreign direct investment -0.7 0.0 0.7 0.9 0.5 1.7 1.7 3.6 1.2 Net ponfolio investmenl 0.0 0.0 0.0 5.0 16.5 14.4 21.9 17.2 4.5
Bank loans and other �.3 -10.2 0.0 0.0 -14.9 -I. I -26.3 -19.8 -20.4
Middle East Total net private capital inflows 10.0 73.0 30.9 27.3 17.9 5.0 -3.1 7.1 22.6
Net foreign direct investment 0.6 0.3 0.1 3.2 3 . 1 2.8 1.7 2.5 2.2
Net ponfolio investment 3.5 2 1 .9 11.3 18.1 12.1 8.3 3.7 2.8 10.8 Bank loans and other 5.8 50.8 19.6 5.9 2.6 -6.1 -8.5 1.8 9.6
Western Hemisphere Total net private capital inflows 13.7 24.1 55.9 62.6 47.5 38.3 82.0 87.3 69.0
Net foreign direct investment 6.7 J 1.3 13.9 12.0 24.9 26.0 39.3 50.6 54.0
Net portfolio investment 17.5 14.7 30.3 61.1 60.8 1.7 40.0 39.7 33.0
Bank loans and other -10.5 -2.0 11.7 -10.6 -38.2 10.6 2.7 -3.1 -18.1
Brazil Total net private capital inflows 8.1 3.1 14.1 12.0 10.0 33.1 35.2 20.5 1 7 . 1
Net foreign direct investment 0.3 0.1 1.9 0.8 2.0 2.8 10.0 15.5 25.0 Net portfolio investment 0.5 3.8 14.5 12.3 5 1 . 1 1 1 . 7 21.4 10.5 17.5
Bank loans and other 7.3 -0.8 -2.3 -1.2 -43.2 18.6 3.8 -5.5 -25.4
1997 from a djversion of flows from Asia saw reduced modest fall tn net inflows to the other emerging flows in 1998. Net private outflows from the five markets in Europe. Net private flows to Africa fell, crisis-affected countries increased relative to 1997, while net flows to the Middle East are estimated to with net outflows of $46 billion, a massive 7 percent have risen substantially as foreign asset positions have of GDP. In addition, financing pressures worsened for been drawn down amid the weakness in oil prices. the rest of Asia, with net private outflows from these Overall, net private flows to countries outside Asia re-countries estimated at $9 billion in 1998, versus net mained-despite their decline in 1998-above their inflows of $23 billion in 1997. In the Western Hemi- 1 996 1evel, suggesting that the impact on private flows sphere region, net inflows continued in 1998, but fell to emerging markets outside Asia had been fairly relative to 1997 for both Brazil and other countries. modest. In tight of the savage reversal-more than Not surprisingly, there were substantial net private $ 1 50 billion-in private financing to Asian countries outflows from Russia in 1998. but there was only a between 1996 and 1998, it would not be surprising if
52
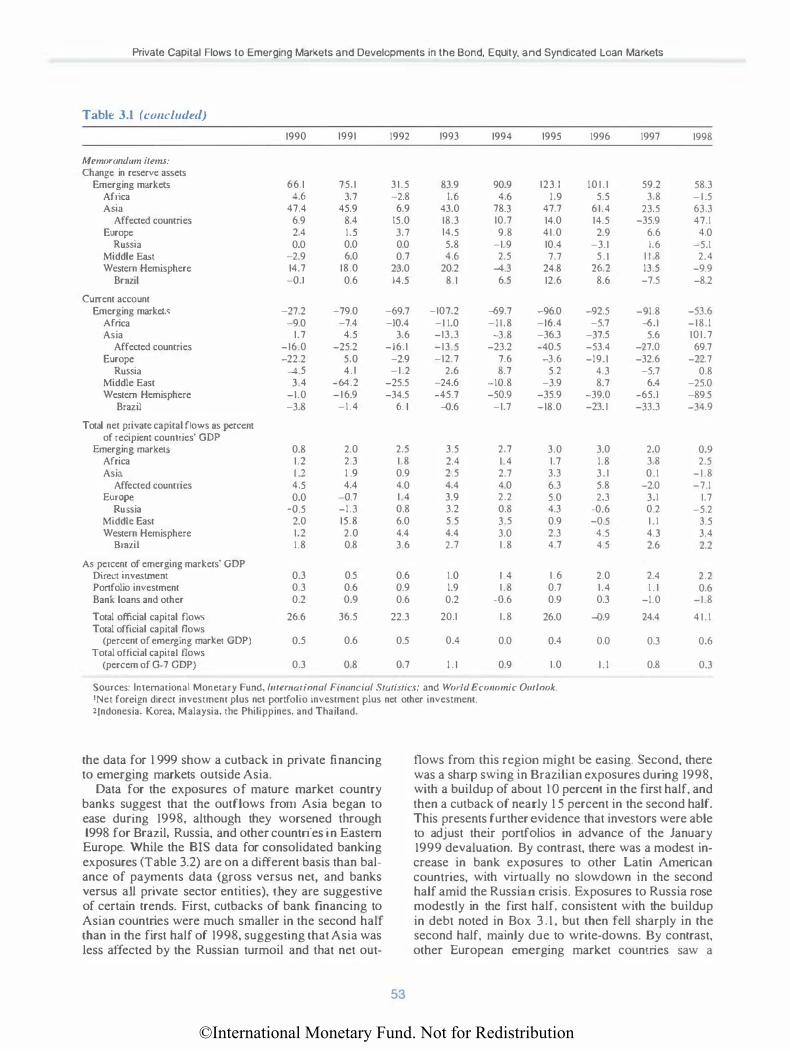
©International Monetary Fund. Not for Redistribution
Private Capital Flows to Emerging Markets and Developments in the Bond, Equity, and Syndicated Loan Markets
Table 3.1 (cunclutfed) 1990 1991 1992 1993 1994 1995 1996 1997 1998
Memorandum items: Change in reserve assets
Emerging markets 66.1 75.1 31.5 83.9 90.9 123.1 I 01.1 59.2 58.3 Africa 4.6 3.7 -2.8 1.6 4.6 1.9 5.5 3.8 -1.5 Asia 47.4 45.9 6.9 43.0 78.3 47.7 61.4 23.5 63.3
Affected countries 6.9 8.4 15.0 18.3 10.7 14.0 14.5 -35.9 47.1 Europe 2.4 1.5 3.7 14.5 9.8 41.0 2.9 6.6 4.0
Russia 0.0 0.0 0.0 5.8 -1.9 10.4 -3.1 1.6 -5.1 Middle E:bt -2.9 6.0 0.7 4.6 2.5 7.7 5 . 1 1 1 .8 2.4 Western Hemjsphere 14.7 18.0 23.0 20.2 -4.3 24.8 26.2 13.5 -9.9
Brazil -{).I 0.6 14.5 8.1 6.5 12.6 8.6 -7.5 -8.2
Current account Emerging markets -27.2 -79.0 -69.7 -107.2 -69.7 -96.0 -92.5 -91.8 -53.6
Africa -9.0 -7.4 -10.4 -1 1.0 -11.8 -16.4 -5.7 -6.1 -18.1 Asia 1.7 4.5 3.6 -13.3 -3.8 -36.3 -37.5 5.6 101.7
Affected countries -16.0 -25.2 -16.1 -13.5 -23.2 -40.5 -53.4 -27.0 69.7 Europe -22.2 5.0 -2.9 -12.7 7.6 -3.6 -19.1 -32.6 -22.7
Russia -4.5 4.1 -1.2 2.6 8.7 5.2 4.3 -5.7 0.8 Middle East 3.4 -64.2 -25.5 -24.6 -10.8 -3.9 8.7 6.4 -25.0 Westem Hemisphere -1.0 -16.9 -34.5 -45.7 -50.9 -35.9 -39.0 -65.1 -89.5
Brazil -3.8 -1.4 6. 1 -{).6 -1.7 -18.0 -23.1 -33.3 -34.9
Total net private capital flows as percent of recipient countries' GOP
Emerging marketS 0.8 2.0 2.5 3.5 2.7 3.0 3.0 2.0 0.9 Africa 1.2 2.3 1.8 2.4 1.4 1.7 1.8 3.8 2.5 Asia 1.2 1 .9 0.9 2.5 2.7 3.3 3.1 0.1 -1.8
Affected countries 4.5 4.4 4.0 4.4 4.0 6.3 5.8 -2.0 -7.1 Europe 0.0 -{).7 1.4 3.9 2.2 5.0 2.3 3.1 1.7
Russia -{).5 -1.3 0.8 3.2 0.8 4.3 -0.6 0.2 -5.2 Middle East 2.0 15.8 6.0 5.5 3.5 0.9 -0.5 1.1 3.5 Western Hemisphere 1.2 2.0 4.4 4.4 3.0 2.3 4.5 4.3 3.4
Brazil 1.8 0.8 3.6 2.7 1.8 4.7 4.5 2.6 2.2
As percent of emerging markets' GOP Direct investment 0.3 0.5 0.6 1.0 1.4 1.6 2.0 2.4 2.2 Ponfolio investment 0.3 0.6 0.9 1.9 1.8 0.7 1.4 1 . 1 0.6 Bank loans and other 0.2 0.9 0.6 0.2 -0.6 0.9 0.3 -1.0 -1.8
Total official capital flows 26.6 36.5 22.3 20.1 1.8 26.0 -{).9 24.4 4 1 . 1 Total official capital tlows
(percent of emerging market GOP) 0.5 0.6 0.5 0.4 0.0 0.4 0.0 0.3 0.6 Total official capital flows
(percem of G-7 GOP) 0.3 0.8 0.7 1 . 1 0.9 1.0 1 . 1 0.8 0.3
Sources: International Monetary Fund, lmemmional Financial Statistics; and World Economic Outlook. 'Net foreign direct investment plus net portfolio investment plus net other investment. 2[ndonesia, Korea, Malaysia, the Philippines, and Thailand.
the data for 1 999 show a cutback in private financing flows from this region might be easing. Second, there to emerging markets outside Asia. was a sharp swing in Brazilian exposures during 1998,
Data for the exposures of mature market country with a buildup of about 1 0 percent in the first half, and banks suggest that the outflows from Asia began to then a cutback of nearly 1 5 percent in the second half. ease during 1998, although they worsened through This presents further evidence that investors were able 1998 for Brazil, Russia, and other countries in Eastern to adjust their portfolios in advance of the January Europe. While the B1S data for consolidated banking 1999 devaluation. By contrast, there was a modest in-exposures (Table 3.2) are on a different basis than bal- crease in bank exposures to other Latin American ance of payments data (gross versus net, and banks countries, with virtually no slowdown in the second versus all private sector entities), they are suggestive half amid the Russian crisis. Exposures to Russia rose of certain trends. First, cutbacks of bank financing to modestly in the first half, consistent with the buildup Asian countries were much smaller in the second half in debt noted in Box 3 . 1 , but then fell sharply in the than in the first half of 1998, suggesting that Asia was second half, mainly due to write-downs. By contrast, less affected by the Russian turmoil and that net out- other European emerging market countri.es saw a
53
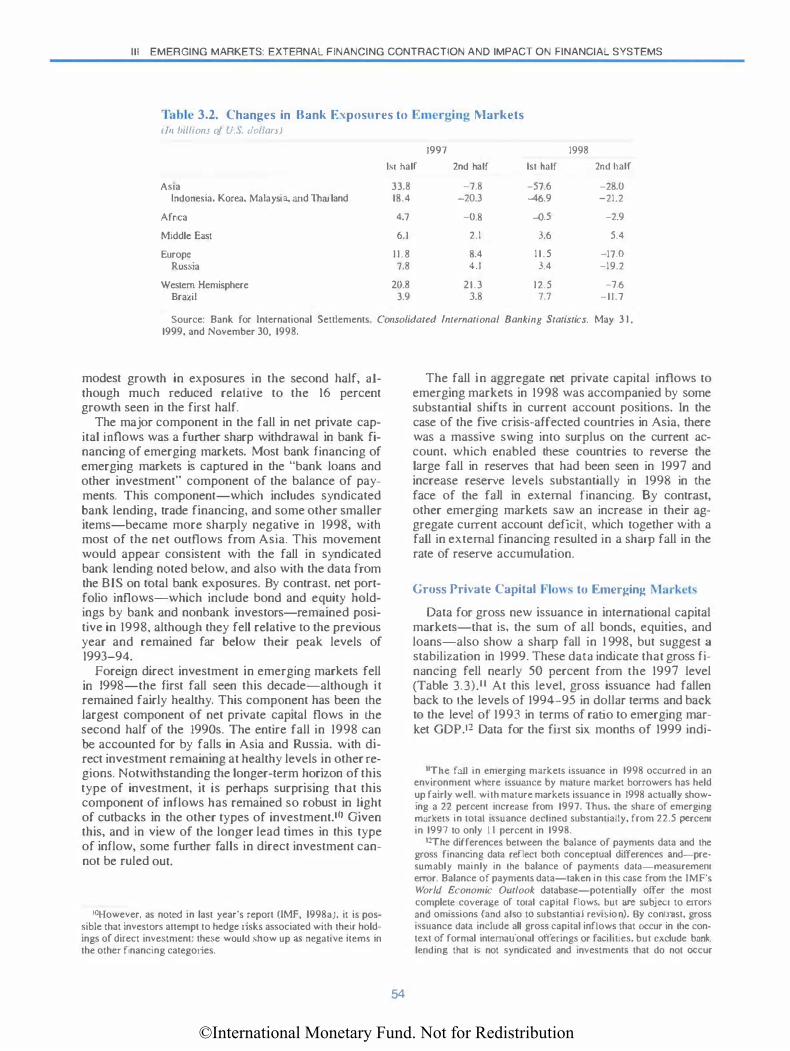
©International Monetary Fund. Not for Redistribution
Ill EMERGING MARKETS: EXTERNAL FINANCING CONTRACTION AND IMPACT ON FINANCIAL SYSTEMS
Table 3.2. Changes in Bank Exposures to E merging Markets 1 In hi/lions oj U.S. dol/an 1
1997 1998 1st half 2nd half 1st half 2nd half
Asia 33.8 -7.8 -57.6 -28.0 Indonesia, Korea. Malaysia, and Thailand 18.4 -20.3 -46.9 -21.2
Africa 4.7 -0.8 -0.5 -2.9 Middle East 6.1 2.1 3.6 5.4 Europe 11 .8 8.4 1 1 . 5 -17.0
Russia 7.8 4.1 3.4 -19.2 Western Hemisphere 20.8 21.3 12.5 -7.6
Brazil 3.9 3.8 7.7 -11.7
Source: Bank for International Settlements. Consolidmed International Banking Statistics. May 3 1 , 1999, and November 30, 1998.
modest growth in exposures in the second half, although much reduced relative to the 16 percent growth seen in the first half.
The major component in the fall in net private capital inflows was a further sharp withdrawal in bank financing of emerging markets. Most bank financing of emerging markets is captured in the "bank loans and other investment" component of the balance of payments. This component-which includes syndicated bank lending, trade financing, and some other smaller items-became more sharply negative in 1998, with most of the net outflows from Asia. This movement would appear consistent with the fall in syndicated bank lending noted below, and also with the data from the BIS on total bank exposures. By contrast, net portfolio inflows-which include bond and equity holdings by bank and nonbank investors-remained positive in 1998, although they fell relative ro the previous year and remained far below their peak levels of 1993-94.
Foreign direct investment in emerging markets fell in 1998-the first fall seen this decade-although it remained fairly healthy. This component has been the largest component of net private capital flows in the second half of the 1990s. The entire fall in 1998 can be accounted for by falls in Asia and Russia, with direct investment remaining at healthy levels in other regions. Notwithstanding the longer-term horizon of this type of investment, it is perhaps surprising that this component of inflows has remained so robust in light of cutbacks in the other types of investment.10 Given this, and in view of the longer lead times in this type of inflow, some further falls in direct investment cannot be ruled out.
IOHowever, as noted in last year's report (IMF, l998a), it is possible that investors attempt to hedge risks associated with their holdings of direct investment: these would show up as negative items in the other financing categories.
54
The fall in aggregate net private capital inflows to emerging markets in 1998 was accompanied by some substantial shifts in current account positions. In the case of the five crisis-affected countries in Asia, there was a massive swing into surplus on the current account, which enabled these countries to reverse the large fall in reserves that had been seen in 1997 and increase reserve levels substantially in 1998 in the face of the fall in external financing. By contrast, other emerging markets saw an increase in their aggregate current account deficit, which together with a fall in external financing resulted in a sharp fall in the rate of reserve accumulation.
Gross Private Capital Flow�> to Emerging Markel'>
Data for gross new issuance in international capital markets-that is, the sum of all bonds, equities, and loans-also show a sharp fall in 1 998, but suggest a stabilization in 1999. These data indi.cate that gross financing fell nearly SO percent from the 1997 level (Table 3.3).11 At this level, gross issuance had fallen back to the levels of 1994-95 in dollar terms and back to the level of 1993 in terms of ratio to emerging market GDP.I2 Data for the first six months of 1999 indi-
11The fall in emerging markets issuance in 1998 occurred in an environment where issuance by mature market borrowers has held up fairly well. with mature markets issuance in 1998 actually showing a 22 percent increase from 1997. Thus, the share of emerging markeLS in total issuance declined substantially, from 22.5 percent in 1997 to only I I percent in 1998.
12Thc differences between the balance of payments data and the gross financing data reflect both conceptual differences and-presumably mainly in the balance of payments data-measurement error. Balance of payments data-taken in this ca�e from the IMF's World Economic Outlook database-potentially offer the most complete coverage of total capital flows. but are subject to errors and omissions (and also tO substantial revision). By conrrast, gross issuance data include all gross capital inflows that occur in the context of formal international offerings or facilities. but exclude bartk lending that is not syndicated and investment� that do not occur
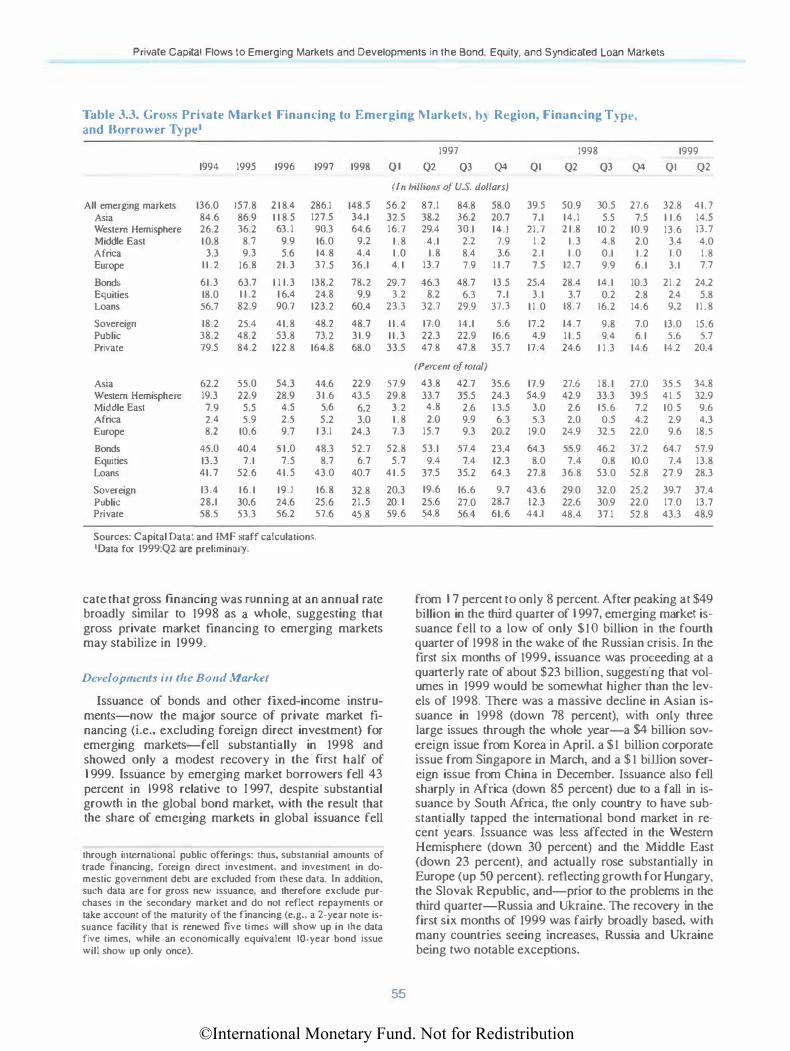
©International Monetary Fund. Not for Redistribution
Private Capital Flows to Emerging Markets and Developments in the Bond, Equity, and Syndicated Loan Markets
Table 3.3. Gross Prhate Market Financing to Emerging Markets, b) Rt!gion, Financ:ing T) pt!, and Borrower Typc1
1997 1998 1999
1994 1995 1996 1997 1998 Ql Q2 Q3 Q4 Q1 Q2 Q3 Q4 Ql Q2
All emerging markets Asia Western Hemisphere Middle East Africa Europe
Bonds Equities Loans
Sovereign Public Private
Asia Western Hemisphere Middle East Africa Europe
Bonds Equities Loans
Sovereign Public Private
136.0 84.6 26.2 10.8
3.3 1 1 . 2 61.3 18.0 56.7
18.2 38.2 79.5
62.2 19.3 7.9 2.4 8.2
45.0 13.3 41.7 13.4 28.1 58.5
157.8 86.9 36.2
8.7 9.3
16.8 63.7 1 1 .2
82.9
25.4 48.2 84.2
55.0 22.9
5.5 5.9
10.6 40.4
7.1 52.6 16.1 30.6 53.3
2 1 8.4 1 1 8.5 63. 1
9.9 5.6
21.3 1 1 1.3
1 6.4 90.7 41.8 53.8
122.8
54.3 28.9
4.5 2.5 9.7
5 1 .0 7.5
41.5 19.) 24.6 56.2
286.1 127.5 90.3 16.0 14.8 37.5
138.2 24.8
123.2 48.2 73.2
164.8
44.6 31.6
5.6 5.2
1 3.1 48.3
8.7 43.0 16.8 25.6 57.6
Sources: Capital Data; and IMF staff calculations. 1Data for 1999:Q2 are preliminary.
(fn billions of U.S. dollars)
148.5 34.1 64.6
9.2 4.4
36.1
78.2 9.9
60.4 48.7 31.9 68.0
56.2 32.5 16.7
1 .8 1 .0 4. 1
29.7 3.2
23.3
1 1 . 4 1 1 . 3 33.5
87.1 38.2 29.4
4.1 1.8
13.7 46.3
8.2 32.7
17.0 22.3 47.8
84.8 36.2 30.1
2.2 8.4 7.9
48.7 6.3
29.9
14.1 22.9 47.8
58.0 20.7 14.1
7.9 3.6
1 1 .7 13.5 7.1
37.3
5.6 16.6 35.7
(Percenr ojroral)
22.9 57.9 43.8 43.5 29.8 33.7
6.2 3.2 4.8 3.0 1 . 8 2.0
24.3 7.3 15.7 52.7 52.8 53.1
6.7 5.7 9.4 40.7 41.5 37.5 32.8 20.3 19.6 21.5 20. 1 25.6 45.8 59.6 54.8
42.7 35.6 35.5 24.3
2.6 13.5 9.9 6.3 9.3 20.2
57.4 23.4 7.4 12.3
35.2 64.3 16.6 9.7 27.0 28.7 56.4 61.6
39.5 7.1
21.7 1.2 2.1 7.5
25.4 3.1
1 1 .0 17.2 4.9
17.4
17.9 54.9
3.0 5.3
19.0 64.3
8.0 27.8 43.6 12.3 44.1
50.9 14.1 2 1 .8
1.3 1.0
12.7 28.4
3.7 18.7 14.7 1 1 . 5 24.6
30.5 5.5
10.2 4.8 0.1 9.9
14.1 0.2
16.2
9.8 9.4
1 1 .3
27.6 7.5
10.9 2.0 1.2 6.1
10.3 2.8
14.6 7.0 6. 1
14.6
32.8 41.7 1 1 .6 14.5 13.6 13.7
3.4 4.0 1.0 1.8 3.1 7.7
21.2 24.2 2.4 5.8 9.2 11.8
13.0 15.6 5.6 5.7
14.2 20.4
27.6 18. 1 27.0 35.5 34.8 42.9 33.3 39.5 41.5 32.9
2.6 15.6 7.2 10.5 9.6 2.0 0.5 4.2 2.9 4.3
24.9 32.5 22.0 9.6 18.5
55.9 46.2 37.2 64.7 57.9 7.4 0.8 10.0 7.4 13.8
36.8 53.0 52.8 27.9 28.3 29.0 32.0 25.2 39.7 37.4 22.6 30.9 22.0 17.0 13.7 48.4 37.1 52.8 43.3 48.9
cate that gross financing was running at an annual rate broadly similar to 1998 as a whole, suggesting that gross private market financing to emerging markets may stabilize in 1999.
from 1 7 percent to only 8 percent. After peaking at $49 billion in the third quarter of 1 997, emerging market issuance fell to a low of only $10 billion in the fourth quarter of 1998 in the wake of the Russian crisis. In the first six months of 1999, issuance was proceeding at a quarterly rate of about $23 billion, suggesting that volumes in 1999 would be somewhat higher than the levels of 1998. There was a massive decline in Asian issuance in 1998 (down 78 percent), with only three large issues through the whole year-a $4 billion sovereign issue from Korea in April, a $1 billion corporate issue from Singapore in March, and a $ 1 billion sovereign issue from China in December. Issuance also fell sharply in Africa (down 85 percent) due to a fall in issuance by South Africa, the only country to have substantially tapped the international bond market in recent years. Issuance was less affected in the Western Hemisphere (down 30 percent) and the Middle East (down 23 percent), and actually rose substantially in Europe (up 50 percent), reflecting growth for Hungary, the Slovak Republic, and-prior to the problems in the third quarter-Russia and Ukraine. The recovery in the first six months of 1999 was fairly broadly based, with many countries seeing increases, Russia and Ukraine being two notable exceptions.
Developmettls itt the Bond lt1arket
Issuance of bonds and other fixed-income instruments-now the major source of private market financing (i.e., excluding foreign direct investment) for emerging markets-fell substantially in 1998 and showed only a modest recovery in the ftrSt half of 1 999. Issuance by emerging market borrowers fell 43 percent in 1998 relative to I 997, despite substantial growth in the global bond market, with the result that the share of emerging markets in global issuance fell
through international public offerings: thus, substantial amounts of trade financing, foreign direct investment, and investment in domestic government debt are excluded from these data. In addition, such data are for gross new issuance. and therefore exclude purchases in the secondary market and do not reflect repayments or take account of the maturity of the financing (e.g., a 2-ycar note issuance facility that is renewed five times will show up in the data five times, while an economically equivalent tO-year bond issue will show up only once).
55
©International Monetary Fund. Not for Redistribution
Ill EMERGING MARKETS: EXTERNAL FINANCING CONTRACTION AND IMPACT ON FINANCIAL SYSTEMS
A striking recent development in the international bond market has been the reduction in access for private sector entities from the emerging markets. While borrowing by sovereigns was virtually unchanged between 1997 and 1998, borrowing by public enterprises and private sector issuers fell sharply, by 68 and 6 1 percent, respectively. l n the ftrst six months of 1999, this trend continued for private sector entities, which saw a further small fall in their share of total borrowing; public enterprises appeared, however, to be regaining access in early 1999 on the back of the recovery in sovereign access. In part, this reflects an increasing preference on the part of investors to lend only to the more highly rated borrowers, especially to sovereigns; see Box 3.7 for a discussion on the extent to which markets are becoming more discriminating.
The decline of private sector access to international markets also reflects the economic health of borrowers. In Asia, the high leverage of many companies precludes the issuance of new debr. In Latin America, companies on average have lower debt burdens but most have found it difficult to get access to debt markets at reasonable interest rates. In general, corporate borrowers have responded to their reduced access to international markets by returning to their domestic markets, mainly the domestic banking systems, where they are displacing smaller, less creditworthy, companies (see below). However, the lack of market access for medium-sized Latin American corporates is beginning to show in cash flow and debt servicing problems. A growing number of companies are missing interest or principal payments on external debt as a result of the worsening in business conditions following the Russian and Brazilian shocks and the loss of access to capital markets for working capital or refinancing purposes. The number of defaults on external debt is expected to increase as 1999 progresses.
Perceptions of higher risk and the reduced appetite for investing in emerging market bonds have caused a worsening in the terms and conditions of market access. After rising modestly in 1997, average yield spreads for emerging market borrowers rose substantially in 1998 and remained high in the first six months of 1999. For sovereign borrowers, the average yield spread in early 1 999 was just under 500 basis points for unenhanced U.S. dollar-denominated bonds, up from 270 basis points in 1996. At the same time, the average maturity of issues has fallen, from a peak of 12.4 years in 1997 to about nine years in both 1998 and in early 1999.
A constant theme in the difficult bond market conditions has been the need for issuers to be innovative in the design of their securities to retain market access at a reasonable price. One trend that has been seen frequently is the reopening of earlier issues: for example, Turkey on three occasions in April and May reopened the five-year sovereign bond it had first issued in February 1999, increasing the outstanding volume from
56
€500 million to €1 billion. Such reissues are attractive because the preexistence of the security minimizes pricing risk for investors and because they boost issue size and liquidity for potential inclusion into benchmark bond indices. Another trend has been the issuance in whatever currency and sector will reduce borrowing cost. For example, Argentina (one of the largest issuers in 1998 and 1999) made sovereign issues in eight different currencies in 1998 and 1999, frequently targeting issues at a particular small class of investors. The use of bonds with stepdown coupons has also been common.13 Such issues may be attractive for two reasons. First, market participants suggest that !he high initial coupons can be attractive to (shortsighted) yield-seeking investors. In addition, !he stepdown can be used to issue bonds at close to par and yet enable fungibility wilh other (lower coupon) bonds at some point in the future, thus enhancing the future liquidity of the bond. For example, two sovereign Argentine issues of euro-denorninated bonds in February and March of 1999 carry coupons of 1 5 and 14 percent unti I February 200 I , after which the coupons fall to 8 percent to become fungible with preexisting deutsche mark, Dutch guilder, and French franc issues from February 1998, and resulting !hen in a single €1.8 billion issue maturing February 2008. Finally, there has also been substantial use of asset-backed securities to reduce the cost of debt. For example, in December 1998 Telef6nica del Peru used telephone receivables from international carriers to enable it to issue bonds rated as investment grade securities, despite the lack of an investment rating for the sovereign. However, asset backing has proven only partially effective in reducing !he cost of borrowing in difficult conditions. For example, in March 1999 PDVSA, !he Venezuelan oil company, had to pay an average spread of over 400 basis points on a $1.2 billion multi-tranche deal that was backed by oil receivables and carried a strong A3 credit rating: in part because of the worsening in market conditions, the tranches carried spreads three or four times the level of a similar, slightly higher-rated (A2) deal in May 1998.
Other innovations have involved giving some form of "sweetener" to investors, which may be costly to the issuer in the future. Several recent bond issues have carried put options, which enable the investor to shorten the stated maturity of the security. Other bonds have carried warrants that enable the bond purchaser to buy other debr securities at predetermined times and prices, which at that point may represent an above-market cost of funds for the issuer. One suggested rationale for warrants is that !heir complexity may offer a way for issuers to raise new funds without driving down !he price of existing "plain-vanilla"
13Bonds with stepdown coupons have coupon payments that "step down" from a high initial level to lower subsequent levels, usually according to a fixed schedule.
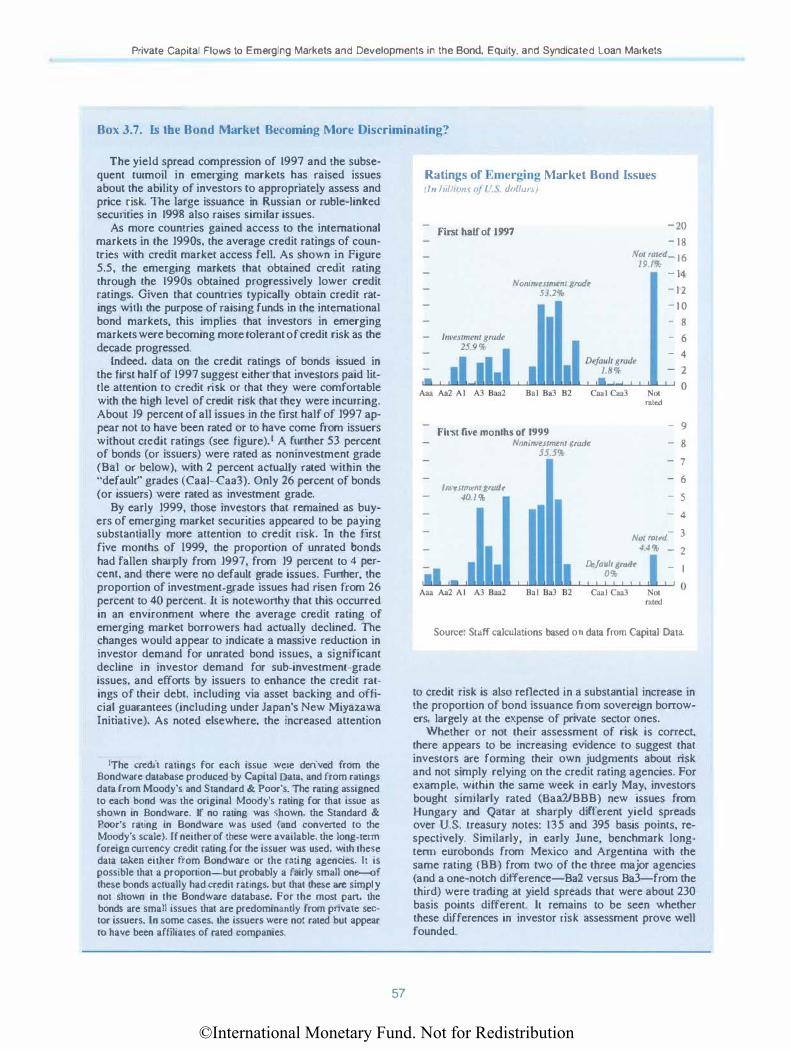
©International Monetary Fund. Not for Redistribution
Private Capital Flows to Emerging Markets and Developments in the Bond, Equity, and Syndicated Loan Markets
Box 3.7. 1'> the Bond Market Becoming More Discriminating?
The yield spread compression of 1997 and the subsequent turmoil in emerging markets has raised issues about the ability of investors to appropriately assess and price risk. The large issuance in Russian or ruble-linked securities in 1998 also raises similar issues.
As more countries gained access to the international markets in the 1990s. the average credit ratings of countries with credit market access fell. As shown in Figure 5.5, the emerging markets that obtained credit rating through the 1990s obtained progressively lower credit ratings. Given that countries typically obtain credit ratings wit.b the purpose of raising funds in the international bond markets, this implies that investors in emerging markets were becoming more tolerant of credit risk as the decade progressed.
Indeed. data on t.be credit ratings of bonds issued in the first half of 1997 suggest either that investors paid little attention to credit risk or that they were comfortable with the high level of credit risk that they were incurring. About 19 percent of all issues in the first half of 1997 appear not to have been rated or to have come from issuers without credit ratings (see figure). I A further 53 percent of bonds (or issuers) were rated as noninvestment grade (Bal or below), with 2 percent actually rated within the "default" grades (Caai-Caa3). Only 26 percent of bonds (or issuers) were rated as investment grade.
By early 1999, those investors that remained as buyers of emerging market securities appeared to be paying substantially more attention to credit risk. In the first five months of 1999, the proportion of unrated bonds had fallen sharply from 1997, from 19 percent to 4 percent, and there were no default grade issues. Further, the proportion of investment-grade issues had risen from 26 percent to 40 percent. 1t is noteworthy that this occurred in an environment where the average credit rating of emerging market borrowers had actually declined. The changes would appear to indicate a massive reduction in investor demand for unrated bond issues, a significant decline in investor demand for sub-investment-grade issues, and efforts by issuers to enhance the credit ratings of their debt, including via asset backing and official guarantees (including under Japan's New Miyazawa Initiative). As noted elsewhere, the increased attention
1The credit ratings for each issue were derived from the Bond ware database produced by Capital Data, and from ratings data from Moody's and Standard & Poor's. The rating assigned to each bond was the original Moody's rating for that issue as shown in Bondware. If no rating was shown. the Standard & Poor's rating in Bondware was used (and convened to the Moody's scale). lf neither of these were available. the long-term foreign currency credit rating for the issuer was used, with these data taken either from Bondware or the rating agencies. It is possible that a proportion-but probably a fairly small one-of these bonds actually had credit ratings. but that these are simply not shown in the Bondware database. For the most pan, the bonds are small issues that are predominantly from priva1e sector issuers. ln some cases. the issuers were not rated but appear to have been affiliates of rated companies.
57
Ratings of Emerging Market Bond Issues I In 1111/wn.\ 1�{/ . • \ dollrll.\)
First balf or 1997 -20
- ts Nor rored _ 16
19./%
Ana Aa2 A I A3 Baa2
Nonin•estment grad� 51.2%
Bal Ba3 82 Caa 1 Caa3
First five months of 1999 Nrminvesrmeu/ t;rode
55.5%
/nwmmem grodt 40.1%
Not rated
- 14
- t 2
- t o
- 8 - 6
- 4
- 2
0
- 9
- 8
- 7
- 6
- 5
- 4
- 3 Nor roud
Default grade 0%
44% - 2
- I
Source: Staff calculations based on data from Capital Data.
to credit risk is also reflected jn a substantial increase in the proportion of bond issuance from sovereign borrowers, largely at the expense of private sector ones.
Whether or not their assessment of risk is correct, there appears to be increasing evidence to suggest that investors are forming their own judgments about risk and not simply relying on the credit rating agencies. For example, within the same week in early May, investors bought simjJarly rated (Baa2/BBB) new issues from Hungary and Qatar at sharply different yield spreads over U.S. treasury notes: 135 and 395 basis points, respectively. Similarly, in early June, benchmark longterm eurobonds from Mexjco and Argentina with the same rating (BB) from two of the three major agencies (and a one-notch difference-Ba2 versus Ba3-from the third) were trading at yield spreads that were about 230 basis points different. It remains to be seen whether these differences in investor risk assessment prove well founded.
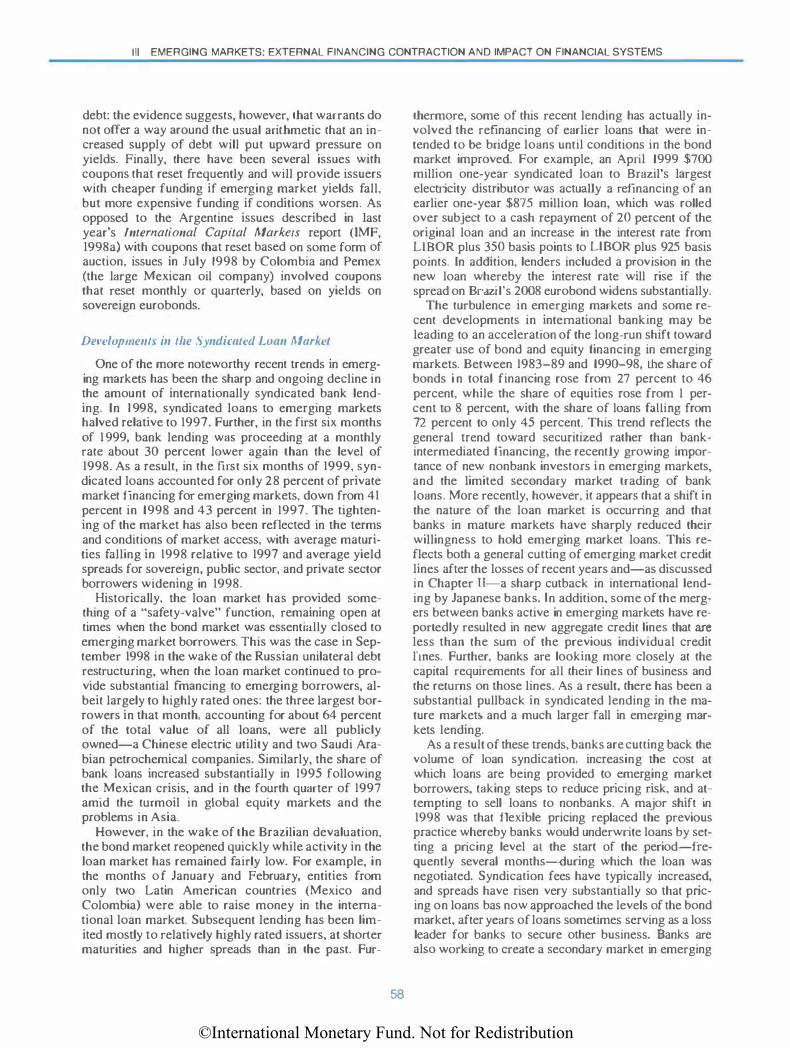
©International Monetary Fund. Not for Redistribution
Ill EMERGING MARKETS: EXTERNAL FINANCING CONTRACTION AND IMPACT ON FINANCIAL SYSTEMS
debt: the evidence suggests, however, that warrants do not offer a way around the usual arithmetic that an increased supply of debt will put upward pressure on yields. Finally, there have been several issues with coupons that reset frequently and will provide issuers with cheaper funding if emerging market yields fall, but more expensive funding if conditions worsen. As opposed to the Argentine issues described in last year's International Capital Markets report (IMF, l998a) with coupons that reset based on some form of auction, issues in July 1998 by Colombia and Pemex (the large Mexican oil company) involved coupons that reset monthly or quarterly, based on yields on sovereign eurobonds.
De••e/opments in the Syndica/etl Loan Market
One of the more noteworthy recent trends in emerging markets has been the sharp and ongoing decline in the amount of internationally syndicated bank lending. In 1 998, syndicated loans to emerging markets halved relative to 1997. Further, in the first six months of I 999, bank lending was proceeding at a monthly rate about 30 percent lower again than the level of 1998. As a result, in the fust six months of 1999, syndicated loans accounted for only 28 percent of private market financing for emerging markets, down from 41 percent in 1998 and 43 percent in 1997. The tightening of the market has also been reflected in the terms and conditions of market access, with average maturities falling in 1998 relative to 1997 and average yield spreads for sovereign, public sector, and private sector borrowers widening in 1998.
HistoricaJly, the loan market has provided something of a "safety-valve" function, remaining open at times when the bond market was essentially closed to emerging market borrowers. This was the case in September 1998 in the wake of the Russian unilateral debt restructuring, when the loan market continued to provide substantial fmancing to emerging borrowers, albeit largely to highly rated ones: the three largest borrowers in that month, accounting for about 64 percent of the total value of all loans, were all publicly owned-a Chinese electric utility and two Saudi Arabian petrochemical companies. Similarly, the share of bank loans increased substantially in 1995 following the Mexican crisis, and in the fourth quarter of 1997 amid the turmoil in global equity markets and the problems in Asia.
However, in the wake of the Brazilian devaluation, the bond market reopened quickly while activity in the Joan market has remained fairly low. For example, in the months of January and February, entities from only two Latin American countries (Mexico and Colombia) were able to raise money in the international loan market. Subsequent lending has been limited mostly to relatively highly rated issuers, at shorter maturities and higher spreads than in the past. Fur-
58
thermore, some of this recent lending has actually involved the refinancing of earlier loans that were intended to be bridge loans until conditions in the bond market improved. For example, an April 1999 $700 million one-year syndicated loan to Brazil's largest electricity distributor was actually a refinancing of an earlier one-year $875 million loan, which was rolled over subject to a cash repayment of 20 percent of the original loan and an increase in the interest rate from LffiOR plus 350 basis points to LffiOR plus 925 basis points. In addition, lenders included a provision in the new loan whereby the interest rate will rise if the spread on Brazil's 2008 eurobond widens substantially.
The turbulence in emerging markets and some recent developments in international banking may be leading to an acceleration of the long-run shift toward greater use of bond and equity financing in emerging markets. Between 1983-89 and 1990-98, the share of bonds i n total financing rose from 27 percent to 46 percent, while the share of equities rose from l percent to 8 percent, with the share of loans falling from 72 percent to only 45 percent. This trend reflects the general trend toward securitized rather than bankintermediated financing, the recently growing importance of new nonbank investors in emerging markets, and the limited secondary market trading of bank loans. More recently, however, it appears that a shift in the nature of the loan market is occurring and that banks in mature markets have sharply reduced their willingness to hold emerging market loans. This reflects both a general cutting of emerging market credit lines after the losses of recent years and-as discussed in Chapter U-a sharp cutback in international lending by Japanese banks. [n addition, some of the mergers between banks active in emerging markets have reportedly resulted in new aggregate credit lines that are less than the sum of the previous individual credit lines. Further, banks are looking more closely at the capital requirements for aU their lines of business and the returns on those lines. As a result, there has been a substantial pullback in syndicated lending in the mature market:. and a much larger fall in emerging markets lending.
As a result of these trends, banks are cutting back the volume of loan syndication, increasing the cost at which loans are being provided to emerging market borrowers, taking steps to reduce pricing risk, and attempting to sell loans to nonbanks. A major shift in 1998 was that flexible pricing replaced the previous practice whereby banks would underwrite loans by setting a pricing level at the start of the period-frequently several months--during which the loan was negotiated. Syndication fees have typically increased, and spreads have risen very substantially so that pricing on loans bas now approached the levels of the bond market, after years of loans sometimes serving as a loss leader for banks to secure other business. Banks are also working to create a secondary market in emerging
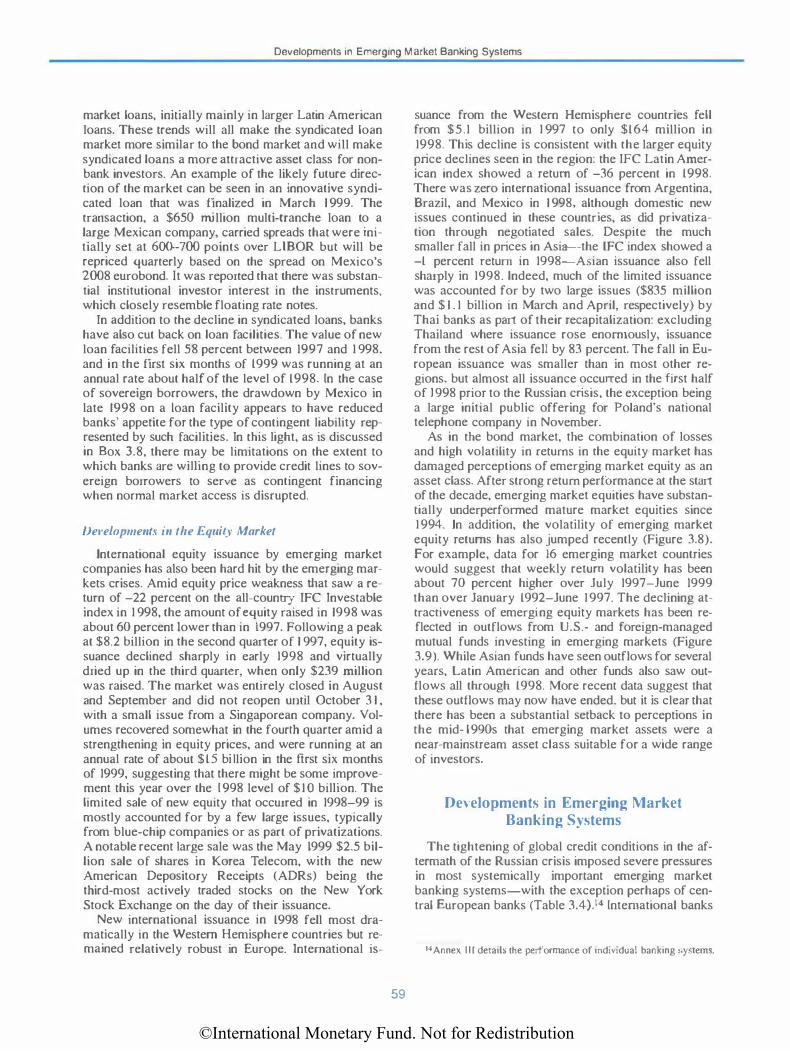
©International Monetary Fund. Not for Redistribution
Developments in Emerging Market Banking Systems
market loans, initially mainly in larger Latin American loans. These trends will all make the syndicated loan market more similar to the bond market and will make syndicated loans a more attractive asset class for nonbank investors. An example of the likely future direction of the market can be seen in an innovative syndicated loan that was finalized in March 1 999. The transaction, a $650 million multi-tranche loan to a large Mexican company, carried spreads that were initially set at 600-700 points over LffiOR but will be repriced quarterly based on the spread on Mexico's 2008 eurobond. It was reported that there was substantial institutional investor interest in the instruments, which closely resemble floating rate notes.
Tn addition to the decline in syndicated loans, banks have also cut back on loan facilities. The value of new loan facilities fell 58 percent between 1997 and 1 998. and in the first six months of 1999 was running at an annual rate about half of the level of 1998. In the case of sovereign borrowers, the drawdown by Mexico in late 1998 on a Loan facility appears to have reduced banks' appetite for the type of contingent liability represented by such facilities. In this light, as is discussed in Box 3.8, there may be limitations on the extent to which banks are willing to provide credit lines to sovereign borrowers to serve as contingent financing when normal market access is disrupted.
De1•elopments in the Equity Market
International equity issuance by emerging market companies has also been hard hit by the emerging markets crises. Amid equity price weakness d1at saw a return of -22 percent on the all-country TFC Investable index in 1 998, the amount of equity raised in 1998 was about 60 percent Lower than in 1997. Following a peak at $8.2 billion in the second quarter of 1 997, equity issuance declined sharply in early 1998 and virtually dried up in the third quarter, when only $239 million was raised. The market was entirely closed in August and September and did not reopen until October 3 1 , with a small issue from a Singaporean company. Volumes recovered somewhat in the fourdl quarter amid a strengthening in equity prices, and were running at an annual rate of about $15 bi Ilion in the ftrst six months of 1999, suggesting that there might be some improvement this year over the I 998 level of $ 1 0 billion. The limited sale of new equity that occurred in 1998-99 is mostly accounted for by a few large issues, typically from blue-chip companies or as part of privatizations. A notable recent large sale was the May 1999 $2.5 billion sale of shares in Korea Telecom, with the new American Depository Receipts (ADRs) being the dlird-most actively traded stocks on the New York Stock Exchange on the day of their issuance.
New international issuance in 1998 fell most dramatically in the Western Hemisphere countries but remained relatively robust in Europe. International is-
59
suance from the Western Hemisphere countries fell from $5.1 billion in 1 997 to only $164 million in 1998. This decline is consistent with the larger equity price declines seen in the region: the IFC Latin American index showed a return of -36 percent in 1998. There was zero international issuance from Argentina, Brazil, and Mexico in 1 998, although domestic new issues continued in these countries, as did privatization through negotiated sales. Despite the much smaller fall in prices in Asia-the [FC index showed a -1 percent return in 1998-Ac;ian issuance also fell sharply in 1998. lndeed, much of the limited issuance was accounted for by two large issues ($835 million and $ 1 . 1 billion in March and April, respectively) by Thai banks as part of their recapitalization: excluding Thailand where issuance rose enormously, issuance from the rest of Asia fell by 83 percent. The fall in European issuance was smaller than in most other regions, but almost all issuance occurred in the first half of I 998 prior to the Russian crisis, the exception being a large initial public offering for Poland's national telephone company in November.
As in the bond market, the combination of losses and high volatility in returns in the equity market has damaged perceptions of emerging market equity as an asset class. After strong return performance at the start of the decade, emerging market equities have substantially underperforrned mature market equities since 1 994. In addition, dle volatility of emerging market equity returns has also jumped recently (Figure 3.8). For example, data for 16 emerging market countries would suggest that weekly return volatility has been about 70 percent higher over July 1997-June 1999 than over January 1992-June 1 997. The declining attractiveness of emerging equity markets has been reflected in outflows from U.S.- and foreign-managed mutual funds investing in emerging markets (Figure 3.9). While Asian funds have seen outflows for several years, Latin American and other funds also saw outflows all through 1998. More recent data suggest that dlese outflows may now have ended. but it is clear that there has been a substantial setback to perceptions in the mid- l 990s that emerging market assets were a near-mainstream asset class suitable for a wide range of investors.
Developments in Emerging Market Banking Systems
The tightening of global credit conditions in the aftermath of the Russian crisis imposed severe pressures in most systemically important emerging market banking systems-with d1e exception perhaps of central European banks (Table 3.4).14 International banks
'4Annex I l l details the performance of individual banking l>ystems.
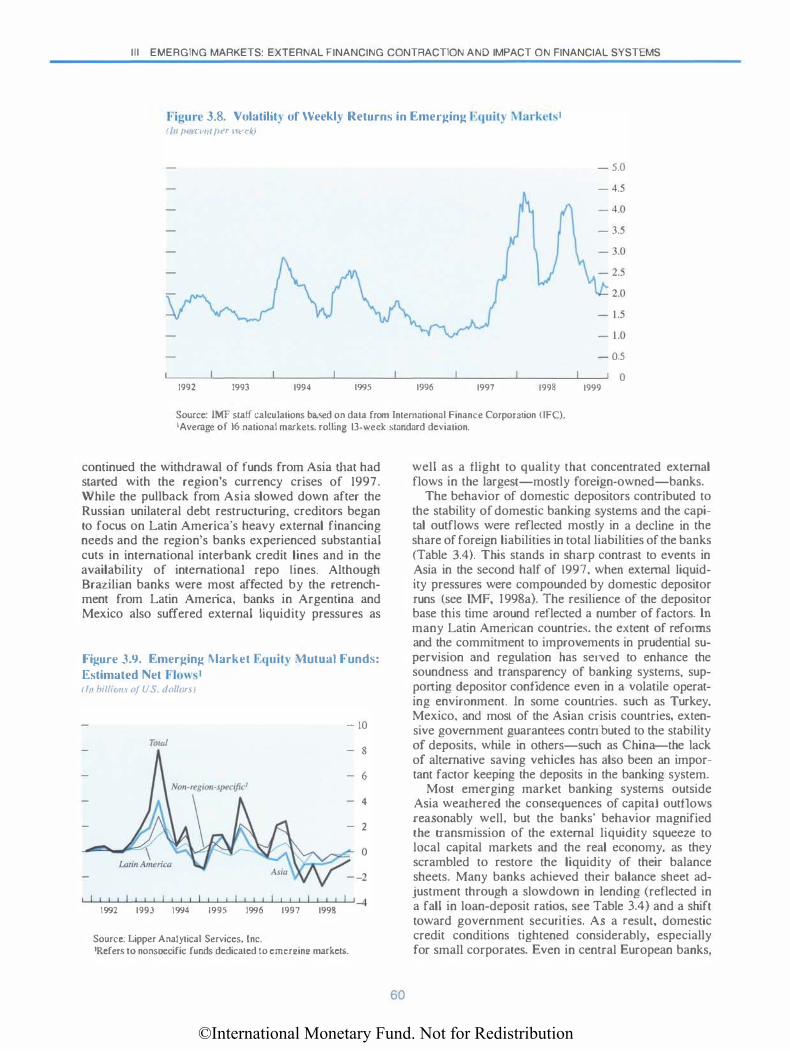
©International Monetary Fund. Not for Redistribution
Ill EMERGING MARKETS: EXTERNAL FINANCING CONTRACTION AND IMPACT ON FINANCIAL SYSTEMS
figure 3.8. Volatilit) of Weekly Returns in Emea·ging Equit) l\larkctsl ( /11 f/I IH'/11 flt'r lll'i'A)
1992 1993 1994 1995 1996 1997 1998
- 5.0
- 0.5
0 1999
Source: IMF staff calculations based on data from Tntemalional Finance Corporation (IFC}. I Average of 16 national markets. rolling 13-week standard deviation.
continued the withdrawal of funds from Asia that had started with the region's currency crises of 1997. While the pullback from Asia slowed down after the Russian unilateral debt restructuring, creditors began to focus on Latin America's heavy external financing needs and the region's banks experienced substantial cuts in international interbank credit lines and in the availability of international repo Lines. Although Brazilian banks were most affected by the retrenchment from Latin America, banks in Argentina and Mexico also suffered external liquidity pressures as
Figure 3.9. Emerging 1\larket Equity Mutual Funds: Estimated Net Flows• f /11 hil/iom o/ C .S. dollt�n 1
Total
I I I I I I I I l t I l 1 I I I I I I
- 10
8
6
4
2
0
I I I I '-4 1992 1993 1994 1995 1996 1997 1998
Source: Lipper Analytical Services. lnc. 'Refers 10 nonsoecific funds dedicated to emereine markets.
60
well as a flight to quality that concentrated external flows in the largest-mostly foreign-owned-banks.
The behavior of domestic depositors contributed to the stability of domestic banking systems and the capital outflows were reflected mostly in a decline in the share of foreign liabilities in total liabilities of the banks (Table 3.4). This stands in sharp contrast to events in Asia in the second half of 1997, when external liquidity pressures were compounded by domestic depositor runs (see IMF, I 998a). The resilience of the depositor base this time around reflected a number of factors. In many Latin American countries. the extent of reforms and the commitment to improvements in prudential supervision and regulation has served to enhance the soundness and trartSparency of banking systems, supporting depositor confidence even in a volatile operating environment. In some countries, such as Turkey. Mexico. and mosl of the Asian crisis countries, extensive government guarantees contributed to the stability of deposits, while in others-such as China-the Jack of alternative saving vehicles has also been an important factor keeping the deposits in the banking system.
Most emerging market banking systems outside Asia weathered the consequences of capital outflows reasonably well, but the banks' behavior magnified the transmission of the external liquidity squeeze to local capital markets and the real economy, as they scrambled to restore the liquidity of their balance sheets. Many banks achieved their balance sheet adjustment through a slowdown in lending (reflected in a fall in loan-deposit ratios, see Table 3.4) and a shift toward government securities. As a result, domestic credit conditions tightened considerably, especially for small corporates. Even in central European banks,
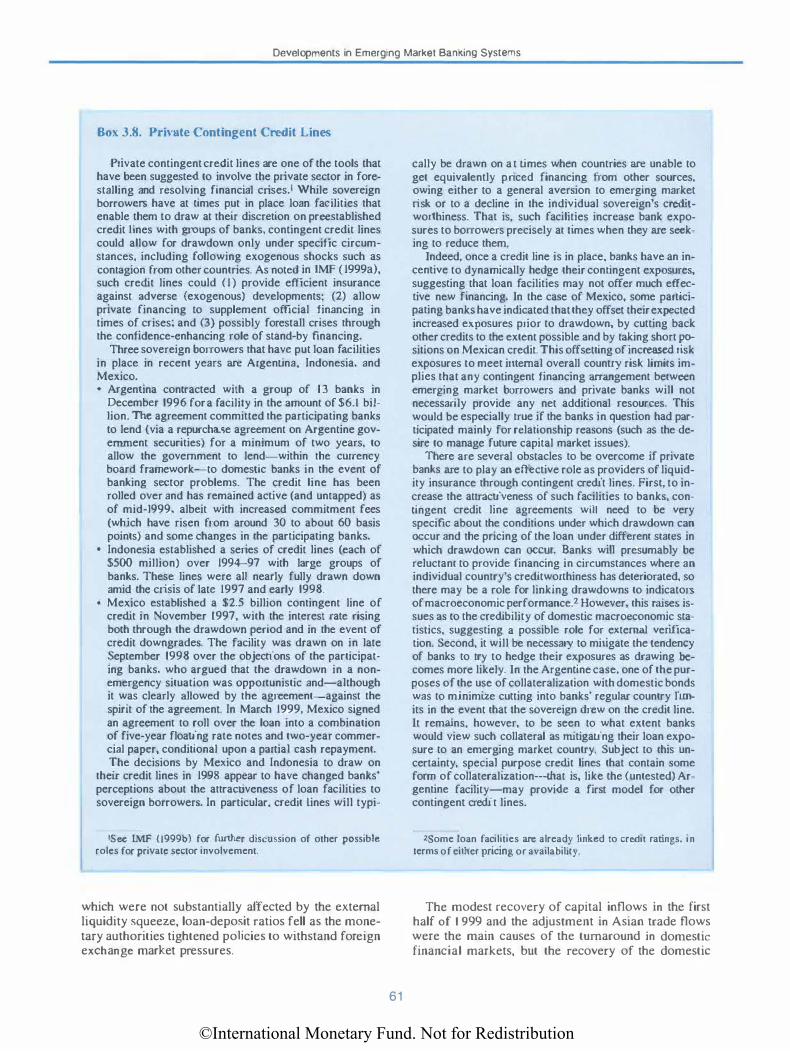
©International Monetary Fund. Not for Redistribution
Developments in Emerging Market Banking Systems
Box 3.8. Private Contingent Credit Lines
Private contingent creclit lines are one of the tools that have been suggested to involve the private sector in forestalling and resolving financial crises.' While sovereign borrowe.rs have at times put in place loan facilities that enable them to draw at their discretion on preestablished credit Hnes with groups of banks, contingent creclit lines could allow for drawdown only under specific circumstances, inclucling following exogenous shocks such as contagion from other countries. As noted in fMF ( 1999a), such creclit lines could (1) provide efficient insurance against adverse (exogenous) developments; (2) allow private financing to supplement official financing in times of crises; and (3) possibly forestall crises through the confidence-enhancing role of stand-by financing.
Three sovereign borrowers that have put loan facilities in place in recent years are Argentina, Indonesia, and Mexico. • Argentina contracted with a group of 1 3 banks in
December 1996 for a facility in the amount of $6.1 billion. The agreement committed the participating banks to lend (via a repurchase agreement on Argentine government securities) for a minimum of two years, to allow the government to lend-within the currency board framework-to domestic banks in the event of banking sector problems. The credit line has been rolled over and has remained active (and untapped) as of mid-1999, albeit with increased commitment fees (which have risen from around 30 to about 60 basis points) and some changes in the participating banks.
• Indonesia established a series of credit lines (each of $500 million) over 1994-97 with large groups of banks. These lines were all nearly fully drawn down amid the crisis of late 1997 and early 1998.
• Mexico established a $2.5 billion contingent line of creclit in November 1997, with the interest rate rising both through the drawdown period and in the event of credit downgrades. The facility was drawn on in late September 1998 over the objections of the participating banks. who argued that the drawdown in a nonemergency situation was opportunistic and-although it was clearly allowed by the agreement-against the spirit of the agreement. In March 1999, Mexico signed an agreement to roll over the loan into a combination of five-year floating rate notes and two-year commercial paper, conditional upon a partial cash repayment. The decisions by Mexico and Indonesia to draw on
their credit lines in 1998 appear to have changed banks' perceptions about the attractiveness of loan facilities to sovereign borrowers. In particular, credit Lines will typi-
'See IMF (1999b) for further discussion of other possible roles for private sector involvement.
which were not substantially affected by the external liquidity squeeze, loan-deposit ratios fell as the monetary authorities tightened po)jcies to withstand foreign exchange market pressures.
61
cally be drawn on at times when countries are unable to get equivalently priced financing from other sources, owing either to a general aversion to emerging market risk or to a decline in the individual sovereign's creclitworthiness. That is, such facilities increase bank exposures to borrowers precisely at times when they are seeking to reduce them.
Indeed, once a credit line is in place, banks have an incentive to dynamically hedge their contingent exposures, suggesting that loan facilities may not offer much effective new financing. In the case of Mexico, some participating banks have indicated that they offset their expected increased exposures prior to drawdown, by cutting back other credits to the extent possible and by taking short positions on Mexican creclit. This offsetting of increased risk exposures to meet internal overall country risk limits implies that any contingent financing arrangement between emerging market borrowers and private banks will not necessarily provide any net additional resources. This would be especially true if the banks in question had participated mainly for relationship reasons (such as the desire to manage future capital market issues).
There are several obstacles to be overcome if private banks are to play an effective role as providers of liquidity insurance through contingent credit lines. First, to increase the attractiveness of such facilities to banks, contingent credit line agreements will need to be very specific about the conditions under which drawdown can occur and the pricing of the loan under different states in which drawdown can occur. Banks will presumably be reluctant to provide financing in circumstances where an individual country's creclitworthiness has deteriorated, so there may be a role for linking drawdowns to indicators of macroeconomic performance.2 However, this raises issues as to the credibility of domestic macroeconomic statistics. suggesting a possible role for external verification. Second, it will be necessary to mitigate the tendency of banks to try to hedge their exposures as drawing becomes more likely. In the Argentine case, one of the purposes of the use of collateralization with domestic bonds was to minimize cutting into banks' regular country limits in the event that the sovereign drew on the credit line. It remains. however, to be seen to what extent banks would view such collateral as mitigating their loan exposure to an emerging market country. Subject to this uncertainty. special purpose creclit lines that contain some form of collateralization-that is, like the (untested) Argentine facility-may provide a first model for other contingent credit lines.
2Some loan facilities are already linked to credit ratings, in terms of either pricing or availability.
The modest recovery of capital inflows in the first half of 1 999 and the adjustment in Asian trade flows were the main causes of the turnaround in domestic financial markets, but the recovery of the domestic
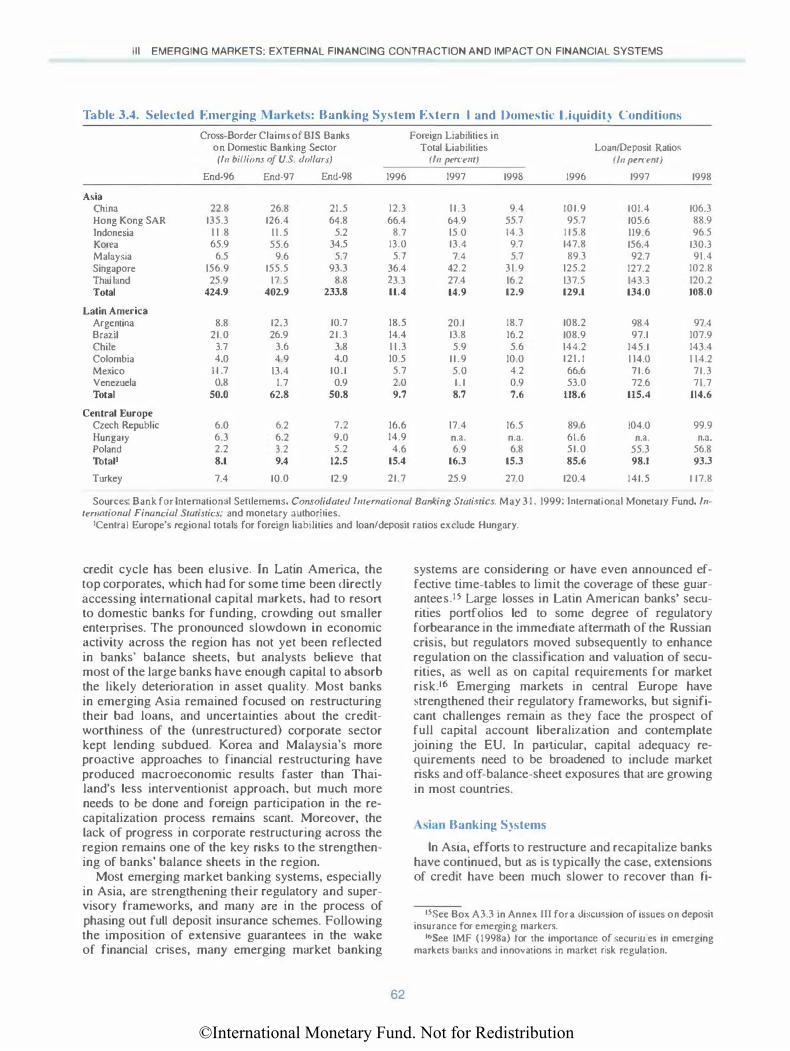
©International Monetary Fund. Not for Redistribution
Ill EMERGING MARKETS: EXTERNAL FINANCING CONTRACTION AND IMPACT ON FINANCIAL SYSTEMS
Table 3A. Selected Emer·ging l\larkel<> : Banking System External and Domestic Liquidity Conditions
Cross-Border Claims of BIS Banks Foreign Liabilities in on Domestic Banking Sector Total Liabilitie.� Loan/Deposit Ratio�
(In billions of U.S. dollars) (In percent) (In percent)
End-96 End-97 End-98 1996 1997 1998 1996 1997 1998
Asia China 22.8 26.8 21.5 12.3 1 1 . 3 9.4 101.9 101.4 106.3 Hong Kong SAR 135.3 126.4 64.8 66.4 64.9 55.7 95.7 105.6 88.9 Indonesia 1 1 .8 11.5 5.2 8.7 15.0 14.3 1 1 5.8 119.6 96.5 Korea 65.9 55.6 34.5 13.0 13.4 9.7 147.8 156.4 130.3 Malaysia 6.5 9.6 5.7 5.7 7.4 5.7 89.3 92.7 91.4 Singapore 156.9 155.5 93.3 36.4 42.2 31.9 125.2 127.2 102.8 Thailand 25.9 17.5 8.8 23.3 27.4 16.2 137.5 143.3 120.2 Total 424.9 402.9 233.8 11.4 14.9 12.9 129.1 134.0 .108.0
Latin America Argentina 8.8 12.3 10.7 18.5 20.1 18.7 108.2 98.4 97.4 Brazil 21.0 26.9 21.3 14.4 13.8 16.2 108.9 97.1 107.9 Chile 3.7 3.6 3.8 1 1 .3 5.9 5.6 144.2 145.1 143.4 Colombia 4.0 4.9 4.0 10.5 1 1 . 9 10.0 121.1 1 14.0 1 14.2 Mexico 1 1 .7 13.4 10.1 5.7 5.0 4.2 66.6 71.6 71.3 Venezuela 0.8 1.7 0.9 2.0 1 . 1 0.9 53.0 72.6 71.7 Total 50.0 62.8 50.8 9.7 8.7 7.6 118.6 115.4 114.6
Central Europe Czech Republic 6.0 6.2 7.2 16.6 17.4 16.5 89.6 104.0 99.9 Hungary 6.3 6.2 9.0 14.9 n.a. n.a. 61.6 n.a. n.a. Poland 2.2 3.2 5.2 4.6 6.9 6.8 51.0 55.3 56.8 Total• 8.1 9.4 12.5 15.4 16.3 15.3 85.6 98.1 93.3
Turkey 7.4 10.0 12.9 21.7 25.9 27.0 120.4 141.5 1 17.8
Sources: Bank for International Seulemems. Consolidared lmemariona/ Banking Sraristics. May 3 1 . 1999: International Monetary Fund. In-ternationa/ Financial Statistics; and monetary authorities.
•central Europe's regional totals for foreign liabilities and loan/deposit ratios exclude Hungary.
credit cycle has been elusive. In Latin America, the top corporates, which had for some time been ctirectly accessing international capital markets, had to resort to domestic banks for funding, crowding out smaller enterprises. The pronounced slowdown in economic activity across the region has not yet been reflected in banks' balance sheets, but analysts believe that most of the large banks have enough capital to absorb the likely deterioration in asset quality. Most banks in emerging Asia remained focused on restructuring their bad loans, and uncertainties about the creditworthiness of the (unrestructured) corporate sector kept lending subdued. Korea and Malaysia's more proactive approaches to financial restructuring have produced macroeconomic results faster than Thailand's less interventionist approach, but much more needs to be done and foreign participation in the recapitalization process remains scant. Moreover, the Jack of progress in corporate restructuring across the region remains one of the key risks to the strengthening of banks' balance sheets in the region.
Most emerging market banking systems, especiaJiy in Asia, are strengthening their regulatory and supervisory frameworks, and many are in the process of phasing out fuJI deposit insurance schemes. Following the imposition of extensive guarantees in the wake of financial crises, many emerging market banking
62
systems are considering or have even announced effective time-tables to limit the coverage of these guarantees.t5 Large losses in Latin American banks' securities portfolios led to some degree of regulatory forbearance in the immectiate aftermath of the Russian crisis, but regulators moved subsequently to enhance regulation on the classification and valuation of securities, as well as on capital requirements for market risk.t6 Emerging markets in central Europe have strengthened their regulatory frameworks, but significant challenges remain as they face the prospect of full capital account liberalization and contemplate joining the EU. In particular, capital adequacy requirements need to be broadened to include market risks and off-balance-sheet exposures that are growing in most countries.
A'iian Banking S�stems
In Asia, efforts to restructure and recapitalize banks have continued, but as is typically the case, extensions of credit have been much slower to recover than fi-
15See Box A3.3 in Annex m for a discussion of issues on deposit insurance for emerging markers.
16See IMF ( I 998a) for the importance of securities in emerging markets banks and innovations in market risk regulation.
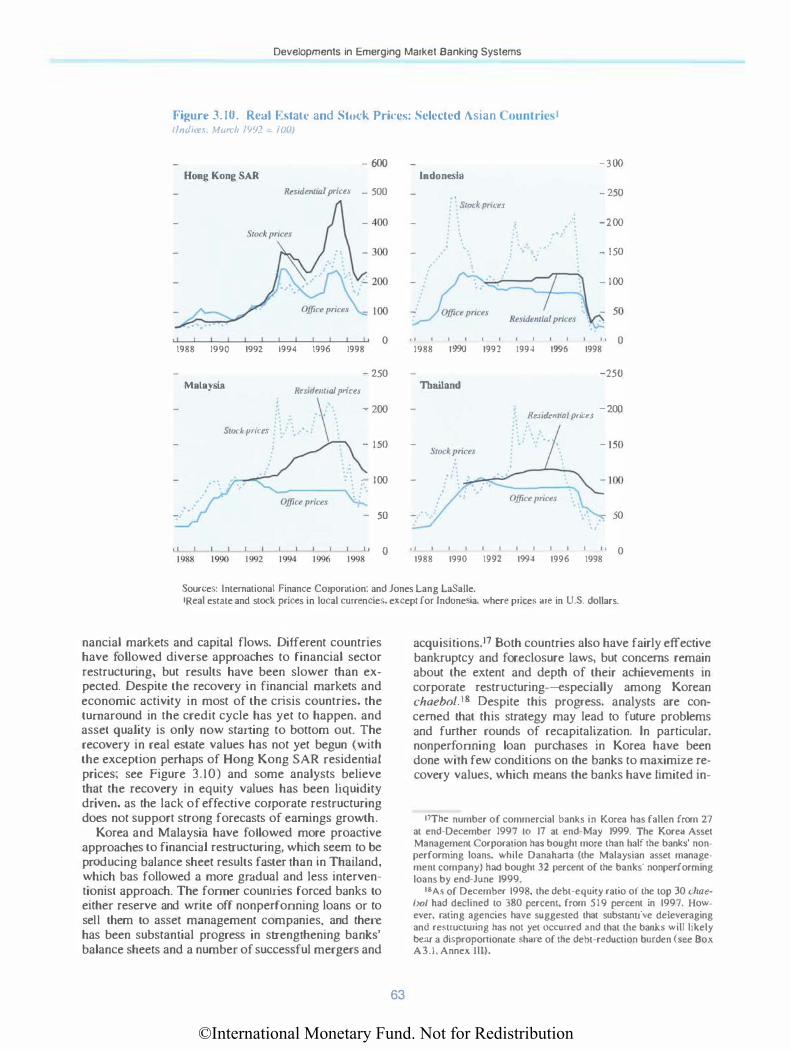
©International Monetary Fund. Not for Redistribution
Developments in Emerging Market Banking Systems
Figure J. IO. Real i• -;tate and Stuc:k Pric:e-;: Selected Asian Cuuntricsl lfndul''· H.tn·h /')</':! - /IIIII
- 600
Hong Kong SAR
R�sidenua/ priu.r - 500
0 1988 1990 1992 1994 1996 1998
- 250 Malaysia
R�sidmtial prices \ - ISO
- 200
Stock pnces
- 100
\.. - 50
1988 1990 1992 1994 1996 1998 0
lndonesla
Stock pria.r
_ /�· \ . .
-;;:' Office pnc11s ....
. . ... . . . � :': : I .... a �· �·
-300
- 250
-200
- 150
- 100
0 1988 1990 1992 1994 1996 1998
Thailand -250
-200 Hesulent<OI pnces
50
0 1988 1990 1992 1994 1996 1998
Sources: International Finance Corporation: and Jones Lang LaSalle. 1Real estate and stock prices in local currencies, except for Indonesia, where prices are in U.S. dollars.
nancial markets and capital flows. Different countries have followed diverse approaches to financial sector restructuring, but results have been slower than expected. Despite the recovery in financial markets and economic activity in most of the crisis countries, the turnaround in the credit cycle has yet to happen, and asset quality is only now starting to bottom out. The recovery in real estate values has not yet begun (with the exception perhaps of Hong Kong SAR residential prices; see Figure 3.10) and some analysts believe that the recovery in equity values has been liquidity driven, as the lack of effective corporate restructuring does not support strong forecasts of earnings growth.
Korea and Malaysia have followed more proactive approaches to financial restructuring, which seem to be producing balance sheet results faster than in Thailand, which bas followed a more gradual and less interventionist approach. The fonner countries forced banks to either reserve and write off nonperfonning loans or to seU them to asset management companies, and there has been substantial progress in strengthening banks' balance sheets and a number of successful mergers and
63
acquisitions_l7 Both countries also have fairly effective bankruptcy and foreclosure laws, but concerns remain about the extent and depth of their achievements in corporate restructuring-especially among Korean chaebof.IS Despite this progress, analysts are concerned that this strategy may lead to future problems and further rounds of recapitalization. In particular. nonperfonning loan purchases in Korea have been done with few conditions on the banks to maximize recovery values, which means the banks have Limited in-
17The number of commercial banks in Korea has fallen from 27 at end-December 1997 10 17 at end-May 1999. The Korea Asset Management Corporation has bought more than half the banks' nonperforming loans. while Danahana (the Malaysian asset management company) had bought 32 percent of the banks' nonperforming loans by end-June 1999.
I BAs of December 1998, the debt-equity ratio of the top 30 chaebol had declined to 380 percent, from 519 percent in 1997. However, rating agencies have suggested that substantive deleveraging and restructuring has not yet occurred and that the banks will likely bear a disproponionate share of the debt-reduction burden (see Box A3.1, Annex Ill).
©International Monetary Fund. Not for Redistribution
Ill EMERGING MARKETS: EXTERNAL FINANCING CONTRACTION AND IMPACT ON FINANCIAL SYSTEMS
centives to improve their lending practices. Thailand has also made some progress in bank restructuring, 19 but its decision to let the banks deal with the nonperforming loans themselves, combined with an only gradual tightening of provisioning requirements and delays in the strengthening of the legal framework, bas Jed to a significant deterioration in asset quality. In particular, this has allowed even healthy borrowers to avoid repaying loans, leading to the accumulation of so-called "strategic" nonperforming loans. However, recent amendments to the bankruptcy and foreclosure legislation, combined with a more proactive role in corporate restructuring, are likely to strut delivering more effective results in the second half of 1999. Indonesia bas closed several banks, but widespread insolvencies and low loan recoveries are han1pering progress in financial restructuring.
Bank recapitalization has required a substantial amount of government resources as foreign participation has been limited. ln Indonesia. the restructuring process has resulted in government ownership of more than 80 percent of the banking system's assets; and the implied costs-currently estimated at more than 50 percent of GDP-could continue to escalate unless a forceful loan collection strategy is implemented. In Korea, the government now owns more than 90 percent of the equity of the second- and third-largest banks, and while foreign ownership in other top-tier banks has increased, strategic foreign investments in nationalized banks have suffered some setbacks. In Thailand, several private banks raised capital using hybrid financial instruments in an attempt to avoid government recapitalization and the Joss of controJ.20
In April, the country's fourth-largest bank completed a landmark $1 .8 billion capital-raising deal whereby the government matched the share purchases of private institutional investors to become the largest shareholder in the bank.
China has begun to set up individual asset management companies to tackle the bad loan problems of each of the four state banks. The establishment of these companies has reflected the determination of the Chinese government to resolve asset quality problems. To promote the operation of asset management companies, consideration has already been given to improving the legislation and market infrastructure. However, analysts have raised doubts about whether the country bas the frnancial infrastructure to allow the companies to be effective, and they foresee problems in the valuation and pricing of the assets. While the bankruptcy of Guangdong ITIC has led foreign banks to cut exposures to mainland borrowers, domestic deposits have continued to grow. Meanwhile,
19Thailand has made substantial progress cleaning up the finance companies. and assets sale$ are well advanced.
20'fhe hybrid capital instruments combine noncumulative preferred shares with subordinated debt (see Box A3.2, Annex Ill).
64
Hong Kong SAR banks have continued to handle the deflationary pressures well and their exposures to the mainland's ITJCs appear to be manageable. Banks in Singapore are preparing to face increased competition after the authorities' gradual move to liberalize the banking sector.
Latin American Banking Systeml>
The largest banking systems in Latin America have shown an enhanced ability to withstand the external Uquidity squeeze; and while depositor confidence was maintained in the midst of financial market turbulence, many banks suffered losses on their securities portfo)jos. The reassessment of international banks' exposure to emerging markets strongly affected the Brazilian banks, but the external Liquidity pressures subsided somewhat after the arrangement of an rMFled financial package in mid-November 1998 and its revision in mid-March 1999. Banks in Argentina and Mexico suffered from cuts in international interbank credit (and repo) lines, but contrary to the experience during the Tequila crisis, deposits continued to grow. The reductions in international interbank exposures and subsequent pressures in currency and securities markets led to losses in the banks' securities portfolios, which were absorbed through a reduction in earnings and the equity accounts-and, in the case of Mexico, through further regulatory forbearance and central bank support.
The decline in asset quality as a result of a deteriorated operating environment has not yet been fuUy reflected in banks' balance sheets and is leading to further banking system consolidation. The persistence of high real interest rates and of the recession has reversed the recent recovery in asset quality across the region, but analysts believe that most large banks have adequate capital bases to withstand the increases in delinquency rates.21 The combination of large foreign ownership and the authorities' strong commitment to improvements in prudential regulation and supervision has strengthened considerably Latin American banking systems in the period since the Tequila crisis. However, the number of banks in many systems remains large and further consolidation is warranted. Smaller and weaker banks in Argentina, Brazil, and Venezuela are facing the double strain of a deteriorated operating environment and the competitive pressures from foreign banks, and are likely to have to exir the market. So far, the authorities in these countries have shown an increased ability to resolve the failures of weaker banks with no adverse effects upon the systems as a whole.
21The largest Mexican banks are an exception, but the recent approval of the Savings Protection Institute (IPAB) Law allows banking reform to move forward by providing a clearer institutional framework to address bank problems and lifting foreign ownership constraints.
©International Monetary Fund. Not for Redistribution
References
Central European Banking Systems
After 1 0 years of transition in the region, restructuring and privatization have strengthened banking systems in Hungary and Poland to a greater extent than in the Czech Republic. These three banking systems continued to receive sizable foreign capital inflows, in part owing to stable relationships with western European banks and the prospects of EU accession. However, exposures to Russia uncovered the fragility of the largely state-owned Czech banks and, after two years of negative profits in the banking industry, the authorities are moving forward with the bank privatization process.22 Capital inflows supported strong loan growth in Hungary and Poland, especially in foreign currency loans to (generally unhedged) borrowers. Competition bas Jed to declining profits and a search for higher yields through lending to the small and medium-sized corporate and consumer segments, but analysts believe that improved financial fundamentals and large foreign ownership would enable banks in both countries to withstand a cyclical downtum. Losses in brokerage subsidiaries of foreignowned banks in Hungary led to funding support from bead offices in the wake of capital outflows during the Russian crisis, providing an example of the resilience afforded by this ownership structure. All of these countries have strengthened their regulatory and supervisory frameworks following the signature of EU Association Agreements, but significant challenges remain as they face the prospect of full capital account liberalization and contemplate joining the EU. In particular, capital adequacy requirements need to be broadened to include market risks and off-balancesheet exposures that are growing in most countries. Also, the convergence to EU deposit insurance levels is likely to require an increase in the coverage of the country's deposit insurance systems.
The Turkish banking system faced increased funding and credit risks during 1998, owing to reduced access to external funding by the lower-tier banks, higher domestic interest rates, and an economic downtum. However, the strength of a core group of wellmanaged top-tier banks, the treasury's readiness to accept high interest rates, and the stability of the depositor base aJlowed the banking system to weather the global crisis relatively well to date. The top-tier
22following the sale of one of the four large state-owned banks in early 1998, the government sold the fourth-largest in early June 1999 and announced a timetable for the privatization of the other two-to be completed in 1999.
65
banks have maintained access to international capital markets and have continued to absorb a large share of U1e lira-denominated government debt. The high real interest rates have raised questions about the dynamics of the government's debt but this has so far not been a key concern with the domestic investor base.23 The large currency mismatch of Turkish banks remains a source of concern, despite the tighter regulations to bring the open positions to 30 percent of equity. As the economy slowed down, asset quality deteriorated somewhat, with the biggest credit risk being the concentration of intragroup lending and guarantees that are not readily apparent in the analysis of banks' accounts. Market analysts see the approval of a new banking law that calls for the establishment of an independent bank supervisory body as a crucial step toward reforming the Turkish banking system.
References
Emerging Markets Traders Association. 1999, "Paris Club Asks Pakistan !0 Reschedule Eurobonds" (New York: EMTA).
G-1 0, 1996, The Resolution of Sovereign Liquidity Crises: A Report to the Ministers and Governors (Basel).
institute of International Finance. 1999, Involving the Private Sector in the Resolution of Financial Crises in Emerging Markets (Washington).
International Monetary Fund, 1998a, lmemational Capital Markets: Developments. Prospects, and Key Policy Issues, World Economic and Financial Surveys (Washington, September).
---. 1998b. World Economic Outlook and Imemational Capital Markets: /me rim Assessment, World Economic and Financial Surveys (Washington, December).
---, 1999a, World Economic Outlook. May 1999: A Survey by the Staff of rile International Monetary Fund. World Economic and Financial Surveys (Washington).
---. 1999b, ·'Involving the Private Sector in Forestalling and Resolving Financial Crises" (Washington: April).
Moody's Investor Services, 1999, "Pakistan's Paris Club Agreement Implies New Official Strategy Regarding Seniority of Sovereign Eurobonds," Special Comment (New York).
Petas, Peter, and Rashique Rahman, 1999, ·'Sovereign Bonds-Legal Aspects that Affect Default and Recovery," Global Emerging Markets, Deutsche Bank, Vol. 2, No. 3, pp. 59-78.
Standard & Poor's, 1999, "Paris Club Agreement Raises Probability of Default on Sovereign Bonds;· Standcm:J & Poor's CredirWeek. February 17, pp. 14-2 1 .
23See Annex Ill for funher details.
©International Monetary Fund. Not for Redistribution
IV Managing Global Finance: Private and Public Policy Challenges Raised by Last Fall's Mature Market Thrbulence
The severe turbulence that erupted in the immediate aftermath of Russia's effective default and de
valuation has raised a number of questions about the adequacy of the current lines of defense against systemic risk and the factors underlying the dynamics and spillovers that characterize modern financial markets. The World Economic Outlook and lntemariona/ Capital Markets: Interim Assessment noted that the three lines of defense against systemic risk-market discipline, prudential supervision and regulation, and macro-prudential surveillance-had proved inadequate to avoid a buildup in vulnerabilities during the two preceding years. As a result, the global financial markets experienced a bout of severe turbulence in the late summer and early autumn of 1998 following the reappraisal of risk triggered by the Russian crisis. Moreover, both market participants and policymakers were surprised by the virulent dynamics and spillovers across markets during the turbuJence-especiaJiy for emerging markets-as a rapid process of deleveragi ng and portfolio rebalancing was set in train by a sharp increase in risk aversion. Even in some of the deepest capital markets in the world, liquidity pressures emerged.
This chapter steps back from the proximate causes of the turbulence to address the questions of whether there are any particular features of financial systems that make them susceptible to such episodes, the degree to which modern risk management practicesand frequent marking to market-may contribute to the severe dynamics and spillovers that have characterized recent periods of deleveraging and portfolio rebalancing, and the associated challenges for public policy. fn the process, the chapter discusses the main proposals that have been advanced by various groups to contain the excessive leverage that contributed importantly to financial market turbulence.
Even though it was influenced by the structure of modem capital markets, the recent turbulence shares several features with earlier episodes of financial distress. Most notably, the turbulence was preceded by a gradual buildup in vulnerabilities, as investors were increasingly willing and able to assume higher levels of risk and, as in earlier episodes, a relatively minor or unrelated event served as a trigger for a sharp reappraisal of risk and the bursting of the euphoria. The turbulence, in short, involved the traditional elements
66
of boom-bust cycles that have been common in financial history.
In at least three respects, the environment of the recent turbulence has evolved from that in earlier episodes. First, reflecting the investments many governments have made in creating financial safety nets, such as deposit insurance and lender of last resort, many of the larger institutions are increasingly operating either explicitly or implicitly under a too-big-tofail policy. As a result, and notwithstanding the stepped-up supervision and regulation that accompanies the safety net, the system itself may be tending to encourage excessively risky behavior while blunting market discipline.
Second, modern risk management practices-such as marking to market, margin calls, dynamic hedging, and frequent portfolio rebalancing to meet internal and regulatory capital requirements-are leading to rapid adjustments in response to new information and/or reappraisals of risk. With the same large globally active institutions operating in many different markets and countries, these systems are also creating the potential for spillovers between seemingly unrelated markets. Moreover, risk management systems are placing an increasing premium on liquidity on account of the higher margin calls triggered during periods of financial stress.
Third, the growing use of OTC derivatives and structured notes is increasing the ability of institutions to leverage up capital positions. The high levels of leverage may be creating fmancial systems that are capable of making costlier mistakes during periods of euphoria (exacerbating the boom) and that can magnify the adverse consequences of a negative shock or a reappraisal of risk.
Following a brief review of some key features of episodes of financial stress as well ac; the growth of financial safety nets, the next section considers the environment in which the buildup in vulnerabilities occurred in the mature financial markets last year. ln addition to a number of structural factors related to modem ftnance, relatively abundant global liquidity and competition among financial institutions appear to have contributed to an environment in which risk became underpriced and leverage rose to unsustainable levels. The next section discusses some key public policy issues raised by the wrbulence, with particular
©International Monetary Fund. Not for Redistribution
Recurring Features of Turbulence and Crisis
emphasis on issues of market discipline, transparency, incentives, moral hazard, and the evolving nature of systemic risk. This is then followed by a review of the main proposals for addressing the risks posed by highly leveraged institutions and activities, and remaining challenges. Finally, the chapter concludes with an overaJI assessment of current proposals to effectively address the private and public policy challenges relating to weaknesses in private risk management and market discipline that contributed to the crisis. Appendix I discusses issues concerning the measurement of off-balance-sheet leverage. Appendix 2 addresses issues of market integrity that have arisen in connection with the activities of some HLis in small and medium-sized markets.
Recurring Features of Turbulence and Crisis: Importance of Lines of Defense
Against Systemic Problems
The mature market turbulence associated with the near-collapse of LTCM is the most recent example of a buildup of financial risks followed by a sharp adjustment in which exposures are unwound. The process of deleveraging was associated with virulent dynamics. Similar buildups of vulnerabilities can be identified in other episodes of financial turbulence and crisis, including most recently in the emerging market crisis in Mexico in 1994-95, the bond-market turbulence of 1994, the Asian crises in I 997-98, and the Russian crisis in 1998.
The episodes have frequently been characterized by relaxed attitudes toward risk taking, sometimes encouraged by economic and financial policies, and sometimes driven by overoptimism about the prospect for returns. The realization that imbalances are about to be unwound often leads to a race for the exits, rapid price adjustments, large volumes of rransactions being unwound-sometimes even closures of institutions, severe price dynamics and liquidity crises, and on some occasions more long-lasting credit crises. These are characteristics of the manias and panics in the early part of this century, documented by Kindleberger and others, including the now seemingly irrational exuberance in the run-up to the bank runs and panics preceding the Great Depression.1 In some cases,2 the accumulation of excessive concenrrations of risk can persist for some time before a series of triggering events encourages investors to reassess risks
'See Kindleberger ( 1 989). ZAs in the banking crisis leading up to the 1930s Great Depres
sion, the 1973 Bankhaus Herstatl international banking crisis, the 1980s developing-country debt crisis, the 1980s U.S. savings and loan crisis, Japan's 1990s asset-price bubble and financial system problems, and Thailand's 1997 foreign exchange and financial sector crisis.
67
and rebalance portfolios. Risks and vulnerabilities can accumulate in systemically important financial institutions, in markets, or, as in more recent emerging market crises, in countries or regions. In the 1990s, excesses and vulnerabilities seem to have become more market based and market oriented than they were in the early pan of the century, but the psychology of market behavior has probably not changed much. 1mbalances between the "greed" for high returns and the "fear" of losses and default have persistently led to swings between overexuberance during asset market booms and irrational panic during busts.
Although earlier episodes of turbulence and crises had similar features to those in the J990s,3 they often had different consequences. For example, in the United States (and in most countries) at the turn of the century, financial markets were much less regulated than today, and financial srructures also were different. ln the period leading up to the 1930s U.S. banking crises and the Great Depression, the banking system and financial markets more generally were less supervised and regulated than now. As a consequence, the banking and financial crises were largely resolved privately, with relatively low direct costs to taxpayers.4 However, the adjuslrnent in the real economy during 1929-33 was devastating-a 30 percent decline in real GDP in the United States and 1 7 percent decline in employment This large real economic damage formed the basis for a significant amount of legislation aimed at creating a ftnancial safety net and a regulatory and supervisory structure, and at ensuring both monetary and financial stability.s That is, it is as a result of the experience in the 1930s that financial markets, and more generally international ftnancial markets, have several lines of defense against the potential for widespread damage or systemic problems. The changes in the United States were in most important respects, but also with some special differences, representative of the approaches taken in other industrial countries and in many developing countries.
As a result, the advanced countries now have financial systems that have significantly different balances of costs related to the buildup and unwinding of fi-
3The buildup of financial excesses during the 1920s included a broad-based expansion of private debt (outstanding corporate bonds rose from 28 percent to 49 percent of GOP between 1920 and 1928) and household mortgages (from 1 2 percent of GOP to 27 percent).
4Bank failures during 1930-33 involved mainly capital losses of owners and deposito rs.
5For example. in the ca$e of the United States. while the Federal Reserve was charged with financial stability as early as 1913. its powers were expanded and consolidated with the Bankjng Acts of 1933 and 1935. The mandate for monetary policy beyond financial stability was not granted until the Employment Act of 1946 provided implicit guidance. Banking legislation during the 1930s also tightened the public safety net with the provision of deposit insurance, but commercial banking, investment banking, and brokering were separated to reduce financial concentration. which was suspected as a contributor to earlier financial excesses.

©International Monetary Fund. Not for Redistribution
IV MANAGING GLOBAL FINANCE: PRIVATE AND PUBLIC POLICY CHALLENGES
nancial excesses. There are extensive official safety nets and monitoring frameworks-banking supervision and market surveillance-and self-regulatory private organizations. By creating safety nets and monitoring frameworks for preventing and managing systemic problems, modern financial systems-in Europe, the United States, and Japan-have sought a different balance of costs than existed in the 1930s between prevention and resolution of crises, in which the potential for higher ex ante costs of prevention and ex post costs of resolution (both borne by taxpayers) yield benefits by reducing the economic damage and systemic consequences.
Meanwhile, national financial systems and the international financial system have been transformed dramatically by financial liberalization, innovation, modernization, and globalization. Most recently, these developments include the growth of derivatives markets (especially the OTC market) and the development of off-balance-sheet finance, the increasingly widespread use of complex quantitative models for portfolio and risk measurement, and the associated practices of marking to market and rapid portfolio rebalancing. International fmance is now driven by globally active financial institutions that rely on modern techniques and instruments of finance using sophisticated information, communication, and computer technologies. Recent crises, and in particular last fall's virulent dynamics, leave open the question of whether the official safety nets and monitoring systems have adapted sufficiently to this new financial environment and whether they are still ensuring that incentive structures encourage an appropriate amount of market discipline.
lt might be argued that, on the basis of the available evidence, it is difficult to justify the absolutely firm conclusion that last autumn's turbulence demonstrates serious weaknesses in the functioning of the global financial system that generate the potential for substantial systemic risk. rt is the function of financial institutions to take on and manage risks. Sometimes ex ante risks materialize in adverse ex post outcomes. and those undertaking such risks incur losses or even become insolvent, with costly consequences for owners, creditors, and counterparties. This is an inevitable feature of the normal and healthy functioning of a market-based, competitive financial system. Realization of losses and occasional insolvencies are essential to instill the necessary discipline on risk management policies and practices for all who participate in the financial system. In addition, periods of turbulence are a normal and recurring feature of financial markets, especially when markers experience significant adverse developments. Realization that such turbulence can occur-because it actually does occur-is also important for instilling proper discipline. In this regard, the difficulties that were encountered and the losses that were sustained in the turbulence that followed the Russian default and the near failure of
68
LTCM have taught (or reinforced) some important lessons about prudent risk management in modern global fmancial markets. Moreover, while the actions of the U.S. Federal Reserve and other central banks to calm financial markets suggest that the turbulence of last autumn did generate the potential for meaningful systemic risk, the comparatively modest extent of these actions and their subsequent success suggests that the level of such risk was well within manageable proportions. That major central banks may, on infrequent occasions, need to fulfill their responsibilities in tlus way does not necessarily imply grave defects in the general functioning of the global financial system.
However, on a reasoned assessment, this would clearly be too sanguine a view of the financial market turbulence of last autumn and of the lessons it should teach concerning the functioning of the global financial system. As emphasized in the World Economic Owlook and International Capital Markets: Interim Assessment, the extent of the turbulence last aurumnwhich affected a broad array of financial markets, including those that are normally the deepest and most liquid--does appear grossly disproportionate to the initiating causes. Something was not right in the buildup of vulnerabilities that preceded the turbulence. and something was not right in the exaggerated market response after the turbulence started. Moreover, one can wonder what might have happened in a similar situation of apparent (at least ex post) vulnerability, if there had been a substantially larger initiating disturbance, such as a sudden upsurge in global inflation or the onset of recession affecting most of the global economy. How would global financial markets have responded? Would the turbulence have been so easily contained and reversed? One can also ask, given the same initiating shocks as last year, what would have happened if monetary policy in the major countries had been less able to calm financial market turbulence because. for example, higher priority needed to be given to containing inflationary pressures? While such questions lack clear answers, they do strongly suggest that the path of prudence is to analyze carefully, with a view to designing and implementing relevant reforms, a variety of deficiencies in the functioning of financial markets and institutions that may contribute either to the unwarranted buildup of risks and vulnerabilities or to their disorderly and turbulent unwinding.
Environment in Which Financial Excesses Accumulated and Created the Potential for
Systemic Problems
The buildup of leverage and the market dynamics experienced last fall occurred in an environment shaped by the structural features of the modern global financial system. These features undoubtedly affected
©International Monetary Fund. Not for Redistribution
Environment in Which Financial Excesses Accumulated
the nature of market dynamics in international financial markets, but do not alone explain the buildup of excesses and the corresponding threat of systemic problems. A combination of conjunctural factors and market psychology also contributed to financial excesses manifest in the buildup of unsustainable risk exposures and concentrations, and leverage. These features, which are described below, cannot be precisely measured, but discussions with market participants strongly suggest that they all played a role in the turbulence.
Market Dynamics Are Changing
Greater Reliance on Securities Markets, Especially OTC Derivati1•e Markets
As the returns from traditional banking have declined, globally active firms have increasingly relied on off-balance-sheet activities and, in particular, OTC derivatives as a source of revenues. For the 50 largest banks, the ratio of other (i.e., noninterest) operating income to net interest revenue rose from almost 50 percent in 199 I to about 85 percent in I 997. This change in the business of global banking reflects at least two important factors. First, the opportunities for unbundling and repackaging risks provided by relatively recent advances in information and computer technologies have made it possible to create new derivative products that can be custom tailored to a customer's needs.6 The development of derivative products and the growth of this market have increased the opportunities for embedding financial features (options) in traditional securities that allow investors to hedge or to take specific positions on precisely defined risks (though the apparent precision may sometimes be illusory, because apparently separate components of financial risk may in fact be closely related at times).
Second, both private and regulatory incentives have encouraged the use of off-balance-sheet OTC derivatives, in part reflecting the more active internal and dynamic reallocations of capital across the various businesses within the organizations. Much of the activity has shifted off balance sheet because this is where profits can be made. Banks' clients now engage in more liquidity and asset management, and in hedging and position taking. Commercial banks have tapped into market-oriented business through other off-balance-sheet instruments as well, such as commercial credit lines and revolving underwriting facilities. The regulatory environment also provides incentives to shift activities off the balance sheet, as
6This has been one of the main driving forces behind the rapid growth in the OTC derivative markets, whose notional value of outstanding contracts amounted to more than $80 trillion at end-1998, up from $47.5 trillion in 1995.
69
off-balance-sheet risks often carry a smaller regulatory capital burden than on-balance-sheet risks. For example, by using OTC derivatives in their trading activities, commercial banks can increase leverage considerably without significant additional bank capital charges. Also, risk taking has shifted to market risk, which can be engineered through the use of offbalance-sheet derivatives. OTC derivatives are valued at market value on the balance sheet, but implicitly may contain additional layers of leverage that are not captured by capital requirements. Moreover, OTC derivative assets currently receive a maximum 50 percent risk weight (compared with 100 percent weight for private loans) according to the Basel Accord.? Finally, loan commitments with a maturity of up to one year, even if they are routinely rolled over, carry no capital charge.
Modern Portfolio Risk Management and Control System.�
A key a�pect of modern finance is the reliance on risk management, measurement, and control systems. Financial institutions now use risk management models and stress tests to measure the risk to capital (and ultimately the risk of insolvency) of their investment positions. Value-at-risk (VaR) models are one way to achieve this objective, as they quantify the amount of the firm's capital that is exposed over a given period, conditional on various assumptions. Some financial institutions also use stress tests in which scenarios are simulated. Regardless of the methodology, if the potential loss is too large, the firm might rebalance its portfolio to reduce the value at risk (the loss on the firm's portfolio that should be exceeded with no more than a small probability).& Some financial institutions also allocate capital on the basis of VaR and similar models.
Modem risk management models have two significant Limitations. First, they rely heavily on historical data and relationships, which may understate the likelihood of future extreme events and often involve the assumption that stable processes generate market prices. Recent events have underscored that rare, "fattailed" events can occur more frequently than might be expected, that correlations can increase and change sign during periods of extreme turbulence, and that volatility can increase sharply.
Second, the modeling of nonmarket risks, such as credit and liquidity risks, is challenging even for the
7The cap on the risk weights for (nonbank) OTC derivatives in the 1988 Basel Accord was based on the (by now questionable) presumption that the counterparties in the OTC derivatives market are of first-rate quality. The proposed revisions to the Basel Accord would eliminate the cap on risk weights for OTC derivatives.
8For example. a firm's value at risk might indicate that its losses over the coming week should exceed $10 million with no more than 5 percent probability.

©International Monetary Fund. Not for Redistribution
IV MANAGING GLOBAL FINANCE: PRIVATE AND PUBLIC POLICY CHALLENGES
most sophisticated financial institutions.9 Credit risk modeling is still in its infancy, in part because defaults are rare, and the risk of default evolves in a complicated fashion. However, the bulk of risk on balance sheets consists of credit risk, and credit losses have been, and still are, key sources of risk. Even less advanced is the modeling of liquidity risk-the risk that transactions (involving assets, liabilities, and offbalance-sheet items) cannot be executed without significant price changes. Risk models generally assume that market liquidity will be maintained so that positions can be closed out when necessary without adverse price declines. Liquidity risk may have been the most significant type of risk in the recent turbulence, since a lack of liquidity may have been responsible for some of the price discontinuities that occurred. tO
Computer-driven portfolio management techniques, such as portfoUo insurance" and dynamjc hedging, 1 2
are an important component of the risk management and control systems used by the major financial institutions. When these methods are widely used they can trigger many simultaneous sell orders and accentuate price declines, as they djd during the 1 987 stock market crash in the United States. Tbe resulting increase in volatility can cause further selling pressures as firms internally reallocate capital to meet margin calls and as quantitative VaR models require portfolio managers to scale back risky positions to balance risk and allocate capital. Risk components that in normal circumstances are isolated-market, liquidity, and counterparty risks--can become blurred in such circumstances, and risk management systems can break down.
Liquidity and Speed
Another, and closely related, aspect of the modem f-inancial system is that modern portfolio and risk management systems rely heavily on market liquidity.l3 Market liquidity can be seen as having three important characteristics: tightness (range for asset price bid-ask spreads), depth (volume of trades possible without affecting prices), and resiliency (speed with which price shocks are dissipated).'4 Financial sys-
11Tcchniques that change a portfolio's market exposure systematically in reaction to prior market movements, with the objective of avoiding large losses and securing as much participation as possible in favorable market movements.
t2Dynamic hedging is a position-risk management technique in which option-like return patterns are replicated by adjusting portfolio positions to offset the impact of a price change in the underlying market on the value of an options position (the "delta"). Dynamic hedging relies on liquid, continuous markets with low transaction costs.
t3Traditional financial intermediation also relies heavily on liqu.idity, but of a fundan1entally different variety-the ability to fund illiquid loans with liquid deposits versus the ability to sell marketable securities at or near the current price.
14See Committee on the Global Financial System (1999).
70
terns have become increasingly "liquidity hungry" as modern hedging and portfolio management need liquid markets to facilitate portfolio rebalancing and unwinding of leveraged positions. Derivative markets in particular require that underlying securities markets produce continuous prices; otherwise, shocks can trigger a snowballing sequence of margin calls and sell orders that can cause prices to move very sharply.
Market-making activities rest with broker/dealers who often take positions themselves and also require ready access to liquid repurchase markets or money markets to finance their positions. Broker/dealers rely on credit lines from banks for funding when circumstances do not permit them to roll over their funding positions in the repo or money markets. For the linkages among market liquidity, broker/dealers, banks, and money markets to operate smoothly, counterparties must be able to assess credit risks and must be assured of efficient and timely clearance and settlement of transactions. Unusual events that raise doubts about credit risk can cause these linkages to break down and lead to an evaporation of market liquidity. When markets become illiquid owing to the withdrawal of market makers, portfolio rebalancing can be disruptive, and asset prices can adjust abruptly.
Such adjustments occurred last fall during the mature market turbulence. As mature markets moved toward their nadir in late September and early October, there were few suppliers of liquidity. Those already holding safe Liquid assets, such as newly issued (that is, on-the-run) U.S. treasury bonds, were not selling tbem, and arbitrageurs that nonnally "insure" liquidity (such as LTCM, other hedge funds, and investment banks) were already highly leveraged and faced liquidity spreads that were likely to widen further. This generated losses and even greater pressures to obtain liquidity. The drying up of liquidity appeared to have been magnified and accelerated because many institutional market makers (investment banks, some commercial banks, and hedge funds) experienced proprietary trading losses and were unable to provide liquidity. These institutions withdrew from market making as they rushed to liquidate positions and absorbed market liquidity, and there appeared to be no natural sellers of liquid assets once the severe market dynamics took hold. Also, as many financial institutions had to meet margin calls, lending to market makers evaporated, which added to pressure on market makers. Discussions with market pruticipants have suggested they are now paying more attention to liquidity risk, and some risk models are being adjusted to mark assets to "liquidation values," using nonlinear pricing formulas, in times of stress rather than to ·•market values" as is done in normal market conditions. IS
t5For a summary of market practices. see Counterparty Risk Management Policy Group { 1999).
©International Monetary Fund. Not for Redistribution
Environment in Which Financial Excesses Accumulated
Even during normal market conditions, however, a particular event could trigger-via modem risk management and control systems-many simultaneous sell or buy orders in the same assets. Decentralized markets obscure the number of participants on the other side of the market (within the normal range of price variation). Without sufficient liquidity to support market transactions, prices can jump sharply as markets become one-sided, especially when market positions have been multiplied by leverage.
All llm•e Influenced Market Dynamic.\
Summing up this part of the discussion, the structural changes just described together have changed market dynamics in two important ways. First, modem finance aiJows risks to be priced and traded more actively, more continuously, in larger quantities, and ideally more safely. Changes in fundamental economic value that were once hidden on bank balance sheets are now recognized more quickly and more frequently in a mark-to-market environment through market prices. In addition, as market prices provide continuous (albeit noisy) signals about value, market participants reappraise risk, rebalance portfolios, and deploy or withdraw capital. This reassessment and rebalancing can, in turn, feed back to market prices. Thus, along with potential improvements in efficiency have come more frequent changes in asset prices and financial flows, and possibly more rapid and complicated market dynamics. Second, because the market makers that provide critical market liquidity are often also traders and investors, large price shocks can be associated with the withdrawal of market makers, a decline in market liquidity, and sharp and disruptive price declines (not only in the market that originally experienced the shock, but in any market where market makers might have been active).
Many of these features of modern finance are efficiency enhancing when used in moderation, but in the event, a critical mass of them were pushed simultaneously, aided by a buildup of high leverage, similar position-taking, and excessive reliance on-and presumption of-continuous market making and ample liquidity. In this environment, the August 1998 Russian default then came as an event that triggered the wholesale reassessment of risk that ultimately led to the mature market turbulence. Given the environment, some other combination of events could have done the same.
Role� of \farkct Psychology, Conjunctural Factors. ami Leverage in ViruJent Market D� namics
Market P.\)'clwlogy
In addition to the above-mentioned features of modern finance, market psychology also played a role.
71
Financial markets have long been seen as subject to cycles of market sentiment, in which excessive optimism suddenly shifts to extreme pessimism. This phenomenon is sometimes attributed to market irrationality, but it can have fundamental underlying causes.l6 Early in the cycle, a critical mass of market participants begins to view some investment opportunity in a more attractive light than in the past. This belief might be triggered by a new paradigm; a strong track record of returns; or the observation that those market participants Lhat are viewed as having "inside information" or special expertise are pursuing that opportunity and profiting from it. These can cause trend-following behavior by market participants that extrapolate past returns. and "copycat" behavior by those that attempt to "free ride" on the superior information of "insiders" and "experts."t7 Eventually, some event puts the initial optimism i n question, and in response, risk is reassessed and portfolios are rebalanced. Sentiment deteriorates rapidly, capital is withdrawn, and prices fall further, potentially creating a cycle of price declines and eroding sentiment that feed upon one another.
These psychological dynamics are generic to financial markets and may have been at work in recent years. Suggestions that the economic structure has changed in the I 990s may have led market participants to overweight the recent unusually favorable experience. The short price history of emerging markets provided a potentially distorted picture of the risks in those markets during the early 1 990s. Generous liquidity in international financial markets-and a presumption that it will continue to be provided on generous terms-may have boosted asset prices in the 1990s.
Conjunctura/ Fa<·tor.�
Conjunctural factors also played an important role in the buildup of imbalances before the fall of 1998. ln the period 1996 to mid-1998, three interrelated factors appear to have influenced conditions in global financial markets. First, low inflation rates, and in some cases near price stability, in the major countries resulted in very low nominal interest rates and a boom in the major fixed-income markets. Second, liquidity was generally ample, if not excessive, in international financial markets (but not necessarily in particular domestic markets). Third, competition to manage funds and maintain high returns intensified an1ong major financial institutions, which along with ample Liquidity compressed margins in many markets, adding to the
16See Chapter 2 of Flood and Garber ( 1994 ). 17Empirical studies of herd behavior and momentum trading
among institutional investors in mature markets include Grinblau, Titman, and Wermers ( 1995) and Lakonishok, Shleifer, and Vishny ( 1992), which find some statistically significant evidence for momentum trading and herding among U.S. equity funds.
©International Monetary Fund. Not for Redistribution
IV MANAGING GLOBAL FINANCE: PRIVATE AND PUBLIC POLICY CHALLENGES
incentives to reach for yield. In tum, these conjunctural factors encouraged changes in market features and practices, which later gave rise to the buildup in vulnerabilities through mid-1998.
Interplay of Financial Market Practices and Conjunctural Factors
Although it is not possible to be precise about the separate influences of market practices and conjunctural factors in the buildup in mature market vulnerabilities, market participants have suggested that the following were particularly important: • lax attitudes toward risk taking, including in emerg
ing markets-manifested, inter alia, in ineffective risk management (including the presumption of continuous market liquidity) and overreliance on collateral (which substituted for counterparty risk assessment and concentrated certain risks in some institutions);
• inadequate transparency about coumerparty risk, because of widespread reliance on off-balance-sheet, OTC, cross-border, and cross-market transactions;
• mark-to-market accounting, which contributed to liquidity pressures; and
• unsustainable Leverage, which became increasingly necessary to remain competitive and meet expectations of continued high returns.
Leverage, Financial Fragility, and Systemic Risk
Perhaps the single most important factor in the buildup of financial conditions that enabled a single credit event-the Russian default-to trigger such large reactions in the deepest and most liquid markets in the world was leverage. Without the exposures magnified by leverage, the effect of moderate shocks on systemically important institutions might not have induced the degree of withdrawal from market making and the extent of selling to meet margin calls witnessed in September and early October 1998. Without such selling pressures, initial declines in prices and widening in spreads might not have been amplified and propagated. Without the amplification and propagation of market shocks, large, systemically important institutions might not have seen the pressures against their profitability and capital that emerged at the height of the market turbulence.
High levels of leverage can give rise to vulnerabilities at every level of the financial system. At the individual firm level, although leverage enhances returns on equity when asset prices move in a favorable direction, leverage also magnifies losses when prices move against the flrm's positions. This magnification of losses increases the risk to the firm's solvency and the risk that the firm will face margin calls and forced liquidation of securities holdings when adverse price movements occur.
72
The same applies for groups of financial institutions, particularly when many of them have similar highly leveraged exposures. ln those circumstances, high levels of leverage can produce simultaneous swings in the profit-and-loss accounts of many ftrms, and by the same token, simultaneous adjustments in portfolios. A large market "shock" can also raise concerns that several financial institutions may simultaneously risk substantial losses. Either mechanism may give rise to sharp price declines and spillovers in response to price shocks, for example, owing to disproportionate selling pressures and reassessment of counterparty risk. Thus. modem financial systems can produce potentially disruptive price movements in the presence of high leverage.
At the financial market level, high leverage may contribute to price variability, as it could create price movements that reduce efficiency. These may occur first during the buildup of leverage, by leading to misallocations of resources and unsustainable appreciations of asset values, and second during the deleveraging process, in which sharp price reversals that are disruptive and temporarily destabilizing are likely. Unsustainable leverage can cause price swings on the downside that are beyond what is required by efficiency as market participants simultaneously attempt to liquidate leveraged positions in order to minimize losses.
In some circumstances, the risk of market disruptions stemming from high leverage can reach systemic proportions if leverage has built up in several markets simultaneously or through markets that are linked by the similar leveraged, cross-market investment strategies pursued by key participants, or if leverage causes the risk of insolvency in a critical mass of systemically important institutions. The potential for systemic consequences can also increase through highly leveraged price arbitrage between different market segments or markets. The buildup of unsustainable leverage can, in extreme circumstances, transform the financial system into one that is temporarily inefficient and unstable.
Finally, despite the risks raised by leverage, too LitUe is known about how to measure leverage, about its role in modem, complex financial institutions, about the optimal degree of leverage within financial markets, and about whether, and if so how, to regulate it. Because of the paucity of data on financial transactions flows, the most direct and observable evidence (ex post) of the buildup of counterparty risk concentrations and of high levels of leverage are various price data. These include the relatively compressed spreads on higher-risk debt instruments, the prevalence of low or zero initial margin requirements and haircuts on repo transactions, and the relatively easy terms of lending to those engaged in arbitrage in the markets for liquidity and short-term credit. The prevalence of these phenomena during the buildup of lever-
©International Monetary Fund. Not for Redistribution
Private and Public Policy Issues and Challenges
age and the severity of the market dynamics during the turbulent deleveraging process last fall suggest that leverage might have been excessive. However, there is no widely accepted analytical framework for determining and assessing the threshold beyond which leverage in a fum-or in a market or financial system-becomes potentially disruptive. If a comprehensive measure of leverage could be formulated and made transparent, then shareholders, creditors, and counterparties could reflect it in their assessments of counterparty risk and in the cost of capital they charge (see Appendix 1). This would add a degree of market discipline to constrain unsustainable leverage.
Regarding optimality, even if it can be argued that each institution pursues a risk management and leverage policy that appears individualJy sensible, the buildup of leverage at the systemic level may, due to unforeseen interactions in a crisis situation, reach unsustainable levels. This would suggest that the use of leverage can at times create a significant negative externality with potential systemic consequences.
Private and Public Policy Issues and Challenges
Because of concerns about the activities of hedge funds and especially about the events surrounding the near-collapse of LTCM, consideration has been given to whether to regulate hedge funds to reduce the possibility of their potentially excessive use of leverage. Like alJ other financial intermediaries, hedge funds use leverage, and in some cases misuse it. However, because the use of Leverage is not by any means confined to hedge funds, the issue of reforms in this area should not focus only on regulating and reforming hedge funds. As observed in previous International Capital Markets reports, 18 hedge funds have not been the only, or even the largest, ftnancial institutions involved in highly leveraged ftnancial activities in international financial markets. Many other financial institutions, including the proprietary trading desks of commercial and investment banks and other institutional investors, are major participants in the same kind of highly leveraged activity. The financial vulnerabilities that accumulated in and across several markets before August 1998 resulted from the activities of a large number of globally active financial institutions and many smaller specialized institutions (brokers, dealers, settlement systems) in both cash and derivative markets, and was not the outcome of the activities of a single group of financial institutions.19
From a public policy perspective, a key concern is that an unsustainable degree of leverage accumulated
18See, for example, lntemalional Monetary Fund ( 1 998a). 19For a general discussion of the role of hedge funds in the Asian
crises see Eichen green and others ( 1998).
73
in the international financial system, with some early warning signs, but without sufficient remedial action to forestall a buildup of vulnerabilities. The relevant pruticipants that could have taken corrective actions include private financial institutions, authorities responsible for supervising internationally active banks and for national market surveillance, and international groupings composed of central banks and national supervisory authorities that monitor international financial markets. The main challenge going forward is for private financial institutions and public policy to maintain the efficiency-enhancing aspects of modem finance while reducing the tendency for financial excesses to build up in the system and generate risks of virulent market dynamics.
Importance of Improving Market Discipline
In a market-based economy, internal private discipline (set by internal incentives and enforced by top management in financial firms) and, ultimately, market discipline (provided by external incentives from creditors, equity holders, and counterparties) are the primary market mechanisms for constraining private risk taking and leverage. Internal and market discipline are intended to detect growing financial imbalances within fmns and remove them through internal management controls and through market mechanisms (appropriate incentive structures, arbitrage opportunities, profit and loss statements, and marketrelated governance, including bankruptcies and the threat of takeovers) before they become large and threatening to a particular financial institution, market, or set of markets.20
While improving private market discipline has been identified as the most important challenge coming out of the turbulence, insufficient market discipline may itself have been a manifestation of other more fundamental deficiencies. Effective internal and market discipline rely on various other features of the economic and financial system and infrastructure. Of paramount importance are the availability of relevant information and the effectiveness of private and regulatory incentive structures. More broadly, challenges
lO"f'here is also the presumption that when a single financial institution develops an unsustainable risk profile (for example. because senior management faces inappropriate incentives). rhis will become known and be reflected either in the share price of the firm or in its ability to attract deposits or raise funds within the market place. ll1ere is the further presumption in most of the mature markets that the infrastructures are built so as tO prevent problems at one instirution from necessarily leading to problems at other institutions through the large-value transfer payments systems and through 01her parts of the private and public financial infrastructures (such as exchanges and securities settlement systems). All of these presumptions rest on the fundamental assumption that there is sufficient information available on a timely basis for investors and counterpartS to assess reasonably accurately the risk profiles of their counterparts and their relationships with them.
©International Monetary Fund. Not for Redistribution
IV MANAGING GLOBAL FINANCE: PRIVATE AND PUBLIC POLICY CHALLENGES
include improving fmancial disclosure and transparency; understanding and better aligning private, market, and regulatory incentive structures; and better understanding the changing nature of systemic risk. Ultimately, however, the presence of the public safety net for financial institutions--especially the largest systemically important institutions-creates countervailing incentives that work against adequate private internal and market discipline; accordingly, containing moral hazard from such public policies is also a key challenge.
Greater Financial Disclosure and Transparem') \hout Risk Exposurt's
Disclosure by financial institutions and transparency about their risk profiles is a fundamental requirement for private market discipline and regulatory and supervisory oversight. Without sufficient and timely information about on- and off-balance-sheet activities. the market disciplining mechanisms that are relied upon to address financial imbalances before they become vulnerabilities will not produce adequate self-corrective adjustments. Because of the complex nature of modem finance, the information requirements for assessing risk profiles of financial institutions are challenging both for those within the institutions (for risk management purposes and for allocating capital among businesses) and externally for stakeholders (including depositors, investors and creditors, counterparties, and supervisors). In an environment i.n which risks can be unbundled, repackaged, and embedded in securities, it is not a simple matter for the senior management of a financial institution to obtain accurate measures of the aggregate risk exposures of the institution. Risk managers from the most sophisticated international commercial and investment banlks report daily estimates of the firms' capital at risk to senior management, by relying on risk management models and stress tests. The combination of estimation ahd testing provides management with some, but not necessarily a sufficient, understanding of the finn's existing exposure and how well the firm's portfolio might perform outside historically based scenarios of market stress and turbulence. The financial industry is now developing techniques for more accurately estimating potential future exposure and for assessing the potential impact of systemic disturbances (that is, of liquidity risk) on the amount of capital at risk.
Investors, depositors, creditors, and counterparties to fmancial institutions also are challenged by the lack of transparency. Often, the only information available about the riskiest off-balance-sheet activity is embedded in footnotes of the firm's presentation of its simplified balance sheet in its annual report. Private stakeholders have the option of not lending to, or not dealing with, counterparties if they do not have suffi-
74
cient information to manage their risks. However, in the highly competitive environment that existed in the rnid-l990s, counterparties appear to have been willing and able to engage cost effectively in counterparty relationships with Limited information. A prophylactic for counterparty complacency would be increased disclosure and enhanced transparency of off-balancesheet activity and other vital parts of a counterparty's operational controls, including risk management.
l n addition to the challenges faced by senior managers and counterparties in assessing risk exposures, there are also systemic concerns associated with the lack of transparency. These concerns extend beyond the exposures of individual systemically important financial institutions, and include the degree of concentration of exposures within specific markets and the linkages across markets. Without such information, it is difficult for those in charge of official market surveillance and systemic risk management to know where all of the risks and vulnerabilities reside within the international financial system and where and how they might be concentrated. Overall, the objective is to enhance the degree of transparency and disclosure so that it strikes the appropriate balance between ( l ) the type of information that allows coumerparties to assess counterparty risk accurately and that allows systemic risk managers to assess market imbalances and vulnerabilities soon enough to take preemptive actions against potentially systemic turbulence; and (2) encouraging and not inhibiting efficiency-enhancing financial activity.
Realigning and lmpro\ing lncenti\e Structures to Promote Better 1\htrket Discipline
Greater disclosure and better transparency, in particular about risk exposures, are necessary but not sufficient for improving credit and counterparty risk assessments. Appropriate incentive structures-both within a financial institution and for outside stakeholders-are also required to encourage firms to obtain sufficient information and act upon it properly. Without such incentives, disclosure would not create sufficient market discipline to discourage the buildup of concentrations of exposures and unsustainable leverage within individual financial institutions. This kind of market discipline appears to have been deficient in the period leading up to the turbulence in the fall of 1998.
The overall incentive structure faced by financial institutions is a complex composite of the internal fum-specific structures, a competitive market environment, corporate governance arrangements, and the supervisory and regulatory framework. Lntemal discipline is guided by business practices, including appropriate capital endowments, sufficient profitability, and acceptable asset quality, and is safeguarded by internal control mechanisms, including risk management and
©International Monetary Fund. Not for Redistribution
Private and Public Policy Issues and Challenges
assessment procedures. Effective internal discipline requires the support of an internal incentive structure that aligns incentives of individual business units and individual decision makers with the overall objectives of the institution. The alignment of incentives at various levels of a complex decentralized organization is difficult because decision makers at various levels have the incentive to take rewards and shift associated risks onto others (or into the future).
That the turbulence appears to have been largely unanticipated suggests that risk management and stress testing systems may have been predicated on insufficient information and incomplete views about market dynamics and possible market repercussions from economic and financial shocks, as might be expected during a process of learning and adaptation to structural changes. The systems may not have fully taken into account the pace of financial innovation and the impact on market dynamics and cross-market linkages of the increasingly widespread use of deriva
·tive financial instruments. For example, until recently, many global financial institutions maintained separate market and credit risk departments, with the consequence that positions that were profitable because of price movements became unprofitable because of their impact on the solvency of the counterpart.
Ultimately, internal discipline is supported (and bolstered) by external market discipline by bank owners, creditors, and counterparties (as well as to some extent by supervisors). However, even if external stakeholders have access to sufficient information about the firms' risk profiles, they may not have strong incentives to closely monitor risk taking and other business activities. External monitoring is likely to be inadequate because of the highly complex nature of modem fmancial institutions, the opacity of their investment positions to outsiders, the nature of competitive pressures, and free-rider problems that are inherent in widely dispersed counterparty and financing relationships. This possibility of less than adequate private external monitoring by private stakeholders suggests there is a role for public policy to provide additional guidance, rules, and incentives for proper risk management.
Although possible, it seems unlikely that the apparent inadequacies of internal discipline within financial institutions and external stakeholder governance and control in the recent turbulence were entirely the combined result of coincidental misjudgments and errors. Because transformations in modern fmance have altered the way national and international financial markets price and allocate resources, it is reasonable to expect that private incentive structures would also need to adjust to these different ways of doing business. Thus, part of the explanation of insufficient discipline is probably that private incentive structures have yet to adapt to account adequately for financial modernization, securitization (market-based finance),
75
and globalization, and may be neither consistent with, nor supportive of, effective market discipline.
This suggests, in turn, that there may need to be adjustments in the role that public policy plays in ensuring that private incentive structures provide an appropriate degree of market discipline in financial markets. In addition to improving private risk management and prudential oversight over the risk-taking activities of financial institutions, policymakers, supervisors, and financial regulators can enhance the ability of market discipline to prevent systemic problems by providing greater incentives for stakeholders to exercise a greater degree of control and governance over the activities of financial institutions with whom they have business relationships. Moreover, because private and regulatory incentives interact and jointly affect private financial decisions, and because of the potential impact of financial modem.ization and globalization on them, it would be beneficial to review existing regulations and their potential impact on private incentives to ensure that distortions are not being created. Part of this effort would include providing a proper balance of insurance against systemic risk and disincentives (penalties) for exploiting the financial safety net
Reducing Moral ll:uard The existence of financial safety nets (for deposi
tors, financial institutions, and markets) creates the presumption that when market discipline is not sufficient to prevent systemic problems, there will be official involvement through the supervisory process and official market surveillance, and occasionally through more direct means of support. Financial stability (for example, in official large-value payments systems) is a public good that can be adversely affected by a collection of private actions. Without some degree of official involvement to insure against systemic risks. private market participants might collectively lack the willingness or ability to undertake optimal levels of financial risk, and they might therefore engage in suboptimal levels of financial intermediation. This seems to have occurred at the height of the market turbulence in the fall, when the widespread fear of private losses disrupted the normal operation of financial markets, to an extent that raised systemic problems. This is one reason why the U.S. Federal Reserve System, and other central banks, intervened to reduce the cost of liquidity and risk taking.
Prudential oversight and other elements of official involvement constitute preventive and corrective mechanisms, whkh-like market discipline-provide a degree of insurance and stability to national financial systems and, more broadly, to the international financial system. This presumes that the degree of official involvement remains within reasonable boundaries and does not unduly influence market participants into thinking they can engage in imprudent risk
©International Monetary Fund. Not for Redistribution
IV MANAGING GLOBAL FINANCE: PRIVATE AND PUBLIC POLICY CHALLENGES
taking without suffering the consequences of bad outcomes. The presumption should be that official involvement occurs only so far-up to the point where it encourages normal and prudent risk taking.
This poses a ctifficult balancing act for policymakers, who are responsible for encouraging normal risk taking and at the same time insuring the financial system against systemic problems. The challenge is for banking supervision, market surveillance, and financial policymaking more generally to balance efforts to manage systemic risks with efforts to ensure that market participants-in particular, the systemically important institutions-will bear the costs of imprudent risk taking and, accordingly, will have the right incentives to avoid imprudence. Accountability also needs to be in place, and perhaps bolstered in some cases, to foster and promote discipline in the exercise of official supervision and surveillance.
Improving Understanding of the Changing Nature of Systemic Risk
The evolving character of the global financial system raises challenges for systemic risk management. The national and international lines of defense put in place over the past twenty years to deal with systemic events rest on a certain conception of the nature of systemic risk, one that may have become too narrow given the expanded opportunities for risk taking and reliance on markets for financing. Most of the existing defenses are built on the presumption that a systemic financial event is (confined to) one in which the problems at one institution might cascade through a payments system, interbank relationships, or depositor runs and infect other institutions to the point of posing risks for the financial system itself.
As ftnancial systems have moved from separate national bank-based intermediation systems to a globally integrated market-based system, national payments systems have also been reformed. Marketbased systems in which securities are traded in markets have lower potential for traditional systemic risk than bank-intermediated systems. Securities firms hold liquid assets that can be traded and have a higher proportion of longer-term funding; and economic shocks are in principle absorbed by price changes, and their effects are spread and ctispersed more widely (in fact, almost globally). There is now a much greater reliance on securitized finance in most national financial systems and certainly within the international financial system. This may have created a more market-oriented form of systemic risk, involving an array of markets and their underlying infrastructures, which by and large are privately owned and operated. As a result, systemic risk may now be more highly concentrated in capital and derivative markets, and involve private settlement systems and quasi-private clearing houses.
76
In addition, there is an element of dynamic competition-a race-between the regulated and the regulator. Because of the combination of technological advances and private incentive structures, private fmancial practices may be changing more quickly and dynamically than it is possible for supervisory and regulawry frameworks to adapt to moniwr them. Likewise, because of differences in resources and incentives, the ability of the private sector to capture the gains from technological advances may have exceeded the ability of officials to learn how these technologies can be applied to the measurement, calibration, and management of systemic risk. As noted by one former senior regulator, the relationship of supervisors and financial institutions is like that of a "bloodhound chasing after a greyhound": regulators have trouble keeping pace with the ability of internationally active financial institutions, and the gap between them may be widening.
Current financial regulatory frameworks generally provide a financial safety net supported by ( l ) prudential regulations requiring banks to maintain sufficient capital, and (2) reporting and accounting standards and best business practices. The former are designed to ensure that fmancial institutions-particularly systemically important ones-have sufficient capital to absorb internally any losses sustained so that taxpayer costs are minimized. The latter are designed to ensure that losses are quickly and adequately reflected in protit/loss statements so that private stakeholders can discipline financial institutions to implement changes that prevent future losses. This general approach has worked reasonably well in limiting collateral systemic damage from private financial excesses and problems. Nevertheless, this approach is not without tensions: it creates potential conflicts between the objectives of regulators, who-by providing insurance-underwrite private risk taking beyond some limit that might not otherwise be taken, and those of regulated institutions. who have incentives to find ways to take greater risks within internal and regulatory capital constraints. A danger in imposing further constraining regulations is that the regulatory environment might then tend to inhibit efficiencyenhancing risk taking; alternatively, the danger in not adequately enforcing existing regulations is that financial institutions will take risks not usually considered worth taking.
There is no final solution to these challenges, and it is neither possible nor desirable for financial supervisors and regulators to know as much about a financial institution and its risk-taking activities as its own management. Nevertheless, financial policymakers must continuously reassess instruments for encouraging prudent behavior and risk management, recognizing that some instruments are likely to be imperfect and blunt. The challenge is to develop instruments that are effective in encouraging prudent behavior and
©International Monetary Fund. Not for Redistribution
Proposals for Reform
management but that do not inhibit efficiency-enhancing activities. As markets evolve and become more complex, regulatory frameworks need to be continuously well adapted to the changing nature of private financial risk and systemic risk.
ln summary, the transformation of the modem financial system is changing the nature of systemic risk. As noted recently by President Tietmeyer of the Deutsche Bundesbank, " . . . systemic risk is not a given quantity. To a large extent, it is an endogenous variable which depends on the structures of the financial markets, on the supervisory framework at the national and international levels and on the decisions taken by the political and monetary authorities."21 A fundamental concern is that private incentives are not strong enough to prevent excesses and that the existing lines of defense presently inadequately address some aspects of the transformed, more market-oriented systemic risk. A desirable approach is to consider reforming existing private and public mechanisms (including crisis prevention and management mechanisms) for dealing adequately with aJl of these evolving element<; of the intemationaJ financial system. In addition to reforming private risk management systems. G-1 0 financiaJ policymakers may also need to consider reforming systemic risk management systems to more effectively deaJ with the evolving nature of systemic risk and events. This will entaiJ a more global approach, as has taken place so far in the policy discussion on, and reform of. the international financiaJ architecture.
Proposals for Reform
Even before the turbulence in the fall of 1998 bad fully dissipated, private market participants, national authorities, and intemationaJ groupings had begun to consider reforms to address the weaknesses revealed by the episode. The proposaJs made so far do not take the view that new regulations (except for improved disclosure), and in particular direct regulations for HLis, are needed at this stage to address the private and public policy chaJlenges posed by the nearcollapse of LTCM and the associated market turbulence.22 Proposals have focused on strengthening market discipline and bank risk management by increasing the transparency of financial institutions through improved disclosure.
Private sector proposals have focused on improvements in private risk management, especially the integration of market and credit risk functions. n They
21See 1ietmeyer ( 1999). 22The main initiatives. both public and pnvate. are summarized in
Annex fV. 23See Counterparty Risk Management Policy Group ( 1999); ln
stituLe of International Fioance (1999); and international Swaps and Derivatives Association ( 1999).
77
stress the need for adapting risk management procedures to the evolving financial environment and for better understanding the role of collateral. Undoubtedly, given the losses sustained at some institutions and lessons learned more generally from the recent turbulence, there have been already, and will continue to be, significant adjustments in risk management policies and practices. This is a favorable result that should help to improve systemic stability. However, some private sector proposals are critical of any attempt to codify risk management practices.24 Although some private studies advocate enhanced transparency in financial markets, others have expressed doubts about the net benefits of requiring extensive public clisclosure of exposures to HLis and direct disclosure by hedge funds.25 This approach adds somewhat to more general doubts about whether private initiatives to improve risk management-important and valuable as they will surely be-will be enough to meet the evolving challenges of the increasingly complex global financial system.
Some national authorities have suggested changes in private risk management procedures or supervisory practices that go beyond private sector proposals. For example, the U.S. President's Working Group on Financial Markets surveyed the issues surrounding hedge funds and recommended a number of measures designed to constrain unsustainable leverage by improving transparency and private risk management.26 The Working Group concluded, inter alia, that hedge funds should be required to report their quarterly financial statements to the public. and that all public companies should publicly disclose their aggregate exposures to HLis. The Working Group also identified a need for regulators to provide guidance on risk managemem practices. IL noted ambiguities in the close-out netting regime and severe shortcomings in the interplay of national bankruptcy laws, in particular vis-a-vis offshore centers. Supervisory clirectives have been issued in the United States by the Federal Reserve Board and by the Office of the Comptroller of the Currency (OCC). These directives provide guidance on key elements of counterparty credit risk, such as the measurement of credit exposures, and on internal controls to ensure that practices comply with policies. They stress that due diligence-not competitive pressures-should drive the credit decision process.
A Bundesbank report noted that sole reliance on market cliscipline is unlikely to suffice to contain excessive leverage.27 The Bundesbank argued that the systemic risks associated with hedge funds depend
!•For example. see Corrigan and Thieke (1999). 25See Harris ( 1999). 26See United States, President's Working Group on Financial
Markets (1999). 27See Deutsche Bundesbank ( 1999).
©International Monetary Fund. Not for Redistribution
IV MANAGING GLOBAL FINANCE: PRIVATE AND PUBLIC POLICY CHALLENGES
primarily on the degree of their integration with the banking system. The report proposed an international credit register as an effective monitoring system for creditors and concluded that it would be desirable i f hedge funds were required, under direct supervision, to comply with reporting rules and possibly with investment and capital requirements. The Bundesbank recognized the practical difficulties in enforcing national regulatory measures given globalized markets and complex investment strategies.
A Reserve Bank of Australia report indicated there is a case for a public policy response to the emergence of hedge funds.28 Although the report argues that regulation of some types of hedge funds was warranted, it also acknowledges considerable practical difficulties, including the possible migration of hedge funds to nonregulated offshore centers and the emergence of new institutions similar to hedge funds that would not be covered by regulation. The report concluded that, given these practical difficulties, the most effective approach would include improving disclosure standards, enhancing the risk monitoring by the creditors of hedge funds, and removing distortions in the Basel capital framework that favor bank exposures to hedge funds.29 The report also noted that, notwithstanding ongoing efforts toward international coordination, there was scope for unilateral action by national regulators, particularly in the United States, with beneficial effects for the global fmancial system.
There have also been several international initiatives. In addition to risk management practices, these have concentrated on how greater appropriate disclosure could be beneficial for improving counterparty risk assessments by private agents and for enhancing banking supervision and official market surveillance efforts for assessing market and system-wide accumulations and concentrations of risk and leverage.
A draft EU paper on the reform of the international financial system concluded that HLis should comply with the same rules on transparency and disclosure that apply to other financial iostitutions.30 HLls' overall leverage should be monitored and bank lending to HLis tightly supervised. The EU paper also proposed a credit register on the overall indebtedness of funds and suggested that financial institutions situated in
28See Reserve Bank of Australia ( 1999). 29'fhe Reserve Bank report notes that. according to the current
Basel Accord on Capital Adequacy, inter alia, banks' derivative exposures to nonbanks receive only a 50 percent risk weight (implying a 4 percent capital requirement compared with the standard 8 percent for claims on the private sector), that short-dated foreign exchange contract� are zero-weighted. and that on-balance-:.heet exposures to hedge funds arc rreated like other claims on the private sector. The proposed revisions to the Basel Accord address some, but not all, of these issues. For example. the Basel Committee proposes lifting the cap on OTC derivatives risk weights and introducing a new 150 percent risk weight category for poor-quality corporate claims.
JOSee EU Economic and Financial Comminec ( 1999).
78
offshore centers could face higher capital requirements or transparency obligations.
The Basel Committee on Banking Supervision issued a paper on, and sound-practice guidelines for, bartks' interaction wirth HLis.31 The paper noted that transactions with HLfs pose special challenges for risk management, given the opaqueness of their activities and the dynamic nature of their trading strategies. Jt urged supervisors to put in place incentives and standards to encourage prudent management of bank exposures to HLis. The sound practices call upon banks, inter alia, to adopt credit standards in line with the specific risks associated with HLis; to monitor exposures frequently; and to develop meaningful measures of potential future exposure and establish appropriate credit limits.
Ongoing work on these issues is taking place in various international forums. In February 1 999, the Financial Stability Foru m was established by the G-7 industrial countries to improve cross-border and cross-sector cooperation of official agencies in identifying incipient vulnerabilities and ensuring that consistent international rules apply across all types of financial institutions. The Financial Stability Forum has three working groups currently examining HLls, offshore financial centers, and capital flows. The three working groups are expected to prepare reports for the next meeting of the Financial Stability Forum in midSeptember 1999.
Work is also under way in various working groups established by the Committee on the Global Financial System (formerly the Euro-currency Standing Committee). One working group is developing templates for disclosure of market exposures and trading positions by the large internationally active banks that will allow national and international authorities to assess market-wide risk exposures and concentrations without knowing details of risk exposures within individual institutions. Another working group is investigating the usefulness of aggregate position data for improving financial system transparency.
Overall, current private and official proposals have emphasized the role of private risk management (the first line of defense) for containing leverage and have viewed regulatory and supervisory activities (the second line of defense) primarily as tools for strengthening market discipline. Much less auention has been devoted to reforms t:hat would improve the ability of supervisory and regulatory frameworks to ensure incentives for a sufficient degree of oversight to effectively monitor and influence the levels of leverage and risk taking. Appropriate incentives-for bank management, credit and market risk management, and supervisors-supported by effective enforcement through supervisory oversight and guidance are aJso necessary.
31See Basel Comminee on Banking Supervision ( 1999b, 1999c).
©International Monetary Fund. Not for Redistribution
Remaining Challenges
[n addition, it would be prudent to make clearthrough appropriate incentives and disincentives, perhaps requiring new regulations and even laws-that senior management (decision makers) and the financial institutions they manage will bear the cost of mistakes.
Remaining Challenges
The proposed measures for enhanced private risk management are by and large appropriate, but there are severral areas that have not yet been addressed fuHy. Bo·th private and public sectors face important challenges in improving incentive structures, increasing the breadth of information to be disclosed and learning how to best utilize it for prudent financial decision making, and redefining a well-articulated and enforceable role for public policy, in particular supervision and market surveillance (the second and third lines of defense against systemic problems). There are also several important areas where improvements can be made in the public sector's role in financial policymaking and implementation: better coordinating micro- and macro-prudential oversight; narrowing the gap between the regulators and the regulated; and better understanding the linkages between monetary and financial stability.
Ineffective Incentive Structures
Current proposals do not, at this stage, sufficiently address the role of incentive structures in preventing a buildup of financial vulnerabilities. Internal incentive structures could be improved through an integrated fl11ll-wide and comprehensive approach to risk management and control that aligns the incentives of all players-from back-office to traders to risk officerswith the incentives and risk preferences of senior management and shareholders. Incentives for screening and monitoring by stakeholders could also be encouraged by providing market participants with additional market-based incentives more in line with publjc policy objectives: for example, by requiring banks to issue subordinated debt.32 Io addressing these inconsistencies in private incentives, official oversight of their implementation can help to ensure that private incentives are more effective.
Official proposals do not explicitly acknowledge the scope for improving regulatory incentive structures. The current proposal to revise the Basel Accord to make it more risk focused suggests there is likely to be greater flexibility in tailoring the regulatory burden (including capital requirements) to the effectiveness of a firm's risk management and control systems, but
JlSec Calomiris (1998) and Meyer tl999).
79
this remains to be seen (see Box 4.1 ). Other similar adjustments in prudential regulations and supervisory oversight may also be considered, many of which have been, and are still being, discussed in the various consensus-oriented committees, subcommittees, and working groups of central bank.<; and supervisory authorities that meet regularly under the auspices of the BrS. [n addition to enforcing private sector safeguards, the effectiveness of public sector involvement may be enhanced by evaluating, and improving if necessary, the ability of incentive structures to limit excesses in the lransformed global fmancial system. Part of this effort should include an evaluation of how regulatory and private incentives interact, and whether regulatory incentives are distorting private incentives, especially in light of the modernization and globalization of finance.
Gap� in Dbdosure and Transpart!nC}
There were also significant gaps in information (vis-a-vis counterparties, supervisors, and the public) in the run-up to last faJI's financial turbulence. Official proposals for increasing disclosure requirements and transparency do not clearly delineate what type of information should be disclosed, how often, and to whom (investors, depositors, shareholders. counterparties, or supervisors). This reflects in part the fact that there has not yet been sufficient time to digest completely how modern financial systems have altered the infonnational requirements for assessing, monitoring, and managing financial risk. Beyond the need to know more about risk exposures, off-balancesheet activity, and OTC derivative markets, the form the information is likely to take remains unclear. A better understanding of the role of leverage, for example, could provide guidance on the type of information regulators and supervisors can provide to market participants about industry or market-wide vulnerabilities. Supervisors might make information available to financial institutions about prevalent types of position taking in key markets that could serve as input to firms' stress-testing exercises wid1 a view to more accurately assessing the simulated market dynarnjcs in response to economic shocks. Those performing market surveillance could also disclose information on aggregate market positions to indicate market excesses and concentrations. Indeed, with global markets, closer coordination among supervisors and those performing market surveillance could be beneficiaL
Further improvements in information on the extensive off-balance-sheet activities by financial institutions could prove useful for both supervision and surveillance. As supervisors intensify their information-gathering efforts, particularly with regard to OTC derivatives, and reftne their methods of assessing risk exposures related to derivatives in individual institutions, a ftner reporting network for surveillance pur-
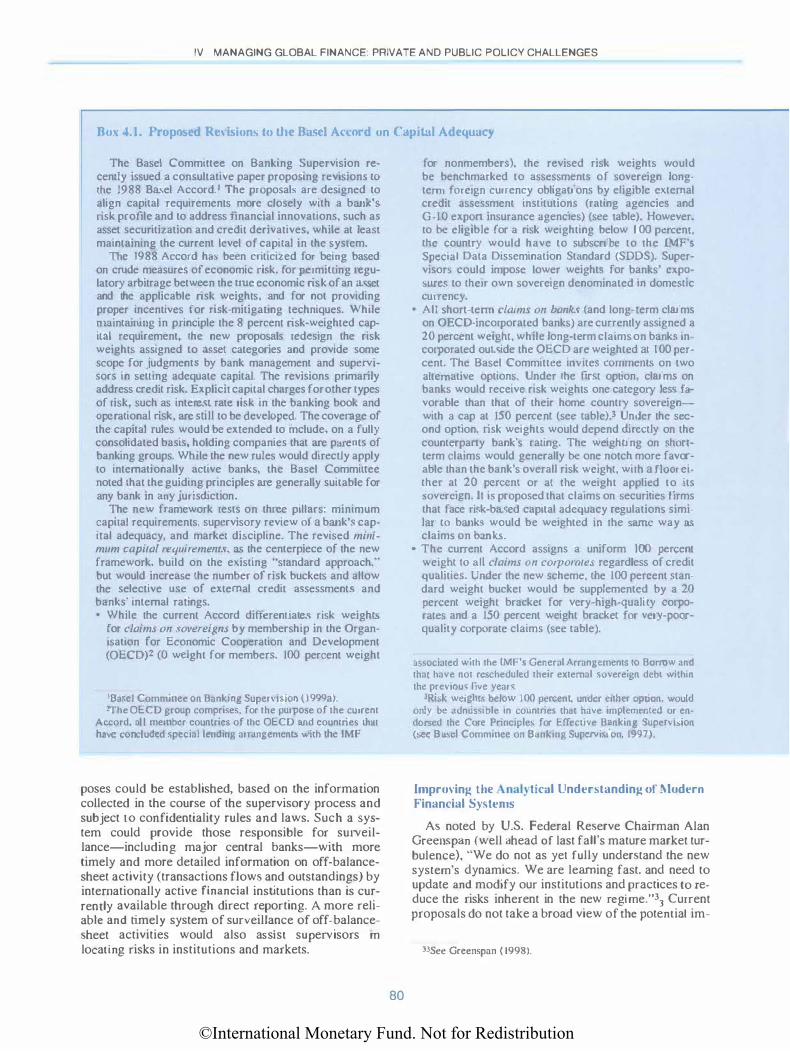
©International Monetary Fund. Not for Redistribution
IV MANAGING GLOBAL FINANCE: PRIVATE AND PUBLIC POLICY CHALLENGES
Oox 4. 1. Proposed Re' is ions to the Bust-1 Accnrd on ( �tpi t�ll AdequaC)
The Basel Committee on Banking Supervision recently issued a consultative paper proposing revtsions to the 1988 Basel Accord. I The proposals are designed to align capital requirements more closely with a bank':. nsk profile and to address financial innovations, such as asset securitization and credit derivatives. while at lea.\! maintaining the current level of capital in the sysrem.
The 1988 Accord hru; been criticized for being based on crude measures of economic risk. for permiuing regulatory arbitrage between the true economic risk of an asset and the applicable risk weights, and for not providing proper incentives for risk-mitigaung techniques. While maintaining in pfinciple the 8 percent risk-weighted capillll requirement, the new proposals redcsJgn the risk weights assigned to asset categories and provide some scope for judgments by bank management and supervisors in setung adequate capital. The revisions primarily address credit risk. Explicit capital charges for other types of risk, such as intereM rate risk in the banking book and operational risk, are still to be developed. The coverage of the capital rules would be extended to mclude, on a fully consolidated basis, holding companies that are parents of banking groups. While the new rules would direcUy apply to internationally active banks, the Basel Commiuee noted that the guiding principles are generally suitable for any bank in any jurisdiction.
The new framework rests on three pillars: minimum capital requirements, supervisory review of a bank'.; capital adequacy. and market di�cipline. The revised minimum capital requirement.\. as the centerpiece of the new framework. build on the existing "standard approach.'' but would increase the number of risk buckets and allow the selective use of external credit a<>sessment..<> and banks' internal ratings. • While the current Accord differentiate:. risk weighL'>
for c:laims on sovereigns by membership in the Organisation for Economic Cooperation and Development (0ECD)2 (0 weight for members. 100 percent weight
'Basel Commmee on Bankmg Superv1!.ion ( 1999a). :!The OECD group comprises. for the purpose of the current
Accord, all member countrie� of 1hc OECD and countrie� thm have concluded special lending armngemcnt:. with the rMF
poses could be established, based on the information collected in the course of the supervisory process and subject £O confidentiality rules and laws. Such a system could provide those responsible for surveillance-including major central banks-with more timely and more detailed information on off-balancesheet activity (transactions flows and outstandings) by internationally active financial institutions than is currently available through direct reporting. A more reliable and timely system of surveillance of off-balancesheet activities would also assist supervisors m locating risks in institutions and markets.
80
for nonmember.,), the revised risk weights v.ould be benchmarked to assessment..<; of sovereign long· term fore1gn currency obligations by eligible external credit assessment institutions (rating agencie!> and G-1 0 expon insurance agenc1es) (see table). However. to be eligible for a risk weighting below 1 00 percent. the country would have to subscribe to the lMFs Special Data Dissemination Standard (SODS). Supervisor., could impose lower weight!> for banks' cxpowres to the1r own sovereign denominated 10 domestic currency.
• All �hort-term claims on banks (and long-term claims on OECD-incorporated banks) are currently assigned a 20 percent weight, while long-term claims on banks incorporated outside the OECD are weighted at I 00 percent. The Basel Committee invites comments on two alternative options. Under the first option, claim� on banks would receive risk weights one category les!t favorable than that of their home country sovereignwith a cap at !50 percent (sec table).l Unc.ler the second opuon. risk weights would depend directly on the counterpany bank'� rating. The weighting on shortterm claims would generally be one notch more favorable than the bank's overall risk weight, with a floor either at 20 percent or at tl1e weight applied to its sovere1gn. It IS proposed that cla1ms on securities firms that face risk-based capital adequacy regulation� similar to banks would be we1ghted m the same way as claim� on bank!>.
• The current Accord assigns a uniform 100 percent weight to all claims on corporate:; regardless of credit qualities. Under the new scheme, the 100 percent stan· dard weight bucket would be supplemented by a 20 percent weight bracket for very-high-quality corporates and a 150 percent weight bracket for very-poorquality corporate claims (see table).
a,'>sociated with the IMF'' General Arrangcment1> to Borrow and that have not re�cheduled their external sovereign debt within the previous live years..
3Ri�k weight' below 100 percent. under either option, would only be adnuss1ble 1n countne� that have implemented or endon.ed the Core Principle' for Effectsve Banking Superv1sion ('ec Bal>cl Commmee on Banking Supcrvi�ion, 1997).
Improving the Anal} tical Understanding of 1\lodern Financial Sy1.tems
As noted by U.S. Federal Reserve Chairman Alan Greenspan (well ahead of last fall's mature market turbulence), "We do not as yet fully understand the new system's dynamics. We are learning fast. and need to update and modify our institutions and practices to reduce the risks inherent in the new regime."33 Current proposals do not take a broad view of the potential im-
JJSee Greenspan ( 1998).
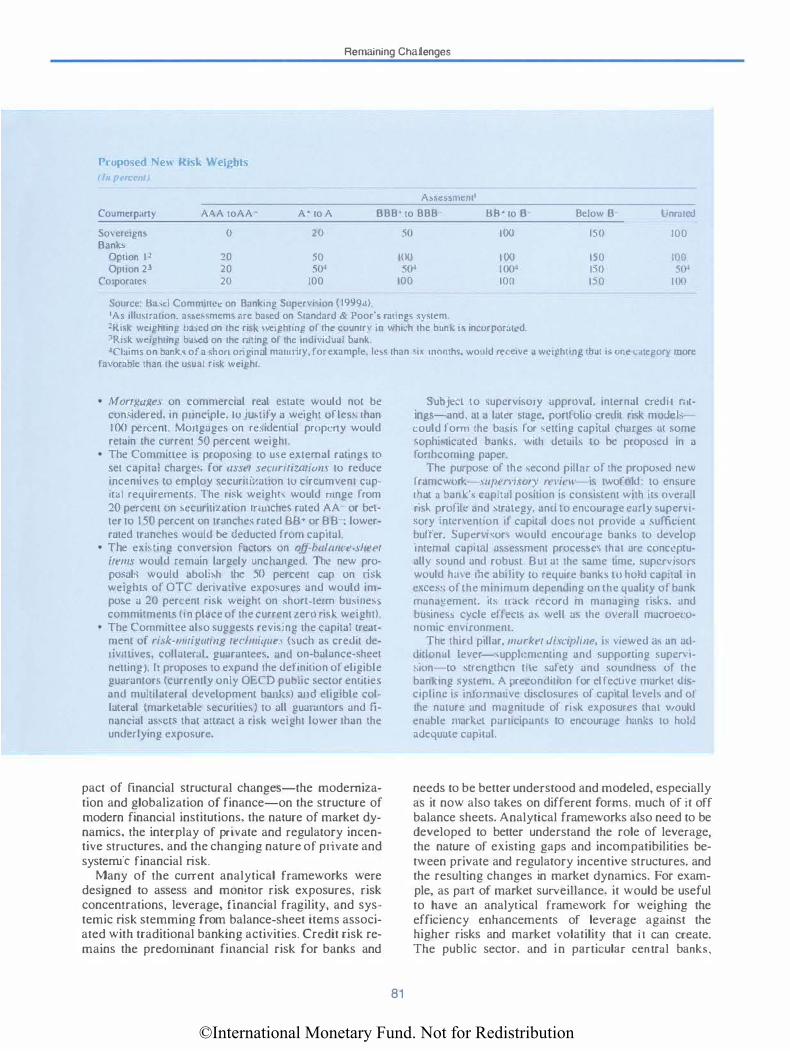
©International Monetary Fund. Not for Redistribution
Remaining Challenges
Proposed Ne" Risk \\eiW!ts I III J>t'Tt t nt)
A�M!''mem'
Coumcrpany AAA toAA- A• to A BBB' to BBB BB� to B Below B Unrated
So"Vere•gn� 0 20 so 100 ISO 100 Bank'
Opuon P 20 50 100 100 150 10() Opuon 21 20 50� "i� I( )()-I ISO ,5()-'
Corporate.' 20 100 100 100 150 100
Source· Ba�c:l Committct: on Bankmg Supervi�ion C !999ul 'As illu�tration. a'sessmems nre ba&ed on Standard & Poor·� ratmg> 'Y'tem. �Ri�k weighting t�:bed on the riSk \\ cightmg uf th.: cuuntry 111 which the bun" '' incurptmucd 3Rbk weighting ba�ed on the rating of the individual bank 4Cimms on banks of a >hon origmal malllrity. for example. lc'' than 'IX month,. \\ould recCIVt: a wcighung that '' one catcgo r} more
favorable than the usual risk weight
• MorrgaJ{e.f on commercial real c�tat.: would not be con�idercd. in princ1plc. 10 justify a we1ght of lcs-. than I 00 pe rcent. Mortgages on re�idcnual propcny would retain the current 50 percent weight.
• The Commlllee 1� propo\ang 10 u"e external ratings w set capitaJ charge)> for asset secur111:.auons to reduce mcentives to employ �ccursu.�:auon w circumvent cupita I requirements. The risk we1ghh would range from 20 percem on �ecuriti.�:ation tr.u1chc!> rated AA or better to I 50 percent on tranche., rated BB• or BB , lowerrated tranche!> would be deducted from cap1tal.
• The ex1�ting conversion facto� on fJjf-balmtce-.�ltet>t items would remain largely unchanged. The new proposal!> would abolbh the 50 percent cap on ri"k weighh of OTC derivative exposure� and would impose a 20 percent risk weight on ... hort-term bu�>me�lo commitment\ (an place of the current tcro nsl-. weight).
• The Committee alo,o suggests rcv1sing the capital treaamcnt of risk-mitiJ{ating rerlmhJIU'.\ (:.uch as credit derivatives, collateml, guarantees. and on-balance-sheet netting). It proposes to expand the detiniuon of eligible guarantors (currently on!) OECD puhlic sector entities and multllateral development banksJ and eligible collateral (market<tbl.: securities) to all guamntors and financial as\ClS that attl':lct a risk weight lower than the underlying exposure.
pact of fmancial structural changes-the modernization and globalization of finance-on the structure of modern financial institutions, the nature of market dynamics, the interplay of private and regulatory incentive structures, and the changing nature of private and systemic financial risk.
Many of the current analytical frameworks were designed to assess and monitor risk exposures, risk concentrations, leverage, financial fragility, and systemic risk stemming from balance-sheet items associated with traditional banking activities. Credit risk remains the predominant financial risk for banks and
81
Subject to �upcrv1sory upproval. internal cred1 t n•t· ings-anc.J at a later stage. portfolio credll rssk mm.lehcould forn1 the basis for setting capital charges ttl some o,ophbticated banks. with detaib to he propo,cd in a fonhcommg paper.
The purpose of the ,econd p1tlur of the propo,ed new I ramcwurl.-.mpervisorv re,•if!ll'- 1� twolbld to ensure that a bank'., capital position is consistent with It<. O\'erall rasl. profit.: and �trategy. anti to encourage early !>Upt:r\ t'ory tnwnenuon 1f capital docs not provide a ,uflil.:1ent buffer. Supervt�or� would encourage banks to develop mtemal capllal a��es�ment proces\C\ that are conccptu· all)' sound and robust But at the same time. supcn 1so� would hm e the ability to require bank!. l<l hold capital in execs!> of the min1mum depending on the quality of bank management. lh truck record m managmg nsl.�. and busines� cycle effects as well us the o\'er'd.ll macroet:o· nomic cnvtronmem.
Thl! third ptllar. market di.1cipline, is VIewed as an atlditionul levcr-<.uppll!ml!nting and supporting supcn t· '>IOn to \ln.:ngthcn tsk safety and �oundne ... s of the banldng system. A precondition for cllcctive market dis· ciplinc i& mlormative disclosures of capttal lcveb and ul the nature und magnitude of rbk exposure� thut v.nuld enable market purticipunts to encourage hunks to hole.! mkquatc capttal.
needs to be better understood and modeled, especially as it now also takes on different fonns, much of it off balance sheets. Analytical frameworks also need to be developed to better understand the role of leverage, the nature of existing gaps and incompatibilities between private and regulatory incentive structures. and the resulting changes in market dynamics. For example, as part of market surveillance, it would be useful to have an analytical framework for weighing the efficiency enhancemems of leverage against the higher risks and market volatility that i t can create. The public sector, and in particular central banks,
©International Monetary Fund. Not for Redistribution
IV MANAGING GLOBAL FINANCE: PRIVATE AND PUBLIC POLICY CHALLENGES
could take a lead role in developing an informative analytical framework, which would be useful for shaping disclosure requirements and to determine what information should be collected and processed at the individual institution level and various levels of aggregation.
Other Challenges fnr the Public Sector
There are other important challenges for the public sector's role in strengthening supervision and surveillance: at the nexus of micro- and macro-prudential oversight; in the gaps between regulators and the regulated; and possibly in gaps between frameworks for ensuring monetary stability and financial stability.
First, financial system stability depends on the soundness of individual financial institutions, especially those that are systemically important. There may be unexploited synergies between macro-prudential-<:oncerned with financial system stabilityand micro-prudential oversight-<:oncerned with the soundness of individual financial institutions. Although meetings occur regularly in international forums, more extensive discussions between supervisors of the internationally active banks could have helped to detect the predominance of creditor and counterparty exposures to LTCM and other hedge funds, and possibly have helped to prevent the buildup of problems last fall. Supervision could benefit from market intelligence gathered through market surveillance to obtain a market perspective on the risks faced at the firm level, while those performing market surveillance could benefit from knowing about financial institutions' market-related activities. Better coordination between macro-prudential market surveillance and micro-prudential financial supervision, and (public) disclosure of information gathered from supervisory activities, could help to limit the accumulation of market imbalances.
Second, because of advantages in the way they use information and technology, and their access to resources, financial institutions have informational advantages over regulators. Competition spurs financial firms to create new financial products, from which they earn rent, by utilizing state-of-the-art financial and information technologies, and they have more knowledge about their own positions and trading strategies than do supervisors. By contrast, the capabilities of public authorities to assess the implications of these financial innovations lag the private sector's capabilities to exploit those innovations. Ln essence, there are asymmetries between regulators and those they regulate in the understanding of changes to financial businesses and in the application of new fmancial and information technologies. Widening gaps are limiting the abiUty of regulators and supervisors to monitor global financial markets,
82
oversee financial institutions and activities, and enforce regulations. Moreover, in view of the national orientation of supervisory, regulatory, and surveillance structures, the globalization of financial markets and the rise of financial conglomerates have also widened jurisdictional gaps. Thus, as noted earlier, continuing efforts are required to update supervisory tools and regulatory frameworks, at a minimum to prevent these gaps from widening, and preferably to reduce them.
Third, there are close Hnkages between monetary stability and financial stability. Although it is unlikely that monetary policies in the major countries contributed directly to this buildup, they may have played a role. l n discussions during the past two years, private market participants in the major international financial centers often noted that there was ample liquidity in international financial markets driving spread compression. Without judging whether this is correct, there may be channels through which national monetary policies have an unintended impact on the global pool of liquidity. For example, while low Japanese interest rates of 0.5 percent may have been appropriate for promoting aggregate demand in Japan in 1997-98, they also were associated with the heavy reliance on the yen carry trade, which suppHed liquidity to several regions via swaps in international capital markets. Similarly, monetary policies in other major financial centers have likely contributed to global liquidity from time to time.
Because national monetary policies affect the global pool of liquidity, they may also at times support, if not encourage, a buildup of leverage and position taking in international markets beyond prudent levels. Current analytical and policy frameworks for conducting monetary and financial policies in the major countries are unljkely to detect growing imbalances of this kind. Thus, there may be important gaps in the ability to monitor international monetary and financial developments: on the one hand, at the nexus of monetary and financial stability, and on the other hand, at the nexus of achieving domestic and international stability. These issues may also require careful consideration by national monetary and supervisory authorities and international bodies composed of national authorities that address related issues regularly in international meetings and forums.
Overall Assessment and Conclusion
Current reform proposals emphasize improving transparency and disclosure and strengthening private risk management, with the objective of enhancing market discipline. One reason leverage and risk concentntions may have produced potential systemic problems is that corrective market mechanisms apparently did not sufficiently limit growing imbalances
©International Monetary Fund. Not for Redistribution
Overall Assessment and Conclusion
within financial institutions and across financial markets. Ultimately, vulnerabilities became large enough that they had to be contained. Various proposals for reform are now under active discussion and consideration by official forums, including the newly created Financial Stability Forum, and many of the issues raised in this chapter are likely to be addressed. The key challenge for private financial institutions and for public policy is to maintain the efficiency-enhancing aspects of modem finance and to reduce the tendency for the system to experience financial excesses and virulent market dynamics.
An initial approach should be to identify concrete and pragmatic ways in which the existing Lines of defense against systemic problems can be bolstered and, if necessary, reformed. More information would improve the ability of financial institutions to strengthen quantitative and qualitative tools for managing financial risk. Better and more timely public disclosure of appropriate information, including about the risk exposures of the financial institutions, could also potentially improve the ability of private stakeholders lO assess risks and act accordingly in pricing risk and allocating portfolios. Likewise, the ability of supervisors and those responsible for surveiUance to exercise adequate oversight could also be improved, with more accurate and comprehensive information about the size and nature of exposures across the complete range of an institution's activities, including both balance-sheet and off-balance-sheet activities. The ability to understand, measure, monitor, and control the buildup of leverage and other aspects of risk taking should be an important part of this agenda.
This, however, is only part of the solution. To know what information is required requires analytical frameworks capable of understanding, assessing, and monitoring modern finance. Authorities can contribute by developing analytical frameworks for understanding, measuring, calibrating, and controlling the degree of leverage in financial systems, including by rigorously pursuing both monetary and financial stability objectives and through prudential oversight and market surveillance. There are no simple solutions to these analytical problems, and they need not be seen as part of a supervisory effort to "run their businesses for them." Just like the institutions they monitor, supervisors also require new tools and techniques and better and more comprehensive information, not necessarily exclusively for examining individual institutions. No one has a comprehensive picture of the positions building up in OTC derivative markets or of the credit with which these positions are leveraged. National market surveillance also can be improved to be better able lO obtain market-wide and system-wide views of growing vulnerabilities that extend beyond inferences from price data about unobserved market activity: data on transactions or some measure of demands and supplies would also be useful.
83
In a market economy, financial decision making is driven by incentives. The incentives faced by modern financial institutions, especially those that are globally active, are a complex composite of laws, regulations, supervisory guidelines, and private incentive structures. The financial playing field has been greatly transformed by the modernization and globalization of finance, and financial institutions are continuously engaged in a learning process about how to profit from these changes. During period<; of learning, understanding of risks can lag behind technical capabilities and opportunities, and the effectiveness of internal discipline can thus become impaired. Moreover, just as regulators have lagged behind financial institutions, incentive structures may have become less effective in achieving their desired objectives and may be affecting behavior in unintended or even unexpected ways.34 To some extent the proposed revisions to the Basel Accord are recognition of this possibility, but more needs to be done in other areas. Tangible reforms to regulatory incentives are difficult to identify without first reexamining the applicability of the existing rules of the game, in light of the modernization and globalization of finance. This may not be urgently required, but it seems to be a prerequisite for proposing long-lasting improvements to the effectiveness of market and regulatory discipline. Although challenging, it would also be beneficial to have a clearer sense of how incentives, risk taking, market structure, and market dynamics interact in modern financial systems.
In the meantime, financial markets will continue to evolve. Private market participants now have gained experience from the financial excesses and market turbulence of last fall and appear to be reforming internal risk management and control systems. Top management also seems to have been more clearly setting risk tolerances to send clear signals to the various lines of business that make up modem financial institutions. Mechanisms need to be put in place, and monitored sufficiently within the firm and through supervisory oversight, to limit imprudent risk taldng and its consequences. No doubt, the next financial problem will be driven by some other aspect of risk taking, so vigilance and flexibi)jty are required.
Finally, there should be little doubt that, at the margin. moral hazard also played a role. Moral hazard is an inevitable consequence of ensuring financial stability. Given that financial stability is a public good. the public sector necessarily must provide insurance to protect against systemic problems. Without this insurance, private market participants may not collectively
34Jf incentives were effective and appropriate, the private sector might then have good reason to obtain the information it needs to make more prudent decisions.
©International Monetary Fund. Not for Redistribution
IV MANAGING GLOBAL FINANCE: PRIVATE AND PUBLIC POLICY CHALLENGES
achieve an optimal level of risk taking and fmancial intermediation, in part because they cannot adequately protect themselves privately against systemic risk. With insurance comes a degree of moral hazard, but the combination of insurance and moral hazard should provide an equilibrium outcome with higher social welfare than without it. To limit moral hazard and maintain the welfare-improving equilibrium. the public sector must also effectively monitor and limit risktaking behavior that would impinge on the balance of welfare considerations-in particular, those individual institutions that are most capable of exploiting the public sector safety net.
The appropriate balance between market discipline and official intervention involves difficult trade-offs between different objectives. On the one hand, financial safety nets appear to have significantly lessened the deadweight losses and collateral damage associated with financial crises earlier this century. On the other hand, the safety nets themselves may be contributing to excessively risky behavior and may involve potentially large costs to taxpayers. A complicating factor in seeking to rely more on supervision and regulation is that the large globaUy active financial institutions are able to circumvent regulation through gaps between the information sets of supervisors and the institutions themselves. Banking supervision, official market surveillance, and systemic risk management are the tools for monitoring. The buildup of financial vulnerabilities that only became evident once the turbulence occurred last autumn was a wakeup call: existing frameworks for banking supervision, official markets surveillance, and managing systemic risk may not be sufficient for the modem financial system.
Ultimately, the part of the insurance provided by the public sector that may create the most obvious moral hazard is that the public sector has in the past intervened to save institutions. either directly or indirectly through markets. One possibility for limiting moral hazard is to take more frequent decisions that reduce the perception that interventions are the rule and failures the exception, for example, by gradually but deliberately reducing the size and scope of the safety net. The U.K. authorities may not have deliberately had this in mind when Barings was allowed lO fail, but there can be little doubt that it bad a sobering impact on U.K. financial institutions. The more general objective would be to have greater involvement of the private sector in preventing systemic problems, not just through improved private risk management to protect themselves. but also through greater awareness that their actions have systemic implications and are affected by systemic problems created by others. Given that the scope of official financial safety nets is unlikely to be reduced quickly or entirely, the ability to monitor, supervise, and surveil modem financial systems remains critical.
84
Appendix I
Off-Ualance-Sheet Leverage
Leverage is the magnification of the rate of return (positive or negative) on a position or investment beyond the rate obtained by a direct investment of own funds in the cash market. Leverage is of concern because ( I ) by definition it creates and enhances the risk of default by market participants; and (2) it increases the potential for rapid deleveraging-the unwinding of leveraged positions-which can cause major disruptions in financial markets by exaggerating market movements.JS
For private and systemic risk management, and market surveillance. it would be useful to have broad measures of the extent of leveraged positions in capital markets. This knowledge would allow market participants to assess the potential for rapid price movements resulting from exogenous adverse market shocks that may cause investors to deleverage in an attempt to mitigate their losses. Anticipation of possible turbulent deleveraging might limit the buildup of unsustainable leverage. Hence, a publicly available measure for overall leverage by institutions and in markets could enhance self-stabilizing forces without necessitating disclosure of proprietary position data to the public. Since leverage in modem financial markets can easily be assumed by using derivative contracts, it is useful to have a measure that captures not only onbalance-sheet leverage but also the leverage implicit in off-balance-sheet transactions. Despite its importance, empirical measures of leverage are difficult to implement.
Leverage is traditionally measured by the ratio of a firm's total assets relative to its equity. Calculating this ratio is straightforward if the firm only relies on balance sheet transactions, such as bank loans. However, if the firm uses off-balance-sheet transactions, such as derivative instruments, the measurement of leverage is more complicated. This appendix first explains how the leverage that is implied by the most common derivative instruments could be measured. More complicated derivatives, such as swaps and structured notes, can generally be decomposed into spot market, forward, and option positions and will therefore not be considered separately. The appendix also presenu. methods for aggregating leverage within an institution and within markets.36
1SSee lntemauonal Monetary Fund ( 1998b). Box 3.3. 36Levemge ha� the capac1ty to mcrea:.e risk. For a given e<tuity
base. leverage allow' the borrower to build up a larger investment position and thu� higher expo�ure to market risk. Since leverage increases the potenual lo�� tnggered by a given adverse price movement, leveraged mvcMor\ are likely to adjust their positions sooner than pure equity invcMors. The simultaneous unwinding of large leveraged positions may. in tum. trigger funher price rnovernenrs and therefore increase risk.
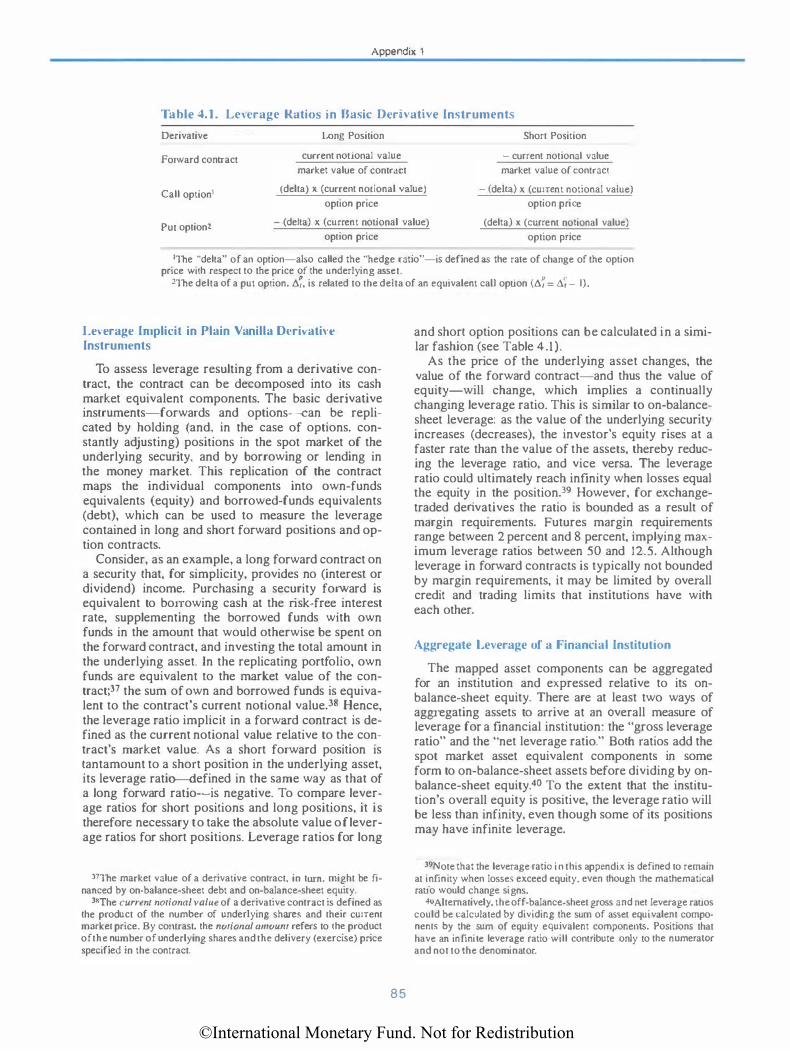
©International Monetary Fund. Not for Redistribution
Appendix 1
Table .J.l . Lc,eragc Ratios in Basic Derli\.athe Instrument�
Derivative
Forward contract
Long Position
current notional value
market value of contract
Short Position
- current notional value
market value of contract
Call option1 (delta) x (current notional value)
option price
- (delta) x (current notional value)
option price
Put option2 (delta) x (current notional value)
option price
(delta) x (current notional value)
option price
•The ''delta" of an option-also called the ''hedge ratio"-is defined as the rare of change of the option price with respect to the price of the underlying asset.
. . P r 2The delta of a put option. 6�. is related to the delta of an eqUivalent caiJ opuon (6, = 6, - I).
Leverage Implicit in Plain Vanilla Dcrivati"c Instruments
To assess leverage resulting from a derivative contract, the contract can be decomposed into its cash market equivalent components. The basic derivative instruments-forwards and options-can be replicated by holding (and, in the case of options, constantly adjusting) positions in the spot market of the underlying security, and by borrowing or lending in the money market. This replication of the contract maps the individual components into own-funds equivalents (equity) and borrowed-funds equivalents (debt), which can be used to measure the leverage contained ln long and short forward positions and option contracts.
Consider, as an example, a long forward contract on a security that, for simplicity, provides no (interest or dividend) income. Purchasing a security forward is equivalent to borrowing cash at the risk-free
_ interest
rate, supplementing the borrowed funds w1th own funds in the amount that would otherwise be spent on the forward contract, and investing the total amount in the underlying asset. In the replicating portfolio, own funds are equivalent to the market value of the contract;37 the sum of own and borrowed funds is equivalent to the contract's current notional value.JS Hence, the leverage ratio implicit in a forward contract is defined as the current notional value relative to the contract's market value. As a short forward position is tantamount to a short position in the underlying asset, its leverage rati�efined in the same way as that of a long forward ratio--is negative. To compare leverage ratios for short positions and long positions, it is therefore necessary to take the absolute value of leverage ratios for short positions. Leverage ratios for long
37The market value of a derivative contract, in turn. might be fi. nanced by on-balance-sheet debt and on-balance-sheet equiry.
38The current notional value of a derivative contract is defined as the product of the number of underlying shares and their current market price. By contrast. the notional amount
. refers to th� prod�ct
of the number of underlying shares and the delivery (exerc1se) pnce specified in the contract.
85
and short option positions can be calculated in a similar fashion (see Table 4.1 ).
As the price of the underlying asset changes, the value of the forward contract-and thus the value of equity-will change, which implies a continuaUy changing leverage ratio. This is similar to on-balancesheet leverage: as the value of the underlying security increases (decreases), the investor's equity rises at a faster rate than the value of the assets, thereby reducing the leverage ratio, and vice versa. The leverage ratio could ultimately reach infinity when losses equal the equity in the position.39 However, for exchangetraded derivatives the ratio is bounded as a result of margin requirements. Futures margin requirements range between 2 percent and 8 percent, implying maximum leverage ratios between 50 and 12.5. Although leverage in forward contracts is typically not bounded by margin requirements, it may be limited by overall credit and trading limits that institutions have with each other.
Aggregate Leverage of a Financial Institution
The mapped asset components can be aggregated for an institution and expressed relative to its onbalance-sheet equity. There are at least two ways of aggregating assets to arrive at an overall measure of leverage for a financial institution: the "gross leverage ratio" and the "net leverage ratio." Both ratios add the spot market asset equivalent components in some form to on-balance-sheet assets before dividing by onbalance-sheet equity.40 To the extent that the institution's overall equity is positive, the leverage ratio will be less than infinity, even though some of its positions may have infinite leverage.
39Note that the leverage ratio i n this appendix is defined to remain at infinity when losses exceed equity, even though the mathematical ratio would change signs. .
40Aiternatively. the off-balance-sheet gross and net leverage rauos could be calculated by dividing the sum of asset equivalent components by the sum of equity equivalent components. Positions that have an infinite leverage ratio will contribute only to the numerator and not to the denominator.
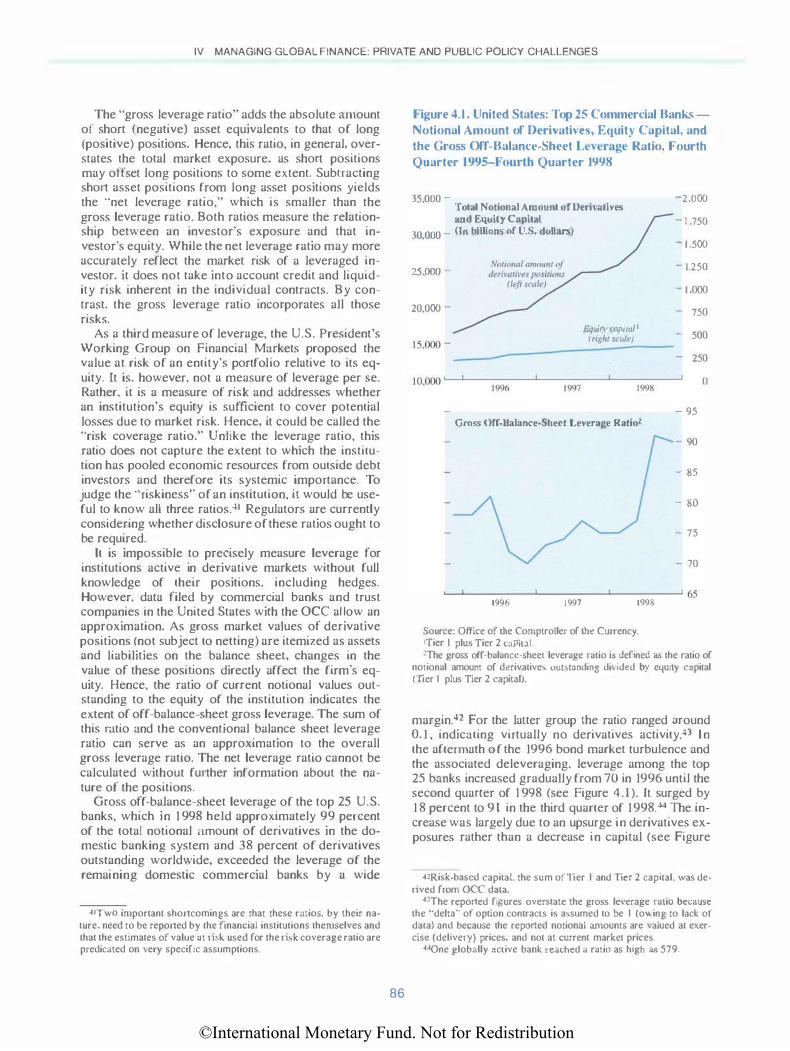
©International Monetary Fund. Not for Redistribution
IV MANAGING GLOBAL FINANCE: PRIVATE AND PUBLIC POLICY CHALLENGES
The "gross leverage ratio" adds the absolute runount of short (negative) asset equivalents to that of long (positive) positions. Hence, this ratio, in general, overstates the total market exposure. as short positions may offset long positions to some extent. Subu·acting short asset positions from long asset positions yields the "net leverage ratio," which is smaller than the gross leverage ratio. Both ratios measure the relationship between an investor's exposure and that investor's equity. While the net leverage ratio may more accurately reflect the market risk of a leveraged investor, it does not take into account credit and liquidity risk inherent in the individual contracts. By contrast. the gross leverage ratio incorporates all those risks.
As a third measure of leverage, the U.S. President's Working Group on FinanciaJ Markets proposed the value at risk of an entity's portfolio relative to its equity. It is, however, not a measure of leverage per se. Rather. it is a measure of risk and addresses whether an institution's equity is sufficient to cover potential losses due to market risk. Hence, it could be called the "risk coverage ratio." Unlike the leverage ratio, this ratio does not capture the extent to which the institution has pooled economic resources from outside debt investors and therefore its systemic importance. To judge the ·'riskiness" of an institution, it would be useful to know all three ratios.4l Regulators are currently considering whether disclosure of these ratios ought to be required.
It is impossible to precisely measure leverage for institutions active in derivative markets without full knowledge of their positions, including hedges. However, data filed by commercial banks and trust companies in the United States with the OCC aUow an approximation. As gross market vaJues of derivative positions (not subject to netting) are itemized as assets and liabilities on the balance sheet, changes in the value of these positions directly affect the firm's equity. Hence, the ratio of current notional values outstanding to the equity of the institution indicates the extent of off-baJance-sheet gross leverage. The sum of this ratio and the conventional balance sheet leverage ratio can serve as an approximation to the overall gross leverage ratio. The net leverage ratio cannot be calculated without further information about the nature of the positions.
Gross off-balance-sheet leverage of the top 25 U.S. banks, which in 1 998 held approximately 99 percent of the total notional <unount of derivatives in the domestic banking system and 38 percent of derivatives outstanding worldwide, exceeded the leverage of the remaining domestic commercial banks by a wide
411\vo important shortcomings are that these rmios, by their nature. need to be reported by the financial institutions themselves and that the estimates of value at risk used for the risk coverage ratio are predicated on very specific assumptions.
86
Figure 4.l . United States: Top 25 Commercial Banks Notional Amount of DerivatiH!S, Equity Capital, and the Gross Off-Balance-Sheet Lnerage Ratio. Fourth Quarter 1995-F'nurth Quarter 1998
35 000 -' Total Notional Amount of Derivatives and Equ.ily Capital
30.000 - (In biUions of U.S. dollars)
25.000 -
-2.000
- 1 .75()
- 1 ,500
- 1,250
- 1 .000
20,000 - 750
L.Jui�· capital I ( rr<>/tt ffall') - 500
15,000 -
--------�
---250
I O.OOO .___,__ __ 1_99_6 __ .__ __ t
99_7 __ ..._ __ 199_8 _ __J
- 95 Gross Off-Balance-Sheet Leverage Ratiol
- 90
- 85
- 80
- 75
- 70
��------��------�--------� 65
t996 1997 1998
Source: Office of the Comptroller of th.: Currency. 1Tier I plus Tier 2 capit:tl.
()
!The gross off-balance-sheet leverage ratio b defined ;c, the ratio of notional amount of derivatives outstanding divided by equity capital (1ier I plus Tier 2 capital).
margin.42 For the latter group the ratio ranged around 0. 1 , indicating virtually no derivatives activity:l3 ln the aftermath of the 1996 bond market turbulence and the associated deleveraging. leverage among the top 25 brulks increased graduaJly from 70 in 1996 until the second quarter of 1 998 (see Figure 4.1 ). rt surged by 1 8 percent to 9 1 in the third quarter of 1 998.44 The increase was largely due to an upsurge in derivatives exposures rather than a decrease in capital (see Figure
42Risk-bascd capital. the sum of Tier I and Tier 2 capital. was derived frorn OCC data.
43The reponed figures overMate the gross leverage ratio because the "delta·· of option contracts is assumed to be I (owing to lack of data) and because the reponed notional amounts arc valued at exer· cisc (delivery) prices. and not at current market prices.
-I-IOne globally active bank reached a ratio as high a� 579.

©International Monetary Fund. Not for Redistribution
Appendix 1
Table 4.2. Global Positions and Approximate Gross Leverage Ratios in OTC Derivatives Markets b) Type of Risk lnstrument1 (/n hil/um.1 of U.S dol/an)
Approximate Gross Leverage Ratio Notional Amount�2 Gross Market ValuesZ Percentage
March 1995 June 1998 March 1995 June 1998 March 1995 June 1998 change
Foreign exchange contracts 13.095 22.055 1 .048 982 12 22 80 Outright forward and forex 8,699 14.658 622 584 14 25 79 Currency swaps 1.957 2.324 346 255 6 9 61 Options 2.379 5.040 7 1 141 34 36 7 Other 61 33 1 0 2 6 17 170
Memorandum ilem: Exchange-traded contracts 1 1 9 103
Jnterest rate contractsJ 26,645 48.124 647 1.354 41 35 -14 Forward rate agreements 4.597 6.602 1 8 39 255 169 -34 Swaps 18,283 32.942 562 1.186 33 28 -15 Options 3.548 8.528 60 126 59 68 14 Other 216 52 7 2 3 1 26 -16
Memorandum i1em: Exchange-traded contract� 9.722 13.107
Equity-linked contracts 579 1.341 50 201 12 7 --42 Forward� and swaps 52 180 7 22 7 8 10 Options 527 1 . 1 6 1 43 IRO 12 6 --47
Commodities contract� 3 1 8 506 28 39 I I 13 14 Gold 147 228 10 9 15 25 72 Other commodities 1 7 1 278 1 8 30 lU 9 -2
Forwards and swaps 120 165 1 3 9 Options 51 1 1 3 5 10
Credit-linked and other comractl>4 1 18 4 30
Estimated g;aps in reporting 6.893 432
Total contr<acts 47.530 72.143 2.205 2.580 22 28 29
Source: Bank for International Settlements. 'Adjusted for inter-dealer double-counting. 2'fhe surveys of March 1995 and June 1998 are not fully comparable because of differences in the reporting basis (locational reponing in
1995: worldwide consolidated reporting in 1998) and in the number of participating countries (26 in 1995: 43 in 1998). JSingle-currency contracts only. 4Not adjusted for double-counting.
4.1 ). In contrast, traditional balance-sheet leverage ranged between 6 and 7 during the same period. While the gross leverage ratio only provides an upper bound to net leverage, the relative movements conftrm the concentration of off-balance-sheet leverage among a few banks and a significant increase of leverage during the third quarter of 1998.
Leverage in Markets
To determine the potential for financial market turbulence stemming from deleveraging it is useful to estimate the extent of leveraged positions in a particular market. In practice, it is not possible to gather such data without individual position data, particularly for off-balance-sheet transactions. However, the recent BIS survey of foreign exchange and derivatives market activity (see Box 2.1) allows approximations of the extent of leverage in certain derivatives markets
87
on a global basis. The survey reports total gross notional amounts and total gross market values outstanding at the end of June .1998 in various segments of the foreign exchange derivative and interest rate derivative markets. Notional amounts are aggregated in a similar fashion as suggested for the gross leverage ratio. Based on the definitions of leverage introduced above, the notional amounts outstanding divided by the gross market value approximates the gross leverage ratio.45
The data indicate that the overall approximate gross leverage ratio increased from 22 in 1995 to 28 in 1998 (see Table 4.2).46 Interest rate derivative contracts had higher leverage ratios than foreign exchange derivative
·ISSee footnote 43. 46Th is compare>. to a r.uio of 36 for the top seven U.S. com mer·
cial banks at the end of the second quaner of 1998.
©International Monetary Fund. Not for Redistribution
IV MANAGING GLOBAL FINANCE: PRIVATE AND PUBLIC POLICY CHALLENGES
contracts, reflecting the fact that the latter-unlike the former-typically involve an exchange of principal. In addition, interest rates tend to be less volatile than exchange rates, so that market values of interest rate cootracts (for a given notional amount) tend to be smaller than those of foreign exchange contracts. The latter also represent exposure to both currency and interest rate risks, which also contributes to a higher market value relative to the notional amount. The high degree of leverage in option contracts can mostly be attributed to the lack of information about the delta.
Appendix 2
Impact of HLls on Small and Medium-Sized Markets
In addition to the systemic issues posed by high levels of leverage, recent attention has also been paid, especially in the Pacific Rim countries, to the impact of HLis on some of the small and medium-sized financial markets.47 A number of countries, including Australia, Hong Kong SAR, South Africa, and Malaysia, have expressed concern about the implications of the size and concentration of positions taken by a number of HLis (especially hedge funds) in their markets, and there have been suggestions that the aggressive tactics of some of these institutions have contributed to excess volatility and mispricing in foreign exchange rates.4S There have, in addition, been numerous newspaper reports questioning the activities of hedge funds in various countries, including in the Pacific Rim,49 and a frequently heard market view is that the large hedge funds "hunt in packs."
Responding to similar concerns raised two years ago, the IMF undertook a study of the role of hedge funds in the Asian crisis, and there has also been some research outside the IMF on the activities of hedge funds in Asia.50 While recognizing that lack of data seriously hampered the analysis, the IMF study reached the conclusion that "popular press" accounts of hedge funds seriously exacerbating the Asian crisis were exaggerated, drawing on anecdotal evidence, discussions with market participants, and return data for hedge funds. In addition, the study suggested that sharp distinctions between hedge funds and other highly leveraged players were overdone and that the proprietary trading desks of some of the internationally active commercial and investment banks frequently engaged
4'The buildup in large positions against a number of Pacific Rim countries by some HL!s during 1998 is discussed in Chapter J[l (see Box 3.2).
48See, for example. Reserve Bank of Australia ( 1999). •9See Krugman ( 1998). sosee Eichengreen and others ( 1998): and Brown. Goetzmann.
and Park ( 1998).
88
in similar activities to hedge funds; moreover, in terms of size, hedge funds were not obviously the largest institutional investors in many of the Asian currency markets. nor were they--<:ontrary £O popular accounts-always ahead of the pack in taking positions against currencies.51 The study, however. only covered the period through the end of 1997, and some HLls, including hedge funds, may subsequently have signjficantly expanded the nature and scope of their activities giving rise to the concerns noted above. 52
Tn assessing the concerns about HLT activities, it is useful to distinguish between issues raised by the large differences in size between many small markets and the large internationa!Jy active institutional investors, and issues of market integrity related to the large and concentrated positions some HLis may have taken in particular markets. The significant asymmetries in size between some international investors and the markets i n which they operate clearly present difficult policy dilemmas for many countries. Large swings in capital flows between advanced and emerging markets have, on several occasions, been driven by autonomous shifts in sentiment in the large advanced countries and may have been an important source of volatility in recipient countries' foreign exchange and domestic asset markets.53 The surges in capital inflows have presented particular problems when international investors are seen as exhibiting herd-type behavior and the capital inflows can be quickly and easily reversed.54 Even though HLls appear to have played a role in these episodes, many other institutions also have been involved-most likely playing a larger role on account of their number and size-and broader systemic issues are raised about the structure and operation of international capital markets.ss The concerns are being addressed, at least in part, through efforts by the international community and national regulators to improve transparency in order to lessen the role of herding; proposed improvement in Basel bank risk weights on country exposures; and strengthening fmancial systems and infrastructures in capital-importing countries. The implications for market dynamics of the significant differences in size between "smaller'' markets
SIBy contrast, the Reserve Bank of Australia's discussion of hedge funds takes the view that hedge funds are fundamentally different from other HLis because they are lightly regulated and do not have longer-tenn relationships with countries. The latter is argued to lead to more aggressive trading strategies.
S2Under its Articles of Agreement, the lMF is given the responsibility of ensuring that countries do not manipulate exchange rates but has no explicit responsibilities regarding possible private manipulation.
S3Whether an open capital account will expose a small country to more or less asset price volatility depends importantly on whether shocks are predominantly internal or external in origin. If domestic shocks dominate. overall volatility may decrease.
S4Sec Schadler and others ( 1993). sssee Mussa and others ( 1999).
©International Monetary Fund. Not for Redistribution
Appendix 2
and the larger institutional investors nevertheless remains an important issue.
An especially contentious issue is whether some HLls have aggressively tried to manipulate some sma!J and medium-sized markets-acting either alone or in collusion-and whether these efforts have been a major and systematic source of volatility and inefficiency. Although the particular strategies that HLls employ is proprietary information, anecdotal evidence from a number of private market participants is consistent with the possibility that some institutions have employed very aggressive tactics, including when they took out very large short positions in a number of Pacific Rim currencies during 1998; little, however, is known in general about the strategies of different institutions. The large apparent size and concentration of the positions taken by a number of HLis in Pacific Rim markets last year has been seen by a number of national authorities as giving these institutions excessive market power. The possibility that some large investors may, in these circumstances. try to manipulate markets cannot be dismissed a priori, given many highly publicized cases of attempted market manipulation in the large advanced financial markets, including on organized exchanges.
There is, however. as discussed below. a substantive issue of whether foreign exchange markets are as susceptible to private manipulation as individual domestic asset markets and whether manipulation can be systematically profitable. Moreover. in determining the feasibility and profitability of such strategies, consideration needs to be given to the exchange rate regime and the terms at which the official sector intervenes in the foreign exchange market.
In the classic case of domestic financial market manipulation, speculators either seek to comer an asset that is in finite supply and profit by squeezing short sellers (a "bear" squeeze) or they abuse insider knowledge and/or spread false information, typically about conditions in a particular industry or market.56 Even though most foreign exchange trading occurs in unregulated OTC markets, there are reasons to think that these kinds of abuses would be more difficult in these markets. Not only are the underlying assets-domestic and foreign money-widely held, the types of macroeconomic information t11at usually drive exchange rates are much more generally available and potentially easier to verify than for a particular commodity or firm. At least in principle, therefore, these differences would tend to make foreign exchange markets less prone to private manipulation than domestic asset markets.
Notwithstanding the above, it has been suggested that some HLls have spread misinformation to try to manipulate foreign exchange markets after they have
56Jmernational Monetary Fund (1993, 1994).
89
built up large short positions in particular currencies and that iliese strategies are typically followed when market sentiment is weak. In what follows, we focus on ilie case in which speculators seek to push a currency down.57 It has been argued, for example, that some HLis-acting either collectively or alone-quietly build up short positions against a currency in the spot, forward, or swap market and then seek to close out their positions at a profit after spreading false information or adverse economic projections iliat cause a loss of confidence in the targeted currency. 58 The information spread is argued to include rumors of changes in government policies or exchange rates, targeted wash sales,59 or publicizing a buildup in short positions in the belief iliat the reputation of ilie HLis as aggressive operators will panic other investors. These strategies are argued to be pursued most often in fragile market conditions where sentiment is already weak and it is not difficult to generate concerns about exchange rates. HLis-and especially hedge funds-are typically singled out by national authorities as the main enthies engaging in such activities.
There is unfortunately only limited theoretical work on the mechanics of these kinds of currency attacks and ilie conditions under which they might generate profits for speculators. Generally, for such strategies to be profitable, it must be possible for speculators to build up positions against a currency without significantly moving prices against iliemselves and then to be able to trigger large-scale selling of ilie targeted currency by other investors (independent of fundamentals) to allow a close out of positions at a profit. In standard models of floating exchange rates, it is generally difficult for speculators to do iliis since the buildup and closing out of positions will tend to move prices against them, and the reactive investors who lose money eventually learn from their mistakes. But such strategies may still be possible under such regimes and have been argued to have been used in some Pacific Rim countries. Tn recent second-generation models of balance of payments crises wiili multiple equilibria. speculators are able to force the collapse of pegged or managed exchange rate regime if they are able to launch a large enough currency attack.60 These mod-
S7Jn principle, manipulation could involve either domestic currency appreciation or depreciation. The e)(ample of pushing a cur· rency down is chosen because it corresponds to the cases of concern, and as argued later, any manipulation is more likely under un�enled and nervous market condilions than in norn1al time�.
S8The double play against the Hong Kong dollar involved simul· taneously taking short positions in the domestic stock market and attacking the domestic currency. The return from the play was intended to derive from the resulling higher domestic interest rates pushing equity prices down. See Box 5. 1 in Chapter V and Tnterna· tiona! Monetary Fund ( 1 998a).
59 A wash sale involves the simultaneous purchase and sale of an asset with the trader making public the sell side of the transaction.
60See Krugman and Obstfeld ( 1997 ).
©International Monetary Fund. Not for Redistribution
IV MANAGING GLOBAL FINANCE: PRIVATE AND PUBLIC POLICY CHALLENGES
els point to the possibility that manipulation might be easier in regimes where there is some government exchange market intervention and speculative attacks might be self-fulfilling. The full implications of these kinds of models, however, have not yet been worked through and it would be premature to draw strong conclusions about the feasibility of systematic manipulation. Moreover. the profitabiJity of speculative attacks in these models is influenced importantly by the authorities' intervention strategies and, in particular, by whether interest rates are raised to defend a currency so as to reduce the possibility of one-way bets and increase the cost of taking short positions.
The strategies that may have been used by some HLls in the Pacific Rim require the targeted currencies' markets to be liquid enough to allow a large (and undetected) buiJdup in short positions and require a large pool of reactive market participants who will follow the actions of speculators. On this basis, it has been argued that medium-sized foreign exchange markets may be more prone to manipulation than small or very large markets since they can provide enough liquidity61 to allow the gradual buildup in positions while at the same time not having the same degree of stabilizing speculation as the large advanced markets.
Beyond the problem of a lack of data on speculative currency positions, one of the major difficulties in empirically assessing the concerns that have been expressed about HLis is to distinguish between the kind of strategic currency attacks that a number of countries have argued take place and the pressures triggered by genuine concerns about underlying economic fundamentals (observational equivalence). Tl is aJso difficult to distinguish empiricaJJy between the coordinated taking of positions against a currency and more general herding behavior related to similar assessments of economic conditions and policies. These difficulties are compounded by the fact that the period in 1998 when Pacific Rim currencies are argued to have been manipulated was a time when tl1ere were serious concerns about economic fundamentals related to the possible spreading of the Asian crisis, and a large number of investors were taking a negative view of economic prospects.
Against this background, it remains unclear to what degree certain HLis have from time to time colluded in efforts to try to manipulate foreign exchange markets and whether such efforts can be a major systematic source of volatility and inefficiency. Re1lecting the importance of the concerns raised, however, the Financial Stability Forum's working group on HLls is
61This t:onclusion is qualified in the event that the ofticial sector is a major panicipanl in the market. The large buildup in speculative positions against the Thai baht in 1997-a relatively small marketwas facilitated by the central bank's willingnc:,s to buy baht forward at an effectively unchanged price. Sec International Monetary Fund ( l998a).
90
expected to report on its assessment of the issues early next year. At this point, several preliminary observations can be made.
First, there is a need for additional analytical and empirical work to better understand the conditions under which private manipulation of exchange rates might be feasible and profitable-on a systematic or unsystematic basis-and the implications of large and concentrated positions in some countries' foreign exchange markets. Among the issues to be more fully addressed are whether official exchange rate intervention may facilitate such strategies, the particular circumstances and market conditions under which manipulation might be prot1table. and how any manipulation might take place.
Second. detailed case studies are needed. both of particular episodes where manipulation is argued to have taken place and of other episodes of large concentrations of positions, to better understand the market dynamics involved when there are large leveraged players in the market.
Finally, it needs to be recognized that even if manipulation is not systemically feasible or profitable. tile possibility mat it may be attempted-especially when sentiment is fragile--can be an important and valid source of concern for countries.
Any initiatives adopted by countries to address their concerns about tl1e activities of certain HLls need to take into account that HLis can be important providers of market Uquidity and that, by virtue of their ability to take contrarian positions. they may be an important stabilizing force when markets have under- or overshot their equilibrium values. Ultimately, the solutions taken to address the concerns will need to baJance issues of market integrity with the need to encourage sufficient stabilizing speculation and to avoid tile domination of markets by a few large players.
References
Basel Committee on Banking Supervision, 1997. Core Principles for Effective Banking Supervision (Basel. September).
---, 1999a, A Ne11· Capiw/ Adequacy Framework (Basel: Bank for International Settlements. June).
---. 1999b, Banks' lmeractions with Highly Le1•eraged lnstitwions (Basel: Bank for International Settlements. January).
---. 1999c, Sound Practices .for Banks' Jweractions with Highly Leveraged Institutions (Basel: Bank for International Settlements, January).
Brown, Stephen J .. William N. Goetzmann. and James Park. 1 998, "Hedge Funds and the Asian Currency Crisis of 1 997," NBER Working Paper No. 6427 (Cambridge, Massachusetts: National Bureau of Economic Research, February).
Calomiris. Charles W .• 1998. '"Blueprints for a New Global Financial Architecture.'' paper presented at the Joint Economic Commillee of the U.S. Congress Hearing on
©International Monetary Fund. Not for Redistribution
References
IMF Reform: Proposals to Stabilize the International Financial System, Washington, October 7.
Commiuee on the Global Financial System. 1999. Marker Liquidity: Resettrch Findings and Selected Policy Implications (Basel: Bank for International Settlements).
Corrigan, Gerald, and Stephen G. Thieke, 1999, Testimony on behalf or the Counterparty Risk Management Policy Group before the Subcommittee on Capital Markets, Securities and Government Sponsored Enterprises, Committee on Banking and Financial Services, U.S. House of Representatives. March 3.
Counterparty Risk Managemeni Policy Group, 1 999, Improving Counterpany Risk Management Practices (New York).
Deutsche Bundesbank, 1999, "Hedge Funds and Their Role in the Financial Markets." Monthly Report. Vol. 5 1 (March), pp. 29-42.
Eichengreen, Barry, Donald Mathieson. Bankim Chadha. Anne Jansen, Laura Kodres, and Sunil Shanna, 1998. Hedge Funds and Financial Market Dynamics, IMF Occasional Paper No. 166 (Washington: International Monetary Fund).
EU Economic and Financial Committee, 1999. "lmprovemenL� in the Functioning of the International Financial System,'' draft report by the Council (ECO/FJN) to the European Council in Cologne (M�lY 20).
Flood. Robert P., and Peter M. Garber, 1994. Speculmive Bubbles. Speculative Arracks, and Policy Switching (Cambridge. Massachuselis: MIT Press).
Greenspan. Alan. 1 998, "Risk Management in the Global Financial System:' remarks before the Annual Financial Markets Conference of the Federal Reserve Bank of Atlanta. Miamj Beach, Florida. February 27.
Grinblatl, Mark, Sheridan Titman, and Russ Wenners. 1995. ''Momentum Investment Strategies. Portfolio Performance. and Herding: A Study of Mutual Fund Behavior," American Economic Review, Vol. 85 (December). pp. 1088- 1 1 05.
Harris, Douglas E., 1999, Testimony before the U.S. House of Representatives. Committee on Banking and Financial Services on the Report of the President's Working Group on Financial Markets on Hedge Funds, Leverage. and the Lessons of Long-Term Capilal Management, May 6.
Institute of International Finance, 1999, Report of the Task Force on Risk Management (Washington. March).
International Monetary Fund, 1993, lmemarional Capital Markets: Developmems, Prospects. and Key Policy Issues, World Economic and Financial Surveys (Washington. August).
91
---. 1994, lntemarional Capiral Markets: Deve/ap-1/Wnts, Prospects. and Key Policy lssue.1·. World Ec()nomic and Financial Surveys (Washington. September).
---. 1 998a. lntemarimwl Capiral Markets: Developmems. Prospects. and Key Policy Issues. World Economic and Financial Survey� (Washington. September).
---, 1998b. World Economic Outlook and lmemational Capital Markers: Interim Assessment. World Economic and Financial Surveys (Washington. December).
I ntemational Swaps ami Derivative� Association. 1999, lSD;\ 1999 Collateral Review (New York. March 24).
Jorion, Philippe. 1997, Value ar Risk: The New Benchmark .for Comrolling Market Risk <Chicago: Irwin Professional Publications).
Kindleberger. Charle!. P .. 1989, Manias. Panics, and Crashes: A Hiswry of Financial Crises (New York: Basic Books).
Krugman, Paul R.. 1 998. ·•1 Know What the Hedges Did Last Summer,'' Fortune (December).
---. and Maurice Obstfeld. 1997, lntemational Economics: Theol)' and Policy (Reading. Massachusetts: Addison-Wesley).
Lakonishok. Josef, Andrei Shleifer. and Robert W. Vishny, 1992, "Impact of Institutional Trading on Stock Prices," Joumal of Finwu.:ial Economics. Vol. 32. (August). pp. 23-43.
Meyer, Laurence H., 1999. "Market Discipline as a Complement to Bank Supervision and Regulation,'' remarks before the Conference on Refonning Bank Capital Standards. sponsored by Ernst & Young and AEJBrookings Joint Center on Regulatory Studies. Council on Foreign Relations. New York. June 14.
Mussa, Michael. Alexander Swoboda, Jeromin Zettel meyer, and Olivier Jeanne. 1999, "Moderating Fluctuation� in Capital Flows to Emerging Market Economies .
.. paper
presented at the Conference on Key Issues in Refonn of the lmernalional Monetary and Financial System, Washington, May.
Reserve Bank of Australia, 1 999, Hedge Funds. Financial Stability and Marker Integrity (Sydney. March).
Schadler, Susan. Maria Carkovic. Adam Bennett. and Robert Kahn, 1993, Recellf EJperiences with Surges in Capital Inflows. IMF Occasional Paper No. 108 (Washington: lnternational Monetary Fund).
Tietmeyer, Hans. 1 999, remark.� at the conference of the Center for Financial Studies. "Systemic Risk and Lender of Last Resort," Frankfurt, June.
United Stares. Presidem's Working Group on Financial Markets. 1999, Hedge Funds. Leverage. wtd the Lessons of Long-Term Capital Management (Washington).
©International Monetary Fund. Not for Redistribution
v Emerging Markets: Nonstandard Responses to External Pressure and the Role of the Major Credit Rating Agencies in Financial Markets
The financial market turbulence experienced by many emerging markets during the past two years
has both generated new policy responses to market pressures and highlighted the key role of institutional investors and agencies in mature markets in determining capital flows to emerging markets. This chapter examines two aspects of this experience. First, while the authorities have traditionally responded to speculative attacks through on-balance-sheet sales of domestic cun-ency and other assets converted into foreign exchange, they have begun to expand the set of instruments and markets in which intervention is undertaken. This chapter analyzes three such interventions-namely, Hong Kong SAR 's equity markets intervention, Brazil's buyback of Brady bonds, and the use of capital controls by Malaysia. The second section focuses on the role of the major credit rating agencies in influencing terms and conditions of access to global securities markets for emerging markets. As global securities markets have become increasingly important sources of funding for emerging markets, the credit ratings assigned to sovereign and private sector issuers have often had an important influence on the demand for these securities. Indeed, some institutional investors often can hold only so-called "investment-grade" securities because of either regulation or self-imposed risk management considerations. Moreover, the Basel Commiuee on Banking Supervision recently proposed that credit ratings would become key determinants in the risk weights attached to bank exposures to sovereign and other borrowers. However, the sharp adjustments of sovereign credit ratings for many emerging markets in the period since July 1997 have raised concerns about the accuracy and stability of the rating process.
Nonstandard Policy Interventions in Emerging Markets
Innovations in financial markets and the accompanying proliferation of instruments have increased the channels through which investors can take positions on expected asset price movements in emerging markets. In times of crisis, a high degree of volatility has often been transmitted through various markets, posing a dilemma for national authorities in pursuing
92
their policy objectives, which have typically included exchange rate and financial system stability, as well as broader macroeconomic objectives such as growth and price stability.
While the classic speculative attack takes place through on-balance-sheet sales of domestic currency and other domestic assets converted into foreign exchange, alternative positions can be taken in markets for other assets, such as domestic and international stocks and bonds, as well as a variety of derivatives such as currency forwards and futures, equity and bond futures, options, and total rate of return swaps. While the typical defense of a speculative attack has meant a combination of spot foreign exchange intervention and an interest rate defense, when strong pressures have been felt in markets and instruments other than domestic credit, national authorities have in some cases been tempted to intervene through nonstandard methods to counter speculative pressures. Some of these interventions have involved alternate uses of foreign exchange reserves, such as buying equity or buying back outstanding debt, or imposing restrictions on the mobility of capital. Since the beginning of the Asian crisis in mid-1997, several countries have adopted such nonstandard interventions, raising questions about the implications of such intervention for the behavior of market participants and asset prices in the future. The line distinguishing standard from nonstandard interventions is by definition elastic, and other episodes of what may be considered nonstandard interventions have been discussed in previous reports. J The following section reviews some of the more notable recent nonstandard responses by authorities.
Hong Kong SAR's Intervention in Equit� Markets
Between August 14 and 28, 1998, the HKMA bought a total of some $ 1 5 billion in stocks and futures in the Hong Kong SAR equity market,2 which
1See, for instance. International Monetary Fund ( 1 998). pp. 44-58, which discusses the Bank of Thailand's failed defense of the baht's peg using forward market intervention. Brazirs intervention in the currency futures market and issuance of dollar-linked real-denominated debt, and Korea's placement of foreign exchange reserves with foreign branches of domestic banks.
2The portfolio is now held under the subsequently established Exchange Fund lnvesonent Limited (EFIL).

©International Monetary Fund. Not for Redistribution
Nonstandard Policy Interventions In Emerging Markets
Figure 5. 1 . Stock 1\larkct Indices: Hong Kong Hang Scng and ()em Jonc' Industrial AYeragc 1./ull I I'JYi' = /(}())
August 13. 1998
1 997 1998
Source: Bloomberg Financial Markets L.P.
constituted 7 percent of the capitalization and between 20 and 35 percent of the free float of the Hang Seng index) This intervention in the equity market was at the rime viewed by a wide variety of market participants as a significant departure from Hong Kong SAR's traditional free market principles and clearly took the markets by surprise.4
The Hong Kong SAR authorities have explained their stock market intervention as being targeted at a specific group of speculators that were manipulating Hong Kong SAR's equity and foreign exchange markets for profit in what was termed a "double play," that is, a simultaneous attack on equity and currency markets.s (See Box 5.1 for a description of the mechanics of a double play.) The authorities perceived certain players as selling Hong Kong dollars to drive
3The portfolio was worth some $26.7 billion following the Hong Kong SAR market's 85 percent rise between September 1998 and end-June 1999 (see Figure 5.1 ), and the government has announced plans to sell up to two-thirds of me ponfolio while allowing money managers to manage the res1. The government plans to sell part of the shares it owns in the form of a unit trust tracking the Hang Seng index. available to retail investors. and preparatory work for its listing will take four tO five months. In the meanwhile, the government's holdings are being managed by EFIL, according to strict guidelines to avoid interference with the day-to-day commercial activities of the companies.
4 However. it may be recalled mat under severe pressures in 1987. me authorities had temporarily shut down the stock market altogemer wim adverse implications for market sentiment.
5The official account is most comprehensively summarized in Financial Secretary Donald Tsang's speech at me Hong Kong Trade Development Council (Tsang. 1998).
93
-150
August 28, 1998 140
-130
- 120
- 1 10
-100
90
80
70
60
50
40 1999
up interest rates-taking advantage of the adjustment mechanism of Hong Kong SAR's linked exchange rate arrangement-and depress stock prices, thus generating profits on previously established substantial short positions in the equity cash and futures markets.6 Certain players were also said to have spread rumors in the market about a Chinese devaluation and its knock-on effect on Hong Kong SAR, and about a collapse of the Hong Kong SAR equity and property markets, to generate selling pressures on the Hong Kong dollar and the stock market. According to the authorities, the speculative attack "was a contrived game with clearly destructive goals in mind . . . [to] drive up interest rates. drive down share prices, make the local population panic and exert enough pressure on the linked exchange rate until it breaks."7
However, some market participants noted that at the time of the pressures, there were fundamental reasons to sell off Hong Kong SAR equity holdings and the Hong Kong dollar. As of August 1998, the Hong Kong SAR economy was heading into its deepest recession in 23 years with recently released figures showing first
6According to the authorities. some of these �ales of Hong Kong dollars may have been facilitated by "prefunding" in the swap market. that is, engaging i n swaps to access Hong Kong dollars that multilateral organizations had raised through meir bond issuances. Multilateral agencies. including inter alia the World Bank Group, the Asian Development Bank. the Inter-American Development Bank. and the European Bunk for Reconstruction and Development, issued HK$36.6 billion (equivalent of US$4.7 billion) worth of bonds in the period January-August 1998.
7From Hong Kong Development Council speech (Tsang. 1998).

©International Monetary Fund. Not for Redistribution
V EMERGING MARKETS: NONSTANDARD POLICY RESPONSES AND THE ROLE OF CREDIT RATING AGENCIES
Box 5.1. The Mechanics of a ·•Double Plaf'l
According to a widely discussed version of events leading up to the intervention by the Hong Kong Monetary Authority in Hong Kong SAR's equity market in AuguM 1 998. some large players were taking large short positions in the spot and futures markets for Hong Kong SAR equities. They then engaged in abrupt sales of Hong Kong dollars, driving up interest rates. This spike in interest rates drove down equity market prices. allowing speculators to close out their short positions at profit. 1l1is is the essence of the so-called "double play," where speculators were shorting both the currency and equity markets, and takJng advamage of the currency board's automatic adjustment mechanism to cause a spike in interest rates-predominantly in very short-term rates. but also to a lesser extent in long-term rates-which would negatively affect asset prices. By some accounts, the players who were manipulating the stock and foreign exchange markets may also have simultaneously spread rumors about the health of the Hong Kong SAR stock and property markets, to create a panic in markets, and may also have established positions that would have become protitable if the exchange rate collap!.ed.
The basic version of the "double play" raises some interesting issues. First, such a play is clearly risky. since it runs the risk that other market participants will understand the intention of the players involved. and will take larger opposite positions. Second. a double play could clearly not occur systematically if other agents are rational. as other agents would quickly come to understand the play and would no longer respond to the artificial spike in interest rates. Instead, a double play presumably needs to exploit
very particular circumstances where markets are unusually susceptible to being pushed by large players in one direction, and perhaps also where some as!>ct price-such as the overnight interest rates in Hong Kong SAR in 1 998-is especially volatile owing to an institutional factor. Third. if a double play can be made in one direc£ion, it is of interest to ask if a similar play could be made in the opposite direction. This is unclear, but one factor that would limit the possibility is the fact that interest rates are bounded below at 7.ero. Fourth, one aspect of the double play is that any profits from shorting the equity market are denominated on Hong Kong dollar!>, so that the potential profit would be reduced if the various short positions result in a devaluation in the exchange rate. Finally, to the extent that an exchange rate devaluation did occur. the experience of some coumries is that equity prices-in domestic currency terms-may actually rise substantially, resulting in losses on the short equity position.
'A fomtal model of tbe mecbsruc� is described in Cbakravorti and Lall (1999).
94
quarter GOP having shrunk 2.8 percent year-on-year. Other data released around tbat time showed unemployment at a 1 5-year high of 4.5 percent, a halving in property prices, and seven consecutive months of falls in retail sales year-on-year. Recent corporate earnings reports had also created a negative senrimem in markets. Reflecting these factors and the general speculative pressures in the region, by August I I the Hang Seng index had slumped 36 percent in 1998, to its lowest level since January 1993. More generaiJy, Asian markets were close to their lowest levels since the onset of the Asian crisis in July 1997 and the outlook for the region was bleak. For example, the lFC Global index for Asia had declined in dollar tem1s by 60 percent over this period (see Figure 5.2). Regional sentimem was very poor, the affected Asian countries were mired in a deep recession, and foreign investors were cutting back their exposures to emerging markets generally. and to Asian emerging markets in panicular. Since Hong Kong SAR is one of the region's most liquid markets. a reduction in Asian regional exposure would trigger sales in Hong Kong SAR's markets. as unwinding of positions in other less liquid markets would generate greater pressures on prices. ln addition, the Japanese yen was also at an eight-year low of¥147 to the dollar, negatively affecting sentiment toward Asia. In this regard, the sell-off in Hong Kong SAR was part of a general shift away from Asian emerging markets at a time or poor market sentiment.
It is, of course, difficul! to ascertain the relative impo•tance of economic fundamentals. general sentiment, and the particular trading strategies of large players in determining market prices. and it is possible that different observers can reasonably i ntcrpret the same evems differently. Given the economic and financial developments during the period. some pressures on the equity and foreign exchange markets may not have been surprising, and many investors no doubt independently decided to sell in one or both markets. In addition, some large players may have followed a trading strategy-the double play-based on the likely response of one market to pressures in the other, although available evidence on this is limited.
Based on the market pressures and information on the positions a11d reported intentions of a few large players, the authorities took the unprecedented step of supporting the equity markets to maintain confidence in the economy and the financial system. The HKMA also subsequently made changes in the operation of the linked exchange rate system to make interest rates less volatile to small shifts in the demand for credit. to strengthen the linked exchange rate arrangement. Since the intervention in August, markets have LUrned around remarkably. The Hang Seng index rose 85 percent between September 1998 and June I 999. A number of factors have been responsible for this turnaround. including the interest rate cuts by the U.S. Federal Reserve and other central banks in the faJl of
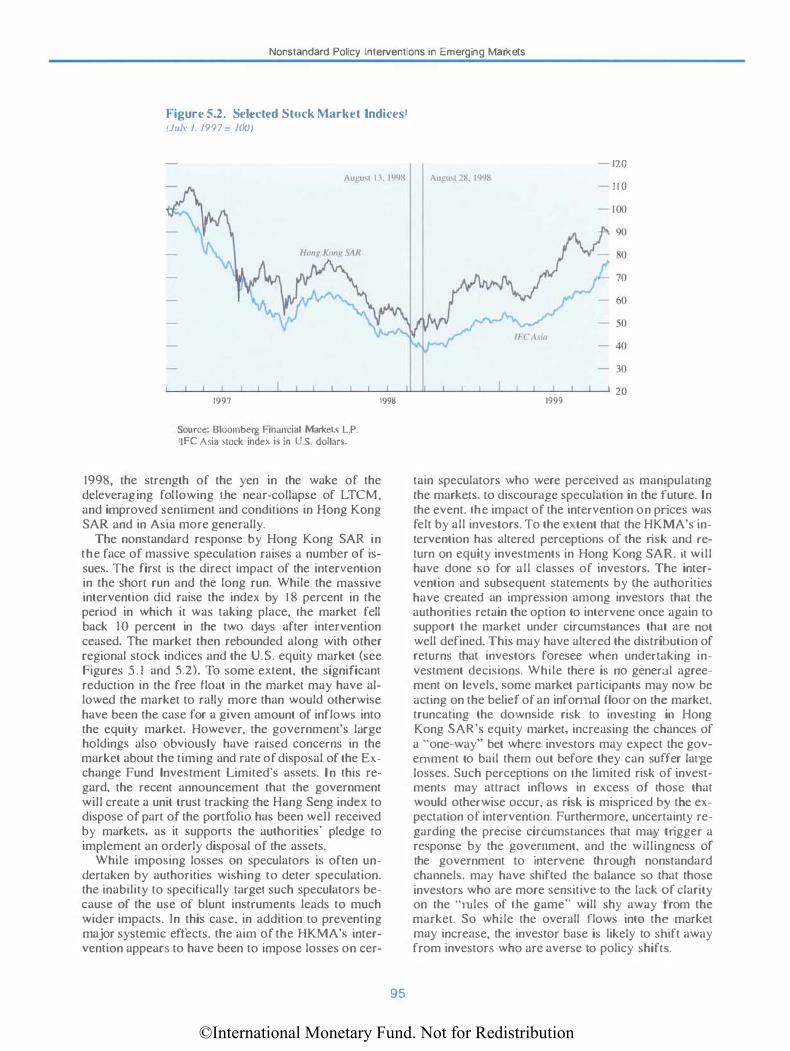
©International Monetary Fund. Not for Redistribution
Nonstandard Policy lnteNentions in Emerging Markets
Figure 5.2. Selected Stock Market lndicesl (Jul\ I. /997 = 100)
120
1 1 0
90
- 30
L-�-L�--��-L�--L-�-L�--L-���--��-L�--L-�-L�� 20 1997 1998
Source: Bloomberg Financial Markers L.P. IJFC Asia srock index is in U.S. dollars.
1998, the strength of the yen in the wake of the deleveraging following the near-collapse of LTCM, and improved senliment and conditions in Hong Kong SAR and in Asia more generally.
The nonstandard response by Hong Kong SAR in the face of massive speculation raises a number of issues. The first is the direct impact of the intervention in the short run and the long run. While the massive intervention did raise the index by 18 percent in the period in which it was taking place, the market fell back I 0 percent in the two days after intervention ceased. The market then rebounded along with other regional stock indices and the U.S. equity market (see Figures 5 . 1 and 5.2). To some extent, the significant reduction in the free float in the market may have allowed the market to rally more than would otherwise have been the case for a given amount of inflows into the equity market. However, the governmenr's large holdings also obviously have raised concerns in the market about the timing and rate of disposal of the Exchange Fund Investment Limited's assets. In this regard, the recent announcement that the government will create a unit trust tracking the Hang Seng index to dispose of part of the portfolio has been weU received by markets, as it supports the authorities· pledge to implement an orderly disposal of the assets.
While imposing losses on speculators is often undertaken by authorities wishing to deter speculation. the inability to specifically target such speculators because of the use of blunt instruments leads to much wider impacts. Jn this case, in addition to preventing major systemic effects. the aim of the HKMA's intervention appears to have been to impose losses on cer-
95
1999
tain speculators who were perceived as manipulating the markets, to discourage speculation in the future. In the event. the impact of the intervention on prices was felt by all investors. To the extent that the HKMA's intervention has altered perceptions of the risk and return on equity investments in Hong Kong SAR, it will have done so for all classes of investors. The intervention and subsequent statements by the authorities have created an impression among investors that the authorities retain the option to intervene once again to support the market under circumstances that are not well defined. This may have altered the distribution of returns that investors foresee when undertaking investment decisions. While there is no general agreement on levels, some market participants may now be acting on the belief of an infom1al floor on the market, truncating the downside risk to investing in Hong Kong SAR's equity market, increasing the chances of a "one-way" bet where investors may expect the government to bail them out before they can suffer large losses. Such perceptions on the limited risk of investments may attract inflows in excess of those that would otherwise occur, as risk is mispriced by the expectation of intervention. Furthermore, uncertainty regarding the precise circumstances that may rrigger a response by the government, and the willingness of the government to intervene through nonstandard channels, may have shifted the balance so that those investors who are more sensitive to the lack of clarity on the "rules of the game" will shy away from the market. So while the overall flows into the market may increase, the investor base is likely to shift away from investors who are averse to policy shifts.
©International Monetary Fund. Not for Redistribution
V EMERGING MARKETS: NONSTANDARD POLICY RESPONSES AND THE ROLE OF CREDIT RATING AGENCIES
Nevertheless, the fact that the HKMA's intervention was fairly transparent, and was followed up by clear statements from the authorities on the extent of intervention and their motivation for intervening, together with the recent announcement on the unit trust to dispose of part of the share portfolio, has been viewed positively by market participants. Furthermore, given that the portfolio's value has appreciated with the Hang Seng index, the negative impact of the intervention on the perception of risk and reward in Hong Kong SAR 's equity market is mitigated by the fact that no contingent liabilities have arisen from the actions.
Buy/Jacks of Bonds
One notable development in emerging market financing in the 1990s has been the growth in the issuance of bonds in imemational markets. Beginning with the Brady plan-which converted the commercial bank debt of several emerging market sovereign borrowers into tradable securities known as Brady bonds, partly collateralized with U.S. treasury bonds- countries also began to issue overseas bonds in various markets such as in the U.S. dollar bond market (yankees) and the yen-denominated bond market (samurais). This year, issuances denominated in euros made their debut.
The volume and pricing of international bonds remains a closely watched indicator of the access of emerging markets to private financing. Since international and Brady bonds (Bradies) are traded in international bond markets and continuously priced, the spreads of these securities over a benchmark have become a common indicator of country creditwo•thiness.s The most common benchmark for dollar-denominated bonds such as Bradies bas been the yield on U.S. treasury securities of comparable maturity, and indices such as J.P. Morgan's Emerging Market Bond Index are interpreted as representing the average spread of bonds in the index over U.S. treasury securities.
While numerous factors determine the spread of sovereign bonds over their benchmark. the most prominent and visible component of the spread is country creditworthiness and, more generally, the country's fundamentals. As a result, when a country is under speculative pressure, spreads on its international bonds and Brady bonds tend to widen. These bonds therefore become an important instrument for taking a short position offshore based on a negative view of the issuing country's fundamentals. Moreover, the very act of short-selling these bonds lowers their price, widens their spreads, and signals negative sentiment, and may fuel speculative pressures through other onshore channels. However, price movements in these bond markets do not in and of themselves trans-
srn the case of Bradies. the stripped spreads-i.e .. without the impact of the collateral-arc the most watched indicators.
96
late into pressures on the issuer in terms of a drawdown of reserves since short-selling the bonds has no strong direct link with the provision of domestic credit, which is the key ro fueling a speculative attack on a country's reserves. It does, of course, influence the price at which a country can access new funding on international capital markets. Furthermore, if the fall in the price of international bonds issued by a country triggers a rebalancing of portfolios by investors away from assets of that country, it may through this channel result in a d.rawdown of reserves.
An impo1tant element of international bonds and Bradies that does, however, have a more direct bearing on a country's ability to defend itself against a speculative attack is the fact that, in many emerging market countries, it is often domestic entities-typically domestic commercial and investment banks, but also mutual funds and other investors-that hold these instruments. This reflects the fact that resident entities often feel they are better equipped to assess the country's fundamentals and creditworthiness and are quick to exploit what they see as attractive pricing relative to risk of these instruments. These instruments are often held on margin. International banks are the counterparties that provide the credit for domestic entities to buy these securities, against the posting of an initial margin as weU as a variation margin that has to be posted if the price of the bonds, and hence value of the underlying position, falls below a threshold. The leveraged holding of such instruments by domestic entities becomes a potentially lucrative asset with high expected rates of return. However, in the event of a faJJ in the prices for these bonds-whether due to deteriorating domestic conditions or a general sell-off across emerging market debt instruments-these leveraged positions can become a source of pressure in domestic markets. This is because the suppliers of credit overseas, the international investment and commercial banks, will require the leveraged domestic investors to post additional (variation) margin or force a sell-off of the bonds. Posting of additional margin, in the event that liquid foreign assets are not available to the investor to liquidate for this purpose, requires selling domestic liquid assets, their conversion to foreign exchange, and their transfer to the overseas banks. This process exerts downward pressures on domestic stock and bond markets, foreign exchange reserves, and the exchange rate, and exerts upward pressure on interest rates. Therefore, developments in Brady and international bond markets can transmit pressures onto the domestic market rapidly and forcefully.
Sovereign issuers have been tempted to intervene in the Brady and international bond markets by buying securities for a number of reasons, as suggested in the above discussion. First, intervening in these markets raises prices and lowers spreads. This has the effect of squeezing those speculators that are short-selling the bonds overseas. While this has a Limited direct impact,
©International Monetary Fund. Not for Redistribution
Nonstandard Policy lnteNentions in Emerging Markets
as discussed above, the resultant nan-owing of spreads sends a more positive signal-perhaps inaccurately if the pricing of bonds is being manipulated by official buying-about the domestic economy's fundamentals and creditworthiness. This may cool direct speculative pressures that may be being felt onshore. Second, supporting the bond markets ensures that margin calls and forced selling will not be imposed by the banks that provide the leverage to domestic entities that have built up long leveraged positions in these instruments. This eliminates one channel for the outflow of reserves and downward pressures on domestic markets when a country's perceived fundamentals deteriorate. Intervention in the market for overseas bonds is done either directly by the central bank or the treasury, or through a state-owned entity such as a bank or a large corporate. The latter two methods would make the intervention less transparent to market participants, as they could be justified as being proprietary positions taken on their own account by the bank or the corporate, reflecting their own views on the fundamentals, which differ from those of the rest of the market.
One notable example of intervening in the overseas bond markets in the recent crisis has been Brazil's reported intervention in the market for its own international bonds. Brazil reportedly imposed a squeeze on speculators that were short-selling the bonds overseas by buying large quantities of the bonds, bidding up the price and making the short positions unprofitable. Market sources report significant buying on behalf of the government at certain times throughout 1 998. The intervention also prevented margin calls from being made on Brazilian domestic banks that were holders of such instruments on margin overseas.9 Other nonstandard forms of intervention by Brazil that have been noted elsewhere-and which have resulted in losses given the subsequent evolution of asset prices-have included its intervention in the currency futures market for the real. and its issuance of dollarlinked domestic currency debt over a period prior to the devaluation of the currency_IO
91n the October 1997 episode. nearly half of the capital oULtlow� from Brazil were attributed to such margin calls on domestic bondholders: see International Monetary Fund ( 1998).
IOSome countries have also periodically intervened in the market for external debt to achieve debt management goals. An example is the buyback of Polish Brady bond.� in 1998, which amounted to some $750 million, after a buyback of some $1.7 billion in 1997. These operations were not officially confirmed until after they had been successfully completed. In Poland. the motivation of the buyback appears different from the Brazilian case, witb the primary goal having been to reduce the debt stock and take advantage of what was seen as a mispricing (underpricing) of the bonds. If the issuer of a bond perceives a bond to be mispriced to the extent that the probability of a dcfaull is judged higher by the market tban by the issuer. then a quiet buyback-i.e .. one that does not drive up the price too muchat the discounted price delivers a net reduction in the debt burden. By all accounts, the Polish Brady buybacks were conducted successfully and reduced the net debt burden of the government.
97
Interventions of this type. where governments buy their own country's bonds, imply a use of liquid foreign exchange reserves in times of possibly severe market pressures to either acquire longer-term illiquid assets or extinguish long-term debt. This reduces the amount of liquid reserves available to counter speculative pressures through traditional means and the interventions must be viewed against this trade-off. Furthermore, the interventions involving bond buybacks have been viewed as much less transparent than the equity purchases in Hong Kong SAR, adding a greater element of uncertainty to market participants' understanding of the official policy stance.
There are numerous other instances where issuing governments have sought to buy back their own debt at discounts. Such nonstandard interventions, motivated by one or more of the factors discussed above, have a number of consequences in addition to the obvious ones mentioned above. Such interventions may skew the subjective distribution of prices that investors in such instruments perceive when making their investment decisions. Investors may begin to perceive informal floors on the prices of these instruments and the risk-reward characteristics they embody. Thjs reduces two-way risk from investing in such instruments. For example, if investors know that spreads will not be aHowed to rise above a certain level, long positions in these instruments will be greater than in the case of other instruments, because the downside of this investment is seen as limited. Such "moral hazard" plays, where it is believed t11e investors will be bailed out in case of a fall in the prices of the bonds, leads to mispricing of risk associated with these instruments and excessive investrnems in them. Further, in the event that investors reassess their earlier expectations of price support on the downside, the price adjustment that subsequently ensues will be much sharper and abrupt
In the case of those countries where domestic investors are significant leveraged holders of international bonds issued by their own country, the knowledge that downside risk has been truncated would lead to incentives to build up larger leveraged long positions overseas, as the (perceived) return adjusted for tisk of such investments has gone up. Therefore. the equilibrium size of leveraged positions may rise. In this case too, in the event that expectations of price support are not validated in the future, the rapid reappraisal of tl1e risk-reward characteristics of the instruments and the resultant positions can lead to a sharper market correction, greater outflows related to margin payments, and greater pressures on authorities facing a speculative attack than would otherwise be the case.
Capital and Exchange Controls nfl Outflows
In an aggressive move to reduce short-term capital flows. on September I , 1 998, Malaysia imposed a
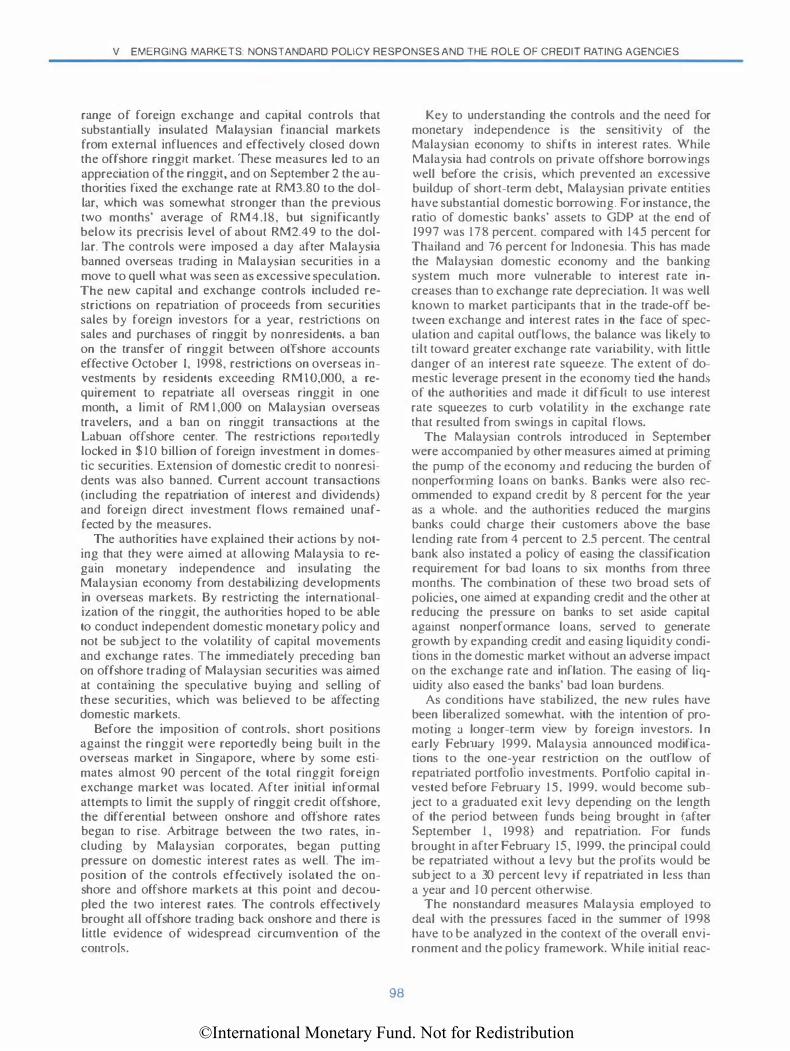
©International Monetary Fund. Not for Redistribution
V EMERGING MARKETS: NONSTANDARD POLICY RESPONSES AND THE ROLE OF CREDIT RATING AGENCIES
range of foreign exchange and capital controls that substantially insulated Malaysian financial markets from external influences and effectively closed down the offshore ringgit market. These measures led to an appreciation of the ringgit, and on September 2 the authorities fixed the exchange rate at RM3.80 to the dollar, which was somewhat stronger than the previous two months' average of RM4.18, but significantly below its precrisis level of about RM2.49 to the dolJar. The controls were imposed a day after Malaysia banned overseas trading in Malaysian securities in a move to quell what was seen as excessive speculation. The new capital and exchange controls included restrictions on repatriation of proceeds from securities sales by foreign investors for a year, restrictions on sales and purchases of ringgit by nonresidents, a ban on the transfer of ringgit between of'fshore accounts effective October 1, 1998, restrictions on overseas investments by residents exceeding RMlO,OOO, a requirement to repatriate all overseas ringgit in one month, a limit of RM 1 ,000 on Malaysian overseas travelers, and a ban on ringgit transactions at the Labuan offshore center. The restrictions rep011edly locked in $10 billion of foreign investment in domestic securities. Extension of domestic credit to nonresidents was also banned. Current account transactions (including the repatriation of interest and dividends) and foreign direct investment flows remruned unaffected by the measures.
The authorities have explained their actions by noting that they were aimed at allowing Malaysia to regrun monetary independence and insulating the Malaysian economy from destabilizing developments in overseas markets. By restricting the internationalization of the ringgit, the authorities hoped to be able to conduct independent domestic monetary policy and not be subject to the volatility of capital movements and exchange rates. The immediately preceding ban on offshore trading of Malaysian securities was rumed at containing the speculative buying and selling of these securities, which was believed to be affecting domestic markets.
Before the imposition of controls, short positions against the ringgit were reportedly being built in the overseas market in Singapore, where by some estimates almost 90 percent of the total ringgit foreign exchange market was located. After initial informal attempts to limit the supply of ringgit credit offshore, the differential between onshore and offshore rates began to rise. Arbitrage between the two rates, including by Malaysian corporates, began putting pressure on domestic interest rates as well. The imposition of the controls effectively isolated the onshore and offshore markets at this point and decoupled the two interest rates. The controls effectively brought all offshore trading back onshore and there is little evidence of widespread circumvention of the COnlTOIS.
98
Key to understanding the controls and the need for monetary independence is the sensitiviry of the Malaysian economy to shifts in interest rates. While Malaysia had controls on private offshore borrowings well before the crisis, which prevented an excessive buildup of short-term debt, Malaysian private entities have substantial domestic borrowing. For instance, the ratio of domestic banks' assets to GDP at the end of 1997 was 178 percent. compared with 145 percent for Thailand and 76 percent for Indonesia. This has made the Malaysian domestic economy and the banking system much more vulnerable to interest rate increases than to exchange rate depreciation. Il was well known to market participants that in the trade-off between exchange and interest rates in the face of speculation and capital outflows, the balance was likely to tilt toward greater exchange rate vatiability, with little danger of an interest rate squeeze. The extent of domestic leverage present in the economy tied the hand�> of the authorities and made it difficult to use interest rate squeezes to curb volatility in the exchange rate that resulted from swings in capital flows.
The Malaysian controls introduced in September were accompanied by other measures aimed at priming the pump of the economy and reducing the burden of nonperforming loans on banks. Banks were also recommended to expand credit by 8 percent for the year as a whole, and the authorities reduced the margins banks could charge their customers above the base lending rate from 4 percent to 2.5 percent. The central bank also instated a policy of easing the classification requirement for bad loans to six months from three months. The combination of these two broad sets of policies, one aimed at expanding credit and the other at reducing the pressure on banks to set aside capital agrunst nonperformance loans, served to generate growth by expanding credit and easing liquidity conditions in the domestic market without an adverse impact on the exchange rate and inflation. The easing of liquidity also eased the banks' bad loan burdens.
As conditions have stabilized, the new rules have been liberalized somewhat. with the intention of promoting a longer-term view by foreign investors. l n early February 1999. Malaysia announced modifications to the one-year restriction on the outflow of repauiated portfolio investments. Portfolio capital invested before February 15. 1999, would become subject to a graduated exit levy depending on the length of the period between funds being brought in (after September I , 1998) and repatriation. For funds brought in after February 15, 1999, the principal could be repatriated without a levy but the profits would be subject to a 30 percent levy if repatriated in less than a year and I 0 percent otherwise.
The nonstandard measures Malaysia employed to deal with the pressures faced in the summer of 1998 have to be analyzed in the context of the overall environment and the policy framework. While initial reac-
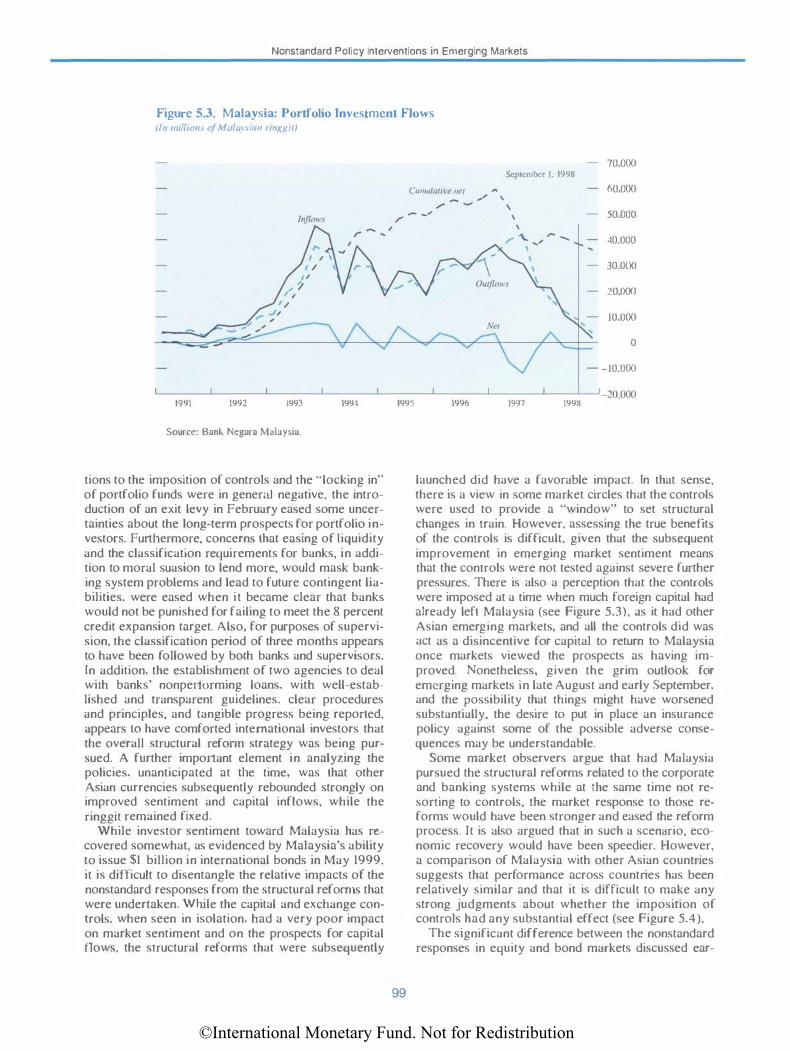
©International Monetary Fund. Not for Redistribution
Nonstandard Policy Interventions in Emerging Markets
Figure 5.3. Malaysia: Portfolio Investment Flows (/n million• of MalavHtm rm�111tl
1991 1992 1993 1994
Source: Bank Negara M3l3y�ia.
tions to the imposition of controls and the .. locking in" of portfolio funds were in generaJ negative, the introduction of an exit levy in February eased some uncertainties about the long-term prospects for portfolio investors. Furthermore, concerns that easing of Liquidity and the classification requirements for banks, in addition to moraJ suasion to lend more, would mask banking system problems and lead to future contingent liabilities, were eased when it became clear that banks would not be punished for failing to meet the 8 percent credit expansion target. Also, for purposes of supervision, the classification period of three months appears to have been followed by both banks and supervisors. In addition, the establishment of two agencies to deal with banks' nonpetforming loans, with well-established and transparent guidelines, clear procedures and principles, and tangible progress being reported, appears w have comforted international investors that the overaJJ structural refonn strategy was being pursued. A further impot1ant element in analyzing the policies, unanticipated at U1e time. was that other Asian currencies subsequently rebounded strongly on improved sentiment and capital inflows, while the ringgit remained fixed.
While investor sentiment toward Malaysia has recovered somewhat, as evidenced by Malaysia's ability to issue $1 biJJion in international bonds in May 1999. it is difficult to disentangle the relative impacts of the nonstandard responses from the structural reforms that were undertaken. While the capital and exchange controls. when seen in isolation. had a very poor impact on market sentiment and on the prospects for capital tlows, the structural reforms that were subsequently
/
Cumulati\.·� ,,., ,. .-" '
Scp1ember I. 1998
/ ' - -"
70.000
60,000
50.000
40.000
30.000
20.0()0
10.000
0
- -10.000
1995 1996 19'>7 1991!
99
launched did have a favorable impact. In that sense, there is a view in some market circles that the controls were used to provide a "window" to set structural changes in train. However, assessing the true benefitl. of the controls is difficult, given that the subsequent improvement in emerging market sentiment means that the controls were not tested against severe further pressures. There is also a perception that the controls were imposed at a time when much foreign capital had already left Malaysia (see Figure 5.3), us it had other Asian emerging markets, and all the controls did was act as a disincentive for capital to return to Malaysia once markets viewed the prospects as having improved. Nonetheless, given the grim outlook for emerging markets in late August and early September, and the possibility that things might have worsened substantially, the desire to put in place an insurance policy against some of the possible adverse consequences may be understandable.
Some market observers argue that had MaJaysia pursued the structural reforms related to the corporate and banking systems while at the same time not resorting to controls, the market response to those reforms would have been stronger and eased the reform process. It is also argued that in such a scenario, economic recovery would have been speedier. However, a comparison of Malaysia with other Asian countries suggests that performance across countries has been relatively similar and that it is difficult to make any strong judgments about whether the imposition of controls had any substantial effect (see Figure 5.4 ).
The significant difference between the nonstandard responses in equity and bond markets discussed ear-
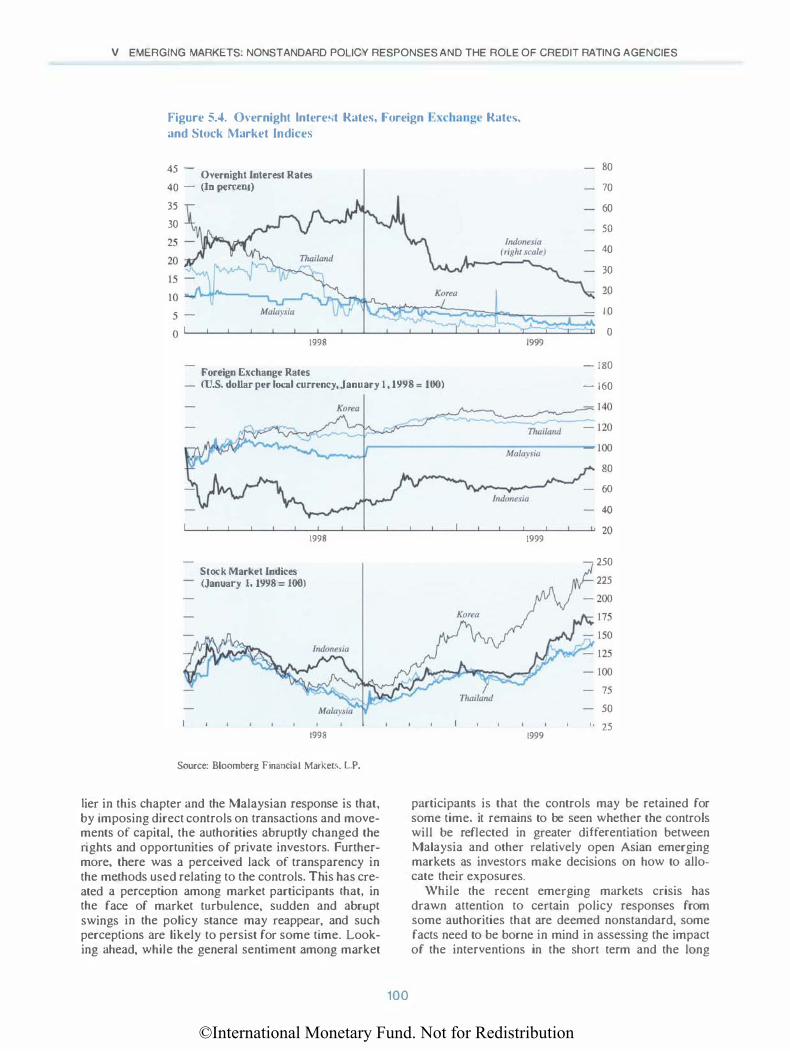
©International Monetary Fund. Not for Redistribution
V EMERGING MARKETS: NONSTANDARD POLICY RESPONSES AND THE ROLE OF CREDIT RATING AGENCIES
Figure 5.�. Overnight lntere!.t Rates, Foreign Exch:mge Ratl'�. and Stock Market Indices
45 - Overnight Interest Rates
40 - (In percent)
35
30
1998
Foreign Exchange Rates
80
70
60
so
40
30
20
10
0 1999
- 180
- (U.S. doUar per local currency, January 1 , 1998 = 100) - 160
�---- too
80
60
40
L-�--L-�--��---L--��---L--L-�--���-L--L-�--�� w
Stock Market Indices (January 1, 1998 = 100)
1998
1998
Source: Bloomberg Financial Marke1s. L.P.
tier in this chapter and the Malaysian response is that, by imposing direct controls on transactions and movements of capital, the authorities abruptly changed the rights and opportunities of private investors. Furthermore, there was a perceived lack of transparency in the methods used relating to the controls. This has created a perception among market participants that, in the face of market turbulence, sudden and abrupt swings in the policy stance may reappear, and such perceptions are likely to persist for some time. Looking ahead, while the general sentiment among market
100
1999
1999
250
225
50
25
participants is that the controls may be retained for some time, it remains to be seen whether the controls will be reflected in greater differentiation between Malaysia and other relatively open Asian emerging markets as investors make decisions on how to allocate their exposures.
While the recent emerging markets crisis has drawn attention to certain policy responses from some authorities that are deemed nonstandard, some facts need to be borne in mind in assessing the impact of the interventions in the short term and the long
©International Monetary Fund. Not for Redistribution
The Role of the Major Credit Rating Agencies in Global Financial Markets
term. The pressures faced by some emerging markets in the depths of the crisis were enormous and, in fact, unprecedented in recent history. Such circumstances may have warranted responses that go beyond the typical combination of an interest rate defense and foreign exchange market intervention. Therefore, a judgment on the particular nonstandard interventions applied should be set against the menu of policy choices that were available to the authorities in such extreme circumstances. For instance, circuit breakers are used in many mature and emerging markets to rein in volatile market conclitions and restore orderly trading. Looking back, some of the nonstandard responses used in various markets in the recent crisis had the same impact as circuit breakers, but were applied without preestablished guidelines and clear rules that circuit breakers typically tend to have. Looking ahead, an understanding of the longer-term implications of the interventions and an ability to clearly differentiate between fundamentals and market panic should guide policies that may be needed to maintain orderly market conclitions in the face of abnormal pressures without interfering with the efficient functioning of markets.
The Role of the Major Credit Rating Agencies in Global Financial Markets
During the 1990s. global securities markets have become an increasingly important source of funding for many emerging market countries. As a result, the portfolio preference and practices of the major institutional players in these markets have been key determinants of the scale and composition of capital flows to emerging markets, as well as the terms and conditions under which those markets can be accessed. Ln this regard, credit rating agencies have been viewed by many market participants as having a strong impact on both the cost of funding and the willingness of major institutional investors to hold certain types of instruments. Indeed, obtaining a sovereign credit rating has often been seen as a prerequisite for issuing a eurobond; and some institutional investors are constrained to hold securities that have been classified by rating agencies as "investment grade," as a result of either official regulations or internal risk management practices. Moreover, under recent proposals put forth by the Basel Committee on Banking Supervision, creclit ratings would become key determinants of the risk weights attached to bank exposures to sovereign and other borrowers.
The sharp adjustments of sovereign credit ratings for many emerging markets in the period since July 1997 have raised concerns about the credit rating process. Indeed, critics have charged that the improvements in ratings during the early and mid-1990s and the subsequent sharp declines in 1997-98 introduced a procycli-
1 0 1
cal element into global capital flows-accelerating inflows during the mid-1 990s and contributing to a collapse of inflows after the Asian crisis emerged-and that the ratings neither warned of the crisis nor accurately reflected economic fundamentals. In adclition, there have been concerns that the agencies have been excessively sensitive to short-term developments, especially during crisis periods.
To examine these concerns, this section reviews the role of credit agencies in global financial markets, as well as the specific experience with sovereign credit ratings for emerging markets during the 1990s. There is first consideration of the general issue of how markets generate information about alternative investments and convey that information to either inclividual savers or institutions serving as their agents. In this setting, credit rating agencies seek to provide information on relative default probabilities for the securities issued by a broad range of public and private sector borrowers. The role of credit rating agencies in global markets is examined by (I) reviewing the history of the credit rating industry and the growing use of ratings in the regulatory process; (2) discussing the nature of the rating process; and (3) analyzing the historical accuracy of ratings. The section then considers the experience with sovereign creclit ratings for emerging markets in the 1990s, with particular emphasis on the period since the beginning of the Asian crisis in July 1997.
Financial Markets and Infnrmation
One of the fundamental problems that financial markets must deal with is the presence of asymmetric information between savers and investors. In decicling whether to fund a particular investment project, a saver would presumably want to examine a broad range of factors that influence the rerum on that investment as well as the associated risks. However. the owner or manager of the investment project is likely to have much more information about some aspects of the project (including the amount of effort the owner/manager will devote to making the project successful) than the saver. As a result, gathering information on a complex investment project can be not only very costly but also often subject to great uncertainty. Moreover, in an international setting, the potential asymmetric information problems confronting each individual saver are likely to be much greater than at the national level, owing to differences in reporting requirements, accounting standards, and legal arrangements.
A variety of financial institutions and markets, supplemented by official disclosure and investor protection policies, have evolved both to reduce the need for individual investors to evaluate a multitude of investments and to generate a mixture of private and public information to help savers evaluate alternative investments. For example, banks have historically been one
©International Monetary Fund. Not for Redistribution
V EMERGING MARKETS: NONSTANDARD POLICY RESPONSES AND THE ROLE OF CREDIT RATING AGENCIES
of the key institutions for dealing with asymmetric information through reliance on private information. Commercial banks pool the funds of depositors and allocate these funds to a variety of investment projects. In addition to allowing for a diversification of risks across a bank's portfolio, banks are able to develop specialized expertise in the evaluation of the credit risks associated with individual investment projects. Banks typically do not share the information they develop about individual investment projects, and they can therefore capture the full value of this private information, which helps to offset the cost of generating such information.
Savers can also make use of public information that is generated both by market institutions and as a result of regulatory disclosure requirements; once this information is available. it is a public good. For example. securities houses employ analysts to evaluate alternative investments and to make investment recommendations to individual savers and institutions. The costs associated with producing such "sell-side'' investment research are indirectly recovered through the transactions fee that the securities house earns when its customers trade on the basis of the investment advice.
Another source of public information is provided by investment newsletters and credit rating agencies, and is not Linked to sales of particular financial products. These entities provide "standardized" evaluations of the likely returns and risks associated with alternative investments, but the decision regarding which investments are undertaken remains with the saver. The cost of generating this information is recovered through subscription charges to subscribers (in the case of newsletters) or through charges imposed on the issuers of rated securities. Alternatively, savers can delegate to investment managers or mutual funds both the evaluation of alternative investment projects and the choice of the most profitable, risk-adjusted mix of investments. In this situation, the cost of such evaluations and investment activities is imposed on savers through commissions and/or fees based on assets under management and deducted from the returns on the investments.
Credit Ratings and the Credit Rating Process
The emergence of the credit rating agencies is a classic example of how market institutions evolve to deal with asymmetTic information in the absence of government intervention. The "good" that they provide is to evaluate financial claims according to standardized creditworthiness categories.
History of the Major Rating Agencies
As a result of geographically fragmented banking and capital markets in the United States in the 1800s, a series of institutions developed to provide private and public information about the creditworthiness of
102
various borrowers. Cantor and Packer ( 1994) argue that the immediate precursors of modem rating agencies were the mercantile credit agencies, which rated merchants' ability to meet their financial obligations. Following the financial pru1ic of 1837. Louis Tappan established the first mercantile credit agency in New York; and Robert Dun subsequently acquired the agency and published its fust rating guide in 1859. Ln 1849. John Bradstreet established his agency and started publishing his rating book in 1857. ln 1933. the two agencies merged to form Dun and Bradstreet, which became the owner of Moody's Investor Service (Moody's) in 1 962.
Ratings were extended to the securities markets in 1909 when John Moody began rating U.S. railroad bonds and in 1910. ratings of utility and industrial bonds were added. Poor's Publishing Company issued its first ratings in 1 9 1 6, Standard Statistical Company, in 1922, and the Fitch Publishing Company, in 1924. Standard & Poor's (S&P's) was formed in 1941 by the merger of Standard Statistical and Poor's Publishing. Duff and Phelps began to provide bond ratings in 1982.
These long-established rating agencies have faced competition from more specialized agencies and newer agencies, particularly in emerging markets. For example, Thomson Bankwatch rates financial institutions, and A.M. Best rates insurance companies. As part of efforts to ·'jump start" domestic securities markets, a number of emerging markets have introduced mandatory rating requirements for the issuance of certain types of domestic securities or required certain institutions to periodically issue securities that will be rated. (Table 5.1 provides a listing of some of the rating agencies in emerging markets). Recently, rating agencies have experienced a rapid expansion of their activities in Europe, where a growing number of corporate entities have sought ratings to facilitate bond issuance. I I
Over time, the agencies have continued to expand both the types of financial insu-uments that they rate and the frequency with which they report these ratings. The major U.S. agencies rate not only long-term sovereign and corporate bonds but also a variety of other instruments, including municipal bonds, preferred stocks, asset-backed securi£ies, medium-term note programs, shelf registrations. private placements. commercial paper, and bank certificates of deposit. Table 5.2 provides a description of the rating categories developed by Moody's and S&P's for longterm foreign currency bonds.l2 More recenlly, they have also begun to evaluate coumerparty risk posed by derivative products, the claims paying ability of insurance companies, and price volatility of mutual funds and mortgage-backed securities.
1 1 See ··on Watch." The Economist, May 15. 1999. p. 82-87. 12 Annex V provides a more detailed listing or the ratings cate
gories used by the two largest ratings agencies-Moody's and S&P"s.
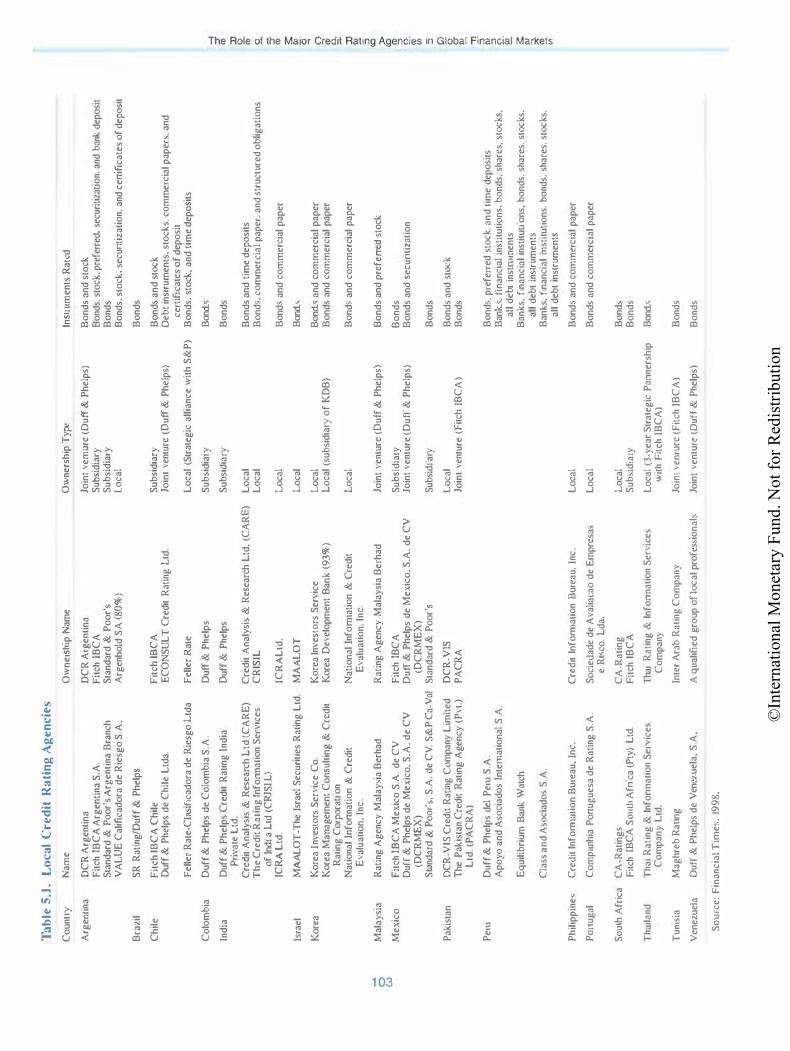
©In
tern
atio
nal M
onet
ary
Fund
. Not
for R
edis
tribu
tion
Ta
ble
S.J
. L
oca
l C
red
it R
ati
ng
Ag
en
cies
Co
unt
ry
Nam
e O
wn
ersh
ip N
ame
Ow
ners
hip
Typ
e ln
s1ru
men
1s R
a1ed
Arg
emin
a O
CR
Arg
enti
na
O
CR
Arg
enti
na
Jo
in!
vem
ure
(D
uff
& P
hel
ps)
B
on
ds
and
s1o
ck
Fit
ch r
BC
A A
rgen
tina
S.A
. F
ilch
LB
CA
Su
bsid
iary
B
ond
s. s
1ock
. pre
ferr
ed.
secu
ritiz
atio
n, a
nd b
ank
depo
sil
Stan
dard
& P
oo
r's
Arg
enti
na B
ranc
h St
anda
rd &
Po
or'
s S
ub
sid
iary
B
ond
s V
AL
UE
Cal
ifica
dora
de
Rie
sgo
S.A
. A
rgen
hold
SA
(80
%)
Lo
cal
Bo
nds.
sto
ck.
secu
riti
zati
on.
and
cen
ifica
tes
of
depo
sit
Bra
zil
SR
Rat
ing
/Duf
f &
Ph
elp
s B
on
ds
Ch
ile
Fit
ch lB
CA
Ch
ile
Fit
ch lB
CA
S
ub
sid
iary
B
on
d10
an
d s
tock
Duf
f &
Phe
lps
de
Chi
le L
tda.
E
CO
NSU
LT
Cre
dit
Rat
ing
Ltd
. Jo
int
vent
ure
(Du
ff &
Ph
elp
s)
Deb
t in
stru
men
ts.
sto
cks.
co
mm
erci
al p
aper
s. a
nd
ce
rtif
icat
es o
f de
posi
t F
elle
r R
ate-
Cia
�ific
ado
ra d
e R
iesg
o L
tda
Fel
ler
Rat
e L
oca
l (S
trat
egic
all
ianc
e w
ith
S&
PJ
Bo
nds.
sto
ck.
and
tim
e d
epo
sits
Co
lom
bia
D
uff
& P
hel
ps
de
Co
lom
bia
S.A
. D
uff &
Phe
lps
Su
bsi
dia
ry
Bon
ds
-f
ind
ia
Duf
f &
Ph
elp
s C
redi
l R
a1in
g I
ndia
D
uff
& P
help
s S
ub
sid
iary
B
on
ds
::::r
(!)
Pri
va1e
Ltd
. JJ
C
red
it A
nal
ysi
s &
Res
earc
h L
td (
CA
RE
) C
red
it A
nal
ysb
& R
esea
rch
Ltd
. (C
AR
E)
Lo
cal
Bo
nd
s an
d t
ime
dep
osi
ts
0 CD
Th
e C
red
it R
ati
ng ln
fon
nat
ion
Ser
vic
es
CR
lSIL
L
oca
l B
ond
s. c
om
mer
cia
l pa
per.
and
str
uct
ure
d o
blig
atio
ns
Q.
of
ind
ia L
td (
CRl
SlL
) 5'
IC
RA
Ltd
. IC
RA
Ltd
. L
oca
l B
ond
1o an
d c
om
mer
cial
pap
er
(!) s:
Isra
el
MAA
LO
T-T
he I
srae
l Se
curi
ties
Rat
ing
Ltd
. M
AA
LO
T
Lo
cal
Bon
d"
.!!!. Q
Ko
rea
Ko
rea
I nve
s10
rs S
ervi
ce C
o.
Ko
rea
lnv
es10
rs S
erv
ice
Lo
cal
Bon
ds
and
com
mer
cial
pap
er
()
Ko
rea
Man
agem
ent
Co
nsu
ltin
g &
Cre
dit
K
orea
Dev
elo
pmen
t B
ank
(9
3%)
Lo
cal
(su
bsi
dia
ry o
f K
DB
) B
ond
s an
d co
mm
erci
al p
aper
iil
Rat
ing
Co
rpo
rat
ion
� N
atio
nal
lnfo
nna
tio
n &
Cre
dit
Nat
iona
l Jnf
on
nati
on
& C
redi
t L
oca
l B
ond
s an
d c
om
mer
cial
pap
er
JJ
Eva
lua1
ion
. Ln
c.
Eva
luat
ion
. ln
c.
!!!
5. M
ala
ysi
a
Rat
ing
Ag
ency
Mal
aysi
a B
erha
d
Rat
ing
Ag
ency
Mal
aysi
a B
erh
ad
Join
t ve
ntu
re (
Du
ff &
Ph
elp
s}
Bo
nd
s an
d p
refe
rred
sto
ck
<0
0
)> w
<0
M
exic
o
Fit
ch L
BC
A M
exic
o S
.A.
de
CV
F
itch
LB
CA
S
ub
sid
iary
B
on
ds
(!)
:l D
uff
& P
hel
ps
de
Mex
ico
. S.A
. d
e C
V
Du
ff &
Ph
elp
s d
e M
exic
o. S
.A.
de
CV
Jo
int
vent
ure
(D
uf
f & P
hel
ps)
B
on
ds
and
sec
un
tiza
tio
n 0 CD
(D
CR
ME
X)
(DC
RM
EX
) (/)
Sta
ndar
d &
Po
or·
�. S
.A. d
e C
V S
&P
Ca-
Val
S
tan
dar
d &
Po
or'
s Su
bsid
iary
B
ond
s 5'
Pak
ista
n O
CR
-VlS
Cre
dit
Rat
ing
Co
mpa
ny L
imit
ed
DC
R-V
lS
Lo
cal
Bo
nds
and
stoc
k G)
0
T
he P
akis
tan
Cre
dit
Rat
ing
Ag
ency
(P
vt.)
P
AC
RA
Jo
inl
vent
ure
(Fit
ch I
BC
A)
Bo
nds
0'
�
Ltd
. (P
AC
RA
) "T1
P
eru
D
uff
& P
hel
ps
del
Per
u S
.A.
Bo
nds.
pre
ferr
ed s
tock.
an
d ti
me
depo
sits
5'
ll>
A
poyo
an
d A
soci
ado
s In
tern
atio
nal
S.A
. B
ank
s. fi
nan
cial
ins
titu
tio
ns,
bo
nd
s. s
hare
s. s
tocks
. :l 0
al
l d
eb I
i nst
nnn
ents
€
Eq
uili
bri
um
Ba
nk W
atch
B
ank
s. f
ina
nci
al
inst
itut
ions
. bo
nds.
sha
res.
stoc
ks.
s:
all
deb
t in
stru
men
ts
ll> ;;<-
Cla
ss a
nd
Asoc
iado
s S
.A.
Ban
ks.
fina
ncia
l m
su1u
tio
ns.
bond
s. s
hare
s. s
tocks
. (!)
a
ll d
ebt
inst
rum
ents
u;
Ph
ilip
pin
e>
Cre
dit
lnfo
mm
ion
Bu
reau
. In
c.
Cre
dit
lnfo
m1a
tio
n B
urea
u. I
nc.
Lo
cal
Bo
nd�
and
co
mm
erci
al
pape
r
Po
rtug
al
Co
mpa
nhi
a P
on
ug
ues
a d
e R
atin
g S
.A.
Soci
edad
e d
e A
valia
cao
de
Em
pres
m.
Lo
cal
Bo
nds
and
com
mer
cial
pap
er
e R
isco
. L
da.
Soul
h A
fric
a C
A-R
atin
gs
CA
-Ra
tin
g
Lo
cal
Bo
nd1o
Fitc
h rB
CA
SO
lnh A
fric
a (P
ty)
Ltd
. F
itch
lB
CA
S
ub
sid
iary
B
on
ds
Tha
iland
T
hai
Ra1
ing
& l
nfo
mt
ati
on
Ser
vic
es
Tha
i R
a1i
ng &
lnfo
nn
atio
n S
ervi
ces
Lo
cal
(3-y
ear
Stra
leg
ic P
anne
rsh
ip
Bon
d�
Co
mp
an}
L1d
. C
om
pan
y w
i1h
Fit
ch
IBC
A)
Tu
msi
a M
agh
reb
Rau
ng
Inte
r A
rab
Ra
ting
Co
mp
any
Jo
mt v
enru
re (
Fit
ch I
BC
A)
Bo
nds
Ven
ezue
la
Duf
f &
Phe
lps
de
Ven
c7.u
ela.
S.A
. A
qu
alif
ied
gro
up o
f loc
al p
rofe
ssio
na
b
Join
t ve
ntu
re (
Du
ff &
Phe
lps)
B
ond
>
So
urc
e: F
ina
ncia
l Tim
e�.
199
8.
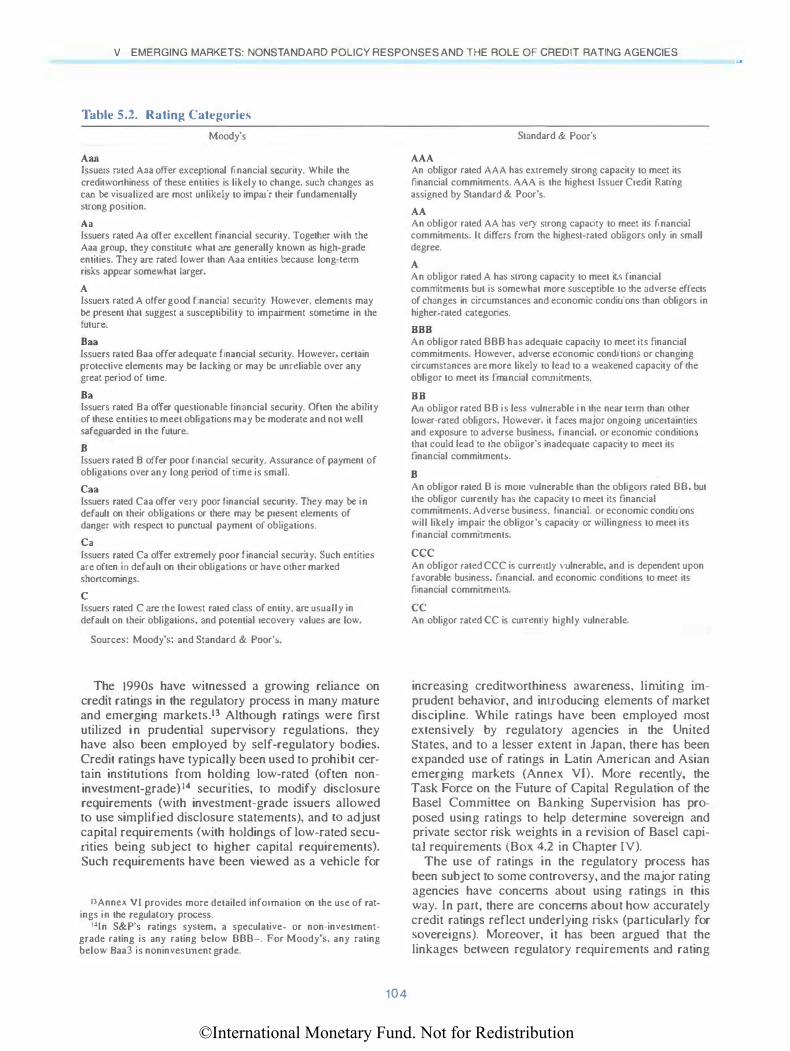
©International Monetary Fund. Not for Redistribution
V EMERGING MARKETS: NONSTANDARD POLICY RESPONSES AND THE ROLE OF CREDIT RATING AGENCIES
Table 5.2. Rating Categories
Moody's
Aaa Issuers rated Ana offer exceptional financial security. While the creditwonhiness of these entities is likely to change, such changes as can be visualized are most unlikely to impair their fundamentally strong position.
A a Issuers rated A a offer excellent financial security. Together with the Aaa group, they constirutc what are generally known as high-grade entities. They are rated lower than Aaa entities because long-term risks appear somewhat larger.
A Issuers rated A offer good financial security. However, elements may be present that suggest a susceptibility to impairment sometime in the future.
Baa Issuers rated Baa offer adequate financial security. However, certain protective elements may be lacking or may be unreliable over any great period of time.
Ba Issuers rated Ba offer questionable financial security. Often the ability of these entities to meet obligations may be moderate and not well safeguarded in the future.
B Issuers rated B offer poor financial security. Assurance of payment of obligations over any long period of time is small.
Caa Issuers rated Caa offer very poor financial security. They may be in default on their obligations or there may be present elements of danger with respect to punctual payment of obligations.
Ca Issuers rated Ca offer extremely poor financial security. Such entities are often in default on their obligations or have other marked shoncomings.
c Issuers rated C are the lowest rated class of entity. are usually in default on their obligations. and potential recovery values are low.
Sources: Moody's: and Standard & Poor's.
The 1990s have witnessed a growing reliance on credit ratings in the regulatory process in many mature and emerging markets.13 Although ratings were first utilized i n prudential supervisory regulations, they have also been employed by self-regulatory bodies. Credit ratings have typically been used to prohibit certain institutions from holding low-rated (often noninvestment-grade) 14 securities, to modify disclosure requirements (with investment-grade issuers aJiowed to use simplified disclosure statements), and w adjust capital requirements (with holdings of low-rated securities being subject to higher capital requirements). Such requirements have been viewed as a vehicle for
13Annex VI provides more detailed information on the use of ratings in the regulatory process.
141n S&P's ratings system, a speculative- or non-investmentgrade rating is any rating below BBB-. For Moody's. any rating below Baa3 is noninvesunent grade.
104
Standard & Poor's
AAA An obligor rated AAA has extremely strang capacity to meet its financial commitments. AAA is the highest Issuer Credit Rating assigned by Standard & Poor's.
AA An obligor rated AA has very strong capacity to meet its financial commitmenL�. ll differs from the highest-rated obligors only in small degree.
A An obligor rated A has strong capacity to meet its financial commitments but is somewhat more susceptible to the adverse effects of changes in circumstances and economic conditions than obligors in higher-rated categories.
888
An obligor rated BBB has adequate capacity to meet its financial commitments. However. adverse economic conditions or changing circumstances are more likely to lead to a weakened capacity of the obligor to meet its fmancial commitments.
88
An obligor rated B B is less vulnerable i n the near term than other lower-rated obligors. However, it faces major ongoing uncertainties and exposure to adverse business. financial. or economic conditions that could lead to the obligor's inadequate capacity to meet its financial commitments.
B An obligor rated B is more vulnerable than the obligors rated BB. but the obligor currently ha� the capacity to meet its financial commitments. Adverse business. financial. or economic conditions will likely impair the obligor's capacity or willingness to meet its financial commitments.
CCC An obligor rated CCC is currently vulnerable, and is dependent upon favorable business. financial. and economic conditions to meet its financial commitments.
cc An obligor rated CC is currently highly vulnerable.
increasing creditworthiness awareness, limiting imprudent behavior, and introducing elements of market discipline. While ratings have been employed most extensively by regulatory agencies in the United States, and to a lesser extent in Japan, there has been expanded use of ratings in Latin American and Asian emerging markets (Annex VI). More recently, the Task Force on the Future of Capital Regulation of the Basel Committee on Banking Supervision has proposed using ratings to help determine sovereign and private sector risk weights in a revision of Basel capital requirements (Box 4.2 in Chapter IV).
The use of ratings in the regulatory process has been subject to some controversy, and the major rating agencies have concerns about using ratings in this way. In part, there are concerns about how accurately credit ratings reflect underlying risks (particularly for sovereigns). Moreover, it has been argued that the linkages between regulatory requirements and rating
©International Monetary Fund. Not for Redistribution
The Role of the Major Credit Rating Agencies in Global Financial Markets
changes can have a sharp impact on market dynamics, both within national markets and across borders. For example, one concern is that if a sovereign is suddenly downgraded from investment to non-investmentgrade in the midst of a crisis, then a number of instiwtional invesrors could be faced with either higher capital charges or prohibition on continued holdings of the sovereign's securities. The ensuing portfolio adjustments could Limit the funding available to sovereigns and/or impose higher borrowing costs.
In the past, the major rating agencies opposed the use of ratings in the regulatory process because of the potential effects on the incentive structures confronting the agencies and their customers. For example, when ratings are mandated by regulation, issuers and intermeruaries could be encouraged to engage in rating shopping-a process in which the issuer searches for the least expensive and/or least demanding rating. Such rating shopping can be particularly dangerous when the ratings are used as a substitute for adequate disclosure requirements. Moreover, linking investments and/or issuance activities to the rating process implicitly gives the rating agencies the right to grant a government license to undertake those investments and/or activities. The importance of the resulting regulatory-driven revenue stream could shift the focus of the agencies away from serving the informational needs of savers. In addition, the agencies are concerned that the growing use of ratings in the regulatory process will lead to calls for official supervision and/or regulation of their industry.
Despite their earlier concerns about the use of ratings in the regulatory process, some of the rating agencies have inrucated that the new Basel Committee proposals for using credit ratings to detenrune risk weights in capital adequacy requirements will have positive implications for bank credit strength and risk strategies. For example, Moody's ( 1999b) has argued that under the Basel Committee proposals there would be extra incentives for banks to focus on the quality of their borrowers and counterparties. Moreover, the new capital framework could result in lower loan-loss provisions to the extent that banks increase their focus on risk at the beginning of the loan relationship rather than at a later stage in that relationship. ln addition, the agency argued that banks would also faced increased regulatory deterrents for undertaking high-risk lending.
Rating Process
The rating agencies view their ratings as providing a forward-looking indication of the relative risk that a debt issuer will have the ability-and willingness-to make full and timely payments of principal and interest over the life of a particular rated instrument. The agencies do not regard their ratings as providing either a preruction of the timing of a default or an indication of the absolute level of risk associated with a particu-
105
Jar financial obligation. The absolute level of the default risk is seen as being influenced by the state of the business and credit cycles. During the Great Depression of the 1930s, even highly rated corporates were more likely to default than in other periods; but the agencies would expect that a more highly rated fmn would default with less frequency than a lower-rated firm during even difficult times. Nonetheless, in assigning ratings, the agencies indkate that they try to see through economic, political, credit, and commodity cycles.15 Thus, a recession or decline in the terms of trade should not, by itself, bring about a rating change if it has been anticipated by the agency. Moreover, the agencies' concept of default is not based on a legal deftnition. A default is viewed as taking place when there is either a failure to meet a principal or interest payment on the due date or a distressed/coercive rescheduling of principal and/or interest on terms less favorable than those originally contracted.
The major rating agencies had initially provided ratings free of charge and financed their operations through the sale of publications. Since these publications could easily be copied, they were not a steady and expanding source of revenues. Faced with the conflict between demands for more comprehensive and expanded coverage and limited revenues, the agencies began to charge issuers for ratings. The major agencies acknowledge that 90 percent or more of their total revenues currently come from the fees they charge for issuing ratings. II\
Some market participants have argued that charging issuers for their ratings could offer tl1e agencies an incentive to assign higher ratings than warranted by fundamentals. However, the agencies have argued that they have an overrirung incentive to maintain a reputation for high-quality accurate ratings. lf savers were to lose confidence in an agency's ratings, issuers would no longer believe they could lower funding costs by obtaining a rating. In addition, inaccurate ratings might expose the agency to costly legal claims. Following the defaults of the Washington Public Power Supply System in 1 983 and Executive Life in 1991, class action suits were brought against rating agencies, but these cases were dropped before verdicts were reached. Given the overrirung incentive for the agencies to maintain their credibility, it seems unlikely
ISSee Treacy and Carey ( 1998) for a discussion of this issue. 16Agencies charge fees that vary with the size and type of issue.
Typically. there is both a floor and a ceiling on the charge for any single bond issue, and frequent issue rs can negotiate rate.�. Treacy and Carey ( 1998, p. 9 1 1 ) reported that S&P's fees for rating a public corporate debt issue ranges from $25,000 to more than $125,000. with the usual fee being 0.0325 percent of the face amount of the issue. A recent survey (Cantwell, 1998) found that in the United States banks tend to pay the highest fees (often over $100.000 a year per agency), due largely to the amount of debt being issued. Utilities and industrials paid each agency on average between $25.000 and $1 00,000 a year.
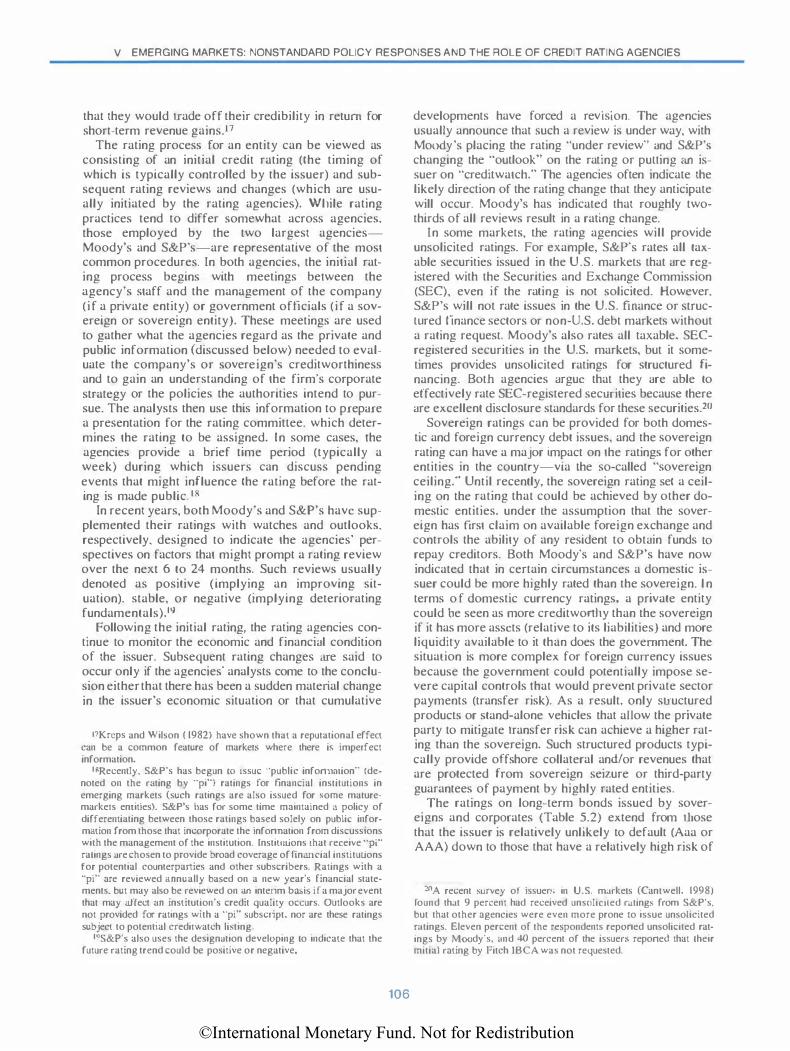
©International Monetary Fund. Not for Redistribution
V EMERGING MARKETS: NONSTANDARD POLICY RESPONSES AND THE ROLE OF CREDIT RATING AGENCIES
that they would trade off their credibility in return for short-term revenue gains.J7
The rating process for an entity can be viewed as consisting of an initial credit rating (the timing of which is typically controlled by the issuer) and subsequent rating reviews and changes (which are usually initiated by the rating agencies). Wltile rating practices tend to differ somewhat across agencies. those employed by the two largest agenciesMoody's and S&P's-are representative of the most common procedures. In both agencies, the initial rating process begins with meetings berween the agency's staff and the management of the company (if a private entity) or government officials (if a sovereign or sovereign entity). These meetings are used to gather what the agencies regard as the private and public information (discussed below) needed to evaluate the company's or sovereign's creditworthiness and to gain an understanding of the firm's corporate strategy or the policies the authorities intend to pursue. The analysts then use this information to prepare a presentation for the rating commitlee. which determines the rating to be assigned. In some cases, the agencies provide a brief time period (typically a week) during which issuers can discuss pending events that might influence the rating before the rating is made public. I S
In recent years, both Moody's and S&P's have supplemented their ratings with watches and outlooks, respectively. designed to indicate the agencies' perspectives on factors that might prompt a rating review over the next 6 to 24 months. Such reviews usually denoted as positive (implying an improving situation). stable, or negative (implying deteriorating fundamentals).l9
Following the initial rating, the rating agencies continue to monitor the economic and financial condition of the issuer. Subsequent rating changes are said to occur only if the agencies· analysts come to the conclusion either that there has been a sudden material change in the issuer's economic situation or that cumulative
17Kreps and Wilson ( 1982) have shown that a reputation a I effect can be a common feature of markets where there i� imperfect information.
18Recently, S&P"s has begun to tssuc ··public infonnmion·· (denoted on the rating by ··pi'") ratings for financial institutions in emerging markets (such ratings are also issued for �orne maturemarkets entities). S&P's has for some time maintained a policy of differentiating between those ratings based solely on public information from those that incorporate the infonnation from discussions with the management of the institution. Institutions that receive ··pr· ratings are chosen to provide broad coverage of financial institutions for potential counterparties and other subscribers. Ratings with a ·'pi"" are reviewed annually based on a new year's financial statements. but may also be reviewed on an interim bru.is ira major event that may affect an institution's credit quality occurs. Outlooks are not provided for ratings with a "pi" subscript. nor are these ratings subject to potential credit watch listing.
19S&P's also uses the designation developing to indicate that the future rating trend could be positive or negative.
106
developments have forced a revts1on. The agencies usually announce that such a review is under way, with Moody's placing the rating "under review" and S&P's changing the "outlook" on the rating or puning an issuer on '"creditwatch." The agencies often indicate the likely direction of the rating change that they anticipate will occur. Moody's has indicated that roughly twothirds of all reviews result in a rating change.
In some markets, the rating agencies will provide unsolicited ratings. For example, S&P"s rates all taxable securities issued in the U.S. markets that are registered with the Securities and Exchange Commission (SEC), even if the rating is not solicited. However, S&P's will not rate issues in the U.S. fUlance or strucwred finance sectors or non-U.S. debt markets without a rating request. Moody's also rates all taxable, SECregistered securities in the U.S. markets, but it sometimes provides unsolicited ratings for structured financing. Both agencies argue that they are able to effectively rate SEC-registered secw-ities because there are excellent disclosure standards for these securities.20
Sovereign ratings can be provided for both domestic and foreign currency debt issues, and the sovereign rating can have a major impact on the ratings for other entities in the country-via lhe so-called "sovereign ceiling ... Until recently, the sovereign rating set a ceiling on the rating that could be achieved by other domestic entities. under the assumption that the sovereign has tirst claim on available foreign exchange and controls the ability of any resident to obtain funds to repay creditors. Both Moody's and S&P's have now indicated that in certain circumstances a domestic issuer could be more highly rated than the sovereign. l n terms o f domestic currency ratings, a private entity could be seen as more creditworthy than the sovereign if it has more assets (relative to its liabilities) and more liquidity available to it than does the government. The situation is more complex for foreign currency issues because the government could potentially impose severe capital controls that would prevent private sector payments (transfer risk). As a result, only su·uctured products or stand-alone vehicles that aUow the private party to mitigate u·ansfer risk can achieve a higher rating than the sovereign. Such structured products typically provide offshore collateral and/or revenues that are protected from sovereign seizure or third-party guarantees of payment by highly rated entities.
The ratings on long-term bonds issued by sovereigns and corp01·ates (Table 5.2) extend from tl1ose that the issuer is relatively unlikely to default (Aaa or AAA) down to those that have a relatively high risk of
20A recent survey of issuen; in U.S. markets (Cantwell. 1998) round that 9 percent had received unsolicued ratings from S&P's. but that other agencies were even more prone to issue unsolicited mtings. Eleven percent of the respondents reponed unsolicited ratings by Moody's, und 40 percent of the issuers reponed that their mitial rating by Fitch IBCA was not requested.
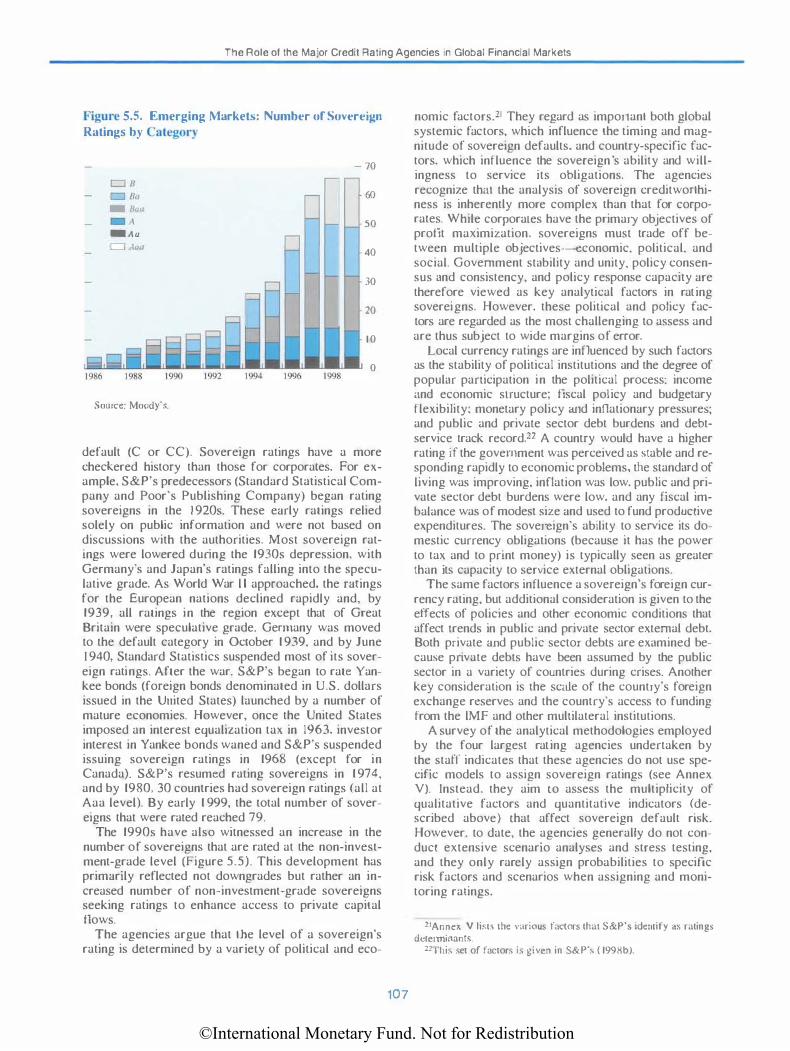
©International Monetary Fund. Not for Redistribution
The Role of the Major Credit Rating Agencies in Global Financial Markets
Figure 5.5. Emerging Markets: Number of SoYereign Ratings by Category
- 70 0 8 c::l DCI 60 • oau . , 50 •:�a CJ .Icra 40
30
20
10
0
Source: Moody"s.
default (C or CC). Sovereign ratings have a more checkered history than those for corporaLes. For example, S&P's predecessors (Standard Statistical Company and Poor's Publishing Company) began rating sovereigns in the 1 920s. These early ratings relied solely on public information and were not based on discussions with the authorities. Most sovereign ratings were lowered during the 1930s depression, with Germany's and Japan's ratings falling into the speculative grade. As World War l l approached. the ratings for the European nations declined rapidly and, by 1939, all ratings in the region except that of Great Britain were speculative grade. Gem1any was moved to the default category in October 1939, and by June I 940, Standard Statistics suspended most of its sovereign ratings. After the war, S&P's began to rate Yankee bonds (foreign bonds denominated in U.S. dollars issued in the Ullited States) launched by a number of mature economies. However, once the United States imposed an interest equalization tax in 1963, investor interest in Yankee bonds waned and S&P's suspended issuing sovereign ratings in 1968 (except for in Canada). S&P's resumed rating sovereigns in 1974, and by 1980. 30 countries had sovereign ratings (all at Aaa level). By early 1 999, the total number of sovereigns that were rated reached 79.
The 1990s have also witnessed an increase in the number of sovereigns that are rated at the non-investment-grade level (Figure 5.5). This development has primarily reflected not downgrades but rather an increased number of non-investment-grade sovereigns seeking ratings to enhance access to private capital flows.
The agencies argue that the level of a sovereign's rating is determined by a variety of political and eco-
107
nomic factors.21 They regard as important both global systemic factors, which influence the timing and magnitude of sovereign defaults. and country-specific factors. which influence the sovereign ·s ability and willingness to service its obligations. The agencie::. recognize thai the analysis of sovereign creditworthiness is inherently more complex than that for corporates. While corporaLes have the primary objectives of profit maximization, sovereigns must trade off between multiple objectives-economic, political, and social. Government stability and unity, policy consensus and consistency, and policy response capacity are therefore viewed as key analytical factors in rating sovereigns. However, these political and policy factors are regarded as the most challenging to assess and are thus subject to wide margins of error.
Local currency ratings are influenced by such factors as the stability of political institutions and the degree of popular participation in the political process: income and economic su·ucture; fiscal pol icy and budgetary flexibility: monetary policy and inflationary pressure!>: and public and private sector debt burdens and debtservice track record.22 A country would have a higher rating if the government was perceived as stable and responding rapidly to economic problems, the standard of living was improving, inflation was low. public and private sector debt burdens were low, and any fiscal imbalance was of modest size and used to fund productive expenditures. The sovereign's ability to service its domestic currency obligations (because it has the power to tax and to print money) is typically seen as greater than its capacity to service external obligations.
The same factors influence a sovereign's foreign currency rating, but additional consideration is given to the effects of policies and other economic conditions that affect trends in public and private sector external debt. Both private and public sector debts are examined because private debts have been assumed by the public sector in a variety of countries during crises. Another key consideration is the scale of the country's foreign exchange reserve!> and the country's access to funding from the lMF and other multilateral institutions.
A survey of the analytical methodologies employed by the four largest rating agencies undertaken by the staff indicates that these agencies do not use specific models to assign sovereign ratings (see Annex Y). Instead, they aim to assess the multiplicity of qualitative factors and quantitative indicators (described above) that affect sovereign default risk. However. to date, the agencies generally do not conduct extensive scenario analyses and stress testing, and they only rarely assign probabilities to specific risk factors and scenarios when assigning and monitoring ratings.
21Annex V lbb the various fac1ors thai S&P's identify a; rating> determinants.
22Th is set of factors i;, g.i ven in S& P' � ( 1998b ).

©International Monetary Fund. Not for Redistribution
V EMERGING MARKETS: NONSTANDARD POLICY RESPONSES AND THE ROLE OF CREDIT RATING AGENCIES
Figure 5.6. Mood) 's-Rated Default Count b) lndustr) and Trend
- Othn'
• Utiliri�.< - Tmnsportatian CJ Finanda/2 CJ lndusmul
1920-29 1930-39
Source: Moody's.
1940-79 1980-89
'Includes sovereign and miscellaneous. 2(ncludes insurance.
1990-98
- 700
- 600
- 500
400
300
200
100
0
Although the rating agencies stress that they do not use a specific formula to combine their evaluations of the political and economic factors to derive the overall rating, there have been a number of empirical studies of which factors have historically received the greatest weights in the decision-making process. In particular, Cantor and Packer (1996, 1997), Reisen and von Maltzan ( 1 999), and Jurtner and McCarthy ( 1998) exarruned the determinants of the levels of Moody's and S&P's ratings for a range of mature and emerging market economies in the rrud- 1990s (see Annex V for an analysis of these studies). The results that were statistically significant indicated that a high rating was associated with a high per capita income, more rapid growth, low inflation, a low ratio of foreign currency debt to exports, the absence of a history of defaults since J 970, and a high level of economic development (as measured by the IMF's classification as an industrial country). However, the fiscal position (as measured by the average annual central government budget surplus relative to GOP in the three years before the rating year) and the external position (as measured by the average annual current account surplus relative to GDP in the three years before the rating year) were statistically insignificant.
Rating Accuracy and Market Response
The usefulness of rating agencies to market participants in terms of overcoming problems created by asymmetric information is ultimately tied to bow accurately the rating agencies measure the relative default probabilities associated with different issuers. Moody's maintains a database on corporate bond ratings and defaults that covers the period since 1920
108
Figure 5.7. Fhe-. Ten-, Fifteen- and T\\ent)-\'car -\verage Cumulathe Default Rates, 1970-1998
0 20·\·rur . 15-y�ar D lll->·rur ·5·\ear
- 60
Aaa Aa
Source: Moody's.
A Baa
50
40
30
20
10
Ba B 0
and encompasses about 15,200 issuers of rated debt and some 2,200 defaulting issuers.23 Default rates are calculated by dividing the number of issuers that defaulted at a particular time by the total number of issuers that could have defaulted. The incidence of defaults has been uneven, with large numbers of defaults in the 1920s, the depression of the 1930s, and then again in the late 1980s and 1990s (Figure 5.6). When examined in terms of rating categories, the 5-. 10-. 15-, and 20-year cumulative default rates are illustrated in Figure 5.7.24 There is clearly a much higher default rate for the lower-rated categories. For example, the average default rates for five-year holding periods rises from 0.1 percent for the Aaa rating category to nearly 28 percent for the B category (Figure 5.7). In addition, there is much greater volatility in the default rates as the ratings move from investment to non-investment-grade levels (Figure 5.8). These mean and variance characteristics of the distribution of corporate defaults have implications for the pricing of corporate securities. To the extent that portfolio managers are risk adverse, the returns on lowerrated debt must compensate them not only for the higher average risk of default, but also for the increased risk that the default rate could differ significantly from its historical average.
Even if the ratings are historically accurate, there is still the issue of the degree to which they influence
2.1This database is described in Moody's ( 1 999a). Annex V also provides comparable information on S&P's experience wi!h defaults, which is quite similar.
24Cumulative default rates represent !he proportion of the issuers in a particular rating's category that default during the specific time period considered.
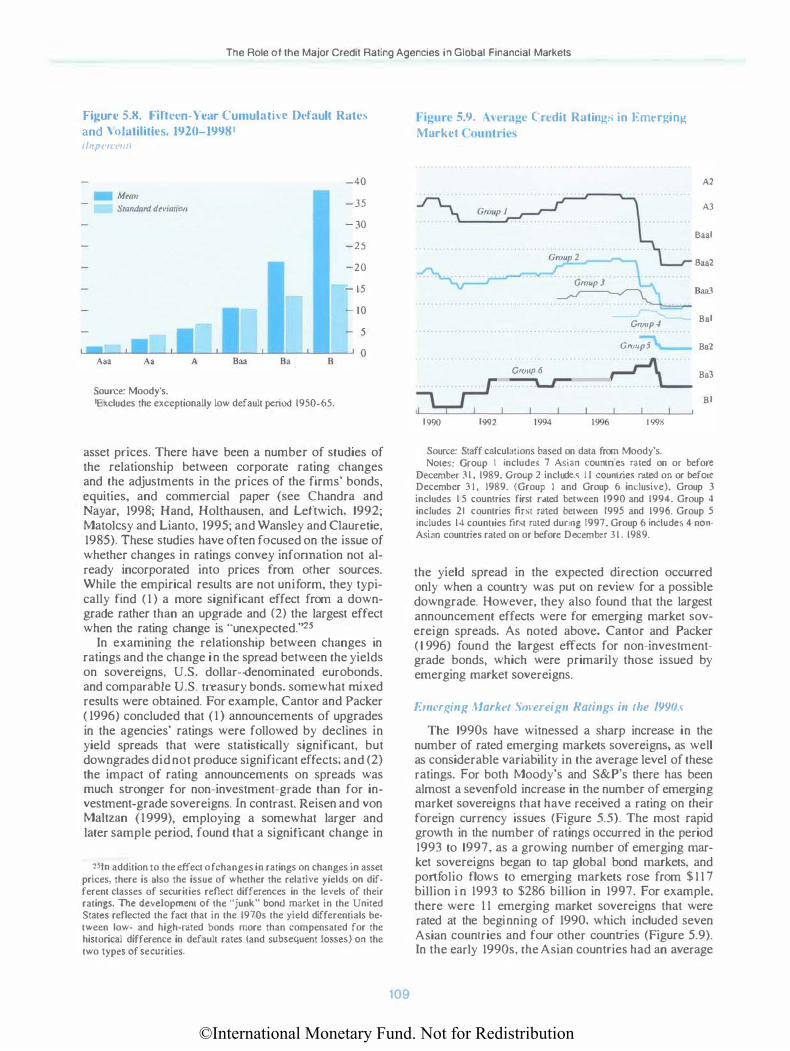
©International Monetary Fund. Not for Redistribution
The Role of the Major Credit Rating Agencies in Global Financial Markets
Fi�urc 5.X. Fifteen· \'car Cumulutin� Dcl'uull Rates and \'nfatililics, 1920-19981 (/npt'IH ill/
-40
Mean Standard deviatima -35
- 30
-25
-20
- 15
- 10
5
0 B
,] Ana Baa Ba A3 A
Source: Moody's. 'Excludes the exceptionally low default period 1950-65.
asset prices. There have been a number of studies of the relationship between corporate rating changes and the adjustments in the prices of the firms' bonds, equities, and commercial paper (see Chandra and Nayar, 1998; Hand, Holthausen, and Leftwich, 1992; Matolcsy and Lianto, 1995; and Wansley and Clauretie, 1985). These studies have often focused on the issue of whether changes in ratings convey information not already incorporated into prices from other sources. While the empirical results are not uniform, they typically find ( 1 ) a more significant effect from a downgrade rather than an upgrade and (2) the largest effect when the rating change is "unexpected."25
In examining the relationship between changes in ratings and the change in the spread between the yields on sovereigns, U.S. dollar-denominated eurobonds, and comparable U.S. treasury bonds, somewhat mixed results were obtained. For example, Cantor and Packer ( 1996) concluded that ( 1) announcements of upgrades in the agencies' ratings were followed by declines in yield spreads that were statistically significant, but downgrades did not produce significant effects: and (2) the impact of rating announcements on spreads was much stronger for non-investment-grade than for investment-grade sovereigns. In contrast, Reisen and von Maltzan (1999), employing a somewhat larger and later sample period, found that a significant change in
25fn addition to the effect of changes in ratings on changes in asset prices, there is also the issue of whether the relative yields on different classes of securities reflect differences in the levels of their ratings. The development of the "junk" bond market in the United States reflected the fact that in the 1970s the yield differentials between low- and high-rated bonds more than compensated for the historical difference in default rates (and subsequent losses) on the two types of securities.
109
Figun• 5.9. \H'r:tgl' { 'n•dit Rating., in Eml•rgin� Markl'l { 'u unlr i c..,
A2
A3
Baal
8aa2 Groupi �Baa3
Group 4 Bal
GroupS Ba2
Group 6 � Ba3
� w Bl
' I I ' 1990 1992 1 994 1996 1998
Source: Staff calculations based on data from Moody's. Notes: Group I includes 7 Asian countries rared on or before
December 31. 1989. Group 2 includes I I countries rated on or before December 3 1 . 1989. (Group I and Group 6 inclusive). Group 3 includes 1 5 countries first rated between 1990 and 1994. Group 4 includes 21 countries first rated between 1995 and 1996. Group 5 includes 14 countries first rated during 1997. Group 6 includes 4 nonAsian countrie-s rated on or before December 31. 1989.
the yield spread in the expected direction occurred only when a country was put on review for a possible downgrade. However, they also found that the largest announcement effects were for emerging market sovereign spreads. As noted above, Cantor and Packer ( 1 996) found the largest effects for non-investmentgrade bonds, which were primarily those issued by emerging market sovereigns.
Elnl'rgin�: .\Jarkct Soren·i�:n Rating\ in the /1)9().,
The 1990s have witnessed a sharp increase in the number of rated emerging markets sovereigns, as well as considerable variability in the average level of these ratings. For both Moody's and S&P's there has been almost a sevenfold increase in the number of emerging market sovereigns that have received a rating on their foreign currency issues (Figure 5.5). The most rapid growth in the number of ratings occurred in the period 1993 to 1997, as a growing number of emerging market sovereigns began to tap global bond markets, and portfolio flows to emerging markets rose from $ 1 1 7 billion i n 1993 to $286 billion in 1997. For example, there were 1 1 emerging market sovereigns that were rated at the beginning of 1990. which included seven Asian countries and four other countries (Figure 5.9). In the early 1990s, the Asian countries had an average

©International Monetary Fund. Not for Redistribution
V EMERGING MARKETS: NONSTANDARD POLICY RESPONSES AND THE ROLE OF CREDIT RATING AGENCIES
Table 5.3. Sovereign Foreign Currenc�· Ratings: Average One-\'ear Transition Rates by Rating Category! I'" J'l'rC"<'fll)
AAA AA A
Rating at year-end AAA 97.3 2.7 0.0 AA 0.8 96.9 0.8 A 0.0 4.6 92.3 BBB 0.0 0.0 5.1 BB 0.0 0.0 0.0 B 0.0 0.0 0.0 CCC 0.0 0.0 0.0
Source: Standard & Poor's. I Ratings from 1975 to 1998.
Moody's rating of A3. which rose to A2 by late 1994. However, as the Asian crisis intensified. the average rating for these countries declined sharply, reaching Baa2 (still investment grade) in late 1998. The nonAsian countries that were rated in the early J 990s had an average rating of B I (non-investment-grade) but improved gradually to Ba2 before the events in Russia and Brazil created uncertainties that led to a decline in the average rating to the Ba3 level. Sovereigns that were rated in the mid-1990s tended to start at the low end of the investment-grade range (Baa3) and to improve slightly before declining as the Asian crisis deepened.
Rating Changes Duriflg Recent Crises
ln examining the experience with sovereign ratings for emerging markets in the late 1990s, it is important to first note that, historically, sovereign ratings have been relatively stable. Indeed, since the agencies argue that they try to see through economic political credit and commodity cycles, a recession or tightening of global liquidity should not, in itself. be an occasion for a downgrade. Rating changes should thus be tied to fundamental factors, such as secular trends or unanticipated policy responses. Table 5.3 indicates that sovereigns have typically stayed in the same rating category for extended periods, although ratings are more likely to change as one goes down the rating ladder.
In the period prior to the Asian crises, there had been only relatively modest rating actions and most Asian countries had investment-grade ratings.26 Moody's placed Thailand on watch for a possible downgrade in February L997 and subsequently downgraded Thailand from A2 to A3 in April 1997. However, the only other rating action was to upgrade the Philippines (to Bal in May 1997) and to assign a rating to Vietnam (Ba3).
26China. Hong Kong SAR, Indonesia. Korea. Malaysia, Singapore. Taiwan Province of China. and Thailand all carried investmentgrade ratings at the beginning of July 1997.
Rating at Beginning of Year
BBB BB B CCC SDOR D
0.0 0.0 0.0 0.0 0.0 0.0 0.8 0.8 0.0 0.0 3.1 0.0 0.0 0.0 0.0
88.1 5.1 1.7 0.0 0.0 6.0 85.1 6.0 1.5 1.5 0.0 20.0 75.0 0.0 5.0 0.0 0.0 0.0 0.0 0.0
S&P's did not make any rating downgrades on Asian economies in the first half of 1997, although it also upgraded China (to BBB+ in May 1997). the Philippines (to BB+ in February 1997), and Hong Kong SAR (to A+ in May 1997). Most market participants have argued that these rating actions gave only a limited warning of the subsequent market lllrmoil and rating adjustments that were to follow. Moreover. a number of observers have argued that, in the agencies· reports on the Asian countries. there was seerningly a "disconnect" between the often critical, and subsequently proven accurate, assessment� of the financial sector weaknesses in the Asian economies and the investment-grade ratings that they were assigned.
1 1 0
Against this background of rating stability, the rating changes on Asian emerging markets observed during the period between July 1997 and November 1998 were. collectively, the largest and most abrupt downgrades in the modern history of sovereign credit ratings (see Annex V, Figures 2-12). The ratings of Indonesia, Korea, Malaysia, and Thailand fell by an average of five "notches·· (a one-step movement in the rating). In the course of these downgrades, Moody's reduced Indonesia, Korea, and Thailand to noninvestment-grade: whereas S&P's reduced Indonesia and Korea to non-investment-grade but assigned the lowest possible investment-grade rating £O Malaysia and Thailand. Korea was retumed to investment grade (BBB-) by S&P's in January 1999. These rating adjustments were accompanied by virtually simullaneous increases in interest rate spreads (see Annex V, Figures 2- I 2). By the beginning of 1 998, spreads were between 3 (for Malaysia) and 8 (for Indonesia) times the levels observed in early July 1997.
The largest rating downgrades typically occurred following the revelation of what the agencies regarded as material new information. Both Moody's and S&P's (as well as some of the other agencies. such as Fitch lBCA) have argued that major rating reviews were triggered by the reports on the size of the Bank of Thailand's forward foreign exchange position; the
©International Monetary Fund. Not for Redistribution
The Role of the Major Credit Rating Agencies in Global Financial Markets
extent of the Bank of Korea's placement of its foreign exchange reserves in offshore Korean banks; and the emergence of widespread political disturbances in Indonesia.
Other market analysts and asset prices also provided little waming of lhe impending crises. Surveys of analysts at major intemational commercial and invesunent banks published just prior to the crises by the Institutional Investor and Euromoney indicated that these analysts gave high creditworthiness ratings to all the Asian countries receiving investment-grade ratings by Moody's and S&P's (see Annex V). Indeed, the most common criticism of lhe rating agencies by other market participant<; during this period was that the agencies were being too "conservative" i n not upgrading some of the countries. Moreover, as illustrated in Figures 2-12 of Annex V, interest rate spreads for most emerging markets (not just those in Asia) were declining or stable and had reached levels that were amongst the lowest observed in the 1990s.
Although Russia's crisis and the near-failure or LTCM triggered extensive turmoil in global financial markets and a further spike in the interest spreads, credit ratings remained relatively stable across all regions (see Annex V, Figures 2-12). As Brazil's exchange rate arrangements came under pressure, lhere were concerns that there would be large, abrupt adjustments in the ratings of Brazil and other Latin American emerging markets. Nonetheless, even the subsequent Brazilian depreciation was accompanied by only modest rating adjustments in Latin America and elsewhere. While Brazil was downgraded by Moody's (to B2 in September 1998) and by S&P's (to B+ in January 1999), there were cumulatively only four ··notches" of rating changes between October 1998 and May 1 999 for the 66 emerging markets rated by Moody's. Such stability would be consistent with the historical pattem of relatively gradual changes in sovereign ratings.
The experience in the period since 1997 has provoked extensive debate about the specific role of the credit rating agencies in the evaluation of sovereign credit risks and, more generally, about bow well market participants assess the risks associated with crossborder capital flows. Critics have argued that the agencies gave too little early warning before the crisis and overreacted once the crisis emerged. This is particularly the case for Korea, where one critic argued that "any agency which rated Korea at the high investment-grade rating of AA- (in lhe case of Fitch IBCA and Standard & Poor's) or A l (in the case of Moody's) before the crisis and downgraded at the worst point of the crisis before Christmas to a speculative grade B-, B+. and Baa I , respectively, was clearly wrong either initially or subsequently."27
27Huhne ( 1998, p. 46).
1 1 1
These cnt•c•sms raise the issue of how the performance of the rating agencies should be evaluated.2R One cannot examine the actual experience with default rates and rating levels (as can be done for corporates) to see ir there is a statistically significant relationship for two reasons. First, as noted earlier, lhere has been only limited experience with sovereign ratiJlgs, both in terms of the length of time since the ratings began (for most emerging market countries. since the early 1 990s) and the number of countries that have been rated. Moreover, under the definitions of default employed by the agencies, there were no sovereign defaults on any rated foreign-currency-denominated security in tl1e period 1975-98.29
One starring point is to consider what the agencies have said about their performance during the crisis and what changes they have made in their analysis of sovereign credit risks. For example, Moody's3o argued that ratings are not intended to predict the precise timing of either when a given borrower might default or when a borrower may face a linancial crisis. Moreover. the most abrupt changes in ratings will occur when the authorities reveal new information that has a significant impact on the short-term liquidity position of the sovereign. In the case of Thailand, lhe most serious rating deterioration occurred after the size of the central bank's forward foreign exchange position was revealed. I n the case of Korea, Moody's argued lhat the crisis intensified when it was revealed that the authorities had deposited most of their international reserves with offshore Korean banks, which implied that these funds were not liquid. I f this type of material information is concealed by the authorities. then Moody's argued that one should always expect at least a review and most likely an abrupt change in a country's rating when it is revealed.
Nonetheless, Moody's indicated that there was a need for a "paradigm shift" in its rating technology as a consequence of the abrupt withdrawal of short-term credit, which produced crises whose severity was far in excess of any previous credit experience. This change will involve ( I ) greater analytic emphasi1. on the risks associated with reliance on short-tenn debt for otherwise creditworthy countries; (2) greater emphasis on the identity and creditworthiness of a country's short-term borrowers: (3) a greater appreciation of the risks posed by a weak banking system (includ-
l8Annex V has a more detailed discussion of potemial evaluation cri1eria, including those Lhat have recently been proposed by lhe Basel Commiuee on Banking Supervbion.
29Both Moody's and S&P's amicipate that. wit.h the growmg scale of non-invcsunent-grade sovereign issues, there will be some defaults in the ncar future, the first of which occurred (under lhe agencies· defini1ion) on May 14. 1999 when Rus�ia failed to make a principal payment on its U.S. dollar-denomina1ed Minislry of Finance (MinFin) Series Ill bonds.
10Moody"s views are given in a special ··white paper·· (Moody\. 1998).
©International Monetary Fund. Not for Redistribution
V EMERGING MARKETS: NONSTANDARD POLICY RESPONSES AND THE ROLE OF CREDIT RATING AGENCIES
ing the contingent liabilities of such weakness for the authorities); (4) identification and consideration of the likely behavior of foreign short-term creditors; and (5) increased sensitivity to the risk that a financial crisis in one country may be contagious for its neighbors. Moreover, Moody's is considering the introduction of sovereign financial strength ratings, which would provide an indication of a country's abiHty to "stand alone·· in the absence of outside credit support from international organizations or other countries.
Recent experience has led S&P's to put renewed emphasis on banking system soundness and to place greater importance on the financial contingency plans of countries with significant cross-border financing needs in its rating process. Banking system soundness is essential to a country's macroeconomic stability, effective demand management, and sustained economic growth. The level and rate of growth of leverage in an economy are seen as the key determinants of the likelihood of stress in the financial systems. In turn, trends in credit growth (to the private and public sectors), corporate and household indebtedness, asset-price inflation, and external funding of financial institutions are viewed as the key indicators of leverage. To gauge the likely costs associated with financial system weaknesses, S&P's has begun to publish estimates of the potential level of gross problem assets in the fmancial system in a reasonable worstcase economic recession or slowdown, expressed as a percentage of domestic credit to the private sector and nonfinancial public enterprises.31 S&P's also argued that one of the key reasons for the rating downgrades was that the response by a number of countries had fallen short of what was required to manage the crisis without a lasting impairment to their credit standing. 32
Fitch IBCA has also acknowledged that it needs to change some aspects of its rating metJ1odology in light of its experience since 1997.33 Sovereign credit risk analysis will always be inherently more difficult than that of corporates and financial institutions because the agencies need to focus on the willingness to pay as well as the ability to pay when analyzing sovereigns. It was noted, however, that this is well recognized by the markets, and this is reflected by the fact that emerging market sovereigns always pay an interest rate risk premium relative to comparably rated U.S. corporates. In terms of the specific lessons from the Asian crisis, Fitch IBCA first argued that inappropriate exchange rate poticies had played a key role in determining the severity of the crisis. Jn particular, the pegged exchange rates maintained by a number of Asian countries were seen as encouraging the private
l1This concept was originally discussed in S&P's (1997). 32S&P's ( 1998a). 33These views are expressed in Fitch lBCA ( 1998).
1 1 2
sector to ignore exchange rate risk and borrow in U.S. dollars to take advantage of a slight gain in interest costs. As a result of this experience, it has emphasized that private as well as public sector debt matters for sovereign credit ratings.34 Moreover, Fitch IBCA had underestimated the importance of the share of shortterm debt in total external debt. One of the important lessons this agency had drawn from the Korean experience is that in the future its staff must look closely at any country with a high proportion of short-term debt in its external liabilities, even if its overall indebtedness is modest.
Fitch ffiCA will also give renewed emphasis in sovereign analyses for aJI countries, not merely that of emerging markets. to vulnerability to liquidity crises. Particular attention needs to be given to the level of official foreign exchange reserves, especially in light of the maturity structure of the economy's foreign currency debt. For the agency to make an accurate evaluation of an economy's external asset and liability position, however, it views transparency-in both the data and the policy framework-as vital. Finally, the most difficult element of the recent crises for the analyst to assess has been contagion. The agency argued that it will maintain lower ratings for countries that are particularly vulnerable to contagion.
Another means of gauging whetller the adjustments in ratings during the recent crises were ''excessive" is to examine whether the empirical models that have been used to identify the relationship between the ratings and economic fundamentals have remained stable and would predict the types of rating changes that have occurred. Juttner and McCarthy ( 1998) recently examined this issue by first reestimating the model developed by Cantor and Packer ( 1 996)35 using the 1995 sovereign ratings given by Moody's and S&P's
for 46 countries. Their estimates are quite similar to those obtained by Cantor and Packer. In particular. five of the macroeconomic variables had significant explanatory power, namely, positive effects associated with the level of per capita income and being an industrial country. and negative effects associated with a high rate of inflation, a high ratio of external debt to exports, and a previous default (as defined by the agencies) on external obligations. The authors then reestimated these equations with data from 1996. L 997, and I 998, and they used these regression results to examine whether the predictive power of the estimated equations declined over time and to identify the largest outliers from the regressions. Juttner and McCarthy were particularly interested in whether the regressions could explain "raring crises"' (i.e., a three-"notch'" sovereign credit rating downgrade on
341n thi� regard. Filch IBCA criticized the IMF's Special Data Dissemination Standard (SDDS) for only including data on public but not private sector external debts.
J5See Annex V for a more detailed discussion of these results.
©International Monetary Fund. Not for Redistribution
The Role of the Major Credit Rating Agencies in Global Financial Markets
long-term foreign currency debt over any six-month period). While the estimation results for both 1996 and 1 997 are similar to the 1 995 results, the number of significant variables and the proportion of the variation in the ratings explained by the regression declined significantly for 1998. Moreover, for 1 998, the empirical model predicted the rating levels for Indonesia and Korea at five and four notches higher, respectively, than the average of the ratings assigned by Moody's and S&P's.
In addition to concerns about the performance of the credit rating agencies, there has been more general criticism that market sources of public information on emerging markets have systematically faHed to produce accurate and adequate amounts of the type of information and analysis that savers need to make appropriate portfolio allocation decisions. Moreover, it has been argued that, even when appropriate analysis was available, there was underutilization of such analysis in the decision making by savers and institutional managers.
The key market failure is the "free-rider" problem, which has two dimensions. First, it is virtually impossible to impose a fee on public information once it is made available. Second, given this inability to capture the value from the information that is produced, Karacadag and Samuels ( 1 998) have argued that there has been a general market failure to assess investment risks adequately. This market failure reflects underinvestmem in the human, information, and technological resources needed for proper analysis of political, economic, and financial risks. The pressures for quick decisions limit the time that can be devoted to research and processing of information and, as a result, telling a defensible story takes precedent over deeper analytical work. It has been argued that the problem of understaffing is compounded by the inexperience of analysts, which reflects both budget constraints and the limited supply of seasoned analysts. As a result of these severe resource constraints, many market analysts attempt to .. free ride" from those that do more indepth analysis, but, to the extent that most analysts do the same, market participants are left with suboptimal, mirror-image analysis on which to base portfolio decisions.
The acute underinvestment in analysis by each institution is nonetheless seen as leading to overinvestment in aggregate production. Critics argue that the market for investment analysis is characterized by a multiplicity of "production'' centers producing similar but superficial analysis. The analysis is flawed in part because much of the "sell-side" analysis originally was aimed at helping institutions market securitized assets that they no longer want to hold on their books and currently is biased by the motive of generating transaction business.
Another fundamental problem in financial markets is the challenge of assessing and pricing the uncer-
1 1 3
tainty surrounding risk factors. Even when information asymmetry problems are overcome. several sovereign risk factors, including political stability and policy response under stress, are inherently difficult to evaluate and predict, and subject to a wide range of outcomes. Critics have argued that the higher the uncertainty of a specific outcome, the less likely it is to be incorporated into the analysis of investment risks. The disconnect between rating agency reports-which highlighted banking and short-term debt risks prior to the Asian crisis-and actual ratings may in part have reflected the challenge of incorporating possible but uncertain events into ratings, especially given strong economic management track records. One way around this may be to ensure that analytical and pricing methods are based on probabilistic approaches, to ensure that low- and high-probability events are assessed and priced.
Another fundamental problem lies in the utilization of avaHable (and sometimes high-quality) risk analysis in decision making by savers and portfolio managers. The concern is that a variety of nonanalytical factors, such as competitive pressures, herd behavior, and meeting short-term performance benchmarks, often play decisive roles in . portfolio allocation, regardless of what fundamental analysis would dictate.
To address these concerns, members of the country risk profession have recently sought to identify weaknesses in their analytical methods and institutional procedures and to recommend "best practices" that can address these shortcomings. For example, a series of roundtable discussions between September 1998 and April 1999 were conducted by members of the country risk profession under the auspices of the Council on Foreign Relations.36 In addition, the Report of the Task Force on Risk Assessment set up by the Steering Committee on Emerging Markets Finance of the Institute of International Finance (llF) in 1 999 has also examined methods for improving risk management practices in emerging market finance. While the scope of the two reports differed, key weaknesses were identified in the areas of country risk analysis methods, the structure of the country risk analysis profession. and the use of country risk analysis in decision making.
First, developments in the global economy have outpaced improvements in the analytical capacity of the country risk profession. This situation has ref1ected such factors as the increased complexity and global interdependence of national economies, the rapid expansion and growing complexity of global financial markets, and. often, the unavailability of timely, accurate, and relevant financial and economic
36The results of these discussions are summarized in Samuels ( 1999).
©International Monetary Fund. Not for Redistribution
V EMERGING MARKETS: NONSTANDARD POLICY RESPONSES AND THE ROLE OF CREDIT RATING AGENCIES
data. These weaknesses should be addressed through lhe use of techniques lhat incorporate uncertainty, such as the development of scenarios, sensitivity analysis, and threshold testing. Moreover, greater attention needs to be given to the identification and incorporation of nonquantifiable variables such as political risk and liquidity analysis. There were also calls for improvements in the timeliness and comprehensiveness of the data on the websites of the international financial institutions and national authorities.
A second weakness was seen in the structure of the country risk profession, which has evolved to support securitization and trading, and has thereby decreased the individual analyst's capacity to openly provide independent, long-term assessments of country fundamentals. It was argued that this should be addressed through the establishment and dissemination of "best practices" for the country risk profession.
A third weakness was that, even when available, quality country risk assessments were often not adequately integrated in decision-making processes. Competitive pressures, herding, and efforts to match a benchmark return have led portfolio managers to ignore quality analysis. To correct this system, it will be necessary to alter the incentives for using quality risk assessment by revising performance benchmarks. to have national and international regulatory regimes reinforce the use of such assessments, and to make efforts to tie asset pricing more closely to risk assessments. In contrast to the solutions proposed for the first two weaknesses, these measures cannot be accomplished solely by the efforts of the credit risk profession but would require the assistance of other agencies, particularly regulators.
In reviewing developments since the beginning of the Asian crises, the staffs of the credjt rating agencies and, more generally, the creilit risk profession have identified a number of economic factors that will receive increased emphasis in any evaluation of a country's creditworthjness; these are quite similar to those receiving increased attention in lMF surveillance. Financial system weaknesses, particularly in the banking system, have been viewed as a key source of vulnerabiHty. Similarly, reljance on short-term external debt and other "confidence-related" capital flows by either the private or the public sector imply that a country can face an abrupt loss of market access. Moreover. it is now recognized that a financial crisis in one country can be contagious to its neighbors. There has also been a clear recognition of the need for greater transparency by countries with regard to both data and policies. In this regard, the Special Data Dissemination Standard (SODS) has been viewed as making an important contribution to transparency, but there have been calls for increased coverage and shorter reporting lags, particularly for data on international reserves and private as well as pubJjc sector external debt.
1 1 4
References
Cantor, Richard, and Frank Packer, 1994, 'The Credit Rating Industry," Quarterly Review, Federal Reserve Bank of New York, Vol. 19 (Summer-Fall), pp. 1-26.
---, 1996, "Determinants and Impacts of Sovereign Credit Ratings," Economic Policy Review, Federal Reserve Bank of New York, Vol. 2 (October), pp. 37-53.
---, 1997, "Differences of Opinion and Selection Bias in the Credit Rating Industry,'' Journal of Banking and Finance, Vol. 2 1 (October), pp. 1 395-1417.
Cantwell, Joseph, 1998. ''Managing Credit Ratings and Rating Agency Relationships," Treasury Management Association Journal (November/December), pp. 14-22.
Chakravarti, Sujit., and Subir Lall, 1999. "The Double Play: Simultaneous Speculative Attacks on Currency and Equity Markets" (unpublished; Washington: International Monetary Fund).
Chandra, U., and N. Nayar, 1998, "The Information Content of Commercial Paper Rating Downgrades: Further Evidence," Journal of Accounting, Auditing, and FillOilCe, Vol. 1 3 (Fall), pp. 4 1 7-35.
Financial Times, 1998, Credit Ratings in Emerging Markets (Winter).
Fitch mCA Sovereign Comment. 1998, "After Asia: Some Lessons of the Crisis," January 13, pp. 1-13.
Hand, John R.M . • Robert W. Holthauscn, and Richard Leftwich, 1 992, "The Effect of Bond Rating Agency Announcements on Bond and Stock Prices," Journal of Finance, Vol. 47 (June), pp. 733-52.
Huhnc, Christopher, 1998, "How the Rating Agencies Blew It on Korea," International Economy, Vol. 1 2 (May/ June), pp. 46--63.
Institute of International Finance, Steering Committee on Emerging MarkeL�. I 999. Report of rhe Task Force on Risk Assessment (Washington, March).
International Monetary Fund, 1998, !tuemarimwl Capital Markets: Developmenrs, Pmspects, and Key Policy Issues, World Economic and Financial Surveys (Washington).
Juttner, Johannes D .. and Justin McCarthy, 1998, ''Modelling a Ratings Crisis" (unpublished; Sydney, Australia: Macquarie Unive rsity).
Karacadag, Cern, and Barbara C. Samuels, ll, 1998, "How Markets Failed Asia," The International Economy, Vol. 1 2 (November/December), pp. 34-37.
Kreps. David M .• and Robert Wilson, 1982, "Reputation and Imperfect Information," Journal of Economic Theory, Vol. 27 (August), pp. 253-79.
Matolcsy, Z.P., and T. Lianto, 1995, "The Incremental Information Content of Bond Rating Revisions: The Aul>tralian Evidence," Journal of Banki11g and Finance. Vol. 19 (August), pp. 891-902.
Moody's Investor Service, 1998, "Moody's Rating Record in the East Asian Financial Crisis" (May).
--- (1999a),"Historical Defauli Rates of Corporate Bond Issuers, 1 920-1 99!"!," Special Comment (January).
--- ( 1 999b), Implications for Banks for the Basel Committee's New Capital Adequacy Proposals" (June). "On Watch," Tile Economist, May 15, 1 999, p. 82-87.
©International Monetary Fund. Not for Redistribution
References
Reisen, Helmut, and Julia von MalLZan, 1999, '"Boom and Bust and Sovereign Ratings.'' International Finance, forthcoming.
Samuels. Barbara C., II, 1999, "Country Risk Analysis in the Post-Asia Crisis Era," Council on Foreign Relations Draft Discussion Paper (forthcoming).
Standard & Poor's, 1997, "Financial System Stress and Sovereign Credit Risk,'' Sovereign Ratings Service (December), pp. 7-14.
---, 1998a, "Government Policy Responses Key to Ratings in Emerging Markets," Standard & Poor's CrediT Week (September 30), pp. 28-30.
1 1 5
I 998b, Sovereign Credir RaTings: A Primer
(December).
Treacy, William F.. and Mark S. Carey, 1998, Credit R1sk
Rating at Large U.S. Banks," Federal Resen1e Bullerin
Vol. 84 (November). pp. 897-9 2 1 .
Tsang. Donald. 1998, speech at the Hong Kong Trade De
velopment Council, Frankfurt, September 29.
Wansley, James W .. and J. Clauretie, 1985, "The Impact of Credit Watch Placement on Equity Returns and Bond
Prices." Journal of Filumcial Research, Vol. 8
(Spring), pp. 3 1-42.
©International Monetary Fund. Not for Redistribution
VI Summary and Conclusions
The last year has been one of extraordinary turbulence in international financial markets, as
spillovers from the crisis that began in Asia in 1997 threatened to engulf the advanced countries in the aftermath of Russia's unilateral debt restructuring and the probJ,ems at LTCM. As a result of timely action by a number of central banks and the international community, a full-blown global crisis was avoided, and greater stability has returned to international financial markets in recent months. Nevertheless, a number of vulnerabilities remain in both the advanced and emerging market countries, and capital flows to the emerging markets remain weU below their levels a few years ago.
The main immediate risks in the outlook are related to uncertainty about the extent to which the ongoing global reappraisal of risk-and the associated deleveraging-has run its course. In the larger advanced countries, the risks are manifested in concerns about the sustainability of the current configuration of high U.S. equity prices and dollar strength. There are also risks for the emerging markets as regards the reduced investor base, the level and structure of external financing, and cutbacks in market making in external debt markets.
The turbulence and severe spillovers have raised issues about the market dynamics associated with highly leveraged financial systems, the adequacy of current approaches to assessing systemic risk, and the sources of spillovers to and across emerging markets. Previous International Capital Markets reports have focused on several aspects of these challenges, and this year's report considers, in particular, the public policy issues posed by the role of off-balance-sheet leverage in modern finance, the impact of HLls on small and medium-sized markets, emerging market responses to severe external pressure, and the performance of the major credit rating agencies during the emerging market crises.
Mature Markets
A key risk-and one which has heightened in the last 12 months-is the possibility of a large con·ection in the U.S. equity market, with the risks of a spontaneous correction in the other advanced markets some-
1 1 6
what lower. Following a brief interruption during last year's turbulence, U.S. equity prices and measures of stock-market valuation have continued to surge to new highs with significant gains in the past 12 months. Uncertainty about the outlook for corporate earnings has, however, increased, given the advanced stage of the U.S. business cycle and the fact that the decline in long-term interest rates has recently reversed. An alternative explanation for the recent gains-a further compression in the equity risk premium-is difficult to reconcile with the evident ongoing global repricing of risk, although the increased participation of individual investors in the equity market implies that the equity risk premium may have declined somewhat.
Conflicting signs of a turning poinr in the inflation and monetary policy cycles and uncertainties about the size and extent of leverage in the global financial system complicate the assessment of the likelihood and implications of any equity-market correction. The small increase in the federal funds rate at the end of June was accompanied by a statement that the U.S. monetary authorities would be especiaJiy vigilant about the potential emergence of inflationary pressures. The unusually favorable inflation performance during the past few years may, however, have led some market participants to underestimate the extent of tightening that may be eventually needed. The I 998 turbulence demonstrated how a shock can be amplified and propagated across leveraged financial systems, giving rise to volatility in far-flung mar�ets. A steep correction in the U.S. equity market would Likely have serious consequences in a similarly leveraged system. Researchers have suggested that leverage and imbalances have been reduced since the turbulence; against this, there are also indications that some channels for leverage (such as the yen carry trade) saw renewed activity in the first part of 1999. and that banks in mature markets have recently increased their exposures to securities markets. Absent comprehensive information about the extent of leverage in the major fmancial systems, the vulnerability of those systems and the emerging markets to a correction in the U.S. equity market may be considerable.
There is also the possibility of sharp adjustments in the dollar if tensions between near-term and mediumterm pressures are resolved abruptly. For example,
©International Monetary Fund. Not for Redistribution
Private and Public Policy Challenges Raised by Highly Leveraged Institutions and Activities
while cyclical differences have kept the dollar strong in effective terms in the last couple of years, current account imbalances suggest a weaker dollar over the medium term. If this tension is reconciled abruptlyor if the realignment is amplified by leverage or other technical features of foreign exchange markets-exchange rate volatility could result, with an associated risk of spillovers into other markets.
The international fmaocial system also faces risks from the Y2K problem. Owing to strong and early efforts by many national authorities, most financial institutions in the major countries will have prepared their own systems in time for the millennium, so that technical risks stemming from their own failures appear to be small. However, financial institutions in mature markets, still face risks stemming from technical failures in those nonfinancial corporations and emerging market financial institutions with whom they have important business relationships; the relatively limited transparency about preparations in these areas adds to concerns. All financial institutions face risks stemming from an adverse market reaction (whether warranted or not), as tensions will likely build up in the run-up to the millennium: market liquidity and the appetite for risk could decline, and Liquidity may command an increasing premium. Market reactions could range from a moderate flight to quality to an extreme flight to cash and large cutbacks by major banks in their exposures to emerging markets. ln view of these risks, and the limited time remaining, it is encouraging that financial institutions and authorities in the mature markets have recently increased their efforts at contingency planning, including to manage liquidity pressures and to ensure business continuity around the date change. Such efforts should be intensified in the regions and sectors where preparations have lagged.
Emerging Markets
The pickup in emerging market asset prices in the ftrst half of 1 999 has occurred despite restricted access to global financial markets (especially for oonsovereign issuers) and a diminished investor base. While improving macroeconomic conditions in a number of emerging markets (particularly in Asia) and in Japan could further stTengthen the asset price recovery, a number of factors pose risks. As noted earlier, a pickup in inflationary pressures in the United States could lead to a further tightening of monetary policy and a rise in global market interest rates. HistoricaJly, a tightening of monetary conditions in mature markets has often been accompanied by a slowdown in capital flows to emerging markets and a widening of interest rate spreads in emerging markets securities. Recent empirical studies suggest that a rise in mature market interest rates not only raises the base cost for emerging mar-
1 1 7
ket borrowing but also increases the spread on that borrowing, and that a tiering of issuers tends to take place (with less creditworthy borrowers not attempting to access global bond markets). Moreover, a sharp adjustment in equity prices in advanced countries such as the United States could have strong negative repercussions on emerging equity markets.
Another development that is drawing increasing attention is the state of the corporate sector in some emerging markets. While there is a perception that limited progress has been made in restructuring Asian corporates, there is also concern that a growing number of Latin American corporates may have difficulties meeting their obligations if external financing remains tight. The deteriorating position of the Latin American corporates is viewed as reflecting the slowdown in economic activity in the region, the presence of high real interest rates in some countries (such as Brazil), and the restricted access to credit from either global markets or domestic banks. These concerns about corporate sector weaknesses are also leading investors to focus on the ability of some banks to absorb a higher level of nonperforming loans.
More generally, the adjustment in the investor base for emerging markets securities is still under way. One concern is that a "vicious circle" has been evident in the period since the Russian debt restructuring. The sharp increase in interest rate spreads and asset price volatility led many investors to reassess the risks associated with holding and trading emerging market securities. For some institutional investors, the higher asset price volatility required a decision as to whether to close out their positions in emerging market securities or to devote more capital to supporting these positions. In many cases, the decision was made to close out the positions. Moreover, some investment banks decided to shut down their emerging market trading desks. As the number of investors actively trading and holding emerging market securities has declined, uquidity in those markets has diminished, which has resulted in higher bid-ask spreads and increased asset price volatility. This adjustment is still not complete, but its ultimate outcome will have important implications for both the terms and conditions of market access and the sustainable level of capital flows to emerging markets.
Private and Public Policy Challenges Raised by Highly Leveraged Institutions
and Activities
The turbulence following Russia's unilateral debt restructuring and devaluation has raised a number of questions about the adequacy of current lines of defense against systemic risk and the factors contributing to the rapid dynamics and spillovers that characterize modern financial markets. The three lines of defense
©International Monetary Fund. Not for Redistribution
VI SUMMARY AND CONCLUSIONS
against systemic risk-market discipline. prudential supervision and regulation, and macro-prudential surveillance-proved inadequate to prevent a buildup in leverage. Moreover, both poUcymakers and market participants were caught by surprise by the spillovers during the turbulence, as a rapid process of portfolio rebalancing and deleveraging was triggered by a sharp increase in risk aversion.
The turbulence has raised a number of important challenges for public policy and the private sector. One important issue is to understand better the broad features of the environment that contributed to a buildup in leverage before the turbulence, with a view to strengthening the ability to avoid similar vulnerabilities in the future. A second is to identify the specific changes in private incentive structures and information disclosure that could facilitate a greater role for the market in containing excessive and imprude111 risk taking, and allow prudential supervision and market surveillance to be more proactive. The third is the need to balance the efficiency-enhancing aspects of modern financial practices with the risk that they may exacerbate the short-run effects of shocks and contribute to spillovers across markets.
The main proposals that have been advanced, or are under consideration. in various forums to contain excessive leverage appropriately emphasize the importance of a significant strengthening of market discipline. For the most part, the proposals do not call for greater direct regulation over hedge funds, since hedge funds are seen as only one of many institutions employing leverage, and a number of difficult issues are posed if attempts are made to directly regulate these funds. Moreover. it is envisaged that banks should tighten controls on their exposures to hedge funds and through this means contain the risk of a buildup in excessive leverage. The proposals appropriately note that improvements in market discipline require a significant increase in the amount of information that financial institutions, including hedge funds, should regularly provide to their counterparties and to markets. Less attention has been given to the improvements in supervision and surveillance that could help better monitor the buildup and concentration of leverage and help identify problems at an early stage (the second and third lines of defense).
Even though current proposals make substantial progress identifying means to improve the lines of defense, a number of important challenges remain. • Analytical framework. There is now no agreed ana
lytical framework for understanding the role of offbalance-sheet leverage. assessing the conditions under which it might rise to levels that pose systemic risk and. more generally, for assessing ex ante when it has become unsustainable. Such a framework is needed by private market participants to assess the riskiness of their own positions and also by national authorities charged with supervision and market sur-
1 1 8
veilJance. One important reason such a framework does not exist is that the recent increases in financial market complexity and the range of instruments by which leverage can be acquired have made it difficult to measure and assess when leverage may become excessive. fn these circumstances, most of the proposals for refom1 focus on the shortcomings in private risk management and information disclosure that are thought to contribute directly ro excessive risk taking, under the assumption that improvements in these areas will help avoid too much leverage. It would clearly be desirable, however, to have a better understanding ex ante of when leverage is rising to levels that could pose systemic risks.
• Incentive stmcrures. Understanding of both private and regulatory incentive structures needs to be improved. Tn particular. the shortcomings in incentive structures within private firms, which contribute to lax risk management practices and poor controls on counterparty exposures. need correction. ln addition. there is the issue of how supervisory and regulatory frameworks may have influenced and possibly distorted private incentive structures. The various proposals that have been made to improve risk management are beginning to address the changes in incentives that will be required within firms to ensure the adequate monitoring and control of risk, but the key to their success will be to increase the role of the stakeholders in these firms in imposing effective and timely discipline.
• Information. The types and frequency of information needed to bolster market discipline and improve supervision and surveillance need to be better understood. Key issues include the nature and form in which off-balance-sheet exposure information is to be presented and the role to be played by valueat-risk and stress testing information. There are. 'in addition, a range of issues related to the assessment and presentation of information on potential future exposures and what information supervisors might disclose to the market. An important next step will be to reach agreement on a core set of data that could be disclosed Lo markets on firms' risk exposures and the frequency with which such data should be made available. The need to bolster systemic or macro-prudential
oversight (third line of defense) introduces a number of other important areas that need to be addressed.
One issue concerns the nexus between monetary and financial policies and the role that liquidity conditions played in the buildup in leverage before the Russian crisis. Market participants frequently described global liquidity as unusually abundant during this period, as reflected in relatively low interest rates in many of the advanced countries. These favorable liquidity conditions were thought to have contributed to the high levels of leverage within advanced countries and the surge in capital flows to the emerging
©International Monetary Fund. Not for Redistribution
Private and Public Policy Challenges Raised by Highly Leveraged Institutions and Activities
markets. Closer monitoring of global liquidity conditions and assessments of the implications for financial markets could play a potentially important role in financial market surveillance and in alerting official sectors to the possible buildup of imbalances. This would allow supervision and market surveillance to become both more proactive and countercyclical and would lead to intensified surveillance during periods when Liquidity is abundant.
Secon<L there is the issue of whether national authorities are adequately exploiting the synergies between prudential macro-surveillance and the supervision of individual financial institutions. In particular, supervisors of individual financial institutions might benefit from greater use of the broader market intelligence obtained through market surveillance in seehlng to identify a buildup in vulnerabilities across institutions and markets. Ln adrution, those undertaking market surveillance would benefit from the information supervisors obtain when considering each institution individually. Greater exploitation of such synergies might, for example, have helped identify the buildup in leverage last year and the concentration of positions in particular markets and vis-a-vis particular institutions. Given that such synergies increasingly exist both within and across national borders, they imply a need for closer cooperation among supervisors and market surveillance across countries.
There is also the problem that the ongoing rapid pace of financial innovation and globalization is leading to widening gaps between what regulators need to know to supervise internationaJJy active financial institutions and the information set and capabi lities of the institutions themselves. These problems are accentuated by the growing scope that financial innovation and globalization are giving to regulatory arbitrage, and they imply that e fforts to regulate one set of institutions or activities can be undone and have unintended consequences. As the rapid pace of innovation and globalization continues. these problems will likely worsen, suggesting the need for additional consideration of how regulators can stay abreast in an increasingly dynamic and interrelated global financial system. There are unlikely to be simple solutions, and supervisors wilJ invariably be at a signiticant information disadvantage relative to the institutions they supervise. Nevertheless, improved understanding of the risk control mechanisms within ftrms and emphasis on the adequacy of risk control practices can help limit the risks from these informational asymmetries.
Another important issue is the role that the heavy reliance on modem risk management practices might play in exacerbating and propagating financial turbulence. As noted i n previous International Capital Markets reports, these practices have been introduced over time by the private sector to manage and control risk, including in helping to facilitate the timely identification of emerging difficulties. In the context of ad-
1 19
verse capital market shocks such as those in 1998, however, there is the possibility that the rigid use of these practices-together with frequent marking to market-may exacerbate financial market strains because of the speed with which they call for portfolio rebalancing and deleveraging. There is no unambiguous answer to the "optimal" design of risk control mechanisms and the balance between the "slow·· adjustment to shocks that has o·aditionally characterized relationship banking and the rapid adjustment in modern dynamic capital markets. Recent experience points to the importance of not relying rigidly on risk models, given their limitations, and the need for judgment and flexibility in managing risk. At the same time, an important consideration is the apparent inability of risk models to play a larger role in the avoidance of excessively risky positions. Given the high level of leverage that had been aJJowed to build up before last year's turbulence, a significant adjustment was probably inevitable, and the key to avoiding the resulting hlnds of turbulence is a strengthening ex ante of risk management and control procedures.
l n addition to the systemic issues posed by high levels of leverage, a number of small and medium-sized countries have expressed concern that their markets have been pushed around by HLls, including hedge funds. In particular. Australia, Hong Kong SAR, Malaysia, and South Africa have argued that some of these institutions cooperated in quietly building up short positions in their foreign exchange or domestic asset markets and then sought to close out their positions at a profit by spreading false or misleading information. Efforts to evaluate these concerns have been compounded by a lack of transparency about the activities of HLls and the paucity of data on transactions in OTC markets. Moreover. the activities of concern have tended to occur during unsenled market conditions, when it is difficult to distinguish between speculative activity based on fundamentals and more aggressive tactics. These are also periods when it is not easy to distinguish between collusive behavior and herding.
Even though U1ere has been only limited analytical work on private foreign exchange market manipulation, there is a relatively strong presumption that because the underlying assets-domestic and foreign money-are widely held and the macro information that usually drives these markets is generally widely available. foreign exchange markets are less prone to private manipulation than are individual domestic asset markets. Furthermore, in the case of a pure tloating exchange rate regime, any speculators attempting to build up large short positions in a currency would find that lhe exchange rate would move against them. The situation is more complicated in the case of pegged or managed exchange rate regimes since official exchange market intervention can influence the profitability of these strategies, and ill-founded, as
©International Monetary Fund. Not for Redistribution
VI SUMMARY AND CONCLUSIONS
well as solid, rumors about exchange rate policy can be an important driving force in short-run exchange market pressures. Based on preliminary discussions with various market participants and national authorities, the IMF staff's view is that the concerns expressed about the activities of some HLis cannot be easily dismissed and that important issues are raised by the apparent large size and concentration of the positions of some HLis in certain markets. Substantive questions remain about whether attempts at exchange market manipulation have, in practice, been a major source of volatility and whether the efforts are systematically able to generate profits for speculators. The possibility that such tactics may be employed from time to time-especially in unsettled market conditions-is, however, a source of concern, and such aggressive tactics may contribute to excessive and unnecessary volatility.
Reforms to deal with the systemic and other issues raised by HLis and highly leveraged activities are currently being actively discussed in a number of national and international forums, including the Financial Stability Forum. In the IMF staff's view, the systemic issues posed by high levels of leverage can, in principle, be addressed through significant enhancements in market discipline, supported by improvements in disclosure and transparency, more rigorous creditor and counterparty assessments of exposures, and strengthened private risk management and control systems. ln addition, more proactive prudential supervision and market surveillance can play a key role in helping to detect and avoid a buildup in vulnerabilities associated with high leverage. The important next steps involve identifying the specific measures and incentives that will be required to encourage and lock in improvements in these areas, including the kinds of information that should be more frequently disclosed to markets and counterparties. Should strengthened risk management and control by banks not prove sufficient to contain excessive leverage and risk, consideration would need to be given to the feasibility and desirability of additional measures, possibly including tighter direct controls on hedge funds and other HLis.
While improvements in the above mentioned areas should help address the systemic issues associated with high leverage, it is not obvious that they will deal with the concerns that a number of countries have expressed about the impact of HLis on their markets. Against this background, further work is needed to better understand the conditions and circumstances under which HLI activities could destabilize small and medium-sized markets and the approaches countries could take to deal with such activities. The solutions adopted will need to balance valid concerns about market integrity with the need to ensure appropriate stabilizing speculation. Among the measures that are being considered by some countries are large-position reporting requirements, higher
120
risk weights on foreign exchange positions. and greater public disclosure by HLls.
Emerging Markets and the International Financial System
Nonstandard Policy Responses
Extraordinary external pressures and, in some cases, concerns about the aggressive tactics of speculators led a number of emerging markets countries during 1998 to adopt what could be characterized as relatively nonstandard policies. l While the classic speculative attack takes place through on-balancesheet sales of the targeted currency, speculative attacks are increasingly being carried out through a variety of derivatives, such as currency forwards and futures, equity and bond futures, and total rate of return swaps. Ln response, national authorities are dealing with external pressures by expanding the range of instruments and markets in which they intervene and are becoming more aggressive.
Three recent examples of relatively nonstandard responses to severe external pressure include the intervention during I 998 by the HKMA in the spot and futures markets for domestic equity to counter the implications of the so-called double play on Hong Kong SAR ·s markets; interventions by Brazil in the Brady bond market to impose a squeeze on speculators short-selling Brazilian paper; and Malaysia's decision in late 1998 to impose wide-ranging foreign exchange and capiral controls to insulate its onshore markets from external pressures and effectively close down the offshore ringgit market. These measures have expanded the menu of responses th!t countries use during periods of pressure and have potentially altered risk-return trade-offs in markets, with implications for asset prices and market liquidity.
Several observations can be made about these nonstandard interventions. • ln all cases, the interventions took place in circum
stances where the authorities believed there was a significant mispricing of assets, volatility was high, and there was a wide divergence of views between the official and private sectors about the economic outlook. In the event, and owing to some degree to subsequent improvements in the global environment, the assets acquired by the HKMA in its inter-
10ver the last couple of years, there have also been a number of other nonstandard responses by emerging markets, including Korea's decision to use its foreign exchange reserves to suppon domestic banks operating offshore and Thailand's effons during 1997 to squeeze speculators in the offshore market for the Thai baht. See International Monetary Fund. lmemariona/ Capital Markets: Dtvelopmems. Prospects. and Key Policy Issues, World Economic and Financial Surveys (Washington, September 1998).

©International Monetary Fund. Not for Redistribution
Emerging Markets and the International Financial System
vention subsequently appreciated in value, implying that the intervention was profitable. Conversely, the capital controls imposed by Malaysia were never reaUy put to the test as many foreign investors had already reduced their exposure to Malaysia, and the partly exogenous improvement in the environment meant that external pressures independently eased. Nonetheless, given the uncertain outlook for emerging markets at the time, the Malaysian authorities put the measures in places as an insurance policy against a further worsening of the external situation.
• The imposition of capital controls by Malaysia was fundamentally different from the interventions by Hong Kong SAR and Brazil. since the Malaysian move reduced the options and choices available to the private sector by constraining the taking of positions. The asset market purchases by the HKMA and Brazil, on the other hand, did not limit the ability of the private sector to adjust its portfolio, although they influenced the risk profile.
• In those cases where the authorities purchased assets (Hong Kong SAR and Brazil), the acquisitions were financed in part by foreign exchange reserves or by assets held by other state entities. This potentially reduced the flexibility of the authorities' capacity to respond to future adverse shocks since it reduced the liquidity and/or size of reserves. Whereas Hong Kong SAR was transparent about its intervention and had ample reserves, Brazil's purchases took place at arm's length and-together with its intervention in other markets-might have reduced its foreign asset cushion.
• Even though the market reaction to the interventions was initially quite negative, sentiment was subsequently influenced importantly by the underlying policies adopted by the authorities. Hence, for example, markets eventually responded relatively positively to Malaysia's decision to use the window of opportunity provided by capital controls to move forward on financial and corporate restructuring; sentiment began to tum around in Hong Kong SAR as the authorities explained the rationale for their actions and took steps to set up an agency to manage their acquired equity holdings. Conversely, market sentiment moved strongly against Brazil when doubts surfaced about its commitment to address its underlying fiscal problems. Ultimately, the assessment of the nonstandard pol
icy responses needs to take into account the fact that a number of emerging markets faced enormous external pressures last year. Such circumstances may indeed have justified policy responses that go beyond the orthodox interest rate increases and foreign exchange market intervention, but nonstandard responses also carry risks. The judgment about the particular measures adopted by the authorities needs to be set against the menu of other policy instruments or circuit breakers potentially available to deal with extreme asset
121
price volatility. Looking ahead, an understanding of the longer-term implications of these interventions, and an improved ability to differentiate between economic fundamentals and situations of unwarranted volatility, would help guide the kinds of policies needed to maintain orderly market conditions without interfering with efficient market functioning.
Credit Ratings
As emerging markets have increasingly been brought imo the orbit of international capital markets, the major credit rating agencies have become important providers of independent assessments of these countries' credit risk. Credit ratings are also becoming increasingly integrated into the regulatory process in both the advanced and emerging markets, and the Basel Committee on Banking Supervision has proposed that ratings should become a key determinant of the amount of capital banks are required to set aside to cover their exposures to sovereign and other borrowers. The most likely new area of growth in the activities of the credit rating agencies will be in Europe. where, spurred by the adoption of the single currency, capital markets are expected to record significant medium-term growth and development. Against this background, increasing attention is likely to be paid by national authorities and regulators to the credit rating process.
While the rating agencies correctly identified growing weaknesses in Asian financial systems, the maintenance of high ratings for many countries right up to the brink of the crisis did little to moderate the largescale capital inflows and excessive compression in interest rate spreads. Moreover, the subsequent sharp downgrades were clearly an element contributing to the abrupt reversal of capital flows. Rather than being an important independent stabilizing force, the major credit rating agencies did not behave very differently from the vast majority of market participants. While the ratings assigned prior to the crisis were too high, it is arguable that the agencies overreacted and in some cases went to the other extreme. [n the aftermath of the spillover of pressures to Latin America following the Russian crisis. a number of countries expressed concern that they might be downgraded by the major agencies as they were increasingly caught up in the global liquidity squeeze. The major credit rating agencies, however, made few changes to their ratings at that time. as they generally looked beyond shon-run liquidity pressures and assessed countries' ability to weather the storm.
The reasons why the major agencies missed the Asian crisis and the subsequent contagion are complex and not altogether different from why the fMF and many others were caught out. Moreover, the key lessons the ratings agencies have drawn are not unlike those that have been drawn for IMF surveiUance. The
©International Monetary Fund. Not for Redistribution
VI SUMMARY AND CONCLUSIONS
key changes the agencies are making in response to the experience include greater attention to banking sector weaknesses and the associated contingent public sector liabilities; to the structure as well as the overall levels of public and private external debt, including the dependence on contidence-driven flows and short-term borrowing: and to assessments of countries' contingency plan-and track records-for dealing with external pressures. In addition, the agencies intend to place much more emphasis on transparency, especially as regards countries· foreign exchange reserves and external debt positions. The major agencies are continuing to struggle with how to deal with contagion, but the increased attention that will be given to confidencedriven capital flows is intended. at least in part. to allow for the importance of spillover effects.
The prospect of an even greater role for the credit rating agencies in the regulatory process places a premium on the enhancemenrs the agencies are currently making to the rating process. An important question in this connection is whether the changes being made will adequately address the underlying factors that contributed to the shortcomings in ratings for Asian countries before the crisis. The importance of thjs issue is underscored by the fact that if the new proposed Basel risk weights (based on crerut ratings) had been in effect in 1997, they would not necessarily have called for more capital to be held for sovereign exposures to countries such as Korea on account of its high rating, and might only have increased the risk weight after the crisis erupted.2
While the changes agencies are making go a substantial way to improving the ratings process. there are at least three areas of potential concern. • It is being increasingly recognized by the country
risk profession that developments in the global economy have been outstripping their analytical capacity and that there is the need for significant improvements in risk assessment techniques. The situation has reflected the increasing globaJ interdependence of national economies and the rapid expansion and growing complexity of globaJ financiaJ markets and instruments. Credit rating agencies will need to continue to address these changes through country risk assessments that more fully incorporate uncettainty. including the greater use of alternative scenarios, sensitivity analysis, and macroeconomic stress testing.
lMore specifically. in the case of Korea. the sovereign credit risk weight could have been zero before the crisis under the Basel proposal (the same as under the current approach). on account of the high investment-grade rating assigned to Korea by all the major agencies. As Korea was downgraded during the crisis. tlle sovereign risk weight would have risen to about 100 percent by the end of 1997. Of course, if the new weights also take into account SODS panicipation and compliance with the Basel principles. a� proposed. these effects could be mitigated.
1 22
• The intention of rhe agencies to put more emphasis on data transparency is appropriate. but significant further progress on data disclosure is required of many countries. In this connection. the agencies have underscored the importance they attach to the SDDS adequately coveting reserves and short-tem1 external debt and. more generally. the need for greater transparency in data if there is to be more stability in ratings and avoidance of the kind of abrupt changes that occurred during the Asian crisi)>.
• Because of the increasingly interrelated and complex global economy, there is aJso the issue of whether the major agencies assign adequate resources to the country rating process. The agencies' resource decisions are. of course. ultimately determined by profit maximization and reputationaJ considerations-and at least one of the major agencies has recently expanded staff-but the assignment by the major agencies on average of onJy one professional to cover as many as seven countries appears low. The expected increased use of credit ratings in the
regulatory process in the wake of the recent Basel proposals will raise a number of issues for the major credit rating agencies. From the regulatory perspective, ratings are a private indicator of credit risk that have (at least in the case of corporates in the United States and some other advanced countries) a reasonable track record. and could be considered for use by banks that have not developed effective internaJ rating systems or internal credit risk models. In the past, however, major crerut rating agencies have expressed concern that the increased regulatory use of ratings may lead to shopping for ratings and generate pressure for the regulation and/or supervision of the agencies themselves. These concerns are not unfounded, and it will be important for national authorities to balance the need to ensure that sound ratings are used for regulatory purposes with the continued independence of the ratings agencies.
* * *
The agenda for the public and private sectors coming out of the recent turbulence and emerging markets crises is a long and ambitious one. Beyond improving our understanding of the market dynamics of increasingly integrated financial markets, there are important chaiJenges related to improvements in surveillance and regulatory regimes, ensuring the adequate dissemination of information and standards, and enhancing market discipline. Within the private sector, there is the need to build upon initiatives already under way to strengthen risk management and control and to adapt to lhe changing nature and complexity of financial markets. While these efforts wilJ obviously not eliminate financial crises. they can play an important role in reducing the frequency and amplitude of such episodes and allow all countries-including emerging markets-to benefit from participation in globaJ capital markets without exposing themselves to high risks.
©International Monetary Fund. Not for Redistribution
Annex I Progress with European Monetary Integration
Amilestone in European integration was achieved when the third and final stage of EMU began on
January I , 1 999, with the introduction of the euro. 1
This annex provides a progress report on several aspects of EMU: European financial market integration; implementation and performance of the EMU payments and securities settlement systems; the outlook for pan-European capital markets; banking system consolidation and restmcturing; and broader financial policy issues, including financial supervision. regulation, and crisis management.
The launch of the euro went smoothly, reflecting careful preparations for the considerable operational and logistical challenges of the conversion weekend. In the first months of EMU, the TARGET payment system effectively transferred liquidity between participating countries, and arbitrage substantially equalized money market interest rates across the euro area. Even with these early successes, it should not be surprising that a single pan-European capital market has not yet emerged from the previous 1 J national markets. Some features of the EMU infrastntcture may be impeding the full integration of money and capital markets, especially for secured (repo) transactions. but these obstacles do not seem insurmountable and initiatives are under way to eliminate them. The consolidation and integration of bond, equity, and detivatives markets may be delayed, reflecting remaining chaJienges in removing problems related to the incomplete and inefficient cross-border links between securities settlement systems. Meanwhile, con sol idalion and restructuring in the European banking sector are taking place mainly within national boundaries, but it is likely that the single currency will gradually increase pressures for cross-border mergers and the creation of pan-European institutions. National super-
I The only additional remaining step is the introduction of notes and coins, which will take place by 2002. The "Eurosystcm," which comprises the ECB and the 1 1 oational central baoks of the participating member states, has responsibility for monewry policy for the entire euro area. The Governing Council of the ECB (fonned by the governors of the 1 1 participating Jlational central banks and the six members of the ECB's Executive Board) has respon�ibility for formulating monetary policy. The main institutional fe::tture� of EMU and implications for financial markets are discussed in lntcrnation::tl Monetary Fund ( 1997). pp. 169-213. and International Monetary Fund ( 1 998). pp. 104-1 10.
123
visors and regulators are stepping up their coordination efforts. and important agreements have been reached in the area of crisis management.
Money Market Integration and EMU Financial Infrastructure
Progresshe Integration of the EMll Money Market
The introduction of a single currency has had an immediate impact on the money markets of the countries participating in EMU. Starting on January I . 1999, national central banks (NCBs) could no longer tailor monetary policies to the needs of their national economies. While NCBs still implement monetary policy decision:., the ECB decides the timing and the size of refinancing operations on the basis of EMUwide considerations. Therefore. effective links between national money markets are necessary to redistribute Liquidity across national borders whenever national banking systems experience asymmetric liquidity shocks or do not obtain sufficient liquidity through the Eurosystem repo auctions.
The experience of the first months of EMU has been positive. The TARGET system has provided an effective means for cross-border payments. European private repo and money markets have been distributing liquidity across borders to ensure the convergence of overnight rates across participating countries. Financial systems and institutions that have excess liquidity are able to supply it to those that need liquidity across the euro area.
At the same time, some elements of the financial infrasuucrure are impeding full integration. Market participants have noted d1at some features of the emo financial infrastructure impede cross-border business within the euro area. especially when it involves crossborder transfer of collateral. These features include differences in market structure (such as the extent of bilateral interbank credit lines), national differences in infrastructure (such as payment and securities settlement systems), and national differences in policies (tax, legal, and regulatory environments, including differences in the legal treatment of repo operations). As a result, single integrated markets for money. repo. and securities will probably not emerge until many of the
©International Monetary Fund. Not for Redistribution
ANNEX I PROGRESS WITH EUROPEAN MONETARY INTEGRATION
differences in market structure, infrastructure. and financial policies are fully worked out. Some of these features will be difficult and time-consuming to change, reflecting technical problems as well as contlicting interests between EMU financial centers.
The Supply of Liquidit)': ECU's Auctions and Standing Facilities
Eurosystem instruments and operating procedures influence the initial distribution of liquidity to the euro-area banking systems2 and also affect the functioning of unsecured and secured (repo) interbank markets in EMU. In addition, banks' bidding behavior at repo auctions and their recourse to the marginal lending and deposit facilities provide useful indirect information on the conditions in the money marker.
ECB 's Main Refinancing Operations and the "Overbidding Problem"
The Eurosystem provides the bulk of liquidity to the banking system through weekly main refinancing operations (MRO), based on repurchase agreements with a maturity of two weeks. These tenders have been conducted as fixed-rate rationed allotment auctions, in which a fixed amount of liquidity is offered at a fixed interest rate.3 Banks bid for a share of liquidity by offering collatera1.4 If total bids exceed total liquidity on offer, each bank receives a pro rata share of the Liquidity, proportional to its share in the overall amount of collateral bid by all banks. For example, if a bank bids I 0 percent of the overall collateral bid by all banks, it receives I 0 percent of the liquidity offered by the ECB.
With this auction system, there may be incentives for banks to bid for a larger amount of liquidity than they actually need. Before the start of EMU. overbidding characterized Bundesbank repo auctions, which were conducted with a similar approach. At the start of EMU, banks were bidding more aggressively than pre-EMU German banks. During the first five months of EMU, the average allotment ratio (the ratio of allotted funds to total bids) was only 9.7 percent in EMU, compared with I 8.4 percent in Germany during 1998. The stepped-up pace of overbidding might re-
2These procedures are described in European Central Bank ( 1 998).
lThe fixed amount of liquidity to be allotted is not announced before the ECB ha:, received all the bids. In principle. this would allow the ECB to vary the quantity of liquidity supplied on the basis of banks· bidding behavior. In practice. however, the very low allotment ratios (see below) suggest that the Ecs·s policy is far from giving banks all the liquidiry they demand.
4The list of assets eligible for the Eurosysrem's monetary policy operations is updated monthly on the ECB website. Both public and private assets are eligible. Initial margins and valuation haircuts serve as risk control measures.
124
tlect the greater interest of EMU banks in obtaining liquidity directly from the Eurosystem, which may, in tum, result from concerns about the ensuing redistribution of funds by the interbank market, at least during the first months of EMU.
The fixed-rate auction system allows banks with the most collateral to collect more liquidity than needed at the auct.ion. leaving some banks sbott of liquidity at the end of the auction.5 In the first months of EMU, this was to some extent a problem for a number of reasons. First. some banks from countries that had previously not used a fixed-rate rationed allotment auction did not allow for the fact that they might have to bid for more liquidity than needed. Second, at the beginning of EMU, some banks had insufficient cross-border credit lines or credit limits. Finally, in the first two months of EMU. it was costly for the less collateralrich banks to acquire liquidity in the unsecured market. instead of at the ECB's auctions. During January and February 1999, the average overnight rate was some 1 0 basis points above the main refinancing rate (and exceeded it by 20 basis points for the first two weeks; see the top panel of Figure A 1 . 1 ). These data are consistent with large banks crowding out both small banks and banks in countries with less eligible collareral.6 More recently, these problems have eased, possibly reflecting an ECB policy directed at holding the overnight rate below the main refinancing rate7 for most of the maintenance period that ended on March 23, which made it unprofitable for some banks to obtain more liquidity than needed at the repo auctions and to lend excess funds in the overnight market. II The decline in the overnight rate below t.he main refinancing rate was likely a consequence of the large amounts of liquidity that the ECB injected during March. ln recent months, despite persistent overbidding (as shown by the still very low allotment ratios), the consequences of any potential crowding out have subsided as the ECB has been able to reduce the spreads between the overnight rate and the main refinancing rate.
To eliminate at the source the distribution problems associated with overbidding in fixed-rate fixed-
5At the beginning of February. the ECB clarified that banks did not actually need to have collateral covering the full value of the!ir bids, but only enough collateral to cover the allotted amount. Nevenheless. the variability of allotment ratios. ranging from 6.1 to 33 percent in the first �ix months. and reaching I 00 percent on one occasion (April 6). makes it unlikely that banks bid greatly in excess of their available collateral.
6Accordlng to market participants. in this respect, the structure of the euro money market is not much different from the structure of domestic money markers prior to EMU. In domestic markets, large banks tended to collect most of the liquidity and could squeeze smaller banks in the unsecured market.
7Some observers have noted that because the overnight rate is an unsecured rate (unlike the MRO rate). the overnight rate should normally trade slightly above the MRO rate.
8The first maintenance period of the euro era ran from January 1 to February 23. Subsequent maintenance periods run from the 24th of the month to the 23rd of the following month.
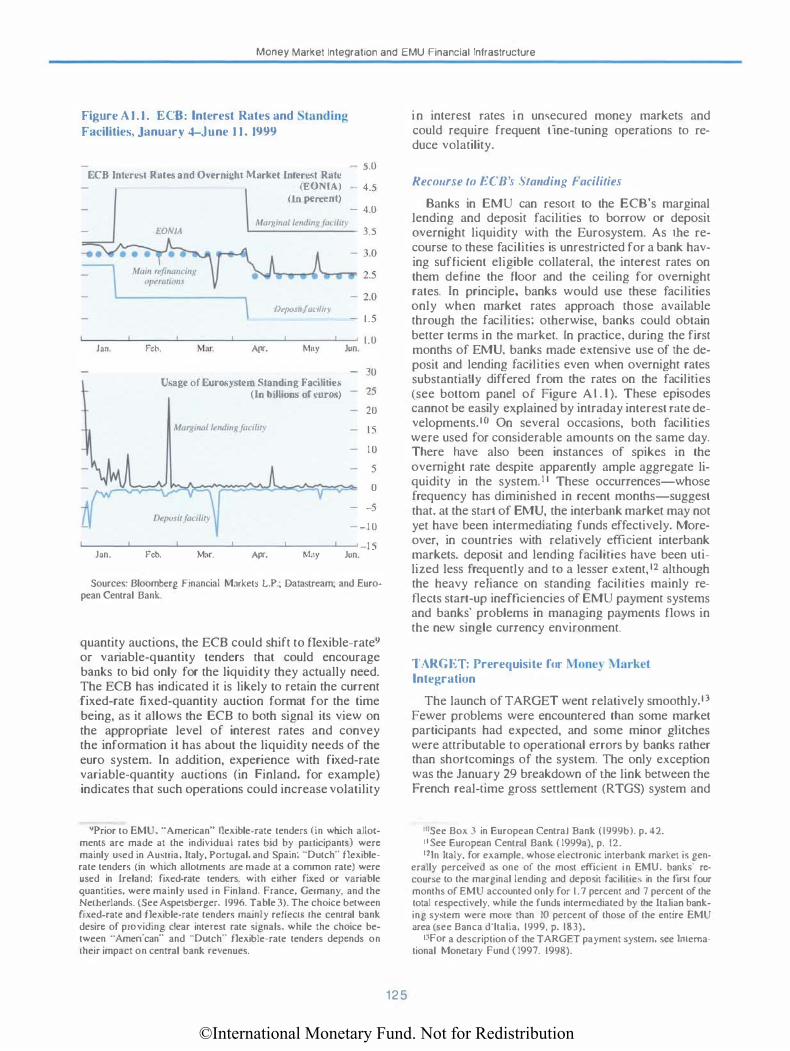
©International Monetary Fund. Not for Redistribution
Money Market Integration and EMU Financial Infrastructure
Figure A 1 . 1 . ECB: Interest Rates and Standing Facilities, .Januar)' 4-.June 1 1 , 1999
- 5.0 ECB lntere.l Rates and Overnight Market Interest Rate
<EOMAl - 4.5 (In percent)
Jan.
Jan.
EON/A
lJ••p<>.lll/adlll\'
Feb. Mar. Apr. Mny
Usage of Euros)stem Standing Fad Iitie, (In billions or curo�)
Feb. Mnr. Apr. May
- 4.0
3.5
1.5
1.0 Jun
30
25
20
15
10
5
0
-5
- - 1 0
1 5 Jun.
Sources: Bloomberg Financial Market� L.P.; Datastream; and European Central Bank.
quantity auctions, the ECB could shift to flexible-rate9 or variable-quantity tenders that could encourage banks to bid only for the liquidity they actually need. The ECB has indicated it is likely to retain the current fixed-rate fixed-quantity auction format for the time being, as it allows the ECB to both signal its view on the appropriate level of interest rates and convey the infom1ation it has about the liquidity needs of the euro system. In addition, experience with fixed-rate variable-quantity auctions (in Finland. for example) indicates that such operations could increase volatility
9Prior to EMU. "American" flexible-rate tenders (in which allotments are made at the individual rates bid by participants) were mainly used in Austria. Italy, Portugal. and Spain; ''Dutch" flexiblerate tenders (in which allotments are made at a common rate) were used in Ireland; fixed-rate tenders. with either fixed or variable quantities, were mainly used in Finland, France, Germany, and the Netherlands. (See Aspetsberger, 1996. Table 3). The choice between fixed-rate and flexible-rate tenders mainly reflects the central bank desire of providing clear interest rate signals. while the choice between "American" and ··Dutch" flexible-rate tenders depends on their impact on central bank revenues.
125
in interest rates in unsecured money markets and could require frequent tine-tuning operations to reduce volatility.
Recourse to ECB \ Standing Facilities
Banks in EMU can resort to the ECB's marginal lending and deposit facilities to borrow or deposit overnight liquidity with the Eurosystem. As the recourse to these facilities is unrestricted for a bank having sufficient eligible collateral, the interest rates on them define the floor and the ceiling for overnight rates. In principle, banks would use these facilities only when market rates approach those available through the facilities; otherwise, banks could obtain better terms in the market. In practice, during the ftrst months of EMU, banks made extensive use of the deposit and lending facilities even when overnight rates substantially differed from the rates on the facilities (see bottom panel of Figure A 1 . 1 ). These episodes cannot be easily explained by intraday interest rate developmems.10 On several occasions, both facilities were used for considerable amounts on the same day. There bave also been instances of spikes in the overnight rate despite apparently ample aggregate liquidity in the system. J 1 These occurrences-whose frequency has diminished in recent months-suggest that, at the start of EMU, the interbank market may not yet have been intermediating funds effectively. Moreover, in countries with relatively efficient interbank markets. deposit and lending facilities have been utilized less frequently and to a Jesser extent, 12 although the heavy reliance on standing faciJjties mainly reflects start-up inefticiencies of EMU payment systems and banks' problems in managing payments flows in the new single currency environment.
TARGET: Prerequisite for !\toney l\larket Integration
The launch of TARGET went relatively smoothly.13 Fewer problems were encountered than some market participants had expected, and some minor glitches were attributable to operational errors by banks rather than shortcomings of the system. The only exception was the January 29 breakdown of the link between the French real-rime gross settlement (RTGS) system and
lOSee Box 3 in European Central Bank ( 1999b). p. 42. I lSee European Centml Bank ( 1999a). p. 12. 121n Italy, for example. whose electronic interbank market is gen
erally perceived as one of the most efficient in EMU. banks' recourse to the marginal lending and deposit facilities in the lirst four months of EMU accounted only for 1.7 percent and 7 percent of the total respectively, while the funds intermediated by the Italian banking system were more than 10 percem of those of the entire EMU area (see Banca d'ltalia, 1999, p. 183).
IJFor a description of the TARGET payment system, see Jmemational Monetary Fund ( 1997. 1998).
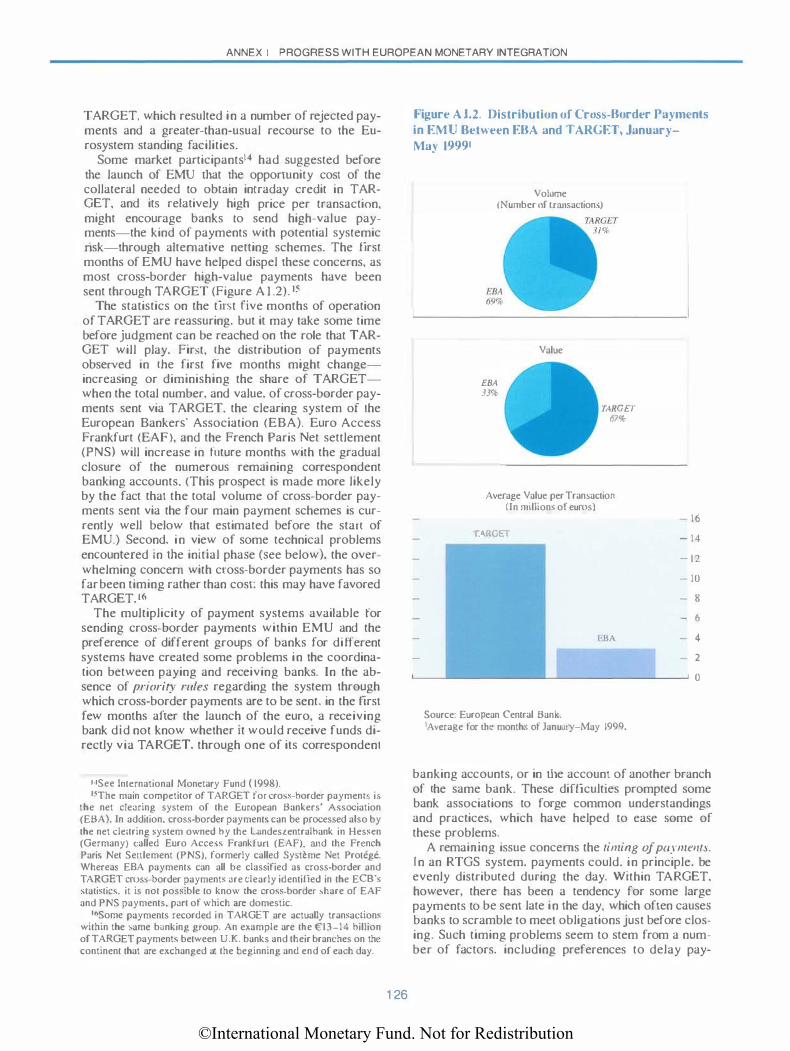
©International Monetary Fund. Not for Redistribution
ANNEX I PROGRESS WITH EUROPEAN MONETARY INTEGRATION
TARGET, which resulted in a number of rejected payments and a greater-lhan-usual recourse to lhe Eurosystem standing facilities.
Some market participants14 had suggested before lhe launch of EMU lhat lhe opportunity cost of the collateral needed to obtain intraday credit in TARGET, and its relatively high price per transaction, might encourage banks ro send high-value payments-the kind of payments with potential systemic risk-lhrough altemative netting schemes. The first months of EMU have helped dispel lhese concerns, as most cross-border high-value payments have been sent through TARGET (Figure A 1 .2). 15
The statistics on the tint five months of operation of TARGET are reassuring. but it may take some time before judgment can be reached on lhe role that TARGET will play. First, lhe distribution of payments observed in lhe first five months might changeincreasing or diminishing the share of TARGETwhen the total number, and value. of cross-border payments sent via TARGET. the clearing system of the European Bankers· Association (EBA). Euro Access Frankfurt (EAF), and the French Paris Net settlement (PNS) will increase in future months with the gradual closure of the numerous remaining correspondent banking accounts. (This prospect is made more likely by the fact that the total volume of cross-border payments sent via the four main payment schemes is currently well below that estimated before the start of EMU.) Second. in view of some technical problems encountered in d1e initial phase (see below). the overwhelming concem with cross-border payments has so far been timing rather than cost: this may have favored TARGET.I6
The multiplicity of payment systems available for sending cross-border payments wilhin EMU and the preference of different groups of banks for different systems have created some problems in lhe coordination between paying and receiving banks. In the absence of priority rules regarding the system lhrough which cross-border payments are to be sent. in the ftrsl few months after the launch of lhe euro, a receiving bank djd not know whelher it would receive funds directly via TARGET, through one of its correspondent
14See International Monetary Fund ( 1998). ISThe main competitor of TARGET for cros�-border payment!; i�
the net clearing system of the European Bankers' A..,sociation (EBA). In addition. cross-border payments can be processed also by the net cle<tring system owned by the Landeszentralbank in Hess�:n (Germany) called Euro Access Frankfun (EAF). and the French Paris Net Senlemem (PNS). formerly called Systemc Net Protege. Whereas EBA payment> can all be classified as cross-border and TARGET cross-border payments are clearly identified in the Ecs·� statistics, it is not possible to know the cross-border �hare of EAF and PNS payments. part of which are domestic.
1bSome payments recorded i n TARGET are actually transactions within the same banking group. An example are the �13-14 billion of TARGET payments between U.K. banks and their branches on the continent that are exchanged at the beginning and end of each day.
1 26
Figure A J .2. Distribution of Cros!o>-Border Payments in EMU Between EBA and TARGET, January-Ma} 19991
Volume {Number of transactions)
£811 33%
Value
TARGET 67'Jf
Average Value per Transaction (In million� of euros)
fARGm 16
- 14
- 12
10
8
- 6
4
2
-...l.-------;_----1 0
EBA
Source: European Central Bank. 'Average for the month� of January-May 1999.
banking accounts. or in the account of another branch of lhe same bank. These difficultjes prompted some bank associations to forge common understandings and practices, which have helped to ease some of these problems.
A remaining issue concerns the timing of payments. In an RTGS system. payments could. in principle. be evenly distributed during the day. Within TARGET. however, there has been a tendency for some large payments to be sent late in the day, which often causes banks to scramble to meet obligations just before closing. Such timing problems seem to stem from a number of factors, including preferences to delay pay-
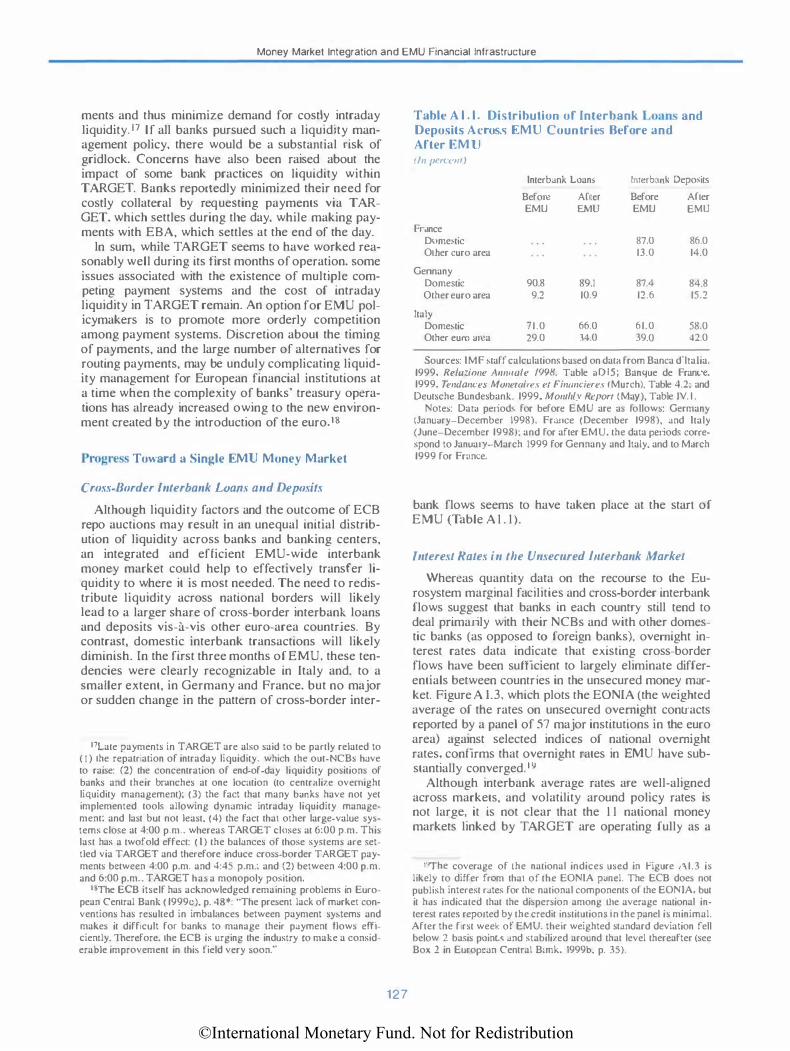
©International Monetary Fund. Not for Redistribution
Money Market Integration and EMU Rnancial Infrastructure
ments and thus minimize demand for costly intraday liquidity. 17 lf all banks pursued such a liquidity management policy, there would be a substantial risk of gridlock. Concerns have also been raised about the impact of some bank practices on liquidity within TARGET. Banks reportedly minimized their need for costly collateral by requesting payments via TARGET, which settles during tl1e day, while making payments with EBA, which settles at the end of the day.
ln sum, while TARGET seems to have worked reasonably well during its tirst months of operation, some issues associated with the existence of multiple competing payment systems and the cost of intraday liquidity in TARGET remain. An option for EMU policymakers is to promote more orderly competition among payment systems. Discretion about the timing of payments, and the large number of alternatives for routing payments, may be unduly complicating liquidity management for European financial institutions at a time when the complexity of banks' treasury operations has already increased owing to the new environment created by the introduction of the euro.rs
Progress Toward a Single EMU Money Market
Cross-Border Interbank Loam and Deposits
Although liquidity factors and the outcome of ECB repo auctions may result in an unequal initial distribution of liquidity across banks and banking centers, an integrated and efficient EMU-wide interbank money market could help to effectively transfer liquidity to where it is most needed. The need ro redistribute liquidity across national borders will likely lead to a larger share of cross-border interbank loans and deposits vis-a-vis other euro-area countries. By contrast, domestic interbank transactions will likely diminish. In the first three months of EMU, these tendencies were clearly recognizable in Italy and. to a smaller extent, in Germany and France, but no major or sudden change in the pattern of cross-border inter-
"Late payments in TARGET are also said to be partly related to { I ) the repatriation of intraday liquidity. which the out-NCBs have to raise: (2) the concentration of end-of-day liquidity positions of banks and their branches at one loc:1tion (to centralize overnight liquidity management): (3) the fact that many banks have not yet implemented tools allowing dynamic intraday liquidity management: and last but not least. (4) the fact that other large-value systems close at 4:00 p.m .. whereas TARGET closes at 6:00 p.m. This last has a twofold effect: (I) the balances of those systems are settled via TARGET and therefore induce cross-border TARGET payments between 4:00 p.m. and 4:45 p.m.; and {2) between 4:00 p.m. and 6:00 p.m .. TARGET has a monopoly position.
18The ECB itself has acknowledged remaining problems in European Central Bank ( 1999c). p. 48*: 'The present lack of market conventions has resulted in imbalance� between payment systems and makes it difficult for banks to manage their payment flows efficienlly. Therefore. the ECB is urging the industry to make a considerable improvement in thi!> field very 'oon:·
127
Table A l . l . Distribution of Interbank Loans and Deposits Across EMU Countries Before and After EMU (/n !"'�"'<'Ill J
Interbank Loan� Interbank Depo�it�
Before After Before After EMU EMU EMU EMU
France Dllme,tic 87.0 86.0 Other curo area 13.0 14.0
Gennany Domestic 90.8 89.1 87.4 84.8 Other euro area 9.2 10.9 12.6 15.2
Italy Domestic 71.0 66.0 61.0 58.0 Other eum area 29.0 34.0 39.0 42.0
Sources: IMF staff calculations bused on data from Banca d"ltalia. 1999. Relu:ione Annuale 1998. Table a015: Banque de France. 1999. Tendanc:es Monera ires et Financieres {Murch). Table 4.2: and Deutsche Bundesbank. 1999. Monthly Report {May), Table IV. I .
Note�: Data period� for before EMU are as follows: Germany (January-December 1998). France (December 1998), and Italy {June-December 1998): and for after EMU. the data periods correspond to January-March 1999 for Gennany and Italy. and lo March 1999 for France.
bank flows seems to have taken place at the start of EMU (Table A I . I).
Interest Rates in the Unsecured llllerbank Market
Whereas quantity data on the recourse to the Eurosystem marginal facilities and cross-border interbank flows suggest that banks in each country still tend to deal primarily with their NCBs and with other domestic banks (as opposed LO foreign banks), overnight interest rates data indicate that existing cross-border flows have been sufficient to largely eliminate differentials between countries in the unsecured money market. Figure A 1.3, which plots the EONIA (the weighted average of the rates on unsecured overnight conu·acts reported by a panel of 57 major institutions in the euro area) against selected indices of national overnight rates, confirms that overnight rates in EMU have substantially converged. ' 9
Although interbank average rates are well-aligned across markets, and volatility around policy rates is not large, it is not clear that the I I national money markets linked by TARGET are operating fully as a
1\Yfhe coverage of lhe national indices used in Figure 1\1.3 is likely to differ from that of the EONIA p<mel. The ECB does not publish interest rates for the national components of the EON I A, but it has indicated that the dispersion among the average national interest rate� reported by the credit institution!. in the panel is minimal. After the first week of EMU. their weighted standard deviation fell below 2 basis points and stabilized around that level thereafter (see Box 2 in European Central B:mk, 1999b, p. 35).
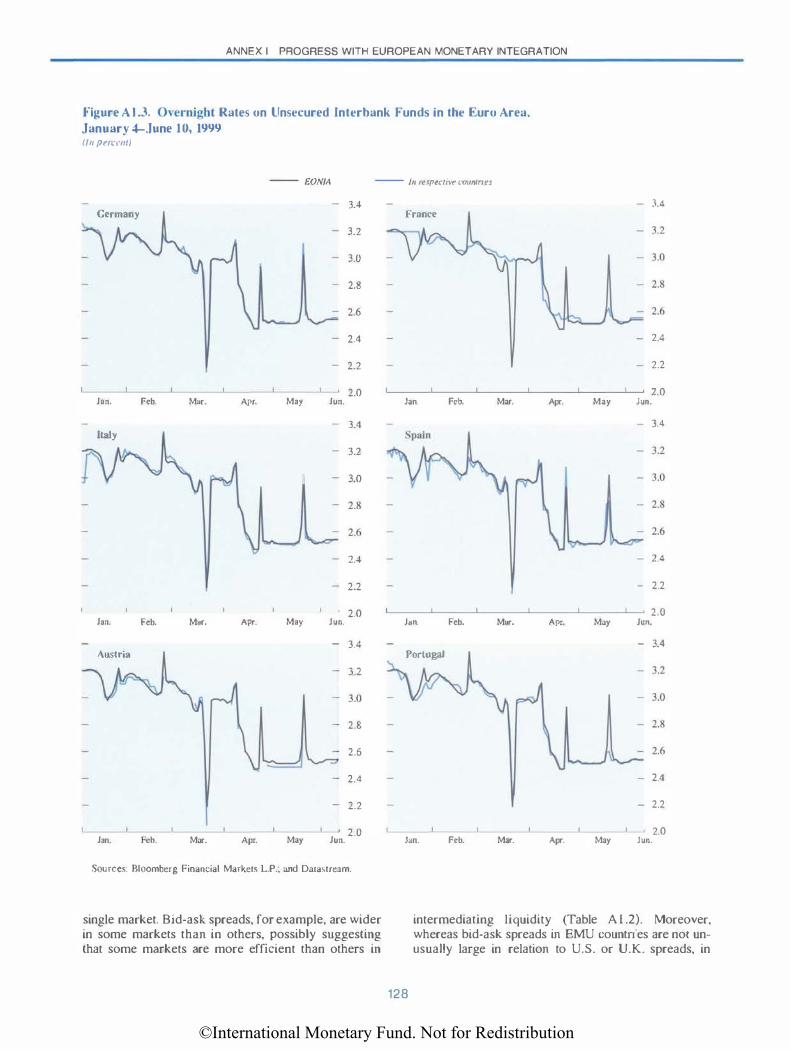
©International Monetary Fund. Not for Redistribution
ANNEX I PROGRESS WITH EUROPEAN MONETARY INTEGRATION
Figure A l .3. Overnight Rates on Unsecured Interbank Funds in the Euro Area, January 4-.June 10, 1999 (/II pNCC/11)
-- EON/A -- /11 respecrive countries
3.4 Germany France
3.2
3.0
2.8
2.6
2.4
2.2
Jon. Feb. Mar. Apr. May Jun. 2.0
Jan. Feb. Mar. Apr.
3.4 Italy Spain
3.2
3.0
2.4
- 2.2
May
3.4
- 2.4
- 2.2
2.0 Jun.
- 3.4
- 2.4
- 2.2
2.0 '----'-----''----'-----'-----'---' 2.0 Jan. Feb. Mar.
Austria
Jan. Feb. Mar.
Apr. May
Apr. May
Jun.
- 3.4
3.2
2.8
2.6
2.4
- 2.2
2.0 Jun.
Sources: Bloomberg Financial Markets L.P.; and Dmastream.
single market. Bid-ask spreads, for example, are wider in some markets than in others, possibly suggesting that some markets are more efficient than others in
Jan. Feb. Mar.
Portugal
Jun. Feb. Mar.
Apr. May
Apr. May
Jun.
- 3.4
- 2.4
- 2.2
2.0 Jun.
intermediating liquidity (Table A 1 .2). Moreover, whereas bid-ask spreads in EMU countries are not unusually large in relation to U.S. or U.K. spreads, in
128
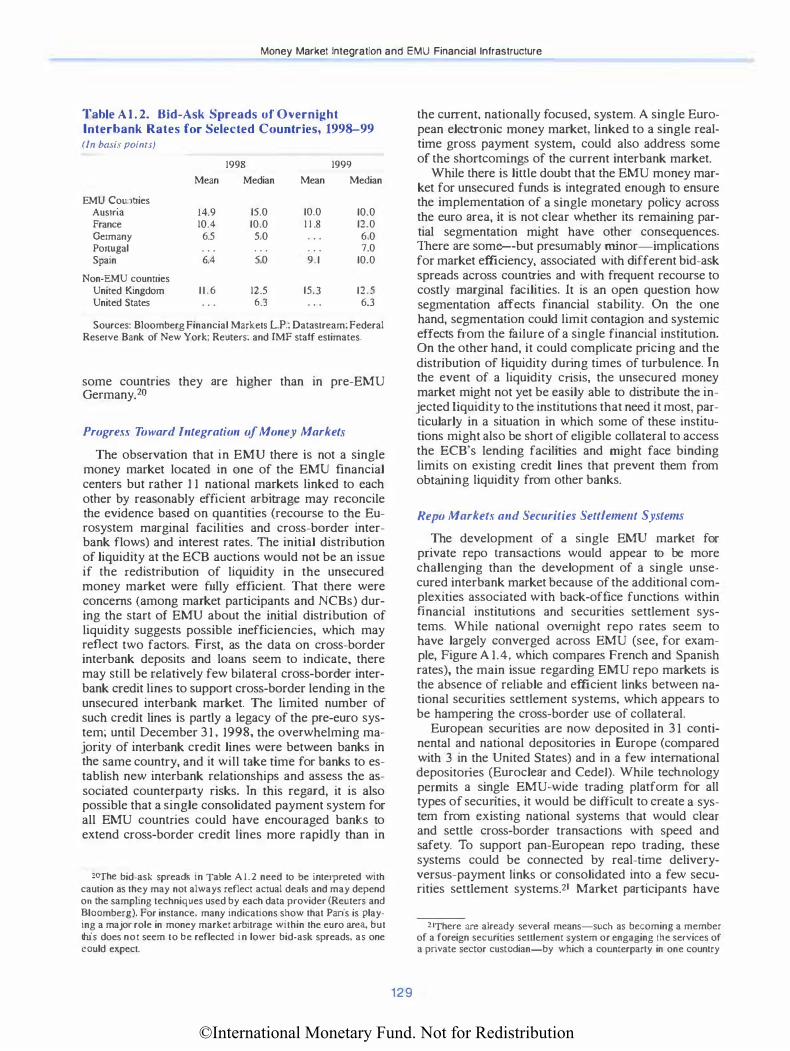
©International Monetary Fund. Not for Redistribution
Money Market Integration and EMU Financial Infrastructure
Table A 1 . 2. Bid-Ask Spreads of Overnight Interbank Rates for Selected Countries, 1998-99
(In basis points)
1998 1999
Mean Median Mean Median
EMU Countries Austria 14.9 15.0 10.0 10.0 France 10.4 10.0 1 1 .8 12.0 Germany 6.5 5.0 6.0 Ponugal 7.0 Spain 6.4 5.0 9.1 10.0
Non-EMU countries United Kingdom 1 1 .6 12.5 15.3 12.5 United States 6.3 6.3
Sources: Bloomberg Financial Markets L.P.; Datastream; Federal Reserve Bank of New York; Reuters; and lMP staff estimates.
some countries they are higher than in pre-EMU Germany.20
Progress Toward Integration of Money Markets
The observation that in EMU there is not a single money market located in one of the EMU financial centers but rather 1 1 national markets linked to each other by reasonably efficient arbitrage may reconcile the evidence based on quantities (recourse to the Eurosystem marginal facilities and cross-border interbank flows) and interest rates. The initial distribution of liquidity at the ECB auctions would not be an issue if the redistribution of liquidity in the unsecured money market were fully efficient. That there were concerns (among market participants and NCBs) during the start of EMU about the initial distribution of liquidity suggests possible inefficiencies, which may reflect two factors. First, as the data on cross-border interbank deposits and loans seem to indicate, there may still be relatively few bilateral cross-border interbank credit lines to support cross-border lending in the unsecured interbank market. The limited number of such credit lines is partly a legacy of the pre-euro system; until December 3 1 , 1998, the overwhelming majority of interbank credit lines were between banks in the same country, and it will take time for banks to establish new interbank relationships and assess the associated counterparty risks. In this regard, it is also possible that a single consolidated payment system for all EMU countries could have encouraged banks to extend cross-border credit lines more rapidly than in
20'fhe bid-ask spread� in Table A 1.2 need to be [nterpreted with caution as they may not always reflect actual deals and may depend on the sampling techniques used by each data provider (Reuters and Bloomberg). For instance, many indications show that Paris is playing a major role in money market arbitrage within the euro area, but this does not seem to be reflected in lower bid-ask spreads, as one could expect.
129
the current, nationally focused, system. A single European electronic money market, linked to a single realtime gross payment system, could also address some of the shortcomings of the current interbank market.
While there is little doubt that the EMU money market for unsecured funds is integrated enough to ensure the implementation of a single monetary policy across the euro area, it is not clear whether its remaining partial segmentation might have other consequences. There are some-but presumably minor-implications for market efficiency, associated with different bid-ask spreads across countries and with frequent recourse to costly marginal facilities. It is an open question how segmentation affects financial stability. On the one hand, segmentation could limit contagion and systemic effects from the failure of a single financial institution. On the other hand, it could complicate pricing and the distribution of Liquidity during times of turbulence. In the event of a liquidity crisis, the unsecured money market might not yet be easily able to distribute the injected Liquidity to the institutions that need it most, particularly in a situation in which some of these institutions might also be short of eligible collateral to access the ECB's lending facilities and might face binding limits on existing credit lines that prevent them from obtaining liquidity from other banks.
Repo Markets and Securities Settlement Systems
The development of a single EMU market for private repo transactions would appear to be more challenging than the development of a single unsecured interbank market because of the additional complexities associated with back-office functions within financial institutions and securities settlement systems. While national ovemight repo rates seem to have largely converged across EMU (see, for example, Figure A 1.4, which compares French and Spanish rates), the main issue regarding EMU repo markets is the absence of reliable and efficient links between national securities settlement systems, which appears to be hampering the cross-border use of collateral.
European securities are now deposited in 3 1 continental and national depositories in Europe (compared with 3 in the United States) and in a few international depositories (Euroclear and Cede!). While technology permits a single EMU-wide trading platform for all types of securities, it would be difficult to create a system from existing national systems that would clear and settle cross-border transactions with speed and safety. To support pan-European repo trading, these systems could be connected by real-time deliveryversus-payment links or consolidated into a few securities settlement systems.21 Market participantS have
21There are already several means-such as becoming a member of a foreign securities settlement system or engaging the services of a private sector custodian-by which a counterparty in one country

©International Monetary Fund. Not for Redistribution
ANNEX I PROGRESS WITH EUROPEAN MONETARY INTEGRATION
Figure A l .4. France and Spain: Overnight Repo Rates, January 4, 1999-.June 1 1, 1999 I In perrt'm J
-3
.5 Rlllt ttpplinltv Frulltt llmitt n'.flr·�'·;�·�'"" • - :'
��--5 - 2.0
Spam
- l -5
L__ __ .J_ __ _J_ __ ____L ___ _.___ __ _.___. 1.0 Jan. Feb. M:tr. Apr. May Jun.
Sources: Bloomberg Financial Markets L.P.; and European Central Bank.
suggested that the choice between a ce��ralized or decentralized market structure for secunttes settlement systems seems to be a politically sensitive issue because of its impUcations for competition among financial centers. So far. the decentralized model has prevailed, but existing national systems are being linked22 and the legal problems associated with a multiplicity of different national repo contracts are being addressed.23 Lnitially, these links wiU not be delivery-versus-payment, so that the cross-border use of securities will remain subject to credit risk (loss of principal) and. at a minimum, to liquidity risk. For this reason, counterparties are still reluctant to use these links for operations other than monetary policy operations.24
To allow for the cross-border use of collateral in monetary policy operations and intraday credit operations in TARGET from the very start of Stage Three of EMU. the Eurosystem created the corre�pondent central banking model (CCBM). Non-euro-area NCBs also participate in the CCBM for the provision of intraday credit to TARGET participants connected to "ouf' RTGS systems. The CCBM basically consists of a network of accounts through which securities deposited by
might hold a security in a securities seu!ement system in another country. even without any cross-border hnks or system consolidation. but these methods are not available (or attractive) to all in· vestors (see Bank of England. 1999). 221n May 1999, the two large European international depositories, Euroclear and Cedel. proposed two competing systems of links and alliances between national securities settlement systems. In the same month. the ECB published a list of 26 links eligible for crossborder use of collateral in Eurosystem monetary policy and ESCB intraday credit operations on a free delivery basis.
13The project ''Euromaster AgTeement" has been designed to overcome legal problem�.
24Additional links are currently under assessment.
130
a financial institution at one NCB can be used by another institution as collateral in repo operations with another NCB. The model was envisaged only as an intetim solution until a market alternative becomes available, but it has already proven successful since more than €65 billion are currently held in cross-border custody through the CCBM. The fact that collateralization is still done primarily on a domestic basis should probably be attributed to the national bias of counterpanies' portfolios rather than to infrastructural barriers.
The use of the CCBM entails at least two constraints. First, given its temporary nature, the CCBM is not an automated real-time system. Procedures are therefore comparatively slow. In the first months of EMU, not aU of these communication links between NCBs have worked efficienLiy. For example, some institutions that used the CCB links to obtain liquidity from the NCB in their country against collateral deposited at another NCB reportedl y waited six hours for confirmation. Owing to this confim1ation lag, the banks were required to undertake another (bridge) operation with their NCB. using domestic collateral deposited at the local securities settlement system, to cover immediate needs for liquidity. A similar need for bridge financing apparently exists when a repo is rolled over while NCBs exchange confirmation messages. These problems may be significant enough to prevent private institutions from using collater?l cross-border in some instances. Second, the CCBM ts construed in such a way that only the NCB in the country where the collateral was issued can act as correspondent central bank. Therefore, assets that had been moved out of the securities settlement system of issuance have to be repauiated before they can be used as collateral for central bank credit.
FaciJitating cross-border transfers of securities may contribute to the development of a single repo market in EMU but, more important, may also contribute to a reduction of systemic risk. owing to a larger share of collateralized cross-border interbank transactions. Options for improvements in the infrastructure for clearing and settlement might include strengthening the links between systems and improving individual systems, or creating a single unified system that could serve all European markets. While private solutions to t11ese problems might be preferable to whoiJy public ones, there may be some scope for public policy to provide incentives and guidance.
Enhancing Efficiency and Integration of Unsecured and Secured EMU Money Markets
The limited integration of unsecured and secured money markets in Europe, particularly at the start or EMU, reflects a common set of features in these markets: the fragmented structure of trading and counterparty relationships and the fragmented (and in some cases weak) supporting infrastructures. including
©International Monetary Fund. Not for Redistribution
Outlook for Pan-European Capital Markets
clearing, settlement, and payment systems.25 These features reflect to a certain extent the decentralized operating procedures for the distribution of liquidity used by the Eurosystem. By entrusting the implementation of monetary policy to NCBs, the framers of EMU have (in effect) supported a level playing field in the competition among European financial centers. On the other hand, they have helped to perpetuate the nationally oriented infrastructure of payments and securities seulement systems, as this infrastructure is used to implement monetary policy in a decentralized fashion.
Summarizing the preceding discussion, there are three measures that might make the current system of European money and private repo markets more unified and efficient. The first measure could be the creation of a single, Europe-wide electronic market for unsecured funds. A second measure might be the improvement of the infrastructure for clearing and settlement. A third could be the creation of incentives to encourage more orderly competition among payment systems. At present, competition among payment systems allows discretion about the timing of payments and the large number of alternatives for routing payments are unduly complicating liquidity management for European financial institutions.
Outlook for Pan-European Capital Markets
The development of pan-European capital markets also seems to face some impediments, notwithstanding substantial pressures for consolidation in the European securities markets. As in other areas of financial services, there is excess capacity. Europe has about 25 derivatives exchanges, 20 derivatives clearing houses, and 1 5 stock exchanges. This fragmentation is costly to market participants that seek pan-European exposures. In an environment in which financial services such as insurance, investment banking, and asset management are increasingly offered by pan-European institutions to customers across Europe. consolid�tion would help to achieve market depth and reduce costs.
There appear to be some important obstacles to the creation of pan-European securities markets at two levels: technical obstacles that are (in principle) straightforward to overcome; and policy-related obstacles that will be more difficult to overcome, particularly as they may serve to protect domestic markets.
As with the money markets, problems in securities settlement systems and other back-office functions are likely to impede the creation of single pan-European markets for bonds, equity, and derivatives. For example, market participants suggested that the main diffi-
25Dcspite these obstacles, there arc some report� of increased cross-border trading. especially in the repo markets. and reports that market participants have �et up new or increased existing bilateral limits to spur trading in the unsecured interbank market.
1 3 1
culties i n creating a pan-Ew·opean market for bluechip stocks are related to back-office problems and incompatibilities, particularly in the area of securities settlement. Some technical problems are related to differences in trading platforms across exchanges.
Some technical problems could be overcome, in part, through linkages among exchanges. as well as through outright mergers. However. the technical capabilities of linked systems would tend to be constrained by the weakest system. Alternatively, the success of prominent initiatives, such as Eurex, EuroMTS. and the London-Frankfurt stock exchange initiative, might establish standards that could be adopted across Europe. Successful Europe-wide initiatives could also encourage the creation of new panEuropean systems to handle back-office functions. including clearing and settlement systems for bonds. equities, and derivatives.
Second, and more important, there are a number of policy-related impediments to consolidation of exchanges across Europe. Among these are differences in tax regimes and in legal and regulatory environments across countries. These differences can raise considerable legal uncertainties about cross-border transactions. Regulatory arbitrage can create incentives for exchanges to migrate outside of EMU. There have been some official efforts to encourage harmonization. notably the EU's Investment Services Directive (LSD) and the Financial Services Action Plan of the European Commission, which was approved by the ECOFlN Council on May 25. 1999.26 ln some cases, the national implementation of this directive has been helpful in fostering European securities markets; for example. the "remote membership" provision of the lSD, which permits electronic access to foreign securities exchanges, contributed to the success of Eurex (a fully electronic exchange). In general, however. progress in harmonization has been slow. Market participants have noted that this degree of inertia might reflect the reluctance of some domestic authorities to level the playing field, because impediments serve to protect domestic markets and market infrastructures from competition.
As it is unlikely that these impediments will be addressed soon, market participants themselves may find ways around these barriers. For example. the owners of the successful Euro-MTS system for trading benchmark European government bonds incorporated their company outside of EMU (in the United Kingdom) as a broker-dealer for regulatory reasons. Exchanges could also be located outside the EU or offshore in order to avoid impediments.
The overall degree of integration is limited and varies from market to market. In the bond markets, no clear national center appears to be emerging for bond
26When ministers of finance or economic affairs meet as the EU Council of Ministers on issues in the domain of tiscal or macroeconomic affair�. the Council is referred to as the ECOFIN Council.
©International Monetary Fund. Not for Redistribution
ANNEX I PROGRESS WITH EUROPEAN MONETARY INTEGRATION
trading. In part, this may reflect differences in backoffice functions, as custody. clearing, and settlement appear to continue to be organized largely along national lines. It may also reflect past practices, including the concentration of portfolios in domestic securities. As currency matching rules within EMU have become irrelevant with the introduction of the euro, institutional government-bond portfolios are becoming increasingly diversified, and pressures for a single European bond market will grow. One possibility is that a system such as Euro-MTS could evolve into a platform for pan-European trading in a variety of European government securities, although competitors of Euro-MTS are likely to emerge in the near future.27
In the equity markets of continental Europe, although there are some precedents for foreign listings, trading is still largely organized along national Jines. The increased focus on credit risk rather than currency risk, the shift from country to sector analysis, and the growth of institutional funds will provide a strong stimulus to the growth of European equity markets. The expansion of asset management and institutional investment is likely to create demand for a single liquid market i n large-capitalization stocks. The realization of such a market is the objective of the London-Frankfurt alliance, although the precise timetable for full integration of the two exchanges remains unclear. Tn May 1999, discussions on the modalities of the initiative were opened to six new participants (the Amsterdam, Brussels, Madrid, Milan, Paris, and Zurich stock exchanges); it remains to be seen how broader participation will affect the pace of decision-making in the alliance. If the alliance moves forward, the European equity market may evolve into a three-tier system with small-cap stocks traded on Easdaq, AlM, or lhe Euro.NM system, mid-caps traded on domestic exchanges, and large-caps traded on the London-Frankfurt system.
In the derivatives markets, Eurex (formed by the merger of the DTB and Soffex) is widely regarded as a success. rivaling or exceeding other global exchanges in terms of turnover. Eurex has taken a clear lead over its U.K. rival Liffe in long-term fixed-income products, although Liffe retains the lead in short-term ftxed-income products. Liffe and other continental exchanges have expressed interest in alliances with Eurex, and Eurex is receptive to such arrangements, but little progress has been achieved. At the same time, Matif has formed an alliance with exchanges in Singapore and Chicago (SIMEX and CME) to trade their most popular products (the "Euro Globex" initiative). [tal ian and Spanish derivatives exchanges (MIFF and MEFF) would be included at some point as well, while Matif's planned alliance with Eurex appears to have stalled.
27There is notably the case of Broker Tee, an electronic platform for trading of European and U.S. bonds developed by a group of large investment banks. whose introduction has been postponed to early 2000 to avoid overlap with Y2K preparations.
132
Looking ahead, and in view of the substantial impediments to full pan-European markets and the limited amount of consolidation that has taken place thus far, the most likely prospect might be the emergence of a two-tiered system of securities markets. At the top tier, one or two systems in each market could serve as centers for trading European benchmarks. For example, euro-area sovereign bonds may be traded principally on Euro-MTS: large-cap equities on the London-Frankfurt exchange; and derivatives on Eurex (particularly long-tenn fixed-income derivatives) and Liffe (particularly short-term fixed-income derivatives). A second tier of exchanges could handle securities that are of national but not Europe-wide importance, including non-benchmark government bonds, small- and mid-cap equities, and various derivatives.
Nevertheless, without pan-European banks, there will be limited pressure for the removal of the impediments that are preventing the formation of truly panEuropean markets. As discussed above, some national authorities appear to sustain interest in continuing national securities markets and settlement systems. While cross-border trading platforms (like Euro-MTS in the bond market) help to integrate the "front-end" of securities markets, "back-end'' inefficiencies in settlement systems remain. Until pan-European banks are formed, progress in the elimination of these settlement problems may be slow, and the potential efficiency gains from the introduction of the euro may not be fully realized.
Banking System Consolidation and Restructuring
For the time being, both official preferences and market forces are encouraging consolidation and restructuring of European banking systems within national markets rather than across borders. 28 There are economic reasons for domestic conso!jdation, including the existence of economies of scale and scope from mergers of retail and universal banks within
28The exceptions to this trend are the Scandinavian and Benelul\ countries. where some cross-border mergers have occurred, and, to some extent, I taly. where foreign participation i� substantial. Italian banks with a significant participation of foreign investors accoum for close to half of the domestic deposits. However, apan frorn one holding of 22 percent (by France's Credit Agricole), this mainly renects a substantial number of holdings of just under 5 percent. the level at which Banca d'ltalia approval must be sought. The role of foreign panners is still modest in France and negligible in Germany. In the case of France. however. the core shareholder group of the privatized Credit Lyonnais, which controls 33 percent of the capital and voting rights. comprises three foreign banks and the French arm of a German insurance company, rogether with three French institutions. Some banks from Spain and Scandinavia have instead expanded cross-bor· der into non-EMU (and, indeed, non-EU) countries with the objective of preseTVing protitabiJjty and increasing their size and market value as a possible defense in the ongoing process of consolidation.

©International Monetary Fund. Not for Redistribution
Banking System Consolidation and Restructuring
highly fragmented national systems. There are also cultural and legal features that discourage crossborder mergers. Importantly, authorities in some countries seem to be reluctant to allow increased foreign participation until the process of domestic consolidation has produced "national champions" that are judged large enough both to discourage takeovers by foreign banks and to potentially undertake crossborder acquisitions themselves.
While there may be reasons for consolidation to continue within national banking systems, there are constraints on the extent and the nature of domestic consolidation. For example, in France and Gem1any a majority of domestic bankjng assets are located with banks with legal and ownership structures that largely insulate them from the consolidation efforts of commercial banks. Absent a change in these institutional factors, tbe pressures to increase size might inevitably lead large banks to look beyond national boundaries even in tbe face of incomplete domestic consolidation. Further, once one big merger shows that cross-border consolidation is under way, the relatively small number of attractive targets in some countries may lead to a "floodgate" effect as banks will wish not to be left out of the process.29
There are indications that national authorities sometimes influence the consolidation process involving domestic entities, as in the case of the declared opposition of some supervisors and regulators to hostile takeovers in the banking sector. ln France, the authorities expressed a desire for the three large banks (BNP. Societe Generate, and Paribas) involved in takeover bids to come to an amicable agreement. In Italy, the authorities expressed a desire for further consolidation, but tbe Banca d'Italia's opposition to two proposed mergers (Unicredito and Banca Commerciale ltaJiana, and San Paolo-IMI and Banca di Roma) was in part attributed by market participants to the hostile nature of tbe bids.JO
Against the background of these trends, there have been some important recent developments in the restructuring of the bankjng sector in continental Europe, especially in France and Italy. Privatization in France has culminated in the sale of Credit Lyonnais and the intended sale of Credit Foncier in July 1 999. Meanwhile, reform of ilie publicly conrrolled savings bank system has made headway. Pending legislation will transfonn the savings bank system into a cooperative system, with state participation limited to a core minority interest held by the state-owned Caisse des Depots et Consignations. Consolidation, however, remains elusive. Most recent mergers and acquisitions
29Jn a related context. it has been suggested that the recent large Spanish merger (Banco Santander and BCH) may have acted as a trigger for the subsequent domestic merger activity in France and Italy discussed below.
30See also Fazio (!999).
133
either involved firms with little overlap in lines of business or were conducted under the assumption that redundant employees would not be aggressively shed. One cross-border merger involving the specialized segment of credit to local governments has, however, performed well and is expected to be further advanced by the future introduction of mortgage bonds in France.
The reorganization of tbe banking sector in Italy has perhaps been the most accelerated in Europe. as illustrated by the 54 mergers that occurred in 1998, the successful privatization of the Banca Nazionale del Lavoro (BNL), and legislation providing incentives for ''charitable foundations'' to relinquish controlling stakes in banks in the next four years. Moreover, at end-June 1999. Banca Intesa and Banca Commerciale Jtaliana
announced their plans to merge, creating Italy's largest banking group and one of the ten largest in Europe. Foreign participation in Italian banks continued to grow, and minority interests of banks from several European countries in BNL, Banca di Roma, and numerous large Northern banks rose. Foreign investment has helped to foster mergers and acquisitions among large banks, some of which bave also acquired smaller institutions. Mergers among top banks have, nonetheless. been hampered by two factors. First, several large institutions are linked through cross-shareholdings stemming from historical relationships, and minority interests have often diverged from one another. Second, the Banca d' ltalia has indicated to market participants that il does not favor hostile takeovers in the bankjng sector. Market participants view these factors as temporary hurdles, which may influence the pairing of specific banks but will not stop the consolidation of the sector. The scope for consolidation is likely to increase with the sale of shares in banks that are currently controlled by ·'foundations;· as new legislation will force foundations to relinquish their interests in banks to retain the special tax s1atus they currently enjoy.
By contrast, bank consolidation in Germany-while progressing-remains constrained. Growing pressure on cooperative banks-heightened by, inter alia, tbe phasing in of more sophisticated risk-management requirements-has resulted in mergers (168 in 1998) among cooperative (or mutual) banks. These mergers, however, did not lead to the development of centralized structures that would save operational expenses (e.g., the unification of back-office and other support activities). Furiliermore, these mergers have largely taken place within the umbrella organization of cooperative banks (Genossenschaftsbanken), rather than involving commercial banks. Some concerns have also been raised about the interest rate risk incurred by mortgage banks, owing to their increasing lending to regional banks, through the issuance of sought-after mortgage bonds (Pfandbriefe). In Germany, there is apparently little concern about the possibility of foreign takeovers, possibly reflecting low interest mar-
©International Monetary Fund. Not for Redistribution
ANNEX I PROGRESS WITH EUROPEAN MONETARY INTEGRATION
gins-due to the large share of savings, cooperative, and public banks (most notably the Landesbanken)and the perception that the big private banks are strong. By contrast, it is generaiJy expected that German banks will be bidders for banks in other countries.
Financial Supervision, Regulation, and Crisis Management
Will Supen isory and Regulatory Frameworks in EMU Keep Pace?
National supervision and regulation in many countries is being challenged by the increased blurring of commercial banking, investment banking, insurance, and asset management. Challenges are also likely to emerge within the euro area from the likely tendency toward greater reliance on securitized, marketoriented finance than on bank-intermediated finance, the likely emergence of pan-European exchanges for securities and derivatives trading, and cross-border mergers between financial institutions.
National-level structures in most European countries divide supervisory and regulatory responsibilities among several agencies (with the notable exceptions of Denmark, Luxembourg, Norway, Sweden, and the United Kingdom, all of which recently introduced a single regulator). While European authorities consider the existing division of responsibilities at the national level to be working reasonably weU, some rationalization is probably desirable and might enhance supervision. However, full-fledged reforms such as those associated with the Financial Services Authority in the United Kingdom seem unlikely in the near future; some uncertainty about the outcome of the U.K. reform is encouraging a wait-and-see attitude among most continental European authorities.
As for structures at the euro-area level, although the 1 1 EMU countries have transferred national monetary sovereignty to the European level, supervisory and regulatory responsibilities have remained a national responsibility. Cooperation currently occurs mainly through bilateral arrangements and meetings in multilateral forums. In the case of banking and securities regulators, there are now bilateral memorandums of understanding between virtually all EMU (and pre-in) countries, providing for both regular meetings and cooperation and information exchange when there are specific concerns or issues. Although memorandums of understanding are typically not legally binding arrangements, cooperation with counterparts in other countries is considered to have worked smoothly. For European banking supervision, the two major multilateral forums are the Banking Supervision Committee of the ECB, a senior-level committee for cooperation between national supervisors, and the Groupe de Contact, a lower-level group
134
that addresses cases involving individual b<mks. European authorities are generally satisfied with the way EMU-wide cooperation has been taking place within these groups.
As long as banking systems remain primarily national and banks' businesses are mainly traditional (with limited reliance on both on- and off-balancesheet securitie� transactions involving cross-border exposures), the current decentralized approach that relies on cross-border cooperation will most likely remain workable and effective. As pan-European financial markets and institutions emerge, and the reliance on securitized market-oriented finance expands, panEuropean financial supervision and regulation may become more desirable and necessary. European officials have acknowledged these possibilities and seem to be taking a pragmatic approach to enhancing cooperation and coordination, and to considering alternative institutional arrangements. Recent developments in this area include ( I ) in February 1999, the signing of a multilateral European memorandum of understanding among securities supervisors that are members of FESCO (Forum of European Securities Commissions):.! I (2) discussions about a strengthening of the multilateral mode of cooperation and infonnation sharing among banking supervisors; and (3) the creation of a high-level group of representatives of EU finance ministers focusing on supervisory developments in EMU (e.g., consolidated in addition to sectoral supervision, the appropriate relationship between the central bank and the supervisory authority. and the need for some form of European-level supervision).
There seem to be different degrees of enthusiasm among European officials about centralization, and the development of a single euro-area supervisor seems to be a long way off. By contrast, once a pan-European exchange for securities-like the pan-European platfonn for blue chips cunently under preparation by the London Stock Exchange and the Deutsche Borse-is created, a central securities supervisor and regulator would become more likely.
Crisis Management
There has been agreement within the Eurosystem on crisis management procedures along the following lines. The ECB regards the adequacy of financial institutions' own risk controls as of utmost importance for financial stability. Where supervisory authorities are not satisfied that institutions· risk management is adequate, Lhey will use available tools to avoid excessive risk taking. The Eurosystem believes it has mechanisms in place to contribute to the smooth conduct of
)1The members of FcSCO are Au�>tria. Belgium. Denmark, Finland, France. Gem1any. Greece, Iceland. Ireland, Italy. Luxembourg, Lhe Netherlands, Norway. Portugal. Spam. Sweden. and Lhe United Kingdom.

©International Monetary Fund. Not for Redistribution
References
policies by the competent authorities relating to the prudential supervision of credit institutions and the stability of the financial system. The main guiding principles underlying these mechanisms are as follows: • the provision of emergency liquidity assistance if
and when appropriate is primarily a national responsibility;
• the associated costs and risks are bome at the national level: and
• mechanisms ensuring an adequate now of information are in place so that any potential liquidity impact can be managed i11 a way consistenl with the maintenance of the appropriate monetary policy stance, and any cross-border implications can be dealt with. This agreement clarifies the framework for cri-
sis management withjn EMU. Two issues remain: ( I ) whether decentralized arrangements wiiJ remain appropriate when pan-European institutions and markets emerge; and (2) whether ar1·angements are in place-although not spelled out to mruntain ·'constructive ambiguity"-to ensure that the Eurosystem will effectively coordinate with the I I national supervisors, treasuries, deposit insurance schemes. and EU authorities, in the event of a crisis involving a potentially insolvent institution.
While a decentralized framework may be adequate to manage a crisis involving a tradjtional bank operating at the national level with few cross-border interbank Links. it Jnay pose chaUenges in the event of a crisis with EMU-wide systemic implications. [n a decentralized framework, it may be difficult to fully internalize the systemic implications of a bank failure. National authorities are likely to take into account the potential costs-which would be bome at the national level-of assisting a troubled institution, but it is not obvious that they would fuiJy consider the benefits of avoiding the cross-border systemic implications of its failure. It is also not unreasonable to expect, even in the absence of pan-European institutions, that the introduction of the euro would increase the potential for systemic events in the European banking industry.32 As discussed, banks are in the process of increasing the number ru1d size of their cross-border interbank credit lines to ensure that they can borrow from and lend to banks across EMU. This implies a need for more cross-border interbank lines than before EMU, with a correspondjngly hjgher systemic risk in case of financial problems in one banking system. To be in a position lO assess systemic risk in a timely manner, there are arrangements to exchange information within the Eurosystem and with banking supervisors. Work is currently under way to enhance the capabilities of the ECB and the Eurosystem to monitor the EU financial system as a whole in cooperation with the NCBs and national supervisors.
12See also Padoa-Schioppa { 1999). p. 6.
135
For dealing with potentially insolvent institutions. the institutional framework in the EU is decentralized and relies on national legislation and arrangements, the exchange of information in U1e Banking Supervision Committee, and bilateral agreements to cope with cross-border spiiJovers. Although the Eurosystem will most likely be involved in crisis management, its actual involvement is not spelled out in laws and regulations. This decemalized approach is relevant in part because of practices associated with "constructive ambiguity," which introduces a degree of uncertainty about the condjtions under which emergency liquidity assistance would be provided to individual institutions or more widely through markets in crisis situations. Constructive ambiguity is regarded by some, but not by all, as a way to limjt the adverse potential consequences of moral hazard. As has been discussed before (lMF, 1998, and Prati and Scltinasi, 1 999), in cases where constructive ambiguity is used to promote strategical ly a degree of uncertainty, there should be no ambiguity about the mechanisms or the allocation of responsibilities that will be called upon to resolve problems and crises.
References
Aspetsberger. A., 1996, ''Open Market Operations in EU Countries:· EM! Starr Paper No. 3 (Frankfurt: European Monetary Institute. May).
Banca d'ltalia. 1999, Relazione Annuale 1998 (Rome). Bank of England, 1999. Practical Issues A rising from the
Euro (London, June). Banque de France, 1999, Tendances Mont!taires et Finan
cieres (Paris, March). DeUischc Bundesbank, 1999, Monthly Report (Frankfurt, May). European Central Bank, 1998, The Single Monetary Policy
in Stage Three: General Documemation on ESCB Monetary Policy Instruments and Procedures (Frankfun, September).
---, 1999a. Monthly Bulletin (Frankfurt, March). ---, 1999b, Monthly Bulletin (Frankfurt. May). ---, 1999c, Monthly Bulletin (Frankfurt. June). Fazio, Antonio, 1999, "La Ristrutturaz.ione del Sistema Ban
cario Italiano.'' testimony before the llaUan Senate, April 20.
International Monetary Fund, 1997. International Capiral Markets: Developments, Prospects. and Key Policy Issues. World Economic and Financial Surveys (Washington. November).
---, 1998. lntemationa/ Capital Markets: Developments, Pro.�pecrs. and Key Policy Issues, World Economic and Financial Surveys (Washington, September).
Padoa-Schioppa, Tommaso, 1999, ''EMU and Banking Supervision,'' LSE Financial Markets Group Special Paper No. 1 1 2 (London: London School of Economic;, and Political Science, March).
Prati, Alessandro, and Garry J. Schinasi, 1999, "Financial Stability in European Economic and Monetary Union," Princeton Studies in international Finance, No. 86 (Princeton, New Jersey: International Finance Section. Department of Economjcs. Princeton University. July).
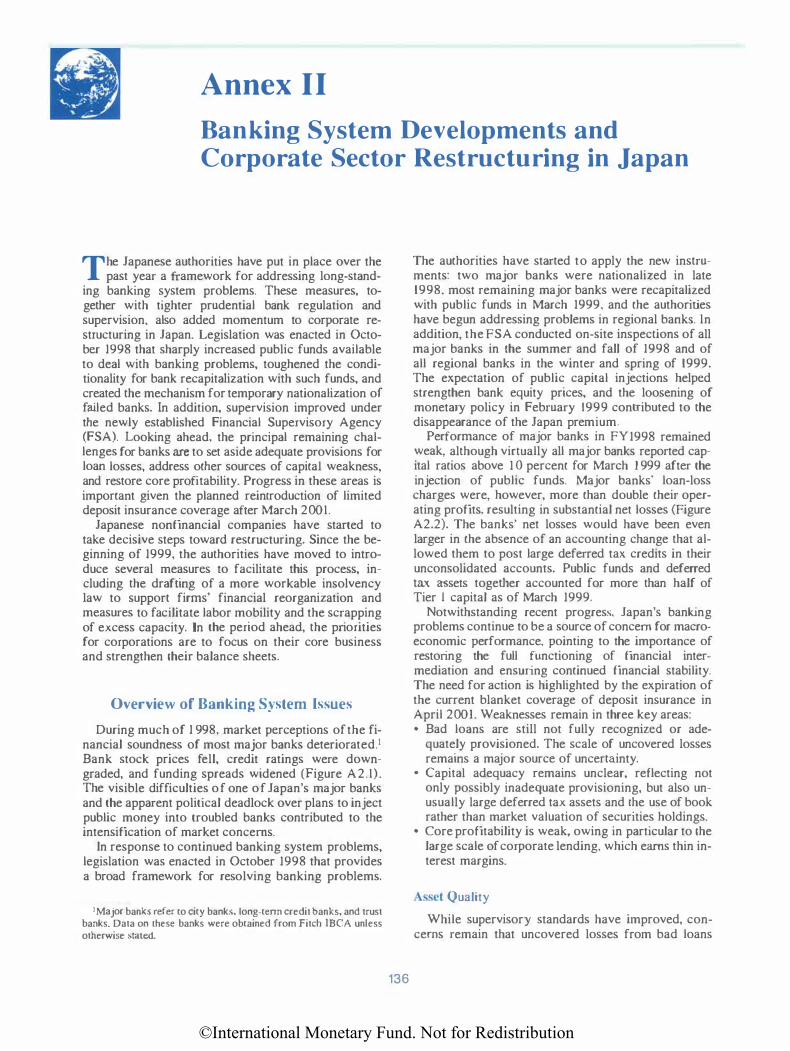
©International Monetary Fund. Not for Redistribution
Annex II Banking System Developments and Corporate Sector Restructuring in Japan
The Japanese authorities have put in place over the past year a framework for addressing long-stand
ing banking system problems. These measures, together with tighter prudential bank regulation and supervision, also added momentum to corporate restructuring in Japan. Legislation was enacted in October 1998 that sharply increased public funds available to deal with banking problems, toughened the conditionality for bank recapitalization with such funds, and created the mechanism for temporary nationalization of failed banks. In addition, supervision improved under the newly established Financial Supervisory Agency (FSA). Looking ahead, the principal remaining challenges for banks are to set aside adequate provisions for loan losses, address other sources of capitaJ weakness, and restore core profitability. Progress in these areas is important given the planned reintroduction of limited deposit insurance coverage after March 2001.
Japanese nonfinancial companies have started to take decisive steps toward restructuring. Since the beginning of 1999, the authorities have moved to introduce several measures to facilitate this process, including the drafting of a more workable insolvency law to support firms' financial reorganization and measures to facilitate labor mobility and the scrapping of excess capacity. In the period ahead, the priorities for corporations are to focus on their core business and strengthen their balance sheets.
Overview of Banking System Issues
During much of 1 998, market perceptions of the financial soundness of most major banks deteriorated.' Bank stock prices fell, credit ratings were downgraded, and funding spreads widened (Figure A2.1). The visible difficulties of one of Japan's major banks and the apparent political deadlock over plans to inject public money into troubled banks contributed to the intensification of market concerns.
ln response to continued banking system problems, legislation was enacted in October 1998 that provides a broad framework for resolving banking problems.
I Major banks refer to city banks, long-tenn credit banks. and trust banks. Data on these banks were obtained from Fitch IBCA unless otherwise stated.
136
The authorities have started to apply the new instruments: two major banks were nationalized in late 1998. most remaining major banks were recapitalized with public funds in March 1999, and the authorities have begun addressing problems in regional banks. ln addition, the FSA conducted on-site inspections of all major banks in the summer and fall of 1998 and of all regional banks in the winter and spring of 1999. The expectation of public capital injections helped strengthen bank equity prices, and the loosening of monetary policy in February 1999 contributed to the disappearance of the Japan premium.
Performance of major banks in FY 1998 remained weak, although virtually all major banks reported capital ratios above 10 percent for March 1 999 after the injection of public funds. Major banks' loan-loss charges were, however, more than double their operating profits, resulting in substantial net losses (Figure A2.2). The banks' net losses would have been even larger in the absence of an accounting change that allowed them to post large deferred tax credits in their unconsolidated accounts. Public funds and deferred tax assets together accounted for more than half of Tier I capital as of March 1999.
Notwithstanding recent progress, Japan's banking problems continue to be a source of concern for macroeconomic performance, pointing to the importance of restoring the full functioning of financial intermediation and ensuring continued financial stability. The need for action is highlighted by the expiration of the current blanket coverage of deposit insurance in April 2001. Weaknesses remain in three key areas: • Bad loans are still not fully recognized or ade
quately provisioned. The scale of uncovered losses remains a major source of uncertainty.
• Capita] adequacy remains unclear, reflecting not only possibly inadequate provisioning, but also unusually large deferred tax assets and the use of book rather than market valuation of securities holdings.
• Core profitability is weak, owing in particular to the large scale of corporate lending, which earns thin interest margins.
Asset Quality
While supervisory standards have improved, concerns remain that uncovered losses from bad loans
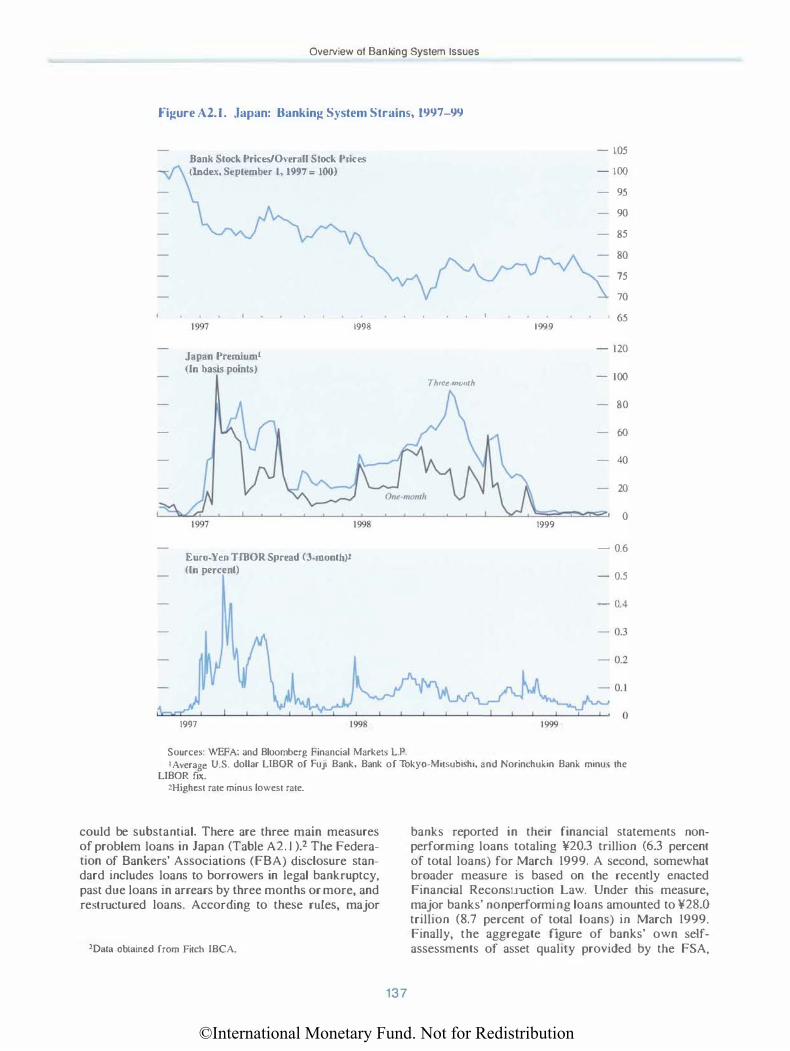
©International Monetary Fund. Not for Redistribution
Overview of Banking System Issues
Figure A2.1. Japan: Banking System Strains, 1997-99
Bank Stock Prices/Overall Stock Prices (Index, September 1, 1997 = 100)
1997
Japan Premium' (In basis points)
Euro-Yen TmOR Spread (3-month)l (ln percent)
1998
1997 1998
Sources: WEFA: and Bloomberg Financial Markets L.P.
1999
Thrt't'·mcmth
1999
1999
- 105
- 100
95
90
85
80
75
70
65
- 120
- 100
80
60
40
20
0
- 0.6
- 0.5
- 0.4
I Average U.S. dollar LLBOR of Fuji Bank, Bank of Tokyo-MitSubishi, and Norinchukin Bank minus the LIBOR fix.
2Highcst rate minus lowest rate.
could be substantial. There are three majn measures of problem loans in Japan (Table A2. J ).2 The Federation of Bankers' Associations (FBA) rusclosure standard includes loans £O borrowers in legal bankruptcy, past due loans in arrears by three months or more, and restructured loans. Accorrung to these rules, major
2Data obtained from Fitch IBCA.
137
banks reported in their financial statements nonperforming loans totaling ¥20.3 trillion (6.3 percent of total loans) for March 1999. A second, somewhat broader measure is based on the recently enacted Financial Reconstruction Law. Under this measure, major banks' nonperforming loans amounted to ¥28.0 trillion (8.7 percent of total loans) in March 1999. Finally, the aggregate figure of banks' own selfassessments of asset quality provided by the FSA,
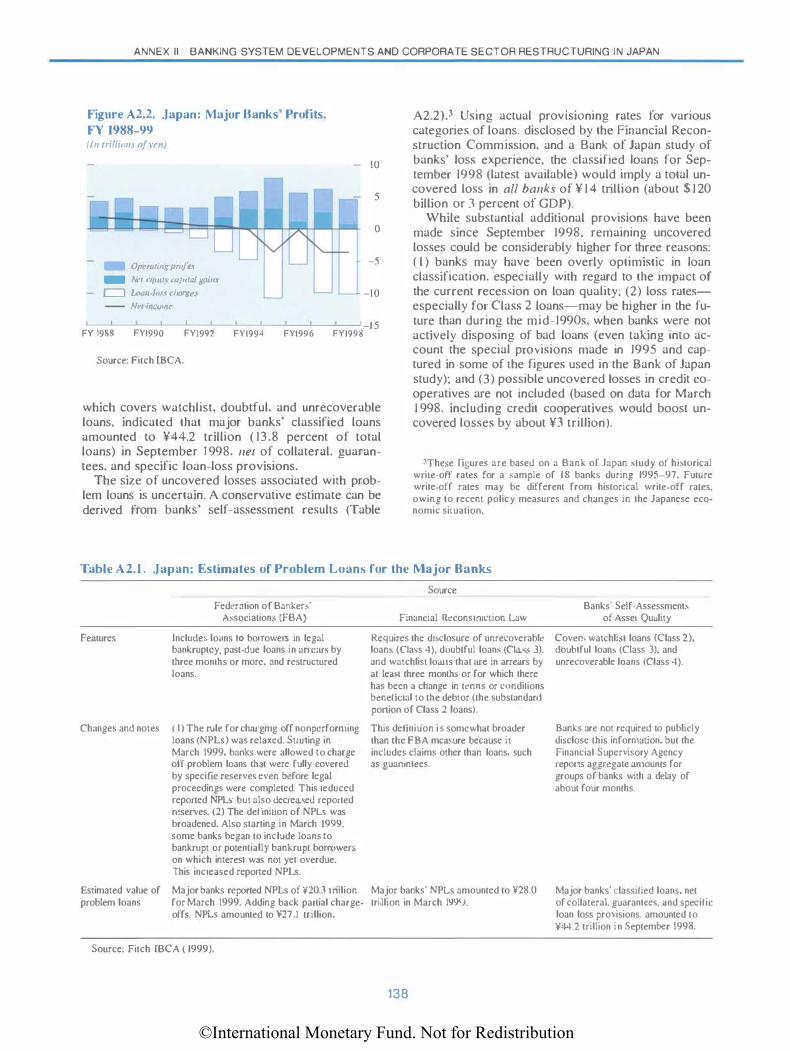
©International Monetary Fund. Not for Redistribution
ANNEX II BANKING SYSTEM DEVELOPMENTS AND CORPORATE SECTOR RESTRUCTURING IN JAPAN
Figure A2.2. Japan: Major Banks' Profits, FY 1988-99 (In trillions nj .n·n)
1&1 Opaarmg prn}iu - NN ,.,,.,;,., t·upilul �aiiU c:::J l..omr-/uu drarge.<
Vl'l ll!<'mnr
FY 1988 FYI990 FY1992
Source: Fitch lBCA.
u FY1994
10
5
0
f -l U L- -10
FY1996 FYI998 1 5
which covers watchlist, doubtful, and unrecoverable loans, indicated that major banks' classified loans amounted to ¥44.2 trillion ( 13.8 percent of total loans) in September 1 998, ne1 of collateral, guarantees. and specific loan-loss provisions.
The size of uncovered losses associated with problem loans is uncertain. A conservative estimate can be derived from banks' self-assessment results (Table
A2.2).3 Using actual prov1s10ning rates for various categories of loans. disclosed by the Financial Reconstruction Commjssion, and a Bank of Japan study of banks' loss experience, the classified loans for September 1998 (latest available) would imply a total uncovered loss in all banks of ¥ 1 4 trillion (about $ 1 20 billion or 3 percent of GDP).
While substantial additional provisions have been made since September 1998, remaining uncovered losses could be considerably higher for three reasons: ( l ) banks may have been overly optimistic in loan classification. especially with regard to the impact of the current recession on loan quality: (2) loss ratesespecially for Class 2 loans-may be higher in the future than during Lhe mid-1990s, when banks were not actively disposing of bad loans (even taking into account the special provisions made in 1995 and captured in some of the figures used in the Bank of Japan study): and (3) possible uncovered losses in credit cooperatives are not included (based on data for March 1 998. including credit cooperatives would boost uncovered losses by about ¥3 trillion).
3The•e figures are based on a Bank or Japan s1udy or hb10rical wrile-off ra1es for a sample of 18 bank!. during 1995-97. FuiUre wrile-·off rates may be different from historical wri1e-off rates. owing lo recent policy measures and ch:mges in lhe Japanese economic situation.
Table A2.1 . Japan: Estimates of Problem Loans for the Major Banks
Federalion of Bankers' Associations (FBA)
Source
Financial Reconslruction Law Banks· Self-Assessmenls
of Asse1 Quality
Femures Includes louns 10 borrowers in legal bankrup1cy, past·due loans in urrcars by three months or more. and restructured loans.
Requires 1he db-closure of unrecoverable Covers wa1chlisl loans (Class 2), loan;, {Cia's 4). doubtful loans (Cia�s 3). doublful loan� (Class 3), and and watchlist loans that arc in arrears by unrecoverable loans (Class 4). at lea.\1 three month� or for which there has been a change in terms or condi1ions benefictal to the debtor (the substandard ponion of Class 2 loans).
Changes and notes ( I J The rule for chargmg off non performing This definiuon is somewhat broader
Estimated value of problem loans
loans (NPLs) was relaxed. Starting in than the FBA mcru.ure because it March 1999. banks were allowed to charge includes claims other than loans. such off problem loans that were fully covered as guaranlees. by speci fie reserve� even before legal proceedings were completed. This reduced reported NPL' but also decreased reported reserves. (2) The definition of NPL� was broadened. Also slarting in March 1999. some banks began to include loans to bankrupt or potentially bankrupt borrower� on which interesl was not yet overdue. This increased reported NPLs.
Major banks reported NPLs of ¥20.3 trillion Major banks· NPLs amounted to ¥28.0 for March 1999. Adding back partial charge- trillion in March 1999. offs. NPL:. amounted to ¥27.1 trillion.
Source: Fitch fBCA ( 1999).
138
Banks nre not required to publicly disclose this infommion, but the Financial Supervisory Agency reports aggregate :unoums for groups or banks with a delay of about four months.
Major banks' classified loans, net of collateral. guaranlce�. and specific loan loss provisions. amounted to ¥44.2 trillion in September 1998.
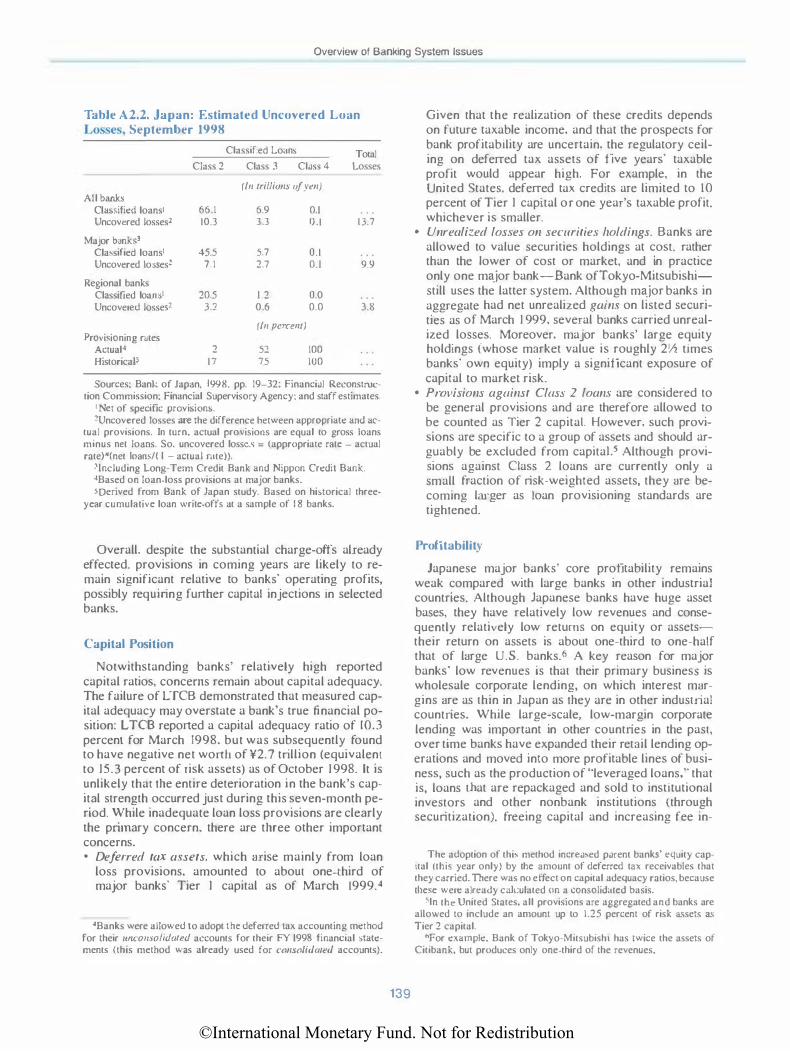
©International Monetary Fund. Not for Redistribution
Overview of Banking System Issues
Table A2.2. Japan: Estimated Uncovered Loan Losses, September 1998
Classified Loans Total Class 2 Class 3 Clas� 4 Losses
(In trillions of yen) All banks
Classified loans1 66.1 6.9 0.1 Uncovered losses� 10.3 3.3 0.1 13.7
Major banks3 Classified loans' �5.5 5.7 0.1 Uncovered losses2 7.1 2.7 0.1 9.9
Regional banks Classified loans' 20.5 1.2 0.0 Uncovered losses2 3.2 0.6 0.0 3.8
(In perr:em) Provisioning r.Jtes
Actual4 2 52 100 HistoricaJS 17 75 100
Sources: Ban!.. of Japan, 1998. pp. 19-32: Financial Reconstruction Commission: Financial Supervisory Agency: and staff estimates.
I Net of specific provisions. 2Uncovcred losses are the difference between appropriate and ac
tual provisions. In turn. actual provisions are equal to gross loans minus net loans. So. uncovered losses = (appropriate rate - actual rate)*(net loans/( I - actual rate)).
3Jncluding Long-Term Credit Bank and Nippon Credit Bank. 4Based on loan-loss provisions at major banks. soerived from Bank of Japan study. Based on hiMorical three
year cumulative loan write-offs at a sample of 1 8 banks.
Overall, despite the substantial charge-offs already effected, provisions in coming years are likely to remain significant relative to banks' operating profits, possibly requiring further capital injections in selected banks.
Capital Position
Notwithstandjng banks' relatively high reported capital ratios, concerns remain about capital adequacy. The failure of LTCB demonstrated that measured capital adequacy may overstate a bank's true financial position: LTCB reported a capital adequacy ratio of 10.3 percenl for March 1998. but was subsequently found to have negative net worth of ¥2.7 trillion (equivalent to 15.3 percent of risk assets) as of October 1998. It is unlikely that the entire deterioration in the bank's capital strength occurred just during this seven-month period. While inadequate loan loss provisions are clearly the primary concern. there are three other important concerns. • Deferred tax assets, which arise mainly from loan
loss provisions, amounted to about one-third of major banks' Tier I capital as of March 1999.4
4Banks were allowed to adopt the deferred lax accounting method for their wrco11solidared accounts for their FY 1998 financial �tatements (this method was already used for consolidated accounts).
139
Given that the realization of these credits depends on future taxable income. and that the prospects for bank profitability are uncertain, the regulatory ceiling on deferred tax assets of five years' taxable profit would appear high. For example, in the United States, deferred tax credits are limited to 10 percent of Tier I capital or one year's taxable profit. whichever is smaller.
• Unrealized losses on securities holdings. Banks are allowed to value securities holdings at cost. rather than the lower of cost or market, and in practice only one major bank-Bank ofTokyo-Mitsubishistill uses the latter system. Although major banks in aggregate had net unrealized gains on listed securities as of March 1 999, several banks carried unrealized losses. Moreover. major banks' large equity holdings (whose market value is roughly 2Y2 times banks' own equity) imply a significant exposure of capital to market risk.
• Provisions against Class 2 loans are considered to be general provisions and are therefore allowed to be counted as Tier 2 capital. However, such provisions are specific to a group of assets and should arguably be excluded from capitaLs Although provisions against Class 2 loans are currently only a small fraction of risk-weighted assets, they are becoming larger as loan provisioning standards are tightened.
Profitability
Japanese major banks' core profitability remains weak compared with large banks in other industrial countries. Although Japanese banks have huge asset bases, they have relatively low revenues and consequently relatively low returns on equity or assetstheir return on assets is about one-third to one-half that of large U.S. banks.6 A key reason for major banks' low revenues is that their primary busines:> is wholesale corporate lending, on which interest margins are as thin in Japan as they are in other industrial countries. While large-scale, low-margin corporate lending was important in other countries in the past, over time banks have expanded their rerail lending operations and moved into more profitable lines of business, such as the production of "leveraged loans.'" that is, loans that are repackaged and sold to institutional investors and other nonbank institutions (through securitization). freeing capital and increasing fee in-
The adoption of this method increased parent banks' equity capital (this year only) by the amount of deferred tax receivables that they carried. There was no e ffect on capital adequacy ratios, because these were already calculated on a consolidated basis.
sln the United States. all provisions are aggregated and banks are allowed to include an amount up lo 1.25 percent of risk a�set� as Tier 2 capital.
<>for example. Bank of Tokyo-Mitsubisht has twice the assets of Citibank. but produces only one-third of the revenues.
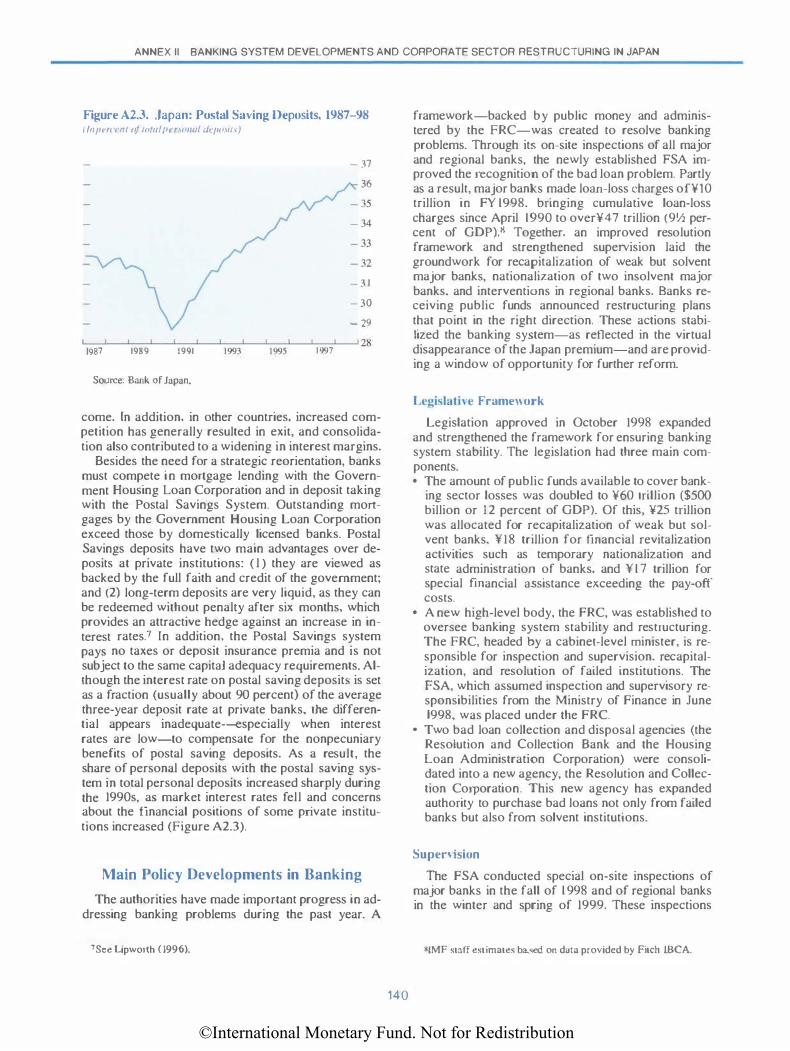
©International Monetary Fund. Not for Redistribution
ANNEX II BANKING SYSTEM DEVELOPMENTS AND CORPORATE SECTOR RESTRUCTURING IN JAPAN
Figure A2.3 . .Japan: Postal Saving l)eposil'i, 1987-98 (/np..rant oj /IJtalpt'fll!lllli tkpmir•)
- 37
36
- 3 1
- 30
- 29
L_��--�-L����--�����-J 28 1993 1995 1997 1987 1991 1989
Source: Bank of Japan,
come. In addition, in other countries, increased competition has generally resulted in exit, and consolidation also contributed to a widening in interest margins.
Besides the need for a strategic reorientation, banks must compete i n mortgage lending with the Government Housing Loan Corporation and in deposit taking with the Postal Savings System. Outstanding mo.rtgages by the Government Housing Loan Corporation exceed those by domestically licensed banks. Postal Savings deposits have two main advantages over deposits at private institutions: ( l ) they are viewed as backed by the full faith and credit of the government; and (2) long-term deposits are very liquid, as they can be redeemed without penalty after six months, which provides an attractive hedge against an increase in interest rates.7 In addition. the Postal Savings system pays no taxes or deposit insurance premia and is not subject to the same capital adequacy requirements. Although the interest rate on postal saving depositS is set as a fraction (usually about 90 percent) of the average three-year deposit rate at private banks, the differential appears inadequate-especialJy when interest rates are low-to compensate for the nonpecuniary benefits of postal saving deposits. As a result, the share of personal deposits with the postal saving system in total personal depositS increased sharply during the 1990s, as market interest rates fell and concerns about the financial positions of some private institutions increased (Figure A2.3).
Main Policy Developments in Banking
The authorities have made important progress in addressing banking problems during the past year. A
7See Lipworth ( 1996).
140
framework-backed by public money and administered by the FRC-was created to resolve banking problems. Through its on-site inspections of all major and regional banks, the newly established FSA improved the recognition of the bad loan problem. Partly as a result, major banks made loan-loss charges of¥10 trillion in FY 1998. bringing cumulative loan-loss charges since April 1990 to over¥47 triJlion (9Y2 percent of GDP).s Together, an improved resolution framework and strengthened supervision laid the groundwork for recapitalization of weak but solvent major banks, nationalization of two insolvent major banks. and interventions in regional banks. Banks receiving public funds announced restructuring plans that point in the right direction. These actions stabiLized the banking system-as retlected in the virtual disappearance of the Japan premium-and are providing a window of opportunity for further reform.
Legislati\.e Frame" ork
Legislation approved in October 1998 expanded and strengthened the framework for ensuring banking system stability. The legislation had three main componenrs. • The amount of public funds available to cover bank
ing sector losses was doubled to ¥60 trillion ($500 billion or 1 2 percent of GDP). Of this, ¥25 trillion was allocated for recapitalization of weak but solvent banks. ¥18 trillion for financial revitalization activities such as temporary nationalization and state administration of banks, and ¥ 1 7 trillion for special fmancial assistance exceeding the pay-off costs.
• A new high-level body, the FRC, was established to oversee banking system stability and restructuring. The FRC, headed by a cabinet-level minister, is responsible for inspection and supervision, recapitalization, and resolution of failed institutions. The FSA, which assumed inspection and supervisory responsibilities from the Ministry of Finance in June 1998, was placed under the FRC.
• Two bad loan collection and disposal agencies (the Resolution and Collection Bank and the Housing Loan Administration Corporation) were consolidated into a new agency, the Resolution and Collection Corporation. This new agency has expanded authority to purchase bad loans not only from failed banks but also from solvent institutions.
Supen ision
The FSA conducted special on-site inspections of major banks in the fall of 1 998 and of regional banks in the winter and spring of 1999. These inspections
B!MF staff estimates based on data provided by Fitch meA.

©International Monetary Fund. Not for Redistribution
Main Policy Developments in Banking
Table Al.3. Japan: Financial Supervisory Agency's Special Ins pections of Major Banks. December 1998 (In trillum.l of 1'<'11 1
Total credit LTCB and NCB
Class I LTCB and NCB
Class 2 LTCB and NCB
Class 3 LTCB and NCB
Class 4 LTCB and NCB
Required loan-loss provisions Of which:
LTCB and NCB
Assessment of Credit Quality. as of March I 998'
FSA Banks Difference
394.2 394.2 0.0 27.5 27.5 0.0
344.7 350.1 -5.4 19.6 21.5 -1.9
43.8 40.2 3.6 5.2 5.0 0.2
5.3 3.8 1.6 2.4 1.0 1.4
0.4 0.1 0.3 0.3 0.0 0.3
8.6 7.6 1.0
1.6 0.8 0.!!
Source: Financial Supervisory Agency (FSA). Note: LTCB stands for Long-Term Credit Bank: NCB stands
(here) for Nippon Credit Bank. ICiassilicd loans arc reported net of specific provisions.
were more intensive than in the pa<;t and provided the authorities with effectively simultaneous evaluations of banks' asset quality. Following lhe inspections, the FSA sent letters to banks, detailing its evaluation of each bank's loan classification. Banks were required to respond within a month and were encouraged to incorporate recommendations into subsequent loan classification exercises. The FSA's policy is not to comment publicly on any individual bank (with the exception of nationalized banks), but the FSA retains the ability to use market pressure to encourage compliance, for exanlple through frequent examinations, which would become known in the financial community.
The FSA found that major banks had understated classified loans by ¥5.4 trillion in March 1998 (Table A2.3). However, the bulk of the FSA's reclassification (¥3.6 trillion) was from Class I to Class 2, which implied little additional provisioning, and the only significant reclassification (¥1.6 trillion to Class 3) applied mainly to banks that were subsequently nationalized. Similarly, the FSA found significant discrepancies in loan provisioning only in the nationalized banks. These results were not surprising, given that the FSA's evaluation of the adequacy of Joan classification and provisioning was based on banks' own criteria. The FSA also found that regional banks had understated their problem loans as of March 1998, with the amount of reclassification ( 1 .4 percent of loans) being similar to that in major banks.
A new inspection manual was issued in April 1999 and will become effective in July. Although the new
141
manuaJ is intended to clarify-rather lhan strengthenexisting standards, it will effectively tighten standards by removiJ1g loopholes. The new manual is not expected to have a large impact on loan loss provisioning.
The increase in supervisory resources will allow for more frequent regular on-site inspections. Staff of the FSA's Inspection Department are to increase from 165 to 249. Although about 90 percent of current FSA staff are on secondment from other ministries, most are expected to remain at the FSA because it is already the principal agency for financial issues and will acquire the financial planning system function from the Ministry of Finance in 2000. The FSA's current objective is to inspect all major banks and about half the regional banks every year, and to inspect the remainder of lhe regional banks (generally the stronger ones) every other year. In addition, special inspections will focus on particular issues, such as Y2K preparedness.
Nationalization of Two Major Banks
The new bank legislation and the special inspections prepared the ground for lhe temporary nationalization of two major banks. LTCB 's stock price had started to drop sharply in June 1998 on reports that lhe bank was having difficulties raising funds. The authorities' initial plan-announced at the end of Junewas to merge LTCB with smaller Sumitomo Trust Bank, but lhis plan was eventually abandoned, in part because Sumitomo Trust was reluctant to take over LTCB's substandard loans. The failure i n September of Japan Leasing, one of LTCB 's main affiliates witll more than ¥1.5 trillion in debt (including ¥256 billion to LTCB and ¥150 biJiion to Sumitomo Trust), left little doubt that LTCB was insolvent and contributed to the buildup of market pressures. After LTCB applied for nationalization on October 23, lhe Deposit Insurance Corporation acquired all lhe outstanding shares and provided financial support, thus allowing LTCB to continue its regular operations and meet all of its obligations.
LTCB's capital turned out to be much lower than originally believed. LTCB reported a capital adequacy ratio of 10.3 percent for March 1998 and 6.3 percent for September 1998. At the time LTCB was nationalized in October, the FSA's special inspection found that the bank had negative net worth of ¥340 billion (about 1.9 percent of risk-weighted assets) as of endSeptember, including unrealized losses on securities holdings. In March 1999, the FRC declared that LTCB's negative net worth was in fact ¥2.7 trillion (15.3 percent of risk-weighted assets as of endSeptember) as of October 1998. LTCB 's losses were borne i n part by its former shareholders. as the share price for the nationalization was set at zero.
LTCB's government-appointed management is currently seeking a buyer for the bank with the assistance of a foreign investment advisor. To increase its attrac-
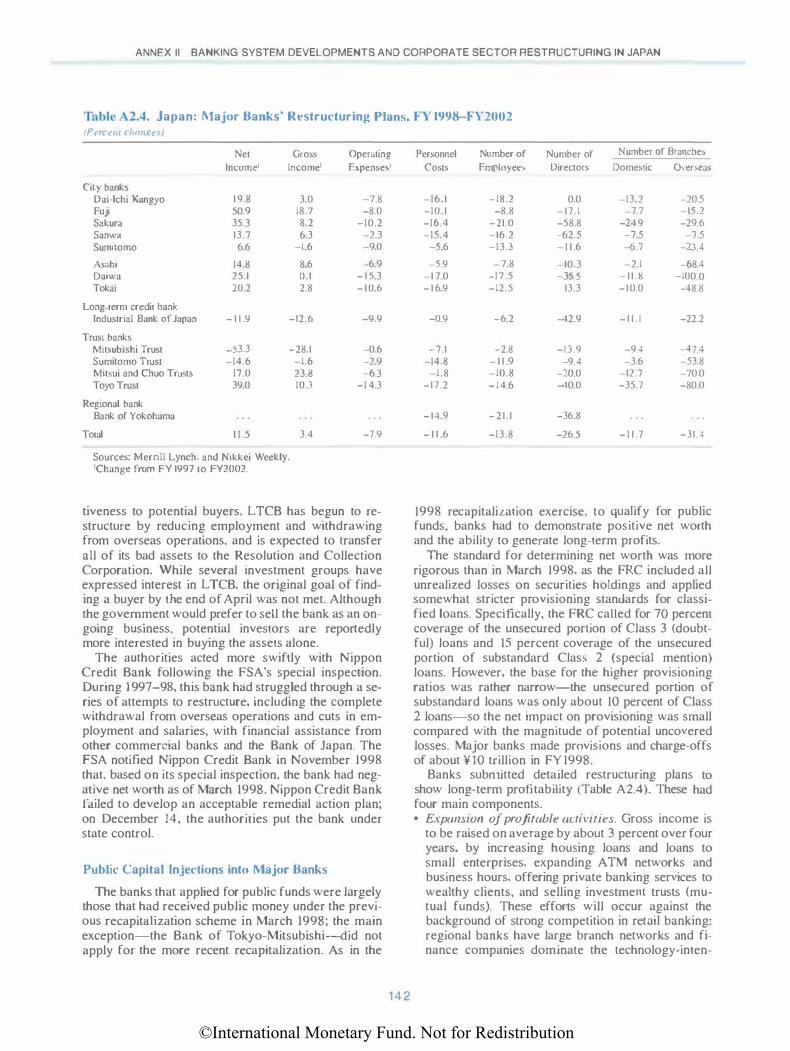
©International Monetary Fund. Not for Redistribution
ANNEX II BANKING SYSTEM DEVELOPMENTS AND CORPORATE SECTOR RESTRUCTURING IN JAPAN
Table A2.4. Japan: 1\tajor Banks' Restructuring Plans, FY 1998-FY2002 (Pacem chnngp I
Net Gross Operating Income' Income' Expenses'
City bank' Dai-lchi Kangyo 19.8 3.0 Fuji 50.9 18.7 Sakura 35.3 8.2 Sanwn 13.7 6.3 Sumuomo 6.6 -1.6
Asuhi 14.8 8.6 Daiwa 25.1 0.1 Tokai 20.2 2.8
Long-term credit bank Industrial Bank of Japan - 1 1 .9 -12.6
Trust banks Mitsubishi Trust -53.3 -28.1 Sumitomo Trust -14.6 -1.6 Mitsui and Chuo Trusts 17.0 23.8 Toyo Trust 39.0 10.3
Regional bank Bank of Yokohama
Total 1 1 .5 3.4
Sources: Merrill Lynch; and Nikkei Weekly. 'Change from FY 1997 to FY2002.
-7.8 -8.0
-10.2 -2.3 -9.0
-6.9 - 1 5.3 -10.6
-9.9
-0.6 -2.9 -6.3
-1 4.3
-7.9
tiveness to potential buyers, LTCB has begun to restructure by reducing employment and withdrawing from overseas operations. and is expected to lransfer all of its bad assets to the Resolution and Collection Corporation. While several investment groups have expressed interest in LTCB, the original goal of finding a buyer by the end of April was not met. Although the government would prefer to sell the bank as an ongoing business, potential investors are reportedly more interested in buying the assets alone.
The authorities acted more swiftly with Nippon Credit Bank following the FSA's special inspection. During 1 997-98, this bank had struggled through a series of attempts to restructure, including the complete withdrawal from overseas operations and cuts in employment and salaries, with financial assistance from other commercial banks and the Bank of Japan. The FSA notified Nippon Credit Bank in November 1998 that. based on its special inspection, the bank bad negative net worth as of March 1998. Nippon Credit Bank failed to develop an acceptable remedial action plan; on December 14, the authorities put the bank under state control.
Public Capital Injections into Major Banks
The banks that applied for public funds were largely those that had received public money under the previous recapitalization scheme in March 1998; the main exception-the Bank of Tokyo-Mitsubishi-did not apply for the more recent recapitalization. As in the
1 4 2
Personnel Number of Number of Number of Branches
Costs Employees Directors Domestic Overseas
-16.1 -18.2 0.0 -13.2 -20.5 -10.1 -8.8 -17.1 -7.7 -15.2 -16.4 -21.0 -58.8 -24.9 -29.6 -15.4 -16.2 -62.5 -7.5 -7.5
-5.6 -13.3 - 1 1 .6 -6.7 -23.4
-5.9 -7.8 -10.3 -2.1 -68.4 -1 7.0 -17.5 -35.5 -11.1! -100.0 -1 6.9 -12.5 13.3 -10.0 -48.8
-0.9 -6.2 -42.9 - I I . I -22.2
-7.1 -2.8 -13.9 -9.4 -47.4 -14.8 - 1 1 .9 -9.4 -3.6 -53.8
-1.8 -10.8 -20.0 -12.7 -70.0 -17.2 -14.6 -40.0 -35.7 -!10.0
-14.9 -21.1 -36.8
- 1 1 .6 -13.8 -26.5 - 1 1 .7 -31.4
1998 recapitalization exercise, to qualify for public funds, banks had to demonstrate positive net worth and the ability to generate long-term profits.
The standard for determining net worth was more rigorous than in March 1998, as the FRC included all unrealized losses on securities holdings and applied somewhat stricter provisioning standards for classified loans. Specifically, the FRC caiJed for 70 percent coverage of the unsecured portion of Class 3 (doubtful) loans and 15 percent coverage of the unsecured portion of substandard Class 2 (special mention) loans. However, the base for the higher provisioning ratios was ralher narrow-the unsecured portion of substandard loans was only about 10 percent of Class 2 loans-so the net impact on provisioning was small compared with the magnitude of potential uncovered losses. Major banks made provisions and charge-offs of about ¥10 trillion in FY 1998.
Banks submitted detailed restructuring plans to show long-term profitability (Table A2.4). These had four main components. • Expansion of profitable activities. Gross income is
to be raised on average by about 3 percent over four years. by increasing housing loans and loans to small enterprises, expanding ATM networks and business hours, offering private banking services to wealthy clients, and selling investmem trusts (mutual funds). These efforts will occur against the background of strong competition in retail banking: regional banks have large branch networks and finance companies dominate the technology-inten-
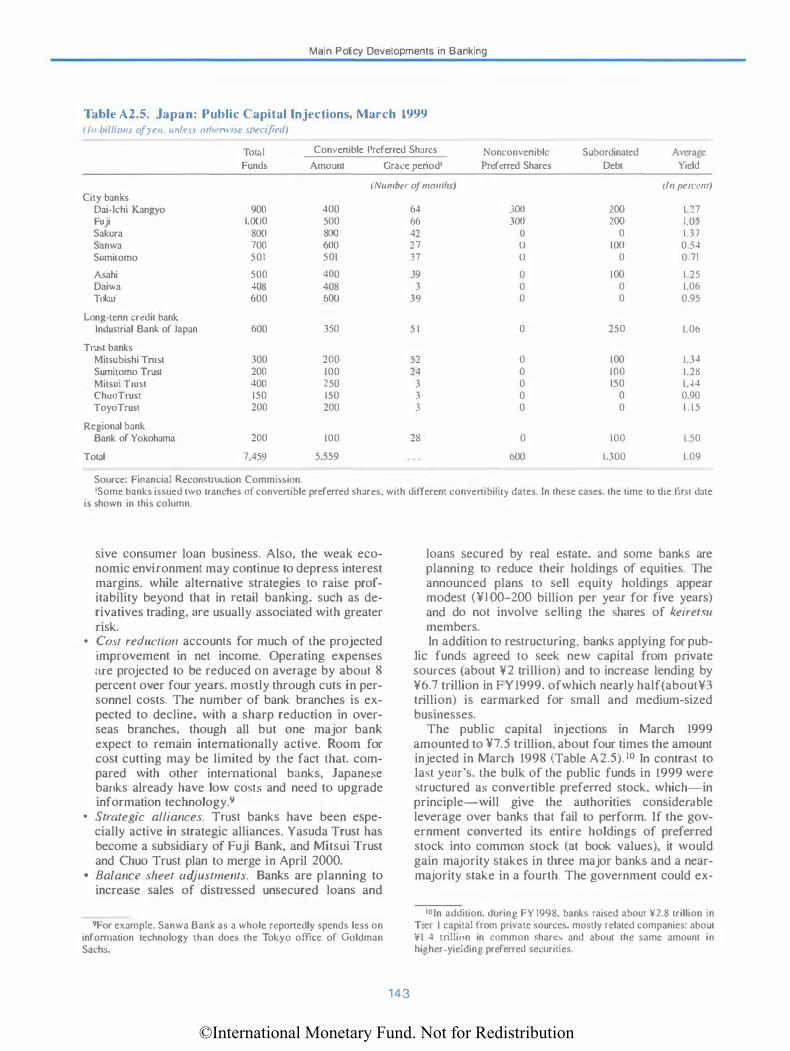
©International Monetary Fund. Not for Redistribution
Main Policy Developments in Banking
Table A2.5. Japan: Public Capital Injections, March 1999 (/11 bi/!tom of yen. unit• .\,\ othennsc .\peCI}icd)
Total Convenible Preferred Shares Nonconveniblc Subordinated Average Funds Amount Grace penod' Preferred Shares Debt Yield
(Number of momhs) (In peJt·enr) City banks
Dai-lchi Kangyo 900 400 64 JOO 200 1.27 Fuji 1,000 500 66 300 200 1.05 Sakura 800 800 42 () 0 1.37 Sanwa 700 600 27 () 100 0.54 Sumitomo 501 501 37 () 0 0.71
Asahi 500 400 39 0 100 1.25 Daiwa 408 408 3 0 0 1.06 Tokai 600 600 39 0 0 0.95
Long-tenn credit bank Industrial Bank of Japan 600 350 5 1 0 250 1.06
Trust banks Mitsubishi TnlSt 300 200 52 0 100 1.34 Sumitomo Trust 200 100 24 0 100 1.28 Mitsui TruM 400 250 3 0 150 1.44 ChuoTrust 150 150 3 0 0 0.90 ToyoTrust 200 200 3 0 0 1 . 15
Regional bank Bank of Yokohama 200 100 28 0 100 1.50
Total 7.459 5.559 600 1.300 1.09
Source: Financial Recon�r.n.1ction Commission. 'Some banks issued two tranches of convenible preferred shares. with different convenibiliry dates. In these cases, the time to tbe tirst date
is shown in this column.
sive consumer loan business. Also, the weak economic environment may continue to depress interest margins. while alternative strategies w raise profitability beyond that in retail banking. such as derivatives trading, are usually associated wilh greater risk.
• Cost reduction accounts for much of the projected improvement in net income. Operating expenses are projected to be reduced on average by about 8 percent over four years, mostly through cuts in personnel costs. The number of bank branches is expected to decline, with a sharp reduction in overseas branches, though all but one major bank expect to remain internationally active. Room for cost cutting may be limited by the fact that, compared with other international banks, Japanese ban.ks already have low costs and need to upgrade information technology.9
• Strategic alliances. Trust banks have been especially active in strategic alliances. Yasuda Trust has become a subsidiary of Fuji Bank, and Mitsui Trust and Chuo Trust plan to merge in April 2000.
• Balance sheet adjustments. Banks are planning to increase sales of distressed unsecured loans and
9For example, Sanwa Bank as a whole reponedly spends less on information technology than does the Tokyo office of Goldman Sachs.
143
loans secured by real estate. and some banks are planning to reduce their holdings of equities. The announced plans to sell equity holdings appear modest (¥1 00-200 billion per year for five years) and do not involve selling the shares of keiretsu members. In addition to restructuring, banks applying for pub
Lic funds agreed to seek new capital from private sources (about ¥2 trillion) and to increase lending by ¥6.7 trillion in FYJ999, ofwhich nearly half(about¥3 trillion) is earmarked for small and medium-sized businesses.
The public capital injections in March 1999 amounted to ¥7.5 trillion, about four times the amount injected in March 1998 (Table A2.5). 10 In contrast tO last year's. the bulk of the public funds in 1999 were structured as convertible preferred stock, which-in principle-will give the authorities considerable leverage over banks that fail to perform. If the government converted its entire holdings of preferred stock into common stock (at book values), it would gain majority stakes in three major banks and a nearmajority stake in a fourth. The government could ex-
IO(n addition. during FY 1998. banks raised about ¥2.8 trillion in Tier I capital from private sources. mostly related companies: about ¥1.4 trillion in common �har.:s and about the same amount in higher-yielding preferred securities.
©International Monetary Fund. Not for Redistribution
ANNEX II BANKING SYSTEM DEVELOPMENTS AND CORPORATE SECTOR RESTRUCTURING IN JAPAN
ercise its right to convert stock at these four banks as early as July 1999; conversion dates are longer-up to seven years-for stronger banks. The average yields to be paid on the public funds are low-even lower than the interest rates on last year's injections of subordinated debt-and Little differentiated across banks. The injections were funded by the Deposit Insurance Corporation, which borrowed ¥6.3 trillion from private financial institutions with a government guarantee.
Application of Prompt Corrective Action to Regional Banks
The regulatory authorities began implementing the prompt corrective action (PCA) framework for domestically active banks in April 1999 (internationally active banks became subject to PCA in April 1998). 1 1
On the basis of the FSA's special inspections, three second-tier regional banks-Kofuku, Kokurnin, and Tokyo Sowa-have been declared insolvent and three more have been required to implement a capital enhancement plan. The authorities confirmed that all deposits would be fully protected and appointed receivers to manage the banks' operations while buyers are sought. Receivership can last up to one year, though a bridge bank can take over within one year, and the banks are expected to sell their bad loans to the Resolution and Collection Corporation. Three more banks-first-tier Hokkaido Bank and secondtier Niigata Chuo and Namihaya-have been ordered to increase their capital to meet the newly effective 4 percent capital adequacy ratio for banks that only operate domestically.
Measures to Facilitate Debt Workoulo; and Bad Loan Disposal
The tax code was amended in June 1998 to facilitate debt workouts. Specifically, banks were permitted to deduct from taxable income the losses incurred from out-of-court debt restructuring agreements, and debtors were allowed to offset the corresponding windfall gains against past losses. To benefit from this favorable tax treatment, the debt workout agreement must involve a comprehensive restructuring plan and be approved by all creditors.
The October 1998 bank legislation aided disposal of bad loans by legalizing private loan collection companies. Until recently, only lawyers had been allowed to collect loans on behalf of financial institutions. Under the new law, private companies not only may collect loans on behalf of financial institutions but they may also buy collateralized loans from financial institu-
• •For details of the PCA framework, see International Monetary Fund (1998).
144
tions and collect loans on their own account. Thus far, the Ministry of Justice has licensed 4 companies and expects to license about 30 altogether by the summer.
Legislation enacted in June 1998 facilitated the creation of special purpose vehicles. The new securitization Jaw, which regulates securities backed by loans collateralized by real estate, enhances the special purpose vehicles' ability to secure claims on specific assets by creating a centralized system for registering secured interest in (or ownership of) specified financial assets. Under the new law, the original borrowers no longer need to be notified about the sales of their loans. Favorable tax treatment was also granted to special purpose vehicles and related transactions.
Implementation of Big Bang Reforms
The "Big Bang" financial reforms remain on schedule. Following the enactment of tbe Financial System Reform Law in June J 998, most remaining measures were implemented during the course of FYl998. Important recent changes include allowing banks to sell investment trusts (mutual funds), establishing investor protection schemes for the life iJ1surance, non-life insurance, and securities industries, abolishing the securities transaction tax, instituting market pricing of short-term govemment financing bills, and allowing finance companies to issue bonds to raise funds for lending.l2 Among the remaining reform measures, three major ones are scheduled to take effect in October 1999: commercial banks will be allowed to issue straight bonds, restrictions on the stock brokerage business of banks' securities subsidiaries will be lifted, and brokerage commissions will be fully liberalized. Cross-sectoral competition between banks and insurance companies will be allowed at some time in the future.
Remaining Challenges
Planned Removal of Blanket Deposit Insurance
The planned removal of blanket deposit insurance in 2001 is refocusing attention on banking sector restructuring. Given that there are potential uncovered losses and given the uncertainty about banks' future profitability, the planned replacement of blanket deposit insurance with linuted insurance in April 2001 is
12Hitheno, nonbank$ were allowed to use funds raised through bonds for capital investment, but had to raise loanable funds through bank borrowing or equity financing. The right to issue bonds to raise loanable funds will be limited to nonbanks capitalized at over¥ I billion (these non banks also have to meet the same standards for bad loan disclosure as banks). This change is expected to benefit large nonbanks engaged in mongage lending, consumer lending, and leasing.

©International Monetary Fund. Not for Redistribution
Financial Reorganization and Corporate Restructuring
raising interest spreads on bank debentures with maturities greater than two years. While the prospect of market discipline could spur bank restructuring efforts, markets could begin anticipating liquidity problems well ahead of April 2001. The government must be prepared in case important weaknesses remain.
Recognition and Provisioning of Bad Loans
Notwithstanding the improvement in supervision, concerns remain that bad loans may not be fully recognized and adequately provisioned. The authorities might consider four steps to address these concerns. First, loan classification and provisioning standards, especially for Class 2 loans, as well as capital adequacy requirements, might be further strengthened. Second, supervision could be further improved by increasing the FSA's resources, to allow more frequent on-site inspections of troubled banks, and increasing its autonomy, including through independent funding (such as levies on supervised institutions) and the authority to set its own salaries.l3 Third, adequate provisioning could be encouraged through the automatic tax deductibility of specific provisions consistent with loan classification standards, subject to future recapture if actual losses tum out to be less than expected.14 Finally, disclosure standards could be strengthened by increasing the frequency and depth of disclosure, with, for example, quarterly rather than semiannual disclosure and full disclosure of self-assessments. including gross amounts of loans by asset class, the amounts covered by collateral or guarantees, and provisions.
.Bank Restructuring
Major banks' restructuring plans by themselves may not boost core profitability. Market participants consider that banks need to more aggressively consolidate (to generate economies of scale), securitize corporate loan portfolios, and expand fee-based income. Although the mergers announced so far are welcome, they are probably not sufficient to eliminate the excess capacity in the banking system. The authorities could facilitate restructuring in three ways. First, the injection of further public funds could be tied to a market test, such as a requirement to raise matching funds from private markets. Second, the early exit of nationali.zed banks from the marketplace could be encouraged, for example, by allowing them to cease func-
13Jmproved supervision is especially important in light of the Big Bang financial reforms that expand banks' range of activities.
14The recent tax change that allows banks to deduct debt forgiveness did not address the deductibility of provisions. Currently, provisions are automatically deductible only under certain narrow circumstances; otherwise tax deductibility depends on ruJings by the tax authorities.
145
tioning as ongoing concerns while selling off their assets and liabilities. Finally, strategies to reduce the role of the public sector in financial intermediation (e.g., the Postal Savings system) could be considered.
Disposal of Bad Loans
The pace of bad loan disposal remains slow. Analysts have often noted the importance of sales of loans and collateral to introduce better recognition of value and to establish realistic floors on asset prices. Delayed progress on this front is impeding restructuring in banks and nonfinancial corporations. The main obstacle is inadequate recognition of bad loans, as disposal would force banks to realize additional losses. In addition to ensuring the full recognition of loan losses, the authorities could encourage the Resolution and Collection Corporation to periodically auction bad loans that it has acquired from failed financial institutions.
Financial Reorganization and Corporate Restructuring
Japanese corporations have Jagged behind their counterparts in several large industrial countries throughout the 1990s. While a number of large exportoriented companies remain international leaders, a general concern has surfaced that many Japanese firms are too highly leveraged, inefficient, and in need of real or financial restructuring. The depletion of many firms' financial resources and a gloomy profit outlook have led to a persistent decline in equity prices since their high at the start of 1990. Credit ratings have been reduced for many Japanese corporations-including major trading companies. Indeed, the consequences of the large expansion of credit during the years of rapid increases in asset prices (notably land) in the 1980s, and the surge in investment that accompanied it. continue to have ramifications throughout the corporate sector, contributing to low corporate profitabiJjty. A reallocation of resources continues to be hindered by several factors, including shortcomings of existing insolvency laws, the weak capital position of banks. and firms' reluctance to shed labor.
Several factors have raised concerns about the Japanese corporate sector. First, the high level of corporate investment during the late 1980s yielded low real rates of return; much of this investment was directed to sectors in which Japan li.kely did not have a comparative advantage. and similar diversification strategies pursued by many large ftrms led to excess capacity in several markets.15 Second, Japanese com-
15See, for example. Mitsuhiro ( 1994): and Moriaki and Yoshinobu ( 1997).
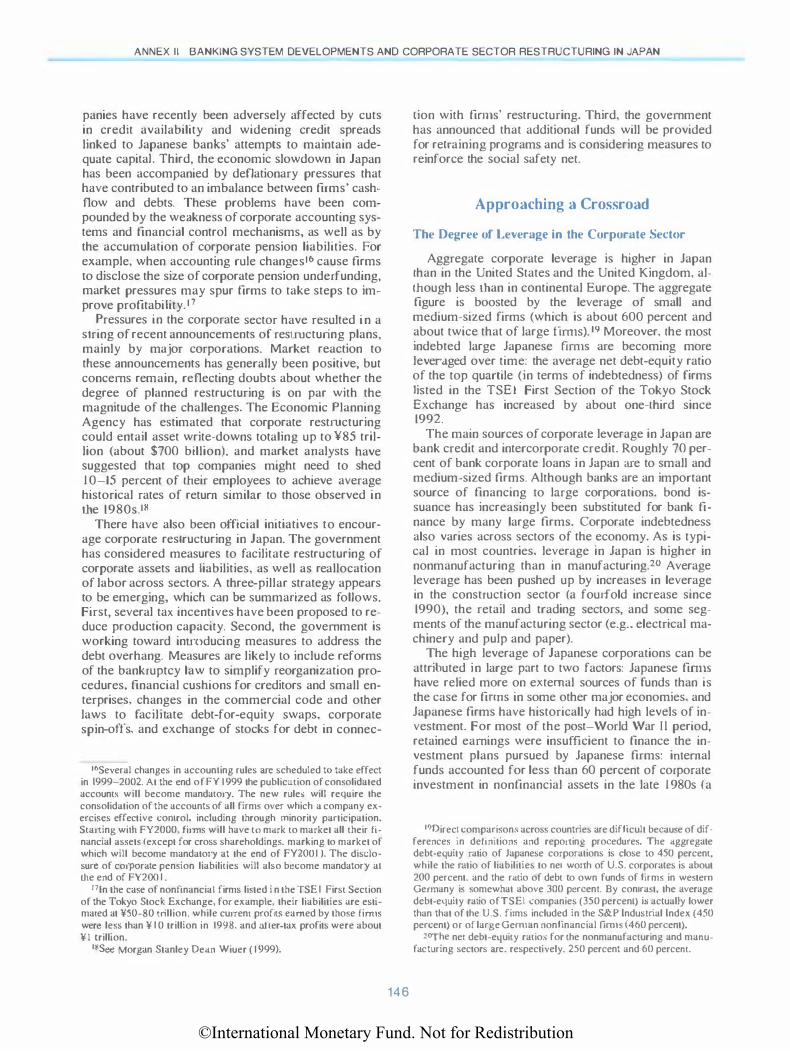
©International Monetary Fund. Not for Redistribution
ANNEX II BANKING SYSTEM DEVELOPMENTS AND CORPORATE SECTOR RESTRUCTURING IN JAPAN
panies have recently been adversely affected by cuts in credit availability and widening credit spreads linked to Japanese banks' attempts to maintain adequate capitaL Third, the economic slowdown in Japan has been accompanied by deflationary pressures that have contributed to an imbalance between firms' cashflow and debts. These problems have been compounded by the weakness of corporate accounting systems and financial control mechanisms, as well as by the accumulation of corporate pension liabilities. For example, when accounting rule changes16 cause firms ro disclose the size of corporate pension underfunding, market pressures may spur firms to take steps to improve profitabi I i ty. 1 7
Pressures in the corporate sector have resulted i n a string of recent announcements of restructuring plans. mainly by major corporations. Market reaction to these announcements has generally been positive, but concerns remain, reflecting doubts about whether the degree of planned restructuring is on par with the magnitude of the challenges. The Economic Planning Agency has estimated that corporate restructuring could entail asset write-downs totaling up to ¥85 trillion (about $700 billion), and market analysts have suggested that top companies might need to shed I 0-15 percent of their employees to achieve average historical rates of return similar to those observed in the 1980s.18
There have also been official initiatives to encourage corporate restructuring in Japan. The government has considered measures to facilitate restructuring of corporate assets and liabilities, as well as reallocation of labor across sectors. A three-pillar strategy appears to be emerging, which can be summarized as follows. First, several tax incentives have been proposed to reduce production capacity. Second, the government is working toward inu·oducing measures to address the debt overhang. Measures are likely w include reforms of the bankruptcy law to simplify reorganization procedures, financial cushions for creditors and small enterprises. changes in the commercial code and od1er laws to facilitate debt-for-equity swaps, corporate spin-offs, and exchange of stocks for debt in connec-
16Several changes in accoun1ing rules are scheduled lO take effect in 1999-2002. At the end ofFY 1999 the publication of consolidated account� will become mandatory. The new rule, will require the consolidation of the accounts of all firms over which a company exercises effective com:rol, including through minority participation. Starting with FY2000, �irms will have tO mark to market all their financial assets (except for cross shareholdings. marking to market of which will become mandatory at the end of FY200 I ). The disclosure of corpor.ue pension liabilities will also become mandatory a1 the end of FY200 I .
'7In the case of nonfinancial firms listed i n the TSE I First Section of the Tokyo Stock Exchange, for example, their liabilities ;are estimated at ¥50-80 trillion. while current profits earned by those !inns were less than ¥ I 0 trillion in 1998, and after-tax profits were about ¥ 1 trillion.
18See Morgan Stanley Dean Wiuer ( 1 999).
146
lion with fim1s' restructuring. Third, the government has announced that additional funds will be provided for reu·aining programs and is considering measures to reinforce the social safety net.
Approaching a Crossroad
The Degree of Leverage in the Corporate Sector
Aggregate corporate leverage is higher in Japan than in the United States and the United Kingdom, although less U1an in continental Europe. The aggregate figure is boosted by the leverage of small and medium-sized firms (which is about 600 percent and about twice that of large firms). l9 Moreover, the most indebted large Japanese fmns are becoming more leveraged over time: the average net debt-equity ratio of the top quartile (in terms of indebtedness) of firms listed in the TSEI First Section of the Tokyo Stock Exchange has increased by about one-lhird since 1992.
The main sources of corporate leverage in Japan are bank credit and intercorporate credit. Roughly 70 percent of bank corporate loans in Japan are to small and medium-sized firms. Although banks are an important source of financing ro large corporations. bond issuance has increasingly been substituted for bank finance by many large firms. Corporate indebtedness also varies across sectors of the economy. As is typical in most countries, leverage in Japan is higher in nonmanufacturing than in manufacturing.20 Average leverage has been pushed up by increases in leverage in the construction sector (a fourfold increase since 1990), the retail and trading sectors, and some segments of the manufacturing sector (e.g .. electrical machinery and pulp and paper).
The high leverage of Japanese corporations can be attributed in large part to two factors: Japanese firms have relied more on external sources of funds than is the case for finns in some other major economies. and Japanese firms have historically had high levels of investment. For most of the post-World War Tl period, retained earnings were insufficient to finance the investment plans pursued by Japanese firms: imernal funds accounred for less than 60 percent of corporate investment in nonfinancial assets in the late I 980s (a
19Direct comparison> across countries are difficult because of differences in definitions and reporting procedures. The aggregate debt-equity ratio of Japanese corporations is close to 450 percent, while the ratio of liabilities to ne1 worth of U.S. corporales is about 200 percent. and the ratio of debt to own funds of firms in western Gennany is somewhat above 300 percent. By contrast, the average debt-equity ratio ofTSEI companies (350 percenl) b aclually lower than that of the U.S. firms included in the S&P Industrial Index (450 percent) or of large German nonfinancial firn1s (460 percent).
20"fhe net debt-equity ratios for the nonmanufacturing and manufacturing sectors are. respectively. 250 percent and 60 percent.
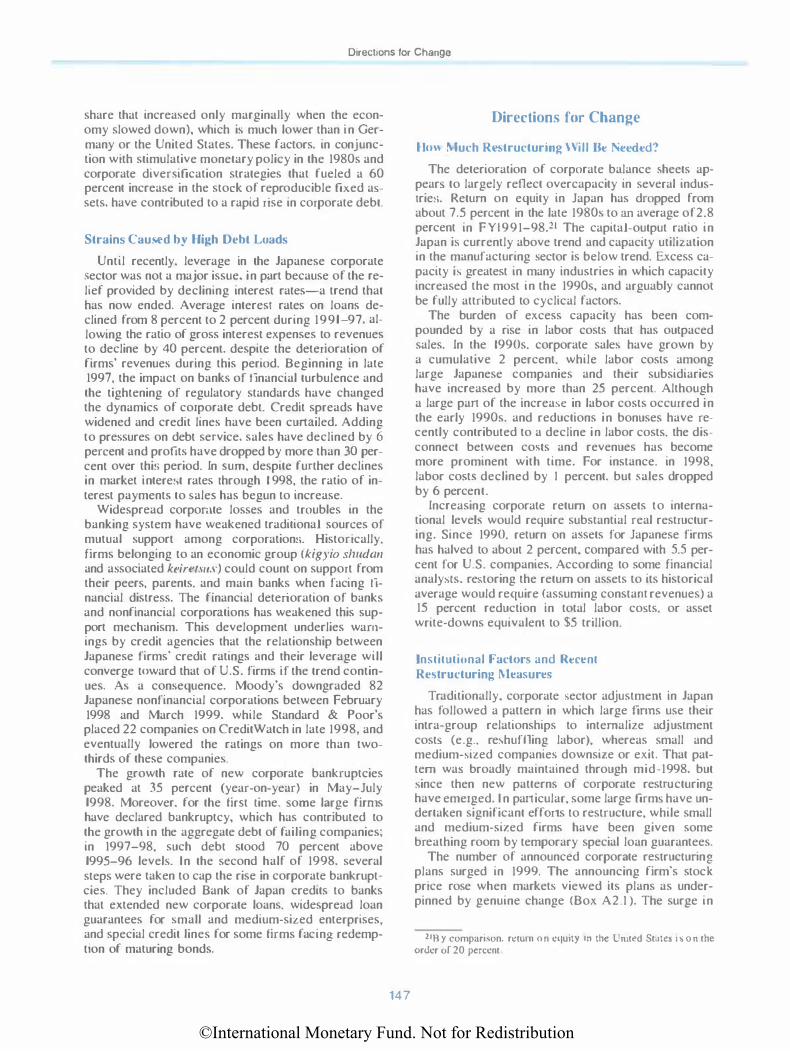
©International Monetary Fund. Not for Redistribution
Directions for Change
share that increa�ed only marginaJJy when the economy slowed down), which i� much lower than in Germany or the United States. These factors. in conjunction with stimulative monetary policy in the 1980s and corporate diversification strategies that fueled a 60 percent increase in the stock of reproducible fixed assets, have contributed to a rapid rise in corporate debt.
Strains Cauwd b} lli�h Debt Loads
Until recently, leverage in the Japanese corporate :-.ector was not a major issue, in part because of the relief provided by declining interest rates-a trend that has now ended. Average interest rates on loans declined from 8 percent to 2 percent during 1991-97, allowing the ratio of gross interest expenses to revenues to decline by 40 percent. despite the deterioration of firms' revenue� during this period. Beginning in late 1997, the impact on banks of financial turbulence and the tightening of regulatory standards have changed the dynamics of corporate debt. Credit spreads have widened and credit line� have been curtailed. Adding to pre�sures on debt service. sales have declined by 6 percent and profit� have dropped by more than 30 percent over thi'> period. In �urn, despite further declines in market i ntere<,t rates through 1 998, the ratio of interest payments to <,ale� has begun to increase.
Widespread corporate losses and troubles in the banking system have weakened traditional sources of mutual �upport among corporation::.. Historically. firms belonging to an economic group (kigyio slwdan and a!>sociated keiretsu.\·) could count on support from their peers, parents. and main banks when facing financial distress. The financial deterioration of banks and nonfinancial corporations has weakened this support mechanism. This development underlies warnings by credit agencies that the relationship between Japanese firms' credit ratings and their leverage will converge tOward that of U.S. firms if the trend continues. A� a con�equence. Moody's downgraded 82 Japanese nonfinancial corporations between February 1998 and March 1999, while Standard & Poor's placed 22 companies on Credit Watch in late 1998, and eventually lowered the ratings on more than twothirds of these companie�.
The growth rate of new corporate bankruptcies peaked at 35 percent (year-on-year) in May-July 1998. Moreover, for the fir�t lime. <;orne large fim1s have declared bankruptcy, which has contributed to the growth in the aggregate debt of failing companies; in 1997-98. such debt stood 70 percent above 1995-96 level!>. In the second half of 1998. several steps were taken to cap the rise in corporate bankruptcies. They included Bank of Japan credits to banks that extended new corporate loans. widespread loan guarantees for �mall and medium-sized enterprises, and special credit lines for some firms facino redemp-tion of maturing bonds.
0
147
Directions for Change
lltm \luch R�\tructurin� \\ ill llc \'l'l'<icd?
The deterioration of corporate balance c;heets appear\ to largely renect overcapacity in several induserie:-.. Return on equity in Japan has dropped from about 7.5 percent in the late 1980� to an average of2.8 percent in FYI991-98.21 The capital-output ratio in Japan i-; currently above trend and capacity utiliLation in the manufacturing !>ector is below trend. Excess capacity il-. greatest in many industries in which capacity increased the most in the 1990s, and arguably cannot be fully attributed to cyclical factors.
The burden of excess capacity has been compounded by a rise in labor costs that has outpaced sales. In the 1990s. corporate sale� have grown by a cumulative 2 percent. while labor costs among large Japanese companies and their subsidiaries have increased by more than 25 percent. Although a large pan of the increa\c in labor costs occurred in the early 1990s. and reductions in bonuses have recently contributed to a decline in labor costs. the disconnect between coMs and revenues has become more prominent with time. For instance. in 1998, labor cost<; declined by I percent. but o,ales dropped by 6 percent.
Increasing corporate return on assets to international leveb. would require substantial real restructuring. Since 1990. return on ao,sets for Japanese firms has halved to about 2 percent. compared with 5.5 percent for U.S. companies. According to some financial analyMs. rc.'>toring the return on assets to its historical average would require (assuming constam revenues) a 15 percent reduction in total labor costs. or asset write-downs equivalent to $5 trillion.
I nstitutiunal Factor., and l�crcnt Re<,lructurinJ.: 1\lcasurc'>
Traditionally. corporate !>ector adjustment in Japan has followed a pattern in which large tirms use their intra-group relationships to internalize adjustment cost\ (e.g.. rel>huffling labor). whereas small and medium-'>ited companie� downsize or exit. That pattern wa., broadly maintained through mid-1998. but \ince then new patterns of corporate restructuring have emerged. I n particular. some large firms have undertaken significant efforts to restructure. while small and medium-siLed firms have been given some breathing room by temporary special loan guarantees.
The number of announced corporate restructurino plans surged in 1999. The announcing firm's stock
price rose when market� viewed its plans as underpinned by genuine change (Box A2.1 ). The surge in
�1 By compari�on. return on equity 10 the Umted Stat.:� i� on the order or 20 percent
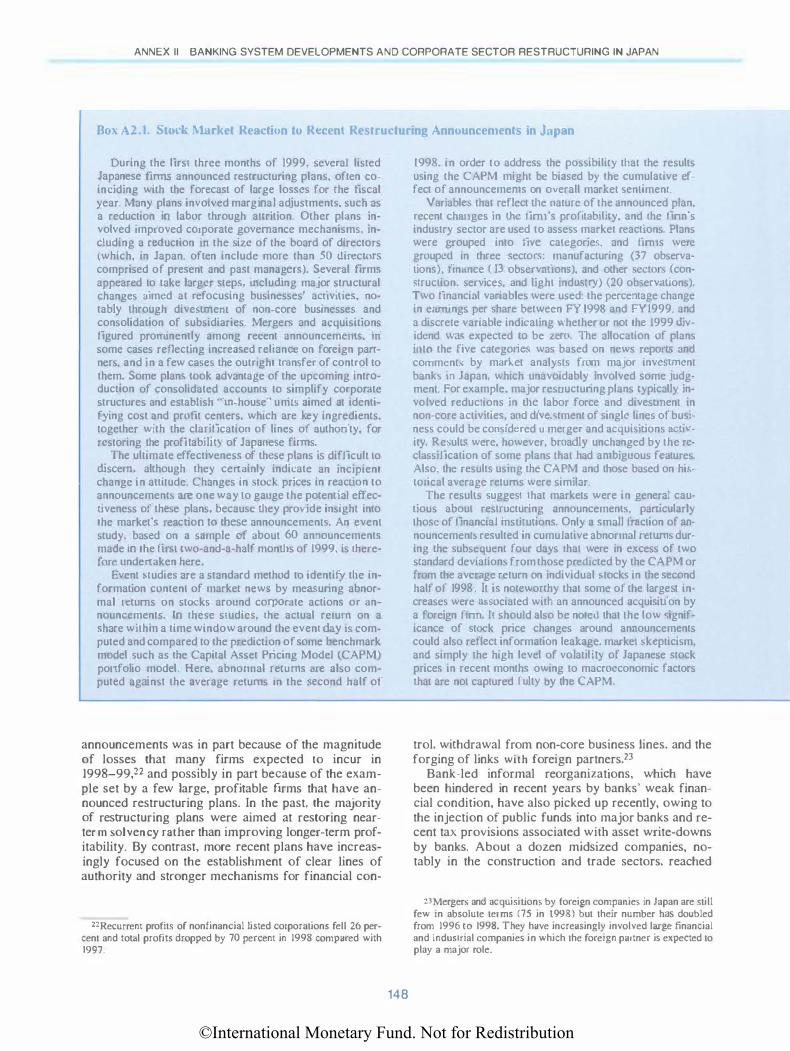
©International Monetary Fund. Not for Redistribution
ANNEX II BANKING SYSTEM DEVELOPMENTS AND CORPORATE SECTOR RESTRUCTURING IN JAPAN
Box A2.1. Stod Mm·ket Reaction to Recent Restructuring Announcements in Japan
During the lirst three months of 1999. several listed Japanese firms announced restructuring plans. often coinciding with the forecast of large lossc� for rhe liscal year. Many plan� invoh·ed marginal adJustment�. such as a reduction in labor through attrition. Other plans involved improved corporate governance mechanism!>, including a reduction in the �ize of the board of directors (which, in Japan. often include more than 50 directors comprised of present and past managers). Several hrms appeared to take larger <;tep�. including major structural changes mmed at refocusing businesses· ac11vit1es, notably through dive:o.tmem of non-core businesse\ and consolidation of subsidiaries. Merger<; and acquisition:.. figured prominently among recent announcements. m some cases renecting increased reliance on foreign panners, and in a few cases the outright rmnsfer of control to them. Some plan� took advantage of the upcoming introduction of consolidated account<> to simplify corpomtc structures and estabhsh "in-house" umb aimed at identifying cost and prolit centers. wh1ch are key ingredients, together with the clarification of lines of authority, for restoring the profitabilit) of Japanese firm�.
The ultimate effectiveness of these plans as diflicult to discern. although they ccnainly indicate an incipient change in attitude. Changes in stod .. prices in reaction to announcements arc one way to gauge the potential effectiveness of the�e plans, becau�c the)' pro\ ide insighr into the market's rcacuon to these announcemenrs. An event study. based on a sample of about 60 announcements made in the liN two-and-a-half months of 1999. is therefore undenaken here.
Evenr Mudie� are a standard method to identify the information content of market new-. by measunng abnormal returns on stocks around coll)Ornte actions or announcements. In these studie�. the actual rerum on a share withm a time window around the event day IS computed and compared to the prediction of some benchmark model such as the Capital Asset Pncing Moue! <CAPM) portfolio model. Here. abnormal returns are also computed against the average returns in the :..ccond half of
announcements was in part because of the magnitude of losses that many firms expected to incur in 1998-99,22 and possibly in part because of the example set by a few large, profitable firms that have announced restructuring plans. In the past, the majority of restructuring plans were aimed at restoring nearter m solvency rather than improving longer-term profitability. By contrast, more recent plans have increasingly focused on the establishment of clear lines of authority and stronger mechanisms for financial con-
21Recurrent profits of nonfinancial listed corporations fell 26 percent and to tal profits dropped by 70 percent in 1998 compared with t997.
148
1998. in order to address the possibility that the results using the C APM might be biased b) the cumulative effect of announcemems on overall market sentiment.
Variabl� that reflect the nature of the announced plan. recent changes in the tirnl's profitabllity, and the linn's industry secror are used to assess market reactions. Plans were grouped into live categoric�. and tirn1� were groupc.cl in three secto rs: manufacturing (37 observations), tinunce ( 13 observntton'>), and other .. ectors (con�truction. �ervice\, and light indu�Lry) (20 observations). Two financ10l variables were used: the percentage change in earnings per share between FY 1998 and FYI999, and a discrete variable indiCating whether Of not the 1999 UiV· idcnd wa' expected to be Lcm. The allocation uf plans intll the Jive catego1ics wa� based on new� repon., and comments by market analysts from major invc.\lmcnt banh in Japan. which unavoidably involved some judgment. For example. major resrructunng plans typically involved reduction� in the labor force and divesunent in non-core activities, and drvestmcnt of �inglc lines of business could be consadcred u merger and acquisiuons activity. Re�ults were. however. broadly unchanged by the rccla�silication of some plans that had ambiguous features. Also. the result<; usmg the CAPM and those based on hi'>torical average returns were similar.
The results suggesr rhat markets were in general cau· tious about restructuring announcemenb. panicularly those of linancial msurutions. Only a small fraction of announcemenl5 resulteu in cumulative abnormal return� dur· ing the �ubsequent lour days that were in excess of two standard dev1ations from those predicted by the CAPM or from the avcruge return on individual ... rocks in the second half of 1998 It is noteworthy that some ol the largest increases were asl>ociated with an announced acquisition by a foreign linn. It should also be noted that the low -;ignificance of stock pnce changes around announcements could also ret1cct information leakage. marker ... kcpticism. ami simply the h1gh level of volatility or Japanese stock prices in recent months owing to macroeconomic factors rhat are not captured full> by the CAPM.
trol. withdrawal from non-core business Jines. and the forging of links with foreign partners.23
Bank-led informal reorganizations, which have been hindered in recent years by banks' weak financial condition, have also picked up recently, owing to the injection of public funds into major banks and recent tax provisions associated with asset write-downs by banks. About a dozen midsized companies, notably in the construction and trade sectors, reached
23Merger� and acquisitions by foreign companies in Japan are still few in absolute terms (75 in 1998) but their number has doubled from 1996 10 1998. They have increasingly involved large financial and industrial companies in which the foreign partner is expected to play a major role.
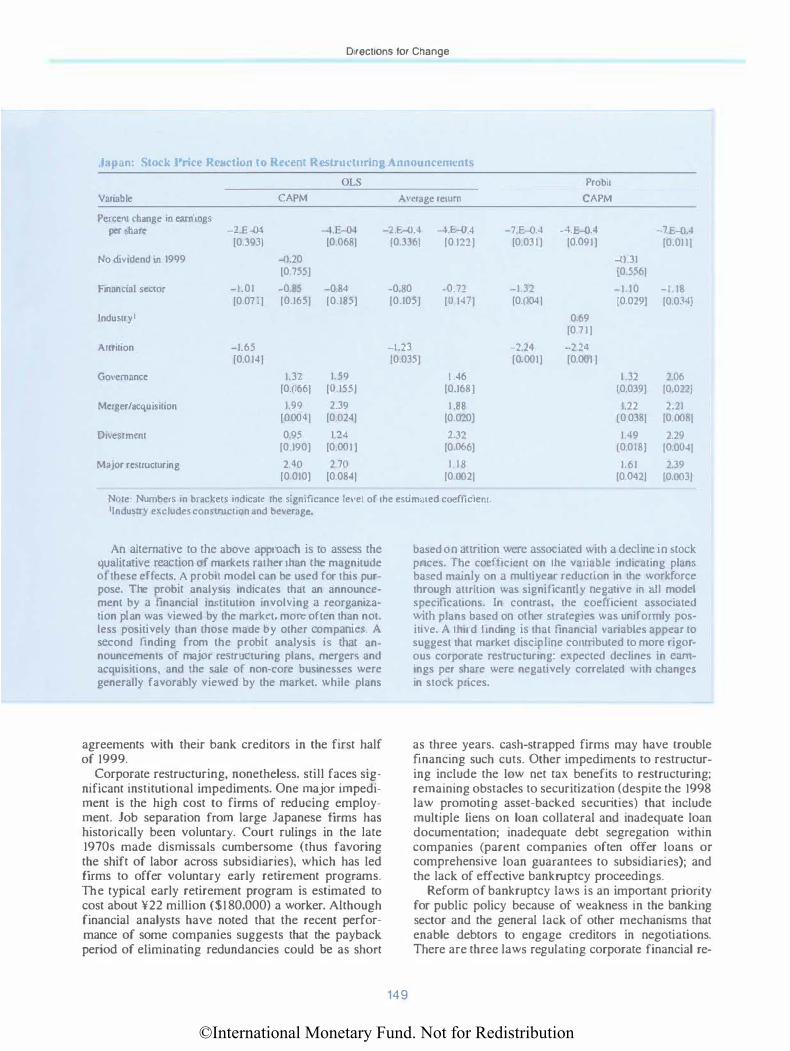
©International Monetary Fund. Not for Redistribution
Directions for Change
.Japan: Stock l,rice Reaction to l�t>eent HCSIItJC.:tl'' ing Announcements OLS Probit
Variable CAPM Average return CAPM
Percent change io earning• per �hare -l..E-{)4 -J.E-04 -2.E-0.4 -4..E-0.4 -7.E-0.4 -4.E-0.4 -7.E-0.4
[0.3931 [0.0681 [0.3361 [0.1221 [0.031 ) [0.091] [0.01 1 J No dividend tn 1999 -0.20 -0.31
(0.7551 [0.5561
Financtal sector -1.01 -0.85 -0.84 -0.80 -0.72 -1.32 -1.10 -1 . 18 [0.071) [0.165) [0.185] [0.1051 [0.147) [0.()()41 [0.029] [0.034)
lndu�try1 0.69 [0.7 1 )
Anrition -1.65 -1.23 -2.24 -2.14 10.014) (0.0351 10.0011 10.001 )
Governance 1.32 1.59 1 .46 I 32 2.06 [0.(>661 (0.155] [0.168) [0.0391 [0.022)
Merger/acqui5ition 1.99 2.39 1 .88 1.22 2.21 [00041 [0.0241 [0 0201 (0.0381 [0.0081
Divestment 0.95 1.24 2.32 1.49 2.29 [0.1901 [0.001 ] [0.066] (0.018] [0.0041
MaJOr restructuring 2.40 2.70 1 . 18 1.61 2.39 [0.010] (0.0841 [0.0021 [0.042] [0.003]
Note: Numbers in brackets indicate the significance le,•el of the esumated coeffic1enr. 'I ndu�try excludes consLntction and beverage.
An alternative to the above approach is to assess the qualitative reaction of markets rather than the magnitude of these effects. A pro bit model can be used for tills purpose. The probit analysili indtcates that an announcement by a financial institution involving a reorgani£ation plan was viewed by the market, more often than not. less positively than those made by other companic!>. A second finding from the probit analysis IS that announcements of major restructuring plans, merger� and acquisitions, and the sale of non-core businesses were generally favorably viewed by the market. while plans
agreements with their bank creditors in the first half of 1999.
Corporate restructuring, nonetheless. still faces significant institutional impediments. One major impediment is the high cost to firms of reducing employment. Job separation from large Japanese firms has historically been voluntary. Court rulings in the late 1970s made dismissals cumbersome (thus favoring the shift of labor across subsidiaries), which has led firms to offer voluntary early retirement programs. The typical early retirement program is estimated to cost about ¥22 million ($180,000) a worker. Although financial analysts have noted that the recent performance of some companies suggests that the payback period of eliminating redundancies could be as short
149
based on attrition were associated with a dechne in stock prices. The coefficient on the variable indicating plan� based mamly on a multiyear reducuon tn the workforce through attrition was significantly negative in all model specifications. In contrast, the coe(Jicient associated with plans based on other strategies was uniformly positive. A third 11nding is that financial ''ariables appear to suggest that market discipline contributed to more rigorous corporate restructuring: expected declines in earnings per share were negatively correlated with change� in stock prices.
as three years, cash-strapped firms may have trouble fmancing such cuts. Other impediments to restructuring include the low net tax benefits to restructuring; remaining obstacles to securitization (despite the 1998 law promoting asset-backed securities) that include multiple liens on loan collateral and inadequate loan documentation; inadequate debt segregation within companies (parent companies often offer loans or comprehensive loan guarantees to subsidiaries); and the lack of effective bankruptcy proceedings.
Reform of bankruptcy laws is an important priority for public policy because of weakness in the banking sector and the general lack of other mechanisms that enable debtors to engage creditors in negotiations. There are three laws regulating corporate financial re-

©In
tern
atio
nal M
onet
ary
Fund
. Not
for R
edis
tribu
tion
Ul
0
Ta
ble
A2
.6 .
.Ja
pa
n:
Leg
al
Pro
ced
ure
s fo
r In
solv
ent
Co
mp
an
ies
Liq
uida
tio
n
Proc
edur
e
App
licat
ion
Con
trol
of
the
fin
n
Sec
ured
cre
dits
Uns
ecur
ed c
red
itors
Vot
ing
Ban
kru
ptcy
Ha
n sa
n (
unde
r !h
e B
ankr
uptc
y L
aw o
f 19
22
).
Sim
ilar
to U
.S. C
hapt
er 7
ai
lhou
gh i
nsp
ired
by
Ger
man
la
w. C
an b
e tr
ansf
orm
ed i
nto
a re
orga
niza
tion.
Con
vers
ely,
it
may
res
ult f
rom
the
fai
lure
of
reor
gan
izat
ion
effor
ts.
A tr
uste
e (a
law
yer)
is
appo
inte
d.
who
wil
l liq
uida
te t
he c
om
pan
y in
depe
nden
tly
of th
e cr
edito
rs
and
dist
ribu
te m
oney
pro
rat
a.
May
be
exec
uted
sep
arat
ely.
Par
tici
pat
e in
the
pro
cedu
re:
seni
ority
rig
hts
not a
bsol
ute.
Pow
er to
rar
ify
plan
s A
mou
nts
reco
vere
d ar
e di
vide
d by
th
e co
urt:
typ
ical
ly !
hey
add
to
less
!ha
n I 0
per
cent
of
the
clai
m.
Liq
uida
tio
n C
om
po
sitio
n
Tokll
beiS
II·se
isa
n (S
ectio
n 4
32 e
t. W
ag
i (C
om
po
sili
on
Law
of
seq. o
f th
e 18
99
Com
mer
cial
19
22
).
Co
de).
Ap
plic
able
to
com
pani
es be
ing
P
op
ular
sys
tem
whe
re a
n w
oun
d up
!ha
t are
co
nsid
ered
to
arran
gem
ent
wit
h cr
edito
rs c
an
be i
nso
lven
t. A
ny jo
int
stoc
k al
low
!he
firm
to
cont
inue
in
co
mpa
ny m
ay u
se i
t. I
I is
mor
e bu
sine
ss.
effi
cien
t th
an b
ank
rup
tcy
if th
e cr
edit
ors
are
co
ope
rativ
e.
A f
orm
er d
irec
tor
of th
e A
n ap
po
inte
d tr
uste
e re
tain
s th
e co
mpa
nyis
cho
sen
as li
quid
ato
r:
po
wer
of
adm
inis
trat
ion
ove
r no
tru
stee
is a
ppo
inte
d.
!he
firm
s· a
sset
s (m
anag
emen
t re
tain
s so
me
cont
rol
over
or
dina
ry b
usin
ess
acti
ons
).
Sep
arat
e ex
ecut
ion
may
be
May
be
exec
ute
d se
para
tely
. re
stri
cted
by
cour
t or
der.
.. E
qual
ity ..
is r
equi
red
by l
aw.
Abs
olut
e pr
iori
ty s
ubje
ct t
o b
ut m
ay b
e ad
just
ed r
enec
ting
trus
tee'
s de
cisi
on.
ag
reem
ent
by
a m
ajo
rity
of
cred
itors
.
Vot
es e
quiv
alen
t to
thre
e-V
otes
equ
ival
ent
to t
hree
-fou
nhs
fo
urth
s o
f cl
aim
s re
quir
ed.
of c
laim
s re
quir
ed.
Pay
men
ts w
ill b
e m
ade
acco
rdin
g T
he c
oun
app
rove
s th
e sh
arin
g to
a c
onv
enti
on
appr
oved
by
the
arran
gem
ent,
subj
ect
to a
gree
men
t le
gal
maj
ori
ty o
f cr
edito
rs. a
fter
by
cre
dito
rs.
appr
ova
l by
!he
cou
n.
Reo
rgan
izat
ion
Cor
pora
te re
arran
gem
ent
Kai
sha
-sei
ri (
Sect
ion
38
1 et
. se
q. o
f th
e C
om
mer
cial
Cod
e.
mod
ifie
d in
19
38
to a
dd f
eatur
es
of U
.K. l
aws)
.
Cor
pora
te r
eorg
aniz
atio
n
Ka
isha
-kou
sei
(Cor
por
ate
Reo
rgan
izat
ion
Law
19
52,
revi
sed
in !h
e 19
70s)
.
Reo
rgan
izat
ion
occu
rs u
nder
S
imil
ar to
Cha
pter
10
of
the
old
m
inim
al s
uperv
isio
n by
the
cou
n.
U.S
. B
ankr
upt
cy C
ode
. or
!he
Can
be
used
onl
y b
y u
nani
mo
us
.. Adm
inis
trat
ion
Ord
er .. un
der
the
agre
emen
t am
ong
cre
dito
rs.
U.K
. Ins
olv
ency
Act
. Typ
ical
ly
Typ
ical
ly a
pplie
d to
sm
all
and
used
by
larg
e co
rpor
atio
ns;
it m
ediu
m-s
ized
co
mp
anie
s.
oft
en ta
kes
a lo
ng t
ime
to b
e co
mp
lete
d.
The
co
mp
any
reta
ins
its
adm
inis
trat
ive
pow
ers.
ex
cep
t if
!h
e co
urt
deci
des
oth
erw
ise.
Sep
arate
exe
cuti
on
may
be
rest
rict
ed b
y co
urt
orde
r.
lndi
vidu
al e
xecu
tion
of
clai
ms
is s
uspe
nded
. but
the
fi rrn
may
re
pay
spec
ific
deb
ts (p
refe
renc
e).
Una
nim
ity.
The
firm
has
dis
cret
ion
on
whi
ch
paym
ents
it
mak
es. s
ubje
ct t
o ag
reem
ent
by c
redi
tors
.
A r
eorg
aniz
ario
n tr
uste
e is
ap
poin
ted.
who
ho
lds
all
nece
ssar
y m
anag
emen
t po
wer
s.
May
be
exec
uted
onl
y th
roug
h !h
e pr
oced
ure.
All
cred
itors
par
ticip
ate
in t
he
proc
edur
e.
Qua
lifie
d m
ajor
ity b
y cl
ass
of
cred
itor.
The
sch
eme
of
reor
gani
zatio
n sh
oul
d be
agr
eed
by t
he m
ajor
ity
of
cred
itors
. T
he s
chem
e it
self
an
d ex
ecut
ion
are
subj
ect t
o th
e su
per
visi
on
of th
e co
urt.
:>
z
z
m
X
=
CD
:>
z
;:<;
z
G)
(/)
� � m
�
0
m
<
m 5 -o
�
m
z cri :>
z
0
()
0
JJ
-o
0
JJ � m
(/) � b JJ
JJ
m
(/)
-i
JJ
c � JJ
z
G)
z
c...
:> � z
©International Monetary Fund. Not for Redistribution
Directions for Change
organization in Japan, in addition to two laws regulating liquidations (Table A2.6). Under current laws, debtors in Japan face numerous restrictions and incur large risks when they attempt to initiate formal reorganization procedures.24 Fonnal reorganization procedures are thus seldom used in Japan: only about 300 petitions are filed in a typical year, of which a large number are withdrawn before proceedings actually start. By contrast, some 20,000 petitions for reorganization under Chapter 1 I of the U.S. Bankruptcy Code were filed every year in the United States during 1983-93. ln the past, the lack of effective formal procedures might not have posed a major problem because banks were not financially constrained and thus could initiate necessary workouts.
Oflicial Initiatives
The Ministry of International Trade and Industry bas issued a set of proposals in advance of the introduction of government legislation to facilitate corporate restructuring. The following are among proposals that reflect early suggestions made by d1e Economic Strategy Council, and have in part been incorporated in recent government plans: • Tax incentives to reduce production capacity and
promote corporate reorganization. The measures include exemptions of capital gains realized in connection with the transfer or reorganization of subsidiaries and divisions; an extension of favorable tax treatment of land transactions not involving sales (such as in-kind transfer of land to newly incorporated firms); tax breaks for asset write-offs in connection with the scrapping of production capacity (e.g., a firm absorbing a loss-making operation could carry losses forward for l O years rather than 5 years). Consideration has also been given to shifting corporate income taxation to a consolidated basis. This would permit fmns to offset taxable income from one subsidiary with losses in other subsidiaries, and could lead to unifonn corporate tax rates and fewer subsidiaries (small firms are currently subject to lower corporate tax rates).
• Legal changes to facilitate corporate reorganization and clumge in cotporate ownership strucwres. These include proposals to permit banks to exceed the 5 percent limit on equity holdings in a nonfinancial fl11ll in the event of a swap of debt for equity;25
:!-�Rehabilitation procedures using bankruptcy laws aimed at small and midsized firms focus on protecting secured debto rs. Other procedures aimed at large firms email the transfer of corporate control to a court-appointed trustee and can be relatively complex.
25TJ1is change is expected to aid corporate reorganization. The experience in the United States may be illustrative. James ( 1 995, 1996) shows that U.S. banks were willing to participate in debt
equity swaps or severely impaired claims and take advantage or exemptions to the U.S. law banning banks from holding corporate
151
more flexible implementation of antimonopoly laws, to permit Japanese companies competing in the global economy to hold a large share of the Japanese market; and changes in ilie Commercial Code to facilitate change in ownership structures (that includes broadening the ability of corporate boards to dispense wid1 a general shareholders' meeting when deciding on the sale of businesses or other resu·ucturing steps, to force minority shareholders to sell their shares when a bidder has acquired over 50 percent of company shares. and to allow payment in shares of the acquiring firm for corporate acquisitions).
• Use of public funds, such as a public lending facility to finance capacity reductions at special interest rates; subsidies to firms that increase employment (in designated sectors); and the financing of individual training. The authorities are also reviewing bankruptcy laws
with the aim of improving the efficiency of corporate rehabilitation procedures. Specifically, the Ministry of Justice has announced the acceleration of plans to complement the law typically applied to small and medium-sized companies (the Composition Law) with a new Financial Rehabilitation Law. The latter would incorporate several provisions paralleling those in Chapter I I of the U.S. code (see Table A2.7). Although some of the proposed provisions already exist in Japanese law, they are scattered over three different laws and are therefore not fully operational. Main proposed features include: • Relieving debtors of the need to prove that their
finn is insolvent (or nearly insolvent) when petitioning for court protection, and embracing the debtor-in-possession principle. This principle permits incumbent management to maintain control of the fmn during the procedure, and to propose the reorganization plan; it is also associated with the granting of seniority of debt acquired after filing for court protection over previous debts.
• Greater protection against creditors, by aiJowing ilie court to stay secured creditors, thus reducing the risk of the firm being stripped of essential assets and winding up in liquidation. Also, a (qualified) majority of creditors will suffice for approving reorganization plans, rather than the unanimous consent of creditors.
• Priority rules will be weakened to pennit debt-forequity swaps whereby debt would be converted into equity through the issuance of additional equity, rather than by replacing existing equity (i.e., absolute priority would not be observed); and debtors will be able to satisfy claims of secured creditors by paying off the current (estimated) value of the collateral and
equity when the going-concem value of a distressed debtor was higher than its liquidation value. Banks usually agreed to swaps when other creditors also participated in the workout.

©International Monetary Fund. Not for Redistribution
ANNEX II BANKING SYSTEM DEVELOPMENTS AND CORPORATE SECTOR RESTRUCTURING IN JAPAN
Table A2.7 . . Japan: Features uf Rcorgani.tatiun Prucedurcs in the U nited States and German) and the Prospective Financial Rehabilitation Law in .Japan
Procedure
Main objective and application
Solvency and other requirements
Control rights and authority to propose a reorganization plan
Uni1ed States
Chapter I I of Bankruptcy Code
Reorganization of the firm as an ongoing concern; only indirect consideration for swkeholders other than the debtor.
Firm need not be insolvent; protection is often sought by debtor.
Debtor i n control: in 50 percent of cases. previous managers retain control; in remainder. new manage rs are appointed by debtors. Managers have 120 days after the tiling (extendable by the coun) to present reorganization plan. The 1995 reform somewhat increased the power of creditors to reject that plan.
Automatic stay against Most creditors' claims and the service creditor claims of those claims are s tayed (with
exceptions such as lease payments).
Renegotiation of liabilities and vot.ing rights
New financing
Preservation of residual claims on equity holders and deviations of absolute priority
Other options for distressed firms and their main objectives
Great discretion to renegotiate debt contrclcts. Impaired creditors vote by class; plan is approved by simple majority by number and 2A majority by claim, subject to coun confirmation. Coun can "cram down'' junior creditors.
New financing is easily accommodated because i t has priority over existing claims, under the debt-in-possession (DIP) s tatute.
Equity often retains value, u�uaiJy through creditor's consent. and sometimes through a coun "cram down." Junior creditors may be paid while senior creditors may not be paid in full, when the latter were undersecured, or made concessions.
"Prepackaged" Chapter I I (in which impacted creditors agree on a plan before filing): informal debt workouts. including through the exchange of claims; liquidation under Chapter 7 of the Bankruptcy Code.
Gcm1any
1994 Bankruptcy Code
Liquidation, reorganization (composition). or possible auction: some con�iderauon for "social" and other external objectives.
Firm cannot meet payments or is overindebted. It needs to prove it has enough funds to pay for procedural costs (after netting out secured assets).
Power IS shared. Coun appoints a creditors· committee and an administrator. who propose� a reorganization plan to the creditors' assembly within three months. If the plan is rejected, the administrator may be allowed to propose a new plan or a chance can be offered for the debtor to take the lead.
Automatic minimum three-month stay for all claims; stay can be extended by creditors' assembly.
Ample scope for renegotiation (in the past. essentially only the repayment schedule of claim� could be renegotiated). Creditors vote by class; plan is approved by simple majority by number and by size of claim. and subject to coun confirn1ation.
New senior financing allowed (it was the case i n the old code).
Deviations can be proposed, but muM be agreed by a creditor·� vote. In compositions. they tended to occur.
The new code combined the compulsory liquidation (Konkursstmlmmg) and composition (Vergleichsordmmg) procedures; informal debt workouts most common.
Japan
(Prospective) Financial Rehabilitation Law
Financial rehabilitation of individuals. unincorporated firms. and corpor.nions through a streamlined procedure.
Solvent firms can apply 1f debt burden becomes exces�ive: prepayment of coun costs IS likely to still be required.
Debtor-m-possession principle is embraced: similar to current practice under the commercial code, incumbent managers may retain control of the firm, with some supervision from the coun, and propose the reorganization plan. Implementation of the plan will be overseen by coun. but without deep involvement.
Stays against secured creditors are not automatic, but are expected to be granted liberally and expeditiously by couru (comprehensive stays will substitute for the current system where the debtor has to seck individual injunctions against each creditor).
Creditors are likely to vote as one class, with plans to be approved by a qualitied majority by number and size of claim. Firms will be able to be sold as going concerns during the procedure.
New financing to receive senior status.
Deviation from absolute priority expected, e.g .. debtors will be able to satisfy the claims of secured credito rs by paying off the actual value of the collateral (arbitrated by a third pany) and debt-for-equity swaps will not require the wiping out of shareholders' wealth.
All existing legislation (Composition, Rearrangement, and Corporate Reorganization Laws) will remain in place until they are fully revised and possibly unified within a 3-5-year horizon.
aggregating the residual part of the loan with other unsecured debts. This provision may be important because, given tbe decline in land prices since 1999, banks often consider holding a title on a loan with real estate collateral to be akin to holding an option on the value of that land. By permitting debtors to satisfy the secured part of those claims by paying cash for the current value of collateral, the law pro-
vides a way for companks to eliminate that option and creates an incentive for banks to renegotiate.
152
Prospects and Risks
Official proposals to encourage financial and real restructuring in the Japanese corporate sector are, on
©International Monetary Fund. Not for Redistribution
Prospects and Risks
balance. positive. The government has recognized the importance of establishing an environment conducive to corporate restructuring, while ensuring that primary responsibility for initiatives rests with indiv.iduaJ firms. For the most part, the government appears to have resisted the temptation to provide direct corporate subsidies. In addition, current proposals may stimulate restructuring efforts and the implicit fiscal contribution may help the corporate sector to absorb the costs of restructuring. These fiscal measures could reduce the burden on banks and possibly also reduce the magnitude of required public injections of capital into the banking system. The possible expansion of the social safety net could help cushion the social impact of dismissals while helping to promote the needed reallocation of labor in the corporate sector; it could also dampen the rise in precautionary saving, reducing downward pressures on prices and corporate revenues. On the other hand, provision of public loans to ftrms undergoing reorganization could become a lifeline to impaired businesses that are not financially viable. Similarly, subsidization of jobs irt designated sectors has the potential to introduce distortions into the market mechanism.
The refonn of bankruptcy laws points in the right direction, but efficiency considerations highlight the i mportance of also fostering a market for corporate control. The incorporation of several Chapter I I mechanisms into the new Financial Rehabilitation Law would tend to encourage the early use of formal procedures that could help mitigate the existing debt overhang problem. By giving protection to incumbent management, these provisions could favor finns that are not viable and should exit rather than be reorganized. The new German bankruptcy code addresses these issues, inter alia, by giving prominence to creditors' committees in the decision about whether to reorganize or liquidate the finn. The new law in Japan is expected not to include explicit mechanisms such as those in the German code. Hence, greater reliance on a strong market for corporate control might be required, as suggested by the experience in the United States, where the existence of such a market has been an important factor to balance any pro-management bias in the law.
The effectiveness of new bankmptcy laws will also hinge on the amount of resources made available for their implementation. Key factors in the success of bankmptcy laws in the United States are the powers embodied in bankruptcy courts and the role of private trustees in relieving judges of much of their administrative responsibiHties. In Japan, there are only two speciaHzed bankruptcy courts. As a consequence, debtors may be discouraged from more use of formal procedures against creditors because of perceptions that the courts may not be expeditious. A review of court procedures and available resources, including in the legal profession, may therefore help improve the legal resolution of financial reorganizations.
153
Effective corporate governance is also an important factor in facilitating restructuring of the corporate sector. An increasing number of Japanese companies have professed that their main goal is to maximize shareholder value. Nonetheless, mechanisms to enforce management accountability remain limited. The high degree of corporate cross-shareholding significantly limits the scope for hostile takeovers. Although the forthcoming mandatory marking w market of cross-shareholdings could create incentives for firms to unwind them, prospective measures that would allow companies to reduce their exposure to these assets by shifting the ownership rights of stockholdings to trusts (to fund corporate pension commitments), but retain the associated control rights. may perpetuate this problem. On the other hand. the new holdingcompany law as well as the possible move toward consolidated corporate taxation have helped spur the reorganization of large firms into vertical organizations under holding companies, which may facilitate managerial accountability.
Further development of domestic capital markets could improve corporate governance and the efficiency of Japanese firms. For example, increased market incentives from well-functioning corporate debt and equity markets for small firms could facilitate the streamHning of existing keiretsus through an aggressive divestment policy supported by the redirection of domestic savings to new financial instruments (also helping address potential concerns of excessive ownership concentration on the heels of a relaxation of the antimonopoly law). Wider use of these markets could also provide a potentially lucrative advisory business to banks, while submitting a larger share of the corporate sector to the discipHne and disclosure implied by the reliance on public corporate instruments. Debt-for-equity swaps could also play an important role in supporting financial reorganization in Japan. provided other constraints on corporate restructuring are addressed. Specifically, banks may be reluctant to engage in such operations with firms that are limited in their ability to shed labor or take other measures to improve their performance.
ln summary, there are encouraging signs that further restructuring will occur. There is recognition of the need for restructuring, and ftnns are increasingly committed to change. The Japanese authorities have shown increasing resolve in advancing that process, for example, by encouraging large ftnns to restructure, considering an expansion of the social safety net to protect dislocated workers, and introducing measures to stimulate the development of start-up ftnns. Nevertheless, some observers have noted that the positive reaction of markets to steps taken to date could result in complacency. Although a rapid restructuring could lead to a temporary contraction in GOP, this shock may be partially cushioned by pubHc policies.
©International Monetary Fund. Not for Redistribution
ANNEX II BANKING SYSTEM DEVELOPMENTS AND CORPORATE SECTOR RESTRUCTURING IN JAPAN
By contrast, a greater risk could arise from delaying corporate restructuring, as that might dampen economic growth for many years and entail considerable fiscal costs.
References
Bank of Japan, 1998, "Utilization of Financial Institutions' Self-Assessment in Enhancing Credit Risk Management," Quarterly Bulletin, Vol. 6 (February), pp. 19-32.
Fitch ffiCA, "Japan: Major Banks' Results for 1998/99" (Tokyo. June).
International Monetary Fund> 1998, international Capital Markets: Developments, Prospects. and Key Policy Issues, World Economic and Financial Surveys (Washington, September).
154
James, Christopher, 1995. "When Do Banks Take Equity in Debt Restructurings?" Review of Financial Studies, Vol. 8 (Winter). pp. 1209-34.
---. 1996. "Bank Debt Res1ructurings and the Composition of Exchange Offers in Financial Distress:· Joumaf ofFincmce, Vol. 50 (June), pp. 71 1-27.
Lipworth, Gabrielle, 1996, ''Postal Saving in Japan;· in Japan: Selected Issues. lMF Staff Country Report No. 961 1 1 4 (Washington: International Monetary Fund, September).
Mitsuhiro, Scki, 1994, Beyond the FuU-Set lndustrial Structure: Japanese Industry in the New Age of East Asia (Tokyo: LTCB International Library Foundation).
Morgan Stanley Dean Witter, 1999, Japan Restruclllring (Tokyo, May).
Moriaki, Tsuchjya, and Konomi Yoshinobu, 1997, Shaping the Future of Japanese Management: New Leadership ro Overcome rhe Impending Crisis (Tokyo: LTCB International Library Foundation).
©International Monetary Fund. Not for Redistribution
Annex III Developments in Emerging Market Banking Systems
The turbulence in global markets in the aftennath of Russia's devaluation and unilateral debt re
structuring imposed severe pressures on most systemically important emerging market banking systems, which was reflected in weaker earnings and asset quality. Many Asian and Latin American banks experienced substantial cuts in international interbank credit lines and losses in international repo lines, but their domestic deposit bases proved resilient to the turbulence in 1998-in many cases aided by extensive government guarantees. Banks' responses magnified the transmission of the external liquidity squeeze to local capital markets and the real economy, as they scrambled to restore the Liquidity of their balance sheets shifting funds away from the corporate sector and into government securities. Losses in some banks' securities portfolios were followed by increased delinquencies i n their loan portfolios owing to a deteriorated operating environment.
Emerging market banking systems outside of Asia weathered the consequences of capital outflows reasonably well, but the recovery of the domestic credit cycle has been elusive-with the exception of some central European banks. Most banks in emerging Asia remained focused on restructuring their bad loans, and uncertainties about the creditworthiness of the (unrestructured) corporate sector kept lending flows subdued. The lack of progress in corporate debt restructuring across the region remains one of the key risks to the strengthening of banks' balance sheets. The largest banking systems in Latin America have shown an enhanced ability to withstand the external liquidity squeeze, but the pronounced slowdown in economic activity has not yet been fully reflected in banks' balance sheets and is leading to further consolidation in the systems. The healthiest banking systems in emerging Europe have continued to attract sizable capital flows and to expand credit to a fledging corporate sector, as competition grows and foreign banks contribute to a more stable and efficient financial intermediation.
Most emerging market banking systems strengthened their regulatory and supervisory frameworks and many are in the process of phasing out full deposit insurance schemes. FoiJowing the imposition of extensive guarantees in the wake of financial crises, many emerging market banking systems are considering or have even announced effective timetables to limit the
155
coverage of these guarantees. Large losses in Latin American banks' securities portfolios led to some degree of regulatory forbearance in the immediate aftermath of the Russian unilateral debt restructuring, but regulators moved subsequently to enhance regulation on the classification and valuation of securities, as well as on capital requirements for market risk.l Emerging markets in central Europe have strengthened their regulatory frameworks, but significant challenges remain as they face the prospect of full capital account liberalization and contemplate joining the EU. In particular. capital adequacy requirements need to be broadened to include market risks and offbalance-sheet exposures, which are growing in most countries.
Asia
Bankers and government officials in the Asian crisis countries are dealing with the task of bank restructuring and recapitalization, as the credit cycle Jags relative to the recovery in financial markets and capital flows. Different countries have followed diverse approaches to financial sector restructuring, but results have been slower than expected. Korea and Malaysia have followed more interventionist approaches to financial restructuring that are producing balance sheet results faster than in Thailand, which has followed more market-driven changes that are likely to prove more resilient. The former countries, which forced banks to reserve/write-off nonperforrning loans or to sell them to asset management companies, have made substantial progress in strengthening banks' balance sheets and have successfuiJy encouraged mergers and acquisitions. Both countries also have fairly effective bankruptcy and foreclosure laws, but concerns remain about the extent and depth of their achievements in corporate restructuring�specially among Korean chaebol. Analysts worry that the rapid results of this strategy may lead to a recurrence of problems and further rounds of recapitalization. Indonesia has closed
1See IMF (1998) for the imponance of securities in emerging market banks' portfolios and for related innovations in market risk regulation.

©International Monetary Fund. Not for Redistribution
ANNEX Ill DEVELOPMENTS IN EMERGING MARKET BANKING SYSTEMS
several banks, but widespread insolvencies and low loan recoveries are hampering progress in financial restructuring. Foreign participation in bank recapitalization has not been large, and more government support than originally expected bas been needed. Despite the recovery in financial markets and economic activity in most of the crisis countries, the turnaround in the credit cycle has yet to happen and asset quality is only now starting to bottom out.
China has began to set up individual asset management companies to tackle the bad loan problems of the state banks and while the bankruptcy of Guangdong ITIC has reduced foreign banks' exposures to mainland borrowers, Hong Kong SAR banks have continued to handle the deflationary pressures well. Banks in Singapore are preparing to face increased competition after the authorities' gradual move to Liberalize the banking sector.
Indonesia
The resolution of the insolvent Indonesian banking system has left the government as the owner of more than 80 percent of the system's assets and the implied costs--<:urrently estimated by rating agencies at more than 50 percent of GDP--<:ould continue to escalate unless a forceful loan collection strategy is implemented. The authorities announced a bank recapitalization program in August 1 998, which was refined in December 1998. The plan aimed to recapitalize state and local government banks and those private banks that had met minimum capital requirements and had fit and proper managers and shareholders, a viable business plan, and owners that could supply 20 percent of the costs of recapitalization. On March 14, 1999, the authorities announced that 38 banks would be closed, 7 would be taken over by the Indonesian Bank Restructuring Agency. and 9 private banks would be recapitalized. The government will subscribe for up to 80 percent of the banks' rights issues by issuing bonds and the original shareholders will subscribe to the other 20 percent and will have an option to buy back the government shareholding within three years at cost plus a premium (based on an average bond yield). The banks also signed performance contracts that stipulated that banks would reach a capital adequacy ratio of 8 percent, return on equity of 20 percent, and nonperforming loans of less than 5 percent by 200 1 . Analysts perceive these targets set by the central bank as too optimistic. While the merger of four state banks to create Bank Mandiri-whlcb will have 30 percent of the deposit market-is moving ahead, the restructuring of three other large state banks and 12 Indonesian Bank Restructuring Agency banks has been delayed. In their latest letter of intent to the IMF, the authorities stated that the large state-owned banks would start proceedings against their 20 largest debtors by
156
end-August 1999, and a consistent strategy to improve loan recoveries includes the closely intertwined task of accelerating corporate restructuring (see Box A3.1).
The successfu I completion of the second interbank debt exchange is expected to contribute to the restructuring of the banking system, but foreign participation in the bank recapitalization process has been minimal so far. The Indonesian authorities and the Bank Steering Committee reached an agreement on a second interbank exchange offer on March 29, 1999, and most of the $3.8 billion of Indonesian bank external debt due through December 200 I has been rescheduled under better terms than the first exchange. Of the eight private banks that had deposited additional capital under the recapitalization program, only one included the entry of a major international bank. However, some market participants believe that this particular transaction could provide a significant psychological boost to the recapitalization process, and two foreign financial institutions have reportedly expressed an interest in taking a stake in another of d1e medium-sized private banks. Two large banks that were nationalized last year are slated for privatization in the second half of 1999.
Korea
The Korean authorities have completed the initial stages of the process of recapitalization and restructuring of the banking system, but much remains to be done, in particular on corporate debt restructuring, the cleanup of nonbank financial intermediaries, and the efficiency of the intermediation process. After the closure of five insolvent banks and their absorption by healthier institutions, six other commercial banks were persuaded to merge in 1998 and a four-bank merger was completed in early May 1999-to bring the number of commercial banks to 17 (from 27 in December 1997).2 The government spent W 41 trillion last year (and plans to spend another W 23 trillion this year) to rehabilitate the banking system-roughly half spent in nonperforming loan purchases and the other half used to pay for deposits and inject new capital in restructured banks-to own more than 90 percent of the equity of the second- and third-largest banks. Korea's Financial Supervisory Commission estimates that nonperforming loans amounted to 7.4 percent of outstanding loans at the end of 1998 after the Korea Management Corporation (KAMCO) purchases of
2Aside from closing 1 6 out of 30 merchant banks. the authorities closed several insolvent insurance companies, securities firms, and investment U'USt companies, and some forty credit unions. Many others were placed under rehabilitation plans monitored by the Financial Supervisory Commission, but the restructuring of the nonbank financial system remains incomplete.

©International Monetary Fund. Not for Redistribution
bad Joans.3 Bank analysts estimate that the actual nonperforming loan ratio is much higher and, more important, is likely to increase once corporate restructuring takes hold, loan classification is tightened to reflect capacity to repay, and public guarantees for small- and medium-enterprise loans are limited. Banks are downsizing, cutting costs (employment is down by one-third and a number of branches were closed), and effecting some changes in management. However, building up risk management and credit assessment skills will be further hauled by the resources involved in the process of corporate restrucruring (see Box A3.1) .
As foreign confidence in the Korean economy improved in the first half of 1999, the external funding profile of the banking system strengthened considerably. Rollover rates for financial institutions' term loans continued to increase in 1998 and net flows turned positive in January 1999 for the first time since the crisis began. The improved short-term external liquidity position allowed the banks to repay $3.8 billion in one-year foreign debts rescheduled as part of the March 1998 landmark agreement with 134 foreign creditors. Foreign ownership in Korean banks has increased and will continue to drive the reform process. However, as of June 1999, negotiations to seU two large nationalized banks had not been concluded. Apart from strategic foreign investments in nationalized and private banks, foreign ownership of shares in many of the top-tier banks exceeds one-third of total shares.
Malaysia
The Malaysian authorities have moved decisively to restructure the banking system, have established a coherent approach to financial sector restructuring, and are moving rapidly to implement it. However, some analysts remain concerned about the loosening of prudential requirements and moral suasion to expand lending i n a still over-leveraged environment. The condition of the banking system deteriorated quite rapidly during I 998, and by end-1998 the non performing loan ratio reached 20 percent-using the three-month default period and including loans sold to Danaharta, the government-run asset management company. The combined efforts of Danabarta (which by end-June had bought about 30 percent of the banks' nonperforming loans), and Danamodal (which has recapitalized 10 banks) have contributed to the rehabilitation of the banks and the investors' perception of the country and its banking system. Some analysts believe the 37 percent average discount on the pur-
3As of end-February 1999. KAMCO had purchased W 44 trillion of loans for W 20 uillion, a 55 percent discount. Total disposals and collections were just W 1.7 uillion, but the agency has so far recovered more than it had paid on the most desirable properties.
Asia
157
chase of nonperforming loans-' has been fairly generous, but the authorities are confident that the discount will be moving up as the acquisition phase is completed. Banks are allowed to amortize the resultant losses over a maximum five-year period, and Danaharta will attempt to restructure the acquired bad loans and if possible avoid auction them off at an early stage-with a view to maximizing the recovery value of its assets. Although shareholders absorbed losses before receiving Danamodal's funds, the authorities have been more cautious about removing managersowing to the relative lack of local banking skills-and are hoping to use their role as strategic shareholders to effect internal changes in banks' lending and risk management practices. In early April, the central bank announced new regulatory measures, including higher capital adequacy ratios for banks with higher risk profiles, disassociating banks from entities (such as securities houses) not supervised by the central bank. disallowing lending to controlling shareholders, intensifying on-site bank examination, and reviewing the performance of bank directors and managers biannually. Market participants worry that the latter could be used to press banks to meet the targeted 8 percent lending growth, a potentially dangerous goal in the conrext of prescribed maximum lending margins and overleveraged corporations.
Thailand
The severe recession and liquidity squeeze suffered by the Thai corporate sector in the aftermath of the financial crisis, together with a breakdown in the repayment culture, have led to large operating losses and a massive deterioration in Thai banks' asset quality. Nevertheless, nonperforming loans seem to have peaked in February-March 1999, when they reached 52 percent of total commercial lending. The deterioration in economic conditions has been exacerbated by the weak legal infrastructure. which gives creditors scant power over delinquent debtors. The weak legal environment has allowed even healthy borrowers to avoid repaying loans, the so-called "strategic nonperforming loans." Analysts estimate that while roughly 40-50 percent of the banks' nonperforrning loans are distressed but fit for restructuring, 30 percent of nonperforming loans are not, and about 20-30 percent are "strategic" nonperforming loans that could easily become performing with a tightening of the legal/judicial environment. To speed up the debt restructuring process (see Box A3.l), the Bank ofThailand has relaxed the rules on the classitication of nonperforming loans: instead of waiting for three months of renewed debt service on a restructured Joan. these will now be
4The discount is 61 percent if one large loan bought for a nominal amount is included.
©International Monetary Fund. Not for Redistribution
ANNEX Ill DEVELOPMENTS IN EMERGING MARKET BANKING SYSTEMS
Box \3.1. Corporntc Ocht Rcstnu."turing in Asiu
Corporate debt restructunng is an essential complement to bank recapitalization, and slow or uneven progress 1n etther one 1s likely to lead to renewed linancial distress und continuing vulnerability. Two factors that make corpurate debt restructuring in Asia a major challenge are the lack of an mstitutional framework to address the issue and the systemic nmure of the pmblem-related lO the large number of ca�el> and the involvement of foreign creditors.
Many countrie� have moved ahead in improving the institutional framework, and the degree ot government involvement in the restructuring proces� differl- acros� countries. Most countries arc following a market-hased, voluntary approach to debt restructuring. where the government plays the role of a facilitator of both formal and informal debt workouts. Formal debt workouts require an effective bankruptcy procedure. that is. one that hlb clear liquidation and rehabilitation procedures, where the latter attempt� to maximize the ex post value ol the firm while preserving the ex ante oonding role of debt The presence of an effective bankruptc� system creates appropriate incentives for debtors and creditors to reach out-of-court (or informal) debt restructuring, and mO!.t Asian countries have adopted variants of the so-called "London Approach" to facilitate voluntary debt workoutli m a n environment where courts lack the experience or resources to handle a large number of cases. Government agencies CO(lrdinate. mediate, and arbitrate (and sometimes even dictate) negouations between debtors and creditors. encouraging also the use of standard agreements to speed up the process. Jn Korea. the government ha!> played a much more direct role than elsewhere, imposing quantitative targeL\ for the deleveraging of corpomtes and using its mcreascd position as bank shareholder to encourage rel.tructuling by withholding credit.
A fundamental problem with the voluntary marketbased approach is that the Londtm rules were not designed for systemic corporate debt crise�. and a case can be made for a btgger government role and a lirruted usc of taxpayer resources in resolving the corpc>r''dtc debt problem (such as the provision of guantntces on exchange rate risk). While this may create moral hazard, there is also the need to recognize lhat overburdened debtors and creditors have little mcentivc to arrive at voluntary agreements when the debt overhang problem is related to macroeconomic developments beyond their control. This wa.' recognized tn the restructuring of corporate dcht' in Chile and Mexico in the early 19HOs and is behind the government Cllchange rate guarantees of the Indonesia Debt Restructuring Agreement.
The establishment of un adequate institutional framework is just a first step toward an eflic1ent debt-restructuring process, and Implementation is cntical. The extent of progress is small relative to the severity of the wlderlying problems. which makes banks weak and vulnerable to future shocks. In what follows, we briefly describe the
158
main features of the Asian crisis countries' frameworks for corporc1te debt restructuring and the extent of progress.
'
lndonesta has moved to mcrease the flexioility of a comprehensive fmmework for debt restructuring that has so l'ar shown few concrete rcsuiL<o. A framework for the voluntary restructuring of corporate debt-the Jakana lnitiative-wa� announced in September 1998 to complement the Indonesia Debt Restructuring Agency (lNDRA) scheme and the amended bankruptcy law. The INDRA '>Cherne provides exchange rate risk protection to private debtors who agree to restructure their external debts, while the Jakarta Initiative provide:. a set of principles to guide and strearnlme out-of-court corporate restructunng. In late March 1999, the authorities announced modifications Lo the INDRA scheme to make it more attractive. includmg an extensiOn of the deadliuc for entry to end-1999. which remove election-related uncertatnues. cap debtors· annual payments to INDRA during the grace period, and reduce the min1mum matunty for rescheduled foreign debt if the original debt is reduced through debt forgiveness or debt-equity swaps. As of end-Apdl, 170 companies owing $20.6 billion in foreign currency dent (an estimated 28 percent of the total corporate external debt) had signed up with the task force in charge of managing the Jakarta Jnitiative, although only 16 finns had reached agreements m principle and just4 had standstill agreements. A recent Supreme Court ruling m favor of creditors has reduced ncgauvc market perception of the implementation of the bankruptcy law, but market pantcipants arc skeptical about many more deals being settled before the elections Analysts worry that if it takes too tong to make further progress on debt restructuring through th1s largely voluntary process the government might be forced to adopt a more in ten enuonist role.
li.flr Corporate restructunng in Korea is proceeding on two
separate tracks: ( I) a debt workout framework for the smatter dwt>hol and other large corporation�. \\ hich follows the London Approach in Its voluntary and extrajudicial nature, imd (2) a different approach for the top live dweb11/, which relics on heavy government involvement A Corporate Restructuring Agreement has been signed by 200 financial insutultons. under which the institutions agree to follow specific procedures for dt:bt workouts-including an automatic standstill on deht repayment<> and emergency (syndicated) loans-and to subject themselves to bindmg arbitration by the Corporate Restructuring Coordinating Commiuce. Lead hanks or groups ol insututions holding more than 25 percent nf a corporation's debt can form a creditors' committee and the lead bank-assisted by a group Of rorcign <tdVISO!";-
©International Monetary Fund. Not for Redistribution
ncgouates with the debtor corporation. The authorities negotiated with the top five chaebol the so-called "big dcals"-swaps of subo;idiaries and afftliates-an<l more recently. Capital Srructu1e Improvement Plans. designed to reduce the number of subsidiaries and aftiliates and to reduce the1r tou\1 debt-to-equity rauos to below 200 percent by the end of 1999.
The resu)Lo; so far under Lhb framework arc mixed, showing some p10gress with the smaller chaebol under the voluntary debt workout framework and little progress with the top five chaebol. As of end-December 199M, workout::. for 45 companies had been agreed under the Corporate Restructuring Agreement. but a numher of weaknesses emerged from the complett:d workouts-including concerns about the quality of the due diligence and workout proposals. the banks' reluctance to disclose infommtion and fully integrate their foreign advisors in the process. and the low level of dcht write-downs. The unwmding of cross-guarantees has proceeded rapidly but the ''big deal" swaps and other :u;pect!> of the restructuring of the top five chaebol have faced a "cries of economic and political hurdles and progress has been slow. The authoriucs· success early in the year in forcing one chaebol Lo comply with the terms of 11s "big deal'' obligation�. by ordering the c:haebn/'<.. principal hank to !.U�pcnd its credit lines, is encouraging, but rating agenc1es remam unccnain whether similar results can he achieved for the other�. A� of December 1998, the debt-equity ratio of the top 30 chaebol had declined 10 380 percent (and that of the top five to 335 percent), from 5 1 9 percent in 1997, but rating agencies have suggested that substantive delevemgmg and restructunng has not yet occurred aml that ll 1s likely that the bank:. will bear a disproportionate share of the debt-reduction hurdcn.l
The legal framework in Malays1a is relative!} effective but only a few cases have been resolvell so far Following amendments to Section 176 of the Companies Act in late 1998. u series of loopholes have been tightened, and creditors now have a rl!asonably effective legal fmmework to work out deht problems. Previously. a highly leveraged company could seek protection against its creditors without the creditors' consent or even knowledge. A company now applying for protecuon under Section 176 would lirst have to seck the con�ent of creditors amounung to more than 50 percent of IL� liabilities. Arrangement� would ha\c to he forrnalit.cu within a stipulated period. and creditors' rights have been greatly enhanced (with debtors fadng stricter requirements in terms of disclosure and asset sales during the 60-day standstill period). Despite the creation of a Corpontic Debt Re�tructuring Committee to encourage informal debt restrucruring: arrangements, as of mid-March 1 999 only 48 companies h11d applied for o;uch arr:mgement<; and only two restructuring plans have been imple-
Asia
159
menlcd. As of end-June 1999, the committee has been able to implement a to tal of 1 0 debt restructuring plans.
The institutional framework for debt restructuring has recently been strengthened in the context of a mo!.tl} voluntary. market-based approach. The new Bankruptcy Law, approved in April 1998, has recently been strengthened. with the approval of amendments to remove uncertaintie� on the degree of protection afforded to new
money and the establishment of a specwlized hankruptcy court. A I so. creditors' rights legislation has been amcnc.led, with a 'dew to facilitating forcdosure on U-\sets. The creation of a Corporate Debt Restructuring Au' isory Comm111ee and the introduction of intcrcreditor and debtor-creditor agreements IS expected to speed up out-of-court debt restructuring. The mtcrcreditor agre�:mcnt provides a model tor an arbitmuon panel to sec!.: consensus on u rcstructurmg plan when there i� agreement M at lea�t half the creditors holdmg more than 50 percent of total outstanding debt (but less than the 75 percent required under the Bankruptcy Law). Under the tlcbtM-crcdilOr agreement. ind1vidual debtor' are encouraged to s1gn debtor-creditor mediation contracts, whereby a legally time-bounu resolution pn'ICess automatically triggers intercreditor arbitration contrJCts. This contract-driven process is intended to result in debt re'>lructuring or automatic filing fur liquidauon withm six months: much of the restructuring completed so far ha'> taken more thun a year to accomplish.
Progress has been slo\\-, but the authoritie� have taken further steps to accclen1te corporate debt restructuring. As of end-April 1999 about 48 percent or the total nonperforming loans had entered the restructuring process but only about 15 percent had been successfully restructured. While no comprehensive dutabase on the temts of the restructuring 1s av<�ilable, anecdotal evidence points to small debt reductions for the ca�e of extension in rna turities and dl.,counts of about 30 percent in the case of debt-1u-equ1ty conversion!> (reaching a!- high a� 80 percent in at least one promment case). To accelerate the proces�. the Corporate Debt Restructuring Advrsory Committee has extended its mandate to take on addiuona1 cases. has introduced abbreviated versions of the intercred1tor and dehtor-creditor agreemenb to em er small finns, is in L11e process of hiring its own advisors and professiOnal mediators-<ieal-makers-to guide uehtorli and creditors Iowan! earl} settlement. and ha" cased rules on the class1ficauon of restructured loans. Also. the Stock Exchange of Thailand has announced that lhted tirrns under rehabilitation have urttil the end or the year to reach agreements with crechtors before they ri:.k hcing de listed.
©International Monetary Fund. Not for Redistribution
ANNEX Ill DEVELOPMENTS IN EMERGING MARKET BANKING SYSTEMS
classified as normal as soon as the loan restructuring is approved. While this relaxation should encourage debt restructuring, analysts fear that it may not resolve the bad loan problem and runs the risk of encouraging banks to disguise loan restructurings as a way of avoiding loan-loss provisioning, without regard to the debtor's repayment capacity. The Bank of Thailand has introduced safeguards to prevent such potential abuses in the reclassification of restructured loans, such as requiring that restructurings be done under the Corporate Debt Restructuring Advisory Committee framework or through the judicial courts.
Progress in bank recapitalization has been relatively slow, but a successful initial deal under the statesupported capitalization program and other private initiatives may serve as blueprints for other banks to follow.5 However, the banking system remains very weak, and curren£ levels of capital and reserves are considered to be far short of the amount by which loans will have to be written down-especially in the midsized and intervened banks.6 So far, only three of Thailand's smaller banks have been successful in forging partnerships with foreign banks, as the privatization of three nationalized banks-originally scheduled for March 1999-was delayed to decide the details of the guarantees to be offered to cover nonperfonning loans. The government is committed to sell the three banks in the next several months. During the first quarter of 1999, the three largest private banks raised capital using hybrid financial instruments in an attempt to avoid the loss of control (see Box A3.2). In late April, the country's fourth-largest bank completed a landmark $1.8 billion capital-raising deal whereby the government matched the share purchases of private institutional investors to become the largest shareholder in the bank.7 Provisioning levels would be raised after the capital injection, reducing the dilution born by the original shareholders.
China
The Chinese banks' asset quality continued to deteriorate in 1 998 and the authorities are trying to hold back the rise in nonperforming loans by creating asset management companies in the four state-owned commercial banks. Analysts believe that the four stateowned commercial banks' financial fundamentals have continued to deteriorate in I 998 as a result of falling profitability-which hinders loan provisioning and write-offs-and continued policy lending.8 While
sThailand has made substantial progress in cleaning up the finance companies. and asset sales are well advanced.
6See Moody's (1999b). 7Private investors were given warrants that allow them to buy
shares from the government in three years at a prespecified price. BWhile the People's Bank of China estimates nonperforming
loans to be 20 percent of total loans, most analysts believe the actual
160
there is a perception outside China that the country is making little progress on financial reforms, the authorities have taken their most aggressive step to date to stem the rising nonperfonning loans: the establishment of asset management companies to repackage and sell the problem loans of the big four banks. In a pilot scheme, China Construction Bank's nonperforming loans will be sold to Cinda Asset Management, which was established in April to either collect what it can from these loans or repackage them and sell them off at a discount. The government has reportedly given Cinda the power not only to force the restructuring of state-owned enterprises-including forcing lay-offs-but also to convert unpaid debt into equity-although enabUng legislation has yet to be enacted. However, analysts have raised doubts about whether Cttina has the fmancial infrastructure to enable the asset management companies to work properly and they foresee problems in the valuation, pricing, and management of the assets. Also, even if the asset management companies were to relieve the banks of their old bad debts. preventing them from generating new problem loans would be a more difficult task. To improve asset quaUty and profitability, the four banks will sign "governance contracts"setting out performance goals and supervisory boards-and are in the process of developing new accounting systems, setting up risk management divisions, and cutting back branches and employment.
The closure and bankruptcy of Guangdong !TIC prompted a reduction i n foreign banks' exposure and an increasing differentiation between sovereign and nonsovereign entities in China, but, despite the external ftnancing pressures, the domestic deposit base remained stable. Foreign creditors have complained of a lack of transparency in the liquidation of Guangdong lTlC (see Box 3.4, Chapter [II) and are calling for a clear definition of repayment priorities. Several other ITlCs have encountered liquidity pressures in recent months and total ITIC external debt-including Guangdong lTTC-is estimated by the authorities at $12 billion-but analysts estimate it could reach $20 billion with the inclusion of unregistered external claims and guarantees. However, only about 20 TTICs (out of a total of 240) have borrowed abroad and the ITICs together account for only about 5 percent of total assets of the financial system. The People's Bank of China has announced that the ITlC sector will be restructured through mergers and the reduction in the scope of ITICs' operations. There have been reports of
figure is significantly higher. To better gauge the banks' asset quality, this year the People's Bank of China will require them to reclassify their loans into the standard five categories, but officials have not made public the results of banks that experimented with the plan last year in Guangdong province. Also, RMB 270 billion of Special Treasury Bonds have been issued to recapitalize the four state-owned commercial banks.
©International Monetary Fund. Not for Redistribution
Asia
Box A.3.2. II) hrid lns1ruments In 1\sian Uank Recapitalization
Capital inllows to Asia's banking c;ector have \lowed to a tnckle <;ince the currency crises and banks have struggled tu satisfy capital adequacy requirements while facing a mountain of bad debts to write off. With the pnmary equity markets no longer available as a costeffective source of capital and the controlling shareholders unwilling to dilute theu· holdings, the largest Thai private banks have developed innovative solutionsincluding Stapled Limited Interest Preferred Securities (SLIPS) and Capital Augmented Preferred Securities (CAPS)-to replenish their capital bases. Other Thai banks followed the lead or the large banks. and analysts expect the issuance of similar hybrid capital instruments to become a popular route for bank.c; to recapitalize in other Asian countries.
Both types of instrument.' have essenually the same structure: each one combines noncumulative preferred shares with nondetachable (SU'3Jght or convertible) subordmated debt. In one prominent ca�e. a fixed coupon of 22 percent is paid on the subordinated debt The preferred shares pay a return to mvestors only if the bank has positive retained earnings and pays a dividend to ordinary shareholders. up to a max1mum of 23 percent of the face value of the \hares. I The bank has the option to repurchase the subordinated debt at the end of the fifth year. If the bank does <>0, then it has the option lO repay the preferred shares at par. The result of this rather complex structure IS that investors would receive a min1mum return of I I percent and a maximum return of 22.5 perccm; both rranches are equally valued at ISsuance.
1Provision� for loan lo�ses are onl>· �harcd wuh the SUPS/CAPS holders when Tter I cnp1tul fall� belo'-' 4.25 percent-the rrunJmum regulatory requirement.
a migration of corporate deposits from small and medium-sized financial institutions to the large state commercial banks, but domestic deposits in the system as a whole have continued to grow.
Hong Kong SAR
The exposures of banks in Hong Kong SAR to the ITTCs appear to be manageable and those to the property sector are beginning to recover. Moreover, these risks have to be judged relative to the banks' individual strengths: while nonperforming loans jumped in 1998 to 5 . 1 percent of total loans-from 1 . 8 percent in 1997-the average capital adequacy ratio stood at a healthy 18.6 percent by end-1998. The direct exposures of the Hong Kong SAR banks to mainland China entities are relatively small (around 4.5 percent of total assets) and market participants estimate that the indirect exposures (through a slowdown in mainland China) are unlikely to do more than slightly delay
161
The is�ue:. have been aimed at individuab with a high net wonh who already have deposits at the bank, although the instituuonal investor base 1s also expected to expand. The gO<>d recepllon that the inl.truments have received indicates that there is a ready retail investor base for highyield securities. Bank deposit rate:. have fallen to such low levels that depositors have been ready to <:witch into these instrument:.. which offer better returns-up to 600 basis pomt� over deposit rates. even if the risks are considerably higher. Indeed, while public guarantees are in place for depositors and senior creditors, the po�ition of subordinated creditors ;md preferred shareholders ha<o generally been left unprotected. A key nsk IS that the bank come� under regulatory control and. as a result, there is a write-down of common and preferred equity. lnsmuuonal mvestors have also demonstrated an appetite for the instruments. and the Life Insurance Association ofThailand has al ready received in-principle approval from the authorities for bank-subordinated debt to qualify a'> reserves for insurance compantes.
The Basel Committee on Banking Supervision advises that hybrid equity instruments should account ror no more than 1 5 percent of a banks' Tier I capital but analysts do not view these instruments a\ pure capital. In October 1998. the BIS included noncumulauve preferred �hares as qualifying as Tier I capital up to 15 percent of the total minimum. but each country i� free to define its specific capital requirements and the Bank of Thmland ha� said that bank� will only be allowed to issue SUPS/CAPS m an amount up to 33 percent of total Tier I capital. AnalyMs and rdting agencies see these mstruments as a temporal) measw-e that will evemuall> be replaced by pure equ1ry withlll live to seven years, when the bank. would be able to obtain a better price in a fnendlier capual-raismg environment.
the recovery in Hong Kong SAR. The property market appears to have bottomed out in the first half of 1999 and. in particular, residential prices-where the majority of the property exposures are-have rebounded since the last quarter of 1998 (see Figure 3.1 0, Chapter nn.
Singapore
Singapore's banks were adversely affected by the Asian financial crisis and the aU£horities have moved ahead with reforms to enhance financial sector transparency and position the financial sector for the next wave of regional growth. A sharp increase in nonperforming loans combined with conservative provisioning contributed to a large fall in profits in 1998. The authorities have been promoting consolidation in the sector, and two mergers last year saw the number of domestic banks decline to five. In 1998. the Monetary Authority of Singapore raised disclosure standards for
©International Monetary Fund. Not for Redistribution
ANNEX Ill DEVELOPMENTS IN EMERGING MARKET BANKING SYSTEMS
banks and announced plans to fully liberalize the banking system within five years. l n mid-May 1999, the Monetary Authority removed the 40 percent cap on foreign investors' total shareholdings in local banks, and over 1999-2001 the authorities will issue up to six licenses to foreign banks to designate them as "qualified full banks," allowing them additional branches and automatic teUer machines. Singapore wiU also raise the number of restricted banks from 1 3 to l 8 by 2001, while offshore banks will gain greater flexibility in Singapore-dollar wholesale businessincluding larger lending limits and freedom to engage in Singapore-dollar swaps. Meanwhile, the Monetary Authority of Singapore is expected to further ease capital adequacy requirements-currently at 1 2 percent of risk-adjusted assets-to boost the attractiveness of Singapore to foreign banks and to enhance domestic banks' regional competitiveness.
Latin America
ln most Latin American banking systems, the extent of reforms after the Tequila crisis-including increased foreign ownership-and the commjtrnent to improvements in prudential supervision and regulation have served to enhance the resilience to external liquidjty pressures and domestic volatility. Although Brazilian banks were most affected by the retrenchment of international banks from Latin America after August 1998, banks in Argentina and Mexico also suffered external liquidity pressures as well as a flight to quality that concentrated external flows in the largest banks. The reductions in international interbank exposures, and subsequent pressures in currency and securities markets, led to losses in the banks' securities portfolios that were absorbed through a reduction in earnings and the equity accounts-and, in the case of Mexico, through regulatory forbearance and central bank support. The persistence of high real interest rates and of the recession has reversed the recent recovery in asset quality across the region, but analysts believe most large banks have adequate capital bases to withstand the increases in delinquency rates. Nevertheless, foreign banks with operations in the region remain extremely cautious about lending decisions, and have reportedly shelved expansion plans to the middle market and consumer sectors and focused on consolidating big corporate clients, asset management, and private banking activities.
Argentina
While Argentine banks faced liquidity pressures from cuts in international interbank credit lines and losses of repo lines following the Russian crisis, the deposit base remained relatively stable even after Brazil's devaluation. This was in sharp contrast to the
162
experience during the Tequila crisis, when the Argentine banking system lost nearly 20 percent of its deposits. This stability reflected a number of factors. There has been a drastic improvement in prudential regulation since the Convertibility Plan was inu·oduced, with capital adequacy requirements exceeding minimum Basel Committee recommendations, much improved disclosure and oversight, and liquidity requirements amounting to 20 percent of deposits and other liabilities of less than 90 days' residuaJ maturity9 Moreover. as banks became increasingly concerned about spillover effects from Brazil. they sharply increased their holdings of liquid assets to levels above those required by official liquidity requirements. Despite the difficulties associated with maintaining the external contingent repo facility (see Box 3.8, Chapter III), the facility enhanced the perceived liquidity cushion for Argentine banks since it would allow the central bank to make credit lines available to domestic banks in times of a severe liquidity crisis. Also, the periodic disturbances since the Tequila crisis generated several flights to quality that resulted in a concentration of deposits in the top-tier banks that are mostly foreign-owned institutions. 10 Finally, a number of banks have been forced to close since 1997, and tbe authorities have shown an increasing capacity to respond quickly to these situations-particularly in finding buyers to take over the banks' branch networks-avoiding spillovers to other banks and providing further resilience to the system.
ln addition to building up their liquidity positions, banks responded to the combination of reduced external credit and greater market volatility by reducing the flow of domestic lending. What lending did take place was directed to the top corporales, which had for some time been directly accessing international capital markets. This re-interrnediation of the top corporates through the domestic banking system has continued to squeeze the small and medium-sized enterprises that have all but lost access to private credit. The pronounced slowdown in economic activity has not yet been fully reflected in banks' balance sheets, and nonperforming loans increased slightly to just above I 0 percent at end-December 1998 from 9.5 percent in September 1998.11 Banks with significant exposures
9See IMF ( 1998) for a description of the main aspecL� of Argentina·s BASIC (bondl>. auditing, supervision. infonnation. and credit rating) approach to banking oversight, which combines aspects of rhe conventional approach io regulation and supervision with the monitoring and discipline impo�ed by the market (including the use of credit rating agencies).
10The top I 0 banks accounted for 69 percent of total deposits at end-1998. compared with 50 on the eve of the Mexican crisi�. and foreign banks hold about 40 percem of lotal deposits.
II Net of provisions, nonperfonning loans increased from 3.2 percent of 1otal loans to 3.5 percem. over the same period. Moreover. banks continue to be well capitalized. with the capital adequacy ratio (calculared according to Basel rules) sready at 19.8 perccm-well above international srandards and the requirements of local legislation.
©International Monetary Fund. Not for Redistribution
Latin America
to securities faced a reduction in earnings or deferred the losses by shifting securities into investment accounts. In response to these developments, a few weak banks being taken over were allowed some time to bring their liquidity requirements up to the norm. [n a further strengthening of the regulatory framework, capital requirements for market risk and changes to the accounting standards for securities-initially scheduled for 1998 and aimed at the elimination of the "available-for-sale" account-were implemented on March 1 , 1 999. The requirement that banks issue 2 percent of their liabilities as marketable debt securities was also implemented on that date, and banks that were unable to issue such securities at that time incurred an increase in both liquidity and capital adequacy requirements of 1 percentage poim each.
Brazil
The generalized reassessment of international banks' exposure to emerging markets strongly affected the external liquidity position of Brazilian banks, but the pressures somewhat subsided after the arrangement of an IMF-led financial package in mid-November 1998 and its revision in mid-March 1999.12 Following a gradual process of reduction in international banks' exposures to Brazil in the third quarter of 1998, the process intensified between mid-October and midNovember 1998, and rollover rates on interbank credit lines for a group of 1 0 large international banks declined to less than 20 percent. The process of reduction in interbank exposures was particularly pronounced for international banks with significant local operations, a result of head offices' reduction of funding to local offices on concerns about a possible forced rollover. The announcement of the details of the authorities' IMP-supported adjustment program in mid-November allied these concerns, and rollover rates on interbank credit lines increased to more than 70 percent in December. The uncertainties surrounding the devaluation of the real prompted another reduction in the rollover of interbank credit Lines to about 65 percent in January and February 1999, but in mid-March the authorities obtained assurances from several creditor banks on the maintenance of their interbank and trade credit lines to Brazilian borrowers for at least six months at levels outstanding at endFebruary 1999. Also, some large Brazilian banks regained access to the international bond market, with issuance rising to $850 million in the fust half of 1999 (through end-May) compared with $2.2 billion in lhe same period of 1998 (and just $ 130 million in the second half of 1998).
12'fotal BIS reponing banks' exposure to Brazilian b1mh was reduced by $5.6 billion in 1998, with $5.2 billion of that reduction happening during the second half of the year.
163
Brazilian banks have weathered the economic downturn and market volatility reasonably well, and although analysts expect a deterioration in their financiaJ fundamentals, most market participants perceive systemic risks to be relatively low. Most Brazilian banks adopted a cautious approach to new lending in response to the poor operating environment in 1 998 and applied surplus liquidity to building up holdings of high-yielding short-term government securities. Nonperfonning loans rose from 6 percent of the total loan portfolio in mid- 1 997 to 9.5 percent by end-1998, but the level of provisioning remained above 120 percent of totaJ non performing loans. Most banks were protected against the devaluation by means of hedge mechanisms and long U.S.-dollar positions and recorded extraordinary profits during the first quarter of 1999.13 The ratio of nonperforrning loans is expected to increase, especially in those banks with large U.S. dollar-indexed leasing and consumer portfolios, and rating agencies worry about the repayment capacity of banks' borrowers and the fact that debt refwancings may not be adequately captured in the delinquency ratios. However, total loans account for a small part of the loan portfolio and banks continue to report capitalization in excess of both BTS and local requirements, '4 which may cushion them against the expected increase in delinquencies. Considering the fact that banks are the main holders of government securities, with nearly 60 percent of the total stock, some analysts continue to perceive a government debt restructuring as the main risk to the banking system-but attach a very low probability to such event. Other analysts do not believe that there is any imminent risk of defaull by the federal government
Chile
The low reliance of Chilean banks on short-term external financing shielded them against the external Liquidity squeeze affecting most markets in the region, but the combination of a tightening of domestic Liquidity and a sharp deterioration in economic activity damaged the banks· asset quality. To prevent a
131\vo wholesale banks suffered significant losse� due to large short-dollar positions on the futures exchange. One failed after the devaluation. and the other is undergoing voluntary liquidation. Also. some highly leveraged (domestic) hedge funds suffered severe losses in January, but this had a marginal effect over the banking system. in part owing 10 the implementation of Chinese walls after March 1998: in the ca�e of one large bank. management decided to reimburse investors after several lawsuits were filed against the bank's asset management company.
14By end-August 1998. the concept of Tier 2 capital was intro· duced and could be counted toward meeting the capital adequacy re· quirement of 1 1 percent of risk-weighted assets. The authorities are committed under the LMF-supported program to adopt capital requirements for market risk and to implement a forward-looking loan classification system.
©International Monetary Fund. Not for Redistribution
ANNEX Ill DEVELOPMENTS IN EMERGING MARKET BANKING SYSTEMS
sharp peso depreciation following a severe terms of trade deterioration, the monetary authorities increased interest rates several times in the first three quarters of 1998, which adversely affected those banks whose liabilities reprice faster than d1eir assets. As a result, profitability in the banldng system fell during 1998, while lending increased only slightly and nonperforming loans increased to 1 .5 percent in 1998 (from 1 percent in 1997). Nevertheless, provisions rose to 147 percent of impaired loans and the system capital adequacy ratio reached 12.5 percent of risk-weighted assets. Moreover, banks tightened underwriting guidelines and restricted lending to highrisk sectors such as consumer and middle-market. In response to market volatility, new regulations were introduced to allow banks to classify securities as held for trading (with unrealized gains and losses charged to earnings) or held to maturity (with unrealized gains and losses charged to equity), while all securities of less than one year maturity are marked to market.
Mexico
The Mexican banking system had a diminished role in the transmission of the international liquidity squeeze because its role in the credit process continued to shrink, and losses in securities portfolios prompted further official support for the sector. As the financial intermediation activities of the Mexican banking system stagnated after the crisis of the mid-1990s and gradually shifted offshore and to nonbank financial intermediaries, banks focused on purchasing government securities and only recently started to lend to the upper segment of the corporate sector. Also, banks had gradually extended the duration of their securities portfolios in the first half of 1998, demonstrating limited concern about downside risks. As interest rate spreads on emerging market securities widened in the aftermath of the Russian unilateral debt restructuring and the central bank tightened monetary policy, domestic interest rates rose sharply, and the ensuing losses in banks' securities portfolios wiped out the capital of some institutions and prompted the authorities to allow retroactive changes in the classification of securities in banks' portfolios-from trading (marked to market) to investment accounts (valued at cost). In addition, the central bank engaged in floating-for-fixed-rate swaps to reduce the banks' interest rate exposure. It is widely believed that these swaps were carried out at subsidized rates. In the event, the subsequent turnaround in interest rates did not help the banks since they had given up the upside potential of their original positions.
After four years of extensive government support, many Mexican banks are still in a weak position, and a rapid recapitalization of the system is critical to help
164
offset the incentives created by unlimited guarantees and regulatory forbearance. The approval in December 1998 of the IPAB Law 15 allows banking reform to go forward by providing a clearer institutional framework to address bank problems and a timetable for the phasing out of unlimited guarantees (see Box A3.3). During 1998, banks continued to be hampered by both economic and political factors, and profitability remained very low. While asset quality has improved since the Tequila crisis. bankers reported that during the past year, expectations of a further bailout program Jed debtors to reduce their debt-service payments, and past-due loans edged up to 1 1 .3 percent of total loans by end-December 1998-from 10.7 percent at end-June 1998.16 Analysts argue that if banks fully provisioned and used international best practices for the classification of loans, several banks would be insolvent and others seriously undercapitalized. ln April 1999, the Bankers Association estimated that the industry must boost overall capitalization by at least $5 billion over the following 1 2 to 24 months to complete the unfinished cleanup of loan portfolios and to build up an adequate capital base to resume normal lending operations. More recently, Moody's estimated the capital gap of the system to be about US$13 billion.17
In conjunction with the IPAB Law, the authorities approved the Punto Final program, which provides government-subsidized debt relief for mortgage holders, small and medium-sized businesses, and agricultural and fishing entities.IS Mexican banks have a large share of their assets frozen as a result of the FOBAPROA programs, and IPAB is set to convert the illiquid FOBAPROA notes into liquid securities. Also, the Law has lifted foreign ownership constraints in Mexican banks-prompting talk of a merger between the country's two largest banks-and has paved the way for the resolution of some smaller banks.
15Under the law passed in December 1998, theFondo Bancario de Protecci6n al Ahorro (FOBAPROA) liabilities were transferred to the lnstituto de Prorecci6n del Ahorro Bancario (rPAB), which will have two units: one charged with liquidating the assets currently in 1he hands of FOBAPROA and another that will be responsible for deposit insurance.
16Salomon Smith Barney (1999). "Moody's estimates of economic capi tal in the Mexican banking
system make a series of adjustments to reported capital. including ( I ) a more realistic view of certain impaired assets: (2) adding the unreserved portion of past-due loans; and (3) adjusting assets down. ward for intangibles and deferred tax credits. The agency believes that the estimates are conservative, and the exclusion of franchise values in the calculations is based on the severity of the legacy of impaired assets and the very weak capital-producing earnings after the !994-95 crisis (see Moody's. 1999c).
18Borrowers that are current or bring 1heir accounts current by end-September 1 999 will qualify for discounts of 45 percent for small business loans, 50 percent for mortgages. and 60 percent for fann and fisheries loan balances up to specified ceilings.
©International Monetary Fund. Not for Redistribution
Central Europe
Venezuela
Instability in international markets, coupled with political uncenainties and tight monetary IX?Iicy, precipitated an economic slowdown and a relauvely pronounced deterioration in Venezuelan banks' asset quality, which is likely to accelerate the consolidation of an overbanked banking system. AJthough loan growth was very strong in 1997 and the ftrst half of 1 998, it slowed down considerably during the second half of 1998 as interest rates peaked and macroeconomic conditions worsened. Asset quality deteriorated with nonperforming loans increasing to 5.5 percent by end-1998. up from 2.8 percent at end-1997.19 The ratio of provisions to nonperforming loan� fell slightly to 123 percent of nonperforming loans. while the capital adequacy ratio increased to 17.7 percent by end-1 998-from 1 3 3 percent and 1 6 percent. respectively, at end-1997. The deterioration in asset quality was larger in some small and medium-sized banks with sizable consumer loan portfolios. which continue to represent the system'!. main weakness. However. analysts believe that, given the structural improvements, this weakness would be more likely to intensify the trend to consolidation than to provoke a systemic crisis.20 The ratio of net worth to risk-weighted assets was 1 5.9 percent in March 1999, and liquid assets (reserves at the central bank, holdings of central bank paper, and net foreign assets) represented 36 percent of banks' total deposits. In addition. the authorities have taken measures to help accelerate the consolidation and have continued to improve the revamped regulatory and supervisory framework-including the marking to market of securities and �nflation-adjusted accounting. Still. the system conlln�es to be relatively inefficient. owing in part to htgh reserve requirements and deposit insurance contribution!., as well as a recenlly approved tax on bank debits.
Central Europe
After I 0 years of transition in the region, re�tructuring and privatization have strengthened the ban�ing systems in Hungary and Poland more than that tn the Czech Republic. The three banking systems continued to receive sizable foreign capital inflows. but
'9'fhe deterioration in a.-.sct quality conunucd in the firM lluaner of 1999, with nonperforming loan' increasing to almost 7.3 percent of total loans by end-March 1999. while provistoning fell to 102 percent.
:!OUnlike Mextco, the Vene1uelan bankmg �yMem recovered rapidly from the system1c cri�•� of 1994-95. mamly as a result of increased foreign ownership and the fact that local banks were able to recapitalize them�elves due to foreign exchange gains and high m�rgin\ in a negative real tntere't rate env1ronmem (see Moody s. 1999d).
exposures to Russia uncovered the fragilities of the largely state-owned Czech banks and have
_ pr�mp�ed
the authorities to relaunch the bank pnvattzauon process. Capital inflows supponed strong loan growth in Hungary and Poland, while compe�ition has led to declining profits and a search for htgher yields through lending to the small and medium-sized corporate and consumer segments. Losses in brokerage subsidiaries of foreign-owned banks in Hungary led to funding suppon from head offices in the wake of capital outflows during the Russian crisis, providing an example of the resilience afforded by this ow�er<,hip structure. AJI countries have strengthened the1r regulatory and supervisory frameworks, but signilicant chaUenges remain as they face the prospect of full capital account liberalization and contemplate joining the EU. In particular. capital adequacy requirements need to be broadened to include the market risks and off-balance-sheet exposures that are growing in most countries.
CLcch Republic
The onset of economic recession and exposures to Russia uncovered weaknesses in the Czech banking sy<,tem and prompted the authorities to relaunch the bank privati.wtion program and a revision of the regulatory framework. The Czech banks showed an increasing liquidity preference during 1998 and, as a result, total lending fell in real terms. Bank capital positions therefore improved, even though the ope�ating environment deteriorated. While nonperformmg loans remained stable at about 18.5 percent of total loans. the banks' average capita] adequacy ratio rose to 1 2 percent at end-1998 from 9.5 percent at end-1997. Despite the stable asset quality. banks' profits in 1 998 were negative for the second year in a row, with losses amounling to 0.2 percent of assets. This dismal performance led the authorities to relaunch the bank privatization program. Following the sale of one of the four large state-owned banks in early 1 998, the government sold the fourth-largest bank in early June 1 999 and announced a timetable for the privatization of the other two-to be completed in 1999. One of the latter two banks-indeed. the second-largest in the country-incurred large losses in Russian securities and derivatives markets and had to be recapitalized by the government at end- 1998. The other is also �kely to receive an injection of government funds to tmprove it!> risk profile in the run-up to privatization. A second revision to the Act on Banks, which strengthened bank licensing and supervision, became effective in September 1 998. but more changes are needed to comply with the EU directives-especially on accounting standards. Also, in June 1998 the central bank imposed stricter loan-loss-provisioning requirements, disaJiowing the netting out of collateral from loans overdue more than 365 days.
165
©International Monetary Fund. Not for Redistribution
ANNEX Ill DEVELOPMENTS IN EMERGING MARKET BANKING SYSTEMS
Box A3.3. Deposit lnc;urnncc: Issues for Emerging Markets
Recent development� in emerging market banking system� have led to a rcas�essmcnt or the optimal dc:-.tgn of bank safety nets. in particular deposit insurance systems. Several academic\ and mting agencie... huve stressed that moral-hazard-dnven lending played an Important role tn the A stan bankmg cnses. ad(hng IQ the existing evidence that explicit deposit insumnce increases the probability of systemic banking problcm�.l In pan recognizing this role. many of the countnes suiTenng from recent banking crises are considering or even have effective umetable� to limit the coveruge of their depusit insurance sys tems. In additton, the results of a recent survey suggest a trend toward the auoption of explicit deposit insumnce sy-;tems, to make them compubnry (to avoid adverse selection>. funded (but. in most cases backed up by governments). and to have mk-hasec.l pncing-all clementli that improve the incentive effeclli of the dcpo�it msurance system) However. despite �orne convergence to bc-;t practice among the emerging markets. improvements arc still needed in many countries, and \Cvcral proposab to impr<lvc the c.leposn inwrance system have emerged.
uu • Dunng Cn cs and lilt Moral /Iazard ls�u
The immediate consequence� of recent banking crisc� seem to support a strengthening of guarante� c.luring cri sis periods. but doubL� remam on the teasibility of ameliorating the moral ha1.ard effect!> uuring anu after a cri sis. The example of indonesia. where the closure of only a few banks-VI hen the solvency of many others was questionable on the basis of infom1ution available to dcposiiOrs-led to bank runs. would suggest that less-thanfull insurance unc.ler incomplete infom1ation on banks' asset quality may be qutte costly. However, private toformation about hanks· assets is one key fe:nure nf banking, and the historical evidence suggests that the emphasis on the fragility of banking systems in the absence of a govemmeot safet} net may be overstated.J Mureover. full coverage dunng cnses means that guarantees are strengthened precisely when incentive problems are worse-that is, when banks' capital is very luw. Also. a tightening of supervision and regulation to prevent the ''gambling for recovery" of in!>olvent banks may be eco·
ISee, tor msw.nce. Corsetti, Pcsentl, und Roubini tl998) and Dcmirgilt;-Kunt and Dctragiach;: (I 998).
2See Garcia ( 199\1). ·1St!e Kroszner tl998).
Hungary
The strong growth in the external liabilities of the Hu ngarian banking system was slowed marginally in the aftermath of the Russian crisis, and the repercussions of the events in Russia on local capital markets
166
nomicall; undesirable and politically infca�ible. us it would rcqlllrc banks to cllher mise capital in a very diflicult en\ ironment or n.:c.lucc loam in a procycli�ul VI a).
The recent experience of Mexico ami Turkey provhk clear examples of the problems created by extensive guaro�ntccs !ooevcral year;, after a crists. Both cnuntnes suflcrcd severe banking cri�es in 199-1-95 anc.l �.o'S tubli..,hcd full deposit guarantees thereafter. The mcompletc cleanup ol their banking systems has meant that, as the international capital markcl'i dned up last year, -;omc small and m�olvcnt banks ruiscc.l interest rates to kveb sub:.tantially above that of inter..:st rat..:!> offered by large• and relative!} more solvent bank\.4 As the dtstonionaiJ effech of the rornler hank.\' ]>ricmg bchm mr 111 the interhank and money markets grew. the government rcponculy providcc.l assurances of official !oUpport in the caM: of one Mexican institution to ensure the availabtlity of credtt lines. and man}' Turkish hanh were placed under enhanced surveillance
• rjSif In mt t/1 Erit lwu� In an attempt to balance the bendits of avoiding
bunk ntn:-. and the coslli of incre<tscd risk-taking, man) cuuntries have limited deposit insurance CO\'Crage. Indeed. 62 out of 68 countries sUJvcyed in Garcia ( 1999) already cover only u fracuon of the depositors' accounts, on th..: gwunc.ls that large. inforn1ed depositors would exert market disciphne on the banks. Also. all of the A�illll cri!>is countries-which arc excludeu from the survey-as well ac; Mexico. have announced their inten· tion 10 limit the coverage of their deposit insurance schemes.:�
Although a prccommitmem to limit depostl insurance in countrie� that already httvc an explicit ucposil in�urancc c;cheme entails some nsks, ll al<;o helps fo�us refonn efforts and muster the support 10 effectively clean up the sy�tem <tnd make it more tran�par�nt. Japan j., un example where the expectat10n that the full guar�tntee of deposits will be eliminated by 2001 has contributed to refocus uucntion and e fforts on re�tructuring and recapitul·
40\er the last year. th� \maHer lower-tie• bank, 111 Turkey were reportedly offering dollar interest rates of over 20 percent ll yeur. whih: the tnp·Licr b;mh were paying r.ttc' untlcr 10 percent.
'The convergence of lim11ed deposit msurancc to the surne le1•r/ ol 1.kposits in the EU has meant that poorer countries, on a\'eragc. would offer higher CO\'cragc in rclatillnship to in�'tliiH: thun nchcr countnc:s. lienee. countncs "ith pot<:nttatly weaker banks could be subJect to u higher moral hazart.l problem.
demonstrated the resilience imparted by a sn·ong foreign presence in the banking sector. Banks' foreign liabilities increased by 18 percent (adjusted by the forint depreciation) in 1998, despite declining marginally in the period after the Russian crisis. The Russian crisis and its spillovers to Hungarian money
©International Monetary Fund. Not for Redistribution
Central Europe
ir.ation of the banking sy�tem (see Annex TJ ). In end-May 1999. Mexico announced Lhut 1t w1ll phase out unlimited
dcpo�it insurance from 2003-when the government expects to complete the cleaning up of the banking systt:m-to guarantee deposits of no more than about US$1 00.000 b)- 2005
While there is some evidence that depositors iu emerging markeh d(l exen :.orne sun of discipline on bunb. the small extent of depositor losses in recent crise!\ and the slrengthenmg of safety nets casts doubts on the credibility of JUSt limited support in the event of a recurrence of cnses. Fmpirical c\·idcnce lrom Argentina, Chile, and Mexico !\ugge!>L' that depositors (both small and largeJ do punish hanks that take excesstve risk. by withdrawmg their fund�." However, man) depositors in these countries had suffered los�es from previous crises· usually dcnved from delayed payments after a dcpo!>it freeze-and analysh worry that the lack of meaningful losses 111 recent crises, combined with a more exphcit and creclibl) funded deposit insurance scheme. may weaken depositor discipline. Morco,cr. the savings and loan crisis in the U111ted States vividly showed ho" depositor discipline. and even that of regulators. cannot be rully trusted.
,opos •
Several a!Lcrnarive proposals for the reform of deposit insurance schemes have been put for.vard, and the) can be broadly classified into three groups or approaches.
The early inu.m·emionlclusure upproach has the advantage of maintaining (and strengthening) the existing bunking and deposit insurance <,Lructures. bm criucs nore that the approach's main tlaw is that it relies only on regulatol'li to cnfurce discipline on the hanks. The proposals arc mspircd by rhc U.S. experience after the Federal Depo�it Insurance Corporation Improvement Act ami the Chilean Banking Law of 1986. which aucmpL� to enact clear. explicit pnnc1ples for a timely regulatory intervention or lroublcd hanks.7 The principle\ include prompt corrective action from the hanks to restore capital to the required regulatory ratio� and a precise specification of several alternative closure and recapitalization mechanisms. The mtlin problem With thiS approach is that II relics onl) on hank regulatol'li to identif)- undercapitalized banks and to enforce regulatious. while expcnencc in man) countries ha:-. shoy, n that regulators are nut im-
6See Martinez ;tnd Schmukk'r < 1 9()9). 'See Bcns10n and Kaufman r 19'J7l and .Brock Cl992 ).
and capital markets resulted in a decrease in profits and substantial shifts i n banks' balance sheets. The share of foreign currency assets rose to 36 percent of total assets at end- I 998-roughly the same as that of foreign currency liabilities-from 30 percent at endJune 1998, led mostly by strong growth in foreign-
167
mum: to political pre�sure that may cxaccrhaie incenti\'c problems and fiscal losses.�!
The (tmctimwl appmuclt is hased on the view that thcr.: ure significant costs in maintaining the current ln\titutional structure. It holds that an efficient solution i� lor C<lmmcrdul lending to he financed b) 'tandard instruments such as debt. preferred stock. und equity, and for deposit in�ur.tnce to be limited to institutions or accounh that collateralile demand deposits with liquid. riskless securities-such a� U.S. Lrea .... ury securities.Q This proposal i'> '-llnilar to the "narrow-banldng" pruposals, but alll'W" mstltlllions that rake transaction/demand deposlls to also engage in other financial aclt\ itics, including risk)- lending. It av01ds the diflicuiLics mhercm 10 an eft�ctivc marking l<l market of the early intervention/closure proposals, but IS subject to the credibility problem tJ1at. in the event. o ther habtlilles used to finance loans may end up also bemg fully guaranteed by the government.
The murkel-discipline approach attempts to combine go\'emmcnt deposit insurance and regulation. with monitoring and discipline unposed by the market. Ill Tile key to this approach ts to requ•re banks to mamtain mmimum ratios of �ubordinat.:d debt relative to insured dcposib. such that private agent� that do not share on the up�idc of bank nsk-taking beha\Jor have an mcentive to constrain that behavior. The propos<tl requires thut the subordinated debt he rolled over gradually--to avoid sudden rollover crbes and allow time for corrective action: that 11 be sUbJe.:t to a maximum spread over a riskless instrument: and that 11 be held by parties unrelated to the bank holding company or the guvemment-preferabl)-, by lorcign banks or insututional investors. Argentina has implemented some of lhe element�> of thi!-. proposal. tngetbcr with the requirement that banks obtain anJ make publicly available ratings from two well·cMablished private mting agencies. II Althuugh some Argentine banks have had difficulties issuing such subordinated debt. thts wal> a result of the currently diflicult international en\ imnmem-which has restricted access to most pnvate entitie�-and the good reception of the Thai hybrid capital instruments-�Ahich include a subordinated debt component lSCe Box A3.2)-suggest that it may be feasible for emerging market!> to follow this approach.
MS.:.: Calomiri' I t999l. 9S�:� Menon and Bodie (t993). lOSee Calnmnis c 1997. t999). liTh� rcc.:n1 propo\ab hl modif} the Ba,el Accord incorpo
rate the use of credit raungs for all �overeign lending and for u limited amount or corporare lending (see Chapter IV).
currency-denominated loans. Also, the share of government securities increased to 1 4 percent of toral assets, from I I percent at the end of the ftrst half of the year. Banks experienced a significant decrease in profits, owing to a deterioration in the quality of their portfolios, the introduction of country risk provision-
©International Monetary Fund. Not for Redistribution
ANNEX Ill DEVELOPMENTS IN EMERGING MARKET BANKING SYSTEMS
ing, and losses in trading and brokerage operations. Problems at banks' brokerage subsidiaries, as a result of defaults of highly leveraged retail investors,21 did not lead to many closures, as parent banks-including the head offices of many foreign banks, which dominate the Hungarian banking sector-transferred funds to support their securities subsidiaries. Brokerage losses and the failure of the second-largest retail bank-which was recapitalized by the authorities at year-end-prompted changes to a still well-regarded supervisory and regulatory framework.
Poland
£nternational bank exposure to Polish banks increased during 1998, in part owing to the stable bank relationships with western European banks and the prospects of EU accession, and contributed to strong lending growth. Strong capital inflows led to persistent excess liquidity in the banking system, which was offset by central bank sterilization and through the maintenance of high reserve requirements. Combined with strong competition, this fueled aggressive credit growth--especially in foreign-cUJTency-linked loans to (generally unhedged) borrowers; strong growth in off-balance-sheet activities, albeit. from very low levels; and a 35 percent decline in net profits. Restrictions on foreign participation in the banking sector were lifted early last year, and as of end-1998 foreign banks with wholly owned subsidiaries or major equity stakes in privatized banks accounted for 44 percent of total share capital. Foreign ownership is bound to increase substantially with the privatization of the country's largest bank by mid-1999 and that of the last of the nine regional banks later in the year. As a result of the growth in off-balance-sheet positions, the authorities have introduced prudential regulations to lirnil derivative transactions to 30 percent of equity and have extended solvency requirements to encompass counterparty risks related to off-balance-sheet positions. Although securities are almost one-third of the banks' balance sheet, no capital adequacy requirements for market risk have yet been implemented. Also, while the Polish banking system is evolving rapidly toward a universal banking model, financial sector supervision in Poland is not carried out on a consolidated basis.
Turkey
The Turkish banking system faced increased funding and credit risks during 1998, owing to curtailed
liPrior to the summer of 1998. retail investors made substantial profiL� through carry trades conducted through the currency futures markets, which allowed them to profit from the interest differential (adjusted for exchange rate changes) with very low margins. The Russian crisis and its spillovers to Hungarian money and capiml markets led to the failure of six brokerage houses.
168
access to international funding by the lower-tier banks, higher domestic interest rates, and an economic downturn. However, the strength of a core group of well-managed top-tier banks. the treasury's readiness to accept high interest rates, and the stability of the depositor base allowed tbe banking system to weather the global crisis well. Despite substantial capital outflows in the aftermath of the Russian crisis. external liquidity pressures abated in the last quarter of 1 998, and international syndicated loans to the top-tier Turkish banks were rolled over at a higher-than-expected rate. The predominant reason for the renewal of credit lines was relationship banking with international banks, aided by the sophisticated and flexible risk management of the top-tier banks and the treasury's readiness to accept high interest rates in the scheduled bills and bond auctions.22 The high domestic interest rates have raised questions about the dynamics of the government's debt, but this has so far not been a key concern with the domestic investor base. Domestic depositor contidence was supported by the blanket guarantee of deposits, which allowed some smaller banks and the state-owned banks to offer above-market interest rates to attract deposits (see Box A3.3). Despite concerns about the available resources of the deposit insurance fund, the interventions in two banks that experienced runs were relatively smooth, and some twelve unidentified banks have reportedly been on tl1e treasury's watchlist of financially weak institutions. The maturity mismatch in the sector is not large--except for a few banks that rely heavily on repo transactions-but the large currency mismatch remains a source of concern, despite the tighter regulations that attempt to bring the open positions to 30 percent of equity. As the economy slowed down, asset qualitywidely perceived to be overestimated23-deteriorated. with the biggest credit risk being the concentration of intragroup lending and guarantees that are not readily apparent in the analysis of banks accounts. Market analysts see the approval of a new banking law that calls for the establishment of an independent bank supervisory body as a crucial step toward reforming the Turkish banking system.
References
Benston, George. and George Kaufman. 1997, "FDICIA After Five Years," Journal of Economic Perspectives, Vol. I I (Summer). pp. 1 39-58.
22Turkish banks are the treasury'& large�t creditors as they hold an estimated three-fourths of the lira-denominated government debt. Because of the importance of government securities in the banks' portfolios. any disturbance to the domestic treasuries market entails serious liquidity risks for the banks.
23The real level of problem loans is estimated to be a multiple of the banks' reported ratio of 2 percent of total loans, once restructured credits and bad loans to state enterprises are included.
©International Monetary Fund. Not for Redistribution
References
Brock. Philip, ed .. 1992, "IfTexa� Were Chile: A Primer on Banking Reform" (San Francisco, California: Institute for Contemporary Studies Press).
Calomiris. Charles, 1997, "The Postmodern Bank Safety Net: Lessons from Developed and Developing Economies" (Wa�hington: AEf Press).
---, 1999. "BuiJdjng an Incentive-Compatible Safety Net," Journal of Banking and Finance (forthcoming).
Corsetti, Giancarlo, Paolo Pesenti, and Nouriel Roubini, 1998, "What Caused the Asian Currency and Financial
Crisis?" Banca d'Italia, Terru di Discussionc No. 343 (Rome, December).
DcmirgUrr-Kunl, Asli, and Enrica Detragiache, 1998, "The Determinants of Banking Crises In Developing and Developed Countries." Staff Papers, International Monetary Fund. Vol. 45 (March), pp. 81-109.
Garcia, Gillian, 1999, "Deposit Insurance: A Survey of Actual and Best Practices,'' IMF Working Paper 99/54 (Washington: International Monetary Fund).
International Monetary Fund, 1998, lntemaliOIWI Capital Markets: Developmems. Prospec1s, and Key Policy lssues (Washington).
169
Kroszner, Randall S .. 1998, "Rethinking Bank Regulation: A Review of the Historical Evidence.'' Journal of Applied Corporale Finance. Vol. I I (Summer).
Martinez. M. Soledad, and Sergio Schmukler. 1999, ''Do Depositors Punish Banks for "Bad" Behavior?: Examining Market Discipline in Argentina, Chile. and Mexico" World Bank Policy Research Working Paper No. 2058 (Washington: World Bank, February).
Merton, Robert, and Zvi Bodie, 1993, '·Deposit Insurance Reform: A Functional Approach," Camegie-Roches1er Con
ference Series on Public Policy, Vol. 38 (June), pp. 1-34. Moody's Investor Service. J999a. "Corporate Restructuring
and the Impact on the Korean Banking Sector" (New York, April).
---, 1999b, "Banking System Outlook: Thailand" (New York, May).
---. 1999c. "Special Comment: Look Who's Talking About Capital: The Mexican Banking System and Economic Capital'' (New York, June).
---, 1999d, "Banking System Outlook: Venezuela" (New York, January).
Salomon Smith Barney. 1999. Mexican Bank Reference Guide. Equity Research (April).

©International Monetary Fund. Not for Redistribution
Annex IV Proposals for Improved Risk �anagernent, lransparency, and Regulatory and Supervisory Reforms
Dynamic changes in financial institutions and capital markets are posing increasingly complex
challenges for financial regulation and supervision. Wider circles of counterparties now interact with each other in a larger number of business lines: financial instruments have become more complicated; and financial intermediation relies increasingly on fast-changing financial markets. Consequently, the distinction between commercial banks, securities tirms, insurance companies, and other financial institutions has become blurred, and large diversified financial conglomerates have been created that span the spectrum of financial services and global markets. Highly leveraged activities and institutions engaged in these activities, including unregulated hedge funds, have emerged on a scale that could pose systemic risks. All in all. tinancial innovation (especially off-balance-sheet activities) and globalization may have reduced the transparency of the global tinancial system and increased challenges for market participants and supervisory agencies alike. This annex briefly describes the proposed revisions to the Basel Accord on Capital Adequacy and the newly established Financial Stability Forum and then summarizes regulatory and supervisory developments during the past year in the following areas: ( 1 ) risk management and internal control systems; (2) disclosure and market discipline: (3) HLls, including hedge funds; and (4) the supervision of financial conglomerates and international accounting standards (see Table A4.1 ). The summary focuses on the broad issues and does not cover regulatory developments in particular countries.
Most of the regulatory and supervisory issues are part of the wider agenda on the international financial architecrure.1 Key pillars of the reform agenda are the development, dissemination, and adoption of internationally recognized standards, and the promotion of greater private sector transparency to bolster market discipline. Tn the wake of the 1997 Asian crisis, numerous regulatory initiatives were proposed, mostly targeted at setting global standards and guidelines that
'See the reports on the international financial architecture prepared by the Working Group on International Financial Crises (1 998). che Working Group on Strengthening Financial Systems ( 1 998). and the Working Group on Transparency and Accountabil· ity ( 1998).
170
are in many cases derived from practices in developed countries. These standards were gathered in the Core Principles for Effective Banking Supervisimz2 and have recently been extended in some areas, such as bank transparency. In addition. the 1998 financial market turbulence and in particular the near-collapse of LTCM spawned a wave of regulatory and supervisory reports, guidelines, and forums in both the public and private sectors that are primarily directed at improving risk management, strengthening market discipline by increased transparency and disclosure, improving oversight of banks' interaction with HLis, and enhancing consolidated supervision of financial conglomerates.
The supervisory authorities strive to bring regulatory standards up to date with financial innovations that often seem a step ahead. To adapt regulations flexibly to the increasing pace of innovation and change, supervisors have shifted away from specific regulatory rules and have moved toward a more risk-focused approach to regulation. A key development is the proposed revision to the 1988 Basel Accord on Capital Adequacy that aims at correcting weaknesses in the existing capital regulations and would adapt them to financial innovations and changed banking practices. The consultative paper A New Capital Adequacy Framework. issued by the Basel Committee on Banking Supervision in June 1999. proposes capital adequacy rules that would be more closely aligned with risk profiles) The new framework would rest on three pillars: minimum capital requirements that expand the "standardized approach'' in the current Accord; supervisory review of a bank's capital adequacy and internal assessment processes; and strengthened market discipline as a lever to encourage prudent and sound banking practices. The Committee proposes to use external credit assessments for determining risk weights for claims on sovereigns and banks, and to some extent for claims on corporates. For some sophisticated banks, the Committee believes that, subject to supervisory approval, internal ratings could form the basis for setting capital charges more closely aligned with underlying
2See Basel Commiuee on Banking Supervision ( 1997). lSee Box 4.2 in Chapter IV for a summary of the proposed revi
sions to the Basel Accord on Capital Adequacy.
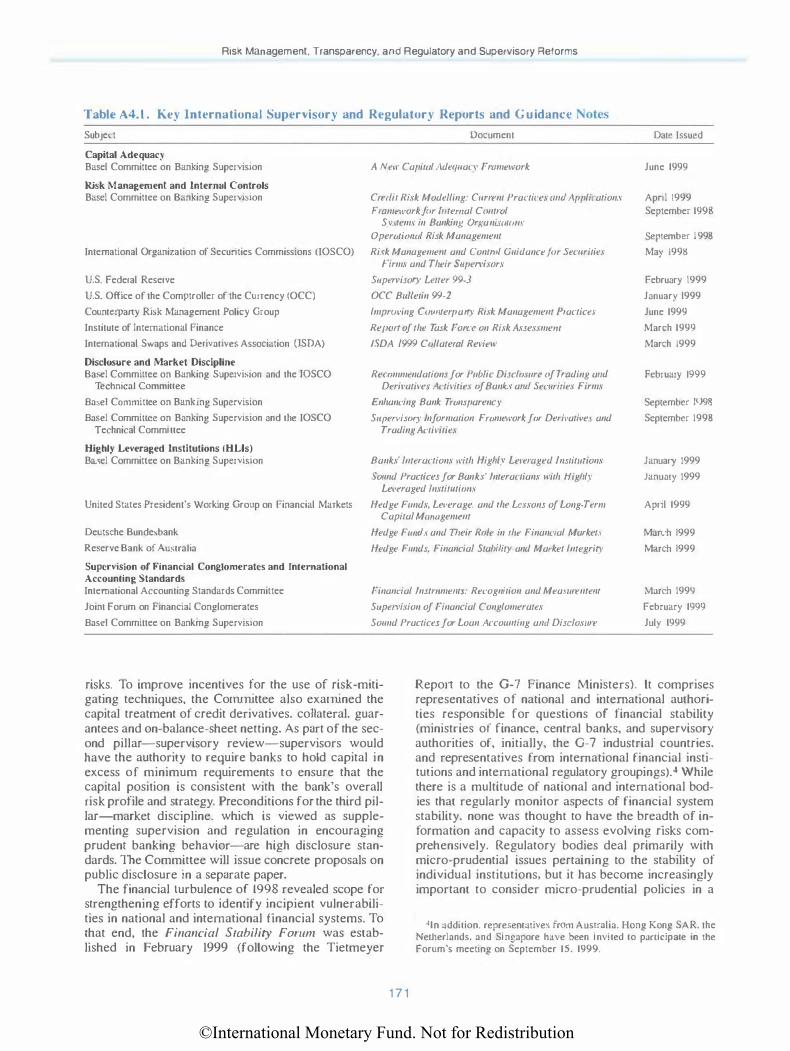
©International Monetary Fund. Not for Redistribution
Risk Management, Transparency, and Regulatory and Supervisory Reforms
Table A4. l . Key International Supervisory and Regulatory Reports and Guidance l\otel.
Subject
Capital Adequacy Basel Commitlee on Banking Supervision
Risk Maoagement and internal Controls Basel Committee on Banking Supervision
International Organization of Securities Commissions (IOSCO)
U.S. Federal Reserve
U.S. Office of the Comptroller of the Currency (OCC)
Counterpany Risk Management Policy Group
Institute of International Finance
International Swaps and Derivatives Association (lSDA)
Disclosure and Market Discipline Basel Commiuee on Banking Supervision and the TOSCO
Technical Committee
Ba�el Committee on Banking Supervision
Basel Committee on Banking Supervision and the IOSCO Technical Committee
Highly Leveraged institutions (HLls) Basel Committee on Banking Supervision
United States President's Working Group on Financial Markets
Deutsche Bundesbank
Reserve Bank of Australia
Supervision of Financial Conglomerates and International Accounting Standards International Accounting Standards Committee
Joint Forum on Financial Conglomerates
Basel Committee on Bankmg Supervision
Document
A Ne11· Capiwl Adeq11an• Framework
Cretlir Risk Modelling: C11rrent Practices mul Application.\
Framework for /me mal Comrol System.\ in Bankint: OrganiSlllt/11.\
Operatimwl Risk Management
Ri.fk Mana gemelli and Control G11idance for Sec11rities Firms and Their S11pen•isors
S11pen•isory Le11er 99-3 OCC Bulletin 99-2 lmprtwing CVtmterpar�\' Risk Managemem Practices
Repot1 of the Task Fon·e on Risk Assessmem
ISDA 1999 Collateral Review
Recommendations for Public Disclosure of Trading ami Deril•atives Activities of Banks ami Sec11rities Firms
Enhancing Bank Transparency
S11pen•isory Information Framework for Derivatives and Trading Activities
Banks' lmeractions with Hig!J/y Le1·eraged /nstitwions
So11nd Practices for Banks' /nteractians with Higflly Levl'raged lnstimtiom
Hedge Funds. Leverage. and the Lessons of Long-Term Capital Mmwgemem
Hedge Fwul.f and Their Role in the Financial Market,\
Hedge F11nds. Financial Stability and Market lmegrity
Financ:ial /nstmmellls: Recognition and Meamremelll
Supervision of Financial Conglomerates
So11nd Practices for Loan Accouming ami Disclosure
Date Issued
June 1999
April 1999 September 1998
September I 998
May 1998
February 1999
January 1999
June 1999
March 1999
March 1999
February 1999
September 1998
September 1998
January 1999
January 1999
April 1999
March 1999
March 1999
March 199l)
February 1999
July 1999
risks. To improve incentives for the use of risk-mitigating techniques, the Committee also examined the capital treatment of credit derivatives. collateral, guarantees and on-balance-sheet netting. As part of the second pillar-supervisory review-supervisors would have the authority to require banks to hold capital in excess or minimum requirements to ensure that the capital position is consistent with the bank's overall 1isk profile and strategy. Preconditions for the third pillar-market discipline. which is viewed as supplementing supervision and regulation in encouraging prudent banking behavior-are high disclosure standards. The Committee will issue concrete proposals on public disclosure in a separate paper.
The financial turbulence or 1998 revealed scope for strengthening efforts to identify incipient vulnerabilities in national and international financial systems. To that end, the Financial Srability Forum was establjshed in February 1999 (following the Tietmeyer
Report to the G-7 Finance Ministers). lt comprises representatives of national and international authorities responsible for questions of financial stability (ministries of finance, central banks, and supervisory authorities of, initially, the G-7 industrial countries. and representatives from international financial institutions and international regulatory groupings).4 While there is a multitude of national and international bodies that regularly monitor aspects of financial system stability. none was thought to have the breadth of information and capacity to assess evolving risks comprehensively. Regulatory bodies deal primarily with micro-prudential issues pertaining to the stability of individual institutions, but it has become increasingly important to consider micro-prudential policies in a
1 7 1
41n addition. repre�entatives from Australia. Hong Kong SAR. the Netherlands. and Singapore have been invited to participate in the Forum's meeting on September 15. 1999.
©International Monetary Fund. Not for Redistribution
ANNEX IV RISK MANAGEMENT, TRANSPARENCY, AND REGULATORY AND SUPERVISORY REFORMS
wider market-based setting. The Forum would also identify gaps in international standards and codes of conduct and ensure that consistent international rules and arrangements apply across all types of significant financial institutions. Three working groups have been established. One working group has been asked to recommend measures to reduce the destabilizing potential of HLis. A second working group will evaluate measures to reduce the volatility of capital flows and the risks of excessive short-term external indebtedness. The third working group will investigate the impact of offshore financial centers on global financial stability and assess progress in enforcing international prudential standards by offshore centers.
Proposals to Strengthen Risk Management and Internal Control Systems
Market disturbances in 1997 and 1 998 revealed weaknesses in counterparty credit risk and market risk assessments. Analyses since the market turbulence have noted that risk management systems failed in part because of technical weaknesses-for example, correlations across market prices behaved erratically and other key assumptions underlying the techniques proved incorrect. The interaction of financial institutions with hedge funds and other HUs also revealed the close ljnk between market risks and credit risks. Moreover, seemingly adequate amounts of collateral and margins proved insufficient. These and other shortcomings point to the need to also improve internal control systems. The majn challenge is therefore how ro adapt risk management tools and internal controls to increasingly global and interrelated markets, new financial products, and potentially more volatile market conditions (including the potential loss of market liquidity).
New supervisory initiatives that have recently been brought under way also aim at narrowing the gap between leading-edge risk management practice and the average industry standard. Tn part owing to significant losses at some banking institutions, banking supervisors are putting more emphasis during inspections on the review of a banking organization's risk management and internal control processes. To underpin these efforts by national supervisors, international forums of regulatory authori6es (such as the Basel Committee on Banking Supervision and the International Organization of Securities Commissions (TOSCO)) and private groups (such as the IlF and the Counterparty Risk Management Policy Group) have drafted reports and guidelines on various aspects of risk management.
Public Sector Reports
The Basel Committee's report on Credit Risk Modelling: Current Practices and Applications (April
172
1999) assesses the state of the art in credit modeling with a view to judging whether existing credit risk models could be used in the regulatory oversight of banking organizations and whether internal credit modeling approaches could serve as the basis for formal regulatory capital requirements to cover credit risk. To be used for that purpose, the report emphasizes that models should be "conceptually sound, empirically validated, and produce capital requirements that are comparable across ins6tutions." At this point, the Basel Committee sees significant hurdles, principally concerning data availability and model validation. As to data limitations, most credit instruments are not marked to market, and credit risk predictions can typically not be derived from statistical projections of future prices based on a comprehensive record of historical prices. The validation of credit risk models is more difficult in part because backtesting needs to rely on a longer 6me horizon (typically one year or more) than market risk models (a few days).
The Basel Committee's Framework for !merna/ Comrol Systems in Banks (September 1998, previously issued for consultation in January 1998) complements the Basel Core Principles on issues of internal controls. Recognizing that sound internal controls are essential for the prudent operation of banks and for promoting financial system stability, the paper emphasizes that an effective system of internal controls must be consistent with the nature, complexity, and risk inherent in the bank ·s on- and off-balance-sheet activities. It outlines 13 principles for use by supervisors to evaluate banks' internal control systems. The principles stress the role of management oversight in understanding the major risks run by a bank, and in taking steps necessary to identify, measure, monjtor, and control these risks. A precondition is that the material risks that could adversely affect the bank are being recognized and continually assessed. Control activities should be an integral part of daily activities of a bank, with controls defined at every business level. The principles also stress that reliable information systems and effective communication channels should be in place. The paper recommends that the effectiveness of the banks' internal controls be monitored on an ongoing basis by an internal audit unit that reports directly to the board of directors or its audit committee.
The Basel Commjuee's paper on Operational Risk Manageme111 (September 1998) reports the results of a survey among some 30 major banks. While there is no universally agreed upon definjtion of operational risk, it is largely considered to be risk arising from human or technical error. Managing operational risk is becoming more difficult as financial instruments and instjtutions become more complex. Many banks in this survey expected most operational risk events to be associated with internal control weaknesses or lack of compliance with existjng internal control procedures. The survey also indicates that while awareness of op-
©International Monetary Fund. Not for Redistribution
Proposals to Strengthen Risk Management and Internal Control Systems
erational risk among senior bank management was increasing, banks were onJy in the early stages of developing operational risk measurement and monitoring systems. Some conceptual difficulties that need to be overcome stem from the fact that, unlike market and credit risk, operational risk factors are largely internal to the bank. In light of these problems. many banks thought that the processes were not sufficiently developed for bank supervisors to mandate guidelines specifying particular measurement methodologies or quantitative Limits on operational risks.
The IOSCO document on Risk Management and Control Guidance .for Securities Firms and Their Supervisors (May 1998)-like the Basel Committee paper on internal controls-provides guidance to securities firms and supervisors about internal controls and risk management. It echoes many of the themes in the Basel documents and outlines recommendations and identifies elements of effective risk management and control systems designed to serve as benchmarks. The recommendations stress that controls should be set and monitored at the senior management level. Risk management and controls should include loss tolerance limits at the level of the firm and individual trading desks and should cover market, credit, and operational risk, as well as liquidity and legal risk. Written documentation on control procedures should contain general guidance at the most senior levels and more specific and detailed guidance for smaller business units and trading desks. Finns and supervisors should ensure that control policies, once established. are effectively applied and keep pace with new products and industry technology. Firms also need to establish mechanisms that ensure that inadequacies and breakdowns in controls are reported to senior management on a timely basis.
The U.S. Federal Reserve and the U.S. Office of the Comptroller of the Currency (OCC) have issued guidance notes on risk management that echo many of the messages contained in international regulatory initiatives. In the U.S. Federal Reserve Supervisory Letter 99-3 (February l , 1999), the Federal Reserve points to "substantive lapses in fundamental risk management principles regarding counterparty risk assessments, exposure monitoring, and the management of credit risk limits" reveaJed by the turbulence in both emerging and mature markets during 1997 and L998.
The Federal Reserve provides guidance on two elements of counterparty credit risk management that may need special attention: adequate internal policies and sufficient internal controls to ensure that practices comply with these policies. As to the assessment of counterparty creditworthiness, supervisors and examiners should pay close attention to the appropriateness, specificity, and rigor of the policies, procedures, and internal controls used to assess counterparty risks. In particular. general policies that broadly apply to all
173
types of counterparlies may prove inadequate, as the example of hedge fund counterparties has demonstrated. Examiners should ensure that bank policies address the risk profiles of particular types of counterparties and instruments. Internal controls, in the form of periodic independent reviews by internal auditors, are necessary to ensure that practices conform with stated policies. As to the measurement of credit risk exposures, the standard calculation of potential future exposures can be inadequate and may need to be supplemented by more real is tic measures of collateralized exposures in times of market stress. Credit enhancements, such as collateral arrangements and contractual closeout provisions. can mitigate but cannot eliminate credit risks. Institutions should ensure that overreliance on collateral does not compromise other elements of sound counterparty credit risk management, such as due diligence. Examiners should focus special auention on meaningful exposure measures, exposure monitoring, and Limit systems, which are considered central to the effective management of coumerparty risk.
ln the same vein, the OCC Bulletin 99-2 (issued on January 25, L 999) provides new risk management guidance on derivative and other bank activities. It highlights weaknesses in existing risk management systems and idemities sound practices for banks' derivatives and trading activities. While the bulletin focuses primarily on credit risk. it also addresses other sources of risk, including market, Liquidity, transaction, and compliance risks. The OCC outlines five key risk management principles: • Banks must fully understand the strengths and
weaknesses of their risk management systems. • Risk outputs (e.g., value at risk) must be stress tested.
Stress testing is an essential component of the market and credit risk managemen1 process. and requires the continuing attention of senior management.
• Due diligence, careful customer selection, and sound credit risk management-not competitive pressures-should drive the credit decision process.
• Risk oversight functions must possess independence. authority, expertise, and corporate stature to provide to senior management effective early warning of negative market trends.
Prhate Sector Reports
Parallel to official reports and guidelines, private institutions and ad hoc working parries are aJso analyzing the issues surrounding risk management practices. In March 1999, the IlF and the International Swaps and Derivatives Association (ISDA) released reports on risk management and collateral management, respectively. Recently, the Counterparty Risk Management Policy Group. which had been formed by J 2 large financiaJ institutions, published a comprehensive list of recommendations.
©International Monetary Fund. Not for Redistribution
ANNEX IV RISK MANAGEMENT, TRANSPARENCY, AND REGULATORY AND SUPERVISORY REFORMS
The Counterparty Risk Management Policy Group (co-chaired by Gerald Corrigan. Goldman Sachs; and Stephen Thieke. J.P. Morgan) released its report on Improving Counterparty Risk Manageme111 Practices in June 1999. The report contains a set of recommendations for effective management of counterparty credit risk, market risk, and liquidity risk. The Group emphasizes the need for constant adaptation and modification of risk management practices as financial environments evolve. The Group is, therefore, critical of any attempt to codify risk management practices.s The quality of risk management is not only viewed as a matter of improving the sophistication and precision of risk estimation models but also as dependent on experience and sound judgment. The Group links the key elements of its recommendations through a conceptual framework that rests on six building blocks:
I . Information sharing between counterparties (particularly credit providers and credit users) constitutes the foundation of effective risk management. The Group therefore proposes to intensify the exchange of infom1ation, but it recognizes that the required intensity of information sharing is a function of. inter alia. the credit exposure, the Liquidity of the underlying transactions, and the degree of independent oversight of the counterparty. The paper proposes safeguards to protect proprietary client information.
2. The Group outlines an integrated analytical framework for assessing the consequences of leverage on various forms of risk, including credit, market, and liquidity risk. It points out that leverage is not a separate source of risk but a factor that can amplify market and credit risk. Financial institutions should take steps to manage the magnifying effect of leverage on their market risk, funding arrangements, and asset liquidity risk.
3. Measures of counterparty exposures should include Liquidity-based potential exposures that take account of the potential for adverse price movements and the liquidity characteristics of contracts and collateral. Stress tests should be based on meaningful customized scenarios. These tests have to be integrated into the fum's risk management process so that risk managers together with trading and credit managers develop stress scenarios that probe for vulnerabilities within and across key portfolios.
4. Strong internal credit practices should combine the various risk elements and take account not only of current creditworthiness but also of potential future exposures. Credit intensive transactions with counterparties that rely heavily on leveraged portfolios should be supported by initial coiJateral. Appropriate internal cost allocation and valuation practices of counrerparty credit risk could provide incentives for traders and
ssee also Corrigan and Thiekc ( 1999).
174
credit risk managers to manage counterparty risks proactively.
5. The Group notes scope for improved infonnation for senior management and. potentially. for the regulatory authorities. An independent risk management function should provide relevant information to enable top management to monitor the finn's risk profile. Senior management should convey clearly the overall tolerance for risk. Financial institutions with significant counterpa1ty risk and market risk exposure should be prepared to meet informally with their primary regulator to discuss their principal risks. Clear understandings between the financial institution and its supervisor should detail permissible use of such information.
6. The Group identifies scope for improvements and harmonization in standard industry documents. including the need to ensure that netting arrangements can be canied out in a timely fashion. Financial institutions should have in place written policies to manage documentation risk.
The Report of the Task Force on Risk Assessment (March 1999). issued by the l lF. contains recommendations for both financial institutions and policymakers. Financial institutions are advised to perform comprehensive stress testing regularly to assess the potential impact of extreme events on portfolios and risk profiles. The report also urges integration of country economic analysis with stress testing and scenario analysis. Communication between senior management, portfolio managers, and line managers needs to be adequate, and a strong independent risk control unit should be in place. Methods would need to be developed to improve the integration of market and credit risk, and the understanding of the relationships between market movements, liquidity risk. and credit risk. To strengthen public policy, the LLF advocates changes in regulation to enhance transparency i n financial markets (including consolidated financial statements), which is viewed as essential to determine potential credit exposures. Emerging market countries should issue long-dated domestic debt instruments and eliminate impediments to the development of local capital markets. Robust legal frameworks need to clarify bankruptcy proceedings and enforce netting arrangements.
The International Swaps and Derivatives Association. as prut of its 1999 Collateral Review. issued an assessment of how collateral management performed during the periods of market volatility in 1997-98. The review finds that the use of collateral proved to be a successful risk-mitigating tool, but also emphasizes that it creates risks of its own. primarily legal and operational risk. Other risks can arise from asset concentrations and correlarions between an underlying exposure and collateral to mitigate that exposure, as well as potential difficulties in selling collateral assets. I n light o f the survey results, the lSDA provides a series

©International Monetary Fund. Not for Redistribution
Disclosure and Market Discipline
of recommendations concerning, inter alia. the management of the risks associated with collateral, dispute resolution. initial margins, and cross-product netting and collateral use.
Disclosure and Market Discipline
Meaningful, accurate, and timely information provides an important foundation for the decisions of market participants and thus is indispensable for imposing market discipline on the conduct of financial institutions. The national and international proposals focus on several aspects of the connection between disclosure and transparency. They emphasize that to achieve transparency the information must be timely. accurate, and relevant to users trying to make proper assessments about financial instirutions and their risk profiles. WeU-informed market participants can bolster financial institutions' incentives to operate prudently and can reinforce effective supervision and regulation. Lack of transparency may also be a source of excessive price movements, because asymmetric infonnation can contribute to herd behavior (when some investors' valuation of assets are based not on fundamentals but rather on their expectations of the behavior of others). By contrast, the reports indicate. promptly disclosed and disseminated information can enable market participants to react more appropriately before economic difficulties reach the point of having systemic implications. Recent initiatives recognize this channel for potentially beneficial interaction of prudential supervision and market discipline in promoting financial stability.
Concerning public disclosure, the Basel Committee and the IOSCO Technical Committee jointly issued a consultative paper on Recommendations for Public Disclosure of Trading and Derivatives Activities of Banks and Securities Firms (February 1999).6 The recommendations relate to two areas: information on trading and derivatives activities, and disclosure of internal risk measurements. The Commiltees emphasize that institutions should disclose meaningful summary information, both quantitative and qualitative, on the scope and nature of their trading and derivatives activities and information of the major risks associated with these activities. Second. institutions should disclose information produced by their internal risk management systems about their risk exposures and the actual perfom1ance of exposure management.
The Basel Committee's guidance note on Enhancing Bank Transparency (September 1998) complements tbe Basel Core Principles in this area. The
6These recommendations complement the annual survey of disclosures about trading and derivatives activitic; of banks and securities tirms (see. e.g .. Basel Committee on Banking Supervision and IOSCO. 1998b).
175
guidelines are based on the premise that there are significant benetits of transparency from a supervisory point of view as well as from a financial stability perspective. The report provides recommendationsalbeit rather general-in six broad categories of information: financial perfonnance, financial positions (including capital), risk management practices, risk exposures, accounting policies, and management and corporate governance. The document provides general guidance to banking supervisors, legislators. and standard setters to improve the regulatory framework for supervisory reporting and public disclosure, and to the banking industry on standards for public information disclosure. The report points out that enhanced public disclosure allows market discipline to work earlier and more effectively, thus reducing the severity of market disturbances. Conversely, market disruptions are likely to be greater if the flow of information is irregular. But the report also acknowledges potential drawbacks of public disclosure, including the potential for market overreaction to adverse information about a bank and the possibility of contagion that could spread to healthy institutions. But the report claims that contagion is less likely "in an environment of adequate ongoing disclosure."
Specifically on supervisory information, the Basel Committee and the TOSCO Technical Committee jointly released a revision to the Supervis01y Information Framework for Derivatives and Trading Activities (September 1998). In a continuing effort to monitor the trading and derivatives activities of banks and securities firms, this revised standard (to the 1995 framework) is designed to bring the framework in line with current practice in risk management, particularly market risk. The new supervisory framework presents first a catalogue of data considered important for an evaluation of risks. Second, a common minimum framework, designed to serve as an internationally harmonized baseline, contains information items useful for assessing institutions' involvement in derivatives activities and their credit risk and for assessing market risk inherent in trading and derivatives activities.
Among ongoing initiatives are the activities by the G-10 Commi11ee on the Global Financial System (formerly the Euro-currency Standing Committee) and its various working groups. The Working Group on Enhanced Disclosure by Individual Institutions (the ·'Fisher Group." chaired by Mr. Peter Fisher of the Federal Reserve Bank of New York) aims to increase transparency and strengthen market discipline by determining useful disclosure standards and prac(ices. The working group's mandate is to identify information suitable for public disclosure thaL would provide an accurate picture of an institution's exposure to market and credit risk; to explore good practices for public disclosure; and to identify steps toward implementation of such practke. The working group is developing a model template for public disclosure that
©International Monetary Fund. Not for Redistribution
ANNEX IV RISK MANAGEMENT, TRANSPARENCY, AND REGULATORY AND SUPERVISORY REFORMS
would include information on credit, market, and liquidity risk (such as the aggregate VaR). Another working group, the Working Group on Enhanced Transparency Regarding Aggregate Positions (the "Patat Group," headed by Mr. Jean-Pierre Patat of the Banque de France), is investigating the usefulness of aggregate position data for improving financial system transparency, particularly given the large number of OTC trades. The working group is also analyzing foreign exchange positions in small markets to examine whether concentrations in holdings can be identified as precursors to market turbulence.
Highly Leveraged Institutions
Last year's financial turbulence, and in particular the near-cpllapse of LTCM. has cast the spotlight on the highly leveraged activities of largely unregulated hedge funds and revealed potential systemic risks for the global financial system.7 An important issue raised by the LTCM incident and highlighted by several reports is the control of leverage and risk taking by unregulated tinancial institutions so that they do not become a source of systemic risk. But transactions with HLis pose special challenges to the risk management process of counterparties, given the opaqueness of the activities of HLls and the dynamic nature of their trading strategies. In particular, standard accounting and balance-sheet concepts do not reveal meaningful details about a fund's risk profile and concentration of exposures i n certain markets.
Since the turbulence revealed a breakdown of the disciplining power of market forces, supervisors and regulators have embarked on efforts to promote market discipline, guided by the view that it presents the most immediate and effective way to minimize the potential for systemic risks arising from the activities of HLls. International supervisors have recommended that market discipline be made more effective by improving risk management practices of creditors and counterparties of hedge funds and by increasing disclosure of information on the risk profiles of hedge funds and their creditors-to the extent that a hedge fund's proprietary information is not compromised. Timeliness of disclosure is particularly important since funds can alter their positions quickly and frequently.
Except for some debate coming out of Europe, direct regulation of HLis, by contrast. is currently not being considered since most regulators are concerned
7Hedge funds are exempt in the United States from SEC repon· ing requirementS and from regulatOry restrictions on leverage or trading suategies. Hedge funds that trade on organized exchanges are, however, required to register with the Commodity Futures Trading Commission as .
. commodity pool operators'" and are sub· ject to reporting requirements on their exchange-traded options and futures positions.
176
that it would significantly weaken market discipline by creating and exacerbating moral hazard. It would also risk moving HLis offshore-beyond the reach of any substantive (indirect) supervision. However, as explicitly stared by the Basel Commitree on Banking Supervision and by the U.S. President's Working Group on Financial Markets, the indirect approach, which relies on the risk management of HLI counterparties, does not exclude the possibility of introducing more direct regulation of HLis if the indirect measures prove to be insufficient.
A Working Group of the Basel Committee, chaired by Mr. Jan Brockmeijer, released a report on Banks· lmeractions with Highly Leveraged Institutions (January 1999), which evaluates the potential risks from the activities of HLls, assesses deficiencies in banks' risk management practices vis-a-vis HLls. and evaluates alternative policy responses to address these risks. The report concludes that recent events. most notably the near-collapse of LTCM. have highlighted deficiencies in banking institutions· risk management. It therefore urges supervisors to pul in place incentives. procedures, and standards to encourage prudent management of bank exposures to HLls. The report identifies deficiencies in due diligence procedures and in the ongoing exposure monitoring. As a result of limited tlnancial information. credit decisions were. to some degree, based on nonsystematic and largely qualitative assessments of risks and on the reputation and perceived risk management capabilities of the HLls concerned. Collateral management systems appeared to adequately provide cover for direct exposures, but not necessarily for secondary market exposures. Banks generally obtained little information on HLls' off-balance-sheet exposures or risk management strategies.
The report compares features of possible indirect and direct policy measures for HLis. Concerning indirect approaches. which would focus on the major counterparties of HLls, the report concludes that many of the risks associated with HLis can be addressed through better risk management at banks and securities firms. The report recommends standards for sound practices in dealings between banks and HLls, and a more comprehensive due diligence process and stress testing, as well as improved measures of potential future exposure. The Committee notes that more prudent risk management by banks could also limit the leverage of HLis. Among measures to enhance the transparency of HLI activities. the report discusses, inter alia, public disclosure by global players and a credit register for bank loans to HLls. According to the report, direct regulation of HLls, such as through licensing requirements and minimum standards for capital and risk management, may be necessary. if the indirect measures together with enhanced transparency should prove to be insufficient. The report notes, however, key obstacles for direct regulation, in-
©International Monetary Fund. Not for Redistribution
Highly Leveraged Institutions
eluding arriving at a workable definition of HLis and establishing jurisdiction over the activities of institutions that are located in offshore centers.
In a companion paper, the Basel Committee outHoed Sound Practices for Banks' Interactions with Highly Leveraged Institutions (January 1999). The paper contains sound practice standards for the management of counterparty credit risk inherent in banks' trading and derivatives activities with HLJs. Among other items, these sound practices caJl upon banks to: • estabHsh clear policies and procedures governing
their involvement with HLis; • adopt credit standards addressing the specific risks
associated with HLls; • develop meaningful measures of potential future
exposure resulting from trading and derivatives transactions;
• estabHsh meaningful overaJl credit Hmits, incorporating the results of stress testing;
• link credit enhancements, including collateral and • early termination provisions: to the specific charac
teristics of HLis; and • frequently monitor exposure vis-a-vis HLis.
The report Hedge Funds, Leverage, and the Lessons of Long-Term Capital Management by the U.S. President's Working Group on Financial Markets (April 1999) focuses on the systemic issues raised by hedge funds and points out that the impact of HLis on market dynamics needs further study. The report concludes that the central policy issue raised by the events in global ftnancial markets in the summer and fall of 1998 is how to constrain excessive leverage more effectively-an issue not limited to hedge funds. The Working Group recommends a number of measures to constrain excessive leverage. These measures are designed to improve transparency in the system, enhance private sector risk management practices, develop more risk-sensitive approaches to capital adequacy, support ftnancial contract netting in the event of bankruptcy, and encourage offshore financial centers to comply with international standards. The Working Group does not recommend direct government regulation of hedge funds at this time. However, it indicates that if indirect approaches are not effective, direct regulation may be given further consideration. Specific recommendations were made in the following three areas.
Public disclosure • Hedge funds should be required to disclose their fi
nancial statements to the public; and • all pubHc companies, including financial institu
tions, should publicly disclose a summary of their direct material financial exposures to significantly leveraged financial institutions.
Risk management • Financial institutions should enhance their practices
for counterparty risk management (the report sug-
177
gests areas where private risk management can be strengthened);
• regulators should encourage improvements in the risk-management systems of regulated entities; and
• regulators should promote the development of more risk-sensitive but prudent approaches to capital adequacy.
Other areas • Regulators' authority to obtain financial information
about unregulated affuiates of broker-dealers and futures commission merchants should be enhanced;
• the close-out netting regime for financial contracts should be reformed;
• the interplay between bankruptcy laws across countries should be improved; and
• through stronger incentives, offshore financial centers should be encouraged to comply with international standards. A report by the Deutsche Bundesbank on Hedge
Funds and Their Role in the Financial Markets (March 1999) points out that, on balance, hedge funds contribute to greater market efficiency but their investment strategies may contain specific risks. The available evidence, the article notes, suggests that hedge funds played a major role in the 1992 ERM crises but that appeared not to be the case in recent episodes of financial turmoil such as the Mexico crisis and the East Asian crisis. The systemic risks associated with hedge funds depend crucially on the degree of the financial integration of the funds with the banking sector. According to the Bundesbank, caiJs for regulation of hedge funds appear warranted since the insolvency of hedge funds could jeopardize the stability of the financial system. To enable counterparties of hedge funds and supervisory authorities to assess the risks involved, the Bundesbank suggests that it would be desirable if hedge funds would have to comply, under direct supervision, with extended reporting rules and possibly also with investment and capital requirements. But the Bundesbank acknowledges that at a practical level questions remain on bow regulatory measures could be made effective in the context of globalized markets and complex investment strategies. Nonetheless, owing to potential conflicts of interest if banks are at the same time investors in and lenders to hedge funds, relying solely on the disciplining effects of the market is unHkely to suffice. The Bundesbank proposes the introduction of an international credit register for large exposures to provide banks with an efficient monitoring system, whichtogether with better risk management-could contribute to crisis prevention.
A Reserve Bank of Australia report on Hedge Funds, Financial Stability and Market Integrity (March 1999) found that large hedge funds are systemically important institutions that can affect the stability of the financial system and could potentially un-
©International Monetary Fund. Not for Redistribution
ANNEX IV RISK MANAGEMENT, TRANSPARENCY, AND REGULATORY AND SUPERVISORY REFORMS
dennine market integrity by manipulating prices. The report, therefore, concludes that there is a strong case for a public policy response to the emergence of hedge funds. Although regulation of some types of hedge funds may be warranted, the report acknowledges considerable practical difficulties, including the possible move by hedge funds to nonregulated offshore centers and the emergence of new institutions outside the regulatory framework. Therefore the most effective approach, according to the report, would include improving disclosure standards, enhancing the risk monitoring by the creditors of hedge funds, and removing distortions in the Basel capital framework that favor bank exposures to hedge funds.
The report notes that more disclosure is required in three areas: information on market concentration; information for sound counterparty risk assessments; and information to assess the health of financial markets. The report proposes, inter alia. large position reporting requirements, an international credit register, and disclosure of information on risk exposures and stress test results. Regulators could enforce disclosure standards by a penalty capital charge on exposures to noncompliant counterparties. The BlS could expand its banking and derivatives statistics coverage to investment banks, hedge funds, and other institutional investors. The report also emphasizes that supervisors have a role in ensuring sound risk assessment by bank management and that regulation should not encourage inappropriate risk taking. In this context, the paper notes that, according to the current Basel Accord on Capital Adequacy, inter alia, banks' derivative exposures to nonbanks receive only a 50 percent risk weight (implying a 4 percent capital requirement compared with the standard 8 percent for claims on the private sector), that short-dated foreign exchange contracts are zero weighted, and that onbalance-sheet exposures to hedge funds are treated just like any other claim on the private sector.8 Notwithstanding ongoing efforts toward international coordination, the report points to scope for unilateral action by national regulators, particularly in the United States, with beneficial effects for the global financial system.
Supervision of Financial Conglomerates and International Accounting Standards
Supervision of the global financial system is still largely fragmented both functionally and geographically, while global financial markets are becoming in-
SThe recent Basel Committee paper on revisions to the Basel Accord (Basel Committee on Banking Supervision, 1999c) suggests abolishing the 50 percent cap on the risk weights of OTC derivative exposures and introducing a new 150 percent risk weight category for poor-quality corporate claims (see Box 4.2 in Chapter IV).
178
creasingly integrated. In response, efforts at international coordination of regulation and supervision (of banks, securities firms, and insurance companies) are being accelerated to improve supervision both across functional lines and across borders. Given the increasing emergence of large global financial conglomerates that are supervised by numerous supervisors of different industries and nationalities, in February 1999 the Joint Forum on Financial Conglomerates issued a set of papers on the Supervision of Financial Conglomerates (which had previously been issued for comments in February 1998).9 The papers cover issues of capital adequacy, fit and proper principles for top management, and the sharing of supervisory information with the objective to work toward a more effective supervisory framework for tinancial conglomerates that stretches across various lines of business and national borders.
The papers concerning capital adequacy outline measurement techniques and principles to assess capital adequacy on a group-wide basis for financial conglomerates. A paper on fit and proper principles provides guidance for supervisors to assess the competence of the management of the various separate entities of a financial conglomerate. Two papers deal specifically with facilitating information sharing between supervisors of regulated entities within internationally active financial conglomerates by outlining a framework and by providing guiding principles for such information sharing. In certain circumstances it might be beneficial to designate one supervisory agency involved in supervising a conglomerate as a coordinator to facilitate information sharing. One of the papers provides guidance on the choice of a coordinator. It points out that the choice of coordinator and the design of its responsibilities are influenced by the trade-off between the benefits of improved coordination and the risks of creating (or appearing to create) a new layer of supervisory oversight or an extension of a government safety net to normally unprotected entities within a conglomerate.
Altl1ough sound loan accounting and disclosure practices are essential to ensure transparency and to facilitate effective supervision and market discipline of financial institutions, national rules and practices on the recognition of deteriorating credit quality vary widely. To address this issue, the Basel Committee on Banking Supervision released a paper on loan valuation, loan-loss provisioning. and credit risk exposure. entitled Sound Practices for Loan Accouming and Disclosure (July l999). The paper complements the Basel Core Principles for Effective Banking Supervision and is designed to advance international barmo-
"The Joint Forum on Financial Conglomerates. which comprises representatives of the Basel Committee on Banking Supervision.
LOSCO, and the International Association of Insurance Supervisors, as well as national supervisors. was established in 1996.
©International Monetary Fund. Not for Redistribution
References
nization in loan valuation and accounting. The paper provides guidance on key loan accounting issues, such as the recognition and valuation of loans, the establishment of Joan-loss allowances, and credit risk disclosure.
On accounti ng standards more generally, the International Accounting Standards Committee (IASC) has been i n the process of developing a core set of international accounting standards. Jn March 1999, it published a comprehensive standard on accounting for financial instruments, including derivatives such as futures, forwards, swaps, and options contracts. The new standard lAS 39 (Financial Instruments: Recog
nition and Measurement) requires that all financial assets and liabilities be recognized on the balance sheet, including derivatives. lAS 39 significantly increases the use of fair-value accounting for financial instruments, and it permits hedge accounting, provided that the hedging relationship is clearly defined, measurable, and actually effective. The Technical Committee of IOSCO bas begun its assessment of the standard to decide whether to recommend that lOSCO members permit foreign issuers to use IASC standards in lieu of national standards for cross-border offering and listing purposes.
References
Basel Committee on Banking Supervision, 1997, Core Principles for Effective Banking Supervision (Basel: Bank for International Settlements September).
---, 1998a, Enhancing Bank Transparency (Basel: Bank for International Settlemems, September).
---, l998b, Framework for Internal Control Systems in Banking Organisations (Basel: Bank for International Settlements, September).
---, 1998c, Operational Risk Management (Basel: Bank for International Settlement<;, September).
---, l999a, Banks' lmeractions with Highly Leveraged Institutions (Basel: Bank for international Settlements. January).
---, 1999b, Credit Risk Modelling: Current Practices and Applications (Basel: Bank for International Settlements, April).
---. 1999c, A New Capital Adequacy Framework (Basel: Bank for International Settlements, June).
---, 1999d, Sound Practices for Banks ' lmeractions with Highly Leveraged Institutions (Basel: Bank for International Settlements, January).
---. 1999e, Sound Practices for Loan Accoullling and Disclosure (Basel: Bank for International Settlements, July).
Basel Committee on Banking Supervision, and the Technical Commiuee of IOSCO, 1998a, Supervisory In-
179
formation Framework for Derivmives and Trading Activities (Basel: Bank for International Settlements. September).
---. 1998b, Trading and Derivatives Disclosures of Banks and Securities Finns: Results of the Survey of 1997 Disclosures (Basel: Bank for International Settlements, November).
---. 1999, Recommendations for Public Disclosure of Trading and Derivatives Activities of Banks and Securities Finns (Basel: Bank for fnternational Settlements, February).
Board of Governors of the Federal Reserve System, 1999. Supervisory Leuer 99-3 (Washington, February).
Corrigan, Gerald, and Stephen G. Thieke, 1999, Testimony on behalf of Counterparty Risk Management Policy Group before the Subcommittee on Capital Markets. Securities and Government Sponsored Enterprises. Committee on Banking and Financial Services, United States House of Representatives. March 3.
Counterparty Risk Management Policy Group, 1999, Improving Counterparty Risk Management Practices (New York, June).
Deut�che Bundesbank, 1999, ''Hedge Funds and Their Role in the Financial Markets," Monthly Report, Vol. 5 1 (March), pp. 29-42.
,lnstitute of International Finance, 1999. Report of the Task Force on Risk Assessment (Washington, March).
International Accounting Standards Committee, 1999, Financial Jnstrumems: Recognition and Measurement (London, March).
International Organization of Securities Commissions, 1998, Risk Management and Control Guidance for Se
curities Firms and Their Supervisors (Montreal, May). International Swaps and Derivatives Association. 1999,
ISDA 1999 Collateral Review (New York, March). Joint Forum on Financial Conglomerates, 1999. Supervision
of Financial Conglomerares (Basel: Bank for International Settlements, February).
Office of the Comptroller of the Currency. 1999. OCC Bulletin 99-2 (Washington, January).
Reserve Bank of Australia, 1999, Hedge Funds, Financial Stability and Market lme�:rity (March).
United States, President's Working Group on Financial Markets, 1999, Hedge Funds, Leverage, and the Lessons of Long-Term Capital Management (Washington, April).
Working Group on International Financial Crises, 1998. Report of the Working Group on lmemational Financial Crises (Basel: Bank for International Settlements, October).
Working Group on Strengthening Financial Systems, 1998. Report of the Working Group on Strengthening Financial Systems (Basel: Bank for International Settlements, October).
Working Group on Transparency and Accountability. 1998. Report of the Working Group on Transparency and Accountability (Basel: Bank for International Settlements, October).
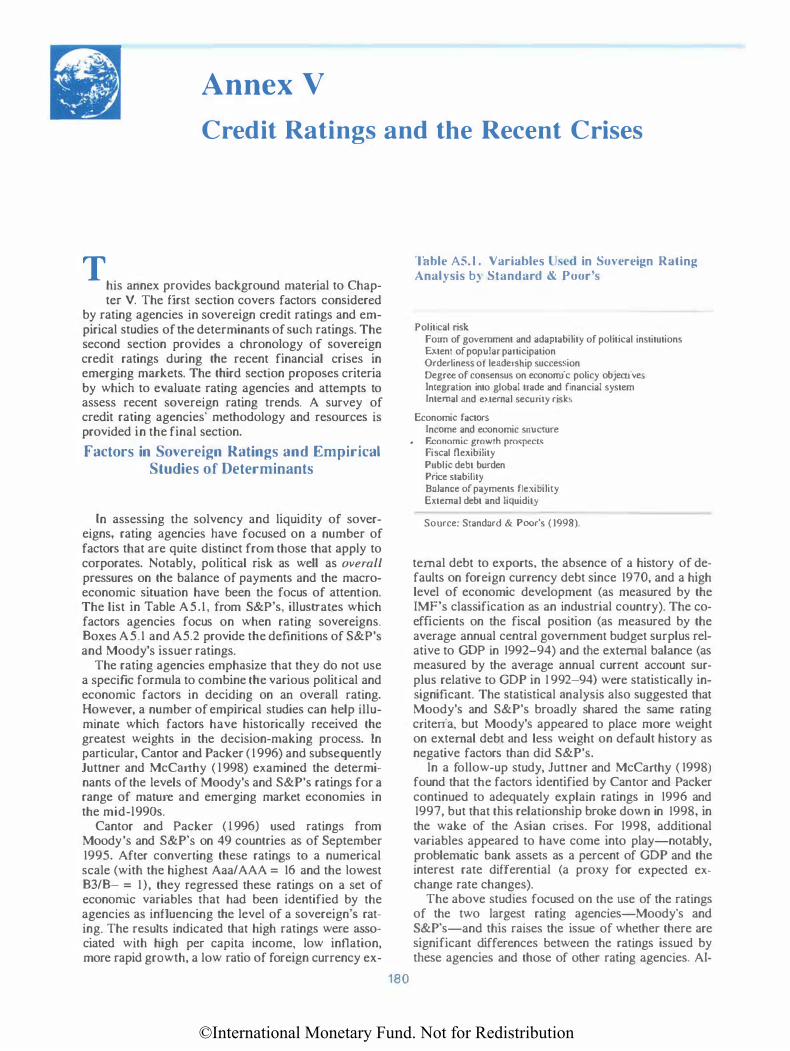
©International Monetary Fund. Not for Redistribution
Annex V Credit Ratings and the Recent Crises
T his annex provides background material to Chap-ter V. The first section covers factors considered
by rating agencies in sovereign credit ratings and empirical studies of the determinants of such ratings. The second section provides a chronology of sovereign credit ratings during the recent financial crises in emerging markets. The third section proposes criteria by which to evaluate rating agencies and attempts to assess recent sovereign rating trends. A survey of credit rating agencies' methodology and resources is provided in the final section.
Factors in Sovereign Ratings and Empirical Studies of Determinants
In assessing the solvency and liquidity of sovereigns, rating agencies have focused on a number of factors that are quite distinct from those that apply to corporates. Notably, political risk as well as overall pressures on the balance of payments and the macroeconomic situation have been the focus of attention. The list in Table A5.1, from S&P's, illustrates which factors agencies focus on when rating sovereigns. Boxes A5.1 and A5.2 provide the definitions of S&P's and Moody's issuer ratings.
The rating agencies emphasize that they do not use a specific formula to combine the various political and economic factors in deciding on an overall rating. However, a number of empirical studies can help illuminate which factors have historically received the greatest weights in the decision-making process. In particular, Cantor and Packer ( 1 996) and subsequently Juttner and McCarthy ( l 998) examined the determinants of the levels of Moody's and S&P's ratings for a range of mature and emerging market economies in the mid-l990s.
Cantor and Packer ( 1 996) used ratings from Moody's and S&P's on 49 countries as of September 1995. After converting these ratings to a numerical scale (with the highest Aaa/AAA = 16 and the Lowest B3/B- = 1), they regressed these ratings on a set of economic variables that had been identified by the agencies as influencing the level of a sovereign's rating. The results indicated that high ratings were associated with high per capita income, low inflation, more rapid growth, a low ratio of foreign currency ex-
180
Table AS. l . Variables Used in So' ereign Rating Analysis b) Standard & Poor's
Political risk Form of government and adaptability of political institutions Extent of popular participation Orderliness of leadership succession Degree of consensus on economic policy objectives Integration into global trade and financial system Internal and e�ttemal security risks
Economic factors Income and economic structure
• F..conomic growth pmspecL< Fiscal fle�tibility Public debt burden Price stability Balance of payments flexibility E�ttemal debt and liquidity
Source: Standard & Poor's ( 1998).
temal debt to exports, the absence of a history of defaults on foreign currency debt since 1970, and a high level of economic development (as measured by the IMF's classification as an industrial country). The coefficients on the fiscal position (as measured by the average annual central government budget surplus relative to GOP in 1992-94) and the external balance (as measured by the average annual current account surplus relative to GOP in 1 992-94) were statistically insignificant. The statistical analysis also suggested that Moody's and S&P's broadly shared the same rating criteria, but Moody's appeared to place more weight on external debt and less weight on default history as negative factors than did S&P's.
ln a follow-up study, Juttner and McCarthy ( 1998) found that the factors identified by Cantor and Packer continued to adequately explain ratings in 1996 and 1997, but that this relationship broke down in 1998, in the wake of the Asian crises. For 1998, additional variables appeared to have come into play-notably, problematic bank assets as a percent of GOP and the interest rate differential (a proxy for expected exchange rate changes).
The above studies focused on the use of the ratings of the two largest rating agencies-Moody's and S&P's-and this raises the issue of whether there are significant differences between the ratings issued by these agencies and those of other rating agencies. AJ-
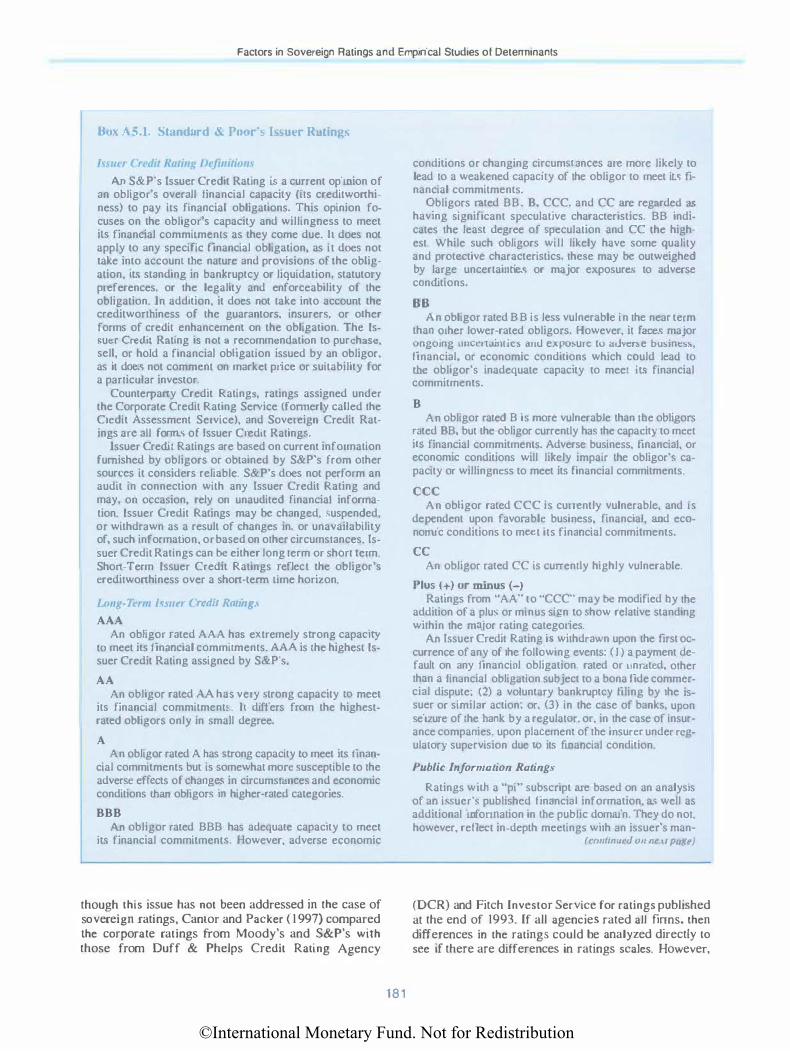
©International Monetary Fund. Not for Redistribution
Factors in Sovereign Ratings and Empirical Studies of Determinants
Box J\5.1. Standnrd & Pour"<; Issuer Ruling�
'·"·" I ; An S&P's Issuer Credit Rating is a current opinion of
an obligor's overall financial capacity (its creditwonhiness) to pay ils financial obligations. This opinion focuses on the obligor's capacity and willingness to meet its financial commiLments as they come due. IL does not apply to any specific financial obligation, as it does not take into accoum the nature and provisions of the obligation, its standing in bankruptcy or liquidation. statutory preferences. or the legality and enforceability of the obligation. In addition, it does not take into account the creditworthiness of the guarantors, insurers, or other forms of credit enhancement on the obligation. The Issuer Credit Rating is not a recommendation to purchase, sell, or hold a financial obhgauon issued by an obligor. as it does not comment on market price or suitability for a particular investor.
Counterpany Credit Ratinglt, ratings assigned under the Corporate Credit Rating Service (formerly called the Credit Assessment Service), and Sovereign Credit Ratings arc all form� of Issuer Credit Rating!>.
Issuer Credit Ratings are based on current information furnished by obligors or obtained by S&P's from other sources it considers reliable. S&P's does not perform an audit in connection with any Issuer Credit Rating and may, on occasion, rely on unaudited financial information. Issuer Credit Ratings may be changed, suspended, or withdrawn as a result of changes in, or unavailability of, such information, or based on other circumstances. Issuer Credit Ratings can be either long term or short term Short-Term Issuer Credit Ratings reflect the obligor·� ereditwonhiness over a shon-term ume horizon.
1 � lc m 11311<1 ruw h(u111g.1 AAA
An obligor rated AAA has extremely strong capacity tO meet its financial commiLments. AAA is the highest Issuer Credit Rating assigned by S&P's.
AA An obligor rated AA has very \trong capacity to meet
its financial commitment<;. h dtffers from the highestrated obligors only in small degree.
A An obligor rated A bas �trong capacity to meet its linan
cial commitments but is somewhat more susceptible to the adverse effects of changes in circumstances and economic conditions lhan obltgors 10 higher-rated categories.
BBB An obligor rated BBB has adequate capac1ty to meet
its financial commitment\. However, adverse economic
though this issue has not been addressed in the case of sovereign ratings, Cantor and Packer (1 997) compared the corporate ratings from Moody's and S&P's with those from Duff & Phelps Credit Rating Agency
181
conditions or changing circum�.tanccs are more likely to lead to a weakened capacny of the obligor to meet its fi. nancial commitments_
Obligors rated BB. B. CCC. and CC are regarded ac; having significant speculative characteristics. BB indicates the least degree of �peculation and CC the highest. While such obligors will likely have some quality and protective characteristics, the.<;e may be outweighed by large uncertainties or major exposures to adverse conditions.
BB An obligor rated B B is les� vulnerable in the near term
than other lower-rated obligors. However, it faces major ongoing un�:ettuint.ie:, aull expv:,uJt: tv allven.e busines�. financial, or economic conditions which could lead to the obligor's inadequate capacity to meet irs financial commitments.
B An obligor rated B is more vulnerable than the obligors
rated BB. but the obligor currently has the capaetty to meet its financial commitments. Adverse business, financial, or economic conditions will likely impair the obligor'<, capacity or willingness to meet its financial commitments.
CCC An obhgor rated CCC is currently vulnerable, and ts
dependent upon favorable busmess, financial, and economic conditions to meet its financial commitments.
cc An obligor rated CC is currently highly vulnerable.
Plus ( +) or minus H Raungs from "AA" to "CCC'' may be modified hy the
addition of a plus or minus sign to !.how relative standing within the ma.JOr rating categories.
An Issuer Credit Rating il> withdrawn upon the first occurrence of any of the following events: (I) a payment default on any tinancinl obligation, rated or u.nrdtcd, other than a financial obligation subject to a bona fide commercial dispute; (2) a voluntary bankruptcy filing by the issuer or similar action: or. (3) in the case of banks, upon seizure of the hank by a regulatOr. or, in the case of insurance companies. upon placement of the msurer under regulatory supervision due to its financial condition
Public Information Rating.1 Ratings wnh a "pi" subscript are based on an analys1s
of an iS!>uer'!. published financial information, a' well as additional infonnation in the public domain They do not, however, reflect in-depth meetings wtth an issuer's man-
( C()JII/IIIIt'd tJ/1 llt!XI pug<•)
(OCR) and Fitch Investor Service for ratings published at the end of 1993. If all agencies rated all fmns, then differences in the ratings could be analyzed directly to see if there are differences in ratings scales. However,

©International Monetary Fund. Not for Redistribution
ANNEX V CREDIT RATINGS AND THE RECENT CRISES
nux \5.1 (ctmcludcd
agcment or incorpor.lle material nonpublic information. and are therefore based on less comprehensive information than ratings without a ··pi" subscript. Ratings with a ··pi" subscript arc revrewed annually based on a new year's financial statements, but rnay be reviewed on au interim basi!i if a major event that may affect an issuer's credit quality occurs. Raungs with a "pi" subscript arc not modified with '+'or ·-· designations. Outlooks will not be prov1ded for raung� With a "pr · subscript. nor will they be subject to potential Credit Watch lisungs.
A-1
uer tmgs
An obligor rated "A- I " has strong capacity to meet it� financial commitments. It i., rated in the highe>.t ca tegory by S&P's. Wilhtn thi� category, ccnai n obligors are des ignatcd with a plus srgn (+) Tht:s indicates that the obligor's capacity to meet il� financial commitments is extremely strong.
A-2 An nbltgor rated "A-2" has sausfactory capacrty to
meet irs financial commitments. However. it 1s somewhat more susceptible tn the adverse effects uf changes in circumstances and economic conditions than obligor-; in the highest rating category.
A-3 An obligor rated "A-3" has adequate capacity to meet
its financial obligations. However, adverse economic conditions or changing circum!:tances are more likely to lead tl> a weakened capacity of the obligor to meet liS financial commllmcnts.
B An obligor rated ··s" is regarded as vulnerable and has
sigmficant speculative characteristics. The obligor currently has the capacity to meet 1ts financial commitments; however. it faces major ongoing uncertainties which could l<!au to the obligor's tnadequate capacity to meet iL\ linancial commitments.
c An obligor rated "C" is currently vuln!!rable to non
pa)'mcnt and is ucpendcnt upon favor..tblc busmess. financial. and economic conditions for it to meet Its finuncial commitments.
An Issuer Credit Rating is withdrawn upon the first occurrence of any of the following: ( I ) a payment default on any financial obhgauon. rated or unrated, other than a financial obligation subject to a bona fitle commercial dispute: (2) a voluntary bankruptcy tiling by the issuer or similar action; or (3) in the case of bank!>. upon seizure of the bank hy a regulator, or. in the case of insurance com-
some firms were not rated by OCR or Fitch, which creates the possibiJity of sample selection bias. A firm might know that one particular agency prov ides more favorable treatment to firms in an industry with its spe-
182
panics. upon placement of the insurer under regulatory supervision due to its linancial condruon.
.. , ney '"" Country risk considerations arc a standard pan of S&P's
analysb for credit ratings on any issuer or issue Currency of repayment is a key factor in this analy�is. An obligor's capacity to repay foreign cUJTI!ncy obligation� may bt> lower than its capacity to repay obligations in its lo.:al currency. owing to the sovereign government's own relatively lower capacity to repay external versus domc�tic: debt. TI1ese sovereign risk considerations are incorporated in the debt mtings assigned to specitic is�ucs. Foreign currency i�suer r.uings arc also distinguished fmm local currency i�suer mtings to Identify those instances where sovcretgn ri�k� make them differ<!nt for the same is!.ucr.
" ok D jiJJihons An S&P's Ratmg Outlook ao;�csses the p()tenLiul direc
tion of a long-term credit r:ning over the imermedJatc to longer term. In detcm1ining a Ruling Oullonk. con:.idcraLion is given to any change� in the cconomic anU/ur funtlamentul business conditions. An Outlook 1s not neces· sanly a precursor of a mting change or future Credit Watch action. Positi1·e means that a rating may be raisetl. Negative means that a rating may he lowered. Stll· bf,f means that a rating is not likely to change. Del•e/apinR means a rating may be mi!;ed or lowered. N.M. means not meaningful.
\. " , .�ntch Crcui!Watch highlights the potential direction or a
short· or long-term rating. It focuse� on itlentifiable events and short-term trends that cause ratings to be placed under special surveillance b) S&P's analytical staff. These may include mergen., recapitalization\, voter rctcrem.lums. regulatury a�.;tion. or anticipated operating development�. Ratings appear on CreditWatch when such an event or a deviation from an expected trentl occurs and additional informauon is ntX"essary to evaluate the current rating. A listing, hnwever, does not mean a rating change is inevitable. and whenever pns<,ible. a range of alternative ratings will be shown. Credit Watch is not intended to inclutle all ratings under review, anti nlling changes may occur without the mtings having liN appt:ared on CrcditWatch. The "positive·· designation means that a rating may bt: rarsecl.; "negative'' m<!ans a mting may be lowcretl: and "developing" mean" that u rating may he raisetl, lowered. or affirmed.
Source· Reproduced rrom IIWII .. WI//Idturlulld(IOOrS.t'tl/11,
cific characteristics. Alternatively, a ftrm m ight be told its likely rating by a particular agency before it is required to commit fully to the new agency's rating process. I n either situation, ordinary regression analy-

©International Monetary Fund. Not for Redistribution
Factors in Sovereign Ratings and Empirical Studies of Determinants
Box A5.2. Mood.) 's Issuer Rntings
For: · rem:y Moody's Foreign Currency Issuer Ratings a.r� opinions
of the ubility of entitLes to honor :-.enior unsecured finunciaJ obligations and conlrJCL\ denommated in fordgn currency. These ratings are subJect to Moody's Foreign Currency Country Ceilings. ls�ucr Ratings arc unlike Moody's long-term Jebt ratings an th.::lt they nrc a�stgned to issuers rather than specific debt ts�uc�. Specific debt issues of the issuer may be rated differently. and are considered unrated unless individually rated by Moody's. Unless !.pecificd, obligation!. guar..tnt..:cd by the is�ucr arc cun!>idcred unrated and are not covered by the issuer rating.
Dnmc Moody's DomeMit: Currency h.suer Raungs arc opin
ions or the ability of entities to honor �enior unsecured financial obligations and contracL� denominated 111 their dome:.tic currency.
Moody's rating symbols lor Issuer Ratings are identical to those used to show the credit quality ot honds. These rating gradations provide creditors a simple system to measure an entity's :�bility to meet its senior tinuncial obligations.
Aaa b�uers rated Aaa ofter exceptional tinanctal loecurity. While the creditworthiness of these entities is likely to change. such changes as can be vi5unlizcd are most unlikely to impuir their fundamentally �trong positiOn.
Aa Issuers rated Aa offer excellent financial security. Together wtth the Aaa group, they constitute what are generdlly J..nown as high grade cntitic�. They are rated lower than Aaa entities because long-rem1 rtsks appear somewhat larger.
A Issuers rated A ofter good financial security. However elements may be present which suggest a susceptibility to tmpatrment sometm1e 111 the future.
Baa Issuer<; rated Baa offer adequate financial security. However. certain protecttvc elements may be lacking or may be unreliable over any great period of timt:.
Ba hsuers rated Ba offer questionable linanctal security. Often the ability of these enuties to meet obligauons may be moderate und not well safeguarJed in the future.
8 Issuers f"dted B offer poor financtal security. Assurance of payment of obligations over any long period of tune 1s small.
Caa Issuers rated Can offer very poor financial security They may be 111 default on their obligations or there may be present elemcntc; of danger with respect to punctual payment of obligations.
Ca Issuers rated Ca offer extremely poor 11nuncta1 security. Such cntitiel> are often in default on their obligations or have other marked shortcomtngs.
C Issue� rated C arc the lowc�t ra ted class of entity. are usually 111 default on their obliguttons. and potential recovery values are low
183
Moody's Short-Term Plimc RaJing System Taxable - d (" .
Moody's short-term debt ratings are opinions of the ability of issuers to repay punctually senior debt obligations. These obhgaltons have an original mawrity not excccJing one year. unless explicit I) noted.
Mondy's employs the following three designation�. all judged to he imestrnent grade. to indicate the relative repayment ability of rdted issuers.
Prime-/ Issuers rated Prime-! (or supporting tnstitutions) have
a superior ability for repayment of senior short-term debt obligation�. Prime- I repayment ability will often be C\ i· denccd b) many of the following characteristics: • Leading market posillons in well-es tablbhed industries. • Htgh rates of return on funds employed. • Conservative capitalil<.ltion structure with moderate re
liance on debt and ample asset protection. • Broad margins in earnings coverage of fixed financial
charges and htgh internal cash generation. • Well-established access to a range of financial markets
and assured sources of alternate liquidity.
Prime-2 Issue r� rated Prime-2 (or supporting inMitutions) have
a strong ability for repayment nf senior short-term debt l)bligations. This will nom1ally be evidenced by many of the characteristics ctted above but to a les�er degree. Eanungs trends und coverage ratios. while sound, may be more! subject to variation. Capitalization charactcri\tic:-., while still appropnate, rna) be more affected b) external conditions. Ample alternate liquidity is maintained.
Prime-3 ls�uers rmcJ Pnme-3 (or supporting institutions) haw
an acceplllble ability for repayment of senior 'hort-term obligations. The effect of indusll) characteri!itit·� and market compositions may be more pronounced. Varmbility in earnings and prulitabilit) may result in chungcs in the level of debt protection measurements and may require relauvely high finunctal leverage. Adequate alternate liquidity is mainlllinc:c.J.
Not Prime lssuers rated Not Prime do not fall \\ithin any of the
Prime raung categories.
Watcllll • ,. ·10m UPG on Review for Posstble Upgrc�de DNG on Review for Possible Downgrade UNC Dtrection uncertain
Source: Reproduced lrom ''""''·"uu•dy.1.com Null:: Muody's applie' numc!rical moc.lilier' 1 . 2 and 3 in each
genc!ric rating category from Aa 10 Caot in the corporate finance sectol', and from Aa 10 B in the publil' tinance sector... The! rnodilit'r I indicute' that the is'u�r i' in the higher end of its let· ter rating category; the modifit!r 2 mdicatc5 <1 mid-mngc mnk· ing: the: modifier 3 indil:.ates that the tssut'r i' 10 the lower end of the leiter mnking category.

©International Monetary Fund. Not for Redistribution
ANNEX V CREDIT RATINGS AND THE RECENT CRISES
sis would produce biased estimates of the factors influencing each agency's rating process and the differences between processes. Cantor and Packer used a two-step procedure developed by Heckman ( 1979) to eliminate sample selection bias. They ftrst sought to identify those factors that influence a firm's decision to seek a rating, and then analyzed whether there were signiftcant differences between the ratings by Moody's and S&P's and the other two agencies. The empirical results indicated that firms were more likely to obtain two or more ratings if they were large and experienced issuers in capital markets. However, there was little evidence that third agencies were employed either to resolve ex ante uncertainty about ratings outcomes or to clear regulatory hurdles. Moreover, while the rating scales of the thlrd agencies appeared to be somewhat higher than others, there was little evidence that decisions of issuers to use them were influenced by that factor.
Figure A5.1 provides a graphical analysis of the variables identified by the Cantor and Packer studies as well as by Juttner and McCarthy. The figure also analyzes a number of other economic determinants of ratings. It uses the average performance of emerging markets rated investment grade (the base group) as a metric to compare the macroeconomic fundamentals on the eve of the Mexican, Asian, and Russian crises. For each macroeconomic variable, the value of that variable for a particular country at any time is normalized using the mean and standard deviation of that variable for the base group. These normalized or standardized variables are then plotted in the figures with a movement away from the oligin signifying a deterioration and a movement toward the origin signifying an improvement. For example, the value of l calculated for the current account for Mexico in 1994 imp(jes that Mexico's current account balance Jay I standard deviation below the average for the base group in 1994.
The analysis shows that the determinants of ratings were stable through 1997 and that ratings were generally consistent with economic fundamentals. This held for investment- and non-investment-grade countries on average, as well as for the countries involved in the recent financial crises.
The first row traces the evolution of the fundamentals of investment-grade countries over time and shows that there is Jjttle difference over time (up to 1997) in their fundamentals, with the exception of investment, savings, the current account, and the government budget, which deteriorate somewhat for investment-grade countries between 1994 and 1996.
The second row tracks the fundamentals of noninvestment-grade countries relative to investment grade countries. It shows that there are marked differences in fundamentals, notably in the level of growth, inflation, debt, savings and investment, and macro-imbalances (current account, budget balance) between investment- and non-investment-grade countries. Over
184
time, lending to the private sector also becomes a differentiating fundamental.
The third row shows the fundamentals of the countries most affected in the recent financial crises. It shows that Mexico, which was rated as noninvestment-grade at the time of its balance of payments crisis, had generally worse fundamentals than investment-grade countries; that the affected Asian countries, which were rated investment-grade, had fundamentals similar to the average for investmentgrade, and that Russia, which was rated noninvestment-grade, had generally worse fundamentals than investment-grade countries (with the exceptionnot surprisingly, given its early stage in transition--of lending to the private sector).
Dynamics of Ratings Changes
An interesting question is whether credit rating agencies can add to the dynamics of-i.e., either accentuate or attenuat�balance of payments crises. A necessary condition for this to occur is the existence of causality from ratings to spreads. A number of studies shed light on this issue using event studies and Granger causaUty studies.
Cantor and Packer (1996) studied the effects of rating announcements (both outlooks (S&P's term)/ watches (Moody's term) and implemented ratings)! on spreads (the differential between yields on sovereign dollar-denominated eurobonds and on comparable U.S. treasury bonds), using daily data covering the periods before and after the 79 announcements covered by their 35-country sample. They found that (1) positive announcements in the agencies' ratings were followed by statistically significant bond yield movements in the expected direction, but that negative changes did not produce signiftcant effects; and (2) the impact of rating announcements on spreads was much stronger for non-investment-grade than for investment-grade sovereigns.
Reisen and von Maltzan (1999), using data on 29 sovereigns from 1989 to I 997 and I 52 rating announcements (of which 97 were for emerging markets), conducted a two-part study. First. they examined the interaction between spreads on sovereign bonds (specifically, the differential between yields on U.S. dollar-denominated sovereign bonds and on 10-year U.S. treasury bonds) and implememed credit ratings, after allowing for the influence of macroeconomic country risk determinants. ln particular, they considered whether credit ratings Granger-caused2
1See Box A5.2 for definitions. 2A variable x is said ro Granger-cause another variable y if pre
diction of the current value of y is enhanced by using the past values of x. This definition is usually implemented by regressing y on past values of x andy and possibly a number of control variables. If past values of x help explain y (as measured by an F·test). x is said to Granger-cause y (Kennedy. 1985).
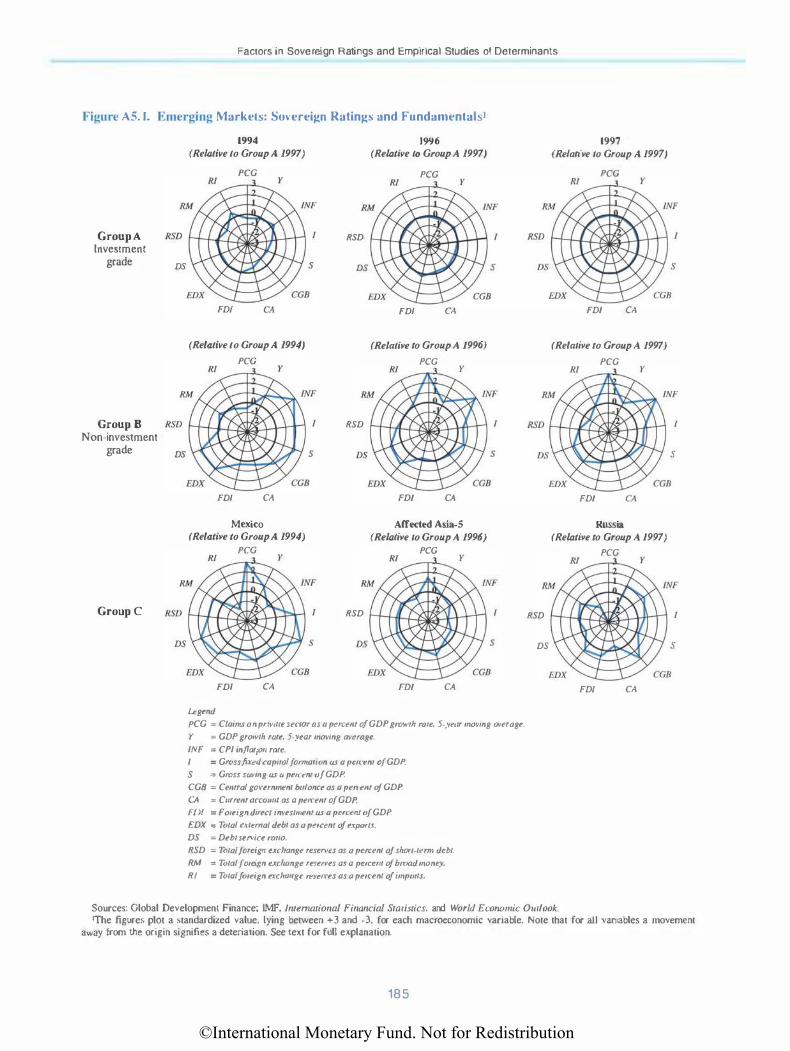
©International Monetary Fund. Not for Redistribution
Factors in Sovereign Ratings and Empirical Studies of Determinants
Figure AS. I. Emerging Markets: Sovereign Ratings and Fundamentals•
Group A Investment
grade
Group B Non-investment
grade
Group C
DS
DS
1994 (Rekztive to Group A 1997)
PCG
FD/ CA
(Relative to Group A 1994) PCG
FDI CA
Mexico (Relative to Group A 1994)
PCG
FDI CA
ugend
s
s
RSD
DS
RSD
RSD
1996 (Relative to Group A 1997)
PCG
FDI CA
(Relative to Group A 1996) PCG
FDI CA
Affected Asia-5 (Rekzlive to Group A 1996)
PCG
FDI CA
s
s
s
PCG = Claims on prtvate secror as a prrcem o/GDP 11rowrh rare, 5-year moving overage.
Y = GDP growth rare, 5-year moving average.
INF = CPI inf/atio11 rare.
I = Gross fu:ed capiro/ fomrarion as a pcrcenr of GDP.
S = Gross savmg as a petunu>f GDP.
CGB = Cemral govunment lxrlonce as a pen:em of GDP.
CA = Currem accowrr as a percem of GDP. FDI = Foreign direcr investmem as a pucefll of GDP.
EDX = Toral e.rtrma/ debt as a percent of exporr.r. DS = Debt sen•ice rario.
RSD = Tara/ foreign exclrange resen•es as a percent of short-term debt.
RM = Total foreign exclrange reserves as a percelll of broad money .
Rl = Total foreign exclr01rg� T!'Serves as 11 percent of imports.
RSD
DS
1997 (Relative to Group A 1997)
PCG
FDI CA
(Relative to Group A 1997) PCG
FDI
Russia (Relative to Group A 1997)
PCG
FD/ CA
Sources: Global Development Finance; IMF. lnremational Financial Stmistics, and World Economic Om/ook.
s
s
'The figures plot a standardized value, lying between +3 and -3, for each macroeconomic variable. Note that for all variables a movement away from the origin signifies a deteriation. See text for full explanation.
185
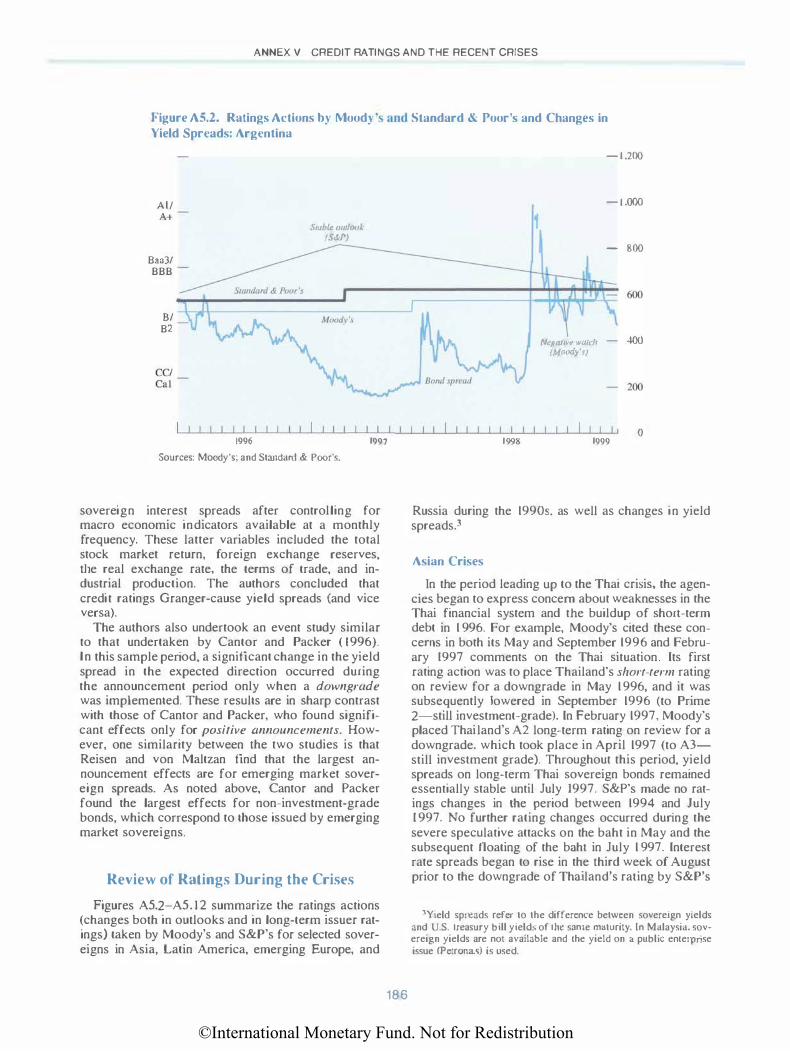
©International Monetary Fund. Not for Redistribution
ANNEX V CREDIT RATINGS AND THE RECENT CRISES
Figure A5.2. Ratings Actions by Mood) 's and Standard & Poor's and Changes in Yield Spreads: Argentina
All A+
Baa3/ BBB
Bf B2
5tuhlt' mllltH>k IS&/'J
1 11 11 11 11 1 11 1 111 Il l 1996 1997
Sources: Moody's; and Standard & Poor's.
sovereign interest spreads after controlling for macro economic indicators available at a monthly frequency. These latter variables included the total stock market return, foreign exchange reserves, d1e real exchange rate, the terms of trade, and industrial production. The authors concluded that credit ratings Granger-cause yield spreads (and vice versa).
The authors also undertook an event study similar to that undertaken by Cantor and Packer ( L 996). l n this sample period, a significant change in the yield spread in the expected direction occun-ed during the announcement period only when a downgrade was implemented. These results are in sharp contrast with those of Cantor and Packer, who found significant effects only for positive announcements. However, one similarity between lhe two studies is that Reisen and von Maltzan find that lhe largest announcement effects are for emerging market sovereign spreads. As noted above, Cantor and Packer found the largest effects for non-investment-grade bonds, which correspond to those issued by emerging market sovereigns.
Review of Ratings During the Crises
Figures A5.2-A5. 1 2 summarize d1e ratings actions (changes both in outlooks and in long-term issuer ratings) taken by Moody's and S&P's for selected sovereigns in Asia, Latin America, emerging Europe, and
186
I I I 1998
1
- 1 ,200
- 1 .000
- 800
Nt·�afl\·� �<·<Udt - 400 (Mtn><l\ '1)
I I I• 0 1999
Russia during the 1990s. as well as changes in yield spreads.3
Asian Crises
Jn the period leading up to the Thai crisis, the agencies began to express concern about weaknesses in the Thai financial system and the buildup of short-term debt in 1 996. For example, Moody's cited these concems in both its May and September 1996 and February 1997 comments on the Thai situation. Its first rating action was to place Thailand's short-term rating on review for a downgrade in May 1996, and it was subsequently lowered in September 1996 (to Prime 2-still investment-grade). In February 1997, Moody's placed Thailand's A2 long-term rating on review for a downgrade, which took place in April 1997 (to A3-still investment grade). Throughout this period, yield spreads on long-term Thai sovereign bonds remained essentially stable until July 1997. S&P's made no ratings changes in d1e period between 1994 and July I 997. No further rating changes occurred during the severe speculative attacks on the baht in May and the subsequent floating of the baht in July 1 997. Interest rate spreads began to rise in the lhird week of August prior to the downgrade of Thailand's rating by S&P's
3Yteld spreads refer to the difference between sovereign yields and U.S. treasury bill yields of Lhe srune maturity. In Malaysia. sovereign yields are not available and the yield on a public enterprise issue (Petronas) is used.
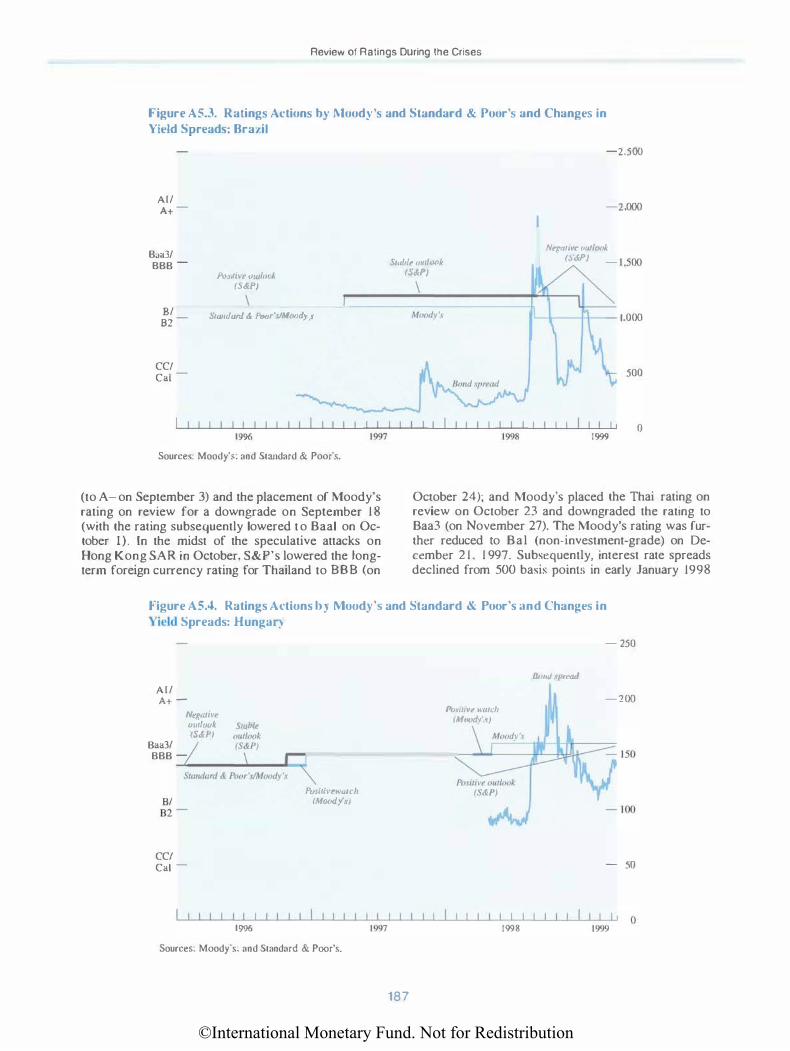
©International Monetary Fund. Not for Redistribution
Review of Ratings During the Crises
Figure A5.3. Ratings Actions b.} I\loodJ's and Standard & Poor's and Changes in Yield Spreads: Brat.il
AI/ A+
Baa3/ BBB -
B/ 82
CCI Cal
it>.<lliV<' outlm>( !S&.PJ
StanJarrl &. PoiJr'.vMI)(x/\ '1
.I'
Swbl� multwk !S&PJ
\
-2.500
-2.000
Nrgatil'< t>UIIt><l� I''&.PJ
1.000
500
l l ll ll ll l l l l l " l 1996
I I I I I 1997
I I I 1998
I I lo 0 1999
Sources: Moody's; and Standard & Poor's.
(to A-on September 3) and the placement of Moody's rating on review for a downgrade on September 18 (with the rating subsequently lowered to Baal on October I). Ln the midst of the speculative attacks on Hong Kong SAR in October, S&P's lowered the longterm foreign currency rating for Thailand to 888 (on
October 24); and Moody's placed the Thai rating on review on October 23 and downgraded the rating to Baa3 (on November 27). The Moody's rating was further reduced to Bal (non-investment-grade) on December 21, 1 997. Subsequently, interest rate spreads declined from 500 basis poinL<; in early January 1998
Figure AS.4. Ratin�s At·tions b) Moody's and Standard & Poor's and Changes in Yield Spreads: llungal")
AI/ A+ -
Ne�:atil'<' tmtltH>k .S/11/J/r
Baa3/ BBB -
IS& PI
-4--.....1--�
CCI Cal -
Pu.<itil·�wutc!J IM(>(I<iv'1)
1 1 1 1 11 1 1 1 1 11 1 1 11 1996
Sources: Moody's; and Standard & Poor's.
I I I 1997
187
/,c>.\'1/IL't' wutdr (M<><I<II'.t)
I I I 1998
8mul vpn'ad
- 250
-200
- 50
I I lo 0 1999
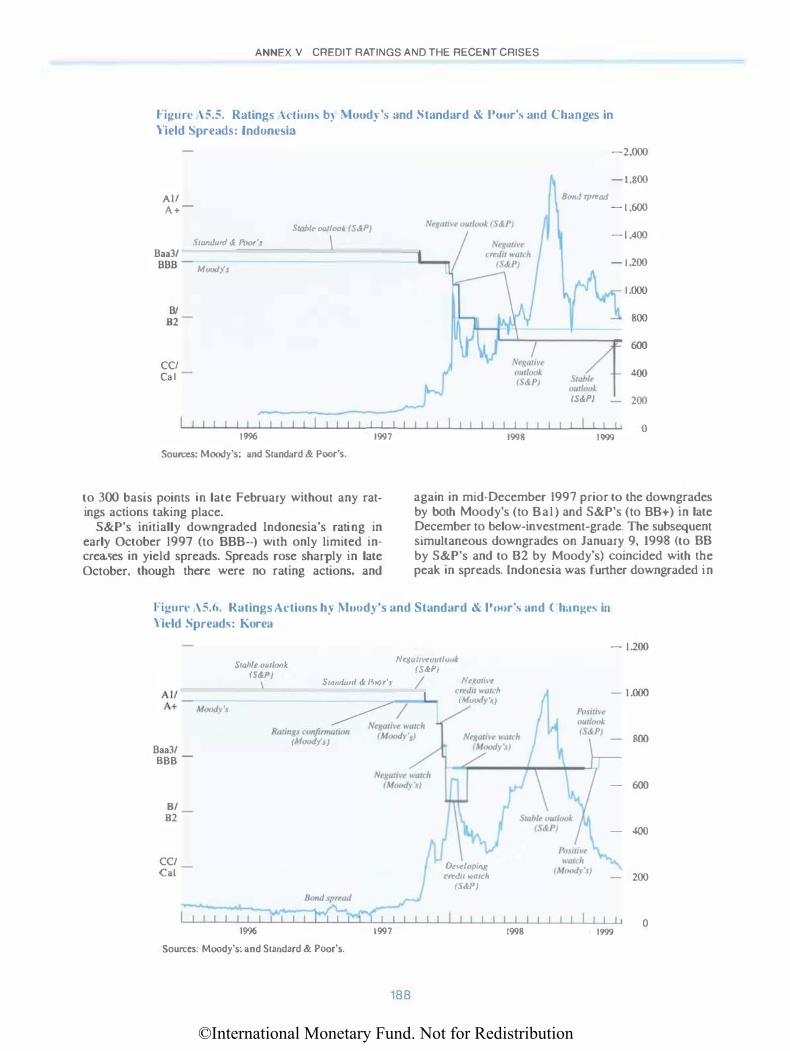
©International Monetary Fund. Not for Redistribution
ANNEX V CREDIT RATINGS AND THE RECENT CRISES
Figun· \5.5. Rating' \ctjous b) \loody'<> and Standard & Pour\ and Changes in Yield "ipread.,: lndone-;ia
All A + -
StundurJ & l'uorJ
Baa3/
BBB -Mm>dy's
B/
82
Stab/� outlook IS6P}
-2,000
- 1 ,800
Hond >f>rtad - 1 ,600
- 1 ,400
- 1 .200
I ,000
800
600
CCI � I 400
1996
Source\: Moody's: and Standard & Poor's.
I I 1997
to 300 basis points in late February without any ratings actions taking place.
S&P's initially downgraded Indonesia's rating in early October 1997 (to BBB-) with only limited increases in yield spreads. Spreads rose sharply in late October, though there were no rating actions, and
I I I I I 1998
ouJb>nk (S&PJ 200
t I I• 1999
0
again in mid-December 1997 prior to the downgrades by both Moody's (to Bal) and S&P's (to BB+) in late December to below-investment-grade. The subsequent simultaneous downgrades on January 9, 1998 (to BB by S&P's and to 82 by Moody's) coincided with the peak in spreads. Indonesia was further downgraded in
Figure ,\5.6 . Ratings Actions h� \luudy's and Standard & Pcwr\ and ( 'hang t'!\ in \'ield Spread<;: Korea
Stablt m11look IS&.PJ
Nrgam·�tml/11,./..
Baa3/ 888
-
8/
82
CCI Cal
\
1996
IS&P)
StandorJ & Pr>nr'.1 /
L �h Ratmg• ronjirmiJTWII 1•1 ··' •• ) IM"'>dy'l) " '""') ·'
I I I 1997
Sources: Moody's: and Standard & Poor's.
188
NtRalil·<' c rrthi >WI< h (MIII><I>'•}
l>nrlf>pml( arJ11 K'UI< h
(.'id/'1
I I I 1998
- 1.200
- 1.000
800
- 600
- 400
- 200
I I I I 1999
0
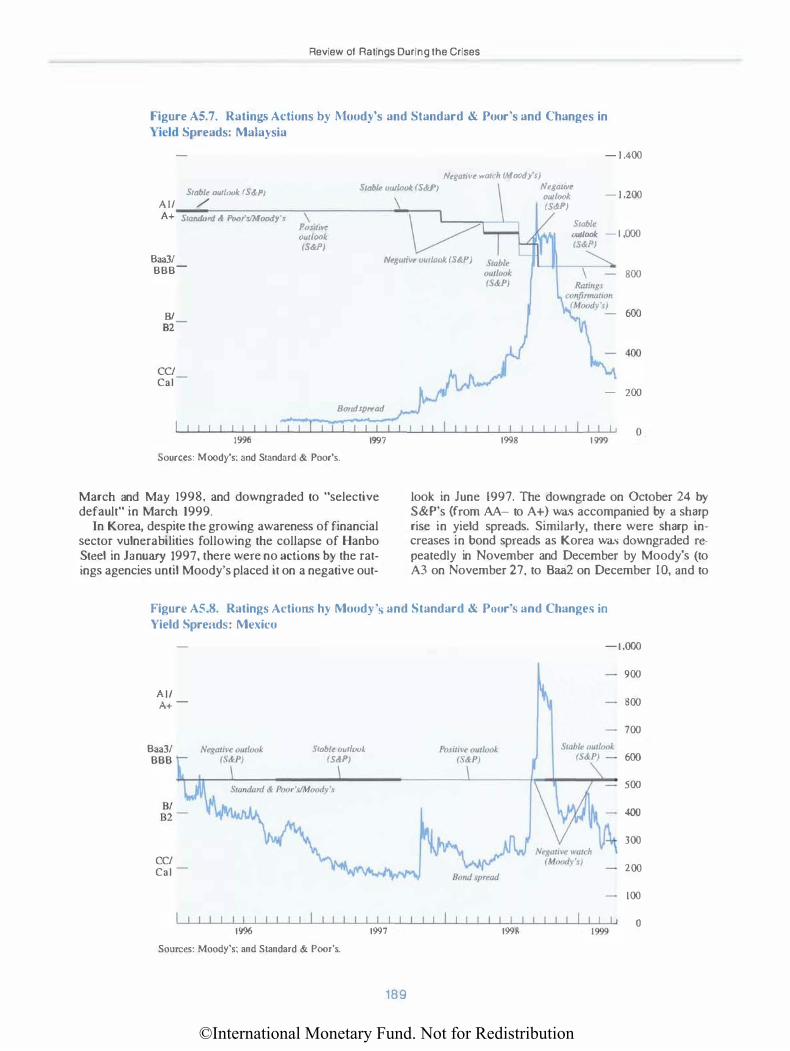
©International Monetary Fund. Not for Redistribution
Review of Ratings During the Crises
Figure A5.7. Ratings Actions by I\loody's and Standard & Poor's and Changes in Yield Spreads: Malaysia
- 1 .400
Negori•·� watch (Moody's)
Stabltt nutlt><Jk (S<!<PJ
All /
Stab//' tJUJ!ook (S&Pi N�goriv� - 1 ,200
A+ S1allliard & Poor'fiMood> ., PiJSI/1\'1' (lu/{(l()k (S&P)
nut look (S<!<PJ
Stable outlook - I ,000 (S&PJ
Baa3/ BBB-
Ntgatiw malook (S<!<P) � 800
B/ 82
CCI Cal
Bmrd.rp�nd
1 I I I I I I I I I I I r I r·ul! I� 1996 1997
Sources: Moody's; and Standard & Poor's.
March and May 1998, and downgraded to "selective default" in March 1999.
In Korea, despite the growing awareness of financial sector vulnerabilities following the collapse of Hanbo Steel in January 1997, there were no actions by the ratings agencies until Moody's placed it on a negative out-
I I I 1998
600
- 200
I I 1, 0 1999
look in June 1997. The downgrade on October 24 by S&P's (from AA- to A+) was accompanied by a sharp rise in yield spreads. Similarly, there were sharp increases in bond spreads as Korea wa<> downgraded repeatedly in November and December by Moody's (to A3 on November 27, to Baa2 on December I 0, and to
Figure A5.8. Ratings Actions hy Mood) '1. and Standard & P11or\ and Changes in Yield Spre�lds: Mexico
All A+ -
Baa3/ BBB
CCI Cal -
Srnblt (}utlotJk !S&PJ
I I I I I I I I I I I I I I I I I I I 1996 1997
Sources: Moody's; and Slandard & Poor's.
189
I
-1,000
900
800
700
600
500
400
300
200
100
I I I I I' 0 1998 1999
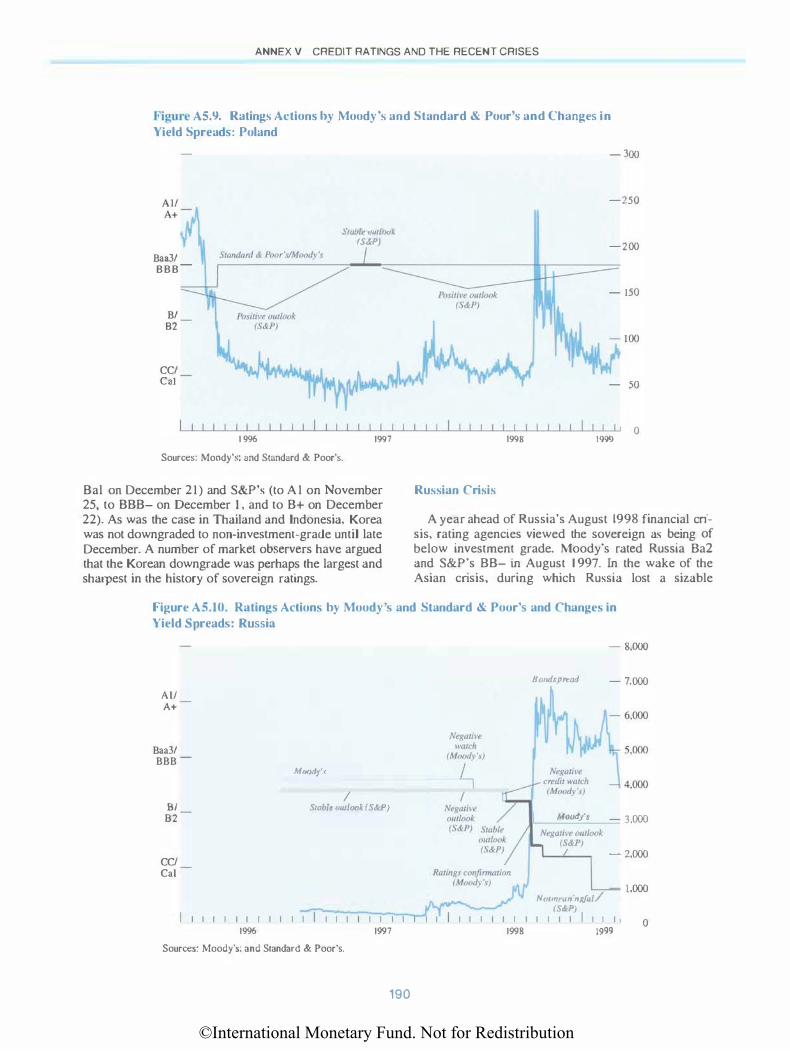
©International Monetary Fund. Not for Redistribution
ANNEX V CREDIT RATINGS AND THE RECENT CRISES
Figure A5.9. Ratings Actions by Moody's and Standard & Poor'!> and Changes in Yield Spreads: Poland
��-1 Stablr <JutltHik rS&PJ
Baa3/ BBB-
B/ 82
CCI Cal
1 111111 1 1 1 1 1 1 111 1 996
Sources: Moody's: and Standard & Poor's.
I I I 1997
Bal on December 21) and S&P's (to AJ on November 25, to BBB- on December I , and to B+ on December 22). As was the case in Thailand and lndonesia, Korea was not downgraded to non-investment-grade until late December. A number of market observers have argued that the Korean downgrade was perhaps the largest and sharpest in the history of sovereign ratings.
Russian Crisis
I I I 1998
- 300
-250
-200
- 150
- 50
I I 1, 0 1999
A year ahead of Russia's August 1998 financial crisis, rating agencies viewed the sovereign as being of below investment grade. Moody's rated Russia Ba2 and S&P's BB- in August J 997. In the wake of the Asian crisis, during which Russia lost a sizable
Figure A5.10. Ratings Actions by Moody's and Standard & Poor's and Changes in Yield S1>reads: Russia
All A+
Baa3/ BBB -
B/ 82
CCI Cal
Mondy:,
Swbfr outlook (St!J>)
--:----1 I I I I I I I I I I I I I I I I I I I 1996 1997
Sources: Moody's: and Standard & Poor's.
Rotmg.< ccmjimrja rmr (MorHiyO.)
- 8,000
Bmrdsprrod - 7,000
-\ 4,000
M()(uly'.t _ 3,000
- 2,000
1,000 (S4ti'J
� NotmMnrnriful/
1 ll l l l l ll i r l lo 0 1998 1999
190
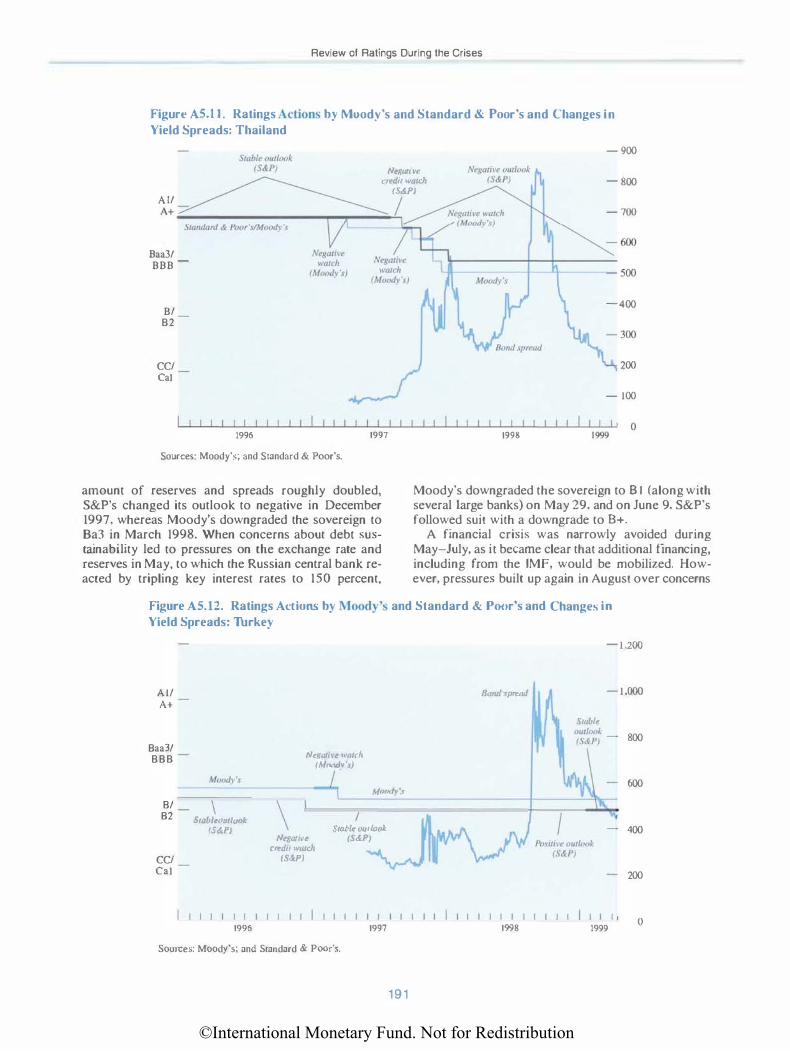
©International Monetary Fund. Not for Redistribution
Review of Ratings During the Crises
Figure AS.l l . Ratings A ctions by Mood) 's and Standard & Poor's and Changes in Yield Spreads: Thailand
- 900 Nr�:uri .. ·�
rrt'dir wtJJdr IS&P!
- 800 A I/ I A+ ._------------------��----�
Baa3/ BBB -
B/ 82
CCI Cal
l l !! l!l! !! !! l !! l 1996
Sources: Moody's; and Slandard & Poor's.
I I I 1997
amount of reserves and spreads roughly doubled, S&P's changed its outlook to negative in December 1997, whereas Moody's downgraded the sovereign to Ba3 in March 1998. When concerns about debt sustainability led to pressures on the exchange rate and reserves in May, to which the Russian central bank reacted by tripling key interest rates to 150 percent,
I I I 1998
- 700
-400
200
- 100
I I I I 0 1999
Moody's downgraded the sovereign to B I (along with several large banks) on May 29, and on June 9, S&P's followed suit with a downgrade to 8+.
A financial crisis was narrowly avoided during May-July, as it became clear that additional financing, including from the IMF, would be mobilized. However, pressures built up again in August over concerns
Figure A5.12. Ratings Actions by Moody's and Standard & Poor's and Changes in Yield Spreads: Thrkey
AI/ A+
8aa3/ 888
8/ 82
CCI Cal
Srabl<'out/oai; (S&.PJ
Negatn·� 1\'rlltlr (Monti� '•J (
\ Negall'�
crrdir ntlldr tS&.PI
L Moody\
Stahlt: out/r}Ol IS&P)
I II I I II I I I I I I I I I I I I 1996 1997
Sources: Moody's; and Standard & Poor's.
191
- 1 .200
IJmul sprratl -1.000
Swblt
800
- 600
400
- 200
I I I 1998 1999
0
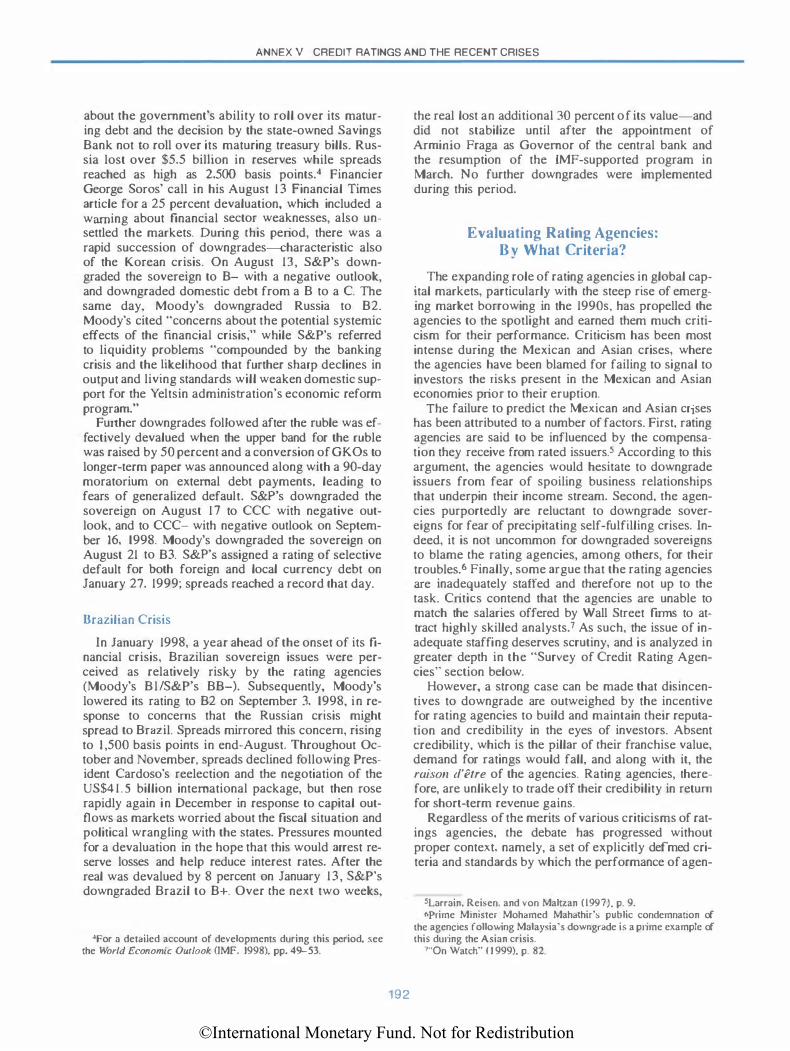
©International Monetary Fund. Not for Redistribution
ANNEX V CREDIT RATINGS AND THE RECENT CRISES
about the government's ability to roll over its maturing debt and the decision by the state-owned Savings Bank not to roll over its maturing treasury bills. Russia lost over $5.5 billion in reserves while spreads reached as high as 2,500 basis points.4 Financier George Soros' call in his August 1 3 Financial Times article for a 25 percent devaluation, which included a warning about financial sector weaknesses, also unsettled the markets. During this period, there was a rapid succession of downgrades�haracteristic also of the Korean crisis. On August 13, S&P's downgraded the sovereign to B- with a negative outlook, and downgraded domestic debt from a B to a C. The same day, Moody's downgraded Russia to B2. Moody's cited "concerns about the potential systemic effects of the financial crisis," while S&P's referred to liquidity problems "compounded by the banking crisis and the Jjkelihood that further sharp declines in output and living standards will weaken domestic support for the Yeltsin administration's economic reform program."
Further downgrades followed after the ruble was effectively devalued when the upper band for the ruble was raised by 50 percent and a conversion of GKOs to longer-term paper was announced along with a 90-day moratorium on external debt payments, leading to fears of generalized default. S&P's downgraded the sovereign on August 1 7 to CCC with negative outlook, and to CCC- with negative outlook on September 16, 1998. Moody's downgraded the sovereign on August 21 to B3. S&P's assigned a rating of selective default for both foreign and local currency debt on January 27. 1999; spreads reached a record that day.
Brazilian Crisis
In January 1998, a year ahead of the onset of its financial crisis, Brazilian sovereign issues were perceived as relatively risky by the rating agencies (Moody's Bl/S&P's BB-). Subsequently, Moody's lowered its rating to B2 on September 3, 1998, in response to concerns that the Russian crisis might spread to Brazil. Spreads mirrored this concern, rising to I ,500 basis points in end-August. Throughout October and November, spreads declined following President Cardoso's reelection and the negotiation of the US$4 1 . 5 billion international package, but then rose rapidly again in December in response to capital outflows as markets worried about the fiscal situation and political wrangling with the states. Pressures mounted for a devaluation in the hope that this would arrest reserve losses and help reduce interest rates. After the real was devalued by 8 percent on January 13, S&P's downgraded Brazil to B+. Over the next two weeks,
4For a detailed account of developments during this period, see the World Economic Outlook (IMF. 1998), pp. 49-53.
192
the real lost an additional 30 percent of its value-and did not stabilize until after the appointment of Armiruo Fraga as Governor of the central bank and the resumption of the IMF-supported program in March. No further downgrades were implemented during this period.
Evaluating Rating Agencies: B y What Criteria?
The expanding role of rating agencies in global capital markets, particularly with the steep rise of emerging market borrowing in the 1990s, has propelled the agencies to the spotlight and earned them much criticism for their performance. Criticism has been most intense during the Mexican and Asian crises, where the agencies have been blamed for failing to signal to investors the risks present in the Mexican and Asian economies prior to their eruption.
The failure to predict the Mexican and Asian crises has been attributed to a number of factors. First, rating agencies are said to be influenced by the compensation they receive from rated issuers.s According to this argument, the agencies would hesitate to downgrade issuers from fear of spoiling business relationships that underpin their income stream. Second, the agencies purportedly are reluctant to downgrade sovereigns for fear of precipitating self-fulfilling crises. Indeed, it is not uncommon for downgraded sovereigns to blame the rating agencies, among others, for their troubles.6 Finally, some argue that the rating agencies are inadequately staffed and therefore not up to the task. Critics contend that the agencies are unable to match the salaries offered by Wall Street firms to attract highJy skilled analysts.7 As such, the issue of inadequate staffing deserves scrutiny, and is analyzed in greater depth in the "Survey of Credit Rating Agencies" section below.
However, a strong case can be made that disincentives to downgrade are outweighed by the incentive for rating agencies to build and maintain their reputation and credibility in the eyes of investors. Absent credibility. which is the pillar of their franchise value, demand for ratings would fall, and along with it, the raison d'etre of the agencies. Rating agencies, therefore, are unlikely to trade off their credibility in return for short-term revenue gains.
Regardless of the merits of various criticisms of ratings agencies, the debate has progressed without proper context, namely, a set of explicitly defmed criteria and standards by which the performance of agen-
5Larrain, Reisen. and von Maltz.an ( 1997). p. 9. 6Prime Minister Mohamed Mahathir's public condemnation of
the agencies following Malaysia's downgrade is a prime example of this during the Asian crisis.
?·'On Watch" ( 1 999). p. 82.
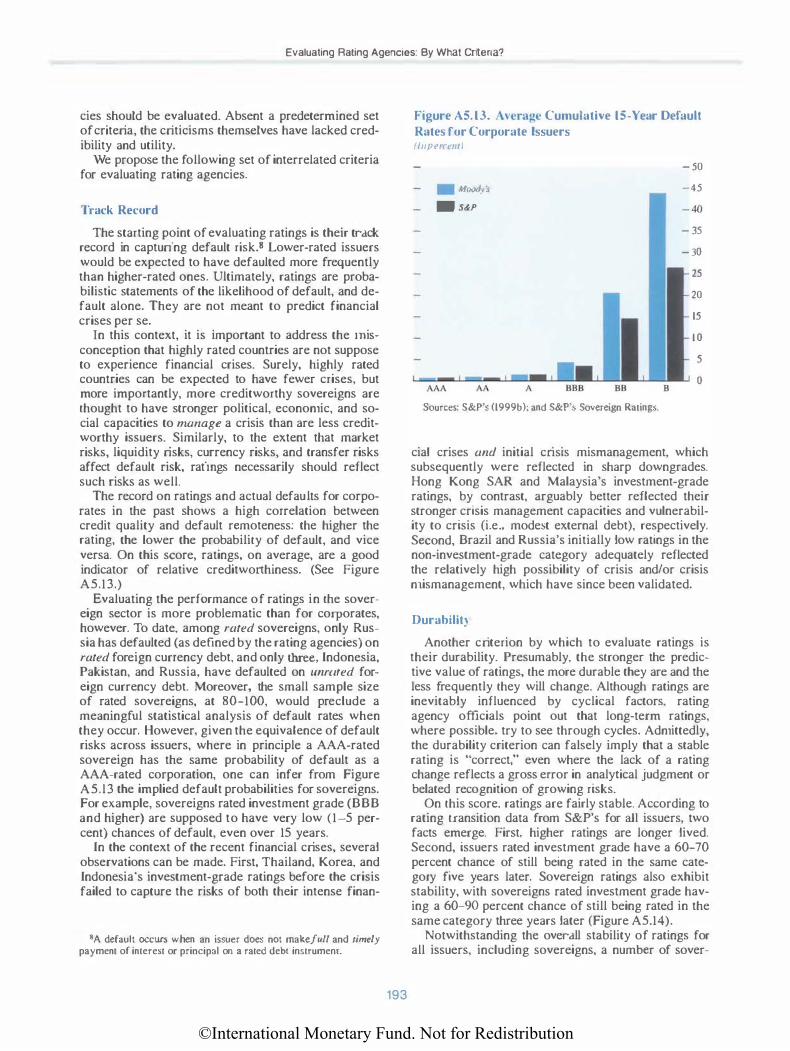
©International Monetary Fund. Not for Redistribution
Evaluating Rating Agencies: By What Criteria?
cies should be evaluated. Absent a predetermined set of criteria, the criticisms themselves have lacked credibility and utility.
We propose the following set of interrelated criteria for evaluating rating agencies.
Track Record
The starting point of evaluating ratings is their track record in capturing default risk.S Lower-rated issuers would be expected to have defaulted more frequently than higher-rated ones. Ultimately, ratings are probabilistic statements of the likelihood of default, and default alone. They are not meant to predict financial crises per se.
In this context, it is important to address the nusconception that highly rated countries are not suppose to experience financial crises. Surely, highly rated countries can be expected to have fewer crises, but more importantly, more creditworthy sovereigns are thought to have stronger political, econonlic, and social capacities to manage a crisis than are less creditworthy issuers. Similarly, to the extent that market risks, liquidity risks, currency risks, and transfer risks affect default risk, ratings necessarily should reflect such risks as well.
The record on ratings and actual defaults for corporates in the past shows a high correlation between credit quality and default remoteness: the higher the rating, the lower the probability of default, and vice versa. On this score, ratings, on average, are a good indicator of relative creditworthlness. (See Figure A5.13.)
Evaluating the performance of ratings in the sovereign sector is more problematic than for corporates, however. To date, among rated sovereigns, only Russia has defaulted (as defined by the rating agencies) on rated foreign currency debt, and only three, Indonesia, Pakistan, and Russia, have defaulted on unrated foreign currency debt. Moreover, the small sample size of rated sovereigns, at 80-100, would preclude a meaningful statistical analysis of default rates when they occur. However, given the equivalence of default risks across issuers, where in principle a AAA-rated sovereign has the same probability of default as a AAA-rated corporation, one can infer from Figure A5.l3 the implied default probabilities for sovereigns. For example, sovereigns rated investment grade (BBB and higher) are supposed to have very low (1-5 percent) chances of default, even over 15 years.
In the context of the recent financial crises, several observations can be made. First, Thailand, Korea, and Indonesia's investment-grade ratings before the crisis failed to capture the risks of both their intense finan-
8A default occurs when an issuer does not makefu// and timely payment of interest or principal on a rated debt instrument.
193
Figure A5.13. Average Cumulative 15-Year Default Rates for Corporate Issuers (/IIJ>Nrl'llti
- 50
Mtxxtv:f -45
. S&P - 40 - 35
- 30
25
20
15
10
5
0 AAA
Sources: S&P's (1999b): and S&P's Sovereign Ratings.
cia! crises and initial cns1s mismanagement, which subsequently were reflected in sharp downgrades. Hong Kong SAR and Malaysia's investment-grade ratings, by contrast, arguably better reflected their stronger crisis management capacities and vulnerability to crisis (i.e .. modest external debt), respectively. Second, Brazil and Russia's initially low ratings in the non-investment-grade category adequately reflected the relatively high possibility of crisis and/or crisis nlismanagement, which have since been validated.
Durabilil)
Another criterion by which to evaluate ratings is their durability. Presumably, the stronger the predictive value of ratings, the more durable they are and the Jess frequently they will change. Although ratings are inevitably influenced by cyclical factors, rating agency officials point out that long-term ratings, where possible, try to see through cycles. Adnlittedly, the durability criterion can falsely imply that a stable rating is "correct," even where the lack of a rating change reflects a gross error in analytical judgment or belated recognition of growing risks.
On this score, ratings are fairly stable. According to rating transition data from S&P's for all issuers, two facts emerge. First, higher ratings are longer lived. Second, issuers rated investment grade have a 60-70 percent chance of still being rated in the same category five years later. Sovereign ratings also exhibit stability, with sovereigns rated investment grade having a 60-90 percent chance of still being rated in the same category three years later (Figure A5.14).
Notwithstanding the overall stability of ratings for all issuers, including sovereigns, a number of sover-
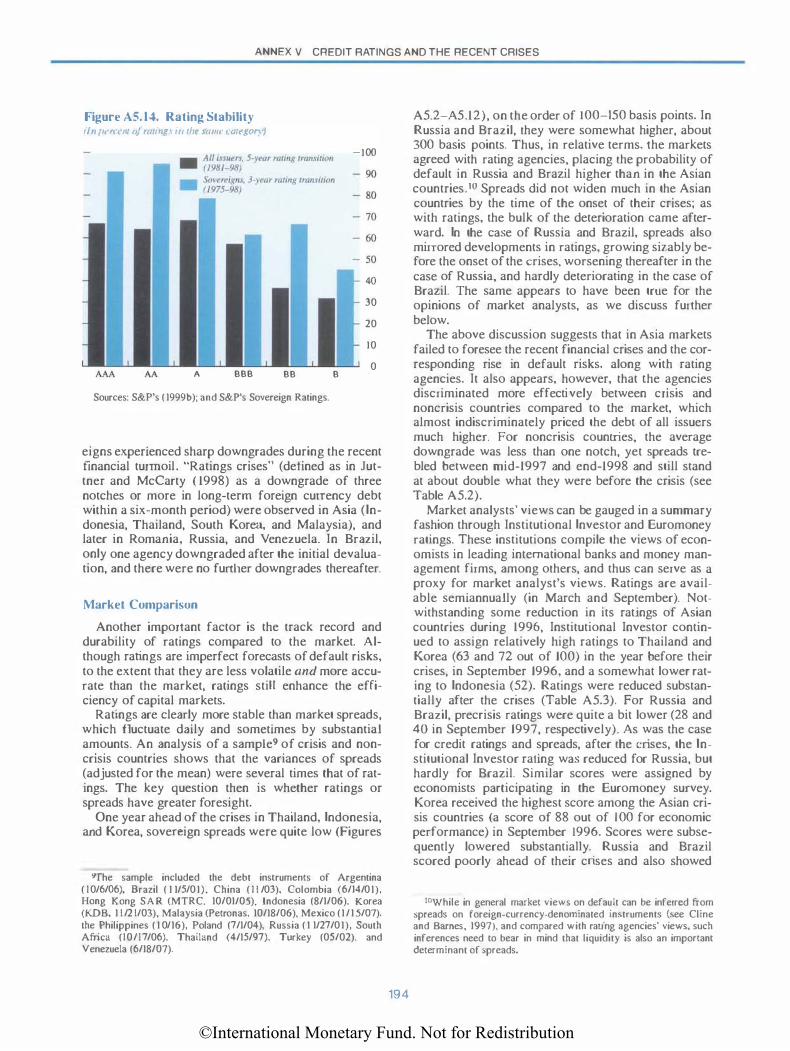
©International Monetary Fund. Not for Redistribution
ANNEX V CREDIT RATINGS AND THE RECENT CRISES
Figure AS. J4. Rating Stability , ,, rwrallloj mting� ill ,,,. \(1/111' t'<Jit'gon·)
AAA AA A BBB BB
Sources: S&P's ( 1999b); and S&P's Sovereign Ratings.
B
-100
40
30
20
10
0
eigns experienced sharp downgrades during the recent financial turmoil. "Ratings crises" (defined as in Juttner and McCarty ( 1998) as a downgrade of three notches or more in long-tenn foreign currency debt within a six-month period) were observed in Asia (Indonesia, Thailand, South Korea., and Malaysia), and later in Romania, Russia, and Venezuela. In Brazil, only one agency downgraded after the initial devaluation, and there were no further downgrades thereafter.
Market Comparison
Another important factor is the track record and durability of ratings compared to the market. Although ratings are imperfect forecasts of default risks, to the extent that they are less volatile and more accurate than the market, ratings stiU enhance the efficiency of capital markets.
Ratings are clearly more stable than market spreads, which fluctuate daily and sometimes by substantial amounts. An analysis of a sampte9 of crisis and noncrisis countries shows that the variances of spreads (adjusted for the mean) were several times that of ratings. The key question then is whether ratings or spreads have greater foresight.
One year ahead of the crises in Thailand, Indonesia, and Korea, sovereign spreads were quite low (Figures
9'fhe sample included lhe debt instruments of Argentina ( 10/6/06). 'Brazil ( 1 115/01). China ( 1 1 103). Colombia (6/14/01). Hong Kong SAR (MTRC. 10/01105). Indonesia (8/1/06). Korea (KDB. 1 1/2 1/03), Malaysia (Petronas, 10/18/06), Mexico (1115/07). lhe Philippines ( 1 0/16), Poland (7/1/04), Russia ( 1 1127/01), South Africa (10/17/06). Thailand (4/15/97). Turkey (05/02). and Venezuela (6/18/07).
194
A5.2-A5.12), on the order of I 00-150 basis points. In Russia and Brazil, they were somewhat higher, about 300 basis points. Thus, in relative terms, the markets agreed with rating agencies, placing the probability of default in Russia and Brazil higher than in the Asian countries.10 Spreads did not widen much in the Asian countries by the time of the onset of their crises; as with ratings, the bulk of the deterioration came afterward. In the case of Russia and Brazil, spreads also mirrored developments in ratings, growing sizably before the onset of the crises, worsening thereafter in the case of Russia, and hardly deteriorating in the case of Brazil. The same appears to have been true for the opinions of market analysts, as we discuss further below.
The above discussion suggests that in Asia markets failed to foresee the recent financial crises and the corresponding rise in default risks, along with rating agencies. It also appears, however, that the agencies discriminated more effectively between crisis and noncrisis countries compared to the market, which almost indiscriminately priced the debt of all issuers much higher. For noncrisis countries, the average downgrade was less than one notch, yet spreads trebled between mid-1997 and end-1998 and still stand at about double what they were before the crisis (see Table A5.2).
Market analysts' views can be gauged in a summary fashion through Institutional Investor and Euromoney ratings. These institutions compile the views of economists in leading international banks and money management firms, among others, and thus can serve as a proxy for market analyst's views. Ratings are available semiannually (in March and September). Notwithstanding some reduction in its ratings of Asian countries during 1996, Institutional Investor continued to assign relatively high ratings to Thailand and Korea (63 and 72 out of 100) in the year before their crises, in September 1996, and a somewhat lower rating to Indonesia (52). Ratings were reduced substantially after the crises (Table A5.3). For Russia and Brazil, precrisis ratings were quite a bit lower (28 and 40 in September 1997, respectively). As was the case for credit ratings and spreads, after the crises, the Institutional Investor rating was reduced for Russia, but hardly for Brazil. Similar scores were assigned by economists participating in the Euromoney survey. Korea received the highest score among the Asian crisis countries (a score of 88 out of l 00 for economic performance) in September 1996. Scores were subsequently lowered substantiaiJy. Russia and Brazil scored poorly ahead of their crises and also showed
IOWhile in general market views on default can be inferred from spreads on foreign-currency-denominated instruments (see Cline and Barnes, 1997), and compared with rating agencies' views, such inferences need to bear in mind that liquidity is also an important determinant of spreads.
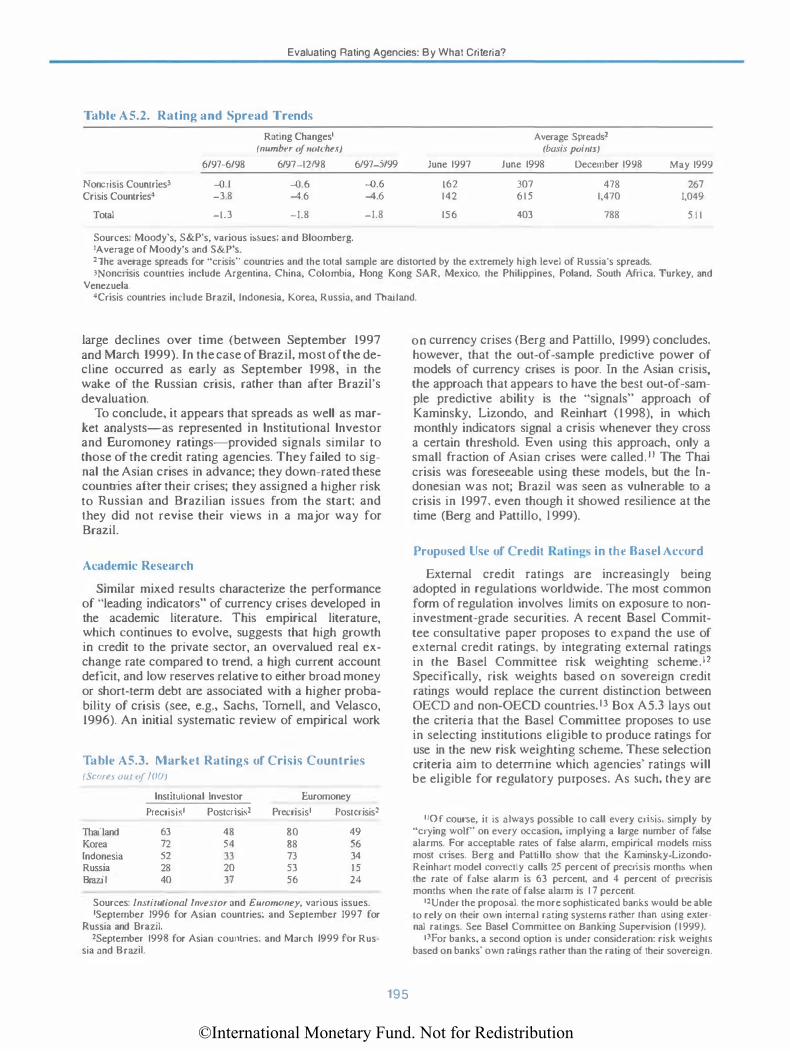
©International Monetary Fund. Not for Redistribution
Evaluating Rating Agencies: By What Criteria?
Table A5.2. Rating and Spread Trends
Rating Changes1 (number of notches)
6/97-6/98 6/97-12198
Noncrisis Countriesl -{).I -{).6 Crisis Countrics4 -3.8 -4.6
Total -1.3 -1.8
Sources: Moody's, S&P's, various issues; and Bloomberg. 'Average of Moody's and S&P's.
6197-5/99 June 1997
-0.6 162 -4.6 142
-1.8 156
Average Spreads2 (basis poims)
June 1998 December 1998
307 615
403
478 1,470
788
May 1999
267 1,049
5 1 1
2Thc average spreads for "crisis" countries and the total sample are distorted by the extremely high level of Russia's spreads. lNoncrisis countries include Argentina, China, Colombia. Hong Kong SAR, Mexico, the Philippines, Poland, South Africa, Turkey, and
Venezuela. 4Crisis countries include Brazil, Indonesia, Korea, Russia, and Thailand.
large declines over time (between September 1997 and March 1999). In the case of Braz.i I, most of the decHne occurred as early as September 1998, in the wake of the Russian crisis, rather than after Brazil's devaluation.
To conclude, it appears that spreads as well as market analysts-as represented in lnstitutional lnvestor and Euromoney ratings-provided signals similar to those of the credit rating agencies. They failed to signal the Asian crises in advance; they down-rated these countries after their crises; they assigned a higher risk to Russian and BraziHan issues from the start; and they did not revise their views in a major way for Brazil.
Academic Research
Similar mixed results characterize the performance of "leading indicators" of currency crises developed in the academic literature. This empirical literature, which continues to evolve, suggests that high growth in credit to the private sector, an overvalued real exchange rate compared to trend, a high current account deficit, and low reserves relative to either broad money or short-term debt are associated with a higher probabiuty of crisis (see, e.g., Sachs, Tornell, and Velasco, 1996). An initial systematic review of empirical work
Table AS.3. Market Ratings of Crisis Countries ( Snm•, mil oj lOIII
lnstitutional lnvcstor Euromoney
Precrisis• Postcrisis2 Precrisis' Postcrisis2
Thailand 63 48 80 49 Korea 72 54 88 56 Indonesia 52 33 73 34 Russia 28 20 53 1 5 Brazil 40 37 56 24
Sources: lnsriturional lnvesror and Euromcney, various issues. 'September 1996 for Asian countries: and September 1997 for
Russia and Brazil. 2September 1998 for Asian countries: and March 1999 for Rus
sia and Brazil.
195
on currency crises (Berg and Pattillo, 1999) concludes, however, that the out-of-sample predictive power of models of currency crises is poor. In the Asian crisis, the approach that appears to have the best out-of-sample predictive ability is the "signals" approach of Kaminsky, Lizondo, and Reinhart (1998), in which monthly indicators signal a crisis whenever they cross a certain threshold. Even using this approach, only a small fraction of Asian crises were called.ll The Thai crisis was foreseeable using these models, but the Indonesian was not; Brazil was seen as vulnerable to a crisis in 1997, even though it showed resiuence at the time (Berg and Pattillo, l 999).
Proposed Use of Credit Ratings in the Basel \ccord
External credit ratings are increasingly being adopted in regulations worldwide. The most common form of regulation involves limits on exposure to noninvestment-grade securities. A recent Basel Committee consultative paper proposes to expand the use of external credit ratings, by integrating external ratings in the Basel Committee risk weighting scheme.l2 Specifically, risk weights based on sovereign credit ratings would replace the current distinction between OECD and non-OECD countries. 13 Box A5.3 lays out the criteria that the Basel Committee proposes to use in selecting institutions eligible to produce ratings for use in the new risk weighting scheme. These selection criteria aim to determine which agencies' ratings will be eligible for regulatory purposes. As such, they are
110f course. it is always possible to call every crisis. simply by "crying wolF' on every occasion, implying a large number of false alarms. For acceptable rates of false alarm, empirical models miss most crises. Berg and Pattillo show that the Kaminsky-LizondoReinhart model correctly calls 25 percent of precrisis months when the rate of false alarm is 63 percent, and 4 percent of precrisis months when the rate of false alarm is 17 percent.
12Under the proposal. the more sophisticated banks would be able to rely on their own internal rating systems rather than using external ratings. See Basel Committee on Banking Supervision (1999).
t3For banks, a second option is under consideration: risk weights based on banks' own ratings rather than the rating of their sovereign.
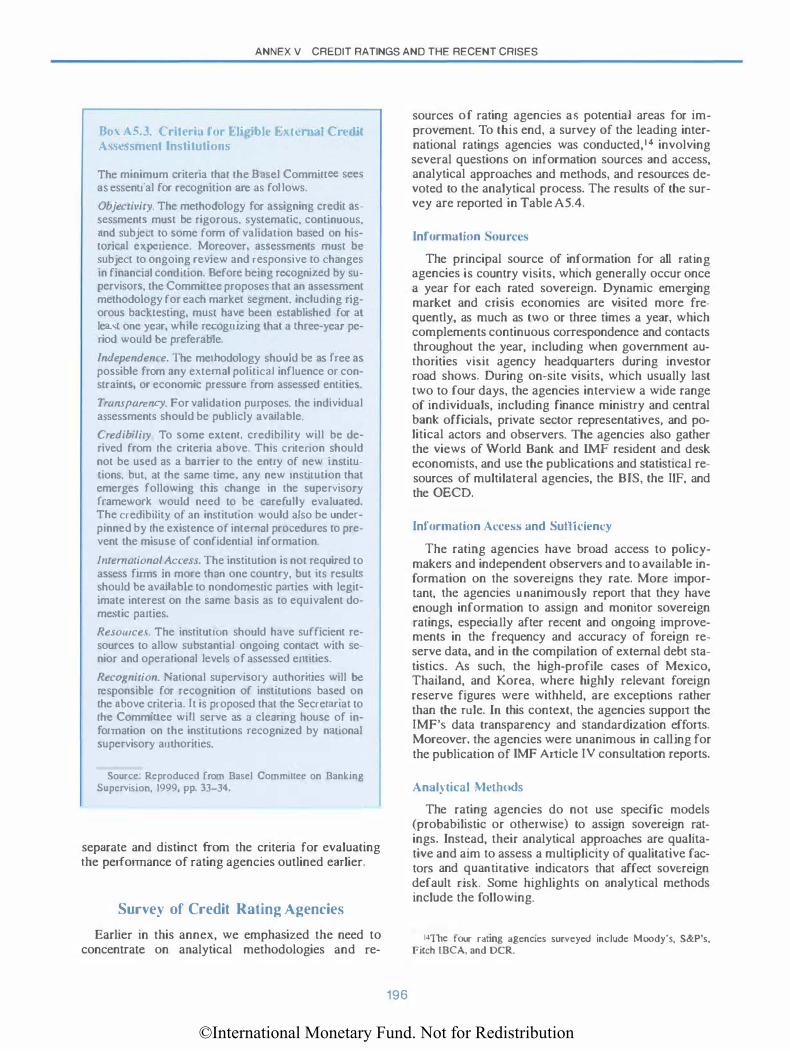
©International Monetary Fund. Not for Redistribution
ANNEX V CREDIT RATINGS AND THE RECENT CRISES
Rox \5.3. Criteria f'or l•ligiblc External Cn·dit Asst•ssmcnt Institutions
The minimum criteria that the Basel Committee sees as essential for recognition are as follows.
Objecriviry. The methodology for assigning credit assessments must be rigorous, systematic, continuous, and subject to some form of validation based on historicaJ experience. Moreover, assessments must be subject to ongoing review and responsive to changes in financial condition. Before being recognized by supervisors, the Committee proposes that an assessment methodology for each market segment. including rigorous backtesting, must have been established for at least one year, while recognizing that a three-year period would be preferable.
Independence. The methodology should be as free as possible from any external political influence or constraints, or economic pressure from assessed entities.
Transparency. For validation purposes. the individual a�sessments should be publicly available.
Credibility To some extent, credibility will be derived from the criteria above. This criterion should not be used as a barrier to the entry of new institutions, but, at the same time, any new anstilution that emerges following this change in the supervisory framework would need to be carefully evaluated. The credibility of an institution would also be underpinned by the existence of internal procedures to prevent the misuse of confidential information.
lmemational Access. The institution is not required to assess firms in more than one country, but its results should be available to nondomestic parues with legitimate interest on the same basis as to equivalent domestic parties.
Resources. The institutiOn should have sufficient resources to allow substantial ongoing contact with senior and operational levels of assessed entities.
Recognition. National supervisory authorities will be responsible for recognition of institutions based on the above criteria. It is proposed that the Secretariat to the Commmee will serve as a cleanng house of information on the institutions recognized by naiional supervisory authorities.
Source: Reproduced from Basel Committee on Banking Supervision, 1999. pp. 33-34.
separate and distinct from the criteria for evaluating the performance of rating agencies outlined earlier.
Survey of Credit Rating <\gencies
Earlier in this annex, we emphasized the need to concentrate on analytical methodologies and re-
196
sources of rating agencies a� potential areas for improvement. To this end, a survey of the leading international ratings agencies was conducted,14 involving several questions on information sources and access, analytical approaches and methods, and resources devoted to the analytical process. The results of the survey are reported in Table A5.4.
Information Sou rces
The principal source of information for all rating agencies is country visits, which generally occur once a year for each rated sovereign. Dynamic emerging market and crisis economies are visited more frequently, as much as two or three times a year, which complements continuous correspondence and contacts throughout the year, including when government authorities visit agency headquarters during investor road shows. During on-site visits, which usually last two to four days, the agencies interview a wide range of individuals, including finance ministry and central bank officials, private sector representatives, and political actors and observers. The agencies also gather the views of World Bank and IMF resident and desk economists, and use the publications and statistical resources of multilateral agencies, the BIS, the IlF, and the OECD.
Information �ccess and Suflidency
The rating agencies have broad access to policymakers and independent observers and to available information on the sovereigns they rate. More important, the agencies unanimously report that they have enough information to assign and monitor sovereign ralings, especially after recent and ongoing improvements in the frequency and accuracy of foreign reserve data, and in the compilation of external debt statistics. As such, the high-profile cases of Mexico, Thailand, and Korea, where highly relevant foreign reserve figures were withheld, are exceptions rather than the rule. In this context, the agencies support the IMF's data transparency and standardization efforts. Moreover, the agencies were unanimous in calling for the publication of rMF Article IV consultation reports.
AnaiJtical Methods
The rating agencies do not use specific models (probabilistic or otherwise) to assign sovereign ratings. Instead, their analytical approaches are qualitative and aim to assess a multiplicity of qualitative factors and quantitative indicators that affect sovereign default risk. Some highlights on analytical methods include the following.
14The four rating agencies surveyed include Moody's, S&P's, Fitch IBCA, and OCR.
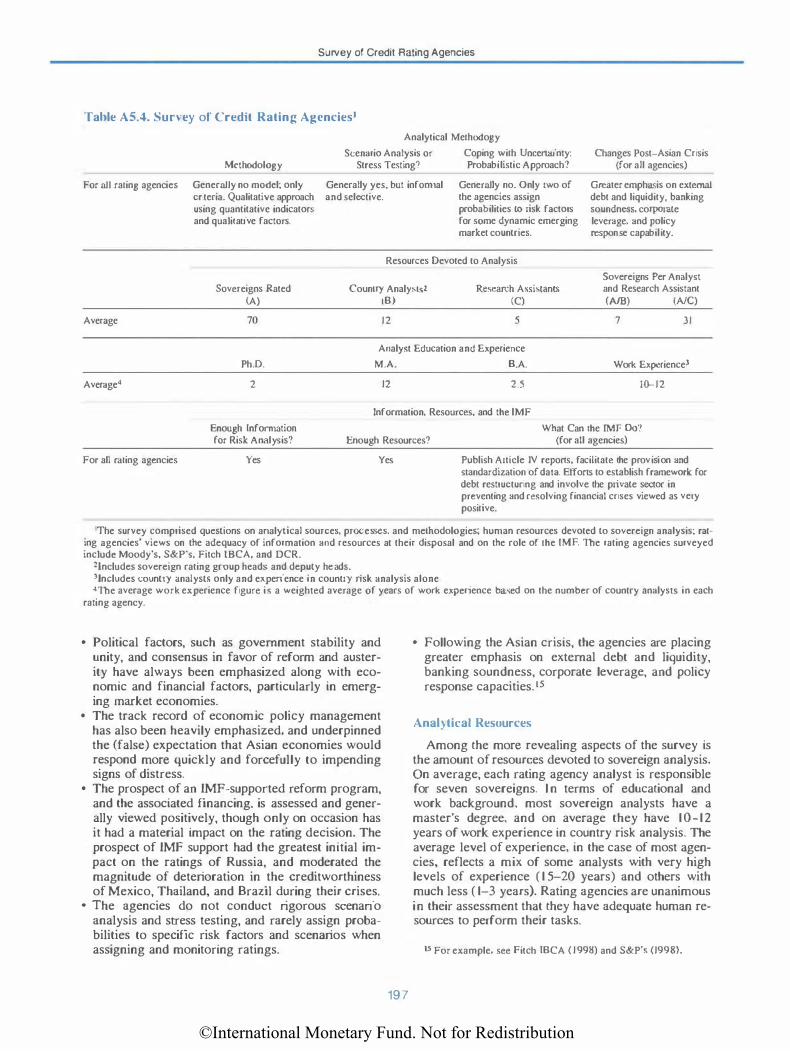
©International Monetary Fund. Not for Redistribution
Survey of Credit Rating Agencies
Table A5.4. Suney of Credit Rating A�cncies1
Analytical Methodogy
Methodology Scenario Analysis or
Stress Testing? Coping with Uncertainty: Probabilistic Approach?
Changes Post-Asian Crisis (for all agencies)
For all rating agencies Generally no model; only Generally yes. but infom1al Generally no. Only two of the agencies assign probabilities to risk factors for some dynamic emerging market countries.
Gremer emphasis on external debt and liquidity, banking soundness, corporate leverage, and policy response capability.
criteria. Qualitative approach and selective. using quantitative indicator.. and qualitative factors.
Resources Devoted to Analysis
Sovereigns :Rated (A)
Country Analysts2 (B)
Research Assistants (C)
Sovereigns Per Analyst and Research Assistant (NB) (NC)
Average 70 12 5 7 31
Analyst Education and Experience
Ph.D. M.A. B.A. Work Experiencel
Average• 2 12 2.5 10--12
Information, Resources, and the lMF Enough Information for Risk Analysis? Enough Resources?
What Can the IMF Do? (for all agencies)
For all mting agencies Yes Yes Publish Article rv reports, facilitate the provision and standardization of data. Efforts to establish framework for debt restructuring and involve the private sector in preventing and resolving financial crises viewed as very positive.
1The survey comprised questions on analytical sources. processes, and methodologies; human resources devoted to sovereign analysis; rating agencies' views on the adequacy of information and resources at their disposal and on the role of the IMF. The rating agencies surveyed include Moody's, S&P's, Fitch ffiCA, and DCR.
2lncludes sovereign rating group heads and deputy heads. lJncludes country analyst� only and experience in country risk analysis alone. 4The average work experience figure is a weighted average of years of work experience based on the number of country analysts in each
rating agency.
• Political factors, such as government stability and unity, and consensus in favor of reform and austerity have always been emphasized aJong with economic and financial factors, particularly in emerging market economies.
• The track record of economic policy management has also been heavily emphasized, and underpinned the (false) expectation that Asian economies would respond more quickly and forcefully to impending signs of distress.
• The prospect of an IMP-supported reform program, and the associated financing, is assessed and generally viewed positively, though only on occasion has it had a material impact on the rating decision. The prospect of IMF support had the greatest initial impact on the ratings of Russia, and moderated the magnitude of deterioration in the creditworthiness of Mexico, Thailand, and Brazil during their crises.
• The agencies do not conduct rigorous scenario analysis and stress testing, and rarely assign probabilities to specific risk factors and scenarios when assigning and monitoring ratings.
197
• Following the Asian crisis, the agencies are placing greater emphasis on external debt and liquidity, banking soundness, corporate leverage, and policy response capacities. IS
Anal) tical Resources
Among the more revealing aspects of the survey is the amount of resources devoted to sovereign analysis. On average, each rating agency analyst is responsible for seven sovereigns. l n terms of educational and work background, most sovereign analysts have a master's degree, and on average they have 10-12 years of work experience in country risk analysis. The average level of experience, in the case of most agencies, reflects a mix of some analysts with very high levels of experience ( 1 5-20 years) and others with much less ( 1-3 years). Rating agencies are unanimous in their assessment that they have adequate human resources to perform their tasks.
15 For example, see Fitch IBCA (1998) and S&P's (1998).
©International Monetary Fund. Not for Redistribution
ANNEX V CREDIT RATINGS AND THE RECENT CRISES
ln light of the survey findings. the following observations can be made: • The agencies' unanimous position that they have
enough information suggests that the real challenge of improving the predictive value of ratings and enhancing market efficiency rests more on improving the analysis of available information and less on generating more information. The agencies' call for the publication of IMF Article rv consultation reports arguably reflects their need for more sources of analysis.
• Given the importance of political factors in shaping policy decisions, policy implementation, and economic performance, the emphasis on political factors as much as economic ones seems appropriate, and a qualitative analytical approach is almost inevitable. Evaluating political factors. however. is inherently difficult, given the wide margin surrounding possible political outcomes in most developing countries. Even when they are accurately assessed, political factors may be less influential in rating outcomes because they are less tangible than economic and financial risks. It may not be coincidental that Indonesia and Russia have been among the most dynamic credit stories over the last year, driven mainly by their unstable politics.
• Similarly, the emphasis on economic management track record and the growing importance of policy responses is welJ placed. However. anticipating the policy responses of governments under stress is also analytically very challenging. Having managed their economies successfu II y for decades, Korea and Thailand were rated highly and were expected to manage their financial stresses successfully without depleting their usable reserves to the extent that U1ey did. The subsequent rating downgrades reflected both the large scale of the crisis, but also the inadequate initial responses.
• Given the uncertainties inherent to political factors and government behavior under stress, the almost complete lack of a probabilistic approach to risk analysis is somewhat surprising, especially because ratings themselves are probabilistic statements of default risk. In the absence of a more probabilistic approach, the danger is that less tangible. but potentially important, risks may not be accorded the appropriate weight in rating decisions.
• The number of countries followed by agency analysts is excessive in light of U1e challenges associated with analyzing sovereigns. Global financial integration and liberalization have strengthened interdependencies to a degree that requires increasingly sophisticated risk assessment techniques, including systemic risk analysis, scenario analysis, and stress testing. The role of common lenders (commercial banks, investment banks, and hedge funds) in transmitting crises means that an intimate knowledge of lender and market behavior is also
198
important. The excessive number of countries followed by agency analysts heightens the challenge of broadening the scope of country risk analysis and applying time-intensive techniques. As such, adequate stafftng is clearly an issue to be contended with by the agencies.
• A key dimension of the resource issue is how the agencies compare to the market. To the extent that the agencies are better staffed than most market institutions, then the agencies clearly can add value. even if they are resource-constrained by some analytical or objective criteria. This issue cannot be assessed at present with the available data.
• Finally, the frequent criticism that the agencies cannot attract high-caliber analysts is not supported by the survey. Virtually aU agency sovereign analysts have graduate degrees. and on average. many years of experience in country risk analysis. The issue is that more of them are needed.
References
Basel Committee on Banking Supervision, 1999, A New Capital Adequacy Framework (Basel: Bank for International Settlements. June).
Berg, Andrew, and Catherine Pattillo, 1999, "Arc Currency Crises Predictable?" IMF Staff Papers. Vol. 46 (June), pp. 107-138.
Cantor. Richard. and Frank Packer, 1996, "Detenninants and Impact of Sovereign Credit Ratings," Economic Policy Review. Federal Reserve Bank of New York, Vol. 2 (October), pp. 37-53.
---, 1997, '·Differences of Opinion and Selection Bias in the Credit Rating Industry,'' Joumal of Banking and Finance, Vol. 2 1 (October). pp. 1395-417.
Cline. William R .• and Kevin J. S. Barnes. 1997. "Spreads and Risks in Emerging Market Lending," Institute of lntemalional Finance Research Paper No. 9711 (Washington: flF. December).
Fitch Ll3CA Sovereign Comment, 1998, "After Asia: Some Lessons of the Crisis" (January 13), pp. l- 1 3.
Heckman. James, 1979, "Sample Selection Bias as a Specification Error;· Econometrica. Vol. 47 (January), pp. 153-6 1 .
lntemalional Monetary Fund, 1998, World Ecmwmic Owlook: A Survey by the Staff of the Jmernatio11al Monetary Fund, World Economic and Financial Surveys (Washington, October), pp. 49-53.
Juttner, Johannes D .• and Justin McCarthy, 1998, '·Modeling a Ratings Crisis'" (unpublished; Sydney, Australia: Macquarie University).
Kaminsky. Graciela, Saul Lizondo, and Carmen M. Reinhart, 1998, "Leading Indicators of Currency Crises," Staff Papers. International Monetary Fund, Vol. 45 (March), pp. 1-48.
Kennedy, Peter, 1985. A Guide ro Econometrics (Cambridge, Massachusetts: MIT Press).
Larrain. Guillenno, Helmut Reisen, and Julia von Maltzan. 1997, "Emerging Market Risk and Sovereign Credit Ratings," OECD Development Centre Technical Paper No. 124 (Paris. April).

©International Monetary Fund. Not for Redistribution
References
Moody's Investor Service, 1998, "Moody's Rating Record in the East Asian Financial Crisis" (May).
---, 1999, Historical Default Rates of Co1porate Bond Issuers, 1920-1998, Special Commelll (January).
"On Watch," The Economist, May 15, 1999, p. 82. Reisen, Helmut, and Julia von Maltzan, 1999. ''Boom and
Bust and Sovereign Ratings," lntem{l(ional Finance, forthcoming.
199
Sachs, Jeffrey, Aaron Tomei!, and Andres Velasco, 1996, "Financial Crisis in Emerging Markets: the Lessons from 1995," Brookings Papers on Economic Acrivity: 1 (Washington: Brookings Institution). pp. 147-2 15.
Standard & Poor's, 1998, Sovereign Credit Ratings: A Primer (December).
---, 1999a, CreditWeek (March 10). --. 1999b. CreditPro (May).
©International Monetary Fund. Not for Redistribution
Annex VI Use of Ratings in the Regulatory Process
The 1990s have witnessed an increased reliance on credit ratings by regulators in both mature and
emerging markets. Indeed, the ratings are used in rather similar fashions in all countries. Perhaps the most extensive use of ratings has been to place investment restrictions on regulated institutions (fables A6.1 and A6.2). Another common regulatory use of ratings relates to establishjng capital requirements for financial institutions.• Various countries impose lower capital ratios for banks and haircuts on securities houses when they hold highly rated securities. A third area of use relates to disclosure and issuance requirements. Initially, disclosure requrrements for issuers of investment-grade securities were reduced. Subsequently, regulators specified that certain types of securities could only be issued if rated, and they often imposed a minimum rating requirement on these issues. Most regulators in emerging markets in Asia and Latin America currently impose a rating requirement on issues of nongovernment bonds and commercial paper. Self-regulatory bodies such as stock exchanges in the United States and Europe also impose rating requirements that issuers have to fulfill in order to be listed.
Most regulators stipulate a list of recognized agencies whose ratings can be used to satisfy ratings requirements. In Japan, for example, the ministry of finance has maintruned a list of designated Japanese and American ratings agencies since I 986.2 In the United States, such agencies are referred to as Nationally Recognized Statistical Rating Organizations (NRSROs), a term introduced by the SEC i n 1 975.3 To resolve the ambiguity created by multiple and, at times, different ratings, most regulations accept the highest or second-highest rating. Most countries that
'The recent proposal on capital adequacy requirements by the Basel Committee on Bank Supervision to use credit rating to determine risk weight is reviewed in Box 4.2, Chapter IV.
llbe list today consists of the following agencies: Japan Rating and Investment Information. Japan Credit Rating Agency, Moody's Investors Service. S&P's, Fitch IBCA. DCR. and Thomson Bank Watch.
3The list of NRSROs in the United States includes the major agencies (Moody's, S&P's, Fitch IDCA. DCR. Thomson Bank Watch) as well a� some smaller ones (McCarthy, Crisanti). Several foreign rating agencies have applications pending with the SEC to acquire NRSRO status.
200
assign a list of recognized agencies accept the ratings of the major international institutions (such as S&P's and Moody's) and those of some local agencies.4
The United States pioneered the regulatory use of ratings some seven decades ago. In J 93 J , the OCC first used the distinction between investment- and non-investment-grade securities when it ruled that, while bonds rated BBB or bener were to be carried at book values by banks, lower-rated bonds had to be written down to market value and 50 percent of the resulting losses were to be charged agrunst capital. In 1936, the OCC and the Federal Reserve Board prohibited banks from holding bonds not rated investment grade by at least two agencies.s The use of the investment- and non-investment-grade distinction to constrain institutional portfolio choices subsequently spread, particularly in the late 1980s and the early 1 990s, to pension funds, savings and loans, and money market funds (see items (6), (7), (8), and ( 13) in Table A6. 1).
The use of ratings soon expanded to areas other than investment restrictions. ln the early 1950s, insurance company regulators were using ratings to help determine the capital to be set aside when certrun types of securities were held. In J 975, the SEC started imposing higher hrurcuts on broker-dealers holding commercial paper not rated in the three highest rating categories and for nonconvertible debt securities that were not investment grade.6 In 1982, the SEC eased disclosure requirements for issuers of investmentgrade securities, hence expanding the use of ratings to yet another new regulatory facet. This type of regulatory use was extended with the adoption of rule 3a-7 by the SEC in 1992, whereby an investment-grade rat-
4The adoption of rating-based regulations was the main force leading to the creation of rating agencies in emerging markets in Latin America and Asia; there are on average three to four such agencies per country in Latin America. In cases where the establishment and operation of a rating agency are subject to a set of rules, as is the case in Argentina, Chile, and Mexico, once such an agency is allowed to be established, its ratings are automatically recognized by regulators.
5This investment-grade distinction was also adopted by the National Association of Insurance Commissioners in 1951.
6 The SEC introduced at that time the concept of an NRSRO by referring to Moody's, S&P's, and Fitch a� agencies whose ratings it recognized for the purpose of this legislation.
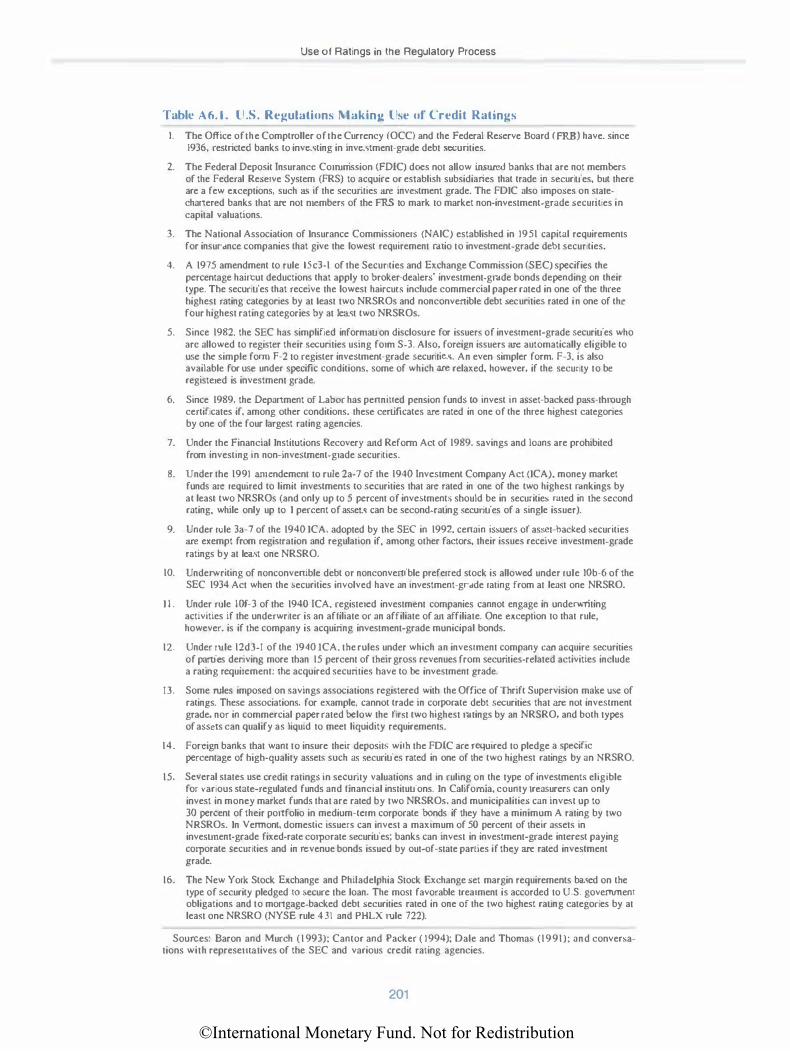
©International Monetary Fund. Not for Redistribution
Use of Ratings in the Regulatory Process
Table A6. 1 . U.S. Regulations Making Use of Credit Ratings
I. The Office of the Comptroller of the Currency (OCC) and the Federal Reserve Board (FRB) have. since 1936, restricted banks to investing in investment-grnde debt securities.
2. The Federal Deposit lnsurancc Commission (FDIC) docs not allow insured banks that are not members of the Federal Reserve System (FRS) to acquire or establish subsidiaries that trade in securities, but there are a few exceptions, such as if the securities are investment grade. The FDIC also imposes on statechartered banks that are not members of the FRS to mark to market non-investment-grade securities in capital valuations.
3. The National Association of Insurance Commissioners (NAlC) established in 1951 capital requirements for insurance companies that give the lowest requirement rc�rio to investment-grade debt securities.
4. A 1975 amendment to rule l5c3-1 of the Securities and Exchange Commission (SEC) specifies the percentage haircut deductions that apply to broker-dealers' investment-grade bonds depending on their type. The securities that receive the lowest haircuL� include commercial paper rated in one of the three highest rating categories by at least two NRSROs and nonconvenible debt securities rated in one of the four highest rating categories by at least two NRSROs.
5. Since 1982. the SEC has simplified information disclosure for issuers of investment-grade securities who arc allowed to register their securities using form S-3. Also, foreign issuers are automatically eligible to use the simple fom1 F-2 to register investment-grade securities. An even simpler form. F-3. is also available for use under specific conditions, some of which are relaxed, however, if the security to be registered is investment grade.
6. Since 1989, the Department of Labor has penni ned pension funds to invest in asset-backed pass-through certificates if. among other conditions, these certificates are rated in one of the three highest categories by one of the four largest rating agencies.
7. Under the Financial Institutions Recovery and Reform Act of 1989, savings and loans are prohibited from investing in non-investment-grade securities.
8. Under the 1991 amcndemcnt to rule 2a-7 of the 1940 Investment Company Act (ICA). money market funds are required to limit investments to securities that are rated in one of the two highest rankings by at least two NRSROs (and only up to 5 percent of investmentS should be in securities nned in the second rating, while only up to I percent of assets can be second-rating securities of a single issuer).
9. Under rule 3a-7 of the 1940 ICA, adopted by the SEC in 1992, cenain issuers of asset-backed securities are exempt from registration and regulation if, among other factors, their issues receive investment-grade ratings by at least one NRSRO.
10. Underwriting of nonconvenible debt or nonconvertible preferred stock is allowed under rule IOb-6 of the SEC 1934 Act when the securities involved have an investment-grade rating from at least one NRSRO.
I I . Under rule IOf-3 of the 1940 !CA. registered investment companies cannot engage in underwriting activities if the underwriter is an affiliate or an affiliate of an affiliate. One exception to that rule, however. is if the company is acquiring investment-grade municipal bonds.
12. Under rule 12d3-1 of the 1940 !CA. the rules under which an investment company can acquire securities of panics deriving more than 15 percent of their gross revenues from securities-related activities include a rating requirement: the acquired securities have to be investment grade.
13. Some rules imposed on savings associations registered with the Office of Thrift Supervision make use of ratings. These associations, for example. cannot trade in corpowte debt securities that are not investment grade. nor in commercial paper rated below the first two highest ratings by an NRSRO, and both types of assets can qualify as liquid to meet liquidity requirements.
14. Foreign banks that want to insure their depositS with the FDIC are required to pledge a specific percentage of high-quality assetS such as securities rated in one of the two highest ratings by an NRSRO.
15. Several states use credit ratings in security valuations and in ruling on the type of investmentS eligible for various state-regulated funds and financial institutions. In California. county treasurers can only invest in money market funds that are rated by two NRSROs, and municipalities can invest up to 30 percent of their portfolio in medium-term corporate bonds if they have a minimum A rating by two NRSROs. In Vermont, domestic issuers can invest a maximum of 50 percent of their assetS in investment-grade fixed-rate corporate securities; banks can invest in investment-grade interest paying corporate securities and in revenue bonds issued by out-of-state parties if they are rated investment grade.
16. The New York Stock Exchange and Philadelphia Stock Exchange set margin requirements ba�ed on the type of security pledged 10 secure the loan. The most favorable treatment is accorded to U.S. government obligations and to mortgage-backed debt securities rated in one of the two highest rating categories by at least one NRSRO (NYSE rule 431 and PHLX rule 722).
Sources: Baron and Murch (1993); Cantor and Packer ( 1994): Dale and Thomas (1991): and conversations with representatives of the SEC and various credit rating agencies.
201
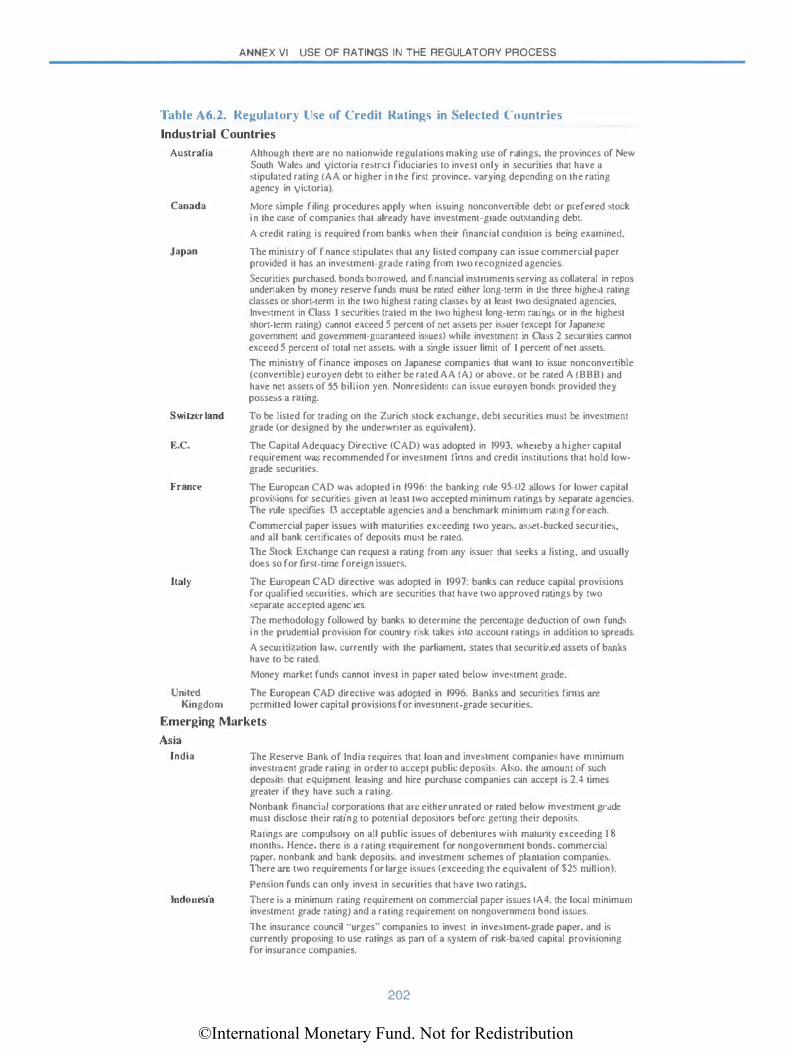
©International Monetary Fund. Not for Redistribution
ANNEX VI USE OF RATINGS IN THE REGULATORY PROCESS
Table A6.2. Regulatory Use of Credit Ibtings in Selected Countries
Industrial Countries
Australia
Canada
Japan
Switzer land
E. C.
France
Italy
Although there are no nationwide regulations making use of ratings, the provinces of New South Wales and Victoria restrict fiduciaries to invest only in securities that have a stipulated rating (AA or higher in the first province, varying depending on the rating agency in Victoria).
More simple filing procedures apply when issuing nonconvenible debt or preferred stock i n the case of companies that already have investment-grade outstanding debt.
A credit rating is required from banks when their financial condition is being examined.
The ministry of finance stipulates that any listed company can issue commercial paper provided it has an investment-grade rating from two recognited agencies.
Securities purchased, bonds borrowed, and financial instrument� serving as collateral in repos undertaken by money reserve funds must be rated either long-term in the three highest rating classes or short-term in the two highest rating classe� by at least two designated agencies. Investment in Class I securities (rated m the two highest long-term ratings or in the highest short-term rating) cannot exceed 5 percent of net assets per issuer (except for Japane.�e government and government-guaranteed i�sues) while investment in Cla:.s 2 securities cannot exceed 5 percent of total net assets. with a single issuer limit of I percent of net assets.
The ministry of finance imposes on Japanese companies that want to issue nonconvertible (convertible) euroyen debt to either be rated AA (A) or above, or be rated A (BBB) and have net assets of 55 billion yen. Nonresident, can issue euroyen bonds provided they possess a rdting.
To be listed for trading on the Zurich stock exchange, debt securities mu�t be investment grade (or designed by the underwriter as equivalent).
The Capital Adequacy Directive (CAD) was adopted in 1993, whereby a higher capital requirement was recommended for investment !inns and credit institutions that hold low-grade securiti�.
The European CAD was adopted i n 1996: the banking nale 95-02 allows for lower capital provi�ions for securities given at least two accepted minimum ratings by separate agencies. The rule specifies 13 acceptable agencies and a benchmark minimum rating for each.
Commercial paper issues with maturitie5 exceeding two yea r,, asset-backed securitie�. and all bank certtlicates of deposits must be rated.
The Stock Exchange can request a rating from any issuer that seeks a listing. and usually does so for first-time foreign issuers.
The European CAD directive was adopted in 1997: banks can reduce capital provisions for qualified securities. which are securities that have two approved ratings by two separate accepted agencie.�.
The methodology followed by banks to determine the percentage deduction of own funds i n the prudential provision for country risk takes into account ratings in addition to spreads.
A securiti?.ation law. currently with the parliament, states that securitized asset� of banks have to be rated.
Money market funds cannot invest in paper rated below investment gmde.
United The European CAD directive was adopted in 1996. Banks and securities firn1s are Kingdom permitted lower capi tal provisions for invesunem-grade securities.
Emerging Markets
Asia India
Indonesia
The Reserve Bank of India requires that loan and investment companies have mtnimum investment grade rating in order to accept public deposits. Also. the amount of such depositS that equipment leasing and hire purchase companies can accept i> 2.4 times greater if they have such a rating.
Nonbank financial corporations that are either unrated or rated below mvestment grade must disclose their rating to potential depositors before getung thetr deposits.
Raungs are compulsory on all public issues of debentures with maturity exceeding 1 8 months. Hence. there is a rating requirement for nongovernment bonds, commercial paper. nonbank and bank deposit�. and investment scheme� of plantation companie•. There are two requirements for large issues (exceeding the equivalent of $25 million).
Pension funds can only invest in securities that have two ratings.
There is a minimum rating requirement on commercial paper issues (A4. the local minimum investment grade rating) and a rating requirement on nongovernment bond issues.
The insurance council "urges" companies to invest in investment-grade paper. and is currently proposing to use ratings as pan of a system of risk-based capital provisioning for insurance companies.
202
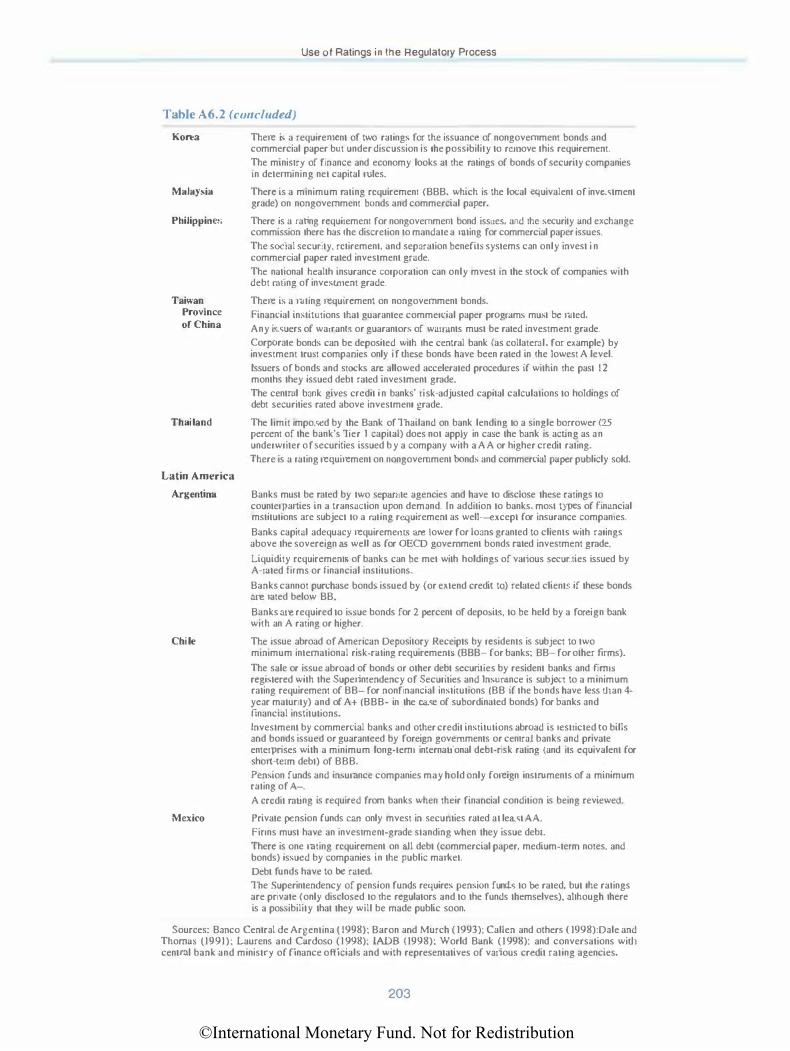
©International Monetary Fund. Not for Redistribution
Use of Ratings in the Regulatory Process
Table A6.2 (concluded) Korea
Malaysia
Philippines
Taiwan Province of China
Thailand
Latin America Argentina
Chile
Mexico
There is a requirement of two ratings for the issuance of nongovernment bonds and commercial paper but under discussion is the possibility to remove this requirement.
The ministry of finance and economy looks at the mtings of bonds of security companies in detern1ining net capital rules.
There is a minimum mting requirement (BBB. which is the local equivalent of investment grade) on nongovernment bonds and commercial paper.
There is a rat·ing requirement for nongovernment bond issues. and the security and exchange commission there has the discretion to mandate a rating for commercial paper issues.
The soctal security. retirement, and separation benefits systems can only invest i n commercial paper rated investment grade.
The national health insurance corporation can only mvest in the stock of companies with debt mung of investment grade.
There is a rating requirement on nongovernment bonds.
Financial in�titutions that guarantee commercial paper progntms mu�t be rated.
Any issuers of warranl� or guarantors of warrants must be rated investment grade.
Corporate bonds can be deposited with the central bank (as collateral. for example) by investment trust companies only i f these bonds have been rated in tbe lowest A level.
Issuers of bonds and stocks are allowed accelerated procedures if within the past 12 months they issued debt rated investment gmde.
The centml bank gives credit i n banks' risk-adjusted capital calculations to holdings of debt securities rated above investment grade.
The limit imposed by the Bank of Thailand on bank lending to a single borrower (25 percent of the bank's Tier I capital) does not apply in case the bank is acting as an underwriter of securities issued by a company with a AA or higher credit rating.
There is a rating requirement on nongovernment bond� and commercial paper publicly sold.
Banks must be mted by two separate agencies and have to disclose these ratings to counterpanies in a transaction upon demand. In addition to banks. most types of financial mstitutions are subject tO a rating requirement as well-except for insurance compantes.
Banks capital adequacy requirements are lower for loans granted to clients with ratings above the sovereign as well as for OECD government bonds rated investment gmde.
Liquidity requirements of banks can be met with holdings of various securities issued by A-rated Finns or financial institutions.
Banks cannot purchase bond� issued by (or extend credit to) related client� if these bonds are rated below BB.
Banks are required to is�ue bonds for 2 percent of depo�it�. to be held by a foreign bank with an A rating or higher.
The issue abroad of American Depository Receipts by residents is subject to two minimum international risk·rating requirement� (BBB- for banks: BB- for other !inns).
The sale or issue abroad of bond� or other debt securities by resident banks and fim1� registered with the Superintendency of Securities and Insurance is subject to a minimum rating requirement of BB- for nonfinancial instirutions (BB if the bonds have less than 4-year maturity) and of A+ (BBB- in the ca�e of subordinated bonds) for banks and financial institutions.
Investment by commercial banks and other credit institutions abroad is restricted to bills and bonds issued or guaranteed by foreign governments or central banks and private enterprises with a minimum long-tem1 international debt-risk rating (and its equivalent for shon-tenn debt) of BBB.
Pension funds and insurance companies may hold only foreign instmments of a minimum rating of A-.
A credit mting is required from banks when their financial condition is being reviewed.
Private pension funds can only mvest in secunties rated at least AA.
Finns must have an investment-gmde standing when they issue debt.
There is one rating requirement on all debt (commercial paper. medium-tenn notes. and bonds) issued by companies in the public market.
Debt funds have to be rated.
The Superintendency of pension funds requires pension funds to be rated. but the ratings are private (only disclosed to the regulators and to the funds themselves). although there is a possibility that they will be made public soon.
Sources: Banco Central de Argentina ( 1998): Baron and Murch ( 1993): Callen and others ( 1998):Dale and Thomas (1991); Laurens and Cardoso (1998); lADS (1998): World Bank (1998): and conversations with centml bank and ministry of finance officials and with representatives of various credit rating agencies.
203
©International Monetary Fund. Not for Redistribution
ANNEX VI USE OF RATINGS IN THE REGULATORY PROCESS
ing for an asset-backed security allowed the issuer to use simplified registration requirements. The use of ratings subsequently expanded to use in regulation on underwriting activities (see items (10) and ( l l ) in Table A6. 1 ) and on restrictions related to the counterparts in security trading (see items ( 1 1 ) and ( 12) in Table A6.1 ).
The expanding use of ratings in regulation was also marked by a shift from the reliance on the investmentgrade rating as a cut-off in rules. Alternative benchmarks became the A rating (adopted by the Department of Labor in restricting pension funds' investments as well as by the SEC in setting haircuts on commercial paper) or the AA rating (adopted by the Federal Deposit Insurance Commission in the conditionality attached to providing insurance to foreign banks' deposits as well as by the Office of Thrift Supervision in regulating the use of commercial paper both in trading and liquidity provisions by savings associations). Moreover. some regulations. instead of introducing a cut-off rating requirement, stipulated a schedule whereby various rating levels would correspond to different restrictions or charges. Hence, the SEC established different quantitative restrictions on the investments of money market funds depending on whether the securities are AAA or AA rated (see item (8) in Table A6.1 ).
Credit ratings were first introduced in Japan in 1974.7 The first Japanese credit rating agency (Japanese Bond Research Institute) was established in 1979, and regulators began using its ratings as eligibility standards for bond issues in the early 1980s. By the 1990s, ratings completely replaced the previous standards for bond issuance based on net asset value and other ftrm data. Most of these extensive rating-based standards were in tum abolished in 1996, however, in a move to further liberalize financial markets. Nevertheless, the ministry of finance still relies on ratings in various ways, mainly in the prudential regulation of money reserve funds. These funds are not allowed to trade in securities rated below A (long-term) or AA (short-term). Issues of euroyen debt by domestic and foreign parties are subject to rating requirements as well (see Table A6.2 on previous page).
In the mid-1980s, the regulatory use of ratings began to spread to countries other than Japan and the United States (see Table A6.2). In Europe, this trend was primarily promoted by the 1993 Capital Adequacy Directive, which specifies capital requirements designed to ensure the safety and soundness of banks and security houses i n the European Community. The 1993 Capital Adequacy Directive stipulates that these institutions should set aside more capital against their holdings of non-investment-grade securities. By 1997,
7[n 1974, Mitsui & Co. was the first Japanese firm to obtain a rating (BBB) from an American agency prior to launching an international bond offering.
204
most EC member countries had amended their legislations to incorporate the 1993 Capital Adequacy Directive in their surveillance of financial companies. The traditional use of ratings in investment prohibitions recurred in Italy, where money market funds are not allowed to invest in low-grade paper. In France, rating requirements were imposed on the issuance of various types of securities, such as commercial paper, assetbacked securities, and bank certificates of deposits. The use of ratings in Europe, while still limited, is rapidly expanding. The recently proposed amendment to the Basel Capital Adequacy requirements, which links risk weights with ratings (see Box 4.2 in Chapter IV), is expected to lead to greater use of ratings in the regulatory process in all countries with internationally active banks.
The regulatory use of ratings in emerging markets, particularly in Latin America, has been fostered by the process of deregulation and liberalization. In some of these markets, capital requirements have been linked to the use of ratings. In Argentina, for example, bank capital requirements are lower for loans granted to clients with ratings above the sovereign, as well as for OECD government bonds rated investment grade. However, ratings are most widely used as benchmarks in restricting portfolio investment and security issuance. Ratingbased investment restrictions are imposed on pension funds in Chile and Mexico, and on the social security and worker compensation systems in the Philippines. Lndia, Indonesia, Korea, Malaysia, the Philippines, Taiwan Province of China, and Thailand figure among the countries that impose rating requirements on security issues. In Latin America, all countries except for Brazil either have already adopted rating-based restrictions on security issuance or are considering their use. Argentina, Chile, and Mexico have implemented rules requiring banks, fmancial companies, and debtors to be rated for a variety of reasons, including specifying conditions under which deposits can be accepted or debt can be issued (see Table A6.2).
References
Banco Central de Argentina, 1998, Main Feawres of llze Regulatory Framework of the Argentine Financial System (Buenos Aires, Argentina: May).
Baron. Neil D., and Leah W. Murch, 1993, "Statutory and Regulatory Uses of Ratings in the United States and Other Jurisdictions," Fitch Investors Service, Inc. (January 14).
Callen. Tim and others, 1998, India: Recent Economic Developmems, IMF Staff Country Report No. 98/120 (Washington, October).
Cantor, Richard, and Frank Packer, 1994, "The Credit Rating Industry," Quarterly Review, Federal Reserve Bank of New York, Vol. 1 9 (Summer/Fall). pp. 1-26.
Dale, Richard S., and Stephen H. Thomas, 1991, "The Regulatory Use of Credit Ratings in International Financial
©International Monetary Fund. Not for Redistribution
References
MarketS," Journal of International Securities Markets (Spring) pp. 9-J 8.
Inter-American Development Bank, 1998, Survey of Financial Systems, available on Lhe internet at hup://www.iadb.org/finanialmarkets/reportltoc.htm (Washington).
205
Laurens, Bernard, and Jaime Cardoso, J 998, "Managing Capital Flows: Lessons from the Experience of Chile," IMF Working Paper 98/168 (Washington: International Monetary Fund, December).
World Bank, 1998, Argenrina Financial Secror Review, Report No. 17864-AR (Washington, September 28).