Download PDF (12.4 MB) - IMF eLibrary - International ...
363
-
Upload
khangminh22 -
Category
Documents
-
view
1 -
download
0
Transcript of Download PDF (12.4 MB) - IMF eLibrary - International ...


I N T E R N A T I O N A L M O N E T A R Y F U N D
EditorMarkus Haacker
©International Monetary Fund. Not for Redistribution

© 2004 International Monetary Fund
Production: IMF Graphics SectionTypesetting: Choon Lee
Figures: Theodore F. Peters, Jr.Cover design: Jorge Salazar
Cover photo: Louise Gubb/Corbis Saba.AIDS orphans Olivia, 15, and her 2-year-old sister Sandra
Cataloging-in-Publication Data
The Macroeconomics of HIV/AIDS / editor, Markus Haacker — [Washington, D.C.] :International Monetary Fund, [2004]
p. cm.
Includes bibliographical references.ISBN 1-58906-360-0
1. AIDS (Disease) — Economic aspects — Developing countries. 2. AIDS(Disease) — Economic aspects — Developing countries — Statistics. I. Haacker,Markus. II. International Monetary Fund.RA643.8.M34 2004
Price: $28.00
Please send orders to:International Monetary Fund, Publication Services
700 19th Street, N.W., Washington D.C. 20431, U.S.A.Telephone: (202) 623-7430 Telefax: (202) 623-7201
E-mail: [email protected]: http://www.imf.org
recycled paper
©International Monetary Fund. Not for Redistribution
Contents
Preface . . . . . . . . . . . . . . . . . . . . . . . . . . . . . . . . . . . . . . . . . . . . . . . . ix
Foreword . . . . . . . . . . . . . . . . . . . . . . . . . . . . . . . . . . . . . . . . . . . . . . xi
Contributors . . . . . . . . . . . . . . . . . . . . . . . . . . . . . . . . . . . . . . . . . . . xvii
1. The Demographic Impact of HIV/AIDS . . . . . . . . . . . . . . . . . . 1Brynn G. Epstein
2. HIV/AIDS: The Impact on the Social Fabric and the Economy 41Markus Haacker
3. Thinking About the Long-Run Economic Costs of AIDS . . . . 96Clive Bell, Shantayanan Devarajan, and Hans Gersbach
4. AIDS and the Accumulation and Utilization of Human Capital in Africa . . . . . . . . . . . . . . . . . . . . . . . . . . . . . . . . . . . . . 134Nancy Birdsall and Amar Hamoudi
5. The Impact of HIV/AIDS on Poverty and Inequality . . . . . . . . 167Robert Greener
6. Welfare Implications of HIV/AIDS . . . . . . . . . . . . . . . . . . . . . . 182Nicholas Crafts and Markus Haacker
7. The Impact of HIV/AIDS on Government Finance and Public Services . . . . . . . . . . . . . . . . . . . . . . . . . . . . . . . . . . . . . . 198Markus Haacker
8. Financial Effects of HIV/AIDS on National Social Protection Schemes . . . . . . . . . . . . . . . . . . . . . . . . . . . . . . . . . . 259Pierre Plamondon, Michael Cichon, and Pascal Annycke
9. An Economic Assessment of Botswana’s National StrategicFramework for HIV/AIDS . . . . . . . . . . . . . . . . . . . . . . . . . . . . . 287Iyabo Masha
iii
©International Monetary Fund. Not for Redistribution
Underline

10. Impact of the HIV/AIDS Epidemic on the Health Sectors of Developing Countries . . . . . . . . . . . . . . . . . . . . . . . . . . . . . . 311Mead Over
Boxes1.1 Methodology for Estimating AIDS Mortality . . . . . . . . . . . . . . . 32.1 Impact of HIV/AIDS on Output and Income per Capita . . . . . 728.1 Impact of AIDS on Defined-Contribution Pension Schemes . . 2789.1 Objectives of the National Strategic Framework . . . . . . . . . . . . 290
Figures1.1 HIV Seroprevalance in Selected Urban Areas in Africa, Asia,
and Latin America and the Caribbean . . . . . . . . . . . . . . . . . . . . 71.2 HIV Seroprevalence in Selected Cities in Uganda . . . . . . . . . . . 101.3 Adult HIV Prevalence by Age and Sex in Three Sub-Saharan
African Countries . . . . . . . . . . . . . . . . . . . . . . . . . . . . . . . . . . . . 161.4 Crude Death Rates With and Without AIDS in Selected
Countries, 2005 . . . . . . . . . . . . . . . . . . . . . . . . . . . . . . . . . . . . . . 181.5 Crude Death Rates With and Without AIDS in Selected
Countries, 2015 . . . . . . . . . . . . . . . . . . . . . . . . . . . . . . . . . . . . . . 191.6 Mortality Rates With and Without AIDS by Age and Sex in
Namibia, 2005 . . . . . . . . . . . . . . . . . . . . . . . . . . . . . . . . . . . . . . . 201.7 Adult Deaths as a Share of All Deaths With and Without
AIDS in Selected Developing Countries, 2005 . . . . . . . . . . . . . . 211.8 Adult Crude Death Rates With and Without AIDS in
Selected Countries, 2005 . . . . . . . . . . . . . . . . . . . . . . . . . . . . . . . 221.9 Adult Crude Death Rates by Sex, With and Without AIDS
in Selected Countries, 2005 . . . . . . . . . . . . . . . . . . . . . . . . . . . . . 241.10 Infant Mortality With and Without AIDS in Selected
Countries, 2005 . . . . . . . . . . . . . . . . . . . . . . . . . . . . . . . . . . . . . . 251.11 Child Mortality With and Without AIDS in Selected
Countries, 2005 . . . . . . . . . . . . . . . . . . . . . . . . . . . . . . . . . . . . . . 261.12 Life Expectancy at Birth With and Without AIDS in
Selected Countries, 2005 . . . . . . . . . . . . . . . . . . . . . . . . . . . . . . . 281.13 Births With and Without AIDS in Botswana . . . . . . . . . . . . . . . 291.14 Change in Population With and Without AIDS in Botswana
and Uganda . . . . . . . . . . . . . . . . . . . . . . . . . . . . . . . . . . . . . . . . . 301.15 Population With and Without AIDS by Age and Sex
in Botswana . . . . . . . . . . . . . . . . . . . . . . . . . . . . . . . . . . . . . . . . . 322.1 Mortality Rates by Age and Sex in Zambia, 2004 . . . . . . . . . . . . 432.2 Estimated Impact of HIV/AIDS on Economic Growth
Rates in Selected Countries . . . . . . . . . . . . . . . . . . . . . . . . . . . . . 71
iv CONTENTS
©International Monetary Fund. Not for Redistribution
Underline
2.3 HIV/AIDS, Individual Risk, and the Economy . . . . . . . . . . . . . 863.1 Human Capital of Succeeding Generations in the Absence
of Premature Adult Mortality . . . . . . . . . . . . . . . . . . . . . . . . . . . 1084.1 Life Expectancy at Birth in Five Sub-Saharan
African Countries . . . . . . . . . . . . . . . . . . . . . . . . . . . . . . . . . . . . 1364.2 Mean Years of Schooling by World Region . . . . . . . . . . . . . . . . . 1374.3 Projected Student-Teacher Ratios in Botswana Under
Alternative Assumptions . . . . . . . . . . . . . . . . . . . . . . . . . . . . . . . 1414.4 New Teachers Required to Be Trained to Maintain a
Constant Student-Teacher Ratio in Botswana . . . . . . . . . . . . . . 1434.5 Educational Attainment Profiles of Selected Birth Cohorts
in Uganda, Zambia, and Zimbabwe . . . . . . . . . . . . . . . . . . . . . . 1464.6 Educational Attainment and Life Expectancy for Selected
Birth Cohorts in Uganda, Zambia, and Zimbabwe . . . . . . . . . . 1484.7 Distribution of Countries Worldwide by Real GDP per
Capita, 2002 . . . . . . . . . . . . . . . . . . . . . . . . . . . . . . . . . . . . . . . . . 1576.1 Impact of HIV/AIDS on Welfare Accounting for Changes
in Life Expectancy . . . . . . . . . . . . . . . . . . . . . . . . . . . . . . . . . . 1866.2 Mortality Rates by Age and Sex in South Africa, 2004 . . . . . . . . 1907.1 Mortality Rates by Age and Sex in Namibia, 2004 . . . . . . . . . . . 2017.2 Mortality Rates by Age and Sex in the Public Sector,
1990–2000 . . . . . . . . . . . . . . . . . . . . . . . . . . . . . . . . . . . . . . . . . . 2028.1 Demoland: Mortality Rates by Sex, With and Without
AIDS, 2010 . . . . . . . . . . . . . . . . . . . . . . . . . . . . . . . . . . . . . . . . . . 2668.2 Demoland: Projected Life Expectancy for Men, Without
and With Impact of AIDS . . . . . . . . . . . . . . . . . . . . . . . . . . . . . . 2678.3 Demoland: Population Pyramids by Sex, Without and
With Impact of AIDS . . . . . . . . . . . . . . . . . . . . . . . . . . . . . . . . . 2688.4 Demoland: Projected Number of Old-Age Pensioners
Without and With Impact of AIDS . . . . . . . . . . . . . . . . . . . . . . 2728.5 Demoland: Projected Number of Disability Pensioners
Without and With Impact of AIDS . . . . . . . . . . . . . . . . . . . . . . 2738.6 Demoland: Projected Number of Widows Without and
With Impact of AIDS . . . . . . . . . . . . . . . . . . . . . . . . . . . . . . . . . 2748.7 Demoland: Projected Number of Orphans Without and
With Impact of AIDS . . . . . . . . . . . . . . . . . . . . . . . . . . . . . . . . . 2759.1 Botswana: HIV/AIDS-Related Deaths and New Infections
Under Alternative Scenarios . . . . . . . . . . . . . . . . . . . . . . . . . . . . 2959.2 Botswana: Population Growth, Crude Death Rate, and
Infant Mortality Under Alternative Scenarios . . . . . . . . . . . . . . 2969.3 Botswana: Labor Force Size . . . . . . . . . . . . . . . . . . . . . . . . . . . . . 302
Contents v
©International Monetary Fund. Not for Redistribution
Underline
10.1 Impact of HIV/AIDS on the Price and Quantity ofHealth Care . . . . . . . . . . . . . . . . . . . . . . . . . . . . . . . . . . . . . . . . 319
10.2 Relationship of Health Expenditure Share of GDP to Public Share of Health Expenditure by World Region and by Income . . . . . . . . . . . . . . . . . . . . . . . . . . . . . . . . . . . . . . 322
10.3 Incidence of Public Health Care Expenditure by IncomeQuintile in Selected Countries . . . . . . . . . . . . . . . . . . . . . . . . . 324
10.4 Unexplained Staff Absenteeism in Primary Schools and Primary Health Facilities in Selected Countries . . . . . . . . . . . . 325
10.5 Coverage of Adults in Need of Antiretroviral Therapy,November 2003 . . . . . . . . . . . . . . . . . . . . . . . . . . . . . . . . . . . . . 327
10.6 Distribution of 3 by 5 Initiative Target Countries by Projected AIDS Expenditure and Population . . . . . . . . . . . . . . 329
10.7 Country Distribution of the Ratio of Projected AIDS Expenditure, 2005, to Total Public Health Expenditure Without AIDS, 2002 . . . . . . . . . . . . . . . . . . . . . . . . . . . . . . . . . 330
10.8 Distribution of 3 by 5 Initiative Target Countries by Cost ofAIDS per Capita and Public Health Spending per Capita . . . . 331
10.9 Distribution of 3 by 5 Initiative Target Countries by Cost of AIDS per Physician and GDP per Capita . . . . . . . . . . . . . . . 332
10.10 The AIDS Transition . . . . . . . . . . . . . . . . . . . . . . . . . . . . . . . . . 33710.11 Possible Alternative Scenarios to a Successful
AIDS Transition . . . . . . . . . . . . . . . . . . . . . . . . . . . . . . . . . . . . . 339
Tables1.1 Key Demographic Indicators of the HIV/AIDS Epidemic by
Developing Region and for Selected Countries, End-2003 . . . 41.2 Projected Total Dependency Ratios for Selected Countries . . . 331.3 Estimated Number of Orphans by Developing Region and
in Selected Countries . . . . . . . . . . . . . . . . . . . . . . . . . . . . . . . . 341.4 Life Expectancy at Age 15 by Sex, With and Without AIDS,
in Selected Countries . . . . . . . . . . . . . . . . . . . . . . . . . . . . . . . . 361.A1 Impact of HIV/AIDS on Demographic Characteristics of
Selected Countries, 2005 and Projected 2015 . . . . . . . . . . . . . . 381.A2 Impact of HIV/AIDS on Adult Mortality Indicators in
Selected Countries, 2005 and Projected 2015 . . . . . . . . . . . . . . 392.1 Impact of HIV/AIDS on Mortality and Life Expectancy
in Selected Countries . . . . . . . . . . . . . . . . . . . . . . . . . . . . . . . . 442.2 Impact of HIV/AIDS on Dependency Ratios and
Orphanhood in Selected Countries . . . . . . . . . . . . . . . . . . . . . 462.3 Costs of HIV/AIDS for Two Companies in Côte d’Ivoire . . . . 52
vi CONTENTS
©International Monetary Fund. Not for Redistribution
Underline

2.4 Compensation and Benefits Provided to Low-Skilled Employeesand Contract Workers at One South African Company . . . . . . 55
2.5 Ranking of Importance of HIV/AIDS-Related Costs to Businesses . . . . . . . . . . . . . . . . . . . . . . . . . . . . . . . . . . . . . . . . 59
2.6 Estimated Funding for HIV/AIDS Spending in Low-IncomeCountries, 2003 . . . . . . . . . . . . . . . . . . . . . . . . . . . . . . . . . . . . . . 63
2.7 Income and Expenditure of Households Affected by Illness in South Africa . . . . . . . . . . . . . . . . . . . . . . . . . . . . . . . . . . . . . . 82
2.8 Human Development Indices for Selected Countries,1950–2001 . . . . . . . . . . . . . . . . . . . . . . . . . . . . . . . . . . . . . . . . . . 88
2.9 Aggregate Welfare Effect of Increased Mortality, 2004 . . . . . . . . 893.1 Adult Mortality by Sex in South Africa and Zimbabwe . . . . . . . 1013.2 Family State Probabilities and Survival Rates in South Africa
and Zimbabwe . . . . . . . . . . . . . . . . . . . . . . . . . . . . . . . . . . . . . . . 1153.3 Three Growth Paths for the South African Economy . . . . . . . . 1164.1 Ordinary-Least-Squares Regressions of Educational
Attainment on Life Expectancy and Other Variables . . . . . . . . . 1494.2 Tobit Regressions of Educational Attainment on Life
Expectancy and Other Variables . . . . . . . . . . . . . . . . . . . . . . . . . 1524.3 Regressions of Primary Enrollment Ratios on Life
Expectancy and Other Variables . . . . . . . . . . . . . . . . . . . . . . . . . 1544.4 Regressions of Changes in Primary Enrollment Ratios
on Changes in Life Expectancy and Other Variables . . . . . . . . . 1555.1 Estimated Impact of HIV/AIDS on Income, Inequality,
and Poverty in Botswana . . . . . . . . . . . . . . . . . . . . . . . . . . . . . . . 1776.1 Impact of HIV/AIDS on Mortality and Life Expectancy in
Selected Countries . . . . . . . . . . . . . . . . . . . . . . . . . . . . . . . . . . . . 1896.2 Estimated Welfare Effect of Increased Mortality in Selected
Countries . . . . . . . . . . . . . . . . . . . . . . . . . . . . . . . . . . . . . . . . . . . 1937.1 Zambia: Estimated Survival Probabilities for 20-Year-Olds,
by Sex, 2004 . . . . . . . . . . . . . . . . . . . . . . . . . . . . . . . . . . . . . . . . . 2037.2 Estimated Costs of Scaling up HIV/AIDS Activities in Low-
and Middle-Income Countries, 2005 . . . . . . . . . . . . . . . . . . . . . 2117.3 Cost of Selected Prevention Measures in Various Countries
in Sub-Saharan Africa . . . . . . . . . . . . . . . . . . . . . . . . . . . . . . . . . 2167.4 Selected Indicators of the Quality of Health Services in
HIV/AIDS-Affected Countries . . . . . . . . . . . . . . . . . . . . . . . . . . 2197.5 Selected Indicators of the Impact of HIV/AIDS on the
Health Sector in Sub-Saharan Africa . . . . . . . . . . . . . . . . . . . . . 2227.6 Economic Costs and Benefits of Highly Active
Antiretroviral Treatment . . . . . . . . . . . . . . . . . . . . . . . . . . . . . . . 226
Contents vii
©International Monetary Fund. Not for Redistribution
Underline

7.7 Indicative Estimates of the Costs of HIV/AIDS-RelatedHealth Services . . . . . . . . . . . . . . . . . . . . . . . . . . . . . . . . . . . . . 229
7.8 Zimbabwe: New Teachers Required to Maintain Given Pupil-Teacher Ratios . . . . . . . . . . . . . . . . . . . . . . . . . . . . . . . . . . 233
7.9 Orphans in Selected Sub-Saharan African Countries . . . . . . . . 2357.10 Financing of Health Services in Selected HIV/AIDS-Affected
Countries, 2001 . . . . . . . . . . . . . . . . . . . . . . . . . . . . . . . . . . . . . . 2437.11 Estimated Funding for HIV/AIDS Spending in Low-Income
Countries by Source, 2003 . . . . . . . . . . . . . . . . . . . . . . . . . . . . . 2478.1 Total Public Social Expenditure by Major Function in
Six World Regions, 1990–93 . . . . . . . . . . . . . . . . . . . . . . . . . . . . 2608.2 Staffing Ratios in National Health Care Systems in Selected
African and Comparator Countries in the Mid-1990s . . . . . . . . 2628.3 Indicators of the Utilization of Care in Selected Sub-Saharan
African Countries in the Mid-1990s . . . . . . . . . . . . . . . . . . . . . . 2638.4 Coverage of Formal Pension Systems in Selected Sub-Saharan
African Countries . . . . . . . . . . . . . . . . . . . . . . . . . . . . . . . . . . . . 2648.5 Pension Arrangements in Sub-Saharan African Countries . . . . 2658.6 Demoland: Assumptions on Labor Force Participation
Rates by Age and Sex . . . . . . . . . . . . . . . . . . . . . . . . . . . . . . . . . . 2708.7 Demoland: Assumptions on Social Security Coverage
Rates by Age and Sex, 2000 . . . . . . . . . . . . . . . . . . . . . . . . . . . . . 2718.8 Demoland: Assumptions on Social Security Coverage
Rates by Sex and Year . . . . . . . . . . . . . . . . . . . . . . . . . . . . . . . . . 2718.9 Demoland: Required Pension Contribution Rates . . . . . . . . . . . 276
8.10 Demoland: Social Budget Without and With Impact ofHIV/AIDS . . . . . . . . . . . . . . . . . . . . . . . . . . . . . . . . . . . . . . . . . . 280
9.1 Botswana: Quantitative Targets and Outcome Indicators ofthe National Strategic Framework for the Population at Risk . . 291
9.2 Botswana: Projected Program Cost for the HIV/AIDS National Strategic Framework . . . . . . . . . . . . . . . . . . . . . . . . . . 292
9.3 Botswana: Contributions to Projected Changes in GDP Under Alternative Scenarios . . . . . . . . . . . . . . . . . . . . . . . . . . . . 303
9.4 Botswana: Comparison of Changes in Expenditure Categories in 2010 Projected by BIDPA (2000) and NACA (2003) . . . . . . . 305
9.A1 Botswana: Population by Age and Sex . . . . . . . . . . . . . . . . . . . . 30910.1 Hospital Beds Occupied by HIV-Positive Patients in Selected
Cities, Circa 1996 . . . . . . . . . . . . . . . . . . . . . . . . . . . . . . . . . . . . . 32010.2 High-Priority Countries for the WHO 3 by 5 Initiative . . . . . . 32810.3 Projected AIDS Spending in Countries Targeted by the
WHO 3 by 5 Initiative . . . . . . . . . . . . . . . . . . . . . . . . . . . . . . . . . 333
viii CONTENTS
©International Monetary Fund. Not for Redistribution
Underline

Preface
Iam pleased to introduce this volume on The Macroeconomics ofHIV/AIDS, to be published by the IMF on World AIDS Day (December
1) 2004. This is the first IMF book to focus specifically on a public healthissue. However, the HIV/AIDS epidemic is a matter of such serious con-cern—adversely affecting the development prospects of many of ourmember countries—that it calls for unprecedented actions. The effects ofthe epidemic touch on virtually all aspects of a country’s social, economic,demographic, and political development, and thus HIV/AIDS must be amajor issue of concern to the IMF. The IMF’s experience in these countriesincreasingly reflects this reality. The studies collected in this volume arethus highly relevant to the work of the IMF.
Within its mandate, and in close cooperation with other developmentpartners, the IMF is assisting member governments’ efforts to fight the epi-demic and cope with its economic and development consequences. TheIMF has endorsed the call by the United Nations Secretary-General for aglobal campaign in the fight against HIV/AIDS, and is collaborating withthe UN community to expand country-level AIDS prevention and treat-ment programs. In December 2003, Horst Köhler, my predecessor as theIMF’s Managing Director, noted that “the IMF must do everything possi-ble within the context of its mandate to assist the agencies that are in thefront lines of the fight against HIV/AIDS.”1
In terms of the IMF’s operational work, this means that IMF countryteams have tried to take account of the epidemic’s adverse effects in theireconomic policy advice and, where applicable, in program design. Moregenerally, concessional lending by the IMF and the World Bank, supportedby Poverty Reduction Strategy Papers, and debt relief under the HeavilyIndebted Poor Countries (HIPC) Initiative, have financed poverty-reducing expenditures in many countries, frequently including measuresto fight HIV/AIDS and mitigate its impact. Moreover, the IMF encourages
ix
1IMF Press Release No. 03/208.
©International Monetary Fund. Not for Redistribution
donors to provide grants that finance enhanced service delivery as well ascommit to a predictable flow of grant resources. This is particularly vitalfor AIDS treatment and prevention programs, because it would be highlydisruptive if these programs could not make sustained financial commit-ments to health workers and patients alike.
There can be no doubt that the impact of HIV/AIDS, and the associatedresponse of the international community, raises issues that go muchbeyond the core areas of experience of the IMF, or for that matter of anyindividual international organization. Close cooperation among the rele-vant UN agencies as well as other international organizations combatingHIV/AIDS will be critical for an effective response to the epidemic. Thisvolume exemplifies the value of such cooperation, representing a collabo-ration of staff members from several international organizations, govern-ment agencies, universities, and independent research institutes, includingthe Center for Global Development, the International Labor Organization,the International Monetary Fund, the Joint United Nations Programme onHIV/AIDS (UNAIDS), the London School of Economics, the U.S. Bureauof the Census, and the World Bank.
The publication of this volume on World AIDS Day 2004 marks animportant contribution by the international community in its effort toaddress the consequences of this epidemic. However, as the epidemic con-tinues, in the words of the Secretary-General, its “lethal march,” there canbe no reason for complacency. The fight against HIV/AIDS and its direconsequences requires our continuing best efforts to reduce the numbersof new infections, provide treatment to people living with HIV/AIDS, andassist affected individuals and countries facing severe epidemics to mitigateits adverse social and economic impact.
Rodrigo de RatoManaging DirectorInternational Monetary Fund
x PREFACE
©International Monetary Fund. Not for Redistribution

Foreword
HIV/AIDS, through its demographic effects and its social and economicconsequences, has evolved into a major threat to economic development inmany countries around the world. In sub-Saharan Africa, where most ofthe worst-affected countries are found, the Joint United Nations Programon HIV/AIDS (UNAIDS, 2004) estimates that 7.5 percent of the popula-tion aged 15–49 were infected as of the end of 2003, with HIV prevalencerates for this age group ranging from about 1 percent (in The Gambia andSenegal) to almost 40 percent (in Botswana and Swaziland). Indeed,HIV/AIDS has become one of the leading causes of death in the region.According to the World Health Organization’s World Health Report 2004,the HIV/AIDS epidemic now accounts for about 20 percent of all deaths insub-Saharan Africa and more than half of the deaths in some countries.Even in countries where infection rates are lower, such as Cambodia andHaiti, HIV/AIDS accounts for about one-half of the deaths of individualsaged 15–49. Low national infection rates often mask serious regional epi-demics, as is the case in countries such as China and India. (India has thelargest number of people living with HIV outside South Africa.)
The economic and social consequences of the increased mortality andmorbidity associated with HIV/AIDS are serious and manifold. The fol-lowing are only a few of them. Average life expectancy has declined bymore than 20 years in some of the worst-affected countries. In addition tothe trauma of losing family members, households affected by HIV/AIDSmay experience a precipitous decline in living standards because of loss ofincome and the high cost of caring for the sick. Given that HIV/AIDS typ-ically strikes people of childbearing and childrearing age, the number oforphans is rising. In some countries, 20 percent of the population aged 17and under have lost one or both parents, the majority to HIV/AIDS (seeUNAIDS, UNICEF, and U.S. Agency for International Development,2004). Increasing production costs, as skilled workers succumb to AIDS-related illnesses, erode competitiveness and—together with a deterioratingeconomic outlook—may deter investment. Economic growth slows formany reasons, most directly because the working-age population expands
xi
©International Monetary Fund. Not for Redistribution

more slowly or contracts, but there is considerable uncertainty regardingthe size of this effect, especially in the longer run. The most visible fiscalconsequences of HIV/AIDS include increased spending on prevention,care, and treatment, but the fiscal implications go far beyond this. As eco-nomic growth declines, the domestic tax base weakens and domestic rev-enues fall. At the same time, HIV/AIDS erodes public services as mortalityrates for civil servants rise, and it drives up government spending even inareas not directly related to combating HIV/AIDS. For example, personnelcosts rise as staff lost to AIDS must be replaced and new staff trained, as dosocial expenditures on survivors’ pensions and other benefits for individu-als and households affected by HIV/AIDS.
As the above sketch of the situation makes clear, policymakers and ana-lysts simply cannot address the economic issues facing severely affectedcountries without taking into account the numerous social, economic, andfiscal effects of the epidemic. This, of course, is not a new insight; indeed,the impact of, and the response to, the HIV/AIDS epidemic have becomecentral issues in economic development. Evidence of this is the fact that thecontributors to The Macroeconomics of HIV/AIDS represent not only inter-national organizations that are key players in the fight against HIV/AIDS(such as UNAIDS and the World Bank) but also other organizations thathave added HIV/AIDS to their work agendas, primarily because of its socialand economic repercussions (such as the Center for Global Development,the International Labor Organization, and the IMF). The book grew out ofthe authors’ experience in providing economic analysis and policy advicein countries severely affected by the epidemic.
By bringing together studies by authors with diverse backgrounds andfrom different organizations and institutions, this book aims to provide acomprehensive resource on the social, economic, and fiscal effects ofHIV/AIDS. It seeks to strengthen efforts by public policymakers to formu-late and implement strategies to fight the epidemic and mitigate thoseeffects, and to do so along two lines. First, a good understanding of the eco-nomic consequences of the epidemic can help in formulating policies andallocating scarce resources. Second, well-crafted programs designed to fightthe epidemic and mitigate its impact can offset or reduce some of the seri-ous social and economic consequences of HIV/AIDS. Thus a successfulstrategy will have a positive impact on the economic and fiscal outlook,which, in turn, means that more funds can be mobilized to support longer-term health strategies. In this sense, HIV/AIDS strategies are a form ofeconomic policy. The book highlights the epidemic’s fiscal consequences—direct (HIV/AIDS-related expenditures) as well as indirect (the impact ofHIV/AIDS on the domestic tax base and some expenditure categories
xii FOREWORD
©International Monetary Fund. Not for Redistribution

affected by the epidemic)—and links the response to HIV/AIDS to amacroeconomic framework. It also formulates a framework for assessingthe various impacts of HIV/AIDS on developing economies.
The Macroeconomics of HIV/AIDS is intended to fill in the gap in theliterature between studies of specific sectors—especially public health andeducation—and bird’s-eye assessments of the broader social and economicconsequences of HIV/AIDS. In contrast with most other macroeconomicstudies on the subject, The Macroeconomics of HIV/AIDS emphasizes howHIV/AIDS affects society and the economy through its microeconomicimpacts and also how the social and economic impact, combined with theincrease in mortality rates, affects the welfare of individuals and house-holds. The book has thus been written for a broad readership, which couldinclude, for example, officials in a finance ministry assessing the impact ofHIV/AIDS on the fiscal balance and outlook of their country. It couldinclude representatives of an international financial organization and theircounterparts in an AIDS-ravaged developing country, meeting to discussthe economic outlook or negotiate a policy program. The book is also likelyto be of interest to members of the media and other policy observers incountries affected by HIV/AIDS, as well as to the representatives of non-governmental organizations advocating an expanded response toHIV/AIDS in their home countries or worldwide. Last but not least, aspolicies to fight the epidemic attain increasing macroeconomic and fiscalrelevance, this book’s readership could include those officials in interna-tional organizations, donor agencies, implementing agencies, and countrygovernments who formulate and carry out such policies.
The studies that make up the book explore several separate strands ofinquiry, which can be grouped under three general headings: the demo-graphic impact, the macroeconomic consequences, and the effect on gov-ernment finance and public services. Because most of the effects ofHIV/AIDS arise directly from increased morbidity and mortality, the bookbegins, in Chapter 1, by focusing on the demographic impact, providing abasis for the analysis in the chapters that follow.
Chapters 2 through 6 discuss the macroeconomic effects of HIV/AIDS,addressing three topics in particular. The first is the relationship betweenthe microeconomic effects of HIV/AIDS—for example, at the householdor company level—and those at the macroeconomic level. This theme istaken up in Chapter 2 in a general fashion, while Chapter 3 builds itsmacroeconomic analysis around a household-level model. The secondtopic is the impact of HIV/AIDS on economic growth. Chapter 2 intro-duces this theme by describing the most common approaches used inaccounting for growth in the context of an HIV/AIDS epidemic, while
Foreword xiii
©International Monetary Fund. Not for Redistribution

Chapters 3 and 4 focus on the impact of HIV/AIDS on education and theaccumulation of human capital. The third topic is the effect of HIV/AIDSon welfare. Because the impact of HIV/AIDS is spread unevenly acrossindividuals and households, standard estimates of aggregate macroeco-nomic changes contain very little information on welfare effects. Chapter 5therefore discusses the impact of HIV/AIDS on poverty and inequality, andChapter 6 estimates the broader welfare effects of HIV/AIDS stemmingfrom increased mortality rates.
Chapters 7 through 10 deal with the impact of HIV/AIDS on the publicsector. First, they provide a framework for assessing the effect of HIV/AIDSon the public sector itself. Second, although most issues in the formulationof a broad HIV/AIDS strategy—particularly the choice between differentinterventions—are beyond the scope of this book, these chapters seek tosupport this work by improving the understanding of the macroeconomicand fiscal context in which such strategies will be implemented, providingpolicymakers and donors with tools for assessing and evaluatingHIV/AIDS strategies from a broader development perspective. In this con-text, Chapter 7 assesses the impacts of HIV/AIDS on public services (forexample, through the erosion of capacities) and on government finance.One area where HIV/AIDS can have a substantial impact is social secu-rity—pension funds in particular—and this is taken up in Chapter 8.Chapter 9 describes and assesses Botswana’s National Strategic Frameworkon HIV/AIDS, illustrating the potential of a comprehensive nationalHIV/AIDS strategy to reverse the macroeconomic damage associated withthe epidemic. Finally, Chapter 10 focuses on the impact of HIV/AIDS onthe health sector and the challenges facing countries that set out to sub-stantially expand access to HIV/AIDS treatment.
The book represents the efforts of many individuals from differentbackgrounds. The authors are drawn from a wide range of institutions,specifically (in alphabetical order), the Center for Global Development, theInternational Labor Organization, the International Monetary Fund, theJoint United Nations Programme on HIV/AIDS (UNAIDS), the LondonSchool of Economics, the University of California Los Angeles, the Univer-sity of Heidelberg, and the World Bank. The book received material sup-port in particular from the African, External Relations, and Fiscal AffairsDepartments at the International Monetary Fund, and the AIDS CampaignTeam for Africa at the World Bank. The views expressed in this book arethose of the individual authors and do not necessarily reflect the opinionor policy of any of the organizations with which they are affiliated.
In addition to the authors, individuals who at some stage have contributedto or supported this effort include Tony Barnett, Abdoulaye Bio-Tchané,
xiv FOREWORD
©International Monetary Fund. Not for Redistribution

Hugh Bredenkamp, Benedicte Christensen, Phil Compernolle, PatrickConnelly, Keith Hansen, Peter Heller, Alison Hickey, Robin Kibuka, Mau-reen Lewis, Bill McGreevey, Jeanette Morrison, Bella Nestorova, NanaPoku, Marina Primorac, Sydney Rosen, Doris Ross, John Starrels, SusanStout, Michael Treadway, Matthias Vocke, and Alan Whiteside. On behalf ofthe authors, I would also like to thank Maizie Archie, Cassandra Banks, JereBehrman, Stefano M. Bertozzi, Ramona Bruhns, Jinkie Corbin, WilliamEasterly, Augustin Fosu, Timothy Fowler, Juan Pablo Gutierrez, Vicki Hart-Spriggs, Keith Jefferis, Benjamin Johns, Peter Johnson, Dilip Parajuli,Happy Siphambe, Rhaiza Vélez Soto, Dagmar Voelker, Staci Warden,Debrework Zewdie, the staff of the Population Studies Branch and theEurasia Branch of the International Programs Center at the U.S. CensusBureau, and the Global HIV/AIDS Program of the World Bank.
The authors hope that their work will prove useful to all who deal withor are interested in the social, economic, and fiscal effects of HIV/AIDS,but we are also well aware that the mission—even in its analytical dimen-sion, to say nothing of its execution—is as yet by no means accomplished.A lack of available data often means that the economic analyst, rather thanproviding compelling answers, can only formulate questions and hypothe-ses, supported by assorted observations pulled together from differentcountries. For various reasons, this constraint applies in particular to theimpact of HIV/AIDS over time, to the macroeconomic consequences, andto the fiscal effects of HIV/AIDS, as they go far beyond specific HIV/AIDS-related expenditures. Thus, where this book cannot provide full answers, itis hoped that it may at least stimulate further research that can help us bet-ter understand the economic and fiscal consequences of the epidemic andthat can complement and support efforts to fight this scourge.
Markus HaackerMbabane, SwazilandNovember 1, 2004
Foreword xv
©International Monetary Fund. Not for Redistribution

This page intentionally left blank
©International Monetary Fund. Not for Redistribution

Contributors
Pascal Annycke, International Labor Organization
Clive Bell, University of Heidelberg
Nancy Birdsall, Center for Global Development
Michael Cichon, International Labor Organization
Nicholas Crafts, London School of Economics
Shantayanan Devarajan, World Bank
Brynn Epstein, International Programs Center at the U.S. Bureau of the Census
Hans Gersbach, University of Heidelberg
Robert Greener, Joint United Nations Programme on HIV/AIDS
Markus Haacker, International Monetary Fund
Amar Hamoudi, University of California, Los Angeles
Iyabo Masha, International Monetary Fund
Mead Over, World Bank
Pierre Plamondon, International Labor Organization
xvii
©International Monetary Fund. Not for Redistribution
This page intentionally left blank
©International Monetary Fund. Not for Redistribution

1
The Demographic Impact of HIV/AIDS
BRYNN G. EPSTEIN
It is now 20 years since the first cases of acquired immune deficiency syn-drome (AIDS) were discovered in sub-Saharan Africa. At the beginning
of the third decade of the global pandemic, AIDS has reversed gains in lifeexpectancy and improvements in child mortality in many countries; mor-tality among the population aged 15–49 has increased manyfold, even incountries with modest epidemics.1 AIDS is the leading cause of mortalityamong adults (WHO, 2004). According to estimates by the Joint UnitedNations Programme on AIDS (UNAIDS), as of the end of 2003, over 20million people had died of AIDS. Some 38 million people are estimated tobe living with the human immunodeficiency virus (HIV), the virus thatcauses AIDS, the overwhelming majority of whom—over 90 percent—arein the developing world.
In the absence of drug therapy, survival with HIV/AIDS is estimated tobe around 10 years. Because of this lag between infection and death, thedeaths of those who were infected with HIV in the early 1990s are ampli-fying mortality rates today. In sub-Saharan Africa the increase in mortal-
1
This report is released to inform interested parties of research and to encourage discussion.The views expressed on statistical issues are those of the author and not necessarily those ofthe U.S. Census Bureau. The use of data not generated by the U.S. Census Bureau precludesperforming the same statistical reviews on those data that the U.S. Census Bureau does on itsown data.
1World Health Organization (WHO, 2004). For Thailand, a country with an estimatedadult HIV prevalence rate of “only” 1.5 percent (Joint United Nations Programme onHIV/AIDS, 2004a), the WHO estimates that the “crude mortality rate for those aged 15–49years almost doubled from 2.8 to 5.4 per thousand between 1987 and 1996” (WHO, 2004,p. 6).
©International Monetary Fund. Not for Redistribution

ity due to AIDS is already a significant demographic event, effectivelynegating earlier progress made in such key human development indicatorsas infant mortality and life expectancy. The spread of HIV/AIDS is alsoaffecting the attainment of almost all of the Millennium DevelopmentGoals adopted by the United Nations in 2000. In the absence of broadaccess to treatment, HIV/AIDS will result in radical changes in the size andstructure of the population in many of the world’s poorest countries.
HIV serosurveillance studies (studies based on blood tests, mainly fromantenatal clinics) compiled by the U.S. Census Bureau in the HIV/AIDSSurveillance Data Base since 1987 provide some picture of the state of theepidemics in Africa, Asia, Latin America, the Caribbean, and EasternEurope. The Census Bureau conducts further analysis of the demographiceffects through estimates of AIDS mortality for countries in the developingworld where the epidemics have reached a significant level. These estimatesare incorporated into population projections for 56 countries to give a pic-ture of the effect of AIDS mortality on population characteristics (see Box1.1 for a description of this methodology). This chapter outlines the stateof the various epidemics in those regions most seriously affected. It alsoassesses the current and future impact of HIV/AIDS on several demo-graphic indicators for 15 countries in Africa, Asia, Latin America, and theCaribbean that are representative of the diverse global epidemics.
In addition, this chapter elaborates on certain demographic events spe-cific to the HIV/AIDS pandemic. The mortality and morbidity associatedwith AIDS make it unlike most other types of sickness and disease.Whereas most diseases prey largely on the very young, the old, or the weak,the way in which HIV is contracted and spread makes young adults, andespecially young women, the most vulnerable. As a result, in countries withhigh HIV prevalence, the socioeconomic consequences of high mortalityamong adults can be far-reaching, devastating households, families, andcommunities and eroding formal and informal mechanisms of socialsupport.
History and State of the Pandemic
The global HIV/AIDS pandemic consists of many separate epidemics,each with its own distinct origin in terms of geography and populationgroups affected, and each involving different types and frequencies of riskybehaviors and practices. Sub-Saharan Africa is the region of the world mostseverely affected by AIDS. Despite being home to just over 10 percent of theworld’s population, it has two-thirds of the world’s HIV-positive people
2 BRYNN G. EPSTEIN
©International Monetary Fund. Not for Redistribution

The Demographic Impact of HIV/AIDS 3
Box 1.1. Methodology for Estimating AIDS Mortality
The U.S. Census Bureau compiles HIV prevalence information for develop-ing countries in its HIV/AIDS Surveillance Data Base. This database containsover 75,000 records from various publications and surveillance reports. HIVprevalence points taken from this database are the basis for projecting HIVprevalence, estimating AIDS mortality, and estimating and projecting theimpact of AIDS on the number of orphaned children.
To obtain estimates of AIDS-related mortality, a new application devel-oped at the Census Bureau incorporates estimates of HIV prevalence fromthe Estimation and Projection Package (EPP), an epidemiologically realisticmodel developed and used by the World Health Organization (WHO) andthe Joint United Nations Programme on AIDS (UNAIDS). EPP produces anational “best fit” curve of adult HIV prevalence using sentinel surveillancedata pertaining to pregnant women. We use country-specific adult HIVprevalence estimates from EPP for years from the beginning of the epidemicto 2010.
The Census Bureau application applies assumptions from the WHO/UNAIDS Epidemiological Reference Group about the age and sex dis-tribution of HIV incidence, sex ratios of new infections, the mother-to-child transmission rate, and disease progression. The model allows forcompeting risk of death and projects HIV incidence implied by the EPPestimates of HIV prevalence through 2010, assuming a decline in HIV inci-dence of 50 percent by 2050. The model can include the impact of antiretro-viral therapy, but the current projections assume that no one will receivetreatment.
This methodology works in conjunction with the Census Bureau’s cohortcomponent Rural-Urban Projection (RUP) program, which is used to preparepopulation estimates and projections. RUP is used to produce the with-AIDSand without-AIDS scenarios.
A with-AIDS series is generated, showing what has happened and whatis projected to happen in a country as a result of AIDS mortality and itsdemographic consequences. Next, a hypothetical without-AIDS scenarioshows what the Census Bureau’s modeling work indicates would havehappened if the country had not been affected by the HIV/AIDS epi-demic. This modeling takes into account not only lower death rates butalso associated changes to a country’s age and sex profile and, indirectly,the combined effects of lower mortality and changing population composi-tion on demographic indicators. The without-AIDS scenario currentlyassumes the same fertility rates (based on observed data) as the with-AIDSseries and thus underestimates what fertility might have been in the absenceof AIDS. In the with-AIDS series the number of births decreases as a resultof mortality-induced reductions in the number of women of reproductiveage.
©International Monetary Fund. Not for Redistribution

(UNAIDS, 2004a). About 7.5 percent of adults (defined here as persons15–49 years of age) in the region were HIV-positive at the end of 2003,compared with a global prevalence rate of 1.1 percent and a prevalence rateof 0.4 percent for the world excluding sub-Saharan Africa. (Table 1.1 sum-marizes the latest available estimates from UNAIDS of the numbers of peo-ple living with HIV/AIDS and of AIDS-related deaths in selected regionsand for specific countries.) In six countries in southern Africa—Botswana,Lesotho, Namibia, South Africa, Swaziland, and Zimbabwe—it is estimatedthat at least one in five adults is living with HIV. Another four countries—
4 BRYNN G. EPSTEIN
Table 1.1. Key Demographic Indicators of the HIV/AIDS Epidemic by DevelopingRegion and for Selected Countries, End-2003(Thousands of persons except where stated otherwise)
People Living with AIDS DeathsHIV/AIDS HIV Prevalence Among Adults______________________
Adults1 and Among Adults and ChildrenRegion and Country children Adults (percent) in 2003
Global total 37,800 35,700 1.1 2,900
Sub-Saharan Africa 25,000 23,100 7.5 2,200Botswana 350 330 37.3 33Côte d’Ivoire 570 530 7.0 47Ethiopia 1,500 1,400 4.4 120Kenya 1,200 1,100 6.7 150Malawi 900 810 14.2 84Mozambique 1,300 1,200 12.2 110Namibia 210 200 21.3 16Nigeria 3,600 3,300 5.4 310Rwanda 250 230 5.1 22South Africa 5,300 5,100 21.5 370Tanzania 1,600 1,500 8.8 160Uganda 530 450 4.1 78Zambia 920 830 16.5 89Zimbabwe 1,800 1,600 24.6 170
Asia2 6,500 6,300 0.6 460Cambodia 170 170 2.6 15Thailand 570 560 1.5 58Vietnam 220 200 0.4 9
Latin America 1,600 1,600 0.6 84Brazil 660 650 0.7 15Guyana 11 11 2.5 1
Caribbean 430 410 2.3 35Haiti 280 260 5.6 24
Eastern Europe 1,300 1,300 0.6 49
Source: UNAIDS (2004a).1Adults are defined as persons aged 15–49.2Excluding the former Soviet Union.
©International Monetary Fund. Not for Redistribution
the Central African Republic, Malawi, Mozambique, and Zambia—haveestimated adult prevalence rates above 10 percent, and another eight coun-tries have rates exceeding 5 percent.2
In Asia, by contrast, estimated adult HIV prevalence exceeded 1 percentin only three countries: Cambodia, Myanmar, and Thailand. Nevertheless,the enormous size of the Asian population means that the Asia-Pacificregion could account for a very substantial share of new infections in thecoming years.3 In India and China, the world’s two most populous coun-tries, prevalence rates are relatively low at present (between 0.4 and 1.3 per-cent in India, and about 0.1 percent in China). These country averages,however, mask concentrated epidemics in some local areas or amonggroups engaging in high-risk behaviors such as injecting drugs and sexwork, and the experience from other countries has shown that the epi-demic can spread from these groups to the general population in just a fewyears.
In Latin America and the Caribbean, epidemics that seem mostlydriven by heterosexual transmission are found in The Bahamas, Guyana,Haiti, and Honduras, all of which are among the countries with thehighest adult HIV prevalence in the region. But the nature of the epidemicvaries in this region: in some countries, such as Argentina and Uruguay,HIV/AIDS is concentrated among injecting drug users, whereas in others,such as Mexico and Peru, it is concentrated among men who have sexwith men.
HIV/AIDS began to spread quickly in Eastern Europe and CentralAsia in the mid-1990s, fueled largely by injecting drug use. The patternhere is mainly one of locally concentrated epidemics; reported HIV pre-valence rates are low among the general population, and therefore previ-ous rounds of AIDS mortality estimates prepared by the Census Bureaudo not include countries in this region. However, this may soon change,as there is evidence that the epidemic is growing through heterosexualtransmission.
In all of these regions HIV-1 is the primary type of virus. This type isdriving the greater part of the demographic impact. Another type, HIV-2,is found predominantly in West Africa. HIV-2 differs from HIV-1 in thatthe progression from HIV to AIDS and from AIDS to death is much slower.
The Demographic Impact of HIV/AIDS 5
2All estimates of adult HIV prevalence rates are from UNAIDS (2004a). In the literature,adult prevalence rates generally refer to the 15–49 age range; this chapter follows thatconvention.
3Schuettler (2003) suggests that the region could account for 40 percent of new globalinfections by 2010 if prevention efforts are not stepped up.
©International Monetary Fund. Not for Redistribution
Therefore, for the purposes of assessing the demographic impact of AIDSmortality, the Census Bureau utilizes HIV-1 prevalence data for analysis inselected countries.
In taking a closer look at epidemics within regions and within coun-tries, a good place to start is the percentage of pregnant women attendingantenatal clinics (ANCs) who test HIV-positive. Several studies thathave compared HIV prevalence among pregnant women with that amongadult men and women from other, community-based studies have shownthat antenatal clinic seroprevalence gives a reasonable estimate of HIVprevalence in the general adult population.4 Also, for many countriesantenatal clinic data are the primary source of information on preva-lence trends among the population and form the basis of estimates ofthe demographic effects of HIV/AIDS.5 Figure 1.1 shows trends in HIVprevalence for selected urban areas in sub-Saharan Africa, Asia, LatinAmerica, and the Caribbean during the past two decades. Variations intrends are apparent, and the rest of this section discusses each region ingreater detail.
Sub-Saharan Africa
The Census Bureau first started to incorporate estimates of AIDS mor-tality in its population projections in 1994. At that point a total of 14countries had 5 percent or higher prevalence among their low-risk urbanpopulations (the criterion then applied by the Census Bureau for explic-itly including AIDS mortality in demographic estimates and projections).6
Thirteen of these countries are located in sub-Saharan Africa, whereHIV/AIDS is largely spread through heterosexual sex. In many cities ofsub-Saharan Africa, HIV prevalence among sex workers approached 50percent from the mid-1980s to the early 1990s, and in several, seropreva-lence among sex workers ranged from 50 percent to over 80 percent (Wayand Stanecki, 1994). During the 1990s the epidemic quickly expandedthroughout the population in many countries in this region, and the cur-
6 BRYNN G. EPSTEIN
4HIV prevalence among pregnant women tends to underestimate prevalence among allwomen but to overestimate it among men.
5Antenatal clinic data and HIV prevalence levels from other population groups are com-piled in the U.S. Census Bureau’s HIV/AIDS Surveillance Data Base, 2004 release.
6The 14 countries are Burkina Faso, Burundi, the Central African Republic, Congo, Côted’Ivoire, Haiti, Kenya, Malawi, Rwanda, Tanzania, Uganda, the Democratic Republic ofCongo (formerly Zaïre), Zambia, and Zimbabwe. Because previous modeling work hadalready been undertaken in Brazil and Thailand, those countries also had estimated AIDSmortality incorporated into their population projections.
©International Monetary Fund. Not for Redistribution

rent round of population estimates and projections incorporates esti-mated AIDS mortality into the projections for 37 sub-Saharan Africancountries.
Many of the countries where HIV epidemics first erupted are located inEast Africa, along the Great Rift Valley from Ethiopia to central Mozam-bique. From 1985 to 1992 there was a consistent and rapid increase in sero-prevalence among pregnant women in the capital cities of Malawi, Uganda,and Zambia. In just five years these rates more than doubled, and in Malawi
The Demographic Impact of HIV/AIDS 7
0
10
20
30
40
50
0
4
8
12
16
Francistown, Botswana
Kampala, Uganda
Cite Soleil, Haiti
Georgetown, Guyana
Sao Paulo, Brazil
Phnom Penh,Cambodia
San Pedro Sula,Honduras
Nairobi, Kenya
See inset below
Inset
KwaZulu/Natal, South Africa
Bangkok,Thailand
Rangoon,Burma
Dakar,Senegal
1985 87 89 91 93 95 97 99 2001
1985 87 89 91 93 95 97 99 2001
Figure 1.1. HIV Seroprevalence in Selected Urban Areas in Africa, Asia, and Latin America and the Caribbean(Percent)
Source: U.S. Census Bureau, International Programs Center, HIV/AIDS Surveillance Data Base (2004).
©International Monetary Fund. Not for Redistribution

seroprevalence rose from under 5 percent to over 20 percent. In contrast,during the same period, moderate increases were documented in the Cen-tral African Republic and Kenya, with rates reaching 15 percent by 1992(Way and Stanecki, 1994).
Many areas of Zimbabwe reported a rapid increase in HIV prevalenceamong pregnant women in the early 1990s. Prevalence there has sincestabilized, albeit at a high rate. In 2001, in the capital city of Harare,30 percent of pregnant women tested were HIV-positive. Zimbabwe alsohas high prevalence rates among such high-risk groups as sex workersand patients with other sexually transmitted infections. Both urban andrural areas appear equally affected. In the Democratic Republic of Congo,where the first cases of AIDS were discovered, prevalence rates amongpregnant women attending antenatal clinics rose sharply in the early 1990sbut have since declined and stabilized at a lower rate. Prevalence ratesfor pregnant women in Kinshasa remained below 5 percent during thelast decade.
The epidemic also began in the early 1980s in Kenya and Tanzania.Prevalence tends to be higher in urban areas in Tanzania. In Kenya, how-ever, by 1997 some rural and urban areas had prevalence rates higher thanin the capital city of Nairobi. Recent data show rates stabilizing or decreas-ing in some urban and rural sites. In the capital cities of these two coun-tries, prevalence rates among pregnant women remained around 15percent in the early 1990s, and median antenatal clinic prevalence in majorurban areas has stayed between 10 and 15 percent for the past 10 years.Although the apparent stabilizing of prevalence rates may seem encourag-ing, the reality is that HIV prevalence is a function of AIDS mortality andnew infections. Because mortality among HIV-positive people is high, aprevalence rate that stabilizes at a high level can mean that a large numberof new infections are replacing a roughly equal number who are dying ofHIV/AIDS or related causes.
HIV prevalence among pregnant women is generally lower in westernAfrica. By 1994 only Burkina Faso and Côte d’Ivoire met the Census Bureaucriteria for including estimated AIDS mortality in their population projec-tions. Rates among pregnant women in several sentinel sites in Burkina Fasoremained stable at or below 10 percent through the 1990s, and theyremained low, at around 5 percent both in and outside major urban areas,in 2002. Côte d’Ivoire reported a rapid increase in seroprevalence in themid-1980s but a slower increase throughout the 1990s, and current ratesseem to have stabilized at around 10 percent in some urban sentinel sites.
By 1996, Cameroon and Nigeria in the west, Ethiopia in the east, andBotswana, Lesotho, and South Africa, south of the Great Rift Valley, had
8 BRYNN G. EPSTEIN
©International Monetary Fund. Not for Redistribution

seen prevalence among their low-risk urban populations rise to 5 percent.And just two years later, as the epidemics continued to spread throughsouthern Africa, Namibia and Swaziland met the criteria for including esti-mated AIDS mortality in population projections.
In Ethiopia estimated adult HIV prevalence remained around 4 percentfrom 2001 to 2003. Prevalence among pregnant women attending antena-tal clinics rose sharply in the early 1990s, but levels have since declined andstabilized at a lower rate. Median antenatal clinic prevalence in majorurban areas in Ethiopia declined from 20 percent in 1995 to 15 percent in2000.
Seven countries clustered in the Southern Cone of Africa have extraor-dinarily high estimated adult prevalence rates. Although the HIV/AIDSepidemics in this area started later, they quickly exploded. As seen in Figure1.1, seroprevalence among pregnant women in Francistown, Botswana,increased from 7 percent in 1991 to 44 percent in 2000. Both rural andurban areas seem to be affected to the same extent in this region. The dra-matic rise in HIV prevalence among pregnant women in the mid-1990s isechoed in the neighboring countries of Namibia, where seroprevalence inthis group had reached nearly 30 percent by 2002, and South Africa, whereit had reached 25 percent by 2001. In Swaziland and Lesotho, two smallcountries surrounded by South Africa, seroprevalence among pregnantwomen reached nearly 40 percent in 2002 and 30 percent in 2003,respectively.
The most recent estimates, completed in 2002, include more countries incoastal West Africa and in the Sahel region, a stretch of countries lyingbetween the Sahara to the north and the rain forest to the south, from theAtlantic Ocean in the west to the Horn of Africa in the east. Although veryfew data are available for these countries, UNAIDS estimates that adultprevalence levels are 2.7 percent in Eritrea and 4.8 percent in Chad. Asalready discussed, variations in the estimated starting dates of a generalizedepidemic are a misleading indicator of its strength and severity. Many of thecountries with older epidemics are now showing modest declines or stabi-lizing prevalence rates. On the other hand, epidemics have escalated in someof the worst-affected countries, with prevalence rising from less than 5 per-cent to more than 30 percent in only about 10 years. In general, there aremany reasons for the variation in seroprevalence across countries. Povertyand political instability have major consequences for the spread of HIV. Alarge number of people migrating to specific areas to find jobs, or mass pop-ulation movements such as those that followed the genocide in Rwanda andwar in Angola and Mozambique, can be expected to result in an increase inprevalence rates in semiurban areas that have large numbers of migrants.
The Demographic Impact of HIV/AIDS 9
©International Monetary Fund. Not for Redistribution

Two countries in sub-Saharan Africa, Uganda and Senegal, remainnotable success stories. In Uganda, after a dramatic rise in the early 1990s,prevalence among pregnant women began to decline at most sentinel sur-veillance sites. In Kampala, the capital, HIV prevalence declined from itspeak of 30 percent in 1993 to 11 percent in 2000 (Figure 1.1). Figure 1.2shows that, in other urban areas throughout Uganda, HIV prevalence ratesfrom sentinel surveillance reporting indicate a decline or leveling off ofinfection levels. In Senegal, AIDS control programs are credited withkeeping HIV prevalence at very low levels, currently estimated at less than1 percent.
Asia
HIV prevalence rates in Asia are lower, and the epidemics there startedlater, first spreading during the 1990s, mostly among injecting drug users.Today HIV transmission is occurring more through sexual contact,although it is still concentrated among sex workers and injecting drugusers. High prevalence is also recorded among men who have sex withmen. But concentrated epidemics do not confine HIV to particular riskgroups. HIV spreads from high-risk behavior such as sharing dirty needlesand unprotected sex; those who engage in risky behavior may be a part ofmore than one risk group. For example, many sex workers often use
10 BRYNN G. EPSTEIN
0
5
10
15
20
25
30
35
HoimaKilembeJinjaMatanyMbararaTororo
1989 91 93 95 97 99 2001
Figure 1.2. HIV Seroprevalence in Selected Cities in Uganda(Percent)
Source: U.S. Census Bureau, International Programs Center, HIV/AIDS Surveillance Data Base (2004).
©International Monetary Fund. Not for Redistribution

injecting drugs, and many men who have unprotected sex with men alsohave sex with women. These populations serve as bridging populationsand aid in the spread of HIV to the general population (MAP Network,2001).
Thailand was one of the first countries in which the Census Bureauundertook modeling work, and estimated AIDS mortality was included forMyanmar and Cambodia by the 1998 round of Census Bureau populationprojections. Currently, a generalized HIV epidemic is found in just thesethree countries.
Cambodia has the most serious epidemic in the region. Sentinel surveil-lance among pregnant women in Phnom Penh show a rise in prevalencefrom no evidence of infection in 1992 to 5 percent by 1999. In 2002 HIVprevalence among pregnant women was 3.5 percent. Rates are similar forrural and urban areas: sentinel surveillance sites in 18 provinces reportedprevalence rates ranging from 2 to 6 percent for 2002.
Located between Myanmar and Cambodia, Thailand has one of the old-est epidemics in the region but is considered a success for its ability to cur-tail the epidemic and keep HIV prevalence low. Throughout the latter halfof the 1990s, declining or stable prevalence rates were evident among sexworkers in four regions of the country (north, northeast, central, andsouth), ranging from 5 to 15 percent in 1990 and from 5 to 9 percent in2002. In Bangkok rates declined from 10 percent in 1990 to 3 percent in2002. Rates for injecting drug users have mostly remained around 40 per-cent in all four regions and in Bangkok since the early 1990s.
In Myanmar HIV seroprevalence rose dramatically in the 1990s amongsex workers in Yangon and Mandalay, from 2 percent and 5 percent,respectively, in 1992 to 26 percent and 50 percent by 2000. In 1992 sero-prevalence levels for injecting drug users was already at 50 percent orhigher in both these cities and in the smaller cities of Myitkyina andTaunggyi. By 2000 the highest rates were in Mandalay (58 percent) and intwo cities near the border with China, Myitkyina (90 percent) and Lashio(76 percent).
Throughout the 1990s in Myanmar, HIV prevalence among pregnantwomen remained stable at a low rate, and in 2000 most sentinel surveil-lance sites reported HIV prevalence below 3 percent in this group. How-ever, the centrally located city of Mandalay as well as several sentinel siteswithin towns on or near the Chinese and Thai borders—Muse, Tachileik,Dawei, Myitkyina, and Lashio—had higher prevalence rates, ranging from3.5 to over 5 percent.
Also, although such countries as India and China have low aggregateprevalence rates, these rates mask high prevalence rates in some popula-
The Demographic Impact of HIV/AIDS 11
©International Monetary Fund. Not for Redistribution

tions at risk; HIV prevalence rates are also high in some regions in Chinawhere people were selling blood plasma to supplement their incomes(UNAIDS, 2004a). Given the very large populations of these two countries,a further increase in their prevalence rates could mean that most HIV-positive people in the world will be living in these countries. According toUNAIDS (2004a), India may already have the world’s largest populationliving with HIV/AIDS,7 and the number of people infected in China couldreach 10 million by 2010.
The epidemic in India varies in scope from state to state and is concen-trated among commercial sex workers and injecting drug users. HIV preva-lence increased dramatically among sex workers in Mumbai, whereprevalence was 1 percent in 1987, peaked at 64 percent in 1999, and thendeclined slightly to 52 percent in 2001. However, recent data from 2001show 31 serosurveillance sites throughout the country reporting HIVprevalence above 1 percent among pregnant women. At four sentinel sitesin Mumbai in 2001, HIV prevalence among pregnant women ranged from2 percent to nearly 8 percent. Eight other sentinel sites in Maharashtra statereported HIV prevalence above 1 percent in pregnant women. Seven sitesin Andhra Pradesh state and five sites in Tamil Nadu state also reportedHIV prevalence above 1 percent.
There is recent evidence of rapidly growing epidemics in at-risk popu-lation groups in China, Indonesia, and Vietnam. In selected areas ofChina’s Yunnan province, which borders Myanmar, Thailand, Lao PDR,and Vietnam, HIV prevalence rates among these groups ranged from20 percent in Luxi to 70 percent in Kaiyuan in 1997. HIV prevalence rosefrom no evidence of infection in 1995 to 21 percent and 17 percent,respectively, for Guangdong province (where Hong Kong SAR is located)and Guangxi province in only five years. Yining, a site in Xinjiang provincethat borders Kazakhstan, had prevalence rates among the high-risk popu-lation of 80 percent or more from 1998 to 2000. Another group with rela-tively high HIV prevalence rates in this region is men who have sex withmen. For example, although Indonesia records low seroprevalence amongsex workers (below 1 percent), seroprevalence among transgendered per-sons, or waria, rose from no evidence of infection in 1992 to 6 percent in1997.
12 BRYNN G. EPSTEIN
7UNAIDS (2004a) provides a point estimate of 5.3 million people living with HIV/AIDSin South Africa, with a low estimate of 4.5 million and a high estimate of 6.2 million. Reflect-ing the lack of data, UNAIDS (2004a) does not provide a point estimate for India, but onlya low and a high estimate of 2.2 million and 7.3 million, respectively.
©International Monetary Fund. Not for Redistribution

Recent data suggest that Vietnam has an epidemic that is moving fromconcentrated to general. Although still at low levels, seroprevalence amongsex workers steadily increased in three cities of Vietnam during the 1990s.In 1999, 6 percent of sex workers were infected in Hanoi, 5 percent in HoChi Minh City, and 3 percent in Haiphong, a major port and industrial cityin the north of the country. Sentinel surveillance in 2002 found that morethan 20 percent of injecting drug users in most provinces were HIV-positive.
Although no signs have yet emerged of a generalized epidemic in manyof the countries in Asia, the conditions are ripe for a rapid spread of HIV.Serious concentrated epidemics are found in injecting drug users and sexworkers in various parts of some countries. Injecting drug use is on the risein this region (MAP Network, 2001); the spread of this behavior, coupledwith low condom use rates and sharing of dirty needles, means that theseepidemics could very easily spread throughout a country.
Latin America and the Caribbean
In Latin America and the Caribbean, epidemics occurred initiallyamong men who have sex with men, but by the early 1990s there were largeincreases among injecting drug users and sex workers. Initially, Brazil andHaiti were the only countries to have estimated AIDS mortality explicitlyincluded in the Census Bureau’s population projections. Estimated AIDSmortality was included for Guyana in 1996, Honduras in 1998, and TheBahamas, Barbados, Belize, the Dominican Republic, Guatemala, Panama,Trinidad and Tobago, and Suriname by 2002.
UNAIDS (2004a) estimates that adult prevalence among the countriesof this region ranged from less than 1 percent to nearly 6 percent. Injectingdrug use and sex between men are driving the epidemic in most SouthAmerican countries, whereas in Central America and in the Caribbeanboth sex between men and heterosexual sex are spreading HIV (UNAIDS,2004a).
Haiti, with an estimated adult prevalence of 5.6 percent, has the mostserious epidemic in this region. Seroprevalence among pregnant women inthe capital, Port-au-Prince, was 10 percent in 1996 but thereafter declinedto 4 percent by 1999–2000. Sentinel surveillance sites from various cities inHaiti report similar declines in rates by 1999–2000, ranging from 2 percentin Fond des Nègres to 5 percent in Jérémie.
In Rio de Janeiro, Brazil, HIV prevalence among men who have sex withmen declined during the mid-1990s. In 1994, 25 percent of men in thisgroup were HIV-positive; by 1996, only 9 percent tested positive for the
The Demographic Impact of HIV/AIDS 13
©International Monetary Fund. Not for Redistribution

virus. Seroprevalence among sex workers in various cities of Brazil duringthe 1990s ranged from 2 percent in 1993–94 in Fortaleza, a coastal city inCeara state in the northeast, to 18 percent in 1998 in São Paulo, Brazil’slargest city. Higher prevalences are found among injecting drug users,although there was wide variation in infection levels in various Braziliancities during the mid-1990s. Twenty-eight percent of injecting drug userstested in Rio de Janeiro in 1995–96 were HIV-positive, and 71 percent ofusers in Itajai, a coastal city in Santa Catarina state in southern Brazil,tested positive in 1995–96. In a study of injecting drug users seen at theblood transfusion service at Eva Peron Teaching Hospital in the town ofGranadero Baigorria, Argentina, HIV prevalence was 29 percent amongmale drug users and 17 percent among female users in 1995.
In 1990, 1 percent of pregnant women in São Paulo tested positive forHIV. As more sentinel sites began reporting, the median HIV prevalencerate among antenatal clinic attendees varied around 1 percent of womentested. In 1995 nearly 3 percent of pregnant women tested in Porto Alegreand Rio de Janeiro were positive for HIV, and in 1996, 5 percent of preg-nant women in the port city of Santos tested positive for HIV. In 1996 fed-eral law in Brazil mandated the free provision of antiretroviral therapythrough the public health system, thus drastically reducing mortality fromAIDS and extending life with HIV.
In Honduras HIV seroprevalence among sex workers in San Pedro Sulafluctuated between 12 and 21 percent during the 1990s. In 2001–02 HIVprevalence was 13 percent. Prevalence among pregnant women reached5 percent in 1998. In Tegucigalpa, the capital, seroprevalence amongpregnant women did not rise above 1 percent during the 1990s, yet thepercentage of sex workers testing positive rose steadily to 13 percent in1997; it has since declined to 8 percent. In the Dominican Republic HIVprevalence rates among sex workers in the capital, Santo Domingo,declined from a peak of 9 percent in 1993 to 5 percent in 1999. La Romanareports a similar decline, but rates from Bani fluctuated between 6 and 11percent during the same period. Sentinel surveillance among pregnantwomen did not rise above 2 percent throughout the 1990s in SantoDomingo, and by 1999 rates had declined or stabilized below 2 percent forother urban areas.
Eastern Europe and Central Asia
Very few data on HIV/AIDS prevalence are available from EasternEurope and Central Asia. UNAIDS (2004a) estimates that the total numberof people living with HIV in the region is 1.3 million. In 2003, 360,000 peo-
14 BRYNN G. EPSTEIN
©International Monetary Fund. Not for Redistribution

ple in the region became newly infected, and AIDS claimed 49,000 lives.The epidemics in this region are considered to be concentrated amonginjecting drug users, although at the same time there is evidence of a grow-ing heterosexual epidemic. As of the most recent round of estimates, theCensus Bureau will include estimated AIDS mortality in the populationprojections for the Russian Federation.
The worst-affected countries are the Russian Federation, Ukraine, andthe Baltic states, but HIV continues to spread in Belarus, Moldova, Kaza-khstan, the Kyrgyz Republic, and Uzbekistan. Injecting drug use and unsafesex are the predominant modes of transmission in this region, especiallyamong young people. According to the European Centre for the Epidemi-ological Monitoring of AIDS (2003), 41 percent of new infections in 2002were among injecting drug users, and 10 percent were through heterosex-ual transmission, although the number of new infections attributed to het-erosexual transmission continues to rise. In the countries first affected, theproportion of injecting drug users who were HIV-positive peaked in1996–98, whereas cases from heterosexual contact continued to rise,accounting for 28 percent of all cases in Moldova, 29 percent in Ukraine,and 35 percent in Belarus in 2002. New infections peaked in Estonia,Latvia, and the Russian Federation in 2001, also marked by declines ininjecting drug users and increases among heterosexuals.
There are more than 600,000 injecting drug users in Ukraine and up to200,000 in Kazakhstan. Injecting drug use is on the rise—in Estonia andLatvia it is estimated that up to 1 percent of the adult population injectdrugs, and in the Kyrgyz Republic it could be as many as 2 percent. The fiveCentral Asian republics straddle major drug trafficking routes into theRussian Federation and Europe. On the whole, more than 80 percent ofpeople who are HIV-positive in this region are not yet 30 years of age(UNAIDS, 2003).
In the Russian Federation, condom use is very low among teenagers, sexworkers, and injecting drug users, making the sexual spread of HIV a moreprominent feature, since most injecting drug users are young and sexuallyactive. Four studies have revealed high prevalence levels among female sexworkers who were also injecting drug users (European Centre for the Epi-demiological Monitoring of AIDS, 2003).
Differences by Sex
As the global HIV pandemic is increasingly driven by heterosexual sex,women are becoming infected at faster rates. Women, and especially youngwomen, have multiple vulnerabilities to HIV transmission: biological, cul-
The Demographic Impact of HIV/AIDS 15
©International Monetary Fund. Not for Redistribution

tural, social, and economic. The nature of sexual intercourse alone makesit easier for women to contract HIV, and male-to-female transmission isestimated to be twice as likely as female-to-male transmission. In addition,the immaturity of the reproductive tract in young women makes themmore susceptible. Economic dependency on men, a cultural preference forhigh fertility, lack of power to negotiate safe sex practices, and lack of accessto information and health care all combine to make it difficult and unde-sirable for women to be proactive in safe sex negotiation.
UNAIDS estimates that about 57 percent of adults living with HIV insub-Saharan Africa are women and that new infections among women areincreasing, especially among adolescents. Peak HIV prevalence amongwomen occurs at younger ages and generally at a higher rate than amongmen, as Figure 1.3 shows for three countries in the region. This may be evi-dence of younger women having sexual relations with older men. Manystudies from this region show that younger women from poor communi-
16 BRYNN G. EPSTEIN
0
5
10
15
20
25
30
0
5
10
15
20
25
30
35
0
3
6
9
12
15
15–19 15–1925–29 25–2935–39Age Age
Age
35–3945–49
15–19 25–29 35–39
45–49 55+
FemalesFemales
Females
Males
Males
Males
Figure 1.3. Adult HIV Prevalence by Age and Sex in Three Sub-Saharan African Countries(Percent)
Sources: Zambia Central Statistical Office and Central Board of Health (2002); Shisana, Simbayi, and Phil (2002) for South Africa; and Urassa and others (2002) for Tanzania.
Zambia,2001–02
South Africa, 2002
Tanzania, 1998–2000
©International Monetary Fund. Not for Redistribution

ties often resort to selling sex in an effort to support their family or paytheir school fees.
The data in Figure 1.3 are from population-based serosurveillance. Datafrom this type of survey provide a clearer picture of the spread of the epi-demic in the population at large. The Demographic and Health Surveys(DHS) recently incorporated an HIV surveillance module into several oftheir population-based surveys, and data from Zambia for 2001–02 showthat prevalence among adult women is peaking at younger ages and at ahigher rate than among adult men: prevalence peaks at 29 percent among30- to 35-year-old women and at 22 percent among men 5 to 10 yearsolder. Higher HIV prevalence among adult women is reported from bothrural and urban areas: in Zambia, for example, rates of 12 percent and9 percent, respectively, are reported for women and men from rural areas,and of 26 percent and 19 percent from urban areas (Zambia Central Sta-tistical Office and Central Board of Health, 2002). Data from the NelsonMandela/HSRC Study of HIV/AIDS conducted in South Africa show thatHIV prevalence for 2002 peaked at 32 percent among 25- to 29-year-oldwomen, versus 24 percent among 30- to 35-year-old men (Shisana, Sim-bayi, and Phil, 2002). In a rural region in Tanzania, prevalence during1998–2000 was higher among women in each of the five-year age groupsfrom 15 to 34 years (Urassa and others, 2002).
In other regions of the world, men still make up the majority of theHIV-positive population. In Asia, however, recent data show that sero-prevalence among women is rising rapidly. In the Mekong region womenare becoming infected at faster rates than men. And in Papua New Guineainfections in women 15 to 29 years old already outnumber those in men ofthe same age (UNAIDS, 2004b). In the Russian Federation as well, womenaccount for an increasing share of newly diagnosed infections: 33 percentin 2002, up from 24 percent the year before (European Centre for the Epi-demiological Monitoring of AIDS, 2003). One consequence of a rise inprevalence among women is a corresponding rise in the spread of HIVthrough mother-to-child transmission.
Mortality
The impact of AIDS mortality on demographic characteristics isdetailed in Appendix Tables 1.A1 and 1.A2. Through the proceduresdescribed in Box 1.1, the Census Bureau provides estimates and projectionsfor the analysis of how a population is affected by increased AIDS mortal-ity. The adult crude death rate, the infant mortality rate, the under-5 mor-
The Demographic Impact of HIV/AIDS 17
©International Monetary Fund. Not for Redistribution

tality rate, life expectancy, and the population growth rate in the presenceof AIDS are compared with those in a without-AIDS scenario for the 15focus countries of the President’s Emergency Plan for AIDS Relief (forwhich the most current demographic estimates and projections are avail-able at this time): Botswana, Côte d’Ivoire, Ethiopia, Guyana, Haiti, Kenya,Mozambique, Namibia, Nigeria, Rwanda, South Africa, Tanzania, Uganda,Vietnam, and Zambia. Indicators are estimated for 2005 and 2015 inAppendix Tables 1.A1 and 1.A2.
Crude Death Rates
The most direct impact of AIDS is an increase in the number of deathsin the affected populations. As seen in Figure 1.4, because of high HIVprevalence in sub-Saharan Africa, estimated crude death rates—the num-ber of people dying per 1,000 of the population—for 2005 is already con-siderably higher for most countries because of AIDS. In Botswana, Kenya,Namibia, South Africa, and Haiti, crude death rates would be expected tobe in the single digits without AIDS but are in double digits with AIDS. InSouth Africa, for example, the crude death rate in 2005 is estimated to be21 per 1,000 with AIDS versus 7 per 1,000 without AIDS; in Botswana the
18 BRYNN G. EPSTEIN
BotswanaNamibia
South AfricaKenya
UgandaZambia
Côte d’IvoireTanzaniaEthiopiaRwandaNigeria
Mozambique
GuyanaHaiti
Vietnam
Without AIDS
With AIDS
0 5 10 15 20 25 30 35 40
Figure 1.4. Crude Death Rates With and Without AIDS in Selected Countries, 2005 (Deaths per 1,000 population)
Source: U.S. Census Bureau, International Programs Center, HIV/AIDS Surveillance Data Base (2004) and unpublished tables.
©International Monetary Fund. Not for Redistribution

crude death rate is estimated to be 29 per 1,000 with AIDS versus 3.5 per1,000 without AIDS (Figure 1.4).
With the HIV epidemic still growing in many countries, and in light ofthe long time lag between infection and death, HIV-related mortality isprojected to continue to increase in many countries over the coming years.This means that the adverse impact of HIV/AIDS on society and the econ-omy is likely to worsen.
By 2015 estimated crude death rates may stabilize or decline for somecountries, although they will still be higher because of AIDS than theywould be otherwise. Other countries, especially those with younger epi-demics, are likely to continue to experience a rise in crude death rates by2015 even though mortality due to non-AIDS causes is projected todecline. Rates are estimated to increase by 2, 3, 5, or even 10 times as aresult of AIDS in Botswana, Mozambique, Namibia, South Africa, andZambia.
Estimated HIV prevalence is declining in Kenya and Uganda, and as aresult the increase in crude death rates due to AIDS mortality will be con-siderably reduced in the next decade. Crude death rates are projected todecline from 15 per 1,000 to 8.5 per 1,000 for Kenya and 13 per 1,000 to 9per 1,000 for Uganda by 2015 (Figure 1.5).
The Demographic Impact of HIV/AIDS 19
BotswanaNamibia
South AfricaKenya
UgandaZambia
TanzaniaCôte d’Ivoire
EthiopiaRwandaNigeria
Mozambique
GuyanaHaiti
Vietnam
Without AIDS
With AIDS
Figure 1.5. Crude Death Rates With and Without AIDS in Selected Countries, 2015(Deaths per 1,000 population)
Source: U.S. Census Bureau, International Programs Center, HIV/AIDS Surveillance Data Base (2004) and unpublished tables.
0 5 10 15 20 25 30 35 40
©International Monetary Fund. Not for Redistribution
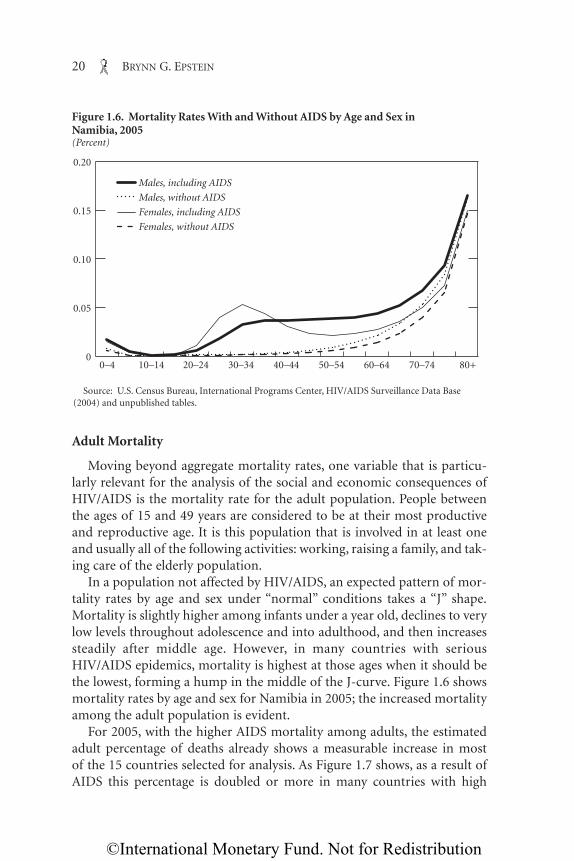
Adult Mortality
Moving beyond aggregate mortality rates, one variable that is particu-larly relevant for the analysis of the social and economic consequences ofHIV/AIDS is the mortality rate for the adult population. People betweenthe ages of 15 and 49 years are considered to be at their most productiveand reproductive age. It is this population that is involved in at least oneand usually all of the following activities: working, raising a family, and tak-ing care of the elderly population.
In a population not affected by HIV/AIDS, an expected pattern of mor-tality rates by age and sex under “normal” conditions takes a “J” shape.Mortality is slightly higher among infants under a year old, declines to verylow levels throughout adolescence and into adulthood, and then increasessteadily after middle age. However, in many countries with seriousHIV/AIDS epidemics, mortality is highest at those ages when it should bethe lowest, forming a hump in the middle of the J-curve. Figure 1.6 showsmortality rates by age and sex for Namibia in 2005; the increased mortalityamong the adult population is evident.
For 2005, with the higher AIDS mortality among adults, the estimatedadult percentage of deaths already shows a measurable increase in mostof the 15 countries selected for analysis. As Figure 1.7 shows, as a result ofAIDS this percentage is doubled or more in many countries with high
20 BRYNN G. EPSTEIN
0
0.05
0.10
0.15
0.20
Males, including AIDS
Males, without AIDS
Females, including AIDS
Females, without AIDS
0–4 10–14 20–24 30–34 40–44 50–54 60–64 70–74 80+
Figure 1.6. Mortality Rates With and Without AIDS by Age and Sex in Namibia, 2005(Percent)
Source: U.S. Census Bureau, International Programs Center, HIV/AIDS Surveillance Data Base (2004) and unpublished tables.
©International Monetary Fund. Not for Redistribution

estimated adult HIV prevalence. Adults are estimated to account for overhalf of all deaths in Botswana, Namibia, and South Africa and over 40 per-cent in Kenya, Mozambique, and Zambia. In countries such as Côted’Ivoire, Ethiopia, Nigeria, Rwanda, Tanzania, Uganda, Haiti, and Guyana,with moderate or low HIV prevalence, the estimated adult percentage ofdeaths is still increased from one-fifth or one-fourth to a third of alldeaths.
In 2005, in the 15 selected countries, AIDS is estimated to have increaseddeaths among adults by 1.5 million. Even countries with low estimatedprevalence, where mortality due to other causes may be lower, are esti-mated to experience increases in deaths among the adult population. Adramatic rise will be seen among those countries with estimated adult HIVprevalence rates over 30 percent, such as Botswana, where AIDS is esti-mated to increase crude death rates among adults by over 30 per 1,000(Figure 1.8).
Countries reporting stabilizations or declines in HIV seroprevalenceare still likely to experience amplified adult crude death rates due toinfections from 10 years previous. Zambia has an estimated adult crudedeath rate of 19 deaths per 1,000 adults in 2005, a tripling due to AIDS
The Demographic Impact of HIV/AIDS 21
NigeriaNamibiaUganda
BotswanaSouth Africa
ZambiaEthiopiaTanzaniaRwanda
MozambiqueCôte d’Ivoire
Kenya
HaitiGuyana
Vietnam
Without AIDS
With AIDS
Figure 1.7. Adult Deaths as a Share of All Deaths With and Without AIDS in Selected Countries, 20051
(Percent)
Source: U.S. Census Bureau, International Programs Center, HIV/AIDS Surveillance Data Base (2004) and unpublished tables.
1Adults are defined as persons aged 15–49.
0 20 40 60 80
©International Monetary Fund. Not for Redistribution

mortality. Rwanda and Kenya have estimated crude death rates of10.5 and 10 per 1,000 adults, an increase of 6 per 1,000. Even with thedecline in prevalence levels in Uganda, death rates there are still inflatedby 4 per 1,000 adults as a result of AIDS, to a rate of 9 deaths per 1,000adults.
In Haiti, with an estimated adult HIV prevalence of 6 percent, the high-est in Latin America and the Caribbean, the adult crude death rate is esti-mated at 9 per 1,000 adults, compared with 4 deaths per 1,000 withoutAIDS mortality. In Guyana, with an estimated adult HIV prevalencearound 3 percent, estimated adult crude death rates are slightly higher withAIDS mortality. With an estimated HIV prevalence below 1 percent, theadult crude death rate for Vietnam is estimated to be only slightly increasedbecause of AIDS. If Vietnam is able to keep its epidemic under control,rates will remain stable for the next decade.
In the absence of AIDS, by 2015 the percentage of all deaths projected tooccur in adults would likely remain stable; however, with AIDS mortalityan increase in the adult percentage of deaths is projected for many of thecountries selected. In Côte d’Ivoire, Mozambique, South Africa, Tanzania,Zambia, and Haiti, 40 to 50 percent of all deaths are projected to occur in
22 BRYNN G. EPSTEIN
BotswanaNamibia
South Africa
Kenya
Uganda
ZambiaCôte d’Ivoire
Tanzania
EthiopiaRwanda
Nigeria
Mozambique
HaitiGuyana
Vietnam
Without AIDS
With AIDS
Figure 1.8. Adult Crude Death Rates With and Without AIDS in Selected Countries, 2005 (Deaths per 1,000 adults)
Source: U.S. Census Bureau, International Programs Center, HIV/AIDS Surveillance Data Base (2004) and unpublished tables.
0 5 10 15 20 25 30 35 40
©International Monetary Fund. Not for Redistribution

the adult population. In Botswana and Namibia, over 60 percent of alldeaths are likely to occur among adults.
Given an assumed peak in estimated HIV prevalence by 2010, deathrates are likely to remain stable or decrease by 2015, depending on thenature of the epidemic in each country. Estimated adult crude death rateswill be inflated by 14 to 36 deaths per 1,000 adults in Botswana, Mozam-bique, Namibia, South Africa, and Zambia. Adult crude death rates are pro-jected to remain lower for Uganda and Kenya as HIV prevalence continuesto decline, at 6 and 9 deaths per 1,000 adults, respectively; these representonly slight increases over the without-AIDS scenario.
AIDS mortality patterns are driven by HIV prevalence patterns. Mortal-ity rates among 15- to 49-year-old women are increasing dramatically asmore women become infected through heterosexual transmission. Asstated previously, in sub-Saharan Africa women make up more than half ofall infections and are becoming infected at younger ages and in greaternumbers than men. As a consequence, the impact of AIDS on mortality forwomen is also more pronounced: following the age pattern of HIV preva-lence, mortality for women is estimated to peak among 30- to 34-year-olds,whereas the peak for men is later in life, among 35- to 44-year-olds (seeFigure 1.6 for South Africa). In the absence of AIDS, deaths tend to behigher among 15- to 49-year-old men than among women of the same age,but this ratio is reversed in many countries affected by HIV/AIDS. Forexample, in Botswana and South Africa, countries with HIV prevalencerates over 20 percent, women accounted for over 50 percent of all deaths inthe population aged 15–49 in 2005, compared with 35 percent and 33 per-cent, respectively, in the absence of AIDS (Appendix Table 1.A2).
Figure 1.9 further illustrates that, in the absence of AIDS, male adultcrude death rates would be expected to be higher than female rates formost of the countries selected. With the addition of AIDS mortality, esti-mated female adult crude death rates not only jump significantly, but alsoare noticeably higher than those of their male counterparts in manyAfrican countries. The estimated female adult crude death rate forBotswana increases dramatically, from 1 death per 1,000 adults in thewithout-AIDS scenario to 40 deaths per 1,000 in the with-AIDS scenario.The latter is higher than the estimated male adult crude death rate of 37deaths per 1,000 adults, thus decreasing the ratio of male to female adultdeaths from 1.8 to 0.9 for 2005. The estimated female adult crude deathrate increases by 12 deaths, to 23 deaths per 1,000 adults, for Mozambique,Namibia, Zambia, and South Africa with the addition of AIDS mortality,compared with an increase of 9 deaths, to 16 deaths per 1,000 adults, formales in the same countries.
The Demographic Impact of HIV/AIDS 23
©International Monetary Fund. Not for Redistribution

Infant and Child Mortality
The fact that women are getting infected, falling ill, and dying inthe midst of their reproductive years means an increase in thenumber of babies born HIV-positive. The relative impact of AIDS oninfant mortality—the estimated number of infants per 1,000 live birthswho will die before their first birthday—will depend on the prevalenceof HIV in the population, in addition to infant mortality from othercauses. Unfortunately, because of the AIDS pandemic, much of thedecrease in infant mortality seen during the 1980s and 1990s has disap-peared. In sub-Saharan Africa over 30 percent of all children born to HIV-infected mothers become HIV-positive through the birth process or bybreastfeeding.
It is estimated that in 2005 more infants are likely to die from AIDS thanfrom any other cause in Botswana and Namibia (Figure 1.10). With an HIVprevalence of nearly 40 percent, Botswana has an estimated infant mortal-ity rate of 55 infant deaths per 1,000 live births in 2005; it would be 14 per1,000 live births in the absence of AIDS. Namibia’s estimated infant mor-tality rate is 49 infant deaths per 1,000 live births, an increase of 26 infant
24 BRYNN G. EPSTEIN
Females without AIDS
Females with AIDS
Males without AIDS
Males with AIDS
BotswanaNamibia
South Africa
Kenya
Uganda
Zambia
Côte d’Ivoire
Tanzania
EthiopiaRwanda
Nigeria
Mozambique
HaitiGuyana
Vietnam
Figure 1.9. Adult Crude Death Rates by Sex, With and Without AIDS in Selected Countries, 20051
(Deaths per 1,000 adults)
Source: U.S. Census Bureau, International Programs Center, HIV/AIDS Surveillance Data Base (2004) and unpublished tables.
1Adults are defined as persons aged 15–49.
0 10 20 30 40
©International Monetary Fund. Not for Redistribution
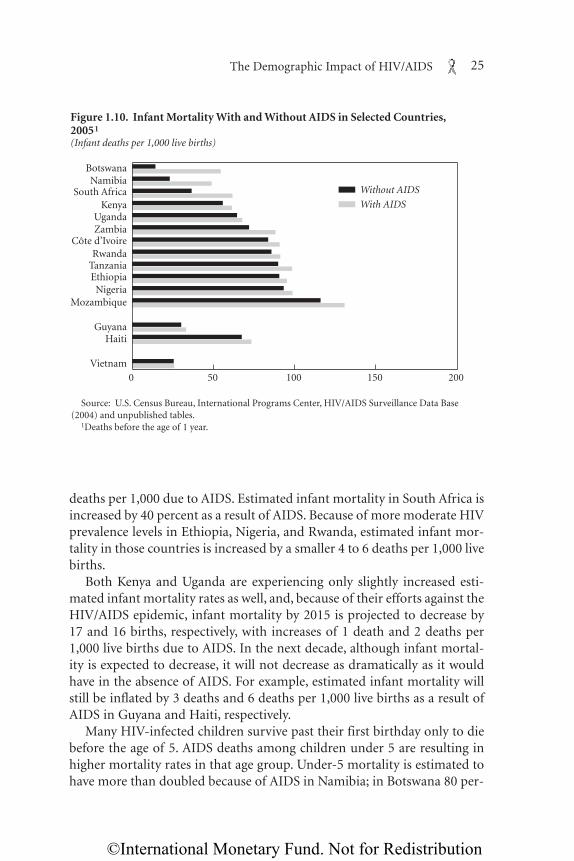
deaths per 1,000 due to AIDS. Estimated infant mortality in South Africa isincreased by 40 percent as a result of AIDS. Because of more moderate HIVprevalence levels in Ethiopia, Nigeria, and Rwanda, estimated infant mor-tality in those countries is increased by a smaller 4 to 6 deaths per 1,000 livebirths.
Both Kenya and Uganda are experiencing only slightly increased esti-mated infant mortality rates as well, and, because of their efforts against theHIV/AIDS epidemic, infant mortality by 2015 is projected to decrease by17 and 16 births, respectively, with increases of 1 death and 2 deaths per1,000 live births due to AIDS. In the next decade, although infant mortal-ity is expected to decrease, it will not decrease as dramatically as it wouldhave in the absence of AIDS. For example, estimated infant mortality willstill be inflated by 3 deaths and 6 deaths per 1,000 live births as a result ofAIDS in Guyana and Haiti, respectively.
Many HIV-infected children survive past their first birthday only to diebefore the age of 5. AIDS deaths among children under 5 are resulting inhigher mortality rates in that age group. Under-5 mortality is estimated tohave more than doubled because of AIDS in Namibia; in Botswana 80 per-
The Demographic Impact of HIV/AIDS 25
BotswanaNamibia
South AfricaKenya
UgandaZambia
Côte d’Ivoire
TanzaniaEthiopia
Rwanda
NigeriaMozambique
GuyanaHaiti
Vietnam
Without AIDS
With AIDS
Figure 1.10. Infant Mortality With and Without AIDS in Selected Countries, 20051
(Infant deaths per 1,000 live births)
Source: U.S. Census Bureau, International Programs Center, HIV/AIDS Surveillance Data Base (2004) and unpublished tables.
1Deaths before the age of 1 year.
0 50 100 150 200
©International Monetary Fund. Not for Redistribution

cent of deaths among children under 5 are due to AIDS; and 40 percent ofunder-5 mortality in South Africa is due to AIDS. AIDS will also aggravateunder-5 mortality rates in countries such as Côte d’Ivoire, Ethiopia,Mozambique, Nigeria, Rwanda, Tanzania, Uganda, Zambia, and Haiti,which already have high under-5 mortality rates due to other causes (Fig-ure 1.11).
Without the prevention of mother-to-child transmission, under-5mortality rates in 2005 are significantly higher with AIDS than without it.Even in countries with lower HIV prevalence, AIDS mortality is increas-ing under-5 mortality rates. By 2015 AIDS mortality is estimated to makeup nearly 90 percent of deaths in this age group in Botswana, two-thirdsof deaths in Namibia, and half of deaths in South Africa.
Life Expectancy
One of the most shocking markers of the demographic effect of AIDSmortality is life expectancy at birth—the estimated average number ofyears a person could expect to live if age-specific death rates prevailthroughout his or her life. In developing countries life expectancy was
26 BRYNN G. EPSTEIN
BotswanaNamibia
South AfricaKenya
UgandaZambia
Côte d’IvoireTanzaniaEthiopiaRwanda
NigeriaMozambique
GuyanaHaiti
Vietnam
Without AIDS
With AIDS
Figure 1.11. Child Mortality With and Without AIDS in Selected Countries,2005(Deaths per 1,000 children under 5 years)
Source: U.S. Census Bureau, International Programs Center, HIV/AIDS Surveillance Data Base (2004) and unpublished tables.
0 50 100 150 200
©International Monetary Fund. Not for Redistribution

chronically low mainly because of high infant mortality. Once measureswere taken to alleviate the common causes of infant mortality, lifeexpectancies began to climb. However, life expectancies in many sub-Saharan African countries are now estimated to be cut in half because ofAIDS mortality among adults.
More generally, life expectancy is an important component of key indi-cators of welfare such as the Human Development Index (HDI) of theUnited Nations Development Programme, which also includes measures ofeducational attainment and GDP per capita. In sub-Saharan Africa most ofthe attainment in human development, as measured by the HDI, over thelast 50 years was based on increased life expectancy; this attainment is nowrapidly being eroded by the HIV epidemic. Similarly, using a method basedon individual valuations of mortality risk, Crafts and Haacker (Chapter 6,this volume) estimate that the welfare impact of reduced life expectancydue to HIV/AIDS dwarfs all estimates of the impact of HIV/AIDS on GDPper capita.
Estimated average life expectancy at birth for the selected countries inAfrica is 45 years in 2005—an average of 14 years of life less than it wouldhave been without AIDS mortality. The countries with estimated adult HIVprevalence over 20 percent (Botswana, Namibia, and South Africa) are esti-mated to have lost 24 to 42 years of life expectancy at birth as a result ofAIDS mortality (Figure 1.12). All of the selected countries in Africa wouldhave estimated life expectancies of 50 years or more without AIDS.
Estimated crude death rates are lower in countries outside of Africa withlower HIV prevalence, but life expectancy is still affected, although to alesser extent than in sub-Saharan Africa. With the addition of AIDS mor-tality, life expectancy in Haiti is 53 years instead of 61 years; in Guyana lifeexpectancy is 65.5 years instead of 70 years.
Within less than 10 years, some countries in sub-Saharan Africa areprojected to see life expectancies at birth fall to around 30 years—levelsnot seen since the beginning of the twentieth century. Among thoseselected countries that would have approached or exceeded life expec-tancies of 70 years by 2015 (Botswana, Namibia, and South Africa) inthe absence of AIDS, life expectancy is instead projected to be 35 yearsin Botswana, 38.5 years in Namibia, and 44.5 years in South Africa; thesefigures represent losses of 45 years, 28.5 years, and 25.5 years of life,respectively.
AIDS mortality is expected to continue to result in lower life expectan-cies in Latin America, the Caribbean, and Asia. Life expectancies in 2015are projected to be 5 and 8 years lower in Guyana and Haiti, respectively,than they would be without AIDS. And although estimated HIV prevalence
The Demographic Impact of HIV/AIDS 27
©International Monetary Fund. Not for Redistribution

is very low in Vietnam, projecting the current epidemic results in a loss of1 year of life by 2015.
Fertility and Population Growth
Even as mortality rates are rising, fertility rates are expected to declineby 2015. HIV/AIDS affects fertility rates, as fertility tends to be lowerfor HIV-infected women than for uninfected women. In addition,approximately one-third of children born to HIV-positive mothers areinfected and unlikely to reach childbearing age themselves. HIV/AIDSmay also reduce birthrates indirectly, through its impact on sexual behav-ior, as women may reduce risky sexual practices by increasing abstinenceand condom use and reducing the number of sexual partners theyhave over time. Finally, in many countries affected by the pandemic,AIDS mortality may affect population growth as the increase in deathsamong reproductive-age women leads to fewer births. As Figure 1.13illustrates, Botswana, which has a high crude death rate among adultwomen, is expected to experience a decline in births throughout thisdecade.
28 BRYNN G. EPSTEIN
BotswanaNamibia
South Africa
KenyaUganda
ZambiaCôte d’Ivoire
TanzaniaEthiopia
RwandaNigeria
Mozambique
GuyanaHaiti
Vietnam
Without AIDS
With AIDS
Figure 1.12. Life Expectancy at Birth With and Without AIDS in Selected Countries, 2005 (Years)
Source: U.S. Census Bureau, International Programs Center, HIV/AIDS Surveillance Data Base (2004) and unpublished tables.
0 10 20 30 40 50 60 70 80
©International Monetary Fund. Not for Redistribution

Population will continue to grow in most of the selected countries, eventhough estimated crude death rates are high, because of high fertility andlarge numbers of young people. However, populations in severely affectedcountries are projected to decline over time, as is evident in Botswana,where the estimated 2005 growth rate is negative. In addition, populationgrowth rates in Namibia and Zambia for 2005 are estimated to be half orless of what they would have been without AIDS.
By 2015, in addition to Botswana and South Africa, Guyana and Namibiaare projected to experience negative or zero population growth rates becauseof AIDS mortality compounded by lower fertility and international migra-tion. Although Uganda and Kenya are only slightly affected by AIDS mortal-ity in 2005, estimated growth rates for these two countries will no longer beslowed by AIDS by 2015.
As a direct consequence of lower population growth rates, populationswill be much smaller in the future than they would have been in theabsence of HIV/AIDS in many of the affected countries. Figure 1.14 showspopulation projections for Botswana, where the population is projected todecline in absolute terms by 12 percent between 2000 and 2050, and wherethe projected 2050 population is 67 percent lower than in a scenario withno AIDS; and Uganda, where the population in 2050 is projected to be 11percent lower than in a scenario without AIDS.
The Demographic Impact of HIV/AIDS 29
0
20000
40000
60000
Without AIDS
Figure 1.13. Births With and Without AIDS in Botswana(Thousands)
Source: U.S. Census Bureau, International Programs Center, HIV/AIDS Surveillance Data Base (2004) and unpublished tables.
2000 2005 2010 2015
With AIDS
©International Monetary Fund. Not for Redistribution

Socioeconomic Aspects of Changes in thePopulation Structure
In countries with projected negative population growth, AIDS mortalityis likely to produce population pyramids of a pattern never seen before. Asmortality increases among 15- to 49-year-olds, the population structures ofcountries with high HIV prevalence are likely to change from the typical
30 BRYNN G. EPSTEIN
0
1000
2000
3000
4000
5000
0
20000
40000
60000
80000
100000
120000
140000
160000
Without AIDS
Without AIDS
Figure 1.14. Change in Population With and Without AIDS in Botswana and Uganda(Thousands)
Source: U.S. Census Bureau, International Programs Center, HIV/AIDS Surveillance Data Base (2004) and unpublished tables.
1990 95 2000 05 10 15 20 25 30 35 40 45 50
1990 95 2000 05 10 15 20 25 30 35 40 45 50
With AIDS
With AIDS
Botswana
Uganda
©International Monetary Fund. Not for Redistribution

pyramid shape of a young and growing population to one more in theshape of a chimney. For example, in Botswana (Figure 1.15), men below theage of 20 and between the ages of 25 and 55 are likely to outnumberwomen in each of the 5-year age cohorts by 2025.
The socioeconomic implications of such a population chimney are notyet clear, but such a dramatic rise in adult mortality is sure to have pro-found and far-reaching effects. Most notable are the resulting increase inorphans and other vulnerable children, subsequent changes in householdcomposition, a decrease in the labor force, and an increase in demand forand costs of social services.
Dependency Ratios
The estimated increase in mortality among adults may bring abouta corresponding increase in the total dependency ratio, or the numberof children and people of retirement age divided by the adult popula-tion available to support them. However, with infant and child mortalityalso increasing because of transmission from mother to child, a lowerfertility rate for HIV-infected women, and a decline in the number ofpeople reaching retirement age, this increase may not be as dramatic as onemight expect.8 Table 1.2 shows the change in the dependency ratio amongthe 15 countries selected for analysis. There is a small increase in the depen-dency ratio in the projections incorporating estimated AIDS mortality;however, there is also a decline in these ratios from 2005 to 2015.
The loss of support from an economically active adult can impose agreat financial burden on the remaining members of the household, inaddition to putting a strain on already weak health and social services sys-tems. Studies conducted throughout the 1990s indicate that the death of anHIV-positive adult member of a household imposed more of a financialburden on the household than if the adult had died from another cause,that the household’s consumption of basic necessities fell following thedeath of a member from AIDS, and that the death of an adult female had astronger negative impact on household consumption than that of an adultmale (Ainsworth, Fransen, and Over, 1998).
Parents of adults who are HIV-positive may have an unexpected finan-cial burden to bear in addition to the physical and emotional trauma of
The Demographic Impact of HIV/AIDS 31
8Haacker (Chapter 2, this volume) attributes observed increases in dependency ratios toan increase in the ratio of the young population (ages 0–14) to the working-age population(ages 15–49) while the relative size of the old population declines, mitigating the increase intotal dependency.
©International Monetary Fund. Not for Redistribution

32 BRYNN G. EPSTEIN
0-4
10-14
20-24
30-34
40-44
50-54
60-64
70-74
80+
0-4
10-14
20-24
30-34
40-44
50-54
60-64
70-74
80+
0-4
10-14
20-24
30-34
40-44
50-54
60-64
70-74
80+
Males Females
Age (in years)
140 140120 120100 10080 8060 6040 4020 200
2005
Males Females
Age (in years)
140 140120 120100 10080 8060 6040 4020 200
2015
Males Females
Age (in years)
140 140120 120100 10080 8060 6040 4020 200
2025
Figure 1.15. Population With and Without AIDS by Age and Sex in Botswana(Thousands)
Source: U.S. Census Bureau, International Programs Center, HIV/AIDS Surveillance Data Base (2004) and unpublished tables.
Without AIDS With AIDS
©International Monetary Fund. Not for Redistribution

having to care for their ill children. They may have to assume the cost ofproviding material support during their offspring’s illness, of paying forfunerals, and of fostering grandchildren—all at an age when they wouldotherwise be expecting their adult children to take care of them.
Orphans and Vulnerable Children
What the dependency ratios mask is the impact of increasing numbersof children affected by AIDS. UNAIDS, the United Nations Children’s Fund(UNICEF), and the U.S. Agency for International Development (USAID)estimate that, in 2003, 143 million children under the age of 18 in Africa,Asia, Latin America, and the Caribbean (8.4 percent of all children in thoseregions) were orphans, and that HIV/AIDS had created 15 million orphans(UNAIDS, UNICEF, and USAID, 2004).9
As Table 1.3 shows, these aggregates mask very substantial differencesacross regions and countries. Sub-Saharan Africa, the region worst affectedby HIV/AIDS, has the largest share of orphans: its 43.4 million orphans in2003 made up 12.3 percent of all children in the region; 12.3 million (28.3
The Demographic Impact of HIV/AIDS 33
Table 1.2. Projected Total Dependency Ratios for Selected Countries (Dependent persons per 100 persons of working age)
2005 Projected 2010_____________________________ ____________________________Country With AIDS Without AIDS With AIDS Without AIDS
Botswana 74.0 66.7 62.0 54.6Côte d’Ivoire 77.6 76.7 73.2 71.8Ethiopia 87.4 86.9 77.2 76.4Kenya 81.2 79.8 78.5 77.2Mozambique 84.7 83.0 72.8 69.9Namibia 73.3 70.6 56.7 54.6Nigeria 83.1 82.4 82.1 81.1Rwanda 80.2 79.6 80.5 78.9South Africa 55.0 52.7 47.2 44.9Tanzania 87.3 85.8 77.8 76.0Uganda 109.7 107.8 104.2 101.2Zambia 95.8 92.7 87.7 83.1Guyana 46.1 45.7 45.7 44.9Haiti 85.4 84.7 78.9 77.2Vietnam 50.7 50.6 40.1 40.0
Sources: U.S. Census Bureau, International Programs Center, International Data Base (2004), andunpublished tables.
9The recent estimates on orphans and vulnerable children affected by AIDS define anorphan as a child under the age of 18 who has lost at least one parent as a result of AIDS(UNAIDS, UNICEF, and USAID, 2004).
©International Monetary Fund. Not for Redistribution

percent) of these orphans were AIDS orphans. By 2010 the total number oforphans is projected to increase to 50 million (12.5 percent of all children),of whom 18.4 million (36.8 percent) will be AIDS orphans. In 7 of the 14African countries in Table 1.3, half or more of all orphans are AIDSorphans. In countries with high HIV prevalence such as Botswana andZimbabwe, three-quarters of all orphans are AIDS orphans. But a lowerestimated adult HIV prevalence does not necessarily translate into less ofan impact on children. Ethiopia, Kenya, Rwanda, and Uganda all have esti-mated adult HIV prevalence between 4 percent and 7 percent. Nearly halfof all Uganda’s orphans, and over a third of Kenya’s orphans, are AIDSorphans, compared with one-fifth in Rwanda and Ethiopia.
Table 1.3 also reports estimates and projections of the numbers oforphans in Asia and Latin America. Countries in Asia have much lower esti-
34 BRYNN G. EPSTEIN
Table 1.3. Estimated Number of Orphans by Developing Region and inSelected Countries
2003 Orphans, Projected________________________________________Orphans AIDS orphans 2010___________________ ___________________ ___________________
Percent Percent Percent of all of all of all
Region/Country Thousands children Thousands children Thousands children
Sub-Saharan Africa 43,400 12.3 12,300 28.3 50,0001 12Botswana 160 20.0 120 75.0 190 24Côte d’Ivoire 940 13.4 310 33.0 1,000 13Ethiopia 3,900 11.1 720 18.5 4,700 11Kenya 1,700 11.3 650 38.2 1,900 11Malawi 1,000 14.3 500 50.0 1,300 15Mozambique 1,500 15.0 470 31.3 1,900 17Namibia 120 12.0 57 47.5 180 18Nigeria 7,000 10.1 1,800 25.7 8,200 10Rwanda 810 16.2 160 19.8 800 14South Africa 2,200 12.9 1,100 50.0 3,100 19Tanzania 2,500 17.9 980 39.2 2,900 15Uganda 2,000 11.1 940 47.0 1,900 11Zambia 1,100 18.3 630 57.3 1,200 19Zimbabwe 1,300 18.6 980 75.4 1,400 21
Asia2 87,600 7.3 . . . . . . 80,100 7Cambodia 670 9.6 . . . . . . 690 9Thailand 1,400 7.0 . . . . . . 1,400 7Vietnam 2,100 7.0 . . . . . . 1,800 6
Latin America and Caribbean 12,400 6.2 . . . . . . 12,000 6
Brazil 4,300 7.4 . . . . . . 4,000 7Haiti 610 15.3 . . . . . . 560 13
Source: UNAIDS, UNICEF, and USAID (2004).1Of which 36.8 percent are projected to be orphaned as a result of HIV/AIDS.2Excluding the former Soviet Union.
©International Monetary Fund. Not for Redistribution

mated adult HIV prevalence, yet because of its large population this regionhas the largest number of orphans. As of 2003, although only 7.3 percent ofall children in Asia were orphans, their number amounted to 87.6 million.This region also has younger epidemics, which have the potential to expandrapidly throughout the population. For example, Vietnam has an epidemicconcentrated mainly among injecting drug users and sex workers; estimatedadult HIV prevalence was below 1 percent in 2003 (UNAIDS, 2004a). Withorphans already estimated to number over 2 million, a modest increase inHIV prevalence could increase this number dramatically.
AIDS has such a great impact on the number of orphans and vulnerablechildren because it so often creates double orphans—if one parent suc-cumbs to AIDS, it is very likely that the other parent will as well. Frequently,orphans are taken care of by extended family; yet AIDS is not just killingparents, but aunts and uncles also. Often grandparents are raising theirgrandchildren, or orphaned children are themselves assuming the role ofhead of household. According to recent DHS data on household composi-tion, one-fifth to one-quarter of households in Rwanda, Tanzania, Uganda,Zambia, and Zimbabwe are fostering children. And, in Tanzania andZimbabwe, the percentage of children under 18 who have lost one or bothparents is projected to increase over the next 10 years (UNAIDS, UNICEF,and USAID, 2004). Orphans tend to live in households with lower incomeper capita and may have impaired access to education: UNICEF (2003)estimates that, in sub-Saharan Africa, median dependency ratios are 20percent higher in orphan households than in nonorphan households, andthat school enrollment rates for orphans are 13 percent lower than fornonorphans.
Children under 5 who are orphaned by AIDS are at risk of dying fromAIDS themselves—as noted above, without intervention approximately athird of children born to HIV-positive mothers will be infected either atbirth or through breastfeeding. But many more children are vulnerable tothe effects of the large number of adults dying from AIDS around them.These children will be living with and caring for one or both sick and dyingparents, or living in a household that has taken in one or more orphans. Girlsespecially may have to cut short their education in order to support the restof the family. Providing enough food will become an increasing problem forrural households, if there is no longer anyone to cultivate the family crops.
Labor Force
As Figure 1.3 showed, the bulk of HIV infections are occurring amongyoung adults, those just entering the workforce. Unless they receive treat-
The Demographic Impact of HIV/AIDS 35
©International Monetary Fund. Not for Redistribution

36 BRYNN G. EPSTEIN
ment, those who become infected today are expected to become ill anddie within 10 years. At current estimates, life expectancy for those justreaching maturity is expected to decrease significantly in many countriesstruggling with an overwhelming HIV/AIDS epidemic. For several high-prevalence countries in Africa, as Table 1.4 details, in 2005 those aged 15years are only expected to live another 25 to 35 years.
The rise in mortality among adults in their prime productive andreproductive years has implications for the labor force, and not just as areduction in numbers, but also in terms of the structure of the working-age population. As detailed in Figure 1.15, the age pyramid will narrowas mortality, especially for the working-age population, increases and, asa consequence, fewer people live to an advanced age. This means thatthe pool of more experienced individuals, those who would qualify forleading positions in society and the economy, shrinks. Higher mortalitycauses increased attrition rates, disrupting economic processes andimposing additional costs on producers, through higher medical anddeath-related benefits and higher training costs associated with thereplacement of staff. Long before an HIV-positive individual enters thelast stage of the illness and finally dies, his or her well-being and health
Table 1.4. Life Expectancy at Age 15 by Sex, With and Without AIDS,in Selected Countries(Years)
2005 Projected 2015__________________________________ _________________________________Male Female Male Female_______________ ________________ _______________ _______________
Without With Without With Without With Without WithCountry AIDS AIDS AIDS AIDS AIDS AIDS AIDS AIDS
Botswana 60.6 23.5 64.9 23.2 63.4 24.7 67.6 24.1Côte d’Ivoire 47.6 41.5 53.1 43.9 49.3 42.0 55.4 44.4Ethiopia 47.5 43.3 50.5 44.9 49.1 43.8 52.7 45.3Kenya 48.6 40.4 49.4 38.6 50.8 48.7 52.2 49.3Mozambique 46.4 36.1 48.9 36.5 48.1 33.6 51.1 31.5Namibia 56.3 34.8 60.0 32.4 58.0 36.2 62.2 32.6Nigeria 49.6 44.0 52.4 44.4 50.7 45.2 54.0 46.3Rwanda 48.1 42.8 51.0 44.1 49.6 44.5 53.0 46.1South Africa 53.1 34.5 60.0 33.6 54.9 36.3 61.5 33.6Tanzania 48.4 39.3 51.6 39.5 50.1 41.3 53.9 42.0Uganda 50.9 44.7 54.0 45.7 52.5 49.4 56.1 52.1Zambia 49.6 34.0 53.1 33.4 51.2 35.8 55.2 34.6Guyana 54.9 51.7 61.3 56.5 56.8 53.6 63.4 58.0Haiti 50.9 44.1 54.4 46.1 52.7 46.1 56.8 48.0Vietnam 56.8 55.9 62.3 61.9 58.6 57.7 64.1 63.4
Source: U.S. Census Bureau, International Programs Center, International Data Base (2004) andunpublished tables.
©International Monetary Fund. Not for Redistribution

become impaired, and the infected person increasingly requires medicalattention and home care. This rise in morbidity results in an increase insick leave and absenteeism, as well as declining productivity on the job. Atthe household level, the sickness of a breadwinner reduces income andwealth, and other household members have to divert time from produc-tive activities or education to provide care. As the expected remainingworking time of the average worker declines, the expected returns oninvestments in training decline, with possible implications for the accu-mulation of human capital.
Conclusions
Twenty years ago, few would have predicted the current state of theHIV/AIDS pandemic. As the world enters a third decade with high HIVprevalence rates in many countries and the likelihood of an effective vac-cine, or even widespread availability of therapeutic medication, still low,many millions more are likely to die from AIDS than have died already overthe past two decades. This fact, together with increasing stress on healthinfrastructures and lack of institutional supports for social services, meansthat poor countries are likely to be under enormous strain as they attemptto cope with the consequences of AIDS morbidity and mortality—not tomention the burden future generations will likely have to bear in dealingwith the pandemic.
In addition to the psychological and social strain, the increase inHIV infections and AIDS deaths among adults in their prime has impli-cations for the public financing of services for the older population, fromhealth care to pensions to welfare. Instead of contributing to these mea-sures, the increase in the number of adults affected by HIV/AIDSwill reduce the resources available and increase competition for theseservices.
Some countries in southern Africa are just beginning to experience theeffects of high AIDS mortality. In many other countries the epidemic ispoised to explode. Although Senegal, Thailand, and Uganda are notablesuccess stories, that success is due to concerted efforts at all levels of soci-ety. And although HIV/AIDS prevalence in Asia has not approached thatseen in some countries in Africa, the large populations of some of thesecountries suggest that the sheer numbers of HIV infections and of AIDSdeaths could become overwhelming. Hence the current burden of disease,death, and orphanhood is likely to be a problem in many countries aroundthe world for the foreseeable future.
The Demographic Impact of HIV/AIDS 37
©International Monetary Fund. Not for Redistribution
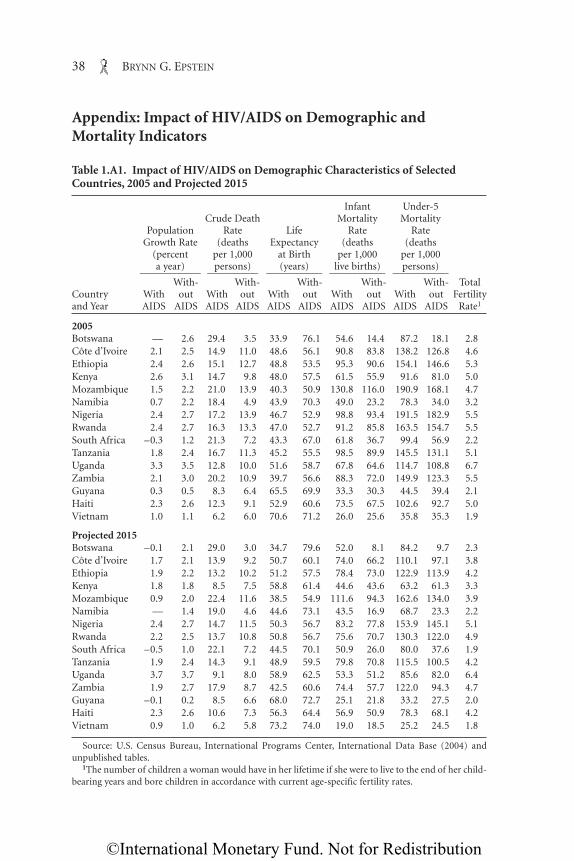
Appendix: Impact of HIV/AIDS on Demographic andMortality Indicators
38 BRYNN G. EPSTEIN
Table 1.A1. Impact of HIV/AIDS on Demographic Characteristics of SelectedCountries, 2005 and Projected 2015
Infant Under-5 Crude Death Mortality Mortality
Population Rate Life Rate RateGrowth Rate (deaths Expectancy (deaths (deaths
(percent per 1,000 at Birth per 1,000 per 1,000a year) persons) (years) live births) persons)____________ __________ ___________ ___________ ___________
With- With- With- With- With- TotalCountry With out With out With out With out With out Fertilityand Year AIDS AIDS AIDS AIDS AIDS AIDS AIDS AIDS AIDS AIDS Rate1
2005Botswana — 2.6 29.4 3.5 33.9 76.1 54.6 14.4 87.2 18.1 2.8Côte d’Ivoire 2.1 2.5 14.9 11.0 48.6 56.1 90.8 83.8 138.2 126.8 4.6Ethiopia 2.4 2.6 15.1 12.7 48.8 53.5 95.3 90.6 154.1 146.6 5.3Kenya 2.6 3.1 14.7 9.8 48.0 57.5 61.5 55.9 91.6 81.0 5.0Mozambique 1.5 2.2 21.0 13.9 40.3 50.9 130.8 116.0 190.9 168.1 4.7Namibia 0.7 2.2 18.4 4.9 43.9 70.3 49.0 23.2 78.3 34.0 3.2Nigeria 2.4 2.7 17.2 13.9 46.7 52.9 98.8 93.4 191.5 182.9 5.5Rwanda 2.4 2.7 16.3 13.3 47.0 52.7 91.2 85.8 163.5 154.7 5.5South Africa –0.3 1.2 21.3 7.2 43.3 67.0 61.8 36.7 99.4 56.9 2.2Tanzania 1.8 2.4 16.7 11.3 45.2 55.5 98.5 89.9 145.5 131.1 5.1Uganda 3.3 3.5 12.8 10.0 51.6 58.7 67.8 64.6 114.7 108.8 6.7Zambia 2.1 3.0 20.2 10.9 39.7 56.6 88.3 72.0 149.9 123.3 5.5Guyana 0.3 0.5 8.3 6.4 65.5 69.9 33.3 30.3 44.5 39.4 2.1Haiti 2.3 2.6 12.3 9.1 52.9 60.6 73.5 67.5 102.6 92.7 5.0Vietnam 1.0 1.1 6.2 6.0 70.6 71.2 26.0 25.6 35.8 35.3 1.9
Projected 2015Botswana –0.1 2.1 29.0 3.0 34.7 79.6 52.0 8.1 84.2 9.7 2.3Côte d’Ivoire 1.7 2.1 13.9 9.2 50.7 60.1 74.0 66.2 110.1 97.1 3.8Ethiopia 1.9 2.2 13.2 10.2 51.2 57.5 78.4 73.0 122.9 113.9 4.2Kenya 1.8 1.8 8.5 7.5 58.8 61.4 44.6 43.6 63.2 61.3 3.3Mozambique 0.9 2.0 22.4 11.6 38.5 54.9 111.6 94.3 162.6 134.0 3.9Namibia — 1.4 19.0 4.6 44.6 73.1 43.5 16.9 68.7 23.3 2.2Nigeria 2.4 2.7 14.7 11.5 50.3 56.7 83.2 77.8 153.9 145.1 5.1Rwanda 2.2 2.5 13.7 10.8 50.8 56.7 75.6 70.7 130.3 122.0 4.9South Africa –0.5 1.0 22.1 7.2 44.5 70.1 50.9 26.0 80.0 37.6 1.9Tanzania 1.9 2.4 14.3 9.1 48.9 59.5 79.8 70.8 115.5 100.5 4.2Uganda 3.7 3.7 9.1 8.0 58.9 62.5 53.3 51.2 85.6 82.0 6.4Zambia 1.9 2.7 17.9 8.7 42.5 60.6 74.4 57.7 122.0 94.3 4.7Guyana –0.1 0.2 8.5 6.6 68.0 72.7 25.1 21.8 33.2 27.5 2.0Haiti 2.3 2.6 10.6 7.3 56.3 64.4 56.9 50.9 78.3 68.1 4.2Vietnam 0.9 1.0 6.2 5.8 73.2 74.0 19.0 18.5 25.2 24.5 1.8
Source: U.S. Census Bureau, International Programs Center, International Data Base (2004) andunpublished tables.
1The number of children a woman would have in her lifetime if she were to live to the end of her child-bearing years and bore children in accordance with current age-specific fertility rates.
©International Monetary Fund. Not for Redistribution

References
Ainsworth, Martha, Lieve Fransen, and Mead Over, eds., 1998, Confronting AIDS: Evi-dence from the Developing World (Washington: World Bank).
European Centre for the Epidemiological Monitoring of AIDS, 2003, “HIV/AIDS Sur-veillance in Europe, End-Year Report 2002” (Saint-Maurice, France: Institut deVeille Sanitaire).
The Demographic Impact of HIV/AIDS 39
Table 1.A2. Impact of HIV/AIDS on Adult Mortality Indicators in SelectedCountries, 2005 and Projected 20151
Adult Deaths Adult Crude Death Rate Ratio of Male(percent (deaths per 1,000 adults) to Female_______________________________________
of all deaths) All adults Males Females Adult Deaths_____________ ____________ _____________ ____________ _____________Country With Without With Without With Without With Without With Withoutand Year AIDS AIDS AIDS AIDS AIDS AIDS AIDS AIDS AIDS AIDS
2005Botswana 68 21 38.6 1.4 37.3 1.8 39.9 1.0 0.9 1.8Côte d’Ivoire 36 24 11.0 5.3 11.0 6.4 11.0 4.2 1.0 1.5Ethiopia 30 22 9.6 6.0 9.5 6.5 9.8 5.6 1.0 1.2Kenya 44 30 13.1 6.0 11.2 5.8 14.9 6.2 0.8 0.9Mozambique 40 23 17.8 6.9 16.9 7.3 18.7 6.5 0.9 1.1Namibia 58 20 21.3 1.9 18.2 2.2 24.6 1.5 0.8 1.5Nigeria 27 17 9.8 4.9 9.2 5.4 10.5 4.5 0.9 1.2Rwanda 32 23 10.5 6.2 10.4 6.8 10.6 5.5 1.0 1.2South Africa 56 21 22.0 2.8 19.7 3.7 24.2 1.8 0.8 2.0Tanzania 38 22 13.4 5.3 12.4 5.8 14.4 4.9 0.9 1.2Uganda 30 20 8.8 4.7 8.5 5.3 9.1 4.1 1.0 1.3Zambia 44 22 19.2 5.2 17.5 5.8 20.9 4.5 0.9 1.3Guyana 34 21 8.8 4.0 8.5 4.5 9.1 3.6 0.9 1.2Haiti 22 19 2.3 2.0 3.0 2.5 1.7 1.5 1.8 1.7Vietnam 34 22 4.9 2.4 5.0 3.1 4.7 1.8 1.1 1.8
Projected 2015Botswana 71 18 36.8 1.0 34.9 1.3 38.8 0.7 1.0 2.0Côte d’Ivoire 42 25 11.4 4.6 11.3 5.8 11.5 3.4 1.0 1.6Ethiopia 36 25 9.6 5.1 9.3 5.6 9.8 4.5 1.0 1.2Kenya 37 32 6.3 4.9 6.0 4.9 6.7 4.9 0.9 1.0Mozambique 48 25 21.1 5.8 18.6 6.3 23.6 5.3 0.8 1.2Namibia 60 19 20.5 1.6 16.9 1.9 24.4 1.2 0.8 1.6Nigeria 29 18 9.0 4.3 8.6 4.9 9.4 3.8 1.0 1.3Rwanda 34 24 9.7 5.3 9.6 6.0 9.9 4.6 1.0 1.3South Africa 54 19 21.3 2.4 17.9 3.2 24.9 1.6 0.8 2.0Tanzania 43 25 12.1 4.5 11.3 5.1 13.0 3.9 0.9 1.3Uganda 28 21 5.8 3.8 6.0 4.5 5.5 3.2 1.1 1.4Zambia 50 24 18.4 4.4 16.6 5.1 20.4 3.6 0.9 1.4Guyana 39 23 8.3 3.3 8.0 3.9 8.7 2.8 0.9 1.4Haiti 31 18 4.8 2.2 4.8 2.8 4.8 1.5 1.1 1.9Vietnam 20 17 2.1 1.7 2.7 2.1 1.6 1.2 1.8 1.9
Source: U.S. Census Bureau, International Programs Center, International Data Base (2004) andunpublished tables.
1Adults are defined as persons aged 15–49.
©International Monetary Fund. Not for Redistribution

40 BRYNN G. EPSTEIN
Joint United Nations Programme on HIV/AIDS (UNAIDS), 2003, “AIDS EpidemicUpdate: December 2003” (Geneva).
———, 2004a, Report on the Global AIDS Epidemic 2004 (Geneva).
———, 2004b, “Women in Mekon Region Faced With Higher Rates of HIV InfectionThan Men” (Geneva).
———, United Nations Children’s Fund (UNICEF), and U.S. Agency for InternationalDevelopment (USAID), 2004, “Children on the Brink 2004: A Joint Report ofNew Orphan Estimates and a Framework for Action” (Geneva, New York, andWashington).
MAP Network, 2001, “Monitoring the AIDS Pandemic: The Status and Trends ofHIV/AIDS/STI Epidemics in Asia and the Pacific” (Washington: MAP Secretariat,International Programs Center, Population Division, U.S. Census Bureau).
Niambele, I., and others, 2001, “First Successful Integration of HIV Biomarkers into aNational Demographic and Health Survey (DHS+) in Mali, West Africa,” pre-sented at the XIIth International Conference on AIDS and STD in Africa, Oua-gadougou, Burkina Faso, December 9–13.
Schuettler, Darren, 2003, “Asia Leaders Ignore Looming AIDS Crisis—UN Envoy,”Reuters, CDC HIV/STD/TB Prevention News Update 09/02/03.
Shisana, Olive, and Leickness Simbayi, 2002, Nelson Mandela/HSRC Study of HIV/AIDS,South African National HIV Prevalence, Behavioural Risks and Mass Media: House-hold Survey (Cape Town, South Africa: Human Sciences Research Council).
Urassa, M., and others, 2002, “Continuing Spread of HIV in Rural Tanzania: Prevalenceand Incidence Trends in Kisesa during 1994–2000,” presented at the XIV Interna-tional AIDS Conference, Barcelona, Spain, July 7–12.
U.S. Census Bureau, International Programs Center, 2000, “Country Profiles.” Availablevia the Internet: at www.census.gov/ipc/www/hivctry.html.
———, 2004, HIV/AIDS Surveillance Data Base (Washington).
———, 2004, International Data Base (Washington). Available via the Internet:www.census.gov/ipc/www/idbnew.html.
United Nations Children’s Fund, 2003, “Africa’s Orphaned Generations” (New York).
Way, Peter O., and Karen A. Stanecki, 1994, “The Impact of HIV/AIDS on World Popu-lation” (Washington: U.S. Census Bureau).
World Health Organization, 2004, The World Health Report 2004—Changing History(Geneva).
Zambia Central Statistical Office and Central Board of Health, 2002, “Zambia Demo-graphic and Health Survey 2001–2002 Preliminary Report” (Calverton, Maryland:ORC Macro).
©International Monetary Fund. Not for Redistribution
2
HIV/AIDS: The Impact on the SocialFabric and the Economy
MARKUS HAACKER
In many countries, the HIV/AIDS epidemic has attained a scale at whichthe impact on the economy and, even more broadly, on societies, is
both evident and very serious. Through its broad economic impact,HIV/AIDS thus becomes an issue for macroeconomic analysis, and poli-cies to prevent the spread of the virus have direct implications for key eco-nomic indicators such as economic growth and income per capita,1 andfor economic development more generally. However, because the impactis very uneven across individuals or households, an analysis that capturesonly the main aggregate economic variables would miss many of themicroeconomic effects of HIV/AIDS on living standards, which also mat-ter for public policy and which, in turn, affect the main aggregate eco-nomic variables, for example through the accumulation of physical andhuman capital.
To start with the most obvious effect, increased mortality means thatthe economy is left with fewer workers, both in total and across differentoccupations and skill levels. As private employees and public servants fallill and eventually die, the efficiency of production or administrativeprocesses is diminished. On the consumer side, households can seldomfully compensate for the loss of a breadwinner; as a result, poverty risesand children’s access to education deteriorates. In the longer run
41
1This point is discussed in much more detail by Masha (Chapter 9, this volume).
©International Monetary Fund. Not for Redistribution

HIV/AIDS affects the accumulation not only of human capital but ofphysical capital as well. For example, as expenditure is shifted towardHIV/AIDS-related activities, aggregate saving is likely to decline, leavingfewer resources available for investment; at the same time, increased pro-duction costs and deteriorating economic prospects make investment inthe affected countries less attractive. Through increased mortality and itseconomic repercussions, HIV/AIDS also increases economic risk, andthis, too, contributes to a deterioration in welfare.
This chapter discusses the available evidence from studies on themacroeconomic impact of HIV/AIDS. The key concept that connectsthe various strands of analysis is this: HIV/AIDS affects the economyand economic development through its adverse impact on the social fabricitself. Here the term “social fabric” extends not only to the social andeconomic institutions already noted—households, companies, and thegovernment—but also to more abstract concepts such as governanceand social coherence. HIV/AIDS does have a serious impact on tradi-tional economic measures such as economic growth, income per capita,and investment, but it does so by affecting very diverse areas of public,social, and economic life. To understand all the macroeconomic reper-cussions, the economic analyst thus needs to cast the net very widely.
This chapter will pursue three lines of inquiry. The first proceeds fromthe bottom up, focusing on the impact of HIV/AIDS on different socialand economic institutions and highlighting its macroeconomic conse-quences. The second, in contrast, takes a bird’s-eye perspective, address-ing how HIV/AIDS, through its microeconomic impacts, affects typicalmacroeconomic variables, and reviewing how this is captured in variousmodels of economic growth. The third, drawing on the first two, analyzeshow HIV/AIDS, both directly and through its impact on social andeconomic institutions, affects poverty, inequality, individual risk, andwelfare.
Impact of HIV/AIDS on Social and Economic Institutions
HIV/AIDS affects an economy primarily through increased mortalityand morbidity. To capture the impact of increased mortality at all levelsand across all sectors, this chapter uses the term “social and economicinstitutions.” This term covers not only households and extended families,small and large enterprises, and local public services and the central gov-ernment, but also more abstract concepts such as the strength of the legalsystem and of property rights.
42 MARKUS HAACKER
©International Monetary Fund. Not for Redistribution

Increased Mortality
Figure 2.1 illustrates the impact of HIV/AIDS on mortality rates byage and sex for Zambia in 2004, where it is estimated that HIV/AIDShas raised the mortality rate for the population aged 15–49 almostfourfold, from 0.5 percent annually to 1.9 percent. For the entire pop-ulation, mortality has increased from 1.0 percent to 2.1 percent, makingHIV/AIDS the leading cause of death. Just as striking, Figure 2.1 showsthat, in Zambia (as in the other countries in the region), AIDS-relatedmortality affects women to a greater extent and at an earlier agethan men, because females on average begin sexual activity at an earlierage and because the risk of transmission of the virus is greater frommale to female than from female to male. Among Zambian women,mortality rates from all causes peaked at 4.5 percent for the cohortaged 35–39, and 87 percent of these deaths (3.9 percent in absolute terms)were accounted for by HIV/AIDS. Among working-age men, mortal-ity from HIV/AIDS-related causes peaks for the cohort aged 40–44(at 3.1 percent, or 78 percent of deaths in this cohort); overall mortal-ity for men then increases by cohort, as increasing deaths from othercauses more than offset the decline in HIV/AIDS-related mortalitywith age.
HIV/AIDS: The Impact on the Social Fabric and the Economy 43
0
2
4
6
8
10
0–4 10–14 20–24 30–34 40–44 50–54 60–64
Male, total
Female, total
Female, from AIDSMale, from AIDS
Figure 2.1. Mortality Rates by Age and Sex in Zambia, 2004(Percent)
Source: International Programs Center, U.S. Census Bureau.
©International Monetary Fund. Not for Redistribution

Table 2.1 illustrates the catastrophic impact of HIV/AIDS in countriesaround the world where it is widely prevalent.2 In Botswana, South Africa,and Zambia, AIDS is the leading cause of death; mortality rates for the15–49 age group in these countries have increased dramatically. As a con-sequence, life expectancy at birth has declined dramatically: for some ofthe worst-affected countries covered in Table 2.1, it declined by 20 years ormore from what it would have been in the absence of AIDS. The table alsoshows the severe impact of HIV/AIDS in countries with more “moderate”HIV epidemics. For example, in Ethiopia, with an estimated adult HIVprevalence rate of 4.4 percent, overall mortality has increased by 18 per-cent, mortality among the working-age population has risen by over 50percent, and life expectancy at birth has declined by 4.5 years.
The demographic impact of HIV/AIDS, through increased mortality andreduced birthrates, is discussed in more detail elsewhere (see, for instance,Epstein, Chapter 1 of this volume). Some of its aspects, such as the increasednumbers of orphans, changes in dependency rates, and changes in the com-position of the working-age population, will be taken up below in the con-text of the impact of HIV/AIDS on social and economic institutions.
44 MARKUS HAACKER
Table 2.1. Impact of HIV/AIDS on Mortality and Life Expectancy in Selected Countries (Percent except where stated otherwise)
HIV Mortality, Mortality, Life Expectancy
Prevalence Mortality, Ages 15–49, Ages 15–49, at Birth
Rate, All Ages, 2004 2004 Projected 2010 (years)____________ ____________ ____________ ______________Ages 15–49, From From From Without
Country End-20031 Total AIDS Total AIDS Total AIDS Actual AIDS
Botswana 37.3 2.9 2.5 3.8 3.7 3.6 3.5 34.2 75.7Côte d’Ivoire 7.0 1.5 0.4 1.1 0.6 1.1 0.7 48.4 55.7Ethiopia 4.4 1.5 0.2 1.0 0.4 1.0 0.4 48.7 53.1Haiti 5.6 1.3 0.3 0.9 0.5 0.9 0.5 52.6 60.2South Africa 21.5 2.9 2.5 2.3 2.0 2.1 1.9 44.1 66.7Vietnam 0.4 0.6 0.02 0.2 0.03 0.2 0.04 70.4 70.9Zambia 16.5 2.1 1.0 1.9 1.4 1.9 1.4 39.4 56.2
Sources: Joint United Nations Programme on HIV/AIDS (2004); U.S. Census Bureau, InternationalPrograms Center, International Data Base (2004) and unpublished tables.
1Data refer to the population aged 15–49.
2The prevalence rate most frequently quoted is that for the age group 15–49. This rate isoften (and somewhat imprecisely) referred to as the adult prevalence rate, or the prevalencerate for the working-age population. It is important to recognize that this rate is an averageover age groups with very different prevalence rates. The proportion of the population thateventually dies of AIDS is usually closer to the prevalence rate for the worst-affected agegroup (which, however, does not include the members of this cohort who died earlier or willget infected later).
©International Monetary Fund. Not for Redistribution

Households and Extended Families
HIV/AIDS has profound effects on the economic situation of thosehouseholds it afflicts.3 Income declines as breadwinners fall ill and die andas other household members are obliged to take time off from other pro-ductive activities to care for sick relatives. At the same time, householdshave to reallocate their spending to devote a much greater share to healthcare, including not only drugs and doctors’ fees but also supplies for homecare. The impact of HIV/AIDS also extends beyond those householdsdirectly affected, to the many other households who intervene to providethem with support. When a household affected by HIV/AIDS dissolves,members of the extended family frequently take care of the surviving chil-dren. The loss of a household member can have long-term effects on thewell-being of other members, through the costs of treatment and, espe-cially, if children have to take time off from school for financial reasons orto care for sick relatives.
Beyond this very general description of the impact of HIV/AIDS, it isimportant to acknowledge that the ability of a household to cope with theillness or death of a member depends on the afflicted person’s statuswithin the household. To the extent that HIV/AIDS raises mortalityamong very young adults (Figure 2.1), it is less likely to strike a primaryincome earner or head of household. The impact also depends on thehousehold’s socioeconomic characteristics. Households with low incomeor few assets may be in a worse position to cope with the income andexpenditure shocks associated with HIV/AIDS; small farm households,because of their different economic structure and access to social support,may be affected by and respond to HIV/AIDS differently than urbanhouseholds (especially those drawing their income from the formal sec-tor). More generally, the structure of the household need not be fixed: fol-lowing the death of a household member, others in the household mayleave (or, in the case of orphans, be taken in by other relatives), or thehousehold may dissolve entirely. At the same time, other people may jointhe household and take on the role left vacant by the deceased householdmember.
The aggregate demographic indicators reported in Table 2.2 providesome information on how HIV/AIDS affects households. The total depen-dency ratio increases, mainly because the increase in deaths among the
HIV/AIDS: The Impact on the Social Fabric and the Economy 45
3For a thorough review of the literature up to 2000, see Booysen and Arntz (2001). A morecurrent (but much shorter) discussion is included in Joint United Nations Programme onHIV/AIDS (2004, pp. 41–51).
©International Monetary Fund. Not for Redistribution

working-age population raises the relative size of the young population, asreflected in the child dependency ratio.4 The increase in child dependencyis closely related to the fact that the number of orphans increases as theirparents succumb to HIV/AIDS. For Botswana and Zambia, a rough esti-mate is that 20 percent of the population aged 17 or younger are orphans,and the majority of these orphans (77 percent in Botswana, 60 percent inZambia) were orphaned by HIV/AIDS. The pattern regarding old-agedependency is inconclusive at first blush, likely reflecting several effectsworking in different directions. In the early stages of the epidemic, old-agedependency may increase, because the disease predominantly kills youngpeople. But as these younger cohorts decimated by HIV/AIDS themselvesattain old age, this effect is reversed.
HIV/AIDS affects the income of the affected households not onlythrough the sickness and death of household members, but also as thetime previously devoted to income-generating activities by other house-hold members must be reallocated to the care of the sick member. Theimpact of HIV/AIDS on the income of an affected worker depends on the
46 MARKUS HAACKER
Table 2.2. Impact of HIV/AIDS on Dependency Ratios and Orphanhood inSelected Countries (Percent)
Orphans as Share ofPopulation
Adult HIVDependency Ratios, 2004 Aged 17 and Under________________________________________ ____________________
Prevalence Total1 Child2 Old-age3 2003 Projected,_____________ ____________ _____________ ___________Rate, End Without Without Without Due to 2010
Country of 2003 Actual AIDS Actual AIDS Actual AIDS Total AIDS (total)
Botswana 37.3 95.6 88.7 76.6 69.7 19.1 19.7 20.0 15.0 24Côte d’Ivoire 7.0 105.5 105.4 84.6 84.0 20.9 21.4 13.4 4.4 13Ethiopia 4.4 115.3 115.0 95.1 94.6 20.3 20.4 11.1 2.1 11Haiti 5.6 111.7 112.4 90.9 90.7 20.8 21.7 15.3 . . . 13South Africa 21.5 85.4 82.9 57.3 55.2 28.1 27.7 12.9 4.5 19Vietnam 0.4 74.3 74.2 50.2 50.1 24.1 24.1 7.0 . . . 7Zambia 16.5 113.8 116.6 100.8 100.8 13.0 15.8 18.3 10.5 19
Sources: UNAIDS (2004); UNAIDS, UNICEF, and USAID (2004); and author’s calculations based ondata provided by the International Programs Center, U.S. Census Bureau.
1Sum of child and old-age dependency ratios; numbers may not sum to totals because of rounding.2Ages 0–14.3Ages 50 and over.
4The total dependency ratio is defined as the sum of the population aged 14 or less (P0–14)and the population aged 50 or more (P50+) divided by the working-age population (P15–49),or (P0–14 + P50+)/P15–49.
©International Monetary Fund. Not for Redistribution

source of that income. If the worker is self-employed or is paid accordingto his or her productivity (for example, a tea picker), income declinesimmediately as the worker’s health (and thus productivity) starts to dete-riorate. If instead the worker receives a fixed salary (as is typical in the pub-lic sector and parts of the private formal sector), the income loss is notdirectly tied to the decline in productivity, and, as absenteeism increases,the loss is mitigated through sick leave and, possibly, a disability pension.
In assessing the impact of HIV/AIDS on income, it is useful to distin-guish between time lost from work (absenteeism) and declining produc-tivity on the job. There is substantial evidence that both time at work andproductivity decline well before a worker dies or retires because of illhealth. In one South African sugar mill, about 10 percent, on average, of asick employee’s working time was lost in the two years before the workerretired (Morris and Cheevers, 2000). According to Fox and others (2004),tea pickers on an estate in Kenya who retired or died from AIDS-relatedcauses earned 16 percent less in their penultimate year at work, and 17.7percent less in the final year. Notably, there was also a substantial increasein the number of days these employees spent on light duty.
The household’s living standard also deteriorates as other householdmembers have to reallocate time from other productive activities (not nec-essarily income-generating) in order to care for a sick relative. In thisregard, Steinberg and others (2002), using data from a survey of 771 AIDS-affected households in different parts of South Africa, find that over two-thirds of caregivers are women. Twenty-two percent of caregivers had totake time off from work and other income-generating activities, 20 percenthad to forgo school or study time, and 60 percent took time from otherhousework and gardening activities.
The most comprehensive study of the impact of adult mortality onrural households, that by Mather and others (2004), synthesizes studiesfrom five countries: Kenya, Malawi, Mozambique, Rwanda, and Zambia.5
Their findings include the following. First, HIV infection does not seem tobe correlated with relative income or education.6 Second, among women,those most severely affected by the deaths of other prime-age adults in ahousehold are young dependents, not wives or female heads of house-
HIV/AIDS: The Impact on the Social Fabric and the Economy 47
5The sample size ranges from 420 (Malawi) to 6,922 (Zambia), the data take the form ofpanel data (Kenya and Malawi) or cross sections with recall surveys, and the time frames ofthe surveys range from 4 years (1999–2002 in Mozambique and Rwanda) to 13 years(1990–2002 in Malawi).
6The study makes inferences on the impact of HIV/AIDS (as opposed to other causes ofmortality) based on the incidence of prime-age adult mortality.
©International Monetary Fund. Not for Redistribution

holds. Third, households affected by adult deaths do not uniformly haveless available prime-age labor than nonaffected households—a findingthat may reflect the ability of those households to attract new members.Fourth, the death of a male household head is associated with a largerdecline in crop production and nonfarm income than the death of anyother type of household member. Yamano and Jayne (2004), whose studyis one of those covered by Mather and others (2004), find that the impactof adult mortality on households is related to household wealth. Splittingtheir sample in half based on initial asset levels, they “find negative impactson the net value of crop production, assets, and off-farm income only inthe case of male head-of-household mortality among relatively poorhouseholds.” This study also finds that the death of a male household head(aged 16–59) “is associated with a 68 percent reduction in the net value ofthe household’s crop production,” and that female adult mortality is asso-ciated with an adverse effect on grain crops, whereas male adult mortalityhas a stronger effect on cash crops such as coffee, tea, and sugar.
HIV/AIDS results in increased demand for health-related goods and ser-vices. Because household income tends to shrink at the same time thisdemand is rising, the household is forced to cut other expenditures or sellsome of its assets. Steinberg and others (2002) find that households affectedby HIV/AIDS spend about one-third of their income on health care, com-pared with a national average of 4 percent. Other categories of expendituresare cut correspondingly, most notably clothing and electricity. This findingis consistent with an earlier World Bank study, which found that house-holds affected by HIV/AIDS lowered their overall expenditures, but that theshare of medical expenditure in the total rose (World Bank, 1999). Oneimportant part of HIV/AIDS-related expenditure is the cost of funerals.Steinberg and others (2002) suggest that funeral expenses are, on average,equivalent to four months’ salary. Naidu (2003) reports that the averagecost of a funeral for low-income households in Soweto, South Africa, wasabout 9,000 rand (about $1,400), or 3.5 times the average monthly house-hold income.7 Over 30 percent of funeral costs were paid from householdsavings, and 40 percent “from family and friends”; only 10 percent of thesampled households had some form of funeral insurance.
Although households directly affected by HIV/AIDS bear the brunt ofthe economic costs, these costs can be mitigated by various forms of formaland informal insurance provided through the private sector, the public sec-tor, or the extended family and local community. Workers in the formal sec-
48 MARKUS HAACKER
7Quoted in the Sunday Times (South Africa), August 31, 2003.
©International Monetary Fund. Not for Redistribution

tor may have access to private insurance that provides medical and death-related benefits; in most countries separate insurance schemes exist forpublic servants. However, the coverage of such formal insurance schemes isgenerally quite low: in most countries in sub-Saharan Africa, for example,fewer than 10 percent of the working-age population are covered.8 More-over, these formal insurance schemes come under strain as HIV/AIDSbecomes widespread. For the population not covered by formal insuranceschemes, the public sector can provide some forms of social security. In thecontext of HIV/AIDS, the most important form of such implicit insuranceis public health services. Other forms of social security provided throughthe public sector are destitution allowances and (particularly relevant here)orphan allowances (see, for example, Botswana Institute for DevelopmentPolicy Analysis (BIDPA), 2000) and disability grants. One example of thepotential role of grants comes from the study of the impact of HIV/AIDSon urban households in Soweto, mentioned above (Naidu, 2003). Thatstudy finds that income in households affected by HIV/AIDS was, on aver-age, 8 percent lower than in households not affected, but that earnedincome was 27 percent lower; the loss of earned income was to some extentoffset by higher receipts of disability grants and pensions.
Where insurance through the private or public sector is insufficient ornot available, the extended family or the community can provide someform of informal insurance. As previously noted, when householdsaffected by HIV/AIDS dissolve, other households often take in orphanswho have lost one or both parents. Rugalema (1999) reports on the impactof HIV/AIDS in the Bukoba district of Tanzania; there, in addition to the32 percent of households directly affected by HIV/AIDS, a further 29 per-cent experienced indirect effects, including “fostering orphans, providinglabor or cash to help care for the sick person, and providing for survivors.”9
And, as noted above, friends and family covered about 40 percent offuneral expenses in Soweto, according to Naidu (2003).
The data in Table 2.2 point to a very substantial increase in the numberof orphans. In Zimbabwe, for example, orphans (defined as children whohave lost at least one parent) are estimated to have accounted for 18.6 per-cent of the young population at the end of 2003; this share is projected toincrease to 21 percent by 2010. It is important to note that these shares areaverages and that the share of orphaned children increases with age. For
HIV/AIDS: The Impact on the Social Fabric and the Economy 49
8See Barbone and Sanchez (1999) for a broad survey of pensions and social security sys-tems in sub-Saharan Africa, and Plamondon, Cichon, and Annycke (Chapter 8, this volume)on social security in the context of HIV/AIDS.
9Quoted in Whiteside (2002).
©International Monetary Fund. Not for Redistribution

those aged 10–14 (by some accounts a group whose access to education isparticularly at risk), the share of orphans is likely to be higher than theaverage.
The loss of one or both parents to HIV/AIDS affects the well-being oftheir orphaned children directly, but it also has important economic reper-cussions. As households affected by HIV/AIDS lose income and have toreallocate resources toward care, children are at higher risk of malnutri-tion. The loss of a loving parent, the increased financial hardship, and thefrequent need to take time off from school to care for a sick family mem-ber cause their education and thus their economic prospects to suffer.During the parent’s illness and after his or her death, members of theextended family frequently care for the children of the family. Case, Pax-son, and Ableidinger (2002), using data from 19 Demographic and HealthSurveys conducted in 10 countries in sub-Saharan Africa between 1992and 2000, show that orphans tend to live in poorer households thannonorphans and that school enrollment rates for orphans tend to be lowerthan for nonorphans, even after controlling for household income. Thesefindings are consistent with estimates by the United Nations Children’sFund (UNICEF, 2003), which suggest that dependency ratios (a crudeproxy for income per capita) in households caring for orphans are 20 per-cent higher than in nonorphan households (1.8 rather than 1.5), and thatenrollment rates for orphans are 13 percent (not percentage points) lowerthan for nonorphans. Again there is an issue regarding the aggregationover age groups: for example, Ainsworth, Beegle, and Koda (2002) providesome evidence for Tanzania that the drop in enrollment rates is larger forthe 10–14 age group than for the 5–9 age group.
From a macroeconomic perspective, access to education is intimatelylinked to the accumulation of human capital, as the discussion below ofeconomic growth will make clear. Also, the study by Bell, Devarajan, andGersbach (Chapter 3, this volume) is built around the impact of increasedmortality on the transfer of human capital between generations, which isdisrupted through the death of one or both parents, and the incentives toinvest in human capital.
Private Sector10
HIV/AIDS, by increasing morbidity and mortality, affects both the pro-ductivity of employees living with the disease and productivity in general,
50 MARKUS HAACKER
10The section on the impact of HIV/AIDS on the private sector benefited from extensivecomments by Patrick Connelly.
©International Monetary Fund. Not for Redistribution

as the retirement or death of employees disrupts companies’ operations.For most companies, however, the most important costs associated withHIV/AIDS are monetary, including medical and death-related benefits,which add to personnel expenses. HIV/AIDS also has implications for thecosts of recruitment and training: employees lost to AIDS must bereplaced, and their successors must be trained. These costs include notonly the direct financial costs but also various indirect costs, such as man-agerial time devoted to hiring and training new staff, and the productivitylosses incurred while the new hires are learning their job. Looking forward,increased mortality means that companies need to train more staff foreach of a number of specific tasks, to ensure that a sufficient number ofemployees with these skills will always be available; at the same time, thefinancial returns to these investments in training decline, because the newhires are themselves at greater risk of dying. This section will discuss allthese issues, as well as how the impact of and the response to HIV/AIDSdiffer between small and large companies.
Some of the costs of HIV/AIDS to companies have already been dis-cussed in the context of the income effects on households. From studies ofthe effects of HIV/AIDS on worker performance, it appears that absen-teeism rises and productivity declines well before the death or retirementof an employee due to AIDS. The extent to which this represents a cost tothe employer depends on the context. In the case of piece workers, theinfected workers themselves bear most of the costs of their lower produc-tivity. For workers who receive a fixed salary, the company bears most ofthe costs.
Table 2.3, adapted from Aventin and Huard (2000), shows the break-down of HIV/AIDS-related costs for two companies in Côte d’Ivoire: afood-processing company (company 1) and a textile company (company2). The largest cost component is that for medical care and related costs:the sum of all health-related costs, including preventive measures, HIVscreening, payments to medical workers on the payroll, and health insur-ance, exceeds 35 percent of all HIV/AIDS-related costs for company 1 and25 percent for company 2. Also important are sick leave, costs related tolost productivity and reorganization, funeral costs, and (for company 1)disability pensions to staff retiring for health reasons. Funeral grants, cor-responding to about one monthly salary at company 1 and almost twomonthly salaries at company 2, cover a substantial proportion of thefuneral costs of deceased staff.
One potential cost to companies not covered in Table 2.3 is death-related benefits (other than funeral grants) paid to surviving spouses anddependent children; these can take the form of an ongoing pension or a
HIV/AIDS: The Impact on the Social Fabric and the Economy 51
©International Monetary Fund. Not for Redistribution

lump-sum payment. It is common when discussing pensions to distin-guish between defined-contribution and defined-benefit schemes. In theformer, the employee or the company, or both, make contributions to apension fund, and the invested proceeds, plus any return, are paid out atretirement or death. In a defined-benefit scheme, payments are madeaccording to a formula, often linked to tenure, and are not directly linkedto past contributions. In general, the costs of HIV/AIDS to a company witha defined-contribution pension plan are likely to be small. If instead thecompany has a defined-benefit scheme that provides a fixed payout in caseof death, however, HIV/AIDS-related payouts can be substantial. Mostdeath benefits reported in the literature range from two to four timesannual salary; for company 1 in Table 2.3, this could amount to an addi-tional 3.8 to 7.6 percent of the wage bill. Thus HIV/AIDS can have amarked impact on personnel costs: one much-quoted earlier study forSouth Africa, assuming relatively generous benefits, projected that AIDScould add up to 15 percent to the wage bill by 2010 (Moore, 1999). In theabsence of successful prevention measures to contain the numbers of newinfections, this could mean that the company’s profits, salary levels, orbenefit levels are not sustainable.
Rosen and others (2004) provide a comparative analysis of six SouthAfrican companies and identify four main determinants of differences in
52 MARKUS HAACKER
Table 2.3. Costs of HIV/AIDS for Two Companies in Côte d’Ivoire(Percent of total except where stated otherwise)
Cost Item Company 1 Company 2
Medical care 25.2 13.0Prevention 1.0 1.2HIV screening 0.6 —Wage bill for medical personnel 5.2 12.5Increased health insurance costs 5.0 —Disability pensions 23.7 —Sick leave 9.3 18.2Attendance at funerals 3.1 3.3Dismissals and severance pay — 1.1Recruitment and training — 5.2Loss of productivity, reorganization 13.3 25.0Funeral costs 13.5 20.5
Total HIV/AIDS-related costs1 100.0 100.0Total as percent of wage bill 1.3 0.8
Memorandum: HIV incidence among company
employees (percent of workforce a year) 1.9 1.1
Sources: Author’s calculations based on data from Aventin and Huard (2000).1Items may not sum to totals because of rounding.
©International Monetary Fund. Not for Redistribution

costs per new HIV infection: the level of death and disability benefits pro-vided, the level of medical care for lower-level employees, the status ofunskilled workers (whether permanent employees or contractors), andlabor productivity or the composition of the workforce. The costs arehigher for skilled employees, reflecting the higher costs of absenteeism andtraining. In particular, for companies providing disability pensions andpensions to surviving dependents, these tend to be the largest componentsof total costs, followed by productivity losses and sick leave and absen-teeism. Rosen and others (2004) estimate that the actual costs for the sixSouth African companies they studied ranged from 0.4 to 6.0 percent ofthe wage bill, depending on the demographics and the skill level of work-ers, and on the types of medical or death-related benefits provided.
Companies can take various steps to contain HIV/AIDS-related costs,including measures to prevent their employees from contracting AIDS,changes in the types or amounts of benefits they offer, and screening andmedical treatment for their employees. Among these, prevention standsout, since it is generally recognized as the most cost-effective class of inter-ventions from the company’s point of view. It can be even more cost-effective from a social perspective, when one takes into account thatcompanies bear only part of the costs of a worker’s illness and death.Unfortunately, many companies do not have HIV avoidance policies inplace, and often companies come to recognize prevention as a priority onlyafter HIV cost avoidance has become a necessity. For example, SouthAfrica’s Bureau for Economic Research (BER, 2004) reports that only one-fourth of about a thousand companies surveyed in that country hadimplemented a formal HIV/AIDS policy. Conversely, a forward-lookingprevention strategy that keeps down the number of infections among theworkforce can reduce the financial pressure to cut costs by reducingemployee benefits. On the other hand, companies who primarily employcasual workers may have little financial incentive to invest in prevention,because they incur only modest benefit costs, if any; because training costsfor such workers tend to be low; and because high turnover means thatmost of these workers will have left the company long before current pre-vention efforts result in a smaller number of AIDS cases.
Once a company faces the possibly huge financial costs of an HIV epi-demic among its employees, it will presumably seek ways to reduce thosecosts. Because death-related benefits and pensions to surviving dependentsfrequently account for a large share of the direct financial costs ofHIV/AIDS, they are also a primary target for cost cutting. The availableevidence suggests that HIV/AIDS is already affecting retirement funds in avery substantial way. For the most common form of retirement plan in
HIV/AIDS: The Impact on the Social Fabric and the Economy 53
©International Monetary Fund. Not for Redistribution

South Africa, defined-contribution schemes, Sanlam (2004) reports thatdeath benefit premiums have increased from 1.9 percent to 2.5 percent ofthe wage bill (a relative increase of over 30 percent), and disability benefitpremiums have risen from 1.5 percent to 1.8 percent between 2002 and2004. Together with declines in employer contributions and increasedadministrative costs, these escalating costs have contributed substantiallyto a decline in retirement provisions from 12.4 percent to 10.8 percent (arelative decline of 13 percent). Because defined-contribution schemeseventually pay out the accumulated contributions minus the costs of riskbenefits and administrative costs, this decline would mean that payouts atretirement or upon death in service (in addition to death benefits) willeventually decline and that the increased costs of risk benefits are passedthrough to employees. Looking ahead, most fund managers polled (72percent) expected a substantial further increase in the cost of risk benefitsover the next two years.
As the costs of death-related, disability, and medical benefits increase,companies may respond by reducing the costs of medical benefits, forexample by cutting benefit levels or shifting a larger share of the cost toemployees. Reductions in benefits—medical or death-related—frequentlytake the form of contracting out certain tasks and replacing permanentemployees (especially low-skilled workers) with fixed-term contract work-ers or casual labor. This is illustrated in Table 2.4, from Rosen and Simon(2003), which compares benefits for regular and casual employees; thisstudy also provides other examples of such burden shifting. In the case ofmedical benefits, the erosion of private health coverage implies increasedeconomic risk for households facing an HIV/AIDS epidemic. To the extentthat households who previously relied on private health services make useof public services instead, part of the burden of the disease is absorbed bythe public sector (as the demand for public health services increases) orthe public at large (as a larger number of patients relying on the public sec-tor draw on limited health resources).
The above examples have described the various costs of HIV/AIDS tocompanies and various approaches to reducing those costs, but expendi-ture on prevention and treatment can also be interpreted as a form ofinvestment. When a company extends or expands health services benefitsto its HIV-positive employees, it does incur additional costs, but theseexpenditures may produce savings for the company in time as the numberof employees contracting the virus is reduced, as the onset of morbidityand mortality for those who do become infected is delayed. Denote, forexample, the cost of a particular form of treatment as CT, and the costs ofmortality (discussed above) as CM. The treatment delays the onset of the
54 MARKUS HAACKER
©International Monetary Fund. Not for Redistribution

symptoms of AIDS and the employee’s death from time T to time T′. Thenet financial gain from providing this treatment is
Net financial gain = ∑T′
i=1(1 + r)–i CT(i) + [(1 + r)–T′ – (1 + r)–T]CM , (1)
where r is the discount rate and i indexes time. The first term on the right-hand side of equation (1) gives the present discounted value of the costs oftreatment, and the second, the discounted financial gain associated withthe employee’s increased life expectancy. Rosen and others (2001, 2004),for example, use this approach to illustrate the cost-effectiveness of vari-ous prophylactic treatments and of HIV testing and counseling. Theapproach has also been used to assess the cost-effectiveness of antiretrovi-
HIV/AIDS: The Impact on the Social Fabric and the Economy 55
Table 2.4. Compensation and Benefits Provided to Low-Skilled Employees andContract Workers at One South African Company
Item Permanent Employees Fixed-Term Contract Workers
Employment term Permanent 10-month contract, renewableannually
Average salary or wage 85 rand a day 71 rand a day
Retirement benefits1 Proceeds of employee’s account None with defined-contribution provident fund, to which companycontributes 7 percent of salary
Disability benefits2 Lump-sum payment of two times None annual salary
Death benefits Lump-sum payment of two times Noneannual salary
Funeral benefits None 1,800 rand for coffin andtransport
Health insurance Company contributes 60 percent None(medical aid) of premium3
Primary medical care Free to worker and dependents at Free to worker at company company clinic; referral to public clinic; referral to public hospitalhospital
Paid sick leave 12 days a year, plus extensions at 12 days in each 10-month contractmanagement discretion
Memorandum: Share of males in 95 percent 97 percentworkforce
Source: Rosen and Simon (2003); the identity of the company is confidential.1Payable upon normal retirement, death, or medical retirement.2Payable upon medical retirement.3For a family of four, the remaining 40 percent amounts to 31 percent of salary for a low-skilled
employee; almost no low-skilled workers join.
©International Monetary Fund. Not for Redistribution

ral treatment. Suppose, for example, that the cost of providing such treat-ment is $1,000 a year and that the treatment increases an employee’sremaining life expectancy from two years to six years. The costs associatedwith the employee’s death are $20,000, and the company applies a discountrate r of 10 percent. The present discounted value of the cost of treatmentfor six years is then $4,355, and the postponement of the employee’s deathlowers the present discounted value of death-related costs by $5,239.
A company following this approach would typically find that it gainsfinancially from providing antiretroviral treatment to its higher-paid staff.An important additional consideration, however, is that employees valuemedical benefits as part of their compensation package. This means thatthe company would be able to pass on some of the cost of expanded treat-ment options to its employees, either through employee contributions tothe company’s medical plan or through lower salaries. Finally, companiesthat provide more extensive medical benefits packages have more to gainfrom effective prevention programs. The evidence available suggests thatboth considerations are relevant, with some examples of companies pro-viding antiretroviral treatment to their senior staff, and others providingantiretroviral treatment to all employees and in some cases to their fami-lies as well.11
As companies, whether by choice or by necessity, internalize some of thecosts and economic benefits of prevention measures and treatment efforts,they are frequently willing to implement or finance some HIV preventionmeasures among their workers. Only very large companies will find it cost-effective to develop an HIV prevention program on their own. However,some insurers have developed integrated medical and HIV preventionpackages in which companies can participate, and this expands the rangeof companies with access to prevention programs.
HIV/AIDS also affects the availability of employees with specific quali-fications. This follows from the changes in the working-age populationbrought about by increased mortality, but HIV/AIDS also affects thereturn to investment in skills. Although an employer may be able to replacea worker who has died for HIV/AIDS-related reasons, the worker’s deathshrinks the aggregate supply of labor. This means that wages for workerswith specific skills are likely to rise, or that workers who die will bereplaced with workers with less skill and less experience. At the same time,the age structure of the working-age population changes: increased mor-tality means that employees are, on average, younger, and that individuals
56 MARKUS HAACKER
11For this latter group, examples in South Africa include AngloGold, BMW, and Sasol.
©International Monetary Fund. Not for Redistribution

with substantial experience in their profession, normally a prerequisite forleading positions in a company, become more scarce.
Companies also invest in training, especially to enhance the skills oftheir employees that are job-specific. With increased mortality, the returnsto such investments decline, and, as a consequence, companies are likely toreduce their investments in training. For example, suppose a companyobserves that its employees quit with a probability of 10 percent a year, andthat the company applies a discount rate of 5 percent. In this case, if themortality rate among its employees rises from 0.25 percent to 1 percent,returns to training employees will fall by 4.7 percent.12 If the mortality raterises to 3 percent, returns to training will fall by 15.3 percent. Alternatively,the company may have to maintain a constant number (say, 100) ofemployees with certain skills that are key to its operations. As mortalityrates rise from 0.25 percent to 1 (or 3) percent, the average number ofemployees who need to be trained each year then rises from 10.2 to 10.9(or 12.7), and the annual training budget would have to rise by 6.6 (or24.2) percent. Another cost of additional training, not captured so far, islearning on the job: workers usually need time to adjust to a new workenvironment and become fully productive. Connelly and Rosen (2004)estimate that the time needed on the job to become fully productive rangesfrom 5 days for unskilled workers to 20 days for skilled workers and 60days for managers.
The above examples of the impact of HIV/AIDS on companies derivefrom case studies or simulations; another important source of informationis business surveys. Based on questionnaires or interviews with managers,these surveys provide qualitative assessments of the impact of HIV/AIDS,for example on employees, production costs, profits, and the economicenvironment. The most comprehensive survey so far is that by the BER(2004) in South Africa, which reports that 39 percent of responding com-panies indicated that HIV/AIDS has reduced labor productivity orincreased absenteeism.13 In the same survey 40 percent of respondentsindicated that “the epidemic increased their demand for labor (e.g., via
HIV/AIDS: The Impact on the Social Fabric and the Economy 57
12The returns to training are calculated as (s + m + δ)∫ωα(i – α)e–(s+m+δ)*(i–α)/di +
(ω – α)e–(s+m+δ)*(ω–α), where s is the job separation rate, m is the mortality rate, δ is the dis-count rate, α is the employee’s age, and ω is the age at which the employee retires from thelabor force. In this example, α equals 15 and ω equals 60. For simplicity, it is assumed thatquit rates and mortality rates do not differ across workers. The assumed quit rate of 10 per-cent is near the middle of the range of 6.8 to 18.3 percent (excluding workers leaving becauseof sickness or death) reported by the World Bank (1999).
13The study was commissioned by the South African Business Coalition on HIV/AIDS andis therefore frequently referred to as the SABCOHA study or survey.
©International Monetary Fund. Not for Redistribution

work shadowing or replacement of AIDS sick workers.” Although fewerthan 10 percent of companies noticed an adverse impact of HIV/AIDS onsales, 30 percent expected to see an adverse impact after five years.14 Astudy from Malawi focusing on micro- and small enterprises finds that themost important channel through which HIV/AIDS affects these compa-nies is the demand for their products or services.15
The BER (2004) study also provides important insights into the differ-ing impacts of HIV/AIDS on businesses of different sizes, and theirresponses. It reports that 25 percent of all South African businesses havean HIV/AIDS policy in place, but only 13 percent of small companies(those with fewer than 100 employees) do; in contrast, 90 percent of com-panies with more than 500 employees have such a policy.16 Table 2.5shows that, for smaller companies, productivity losses and direct costs(loss of experience, higher turnover, and recruitment and training costs)associated with the loss of employees are the principal financial repercus-sions of the epidemic. The survey also finds that the larger the company,the more important are the costs of higher employee benefits. Althoughthe cost rankings are very similar for small and medium-sized companies(the only difference being the ranking of benefit costs), they are markedlydifferent for large companies. For these companies the costs of benefitsand measures to contain the adverse impact of HIV/AIDS dominate.These trends are consistent with the conjecture that there is a positive cor-relation between prevention efforts and benefit levels. They may alsoreflect a weaker capacity of small business management to implementHIV policies; from this perspective, the rankings for smaller companiesreflect a more passive attitude and an emphasis on direct costs, whereasthe larger companies tend to have some active policy in place. Indeed, ina survey of the major business concerns of small and medium-size enter-prises (Connelly and Rosen, 2004), HIV/AIDS ranked only ninth (out of10), although some higher-ranking concerns (including the number-oneconcern, worker productivity) were in some way related to HIV/AIDS.Small companies may also provide retirement benefits to workers. In
58 MARKUS HAACKER
14The impact of HIV/AIDS on sales differs from sector to sector and is generally less forexport-oriented businesses (such as mining companies). Companies providing health- anddeath-related services (such as hospitals, pharmacies, and funeral parlors) may experience asubstantial increase in demand.
15See Ebony Consulting International and Malawi National Statistical Office (2000).16Rosen (2002) and Rosen and others (2003) report a similar finding for Nigeria: firms
that were part of a family of firms or an industrial group were twice as likely to take actionsagainst HIV/AIDS (informational materials, speakers, condom distribution, training ofemployees as peer educators or counselors).
©International Monetary Fund. Not for Redistribution

most cases these would be provided through a provident fund that man-ages benefit programs for many companies. Because the contributionrates to such a retirement fund would not reflect AIDS mortality in theworkforce of any individual small company, there is no direct linkbetween HIV/AIDS (at the company level) and the costs of benefits, andmanagers have less of a financial incentive to take action.17
The discussion above has already highlighted some of the differencesbetween small and large businesses in the impact of and the response toHIV/AIDS. The role of small businesses is discussed in more detail below,in an effort to bridge the gap between the chapters on households and thediscussion of larger private businesses. Because smaller businesses aremore likely to be part of the informal sector, much of what follows can alsobe interpreted in terms of differences between the formal and the informaleconomy.18
HIV/AIDS: The Impact on the Social Fabric and the Economy 59
Table 2.5. Ranking of Importance of HIV/AIDS-Related Costs to Businesses
Importance (1 = Most Number of Employees_______________________________________________________________________Important) Fewer than 100 100 to 500 More than 500 All companies
1 Lower productivity Lower productivity Higher employee Lower productivityand increased and increased benefit costs and increasedabsenteeism absenteeism absenteeism
2 Loss of experience Higher employee Voluntary counseling Higher employeeand vital skills benefit costs and testing or benefit costs
HIV/AIDS awareness program
3 Higher labor Loss of experience Lower productivity Loss of experienceturnover rates and vital skills and increased and vital skills
absenteeism
4 Higher employee Higher labor HIV/AIDS treatment1 Higher laborbenefit costs turnover rates turnover rates
5 Higher recruitment Higher recruitment Research into the Higherand training costs and training costs impact of HIV/AIDS recruitment and
training costs
Source: Bureau for Economic Research (2004).1Including provision of antiretroviral therapy.
17Of course, there is an externality involved here. On risk benefits in small companies, seeConnelly and Rosen (2004).
18This concept of “small businesses” is similar to the one used in Ebony Consulting Inter-national and Malawi National Statistical Office (2000), who “visited a stratified sample ofover 22,000 households and small businesses to identify active business activities of all kindsemploying fewer than 50 employees. This study also enumerated on-farm agricultural activ-ities, as long as 50 percent of the production was sold. . . .”
©International Monetary Fund. Not for Redistribution

Apart from issues related to data availability, much of the focus of theliterature has been on larger companies, because these include some of themajor contributors to GDP, and because the government’s tax base islargely associated with the formal economy. However, in many countrieswith severe AIDS epidemics, the majority of the population works in theinformal sector. Also, incomes are generally lower in the informal econ-omy, and many of the instruments available in the formal sector to miti-gate the impact of HIV/AIDS on households (such as medical anddeath-related benefits) do not exist there. In assessing the welfare effects ofHIV/AIDS, it is therefore important to give appropriate weight to smallbusinesses.
Small companies are less likely to adopt prevention and awareness mea-sures, because there is a fixed cost involved in developing an HIV/AIDSpolicy or contracting HIV/AIDS-related services, and they may find itharder than large enterprises to replace key staff. The impact of HIV/AIDSon a small business is also less predictable.
Phororo (2003) discusses in some detail the response of small Namib-ian businesses to HIV/AIDS among their workers. In light of the resourceand time constraints hindering an active response of small businesses toHIV/AIDS, most of the policy measures she discusses rely on collaborationto hold down the costs of HIV policies to small companies (for example,by building a national business coalition on HIV/AIDS) or on includingsmall businesses in programs implemented by other companies. Connellyand Rosen (2004) emphasize that the costs per employee of HIV/AIDS-related services are much higher for small companies, largely because offixed costs incurred by providers and the additional costs of marketing anddelivering services. One of the costs of developing a response to HIV/AIDSis that of obtaining information. Public awareness measures can thereforefacilitate the adoption of HIV prevention strategies by small companies.Rosen (2002), drawing on earlier work (published as Rosen and others,2003), observes that “receiving information from an outside source” is a“good predictor of company action.”
When key employees fall ill or die from HIV/AIDS, small companiescan find themselves at a disadvantage with respect to large companies incovering for and eventually replacing those individuals. Large enterprisescan cope temporarily with the loss of an employee by reallocating work toco-workers with similar experience and skills. This is especially relevant ifthe position requires specialized training or some experience within thecompany, as in the case of the branch manager of a bank, a software spe-cialist, or an accountant. The ability to reallocate work within the companyalso makes it easier to find a permanent replacement for workers retiring
60 MARKUS HAACKER
©International Monetary Fund. Not for Redistribution

or dying from HIV/AIDS. Small businesses are much less likely to be ableto replace key employees from within the company, raising the cost ofreplacement; in extreme cases, the loss of a key member can result in thedissolution of the business.19 However, small companies, especially thosein the informal sector, rely more on casual employees for their unskilledlabor.20 The company does not have to cover any medical or death-relatedbenefits for these employees and can easily replace them if they are nolonger able to fulfill their tasks.
Size—and the law of large numbers—also makes the impact ofHIV/AIDS more predictable for large companies. Large employers canexpect the HIV prevalence rate among their employees to be close to therelevant population average; small companies, in contrast, will see greaterdispersion, with some lucky ones barely affected, while others experienceprevalence rates well above the average. This greater predictability alsoallows large companies to mitigate the impact of HIV/AIDS throughforward-looking resource management. For example, a large company thatemploys 100 accountants might simply decide to hire two more in order toself-insure against a likely increase in absenteeism and HIV/AIDS-relatedattrition. In contrast, a small company would likely not find it cost-effective to employ even one more accountant to insure against the loss ofthe one already on the payroll. At the extreme, a very small single propri-etorship may well cease to exist if the owner dies or retires.
Finally, HIV/AIDS complicates small businesses’ access to credit. Largebusinesses tend to be incorporated, and therefore HIV/AIDS does notchange their default risk other than through its impact on company prof-its. The owner of a small business, in contrast, is likely to have to borrowin his or her own name. In this case a substantial increase in mortalityowing to HIV/AIDS increases default risk, reducing the business’s access toor cost of credit.
Public Sector
The implications of HIV/AIDS for the government are fundamentallydifferent from those discussed above for other social and economic insti-tutions, because of the government’s public mandate and its key role in
HIV/AIDS: The Impact on the Social Fabric and the Economy 61
19One implication of this for researchers is that surveys of the impact of HIV/AIDS onsmall businesses tend to underestimate the effects, because many of the worst-affected firmsno longer exist and are therefore missed by the survey. This measurement problem also arisesin the context of the dissolution of HIV/AIDS-affected households.
20See Coetzee (2003) for an illustration.
©International Monetary Fund. Not for Redistribution
formulating and implementing the country’s response to HIV/AIDS.The impact of HIV/AIDS on the public service and government financeis discussed in some detail in Haacker (Chapter 7, this volume); thereforethe discussion that follows highlights only a few issues that are par-ticularly relevant for the impact of HIV/AIDS on the economy in generaland on welfare. These issues include the impact on the delivery of publicservices, the government’s personnel costs, the demand for certain gov-ernment services, and the role of international assistance in supportingand, in particular, financing the response to HIV/AIDS in low-incomecountries.
HIV/AIDS causes disruptions to government services in ways similar tothose discussed above for the private sector. As public servants fall ill anddie, the efficiency of government agencies declines because of falling pro-ductivity and disruptions related to increasing attrition rates. These dis-ruptions can be particularly severe if employees are allowed extended sickleave, or if long lags intervene between the advertising of a position and thehiring of a replacement. Disruptions can be particularly severe for decen-tralized government services, such as local education and health services.21
Because a given small community receives these services from only one ora few public servants, illness or death among them can cause a prolongedlocal disruption in these services.
HIV/AIDS also erodes the government’s financial resources, from boththe revenue and the expenditure side. Countries afflicted by the epidemicsee their tax base and thus their domestic revenue grow more slowly oreven shrink, even as demand for government expenditure, including forpersonnel, increases. Although countries can often obtain external financefor specific HIV/AIDS-related interventions (according to Table 2.6,almost 80 percent of public spending on HIV/AIDS in low-income coun-tries was financed by external grants), such funding is typically not avail-able to cover the indirect costs of HIV/AIDS, such as the impact on thegovernment payroll or certain categories of social expenditure.
The impact of HIV/AIDS on the government’s personnel costs, throughincreased medical and death-related benefits and increased training andrecruitment costs, can be severe. These effects are similar to those dis-cussed above in the context of the private sector and need not be furtherdiscussed here. However, the financial costs of benefits are likely to behigher for the public sector, because benefits are typically more compre-
62 MARKUS HAACKER
21See Topouzis (2003) for a discussion of the impact of HIV/AIDS on agricultural exten-sion services.
©International Monetary Fund. Not for Redistribution

hensive than in the private sector. Public servants are more likely to be per-manently employed (a condition associated with higher benefit levels),and governments may refrain, for political economy reasons, from cuttingbenefit levels as a way of containing costs. Thus personnel costs are likelyto increase in all areas of the public service.22
The sector most directly affected by HIV/AIDS is the health sector.23
The demands on the public health service rise sharply with the spread ofthe epidemic; at same time, health personnel, too, are affected byHIV/AIDS. Initially, with antiretroviral treatment in low-income coun-tries out of reach for all but a few (who could afford it or who benefitedfrom a pilot program), public health services could provide little morethan palliative care and treatment of opportunistic infections. Even so,reported occupancy rates of hospital beds by HIV patients—rangingbetween 30 and 70 percent—indicate that HIV/AIDS absorbed much ofthe existing capacities of health services at that stage. With the dramaticfall in the price of antiretroviral treatments in recent years, however, moreand more countries have started to make these treatments availablethrough the public health service. At the same time, the internationalcommunity is working diligently to provide financing and other supportto expand access to treatment in low-income countries. Even with suchsupport, however, expanding health services sufficiently to meet the
HIV/AIDS: The Impact on the Social Fabric and the Economy 63
Table 2.6. Estimated Funding for HIV/AIDS Spending in Low-Income Countries, 2003(Millions of dollars)
Source of Funding Amount Spent
Bilateral, United States 852Bilateral, other governments 1,163Global Fund 547UN agencies 350World Bank1 120Foundations and other NGOs 200Governments of affected countries 1,000
Total 4,232
Source: Summers and Kates (2003).1Grant component of concessional loans.
22Some of the costs may not appear directly in the government’s budget, for example if thepublic sector pension fund is not part of the general budget, or if some forms of benefits arecovered from discretionary funds at the ministerial level.
23For a thorough discussion of the impact of HIV/AIDS on the health sector, see Over(Chapter 10, this volume).
©International Monetary Fund. Not for Redistribution

potential demand for treatment remains a serious challenge in manycountries.
International donors play a critical role in the financing of HIV/AIDS-related expenditure in sub-Saharan Africa and (to a somewhat lesserextent) of health expenditure generally. Table 2.6 reports estimates of thesources of funding of HIV/AIDS-related expenditures in low-incomecountries for 2003. More than three-fourths of public health expenditurewas financed through external grants. The data do not distinguish clearlywhich agencies would provide the services: some grants would financegovernment activities included in the budget, whereas others would go tointernational nongovernmental organizations (NGOs) providing servicesdirectly in the affected countries. But the data do show that governmentsthat offer a convincing and comprehensive HIV/AIDS program can raise asubstantial proportion of the necessary funds from external grants. On theother hand, managing the aid flows, catering to the specific needs of dif-ferent donors, and coordinating the activities of numerous agencies andNGOs, some of which are directly financed from abroad, can be a chal-lenge for a government whose human resources are already stretched thinby the epidemic.
In the longer run, the impact of HIV/AIDS in a given country doesdepend on the government’s policies and its actions to fight the epidemicand mitigate its impact. A policy that brings down the incidence of newinfections and improves the health status of people living with HIV,through prevention campaigns and improved access to treatment, willreduce the adverse macroeconomic effects. As the domestic revenue baseimproves (or at least deteriorates less rapidly) and outlays related toHIV/AIDS fall, some of the costs of a comprehensive HIV/AIDS frame-work will be offset by these indirect fiscal gains arising from reduced HIVprevalence and improved health.
Impact of HIV/AIDS on the Economy and Society
HIV/AIDS, through its impact on mortality and morbidity and theresulting demographic changes, affects all levels of an economy andsociety, from individuals and households to small and large businesses tothe different levels and activities of government. Most of these changescan be described in terms of frictions that affect the efficiency of someentity or process, demographic changes (especially losses in human capi-tal), and changes in the composition of domestic demand. These frictionsrelate to entities that are in some way tangible. But HIV/AIDS can alsoaffect the less tangible social and economic institutions of a country, such
64 MARKUS HAACKER
©International Monetary Fund. Not for Redistribution

as its civil society, its democratic processes, the acceptance of governmentby the public, the quality of governance, and social cohesion, which inturn have very direct consequences for economic development.
This chapter has already described (drawing on Chapter 7 of this vol-ume, by Haacker) how HIV/AIDS erodes government’s capacities and dis-rupts public services. Although the emphasis there was on the delivery ofservices, HIV/AIDS also affects legislative bodies and policymakers. Polit-ical processes are adversely affected, especially because this is an area inwhich experience is particularly important. For all these various reasons,the efficiency of government at all levels is likely to suffer. One possibleconsequence is increased political instability, spurred by dissatisfactionwith the government in place or with the political process in general. Morebroadly, an essential complement to democratic institutions is a strongcivil society, and this, too, is eroded by increased mortality and by many ofthe social and economic impacts of HIV/AIDS discussed elsewhere in thischapter.24
HIV/AIDS, through the economic repercussions of increased mortalityand weakened social institutions and government capacities, also con-tributes to deteriorating security at the individual, community, andnational level, and does so both in economic terms and in a more funda-mental way.25 Some of the economic dimensions of increased risk are dis-cussed elsewhere in this chapter, for example in the context of the impacton households (above) and in the discussion on risk and welfare (below).In particular, domestic security deteriorates when the government’s capac-ities are eroded,26 and weakened governments and deteriorating economicprospects are associated with increased crime and instability.27
In an already fragile society, HIV/AIDS can contribute to the outbreakof civil war or prolong its duration. According to a recent World Bank Pol-icy Research Report (Collier and others, 2003),“if a country is in economicdecline, is dependent on primary commodity exports, and has a low per
HIV/AIDS: The Impact on the Social Fabric and the Economy 65
24For a more thorough discussion of the impact of HIV/AIDS on democracy, governance,and security and vice versa, see Nelufule (2004).
25A report by the International Crisis Group (ICG, 2001) on “HIV/AIDS as a SecurityIssue” provides a thorough analysis of the multidimensional impact of HIV/AIDS onsecurity.
26ICG (2001) lists some examples of how HIV/AIDS has affected policing in Kenya,Namibia, and South Africa.
27Various authors have also addressed the economic and security implications of the dra-matically increasing number of orphans, currently estimated at about 20 percent of theyoung population in some of the countries worst affected by HIV/AIDS. See Nelufule (2004)for a recent discussion.
©International Monetary Fund. Not for Redistribution
capita income and that income is unequally distributed, it is at high risk ofcivil war.” This description applies to many countries affected byHIV/AIDS (sometimes even before the escalation of the epidemic), and,through its economic impact, the epidemic thus exacerbates a country’svulnerability to civil war. The discussion of democracy and politicalprocesses is also relevant: according to Collier and others (2003), “in suchconditions the state is likely to be weak, nondemocratic, and incompetent,offering little impediment to the escalation of rebel violence, and maybeeven inadvertently provoking it.” This observation echoes the discussionabove of the effects of HIV/AIDS on government capacities.
What this discussion shows is that the impact of HIV/AIDS on an econ-omy and society goes far beyond disruptions of more or less tangible eco-nomic or administrative processes within households, businesses, orgovernment agencies. To the extent that a stable and efficient government,a strong civil society, and economic and social stability contribute to eco-nomic development, these broader effects tend to reinforce the otheradverse effects of HIV/AIDS on the economy. The discussion later in thischapter of the impacts of HIV/AIDS on economic growth focuses on anarrower set of economic effects. Thus it is important to stress here thatthe increases in mortality, the declines in birthrates, and the resultingdemographic changes may so transform an economy and society as to giverise to economic effects that these models do not capture—or the modelsmay not be structurally stable in such a dramatically altered setting.
Economic Growth and Income per Capita
Drawing on the evidence discussed above on the impact of HIV/AIDSon social and economic institutions, many studies have attempted to assessthe epidemic’s impact on economic growth and income per capita. Projec-tions of the induced changes in economic growth are useful in severalregards. For example, such changes are closely associated with changes inthe domestic tax base and thus can be used in forecasting the resourcesthat will be available for general government operations, including the pol-icy response to HIV/AIDS. Changes in income per capita have implica-tions for living standards, although here it is important to take intoaccount the composition of spending (see Arndt and Lewis, 2001) and thedistribution of income (as discussed below and in Greener, Chapter 5 ofthis volume).
Most studies of the impact of HIV/AIDS on economic growth andincome per capita utilize some form of the neoclassical growth model,
66 MARKUS HAACKER
©International Monetary Fund. Not for Redistribution

incorporating assumptions regarding the impact of HIV/AIDS on produc-tivity and labor efficiency, on saving and investment behavior, and ondemographics. HIV/AIDS has an immediate macroeconomic impactowing to the productivity losses it imposes on the private sector, as dis-cussed above; macroeconomic studies generally include some assumptionsabout aggregate productivity changes inspired by this microeconomic evi-dence. The assumption of changes in the saving rate is in most cases moti-vated by the increase in medical expenditure observed to accompanyincreased HIV/AIDS prevalence and its impact on households’ ability tosave. Finally, demographic changes have three kinds of effects in thesemodels: a smaller labor supply translates into lower output; a lower growthrate of the labor supply is associated with a higher capital-output ratio(mitigating the otherwise adverse effects of HIV/AIDS on output percapita); and higher mortality, by eroding human capital (as measured bytenure or experience), lowers the average efficiency of labor. The principaldifferences between studies following this approach concern the level ofdisaggregation of the labor force by skill (studies typically distinguish insome way between skilled and unskilled labor) and by sector (distinguish-ing, for example, between a formal and an informal sector). This chapterwill also explore the potential impact of HIV/AIDS on investment, in anopen-economy model in which investment responds to changes in the rateof return to capital.
However, HIV/AIDS has a much more direct and severe effect on theaccumulation of human capital: it destroys it in those it kills. Taking alonger view, investment in human capital is also likely to be affected. First,by increasing mortality, HIV/AIDS has a strongly adverse effect on thereturns to investment in human capital (schooling and training), whichmay discourage individuals or companies from undertaking such invest-ment.28 Second, because so many of its victims are adults of parenting age,HIV/AIDS is associated with an increase in orphans—as noted above,orphans now make up around 20 percent of the under-18 population insome of the worst-affected countries—and there is empirical evidence thatorphans have poorer access to education than nonorphans. More gener-ally, HIV/AIDS, through increased uncertainty and the deteriorating eco-nomic outlook, will further discourage any form of investment, whether inhuman, physical, or social capital, and some authors, mirroring the above
HIV/AIDS: The Impact on the Social Fabric and the Economy 67
28For this to be true, individuals and companies must do an adequate job of projectingmortality rates; in a setting where these rates are rapidly rising, this may not be a realisticassumption.
©International Monetary Fund. Not for Redistribution
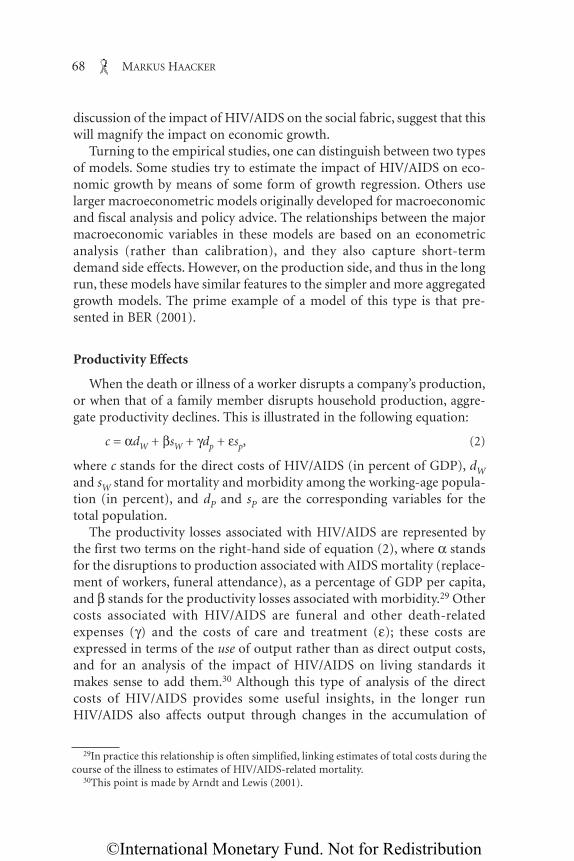
discussion of the impact of HIV/AIDS on the social fabric, suggest that thiswill magnify the impact on economic growth.
Turning to the empirical studies, one can distinguish between two typesof models. Some studies try to estimate the impact of HIV/AIDS on eco-nomic growth by means of some form of growth regression. Others uselarger macroeconometric models originally developed for macroeconomicand fiscal analysis and policy advice. The relationships between the majormacroeconomic variables in these models are based on an econometricanalysis (rather than calibration), and they also capture short-termdemand side effects. However, on the production side, and thus in the longrun, these models have similar features to the simpler and more aggregatedgrowth models. The prime example of a model of this type is that pre-sented in BER (2001).
Productivity Effects
When the death or illness of a worker disrupts a company’s production,or when that of a family member disrupts household production, aggre-gate productivity declines. This is illustrated in the following equation:
c = αdW + βsW + γdp + εsp, (2)
where c stands for the direct costs of HIV/AIDS (in percent of GDP), dWand sW stand for mortality and morbidity among the working-age popula-tion (in percent), and dP and sP are the corresponding variables for thetotal population.
The productivity losses associated with HIV/AIDS are represented bythe first two terms on the right-hand side of equation (2), where α standsfor the disruptions to production associated with AIDS mortality (replace-ment of workers, funeral attendance), as a percentage of GDP per capita,and β stands for the productivity losses associated with morbidity.29 Othercosts associated with HIV/AIDS are funeral and other death-relatedexpenses (γ) and the costs of care and treatment (ε); these costs areexpressed in terms of the use of output rather than as direct output costs,and for an analysis of the impact of HIV/AIDS on living standards itmakes sense to add them.30 Although this type of analysis of the directcosts of HIV/AIDS provides some useful insights, in the longer runHIV/AIDS also affects output through changes in the accumulation of
68 MARKUS HAACKER
29In practice this relationship is often simplified, linking estimates of total costs during thecourse of the illness to estimates of HIV/AIDS-related mortality.
30This point is made by Arndt and Lewis (2001).
©International Monetary Fund. Not for Redistribution

capital (including through an increase in HIV/AIDS-related expenditure,as represented by parameters γ and ε), or in the composition of the supplyof labor. Looking beyond the very short run, it is therefore necessary toadopt a more general framework.
Studies Using the Neoclassical Growth Model
The earliest studies of the macroeconomic impact of HIV/AIDS usedthe neoclassical growth model, to explore different channels throughwhich the epidemic affects the economy. These studies included those byOver (1992) and Cuddington (1993a, 1993b). This model still is frequentlyused, both as a framework for synthesizing estimates of the impact ofHIV/AIDS on various macroeconomic aggregates, and to draw inferencesabout how the impact will evolve over time.31
Many of the insights from these studies can be summarized using a one-sector growth model, in which output (Y) is a function of the levels of cap-ital (K) and labor (L), with the latter disaggregated into highly skilled andunskilled labor:
Y = AKα(eHpHL)β(eUpUL)γ, (3)
where α + β + γ = 1; pH stands for the proportion of highly skilled indi-viduals in the working population; and pU = 1 – pH for the proportion ofunskilled individuals. A denotes total factor productivity, and eH and eUrepresent the efficiency of highly skilled individuals and unskilled individ-uals, respectively.
The capital stock evolves according to
K·
= sY – δK, (4)
where K·
denotes the rate of growth of the capital stock over time. Studiesfollowing this approach usually assume that gross investment equalsdomestic saving (sY) and that net investment therefore is equal to savingminus the depreciation of capital. The supply of labor (and of its skilledand unskilled components) grows at rate n. Transforming the model intoper capita terms (with k = K/L and y = Y/L), the capital-labor ratio evolvesaccording to
k·
= sy – (δ + n)k, (5)
HIV/AIDS: The Impact on the Social Fabric and the Economy 69
31Haacker (2002b) provides a more detailed and technical discussion of the issues coveredin this section.
©International Monetary Fund. Not for Redistribution

and the economy moves toward an equilibrium in which sy – (δ + n)k andthe capital-labor ratio, and therefore output per capita, are constant. Solv-ing for the steady-state capital-labor ratio (k*) and output level (y*) yields
sA 1/(β+γ)k* = (–––––) (eH pH)β/(β+γ)(eUpU)γ/(β+γ) (6)
δ + n
and
y* = A(k*)α(eH pH)β (eUpU)γ ; (7)
that is,
1/(β+γ) s α/(β+γ) β/(β+γ) γ/(β+γ)y* = A (–––––) (eH pH) (eUpU) (8)δ + n
Equations (6), (7), and (8) provide a framework for the assessment ofthe economic impact of HIV/AIDS, at least in the longer run, described bythe steady state. In particular, the various channels through whichHIV/AIDS can affect GDP per capita are as follows.
• Changes in total factor productivity (A) or in the efficiency of skilled orunskilled labor (eH and eU). Usually, changes in A are taken to reflect thedisruptions caused by increased mortality, whereas changes in eH andeU capture losses in human capital associated with the loss of experi-enced workers. Estimates of the change in A are based on studies of theimpacts of HIV/AIDS on productivity or on production costs(although, from a macroeconomic perspective, the latter partly reflecttransfers). In line with the microeconomic studies cited above, moststudies would assume that an increase in AIDS incidence of 1 percentis associated a decline in total factor productivity of 0.5 to 1 percent.
• Changes in the composition of the workforce (pH and pU). If HIV preva-lence is higher among the unskilled, the workforce share of the skilled(pH) will rise, and output per capita will rise. There is no clear patternacross countries regarding the skill bias of HIV/AIDS. Studies fromSouth Africa (such as BER, 2001) and Botswana (BIDPA, 2000) typi-cally suggest that HIV prevalence is higher among workers with lowskills, but these results are not robust across countries and maychange during the course of an epidemic.
• Changes in the saving rate. The assumptions adopted in the literatureregarding changes in aggregate saving are inspired by studies of theimpact of HIV/AIDS on individual households. If, for example,households affected by HIV do not save because they must meet thecosts of treatment and care, this translates into a decline in aggregatesaving, which can be related to observed HIV prevalence rates. As dis-
70 MARKUS HAACKER
©International Monetary Fund. Not for Redistribution

cussed below, however, studies addressing the optimal saving behav-ior of households who face a substantially increased risk of mortalitypredict a much larger decline in saving rates.
• Changes in the rate of population growth. HIV/AIDS is associated witha decline in population growth, initially owing to increased mortalitybut later also reflecting lower birthrates. A decline in the growth rateof the working-age population is associated with an increase in thecapital-labor ratio (and thus of income per capita), as the existingcapital stock is spread across fewer incoming workers.
Studies projecting the impact of HIV/AIDS on economic growth usingan approach similar to that outlined above typically predict declines of 1.0to 1.5 percentage points for the worst-affected economies, defined as thosewith HIV prevalence rates for the working-age population over 20 percent(in Botswana and Swaziland, the rate exceeds 35 percent).32 This is illus-trated in Figure 2.2, adapted from Joint United Nations Programme onHIV/AIDS (UNAIDS, 2004). As the rate of population growth also slows,the estimated impact on GDP per capita becomes even smaller. Box 2.1,
HIV/AIDS: The Impact on the Social Fabric and the Economy 71
Botswana, Lesotho, Namibia
South Africa Botswana Thirty countries
Figure 2.2. Estimated Impact of HIV/AIDS on Economic Growth Rates in Selected Countries(Percentage points of GDP)
Source: UNAIDS (2004).
0
-0.5
-1.0
-1.5
-2.0
32The studies represented in Figure 2.2 may have a more elaborate sectoral structure; thisissue is discussed further below.
©International Monetary Fund. Not for Redistribution

which draws on Haacker (2002b), provides an example of the impact ofHIV/AIDS on steady-state GDP per capita.
In one important regard there is a disconnect between the frameworkdescribed above and the concerns in the business and political communi-ties regarding the impact of HIV/AIDS on domestic and foreign directinvestment. Whereas the latter fear that an uncertain and deterioratingeconomic outlook could deter investment, and thus worsen the economicimpact of HIV/AIDS, the above closed-economy framework assumes thatinvestment changes only in line with domestic saving, and that an increasein the capital-labor ratio offsets much of the adverse impact of HIV/AIDS.At the same time, the rate of return to capital declines (as the capital-laborratio increases); the assumption that investment responds passively tochanges in saving is therefore implausible.
72 MARKUS HAACKER
Impact of HIV/AIDS on Output and Income per Capita (Percent)
Contribution of:__________________________________________
Type of economy and Population Labor efficiency________________output or income Total TFP1 Saving growth Skilled Unskilled
Closed economyOutput per capita –0.5 –2.4 –1.2 4.5 –0.9 –0.6Income per capita –0.5 –2.4 –1.2 4.5 –0.9 –0.6
Open economy with perfect capital mobilityOutput per capita –3.8 –2.4 0.0 0.0 –0.9 –0.6Income per capita –1.7 –2.4 –0.7 2.8 –0.9 –0.6
Source: Haacker (2002b).1Total factor productivity.
Box 2.1. Impact of HIV/AIDS on Output and Income per Capita
The table below summarizes the impact of HIV/AIDS in a growth modelas described in equations (3) through (9), both for a closed and for an openeconomy. For the open economy, the table differentiates between theimpacts on output and on income, as capital outflows result in investmentincome accruing to domestic residents (or, vice versa, lower inward invest-ment is associated with lower interest payments to foreign residents).
Consider an economy with an HIV prevalence rate of 10 percent. Thegrowth rate of the working population falls by 1 percentage point, from3 percent to 2 percent a year. Skilled workers account for 20 percent of theworking population. Factor shares are 37 percent for capital, 28 percent for
©International Monetary Fund. Not for Redistribution

A simple model that does take these considerations into account is theopen-economy version of the neoclassical growth model.33 In this modelthe rate of return to capital is tied to the world interest rate, possiblyadjusted for country risk.34 In the present context this means that
∂Y––– = r* + risk premium. (9)∂Y
HIV/AIDS: The Impact on the Social Fabric and the Economy 73
33For a general discussion of this model, see Barro, Mankiw, and Sala-i-Martin (1995) orHaacker (2002b).
34One possibility not explored here is that an HIV/AIDS epidemic may itself increase acountry’s risk premium, reflecting the country’s deteriorating and more uncertain economicoutlook. Instead the risk premium is assumed to be constant.
skilled labor, and 35 percent for unskilled labor. The rate of depreciation is10 percent a year. In the open-economy model, the economy starts out witha net investment position of zero. As a result of increasing mortalityrates, average labor productivity falls by 2 percent for skilled workers and by1 percent for unskilled workers. The aggregate saving rate (for both theformal and the informal sector) falls from 15 percent to 14.7 percent—thatis, by 2 percent (0.3 percentage point)—and total factor productivitydeclines by 1.5 percent.
As a result of these changes, output per capita declines by 0.5 percent inthe closed-economy model, owing to declines in total factor productivityand the efficiency of labor, which together account for a decline in outputper capita of 3.8 percent. Although the saving rate decreases (accounting fora further decline of output per capita of 1.2 percent), most of the adverseeffect on output per capita from all these sources is offset by slower popu-lation growth (which, other things equal, would raise output per capita by4.5 percent), so that the overall effect on output per capita is relativelysmall.
If investment is sensitive to changes in the rate of return to capital, asin the open economy described by equation (9), the impact of HIV/AIDSon output per capita is much stronger, because changes in the populationgrowth rate (and in the saving rate) no longer have an impact on outputper capita. Since in this case the country’s net investment position changes(as residents accumulate foreign assets or the level of foreign-owned assetsin the domestic economy declines), it is important to take into account theassociated interest income streams. In this example, output per capitadeclines by 3.8 percent, whereas income per capita falls by only 1.7 percent.
©International Monetary Fund. Not for Redistribution

As the rate of return to capital falls—for example, because of the costsand productivity losses associated with an HIV/AIDS epidemic—domesticand multinational investors in this model reduce their investment in theaffected economy and instead invest abroad. This means that the capital-labor ratio declines, and the adverse impact of HIV/AIDS is exacerbatedrather than mitigated as above. Box 2.1 provides a numerical example forthis type of model, drawing on Haacker (2002b).35
One of the issues frequently raised regarding the impact of HIV/AIDSon GDP is whether and to what extent the impact can be mitigated orincome per capita can rise through shifts of workers from the informal tothe formal sector. When an employee of a high-productivity company inthe formal sector retires or dies and is replaced by a hitherto less gainfullyemployed worker from the informal sector, income per capita rises. Thisargument, however, is at best misleading and, in many situations, wrong,because it rests on the assumption that the demand for labor in the formalsector is a given. First, it is important to understand that the formal sectorrelies to a larger extent on employees with particular qualifications,whereas people moving from the informal to the formal sector (and thosein the formal sector they replace) typically have fewer professional skills.Second, HIV/AIDS also affects professionals with formal skills, and in theaggregate this is likely to have an adverse effect on the demand forunskilled labor.
Indeed, for the most common forms of the neoclassical growth model,it can be shown that an equiproportionate change in the number of skilledand unskilled workers will eventually leave the shares of skilled andunskilled workers working in the two sectors (and thus GDP per capita)unchanged. In this case changes in GDP per capita would need to comefrom changes in the composition of the labor supply or in the accumula-tion of capital, along lines similar to those discussed above.36
Several studies have addressed the impact of HIV/AIDS using morecomplex, computable general equilibrium models.37 Although these mod-els typically feature a much larger number of sectors, the dynamic struc-ture is similar to that of the neoclassical growth model. One of the distinctadvantages of this approach is that it allows a more realistic sectoral disag-
74 MARKUS HAACKER
35Although they do not make it explicit, Drouhin, Touzé, and Ventelou (2003) also use thisframework regarding the accumulation of physical capital.
36For a thorough discussion for the impact of HIV/AIDS in a dual economy, see Haacker(2002b).
37Examples include Kambou, Devarajan, and Over (1992) for Cameroon, Arndt and Lewis(2001) for South Africa, and Arndt (2003) for Mozambique.
©International Monetary Fund. Not for Redistribution
gregation of GDP. However, the insights from these models resemble thoseof the dual-economy model discussed above: those sectors that use factorsthat are more affected by a shock will contract. An analysis of this familyof models is beyond the scope of the present study, but the studies refer-enced also discuss some of the more general issues regarding computablegeneral equilibrium models.
Saving and the Accumulation of Human Capital
The studies discussed above make rather simple assumptions about thelink between HIV/AIDS and saving, typically relating changes in saving tothe cost of treatment. There are good reasons to believe, however, thatHIV/AIDS has a much more extensive and complex impact on saving.The increased risk of mortality means that individuals have less of anincentive to save, both for themselves and for their offspring. Thisapproach also extends to the accumulation of human capital. The modelsdiscussed above interpret HIV/AIDS as a disruption to productionprocesses, which reduces productivity, but the impact on productivity canbe much larger in the longer run as individuals invest less in their own ortheir children’s education, or as companies reduce their investment inemployee training.
Freire (2002) addresses the impact of HIV/AIDS on saving using amodel with intertemporally optimizing consumers; her paper alsoincludes an application to South Africa. Linking the optimal consumptionpaths to a representative individual’s mortality, she estimates that saving asa proportion of GDP will be about 14 percent (not percentage points)lower by 2010, a much larger number than would be obtained using themore common approach, whereby some of the direct costs of HIV/AIDSare financed from savings. Several other studies focus on the impact ofHIV/AIDS on the accumulation of human capital. Ferreira and Pessoa(2003) adopt a model in which individuals allocate their lifetime betweeneducation and work in order to maximize the present discounted value oflifetime income. Equilibrium is characterized by some optimal level ofschooling, a steady-state capital-labor ratio, and an allocation of agents tothe goods and education sectors. Although the calibrations of the modelyield projections of the impact of HIV/AIDS that are on the high side (forZambia, for example, the estimate is of a decline in education time by half,and a drop in income per capita by one-third), the authors very thor-oughly discuss their findings in the context of the earlier literature.
The most ambitious attempt so far to assess the impact of HIV/AIDS oneconomic growth is that by Bell, Devarajan, and Gersbach (2003 and
HIV/AIDS: The Impact on the Social Fabric and the Economy 75
©International Monetary Fund. Not for Redistribution

Chapter 3, this volume). The unit of analysis is the individual household.HIV/AIDS may result in the death of one or both parents in a household,which affects the accumulation of human capital in several ways. It affectstheir children’s ability to accumulate human capital, and it reduces thefamily’s income. Looking ahead, the increased risk of mortality reduces thereturns to investment in the children’s education. This is an effect similarto those described above, and it applies to all households. In light of thelarge numbers of orphans in countries with severe epidemics, theseauthors’ emphasis on the asymmetric effects on orphans is highly relevant:not only do orphans attain lower levels of human capital in this analysis,but, because a child’s level of human capital depends on that of the child’sparents, their own offspring will be affected as well.
Birdsall and Hamoudi (Chapter 4, this volume) assess the impact ofHIV/AIDS on the accumulation and utilization of human capital. The keyto their argument is that lower life expectancy reduces the returns to accu-mulating human capital, thus reducing the demand for education, andthey present evidence that increased life expectancy has indeed been asso-ciated with increased duration of schooling and higher primary schoolenrollment rates. The impact of HIV/AIDS on GDP will be exacerbated if,because of HIV/AIDS, the economy falls back below a critical mass ofhuman capital. Finally, the authors point out that, as HIV reduces theaccumulation of physical capital, this would in turn reduce the returns tohuman capital.
Incorporating the Impact of HIV/AIDS into a Large-ScaleMacroeconomic Model
Several studies have analyzed the impact of HIV/AIDS in South Africausing more complex macroeconomic models. A study commissioned byING Barings South African Research (2000) emphasizes the impact ofHIV/AIDS on the labor force (distinguishing among four skill levels), onproductivity (through absenteeism and illness), on production costs, andon the demand for health services. They predict that the labor supply(weighted by skill level) will decline by 12.8 percent by 2010 and that realGDP will decline by 3.1 percent compared with a scenario without AIDS,implying a substantial increase in per capita income.38 Arndt and Lewis(2001), using a 15-sector computable general equilibrium model, draw on
76 MARKUS HAACKER
38This substantial increase in income per capita appears to stem from a decline in unem-ployment and an increase in aggregate demand (in per capita terms).
©International Monetary Fund. Not for Redistribution

the same demographic projections used in the ING Barings study. Theyproject that GDP per capita will decline by 8 percent by 2010, relative to ano-AIDS scenario, and that domestic absorption, excluding food, medicalservices, and HIV/AIDS-related government expenditure, will fall by 13percent. BER (2001) focuses on the epidemic’s effects on the overall pop-ulation and the labor force, the direct and indirect costs to private busi-nesses, and government and household expenditure. The study projectsthat GDP growth will decline by between 1.4 and 1.8 percentage pointsbetween 2002 and 2015, and that GDP growth per capita will increase by0.7 to 1.0 percentage points over the same period.
Empirical Studies
Several studies have attempted to evaluate the impact of HIV/AIDS oneconomic growth empirically, with mixed results. An early study by Bloomand Mahal (1997), using data through 1992, finds an insignificant linkbetween growth of GDP per capita and cumulative AIDS cases for a crosssection of 51 countries. Bonnel (2000) finds that HIV/AIDS may affectgrowth of GDP per capita both directly and through its impact on policyinstitutions. He reports that, in the 1990–97 period, increased HIV preva-lence was associated with a decline in growth of GDP per capita. For acountry with an HIV prevalence rate of 15 percent, for example, he postu-lates a decline in growth of GDP per capita of 1 percent. Using panel datafrom 41 African countries between 1960 and 1998, Dixon, McDonald, andRoberts (2001) find a significant effect of HIV/AIDS on “health capital”(as measured by life expectancy), but no significant impact of health cap-ital on growth.
In interpreting these empirical studies, it is important to bear in mindtwo principal shortcomings. First, it is generally not possible at this stageof the epidemic to distinguish whether the observed changes in the growthrate of GDP per capita (if any) reflect long-term changes or changes in thelevel of steady-state GDP per capita associated with a temporary change inGDP growth as the economy adjusts to the new equilibrium. For example,it is not possible to extrapolate the findings of Bonnel (2000) beyond the1990–97 period he considers. Second, the empirical analysis of the impactof HIV/AIDS on economic growth is beset with serious problems arisingfrom errors in variables, affecting both the dependent variable (economicgrowth) and the HIV-related variables (mortality, prevalence, and soforth). Regarding GDP growth, the national accounts framework in manycountries with high HIV prevalence rates is weak, and the data on GDPgrowth are unreliable. Data on HIV prevalence and mortality, in turn, are
HIV/AIDS: The Impact on the Social Fabric and the Economy 77
©International Monetary Fund. Not for Redistribution

usually derived from relatively few observations, usually seroprevalencedata from blood tests at antenatal clinics, which are incorporated into anepidemiological and demographic model to obtain aggregate estimates atthe national level, with a large margin of error.
Balance of Payments
The two components of the balance of payments are the capitalaccount (also called the financial account, which captures investmentflows) and the current account (which comprises payments for goods andservices, and transfers, including external grants). One of the concernsregarding the macroeconomic impact of HIV/AIDS, alluded to above, isthat the deteriorating and uncertain economic outlook and higherproduction costs in afflicted countries are likely to deter investment.Domestic investors would shift funds abroad, and international investorswould refrain from investing in the affected economy; as a consequence,the balance on the capital account would decline. At the same time, thegrant flows associated with an expanded response to HIV/AIDS can besubstantial, amounting to several percent of GDP in some countries.One of the possible adverse macroeconomic effects of such increasedaid flows is Dutch disease: an inflow of external grants can cause thedomestic currency to appreciate, reducing the competitiveness of domes-tic industry.
To understand the potential implications of capital outflows, considerthe discussion above of the impact of HIV/AIDS on the growth of out-put and income per capita in an open economy. In the most commonlyused closed-economy models, increased mortality and lower birthratesresult in an increase in the capital-labor ratio, which mitigates the impacton output per capita. A higher capital-labor ratio, however, is associatedwith a decline in the rate of return to capital. In the open-economymodel, investment responds to a decline in the rate of return to capital,by rising until this rate is back in line with the rate of return of some com-parator asset. What are the quantitative implications for the capitalaccount? In the numerical example in Box 2.1, based on Haacker (2002b),capital outflows cause output per capita in the open economy to declineby an additional 3.3 percent. Given an elasticity of output with respect tocapital of 37 percent (see Box 2.1) and a capital-output ratio of 2 (a not-uncommon ratio for many developing countries), the accumulatedchange in the capital account (through larger capital outflows or a declinein foreign direct investment) could eventually amount to 19 percent of
78 MARKUS HAACKER
©International Monetary Fund. Not for Redistribution

GDP.39 Even under the assumed conditions of perfect capital mobility, thisaccumulated change would materialize only as the demographic and eco-nomic impacts of the epidemic unfold over time. On an annual basis, thechanges in the balance of payments are therefore much smaller than theeventual accumulated change. A second issue for the balance of paymentsis the increased grant inflows associated with an expanded response toHIV/AIDS. Most of these funds would initially finance prevention-relatedactivities such as voluntary counseling and testing (which are projected toaccount for 9.5 percent of the total costs of scaling up HIV/AIDS activitiesin low- and middle-income countries in 2005; see UNAIDS, 2004), pro-grams for populations at risk (19.3 percent), condom marketing and pro-vision (8.7 percent), and management of sexually transmitted diseases (5.7percent), or social expenditures such as community and orphan support(9.3 percent). Treatment and care—presumably with a somewhat higherimport content—are projected to account for only about one-third of thecosts of scaling up HIV/AIDS-related programs in 2005 and 2007. Thusmost of the grant financing would finance locally provided services with arather low import content, or transfers and social expenditure.
This raises the question of whether these grant inflows would createsome imbalance in the balance of payments, causing currencies to appre-ciate in the recipient countries—a phenomenon commonly referred to as“Dutch disease.” The empirical literature on the link between aid andDutch disease is inconclusive.40 In the case where grant inflows financeHIV/AIDS-related spending, it is also important to distinguish betweenchanges in the nominal exchange rate and changes in productivity andcompetitiveness. From a macroeconomic perspective, HIV/AIDS-relatedexpenditures are productive expenditures, enhancing the productivecapacity of the economy both immediately (through treatment) and in thelonger run (through enhanced prevention and orphan support). Thiswould enhance productivity and competitiveness and facilitate the steril-ization of foreign currency inflows.
Finally, although this discussion has treated the current and capitalaccounts as separate issues, one should not simply add up the effects ofHIV/AIDS on the two, because the effects are interdependent. A compre-hensive response to HIV/AIDS, financed through external grants, wouldmitigate many of the effects on demographics, productivity, and produc-
HIV/AIDS: The Impact on the Social Fabric and the Economy 79
39This is calculated as (capital/GDP) × (percentage change in output)/(elasticity of outputwith respect to capital).
40For a more thorough discussion of the macroeconomic effects of external aid, see Nkusu(2004).
©International Monetary Fund. Not for Redistribution

tion costs that give rise to capital outflows, and it would give rise to newinvestment opportunities, especially in the health sector. Thus a reductionin capital outflows (or an increase in foreign direct investment) would bepart of a successful scenario financed by external grants.
Poverty and Inequality
HIV/AIDS affects most of the common indicators of living standards,such as income, health standards, and access to education. Success in com-bating HIV/AIDS, malaria, and other diseases is therefore itself one of theMillennium Development Goals (MDGs) defined by the United Nations,and it will have a direct effect on at least five other MDGs: eradicatingextreme (income) poverty and hunger, achieving universal primary educa-tion, promoting gender equality and empowering women, reducing childmortality, and improving maternal health.41 At the same time, povertyaffects people’s vulnerability to HIV/AIDS, both by increasing the risk ofcontracting the virus oneself (for example, through lack of education orsexual choice) and by reducing one’s ability to deal with the economic andsocial consequences of AIDS: poor households are in a worse position thanothers to cope with the illness and death of a household member.
The primary objective of this and the following section is to show howHIV/AIDS, through its demographic and economic impacts, affects livingstandards at the individual and the household levels. Although it echoesthe discussion of the microeconomic effects of HIV/AIDS, especially at thehousehold level, the discussion also draws on the analysis of the impact ofHIV/AIDS on economic growth. The key hypothesis guiding the discus-sion is that, in light of the uneven impact of HIV/AIDS across individualsand households, the distributional aspects of the impact of HIV/AIDS areas much a part of the picture for the economic or fiscal analysis ofHIV/AIDS as the impacts on economic growth or income per capita.Without prejudice to the other dimensions of the impact of AIDS onpoverty, the analysis here focuses on that impact in terms of householdand individual income, since this most directly relates to the contents ofthis chapter. The discussion in this section is also complemented by themore extensive analysis by Greener (Chapter 5 of this volume).42
80 MARKUS HAACKER
41The MDGs less directly affected are ensuring environmental sustainability and develop-ing a global partnership for development.
42For broader discussions of the impact of HIV/AIDS on poverty, see also Loewenson andWhiteside (2001), van Donk (2002), and Whiteside (2002).
©International Monetary Fund. Not for Redistribution

HIV/AIDS can affect poverty and the distribution of income in severalways. As wages and salaries (and other factor income) change, reflectingchanges in factor markets, the income distribution changes. The most vis-ible effects are on those households with an HIV-positive member.Through the loss of an income earner, or as other household membersneed to divert time from work to the care of one who is sick, the house-hold’s income declines. At the same time, the household’s needs increasebecause of higher medical expenses.
Before discussing the link between HIV/AIDS and poverty, it is worthtaking one step back to discuss the meaning of poverty in this context.43 Inmost cases poverty is defined in terms of income, either in absolute termssuch as dollars per capita or per household, or in relative terms, for exam-ple as a percentage of average household income in the economy. House-holds or individuals whose income is below some critical value, or povertyline, are classified as poor. A more comprehensive definition of poverty isneeds based; here the poverty line is defined as the price of a consumptionbundle, whose content is based on an assessment of critical needs, whichmay differ according to household characteristics. Because HIV/AIDS isassociated with an increased need for health-related spending in thosehouseholds affected, the critical income level will be higher for thosehouseholds.
Not only can HIV/AIDS cause poverty, but poor households, in turn,are also more vulnerable to HIV/AIDS, in that they are less able than otherhouseholds to maintain a given level of consumption when faced withsome new adversity. Although health expenditure as a share of householdincome is frequently similar across households with different incomes,higher expenditure, of course, buys better health care. Moreover, higher-income households have better access to credit and insurance markets (forexample, through employment-based health and social insurance), miti-gating the impact of illness on living standards. Especially in the absenceof well-functioning credit and insurance markets, a household’s wealth isalso relevant. A household that derives a larger share of its income fromassets that it owns is in a better position to smooth consumption inresponse to changes in its income.
The discussion above of the macroeconomic effects of HIV/AIDSalready has some implications for the distribution of income (and, to amuch lesser extent, the incidence of poverty), primarily through changes
HIV/AIDS: The Impact on the Social Fabric and the Economy 81
43The applicable definitions of poverty are discussed in more detail in Greener (Chapter5, this volume).
©International Monetary Fund. Not for Redistribution

in wage rates. Typically, studies of the effects of HIV/AIDS on GDP percapita, inspired by the neoclassical growth model, distinguish between dif-ferent types of labor (skilled and unskilled, for example) and between sec-tors (formal and informal; agriculture, manufacturing, and services; andso forth). Wage rates reflect the scarcity of each type of labor. If the macro-economic model predicts that the incomes of skilled workers will increase,this points toward an increase in inequality, because skilled workersalready typically draw higher salaries than unskilled workers. The princi-pal limitation of this type of model in analyzing poverty and inequality,however, is that it focuses on the aggregate supply of labor rather than thewell-being of households. Thus, in such an analysis, a worker dying ofAIDS simply disappears from the labor force, whereas in fact the death ofan income earner has obvious implications for the income and welfare ofthe affected household.
The most direct information on the impact of HIV/AIDS on house-holds comes from case studies comparing households affected with thosenot affected by the disease (or by illness in general). For example, Bach-mann and Booysen (2003), using a sample of 404 households from SouthAfrica, find that income and expenditure for households affected byHIV/AIDS or other illness is substantially lower than for households notaffected (Table 2.7). The impact of HIV/AIDS on income seems to be moresevere than for other illnesses, and this is consistent with a higher inci-dence of hospital visits for people living with HIV.
The principal shortcoming of detailed case studies of the impact ofHIV/AIDS is the limited sample size. An alternative approach, taken byGreener (Chapter 5, this volume) and the earlier study from Botswana thatthis chapter draws on, by Greener, Jefferis, and Siphambe (2000), combinesa macroeconomic framework with detailed data on household income and
82 MARKUS HAACKER
Table 2.7. Income and Expenditure of Households Affected by Illness in South Africa(Percent of income or expenditure in unaffected households)
Item Any Illness HIV/AIDS
Household incomeTotal 84 71Per person 74 61Per adult equivalent 78 65
Household expenditureTotal 81 78Per person 70 68Per adult equivalent 74 72
Source: Bachmann and Booysen (2003).
©International Monetary Fund. Not for Redistribution

household composition from a Household Income and Expenditure Sur-vey and a definition of poverty based on the costs of a basket of basicgoods. Unlike Bachmann and Booysen (2003), this study focuses on theimpact of HIV/AIDS owing to increased mortality only, modeled as a one-time shock, and thus does not capture the adverse impact on the house-holds of people living with HIV.
The primary effect of HIV/AIDS on poverty and inequality in Greener(Chapter 5, this volume) derives from its impact on household incomes.The study finds that, for a given wage rate, HIV/AIDS results in an increasein the poverty rate, and that poor households are disproportionatelyaffected. The household poverty count increases from 37.7 percent to 43.7percent. At the same time, however, inequality as measured by the Ginicoefficient barely changes. Adding the changes in the macroeconomicenvironment to the analysis mitigates the impact on the householdpoverty count by 1 percentage point, as household income in this caserises. Thus the study confirms that income per capita is not a meaningfulindicator of the impact of HIV/AIDS on poverty: although income percapita rises on average, poverty rates increase.
The studies just discussed cover a relatively short time horizon. In fact,the impact of HIV/AIDS on poverty is likely to evolve over a longer period,as more households become affected; on the other hand, the fortunes of ahousehold affected by HIV/AIDS today may improve in the future. In theabsence of empirical studies thus far, a hypothetical example will illustratethis point. Consider an economy in which all households are either “rich”or “poor.” The evolution of the income distribution over time can be char-acterized by a transition matrix, which shows the probability that a house-hold will remain rich or poor in the next year or move up or down thissimplistic income distribution. Formally,
sr,t+1 αrr αrp sr,t[ ] = [ ] [ ], (10)sr,t+1 αrr αrp sr,t
where sr,t and sp,t represent the shares of the rich and the poor in the pop-ulation at time t, respectively, and αrp denotes the probability that a poorhousehold will belong to the rich group in the next period. Assume that,in a given year, 2 percent of rich households experience an adverse shockand become poor (αpr = 0.02, and therefore αrr = 0.98), and 4 percent ofpoor households become rich (αrp = 0.04). Over time the economy willthen converge to a steady state in which 67 percent of households are richand 33 percent are poor. Now assume that, because of HIV/AIDS, 2 per-cent of households each year will lose an income earner. As a consequence,half of the rich households affected will become poor (and αpr rises by
HIV/AIDS: The Impact on the Social Fabric and the Economy 83
©International Monetary Fund. Not for Redistribution

about 1 percentage point, to 0.0298), and none of the poor householdsaffected will become rich (αrp falls to 0.0392). This would mean that, overtime, with more rich households becoming poor and fewer poor house-holds becoming rich, the poverty rate rises from 33 percent to 43 percentin the new steady state. Although this example is only illustrative, it sug-gests that even a relatively low incidence of HIV/AIDS can have a substan-tial impact on poverty rates as this impact accumulates over time.44
Booysen (2003) uses this type of approach over a relatively short timehorizon and shows that HIV/AIDS is associated with a decline in theincome ranking of the affected households. He uses a relatively small sam-ple (325 households, with three semiannual observations for each), whichhe sorts into five income quintiles.45 His findings suggest that householdsaffected by HIV/AIDS are more likely to move down the income distribu-tion and less likely to move up. The principal difference between thisanalysis and the example above is that Booysen focuses on the income dis-tribution (and movements of households affected by HIV/AIDS withinthe distribution) rather than movements relative to some poverty line.
One study concerned with the impact of HIV/AIDS on poverty in thelong run is that by Bell, Devarajan, and Gersbach (Chapter 3, this volume),already discussed above in the context of economic growth. In that chap-ter HIV/AIDS has an immediate impact on household income; in terms ofthe above transition matrix, αpr, the probability of a rich household turn-ing poor, increases. Additionally, there are some factors at play that affectthe future prospects of household members, including a disruption of thetransfer of human capital between parents and children and a disadvan-tage in access to formal education. Thus for those households αrp, theprobability of becoming rich, may decline.
Two primary conclusions can be drawn from this analysis of the impactof HIV/AIDS on poverty (as measured here in terms of household or indi-vidual income). First, because the economic impact of HIV/AIDS is veryuneven across households (depending, in the first place, on whether ahousehold member has become infected or dies), aggregate measures ofthe economic impact of HIV/AIDS provide very little information regard-ing the impact on poverty. Second, the impact of HIV/AIDS may accumu-late over time, because an increased risk of becoming poor at some pointduring a given period of time—measured in terms of the coefficients in a
84 MARKUS HAACKER
44In this numerical example, it takes 10 years to complete half of the adjustment towardthe new steady state.
45The sample appears to be the same as in Bachmann and Booysen (2003), apart fromattrition between the second and third wave of the exercise.
©International Monetary Fund. Not for Redistribution

transition matrix as in equation (10)—translates into larger changes in thesteady-state income distribution. Similarly, but looking at a longer timeframe, the impact of HIV/AIDS may be cumulative because its adverseeffects are passed on to the next generation, for example in terms of chil-dren’s education as in the study by Bell, Devarajan, and Gersbach.
Risk and Welfare
The presence of HIV/AIDS increases individual risk—to health and life,but also in terms of material living standards—and most measures of wel-fare are in some way affected by such changes. This section discusses firstsome of the direct economic effects of the increased risk to individuals dueto HIV/AIDS. However, the fact that economic and social institutionsmust adjust to cope with the impact of increased mortality often hasimplications of its own for individual risk. Against this background, thissection will discuss several measures of welfare and provide examples ofthe impact of HIV/AIDS on welfare in several countries.
Economic Repercussions of Increased Risk
Through its impact on morbidity and mortality and its many economicrepercussions, an increased prevalence of HIV/AIDS is associated with anincrease in economic risk. This increased risk derives most directly fromthe decrease in life expectancy, but also from increased uncertainty aboutfuture living standards, business prospects, and the general economic out-look. Increased risk, in turn, affects the behavior of those subject to it and,consequently, the whole economy. The broad economic repercussions, inturn, generally result in a further increase in individual risk. Figure 2.3illustrates the macroeconomic effects of increased economic risk and howthe impact of HIV/AIDS on the economy indirectly increases individualrisk.
Through its impact on mortality and life expectancy, HIV/AIDS reducesthe expected returns to investments in human capital, both directly for theindividuals concerned and—in the context of an overlapping-generationsmodel—for their children. This insight is at the core of the theoreticalanalysis in Bell, Devarajan, and Gersbach (2003, and Chapter 3, this vol-ume); Birdsall and Hamoudi (Chapter 4, this volume) provide someempirical evidence for this relationship. Increased mortality risk alsoaffects the expected returns from other forms of savings. When individu-als perceive that their mortality risk has increased, they will discount
HIV/AIDS: The Impact on the Social Fabric and the Economy 85
©International Monetary Fund. Not for Redistribution

future earnings at a higher rate. Thus the incentive to save income or investin assets declines.46 Moreover, domestic private savings decline if addi-tional health expenditures are partly financed from savings. On the otherhand, the economic risk associated with HIV infection could encourageprecautionary saving.
Through its macroeconomic impacts, HIV/AIDS also has more indirecteffects on the economic risk faced by households and individuals. The mostimportant of these are the impact on public health services, on companies(especially their willingness and ability to provide employment-based riskbenefits), and on credit and insurance markets. In most countries facingsevere epidemics, health insurance coverage is very limited, but publichealth expenditure implicitly provides some degree of insurance. The avail-able evidence suggests that, so far, existing health services can barely copewith the increased demand, and they respond by rationing services. Thus,in the absence of greatly increased resources, public health services can nolonger fulfill their role of providing some degree of health insurance tothose not covered by formal health insurance schemes.
As discussed in more detail above, employees in the formal sector arefrequently covered by a corporate health insurance policy and receive cer-tain death-related benefits. In response to the rising cost of these benefits,many companies have reduced the coverage of their health insurance plansand have shifted their pension plans from defined-benefit schemes todefined-contribution schemes. Such a change in pension arrangementstypically means that employees dying from AIDS will receive less, becausethey are likely to die at a relatively young age.
Additionally, HIV/AIDS affects the functioning of credit and insurancemarkets, as increased mortality raises individual default risk for personal
86 MARKUS HAACKER
Figure 2.3. HIV/AIDS, Individual Risk, and the Economy
Individual risk Human capitalSaving
Individual risk Health servicesCompaniesCredit and insuranceDomestic security
46Freire (2002) analyzes this aspect in the context of South Africa.
©International Monetary Fund. Not for Redistribution

loans and increases the cost of life insurance.47 Regarding loans, it is use-ful to distinguish between personal loans and mortgages. For personalloans the primary effect of increased mortality-related default risk is anincrease in the cost of lending. To the extent that prevalence rates differacross population groups, borrowers in high-prevalence groups are likelyto see their access to credit deteriorate. For people known to be HIV-positive, Jurisich, Liber, and Elkounovitch (2002) report that “some 30 per-cent of non-mortgage lenders would decline a loan, [and the other lendersindicated that] a solution might be found using a combination of a shorterloan term, other security methods . . . [or] ensuring that there is existinginsurance in place.” For mortgages, which tend to involve larger sums andlonger repayment periods, banks tend to be more concerned aboutmortality-related default and may ask that the borrower take out life insur-ance as a condition for lending. In that case, if HIV-positive borrowerscannot obtain life insurance, they are excluded from obtaining or refi-nancing a mortgage.
Finally, and echoing the earlier discussion of social and economic insti-tutions, HIV/AIDS increases individual risk to the extent that it adverselyaffects domestic security. Most directly, widespread prevalence ofHIV/AIDS impairs the capacities of government institutions to fulfill theirtasks, including the enforcement of domestic security. At the same time,poverty rates may increase and access to education may decline, both ofwhich could eventually increase the incidence of crime. More generally, theWorld Bank’s recent report on civil war and development policy (Collierand others, 2003, discussed above) makes the case that the incidence ofcivil war is much higher in low-income countries whose economies arestagnant or declining. Thus, in politically unstable countries, anHIV/AIDS epidemic, by hindering or reversing economic development,contributes to a political and economic setting that makes domestic con-flict more likely.
Welfare
Changes in income per capita fail to capture the full impact ofHIV/AIDS on living standards, primarily because increased mortalitymeans that lives become more uncertain and, on average, shorter, but also
HIV/AIDS: The Impact on the Social Fabric and the Economy 87
47Jurisich, Liber, and Elkounovitch (2002), in a study from South Africa, report that death-related defaults accounted for 28 percent of defaults on loans and 20 percent of defaults onmortgages. Because mortality is expected to rise over the next several years, these shares (andoverall default risk) are likely to increase.
©International Monetary Fund. Not for Redistribution

because of the manifold economic repercussions of HIV/AIDS discussedabove. Having already addressed the impact of HIV/AIDS on many of thespecific aspects of economic development (such as access to education,health standards, and poverty rates), this chapter will instead focus in thissection on two summary measures of the impact of HIV/AIDS on welfare.The first of these is the Human Development Index (HDI) developed bythe United Nations Development Programme (2003), and the second(used, for example, in Crafts and Haacker, Chapter 6 of this volume) is ameasure based on individuals’ valuations of increased mortality risk.
The HDI attaches equal weights to educational attainment, income percapita, and life expectancy at birth, all three of which are likely to beaffected by HIV/AIDS. The largest impact, however, comes from declininglife expectancy; changes in the other two factors are more uncertain anddependent on the policy response and as such are not included in the pre-sent analysis. Table 2.8 illustrates the changes in the HDI brought about bythe lowering of life expectancy due to HIV/AIDS and establishes a histor-ical perspective. It demonstrates how the reduced life expectancy at birthdue to HIV/AIDS slows an economy’s development as measured by theHDI and offsets any gains in educational attainment and GDP per capita.For example, whereas countries like Botswana, South Africa, and Swazi-land—had they not been affected by severe HIV/AIDS epidemics—mighthave attained living standards (as measured by the HDI) comparable tothose in Brazil or Russia, their HDIs are now more comparable to those incountries like Bolivia (for South Africa), or India and Cambodia (forBotswana and Swaziland).
The second approach involves imputing the costs of increasing mortal-ity from individuals’ valuations of increased mortality risk. This approachhas an explicit foundation in the microeconomic theory of the consumer:
88 MARKUS HAACKER
Table 2.8. Human Development Indices for Selected Countries, 1950–2001
2001_____________________________In absence of
Country 1950 1975 Actual AIDS
Botswana 0.25 0.50 0.57 0.77Malawi 0.27 n.a. 0.48 0.52Mozambique 0.16 0.32 0.39 0.48Haiti 0.18 n.a. 0.32 0.36South Africa 0.48 0.65 0.68 0.77Swaziland 0.24 0.51 0.58 0.74Thailand 0.39 0.60 0.78 0.79
Sources: Crafts (2001); and author’s calculations based on data from United Nations DevelopmentProgramme (2003) and the U.S. Census Bureau.
©International Monetary Fund. Not for Redistribution

expected lifetime utility declines if mortality rises (and, consequently, lifeexpectancy falls). One can measure the welfare loss associated withincreased mortality by determining the loss in income that, for a givenindividual, would yield the same loss in lifetime utility as the observed lossin life expectancy. In general, risk aversion implies that the welfare lossthus defined will exceed the loss in expected income owing to reduced lifeexpectancy. This means that an increase in risk, as measured by increasedmortality owing to HIV/AIDS or through its economic repercussions, canhave strong implications for welfare.
Estimating the welfare loss associated with increased mortality requiresestimating the trade-off between income and mortality or life expectancy.In the literature, such estimates of the “value of statistical life” are typicallyobtained from wage differentials between jobs with different mortalityrisks; data on these differentials are often available from past assessmentsof environmental or health interventions. Table 2.9 summarizes estimatesof the welfare loss due to HIV/AIDS from Crafts and Haacker (Chapter 6,this volume), which also describes this approach in more detail.
The estimates reported in Table 2.9 suggest that the welfare effects ofincreased mortality are huge, dwarfing even the most pessimistic estimatesof the economic impact in terms of GDP per capita. Among the countriescovered here, welfare losses range from 2.3 percent of GDP in Thailand,where life expectancy declines by 0.8 percent, to 89 percent of GDP forBotswana, with life expectancy declining by 59 percent.48 Whatever the sig-nificance of these point estimates, they clearly show that the impact of
HIV/AIDS: The Impact on the Social Fabric and the Economy 89
Table 2.9. Aggregate Welfare Effect of Increased Mortality, 2004
Change:____________________________________________________________In mortality In life expectancy In welfare
Country (percentage points) (percent) (percent)
Botswana 3.1 –59.1 –88.9Côte d’Ivoire 0.4 –13.3 –37.3Ethiopia 0.2 –8.5 –25.3Haiti 0.3 –12.7 –33.9South Africa 1.1 –32.3 –69.6Thailand 0.02 –0.8 –2.3Zambia 1.1 –32.3 –68.8
48The fact that the estimated welfare loss is larger than the decline in life expectancy canbe linked to individuals’ preferences; the estimates imply that these preferences exhibit somedegree of risk aversion, which is a standard assumption in the microeconomic literature. SeeCrafts and Haacker (Chapter 6, this volume) for a more detailed discussion.
©International Monetary Fund. Not for Redistribution

HIV/AIDS on economic growth and income per capita, although a usefulmeasure in many respects, is not a meaningful indicator of the full eco-nomic costs of the epidemic.
Conclusions and Outlook
The primary effect of HIV/AIDS is an increase in mortality and a dete-rioration in health. The epidemic affects primarily young adults, who areintegrated into all areas of economic and social life, and this chapter hashighlighted its effects at the household level, for businesses, and for gov-ernment services. With mortality rates for the working-age populationincreasing manyfold in countries with severe epidemics, the economicimpact is grave: indeed, HIV/AIDS is clearly the most serious impedimentto economic growth and development in these countries. Therefore anunderstanding of the economic consequences of HIV/AIDS is essential foreconomic analysts and policymakers working in countries with severeepidemics.
However, the channels through which HIV/AIDS affects economicgrowth are not well understood. Most of the earlier studies focused on dis-ruptions to the production process associated with increased mortalityand morbidity and on the impact of increased health expenditure ondomestic saving. This chapter’s analysis of the microeconomic effects ofHIV/AIDS, for example on households and the private sector, and of theimpact on social and economic institutions in general, suggests that theseeffects are very serious and that many are not captured in macroeconomicassessments. Studies that have attempted to capture some of these effects(such as Bell, Devarajan, and Gersbach, Chapter 3, this volume, for house-holds, and Haacker, 2002b, for investment) find substantial downside risksto economic growth, related, for example, to the accumulation of humancapital and its transfer between generations at the household level, and tocapital outflows or declines in foreign direct investment.
Although the impact of HIV/AIDS on economic growth is important fora variety of reasons, it is necessary to keep in mind that this impact is spreadvery unevenly across the population. It is obviously most profound for peo-ple living with HIV/AIDS, and their households, especially when theafflicted member is an income earner. On the other hand, many householdsare affected only through the macroeconomic repercussions of HIV/AIDS,and some may even benefit, for example when a worker is promoted toreplace someone who has died, or when a business competitor closes down.Thus, even if the estimated impact of HIV/AIDS on average income per
90 MARKUS HAACKER
©International Monetary Fund. Not for Redistribution

capita is small, poverty rates can increase.49 More generally, it is question-able whether GDP and GDP per capita are meaningful measures of the eco-nomic impact of HIV/AIDS. If, for example, the probability for a20-year-old to survive until age 60 declines from over 70 percent to lessthan 30 percent, this has a serious impact on living standards beyond anychanges in consumption.50 Several studies have attempted to assess theimpact of increased mortality on welfare directly,51 and they find that itdwarfs any estimated effects on economic growth. Even for countries withonly moderate HIV epidemics, such as Vietnam (Table 2.9), the welfarelosses can be significant; for some of the worst-affected countries, such asSouth Africa and Botswana, they can exceed three-fourths of GDP.
HIV/AIDS, through its numerous impacts on households and individ-uals, on the productive capacity of the economy, and on governmentfinances, is a serious constraint on economic development. In many coun-tries with severe epidemics, it is the single most serious challenge today tomaintaining and, where possible, improving living standards. However,getting the response right, in terms of preventing new infections and mit-igating the impact of those that do occur, represents a huge challenge togovernments and their development partners, especially where the humancapacities of the public services are themselves eroded by the epidemic.The international community has responded by developing programs,such as the WHO’s “3 by 5” initiative, designed to increase access to treat-ment quickly and substantially. The analysis in this chapter shows thatthese international efforts are warranted, indeed imperative, when mea-sured against the economic development objectives of the internationalcommunity.
References
Ainsworth, Martha, Kathleen Beegle, and Godlike Koda, 2002, “The Impact of AdultMortality on Primary School Enrollment in Northwestern Tanzania,” AfricaRegion Human Development Working Paper (Washington: World Bank).
Arndt, Channing, 2003, “HIV/AIDS, Human Capital, and Economic Growth Prospectsfor Mozambique,” Africa Region Working Paper No. 48 (Washington: WorldBank).
HIV/AIDS: The Impact on the Social Fabric and the Economy 91
49See Greener (Chapter 5, this volume)50The numerical example of survival rates by age is based on Table 7.1 in Haacker (Chap-
ter 7, this volume) and applies to Zambia in 2004.51See, for example, Crafts and Haacker (Chapter 6, this volume) and Jamison, Sachs, and
Wang (2001).
©International Monetary Fund. Not for Redistribution
———, and Jeffrey D. Lewis, 2001, “The HIV/AIDS Pandemic in South Africa: SectoralImpacts and Unemployment,” Journal of International Development, Vol. 13, No. 4,pp. 427–49.
Aventin, Laurent, and Pierre Huard, 2000, “The Cost of AIDS to Three ManufacturingFirms in Côte d’Ivoire,” Journal of African Economics, Vol. 9, No. 2, pp. 161–88.
Bachmann, Max O., and Frederick le Roux Booysen, 2003, “Health and EconomicImpact of HIV/AIDS on South African Households: A Cohort Study,” BMC Pub-lic Health, Vol. 3, No. 1.
Barbone, Luca, and Luis-Alvaro Sanchez B., 1999,“Pensions and Social Security in Sub-Saharan Africa: Issues and Options,” World Bank Africa Region Working PaperNo. 4 (Washington: World Bank).
Barro, Robert J., N. Gregory Mankiw, and Xavier Sala-i-Martin, 1995, “Capital Mobil-ity in Neoclassical Models of Growth,” American Economic Review, Vol. 85, No. 1,pp. 103–15.
Bell, Clive, Shantayanan Devarajan, and Hans Gersbach, 2003, “The Long-Run Eco-nomic Costs of AIDS: Theory and an Application to South Africa,” PolicyResearch Working Paper No. 3152 (Washington: World Bank).
Bloom, David E., and Ajay S. Mahal, 1997, “Does the AIDS Epidemic Threaten Eco-nomic Growth?” Journal of Econometrics, Vol. 77, No. 1, pp. 105–24.
Bonnel, René, 2000, “HIV/AIDS and Economic Growth: A Global Perspective,” SouthAfrican Journal of Economics, Vol. 68, No. 5, pp. 820–855.
Booysen, Frederick le Roux, 2003, “Poverty Dynamics and HIV/AIDS-Related Morbid-ity and Mortality in South Africa,” paper presented at an international conferenceon “Empirical Evidence for the Demographic and Socio-Economic Impact ofAIDS,” Health Economics and HIV/AIDS Research Division (HEARD), Universityof KwaZulu-Natal, South Africa, March 26–28.
———, and Tanya Arntz, 2001, “The Socio-Economic Impact of HIV/AIDS on House-holds: A Review of the Literature” (Blomfontein, South Africa: Centre for Devel-opment Support and Joint Centre for Political and Economic Studies).
Botswana Institute for Development Policy Analysis (BIDPA), 2000, “MacroeconomicImpacts of the HIV/AIDS Epidemic in Botswana” (Gaborone, Botswana).
Bureau for Economic Research (BER), 2001, “The Macro-Economic Impact ofHIV/AIDS in South Africa,” Economic Research Note No. 10 (University of Stel-lenbosch, South Africa).
———, 2004, “The Impact of HIV/AIDS on Business in South Africa” (University ofStellenbosch, South Africa).
Case, Anne, Christina Paxson, and Joseph Ableidinger, 2002, “Orphans in Africa,”Working Paper No. 9213 (Cambridge, Massachusetts: National Bureau of Eco-nomic Research).
Coetzee, Celeste, 2003, “Hiring Patterns, Firm Level Dynamics and HIV/AIDS: A CaseStudy of Small Firms on the Cape Flats,” Centre for Social Science Research(CSSR), Working Paper No. 52 (Rondebosch, South Africa: University of CapeTown).
92 MARKUS HAACKER
©International Monetary Fund. Not for Redistribution
Collier, Paul, and others, 2003, Breaking the Conflict Trap. Civil War and DevelopmentPolicy (New York: World Bank and Oxford University Press).
Connelly, Patrick, and Sydney Rosen, 2004, “Will Small and Medium Enterprises Pro-vide HIV/AIDS Services to Employees? An Analysis of Market Demand” (unpub-lished; Boston: Center for International Health and Development, BostonUniversity School of Public Health).
Crafts, Nicholas, 2001, “The Contribution of Increased Life Expectancy to Growth ofLiving Standards in the UK,” 1870–1998” (unpublished; London School ofEconomics).
Cuddington, John T., 1993a, “Modeling the Macroeconomic Effects of AIDS, with anApplication to Tanzania,” World Bank Economic Review, Vol. 7, No. 2, pp. 173–89.
———, 1993b, “Further Results on the Macroeconomic Effects of AIDS: The Dualis-tic, Labour-Surplus Economy,” World Bank Economic Review, Vol. 7, No. 3,pp. 403–17.
Dixon, Simon, Scott McDonald, and Jennifer Roberts, “HIV/AIDS and Development inAfrica,” Journal of International Development, Vol. 13 (May), pp. 381–521.
Drouhin, Nicholas, Vincent Touzé, and Bruno Ventelou, 2003, “AIDS and EconomicGrowth in Africa: A Critical Assessment of the ‘Base-Case Scenario’ Approach,” inEconomics of AIDS and Access to HIV/AIDS Care in Developing Countries: Issuesand Challenges, ed. by Jean-Paul Moatti and others (Paris: Agence Nationale deRecherches sur le SIDA).
Ebony Consulting International and Malawi National Statistical Office, 2000, “MalawiNational Gemini MSE Baseline Survey” (Lilongwe, Malawi).
Ferreira, Pedro Cavalcanti, and Samual Pessoa, 2003,“The Long-Run Economic Impactof AIDS” (Rio de Janeiro: Graduate School of Economics, Fundação GetulioVargas).
Fox, Matthew P., and others, 2004, “The Impact of HIV/AIDS on Labour Productivityin Kenya,” Tropical Medicine and International Health, Vol. 9, No. 3, pp. 318–24.
Freire, Sandra, 2002, “Impact of HIV/AIDS on Saving Behaviour in South Africa,”paper presented at the IAEN Symposium on the Economics of HIV/AIDS inDeveloping Countries, Barcelona, July 6–7.
Greener, Robert, Keith Jefferis, and Happy Siphambe, 2000, “The Impact of HIV/AIDSon Poverty and Inequality in Botswana,” South African Journal of Economics,Vol. 68, No. 5, p. 888–915.
Haacker, Markus, 2002a, “The Economic Consequences of HIV/AIDS in SouthernAfrica,” IMF Working Paper 02/38 (Washington: International Monetary Fund).
––—––, 2002b, “Modeling the Macroeconomic Impact of HIV/AIDS,” IMF WorkingPaper 02/195 (Washington: International Monetary Fund).
ING Barings South African Research, 2000, “Economic Impact of AIDS in SouthAfrica: A Dark Cloud on the Horizon” (Johannesburg, South Africa: ING BaringsSouth Africa).
International Crisis Group (ICG), 2001, “HIV/AIDS as a Security Issue” (Washingtonand Brussels).
HIV/AIDS: The Impact on the Social Fabric and the Economy 93
©International Monetary Fund. Not for Redistribution

Jamison, Dean, Jeffrey D. Sachs, and Jia Wang, 2001, “The Effect of the AIDS Epidemicon Economic Welfare in Sub-Saharan Africa,” CMH Working Paper No. WG1:13(Geneva: Commission on Macroeconomics and Health, World HealthOrganization).
Joint United Nations Programme on HIV/AIDS (UNAIDS), 2004, 2004 Report on theGlobal AIDS Epidemic (Geneva).
–—–––, United Nations Children’s Fund (UNICEF), and U.S. Agency for InternationalDevelopment (USAID), 2004,“Children on the Brink 2004: A Joint Report of NewOrphan Estimates and a Framework for Action” (Geneva, New York, andWashington).
Jurisich, Stephen, Dominic Liber, and Ron Elkounovitch, 2002, “The Calm Before theStorm (1): Perceptions of, and Responses to, the Risk of HIV/AIDS in the Low-Income Housing Finance Sector,” Occasional Paper No. 6 (Johannesburg, SouthAfrica: Housing Finance Resource Programme).
Kambou, Gérard, Shantayanan Devarajan, and Mead Over, 1992, ”The Economic Impactof AIDS in an African Country: Simulations with a Computable General Equilib-rium Model of Cameroon,” Journal of African Economies, Vol. 1 No. 1, pp. 109–30.
Loewenson, Rene, and Alan Whiteside, 2001, “HIV/AIDS: Implications for PovertyReduction,” background paper for the UN General Assembly on HIV/AIDS,June 25–27, United Nations Development Programme.
Mather, David, and others, 2004, “A Cross-Country Analysis of Household Response toAdult Mortality in Rural Sub-Saharan Africa: Implications for HIV/AIDS Mitiga-tion and Rural Development Policies,” International Development Working PaperNo. 82 (East Lansing, Michigan: Michigan State University).
Moore, Deane, 1999, “The AIDS Threat and the Private Sector,” AIDS Analysis Africa,Vol. 9, No. 6, pp. 1–2.
Morris, Chester N., and Edward J. Cheevers, 2000, “The Direct Costs of HIV/AIDS in aSouth African Sugar Mill,” AIDS Analysis Africa, Vol. 10, No. 5, pp. 7–8.
Naidu, Veni, 2003, “Economic Impact of HIV/AIDS on Urban Households—A PilotStudy in Soweto.” Available via the Internet: www.jeapp.org.za/attachment.php?attachmentid=14.
Nelufule, Maanda David, 2004, “AIDS and Democracy: What Do We Know?” (Durban,South Africa: Health Economics and HIV/AIDS Research Division, University ofKwaZulu-Natal).
Nkusu, Mwanza, 2004, “Aid and the Dutch Disease in Low-Income Countries:Informed Diagnoses for Prudent Prognoses,” IMF Working Paper No. 4/49(Washington: International Monetary Fund).
Over, Mead, 1992, “The Macroeconomic Impact of HIV/AIDS in Sub-Saharan Africa,”Africa Technical Working Paper No. 3 (Washington: Population Health and Nutri-tion Division, Africa Technical Department, World Bank).
Phororo, Hopolang, 2003, “HIV/AIDS and the Private Sector in Namibia: Getting theSmall Businesses on Board,” Occasional Paper No. 3/2003 (Windhoek, Namibia:Hanns Seidel Foundation Namibia).
94 MARKUS HAACKER
©International Monetary Fund. Not for Redistribution

Rosen, Sydney, 2002, “What Makes Nigerian Manufacturing Firms Take Action onHIV/AIDS?” Findings Report No. 199 (Washington: Africa Region, World Bank).
———, and Jonathan L. Simon, 2003, “Shifting the Burden: The Private Sector’sResponse to the AIDS Epidemic in Africa,” Bulletin of the World Health Organiza-tion, Vol. 81, No. 2, pp. 131–37.
Rosen, Sydney, and others, 2001, “Investing in the Epidemic: The Impact of HIV/AIDSon Businesses in Southern Africa,” presentation at the Center for InternationalHealth, Boston University School of Public Health.
———, 2003, “Why Do Nigerian Manufacturing Firms Take Action on AIDS?” Healthand Development Discussion Paper No. 3 (Boston: Center for InternationalHealth and Development, Boston University School of Public Health).
———, 2004,“The Cost of HIV/AIDS to Businesses in Southern Africa,” AIDS, Vol. 18,No. 2, pp. 317–24.
Rugalema, Gabriel, with Silke Weigang and James Mbwika, 1999, “HIV/AIDS and theCommercial Agricultural Sector of Kenya—Impact, Vulnerability, Susceptibility,and Coping Strategies” (Rome: Food and Agriculture Organization of the UnitedNations).
Sanlam, 2004, “The 2004 Sanlam Survey on Retirement Benefits” (Bellville, South Africa).
Steinberg, Malcolm, and others, 2002, “Hitting Home: How Households Cope with theImpact of the HIV/AIDS Epidemic,” Publication No. 6059 (Washington: KaiserFamily Foundation).
Summers, Todd, and Jennifer Kates, 2003, “Global Funding for HIV/AIDS in ResourcePoor Settings” (Washington: Kaiser Family Foundation).
Topouzis, Daphne, 2003, “Addressing the Impact of HIV/AIDS on Ministries of Agri-culture: Focus on Eastern and Southern Africa” (Rome: Food and AgricultureOrganization and Joint United Nations Programme on HIV/AIDS).
United Nations Children’s Fund, 2003, Africa’s Orphaned Generations (New York).
United Nations Development Programme, 2003, Human Development Report (New York).
van Donk, Mirjam, 2002, “Conceptual Shifts for Sound Planning: Towards an Inte-grated Approach on HIV/AIDS and Poverty,” Concept Paper No. 1 (Pretoria,South Africa: UNDP Regional Project on HIV and Development).
———, 2003, “Understanding the Link Between Development Planning andHIV/AIDS in Sub-Saharan Africa,” Concept Paper No. 2 (Pretoria, South Africa:UNDP Regional Project on HIV and Development).
Whiteside, Alan, 2002, “Poverty and HIV/AIDS in Africa,” Third World Quarterly,Vol. 23, No. 2, pp. 313–32.
World Bank, 1999, Confronting AIDS: Public Priorities in a Global Epidemic (New York:Oxford University Press, rev. ed.).
World Health Organization, 2004, The World Health Report 2004—Changing History(Geneva).
Yamano, Takashi, and T.S. Jayne, 2004, “Measuring the Impacts of Working Age AdultDeath on Rural Households in Kenya,” World Development, Vol. 32, No. 1,pp. 91–119.
HIV/AIDS: The Impact on the Social Fabric and the Economy 95
©International Monetary Fund. Not for Redistribution
3
Thinking About the Long-Run EconomicCosts of AIDS
CLIVE BELL, SHANTAYANAN DEVARAJAN, AND HANS GERSBACH
In his book Plagues and Peoples, McNeill (1976) views history as the inter-play between an array of parasites and their human hosts—a struggle in
which communicable diseases and human responses to them have pro-found social, economic, and cultural effects. Following the outbreak of theAIDS epidemic in the 1980s, humanity must now contend with a newgreat plague, the scale and character of which will surely put McNeill’s the-sis to the test. One vital lesson to be drawn from his account is that anyattempt to understand the effects of the AIDS epidemic must take a long-term perspective. That is a salient feature of the approach we adopt here:we will argue that, from modest beginnings, the economic damage causedby AIDS can assume catastrophic proportions over the long run, andthereby threaten the social fabric itself.
The disease is selective, and its individual course is both lengthy and,until the end stages, largely free of symptoms. Yet when they do sicken, itsvictims are still overwhelmingly young adults or those in the prime of life,the great majority of them with children to raise and care for. The natureof the long-term threat to social well-being now becomes clear. If parentssicken and die while their children are still young, then the means availablewith which to raise their children so that they can become productive andcapable citizens will be greatly reduced. The affected families’ lifetimeincome will shrink, and with it the means to finance their children’s edu-cation, whether in the form of school fees or taxes. When a parent dies,moreover, the children lose the love, knowledge, and guidance that com-plement formal education. AIDS does much more, therefore, than destroy
96
©International Monetary Fund. Not for Redistribution

the existing abilities and capacities—the human capital—embodied in itsvictims; it also weakens the mechanism through which human capital isformed in the next generation and beyond. These ramifications will takedecades to make themselves fully felt: like the course of the disease in indi-viduals, they are long drawn out and insidious. To this it should be addedthat the incessant reminders of the likelihood of an untimely death canseize both individuals and society with a pessimism that hinders provisionfor the future.
AIDS, like all causes of premature adult mortality, is also a potentiallypowerful generator of poverty and inequality. Some children will grow upenjoying the care and resources provided by two parents, others will haveto make do with only one, and still others will suffer the loss of both. Insocieties based on nuclear families, special arrangements are required tosupport one-parent families, and full orphans must hope for adoption intoa loving family as the alternative to an orphanage—or to life on the streets.Determined and compassionate policies can provide material security andeducation, but hardly love and affection. The ideal extended family, inwhich all children, natural and adopted alike, are valued and treated iden-tically by the surviving adults, solves both problems of insurance. Whenpremature adult mortality is rising, however, both systems come underincreasing strain, as the burden on surviving adults grows. AIDS thereforeposes a threat not only to the support of needy nuclear families, but alsoto the traditional extended family as an institution.
The above account assigns central roles, first, to the formation ofhuman capital through a process in which childrearing and formal educa-tion combine to produce the wellspring of long-term economic growth,and, second, to premature adult mortality as the primary threat to thatprocess. The setting is one in which the decision-making unit is the house-hold, nuclear or extended, and premature adult mortality can result ininequality among households. These features are in sharp contrast tomuch of the existing literature on the long-run macroeconomic effects ofAIDS, in which a “beneficial” lower rate of population growth vies in anaggregate world with the diversion of savings away from the formation ofphysical capital, with a heavy emphasis on steady-state analysis. The nat-ural choice of framework for our purposes is therefore the overlapping-generations (OLG) model, rather than the usual Solow (1956) model.
The plan of the chapter is as follows. We first motivate our approach byidentifying the main economic consequences of AIDS and describing thesheer scale of the wave of premature adult mortality that now threatens toengulf many countries in eastern and southern Africa. A detailed treat-ment of the OLG model, which incorporates a wide array of these effects,
Thinking About the Long-Run Economic Costs of AIDS 97
©International Monetary Fund. Not for Redistribution

is set out in the next section, followed by an analysis of the outbreak of theepidemic and its effects. We then examine the policy problem, namely, howto find the right combination of interventions to preserve economicgrowth in the face of the epidemic. In the penultimate section we discusssome of the economic effects of the epidemic that the earlier sectionsmostly neglected and show how they, too, can be incorporated into thatframework. We draw together our conclusions in the final section.
The Approach and Its Motivation
We begin by listing what are arguably the primary effects of morbidityand mortality in the age groups that AIDS typically strikes, namely, youngand prime-aged adults. It is useful to order such effects, whether due toAIDS or to other causes, in the following way:
(a) Morbidity reduces productivity on the job or results in outrightabsenteeism. If the worker dies, his or her skills and experience aredestroyed.
(b) Firms and the government lose trained workers on both counts andmust replace them. In particular, many teachers die prematurely ofAIDS.
(c) Substantial expenditure, public and private alike, may be requiredto treat and care for those who become sick. (This is certainly so inthe case of AIDS.)
(d) Savings are also diverted out of net investment in physical andhuman capital into the treatment and replacement of workers whofall sick and die.
(e) Lifetime family income is greatly reduced, and with it the family’smeans to invest.
(f) Children lose the love, care, guidance, and knowledge of one orboth parents, which plausibly weakens the transmission of knowl-edge and capacity from generation to generation.
(g) The tax base shrinks.(h) Collateralization in credit markets becomes more difficult, and as a
consequence credit markets function less well.(i) Social cohesion and social capital decline.Most of the earlier work on the macroeconomic effects of AIDS focused
on the first two effects, which are concerned with disruptions to the pro-duction process. These contributions have been based on variants of theSolow (1956) model, in which the level of productivity in the long rundepends on thrift and the rate of population growth. In this framework a
98 CLIVE BELL, SHANTAYANAN DEVARAJAN, AND HANS GERSBACH
©International Monetary Fund. Not for Redistribution

general increase in mortality, with unchanged fertility and thrift, will reducethe pressure of population on existing land and physical capital, and soincrease productivity in both the short and the long run. When appliedempirically to countries heavily afflicted by AIDS, the model yields pre-dictable results, namely, that the epidemic tends to reduce the aggregate rateof growth—the estimates range from –0.3 to –1.5 percentage points ayear—but to increase the rate of growth of GDP per capita.1 The latter find-ing has driven some authors to tinker with other elements of the model,commonly in the form of diverting savings from the formation of physicalcapital into expenditure on health—effects (c) and (d) above—and of low-ering the productivity of infected individuals in an attempt to overturn it;but these exertions often bring about only modest “corrections.”
This chapter will argue that a different sort of framework, with awholly different emphasis, is needed. The center stage is given over to theformation of human capital as the main wellspring of economic growth,in which the transmission of capacities and knowledge across generationswithin nuclear or extended family structures plays a vital role. Effects (e)through (g) weaken the mechanism through which human capital isaccumulated, by depriving the victims’ children of parental upbringingand, very likely, of as much education as they would otherwise haveenjoyed. Expectations concerning the future level of premature adultmortality come into play here, because it affects the expected returns oninvestment in human capital. To the extent that the education both ofchildren in general and of needy children in particular is supported bypublic expenditure, and that medical treatment and survivors’ pensionsare publicly provided, a reduction in tax revenue aggravates the problem.Completing the list, poorly functioning capital markets also hinder eco-nomic growth, as does a lack of social cohesion and social capital under-stood in the broad sense, for both form part of the larger structure withinwhich transactions are made. Effects (h) and (i) therefore intensify thoseof (e) through (g).
The magnitudes of all the effects listed above clearly depend heavily onthe levels of morbidity and premature adult mortality. The first step in anyattempt to assess the economic effects of AIDS, therefore, is to establish thescale of such mortality before and after the outbreak of the epidemic. Mor-tality was already high among all age groups in sub-Saharan Africa in the1950s and 1960s. It then began to fall, especially among infants and young
Thinking About the Long-Run Economic Costs of AIDS 99
1See for example, Cuddington (1993) and Over (1992). Multisector models of this genreare to be found in Kambou, Devarajan, and Over (1992) and Arndt and Lewis (2000).
©International Monetary Fund. Not for Redistribution

children, so that by the middle of the 1980s great improvements in lifeexpectancy at birth and substantial improvements at prime ages had beenachieved. In most countries, however, premature adult mortality was stillsignificant when the AIDS epidemic began to take its toll. Its impact on theprofile of mortality is reduced by what some demographers call the sub-stitution effect: some of those who contract AIDS would have died prema-turely of other causes. The higher the level of preexisting mortality, thelarger this effect will be. By studying countries such as South Africa andZimbabwe, where premature adult mortality was comparatively low in the1980s but is now very high, we should therefore be able to get a good ideaof the disease’s net effect on such mortality, and hence of the gravity of thethreat it poses to economic progress.
It is common practice among demographers who deal with AIDS todefine premature adult mortality as the probability of dying before the ageof 60, conditional on surviving to the age of 15 (Feeney, 2001); this prob-ability is denoted by 45q15, that is, the probability of dying within 45 years,starting at age 15. This is evidently unsuitable for purposes of studying theeffects of mortality on childrearing; more natural choices are 20q20 and
30q20. The former better fits the cycle of childrearing, because new parentsare typically between the ages of 20 and 40; the latter captures the sub-stantial mortality due to AIDS among those, especially men, in their for-ties, when adults are still very much in their productive years. Yet whateverthe measure adopted, premature adult mortality has risen dramatically inboth South Africa and Zimbabwe following the full-scale outbreak of theepidemic (Table 3.1). The levels for 2010 forecast by Dorrington and oth-ers (2001) are grim; those of the U.S. Census Bureau, as reported byDorrington and others, are grimmer still.
It should be emphasized that these measures refer to steady states, in thesense that the q for each year is calculated on the basis of the continuationof that mortality profile. Note, however, that the HIV/AIDS prevalencerate among adults in the age group 15–49 in South Africa rose from about1 percent in 1990 to about 20 percent in 2000. In the latter year the rate inZimbabwe had reached 25 percent. According to Dorrington and others(2001), the rate in South Africa will peak in about 2006. In light of the longlags between infection and death, the above estimates of q for 2010 aretherefore close to the values that would prevail if the disease establisheditself in the population at that level for good. The observed values for 1990(1986 for Zimbabwe) correspond to the counterfactual case in which thereis no epidemic at all.
That this developing wave of morbidity and mortality will considerablyslow or even reverse the growth in the numbers of those of working age in
100 CLIVE BELL, SHANTAYANAN DEVARAJAN, AND HANS GERSBACH
©International Monetary Fund. Not for Redistribution

the decades to come is clear. Yet this effect on the labor force fails by a widemargin to convey the force of the prospective effects on families with chil-dren, and hence on the formation of human capital through the mecha-nism discussed above. It is one thing when 11 percent of 20-year-oldmales, and 4 percent of 20-year-old females, will fail to see their fortiethbirthday (the case in South Africa in 1990); it is a problem of an altogetherdifferent kind when those proportions are 36 and 54 percent, yet this is theappalling prospect confronting South Africa in the coming two decades.Seen in this light, the loss of workers in their most productive years signalsonly the beginning of the damage the epidemic will eventually wreak uponthe economy and society.
Overlapping-Generations Framework
The structure that follows draws upon and in some ways extends that inBell, Devarajan, and Gersbach (2003). For simplicity we confine the expo-sition to the case of two overlapping generations, each going through twoperiods of life, which we call childhood and adulthood.2 Rather than pro-vide an exhaustive technical description of the model, here we seek to pro-vide an accessible discussion of the factors listed in the previous section
Thinking About the Long-Run Economic Costs of AIDS 101
Table 3.1. Adult Mortality by Sex in South Africa and Zimbabwe
45q151
20q202
30q203
________________ ________________ ________________Country Year Male Female Male Female Male Female
South Africa 1990 0.265 0.265 0.106 0.040 0.182 0.0982000 0.419 0.419 . . . . . . . . . . . .2010 0.790 0.790 0.359 0.541 0.616 0.707
Zimbabwe 1986 0.310 0.195 . . . . . . 0.169 0.1071997 0.553 0.417 . . . . . . 0.414 0.331
Sources: Dorrington and others (2001); Feeney (2001, Table 1); and authors’ calculations.1
xqy denotes the probability of living y more years having reached age x. Data for 45q15 for South Africaare from Dorrington and others (2001), who report only the average over both sexes.
2Calculated by the authors using data from Dorrington and others (2001).3Data for Zimbabwe are from Feeney (2001), who reports 35q15 instead of 30q20.
2An extensive literature analyzes the main differences and equivalences between modelspopulated by immortal representative agents and those by mortal overlapping generations interms of determinacy, Pareto optimality, and existence and dynamics in general, which is rel-evant for the type of model in this paper; see Aiyagari (1987, 1992), Huo (1987), Woodford(1986), and Lovo (2000).
©International Monetary Fund. Not for Redistribution

and how they relate to one another. Even so, a precise account demands acertain degree of formality. Since some readers may find the flavor of themain exposition unduly formal, we begin with a narrative sketch of themain idea.
The basic economic unit is the family, nuclear or extended, in which theadult members decide how current resources available to the family are tobe allocated between consumption and the children’s education. The levelof those resources is heavily determined by the parents’ human capital andtheir survival rate through their offspring’s early childhood and schoolyears, but the children themselves can also contribute labor instead ofattending school. How much of childhood, if any, is spent at schooldepends not only on the family’s available resources, but also on three otherfactors. The first is the strength of the parents’ altruism, which expressesitself in their willingness to forgo some current consumption in favor ofinvestment in their children’s schooling, and hence in favor of the children’shuman capital when they attain adulthood in the next period. Second is theefficiency with which schooling is transformed into human capital, and thisarguably depends on the quality both of the school system and of childrea-ring within the family; the latter is expected to improve with the parents’own human capital (if indeed they survive this phase of life). Third, thereturns to the investment in any child will be effectively destroyed if thatchild dies prematurely in adulthood. This implies that the expected returnsto education depend on parents’ (subjective) assessment of the probabilitythat their children will meet an untimely death. At the end of each genera-tion, or “period” in the model, the surviving adults die in old age, and thestory continues as the children become adults in their turn.
Dynamic elements are at work in this story through several channels.The levels of human capital and premature adult mortality in the presentgeneration play a key role in determining the level of human capitalattained by the next generation, as do present expectations concerningpremature adult mortality in the future. Dynamic systems of this kind canexhibit multiple equilibria and regimes of behavior. If current levels ofhuman capital are low, families may be so poor that parents are not pre-pared to make the investments in schooling that would raise their childrenout of poverty upon reaching adulthood. In this case poverty can perpet-uate itself. At much higher levels of human capital, in contrast, affluencewill yield a fine upbringing and education, and so beget still more afflu-ence. High levels of premature adult mortality can give rise to a povertytrap, with an increasing share of the population mired in poverty and fac-ing little or no prospect of upward mobility, and may dampen the accu-mulation of human capital even under conditions of affluence. The
102 CLIVE BELL, SHANTAYANAN DEVARAJAN, AND HANS GERSBACH
©International Monetary Fund. Not for Redistribution

outbreak of an epidemic may even pitch what was a growing system intothe widening jaws of a poverty trap.
Basic Model
The place to start is with the formation of families and of human capi-tal. For the present, let the family structure be nuclear. At the beginning ofeach period (generation) t, every young adult chooses a partner with thesame level of human capital—that is to say, there is assortative mating.Each cohort begins with equal numbers of young men and women, and allfind a partner. All couples have their children soon afterward. With AIDSvery much in mind, premature adult mortality is assumed to occur abouta decade into full adulthood, this being the median time from infection todeath in the absence of treatment with antiretroviral drugs. Thus, whenthe children have just started school, some parents sicken and then die,leaving their children as half or full orphans. At this stage, therefore, thefamily will find itself in one of the following four states:
• both parents survive into old age (st = 1),• the father has died (st = 2),• the mother has died (st = 3),• both parents have died (st = 4).Let Λt(st) denote the surviving adults’ total human capital when the
family is in state st, so that
Λt(1) = 2λt , Λt(2) = Λt(3) = λt , Λt(4) = 0,
where λt denotes the level of human capital possessed by each parent. Letthe probability that a family formed at the beginning of period t winds upin state st be denoted by π(st). Given the assumption that each cohortbegins adulthood with equal numbers of males and females, the propor-tion of adults surviving into old age is given by
κt = [2π(1) + π(2) + π(3)]/2 = [1 + π(1) – π(4)]/2. (1)
The relationship among between π(st), κt, and the mortality statistic q isdeferred to a later section.
Apart from innate ability, the two main factors that influence the levelof human capital a young adult attains are the quality of childrearing andformal education. The former involves not only care and a loving upbring-ing, but also the transfer of knowledge. As a rule, it is surely both increas-ing with the parents’ human capital and complementary with formaleducation. Let the latter be represented by the fraction of childhood,et∈[0, 1], spent in school, where this phase of childhood may be thought
Thinking About the Long-Run Economic Costs of AIDS 103
©International Monetary Fund. Not for Redistribution

of as spanning the period from 6 to 18 years of age. Then the processwhereby these factors yield human capital in adulthood in period t + 1 fora child born in period t can be represented by
λt+1 = z(st)g(et) Λt(st) + 1, with st = 1, 2, 3, 4. (2)
The term z(st) may be thought of as a transmission factor, in the sensethat its magnitude expresses the strength with which the parents’ humancapital creates in their children a potential capacity to acquire humancapital themselves. If, as is plausible, fathers and mothers are not perfectsubstitutes for one another, then having both parents will be better thanhaving only one: formally, z(1) > max[z(2)/2, z(3)/2]. It is plausible, too,that z depends on the number of children within the family, but we deferdiscussion of this point for the moment. The function g(et) represents theeducational technology, where g is increasing in et. That g(et) and Λt(st)enter into equation (2) multiplicatively expresses the complementaritybetween the quality of childrearing and formal education: the strongerthe transmission factor and the greater the parents’ human capital, themore productive of human capital is any given level of the child’sschooling. Now suppose further that some formal education is needed ifa child is to realize at least some of the potential z(st)Λt(st) created bychildrearing: formally, g(0) = 0. It then follows that any child deprived ofall formal schooling will attain λ = 1 as an adult, whatever the parents’level of human capital, whereby the value λ = 1 is simply a convenientnormalization.
As it stands, the difference equation (2) is a purely “technical” relation-ship, in the sense that it yields the resulting formation of human capital forany given level of education but says nothing about how that level is cho-sen. This difference equation is also a stochastic one, in that the child of aunion formed in period t with human capital 2λt can attain any of fourarguably different levels of human capital as an adult one generation later,depending on the incidence of premature mortality among the child’s par-ents in period t. Given the state st, and hence Λt(st), the choice of et deter-mines the outcome for the child, in the form of the level of λt+1.
How, then, is et chosen? One possibility is that school attendance is rig-orously enforced by the authorities, and that full orphans are taken intofirst-rate care. Remedial measures might also be needed to offset the dis-advantages suffered by half orphans. Such a policy would ensure the con-tinued formation of human capital in society at large, while holdinginequality within tolerable bounds. Yet the chances of actually implement-ing it in most poor countries are remote, to say nothing of the financialdemands on the national treasury. In view of these difficulties, it seems
104 CLIVE BELL, SHANTAYANAN DEVARAJAN, AND HANS GERSBACH
©International Monetary Fund. Not for Redistribution
much more compelling to treat et as the parents’ decision, which they makein light of the resources available to them and the expected returns toeducation.
We start with output and income. As in the Solow model, there is anaggregate consumption good, which is taken to be the numéraire, andthere are constant returns to scale in its production, but the only input islabor, which is measured in efficiency units. In this setting it is natural todefine an adult’s endowment of labor so measured as λt, which he or shesupplies completely inelastically. Children will be less productive workersthan their parents, and, given the reasoning underlying equation (2), itseems plausible to assume that a child could supply at most γ (< 1) effi-ciency units of labor to production. A family with Nt children then has thefollowing level of full income, measured in units of the aggregate con-sumption good, in state st:
Ωt(Λt, Nt, st) ≡ α[Λt(st) + Nt γ], with st = 1, 2, 3, 4, (3)
where the positive scalar α denotes the productivity of human capital,measured in units of the numéraire, and the expression in brackets is thetotal labor, measured in efficiency units, that the household can supply. Itis seen at once that we are employing what is known in the literature oneconomic growth as an AK model. The sole means of production is humancapital, which is itself produced through a process involving childrearingand formal education, and each unit of input of human capital in the pro-duction process yields α units of output.
The allocation of full income among competing uses lies in the parents’hands, so long as at least one of them survives into old age. We rule outbequests at death, so that full income is spent on the consumption goodand the children’s education. For simplicity, let the adults behave as equalpartners, and let each child receive the fraction β∈(0, 1) of a survivingadult’s consumption. Since children of school age can also work, let this bethe alternative to attending school, and let all siblings be treated in thesame way. For the present, let the only costs of schooling be the opportu-nity cost of the children’s time. Then, in the absence of taxes or subsidies,the household’s budget line in the “goods” ct(st) and et(st) may be writtenas
[(3 – st) + βNt]ct(st) + αγNtet(st) = Ωt(st), with st = 1, 2, (4)
where ct(st) denotes the level of each adult’s consumption. The assumptionof assortative mating implies that states 2 and 3 are identical in this regard,so that equation (4) implicitly covers state 3. Observe that, given λt and Nt,single-parent families have less full income and face a higher relative price
Thinking About the Long-Run Economic Costs of AIDS 105
©International Monetary Fund. Not for Redistribution

of education than do two-parent families. Full orphans (st = 4) are left tofend for themselves: they do not attend school and they consume whateverincome they earn as child laborers.
To complete this account of the family’s decision problem, we mustspecify its preferences. Let mothers and fathers have identical preferencesover their consumption of the aggregate good and their children’s welfareas adults, the level of which they can influence by choosing the level ofschooling et(st).3 It is clear from equation (4) that they will maximize theirown consumption by using the children as full-time workers, so that onecan say that their altruism toward their children is operative only whenthey choose et(st) > 0. When both parents survive, let there be no “joint”aspect of the bundle [ct(1), et(1)]: each adult enjoys ct(1) as a private good,whereas the children’s resulting level of human capital as adults, λt+1, asgiven by equation (2), is a public good within the marriage. Since all theirchildren will attain that value of λt+1, the only uncertainty that arises con-cerns the number of children who will die prematurely as adults in periodt + 1, each such death being regarded as a “wasted” investment. To be exact,we assume that parents in period t form expectations about the prematuremortality that will afflict their children as adults in period t + 1 and thatthey take the average number of survivors in weighting the payoff toschooling in the form of λt+1.
The appendix sets out a formal statement of the household’s decisionproblem. Let [(ct
0(st), et0(st)] denote the household’s optimum bundle of
current consumption and schooling. It can be shown that, under weakassumptions, et
0(st) is increasing in λt whenever 0 < et0(st) < 1. For any given
value of λt, (a) children in two-parent families receive at least as muchschooling as those in single-parent families, and, strictly, more if the latterchoose some, but not full, schooling; (b) children in two-parent familiesattain, as adults, at least as much human capital as those in one-parentfamilies, and, strictly, more if fathers and mothers are not perfect substi-tutes in childrearing; and (c) an increase in expected premature mortalityin period t + 1 will reduce schooling in period t if 0 < et
0(st) < 1, and maydo so if et
0(st) = 1 (st = 1, 2, 3). All these results accord with elementaryintuition. To complete matters, we introduce a further, plausible assump-tion, namely, that uneducated couples (Λt = 2) are so poor that, in the
106 CLIVE BELL, SHANTAYANAN DEVARAJAN, AND HANS GERSBACH
3This implicitly assumes that adults are concerned directly only with their own consump-tion and the size of their children’s budget sets, whereby the grandchildren’s opportunitiesappear in the latter, and so on. Thus all generations are effectively connected. For further dis-cussion of this formulation in the context of this OLG structure, see Bell and Gersbach(2003).
©International Monetary Fund. Not for Redistribution

absence of compulsory education, they choose not to educate their chil-dren; that is, et
0(st) = 0, even if neither dies prematurely.
Dynamics
The next step is to investigate the system’s dynamic behavior. By replac-ing the nonspecific et in equation (2) with et
0(st), we obtain the system’sequation of motion, as governed by the rational, forward-looking behav-ior of individual households in the technical and mortality environment inwhich they find themselves:
λt+1 = z(st)g{et0[Λt(st), st, κt+1]}Λt(st) + 1, with st = 1, 2, 3, 4, (5)
where κt+1 is a measure of the children’s survival chances after they havereached adulthood in period t + 1, as assessed by their parents in period t.Like equation (2), equation (5) is a stochastic difference equation, a fulltreatment of which would go well beyond the scope of this chapter. Notethat there are 16 possible cases: a child in any of the four family states inperiod t may wind up, as an adult, in any of the same four states in periodt + 1. What follows, therefore, is an intuitive sketch of the main idea.
Full orphans (st = 4) can be dealt with at once. In the absence of sup-port, they do not attend school, and each will marry another uneducatedindividual. In the absence of support or compulsion, the offspring of theseunions will also go uneducated, and so on. Observe that any prematureadult mortality will produce a new crop of orphaned children in eachperiod and that these lineages will fall into poverty and illiteracy, even ifthey were not in that condition before. Hence, as time progresses, a steadilyincreasing proportion of the whole population finds itself in poverty. Car-ing for orphans is not, of course, a new problem for humankind, and soci-eties have devised various ways of dealing with it. Whether thesearrangements can withstand the burden of an epidemic like AIDS, how-ever, remains to be seen. We return to this question below.
At the other extreme, consider children who have the good fortune notonly to see both parents survive into old age, but also to experience thesame outcome themselves in adulthood (this is the case where st = st+1 = 1).If premature adult mortality is not too high, this is the typical case, theessentials of which are captured in the phase diagram in Figure 3.1. LetΛd(1) be the parents’ endowment of human capital such that, for all largervalues, their children will receive some schooling, but otherwise none.As the individual level of human capital (λ) cannot fall below one, the par-ents’ combined level of human capital (Λ) cannot fall below two. Observethat Λd(1) is determined by the parents’ altruism, family income, and
Thinking About the Long-Run Economic Costs of AIDS 107
©International Monetary Fund. Not for Redistribution

the expected level of premature adult mortality in the next generation.Similarly, let Λa(1) (= 2λa) be the smallest value of the parents’ humancapital such that their children will receive complete schooling. As thevalue of Λt(1) rises from 2 to Λd(1), the children will remain wholly une-ducated. As it rises further, from Λd(1) to Λa(1), increasing affluence willcause et
0(1) to rise from zero to unity, so that, from equation (5), λt +1 willincrease from unity to [z(1)g(1)Λa(1) + 1]. Suppose further that[z(1)g(1)Λa(1) + 1] > Λa(1)/2, that is, that every child of couples withΛa(1) attains a level higher than Λa(1)/ 2, the human capital of each suchparent. Now consider the graph of Λt+1(1) (= 2λt+1) and Λt(1). For allΛt(1) ∈[2, Λd(1)], the children will not attend school, with the outcomeΛt+1(1) = 2. For all Λt(1) ∈[Λd(1), Λa(1)], Λt+1(1) is increasing in Λt(1),and its graph cuts the 45-degree line through the origin at least once, by
108 CLIVE BELL, SHANTAYANAN DEVARAJAN, AND HANS GERSBACH
Λt+1
Λ∗
Λ∗ ΛaΛd Λt
2
45°
2
0
Figure 3.1. Human Capital of Succeeding Generations in the Absence of Premature Adult Mortality
Source: Authors’ calculations using model described in the text.
©International Monetary Fund. Not for Redistribution

virtue of the assumption that [z(1)g(1)Λa(1) + 1] > Λa(1)/2. Suppose itdoes so just once, at Λt(1) = Λ*(1).4 Then the system possesses two station-ary equilibria: Λt(1) = 2 and Λt(1) = Λ*(1). It is clear from Figure 3.1 thatthe former is stable, that the latter is unstable, and that the system exhibitsa poverty trap. We show in the appendix that when the transmission fac-tor and educational technology combine to ensure that the condition2z(1)g(1) > 1 holds, long-term growth is, in principle at least, possible. Inwhat follows we assume that this condition indeed holds, and Figure 3.1 isdrawn accordingly.
Children in single-parent families (st = 2, 3) face a less favorable situa-tion. All of Λd(st), Λa(st), and Λ*(st) will be larger than their counterpartsΛd(1), Λa(1), and Λ*(1), respectively; in other words, the size of the trap-door into poverty will be correspondingly larger. The long-term rate ofgrowth will also be lower if fathers and mothers are not perfect substitutesin childrearing, for if they are not, then 2z(1) > max[z(2), z(3)]. Indeed,unbounded growth may not be possible at all for one or both of these sub-groups, even when it is so for two-parent groups. Summing up, prematureadult mortality in a nuclear family setting is a powerful force for inequal-ity in the future as well as in the present.
Social Response to Premature Adult Mortality
The death of parents while their children are still young poses suchgrave problems in strictly nuclear families that societies have been drivento find solutions to them. In Africa the widespread practice of fosteringand adoption within the circle of kinship is such a response. In effect, thisis a collective, or pooling, arrangement to deal with the individual risks ofpremature adult mortality as they affect the rearing of children and hencethe future well-being of the group or society. Since any such poolingarrangement also needs rules, one can suppose that one such rule is thatall children must be treated alike. We now analyze such an arrangement ina starkly simplified form.
Let there be complete pooling, in the sense that all the surviving adultstake on responsibility for all children. This family structure, or “state,” willbe denoted by st = 0. The rule that all children be treated the same thenensures that there will be no inequality within each generation. The pro-portion of all adults surviving into old age in period t is denoted by κt. For
Thinking About the Long-Run Economic Costs of AIDS 109
4 A sufficient condition for this to hold is that the graph be convex over the specified inter-val. For a full discussion see Bell and Gersbach (2003).
©International Monetary Fund. Not for Redistribution

simplicity, let premature mortality afflict men and women equally, so thateach surviving “couple” will raise, not Nt children, but
Nt(0) = Nt/κt . (6)
The couple’s budget constraint is
[2 + βNt /κt]ct(0) + αγ(Nt /κt)et(0) = α[2λt + (Nt /κt)γ] ≡ Ωt(0). (7)
A comparison of equation (7) with equation (4) reveals that, relative to anotherwise identical two-parent nuclear family, the burden of poolingimplies, first, a lower relative price of current consumption and, second, alower level of full income, measured in units of an adult’s consumption,provided β > γ. Both effects work in the direction of reducing schoolingrelative to what would occur in the two-parent nuclear family.
Turning to preferences, let the couple go beyond the requirements ofthe social rule of equal treatment and regard all the children in their care,natural and adopted alike, with the same degree of altruism. Altruism inthis degree therefore furthers investment in education by increasing theweight attached to the payoff in the form λt+1, since Nt(0) > Nt. Whetheraltruism or even equal treatment prevails in practice will be taken up laterin the chapter.
Given the burden of rearing Nt(0) as opposed to Nt children, it is nat-ural to ask whether the transmission factor will not be correspondinglyweakened. To allow for this possibility, we write the latter as z(0, κt), whereit is plausible that z(0, κt) is increasing in κt. Note also that, in the absenceof premature adult mortality, pooling will be superfluous and all childrenwill be raised by their natural parents, so that z(0, 1) = z(1). The funda-mental difference equation now takes the form
λt+1 (0) = z(0, κt)g{et0[Λt(0), 0, κt, κt+1]}Λt(0) + 1, (8)
where it should be noted that the current level of premature adult mortal-ity influences both investment in schooling and the transmission factor.
The dynamics are comparatively simple, in the sense that there is onlyone family state in all periods—so long as the institution of pooling canbear the weight of mortality among young adults. For any given κt, there iseffectively a two-parent family with Nt(0) children and transmission factorz(0, κt), and Figure 3.1 may be used once more. Whether the trapdoor intopoverty is larger than its counterpart in the corresponding nuclear familysetting depends on whether the effects of pooling on the family’s budgetline and the transmission factor outweigh those of altruism. In any eventthe long-term rate of growth will be lower, since z(0, κt) < z(1) wheneverκt < 1. When all the single-parent households and full orphans are brought
110 CLIVE BELL, SHANTAYANAN DEVARAJAN, AND HANS GERSBACH
©International Monetary Fund. Not for Redistribution
into the reckoning, however, the average growth rate of a society of nuclearfamilies may well be smaller than the growth rate under pooling, namely,[2z(0, κt)g(1) – 1].5
Calibration
In order to apply the model, certain qualitative choices must be madeand a whole variety of parameters estimated. How all this is to be donedepends, naturally enough, on the data and resources available. Onething, however, is immediately clear: the system is almost certainly heav-ily underidentified, so that a resort to calibration is unavoidable. That is,the functional forms are chosen exogenously, and the values of the para-meters are then derived by solving the system in an exactly identified formso that it reproduces some set of past configurations. There is no cook-book recipe for this procedure. What follows is a brief description of howwe accomplished this task for South Africa, with the aim of conveying thenature of the difficulties we encountered and how we attempted to over-come them.6
The phenomena of interest are inherently of a time-series nature, theavailable data for which are overwhelmingly of the aggregate kind: GDP,labor force, average years of schooling completed, total fertility rate, and soforth. This simple fact makes an approach based on a representative unitvirtually unavoidable, so that the choice of institutional arrangement fallson what we have called pooling, with all the advantages of simplification itbrings. It must be conceded that, especially in light of South Africa’s his-tory of apartheid, the assumption of pooling is also nothing short ofheroic. Indeed, the calibration is based on the period 1960–90, at whoseclose apartheid was about to collapse and the epidemic was in its very earlystages.
With this much decided, we can work with various aggregates. At anypoint in time, total output (GDP) is defined as the product of theunknown parameter α and the total input of labor, measured in efficiencyunits. If we ignore open unemployment and child labor, the total input of
Thinking About the Long-Run Economic Costs of AIDS 111
5Note that, with a representative family unit of this kind, the OLG model is equivalent toa Solow model in which output is proportional to inputs of efficiency units of labor. The dif-ference is that whereas the OLG model provides the structure that yields the evolution ofhuman capital, the latter must be supplied exogenously to the Solow equivalent, which isthen, in effect, the fifth wheel of the coach.
6Readers interested in the detailed derivations are directed to Bell, Devarajan, andGersbach (2003).
©International Monetary Fund. Not for Redistribution

efficiency units of labor is the product of the labor force, which we canobserve, and the average value of λt, which we need to estimate. Since a(quinquennial) series for average years of schooling completed among theadult population is available for 1960–90 (Barro and Lee, 1996), the nextstep is to employ the difference equation (2) with st = 0 as a purely techni-cal relationship. To save on degrees of freedom, two further assumptionsare now needed: first, that the function z(0, κt) is a constant throughoutthis period, and second, that the educational technology, as defined by thefunction g(et), takes the very simple form g(et) = et. Repeated applicationof equation (2), with appropriate rescaling to allow for the fact that, whenbut two overlap, a single generation spans 30 years and that some of thedata are annual and others quinquennial, permits us, at length, to coax outthe following estimates: α = 3,419, z = 0.818, and λ1960 = 2.62.
These estimates yield the following implications. First, a wholly unedu-cated adult, who by definition possesses 1 efficiency unit of labor (λ = 1),will produce $3,419 a year (in 1995 dollars). Second, the starting value ofhuman capital (λ1960) is not only much larger than this reference value, butalso placed South Africa well out of reach of the poverty trap that existedat the levels of premature adult mortality prevailing at that time. Third, thevalue of z is such that, when all children receive a full education, output percapita will eventually grow at the rate of (2 × 0.818) – 1 = 0.636 per gen-eration, or about 1.64 percent annually. Although this rate is hardly in theEast Asian league, it does promise considerable prosperity within two tothree generations.
The remaining steps involve treating the Barro and Lee series for aver-age years of schooling as the outcome of rational decisions made by anextended family, as set out above and in the appendix. That is to say, a rep-resentative couple in 1960 chose e1960 such that individuals born between1935 and 1965 attained, on average, the Barro-Lee estimate of five years ofschooling for adults aged 25 years and older in 1990. The couple’s prefer-ences over current consumption and the level of human capital attained byeach of their children in adulthood are assumed to be additively separablein logarithms—a formulation in keeping with common practice through-out the macroeconomics literature. The parameters β and γ are set exoge-nously, the former at around one-half, the latter at one-fifth of the value ofα. The total fertility rate Nt is taken from the World Development Indica-tors (World Bank, 2002), and values for κt are derived from a procedurethat we describe in the next section in connection with the outbreak ofthe epidemic. With the “taste” and mortality parameters thus determined,the family’s choice et
0(Λt(0), 0, κt, κt+1) can be derived in every givensituation.
112 CLIVE BELL, SHANTAYANAN DEVARAJAN, AND HANS GERSBACH
©International Monetary Fund. Not for Redistribution
Outbreak of an Epidemic
What happens when the outbreak of a hitherto unknown disease bringsabout a dramatic rise in premature adult mortality, albeit with a lag of adecade or so? At first, very little, because those infected show no symp-toms. As time wears on, however, they begin to sicken and die, and the sur-vivors begin to revise their assessments of the chances that their childrenwill die prematurely on reaching adulthood. The first wave of deaths leavesbehind orphans on a scale not seen in earlier generations.
A careful distinction between nuclear and collective family structuresis needed. Given the nature of AIDS, infection of one partner in a mar-riage is likely to be followed by infection of the other, so that the propor-tion of full orphans in the child population will rise dramatically as well.Yet the effects of the adverse shift in the proportions of nuclear familiesfalling into the four states will make themselves fully felt only in the nextgeneration and beyond, in the form of lower levels of human capitalaveraged over the population as a whole. Under pooling, the fall in κt hasboth an immediate, adverse effect on the common budget set, by increas-ing Nt(0), and a damaging long-term effect on the accumulation ofhuman capital.
If the disease persists—or, rather, if the adults expect it to do so—therewill be a further effect in the present, certainly adverse and perhaps devas-tating. If families are nuclear, a fall in the expected level of κt+1 will causeΛd(st), Λa(st), and Λ*(st) to increase for two-parent and single-parent fam-ilies alike, for it will reduce the expected returns to education. In otherwords, it will make the trapdoor larger, so that groups that were enjoyingsustained growth before the outbreak could slide into poverty. Again, thiseffect will make itself felt only with a long lag, but if the (expected) increasein mortality is large enough, the whole system could switch regimes fromone generation to the next. Under pooling, the sharing of resources andresponsibilities will stave off such a collapse if neither κt nor the expectedlevel of κt+1 falls too far, even though a permanent fall in κ will tend toreduce the long-run rate of growth by weakening the transmission factor.Otherwise the entire group will slide into poverty together, a disaster thatmay well undermine the institution’s rules and even the institution itself.
We now use the model, as calibrated to South Africa, to investigate theepidemic’s effects on human capital formation and economic growth.Although a mere glance at Table 3.1 reveals that the situation is alreadygrave and threatens to become worse, what we actually need in order toapply the OLG model are the probabilities of each of the four family states,that is, the π(st), which, through equation (1), also yield the survival sta-
Thinking About the Long-Run Economic Costs of AIDS 113
©International Monetary Fund. Not for Redistribution

tistic κ needed in the pooling case. In order to derive the π(st) from themortality measures q, an assumption has to be made about the occurrenceof mortality within marital unions. In the absence of AIDS, one could per-haps make a case for treating the premature deaths of spouses as indepen-dent events, at least as a working approximation for the population as awhole. Given the nature of the disease, however, it is tempting to assumethat the infection of one partner outside the relationship will soon be fol-lowed by the infection of the other within it. Viewed in a time frame of 20or 30 years, single-parent households would become rather rare.
In fact, the probability of transmission within a union appears to be onthe order of 10 percent a year under the conditions now prevailing in EastAfrica (Marseille, Hoffman, and Kahn, 2002). Cumulated over the mediancourse of the disease from infection to death, namely, about a decade, thisimplies that the probability that both partners will become infected, con-ditional on one of them getting infected outside the relationship, is about0.65; this is high, but still far removed from infection being perfectly cor-related within a union. Since it would take anywhere from one to twodecades for both to die, the chances that all their children will lose bothparents before reaching the end of adolescence are correspondinglyreduced. This has a strong bearing on deriving the state probabilities using
20q20, which is the natural measure in connection with analyzing the effectsof premature adult mortality on the distribution of family types. To err onthe side of caution where the numbers of full orphans are concerned, letus therefore assume that infection is indeed an independent event withina union. This yields the state probabilities corresponding to any choice ofq as follows:
π(1) = [1 – q(M)] · [1 – q(F)]
π(2) = q(M) · [1 – q(F)]
π(3) = [1 – q(M)] · q(F)
π(4) = q(M) · q(F).
Various constellations, together with the corresponding values of κt, are setout in Table 3.2.
The effects of the AIDS epidemic on families are appalling to contem-plate. In its absence, about 86 percent of South African children in nuclearfamilies would have grown up in the happy circumstances of having bothparents to care for them, and fewer than 1 percent would have been com-pletely orphaned. In the mature phase of the epidemic, as described by thesteady state corresponding to 2010, these proportions will lie close
114 CLIVE BELL, SHANTAYANAN DEVARAJAN, AND HANS GERSBACH
©International Monetary Fund. Not for Redistribution

together, at 29 and 19 percent, respectively, and just over half of all childrenwill be raised by a single parent. The fraction of adults surviving beyondthe age of 40 would have been 93 percent; instead, only about 55 percentwill do so, which speaks eloquently of the burden already beginning to fallon survivors under pooling arrangements. In Zimbabwe, where the epi-demic broke out earlier, the observed shift over the period 1986–97 isscarcely less dramatic, and the epidemic still had not peaked at the end ofthat period. One should not, of course, make too much of a few percent-age points here or there, but the broad qualitative nature of the results issurely robust to any reasonable amendments to the underlying mortalityprofiles. Viewed in the light of how human capital is formed, these drasticshifts in family state probabilities and adult survival rates contain the veryreal threat of an economic collapse if the epidemic continues unabated onits present course.
To pursue this possibility, the model is run from 1960 onward in threevariants. The first is the counterfactual, in which the AIDS epidemic neveroccurs and the mortality profile in 1990 continues on into the indefinitefuture. In this happy event, the South African economy would haveenjoyed modest economic growth, with almost universal and completeprimary education (of 10 years) attained in one generation, that is, by2020. Income per family, y(0), which includes the contribution of childlabor, if any, would have quadrupled over its 1990 level in three genera-tions (Table 3.3).
With the outbreak of the AIDS epidemic, and with no interventions tostem it, this salutary path will be interrupted. In the second variant notonly do the surviving parents have to cope with a very heavy burden ofchild dependency from 1990 onward, but they also immediately revisetheir expectations about future mortality: they correctly forecast currentmortality in their generation, as described by the steady-state value of κ in
Thinking About the Long-Run Economic Costs of AIDS 115
Table 3.2. Family State Probabilities and Survival Rates in South Africaand Zimbabwe
Both Parents Father Only Mother Only Neither Parent Survival Surviving Surviving Surviving Surviving Rate1
Country Year π(1) π(2) π(3) π(4) κ
South Africa 1990 0.855 0.101 0.039 0.005 0.9252010 0.294 0.168 0.347 0.194 0.550
Zimbabwe 1986 0.742 0.151 0.089 0.018 0.8621997 0.392 0.277 0.194 0.137 0.628
Source: Authors’ calculations, based on 20q20 for South Africa and 35q15 for Zimbabwe (Table 3.1).1Proportion of adults surviving into old age.
©International Monetary Fund. Not for Redistribution

2010 and denoted formally by κ1990, and they expect that level to rule inthe next generation, too: formally, E1990(κ2020) = κ1990. With currentresources much reduced and the outlook grim, primary education levelsbegin to decline, and if this scale of mortality continues, the society will befull of uneducated adults in two generations. Economic performancedeclines accordingly, and income per family, instead of quadrupling by2080, declines to about half its 1990 value.
It might be argued that the second variant constitutes too harsh an esti-mate of the conditions prevailing in 1990–2020, and that, in particular, therevision of expectations will take time. Suppose, therefore, that this revi-sion does not occur until the very start of the next generation, when thechildhood experience of death among their parents will be vivid in theminds of the next cohort of young adults: their firm expectations areE2020(κ2050) = κ1990. Suppose, further, that these expectations are realizedand that this scale of mortality persists into the future. The happy, butfalse, expectations about future mortality in 1990, coupled with what isassumed to be the rich altruism of full pooling, induce adults to investheavily in the children’s education, despite the heavy reductions inresources caused by the outbreak of the epidemic. Yet although the gener-ation of adults starting out in 2020 are every bit as well endowed withhuman capital as they would have been in the absence of the epidemic,their expectations concerning their children’s future are so bleak as toinduce them to roll back investment in schooling to levels not seen sincethe middle of the twentieth century, and the result is to send the entire sys-tem into a progressive decline. Income per capita peaks in the period start-ing in 2020, and two generations later the fresh cohort of adults will be
116 CLIVE BELL, SHANTAYANAN DEVARAJAN, AND HANS GERSBACH
Table 3.3. Three Growth Paths for the South African Economy
With AIDS__________________________________________________No AIDS E1990(κ2020) = κ1990 E2020(κ2050) = κ1990________________________ _________________________ ________________________
Human Family Human Family Human Familycapital Schooling income capital Schooling income capital Schooling income
Year λ e y(0)1 λ e y(0)1 λ e y(0)1
1960 2.62 0.50 19,500 2.62 0.50 19,500 2.62 0.50 19,5001990 3.14 0.64 22,340 3.14 0.20 26,370 3.14 0.68 23,4002020 4.32 0.97 29,590 2.01 — 17,770 4.52 0.39 34,6902050 7.86 1.0 53,720 1.0 — 12,900 3.80 0.29 30,2802080 13.85 1.0 94,720 1.0 — 12,900 2.78 0.14 24,250
Source: Bell, Devarajan, and Gersbach (2003). All results are based on 30q20.1In rand. From 1990 onward a representative “family” comprises two surviving adults and 3.49 chil-
dren in the absence of AIDS, and two surviving adults and 8.87 children in its presence.
©International Monetary Fund. Not for Redistribution
scarcely more productive than their forebears in 1960. Only a revival ofoptimism about the future—and the resumption of low levels of prema-ture adult mortality to confirm it—will stave off a complete collapse.7
Policy
The real possibility that the economy can have two strikingly differentequilibria—a poverty trap and steady growth—means that there is a jobfor the government to do, namely, to bring about the latter state by ensur-ing the reproduction of human capital and its accumulation. Yet althoughthe need for intervention to secure such an outcome is clear enough, therationale for it must be sharpened if the government is to intervene in theright way. The first reason is paternalistic, for the failure to attain, or main-tain, growth may stem from parents’ weak altruism. In the formulation ofprivate preferences chosen by Bell, Devarajan, and Gersbach (2003), weakaltruism expresses itself in the form of parents assigning a low value totheir children’s level of human capital in adulthood, which effectively com-petes with their own current consumption. A closely related considerationis that although parents are not necessarily myopic, inasmuch as they rec-ognize that their children will, in turn, care about their own children, andso on, they may not directly value any generation’s welfare beyond theirchildren’s. All else being equal, the fewer the number of future generationswhose well-being today’s parents directly value, the weaker are the incen-tives to invest in education today. Although it is hard to distinguishbetween these aspects of altruism in a practical calibration, the distinctionis still important.
The second reason for intervention is that AIDS, as a communicabledisease, involves an externality whose full ramifications can be enormouslydamaging. The third reason has to do with information: the course of thedisease is long and insidious, and in many communities knowledge of howit is transmitted and how to prevent it is often sketchy and sometimes woe-fully wanting and distorted. A fourth reason is that there is—or shouldbe—a social aversion to inequality, a condition that premature adult mor-tality does much to promote.
In formulating policies it will be useful to begin by drawing a distinc-tion between preventive and remedial measures, with a firm emphasis on
Thinking About the Long-Run Economic Costs of AIDS 117
7The fact that false expectations can be helpful in overcoming shocks raises some delicatequestions concerning the value of transparency in public policy in the present context. Weshun them religiously here.
©International Monetary Fund. Not for Redistribution
their economic and social consequences. A second, more conventional dis-tinction is among the socioeconomic sectors in which intervention isundertaken: education, health, and support of the needy. We take them upin that order. Once formulated, the spending programs must be financed,and raising the additional revenue will itself have an effect on the accu-mulation of human capital through the channels identified above. Theframework laid out above enables us to treat interventions in a way thatreveals their full ramifications in a long-run setting.
Premature adult mortality in the present and expectations concerningits level in the future emerged above as key factors influencing long-termeconomic performance. The outbreak of a disease like AIDS calls for con-tainment on both scores. The first economic preventive measure is, almosttautologically, the vigorous pursuit of public health measures to stem thespread of the epidemic, ideally in the very early stages. (AIDS is, after all,very much a preventable disease.) The second such measure, however,involves medical treatment of the infected, to maintain their productivityand prolong their lives, and so enable them to provide more of the vitalthings their children need to become productive members of society.Although there is yet no cure for AIDS, treating opportunistic infectionsand providing antiretroviral therapies still enter into the reckoning, at leastpotentially. The second class of measures is unquestionably much moreexpensive than the first, but both directly further the formation of humancapital and equality in the next generation.
Premature adult mortality cannot be eliminated, however, and there-fore remedial action in the form of supporting the survivors, adults andchildren alike, is also essential. In a nuclear family setting this will involvemaking payments to single-parent and foster families, as well as estab-lishing orphanages for those children who would otherwise lack a home.In extended family settings the aim must be to support the institutionitself, while seeing to it that all children enjoy equal treatment. Note thatall these measures are also preventive, to the extent that they furtherinvestment in the children’s education and so help them to become pro-ductive adults.
It is here that social and educational policy overlap. The case for thegovernment to intervene rests heavily on market failures that result insocially suboptimal levels of schooling, especially when the family struc-ture is nuclear. Received theory tells us that distortions of this kind shouldbe attacked as close to their source as possible, which suggests that theright form of intervention is a subsidy payable to the family contingent oneach child’s attendance at school. In poor societies this intervention is gen-erally desirable even in the absence of premature adult mortality (Bell and
118 CLIVE BELL, SHANTAYANAN DEVARAJAN, AND HANS GERSBACH
©International Monetary Fund. Not for Redistribution

Gersbach, 2003; Siemers, 2002); in the face of the AIDS epidemic, such asharp instrument is surely of great importance. It is quite possible, ofcourse, that the government is unable to implement such a policy, in whichcase it might have to fall back on unconditional transfers to all needyhouseholds. But this is an administratively troublesome policy, too.
What, then, is the right balance between preventive and remedial mea-sures? This is a complicated question to which there is no ready, generalanswer. The need to finance any bundle of policies selected from the abovemenu also enters into the reckoning, and, as in all questions involving pub-lic economics, the means available will exert an influence on the rightchoice. Foreign aid, in the form of outright grants, will relieve the burden,but no society can expect help on a scale that will make increases indomestic taxation unnecessary. For clarity of exposition, therefore, we goto the other extreme of self-reliance. We treat pooling first, since this is rel-atively straightforward, and then outline the additional considerations thatarise when families are nuclear. The framework presented earlier willenable us to formulate the problem in such a way as to gain qualitativeinsights. We then follow this discussion with a sketch of how to estimatethe relationship between public spending and premature adult mortalityfor purposes of incorporating it into the framework, and then we offer abrief account of the quantitative results obtained for South Africa.
Optimal Policy Under Pooling
There is neither scope nor need for redistribution among families underpooling, and therefore the government can impose poll taxes to finance itsexpenditure. Let each “couple” pay the amount τt in period t. For themoment let us rule out school attendance subsidies, so that τt will be usedsolely for “economic” preventive measures, that is, effectively to increasethe survival statistic κt. To emphasize the connections, we write κt = κt(τt),and hence z(0) = z[0, κt(τt)], both of which are increasing in τt. These aretwo of the factors yielding benefits, whereby diminishing returns will set inat some point. The drawback is the reduction in full income in the amountτt. The budget constraint in equation (7) becomes
Nt αγNt γNt[2 + β –––––]ct(0) + ––––– et(0) = α[2λt + –––––] – τt ≡ Ωt(0, τt). (9)κt(τt) κt(τt) κt(τt)
Thus parents must form expectations not only about the general mortal-ity environment in the next period, but also about the level of the govern-ment’s expenditure (equals tax revenue) on mitigating it. Hopes of a less
Thinking About the Long-Run Economic Costs of AIDS 119
©International Monetary Fund. Not for Redistribution

dangerous future will induce more schooling; pessimism will reduce it. Afailure to act swiftly and publicly can therefore do enormous damagethrough this channel alone.
Armed with this pair of instruments, the government has the task ofchoosing a sequence of taxes, or “plan,” over some time horizon starting inperiod 0, {τt}
Tt=0, with the aim of maximizing social welfare. This is a diffi-
cult problem, for not only are all the periods connected through the for-mation of parents’ (rational) expectations about the course of futurepolicy, but in addition there may be problems of credibility if the govern-ment is unable to commit itself to a certain future course of action. This isnot the place to go into the details. A sketchy account is given in the appen-dix, and the interested reader is referred to Bell, Devarajan, and Gersbach(2003).
To complete the formulation of the government’s decision problem, wemust define social welfare. Since there is no inequality within each gener-ation, but the threat of a collapse is ever present, it is intuitively appealingto put a heavy emphasis on accumulating human capital rapidly. Bell,Devarajan, and Gersbach (2003) argue that the following claim is validwhen each generation covers a sufficiently long period.
The pooling case: If, in each and every period, the governmentchooses the level of the tax in that period so as to maximize the levelof human capital attained by a child on reaching adulthood in thenext, the resulting plan will be “good,” in the sense of not departingvery far from the optimum.
That is to say, it is enough for the government to look just one genera-tion ahead in order to attain a “good” result, given the expenditure instru-ments at its disposal. The government’s problem is set out formally in theappendix.
We now introduce school attendance subsidies, which, if available, willyield a further improvement. Let the amount paid per child in period t beσt for each unit of time the child spends in school. The fact that the gov-ernment must allocate its revenue between combating mortality and sub-sidizing schooling directly calls for a little additional notation. Denote totalspending on the former by ηt, where this expenditure should be thoughtof as producing a public good within the family, so that κt(ηt) replacesκt(τt). The family’s budget constraint then reads
Nt Nt[2 + β –––––]ct(0) +(αγ – σt) ––––– et(0)κt(ηt) κt(ηt) (10)
120 CLIVE BELL, SHANTAYANAN DEVARAJAN, AND HANS GERSBACH
©International Monetary Fund. Not for Redistribution

Nt= α[2λt + ––––– γ] – τt ≡ Ωt(0,ηt,τt ).κt(ηt)
a comparison of which with equation (9) reveals that the subsidy works byreducing the opportunity cost of the child’s time, and so encouragesinvestment in schooling directly. The government’s budget constraint willalways bind at the optimum, so that the ministries of health and educationwill be competing for funds.
The trade-off is subtle and complex. For any level of taxation, addi-tional spending on reducing mortality will increase not only current fullincome, but also positive expectations about future mortality. Both workto increase schooling and so offset the reduction in schooling broughtabout by the correspondingly smaller subsidy on school attendance.Finding the right balance between them involves solving problem (A9)in the appendix; but it is intuitively clear that, when a society is threatenedby very high mortality, the best policy will always involve a fairly sub-stantial effort to combat it if the available measures are even moderatelyeffective.
Optimal Policies with Nuclear Families
In societies with strictly nuclear family structures, premature adultmortality brings about inequality within each generation unless there iscountervailing action by communities or government. In this respect,therefore, the government’s task is more complicated than under pooling.Indeed, avoiding such inequality may not be possible, depending on theinstruments available and the pressures exerted by the need to ensurelong-term growth. Yet most of the elements that make up the policy pro-gram are clear. Suppose, for simplicity, that the authorities are able toobserve each family’s status. The tax base is normally provided by two-parent households, for only under conditions of some affluence will sin-gle-parent households have any taxable capacity when their childrenattend school full-time. The society’s needy, therefore, are the members ofsingle-parent households and full orphans, who must be cared for in spe-cial institutions. The budget constraints for households with adults can beexpressed as before, taking into account whatever taxes and subsidies arepayable. Suitable standards must be drawn up for orphanages, whosestaffing must suffice to provide decent care for their charges, and whosestaff must be paid their opportunity cost in the production of the aggre-gate consumption good. At the very least, the children should receive thepackage of consumption and education enjoyed by their counterparts in
Thinking About the Long-Run Economic Costs of AIDS 121
©International Monetary Fund. Not for Redistribution

single-parent households. The government’s budget constraint is writtenout accordingly.
The absence of pooling as a form of insurance and as an instrument toensure equality within each generation requires a reformulation of thepolicy program. Bell, Devarajan, and Gersbach (2003) argue that one wayof arriving at a “good” program is as follows.
The nuclear family case: In each and every period, choose a tax andexpenditure plan so as to maximize the society’s expected taxablecapacity in the next period.
Observe the switch from the future attainment of the representativechild under pooling to future aggregate taxable capacity. The intuition hereis that, given the need sooner or later to undertake redistribution within ageneration, it is this capacity that ultimately determines whether the wholesociety can eventually escape from want and illiteracy. In dire circum-stances, however, it may happen in some periods that it is not optimal togrant support to all those in need. The full problem is written out formallyin Bell, Devarajan, and Gersbach (2003) and will not be repeated here. Suf-fice it to say that the tension between providing direct support to families(whether conditional on school attendance or otherwise) and combatingmortality necessarily arises once more, with the further twist that avoidingpremature mortality in period t has an immediate effect both on the taxbase and on the numbers and types of the needy, through its influence onthe distribution of family types in period t.
Estimating the Costs and Effects of Policies
We introduced above public spending on combating premature adultmortality from all sources as an instrument to improve economic perfor-mance and well-being. What especially concerns us in this chapter, ofcourse, is spending on combating AIDS, and here we know much less thanwe would like about the effects of the disease on the level of mortality. Thisobstacle notwithstanding, we need to estimate the function q(η) if we areto reach defensible conclusions about the right policies to be pursued.There follow a discussion of the elements of the approach and a shortsummary of the results it yields when applied to South Africa.
We begin with two useful reference cases. The first is the counterfactual,in which the human AIDS virus never came into existence; we denote thisdisease environment by D = 0. This, as we argued above, can be taken ascorresponding to the mortality profile that prevails in the very early stages
122 CLIVE BELL, SHANTAYANAN DEVARAJAN, AND HANS GERSBACH
©International Monetary Fund. Not for Redistribution

of the epidemic, as exemplified by Zimbabwe in 1986 and South Africa in1990. The second step involves the second reference case, which ariseswhen the epidemic simply runs its course, unhindered by public action ofany kind. Specifying this alternative poses various problems, for even herethe course of the epidemic depends on individual behavior, which may, inits own turn, respond to the experience of the epidemic, and on whetherthe virus adapts to its human hosts by becoming less virulent over thelonger run. There is, unfortunately, not a single historical example of thisparticular epidemic simply running its full course in some society to offerany guidance on this matter. In neither South Africa nor Zimbabwe hadthe epidemic reached maturity by the end of the 1990s, grim though thesituation had already become in both countries. Describing this secondcase is therefore a task more for epidemiologists and virologists than forsocial scientists. For South Africa the forecast by Dorrington and others(2001) for 2010 reflects such considerations, and it seems to be a goodworking approximation of what is needed, with the reservation that pal-liative care of the sick and the treatment of opportunistic infections arealready absorbing resources on a substantial scale.
The next step is to connect these two reference cases through the plau-sible assertion that very heavy spending on combating the disease wouldrestore the status quo ante profile of mortality. If this much is granted,then the probability of premature mortality, viewed as a function ofspending on combating the disease, namely, q(η; D = 1), will be anchoredat both ends of the spending range. To supply the shape of the curve inbetween, it is natural, for economists at least, to appeal to diminishingreturns; thus q(η; D = 1) would be downward sloping and convex, steepwhen η is small and flat when it is large. It is also tempting to associatethese endpoints of the spending range with preventive measures and anti-retroviral treatments, respectively.
One intervention that commends itself in connection with the controlof all sexually transmitted diseases is to target sex workers and their clients;in this context the use of condoms is also strongly promoted. Marseille,Hoffman, and Kahn (2002) give the corresponding cost of averting a sin-gle case of AIDS in Kenya, for example, as $8 to $12. This is cheap indeed,but given the nature of the disease and of people, it must be inferred thatthis is an expenditure that will recur annually. They also present evidencethat other preventive measures, such as ensuring a safe blood supply andtreating mothers at birth with nevirapine, are less cost-effective by a factorof 10 or more. Choosing a bundle of diverse preventive measures, theyestimate the resulting cost per disability-adjusted life-year (DALY) sosaved at $12.50.
Thinking About the Long-Run Economic Costs of AIDS 123
©International Monetary Fund. Not for Redistribution

At the other end of the range, the overwhelming bulk of expenditure isdevoted to treating those with the disease. Such treatment covers not onlyopportunistic infections, especially in the later stages of the disease, butalso antiretroviral therapies. These measures keep infected individualshealthier and can extend their lives for a few years, thereby raising lifetimefamily income and improving parental care. It seems perfectly defensible,therefore, to interpret these gains as equivalent to a reduction in q withinthe OLG framework. Marseille, Hoffman, and Kahn (2002) put the cost ofsaving one DALY by these means at $395, on the very conservative assump-tion that the drugs take the form of low-cost generics and that the costs ofthe technical and human infrastructure needed to support an effectiveHAART (highly active antiretroviral therapy) regimen of this kind can bewholly neglected.
At this point the reader may be forgiven for wondering how much acomprehensive HAART program might cost. The elements of an estimatefor Burkina Faso, a poor West African country in which the AIDS preva-lence rate is about 8 percent, are set out in World Bank (2003). If genericantiretroviral drugs can be purchased from Indian firms, the annual costof treating each individual would be about $810; under the next-best,negotiated alternative, it would more than double, to $1,730. At the pre-vailing prevalence rate, the lower of the two estimates translates into anaggregate outlay roughly equivalent to 80 percent of the health ministry’scurrent budget, or about 1.8 percent of GDP. In Kenya, where the preva-lence rate is about 15 percent and GDP per capita is similar, the aggregateoutlay would be roughly twice as large. These are sobering numbers, butbroadly in line with the values of {ηt} that emerge from the “good” pro-grams derived in Bell, Devarajan, and Gersbach (2003) for South Africa,which we now summarize.
In the pooling case without school attendance subsidies, the sequentialprocedure described earlier yields a “good” plan {ηt} in which total expen-diture per family or subfamily is $960 in 1990 and $1,030 in 2020 andthereafter, which correspond to about 4.5 and 3.6 percent of GDP, respec-tively. This represents a very considerable fiscal effort, over and above thatalready implicitly contained in the calibration for the period 1960–90,which must also continue into the future to maintain the validity of theparameter values so derived. If this effort is politically possible, not onlywould it stave off a collapse and virtually restore the status quo ante withrespect to premature adult mortality, but it would also leave λ in 2080 onlyabout 12 percent lower than that in the counterfactual case without AIDS.
Such satisfactory results where long-run growth is concerned are notattainable under a nuclear family system, if inequality in individual levels
124 CLIVE BELL, SHANTAYANAN DEVARAJAN, AND HANS GERSBACH
©International Monetary Fund. Not for Redistribution

of human capital is to be avoided in each and every generation. The two-parent families that form the tax base must finance spending programs notonly to combat the epidemic, but also to support one-parent families andfull orphans. Recall that, since there is no extended family to ensure equal-ity within each generation, formulating a “good” plan under these circum-stances involves maximizing a different objective function, namely,aggregate taxable capacity in the next period. The corresponding sequen-tial procedure described there yields expenditure on combating the epi-demic that is about 15 percent higher than under pooling; in addition,each one-parent family receives a (lump-sum) subsidy that is about twiceas large as ηt. To finance all this, each two-parent family pays about twicethe amount of the subsidy as a lump-sum tax. The higher levels of spend-ing to combat the disease in each period are warranted because they leadto fewer needy families and orphans in that period, and hence to lessinequality among adults in the next generation. Put slightly differently,these results confirm the importance of keeping premature mortalityamong adults low, so that parents can provide and care for their children.This clutch of ambitious interventions does stave off collapse and theemergence of inequality, but at the cost of much slower growth. Full edu-cation for all is reached only in 2080, and λ in 2080 is less than half its levelin the counterfactual case without AIDS. These findings point to themacroeconomic significance of informal social insurance throughextended family structures in the face of increasing adult mortality.
Other Economic Losses
Certain of the primary effects of morbidity and mortality among youngadults listed at the outset have received rather short shrift thus far. Here,therefore, we show how they can be given a home in the framework devel-oped above.
An adult who dies prematurely will, all else being equal, produce lessover the life cycle than one who does not. This loss of output and all its con-sequences are fully taken into account in the OLG framework, and there isno real need to estimate it independently in its own right. Much is some-times made of the loss of trained workers in particular. Here, too, to theextent that productivity in adulthood depends only on the quality of chil-drearing and formal education, this loss of human capital is captured in fullin the above framework. To the extent that workers acquire specific skillsthrough training on the job, however, premature mortality among themwill indeed entail losses for which that framework does not allow, and so
Thinking About the Long-Run Economic Costs of AIDS 125
©International Monetary Fund. Not for Redistribution

the results derived from it will be on the optimistic side. Assuming thatfirms are rational in their investment in workers through such training, thecosts of training replacements places a lower bound on such losses.
Some idea of the order of magnitude of these losses in the case of finan-cial services companies in South Africa can be gained from estimates bySchneider and Kelly (2003). Their analysis covers the following items:main risks costs (for example, the costs of death-related and disability ben-efits), defined pension benefits, replacement and retraining, sick leave, eco-nomic costs of absences, maternity benefits, and ancillary insured benefits.In the absence of AIDS the combined costs of these items to a hypotheti-cal company in the financial services sector are estimated to account for24.8 percent of the firm’s outlay on basic payroll. (The contribution ofreplacement and retraining is a very modest 1.1 percent.) In the currentphase of the epidemic, this combined total is estimated to have risen by2.8, 2.9, and 2.3 percent of basic payroll in Gauteng, KwaZulu-Natal, andWestern Cape provinces, respectively. Of these increases, only 0.1, 0.2, and0.1 percentage point, respectively, arise from additional replacement andretraining costs (Schneider and Kelly, 2003, pp. 9–10). For a hypotheticalmanufacturing company in Gauteng province, the contribution ofreplacement and retraining costs is not only larger in the absence of AIDS(1.4 percent of basic payroll) but also more sensitive to the epidemic,which induces an increase of 0.9 percentage point (Schneider and Kelly,2003, p. 75). None of these estimates is strikingly large, but they are costsall the same.
What we have called the transmission factor z(st), st = 0, 1, 2, 3, 4, andthe educational technology g(.) play a vital role in determining thedynamic behavior of the system, especially where its long-run rate ofgrowth, 2zg(1) – 1, is concerned. Our direct empirical knowledge of theseelements, so formulated, is limited, but something can be said about thedirection of the epidemic’s effects. For strictly nuclear families, the value ofz(st) is given, and changes in mortality work their effects by changing thestate probabilities πt(st). If, however, surviving couples take in orphans—pooling arrangements provide an extreme “ideal”—then the sheer burdenof caring for more children will at some point surely reduce the quality ofchildrearing they can provide, although the magnitude of the effectremains a matter for speculation. Given the related financial stress, it isonly to be expected that these parents might favor their natural childrenover their adopted or foster ones, not only in matters of nutrition, educa-tion, and health but also in that vital intangible, loving care and attention.Some recent empirical work supports the view that these adverse effectsare indeed at work. A study of Indonesian children, for example, yields the
126 CLIVE BELL, SHANTAYANAN DEVARAJAN, AND HANS GERSBACH
©International Monetary Fund. Not for Redistribution
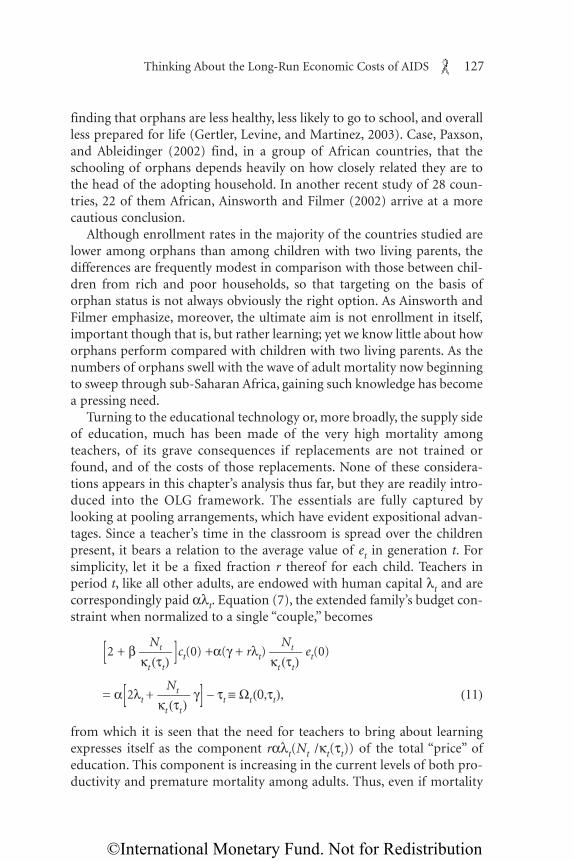
finding that orphans are less healthy, less likely to go to school, and overallless prepared for life (Gertler, Levine, and Martinez, 2003). Case, Paxson,and Ableidinger (2002) find, in a group of African countries, that theschooling of orphans depends heavily on how closely related they are tothe head of the adopting household. In another recent study of 28 coun-tries, 22 of them African, Ainsworth and Filmer (2002) arrive at a morecautious conclusion.
Although enrollment rates in the majority of the countries studied arelower among orphans than among children with two living parents, thedifferences are frequently modest in comparison with those between chil-dren from rich and poor households, so that targeting on the basis oforphan status is not always obviously the right option. As Ainsworth andFilmer emphasize, moreover, the ultimate aim is not enrollment in itself,important though that is, but rather learning; yet we know little about howorphans perform compared with children with two living parents. As thenumbers of orphans swell with the wave of adult mortality now beginningto sweep through sub-Saharan Africa, gaining such knowledge has becomea pressing need.
Turning to the educational technology or, more broadly, the supply sideof education, much has been made of the very high mortality amongteachers, of its grave consequences if replacements are not trained orfound, and of the costs of those replacements. None of these considera-tions appears in this chapter’s analysis thus far, but they are readily intro-duced into the OLG framework. The essentials are fully captured bylooking at pooling arrangements, which have evident expositional advan-tages. Since a teacher’s time in the classroom is spread over the childrenpresent, it bears a relation to the average value of et in generation t. Forsimplicity, let it be a fixed fraction r thereof for each child. Teachers inperiod t, like all other adults, are endowed with human capital λt and arecorrespondingly paid αλt. Equation (7), the extended family’s budget con-straint when normalized to a single “couple,” becomes
Nt Nt[2 + β –––––]ct(0) +α(γ + rλt) ––––– et(0)κt(τt) κt(τt)
Nt= α[2λt + ––––– γ] – τt ≡ Ωt(0,τt), (11)κt(τt)
from which it is seen that the need for teachers to bring about learningexpresses itself as the component rαλt(Nt /κt(τt)) of the total “price” ofeducation. This component is increasing in the current levels of both pro-ductivity and premature mortality among adults. Thus, even if mortality
Thinking About the Long-Run Economic Costs of AIDS 127
©International Monetary Fund. Not for Redistribution

among teachers is no different from that in the rest of the population, itstill discourages investment in education. If, further, teachers require spe-cial training, then the costs discussed above compound the problem byimposing an additional burden on the national treasury, and hence onfamilies through taxation.
It was argued above that parents effectively choose the level of school-ing, so that et is influenced by the whole range of factors discussed above,including premature adult mortality. Disentangling them empirically is avery tall order indeed, but one can still attempt to establish whether thereis an association between such mortality and schooling, and thereby pro-vide indirect support for the approach chosen here. This has been under-taken by Hamoudi and Birdsall (Chapter 4, this volume), using data fromDemographic and Health Surveys conducted in 23 sub-Saharan Africancountries. Employing two specifications, they settle on the estimate that areduction in life expectancy at birth of 10 years is associated with a fall of0.6 year in the average schooling attained by that cohort. Given that lifeexpectancy at birth in most countries in southern and East Africa fell by 10years or more from 1985 to 2000 (Dorrington and Schneider, 2002), andthat average schooling among the population aged 25–49 was in the mod-est range of three to six years, this is a disturbing finding. In the light of theOLG framework, it would be useful to know whether the general magni-tude of this effect also holds good for the more pertinent indicators 20q20and 30q20, but no such results appear to be available.
Conclusion
Like the Black Death of the 1300s (Cohn, 2003), AIDS has the poten-tial to transform the societies in which its victims live. But unlike thatgreat plague, AIDS can have this effect largely by undermining the trans-fer of human capital from one generation to the next—arguably the coremechanism by which societies grow and flourish. The reason is that, incontrast with other epidemics, AIDS is overwhelmingly a fatal disease ofyoung adults. Not only does AIDS cause unspeakable human suffering,but it also makes it difficult for these young men and women to providefor the education of their children, not to mention offer them the loveand care they need to complement their formal schooling. The result ispossibly a whole generation of undereducated and hence underproduc-tive youth, who in adulthood will find it difficult to provide for their chil-dren’s education, and so on. In this way an otherwise growing economycould, when hit with an enduring and sufficiently severe AIDS epidemic,
128 CLIVE BELL, SHANTAYANAN DEVARAJAN, AND HANS GERSBACH
©International Monetary Fund. Not for Redistribution

spiral downward into a low-level subsistence economy in three or fourgenerations.
This threat of a progressive collapse of the economy is particularly insid-ious because the effects will not be felt immediately. Thus estimates of theeconomic impact of AIDS that look only at the short- to medium-termeffects of reductions in labor supply are dangerously misleading. They risklulling policymakers, especially those concerned with short-term economicfluctuations, into a sense of complacency. As this chapter has shown, it ispossible to avert the downward spiral, but only with an aggressive set ofpolicies aimed at shoring up the faltering mechanisms of human capitaltransmission between generations—policies that prevent AIDS, prolongthe lives of its victims, and support the education of their children. Thesepolicies are expensive, but, when viewed against the specter of a collapse ofthe economy and possibly of society itself, they seem like a bargain.
Appendix: Some Technical Notes
The Household’s Decision Problem
Let preferences be separable in ct and λt + 1, with representation in termsof the (expected) utility function
EUt(st) = (3 – st){u[ct(st)] + EtAt+1ν(λt+1)} , with st = 1, 2, (A1)
where the random variable At+1 ∈ {0, 1, . . . , Nt} is the number of the Ntchildren born in period t who survive into old age in period t + 1, and Etis the expectations operator. To put it somewhat differently, parents inperiod t form expectations about the premature mortality that will afflicttheir children as adults in period t + 1, and they consider the average num-ber of survivors in weighting the payoff v(λt+1).
We are now in a position to write out the household’s problem formally.As a preliminary, we substitute for λt+1 in equation (A1) using equation(2), which yields
EUt(st) = (3 – st){u[ct(st)] + EtAt+1ν[z(st)g(et)λt+1)}, with st = 1, 2. (A2)
A family in state st (=1, 2, 3) chooses the bundle (ct(st), et(st)) so as tomaximize EUt, subject to equation (4),
ct(st) ≥ 0, and et(st) ∈[0, 1]. (A3)
A full analysis of problem (A3) is provided in Bell, Devarajan, and Gers-bach (2003).
Thinking About the Long-Run Economic Costs of AIDS 129
©International Monetary Fund. Not for Redistribution

Dynamics
To establish whether unbounded growth is possible, consider the inter-val [Λa(1), ∞), in which et
0(1) = 1. The growth rate of human capital inperiod t in those families such that st = st+1 = 1 is
Λt+1(1) 2––––––– – 1 = [2z(1)g(1) – 1] + –––––.
Λt(1) Λt(1)
Hence, for all families in the group such that st = st+1 = 1 for all t andΛt(1) >Λ*(1) at some point in time, human capital per capita will indeedgrow without bound if and only if 2z(1)g(1) ≥ 1, the asymptotic growthrate being 2z(1)g(1) – 1.
Preferences Under Pooling
Given the assumptions about altruism in the text, the “couple’s” prefer-ences are represented as
EUt(0) = 2{u[ct(0)] + EtAt+1(0)ν(λt+1)}, (A4)
where the random variable At+1(0) ∈ {0, 1, . . ., Nt(0)} is the number of theNt(0) children born in period t who survive into old age in period t + 1.The term Et At+1 depends on the parents’ expectations in period t aboutpremature adult mortality among their children in period t + 1. In thepresence of the poll tax τt, the variable Nt(0) must be rewritten accord-ingly: the random variable At+1(0) ∈ {0, 1, . . ., Nt[0, κt(τt)]} and
Et At+1 = [Etκt+1(τt+1)]·Nt /κt(τt). (A5)
Thus the parents must form expectations about not only the mortalityenvironment in the next period, but also the level of the government’sexpenditure (equals taxation) on mitigating it. If these expectations arestationary, that is, that the future will be like the present, then equation(A5) will specialize to the simple form
Et At+1 = Nt . (A6)
Optimum Policy
Where expectations are concerned, Bell, Devarajan, and Gersbach(2003) argue that a good approximation to a full optimum can be achievedas follows. Suppose there are stationary expectations, so that equation (A6)holds and the forward connection among periods is cut. Then, startingfrom period t, the sequence {τt}
Tt=0 can be constructed as a series of taxes,
130 CLIVE BELL, SHANTAYANAN DEVARAJAN, AND HANS GERSBACH
©International Monetary Fund. Not for Redistribution

each element of which is derived independently of all future values as theoptimum for the period in question. There is, however, an important con-nection with the immediately preceding period: the condition τt–1 ≤ τtmust not be violated, for otherwise the extended family will have chosenthe level of education in period t – 1 on the basis of falsely optimisticexpectations about mortality in period 1. Observe that if the sequence set-tles down into a stationary one, it will also involve a rational expectationsequilibrium.
Formally stated, the government’s problem is as follows. Starting inperiod 0,
maxτt
{2z[0, κ(τt)]g[e0t (Ωt(0, τt),0,κ(τt)]λt + 1},
(A7)subject to τt ≥ 0 and τt ≥ τt–1∀t .
Observe that the potential problem of credibility is implicitly assumedaway: when the family forms its (stationary) expectations in period t, thegovernment has found some way to commit itself to τt+1 = τt.
Following the introduction of school attendance subsidies as an addi-tional instrument, the government’s own budget constraint reads
ηt + σt[Nt/κt(ηt)]et0[Ωt(0, ηt, τt), 0, σt ,κt(ηt)] ≤ τt. (A8)
Problem (A7) becomes
maxηt ,σt ,τt
{2z[0, κ(ηt)]g[e0t (Ωt(0, ηt, τt),0,σt ,κt(ηt))]λt + 1},
(A9)subject to τt ≥ 0, τt ≥ τt–1 and (A8) ∀t.
References
Ainsworth, Martha, and Deon Filmer, 2002, “Poverty, AIDS and Children’s Schooling:A Targeting Dilemma,” Policy Research Working Paper No. 2885 (Washington:World Bank).
Aiyagari, S. Rao, 1987, “Optimality and Monetary Equilibria in Stationary OverlappingGenerations Models with Long-Lived Agents: Growth Versus Discounting,” Jour-nal of Economic Theory, No. 43, pp. 292–313.
———, 1992, “Co-existence of a Representative Agent Type Equilibrium with a Non-representative Agent Type Equilibrium,” Journal of Economic Theory, No. 57,pp. 230–38.
Arndt, Channing, and Jeffrey D. Lewis, 2000, “The Macro Implications of HIV/AIDS inSouth Africa: A Preliminary Assessment,” South African Journal of Economics,Vol. 68, No. 5, pp. 856–87.
Thinking About the Long-Run Economic Costs of AIDS 131
©International Monetary Fund. Not for Redistribution

Barro, Robert J., and Jong Wha Lee, 1996. “International Measures of Schooling Yearsand Schooling Quality,” American Economic Review, Papers and Proceedings,Vol. 86 (May), pp. 218–23.
Bell, Clive, and Hans Gersbach, 2003,“Child Labor and the Education of a Society,” IZADiscussion Paper No. 338 (Heidelberg, Germany: Alfred Weber Institute, Heidel-berg University).
Bell, Clive, Shantayanan Devarajan, and Hans Gersbach, 2003, “The Long-Run Eco-nomic Costs of AIDS: Theory and an Application to South Africa,” PolicyResearch Working Paper No. 3152 (Washington: World Bank).
Case, Anne, Christina H. Paxson, and Joseph D. Ableidinger, 2002, “Orphans in Africa,”Working Paper No. 9213 (Cambridge, Massachusetts: National Bureau of Eco-nomic Research).
Cohn, Samuel K., 2003, The Black Death Transformed: Disease and Culture in EarlyRenaissance Europe (London: Arnold).
Cuddington, John T., 1993, “Modeling the Macroeconomic Effects of AIDS, with anApplication to Tanzania,” World Bank Economic Review, Vol. 7, No. 2, pp. 173–89.
Dorrington, Rob, and others, 2001, “The Impact of HIV/AIDS on Adult Mortality inSouth Africa,” Technical Report, Burden of Disease Research Unit (Tygerburg,South Africa: Medical Research Council of South Africa).
Dorrington, Rob, and David Schneider, 2002, “Fitting the ASSA2000 Urban-RuralAIDS and Demographic Model to 10 Sub-Saharan African Countries” (unpub-lished; Rondebosch, South Africa: Centre for Actuarial Research, University ofCape Town).
Feeney, Griffith, 2001, “The Impact of HIV/AIDS on Adult Mortality in Zimbabwe,”Population and Development Review, Vol. 27, No. 4, pp. 771–80.
Gertler, Paul J., David Levine, and Sebastian Martinez, 2003, “The Presence and Pre-sents of Parents: Do Parents Matter for More Than Their Money?” (Berkeley, Cal-ifornia: University of California at Berkeley).
Hamoudi, Amar, and Nancy Birdsall, 2002, “HIV/AIDS and the Accumulation and Uti-lization of Human Capital in Africa,” Working Paper No. 2 (Washington: Centerfor Global Development).
Huo, Teh-Ming, 1987, “Observational Equivalence of the Overlapping Generations andthe Cash-in-Advance Economies,” Economics Letters, Vol. 25, pp. 9–13.
Kambou, Gerard, Shantayanan Devarajan, and Mead Over, 1992, “The EconomicImpact of AIDS in an African Country: Simulations with a Computable GeneralEquilibrium Model of Cameroon,” Journal of African Economies, Vol. 1, No. 1,pp. 109–30.
Lovo, Stefano, 2000, “Infinitely Lived Representative Agent Exchange Economy withMyopia,” Discussion Paper (Toulouse, France: IDEI, Université de SciencesSociales de Toulouse).
Marseille, E., P.B. Hoffman, and J.G. Kahn, 2002, “HIV Prevention before HAART inSub-Saharan Africa,” The Lancet, Vol. 359, No. 9320, pp. 1851–56.
132 CLIVE BELL, SHANTAYANAN DEVARAJAN, AND HANS GERSBACH
©International Monetary Fund. Not for Redistribution

McNeill, William H., 1976, Plagues and Peoples (Chicago: Anchor Press).
Over, Mead, 1992, “The Macroeconomic Effect of AIDS in Sub-Saharan Africa,” AFTNTechnical Working Paper No. 3 (Washington: Population, Health and NutritionDivision, Africa Technical Department, World Bank).
Schneider, D.H., and N.J. Kelly, 2003, AIDS Impact Assessment: Financial Services Com-panies in South Africa (Gaborone, Botswana: Actuarial Solutions).
Siemers, Lars, 2002, “Human Capital Transfers: Conditional and Unconditional Subsi-dies” (Heidelberg, Germany: Alfred Weber Institute, University of Heidelberg).
Solow, Robert M., 1956, “A Contribution to the Theory of Economic Growth,” Quar-terly Journal of Economics, Vol. 70, No. 1, pp. 65–94.
World Bank, 2002, World Development Indicators 2002 (Washington: World Bank).
———, 2003, “A Technical Guide to the Contemporary Context and Procurement ofHIV/AIDS Medicines and Related Supplies Under Bank-Funded Programs”(Washington).
Woodford, M., 1986, “Stationary Sunspot Equilibria in a Finance-Constrained Econ-omy,” Journal of Economic Theory, Vol. 40, pp. 128–37.
Thinking About the Long-Run Economic Costs of AIDS 133
©International Monetary Fund. Not for Redistribution

4
AIDS and the Accumulation andUtilization of Human Capital in Africa
NANCY BIRDSALL AND AMAR HAMOUDI
Among the great challenges of development, education continues totake pride of place. In this chapter we highlight some of the channels
by which the AIDS pandemic in Africa may affect the continent’s ability toproduce education and to use it effectively for growth and poverty reduc-tion. Our assessment is preliminary; we hope here to sketch a largerresearch agenda rather than to dispose of it.
The effect of the pandemic on the supply of and demand for adequatepublic education matters because education is both constitutive of andinstrumental in the process of development (Sen, 1999). Education is anend in itself, a vital part of individuals’ capacity to lead lives that theyvalue. Furthermore, it is an important instrument with which people canimprove their lives in other ways. For example, more education, particu-larly of women, is associated with better family health and improvedcapacity to plan and time births. Education also enhances the capacity ofpoor people to participate in the political process, and thus to organize forother social and political rights and to demand governments that are morerepresentative and accountable.
The effect of the pandemic on African economies’ ability to use educa-tion to enhance growth matters because faster growth is important to sus-tain poverty reduction and human development. Education contributesto higher individual productivity and income, and thus to sustainableeconomic growth, although education alone is not sufficient for fastergrowth. High measured levels of education and human capital did notgenerate healthy growth in the Soviet Union, nor have rapid increases in
134
©International Monetary Fund. Not for Redistribution

average education done so in Egypt, Latin America, and much of sub-Saharan Africa in the last three decades. But microeconomic analysesdemonstrate repeatedly the contribution of education to productivity atthe individual, household, and farm and firm level.1 Where the relation-ship between “more” education and faster growth has failed to material-ize—both within countries and between countries (see, for example,Pritchett, 1999)—one or more of several difficulties may be responsible.First, “more” education is often assessed in terms of increasing publicspending on education; but, if education systems are weak, more publicspending may not translate into true increases in the human capital stock.Second, even where the human capital stock is increasing, problems inother policy spheres (including, for example, macroeconomic instability,civil unrest, or market distortions) may prevent these gains from beingtranslated into economic growth.2 Third, it may be that as long as theexisting stock of human capital remains below some threshold, modestincreases are relatively ineffective in producing growth; indeed, the deficitbetween the existing stock and this threshold, combined with an adverseeconomic structure and low organizational and institutional capacity,could perpetuate a poverty trap (an issue to which we will return). Thecontribution of education to high and relatively equitable growth inmuch of East Asia over the last five decades, where educational systemswere relatively high in quality and where market and other distortionswere limited, provides the best counterexample on all these scores (Bird-sall, Ross, and Sabot, 1995).
In addition to its effect on growth, education also affects the distribu-tion of incomes; universal education is essential to creating the pattern ofgrowth that is most likely to reduce poverty. For the poor, the human cap-ital acquired through formal education is a critical economic asset that,once acquired, cannot be appropriated by others. At the societal level, edu-
AIDS and the Accumulation of Human Capital in Africa 135
1Schultz (1961) first made this point; Schultz (1989) reviews the now-large microeco-nomic literature.
2In fact, various market distortions in developing countries typically keep the marginalprivate return, if not the average private return, high compared with that in industrial coun-tries. In Egypt, for example, a policy of guaranteeing a public sector job to all secondary anduniversity graduates ensured high marginal private returns, especially to higher education,but these returns were independent of the quality of education; of the actual productivity ofpeople attributable to some combination of their human capital, their motivation, and com-plementary inputs on the job; and, of course, of whether or not a real demand existed fortheir skills in the public sector. The policy probably also reduced the demand for and thepressure on the educational system to achieve real gains in learning and skills as opposed tosimply certifying graduates (Birdsall and O’Connell, 1999).
©International Monetary Fund. Not for Redistribution

cation that is broadly shared contributes to a more equitable distributionof total wealth (including human capital wealth; Birdsall, 1999; Birdsalland Londoño, 1997) and thus ultimately to a more equitable distributionof opportunities and of income.
Prospects for accumulation and effective economic deployment of edu-cation in Africa have to be assessed against the backdrop of the ongoingHIV/AIDS epidemic. According to estimates by the Joint United NationsProgramme on HIV/AIDS (UNAIDS), AIDS claimed the lives of about 2million to 2.5 million adults and children in sub-Saharan Africa in 2003.Over the same period, an estimated 3 million Africans were newly infectedwith HIV; barring very dramatic increases in treatment coverage, almostall of these individuals will die over the next decade (UNAIDS, 2004). Asthe death toll from the epidemic has mounted, life expectancies across thecontinent have plummeted. In Zambia, for example, life expectancy atbirth increased from 43 years to 51 years between 1962 and 1982, only todecline again from 50 years to 38 years between 1985 and 1999—a loss ofover 20 years’ progress in less than a decade (World Bank, 2001). Figure 4.1shows some of the more dramatic declines in life expectancy amongAfrican countries over the past four decades. Economists and others havebegun to focus attention on the likely effects of the epidemic on overallsocial welfare and material well-being. However, its more specific effects
136 NANCY BIRDSALL AND AMAR HAMOUDI
35
40
45
50
55
60
65
Botswana
Kenya
Zambia
Uganda
South Africa
1960 65 70 75 80 85 90 95 99 2002
Figure 4.1. Life Expectancy at Birth in Five Sub-Saharan African Countries(Years)
Source: Data from World Bank (2004).
©International Monetary Fund. Not for Redistribution

on the supply of, demand for, and productive use of education have notbeen explicitly explored.
To be sure, the problem of Africa’s small human capital stock predatesthe arrival of the epidemic. Figure 4.2 shows the evolution of one (verycrude) measure of the region’s human capital stock: average years ofschooling attained among the general population aged 25 years and older.Although the rate of growth in human capital by this measure in sub-Saharan Africa picked up briefly in the late 1970s, the continent continuesto lag behind other developing regions.
This chapter explores some of the ways in which the AIDS epidemic islikely to affect the rate of new human capital formation on both the sup-ply and the demand sides, and the productivity of the existing human cap-ital stock in Africa. We focus on four specific channels:
• The loss of millions of adults—among them tens of thousands ofteachers—affects the rate at which education systems in Africa areable to train the next generation for any given cost and with any givenquality.
• The foreshortening of time horizons attendant on these prematuredeaths reduces the expected lifetime private return to schooling andtherefore may reduce demand for education. In addition, increasinghousehold dependency ratios, as the children of AIDS victims are
AIDS and the Accumulation of Human Capital in Africa 137
0
1
2
3
4
5
6
7
8
9
Figure 4.2. Mean Years of Schooling by World Region(Years)1
Source: Data from Barro and Lee (1996).1Regional data are unweighted country averages for the population aged over 24 years.
1960 65 70 75 80 85 90
Industrial countries (22 countries)
East Asia (6)
Latin America and Caribbean (24)
Sub-Saharan Africa (27)
©International Monetary Fund. Not for Redistribution

transferred to the care of foster parents, may reduce the likelihoodthat children are enrolled in school.3
• The loss of so many already-educated people could reduce the socialreturns to skill among the educated people who survive, to the extentthat there are positive externalities associated with a larger total stockof human capital. This could result in a smaller contribution of edu-cation to aggregate growth. In addition, if general human capitalacquired through education does not substitute perfectly for job-specific human capital acquired through experience, the loss of expe-rienced workers could slow growth.
• As higher production costs result in lower investment by businesses,the consequent decline in physical capital assets would likely reducethe ability of educated people to contribute to economic production,to the extent that physical capital and human capital are complemen-tary inputs.
The last two of these channels could also affect the long-run privatedemand for education, insofar as average, if not marginal, private returnsto education remain low in low-productivity settings. This is the case eventhough marginal private returns to education, especially above the pri-mary level, could well remain high because of the relative scarcity of well-educated workers (including managers and administrators).4
Of course, there are other ways in which AIDS is likely to affect educa-tion and human capital in Africa. For example, increasing fears, especiallyfor girls, about exposure to HIV in schools may reduce demand for sec-ondary schooling. In this chapter we abstract from such social or psycho-logical effects, to focus on the primarily economic channels, direct andindirect.
HIV/AIDS and the Supply of Schooling in Sub-Saharan Africa
Of the 25 million people in sub-Saharan Africa estimated by UNAIDS(2004) to be living with HIV infection, about 90 percent are adults andyouths over the age of 15 years. Partly as a result of the epidemic, adult
138 NANCY BIRDSALL AND AMAR HAMOUDI
3We do not use the phrase “AIDS orphans” here, only because many children may be fos-tered out to new homes before their ill parents actually die.
4Psacharopoulos (1994) reports that, on average, marginal private returns to education,especially higher education, are higher in developing countries than elsewhere. This does notmean, of course, that the average returns reflected in wage or salary levels are higher, but onlythat the additional return over and above that realized by less educated workers is greater.
©International Monetary Fund. Not for Redistribution

mortality rates in Africa are over three times the world average. During1999, an African between the ages of 15 and 60 stood, on average, a1.4 percent chance of dying; the world average that same year was 0.4 per-cent (World Bank, 2001). According to UNAIDS, UNICEF, and USAID(2004), by the end of 2003 about 12 million African children had losteither their mother or both parents to AIDS, and, in some of the worst-affected countries, close to 20 percent of all children under age 17 had lostat least one parent, the majority to HIV/AIDS. Furthermore, empiricalevidence suggests that among those adults who were infected early in theepidemic, and who are falling ill and dying now, a disproportionate num-ber are relatively well educated, urban, white-collar workers (Ainsworthand Semali, 1998; Filmer, 1998; Deheneffe, Caraël, and Noumbissi, 1998).It is not surprising, therefore, that educators are one of the hardest-hitprofessions in many AIDS-ravaged African countries. In Zambia, forexample, the World Bank estimates that mortality rates among teachersare 70 percent higher than among the general adult population (WorldBank, 2001). The United Nations Children’s Fund (UNICEF, 2000) esti-mates that, in 1999 alone, 860,000 African schoolchildren lost their teach-ers to AIDS (out of a total population of some 70 million pupils), on acontinent that in 1997 had only one teacher for every 59 students (WorldBank, 2001).
Demographic projections, using specialized software packages, havebeen employed to speculate on some of the likely effects of the loss ofteachers to AIDS in specific African contexts (Malaney, 2000). One generalway to assess these effects is to consider a simple two-equation model.Divide the population in the education system into two mutually exclusivegroups, teachers and students, and divide each person’s lifetime into twoperiods, childhood and adulthood. Assume that all students are children,added to the system at some constant net rate determined by the differencebetween enrollment and attrition. Teachers are assumed to be adults,added to the system by training some proportion of the previous period’sstudents, and lost to the system by death, retirement, and other sources ofteacher attrition.
With these assumptions, the number of teachers and students in anygiven period can be expressed as
St = [1 + n] St–1
Tt = [1 + dt ] Tt–1 + rSt–1.
In these equations n is the rate at which students are added to the educa-tion system (net of the rate at which they graduate or drop out), r is the
AIDS and the Accumulation of Human Capital in Africa 139
©International Monetary Fund. Not for Redistribution

proportion of the last period’s students who complete school and then areretained within the system as teachers, and d is the rate of teacher attrition.Using these two equations, one can determine the teacher-student ratio ineach period as a function of n, r, d, and the teacher-student ratio in the pre-vious period:
Tt r Tt–1–– = ––––– + (1– dt)(––––).St 1 + n St–1
Using plausible parameter estimates, we can apply this model to a real-world case in order to speculate on the scale of the effects of futureincreases in teacher mortality.
According to the World Bank, the current student-teacher ratio inone of the hardest-hit countries in Africa, Botswana, is about 28. (Ratherthan teacher-student ratios, the World Bank reports the inverse; theratio for Botswana is less than half the continent-wide average of 59.)According to the World Bank, the population under 14 years in Botswanais projected to grow over the next 15 years at an average annual rate of–0.4 percent.5 Abstracting from any changes in the proportion of thispopulation that is of primary school enrollment age, and from anychanges in enrollment rates, the net rate of increase in the studentpopulation (n), therefore, would be –0.004. Data indicating the rate atwhich students are trained to become teachers in Botswana are notreadily available. However, neighboring Namibia trains about 1,000teachers each year, or some 0.2 percent of the student body (Malaney,2000). Assuming that Botswana’s education system retains this sameproportion of its student body to become teachers, we can set r = 0.002.Finally, we assume that the “background” rate of teacher attrition—thatis, the rate of teacher attrition due to retirement and other traditionalsources—is about 5 percent a year, and that the teacher mortality rate inBotswana is about 3 percent a year (the current adult mortality rate in thecountry).
Given these assumptions, Figure 4.3 shows the evolution of thestudent-teacher ratio over the next 20 years under three scenarios. The
140 NANCY BIRDSALL AND AMAR HAMOUDI
5This projected decline reflects the expected decline in fertility and the effects of forecastsof adult mortality as much as or more than any increase in mortality at young ages. Declinesin fertility are occurring elsewhere in Africa, as the education of mothers and access to healthcare, including modern family planning services, have been increasing, the latter especially inurban areas. As noted below, our simulation results are highly robust to variations withinplausible ranges of this parameter, but obviously a faster growth rate of the school-aged pop-ulation would exacerbate the problem we illustrate.
©International Monetary Fund. Not for Redistribution

first scenario holds teacher attrition constant at the background rate.The second holds teacher attrition at 8 percent—of which the back-ground rate accounts for 5 percentage points and the current adult mor-tality rate in Botswana for the remainder. The last scenario assumes—inkeeping with projections by the United Nations Development Pro-gramme (2000)—that adult mortality (and hence, by assumption, teachermortality) will double over the next 10 years and decline very graduallythereafter.
These projections are highly robust to changes in the assumptionsabout the rate of growth in the student population—which, after all, islikely to be affected by the epidemic as well, although almost certainly notas dramatically as the rate of growth in the teacher population. The WorldBank (2001) has projected, for example, that the primary-school-agedpopulation in Zimbabwe is likely to contract by about 0.8 percent a yearover the next decade. Adjusting our assumptions to examine the effects ifthe school-aged population in Botswana suffered the same decline, how-ever, does not significantly change the projections shown in Figure 4.3 overthe time horizon of the simulation.
AIDS and the Accumulation of Human Capital in Africa 141
0
10
20
30
40
50
Assumes teacher mortality doubles over next 10 years and then slowly declines
Assumes teacher attrition remains constant at background rate(5 percent a year)
Assumes teacher attrition remains constant at 8 percent a year2
Figure 4.3. Projected Student-Teacher Ratios in Botswana Under Alternative Assumptions1
(Students per teacher)
Source: Authors’ calculations using the model described in the text.1Assumptions underlying all scenarios are that there are 28 students per teacher in 2000, that the
student population (net) grows at a rate of –0.4 percent a year, that 0.2 percent of each year’s students are trained to become teachers the following year, and that teacher attrition is 5 percent a year plus the rate of teacher mortality, which equals the rate of adult mortality.
2Background rate (5 percent a year) plus adult mortality of 3 percent a year.
2000 02 04 06 08 10 12 14 16 18 20
©International Monetary Fund. Not for Redistribution

By contrast, the projections are more sensitive to assumptions about therate of retention of students to become teachers.6 For example, theincrease in student-teacher ratios shown in the most pessimistic scenarioin Figure 4.3 can be entirely averted if the rate at which students aretrained to become teachers is increased from 0.2 percent a year to about0.35 percent a year. Figure 4.4 plots the retention ratio necessary to main-tain a constant student-teacher ratio for various rates of teacher attrition;at points above each line, the student-teacher ratio is improving (that is,declining), whereas at points below, it is worsening.
The focus here on student-teacher ratios is not meant to imply that thisis the sole measure—or even a good measure—of school quality or effi-ciency. However, these ratios do reflect clearly one of the most directeffects of the HIV epidemic on the supply of schooling in sub-SaharanAfrica, namely, the loss of enormous numbers of teachers over themedium term. For example, from Figure 4.4 it is straightforward todiscern that, in order to maintain its current ratio in the face of excessannual adult mortality, a country like Botswana must plow nearly150 percent more of its students back into the education system tobecome teachers. Therefore, in order to continue to supply schoolingservices at current enrollment rates, African education systems will eitherhave to tolerate a dramatic increase in class sizes, or find ways to retainsignificantly more of the country’s precious human capital within theeducation system, or both. And this must happen at a time when othersectors of the economy are also desperate to replace their own educatedworkers who are being lost to the epidemic (African DevelopmentForum, 2000). The implication is that, even with increases in class size,public education systems will need to increase the salaries of teachers toattract a larger proportion of graduates into the field. Yet salaries of teach-ers in sub-Saharan Africa are already higher, relative to average wages inthe economy, than in other regions of the world, probably reflecting therelative scarcity of postsecondary graduates.7 These results imply anincrease in an already high fiscal burden of teacher salaries relative toother regions, or the need to reduce the educational requirements forteachers. The latter adjustment is likely to be necessary, especially in rural
142 NANCY BIRDSALL AND AMAR HAMOUDI
6This, of course, is not surprising, given the structure of the model, in which an increasein the size of today’s student body has two effects that work in opposite directions. First, itincreases the student-teacher ratio in the present, but, second, it provides a larger pool of newpotential teachers in the future. The effects of a decrease in the rate of teacher training, how-ever, are not mitigated in any analogous way.
7On this point, World Bank (2000) cites Alain Mingat.
©International Monetary Fund. Not for Redistribution

areas, and is likely to be even more costly in terms of quality than anyincrease in class size.8
Furthermore, focusing as these results do on nationwide averagesimplicitly assumes that the government is able to deploy teachers rela-tively easily throughout the country, in order to ensure that the effects ofteacher shortages are evenly felt. The reality, of course, is decidedly morecomplicated. Student-teacher ratios are generally much higher in ruralareas, for example, than in urban areas, and the increase in teachermorbidity and mortality may be worsening this disparity by increasingdemand for posts in urban areas closer to health facilities (UNICEF,2000). The effects of the epidemic in some rural schools, especially thesmaller ones with only one or two teachers teaching multiple grades,may be far more dramatic than these model results suggest. In the Demo-cratic Republic of the Congo, for example, some schools have reportedlybeen forced to close entirely for lack of teachers (African DevelopmentForum, 2000).
AIDS and the Accumulation of Human Capital in Africa 143
0
0.05
0.10
0.15
0.20
0.25
0.30
0.35
0.40
28 30 32 34 36 38Students per teacher
40 42 44 46 48
If teacher attrition = 5 percent a year
If teacher attrition = 8 percent a year
If teacher attrition = 10 percent a year
Figure 4.4. New Teachers Required to Be Trained to Maintain a Constant Student-Teacher Ratio in Botswana(Percent of preceding year’s student population)
Source: Authors’ model described in the text.
8Behrman and Birdsall (1983) use differences in teacher education as a proxy for differ-ences in the quality of schools across U.S. states. The resulting differences in the quality ofschooling across individuals have a strong and highly robust effect on the private returns toschooling (and presumably the social returns).
©International Monetary Fund. Not for Redistribution

HIV/AIDS and Demand for Schooling in Sub-Saharan Africa
The previous section framed an approach to assessing the possiblesupply-side effects of the AIDS epidemic on education. Since the basicfindings—that student-teacher ratios are likely to rise unless retentionincreases as a proportion of the total population leaving school—are fairlyrobust to assumptions about demand-side changes, we were able toabstract from these. However, two of the major channels through whichthe epidemic is likely to affect demand for education include time horizoneffects and liquidity effects. We will discuss the latter briefly, and then theformer at greater length.
Liquidity Effects
For many reasons (including the fact that individuals cannot be dispos-sessed of their own human capital), adults cannot formally borrow onbehalf of their children in order to finance their education. As a result, anyprivate investments in children’s education must be financed out of par-ents’ or caregivers’ wealth. If parents and caregivers face liquidity con-straints as a result of increasing household dependency ratios, they mayfind that financing more difficult. Furthermore, Case, Paxson, and Ablei-dinger (2004), Deininger, Garcia, and Subbacao (2003), and Bishai andothers (2003) all find descriptive evidence suggesting that parents mayfavor their own biological children over foster children. If, in fact, a causalrelationship exists between biological relatedness and parental “altruism,”the displacement of millions of orphans to the care of nonbiological par-ents may adversely affect their educational opportunities.
Time Horizon Effects
Recent theoretical and empirical work has explored the relationshipsbetween life expectancy and investment in human capital. The reasoningis that, when individuals and households anticipate a longer time horizonover which to reap returns, they are likely to be more willing to incur theup-front costs of investment in schooling. Kalemli-Ozcan, Ryder, and Weil(2000) develop a model in which individuals facing a constant probabilityof death weigh the earnings forgone during the time spent in schoolagainst the anticipated returns to schooling in deciding when to leaveschool and enter the labor force. Calibrating their model using reasonableparameters based on real-world data, these authors speculate that changesin life expectancy over the past 150 years can explain a significant fraction
144 NANCY BIRDSALL AND AMAR HAMOUDI
©International Monetary Fund. Not for Redistribution

of the observed increases in schooling rates in the most developedcountries.9
Such a model would also capture stylized facts from developing coun-tries over the more recent past. In an empirical treatment of this question,Behrman, Duryea, and Székely (1999) relate the educational attainment ofbirth cohorts—using data from household surveys conducted in LatinAmerica—to fixed-country effects, secular trend effects, and several year-and country-specific variables, including life expectancy, that reflect thebroader economic and institutional setting.10 Their results suggest thatchanges in life expectancy were associated with quantitatively and statisti-cally significant changes in educational attainment. On average, theyfound a 10-year increase in life expectancy to be associated with a 0.3- to0.4-year increase in schooling completed.
Here we use a similar “quasi-panel” technique to try to describe thisrelationship in African contexts over the past generation. We use data fromthe Demographic and Health Surveys (DHSs), in which nationally repre-sentative samples of 15- to 49-year-old women are interviewed on suchtopics as reproduction, household assets, children’s health, employmentstatus, and educational attainment. We emphasize that the main lesson tobe drawn from our results is descriptive, not directly causal, and morequalitative than the econometric results could be taken to imply. Our find-ings, like those of Behrman, Duryea, and Székely, point to a decline indemand for education accompanying a decline in life expectancy; this is asfar as we intend to interpret the results presented below. One of manycausal interpretations of this descriptive finding includes the sort of timehorizon effects that Kalemli-Ozcan, Ryder, and Weil outline in their theo-retical model. Empirical analysis to identify such a causal effect is animportant direction for future research.
The DHS data demonstrate steady improvements in the educationalattainment of birth cohorts across the continent over time. (Figure 4.5shows attainment profiles for five-year birth cohorts that reached ages
AIDS and the Accumulation of Human Capital in Africa 145
9Of course, it is not clear that increasing life expectancy per se has had a direct causal effecton these increases in schooling; life expectancy is usually closely associated with otherchanges, including increasing average income, technological shifts, and improving institu-tions, all of which would raise the returns to and the demand for education. These factors areguaranteed to confound any empirical investigation of the effects of life expectancy ondemand for education, including the one we undertake here. Given the impossibility of con-ducting controlled experiments, any empirical analysis—including this one—will necessarilybe more suggestive of the direction of such effects than conclusive regarding their magnitude.
10As with life expectancy, these other variables have mostly statistically significant effectsin the expected direction on differences and changes in average education.
©International Monetary Fund. Not for Redistribution

146 NANCY BIRDSALL AND AMAR HAMOUDI
0
20
40
60
80
100
0
20
40
60
80
100
0
20
40
60
80
100
2 3 4 5 6 7
1967
1967
1967
1977
1977
1977
1987
1987
1987
1992
1992
1992
Figure 4.5. Educational Attainment Profiles of Selected Birth Cohorts in Uganda, Zambia, and Zimbabwe1
(Percent of cohort population)
Years of schooling
2 3 4 5 6 7Years of schooling
2 3 4 5 6 7Years of schooling
Uganda
Zambia
Zimbabwe
Source: Authors’ calculations using data from Demographic and Health Surveys for Uganda (1995), Zambia (1996), and Zimbabwe (1999).
1Profiles are constructed by stratifying survey responses according to the respondent’s year of birth and tracking the proportion of respondents who reported having completed each year of school. Responses are weighted by sampling weights.
2Years are those in which the indicated cohort reached age 12–17.
©International Monetary Fund. Not for Redistribution

12–17 in 1967, 1977, 1987, and 1992 in Uganda, Zambia, and Zimbabwe.)The older cohorts in almost all countries reported lower attainment. Ineach of the 23 countries for which surveys were available, the same generaltrend may be observed.11 It is important to be careful in interpreting theseobservations, however. The observations are not truly longitudinal, sincethey are derived from cross-sectional surveys. The time component comesfrom subdividing the cross-sectional responses to the survey questionsaccording to the year of birth of each respondent. We discuss this at greaterlength later in this section.
However, it is worth observing a few country experiences over time. Fig-ure 4.6 shows differences in average years of schooling between birthcohorts and changes in life expectancy at birth in the three countriesshown in Figure 4.5. In Uganda and Zambia, for example, each five-yearbirth cohort appears to have been more educated than the one before ituntil 1977. Those reaching ages 12–17 in 1982 and after, however, began tosee shorter and shorter life expectancies and had the same or fewer yearsof schooling as the cohorts before them.
With this approach we seek to explore the extent to which changes ineducational attainment among individuals and cohorts can be correlatedwith differences in life expectancy in the years when the individuals andcohorts are making decisions about whether to remain in school. To thisend we compiled comparable data from 37 DHSs conducted in 23 sub-Saharan African countries over 12 years, resulting in individual data onsome 192,000 respondents. We collapsed these respondents into 214 five-year birth cohorts and related average years of schooling within thesecohorts to household and national characteristics. The oldest of the cohortswas born during 1935–39, and the youngest during 1980–84. The choice offunctional form is similar to that employed by Behrman, Duryea, andSzékely, with household and country characteristics relating to schoolingattainment in a linear fashion.12 Table 4.1 shows the results of ordinary-least-squares (OLS) regressions of average years of schooling in each five-
AIDS and the Accumulation of Human Capital in Africa 147
11The attainment profiles for the other 20 countries are not shown but are available onrequest from the authors.
12Although the objective here is description, this linear functional form refers back to aspecific structural model, namely, the standard Mincerian (Mincer, 1974) model in whichindividuals seek to maximize their expected income, weighing forgone time in the labor forceagainst the wage premium attributable to schooling. In such a model, individuals would beexpected to remain in school until the present value of their expected lifetime returns to anadditional year of school equals potential earnings from a year in the labor force. Theseexpected returns are of course linearly related to life expectancy, with each additional year oflife in the labor force bringing one additional year of returns.
©International Monetary Fund. Not for Redistribution

148 NANCY BIRDSALL AND AMAR HAMOUDI
40 45 50 55 60 650
2 1962
1962
1962
67
67
67
72
72
72
77
77
77
82
82
82
87
87
87
92
92
92
4
6
8
10
40 45 50 55 60 650
2
4
6
8
10
40 45 50 55 60 650
2
4
6
8
10
Figure 4.6. Educational Attainment and Life Expectancy for Selected Birth Cohorts in Uganda, Zambia, and Zimbabwe1
Source: Authors’ calculations using data from Demographic and Health Surveys for Uganda (1995), Zambia (1996), and Zimbabwe (1999) and World Bank (2001).
1Each point represents the five-year birth cohort that reached ages 12–17 in that year.2Calculated by collapsing DHS respondents into cohorts based on birth year and averaging the years
of education reported by respondents in each group, weighted by survey sampling weights.
Mean years of schooling2
Life expectancy at birth when cohort reached ages 12–17
Mean years of schooling2
Life expectancy at birth when cohort reached ages 12–17
Mean years of schooling2
Life expectancy at birth when cohort reached ages 12–17
Uganda
Zambia
Zimbabwe
©International Monetary Fund. Not for Redistribution

year birth cohort on national average life expectancy at birth when thecohort was aged 12–17. (Sample sizes in some of the regressions are reducedbecause of lack of data on many of the DHS wealth variables or on GDP percapita adjusted for purchasing power parity.13) Control variables for eachcohort in each country include indicators of household asset wealth oraverage income per person, the proportion of each cohort living in urban
AIDS and the Accumulation of Human Capital in Africa 149
Table 4.1. Ordinary-Least-Squares Regressions of Educational Attainment on LifeExpectancy and Other Variables
Regression1___________________________________________________
Independent Variable (1)2 (2)2 (3) (4) (5)2,3 (6)2,3
Life expectancy at birth (in years) 0.175 0.064 0.170 0.086 0.070 0.062(0.053) (0.045) (0.085) (0.075) (0.051) (0.050)
Real GDP per capita (in 1987 international dollars)4 0.002 0.001
(0.001) (0.001)
Year5 .0069 0.494 –0.068 0.513 0.055 0.404(0.027) (0.069) (0.052) (0.159) (0.023) (0.180)
Year squared –0.003 –0.004 –0.002(0.000) (0.001) (0.001)
Number of observations 144 144 107 107 105 105R2 0.97 0.98 0.96 0.97 0.95 0.96
Source: Authors’ regressions using data from Demographic and Health Surveys (DHS) and WorldBank (2001).
1The dependent variable is average years of schooling; data are calculated from the DHS for cohortsreaching ages 12–17 in 1962, 1967, 1972, 1977, 1982, 1987, and 1992 in 23 sub-Saharan African countries.Cohort averages are taken by collapsing individual respondents into five-year cohorts defined by the yearof their birth and taking an average of responses (weighted by survey sampling weights). Some cohortswere omitted from the regressions for lack of data. For robustness to heteroskedasticity, standard errorsof coefficient estimates (in parentheses) are calculated using the Huber-White estimator of the variance-covariance matrix. All regressions include country-specific intercepts and country-specific time trendsexcept where noted otherwise.
2Regressions include indicators of household asset wealth (percent of cohort with electricity, radio,bicycle, motorcycle, car).
3Only those cohorts that reached the ages of 12–17 before 1987 are included. Country-specific timetrends are not included.
4Dollars adjusted for differences in purchasing power across countries.5Variable defined as year minus 1900.
13Because of incomplete data, our regressions do not include all 214 birth cohorts. Noaggregate data were available for those birth cohorts that reached ages 12–17 before 1962,leaving 161 cohorts. For some of these, data on household wealth and GDP per capita werenot available. However, we used a probit regression to test for systematic differences betweenthose observations for which GDP and household wealth data were available and those forwhich they were not; the two groups were not statistically different in terms of the otherregressors or the dependent variable.
©International Monetary Fund. Not for Redistribution

areas, a separate time trend for each country, and country dummy variablesto capture fixed effects on demand for schooling within countries.
As already noted, this “quasi-panel” technique is not truly longitudinal,since the time-varying component in the data comes from sorting indi-vidual respondents into groups based on the five-year period in which theywere born. One difficulty that arises from this procedure relates to thequestion of selection bias due to mortality rates possibly being correlatedwith education level. Say, for example, that the more educated individualsin each birth cohort are likely to live longer than their less educated peers.Then, even in the absence of any true secular trend, older birth cohortswould appear relatively more educated than younger ones at any momentin time, since the less educated among the older cohorts will be more likelyto have been removed (by death) from the sample of potential respon-dents.14 To correct for this effect, we include a linear time trend in theregressions relating schooling attainment to life expectancy, which implic-itly assumes that the effect of education on an individual’s mortality risk isconstant across birth cohorts.15 This assumption may fail, however,because of the nature of the AIDS epidemic: as noted above, the epidemic(at least in its first wave) appears to have greatly increased the risk of mor-tality among younger, more educated people relative to younger, less edu-cated people. As a result, the younger birth cohorts may have been purgedby the time of the surveys of the more educated among them, whereas theolder birth cohorts would have been purged of the less educated. Even inthe absence of any true time trend, this would create an apparent concaverelationship between time and average schooling. We know (see Figure4.1) that the same sort of relationship holds between life expectancy andtime, because of the epidemic. Therefore some of the apparent relationshipbetween life expectancy and schooling may simply be an artifact of this“differential mortality” problem. One way to try to separate out this effectfrom the “true” relationship between schooling and life expectancy is toinclude the square of the year in the regressions, as we do in columns (2)and (4) of Table 4.1. The difficulty with this approach, however, relates tomulticollinearity in the data: life expectancy among the 138 “quasi-cohorts” in columns (1) and (3) is almost perfectly quadratic in time, after
150 NANCY BIRDSALL AND AMAR HAMOUDI
14Of course, selection bias may result from dynamics other than just mortality risk. Forexample, if educated people are more likely at any time to emigrate, the same problem wouldresult. The reasoning is essentially the same, regardless of the selection factor.
15Of course, this is not the only reason we include a time trend. Including a year trend alsocaptures institutional and technological changes and other developments, so long as thesethings occur monotonically (and in fact linearly) over time.
©International Monetary Fund. Not for Redistribution

controlling for the other factors.16 It is difficult, therefore, to determinefrom the existing data how much of the apparent relationship betweenschooling and life expectancy is simply an artifact of selection bias.
Another way to deal with this is to restrict the period of analysis to thetime before the epidemic, as we do in columns (5) and (6) of Table 4.1.After all, it is likely that any effect of education on the relative risk of mor-tality would be constant across time during this period, so that includingtime linearly in this regression would control for the possibly differentialeffect of education on mortality.17 But, again, before 1987 improvementsin life expectancy were almost perfectly linear with time across Africa, aftercontrolling for household wealth and country-specific factors.18 Thereforethis approach does not entirely solve the problem.
Nonetheless, it is worth underlining that we account for time-invariantcountry-specific differences (such as differences in economic and socialpolicy and institutions) by including a country-level fixed effect, and forany country-specific effects that change linearly with time by includingcountry-year interaction terms.19 These results suggest that, in cohortswhose life expectancy was 10 years longer, schooling attainment was some0.6 to 0.9 year higher.
Table 4.2 reports results of the same regression, but with each individ-ual entered into the regression as a single observation, rather than withindividuals aggregated into birth cohorts. Because schooling attainmentfor individuals is truncated at zero years (one cannot spend a negativenumber of years in school), we use a tobit specification.20 The results sug-
AIDS and the Accumulation of Human Capital in Africa 151
16A regression of life expectancy at birth against the other regressors in column (2) ofTable 4.1 produces an R2 of 0.99.
17The coefficient on year squared in column (6) is not statistically significantly differentfrom zero at the 5 percent confidence level.
18A regression of life expectancy at birth against the other regressors in column (5) ofTable 4.1 produces an R2 of 0.96, with each additional calendar year bringing an additional0.39 year of life expectancy (with a standard error of 0.02).
19Analysis of the country dummies and country-specific year trends (not shown) indicatesthat among the large positive outliers are Ghana and Uganda, and among the large negativeoutliers are war-torn Ethiopia as well as Nigeria and Niger; these findings are consistent withour intuition about at least institutional variation across countries in the region.
20The tobit functional specification assumes that the schooling attainment data are truncated,not censored by some independent set of dynamics that determines whether individuals go toschool separately from those that determine how long they remain in school, once enrolled. Totest whether this assumption is appropriate, we estimated the probability that a respondent willhave obtained any schooling at all—regardless of how much—and compared the coefficient esti-mates from this regression with those of the tobit regression in Table 4.2. If the assumptionunderlying the tobit specification holds, we should expect the coefficient estimates (scaled by thestandard error of the estimate) to be equal. The estimates were indeed quite close.
©International Monetary Fund. Not for Redistribution

gest that individuals facing 10 years greater life expectancy attained some0.3 to 0.6 year more schooling—somewhat less than the 0.6 to 0.9 yearobtained using the “quasi-cohort” data.
Another way to attack the problem empirically—one that is less subjectto the differential mortality problem—is to examine the relationshipbetween gross primary enrollment ratios at the national level and lifeexpectancy at birth. In generating internationally comparable estimates ofschooling attainment, Barro and Lee (1996) employ a “perpetual inven-tory” method to translate gross enrollment ratios and demographic struc-ture into stocks and flows of population at various levels of educationalattainment (no schooling, incomplete primary, complete primary, and soon).21 They estimate, for example, that the population over age 15 who hascompleted at least some primary education in any five-year period is equalto the primary-educated population from the previous period that has
152 NANCY BIRDSALL AND AMAR HAMOUDI
Table 4.2. Tobit Regressions of Educational Attainment on Life Expectancy andOther Variables
Regression1____________________________________________
Independent Variable (1) (2) (3)2 (4)2
Life expectancy at birth (in years) 0.058 0.029 0.107 0.060(0.019) (0.019) (0.020) (0.022)
Year 0.097 0.947 0.156 0.677(0.017) (0.058) (0.007) (0.118)
Year squared –0.005 –0.003(0.000) (0.001)
Dummy variable for urban residence 3.135 3.126 3.475 3.475(0.058) (0.058) (0.078) (0.078)
Number of observations 54,830 54,830 37,650 37,650
Left-censored observations (zero years of school) 24,985 24,985 18,577 18,577
Sources: Authors’ regressions using data from Demographic and Health Surveys (DHS) and WorldBank (2001).
1The dependent variable is average years of schooling; regressions are as in Table 4.1 except that eachindividual respondent is entered as a separate observation rather than included in a five-year birthcohort. Only those individuals who reached age 12 in 1962, 1967, 1970, 1972, 1977, 1980, 1982, 1985,1987, 1990, and 1992 are included in the regressions. All regressions include country-specific intercepts,country-specific time trends (except where noted otherwise), and indicators of household asset wealth(whether the respondent’s household has electricity, radio, bicycle, motorcycle, car).
2Regression includes only those individuals who reached age 12 before 1987 and does not includecountry-specific time trends.
21They have subsequently used “adjusted gross enrollment ratios” in order to avoiddouble-counting individuals who repeat grades (Barro and Lee, 2000).
©International Monetary Fund. Not for Redistribution

survived, plus the population that turned 15–19 over the previous fiveyears and attended any primary school. The latter population is estimatedby multiplying the total population of each five-year birth cohort by thegross primary enrollment ratio in the period when that cohort was aged10–14.
The assumption, therefore, is that the gross primary enrollment ratiowhen a five-year birth cohort is aged 10–14 indicates the proportion of 15-to 19-year-olds who have at least some primary education. Employing thisassumption, we regress gross national primary enrollment ratios acrosscountries and over time against period- and country-specific lifeexpectancy at birth, income per person, and time trends. This approach isuseful for comparison with our previous results, since it is not subject tothe differential mortality problem. As Table 4.3 shows, the results suggestthat, in environments where life expectancy at birth was 10 years longer,primary enrollment ratios were about 0.2 to 0.3 (or about 20 to 30 per-centage points) higher.22
Of course, more than one causal model can be constructed to accountfor these descriptive results. However, the most obvious causal stories—specifically, those involving factors that are time invariant, or seculartrends within countries—can be ruled out, since the relationship observedis net of such effects. Such effects might include, for example, differencesamong countries in the quality of social services or the rate of improve-ment of these services. Furthermore, Table 4.4 shows the results of first-difference regressions, in which the change in gross primary enrollmentratios in each country from one five-year period to the next is related tothe proportional change in GDP and life expectancy over the same period.Consistent with the results in Table 4.3, these results suggest that countriesin which life expectancy increased by 10 years between one five-yearperiod and the next also saw improvements in school enrollment ratios ofabout 0.2 (or 20 percentage points) over the same interval. This is alsocompatible with our descriptive findings using the DHS data.23
AIDS and the Accumulation of Human Capital in Africa 153
22Since gross primary enrollment ratios are not bounded from above at one as net enroll-ment ratios are, and since there were no country-period observations where gross enroll-ment ratios were at the lower bound of zero, a functional form that is linear, rather than tobitor cumulative normal or logistic, is not inappropriate.
23In translating enrollment rates into average schooling attainment, Barro and Lee multi-ply the proportion of the population enrolled at each educational level by the number ofyears in that level, and then by the probability of completion. The Barro-Lee data suggest thatabout 25 percent of those in Africa who enroll in primary school complete it. Therefore,assuming six years in primary school, an increase in enrollment of 0.2 would translate intoan increase of (0.2) × (0.25) × 6 = 0.3 year in attainment.
©International Monetary Fund. Not for Redistribution
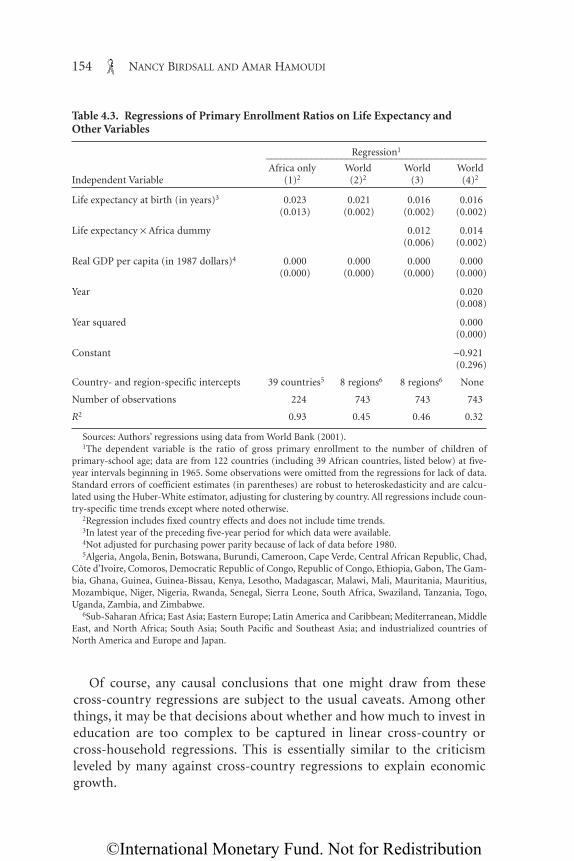
Of course, any causal conclusions that one might draw from thesecross-country regressions are subject to the usual caveats. Among otherthings, it may be that decisions about whether and how much to invest ineducation are too complex to be captured in linear cross-country orcross-household regressions. This is essentially similar to the criticismleveled by many against cross-country regressions to explain economicgrowth.
154 NANCY BIRDSALL AND AMAR HAMOUDI
Table 4.3. Regressions of Primary Enrollment Ratios on Life Expectancy andOther Variables
Regression1____________________________________________Africa only World World World
Independent Variable (1)2 (2)2 (3) (4)2
Life expectancy at birth (in years)3 0.023 0.021 0.016 0.016(0.013) (0.002) (0.002) (0.002)
Life expectancy × Africa dummy 0.012 0.014(0.006) (0.002)
Real GDP per capita (in 1987 dollars)4 0.000 0.000 0.000 0.000(0.000) (0.000) (0.000) (0.000)
Year 0.020(0.008)
Year squared 0.000(0.000)
Constant –0.921(0.296)
Country- and region-specific intercepts 39 countries5 8 regions6 8 regions6 None
Number of observations 224 743 743 743
R2 0.93 0.45 0.46 0.32
Sources: Authors’ regressions using data from World Bank (2001).1The dependent variable is the ratio of gross primary enrollment to the number of children of
primary-school age; data are from 122 countries (including 39 African countries, listed below) at five-year intervals beginning in 1965. Some observations were omitted from the regressions for lack of data.Standard errors of coefficient estimates (in parentheses) are robust to heteroskedasticity and are calcu-lated using the Huber-White estimator, adjusting for clustering by country. All regressions include coun-try-specific time trends except where noted otherwise.
2Regression includes fixed country effects and does not include time trends.3In latest year of the preceding five-year period for which data were available.4Not adjusted for purchasing power parity because of lack of data before 1980.5Algeria, Angola, Benin, Botswana, Burundi, Cameroon, Cape Verde, Central African Republic, Chad,
Côte d’Ivoire, Comoros, Democratic Republic of Congo, Republic of Congo, Ethiopia, Gabon, The Gam-bia, Ghana, Guinea, Guinea-Bissau, Kenya, Lesotho, Madagascar, Malawi, Mali, Mauritania, Mauritius,Mozambique, Niger, Nigeria, Rwanda, Senegal, Sierra Leone, South Africa, Swaziland, Tanzania, Togo,Uganda, Zambia, and Zimbabwe.
6Sub-Saharan Africa; East Asia; Eastern Europe; Latin America and Caribbean; Mediterranean, MiddleEast, and North Africa; South Asia; South Pacific and Southeast Asia; and industrialized countries ofNorth America and Europe and Japan.
©International Monetary Fund. Not for Redistribution

Direct causal analysis is also hampered by the lack of truly longitudinaldata in Africa. In its absence, more detailed and qualitative “case study”approaches, which examine changes in educational attainment, attitudestoward investment in human capital, and health status in specific commu-nities or countries over time, could serve well. As these data become avail-able in sufficient detail in African contexts, this line of inquiry deserves ahigh priority.
Furthermore, even if life expectancy has had an effect on demand forschooling similar to the effects we estimate here, that effect may be dra-matically different depending on the direction in which life expectancy ischanging. That is to say, even if 10 additional years of life expectancy reallydid increase demand for schooling by some number of years, this by nomeans necessarily implies that a loss of 10 years of life expectancy wouldreduce demand for schooling by the same number of years. In an epidemic,after all, past trends are not always replicated in the future.
This is particularly the case if life expectancy in the past reflected arange of institutional and policy factors that would remain relatively con-stant (or could even improve) in countries hit by the epidemic. On theother hand, we cannot be sure that the future relationship will not betighter (and thus worse where life expectancy declines), since the effect ofdemand for education could be exacerbated by the disproportionate num-ber of adults affected, compared with the past when increased life
AIDS and the Accumulation of Human Capital in Africa 155
Table 4.4. Regressions of Changes in Primary Enrollment Ratios on Changes inLife Expectancy and Other Variables
Regression1_______________________________________
Independent Variable (1) (2) (3)
Change in life expectancy at birth over previous five years (in years) 0.015 0.025 0.020
(0.005) (0.015) (0.010)Change in real GDP per capita over
previous five years (in 1987 dollars) 0.000 0.000 0.000(0.000) (0.000) (0.000)
Constant 0.003(0.021)
Country- and region-specific intercepts 8 regions 39 countries None
Number of observations 613 181 181R2 0.05 0.25 0.04
Sources: Authors’ regressions using data from World Bank (2001).1The dependent variable is the change in the gross primary enrollment ratio (see Table 4.3) over the pre-
ceding five years; data are from 122 countries (including 39 African countries, listed in the notes to Table4.3) at five-year intervals beginning in 1970 (change from 1965) and ending in 1995. Some observationswere omitted from the regressions for lack of data. See Table 4.3 for other details of the regression.
©International Monetary Fund. Not for Redistribution

expectancy resulted heavily from improvements in infant mortality. Inshort, although our results are only illustrative and certainly not definitivein terms of causality, they do at least provide a point from which to beginthinking about the effects of declining life expectancy on the demand foreducation.
HIV/AIDS and the Productivity of Africa’s Human Capital
AIDS is unlike many other diseases in that it disproportionately affectsadults of working age. Furthermore, at least for the first decade of the epi-demic, HIV was much more likely to infect the relatively well educated. Theepidemic will therefore carry off an unprecedented proportion of Africa’sexisting human capital stock. Beyond the incalculable human tragedy vis-ited upon those who die prematurely and their loved ones, we can expectthese deaths to have effects on the productivity of those who survive.
An agglomeration of skilled workers is much more productive than anequal number of skilled workers acting alone. One of the most dramaticillustrations of this principle of increasing marginal returns to human cap-ital is the stylized fact of the “brain drain.” Skilled workers in many indus-tries tend to migrate from places where they are relatively scarce to thosewhere they are relatively abundant, in order to increase their income.Indian engineers, for example, can quadruple their income by movingfrom Kerala to Silicon Valley. Similarly, African professionals in manyfields are likely to be concentrated in urban rather than rural areas, wher-ever they may have been born. Another indication of this phenomenon isin the formation of universities, which, after all, exist because they offerindividuals with particularly specialized skills the opportunity to be in acommunity with others of similar or complementary skills.
Becker, Murphy, and Tamura (1990) use the idea of increasing returnsto human capital to generate a model of multiple equilibria in the size,overall schooling, and welfare of households. Their reasoning is that, in themore desirable equilibrium, each household has fewer children but investsmore heavily in the “quality” of each child. This increases aggregate humancapital in the succeeding generation, which increases the opportunity costof the grown children’s time and the future returns to their skills, therebyinducing them, as parents themselves, also to have fewer children whileincreasing the attractiveness of investment in the “quality” of those chil-dren. This in turn increases their productivity, leading to the long-run per-sistence of a highly skilled and productive workforce. In contrast, in theless desirable equilibrium, where skills are relatively scarce, returns to
156 NANCY BIRDSALL AND AMAR HAMOUDI
©International Monetary Fund. Not for Redistribution

investment in schooling are smaller and the opportunity cost of parents’time is relatively low. Parents are therefore inclined to invest time andresources in a larger number of children, who obtain less schooling,thereby perpetuating the scarcity of skills.24
The real world does indeed seem to bear out these sorts of stories basedon multiple equilibria. For example, as Figure 4.7 demonstrates, the distri-bution of average income per capita across the countries of the world ishighly bimodal, with a large cluster of very poor countries (with GDP percapita, adjusted for purchasing power parity, of up to $2,000), anothercluster of very rich ones (with GDP per capita at or around $22,000 to$28,000), and a smattering of countries in between. In the case of sub-Saharan Africa, only 7 of the 39 countries included in Figure 4.7 have GDPper capita (adjusted for purchasing power parity) at or above $4,000.
This highly bimodal distribution of countries is consistent with anynumber of stories about the nature of economic growth. However, it also
AIDS and the Accumulation of Human Capital in Africa 157
0 10 20 30Number of countries2
GDP per capita (in 2002 international dollars)1
40 5032000+
30000–3200028000–2999926000–2799924000–2599922000–2399920000–2199918000–1999916000–1799914000–1599912000–1399910000–11999
8000–99996000–79994000–59992000–3999
0–1999
Figure 4.7. Distribution of Countries Worldwide by Real GDP per Capita, 2002
Source: Data from World Bank (2004).1Real GDP per person in 2002, corrected for purchasing power parity.2Data were available for 148 countries, including 39 in sub-Saharan Africa.
24Empirical evidence offered in studies by Psacharopoulos that private and social rates ofreturn to education are fairly constant across countries might appear to militate against sucha hypothesis. However, these studies do not capture the true social returns to education(Birdsall, 1996).
©International Monetary Fund. Not for Redistribution

rules out many traditional ones. For example, it is much easier to reconcilethis stylized fact with the notion of a poverty trap—whereby very pooreconomies remain very poor until some positive external shock breaks thevicious cycle—than with some stagewise model of development. There-fore, although of course the stylized fact of bimodal income distributiondoes not by itself imply the existence of poverty traps, it is quite consistentwith such a hypothesis.
A sufficiently large increase in life expectancy could jump-start an econ-omy (Bloom and Canning, 2000), as could a large decline in fertility, sincethe latter subsequently produces a greatly increased ratio of workers tochildren (Kelley and Schmidt, 1996, 1999; Williamson, 1998). In these andother cases, the story is generally applied to various of the so-called mira-cle economies of East Asia, where large gains in life expectancy, declines infertility, and subsequent huge increases in the number of workers relativeto children (and the elderly) occurred throughout much of the high-growth decades of the 1970s and 1980s.25 In a case study in Uganda, Big-sten and Kayizzi-Mugerwa (1999) suggest that the structural constraintstypical of a poverty trap (although they do not use that expression) makeit difficult to capture the benefits of globalization in the short run, evenwith a substantially improved policy environment.
Similarly, the accumulation of human capital beyond some critical massis likely to be one such shock in itself. Lau and others (1996), analyzingcross-sectional evidence from Brazilian states, find that the impact of edu-cation on total economic output becomes particularly dramatic only afterthe average level of education of the workforce reaches a certain threshold;in Brazil this threshold was reached when average educational attainmentreached about three to four years. Most African nations, especially in thesouthern part of the continent, have made progress in building their owncritical mass of skills. In Botswana gross secondary school enrollmentincreased from 19 percent of the school-aged population at the beginningof the 1980s to 56 percent in the mid-1990s. Over the same period this rateincreased from 8 percent to 47 percent in Zimbabwe, and from 3 percentto 98 percent in Malawi. Between the early 1970s and the mid-1990s, SouthAfrica’s gross secondary school enrollment ratio increased from 20 percentto 84 percent (World Bank, 2001). The AIDS epidemic, however, has hit
158 NANCY BIRDSALL AND AMAR HAMOUDI
25Similarly, Bloom, Canning, and Malaney (1999) describe for East Asia a world of “cumu-lative causation,” in which low incomes and adverse demographic and health conditions inEast Asia formed a web of cause and effect until the early 1960s. These authors attribute theescape from the vicious cycle to rapid improvements in health, which reoriented the causalcycle, resulting in extremely rapid economic growth.
©International Monetary Fund. Not for Redistribution

these nations hardest: the six countries worst affected by HIV/AIDS arelocated in Southern Africa, with adult HIV prevalence ratios exceeding20 percent in 6 countries, including Botswana and Swaziland where theyapproach 40 percent (UNAIDS, 2004). By skimming off the most skilledworkers in the economy (at least in the first wave), HIV/AIDS threatens toforestall the emergence of a critical mass of these workers.
These effects are difficult to quantify at the microeconomic level, sincethey follow a dynamic in which the number of already-educated peopleincreases the social (that is, external to individuals) return to education,but not necessarily the private return. The measured private return mayactually decline, as noted above, as more people are educated and skilledworkers become relatively more plentiful. This is what explainsPsacharopoulos’s finding that private returns, especially to higher educa-tion, tend to diminish as country GDP per capita rises.26 (Implicitly, themodel presented by Becker, Murphy, and Tamura assumes that, otherthings equal, some of the positive externalities associated with a larger totalstock of human capital are reflected at least in the form of higher absoluteprivate returns.) At the aggregate level, however, it is individuals’ decisionsabout these investments that determine the number of educated people.Increasingly sophisticated empirical techniques have been employed toquantify effects in the context of these sorts of causal cycles. In the mean-time, however, it is sufficient to understand the qualitative implications ofthe loss of the positive externalities generated by Africa’s stock of skilledand educated workers. The first of these is an increase in the rate of braindrain, as skilled workers move to take advantage of these externalities else-where. The second is a decrease in the average productivity of those work-ers (unskilled as well as skilled) who do survive. The third is a decline inthe demand for schooling among workers in the future, attendant on adecline in the absolute, if not the marginal, private returns to education.
HIV/AIDS, Physical Capital, and Human Capital
Human capital and physical capital are complementary. For example,Birdsall, Pinckney, and Sabot (1997) posit that, where credit markets areincomplete or imperfect, poor households must finance their investments
AIDS and the Accumulation of Human Capital in Africa 159
26Psacharopoulos (1994) also reports diminishing social returns to education with higherGDP per capita, but this is because he measures the “social” return at the country level assimply the private return minus the country-specific cost of schooling at different levels.
©International Monetary Fund. Not for Redistribution

entirely out of their own savings. These credit-constrained households,therefore, save not only to buffer against stochastic income shocks, but alsoto finance investment. Because they will invest only when the expectedreturn exceeds the (relatively high) discount rate, investments available tothe poor are likely to have higher returns than those available to the rich,who are unable to take advantage of these investment opportunitiesbecause of imperfections in the credit market.
This situation holds particularly true for investments in human capital,which yield extremely high private returns relative to most other invest-ments, but are nontransferable and hence extremely difficult to guarantee.For example, once trained, an individual has no reason to fear expropria-tion of his or her newly acquired skill, and so, in the absence of sophisti-cated credit monitoring mechanisms, that individual may choose not tomake good on any commitment to repay the training costs. The rich,therefore, supplement investments in their own human capital with invest-ments in third-party instruments, including, for example, equity marketsand other traditional instruments. These are easier to guarantee, but theyare also likely to be less productive than the investments of the poor (intheir farms and businesses as well as in their human capital).27 In suchcontexts, if the poor are forced to forgo investments in their own educa-tion for lack of savings, the potential benefits are lost to the economy.
One of the most salient clinical characteristics of HIV/AIDS is the longperiod of illness before the infected person finally succumbs. Evidencefrom a recent cohort study in rural Uganda suggests that the median timefrom infection to death in that setting is about 10 years, during which theillness becomes more and more debilitating, with the last 10 months usu-ally spent in a state of complete incapacity (Morgan and others, 2002).Since those infected are likely to be adults of working age, this protractedillness hits household saving and investment twice: first by depriving thehousehold of a wage earner, and then by requiring an outlay of householdresources to care for the infected person. Although some of these outlaysare financed by diverting present consumption or through interhouseholdtransfers, evidence suggests that most of it is financed by reductions in sav-ing and the selling off of physical assets (Menon and others, 1998; Béchu,1998). Poorer households, when forced to make these adjustments, areobviously more likely to have to forgo investment in the human capital oftheir children. Amplifying this effect is the fact that the loss of adults in ahousehold often increases the opportunity cost of the children’s time,
160 NANCY BIRDSALL AND AMAR HAMOUDI
27See also Acemoglu (1997) and Acemoglu and Pischke (1999).
©International Monetary Fund. Not for Redistribution

because their work becomes more vital to the ongoing operation of thehousehold (Mutangadura, 2000).
Furthermore, using year- and country-specific data from Latin Amer-ica, Behrman, Birdsall, and Székely (2001) find evidence that, when andwhere the financial markets in the region have been more open to inter-national capital flows, the skill premium in wages has been higher; that is,the returns to secondary and higher education are greater relative to thereturns to primary schooling. They infer that skilled labor is complemen-tary to capital, so that new investments in physical capital generateincreased demand for skills. Intuitively, the idea that physical capital andhuman capital are complementary is appealing—specialized skills arerequired, for example, in the operation and maintenance of mostmachines. The AIDS epidemic is likely to have a dramatic effect not onlyon domestic saving (through the foreshortening of time horizons and theincreased demand for present consumption to finance medical care), butalso on the attractiveness of foreign investment. These effects together arelikely to erode the physical capital stock in many of the hardest-hit coun-tries. Insofar as this in turn reduces the skill premium, it will reduce incen-tives for households to invest resources and time in the education of theirchildren beyond the basic, primary level.
Conclusion
This chapter has explored four channels by which the epidemic ofHIV/AIDS in Africa may affect the size, rate of growth, and productivity ofthe continent’s human capital stock. It would make for a compelling pre-sentation, no doubt, if we could add up the effects of these four channelsboth on the future expected stock of total human capital and on economicgrowth itself through any change in the economy-wide return to theadjusted stock. We have not developed the complex model that mightguide us in doing that, and we believe in any event that the results of anysuch simulation would be highly sensitive to some basic assumptionsabout the dynamics of the process. Such models must take into accountthe likelihood of multiple equilibria, the interactions between general andlocal characteristics, and other complicating factors about which we stillhave very little information. This is true both in terms of the expected totalstock and certainly in terms of the expected economic effects.
However, we do believe that the evidence for the channels describedadds up to the qualitative conclusion that, absent offsetting policies andprograms, the AIDS epidemic is likely to worsen Africa’s dearth of human
AIDS and the Accumulation of Human Capital in Africa 161
©International Monetary Fund. Not for Redistribution

capital. The epidemic could have this effect not only from the supply side,by reducing the capacity of the educational system to train the next gener-ation, but also from the demand side, by foreshortening time horizons andincreasing the opportunity cost of children’s time, thus making investmentin schooling less attractive. These effects will slow the rate of Africa’s accu-mulation of human capital. The epidemic also threatens to erode thealready existing human capital stock, as the death of many of the conti-nent’s most skilled workers reduces the average productivity of those leftbehind. Finally, the epidemic threatens to sap away the savings and physi-cal capital assets of households and nations across the continent, therebyreducing the productivity of workers who rely on physical capital to makeuse of their skills.
Of course, the effects of the epidemic on the accumulation and pro-ductivity of human capital in Africa are likely to go beyond those exploredhere. For example, to the extent that states are forced to reorient their fis-cal priorities to health spending, to care for those already infected anddying, education systems may find themselves starved for funding. Fur-thermore, the orphaning of millions of children across the continent maybe expected to leave communities unable to rear children with the tradi-tional level of care or attention. The four effects emphasized in this chap-ter are relevant to understanding the economics of human capital and havethe potential over the long run to, if not offset, at least reduce the stock ofhuman capital and the economic gains from that capital in countriesaffected by HIV/AIDS.
Our analysis is not meant to be a counsel of despair, however. Rather, itillustrates the likely need for adjustment, for example in countries’ educa-tional policies and priorities, including teacher salaries and placement,class size, spending on student transportation (given the particular diffi-culties in staffing small rural schools), and other changes to minimize theeffects of AIDS on the availability and quality of schooling. It also illus-trates the logic of ensuring that information about public efforts to con-tain the epidemic, and successes in those efforts, are well publicized,because this may help maintain demand for schooling in the face of short-term perceptions of declining returns. The analysis has implications forexpected growth in the region, and thus for fiscal expectations and the sus-tainability of the large debt stock borne by many African countries. For thecountries worst hit by the AIDS epidemic, it reinforces the logic of massivedonor support, to reduce the probability of countries falling into thewrong, low-level, “poverty trap” equilibrium by fighting the disease itselfand by helping finance the additional costs of meeting all the developmentchallenges the region faces, including the education challenge. Finally, for
162 NANCY BIRDSALL AND AMAR HAMOUDI
©International Monetary Fund. Not for Redistribution
the community of research economists, it illustrates the multiple linksamong health, education, and economic growth; the relevance of thedemand as well as the supply side for sustaining and increasing education;and, more generally, the centrality of human capital to developmentprogress.
References
Acemoglu, Daron, 1997, “Matching, Heterogeneity, and the Evolution of IncomeInequality,” Journal of Economic Growth, Vol. 2, No. 1, pp. 61–92.
———, and Jorn-Steffen Pischke, 1999, “Beyond Becker: Training in Imperfect LaborMarkets,” Economic Journal Features, Vol. 109, No. 3, pp. F112–F142.
African Development Forum, 2000, “HIV/AIDS and Economic Development in Sub-Saharan Africa,” report of a conference on “AIDS: The Greatest Leadership Chal-lenge,” Addis Ababa, Ethiopia, December 3–7.
Ainsworth, Martha, and Innocent Semali, 1998, “Who Is Most Likely to Die of AIDS?Socioeconomic Correlates of Adult Deaths in Kagera Region, Tanzania,” in Con-fronting AIDS: Evidence from the Developing World, ed. by Martha Ainsworth,Lieve Fransen, and Mead Over (Brussels: European Commission).
Barro, Robert J., and Jong-Wha Lee, 1996, “Barro-Lee Data Set: International Measuresof Schooling Years and Schooling Quality” (Washington: World Bank).
———, 2000, “International Data on Educational Attainment Updates and Implica-tions,” Working Paper No. 7911 (Cambridge, Massachusetts: National Bureau forEconomic Research).
Béchu, N., 1998, “The Impact of AIDS on the Economy of Families in Côte d’Ivoire:Changes in Consumption Among AIDS-Affected Households,” in ConfrontingAIDS: Evidence from the Developing World, ed. by M. Ainsworth and others (Brus-sels: European Commission).
Becker, Gary S., K.M. Murphy, and R. Tamura, 1990, “Human Capital, Fertility, andEconomic Growth,” Journal of Political Economy, Vol. 98, No. 5, pp. S12–S37.
Behrman, Jere R., and Nancy Birdsall, 1983, “Quality of Schooling: Quantity Alone isMisleading,” American Economic Review, Vol. 73, No. 5, pp. 928–46.
Behrman, Jere R., Nancy Birdsall, and M. Székely, 2001, “Economic Policy and WageDifferentials in Latin America,” Penn Institute for Economic Research WorkingPaper No. 01–048 (Philadelphia: University of Pennsylvania).
Behrman, Jere R., S. Duryea, and M. Székely, 1999, “Schooling Investments and Macro-economic Conditions: A Micro-Macro Investigation for Latin America and theCaribbean,” Working Paper No. 407 (Washington: Inter-American DevelopmentBank).
Bigsten, Anne, and Steve Kayizzi-Mugerwa, 1999, Crisis, Adjustment, and Growth inUganda: A Study of Adaptation in an African Economy (London: Macmillan).
AIDS and the Accumulation of Human Capital in Africa 163
©International Monetary Fund. Not for Redistribution

Birdsall, Nancy, 1996, “Public Spending on Higher Education in Developing Countries:Too Much or Too Little?” Economics of Education Review, Vol. 15, No. 4,pp. 407–19.
———, 1999, “Education: The People’s Asset,” CSED Working Paper No. 5 (Washing-ton: Brookings Institution).
———, and Juan-Luis Londoño, 1997, “Asset Inequality Matters: An Assessment of theWorld Bank’s Approach to Poverty Reduction,” American Economic Review, Papersand Proceedings, Vol. 87, No. 2, pp. 32–37.
Birdsall, Nancy, and L. O’Connell, 1999, “Putting Education to Work in Egypt,” paperpresented at a conference on “Growth Beyond Stabilization: The Prospects forEgypt,” Cairo, February 3–4.
Birdsall, Nancy, Richard H. Sabot, and Thomas C. Pinckney, 1997,“Equity, Savings, andGrowth,” CSED Working Paper No. 8 (Washington: Brookings Institution).
Birdsall, Nancy, David Ross, and Richard H. Sabot, 1995, “Inequality and GrowthReconsidered: Lessons from East Asia,” World Bank Economic Review, Vol. 9, No. 3,pp. 477–508.
Bishai, David, and others, 2003, “Does Biological Relatedness Affect Child Survival?”Demographic Research, Vol. 8, Art. 9.
Bloom, David E., and David Canning, 2000, “Public Health: The Health and Wealth ofNations,” Science, Vol. 287, pp. 1207–08.
———, and P.N. Malaney, 1999, “Demographic Change and Economic Growth inAsia,” CAER II Discussion Paper No. 58 (Cambridge, Massachusetts: HarvardUniversity).
Case, Anne, Christina Paxson, and Joseph Ableidinger, 2004, “Orphans in Africa:Parental Death, Poverty, and School Enrollment,” Demography, Vol. 41, No. 3,pp. 483–508.
Deheneffe, Jean-Claude, Michael Caraël, and Amadou Noumbissi, 1998, “Socioeco-nomic Determinants of Sexual Behaviour and Condom Use,” in ConfrontingAIDS: Evidence from the Developing World, ed. by M. Ainsworth and others(Brussels: European Commission).
Deininger, Klaus, Marito Garcia, and K. Subbarao, 2003, “AIDS-Induced Orphanhoodas a Systemic Shock: Magnitude, Impact, and Program Interventions in Africa,”World Development, Vol. 31, No. 7, pp. 1201–20.
Filmer, Deon, 1998, “The Socioeconomic Correlates of Sexual Behaviour: A Summaryof Results from an Analysis of DHS Data,” in Confronting AIDS: Evidence fromthe Developing World, ed. by M. Ainsworth and others (Brussels: EuropeanCommission).
Hamoudi, Amar, and Nancy Birdsall, 2002, “HIV/AIDS and the Accumulation and Uti-lization of Human Capital in Africa,” Working Paper No. 2 (Washington: Centerfor Global Development).
Joint United Nations Programme on HIV/AIDS (UNAIDS), 2004, 2004 Report on theGlobal AIDS Epidemic (Geneva).
164 NANCY BIRDSALL AND AMAR HAMOUDI
©International Monetary Fund. Not for Redistribution

––—––, United Nations Children’s Fund (UNICEF), and U.S. Agency for InternationalDevelopment (USAID), 2004,“Children on the Brink 2004: A Joint Report of NewOrphan Estimates and a Framework for Action” (Geneva).
Kalemli-Ozcan, Sebnem, Harl E. Ryder, and David N. Weil, 2000, “Mortality Decline,Human Capital Investment, and Economic Growth,” Journal of Development Eco-nomics, Vol. 62, No. 1, pp. 1–23.
Kelley, Allen C., and Robert M. Schmidt, 1996, “Saving, Dependency, and Develop-ment,” Journal of Population Economics, Vol. 9, No. 4, pp. 365–86.
———, 1999, “Economic and Demographic Change: A Synthesis of Models,Findings, and Perspectives” (unpublished; Durham, North Carolina: DukeUniversity).
Lau, Lawrence J., and others, 1996, “Education and Economic Growth: Some Cross-Sectional Evidence,” in Opportunity Foregone: Education in Brazil, ed. by NancyBirdsall and Richard H. Sabot (Baltimore, Maryland: The Johns Hopkins Univer-sity Press for the Inter-American Development Bank).
Malaney, P., 2000, “The Impact of HIV/AIDS on the Education Sector in SouthernAfrica,” CAER Discussion Paper No. 81 (Cambridge, Massachusetts: HarvardUniversity).
Menon, R., and others, 1998, “The Economic Impact of Adult Mortality in Householdsin Rakai District, Uganda,” in Confronting AIDS: Evidence from the DevelopingWorld, ed. by Martha Ainsworth, Lieve Fransen, and Mead Over (Brussels: Euro-pean Commission).
Mincer, Jacob, 1974, Schooling, Experience, and Earnings (New York: National Bureau ofEconomic Research and Columbia University Press).
Morgan, Dilys, and others, 2002,“HIV-1 Infection in Rural Africa: Is There a Differencein Median Time to AIDS and Survival Compared with That in IndustrializedCountries? AIDS, Vol. 16, No. 4, pp. 597–604.
Mutangadura, Gladys B., 2000, “Household Welfare Impacts of Mortality of AdultFemales in Zimbabwe: Implications for Policy and Program Development”(unpublished; Washington: International AIDS Economics Network).
Pritchett, Lant, 1999,“Where Has All the Education Gone?” (unpublished; Washington:World Bank).
Psacharopoulos, George, 1994,“Returns to Investment in Education: A Global Update,”World Development, Vol. 22, No. 9, pp. 1325–43.
Schultz, Theodore W., 1961, “Investment in Human Capital,” American EconomicReview, Vol. 51, No. 1, pp. 1–17.
———, 1989, “Education Investments and Returns,” in Handbook of Development Eco-nomics, Vol. I, ed. by Hollis B. Chenery and T.N. Srinivasan (Amsterdam: NorthHolland Press).
Sen, Amartya, 1999, Development as Freedom (New York: Alfred A. Knopf).
United Nations Children’s Fund (UNICEF), 2000, The Progress of Nations 2000 (NewYork). Available via the Internet: www.unicef.org/pon00/contents.htm.
AIDS and the Accumulation of Human Capital in Africa 165
©International Monetary Fund. Not for Redistribution

United Nations Development Programme, 2000, Botswana Human Development Report2000. (New York). Available via the Internet: www.undp.org/hiv/hdr2000.
Williamson, Jeffrey G., 1998, “Growth, Distribution, and Demography: Some Lessonsfrom History,” Explorations in Economic History, Vol. 35, No. 3, pp. 241–71.
World Bank, 2000, Can Africa Claim the 21st Century? (Washington: World Bank).
———, 2001, World Development Indicators (CD-ROM and print) (Washington).
———, 2004, World Development Indicators (CD-ROM and print) (Washington).
166 NANCY BIRDSALL AND AMAR HAMOUDI
©International Monetary Fund. Not for Redistribution

5
The Impact of HIV/AIDS on Povertyand Inequality
ROBERT GREENER
Most studies on the economic impact of HIV/AIDS focus on such vari-ables as GDP growth or income per capita. Early studies, incorpo-
rating the impact of HIV/AIDS in a one-sector neoclassical growth model,found that although the impact of HIV/AIDS on GDP growth is substan-tial, the impact on GDP per capita may well be small. Later studies refinedthis approach, for example by considering a larger number of sectors,including some demand-side effects, or allowing for an impact of changesin life expectancy on individuals’ decisions.1
However, these studies provide little information about how changes inincome are distributed among the population. Empirical studies and morecasual evidence show that HIV/AIDS does have a serious adverse effect onthe households it strikes, through the costs of care (both financial costsand the opportunity cost of otherwise productive time reallocated to care)and loss of income. Other households may provide support to householdsaffected directly or may take care of children whose parents have fallen illor died. More generally, HIV/AIDS affects all households through itsmacroeconomic repercussions, for example through changes in wages, andthese macroeconomic effects may also differ among households.
In light of these facts, the average change in income per capita con-tains very little information that is relevant from a policy perspective.
167
1For a broader discussion of studies of the impact of HIV/AIDS on economic growth, seeHaacker (Chapter 2, this volume).
©International Monetary Fund. Not for Redistribution

More generally, studies of the impact of HIV/AIDS on economic growth,imputing aggregate changes in saving or focusing on the behavior ofsome representative agent, can yield misleading results. For example,HIV/AIDS can affect the accumulation of human capital at the levelof individual households, in particular if children have to take timeoff from school to care for sick dependents, or if households can nolonger afford to send children to school. A macroeconomic analysis focus-ing on a representative individual would not capture many of theseeffects.
These concerns have motivated new research on the impact ofHIV/AIDS on economic growth, focusing on the effects on households.Most notably, Bell, Devarajan, and Gersbach (Chapter 3, this volume)use an overlapping-generations framework in which the death of a parentaffects the children’s education through a loss in household income,through a breakdown in the direct transfer of human capital fromparent to child, and as the decline in returns to human capital associatedwith higher expected mortality makes investment in children’s educa-tion less attractive. In this framework HIV/AIDS has the potential toincrease poverty, as children of parents who died of AIDS are endowedwith less human capital and will receive lower salaries in their work-ing years. With less human capital and less family income, their chil-dren, in turn, will end up with less human capital, and so on. In thisframework, then, HIV/AIDS can have adverse effects that persist overgenerations.
This chapter pursues a different and in some ways complementaryapproach. Rather than discussing the repercussions of the impact ofHIV/AIDS on households for the economy and economic growth, itdescribes a method of analyzing the impact of HIV/AIDS on householdsthat draws on an aggregate macroeconomic framework and uses existinghousehold income and expenditure surveys.2 Thus it is possible to drawinferences about the impact of HIV/AIDS for different types of house-holds. In particular, the chapter will assess how HIV/AIDS may alterpoverty levels (as affected households are pushed below some poverty line)or the extent of inequality (if more poor households than rich householdsare affected, or if the income shock to the poor is relatively greater than forthe rich households).
168 ROBERT GREENER
2Although the chapter’s emphasis is more general, the analytical part draws on and usesnumerical examples from an earlier study focusing on Botswana (Greener, Jefferis, andSiphambe, 2000).
©International Monetary Fund. Not for Redistribution

The chapter is organized as follows. The first section provides somecontext, in particular on the links among poverty, inequality, and welfare.The second discusses the impact of HIV/AIDS on households, as well assome methodological issues and additional data requirements pertainingto the analysis of poverty and inequality. The third section reports esti-mates of the impact of increased HIV/AIDS-related mortality on inequal-ity and poverty in Botswana, and the final section concludes.
Poverty, Inequality, and Welfare
Before outlining the chapter’s approach to assessing changes in povertyand inequality due to HIV/AIDS, it is worth taking a step back to discusshow these measures of the impact of HIV/AIDS relate to welfare moregenerally. First, the analysis focuses on household income and, because ofdata limitations, does not take into account household wealth. This is animportant limitation: the ownership of assets enables households to miti-gate the impact of income shocks on consumption, because it enablesthem to smooth consumption over time, and because the volatility ofincome from assets is presumably less volatile than income from labor inthe present context.
A second and somewhat related point is that a household’s welfaredepends not just on its consumption but also on the risks to livingstandards that the household faces. These risks are related to, but go wellbeyond, the risk to household income. For example, Crafts and Haacker(Chapter 6, this volume) focus on the link between increased mortalityrisk and welfare. Also, HIV/AIDS can erode existing support instruments,for example from the extended family or the community (see also White-side, 2002). Certain public services—for example, free health services—can also mitigate the economic burden of the disease. There is evidencethat, in countries with escalating HIV epidemics, health services at firstcannot fully cope with the greatly increased demand and have to resortto rationing. However, very substantial efforts are under way to rapidlyincrease access to antiretroviral treatment in developing countries.Since poor households would not be able to afford the costs of suchtreatment, these efforts also have implications for the impact ofHIV/AIDS on poverty. HIV/AIDS also results in a substantial increase inthe number of orphans. Children living in families affected by HIV/AIDSsee their living standards fall as household income declines and expendi-ture is reallocated to the care of the infected family member. Orphanedchildren tend to live in poorer households and may have limited access to
Impact of HIV/AIDS on Poverty and Inequality 169
©International Monetary Fund. Not for Redistribution

education.3 For various reasons, the impact of HIV/AIDS on children islikely to be more severe in low-income households. A government policyof universal access to education, together with other measures to supportchildren affected by HIV/AIDS, can mitigate this adverse impact. Forexample, the decline in school attendance for orphans is lower in coun-tries with higher overall enrollment rates, suggesting that impediments toeducation for the poor are low in those countries.
Third, the emphasis of this chapter’s analysis is on the short run, treat-ing HIV/AIDS as a mortality shock that affects wage rates and the dis-tribution of income across households. In the longer run it is necessaryto address how the distribution of income among households evolvesover time, as households dissolve and new ones are formed, and asincome shocks not related to HIV/AIDS change the distribution ofincome. This is discussed in more general terms in Haacker (Chapter 2,this volume), using an approach similar to that of Booysen (2003);Bell, Devarajan, and Gersbach (Chapter 3, this volume) offer an analysisof the long-term effects of HIV/AIDS as income shocks, the loss of par-ents, and a decline in returns to human capital affect the accumulation ofhuman capital.
Measurement Issues
The study of the impact of HIV/AIDS on poverty and income inequal-ity draws on many different types of data. Numerous studies analyze theimpact of HIV/AIDS at the household level. These studies, however, aretypically based on relatively small samples and not representative of theoverall population; also, the data are presented in a way that yields fewinsights in terms of changes in poverty and inequality.
To arrive at estimates of the impact of HIV/AIDS on poverty andinequality, this chapter therefore uses additional data on households’ com-position, income, and expenditure; estimates of the macroeconomiceffects of HIV/AIDS; and demographic estimates of the impact ofHIV/AIDS. Appropriate definitions of poverty and inequality are alsorequired.
170 ROBERT GREENER
3The United Nations Children’s Fund (UNICEF, 2003) reports that school attendance ratesfor orphans were 13 percent lower than for nonorphans in sub-Saharan Africa. The mediandependency ratio for households with orphans (1.8) was 20 percent higher than that fornonorphan households (1.5).
©International Monetary Fund. Not for Redistribution

Households
HIV/AIDS typically begins to affect a household’s income during theillness of an HIV-positive household member. If the infected person’sincome depends on his or her productivity (as it often does, for example,in smallholder agriculture), the income loss sets in during the illness. If theindividual works in the formal private sector or the public sector, however,provisions for sick leave or disability benefits, or both, may mitigate theloss. In addition, to the extent that the working time of household mem-bers is diverted from productive activities to the care of the ill family mem-bers, the household’s income will decline further. Eventually, if anHIV-positive member dies, his or her income is lost to the household.However, for employees in the formal private or the public sector, lifeinsurance or a pension scheme (possibly including pensions for survivingdependents) can mitigate the loss.
HIV/AIDS also affects households’ incomes indirectly through itsmacroeconomic effects, whether any household member is affected byHIV/AIDS or not. If, for example, increased mortality makes certain cate-gories of labor more scarce while demand is largely unaffected, wages forthat labor will rise, and with them the incomes of the households thatreceive those wages. More generally, HIV can affect the level of wagesacross all skill categories. For example, the neoclassical growth model pre-dicts that a decline in the rate of growth of the working-age populationwill result in an increase in the capital-labor ratio; as the marginal productof labor then rises, so will wages. Some studies suggest that when largenumbers of workers in the formal sector with relatively high incomes die,they are replaced by “surplus labor” from the informal sector, thus raisingaverage income. On the other hand, the deteriorating economic outlookand higher production costs can result in a decline in investment and thusin employment opportunities.
Households affected by HIV/AIDS face additional costs of two majorkinds. The first is the increased cost of medical treatment for HIV-positivemembers who are beginning to develop symptoms of AIDS and are expe-riencing more frequent illnesses. The total expenditure of a household willdepend on its income and circumstances. Wealthy households may opt forvery expensive private treatment, using the results of the latest medicalresearch, which can keep infected people asymptomatic for extended peri-ods. The poorest households will be forced to rely on public medical pro-vision but will still face additional costs for transport and food. The secondadditional cost is the cost of a funeral when the ill household member dies.Funerals can be very expensive, often requiring a large number of people
Impact of HIV/AIDS on Poverty and Inequality 171
©International Monetary Fund. Not for Redistribution

to be fed for many days, in addition to the costs of the casket and cere-mony. The total expenditure will again depend upon the household’sincome.
Impact on Poverty and Inequality
The household studies referred to above yield limited insights into theimpact of HIV/AIDS on poverty and inequality, mainly because of the lim-ited sample size. One important study from a methodological point ofview is Booysen (2003), which is based on a panel of 355 South Africanhouseholds, with three observations for each. Booysen shows that the inci-dence of poverty is higher for households affected by HIV/AIDS (35 per-cent of which were classified as poor) than for those not affected (21percent were classified as poor). Dividing the sample into five incomequintiles, Booysen then shows that the income ranking of householdsaffected by HIV/AIDS is more likely to deteriorate and less likely toimprove than that of other households. These results are reinforced by sev-eral regressions suggesting that HIV/AIDS did indeed contribute to theobserved differences in poverty levels and income mobility.
The data on the distribution of income across households that form thebasis of this chapter’s assessment of the extent of and changes in incomeinequality come from a national household income and expenditure sur-vey in Botswana. This survey provides data on household composition(the number, age, and sex of household members), household income andits sources, and detailed household expenditure.
The extent of inequality in the analysis below makes use of the Ginicoefficient, which measures the difference between the observed dis-tribution of income (across households or individuals) and perfectincome equality. The Gini coefficient lies between zero and one. A valueof zero corresponds to the situation in which every person in a group hasexactly the same income, and a value of one corresponds to the oppositeextreme where one person receives all the group’s income and everyoneelse has none. Thus a higher Gini coefficient indicates greater incomeinequality.
Poverty can be defined in absolute or relative terms. As an example ofthe former, one can define a critical income level, based on householdcomposition, a basket of basic needs, and the cost of that basket in thehousehold’s location. Households are classified as poor if their income isless than this poverty datum line (PDL). The household poverty rate thenrefers to the percentage of households with income below the PDL, and theindividual poverty rate (or the poverty head count) is defined as the
172 ROBERT GREENER
©International Monetary Fund. Not for Redistribution

percentage of all individuals who live in households with income belowthe PDL.
However, in assessing the impact of HIV/AIDS on poverty, it is neces-sary to determine how additional, HIV/AIDS-related expenses interactwith the PDL by adding to the cost of the basic basket the required cost ofmedical treatment or, in the case of death, a funeral. Later on, once ahousehold member dies from HIV/AIDS-related causes, the household nolonger has to meet the deceased person’s expenditure requirements (med-ical and cost of living), and the PDL for the household needs to be adjustedaccordingly. Such a household is less likely to be classified as poor. Whetherthe expenditure effects described here increase or decrease total povertydepends on the magnitude of the expenditures considered.
Another useful statistic is the income dependency ratio. This is the aver-age number of people within a household who are supported by a house-hold member who is employed and earning an income. This is usuallyconsidered to be a sensitive indicator of household poverty and of the vul-nerability of a household to the loss of an income earner. The situation ofthe poorest households is represented by the lowest income quartile: the25 percent of households with the lowest incomes per capita. The two sta-tistics chosen below to measure the situation of the poorest households arelowest-quartile household income and the lowest-quartile income depen-dency ratio.
Data on HIV prevalence are usually obtained from sentinel surveys,most commonly from blood tests at antenatal clinics. These data are avail-able only for subgroups of the population such as pregnant women, sexworkers, or hospital patients. To draw inferences from these data on HIVprevalence for the whole population by age and sex, a model of the spreadof HIV infection and of AIDS in a population is required; estimates of HIVprevalence by population group are then obtained by fitting the parame-ters of the model to the available observations (see Epstein, Chapter 1 ofthis volume, for a more detailed discussion of this approach).
For the analysis performed here, it is necessary to draw inferences onHIV prevalence at the household level from the available estimates by agecohort and sex. The principal challenge here is that the likelihood that ahousehold member is infected depends on the other household members’HIV status. For example, regular sexual partners are likely to infect eachother, and infants are often infected at birth or during breastfeeding if themother is HIV-positive. In the absence of sufficient data to estimate thecorrelation of HIV status among household members, researchers oftenuse aggregate estimates of HIV prevalence for individual household mem-bers; this approach, however, overestimates the share of HIV-affected
Impact of HIV/AIDS on Poverty and Inequality 173
©International Monetary Fund. Not for Redistribution

households and underestimates the share of households with multipleHIV infections.
An Application to Botswana
The analysis presented here makes use of household income and expen-diture data from the Botswana Household Income and Expenditure Sur-vey (HIES) conducted in 1993/94.4 The survey recorded householdcharacteristics, such as the age and sex of all household members and thelocation of the household, and measured all sources of income and itemsof expenditure. Because these data on household characteristics are static,they are not suitable for a dynamic analysis. In particular, they cannot beused to trace how households’ income changes over time, as does Booysen(2003), or to model how households dissolve over time and new house-holds are formed.
The definition of poverty (the PDL) used here comes from a majorstudy of poverty and poverty alleviation carried out by the Botswana Insti-tute for Development Policy Analysis (BIDPA) in 1996 on behalf of theBotswana Ministry of Finance and Development Planning (1996). Thestudy made use of data from the HIES conducted in 1985/86 and 1993/94and added a definition of poverty based on the cost of a basket of basicgoods and the structure and location of individual households.
Macroeconomic Effects
Estimates of the macroeconomic impacts of HIV/AIDS also come froma Botswana Ministry Finance and Development Planning study (BotswanaMinistry of Finance and Development Planning, 2000). An equilibriummodel comprising two sectors and three factors was constructed for theBotswana economy, following the approach used for Tanzania by Cud-dington (1993). The model distinguished between skilled and unskilledlabor and between the formal and informal sectors. The impacts ofHIV/AIDS operated through the supply of labor and through investmentgrowth.
The study considered a number of different scenarios in order to dealwith uncertainties in the assumptions. Under the most likely scenario,
174 ROBERT GREENER
4The analysis in this section is based on earlier work by Greener, Jefferis, and Siphambe(2000).
©International Monetary Fund. Not for Redistribution

HIV/AIDS reduced the growth rate of GDP by 1.5 percentage points, sothat after 25 years the economy would be 31 percent smaller than it wouldotherwise have been. GDP per capita for the survivors was virtually unaf-fected by HIV/AIDS because of the projected population impact. However,GDP in Botswana has a significant rent component arising from miningrevenue, which accrues almost entirely to the government rather than tohouseholds. In this situation, where HIV/AIDS leaves the rent componentunchanged but GDP per capita remains the same, household income percapita nevertheless falls by 5 to 10 percent.
The same scenario predicted that unemployment among unskilledworkers would be 8 percent lower as a result of HIV/AIDS. The existingshortage of skilled workers would be exacerbated, causing skilled wages torise by 12 to 17 percent. The model also predicted an 18 percent rise in thecapital-output ratio, confirming the expected factor substitution awayfrom labor.
Demographic Effects
To assess the impact of HIV/AIDS at the household level, AIDSwas assigned in a random fashion to individuals in the population. Giventhe structure of households in Botswana, this leads to the outcome that49 percent of households are affected by HIV/AIDS (that is, have at leastone infected member). To the extent that HIV occurs in “clusters,” suchthat individuals are more likely to be infected if other family membersare, the total share of households with an infected member would beless than 49 percent, but more households would be affected with multi-ple infections. The analysis then assumed that all infected householdmembers die within 10 years, and the income and expenditure of eachhousehold were recalculated based on the resulting, depleted householdstructure.
As a result of the employment structure in Botswana, 26 percent ofhouseholds in the analysis lose income as a result of the death of anincome earner. This is less than the total percentage affected by HIV/AIDSbecause of the country’s high rate of unemployment. A key assumption inthis analysis is that susceptibility to HIV is not related to employment sta-tus or skill level. If otherwise,5 the percentage of households losing income
Impact of HIV/AIDS on Poverty and Inequality 175
5Evidence from the 2000 and 2001 sentinel surveys suggests a weak relationship betweenHIV status and employment status for pregnant women, with HIV prevalence slightly higheramong employed women.
©International Monetary Fund. Not for Redistribution
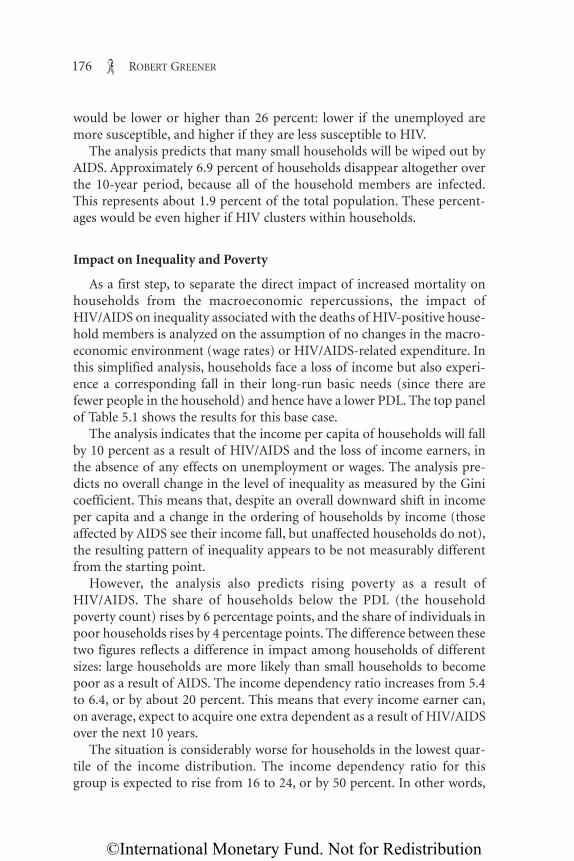
would be lower or higher than 26 percent: lower if the unemployed aremore susceptible, and higher if they are less susceptible to HIV.
The analysis predicts that many small households will be wiped out byAIDS. Approximately 6.9 percent of households disappear altogether overthe 10-year period, because all of the household members are infected.This represents about 1.9 percent of the total population. These percent-ages would be even higher if HIV clusters within households.
Impact on Inequality and Poverty
As a first step, to separate the direct impact of increased mortality onhouseholds from the macroeconomic repercussions, the impact ofHIV/AIDS on inequality associated with the deaths of HIV-positive house-hold members is analyzed on the assumption of no changes in the macro-economic environment (wage rates) or HIV/AIDS-related expenditure. Inthis simplified analysis, households face a loss of income but also experi-ence a corresponding fall in their long-run basic needs (since there arefewer people in the household) and hence have a lower PDL. The top panelof Table 5.1 shows the results for this base case.
The analysis indicates that the income per capita of households will fallby 10 percent as a result of HIV/AIDS and the loss of income earners, inthe absence of any effects on unemployment or wages. The analysis pre-dicts no overall change in the level of inequality as measured by the Ginicoefficient. This means that, despite an overall downward shift in incomeper capita and a change in the ordering of households by income (thoseaffected by AIDS see their income fall, but unaffected households do not),the resulting pattern of inequality appears to be not measurably differentfrom the starting point.
However, the analysis also predicts rising poverty as a result ofHIV/AIDS. The share of households below the PDL (the householdpoverty count) rises by 6 percentage points, and the share of individuals inpoor households rises by 4 percentage points. The difference between thesetwo figures reflects a difference in impact among households of differentsizes: large households are more likely than small households to becomepoor as a result of AIDS. The income dependency ratio increases from 5.4to 6.4, or by about 20 percent. This means that every income earner can,on average, expect to acquire one extra dependent as a result of HIV/AIDSover the next 10 years.
The situation is considerably worse for households in the lowest quar-tile of the income distribution. The income dependency ratio for thisgroup is expected to rise from 16 to 24, or by 50 percent. In other words,
176 ROBERT GREENER
©International Monetary Fund. Not for Redistribution

every income earner in this category can, on average, expect to support anextra eight dependents as a result of HIV/AIDS. There is a correspondingfall of 18 percent in the average income of households in the lowest quar-tile—nearly double the income loss among the population as a whole. Thisanalysis implies that the poor are particularly vulnerable to the impacts ofHIV/AIDS.
The results with respect to poverty rates also suggest that the finding,based on the Gini coefficient, of little change in inequality needs to bequalified. In fact, the impact of HIV/AIDS on poor households (whethermeasured by income loss or by a higher income dependency ratio) is worsethan for the rest of the population. Taken by itself, the differential effect onpoor households’ incomes alone indicates that the Gini coefficient shouldrise. The fact that it does not means that a second effect must be at work:although the bottom of the income distribution drops further, HIV/AIDSappears to reduce inequality for the higher-income quartiles.
At the very bottom of the income distribution, the analysis also predictsa dramatic increase in the number of destitute households, defined for thispurpose as households with no income earners. The proportion of house-holds with zero income rises by 1.5 percentage points, the proportion withincome per capita of less than 10 pula a month rises by 2.1 percentagepoints, and the proportion with income per capita of less than 25 pula a
Impact of HIV/AIDS on Poverty and Inequality 177
Table 5.1. Estimated Impact of HIV/AIDS on Income, Inequality, and Povertyin Botswana
All Households Poorest Quartile_______________________________________________ ________________Income Household Individual Income Income Income
per capita poverty poverty depen- per capita depen-(pula Gini count count dency (pula dency
a month)1 coefficient (percent) (percent) ratio a month)1 ratio
Base case Without HIV/AIDS 215 0.51 37.7 47.8 5.4 43 15.8With HIV/AIDS 193 0.51 43.7 51.9 6.4 36 23.7Difference
Absolute –22 0.00 6.0 4.0 1.1 –8 7.9In percent –10 0 16 8 20 –18 50
Including macro-economic effects
Without HIV/AIDS 215 0.51 37.7 47.8 5.4 43.3 15.8With HIV/AIDS 199 0.51 42.7 50.9 5.9 37.6 19.7Difference
Absolute –16 0.00 5.0 3.1 0.5 –5.6 3.9Percent –8 0 13 6 10 –13 25
Source: Greener, Jefferis, and Siphambe (2000).1In 2000, one dollar was worth about 5.12 pula (year average).
©International Monetary Fund. Not for Redistribution

month rises by 2.5 percentage points. Thus, however destitution is defined,it is likely to rise by 1.5 to 2.5 percent of all households over the next 10years. Applied to the population of Botswana, this implies an increase inthe number of destitute households by 4,000 to 7,000 over the decade.
Adding the Macroeconomic Effects
The macroeconomic scenario described above (Botswana Ministry ofFinance and Development Planning, 2000) projects that unemploymentfalls by 5.7 percent with HIV/AIDS and the incomes of skilled workers riseby 12.2 percent. Thus some households experience an income gain as ahousehold member finds new employment, and households with skilledwage earners benefit from an increase in the overall wage level.
The addition of the macroeconomic effects reduces the impact on over-all income per capita from 10 percent to 8 percent (bottom panel of Table5.1). This analysis therefore predicts a fall of at least 8 percent in householdincome per capita, despite the earlier finding that aggregate GDP percapita is unlikely to fall as a result of HIV/AIDS. The Gini coefficient is notsensitive to the addition of income effects and does not change signifi-cantly from the base value. The addition of the income effects also miti-gates the impact on poverty to a small extent. The impact on thehousehold poverty rate falls from 6 percentage points to 5, and the impacton the individual poverty rate from 4 percentage points to 3. However,owing to the decline in the unemployment rate, the rise in the incomedependency ratio is mitigated considerably, increasing by 10 percent ratherthan 20 percent in the base case. This means that each wage earner can, onaverage, expect to bear “only” half an extra dependent.
The income dependency ratio for the lowest quartile of households isprojected to rise from 16 to 20, or by 25 percent. The income effects thushalve this expected impact as well. Nevertheless, every income earner inthis category can, on average, expect to support an extra four dependentsas a result of HIV/AIDS. There is a fall of 13 percent in the average incomeof households in the lowest quartile when the income effects are included,compared with 18 percent in the base case. This supports the conjecturesabout the vulnerability of the poorest households.
Expenditure Effects
This analysis of the demographic effects of HIV/AIDS is limited to theeffect of increased mortality on the structure of households. Thus it doesnot lend itself easily to an analysis of HIV/AIDS-related expenditures,
178 ROBERT GREENER
©International Monetary Fund. Not for Redistribution

because these (with the exception of funeral expenses) are mostly linked tothe treatment of and care for HIV/AIDS-related health conditions. How-ever, it is possible to draw some more general inferences regarding the roleof expenditure effects.
High-income households are likely to be covered by medical aidschemes and to fall within their rules and restrictions. This option is clearlynot available for households in the lowest income quartile, whose incomeper capita is around 75 pula a month (at current prices), and who are notin any case covered by medical aid schemes. These poorer households willbe forced to make use of the state health system, which will bear any costsof treatment. However, these households will still face a variety of addi-tional costs—for example, for transportation to and from clinics and hos-pitals and for additional nutrition requirements. Those households thatconsult traditional healers will have to meet those costs directly.
The middle two income quartiles in Botswana spent about 3 percent oftheir income for medical purposes in the 1993/94 HIES. If this werequadrupled, to 12 percent, their total monthly expenditure at currentprices would be about 32 pula, which is about one-tenth the amount avail-able to high-income households—and nowhere near the amount neededfor effective treatment. Many households, even those above their PDL, willbe forced to choose between AIDS treatment and other, basic needs suchas food and shelter. This will inevitably lead to both an increase in and adeepening of poverty.
Eventually, all households with HIV-positive members will also berequired to meet their funeral costs. For the purpose of this analysis, thesecosts can be annualized over a 10-year period. They will also be related tohousehold income but might be expected to lie in the range of 1,500 to10,000 pula. A funeral costing 4,000 pula, annualized over 10 years, wouldcost the average household about 35 pula a month, or about 12 percent ofhousehold income per capita.
Discussion and Conclusions
This chapter’s analysis of the impact of HIV/AIDS in Botswana suggeststhat HIV/AIDS does have a substantial effect on inequality and poverty.Although the Gini coefficient, an aggregate measure of the inequality ofthe income distribution, does not change significantly, it appears that thisresult masks two different effects working in opposite directions. Whereaspoor households appear to be more vulnerable to income losses owing toincreased HIV/AIDS-related mortality (an effect that by itself would
Impact of HIV/AIDS on Poverty and Inequality 179
©International Monetary Fund. Not for Redistribution
increase inequality as measured by the Gini coefficient), income inequal-ity among higher-income households appears to decline. Almost all thechanges in poverty derive from the direct income shocks to householdsthat lose the income of a member who dies from HIV/AIDS; the broadmacroeconomic effects play a minor role in this regard. This reinforces thepoint made at the outset that estimates of the impact of HIV/AIDS onaggregate economic variables such as GDP provide little informationregarding the impact on poverty.
There are, however, several limitations to this analysis. First, it focuseson the effects of HIV/AIDS on households’ earned income—investmentincome is not affected by the death of a household member. However, tothe extent that households invest their wealth in the domestic economy,the macroeconomic effects of AIDS could lead to changes in their invest-ment income. Because the share of investment income in a household’sincome is typically higher at the top of the income distribution, taking intoaccount the role of this income would presumably result in some reassess-ment of the impact of HIV/AIDS on inequality.
Second, a more complete assessment of the impact of HIV/AIDS onpoverty and inequality would require a more elaborate demographicmodel than is used here. The example presented in this chapter essentiallytreats HIV/AIDS as a one-time mortality shock. Although this approachyields indicative estimates of the impact of HIV/AIDS in the longer run, itdoes not address income losses that result from the illness of a householdmember or from the diversion of the productive time of other householdmembers to the ill person’s care. Nor does it address the changes in house-hold structure that result from the aging of all household members by 10years, such as gains and losses in potential working members, the dissolu-tion of households as some household members die, and the formation ofnew households.
References
Booysen, Frederick le Roux, 2003, “Poverty Dynamics and HIV/AIDS Related Morbid-ity and Mortality in South Africa,” paper presented at an international conferenceon “Empirical Evidence for the Demographic and Socio-Economic Impact ofAIDS,” Health Economics and HIV/AIDS Research Division, University ofKwaZulu-Natal, South Africa, March 26–28.
Botswana Ministry of Finance and Development Planning, 1996,“Study of Poverty andPoverty Alleviation” (Gaborone, Botswana).
———, 2000, “Macroeconomic Impacts of the HIV/AIDS Epidemic in Botswana”(Gaborone, Botswana).
180 ROBERT GREENER
©International Monetary Fund. Not for Redistribution

Cuddington, John T., 1993, “Further Results on the Macroeconomic Effects of AIDS:The Dualistic, Labor-Surplus Economy,” World Bank Economic Review, Vol. 7,No. 3, pp. 403–17.
Greener, Robert, Keith Jefferis, and Happy Siphambe, 2000, “The Impact of HIV/AIDSon Poverty and Inequality in Botswana,” South African Journal of Economics,Vol. 68, No. 5, pp. 888–915.
Greener, Robert, P. Ward, J. Pitso, and L. Hunter, 2000, “Review and Evaluation ofHIV/AIDS Related Data for an Expanded National Response to the HIV/AIDSEpidemic in Botswana” (Gaborone, Botswana: Ministry of Finance and Develop-ment Planning).
United Nations Children’s Fund, 2003, Africa’s Orphaned Generations (New York).
Whiteside, Alan, 2002, “Poverty and HIV/AIDS in Africa,” Third World Quarterly,Vol. 23, No. 2, pp. 313–32.
Impact of HIV/AIDS on Poverty and Inequality 181
©International Monetary Fund. Not for Redistribution

6
Welfare Implications of HIV/AIDS
NICHOLAS CRAFTS AND MARKUS HAACKER
The HIV/AIDS epidemic has resulted in significant increases in mortal-ity rates in the affected countries, and it is now the leading cause of
death in southern Africa. In Botswana, one of the worst-affected countries,with an adult HIV prevalence rate of 37.3 percent, mortality among theworking-age population had increased to 3.8 percent a year (of which 3.7percentage points, or 96 percent, is HIV/AIDS related) by 2004. Corre-spondingly, life expectancy has decreased substantially, frequently wipingout gains achieved over several decades. For example, life expectancy atbirth is now estimated at less than 40 years for Botswana and Zambia(declines of 41 and 17 years, respectively, compared with a no-AIDSscenario).1
A considerable number of studies have addressed the impact ofHIV/AIDS on GDP per capita.2 Some have used a neoclassical growthframework to estimate the impact on aggregate output or income, whereasothers have used a general equilibrium model with a larger number of sec-tors. Studies also differ according to the types of labor or human capitalcaptured, the extent of labor mobility between sectors, the extent of inter-national or domestic capital mobility, and the assumptions regarding theimpact of HIV/AIDS on productivity. Although most studies project a
182
1Unless stated otherwise, all estimates of HIV prevalence rates quoted in this paper arefrom Joint United Nations Programme on HIV/AIDS (UNAIDS, 2004), and estimates of theimpact of HIV/AIDS on mortality and life expectancy were provided by the InternationalPrograms Center at the U.S. Census Bureau (see Epstein, Chapter 1, this volume).
2See Haacker (Chapter 2, this volume) for a discussion of the literature.
©International Monetary Fund. Not for Redistribution

small negative impact of HIV/AIDS on output per capita, the estimates arevery sensitive to the underlying economic assumptions. For example, astudy on South Africa (with an adult HIV prevalence rate of about 20 per-cent) commissioned by ING Barings (2000) projects that GDP per capitawill increase by about 9 percent by 2010 compared with a no-AIDS sce-nario. Arndt and Lewis (2001), using similar demographic assumptions,estimate that GDP per capita will be 8 percent lower in 2010, again com-pared with a no-AIDS scenario.3
Estimates of the impact of HIV/AIDS on GDP are useful, even essential,in many contexts, for example as a key indicator of living standards and asa summary measure of the broad economic repercussions of the epidemic.Because the various components of the government’s tax base (such as cor-porate profits, individual incomes, or imports) are closely linked to thelevel of economic activity, changes in economic growth also have direct fis-cal implications.
However, changes in GDP or in income per capita give a very crude pic-ture of the economic impact of HIV/AIDS, in several ways. First, the impactdiffers across individuals and households, mainly depending on whether ornot a given household has a member who becomes infected. Changes in thedistribution of income result, which aggregate economic indicators, such asGDP, fail to capture (see Greener, Chapter 5, this volume). Second, poorhouseholds, which account for a small share of GDP, are less able to accom-modate adverse shocks to income or expenditure (such as health expendi-ture) and are therefore more vulnerable to HIV/AIDS. More broadly,changes in income do not capture the substantial increase in risk associatedwith increased mortality and reduced life expectancy, the risk of losing rel-atives, and a decline in living standards for those infected, their relatives,and—eventually—their surviving dependents.
Some of these shortcomings of aggregate indicators have been recog-nized in the literature and practice of economic development (see, forexample, Sen, 1999). Most prominently, the United Nations’ MillenniumDevelopment Goals not only constitute a political and economic agenda,but also define a comprehensive set of economic development indicators.The United Nations Development Programme assigns equal weights tomeasures of income per capita, educational attainment, and life
Welfare Implications of HIV/AIDS 183
3The differences between the two studies arise mainly because ING Barings (2000) putsmuch emphasis on demand-side effects, whereas Arndt and Lewis (2001) assume thatHIV/AIDS has an impact on productivity growth (rather than the level of productivity), andthat this impact accumulates over time.
©International Monetary Fund. Not for Redistribution
expectancy in calculating its Human Development Index (HDI; UNDP,2001; see also Crafts, 2002). Most of the gains in the HDI over the pastcentury resulted from gains in life expectancy, which in many countrieswill be largely lost as a consequence of HIV/AIDS. As noted by Haacker inChapter 2 of this volume, although countries like Botswana, South Africa,and Swaziland would have attained living standards comparable to thosein Brazil or Russia by 2001 (which have HDIs around 0.77) had theHIV/AIDS epidemic never occurred, their HDIs instead compare withcountries like Bolivia (for South Africa) or India and Cambodia (forBotswana and Swaziland).
To sum up, the most direct welfare effects of HIV/AIDS are associatedwith increased mortality. For example, the losses in life expectancy in theworst-affected countries are reversing all the health gains achieved over thepast century (Stanecki, 2000); HIV/AIDS is the biggest factor contributingto decreases in healthy life expectancy in Africa overall (Mathers and oth-ers, 2000), and in Zimbabwe about 15 percent of the population youngerthan 15 years were orphans in 2001.
Against this background, the purpose of this chapter is twofold. The firstis to develop and present new quantitative indicators of the welfare effectsof HIV/AIDS by evaluating the welfare cost of increased mortality. Thesecond, given that this approach yields estimates of the welfare cost ofHIV/AIDS as a percentage of GDP, is to provide some perspective on theearlier impact studies that focused on output and income.
The approach uses a technique originally developed to assess the impactof health, environmental, or work safety interventions, focusing on thevalue of statistical life (VSL). Estimates of the VSL are generally obtainedfrom microeconometric studies relating differences in wages betweenemployment categories to differences in mortality risks (see Miller, 2000,and Viscusi and Aldy, 2003). Provided that these observed wage differen-tials accurately reflect willingness to pay for a decrease in mortality, theseestimates of the VSL can then be used to assess the costs and benefits of cer-tain policy interventions.
More recently, this approach has been used in macroeconomic studiesassessing the impact of improved health standards on economic welfare.For example, Nordhaus (1998, 2002) finds that, for the United States over1900–95, the contribution of health improvements to living standards wassimilar in magnitude to the contribution of increased consumption. Crafts(2001), drawing on Nordhaus (1998), reports similar findings for theUnited Kingdom over the period 1870–1998.
This chapter adapts this method to the study of the economic impactof HIV/AIDS. Although the key concept translates very easily, certain lim-
184 NICHOLAS CRAFTS AND MARKUS HAACKER
©International Monetary Fund. Not for Redistribution

itations are important to bear in mind. One is that few empirical studieson the VSL are available for lower-income countries, and none are avail-able for sub-Saharan Africa. Hence the usual shortcomings associatedwith out-of-sample predictions apply (see Bowland and Beghin, 2001,for a discussion of this point). In particular, income in sub-Saharan Africais lower than in those countries for which studies are available; lifeexpectancy is lower; the informal sector is larger; the structure of (formalsector) labor markets, including the coverage of social insurance systems,is different; average educational attainment is lower than in those coun-tries for which empirical studies are available; and, in most countries,the changes in mortality associated with HIV/AIDS are generally largerthan those in the available studies. Also, the estimates presented herereflect the impact of increased mortality only, not of the deteriorationin overall health.4 Thus our point estimates are subject to considerableuncertainty; nevertheless, they do show that HIV/AIDS has a catastrophicwelfare impact that dwarfs the economic assessments based on incomeper capita.5
The first section of the chapter outlines the methodology used. The sec-ond section then discusses the demographic data and projections used, andthe third presents estimates of the impact of HIV/AIDS on welfare forselected countries. The final section concludes.
A Method of Accounting for Increased Mortality
The approach followed in this chapter is built on two simple premises.Individuals like higher income, and they like to live longer. The (somewhatsimplified) outlook on life of these individuals can be illustrated by meansof a utility function, which relates expected lifetime utility U to annualincome Y and life expectancy LE:
U = F(Y, LE). (1)
Consider a situation with Y = Y0 and LE = LE0, and hence U0 = F(Y0, LE0),where subscripts index time periods or different states of nature. Assume
Welfare Implications of HIV/AIDS 185
4A more refined measure of the impact of HIV/AIDS on life expectancy is the “disability-adjusted life expectancy” (DALE), used, for example, by the World Health Organization (seeMathers and others, 2000). This chapter does not follow this approach because sufficientlydetailed demographic projections are not available, and because extending our method ofaccounting for the VSL to changes in DALE is not straightforward.
5Using a similar method, Jamison, Sachs, and Wang (2001) study the impact of HIV/AIDSon economic growth and “real income.”
©International Monetary Fund. Not for Redistribution

that, because of an HIV/AIDS epidemic, income falls to Y = Y1,life expectancy declines to LE = LE1, and utility becomes U1 = F(Y1, LE1),as illustrated in Figure 6.1. An economist focusing on the impact ofHIV/AIDS on income per capita might find a very small effect (Y1 – Y0),but this does not take into account the possibility that most of the wel-fare loss comes from the decline in life expectancy, not the decline inincome. Instead, therefore, we measure the welfare loss associated withHIV/AIDS as the decline in income, Y1* – Y0, that, for a given lifeexpectancy, would yield the same level of welfare as the actual changes inincome and life expectancy associated with HIV/AIDS. Formally, Y1* canbe calculated as
F(Y1*,LE 0) = F(Y1 , LE 1). (2)
More specifically, we assume that an individual values consumption andlife expectancy according to the following lifetime utility function:
U[{ct},{μs,t},ρ, s] = ∫∞
su(ct)e–∫
t
s(ρ+μs,v)dvdt, (3)
where {ct} denotes the individual’s consumption stream over time, s standsfor the individual’s initial age, {μs,t} is the set of time-varying mortality
186 NICHOLAS CRAFTS AND MARKUS HAACKER
U1
LE1
Y1* Y1 Y0 Income
Life expectancy
LE0
U0
Figure 6.1. Impact of HIV/AIDS on Welfare Accounting for Changes in Life Expectancy
©International Monetary Fund. Not for Redistribution

rates of an individual with initial age s at time t, with t (∈(s, ∞), and ρ givesthe discount rate. The individual’s budget constraint is
∫∞
scte
–∫t
srvdvdt = ∫
∞
syt e
–∫t
srvdvdt, (4)
where yt stands for the individual’s income at time t. For simplicity, weassume that income is constant over an individual’s life span (that is,yt = y*) and that the real interest rate equals the discount rate. In this casethe optimal level of consumption is ct = c* = y*, and the optimized level oflifetime utility is equal to
V({μs,t},y*,ρ, s) = u(y*)∫∞
se–∫
t
s(ρ+μs,v)dvdt, (5)
or V({μs,t},y*,ρ, s) = u(y*)LE({μs,t},ρ, s),
with LE({μs,t},ρ, s) = ∫∞
se–∫
t
s(ρ+μs,v)dvdt. (6)
In other words, lifetime utility is the product of an individual’s flow utilityfrom the consumption stream y*and the discounted life expectancy LE.
Empirical studies of the VSL generally link observed differences inincome, for example across professional categories, to differences in mor-tality risk. For a constant mortality rate μs,t = μ, using equation (5), life-time utility becomes V =u(y*)/δ + μ, and the change in income y* thatwould compensate for an increase in mortality, leaving V unchanged, isequal to
dy* dV/dμ u(y*) u(y*)–––| = – –––––– = ––––––––––– = ––––– LE, (7)dμ V=V
– dV/dy* u′(y*)(δ + μ) u′(y*)
or, equivalently,
dy* u(y*) u(y*)LE––– = ––––––––––––– dμ = ––––––– = dμ, (8)y* u′(y*)y*(δ + μ) u′(y*)y*
which is the specification on which most empirical studies are based. Oncethe coefficient of dμ is estimated based on equation (8), the VSL can beobtained as
u(y*) u(y*)LEVSL = ––––––––––––– y*= ––––––– y*, (9)u′(y*)y*(δ + μ) u′(y*)y*
which is the implied compensation for one statistical death. As an illustra-tion, suppose that an empirical study finds that a professional mortalityrisk of 0.1 percent annually is associated with a salary that is 10 percent
Welfare Implications of HIV/AIDS 187
©International Monetary Fund. Not for Redistribution

higher than for a comparator group. This would mean that the VSL is 100times the applicable income level.
Because, in the context of the HIV/AIDS epidemic, we deal with mor-tality rates that differ across age groups and over time, it is more appropri-ate to focus on the induced change in (discounted) life expectancy ratherthan the changes in mortality rates. Using equation (6), the change in util-ity can be described as the sum of the change in income (weighted by mar-ginal utility) and the change in the discounted life expectancy:
d(V) u′(y*)dy* dLE–––– = –––––––– + ––––. (10)V u(y*) LE
What we are interested in is the change in income that is as bad (orgood) as some change in life expectancy. This can be obtained, using equa-tion (10), as –1 times the change in income that would leave welfare Vunchanged, following a change in life expectancy. Thus the incrementalchange in income that is “equivalent” to an incremental change in lifeexpectancy is given by
dy* u(y*) dLE––– = ––––––– ––––. (11)y* y*u′(y*) LE
Equation (11) directly relates to the empirical estimates of the VSL fromequation (9), as
dy* VSL dLE––– = –––– ––––. (12)y* y*LE LE
Although most studies, which focus on small changes in mortality rates,use a linear framework, this approach seems inappropriate in the presentcontext of comparatively large changes in mortality rates or life expectancy.Although equation (11) or equation (12) can be used for any utility func-tion of the general form used above to calculate the welfare losses associ-ated with declining life expectancy in a piecemeal fashion, assuming aconstant-elasticity utility function allows us to integrate equations (11) and(12), which yields
y* = constant · LEu(y*)/y*u′(y*) = constant · LEVSL/y*LE, (13)
where the coefficients u(y*)/y*u′(y*) and VSL/y*LE are constant by assump-tion. The discrete percentage change in income that would restore the pre-vious level of utility following a change in life expectancy is
Δy LE + ΔLE VSL/y*LE––– = [ –––––––– ] –1. (14)y* LE
188 NICHOLAS CRAFTS AND MARKUS HAACKER
©International Monetary Fund. Not for Redistribution

Data
All demographic estimates and projections used in this chapter wereprovided by the International Programs Center (IPC) of the U.S. CensusBureau (see Epstein, Chapter 1 of this volume for a more extensive discus-sion). These include annual data on population size and mortality, by agegroup (five-year cohorts) and sex, from the (estimated) onset of theepidemic in each country through 2050. Importantly for the purpose ofthis chapter, they also include a counterfactual scenario excluding theimpact of HIV/AIDS. Whereas the IPC provides mortality rates by five-year cohort, we have derived mortality rates for each year of age throughlinear intrapolation.
Table 6.1 provides some demographic indicators for the impact of theHIV/AIDS epidemic. The countries have been chosen to include not onlysome of the worst-affected countries in southern Africa (such as Botswana,South Africa, and Zambia), but also some countries with relatively highHIV prevalence rates in other parts of Africa and elsewhere (Côte d’Ivoire,Ethiopia, Vietnam, and Haiti). The impact of HIV/AIDS on mortality ratesand life expectancy is catastrophic in the worst-affected countries. InBotswana, the worst-affected country covered in Table 6.1, for example, lifeexpectancy has dropped to 34 years, compared with 76 years in a no-AIDSscenario; overall mortality has risen about almost eightfold, to 2.9 percent;mortality in the working-age population (ages 15–49) has risen 27-fold, to3.8 percent. Even in countries where the HIV/AIDS epidemic has not (or
Welfare Implications of HIV/AIDS 189
Table 6.1. Impact of HIV/AIDS on Mortality and Life Expectancy in Selected Countries (Percent except where stated otherwise)
HIV Mortality, Life Expectancy
Prevalence Mortality, Mortality, Ages Ages 15–49, at Birth, 2004
Rate, Ages All Ages, 2004 15–49, 2004 Projected 2010 (years)_____________ _____________ _____________ ______________15–49, End From From From Without
Country of 20031 Total AIDS Total AIDS Total AIDS Actual AIDS
Botswana 37.3 2.9 2.5 3.8 3.7 3.6 3.5 34.2 75.7Côte d’Ivoire 7.0 1.5 0.4 1.1 0.6 1.1 0.7 48.4 55.7Ethiopia 4.4 1.5 0.2 1.0 0.4 1.0 0.4 48.7 53.1Haiti 5.6 1.3 0.3 0.9 0.5 0.9 0.5 52.6 60.2South Africa 21.5 2.9 2.5 2.3 2.0 2.1 1.9 44.1 66.7Vietnam 0.4 0.6 0.02 0.2 0.03 0.2 0.04 70.4 70.9Zambia 16.5 2.1 1.0 1.9 1.4 1.9 1.4 39.4 56.2
Source: UNAIDS (2004); U.S. Census Bureau, International Programs Center, International Data Baseand unpublished tables.
1Data refer to the population aged 15–49.
©International Monetary Fund. Not for Redistribution

not yet) escalated to such dimensions, the impact is severe. In Haiti, withan adult HIV prevalence rate of about 6 percent, overall mortality increasesby one-third, and life expectancy decreases by about 8 years. In Vietnam,with an adult HIV prevalence rate of only 0.4 percent, life expectancydecreases by half a year, and mortality increases by 15 percent (not per-centage points) among the working-age population and 4 percent amongthe total population.6
Complementing the aggregate data, Figure 6.2 shows the impact ofHIV/AIDS on mortality by age and sex, using South Africa as an example.Because of HIV/AIDS, male mortality rates increase very substantiallybetween ages 20 and 39 and reach 3.5 percent for the group aged 40–44,of which 86 percent is HIV-related; for older ages mortality increasesmore slowly, as HIV/AIDS-related mortality declines while mortalityfor other reasons increases with age. Female mortality rates rise evenhigher and peak somewhat earlier (because of higher rates of male-to-female viral transmission and because sexual activity tends to begin at an
190 NICHOLAS CRAFTS AND MARKUS HAACKER
0
2
4
6
8
10
0–4 10–14 20–24 30–34 40–44 50–54 60–64
Male, total
Male, from AIDS
Female, total
Female, from AIDS
Figure 6.2. Mortality Rates by Age and Sex in South Africa, 2004(Percent)
Source: International Programs Center, U.S. Census Bureau.
6It is important to note that the adult HIV prevalence rate for Vietnam, in turn, is actu-ally lower than for many countries for which comparable demographic estimates andprojections of the impact of HIV/AIDS are not available, such as Brazil (0.7 percent), India(about 0.7 percent), Russia (1.1 percent), Spain (0.7 percent), and the United States(0.6 percent).
©International Monetary Fund. Not for Redistribution

earlier age among females) at 4.5 percent for the group aged 30–34, ofwhich 96 percent is HIV-related. In the present context, one lesson fromFigure 6.2 is that mortality rates and thus remaining life expectancy varyquite substantially by age. This implies that average mortality rates,for different age distributions of the population or age profiles of mor-tality, can have different implications for life expectancy and thus for wel-fare. Below we therefore evaluate the impact of HIV/AIDS on welfare byage group.
Impact of HIV/AIDS on Welfare
The focus of our analysis is on the countries worst affected byHIV/AIDS. Very few empirical studies on the VSL for these countries, orcountries with similar levels of income per capita, are available. We there-fore proceed by discussing the available literature, particularly cross-country “meta” studies that include low- or medium-income countries inthe sample; we then apply the most suitable specifications to the analysis ofthe impact of the HIV/AIDS epidemic.
Miller (2000) draws on 68 studies from 13 different countries, findingincome elasticities of the VSL between 0.95 and 1.00. Projecting beyond therange of his sample, he estimates the VSL at about $40,000 for Nigeria in1997, when GDP per capita was about $250 (both numbers are in 1995dollars).
Bowland and Beghin (2001) attempt to address the problem of out-of-sample prediction by focusing on specifications that, according to severalcriteria, perform well for the lower-income countries in their sample. Fortheir preferred specification, they find an income elasticity of 1.52. Thewillingness to pay for a reduction in mortality is positively related to edu-cation; the availability of insurance has a strong negative effect.
Viscusi and Aldy (2003), the most comprehensive study available at pre-sent, discusses, among other issues, data problems, the role of unioniza-tion, and the effects of age. Using estimates of the VSL from 46 studies(about two-thirds of which are from the United States), they find incomeelasticities of 0.51 to 0.53.
A recent study by Mrozek and Taylor (2002) finds an elasticity of theVSL with respect to earnings of 0.46 to 0.49 when observations from out-side the United States are included in the sample. Importantly, they alsofind evidence that the VSL declines with risk. However, their sample fea-tures mortality rates much lower than those considered here, and they usea complex specification that includes variables for which data are not avail-
Welfare Implications of HIV/AIDS 191
©International Monetary Fund. Not for Redistribution

able for the countries of interest here. Thus it is not possible to adapt theirfindings to the present context.
The most useful starting point for our investigation is the study byMiller (2000), which conditions the VSL on GDP per capita rather thanwages. Thus the specification for the VSL that we adopt is
GDPVSL1 = 136.7* –––––. (15)capita
which is based on regression (4) in Miller (2000). This specification impliesthat the elasticity of the VSL with respect to income is equal to 1. For exam-ple, for a country with GDP per capita of $28,800 (the mean of Miller’ssample), the VSL is equal to $3.9 million.7
In the studies discussed above, the estimated income elasticities of theVSL range from about 0.5 to 1.5. Using the sample average of Miller (2000)as a starting point, it is possible to accommodate different elasticities εusing the following equation:
GDP/capita GDPVSL1 = 136.7 (––––––––––)ε
–––––, (16)US$28,800 capita
In light of the substantial differences in GDP per capita among thecountries considered here, the choice of the income elasticity in the VSLfunction obviously has a large impact on the estimates of the VSL. In acountry with income per capita of $1,000, for instance, the VSL would beequal to $137,000 for an income elasticity of 1, but it could range from$25,500 to $733,600 for income elasticities between 0.5 and 1.5. Alterna-tively, this would imply that, with an income elasticity of 1.5, the VSL (interms of GDP per capita) in a country with GDP per capita of $1,000 isonly about 19 percent what it would be in a country with income per capitaof $28,800, but over 500 percent of the latter’s income per capita if theincome elasticity is 0.5. Although one would expect to observe an incomeelasticity somewhat larger than 1, since we do not explicitly account forvariations in human capital,8 these large variations in the relative valuationof life seem implausible when considering countries with large differencesin income per capita. Overall, an income elasticity of around 1, as proposedby Miller (2000), appears to be a good approximation. Our estimates below
192 NICHOLAS CRAFTS AND MARKUS HAACKER
7Whereas Miller uses GDP data in 1995 dollars, we use data at 2001 prices, which are16 percent higher.
8The accumulation of human capital implies a postponement of earnings. In countrieswith more human capital, an increase in mortality would thus have a stronger impact on life-time earnings, and hence on the VSL.
©International Monetary Fund. Not for Redistribution

are therefore based on the link between life expectancy and equivalentchange in income as specified in equation (14), using the VSL estimatefrom equation (15).
Because the impact of HIV/AIDS on mortality and life expectancydepends on an individual’s age, Table 6.2 provides estimates of welfare
Welfare Implications of HIV/AIDS 193
Table 6.2. Estimated Welfare Effect of Increased Mortality in Selected Countries(Percent except where stated otherwise)
Change in:_____________________________________________________________Welfare__________________________
Based on Mortality (in Discounted Based on decline
percentage Life life decline in life in discountedCountry points) expectancy expectancy expectancy life expectancy
2004, evaluated at age 0Botswana 1.6 –55.1 –39.5 –76.7 –83.9Côte d’Ivoire 0.3 –13.1 –8.8 –29.5 –34.5Ethiopia 0.2 –8.4 –5.6 –20.5 –24.2Haiti 0.2 –12.6 –8.4 –26.4 –31.4South Africa 0.8 –34.0 –23.8 –57.6 –66.0Vietnam 0.01 –0.8 –0.5 –1.6 –2.0Zambia 0.8 –30.1 –20.5 –58.4 –64.8
2004, evaluated at age 15Botswana 2.6 –62.5 –50.0 –88.6 –93.6Côte d’Ivoire 0.4 –14.8 –11.2 –35.8 –41.9Ethiopia 0.2 –9.6 –7.2 –24.7 –29.5Haiti 0.3 –14.2 –10.7 –33.0 –39.3South Africa 1.1 –38.1 –29.8 –69.0 –77.4Vietnam 0.02 –1.0 –0.7 –2.2 –2.9Zambia 1.0 –34.5 –26.3 –67.9 –74.8
2004, aggregate1
Botswana 3.1 –59.1 –49.2 –88.9 –92.9Côte d’Ivoire 0.4 –13.3 –10.5 –37.3 –43.5Ethiopia 0.2 –8.5 –6.6 –25.3 –30.0Haiti 0.3 –12.7 –10.0 –33.9 –40.1South Africa 1.1 –32.3 –26.6 –69.6 –76.9Vietnam 0.02 –0.8 –0.6 –2.3 –2.9Zambia 1.1 –32.3 –25.5 –68.8 –75.1
Projected 2010, aggregate1
Botswana 3.3 –61.1 –51.1 –89.5 –93.4Côte d’Ivoire 0.4 –14.9 –11.8 –40.2 –46.9Ethiopia 0.3 –10.3 –8.1 –29.7 –35.1Haiti 0.3 –12.9 –10.2 –33.7 –40.2South Africa 1.4 –37.8 –30.5 –75.5 –82.0Vietnam 0.03 –1.1 –0.9 –3.4 –4.3Zambia 1.1 –31.8 –25.2 –67.3 –74.1
Sources: Authors’ calculations based on the model described in the text and data from the Interna-tional Programs Center, U.S. Census Bureau (see Epstein, Chapter 1 of this volume).
1Average of welfare losses by age group, with age groups weighted by survival rates.
©International Monetary Fund. Not for Redistribution

losses evaluated at age 0 (top panel) and age 15 (second panel), as well asestimates of the average welfare loss, obtained as a weighted average ofwelfare losses by age group, with age groups weighted by their survivalrates (third panel).9 As a robustness check regarding the discountrate applied to life expectancy—see equations (3) and (6)—we provideestimates of the impact of HIV/AIDS on welfare based on the changein life expectancy or the change in the discounted life expectancy, using adiscount rate of 2 percent. The average mortality rates reported in thefirst column are derived from estimated mortality rates by age groupfor 2004, weighted by the survival rates implied by these mortality rates.This means that, unlike the population averages reported in Table 6.1,they do not depend on other demographic trends, such as changes inbirthrates.
Table 6.2 shows that the welfare losses caused by the HIV/AIDS epi-demic are significant even for countries with relatively low prevalencerates, and horrific for the worst-affected countries. For Vietnam, with anadult HIV prevalence rate of 0.4 percent, welfare losses already exceed 2percent of GDP (third panel of Table 6.2). In Zambia, with an adult HIVprevalence rate of 16.5 percent, they exceed two-thirds of GDP, and inBotswana, with an adult HIV prevalence rate of 37.3 percent, they arearound 90 percent of GDP.10
Reflecting the age pattern of HIV/AIDS-related mortality (Figure 6.1),which (apart from an increase in infant mortality) rises from about age15 and peaks at about ages 30–35, the decline in welfare for those at age 15(second panel of Table 6.2) actually exceeds the change in welfare evaluatedat age 0 (first panel of Table 6.2). For older generations the welfare losseventually declines, as HIV/AIDS has a smaller impact on the remaininglife expectancy.
The HIV/AIDS epidemic is evolving, and, for most countries,HIV/AIDS-related mortality rates are projected to increase over the nextseveral years (see Table 6.1). The bottom panel of Table 6.2 thereforereports estimates of aggregate welfare changes for 2010. Reflecting changes
194 NICHOLAS CRAFTS AND MARKUS HAACKER
9We attach equal weight to the relative decline of lifetime utility for each individual,regardless of age. Alternatively, it is possible to assign larger weights to younger people, forexample assigning a 50 percent loss in life expectancy for someone aged 15 a larger weightthan for someone aged 50. Since HIV/AIDS-related mortality is concentrated among a rela-tively narrow, middle-aged group, the weights applied to each age group do not make a bigdifference.
10Crafts and Haacker (2002) provide estimates for a larger group of countries, based ondemographic estimates and projections available at that time.
©International Monetary Fund. Not for Redistribution

in mortality rates, welfare losses increase further for most countries. ForSouth Africa, for example, the projected welfare losses rise by 5 percent ofGDP, to about 75–82 percent of GDP.
Conclusions
This paper has attempted to quantify the welfare effects of theHIV/AIDS epidemic. Using estimates and projections of the impact ofHIV/AIDS on mortality rates and life expectancy, and drawing on existingstudies on the value of statistical life, we estimate the welfare loss ofHIV/AIDS as the loss in income per capita that would have the same effecton lifetime utility as the increase in mortality.
Although our point estimates of welfare losses are subject to a highdegree of uncertainty, they are of a much higher magnitude (generally,more than 10 times larger) than the available estimates of the impact ofHIV/AIDS on output and income per capita. For South Africa, for exam-ple, the available projections of the impact of HIV/AIDS on GDP percapita range from –8 percent to +9 percent by 2010. This paper, in con-trast, evaluates South Africa’s welfare loss associated with increased mor-tality at around 80 percent of GDP. Thus the estimated changes in GDPper capita, although valuable in some other regards, not only give anincomplete picture of the welfare effects of HIV/AIDS, but, as far as wel-fare is concerned, appear negligible compared with the direct effect ofincreased mortality.
It is important to bear in mind certain limitations of our analysis. Ourestimates are subject to the usual problems associated with out-of-sampleprojections: the bulk of studies on the VSL deal with countries with higherGDP per capita than those considered here, and the available studies dealwith changes in mortality that are smaller than those observed in the coun-tries significantly affected by HIV/AIDS. Also, our measure of welfare isentirely based on changes in mortality and does not take into account thedirect and indirect effects of HIV/AIDS on the health status of the popula-tion.11 However, the magnitude of our estimates suggests that our key find-ing—that the direct welfare effects of HIV/AIDS through increasedmortality substantially outweigh even the worst projections of the impact
Welfare Implications of HIV/AIDS 195
11HIV/AIDS directly affects the health status of those infected, but it also has indirecthealth effects, for example through an increase in infections like tuberculosis or declines inthe general quality of health services owing to overwhelming demand.
©International Monetary Fund. Not for Redistribution

on GDP per capita—is robust to alternative specifications or broader defi-nitions of welfare.
References
Arndt, Channing, and Jeffrey D. Lewis, 2001, “The HIV/AIDS Pandemic in SouthAfrica: Sectoral Impacts and Unemployment,” Journal of International Develop-ment, Vol. 13, No. 4, pp. 427–49.
Bowland, Bradley J., and John C. Beghin, 2001, “Robust Estimates of Value of a Statis-tical Life for Developing Economies,” Journal of Policy Modeling, Vol. 23,pp. 385–96.
Crafts, Nicholas, 2001, “The Contribution of Increased Life Expectancy to Growth ofLiving Standards in the UK, 1870–1998” (unpublished; London School ofEconomics).
———, 2002, “The Human Development Index, 1870–1999: Some Revised Estimates,”European Review of Economic History, Vol. 6, No. 3, pp. 395–405.
———, and Markus Haacker, 2002, “Welfare Implications of HIV/AIDS,” IMF Work-ing Paper 03/118 (Washington: International Monetary Fund).
ING Barings, South African Research, 2000,“Economic Impact of AIDS in South Africa.A Dark Cloud on the Horizon” (Johannesburg, South Africa).
Jamison, Dean T., Jeffrey D. Sachs, and Jia Wang, 2001, “The Effect of the AIDS Epi-demic on Economic Welfare in Sub-Saharan Africa,” CMH Working Paper SeriesNo. WG1:13 (Geneva: Commission on Macroeconomics and Health, World HealthOrganization).
Joint United Nations Programme on HIV/AIDS (UNAIDS), 2004, 2004 Report on theGlobal AIDS Epidemic (Geneva).
Mathers, Colin D., and others, 2000, “Estimates of DALE for 191 Countries – Methodsand Results,” Global Programme on Evidence for Health Policy Working PaperNo. 16 (Geneva: World Health Organization).
Miller, Ted R., 2000, “Variations Between Countries in Values of Statistical Life,” Journalof Transport Economics and Policy, Vol. 34, Part 2, pp. 169–88.
Mrozek, Janusz R., and Laura O. Taylor, 2002, “What Determines the Value of Life? AMeta-Analysis,” Journal of Policy Analysis and Management, Vol. 21, No. 2,pp. 253–70.
Nordhaus, William, 1998, “The Health of Nations: Irving Fisher and the Contributionof Improved Longevity to Living Standards,” Cowles Foundation Discussion PaperNo. 1200 (New Haven, Connecticut: Cowles Foundation).
———, 2002, “The Health of Nations: The Contribution of Improved Health to LivingStandards,” NBER Working Paper No. 8818 (Cambridge, Massachusetts: NationalBureau of Economic Research).
Sen, Amartya, 1999, Development as Freedom (New York: Alfred A. Knopf).
196 NICHOLAS CRAFTS AND MARKUS HAACKER
©International Monetary Fund. Not for Redistribution

Stanecki, Karen A., 2000, “The AIDS Pandemic in the 21st Century. The DemographicImpact in Developing Countries,” paper presented at the 13th International AIDSConference, Durban, South Africa, July.
United Nations Development Programme (UNDP), 2001, Human Development Report2001: Making New Technologies Work for Human Development (New York).
Viscusi, W. Kip, and Joseph E. Aldy, 2003, “The Value of a Statistical Life: A CriticalReview of Market Estimates Throughout the World,” NBER Working PaperNo. 9487 (Cambridge, Massachusetts: National Bureau of Economic Research).
Welfare Implications of HIV/AIDS 197
©International Monetary Fund. Not for Redistribution

7
The Impact of HIV/AIDS onGovernment Finance and Public Services
MARKUS HAACKER
HIV/AIDS is a serious challenge to economic development. Increasingmortality and morbidity reduce living standards directly and have
repercussions that affect all areas of the economy. Individuals and house-holds face increasing risks, both directly through the risk of infection, andindirectly as formal and informal social insurance mechanisms areeroded. Companies face productivity losses and increasing costs of med-ical and death-related benefits. At the macroeconomic level, economicgrowth declines as the population grows more slowly and as reducednational saving, rising costs, and declining economic prospects deterinvestment.1
Against this background, this chapter examines the implications ofHIV/AIDS for government finance and public services. In countriesafflicted by HIV/AIDS epidemics, governments’ capacities are diminishedby increasing mortality, and domestic revenue slows, even as the demandfor certain government services, most notably in the health sector,expands.2 Along these lines, this chapter will address three broad questions:
198
1For a broader discussion of the macroeconomic effects of HIV/AIDS, see Haacker (Chap-ter 2, this volume).
2Barnett and Whiteside (2002) also discuss the impact of HIV/AIDS on the public sectorbut take a wider perspective, covering the impact of HIV/AIDS on political processes inmore detail. Braimah (2004) provides a much shorter discussion of the issues discussedhere; his study also considers broadly the responses to HIV/AIDS from a public sectorperspective.
©International Monetary Fund. Not for Redistribution

• What is the impact of HIV/AIDS on government employees, personnelcosts, and the efficiency of public services? Increased mortality, concen-trated among the working-age population, results in disruptions topublic services and, over time, will change the age composition ofpublic servants. At the same time, governments frequently offerhealth and other benefits to public servants that are generous bynational standards, and the costs of these benefits are likely to rise.
• What are the implications of HIV/AIDS for public policy, and what arethe fiscal consequences? The most direct policy responses are efforts atprevention (for example, through the mass media, education, orworkplace interventions) and the expansion of public health services.Through the adverse economic consequences of HIV/AIDS on indi-viduals and households, the epidemic also creates challenges for socialpolicy, in particular regarding the very substantial numbers oforphans. In light of the key role of education in economic develop-ment and also HIV/AIDS prevention, this chapter also discusses theimpact of HIV/AIDS on the education sector.
• How does HIV/AIDS affect government revenue, and what is the role ofexternal finance? HIV/AIDS has an adverse impact on the domestictax base, and thus on government revenue. For most countries withhigh HIV prevalence, external grants account for a large proportionof general health expenditure and probably an even greater propor-tion of expenditure related to HIV/AIDS. Also, since external grantsare frequently disbursed not through the government budget, butdirectly from the donor to the implementing agency, coordination ofthe various agencies active in this area is an important aspect of thegovernment’s agenda.
With data still scarce and our present understanding of the broad eco-nomic effects of HIV/AIDS still poor (at least in terms of a quantitativemacroeconomic analysis), this chapter will not arrive at conclusive answersto these three questions. Instead, the aim of this chapter is to formulate ananalytical framework and to synthesize the data that are available, to assistpolicymakers in developing a policy response to HIV/AIDS. At the sametime, the fiscal repercussions of HIV/AIDS—its impact on the civil service,government expenditure, and government revenue—go far beyond what isgenerally subsumed under the costs of or the response to HIV/AIDS. Forcountries with severe epidemics, HIV/AIDS is therefore a general fiscalpolicy issue, and this chapter aims to contribute to an improved under-standing of the consequences of HIV/AIDS from this angle as well.
The chapter is organized as follows. The first section analyzes howHIV/AIDS affects the government’s human capacities through increased
Impact of HIV/AIDS on Government Finance and Public Services 199
©International Monetary Fund. Not for Redistribution

mortality. Because of medical and death-related benefits and other costsrelated to increased attrition, the costs of public services increase for allareas of government. The losses in efficiency of public services, however,extend beyond the disruptions associated with increased attrition. Forexample, the age composition of government employees changes as manymore die young and many fewer reach retirement age. The next foursections highlight various areas of government services or public expen-diture particularly affected by HIV/AIDS: HIV prevention, care, andtreatment; education; social expenditure; and pension schemes.HIV/AIDS also has an impact on government revenue. Therefore thechapter’s sixth section discusses changes in domestic government revenueand the financing of general and HIV/AIDS-specific health expenditure.In many low-income countries, external grants play a very importantrole in financing HIV/AIDS-related expenditure, and this is the topic ofthe seventh section. The penultimate section discusses some issues per-taining to the impact of HIV/AIDS in the longer run. The final sectionconcludes.
Impact on Government Employees and Personnel Costs
The HIV/AIDS epidemic affects all levels and functions of governmentas an increasing number of government employees fall ill and die. Beyondthe disruptions to public services associated with increased attrition rates,HIV/AIDS also affects the composition of government employees in vari-ous dimensions and the level of human capital available to the govern-ment. Also, because government employees generally enjoy some form ofretirement, death-related, and medical benefits, the government’s person-nel costs increase.
Increased Mortality
Higher mortality and morbidity affect public services through higherattrition and absenteeism of government employees affected by HIV/AIDS,and through lower productivity owing to their deteriorating health. Morebroadly, HIV/AIDS also results in higher absenteeism among those notinfected—for example, as these workers are obliged to care for sick familymembers and to attend funerals. The demographic implications of the epi-demic are treated in more detail elsewhere in this volume; this sectiontherefore only briefly highlights some of the consequences for the publicsector and discusses the available evidence.
200 MARKUS HAACKER
©International Monetary Fund. Not for Redistribution

To illustrate the implications of the demographic impact ofHIV/AIDS, Figure 7.1 shows the estimated mortality pattern by age andsex for Namibia in 2004. With an estimated prevalence rate of 21 percent,Namibia is one of the countries worst affected by HIV. Mortality peaks at4.2 percent at ages 30–34 for females, and at 3.2 percent at ages 40–44for males. The impact of HIV/AIDS on mortality has been discussed inmore detail elsewhere (see, in particular, Epstein, Chapter 1 of this vol-ume), and this chapter will not duplicate that discussion. Regarding theimpact on the civil service, it is important to note that for ages 20–54, arange that includes most public servants, mortality averages 2.5 percent,of which AIDS accounts for 2.2 percentage points, or almost 90 percent.This means that, for this age group, mortality increases about 7!/2-foldfor men and almost 12-fold for women. The data also show a strongsex bias, with women affected at an earlier age and suffering higher mor-tality overall.
One of the most thorough studies so far of the impact of HIV/AIDS ongovernment workers covers the staff of five ministries in Malawi (Govern-ment of Malawi and United Nations Development Programme (UNDP),2002). It shows that death-related attrition rates increased substantiallybetween 1990 and 2000, for example, from 0.1 percent to 0.7 percent forthe Ministry of Education, and from 1.1 percent to 2.7 percent for thepolice service. Although these data are subject to some uncertainty, the ageprofile of the observed mortality, peaking at ages 30–34, suggests that
Impact of HIV/AIDS on Government Finance and Public Services 201
0
2
4
6
8
10
0–4 10–14 20–24 30–34 40–44 50–54 60–64
Male, total
Male, from AIDS
Female, total
Female, from AIDS
Figure 7.1. Mortality Rates by Age and Sex in Namibia, 2004(Percent)
Source: International Programs Center, U.S. Census Bureau.
©International Monetary Fund. Not for Redistribution
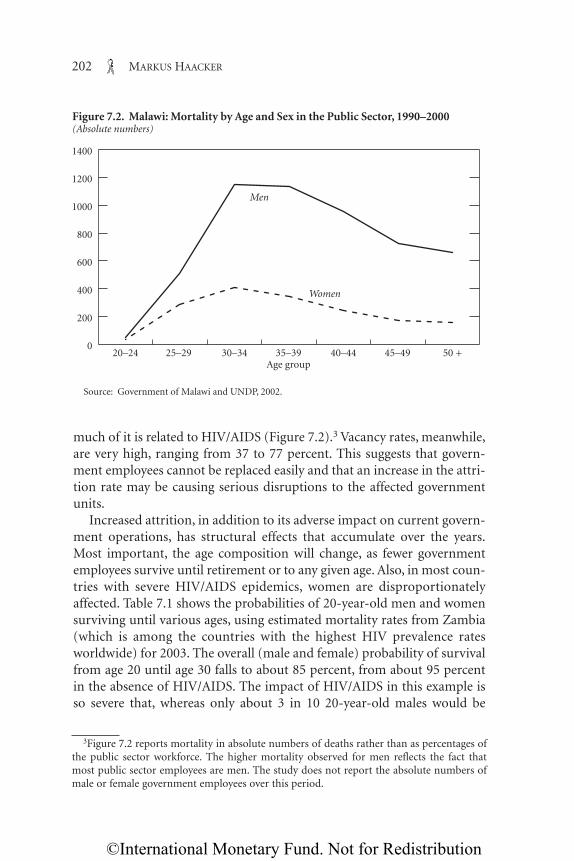
much of it is related to HIV/AIDS (Figure 7.2).3 Vacancy rates, meanwhile,are very high, ranging from 37 to 77 percent. This suggests that govern-ment employees cannot be replaced easily and that an increase in the attri-tion rate may be causing serious disruptions to the affected governmentunits.
Increased attrition, in addition to its adverse impact on current govern-ment operations, has structural effects that accumulate over the years.Most important, the age composition will change, as fewer governmentemployees survive until retirement or to any given age. Also, in most coun-tries with severe HIV/AIDS epidemics, women are disproportionatelyaffected. Table 7.1 shows the probabilities of 20-year-old men and womensurviving until various ages, using estimated mortality rates from Zambia(which is among the countries with the highest HIV prevalence ratesworldwide) for 2003. The overall (male and female) probability of survivalfrom age 20 until age 30 falls to about 85 percent, from about 95 percentin the absence of HIV/AIDS. The impact of HIV/AIDS in this example isso severe that, whereas only about 3 in 10 20-year-old males would be
202 MARKUS HAACKER
0
200
400
600
800
1000
1200
1400
Women
Men
20–24 25–29 30–34 35–39Age group
40–44 45–49 50 +
Figure 7.2. Malawi: Mortality by Age and Sex in the Public Sector, 1990–2000(Absolute numbers)
Source: Government of Malawi and UNDP, 2002.
3Figure 7.2 reports mortality in absolute numbers of deaths rather than as percentages ofthe public sector workforce. The higher mortality observed for men reflects the fact thatmost public sector employees are men. The study does not report the absolute numbers ofmale or female government employees over this period.
©International Monetary Fund. Not for Redistribution

expected to die before age 60 in the absence of HIV/AIDS, in its presenceonly about three in ten are expected to survive until age 60. Table 7.1 alsoshows that women are affected more severely than men, and at an earlierage. For 20-year-old women the survival rate until age 60 declines fromthree-fourths to less than 30 percent, and the impact of HIV/AIDS on 20-year-old women’s mortality until age 30 (an increase of 13.2 percentagepoints) is about twice the impact for men (6.7 percentage points).
Personnel Costs
HIV/AIDS-related personnel costs for the general civil service (asopposed to the costs of expanding certain public services, such as health,which are discussed further below) can broadly be categorized in terms ofabsenteeism (of the sick staff members themselves, and of other employ-ees who will attend their funerals), sick leave, medical benefits, death-related benefits, and the additional costs of replacing staff lost due toHIV/AIDS (most notably training costs).4
As the health status of those infected deteriorates, and as the need tocare for sick relatives increases, HIV/AIDS results in an increase in absen-teeism. Because absenteeism, unlike sick leave, is characterized by informalabsences, whether for extended periods or only for several hours at a time,it is very difficult to measure. For instance, the Government of Malawi and
Impact of HIV/AIDS on Government Finance and Public Services 203
Table 7.1. Zambia: Estimated Survival Probabilities for 20-Year-Olds, by Sex, 2004(Percent)
Probability of Survival Until Indicated Age___________________________________________________________________Male Female___________________________ ____________________________
In absence of In absence ofAge Actual AIDS Actual AIDS
30 87.8 94.5 82.9 96.140 62.8 88.4 52.2 91.050 41.5 80.2 37.9 84.360 26.7 67.7 29.3 74.3
Source: Author’s calculations, based on U.S. Census Bureau estimates of mortality rates for 2004.
4Much of the literature on the costs of HIV/AIDS to the private sector also applies; seeHaacker (Chapter 2, this volume) for a discussion. However, the impact of HIV/AIDS onpersonnel costs in the public sector is generally larger, because benefits tend to be more com-prehensive (partly because of a larger share of permanent employees in the public sector),and because the private sector is more likely to adjust benefits downward in response to ris-ing costs. Barnett and Whiteside (2002) make a similar point.
©International Monetary Fund. Not for Redistribution

UNDP (2002) estimate that absenteeism averages 65 days a year foremployees with full-blown AIDS, and 15 days a year for those who areinfected but have not yet developed the full symptoms. This means that if2 percent of public servants have full-blown AIDS, and another 20 percenttake health-related absences of 15 days each, then absenteeism will amountto 2.0 percent of all working hours (assuming 220 working days in a year).
Grassly and others (2003) estimate that absenteeism amounts to anaverage of 1.3 months annually per HIV-infected employee, with eachinfected worker experiencing 12 to 14 illness episodes before the terminalillness (Government of Malawi and UNDP, 2002). With an overall HIVprevalence rate of 20 percent, this would mean a rise in absenteeism of2.2 percent.
When public servants become too sick to work, they can usually requestsick leave at full or reduced pay for a specified period. In Zambia, forexample, the Ministry of Agriculture, Food, and Forestry allows for a con-tinuous absence of 90 days at full pay, and another 6 months at half pay. InSwaziland a public servant may take up to 6 months of sick leave at fullpay, and another 6 months at half pay. Although these examples cannot begeneralized (provision for sick leave differs substantially across countries),these two examples suggest that, for a country where 2 percent of publicservants drop out of the service for HIV/AIDS-related reasons, about 1 to1.5 percent of all public servants may be on sick leave at a given time as aconsequence.
Apart from morbidity-related absenteeism and sick leave, another pri-mary cause of absenteeism is attendance at the funerals of those who havedied of AIDS. At the aggregate level, it is possible to draw some conclusionson the impact of HIV/AIDS-related mortality on funeral attendance. If, forexample, mortality rises by 2 percentage points, 40 people attend eachfuneral, funeral attendance requires an absence of 2 days (including traveltime), and total working time each year is 220 days, then HIV/AIDS willincrease absenteeism by 0.7 percentage point. However, these aggregatenumbers are likely to understate the disruptions caused by funeral atten-dance. As government employees die of AIDS and their colleagues attendthe funeral, the work of the affected government agency can come to astandstill.
Altogether, these considerations suggest that the impact of HIV/AIDSon the productivity of government employees can be considerable. For acountry with HIV/AIDS-related mortality of 2 percent, absenteeism andsick leave would absorb 2 to 3 percent of the total working time of publicservants. At least in the case of informal absences (and in light of existingbudget constraints), it is likely that this would not translate into additional
204 MARKUS HAACKER
©International Monetary Fund. Not for Redistribution

hiring, but instead into reduced productivity and reduced delivery of pub-lic services. Moreover, the problem of increased absenteeism will be com-pounded by an increase in vacancies if positions are not filled immediately.Although these increased vacancies do not directly contribute to costs(indeed, for a given number of positions, an increase in vacancies wouldreduce personnel costs), they are likely to exacerbate service disruptions.5
In countries with weak governance and nontransparent public records,the efficiency of the public service may also suffer if deceased governmentemployees remain on the payroll, to the benefit of corrupt governmentofficials or the surviving dependents. In this case increased mortalitywould result in an increase in the number of “ghost workers.”
Government employees generally enjoy some form of medical benefits,which can take the form of medical insurance, free (and possibly privi-leged) access to public health services, or discretionary funds (for example,at the ministerial level). HIV prevention, care, and treatment are discussedin more detail below. However, some aspects are specific to the govern-ment’s role as an employer. In particular, workplace prevention measures(by reducing the incidence of new infections) and the provision of careand treatment (by improving the health status of government employeesand reducing mortality rates) not only reduce other HIV/AIDS-relatedcosts but also mitigate losses in the efficiency of government services, dis-cussed below. The costs and financial benefits of HIV/AIDS workplaceinterventions have been discussed in some detail for the private sector, forexample by Rosen and others (2004) and Simon and others (2000).6 Oneof the lessons from these studies, which also applies here, is that the finan-cial benefits from improvements in prevention measures and medical ser-vices are significant, and they need to be taken into account when assessingthe overall fiscal effects of HIV/AIDS.
Death-related benefits comprise funeral benefits, lump-sum benefitspaid to surviving dependents, and pensions to surviving dependents (typ-ically the deceased worker’s spouse and under-age children). Because pub-lic pension funds may cover the civil service only or parts of the privatesector as well, this issue is treated in more detail below. Government agen-cies often cover the funeral expenses of their employees, whether by formal
Impact of HIV/AIDS on Government Finance and Public Services 205
5JTK Associates (2002), in a study of the impact of HIV/AIDS on three government min-istries in Swaziland, emphasizes the high level of vacancies, which increases the workload ofthe remaining government employees. The study points out that, “should the central agen-cies continue growing at the same rate as in the past several years (i.e. at close to 2% [a year]),recruitment will need to double to accommodate the loss of personnel to AIDS.”
6See also Haacker (Chapter 2, this volume), which draws on this earlier literature.
©International Monetary Fund. Not for Redistribution

or informal arrangement. The cost can be substantial. For instance, in asample of households from South Africa, the cost of a funeral averagedfour monthly salaries; the average cost of a single funeral to the Ministryof Education in Zambia was $176 (in 2001 dollars), or 11 percent of anaverage annual salary.7 Thus, if all government employees are eligible forfuneral grants in the range of 1 to 4 monthly salaries, and if theHIV/AIDS-related mortality rate is 2 percent, the total cost will equalabout 0.2 to 0.7 percent of the total wage bill. If the government also pro-vides funeral grants for family members of its workers, the total could besubstantially higher.
Because government employees who have fallen sick or died need to bereplaced, HIV/AIDS also has implications for the costs of training.Depending on the employee’s job category, these costs range from smallamounts for basic on-the-job training to very substantial investmentsinvolving several years of training abroad. Training costs may appear in thegovernment budget directly (for example, when line ministries conducttraining events) or indirectly (through increased allocations to general orvocational educational institutions, or informal training on the job); if thepublic servants lost due to HIV/AIDS are not replaced by similarly quali-fied staff, the primary cost will be a decline in the quality of the civilservice.
The increase in training costs due to HIV/AIDS can be calculated in dif-ferent ways. One way is to multiply the estimated average cost of trainingper person by the number of new staff needed. Another is to assess, usingmore aggregated data on the existing capacities and budgets of educationalinstitutions, how much these institutions will have to expand.
Following the first approach, Grassly and others (2003) estimate, for thecase of Zambia, the cost of training one teacher over two years at $413 to$606 (in 2001 dollars), an amount equal to about four monthly salaries. Inthis case, if mortality among teachers increases by 2 percent, the additionaltraining of teachers will cost an amount roughly equivalent to 0.7 percentof the wage bill for teachers. However, for positions requiring several yearsof university education, the costs can be much higher. Topouzis (2003),citing another study from Zambia, reports annual costs of university edu-cation of between $2,500 and $3,000; professional staff at the Ministryof Agriculture, for example, usually have at least five years of universitytraining.
206 MARKUS HAACKER
7See Steinberg and others (2002) for South Africa, and Grassly and others (2003) forZambia.
©International Monetary Fund. Not for Redistribution

The primary advantage of the second approach is that it requires fewerdata: in its simplest form, all one needs is data on attrition rates with andwithout AIDS. For example, if staff attrition is 2 percent without HIV/AIDS,and HIV/AIDS raises it by 1 percentage point, then, for every 100 publicservants, three rather than two new staff members need to be hired andtrained annually, corresponding to an increase of 50 percent in requiredtraining. This method can also be applied to identifying bottlenecks in thecapacities of relevant training institutes.
One very important factor in determining training costs, especially inhealth services, is brain drain. The emigration of trained workers cangreatly increase the number of people who need to be trained to replaceemployees who have died, or to meet the requirements of an expandedresponse to HIV/AIDS. Especially in low-income countries, recent gradu-ates may leave the country to take higher-paid positions in other countriesin the region or further abroad. To some extent this is presumably includedin estimated rates of attrition, but such measures do not capture braindrain among new graduates. If, for example, 20 percent of graduatesimmediately take jobs abroad, estimates of the required costs of trainingusing the first method described above would need to be adjusted upwardby 20 percent. The second method, which applies a multiplier to the totalnumber of people actually trained, does account for this form of braindrain, provided that the rate of brain drain does not change in response toincreased HIV prevalence.
One other consideration is often overlooked in analyses of the cost oftraining, namely, that at the national level the number of job candidateswith suitable skills is limited. In the worst-affected countries in sub-SaharanAfrica, there is considerable slack in the labor market for the lower educa-tional categories. For higher educational or skill categories, however, thelabor market is much tighter, and hiring additional staff in these categorieswould crowd out hiring by other employers. Thus any policy to compensatefor or offset the impact of HIV/AIDS on the public sector, or to expand var-ious categories of public services, needs to be consistent with the situationin the labor market and with the country’s overall development objectives.
Efficiency of Public Services
HIV/AIDS increases the number of government employees taking earlyretirement for medical reasons or dying in service. Increased attrition ratesand absenteeism for medical reasons or to attend funerals (discussedabove) cause disruptions to work processes and thus affect the efficiency ofpublic services.
Impact of HIV/AIDS on Government Finance and Public Services 207
©International Monetary Fund. Not for Redistribution

Some of the efficiency losses—those related to sick leave, increasedabsenteeism for medical reasons, and funeral attendance—have alreadybeen discussed in the context of personnel costs. In a private sector contextthese losses would result in an increase in unit costs, which can be inter-preted either as an increase in production costs to achieve a given output,or as a decline in the productivity of a given number of employees.8
In the public sector these losses are most likely to result in a decline inthe quality of services rather than additional hiring, for two reasons. First,almost all government employees are permanent employees, and the posi-tions of those falling ill cannot be filled before they either die or retire.Thus the responsibilities of an ill employee are typically taken on by some-one else in an acting capacity (who in turn usually must pass on some ofhis or her normal responsibilities) or shared between colleagues in thesame unit. Second, staff allocations are typically driven by a centralizedannual budget process, and so there is little flexibility to hire additionalstaff to cover bottlenecks in particular units, especially on a temporarybasis.
These efficiency losses are likely to go beyond those caused by increasedabsenteeism. Once a government employee dies or retires, the positioncannot be filled instantaneously. Many government jobs, in particularsenior positions, need to be advertised, the applications screened, and can-didates interviewed. The government agency then selects one or more can-didates and makes offers, which may be rejected or may have to benegotiated. Once a candidate accepts an offer, the appointment needs to beconfirmed. Especially for senior positions, the entire process can take sev-eral months or more to complete.
Aggregate estimates of increased absenteeism do not reflect differencesin the extent to which the workload of government employees can be real-located temporarily during episodes of sickness. Generally, those staffmembers who are most difficult to replace are those holding critical posi-tions at the nodes of the government’s organization or internal communi-cations, or whose positions are endpoints in the localized delivery ofservices, especially in rural areas. The first group includes primarily seniorgovernment staff, who often have advanced degrees and many years of
208 MARKUS HAACKER
8Note, however, that the increase in staff required to achieve a particular output generallyexceeds the percentage of working time lost to HIV/AIDS. The reason is that labor can beinterpreted as a homogeneous factor of production only in very special circumstances. Morecommonly, each worker fulfills a certain role within an organization, which requires certainspecific skills; any replacements would have to match those skills. Since labor is not easilydivisible, this matching can be hard to achieve.
©International Monetary Fund. Not for Redistribution

experience. When these public servants fall ill, the efficiency of the gov-ernment units reporting to them can be undermined. Government ser-vices in rural areas are particularly vulnerable because the units providingthese services are generally smaller or more decentralized. Examplesinclude local schoolteachers and agricultural extension workers (seeTopouzis, 2003). In the smallest local government units (such as a schoolwith one or two teachers), it is simply impossible to cover for the sicknessor death of a public servant by reallocating work to co-workers. Also,because of the distances involved, supervisors are likely to be less aware ofan increase in health-related absenteeism.
The change in the age structure of government employees also hasimplications for the efficiency of public services. Again, senior governmentstaff are typically drawn from a pool of public servants with many years,even decades, of experience. Increased mortality means that this pool isshrinking. Assume, for example, that a minister has to be appointed, andthat ordinarily there would be six candidates on the short list, all of themabout 50 years of age. If the example from Table 7.1 is representative ofgovernment employees at this level, the likelihood is that, of the six candi-dates who would have ordinarily made the short list, three will be dead bythe age of 50.9 Although this statistical probability may or may not affectany particular appointment, it does indicate a catastrophic loss of seniorpublic servants in total, which would have a severe impact on the qualityof management of government agencies and decision making at the high-est levels.
More generally, the efficiency of an organization at any level maydepend on the number of employees who “know the ropes” and who havedeveloped their problem-solving skills through experience. By thinningout this stock of experience, increased mortality—in addition to disrup-tions caused by sickness and higher attrition—can have an accumulativeeffect. These longer-term effects are captured in the term “institutionalmemory.” An institution’s memory is largely embodied in its staff, andespecially in those employees who have stayed with the institution for along time. To gain a sense of the implications of HIV for institutionalmemory, consider its impact on the number of government employeeswith a tenure of 10 years. Suppose that the attrition rate, excludingHIV/AIDS-related mortality, is 2 percent and that with HIV/AIDS it rises
Impact of HIV/AIDS on Government Finance and Public Services 209
9This is calculated as the survival probability until age 50 divided by the survival proba-bility in the absence of HIV/AIDS. The increase in attrition is higher among women thanamong men, reflecting the differing impact of HIV/AIDS by sex.
©International Monetary Fund. Not for Redistribution

by another 2.4 percentage points (in line with the above example forNamibia). In the absence of HIV/AIDS, attrition over a 10-year periodwould be 18 percent, but including the effects of HIV/AIDS it is 36 per-cent. Equivalently, institutional memory (here measured by the numberof employees remaining with the institution for 10 years) declines by22 percent.10
Prevention, Care, and Treatment
The preceding section focused on the general impact of HIV/AIDS onthe civil service and on personnel costs. This section turns to the govern-ment’s activities in fighting the epidemic through the prevention of newinfections, antiretroviral treatment, and other forms of care. The sectionbegins with a discussion of the most recent estimates of global resourceneeds for HIV/AIDS-related activities from the Joint United Nations Pro-gramme on HIV/AIDS (UNAIDS), mapping out the various componentsof the global response to the epidemic. In light of the central role of pre-vention measures in turning back the epidemic, and their crucial role instrengthening efforts to expand access to treatment for people living withHIV/AIDS, prevention programs are discussed next. An analysis of generalhealth expenditure and human resources in some of the worst-affectedcountries follows, leading into the discussion on care and treatment. Thatdiscussion takes a broad perspective, including an assessment of themacroeconomic costs and benefits of antiretroviral treatment. Finally, inmost countries with severe HIV epidemics a substantial proportion ofHIV/AIDS-related expenditure is financed through external grants andconcessional lending, and therefore the section ends by focusing on issuesrelated to and trends in external financing.
Estimates of Global Resource Needs
UNAIDS’s latest estimates of global resource needs for an expandedresponse to AIDS in low- and middle-income countries, issued in June2004 (UNAIDS, 2004b, shown in Table 7.2) provide some information onpriority interventions from a global perspective. The prioritization dif-
210 MARKUS HAACKER
10Let attrition without HIV/AIDS be denoted as α, and attrition owing to HIV/AIDS as β.Ten-year attrition rates are then computed as 1 – (1 – α)10 and 1 – (1 – α – β)10, respectively.(For convenience, it is assumed that attrition rates are not correlated with tenure.) Thedecline in institutional memory is then defined as 1 – [(1 – α – β])/[(1 – α)]10.
©International Monetary Fund. Not for Redistribution

Impact of HIV/AIDS on Government Finance and Public Services 211
Table 7.2. Estimated Costs of Scaling up HIV/AIDS Activities in Low- and Middle-Income Countries, 2005
Millions Percent ofItem of Dollars Total Costs
Prevention-related activitiesGeneral population interventions
Mass media 96 0.8Voluntary counseling and testing 1,101 9.5_____ ____
Total for general population interventions 1,197 10.3Programs for key populations at high risk
AIDS education in schools 95 0.8Outreach for out-of-school youth 633 5.5Interventions focused on sex workers and their clients 384 3.3Interventions focused on men who have sex with men 342 3.0Harm reduction programs 124 1.1Workplace prevention 505 4.4Prevention programs for people living with HIV 34 0.3Prevention for special populations1 115 1.0_____ ____
Total for programs for key populations at high risk 2,232 19.3
Service delivery 2,569 22.2Condom social marketing 147 1.3Public and commercial sector condom provision 865 7.5Improving management of sexually transmitted infections 660 5.7Prevention of mother-to-child transmission 167 1.4Blood safety 224 1.9Postexposure prophylaxis 1 0.0Safe medical injections 93 0.8Universal precautions 394 3.4Other prevention 18 0.2_____ ____
Total for service delivery 2,569 22.2_____ _________ ____Total for prevention-related activities 5,998 51.7
Orphan supportOrphanage support 509 4.4Community support 364 3.1School fees 204 1.8_____ _________ ____
Total for orphan support 1,077 9.3
Treatment and care 3,815 32.9Palliative care 271 2.3Diagnostic testing 24 0.2Treatment for opportunistic infections 349 3.0Prophylaxis for opportunistic infections 114 1.0Antiretroviral therapy 2,875 24.8Laboratory monitoring for antiretroviral therapy 182 1.6_____ _________ ____
Total for treatment and care 3,815 32.9
Policy, advocacy, administration, and research 545 4.7
Program costs 155 1.3_____ _________ ____Total, all items 11,592 100.0
Sources: UNAIDS (2004b), and author’s calculations.1Prisoners, migrants, truck drivers, and others.
©International Monetary Fund. Not for Redistribution
fers, however, from country to country. For example, countries with lowHIV prevalence at present would be advised to place more emphasis ongeneral prevention; in countries where the epidemic is concentrated inparticular subgroups, targeted prevention programs would carry a largerweight. Estimates of resource needs for treatment also reflect an assess-ment of how quickly access to treatment can be expanded in a given coun-try.11 Total resource needs for low- and middle-income countries in 2005are estimated at $11.6 billion, just over half of which (52 percent) goestoward prevention-related activities, 9 percent for social expenditure, 33percent for treatment, and 6 percent largely for overhead expense andresearch.
Within the category of preventive activities, some measures aim at spe-cific population groups, largely those at high risk of infection (such as sexworkers, men who have sex with men, prisoners, migrants, and truck dri-vers). In order to reach young people before HIV prevalence in theircohort rises, prevention strategies for this group should include educationin the classroom (at relatively low additional cost, since it is deliveredthrough an existing service), and outreach programs for out-of schoolyouth (who are at greater risk of contracting the virus). Workplace pro-grams, at 4.4 percent of total costs, are an important channel for reachingprime-age adults. These measures are complemented by interventions tar-geting the general population, such as mass media campaigns and volun-tary counseling and testing. The latter is one of the more expensivecomponents of the total response, accounting for 9.5 percent of total costs.Whereas these measures aim primarily at education and modification ofrisky behavior, other prevention measures (those under the heading“service delivery”) focus on specific efforts to reduce infection riskthrough sexual contact (condom provision), during pregnancy or at birth,or through exposure to infected blood (blood safety protocols and safeinjections).
Because of the vulnerability of children in households affected byHIV/AIDS,12 the global response to HIV/AIDS, as envisaged in the esti-mates of resource needs, includes provisions targeted at orphans and thehouseholds and communities who care for them; these resource needsamount to 9.3 percent of the total. Some of these measures aim at
212 MARKUS HAACKER212 MARKUS HAACKER
11Because some of these estimates are politically sensitive, UNAIDS does not release esti-mates at the country level.
12See also Haacker (Chapter 2, this volume), Birdsall and Hamoudi (Chapter 4, this vol-ume), and Bell, Devarajan, and Gersbach (Chapter 3, this volume), and the section titled“Focus—AIDS and Orphans: A Tragedy Unfolding,” in UNAIDS (2004a).
©International Monetary Fund. Not for Redistribution

improving orphans’ material living standards (for example, throughorphanage and community support), whereas others are directed toimproving access to education (for example, through subsidies to coverschool fees).
About one-third (32.9 percent) of the total estimated resource needs gotoward expanded treatment and care. Within this category, antiretroviraltherapy (24.8 percent) and associated laboratory costs (1.6 percent)together account for the largest share. The remainder (6.5 percent) coversthe estimated costs of palliative care and treatment and prophylaxis foropportunistic infections.
Although the line items in Table 7.2 also describe the major compo-nents of an HIV/AIDS program at the country level, the mix of interven-tions also depends on the state of the epidemic and on the government’spolicy objectives: many of the interventions, especially in the areas ofcare, treatment, and social expenditure, are very strongly linked to the rateof HIV or AIDS prevalence in the country. The mix can also vary accord-ing to the main transmission modes of the virus, which can differ betweenand within countries. In designing a broad HIV/AIDS program, it is alsoimportant to acknowledge the close interrelationships between someinterventions. For example, achieving and maintaining high rates of cov-erage of antiretroviral treatment will often be possible only if preventionmeasures succeed at keeping the number of new infections low.13 At thesame time, the option of receiving treatment is a major incentive for AIDSvictims to seek counseling and testing. Some sense of the range ofnational responses can be gleaned from countries’ announced plans fortheir general response to HIV/AIDS. For example, Botswana’s NationalStrategic Framework for HIV/AIDS 2003–09 is at once a national planand a means of engaging government ministries and regional entities inthe national response, requiring each to formulate its own response toHIV/AIDS (see Botswana National AIDS Coordinating Agency, 2003; seealso Masha, Chapter 9 of this volume). An important feature of SouthAfrica’s Operational Plan for Comprehensive HIV and AIDS Care, Man-agement, and Treatment (Government of the Republic of South Africa,2003) is the strong emphasis on embedding the response to HIV/AIDSwithin the government’s objective of broadening and improving access tohealth care.
Impact of HIV/AIDS on Government Finance and Public Services 213
13UNAIDS (2004a, p. 69) points out that “without sharply reducing HIV incidence,expanded access to treatment becomes unsustainable. Antiretroviral therapy providers willbe swamped by demand.”
©International Monetary Fund. Not for Redistribution

From a broad fiscal perspective, three points about Table 7.2 are worthmaking. First, it is unclear how the analysis on which the table is based hasincorporated the fixed costs of rapidly expanding HIV/AIDS-related ser-vices, especially in the area of treatment, other than through assumptionsregarding feasible rates at which HIV/AIDS-related services can beexpanded. Second, the strategy to improve access to treatment for HIVpatients is normally part of a broader strategy for the health sector, and itis often difficult or infeasible to distinguish investments in HIV/AIDS-related services from those in health services generally. Third, in most casesthe table shows only the direct fiscal costs of HIV/AIDS-related interven-tions. The total fiscal costs, however, also include the indirect effects (forexample, higher personnel costs and reduced domestic revenue, both ofwhich are treated elsewhere in this chapter), but these are usually notincluded in studies focusing on the response to HIV/AIDS.
Prevention-Related Activities
Prevention programs are the centerpiece of the public response toHIV/AIDS. The epidemic has a devastating effect not only on the individ-uals affected, but also on their households and, in countries with highprevalence rates, on societies (see Haacker, Chapter 2 of this volume).Improved access to treatment can mitigate these effects, but they can beavoided only if successful prevention measures bring down the number ofinfections. However, the broader microeconomic, macroeconomic, andsocial costs of HIV/AIDS are not included in standard estimates of thecost-effectiveness of prevention and treatment programs, either becausethey cannot easily be quantified, or because the studies focus on the finan-cial costs of HIV/AIDS-related programs only. Nevertheless, even fromthis narrow perspective, some prevention measures are known to be highlycost-effective (as discussed further below), and institutions such asUNAIDS emphasize the role of effective prevention programs as a prereq-uisite to successfully expanding access to treatment. Against this back-ground, the discussion here will focus on a few issues that are particularlyrelevant from a fiscal and general policy perspective. A comprehensive dis-cussion of the various types of prevention measures is beyond the scope ofthe chapter; UNAIDS (2004a, 2004b), Global HIV Prevention Group(2003), and World Bank AIDS Campaign Team for Africa (2001) are use-ful starting points.
Although innovations in the market for antiretroviral drugs andenhanced political commitment have vastly increased the potential toprovide, through the public sector, treatment to large numbers of people
214 MARKUS HAACKER
©International Monetary Fund. Not for Redistribution

living with HIV/AIDS, the disease remains, by a large margin, the leadingcause of death in sub-Saharan Africa, and no cure yet exists. Moreover,in light of the limited capacities of providers of antiretroviral treatment,the only way to provide sustainable expanded access to treatment isby sharply reducing the incidence of HIV through expanded preven-tion programs (UNAIDS, 2004a). The link also runs in the opposite direc-tion: improved access to treatment enhances prevention efforts, such asvoluntary counseling and testing, by adding an incentive to get testedfor HIV.
The most common “recipes” for enhanced prevention programs distin-guish between low-prevalence and high-prevalence settings. In the former,prevention measures are targeted at key populations at risk (such as sexworkers, injecting drug users, and men who have sex with men), to keepthe epidemic from spreading through the general population. In the latter,these measures are complemented by strategies aiming at broader seg-ments of society (UNAIDS, 2004a; see also Table 7.2). Programs targetinghigh-risk groups are also among the most efficient preventive interven-tions. For example, World Bank (2003), on the basis of assessments ofalternative measures in Guatemala, Honduras, and Panama, suggests thatthe most cost-effective measures include free condom distribution to high-risk groups; information, education, and communication targeting thesegroups; as well as some measures aimed at the more general population,such as social marketing of condoms and voluntary counseling and test-ing. The Global HIV Prevention Group (2003) also stresses the control ofsexually transmitted diseases, safe injections for drug users, and the pre-vention of mother-to-child transmission.
The most comprehensive studies of the costs of prevention programs,as well as of the costs of care and treatment, are World Bank AIDS Cam-paign Team for Africa (2001) and Creese and others (2002). The WorldBank study aims at costing an expanded global response to HIV/AIDS andpresents estimates in a format similar to that in Table 7.2. It also reportsestimates of the underlying unit costs. Creese and others (2002) synthesizethe available cost estimates at the country level; in addition to unit costs,they provide estimated costs per HIV infection averted and per disability-adjusted life year saved (Table 7.3).
Table 7.3 reinforces the points made about the interrelationshipsamong prevention, care, and treatment in the context of a nationalresponse to HIV/AIDS. The estimated costs of preventive measures perHIV infection prevented are lower (in most cases, much lower) than thecosts of care and treatment (which are discussed in more detail below) perinfection. This shows clearly that prevention measures are the key compo-
Impact of HIV/AIDS on Government Finance and Public Services 215
©International Monetary Fund. Not for Redistribution
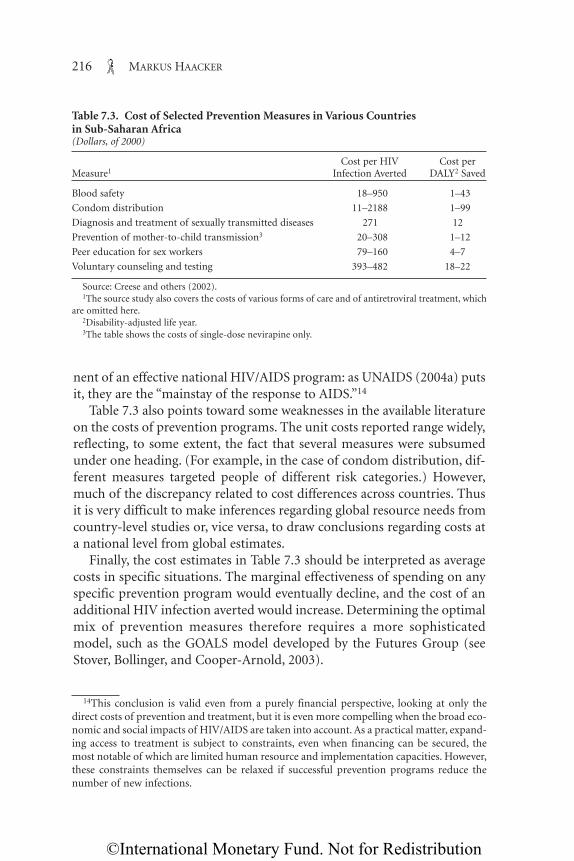
nent of an effective national HIV/AIDS program: as UNAIDS (2004a) putsit, they are the “mainstay of the response to AIDS.”14
Table 7.3 also points toward some weaknesses in the available literatureon the costs of prevention programs. The unit costs reported range widely,reflecting, to some extent, the fact that several measures were subsumedunder one heading. (For example, in the case of condom distribution, dif-ferent measures targeted people of different risk categories.) However,much of the discrepancy related to cost differences across countries. Thusit is very difficult to make inferences regarding global resource needs fromcountry-level studies or, vice versa, to draw conclusions regarding costs ata national level from global estimates.
Finally, the cost estimates in Table 7.3 should be interpreted as averagecosts in specific situations. The marginal effectiveness of spending on anyspecific prevention program would eventually decline, and the cost of anadditional HIV infection averted would increase. Determining the optimalmix of prevention measures therefore requires a more sophisticatedmodel, such as the GOALS model developed by the Futures Group (seeStover, Bollinger, and Cooper-Arnold, 2003).
216 MARKUS HAACKER
Table 7.3. Cost of Selected Prevention Measures in Various Countries in Sub-Saharan Africa(Dollars, of 2000)
Cost per HIV Cost perMeasure1 Infection Averted DALY2 Saved
Blood safety 18–950 1–43
Condom distribution 11–2188 1–99
Diagnosis and treatment of sexually transmitted diseases 271 12
Prevention of mother-to-child transmission3 20–308 1–12
Peer education for sex workers 79–160 4–7
Voluntary counseling and testing 393–482 18–22
Source: Creese and others (2002).1The source study also covers the costs of various forms of care and of antiretroviral treatment, which
are omitted here.2Disability-adjusted life year.3The table shows the costs of single-dose nevirapine only.
14This conclusion is valid even from a purely financial perspective, looking at only thedirect costs of prevention and treatment, but it is even more compelling when the broad eco-nomic and social impacts of HIV/AIDS are taken into account. As a practical matter, expand-ing access to treatment is subject to constraints, even when financing can be secured, themost notable of which are limited human resource and implementation capacities. However,these constraints themselves can be relaxed if successful prevention programs reduce thenumber of new infections.
©International Monetary Fund. Not for Redistribution

Most of the literature dealing with the financial aspects of the responseto HIV/AIDS (including this chapter) focuses on the costs of care andtreatment, especially (over the past several years) the cost of antiretroviraltreatment. This emphasis may seem to contrast with the very importantrole attributed to preventive measures in the global response to HIV/AIDS,as evident, for example, from UNAIDS’s (2004b) estimates of totalresource needs (of which preventive measures account for half), but it doesnot necessarily signify a contradiction. The resource requirements for pre-vention are estimated roughly according to the number of people at risk ofcontracting HIV/AIDS. Except in countries with very low HIV prevalence,the share of people at risk (and thus the resource requirements for pre-vention) is similar across countries, and so are the fiscal and humanresource implications of expanded prevention measures. In contrast, thelevel of required health expenditure mirrors the number of people livingwith HIV/AIDS in a country, which differs very substantially across coun-tries, so that estimates of the costs of treatment can result in very substan-tial shifts in health spending or in overall public expenditure. As aconsequence, spending on prevention does not raise the same type of fun-damental issues regarding the management of public sector financial andhuman resources that expanded care and treatment do. In particular,because expanded treatment draws not only on the government’s financialresources (which, for most developing countries with severe epidemics, aresubstantially enhanced by foreign grants), but also on certain scarcehuman resources, such as physicians, the obstacles to achieving desiredcoverage rates can be complex and have therefore attracted a “dispropor-tionate” share of research compared with the respective roles of treatmentand prevention in national HIV/AIDS programs.
In some regards, however, the situation and policy challenges regardingexpanded prevention measures are similar to the obstacles to increasedaccess to treatment. This applies, in particular, to the limited coverage ratesof prevention measures. In sub-Saharan Africa in 2001, only 6 percent ofpeople had access to voluntary counseling and treatment, and only 1 per-cent of pregnant women had access to treatment to prevent mother-to-child transmission (Global HIV Prevention Group, 2003). Withincountries, coverage of prevention is also correlated with social status (as isaccess to treatment); for example, fewer out-of-school youth have access toprevention programs than do youth attending school.
One important aspect of government’s prevention efforts is measurestargeted at public servants. The cost of increased HIV/AIDS-related mor-tality to the government, both in financial terms and through its adverseeffect on the delivery and productivity of public services, has already been
Impact of HIV/AIDS on Government Finance and Public Services 217
©International Monetary Fund. Not for Redistribution
discussed. Enhanced prevention measures help to contain these costs.15
However, because the government is instrumental in formulating andimplementing the national response to HIV/AIDS, introducing awarenessprograms at government agencies also helps to reinforce the government’spolicies and thus the national response in this area.16
Health Sector Resources
The ability of the domestic health sector to cope with the HIV/AIDSepidemic and the extent of the challenge to improve treatment forHIV/AIDS—within the context of the government’s development objec-tives for the health sector in general—are determined by the quality andcoverage of existing health services, and these in turn depend on the avail-able financial resources and health personnel.17 As a starting point, Table7.4 provides data on the strength of the health sector—health expenditure,human resources, and access to various forms of heath services—in aselection of countries affected by HIV/AIDS worldwide. The countriescovered (in the table and below) include those with the highest prevalencerates overall, as well as a few countries with lower prevalence rates, to illus-trate the still-significant effects of HIV/AIDS in these countries. (TheUnited Kingdom and the United States are also included as comparators.)Total health expenditure per capita ranges from $3 a year in Ethiopia tomore than $200 a year in Botswana, Brazil, and South Africa; these figurescorrespond to roughly 0.1 percent and 4.0 percent, respectively, of U.S.spending per capita on medical care.
These differences in spending on health services across countriesmainly reflect differences in GDP per capita. As a percentage of GDP,the range in health expenditure is much narrower, from 3.3 percent forSwaziland to 8.6 percent for South Africa. To put it another way, whereasabsolute expenditure varies across the developing countries in the tableby a factor of 75, expenditure as a share of GDP differs by a factor ofonly 2.6.
If the purchasing power of the dollar differs across countries, becauseprices for services and nontraded goods are lower in lower-income coun-tries, health spending in dollar terms is a poor indicator of the quality of
218 MARKUS HAACKER
15This is discussed in more detail in Haacker (Chapter 2, this volume) in the context of theprivate sector.
16For example, Botswana’s National Strategic Framework on HIV/AIDS includes HIV pre-vention policies for each ministry.
17This point is also discussed by Over (Chapter 10, this volume).
©International Monetary Fund. Not for Redistribution

services. At exchange rates adjusted for purchasing power differences(called purchasing-power-parity, or PPP, exchange rates), total healthexpenditure per capita ranges from $23 a year in Tanzania to $971 a yearin South Africa, corresponding to between 0.5 and 19.6 percent of U.S.health expenditure per capita (Table 7.4).18 Although these differences aresubstantial, the data are likely to understate somewhat the availability ofhealth services to the typical residents of low-income countries comparedwith those in industrialized countries, for three reasons. First, older people
Impact of HIV/AIDS on Government Finance and Public Services 219
Table 7.4. Selected Indicators of the Quality of Health Services in HIV/AIDS-Affected Countries
Access toHealth Expenditure Hospital Essential
per Capita, 2001 Physicians Nurses per Beds per Drugs 1997,_____________________Dollars Percent per 100,000 100,000 1,000 (percent of
Country Dollars at PPP1 of GDP Population Population Population population)2
Botswana 202 516 6.6 23.8 (1994) 219.1 (1994) 1.2 (2001)3 90Brazil 222 559 7.6 127.2 (1996) 41.3 (1996) 3.1 40Côte d’Ivoire 39 92 6.2 9.0 (1996) 31.2 (1996) . . . 80Ethiopia 3 29 3.4 2.9 (1995)3 . . . . . . . . .Haiti 23 93 5.0 16.0 (1995) 10.7 (1997) 0.7 30Lesotho 21 133 5.5 5.4 (1995) 60.1 (1995) . . . 80Malawi 13 45 7.8 2.8 (1995) . . . 1.34 (1998) . . .Mozambique 12 67 5.9 . . . . . . 0.9 50Namibia 121 499 7.0 29.5 (1997) 168.0 (1997) 0.3 80South Africa 225 971 8.6 56.3 (1996) 471.8 (1996) 0.83 80Swaziland 39 143 3.3 15.1 (1996) . . . 0.7 . . .Tanzania 12 23 4.4 4.1 (1995) 85.2 (1995) 0.9 . . .Thailand 69 237 3.7 24 (1995) 87 (1995) 2.0 (1995) 95Uganda 15 88 5.9 . . . 18.7 (1996) 0.9 70Zambia 20 44 5.7 6.9 (1995) 113.1 (1995) . . . . . .Zimbabwe 44 142 6.2 13.9 (1995) 128.7 (1995) 0.5 70
Memorandum:United Kingdom 1,398 1,384 7.6 180 (2000) . . . 4.1 (2000) . . .United States 4,956 4,956 13.9 279.0 (1995) 972.0 (1996) 3.6 (2000) . . .
Sources: WHO (2004b); WHO, Estimates of Health Personnel, various years; World Bank (2004b); Min-istry of Health, South Africa; Ministry of Health, Botswana; country sources; and authors’ calculations.
1PPP is purchasing power parity (nominal dollars are adjusted for differences in the purchasing powerof the dollar in different countries).
2Share of the population for which a certain minimum of essential drugs is available within one hour’swalk.
3Public hospitals only.
18PPP exchange rates also have the advantage that they respond less to short-term fluctu-ations in the nominal exchange rate. On the other hand, PPP exchange rates are estimatedfrom the prices of a comprehensive bundle of goods and services, which in many cases dif-fer from the goods and services used by the health sector.
©International Monetary Fund. Not for Redistribution
generally account for a disproportionate share of health expenditure, andthe age distribution of southern African countries is tilted toward theyoung. Second, the official data are likely to exclude the informal sector(including moonlighting physicians; see Over, Chapter 10 of this volume),which presumably is larger in low-income countries. Third, in the lowest-income countries, those individuals who can afford it may seek treatmentabroad; national data would not capture these outlays.
Another difficulty in interpreting the available national data on generalaccess to health services is that health spending may be skewed towardspending in expensive hospital facilities, available only in few major citiesand towns, rather than toward basic health services with universal cover-age; the aggregate data do not show which of these is the case. However,Gupta, Verhoeven, and Tiongson (2001) find that higher aggregate publichealth expenditure is associated with better health status for the poor,especially in low-income countries, and Castro-Leal and others (2000)report that although public spending on health care does favor the better-off, it is nevertheless “reasonably progressive,” in that inequality in thedistribution of benefits is less than that in the distribution of income.However, authors such as Filmer, Hammer, and Pritchett (2000, 2002)highlight the role of provider incentives in the delivery of health ser-vices,19 and they note the possibility of a crowding out of private marketsfor health care—both issues that are also relevant in the context ofHIV/AIDS.
More generally, public health expenditure, in the absence of generalaccess to private health insurance (the case in many low-income coun-tries), provides implicit insurance, and thus mitigates the economic risksassociated with sickness.
An alternative indicator of the quality of health services is the availabil-ity of skilled staff. The best-trained health workers—physicians—areextremely scarce in the poorest countries in the region. Among the coun-tries covered in Table 7.4 Ethiopia and Malawi are at the bottom of thismeasure, with about 3 formally trained physicians per 100,000 people,about 1 percent of the level in the United States. However, in the poorercountries a larger range of health services is provided by staff who are notformally qualified as physicians. For example, the ratio of nurses to doc-tors ranges from 10 to 1 to 20 to 1 in southern African countries, whereasa ratio of 3 or 4 to 1 is more common in industrialized countries.
220 MARKUS HAACKER
19World Bank (2004a) and Over (Chapter 10, this volume) provide a more thorough dis-cussion of some of these issues.
©International Monetary Fund. Not for Redistribution

In addition to data on financial and human health resources, Table 7.4includes two indicators of access to health services. The availability of hos-pital beds serves as a measure of the availability of health services at thehigh end. It is also relevant because one of the frequently reported conse-quences of HIV/AIDS is rising occupancy rates of hospital beds by HIVpatients. Although differences between countries on this measure are lesspronounced, the quality of hospital beds, in terms of the available facilitiesand services, and in light of the data on health expenditure, is likely to dif-fer substantially across countries. Access to essential medicines (defined asthe share of the population for which a minimum of essential drugs areavailable within one hour’s walk; World Bank, 2001) ranges from 30 to 95percent and is more indicative of the geographical coverage of basic healthservices. However, limited geographical coverage also translates intohigher costs of accessing health care, which creates a barrier to access, espe-cially for the poor.
Impact of HIV/AIDS on the Health Sector
The impact of HIV/AIDS on the health sector and the challenges coun-tries face in implementing their response to the epidemic depend on thescale of the epidemic, but also on the available health resources relative tothe scale of the epidemic (Table 7.5).20 Some inferences can be drawn fromthe estimated increases in mortality. Although HIV/AIDS reduces theprevalence of certain diseases, since many individuals do not live longenough to be afflicted by those diseases related to old age,21 the overallhealth status of the population declines, and the demand for health ser-vices expands. Moreover, that demand is likely to increase more than pro-portionally with the spread of HIV, because it affects primarily individualsof working age, who account for a disproportionate share of health expen-diture (see Over, Chapter 10 of this volume). Also, the treatment of AIDSand the opportunistic infections that accompany it tends to be more costlythan that of many other common diseases (see, for example, Hansen andothers, 2000).
In 5 of the 15 countries covered in Table 7.5, HIV/AIDS accounted formore than half of all deaths in 2000. Following the increase in HIV preva-
Impact of HIV/AIDS on Government Finance and Public Services 221
20Also relevant are the available financial resources in the health sector and how theserelate to the estimated costs of treatment. This financial dimension is discussed in somedetail later in the chapter.
21This is a reason why the difference between deaths from all causes and AIDS-relateddeaths narrows in countries with high HIV prevalence.
©International Monetary Fund. Not for Redistribution
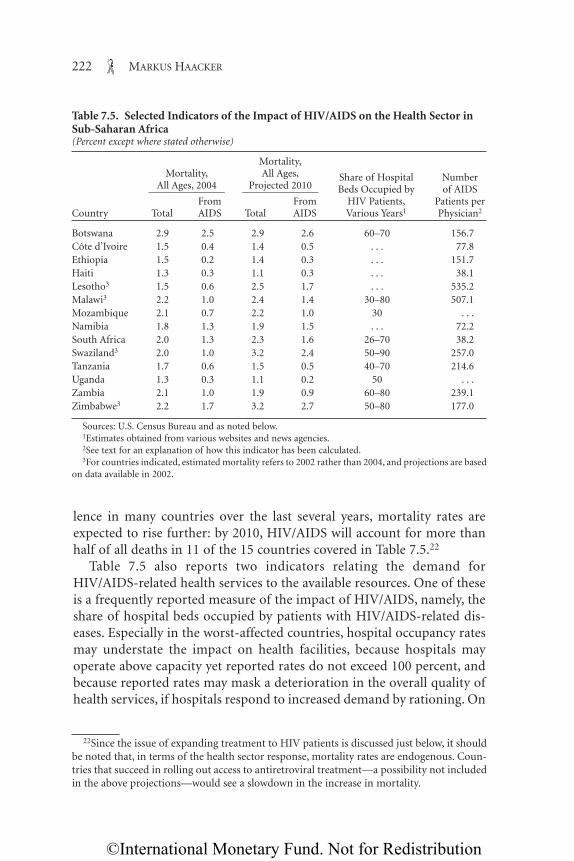
lence in many countries over the last several years, mortality rates areexpected to rise further: by 2010, HIV/AIDS will account for more thanhalf of all deaths in 11 of the 15 countries covered in Table 7.5.22
Table 7.5 also reports two indicators relating the demand forHIV/AIDS-related health services to the available resources. One of theseis a frequently reported measure of the impact of HIV/AIDS, namely, theshare of hospital beds occupied by patients with HIV/AIDS-related dis-eases. Especially in the worst-affected countries, hospital occupancy ratesmay understate the impact on health facilities, because hospitals mayoperate above capacity yet reported rates do not exceed 100 percent, andbecause reported rates may mask a deterioration in the overall quality ofhealth services, if hospitals respond to increased demand by rationing. On
222 MARKUS HAACKER
Table 7.5. Selected Indicators of the Impact of HIV/AIDS on the Health Sector inSub-Saharan Africa(Percent except where stated otherwise)
Mortality,Mortality, All Ages, Share of Hospital Number
All Ages, 2004 Projected 2010 Beds Occupied by of AIDS_______________ _______________From From HIV Patients, Patients per
Country Total AIDS Total AIDS Various Years1 Physician2
Botswana 2.9 2.5 2.9 2.6 60–70 156.7Côte d’Ivoire 1.5 0.4 1.4 0.5 . . . 77.8Ethiopia 1.5 0.2 1.4 0.3 . . . 151.7Haiti 1.3 0.3 1.1 0.3 . . . 38.1Lesotho3 1.5 0.6 2.5 1.7 . . . 535.2Malawi3 2.2 1.0 2.4 1.4 30–80 507.1Mozambique 2.1 0.7 2.2 1.0 30 . . .Namibia 1.8 1.3 1.9 1.5 . . . 72.2South Africa 2.0 1.3 2.3 1.6 26–70 38.2Swaziland3 2.0 1.0 3.2 2.4 50–90 257.0Tanzania 1.7 0.6 1.5 0.5 40–70 214.6Uganda 1.3 0.3 1.1 0.2 50 . . .Zambia 2.1 1.0 1.9 0.9 60–80 239.1Zimbabwe3 2.2 1.7 3.2 2.7 50–80 177.0
Sources: U.S. Census Bureau and as noted below.1Estimates obtained from various websites and news agencies.2See text for an explanation of how this indicator has been calculated.3For countries indicated, estimated mortality refers to 2002 rather than 2004, and projections are based
on data available in 2002.
22Since the issue of expanding treatment to HIV patients is discussed just below, it shouldbe noted that, in terms of the health sector response, mortality rates are endogenous. Coun-tries that succeed in rolling out access to antiretroviral treatment—a possibility not includedin the above projections—would see a slowdown in the increase in mortality.
©International Monetary Fund. Not for Redistribution

the other hand, the numbers reported generally refer to clinical beds; insurgical and pediatric wards the share of HIV patients is lower.
Table 7.5 relates HIV prevalence to the available human resources of thehealth sector. The indicative estimates of the numbers of AIDS patients perphysician are based on the assumption that 10 percent of HIV-positiveindividuals seek the services of a trained physician. Although this figure isadmittedly arbitrary, it is more meaningful than the simple ratio of thenumber of HIV-positive individuals to physicians, because many infectedpersons are asymptomatic and do not know they are infected. The esti-mates illustrate that, in order to expand health services and treatment forHIV patients, it is crucial to overcome the existing shortages in humanresources. In only two of the countries with prevalence rates over 20 per-cent (Namibia and South Africa) is the ratio of HIV patients to doctorslower than 100 to 1. At the other extreme, it exceeds 500 to 1 for Lesothoand Malawi.23 Looking forward, the number of health personnel requiredwill also depend on (or, if the targets for training and hiring additionalstaff are missed, constrain) the response to HIV/AIDS. Although success-ful prevention programs contribute to keeping down the number of peo-ple requiring treatment, ongoing efforts to substantially expand access totreatment will also, all else equal, increase the number of patients, mostlybecause successful antiretroviral treatment extends life expectancy.
By highlighting the existing human resource constraints, Table 7.5 illus-trates the potentially severe consequences of increased attrition of healthpersonnel themselves, whether due to higher mortality rates among themor to brain drain. It was shown above, in a more general public sector con-text, that the implications of increased mortality for the required numberof newly trained staff can be substantial. The consequences of increasedmortality for the functioning of the health sector are presumably evenmore severe than for the public service in general, because the demandfor health services is increasing sharply at the same time that supply isshrinking.
Especially in countries with very low income per capita (and thus lowsalary levels), brain drain is another source of losses of qualified person-nel. Some of these highly skilled workers may move from one to anotherof the countries covered in Table 7.5, but others will leave the region alto-gether. For Zimbabwe, a country ravaged both by HIV/AIDS and by asevere economic crisis, Noguera and others (2003) report that only 18 per-
Impact of HIV/AIDS on Government Finance and Public Services 223
23As indicated in Table 7.2, some of the available data on health personnel are almost 10years old. The lack of timely data obviously introduces a substantial margin of error.
©International Monetary Fund. Not for Redistribution

cent of available pharmacist posts at Harare Central Hospital were filled,and that vacancies for nurses ranged from 27 percent (at Harare Central)to 50 percent (at Bulawayo city health clinics). To the extent that theHIV/AIDS epidemic worsens a country’s economic prospects and createspoorer working conditions for health personnel, competing demands forhealth personnel in other, more affluent markets will likely result in fur-ther losses of skilled personnel.
Fiscal Effects of an Expanded Effort at Treating HIV/AIDS
The discussion now turns to an assessment of the financial costs ofexpanding treatment. Most of the earlier literature distinguished betweenthe treatment of opportunistic infections, on the one hand, and antiretro-viral treatment, which attacks the virus causing AIDS directly, on the other.The main reason for this dichotomy was that antiretroviral treatment wasvery expensive: a year’s treatment frequently cost several times GDP percapita in countries with severe epidemics, and many times average healthspending per capita. Antiretroviral treatment was therefore not considereda viable option for public health services in many low- and middle-incomecountries. However, prices of antiretroviral treatment have come downmarkedly in recent years (partly as a result of efforts to broaden access totreatment), and this approach to treatment has therefore become a centralcomponent of national and international strategies to fight the epidemicand mitigate its impact. Many countries have started to offer antiretroviraltreatment through their public health services. Access remains limited inlow- and middle-income countries, however: WHO (2004c) estimates thatonly 440,000 people in these countries were receiving this form of treat-ment as of mid-2004.
Opportunistic infections occur as HIV suppresses the immune systemand people living with the virus become more susceptible to infections.Some of these diseases, such as tuberculosis, are relatively common even inthe absence of HIV/AIDS, but HIV has resulted in a substantial increase intheir incidence, both directly, because people living with HIV/AIDS aremore likely to become infected, and indirectly, as the resulting higherprevalence of tuberculosis means that more people who are not HIV-positive also get infected.
Various studies have estimated the costs of expanding treatment foropportunistic infections on the basis of case histories of HIV-positivepatients and the unit costs of different treatments. One of the more com-prehensive studies, that by the World Bank AIDS Campaign Team forAfrica (2001), estimates the cost of care for an opportunistic infection and
224 MARKUS HAACKER
©International Monetary Fund. Not for Redistribution

its related symptoms at between $247 and $359 for a low-income country,and between $471 and $698 for the higher-income countries in sub-Saharan Africa. Creese and others (2002) synthesize the studies availableat the time of their writing and provide indicators of the cost-effectivenessof various forms of treatment. Hansen and others (2000) assess the costsof treatment of HIV-positive and HIV-negative patients in hospitals andfind that the costs per stay were about twice as high for the former.Although the cost per inpatient day did not differ substantially betweenthe two groups, HIV-positive patients stayed longer in the hospital. Themost common conditions presented by HIV-positive patients were tuber-culosis, pneumonia, and meningitis. Since these are known to be threeof the most common opportunistic infections among patients with AIDS,it is likely that most of these infections were for HIV/AIDS-relatedconditions.
If indeed the costs per inpatient day are similar for HIV-positive andHIV-negative patients, it is possible to draw certain inferences regardingthe costs of HIV/AIDS-related treatment from the reported data on hos-pital occupancy rates by HIV patients, most of whom are presumablybeing treated for opportunistic infections (see Table 7.5). This would allowone to attribute a certain percentage of the total costs of hospital care toHIV/AIDS. Observed hospital occupancy rates, however, indicate in thefirst place the impact of HIV/AIDS on limited health sector resources. If avery high proportion of hospital beds are occupied by HIV patients, in theabsence of a very substantial increase in the number of beds, this meansthat hospitals are dealing with the increased demand for their services byrationing, admitting patients only at a later stage of HIV infection thanbefore. Thus the quality of health services declines as existing resources areoverwhelmed by increased demand.
Substantial reductions in the price of antiretroviral drugs have openedthe door to greatly increased access to highly active antiretroviral therapies(HAARTs): for example, the 3 by 5 initiative of the World Health Organi-zation (WHO) aims to provide HAARTs to 3 million patients by 2005.However, given the limited health resources in many countries and theheavy toll the HIV epidemic is taking on the health sector, increasingaccess to antiretroviral drugs on this scale poses substantial challenges, interms of the required financial resources, the available health facilities anddistribution channels for medical supplies, and the training of healthpersonnel.
This chapter is concerned with health policy primarily from a fiscal per-spective and in the context of the government’s overall development objec-tives. In light of the broad macroeconomic repercussions of rolling out
Impact of HIV/AIDS on Government Finance and Public Services 225
©International Monetary Fund. Not for Redistribution

access to antiretroviral treatment (discussed, for example, in Haacker,Chapter 2 of this volume), it is therefore necessary to take a more compre-hensive perspective, taking into account the indirect fiscal and macroeco-nomic consequences. Table 7.6 illustrates the costs and benefits ofantiretroviral treatment from a public policy perspective. The costs oftreatment are discussed in more detail below; here the focus is on the costsof the drugs themselves, the required health personnel, and the costs of therequired infrastructure—for example, distribution systems and medicallaboratories. The most direct fiscal effects stem from delays in the need totreat opportunistic infections. However, the fiscal gains go well beyondthis. As mortality declines and the loss of skills is mitigated, the productivecapacity of the economy is strengthened. Looking further ahead, much ofthe delayed impact of HIV/AIDS on the economy (for example, throughaccumulated losses of human capital) is also mitigated. As a consequence,the domestic tax base improves, and so therefore does government rev-enue. Masha (Chapter 9, this volume), looking at Botswana, suggests thatthese indirect fiscal gains can offset a significant proportion of the costs ofa program to improve access to antiretroviral treatment.
At the most general level, the government has a broad mandate toenhance welfare, and public expenditure is ultimately a means to this end.In the context of HIV/AIDS, some authors (for example, Crafts andHaacker, Chapter 6 of this volume) suggest that the primary effects ofHIV/AIDS on welfare derive from increasing mortality rather thanchanges in income. From a somewhat different angle, the InternationalCrisis Group (2001) emphasizes the impacts of HIV/AIDS on economicrisk and security in general.
As the government, possibly with substantial external support (as dis-cussed below), sets out to expand access to antiretroviral treatment, itneeds to take into account not only the financial cost of purchasing thedrugs, but also the cost of delivering the services: these include the finan-cial costs, the health personnel required, and the necessary infrastructure
226 MARKUS HAACKER
Table 7.6. Economic Costs and Benefits of Highly Active Antiretroviral Treatment
Costs Benefits
Drugs Delay in costs of treatment of opportunisticHuman resources infectionsHealth facilities and other infrastructure Gain in productive capacity of economy
Increased fiscal revenueFavorable indirect and long-term
macroeconomic effectsIncreased individual welfare
©International Monetary Fund. Not for Redistribution

(laboratories, distribution channels, and so forth). In the wake of substan-tial reductions in the costs of antiretroviral drugs and the required labora-tory tests, widespread access has become a real possibility. In 2001 theHarvard Consensus Statement (Harvard University, Individual Membersof the Faculty of, 2001) estimated the total cost per patient of antiretrovi-ral treatment in low-income countries at $1,123, of which $650 was for thedrugs themselves (at the average price). WHO estimates the average drugcost of first-line treatment in low-income countries (the average cost offour commonly used combination therapies as of April 2004) at $488 ayear. That cost is likely to come down further; for example, WHO (2004a)reports that one form of treatment is now available at a cost of $168 a year,and the Clinton Foundation has developed a program that makes twoforms of antiretroviral treatment available at only $140 a year.24 Thesefirst-line treatments are frequently complemented by more expensivesecond-line treatments, to be used if the first-line treatment fails. As a con-sequence, the average drug cost for the whole program, including second-line treatments, will be higher.
In estimating the total cost of antiretroviral treatment, it is necessaryalso to include the cost of monitoring tests, as well as personnel and over-head costs. In addition to the Harvard Consensus Statement, whichincludes a comprehensive estimate of the cost of treatment, several studieshave estimated the total cost of treatment for individual countries.
A study from Zambia (Kombe and Smith, 2003) puts the annual costper patient at $488 in 2003 (including $277 for drugs and $178 for moni-toring tests) and $1,752 for second-line treatment; these numbers excludemost personnel costs, which the study treats in the context of overallhuman resource constraints. A subsequent study (Kombe and Smith,2004), reports similar costs of first-line treatment for Uganda of $483 ayear. Kombe, Galaty, and Nwagbara (2004) estimate the total annual costper patient in Nigeria at $742; this estimate includes somewhat higherdrug costs than in the Zambia and Uganda studies, as well as $161 in laborcosts, which the other two studies excluded.
A study of the cost of antiretroviral treatment in Mexico (Bautista andothers, 2003) takes a broader perspective. Focusing on the total utilizationof health facilities by patients receiving treatment, both before and afterinitiation of antiretroviral therapy, this study also captures such indirecteffects as declines in the cost of care for opportunistic infections. After ini-
Impact of HIV/AIDS on Government Finance and Public Services 227
24This price, however, applies only in the context of a comprehensive program to expandaccess to treatment. The arrangement is also discussed in more detail below, in the contextof changes in the international market for antiretroviral drugs.
©International Monetary Fund. Not for Redistribution

tiation of antiretroviral therapy, the cost per patient increased from about$1,000 a year to between $3,000 and $4,000 a year, with drugs accountingfor three-fourths. Other cost components, such as the costs of hospitaliza-tion and of outpatient visits, did not decline, suggesting that any indirectfinancial effects associated with improvement in patients’ health are smalland, even within these line items, offset by the additional requirements ofantiretroviral treatment.25
Among country policy documents, South Africa’s Operational Plan isnoteworthy for including very detailed budget estimates. It envisagesincreasing the number of patients receiving antiretroviral treatment toabout 1 million in fiscal year 2007/08, at a cost of 4.5 billion rand, thelargest components being the costs of drugs (about one-third), personnelcosts (somewhat less than one-fourth), and monitoring tests (close to one-fifth). For fiscal year 2004/05, projected costs per patient are 1,955 randfor drugs, and 806 rand for laboratory tests (about $300 and $125,respectively).
In addition to the costs of drugs and laboratory tests, antiretroviraltreatment will place heavy demands on available health personnel. Kombeand Smith (2003) estimate that treating 10,000 patients will require 13trained physicians, 13 nurses, 32 laboratory technicians, and 15 pharma-cists. In this example, achieving full coverage of antiretroviral drugs, with100,000 patients in the first year and 330,000 patients in the fifth year,would require 130 physicians and 316 technicians in year one, rising to 429physicians (about 50 percent of Zambia’s current physician workforce)and 1,043 technicians (more than twice the number of technicians inZambia) by year five.
These examples show that a strategy to expand antiretroviral treatment,in addition to securing the financial requirements, needs to be carefullyplanned in terms of the human resource requirements, identifying poten-tial bottlenecks well in advance and addressing them through training.26
WHO’s 3 by 5 initiative, for example, acknowledges this need and includesa very substantial training component (WHO, 2003b, 2004a). Lookingahead, the number of patients receiving antiretrovirals, for any given cri-
228 MARKUS HAACKER
25This study differentiates between highly active antiretroviral treatment (triple therapy)and simpler forms of antiretroviral treatment (monotherapy and double therapy), whichwere available earlier. In this chapter, “antiretroviral treatment” refers to highly active anti-retroviral treatment.
26However, for the poorest of the countries facing severe epidemics, this task is compli-cated by the potential for brain drain, as trained health personnel are attracted by highersalaries abroad.
©International Monetary Fund. Not for Redistribution

teria for starting antiretroviral therapy, will increase sharply over the firstyears of the program.
At the onset of antiretroviral therapy, the health status of the patienttypically improves markedly, making him or her less susceptible to oppor-tunistic infections such as tuberculosis and cryptococcal meningitis. Thiswill result in some savings in treatment costs, both directly and indirectlythrough reduced spread of these infections. These financial gains, however,are likely to taper off, because antiretroviral treatment only delays ratherthan halts the progression of the disease.
Table 7.7 provides some indicative estimates of the financial resourcerequirements for expanding the treatment of opportunistic infections andimproving access to antiretroviral treatment. Actual coverage rates for thedifferent forms of treatment presumably differ among these countries, asdoes the ability of each country’s health services to expand medical care.The purpose of the table, however, is to compare the financial implicationsof attaining a given standard of health care. The estimated costs are there-fore based on a coverage rate for the care for opportunistic infections of10 percent in 2003, rising to 50 percent by 2010. For antiretroviral treat-ment it is assumed that the number of patients receiving the treatment
Impact of HIV/AIDS on Government Finance and Public Services 229
Table 7.7. Indicative Estimates of the Costs of HIV/AIDS-Related Health Services(Percent of GDP except where stated otherwise)
Costs of HIV-Related Health Total HealthServices, 2010 Total Expenditure, Public Total Domestic______________
For anti- Health 2001 Health Government Governmentretroviral Expenditure, (dollars Expenditure, Expenditure, Revenue,
Country Total treatment 2001 per capita) 2001 2001 2001
Botswana 0.8 0.6 6.6 202 4.4 40.8 41.9Côte d’Ivoire 1.4 1.0 6.2 39 1.0 16.6 17.0Ethiopia 9.7 7.0 3.6 3 1.5 29.1 18.8Haiti 0.8 0.6 5.0 23 2.7 10.0 . . .Lesotho 3.8 2.8 5.5 21 4.3 43.0 40.8Malawi 7.8 5.7 7.8 13 2.7 33.1 18.4Mozambique 6.6 4.8 5.9 12 4.0 34.6 13.3Namibia 1.4 1.0 7.0 121 4.7 30.1 31.9South Africa 0.6 0.4 8.6 225 3.6 26.8 24.3Swaziland 1.3 1.0 3.3 39 2.3 30.7 26.9Tanzania 2.5 1.8 4.4 12 2.1 16.1 11.4Uganda 2.2 1.6 5.9 15 3.4 19.8 10.9Zambia 3.9 2.8 5.7 20 3.0 32.1 19.1Zimbabwe 3.3 2.4 6.2 44 2.8 37.6 27.1
Sources: WHO (2004a); IMF World Economic Outlook/Economic Trends in Africa database; andauthor’s estimates.
©International Monetary Fund. Not for Redistribution

through public health services is negligible in 2003 and that coverage risesto 50 percent by 2010. (These assumptions regarding coverage rates aresimilar to those made by the Commission on Macroeconomics and Health(2001), which assumes that, by 2015, coverage rates will rise to 70 percentfor treatment of opportunistic infections, from an initial 10 percent, andto 65 percent for antiretroviral treatment, from less than 1 percent.)Patients are assumed to receive treatment for opportunistic infections forthe two years before death. Antiretroviral treatment starts at the same timebut extends life (and thus delays the period through which patients needtreatment for opportunistic infections) by an additional three years. Theassumed cost of treatment of opportunistic infections is $400; the cost ofantiretroviral treatment is assumed to fall to $450 by 2010; this is consis-tent with drug costs of around $150 and personnel and other costs of $300.This approach may understate the costs for some countries with higherincome per capita (such as Botswana and South Africa) covered in thetable, relative to the lower-income countries, for two reasons.
First, about one-fourth to one-third of the costs of expanded access totreatment are commonly attributed to personnel costs. These can beexpected to be higher in countries where average income is higher. In theabsence of wage data, one way of accommodating this in the estimates isto assume that personnel costs are proportional to income per capita.However, income per capita also depends on many other factors, includingthe size of the formal sector; therefore, simply scaling up wage rates forhealth personnel in line with income per capita does not necessarily yieldmore reliable results. It is also worth noting that the estimated cost oftreatment in the Operational Plan for South Africa (the country with thehighest income per capita in Table 7.7), discussed above, is not muchhigher than for the other countries for which detailed estimates were avail-able. Although this could also reflect differences in methodologies, it sug-gests that the bias introduced may not be large.
Second, to obtain consistent indicators for the challenges countries arefacing as they expand access to treatment, the estimates presented here arebased on coverage rates that are equal across countries. Because lower-income countries generally find it more difficult to achieve these targets,the result may be lower coverage rates in these countries. (Over, in Chap-ter 10 of this volume, discusses the challenges to expanding antiretroviraltreatment in more detail.) As a result, the gap in actual health expenditureas a percentage of GDP (rather than expenditure required to achieve uni-form coverage rates) may turn out to be lower.
Table 7.7 summarizes estimates of the costs of attaining the specifiedtargets in coverage rates of treatment of opportunistic infections and
230 MARKUS HAACKER
©International Monetary Fund. Not for Redistribution

antiretroviral treatment. The latter accounts for the bulk of expenditure(around three-fourths in most countries), because increased lifeexpectancy owing to antiretroviral treatment means that a larger numberof patients will receive this form of treatment.27 Overall, the costs aresubstantial for all the countries covered in the table, ranging from 0.6 per-cent to 9.7 percent of GDP. These differences in cost stated as a percent-age of GDP partly reflect differences in income per capita. Therefore, twoof the countries with very high HIV prevalence, Botswana and SouthAfrica, are among those that could conceivably finance substantiallyexpanded access to treatment. However, even for these countries thefinancial burden is daunting, corresponding in South Africa to 17 percentof the health budget and over 2 percent of total government expenditurein 2001. On the other hand, the required expenditure exceeds 5 percent ofGDP for three countries (Ethiopia, Malawi, and Mozambique) andexceeds total public health expenditure (as a percentage of GDP in 2001)for these and four other countries (Côte d’Ivoire, Tanzania, Zambia, andZimbabwe).
A key obstacle to an enhanced response to HIV/AIDS is existing capac-ity constraints, the most serious of which relate to the shortage of humanresources.28 Even if sufficient financing were available, a shortage oftrained personnel could mean that the available funds would not be spent,or that they would not be spent effectively because the quality of the pro-gram is compromised. UNAIDS (2003b), in its Progress Report on theGlobal Response to the HIV/AIDS Epidemic, reports that in one-third ofthe countries covered a lack of human resources hampered the response toHIV/AIDS. For Botswana and South Africa, which are among the wealth-iest countries in sub-Saharan Africa and have relatively well-developedhealth sectors (see Table 7.4), the report notes that “[in Botswana] theshortfall in human resources has become a major concern” and that the“main challenge [in South Africa] to implementation relates to capacity,especially with respect to health workers’ clinical skills.” For the same rea-sons, WHO’s strategic framework for the 3 by 5 initiative, which aims atsubstantially improving access to antiretroviral treatment, stresses the
Impact of HIV/AIDS on Government Finance and Public Services 231
27For example, if 0.5 percent of the population start antiretroviral treatment each year (atour target coverage rate of 50 percent, consistent with an overall prevalence rate of around10 percent, or a prevalence rate for the working-age population of about 20 percent, as forexample in Namibia or South Africa), our assumptions mean that about 2.5 percent of thepopulation will eventually receive treatment. Treatment for opportunistic infections, whichmay or may not be concurrent with antiretroviral treatment, last two years, and, at coveragerates of 50 percent, only 1 percent of the population would receive it.
28A point also made by the Commission on Macroeconomics and Health (2001, p. 50).
©International Monetary Fund. Not for Redistribution
need for additional financial resources for health systems in general,improvements in the physical infrastructure, programs to address theincreased mortality and morbidity of health workers, improved procure-ment and distribution systems, and measures to stimulate demandthrough community mobilization (WHO, 2003a).
Education
The public education sector is one of the focal points of a broad policyresponse to HIV/AIDS, primarily reflecting the role of education in pre-vention. More generally, “education is a major engine of economic andsocial development” (World Bank, 2002), and it relates directly or indi-rectly to several of the Millennium Development Goals. From a macro-economic perspective, education and the accumulation of human capitalare a key ingredient to achieving sustainable growth (as discussed in moredetail in Birdsall and Hamoudi, Chapter 4 of this volume). In countriesafflicted by HIV/AIDS, however, the capacity of the education sector isweakened through increased teacher mortality. On the other hand,HIV/AIDS also results in lower birthrates and increased child mortality,so that the number of children (and thus the demand for education)grows more slowly. Finally, orphans and children living in householdsaffected by HIV can find their access to education impaired; public policyhas a role in mitigating the adverse consequences of HIV/AIDS for thesechildren.
Education contributes to HIV/AIDS prevention in two major ways.First, education in general facilitates access to information, thus con-tributing to HIV prevention while also raising health standards andimproving living conditions. By reducing girls’ economic dependency,education can also reduce their vulnerability to HIV/AIDS. Second, pub-lic education is an important channel for delivering HIV preventionefforts to young people, promoting lower-risk sexual behavior, and thusavoiding HIV infections as young people become sexually active. Using anexisting infrastructure (the public education system) also lowers the costof these efforts.29 However, the role of public education in HIV preven-tion also reinforces the need to ensure access to education for childrenaffected by HIV/AIDS.
232 MARKUS HAACKER
29World Bank (2002) provides a thorough discussion of the role of public education inHIV prevention.
©International Monetary Fund. Not for Redistribution

Maintaining a Sufficient Number of Teachers
While the increased mortality of teachers means that more teachersneed to be trained to replace those lost to HIV/AIDS, HIV/AIDS alsoaffects birth rates and infant mortality, thereby reducing the size of theschool-age population. To estimate this impact, numerous studies haveassessed the change due to HIV/AIDS in the number of new teacherswho need to be trained in order to maintain some given pupil-teacherratio (see, for example, Malaney, 2000; and Birdsall and Hamoudi,Chapter 4 of this volume). Table 7.8 shows the results of such an exercisefor Zimbabwe.30 By 2005 the number of new teachers required risesfrom 5,478 to 6,655, or 21.5 percent. More than half of these teachers(3,452) would replace teachers who have died for HIV/AIDS-relatedreasons. However, the number of new teachers who do not replace thosewho have died of AIDS, reflecting the slowdown in the young population,declines very substantially (to 3,204, a decline of about 40 percent).By 2015, as the school-age population stagnates, the number of newteachers required actually declines by 5 percent, despite much higherteacher mortality, compared with projections excluding the impact ofHIV/AIDS.
Impact of HIV/AIDS on Government Finance and Public Services 233
Table 7.8. Zimbabwe: New Teachers Required to Maintain Given Pupil-Teacher Ratios
Number ofNew Teachers IncreaseNumber of New Teachers Required
Increase Required as Percent in Share of__________________________________In presence of AIDS in New of Graduates Graduates_________________________ _________________
As replace- For In Teachers In In Becomingments for other absence Required presence absence Teachers
Year Total AIDS deaths causes of AIDS (percent) of AIDS of AIDS (percent)
2005 6,655 3,452 3,204 5,478 21.5 2.1 1.6 29.02010 6,695 3,610 3,085 6,227 7.5 2.3 1.8 23.22015 6,507 3,401 3,105 6,837 –4.8 2.6 2.1 22.3
Source: Author’s calculations using U.S. Census Bureau estimates of mortality rates for 2003.
30The calculations are based on demographic projections from the International ProgramsCenter at the U.S. Census Bureau and on data on the numbers of pupils and teachers in pri-mary and secondary education from UNESCO’s World Education Report 2000 (UNESCO,2001; see also Haacker, 2002). In the absence of HIV/AIDS, teacher attrition rates areassumed to be 5 percent. Although these are lower than the attrition rates frequentlyreported, the latter are gross rates (excluding teachers who are rehired), whereas the analysishere is interested in net attrition.
©International Monetary Fund. Not for Redistribution

These results match estimates from other studies, indicating that theimpact of HIV/AIDS on the number of new teachers required is small andmay actually decline. This is no source of comfort, however. Fewerstudents also means that the pool from which new teachers are drawnshrinks. Although, in the example above, the absolute number of teacherswho need to be trained in 2015 declines by 4.8 percent, their share of thepopulation at age 19 (roughly the population from which new teachersare drawn) increases from 2.1 percent to 2.6 percent (by no means allof whom would have the required educational background), or by22.3 percent. Thus, in order to meet the need for teachers, an increasingshare of educated individuals would have to become teachers, leavingfewer skilled people to work in other sectors of the economy. Moreover,the earlier discussion of the disruptions to public services caused byincreased mortality and morbidity applies to teachers as well. Increasedabsenteeism among teachers and a larger number of vacancies in teacherpositions would imply that a constant pupil-teacher ratio would actuallysignify a decline in the quality of education. This problem is probablymost relevant for rural and small local schools, where, as noted previ-ously, the loss or sickness of a teacher cannot be temporarily covered bycolleagues.
Securing Access to Education
HIV/AIDS can impede access to education for children living inaffected households and for orphans. Households with sick membersare likely to suffer income losses, either directly, if household membersare too sick to work, or indirectly, if other household members diverttime from other productive activities to the care of sick relatives. Ifthese households can no longer afford to send children to school, or ifchildren have to contribute to household income or help care for sickrelatives, their access to education is compromised. Orphans are likely tobe even worse off, because they tend to live in poorer households andmay suffer discrimination in favor of the head of household’s biologicalchildren.31
Table 7.9 sheds some light on the impact of HIV/AIDS on children inseven African countries. HIV/AIDS has increased the number of orphanssubstantially in all of these countries: in several, about one-sixth of the
234 MARKUS HAACKER
31For an in-depth study focusing on South Africa, see Case, Pakson, and Ableidinger(2002).
©International Monetary Fund. Not for Redistribution

child population were orphans in 2001, more than half of whom wereAIDS orphans. Reflecting increasing mortality among adults, the shareof orphans is expected to rise further in some of the worst-affectedcountries, to more than 20 percent by 2005 in Botswana and Zimbabwe.Estimated increases in dependency ratios suggest that orphans frequentlylive in lower-income households. For example, the dependency ratiosfor Zimbabwe (1.4 for nonorphan households with children, 2.2 fororphan households) suggest that income per capita among house-holds with orphans may be 20 percent lower than among other house-holds with children.32 Among the countries covered, the difference inschool enrollment rates between orphans and nonorphans ranges from arather low 1 percentage point in Botswana to 40 percentage points inEthiopia. In general, countries with high enrollment rates overall (whichtend to be those countries whose education systems cover a substantialproportion of the poor) show small declines in enrollment rates fororphans.
Although the impact of orphanhood on school enrollment seems to besmallest in countries with universal or near-universal education, somemicroeconomic evidence suggests that income and wealth have an impor-tant role in mitigating the adverse effects on orphans, and that financialassistance can have a highly favorable impact on orphans’ enrollmentrates. For example, data reported by Ainsworth, Beegle, and Koda (2002)
Impact of HIV/AIDS on Government Finance and Public Services 235
Table 7.9. Orphans in Selected Sub-Saharan African Countries
Orphans as Share of Ratio ofYoung Population, Average Dependency Ratio2
Orphans to____________________________2003 (in Percent)1
Households Nonorphan__________________All AIDS Households with children Children
Country orphans orphans with orphans but no orphans Attending School
Botswana 15.1 10.6 1.4 1.7 0.99Côte d’Ivoire 13.3 6.2 1.4 1.5 0.83Ethiopia 13.2 3.4 1.5 1.6 0.60Malawi 17.5 8.7 1.5 2.0 0.93South Africa 10.3 4.5 1.4 1.7 0.95Uganda 14.6 7.5 1.7 2.3 0.95Zimbabwe 17.6 13.5 1.4 2.2 0.85
Sources: UNAIDS/UNICEF/USAID (2004); and UNICEF (2003).1Children are defined as persons aged 0–17.2Number of dependents of all ages divided by the number of working-age adults in the household.
32This assumes that the share of income earners among working-age household members,and their incomes, do not differ systematically between the two groups of households.
©International Monetary Fund. Not for Redistribution

suggest that enrollment rates among orphans living in households receiv-ing financial assistance were much higher than among orphans outside ofsuch households. For single-parent orphans, enrollment rates were20 percentage points higher with financial assistance, whereas for orphanswho had lost both parents the difference was close to 50 percentagepoints.33
Thus, to protect access to education in general and to mitigate theimpact of HIV/AIDS on the life prospects of orphans, governments facethree challenges. First, they need to minimize the disruptions to educationcaused by increased absenteeism and mortality, especially in rural areas.Second, they need to ensure that a sufficient number of teachers aretrained to compensate for increased attrition. Third, they need to set upsupport mechanisms (such as subsidies to school fees) to offset orphans’disadvantages in access to education. As the preceding section showed, thisgenerally means that although the absolute number of teachers trainedmay not have to increase (because the number of pupils declines at thesame time), an increasing share of graduates will have to become teachers.Casual observation might suggest that failure to meet the third objectivewould facilitate meeting the other two. This apparent trade-off, however,is shortsighted: even though a declining enrollment rate might make iteasier to meet a given targeted pupil-teacher ratio, it also means that thenumber of children receiving an adequate education—the key output ofthe education sector—would decline. The number of educated people(and thus the pool from which teachers are drawn) would shrink, and theshare of graduates who would have to become teachers to achieve targetenrollment rates would increase.
In several countries with severe epidemics, the orphan population isprojected to increase to more than 15 or even 20 percent of the youngpopulation (ages 0 to 17) by 2010. Securing unimpeded access to educa-tion for orphans can therefore represent a significant logistical and fiscalchallenge. Consequently, national governments (see, for example,Botswana’s National Strategic Framework on HIV/AIDS), internationalagencies like UNAIDS, and bilateral donors (as evident, for example, fromthe first round of grants under the U.S. President’s Emergency Plan forAIDS Relief, or PEPFAR) have made programs to improve the situation oforphans a key component of their policy frameworks on HIV/AIDS.
236 MARKUS HAACKER
33The numbers for nonorphans, paternal orphans, maternal orphans, and two-parent(full) orphans are 57.3, 49.0, 47.1, and 25.6 percent enrolled without financial assistance, and62.0, 68.3, 70.8, and 73.2 percent enrolled with financial assistance, respectively (Ainsworth,Beegle, and Koda, 2002).
©International Monetary Fund. Not for Redistribution

Social Expenditure
The categories of social expenditure most directly affected byHIV/AIDS are public health expenditure (interpreted as a form of socialinsurance), spending targeted at orphans (including income support andsubsidies for school fees), and various forms of income support for otheraffected persons. This paper will touch on only the most important issues(Chapter 8 of this volume, by Plamondon, Cichon, and Annycke, providesa more comprehensive discussion, including coverage rates of socialinsurance schemes in the worst-affected countries and a quantitativeassessment). Especially in countries where health insurance coverage islow, public health expenditure, discussed above, plays an important rolein mitigating the economic burden of disease on the affected households.However, as HIV/AIDS weakens and eventually kills a household’sincome earners, or as other household members have to reallocate time totheir care, household income declines and some of the remainder must bediverted to cover the costs of care and treatment. The loss of family mem-bers dying for HIV/AIDS-related reasons has further implications forpoverty, as assessed by Greener (Chapter 5, this volume). Thus outlaysrelated to social assistance schemes for poor households are likely to rise.Because it primarily strikes young adults, HIV/AIDS is associated with anincrease in the number of orphans, as already discussed; they are particu-larly vulnerable because even a temporary episode of poverty can com-promise their access to education. The government may also operatesocial insurance schemes providing pensions or lump-sum benefits forthe elderly, surviving dependents, or disabled persons. Because most ofthese schemes are contributory, so that HIV/AIDS affects revenue as wellas expenditure, pension schemes are covered separately below.
Coverage of formal, contributory social security schemes in most coun-tries facing severe epidemics is limited, but some provide various forms ofincome support from the general budget. For example, in Botswana resi-dents over age 65 are entitled to a monthly pension of 151 pula (about$30), and in South Africa male residents over age 65 and female residentsover 60 are entitled to a means-tested pension of up to 640 rand (about$100) a month (for details see U.S. Social Security Administration Officeof Policy, 2003). With fewer residents reaching old age, the cost of publicincome support to the elderly declines, but the fiscal cost of disability ben-efits rises: for example, South Africa’s pension is also extended to the per-manently disabled. More-comprehensive social security programs aregenerally contributory, which implies that often they are accessible to per-manent employees in the public and formal private sectors only. However,
Impact of HIV/AIDS on Government Finance and Public Services 237
©International Monetary Fund. Not for Redistribution

HIV/AIDS affects the number of poor households, so that social expendi-ture targeted at the poor, such as destitution allowances or any form ofmeans-tested grants, is likely to rise.
Orphans are likely to experience at least temporary hardship during thesickness of their parents or other household members, and their access toeducation can be impaired if they have to care for sick relatives or are dis-criminated against in their foster families.34 For these reasons UNAIDSand major donors have included orphan support as one of the focal pointsof their comprehensive HIV/AIDS programs (see Table 7.2). Havingalready discussed the impact of HIV/AIDS on orphans in some detail, inthe context of access to education, this discussion will merely add somenotes from a social policy perspective. First, universal access to educationis a powerful weapon for fighting poverty in general. Since the decline inorphans’ enrollment rates tends to be lowest in countries with high over-all enrollment (indicative of an education system that is accessible to thedisadvantaged segments of the population), such systems are also likely tobe more effective at keeping orphans in school. However, orphans are alsolikely to experience a decline in their material living standards. Case, Pax-son, and Ableidinger (2002), for example, provide evidence on this scorefrom South Africa, which is also supported by the available data on depen-dency ratios in orphan versus nonorphan households (Table 7.9). Giventhe large numbers of children being orphaned by HIV/AIDS, mitigatingthe impact on their living standards and securing their access to educationwill become the key challenge for social policy in countries with severe epi-demics, if it is not already.
Pension Schemes
Pension schemes encompass many different institutional arrangements,some operated directly by the government, and others operating indepen-dently but with some government oversight and a government guarantee,explicit or implicit, of the pension fund’s obligations.35 Coverage may
238 MARKUS HAACKER
34Case, Paxson, and Ableidinger (2002, abstract) “find that orphans in Africa on averagelive in poorer households than non-orphans, and are significantly less likely than non-orphans to be enrolled in school. However, orphans’ lower school enrollment is notexplained by their poverty: orphans are equally less likely to be enrolled in school relativeboth to non-orphans as a group and to the non-orphans with whom they live.”
35For a survey of social security issues in sub-Saharan Africa, see Barbone and Sanchez(1999). The most comprehensive and up-to-date survey of existing pension arrangements isU.S. Social Security Administration, Office of Policy (2003).
©International Monetary Fund. Not for Redistribution
extend to government employees only, or to the private sector, or to thegeneral public. Although increased mortality results in a decline in thenumber of recipients of old-age pensions, outlays on pensions for surviv-ing dependents (the spouse and any under-age children) may increase.Quantitatively, the impact of HIV/AIDS on pensions can amount to a verysubstantial proportion of the cost of the epidemic.36 JTK Associates (2002)finds that, to accommodate the impact of HIV/AIDS, contributions to theSwazi public employee pension fund would have to increase by between2 and 4 percent of the government’s payroll. Since the pension fund is con-tributory, the costs of HIV/AIDS may accrue either to the government,through increased contributions to the pension fund from general rev-enue, or to government employees, through increased contributions orreduced benefits.
A distinction is commonly made between defined-benefit pensionschemes and defined-contribution schemes (the latter including providentfunds). Pension benefits under a defined-benefit scheme are typically cal-culated using a formula based on the duration of contributions and on thecontributor’s salary or contribution level during his or her last years ofwork. Because benefits are not tightly linked to accumulated contribu-tions, such schemes are more vulnerable to the demographic shifts associ-ated with HIV/AIDS. In addition to old-age pensions and survivorbenefits, defined-benefit schemes typically provide disability benefits,funeral grants, or other death-related lump-sum benefits. Outlays on thesebenefits are strongly affected by HIV/AIDS, because they rise essentiallyproportionally with HIV prevalence or mortality.
Under a defined-contribution scheme, participants’ contributions arecredited, after certain deductions, to their individual accounts within thescheme. At retirement, participants are entitled to receive back their accu-mulated contributions plus accrued interest, either as a lump sum or as anannuity. If the participant dies before retirement, the accumulated amountis paid out to the heirs. Most defined-contribution schemes also includesome elements of defined-benefit schemes, for example to cover the risksof death in service and of disability. The costs of these risk benefits, as wellas a share of administrative costs, are subtracted from the contributions.As a consequence, either the accumulated amount available at retirementis smaller than it would be without these benefits (see, for example, San-lam, 2004), or contribution rates must be adjusted upward to pay for the
Impact of HIV/AIDS on Government Finance and Public Services 239
36This is discussed in some detail in Haacker (Chapter 2, this volume), in the context ofthe private sector.
©International Monetary Fund. Not for Redistribution

benefits. Increased HIV/AIDS-related mortality has little impact on par-ticipants’ balances under a defined-contribution scheme, because all con-tributions (net of administrative costs and any risk benefits) credited toany individual account are eventually paid out.37 However, with increasedmortality the total funds administered by the scheme are likely to decline,as contributors (or their surviving dependents) tend to withdraw theiraccumulated balances earlier than they would have otherwise.
Assessing the net financial impact of HIV/AIDS on the costs of pen-sions is a complex undertaking. Although fewer contributors reach retire-ment age and draw retirement pensions, those dying of HIV/AIDS oftenleave behind young spouses (who may be infected as well) and dependentchildren, who may be eligible for survivors’ pensions. A full quantitativeanalysis would require complex demographic modeling and therefore isbeyond the scope of this chapter. Among the more detailed studies extant,Plamondon, Cichon, and Annycke (Chapter 8, this volume), using ahypothetical example of a country in sub-Saharan Africa, find thatHIV/AIDS raises pension outlays by 0.5 percent of GDP by 2015 (from1.7 percent of GDP without AIDS to 2.2 percent, or by 29 percent). Thisreflects a 16 percent decline in the number of old-age pensioners, offsetby increases in the numbers of disability pensioners (by 64 percent), wid-ows (also by 54 percent), and orphans (which almost treble). The netimpact on the fiscal balance or required social security contributionswould depend on whether the contributor base remains unchanged(because workers dying of AIDS are replaced) or shrinks. The studyexamines scenarios along both lines.
Government Revenue and the Financing of Health Expenditure
HIV/AIDS affects domestic government revenue through its adverseeffects on the macroeconomy and thus the tax base. Fiscal policy needs totake these changes into account, both in terms of the medium-term fiscalframework and in the context of resource mobilization in the fight againstHIV/AIDS. The first part of this section therefore discusses some of theimplications of HIV/AIDS for domestic government revenue. In light ofthe key role of the health sector in mitigating the impact of the epidemic,
240 MARKUS HAACKER
37However, if the quality of the pension fund’s portfolio is low, increased mortality woulddrain the funds available for such investments and could accelerate the pension fund’s even-tual insolvency. If the government, explicitly or implicitly, guarantees the obligations of thepension fund, it may have to bail the fund out, at a considerable cost.
©International Monetary Fund. Not for Redistribution

and the substantial role of private and external financing, the second partprovides a more detailed discussion of the financing of health expenditure.External grants, an important source of health financing in low-incomecountries, are considered in the context of the international response inthe next section of the chapter.
Domestic Government Revenue
Essentially all macroeconomic studies of countries with severe HIV epi-demics agree that GDP growth will slow, leaving GDP substantially lowerthan what might have been expected before the epidemic escalated.38 As aconsequence, growth in the domestic tax base, and thus in domestic gov-ernment revenue, also slows, complicating the government’s efforts tocope with the increased demand that the epidemic places on its services. Asthe present discounted value of tax revenue declines, it also becomes moredifficult to service a given level of public debt.39
The components of domestic revenue most likely to be adverselyaffected by HIV/AIDS are income taxes and import duties. Corporateincome tax revenue declines as increased expenses for training, medicaland death-related benefits, and lower employee productivity raise person-nel costs for a given level of output. To the extent that companies can passon these costs to their employees (by cutting benefits or salaries), this willresult, all else equal, in a decline in personal income tax revenue. Importduties decline to the extent that the increased demand for health servicescauses imported medical products, which tend to have reduced or evenzero tariff rates, to crowd out other imports on which full duties are paid.Privately financed health expenditure is particularly likely to have such aneffect. The government could respond by mobilizing additional resources,for example by raising taxes. Zimbabwe, for example, financed increasingHIV/AIDS-related expenditure through a 3 percent surcharge on payrolltaxes, earmarked toward an HIV/AIDS fund. However, in light of the sub-stantial burden of HIV/AIDS on the private sector, the scope for raisingadditional revenue from this source is limited.
For many countries in sub-Saharan Africa, royalties from various formsof resource extraction (such as oil, minerals, and timber) account for alarge share of domestic revenue. There are reasons to believe that these
Impact of HIV/AIDS on Government Finance and Public Services 241
38The macroeconomic impact of HIV/AIDS is discussed in much more detail in Haacker(Chapter 2, this volume).
39In a different context, Easterly (2001) suggests that failure to respond to the growth slow-down after 1975 was an important cause of the debt crises of the 1980s and 1990s.
©International Monetary Fund. Not for Redistribution

activities may be less vulnerable to the HIV epidemic. One reason is sim-ply that a large share of the sector’s value added derives from economicrents on the extracted resources rather than from labor. Second, large-scaleresource extraction is often conducted by multinational firms, who bringin expatriates to staff key positions and are thus less vulnerable toHIV/AIDS-related shortages in the supply of certain skills; their high valueadded per employee may also make it profitable for these firms to provideexpensive medical treatment to key employees. Third, if these companiespay comparatively high wages to employees with lower skills, they will beable to replace employees lost to HIV/AIDS relatively easily. However,these companies, too, face disruptions to production associated withincreased attrition, and, for permanent employees, higher coverage rates ofvarious forms of benefits (medical, pension, and other) mean that theimpact on personnel costs is relatively high.
With respect to health expenditure, patient contributions provideanother potential source of domestic financing. However, the still-substantial cost of antiretroviral treatment relative to most households’incomes means that high co-payments will effectively exclude poor house-holds from treatment. To achieve equitable access to treatment, co-payments would have to be means-tested, adding to the administrativecosts of the program. More broadly, in countries without a well-function-ing private insurance sector, public health services are an essential elementof social insurance, and substantial user fees would add to the economiccosts of HIV/AIDS for the affected households.
Financing of Health Expenditure
Table 7.10 summarizes available information on the financing of healthexpenditure in some countries affected by HIV/AIDS. In principle, healthexpenditure can be financed from government general revenue, publicsocial insurance, external grants, or private insurance, or directly by theindividuals or households affected.
The share of public expenditure in total health expenditure varies con-siderably across African countries, from 16 percent in Côte d’Ivoire to79 percent in Lesotho. Virtually all public health expenditure is financed byeither taxation or external resources; with the exception of Thailand, pub-lic health insurance does not play a significant role in any of the countriescovered. Especially for countries with relatively low income per capita,external assistance is an important source of financing; in Malawi itaccounts for fully 87 percent of public health expenditure, and 41 percentof total health expenditure.
242 MARKUS HAACKER
©International Monetary Fund. Not for Redistribution

Impact of HIV/AIDS on Government Finance and Public Services 243
Tab
le 7
.10.
Fin
anci
ng
ofH
ealt
h S
ervi
ces
in S
elec
ted
HIV
/AID
S-A
ffec
ted
Cou
ntr
ies,
2001
Pri
vate
Fin
anci
ng
____
____
____
____
____
____
____
____
____
____
____
____
____
____
Pu
blic
Pu
blic
Exc
ludi
ng
All
priv
ate
Pre
paid
as
Tota
l Fin
anci
ng
Fin
anci
ng
asE
xter
nal
Res
ourc
esas
per
cen
tO
ut
ofpo
cket
perc
ent
of__
____
____
____
____
___
____
____
____
____
____
____
____
___
Per
capi
taPe
rcen
tPe
rcen
t of
as P
erce
nt
ofP
ubl
icof
tota
lPe
rcen
t of
tota
lPe
rcen
t of
priv
ate
priv
ate
Cou
ntr
y(d
olla
rs)
ofG
DP
Tota
lE
xpen
ditu
refi
nan
cin
gfi
nan
cin
gex
pen
ditu
reex
pen
ditu
re
Bot
swan
a20
26.
666
.20.
633
.811
.935
.364
.7B
razi
l22
27.
641
.61.
258
.437
.464
.135
.9C
ôte
d’Iv
oire
396.
216
.020
.084
.075
.389
.710
.3E
thio
pia
33.
640
.584
.759
.550
.484
.715
.3H
aiti
235.
053
.480
.346
.621
.145
.354
.7Le
soth
o21
5.5
78.9
7.6
21.1
21.1
100.
00.
0M
alaw
i13
7.8
35.0
75.7
65.0
28.4
43.7
56.3
Moz
ambi
que
125.
967
.454
.732
.612
.839
.360
.7N
amib
ia12
17.
067
.85.
632
.25.
817
.982
.1So
uth
Afr
ica
225
8.6
41.4
1.0
58.6
13.0
22.1
77.9
Swaz
ilan
d39
3.3
68.5
11.5
31.5
31.5
100.
00.
0Ta
nza
nia
124.
446
.763
.253
.344
.383
.116
.9T
hai
lan
d69
3.7
57.1
10.
242
.936
.585
.015
.0U
gan
da15
5.9
57.5
43.1
42.5
22.7
53.4
46.6
Zam
bia
205.
753
.191
.746
.933
.771
.828
.2Z
imba
bwe
446.
245
.317
.254
.728
.652
.247
.8
Sou
rce:
WH
O (
2004
b).
1 In
clu
des
26.8
per
cen
t of
tota
l pu
blic
hea
lth
exp
endi
ture
fin
ance
d by
th
e so
cial
sec
uri
ty s
yste
m.
©In
tern
atio
nal M
onet
ary
Fund
. Not
for R
edis
tribu
tion

Although some African countries with large shares of private healthexpenditure feature some form of private health insurance, in many theshare of private out-of-pocket health expenditure is high by internationalstandards, especially as a proportion of total private health expenditure.This likely reflects the relatively minor role of private health insurance inmany low-income countries. Correspondingly, for Botswana, Namibia,South Africa, and Zimbabwe—countries with a relatively well-developedinsurance sector—private out-of-pocket health expenditure is less of a fac-tor. In some countries the lack of private health insurance appears to becompensated by public health expenditure.
Detailed data like those presented in Table 7.10 are not available for thefinancing of HIV/AIDS-related health expenditure specifically. However,Martin (2003) analyzes the financing of HIV/AIDS-related public expen-diture in Botswana, Lesotho, Mozambique, South Africa, and Swaziland.40
Her findings show that the role of external finance for HIV/AIDS-relatedexpenditure is even more pronounced than that for general health expen-diture. With the exception of South Africa, which receives very little exter-nal aid, external financing accounted for between 79 and 85 percent ofHIV/AIDS-related public expenditures in these countries.
External Finance and the International Response
External finance plays a very important role in the financing ofHIV/AIDS-related expenditure, but the fiscal implications of the interna-tional response to HIV/AIDS are much broader. Most important, changesin the international market for drugs have facilitated the import of cheapergeneric versions of patented drugs for countries facing a health emergency.Partly as a response to these developments, a regulated market for genericversions of antiretroviral drugs is emerging, with the aim of making thesedrugs available to low-income countries at the lowest possible cost. As aconsequence, the emphasis of the international response has broadenedfrom an early focus on prevention to a strategy that includes substantiallyexpanded access to antiretroviral treatment.
At the same time, international donors—governments, multilateralorganizations, and nongovernmental organizations (NGOs)—have sub-stantially increased their funding of HIV/AIDS-related projects. Comple-menting the above discussion of the financing of health expenditure at
244 MARKUS HAACKER
40The study also covers Zimbabwe, but data on HIV/AIDS-related expenditure were notavailable for this country.
©International Monetary Fund. Not for Redistribution

the country level, this section will therefore look at global trends in thefinancing of HIV/AIDS-related expenditure. The management of sub-stantial aid flows, whether they go through the budget or are directly dis-bursed to NGOs working in the affected countries, poses challenges to thehost government and the donor agencies. For example, the activities ofthe various government agencies and NGOs need to be coordinated, orelse the country’s limited human resources may be overwhelmed. (Themacroeconomic impact of large aid flows on the current account is dis-cussed in Chapter 2 of this volume.) Looking ahead, there is the potentialfor a “maturity” mismatch between expenditure and its funding: whereasgrants are typically short-term (although often with the expectation thatthey will be renewed) and may be subject to delays in disbursement,HIV/AIDS-related spending—especially investments in treatment—involves longer-term financial commitments.
Changes in the International Market for Antiretroviral Drugs
In 2001 the TRIPs (Trade-Related Aspects of Intellectual PropertyRights) agreement of the Doha round of World Trade Organization nego-tiations formalized trade rules governing patented goods. This is highlyrelevant for the international market in pharmaceutical products: becauseresearch and development costs in the pharmaceutical industry are high,companies can only recover these costs by charging sizable markups overproduction costs while the products are under patent. Importantly in thecontext of HIV/AIDS, the TRIPs agreement formalized rules whereby acountry facing a public health emergency could grant a “compulsorylicense,” requiring a foreign pharmaceutical firm to license a domesticproducer to produce generic versions of its patented medicines fordomestic consumption. However, many African countries do not haveany domestic pharmaceutical industry to speak of. Partly reflectinggrowing international concern over the escalating HIV/AIDS crisis, theagreement was therefore subsequently extended to allow countries with-out domestic production capabilities to import generic versions ofpatented drugs.
Besides opening the door to the import of generic drugs to combatAIDS, this option also improves the bargaining power of countries facingHIV epidemics when negotiating with the original producers of the drugs.Major reductions in the prices of antiretroviral drugs have already beenachieved by individual agreements between pharmaceutical companies—the patent holders or producers of generic versions—and governments ofaffected countries.
Impact of HIV/AIDS on Government Finance and Public Services 245
©International Monetary Fund. Not for Redistribution

However, changes in the international market for antiretroviral drugs,together with the associated fall in the prices of these drugs for developingcountries, have resulted in and are being reinforced by the emergence of amore regulated market, in which NGOs or government agencies act asintermediaries. For example, the Clinton Foundation has established aprogram that aims to reach 2 million people in four African and severalCaribbean countries by 2008. It was able to secure low prices for sometypes of antiretroviral treatment (about $140 a year) by securing the com-mitment of the participating countries to substantially roll out antiretro-viral drug treatment programs, and by helping to raise funds to cover thecosts of the program. The companies involved were able to reduce theprice of the drugs because the program guarantees the drug makers a highand predictable volume of sales, and because the arrangement allows com-panies to save on marketing and distribution costs.41 Other major initia-tives, including PEPFAR, which have a broader HIV/AIDS agenda, alsoinvolve bulk purchases of antiretroviral drugs.
Global Financing of HIV/AIDS-Related Expenditure
HIV/AIDS-related spending and funding have increased sharply overthe last several years. Estimates of household spending on HIV/AIDS areavailable for only a few countries (and, where available, are frequently basedon small samples). Therefore most of the available data relate to spendingby national governments or to sources of financing. Such institutionalspending has risen considerably over the last several years for low- and mid-dle-income countries, from about $300 million in 1996 to $4.2 billion in2003 (see Summers and Kates, 2003). Accounting for most of theseincreases are increases in national spending (from $20 million in 1996 to$1.0 billion in 2003) and in bilateral grants (from $160 million to $2.0 bil-lion over the same period). The largest contributor at present is the UnitedStates, which today accounts for about 20 percent of global funding.
The patterns of financing differ very substantially across regions andcountries. According to the HIV/AIDS national accounts published by theRegional AIDS Initiative for Latin America and the Caribbean (SIDALAC),external finance plays a relatively minor role in the Latin America andCaribbean region, accounting for only 1.7 percent of total funding,
246 MARKUS HAACKER
41WHO (2004a, p. 25) suggests, however, that the guarantees that participating countriesor programs need to provide to benefit from this low price are “difficult to provide given therelatively small size of their antiretroviral treatment programmes and uncertainty aboutlong-term funding.”
©International Monetary Fund. Not for Redistribution

whereas the domestic public sector accounts for 84.6 percent of HIV/AIDSspending.42 In sub-Saharan Africa, although data are available for only afew countries, it seems clear that external finance is the most importantsource of funding.43 For example, Martin (2003) estimates that externalfinance accounted for between 79 and 85 percent of all HIV/AIDS spend-ing in Botswana, Lesotho, Mozambique, South Africa, and Swaziland in2002. UNAIDS (2004b) reports that external financing in Ghanaaccounted for 74 and 59 percent of all HIV/AIDS-related expenditure inthat country in 2002 and 2003, respectively.
Summers and Kates (2003) estimate that total HIV/AIDS-related fund-ing in low-income countries, excluding private health expenditure,amounted to $4.2 billion in 2003 (Table 7.11). This estimate was based onbudget allocations for HIV/AIDS-related grants. Actual disbursements onHIV/AIDS-related activities were somewhat lower, because not all thebudgeted grants were disbursed in 2003. As a consequence, Summers andKates’s estimates are about $600 million higher than those provided byUNAIDS (2004b).44 The largest discrepancies between funding and spend-ing relate to the activities of the Global Fund to Fight AIDS, Tuberculosis,and Malaria, contributions to which are counted as funding, whereas grant
Impact of HIV/AIDS on Government Finance and Public Services 247
Table 7.11. Estimated Funding for HIV/AIDS Spending in Low-Income Countriesby Source, 2003
Source Millions of Dollars
Total 4,232U.S. government bilateral 852Other government bilateral 1,163Global Fund1 547U.N. agencies 350World Bank2 120Foundations and other NGOs 200Governments of affected countries 1,000
Source: Summers and Kates (2003).1HIV/AIDS spending only.2Grant component of concessional loans.
42Data from UNAIDS (2004b). More detailed data are available on SIDALAC’s website,www.sidalac.org.mx.
43The most notable exception is South Africa, which does not receive substantial amountsin external grants, because of its relatively high income per capita.
44UNAIDS (2004b) estimates total expenditure of $4.7 billion, including $2.1 billion fromwithin-country sources (unlike the Summers and Kates data, these include private expendi-ture). Excluding within-country sources from both sets of estimates yields expenditures of$3.2 billion and $2.6 billion, respectively.
©International Monetary Fund. Not for Redistribution

disbursements are counted as spending. Since the Global Fund disbursedonly about 17 percent of what it received in that year, there is a discrepancyof about $400 million.45 Similar discrepancies can and commonly do ariseas bilateral grants that are pledged are not disbursed, either because therecipient does not meet some formal condition attached to the grant, orbecause capacity constraints prevent the recipient from implementing thefunded project.
UNAIDS (2004b) estimates, on the basis of existing funding commit-ments, the emergence of major new multilateral and bilateral donors (suchas the Global Fund and PEPFAR, respectively), and current trends, thatHIV/AIDS funding in low- and middle-income countries will increase tojust over $8 billion in 2005 and about $10 billion in 2007. Reflecting theimportant and growing role of the Global Fund (which received $1.4 bil-lion in contributions in 2003) and PEPFAR (which may provide up to$15 billion over five years), multilateral and bilateral sources account formost of this increase.46 The largest share of these resources (43 percent)will be needed in sub-Saharan Africa. However, even this lion’s share ismuch lower than the region’s share of people living with HIV/AIDS world-wide: sub-Saharan Africa is home to 66 percent of all HIV-positive indi-viduals worldwide. This discrepancy may reflect the fact that expenditureon prevention is spread more evenly across countries than expenditure oncare and treatment, that unit costs for some interventions are lower inAfrica than in other regions (in line with its lower income per capita), orthat the expansion of services in Africa is impeded by capacity constraintsin the short run.
These estimates can be compared against projections of global resourceneeds (UNAIDS, 2004b) of $11.6 billion in 2005 (as discussed in somedetail above; see Table 7.2), and $19.9 billion in 2007. The WHO’s 3 by 5initiative, which is more narrowly geared toward medical interventions(palliative care, treatment of opportunistic infections, and antiretroviraltreatment account for about 70 percent of total costs), is estimated to costbetween $3.1 billion and $3.8 billion, depending primarily on what pricesare assumed for the various forms of antiretroviral treatment used (seeGutierrez and others, 2004). Now somewhat outdated in terms of its finan-
248 MARKUS HAACKER
45The low ratio of disbursements to receipts largely reflects the fact that the Global Fundtypically commits its funds over several years and is only starting operations. Grants com-mitted accounted for 80 percent of contributions received in 2003, according to the GlobalFund’s financial statements (Global Fund to Fight AIDS, Tuberculosis, and Malaria, 2004).
46For a more comprehensive profile of PEPFAR and the Global Fund, see UNAIDS(2004b).
©International Monetary Fund. Not for Redistribution

cial projections, but still very valuable for its broad assessment of the link-ages between macroeconomics and health and its articulation of a broaderstrategy for investment in health for human development, is the study bythe Commission on Macroeconomics and Health (2001). That study esti-mated that an additional $14 billion would be needed by 2007, and around$22 billion by 2015, to scale up the response to HIV/AIDS in 83 low- andmiddle-income countries.
By all these accounts, the amounts available to fund the response toHIV/AIDS fall well short of the projected resource needs. According to theestimates by UNAIDS, the projected gap between resource needs and avail-able resources amounts to $3.3 billion in 2005—a shortfall of about 30percent. On the basis of current commitments and funding trends,UNAIDS projects that this gap will grow, both in absolute and in relativeterms, to $9.7 billion by 2007.
In the absence of increased funding, this emerging (and, according tocurrent projections, growing) resource gap will raise serious political andethical questions. The most immediate is one of rationing: what will be theappropriate mix of interventions if the required levels of funding are notattained? It may turn out that some countries are successful in planningand implementing a comprehensive response to HIV/AIDS, and attractsufficient funding, while others fail to overcome obstacles to an expandedresponse. Since countries with a well-functioning health infrastructure inplace and a broader human resource base are in a better position to imple-ment such a program, allocating HIV/AIDS funds primarily according tomedical criteria could intensify existing inequities between countries, interms of access to health care and key development indicators such as lifeexpectancy. Rationing can also affect inequities within countries, if, forexample, treatment for HIV patients is offered only at a limited number ofhealth facilities located primarily in urban areas. On the other hand, avail-ability of funding may prove not to be the binding constraint to expand-ing access to treatment, if only a limited share of the population seeksHIV/AIDS-related services, such as voluntary counseling and testing, andthe uptake of treatment remains low.
Managing HIV/AIDS-Related Aid Flows
As the global response to HIV/AIDS unfolds, many countries will expe-rience substantial increases in health and other HIV/AIDS-related expen-ditures, largely financed by external grants. For some countries, especiallythose with very low income per capita, the additional requirements for anadequate response to HIV/AIDS exceed current health expenditure. This
Impact of HIV/AIDS on Government Finance and Public Services 249
©International Monetary Fund. Not for Redistribution

means that health services need to be expanded very rapidly in order toachieve significant coverage rates for treatment and other HIV/AIDS-related interventions. Challenges to the government include formulating acomprehensive strategy that optimizes the allocation of HIV/AIDS-relatedfunds and is consistent with overall health and development objectives,and coordinating the activities and programs of various donors and imple-menting agencies—public sector, private sector, and NGOs.47
Managing this substantial and rapid increase in health services andcoordinating among the various government agencies, donors, and imple-menting agencies and NGOs poses a difficult challenge. However, manycountries affected by HIV/AIDS already start from a situation in whichpublic health services and health facilities operated by various NGOs coex-ist, and external grants play a key role in enhancing the quality andexpanding the geographical coverage of their health services. As externalgrants are used to strengthen existing health services eroded by increasedHIV/AIDS-related demand, to make treatment available to more patients(often using existing health facilities), or to increase the availability ofhealth services, this will strengthen these countries’ mixed system of healthfacilities operated by the government, NGOs, and private providers.Depending on the national strategy on HIV/AIDS or donor objectives,however, the mix of public and private providers may change. (Bennettand Fairbank, 2003, also stress the impact on procurement and distribu-tion of drugs and related commodities.)
There is a need for coordination at the national level—among the gov-ernment, donors, implementing agencies and NGOs, and civil society—toensure that the national response to HIV/AIDS is consistent with overallhealth and development objectives, and to avoid duplication of activities.By developing a strategic framework, the various participants can ensurethat the response to HIV/AIDS is adequate at all levels and that the avail-able funds are allocated optimally. Close coordination between the variousagencies and civil society would also enhance accountability and comple-ment the oversight and financial control mechanisms of the governmentand donors.
One area where potential trade-offs exist is the often-limited availabilityof trained personnel.48 As the international response has evolved to include
250 MARKUS HAACKER
47Bennett and Fairbank (2003) provide a thorough assessment of the health “system-wideeffects of the Global Fund to Fight AIDS, Tuberculosis, and Malaria.” Although their discus-sion goes beyond HIV/AIDS-related activities, the issues they raise apply directly to the dis-cussion here.
48On the issues raised in this paragraph, see also Over (Chapter 10, this volume).
©International Monetary Fund. Not for Redistribution

substantially enhanced access to antiretroviral treatment, and as this hasincreasingly become financially possible, major initiatives to expand accessto treatment have addressed the lack of human resources in two ways. Thefirst is by developing forms of treatment that minimize the demands onhighly trained health personnel. The second is by focusing on training andretaining a sufficient number of health personnel to achieve targets forincreased access to treatment (see, for example, WHO, 2003a, 2003b).49
Especially for countries with relatively low income per capita, this may alsoinvolve increasing salaries for health personnel, to reduce brain drain andabsenteeism. Nevertheless, the expected increase in the demand for quali-fied health personnel is substantial, and the government, in cooperationwith the various donors and implementing agencies, needs to ensure thatincreases in HIV/AIDS-related health services do not create bottleneckselsewhere. Although trade-offs in the allocation of a given number of healthpersonnel exist in the very short run, they can be resolved in the longer run.Major initiatives like the WHO’s 3 by 5 initiative, as well as many countryproposals submitted to the Global Fund, include provisions for the trainingof additional health personnel. To the extent that this training is synchro-nized with the expansion of HIV/AIDS-related services, there will be noadverse effect on other areas of health service provision.
For health services that are largely financed by grants, the sustainabilityof financing—and thus, in many cases, of the funded services—is an issue.Establishing new health services often implies a political commitment onthe part of the government, which cannot easily be reversed should fund-ing dry up. (For example, the closure of hospitals is often a hotly contestedpolitical issue.) Outside the HIV/AIDS context, many grants financeinvestments in infrastructure, with government bearing some of theinvestment costs and all the operating costs. For these grants (providedthat the government decides that it can sustain the operating costs), sus-tainability is less of an issue, since the time frame of the grant is similar tothat of the project, and delays in disbursements can frequently be accom-modated simply by delaying the project. HIV/AIDS-related grants, how-ever, are primarily applied to the current costs of programs, and increasedaccess to treatment—treatment that is cost intensive in terms of medicalsupplies and human resources—will reinforce this trend. Once thesehealth services are established, scaling them down in response to shortfallsin aid flows would be very difficult, not to mention undesirable from a
Impact of HIV/AIDS on Government Finance and Public Services 251
49Over (Chapter 10, this volume) provides a thorough discussion of the changes in thedemand for and supply of health services.
©International Monetary Fund. Not for Redistribution

public health perspective, and would leave the government financially andpolitically vulnerable.
Impact of HIV/AIDS in the Longer Run
There are three key areas in which an assessment of the impact of and theresponse to HIV/AIDS highlights fundamentally different challenges in thelonger run. One is that coping and prevention strategies are less affected inthe longer run by preexisting capacity constraints. Whereas the emphasis inthe short run is on optimizing the response given institutional, physical, andsocial constraints, in the longer run these constraints are endogenous.Another is that most of the analysis of the adverse impact of HIV/AIDSfocuses on the disruptions caused by HIV/AIDS-related morbidity andmortality. However, some of the impact of HIV/AIDS may accumulate overtime. Examples include the effects of HIV/AIDS on institutional memory,discussed above, and the implications for investments in physical andhuman capital. The third is the indirect effect on the fiscal balance of thegovernment’s response to HIV/AIDS, if it succeeds in bringing down HIVprevalence and mitigating the macroeconomic impact.
The government’s response to HIV/AIDS is subject to financial con-straints and existing capacity constraints, both in terms of humanresources and in terms of physical infrastructure. For example, withtrained health personnel in short supply, a given increase in health spend-ing may fail to achieve a commensurate increase in health services cover-age. Strategies to improve access to treatment for HIV patients, in additionto the financing of drugs, therefore emphasize investments in health per-sonnel and facilities. The WHO’s 3 by 5 initiative, for example, includes astrong training component.
Most of the literature on the economic and developmental impact ofHIV/AIDS, whether on the macroeconomy, on the public service, on theprivate sector, or on households, focuses on current disruptions caused byincreased mortality and morbidity. However, much of the adverse impactof HIV/AIDS may become evident only in the longer run. One example,discussed above, is institutional memory. An institution may be able toaccommodate the loss of an additional 2 or 3 percent of its staff in a givenyear, replacing them through internal reassignments or newly recruitedstaff with similar skills. Replacing an additional 25 percent of its staff over10 years, however, may prove much more difficult and damaging to theorganization’s efficiency, as institutional memory is weakened and therange and depth of the staff ’s experience deteriorate.
252 MARKUS HAACKER
©International Monetary Fund. Not for Redistribution
To the extent that the government succeeds in reducing HIV prevalencerates and mitigating the macroeconomic effects, the fiscal balance willimprove. For example, reduced HIV prevalence results in lower personnelcosts, reduced health expenditure, and reduced social outlays. It will alsomitigate the slowdown in GDP growth, and thus in the growth of the domes-tic tax base. Masha (Chapter 9, this volume) shows that a sound HIV/AIDSpolicy framework can yield both savings on some types of HIV/AIDS-related expenditure and improvements in domestic revenue, which can off-set a significant proportion of the costs of implementing the framework.These gains, however, derive largely from reduced mortality and morbidity.Thus, given the long time it takes for preventive measures to reduce theincidence of HIV infection, these financial gains have little impact in theshort run. Yet even though the macroeconomic effects do not appearimmediately, including a macroeconomic assessment in a policy frame-work on HIV/AIDS can help in informing the choice of policy targets.
Conclusions
HIV/AIDS poses a huge challenge to governments facing severe epi-demics. Even as the demand for certain categories of public services (mostimportantly, health services) increases substantially, the capacities of gov-ernments to cope with the epidemic are eroded, in part because ofincreased mortality and morbidity among government employees. Theanalysis in this chapter shows that the impact of HIV/AIDS on govern-ment employees goes far beyond the disruptions and increased costs asso-ciated with increased attrition owing to HIV/AIDS. As mortality amongyoung adults increases, the age composition of the civil service changes.Fewer public servants survive to an age when they might normally be can-didates for higher managerial positions; as a result, some of these positionsmust be filled with less qualified or less experienced people, and the qual-ity of decision making is likely to deteriorate.
The most visible impact of HIV/AIDS on governments’ operations hasbeen on health services and expenditures. With antiretroviral treatment ini-tially out of reach for all but a few AIDS victims, the emphasis in the healthsector was on palliative care and the treatment of opportunistic infections.The existing health services had insufficient capacity to cope with theincreased demand, and health facilities responded by reducing access tocare for less urgent medical conditions. Following the dramatic decline inthe prices of antiretroviral treatment, and with financial support from theinternational community, much of the emphasis has shifted toward
Impact of HIV/AIDS on Government Finance and Public Services 253
©International Monetary Fund. Not for Redistribution

improving access to that treatment. Given the still-limited availability ofhealth personnel and the toll that HIV/AIDS is taking on governmentemployees, providing antiretroviral treatment in a way that makes the mostefficient use of trained staff is an integral part of the approach.
Grants from international and bilateral donors play a critical role in thefinancing of HIV/AIDS-related expenditure. UNAIDS estimates that, in2003, more than three-fourths of public expenditure on HIV/AIDS indeveloping countries worldwide (including the activities of NGOs) wasfinanced by external grants. Thus a government that presents to potentialinternational donors a sound policy framework for fighting the epidemicand mitigating its impact may be able to cover most of its costs throughgrants. However, such grants typically finance only those expenditures thatdirectly relate to HIV/AIDS. Most of the more indirect costs ofHIV/AIDS—increasing personnel costs, rising social expenditure, and adecline in domestic revenue as the tax base is eroded—would still be cov-ered by the government from its own resources, and the analysis in thischapter has shown that these costs can be substantial.
The analysis presented here grew out of the experience of providingeconomic policy advice in countries facing severe HIV/AIDS epidemics.Considering the impact of and the response to HIV/AIDS from a fiscalpolicy perspective is important for a variety of reasons. First, in countrieswith severe epidemics, HIV/AIDS affects all areas of public services andthe domestic tax base, and it forces substantial increases in spending insome services. In these circumstances, one simply cannot conduct respon-sible fiscal policy without taking into account the broad impact ofHIV/AIDS on government employees and the budget. Second, efforts tofight the epidemic and mitigate its impact have important consequencesfor the budget and the management of public services, in the form ofincreased expenditure, increases in required personnel, and the need tocoordinate the activities of international donors. Finally, a successfulHIV/AIDS policy, by reducing the number of new infections and improv-ing the health status of people living with HIV, can mitigate the impact ofHIV/AIDS on the economy as a whole, and thus soften the impact on pub-lic services and the government budget.
References
Ainsworth, Martha, Kathleen Beegle, and Godlike Koda, 2002, “The Impact of AdultMortality on Primary School Enrolment in Northwestern Tanzania,” AfricaRegion Human Development Working Paper (Washington: World Bank).
254 MARKUS HAACKER
©International Monetary Fund. Not for Redistribution

Barbone, Luca, and Luis-Alvaro Sanchez B., 1999,“Pensions and Social Security in Sub-Saharan Africa: Issues and Options,” World Bank Africa Region Working PaperNo. 4 (Washington: World Bank).
Barnett, Tony, and Alan Whiteside, 2002, AIDS in the Twenty-First Century—Diseaseand Globalization (Basingstoke, United Kingdom, and New York: PalgraveMacmillan).
Bautista, Sergio Antonio, and others, 2003, “Costing of HIV/AIDS Treatment in Mex-ico” (Bethesda, Maryland: Abt Associates).
Bennett, Sara, and Alan Fairbank, 2003, “The System-Wide Effects of the Global Fundto Fight AIDS, Tuberculosis, and Malaria: A Conceptual Framework” (Bethesda,Maryland: Abt Associates).
Botswana National AIDS Coordinating Agency, 2003, Botswana National StrategicFramework for HIV /AIDS 2003–09 (Gaborone, Botswana).
Braimah, Samuel D., 2004, “HIV/AIDS and the Public Sector” (unpublished; Durban,South Africa: Health Economics and HIV/AIDS Research Unit, University ofKwaZulu Natal).
Case, Anne, Christina Paxson, and Joseph Ableidinger, 2002, “Orphans in Africa,”NBER Working Paper No. 9213 (Cambridge, Massachusetts: National Bureau ofEconomic Research).
Castro-Leal, Florencia, and others, 2000, “Public Spending on Health Care in Africa:Do the Poor Benefit?” Bulletin of the World Health Organization, Vol. 78, No. 1,pp. 66–74.
Commission on Macroeconomics and Health, 2001, “Macroeconomics and Health:Investing in Health for Economic Development” (Geneva: World HealthOrganization).
Creese, Andrew, Katherine Floyd, Anita Alban, and Lorna Guinness, 2002, “Cost-Effec-tiveness of HIV/AIDS Interventions in Africa: A Systematic Review of the Evi-dence,” The Lancet, Vol. 359, pp. 1635–42.
Easterly, William R., 2001,“Growth Implosions and Debt Explosions: Do Growth Slow-downs Cause Public Debt Crises?” Contributions to Macroeconomics, Vol. 1, No. 1.
Filmer, Deon, Jeffrey Hammer, and Lant Pritchett, 2000, “Health Policy in Poor Coun-tries: Weak Links in the Chain,” Policy Research Working Paper No. 1874 (Wash-ington: World Bank).
———, 2002, “Weak Links in the Chain II—A Prescription for Health Policy in PoorCountries,” World Bank Research Observer, Vol. 17, No. 1, pp. 47–66.
Global Fund to Fight AIDS, Tuberculosis, and Malaria, 2004, Annual Report 2003(Geneva).
Global HIV Prevention Group, 2003, “Access to HIV Prevention—Closing the Gap”(Seattle, Washington, and Washington, D.C.: Bill and Melinda Gates Foundationand Kaiser Family Foundation).
Government of Malawi and United Nations Development Programme (UNDP), 2002,“The Impact of HIV/AIDS on Human Resource in the Malawi Public Sector”(Lilongwe, Malawi).
Impact of HIV/AIDS on Government Finance and Public Services 255
©International Monetary Fund. Not for Redistribution

Government of the Republic of South Africa, 2003, “Operational Plan for Comprehen-sive HIV and AIDS Care, Management and Treatment for South Africa” (Pretoria).
Grassly, Nicolas C., and others, 2003, “The Economic Impact of HIV/AIDS on the Edu-cation Sector in Zambia,” AIDS, Vol. 17, No. 7, pp. 1039–44.
Gupta, Sanjeev, Marijn Verhoeven, and Erwin Tiongson, 2001, “Public Spending onHealth Care and the Poor,” IMF Working Paper No. 01/127 (Washington: Inter-national Monetary Fund).
Gutierrez, Juan Pablo, and others, 2004, “Achieving the WHO/UNAIDS AntiretroviralTreatment 3 by 5 Goal: What Will It Cost?” The Lancet, Vol. 364, pp. 63–64.
Haacker, Markus, 2002, “The Economic Consequences of HIV/AIDS in SouthernAfrica,” IMF Working Paper 02/38 (Washington: International Monetary Fund).
Hansen, Kristian, and others, 2000, “The Costs of HIV/AIDS Care at Government Hos-pitals in Zimbabwe,” Health Policy and Planning, Vol. 15, No. 4, pp. 432–40.
Harvard University, Individual Members of the Faculty of, 2001, “Consensus Statementon Antiretroviral Treatment for AIDS in Poor Countries” (Cambridge, Massachu-setts: Harvard University).
International Crisis Group, 2001, “HIV/AIDS as a Security Issue” (Washington andBrussels).
Joint United Nations Programme on HIV/AIDS (UNAIDS), 2002, Report on the GlobalHIV/AIDS Epidemic (Geneva).
———, 2003a, “Report on the State of HIV/AIDS Financing (Revised/Updated June2003)” (Geneva).
———, 2003b, “Progress Report on the Global Response to the HIV/AIDS Epidemic”(Geneva).
———, 2004a, 2004 Report on the Global HIV/AIDS Epidemic (Geneva).
———, 2004b, “Financing the Expanded Response to AIDS—July 2004” (Geneva).
Joint United Nations Programme on HIV/AIDS (UNAIDS), United Nations Children’sFund (UNICEF), and U.S. Agency for International Development (USAID), 2004,“Children on the Brink 2004” (Geneva, New York, and Washington).
JTK Associates, 2002, “The Impact of HIV/AIDS on the Central Agencies of the Gov-ernment of Swaziland” (Mbabane, Swaziland).
Kombe, Gilbert, David Galaty, and Chizoba Nwagbara, 2004, “Scaling Up Antiretrovi-ral Treatment in the Public Sector in Nigeria: A Comprehensive Analysis ofResource Requirements” (Bethesda, Maryland: Abt Associates).
Kombe, Gilbert, and Owen Smith, 2003, “The Costs of Anti-Retroviral Treatment inZambia” (Bethesda, Maryland: Abt Associates).
———, 2004, “Emerging Issues in Implementing Antiretroviral Treatment in Sub-Saharan Africa: Evidence from Zambia and Uganda,” paper presented at the con-ference of the International AIDS Economics Network, Bangkok.
Malaney, Pia, 2000, “The Impact of HIV/AIDS on the Education Sector in SouthernAfrica,” CAER II Discussion Paper No. 81 (Cambridge, Massachusetts: HarvardInstitute for International Development).
256 MARKUS HAACKER
©International Monetary Fund. Not for Redistribution

Martin, H. Gayle, 2003, “A Comparative Analysis of the Financing of HIV/AIDS Pro-grammes in Botswana, Lesotho, Mozambique, South Africa, Swaziland, and Zim-babwe” (Pretoria, South Africa: Human Sciences Research Council).
Noguera, Marilyn, and others, 2003, “Zimbabwe: Antiretroviral Therapy Program:Issues and Opportunities for Initiation and Expansion” (Arlington, Virginia:DELIVER, John Snow Inc.).
Opuni, Marjorie, and Stefano Bertozzi, 2003, “Financing HIV/AIDS Prevention andCare in Low- and Middle- Income Countries (September 2003).” Available via theInternet: hivinsite.ucsf.edu/InSite.
Rosen, Sydney, and others, 2004, The Cost of HIV/AIDS to Businesses in SouthernAfrica,” AIDS, Vol. 18, pp. 317–24.
Sanlam, 2004, “The 2004 Sanlam Survey on Retirement Benefits” (Bellville, South Africa).
Simon, John, and others, 2000, “The Response of African Businesses to HIV/AIDS,” inCommonwealth Secretariat, HIV/AIDS in the Commonwealth 2000/01 (London:Kensington Publications).
Steinberg, Malcolm, and others, 2002, “Hitting Home: How Households Cope with theImpact of the HIV/AIDS Epidemic” (Washington: Kaiser Family Foundation).
Stover, John, Lori Bollinger, and Katharine Cooper-Arnold, 2003, “Goals Model forEstimating the Effects of Resource Allocation Decisions on the Achievement ofthe Goals of the HIV/AIDS Strategic plan (Version 3.0)” (Glastonbury, Connecti-cut and Washington: The Futures Group International).
Summers, Todd, and Jennifer Kates, 2003, “Global Funding for HIV/AIDS in ResourcePoor Settings” (Washington: Kaiser Family Foundation).
Topouzis, Daphne, 2003, “Addressing the Impact of HIV/AIDS on Ministries of Agri-culture: Focus on Eastern and Southern Africa” (Geneva and Rome: UNAIDS andFAO).
United Nations Children’s Fund (UNICEF), 2003, “Africa’s Orphaned Generation”(New York).
United Nations Educational, Scientific, and Cultural Organization (UNESCO), 2001,World Education Report 2000 (Paris).
United States Social Security Administration, Office of Policy, 2003, “Social SecurityPrograms Throughout the World: Africa, 2003” (Washington).
World Bank, 2001, World Development Indicators 2001 (Washington).
———, 2002, “Education and AIDS—A Window of Hope” (Washington).
———, 2003, “HIV/AIDS in Central America: An Overview of the Epidemic and Pri-orities for Intervention” (Washington).
———, 2004a, World Development Report 2004: Making Services Work for Poor People(Washington).
———, 2004b, World Development Indicators 2004 (Washington).
World Bank AIDS Campaign Team for Africa, 2001, “Costs of Scaling HIV ProgramActivities to a National Level in Sub-Saharan Africa: Methods and Estimates”(Washington).
Impact of HIV/AIDS on Government Finance and Public Services 257
©International Monetary Fund. Not for Redistribution

World Health Organization (WHO), 2003a, “Treating 3 Million by 2005—Making ItHappen: The WHO Strategy” (Geneva).
———, 2003b, “Scaling up Antiretroviral Treatment in Resource-Limited Settings:Making It Happen” (Geneva).
———, 2004a, “Investing in a Comprehensive Health Sector Response to HIV/AIDS—Scaling up Treatment and Accelerating Prevention” (Geneva).
———, 2004b, World Health Report 2004 (Geneva).
———, 2004c, “3 by 5 Progress Report—December 2003 Through June 2004”(Geneva).
258 MARKUS HAACKER
©International Monetary Fund. Not for Redistribution

8Financial Effects of HIV/AIDS onNational Social Protection Schemes
PIERRE PLAMONDON, MICHAEL CICHON, AND PASCAL ANNYCKE
Through its demographic and economic effects, the HIV/AIDS pan-demic poses a huge challenge to the financial management of national
social protection systems. For example, increased mortality owing toHIV/AIDS may reduce the number of contributors to pension schemes.And although the share of contributors reaching retirement age declines,the number of surviving dependents entitled to benefits increases. At thesame time, the demand for health services increases. Using a simplifiedsocial budget model, this chapter tries to assess the potential financialeffects of HIV/AIDS on national social protection schemes.
The institutional arrangements and coverage of social insurance schemesdiffer substantially across developing countries, and often only a small pro-portion of the population is covered by formal schemes. The chapter there-fore begins with an overview of social protection arrangements andcoverage in low-income developing countries. The next section discusses thedemographic and economic impact of HIV/AIDS, using the hypotheticalcase of a country (“Demoland”) hard hit by HIV/AIDS. The concluding sec-tion assesses the impacts of HIV/AIDS on different elements of social pro-tection schemes, on the social budget, and on the fiscal balance.
Social Protection Arrangements and Coverage inDeveloping Countries
Formal public social protection systems cover only a minority of thepopulation in developing countries, particularly in Africa. Typically, such
259
©International Monetary Fund. Not for Redistribution
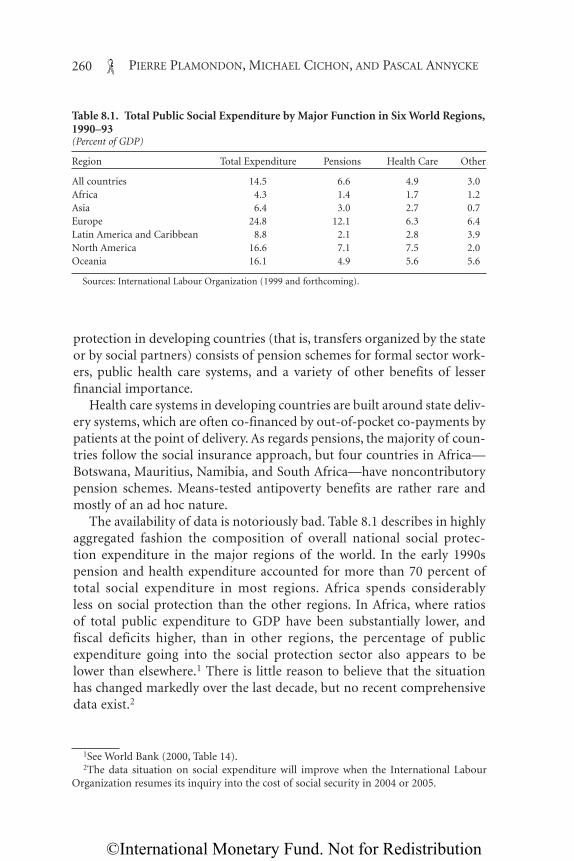
protection in developing countries (that is, transfers organized by the stateor by social partners) consists of pension schemes for formal sector work-ers, public health care systems, and a variety of other benefits of lesserfinancial importance.
Health care systems in developing countries are built around state deliv-ery systems, which are often co-financed by out-of-pocket co-payments bypatients at the point of delivery. As regards pensions, the majority of coun-tries follow the social insurance approach, but four countries in Africa—Botswana, Mauritius, Namibia, and South Africa—have noncontributorypension schemes. Means-tested antipoverty benefits are rather rare andmostly of an ad hoc nature.
The availability of data is notoriously bad. Table 8.1 describes in highlyaggregated fashion the composition of overall national social protec-tion expenditure in the major regions of the world. In the early 1990spension and health expenditure accounted for more than 70 percent oftotal social expenditure in most regions. Africa spends considerablyless on social protection than the other regions. In Africa, where ratiosof total public expenditure to GDP have been substantially lower, andfiscal deficits higher, than in other regions, the percentage of publicexpenditure going into the social protection sector also appears to belower than elsewhere.1 There is little reason to believe that the situationhas changed markedly over the last decade, but no recent comprehensivedata exist.2
260 PIERRE PLAMONDON, MICHAEL CICHON, AND PASCAL ANNYCKE
Table 8.1. Total Public Social Expenditure by Major Function in Six World Regions,1990–93(Percent of GDP)
Region Total Expenditure Pensions Health Care Other
All countries 14.5 6.6 4.9 3.0Africa 4.3 1.4 1.7 1.2Asia 6.4 3.0 2.7 0.7Europe 24.8 12.1 6.3 6.4Latin America and Caribbean 8.8 2.1 2.8 3.9North America 16.6 7.1 7.5 2.0Oceania 16.1 4.9 5.6 5.6
Sources: International Labour Organization (1999 and forthcoming).
1See World Bank (2000, Table 14).2The data situation on social expenditure will improve when the International Labour
Organization resumes its inquiry into the cost of social security in 2004 or 2005.
©International Monetary Fund. Not for Redistribution

Data on coverage are even scantier than data on expenditure. The fol-lowing subsections describe what little is known about the level of cover-age in the two main expenditure items in national social budgets.
Health Care Coverage
In principle, most developing countries provide health services to theircitizens through a network of public sector delivery units, such as healthcenters, dispensaries, and government hospitals. The existence of suchfacilities, however, does not necessarily mean that people enjoy meaning-ful access to basic health services. Access may be compromised by
• lack of facilities or services in a given region,• large distances separating people from the nearest health care delivery
facility,• poor quality of care in the nearest facility or facilities, or• high user charges that constitute a barrier to access for the poor.Again, internationally comparable indicators on access to care are few.
Access to and quality of care can generally be estimated only indirectly. Table8.2 provides some basic statistics on ratios of health care staff to populationin Africa and compares them with ratios in the United Kingdom, the UnitedStates, and Germany. The United Kingdom can be regarded as providing a“lean” health service by industrial country standards, and Germany’s as anamply staffed service, with that of the United States somewhere in between.
Table 8.2 shows that, with a few notable exceptions, the staffing ratio (thenumber of health care staff per 100,000 people) in Africa is typically lessthan 10 percent of the U.K. ratio. This can be interpreted in one of twoways: either access to care is dramatically worse for virtually all of the pop-ulation in most African countries than in Europe, or access meets orapproaches European levels for some in these countries but a large propor-tion of the population have no access at all. Most likely the figures reflect acombination of the two. However, there are indications that a substantialproportion of the population in many African countries do not seek helpfrom health professionals in the event of illness (Table 8.3). This fact indi-cates the existence of either physical or monetary barriers to access.
It is hard to predict how the understaffed and underfunded health sys-tems of developing countries will be affected by increasing HIV infectionrates.3 If capacity utilization is already at its limit, and cannot be expanded
Financial Effects of HIV/AIDS on National Social Protection Schemes 261
3See Over (Chapter 10, this volume) for a more detailed discussion of the impact ofHIV/AIDS on health systems.
©International Monetary Fund. Not for Redistribution

quickly, the new demand due to increased morbidity cannot be accom-modated. In this case, there will be no impact on the cost of delivery sys-tems—people will simply go uncared for. However, in light of theincreased demand for HIV/AIDS-related health services and a crowdingout of other health services, the system will most likely try to adjust, byrequiring fresh public resources, seeking external funding, or divertingresources from other purposes.
Pension Coverage
Social insurance schemes in developing countries, where they exist, typ-ically provide pensions and short-term cash benefits. Pensions are gener-ally of much greater financial importance in the long run. The share of the
262 PIERRE PLAMONDON, MICHAEL CICHON, AND PASCAL ANNYCKE
Table 8.2. Staffing Ratios in National Health Care Systems in Selected African andComparator Countries in the Mid-1990s(Personnel per 100,000 population except where otherwise stated)1
TotalPharma- (percent of
Country Year Physicians Nurses Midwives Dentists cists Total U.K. level)
Benin 1995 5.7 20.4 7.9 0.3 . . . 34.3 4.3Burkina Faso 1995 3.4 19.6 3.4 0.3 . . . 26.7 3.3Cameroon 1996 7.4 36.7 0.5 0.4 . . . 45.0 5.6Cape Verde 1996 17.1 55.6 . . . 1.5 . . . 74.2 9.2Central African Rep. 1995 3.5 8.8 4.9 0.2 . . . 17.4 2.2Chad 1994 3.3 14.7 2.3 0.2 . . . 20.5 2.6Côte d’Ivoire 1996 9.0 31.2 15.0 . . . . . . 55.2 6.9Eritrea 1996 3.0 16.0 2.2 0.1 . . . 21.3 2.7Ghana 1996 6.2 72 53.2 0.2 . . . 131.6 16.4Guinea 1995 13 55.7 5.2 . . . . . . 73.9 9.2Kenya 1995 13.2 90.1 . . . 2.2 . . . 105.5 13.1Lesotho 1995 5.4 60.1 47 0.5 . . . 113 14.1Liberia 1997 2.3 5.9 4.3 0.1 . . . 12.6 1.6Mali 1994 4.7 13.1 3 0.1 . . . 20.9 2.6Namibia 1997 29.5 168 116.5 4 . . . 318 39.6Niger 1997 3.5 22.9 5.5 0.2 . . . 32.1 4.0Nigeria 1992 18.5 66.1 52.4 2.6 . . . 139.6 17.4Senegal 1995 7.5 22.1 6.6 1.2 . . . 37.4 4.7Somalia 1997 4 20 . . . 0.2 0.1 24.3 3.0South Africa 1996 56.3 471.8 . . . 17.8 . . . 545.9 68.0Togo 1995 7.6 29.7 10.4 0.7 . . . 48.4 6.0Zimbabwe 1995 13.9 128.7 28.1 1.3 172 21.4
Memorandum:United Kingdom 1993 164 497 43.3 39.8 58.2 802.3 100.0Germany 1998 350 957 11.3 75.9 57.7 1,451.9 181.0United States 1995 279 972 . . . 59.8 . . . 1,310.8 163.4
Source: World Health Organization Statistical Information System (WHOSIS).1Numbers may not sum to totals because of rounding.
©International Monetary Fund. Not for Redistribution

labor force that contributes to social insurance schemes is typically verylow, because the informal sector is large and most social security institu-tions have difficulty enforcing the legally required contributions. More-over, coverage of the formal labor force is high only in countries where thepublic sector dominates formal employment.
Figures for the early 1990s (Barbone and Sanchez, 1999) show that, inmany African countries, fewer than 10 percent of the labor force are cov-ered by national pension systems (Table 8.4). More recent data (for 1998)reveal that the coverage of social security schemes was only 19.4 percentin Kenya, 12.5 percent in Zambia, and 9.6 percent in Ghana (Baruti,2003), levels that are very low when one considers that these three coun-tries have some of the best organized social security systems in sub-Saharan Africa.
Public pension arrangements vary greatly in Africa, ranging from socialinsurance schemes to provident funds to social assistance schemes. Insome countries the only existing pension scheme applies to state employ-ees, and sometimes only a subset of those. As Table 8.5 shows, the major-ity of old-age pension arrangements are based on the social insurance
Financial Effects of HIV/AIDS on National Social Protection Schemes 263
Table 8.3. Indicators of the Utilization of Care in Selected Sub-Saharan AfricanCountries in the Mid-1990s(Percent)
Share of Persons Care Sought by Persons Reporting Illness__________________________________________Country and Reporting Illness Modern Modern Other, includingIncome Quintile During Past 4 Weeks None (public) (private) traditional
Côte d’ IvoirePoorest 30 73 26 1 0Richest 50 35 55 10 0
GhanaPoorest 33 59 23 14 4Richest 58 43 28 24 5
GuineaPoorest 24 60 15 0 25Richest 32 31 52 6 11
MadagascarPoorest 20 72 20 3 5Richest 34 52 29 16 3
South AfricaPoorest 12 25 46 23 6Richest 26 14 9 74 3
TanzaniaPoorest 12 42 37 17 4Richest 22 27 32 39 2
Source: Castro-Leal and others (2000).
©International Monetary Fund. Not for Redistribution

principle, which links retirement pensions to contributions paid duringthe years spent at work. The majority of the population are excluded fromold-age pension arrangements altogether, and typically the elderly con-tinue to work regardless of age. When workers become disabled orexhausted by old age, traditional African family solidarity dictates thatthey be supported by their children.
Demographic and Economic Impact of HIV/AIDS
For our analysis we have built a model based on a hypothetical countrycalled Demoland, which we will use to simulate the impact of theHIV/AIDS pandemic on social security. The demographic and economiccharacteristics of Demoland are similar to those that prevail in some coun-tries in sub-Saharan Africa, the world region worst affected by HIV/AIDS.We assume that Demoland has a population of 14.8 million people in2000, the starting year of the simulation. The population is young: 43 per-cent are under age 15, and only 5 percent are 60 and over. The total fertil-ity rate is 5.1 children per woman. GDP per capita in 2000 is $720 at thecurrent exchange rate, corresponding to $1,400 at purchasing power par-ity, and real GDP is growing at a rate of 5 percent a year. Productivity perworker is increasing at 1.2 percent a year. Labor force participation ratesare 76 percent for males and 63 percent for females, and the unemploy-ment rate is 13 percent. It is estimated that 20 percent of the labor force isin the informal sector.
264 PIERRE PLAMONDON, MICHAEL CICHON, AND PASCAL ANNYCKE
Table 8.4. Coverage of Formal Pension Systems in Selected Sub-SaharanAfrican Countries(Percent)
Covered Wage Bill Contributors as Country Year as Fraction of GDP Share of Labor Force
Burundi 1993 5 3.3Cameroon 1993 5.5 13.7Côte d’Ivoire 1989 11 9.3Ghana 1993 5.7 7.2Kenya 1993 6.8 25Madagascar 1993 . . . 5.4Mali 1990 . . . 2.5Niger 1992 5 1.3Senegal 1992 . . . 6.9Tanzania 1992 . . . 4.3Togo 1993 . . . 6.6Zambia 1994 . . . 10.2
Source: Barbone and Sanchez (1999).
©International Monetary Fund. Not for Redistribution

Demographic Impact
It is assumed that 700,000 Demolanders are infected with HIV. Ten per-cent of the adult population (those aged 15–49) are estimated to be HIV-positive. AIDS caused 72,000 deaths in 2000. In the absence of HIV/AIDS,life expectancy at birth would be 56 years for males and 59 years forfemales. With HIV/AIDS, however, life expectancy at birth has dropped to
Financial Effects of HIV/AIDS on National Social Protection Schemes 265
Table 8.5. Pension Arrangements in Sub-Saharan African Countries
Special System for Public
Country Type of Arrangement Employees?
Benin Social insurance YesBotswana Universal program YesBurkina Faso Social insurance YesBurundi Social insurance YesCameroon Social insurance YesCape Verde Social insurance YesCentral African Republic Social insurance NoChad Social insurance NoCongo, Dem. Rep. of Social insurance YesCongo, Rep. of Social insurance NoCôte d’Ivoire Social insurance YesEquatorial Guinea Social insurance NoEthiopia Social insurance YesGabon Social insurance YesGambia Pension scheme and provident fund YesGhana Social insurance For army onlyGuinea Social insurance NoKenya Provident fund YesLiberia Social insurance and social assistance NoMadagascar Social insurance YesMalawi No countrywide arrangement OnlyMali Social insurance YesMauritania Social insurance YesMauritius Noncontributory program and social insurance YesNiger Social insurance YesNigeria Social insurance YesRwanda Social insurance NoSão Tomé and Príncipe Social insurance NoSenegal Social insurance YesSeychelles Social security fund NoSouth Africa Social assistance YesSudan Social insurance YesSwaziland Provident fund YesTanzania Provident fund and social insurance NoTogo Social insurance YesUganda Provident fund YesZambia Provident fund YesZimbabwe Social insurance No
Source: U.S. Social Security Administration, Office of Policy (2003).
©International Monetary Fund. Not for Redistribution

49 and 54 years, respectively. It is assumed that HIV/AIDS prevalence willreach its peak in 2010 and that preventive measures will make AIDS grad-ually disappear by 2050.
Demoland introduced its pension scheme 30 years before, in 1970. Thecountry’s social security law calls for coverage of the entire labor force, butbecause of compliance problems and the size of the informal sector, only 34percent of the workforce (for both males and females) actually contributeto the scheme. The present legal contribution rate is 8.0 percent of insuredearnings. Pension expenditure represented 1.1 percent of GDP in 2000.
Public health expenditure in Demoland amounts to 2.5 percent of GDP,and private health expenditure for 1 percent of GDP. Other social pro-grams, with total annual spending of 1.2 percent of GDP, include unem-ployment insurance, sickness and maternity benefits, a basic disabilityprogram, tax-financed family benefits, and a limited social assistanceprogram.
HIV/AIDS will cause a dramatic increase in mortality for two criticalage groups: the very young (0–4 years) and young adults (15–49 years).Figure 8.1 shows projected mortality rates for the peak year 2010. Theadditional deaths due to AIDS are concentrated in the population betweenages 15 and 50. The additional mortality for men is likely to appear atslightly higher ages than for women. The additional mortality among thevery young results from transmission of HIV from mother to child.
266 PIERRE PLAMONDON, MICHAEL CICHON, AND PASCAL ANNYCKE
0
1
2
3
4
5
6
7
8
9
10
0 5 10 15 20 25 30 35Age (in years)
40 45 50 55 60 65 70
Males, with AIDS
Females,with AIDS
Females, without AIDS
Males,without AIDS
Figure 8.1. Demoland: Mortality Rates by Sex, With and Without AIDS, 2010(Percent)
Source: Authors’ model described in the text.
©International Monetary Fund. Not for Redistribution

These changes in mortality will have a major impact on life expectancy.In the scenario without AIDS, life expectancy at birth is assumed toincrease gradually and continuously from its present level of 56 yearsfor males and 59 years for females in 2000 to 72 years for males and 77years for females in 2050. In the scenario with AIDS, in contrast, lifeexpectancy does not improve until 2010, after which it starts to increaseso as to eventually approach the without-AIDS values only in 2050(Figure 8.2).
HIV/AIDS may also affect fertility, in part because more women willbecome widows and stop bearing children, but also because womeninfected by HIV will be in too poor health to bear children or will decideto have no more. In the base scenario (that is, without the impact ofHIV/AIDS), it is supposed that the total fertility rate decreases from5.1 children per woman in 2000 to 2.1 in 2025 and remains at that levelthereafter. Taking into account the impact of HIV/AIDS, it is supposedthat the ultimate rate of 2.1 will be reached more rapidly, in 2010 insteadof 2025.
The combined effects of HIV/AIDS on mortality and fertility in theprojected population can be very important. Figure 8.3 illustrates the pop-
Financial Effects of HIV/AIDS on National Social Protection Schemes 267
30
40
50
60
70
80
2050202520102000
Without AIDS
With AIDS
Figure 8.2. Demoland: Projected Life Expectancy for Men, Without and With Impact of AIDS(Years)
Source: Authors’ calculations using model described in the text.
©International Monetary Fund. Not for Redistribution
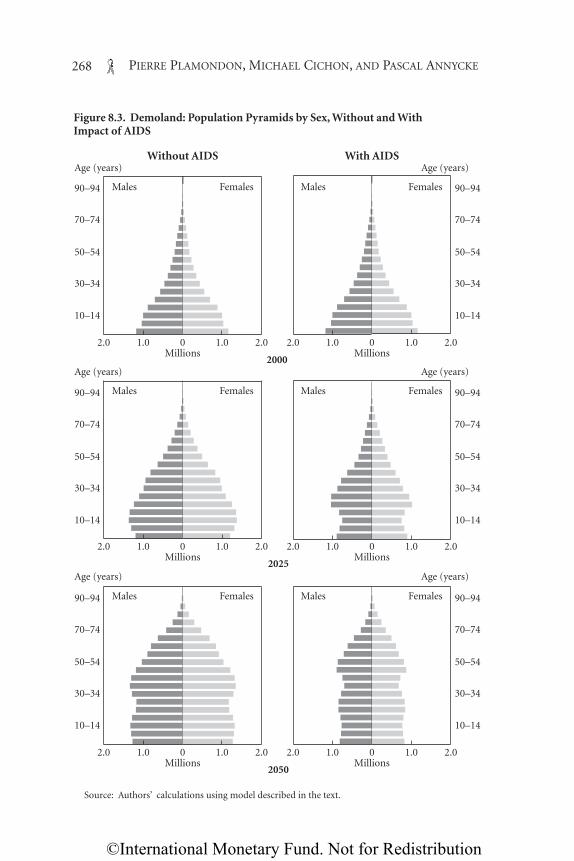
268 PIERRE PLAMONDON, MICHAEL CICHON, AND PASCAL ANNYCKE
01.0
Males Females Males Females
Males Females Males Females
Males Females Males Females
10–14
30–34
50–54
70–74
90–94
Age (years)
Age (years)
Age (years)
Age (years)
Age (years)
Age (years)
10–14
30–34
50–54
70–74
90–94
10–14
30–34
50–54
70–74
90–94
10–14
30–34
50–54
70–74
90–94
10–14
30–34
50–54
70–74
90–94
10–14
30–34
50–54
70–74
90–94
1.02.0 2.0 0Millions
2000Millions
Without AIDS With AIDS
1.0 1.02.0 2.0
01.0 1.02.0 2.0 0Millions
2025Millions
1.0 1.02.0 2.0
01.0 1.02.0 2.0 0Millions
2050Millions
1.0 1.02.0 2.0
Figure 8.3. Demoland: Population Pyramids by Sex, Without and With Impact of AIDS
Source: Authors’ calculations using model described in the text.
©International Monetary Fund. Not for Redistribution
ulation structure with and without HIV/AIDS, using population pyra-mids. Under the no-AIDS scenario, the total population of Demolandincreases from 14.8 million in 2000 to 34.1 million in 2050, for an averageannual growth rate of 1.7 percent. With AIDS, however, the populationreaches only 22.6 million in 2050, because of fewer births and higher mor-tality. The figure shows the combined effect of lower fertility and higherinfant mortality on the population below age 20, which represents thefuture workforce and social security contributors. Figure 8.3 also showsthat mortality due to AIDS will prevent a large proportion of the popula-tion from reaching retirement age.
Economic Impact
HIV/AIDS affects the economy in many different ways. For example,increased mortality and morbidity adversely affect productivity, increasedexpenditure on health is likely to affect public and private saving, andincreased production costs and a deteriorating economic outlook affectinvestment behavior. In analyzing the financing of social security, the mostimportant economic variables are GDP (or, more specifically, the tax basefor domestic government revenue), labor force participation rates, and thenumber of contributors to the social security scheme.
A detailed analysis of the impact of HIV/AIDS on GDP is beyond thescope of this chapter.4 For Demoland it is assumed that HIV/AIDS causesa reduction in GDP growth of 2 percentage points (from 5 percent to3 percent) initially (2000–04) and that the impact of HIV/AIDS on GDPgrowth then gradually diminishes to 1.5 percentage points in 2005–09,1 percentage point in 2010–19, and 0.5 percentage point thereafter.
Labor productivity increases by 1.2 percent a year in the scenario with-out AIDS. With HIV/AIDS, productivity is assumed to increase at a rate ofonly 1.0 percent a year until 2039 and to return to its earlier growth ratethereafter. For simplicity, we assume that salary increases go hand in handwith increases in productivity.
As regards the impact of AIDS on labor supply, it is assumed that theparticipation rates of men will be lower at all ages except 15–24 (Table 8.6).For women, the need for children and widows to seek employment willcause their participation rates to rise at all ages below 44. Reflecting slowerGDP growth, the unemployment rate in the with-AIDS scenario is
Financial Effects of HIV/AIDS on National Social Protection Schemes 269
4See Haacker (Chapter 2, this volume) for a discussion of the macroeconomic effects ofHIV/AIDS.
©International Monetary Fund. Not for Redistribution

assumed to increase from 14 percent in 2000 to 20 percent in 2015, andthen decrease as total population falls as a result of AIDS mortality.5
For contribution-financed social security schemes, such as the pensionscheme discussed below, the assumptions regarding the number of con-tributors are critical. In assessing the impact of HIV/AIDS on contributionrates, we distinguish four different scenarios. Scenario 1 is the base sce-nario, without AIDS. In scenario 2 the number of contributors changes inproportion to the change in the total number of workers, so that the per-centage of workers covered by the scheme is held constant. For these twoscenarios, the assumed coverage rates are presented in Tables 8.7 and 8.8.
In scenario 3 the number of contributors to the social security schemeis the same as in the base scenario. This reflects the assumption that,because of the size of the uncovered population and of the informal sec-tor, all contributors dying from AIDS are replaced by workers previouslynot covered by the scheme. This scenario may also be realistic in the con-text of a civil service pension plan, which is the principal pension arrange-ment in a large number of developing countries. Scenario 4, the mostpessimistic scenario, freezes the number of contributors at its 2000 level,on the assumption that AIDS deaths and slower economic growth preventany increase in the covered population.
270 PIERRE PLAMONDON, MICHAEL CICHON, AND PASCAL ANNYCKE
Table 8.6. Demoland: Assumptions on Labor Force Participation Rates by Age and Sex (Percent of working-age population)
Age Scenario 1 (No AIDS) Scenarios 2–4 (With AIDS)_________________________ _________________________(years) Males Females Males Females
15–19 58 37 65 5020–24 89 44 90 6025–29 97 47 90 6030–34 98 49 90 6035–39 99 49 90 6040–44 98 51 90 6045–49 97 51 90 5050–54 97 49 90 5055–59 90 46 60 3060–64 88 39 20 2065–69 72 23 20 20
Source: Authors’ model described in the text.
5Unemployment rates in many developing countries are significantly above these levels,sometimes reaching 40 percent or more. In that context our assumptions may appear opti-mistic. However, as described earlier, high unemployment combined with an abundance ofunskilled labor may make it easier to replace workers dying from AIDS with unemployedworkers or workers from the informal sector. Consequently, keeping the unemployment ratelow may generate a greater impact of AIDS on the social security system.
©International Monetary Fund. Not for Redistribution

Individual Social ProtectionSchemes and the Fiscal Balance
HIV/AIDS will most likely increaseexpenditure on all social protectionschemes and consequently affect thebudgetary situation of the govern-ment. This section presents the finan-cial implications of the epidemic onthe individual schemes and shows howthey affect the social budget and thefiscal balance of Demoland.
Pensions
The impact of HIV/AIDS on pension schemes may be viewed from twoperspectives. On the expenditure side, AIDS is expected to reduce the num-ber of old-age pensions in the long term, but to increase survivors’ and dis-ability pensions in the short term. On the revenue side, AIDS will have animpact to the extent that a smaller total population will cause a reductionin the number of people employed, and to the extent that those employedpersons affected by HIV/AIDS are among the contributors to the scheme.The reality in most developing countries is that the coverage of social secu-rity schemes is far from complete, and it can be assumed in some cases thatnew contributors will replace—at least partly—those who die from AIDS.However, the extent of this substitution is unknown. Thus we analyze twoscenarios with respect to the impact of AIDS on the number of contribu-tors to the Demoland pension scheme: a zero-substitution scenario and afull-substitution scenario.
The impact of HIV/AIDS on old-age pensions varies over time. Ini-tially, the number of pensions will bealmost unaffected, because the dis-ease mainly strikes persons youngerthan 50 (Figure 8.4). But later, whenthe generations now younger than50 reach retirement age, the schemewill experience a reduction in thenumber of old-age pensioners.
The number of disability pensionswill be affected by several factors.
Financial Effects of HIV/AIDS on National Social Protection Schemes 271
Table 8.7. Demoland: Assumptionson Social Security Coverage Rates byAge and Sex, 2000(Percent)
Age (years) Males Females
15–19 20 2020–24 25 2525–29 30 3030–34 40 3535–39 40 4040–44 50 4545–49 50 5050–54 60 5555–59 60 60
Source: Authors’ model described in the text.
Table 8.8. Demoland: Assumptionson Social Security Coverage Rates bySex and Year(Percent)
Year Males Females
2000 34 342010 35 352020 36 362030 37 372040 38 382050 37 38
Source: Authors’ model described in the text.
©International Monetary Fund. Not for Redistribution

The incidence of new disability cases should increase as workers in thelate stages of AIDS become incapacitated. However, the average durationof disability pensions should fall because of the relatively rapid and fatalcourse of AIDS. Moreover, if the period from incapacitation to death isrelatively short—for instance, because life-prolonging drugs are unavail-able—it may well happen that only a few persons will claim the disabilitypension and receive benefits for more than a short period.
Figure 8.5 presents one possible scenario in which the presence of AIDSmultiplies the incidence of disability by a factor of 5 from 2000 to 2010,after which the multiplier gradually falls to 1 between 2010 and 2050. Inchoosing these values, we have assumed that those who die from AIDS willbe eligible for a disability pension for at least a short period before death.In addition, it is assumed that the average duration of disability pensionsis reduced for those afflicted by AIDS. Finally, it is assumed that the mor-tality rates of disability pensioners are five times higher than in the basescenario from 2000 to 2010 and that this factor thereafter declines gradu-ally to unity between 2010 and 2050.
As regards survivors’ benefits, AIDS will increase the number of widowsand widowers (Figure 8.6) and the number of orphans (Figure 8.7). If thepension scheme provides for a funeral grant, expenditure on such bene-fits will increase sharply. On the other hand, the duration of widows’ andwidowers’ pensions should decrease as a result of HIV/AIDS, since sur-
272 PIERRE PLAMONDON, MICHAEL CICHON, AND PASCAL ANNYCKE
0
0.5
1.0
1.5
2.0
2001 2010 2020 2030 2040 2050
Without AIDS
With AIDS
Figure 8.4. Demoland: Projected Number of Old-Age Pensioners Without and With Impact of AIDS(Millions)
Source: Authors’ calculations using model described in the text.
©International Monetary Fund. Not for Redistribution

viving spouses have a high probability of having been infected by HIVthemselves before the death of their spouse. The increase in the numberof orphans’ pensions will be proportionately larger than that for widows’and widowers’ pensions, because the death of the insured person typicallyhappens at an early age, when there are many dependent children underthe age of 20 (as in the Demoland case) in the household.
HIV/AIDS will have an impact on pension scheme revenue to the extentthat it affects the number of contributors, their earnings, and contributionrates. Below we assume that contribution rates are adjusted regularly sothat pension outlays equal pension revenue at all times. The macroeco-nomic assumptions for each of four scenarios are described above.
The global impact of HIV/AIDS on the cost of a social security pensionscheme will vary over time. In the short run the additional survivors’ anddisability pensions will increase expenditure, and HIV/AIDS may(depending on the scenario) have the effect of reducing the number ofcontributors through death or incapacitation. In the longer run HIV/AIDSis expected to reduce the number of persons who reach retirement age,thus reducing expenditure on old-age pensions.
In scenario 2, where HIV/AIDS affects the number of contributors inthe same proportion as the entire labor force, the present contribution rateof 8 percent becomes insufficient as early as 2000. The contributionrate must be increased in increments, to 10.5 percent in 2010 (Table 8.9),
Financial Effects of HIV/AIDS on National Social Protection Schemes 273
0
0.2
0.4
0.6
0.8
2001 2010 2020 2030 2040 2050
Figure 8.5. Demoland: Projected Number of Disability Pensioners Without and With Impact of AIDS(Millions)
Source: Authors’ calculations using model described in the text.
Without AIDS
With AIDS
©International Monetary Fund. Not for Redistribution

because of the increasing expenditure pattern and the lower salary baseresulting from HIV/AIDS. Scenario 3, where HIV/AIDS does not affect thenumber of contributors, also requires an increase in contribution ratescompared with the base scenario without HIV/AIDS, but the increase ismore gradual than in scenario 2. In the worst-case scenario, scenario 4, thecontribution rate has to increase rapidly, to 17.3 percent in 2020 and even-tually to 23.2 percent in 2050.
It may be helpful to compare the general average premium for the pen-sion scheme under the various scenarios. The general average premium isdefined here as the minimum constant contribution rate sufficient tofinance all benefits of the scheme over the period 2000–50. In the base sce-nario the general average premium would be 10.3 percent, whereas in sce-nario 2 it rises to 11.4 percent. This means that, in scenario 2, the adventof AIDS requires an immediate and sustained increase in the contributionrate of 1.1 percentage point over the next 50 years. On the other hand, ifwe assume that HIV/AIDS does not affect the number of contributorsbecause of full substitution by previously uncovered workers (scenario 3),the general average premium increases only to 11.0 percent, or by 0.7 per-centage point. In the least favorable scenario, scenario 4, the general aver-age premium would be 16.5 percent.
The above discussion assumes a typical defined-benefit pensionscheme. Other types of pension arrangements may exist in a number of
274 PIERRE PLAMONDON, MICHAEL CICHON, AND PASCAL ANNYCKE
0
0.5
1.0
1.5
2001 2010 2020 2030 2040 2050
Figure 8.6. Demoland: Projected Number of Widows Without and With Impact of AIDS(Millions)
Source: Authors’ calculations using model described in the text.
Without AIDS
With AIDS
©International Monetary Fund. Not for Redistribution

countries, which will thus face the AIDS threat in a different way. Box 8.1describes the impact of AIDS in the context of a defined-contribution (orprovident fund) arrangement and shows how this type of scheme isequipped to address the issue of HIV/AIDS.
Health
Health expenditure related to HIV/AIDS can be divided into curativecare and prevention. In a developing country, health care may be offeredby the public sector, by the private sector, or by foreign-based donors. Inthe case of Demoland, it is assumed that all public expenditure on healthis financed from general revenue and that no national health insurancescheme exists.6 Initially, most of the additional need for health services dueto HIV/AIDS goes unmet. Through 2003, only 10 percent of opportunis-tic infections are treated, partly reflecting limited capacity at the local level,but also limited take-up of HIV-related health services because of stigma-tization. The public sector does not provide any antiretroviral (ARV) treat-
Financial Effects of HIV/AIDS on National Social Protection Schemes 275
0
0.2
0.4
0.6
0.8
2001 2010 2020 2030 2040 2050
Figure 8.7. Demoland: Projected Number of Orphans Without and With Impact of AIDS(Millions)
Source: Authors’ calculations using model described in the text.
Without AIDS
With AIDS
6In fact, the private sector may provide some health treatments, and thus the economiceffect of HIV/AIDS may extend beyond the fiscal effect, but given the high cost of treatingHIV patients it is assumed here that the private sector provides very limited coverage andthat most health expenditure is supported by the government.
©International Monetary Fund. Not for Redistribution

ment through 2003, although a small percentage of patients (fewer than1 percent of those requiring treatment) may receive ARV drugs throughpilot projects or private providers. In 2004 the government embarks on anambitious program to improve access to treatment, reaching coveragerates of 45 percent (for ARV treatment) and 40 percent (for opportunisticinfections) by 2007, and 65 percent and 70 percent, respectively, by 2015.7
Annual spending per patient is $400 for opportunistic infections and $500for ARV treatment, enough to cover the costs of the drugs and of servicedelivery.8 HIV patients are assumed to need treatment for opportunisticinfections for the last two years of their lives, and ARV treatment isassumed to begin two years before the patient would otherwise die and toextend life by three years, so that patients receive treatment for a total offive years.9
In most countries afflicted by HIV/AIDS, the effects on health expendi-ture are very small initially, because the health sector is not well equippedto deal with the additional demand, or because fixed budget allocations
276 PIERRE PLAMONDON, MICHAEL CICHON, AND PASCAL ANNYCKE
Table 8.9. Demoland: Required Pension Contribution Rates (Percent)
Scenario1______________________________________________________________
Year 1 2 3 4
2000 8.0 8.2 8.0 8.32001 8.0 8.5 8.2 8.92002 8.0 8.8 8.6 9.62003 8.0 9.1 9.0 10.42004 8.0 9.4 9.3 11.12005 8.1 9.6 9.5 11.72010 8.4 10.5 10.1 14.12020 9.0 11.7 10.1 17.32030 10.0 11.3 10.7 19.92040 11.8 11.7 12.0 21.62050 15.5 15.2 15.2 23.2
Source: Authors’ calculations using model described in the text.1Scenario 1 is a no-AIDS scenario; in scenario 2 the change in the number of contributors is propor-
tional to the change in the total number of workers, so that the percentage of workers covered by thescheme is held constant; in scenario 3 contributors dying from AIDS are replaced by workers previouslynot covered by the scheme, so that the number of contributors is the same as in the scenario withoutAIDS; and in scenario 4 the number of covered workers remains constant.
7The assumed coverage rates are inspired by targets proposed by the Commission on Mac-roeconomics and Health (2001).
8These estimates are derived from Schwartländer and others (2001) and Individual Mem-bers of the Faculty of Harvard University (2001), using updated prices for ARV drugs.
9See Schwartländer and others (2001). An economic side effect of ARV treatment is that itreduces or delays outlays on treatment of opportunistic diseases.
©International Monetary Fund. Not for Redistribution

mean that, in the short run, hospitals and doctors must resort to rationing.In Demoland, public health expenditure increases by only about 2 percent(0.05 percent of GDP) by 2000. As coverage rates for ARV treatment andopportunistic infections increase, public health expenditure rises by 0.3percent of GDP by 2005, 1.1 percent of GDP by 2010, and 1.3 percent ofGDP by 2015, in which year HIV/AIDS-related expenditure amounts to 52percent of initial public health expenditure.
Other Social Security Schemes
Unemployment insurance schemes are rather rare in developing coun-tries. We assume that Demoland is one of the few countries with such ascheme for the formal sector. In our example, as already mentioned, theunemployment rate increases from 14 percent in 2000 to 20 percentin 2015. After 2015, because HIV/AIDS reduces the working-age popula-tion, the unemployment rate starts to decrease and eventually (after 2025)falls below the rate in scenario 1. Demoland’s unemployment insurancescheme is financed by employer and worker contributions that togetherequal 1 percent of covered earnings initially. In line with the increasein unemployment, we assume that unemployment insurance contri-butions will have to increase gradually to 1.5 percent of covered earningsin 2015.
In our example, short-term benefits include sickness, maternity, and on-the-job injury benefits. We assume that the cost of sickness benefits increasesby 50 percent as a result of HIV/AIDS, from 0.50 percent of payroll to 0.75percent. Maternity benefits (0.5 percent of payroll in 2000) follow thedecrease in the fertility rate as a result of HIV/AIDS, and the cost of on-the-job injury benefits is unaffected, remaining at 1.0 percent of payroll.
We assume that tax-financed family benefits are unaffected byHIV/AIDS. Any change in the country’s demography is compensated by achange in benefit amounts so as to keep total expenditure constant.
A basic social assistance program exists in Demoland. The program’sexpenditure, financed from general revenue, amounts to 0.25 percent ofGDP. We assume that HIV/AIDS increases poverty and that the govern-ment will have to support those in need because of loss of income orincreased personal health care expenses. We further assume that the num-ber of social assistance recipients doubles in 2000 because of AIDS andthat the number of additional recipients increases over time in line withthe demographic projections presented above. Under these assumptionsthe cost of the social assistance program doubles in 2000, to 0.50 percentof GDP, and reaches 0.90 percent of GDP in 2015.
Financial Effects of HIV/AIDS on National Social Protection Schemes 277
©International Monetary Fund. Not for Redistribution

Impact of HIV/AIDS on the Social Budget and the Fiscal Balance
Table 8.10 presents the social budget of Demoland without and with theimpact of HIV/AIDS, respectively. Without HIV/AIDS total social expen-diture represents 5.0 percent of GDP in 2000, of which 2.5 percent of GDPis for public health expenditure and 1.1 percent for pensions. Under thisscenario, total social expenditure grows modestly through 2015, from 5.0percent of GDP to 5.4 percent, mainly because of increased expenditure onpensions. Since pensions are financed from payroll contributions fromemployers and workers, the burden on general revenue decreases slightlyduring the period, from 3.2 percent of GDP to 3.1 percent.
The HIV epidemic already has a significant effect on social expenditurein 2000. Compared with the scenario with no AIDS, current social expen-diture rises by 0.5 percent of GDP (10 percent), mainly because ofincreased outlays for social assistance. In light of our assumptions basedon limited historical coverage rates for HIV/AIDS-related health services,health expenditure increases only very modestly at this stage. By 2015
278 PIERRE PLAMONDON, MICHAEL CICHON, AND PASCAL ANNYCKE
Box 8.1. Impact of AIDS on Defined-Contribution Pension Schemes
This box addresses the financial impact of HIV/AIDS in the context ofdefined-benefit pension schemes, which are the most common form of publicsector pension scheme. However, certain developing countries have adoptedother forms of pension provision, such as provident funds or other forms ofdefined-contribution systems. Defined-contribution pension schemes havealso become more common in the private sector, as companies seek to containthe rising costs of risk benefits associated with HIV/AIDS (see Rosen andSimon, 2003).
Under a defined-contribution scheme, contributions are accumulated in anindividual account, and the accumulated amount is normally paid at retire-ment in the form of an annuity, a lump sum, or scheduled withdrawals. Theusual death benefit under a defined-contribution scheme is a refund of theamount accumulated on behalf of the accountholder (the sum of contributionspreviously paid plus accumulated interest) at the time of death. If death occursnot long after the worker has started contributing to the scheme, the accumu-lated amount will be low. Using the same 8 percent contribution rate as in theDemoland case, the table presents the accumulated value of a defined-contri-bution account at different ages for a worker who started contributing to thescheme at age 20.
The regular income that can be purchased from the accumulated account isfar below the current salary if death occurs before age 45. This also shows thatdefined-contribution schemes are poorly adapted to face the threat of AIDS,because they cannot provide regular long-term income to the survivors of par-
©International Monetary Fund. Not for Redistribution

social expenditure reaches 8.4 percent of GDP in this scenario, an increaseof 3.2 percent of GDP relative to a situation with no HIV/AIDS. Mostnotably, HIV/AIDS results in an increase in health expenditure of 1.3 per-cent of GDP by 2015 (with much improved access to HIV/AIDS-relatedhealth services, including ARV treatment), pension outlays rise by 0.5 per-cent of GDP, and social assistance payments rise by 0.7 percent of GDP, rel-ative to the no-AIDS scenario.
To assess the impact of increased social expenditure on the fiscal balance,it is also important to take into account the financing of that expenditure.We have assumed that pensions, unemployment insurance, and short-termbenefits are financed by contributions; the increase in expenditure on theseitems (1 percent of GDP) is offset by increased contributions.10 As a conse-
Financial Effects of HIV/AIDS on National Social Protection Schemes 279
10Additional sources of financing are changes in reserves and investment income of socialsecurity institutions. In our example, these items play a minor role. However, in a situationwith significant reserves of the social security system, these can be used to smooth peaks incontribution rates or taxes to finance HIV/AIDS-related expenditure.
ticipants in the age groups most affected by HIV/AIDS (those aged 20–45). Onthe other hand, some provident funds allow the prepayment of the account bal-ance in the case of certain defined events before retirement. Such a provisionmay help pay medicines and hospital expenses and support the worker’s familyduring his or her last months of life.
Accumulated Pension Contributions in a Defined-Contribution Scheme1
Value of Spouse’sAccumulated Ratio of a $1-a-Year Income from
Age of Current Value of Accumulated Life Annuity to a Life Annuity Worker Salary Account Account Value to Surviving Spouse (percent of(years) (dollars) (dollars) Current Salary (dollars) current salary)2
25 5,853 3,096 0.5 19.4 2.730 6,851 7,122 1.0 18.6 5.635 8,020 13,017 1.6 17.6 9.240 9,388 21,502 2.3 16.5 13.945 10,989 33,552 3.1 15.2 20.1
Source: Authors’ calculations.1It is assumed that workers enroll in the pension plan at age 20, that their starting salary is $5,000
and increases by 3.2 percent (nominal) a year, that each individual account earns interest at 6.0 per-cent a year, and that the life annuity is indexed at 2 percent a year.
2Calculated as 100 × (accumulated account value / current salary) / value of $1-a-year lifeannuity).
©International Monetary Fund. Not for Redistribution

quence, the balance of the social budget (financed from general revenue)increases by 2.0 percent of GDP by 2015. This could be financed from anincrease in external grants or from domestic revenue. As detailed byHaacker (Chapter 7, this volume), a substantial proportion of health expen-diture in most countries severely affected by HIV/AIDS currently isfinanced in this way.11 However, other components of the additional costs(such as most forms of social assistance) are usually financed from domes-
280 PIERRE PLAMONDON, MICHAEL CICHON, AND PASCAL ANNYCKE
Table 8.10. Demoland: Social Budget Without and With Impact of HIV/AIDS(Percent of GDP)1
Without Impact of AIDS With Impact of AIDS________________________ ________________________Item 2000 2005 2010 2015 2000 2005 2010 2015
ExpenditureTotal current social expenditure 4.7 4.9 5.1 5.4 5.2 6.1 7.5 8.4
Pensions 1.1 1.3 1.5 1.7 1.1 1.5 1.8 2.2Health (public expenditure only) 2.5 2.5 2.5 2.5 2.6 2.8 3.6 3.8Unemployment 0.1 0.2 0.2 0.2 0.2 0.2 0.3 0.4Short-term benefits 0.3 0.3 0.3 0.4 0.3 0.4 0.5 0.6Family benefits 0.5 0.4 0.4 0.4 0.5 0.5 0.5 0.5Social assistance 0.2 0.2 0.2 0.2 0.5 0.7 0.8 0.9
Change in reserves 0.2 0.2 0.1 — 0.2 0.2 0.2 0.1Pension insurance 0.2 0.2 0.1 — 0.2 0.2 0.2 0.1Health insurance — — — — — — — —Short-term benefits — — — — — — — —Unemployment insurance — — — — — — — —
Total social expenditure 5.0 5.1 5.2 5.4 5.4 6.3 7.7 8.5
IncomeSocial security contributions 1.6 1.7 2.0 2.2 1.6 2.1 2.6 3.2
Pension insurance 1.1 1.3 1.5 1.6 1.1 1.5 1.8 2.2Health insurance — — — — — — — —Short-term benefits 0.3 0.3 0.3 0.4 0.3 0.4 0.5 0.6Unemployment insurance 0.1 0.2 0.2 0.2 0.2 0.2 0.3 0.4
Investment income 0.2 0.2 0.2 0.2 0.2 0.2 0.2 0.2Pension insurance 0.2 0.2 0.2 0.2 0.2 0.2 0.2 0.2Health insurance — — — — — — — —Short-term benefits — — — — — — — —Unemployment insurance — — — — — — — —
Income from general revenue 3.2 3.2 3.0 3.1 3.6 4.0 4.9 5.1
Total income 5.0 5.1 5.2 5.4 5.4 6.3 7.7 8.5
Source: Authors’ calculations.1Numbers may not sum to totals because of rounding.
11Summers and Kates (2003), updating estimates by the Joint United Nations Programmeon HIV/AIDS (UNAIDS), project that over three-fourths of institutional spending onHIV/AIDS in developing countries in 2003 was financed through external assistance. Martin(2003), in a study of several countries in southern Africa, reports similar findings.
©International Monetary Fund. Not for Redistribution

tic revenue. Thus, financing these expenditures, to the extent that they arenot financed externally, would require an increase in tax and other revenueor cutbacks in other areas.
Improving the Coverage of Social Protection Schemes to Copewith HIV/AIDS
How can governments of developing countries meet the social challengesposed by HIV/AIDS and its expected severe budgetary consequences? Thesocial challenges are of a twofold nature. On the one hand, health care hasto be provided to those affected. On the other hand, the victims of the pan-demic and their families need income support to prevent the medical disas-ter caused by AIDS from turning into a social disaster. Improving thecoverage of social protection schemes appears to be the solution.
Because traditional social insurance transfers fail to reach the majorityof the population, both in Africa and in other developing countries, andgiven that the AIDS pandemic will affect all population subgroups, more-universal income replacement schemes could be effective new instrumentsin the struggle against AIDS-triggered poverty. A universal flat-rate pen-sion for the elderly, the disabled, and survivors, paid to all persons over acertain age (on the basis of residency, for example), is one way to providebasic income to families that have an elderly member. Such a measurecombats old-age poverty while also reinforcing the intergenerational sup-port so urgently needed among AIDS families with a missing generation.Ancillary benefits or additional conditions attached to a universal pensioncan be used to provide supplementary income for families to take care ofAIDS-affected individuals; they may also help prevent children from hav-ing to leave school at an early age to earn an income. According to all avail-able experience, a universal pension would cost on the order of 1 to2 percent of the developing country’s GDP.12 The financing of such pen-sions may require the suppression of subsidies to social insurance schemesor the suppression of tax advantages for private pension schemes. Intro-ducing universal pension benefits where they did not exist before will, ofcourse, require substantial public debate. However, the total cost does notseem exorbitant, and a gradual introduction over 10 or more years may befeasible in a range of countries.13
Financial Effects of HIV/AIDS on National Social Protection Schemes 281
12See the figures quoted by the Institute of Development and Policy Management and HelpAge (United Kingdom, Department for International Development, 2003, Chapter 3.5).
13The Financial and Actuarial Service of the International Labour Organization has startedan initiative to establish the financial affordability of this type of benefit.
©International Monetary Fund. Not for Redistribution

Another way to reduce the pressure on the government budget wouldbe to “bail in” the private sector, by introducing a public health insurancescheme financed by earmarked contributions. However, such a schemewould be introduced in an environment where HIV/AIDS is alreadyraising companies’ personnel costs, and where many companies aretaking steps to contain the rising costs of health coverage related to ahigh incidence and high cost of care related to AIDS. Thus, fiscalmeasures to finance such a scheme would have to be mindful of theimpact on personnel costs, especially for employees at the low end of thepay scale.
Although HIV/AIDS raises the costs of social insurance, these programsalso have substantial benefits. For example, income support mitigates theadverse economic effects on the families affected, and Ainsworth, Beegle,and Koda (2002) suggest that such support has a positive effect on schoolenrollment rates for orphans. Improved health coverage results in fewernew HIV infections, fewer orphans, more people staying at work, fewerdisability grants, and longer life expectancy.14 Thus, in addition to miti-gating the impact on the affected individuals and households and reduc-ing the human toll, these measures would also help to reduce or evenreverse the economic decline caused by HIV/AIDS, thereby helping tofinance the increased costs of social security.15
Conclusions
Health and pension expenditure account for about three-fourths ofall social expenditure in any country with a fairly well developednational social transfer system. But HIV/AIDS affects each of these twotypes of spending differently. These effects can be simulated, but notwithout a substantial degree of uncertainty. In particular, the effects onthe pension system are probably less predictable than those on the healthsystem.
As long as a pension scheme can find new contributors to replacethose prematurely dying of AIDS, the impact of AIDS on national pen-sion schemes appears to be financially manageable. However, the impactof HIV/AIDS on the number of contributors to these schemes is the great
282 PIERRE PLAMONDON, MICHAEL CICHON, AND PASCAL ANNYCKE
14See Haacker (Chapter 2, this volume) for a discussion of the macroeconomic benefits ofARV treatment.
15See Masha (Chapter 9, this volume) for an assessment of the macroeconomic effects ofBotswana’s National Strategic Plan on HIV/AIDS.
©International Monetary Fund. Not for Redistribution

unknown. For developing countries it may be assumed that highunemployment and a large informal sector will allow HIV/AIDS-relateddeaths in the workforce to be replaced to a considerable degree byworkers from outside the formal sector and the unemployed. Even then,however, overall economic growth may slow, because the productivityof the replacements is likely to be less than that of the workers they arereplacing. Moreover, the cost of training the new workers will increasethe overall cost to the enterprise, also reducing growth. The dramaticresults of our nonreplacement scenario show (although it describesan improbable, extreme case in which the number of contributors isfrozen at the 2000 level) that the financial risks of pension schemesassociated with a potential draining of the economy of qualified workersare substantial.
The social budget exercise presented in this chapter shows that the costof social programs other than pension schemes might also increase sub-stantially as a result of AIDS. The cost of health care, sickness, and unem-ployment benefits schemes may rise dramatically as HIV/AIDS putspeople out of work and generates the need for income support and healthcare. In countries where the prevalence of HIV/AIDS is high, the burdenon general revenue may put governments in a difficult financial position,even though the emerging deficits in the next decades may not be unman-ageable, as our projections show.
Solutions appear to be available in the form of a set of policy optionsthat could help address the medical, social, and financial consequences ofthe AIDS pandemic. Universal pensions, probably combined with more-targeted social assistance for AIDS-affected families, would help alleviatethe social consequences. Abolishing tax breaks for private pension schemescould possibly finance most of the cost without increasing the emerginggovernment deficit.16 Investing a part of the social budget in awarenesscampaigns can also reduce the long-term cost. And the introduction of anational health insurance scheme could probably help close the emergingdeficit. Even so, deficits will most likely increase over what they would havebeen under the status quo. Further tax increases may be necessary,although these may be less dramatic than is often assumed. The challengewill be to design these taxes in such a way that they do not further weakencountries’ already fragile growth rates.
Financial Effects of HIV/AIDS on National Social Protection Schemes 283
16The cost of South Africa’s social pension is estimated to be on the order of 1.4 percent ofGDP, compared with tax breaks for private pensions that currently amount to 1.7 percent ofGDP.
©International Monetary Fund. Not for Redistribution

Bibliography
Ainsworth, Martha, Kathleen Beegle, and Godlike Koda, 2002, “The Impact ofAdult Mortality on Primary School Enrollment in Northwestern Tanzania,”Africa Region Human Development Working Paper (Washington: World Bank).
Annycke, Pascal, 2003, “The Impact of HIV/AIDS on Security for the Elderly in Africa,”paper presented at the African Technical Consultation “Economic Security andDecent Work,” Tanzania, May.
Barbone, Luca, and Luis-Alvaro Sanchez B., 1999,“Pensions and Social Security in Sub-Saharan Africa: Issues and Options,” World Bank Africa Region Working PaperNo. 4 (Washington: World Bank).
Baruti, Elias, 2003, “Extension of Social Security Coverage to the Poor in the InformalUrban Sector in Tanzania Through Micro Credit,” paper presented at the Inau-gural Tanzanian Biennial Development Forum.
Bollinger, Lori, and John Stover, 1999, “The Economic Impact of AIDS in Angola”(Washington: The Futures Group International)
Bonnel, René, 2000, “HIV/AIDS: Does it Increase or Decrease Growth in Africa?”Working paper (Washington: World Bank).
Castro-Leal, Florencia, and others, 2000, “Public Spending on Health Care in Africa:Do the Poor Benefit?” Bulletin of the World Health Organization, Vol. 78, No. 1,pp. 66–74.
Cichon, Michael, 2002, “A Global Social Trust Network: Investing in the World’s SocialFuture” (Geneva: Financial, Actuarial and Statistical Services Branch, Interna-tional Labour Organization).
Commission on Macroeconomics and Health (CMH), 2001, “Macroeconomics andHealth: Investing in Health for Economic Development” (Geneva: World HealthOrganization).
Cuddington, John T., 1993, “Modeling the Macroeconomic Effects of AIDS, with anApplication to Tanzania,” World Bank Economic Review, Vol. 7, No. 2, pp. 173–89.
———, and John D. Hancock, 1993, “Assessing the Impact of AIDS on the GrowthPath of the Malawian Economy,” Journal of Development Economics, Vol. 43, No. 2,pp. 363–68.
———, 1995, “The Macroeconomic Impact of AIDS in Malawi: A Dualistic, LabourSurplus Economy,” Journal of African Economics, Vol. 4, No. 1, pp. 1–28.
Individual Members of the Faculty of Harvard University, 2001, “Consensus State-ment on Antiretroviral Treatment for AIDS in Poor Countries” (Cambridge,Massachusetts).
International Labour Organization, 1997, “International Inquiry into the Cost of SocialSecurity 1990–1993” (unpublished; Geneva). Available via the Internet: www.ilo.org/public/english/protection/socfas/research/css/cssindex.htm.
———, 1999, “ILO Action Against HIV/AIDS—A Draft Framework for Global andRegional Initiatives” (Geneva).
284 PIERRE PLAMONDON, MICHAEL CICHON, AND PASCAL ANNYCKE
©International Monetary Fund. Not for Redistribution

———, 2000, “HIV/AIDS: A Threat to Decent Work, Productivity and Development,”document for discussion at the Special High-Level Meeting on HIV/AIDS and theWorld of Work, Geneva, June 8.
———, 2001, “Côte d’Ivoire—Evaluation actuarielle du régime des pensions obliga-toires de la Caisse Générale de Retraite des Agents de l’Etat au 31 décembre 1998”(Geneva).
———, 2002a, “ILO Compendium of Official Statistics on Employment in the Infor-mal Sector,” Stat Working Paper 1 (Geneva).
———, 2002b, “A Global Social Trust Network: Investing in the World’s Social Future”(Geneva: Financial, Actuarial and Statistical Services Branch, InternationalLabour Organization).
———, 2002c, “Contributing to the Fight Against HIV/AIDS Within the InformalEconomy: The Existing and Potential Role of Decentralized Systems of Social Pro-tection” (Geneva).
———, forthcoming, Social Protection Financing (Geneva).
Joint United Nations Programme on HIV/AIDS (UNAIDS), 2000a, “AIDS EpidemicUpdate: December 2000” (Geneva).
———, 2000b, “Côte d’Ivoire – Epidemiological Fact Sheet on HIV/AIDS and SexuallyTransmitted Infections” (Geneva).
———, 2000c, “Guidelines for Studies of the Social and Economic Impact ofHIV/AIDS” (Geneva).
Kamuzora, Peter, 1999, “Extension of Formal Social Security Schemes in the UnitedRepublic of Tanzania” (Dar es Salaam, Tanzania: University of Dar es Salaam)
Martin, H. Gayle, 2003, “A Comparative Analysis of the Financing of HIV/AIDS Pro-grammes in Botswana, Lesotho, Mozambique, South Africa, Swaziland, and Zim-babwe” (Pretoria, South Africa: Human Sciences Research Council).
Rosen, Sidney, and Jonathon Simon, 2003, “Shifting the Burden: The Private Sector’sResponse to the AIDS Epidemic in Africa,” Bulletin of the World Health Organiza-tion, Vol. 81, pp. 131–37.
Schwartländer, Bernhard, and others, 2001, “Resource Needs for HIV/AIDS,” Science,Vol. 292, No. 5526, pp. 2434–36.
Sehgal, Jag M., 1999, “The Labour Implications of HIV/AIDS: An Explanatory Note,”Discussion Paper on HIV/AIDS and the World of Work (Geneva: InternationalLabour Organization).
Summers, Todd, and Jennifer Kates, 2003, “Global Funding for HIV/AIDS in ResourcePoor Settings” (Washington: Kaiser Family Foundation).
Tossa, José, forthcoming, “SPERs Benin” (Geneva: Social Protection—Financial, Actu-arial, and Statistical Services Branch, ILO).
United Kingdom, Department for International Development, 2003, “Non-contribu-tory Pensions and Poverty Prevention in Developing Countries: A ComparativeAnalysis between South Africa and Brazil” (London).
United Nations, 1999, World Population Prospects: The 1998 Revision” (New York).
Financial Effects of HIV/AIDS on National Social Protection Schemes 285
©International Monetary Fund. Not for Redistribution

U.S. Social Security Administration, Office of Policy, 2003, Social Security ProgramsThroughout the World: Africa, 2003 (Washington).
World Bank, 1999, Confronting AIDS: Public Priorities in a Global Epidemic (New York:Oxford University Press).
———, 2000, World Development Report 2000/01 (Washington).
286 PIERRE PLAMONDON, MICHAEL CICHON, AND PASCAL ANNYCKE
©International Monetary Fund. Not for Redistribution

9
An Economic Assessment ofBotswana’s National StrategicFramework for HIV/AIDS
IYABO MASHA
Botswana’s economic transformation during the past 30 years is one ofthe most highly regarded success stories of the African continent. Real
GDP grew at an average annual rate of 13.9 percent between 1965 and1980, and 11.3 percent between 1980 and 1989, making Botswana theworld’s fastest-growing economy during the period. Between 1990 and1998, however, GDP growth averaged only 4.75 percent a year. Real GDPper capita increased by an average of 5 percent a year, reaching $3,417 in1997/98 and $3,170 in 2003. Botswana made major strides in terms ofstandard development indices as well. The under-5 mortality rate, whichhad been 151 per 1,000 live births in 1971, declined to 48 per 1,000 by1991. By 1996 net primary enrollment was 95 percent, more than doublethe 1971 rate. In 1993, 47 percent of Batswana (the name for the peopleof Botswana) lived below the official poverty threshold, compared with 59percent in 1985. These substantial economic gains resulted in part fromthe discovery of large mineral deposits in 1968, and mining value addednow accounts for about a third of GDP. But in addition to the discoveryof diamonds, the pursuit of prudent and consistent macroeconomic poli-cies has resulted in a stable macroeconomic environment.
These gains, however, are gravely threatened by the scourge ofHIV/AIDS. Botswana has one of the highest HIV/AIDS prevalence ratesin the world: a 2002 survey estimated that about 35.4 percent of adultsaged 15–49 years carried the virus. The overall prevalence rate has morethan doubled since 1992, and an estimated 138,000 Batswana had died of
287
©International Monetary Fund. Not for Redistribution

AIDS by 2002, out of a population of about 1!/2 million. The high pre-valence rate has resulted in declining life expectancy, from 65 years in1991 to 56 years in 2001, according to official census data. The infantmortality rate is estimated at 55.2 per 1,000 live births, compared with 48per 1,000 in 1991, and in contrast to an estimated 26.3 per 1,000 in theabsence of AIDS. The U.S. Census Bureau (2003) projects that populationgrowth during 2010–20 will average –2.1 percent a year, compared with+3.6 percent a year during 1980–90. In addition to the human conse-quences, the macroeconomic impact of the epidemic has been researched,and many studies, drawing on demographic projections and standardeconomic theory, have modeled the long-term negative impact ofHIV/AIDS on total factor productivity, labor, capital, and output, amongother variables.1
The HIV/AIDS epidemic poses a serious challenge to achieving the gov-ernment’s objectives of poverty reduction, economic diversification, andgrowth. These objectives, formally articulated in Botswana’s medium-termeconomic framework, the National Development Plan 9 (NDP-9, covering2003–09), depend crucially on the government’s ability to attract foreigninvestment into areas outside of mining, and to undertake the structuralreforms needed to increase private sector participation in the economy.The National Strategy for Poverty recognizes that HIV/AIDS is both causeand consequence of poverty, unemployment, and inequality and aims toeliminate poverty in Botswana by 2016. The strategy seeks to directantipoverty interventions toward the root causes affecting income, capac-ity, and participation, by integrating poverty reduction strategies into themedium-term economic framework. The costs of these programs areincreased further by the huge outlays required to manage the HIV/AIDSepidemic. Coming at a time when diamond output is plateauing, theimmediate challenge facing the government is how to finance the cost offighting the epidemic while mitigating its adverse consequences. Effectivemanagement of the epidemic would enable Botswana to moderate thedecline in human development indices and the adverse macroeconomicimpact of the disease.
The government of Botswana has developed a National Strategic Frame-work (NSF) for HIV/AIDS covering the period 2003–09. The NSF is a com-prehensive, multisector program for managing the epidemic, with theobjective of having an HIV-free generation by 2016. This chapter assessesthe macroeconomic impact of HIV/AIDS in Botswana under the assump-
288 IYABO MASHA
1See Bloom and Mahal (1995), Green and others (2002), and Haacker (2002a).
©International Monetary Fund. Not for Redistribution

tion that implementation of the NSF program succeeds in lowering theHIV prevalence rate. This assessment is undertaken by incorporatingthe improvements that are hoped to ensue under the NSF program scenariointo existing macroeconomic models of the impact of HIV/AIDS.
The plan of the chapter is as follows. The first section discusses themanagement of HIV/AIDS in Botswana, with particular focus on thenew NSF. The second section discusses the broad macroeconomic reper-cussions of the NSF. To the extent the demographic impact of HIV/AIDSis mitigated, the economic effects, for example on GDP growth, will alsobe less pronounced. To assess the impact of HIV/AIDS on governmentfinance, it is therefore important to take into account these indirect effectsof government efforts to combat the epidemic. The final sectionconcludes.
Response to HIV/AIDS in Botswana
The approach taken by the government of Botswana to managing theHIV epidemic has evolved as the infection has spread through thepopulation. Whereas the focus in the early phase was mainly on preven-tive health care, by 1993, with prevalence rates already as high as 23 per-cent, comprehensive medical and social care was included in the overallHIV/AIDS management scheme. Although the government of Botswanadoes not disaggregate expenditure on HIV/AIDS ex ante, budgetaryallocations to the health sector have increased substantially, from 2.2 per-cent of GDP in 2000/01 to 4.0 percent in 2003/04, and both the publicand the private sectors in Botswana have put in place extensive awarenessprograms and integrated health care arrangements for HIV-positiveemployees.2
The Medium-Term Program II for HIV/AIDS (1996–2002) was the firstframework to take a multisectoral approach, consolidating program activ-ities over a dispersed number of agencies. The NSF, the successor to theMedium-Term Program II, represents the most ambitious attempt so farto grapple with the epidemic. The framework offers a systematic, multi-
An Economic Assessment of Botswana’s National Strategic Framework 289
2According to Botswana’s National AIDS Coordinating Agency (NACA, 2003), the privatesector, state enterprises, and civil society are expected to implement an agreed MinimumInternal Package for HIV/AIDS prevention. Debswana Corporation, Botswana Telecommu-nications, Barclays Bank of Botswana, Standard Chartered Bank, and Botswana Power Cor-poration are some of the firms that are implementing comprehensive workplace AIDSpolicies, some of which extend to their subcontractors.
©International Monetary Fund. Not for Redistribution

sectoral approach to managing the epidemic and makes the National AIDSCoordinating Agency (NACA), chaired by the president of Botswana, thefocal point for facilitating and coordinating the various HIV/AIDS inter-ventions in the country. The overriding objective of the NSF is “to elimi-nate the incidence of HIV and reduce the impact of AIDS in Botswana”(NACA, 2003).
The NSF formulates a broad response to HIV/AIDS in the areas of pre-vention, care, and support; management of the national response; mitiga-tion of the economic impact; and strengthening of the legal and ethicalenvironment. It specifies 10 objectives (see Box 9.1) and defines time-bound quantitative targets and indicators by which to measure progresswithin the framework (Table 9.1). Treatment focuses on the administra-tion of antiretroviral drugs, to prolong the life span of infected personsand increase average productivity. The mother-to-child transmission pro-gram provides treatment for pregnant women to reduce the transmissionof HIV at birth. In addition, treatment of tuberculosis and opportunisticand sexually transmitted diseases as well as voluntary counseling and test-
290 IYABO MASHA
Box 9.1. Objectives of the National Strategic Framework
• Increase the number of persons within the sexually active population(especially those aged 15–24) who adopt HIV prevention behaviors inBotswana by 2009.
• Decrease HIV transmission from HIV-positive mothers to their newbornsby 2009.
• Decrease the prevalence of HIV in transfused blood in the country.• Increase the level of productivity of people living with HIV/AIDS, espe-
cially those on antiretroviral therapy.• Decrease the incidence of tuberculosis among HIV-positive patients in the
country.• Broaden the skills of health workers (doctors and nurses) to accurately
diagnose and treat opportunistic infections.• Ensure the implementation of the NSF Minimum HIV/AIDS Response
Packages by all sectors, ministries, districts, and state enterprises.• Ensure the full implementation of all planned HIV/AIDS activities at all
levels.• Minimize the impact of the epidemic on the persons infected, those oth-
erwise affected, public services, and the economy.• Create a supportive, ethical, legal, and human rights-based environment
conforming to international standards for the implementation of theNational Response.
©International Monetary Fund. Not for Redistribution
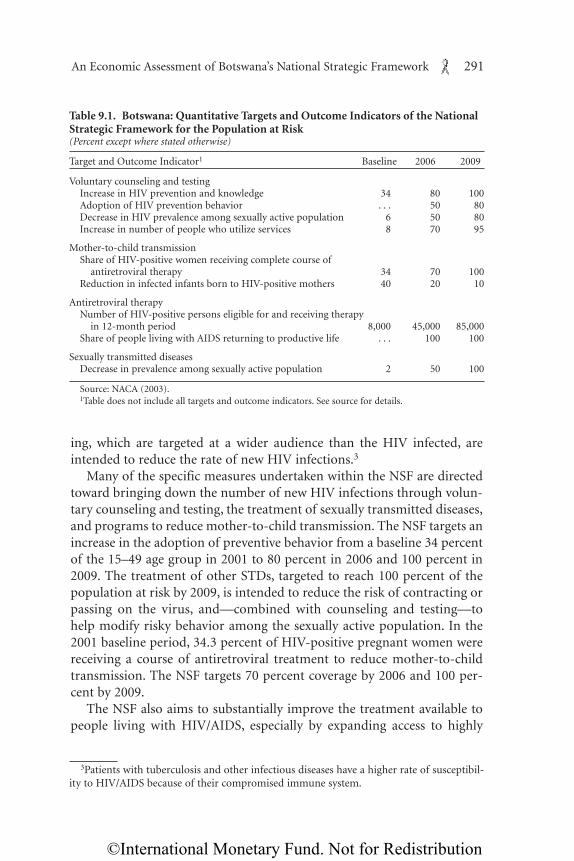
ing, which are targeted at a wider audience than the HIV infected, areintended to reduce the rate of new HIV infections.3
Many of the specific measures undertaken within the NSF are directedtoward bringing down the number of new HIV infections through volun-tary counseling and testing, the treatment of sexually transmitted diseases,and programs to reduce mother-to-child transmission. The NSF targets anincrease in the adoption of preventive behavior from a baseline 34 percentof the 15–49 age group in 2001 to 80 percent in 2006 and 100 percent in2009. The treatment of other STDs, targeted to reach 100 percent of thepopulation at risk by 2009, is intended to reduce the risk of contracting orpassing on the virus, and—combined with counseling and testing—tohelp modify risky behavior among the sexually active population. In the2001 baseline period, 34.3 percent of HIV-positive pregnant women werereceiving a course of antiretroviral treatment to reduce mother-to-childtransmission. The NSF targets 70 percent coverage by 2006 and 100 per-cent by 2009.
The NSF also aims to substantially improve the treatment available topeople living with HIV/AIDS, especially by expanding access to highly
An Economic Assessment of Botswana’s National Strategic Framework 291
Table 9.1. Botswana: Quantitative Targets and Outcome Indicators of the NationalStrategic Framework for the Population at Risk(Percent except where stated otherwise)
Target and Outcome Indicator1 Baseline 2006 2009
Voluntary counseling and testing Increase in HIV prevention and knowledge 34 80 100Adoption of HIV prevention behavior . . . 50 80Decrease in HIV prevalence among sexually active population 6 50 80Increase in number of people who utilize services 8 70 95
Mother-to-child transmission Share of HIV-positive women receiving complete course of
antiretroviral therapy 34 70 100Reduction in infected infants born to HIV-positive mothers 40 20 10
Antiretroviral therapy Number of HIV-positive persons eligible for and receiving therapy
in 12-month period 8,000 45,000 85,000Share of people living with AIDS returning to productive life . . . 100 100
Sexually transmitted diseases Decrease in prevalence among sexually active population 2 50 100
Source: NACA (2003).1Table does not include all targets and outcome indicators. See source for details.
3Patients with tuberculosis and other infectious diseases have a higher rate of susceptibil-ity to HIV/AIDS because of their compromised immune system.
©International Monetary Fund. Not for Redistribution

active antiretroviral treatment. Under the program, the number of patientsreceiving treatment is slated to rise from 8,500 to 45,000 by 2006 and85,000 by 2009. By 2009 the goal is to have all people living with HIV/AIDSreturn to productive life.
The projected cost of implementing the NSF is approximately 12 billionpula (about $2.4 billion) over the program years (Table 9.2). This trans-lates into an average of 5 percent of GDP devoted to HIV-related spendinga year, compared with an annual average of 4 percent of GDP spent on theentire health sector in the past three years. Botswana has already receivedextensive support from its development partners, who are also expected tosupport the new medium-term framework financially. Such supportwould be expected in the areas of financial and human resources, materialsupplies, and mitigation of the fiscal burden.
Apart from program support from the UN agencies, other partnershipsinclude the African Comprehensive HIV/AIDS Partnership, a partnershipbetween the Bill and Melinda Gates Foundation and the Merck Pharma-ceutical Foundation, which is committed to disbursing $100 million over2000–05. The Botswana Harvard AIDS Institute Laboratory in Gaboroneis the largest of its kind in Africa, and the government has established part-nerships with the U.S. Centers for Disease Control and a host of other gov-ernments and agencies. In December 2003 Botswana signed an agreementfor an $18.5 million grant from the Global Fund for HIV/AIDS, Malaria,and Tuberculosis, funding a two-year program aimed at recruitment andtraining; strengthening treatment, care, and support activities; scaling upprevention programs; and reducing the stigma and discrimination associ-ated with HIV infection.
As part of efforts to keep track of developments arising from the frame-work’s implementation, the Botswana HIV Response Information Man-
292 IYABO MASHA
Table 9.2. Botswana: Projected Program Cost for the HIV/AIDS NationalStrategic Framework1
(Millions of pula except where stated otherwise)
Item 2002/03 2003/04 2004/05 2005/06 2006/07 2007/08 Average
Prevention of HIV infection 185.8 241.0 264.5 234.3 164.3 156.70 207.8Provision of care and support 408.9 641.6 781.0 1,117.1 1,577.4 2,229.90 1,126.0
ART drugs 38.6 139.2 251.0 374.0 504.0 642.00 324.8Other costs 354.3 299.4 455.5 617.6 868.3 1,419.40 669.1_____ ______ ______ ______ ______ _______ ______Total program cost 949.0 1,182.0 1,501.0 1,969.0 2,610.0 3,806.00 2,002.8
Percent of GDP 2.78 3.16 4.04 4.84 5.92 8.00 4.99
Source: NACA (2003).1Years are fiscal years beginning April 1.
©International Monetary Fund. Not for Redistribution

agement System (BHIVRIMS) was developed to gather information and tomonitor and evaluate trends and progress, as well as progress in interna-tional agreements and financial commitments. The BHIVRIMS isexpected to become the institutional memory in the management of theHIV pandemic.
Demographic and Economic Impact of Botswana’s NationalStrategic Framework
The measures spelled out in the NSF are expected to reduce the num-ber of new infections and, through improvements in treatments availableto people living with HIV/AIDS, reduce mortality among those infected.These efforts will also mitigate the adverse impact of HIV/AIDS on theeconomy. The analysis below shows that the potential demographic andeconomic effects of the NSF are substantial. This means that it is impor-tant to assess how the NSF, beyond its direct costs, will affect the fiscal bal-ance. For example, government revenue is related to the level of economicactivity, and reductions in HIV/AIDS-related mortality and morbidityaffect various categories of government expenditure. An analysis of thedemographic impact of the NSF, using a simple macroeconomic frame-work, is presented below, as well as an assessment of the effect on GDP.Finally, a preliminary assessment is made of the NSF’s fiscal repercussions,through its demographic and economic effects.
Demographic Impact
The demographic estimates for the simulation were generated with theSpectrum AIM program,4 using initial values from the Botswana CentralStatistics Office, the population census projection for 1991, and the latestavailable data on labor force participation rates by five-year cohort fromthe 1995/96 labor force survey. The Spectrum population projectionmodel makes use of detailed assumptions about fertility, mortality, andHIV prevalence rates. The projection parameters are based on information
An Economic Assessment of Botswana’s National Strategic Framework 293
4The Spectrum AIM model, developed by The Futures Group, is a Windows-based pro-gram designed to calculate the demographic consequences of HIV/AIDS; it can be down-loaded from www.tfgi.com. Demographic data for 1991–2003 match the actual values, andthe parameters used to generate the remaining years are from UN and U.S. Census Bureauprojections. Epidemiological data from NACA were used for the AIDS-without-interventionscenario, and the NSF targets for the AIDS-with-intervention scenario.
©International Monetary Fund. Not for Redistribution

from the 1991 census and HIV prevalence survey data. In simulating theprojections for the impact of AIDS, historical data and NSF program base-line data were used for the AIDS-without-intervention scenario. For theAIDS-with-intervention scenario, pre-2002 data are the same as for theAIDS-without-intervention scenario, and the expected changes in popula-tion and in prevalence rates during 2003–16 reflect the targets set in theNSF. The key assumptions of the AIDS-with-intervention scenario are thefollowing. First, prevention of mother-to-child transmission, which cov-ered 34 percent of the at-risk population at baseline in 2002, will graduallyexpand to cover 70 percent by 2006. Second, voluntary counseling andtesting, which also covered 34 percent of the at-risk population in 2002,will reach 80 percent coverage in 2006. Third, antiretroviral therapy willreach 90 percent coverage by 2006. Fourth, sexually transmitted diseaseprevalence rates will decline by 50 percent by 2006. Although the NSF’starget for each of the programs is 100 percent coverage of all at-risk groupsby 2009, in view of reservations about implementation capacity and pos-sible program reach, the targets were relaxed for the purpose of the simu-lation, so that beyond 2006 all interventions remain at 90 percent coverage.
The simulations suggest that the program laid out in the NSF wouldresult in a substantial decline in new HIV infections (Figure 9.1), reachingabout 15,000 by 2015, compared with more than twice as many in theAIDS-without-intervention scenario. By 2005, as the antiretroviral therapyprogram expands, AIDS deaths would start falling rapidly, to fewer than10,000 in 2015, compared with more than 30,000 in the same year underthe AIDS-without-intervention scenario. As a consequence, the model pre-dicts that the demographic impact of HIV/AIDS would be mitigated sub-stantially (Figure 9.2). The overall population growth rate in 2015 wouldbe 2 percent, compared with 0.9 percent in the AIDS-without-interventionscenario and 2.9 percent in a no-AIDS scenario.
The impact of the mother-to-child transmission program on infantmortality is a significant factor in increasing the growth rate of the popu-lation. In 1997 it was estimated that 18 percent of reported HIV cases werein children under the age of 4. Most of these children are born HIV-posi-tive, whereas others become infected in infancy (usually through breast-feeding). For these children the progression to AIDS generally takes aboutone to two years, with death occurring in the third or the fourth year.NACA estimates that only about 34 percent of pregnancies benefited fromthe mother-to-child transmission program in the 2002 baseline period.Under the assumption that the targeted increase in participation, to 70percent by 2006 and 100 percent by the end of the program, is achieved,the decline in the infant mortality rate arising from an effectively imple-
294 IYABO MASHA
©International Monetary Fund. Not for Redistribution

mented mother-to-child transmission program results in a higher rate ofpopulation growth.
The NSF results in higher population growth rates than in the AIDS-without-intervention scenario for several reasons. First, the life span ofthose receiving antiretroviral treatment is extended, and mortality ratesdecline initially. Later on, although a number of patients on antiretroviraltreatment eventually die (raising mortality in later years, other thingsequal), increasing coverage rates of antiretroviral treatment and a declinein new infections mean that mortality stays lower throughout the time
An Economic Assessment of Botswana’s National Strategic Framework 295
0
5
10
15
20
25
30
35
40
45
0
5
10
15
20
25
30
35
1991
HIV/AIDS-Related deaths
New HIV Infections
1996 2003 2005 2010 2015
1991 1996 2003 2005 2010 2015
With intervention
With intervention
Without intervention
Without intervention
Figure 9.1. Botswana: HIV/AIDS-Related Deaths and New Infections Under Alternative Scenarios(Thousands)
Source: Authors’ calculations using data from Botswana national authorities and the Spectrum model.
©International Monetary Fund. Not for Redistribution

296 IYABO MASHA
-1.0
-0.5
0
0.5
1.0
1.5
2.0
2.5
3.0
3.5
4.0Percent a year
Deaths per thousand
Deaths per thousand
201520102005200319961991
0
5
10
15
20
25
30
35
201520102005200319961991
40
50
60
70
80
201520102005200319961991
Population Growth
Crude Death Rate
Infant Mortality
Without AIDS
Without AIDS
Without AIDS
AIDS with intervention
AIDS with intervention
AIDS with intervention
AIDS without intervention
AIDS without intervention
AIDS withoutintervention
Figure 9.2. Botswana: Population Growth, Crude Death Rate, and Infant Mortality Under Alternative Scenarios
Source: Authors’ calculations using data from Botswana national authorities and the Spectrum model.
©International Monetary Fund. Not for Redistribution

horizon of the NSF. Second, lower mortality and morbidity among the sex-ually active population also mean that the decline in birthrates associatedwith HIV/AIDS is mitigated.
A Macroeconomic Framework
One of the earliest attempts to model the impact of the HIV/AIDS epi-demic in Africa was that by Over (1992), which was based on an econo-metric estimation of growth in a cross section of 30 countries, looking inparticular at differences in impacts by skill level and at the financing of pri-vate health expenditure. Cuddington (1993a, 1993b) and Cuddington andHancock (1995) explored the impact of HIV/AIDS in a neoclassicalgrowth model with one or two sectors, including a link between the agestructure of the workforce and productivity, through experience or on-the-job learning.
A major study of the impact of HIV/AIDS on Botswana’s economy (andstill one of the most comprehensive studies available internationally) wasprepared by the Botswana Institute for Development and Policy Analysis(BIDPA, 2000). Using a Solow-type production function, the study ana-lyzed the impact in a two-sector model, using calibrated estimates. Usingpopulation projections based on the expected future path of HIV, thestudy derived projections of the size of the labor force and the subsequenteffect of HIV/AIDS on aggregate output and output per capita through2021, the distribution of income among different groups, and the long-term fiscal outlook. The study showed that HIV/AIDS would reduce theannual growth rate of the economy by an average of 1.5 percentage points,so that after 25 years the economy would be 31 percent smaller than itwould otherwise have been.
Drawing on the BIDPA model, MacFarlan and Sgherri (2001) focusedon the effect of HIV/AIDS on the long-term productive capacity of theeconomy. The channels through which the impacts are transmitted arelabor supply and productivity, which in turn affect saving and investment,financial intermediation, and the prospects for economic diversification.The results of high HIV prevalence rates are declining productivity andincreased mortality among the most economically active members of thepopulation, leading to a reduction in capital and human resources avail-able for production and investment, and reductions in the saving rate andreal income. Assuming higher prevalence rates than used in the BIDPAstudy, MacFarlan and Sgherri predicted that annual GDP growth outsidethe mining sector would fall by 3 to 4 percentage points on average overthe decade.
An Economic Assessment of Botswana’s National Strategic Framework 297
©International Monetary Fund. Not for Redistribution

The principal objective of this chapter is to assess the macroeconomiceffects of a comprehensive program of enhanced prevention measures andincreased access to health care. Because the demographic projections donot allow for a differentiation of the impact of HIV/AIDS by sector, themodel adopted is a relatively simple growth model that follows Cudding-ton (1993a) but extends the framework by allowing for changes in the sizeand productivity of the labor force arising from the implementation of apackage of HIV-related interventions. The model presented is highly gen-eralized, but it does capture the moderating effect of changing demo-graphic patterns on the evolution of HIV/AIDS and, subsequently, itsmacroeconomic effect through the labor force and the capital stock.
Production in the economy, Y, is characterized by a Cobb-Douglas-typetechnology with constant returns to scale. Equation (1) specifies that out-put is a function of labor, capital, and total factor productivity:
Yt = αγ tLtβKt
(1–β), (1)
where Yt is aggregate output, Lt represents the labor input measured in effi-ciency units, and Kt is the capital input. The variable γ is the rate of tech-nological change over time, β is the share of labor in aggregate output, andcapital’s share is derived residually. Finally, α is a scale factor adjusted to fitthe actual data in the base year.
In studies of countries in which resource extraction (such as minerals,oil, or timber) makes up a large share of GDP, it is often useful to accountfor this sector separately, because it is vulnerable to changes in the worldprices of the extracted goods, or because the large share of economic rentsin resource extraction may account for a significant share of its valueadded. The latter consideration also means that this sector is less sensitiveto changes in domestic factor markets; this is reinforced if companies inthe sector (for example, multinational mining corporations) bring in keypersonnel from abroad. Thus mining companies may have some scope forabsorbing additional HIV/AIDS-related expenditures, and the impact ofHIV/AIDS on output could be minimal.5
This consideration is particularly relevant for Botswana, where miningoutput constitutes more than a third of value added in output, as noted pre-viously, and more than half of domestic government revenue. The analysis
298 IYABO MASHA
5On the other hand, if profit margins are low, an increase in production costs by severalpercentage points (not an unusual number in the context of HIV/AIDS) could turn an oper-ation unprofitable and even result in its closure. This consideration is particularly relevant inthe longer run, when start-up and investment costs need to be considered and do not con-stitute sunk costs as they do in the short run.
©International Monetary Fund. Not for Redistribution

in this chapter assumes that mining output and the number of peopleworking in the mining sector are not affected by HIV/AIDS. This impliesthat mining workers who die or retire are replaced by workers from othersectors, thus exacerbating the impact of HIV/AIDS on nonmining GDP.
HIV/AIDS has an impact on labor in two ways, through the productiv-ity of the labor force and through its size. The efficiency unit of labor is afunction of the number of HIV-infected workers, as well as of the propor-tion of the work period lost to absence or reduced productivity:
Lt = ∑64
i=15(1—ztait)ρit Eit. (2)
In equation (2) the effective labor supply, L, is a function of the fraction zof the work year lost per infected worker because of HIV-related absencesand reduced productivity, and the proportion a of the population that isinfected with HIV. Eit is the employed workforce of age i at time t, and ρmeasures the productivity gain that comes with experience on the job.6
The efficiency of labor depends not only on the labor force participationrate but also on the workers’ experience, which is increasing in the num-ber of years spent working. As prevalence rates rise, progression to AIDSmeans that the labor force becomes younger as older and more experi-enced workers drop out of the labor force and are replaced by younger, lessexperienced workers. Denoting the population growth rate as gn,
gnt = gnt(at). (3)
By equation (3) the population growth rate is a function of a, the pro-portion of persons infected with HIV. Higher rates of infection wouldresult in future declines in the population, depending on how rapidly HIVinfection progresses to AIDS. Capital accumulation is financed by domes-tic saving and foreign capital inflows, as expressed by
ΔK = f(S, Sf), (4)
where S is domestic saving and Sf net capital inflows.The increasing cost of managing the epidemic imposes certain con-
straints on public and private saving, directly or indirectly. In Botswanasome health care expenditure is categorized as “development” or capitalexpenditure. As morbidity and mortality rise, health care expenditure by
An Economic Assessment of Botswana’s National Strategic Framework 299
6Following Cuddington (1993a), the productivity gain is defined as a worker’s experience,proxied by taking the worker’s age and subtracting 15, the assumed age of entry into thelabor force. BIDPA’s estimate of the earnings function for Botswana assumes a starting age of20 years in the formal sector, as follows: ρ = δ1 + δ2(i – 20) + δ3(i – 20), where the δs are esti-mated from the earnings function of the labor force.
©International Monetary Fund. Not for Redistribution

the government, households, and firms will be increasing in the number ofHIV patients, as prevalence rates rise. Public expenditure will consist ofdirect health expenditure on treatment or prevention as well as somespending for training to replace absent or dead HIV-infected workers. Pri-vate sector saving is also affected, as firms increase the share of expendi-ture allocated to HIV prevention and care. Households will also spendmore of their income on medications, funerals, visits to hospitals, and soforth. It is likely that some of these expenditures will come from incomethat would otherwise have been saved, thereby adversely affecting the sav-ing rate, or from reduction of other current expenditure. Therefore theevolution of total domestic saving St in the presence of HIV is
St = stYt—xpat Lt, (5)
where st is the domestic saving rate. In the AIDS-without-intervention sce-nario, in other words, domestic saving St will equal the national saving ratetimes income, less x, the proportion of annual AIDS expenditure financedout of savings; p, the cost per patient in pula; and at Lt, the number of HIV-infected workers in the labor force.
For simplicity, assume that net inflows of foreign direct investment areconstant as a proportion of GDP. (For countries exporting capital, thisinvestment may well be negative, in which case domestic saving exceedsdomestic investment.) To the extent that HIV/AIDS results in capital flightand reduces this ratio, the impact of HIV/AIDS on GDP (and thus themacroeconomic benefits from its mitigation) will be stronger than in themodel discussed here.7
If capital is expressed in terms of the labor force, K/L = k, then theperiod-to-period change in the capital-labor ratio is
Δk = [s(a) + sf] f(ka) – gn(a)k – θk, (6)
where θ is the depreciation rate and sf the ratio of net capital inflows toGDP. The equation specifies the capital-labor ratio as a function of thetotal saving rate, production per worker, the HIV prevalence rate a, thepopulation growth rate gn, and the depreciation rate θ.
Macroeconomic Impact of Botswana’s National Strategic Framework
In the model under consideration, the macroeconomic impact ofHIV/AIDS could be moderated through effective intervention programs.
300 IYABO MASHA
7See Haacker (2002b) for a more detailed discussion of this point.
©International Monetary Fund. Not for Redistribution

The negative effect on the labor force would be ameliorated as the rate ofnew infections slows and the useful life span of the infected is extended,and this will raise productivity as less working time is lost and the declinein workers’ experience is mitigated. In the short run, the effect on capitalaccumulation will be negative, especially if a substantial proportion of thecost is financed from saving, possibly with the addition of donor-supported capital inflows. These effects could therefore result in a less pes-simistic outlook for output growth than in a without-interventionscenario.
The specified model is simulated over the period 1991–2016, based onthe actual values of the variables in 1991, and under three alternative sce-narios: no AIDS, AIDS without intervention, and AIDS with intervention.Data for 1991 are used for the initial values of real GDP, the capital stock,and gross domestic investment. Following closely on previous work onBotswana, the labor-output and capital-output ratios are assumed to be 0.3and 0.7, respectively, and the exogenous technological trend is set at 0.004.The depreciation rate is set at 7 percent, in line with CSO practice. In thepreprogram years, separate data did not exist for the cost of HIV/AIDStreatment, but a range of 400 to 954 pula per patient was estimated basedon expenditure data from the Ministry of Health. In the program years, theaverage cost per patient was 7,383 pula a year. In the past Botswana was ableto run a surplus on the recurrent budget, which includes health care costs.In the medium-term program, however, it is assumed that Botswanafinances 50 percent of the program cost from savings.
Labor force and human capital
The positive effect of the NSF program on the labor force (Figure 9.3)arises from the expanded labor force, the higher participation rate, and theimpact on skill accumulation in the economy. The labor force becomeslarger than in the AIDS-without-intervention scenario because varioustreatment options prolong the life of AIDS patients, enabling them to par-ticipate in the labor force. Furthermore, the slowdown in new infectionsmeans that newer entrants to the labor force are virtually HIV-free and notlikely to drop out because of HIV-related illnesses.
In addition to the positive effect on labor force size, productivity andthe efficiency of labor improve relative to the AIDS-without-interventionscenario. Although the lost human capital can only be replaced in the longrun as new entrants to the labor force acquire more experience, the use ofantiretroviral therapy results in a more productive life than would other-wise be the case. Although the impact of productivity may be difficult to
An Economic Assessment of Botswana’s National Strategic Framework 301
©International Monetary Fund. Not for Redistribution

measure, an analysis of the contribution to economic growth in the threescenarios (Table 9.3) shows that, in the AIDS-with-intervention scenario,the contribution of labor to changes in the growth rate improves remark-ably in the medium term.
Saving and capital accumulation
The NSF program involves the commitment of substantial resources tofinancing the HIV/AIDS program. Therefore the effect on public and pri-vate saving in the initial program years is remarkable. Even though themodel assumes that only half of the cost is financed from savings, by 2008the contribution of capital to the change in real output is lower than ineither the AIDS-without-intervention or the no-AIDS scenario. Thiscomes about mainly because, in the AIDS-without-intervention scenario,there is no programmatic spending on HIV outside of the allocation in thehealth ministry’s budget. Apart from public saving, private saving wouldalso fall as firms’ health care costs increase and households assume someof those costs. However, because these are one-time effects, by 2013 thecapital contribution to GDP resumes its upward trend.
The implication of declining saving is a slower rate of capital accumu-lation in the program years. A crucial determinant of the overall outcomeis the extent to which Botswana can attract the financial support of devel-
302 IYABO MASHA
300
400
500
600
700
800
201520102005200319961991
Without AIDS AIDS withintervention
AIDS without intervention
Figure 9.3. Botswana: Labor Force Size(Thousands)
Source: Authors’ calculations using data from Botswana national authorities and The Spectrum model.
©International Monetary Fund. Not for Redistribution

opment partners in managing the epidemic. Again, the current results arebased on the assumption that 50 percent of the cost is financed from sav-ings. Should donor support fail to materialize, requiring a greater relianceon domestic saving than projected, the outlook may be much worse thanexpected, because the negative effect on capital accumulation would begreater.
Overall economic growth
The most significant macroeconomic impact is the increase in the growthrate of the economy under the AIDS-with-intervention scenario comparedwith the AIDS-without-intervention scenario. Under the with-interventionscenario, GDP is projected to grow at an annual rate of 4.1 percent by theend of the program in 2008, compared with 3.5 percent in the absence of
An Economic Assessment of Botswana’s National Strategic Framework 303
Table 9.3. Botswana: Contributions to Projected Changes in GDP UnderAlternative Scenarios(Percentage points)
Contribution of Change in:__________________________________Change in Real Total factor
Scenario and Year Output Growth productivity Capital Labor
No AIDS2005 5.5 0.4 4.3 0.82008 5.2 0.4 4.0 0.82011 5.1 0.4 3.9 0.82012 5.0 0.4 3.8 0.82013 5.0 0.4 3.8 0.82014 4.9 0.4 3.7 0.82015 4.9 0.4 3.7 0.8
AIDS without intervention2005 4.0 0.3 3.8 –0.22008 3.5 0.3 3.3 –0.22011 3.2 0.2 2.9 –0.12012 3.1 0.2 2.8 –0.12013 3.0 0.2 2.7 –0.12014 3.0 0.2 2.6 0.02015 2.9 0.2 2.5 0.0
AIDS with intervention2005 4.8 0.3 3.9 0.22008 4.1 0.3 2.5 0.22011 4.0 0.3 2.5 0.42012 4.1 0.4 2.7 0.52013 4.1 0.4 2.7 0.52014 4.1 0.4 2.8 0.62015 4.1 0.4 3.1 0.6
Sources: Spectrum model software and author’s calculations.
©International Monetary Fund. Not for Redistribution

intervention. By 2015 GDP is growing at a rate of 4.1 percent a year underthe AIDS-with-intervention scenario, compared with 2.9 percent under thewithout-intervention scenario; however, even the higher rate is still less thanthe 4.9 percent rate projected in the absence of AIDS.
A growth accounting exercise (Table 9.3) illuminates some of thedynamics of the growth simulation, in particular how the relative sizes ofthe mining and nonmining sectors in Botswana condition the outcome. Inthe AIDS-without-intervention scenario, the contribution of labor togrowth is negative until 2013, since in the absence of intervention the sizeand productivity of the labor force contract over time. Following from theinitial assumption that the effect of HIV/AIDS on the mining sector is neg-ligible, this outcome is mainly driven by the contraction in labor force par-ticipation in the highly labor-intensive nonmining sector. The decline incapital’s contribution, however, is not as remarkable because of theassumed negligible effect in the mining sector and lower capital accumu-lation in the nonmining sector.
Direct and Indirect Effects on Government Finances
The most thorough assessment of the fiscal effects of HIV/AIDS inBotswana is that in BIDPA (2000). The demographic projections used herecorrespond most closely to BIDPA’s “high” scenario, to which all citationsbelow refer.8
According to BIDPA, in the high scenario direct and indirect expendi-ture on HIV/AIDS exceeds 5 percent of GDP by 2010. Direct costs, such asthe clinical cost of AIDS treatment and care, as well as the cost of aware-ness campaigns and other HIV/AIDS prevention measures, are projectedto reach about 3.5 percent of GDP. Indirect costs (a term that is used in thischapter for all expenditures not included in specific HIV/AIDS budget lineitems) for social expenditure are approximately 1.5 percent of GDP. Socialexpenditure—mainly poverty alleviation programs aimed at redistribut-ing income—are projected to increase by 10 percent, roughly in line withthe decrease in income among those falling below the poverty line as aresult of HIV/AIDS-related morbidity and mortality. The increase inallowances for the destitute and for orphans would also be commensuratewith the increase in those groups, as HIV infection spreads and moreincome earners die from AIDS-related illnesses.
304 IYABO MASHA
8The presentation differs, however, in that it presents estimates as percentages of GDP,whereas BIDPA presents expenditure as a percentage of recurrent expenditure, and revenueas a percentage of total revenue.
©International Monetary Fund. Not for Redistribution

These, however, are not the only indirect costs. BIDPA’s projection envis-ages increased staff costs in the public service arising from an increase in thegovernment’s wage bill by about 6 percent, as a shortage of skilled laborcauses their wages to be bid up. It is also expected that the increase in deathswill raise death-related benefits, funeral expenses, and disability benefits. Tosome extent, however, these costs could be offset by the reduction in thegovernment’s pension obligations from the higher mortality rate. Althoughstaff costs could also arise from training and recruitment expenditure, asrecruitment rises and newly recruited staff require training, decliningexpenditure on education would dampen some of these adverse impacts.
Table 9.4 presents BIDPA’s estimates of the impact of HIV/AIDS on gov-ernment expenditure in 2010; these estimates do not include a feedbackeffect from prevention and treatment efforts. The estimates for the indirectfiscal effects of the NSF are then obtained by, first, replacing the BIDPA esti-mates for health expenditure with the latest projections specified under theNACA (2003). Second, BIDPA (2000) does not include most of the over-head and other expenses related to the NSF, which are summarized under“other costs.” Fiscal savings arise in the various areas of social expenditureand the costs of the public service (for example, owing to reduced costs ofbenefits). These are largely associated with lower mortality due toHIV/AIDS owing to measures implemented within the NSF. To obtain esti-mates of the savings in these expenditure categories, most of which are notbudgeted for in the NSF, the projected costs of HIV/AIDS from BIDPA arethen scaled down in line with lower mortality under the NSF.
Table 9.4 shows that the savings owing to feedback effects fromHIV/AIDS programs can contribute to the financing of a comprehensiveHIV/AIDS framework. The NSF envisages higher expenditure on healthservices, reflecting, to a large extent, increased access to antiretroviral treat-
An Economic Assessment of Botswana’s National Strategic Framework 305
Table 9.4. Botswana: Comparison of Changes in Expenditure Categories in 2010Projected by BIDPA (2000) and NACA (2003)(Percent of GDP)
Source of Projection_____________________Item BIDPA NSF Indirect Fiscal Gains
Health and prevention 3.5 5.0 —Social expenditure 1.5 0.7 0.8Public service 0.8 0.3 0.5Education 0.3 0.1 –0.2Other 0.2 3.0 —Indirect fiscal gains (sum) 1.1
Sources: BIDPA (2000), NACA (2003), and author’s calculations.
©International Monetary Fund. Not for Redistribution

ment.“Other costs” include investment costs and smaller items that, owingto different coverage, are not comparable between BIDPA and the NSF.The savings in the areas of social expenditure, public service, and educa-tion, amount to 1.1 percent of GDP, or about 14 percent of the costs of theNSF. However, these numbers most likely understate the fiscal savingsassociated with the NSF, because they do not include savings within theline items of our highly aggregate presentation. Such savings arise, forexample, if prevention efforts contribute to a decline in treatment costs.
Worldwide, a substantial proportion of HIV/AIDS-related expenditureis financed by external grants; the Joint United Nations Programme onHIV/AIDS (UNAIDS, 2003) estimates that, in 2003, more than three-fourths of institutional HIV/AIDS spending worldwide came from inter-national sources, including bilateral sources, the U.N. system, the grantcomponent of World Bank loans, and international nongovernmentalorganizations. For Botswana, Martin (2003) estimates that HIV/AIDS-related expenditure in 2001/02 amounted to $113 million, of whichdonors financed $96 million. Although Botswana’s NSF does not provideany estimates of expected donor assistance, it makes repeated reference tothe important role of Botswana’s development partners. More generally, abroad national strategy on HIV/AIDS, developed with inputs from all lay-ers of government, civil society, and development partners, can be used tomobilize additional funding from international donors and facilitate coor-dination among them.
Regarding the impact of HIV/AIDS on domestic revenue, many com-ponents of tax and other revenue can be expected to change at about thesame rate as GDP. According to estimates in Kibuka and others (2004), forexample, government revenue amounted to 41.9 percent of GDP in2002/03. Excluding items such as mineral revenue (21.9 percent of GDP),interest, asset sales, and grants, revenue that would grow at a similar rateas overall economic activity accounts for 19 percent of GDP. Given thatGDP increases by 25 percent by 2010 in this chapter’s AIDS-with-intervention scenario, relative to the scenario without intervention, thiswould mean that government revenue grows by 3.8 percent of GDP. How-ever, not all of this additional revenue can be mobilized for the financingof the NSF, because an increase in GDP and, in particular, in the size of thepopulation also implies an increase in the demand for general governmentservices.
Although simplistic, this analysis of the fiscal repercussions of the NSFsuggests that the indirect fiscal effects of a comprehensive prevention andtreatment program can contribute significantly to the program’s ownfinancing. (Of course, the indirect fiscal benefits are only part of the
306 IYABO MASHA
©International Monetary Fund. Not for Redistribution

broader social and economic benefits arising from a successful HIV/AIDSprogram.) These indirect gains, in turn, are interrelated with the macro-economic effects, which this chapter’s analysis of the fiscal effects does notinclude explicitly. Given the size of the indirect fiscal gains (whether theycan be mobilized for a program like the NSF or not), a fuller analysis iswarranted, including a more disaggregated analysis of government expen-diture and taking into account the linkages between the broad macroeco-nomic effects and the fiscal effects.
Conclusions
Botswana’s NSF formulates a broad response to the HIV/AIDS epi-demic around the “central goal of the National Response to HIV/AIDS,”namely, “to eliminate the incidence of HIV and reduce the impact of AIDSin Botswana” (NACA, 2003), and it defines HIV/AIDS-related actions forall functional and regional divisions of government. The NSF does notspell out its potential impact in terms of human development and macro-economic performance. However, it envisages that HIV-related death rateswill be lower, that patients will have longer and more productive lives, thatthe number of orphans will be fewer, and that mother-to-child transmis-sion rates can be considerably reduced.
Using a simple macroeconomic model, this chapter has sketched how toexpand this strategic framework, focusing in particular on the impact ongovernment finance. The NSF envisages a substantial allocation ofresources to fighting the epidemic. However, through its demographic andmacroeconomic effects, which in themselves are highly desirable, it alsohelps contain certain categories of expenditure, and, by mitigating theadverse effects of HIV/AIDS on the tax base, it mobilizes domestic revenueto offset some of the fiscal costs of the program.
This analysis demonstrates the benefits of integrating a strategic frame-work on HIV/AIDS, such as Botswana’s NSF, into a broader economic andfiscal framework and, vice versa, incorporating an assessment of the indi-rect economic and fiscal benefits of reduced HIV incidence and improvedaccess to treatment into a strategic framework for dealing with HIV/AIDS.From this analysis, looking narrowly at the financial costs and benefits ofHIV/AIDS interventions, it appears that the indirect macroeconomic andfiscal effects are an important part of the picture. Taking a wider perspec-tive, an analysis of the broad development impact of HIV/AIDS, and thusalso of a strategic framework on HIV/AIDS, can help in defining the oper-ational targets of such a strategy.
An Economic Assessment of Botswana’s National Strategic Framework 307
©International Monetary Fund. Not for Redistribution

Appendix: Assumptions Used in the Demographic Projections
The demographic projection was generated using Spectrum, a Windows-based program developed by The Futures Group with funding from theU.S. Agency for International Development. The program uses currentinformation on population, fertility, mortality, and migration to projectthe future demographic trend of a population group. There are six mod-ules in the program, the most relevant to this exercise being the DemProj,which was used to generate the population trend, and the AIDS ImpactModule (AIM), which was used to project the consequences of the AIDSepidemic.
The following information was used to generate the demographic pro-jection for Botswana:
• Population by age and sex in the base year 1991 is presented in Table9.A1 and is from the 2001 Botswana Central Statistics Office (CSO)Statistical Bulletin.
• Total fertility rates are defined as the average number of births that afemale in the 15–49 age group would be expected to have in her life-time, based on existing fertility patterns. According to the latest cen-sus data from the CSO Statistical Bulletin, 2001, p. 15, the total fertilityrate was 6.5 for 1971, 6.6 for 1981, and 5.2 for 1991.
• Age-specific fertility rates, defined as the number of live births per1,000 women in each age group, are averages for all of sub-SaharanAfrica and are from the United Nations; they are incorporated intothe Spectrum model as the default.
• Sex ratio at birth in 1991 is 92 males per 100 females and is from theCSO Statistical Bulletin, 2001, p. 14.
• Life expectancy at birth in the absence of AIDS is 63.3 years for malesand 67.1 for females; data are from the CSO Statistical Bulletin, 2001,p. 15, for 1991 and United Nations population projections for subse-quent years.
• Infant mortality is 87.5 per 1,000 births in 1991 and is from the Sta-tistical Bulletin, 1991; for other years the Spectrum model uses theUnited Nations General Life Table, which translates to an assumedinfant mortality rate of 54 per 1,000 births.
• Crude death rates are 13.9 per 1,000 population for 1981 and 11.5 per1,000 for 1991, from CSO Statistical Bulletin, 2001, p. 15; for otheryears the Spectrum model uses the United Nations General Life Table,which translates to an assumed crude death rate of 8.2 per 1,000.
• International migration (net) is the model default, taken from UnitedNations data.
308 IYABO MASHA
©International Monetary Fund. Not for Redistribution

References
Bloom, David E., and Ajay S. Mahal, 1995, “Does the Aids Epidemic Really ThreatenEconomic Growth?” NBER Working Paper No. 5148 (Cambridge, Massachusetts:National Bureau of Economic Research).
Botswana Institute for Development Policy Analysis (BIDPA), 2000, MacroeconomicImpacts of the HIV/AIDS Epidemic in Botswana (Gaborone, Botswana).
Botswana Central Statistical Office, 2001, Statistical Bulletin (Gaborone, Botswana).
Cuddington, John T., 1993a, “Modeling the Macroeconomic Effects of AIDS, with anApplication to Tanzania,” World Bank Economic Review, Vol. 7, No. 2, pp.173–89.
———, 1993b, “Further Results on the Macroeconomic Effects of AIDS: The Dualis-tic, Labour-Surplus Economy,” World Bank Economic Review, Vol. 7, No. 3,pp. 403–17.
———, and John D. Hancock, 1995, “The Macroeconomic Impact of AIDS in Malawi:A Dualistic, Labour Surplus Economy,” Journal of African Economics, Vol. 4, No. 1,pp. 1–28.
Green, John H., and others, 2002, “Botswana: Selected Issues and Statistical Appendix,”IMF Staff Country Report No. 02/243 (Washington: International MonetaryFund).
Haacker, Markus, 2002a, “The Economic Consequences of HIV/AIDS in SouthernAfrica,” IMF Working Paper 02/38 (Washington: International Monetary Fund).
———, 2002b, “Modeling the Macroeconomic Impact of HIV/AIDS,” IMF WorkingPaper 02/195 (Washington: International Monetary Fund).
An Economic Assessment of Botswana’s National Strategic Framework 309
Table 9.A1. Botswana: Population by Age and Sex, 1991
Age (years) Males Females Total
0–4 96,676 96,989 193,6655–9 97,563 99,051 196,614
10–14 89,887 93,596 183,48315–19 73,112 79,413 152,52520–24 54,261 62,622 116,88325–29 45,408 54,440 99,84830–34 36,620 44,013 80,63335–39 30,487 35,741 66,22840–44 23,197 25,001 48,19845–49 18,553 20,496 39,04950–54 16,192 17,519 33,71155–59 12,746 15,003 27,74960–64 10,485 12,271 22,75665–69 8,688 11,155 19,84370–74 6,857 7,872 14,72975+ 13,668 17,214 30,882
Total 634,400 692,396 1,326,796
Source: Botswana Central Statistical Office (2001), p. 13.
©International Monetary Fund. Not for Redistribution

Joint United Nations Programme on HIV/AIDS (UNAIDS), 2003, “Report on the Stateof HIV/AIDS Financing (Revised/Updated June 2003)” (Geneva).
Kibuka, Robin, and others, 2004, “Botswana: Selected Issues and Statistical Appendix,”IMF Country Report No. 02/212 (Washington: International Monetary Fund).
MacFarlan, Maitland, and Silvia Sgherri, 2001, “The Macroeconomic Impact ofHIV/AIDS in Botswana” IMF Working Paper No. 01/80 (Washington: Interna-tional Monetary Fund).
Martin, H. Gayle, 2003, “A Comparative Analysis of the Financing of HIV/AIDS Pro-grammes in Botswana, Lesotho, Mozambique, South Africa, Swaziland, and Zim-babwe” (Pretoria, South Africa: Human Sciences Research Council).
National AIDS Coordinating Agency (NACA), 2003, Botswana National StrategicFramework for HIV /AIDS 2003–09 (Gaborone, Botswana).
Over, Mead, 1992, “The Macroeconomic Effect of AIDS in Sub-Saharan Africa,” AFTNTechnical Working Paper No. 3 (Washington: Population, Health and NutritionDivision, Africa Technical Department, World Bank).
U.S. Census Bureau, 2003, “International Data Base” (Washington: U.S. CensusBureau).
310 IYABO MASHA
©International Monetary Fund. Not for Redistribution

10
Impact of the HIV/AIDS Epidemic on theHealth Sectors of Developing Countries
MEAD OVER
Any discussion of the impact of acquired immune deficiency syndrome(AIDS) on health care systems must distinguish between treatment of
the opportunistic illnesses associated with AIDS and treatment directed atthe underlying cause, namely, the human immunodeficiency virus (HIV).Treatment of opportunistic illnesses can alleviate suffering but typicallyextends life by only months. Treatment that controls the HIV in thepatient’s body, called antiretroviral therapy or ART, can be much moresuccessful, adding years to life expectancy.
Before 2001 the annual cost of a three-drug combination ART regimenfor a patient in a poor country was approximately $10,000 to $25,000.Only a few of the richest developing countries, such as Brazil and Thai-land, could attempt to finance ART for their AIDS patients. In most devel-oping countries the only patients receiving ART were the very rich or thosewho had access to rationed, low-price supplies through a variety of pilot orresearch projects. Most other patients had little access to ART, and thus theimpact of AIDS on these countries’ health systems could be understoodsimply by considering the demand for and supply of the treatment ofopportunistic illnesses.
Since 2001, however, generic versions of ART medications have becomeavailable in poor countries at a cost of as little as $150 a year. In 2001, atthe Doha round of World Trade Organization (WTO) discussions, bothindustrial and developing countries negotiated and signed a Declarationon Trade-Related Aspects of Intellectual Property Rights (TRIPs) and Pub-lic Health, which confirmed provisions already implicit in earlier WTO
311
©International Monetary Fund. Not for Redistribution

agreements: a country would have the right to grant “compulsory licenses”to a domestic pharmaceutical manufacturer to produce medications fordomestic consumption when the national government decides there is apublic health emergency. In 2003 further negotiation led to an extensionof the declaration to permit countries without domestic pharmaceuticalindustries to import generic versions of patented drugs. Permission wasmade subject to the WTO’s endorsement of the absence of domestic pro-duction capability, and generic manufacturers and exporters were requiredto ensure that the generic versions be easily distinguishable visually fromthe patented version.
Simultaneous with the dramatic fall in the prices of ART medication,poor countries are finding that new external sources for AIDS medicationhave appeared. Created in 2002, the Global Fund for AIDS, Tuberculosis,and Malaria has been funding proposals to finance the expansion of AIDStreatment in poor countries. The World Bank, which had previouslyfinanced the treatment of opportunistic illnesses and palliative care forAIDS, is allowing existing grants and credits to be reallocated to helpstrengthen national capacities for ART delivery. The U.S. government isdramatically increasing funding for ART in selected countries. And theWorld Health Organization (WHO) has joined with national governmentsand private foundations to announce the “3 by 5 Initiative,” an ambitiousplan to provide ART to 3 million AIDS patients by 2005.
Governments are struggling to understand the consequences of theserapid changes for their health care systems and to define their own policiesfor guiding the inflow of resources and complementing them with domesti-cally financed initiatives. Questions they are asking include the following.How many AIDS patients do we have in our country? How many of themwill come forward for ART? How many health workers do we have who canmanage an AIDS patient on ART? Can our health care system achieve healthbenefits to AIDS patients as good as those achieved in pilot studies? WillAIDS patients crowd out other important health care programs, such asmother and child health programs, vaccination programs, and care fortuberculosis, malaria, diabetes, respiratory illness, and trauma? Will the cur-rent sources of funding for ART at some point dry up, forcing us to financethese drugs ourselves or let patients die? How can we ensure that our gov-ernment and our health care system will be able to manage the inflow ofresources for AIDS treatment without corruption or waste? What will be theimpact of newly available, highly effective ART on the rate of new HIV infec-tions? How should we alter our AIDS prevention programs as ART becomeswidely available? How will current commitments to care for AIDS patientsaffect national expenditure and national priorities in the future?
312 MEAD OVER
©International Monetary Fund. Not for Redistribution
The answers to these questions are complex and will necessarily differfrom country to country. This chapter attempts to provide some guidanceby, first, presenting a conceptual framework for analyzing the impact ofAIDS on the health care system in the absence of ART, and then by addingART to that picture.
Adjusting the Health Sector to the Treatment ofOpportunistic Illnesses
AIDS affects the output of the health sector in two ways: by increasingdemand and by reducing the supply of a given quality of care at a givenprice.1 As a result, some HIV-negative people who would have obtainedtreatment for other illnesses had there been no epidemic are unable to doso, and total national expenditure on health care rises, both in absoluteterms and as a proportion of national product.
Effect of AIDS on Demand for Care Before ART Was Available
Most people who develop AIDS are prime-age adults, defined as thoseaged 15 to 49. In the absence of AIDS, this age group typically accounts foronly 10 to 20 percent of all deaths in a developing country in a given year,but the illnesses leading to these deaths typically generate a disproportion-ate share of total health care demand (Over and others, 1992; Sauerborn,Berman, and Nougtara, 1996). Moreover, several studies suggest thatprime-age adults with AIDS tend to use more health care before deaththan those who die of other causes, or even than those with other pro-longed illnesses. Thus the percentage increase in the demand for care byprime-age adults due to AIDS is likely to exceed the percentage increase intheir mortality due to AIDS. As a result of these two factors, in a countrywhere prime-age adults utilized one-fourth of all health care before AIDS,a given percentage increase in their demand for health care will increasetotal demand by at least one-fourth of that percentage. For example, a40 percent increase in the mortality rate of prime-age adults will increasetotal demand for care by at least 10 percent, even though total mortalityhas increased by only 4 to 8 percent. If AIDS patients use ART, which pro-longs their lives but does not cure them, the increase in demand will bemuch greater.
Impact of the HIV/AIDS Epidemic on Health Sectors 313
1 This section draws on previously published material in World Bank (1997, 1999).
©International Monetary Fund. Not for Redistribution

How much the demand for care increases in the aggregate depends onthe increase in the prime-age adult death rate, which in turn depends onHIV prevalence in this group and the median time from infection to death.A stable prevalence rate of 5 percent among prime-age adults eventuallyincreases their annual mortality by about 5 deaths per 1,000 persons if themedian time from infection to death is 10 years. A prevalence rate of30 percent, as observed in parts of southern Africa, will increase the num-ber of deaths per 1,000 prime-age adults by 30 to 60, depending on themedian time to death. In sub-Saharan Africa, where mortality rates in thisage group were as high as 5 per 1,000 before the epidemic, even a 5 percentinfection rate will double or triple the adult death rate. In a middle-incomedeveloping country with pre-epidemic adult mortality of 1 per 1,000, thesame endemic level of HIV infection will increase prime-age adult mortal-ity 5- or 10-fold.
Given these parameters, how much will the epidemic increase thedemand for care? Consider a country where prime-age adults consumedone-fourth of all health care before the AIDS epidemic, where HIV preva-lence is constant at 5 percent of prime-age adults, where the median timeto death is 10 years, and where the baseline mortality rate among prime-age adults is 5 per 1,000. In this case mortality among prime-age adults willapproximately double as a consequence of HIV/AIDS. If the demand fortreatment is proportional to mortality for the respective causes (thisdepends on the costs of treatment, as well as the duration of the illness),then the demand for health services, at any given price, would increase by25 percent. If the prevalence rate is higher, if mortality rates among thoseinfected are higher (for given prevalence rates), or if the baseline adultmortality rate is lower, the percentage increase in demand will be corre-spondingly greater.
A final important factor that may increase demand is third-party pay-ment for health care. This may take the form of private insurance, agovernment-run insurance program, or, more typically, health care partlyfinanced through general taxation and offered at reduced cost to thepatient. Because one or more of these types of third-party payment oftencover a portion of health care costs, the price paid by the patient is usuallya fraction of the cost of providing the care. Since third-party payment thusenables patients to purchase more care than they would otherwise, itincreases the demand for care arising from any given level of illness, thusmagnifying the price shock of an AIDS epidemic. For example, if patientsthemselves pay 25 percent of the cost of their care, they will reduce theirutilization in response to any increase in cost by only one-fourth as muchas they would if they had to pay the full increase.
314 MEAD OVER
©International Monetary Fund. Not for Redistribution

Effect of AIDS on the Supply of Care Before Antiretroviral TherapyWas Available
Even as it increases the demand for care, the AIDS epidemic will reducethe supply of care available at a given price, in three ways. The magnitudeof these effects will generally be larger, the poorer the country and themore widespread and severe the epidemic.
The first and largest effect is the increased cost of maintaining a givenlevel of safety for medical procedures. Even without HIV, hospitals andclinics in poor countries may themselves pose a risk to health. Needles andother instruments are not always sterilized, rooms are often overcrowdedand poorly ventilated, and care providers may lack rubber gloves andsometimes even soap. Without modern blood banks, a transfusion mightinfect the recipient with hepatitis B. In such situations infections of alltypes spread rapidly; some, including such common illnesses as pneumo-nia, may kill. Before HIV, however, infections picked up in a clinic or hos-pital were rarely fatal to persons not already in a seriously weakened state.
Because the AIDS epidemic has greatly increased the risk to patients ofexisting medical procedures, simply maintaining the level of safety thatexisted before HIV requires additional hygiene and blood screening, bothof which increase the cost of care. In middle- to high-income countries,where blood screening and sterilization of injecting equipment are alreadythe norm, the impact of AIDS is confined to the incremental cost of addingan HIV test to existing tests and using rubber gloves and face masks in sit-uations where they were not used previously. In poor countries, whereblood screening and needle sterilization were lacking before the epidemic,the resources needed to maintain the quality of care in the face of the AIDSepidemic can be substantial. For example, the annual budget of the Ugan-dan Blood Transfusion Service, which was established in response to theepidemic and meets the demands of the entire Ugandan national healthcare system for clean blood, is estimated to be about $1.2 million, includ-ing capital and recurrent costs. This amounts to about 2 percent ofnational public health expenditure, or about 1 percent of total nationalhealth expenditure (European Commission, 1995).
Despite the potentially high costs of blood screening, HIV has greatlyincreased the justification for a government role in ensuring a safe bloodsupply. However, there is no convincing rationale for government to sub-sidize the entire cost of running such a service indefinitely. Blood screen-ing and improved collection procedures will protect blood donors andrecipients. However, since the average donor and recipient do not engagein unprotected sex with a large number of partners, a person infected
Impact of the HIV/AIDS Epidemic on Health Sectors 315
©International Monetary Fund. Not for Redistribution

while giving or receiving blood is not likely to pass the infection to manyothers. Thus, in developing countries where the cost of establishing a safeblood supply is high, blood screening will not be among the morecost-effective approaches to preventing an epidemic based on sexualtransmission.
To be sure, blood screening and better hygiene will help to prevent thespread of other infectious diseases besides AIDS. Such measures will alsoreduce the occupational risk of contracting AIDS and other diseases thathealth care workers face, and therefore reduce the amount of additionalcompensation needed to offset their occupational risk—an issue that willbe discussed below. A careful accounting of the net cost of protectingpatients from HIV by screening blood would need to take into considera-tion these additional benefits, for which data are lacking. However, it seemslikely that, even if these benefits are taken into account, the remaining costof screening blood and improving hygiene to protect patients fromHIV/AIDS would substantially increase the unit cost of medical care.
The second factor reducing the supply of medical care at a given priceis the increased attrition and absenteeism of health care workers whobecome infected with HIV. Like all prime-age adults, health care workersmay become infected with HIV as a result of sexual contact or the use ofunsterile injecting equipment outside of their work. Unlike other adults,they face an additional risk of becoming infected in the course of theirwork; however, this risk is generally much smaller than the risk from sex-ual contact. Thus whether the AIDS mortality rate among health careworkers is higher or lower than among the general population dependsmostly on the effects of income, education, and social status on sexualbehavior. Two studies of HIV prevalence among health care workers fromAfrica suggest that doctors and nurses are at least as likely to becomeinfected as other people (Mann and others, 1986; Buvé and others, 1994).If this is true elsewhere, a country with stable 5 percent HIV prevalencecan expect that each year between 0.5 and 1 percent of its health careproviders will die from AIDS; a country with 30 percent prevalence wouldlose 3 to 7 percent a year. This attrition from AIDS deaths may substan-tially increase the cost of health care. For example, if labor costs are half oftotal health care costs, and if training or recruiting a replacement workerrequires a one-time expenditure equal to the worker’s annual salary, thena 7 percent increase in attrition will increase total costs in the health sectorby 3.5 percent.
The third way in which AIDS reduces the supply of health care isthrough the additional risk it imposes on health care workers. Even thoughmost HIV-infected health care workers acquire their infection through
316 MEAD OVER
©International Monetary Fund. Not for Redistribution

sexual contact, in a society with a large proportion of HIV-positivepatients, health care work will be more dangerous than if there were noHIV. Some students who would have become doctors and nurses willtherefore choose alternative occupations, unless they are compensatedwith higher pay for the increased risk. A recent survey of medical andnursing students in the United States found that AIDS had indeed reducedthe attractiveness of specialties in which contact with HIV-positivepatients was more likely (Bernstein, Rabkin, and Wolland, 1990; Mazzulloand others, 1990). This problem is likely to be most severe in hard-hitdeveloping countries, where HIV prevalence is much higher and rubbergloves and other protective equipment are often in short supply. In Zam-bia, for example, some nurses have demanded special payments to com-pensate for the increased occupational risk due to HIV (Buvé and others,1994). A recent qualitative study in Ethiopia quotes health workers as say-ing, for example, “HIV/AIDS has increased our exposure to the virus andwe fear contracting it,” and “I have a son who used to be interested in join-ing the medical profession . . . but decided to join another profession. Hisreason was that he has observed the risk his parents are exposed to . . .”(Lindelöw, Serneels, and Lemma, 2003).
The magnitude of these increased costs due to higher required com-pensation of medical staff has not been estimated. As noted above,improved precautions in hospitals and clinics may reduce these costs. Butbecause people respond to perceived risk rather than actual risk, suchimprovements may have little impact on the demand for increased com-pensation. Thus it seems clear that health care workers’ perception of riskwill either increase the cost or lower the quality of care. In either case theeffect is an unambiguous increase in the cost of a quality-adjusted unit ofcare.
The total impact of these three effects—increased cost of preventinginfections in medical facilities, attrition of health care workers due toHIV, and the additional pay that health care workers demand to com-pensate them for the increased risk of becoming infected—will dependmost importantly on the prevalence of HIV and whether modern bloodbanks and hygienic practices are already in place. In a country that has5 percent HIV prevalence among prime-age adults and lacked bloodbanks and blood screening before the epidemic, a conservative guess isthat the cost of providing care of a given quantity and quality will rise byabout 10 percent.
Now that relatively inexpensive ART is available, health care systems canuse it to mitigate the effects of the attrition of workers due to HIV/AIDSand the fear of becoming infected from a patient. Workers with AIDS who
Impact of the HIV/AIDS Epidemic on Health Sectors 317
©International Monetary Fund. Not for Redistribution
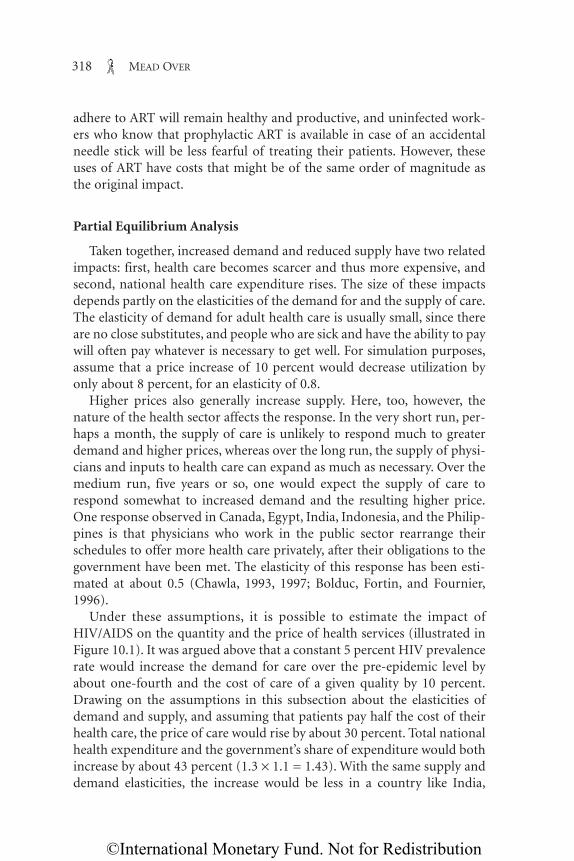
adhere to ART will remain healthy and productive, and uninfected work-ers who know that prophylactic ART is available in case of an accidentalneedle stick will be less fearful of treating their patients. However, theseuses of ART have costs that might be of the same order of magnitude asthe original impact.
Partial Equilibrium Analysis
Taken together, increased demand and reduced supply have two relatedimpacts: first, health care becomes scarcer and thus more expensive, andsecond, national health care expenditure rises. The size of these impactsdepends partly on the elasticities of the demand for and the supply of care.The elasticity of demand for adult health care is usually small, since thereare no close substitutes, and people who are sick and have the ability to paywill often pay whatever is necessary to get well. For simulation purposes,assume that a price increase of 10 percent would decrease utilization byonly about 8 percent, for an elasticity of 0.8.
Higher prices also generally increase supply. Here, too, however, thenature of the health sector affects the response. In the very short run, per-haps a month, the supply of care is unlikely to respond much to greaterdemand and higher prices, whereas over the long run, the supply of physi-cians and inputs to health care can expand as much as necessary. Over themedium run, five years or so, one would expect the supply of care torespond somewhat to increased demand and the resulting higher price.One response observed in Canada, Egypt, India, Indonesia, and the Philip-pines is that physicians who work in the public sector rearrange theirschedules to offer more health care privately, after their obligations to thegovernment have been met. The elasticity of this response has been esti-mated at about 0.5 (Chawla, 1993, 1997; Bolduc, Fortin, and Fournier,1996).
Under these assumptions, it is possible to estimate the impact ofHIV/AIDS on the quantity and the price of health services (illustrated inFigure 10.1). It was argued above that a constant 5 percent HIV prevalencerate would increase the demand for care over the pre-epidemic level byabout one-fourth and the cost of care of a given quality by 10 percent.Drawing on the assumptions in this subsection about the elasticities ofdemand and supply, and assuming that patients pay half the cost of theirhealth care, the price of care would rise by about 30 percent. Total nationalhealth expenditure and the government’s share of expenditure would bothincrease by about 43 percent (1.3 × 1.1 = 1.43). With the same supply anddemand elasticities, the increase would be less in a country like India,
318 MEAD OVER
©International Monetary Fund. Not for Redistribution

where only about one-fifth of the cost of care is paid by the government,and substantially more in many countries of Latin America and EasternEurope, where three-fourths or more of the cost is typically subsidized.
Does the available empirical evidence support these conclusions? Mea-suring the scarcity of medical care through changes in the price of care ofa given quality is problematic because of the difficulties in measuring qual-ity. This is especially true in developing countries, where a general lack ofdata is compounded in the health sector by government subsidies andnonprice forms of rationing. In such cases the effective price of care mayrise even though nominal prices remain constant. Furthermore, because ofthe lag between infection and death, the time between the attainment of agiven HIV prevalence rate and the full impact of that rate on the demandand supply of health care can be 10 years or more. For these reasons onecannot accurately assess changes in the scarcity of health care in develop-ing countries by observing changes in nominal prices. Nonetheless, onecan get some sense of the extent to which HIV/AIDS increases the effectiveprice of health care by considering whether the epidemic makes it moredifficult to obtain care. Studies of hospital admissions data suggest thatthis is the case.
Table 10.1 shows the percentage of beds occupied by HIV-positivepatients in six referral hospitals in developing countries that had large epi-demics in the mid-1990s. The hospitals in question are the top health careinstitutions in each country, providing the best care available outside of a
Impact of the HIV/AIDS Epidemic on Health Sectors 319
BeforeAIDS
BeforeAIDS
AfterAIDS
Price
AfterAIDS
Quantity
Supply beforeAIDS
Demand beforeAIDS
Supply afterAIDS
Demand afterAIDS
Figure 10.1. Impact of HIV/AIDS on the Price and Quantity of Health Care
©International Monetary Fund. Not for Redistribution

few expensive private clinics. Because these hospitals are at the apex oftheir health care pyramids, it is likely that AIDS patients make up a signif-icant proportion of their patients. Even so, the percentage of beds occupiedby HIV-positive patients is striking, ranging from 39 percent in Nairobi,Kenya, to 70 percent in Bujumbura, Burundi.
If these hospitals were operating well below capacity before the epi-demic, they might have accommodated the HIV-positive patients withoutreducing care for the HIV-negative ones. Although no data on occupancyprior to the epidemic are available for these specific hospitals, bed occu-pancy rates in such hospitals typically were well above 50 percent evenbefore AIDS appeared on the scene.
The best evidence that AIDS sometimes makes it more difficult for peo-ple not infected with the virus to get medical treatment comes from an in-depth study of Kenyatta National Hospital, the premier teaching hospitalin Nairobi, Kenya. The study compared all patients admitted during a 22-day period in 1988 and 1989 with those admitted during a 15-day periodin 1992 (Floyd and Gilks, 1996). The researchers found that the number ofHIV-positive patients more than doubled, whereas the number of HIV-negative admissions shrank by 18 percent. Since it is very unlikely that thenumber of HIV-negative people in the hospital’s catchment area shrank bythis much, this evidence suggests that the AIDS epidemic did in fact resultin some HIV-negative patients being dissuaded or barred from admissionto the hospital.
Of course, no data exist on what happened to the HIV-negative patientswho were not admitted. But hospital records show that the mortality ratesfor those who were admitted increased between the two periods, from 14percent to 23 percent. The mortality rate for the HIV-positive patients didnot increase, and other indicators of the quality of care remained constant.Thus the most likely explanation for the increased mortality rate amongthe HIV-negative patients is that the rationing scheme used to allocate
320 MEAD OVER
Table 10.1. Hospital Beds Occupied by HIV-Positive Patients in Selected Cities,Circa 1996(Percent)
City Hospital Share of Beds
Chiang Mai, Thailand Provincial 50Kinshasa, Democratic Republic of Congo Mama Yemo 50Kigali, Rwanda Central 60Bujumbura, Burundi Prince Regent 70Nairobi, Kenya Kenyatta National 39Kampala, Uganda Rubaga 56
Source: World Bank (1999).
©International Monetary Fund. Not for Redistribution

increasingly scarce beds had the effect of changing the mix of HIV-negative patients toward those with more severe illnesses. Whether therationing was imposed by hospital staff or was a response by prospectivepatients to their perception of a higher effective price of care, it is likely tohave excluded some patients whose lives the hospital could have saved.2
Characteristics of the Market for AIDS Treatment
The substantial resource flows necessary to expand the availability ofART in poor countries will shift the demand curve for health care servicesupward and to the right, as depicted in Figure 10.1. In each country thesize of the epidemic, together with the amount of new funding available,will determine the extent of the shift in demand. The amount of fundingalso affects the elasticity of the demand curve, with more funding associ-ated with less elasticity. When the demand curve is less elastic, any increasein the cost of care is translated directly into increases in both prices andexpenditure, rather than into reductions in utilization. Thus the outcomeof new ART funding will depend largely on the nature of the public andprivate supply responses.
The model of supply implicit in Figure 10.1 is a simple one, derivedfrom models of perfectly competitive firms. In reality only a portion of themarket for health care services is served by private, for-profit health carefacilities. Figure 10.2 shows that, even in the poorest countries, wherehealth expenditure is a small proportion of domestic product, at least one-fifth of all health expenditure occurs in the public sector. Another sub-stantial proportion of health care services is delivered by nonprofit,nongovernmental organizations, many of which are faith-based.
Agency Problems in Health Care
Patients seek the care of trained health care providers partly becausethese providers have specialized knowledge, and partly because theprovider gives them access to pharmaceutical products and medical proce-
Impact of the HIV/AIDS Epidemic on Health Sectors 321
2In a follow-up study of the same hospital, the authors found that HIV-negative admis-sions were back up. However, hospital utilization had surged to over 100 percent, implyingthat some patients were sleeping on the floor and in hallways. Thus the quality of care waslower, and the “effective price” of care was driven upward by the epidemic (Floyd and Gilks,1996).
©International Monetary Fund. Not for Redistribution

dures that patients have difficulty obtaining directly. The provider servesas the agent of his or her patients, but is also, like all agents, subject to con-flicting interests. Professional ethics and concern for his or her reputationboth motivate the provider to be a “good” agent, making choices that thepatient would make with the same information. However, the provider isalso tempted to make choices against the best interests of patients. Forexample, the provider has an incentive to spend more on medical care ofdoubtful efficacy, when wasteful expenditures would benefit the providerand cannot easily be distinguished from useful expenditures by the patient.
322 MEAD OVER
4 6 8Share of health expenditure in GDP, 2001
Public share of health expenditure, 2001
10 1220
30
40
50
60
70
80
Europe and Central Asia
Middle East andNorth Africa
East Asia and Pacific
Europe EMU
High income
Upper middle income
Lower middle income
Low income
South Asia
Sub-Saharan Africa
Latin America and Caribbean
World
Figure 10.2. Relationship of Health Expenditure Share of GDP to Public Shareof Health Expenditure by World Region and by Income(Percent)
Source: World Bank (2004, Table 2.14).
©International Monetary Fund. Not for Redistribution

Furthermore, the provider has some monopoly power, due not only to hisor her specialized knowledge but also to the difficulty the patient wouldface in switching to another provider. The equilibrium between these con-flicting interests can shift when the demand for health care is dramaticallyincreased, for example by an AIDS epidemic. In situations of excessdemand, the patient is less likely to be able to choose his or her provider,and the potential financial rewards to the provider from opportunisticbehavior increase. Thus with excess demand the equilibrium is likely toshift toward more opportunistic provider behavior.
The situation is more complex when the provider is employed by thepublic sector or accountable to a third-party payer, such as a governmentor private health insurance fund. In these situations the provider is anagent not only of the patient, but also of the third party. With respect tothe third-party payer, perfect agency on the part of the provider meansmaximizing efficiency and maximizing the equity of distribution of his orher output by income class. This is not always the same as maximizingquality or patient satisfaction, and thus is not completely in accord withperfect agency on behalf of the patient. The health care provider now mustadvise the patient in a way that balances the requirements of both thesedifferent principals against each other and against his or her own personalneeds and constraints.
The government or other third-party financer of health care canobserve the performance of the provider by periodically exercising super-vision or in a variety of more subtle but more expensive ways. For exam-ple, the supervisor might employ actors to impersonate an individualseeking care and report the provider’s behavior and treatment decisions.However, accurate quality control requires resources, which could haveotherwise been spent on higher salaries for the providers, on more drugsor other medical supplies, or on public goods outside the health sector.
Furthermore, the salaries of civil servants, including health careproviders, in poor countries are often extremely low, and lower than thoseof providers in the private sector. These low salaries combined with tradi-tional job protection for civil servants limit the sanctions that the govern-ment can bring to bear on the provider. Indeed, evidence and experienceshow that, in many poor countries, the government cannot even identifyand remove nonexistent employees from the payroll, much less those whodo exist but only occasionally show up for work. For example, a study ofcivil service rolls in Honduras in 2000 found that 8.3 percent of the healthworkers and 5.0 percent of employees in public education receivingsalaries were “ghost workers” who had either died, left the service, or neverexisted (Lindelöw, 2003).
Impact of the HIV/AIDS Epidemic on Health Sectors 323
©International Monetary Fund. Not for Redistribution

Similarly, the patient can, in theory, learn that a given provider givespoor service or low-quality treatment and choose a different provider thenext time. However, in rural areas of poor countries, alternative providersare scarce, and patients must often walk long distances to exercise thisoption. In that case, local providers, whether in the public or the privatesector, have substantial market power and can exercise that power in theirown interest, to the detriment of their patients. The result is often poor per-formance of the health system overall, as documented in the next section.
Poor Performance of Health Services in Poor Countries
How well do health care providers serve as agents to their two princi-pals? Figure 10.3 casts light on whether public health care spending inpoor countries is truly serving the poor—a presumed objective of the gov-ernment. Note that, in most of the countries in the figure, the richest quin-tile benefits far more than the poorest from all health spending. Primaryhealth care, which tends to be located in rural areas, is also biased towardthe richest quintile, although less extremely so than overall health care
324 MEAD OVER
0 010 1020 2030 3040 4050 50
Guinea1994
Armenia1999
Ecuador1998India
1995/96Côte d’Ivoire
1995
Madagascar1993
Bangladesh 2000
Bulgaria 1995
Costa Rica 1992
Primary health care spendingAll health spending
Richest quintile Poorest quintile
Figure 10.3. Incidence of Public Health Care Expenditure by Income Quintilein Selected Countries(Percent)
Sources: World Bank (2003); Filmer (2003).
©International Monetary Fund. Not for Redistribution

spending. As publicly financed AIDS treatment expenditure increases inpoor countries, it would be surprising if this expenditure did not primar-ily benefit the richest AIDS patients.
Another basic indicator of the performance of health care workers iswhether they show up for work. Data collected in eight countries for theWorld Bank’s World Development Report 2004 suggest that absenteeism isfrequently a serious problem (World Bank, 2003). Figure 10.4 shows thatthe share of staff in peripheral health facilities with unexplained absencesvaried from 18 percent in Papua New Guinea to 43 percent in India. Vari-ation within countries is also important. For example, in Bangladeshabsenteeism among physicians is fully 75 percent, much higher than thatamong nonphysicians.
These data suggest that expanding ART or any other any medical pro-gram that depends on the dedicated hard work of rural public health careproviders is likely to fall short of its potential unless the incentives thatguide these workers’ behavior are restructured. One ingredient of thisrestructuring will certainly be higher salaries for health care workerscharged with these new responsibilities. However, a recent study from
Impact of the HIV/AIDS Epidemic on Health Sectors 325
0
10
20
30
40
50
Primary schools
Primary health facilities
Bangladesh Ecuador India Indonesia Peru Zambia UgandaPapuaNew
Guinea
Figure 10.4. Unexplained Staff Absenteeism in Primary Schools and PrimaryHealth Facilities in Selected Countries1
(Percent)
Source: World Bank (2003).1Percent of all staff who were supposed to be present but were not on the day of an unannounced
visit. It includes staff whose absence is excused for various reasons, such as training.
©International Monetary Fund. Not for Redistribution

Uganda, which compared the efficiency and quality of health care in thepublic sector with that in the faith-based private sector, found that, despitesomewhat higher salaries, the public sector was less productive and wasperceived by patients as producing lower-quality care (Reinikka and Svens-son, 2003). Better performance is more likely to depend on improvedsupervision and a closer link between worker performance and a variety ofrewards, including financial compensation and professional prestige.
Impact of Antiretroviral Medication on the Health Sector
Of the more than 40 million people worldwide believed to be infectedwith HIV, WHO estimates that approximately 5.9 million currently needART to prolong their lives (WHO, 2003). Most of those in need who livein rich countries are receiving such care. But more than 3 million peopleliving mainly in poorer countries do not currently have access to that care.Figure 10.5 shows that the gap between current coverage and need is con-centrated in the poorest countries of Africa and Asia.
As mentioned previously, WHO has advanced the goal of providingART to 3 million of the more than 5 million needing treatment by the year2005—the 3 by 5 Initiative. The organization has focused on 34 high-priority countries (listed in Table 10.2) that, according to estimates,together have approximately that number of people currently in need ofART.
Basics of Combination Therapy for AIDS
Four classes of medications are used in ART: antiretroviral drugs, nucle-oside reverse transcriptase inhibitors (NRTIs), nonnucleoside reverse tran-scriptase inhibitors (NNRTIs), and protease inhibitors (PIs). Each actsagainst HIV in a different way. The therapy recommended for patientsentering ART for the first time consists of two NRTIs and one other com-pound, either an NNRTI or a PI. If a patient has problems with the firsttherapy received, he or she is moved to the second-line therapy, which isoften more expensive.
Whether ART is successful in preventing HIV-related illness and pro-longing the life of the patient depends most of all on how well the patientadheres to the prescribed times and doses of all of the medications. Typi-cally the patient must take medications several times a day, at precise inter-vals. Some medications must be taken before eating, others after eating. Themedical regime is simplified if the three drugs are packaged in the same pill,
326 MEAD OVER
©International Monetary Fund. Not for Redistribution

but only a few triple-drug combinations are available in single-pill format.Imperfect adherence leads to the selection of a strain of HIV that is resis-tant to this drug combination. Adherence is thus important not only for theindividual patient, but also to prevent the possibility that the patient willtransmit a resistant strain to others, for whom the same drug combinationwould then not be helpful. Since, again, second- and third-line therapiestend to be more expensive, patients with resistant strains might not be ableto find the right drug combination at a price they can afford.
A matter still under some dispute in the medical community is whethertest results materially assist physicians attempting to manage patients onART. So-called CD-4 tests are relatively inexpensive and track the status ofthe immune system. Viral load tests, which measure the quantity of virusin the bloodstream, are more expensive. The 3 by 5 program is based onthe assumption that relatively few tests are needed, far fewer than have typ-ically been funded in poor countries.
So far, the available evidence suggests that adherence to treatment regi-mens in developing countries has been relatively good. For example, inUganda a pilot study reported adherence rates above 85 percent (Okeroand others, 2003). However, since treatment has thus far been availableonly to a small fraction of the eligible populations in developing countries,
Impact of the HIV/AIDS Epidemic on Health Sectors 327
75–10050–74.925–49.95–24.9Less than 5No data
Figure 10.5. Coverage of Adults in Need of Antiretroviral Therapy, November 2003(Percent)
Source: World Health Organization (2003).
©International Monetary Fund. Not for Redistribution

it remains unknown how well the general population of HIV-infected peo-ple in these countries will be able to adhere.
Projected Burden if the 3 by 5 Goals Are Met
The attempt to scale up ART until 3 million patients have access willpresent serious challenges to most countries. WHO has projected the AIDSprogram expenditure for 2004/05 that would be necessary to meet the 3 by5 goal in each of the 34 countries in Table 10.2. Figure 10.6 plots for eachcountry this estimated expenditure against the country’s population. Theareas of the circles representing individual countries in the figure are pro-portional to their share of all AIDS patients in this group, and the straightline represents annual expenditure per capita (for the whole population,not just of AIDS patients) of $2. Countries above and to the left of the lineare estimated to need to spend more than $2 per capita a year.
How does this projected expenditure compare with existing publichealth expenditure in the same countries? Figure 10.7 shows, for the 34countries, the ratio of projected AIDS expenditure in 2005 to public healthexpenditure without AIDS in 2002. In 20 of the 34 countries, that ratio isone-third or less, so that the goal seems feasible on this measure. But in theother 14 countries, the ratio is greater than one-third, and in 3 countries itis greater than one. That is, projected total AIDS expenditure in thesecountries in 2005 will exceed total public health expenditure in 2002.These 14 countries, and especially the last 3, will have great difficultyabsorbing the proposed AIDS expenditure.
Figure 10.8 plots the same variables in per capita terms, with each cir-cle again proportional in size to the country’s share of the 3 million AIDSpatients in these countries as a group. It is somewhat reassuring to notethat, of the four countries with the largest numbers of patients needingcare, two lie below the line, indicating that the required increase in public
328 MEAD OVER
Table 10.2. High-Priority Countries for the WHO 3 by 5 Initiative
Angola Ethiopia Mozambique SwazilandBotswana Ghana Myanmar TanzaniaBurkina Faso Guinea Namibia ThailandBurundi Haiti Nigeria UgandaCameroon India Russian Federation UkraineCentral African Rep. Indonesia Rwanda VietnamChina Kenya South Africa ZambiaCongo, Dem. Rep. of Lesotho Sudan ZimbabweCôte d’Ivoire Malawi
Source: World Health Organization (2003).
©International Monetary Fund. Not for Redistribution

expenditure will be less than one-third of current public health expendi-tures in these countries.
The above analyses assume that a country’s ability to absorb additionalAIDS expenditure depends on the magnitude of this additional expendi-ture relative to current public health expenditure. An alternative perspec-tive is provided by comparing prospective expenditure with the number ofphysicians in the country. Several objections might be raised to thisapproach. First, not all physicians will be involved in AIDS care. Some willcontinue to specialize in other types of care, never treating an AIDSpatient, whereas many general practitioners and internal medicine special-ists will treat AIDS cases as an increasingly large proportion of their prac-tices. Second, according to the guidelines developed by WHO for the 3 by5 Initiative, certain types of paramedical personnel, including nurse prac-titioners and some nurses with special training, will be managing AIDSpatients under the guidance of supervising physicians. Despite these draw-
Impact of the HIV/AIDS Epidemic on Health Sectors 329
110
100
1000
10 100Population in 2005 (millions)
Projected cost of AIDS in 2005 (millions of dollars)
1000
Figure 10.6. Distribution of 3 by 5 Initiative Target Countries by Projected AIDS Expenditure and Population1
Source: Benjamin Johns, Stefano Bertozzi, and others on the WHO 3 by 5 Initiative team, personal communication with the author.
1Both axes scaled in logarithms. Each circle represents one country, with its area proportional to the country’s share of all AIDS patients in the 34 countries (listed in Table 10.2).
©International Monetary Fund. Not for Redistribution

backs, the perspective provided by this measure is potentially useful,because physicians will remain the primary decision makers in the alloca-tion of existing and new publicly provided AIDS treatment resources.
The vertical axis in Figure 10.9 plots, for each of the 34 countries, theratio of projected 2005 AIDS expenditure to the number of physicians inthe country. The horizontal axis plots countries’ GDP per capita. The cir-cles again are proportional in size to the country’s share of total AIDSpatients in the 34 countries. (Both axes are scaled in logarithms for greaterclarity.) The two lines divide the figure into four sections. The upwardsloping line represents 10 times GDP per capita. Countries above this linewill be attempting to allocate AIDS treatment resources per physicianexceeding that amount. The second, vertical line separates the poorestcountries (those with GDP per capita less than $500) from the less poor.
Figure 10.9 thus classifies the 34 countries into essentially three groups,summarized in Table 10.3. In the eight countries in the lower right quad-rant of the figure, projected AIDS expenditure per physician in 2005 isless than 10 times GDP per capita, and GDP per capita is relatively large.These countries face a feasible challenge. The average country in thisgroup will have to allocate about 1.8 times GDP per capita for each physi-
330 MEAD OVER
1.331.000.670.3300
5
10
15
20
Ratio
Number of countries1
Figure 10.7. Country Distribution of the Ratio of Projected AIDS Expenditure, 2005, to Total Public Health Expenditure Without AIDS, 2002
Source: Benjamin Johns, Stefano Bertozzi, and others on the WHO 3 by 5 Initiative team, personal communication with the author.
1Countries are the 34 countries listed in Table 10.2.
©International Monetary Fund. Not for Redistribution

cian. These countries are more likely than the others in the figure to haveboth the economic resources and the medical resources (as proxied by thenumber of physicians) necessary to greatly expand ART access, shouldthey receive the resources and direct their energy to the vigorous expan-sion of ART.
The 11 countries in the upper right portion of the figure face a sub-stantial challenge. Although their economic resources are similar to thoseof the group of countries below them in the figure, they have more AIDSpatients or fewer physicians, or both. For the average country in this group,the 3 by 5 Initiative will require that they channel new resources to AIDScare equivalent to about 113 times their 2005 GDP per capita, for each res-ident physician. In these countries, then, the effort to reach the 3 by 5 goalwill put greater pressure on existing resources.
The remaining 14 countries in the upper left portion of Figure 10.9(only one country lies in the lower left quadrant) face the greatest chal-
Impact of the HIV/AIDS Epidemic on Health Sectors 331
100
10
1
1 10 100
Projected public health expenditure per capita in 2005 (in dollars)
Projected cost of AIDS per capita in 2005 (in dollars)
Figure 10.8. Distribution of 3 by 5 Initiative Target Countries by Cost of AIDS per Capita and Public Health Spending per Capita1
Source: Benjamin Johns, Stefano Bertozzi, and others on the WHO 3 by 5 Initiative team, personal communication with the author.
1Both axes scaled in logarithms. Each circle represents one country, with its area proportional to the country’s share of all AIDS patients in the 34 countries (listed in Table 10.2).
One-third of 2005 public health expenditure per capita
©International Monetary Fund. Not for Redistribution

lenge. Both their economic capacity and their medical capacity are small inrelation to their number of AIDS cases. The average country in this groupwill be required to increase health spending by 368 times GDP per capitafor each resident physician. In the most severely challenged country thisratio reaches 879. In all these 14 countries the attempt to spend millions ofdollars on expanding ART must cope with systems that are not equippedto manage such large sums. Medical personnel are already stretching tomeet current public health objectives and will have to divert time fromthese objectives to expand their treatment of AIDS cases. The temptationsfor medical personnel to divert AIDS treatment resources to other uses orto sell treatment access at black market prices will be extreme, and theresulting leakage from the system will reduce the efficiency of AIDS expen-diture. As a result, in the 14 countries facing the greatest challenge, eitherthe number of AIDS patients effectively treated will fall short of the objec-tive, or the total expenditure required will be greater.
332 MEAD OVER
106
105
104
103
102
Projected GDP per capita in 2005 (dollars)
Projected cost of AIDS per physician in 2005 (dollars)
Figure 10.9. Distribution of 3 by 5 Initiative Target Countries by Cost of AIDS per Physician and GDP per Capita1
Source: Benjamin Johns, Stefano Bertozzi, and others on the WHO 3 by 5 Initiative team, personal communication with the author.
1Both axes scaled in logarithms. Each circle represents one country, with its area proportional to the country’s share of all AIDS patients in the 34 countries (listed in Table 10.2).
100 200 500 1000 2000 5000
Countries facing greatest challenge
Countries facing substantial challenge
Countries facing feasible challenge
10 x GDP per capita in 2005
©International Monetary Fund. Not for Redistribution

Impact on Demand
The above assessment is perhaps too pessimistic in one respect: it doesnot take into account the reduction in the demand for treatment of oppor-tunistic illnesses that occurs when AIDS patients are effectively treatedwith antiretroviral medications. In Brazil the demand for health care totreat three important types of opportunistic illness decreased during theperiod when that country expanded access to antiretroviral medication(Schechter, 2004). So, to the extent that the 34 high-priority countries dis-cussed above are currently treating opportunistic illnesses in their AIDSpatients, the effort to increase access to ART will be partly offset bydecreased demand for treatment of these dangerous illnesses.
It is difficult to take much comfort from this possibility, however, forone reason: Brazil’s level of development is much higher than that of anyof the 14 countries identified in Figure 10.9 as facing the greatest chal-lenge. Indeed, with a GDP per capita of approximately $3,000, Brazil’s eco-nomic strength exceeds that of all but 2 of the 34 priority countries.Furthermore, Brazil has more physicians per capita than any other coun-try on the list except Russia. Thus, in the classification in Figure 10.9, Brazilwould have appeared in the lower right portion as one of the countries fac-ing a feasible challenge. Lessons from Brazil may be difficult to apply to thecountries facing the greatest challenge, which have on average one-sixthBrazil’s GDP per capita, much higher HIV prevalence, and far less medicalresources and infrastructure.
In developing countries, instead of seeing a reduction in the demand foropportunistic care, ART program managers may find themselves frus-trated by insufficient uptake of the publicly financed ART care available.Reports from both Thailand and Botswana suggest that it may be difficultto recruit patients who are eligible for ART until their illness has advanced
Impact of the HIV/AIDS Epidemic on Health Sectors 333
Table 10.3. Projected AIDS Spending in Countries Targeted by the WHO 3 by 5 Initiative
Projected Spending Countries Facing:1___________________________________________(as multiple of GDP per Feasible Substantial Greatest capita per physician) challenge challenge challenge
Average of countries in group 1.8 113 368Highest country in group 8.7 441 879
Memorandum: Number of countries 8 11 14Share of ART patients (percent) 21 41 38
Source: Author’s calculations based on data from Gutierrez and others (2004).1As identified in Figure 10.9.
©International Monetary Fund. Not for Redistribution

so far that they are difficult to help. In order to achieve their coveragegoals, governments may find it necessary to provide incentives to patientsin order to compensate them for the stigma of seeking care before they aresick, and for transportation and other costs associated with ART adher-ence. When such incentives are financial, they are referred to in other con-texts as “conditional grants,” because they are conditioned on the patientperforming certain activities—in this case, seeking care and adhering to amedication regime. Such payments are not considered in the WHO esti-mates used above. The cost of such demand-side subsidies will inflate pro-gram costs and complicate management.
Impact on Supply
Increasing government expenditure on ART will have four effects onthe supply of medical care. First, when ART is also made available to healthcare personnel who suffer needle-stick or other accidents that threaten toinfect them with HIV, it increases their willingness to treat AIDS patients.Indeed, since health care personnel often do not know who is HIV-positive, the availability of prophylactic ART increases their willingness tosupply all types of medical care.
The complexity of ART and the potential financial and professionalrewards from the management of AIDS patients will increase the demandfor training by medical personnel. In less poor countries some of thisdemand will be satisfied by the private sector. Governments may want to atleast observe, if not regulate, the quality of such privately offered training inAIDS management. To the extent that countries have difficulty recruitingpatients to ART regimes, they will need to reinforce and expand their vol-untary counseling and testing programs and the communication campaignsthat support them. Only if people trust in the confidentiality of such pro-grams and can find a center located close to their home are they likely to seekinformation about their HIV status and seek care at the appropriate stage.
Physicians will benefit from greatly expanded expenditure on ART,regardless of the quality of care offered or the difficulty of accessing it. Thesubstantial increase in the demand for their services caused by this influxof medical spending will raise both the wages and the prestige of physi-cians and, to some degree, of all medical personnel. Although this increasein their status is appropriate if they respond to the higher wages withincreased effort and quality of care, governments may want to strengthenmedical review boards and other professional systems designed to ensurethat ethical considerations outweigh financial ones in the conduct of med-ical business.
334 MEAD OVER
©International Monetary Fund. Not for Redistribution
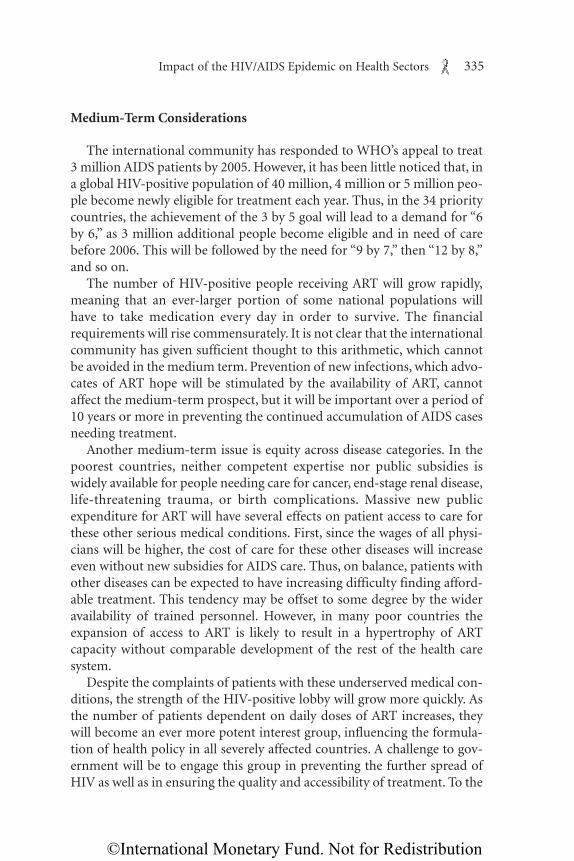
Medium-Term Considerations
The international community has responded to WHO’s appeal to treat3 million AIDS patients by 2005. However, it has been little noticed that, ina global HIV-positive population of 40 million, 4 million or 5 million peo-ple become newly eligible for treatment each year. Thus, in the 34 prioritycountries, the achievement of the 3 by 5 goal will lead to a demand for “6by 6,” as 3 million additional people become eligible and in need of carebefore 2006. This will be followed by the need for “9 by 7,” then “12 by 8,”and so on.
The number of HIV-positive people receiving ART will grow rapidly,meaning that an ever-larger portion of some national populations willhave to take medication every day in order to survive. The financialrequirements will rise commensurately. It is not clear that the internationalcommunity has given sufficient thought to this arithmetic, which cannotbe avoided in the medium term. Prevention of new infections, which advo-cates of ART hope will be stimulated by the availability of ART, cannotaffect the medium-term prospect, but it will be important over a period of10 years or more in preventing the continued accumulation of AIDS casesneeding treatment.
Another medium-term issue is equity across disease categories. In thepoorest countries, neither competent expertise nor public subsidies iswidely available for people needing care for cancer, end-stage renal disease,life-threatening trauma, or birth complications. Massive new publicexpenditure for ART will have several effects on patient access to care forthese other serious medical conditions. First, since the wages of all physi-cians will be higher, the cost of care for these other diseases will increaseeven without new subsidies for AIDS care. Thus, on balance, patients withother diseases can be expected to have increasing difficulty finding afford-able treatment. This tendency may be offset to some degree by the wideravailability of trained personnel. However, in many poor countries theexpansion of access to ART is likely to result in a hypertrophy of ARTcapacity without comparable development of the rest of the health caresystem.
Despite the complaints of patients with these underserved medical con-ditions, the strength of the HIV-positive lobby will grow more quickly. Asthe number of patients dependent on daily doses of ART increases, theywill become an ever more potent interest group, influencing the formula-tion of health policy in all severely affected countries. A challenge to gov-ernment will be to engage this group in preventing the further spread ofHIV as well as in ensuring the quality and accessibility of treatment. To the
Impact of the HIV/AIDS Epidemic on Health Sectors 335
©International Monetary Fund. Not for Redistribution

extent that HIV-positive groups assist in reducing new infections, they willhelp ensure the affordability of continued treatment and thus serve theirown long-term interests.
A Longer-Term Perspective: The AIDS Transition
The literature on the population problem in developing countriesstresses the so-called demographic transition, from a growth path of highbirth and death rates to one of low rates of both births and deaths. Whendeath rates first fell in poor countries in the mid-twentieth century, therewas no immediate prospect of a fall in birthrates. Instead observers werealarmed by a doubling or tripling of population growth rates. Applying thearithmetic of compound interest to these high growth rates led to use ofterms like the “population explosion” and “the population bomb” (the titleof a popular book in the late 1960s). In the latter half of the century, how-ever, birthrates began to fall in one poor country after another. Sometimesthey fell as a result of draconian government intervention, such as the “onechild per family” policy in China or forced sterilization in India. Elsewherecountries achieved similar results through a combination of publiclyfinanced family planning clinics, public information campaigns designedto persuade people to have fewer children, and economic development,which shifted the economic incentives of households toward having fewerbut more educated children. In the early twenty-first century the story ofthe demographic transition from a high-birth, high-death regime to a low-birth, low-death regime is a subject of largely historical research.
Today we are arguably at the beginning of an “AIDS transition,” forwhich aspects of the demographic transition may hold lessons. Figure10.10 relabels the curves from the familiar depiction of the demographictransition with the analogous concepts from the AIDS transition. The roleof births in the demographic transition is played by the flow of new HIVinfections, and the role of overall population mortality, by AIDS mortality.As ART becomes accessible to an ever-larger proportion of those withadvanced HIV-related disease, some countries are beginning to experiencean increase in the growth rate of people living with HIV/AIDS, of whoman ever-larger percentage will be dependent on ART for survival.
If AIDS deaths decline while the incidence of HIV infection remainsstable, there will necessarily be an “explosion” of ART patients analogousto the perceived population explosion of 40 years ago. AIDS-affected soci-eties and the international community must hope for and should work tofacilitate the transition to a new equilibrium. In this pattern the decreasein the death rate from AIDS is followed in as short a time as possible by a
336 MEAD OVER
©International Monetary Fund. Not for Redistribution

decrease in the rate of new infections, so that the growth rate of patientson ART is again reduced. Ideally the rate of AIDS deaths would fall almostto the mortality rate of the HIV-negative population, and the rate of newinfections would fall even lower, so that over time the number of peopledependent on ART declines. If most societies follow this path, a largecohort of patients on ART will pass through the population, but the healthsector will be only temporarily (for perhaps 10 or 15 years) dominated byAIDS treatment concerns. Once both rates are again low, AIDS willbecome just one of many chronic illnesses, and the health sector willincreasingly resemble what it would have been in the absence of the AIDSepidemic.
The AIDS transition pattern depicted in Figure 10.10 is one of victoryover the AIDS epidemic, but the mechanisms for achieving that victory arenot obvious. First, reducing the death rate from AIDS to a level approach-ing that of the rest of the population, and keeping it there, will require con-tinued improvement in the pharmacological properties of ART, so thatfewer patients fail first-line therapy and those who do can more often behelped with second- or third-line therapies. Getting the “birthrate” of newinfections to fall, as the actual birthrate did in the case of the demographictransition, will require some combination of aggressive government pre-vention policy and autonomous individual decisions to reduce riskybehavior. With respect to the former, early evidence suggests that mar-
Impact of the HIV/AIDS Epidemic on Health Sectors 337
}
Rate of growth of population living
with HIV
New infections
AIDS deaths
“Explosion” of patientsTime
New infections or deaths per 1,000 population
Figure 10.10. The AIDS Transition
©International Monetary Fund. Not for Redistribution

shalling the political will and the financial resources to offer ART to anation’s HIV-infected population will distract governments from HIV pre-vention programs rather than strengthen the political will to prevent newinfections. For individuals the availability of ART will probably encouragevoluntary counseling and testing, but it is not clear how such informationwill affect individual risk behavior or the consequent rate of newinfections.
Figure 10.11 presents three alternative future patterns that are less opti-mistic than the AIDS transition pattern depicted in Figure 10.10. In allthree (individually and in various combinations), the population under-going treatment with ART will grow until, by the arithmetic of compoundinterest, it consumes an ever-growing portion of the total resources of thehealth sector and then of society as a whole.
The top panel of Figure 10.11 shows a pattern that would result ifadherence rates are so low that the introduction of ART only temporarilylowers death rates, while HIV infection rates remain stable. Realization ofthis path would mean that the attempt to alter the course of the AIDS epi-demic by expanding access to ART has not worked. There would be a“boom” in the HIV-positive population as a cohort of ART patientsemerges whose lives are extended by ART, and as all HIV-infected peoplewould experience longer life expectancy than before the ART expansion.But without a decrease in the infection rate, the gap between the growthrates of infection and AIDS mortality would be wider than before, so thatthe number of people dependent on ART would grow faster.
The middle panel of Figure 10.11 illustrates an ART “explosion” similarto the population explosion feared in the 1960s. The number of ARTpatients would grow rapidly, and compound interest would ensure that,within a decade or two, caring for people on ART would consume animpossibly high 100 percent of GDP. But the number of ART patientscould grow even faster if the scenario depicted in the bottom panel of thefigure should come to pass. Here the possibility of successful treatment forAIDS (as shown by the fact that the AIDS death rate falls and remains low)encourages a resumption of high-risk behavior, from which people mightotherwise have abstained for fear of contracting AIDS.3 Thus the rate ofnew HIV infections accelerates while that of AIDS mortality slows. Theimpossible outcome of 100 percent of GDP being spent for AIDS treat-ment arrives even sooner under this scenario.
338 MEAD OVER
3See Over and others (2004) for simulations, in the context of India, of the cost-effectivenessof ART with and without changes in risk behavior.
©International Monetary Fund. Not for Redistribution

Impact of the HIV/AIDS Epidemic on Health Sectors 339
}}
}
Rate of growth of population living with HIV/AIDS
Rate of growth of population living with HIV/AIDS
New infections
New infections
New infections
AIDS deaths
AIDS deaths
AIDS deaths
“Explosion” of ART patients
Failed transition due to poor adherence to ART and lack of access to second- and third-line therapy
Failed transition due to continued risk behavior
Failed transition due to increase in riskbehavior
Time
“Explosion” of ART patients
“Explosion” of ART patients
Time
Time
Figure 10.11. Possible Alternative Scenarios to a Successful AIDS Transition(New infections or deaths per 1,000 population)
Rate of growth of population living with HIV/AIDS
©International Monetary Fund. Not for Redistribution
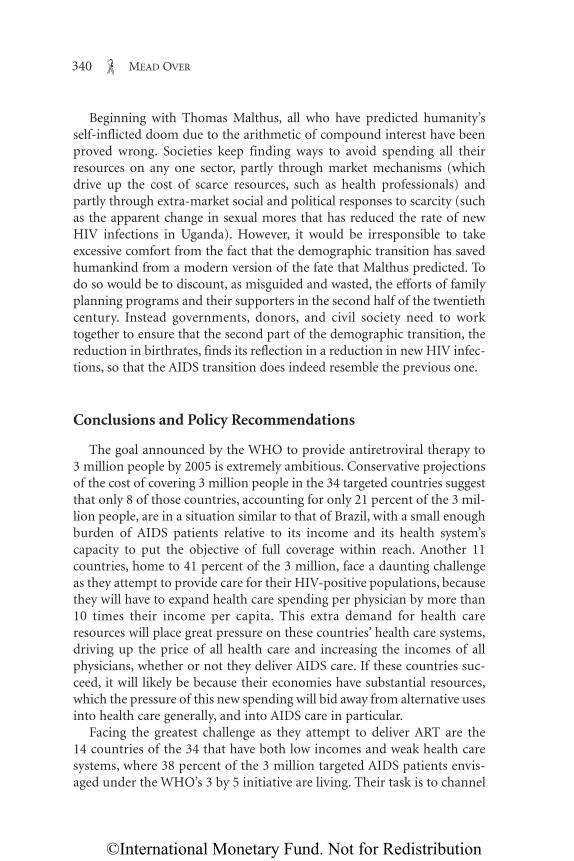
Beginning with Thomas Malthus, all who have predicted humanity’sself-inflicted doom due to the arithmetic of compound interest have beenproved wrong. Societies keep finding ways to avoid spending all theirresources on any one sector, partly through market mechanisms (whichdrive up the cost of scarce resources, such as health professionals) andpartly through extra-market social and political responses to scarcity (suchas the apparent change in sexual mores that has reduced the rate of newHIV infections in Uganda). However, it would be irresponsible to takeexcessive comfort from the fact that the demographic transition has savedhumankind from a modern version of the fate that Malthus predicted. Todo so would be to discount, as misguided and wasted, the efforts of familyplanning programs and their supporters in the second half of the twentiethcentury. Instead governments, donors, and civil society need to worktogether to ensure that the second part of the demographic transition, thereduction in birthrates, finds its reflection in a reduction in new HIV infec-tions, so that the AIDS transition does indeed resemble the previous one.
Conclusions and Policy Recommendations
The goal announced by the WHO to provide antiretroviral therapy to3 million people by 2005 is extremely ambitious. Conservative projectionsof the cost of covering 3 million people in the 34 targeted countries suggestthat only 8 of those countries, accounting for only 21 percent of the 3 mil-lion people, are in a situation similar to that of Brazil, with a small enoughburden of AIDS patients relative to its income and its health system’scapacity to put the objective of full coverage within reach. Another 11countries, home to 41 percent of the 3 million, face a daunting challengeas they attempt to provide care for their HIV-positive populations, becausethey will have to expand health care spending per physician by more than10 times their income per capita. This extra demand for health careresources will place great pressure on these countries’ health care systems,driving up the price of all health care and increasing the incomes of allphysicians, whether or not they deliver AIDS care. If these countries suc-ceed, it will likely be because their economies have substantial resources,which the pressure of this new spending will bid away from alternative usesinto health care generally, and into AIDS care in particular.
Facing the greatest challenge as they attempt to deliver ART are the14 countries of the 34 that have both low incomes and weak health caresystems, where 38 percent of the 3 million targeted AIDS patients envis-aged under the WHO’s 3 by 5 initiative are living. Their task is to channel
340 MEAD OVER
©International Monetary Fund. Not for Redistribution

into AIDS treatment resources per physician amounting to 20 to 500times their income per capita, and their efforts are bound to encounterobstacles and bottlenecks. History suggests that attempts to direct suchvast resources into new programs in poor countries will result in eitherfailure to disburse or substantial leakage of resources into avenues notanticipated in the program design. Success will require a total transfor-mation of these countries’ health care systems, which internationaldonors have already been working to transform since the 1960s. Givensufficient political commitment, however, such an unprecedented trans-formation may yet be possible.
Even if the 3 by 5 target is not reached, the effort to expand treatmentto all 34 of these countries will in any event help large numbers of AIDSpatients postpone for years the onset of opportunistic illnesses and death.This is a laudable outcome. But the opportunity cost to countries receiv-ing these resource flows is likely to be largest in those countries wherecapacity is currently weakest. The health costs of diverting humanresources from other parts of the health care system to AIDS care, thedamage to health care institutions from the effort to prevent leakage tounintended uses (or from failure to prevent such leakage), and the fact thateach person helped by the program will become dependent on the healthcare system for a lifetime supply of antiretrovirals—all these costs must beset against the expected health benefits. Vigorous national and interna-tional attention to the effects of these programs on the people and institu-tions of the recipient countries will be required to maximize these benefitsand minimize the costs.
What policies can governments and donors adopt to maximize the ben-efits of new AIDS resource flows and minimize their cost? Although thespecifics of those policies will differ in each country’s program, lessons canbe learned from applying the principles of improving public sectoraccountability detailed in World Development Report 2004 (World Bank,2003). As discussed earlier in this chapter, the report points out that healthcare providers in charge of administering an ART program are agents fortwo sets of principals: their patients, who are the consumers of their ser-vices, and their employers, who supervise, reward, and sanction theproviders. The report argues that the effort and the quality of health careproviders, like those of other public service providers, are affected not onlyby their professional training and ethics, but also by the quality of super-vision they receive from both sets of principals, and by the strength of theincentives these principals can bring to bear.
The data presented in Figures 10.3 and 10.4 show that these providersare not currently performing even close to existing norms in many poor
Impact of the HIV/AIDS Epidemic on Health Sectors 341
©International Monetary Fund. Not for Redistribution

countries. The World Bank report argues that these deficiencies in perfor-mance are due as much to poor supervision and a lack of results-basedincentives as to insufficient financing. However, success stories can befound. The increased flow of public resources that arrived at Ugandan vil-lage schools after villagers were told how much was supposed to arriveshows how powerful public disclosure can be in ensuring quality perfor-mance on the part of health care agents (Reinikka and Svensson, 2004).Contracting out health care services achieves substantial efficiency andquality improvements when the contract is properly defined and ade-quately funded. Over the medium run and beyond, governments can followpolicies that will facilitate an AIDS transition, to a regime in which AIDSmortality begins to resemble the mortality rate of HIV-negative people andthe rate of new infections drops even lower. However, alternatively, muchless optimistic scenarios may also materialize and may even be likely in theabsence of increased government attention to prevention programs.
The challenge in expanding access to antiretroviral treatments will befor governments and donors to monitor and evaluate the treatment pro-grams well enough to detect signs of problems early, when they can still becorrected. Multiple experimental designs of systems to deliver ART shouldbe allowed, to increase the chances of finding the best approach. Onlythrough heavy investment in monitoring and evaluation will sponsors beable to track and identify failures as well as successes, and to learn how toavoid the former and ensure the latter.
References
Bernstein, C.A., J.G. Rabkin, and H. Wolland, 1990,“Medical and Dental Students’ Atti-tudes About the AIDS Epidemic,” Academic Medicine, Vol. 65, No. 7, pp. 458–60.
Bolduc, Denis, Bernard Fortin, and Marc-Andre Fournier, 1996, “The Impact of Incen-tive Policies on the Practice Location of Doctors: A Multinomial Probit Analysis,”Journal of Labor Economics, Vol. 14 (October), pp. 703–32.
Buvé, S., and others, 1994, “Mortality Among Female Nurses in the Face of the AIDSEpidemic: A Pilot Study in Zambia,” AIDS, Vol. 8, No. 3, p. 396.
Chawla, Mukesh, 1993, “Physician Moonlighting in Egypt” (Ph.D. dissertation; Boston,Massachusetts: Boston University, Department of Economics).
———, 1997, “Dual-Job Holdings by Public Sector Physicians in India,” Departmentof Population and International Health Working Paper (Boston, Massachusetts:Harvard School of Public Health).
European Commission, 1995, Safe Blood in Developing Countries: The Lessons fromUganda, ed. by Rex Winsbury, Development Studies and Research Series (Luxem-bourg: Office for Official Publications of the European Communities).
342 MEAD OVER
©International Monetary Fund. Not for Redistribution

Filmer, Deon, 2003, “The Incidence of Public Expenditures on Health and Develop-ment,” background note for World Development Report 2004 (Washington: WorldBank).
Floyd, Katherine, and Charles F. Gilks, 1996, “Impact of, and Response to, the HIV Epi-demic at Kenyatta National Hospital, Nairobi,” Report 1, April (Liverpool, UnitedKingdom: Liverpool School of Tropical Medicine).
Gutierrez, Juan Pablo, and others, 2004, “Achieving the WHO/UNAIDS AntiretroviralTreatment 3 by 5 Goal: What Will It Cost?” The Lancet, Vol. 364, No. 9428,pp. 63–64.
Lindelöw, Magnus, 2003, “Public Expenditure Tracking and Service Delivery Surveys,”paper presented at the 11th International Anti-Corruption Conference, May25–28, Seoul.
———, Pieter Serneels, and Teigesti Lemma, 2003, “Synthesis of Focus Group Discus-sions with Health Workers In Ethiopia” (unpublished; Washington: DevelopmentResearch Group, World Bank).
Mann, Jonathan, and others, 1986, “HIV Seroprevalence Among Hospital Workers inKinshasa, Zaire: Lack of Association with Occupational Exposure,” Journal of theAmerican Medical Association, Vol. 256, No. 22, pp. 3099–3102.
Mazzullo, J., and others, 1990, “Influencing Choices of Medical Students to HIV-Related Careers,” Abstract no. S.D.910, Sixth International AIDS Conference, SanFrancisco, June 20–24.
Okero, F. Amolo, and others, 2003, “Scaling up Antiretroviral Therapy: Experience inUganda—Case Study” (Geneva: World Health Organization).
Over, Mead, and others, 1992, “The Consequences of Adult Ill-Health,” in The Healthof Adults in the Developing World, ed. by Richard A. Feachem and others (NewYork: Oxford University Press).
———, 2004, HIV/AIDS Prevention and Treatment in India: Modeling the Costs andConsequences (Washington: World Bank).
Reinikka, Ritva, and Jakob Svensson, 2003, “Working for God? Evaluating ServiceDelivery of Religious Not-for-Profit Health Care Providers in Uganda,” PolicyResearch Working Paper No. 3058 (Washington: World Bank).
———, 2004, “The Power of Information: Evidence from a Newspaper Campaign toReduce Capture,” Policy Research Working Paper No. 3239 (Washington: WorldBank).
Sauerborn, R., P. Berman, and A. Nougtara, 1996, “Age Bias, but No Gender Bias, in theIntra-Household Resource Allocation for Health Care in Rural Burkina Faso,”Health Transition Review, Vol. 6, No. 2, pp. 131–45.
Schechter, Mauro, 2004, “Lessons Learned from the Scale-up of ARV Treatment inBrazil,” presentation at a Workshop on Antiretroviral Drug Use in Resource-Constrained Settings, January 27–28 (Washington: Institute of Medicine).
World Bank, 1997, Confronting AIDS: Public Priorities in a Global Epidemic. (New York:Oxford University Press).
Impact of the HIV/AIDS Epidemic on Health Sectors 343
©International Monetary Fund. Not for Redistribution

———, 1999, Confronting AIDS: Public Priorities in a Global Epidemic, (New York:Oxford University Press, rev. ed.).
———, 2003, World Development Report 2004: Making Services Work for Poor People(Washington: World Bank and Oxford University Press).
———, 2004, World Development Indicators 2004 (Washington).
World Health Organization, 2003, “Treating 3 Million by 2005—Making It Happen:The WHO Strategy” (Geneva).
344 MEAD OVER
©International Monetary Fund. Not for Redistribution