Download PDF (8.8 MB) - IMF eLibrary
184
-
Upload
khangminh22 -
Category
Documents
-
view
1 -
download
0
Transcript of Download PDF (8.8 MB) - IMF eLibrary


©International Monetary Fund. Not for Redistribution
------[WoRLD ECONOMIC AND FINANCIAL SURVEY-s]!-------
Issues and Developtnents in International
Trade Policy
Prepared by a Staff Team led by Margaret Kelly and Anne Kenny McGuirk
Peter Winglee Clemens Boonekamp
YoonJe Cho Bernhard Fritz-Krockow
Peter Uimonen
INTERNATIONAL MONETARY FUND Washington, DC
August 1992

©International Monetary Fund. Not for Redistribution
© 1992 International Monetary Fund
Library of Congress Cata.loging-in-Publication Data
Issues and developments in international trade policy I by a staff team led by Margaret Kelly and Anne Kenny McGuirk : Peter Winglee ... [cl al.).
p. cm. - (World economic and financial �urvcys) Includes bibliographical references. ISBN 1-55775-31 1-3 1. Commercial policy.2. International trade. I. Kclly, Margarc1. 11. McGuirk. Annc Kenncy. Ill. Winglcc. Peter IV. Series
HF1411.184 1992 92-28466 382.3-dc20 CIP lSSN 0258-7440
Price: US$20.00 (US$12.00 to full-time faculty members and students at universities
and colleges)
Please send orders to: International Monetary Fund. Publication Services
700 l9•h Street N.W. Washington. D.C. 20431, U.S.A. Tel.: (202) 623-7430 Tclcfax: (202) 623-7201

©International Monetary Fund. Not for Redistribution
Contents
Page
Preface ix
I. Overview 1 Major Developments in Trade and Trade-Related
Policies I Background to Developments I Industrial Countries 2 Developing Countries 4 Regional Developments and fnitiatives 5
Developments in the Multilateral Trade System 6
11. Overall Trends 8 Output, Trade. and Foreign Investment 8 Trade Trends in Developing Countries 10
Ill. Industrial Countries' Trade and Trade-Related Policies 12 Recent Trends in Trade Policies 1 2
Tariffs 1 2 Nontariff Measures 1 3 Antidumping and Countervailing Duties 1 5
Trends in Government Support 17 Industrial Subsidies 17 Multilateral Efforts to Curb Subsidies 20
Trade Policy Developments in Individual Countries 2 1 United States 2 1 Japan 23 European Community 24 Canada 25 Other Industrial Countries 25
IV. Trade Liberalization in Eastern European Countries 27 Historical Setting: Trade Policy in the Context of
Central Planning 27 Recent Reforms and Design Issues 28
Recent Reforms 28 Issues in the Design of Trade Reform 33
Integration into the Multilateral Trading System 34 Access to Industrial Country Markets 35 Full Integration into GATT 37
V. Trade Policies of Developing Countries 40 Trade Policies Prior to the Mid-1980s 40 Trade Policies Since the Mid-1980s 41
Extent of Reforms 4 1 Issues in the Design and Implementation of Trade
Reforms 43 Trade Liberalization Versus Export Promotion and
Selective Intervention 48
iii

©International Monetary Fund. Not for Redistribution
VI.
VII.
Boxes
I CONTENTS I
Agricultural Trade Policies: Recent Developments and Issues in Reform
Recent Policy Developments General Setting United States European Community Japan EFT A Countries Canada, Australia, and New Zealand Eastern Europe Developing Countries
The Reform of Agriculture Rationale for Agricultural Support Studies of the Gains from Liberalization Approaches to the Reform of Support Policies
Issues for the 1990s Integration of Developing and Eastern European
Countries into the Multilateral Trade.System Regional Arrangements and the Multilateral Trade
System Globalization of Investment and Production
Interrelation Between Trade and Competition Policies Issues Related to Trade and lnvestment Policies Issues Related to Innovation and "Strategic" Trade
Policies Trade and the Environment
I . Trade-Related Work Program of the OECD 2. Methodology Used in Trade Review
Page
50 50 so 52 53 54 55 55 55 56 57 57 58 59
62
62
63 64 64 65
66 68
1 8 42
Appendices
I . The GATT System 69 The Contracting Parties 69 The GATT Council of Representatives 69 GATT Surveillance 72 Instruments of Protection 74 The Committee on Trade and Development 77
11. The Interface Between Trade and Competition Policies 79 Definitions, Aims, Sources of Conflict, and Implications 80 Past Efforts to Deal with the Interaction Between Trade
and Competition Policies 82 Examples of Conft icts Between Trade and Competition
Policies 86 Proposals to Reduce Policy Inconsistencies 95
Ill. Measures and Costs of Protection 99 Measuring Nontariff Barriers 99 Measuring the Effects of Nontariff Barriers I 00
Statistical Appendix 109
Bibliography
iv
©International Monetary Fund. Not for Redistribution
Contents
Page
Tables
Section
n. l . Developments in Regional Trade Flows, 1980-89 8 2. Merchandise Trade 10 3 . Developing Countries: Export Volumes, 1973-90 1 1
Ill. 4. Import Coverage Ratios of Selected Nontariff Measures, by Type of Measure, Applied by Selected Developed Market-Economy Countries 14
5. Summary of Export Restraint Arrangements by Product and Exporting Region, End of March 1989 15
IV. 6. Trade and Payments Systems of Eastern European Countries as of June 1991 30
7. Bilateral Trade Arrangements Between Eastern European Countries and the Former U.S.S.R. 32
8 . Market-Opening Measures Taken by Industrial Countries for Eastern European Exports 36
9. Industrial Countries' NontariffBarriers to Exports by Eastern Europe 38
10. Current Situation of Eastern European Countries in GATT 39 V. 1 1 . Developing Country Trade Regimes Before Liberalization 44
12 . Trade Reform Programs in Developing Countries 45 1 3 . Current Structure of Developing Country Trade Regimes 46 14. Trade Liberalization, Stabilization. or Both 47
Vl. 15 . Total Transfers Associated with Agricultural Policies 5 1 16. Ner Producer Subsidy Equivalenrs 51
vn. 17. Old Arguments in New Cloth? 67 Appendix
II. 18. lnd icati ve Check! ist for the Assessment of Trade Policy Measures 83
19. Dumping and Antidumping 87 20. Examples of Problems with Antidumping Laws and
Procedures 90 2 1 . Excerpts from OECD Communique, June 1991 97
m. 22. Estimated NTB Tariff Equivalents in Japan and the United States, 1973 100
23. A Comparison of NTB Tariff Equivalents 104 24. A Comparison of the Stoeckel Model and the Deardorff and
Stern Model 105 Statistical Appendix
A 1 . Major Industrial Countries: Real GNP, Domestic Demand. and Trade Volumes, 1973-90 109
A2. Shares in World Exports of Manufactures, 1963-89 1 1 0 A3. Developing Countries' Exports by Product, 1980-88 J 11 A4. Shares of Exports of Manufactures by Area and Sector,
1 973-88 1 1 2 AS. The Level of Post-Tokyo MFN, Applied, and GSP Tariffs in
Selected Developed Countries I 13 A6. Importance of GATT Tariff Bindings in Industrial Countries 115 A 7. Import Coverage Ratios of Selected Nontariff Measures, by
Country Groupings. Applied by Selected Developed Market-Economy Countries 1 1 6
V

©International Monetary Fund. Not for Redistribution
I CONTENTS I
A8. Page
Trade Coverage Rates of Selected NTMs Applied by Developed Countries, 1981-90 1 16
A9. Export Restraint Arrangements, 1987-90 1 17 AIO. Textiles and Clothing: Nontarilf Barriers to Trade 1 1 8 A l l . Summary of Antidumping Actions Taken by Selected
Countries, 1981-90 1 19 A l 2. Summary of Countervailing Actions Taken by Selected
Countries, 1981-90 120 A 13 . United States: Outstanding Unfair Trade Practice Cases
Abroad and Safeguard Petitions, December 3 I , 1990 121 A 14. Industrial Country Subsidies 122 A 15 . Subsidies by Sector (National Accounts Definition) 123 Al6. Government Support in the EC by Sector 1 24 A l 7 . Support to Manufacturing i n the EC and EFTA Countries by
Instrument 125 A 18. Government-Financed Expenditure on Research and
Development in the Enterprise Sector, 1970-88 126 A 19 . Determinations Under the 1988 Amendments to Section 301
of the 1974 Trade Act of the United States 127 A20. Commodity Composition of Exports, by Selected Eastern
European Countries 128 A21 . Commodity Composition of Imports, by Selected Eastern
European Countries 129 A22. Total Transfers Associated with Agricultural Policies 130 A23. Agriculture in National Economies, 1988 1 3 1 A24. Factors Contributing to the Changes in Total Net Producer
Subsidy Equivalents 132 A25. Trade in Agricultural Products of Selected Industrial
Countries 132 A26. Cereal Exports. 1978179-1 990/91 133 A27. Cereal Imports, 1978179-1990/91 133 A28. Main Agricultural Producer Support Policies for Selected
Countries and Major Commodities, 1991 134 A29. United States: Agricultural Support, 1980-92 135 A30. United States: Support Programs for the Main Agricultural
Commodities 136 A3 l . United States: Budgetary Spending on Agriculture, by
Commodity, 1985/86- 1991/92 137 A32. United States: Quantitative Restrictions on Agricultural
Imports 138 A33. European Community: Average Degree of Self-Supply in
Selected Agricultural Products. 1956-89 139 A34. European Community: European Agricultural Guarantee
and Guidance Fund-Guarantee Section, Expenditures by Sector, 1976-90 140
A35. European Community: Target Prices for Selected Commodities, 1980/81-1991/92 141
A36. Japan: Self-Sufficiency Rates of Major Agricultural Products 142 A37. Japan: Administrative Prices of Major Agricultural Products 142 A38. Japan: Expenditure on Agriculture and Rural Development,
1975-91 143 A39. Japan: Nominal Protection Coefficients 144 A40. Direct, Indirect, and Total Nominal Protection Rates 145 A4l. Estimates of the Impact of Liberalization of Agricultural
Policies by Industrial Countries 146 A42. Effects on Global Welfare of Liberalization by Industrial
Countries 147
vi
©International Monetary Fund. Not for Redistribution
Contents
A43. GATT Membership Page
148 A44. Muhilateral Trade Negotiation (MTN) Agreements-Legal
Status at December 7, 1990 A45. GATT Panels Established Since 1985
1 5 1 154
A46. Balance of Payments Consultations Since Introduction of 1979 Declaration 164
A47. Recourse to Article XIX of the General Agreement on Tariffs and Trade, 1978-91 165
Chart l . Real Trade and GDP Growth, 1960-90
The following symbols have been used throughout this paper:
. . . to indicate that data are not available;
- to indicate that the figure is zero or less than half the final digit shown, or that the item does not exist;
- between years or months (e.g., 1990-91 or January-June) to indicate the years or months covered. including the beginning and ending years or months:
I between years (e.g., 1990/91) to indicate a crop or fiscal (financial) year.
·'Billion" means a thousand million.
Minor discrepancies between constituent figures and totals are due to rounding.
The term "country" used in this study does not in all cases refer to a territorial entity that is a state as understood by international law and practice. The term also covers some territorial entities that are not states, but ior which statistical data are maintained and provided internationally on a separate and independent basis.
vii
9

©International Monetary Fund. Not for Redistribution
This page intentionally left blank
©International Monetary Fund. Not for Redistribution
Preface
This study was prepared in the Trade and Payments Division of the Exchange and Trade Relations Department of the International Monetary Fund. Its authors are Margaret Kelly, Division Chief; Anne McGuirk, Deputy Division Chief; Peter Winglee, Senior Economist; Clemens Boonekamp, Senior Economist (Geneva Office); Yoon Je Cho and Bernhard Fritz-Krockow, Economists; and Peter Uimonen, Research Assistant.
To obtain information and collect views for this paper, staff teams held discussions with trade and economics officials in Bono, Brussels (the Commission of the European Communities), Canberra, London, Ottawa, Paris, Seoul, Tokyo, Washington, and Wellington. In addition, a staff team visited Geneva and Paris for discussions with GATT and OECD officials. Staff members of the Western Hemisphere Department participated in the discussions held in OHawa and Washington. Staff members of the European Department participated in the discussions in Brussels, Canberra, Paris, and Wellington, and staff members of the Asian Department participated in the discussions in Seoul and Tokyo. While in Europe, the staff team was assisted by the Fund Office in Europe and the Fund Office in Geneva.
The study reviews major issues and developments in the trade area and outlines the challenges governments face as they seek to liberalize trade in the Uruguay Round of trade negotiations and address "new" trade issues. The coverage of the study is through October 1991 and, as a result, does not reflect subsequent developmems, most notably in Eastern Europe and the former Soviet Union. It follows the pattern of the Fund staff surveys prepared in 1978, 198 1 , 1982, 1985, and 1988.1
The authors are indebted to a number of colleagues, both in the Fund and in other national and international agencies, for their will ingness to exchange views and provide information. The authors are grateful to Joslin Landell-Mills for her assistance in preparing the study from a longer manuscript; to the editor Juanita Roushdy of the External Relations Department; to Christine Horbinger for research assistance, and to Marcela Toso and Elizabeth Mack for keyboarding. The authors alone are responsible for the study; any opinions expressed are theirs and do not necessarily reflect the views of the Fund.
1 International Moncrary Fund, The Rise in Protectionism, lMF Pamphlet Series, No. 24 (Washington, 1978); Trade Policy Developments in Industrial Coumries, IMF Occasional Paper, No. 5 (Washington. July 1981); Developmems in International Trade Policy. IMF Occasional Paper, No. 16 (Washington. second printing, 1983); Trade Policy Issues and Developments, IMF Occasional Paper. No. 38 (Washington. July 1985). See also Selected References a1 the end of the paper; and Issues and Developments in Imemationa/ Trade Policy. IMF Occasional Paper, No. 63 (Washington, December 1988).
ix
©International Monetary Fund. Not for Redistribution
This page intentionally left blank

©International Monetary Fund. Not for Redistribution
----------------�00�-----------------
Overview
� his paper reviews recent developments and L..J,J issues in trade and trade-related policies of the industrial, Eastern European, and developing countries, focusing primarily on the period since the most recent occasional paper prepared in 1988. 1 The paper is organized as follows. Section I reviews the international economic environment and describes briefly the recent developments in trade policy. Section IT describes recent trade trends in industrial and developing countries against which developments in trade policies are analyzed. Sections I l l , IV, and V review developments and issues in trade policy for the industrial, Eastern European, and developing countries, respectively. Section VI provides more detailed coverage of trade-related policies in the agricultural sector and surveys the empirical evidence on the costs of protection and the possible effects of trade liberalization in this sector. Section Vll provides an overview of the issues that will be central to the trade policy discussions of the 1990s. Appendix I reviews activities of the General Agreement on Tariffs and Trade (GATT). Appendix IJ surveys the relationship between trade and competition policies. Appendix Ill discusses some of the methodological issues involved in measuring the incidence and effects of nontariff barriers, looks at estimates of the costs of protection in selected industrial sectors affected by nontariff barriers, and compares the results of researchers' efforts to estimate the possible gains from multilateral trade liberalization.
Major Developments in Trade and Trade-Related Policies
Background to Developments
Following the 1981-82 recession, the 1980s witnessed a sustained expansion of output and trade and a further integration of the world economy. The
ISee M. Kelly and others (1988). In this repon, the definition of industrial countries. major industrial countries, and Eastern European countries conforms to that used in International Monetary Fund (1991a).
1
decade was marked by a renewed focus on market principles as the means of achieving greater efficiency in resource use and higher economic growth. In industrial countries, the reorientation of policies was most apparent in steps taken to liberalize financial markets and foreign direct investment, privatize public enterprises, and deregulate services, particularly in the transportation and communication sectors. Among developing countries, a growing number recognized the merits of outward, market-oriented policies and took steps to liberalize their trade regimes and open their economies to international competition. There was also a renewed interest in regional integration as a spur to efficiency and an assurance of market access in a more competitive and uncertain world trading environment. These developments and the globalization of business strategies were reflected in a rapid expansion of foreign direct investment and a growing importance of services in international commerce.
By and large, the increased focus on market principles in industrial countries did not carry over to trade and industrial policies nor, most notable, to the agricultural sector. Despite strong growth performance in L 983-89, little progress was made in rolling back the protective barriers that had risen during the preceding recessionary period; protection persists in agriculture and declining sectors and has spread to newer "high-tecb" areas (aerospace, electronics, biotechnology). In general, the western industrial countries have been slow to adjust to the fundamental changes in the structure of world production and trade, including the shift in comparative advantage toward developing countries in mature industries.
Against this background, developments in the multilateral trade system are a cause for concern. The Uruguay Round of trade negotiations was not concluded on schedule, owing in significant part to differences over the liberalization of agriculture. The extension of the Round, though essential to its successful conclusion, continues to postpone important reforms that would strengthen the multilateral trade system. In this uncertain trade environment, countries are tending increasingly to address their concerns in the context of bilateral and regional trade arrangements.

©International Monetary Fund. Not for Redistribution
OVERVIEW
Industrial Countries
Since the Uruguay Round began in 1986, protectionist pressure has persisted despite the expansion of output and trade in the industrial countries. While restraint has been exercised during the trade negotiations, liberalizing measures have been limited, and the evidence suggests that little, if any, overall reduction in protection in industrial countries has occurred since the beginning of the Round, particularly with respect to exports from developing countries. A few countries have liberalized unilaterally on a most-favored-nation (MFN) basis, mainly in conjunction with a reorientation of domestic policies, but most other trade liberalization has been undertaken on a preferential basis in the context of regional, bilateral, or sectoral initiatives. Progress in addressing long-standing problems in agriculture and declining industries, such as textiles, clothing, steel, and shipbuilding, is linked to negotiations under way in multilateral forums; most countries have delayed liberalizing action pending the outcome of these negotiations.
Trade tensions remain high. Major sources of friction are the competitive subsidization of agriculture and industry, including through export credits. In agriculture, this has increased agricultural surpluses, depressed commodity prices on world markets, and weakened export prospects for efficient producers, some of whom are heavily indebted developing countries. In the second half of the 1980s, there was an unprecedented number of GATT disputes, many of which dealt with trade in agriculture (Appendix I). Other areas frequently contested relate to the use of subsidies (the Airbus controversy), where GATT rules are vague; antidumping practices (anticircumvention legislation); and rules of origin (European Community (EC) and U .S.-Canada Free Trade Agreement). A number of GATT panel decisions have not been implemented, and trade disputes are frequently settled bilaterally (the U . S. -Japan semiconductor agreement, ECJapan automobile agreement. U.S.-Japan Structural Impediments Initiative) or unilaterally (the U .S . Export Enhancement Program, Section 301 of the 1974 U .S . Trade Act, as amended).
llldustry
During the 1980s, industrial countries resorted increasingly to nontariff measures to protect tradesensitive industries from foreign competition. The percemage of manufactured products affected by nontariff measures is estimated to have risen from 14 percent in 198 1 to nearly 1 9 percent in 1990 and reflects primarily the increased reliance on voluntary export restraints (VERs) and antidumping and
2
countervailing actions.2 The EC and the United States made the most frequent use of VERs to protect steel, textiles, automobiles, machine tools, and electronics. In addition to these, the coverage of the Multifibcr Arrangement (MFA) has been progressively broadened since it replaced earlier arrangements in 1974 and, in July 199 1 , the MFA was extended without change through 1 992 because of the delay in concluding the Uruguay Round.3 A substantial proportion of nontariff measu�es h�ve been directed against Japan and the dynamtc Astan economics. 4
On the positive side, protectionist measures are being recognized as inefficient and costly. Apart from the Uruguay Round, multilateral �ffo�s �re progressing toward making steel and shtpbutl.dt.ng subject to stricter international ru�es on. s.ubstdtes and gray-area measures. 5 DomestiC poltctes have been reoriented during the 1980s to strengthen market mechanisms and to achieve greater flexibility in output and factor markets.6 Trends toward rising subsidies have been contained and cut back in some countries (most notably in the United Kingdom and New Zealand), in part owing to budget constraints and, in the EC, to the closer scrutiny of state aids under EC competition policy, and government assistance is becoming less sector-specific. There is little evidence, however, that overall assistance to industry has declined with the shift in government support to more broadly based programs, such as research and development funding, support for small and medium-sized enterprises, and regional assistance. Moreover, increased reliance on nontariff measures suggests that these measures are being used to "assist" industries.
Since the mid-I980s, Australia, New Zealand, and, to a lesser extent, Japan, Canada, and Sweden have liberalized unilaterally, thereby reducing the need to resort to quantitative restrictions and other
2Unllcd Nations Conference on Trade and Developmenl (UNCTAD) ( 1991). and UNCTAD Data Base on Trade Control Measures.
'Sweden umlaterally removed 1mport rcstnctions on texules at 1he end of July. making it the only participating country that did not adhere to the ex1en�ion of I he MFA.
4This group comprises Hong Kong, Korea. Matays1a. Singapore, Taiwan Province of China, and Thailand.
�The liberalization of steel i� proceeding in multilateral negotiations under the U.S. Steel Li.beraliz.ation Program. which aims 10 eliminate tariff and nontanff barners and proh1b1t mos1 subsidies: an agreement that would phase out subsidies to shipbuilding and repair is being negotiated in the OECD Council Working Party on Shipbuilding. "Gray-area" meal>ur�l>, such as voluntary export restramtl>, arc 1hosc taken outstdc GATT surveillance and whose consistency w11h GATT rule� has not been tested.
�>For a comprehensive review of Mructural policies in indw.trial countries see International Monetary Fund ( 1989).

©International Monetary Fund. Not for Redistribution
Major Developments
nontariff measures and lowering tariffs. In regional arrangements, trade barriers have been eliminated or progressively reduced between Australia and New Zealand, the United States and Canada, the United States and Israel, and within the EC. There has been some improvement in the access of developing countries to industrial country markets through preferential trade arrangements under the Generalized System of Preferences (GSP), the Caribbean Basin Initiative, and Lome IV. Eastern European countries have benefitted from the dismantling of selected import restrictions against their exports, the extension of MFN treatment and GSP privileges in some cases, and the relaxation of export restrictions imposed by the Coordinating Committee on Multilateral Export Controls (COCOM), but their potential exports of manufactures still face important barriers in textiles, clothing, steel, and coal.
Agriculture
The major industrial countries have made little progress in reforming their costly, trade-distorting agricultural support policies. The level of agricultural support increased sharply in 1986, when the Uruguay Round was launched and has remained high since then. During 1 988-89, the total value of agricultural support declined owing mainly to rising world prices. In 1 990, however, world market prices fell, reflecting good harvests, and total transfers to farmers rose to about $300 billion, equivalent to 2 percent of the gross domestic product (GDP) of the countries of the Organization for Economic Cooperation and Development (OECD), compared with 1 . 8 percent of GDP in 1989.7 In 199 1 , lower world prices are expected to continue, keeping support levels high, especially export subsidies. It is estimated that about 40 percent of support comes from government budgets; the remainder is paid by consumers through higher domestic prices maintained by trade barriers. 8
Among the major industrial countries, the United States has been a strong proponent of agricultural reform in the context of the Uruguay Round and has taken an aggressive stance on domestic farm policy to pursue its objectives. Its 1990 Farm Bill reduced some of the production distortions resulting from farm programs, but it also removed the limit on the funding of the Export Enhancement Program (EEP) and included a "GATT trigger" that will further increase export subsidies if an agreement in the
7QECD (1991). 8lbid.
3
Uruguay Round is not reached by July 1992.9 Export support policies have helped raise the U .S . share in world agricultural exports and to lower world market prices, putting pressure on the EC farm budget, but the gain in U .S. market share has been largely at the expense of unsubsidized thirdcountry exporters .
In response to budget constraints and economic changes in Europe, the EC is crafting a program to reform the Common Agricultural Policy (CAP). Substantive negotiations on reform of the CAP will need to address the level and form of agricultural supports, the implications of the European Economic Area (EEA), market access, and environmental effects. The negative response by some EC member countries to the EC Commission's proposed reform plan, which would cut support prices significantly and introduce income supports with new set-aside rules favoring small farmers, suggests that negotiations could be protracted, with implications for the Uruguay Round. The EC views CAP reform as separate from the negotiations in the Round, but other countries believe that a fundamental change in the CAP, with the prospect of ongoing reforms, is essential to break the impasse in agriculture.
Japan has opened its market to imported beef, citrus products, and some minor agricultural products, but its agricultural sector remains highly protected. The level of agricultural support, though declining, is the highest among the major OECD countries. Unlike the case in other major trading countries, no discussion of fundamental agricultural reforms is under way in Japan, although some suggestions have been made that import access to a small share of the domestic rice market could be permitted.
Canada, Australia, and New Zealand are members of the Cairns Group, which has pressed for a substantial reduction in the most trade-distorting measures (import restrictions, domestic supports. and export subsidies) . 10 Recently, Canada introduced major changes to its agricultural policies that will replace the ad hoc measures used to shelter Canadian producers from world price fluctuations
9U.S. agricultural policy is established in major farm bills, which arc usually legislated every five years.
'O'fhe Cairns Group is a coalition of industrial and developing country agricultural exporters. It comprises Australia, Argentina, Brazil, Canada, Chile, Colombia, Fiji, Hungary. Indonesia, Malaysia, New Zealand, the Philippines, Thailand, and Uruguay. In contrast to other members of the Cairns Group, Canada is also a major importer of agricultural products and has sought to strengthen the GATT provision (Article Xl.2.c.) covering supply management programs, which Canada maintains for dairy and poultry products.

©International Monetary Fund. Not for Redistribution
OVERVIEW
with a unified program of income protection. Australia and New Zealand now have the lowest support levels for agriculture of any of the OECD countries; however, their reforms have been undermined by low world prices stemming from other countries' agricultural support policies and by restrictions on market access.
Among the countries of the European Free Trade Association (EFTA), Sweden initiated, in July 199 1 , a three-year agricultural reform program to phase out agricultural price supports and export subsidies; these will be replaced by direct income supports during a transition period. A general reduction of border protection has been deferred, pending the outcome of the Uruguay Round.
Developing Countries
At the start of the 1980s, the trade regimes of many developing countries were highly restrictive following decades of import-substitution policies with a strong anti-export bias. Exceptions were the export-oriented Asian economies, whose largely price-based trade regimes promoted exports while restricting imports of "nonessential" consumer goods, and a few Latin American countries that had eliminated quantitative restrictions in the 1 970s. During the 1 980s, developing countries increasingly turned away from inward-looking trade and industrial policies and sought to participate more fully in world markets. This process accelerated toward the end of the decade when many countries in Latin America and Eastern Europe took major steps to open up their economies. The redirection of policies reflected the emerging consensus that countries following an outward-oriented, market-based development strategy had achieved relatively higher rates of growth and living standards, while countries with heavily regulated economies that were closed to foreign competition had fallen further behind.
While countries have implemented reforms in different ways depending on their circumstances, there are some observable regional patterns. The dynamic Asian economies, which did not have heavily restricted regimes in the early 1980s, further liberalized by gradually opening up importcompeting sectors when domestic producers became more competitive internationally; some countries with sustained external surpluses also faced international pressure to liberalize. The outward-oriented growth strategy followed by these countries helped to ensure that external competitiveness was maintained and, in general, this was supported by fiscal discipline. Government intervention in the economy has varied among countries in this group. Most countries have supported indirectly productive capital, such as education and
4
infrastructure. Some have also actively supported export industries (through subsidies, credit policies, duty exemptions schemes, informal guidance, and other means) with mixed results. 11
In contrast to the dynamic Asian economies, many countries in Latin America and Eastern Europe that had followed import-substitution policies and inward-looking regional development strategies have liberalized their trade regimes more quickly and extensively in order to expose inefficient domestic industries to international competition. The opening of their economies is playing an important role in both stabilization and the reallocation of resources to more efficient uses. Most often, reforms have been implemented in the face of large external and domestic imbalances and in environments where the forces of competition had been suppressed through government intervention in the enterprise sector (Latin America) or through centrally planned economic systems (Eastern Europe).
During 1 990-91 , many Latin American countries simplified their tariff structures and lifted virtually all quantitative restrictions on trade; in recent accessions to GATT many of these countries locked in these reforms by binding their entire tariff schedules in the GATT. In Eastern Europe, all countries are now moving to transform their economies to market-based systems, and the liberalization of their trade and payments systems forms an integral part of this process. While some countries have advanced further in reforming their economies than others, in the area of trade policy all have abolished the state monopoly of foreign trade, lifted most quantitative restrictions, and now rely mainly on low import tariffs for protection.
Moves to liberalize trade have been less extensive in Africa and South Asia, where many countries continue to maintain high levels of protection that impede their export growth and development. Nevertheless, dramatic changes have occurred in a number of African countries during the past five years. Important liberalizations (Cote d'Ivoire, The Gambia, Ghana, Kenya, Za"ire) have virtually eliminated quantitative restrictions including the allocation of foreign exchange. In South Asia, Sri Lanka has maintained an open trade regime since the late 1970s and has continued to liberalize during the 1980s. Pakistan has taken steps to decontrol its trade regime, and lndia is beginning to liberalize its restrictive trade and business practices.
11Sec Australian Industry Commission ( 1990) for an assessment of pro-active industrial policies in Japan. Korea. Taiwan Province of China. Hong Kong, and Singapore.

©International Monetary Fund. Not for Redistribution
Major Developments
Regional Developments and Initiatives
A striking feature of the I 980s was the renewed interest in regional integration and free trade areas among the major industrial countries. 12 The launching in 1985 of the Single European Market Program (EC I 992) and the difficulty of starting and concluding the Uruguay Round have fr�quently been mentioned as important factors behtnd the recent trend toward regionalism. The initiation of EC 1992 was followed by the negotiation of the U.S.-Canada Free Trade Agreement, which went into effect January 1, 1989. More recently, in June 1990. formal negotiations started between the EC and. EFTA toward the creation of a European Econom1c Area (EEA) by 1993. Three EFTA members, Austria, Finland, and Sweden, have applied for EC membership, and the former German Democratic Republic became part of the EC as a conseq�ence of G��an unification. The EC has also negotiated Assoc1at10n Agreements with several Eastern European countries (Czechoslovakia, Hungary, and Poland) that would involve preferential access to the EC market.
In the Western Hemisphere, U .S. President Bush announced the Enterprise for the Americas Initiative (EAI) in June 1 990. In the area of trade, the aims for EAI are to complete the Uruguay Round and reduce barriers to trade and investment in the Western Hemisphere; ultimately, the EAI envisions a hemispheric free trade area. ln April 1991. the governments of the United States, Canada, and Mexico launched tripartite negotiations for a North American Free Trade Area (NAFTA).
While formal regional arrangements have figured less prominently in Asia, during th.e 19�0s intr�regional trade grew at a faster pace m As1a than �n the EC and North America. Th1s reflected the rap1d development of the dynamic Asian economies,. as well as the increasing division of labor and capttal in the region as Japan and, more recently. Korea and Taiwan Province of China have moved production facilities to lower-wage countries unaffected by VERs. Although the size of Japan's economy, its extensive network of foreign direct investment in Asia, and its prominent role as a provider of foreign aid have increased its economic interrelations in the region, Japan has avoided membership in any formal regional trade arrangement.
In response to these developments, there is renewed interest in reviving regional arrangements in Africa, the Asia-Pacific region, and Latin America in part for defensive reasons. The EEA and the NAFTA w�uld create markets of nearly equivalent size; together they accounted for 65 . percent of world imports and 47 percent of developmg country
12see de la Torre and Kelly ( 1992).
5
exports in 1 990; clearly, the stance of trade policies in these two regions is of vital interest to all nations.
The completion of EC 1992, the prospective enlargement of the EC, and the possible extensi.on of trade preferences to Eastern European countnes have all raised concerns among the EC's trade partners. The EC 1992 program calls for removal of internal barriers to trade. The net impact of this on nonmember countries is an empirical question that depends on whether the trad� diversi.o� owing to the reduction in costs and pnces ansmg from the removal of trade barriers within the EC would be outweighed by the positive dynamic effects on economic activity and import growth. For example, ONCTAD estimates that the overall net effect of EC 1992 on exports from developing countries could be positive if the dynamic effects increase EC income by at least 5 percent, an esti�ate that is in line with the income effects estimated by the EC Commission. 13
In the area of trade policy, EC 1 992 calls for the elimination of national trade restrictions maintained under Article 1 15 of the Treaty of Rome, which mainly affect trade-sensitive nonagricultural imports (Japanese automo�iles, motorbikes .and mopeds, consumer electromcs, footwear, textlles. and clothing). It is uncertain whether or not t�e implementation of the EC 1992 program will increase protection in these and other areas, for example, by converting national restrictions to ECwide restrictions. 14 Another concern is that the enlargement of the EC will extend distortionary EC policies, particularly the CAP. to a wider group �f countries and intensify distortions in world agncultural markets. These fears may be mitigated to some extent by the budgetary costs arising from the agricultural surpluses that would be involved in any expansion of CAP in its present form, and are a factor underlying the search for reforms of the CAP. Access to the EC market by third countries would also be impaired if trade preferences were extended to Eastern European countries in heavily protected areas, such as agriculture, steel, textiles, and clothing.
"See UNCTAD ( 1990a). Chapter Ill. 14The recent agreement reached be1wecn 1he EC and Japan to
convert national VERs on Japan's automobile expons to EC countries to an EC-widc monitoring arrangement. which will limit Japan's exports of automobiles to their current EC-wide level 1hrough the year 1999 and which includes projected 1ncrcascs in sales by .. tran�planh:· " a market-shanng arrangement of dubious legality under EC competition law1.. While Japan and the EC have agreed tO defend this arrangement in GATT. it is similar to other gray-area measures whose conl>iMency with the GATT principle of nondiscrimination is que�tionablc. The Community has announced that it will not request any such cooperative measures after the end of 1999.

©International Monetary Fund. Not for Redistribution
OVERVIEW
The NAFTA and the prospects of a free trade area in the Western Hemisphere have raised questions concerning the greater scope for trade diversion in regional arrangements involving developed and developing countries, which generally have higher levels of protection. Asian countries, in particular, are concerned that the proximity of Mexico to the U .S. market, together with its lower wages and preferential access, could divert U.S. imports toward Mexico. The eventual reduction in barriers to trade in the heavily protected industries, such as footwear, textiles, and garments, would give Mexico significant advantages over third-country suppliers.
Apart from issues of access and trade diversion, another major concern is the potential distortionary effects of large regional blocs on investment. One of Mexico's primary aims in pursuing a free trade area with the United States is to attract foreign direct investment and the associated technology needed to foster development. Similarly, Canada's full participation in the NAFTA reflects in large part the concern that the hub-and-spoke model of regional integration with the United States at the center would seriously undermine Canada's ability to attract foreign investment. 15 At a more general level, uncertainty of access to outsiders conveys clear advantages to being inside a regional bloc, either as a member or through foreign investment that is a substitute for trade. This is apparent from the number of countries seeking entry into the EC and closer ties with the United States.
Developments in the Multilateral Trade System
The GATT provides the multilateral framework that governs international trade and the principal forum for multilateral trade negotiations (MTNs). Two key principles, nondiscrimination and transparency, underlying the GATT system have been severely challenged by the widespread use of selective nontariff measures; the exemption of important sectors (agriculture, textiles, and clothing) from GATT rules; the de facto management of major portions of trade in other sectors (steel, automobiles, electronics) through the use of gray-area measures and procedural protection; extended delays in adopting and implementing dispute panel findings; and the drift toward unilateral, bilateral, and regional initiatives to solve trade problems. These developments stem from weaknesses inherent in the GATT system (vague rules, multiple dispute settlement forums, weak enforcement mechanisms, cum-
ISWonnacott ( 1990).
6
bersome trade negotiations), the inadequate adjustment to changed economk conditions in both industrial and developing countries, and new issues arising from the evolution of the world trading environment (globalization of investment and production and the growing importance of trade in services).
The Uruguay Round, under way since 1986. is trying to address the erosion of GATT disciplines, the need to modernize the GATT, and ways to improve market access and the functioning of the GATT system. Countries differ little in their views on the importance of the Uruguay Round. At the London economic summit in July 199 1 , the heads of state and government of the seven major industrial countries and the representatives of the European Community concluded in their Economic Declaration that "[n]o issue has more far-reaching implications for the future prospects of the world economy than the successful conclusion of the Uruguay Round." They considered a successful Round "essential to encourage the integration of developing countries and Central and Eastern European nations into the multilateral trading system," and they committed themselves to "an ambitious, global and balanced package of results from the Round, with the widest possible participation by both developed and developing countries." To this end, progress was urgently needed in the areas of market access, agriculture, services, and intellectual property, "taken together." 16
The evolution of the world trade system depends importantly on whether the commitments made in the Economic Declaration can be translated into concrete steps to conclude the Uruguay Round and preserve an open multilateral trade system based on clear, enforceable rules. Extending the Round postpones important reforms that would facilitate adjustment and increase market access and delays the full integration of Eastern Europe into the global trading system. Perhaps more important is that extension erodes confidence in the GATT system and encourages the trend toward regional trade arrangements, which holds risks for the multilateral system and could harm many developing countries excluded from trading blocs.
Beyond the Uruguay Round, the world trade system faces new challenges in the 1990s. The globalization of trade and investment, while a positive development, has increased the scope for conflicts between trade and domestic competition policies and raised questions concerning the appropriateness of traditional trade policy instruments and GATT rules. Conflicts are also increasing in "strategic" sectors as countries seek to maintain a competitive
16·'Economic Declaration of the London Summit" (1991), p. 1 1 28.

©International Monetary Fund. Not for Redistribution
Multilateral Trade System
edge through "innovation" policies, which aim to assist firms in developing and adapting new technologies to commercial uses. These developments are confronting governments with the need to harmonize domestic competition, invesnnent, and innovation policies. 1 7 Another growing concern is
nostry ( 1990).
7
the use of trade policies to pursue nontrade objectives in areas such as the environment and workers' rights. Agreed guidelines would help to differentiate between legitimate social objectives and protectionist motives. These issues are under discussion in various forums, including the OECD and the United Nations Conference on Environment and Development, and they are likely to be on the agenda of future GATT rounds.

©International Monetary Fund. Not for Redistribution
----------------�uu-----------------
Overall Trends
Output, Trade, and Foreign Investment
� he sustained recovery in economic growth LI.J following the 1981-82 recession was accompanied by a rapid expansion of trade (Chart l ) and a further integration of the world economy; for the 1980s as a whole. the growth of world trade exceeded output by 50 percent. Economic performance varied among the major groups of countries: Asia experienced the most rapid growth of output and exports since 1983. followed by North America, and Western Europe; the other developing countries fared less well. The Asian region also experienced the most rapid growth of intraregional trade in recent years (Table 1 ) . The growth of output and trade slowed in 1990-9 1 , in part reflecting the recession in North America and the United Kingdom; however, in contrast to 1981-82, demand pressures remained strong in Germany and Japan. Among the major industrial countries. a notable development was the rapid growth of U.S. export volumes after 1985 and the slower growth in Japan's export volumes, owing to exchange rate movements and shifts in relative cyclical positions (Table A J ) .
The postrecession period also witnessed a rapid expansion of foreign direct investment (FDI). Between 1983 and 1989. it is estimated that FDl nows expanded at an annual rate of nearly 30 percent, or three times faster than merchandise trade flows. FDI, which is highly cyclical, was boosted by the sustained economic expansion during this period as well as institutional and structural factors, including the deregulation and liberalization of financial markets, shifts in comparative advantage. technological advances in international communication and transportation, and efforts to circumvent protection in major world markets. The share of services in the outward stock of FDI increased significantly during the 1980s, reflecting the growing importance of trade in services. particularly financial, retail, and professional services. which often require the establishment of overseas facilities to conduct business . 1 8 Overall, the developing coun-
•RGATT (1990a). Vol. I, pp. 40-42 and 55.
8
Table 1 . Developments In Reglonal lrade Flows, 1980-89
(Average annual percentage change in value)
1980-89 1989
North America with A�ia 1 1 .0 9.5 Western Europe with Asia 10.5 9.0 Central and Eastern Europe and
the former U.S.S.R. with Asia 7.0 3.5 North America wath Western
Europe 6.5 7.0 lntra-Asia 10.0 10.5 Intra-North Amcraca 8.0 7.0 intra-Western Europe 6.5 7.0
Source· GcncrJI Agrecmcnl on Tarift\ and Trade. lntnnu-titmal Tratlt• /989-90.
tries received a declining share of FDI flows. although investment in developing Asia. China. and Mexico grew substantially.
Adjustment pressures in the industrial countries continued during the 1980s as the fast-growing Asian and other developing countries gained market shares in exports of manufactures (Table A2). The share of industrial countries in world trade in manufactures has declined steadily during the past two decades, renecting longer-term shifts in comparative advantage. In traditional industries with standardized technologies, such as textiles and clothing. footwear, steel, auro parts, and consumer electronics, comparative advamage has shifted to lower-wage countries. The globalization of investment and production has facilitated the transfer of technology and industry to developing countries. a process that increases the trade and welfare gains from specialization provided that countries adapt to the ongoing structural changes in the world economy.
During the 1980s. these longer-term adjustment pressures were intensified by the global recession in 198 1-82 and the large swings in exchange rates and external imbalances resulting in part from the stance of macroeconomic policies in major industrial countries. Progress in addressing macroeconomic imbalances has helped to alleviate pressures for protection. but trade friction remains high

©International Monetary Fund. Not for Redistribution
1 0
8
6
4
2
0
-2
-4
1 0
8
6
4
2
0
Output, Trade, and Foreign Investment
Chart 1. Real Trade and GDP Growth, 1960-90 (Annual changes, in percent)
196Q-70 197Q-80 198G-90 1980 1981
• Trade
1982 1983
• GDP
1984 1985 1986 1987 1988
Real Export and GDP Growth in Selected Regions, 1983-90 (Average annual changes, in percent)
• Exports • GDP Asia North
Sources: General Agreement on Tarriff; and Tmdc: und lurcmntional Monetary Fund, World l�conomic OutltJ<>�. vnriou' iS\uc'
9
1989 1990

©International Monetary Fund. Not for Redistribution
I OVERALL TRENDS l
Table 2. Merchandise Trade (In percent of GDP)
1973 1988
Canada 39.6 47.5 United States 10.8 16.2 Japan 16.6 15.9 France 28.3 36.5 West Germany 33.3 47.7 haly 3 1 .0 32.1 United Kingdom 35.9 40.7
Source· General Agreemem on Tanfl'; and Trade. /ntuna-tional Trad�. various issues.
among the industrial countries and, with slower growth in some of the major countries, pressures for protection have recently re-emerged in sectors with excess capacity, for example, the automobile sector.
To some extent trade friction is a natural outcome of the growing importance of the external sector in industrial country economies (Table 2) and the closer integration of their economies through trade and investment flows. The industrial countries remain both the largest source and destination of foreign direct investment. While greater economic interdependence conveys many benefits, the "spider's web" of cross-investments has intensified competition in domestic and third markets, created disputes in areas where GATT rules are nonexistent or unclear, and raised questions concerning the relevance of existing trade rules. 19 It has also increased awareness of the effects of domestic policies on trade, investment, and international competition. A notable example is the U . S. -Japan Structural Impediments Initiative, which seeks to address domestic policies that are considered impediments to external adjustment, market access, and competition.
Trade Trends in Developing Countries
For developing countries as a group the volume of trade increased significantly in the latter part of the 1980s. The growth of export volumes increased to an annual average of 6 percent in 1 987-90 compared with 5 percent in 1983-86 and stagnant
' levels
19Bhagwati ( 1991) refers to the "spider's web" phenomenon. Appendix IJ examines the implications of the globalization of Investment and production for exisung trade rule!>. Appendix I on the GATT system discusses recent disputes concerning FDI and local content rules.
1 0
in the 1 970s (Table 3). Excluding the developing countries in Europe, which include countries of Eastern Europe and the Commonwealth oflndepen?ent States, export volumes grew by over 8 percent m 1987-90, up from about 4 percent in 1983-86. The impact of liberalization measures and adjustment policies is likely to have made an important contribution to this turnaround. The rebound in import volumes was even more marked. changing from a decline in 1 983-86 to an annual average growth rate of more than 6 percent in 1987-90. This �ompares �ith the real GDP growth of the developmg countnes of about 3 percent in 1987-90.
Regional developments in the growth of export volumes have varied significantly. Export volumes of African countries increased by an average of about 3 percent a year in the 1 980s, compared with declines of about 2 percent annually in 1973-82, but the turnaround in export volume growth was much weaker for sub-Saharan Africa. In Western Hemisphere countries, export volumes have increased substantially since 1987, growing at an average rate of 7 percent as their far-reaching reforms have taken hold. The growth of exports from Asia since the start of the 1970s has been dramatic; up to 1988, the newly industrializing economies (NIEs)20 have had very high growth rates of exports, but subsequently this growth has slowed and has been outpaced by the growth of exports from other open Southeast Asian countries. The only group that experienced an appreciable slowdown in export growth in the recent period was the developing countries of Europe, where trade has been disrupted by developments in the former U.S.S .R. and the transition away from regional trading arrangements.21
With respect to imports, Asian countries had the highest growth in imports in real terms among the developing regions, at 13 percent a year in 1987-90, reflecting their reliance on imported raw materials and components, the strong growth of domestic demand, and import liberalization measures. The growth rate of import volumes in Western Hemisphere countries has also increased, to 5 percent, as their economies have opened up and access to financial markets has improved. Continued economic problems in sub-Saharan Africa have resulted in little respite from the declining volume of imports. Imports of the developing countries in Europe grew steadily from the 1970s up to the end of the 1980s at 3-4 percent a year, but have fallen sharply in 1990-91 .
2CIHong Kong, Korea. Smgapore. and Taiwan Province of China.
21tnternational Monetary Fund (1991b), Annex l .

©International Monetary Fund. Not for Redistribution
Trade Trends in Developing Countries
Table 3. Developing Countries: Export Volumes, 1973-90 (In annual average percent changes)
1973-82 1983 86 1987-90
Export volumes
Total Developing Countries 0.2 4.7 5.7
Africa -2.4 4.4 2.3 Asia 9.2 10.5 1 1 .8 Europe• 4.3 5. I -4.2 Middle East -5.1 -1 1 5.4 Western Hemi�phere 1.9 2.6 7.2
Subregions Sub-Saharan Africa - 1 .0 1 . 7 1 .0 Four Asian NIEs2 13 .3 13.4 1 1 .4
Import volumes
Total Developing Countries 7.3 -0.5 6.5
Africa 4.7 6.5 1 .2 A�ia 8.8 6.7 12.9 Europe• 3 . 1 2.6 2.4 Middle East 13.9 -10.4 -0.4 Western Hemisphere 3.6 -4.8 4.7
Subregion� Sub-Saharan Africa 0.7 -3.0 0 . 1 Four Asian N1Es2 10. 1 8. I 15.7
Source: lnternauonal Monetary Fund ( 1991b). 'Includes Eastern European coumncs and the former Soviet Un1on
>The four newly induMrialit•ng cconom1es (NIEs) are Hong Kong, Korea. Smgaporc. and Ta•.,.,an Pro' mce ofChma.
Developing country exports of manufactured goods, which increased by 14 percent a year during the eight years to 1988, grew much more rapidly than exports of primary products (Table A3) and, by 1988, manufactures accounted for more than half of total exports. Machinery and transport equipment displayed the fastest growth at 1 8 percent a year; this product group is now the largest product group and about the same magnitude as consumer goods exports, the main product group in 1980. Between 1973 and 1988, the developing countries' share of world exports of manufactured goods doubled and this was reflected across most manufactured products (Table A4); an exception is
1 1
textiles and clothing where trade is controlled under the Multifiber Arrangement. Over the same period, the importance of developing countries as a market for traded goods increased substantially from 1 8 percent of total non-oil imports in 1973 to 30 percent in 1988. The growing importance of developing countries in world trade has been reflected in their greater role in the Uruguay Round trade negotiations. For the first time they have been asked to make concessions in the "new" areas of interest to industrial countries (services, investment, and intellectual property) in exchange for improved market access in areas where they have a comparative advantage (agriculture. textiles, and clothing).

©International Monetary Fund. Not for Redistribution
-----------�1 1 1 1 �-l --------
Industrial Countries' Trade and Trade-Related Policies
!Cl ince the mid-1980s, there has been little, if � any, decline in the overall level of trade protection in industrial countries despite the expansion of output and trade, the reduction in current account imbalances among the major industrial countries, and the ongoing Uruguay Round of multilateral trade negotiations. Protection persists in agriculture and in declining industries, and new pressures have emerged for government intervention in sectors considered "strategic." The limited progress in addressing the long-standing problems in agriculture and declining industrial sectors will intensify adjustment pressures in the industrial countries as the European single-market program progresses, the developing countries continue to expand and diversify exports, and the Eastern European countries seek to reintegrate their economies into the multilateral trade system.
Many of the issues that need to be resolved to expedite adjustment in agriculture and in mature industries, such as textiles and steel, are under negotiation in the Uruguay Round trade negotiations and in other multilateral forums. The Uruguay Round, which was extended following the failure to conclude the Round on schedule, aims to substantially reduce tariff and nontariff barriers to trade, strengthen existing rules and dispute-settlement procedures, bring sectors such as agriculture and textiles and clothing under normal GATT disciplines, create disciplines in new areas (services, foreign investment, and intellectual property), and improve GATT surveillance over trade policies and the coherence of trade and financial policies. The liberalization of steel is proceeding in multilateral negotiations under the U .S . Steel Liberalization Program, and an agreement that would phase out subsidies to shipbuilding and repairs is being negotiated in the OECD Council Working Party on Shipbuilding.
Despite these negotiations, the salient feature of trade policy developments among the major industrial countries is the threat of reduced reliance on the multilateral approach in relations with trade partners. Issues of "fair'' trade and market access are often dealt with bilaterally, outside the scrutiny of the GATT Contracting Parties and in ways that are at variance with GATT rules or the principles of nondiscrimination and transparency that underlie
12
the GATT. Areas not covered by the GATT have become a growing source of trade friction: services, foreign investment, and intellectual property rights. With the limited progress in the Uruguay Round, countries are addressing these issues in bilateral and regional trade arrangements where it is easier to reach a consensus. Liberalization among the industrial countries is proceeding largely in the context of regional trade arrangements . While such arrangements can expand the scope for free trade, they hold risks for the multilateral trade system and are a source of concern for countries that fall outside regional groupings.
In 1990 and 1 99 1 , the industrial countries began to dismantle selected import restrictions affecting Eastern European countries and to establish normal trading relationships with these countries. These developments are discussed separately in Section lV. Similarly, industrial country policies on agriculture are described in Section VI.
The rest of this section reviews recent developments in industrial countries' trade policies and trade-related industrial policies. The first part covers the main instruments of trade policy. The second reviews government support policies and efforts under way to curb trade-distorting subsidies. The third discusses trade policies in selected individual countries.
Recent Trends in Trade Policies
Tariffs
The GATT system has sought to establish nondiscriminatory tariffs as the principal means of protection. During the past forty years, industrial countries have dismantled most import quotas on nonagricultural products and, through seven rounds of multilateral trade negotiations, have reduced the average level of MFN tariff rates from around 40 percent at the end of World War 1 1 to around 5 percent at the end of the Tokyo Round in 1979. Further reduction in average tariff levels by one third is a major objective of the Uruguay Round. The progressive decline in tariff rates has lessened their importance as an instrument of trade policy,
©International Monetary Fund. Not for Redistribution
I Recent Trends In Trade P�o�l�lc��!e�sJ-----------------
although the levels of protection they provide differ considerably across countries and products (Table AS). 22 The tariff rates applied after the Tokyo Round are relatively high (tariff peaks) in a number of countries for agricultural products and for clothing. textiles, and footwear. Progressively higher tariffs along the processing chain (tariff escalation) arc also a feature of most industrial countries' schedules, particularly for certain foodstuffs, leather, fabrics, and some petrochemical products. ln contrast, tariffs on capital and intermediate goods and durable consumer goods are relatively low.
Applied tariff rates may differ from the Tokyo Round MFN rates because of subsequent tariff cuts or preferential trade arrangements among countries, including customs unions, free trade areas, and tariff preference schemes such as the GSP. Nearly 40 percent of world trade is conducted within preferential trade arrangements among industrial countries.23 Because of this, average applied tariff rates can be lower for some products than average rates applicable to GSP beneficiaries. This is a major concern of developing countries, which complain that free trade areas can undermine their preferential access to industrial country markets. At the midterm review of the Uruguay Round, industrial countries agreed to a moderate reduction in tariffs on tropical products that are of particular interest to developing countries.
Nontariff Measures
With the decline in industrial country tariff rates and the high level of bound tariffs, particularly for industrial products (Table A6), countries have increasingly relied on nontariff measures in response to adjustment pressures in trade-sensitive sectors. Such measures include VERs, similar restraints under the MFA, other orderly market arrangements, tariff quotas, surcharges, variable levies, prohibitions. licensing, import monitoring, antidumping and countervailing actions, and price control measures. The incidence and restrictiveness of nontariff measures are difficult to judge (Appendix lll), but trade coverage ratios estimated by UNCTAD using its Data Base on Trade Control Measures indicate that nontariff measures affected almost 19 percent of nonfuel imports of 22 indus-
220uring the 1980s, New Zealand and Australia initiated tariff reform programs that have reduced tariff rate� below tho�e indicated in Table 3. Several other countrie� have reduced taraff� on selected items. including. Canada. Japan. and the Unncd States.
l'Thcsc comprise the EC. EFTA. the U.S.-Canada Free Tro�dc Agreement, and the Australia-New Zealand Closer Economic Relations Trade Agreement.
trial countries in I 990 (Table 4). 24 Coverage varies significantly among product groups with the highest incidence on food items (36 percent) and the mature industries: iron and steel (53 percent), textiles (39 percent). clothing (63 percent) , footwear (20 percent), and motor vehicles (55 percent). Imports of textiles and clothing. footwear, steel, and motor vehicles are mainly affected by VERs and the MFA. while imports of agricultural products are controlled by other quantitative restrictions.
1 3
Overall , nontariff measures affect exports from developing countries to a greater extent than do exports from industrial countries, particularly for manufactured products (Table A 7). This primarily reflects the high proportion of imports of textiles, clothing, and footwear subject to nontariff measures.25 For imports of food items. iron and steel, and motor vehicles, the proportion of trade affected is greater for exports originating in industrial countries. For most categories of goods, exports from the former U .S .S .R. and Eastern Europe have had the highest trade coverage ratios; some of these were dismantled in 1990, but the indicators reported here will not reflect these developments until 199 I .
In order to assess the longer-term trend in the use of nontariff measures, Laird and Vossenaar ( 1991) combined the most recent UNCTAD estimates for the period 1988-90 with earlier estimates for the period 198 I -88 (Table AS). Their calculations suggest that the incidence of the "core" nontariff measures. 26 which are considered the most restrictive, increased by about 5 percent between 1981 and 1987-88, but had declined somewhat by 1 990. The experience varies across countries during the 1980s. The coverage ratios rose most for both the United States and the EC, which made increased use of VERs (many directed against Japan and the newly industrializing economics in Asia) on motor vehicles, steel, machine tools, textiles, and, in the case of the EC, consumer electronic products; in the EC, some national VERs were phased out after 1983 (Tables 5 and A9). Japan's trade coverage ratio declined in the second ha If of the 1980s owing
l4A trade coverage ratio mea�ure� the percent of trade in an item subJeCt to noma riff measures in the total trade in that item 11 ha� important limitations as an indicator of restrictivene�s because it is not known what the levels of trade would be in the absence of restrictions. Also. the trade coverage ratio does not e<�pture the effects of a tightening or loosening of restrictions; it only reflects changes an product coverage. Only border measures arc covered in the UNCTAD data base
��Restrictive measures affect not only products currcntl}' exported. but may also deter anvestmcnt in areas where developing coumncs have export potential
l<>"Core" nontariff mea�ure� exclude antidumping and countervaaling actions. automatic licen�ing. import �urveillance measures, and para-tariff measures

©International Monetary Fund. Not for Redistribution
INDUSTRIAL COUNTRIES
Table 4. Import Coverage Ratios of Selected Nontariff Measures, by Type of Measure, Applied by Selected Developed Market-Economy Countries1
(In percent)
All NTMs2
Product Group 1988 1990
All food items 35.4 35.9 Food and live animals 38.8 39.3 Oilseeds and nuts 7.4 7.4 Animal vegetable oils 10.1 10.0
Agricultural raw materials 4.3 4.3
Ores and metals 19.0 17.9 Iron and steel 56.2 52.9 Nonferrous metals 0.8 0.8
Fuels 17.9 17.9
Chemicals 10.7 10.8
Manufactures. excluding chemicals 16.0 17.8 Leather 9.3 13.2 Textiles, yarn and fabrics 38.6 38.7 Clothing 63.7 63.1 Footwear 19.7 19.7 Yehicless 54.9
All items, excluding fuels 17.3 18.5
All items 17.4 18.4
NTM Coverage by Type of NTM
Subgroup of Quantitative NTMsJ restrictions
1988 1990 1988 1990
32.9 3 1 .8 26.5 25.3 35.8 34.5 29.8 28.4
6.9 6.9 5 . 8 5.8 9.6 9.6 4.3 4.2
2.9 2.9 2.4 2.4
12.7 1 1 .6 12.7 1 1 .5 38.9 35.3 38.9 35.3
0.2 0 2 0.2 0.2
13.5 13.5 12.7 12.7
6.7 6.6 5.5 5.4
1 1 .0 1 1 .0 10.4 10.3 1 . 3 1 .3 1 . 3 1 . 3
34 .2 34.3 34.1 34.1 5 7 . 1 56.6 57.1 56.6
1 . 9 8.0 1.9 8.0 29.6 28.4
1 2 . 7 1 2 . 5 1 1 .5 1 1 .3
12.8 12.6 1 1 .6 1 1 .4
Of which : YERs and OMAs4
1988 1990
2.8 1.5 3.4 I . 7
10.4 10.3 32.5 32.5
8.7 8.8 0.2 0.2
24.6 24.6 53.6 53.0
0.9 7.6 28.0
7.2 7 . 1
6.3 6.2
Source: United Nations Conference on Trade and Development ( 1991 b). Note: NTMs = nontaritf measures; OM As = orderly marketing arrangements: VERs = voluntary export restraints. 'Ratios have been computed using as far as possible 1988 trade weights: otherwise trade statistics for 1986 (or 1989 in the calculations
regarding the United States} were used. The countries are Australia. Austria. Canada. EC-12. Finland. Japan. New Zealand. Norway. Sweden. Switzerland. and the United States.
21nclude cenain para-tariff measures. surcharges. variable levies. antidumping and countervailing actions. quantitative restrictiOns (including prohibitions, quotas, nonautomatic licensing. state monopolies, voluntary export restraints and restraints under the Multifiber Arrangement {MFA} and similar textile arrangements). import surveillance, automatic licensing. and price control measures.
'All selected trade measures. excluding para-tariff measures. surcharges. antidumping and countervailing actions. automatic licensing. and import surveillance.
•Including restraint agreements under the MFA . SFrom Laird and Vossenaar ( 1991 ).
to the lifting of restrictions on some agricultural products. Several other countries, namely, Canada, New Zealand, and Norway, have recorded notable declines in their import coverage ratios since the mid-1980s. Canada terminated a VER agreement with Japan covering exports of automobiles and phased out restrictions on imports of footwear ( 1985-88); New Zealand substantially reduced quantitative restrictions as part of a comprehensive reform program to deregulate and open up its economy; and Norway lifted quotas on imports from Japan and some other Asian countries. 27
The increased use of nontariff measures by the EC and the United States, particularly VERs and orderly market arrangements, which fall outside the
27Laird and Vosscnaar ( 1991), pp. 8-9.
1 4
GATT framework, and frequent recourse to "unfair" trade remedies (antidumping and countervailing actions) have been linked to the difficulties of applying safeguard provisions under Article XIX of the GATT, as evidenced by the decline in their use (Appendix I). A country must prove serious injury to meet the GATT criteria to apply safeguards, normally take any action in a nondiscriminatory manner (MFN basis), and compensate affected exporting countries or risk retaLiation. In contrast, VERs and "unfair'' trade remedies can be applied selectively, by product and country, and, in the case of VERs or price undertakings. they automatically compensate the exporter through higher prices and thereby foster cartel-like behavior (Appendix 11). The attractive features of VERs to domestic industries seeking protection from imports and to export industries abroad explain their rapid
©International Monetary Fund. Not for Redistribution
I Recent Trends In Trade Policies I
Table 5. Summary of Export Restraint Arrangements by Product and Exporting Region, End of March 19891
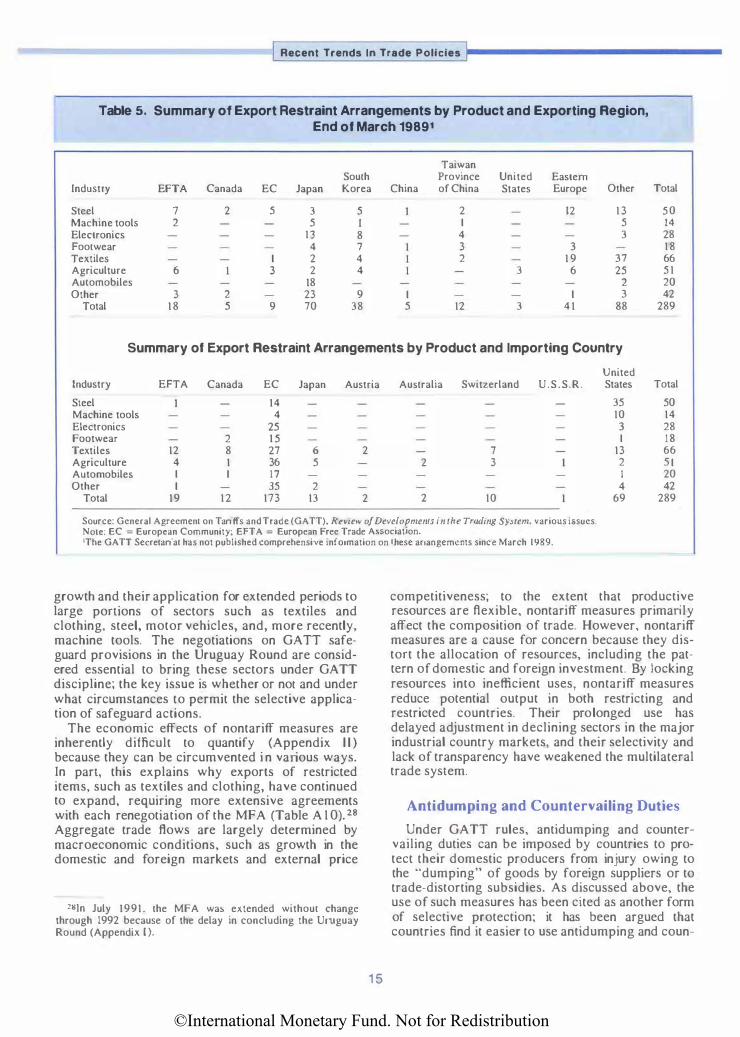
Taiwan South Province United Eastern
Industry EFTA Canada EC Japan Korea China of China States Europe Other Total
Steel 7 2 5 3 5 2 12 13 50 Machine tools 2 5 I I 5 14 Electronics 13 8 4 3 28 Footwear 4 7 3 3 18 Textiles I 2 4 2 1 9 3 7 66 Agriculture 6 3 2 4 3 6 25 5 1 Automobiles 18 2 20 Other 3 2 23 9 I I 3 42
Total 18 5 9 70 38 5 12 3 41 88 289
Summary of Export Restraint Arrangements by Product and Importing Country
United Industry EFTA Canada EC Japan Austria Australia Switzerland U.S.S.R. States Total
Steel 14 35 50 Machine tools 4 10 14 Electronics 25 3 28 Footwear 2 1 5 I 18 Textiles 12 8 27 6 2 7 13 66 Agriculture 4 1 36 5 2 3 2 S I Automobiles I I 17 I 20 Other I 35 2 4 42
Total 19 12 173 13 2 2 10 69 289
Source: General Agreement on Tariffs and Trade (GATT). Review of Developments in the Tra1ling System, various issues. Note: EC = European Community; EFTA = European Free Trade Association. 1The GATT Secretariat has not published comprehensive information on these arrangements since March 1989.
growth and their application for extended periods to large portions of sectors such as textiles and clothing, steel, motor vehicles, and, more recently, machine tools. The negotiations on GATT safeguard provisions in the Uruguay Round are considered essential to bring these sectors under GATT discipline; the key issue is whether or nor and under what circumstances to permit the selective application of safeguard actions.
The economic effects of nontariff measures are inherently difficult to quantify (Appendix I I ) because they can be circumvented in various ways. In part, this explains why exports of restricted items, such as textiles and clothing, have continued to expand, requiring more extensive agreements with each renegotiation of the MFA (Table A 1 0). 28 Aggregate trade flows are largely determined by macroeconomic conditions, such as growth in the domestic and foreign markets and external price
28!n July 1991. the MFA was extended without change through 1992 because of the delay in concluding the Uruguay Round (Appendix 1).
1 5
competitiveness; to the extent that productive resources are flexible, nontariff measures primarily affect the composition of trade. However, nontariff measures are a cause for concern because they distort the allocation of resources, including the pattern of domestic and foreign investment. By locking resources into inefficient uses, nontariff measures reduce potential output in both restricting and restricted countries. Their prolonged use has delayed adjustment in declining sectors in the major industrial country markets, and their selectivity and lack of transparency have weakened the multilateral trade system.
Antidumping and Countervailing Duties
Under GATT rules, antidumping and countervailing duties can be imposed by countries to protect their domestic producers from injury owing to the "dumping" of goods by foreign suppliers or to trade-distorting subsidies. As discussed above, the use of such measures has been cited as another form of selective protection; it has been argued that countries find it easier to use antidumping and coun-

©International Monetary Fund. Not for Redistribution
INDUSTRIAL COUNTRIES
tervailing measures, which involve a weaker injury test (or no test in some cases), when a safeguard action would be more appropriate, that is. when the nature of the problem is injury from trade. not ··unfair" trade. Questionable practices and vague rules and definitions for determining injury, dumping margins, and subsidies provide considerable scope for variations in domestic legislation and the application of "unfair" trade laws.29 In examining the use of unfair trade remedies in the EC and the United States, Messerlin found that they often led to the introduction of more secure non tariff barriers, such as VERs or quantitative restrictions (steel, electronic products, and textiles and clothing), or they became the main tool of protection (chemicals, abrasives); he also found evidence of collusive behavior among the domestic and foreign firms affected by such measures.
The pattern and volume of antidumping and countervailing actions lend support to the view that these measures respond to pressures for protection by import-competing firms. In the early 1 980s, in the wake of a second round of oil price increases and a severe world-wide recession, the demand for relief from import competition through antidumping and countervailing measures increased (Tables A 1 1 and A 12) . Since the mid-1980s, the number of investigations initiated has declined significantly; although, the trade coverage ratios in Table 4 suggest that the proportion of trade affected by antidumping and countervailing actions has increased somewhat since 1988. The sectors most affected by these measures are motor vehicles, steel, textiles and clothing, and leather products, the same sectors that are protected by other nontariff measures.
The United States, the EC, Canada, and Australia account for nearly all antidumping investigations initiated by industrial countries. 30 In the United States, the sharp rise in antidumping cases in the first half of the 1 980s has been attributed to the real appreciation of the dollar and structural problems in the international steel industry. 3 1 While the number of antidumping investigations initiated declined during the second half of the 1 980s, the stock of outstanding cases continued to rise until
29See Finger and Nogues ( 1 987), Messerlin ( 1989), and Nicolaides (1991) for reviews of amidumping and countervailing practices in the United States and the EC. l n particular, Messerlin argues that features of the codes governing antidumping and countervailing actions and their application in practice make these two instruments substitutable to the import-competing firm. He finds that cases initiated by the EC and the United States target a narrow range of industries and have a strong sector-specific impact.
30According to GATT (1991a, p. 8), these four countries initiated over 1 .000 investigations since 1980. 500 of which resulted in protective measures.
3tQffice of the United State� Trade Representative ( 1991).
1 6
1989/90, when it declined slightly. At the end of 1990, Japan, ClLina. Korea, and Taiwan Province of China accounted for 83 of the 195 outstanding cases; developing countries accounted for most of the rest (Table A 13) . The iron and steel sector accounted for most (54 percent) of the antidumping cases initiated in 1980-87, followed by chemicals ( 1 1 percent).
The EC has been a frequent user of antidumping procedures; its stock of outstanding cases rose from 124 in 1983/84 to 170 in 1988/89, but declined to 152 in 1989/90, partly because of a reduction in cases involving Central and Eastern Europe. Measures against these countries have accounted for more than half of the total cases. 32 EFTA countries, Japan, China, Hong Kong, and Korea have also been frequently investigated. The principal sectors initiating cases in I 980-87 were chemicals (42 percent), iron and steel ( ! I percent) . nonelectrical and electrical machinery ( 1 5 percent).
Both the EC and the United States have widened the provisions of their antidumping legislation to address the circumvention of antidumping duties, although the EC has been the main user of anticircumvention measures (all directed against Japan).33 The EC legislation was challenged in the GATT and found inconsistent with GATT rules (Appendix I) . As a result, the EC has suspended the use of its anticircumvention legislation, but it does not intend to change its laws until an acceptable solution to the problem of circumvention is agreed in the Uruguay Round. The ongoing globalization of investment and production and the increase in regional arrangements is likely to increase trade friction related to rules of origin.
ln contrast to the United States and the EC, recent changes in antidumping legislation have worked to reduce outstanding dumping cases in Canada and Australia. In Canada, the number of outstanding antidumping cases began to decline in 1989 as a result of the five-year sunset provision in the Special Import Measures Act, which went into effect in 1984. Outstanding cases fell to I 03 in 1990 compared with 159 in 1988. Australia's antidumping legislation was modified in 1988 and 1 989 to clarify what constitutes material injury and normal values and to tighten the review process. As a result of these changes. outstanding antidumping cases fell from 109 in 1987 to l l in 1 990. In March 1991, when further tariff reform measures were announced, a number of changes were made to Australia's antidumping procedures to widen
32GATT ( l991c), p. 7. 33Circumvention may occur when the location of certain pro
duction processes. such as final assembly. changes as a result of antidumping or countervailing duties that have been threatened or applied on a final product.

©International Monetary Fund. Not for Redistribution
I Trends in Government Support
their applicability and expedite the handling of investigations. 34
The United States has made the greatest use of countervailing duties in part because of the relatively limited role of subsidies in the United States and U .S. efforts to limit the subsidies of other countries. Also, under U . S . law, countervailing duties may be imposed without an injury test for those countries that have not signed the GATT Subsidies Code or negotiated a bilateral agreement with the United States.35 Outstanding countervailing actions rose steadily from 53 in 1 982/83 to 86 in 1 984/85 and remained at about this level before declining to 73 in 1 989/90 (Table A 1 2); most of the outstanding cases at the end of 1 990 affected developing countries (Table A l3). Over half of the countervailing cases initiated in 1980-87 were lodged by the iron and steel industry; the other industries initiating a significant number of cases were textiles, chemicals, and food products, each accounting for about 7-8 percent of cases.
Trends in Government Support
Governments use a wide range of domestic policies to promote industrial adjustment and development and to pursue "noneconomic" objectives, such as environmental quality, education and health, and regional equity. Various forms of intervention include direct subsidy payments, tax concessions, subsidized loans and loan guaranrees, government procurement, regulations and standards, and administrative guidance. This section focuses on the nature and extent of direct and indirect subsidies to the industrial sector because of their possible trade-distorting effects and the lack of comparable information on other forms of government assistance. Countries disagree on which subsidies distort trade, but generally, sector-specific subsidies fall into this category. while broadly based subsidies, such as support for education and health or basic research, that do not confer differential advantage on specific industries are considered less trade distorting. While governments have made some progress in reducing support to declining industries, the evidence suggests that support to high technology industries is rising.
Industrial Subsidies
In recent years, governments have scrutinized subsidies more carefully because of budgetary constraints, the failure of sector-specific assistance to
J4Banks ( 1990). 35Qffice of the United States Trade Representative ( 1991 ).
1 7
facilitate adjustment, the possibility of countervailing actions, and the desire to establish a more neutral incentive framework. In the EC, in particular, the Single Market Program has entailed stricter discipline on and monitoring of state aids to ensure a "level playing field" within the Community. Despite the widespread use of subsidies, comprehensive and comparable data are not readily available, although work is under way at the OECD, the EC. and EFTA to improve information in this area. In a recent OECD study, Ford and Suyker ( 1990) draw on data from the OECD national accounts, the EC surveys of state aids, and the EFTA Secretariat reports to compile cross country data on subsidies. The three data sources differ regarding the sectors covered and the definitions of subsidies used and are therefore not comparable, but they do provide a basis for the analysis of developments within each data set.
The broad trends in industrial country subsidies based on OECD national accounts data compiled by Ford and Suyker are shown in Table A 14. These data cover current transfers to the productive sectors as a whole and exclude indirect subsidies, such as tax concessions and expenditures by state and local governments, which vary in importance across countries. 36 The data indicate that in most countries total government subsidies (Panel I) increased during the 1 970s and the first ha If of the 1980s when governments intervened to assist industries that had lost price competitiveness but have leveled off or declined since then. Data excluding subsidies to agriculture and food processing show a similar pattern (Panel ll). The overall subsidy rate in OECD countries and in the major seven countries has stabilized at about 1 112 percent of GDP; for OECD Europe, the subsidy rate is nearly 3 percent of GDP. Subsidy rates differ significantly across countries. Industrial subsidization is highest in Sweden and Norway and lowest in the United States and Japan. Canada and the European countries record industrial subsidy rates in the range of 2 to 4 percent of GDP. In terms of claims on budgetary expenditures (Panel Ill), current transfers to industry are about l percent of outlays in the United States, but 3 to 5 percent of outlays in the other major industrial countries.
New Zealand and the United Kingdom showed the most dramatic reversal in subsidies to industry during the 1980s, as a result of policies to reduce government intervention in their economies through deregulation and privatization. Norway also
16The OECD"s national accounts data define subsidies as all grams on current account by government to private industries and public corporations. plus grants to government enterprises for operating losses owing to government policies to maintain prices below the costs of production.

©International Monetary Fund. Not for Redistribution
INDUSTRIAL COUNTRIES
Box 1
Trade-Related Work Program of the OECD
The Orgamzauon for Economic Cooperation and Development (OECD) has an extensive work program on traderelated issues involving a number of its Committees. Below IS an outline of the ongoing work related to the functioning of the trade system and the OECD's future work program as set out in the communiqu� of the OECD ministerial meeting of June 1991. The Trade Committee of the OECD played an important role in developing the agendas for the past two GATT rounds of trade negotiations (Tokyo Round and Uruguay Round). and it is expected that many of the issues included in the future work program will be on the agenda for the next round of trade negotiations.
Subsidies
The Agric:ulrure Commirtee has contributed significantly to the process of agricultural reform by monitoring developments and policies in agriculture. developing standardized measures of agricultural �upport, and analyzing the economic. social. and environmental effects of changes in agricultural support and protection policies. The June ministerial meeting called for a continuation of this work.
During the past two years the lndusrry Commiuee has intensified us work on standardizing and quantifying industrial subsidies. The development of measures of industrial subsidization that are comparable across countries is the first Mep toward strengthening disciplines on subsidies that distort trade. The Economic Policy Commiuee has also initiated a small pilot prOJect tO develop measures of effective rates of assistance (ERAs). At the June ministerial meeting. the OECD MiniMers invited the Organization to systematically monitor industrial subsidies and committed their governments to provide the necessary information.
The Export Credit Group of the Trade Commirtee is the forum for negotiations on the Export Credit Consensus. which the OECD Secretariat will administer. The Consensus would establish guidelines for the terms and conditions of export credit!> and limit the use of tied aid credits to commercially unviable projects. The June ministerial meeting called for the conclusion of these negotiations as soon as possible but not later than the end of 1991 . and it welcomed a proposed in depth study of export premium systems and structures.
In the OECD Council Working Party 011 Shipbuilding, negotiations launched in 1989 aim for an agreement that would phase out subsidies to shipbuilding and repair over a short transition period.
Technology and Investment Policies
Ministers acknowledged that government support to corpo· rate research and to "strategic technologies" may create friction at the international level and may affect international access to science and technology. In thi� regard. Ministers called on the OECD to deepen its analysis of government support to private sector rc�earch and development and to ··strategic technologies .. in order bener to understand the policy implications and possible trade and investment distortions. On the ba�b of this analy�is the possible need for guidelines on government support to research and development will be examined. Min1sters also requested the OECD to analyze further the issue of equal acces� for domestic and foreign-controlled firms to publicly funded research, includ-
ing the desirability of granting access to governmentsponsored consoma and programs.
Ministers called on the OECD. taking 1nto account the ongoing negotiations in the General Agreement on Tariffs and Trade (GATT) and in other international forums, to deepen it� analysis of policies related to countries· competitive positions. inter alia, 111 the fields of innovation. public procurement. public ownership of companies, taxation. and competition, as well as of financial and foreign direct investment and the interconnections between these policies. with a view to limiting the scope for International friction through greater transparency. Ministers asked the OECD, where appropriate. to explore the need for improving existing multilateral instruments and whether there is a need to develop additional "rules of the game."
The OECD Codes and National Treatment Instrument
The Committee on Capital Mo••emerus and lm•isible Transactions oversees the implementation of the Codes of Liberalization. which arc legal inMruments through which the Members commit themselves to the progressive liberalization of capital movements and current invisible transactions. Work is continuously under way to strengthen and extend these code!., wh1ch requ1re nondiscnmination on a "best effort" basb.
The Committee on lntemaltonal /111·estment and Multinational Enterprius oversees the application of the National Treatment lnstnunent, which forms part of the Declaration and Dec1sions on International Investment and Multinational Enterpri�es. The lnMrument, which is voluntary. commits OECD countries to nondiscrimination between domestic and foreign-owned firms once they have been established. At the June Ministerial Meeting. it was agreed to reinforce the procedures for implementing existing substantive commitments through notification. examination. and a multilateral framework for dealing with conflicts.
The Future Agenda
The Communique of the OECD Ministerial Meeting of June 1991 also called for a new work agenda that would involve enhanced cooperation between the Trade Committee and other committees on emerging issues in the following area�.
Competition Policy
The Committee on Competition LL11• and Policy is the focus of the analy�is and d1scussion of competition policy. In their communique. Ministers asl.cd the OECD to continue its work on the international c.Jtmens10ns of competition policies and on their interaction wuh policies 1n other areas. such as trade and Industry. They noted that recent work in the OECD on competition law and policy provided the foundation for greater policy convergence and progress toward updating and strengthening the exiSting rules and arrangements for international cooperation. They invucd the relevant comminees to pursue actively these maners. including the effectiveness of trade rules in facilitating international competition.
1 8
©International Monetary Fund. Not for Redistribution
Trends In Government Support
Box 1 (concluded)
Environmental Policy
Ministers called for improved integration of environmental considerations into all economic sectors and for the OECD to continue its work on analyzing the policy interconnections. They agreed that effective policy integration will require a greater degree of dialogue with and participation from all sectors of society and the economy if environmental goals arc to be met effectively and efficiently and to prevent policy conH icts arising. in such areas as agriculture, coastal zone management, energy, transport, and, more generally, trade and investment. Ministers endorsed the preliminary views developed by the Trade and Environment Committees on a work program that will underpin further analysis and could lead, in
reduced direct subsidies to producers from the early 1980s, although support remains high and sector specific. Afver 1984, subsidy rates declined in Canada and Australia where policies have been reoriented to expedite adjustment in declining industries; in other countries, subsidies to industry were relatively stable or increased. Data on the sectoral composition of subsidies (Table A 15) show that in most countries the agricultural sector is more heavily subsidized than the industrial sector and that, within industry, transport, communications, and housing tend to attract higher subsidies than other industries.
The surveys of state aids in the European Community cover more forms of subsidization than the national accounts data. They aim to capture subsidies that potentially distort trade and competition within the EC and include grants, tax concessions (with incomplete coverage), equity participation, soft loans, and loan guarantees. 37 Data from the first two surveys show that subsidies have been concentrated in agriculture and declining sectors such as steel, shipbuilding, railways, and coal (in Germany and Spain) (Table A l6). The average subsidy rate to manufacturing in the EC declined by I percentage point of GDP from the period 198 1-86 to 1986-88, owing largely to curbs on subsidies to steel and shipbuilding. In the steel sector, state aids
37The surveys exclude important sectors, most notably, energy (except coal), transport (except railways and inland water.vays), and housing. Aid granted by the European Community is not covered; about 80 percent of this goes to the agricultural sector.
a subsequent stage. to the drawing up of guidelines on ways to protect the environment and preserve the open multilateral system.
Regional Cooperation
Ministers noted that regional integration is another significant area of development in trade relations. It can stimulate the multilateral liberalization process and should be in conformity with international obligations and with the objective of maintaining and strengthening the multilateral trading system. Ministers invited the OECD to continue to monitor developments in the field of regional integration.
1 9
are permitted only for restructuring to reduce capacity; operating subsidies are banned. As a result of these policies, state aids to the steel industry were virtually eliminated among the EC(lO) countries in 1 986-88.38 State aids to shipbuilding had risen from 5 percent to 28 percent of operating costs between 1980 and 1987. A Community directive adopted in early 1987 now limits operating subsidies to a proportion of contract value, which is reviewed annually. Under the directive, state aid fell to 20 percent of operating costs in 1990 and will be reduced to 1 3 percent of such costs in 199 1 .
Excluding steel and shipbuilding, there was little overall decline in subsidies to manufacturing, but notable reductions in the most recent period were recorded for Italy, the United Kingdom, Denmark, Ireland, and the Netherlands, with offsetting increases in other countries. Differences between these results and those based on the national accounts data are possibly explained by the relative importance of different subsidy instruments (Table A 17). Budgetary grants account for the bulk of subsidies in most of the EC and EFTA countries. Exceptions are Germany and Portugal, where tax concessions account for about 60 percent of subsidies, and Austria, which relies mainly on equity participation. Tax concessions are also quite importam for Italy, Ireland, and the Netherlands.
Government-financed expenditure on research and development in the industrial sector varies widely across OECD countries (Table A 18). It has
38The EC( 10) countries are Belgium, Denmark, Germany, Greece, France, Ireland, Italy, Luxembourg. the Netherlands, and the United Kingdom.

©International Monetary Fund. Not for Redistribution
INDUSTRIAL COUNTRIES
traditionally been highest in the United States, in part owing to defense-related research contracts, and lowest in Japan. While the share of government-financed research and development has been relatively stable in most countries, total expenditures on research and development have been rising and government support for it has accounted for an increasing share of government assistance to industry, reflecting the shift away from support to declining industries. The major part of government-financed research and development goes to the aerospace industry, where externalities and security issues are considered important. Aerospace has the first or second highest share of government-financed research and development in most countries for which data are available. 39
The picture emerging from these data is that the growth of subsidies concentrated in declining sectors that characterized the 1970s and early 1 980s has subsided. Countries that have completely reoriented their policies, notably the United Kingdom and New Zealand, have substantially reduced assistance to industry. In some countries, progress has also been made in reducing subsidies to steel and shipbuilding. In other areas, overall assistance to industry was broadly unchanged from the mid-1 980s through 1988, and its claim on domestic resources remained relatively large, on the order of 2 to 3 percent of GDP for Canada and European countries and 1/2 to 1 percent of GDP for the United States and Japan.
Work is under way at the OECD Secretariat to develop internationally comparable data on subsidy rates that could provide a basis for increased multilateral surveillance of public support policies (Box 1 ) . Over the past two years, the ministerial meetings of the OECD have stressed the importance of greater transparency in policies to support industry and work in this area has intensified. The Industry Committee of the OECD is conducting a project to develop more comprehensive and comparable information on subsidies to industry across OECD countries. With the cooperation of member countries, a data base is being assembled for the years 1986 to 1991 covering 800 central government programs in 22 OECD countries; the coverage of local and provincial authorities is thus far incomplete. Preliminary analysis of these data suggests that traditional production subsidies have declined, while subsidies to investment (especially to research and
J9QECD ( 1 990a), p. I l l . These figures measure only government-funded research and development in the indu�trial sector. Research and development spending by governments ranges from about 20 percent of total research and development �pending in Japan to about 50 percent in the other major industrial countries.
20
development, high-tech equipment, and technology-related intangibles) seem to be rising. In terms of instruments, the increased support for research and development was mainly in the form of grants and tax concessions; the use of loan guarantee schemes, including those not covered by the OECD Consensus on Export Credits, had also risen. The overall direction of support to industry for OECD countries as a group was less certain because of different developments across countries. A pilot project for the Economic Policy Committee has also been initiated to develop measures of effective rates of assistance.
Multilateral Efforts to Curb Subsidies
Mult�lateral discipline on subsidies is considered essential to the success of negotiations in multilateral forums to dismantle trade barriers in declining industries. In the Uruguay Round, efforts to strengthen the international rules on subsidies established in the Tokyo Round (the Subsidies Code), which prohibit export subsidies on manufactures, aim to control the trade-distorting effects of subsidies. Key issues in the negotiations concern the definition of subsidies, the circumstances under which subsidies would be permitted, and the rules that would govern coumervailing actions. Clear rules and strengthened dispute settlement procedures would go some way toward reducing trade friction arising from government assistance to industry. The U .S.-EC Airbus dispute is a good example of the difficulties encountered under current GATT rules in determining what constitutes an actionable subsidy and in what forum disputes should be settled (Appendix 1).
Outside the Uruguay Round, multilateral efforts have been an important factor in fostering adjustment and phasing out assistance to steel and shipbuilding, as well as curbing subsidized export credits. In 1989, President Bush announced the U .S . Steel Liberalization Program, which ultimately aims to establish free-market conditions for international trade in steel. The program involves an extension of the VERs with 19 individual countries and the EC negotiated in 1984 (whkh would have expired in 1989) through March 1992. In the interim, the United States has concluded bilateral consensus agreements with its major steel trading partners that discipline subsidies and work to reduce or eliminate tariff and nontariff barriers . Negotiations are under way to incorporate these agreements into a multilateral consensus to prohibit most subsidies, eliminate tariffs, and establish a dispute settlement mechanism. The aim is to reach agreement before the end of March 1992 when the existing VERs on steel exports to the United States expire� however, one of the difficulties that has

©International Monetary Fund. Not for Redistribution
Trade Policy Developments I
emerged in the talks is that participants are reluctant to commit themselves on issues that might prejudice their positions in the Uruguay Round negotiations on antidumping and subsidies.
In late 1989, negotiations were launched on a new agreement 40 to phase out subsidies to the shipbuilding and repair industry. Negotiations are taking place in the OECD Council Working Party on Shipbuilding with the aim of concluding an agreement by the end of 1 99 1 . Outstanding issues include, inter alia, the treatment of export credits, domestic credit schemes, and the timetable for phasing out government assistance.
In the OECD's Export Credit Group, which has 22 industrial country members, negotiations are proceeding on a new Arrangement on Export Credits (Consensus) that would strengthen the most recent agreement concluded in 1987. The Consensus is designed to prevent "destructive competition" for export credit among member countries, whose export credit agencies are in most cases financed by national governments. Under discussion are measures that would reduce trade distortions resulting from tied aid credits and interest subsidies. Since around 1982, export credit agreements have virtually eliminated the average subsidy element on medium-term credits to middle-income countries. As a result, member countries have been using mixed credits and aid to promote exports. A proposed agreement presented at the June 1991 OECD ministerial meeting proved unacceptable and ministers agreed to an end of 1991 deadline for concluding an agreement; this commitment was reiterated at the London economic summit in July.
Trade Policy Developments in Individual Countries
United States
In recent years, the principal objectives of U .S . trade policy have been to strengthen the multilateral trade system by completing the Uruguay Round; to open foreign markets to U.S. goods, services, and investment; and to promote free and "fair" trade.41 These objectives have been pursued through multilateral negotiations, bilateral and regional initiatives, and the unilateral implementation of U .S .
40The previous agreement was concluded i n 1973 and revised in 1983.
41Jn the GATT, trade liberalization proceeds by the reciprocal exchange of rcduclioos in trade barriers based on a rough balance of concessions. By contrast, ··rair"' trade increasingly demands "strict" reciprocity. or equal market access product by product.
21
trade law. The United States played a major role in launching the Uruguay Round and continues to place highest priority on its successful conclusion as the best means of strengthening the multilateral trade system. It has strongly supported agricultural reform and the extension of GATT disciplines to the new areas: services. trade-related investment, intellectual property; its agricultural offer indicated a readiness to eliminate the 1955 waiver under which it maintains restrictions on certain agricultural products.
1 n May 1991 , the U . S . Congress extended the President's fast-track negotiating authority through June 1993, removing one obstacle to the resumption of serious negotiations. The fast-track extension also paved the way for negotiation of a North American Free Trade Agreement including the United States, Canada, and Mexico. The United States has supported regional integration in Europe and elsewhere and believes that it can be a force for liberalization when pursued in a GATT-consistent framework. Domestically. the Government has been fairly successful in containing protectionist pressures in the U .S. Congress; however, its unilateral use of U .S. trade law to pry open foreign markets and protect U .S. interests has heightened tensions with trade partners. The United States is a party to two free trade agreements-one with Israel, established in 1985, and one with Canada, effective January l , 1989-under which it is phasing out tariffs and other trade barriers according to agreed tenyear timetables. Under the U .S .-Canada Free Trade Agreement (FTA), two rounds of accelerated tariff cuts, together covering $8 billion of two-way trade, were completed by mid-199 1 . Whjle it is too early to assess the economic impact of the partially implemented FTA, reviews of performance during the first two years indicate that both countries consider that implementation has gone smoothly and that the dispute settlement process has worked effectively ;42 the number of countervailing and dumping cases declined from 1 2 in 1989 to 4 in 1990. However, recent disagreements have surfaced over automobile rules of origin (involving imports of Honda Civics by Honda Motor Co. Ltd.'s U .S . subsidiary from its Canadian plant) and the domestic content rule for autos under the U . S.Canada Auto Pact. The United States wants to increase the latter from 50 percent to 60 percent.
ln February of 1 99 1 , the governments of the United States, Canada, and Mexico announced their intention to pursue a North American Free Trade Agreement (NAFTA), and negotiations began in June. The aim is to eliminate barriers to
42See United States. Office of the President ( 1991). and Stratcgico, Inc. ( 1990).

©International Monetary Fund. Not for Redistribution
INDUSTRIAL COUNTRIES
the flow of goods, services, and investment and to protect intellectual property rights. A number of developing countries have raised concerns about the potential for a NAFTA to divert trade and investment flows and to erode their trade preferences, and various domestic constituencies in the United States and Canada have raised a number of "nontrade" concerns stemming from Mexico's lower level of income and standard of living. These include differences in environmental and tabor standards, health and safety standards, and regulatory and distribution systems that may affect cost competitiveness indirectly and lower environmental and other standards under a free trade agreement.
In June of 1990, President Bush announced the Enterprise for the Americas Initiative (EAI), which seeks to address the interrelated problems of debt, investment, trade, and the environment. In trade, the aims are to successfully conclude the Uruguay Round and reduce barriers to trade and investment in the Western Hemisphere; ultimately, the EAI envisages a hemisphere-wide free trade area. Since the announcement of the EAI, the United States has concluded trade and investment framework agreements with most countries in Central and South America and the Caribbean. Other initiatives in the Western Hemisphere included the permanent extension of the Caribbean Basin Initiative, which provides tariff preferences to Caribbean countries, and the extension of trade preference to the Andean countries (Bolivia, Colombia, Ecuador, and Peru) additional to those available under the GSP
The implementation of U .S. trade law to open foreign markets was intensified after 1988. Section 30 I of the 1974 Trade Act gives the President the right to take action against trade practices deemed unreasonable, unjustifiable, or discriminatory and that burden or restrict U.S. commerce. It covers practices related to trade in goods and services, to U.S. foreign investment, and to the protection of U. S. intellectual property rights. The 1988 Omnibus Trade and Competitiveness Act strengthens Section 30 I in several ways: inter alia, it transfers authority to initiate unfair cases from the President to the U .S. Trade Representative (USTR); it requires the USTR, under the "Super" 301 provision, which expired in 1990, to identify priority countries and practices and establish a timetable for the investigation and resolution of identified practices; and it requires the USTR, under "Special" 301 , to identify countries that violate U.S. intellectual property rights. The 1988 act also requires identification of countries and practices that restrict U .S. exports of telecommunication equipment and services and U . S . access to foreign government procurement.
Actions taken under the Super and Special 301 provisions of the 1988 Act are summarized in Ta-
22
ble Al9. In 1989, three countries-Brazil, Japan, and India-were identified as priority countries under Super 301 ; issues were resolved with Brazil and Japan, but India was identified again in 1990. After consultations with India, USTR decided not to take action since the practices under investigation, which relate to investment measures and access to the insurance market, were being addressed in the Uruguay Round. No priority countries were identified under Special 301 in either 1989 or 1990 because of progress made in ongoing negotiations; however, in 1 99 1 , three priority countries were identified for violating U .S. intellectual property rights: China, India, and Thailand. Under the telecommunications provision of the 1988 Act, the EC and Korea were designated as "priority foreign countries" in 1989 and agreements on market access were reached in subsequent negotiations. No countries have been identified as discriminating in government procurement and, thus far, no retaliatory measures have been taken under the Super and Special 301 provisions of the 1988 Trade Act.
Another important development in trade relations was the inauguration in 1989 of the U .S.-Japan Structural Impediments Initiative (Sll), which aimed to address fundamental impediments to trade and balance of payments adjustment. Each side identified structural impediments to adjustment in the other country and agreements were reached in June 1 990 to deal with them.43 Follow-up procedures call for ongoing discussions and annual progress reports; the first annual report was issued in May 199 1 . The novel feature of the SIT talks is their focus on domestic policies, particularly competition policies and corporate behavior. Five of the six impediments identified by the United States were related to domestic competition policies. Japan identified the shortsighted behavior of U .S. corporations and inadequate investment in research and development and human resources as factors impeding U .S. competitiveness. These developments point to the increased awareness that differences in competition policies and conflicts between competition and trade policies can distort international trade and investment flows. These issues are explored in Appendix II, which examines the interface between trade and competition policies and the
43Japan agreed to increase public investment in infrastructure. reform land use policies and the distribution system. eliminate exclusionary business practices and make keirersu relations more transparent. and liberalize the foreign investment regime. The United States agreed to reduce the federal budget deficit and the Government's exposure to risks from federal credit programs, promote private saving, improve U.S. competitiveness through greater investment in research and development and workforcc education and training. and lower the cost of capital.

©International Monetary Fund. Not for Redistribution
j Trade Policy Developments
efforts under way to harmonize competition policies.
The 1988 Trade Act also authorizes the President to restrict foreign investment that threatens national security (the Exon-Florio amendment). As of May 199 1 , the Committee on Foreign Investment in the United States had received 560 notices. Of these, 1 2 transactions were subject to investigation; the President acted in only one case, ordering the divestment of a U .S. aircraft parts manufacturer by the China National Aero-Technology Import and Export Company. On August 17 , 199 1 , President Bush signed a bill providing for permanent reauthorization of the Ex on-Florio provision.
Japan
Japan has implemented a series of marketopening measures over the past five years and has eliminated virtually all formal trade barriers to the imports of manufactured goods. Despite this, some of its major trading partners consider that informal practices impede imports, foreign investment, and competition in the domestic market, and this has led to ongoing discussions of market access issues. Largely under pressure from trading partners, Japan has gradually liberalized the imports of beef, citrus fruits, and some other agricultural products, but its agricultural sector remains heavily protected, imposing substantial costs on its economy and causing trade friction with agricultural exporting countries (Section VI). On the export side, Japan has continued to resort frequently to voluntary export restraints and other forms of managed trade to handle disputes with its trading partners, rather than seeking multilateral solutions. In a significant departure from past practice, Japan, in 1988, challenged the GATT legality of the EC's anticircumvention laws and was supported by the GATT panel ruling reached in 1 990.
Japan has been an active participant in the Uruguay Round and is particularly interested in strengthening trade rules in the areas of antidumping, rules of origin, safeguards, and dispute settlement. In the new areas, it seeks to establish disciplines on trade-related investment measures and intellectual property rights. In agriculture, Japan has stressed the importance of food security and its need to maintain self-sufficiency, particularly in rice; in its view, agricultural reforms should first aim to reduce export subsidies.
During the past several years, market-opening measures have been implemented in the context of various initiatives. Under the Action Program for Improved Market Access, in force for three years beginning in July 1985. Japan eliminated or reduced tariffs on over 2,000 items, improved GSP benefits, and simplified standards, certification, and
23
import procedures. ln response to a 1988 GATT panel ruling, 10 agricultural items were liberalized. Separate bilateral discussions with the United States and Australia led to progressively larger import quotas for beef and citrus fruit and their eventual replacement with tariffs in April 199 1 .
The Market-Oriented, Sector-Specific (MOSS) Talks initiated in 1985 with the United States have sought to improve market access on an MFN basis in electronics, telecommunications, pharmaceuticals and medical equipment, forestry products, and auto parts. As part of this ongoing process, in September 1991 Japan and the United States agreed to undertake a joint study of the originating source of auto parts used in U .S . and Japanese cars and to study the problems facing U .S. vehicle and parts makers trying to export to Japan. In 1 990, Japan introduced a new program of comprehensive import expansion measures, including tax incentives to import, financial assistance to importers, the elimination or reduction of tariffs on l ,008 industrial products ( vaJ ued at $ 1 3 billion in 1988), and promotional programs to encourage imports.
In response to the relatively rapid growth of domestic demand and the large real appreciation of the yen in 1985-87, Japan's trade surplus fell sharply during 1988-90 from its 1987 peak. This alleviated protectionist pressures in other countries to some extent, but the recent and prospective widening of Japan's trade surplus has contributed to a resurgence of protectionist sentiment in the EC, the United States, and in some Asian countries as well. Recent years have also seen a change in the structure of Japan's imports and exports.44 The rapid growth of manufactured imports has exceeded predictions based on historical relationships. suggesting that market-opening measures may have played a role. While the share of manufactured imports in Japan's total imports has risen significantly since 1985, the view that the level of Japan's imports is unusually low by industrial country standards continues to be debated by trade specialists.4s
On the export side, total real export growth slowed sharply following the appreciation of the yen, reflecting mainly weak demand for consumer exports, while capital goods exports continued to expand. Corker ( 1990) suggests that this pattern is consistent with the nearly sixfold increase in Japa-
44See Corker ( 1990). 45Recent reviews of the evidence are provided in Ostrom
(1991), Bhagwati ( 1 991). and Balassa and Noland (1988). A number of researchers (Bergsten and Cl ine ( 1987). Saxonhouse (1983) ( 1985)) have found that the level and composition of Japan's imports can be explained by its factor endowments. Others (Balassa ( 1986), Lawrence ( 1987), and Lincoln ( 1990)) find evidence that Japan's imports are "too low·• based on its characteristics or that nomrade barriers have affected the level of imports.

©International Monetary Fund. Not for Redistribution
INDUSTRIAL COUNTRIES
nese foreign direct investment (FDI) since 1985. The growth of outward investment has been attributed to the appreciation of the yen, which has led to the establishment of overseas production facilities in lower cost Asian countries, and to the circumvention of trade barriers, particularly VERs and antidumping duties, in the United States and the EC. As reviewed above, a high proportion of EC and U .S . antidumping actions are directed against exports from Japan, and Japan maintains the largest number of known voluntary export restraint arrangements (Table A9). The M inistry of International Trade and Industry (MITI) estimated that in 1 989, exports covered by restraint agreements accounted for 121 h percent of Japan's exports (about 29 percent of exports to the United States). 46
Japan is also party to "voluntary import expansion" agreements with the United States, which have raised concerns about discriminatory market access. As a result of negotiations under Super 30 I , Japan and the United States, in March 1990, reached agreements on Japanese Government procurement procedures for satellites and supercomputers. In June 1 99 1 , Japan and the United States signed a new agreement replacing the 1 986 semiconductor agreement. Inter alia, the new agreement aims to increase Japan's imports of semiconductors to more than 20 percent of the domestic market by the end of 1992; it also eliminates price monitoring and re-establishes normal antidumping procedures. As part of the agreement, the United States agreed to lift the $ 1 65 million in penalty tariffs imposed in 1987 because of Japan's noncompliance with some provisions of the 1986 agreement.
Japan and the United States also reached agreement in June 1991 on amendments to the 1988 Major Projects Agreement that will add another 1 7 Japanese construction projects to the original 1 7 projects included i n the agreement and improve the transparency of notification and bidding procedures, as well as dispute settlement procedures. The total value of projects covered by the agreement will increase by $6 billion to nearly $30 billion, compared with public sector construction valued at $ 1 65 billion. Only a small portion of this has been bid on to date.
European Community
In the EC, trade policies have been strongly influenced by the objectives of EC 1992, developments in Eastern Europe and the former U .S .S .R . , and negotiations in the Uruguay Round. EC 1992 aims
46(JATT ( 1990d), p. 200. MITl's figures do not include exports to the EC of passenger cars. video-cassette recorders (VCRs). and color televisions, which are subject to monitoring measures.
24
to establish a unified internal market by the end of 1992. This is being achieved by the dismantling of remaining intra-EC barriers to the free flow of goods, services, and factors of production and by the mutual recognition of national laws and regulations, subject to agreement on certain essential minimum requirements.
Unification has important implications for trade policies at both the national and EC-wide levels. Under Article 1 15 of the Treaty of Rome, the EC Commission may authorize import restrictions (VERs, quotas, etc.) against third countries at the national level and permjt intra-EC restrictions to prevent indirect imports through other EC countries. Intra-EC barriers will need to be eliminated and trade restrictions at the national level will either be eliminated or replaced by EC-wide measures. Reflecting a tightening of the criteria used by the Commission in assessing member countries' requests for intra-EC restrictions, total authorizations for such measures declined to 128 in 1988, just over one half of their 1980 level, and to 79 in 1990.
Proposals regarding the phasing out of national restrictions and the EC 's common external regime after 1992 are still under discussion. National restrictions could be replaced by EC-wide measures that are either more or less restrictive on balance than existing national restrictions. Most of these restrictions are in the form of voluntary export restraints or other forms of monitoring. In March 1989, the last date for which detailed data are available, the EC was party to an estimated 173 export restraint arrangements, 96 of which were imposed at the national level. Sixty-three of these agreements involved Japan, and informal consultations between Japan and the EC are progressing toward elimination of VERs by the end of 1992. One outcome of these discussions was the July agreement to convert national VERs on Japan's automobile exports to EC countries to an EC-wide monitoring arrangement that will limit through 1999 Japan's exports of automobiles to their current EC-wide level (about 1 .25 million units) and permit scheduled growth in sales by "transplants," Japanese affiliates producing inside the EC. This marketsharing arrangement has elicited calls for a similar arrangement between Japan and the United States in the U .S . Congress.
The Single Market Program and developments in Eastern Europe and the former republics of the U.S.S.R. have led to the prospects of an enlarged EC and other regional preferential trade arrangements. The former German Democratic Republic became part of the EC as a consequence of German unification, and five other countries have formally applied to enter the EC: Austria, Cyprus, Finland, Sweden, and Turkey; their applications will be con-

©International Monetary Fund. Not for Redistribution
I Trade Policy Developments
sidered after completion of EC 1992. In June 1 990, formal negotiations started between the EC and EFT A toward the creation of a European Economic Area (EEA) by 1993.
Developments in Eastern Europe and the former U.S.S .R. have added to pressures to reform the EC's Common Agricultural Policy (CAP), which is a major source of friction with the EC's trading partners . A fundamental reform of the CAP that would substantially reduce its adverse effects on world markets and efficient agricultural producers is considered essential to bring the Uruguay Round to a successful conclusion. The EC is working toward this end, but progress has been slow.
Canada
Since 1984, Canada has reoriented policies to strengthen the role of market forces in its economy through tax reform, deregulation and privatization, and greater openness to foreign trade and investment. ln the area of trade policy, liberalization is taking place primarily in the context of regional arrangements. Canada has sought to secure market access and gain the benefits of economies of scale and greater competition through the establishment of the free trade area with the United States, its largest trade partner, and it is now a full and equal partner in the trilateral negotiations between Canada, Mexico, and the United States to establish a NAFTA. Regarding the latter, Canada is interested in securing its interests in the areas of services, intellectual property rights, and dispute settlement procedures and in preserving Canada's attractiveness as a host for foreign direct investment.
The economic impact of N AFT A on the Canadian economy is not expected to be substantial. Trade with Mexico is relatively small; almost 80 percent of imports from Mexico enter Canada duty free, with auto components making up the largest component. The NAFTA might exclude certain sensitive areas from freer trade: Mexico is interested in excluding the energy sector; the United States wants to restrict labor mobility; and Canada would like to exclude cultural goods.
The Canadian authorities consider that the future complementarity of regional integration with multilateral liberalization will depend on the outcome of the Uruguay Round and the effectiveness of the dispute settlement process; accordingly, it continues to place highest priority on a successful conclusion to the Round. Having opened up to its largest trade partner, Canada has strongly supported the multilateral liberalization of trade and services and strengthened trade rules. In agriculture, Canada is concerned about the escalation of the subsidies war between the United States and the EC, which has become more acute with the increase in the U .S .
25
Export Enhancement Program to $ 1 .5 billion. As a member of the Cairns Group, Canada has worked for a substantial reduction in trade-distorting agricultural policies, although it wishes to retain its supply management programs covering milk, eggs, and poultry.
With the establishment of Investment Canada in 1985 under the Investment Canada Act, restrictive policies governing foreign investment were reoriented toward a regime that actively promotes foreign investment. Certain restrictions remain in sectors considered "strategic" (oil and gas, uranium, fisheries) and in cultural industries, and Investment Canada continues to review investments above specified thresholds.
Other Industrial Countries
Among the smaller industrial countries, Australia and New Zealand have undertaken the most farreaching liberalization of trade in the context of comprehensive structural reform programs aimed to deregulate and open their economies to international competition. Traditionally, their levels of protection have been substantially higher than other industrial countries and the proportion of tariff lines that are bound is relatively low by industrial country standards (Tables AS and A6). As part of the Australia-New Zealand Closer Economic Relations Trade Agreement, these countries achieved free bilateral trade in goods on July I , 1990, five years ahead of schedule. Free trade has also been achieved in most services.
Australia initiated a five-year trade reform program in 1988. Under the program, tariffs above 1 5 percent are to be reduced to 1 5 percent by July 1992; those between 10 and I S percent are to be reduced to 10 percent. Excepted from these tariff reduction schedules are textiles, clothing, and footwear and passenger motor vehicles, which are to be liberalized more gradually; import quotas on passenger motor vehicles were eliminated in 1988. In March 1991 , a second phase of tariff reform was announced that will lower tariffs on passenger motor vehicles from 35 percent in 1 992 to 15 percent in 2000; will lift quotas on textiles, clothing, and footwear by March 1 , 1 992 and reduce the maximum tariff on these items from 55 percent in 1992 to 25 percent by the year 2000; and will reduce assistance to agriculture in line with reforms in manufacturing. It is estimated that completion of the announced reforms will reduce the effective rate of assistance to 5 percent by the end of this decade.
New Zealand initiated comprehensive economic reforms in 1984. On the external side, these included the elimination of most export subsidies and incentive schemes, the phasing out of import licensing (except for some sensitive sectors such as

©International Monetary Fund. Not for Redistribution
INDUSTRIAL COUNTRIES
textiles, clothing, and footwear, which are being Liberalized in the context of industry plans), a phased 50 percent reduction in tariffs between 1986 and 1992, the lifting of exchange controls, and the liberalization of the foreign investment regime. In 1988, import I icensing was abolished for ha! f of the
26
items previously affected and will be entirely eliminated by July 1992. In September 1 99 1 , the government announced a further reduction in tariffs by one third between 1992 and 1 996, a somewhat slower pace of reform than that proposed by the previous government.
©International Monetary Fund. Not for Redistribution
--------------�I IV �I ---------------
Trade Liberalization in Eastern European Countries
rn n the past few years, Eastern European countries have initiated and in some cases acceler
ated comprehensive reform programs designed to transfonn their economic systems rapidly into market -based economies. 47 Liberalization of the trade and exchange system is an important component of these reforms. All six countries have eliminated the state monopoly of foreign trade, substantially reduced quantitative restrictions, and moved toward a trade regime in which price-based measures (tariffs and exchange rates) are the majn trade policy instruments. Export subsidies, except those on some agricultural products, have been removed, and export licensing has been reduced significantly. In parallel with the removal of trade restrictions, all six countries have established the essential elements of convertibility for current international transactions although some restrictions remain in place.
Notwithstanding these reforms, the Eastern European countries are not yet fully integrated into the multilateral trade system. Further progress in this area will depend, inter alia, on (i) further progress in their own systemic reforms; and (ii) increased and more secure access to foreign markets, particularly those of industrial countries. The latter is of particular importance given the collapse of trade among former members of the CMEA, the adverse impact of the Middle East conflict on some of these countries, and the rapid deterioration in economic conditions in most of Eastern Europe.
At the London economic summit in July 1991 the heads of state and government of the Group of Seven and the representatives of the European Community recognized that opening their markets
47The countries covered in this section include Bulgaria, the Czech and Slovak Federal Republic (Czechoslovakia), Hungary, Poland. Romania, and Yugoslavia. Yugoslavia differs from the other Eastern European countries in several important respects: in the 1950s, it abandoned central economic management: its firms were self-managed by workers: its trade and price regimes were largely liberalized; and it never joined the Council for Mutual Economic Assistance (CMEA). Its trade policies are covered in this section because it shared with other Eastern European countries some of the essential features of the socialist economic system, including public ownership of the means of production, and it has recently accelerated its economic reforms.
27
was the most effective way to assist Eastern European and other developing countries. They undertook to bring the Uruguay Round to an "ambitious" conclusion and to improve access to industrial country markets, including in sectors such as agriculture, steel, and textiles and clothing. As major industrial countries are reluctant to reduce barriers in these sectors unilaterally, the outcome of the Uruguay Round is critical to the success of reforms in Eastern Europe. Greater security of access to foreign markets for Eastern Europe is also linked to negotiations to revise the conditions of their membership within GATT to reflect the greater market orientation of their economies.
Historical Setting: Trade Policy in the Context of Central Planning
After World War 11, the Eastern European countries were reorganized under the influence of the U.S.S.R. system of central planning. This process was largely completed by 1950 and involved largescale nationalization of the means of production and distribution, and the introduction of a central planning system to set output targets, prices and wages, and to allocate resources among enterprises.
The coordination of imports and exports was an integral part of the central planning process. The composition and level of trade were influenced by a number of control mechanisms including central allocation of foreign exchange, and licensing. Foreign trade organizations were established and had a state monopoly on foreign trade. Firms did not trade directly with their foreign counterparts or face world prices; they exported and imported products through foreign trade organizations at ruling domestic prices, with the difference between international and domestic prices being absorbed (in the case of losses) or taxed (in the case of profits) by the government budget. Thus, although tariffs were generally low, central-plan tools and exchange controls provided a high level of protection for domestic production.
Trade with other centrally planned economies and market economies involved different arrangements. The former was largely undertaken in nonconvertible currencies within the arrangements of

©International Monetary Fund. Not for Redistribution
EASTERN EUROPEAN COUNTRIES
the CMEA. 48 This trade was based on five-year bilateral agreements with annual negotiations to agree on prices and other details. 49 A bilateral surplus with one country could not be used to finance a bilateral deficit with another country. Trade with market economies was undertaken mainly in convertible currencies and was subject to state control.
The CMEA arrangements resulted in a considerable increase in trade among member countries but also created strong structural dependencies among member countries and added to distortions in resource allocation. 50 Although some Eastern European countries were quite open, in terms of the ratio of trade to GDP, their trade was highly concentrated in transactions with other centrally planned economies, in particularthe former U.S.S.R.s 1
The commodity composition of CMEA trade with socialist countries (mostly in the CMEA area) djffered significantly from that with the market economies (Tables A20 and A2 1 ) . 52 Machinery and transport equipment were the most important exports to socialist countries; while food, crude materials, and manufactured articles generally were the most important exports to industrial countries. The Eastern European countries exported mainly machlnery equipment and other manufactures to the former U .S.S.R. in exchange for fuels and raw materials. Although the arbitrariness of cross exchange rates used between transferable rubles and local currencies complicates the analysis, it is generally agreed that until recently the prices of Eastern European exports to the former U.S.S.R., relative to the world market prices, were set more favorably than were the prices of Eastern European
4�The CMEA was founded by Bulgaria, Romania. Czechoslovakia, Poland, Hungary, and the former U.S.S.R. in 1949. The former German Democratic Republic joined in 1950. Mongolia. Cuba, and Viet Nam joined in later years. Albania was a temporary member: Yugoslavia, excluded from membership in 1949, became an associate member in 1965.
49Prices were denominated in ''transferable rubles" (TR). The Bucharest formula for pricing goods traded among CMEA members was. in principle, a five-year moving average of comparable world market prices. This formula was easily applied to trade in primary products, such as crude oil and natural gas. However. it was more difficult to use for trade in manufactures. since the quality of the goods made in the CMEA region was generally inferior to that of the Western goods used as the basis for the price comparisons. As a result, the five-year average prices served as a basis for negotiations.
50Jnternational Monetary Fund and others ( 1990), p. 50. S1For example. in 1989 exports to the former U.S.S.R. as a
share of total exports were 65.8 percent for Bulgaria. 30.5 percent for Czechoslovakia, 25. I percent for Hungary, 20.5 percent for Poland. 2 1 .4 percent for Romania, and 20.9 percent for Yugoslavia (International Monetary Fund (199la), p. 29, Table 7). Also International Monetary Fund ( 1990b), p. 65, Table 18 .
52Socialist countries consisted of CMEA countries, Albania. China, Cambodia, the Democratic People's Republic of Korea, the Lao People's Democratic Republic. and Yugoslavia.
28
imports from the former U .S.S.R., relative to world market prices. Given the importance of the former U.S.S.R. in their total trade (and provided trade patterns were unchanged), this implied that the overall terms of trade of Eastern European countries were quite favorable compared with what they would have been without the CMEA arrangements; it has been estimated that moving to world market prices would involve a terms of trade deterioration in the range of 20 to 30 percent for Eastern Europe. 53
Some Eastern European countries had undertaken partial economic reforms prior to the political revolution that swept Eastern Europe in 1989. For the most part, these reforms were undertaken within the context of the socialist system, and they attempted economic decentralization and partial decontrol of prices while retaining social ownership of the means of production.54 But market freedom remained circumscribed by state orders and remaining price controls. Although planners no longer exerted total control over trade, central planning tools and administrative control measures continued to dictate trade flows and patterns. The absence of private property rights limited the role of profit incentives and discouraged entrepreneurship.
Recent Reforms and Design Issues
Recent Reforms
While the extent of reform and the initial conditions have varied considerably across Eastern Europe, the process of systemic change has accelerated during the past two years. ss After decades of partial reforms, Hungary, Poland, and Yugoslavia accelerated their reform efforts in 1989, and in 1990 Poland implemented more far-reaching reform measures. Although their systems remained more centralized up to 1 990, in early 199 1 , Czechoslovakia. Bulgaria, and Romania began to implement comprehensive reforms. In all countries, reforms are being supported by financial resources and technical assistance provided by the Fund and the World Bank.
A move toward currency convertibility and more open trade regimes are important components of reform in all Eastern European countries. 56 As of
S3Kenen (1991). 54Earlier reform efforts are discussed in International Mone
tary Fund (199la), Williamson (1991), Gelb and Gray (1991). and. for the Hungarian case, Boote and Somogyi ( 1987).
sssee International Monetary Fund ( 199Ja) and Starrels (1991) for a discussion of the main features of economic reforms implemented during the past two years.
S<>The concept of currency convertibility as defined by the International Monetary Fund refers to the unrestricted and non-

©International Monetary Fund. Not for Redistribution
Recent Reforms and Design lssu!S]
June 199 1 , most of these countries had substantially liberalized their trade and payments systems (Table 6). In parallel with the removal of trade restrictions, all countries have established a degree of convertibility, although some restrictions remain in place. In Hungary and Poland, convertibility is largely limited to the enterprise sector, and most countries have maintained limits on travel allowances. 57 Most countries have a unified official exchange rate for commercial transactions; in the 1980s Hungary, Poland, and Yugoslavia unified official exchange rates for trade with the convertible currency area, and Poland and Yugoslavia gradually eliminated various exchange subsidies, the level of which was dependent (except in the case of Hungary) on the end-user of foreign exchange. Bulgaria and Czechoslovakia unified exchange rates for commercial transactions between December 1990 and February 199 1 . In Czechoslovakia, Hungary, Poland, and Romania residents are authorized to hold foreign currency accounts and use them freely. In Yugoslavia, convertibility was largely established in January 1990, but various restrictions, including limitations on withdrawals from foreign currency accounts, were reintroduced toward the end of the year when foreign exchange reserves dwindled. All countries permit inward foreign investment and repatriation of dividends and profits.
In the trade area, all six countries have eliminated the state monopoly on foreign trade and drastically reduced quantitative import restrictions. 58 In Yugoslavia, the share of liberalized imports increased from 1 5 percent in 1986 to 88 percent by the end of 1990. In Hungary, 90 percent of imports are being liberalized over a three-year period starting 1989, with most having been liberalized by 1990. In Romania, all quantitative restrictions have been eliminated. In Poland, most nontariff restrictions were removed in January 1990, Czechoslovakia virtually eliminated import licensing in January 199 1 , and Bulgaria eliminated import licensing except for a small negative list of imports, in February 1991 .59
The elimination of most implicit and explicit nontariff barriers and the liberalization of exchange controls means that tariffs and exchange rates have become the principal trade policy instruments in
dbcriminatory availability and use of domestic currency to effect payments and transfe� for current international transactions
.H(n Poland. however, hou�ehold� are allowed to acquire foreign exchange tn the parallel market at the prevailing rate for transactions for which foreign exchange is not available through the official market.
S8Jn Yugo�lavta. the state monopoly on foreign Lrade wa� removed in 1950.
S'�Licensing wa� remtroduced tn June 1991 for cattle, beef, and butter.
29
these countries. Traditionally, the level of tariffs in Eastern Europe was relatively low and domestic industry was effectively protected by central planning tools. While some modifications in tariff rates and structures have been made, average tariff rates in these countries remain relatively low.60
Modifications in tariffs include the following: Poland unified its three commercial and noncommercial customs tariffs schedules (January 1 990) and suspended customs duties (June I 990) on 4,500 import items until July 3 1 , I 99 1 . Poland recently restructured its tariff schedule to provide an average rate of about 14 percent, including a virtual acrossthe-board temporary surcharge of 5 percent; this is significantly above the rate that prevailed prior to suspension of some tariffs in June 1990. Yugoslavia reduced tariff rates and the number of items exempted from tariffs, which left the average effective tariff rate largely unchanged (March 1990). Romania eliminated various discriminatory features in its tariff system, such as the application of different tariff rates depending on the end use of imports and reduced its highest rates (January 1991); a further reduction in the average tariff level and a more simplified tariff structure are expected to be introduced in the second half of 199 1 . Czechoslovakia introduced a temporary surcharge of 20 percent on consumer goods imports (end of 1990) to mitigate the impact of rapid import liberalization on the balance of payments;6t the rate was reduced to 1 5 percent in June 1991 and is to be eliminated by the end of 199 1 . Bulgaria introduced a temporary surtax of 15 percent on imports of consumer and some other goods (early 1991) to provide protection to industries as they restructure and to safeguard the balance of payments. Major reviews of the tariff and protective structure have been initiated by Bulgaria and Czechoslovakia in consultation with the World Bank. Funher adjustments are contemplated in tariffs in some countries in the context of multilateral and bilateral negotiations.
Measures have also been taken to liberalize exports. Most export subsidies have been removed and export licensing has been significantly reduced in most countries. However, some restrictions remain in place in all Eastern European countries, in particular, to comply with VERs and quotas
60Avcrage tanff rates were about 5 percent in Czcchoslova""ia (1990). 16 percent in Hungal) (1991), about 14 percent in Poland (1991). and about 7 percent in Yugoslavia (1990). In Bulgaria. aver-o�ge MFN tariff rates are 5.9 percent on intermediate good�. 7.4 percent on capital goods. 13.3 percent on consumer goods. and 7. 9 percent on agricultural products
o•Thb wa�o applied to all impon!. except those from countries with which C1cchoslovakin ha� free trade agreements (e.g . . Finland). Czechoslovakia notified this sunax to the GATT Balance of Payments Committee because it increased some tariffs above their "bound'" level-!..

©In
tern
atio
nal M
onet
ary
Fund
. Not
for R
edis
tribu
tion
Tab
le 6
. Tr
ad
e a
nd
Pa
ym
en
ts S
ys
tem
s o
f E
as
tern
Eu
rop
ea
n C
ou
ntr
ies
as
of
Ju
ne
19
911
Sel
ecte
d C
om
plem
enta
ry
Sta
te
Impo
rt�
Exp
orts
F
orei
gn
Mea
sure
s
Mo
nopo
ly
Qua
ntit
ativ
e Q
uant
itat
ive
Exc
hang
e F
ore
ign
on
Tra
de
Stat
e P
lan
rest
rict
ions
T
ariff
s re
stri
ctio
ns
Sub
sidi
es
Sys
tem
P
rice
co
ntro
l in
vest
men
t
Bul
gar
ia
Abo
lishe
d A
bolis
hed
All
rem
oved
in
A n
ew c
usto
ms
Mos
t re
stri
c-N
o su
b-U
nifi
ed,
float
-M
ost
pric
e U
p to
10
0
Feb
ruar
y
tari
ff b
ased
on
tio
ns r
emo
ved
si
dies
. in
g e
xcha
nge
cont
rols
eli
mi-
per
cen
t o
wne
r-19
91.
Lic
ense
s th
e ha
rmo-
exce
pt f
or
rate
. C
onve
rt-
nate
d. P
rice
s sh
ip p
erm
itte
d.
arc
req
uire
d ni
zcd
syst
em
expo
rt b
an o
n ib
ility
fo
r mos
t un
der
co
ntro
l N
o r
estr
icti
on
for g
oo
ds c
ov-
was
impl
e-si
x it
ems
and
curr
ent t
rans
-ar
e le
ss t
han
I 0
on
pro
fit
ered
by
trad
e m
ente
d Ju
ne I
. li
cens
ing
ac
tio
ns e
xcep
t pe
rcen
t of
rep
atri
atio
n.
agre
emen
ts
199
1. A
ter
n-re
quir
emen
ts
trav
el.
Ret
en-
reta
il a
nd
wit
h th
e fo
r-po
rary
im
port
fo
r ex
port
s ti
on s
chem
e w
hole
sale
m
er U
.S.S
.R.
tax
of
15 p
er-
cove
red
by
abo
lishe
d.
tu m
over
. fo
r m
oni
tori
ng
cent
intr
o-
bila
tera
l agr
ee-
m pu
rpo
ses,
etc
. du
ced
mo
stly
m
ents
. ,.
en o
n co
nsum
er
-4 g
oo
ds.
m ::tl C
zech
oslo
vaki
a A
bolis
hed
Abo
lishe
d N
o g
ener
al
Tar
iff ra
tes
Mos
t rc
stri
c-A
bolis
hed
Uni
fied
, fi
xed
Mo
st p
rice
U
p to
10
0 p
er-
z m
impo
rt li
cens
e un
chan
ged
ti
ons
rem
oved
in
Jan
uary
ex
chan
ge r
ate.
co
ntro
ls e
lim
i-ce
nt
ow
ners
hip
c is
req
uire
d si
nce
Janu
ary
exce
pt f
or
199
1.
Co
nver
tibl
e na
ted.
So
me
5 pe
rmit
ted.
No
::tl
0
w
ex
cept
for
19
89.
A t
em-
licen
sing
S
om
e su
b-fo
r mo
st c
ur-
perc
ent o
f to
tal
rest
rict
ions
on
'tl
0
cr
ude
oil.
nat
u-po
rary
im
port
re
quir
emen
ts
sidi
es
rent
tra
nsac
-tu
rno
ver
sub-
pro
fits
and
div
-m
,.
ra
l gas
. na
r-su
rcha
rge
on
for
ener
gy.
re
mai
n o
n ti
ons
. je
ct to
pri
ce
iden
ds
z co
tics
, and
co
nsum
er
cert
ain
raw
ag
ricu
ltur
al
Ret
enti
on
cont
rols
. re
patr
iati
on
. 0
m
ilita
ry e
quip
-go
ods
of2
0
mat
eria
ls,
and
prod
ucts
. sc
hem
e ab
ol-
Cap
ital
0
c
m
ent,
and
pe
rcen
t in
tro
-th
ose
sub
ject
is
hed.
re
patr
aiti
on
z (s
ince
Ju
ne
duce
d at
end
of
to v
olu
ntar
y al
low
ed in
the
-4 ::tl
199
1) c
attl
e,
199
0.
whi
ch
expo
rt
case
of
liqui
da-
m
beef
. and
but
-w
as r
educ
ed t
O
rest
rain
ts b
y ti
on.
en
ter.
15
per
cent
in
othe
r co
un-
June
19
91.
tr
ies.
Hun
gar
y A
boli
shed
A
boli
shed
O
ver
90 p
er-
Tar
iff r
ate�
A
bout
30
per
-S
ubsi
dies
U
nifi
ed,
fixe
d A
bout
90
per
-U
p to
10
0 p
er-
cent
of
imp
ort
s re
mai
n la
rgel
y ce
nt o
f ex
port
s re
mai
n on
ex
chan
ge r
are.
ce
nt o
f pr
ices
ce
nt o
wne
rshi
p ha
ve b
een
lib
-un
chan
ged
su
bjec
t to
ag
ricu
ltur
al
Co
nver
tibi
lity
are
liber
aliz
ed.
perm
itte
d. N
o
cra
lized
fro
m
sinc
e 19
89
. lic
ensi
ng.
prod
uct)
fo
r mos
r cu
r-re
stri
ctio
ns o
n lic
ense
A
bout
80
per-
mai
nly
and
pro-
rent
tra
nsac
-re
patr
iati
on
of
req
uire
men
ts.
cent
of
indi
vid-
incl
udes
goo
ds
cess
ed
tio
ns.
pro
fit a
nd
Glo
bal
quot
a ua
l ra
tes
are
subj
ect t
o v
ol-
foo
d.
Tra
nsac
tion
s in
vest
ed c
api-
on
cons
umer
bo
und
in t
he
unta
ry e
xpo
rt
chan
nelle
d ta
l. go
ods
rem
ains
G
ener
al A
gre
e-re
stra
int
thro
ugh
corn
-in
pla
ce.
men
to
n T
ariff
s ar
rang
emen
ts.
rner
cial
ban
ks.
and
Tra
de
(GA
TT
).
Po
land
A
bolis
hed
Abo
lishe
d N
o r
estr
icti
ons
A u
nifi
ed ta
rif
f E
xpo
rt q
uota
s M
ost
�ub-
Mu
ltip
le r
ates
O
ver
80 p
er-
Up
to 1
00
per
-ex
cept
for
in
tro
duce
d. I
n re
duce
d to
5
sidi
es a
bol-
in p
lace
. O
ffi-
cent
of c
on-
cent
ow
ners
hip
licen
se
July
19
90
. cu
s-it
ems
in A
pril
ishe
d in
ci
al e
xcha
nge
sum
er p
rice
s p
ermit
ted.
No

©In
tern
atio
nal M
onet
ary
Fund
. Not
for R
edis
tribu
tion
req
uire
men
ts
tom
s d
utie
s o
n
199
0 f
rom
Ja
nua
ry
rate
un
ifie
d
an
d a
bou
t90
re
stri
cti
on
s o
n
for
trad
e u
nder
4
,50
0 it
ems
app
rox
imat
ely
19
90
. an
d fi
xed
fo
r p
erce
nt o
f p
ro-
tran
sfer
of
bil
ate
ral a
gre
e-re
du
ced
or
sus-
100
ite
ms
in
conv
erti
ble
du
cer
pri
ces
pro
fits
and
div
-m
ents
. p
end
ed u
nti
l la
te 1
98
9.
curr
ency
tra
de
. li
bera
lize
d.
ide
nd
s.
July
19
91.
L
icen
ses
Co
nver
tibi
lity
S
ubse
qu
entl
y
req
uire
d fo
r 20
fo
r m
ost
cur
-P
ola
nd r
estru
c-it
ems
for
con
-re
nt t
rans
ac-
ture
d it
s ta
riff
v
erti
ble
cur-
tio
ns b
y
sch
edul
e,
renc
y tr
ade.
en
re rp
rise
s.
yie
ldin
g a
n
Ind
ivid
ua
ls
aver
age
tari
ff
may
acq
uire
ra
te o
f 14
per
-fo
reig
n ce
nt,
incl
ud
ing
ex
chan
ge
in
a t
emp
ora
ry
the
par
alle
l su
rch
arg
e o
f 5
ma
rke
t. R
eten
-p
erce
nt.
ti
on
sch
eme
ab
oli
she
d.
Ro
man
ia
Abo
lish
ed
Abo
lish
ed
lmp
ort
lic
en
s-V
ario
us d
is-
Ex
po
rt l
icen
s-E
xpo
rter
s D
ual
rate
s w
ith
M
ore
th
an 8
0
100
per
cent
in
g m
aint
ain
ed
crim
inat
ory
in
g m
aint
ain
ed
exem
pte
d
a c
om
mit
men
t p
erce
nt
ow
ners
hip
per
-l:J
fo
r st
atis
tica
l fe
atur
es o
f ta
r-fo
r st
atis
tica
l fr
om
tu
rn-
to u
nify
. C
on
-(w
eig
hte
d p
ro-
mil
led
. S
om
e CD n
pu
rpo
ses
on
ly.
iff c
ode
wer
e p
urp
ose
s.
ov
er ta
x.
ve
rtib
ilit
y f
or
du
ct io
n)
of
rest
rict
ions
on
CD �
eli
min
ate
d a
nd
Q
uo
tas
an
d
mo
st c
urre
nt
pri
ces
are
free
. pr
ofi
t tr
ansf
er.
-
hig
hes
t ta
rif
f ex
po
rt b
an
s tr
ansa
ctio
ns
113
pro
duc
ts
l:J CD ra
tes
we
re c
ut.
im
po
sed
on
ex
cep
t p
rofi
t re
mai
n s
ubje
ct
- 0 P
ric
e e
qua
liza
-ab
out
12
0
rem
itta
nce
. to
co
ntro
l. 2
... 3
tio
n s
chem
e it
ems
that
are
R
eten
tio
n
(I) w
e
lim
ina
ted
. su
bjec
t to
pri
ce
sch
eme
is
Ill � co
ntro
ls o
r m
aint
aine
d.
Q. im
po
rted
A
uct
ion
0
th
roug
h t
he
sch
em
e in
tro
-CD (I)
offi
cia
l d
uc
ed
in F
eb-
ce·
exch
ang
e m
ar-
ruary
19
91.
�
ke
t. B
ut
the
ii (I)
lev
el o
f q
uota
s c CD
subs
tan
tial
ly
(I) in
crea
sed
fo
r no
nfo
od
ite
ms.
Yu
go
slav
ia
Abo
lish
ed
Abo
lish
ed
Abo
ut
10 p
er-
Red
uct
ion
in
Few
res
tric-
Abo
lish
ed
Un
ifie
d,
fix
ed
A
t en
d o
f U
p to
10
0 p
er-
cen
t o
f im
po
rts
tari
ff r
ates
in
ti
on
s. L
icen
ses
in D
ecem
-ex
chan
ge
rate
. 19
90
, 9
0 p
er-
cent
ow
ners
hip
su
bjec
t to
M
arch
19
90
: re
qui
red
for
b
er
199
0.
Co
nv
ert
ibil
ity
ce
nt o
f p
ro-
per
mit
ted
. N
o
qu
ota
. bu
t si
mu
l-ce
rtai
n r
aw
for
curr
ent
du
cer
pri
ces
rest
rict
ions
on
ta
neo
us
red
uc-
mat
eri a.
ls t
o
tran
sact
ion
s w
ere
free
of
p
rofi
t tr
ansf
er.
tio
n in
the
en
sure
ad
e-es
tabl
ish
ed i
n
con
tro
l.
nu
mb
er
of
qua
te d
om
esti
c Ja
nuar
y 1
99
0.
exem
pti
on
s to
su
pp
ly.
But
so
me
cust
om
s re
stri
ctio
ns
du
tie
s.
imp
ose
d i
n
199
0.
So
urc
e: V
ario
us I
MF
do
cum
ents
. 1 F
or
Yug
osl
avi
a.
as o
f D
ecem
ber
t 99
0, a
nd
fo
r C
zech
osl
ova
kia
, as
of
Oct
ob
er t
. 19
91.
2J
n J
uly
199
t. f
urth
er p
rice
lib
era
liza
tio
n re
sult
ed i
n o
nly
14
ite
m�
tha
t ar
e su
bjec
t tO
pri
ce
cont
rol.

©International Monetary Fund. Not for Redistribution
EASTERN EUROPEAN COUNTRIES
Table 7. Bilateral Trade Arrangements Between Eastern European Countries and the Former U.S.S.R.1
Bulgaria Negotiated an agreement with the former U.S.S.R. in January 1991, which contains an indicative list of tradable goods. Trade under the agreement is effected at world market prices in U .S. dollars on a clearing basis in convertible currencies. A trade agreement was signed with Belarus and the Russian Federation, and discussions are under way with Ukraine.
Czechoslovakia ;<Indicative lists" of products in which trade between Czechoslovakia and the former U .S.S.R. would be of mutual benefit have been drawn up, and a temporary clearing arrangement denominated in U .S. dollars is in operation for these goods. In addition, clearing accounts in national currencies are to be established for goods outside indicative lists with prices to be negotiated between trading parties involved and without guarantees by authorities. Efforts are being made to establish barter trade between Russia and Czechoslovakia and to set up a foreign trade bank to help develop trade between the republics.
Hungary The authorities arc seeking to boost trade, particularly exports, with the former U .S.S.R. by bilateral contracts involving barter deals.
Poland Negotiated an agreement with the former U.S.S.R. in early 1991, which contains a selective indicative list of tradable goods. The mode of trade and payments (cash, countertrade. barter, etc.) has been left at the discretion of the traders themselves. In addition, Poland recently signed an agreement with the former U .S.S.R. (July 1991) to supply (i) medicine in exchange for oil and natural gas, under a barter deal; (ii) food in exchange for metals; (iii) textiles in exchange for petroleum products: and (iv) railway wagons in exchange for natural gas.
In September 1991, Poland signed agreements with the former U .S.S.R. to supply (i) medicine and electric engineering products in exchange for iron ore, natural gas, cellulose, and other raw materials; and (ii) fruit and agricultural products in exchange for natural gas.
Romania The authorities are discussing with the former U.S.S.R. a "mini-clearing" arrangement whereby the two countries would agree on a list of products that would comprise their mutual trade: any imbalances would be settled in U .S. dollars. In addition, other arrangements including barter, countcrtrade. and special clearing for military goods are being sought.
Yugoslavia The bilateral clearing arrangement with the former U.S.S.R. was terminated in January 1991.
Source: Based o n information provided by national authorities. 'Following the dissolution of the Council for Mutual Economic Assistance (CM EA). and the breakdown of uade among former members.
the former U.S.S.R. announced its intention to return to clearing arrangements in national currencies with former CMEA countries. The former U.S.S.R. has allowed its banks to establish correspondent accounts in national currencies with banks in Czechoslovakia and Poland. which would serve for sculement in national currencies of certain trade in goods and services. including tourism expenditure.
applied by trading partners in sectors such as textiles and clothing, agriculture, steel, and coal. In addition, temporary export bans were introduced (Bulgaria in 1990) and licensing retained (Czechoslovakia) to ensure adequate domestic supplies of products such as foodstuffs and raw materials during the adjustment process62 and to prevent the export (or re-export) of products that are subject to domestic price controls or imported at the official exchange rate (Romania).
At its 1990 meeting in Sofia, the CMEA announced that it intended to conduct all trade in convertible currencies and at world market prices beginning January 1 , 199 1 . However, with the collapse of CMEA trade, countries have made or are
621 n June 1991, Bulgaria reduced the number of export bans to six items and eliminated all export taxes.
32
making arrangements aimed at maintammg some minimum level of trade with former CMEA countries, especially the Commonwealth of Independent States (Table 7). Poland, Bulgaria, and Czechoslovakia negotiated agreements with the former U.S.S.R. that contain a selective "indicative list" of tradable goods and barter trade. Hungary and Romania are also seeking to boost trade with the former U .S .S .R. through the use of bilateral trade arrangements that may involve barter trade. In June 199 1 , the former U.S.S.R. lifted the ban on barter trade that applied during the first several months of 1 99 1 .
By and large, the Eastern European countries now have relatively open trade and payments systems. However, with the collapse of CMEA trade and the deterioration in their domestic economies and external accounts, some of these countries are facing pressure to provide protection for domestic

©International Monetary Fund. Not for Redistribution
Recent Reforms and Design Issues
producers. 63 In addition, partly in response to access difficulties in industrial country markets and EC export subsidies, some of the Eastern European countries have introduced measures to protect their agricultural sectors. In Czechoslovakia (pending amendments to customs tariffs and other forms of protection), export subsidies and import quotas were introduced on agricultural products in June 1991 to deal with mounting surplus production. Poland has reintroduced tariffs on some agricultural products, under pressure from its farm lobby.
Issues in the Design of Trade Reform
A broad consensus has emerged both on the need for a rapid and comprehensive reform in Eastern Europe and on the main elements of such a reform package. 64 The latter include macroeconomic stabilization and control; liberalization of trade and establishment of convertibility for current account transactions; price liberalization and the development of a competitive private enterprise sector; the creation of efficient financial institutions and the liberalization of financial markets; deregulation of labor markets, and the establishment of a social safety net. Reform programs must be credible and specify the long-term objectives and transition path at the outset of the reform. 65
Within this context, there is a broad consensus that trade liberalization should be implemented early in the reform process66 An accelerated pace of trade liberalization in reforming socialist economies is considered essential because, compared with market economies, relative prices are highly distorted, factor markets function poorly, domestic production is more highly concentrated, the extent of state ownership is much greater, and trade has been distorted by arrangements among former CMEA members. 67 In these circumstances, liberalization of the trade and payments system helps to establish a rational set of relative prices for traded goods and to prevent distortions due to monopolistic pricing and the loss of productive efficiency. In addition, access to imports and foreign investment facilitates the acquisition of foreign technology.
Notwithstanding the above considerations, it has
6J This point was made, for example, by the Hungarian representative to the GATT Council at the time of the review of Hungary's trade policies under GATT's Trade Policy Review Mechanism (GATT Newsletter. May/June 1991).
64international Monetary Fund ( 1 991a) and Gelb and Gray ( 1991).
6SCalvo and Frenkel (1991a) and Genberg (1991). 66Jnternational Monetary Fund and others ( 1990), Lipton and
Sachs ( 1990), Fischer ( 1990), and Havrylyshyn and Tarr ( 1991).
67Havrylyshyn and Tarr ( 1991).
33
been suggested that temporary tariff protection might be provided in the short run to avoid the move to world prices being disruptive. McKinnon (1991a), for example, notes that enterprises in Eastern Europe have long faced distorted relative prices and argues that the tari If structure should initially continue to provide some protection to those industries that were heavily protected under the old system; this would involve differential tariff increases-not across-the-board surcharges-for industries that would be viable if provided a temporary adjustment period. 68 Tariffs would subsequently be unified and phased down according to a preannounced schedule. In this connection, it has been noted that devaluation is not an option because it increases the price of all goods, including inputs for production, which would still result in negative value added in certain industries under the new world price structure. 69
Others point out that consideration of the above approach also needs to take into account its potential costs and risks, as well as any GATT implications. 70 In particular, this approach has risks if the preannounced schedule of tariff reductions lacks credibility; a perception that the weakened links between domestic and world relative prices could be extended for longer periods would reduce pressure for adjustment in precisely those enterprises facing the largest adjustment tasks and delay their integration into the world economy; in this context, even if a schedule is preannounced, a phased approach would allow time for political opposition to further liberalization to be mobilized. Apart from these considerations, experience elsewhere suggests that governments are not well placed to determine which industries are likely to be viable over the medium term. In addition, high average tariff rates, whatever the degree of dispersion, act as a tax on exports. A final point of particular importance to reforming socialist economies is that this approach would partly negate the positive contribution trade liberalization can make toward eliminating distortions due to monopolistic market structures.
681 n particular, before the reforms, the prices of energy and raw materials were held artificially low. while quantitative restrictions kept out foreign produced manufactured goods. This resulted in high rates of effective protection for finished manufactured goods and negative rates of protection for energy and raw materials.
69McKinnon ( 1991a). However, sufficient restraint on wages. a significant input for production. would probably address the negative value-added problem.
70J ncreases that wou Id raise tariffs above "bound .. levels in GATT would need to be negotiated with other Contracting Partics. Although there is no explicit legal precedent for accepting higher tariffs in exchange for a reduction in quantitative restrictions, Article XXVIII of GATT provides the legal framework for renegotiating tariff bindings.
©International Monetary Fund. Not for Redistribution
EASTERN EUROPEAN COUNTRIES
Tariffs have been increased in some cases to protect the balance of payments, to reduce budget deficits (Bulgaria and Poland), and to discourage imports of consumer goods. Those who argue against the use of tariffs for these purposes note that devaluation supported by appropriate fiscal and monetary policies is normally a better option to protect the balance of payments and contain inflation, in that it provides a neutral incentive structure,71 and that domestic taxes are a less distortionary instrument to increase fiscal revenue and discourage consumption.
To the extent that the domestic tax instruments and other indirect policy instruments necessary for macroeconomic control are not in place, however, and that the administrative capacity to put such systems in place quickly is lacking, some temporary increases in tariffs may be unavoidable.72 In this connection, as a mechanism to control the balance of payments, price-based measures, such as tariffs, are preferable to quotas and other quantitative restrictions, in that they are more transparent and, provided tariffs are not prohibitive, they maintain the link between domestic and international prices.
As indicated above, Eastern European countries have negotiated or are seeking new bilateral trade and barter agreements with the former U.S.S.R. or the Commonwealth of Independent States (and in some cases with other former CMEA countries) as a way of cushioning the impact of the collapse of CMEA trade. In the current circumstances, with the collapse of trade due to the shortage of foreign exchange and disorganization in the Commonwealth of Independent States, these arrangements are considered necessary to maintain a certain level of trade and avoid unnecessary enterprise closure. In most cases, barter trade appears to involve interenterprise arrangements. These agreements tend to sustain the distorted production structures and trade flows and to delay the process of adjustment. To limit the possible adverse effects of such arrangements, it has been suggested that where they involve government agreements, they should ensure that they do not limit the autonomy of indi-
71Some suggest that tariffs are a beuer option in the shon run because (i) tariffs raise revenue and thus improve the country's fiscal position. whereas devaluation has that effect only if the government owns the expon industries; (ii) devaluation pushes up the prices of all goods, including intermediate goods and necessities, whereas tariffs can be concentrated on less essential goods; and (iii) the prospect of future declines in the prices of durable consumer goods as the tariffs are removed will create an intenemporal substitution effect in favor of delaying consumption (see Williamson (1991)).
12This issue is discussed in Lane and Dinopoulos (1991), who conclude that some combination of debt reduction and tax reform may facilitate market-oriented reforms in socialist economies.
34
vidual enterprises to negotiate with the foreign enterprises and that trade is conducted at world market prices and imbalances settled in convertible currencies within a relatively short period. 73
With the collapse of CMEA, interest has reemerged in regional clearing and payment arrangements covering Eastern Europe alone or together with the Commonwealth of Independent States. Two basic alternatives have been suggested: (i) a simple clearing arrangement with a relatively short interval between settlement dates (one to three months); and (ii) payments arrangements, where clearing is supplemented by a facility that provides short (one year) or even medium-term credit to the participants-similar to the European Payment Union (EPU) after World War ll. 74 It is widely recognized, however, that there are large differences between the postwar situation in Western Europe and the present situation in Eastern Europe. In particular, the combined market size of Eastern Europe is relatively small; the combined trade of Eastern Europe (in both convertible and nonconvertible currencies) was estimated at less than 4 percent of total world trade in 1988, while members of the EPU accounted for about 35 percent of world exports in 1950.75 Even if the former U .S.S.R. is included, the combined market size covered is relatively small;76 moreover, to the extent that trade with the former U.S.S.R. has been interrupted by administrative problems, there is great uncertainty regarding new clearing schemes that rely on better administration and communications. Thus, while such schemes may be somewhat less distortionary than bilateral ones, they are unlikely to resolve the underlying problems and could slow the process of integration of former CMEA countries into the international trade system.
Integration into the Multilateral Trading System
The full integration of the Eastern European countries into the multilateral trade system will depend on (i) further progress in their own systemic reforms; and (ii) increased and more secure access to Western markets. While the trade reforms already implemented will take time to have their full impact, further domestic reforms to make markets more competitive are required to enable East-
73Michalopoulos and Tarr ( 1991). 74See Michalopoulos and Tarr (1991) and Kenen ( 1991) for
detailed discussions. 75Tarr ( 1991 ) . 76The combined trade of Eastern Europe and the former
U.S.S.R. is estimated at less than 10 percent of total world trade (see Collins and Rodrik (1991)).

©International Monetary Fund. Not for Redistribution
Multilateral Trading System
ern Europe to realize the full benefits of the exchange and trade reforms recently implemented. Ln this connection, privatization, the development of competitive factor markets. and the establishment of the legal framework necessary to secure a competitive market environment are of particular importance.
As the Eastern European countries reform their economies, their trade expansion and changing trade pattern will need to be accommodated mainly by western industrial markets. Several recent studies estimate that, with the disappearance of the CMEA arrangements and the transition to market economies, the pattern of trade of Eastern Europe would be substantially changed, shifting from centrally planned economies to industrial markets, especially to Western European countries. 77
The recent collapse of CMEA trade, especially with the dissolution of the U.S.S.R. and East Germany, and the disruption of trade with Iraq (a significant trade partner for Czechoslovakia, Bulgaria, and Romania) makes access to western markets of even greater importance. The volume of exports to former CMEA trading partners in 1991 is expected to decline by 35-65 percent in Bulgaria, Czechoslovakia, Hungary, and Romania, and by about 75 percent in Poland. 78 This was mainly due to dislocation and foreign exchange shortage in the former U.S.S .R. (as well as in other CMEA countries, notably Romanja and Bulgaria); the unification of Germany, which partly diverted east Ger-
ne enter for Economic Policy Research (CEPR) ( 1990), Collins and Rodrik (1991), and Havrylyshyn and Pritchett (1991). For example, Havrylyshyn and Pritcheu show, using a gravity model, that the bilateral trade pattern in Eastern Europe is markedly different from that expected for countries with their income level, location, and size because it was determined less by market forces and more by political and economic relationships binding Eastern Europe and the former U .S.S.R. together in the CMEA. They find that a natural pattern of trade would be almost exactly the reverse of the current pattern where actual flows of trade for Eastern Europe are about 60-80 percent within the East Bloc; and 20-30 percent with Northern Europe. Collins and Rodrik also conclude that the natural trade partners of Eastern Europe arc the advanced industrial countries of Europe, rather than each other. Some scope for trade expansion may also exist between Eastern Europe and the dynamic Asian economies. Trade between the two regions has expanded rapidly during the last several years. For example, the value of the Republic of Korea's exports to Eastern Europe has increased by about five times and imports have increased by about 3.5 times during 1988-90. Major export items by the dynamic Asian economies to Eastern Europe include electronics and other consumer goods, while major export items by Eastern Europe to those economies include machinery, chemical, and steel products. Total amounts of Eastern European trade with dynamic Asian economies, however. remain small relative to trade with industrial markets.
78The decline of non-CMEA exports was also significant for these countries, except for Hungary and Poland where nonCMEA exports increased significantly.
35
many's trade from Eastern Europe; the inexperience of traders in managing trade under the new trade rules; and the expected adjustment of trade flows to the removal of controls and distortions that previously characterized the CMEA regime. This situation has been aggravated by the extension of tied aid and expon credits by industrial countries to the former U.S .S .R. , which may have diverted trade from Eastern Europe to industrial countries.
Access to Industrial Country Markets
During the past three years industrial countries have taken a number of steps to improve the access of Eastern Europe to their markets (Table 3). Previously, the lack of MFN tariff status was the major obstacle to the United States market. In 1989, only Hungary, Poland, and Yugoslavia had MFN status; imports from Romania, Bulgaria, and Czechoslovakia were subject to substantially higher-thanMFN rates of duty. 79 The United States extended MFN status to Czechoslovakia in November 1990 and to Bulgaria in Apri l 1991 and is expected to extend it to Romania soon. (It extended permanent MFN status to Hungary and Czechoslovakia in October 1 99 1 .) It also extended GSP treatment to Hungary (November 1 989), Poland (January 1990), and Czechoslovakia (May 1991). so In addition, the United States has increased the quantities of steel products subject to VERs that may be imported from Hungary and Poland. It plans to further relax quotas on textiles and steel imports from Czechoslovakia, Poland, and Hungary, and to expand the list of imports under GSP from these countries.81
Major changes in EC relations with Eastern Europe have occurred in the past three years. Prior to the Luxembourg Declaration between the EC and CMEA in June 1988, trade with CMEA countries was subject to extensive quantitative restrictions of both a selective (discriminatory) and nonselective nature. Between 1988 and 1 99 1 , the EC entered into separate Cooperation Agreements with Bulgaria, Czechoslovakia, Hungary, Poland, and Romania (Table 8). 82 These agreements contained
79Jn the case of Romania, after the Ceausescu Governmem renounced MFN privileges in February 1988, the United States suspended the MFN provision under the 1974 Trade Agreement.
SOYugoslavia has received GSP treatment from the United States since 1976.
S•Thc United States plans to renegotiate bilateral agreements on textile quotas with Hungary, Poland, and Czechoslovakia by the end of 1991 . 1t also plans to increase cheese quotas in the context of the Uruguay Round negotiations (White House. July 12, 1991).
32The EC has had a cooperation trade agreement with Yugoslavia since 1980; it provides for financial and technical aid and includes trade preferences for Yugoslavia's exports.

©International Monetary Fund. Not for Redistribution
EASTERN EUROPEAN COUNTRIES
Table 8. Market-Opening Measures Taken by Industrial Countries for Eastern European Exports
Country MFN Treatment GSP Treatment Bilateral Agreements for Market Opening
Bulgaria A l l OECD countries (United States in April 1991)
Australia, Austria, Canada, EC (January 1991), Finland, Japan, New Zealand, Norway, Sweden, Switzerland
EC (Apri1 1990), 1 United States (October 1990)2
Czechoslovakia All OECD countries (United Stales io November 1990)
EC (January 1991), United Stales (May 1991)
EC (December 1988), I United States (April 1990).2 EFTA (June 1990)3
Hungary All OECD countries (United States in 1978)
Australia, Austria (July 1988), Canada, EC (January 1990), Japan. New Zealand,
EC (September 1988), 1 EFTA (June 1 990)3
United States (November 1989)
Poland All OECD countries (United States in 1987)
Australia, Austria, Canada, EC (January 1990), Japan, New Zealand. United States (January 1990)
EC (September 1989), I EFTA (June 1990)3
Romania All OECD countries except United States4
Australia, Austria, Canada, EC, Finland, Japan, New Zealand, Norway, Sweden, Switzerland
EC (May 1991) 1
Yugoslavia All OECD countries (United States in 1948)
United States ( 1976)
Sources: United Nations Conference on Trade and Development ( 1990b); and national authorities. Note: EC = European Community; EFTA = European Pree Trade Association; GSP = Generalized System of Preferences; MFN = most
favored nation; OECD = Organization for Economic Cooperation and Development. 'Cooperation agreements with the EC that contained an MFN clause and provided for the phasing out over a ten-year period of all selective
quantitative restrictions. lThe agreements provide for the mutual extension of MFN treatment and will generally improve the capacity of American businesse� to
operate in the corresponding countries. :�Cooperation agreements that cover trade promotion and economic, industrial, technological, and scientific cooperation. 4MFN status suspended by United States on July 3. 1988 by mutual agreement. IL is expected that the United States will resume MFN status
soon.
an MFN clause and provided for the phasing-out over a ten-year period of all selective quantitative restrictions. The implementation of these agreements was overtaken by the dramatic developments since 1989. In 1990, the EC abolished the application of selective quantitative restrictions, except in sensitive sectors, such as agriculture, textiles and clothing, steel, and coal, and suspended the application of nonselective quantitative restrictions to Czechoslovakia, Hungary, and Poland. It also granted GSP treatment to all Eastern European countries.
In addition, the EC has concluded Association Agreements with Czechoslovakia, Hungary, and Poland. 83 In the trade area, these agreements will provide for a move to free trade between the EC and each of the three countries in most industrial products, but separate protocols are likely for agriculture, textiles and clothing, steel, and coal; the extent to which these sectors will be covered in the
83Bulgaria and Romania have also requested the EC to undertake preliminary discussions on an Association Agreement.
36
agreements is still under discussion. They are also expected to contain provisions on safeguards, rules of origin, antidumping rules, subsidies, intellectual property, the legal protection of nationals from the three Eastern European countries in the EC, and competition policy. The agreements are expected to be implemented over a maximum period of ten years, but the EC will likely reduce tariff and nontariff barriers faster than its partners.
The likely provision of separate protocols for agriculture, steel, coal, and textiles and clothing, reflects the "sensitivity" of these sectors in EC member states. For agriculture, the coverage of products, particularly those covered by the CAP, has been subject to intensive discussion. A limited coverage of agriculture may raise doubts about the conformity of these agreements with GATT, in that Article XXIV of GATT requires, inter alia, that free trade agreements cover substantially all trade. The extension of these agreements to cover all agricultural products would, however, in the absence of a fundamental reform of EC agricultural policies, add to the surplus EC production, increase the budgetary costs of the CAP, and further depress world

©International Monetary Fund. Not for Redistribution
Multilateral Trading System
market prices.84 A significant increase in access to the EC market for Eastern European agricultural products would thus seem to be linked to the reform of the CAP and the outcome of the Uruguay Round negotiations. 85
The inclusion of a separate protocol on coal and steel partly reflects institutional factors. 86 In addition, in the case of coal, the move to free trade creates difficulties for EC member states (Germany and Spain) that have heavily subsidized coal sectors and limit imports of coal from Poland through bilateral agreements. Although steel will likely be covered by a separate protocol, the EC council decided (April 1 5 , 1991) that this product would be treated as any other industrial product, provided the three Eastern European countries abide by EC rules on prices and subsidies. A question yet to be decided is whether the three Eastern European countries will be required to commjt themselves to capacity reductions in steel . 87 In the case of textiles and clothing, the EC and other industrial country markets are currently protected by the MFA and VERs. The main issue to be decided in the negotiations between the EC and the Eastern European countries involves the length of the transitional period to free trade.
Czechoslovakia, Hungary, and Poland also signed cooperation agreements with the EFTA in June 1990 and agreed to jointly examine the conditions for gradually establishing a free trade area. For a transition period of ten years, tariff reductions by the EFTA members are envisaged to proceed more rapidly than in the partner countries.
In spite of measures taken so far, Eastern Europe still faces substantial barriers to industrial country
ll4According to one estimate (Center for Economic Policy Research ( 1990)) a world market price reduction of at least 10 percent for wheat and 9 percent for coarse grains would be necessary to absorb a 20 percent increase in the production of these commodities in Eastern Europe and the former U.S.S.R. from their 1988 1evels.
&SA September 30, 1991 proposal by EC foreign ministers would allow a 10 percent annual increase in beef and mutton imports from the three Eastern European countries for five years. (Current shipments from the three countries are around 28,000 metric tons a year.) Under a "triangular trade" arrangement. the EC would help finance food exports from the three Eastern European countries to the former U.S.S.R.; such exports would be deduced from the increased EC quota (International Trade Reporter (1991), p. 1425).
86Steel and coal are covered by the European Coal and Steel Community (ECSC) treaty signed in 1 95 1 . The EC has executive authority for the ECSC, but its powers under the ECSC treaty arc greater than under the EEC treaty; these powers have been used to control production and prices of steel within the EC.
S7Steel industry experts in the EC and independent studies suggest that production in the whole of Eastern Europe, including the former U .S.S.R., needs to be cut by 50 percent to achieve the aim of a competitive subsidy-free industry (European Report (1991)).
37
markets, particularly in agriculture, textiles and clothing, and steel products, which are important export items of Eastern Europe to industrial countries. 88 These barriers take the form of quotas. VERs, and other restrictions, as well as tariff peaks and escalation and also affect other developing countries (Table 9). In this connection, the EC quota on beef from Eastern Europe was cut in April 1991 to avoid a further growth in stockpiles in the EC.
Without substantial improvement in the access of Eastern Europe to industrial country markets, the economic reforms of these countries could be jeopardized. The major remaining barriers to industrial country markets are concentrated in sensitive areas, such as agriculture, steel, and textiles and clothing. Given the reluctance of major industrial countries to remove restrictions in these sectors on a urulateral basis, increased access to these sectors is dependent, in part, on the outcome of the Uruguay Round.
As indicated above, bilateral credits and easy financing terms offered by industrial countries that are tied to imports from industrial countries may have diverted trade from Eastern Europe. In this connection, the United States recently provided farm aid credit to the former U.S.S.R. that is tied to purchases of U . S . farm goods. The German authorities have put in place special export insurance facilities to support east German exports to the former U.S .S .R . ; these facilities, which were granted a waiver from normal rules followed by OECD members until the end of 199 1 , permit zero cash down payments, a grace period on long-term credits, and extended repayment periods. In addition, budget subsidies granted by the German federal government for exports to the former U .S.S.R. by east Germany increased east German exports to the former U.S.S.R. in 1990, possibly displacing Eastern European exports.
Full Integration into GATT
All Eastern European countries, except Bulgaria, are Contracting Parties to the GATT. Bulgaria has been an observer to GATT since 1967 and applied for membership in 1986; a Working Party on its accession was established in 1986. With the exception of Czechoslovakia and Yugoslavia, special provisions were applied to these countries when they acceded to GATT to ensure that reciprocal
88For example, during 1985-89 these three sectors represented 28 percent of Czechoslovakia's exports to the EC and 36 percent of its exports to the United States; for Hungary, the corresponding figures were 39 percent and 27 percent: and for Poland. 30 percent and 65 percent.

©International Monetary Fund. Not for Redistribution
EASTERN EUROPEAN COUNTRIES
Table9. Industrial Countries' Nontariff Barriers to Exports by Eastern Europe1
Antidumping3
Voluntary Expon Investigations Provisional Definitive Price Country Restraint/Quota2 initiated measures duties undertakings
Bulgaria EC (meat, textiles and EC (3) EC (4) EC (2) EC (I) clothing, steel)
Austria (textiles) Canada (clothing) Sweden (textiles and clothing) Switzerland (textiles and
clothing) United States (woolen coats)
Czechoslovakia EC (meat. textiles and EC(4) EC (2) EC (2) EC ( I ) clothing. steel) Australia (2) Australia (I) Australia (I)
Canada (clothing) Sweden (2) Norway (textiles) Sweden (textiles and clothing) Switzerland (textiles and
clothing) United Kingdom (footwear,
leather) United States (steel, steel
products, textiles)
Hungary EC (meat, steel) EC (3) EC (I) Sweden (textiles and clothing) Australia ( I ) Australia (I) Switzerland (textiles and Sweden (2)
clothing) United Kingdom (footwear,
leather) United States (steel, steel
products)
Poland EC (meat, steel) EC (3) EC (I) EC (I) EC (I) Denmark (table porcelain) Australia (I) Australia (I) Canada (I) Sweden (textiles and clothing) Canada (2) Canada (I) Finland (I) Switzerland (textiles and Finland (I) Finland (I)
clothing) Sweden (2) Sweden (I) United Kingdom (footwear.
leather) United States (steel. steel
products)
Romania EC (meat, steel) EC (5) EC (3) EC (4) EC (I) Australia (canned ham) Canada (2) Finland (I) Finland (I) Sweden (textiles and clothing) Finland (I) United States (I) United States (I) Switzerland (textiles and Sweden ( I )
clothing) United States (I) United Kingdom (footwear.
leather) United States (steel, steel
products)
Yugoslavia EC (meat, textiles and EC(13) EC (4) EC ( 10) EC (2) clothing) Australia (I) United States (I) Canada (I)
United States (steel) Canada ( I ) United States ( I ) United States ( I )
Sources: Bureau of National Affairs. llllernational Trade Reporter, various issues: General Agreement on Tariffs and Trade, Review of Developmellls in the Trading System, various issues; European Community (EC). Bulletin ofrhe European Communities. various issues: and European Report. various issues.
•Excluding bilateral quota agreements under the Multifiber Arrangement (MFA). ZMeasures effective during 1988-91 . 3Measures taken during the period or 1988-90. Figures in parentheses indicate the number of cases under each category.
38

©International Monetary Fund. Not for Redistribution
Multilateral Trading System
Table 10. Current Situation of Eastern European Countries in GATT
Conditions Applied to Eastern European Countries Concession from
Country
Czechoslovakia Yugoslavia Poland5 Romania Hungary
Nonmember
Accession
1948 1966 1967 1971 1974
Customs Tariff As
Trade Review Concession' process
Yes No No Annual No Biannual Yes Biannual
Under Protocol of Accession Contracting Parties
Import Elimination of commit- Discriminating quantitative
m ems safeguards2 Suspension3 restrictions4
No Protocol No No No No
Yes6 Yes Yes No deadline Yes7 Yes Yes End of 1975 No Yes Yes Early 1975
Bulgaria Observer status gramed in 1967. It requested accession in 1986. Working Party on its accession established in April 1990.
Source: General Agreement on Tariffs and Trade (GATT). 'In the case of Hungary and Yugoslavia. the customs tariff was considered by Contracting Parties as their main concession when they
acceded. 2A discriminatory safeguard provision allowing Contracting Panics to restrict exports from the corresponding country which cause or
threaten serious injury to domestic producers. 3The suspension of concessions or other obligations under the protocol in case of disputes not settled in consultation. 4A concession from Contracting Parties applying prohibition or quantitative restrictions against the corresponding country's exports, which
are inconsistent with GATT Article XIII. that these restrictions would be progressively eliminated within a certain time period. spoJand is currently renegotiating its protocol of accession. 6Under its present protocol. Poland is required to increase its imports from Contracting Panics at an annual avemge compound rate of 7
percent in every three year period from 1973-75. Annual increase of imports value should be not less than 7 percent. 'Romania committed to increase its imports to an amount that is not smaller than the expected total imports provided for in the Five-Year
Plans.
trade concessions would not be impaired by nonmarket mechanisms (state-trading, artificial prices, bilateral trade arrangements, allocation of exports and imports). The five Eastern European countries joined GATT at different times and the conditions of membership differed, as did the concessions made to them by the Contracting Parties (Table I 0). Czechoslovakia was an original contracting party and the terms of its accession were not renegotiated even though it substantially modified its foreign trade system after 1 948.89 Yugoslavia acceded to GATT, in effect, as a market economy.
As the Eastern European countries transform
S9The United States, however, suspended the application of the General Agreement to Czechoslovakia in 195 I . In November 1990, it waived the suspension of MFN treatment (see above).
39
their economies into western-style market-based economies these special provisions in GATT will become unnecessary. For example, in the case of Poland the requirement to guarantee that imports increase by a certain percentage in value terms conflicts with the principles of a free market economy. Poland and Hungary are in the process of renegotiating their Protocols of Accession to reflect changes toward the greater market orientation of their economies (Appendix 1) .
Membership in GATT on normal terms is essential to provide Eastern Europe with greater security of access to markets of other Contracting Parties. At the same time, acceptance of the full obligations of GATT membership may enable Eastern European governments to lock in trade reforms and to resist protectionist pressures that may arise to backtrack on reforms.

©International Monetary Fund. Not for Redistribution
----------------���-----------------
Trade Policies of Developing Countries
Since the mid-l980s, there has been a marked shift in the orientation of the trade and industrial policies of most developing countries90 away from a heavy reliance on direct intervention and inwardlooking industrial policies toward less controlled and more export-oriented trade regimes. In a selected group of 36 regionally important developing countries that have embarked on trade reform programs since around 1985, 1 7 have virtually eliminated quantitative restrictions from their restrictive trade systems. Another 8 countries have maintained or further liberalized their open or somewhat open trade systems (Tables 1 1-13).
While most developing countries have made substantial progress in liberalizing their trade and trade-related exchange systems, progress across regions has been uneven. The shift in the orientation of trade policies is most striking in Latin America where almost aU of the largest countries have, or are now committed to, open or relatively open trade systems. This contrasts starkly with the strong inward orientation that prevailed as late as 1984. The liberalization policies in these countries have been marked by a rapid elimination of quantitative restrictions and a clear plan for subsequent reductions in tariffs to quite low and uniform levels. 9t In contrast, reforms in East and Southeast Asia, where most countries have had relatively open systems since the early 1980s, have tended to be gradual. Their reforms have progressively increased the range of sectors subject to import competition. While some low-income countries have made substantial progress in liberalizing their trade systems, many countries in Africa and South Asia have not yet opened their economies to significant foreign competition; much of the reform has focused on inputs for production, and now they face the more difficult task of liberalizing quantitative restrictions on competing products and reducing very high tariffs. Reforms are continuing and more countries are l ikely to adopt open trade systems in the near
90Sce Section TV for a separate discussion of Eastern European countries.
91Quantitative restrictions are defined to include both trade and trade-related exchange restrict.ions and tariffs to include all import charges.
40
future. A key feature of the latest round of reforms is that they are part of an integrated package of macroeconomic and structural reforms (often supported by multilateral institutions). Trade reforms that are accompanied by appropriate supporting policies are more likely to contribute to improved economic performance and to be sustained over time.
The increased participation of developing countries in the multilateral trade system is an important development linked to recent reforms. Many Latin American countries, for example, have bound 100 percent of their tariff schedules in GATT, in part to secure the trade reforms made so far. To consolidate these achievements, reciprocal liberalization within the framework of the Uruguay Round will be important. Secure access to foreign markets in the areas where developing countries have a comparative advantage is the most beneficial way of fostering genuine trade reforms and ensuring effective use of foreign aid and financing.
Trade Policies Prior to the Mid-1980s
Two important reasons explain the predominance of restrictive regimes prior to the mid-1 980s. First, the desire to protect domestic industry to foster import substitution, which was seen as essential for development. Export pessimism, in terms of market access and unfavorable terms of trade, had played an important part in providing the justification for import substitution. Under the infant industry argument, import substitution required the protection of the industrial sector, to enable it to expand and to reduce its costs through economies of scale and learning by doing. Protected manufacturing industries were expected to provide externalities, such as urban employment, a "modern" industry, and diversification of the economy away from traditional exports of primary products. Corden ( 1987) reviews some of the arguments for protection and Bhagwati ( 1 988) provides a historical perspective on the various reasons for this dirigiste approach.
Second, in the context of inappropriate macroeconomic policies and real exchange rate appreciation, discretionary import licensing and foreign
©International Monetary Fund. Not for Redistribution
Trade Policies Since the Mid-1980s
exchange restrictions were used to limit the demand for, and allocate the supply of, foreign exchange to cope with chronic balance of payments pressures.92 In some cases this was done on an ad hoc basis; in others it was done in the context of annual import plans (e.g., India, Pakistan, and Bangladesh).93 Whalley ( 1 989) has argued that external sector controls in many developing countries were imposed cyclically to absorb some of the fluctuations in export receipts and capital flows. For example, the external regimes of many developing countries became more restrictive in response to the first oil crisis and the collapse of commodity prices in 1973, and the subsequent 1974-75 recession, after having been liberal in the 1960s and the early 1970s. Similarly, many developing countries responded to the debt crisis and recession starting in the early 1980s by initially tightening trade and exchange restrictions.
In this connection, some 80 percent of quantitative restrictions notified to the GATT by developing countries were justified for balance of payments reasons under Article XVIII:B. ln addition, a number of countries employed foreign exchange restrictions on current account transactions, particularly those with tightly controlled regimes. In many of these countries, the restrictive measures used to shelter the import-competing sector bad the important indirect effect of biasing the incentive structure against agriculture as well as exports.94
A number of developing countries nevertheless undertook trade reforms before the mid-1980s, with varying intensities and with mixed results. An extensive review of some of the main cases of trade liberalization prior to the mid-1980s is contained in Michaely, Papageorgiou, and Choksi ( 1991). An important conclusion of this study is that the strong reforms were likely to be sustained and the weak reforms were Likely to be reversed. The single most
92Krueger ( 1984) stresses the relationship between inappropriate macroeconomic policies and the extensive use of restrictions and controls in developing countries in the period up to the early 1980s. Corden ( 1987) analyzes the Cambridge argument of real wage rigidity to justify the use of controls rather than a devaluation to correct an external imbalance. He notes, however, that there is no particular reason to make this assumption.
930uring this period, lndja was one of the few developing countries to maintain relatively restrained macroeconomic policies while using extensive controls to underpin its strongly inward-oriented development strategy. However, the pervasiveness of controls was also reflected in a more appreciated exchange rate than would have otherwise been the case.
94$ee Section VI for a review of agricultural trade policies. In studies reported therein, it is estimated that in the first half of the 1980s direct and indirect government intervention in the agricultural and industrial sectors resulted in substantially negative effective rates of assistance to agricultural export crops and domestic food crops.
41
important reason for the reversal of reforms was inadequate macroeconomic policies, which led to the reimposition of licensing or exchange controls to protect the balance of payments. In many cases where first attempts at reform were weak and failed, subsequent reforms were likely to succeed if they were strong. Some of the strong reforms that succeeded were those in Chile ( 1974-8 1 ) , Indonesia ( 1966-72), Sri Lanka ( 1977-79), and Thrkey (1 980-84). Korea (with reforms in 1 965-67 and 1978-79) is the only developing country with reforms classified as weak that succeeded. Two important and contrasting cases in the 1970s and 1 980s are Chile and Korea. Their goals of high export growth were achieved through different strategies of trade liberalization. Chile adopted a strong and rapid liberalization program and became an open economy in the late 1 970s. Korea adopted gradual, sustained reforms and became a partially open economy only in the mid-1980s. In both countries, generally prudent macroeconomic policies that stressed Low inflation and a realistic exchange rate were, despite some slippages, the foundation of their success.
In the sample of 36 developing countries referred to earlier, most of the countries with nonrestrictive trade systems during the early 10 mid-1980s performed well in the 1980s in terms of real growth of exports and output. Five of the eight countries in this category had better export growth and six had better output growth than the average for developing countries in 1 983-90. Two of the countries with weak performance, Costa Rica and Uruguay, had very high tariffs to foster import substitution, yet still performed close to the Western Hemisphere average. Senegal experienced export growth well below the average for sub-Saharan Africa. It is a member of the franc zone and is relatively free of quantitative restrictions, but it had a complex system of taxes on imports that resulted in very high tax rates, and used high reference prices for a Large range of imports.
Trade Policies Since the Mid-1980s
Extent of Reforms
In recent years, many developing countries pursuing structural reforms have included some trade liberalization measures. In order to assess the extent and quality of trade reforms in these countries, a review was made of trade policies in 36 countries that have implemented trade reform programs since the mid-1980s (Box 2). In all but five of the programs reviewed, trade liberalization was supported by arrangements with the Fund and in

©International Monetary Fund. Not for Redistribution
DEVELOPING COUNTRIES
Box 2
Methodology Used in Trade Review
Coverage
A review of the major countries in each geographic region based on the size of trade or gross domestic product (GDP) was undertaken to assess the extent and quality of trade reforms undertaken since the mid- 1980s. All but five of the countries (Brazil, India, Indonesia, Malaysia, Peru)-had Fund-supported trade reform programs after the mid-1980s. Brazil. India. and Peru have recently concluded agreements with the IMF. Indonesia's trade reforms have been supported by World Bank loans and technical assistance from the Fund to introduce a value-added tax. The Eastern European countries are not included in this sample, but their trade reform progmms are reviewed in Section IV. Comprehensive reform of their trade and payments systems is a key element of their reform programs.
Measurement of Trade and Trade-Related Measures
Tariffs and other import charges arc measured in this study by the predominant maximum and minimum rates. The range of tariff rates provides information on the d ispcrsion compared with average or effective tariff rates. Effective mtes of protection would have been a preferable measurement. but are not available for most countries or for recent years. High tariff rates that applied only to a few items have been excluded and if exemptions arc widespread, a zero minimum tariff rate has been used, even if there was no statutory zero rate.
Nontariff barriers are measured in terms of their coverage of import values. The import values generally relate to the pattern of imports in the measured year. h would be preferable to measure the coverage in terms of import patterns that would exist in the absence of restrictions, as otherwise the items subject to the most severe restrictions would receive the least weight. In the limit, items which are prohibited or for which no licenses arc issued have a zero weight. Where this problem is quite extensive the proportion of tariff code items subjected to quantitative restrictions is provided as an alternative measure.
There are other shortcomings with the use of the coverage of quantitative restrictions in terms of import values or tariff code items as an indicator of the restrictiveness of quantitative trade measures. First, although this indicator is a measure of the existence of controls, it is not a good measure of the protective impact of quantitative restrictions. given the difference in size and diversification of the domestic industries of countries. Jn a small country. quantitative restrictions applied to a relatively small range of import values can protect a large proportion of domestic production. Tunisia, for example, had liberalized quantitative restrictions on 70 percent of import values by early 1991 ; however. 70 percent of domestic production remains sheltered by quantitative restrictions. ln smaller, lower· income countries, the same proportion of domestic production is likely to be protected by
an even smaller import covemge of quantitative restrictions. This problem can be overcome by weighing the coverage in terms of the shares of domestic production protected by them, but this measure is not available in most countries. Second, the coverage of quantitative restrictions indicates only the existence of one or more restrictions but not the scarcity value they imply.
Trade Liberalization
Trade liberalization covers deconrrol-the elimination of nontarilf measures-as well as policies that shift the trade regime toward neutrality-a reduction in the bias toward a particular activity. especially the production of import substitutes.
Neutrality is defined as a situation in which the effective exchange rate for a country's exports-nominal exchange rate adjusted for export taxes and export subsidies and tax credits-is equal to the effective exchange rate for importsnominal exchange rate adjusted for duties and premiums resulting from quantitative restrictions (Bhagwati ( 1988)). An incentive system that is approximately neutral is preferable in that it fosters an efficient use of resources. Export rebates or duty-drawbacks may improve neutrality because they offset the bias against exports created by the protective system. However. export subsidies could imply a shift away from neutrality and lead to an inefficient use of resources.
Decontrol does not necessarily imply a shift toward neutrality. An example of decontrol without a move toward neutrality is the replacement of quantitative restrictions with equivalent tarifl"s. However. the elimination of quantitative restrictions makes trade regimes more transparent. helps to reduce rent-seeking activities, increases the price sensitivity of the trade system. and serves as the basis for subsequent tariff reductions. Another example of decontrol without a more neutral incentive structure is the removal of quantitative restrictions on input� to import-substituting sectors without the decontrol of the final goods. This encourages the expansion of protected production and may increase the effective rate of protection for final import-competing goods.
Criteria Used to Classify Trade Regimes
42
For the purposes of the review of trade reforn1s, the following criteria were used to classify countries' trade regimes. In regimes with right and significant control, quantitative restrictions (QRs) cover more than 50 percent or between 15 percent and 50 percent of imports. respectively. Relatively open regimes have QRs covering 5-15 percent of imports or QRs covering less than 5 percent of imports and maximum tariffs and charges that exceed 50 percent. An open regime has taritrs and other import taxes not greater than 50 percent and QRs covering less than 5 percent of imports. No allowance has been made for differences in the administration of QRs or the structure of tariffs that may also alfect the degree of restrictiveness of the trade system.

©International Monetary Fund. Not for Redistribution
Trade Policies Since the Mid-1980s
many cases by World Bank adjustment loans. Of the 36 developing countries reviewed, 28 had either a tightly controlled (2 1 ) or a significantly controlled (7) trade regime, while only 8 had either a relatively open (7) or an open ( 1 ) regime (Table 1 1 ) .
Of the 28 countries with restrictive trade systems, 1 7 undertook comprehensive trade reforms that resulted in relatively open or open trade regimes, while 1 1 implemented only partial reforms that left their domestic sectors substantially protected by quantitative restrictions (Table 12).95 The 17 countries that introduced comprehensive reforms virtually eliminated trade and payments restrictions, usually within a two-year period, leaving tariffs and surcharges as the principal means of protection; 1 2 countries narrowed the range of tariffs, but 5 raised tariffs or surcharges when quantitative restrictions were lifted. In the partially open countries, tariffs remained high and widely dispersed, but the initial reforms greatly improved the transparency and price sensitivity of the trade regime. Thus by the end of the period under review, 60 percent of the countries with initially restrictive trade regimes had succeeded in removing the most distorting trade barriers (Table 13) . In the 1 1 countries that implemented minor refom1s, the quality of reforms varied, but in most cases the removal of quantitative restrictions was gradual and partial, with inputs for production or noncompeting imports decontrolled first, leaving quantitative restrictions on many final products and potentially raising their effective levels of protection. Such partial reforms may increase the level of effective protection on final import-competing products, rather than reduce it.
The main instruments used to promote export growth and diversification in the programs reviewed have been adjustments to exchange rates and producer prices and tariff reforms to reduce the antiexport bias in the structure of import protection. In countries with extensive foreign exchange controls, foreign exchange retention schemes for exporters were sometimes introduced; and in some cases, special licenses were provided to exporters to import inputs or duty drawback systems were used. In general, such schemes have not effectively addressed the anti-export bias facing export industries in restrictive systems and have proved difficult to administer. In more neutral regimes, however, duty exemption schemes can play an important role.
Overall, while most countries reviewed made considerable progress in substantially eliminating quantitative restrictions on trade and payments, tariff protection still remains high in most of them. Only nine have achieved an open trade regime with
95Comprehensive trade reform programs are those classified as either major or moderate reform programs.
43
few quantitative restnctiOns and low tariff rates. Most others continue to maintain high and widely dispersed tariff structures that hinder the efficiency of resource use and growth prospects. A high tariff level results in inefficient import substitution and raises the cost structure of the economy; the resulting higher equilibrium value of the currency acts as a general tax on the export sector. A wide dispersion in the structure of tariff rates provides greater protection for those industries with the higher tariffs, attracting scarce resources from more efficient sectors.
Issues in the Design and Implementation of Trade Reforms
Compared with trade reform programs undertaken in earlier periods,96 the programs reviewed were more frequently designed and implemented in the context of comprehensive macroeconomic and structural adjustment programs that introduced complementary measures to deregulate domestic product and factor markets and improve the efficiency of the public sector. In addition to appropriate financial and exchange rate policies, structural measures that accompanied trade I iberalization commonly included measures to improve public expenditure and tax programs, reform public enterprises and marketing boards, decontrol domestic prices and financial markets, attract foreign direct investment, and reduce labor market rigidities. These measures aimed to improve the responsiveness of economic agents to relative price changes and the climate for private sector investment and thereby reduce the costs of adjustment. In turn, the liberalization of trade and payments has supported macroeconomic adjustment by fostering greater competition in the domestic market and alleviating the foreign exchange constraint; it also eliminates distortions facing many developing countries and thereby stimulates production based on comparative advantage.
There is broad agreement, which is confirmed by experience under the programs reviewed, that credible and balanced macroeconomic policies are essential to reap the benefits from trade liberalization. Where macroeconomic policies lack credibility, the need for frequent changes in policies and nominal exchange rates have led to inflationary expectations, speculative imports, and the reimposition of import restrictions (the Philippines. Zambia). In some other cases, inadequate fiscal adjustment has placed too great a burden on monetary policy, putting upward pressure on real interest
%See also Michaely (1991) for a review of trade reform programs from the 1950s up to 1984.

©International Monetary Fund. Not for Redistribution
DEVELOPING COUNTRIES
Table 1 1 . Developing Country Trade Regimes Before Liberalization
Tariffs and Surchargcs2 Quantitative Restrictions3
Statutory tariff Charges Coverage4
Country Year1 (In percent) (In percent) Main measure (In percent)
Tight control Argentina 1986 0-100 0-14 Nonautomatic licensing 60 Bangladesh 1984 0-300 15-100+ Prohibitions 5 1 Bolivia 1984 0-60 0-2 Nonautomatic licensing 90 Cameroon 1988 0-100 5-10 Nonautomatic licensing >90 Colombia 1984 6 1 2 0-18 Prohibitions 935 Gambia, The 1985 0-60 0-6 Nonautomatic licensing > 5 0 Ghana 1988 0-100 10-40 Nonautomatic licensing 100 India 1987 0-295 0-50 Nonautomatic licensing >90 Jamaica 1984 0-75 0-28 FX allocation 50 Kenya 1987 0-125 FX allocation 58 Malawi 1987 0-40 0-35 FX allocation 85 Morocco L982 0-45 10-45 Nonautomatic licensing >90 Nepal 1985 5-100 0-105 Nonautomatic licensing >90 Nigeria 1985 5-100 0-5 FX allocation 925 Pakistan 1988 10-225 6- 1 1 Nonautomatic licensing 805 Peru 1989 0- 1 1 7 3-147 Prohibitions 100 Tanzania 1987 6-100 FX allocation 70 Tunisia 1986 5-236 0-50 Nonautomatic licensing 76 Venezuela 1988 0-80 2-5 FX allocation 65 Za"ire 1982 0-50 FX allocation >90 Zambia 1984 0-100 FX allocation >90
Significant control Brazil 1985 8 1 2 Nonautomatic licensing 345 Cote d'Ivoire 1983 2-30 Nonautomatic licensing 15-50 Ecuador 1984 0-290 1-30 Nonautomatic licensing 385 Indonesia 1984 0-60 0-40 Nonautomatic licensing 32 Mexico 1984 0-100 3-19 Nonautomatic licensing 38 Philippines 1 984 0-50 0-25 Nonautomatic licensing 36 Trinidad and Tobago 1988 5-35 10-100 FX allocation 15-50
Relatively open Costa Rica 1985 0-220 13-100 1 Korea 1984 262 155 Malaysia 1985 142 0-60 5 Senegal 1985 15-45 7-50 155 Sri Lanka 1986 0-100 0-45 1 3 Thailand 1981 0-100 6 Uruguay 1982 0-75 0-74 0
Open Chile 1984 0-35 5-15 0
Sources: International Monetary Fund. Aww(l/ Report 011 Exchange Arrtmgemellls cllul Exchange Restrictions; United Nations Conference on Trade and Development; General Agreement on Tariffs and Trade.
Note: FX = foreign exchange. Countries are classified based on the following critena. In regimes with tight and significant control, quantitative restrictions (QRs) cover more than 50 percent or between 15 percent and 50 percent of imports. respectively. Relatively open regimes have QRs covering 5 - 1 5 percent of imports or QRs covering less than 5 percent of impons and maximum tariffs and charges that exceed 50 percent. An open regime has tariffs and other impon taxes not greater than 50 percent and QRs covering less than 5 percent of imports. No allowance has been made for differences in the administration of QRs or the structure of tariffs that may also affect the degree of restrictiveness of the trade system.
'Year immediately before trade reform. Information in the other columns refers to this year. 2When available. a range of tariffs was used. If not available. the unweighted average of statutory rates or an average effective rate was used.
Very high rates applied to only one or two items were dbregarded. Charges were disregarded if they were applied equally to dome�tic and imported goods.
'Quantitative re>triction; include value limitations on imports through foreign exchange allocation or by the requirement that importers provide their own foreign exchange.
"Percent of total imports covered by all quantitative restrictions unless otherwise specified. 'ln percent of total tariff code items.
44

©International Monetary Fund. Not for Redistribution
Trade Policies Since the Mid-1980s
Table 12. Trade Reform Programs in Developing Countries
Year Began
IMF Program '
Reforms in initially restrictive regimes
Major reforms Argentina Bolivia Colombia
Gambia. The
Ghana
Jamaica Kenya Mexico Peru Venezuela za·ire
Moderate reforms Brazil Cote d"lvoire
Ecuador Indonesia
Philippines Trinidad and Tobago
Minor reforms
Bangladesh Cameroon India Malawi
Morocco
Nepal Nigeria Pakistan Tanzania Tunisia Zambia
1987 1985 1985
1986
1986
1985 1988 1985 1990 1989 1983
1986 1984
1985 1985
1985 1989
1985 1989 1988 1988
1983
1986 1986 1989 1988 1987 1990
SBA ESAF SBA
ESAF
ESAF
SBA ESAF EFF None EFF SAF
None SBA
SBA None
SBA SBA
SAF SBA None ESAF
SBA
SAF SBA SAF SAF EFF
RAP'
Reforms i n initiaiJy non restrictive regimes Chile 1985 EFF Costa Rica 1985 SBA
Korea 1984 SBA Malaysia 1986 None Senegal 1 986 ESAF Sri Lanka 1987 SAF
Thailand 1982 SBA Uruguay 1983 SBA
Reform Measures>
Quantitative restrictions
Gradual vinual elimination. Vinual elimination up front. Gradual rcducllon. replacement with
tariffs. Complete OGL: some �tate trading
elimination. Vinual elimination through FX auction
access. Major reduction in import licensing. Grndual replacement with tariffs. Gradual vinual elimination. Vinual elimination up front. Vinual elimination up front, rest by 1992. Vinual elimination up front.
Gradual vinual elimination. Some replacement with surcharge�.
Phased elimination of QRs. Reduction in QRs. also on competing
goods. Gradual replacement with tariffs. Grndual replacement with surcharges by
1991.
Some reduction for intermediate good�. Gradual replacement with tariffs. Some net additions to OGL list. Limitation of FX allocation to a small
negative list. Reduction in QRs on noncompeting goods.
Expansion of impon license auction. Gradual replacement with tariffs. Grndual replacement with tariffs. Gradual widening of OGL. Gradual replacement with surcharges. Gradual increase of OGL and exchange rate
unification.
Constitutional prohibition of QRs. Elimination of remaining QRs by 1994.
Removal of nonagricultural QRs. Gradual replacement with tariffs. Gradual virtual elimination. Gradual elimination of most remaining
QRs. Removal of nonagricultural QRs. No measures.
Tariff
Sharp reduction. Low tariffs in two-tier range. Very gradual reduction of tariffs.
No measures.
Reduction of maximum and rnuonalization.
Large offsetting increases. Offsetting increases. Sharp reduction in rates and dispersion. Low tariffs in two-tier range. Reduction of maximum and rntionalization. Reduction of maximum and range.
Gradual reduction over4 years from 1990. Tariff increase instead of gmdual
reduction. Tariff maximum reduced to 35 percent. Reduction of maximum.
Reduction of tariff bands. Gradual surcharge reduction by 1993.
Reduction of maximum tariff. Rationalization of tariff structure. Some increases. Transfer QRs to surtaxes.
Sharp reduction of maximum: new surcharge.
Harmonization of tariffs. Large olrsetting increases in tariffs. Reduction of maximum tariff. Rcducuon of maximum and simplification. Tariff reduction: increases in surcharges. Reduction of maximum and range.
Reduction of uniform rate. Maximum tariffs and charges. 55 percent
by 1994. Reduction of unweighted avemge tariff. Harmonization of tariffs. Gro�dual reduction over 3 years. Reduction of maximum and dispersion.
Restructuring later reversed. Sharp reduction in maximum.
Sources: International Monetary Fund (IMF). Annual Report on £.�change Arrangements and Exchange RestriCtions; United Nations Conference on Trade and Development: and Geneml Agreement on Tariffs and Trade.
Note: EFF = Extended Fund facility: ESAF = enhanced structural adjustment facility: FX = foreign exchange; OGL = open general license: QRs = quantitative restrictions: SAF = structural adjustment facility: SBA = stand-by arrangement.
'Main IMF program associated with the trade reform. 2lncluded are measures implemented before May 1991. All measures have been carried out unlcs� otherwise stated. 3Rights accumulation program of the IMF.
45

©International Monetary Fund. Not for Redistribution
DEVELOPING COUNTRIES
Table 13. Current Structure of Developing Country Trade Regimes
Most Recent Year of
Country Reform
Tight control India 1990 Nepal 1989 Tanzania 1990
Significant control Bangladesh 1990 Cameroon 1991 Malawi 1991 Morocco 1989 Nigeria 1989 Pakistan 1991 Tunisia 1990 Zambia 1990
Relatively open Brazil 1991 Colombia 1991 C6te d'lvoire 1987 Ecuador 1991 Indonesia 1990 Jamaica 1988 Kenya 1991 Malaysia 1989 Peru 1991 Philippines 1989 Senegal 1991 Sri Lanka 1990 Thailand 1990 Trinidad and Tobago 1991 Venezuela 1991 Zaire 1986
Open Argentina 1991 Bolivia 1988 Chile 1988 Costa Rica 1990 Gambia. The 1991 Ghana 1988 Korea 1990 Mexico 1988 Uruguay 1985
Tariffs and Surcharges'
Statutory tariff Charges (in percent) (in percem)
0-295 5-100 0-60
0-> 100 0-100 0-45 0-45 0-200 0-95 0-43
15-50
0-65 0-63 5-30 5-35 0-40 0-60 0-100
15-25 10-50 15-45 5-50 0-100 5-45 0-20 0-50
0-22 5-10
15 10 1-40
0-23 0-25 1-50 0-20 0-45
0-78 0-105 0-50
5-10 0-85 0-13
7
0- 15 15-30 0-20
0-16 0-12
0-40
0-25 10-50
0-60
0-23
0-4 1-2 5-20 0-18
0-23
0-5
Quantitative Restrictions2
Coverage3 Main measure (in percent)
Nonautomatic licensing Nonautomatic licensing FX allocation
Prohibitions Nonautomatic licensing Nonautomatic licensing Nonautomatic I icensing Prohibitions Prohibitions Nonautomatic licensing FX allocation
70 >50 >50
24�.s 15-50
176 224 214 2 1 4.7 30
15-50
14 144 7•
15� I 54 7 6 5 5 84 6• 94 84.8 0'�
1 0 8
44 2 0 I I 0 4 2 0
Sources: International Monetary Fund. Annual Report 011 Exchange Arrangemt'IIIS and Exchange Restrictions: United Nations Conference on Trade and Development; Gene m I Agreement on Tariffs and Trade.
Note: FX = foreign exchange. Countries are classified based on the following criteria. In regimes with tight and significant control. quantitative restrictions (QRs) cover more than 50 percent or between 15 percent and 50 percent of impons. respectively. Relatively open regimes have QRs covering 5- 15 percent of impons or QRs covering less than 5 percent of impons and maximum tariffs and charges that exceed 50 percent. An open regime has tariffs and other impon taxes not greater than 50 percent and QRs covering less than 5 percent of impons. No allowance has been made for differences in the administration of QRs or the structure of tariffs that may also affect the degree of restrictiveness of the trade system.
'When available a range of tariffs is used. If not available the unweighted average of statutory rates or an average effective rate was used. Very high rates applied to only one or two items have been excluded. Charges that were applied equally to domestic and imponed goods have also been excluded.
2Quantitative restrictions include value limitations on impons through foreign exchange allocation or through the requirement that imponers provide their own foreign exchange.
'Percent of total impons covered by all quantitative re�triction� unless otherwise specified. •tn percent of total tariff code items. 'Includes rights-of-refusal items. 6l ncludes foreign exchange licensing and prior approval lists. 'The restricted list covers 283 tariff lines and the banned list covers 8 1 8 items out of a total of 5.355. Reductions were undenaken in both
categories after April 1991. •Refers to 1989. "Target. end of 1991. IOUniform tariff.
46

©International Monetary Fund. Not for Redistribution
Trade Policies Since the Mid-1980s
Table 14. Trade Liberalization, Stabilization, or Both
A. Li beralize Trade First I . If foreign funds are available. tariffs can be reduced without an accompanying real depreciation. helping the stabili
zation effort by providing an anchor for (many) domestic prices. Krucger ( 1978).
B. Implement Both Policies Simultaneously 2. Trade reforms complement fiscal adjustment. Papageorgiou. Choksi. and Michaely ( 1990). 3 . I n theory there is very linlc connection between the determinants of inflation and the orientation of the trade regime.
It is possible to auack both problems at the same time as long a� we avoid overvaluation. Krucger ( 1981 ). 4. Postponement of liberalization implies prolonging inefficiency costs. Do it simultaneously following crawling peg
and assuming that government will not resort to controls to curb inOation. Krueger ( 1984). 5. Liberalization will only succeed with depreciated real exchange rate. Thb require� �olving fiscal deficit pre��urc�
simultaneously, Michaely ( 1987). 6. As long as overvaluation is avoided. it is possible to carry on both policies at the same time, Corden (1987). 7. A variety of trade reforms complement fhcal adjustment, �uch a� the conver�ion of quantitative re�triction� to tariffs
and reduction of tariff dispersion. Thomas. Mat in, and Nash ( 1990).
C. Stabilize the Economy First 8 . Liberalization� will have a better chance o f succeeding if undenaken with a fiscal �urplu�. I n thb way we c:m a��urc
that we will maintain a depreciated real exchange rate, McKinnon and Mathicson ( 1981 ). 9. Main problem with aborted liberalizations is that they have been accompanied with massive capital innows resulting
in real appreciation. Need for foreign funds can be avoided by achieving fiscal surplu� before liberalizing, McKinnon ( 1984).
10. Since intlation generate� serious distortions, liberalization will take place under inappropriate signal:.. Thus, inOation should be brought down first, Fischer ( 1986. 1987).
1 1 . Both policies result in a "competition for instruments." where what is required to succeed on one front is the oppostte of what is needed to succeed on the other. Historical evidence from successful Asian exporte rs suggests that stabilization �hould be con�olidatcd before attempting trade reform�. In countrie� with high intlation where stabilization requires the use of exchange rate as a nominal anchor, it is preferable to postpone trade reform until the economy is stabilized, Sachs ( 1987. 1988).
12 . Reduction in tariffs to low levels ha� a direct revenue impact and an indirect budgetary impact because of lower activity and employment and the payment of safety net benefits. Thus fiscal consolidation and reform need to come before complete liberalization. Blejer and Cheasty ( 1990).
I J. De�pite their complementary nature, trade reform� may have to be delayed in high inflation �ituation�. Thoma1.. Mar in. and Nash ( 1990).
Source: Based on Table 4. I in Opcnttions Evaluation Dcpanmcms, World Bank Support for Trade Pnlic.� Reform, Report No 9527 CWa;,hington: Worlu Bank. 1991).
rates and exchange rates and penalizing the productive sector (Argentina and other Southern Cone countries in the 1970s; and Argentina, Brazil, Jamaica, and Peru in the 1980s and early l 990s).97
In the context of comprehensive programs, an important issue is the proper sequencing of trade reforms in relation to other policies. Views differ about whether macroeconomic stabilization needs to precede trade liberalization or whether the two go hand in hand. The review of experience indicates that trade liberalization has succeeded both after (Ghana, Korea) and during macroeconomic stabilization programs (Chile, Mexico, Venezuela).9S While the choice in sequencing depends on the initial conditions in the country concerned, the inter-
97 Among the industrial countries, trade reforms in Australia and New Zealand were also hampered by an inappropriate fiscal-monetary policy mix.
98Korea liberalized its trade regime progressively during the 1970s and early 1980s, but its major long-term import liberali
zation programs began in 1984. By 1984. Korea had largely adjusted to the major oil price shocks of the late 1970s and early 1980s.
47
national economic environment, and the overall program design. there is a growing consensus that high priority should be given to trade reform at an early stage in the adjustment effon {Table 14). Financial, exchange rate, and wage policies are essential to the adjustment process, but when these policies are complemented by the liberalization of the trade and payments regime, a more efficient framework for restoring a viable external position can be achieved.
The interaction between the government budget and the various stages of trade reform needs to be considered when a trade liberalization program is designed. This includes both the direct fiscal impact of changes in trade-related taxes and the indirect effects of changes in budgetary receipts and payments owing to a possible initial contraction in economic activity and employment and the provision of safety net benefits. 99 The initial stages of trade
9'1The complex linkages between trade liberalization and fiscal policy are discussed in more depth in other papers (see, for example. Farhadian-Lorie and Katz ( 1989) and Blejer ( 1990)).

©International Monetary Fund. Not for Redistribution
I DEVELOPING COU�N�T�R�IE�s� .............................. ..
reform, when quantitative restrictions are replaced by tariffs and tariff exemptions are eliminated, can complement fiscal adjustment. However, in countries that depend heavily on import taxes, a reform of the domestic tax system is required before tariffs can be brought down to a sustainable basis. Of the countries reviewed, a number that have successfully liberalized have introduced value-added tax systems to broaden the domestic tax base (Indonesia. Mexico). Some others have delayed tariff reductions (Bolivia, Pakistan, Sri Lanka, Thailand) or introduced surcharges (Chile and Morocco) for revenue reasons.
Appropriate exchange rate policies are also essential to ensure that trade reforms are consistent with balance of payments objectives. Because the equilibrium exchange rate is partly determined by the degree of import restrictiveness, major reform programs often involve an exchange rate adjustment; ultimately, the choice of exchange rate policy will depend on initial conditions and the other elements of the macroeconomic program. In the sample reviewed, all but two of the programs that resulted in relatively neutral trade regimes with low tariffs were associated with a substantial devaluation of the nominal exchange rate at about the time trade reforms were initiated, which resulted in a real effective depreciation that was sustained by policies thereafter. Korea's trade reform program, which was gradual and preannounccd, was not associated with a major exchange rate adjustment.
As discussed above, the scope and pace of liberalization programs has varied significantly across geographic regions. Recent trade reform programs in Latin America and Eastern Europe have been comprehensive and relatively quick, while those in Southeast Asia have been gradual and most reforms in Africa and South Asia are not yet complete. It is difficult to assess at this stage whether the "big bang" or the gradual approach will be more enduring; however, an important measure of success has been achieved by countries that have substantially completed the liberalization process using either approach. Bolivia. Chile, and Venezuela in Latin America, and the dynamic Asian economies have all had considerable success in sustaining their earlier reforms.
There are strong indications that the completeness and the credibility of a reform program are the most important factors for success. Elements of trade reform programs that have contributed to sustained liberalization include the preannouncement of the timing and scope of reforms, the early removal of quantitative restrictions, the reduction of tariff levels and dispersion, and complementary domestic price, tax, and public enterprise reforms. Locking in reforms in various ways also enhances credibility. Many countries in Latin America have
bound their entire tariff schedules in the GATT; Chile introduced an amendment to its constitution forbidding the use of quantitative import restrictions; and countries that adopt a relatively uniform tari fT schedule may find it easier to resist pressures for protection from special interest groups.
The economic effects of trade liberalization are difficult to disentangle from the effects of other policies, but the evidence from a number of comprehensive studies indicates that the long-run effects of trade liberalization on output and employment growth, trade expansion, and the balance of payments were beneficial. lOO A recent comparison by the IMF of the trade orientation and growth performance of 4 1 developing countries showed that during 1975-89, the outward-oriented countries achieved, on average, significantly higher growth rates of potential GDP and of total factor productivity than the inward-oriented countries. 101 The review of countries' trade reform programs also indicates that most of the countries that had open or relatively open trade regimes in the early 1 980s have performed well in term!> of the growth of output and exports and have avoided serious balance of payments problems.
48
Although trade liberalization has been shown to be beneficial in the longer run, shorter-run adjustment costs are likely to be incurred when formerly protected sectors arc exposed to import competition. The elimination of price controls and rationing, which frequently accompanies trade reforms. can also put basic necessities out of reach of the poorest segments of the population. In these circumstances. public support for reforms can be enhanced and transition costs reduced by policies that improve external competitiveness, facilitate adjustment in labor markets, and target safety net benefits to the most needy.
Trade Liberalization Versus Export Promotion and Selective Intervention
Trade liberalization is now considered a more efficient instrument for promoting export diversification than some of the earlier schemes used for this purpose. These included export subsidies for nontraditional exports, including cash subsidies and income rebates, which were common in Latin America before the recent reforms, or duty relief schemes, which have assisted a large range of exports in Korea and relatively open countries, such as Indonesia and Malaysia. In the absence of a rei a-
IIIOScc. for example. Michacly (1991). Krueger ( 1 978). and Chnc (1981).
HHScc lmcrnational Monetary Fund ( i990c). pp. 68-69. and Table 16.

©International Monetary Fund. Not for Redistribution
Trade Policies Since the Mid·1980s
tively open trade system, these schemes have not generally been successful in that by and large such countries did not reduce their reliance on traditional exports during the 1960s and 1970s. Export processing zones have been set up in a large range of countries to enable certain export production to avoid domestic taxes and restrictions altogether; however, their contribution to exports has been significant in only a few cases.
Competition provided by the liberalization of imports of final products can serve as part of an anti-inflation policy and can promote the adjustment of real wages needed to strengthen export competitiveness. In a protected industry, enterprises often give wage increases to workers to compensate for devaluation-induced price increases, rather than face industrial unrest. Competition from imports can induce greater restraint on the part of firms and workers. This objective has been an important part of the trade liberalization programs in Latin America as well as in Eastern Europe.
Despite the widespread shift to more marketoriented policies some development economists and governments advocate selective intervention in the economy through trade and industrial policies. The
49
economic reform programs supported by the Fund and the World Bank envisage a strong and active role for governments in creating an environment for efficient economic activities, rather than the government intervening in the economy to "pick winners." 102 Proponents of selective intervention justify it on the basis of market failures or strategic needs. They envisage protection of a few sectors via planning, directed credit, or import allocation to create internationally competitive industries. ro3 Many of the arguments in favor of intervention are simply variations of the infant industry argument. Counterarguments stress that the choice of which industry to support requires a great deal of information as well as impartial and nonpolitical decision making. Since market prospects can change rapidly, such decisions have to be taken quickly while avoiding the temptation to prolong support to industries that are unprofitable. The possible gains from the few industries that may succeed have to be weighed against the large potential looses from incorrect decisions.
•02See World Bank ( 1991 b). I03Sce Wade ( 1990) and Singer and A1izadeh ( 1988).

©International Monetary Fund. Not for Redistribution
--------------�l vt �l ---------------
Agricultural Trade Policies: Recent Developments and Issues in Reform
rn:l uring the 1 980s, awareness of the need for L.l. � substantial reforms in agricultural support policies has increased. Such reforms are essential for an open multilateral trading system and for the integration of Eastern European and developing countries into that system. Reform would also ease budgetary pressures and price distortions in industrial countries and reduce trade frictions. Many countries, especially those undertaking major economic reforms. have a strong interest in ending the export of surplus production and in achieving greater market access for their products. Another prominent issue is the growing concern about the environmental damage caused by excessive incentives for intensive agricultural production; the perceived advantages of more ecologically sound land use, particularly in the densely populated industrial countries, arc encouraging needed reforms. Despite these developments, the fundamental changes that would reduce support and make agriculture more market oriented have not generally been implemented. This trend is reflected in the total value of transfers from taxpayers and consumers to support agriculture in 1990. which rose significantly to $300 billion.
Relatively few major liberalizations in agricultural support policies have occurred since the start of the Uruguay Round in September 1986. Some changes introduced in the United States in the 1990 Farm Bill have made the operation of support policies for cereals less distorting, but expenditures. especially export subsidies, are likely to increase and import barriers to remain. The EC discussions are continuing on the reform of the CAP to reduce the need for import barriers and export subsidies, but negotiations are likely to be protracted. In Japan, despite liberalization of some products and reductions in the overall level of support in 1990, there is no discussion of a fundamental reform of its policies, although the possibility of a limited opening of the rice market has been raised. Canada has introduced changes to rationalize its support policies, but its support levels remain high. Australia. New Zealand, and Sweden have made reforms to their agricultural policies that entail reductions in support.
Eastern European and most developing countries could gain substantially from a worldwide reform
50
of agricultural protection policies if they continue with the structural reforms they arc implementing. Reduced export taxes. more appropriate exchange rates, reduced industrial protection. and other market-oriented reforms will make the exports of these countries more competitive. Improved market access and the elimination of export subsidies are important to sustain the economic reform in Eastern Europe and developing countries. Reforms in foodimporting developing countries and the likely phasing of industrial country liberalization would reduce the amount of adjustment food importers would need to make.
Recent Policy Developments
General Setting
Despite the attention given to agriculture in the 1980s and in the Uruguay Round, support levels for agriculture remain high. Total transfers associated with support policies in OECD countries peaked at $300 billion in 1990 (Table A22). About 40 percent of such transfers came from government budgets; the remainder was paid by consumers through higher domestic prices resulting from trade barriers. These transfers from taxpayers and consumers were about 2 percent ofGDP in 1990; in the Scandinavian countries, total transfers amounted to more than 4 percent of GDP, while in Japan and the EC they were slightly more than 2 percent of GDP (Table 15) . This amount is substantial in comparison with the value added of agriculture. about 3 percent of GDP in OECD countries (Table A23). Support. measured by producer subsidy equivalents as a percentage of the value of production, increased sharply in the mid- 1980s to an average level of 50 percent for OECD countries (Table 16). 104 In 1988 and 1989. support declined mainly because of increases in world prices (in terms of U .S . dollars) owing to poor weather-
11.,The producer subsid) equivalent of a suppon policy is the eMimated transfer needed to replace a !.uppon policy and leave the producer no worse off. lt can be expre�sed as a total value of the transfer or as a percentage of the value of production at internal prices.

©International Monetary Fund. Not for Redistribution
Recent Policy Developments
Table 15. Total Transfers Associated with Agricultural Policies (In percent of GDP)
1979-81 1983-85 1990 Average 1986 1987 1988 1989 Estimate
Australia 0.4 0.5 0.5 0.3 0.2 0.2 0.2 Austria 1 .7 2 . 6 2.8 3.2 2.7 2.2 2 .4 Canada 0.9 1 . 7 2.2 2.2 1 .9 1.4 1 .4 EC-12 ' 1 .6 2.5 2.9 2.8 2.5 2 . 1 2 . 2 Finland 6.8 4.9 4.8 4 .3 4.3 Japan 1 .7 2 . 8 2 . 8 2.8 2.4 2.3 2 . 1 New Zealand 0.8 2 .0 3.8 0.3 0.5 0.3 0.2 Norway 3.9 4.0 3.9 3.6 4 . 1 Sweden 2.6 1 .9 1 .6 1 .6 1 .5 Switzerland 3.2 3.2 3 . 1 2.9 2 .8 United States 0.8 1 .9 2. 1 1 .8 1 . 4 1 .4 1 .3
Average OECD2 1 .3 2.2 2.5 2.4 2 . 1 1 . 8 1.9
Sources: Organization for Economic: Cooperation and Development (OECD). A}iriculwml Pulicit•.1. Markets and Trade. Muniwring and Outlook (Paris). variou� is�ues: and lnternation;ll Monetary Fund. lntem(llional Fimwdul Sttlli.Hicl. variou� bsuc>.
'EC-1 0 priono 1986. Total tran�fcr� of EC-10 in 1986 were $97.7 billion und 3 percent of their GDP. 1Total transfers ofOECD countrie; divided by OECD GDP.
Table 16. Net Producer Subsidy Equivalents1 (In percent of total value of production)2
1979-81 1983-85 1990 Average 1986 1987 1988 1989 E�timate
Australia 9 14 16 1 1 9 10 1 1 Austria 36 37 49 48 47 39 46 Canada 24 33 49 49 42 37 4 1 EC-12·1 37 35 50 49 46 41 48 Finland 68 72 73 70 72 Japan 57 65 75 76 74 7 1 68 New Zealand 18 24 33 14 75 5 5 Norway 76 76 76 75 77 Sweden 60 57 52 52 59 Switzerland 80 80 78 73 78 United States 1 6 25 42 4 1 34 29 30
Total 29 34 5 1 50 46 4 1 44
Source: Organization for Economic Cooperation and Development . Agricultural Policies. Markets and Trade. Monitomrg and Outlook (Paris). various issues.
'Producer subsidy cquavalents of suppon policic� arc the transfer needed to replace thc>c policJC> and lcuve the producer no worse off. They arc net for some products, for example, beer. a:. the cosb of their inputs are inOatcd because of other 'uppon policies and this effect i• ne11cd out.
�Total value of production valued at internal price>. 'EC- 10 priorto 1986. The net producer subsidy equivalent for EC-10 in 1986 was 52 percent.
affected harvests (Table A24). Lower prices associated with a return to normal crop seasons were the main source of increased producer subsidy equivalents in 1990.
Some major shifts in the pattern of agricultural trade occurred in the 1980s. The Unjted States is the largest agricultural exporter; the value of its exports declined for much of the 1980s but rose
51
sharply in 1988 (Table A25). The EC is the second largest exporter, and the largest agricultural importer. It was the largest net importer of agricultural products in 1980, but the size of its net imports has declined steadily. Japan became the largest net importer by 1983 and has experienced strong growth in agricultural imports since 1987.
Cereals are the main food commodity traded

©International Monetary Fund. Not for Redistribution
I AGRICULTURAL TRADE POLICIES I
internationally; the largest exporters are the industrial countries; the largest importers are developing countries (Tables A26 and A27). The United States, the largest exporter, lost some market share in the mid-l980s but has subsequently regained most of it. The share of the EC in world cereal exports has continually expanded and the market shares of Australia and Argentina have declined since 1987. The volume of Japanese cereal imports has grown slightly since the late 1970s, but EC cereal import volumes have fallen dramatically. Cereal imports of North Africa have stabilized at around the levels of the mid-J 980s, but those of sub-Saharan Africa have declined sharply.
United States
The system of agricultural support in the United States is very complex; some basic features are outlined in Table A28. The operation of these policies has generally remained the same since 1985, although in 1 990 limited progress toward an increased market orientation for export crops was made. 105 While it was expected that the changes to farm policies would reduce agricultural spending, lower world prices have increased budgetary costs (Table A29).
Support for cereals, the main export crop of the United States, is now mainly based on income support through the system of deficiency payments. The major change introduced in the 1985 Farm Bill was the substantial reduction in support prices (loan rates) for cereals while farmers' incomes were sheltered by target prices, on which deficiency payments are based and which were only reduced slightly (Table A30). In the 1 990 Farm Bill, target prices were kept at their 1 990 level. This system of deficiency payments entails high levels of budgetary expenditures when world prices are low, as in 1985/86-1986/87 and probably in 1990/9 1 (Table A31) . Expenditures are partly limited by the operation of the set-aside, which reduces the acreage on which deficiency payments are based and restrains production to prevent further declines in world market prices.
The 1990 Farm Bill only addressed a limited range of distortions created by the support system for cereals. First, because payments are related to farm size there is an incentive to expand the size of the farm, often using new land that is only mar-
•osAgricultural support policies in the United States are set every five years in the "Farm Bills." The full title of the 1985 Farm Bill was the Food Security Act of 1985, and the term 1990 Farm Bill covers the Food, Agriculture. Conservation. and Trade Act of 1990, enacted on November28, 1990. and the Omnibus Budget Reconciliation Act of 1990, enacted on November 5, 1990.
52
ginally productive and environmentally fragile. Second, deficiency payments are based on participation in a program crop and producing another crop reduces the entitlement to such payments. The 1990 Farm Bill partly addressed these problems by tightening some environmental provisions and by introducing some options to increase planting flexibility. Nevertheless, deficiency payments continue to contribute to increased production by supporting production at levels of average costs that are above world prices.
The export subsidies under the Export Enhancement Program (EEP), mainly on cereals, were continued in the 1990 Farm Bill. The limit on EEP spending was replaced by a minimum funding requirement of $500 million annual1y. It is expected that $900 million and $ 1 ,200 million will be spent in the 1991 and 1992 fiscal years, respectively; the latter is above the high levels of the mid- 1 980s when export competition drove grain prices to very low levels (Table A31) . Thus, while the EC budget is put under stress, unsubsidized exporters bear the brunt of the adjustment to low world prices as shown in Table A26. Recently, U .S . wheat has been exported to Brazil with EEP bonuses, under protest from Argentina and Uruguay. Australia has also protested strongly at the use of the EEP in markets where it has been traditionally strong, for example, in the Middle East and China.
Restrictions on imports competing with domestic agricultural production remain tight (Table A32). In 1990, a GATT panel found that quotas imposed on raw sugar under a headnote to the U.S. Tariff Schedule were not consistent with the GATT. To bring them into compliance with the GATT, the quotas were converted to tariff quotas with a prohibitive tariff for imports in excess of the quotas. The quota on peanuts, one of the products protected by quotas under the 1955 waiver from the GATT, restricts imports to very low levels. Domestic supply problems resulted in a decision to increase the quota in 199 1 , but a very short time frame for bringing in imports resulted in a low level of actual imports. Imports of dairy products also remain restricted, and reductions in the support price for milk from its 1 990 level were ruled out until 1995. The continued tendency for excess supply has resulted in renewed Commodity Credit Corporation (CCC) accumulation of dairy stocks.
The 1 990 Farm Bill included a "GATT trigger" under which, if there is no agreement in the Uruguay Round by mid-1992, export competition from the United States will be intensified. The measures provide for increased funding of the EEP by $ 1 billion, marketing loan programs for wheat and feedgrains (which effectively are also export subsidies) (see Table A28), and a waiver of the setasides. These measures, if implemented, would

©International Monetary Fund. Not for Redistribution
I Recent Policy Developments J
both push down world prices significantly and greatly increase budgetary costs.
A recent study by the U .S . Department of Agricuhure (USDA) suggests that relatively little would have to be modified in the 1990 Farm Bill if the proposals made by the United States in October 1990 in the Uruguay Round group on agriculture were accepted. 106 Increases in world prices for grains would be expected to reduce support levels sufficiently to enable the commitment on internal supports and export subsidies to be met. There would have to be some reduction in support prices for dairy products and sugar, which could reduce incomes of those producers by up to 10 percent. With the anticipated world price increases, the income of the U .S . farm sector could rise by $ 1-2 billion in 1996.
European Community
The need to reform the CAP has been a recurrent issue for many years. High level!. of support for agriculture in the EC, which had a producer subsidy equivalent ratio of 48 percent in 1990, have significantly reduced the EC's net food imports since the 1970s, and substantially increased self-sufficiency ratios (Table A33). The CAP has been under great pressure to reduce the drain on the EC budget, to recognize the export interests of other countries, especially those undergoing economic reforms, and to unlock the Uruguay Round.
In Kell y and others ( 1988). it was noted that the range of measures agreed to in February 1988, while a first step at reform, focused mainly on reducing the budgetary cost of the CAP but did not increase market access for imports or reduce directly the extent of subsidized exports. The February 1988 measures completed the system of "stabilizers" for each of the main products and set an overall limit on the increase in EC spending on agriculture to not more than 74 percent of the rate of increase in the GNP of the EC.
Although EC agricultural spending was limited by higher world prices for food products in 1988-89, subsequent world price declines, a large accumulation of beef stocks, and the additional cost of support in eastern Germany placed pressure on spending in 199 1 . Estimates in early 1991 indicated
H��>See United States. Department of Agriculture ( 1991). One reason for this result is the assumed price effects of the Uruguay Round agreement. Even with only partial liberalization it b expected that. for example, wheat prices would rise by 22-28 percent compared with the 1986-88 baseline. with increases of 6-8 percent and 50-55 percent for com and rice, respectively. These price ancreases are similar in magnitude to the price increases from complete liberalization discu�scd below and thus appear to be rather high.
53
that CAP spending would increase in 1991 by a record 32 percent, to ECU 36.6 billion, or about ECU I . I billion over the budget guideline (Table A34), although ECU 1 .5 billion was attributed to the cost of German unification.107 The 1991 price package agreed on at the end of May 1991 held spending close to the budgetary guideline although it did not address the major reform issues. The price package included a slight reduction in the support price of cereals (Table A35) with an increase in the eo-responsibility levy to 5 percent, but producers who set aside 15 percent of their acreage would receive an exemption from that levy, a 2 percent reduction in the quotas for milk, and a slight reduction in the intervention price for beef.
Pressure for the reform of the CAP has been mounting in Europe. There remains the continuing disparity of price supports benefitting the more affluent farmers in northern coumries more than the smaller and poorer farmers in the southern countries. Also. there is a growing awareness of the environmental consequences of the intensive agriculture encouraged by high price supports. ln addition, an expansion of the EC to include some EFTA countries lOS would magnify current problems under an unreformed CAP. The reforming Eastern European countries need a destination for their exports. The EC is an attractive market for farm products from Eastern Europe but these are limited by restrictions; the export of beef to the EC has been blocked by EC activation of its quotas to avoid further growth in stockpiles.
The proposals of the EC Commission for the reform of the CAP issued in mid-June 1 99 1 called for substantial reductions in !>Upport prices with offsetting direct income support. The main reforms proposed were for cereals where support prices would be reduced by about 35 percent to ECU lOO a ton over three years. Under a scheme similar to the U .S. system of deficiency payments for cereals, compensatory payments would be made to compensate for the reduction in support price. Comparable arrangements would be introduced for oilseeds and protein crops (which are alternate crops for cereal farmers). The compensatory payments would be based on a regional yield and a farm area adjusted for the proposed set-aside, initially set at 15 percent for the combined area of cereals, oilseeds. and protein crops. Farms of 20 hectares or less would be exempt from the set-aside; compensation for the set-aside would be subject to a ceiling of 7.5 hectares so that farms of over 50 hectares would not
1071'able A34 shows the preliminary draft budgea onl). which had predicted a smaller incrca�e.
HlliAuMria. Finland, Iceland. Liechtenstein. Norway, Sweden, and Switzerland.

©International Monetary Fund. Not for Redistribution
I AGRICULTURAL TRADE POLICIES I
receive an additional payment on the set-aside. Once EC market prices are aligned with world prices, export refunds would no longer be required. Beef support prices would be reduced by 1 5 percent because of lower feed costs. Milk quotas would be cut by 4 percent. An early retirement scheme would be introduced for farmers aged 55-65 (about half the EC farmers), and there would be increased incentives for using farmland for forestry. Budgetary spending would initially rise as the costs now borne by consumers would be transferred to the budget. However, the Commission estimates that if the plan becomes operational by 1993, by 1997 the cost of the reformed system would be below the cost of the current policies extrapolated to that date.
Initial reactions by EC member agriculture ministers were mixed. M inisters from the northern countries criticized the proposals; the French, German, and U.K. ministers would prefer direct controls on supply, which have a lower budgetary cost. The U.K. minister also criticized the reduced payments to larger farms on the grounds that such payments would encourage inefficient small farms. Ministers from the southern countries broadly supported the plan with its full compensation to small farmers. While the Commission's proposal was not entirely acceptable to all EC members, it could provide a basis for completing negotiations on the reform of the CAP. For a discussion of some of the issues related to agricultural reform see the section below titled "Approaches to the Reform of Support Policies."
Japan
Although there has been liberalization in some agricultural products and progressive declines in the producer subsidy equivalency ratios, basic food commodities remain highly protected in Japan. 109
Japan is the largest net importer of food and its overaJI self-sufficiency ratios remain very low, at about 30 percent for aJI grains but lOO percent for rice (Table A36). Support prices have been reduced progressively for almost all products since 1985 (Table A37) but for rice the support price is still about six times the world price. While budgetary spending on agriculture has fallen since 1980 (Table A38), most support is paid by consumers as a result of substantial import barriers (Table A22); the level of Japanese support, as measured by the producer subsidy equivalency ratio of 68 percent in 1990, is the highest of all the OECD countries, except some of the EFTA countries. Unlike the
1o<IExcept as noted, there have not been any recent significant changes in the operation of Japanese agricultural policies; the description of the system in Citrin ( 1 990) remains applicable. The main features are summarized in Table A38.
54
other major trading countries, there is no discussion of fundamental reforms for the major commodities (e.g., rice) through explicit steps to make the Japanese agricultural sector more responsive to world market prices. Some suggestions have been made to provide import access to a relatively small share of the domestic rice market. In the Uruguay Round, Japan has stressed the need to eliminate export subsidies as well as the need for provisions to ensure food security in basic foodstuffs.
Liberalization has occurred in a number of food items over the past few years. In line with agreements with the United States, Australia. and New Zealand, as of April 199 1 , the quotas on beef were eliminated and replaced with tariffs that will be progressively reduced. 1 1o Imports of apple juice, oranges, and processed dairy products have been liberalized and nontariff barriers on imports of other minor products have been eased.
The main food products, especially rice, remain highly protected. The producer price of rice was reduced from ¥3 1 1 in 1986 to ¥275 per kilogram. This, together with increases in the world price for rice, has reduced the ratio of the support price of rice to world prices from about nine times in 1986, to six times in 1990 (Table A39). 1 1 1 The current very high support prices tend to generate excess production, even with the current cost structure of farms. but relatively tight supply control systems are used to prevent the emergence of excess supply. Some limited steps have to be taken to improve the market orientation of rice production by excluding less efficient growers from the formula used to set support prices and to partly liberalize distribution of rice.
Although food security through self-sufficiency is an important goal of Japan's rice policy, current policies do not achieve this objective efficiently. Food security requires efficient or potentially efficient production, but support policies and other regulations have resulted in highly inefficient rice farms. In 1985, the average size of rice farms was about 0.6 hectares, about 29 percent of farmers were over 65 years old, and only 20 percent of farm households were considered to have farming as their primary means of support. 1 t2
I IOThe tariff rate will be 70 percem for the Japanese fiscal year (JFY) 1991 /92 (April 199 1-March 1992). 60 percent for JFY 1992/93, and SO percent for JFY 1993/94. ll will subsequently be subject to agreements in the Uruguay Round. There is also a safeguard mechanism utilizing an emergency tariff of 25 percent (Harris ( 1990)).
1 1 1Different results for the nominal protection coefficient (NPC) can result from using different measures of world prices and the inclusion of freight. Nevertheless, alternative measures show similar changes. in OECD ( 1991) the NPC is estimated to have declined from 7. 7 in 1987 to 5.2 in 1990.
1 12Japan (1987).

©International Monetary Fund. Not for Redistribution
Recent Policy Developments I
EFTA Countries
The EFTA countries have high levels of protection for their agriculture. In 1990, Norway, Finland, and Switzerland had producer subsidy equivalency ratios of more than 70 percent, although Austria and Sweden had lower levels of 46 percent and 59 percent, respectively (Table 16). In Finland and Norway, producer prices generally increased in 1990, and in Finland an additional flat subsidy was introduced to avoid an increase in cereal prices. The high producer prices in all EFTA countries are maintained mainly by import restrictions and deficiency payments related to production. Export subsidies are also used to dispose of excess production. In Finland, there are some additional income supports that are modulated in terms of farm size or region and arc not linked to production.
Support for agriculture in Sweden is now in the process of being reduced. In the period up to 1986, support levels increased significantly, but as this did not provide reasonable food costs and an efficient use of resources, a program of reform was initiated in July 1990. The first round related to the deregulation of the domestic distribution arrangements. The second round-the phasing out over a three-year period of administered prices and export subsidies-started in July 199 1 . Supplementary income supports will be given to grain producers during the transitional period only. The government has undertaken to reduce border protection in the context of an agreement in the Uruguay Round.
Canada, Australia, and New Zealand
Canada, Australia, and New Zealand are all export-oriented agricultural producers with a strong interest in reform, as reflected by their membership in the Cairns Group. 1 13 Despite this interest, Canada had a producer subsidy equivalency ratio of 4 1 percent in 1990 with an extensive income support system and a heavily protected, domestically oriented agricultural sector. Australia and New Zealand, after their reforms, have the lowest levels of agricultural support of the OECD countries.
Canada has introduced a major change to a substantial part of the country's support programs by rationalizing them under a standard framework. This has been done by the introduction of the Gross Revenue Insurance Plan (GRIP) and the Net Income Stabilization Account (NISA), which for 1991/92 have been implemented for grains and oilseeds. The two programs are designed to replace the temporary measures provided in the recent past. The new schemes shelter the income of Canadian producers from variations in yields and price fluctuations.
I IJFor a description of the Cairns Group. sec footnote 10.
The protection for Canada's import-competing products remains high. In 1990, a GATT panel found that Canada's import restrictions for ice cream and yogurt were inconsistent with GATT Article XI.2(c). Canada has undertaken to bring these restrictions into conformity with GATT in light of an agreement in the Uruguay Round.
55
Australia has liberalized most of its agricultural sector. Controls on wheat marketing and sugar imports have been lifted. Under the Australia-New Zealand Closer Economic Relations Trade Agreement (ANZCERTA), free trade was established on goods with New Zealand in July 1990, including dairy products, thus subjecting Australian processed dairy products to world prices. The operation of the wool reserve price system of the Australian Wool Corporation (AWC) created severe problems for this sector by supporting a wool price in 1990 that was no longer viable. In February 199 1 , the Government suspended the wool reserve price system by which time the AWC had accumulated stocks equivalent to about one year's supply and a government guaranteed debt of $2.4 billion. During this time other wool-growing countries benefitted from the high prices. although it is now expected that prices will remain relatively depressed until the surplus stocks are eliminated.
New Zealand is the industrial country that has most completely libemlized its agriculture, but the full gains from the liberalization have not yet emerged. The reforms in New Zealand since 1984 were part of a general liberalization of all sectors of the economy. It was expected that the liberalization program would benefit the farm sector as resources shifted there on the basis of comparative advantage. However, while some important adjustments have taken place in the farm sector, including the diversification into a range of horticultural products and nontraditional livestock, it has remained weak. Macroeconomic developments, including an appreciation of the real exchange rate and high real interest rates; the much slower liberalization of the manufacturing sector, resulting in negative effective rates of assistance to the agricultural sector; and continued low world prices of farm products partly caused by policies of other industrial countries, have worked against the agricultural sector in New Zealand . 1 14
Eastern Europe
Since the early 1970s, Eastern Europe and the former U.S.S.R. had been a major source of increased demand for agricultural products, mainly cereals. but the refonns in these countries are likely to change this situation dramatically. Despite hav-
1 1 4For further detail� �cc Sandrcy and Reynold� ( 1990).

©International Monetary Fund. Not for Redistribution
I AGRICULTURAL TRADE POLICIES]
ing more arable land per person than Western Europe, Eastern Europe and the former U .S.S.R. as a group had become major net importers of agricultural products because of both lower productivity and much higher losses in the food distribution system.
As reforms in Eastern European economies take hold, agricultural exports are likely to increase. The initial exportable surplus has come from reduced demand as food subsidies have been cut back, but after a short lag, there should also be a significant supply response. 1 15 While initial conditions vary across countries, the experience of China and Viet Nam suggests the agricultural sector can have a strong and relatively quick supply response to market-based reforms. Hungary, for example, which has been a grain exporter to other Eastern bloc countries in the recent past and to much of Europe in the prewar period, could again return to world markets. The implications of this for world markets depends on the responses of other countries; if barriers to agricultural products remain, increased exports from Eastern European countries will place further downward pressure on world prices for food products, thereby weakening the reform efforts of a broad range of countries. Mounting surpluses in Czechoslovakia have resulted in a plan to subsidize farm exports. The move toward trade in convertible currencies between the former members of the CMEA has also reduced regional exports as the United States and EC are able to offer the Commonwealth of Independent States generous credit terms for their agricultural exports.
Developing Countries
As with the industrial countries, the trade and trade-related aspects of the agricultural policies of the developing countries are complex. In general, however, the policies of many developing countries have resulted in a net bias against agriculture, although this has been reduced in the context of recent structural adjustment programs. Continued progress in this direction is necessary to enabJe developing countries to take advantage of market opportunities. Developing country exporters would gain from the liberalization of agricultural trade by industrial countries, mainly from the liberalization of temperate products but also from liberalization in tropical products. Reductions in direct and indirect export subsidies by industrial countries and domestic reforms in developing countries would enable food importers to improve their self-sufficiency in food. The liberalization of developing countries'
115A �ignificant exportable surplu� ha� been predicted by a number of authors. for example. Center for Economic Policy Research ( 1990).
56
direct support for agriculture should be coordinated with the rest of their structural adjustment programs to avoid increasing the negative effective rates of protection on agriculture.
The biases against agriculture resulting from exchange rate and industrial protection policies in developing countries up to the mid-1980s have been significant. In a recent study, Krueger, Schiff, and Valdes ( 1988) examined the net effects of direct and indirect policy interventions on export crops and food crops. In the case of export crops, the net effect of policies was highly negative at minus 40 percent. For food products, the positive direct support did not offset the negative indirect effects of other policies; the net effect was minus 6 percent. However, upper-income developing countries, especially Malaysia and Korea, have tended to give their import-competing agricultural sectors more positive support. If these countries are excluded, the average net impact of policies on food crops in the remaining countries was strongly negative, minus 22 percent.
The net effect of policies was derived from direct and indirect support. Direct support was taken as the difference between domestic producer prices, net of explicit taxes, and world prices at the official exchange rate; in 1980-84 for export crops and food crops this averaged minus 1 1 percent and plus 2 I percent, respectively (Table A40). For export crops, the negative support was due to export taxes and excessive margins retained by state trading entities; for food crops. high domestic producer prices and input subsidies for materials and credit contributed to the positive support. Indirect support was calculated as the divergence between the official exchange rate and the exchange rate that would have prevailed under well-functioning markets with free trade, plus the effects of protection for the industrial sector, and was estimated to average minus 29 percent in 1980-84.
Since the mid- 1 980s, most developing countries have undertaken important structural adjustment programs that have addressed many of these problems. There have been significant reductions in the taxation of exports, and steps have been taken to correct misaligned exchange rates, and to improve the targeting of food subsidies. Progress has also been made, although of a more limited character, in reducing the protection for the manufacturing sector in many of the low-income developing countries. 1 16 A reduction in the biases against agriculture is important to enable developing countries to take advantage of liberalization by industrial countries, as domestic economic problems have at times con-
1 16Tradc reforms by developing countries are discussed in Section V.

©International Monetary Fund. Not for Redistribution
Reform of Agriculture
strained the supply response by developing countries. For example, Brazil, a large sugar producer, has recently had to import sugar and has been unable to meet its quota allocations for sugar exports to the United States. In this connection, however, the reduction of the direct support for the agricultural sector should be coordinated with the reform of industrial policy. As shown in the case of New Zealand, welfare gains are likely to be reduced if agriculture is liberalized ahead of a more highly protected industrial sector.
A strong domestic food industry has often been recommended as an important element for diversifying the productive structure of developing countries, but it is important that this be achieved efficiently. The volatile nature of earnings from their export crops results in problems for developing countries with the management of their economies and foreign exchange flows. Since export price stabilization schemes have not generally proved successful, an alternative is a more diversified agricultural sector. 1 17 The programs supported by the Fund and the World Bank have sought to aid the agricultural sector by reducing the biases against it, both direct and indirect, while Bank projects have contributed to improved infrastructure and information services. Some reports on this problem have stressed the importance of fostering increased domestic food production capacity with the aim of self-sufficiency. 1 1s While direct positive support through import restrictions on agricultural products may produce a quick supply response in the protected products, the efficiency of such production is often low. Also, strong net positive support for import-competing agriculture, in the presence of net support for industry, is likely to increase the bias against export-oriented agriculture.
The Reform of Agriculture
Rationale for Agricultural Support
The rationale for agricultural support is made along three main lines: ( l ) agriculture provides some important externalities or noneconomic benefits that need to be supported; (2) support can influence other countries' policies directly or can be a bargaining chip in trade negotiations; and (3) as discussed immediately above, mainly in the case of developing countries, direct support is needed to preserve the sector that is adversely affected by indirect biases against it from industrial and exchange rate policies.
• •7The example of the Australian wool reserve price scheme discussed above is bul the latest example of failure.
• •suN-PAAERD ( 1 990}.
57
Noneconomic justifications for agricultural support are based on the view that free markets would not achieve some goals that are considered to be socially desirable. These goals include food security, the preservation of small family farms, a certain type of landscape, and a certain regional pattern of development-especially to avoid the centralization of populations.
The need for food security in the basic crops has been strongly argued by Japan, Korea, Switzerland, and the Nordic countries. While it is clear that food is a necessity, it is important to distinguish between food security and self-sufficiency. Food security could be achieved through stockpiles and diversified supply contracts with other countries rather than by self-sufficiency. Japan, for example, is highly dependent on many imported commodities in addition to food, such as energy and inputs for agriculture, and has secured relatively stable sources of supply for these commodities. Compared with other essential commodities, the sources of food exports are very diverse so that alternative supplies are generally available in case of an embargo. Hostilitjes need to reach the stage of a blockade before there may be an appreciable effect. 1 19 Also, the best strategy for self-sufficiency during an embargo may not be self-sufficiency during normal times since intensive farming can degrade the quality of farmland. 120
Other noneconomic reasons, such as support of the family farm, regional development, and the natural environment and traditional landscapes, should also be scrutinized to find the most efficient means of achieving these goals . 12 1 The experience of the EC and the United States has shown that market price supports mainly benefit large farmers and those in the highly productive regions. To the extent that farm size and regional goals are strongly desjred, carefully targeted income supports not related to production, but directly to the goal, should be used. Indeed, the preference for small farms may reflect the more fundamental desire of retaining a certain population pattern in some regions. Regional objectives may be better supported by providing infrastructure and leaving the market to decide whether agriculture, industry, or services should develop in that region. Intensive farming resulting from high support prices has a very damaging effect on the natural environment
119Hufbauer. Schou, and Elliolt ( 1990). conclude that, in general, embargoes have not been very successful.
120see Winters ( 1 990). 121An addilional justification for intervention in agriculture
is to stabil ize farm incomes, but a pure income stabilization scheme would result in a zero level of support over lime. This is not the case with support policies in most industrial countries.

©International Monetary Fund. Not for Redistribution
I AGRICULTURAL TRADE POLICIES I
owing to high levels of pesticide and fertilizer use. 122 Payments for farming, including those decoupled from production levels, create an incentive for farming compared with alternative land uses, including grazing, forestry, and recreational uses. Many of the marginal farmlands in remote areas are ill-suited to farming, which has degraded the quality of the land. Direct incentives for conservation uses as in the United States and the proposed reforms of the CAP are second-best policies; a reduction in direct incentives for farming would be more efficienl.
The tactical rationale for support is relevant for both large and small countries. A large country may choose to intensify its subsidies to influence the offending policies of another country; for example, the United States has attempted to direct the EEP against the EC's export subsidies. While this strategy may have increased the market share of the United States and increased the pressure for the reform of the CAP, the effects on smaller third countries need to be considered. Evidence suggests the increase in the market share of the United States has been at the expense of smaller nonsubsidizing exporters (Table A26). Some smaller countries have high levels of support, despite an internationally competitive agricultural sector, for example, Canada. In some of these cases, support has been justified as a "defensive" strategy against price swings amplified by protection and export subsidies in other countries.
Studies of the Gains from Liberalization
Liberalization in Industrial Countries
Recent estimates in studies confirm that the economic costs of agricultural support policies are high. Aside from the actual value of the transfers, the burden to taxpayers and consumers of support policies is reflected both in terms of static welfare losses, measured by partial equilibrium (or single sector) models, and the loss of competitiveness of the more efficient sectors from the support of the less efficient sectors and the resultant higher real wages (in terms of world prices), as analyzed by general equilibrium models. In all these models the costs of agricultural support policies are generally measured by complete liberalization: this is distinct from the impact of a possible Uruguay
122Anderson (1991) cites evidence on the correlation between chemical fenillzer use and support levels. In 1985, Japan. Korea, and Switzerland used 375-440 ki lograms of chemical fertilizers per hectare of arable land under permanent crops. Austria. the EC, and Norway, used 200-300 kilograms; the United States, 94 kilograms; Canada, 50 kilograms; New Zealand, 30 kilograms; and Australia. 24 kilograms.
58
Round agreement that may involve only a partial liberalization.
The models that focus on the response of the agricultural sectors across countries to liberalization are useful in analyzing the effects of support policies on prices for agricultural products and trade flows. Table A41 shows the latest estimates of the price effects from various models. Overall there would be a significant rise in the world prices of most agricultural products, especially those that now have high rates of domestic support, such as dairy products, sugar, and meats. The results are less clear-cut for cereals. One group of models (the Tyers and Anderson ( l ) and the Krissoff, Sullivan, and Wainio (USDA) models) shows that there would also be a significant increase in the price of cereals, while another group (the Moreddu and Huff (OECDMTM), Tyers and Anderson (2), and Zeitz and Valdes models) suggests that there would be price falls. 123 In general, the studies have also assumed that policies of Eastern Europe and the former U.S.S.R. will remain unchanged from the base period, that is, this group will remain a net importer. Policy reforms by these countries, as noted above, should eventually reduce their net import demands, with the effect of reducing prices compared with those prevailing in the 1980s.
These models of agricultural markets show substantial gains to consumers and taxpayers, as a result of liberalization, that are significantly greater than the costs to producers. One study shows, based on support levels in 1986/87, that complete liberalization would result in a net welfare increase of $35 billion (Table A42). 124 Producers would lose $66 billion but consumers and taxpayers would gain $104 billion from complete liberalization. Since an agreement in the Uruguay Round would not rule out nondistorting supports, some of the producer losses could be offset by transfers that would leave the net benefits roughly unchanged.
The impact of agricultural liberalization is also important for the rest of the economy. One model, the OECD's WALRAS model, estimates that OECD income could rise by about 1 percent, $72 billion in 1988 prices and exchange rates, which is significant in comparison to agriculture's 3 percent share of GDP. It suggests that agricultural output would declme by about 1 4 percent for the OECD and by 19 percent and 24 percent for the EC and Japan, respectively. Output in the nonagricultural
123Studies are reponed in Table A41. To a large extent these ditrerenccs reflect different views about the impact of production controls, especially the U .S. set-aside.
124This base period is useful because it is the most recent used by such studies and i t is close to the base period being discussed in the Uruguay Round. However, it was a period when support levels were very high.
©International Monetary Fund. Not for Redistribution
Reform of Agriculture
manufacturing sectors would increase, especially in the EC and Japan, with increases of 2-4 percent . In terms of cost per job "saved" in agriculture the WALRAS model suggests that this would vary from about $ 1 3,000 in Japan, to $20,000 in the EC and the United States, and $ 100,000 in Canada. 12s
Liberalization in Developing Countries
The effect of liberalization on agriculture in developing countries depends greatly on their individual economic policies. Many agricultural exporters would gain substantially, with the amount increasing with the degree of structural reform in their economies. Food-importing developing countries would roughly break even in terms of their agricultural trade balance if they passed through the full value of the price increases. Further liberalization of developing countries' agricultural and industrial policies would produce very significant gains.
The importance of a reduction in support levels in industrial countries for most developing countries is highlighted by the results of some multicountry models (Table A41 ). Their baseline scenarios show that the agricultural trade balance of all developing countries combined would increase substantially.126 Latin America and Asia, where there arc major food exporters, gain very substantially. The results are less clear for North Africa and the Middle East where the gains are smaller but are only negative in one of the four studies presented. The loss in sub-Saharan Africa comes from the model using a 1981-83 base period. Models using more recent base periods show this region gaining.
Two models designed to analyze the effects of industrial and developing country liberalization are Tycrs and Anderson ( 1992) and Krissoff, Sullivan, and Wainio ( 1 990) . 127 Their alternative scenarios assume developing countries liberalize their own economies by completely removing distortions affecting their agricultural and industrial sectors and realign their exchange rates to market clearing levels. These assumptions result in an improvement in the agricultural trade balance for all developing countries of about twice that in the baseline scenarios and is positive for all regional groups. The sustained implementation of structural adjustment programs that have been undertaken by most devel-
tHBurniaux and others ( 1990). t26The ba�eline scenarios assume that tncrea�es in world
prices arc passed on to consumers and producers. an appropriate response to a permanent change in the price of traded goods
t27Thc model re�ults are shown in Table A41 a� A-T (I) and (2) and USDA (I) and (2). The ba:.elinc scenarios are de:.ignatcd C I ) and the ahernative scenanos are designated (2).
59
oping countries is likely to mean that the impact of industrial country liberalization is closer to that shown in the alternative scenarios.
These results underscore the importance of industrial country liberalization for supporting the reform efforts of developing and Eastern European countries. The liberalization of the agricultural policies of the industrial countries, especially improved market access, is important to current and potential food exporters, to enable them to support their liberalization programs and to restore their growth on an efficient and sustainable basis. Major increases in net supply from Eastern European countries and the Commonwealth of Independent States, without improved market access in industrial countries for all countries, will only add to the intense trade conflicts in this sector. Liberalization should not only be in the temperate food products but also in tropical products and should seek to reduce the escalation of tariffs and nontariff barriers on such products. Such products are important for a broad range of developing countries. including those that import significant amounts of food.
Approaches to the Reform of Support Policies
Three broad approaches to the reform of agricultural policies are widely discussed. The first is based on nonmarket intervention to restrict domestic supply while retaining import restrictions to maintain high support prices. The second would allow production to be sold at roughly world market prices, thus obviating the need for import restrictions and export subsidies. but provide general direct income support to compensate fanners for lower prices. The third alternative is similar to the second but income support would be targeted to achieve specific objectives after il has been determined that the optimal method to attain the noneconomic goals is indeed a subsidy.
Nonmarket Intervention
Proponents of this approach to reform note the problem of excess supply in agricultural markets and advocate overcoming it by restricting supply by means of direct controls. In conjunction with import restrictions this approach can maintain a high domestic support price, which is effectively paid for by consumers rather than by the budget; this enables farmers to claim that they are earning their living from the market rather than from ·'government handouts." The volume of subsidized exports would be determined by the severity of the supply controls. Proponents point to GATT Article Xl:2(c). which permits the use of import restric-

©International Monetary Fund. Not for Redistribution
I AGRICULTURAL TRADE POLICIES I
tions to enable the operation to supply controls on a like product. Recent GATT panel reports have restricted the applicability of this provision, but many countries want the applicability of Article Xl:2(c) to be broadened. t28 Market access would be negotiated and set in terms of quotas at levels that could be above the current ones. Proponents of specific provisions for food security also advocate some modification to the GATT to permit import restrictions for this purpose.
The main problem with this approach is that it maintains current inefficiencies and thus can inhibit further reform. t29 The high support prices under this approach are paid by consumers, while large producers are able to obtain most of the benefits from this system. In addition, the high marginal return on production induces excessively intensive production that results in high levels of pesticide and fertilizer use that has damaging environmental consequences. While quotas could be set at levels that are attractive to some exporters, especially because these may also benefit from the rents, they do not fully address the rights of all potential exporters, especially those currently reforming their economies and that have yet to realize their full supply potential.
Generalized Income Supports
Generalized income supports also create market distortions, although they are less severe than those created by market price supports. In the above survey of recent developments in support systems. it was observed that some form of direct income support had been adopted by countries seeking to improve the efficiency of their agriculture while maintaining the income levels of farmers. This includes the United States, Canada, Sweden, and the EC Commission's proposal for the reform of the cereal sector of the CAP. In all of the above cases, except Sweden, the income supports are generalized; typically, the subsidy is calculated per unit as the difference between a "target price" and the market price. Thus, they may be considered production or farming subsidies as they are either related to past, present, or future production or a factor of production (often land) and require the recipient to be engaged in the production of crops or a particular crop. t30
128For example, the EC, Canada, the Nordic coumnes, Japan. and Korea. The restricted applicability of this provision arises because the import restrictions have to be on the product subject to the supply controls, or a like product. The problem in Article XI for the protection of the dairy sector is that the supply controls are on milk production but the import restrictions a re on processed dairy products.
129For a fuller discussion see OECD ( 1990b). 130QECD (1990b).
60
Since this form of support does not require border protection, the cost to consumers is eliminated and the support is funded entirely from the budget. Budgetary spending will increase substantially, as was the case in the United States and is expected in the proposed reform of the CAP. This increase can be limited by land set-asides and from second-round increases in world prices as export subsidies and production are reduced. Explicit export subsidies would not be required, but income supports under the current schemes would be paid on exported production. t3 t However, as noted in the case of the United States, generalized income supports can have a significant production-enhancing effect compared with no supports, because they enable farmers to operate at higher levels of average costs, are based on farm area, and are linked to the production of specific crops.
Targeted and "Pure" Income Supports
The problems of the production-enhancing effect and high budgetary cost of generalized income support should be addressed efficiently through better targeting of the support to desirable noneconomic factors rather than the use of supply controls. Compared with market price supports, income supports can be targeted to achieve certain objectives and to foster desirable noneconomic benefits. Reducing the relationship of these supports to production, factors of production, and farming activities, as well as the duration of the supports mitigates the impact on production. One role of income supports is to compensate farmers for their loss of the distorting market price supports, but there is no reason to do this in perpetuity. The cost and the production-distorting effect could be reduced if payments are made only to current farmers on the basis of current farm size and possibly only for a transitional period; Sweden has adopted this form. Attractive early retirement schemes are also useful in restructuring farms that would not be viable at world prices when a large proportion of the farm population is close to retirement age. as in the cases of Japan and the EC. While targeted income supports may not be the most efficient means, they can also be used to promote regional development.
Concluding Comments
A decision on the refom1 of the CAP has acquired a highly visible position, and it is important that such a decision reflect the role of the EC in the
lll[n lhe Uruguay Round, whether income supports paid on exported produclion will be classified as export subsidies is an issue.

©International Monetary Fund. Not for Redistribution
Reform of Agriculture
international trading system. Initial reactions by some EC agriculture ministers have focused on the high budgetary costs and the inefficiencies that may result from higher support levels per unit of output directed to small farms. Solutions to reduce budgetary costs proposed by some EC members entail continued market price supports bolstered by supply restrictions. These would, however, give rise to the problems noted above. Lower rates of support for large farms through the operation of the setaside scheme that reduce the budgetary cost have been criticized as promoting inefficient production methods. However, it is unlikely that the roughly 15 percent margin in unit levels of support for small farmers will create an incentive for inefficient
61
farms, as the cost advantages of large farms typically exceed this margin. Further improvements in the targeting of income supports or reduced unit levels of support are the most efficient ways of reducing the budgetary costs.
The proposed system of generalized income supports for growers of cereals and oilseeds, while an improvement on the current CAP, would have production distortions comparable to support systems in the United States and Canada. As noted earlier, all these direct income support systems entail significant production distortions. Thus, it is essential that support levels are reduced substantially and market orientation in agriculture is increased in all industrial countries.

©International Monetary Fund. Not for Redistribution
-------�1 Vll �--1 --------
Issues for the 1990s
[lJ n some respects the issues for the 1990s remain those of the past two and even three
decades-agriculture, steel, textiles and clothing, subsidies, nontariff barriers, etc. Progress in these areas depends on the outcome of the Uruguay Round, which is expected to have an important bearing on the full integration into the multilateral trade system of the developing and Eastern European countries. Meanwhile. new problems have emerged in response to changes in the world trading environment, which relate to the increased integration of the world economy through the globalization of investment and production and the effects of this on the relative importance of trade in the economy, the geographic organization of production, and the way countries compete in world markets. These forces were behind the inclusion of new issues (services, investment, and intellectual property) in the Uruguay Round and, to some extent, they explain the increased resort to regional arrangements, in the absence of relevant multilateral rules in the new areas. 1 32
The complex interrelations among transnational firms, which invest and produce globally, have broadened the scope of policies that affect trade, foreign investment, and international competition and raised issues concerning the relevance of traditional trade policies and the appropriateness of GATT rules. The use of trade policies to pursue environmental objectives has also created new challenges for GATT and the global economy. These issues are on the trade policy agenda for the 1990s.
Integration of Developing and Eastern European Countries into
the Multilateral Trade System
The experience of the past decade has amply demonstrated the linkages between openness, technological advance, and economic growth, and this has encouraged many developing and the Eastern European countries to deregulate their economies, liberalize their exchange and trade systems, and promote foreign investment. To bear fruit, these
"2Fckctckuty ( 1991 a).
62
efforts will depend on two interrelated elements: the ability of the countries themselves to persist with their reform efforts and greater access to foreign markets, particularly those of the industrial countries. Security of access to foreign markets for developing and Eastern European countries is also linked to their fuller participation in the GATT system. For the Eastern European countries thi!> involves renegotiating the conditions of their membership to reflect the greater market orientation of their economies. 133
The review of trade reforms programs indicated that many developing countries need to move beyond the initial stages of trade reform toward completing trade regimes that rely mainly on pricebased measures and that yield a basically neutral incentive structure. For them and for Eastern European countries, the effectiveness of the substantial exchange and trade reforms already in place will depend on further domestic reforms to develop product and factor markets that foster competition and the allocation of resources based on a realistic relative price structure. In this process greater openness to foreign investment would facilitate privatization, the transfer of technology and knowhow, and the development of competitive industrial and agricultural sectors.
Improved access to world markets is essential for the success of policies aimed at increasing efficient resource allocation. This will depend importantly on a comprehensive agreement in the Uruguay Round, where the major impediments to the exports of developing and Eastern European countries are under negotiation. Liberalization in these areas is likely to be slow, however, considering the long transition periods contemplated in any agreements on sensitive sectors. 134 Industrial countries. from
I "The Czech and Slovak Federal Republic and Yugoslavia acceded to GATT as market economic�; Poland. Hungary, and Romania acceded to GATT under �pccial provisions: Bulgaria. an obscrvcr to GATT since 1967. applied to accede to GATT in 1986. Poland and Hungary have taken Mcps to renegotiate thc1r Protocob of Accession.
I"'Whllc the immediate benefits of a Uruguay Round agreement could be small. the longer-term beneficial effects arc expected to be substantial Some c\limatcs of the potential gatns from a successful Round were reviewed in International Monetary Fund ( 1990c). pp. 74 76.

©International Monetary Fund. Not for Redistribution
Regional Arrangements
their side, look for concessions by developing countries in specific areas of interest to them, namely, services, trade-related investment measures, and intellectual property rights. In contrast to previous GATT rounds, they also seek more secure access to developing country markets, particularly those of the dynamic Asian economies. Although the immediate tangible benefits of a Uruguay Round agreement to developing and Eastern European countries may be small, the strengthening of the multilateral trade rules and their enforcement would be crucial for the outward-oriented adjustment strategy these countries are pursuing.
For Eastern European countries, access to industrial country markets has become more critical because of the collapse of trade among former CMEA countries. As discussed in Section VI, industrial countries have accommodated this to some extent by dismantling restrictions on Eastern European exports and extending MFN treatment and GSP privileges in most cases. The EC is also negotiating Association Agreements with the Czech and Slovak Federal Republic, Hungary. and Poland that would provide for free trade in most industrial products and somewhat more limited access in sensitive areas: agriculture, textiles, clothing, steel, and coal. At the same time, the collapse of Eastern European exports to the former U.S .S .R . has been aggravated by the extension of tied aid and export credits by industrial countries to the former U .S.S.R., including to finance agricultural exports from the former German Democratic Republic.
The longer-term challenge of integrating the Eastern European countries into the world trade system is expected to involve substantial structural adjustment for Western Europe in particular, given its close geographic and cultural ties to Eastern Europe. This could have adverse consequences for other countries depending on the policy responses of Western European countries, especially those of the EC. 135 Adjustment pressures will increase in those sectors that are already heavily protected, but offsetting this is the opportunity to expand exports of goods (particularly capital goods) and services to Eastern Europe. Resisting these structural changes through protectionist policies would reduce the potential benefits the world economy could derive from the opening up of Eastern Europe. Even more, it would jeopardize the effectiveness of financial resources channelled to these countries and their own efforts to create competitive market economies. Such resistance could take the form of pref-
JJSThcse issues are discussed in Coli ins and Rodrik ( 1991). Havrylyshyn, and Pritchett (1991), and Junz (1991). The first two studies provide empirical estimates of the potential impact of the restructuring of Eastern European economies and their patterns of trade.
63
erential access to Western European markets for Eastern European countries at the expense of competing suppliers (both developing and industrial countries), or access could continue to be denied in trade-sensitive areas. While Western Europe may be most directly affected by the opening of Eastern Europe, the same considerations apply to other industrial countries, which need to accompany financial aid to Eastern European and developing countries with improved access to their markets. In this connection, it has been estimated that if industrial countries eliminated all their tariff and nontariff barriers the level of real national income of the developing countries would rise by 3 percent of GDP, equivalent to approximately twice the amount of official development aid extended annually by the industrial countries. t36
Regional Arrangements and the Multilateral Trade System
The increased resort to regional trade arrangements is viewed by many as a cause for concern; others view it as a natural consequence of the regional integration that has already taken place both formally and informally. In any event, it is widely believed that regional trade groups-de facto or de jure-are here to stay. These developments raise the question of whether regional trade arrangements are likely to hinder or support the open, multilateral trade system.
The GATT permits preferential trading arrangements provided that substantially all trade between members is liberalized within a reasonable length of time and that barriers to trade with nonmembers are not raised. These provisions aim to avoid the proliferation of discriminatory arrangements, but in practice they have been weakly enforced and have not prevented the formation of numerous regional trade arrangements during the past forty years that do not fully conform to Article XXIV. A review of the experience with regional arrangements among industrial countries suggests that up until now they have not hindered the process of multilateral liberalization. The compatibility of regional trade arrangements among industrial countries with the multilateral trade system can be attributed to their outward orientation. These arrangements have generally been characterized by high levels of integration and relatively low levels of protection against third countries in most areas of trade. Under such
J36Finger ( 1989), pp. 17-18. This e�timate mea�ures the static gains from the more efficient use of existing resource� and changes in the terms of trade. bur excludes possible improvements in efficiency stimulated by a more open trading system.

©International Monetary Fund. Not for Redistribution
ISSUES FOR THE 1 990s I
conditions, countries gained from greater competition within the region as well as exposure to foreign competition. 137 The obvious exception is the EC's adoption of the CAP, which has sheltered the agricultural sector and built up resistance to multilateral liberalization. In other sensitive areas, the need for consensus within the EC may also slow the speed at which nomariff measures can be phased out.
The more recent regional initiatives have been defended by those involved on the grounds that they permit greater liberalization among like-minded countries than would be possible in a multilateral forum, and that they address the need for stronger or new disciplines in areas of interest to participants. Nevertheless, countries are well aware of the limitations and risks in this approach, especially the potential for trade diversion to outweigh trade creation; the loss of bargaining power and the security provided by the multilateral trade system for countries outside free trade areas; trade warfare among regional blocs; and the diversion of effort away from multilateral trade negotiations. The greatest risk seen in the trend toward regional blocs is the potential for fragmentation and interregional conflicts if the Uruguay Round failed, again underlining the importance of the Round for the stability of the world trade system.
Regionalism is not a substitute for the multilateral trade system. In particular, there are limits to the regional approach to liberalization in the most difficult, heavily protected sectors: agriculture, textiles and clothing, and steel. It is widely believed that the problems in these areas can only be adequately addressed within a multilateral framework, in part because of the greater scope for a reciprocal exchange of concessions but also because disciplines on subsidies and other practices that distort trade and investment would be less effective if implemented only at the regional levcl.
Whether regional trade arrangements hinder or support the multilateral trade system will depend on how closely they conform to Article XXIV and whether remaining trade barriers to exports of nonmember countries can be kept low. To minimize the adverse effects on third countries, it has been suggested that members of regional trade arrangements (free trade areas or customs unions) go beyond the requirements of Article XXIV by reducing their trade barriers. In this context, one advantage of a free trade arrangement over a customs union is that members of the former can liberalize trade without reaching a consensus among member countries.
131Rcgional arrangement� among developing countries have been less successful in fostering development objectives and economic integration owing, in part. to incomplete internal liberalization and the failure to reduce high levels of protection
64
Australia, New Zealand, and Sweden provide recent examples of countries in free trade arrangements that have continued to lower tariff and nontariff barriers against third countries, thereby reducing the potential for trade diversion.
Globalization of Investment and Production
Growing economic interdependence among countries and the globalization of business strategies has increasingly blurred the distinction between national and foreign firms and shifted the focus of trade policy away from traditional trade policy instruments toward domestic policies that affect competition, investment, and innovation. With mobile factors of production, it is now more difficult for countries to mainrain restrictive business practices without impairing their ability to compete in world markets. At the same time, there is increased concern that countries' domestic laws and regulations may unduly limit the ability of foreign firms to compete on the same basis as national firms. Thus, the globalization process is increasingly confronting governments with the need to harmonize trade and trade-related competition. investment, and innovation policies.
Interrelation Between Trade and Competition Policies
Recognition of the interaction between trade and competition policies is not new. Indeed, these issues were covered in the Havana Charter for the International Trade Organization, and attempts have been made subsequently, in the OECD and elsewhere, to achieve greater harmonization of competition laws among countries and to reduce inconsistencies between trade laws and the principles of competition policy. The current focus on these issues, which is reflected in the communique of the OECD ministerial meeting of June 1991 and in extensive work programs under way in the OECD and elsewhere, stems primarily from the increased globalization of investment and production. which has raised questions about the relevance of traditional trade policy instruments that assume "nonnational" firms supply domestic markets primarily through trade. From the perspective of competition policy, it raises fundamental issues concerning the appropriateness of competition laws, which have been developed with domestic transactions primarily in mind. and on the role of governments in fostering competition.
Competition policy defines the rules that regulate competition among domestic firms. Trade policy, in a broad sense. regulates competition among firms

©International Monetary Fund. Not for Redistribution
Investment and Production
across national boundaries. These policies have similar objectives, in that they aim to promote competition and provide remedies for dealing with anticompetitive behavior. Conflicts between these policies and among nations arise for two main reasons. First, not all countries have well-developed competition laws and, where they do exist, there are differences in approach Uurisdiction, investigatory powers, and procedural rules and remedies) and enforcement. The effect of these differences may limit access of foreign firms to domestic markets directly or indirectly via their effects on inward direct investment, or may enable domestic firms to unfairly target foreign markets. Second, both GATT and national trade laws permit trade-limiting actions in certain circumstances, which tend to weaken competition in both international and domestic markets. In addition, the trade-promoting policies of one country may be in conflict with the competition laws of other countries.
Many of the issues discussed under the U.S . Japan Structural Impediments Initiative (SII) fall in the area of competition policy. These include issues related to enforcement of antimonopoly laws that could have allowed restrictive business practices, and restrictions on foreign direct investment. Problems associated with the use of antidumping duties (ADDs) and VERs are examples of issues that fall in the area of trade policy. These trade policy instruments tend to foster noncompetitive behavior by encouraging the formation of cartels and oligopolistic market structures, and the use of restrictive business practices. t3s
Inconsistencies between trade and competition policies, together with the increased potential for these inconsistencies to cause conflict in an interdependent world, call for ( I ) a re-examination of GATT and national trade rules in terms of the principles of competition policy; and (2) an examination of how competition laws affect international trade.
Trade rules in particular need of review include remedies to deal with anticompetitive trade practices (e.g., antidumping and countervailing laws, and laws to protect intellectual property rights), remedies to deal with injury to domestic industries from imports traded competitively (e.g., Article XIX of GATT, VERs, and other gray-area measures), export promotion policies (subsidies), instruments used to pry open foreign markets (e.g., Section 301 of the U.S. 1974 Trade Law), rules of
IJSVERs might be classified as restrictive business practices. particularly when they involve industry-to-industry agreements. Their classification above as a trade policy instrument reflects their frequent use as surrogate "safeguard" measures (instead of Article XlX of GATT) and as substitutes for antidumping duties.
65
origin, and local content rules. The extent to which deficiencies in trade rules are remedied as a result of the Uruguay Round will need to be assessed at the end of the Round.
In the area of competition policy. issues that need to be re-examined from a trade angle include the appropriate economic and geographic definition of the "market"; the criteria applied in assessing the impact on market structures of mergers and acquisitions (both nationally and across borders); and the impact on international trade of restrictive business practices including intrafirm agreements (e.g . . transfer pricing) of multinational enterprises. In addition, the exemption from most competition laws of import and "pure" export cartels needs to be re-examined. 139
One approach to achieve greater harmonization of competition laws, which is being used in EC 1992, involves the prior harmonization of a minimum number of essential regulations; mutual recognition by member countries of regulations that are not harmonized; and factor mobility. 140 As factors of production will likely move to locations with preferred regulatory systems, this will put pressure on national authorities to adopt preferred systems and thus result in a convergence of such policies among EC member states. Despite its appeal, this approach is not considered feasible at a global level or even among all OECD countries at this stage because the necessary conditions, including, in particular, free labor mobility, are not in place.
Competition and trade authorities in a number of countries suggest that the first order of business should be the establishment of competition laws in all countries based on agreed principles, and greater uniformity in enforcement of competition laws across countries. This would provide a better basis than currently exists for a greater convergence of these laws. l n their view, the stepped up efforts in this area in the OECD could facilitate this process.
Issues Related to Trade and Investment Policies
In an open world economy, the trade and investment decisions of firms are closely integrated. The decisions of firms to invest overseas are either factor-driven (access to materials, technology, lower-cost tabor) or policy-driven (investments
IJ9To a degree, the implementation of competition laws has been modified in some countries to accommodate the realities of the global marketplace, but the analysis and remodeling of competition laws from the perspective of trade policy remains to be done.
140'fhis approach is considered more feasible than a "global competition policy," which would require prior harmonization of all competition taws and a supranational competition authority.

©International Monetary Fund. Not for Redistribution
! ISSUES FOR THE 1990s I
directly influenced by national policies). For firms, investments that are policy-driven rather than factor-driven represent a second-best response to impediments or incentives that lead to an inefficient allocation of resources. 1 4 1 This was recognized by the inclusion of trade-related investment measures and investment incentives (under the Subsidies Code) in the Uruguay Round. It is also evident in the efforts of countries to establish more neutral and transparent investment rules through bilateral trade and investment treaties and bilateral and regional trade and investment agreements .
The growing importance of foreign direct investment (FDI) in achieving and maintaining international competitiveness in world markets and in the diffusion of technology has brought into sharper focus a wider range of policies that can distort trade and investment flows and inhibit competition. Such measures affect access to foreign markets, for either goods or investment, and the conditions under which foreign-owned firms compete with national firms. For example, concerns and disputes have grown over trade measures that distort the form and extent of investment and trade flows. These include VERs, antidumping and countervailing measures, local content rules, rules of origin, and regional trade arrangements. Investment to circumvent actual or potential instruments of protection or to ensure future market access distorts the allocation of resources and decreases the share of output that is traded compared with what would be traded in the absence of protection; 142 such investment has become a major source of trade friction (anticircumvenrion laws and transplants). Ideally, protection should be reduced; meanwhile fewer restrictions on factor mobility can reduce the welfare losses owing to the immobility of goods.
Domestic policies affecting investment flows and the way firms compete have also taken on greater importance. These include policies that inhibit foreign investment and competition indirectly through structural impediments, such as cross-corporate ownership relations or differences among countries in merger and acquisition laws and their implementation; prohibitions on investments in sensitive sectors; restrictions on the right of establishment that effectively limit investments in service sectors; and "strategic" policies that raise barriers to entry in research consortia, or otherwise limit the transfer of technology. All these measures are perceived to tilt the playing field and have become a growing source
'4'McCulloch (1991). McCulloch also identifies a third motivation for investment: border-driven investments designed to capture the benefits of being multinational rather than being in a specific location. It should be noted that policies that effectively correct for market failures or externalities would improve resource allocation.
142QATT (1990a) , p. 4 1 .
66
of friction among trade partners. This is increasing pressure on governments to seek regulatory convergence in areas affecting trade and investment decisions.
The ongoing work in the OECD to strengthen the provisions and enforcement mechanisms of the National Treatment Instrument and the Liberalization Codes for capital flows and invisibles could form the basis for multilateral negotiations on an investment accord in a wider forum that would aim to establish clear rules governing the right of establishment (market access) and national treatment and include effective mechanisms for dispute settlement and enforcement. The aim would be to develop more neutral and transparent trade and investment rules to ensure that investment and trade decisions are unaffected by the existence of national borders, thereby maximizing the efficiency gains from an open trade and investment regime.
Issues Related to Innovation and "Strategic" Trade Policies
Innovation (or technology) policies cover a range of government interventions that aim to assist firms in developing and adapting new technologies for commercial uses. These policies are based on the view that the ability to develop and adapt new technology, that is, to innovate, is a key determinant of national competitiveness in manufacturing. The "new" trade theories have provided the intellectual justification for pro-active innovation policies. In contrast to traditional trade theories, which explain the pattern of trade based on countries' relative factor endowments (comparative advantage), the new theories rely on imperfect competition and economies of scale to explain the fact that most trade occurs among countries with similar factor endowments and is dominated by intra-industry trade; in this kind of world, it is argued that countries can create "competitive advantage" through innovation policies. For example, in industries where there are dynamic returns to scale (learning-by-doing), being there first and having access to foreign markets matter. Table 1 7 compares some of the familiar concepts from traditional trade theories with those associated with the new trade theories.
Two basic justifications for government intervention are derived from these theories. One is that in oligopolistic industries that enjoy monopoly profits, government support can deter production by foreign competitors and shift excess profits to national firms. 143 The other is based on the existence of mar-
14�This is the ·'profit-shifting·· model of Brander (I 985), pp. 83-100. Its policy conclusions have been shown to be quite sensitive to the assumptions (no retaliation) and parameters, casting doubt on its practical application.

©International Monetary Fund. Not for Redistribution
Investment and Production
Table 17. Old Arguments in New Cloth?
Old
Comparative advantage: countries gain by specializing in the production and export of goods in which they have a comparative advantage based on their relative factor endowments or relative costs. Trade is mostly interindustry.
Optimal tariff: a large country can improve its terms of trade by imposing a tarifl', which induces foreign suppliers to lower their prices.
Perfect competition: entry unlimited because start-up costs arc low.
Constant returns to scale.
Infant industry: market failures prevent development along lines of potential comparative advantage.
Imperfect capital markets lack the foresight or depth to finance inve�tments with positive discounted present values.
Externalities cannot be appropriated by pioneer firms that create intangible benefits.
ket failures (i .e. , capital market imperfections or externalities). As a practical matter, it is not possible for governments to determine ex ante if the conditions exist to shift profits through intervention or how trade partners will respond to such beggar-thyneighbor policies; capital market imperfections are also difficult to identify and correct. 144 With regard to externalities, there is ample evidence that research and development and high-technology industries generate positive externalities that cannot be fully appropriated by firms. Under these conditions. private markets unaided will underinvest in precompetitive research and development, as well as basic research. The best policy response would be a tax or subsidy directed at the source of the externality if it could be identified and measured, and an effective instrument designed-all difficult tasks. Whether a country could raise its national income from such policies would depend on whether the externalities were national or global in scope and whether the resources drawn from other sectors would be more effectively used. 145
Government policies to support innovation include provisions for research consortia, subsidies for research and development and sunrise industries, access to intellectual property, government procurement, the weakening of competition rules to support national champions or strategic alliances,
144Grossman ( 1990), pp. 1 12-14. 145For a discussion of these issues see Krugman ( 1987).
67
New
Competitive advantage: with rapid technical change, economies of scale and scope, and learning-by-doing, countries can gain by producing and exporting goods in which they have a competitive advantage that is created not endowed. Trade is moSLiy intra-industry.
Profit-shifting: in highly concentrated oligopolistic industries, a subsidy to entry can deter production by foreign competitors and shift excess profits to the home country.
Imperfect competition: entry limited by large fixed startup costs and scale economies that limit the number of firms that can profitably be active in an industry.
Dynamic scale economies arise from learning-by-doing, which reduces unit costs within the firm as output accumulates over time.
High technology industry: market failures and imperfect competition limit the ability of the private sector to profitably develop high technology applications.
Imperfect capital markets: the private costs of funds exceed their social benefit because asymmetries of information result in adverse selection.
Externalities in the creation of knowledge that spill over beyond the firm cannot be appropriated.
restrictions on foreign investment in strategic sectors, and restrictions on the foreign sales of goods embodying new technologies. In each of these areas. there is scope for conflict between innovation, trade, and competition policies. The Tokyo Round Codes cover some of these policies, such as subsidies and government procurement, and the Uruguay Round is dealing with others (intellectual property and investment measures), but awareness of the need to agree on rules of the game is growing. In the case of subsidies, for example, there is no agreement among countries on when the subsidization of basic and precompetitive research ends and direct industrial subsidization begins. 146
International rules governing innovation policies based on free market competition would imply. inter alia. research consortia open to foreign as well as domestic firms, support for generic research and development that is widely diff.used, and competition rules that balance considerations of market power against the need for alliances to pool resources and share the risks of research and development. With regard to trade policies, in industries characterized by imperfect competition and economies of scale, the benefits of trade liberalization have been shown to be even greater than under perfect competition.147 Thus, the presence of imper-
'46See OECD ( 1990a). Part 4, for a review of issues and policies related to government assistance to industrial research and development.
t47R ichardson ( I 989).

©International Monetary Fund. Not for Redistribution
I ISSUES FOR THE 1 990s
feet compettuon further strengthens the case for maintaining a multilateral effort toward greater trade liberalization.
Trade and the Environment
In recent years, environmental concerns have taken on transnational and global dimensions and increased the scope for conflicts between enviro�ment policies and trade policies. This is a�parent m the number of trade disputes related to the tmpact of environmental regulations on trade and in environmental concerns over the prospects of trade liberalization at the regional and multilateral levels. The environmental issues raised in connection with the proposed NAFTA are the most recent examples of the latter. Environmentalists arc concerned that trade liberalization contributes to the degradation of the environment by reducing standards to the lowest common denominator and thereby encouraging the exploitation of resources at an uns�stainable r�te and the migration of "dirty" industnes to countnes with lower environmental standards. On the other hand trade officials are concerned about environment�! policies that are motivated by protectio� and about the use of trade policies to pursue envtronmental goals at national and international levels. 148
In principle. the goals of an open, wo�ld trade system, which aim to promote the effictency of resource use through specialization in areas of comparative advantage, need not conflict with those.of environmental policy, which focus on the sustamable use of resources and pollution control. A host of practical problems emerge, however, when environmental externalities are transnational or global in character and countries differ in their environmental preferences. These relate to the ?esign. of policies to achieve environmental goals, t ncludmg the proper role of trade policy. . . . Many of the problems involved tn reconctltng trade and environmental objectives arise because the prices of internationally tra�ed goods and services do not fully reflect the environmental costs of their production and consumption or .disposal. Environmental policies aim to internaltze these
14HEnvironmental policies that are motivated by protection seck to offset the cost advantages other countries might enjoy because of differences in environmental standards. Trade policies used to achieve national environmental goals usually involve expon controls and import ban�. with ?r without co':"plementary domestic measure:.. At the. lnternauonal level. discriminatory trade measures have been mcluded as enforcement mechanisms in international environmental agreements (e.g . • the Montreal Protocol Concerning the Protection of the Ozone Layer and the Base I Convention on the Control of Transfrontier Movements of Hazardous Wastes and their Disposal). Trade mea�ure!> have also been used to impose one country's environmental preferences on another country.
costs through various forms of intervention including the assignment of property righ�s: environmental regulations and standards. substdtes and tax�s. trade measures, and the use of marketable penmts and emission charges. While price-based measures can achieve environmental goals at lower cost and provide incentives for innov�tion, gover!"me�ts rely primarily on less efficient d1rec.t regulall?n, mcluding trade measures. Poorly d�s1gn�d environmental policies can lead to trade d1st?rt1ons that are not justified in terms of the en�t�onmental benefits achieved. Similarly, trade pohc1es are seldom the best instruments to achieve environmental goals. 149
Environmental issues were not explicitly included in the Uruguay Round agenda� however. several provisions of the GATT and the Toky.o Round Codes and proposals related to these provisions under consideration in the Round could come into play in relation to the efl'ects of environmental measures on trade and the use of trade measures for environmental purposes. These include the Subsidies Code, which defines countervailable subsidies; the Standards Code, which deals with technical barriers to trade; proposed sanitary and phytosanitary regulations; and Article XX, which provides for exceptions to GATT rules for measures "(b) necessary to protect human, animal or pl�nt life or health . . . (g) relating to the conservatiOn of exhaustible natural resources . . ." The proposed improvem�nts to the .Toky? �ound Codes, which aim to clanfy underlytng pnnc1ples and procedures will not fully address possible conflicts betwee� environmental policies and trade policies, and it is expected that these issues will be taken up in a comprehensive way after the Uruguay Round.
The challenge is to develop a policy framework that fosters environmentally sustainable growth and development while maximizing the welfar� gai�s derived from free international trade. Th1s wtll require a multidisciplinary approach to ensure that environmental objectives are scientifically �ased and that policies achieve environmental goals m an efficient manner and with the least distortion to international trade. Apart from GATT, work on these issues is under way at the OECD, UNCTAD, and other forums. In particular, at the June 1991 ministerial meeting, the OECD ministers called for the further analysis of the links between trade and the environment and the development of policy guidelines to protect the environment and preserve the open multilateral trade system.
68
1-'9Sce Low and Safadi ( 1991) for a di�cu��ion of the design of environmental policies and the interaction between trade policy and environmemal policy. In some cases. trade mea�ure� may be needed for effective enforcement. for example. a prohibition on the use of toxic substances.

©International Monetary Fund. Not for Redistribution
Appendix I
The GATT System
rTil ecent activity in the General Agreement on Ll\J Tariffs and Trade (GATT), in part, has been influenced by negotiations in the Uruguay Round. Resort to the GATT's dispute settlement mechanism has been relatively frequent, but implementation of panel findings, in some cases, has been linked to the Round's results; GATT surveillance was strengthened as the result of the Round's midterm review; and there was a significant increase in GATT membership, possibly also reflecting, in part, the breadth of the negotiations. GATT membership now numbers 103 countries (Table A43), accounting for nearly 90 percent of world trade. In addition, 28 countries apply the GATT on a de facto basis, and most other major trading countries hold GATT observer status. Further, the Tokyo Round Codes, which clarify, extend, and enhance GATT disciplines in such diverse areas as subsidies and government procurement, have been accepted by virtually all industrial countries and an increasing number of developing countries (Table A44). The code disciplines, excepting government procurement, form part of the Round's negotiations, with a view that they will apply to the full membership upon conclusion of the Round. Government procurement is the subject of parallel negotiations.
This Appendix deals with recent GATT activities, looking specifically at the Sessions of the CONTRACTING PARTIES, 1 the work of the GATT Council of Representatives, GATT surveillance, GATT involvement with instruments of protection, and the Committee on Trade and Development, which is concerned with issues of trade interest to developing countries.
The Contracting Parties
The Session of the CONTRACTING PARTIES. which usually meets once a year, is the GATT's senior body. As an early result of the Uruguay Round it was agreed in April 1989 that the Session
'Individual GATT members are called Contracting Panics: each has a single vote in decisions to be taken. When members act, invariably by consensus, they do so as the CONTRACTING PARTIES.
69
would meet at the ministerial level at least once every two years; this reflects both the increasing importance of trade to international economic policy developments and the perceived need to improve the effectiveness and decision-making capability of GATT as an institution. It was the November 1982 Session, at the ministerial level, that found the multilateral trading system to be seriously endangered by, inter alia, protectionist pressures and an increasing disregard for GATT disciplines. Ministers consequently agreed to make determined efforts to ensure that trade policies and measures would be consistent with GATT rules and principles. This agreement paved the way for the 1985 Session to initiate the basis for launching the Uruguay Round in Punta del Este, Uruguay, in September 1986. At the most recent Session, held within a week after the December 1990 ministerial meeting failed to conclude the Uruguay Round, Contracting Parties reiterated their commitment to a successful conclusion of the Round. and set the stage for resumption of the negotiations by making explicit the general sense of lost opportunity that had permeated the closing days of the Brussels meeting.
The GATT Council of Representatives
In the period between meetings of the Session, the GATT Council of Representatives (from member governments, normally at ambassadorial level) meets about nine times a year to act on ongoing issues. Its recent agendas have been dominated by membership and dispute settlement matters, but it also has considered such diverse issues as the effects of German unification and the Canada-U.S. Free Trade Agreement. the relationship between trade and the environment, and questions regarding the continued appropriateness of a waiver that has allowed the United States since L 955 to use import restrictions on certain agricultural products.
Since Bolivia,
Membership
August 1990, seven governmentsCosta Rica, El Salvador, Guatemala,

©International Monetary Fund. Not for Redistribution
I APPENDIX I l
Macao,2 Tunisia, and Venezuela-have acceded to the GATT. In addition, membership requests from Algeria, Bulgaria, the People's Republic of China. Honduras, Mongolia, Nepal, Panama, and Paraguay are in various stages of consideration, and Viet Nam is exploring the possibility of joining the GATT, as is Taiwan Province of China. The former U.S.S.R. was granted GATT observer status in May 1990; at the time, it announced that it sees this as a step toward membership, but several Contracting Parties, including Japan and the United States, made clear that acceptance of a Soviet accession request will hinge on progress in its building a market-based price system, consistent with GATT principles. The establishment of the Commonwealth of Independent States and changes in the economic regimes obviously will affect the future relationship with GATT as well.
Further, Poland is in process of renegotiating its Protocol of Accession to reflect the changes toward the greater market orientation of its economy. Accordingly, Poland seeks to replace its present commitment to a specific rate of expansion of its imports from GATT members with acceptance of the full GATT disciplines. including the usual schedule of bound tariffs3 on which GATT accession is normally based. The absence of a bound tariff schedule is making it difficult for Poland to participate in tariff negotiations and could limit its market access opportunities.
Similarly. Hungary has taken steps toward renegotiating its Protocol. It seeks an elimination of the special provision in its Protocol, including its right to use bilateral import measures vis-a-vis other Contracting Parties and vice versa, and Hungary's waiver from its GATT obligations regarding trade with the members of the (former) Council of Mutual Economic Assistance. The normalization of Hungary's GATT status can be expected to result in the withdrawal of the U .S . nonapplication (since 1973) of the GATT to Hungary. Although the United States grants Hungary most favored nation (MFN)4 trading status. it does so on a bilateral basis (which can be withdrawn unilaterally).
2Aithough the People's Republic of China will resume the exercise of �ovcreignty over Macao in December t999. it ha� �tatcd that Macao will remain a free port and a separate customs territory and may decide it:. own economic and trade policies. This autonomy in trade relations allow� Macao. as it doe� Hong Kong (which became a GATT member in April 1986). to have �eparate status as a GATT Contracting Party.
)To bind a tariff is to make a GATT legal commitment not to raise the rate above a specified level; provisions exist for renegotiation of bound rates.
4The most-favored nation (MFN) clause IS a fundamental principle included in GATT Article I, whereby any privilege or concession granted by one contracting party to GATT to a product of another contracting party will be unconditionally granted to the like products of all other contracting parties.
70
The new GATT members followed a trend. starting with the Mexican accession in 1986, of lowering and binding most of their tariffs and, in some cases, of taking measures to liberalize nontariff barriers. Thus, Bolivia, Costa Rica, El Salvador, Guatemala. and Venezuela agreed to bind the entirety of their tariffs, joining Chile and Mexico as the only GATT members to have done so; Macao has announced that by early 1992 it would submit a schedule to bind its tariffs at an acceptable level, and Tunisia bound about one fifth of its tariffs. 5 In addition, Costa Rica will eliminate import surcharges, surtaxes, and quantitative restrictions by late 1994; Guatemala will eliminate its remaining quantitative restrictions by July 1994; Tunisia is to abolish jmport licenses on many products; and Venezuela will continue with its present program of removing import prohibitions, restrictive import licensing requirements and other quantitative measures, with the goal to eliminate them completely by 1995.
Dispute Settlement
This subsection deals with dispute settlement under the GATT (normally handled within the context of Lhe Council), as distinct from that under the Tokyo Round agreements (which are discussed below under " Instruments of Protection").
The working of GATT'� dispute settlement mechanism is normally based on consensus. This has resulted at times in lengthy delay� in the establishment of dispute panels and in the adoption of their reports (with a single party able to block consensus). In 1 989, the Council decided on certain improvements in the dispute procedures. including the establishment of some firm time limits for the conclusion of various phases of the dispute settlement process. 6 In particular, the Council, unless it decides otherwise, is required to establish a panel no later than the Council meeting following that at which the request first appeared on the Council's regular agenda. However. the changes did not address problems in the adoption of dispute panel findings nor their implementation.
The year 1990 marked a substantial decline in the number of dispute panels established by the Council-one panel in 1990, compared with 5 in 1989 and L3 in 1988 (Table A45). Part of the explanation is that U ruguay Round participants were loath to spoil the negotiating atmosphere by trade
�The bindings were taken at levels between 17 percent and 52 percent.
6Thc new procedures are betng Implemented on a trial bas1s as from May I, 1989. pending changes negotiated during. and final adoption in the context of the conclusion of. the Uruguay Round.

©International Monetary Fund. Not for Redistribution
I The GATT System I
disputes with the anticipated conclusion of the Round, in December 1 990, near. This is supported by the fact that the failure to conclude the Round was followed by the almost immediate establishment of four dispute panels.
The greater automaticity under the new procedures appears to have made GATT's dispute settlement more effective. Seven dispute panels (four in L 991) have been established under the revised procedures; in three of these, panels were constituted despite serious reservations on the part of the party complained against (once the EC and twice the United States). Four of the seven panels have submitted their reports, of which two were adopted without difficulty and with no apparent problems regarding their implementation. 7 However, adoption of one of these reports, which found a U .S . countervailing duty on imports of Canadian pork GATT-inconsistent, became entangled with the dispute settlement mechanism of the Canada-U .S. Free Trade Agreement (FTA). The United States noted it was the latter mechanism that would determine whether or not U .S . law had been correctly applied. Canada, with wide support, argued that it was not a matter of whether the duty was consistent with U.S. law, but rather that it had been found in contravention of U .S . obligations under GATT. Once the dispute mechanism under the FTA found against the U.S. duty, the United States, in July 199 1 , agreed to the adoption of the GATT findings. Understandably, this has raised widespread concerns that the GATT mechanism is being undercut.
The improved record is in contrast to that for disputes brought prior to the implementation of the new procedures: Two panels established in 1985 and 1987,8 respectively, still need to start work (due to disagreement on panel members); in 8 out of the 15 panel reports adopted under the old procedures, findings have not been implemented to the satisfaction of some GATT members; and in five of these, the party complained against, in agreeing to adoption of the panel report, tied implementation to the outcome of the Uruguay Round. 9
The importance of an effective GATT dispute
7The report on the U.S. prohibition of certain fish imports under the Marine Mammal Protection Act has not yet been adopted by the Council.
�Concerning a Canadian complaint against U .S. restriction� on imports of certain sugar-containing products and a U. S. complaint about the EC's third-country meat directive, respectively.
'Yfhese cases involve findings that ( I ) aspects of U. S. patent protection arc not consistent with the GATT obligation to grant national treatment to imports; (2) Canadian restrictions on imports of ice cream and yogurt do not fall within the exceptions to the GATT for the general elimination of quantitative restrictions; (3) elements of the EC oilseeds subsidy program were inconsistent with its national treatment obligations and impaired expected market access opportunities under the EC's
71
mechanism is underscored by the fact that even a problem-ridden one has been able to diffuse significant trade differences. Thus, as the result of recent cases, both Japan and Korea have taken measures to liberalize beef imports; Japan has acted to improve market access for eight agricultural products as well as for wines and alcoholic beverages; the United States has introduced measures to bring its customs user fee and its sugar import regime into line with its GATT obligations; and India, Norway, and Sweden have moved to liberalize restrictions on certain agricultural products .
Selected Other Council Matters
In the context of German unification , the EC implemented transitional measures, as of October 1990 until the end of 1 99 1 , to govern imports of industrial products from Bulgaria, the Czech and Slovak Federal Republic, Hungary, Poland, Romania, the former U .S .S .R . , and Yugoslavia to the extent that they are for use in the former German Democratic Republic (GDR). In connection with these measures, which include tariff quotas, the EC requested a temporary waiver from its GATT MFN obligations. Concurrently, the United States proposed a working party to examine both the possible trade diversion effects measures and the possible trade consequences of the extension of the EC's Common Agricultural Policy (CAP) to the former GDR. While the United States saw the EC's waiver request as part of the proposed working party's agenda, the EC saw it as a pro forma matter. After informal consultations, the waiver was granted by an unusual rollcall vote at the December 1990 Session of the CONTRACTING PARTIES along with a decision to create a working party to examine the effects of the measures and to monitor adherence to the waiver conditions.
Following the entry into force of the V. S.Canada FTA on January I , 1989, the Council established a working party to examine the compatibility of the FTA with GATT provisions. The working party began its meetings in 199 1 , and the concerns raised by a number of members indicate that there may be no consensus on the full conformity of the FTA with the GATT. While there is a general view that the FTA follows the GATT closely, particular worries have arisen about its dispute settlement mechanism and its agricultural provisions. On the former, some members question whether parties to
zero tariffs on oilseeds; (4) that EC antidumping duties on certain products assembled in Japanese-owned plants located in the EC involved a discriminatory internal tax in violation of GATT's national treatment requirements; and (5) that Japanese border measures on, inter alia, starch and dairy products were not in conformity with GATT rules on quantitative restrictions.

©International Monetary Fund. Not for Redistribution
APPENDIX I
the FTA would feel more bound by dispute settlement findings under the FTA than under GATT. On agriculture, certain members felt that the perceived lack of full liberalization of trade in agricultural products with the FTA breached the requirement that a regional arrangement cover substantially all trade between its members.
The 1955 V. S. waiver has given rise to contention in the Council in 1990. The waiver has allowed the United States since 1955 to impose, under its Agricultural Adjustment Act, quantitative restrictions and special duties on certain agricultural products. For some time, a number of GATT members, particularly the EC, have felt that the United States has failed to adjust its agricultural policies sufficiently and that therefore the waiver is no longer justified. These views prevented the GATT working party on the 29th and 30th U.S. Annual Reports on the Agricultural Adjustment Acts from reporting consensus conclusions to the Council in 1990. 10 With the United States of the opinion that it was in full compliance with its obligations, the Council's consideration of the working party report, as well as of the 3 1st and 32nd U .S. Annual Reports on the Act, has been postponed, probably until after the Uruguay Round. In this regard, the United States' agricultural offer in the Uruguay Round implied readiness to eliminate the waiver, leading the EC to unblock adoption of a dispute panel report, finding an EC complaint against continued U .S . restrictions on imports of sugar and sugar-containing products unwarranted.
In May I 991 , in recognition of the heavy international environmental agenda leading up to the United Nations Conference on Environment and Development (UNCED), the Council held a structured discussion on the relationship between trade and the environment and the role that GATT would need to play. Participants generally were concerned about the widespread misconception that GATT was an obstacle to environmentally sound policies and agreed that this needed to be dispelled. They also concurred that GATT should not involve itself in the design of global environmental policies, but confine itself to its area of competence. Work would be needed, in particular, to ensure that trade measures taken to protect environmental standards were not simply a disguised form of protection. 1 1 Views on how the work should proceed diverged, how-
IOUnder the waiver, the United States reports annually on the Act.
1 1 ln this regard. the Council established a dispute �eulement panel in February 1991 that could set a precedent on the use of trade measures for environmental reasons: the panel is investigating a U .S. prohibition on imports of certain fish products under the terms of the U.S. Marine Mammal Protection Act. The panel found, in September 1991. that the U.S. embargo violates GATT's prohibition on quantitative restrictions. The
72
ever. Some, particularly members of the European Free Trade Association, look to the activation of a dormant working group on environmental measures, while others prefer to await the outcome of consultations on the terms of reference for the group. 1 2 In the interim, the Secretariat is to ( I ) set out the trade aspects of the preparatory work for UNCED and the history of GATT involvement in the area of trade and the environment, and (2) prepare an inventory of trade measures taken for environmental protection reasons as notified to the GATT.
GATT Surveillance
The surveillance functions of the GATT over trade policies and measures have been strengthened significantly since 1989. At that time the Council began its reviews of members· trade policies and practices under the Trade Policy Review Mechanism (TPRM) and, in that connection, charged GATT's Director-General to report annually on developments in the international trading system. Surveillance over specific aspects of trade policies and measures of individual members or groups of members is exercised through ( I ) the Committee on Balance of Payments Restrictions, which is responsible for multilateral surveillance of trade restrictions taken for balance of payments purposes, (2) in monitoring the Tokyo Round codes, and (3) in the Committee on Trade and Development.
Report by the Director-General
The Council, in April 199 1 , had before it the Director-General's second Annual Report on the status of the trading system, in which he noted that. although slowing down, the growth in the volume of world trade in 1990 had continued to outpace that of output; however, the weakening of the global economy risked intensifying defensive trade actions. Nevertheless, there had been notable positive developments in trade policy. including farreaching liberalization by Central and Eastern Europe and by some developing countries; and the growing and strengthened participation in the multilateral trading system by a number of countries as
maucr is now being discussed bilaterally between the United States and Mexico but ha� yet to be adopted by the Council.
12A GATT working group on Environment Measures and International Trade has been in existence since 1971; springing from the preparatory work for the United Nations' 1972 ··conference on the Human Environment." it was to examine upon request any specific matters relevant to the trade policy aspects of measures to control pollution and protect human environment. especially with regard to the application of the provisiOn of the General Agreement. taking into account the particular problems of developing countries. The group has never met.
©International Monetary Fund. Not for Redistribution
l The GATT System
evidenced by the recent stream of accessions and accession requests and the disinvocation of cover for import restrictions maintained under the GATT's balance of payments provisions. On the negative side was the temporary suspension of the Uruguay Round in December 1990. Although the negotiations had resumed in February 1991, major outstanding issues continued to present difficulties, including agriculture, services, tariffs, and rules. Other identified areas of concern were persistent trade frictions between the EC, Japan, and the United States, and recourse to antidumping and countervailing duty actions with protectionist overtones. Further, there was the need to guard against the risk of an introspective orientation of regional arrangements. The Director-General's overview met with widespread agreement. It is clear, however, that the Council's discussion of broad trade policy issues needs to evolve over time and, at this time, is inhibited on a number of points important to a thorough discussion by the ongoing Uruguay Round negotiations.
The Trade Policy Review Mechanism
The Trade Policy Review Mechanism (TPRM), established in April 1989, aims to make the trade policies and practices of each country under review explicit and to gauge their possible effects on both the country itself and the global trading system. The reviews, however, are not to judge whether a member's trade measures conform with its GATT obligations, that being the task of the dispute settlement mechanism.
All GATT members are subject to the TPRM, with the frequency of reviews varying from two years to six years according to the importance in world trade of the country in question. The reviews are backed by a submission by the country and a paper prepared independently by the GATT staff; the papers are published together with the substance of the discussions in the GATT Council. Since initiation of the reviews in December 1989 through mid- 1991, 17 members have been examined: all the traders on the two-year cycle (Canada, the EC, Japan, and the United States), as well as Australia, Chile, Colombia, Hong Kong, Hungary, Indonesia, Morocco, New Zealand, Nigeria, Norway, Sweden, Switzerland, and Thailand.
The first round of reviews already is contributing considerably toward transparency by clearly setting out existing policy measures and reasoning, which in turn provides the basis for informed discussions at a national and an international level. The TPRM also has focused attention on the widespread adoption of outward-looking, market-oriented trade policies as an integral part of structural adjustment that aims to improve the competitiveness of the econ-
73
omy; countries as varied as Australia, Chile, Colombia, Hungary, Indonesia, Morocco, New Zealand, Nigeria, and Thailand have chosen this economic policy path, switching from a previous bias toward protection and import substitution. In each case, a positive external environment was stressed as being necessary for the success of adjustment efforts. The reviews also have served to highlight the responsibility of the major traders in safeguarding and improving a liberal system. The relative openness of their economies was acknowledged, but each was subject to criticism. Thus, in the case of Canada, stress was laid on the lack of transparency in its multilayered tariff system. For the EC, emphasis was placed on the trade distortions stemming from the CAP, the harassment aspect of its use of antidumping actions. its widespread resort to bilateral trade restrictive agreements, and on the nontransparent nature of its national subsidies. With regard to Japan, concern was evident about its inclination to settle trade matters bilaterally, the lack of transparency in the administration of trade policies, the high level of support for agriculture, and the difficulty in penetrating its market. On the United Sraces, the review was marked by unease that it may have weakened its past strong commitment to the GATT and the multilateral trading system; this was reflected in the stress on the threat of unilateralism, the resort to measures, such as VERs, and the unilateral interpretation of multilateral disciplines, particularly in the context of antidumping investigations and duties. As to other large traders, both Australia and New Zealand were urged to bind more tariffs and to lower rates in areas of concern to developing countries, such as textiles and clothing. Norway, Sweden, and Switzerland were commended for their generally low tariffs, but criticized for their high levels of agricultural protection and tariff peaks in sensitive areas like textiles and (in the case of Switzerland) for the presence of cartels. Hong Kong drew praise for having essentially no trade restrictions, but was urged to increase its tariff bindings.
Balance of Payments Provisions
The GATT authorizes the use of trade restrictions for balance of payments reasons under Articles XII, for developed countries, and XVIII:B, for developing countries. On restrictions maintained under Article XII, full consultations must be conducted annually by the GATT Committee on Balance of Payments Restrictions. On measures maintained under Article XVIII:B, consultations are normally held under simplified procedures every other year. However, under the simplified consultations, the Committee must decide whether these suffice or whether an indepth (full) examination of the con-
©International Monetary Fund. Not for Redistribution
I APPENDIX I
cerned party's use of trade measures is required. Full consultations consider the overall macroeconomic situation of the consulting country, including its prospects and alternative means of adjustment; look at the member's restrictive system in some detail; and take into account external factors, including access to markets, that affect the country's balance of payments situation. Background documentation is supplied by the IMF to the Contracting Parties for all consultations and, in the case of full consultations. the IMF makes a statement assessing the balance of payments situation of the consulting party.
The use of the provisions under Article X l l by developed countries has declined steadily (Table A46). Czechoslovakia is the only country recently to invoke the Article-in early 1991-in connection with an import surcharge on consumer goods and foodstuffs.
ln contrast. Article XVIII: B has been used widely by developing countries and represents the most broadly applied exception to the GATT's general prohibition on the application of quantitative restrictions; some 80 percent of all such restrictions notified to the GATT are justified under the Article. However, since 1989. five developing countries have disinvoked their current use of Article XVlll:B. Argentina, Brazil, Ghana, and Peru did so while the external financial situation remained under pressure, as part of a wholesale lifting of restrictions in the context of national economic policies to remove market impediments; Korea revoked its use of the provisions under comfortable, external circumstances, as part of lengthy negotiations in the Committee in 1989, and is now lifting its remaining restrictions over an agreed time schedule.
Since early 1990, full consultations have been conducted with Czechoslovakia and Yugoslavia and consultations under simplified procedures, with Bangladesh, Egypt, Nigeria, the Philippines, Tunisia, and Turkey. The consultation with Czechoslovakia went smoothly, with the Committee in firm support of its economic transformation efforts. Czechoslovakia's use of the provisions was seen by many as being a model, in that the applied measure was price-based and to be removed within a preset time frame, with the intent to do so more speedily, if possible. The consultation with Yugoslavia also went forward in a sympathetic environment, with the Committee expressing understanding for Yugoslavia's difficult situation and support for its economic policies, commending the scope and pace of economic and trade liberalization efforts.
In the simplified consultations, it was agreed that Egypt, Nigeria, the Philippines, Tunisia, and Turkey would proceed to full consultations. This halted the previous trend of few departures from simplified
74
procedures for developing countries and partly reflects the view of many industrial countries that procedures need to be tightened, particularly to shrink the periods of application and to reduce use of non-price-based measures. Thus, while not denying the right of members under GATT to use trade measures for balance of payments reasons, developed countries have begun to stress their own right to examine such restrictions fully.
Instruments of Protection
Broadly, GATT recognizes tariffs as the only legitimate instrument of protection, although there are exceptions under which nondiscriminatory, nontariff restrictions may be maintained. GATT also allows countries, under certain conditions, to levy selective duties to protect domestic industries against subsidized or dumped imports. This section looks at various instruments of protection and developments in related GATT committees.
Tariffs
Tariffs in industrial countries have been reduced to minimal average levels in successive rounds of multilateral trade negotiations and a large proportion, often in excess of 90 percent, of their tariffs are bound. However, tariff reductions have been less pronounced in some sectors, particularly agriculture and textiles, and both tariff peaks and escalation (successively higher tariffs along the product chain) remain a feature in most countries. In many developing countries, average tariffs are considerably higher, at times at prohibitive levels, than in developed countries; moreover, although there are significant exceptions, a low percentage of their tariffs are bound.
The GATT Committee on Tariff Concessions, after overseeing the phased implementation of the Tokyo Round tariff cuts, continues as a forum for tariff matters, including the supervision of GATT tariff schedules. In recent years, much of the Committee's work has been related to the implementation, begun in 1988, of the new Harmonized Commodity Description and Coding System (HS). Replacing a variety of different and often inconsistent classifications, the HS provides customs and trade officials with an agreed definition of the content of tariff lines, facilitating both the conduct of, and negotiations on, trade. The HS has been adopted by 65 GATT members, accounting for some 95 percent of the trade of Contracting Parties.
Nontariff Measures
The use of nontariff measures (NTMs) has grown in importance since the late sixties, both in relative

©International Monetary Fund. Not for Redistribution
.................................. -{��T�h!e�G�A�T!T�S�y�s�te�m�l ................................ ...
terms, given the decline in tariffs, IJ and in absolute terms. Thus, in 1990, selected NTMs14 affected 18 .5 percent of the value of non fuel imports into 22 industrial countries-an increase of some 20 percent over the 1981 coverage ratio. IS Many of these NTMs are in the form of VERs t6 and other gray area measures that effectively bypass GATT's safeguard provisions.
Safeguards
GATT's main safeguard provision is Article XIX, which allows temporary restrictions on imports when domestic producers experience, or are threatened with, serious injury; the Article provides for compensation to trading partners affected by the restrictions. In practice. Article XIX has proved relatively ineffectual if recourse is measured against the rise of discriminatory, gray-area measures. In the period 1985-90, GATT members used the Article 15 times, bringing the number to 139 for the period 1950-90, while during the same period, the known number of discriminatory export restraint arrangements grew from 69 to 284 (excluding those under the Multifiber Arrangement (MFA)). 17 Since 1980, Article XIX has been invoked by industrial countries only, with one exception (Chile) (Table A47). As of the end of December 1990, 22 Article XIX measures were in force, of which 16 were for longer than three years.
Subsidies
The Subsidies Code, to interpret and apply GATT Articles VI, XVI, and XXIII, was negoti-
13The increase in NTMs may have largely oft"set the reduction of tariff barriers to imports into the developed economics. For example, it is estimated that the economy-wide tariff equivalent of U.S. NTMs on textiles. Meet. and automobiles in 1984 was about 25 percent. bringing protection to the level of the early postwar years. See de Melo and Tarr ( 1988).
14The measures include import deposits and surcharges. vari· able levies. quamitative restrictions (including prohibitions, quotas, nonautomatic licensing. VERs, and restraints under the MFA). automatic licensing, antidumping and countervailing actions, and price control measures.
15UNCTAD ( 1 990b). 16A typical VER i� discriminatory. in that it limit� the supply
of a particular type of exports by country. The GATT, which is concerned with governmental actions affecting trade. prohibits cxpon restraints under normal circumstances; when permitted, they must be nondiscriminatory and. in general, applied through duties, taxes. and charges. However. the involvement of governments in VERs is not always clear. Also. VERs do not always have firm market-sharing provisions; they may, for example. be in the nature of an export forecast and thus be cautionary in nature. For these reasons, VER� fall into a "gray area," in that there can be doubt as to their illegality under GATT. Further, signatories to the Tokyo Round code on Subsidies and Countervailing Duties seem to have acquired legal powers to negotiate VERs.
17GATT ( 1989a) and ( 1 991a).
ated in the Tokyo Round. The Code prohibits export subsidies on manufactures; for primary products it enjoins members to refrain from export subsidies that result in a "more than equitable share" of world export trade. Domestic subsidies are to be avoided to the extent that they have adverse trade effects. Offsetting countervai1ing duties can be imposed under the Code in the case of injury to domestic producers from imports of like products that benefit from subsidies (export or domestic). As of the end of 1990, the Code had 25 signatories, IS accounting for about 90 percent of Contracting Parties' merchandise trade.
It is widely agreed that the Code has shortcomings, including interpretative problems. Views differ on the definition, scope and measurement of subsidies, measurement of injury, and the breadth of application of countervailing duties. The differences include such basic points as whether for a subsidy to be actionable a financial contribution by government is required, how different types of subsidies are to be treated, and the definition of "primary" and "manufactured" products, "domestic industry" and "I ike products." There is also d isagreement about the application of the injury test in determining the need for countervailing duties: some members (e.g . . the EC) apply the test to all countries, whereas others (e.g., the United States) apply it only to signatories of the Code or w those that have entered into bilateral agreements to discipline subsidies.
The Committee on Subsidies and Countervailing Measures is charged with the oversight of the Code. For doing so, it depends on members notifying their relevant use of subsidies. Compliance with the notification obligation is sporadic, partly because of genuine data problems. but partly for defensive reasons. Thus, enforcement of the Code is foundering on nonsupport by the signatories, and trade frictions on subsidies have increased.
75
Nor has dispute settlement under the Code been very effective. Five of the six panel reports brought before the committee have not yet been adopted. as the consensus practice requires the consent of the party losing the case. The sixth report was adopted in the context of a bilaterally agreed solution to the dispute, with the report essentially limiting itself to an outline of the solution, but not coming to any findings. More recently, in May 199 1 , a panel was established to consider a U .S . complaint about the exchange rate guarantee scheme operated by Germany in favor of its civil aircraft manufacturing industry. The EC, though not objecting to the establishment of the panel, maintained that as GATT
·�The EC is counted as one when the number of signatorie� is given, unless otherwise indicated.

©International Monetary Fund. Not for Redistribution
I APPENDIX I
recognized trade in civil aircraft as a special sector, the proper forum for the dispute was under the Civil Aircraft Code. This has raised the more systemic point that action on a report in one forum may be held until parties see that they cannot do better elsewhere.
Dumping
The Tokyo Round Agreement on Antidumping Practices came into effect in 1 980. It interprets the provisions of GATT Article VI, which lays down the conditions under which duties (ADDs) may be imposed as a defense against dumped imports. At present, there are 25 signatories to the agreement, which is administered by the Committee on Antidumping Practices.
In some countries, antidumping actions are the most actively used trade policy instrument (tariffs, of course, are the broadest instrument). Despite a recent decline in the number of antidumping investigations, the broadening scope of such measures has become an important source of trade friction among Contracting Parties. In particular, the Antidumping Code, and its interpretation, has involved controversy over definition and measurement of both dumping and injury, and over the actual application of duties; problem areas also include the application of dumping in third markets, 19 the use of price undertakings in antidumping proceedings, and revision and termination of undertakings. Legislation by some countries to widen the coverage of antidumping duties has been a source of concern to trading partners .
An important recent controversy relates to "local content" arguments in antidumping cases: what determines whether a product is derived from local or foreign sources-factory residence or domestic value added? In June 1987, the EC adopted regulations stipulating that ADDs may be applied, under certain conditions, to products assembled in the EC but using imported parts as materials; this was to prevent circumvention of ADDs on finished products. On this basis, the EC Council in April L 989 imposed ADDs on certain electronic products produced (but largely assembled) by five Japaneserelated companies in the EC. Exports to the EC of similar products by the non-EC based affiliates of these companies were already subject to ADDs. The EC argued that these firms subsequently set up
19A GATT panel established in March 1987. at the request of the EC to investigate the Japan-United States agreement on semiconductors did not address the validity of prevention of dumping in third markets, but it did rule (in June 1988) that the type of measures taken by Japan to prevent dumping of semiconductors in third markets was contrary to the prohibition on quantitative restrictions on exports under the GATT.
76
assembly plants in the EC to evade the original duties. The EC held that the newly imposed duties only enforced compliance with the original ones and, therefore, fell within allowable GATT exceptions to assure, inter alia, that nothing in the GATT shall prevent a member from adopting measures to secure abidance by GATT-consistent laws or regulations (Article XX:D). Japan, in its first dispme settlement case against another GATT member, filed a complaint against the duties. The panel, established by the CounciJ2° in October 1988, found against the EC on the grounds that nothing in the GATT precluded action aimed at the avoidance of duties. The EC levies thus involved a discriminatory internal tax, contravening the requirement of national treatment for importS. The EC agreed to the adoption of the panel report, in May 1990, but noted that it would not consider amending its own legislation until the Uruguay Round had dealt effectively with the circumvention of duties (for which GATT provisions do not now exist).
More recently, there has been a notable increase in dispute activity in the context of the Antidumping Committee. The first dispute panel established by the Committee, in January 1989, found against U .S . ADDs on certain steel imports from Sweden; however, the report, which was submitted to the Committee in September 1990, remains unadopted.21 Late in 1990, the Committee established a dispute panel to examine a Finnish complaint against Australian duties on imports of Finnish power transformers and was informed of Canadian and Mexican requests for dispute settlement consultations regarding possible U .S . anticircumvention measures on duties on imports of color television components and of Mexican consultations with the United States on the latter's imposition of duties on certain cement imports from Mexico. This increase in dispute activity is not surprising in view of the growing perception that antidumping activity is being used defensively, possibly frustrating rather than fostering fair competition.
Government Procurement
The Agreement on Government Procurement, negotiated in the Tokyo Round, is administered by the Government Procurement Committee, which has 12 members. With the government and its agen-
ZOJapan filed its complaint under the GATT dispute mechanism (and hence in the Council) rather than that of the antidumping code as the EC had defended its dutie� under GATT and not within the context of the code.
HThe United States and others are of the view that the panel's specific recommendation. to eliminate the duty. runs contrary to the authority of the panel to draw only general conclusions (that U .S. legislation should be brought into line with its obligation; under the GATT and the code).

©International Monetary Fund. Not for Redistribution
I The GATT System I
cies the largest single purchaser in many countries, the agreement seeks to increase transparency in procurement laws, regulations, and procedures. and to ensure that such measures do not serve to protect domestic producers from international competition or discriminate among foreign suppliers or goods.
Much of the recent work of the Committee has been taken up with negotiations to improve and extend the coverage of the agreement. These negotiations, involving signatories only, are conducted apart from the Uruguay Round, but clearly are influenced by the dynamics of the Round. The first phase of the negotiations was concluded in 1988, with a lowering of the threshold value (above which procurement contracts must be open to bidding to the agreement's signatories) from SDR 150,000 to SDR 130,000, and an extension of the agreement's coverage to leasing contracts. Since then, negotiators have concentrated on increasing ( I ) the number of procurement entities subject to the agreement and (2) its scope to include services. By late in 1990, negotiating offers had been put forward by all major participants, with improvements and the formulation of a final package expected to be coming from further bilateral and plurilateral discussions. However, delay in concluding the Uruguay Round halted the momentum in the government procurement negotiations, which have made little headway since Brussels.
In only its second action on dispute settlement, the Committee established a panel in July 1991 to examine an EC complaint that a U .S. government entity had purchased equipment without following the required tendering procedures.22
Textiles and Clothing
Trade in textiles and clothing is subject to special restrictions under the MFA. The MFA was initially negotiated in 1 974 (to succeed the Short-Term ( 1961-62) and Long-Term ( 1 962-73) Arrangements on Cotton Textiles) and has been renewed three times. MFA IV went into effect in August 1986 and was scheduled to expire on July 3 1 , 199 1 ; i t was recently extended for 1 7 months, pending the results of the Uruguay Round, which are expected to include a phase out of the MFA.
Overall management of the MFA is in the hands of the Textiles Committee, made up of representatives of its 41 signatories and chaired by the Director-General of GATT. MFA members account for some 80 percent of world textile and clothing
22Thc first, adopted in May 1984. found against the EC on a U.S. complaint regarding the exclusion of value-added taxes from the contract price (effectively raising threshold values). a maltcr that the EC brought into line with the agreement in 1987.
77
exports (excluding intra-EC trade). While some 2 1 members maintain few, if any, restrictions, those implemented by others affect up to 50 percent of trade in the sector. The restrictions, in the form of bilateraUy agreed export restraints, constitute a major departure from GATT's central principle of nondiscrimination.
Recent activity in the Textiles Committee centered on the present extension, to the end of December 1992, of MFA IV. Initially, some exporters operating under restraints sought assurances that these would not be tightened during the extension period. Others sought a straightforward extension on the grounds that the appropriate venue for negotiations on the MFA was the Uruguay Round. The latter view held sway, as many MFA signatories thought that detailed negotiations on the extension could complicate the potential Uruguay Round agreement to gradually eliminate, or bring into GATT conformity, all MFA measures.
The Committee on Trade and Development
The Committee on Trade and Development (CTD) deals with issues of trade interest to developing countries. In particular, it examines how Contracting Parties put into practice Part IV of the General Agreement, which provides for differential and more favorable treatment for developing countries on a best efforts basis. The CTD also has primary responsibility for oversight of the Tokyo Round's Enabling Clause, which is the GATT's legal basis for MFN derogations for preferences to and among developing countries. The CTD, accordingly, monitors the implementation of the Generalized System of Preferences (GSP)-under which industrial countries acting individually grant preferential treatment, mainly in the form of lower tariffs, to developing countries-and, more recently, that of the Global System of Trade Preferences Among Developing Countries (GSTP).
Preoccupation of virtually all GATT delegations with work related to the Uruguay Round has kept the CTD's activity low key in the recent past. Its majn issues of concern have included graduation of certain countries from GSP schemes, country coverage of the GSTP, and credits and recognition in GATT (and the Uruguay Round) for unilateral trade liberalization by developing countries.
The Enabling Clause establishes the principle of integrating developing countries fully into the multilateral trading system-that is, the graduation of these countries from differential and more favorable treatment; however, the Clause does not lay down criteria for graduation. Therefore, some industrial countries, notably the United States, have incorpo-

©International Monetary Fund. Not for Redistribution
APPENDIX I
rated graduation aspects into their GSP schemes. This has resulted in some instances in removal of GSP benefits to a number of newly industrialized economies (NIEs), whose competitiveness was seen as no longer warranting special preferences. Developing country concern has centered on the fact that GSP schemes are to be nondiscriminatory (under a 1971 GATT decision and the Enabling Clause). However, with most developing countries now full participants in the Uruguay Round and ready to offer market access concessions in return for those from developed economies. the graduation issue may be less divisive. Rather, the focus of CTD debate has shifted from preferences under GSP to general market access questions in the context of the success or otherwise of the marketoriented, outward-looking policies adopted by many developing and Central and Eastern European countries. The CTD is unanimous on the need for improved market access, but most feel that the structure and extent of a possible improvement is a matter for negotiation in the Uruguay Round.
A related element in the debate on how to help assure domestic and external balance emerging from economic reforms is "credit and recognition" for unilateral market opening by developing coun-
78
tries. While the logic of credit is acknowledged. the how and when is still not defined. It is, however, tacitly agreed that credit should be considered only-in terms of market opening-if liberalization is made irreversible, by binding it in GATT: in this regard, nonbound liberalization could be "recognized" by temporary reciprocity by industrial countries. The airing of views on this issue in the CTD is recent, but any resolution will stem from actual negotiation in the Uruguay Round.
The CTD's concern about the GSTP involves the universaUty of its country coverage. The GSTP went into force on April 19, 1989 and now has 28 GATT members as signatories. 23 Because membership is limited to the Group of Seventy-Seven. some industrial countries and some non-Group of 77 developing countries, believe that the GSTP is at odds with the nondiscriminatory requirements of the Enabling Clause.
23Argcntina. Bangladesh. Bolivia. Brazil. Chile. Cuba, Egypt, Ghana. Guyana, India. Indonesia. Malaysia, Mexico. Morocco, Nicaragua, Nigeria. Paki�wn, Peru, Republic of Korea. Romania. Singapore, Sri Lanka. Thailand. Trinidad and Tobago. Tunisia. Tanzania. Yugoslavia. and Zimbabwe.
©International Monetary Fund. Not for Redistribution
Appendix 1 1
The Interface Between Trade and Competition Policies
� his appendix discusses some of the major L!J interactions between trade and competition policies. It aims to bring together some of the current thinking on these issues and is not intended to be prescriptive. A comprehensive analysis of the issues involved would require an in-depth review of the aims of competition policies, the legal principles underlying competition laws, and differences across countries in competition laws and their enforcement; trade theories and trade rules embodied in GATT and national legislation, as well as their implementation: and traditional and new theories of industrial organization. While a flavor of all issues involved is given, the paper focuses on interlinkages primarily from the perspective of trade policy. Future work could examine these interlinkages in greater depth from the perspective of competition policy.
Recognition of the fact that the effects of competition policies spill across national boundaries and that trade and competition policies are interrelated is not new; however, these spillover effects and interrelationships are now receiving increased attention. This is reflected in the communique of the OECD ministerial meeting of June 1991 and in extensive work programs under way in the OECD and elsewhere on these issues. The current focus on these issues primarily reflects increased tension and new challenges associated with the growing and rapid integration of the world economy through increased trade, but more particularly the globalization of investment and production and the associated increase in intra-firm trade and foreign sales and purchases of firms located abroad. 1
The continued integration of the world through trade and investment has not, in many countries, been accompanied by the structural adjustment nee-
10utward foreign direct investment (FDJ) by Group of Five countries expanded, on average. by 27 percent in real terms during the period 1983-89. or three times faster than merchandise trade Rows. Relative to the rate of growth of real GNP, the growth in FDI is about twice the rate that would have been expected, based on historical experience. l n the United Kingdom. France, and Germany. about one fifth of domestic sales of manufactured goods and over one fourth of exports are from foreign-owned firms; total sales by U.S. firms abroad arc five times U.S. exports (Julius (1991) p. 5).
79
essary to cope with increased competition. Thus, a number of industrial countries continue to protect declining industries and promote "strategic" sectors and "national champions" through nontariff and domestic measures. Such measures frequently conflict with competition laws of countries implementing these measures, as well as with competition policies of exporting countries.
The globalization of investment and production raises issues beyond those that have emerged, because of increased integration through trade. First, to the extent corporations choose to compete in foreign markets by establishment in those markets rather than through trade, their access to markets and the location of industry depends on foreign investment policies for new investment ("greenfield") and takeovers of existing assets (mergers, acquisitions, etc.). Regarding takeovers, the increase in merger activity and takeovers associated with EC 1992 and the extensive powers granted to the EC Commission under its New Merger Control Regulation have brought these issues into sharper focus. 2 Second, the emergence of the "global corporation ":I has blurred the distinction between "national" and ''non national" firms and has raised questions about the relevance of traditional trade policy instruments and rules that assume nonnational firms supply domestic markets primarily through trade and about the relevant criteria for analyzing foreign penetration of domestic markets and domestic penetration of foreign markets.4 From the perspective of competition policy, globalization raises fundamental issues concerning the appropriateness of national competition laws and the role of governments in fostering competition.
lThe number of mergers and acquisitions made by Europe's I ,000 largest firms-either within an EC member state. acros� EC frontiers, or internationally-increa�ed from 208 in 1984-85 to 383 in 1986-87 (Jacquemin and others ( 1990)).
3The term "global corporation" refers to multinational corporations that increasingly operate on the basis of a worldwide rather than a multicountry strategy (Os try ( 1990). p. I).
�This is traditionally done by relating data on imports and exports to domestic variable�. such as apparent con�umption and production. lt has been suggested that foreign sales and purchases of "domestic" firms may be a more relevant criteria (Julius ( 1991 )).

©International Monetary Fund. Not for Redistribution
APPENDIX 11
To provide perspective on the issues covered in this appendix, a few general observations would seem necessary. Many of the problems at the interface of trade and competition policy are, in a sense, problems of trade policy and could be resolved within the existing multilateral framework for international trade. lndeed, some of these issues are on the Uruguay Round agenda; success in the negotiations could go a long way toward resolving international conflicts and creating more competitive markets. It is recognized, however, that a number of the issues at the interface of trade and competition policies go well beyond the Uruguay Round agenda.:5 These include a growing divergence between the ·'nationalistic" objectives of governments and the "global" strategies of corporations;6 an inconsistency between "nationalistic" concepts underlying domestic trade and competition policies and the global concepts that are necessary in an increasingly interdependent world: 7 the need for a better understanding of the access problems created by various business practices; and unresolved issues related to the policy implications of new theories of industrial regulation and "strategic" trade theory. Progress in these areas will likely require substantial analytical and empirical work to get a better handle on the issues involved and their importance.
The rest of the appendix is organized as follows. The first part defines the aims of competition and trade policies, their interaction, the potential for conflict, and the broad implications of these linkages. The second summarizes previous and ongoing efforts to harmonize competition laws and to reduce inconsistencies between trade rules and competition policies and laws. The third discusses the specific nature of the conflicts between these policies with reference to a selected group of trade measures and restrictive practices that currently are a major source of trade friction. The last part outlines recent proposals for resolving conflicts in this area and describes major research under way in the OECD and elsewhere on these issues.
5QECD (1991), Fckctekuty (1991b). Graham and Richardson ( 1991 ).
6For example, "rules of origin" can conflict with "global" strategies.
7Qstry ( 1990). It has been suggested by a number of observers that global (not national) economic welfare ought to be given more priority in competition policy consideration�. For this reason, the exemption for export cartels and import cartels contained in most countries' competition laws should be removed (Goldberg and Ordover (1991), Barton ( 1990)). In cases where the impact on national and global welfare goes in the same direction. governments would likely agree to such a principle. In cases where it does not. this would seem possible only in the context of a multinational agreement.
80
Definitions, Aims, Sources of Conflict, and Implications
Competition policy defines Lhe rules that regulate competition among firms. Although views differ on the appropriate aims of competition policy8 and the role of government in achieving those aims,9 competition policy, in broad terms, seeks to promote the efficient functioning of markets so as to maximize the welfare of consumers. Competition laws cover trusts, monopolies, mergers and acquisitions. and property rights, and they are intended to curtail the abuse of market power through price discrimination, price fixing, collusion, and other restrictive business practices. Such laws basically have been developed with domestic transactions in mind, although the competition laws of some countries (for example, the United States and Germany) and the European Community (EC) do have an extraterritorial reach when the conduct of a foreign enterprise in a foreign country has some "effect" within the domestic territory. to
Trade policy, which includes various multilateral, regional, and bilareraJ trade agreements. as well as national laws, that give effect LO these agree-
SThe aims of competition policy have received considerable attention recently in the literature (�ec. for example. National Consumer Council (1991), Greer ( 1989). and Jacquemin and others ( 1990), and numerous references contained therein). Greer ( 1989) identifies five aims of competition policy covering goals related to efficiency; consumer welfare; the maintenance of competition as an end in itself; fair conduct: equity and distribution concerns; and political and social objective�. These aims are not unambiguous (for example, efficiency cove rs three elements-allocative. productive, and innovative efficiency-which are not alway� compatible) or necessarily consistent with each other. The priorities attached to each differ across countries and. within countries. across sectors. and over time.
9The traditional structure-conduct-performance (S-C-P) paradigm of industrial organization analysis emphasizes the role of government in fostering "competition" (as provided by decentralized market structures) to achieve allocative efficiency. The Chicago School. which rejects the S-C-P paradigm, believes that market concentration enhances efficiency and thus argues for a "smaller" competition policy (one in which governments only curb mergers that create monopolies or near monopolies and discourage blatant collusive restraints, such as horizontal price fixing) (Greer ( 1 989), pp. 1-3). The theory of "contestable" markets (a perfectly contestable market is one in which entry and exit are costless) suggests that governments can have it both ways; governments can protect the public and smaller firms from the threat of monopolistic behavior by large firms and. at the same time. allow larger firms enough freedom to meet the requirements of efficiency (Baumol and Lee ( 1991) p. 1). The laissez-fairc approach of the Chicago School is evident in recent approaches to antitrust enforcement in some countries. which take a more relaxed view of vertical mergers and joint ventures and apply minimal restrictions on the terms of technology licensing.
IOMatsushita ( 1988). p. 427.
©International Monetary Fund. Not for Redistribution
I Trade and Competition I
ments and other national trade objectives, in a broad sense, regulates competition among firms across national boundaries, although the codes and laws that regulate such competition are less comprehensive than those that regulate domestic competition. Competition and trade policies have similar roots in that both aim to promote competition and to provide remedies for dealing with noncompetitive behavior. Policies that promote freer international trade serve to sharpen domestic competition, and thus they reinforce the broad objectives of competition policy.
Conflicts between competition and trade policies and among nations arise for two main reasons. First, not all countries have well-developed competition laws, and, where they do exist, approach, jurisdiction, 1 1 investigatory powers, 12 procedural rules and remedies, 13 and enforcement differ. These differences may limit access of foreign firms to domestic markets directly or indirectly via effects on inward direct investment, or they may enable domestic firms to unfairly target foreign markets. Second, both GATT and national trade laws permit trade-limiting actions in certain circumstances, which may weaken competition in both international and domestic markets. ln addition, the tradepromoting policies of one country may conflict with the competition laws of other countries. Conflicts may also arise when countries have simiJar competition laws; for example, restrictive business practices that normally are actionable under competition law escape such action if they are taken under the "cover" of trade policy or government compulsion. 14
Many of the issues being discussed under the U .S.-Japan Structural Impediments Initiative (Sll) cover trade-related competition issues. These
1 1Under the "'principle of territoriality." most countries apply their laws to conduct that takes place within their territory regardless of the nationality of the pe rsons or firms involved. This principle has been extended in some countries (e.g .. the United States, Germany) and in the EC under the ··doctrine of effects"' and the concept of "enterprise unity" to cover conduct abroad that has an effect on domestic markets (OECD ( 1984). p. 122).
1 2National fac1-finding powers (e.g . . access to informalion), and the mode used to consider competition cases (administrative. judicial. or political) differ!> among coumrie� in large part reflecting differences in practices between civil and common law countries (OECD ( J984). pp. 123-24).
1�1n some countries. only governments can bring sui1�. while in other countries (e.g .. the United States) and the EC. private persons can do so (OECD ( 1984). p. 124).
'4Under the doctrines of ··sovereign Immunity." "'Act of State," and "Foreign Sovereign Compulsion.'' restrictive business practices that arc implemented under governmenl compulsion normally are not actionable under domes1ic or foreign competition laws.
81
include restncttve business practices and lax enforcement of competition laws, which may restrict competition directly, and restrictions on foreign direct investment, which may restrict competition indirectly. Problems associated with the use of antidumping duties (ADDs) and voluntary export restraints (VERs) are examples of competitionrelated trade policies. 15 These trade policy instruments tend to foster noncompetitive behavior by encouraging the formation of cartels, oligopolistic market structures, and the use of restrictive business practices. The specific nature of these conflicts is discussed below.
Inconsistencies between trade and competition policies, together with the increased potential for these inconsistencies to cause conflict in an interdependent world, call for (i) a re-examination of the GATT and national trade Jaws in terms of the principles of competition policy, and (ii) an examination of the relevance of competition laws for international trade.
Trade rules in particular need of review include remedies to deal with "unfair" trade practices (for example, antidumping and countervailing laws, and national laws 10 protect intellectual property rights); remedies to deal with import competition from "fair" trade (for example, Article XIX of GATT, VERs, and other gray-area measures); export promotion policies (for example, direct and indirect subsidies); instruments used to pry open foreign markets (for example, Section 301 of the U.S. 1974 Trade Law); and local content rules and rules of origin. 16
In the area of competition policy. issues that need to be re-examined from a trade angle include the appropriate economic and geographic definition of the "market" ; the criteria applied in assessing the impact on market structures and competition of mergers and acquisitions (both nationally and across borders): the impact on international trade of collusive behavior among domestic producers vis-a-vis foreign producers; collusive behavior among domestic and foreign firms; competition in
1�VERs might be classified a� restrictive busine�s practices. particularly when they involve industry-to-indus1ry agreements. Their classifica1ion above as a trade policy instrument reflects their frequent use by govcrnmems a� substilutes for "safeguard" measures (instead of Article XIX of GATT) and antidurnping and countervailing du1ies.
16Jn its narrowest sense, "unfair" trade refers to trade that takes place partly as a result of dumping and subsidies. while "'fair" trade refers to all other trade. In more general usage, however, the term "unfair" trade tends to be defined to include whatever the user unilaterally determines to be unfair. The distinction used in this paper between "unfair" and "fair'' trade is used purely for prcscntational purposes and does not imply endorsement of such distinctions.

©International Monetary Fund. Not for Redistribution
APPENDIX 11
production and marketing activities; and the activities of regulated industries. t7
Related to the above issues are the rules governing foreign direct investment and the conditions under which foreign firms operate in domestic markets. Domestic policies in these areas affect the access of foreign firms to domestic markets and the conditions under which they compete against domestic firms. Disciplines on trade-distorting investment measures are under negotiation in the Uruguay Round. Other concerns in this area, which have arisen in the context of the rapid increase in outward direct investment during the 1980s, have given rise to proposals to create a more comprehensive rules-based system for investment that would complement the GATT.
Past Efforts to Deal with the Interaction Between Trade and
Competition Policies
A number of attempts have been made in the past at the multilateral, regional, and bilateral levels to harmonize competition policies and to reduce conflicts between trade and competition policies. Most progress in this area has been achieved in the context of regional arrangements. 1 8
Multilateral Efforts
The first and most ambitious attempt to deal with interrelated trade and competition issues was contained in the Havana Charter ( 1945) for an International Trade Organization. Chapter V of the Havana Charter contained policies and principles to assist in preventing business practices that adversely affect international trade, restrain competition, limit access to markets, or foster monopolistic controls. 19 After the Havana Charter failed to obtain the necessary votes for ratification, a proposal was made in Economic and Social Council of the United
"Competition authorities have gone some way toward incorporating the realities or the global market place into competition law� and their enforcement (Goldberg and Ordovcr (1991)). For example, the U.S. Department of Justice's Antitrust Enforcement Guideline� for International Operations ( 1988) allow for tran�national competition in defining the market. assessing market dominance and entry and exit barriers. and calculating market shares. To the extent that trade policy has attempted to deal with the implication� of globalization (for example, Jaws to prevent circumvention of antidu:nping duties and the treatment or "transplants" under trade laws). such allcmpt� have tended to rc�trict trade and competition.
IIIThis section. for the most part. does not cover relevant GATT Articles and Codes or modification� in the implementation or national trade and competition law� to reduce contlicts in these areas.
1'1Jackson ( 1969).
82
Nations (ECOSOC) in 1953 to revive Chapter V as a separate instrument. The proposal was not accepted, however, because it did not receive the support of the United States or of a number of other countries.2° Similar, but unsuccessful, attempts were made in GATT between 1954 and 1 960. Finally, in 1960 the CONTRACTING PARTIES adopted a resolution that recommended consultations whenever a Contracting Party felt it was being harmed by restrictive business practices of firms from other parties. 21 Such activities were to be reported to the Secretariat; no such reports have been made to date.
Beginning in the L 970s, the United Nations continued efforts to develop harmonized international competition policies. In 1980, in line with the 1974 recommendations of a UN Group of eminent persons, "The Set of Multilaterally Agreed Equitable Principles and Rules for the Control of Restrictive Business Practices" (UNCTAD Code) was approved by the General Assembly. The Code is a set of voluntary guidelines that promotes the exchange of information and informal cooperation while leaving each country to devise its own laws. The Code deals with restrictive business practices, trade and antitrust issues, and the activities of multinational corporations, which are of particular concern to developing countries. The Code was reviewed at an UNCTAD conference in 1985. where particular attention was given to OECD analysis that pointed to the risks of antidumping legislatton being applied anticompetitively. 22
Within the OECD, discussions among members on restrictive business practices began in 1953.23 Subsequently, a series of Council Recommendations were adopted that provided the basis for cooperation on competition and trade issues. These include the 1976 Guidelines for Multinational Enterprises (MNEs); the September 1979 Council Recommendation Concerning Cooperation Between Member Countries on Restrictive Business Practices Affecting International Trade; the Revised Recommendations of the Council of May 1986; and the Recommendations of the Council of October 1986 for cooperation between member countries in areas of potential conflict between competition and trade policies. 24 The 1976 agreement contains vol-
20Jackson ( 1969). OECD ( I 984), and Barton ( 1990). 21Jackson ( 1969). p. 526. 22Barton ( !990). nrn I 953 the Organization for European Economic Coopera
tion (the predecessor of the OECD) establi�hed a Group of Experts on Restrictive Business Practices.
2•Thc I 986 Recommendations adopted by the Council resulted from a rcqucM to the Committee of Experts on Re�trictive Busine�s Practices by the 1982 OECD ministerial meeting to review the 1979 recommendation and. after consultation

©International Monetary Fund. Not for Redistribution
I Trade and Competition I
Table 1 8 . Indicative Checklist for the Assessment of Trade Policy Measures
I . What arc the expected direct economic gains to the domestic sector. industry. or firm i n question (technically. the increase in producers' surplus) and also what jobs are expected to be created or protected by the measures?
2 . What are the expected direct gains to government revenues (e.g., from tariffs, import licenses, tax receipts) or increased government costs (e.g . . export promotion. government subsidies. lost tax revenues)?
3. What are the direct costs to consumers owing to the resulting higher prices they must pay for the product in question and the reduction in the level of consumption of the product (technically, the reduction in consumers' surplus)?
4. What is the likely impact of the measure on the structure of the relevant markets and the competitive process within those markets?
5. ln the medium- and longer-term perspective, will the measure. on balance, encourage or permit structural adaptation of domestic industry leading over time to increased productivity and international competitiveness or will it further weaken and delay pressures for such adaptation? What will be the expected effect on investment, by domestic firms in the affected sector, by potential new entrants, by foreign investors?
6. What would be the expected economic effects on other sectors of the economy. in panicular. of firms purchasing products from. and selling products to. the industry in question?
7 . How are other governments and foreign firms likely to react to the measure. and what would b e the expected effect on the economy of such actions? ls the measure a response to unfair practices in other countries?
8. What are the likely effects of the measure on other countries? How can prejudice to trading partners be minimized?
Source: Organization for Economic Cooperation and Development ( 1984). p. 24.
untary guidelines dealing with issues related to dumping, subsidies, distribution and licensing, and conflicting requirements that may be imposed on MNEs as a result of different approaches by OECD member countries to law enforcement and jurisdiction, and it provides for consultation between member states before the OECD Committee on International Investment and Multinational Enterprises. The 1979 and subsequent recommendations encourage governments to take account of the impact of their practices on competition. and they contain provisions for notification, exchange of information, consultation, and conciliation (by the Committee of Experts on Restrictive Business Practices-now called the Committee on Competition Law and Policy) in the event consultation does not produce a satisfactory solution. So far, the conciliation provision has not been used. To further enhance the coordination of trade and competition policies, in April 1985 the OECD Council approved the Indicative Checklist for the Assessment of Trade Policy Measures, which had been developed jointly by the Committee of Experts on Restrictive Business Practices and the Committee on Consumer Policy, in consultation with the Trade Committee (Table 18).25 More generally, trade and competition
with the Trade Commillee, devise revised recommendations to strengthen cooperation in this area. A� a first respon�e to the 1982 Ministerial Council mandate. the Commillee on Restrictive Business Practices produced a report on Competition and Trade Policie.1. OECD, 1984. Part I of this report, consi�ting of an introduction. summary. and conclusions. was transmitted 10 the 1984 Ministerial Council as a background document.
:!5The approach was illustrated in a study on the co�b of VERs in the automobile sector (OECD ( 1987b)) and in a recent
83
issues are discussed in an interdisciplinary manner within the OECD by a number of committees including the Trade Committee, the Economic Policy Committee, the Committee on International Investment and Multinational Enterprises, the Consumer Policy Committee, and the Committee on Competition Law and Policy. The work of these Committees is to be further integrated as part of the expanded work program that the OECD has in progress on trade and competition issues.
Regional Efforts
Attempts to harmonize trade and competition policies have been taken within the context of various regional arrangements. These include the European Community (EC); the European Free Trade Association (EFTA); and the Australia-New Zealand Closer Economic Relations Trade Agreement (ANZCERTA). These issues are also under discussion in the U.S.-Canada Free Trade Agreement (FTA), in the negotiations between the EC and EFTA for the creation of a European Economic Area (EEA), in the negotiations among Canada, Mexico, and the United States to form a North American Free Trade Area (NAFTA), and in the negotiation of Association Agreements between the EC and a number of Eastern European countries.
comp rehensive repor1 prepared for the OECD on nontarifr'barricrs to competition (Goldberg and Ordover ( 1991 )). The results of the L 987 study arc summanzed in Kelly and 01hers ( 1988). p. 165. Further studies using this approach on antidumping duties and distribution-related barrier� to international competition are under way in the OECD.

©International Monetary Fund. Not for Redistribution
APPENDIX 11
The Treaty of Rome, which established the EC, contains the most comprehensive set of rules to ensure the effective functioning of markets among different countries and to minimize the scope for conflict between trade and competition policies. Articles 85 to 94 give the European Commission power to control anticompetitive practices affecting the common market. 26 In particular, noncompetitive behavior related to price discrimination and subsidies within the EC are covered by these articles and not by the EC's Antidumping and Countervailing Laws, which apply to nonmember countries. In addition, Article 1 13 of the Treaty of Rome provides for a common commercial policy, although exceptions have been made (under Article 1 15) for purely national measures. Although the Single European Act (EC 1992) is silent about trade and competition policy, it is understood that the Treaty of Rome will be applied in full after 1993. In particular, the Commission has stated that it will not permit exceptions under Article 1 15. and laws related to state aids (subsidies) are being enforced more strictly.27 In addition, the EC Merger Control Regulation (implemented in September, 1990) creates extensive new obligations for the notification of concentrations between large companies that meet certain threshold requirements. The extent of extraterritorial powers in the directive has the potential to create conflict between the Commission and other competition authorities. 211
With regard to EFTA, Articles 1 3 through 1 7 of the Stockholm Convention contain a set of competition rules covering government aids (subsidies), government purchasing practices, the right of establishment, and dumped or subsidized imports. To prevent dumping by companies of one EFT A member in the markets of other EFTA members, EFTA
26Anicle 85 deals with restrictive agreements by firms; Aniele 86 deals with abuse of a dominan1 position (monopolistic behavior); and Anicles 87-94 deal with subsidies and activities of public utilities.
271! should be noted. however, that the addition to the Treaty of Rome of Anicles 130f-g, which define Community responsibility for the promotion of technological developmenl, il> argued by some as justifying a more protectionist interpretation of other parts of the Treaty (National Consumer Council ( 1991)).
lM··The EC approach to competition policy is quite different from that of the U .S. Justice Depanment. In the United States. the Government must prove that a proposed merger would be amicompetitive before it may prevent it." In the EC. under the new Commission rules, "the burden will rest with the company to provide information to prove that its planl> would nor restrict competition .. (Julius (1991). p. 12). Under Anicle 24 (the socalled reciprocity clause) of the Merger Control Regulation. which requires the Commission to repon by September 1991, and periodically thereafter. regarding the treatment of Community enterprises under merger laws of other countries, third countries may come under pres�urc to alter aspects of their competition laws (Canada (1991). p. 20).
84
competitiOn rules include a "boomerang" provision. which provides for the re-export of products to domestic markets of producing firms.29 Unlike the EC, however, EFTA does not yet have a supranational body to enforce competition pol ieies within the free trade area.
With regard to ANZCERTA, Article 4 of the 1988 Protocol on Acceleration of Free Trade in Goods provided that, with the achievement of full, free trade in goods on July I , 1990, neither country would take antidumping actions against the other; rather, each country would apply its competition laws to anticompetitive conduct affecting transTasman trade in goods.30 To give effect to these commitments both countries amended their competition laws-the Trade Practices Act (Australia) and the Commerce Act (New Zealand)-effective July I , 1990 to extend prohibitions on the anticompetitive use of market power contained in both acts to cover the abuse of market power within transTasman markets. In addition. the competition authorities in each country were given new investigatory powers to obtain information and documents in the other country and the courts of each country were permitted to sit and take evidence (including by videolink) in each other's country.31
In the negotiations leading up to the establishment of the United Srares-Canada FTA . issues related to the interaction between trade and competition policies were discussed. Indeed a major motivation behind Canada's decision to negotiate this agreement was an attempt to shield its exports from "contingent" protection measures (antidumping and countervailing duties) in the United States. For its part. the United States was particularly interested in more effective discipline on the use of subsidies and measures to deal with subsidies and dumping. In the event, little harmonization of these policies was achieved in the FTA because of unresolved technical issues, uncertainty about the economic impact of greater price competition that would result if the existing antidumping laws of both countries were not applied against each other, and difficult questions on the conduct of domestic policy and the exercise of sovereignty. 32 In addition, neither country was willing to dismantle sub-
l'ISmith (1991). 11Yf'his agreement does not cover the u�e of countervailing
duties. 31Apart from these provisions. the two governments under a
1988 Memorandum of Understanding on Harmonization of Business Law are examining the scope for harmonization of business laws and regulatory practice!. that increase transactiOnl> costs of trans-Tasman trade (Broome ( 1990)).
'2Thc Free Trade Agreement contaaned procedural changes that set up a new binational appeal mechanism that can replace existing judicial review by domestic couns of final decisionl> taken by administering agencies. as well as a review mechanil>m to monitor changes in nntidumping and countervailing

©International Monetary Fund. Not for Redistribution
...................................... �ILT�r�a�d�e�a�n�d�C�o�m�p�e�tl�tl�o�n�l ...................................... .
sidies, particularly domestic agricultural subsidies, on a bilateral basis, given concerns about subsidy practices in other countries. A Working Group has a five-to-seven-year timetable to negotiate rules on subsidies and methods for dealing with unfair pricing and government subsidization. 33
In June 1990, the EC and EFTA launched negotiations to form a European Economic Area (EEA). The negotiations aim, inter alia, to harmonize competition laws and rules on subsidies; to agree on mechanisms to ensure that such rules are enforced; and to explore the possibility of using competition policy rather than antidumping and countervailing laws to deal with anticompetitive pricing practices within the EEA.34
Bilateral Efforts
The United States currently has bilateral agreements cover cooperation on antitrust issues with Australia, Japan, Canada, Germany, and the EC. In addition, France and Germany have a bilateral agreement with each other.35 These agreements aim to avoid or minimize conflict in the enforcement of antitrust taws and contain clauses to notify each other of pending proceedings, to cooperate in the development of evidence, and to consult about proceedings. Some provisions of these treaties specifically reflect the close relationship between trade policies and competition taw enforcement. 36
The agreement between the United States and the EC (September 1991) is the most recent bilateral agreement to have been signed. ll includes provisions whereby each party will notify the other when its own antitrust enforcement activities raise the
duty laws as they apply to the partner country. The agreement also provided for the elimination of (i) export subsidie� on bilateral trade in agricultural products and (ii) the elimination by Canada of import-licensing requirements for wheat. oats, and barley when sub�idy levels in the two countries are equivalent. The dispute sculement mechanism will also be used to deal with issues affecting trade in services and foreign direct investment, but not is�ue� related to intellectual property.
33Smith (1991). 34Xafa and Kronenberg (forthcoming). lSQECD ( 1984) and Barton ( 1990). '°For example. the United States-Australia agreement pro
vides the Australian Government with the opllon of notifying the U.S. Government of policies it has adopted. which may have antitrust implications in the United States. This is intended to enable Australian exporters to identify and avoid potential difficulties before they commit themselves to actions that mtght otherwise be subject to U.S. antitrust laws. The agreement also provides for the Australian Government to be notified of decisions by the U.S. Department of Justice or the Federal Trade Commtssion to undertake an antitrust investigation that may have implications for Australian law, policies. or national interests. Both governments have accepted mutual obligations to communicate their concerns arising out of notifications. and each is entitled to request consultations (OECD ( 1984), pp. 13 1-32).
85
possibility of a jurisdictional conflict. h also includes ''lead role" provisions whereby one party may take the major enforcement role in a case of common concern. The lead role provisions reflect the principle of "jurisdictional rule of reason.'' This principle was developed in U .S. Courts to limit jurisdictional claims resulting from the prior reliance on the "effects doctrine,'' which allows a state to claim jurisdiction over conduct that has an effect in its own jurisdiction, even if the conduct originates elsewhere. The parties have agreed to allocate jurisdiction on the basis of "functional advantage" (i.e., a case would be given to the authority with the greatest enforcement powers), the principle of "comity" (the maintenance of international respect and courtesy), an "agency clause" (which allows one party to request the other to take action against anticompetitive conduct in its own territory), and information sharing. Although the agreement does not contain a binding mechanism for resolving disputes, it is expected to provide one avenue for resolving antitrust disputes, including those that may arise under the EC Merger Control Regulation.
Bilateral cooperation between the United States and Japan on competition issues has been strengthened in the context of the U.S.-Japan Structural lmpedimems Initiative (SI/), which was launched in September, 1989. The first Annual Report of the Working Group ( 1990) on SII contained commitments to implement measures to solve structural problems that, inter alia, were intended to remove impediments to more efficient, open, and competitive markets. These commitments cover a wide range of structural issues including a number that deal with the application and the enforcement of competition laws. In response to U .S. concerns about structural impediments to the Japanese market, Japan agreed to reform its distributive system. to make the keiretsu system more open and transparent, tO eliminate exclusionary business practices, to liberalize the foreign direct investment regime, and to implement measures to adjust price differentials between Japan and the United States.37 For its part, the United States agreed to reform its antitrust policy so as to improve the legal climate for joint production ventures and to reduce uncertainty about the treatment of such ventures under
l?The keiretsr1 �yMcm rcfe� to "vertical" linkl. between manufacturers and !>upplierl> of input� and "horizontal" linh between corporations involved in manufacturing. banking. and insurance. Member!> of keiretsu exchange share� have interlocking dircctoratel>. and often make joint personnel and investment decisions. Such relationship� are not necel.sarily exclusive in that member� of keiret�u groupings have business relationships with firms outside of their grouping in the normal course of business.

©International Monetary Fund. Not for Redistribution
----------------------------------�A�P�P�E N�D�IX�I�IJ---------------------------------•
antitrust laws. It also agreed to reform its product liability system so as to encourage innovation and enhance international competition, to maintain an open and nondiscriminatory policy toward foreign direct investment, and to eliminate YERs on machine tools (in the context of the Uruguay Round negotiations) and steel (in the context of the negotiation of a multilateral steel consensus).
Actions to fulfill these commitments were reviewed in the 1991 Annual Report of the Working Group. Significant measures implemented by Japan included a liberalization of foreign direct investment (consistent with the OECD Code of Liberalization of Capital Movements) and revised guidelines to ensure transparency and improved enforcement of the Antimonopoly Act. The guideline document, "The Anti-Monopoly Law Guidelines Concernjng Distribution Systems and Business Practices,'" was issued on July 1 1 , 1991 by the Japanese Fair Trade Commission (FTC). It covers 28 major types of business practices in distribution and other business spheres and gives the FTC's interpretation on enforcement policy under the Anti-Monopoly Law. 38 The document was made available to other OECD member countries for review prior to its implementation.
Examples of Conflicts Between Trade and Competition Policies
This section examines selected trade policies that are currently a major source of friction among countries and their relationship to competition policies. These include trade measures to deal with '·unfair" trade, including business practices that may limit access to markets, measures to provide temporary relief against a surge of imports associated with "fair'' trade, and the use of subsidies to promote "strategic" industries.
Unfair Trade Practices and Remedies
Dumping and Antidumpillg Actions
In principle, antidumping and competition laws have similar objectives with respect to dumping (international price discrimination) and domestic price discrimination, respectively.39 Both seek to
'Kinternational Trade Reporter ( 1991 ) . p. 1077. 111After tariffs, antidumping acuon� are the most frequently
invoked trade policy instrument. The extensive coverage of antidumping actions reflect!> the fact that �uch actions are a maJOr and grow•ng source of fricuon 10 the multilateral trade sy�tem. In addition. antidumping acuon� can be a substitute for coumervailing actions and appear to have become the preferred policy m�trument to deal with unfair trade practices and. in some cases, to shelter sensitive sectors and promote strategic \eCtOr�.
86
ensure that suppliers do not abuse market power so as to reduce or eliminate competition. In practice, however, the objectives of these laws tend to diverge. Whereas domestic competition laws are primarily concerned with protecting "competition," dumping remedies often seem to be more concerned with protecting "competitors."40 This, and other differences between antidumping and competition laws, results in different standards being applied to import-pricing practices in the enforcement of antidumping laws tban would be applied if such practices were examined under competition statutes.4t For example, the standards for measuring price discrimination, assessing the adverse impact of price discrimination on producers, and choosing entities to look at when considering this adverse impact differ between antidumping policy and competition policy.42
To understand the source of conflict between antidumping and competition laws, it is useful to consider if dumping is harmful and, if it is, why can domestic competition laws not be used to contain its harmful effects? As summarized in Table 19, dumping may do economic harm to an importing country if it involves predatory pricing that is intended to drive domestic firms out of business or if it is done on an intermittent basis. Other forms of dumping typically involve pricing behavior that is considered normal market behavior if it occurs in domestic markets. As noted in Table 19, systemic arguments based on the concept of fairness, which are used to defend the use of ADDs to counter nonpredatory dumping, do not stand up to close scrutiny.
Although predatory pricing may be harmful to an importing country, the conditions required for successful predation are quite stringent (Table 19) and, in practice, this does not seem to be the predominant form of dumping.43 Intermittent dumping may occur more frequently, but it is difficult to deal with because harm may be done before ADDs could be applied. Thus, the possibility of successful preda-
"'''The interests of producers were put forcefully m Australia. where producers stated that "'[d]umping �hould be considered as a corporate and not a country activity and national interest 'houtd play no pan .. (Stubbs ( 1989). quoted •n Banks ( 1990) p. 55). In the EC. it has been noted that '"The Community authorities have frequently given more weight to the interests or the complainant industry than to the 1ntercMs or consumers or processo rs'" (Bell ( 1987), p. 30, National Consumer Council (1991), p. 18).
••OECD ( 1 984), Gruen ( 1 986), Bunk ( 1 990), De C. Grey ( 1988). and N icolaides ( 1991).
�2De C. Grey ( 1988). p. 451 41A review of ADD cases ( 1980 85) in Australia. one of the
largeM users of ADDs, revealed no evidence of successful predation (Gruen ( 1986)). Likewise. '"ltlhe link between antidumping action and predatory intent is quite loo�c in the EC chemical industry. contrary to the alleged goal of the antidumping regulations and the claims of petitioners" (Mcsserlin ( 1990). p 466).

©International Monetary Fund. Not for Redistribution
I Trade and CompetliiOil]
Table 19. Dumping and Antldumplng
Is Dumping Harmful? I
I. From the perspective of the importing counrry dumping is harmful if it involves predatory pricing or intermittent dumping (Viner ( 1966)).
a. Predatory pricing involves sales in foreign markets at prices below domestic prices to drive foreign firms out of business, after which prices in the foreign market are increased. This form of dumping is not frequent because the conditions required for successful predation are stringent: (i) there must be only one foreign supplier (world trading monopoly or sustainable canel); (ii) re-entry barriers must exist for local suppliers in the foreign market; and (iii) less costly strategies for auaining market dominance must be absent.
b. Intermittent dumping involves the use of expon sales as a mechanism to dispose of surpluses. For a small country a one-off dump might wipe out an industry.
2. Dumping as normal market behavior. Other forms of "dumping" involving sales in foreign market at prices below domestic prices are pan of a profit-maximizing strategy of private firms; they often are a side-effect of domestic interventions that serve to protect the exponers' domestic market from world competition, keeping home prices high. (The source of the economic costs are the interventions, not dumping as such.) h is not low prices abroad but high prices at home that should be objected to.
This is sometimes viewed as cross-subsidization; but the conditions for such a strategy to be successful are stringent; in particular. the cxponer must be a monopolist or a cane!.
Selling products at a price that does not cover full costs is not regarded as an unfair trading practice internally; it should not be regarded as unfair in international trade (Gruen ( 1986)).
"It is normally in an importing country's overall economic imerest to take the external trading environment as given and accept cheap impons, even if they are dumped or subsidized." (Gruen ( 1986)) (Finger ( 1987)). If dumping is intermiuent, the costs to producers are likely to outweigh the benefits to consumers; if dumping is long term, the opposite is likely to be true.
1Based on Banks (1990) and de C. Grey (1988).
tion would seem to be the main reason antidumping laws are needed.
Jn the above connection, the trade system needs antidumping laws to deal with predatory dumping because domestic competition laws cannot prevent foreign companies from becoming monopolies.44 A major defect in GATT's antidumping provisions, however, is that they make no distinction between
44Nicolaides (1991 ), pp. 130-31 .
87
Are Antidumping Laws Needed?
I . a. Antidumping laws are required to shield domestic producers against anticompctitivc behavior (e.g., predatory pricing and intermittent dumping) in foreign markets. Antidumping laws arc required because domestic competition laws, which are used to remedy anticompetitive behavior of domestic firms, generally cannot be used to deal with anticompetitive behavior in foreign markets. However, it is not easy to identify predatory "intent."
In the case of intermillent dumping, it is difficult to devise a scheme to overcome such dumping because the harm is likely to be done before antidumping duties are put in place.
b. Antidumping laws are also necessary to protect consumers against the consequences of predation. In practice, however, consumer interests are given little weight in antidurnping cases. In general, however. the consumer's best defense against predatory pricing is an alternative supplier (Finger ( 1987)).
2. Some argue that antidumping laws are required to deal with dumping that is not harmful to maintain suppon for an open multilateral trade system.
a. Fairness. If the view is widespread that cenain trade actions are unfair, failure to reflect that view in the rules of the game may erode suppon for the game itself, even if such trade rules are beneficial to a community as a whole (Bhagwati ( 1988). p. 3). This argument would seem more applicable to subsidies (government action) than "dumping" (actions by private firms), especially if there is no predatory intent.
b. Antidumping contract. There is an implicit contract between government and industry regarding the antidumping/protection trade-off (perceptions of political feasibility).
The commitment to a speedy and readily available antidumping system underpin� the existing fragile consensus between government, industry, and unions on the need for change toward a less assisted, more outward-looking, restructured industry (Gruen ( 1 986)).
But such a rationalization may end up endangering the broader liberalization objective it is meant to serve.
predatory and other kinds of dumping. Nor has such a distinction been made in national trade legislation.45 In practice, ADDs tend to be used primarily to counter dumping that is unlikely to be harmful , rather than to deal with predation. I n many cases,
4Sit has been observed, however. that predatory pricing is not easy to identify in practice. which probably explains why 11 is not mentioned in GATT's Antidumping Code or in national laws (Banks ( 1 990)).

©International Monetary Fund. Not for Redistribution
APPENDIX 11
ADDs are thought to present greater problems than the dumping they are intended to remedy. 46 Indeed, existing antidumping regulations are considered to be anticompetitive in their objectives, methods, and instruments.47
The major problems in the implementation of antidumping laws are related to the determination of injury, the calculation of dumping margins, insufficient recognition of the principle of national treatment,48 and the use of antidumping provisions to sustain collusion in domestic markets (Table 20). The latter reflects the frequent use of price undertakings (EC) and VERs (U.S.) as remedies against dumping and an apparent lack of concern as to whether injury is done to a competitive or an oligopolistic industry (Messerlin ( 1 990)).49 In this connection, recent reviews of antidumping cases in the EC are instructive. so
The EC review (based on Commission documents and data) covered all cases in the chemical industry ( 1980-89) involving both anticartel action under Article 85(i) or Article 86 of the Treaty of Romest and antidumping action. 52 It was found that 52 percent of antitrust cases under Article 85(i) had "twin" antidumping cases; thus EC firms being fined for price fixing were simultaneously asking for legal action against foreign price cutting. In addition, EC antidumping procedures were found to provide a high level of protection, to facilitate cartelization of the industry, and to reduce incentives for the industry to adjust. Also, the large net benefits obtained by firms from ADDs, despite anticartel fines imposed later, would likely result in future requests for more antidumping action. The Cana-
46Messerlin ( 1 990), and Banks ( 1 990). 47The Royal Institute o f lnternational Affairs (1991). 48For example, the EC "screwdriver" rules were found
inconsistent by a GATT dispute panel with the principle of national treatment. Others have noted that the treatment of nonnational firms under this law is arbitrary. For example, in some cases, foreign companies previously established in the EC (earlier "transplants") are complainants in antidumping cases against "newer transplants" (Messerlin ( 1990)).
49lt has been noted that ''if dumping is used as a market entry strategy it is more likely to be resorted to by firms attempting to break into oligopolistic industries in which case the prevention of injury further weakens competition" (The Royal Institute of International Affairs (1991)).
50Messerlin ( 1 990), and Lexonomjcs, Inc. (1990). A study of a sample of antidumping cases in all OECD members that are frequent users of ADDs is in progress in the OECD.
51Competition cases involving price discrimination and predatory pricing typically fall under Article 86, which deals with abuse of dominant positions. Article 8S(i) bans all agreements that have as their object or effect the prevention, restriction, or distortion of competition within the EC.
'
S2The chemical industry is the most intensive user of EC antidumping regulations, accounting for about 40 percent of all cases initiated (and 46 percent of those terminated with a restrictive outcome) between 1980 and 1987.
88
dian study covered all antidumping cases during 1980-88. It concluded that it was extremely doubtful that any of the cases reviewed that were actionable under Canadian antidumping laws would have resulted in action under domestic competition law. In most cases, the use of ADDs reduced the pace of restructuring by domestic producers, which were found to be relatively inefficient in global terms. 53
The experience with antidumping duties suggests that greater weight should be given to competition policy criteria, particularly those related to consumer interests, in the determination of antidumping cases. This might be achieved by applying the standards of competition policy to antidumping cases or by replacing antidumping laws with competition laws. In addition, the principle of "national treatment" needs to be recognized in measures dealing with the circumvention of antidumping duties, including through assembly operations that use dumped inputs. With the increased globalization of production, the latter will likely give rise to more frequent international disputes if not addressed. 54
Subsidies and Counlervailing Duties
Subsidies are provided for a variety of reasons, including those related to social and regional objectives, and are not trade distorting in all cases. ss Thus, GATT and rules embodied in the Subsidies Code permit the use of subsidies on exports of primary products; signatories are to avoid export sub-
33The other major findings of the study were as follows: first, successful dumping complaints tended to be in concentrated industries with a domestic market focus (making it ea�ier to coordinate a complaint); producing internationally comparable products (making it easier to obtain a broader coverage of dumped imports on which to apply ADDs): with a low rate of innovation and high exit barriers (making it easier to establish material injury): and low barriers to entry (because products involved "low" or established technology). By contrast, unsuccessful complaints involved highly competitive domestic industries (making it difficult to link injury to import prices}; producing specialized products (making identification of "like" products more difficult); characterized by low exit barriers and high industry innovation (making it easier to redeploy resources) and increasing domestic demand (making the finding of injury unlikely). Second, dumping findings almost always occurred when the measure of normal value was a "constructed" value. The critical criteria applied to determine injury was price suppression; secondary criteria (the impact of dumped imports on capacity utilization, profitability, and employment) did not consider the relative efficiency of Canadian and foreign producers.
S4The Uruguay Round aims to include provisions to deal with anticircurnvention in the GATT Code, to reduce the harassment effects of ADDs, and to phase out VERs (a substitute for safeguards) .
S5The use of subsidies as a strategic policy instrument i� discussed in this section, as well as the use of countervailing duties to deal with unfair trade practices.

©International Monetary Fund. Not for Redistribution
I Trade and Competition I
sidies on primary products that result in a "more than equitable share" of world trade and domestic subsidies that distort trade. However, the Code lacks precision in that it does not define what a subsidy is, nor does it provide much guidance on what subsidies are to be avoided. 56 The GATT also permits countervailing duties (CYDs) to counter the trade-distorting effects of subsidies provided by trading partners . While there is an intuitive complementarity between subsidy rules and rules for CVDs, the rules in fact lack symmetry in that it may be legitimate in GATT for one country to provide a subsidy, and equally legitimate for another country to countervail that subsidy _57 The lack of symmetry and precision in subsidy and CVD rules has permitted these instruments to be used in a manner that reduces competition in domestic and international markets and undermines trade concessions made to trading partners . ss
Of particular importance for trade and competition policy interlinkages is the use of subsidies to promote "strategic" industries in an attempt to gain a competitive advantage. In some cases this is defended by strategic trade theory, which suggests that, in certain circumstances, the use of industrial policies (of which subsidies are a key component) are justified to promote strategic sectors and to prevent global monopolization or oUgopolization of such sectors, (Subsidies to Airbus have been defended on this basis.) But the "empirical" importance of strategic sectors is not known, and countries disagree on the optimal policy approach to foster such sectors.
The globalization of investment and production and the increased importance of competition based on technological superiority call for strengthened multilateral rules on the use of subsidies and countervailing duties and on access to governmentfunded research and development. 59 In the latter context the treatment of "nonnational" firms, which frequently are not accorded national treatment, is of particular concern.
S<>Jt might also be noted that most countries, other than those of the EC and, to a lesser extent, of EFTA. do not have disciplines at the national or regional level on the use of subsidies. Within the context of EC 1992, the Commission is seeking to ensure greater discipline on the use of subsidies, consistent with the Treaty of Rome. Within the OECD, efforts are under way to increase transparency in the use of subsidies and to analyze their economic impact.
S7fingerand Nogues ( J 987), p. l54. 58'fhe use of countervailing duties raises similar issues to
those raised by antidumping. S9The Uruguay Round aims to improve rules relating to sub
sidies and CVDs. However, Messerlin ( 1989) notes that ADDs and CVDs can be substitutes, and that ADDs are the preferred instrument of plaintiffs. Thus, any strengthening of disciplines on the use of CVDs could be meaningless without strengthened disciplines on ADDs.
89
Protection of Intellectual Property Rights
Intellectual property rights (IPRs) are protected by a number of Jaws, including patent law (the most important industrial property law), copyright laws, and "unfair competition laws" that protect trademarks, trade secrets, the copying of designs, and the misappropriation of other commercial values. 60 The protection of IPRs is considered necessary for the functioning of a competitive market-based economy; in particular, given the externalities inherent in IPRs, patent rights and other laws to protect IPRs are required as "second-best" solutions to allow inventors to recover the research and development costs (plus "normal" profits) of their inventions. 6 t Views differ, however, on the extent and form of the protection that is required; "There are problems of both 'too much protection' and 'too little protection'." 62
Intrinsically, intellectual property laws, which confer rights on the owners of IPRs to exploit those rights monopolistically, and competition laws, which seek to prevent monopolies, would seem to be in conflict. At the national level, this potential conflict is resolved in some laws by conferring only a limited monopoly right (one that is limited in time, type, and horizontal coverage) to the holder of an IPR.63 These potential conflicts are further reduced in two basic ways. First, competition policy applies to clauses included in licensing agreements; second, competition policies provide the basis for remedies to deal with the abuse of IPRs. However, conflicts arise among countries because not all countries have laws to protect IPRs. Where laws do exist, differences exist in underlying principles, 64 norms (coverage, rights conferred, 65 duration of protection), and enforcement. In addition,
60S tern ( 1990). 61QECD (1989b). 62Matsushita ( 1988). p. 429. While it is argued by some that
protection of lPRs is essential for research and development generation, Subramanian ( 1990) notes that this is not the case for technology importers for whom imitation serves as a substitute; moreover. the Jack of IPR protection might not adversely affect incentives for global research and development if countries denying such protection are ''small enough."
63Graham and Richardson ( 1991). p. 16. 64For example, Section 337 of the U .S. Tariff Act of 1930
deprives foreign exporters of the right of national treatment in determining whether or not a product violates rPRs. The United States is committed to modify this aspect of the Tariff Act in the context of the Uruguay Round.
65For example, U .S. patent laws are based on "first to invent," while others, including Japan's Jaw, are based on "first to file." "Parallel imports" (i.e . . imports by government of patented products produced under license in the importing country) of goods under patent are permitted in some countries but not others. In Japan, a service mark is not protected as a trademark whereas it is in some other countries. The products covered by patents differ across countries (e.g . . pharmaceuticals) as does the length of the patent.

©In
tern
atio
nal M
onet
ary
Fund
. Not
for R
edis
tribu
tion
tO
0
Tab
le 2
0.
Ex
am
ple
s o
f P
rob
lem
s w
ith
An
tid
um
pin
g L
aw
s a
nd
Pro
ce
du
res
GA
TT
Ant
idum
ping
Cod
e
1.
Init
iat i
on
of
case
s (A
rtic
le 5
(i))
E
stab
lishe
s o
nly
min
imum
sta
ndar
ds.
2.
Det
erm
ina
tio
n o
f d
um
pin
g
a.
""Nor
mal
" p
rice
in
fore
ign
ma
rket
(A
rtic
le 2
(4))
U
se o
f co
nstru
cted
val
ue w
ith
refe
ren
ce to
"re
ason
able
" le
vel
for a
dm
in
istr
ativ
e se
llin
g c
osts
and
pro
fits
. Use
d
onl
y w
here
no
sale
s in
hom
e m
arke
t or
sa
les
do n
ot p
ermit
pro
per
com
pari
son
in t
he o
rdin
ary
cour
se o
f tra
de w
ith a
th
ird
co
untr
y.
b.
Exp
ort p
rice
th
at i
s co
mp
ared
to
do
mes
tic
pri
ces
(Art
icle
2.5
) E
xpo
rt p
rice
may
be
con
stru
cted
if
actu
al e
xpo
rt p
rice
is c
onsi
dere
d un
re
liab
le.
c.
Defi
niti
on
of '
"lik
e p
rod
uct
"
(Art
icle
2.2
) Id
enti
cal p
rod
uct
or p
rodu
ct w
ith
char
ac
teri
stic
s cl
ose
ly r
esem
blin
g th
ose
of
the
prod
uct
und
er c
ons
ider
atio
n.
d.
Siz
e of
rem
edy
(A
rtic
le 8
(3))
T
he
amo
unt o
f dut
y is
no
t to
exc
eed
the
mar
gin
of
dum
ping
.
Eur
opea
n C
om
mun
ity
1
1.
Init
iati
on
of
case
s Se
arch
ing
info
rmal
and
for
mal
rev
iew
by
Co
mm
issi
on
befo
re
laun
chin
g. T
he c
once
pt o
f dom
esti
c in
dus
try
that
can
ini
tiat
e ca
ses
tend
s to
be
"'est
ablis
hed
" fi
rms,
rep
rese
ntin
g a
maj
or p
ro
port
ion
of
the
mar
ket.
Thi
s fa
vors
olig
opo
listi
c st
ruct
ures
. D
omes
tic
indu
stry
con
cept
blu
rred
by
anti
circ
umve
ntio
n ru
les
whe
reby
in s
ome
case
s bo
th d
efen
dant
s an
d c
om
plai
nant
s ar
e ru
nnin
g "
scre
wdr
iver
" pl
ants
.
2.
Det
erm
inat
ion
of
du
mp
ing
a.
"N
orm
al"
pri
ce i
n fo
reig
n m
ark
et.
If th
ere
are
no d
om
esti
c sa
les,
the
dom
esti
c pr
ice
or
norm
al v
alue
can
be
assu
med
to
be
equa
l to
(i)
exp
ort
pri
ce to
a t
hird
co
untr
y; (
ii)
an e
stim
ate
bas
ed o
n co
sts
and
pro
fits
; or (
iii)
dom
esti
c pr
ice
from
a "
sur
roga
te c
oun
try
."
Tw
o th
ird
s o
f in
vest
igat
ions
are
bas
ed o
n (
ii)
or (
iii)
. W
here
(i
i) is
use
d, c
ost
s in
clud
ing
pro
fits
are
bas
ed o
n fu
ll co
sts
rath
er th
an m
arg
ina
l or
aver
age
vari
ab
le c
ost
s, a
s is
the
cas
e fo
r no
rmal
ant
itru
st p
rinc
iple
s.3
1n p
ract
ice,
hig
her
pro
fit m
ar
gin
s te
nd to
be
used
fo
r Jap
anes
e an
d ne
wly
ind
ustr
ializ
ing
ec
ono
mie
s' (
NlE
s) fi
rms
than
for
U.S
. fi
rms;
als
o h
ighe
r pr
ofit
mar
gin
s ar
e us
ed f
or
non-
NIE
dev
elo
ping
cou
ntri
es th
an
for
ind
ustr
ial c
oun
trie
s.
Whe
re (
iii)
is u
sed
. th
e le
vel o
f dev
elo
pmen
t o
f th
e su
rro
gat
e co
untr
y an
d th
e in
vest
igat
ed c
oun
try
diff
ers,
cre
atin
g bi
as i
n fa
vor
of
find
ing
dum
ping
; co
untr
ies
wit
h hi
gh
trad
e ba
rrie
rs
and
mo
nop
olis
tic
eco
nom
ies
(co
ndit
ions
res
ulti
ng in
hig
h co
sts
and
profi
ts) a
re u
sed
as
surr
ogat
e in
43
perc
ent o
f ca
ses
usin
g th
ird
coun
try
dat
a; c
oun
trie
s un
der
dum
ping
inve
stig
ati
ons
are
use
d in
25
perc
ent o
f th
ird
co
untr
y ca
ses
lead
ing
to a
d
om
ino
eff
ect.
b. E
xpo
rt p
rice
th
at
is c
omp
ared
wit
h d
omes
tic
pri
ces
A w
eig
hted
ave
rage
of e
xpor
ters
' dom
esti
c pr
ices
is c
ompa
red
wit
h ex
port
pri
ces
on
a "'t
rans
acti
on
by t
rans
actio
n b
asis
."•
Cas
es o
f "n
egat
ive'
' dum
ping
(exp
ort
pri
ce g
reat
er th
an
dom
esti
c pr
ice)
are
om
itte
d in
det
erm
inin
g d
umpi
ng m
arg
in.
Cos
ts s
uch
as a
dve
rtis
ing
and
ove
rhea
d an
d p
rofi
t est
imat
es
are
giv
en a
sym
met
ric
trea
tmen
t res
ulti
ng
in a
sys
tem
atic
bia
s in
fav
or o
f fin
din
g d
umpi
ng.
c.
Defi
niti
on
of '
'lik
e p
rodu
c1."
A b
road
er d
efini
tio
n o
f "
lik
e"
prod
uct
is u
sed
than
is t
he c
ase
for
EC
co
mpe
titi
on
regu
la
tions
. T
his
crea
tes
prob
lem
s w
hen
prod
ucts
are
ditf
eren
ti
ated
.5
d. S
ize
of r
emed
y (A
rtic
le 8
(3))
U
se o
f ''
less
er d
uty
" (b
elo
w d
umpi
ng m
arg
in)
if a
dequ
ate
to
rem
ove
inju
ry.
Uni
ted
Sta
tes2
I.
Init
iati
on
of
ca
ses
Low
thr
esho
ld t
o es
tab
lish
just
ifica
tio
n fo
r in
vest
igat
ion.
2.
Det
erm
ina
tio
n o
f d
um
pin
g
a.
"Nor
ma
l" p
rice
in
for
eig
n m
ark
et.
Con
stru
cted
val
ues
incl
ude
fixed
and
va
riab
le c
osts
-"fl
oo
rs"
for
sel
ling
and
ad
min
istr
ativ
e ex
pens
es e
stab
lishe
d.
Con
stru
cted
val
ues
can
be u
sed
whe
re
hom
e m
arke
t sal
es h
ave
bee
n m
ade
over
an
exte
nded
per
iod
at
pric
es t
hat
do n
ot p
erm
it r
ecov
ery
of
cost
s o
ver a
re
ason
able
per
iod
of
tim
e.
b.
Exp
ort
pri
ce th
at i
s c
omp
ared
to
d
omes
tic
pri
ces
Sam
e as
for
EC
4 "
de
min
imis
·· d
umpi
ng m
argi
n at
ha
lf a
perc
ent,
whi
ch g
iven
the
man
y ad
just
m
ents
, im
plie
s an
un
wa
rran
ted
degr
ee
of
prec
isio
n. U
se o
f E
xpor
t S
elli
ng
P
rice
(E
SP
) pr
ovi
des
som
e al
low
ance
fo
r sel
ling
cos
ts i
n e
xpor
t m
arke
t.
d.
Siz
e of
rem
edy
(A
rtic
le 8
(3))
M
arg
in b
ased
exc
lusi
vely
on
dum
ping
ra
ther
than
inju
ry.
,.
.,
.,
m
z
c
x

©In
tern
atio
nal M
onet
ary
Fund
. Not
for R
edis
tribu
tion
3.
Det
erm
ina
tio
n o
f "
ma
teri
al"
inju
ry
(Art
icle
3, S
ecti
on
4)
Inju
ry m
ust
be
sho
wn
from
dum
ped
impo
ns
but n
eed
not b
e th
e o
nly
fact
or
caus
ing
inju
ry.
Cas
es m
ay b
e in
itiat
ed i
f th
ere
is a
''t
hrea
t" o
f m
ater
ial
inju
ry.
4.
Na
tio
na
l in
tere
st c
lau
se (
Art
icle
6)
All
inte
rest
ed p
arti
es s
hal
l be
giv
en a
n
oppo
rtun
ity
lo p
rese
nt e
vide
nce.
5.
Rul
es o
f o
rig
in (
an
tici
rcu
mv
enti
on
) -
Not
spe
cifi
ed i
n G
AT
T C
ode
.
6.
Use
of
an
tid
um
pin
g d
uti
es
to s
ust
ain
d
om
esti
c co
llu
sio
n (
Art
icle
7)
Pro
ceed
ing
s ca
n be
sus
pend
ed o
r ter
m
inat
ed b
ased
on
"vo
lunt
ary
" un
der
tak
ing
s o
f ex
port
ers
to r
evis
e pr
ices
or
ceas
e ex
po
rts.
7.
"R
esid
ua
l" d
uti
es
8.
Su
nse
t cl
au
se (
Art
icle
9)
Ant
idum
ping
pro
visi
ons
sho
uld
rem
ain
in
forc
e fo
r o
nly
as lo
ng a
s ne
eded
to c
oun
tera
ct in
jury
.
9.
Cu
mu
lati
on
-
No
t co
vere
d in
GA
TT
Co
de.
'Bas
ed o
n M
esse
rlin
(19
9t)
. ZB
ased
on
Ro
wat
(D
ecem
ber
19
90)
.
3.
De
term
ina
tio
n o
f "
ma
teri
al"
inju
ry (
Art
icle
3, S
ecti
on
4)
Ant
idum
ping
dut
ies
(AD
Ds)
ten
d to
act a
s a
"co
ndit
iona
l saf
egu
ard
" m
echa
nism
-a
sim
ple
cor
rela
tion
bet
wee
n an
ups
urge
in
im
port
s an
d a
decl
ine
in d
om
esti
c pr
oduc
tjon
is
cons
ider
ed a
de
quat
e fo
r m
ater
ial
inju
ry t
est.
The
ab
ility
to i
niti
ate
case
s ba
sed
on "
suffi
cien
tly
free
ly d
ispo
sab
le e
xpo
rt c
apac
ity
" o
f th
e ex
port
er r
esul
ts in
red
uced
im
port
s ev
en w
hen
such
cas
es d
o no
t re
sult
in a
det
erm
inat
ion
of
inju
ry.
4.
Na
tio
na
l in
tere
st c
lau
se
The
use
of
"int
eres
ts o
f th
e C
om
mun
ity"
cla
use
in E
C l
egis
lati
on
is d
isap
poin
ting
. A 1
979
reg
ulat
ion
requ
ired
co
mpe
titi
on
aspe
cts
to b
e ta
ken
into
acc
ount
in a
ntid
umpi
ng a
ctio
ns. D
urin
g th
e pe
rio
d 19
80
-8
3, t
his
clau
se w
as m
ainl
y us
ed to
inc
lude
the
inte
res
ts o
f us
ers
of p
rodu
cts
but
it w
as n
ot u
sed
muc
h. S
ince
198
3 it
has
been
incr
easi
ngly
use
d to
tak
e ac
coun
t of
issu
es r
elat
ed to
"
ind
ust
ries
in c
risi
s."
"fai
r co
mpe
titi
on,
" a
nd i
ndus
trie
s co
nsid
er
ed to
be
"str
ateg
ic."
The
"co
mm
unit
y" in
tere
st r
arel
y co
nsi
ders
co
nsum
ers·
inte
rest
s. 6
5.
Ru
les
of
or
igin
(a
nti
circ
um
ven
tio
n)
"Scr
ewdr
iver
" pl
ants
dee
med
to b
e in
puts
cir
cum
vent
ing
duti
es
mus
t so
urce
40
per
cent
of o
utsi
de h
om
e co
untr
y to
avo
id a
nti·
d
ump
ing
pro
cedu
res.
6.
Use
of
an
tid
um
pin
g d
uti
es t
o s
ust
ain
do
mes
tic
coll
usi
on
T
he u
se o
f pr
ice
unde
rtak
ing
s in
stea
d o
f A
DD
s (m
ain
out
com
e un
til
198
7) c
an b
ecom
e m
echa
nism
for
pri
ce fi
xin
g. B
ut th
e sh
ift
to d
utie
s si
nce
198
8 h
as a
lso
bee
n us
ed a
s an
inst
rum
ent o
f co
llusi
on-
a 19
88
reg
ulat
ion
that
req
uire
s fo
reig
n pr
oduc
ers
not
to b
ear
AD
Ds
(I)
incr
ease
s th
e ba
rgai
ning
pow
er o
f E
C fi
rms
duri
ng n
egot
iatio
n o
f un
dert
akin
gs
and
(2)
stab
ilize
s th
e co
alit
ion
of
EC
pro
duce
rs.
7.
"R
esi
du
al"
du
tie
s T
he im
posi
tio
n o
f d
utie
s on
po
tent
ial e
xport
ers
of p
ote
ntia
l lik
e pr
oduc
ts d
isco
urag
es e
ntry
of
effici
ent
new
com
ers
and
prote
cts
dom
estic
co
alit
ion.
8.
Su
nse
t c
lau
se
Exc
ept u
nder
spec
ial c
ircu
mst
ance
s, A
DD
s la
pse
afte
r fiv
e ye
ars.
9.
Cu
mu
lati
on
C
umul
atio
n o
f exp
ort
s fr
om s
ever
al e
xpo
rtin
g c
oun
trie
s cr
eate
s a
bias
ag
ains
t sm
all e
xpor
ters
incl
udin
g d
evel
opi
ng c
oun
trie
s.
JPri
ces
that
do
no
t cov
er f
ull c
ost
� ar
c ty
pic
al in
a c
yc
lical
ind
ustr
y (
Bar
ton
(Jul
y 1
99
0))
.
3.
Det
erm
ina
tio
n o
f "
ma
teri
al"
in
jury
(A
rtic
le 3
, S
ecti
on
4)
Mat
eria
l inj
ury
defi
ned
as n
ot i
ncon
se
que
nti
al.
imm
ater
ial.
or
unim
port
ant.
N
eed
to s
how
inju
ry a
nd to
sho
w t
hat
impo
rts
wer
e a
caus
e (b
ut n
ot t
he m
ajor
ca
use)
of
inju
ry.
5.
Ru
les
of
ori
gin
(a
nti
circ
um
ven
tio
n)
Ant
icir
cum
vent
ion
pro
visi
on
for
part
s an
d co
mpo
nent
s su
bjec
t to
AD
Ds
is a
pplie
d w
here
diff
eren
ce b
etw
een
val
ue
of
good
s so
ld i
n ih
e U
nite
d St
ates
com
pare
d w
ith
v
alu
e o
f pa
rts
and
com
pone
nts
used
to
prod
uce
go
ods
is l
ow
.
6.
Use
of
an
tid
um
pin
g d
uti
es t
o s
ust
ain
d
om
esti
c co
llu
sio
n.
Und
erta
king
s by
ex
port
ers
to c
ease
du
mp
ing
and
! or
elim
ina
te in
jury
rar
ely
use
d; q
uant
itat
ive
rest
rict
ions
agr
eed
to f
ollo
win
g "
pub
lic
inte
rest
'' as
sess
men
t.
8.
Su
nse
t c
laus
e Q
uasi
-sun
set
clau
se th
at c
an b
e av
oid
ed b
y U
.S.
pro
duce
rs.
9.
Cu
mu
lati
on
Im
port
s fro
m t
wo
or m
ore
co
untr
ies
of
lik
e pr
oduc
ts c
umul
ated
in
det
erm
inin
g t
heir
ef
fect
ive
dom
esti
c in
dust
ry d
espi
te s
ize.
•Thi
s i&
con
side
red
by M
esse
rlin
and
oth
ers
to b
e th
e m
ost
impo
rtan
t b
ias
in th
e an
tid
ump
ing
pro
cedu
re in
tha
t it
pro
vide
s qu
asi-
cert
aint
y o
f fin
din
g d
ump
ing
. 'F
or e
xam
ples
of l
ike
prod
ucts
that
cau
se b
ias.
sec
Mcs
serl
in (
199
0).
''N
atio
nal C
onsu
mer
Co
unci
l ( 1
99
1 ).
�
Ill �
Cll Ill :I �
0
0 3 , �
- 0 :I

©International Monetary Fund. Not for Redistribution
APPENDIX 11
competition laws differ in their treatment of practices and conditions attached to the transfer of technology (e.g., grant-back provisions, exclusive dealing, price fixing, etc .) .
Although Chapter V of the Havana Charter included provisions relating to rights under patents, trademarks and copyrights, GATT does not contain similar provisions. Article XX(d) of GATT exempts IPRs from its disciplines; this exemption permits GATT members to take measures to protect IPRs provided such measures are applied in a nondiscriminatory manner. Article IX of GATT provides for cooperation between Contracting Parties to prevent the use of trade names to misrepresent the origin of a product, but no cases have been examined under this provision. During the Tokyo Round, the United States and the EC formulated rules to cover counterfeit goods, but these were not adopted due to the opposition of developing countries. 66
In recent years, conflicts over the protection of IPRs have increased as technological progress has become an important determinant of international competitiveness. This conflict is most evident in U .S. trade relations with its trading partners;67 countries targeted by "Special 30 I " and other countries object to the unilateral character of this provision and to the possibility that concessions made to the United States might not be available to other countries on an MFN basis. Conflicts also exist, primarily among industrial and developing countries, with regard to the conditions included in licensing agreements.
At the national level and within the OECD, these developments have lead to a re-examination of the interaction between competition policies and laws to protect IPRs.68 At the multilateral level, it led to a decision to include trade-related aspects of intellectual property rights (TRIPs) among the "new issues" of the Uruguay Round. 69 The decision to bring TRIPs into the Uruguay Negotiations
66Matsushita ( 1988). p. 429. 6T[n the absence of what the United States considers adequate
protection of IPRs, "Special 30 I " of the U .S. Trade and Competitiveness Act of 1988 mandates retaliation against countries that do not provide protection for IPRs.
68ln the United States, for example, practices once considered suspect on antitrust grounds are now deemed acceptable (Graham and Richardson ( 1991 )).
<19The Uruguay Round negotiations aim to adapt existing GATT rules to protect lPRs, while ensuring that these rights i n themselves do not become barriers t o legitimate trade. and to establish disciplines on trade in counterfeit goods. The negotiations cover basic principles (applicability of GATT's MFN and national treatment principles); standards concerning availability, scope, and use of IPRs; and enforcement of these rights and dispute settlement. The negotiating issues. the interests of various negotiators, and the national and global welfare consequences of protecting IPRs arc discussed in detail in Subramanian ( 1990). The costs and benefits of extending patent
92
reflected dissatisfaction (by the demanders for increased protection for TPRs) with the provisions of the World Intellectual Property Organization (WIPO), which provides disciplines on the manner (national treatment) but not the extent of intellectual property protection, and with the lack of enforcement mechanisms in WIPO. 70
An agreement in the Uruguay Round on TRIPs would likely eliminate some differences in intellectual property laws among countries. Whether or not conflicts would remain in the area of licensing agreements remains to be seen. Many developing countries would prefer that a TRIPs agreement list abusive or anticompetitive practices that are to be excluded from licensing agreements; whereas most industrial countries would prefer to decide these on a case-by-case basis under their domestic competition laws.
The preference of industrial countries for the case-by-case approach reflects recent thinking on the economic and Legal impact of particular business practices. In this connection, an OECD report on patents and licensing challenged the notion that competition policy and intellectual property rights are in basic conflict and recommended that competition authorities in member countries adopt a caseby-case approach to licensing agreements.71 The report argued that, in practice, the distinction between horizontal agreements (considered to be more restrictive) and vertical agreements (considered less restrictive) is difficult to make; that the presumption that the holder of an intellectual property right automatically has "market power" is incorrect; and that where market power does not exist, restrictions in licensing agreements may foster competition, provided there are no horizontal restraints; and that even when a technology with market power is licensed, vertical restraints in the agreement may be pro competitive in the absence of certain conditions related to market strucrure and entry. The conclusions of the 1989 repon, which differ considerably from the earlier Council Recommendations on Restrictive Business Practices in Patent Licensing ( 1 974), were accepted by the OECD Council; the Council withdrew the 1 974 guidelines and recommended that governments take into account. to the extent possible, the conclusions of the 1989 report.72
protection to devclopmg countnes arc discussed in Deardorff ( 1990).
70Subramanian ( 1990). Intellectual property rights have been under the purview of WIPO since 1970. Existing agreements on IPRs include the Paris Convention ( 1967), the Berne Convention for the Protection of Literary and Artistic Works (1971), the Rome Convention. and the Treaty on Intellectual Property in Respect of Integrated Circuits.
7 1QECD (1989b). TZJn making this recommendation, the Council recognized

©International Monetary Fund. Not for Redistribution
I Trade and Competition
Measures to Deal with "Unfair" Trade Practices Not Covered by GATT
Unilateral and bilateral approaches have been used with increasing frequency to pry open foreign markets and to deal with unfair trade practices not covered by GATT, or, in the view of some Contracting Parties, not adequately covered by GATT. Super 30 I (now lapsed) and Special 30 I (Section IV. e) of the U .S. Trade and Competitiveness Act of 1988, and discussions under SII (Section Ill) are prominent examples of this approach. Bilateral and unilateral attempts to pry markets open are of particular interest from the perspective of trade and competition policies because of their inherent inconsistency with either the principles of competition policy or, in some cases, with each other. In some cases (for example, the U. S. -Japan Semiconductor-Trade Agreements of 1986 and 1991 ) , they tend to encourage anticompetitive practices in markets that are targeted; such anticompetitive practices are discouraged by the United States within the context of SII discussions. 73
The approach used in SII raises more fundamental questions. Os try ( 1990) questions the legitimacy of the objective implicit in SII-a desire to have Japan behave more like the United States. A number of other observers have suggested it would be preferable to address such issues in a multilateral forum. In the latter context, a number of considerations are relevant. First, similar conflicts exist among other countries and will likely increase witb the completion of EC 1 992 and the full implementation of the U.S.-Canada FTA. Second, a greater understanding of the access problems created by collusion and the lack of competition in distribution systems, as well as their impact on international trade. is required before appropriate multilateral solutions can be devised.74 Third, the inconclusive state of the academic debate on the optimal competition policy and the optimal degree of government intervention to influence market structures suggests that solutions in this area require a broader participation of countries if they are to reduce the potential for conflict. 75
that in �ome member countries the recommendations confliCted with existing competition laws and that it would take time for these to be amended.
71Morc generally, the use of VERs encourages anticompetiuve practices in both exporting and importing countries (Section IY.2).
74A review of empirical analysis of the impact of the keiretsu system on Japanese imports and export� concluded that the evidence is Inconclusive (Japan Economic lnMitute ( 1991 )).
n1n thi� context. the Japanese concept of "workable compeuuon" as opposed to "excessive competition" is at odds with other countries' views on market structures.
93
Measures to Deal with Fair Trade: Voluntary Export Restraints
Article XIX of GATT permit!> the use of safeguard measures to deal with temporary import surges associated with fair trade. Because the provisions of Article XIX are considered too restrictive by some GATT Contracting Parties,76 VERs and other gray-area measures are frequently used as substitutes. 77 While the use of VERs might be challenged under Article XI of GATT, which prohibits quantitative restrictions,78 the parties that negotiate such agreements and have "standing" in GATT (i .c., governments in importing and exporting countries that negotiate VERs) have no incentive to do so. Consumers and users of products subject to VERs who bear the costs of these agreements have "no standing" in GATT.79
The prevalence of VERs raises policy issues that straddle both competition and trade policies. These include conflicts between competition laws and trade policy conducted outside domestic statutory frameworks; inconsistencies between elements of existing trade laws and the principles of competition policy;so and differences in the enforcemenr of competition laws among countries.
The implementation of VERs normally requires firms in exporting countries to form cartel-type arrangements (with or without government endorsement) or engage in other restrictive business practices. Enterprises are thus caught between the necessity to solve disputes with trading partners and the requirements of antitrust laws not to engage in restrictive practices. st In practice, however, such
Wfhe prOVISIOns that some Contracting Parties find too rc�trictive include the requirement� tO apply safeguards on a nondiscriminatory basis and to negotiate compensation (or face retaliation) to Contracting Partie� affected by the use of �afeguards.
nsee Section Ill. Appendix I. and Goldberg and Ordover ( 1991) for reasons why YER� have prolt feratcd despite exten�ivc empirical work that document� the �ignificant costs the) impo�e on consumers and importing countries (tn net welfare terms).
7MJad.:.on ( 1989). 7'�Goldberg and Ordover ( 1991) HOVER� increase the scope for collusion tn foreign and
domestic markets and can change the nature of competition. The potential for such collusion is exacerbated by the growing importance of multinational enterprises (Goldberg and Ordover (1991)).
81Matsushita (1988). Exporting firms in such situations might be subject to antitrust laws in the exporting country (if the cartel affects domestic competition) and also in the importing country (if the lauer applies the principle of extraterritoriality). To deal with this connict. Matsushita ( 1988) suggests new rules are needed for VER� to reduce the antitrust liability of such firms. While this would reduce uncertainty for exporting firm!. it would not reduce the anticompetitive characteristics or VERs; it would in fact encourage the use of such measure�.

©International Monetary Fund. Not for Redistribution
APPENDIX 11
conflicts have not been very frequent because VERs are not subject to antitrust legislation in the importing country if they are covered by domestic trade laws. 82 ln cases where domestic trade policy has been conducted outside the domestic statutory framework, foreign government compulsion has been used to eliminate the risk of antitrust action in the importing country. 83 Most VERs in the EC and the United States have been implemented under the cover of foreign government compulsion. 84 But, in any case, the elimination of the risk of antitrust action does not reduce the anticompetitive characteristics of these arrangements.
Such arrangements are possible, not because competition laws and trade laws are inconsistent, but because elements of existing trade laws are not consistent with the principles of competition policy.85 Indeed, as already noted, trade policy overtly encourages anticompetitive behavior involving the formation of cartels and the use of restrictive business practices. 86 In addition to these concerns, VERs create conceptual problems for antitrust market share analysis. 87
82In the United States, for example, the President is permitted to negotiate orderly marketing arrangements, which may involve the use of voluntary restraints by foreign exporters. under Sections 20 l-203 of the I 974 Trade Law. provided they meet certain criteria (in particular, the U.S. International Trade Commission (USJTC) must determine that an article is being imported into the country in such quantities as 10 be a substantial cause of, or threat of, serious injury to the domestic industry); such arrangements are not subject to U .S. antitrust law (Koulen ( 1 988), p. 439). Under Article 1 1 5 of the Treaty of Rome, the Commission can temporarily allow a member state with officially recognized national restrictions (including VERs) to prevent the import of products covered by these restrictions through third countries; with the implementation of the single market program, the Commission intends to eliminate the use of Article 1 15.
li3Koulen (1988), and National Consumer Council ( 1991). 84Matsushita (1988), Koulen (1988), and National Consumer
Council ( 1991 ). Only two cases of VERs negotiated by the United States have been potentially at risk under U.S. antitrust law in that they did not meet the criteria set out in Sections 20 l -203 of the 1974 Trade Law. These were restraints on steel exports from the EC and Japan to the United States ( 1969-74); and the 1981 VER on Japanese autos to the United States (Koulen ( 1988), pp. 444-45). Foreign government compulsion was used in both cases to avoid antitrust risk in the United States (OECD ( 1984)). The VER on Japanese autos could not be implemented under U.S. Trade Law because an investigation under Section 20 I of the Trade Act by USITC had determined (December 1980) that imports of cars into the United States had not increased in such quantities as to be a cause of serious injury or a threat to the domestic industry.
85Koulen ( 1 988), p. 445. 860e C. Grey ( 1988). The circumstances in which this occurs
are described in detail in Goldberg and Ordover ( 199 1). 87Goldberg and Ordover ( 1991 ) . These include difficulties in
(i) facto ring into a concentration index the sales of firms subject to a VER; (ii) adjusting the current level of imports subject to nontariff barrie rs (NTBs) in analyzing the competitiveness effects of mergers, joint ventures. etc.; (iii) measuring the extent to which a VER is being avoided by "washing"-that is,
94
ln the above context, the recent agreement between the EC and Japan on imports of Japanese vehicles into the EC is important because it is viewed as a test case of the EC "post- 1992" approach to imports in trade-sensitive sectors and because of concerns it has raised both inside and outside the EC. 88 Aside from the continued protection of the EC vehicle market for a long transition period, the agreement raises other concerns involving trade and competition policies: the requirement for Japan to monitor exports will likely involve business practices normally considered to be restrictive; to the extent the agreement contains an implicit limit on the output of "transplants,'' it raises questions about its consistency with national treatment and EC competition law; the requirement for Japan to monitor sales from transplants within the EC is only possible because of the block exemption of car distribution from EC competition laws, but this exemption is being questioned by consumer groups within the EC. 89 The agreement implicitly recognizes its dubious legality under EC competition rules and the GATT in that it commits the EC to a declaration that EC competition law will not obstruct the operation of the agreement, and both
diverting imports through lhird countries; and (iv) measuring the entry-inducing effects (through foreign direct investment) of VERs in considering the competitive constraint from foreign firms on domestic industry.
B&The agreement is intended to replace existing national restrictions on imports applied by some EC member states (the United Kingdom, France. Italy. Spain, and Portugal) with an EC-wide restriction that would remain in place until 1999. An EC-wide restriction i s required because national restrictions are not consistent with Articles 9 and 10 of the Treaty of Rome, which provide for the free flow of goods within the single market provided all duties have been paid. and the Commission has stated it does not intend to approve any exceptions (under Article .1 15) to the free flow of goods after 1992. The agreement requires Japan to monitor (i.e . • restrain) exports to the Community and to each market currently restricted so that its total exports do not exceed 1 .23 million a year through 1999 and its exports to each market currently restricted do not exceed agreed "forecasts." The Commission based its negotiations on "working assumptions" concerning the output of ''transplants" (plants that build Japanese vehicles in the EC): Japan and the United Kingdom do not consider these assumptions as placing a limit on the output on "transplants'': other EC members, such as France and Italy, are apparently of the impression that the working assumptions of the Commission imply a limit on the output of transplants. The agreement leaves open the possibility that the export forecasts could be modified during twice yearly consultations to monitor the agreement.
�9Under this exemption. EC car makers have a ten-year antitrust exemption that expires in 1995. which permits them to segregate the market through the use of exclusive dealerships. The system of distribution is currently being investigated in Britain by the Monopolies and Mergers Commission and lS to be reviewed by the European Commission by 1995. European and U.K. consumer groups have complained that the system of car distribution within the EC is illegal under EC rules.

©International Monetary Fund. Not for Redistribution
I Trade and Competition I
the EC and Japan have agreed to defend this agreement in GATT.
Proposals to Reduce Policy Inconsistencies
Much of the basic rethinking that will be necessary to adapt Lrade and competition laws to the realities of the global market place is only in the early stages. Work is proceeding on two fronts. Within the Uruguay Round, negotiations to revise trade rules to provide more predictable access to markets have a bearing on a number of the issues covered in this appendix. Outside the Round, competition laws are being scrutinized to identify the extent to which a greater harmonization of these laws is required and how this might be achieved. In addition, thought is being given to the possibility of using competition laws rather than trade rules to regulate competition across national boundaries.
The Uruguay Round aims, inter alia, to refashion the rules on the use of subsidies, coumervailing and antidumping duties, and safeguards, and to agree on rules of origin. In addition, new rules covering trade-related aspects of investment and intellectual property rights are being devised, and an agreement appears possible to completely phase out the use of VERs over a specified time frame. A successful conclusion to the U ruguay Round would go a considerable way toward reducing many of the conflicts that arise between competition and trade policies because of inadequate trade rules. An assessment of the extent to which the Round is successful in this regard will need to be made at the conclusion of the Round.
Proposals to refashion competition laws fall into four broad categories. These include the development of a global competition policy (this is considered a nonstarter but is described here for completeness and to conlrast it with the EC 1992 model); the achievement of greater harmonization of competition laws through policy convergence (EC 1 992 model); continued efforts within the OECD to harmonize competition policies (this would stop short of either of the first two approaches) and to encourage OECD member countries to give greater weight to competition policy considerations in implementing trade policy; and specific proposals to use competition laws rather than trade rules to regulate competition across borders. The latter include proposals related to dumping and safeguards.
A Global Competition Policy
A global competition policy would need to be based on agreed objectives of competition policy and on the role of governments in achieving those
95
objectives; global economic welfare (rather than net national welfare) would be a leading contender among the possible objectives. 90 These would provide the foundation for global competition laws, which would be enforced by a supranational competition authority. Global competition laws would involve rules for traditional areas covered by national competition laws such as antitrust, and abuse of dominant positions, as well as agreed rules on the use of subsidies and the protection of intellectual property. National competition laws would need to be made consistent with these rules and could be used to deal with the harmful effects of dumping and subsidies rather than existing national antidumping and countervailing laws. Goldberg and Ordover ( 1991) suggest that competition laws might also be used instead of GATT's safeguard provisions to provide temporary relief for industries against import surges (see Section V.4.b). Such an approach would need to explicitly recognize that trade policies can undermine the objectives of competition policy and that current differences in competition laws and their enforcement among countries can undermine trade liberalization agreements. Moreover, it would be based on principles (for example, the geographic and economic definition of the market) and practices (for example, assessment of the effects of mergers and acquisitions on market structures) that allow for the increased integration of the world economy through trade. investment. and production.91
A Global Competition Policy with associated laws and enforcement procedures is not considered within reach in the foreseeable future. This primarily reflects a view that most governments would be reluctant to concede the sovereignty over domestic policies implied by this approach as well as a lack of agreement on what constitutes an optimal competition policy and on the appropriate role of government in fostering competition. Beyond these reasons, such a task would be difficult in that it would likely require a major revision of legal systems in many countries as well as harmonization of thousands of rules and regulations. Indeed, such an approach would go well beyond what has already been achieved in regional arrangements such as the
OOOoldberg and Ordover ( 1991) note that a global welfare criterion would rule out the use of export cartels as well as import cartels that transfer profits from owners/licensors of IPRs to licensees. 911n this context. the role of merger� and acquisitions in facilitating adjustment in an interdependent world has received con�iderable attention. While it frequently il> a�sumed that mergers and acquisitions provide efficiency gains. Jacquemin and others ( 1990) note that this is not supported by theory or empirical studieli. In many cases. small- and medium-sized firms with smaller economies of l>Calc (but more Hexibility) adapt faster than large firms.

©International Monetary Fund. Not for Redistribution
APPENDIX 11
EC, ANZCERTA and the U.S .-Canada Free Trade Agreement and also beyond what is being implemented in the context of EC 1992. As indicated below, however, EC 1 992 suggests that a Global Competition Policy may not be necessary to achieve a greater harmonization of competition policies among countries.
Harmonization of Competition Laws Through Policy Convergence
A somewhat less demanding approach, but one which involves the most advanced model of policy convergence, is that being employed by the EC to implement the Single Market Program. This involves the prior harmonization of a minimum number of essential regulations; "mutual recognition" by member countries of regulations that are not harmonized; and factor mobility. As factors of production (capital, entrepreneurship, and tabor) will likely move to locations with preferred regulatory systems, this will put pressure on national authorities to adopt these preferred systems and thus result in a convergence of such policies among EC member states. The advantages of this approach are (i) it does not require the prior harmonization of all laws, rules, and regulations; and (ii) it accepts different tastes and preferences among consumers in different countries, differing performance of individual enterprises, and acknowledgement that government policies affect the performance of market participants. Policy convergence under this model aims to optimize factor mobility and competition, not to harmonize tastes, culture, and corporate behavior. 92 Despite its appeal, this approach is not considered feasible on a global basis, or even among all OECD members, because the necessary conditions (factor mobility and mutual recognition) are not all likely to be met. In particular, the requirement of labor mobility is considered a major obstacle to this approach.
The Role of the OECD
Given the difficulties inherent in achieving complete harmonizatjon of competition policies, more pragmatic approaches are generally preferred to the far-reaching proposals outlined above. These involve stepped-up efforts within the OECD to achieve greater harmonization of competition 1aws.93 The OECD has in fact already expanded its
92Qst ry ( 1990). 93Qstry ( 1 990) proposed a broad work program for the
OECD that includes. inter alia, issues related to trade and competition policies. This consists of a review of theoretical and empirical literature on "strategic industries" with a view to proposing a consensus working definition for policy use; an
96
work on competitiOn policy and the linkages between competition, trade. and innovation policies. This program involves the trade and competition directorates and was agreed by the June 1991 OECD ministerial meeting (Table 2 1 ) . In this connection, a study on "Nontariff Barriers to Trade and Competition: Theory and Evidence"94 has already been completed and other studies on antidumping and distribution-related barriers to international competition are in progress. 95 The preparation of these studies is intended, in part, to demonstrate the use of the "checklist" approach approved by the Council in 1985 and thereby encourage OECD members to apply this approach at the national level.
Authorities in a number of OECD countries have suggested that a greater harmonization of competition and trade policies would need to be achieved in three stages. First, competition laws would need to be established in all countries, including nonOECD countries, based on agreed principles. Second, steps would need to be taken to achieve greater uniformity in the enforcement of competition laws across countries. Third, at a later date, steps might be taken to ensure greater convergence of these laws across countries.
The Use of Competition Policy to Regulate Trade Across National Boundaries
Alltidumping Laws
Most economists who have analyzed the effects of antidumping actions suggest thal competition principles need to be given greater weight in the implementation of antidumping laws. 96 One way to achieve this would be to replace antidumping regulations with the principle of national treatment under domestic competition laws.97 Thus, the same definition of undesirable pricing behavior that is
analysis of interrelated sets of policies-trade, research and development, and market structure policies. with a view to highlighting the impact of significant differences in policy on industrial and trade performance; and the development of recommendations for short-run action (to defuse international friction) and implementation of a longer-run process of policy convergence.
94Qoldberg and Ordover (1991). 95The study on antidumping will (il analyze a representative
sample of antidumping cases and the criteria applied (including, where relevant, views put forward by competition authorities); (ii) identify common aspects, if any. in the structure of the industries involved in these cases (e.g., market structure in both importing and exporting countries, concentration, product diversification, entry barriers); and (iii) analyze the remedies imposed as a result of these actions and the economic effects of these remedies (including on competition, industry and market structures, and consumer interest).
96Barton ( 1990). 970stry (1 990).

©International Monetary Fund. Not for Redistribution
I Trade and Competition
Table 21. Excerpts from OECD Communique, June 1991
1. Trade agenda (para. 17)
Looking beyond the Uruguay Round to the trade issues of the 1990s. Ministers emphasize the need to add res� the new dimen�ions of trade policy. This includes a whole range of issues which arise because of the incrcasi ng globalization of the world economy and the closer relationship between trade policy and competition. investment. technology and innovation, and environment policies. The increasingly international scope of economic activity has seen the emergence of areas in which the needs of private agents and governments run ahead of the existing ·'rules of the game." There is a perceived need for better understanding of these issues and, where appropriate, convergence policy approaches and consideration of fresh rules. Many issues, traditionally viewed largely from a domestic policy perspective, have taken on an international dimension, affecting the setting of trade and investment policies themselves. Hence, widening the consideration of trade policies in the 1990s to take account of new developments will go hand-in-hand with efforts to avoid conflict with other policy spheres.
2. Competition policy (para. 23)
The increasing international scope of economic activity has resulted in a situation in which the existing "rules of the game," as defined by national or regional competition policies might be usefully complemented. Ministers ask the Organization to continue its work on the international dimension of competition policies and on their interaction with policies in other areas such as trade and industry. They note that recent work in the Organization on competition law and policy provides the foundation for greater policy convergence and progress toward updating and strengthening the existing rules and arrangements (including both policy principles and procedures) for international cooperation in this area. They invite the relevant committees actively to pursue these matters, including the efl'ectivencss of trade rules in facilitating international competition.
applied to domestic firms would be applied to foreign firms exporting to domestic markets; this is similar to the approach used under ANZCERTA.98 Ostry ( 1990) and others suggest that this approach is unlikely to be adopted for two reasons. First, dumping is seen as a policy that achieves strategic trade objectives; it must be controlled to ensure a domestic base in strategic sectors because of "rents" or "externalities." Second, because competition policy differs significantly among countries (in this case with respect to the treatment of pricing behavior), the application of national treatment would result in a substantial divergence in international pricing practices, which would likely be unacceptable to many firms and countries. Third, free trade among countries is considered essential if competition laws are to be applied to dumping to ensure that "parallel imports" arbitrage the difference between prices in exporting and importing markets.99
Other observers suggest that the above approach may deserve further attention. First, as already noted, dumping complaints normally are not associated with predation. In fact, evidence suggests that antidumping Jaws are more frequently used to shelter "sensitive" sectors and promote strategic sectors . Second, the argument that antidumping duties
98Jt differs from the EC approach where common competition laws apply to all members of the Community.
99"Parallel imports" in this context refer to the reimportation of goods previously exported.
97
are necessary where arbitrage is not feasible is not persuasive; if the barrier to arbitrage is a formal trade barrier, it would be preferable to lower the barrier through a GATT proceeding or an administrative law action than to counter it through an antidumping duty; too and where the barrier is a purchasers' refusal to deal, as is often alleged to be the case in Japan, antitrust action is plausible. tO I Antitrust action would not require a formal supranational enforcement procedure, although Barton suggests a GATT-type dispute settlement process might be useful to persuade nations to improve their domestic laws and to assure effective access to domestic courts for foreign parties.
Competition policy considerations could, however, be given more prominence in antidumping cases while stopping short of replacing antidumping laws with the principle of national treatment. This approach, which is supported by competition authorities in a number of OECD countries, would assign competition authorities a much greater role in examining dumping complaints than is currently the case; in fact, some argue that there is no reason why competition authorities should not be responsi-
100'fhis argument seems to assume that tariffs are not major barriers to access and that other barriers could be successfully challenged in GATT. In the context of the Uruguay Round, this suggests that users of ADDs should put more emphasis on increasing access to the markets of countries that dump exports and less on attempts to further tighten the use of ADDs.
101Barton ( 1990).

©International Monetary Fund. Not for Redistribution
----------------------------------�A�P�P�E�N�D�IX�I�!Jr----------------------------------
ble for the implementation of antidumping laws. toz In this connection, the Uruguay Round negotiations arc concerned more with streamlining and strengthening legal procedures and rules than with considering ways to give greater weight to efficiency considerations and consumer interests in antidumping laws. tOJ
Voluntary Export Restraints and Article XIX of GATT
Both trade and competition authorities agree on the need to limit or ban the use of VERs because of the costs they impose on consumers and their adverse effects on competition. Within the Uruguay Round it is proposed to phase out the use of VERs over a transitional period and, in the meantime subject the use of these measures to GATT surveil: lance; this is linked to new safeguard rules, where the main issue is selectivity. Although transition periods to remove VERs may be overly long. an agreement to totally phase out VERs could be a major step forward. To eliminate the possibility of government-to-government VERs being replaced by industry-to-industry VERs, it has been suggested that the exemption of pure export cartels from most competition laws (which is based on a "national" welfare criteria) should be repealed and that antitrust authorities in exporting countries should challenge such arrangements in the interest of "global" welfare. t04 Given the strong built-in incentives for these authorities to consider only the national interest, this proposal may only be workable if it can be enforced by a supranational body.
The negotiations within the Uruguay Round on Article XIX are based on the implicit premise that "safeguard" actions are a necessary policy tool to sustain the multilateral commitment to free trade. While not disagreeing with this assumption, Goldberg and Ordover (1991) suggest that import relief might be based on competition policy, rather than on trade policy. This would involve a more relaxed antitrust policy to permit industries to restructure. In their view, competition policy is more transparent and nondiscriminatory than trade policy, and it is more likely to reflect efficiency considerations as well as consumer, national, and even global welfare concerns.
I02J� .this context. there could be a risk that competition
authonucs would then become subject to the same sectoral pressures as trade authorities. In addition. it assumes that noncompetition-type objectives (for example. regional development, etc.) currently have no role in the enforcement of competition laws. which is not the case in all countries.
10111 �hould be noted, however. that �ome Nordic and Asian countries have argued that greater weight should be gtven to consumer interests in antidumping decisions.
1<>�Goldberg and Ordover ( 1991).
98
Ongoing Research on Trade and Competition Policies
In addition to the extensive OECD work program on trade and competition issues, major research programs are under way in thinktanks and elsewhere. A brief description of two programs involving The lnstitute of International Economics (Washington, D.C.) and The Royal Institute of International Affairs (London) is provided below. The projects will involve input and advice from trade policy practitioners, civil servants, business practitioners, and staff of international institutions.
The Institute for International Economics project, Global Competition Policies, is far-reaching and aims to survey national competition policies and the potential tensions they create in a globally integrated economy, and to evaluate proposals for international harmonization and strategic unilateral alteration of these policies. The project will include several country studies covering the philosophy of competition policy, statutes, practice, and institutional issues, including the relationships between relevant institutions for administering trade and competition policies and the extraterritorial reach of competition policies that cause conflict and inefficiency; thematic studies on issues, such as dumping and antidumping poli�y, VERs, subsidies, intellectual property protectiOn and technology transfer, policies toward nonnational firms, extraterritorial aspects of antitrust laws and policies toward mergers and acquisitions, the keiretsu structure of Japanese industry, and selective exemptions from antitrust policy; a survey of the
.history of efforts to achieve an internationally or
reg10nally consistent competition policy. including the EC's experience in the implementation of EC 1992; and a survey of recent academic literature on "new" trade policies, and "new" thinkino on indus�rial regulation. Based on these studies, �nd taking tnLO account the results of the Uruguay Round, the authors aim to develop a future agenda of competition policy issues that need to be resolved and to suggest a priority to items on this agenda and possible approaches and institutional arrangements that may be needed to address these issues. t05
The Royal Institute of International Affairs project, Anti-Competitive Effects of Trade Policy, aims to investigate whether trade policies in the EC, Japan, and the United States have effects that contradict the objectives of domestic competition policies. Particular attention will be devoted to antidumping. The project will also consider whether trade policy should be reformed to make it more competition oriented and whether the scope of competition policy should be widened to take into account factors that are relevant to competition in international markets.
IO�Graham and Richardson ( 1991).
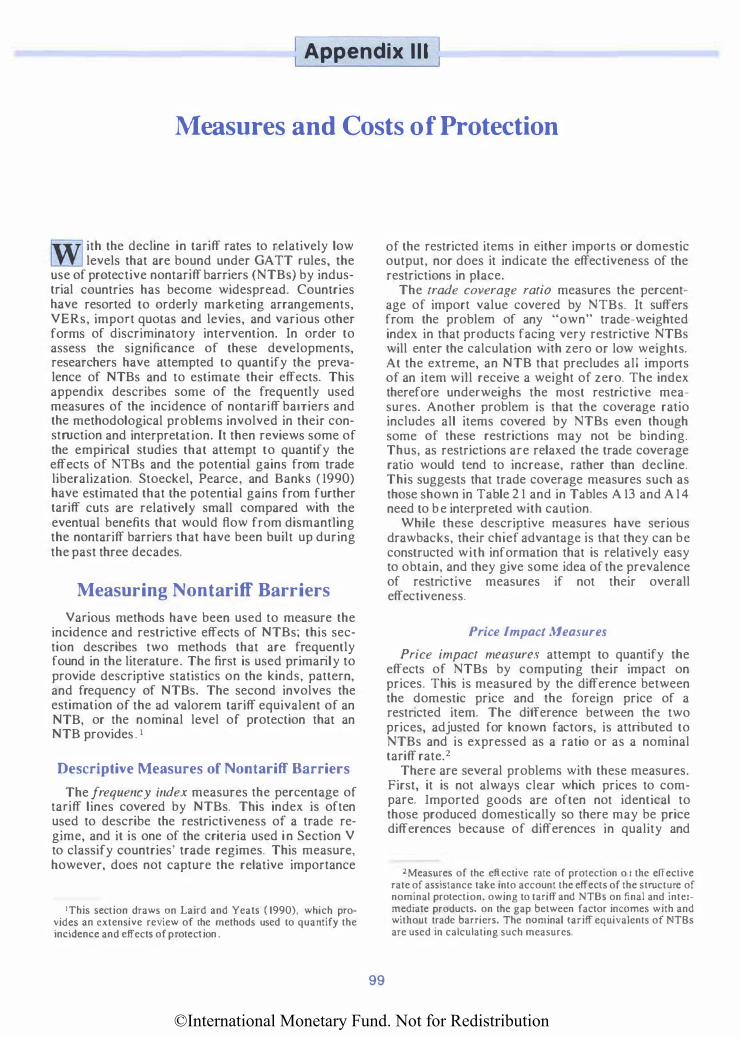
©International Monetary Fund. Not for Redistribution
Appendix I l l
Measures and Costs of Protection
fiUl ith the decline in tariff rates to relatively low LllJ levels that are bound under GATT rules, the use of protective nontariff barriers (NTBs) by industrial countries has become widespread. Countries have resorted to orderly marketing arrangements, VERs, import quotas and levies, and various other forms of discriminatory intervention. In order to assess the significance of these developments, researchers have attempted to quantify the prevalence of NTBs and to estimate their effects. This appendix describes some of the frequently used measures of the incidence of nontariff barriers and the methodological problems involved in their construction and interpretation. It then reviews some of the empirical studies that attempt to quantify the effects of NTBs and the potential gains from trade liberalization. Stoeckel, Pearce, and Banks ( 1990) have estimated that the potential gains from further tariff cuts are relatively small compared with the eventual benefits that would flow from dismantling the nontariff barriers that have been built up during the past three decades.
Measuring Nontariff Barriers
Various methods have been used to measure the incidence and restrictive effects of NTBs; this section describes two methods that are frequently found in the literature. The first is used primarily to provide descriptive statistics on the kinds, pattern, and frequency of NTBs. The second involves the estimation of the ad valorem tariff equivalent of an NTB, or the nominal level of protection that an NTB provides. 1
Descriptive Measures of Nontariff Barriers
The frequency index measures the percentage of tariff lines covered by NTBs. This index is often used to describe the restrictiveness of a trade regime, and it is one of the criteria used in Section V to classify countries' trade regimes. This measure, however, does not capture the relative importance
I This section draws on Laird and Yeats ( 1990), which provides an extensive review of rhe methods used to quantify the incidence and effects of protection .
99
of the restricted items in either imports or domestic output, nor does it indicate the effectiveness of the restrictions in place.
The trade coverage ratio measures the percentage of import value covered by NTBs. It suffers from the problem of any "own" trade-weighted index in that products facing very restrictive NTBs will enter the calculation with zero or low weights. At the extreme, an NTB that precludes all imports of an item will receive a weight of zero. The index therefore underweighs the most restrictive measures. Another problem is that the coverage ratio includes all items covered by NTBs even though some of these restrictions may not be binding. Thus, as restrictions are relaxed the trade coverage ratio would tend to increase, rather than decline. This suggests that trade coverage measures such as those shown in Table 2 1 and in Tables A 13 and A 14 need to be interpreted with caution.
While these descriptive measures have serious drawbacks, their chief advantage is that they can be constructed with information that is relatively easy to obtain, and they give some idea of the prevalence of restrictive measures if not their overall effectiveness.
Price Impact Measures
Price impact measures attempt to quantify the effects of NTBs by computing their impact on prices. This is measured by the difference between the domestic price and the foreign price of a restricted item. The difference between the two prices, adjusted for known factors, is attributed to NTBs and is expressed as a ratio or as a nominal tariff rate. 2
There are several problems with these measures. First, it is not always clear which prices to compare. Imported goods are often not identical to those produced domestically so there may be price differences because of differences in quality and
2Measures of the effective rate of protection o r the effective rate of assistance take into account the effects of the structure of nominal protection. owing to tariff and NTBs on final and intermediate products. on the gap between factor incomes with and without trade barriers. The nominal tariff equivalents of NTBs are used in calculating such measures.
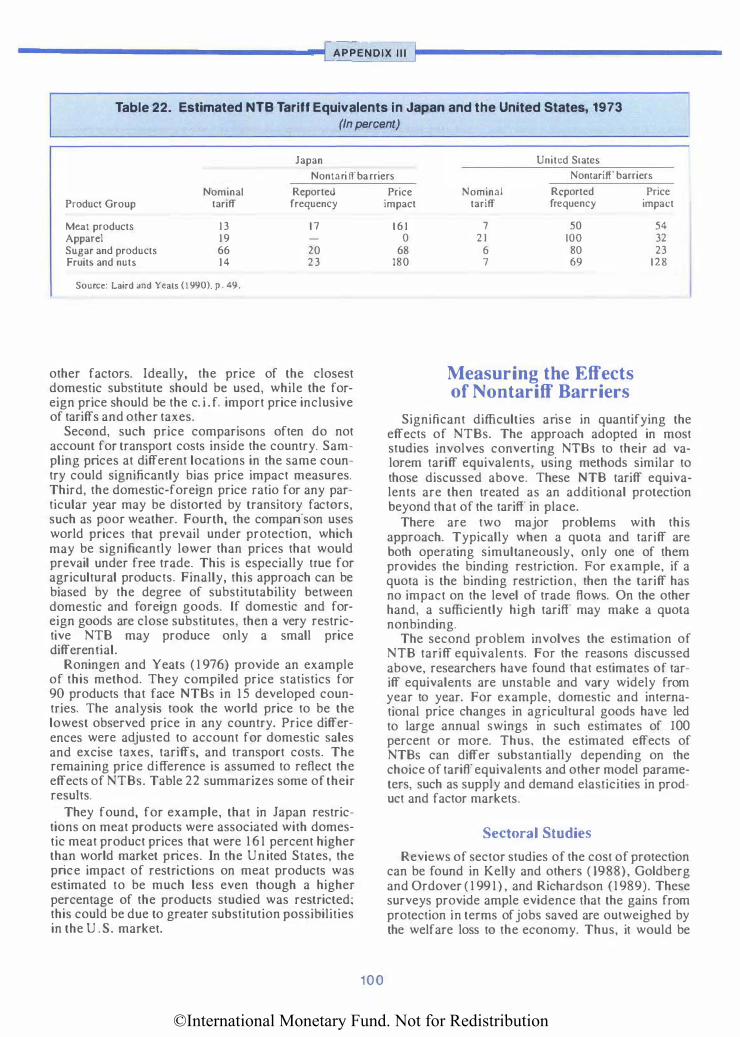
©International Monetary Fund. Not for Redistribution
.................................. -{I�A�P�P�E�N�D�IX�I�II=r-----------------------------------
Table 22. Estimated NTB Tariff Equivalents in Japan and the United States, 1973 (In percent)
Japan United States
Nontari ll' barriers Nontarifr barriers
Nominal Reported Product Group tariff frequency
Meat products 13 17 Apparel 19 -
Sugar and products 66 20 Fruits and nuts 14 23
Source: Laird and Yeats (1990). p . 49
other factors. Ideally, the price of the closest domestic substitute should be used, while the foreign price should be the c. i . f. import price inclusive of tariffs and other taxes.
Second, such price comparisons often do not account for transport costs inside the country. Sampling prices at different locations in the same country could significantly bias price impact measures. Third, the domestic-foreign price ratio for any particular year may be distorted by transitory factors, such as poor weather. Fourth, the comparison uses world prices that prevail under protection, which may be significantly lower than prices that would prevail under free trade. This is especially true for agricultural products. Finally, this approach can be biased by the degree of substitutability between domestic and foreign goods. If domestic and foreign goods are close substitutes, then a very restrictive NTB may produce only a small price differential.
Roningen and Yeats ( 1 976) provide an example of this method. They compiled price statistics for 90 products that face NTBs in 15 developed countries. The analysis took the world price to be the lowest observed price in any country. Price differences were adjusted to account for domestic sales and excise taxes, tariffs, and transport costs. The remaining price difference is assumed to reflect the effects of NTBs. Table 22 summarizes some of their results.
They found, for example, that in Japan restrictions on meat products were associated with domestic meat product prices that were 1 6 1 percent higher than world market prices. ln the United States, the price impact of restrictions on meat products was estimated to be much less even though a higher percentage of the products studied was restricted; this could be due to greater substitution possibilities in the U . S. market.
100
Price impact
161 0
68 180
Nominal Reported tariff frequency
7 50 21 lOO
6 80 7 69
Measuring the Effects of Nontariff Barriers
Price impact
54 32 23
128
Significant difficulties arise in quantifying the effects of NTBs. The approach adopted in most studies involves converting NTBs to their ad valorem tariff equivalents, using methods similar to those discussed above. These NTB tariff equivalents are then treated as an additional protection beyond that of the tariff in place.
There are two major problems with this approach. Typically when a quota and tariff are both operating simultaneously, only one of them provides the binding restriction. For example, if a quota is the binding restriction, then the tariff has no impact on the level of trade flows. On the other hand, a sufficiently high tariff may make a quota nonbinding.
The second problem involves the estimation of NTB tariff equivalents. For the reasons discussed above, researchers have found that estimates of tariff equivalents are unstable and vary widely from year to year. For example, domestic and international price changes in agricultural goods have led to large annual swings in such estimates of I 00 percent or more. Thus, the estimated effects of NTBs can differ substantially depending on the choice of tariff equivalents and other model parameters, such as supply and demand elasticities in product and factor markets.
Sectoral Studies
Reviews of sector studies of the cost of protection can be found in Kelly and others ( 1988), Goldberg and Ordover ( 1 991) , and Richardson ( 1989). These surveys provide ample evidence that the gains from protection in terms of jobs saved are outweighed by the welfare loss to the economy. Thus, it would be

©International Monetary Fund. Not for Redistribution
I Measures and Costs of Protection I
less costly to provide adjustment assistance to facilitate the exit of resources from sectors where comparative advantage has shifted abroad. Most sector studies reach this conclusion based on partial equilibrium models, but those based on general equilibrium models, which take into account lhe pull of resources from other sectors and the higher downstream costs to domestic producers, demonstrate more forcefully that the gains from protection are quite small compared with the costs. Reviewing industries characterized by imperfect competition and economies of scale, Richardson finds that the benefits of trade liberalization are even greater than under perfect competition. Selected studies in those sectors most affected by VERs and quota restraints are discussed below. It should be noted that in some sectors conditions have changed since these studies were done. For example, in recent years, the VER on Japan's automobile exports to the United States has not been a binding constraint for most Japanese companies, and the VER on steel exports to the United States became nonbinding after 1986 for some major exporting countries.
Automobiles
Several effects of automobile VERs on prices have been documented. First, prices of imported automobiles subject to the restraint tend to increase as exporters raise prices to clear markets and earn quota rents. Second, to the extent domestic producers behave oligopolistically and domestic and imported automobiles are imperfect substitutes, domestic prices will also increase. Such price increases will be mitigated to the extent that outside competitors gain entry into the protected market. Finally, there will be some quality upgrading under the VER as producers shift toward production of cars with more optional equipment. It has been argued that VERs have led to substantial quality increases so that price increases as a result of them overstate the costs of the restraint to lhe consumer. However, such quality changes may also have some negative effects if they result in more limited consumer choice.
A number of studies have attempted to estimate these price effects, as well as the costs to consumers and the employment effects of such protection. For example, it was estimated that the VER between the United States and Japan resulted in U.S. import prices being 1 5 to 25 percent higher in 1985 than they otherwise would have been, while prices of domestic cars were about 6 percent higher. In another study of the effects of removing the VER in the mid-1980s, Collyns and Dunaway ( 1987) estimated that import prices would have been 23 percent lower, while domestic prices would decline by up to 12 percent. Feenstra ( 1985) estimated import
101
prices to have been 16 percent higher with the restraint and domestic prices to have been 9 percent higher. The studies by Feenstra and Collyns and Dunaway attributed a significant part of these price increases to quality improvements, with the latter noting that while transactions prices of automobiles rose 23 percent in 1981-84, the automobile component of the consumer price index increased by only 6 percent.
Estimates of the costs of the U .S. VER to consumers have ranged from 1 7 to 20 percent of the value of total U.S. imports of automobiles (6 to 7 percent of apparent consumption), while net welfare costs, which subtract the gains to domestic producers from the quota, have been estimated at between 4 to 8 percent of imports ( I Y2 to 3 percent of apparent consumption). 3
Further, most studies have found the employment gains from the U.S.-Japan VER to have been modest. The estimates of employment gains vary from 20,000 to 35,000 in OECD ( 1987e) to 55,000 in Hufbauer, Berliner, and Elliott ( 1986). The costs to consumers per job saved have been estimated to be substantially higher than average annual wages and salaries.
A recent study by Smith ( 1989) estimated relatively large gains (on the order of 0.2 percent of GDP) from the elimination of the EC's automobile YERs. This analysis broadly confirmed the results of other studies in concluding that eliminating YERs in the EC would increase Japanese automobile sales and reduce prices, with the reduction in prices of domestic cars being more modest. This study further concluded that a decline in profits of some European producers could result in consolidation of the industry through mergers and acquisitions.
Textiles a11d Apparel
The restrictive effects of the MFA have been examined in terms of the tariff equivalents of quotas, or the difference between the price under the quota and that under a free trade regime. For the United States, the tariff equivalent of the MFA quotas on textiles and apparel has been estimated at about 1 5 and 25 percent, respectively.4 A recent USITC ( 1989) study found that, in most cases, quotas were binding in 1987 and that the tariff equivalents on textiles and apparel were 22 percent and 28 percent, respectively. The tariff equivalent of German quotas on men's and boy's shirts has been estimated at 54 percent. For Canada, estimates indicate that without quotas, landed prices would have been lower by 17 percent for outerwear and 25
1USITC ( 1985) and Hufbauer, Berliner. and Elliott ( 1986). 4Ciine (1990).

©International Monetary Fund. Not for Redistribution
APPENDIX Ill
percent for shirts. These results are based on the hypothesis of perfectly elastic supply and may therefore be excessive. Estimates for the United Kingdom, which relax this assumption, suggest that abolishing the MFA would reduce the U.K. landed price of imports by only 5 to 10 percent.
These quotas have resulted in significant costs to consumers in the protected markets. Cline ( 1990) estimated the decline in U.S. net welfare from protection of the textile and apparel sectors to be $0.8 billion and $7.3 billion, respectively, in 1986. This amounts to about 36 percent of the total value of U.S. textile and apparel imports and 61h percent of apparent consumption. Another estimate by the USITC ( 1 989) based on 1987 data ranged between $4.1 and $4.3 billion or about 1 6 percent of the value of imports.
The Cline and USITC studies are similar in their estimates of the employment reduction from elimination of the MFA. Cline estimates this ar about 234,000, while the USITC study estimates a range between 233,000 and 291 ,000. The consumer cost per job saved ranges from $14,000 to $ 19,000 in USITC ( 1989) to $35,000 in Cline.
In a study of the removal of global quotas and tariffs on textiles and apparel by the developed countries, Trela and Whalley ( 1 990) estimated a global net welfare gain of approximately $23 billion in 1986. As expected, the simulation results indicated that the removal of such protection would result in a reallocation of production from the developed to the developing countries. The developing countries would also achieve a net welfare gain of around $8 billion.
Steel
A number of studies have estimated the costs of protection for the U. S. steel industry and the economy. The cost to consumers of U .S . VERs on steel has been estimated at about 3 percent of apparent consumption by Tarr and Morkre ( 1984) and USITC ( 1989) (or about 1 7 percent of the total value of steel imports for Tarr and Morkre and 1 2 percent for USITC). The number of jobs saved by the quotas has been rather small owing to the capital intensity of the production processes, ranging from 9,000 to 10,000 by USITC and Tarr and Morkre, respectively. A study by Tarr ( 1 989) accounting for interdependence among various industries estimates jobs saved at 20,000. The consumer costs per job saved are generally well above $50,000 a year.
Multilateral Trade Liberalization
There is a broad consensus of support for a successful conclusion to the Uruguay Round of trade negotiations based on the benefits that would accrue
102
from a more liberal trading system. A successful outcome of the Round is generally understood as one that would include substantial liberalization of agricultural trade, the phasing out of the MFA and other NTBs, and extended GATT disciplines in new areas of services, investment, and intellectual property.
While a consensus exists around the desirability of reaching agreement in the Uruguay Round based on a qualitative understanding of its benefits, there is less of a consensus regarding the quantitative effects of Uruguay Round-type trade liberalization. Some studies that attempt to quantify global and regional effects of multilateral trade liberalization do exist; however, the results obtained differ substantially for a number of reasons. Among these are differences in methodology and model structure, the measurement of NTB tariff equivalents, and the type of trade policy change simulated. Such differences, as well as similarities, may be illustrated by reviewing three multilateral trade models: Whalley ( 1985); Stoeckel, Pearce, and Banks ( 1 990); and Deardorff and Stem ( 1990). It must be noted, however, that none of these models are capable of estimating some of the complex effects of negotiations in services, investment, and intellectual property.
Model Structure
The differences in the structure of the three models explain some of the differences with respect to simulation results. One common feature of these models, however, is that none of them take account of the dynamic effects associated with increasing returns to scale and imperfectly competitive markets. The simulated effects of trade liberalization measure the one-time static effects that would result after product and factor markets fully adjust to the policy change.
The Whalley model is a computable general equilibrium model and is most closely related to textbook trade theory based on comparative advantages, that abstracts from the macroeconomic effects of changes in aggregate demand and nominal exchange rates. Trade patterns are determined by the interaction of supply and demand in the context of differing endowments of capital and labor between regions. Full employment and balanced trade are assumed for all regions at all times. The basic method is to use given base-year data on production, consumption, and trade, together with certain substitution elasticity parameters for supply and demand relationships in order to calculate equilibrium relative product and factor prices; this step is referred to as calibration. Once the characteristics of the base-year equilibrium are determined, policy simulations may be generated by solving the model for different sets of tariff and NTBs, that is, coun-

©International Monetary Fund. Not for Redistribution
j Measures and Costs of Protection I
terfactual simulation. This method of analysis abstracts from disequilibrium adjustment of output and factor markets, emphasizing long-run real comparative static effects of trade policy changes. These effects are the changes in consumer welfare and producer costs of trade liberalization, terms of trade effects, and decreased tariff revenue and quota rents accruing to the importing country after liberalization.
The Stoeckel model is also a general equilibrium model that focuses on the long-run comparative static effects of trade policy changes. It combines an input-output structure of interindustry flows of intermediate goods with the three primary factors of production: land, labor, and capital. While product, land, and capital markets are assumed to clear, the labor market assumption only requires that there be no unmet labor demand. The primary difference between this model and the Whalley model is that trade may be unbalanced in the former. The Stoeckel model also permits changes in aggregate demand and output.
The Michigan model used by Deardorff and Stern is somewhat different in allowing some additional Keynesian short-run disequilibrium features associated with nominal rigidities and unemployment. It permits nominal exchange rates to have effects on the trade balances and employment. However, the simulations of multilateral trade liberalization incorporate the assumption that aggregate expenditure changes endogenously to maintain a given level of employment, with gross employment changes indicating the required adjustment in labor markets.
The Whalley model consists of 7 regions and 33 commodity groups. Assumptions with respect to consumer preferences allow for varying income elasticities of demand and production technology assumptions permit a variety of elasticities of substitution between inputs. Further, the Whalley model assumes that domestic products and imports from each source are not perfect substitutes.
The Stoeckel model consists of nine regions and seven commodity groups. This model generally assumes a greater degree of substitutability between primary factors of production (land, labor, and capital) and between imported and domestic goods than the Whalley model. However, the Stoeckel model is similar in assuming imperfect substitutability between products from ctifferent regions.
The Michigan model is the most disaggregated and includes 34 countries, 22 traded goods, and 7 nontraded goods. Elasticities of substitution between capital and labor, as well as between domestic and imported commodities, are closer to those in the Whalley model. However, while the other two models assume that imported goods from different sources are imperfect substitutes, as are imported and domestic goods, the Michigan model
treats imports from all sources as identical while permitting incomplete substitution between domestic goods and imports aggregated from all sources.
103
Tariff and Nontarijf Barriers
The Whalley model simulates the effects of eliminating all tariff and NTBs. NTBs are estimated in terms of their ad valorem tariff equivalents using a residual method developed by UNCTAD. This method entails allocating a part of the difference between domestic and world prices to transportation costs and tariffs, with the remainder expressed as a nontariff barrier term. The tariff equivalents of NTBs are set exogenously. In computing the baseyear equilibrium position, this model allocates the quota rents from NTBs to the importing country. The tariff equivalent data for the United States, EC, and Japan are from UNCTAD and an arithmetic average of these was used for the other developed country region. These equivalents are assumed equal to zero for the Organization of Petroleum Exporting Countries (OPEC) and, given a paucity of data for the less developed countries, the Whalley model applies tariff equivalent figures from a study of Bangladesh to the developing country region. Finally, NTB tariff equivalents for the newly industrializing economies (NIEs) are assumed to equal the equivalents for the developing country region multiplied by the ratio of NIE tariffs to developing country tariffs.
The Stoeckel model simulates the effects of a global cut in tariff and NTBs by 50 percent. The NTBs are also expressed in their tariff equivalent form and determined exogenously in the model.
The Michigan model simulates the effects of a complete elimination of tariff and NTBs in the developed countries. ln simulating these effects, estimates of ad valorem tariff equivalents were made using available data for major industrial countries and a subset of developing countries. High and low estimates of these data were made with the latter adjusted for the percentage of trade covered by NTBs. The Michigan model is unique relative to the others in that the tariff equivalents of NTBs vary endogenously to reflect the difference between the estimated demand for a product and the quota restriction. Thus, a decline in import demand owing to changes in other variables would reduce the estimated NTB tariff equivalent.
As may be seen from Table 23, NTB tariff equivalent estimates vary substantially from study to study because of the differing underlying data sources used in the method of calculation, the period for which data were collected, and the extent of trade coverage. Generally, it appears that, at least for manufacturing industries, the estimates of

©International Monetary Fund. Not for Redistribution
APPENDIX Ill
Table 23. A Comparison of NTB Tariff Equivalents (In percent)
Stoeckel. Pearce, and Banks Whalley Deardortr and Stern
European Community Agriculture 5.3 Agriculture and food 33.2 Not available Mining 9.3 Minerals and extractive ores 48.5 Processed food 105.2 Energy 28.2 Textiles, clothing. and footwear 39.8 Nonmechanical manufacturing 7.9 Motor vehicles, metal products. 4.2 Machinery and transport 1 . 7
and machinery 5.6 Other manufactures
United States Automobiles 1 1 . 0 Agriculture and food 43.8 Food. beverages. tobacco 14.5 Motorcycles 30.0 Minerals and extractive ores 0.0 Footwear 4.3 ColorTVs 15.0 Energy 5.6 Printing and publishing 22.3 CB radios 2 1 .0 Nonmechanical manufacturing 7.5 Chemicals 0.0 Textiles and clothing 30.0 Machinery and transport 0.0 Petroleum and related 0.0 Nonrubbcr footwear 18.5 Iron and steel 1 1 .3 Carbon and alloy steel 30.0 Nonferrous metals 0.0 Specialty steels 25.0 Metal products 0.0 Nuts and bolts 15.0 Nonelectrical machinery 0.0 Sugar 30.0 Electrical machinery 0.2 Dairy 80.0 Miscellaneous manufacturing 0.0 Meat 14.0 Peanuts 28.0 Mushrooms 20.0
Japan Not available Agriculture and food 72. 1 Food, beverages. tobacco 27. 1
Minerals and extractive ores 46.0 Footwear 6. 1 Energy 37.7 Chemicals 1 . 1 Nonmcchanical manufacmring 8.1 Petroleum and related 1 .3 Machinery and transport 1 .8 Nonmetallic minerals 1 . 1
Miscellaneous manufacturing 0.8
Sources: Deardorlf and Stern ( t990). Table A tO: Whalley ( 1985). p. 286: and Stoeckel. Pcarcc. and Banks (1990). pp. 40 and 50.
NTBs in the Stoeckel model are somewhat higher than for the other two models.
Simulation Results
The seven-region Whalley model was used to simulate the comparative static effects of multilateral elimination of tariffs and NTBs. The results were presented in terms of the regional long-run net welfare changes which, when scaled by GDP, yield a 2.2 percent gain for the EC, a 0.5 percent increase for the United States, a 2 .8 percent gain for Japan, and an overall global increase in welfare of 0.4 percent of world GDP. The small overall gain is due primarily to terms of trade losses in developing countries. These arise in this experiment because trade barriers in developing countries are very high compared with other regions. In the context of the Uruguay Round, a more appropriate experiment would be an equiproportionate cut in trade barriers.
The Stoeckel model was used to simulate the effects of a 50 percent reduction in tariffs and
104
NTBs. Since trade was permitted to be unbalanced in this model, welfare calculations of the type made in the Whalley model were not, strictly speaking, permitted. However, as mentioned, GDP changes were reported for this simulation and might roughly be compared with the results from the Whalley model. The EC was estimated to gain 5.2 percent of GDP from this liberalization, while North America gains 3.9 percent and Japan, 9 percent. The gain in GDP for the countries reported (and which does not include a residual country category) was estimated at about 5 percent .
Deardorff and Stern used the Michigan model to simulate the effects of a complete trade liberalization by developed countries (including elimination of agricultural subsidies). They do not present welfare calculations for the same reason that the Stoeckel model does not; that is, since trade is permitted to remain unbalanced, welfare calculations would be complicated by issues regarding accumulations and decumulations of reserves. However, a comparison of the effects of this simulation on

©International Monetary Fund. Not for Redistribution
I Measures and Costs of Protection I
Table 24. A Comparison of the Stoeckel Model and the Deardorff and Stern Model
Percentage Change in Value of Exports
Stoeckel, Pearce, Banks
European Community (EC) Japan North America World
Memorandum
16.4 36.7 26.5 1 7 . 1
Change i n terms of trade in Deardorff and Stern (in percem)
EC Japan United States Canada World
-0.30 - 1 . 13
0.08 -O.Q2 -0.05
Deardorff and Stern
EC 5.3 Japan 6.7 United States 3 . 7 Canada 4.6 World 4.7
Percentage Change in Value ofimports
Stoeckel, Pearce, Banks
EC Japan North America World
9 . 5 33.5 26.1 16.0
Deardorff and Stern
EC 5.2 Japan 6.3 United States 3.5 Canada 4.8 World 4.5
Sources: Dcardorff and Stern ( t990), pp. 256-57: and Stocckcl. Pcarce. and Banks ( 1990). p. 70.
changes in exports and imports with Stoeckel 's simulation of a 50 percent global liberalization is presented in Table 24. Generally, the Stoeckel model estimates a much greater increase in trade than the Deardorff and Stern results.
Overall, the results of the three models suggest that the Michigan model lies between the more extreme results of the Whalley and Stoeckel models, to the extent that comparisons can be made between these models given their different struc-
105
tures and simulation experiments. Whalley's results appear to be driven by rather strong terms of trade effects; while Stoeckel's results appear to be driven by somewhat higher degrees of substitution between products and factors of production. The Stoeckel model also assumes higher NTB tariff equivalents than the other two models; this together with higher assumed elasticities of substitution explains the relatively large gains estimated from trade liberalization.

©International Monetary Fund. Not for Redistribution
This page intentionally left blank

©International Monetary Fund. Not for Redistribution
Statistical Appendix

©International Monetary Fund. Not for Redistribution
This page intentionally left blank

©International Monetary Fund. Not for Redistribution
Statistical Appendix
Table A 1 . Major Industrial Countries: Real GNP, Domestic Demand, and Trade Volumes, 1973-90 (Annual changes, in percent)
Average' 1973-82 1983 1984 1985 1986 1987 1988 1989 1990
Real GNP
CanadaZ 3.4 3.2 6.3 4.8 3.3 4.2 4.7 2.5 0.5 United States 2.0 3.6 6.8 3.4 2.7 3.4 4.5 2.5 1 . 0 Japan 3.9 2 .8 4.3 5.2 2.6 4.3 6.2 4.7 5.6 Francc2 2.8 0.7 1 . 3 1 . 9 2.5 2.3 4.2 3.9 2.8 West Germany 1 .9 1 . 9 3 . 1 1 . 8 2 . 2 1 . 5 3.7 3.8 4.5 ltaly2 3.4 l . l 2.7 2.6 2 .9 3 . 1 4.1 3.0 2.0 United Kingdom3 1 . 4 3 . 7 2 . 2 3 . 6 3.9 4.8 4.3 2 . 3 0.8
Real total domestic demand
Canada 3.5 3.6 4.7 5.3 4.2 5.3 5.2 3.8 -0.2 United States 1 . 7 5 . 1 8.7 3 8 3. 3 3 .0 3.3 1 . 9 0.5 Japan 3.4 1 . 8 3.6 4 . 1 3.7 5 . 1 7.6 5.7 5.8 France 2.5 -0.7 0.4 2.5 4.5 3.3 4.4 3.5 3.2 West Germany 1 . 4 2 . 3 1 .9 0.9 3.3 2.6 3 .6 2 . 7 5.0 Italy 2.5 0.2 3.5 2.8 3.0 4 . 1 4.4 3.0 1.9 United Kingdom 1 .2 4.9 2.5 2.7 4.6 5.3 7.8 3.3 -0.1
Export volumes
Canada 4.6 7.4 18.6 6.4 4.0 3.6 9.3 1 . 1 4.5 United States 5 .4 -3.8 8.0 3.2 8.0 14.5 22.5 1 1 . I 8.8 Japan 8.0 7.9 16.2 4.6 -0.6 0.3 5 . 1 3.8 5.5 France 5 . 1 3.7 5.5 1 . 5 0.6 3.5 8.7 8 . 1 4.9 Germany4 5.3 -0.3 9.2 5.9 1 . 3 2.9 6.8 8.0 4.5 Italy 4.6 3.4 7.9 3.2 3.8 3.3 4.9 9.0 3.5 United Kingdom 4.4 2.3 8 . 1 5.6 4.2 5.2 1 . 8 4.8 6.6
lmport volumes
Canada 5.0 1 1 . I 19.7 10.4 8 . 1 6.2 13.6 4.9 -0.4 United States 2 . 8 12.9 24.9 4.5 13 .4 5 .8 6.6 6.2 3.3 Japan 2.4 0.8 10.5 0.4 9.5 9.3 16.7 7.8 5.8 France 5.4 - 1 . 9 3.4 4.2 10. 1 7.5 8.8 7.8 5.2 Germany4 3.0 4.0 5. 1 4. 1 6 . 1 5 .5 6.5 7. 2 1 2 .8 Italy 2.6 - 1 .9 10.8 4 . 1 7 . 6 1 1 .3 6.4 8.3 4.5 United Kingdom 2.3 8.9 1 1 .4 3.2 7.4 7.4 1 3 . 1 7.9 1 . 2
Source: International Monetary Pund ( 1991 b). •Compound annual rotes of change. 'GDP at market prices. lAverage of expenditure. income, and output estimate� of GDP at market price�. •Data through June 30. t990 covers West Germany.
109

©International Monetary Fund. Not for Redistribution
STATISTICAL APPENDIX
Table A2. Shares In World Exports of Manufactures, 1963-891 (In percent)
1963
Total exports 100.0
Developed countries 80.9 European Community'Z 44.0
lntra-EC 20.6 Japan United St ates Other developed countries
Developing countries 5.8 Four Asian N1Es3 Other developing countries
Eastern trading area 13.3
1973
100.0
83.1 46.5 22.8 10.0 12.3 14.3
6.9 3.7 3.2
10.0
1977 1981
100.0 100.0
82.6 8 1 .4 45.0 40.1 20.9 18.9 1 1 .9 13.3 12.0 13.9 13.8 14 . 1
8.0 10.5 4.2 6.2 3.8 4.3
9.3 8 . 1
1986 1989
100.0 100.0
79.6 77.6 42.6 4 1 .5 23.0 24.1 1 4 . 1 12.3 10.3 12.3 12.6 1 1 .5
12.4 15. 1 7.9 10.1 4.5 5.0
8.0 7.3
Sources: General Agreement on Tariffs and Trade (GATT): International Monetary Fund (IMF): United Nations: United Nations Confer-ence on Trade and Development: and !M F staff estimates. Based on GATT classifications.
'Standard International Trade Classification (SIT C) categories 5 through S minus 68. 2EC-10: Belgium, Denmark, France. Germany, Greece, Ireland. Italy, Luxembourg. the Netherlands. and the United Kingdom. 'The newly industrializing economies (NIEs) of Hong Kong. Korea, Singapore, and Taiwan Province of China.
1 1 0

©International Monetary Fund. Not for Redistribution
Statistical Appendix
Table A3. Developing Countries' Exports by Product, 1 980-88
1 980 1985 1988
(Ill millions of U. S. dollars)
Food 65.9 64.1 77.7 Raw materials 20.4 14.5 23.2 Ores and minerals 1 3 . 9 1 1 .0 14.6 Fuels 338. 7 193.5 133.7 Nonferrous metals 10.7 7.5 13.7
Total exports of primary products 449.5 290.4 262.7
Textiles 12.3 1 3 . 8 26.0 Clothing 1 5. 7 22.0 40.6 Other consumer goods 16.9 25.4 49.7 Iron and steel 5 . 1 7.5 1 3 .2 Chemicals 9.5 12.4 23.0 Other semimanufactures 14.7 18.2 37.0 Machinery and transport
equipment 30.7 53. 1 1 14.2
Total exports of m a nu factu res 104.7 152.2 303.7
Total merchandise exports 562.7 448.0 574.8
(Ill percem of rota/ exporrs)
Food 1 1 .7 14.3 13.5 Raw materials 3.6 3.2 4.0 Ores and minerals 2.5 2.4 2.5 Fuels 60.2 43 .2 23.3 Nonferrous metals 1 .9 1 . 7 2.4
Total exports of primary products 79.9 64.8 45.7
Textiles 2 .2 3 . 1 4.5 Clothing 2.8 4. 9 7 . 1 Other consumer goods 3.0 5 .7 8.6 Iron and steel 0.9 1 .7 2. 3 Chemicals 1 . 7 2.8 4.0 Other semimanufactures 2 .6 4 . 1 6.4 Machinery and transport
equipment 5.5 1 1 .8 19.9
Total exports of manufactures 1 8.6 34.0 52.8
Source: General Agreement on Tariffs and Trade, /memo-1ional Trade (Geneva), various issues.
1 1 1

©International Monetary Fund. Not for Redistribution
STATISTICAL APPENDIX
Table A4. Shares of Exports of Manufactures by Area and Sector, 1973-88 (In percent)
1973 1980 1985 1988
Total exports of manufactures Industrial countries 83.1 82.3 79.0 77.6 Developing countries 6.9 9.5 1 2 . 7 1 5 . 1 Eastern trading area 10.0 8 . 1 8.3 7.3
Textiles Industrial countries 73.3 70.0 64.6 58.8 Developing countries 17.3 2 1 .9 25.2 28.0 Eastern trading area 9.3 8 . 1 10.2 13.2
Clothing Industrial countries 55.0 49.3 46.6 40.6 Developing countries 30.3 38.3 45.5 45.4 Eastern trading area 14.7 12.5 8.0 14.0
Other consumer goods Industrial countries 76.0 80.1 75.9 73.5 Developing countries 1 3 . 1 14. 1 18.9 20.5 Eastern trading area 10.9 5.8 5.2 6.0
Iron and steel Industrial countries 83.6 83.9 77.3 76.0 Developing countries 3.3 6.6 10.6 13.0 Eastern trading area 1 3 . 1 9.6 1 2 . 1 1 1 .0
Chemicals Industrial countries 87.1 86.5 65.9 66.6 Developing countries 4.4 6.7 8.2 9.0 Eastern trading area 8.6 6.8 26.0 24.4
Other semimanufactures Industrial countries 80.5 84.5 80.2 78.3 Developing countries 1 1 .7 10.7 14.7 17.1 Eastern trading area 7 . 8 4.8 5 . 1 4.6
Machinery and transport equipment Industrial countries 84.9 84.8 82.6 8 1 . 7 Developing countries 3 . 1 5.9 8.7 1 1 .2 Eastern trading area 1 1 .9 9.4 8.7 7 . 1
Source: General Agreement on Tariffs and Trade. Jmernational Trade (Geneva), various issues.
1 1 2

©In
tern
atio
nal M
onet
ary
Fund
. Not
for R
edis
tribu
tion
Tab
le A
S.
Th
e L
ev
el o
f P
ost
-To
kyo
MF
N, A
pp
lied
, an
d G
SP
Ta
riff
s in
Se
lec
ted
De
ve
lop
ed
Co
un
trie
s
Ne
w
Un
ited
A
ll
Pro
duct
Gro
up
Aus
tral
ia
Aus
tri a
C
anad
a E
EC
F
inla
nd
Ja
pan
N
orw
ay
Zea
land
S
wed
en
Sw
itz
erla
nd
S
tate
s D
evel
op
ed
Ave
rage
MF
N t
ariff
rat
es
All
food
ite
ms
4.9
8
.0
6.2
3
.7
8.9
9
.7
2.8
9
.7
1.6
10
.0
4.1
6
.4
Fo
od
and
liv
e a
nim
als
2.8
5
.9
6.8
3
.2
9.3
10
.0
3.0
5
.7
1.4
9
.0
3.8
6
.5
Oil
seed
s a
nd
nut
s 4
.1
1.9
6
.0
10.3
7
.9
5.6
4
.5
0.9
3
.5
7.5
1.
4
5.3
A
nim
al a
nd
veg
etab
le o
ils
2.0
0
.8
0.1
0
.8
0.3
0
.2
0.9
0
.1
Agr
icul
tura
l ra
w m
ater
ials
5
.1
2.3
0
.6
3.4
1.
1 0
.7
0.6
1.
0
1.7
1.
9
0.3
0
.8
Ore
s an
d m
etal
s 10
.2
5.6
2
.1
2.8
1 .
9
2.5
1 .
5
6.0
2
.5
1.4
1.
9
2.3
Ir
on a
nd
ste
el
17.2
8
.4
5.4
5
.5
3.9
5
.0
1.8
8
.8
4.8
2
.0
4.3
5
.1
No
nfer
rous
met
als
3.9
6
.1
2.2
3
.2
1.2
5
.5
1.9
4
.0
1.0
1.
2
0.7
2
.3
Fue
ls
2.1
1.
4
0.1
0
.1
1.5
0
.2
0.4
I.
I C
hem
ical
s 5
.4
6.3
6
.4
8.4
2
.4
5.5
5
.9
6.7
5
.0
0.9
3
.7
5.8
M
anuf
actu
res
excl
udin
g
chem
ical
s 17
.7
14.1
7
.0
8.1
8
.2
5.7
6
.1
22
.6
5.4
3
.3
5.6
7
.0
Lea
ther
17
.8
5.3
3
.8
10.2
1
1.8
1
1.9
4
.7
20
.9
4.1
1.
8
4.2
5
.1
Tex
tile
s ya
rn a
nd
fab
rics
15
.3
18.2
9
.4
17.3
2
2.7
8
.6
12.8
16
.2
10.6
6
.0
10.6
1
1.7
(/)
Clo
thin
g
49
.3
30
.2
12.6
19
.9
32
.0
15.0
2
0.3
9
3.0
13
.6
8.6
2
0.3
17
.5
- I» F
oo
twea
r 4
3.9
2
5.9
11
.9
22
.5
16.0
14
.2
11.2
4
0.3
14
.3
9.6
1
1.7
13
.4
-O
ther
ite
ms
0.2
3
.3
0.1
4
.8
1.3
2
.3
2.0
1.
2
1.8
0
.4
4.2
3
.8
en ::: �
A
vera
ge a
pp
lied
tari
ff r
ates
C')
-4
!.
w
All
foo
d it
ems
3.1
6
.8
3.0
4
.4
5.2
9
.4
1.4
7
.8
0.8
9
.1
3.5
5
.3
)>
Fo
od
and
liv
e an
imal
s 1.
7
4.9
2
.9
4.8
5
.7
9.7
1.
5
3.9
0
.8
8.4
3
.2
5.3
1:1
1:1
O
il se
eds
and
nut
s 2
.0
1.5
4
.6
4.9
5
.5
4.8
4
.3
0.7
2
.2
7.4
1.
0
4.0
10 :;)
An
imal
and
veg
etab
le o
ils
2.4
0
.8
0.1
0
.8
0.3
0
.2
1.0
0
.2
c. A
gri
cult
ural
raw
mat
eria
ls
0.7
1.
6
3.7
0
.4
1.0
0
.3
0.4
0
.7
1.4
0
.7
0.3
0
.5
)( O
res
and
met
als
4.3
0
.3
2.7
0
.7
0.1
1.
8
0.4
4
.2
0.2
0
.1
2.2
1.
5
Iro
n an
d s
teel
7
.3
0.5
5
.6
2.3
0
.1
2.9
0
.7
6.4
0
.4
0.1
5
.0
3.4
N
on
ferr
ous
met
als
2.4
0
.2
2.8
0
.5
4.3
0
.1
2.1
0
.1
0.1
0
.7
1.3
F
uels
1.
5
0.2
0
.3
1.2
0
.4
0.6
C
hem
ical
s
4.0
0
.5
3.0
3
.4
0.1
4
.8
0.4
4
.9
0.4
0
.1
3.9
3
.1
Man
ufac
ture
s ex
clud
ing
ch
emic
als
11.
5
2.0
6
.2
4.6
1 .
3
4.6
1.
3
18.3
1.
4
0.4
4
.9
4.7
L
eath
er
10.9
0
.9
11.
0
2.1
2
.3
10.7
0
.8
21.
4
0.3
0
.1
2.7
3
.1
Tex
tile
yar
n an
d f
abr
ics
11.
3
2.0
18
.3
5.3
1.
0
7.1
1.
6
10.9
1.
7
0.6
12
.1
7.9
C
loth
ing
3
5.6
5
.1
17.2
7
.3
7.7
10
.0
3.0
7
5.6
4
.8
!.7
18
.1
11.
9
Fo
otw
ear
27
.9
1.2
2
3.4
6
.5
3.8
12
.5
2.4
2
8.4
2
.8
0.6
9
.5
9.0
O
ther
item
s 0
.1
1.1
4.7
0
.1
0.1
0
.7
0.4
0
.9
0.1
0
.2
3.6
3
.3
All
pro
duc
ts
8.3
2
.0
4.4
2
.5
1.0
3
.1
1.0
1
1.0
0
.8
1.0
3
.4
3.0
Ave
rage
ta
riff
for
GS
P
bene
fici
arie
s
All
food
ite
ms
1 .3
9
.0
1.5
5
.0
7.0
1
1. I
0
.3
6.2
0
.4
6.3
3
.6
5.5
F
oo
d a
nd
live
an
imal
s 1.
0
8.9
1 .
3
5.1
7
.2
11.
7
0.3
0
.8
0.4
6
.5
3.4
5
6
Oil
sced
s an
d nu
ts
0.7
0
.1
5.6
6
.2
8.8
5
.0
3.2
1.
7
9.0
0
.3
4.5
A
nim
al a
nd
veg
etab
le o
ils
0.3
0
.3
10.7
1.
2
0.1
0
.1
0.4
A
gri
cult
ural
raw
mat
eria
ls
0.1
1.
4
3.1
0
.5
5.5
0
.5
0.5
2
.1
0.3
0
.1
0.5

©In
tern
atio
nal M
onet
ary
Fund
. Not
for R
edis
tribu
tion
Tab
le A
S (c
on
clu
de
d}
New
U
nite
d
All
P
rodu
ct G
roup
A
ustr
alia
A
ustr
ia
Can
ada
EE
C
Fin
land
Ja
pan
No
rway
Z
eala
nd
Swed
en
Sw
at7.e
rlan
d
Stat
es
Dev
elo
ped
Ore
s an
d m
etal
s 1.
6
0.9
0
.5
0.5
0
.1
1.3
0
.3
0.2
0
.1
0.4
1.
1 0
.9
en
Iro
n an
d st
eel
4.9
2
.9
4.0
3
.3
0.4
2
.0
0.4
2
.3
1.0
0
.4
3.5
3
.0
� N
onfe
rrou
s m
etal
s 0
.3
1.1
0.9
0
.5
3. I
1.
7
0.5
0
.1
0.9
0
.3
1.1
:!
en
Fue
ls
1.5
0
.2
1.3
0
.3
0.6
�
....
Che
mic
als
4.2
4
.0
6.1
4
. I
0.1
5
. I
0.2
I.
I 0
.6
0.4
1.
0
3.7
0
..
.. M
anuf
actu
res
cxcl
udtn
g
,..
�
chem
ical
s 11
.4
18.9
13
8
6.4
9
.3
4.2
5
.9
14.3
6
.9
2.7
6
.6
6.7
r- ,.
. L
eath
er
9.6
6
.6
9.6
2
.8
6.1
8.
4
5.5
18
.0
1.2
I
I 1.
4
3.2
,
T
exti
le y
arn
and
fab
ric�
6
.3
17.5
19
.8
7.6
6
.0
6.1
11
.0
8.5
6
.8
2.7
9
.0
8.4
,
m
C
loth
ing
3
5.1
2
7.2
16
.2
9.3
2
3.6
8
.6
18.9
8
2.8
13
.2
7.6
17
.8
14.6
z
Foo
twea
r 2
5.6
24
.4
23
.3
9.1
14
.8
7.9
1
1.6
2
2.1
13
.4
4.4
9
.4
10. I
0
Oth
er it
ems
5.3
5
.6
0.1
0
.1
1.0
0
.1
1.7
0
.4
4.0
3
.8
X
All
pro
duct
s 4
.3
4.9
4
4
2. I
4
.6
2.3
2
.8
3.3
2
.3
2.3
3
.6
2.7
Sour
ces:
Lai
rd a
nd Y
eat�
( 19
90
); c
alcu
lati
ons
bas
ed o
n th
e G
encr
ol A
gree
men
t o
n T
arill'
s an
d T
rade
Tar
iff S
tud
y a
nd
the
Uni
ted
Nat
ion�
Co
nfer
ence
on
Tra
de a
nd
Dev
elo
pmen
t'!.
Scri
c> D
T
rade
Tap
es.
No
te:
EE
C=
Eur
opea
n E
cono
mic
Co
mm
unit
y: G
SP
= G
cncr
dli1
cd S
yste
m o
f Pr
efe
renc
e,;
MF
N •
mo
M f
avor
cd n
atio
n

©International Monetary Fund. Not for Redistribution
Statistical Appendix
Table A&. Importance of GATT Tariff Bindings in Industrial Countries'
(In percent)
Bound Tariffs
Share in Share in tariff lines impons2
United States Agricuhure 90 87 Industry 100 100
Total 98 99
Canada Agricuhure 90 98 Industry 98 98
Total 96 98
Japan Agriculture 60 63 Industry 97 86
Total 9 1 81
European Community Agricuhure 63 69 Industry 99 99
Total 88 93
Austria Agricuhure 55 75 Industry 96 94
Total 88 91
Finland Agricuhure 5 1 89 Industry 97 99
Total 90 97
Norway Agricuhure 67 96 Industry 95 99
Total 90 99
Sweden Agriculture 46 78 Industry 97 97
Total 88 94
Switzerland Agricuhure 44 57 Industry 99 100
Total 90 93
Australia Agricuhure 26 36 Industry 1 1 24
Total 1 2 25 New Zealand
Agricuhurc 48 59 industry 39 47
Total 4 1 48
All markets Agriculture 6 1 74 industry 87 95
Total 82 92
Sources: General Agreement on Tariffs and Trade (GATT). and Organization for Economic Cooperation and Developmem.
•Tariff bindings are upper limits on tariffs agreed to in GATT All data refer to 1984 except Australia ( 1 980/8 1 ) and New Zea· land ( 1983/84). Since the launching of the Uruguay Round 10
1986. Australia and New Zealand bave offered to bind a larger proponion of their tari ffs.
'Refers to impons subject to a most-favored-nation tariff.
1 1 5

©International Monetary Fund. Not for Redistribution
STATISTICAL APPENDIX
Table A7. Import Coverage Ratios of Selected Nontarlff Measures, by Country Groupings, Applied by Selected Developed Market-Economy Countries
(In percent)
NTM Coverage in Imports from
Former U.S.S.R. World Developed countries Developing countries and Eastern Europe
Product Group Broad Narrow Broad Narrow Broad Narrow Broad Narrow
All food items 35.9 3 1 . 8 4 1 .8 35.4 28.7 26.6 56.7 54.9 Food and live animals 39.3 34.5 47.3 39.2 3 1 .0 28.7 6 1 . 1 59.3 Oilseeds and nuts 7.4 6.9 5.7 4.9 10.3 10.3 8.5 8 .5 Animal and vegetable oils 10.0 9.6 12.9 1 2 . 1 7.6 7.3 23.8 23.7
Agricultural raw materials 4.3 2.9 3.4 2.5 5.9 3.9 5.7 2. 1
Ores and metals 17.9 1 1 .6 20.4 14.2 1 1 .9 5.6 25.3 15.9 Iron and steel 52.9 35.3 56.8 40.7 40.6 19.7 67.1 44.0 Nonferrous metals 0.8 0.2 0.8 0.1 0.3 0. 1 2.4 1 .4
Fuels 17.9 13 .5 23.8 17.2 12.6 9.3 43.8 36.9 Chemicals 10.8 6.6 10.9 7.0 8 . 1 4 . 3 15.8 6.4
Manufactures. excluding 17.8 1 1 .0 15.5 7.2 24.2 2 1 .2 18.9 14.6 chemicals
Leather 13.2 1 .3 7.4 1 . 7 16.8 1 .0 16.2 2.5 Textile yarn and fabrics 38.7 34.3 17.0 1 1 .8 6 1 . 6 58.1 69.3 6 1 . 2 Clothing 63.1 56.6 27.6 6.8 7 1 .6 68.5 75.1 72.9 Footwear 19.7 8.0 14.2 0.2 20.9 10.9 52.5 6.1 Vehicles ' 54.7 29.6 58.6 3 1 .6 0.7 0.7 1 1 . 1 10.7
All items, excluding fuels 18.5 12.5 16.8 9.6 22.4 19.2 22.7 17. 1
All items 18.4 12.6 1 7 . 1 9.9 19.9 16.8 30.4 24.4
Source: United Nations Conference on Trade and Development (199Ja). Note: Ratios have been computed using as far as possible 1988 trade weights; otherwise trade statistics for 1986 (or 1989 in the calculations
regarding the United States) were used. The "broad" group of nontariff measures (NTMs) includes cenain para-tariff measures. surcharges. variable levies, antidurnping and countervailing actions. quantitative restrictions (including prohibitions, quotas. nonautomatic licensing, state monopolies, voluntary expon restraints and restraints under the Multitiber Arrangement (MFA) and similar textile arrangements), impon surveillance. automatic licensing. and price control measures. The "narrow" group of NTMs excludes from the broad group defined above, para-tariff measures, antidumping and countervailing actions, automatic licensing and impon surveillance measures. Australia. Austria. Canada, EC-12. Finland. Japan, New Zealand, Norway. Sweden. Switzerland, and the United States.
'Prom Laird and Vossenaar (1991).
Table AS. Trade Coverage Rates of Selected NTMs Applied by Developed Countries, 1981-90
(1981 = 100)
1981 1982 1983 1984 1985 1986 1987 1988
(Non-fuel rrade; core measures) Total 100.0 101.6 101.7 104.1 103.8 103.3 104.7 105.3
Austria 100.0 100.0 100.0 100.0 100.0 99.6 99.6 99.6 Canada 100.0 1 14.6 1 14.6 1 14.6 107.6 107.6 1 10 . 1 80.2 EC 100.0 106.2 1 14.2 1 1 1 .7 1 10.0 108.9 108.4 108.6 Finland 100.0 100.0 106.0 106.0 106.0 105.5 105.5 105.5 Japan 100.0 100.0 100.1 100.1 100.1 97.2 97.2 96.8 New Zealand 100.0 100.0 100.0 100.1 69.2 66.0 39.8 39.8 Norway 100.0 1 0 1 . 0 100.3 99.1 98.9 98.6 98.6 98.4 Switzerland 100.0 100. 1 100.3 100.8 100.8 100.8 100.8 100.8 United States 100.0 96.3 88.5 97.7 100.0 1 0 1 . 1 106.5 1 10.7
Source: Laird and Vossenanr (1991).
1989 1990
104.6 103.1
99.6 99.6 68.1 68. 1
108.5 109.0 105.5 105.5 96.7 96.7 25.8 19.6 98.4 90.9
100.8 100.8 1 10.4 106.0
Note: Ratios have been computed using 1988 trade weights (except for the EC and the United States, for which 1989 trade weights were used). The group of "core" nontariff measures (NTMs) includes certain surcharges. variable levies, quantitative restrictions (including prohibitions, quotas. nonautomatic licensing. state monopolies. voluntary expon restraints and restraints under the Multitiber Arrangement (MFA). and similar textile arrangements), and price control measures. Countries applying the measures arc Austria, Canada. EC-12, Finland. Japan, New Zealand, Norway, Switzerland, and the United States.
1 1 6

©International Monetary Fund. Not for Redistribution
Statistical Appendix
Table A9. Export Restraint Arrangements, 1987-901 (By number of arrangements)
September May March 1987 19882 19893
Total export restraint arrangements' 135 261 289
By sectoral composition
Steel 38 52 50 Agricultural and food products 20 55 5 1 Automobiles and transport equipment 1 4 1 7 20 Textiles and clothings 28 72 66 Electronic products 1 1 1 9 2 8 Footwear 8 1 4 1 8 Machine tools 7 7 1 4 Other 9 25 42
By protected markets
European Communjty 696 1387 1738
United States 48 62 69 Japan 6 13 1 3 Other industrial countries 12 47 33 Eastern Europe I I
By restrained exporters
Japan 25 28 70 Eastern Europe 20 45 4 1 Korea 24 25 38 Other industrial countries 23 59 57 Other developing countries 42 98 83
December 199()4
284
39 59 23 5 1 37 2 1 15
39
Sources: General Agreement on Tarill"s and Trade (GATT), "Review of Developments in the Trading System," L/6289 and C/W/548 (Geneva, 1987. 1988, 1989): and C/RM/02/2.
'Includes voluntary export restraints (VERs). orderly marketing arrangement�. export forecasts. basic price systems, industry-to-industry arrangements, and discriminatory import systems. Excludes restrictions under the Multifiber Arrangement (MPA).
20f the reported increase from September 1987. almost half were in existence prior to 1988 but were reported to GATT only in 1988. JQf the 289 VERs reported in the September 1988-February 1989 GATT report on developments in the trading system. at least 24 have
either not been confirmed by the countries concerned or may have lapsed. although no termination dates were indicated. •Preliminary data. •Excluding restrictions under the MFA. •Including 20 arrangements involving individual European Community (EC) member states. 7lncluding 5 1 arrangements involving individual EC member states. •Including 96 arrangements involving individual EC member stales.
1 1 7
©International Monetary Fund. Not for Redistribution
Period
1957-62
1961
1962-73
1971
1974-77
1978-81
1982-86
1986-91
STATISTICAL APPENDIX
Table A10. Textiles and Clothing: Nontarlff Barriers to Trade
Agreement
Japanese voluntary export restraint (VER) with the United States
"Short-term agreement" ( 19 countries)
··Long-term agreement .. ( 19 countries)
Japan, Hong Kong, Taiwan Province of China, and South Korea voluntarily restrain their exports to the United States
Multifiber Arrangement (MFA) I
MFA It
MFAIU
MFAlV
Outcome
Restricted export of cotton, textiles, and apparel.
Importing country is allowed to unilaterally impose a quota if exporting country does not come up with an acceptable proposal of VER.
Renewal of short-term agreement plus restrictions on cotton textiles must be compatible with annual export growth of at least 5 percent for each exporting country.
The combined restrictions from long-term agreement and these additional country specific VERs restrict U.S. imports from a total of37 countries.
Bilateral agreements; more fibers subject to restraints; 6 percent annual export growth is allowed.
Further restrictions and entrance of European countries in the agreement.
New restrictions with unilateral quotas allowed in some cases.
Agreement is expanded to include silk blends and vegetable fibers.
Source: Goldberg and Ordover ( 1991 ).
1 1 8

©In
tern
atio
nal M
onet
ary
Fund
. Not
for R
edis
tribu
tion
Tab
le A
11
. Su
mm
ary
of
An
tid
um
pin
g A
cti
on
s T
ake
n b
y S
ele
cte
d C
ou
ntr
ies
, 1
98
1-9
01
Inve
stig
atio
ns In
itia
ted
P
rovi
sio
nal M
easu
res'
D
efini
live
Dut
ies·'
Pr
ice
Un
de
rta
kin
g�•
Ocv
el-
Dev
el-
Dev
el-
Dcv
cl-
Co
untry
ln
du
str
ial
opi
ng
Eas
tern
Y
ear
coun
trie
> co
untr
ie�
Eur
ope
Tot
al
lnd
ustr
ial
opin
g E
aste
rn
coun
trie
s co
untr
ies
Eur
ope
T
ota
l ln
dusr
rial
o
pin
g
Eas
tern
co
untri
es
coun
trie
s E
uro
pe
Tot
al
lndu
stri
al
opi
ng
Eas
tern
co
untr
ies
coun
trie
s E
urop
e T
ota
l
Uni
ted
Sta
tes
198
1
198
2
198
3
198
4
198
5
198
6
198
7
198
8
198
9
199
0
Eur
opea
n 19
81
Co
rnm
unu
y
198
2
(EC
)S
198
3
198
4
198
5
198
6
198
7
198
8
198
9
199
0
Can
ada
198
1
Aus
tral
ia
198
2
198
3
198
4
198
5
198
6
198
7
198
8
198
9
199
0
198
3
198
4
198
5
198
6
198
7
198
8
198
9
199
0
10
44
22
27
21
23
21
23
11
12
16
11
10
18
14
8
4
15
5
4
21
SI
22
16
23
15
17
9
9
6
55
47
34
31
24
7
7
12
3
5
18
16
30
39
15 7
14
11
2
2
4
4
9
6
8
12
I 7
9
6
12
9
7
10
8
5
10
4
5
15
20
24
20
14
11
10
11
2 I 0
10
5
I 0
4
23
12
11
11
9 5 3 7 3
3
3
2
4
2 I 3
3
5
3
2
2
2
0
15
50
40
46
61
63
41
31
25
24
22
36
26
33
34
23
17
30
29
16
29
64
34
26
35
27
24
20
14
14
71
70
63
54
40
20
19
23
5
7
IS
15
18
11
24
12
21
37
8
I 7
6
7
4
2
3
3
17
16
38
27
20
9
11
7
9
21
13
11
15
6
5
4
4
3
3
10
20
10
32
26
14
27
0
I 2
I 2
2
3
7
4
3
1 7
9 JO 9
10
12
3
4
11
9
12
14
9
5
2
6
I 0
1 9
0
5
0
3
0
5
3
2
0
7
I 2
3
2
0
3
2 4 0
I 3
0
2
3
2
0
3
0
9
11
25
36
37
43
55
13
36
67
8
7
16
10
11
6
12
10
9
9
20
23
48
40
31
23
12
20
13
8
33
22
25
32
7
10
9
10
4
39
5
16
18
8
11
16
19
33
5
5
3
5
4
5
3
2
4
3
13
3
28
9
10
12
5
9
3
33
26
25
9
9
3
0
0
4
2
17
8
17
22
6
9
27
0
0 3 2
2
0
2
8
4
0
3
9
3
6
9
3
9
0
29
12
7
6
9
0
3
4
0
So
urce
: G
ener
al A
gre
emen
t on
Tar
iff�
an
d T
rade
(G
AT
T).
Bas
ic ln
stru
mem
� m
u/ Se
lect
ed D
ocum
ems.
vari
ous
yea
rs.
No
te:
n a
. =
no
t av
aila
ble
.
0
4
0
0
2
0
5
0
4
0
0
2
4 I 0
4
0
I 5
2
2
0
I 0
4
0
0
I 7
I 0
0
2 0 0
I 0
4
47
7
33
28
25
38
22
29
64
5
5
10
7
7
7
4
3
12
15
8
37
13
16
25
8
18
4
69
39
32
IS
20
3
5
8
0
'Yea
r; ru
n fr
om J
uly
to J
une.
Th
e�c
dat
a re
fer
to th
e nu
mb
er
of c
ases
an
d d
o n
ot p
rovi
de
any
ind
icat
ion
of
the
mag
nit
ude
of
the
trad
e in
volv
ed.
'Pro
visi
ona
l me
asur
es m
ight
be
tak
en
in a
n an
tid
ump
ing
cas
e p
en
din
g a
de
finit
ive
de
term
inat
ion.
'D
efini
tive
dut
ies
arc
levi
ed f
ollo
win
g a
fina
l po
siti
ve
det
erm
inat
ion
of
dum
pin
g a
nd m
ate
rial
inj
ury
to t
he d
om
esti
c in
dus
try
.
I 0
0
0
0
0
2
0 0 0
4
2
9
8
4
6
4
1 2
6 0 0 0
0
I 2
3 I 5
8
6
2
4
0
2 2
0
I 0
0
0
0
0
0
0
0
I 3
2
3 2
2
4
0
0
0
0
0
0
0
2
0
0
2
1 0
2
0
0
I 0
0
0
0
0
0
0
3
14
14
4
8
3
4
2
2
6
0
0
0
0
0
I 0
0
0
0
0
0
0
0
()
0
0
0
.. P
rice
un
der
tak
ing
s by
exp
ort
ers
mig
ht b
e ac
cept
ed i
n li
eu
of
anti
dum
pin
g a
ctio
n. I
n th
ese
circ
um
stan
ces.
an
exp
ort
er w
oul
d u
nd
erta
ke to
cea
se e
xpo
rts
at d
ump
ed p
rice
s.
'The
EC
act
ion
s re
port
ed r
efer
onl
y t
o o
ther
sig
nato
ries
of
the
GA
TT
Ant
idu
mp
ing
Co
de.
0 The
fig
ure
incl
udes
mea
sure
s ap
plic
able
to i
mp
ort
s fr
om
co
untr
ies
no
t par
ty t
o t
he A
nti
dum
pm
g C
od
e.
7Jn
eff
ect
as o
f S
epte
mb
er I
, 1
99
0.
I 0
0
0
2
0
0
0
8
17
25
13
15
I I
11
5
6
16
0
0
0
0
I 2
5
I 5
10
3 5 4
3
Out
st
andi
ng
Ant
idum
pm
g A
ctio
ns
Tot
al
85
n.a.
5
2
104
112
122
15
1
167
198
192
n.a
. n
.a.
n.a
. 12
4
146
123
n.a
. n
.a.
I 7
00
152
7
123
159
152
155
132
152
150
159
143
103
159
192
167
17
1
109
49
19
11
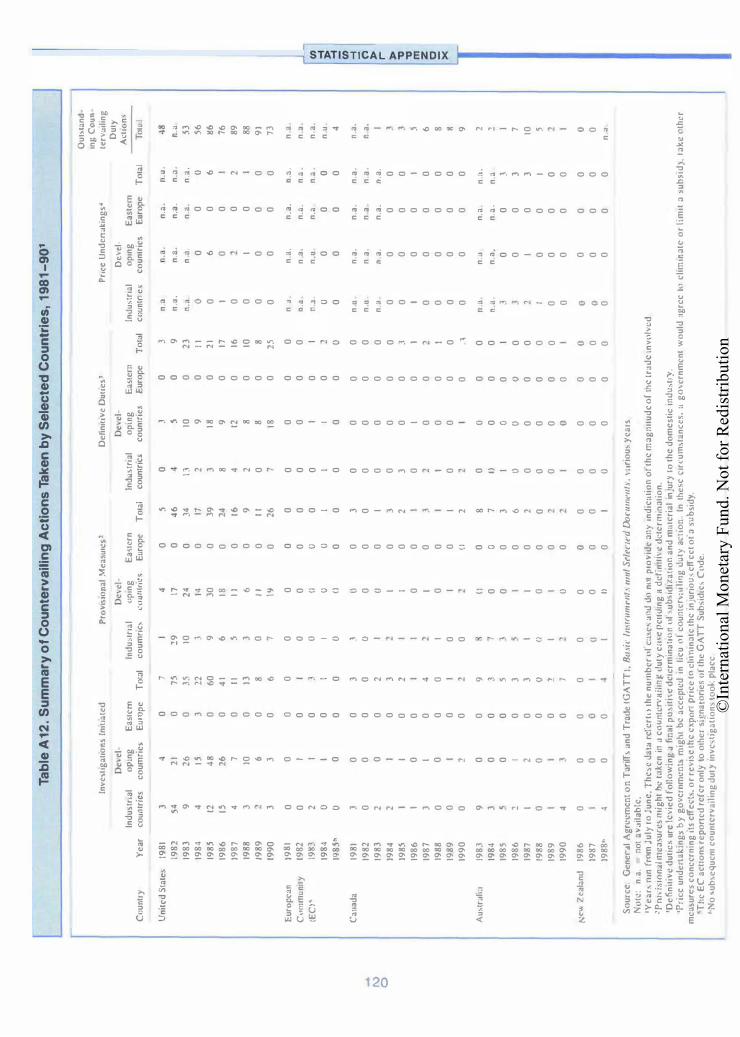
©In
tern
atio
nal M
onet
ary
Fund
. Not
for R
edis
tribu
tion
...
1\)
0
Tab
le A
12. S
um
ma
ry o
f C
ou
nte
rva
ilin
g A
cti
on
s T
ake
n b
y S
ele
cte
d C
ou
ntr
ies
, 1
98
1-
90
1
ln-e
�ug
atoo
ns
lnou
ated
Dev
el-
lnd
u>tn
al
op
ong
E
aste
rn
Pro
vi\l
on
al M
easu
res>
Oe
\cl-
lnd
u,tr
oal
upo
ng
Eas
tern
Deh
nou
ve D
uues
•
Dev
el-
lndu
,tn
ul
opo
ng
EaM
ern
Pn
.::c
Und
enak
ing
s•
Dev
el-
lnd
u,tr
oal
opo
ng
Eas
tern
C
ount
ry
Yea
r co
umri
c;,
coum
rie�
E
uro
pe
Tot
al
coum
nc'
cu
umne
s E
urop
e T
otal
co
untn
c'
coun
trie
< E
urop
e T
otal
co
untr
oe<
coun
trie
s E
urop
e T
otal
Uni
ted
Sta
te>
198
1 19
82
19
83
19
84
!9
85
19
86
198
7
1988
19
89
19
90
Fur
ope
an
19!1
1
Cu
rnm
unity
19
82
(EC
l'
19!13
19
84
19
85
•
C.t
nnda
19
81
198
2
198
3
1984
19
85
1986
19
87
1988
19
89
199
0
Au,
tral
i;o
198
3
1984
19
85
1986
19
87
198
8
1989
19
90
!"c"
Zea
land
19
86
19117
19
88•·
3
54
9
4
12
IS
4
3
3
0
0
2 0 0 3 0
2
2 I 3
0
0
0
9
3
2 I 0
4
0
4
4
21
26
15
4
8
26
7
10
6
3
0 I I 0
0
0
0 I 0 I 0 2 0
0
0 I 2
0
0
0
0
0
0
0
3
0
0
0
0
0
0
0
0
0
0
0
0
0
0
0
0
0
0
0
0
0
0
0
0
0
0
0
0
0
0 0
0
7
75
3
5
22
60
41 11
13
8
6
0 1 0
3
0
2
3 � 4
0
9
3 5
3
3
0
�
7
0
29
10
.l 9
6
5
3
0
7
0 Cl u I () 3 () 1 0
0
() I 0 u I
4
17
24
14
30
18
1
1
6
11
I 'I
0
0
11 u () 11 0 Cl I I 0 I 0
()
0
0 I 0 u 0
0 ()
0
0
0
0
0
0
0
0
0
0
0
0 0 0 0
0
0
0
0
0
0
0
0
0
()
0 0 0
0
0
0
0
0
0
0
0
5
46
34
17
39
24
16
9
11
26 0
0
0 I 0
3
0 I J 2 I 2 8
3
6
2
0
0
0
0
13
2
3
8
4 2
0
0
0
0 I 0
0
0
0
0
3
0 I 0
0
()
()
0
()
0
0
0
()
J 5
10
9
18
9
12 8
8
18
0
0 I 0
0
0
0
0
0 I 0
0
0
() 0 0 0 0
0
0 0 0
0
0
So
urce
. G
ener
al A
gree
men
t nn
Tur
in,
and
Tra
de !
GA
TT
). B
tl\i
l'll
llfl
ltmr
t/1'
111111
St"l
et'ft
•d D
oc-
um
r/11
,, v
;�n
ou'
)C
ars
N
ntc
: n
.a.
=no
t av
aila
ble
.
0
0
0
0
0
0
0
0
0
0
0
0
0
0
0
0
0
0
0
0
0
0
0
0
0
0
0
0
0
0
0
0
0
0
0
0
3 9
23
11
2
1 17
16
10
8
25
0
0 0 0
0
0
0
3 I 2 I 0
-' 0
0
0
0
0
0 0 0
0
'Ye
a.-
run
frn
m J
ul)
to Ju
ne
. Th
c\C
Jam
rcl
'crt
ll th
e n
umb
er u
l c:
o�e'
and
dn
ntll
pro
vid
e a
ny
ond
icat
ion
ol t
he
ma
gn
nu
dc
of
the
tra
de
onv
olv
cd
�Pro
vi�i
onal
mea
sure
' m
ight
he
tukc
n in
a c
ou01
crva
iling
dut
) c
:t'c
pcn
drn
g a
dct
in11
tVe
dete
rmin
atio
n.
'De
fini
tiv
e d
utic
' ur
o.: le
vie
d f
ollo
win
g a
fin
al p
th
iti\
c d
ctcr
min
nlln
n t>
l ..
ub"
dt7
atto
n a
nd m
atcr
ial
tnJu
ry t
o th
e d
om
est
ic i
nd
u,t
l).
n.n
n.u
. n . .
t !)
0 I 0
0
0
0
n a n.u
n
J 0 0
nu
n
u
n.n
0
0
I 0
0
0
0
n.tt I 0
0 Cl Cl 0
n.�
n.a
. n
a.
0
6
0 I 0
0
n.a
. n
n.
n.u
0
0
n.a
. n
a.
n.a
. 0
0
0
0
0
0
0
n.a
n
.n.
0
0 I 0
0
0
0
0
0
n.a
. n
.a.
n.a
. 0
0
0
0
0
0
0
n.a
. n
.a.
n.a
0
0
n.a
. n
a
n.a
. 0
0
0
0
0
0
0
n.a
. n
.a.
0
0
0
0
0
0
0
0
0
n.u
n.u
n
.d.
() 6
2
0
0
n ....
n.a
n
.a 0
0
n.a
n
.a
n.a
. 0
0
1 0
0
0
0
n.n
. n
.a
3
3
3 I 0
0
0
0
0
OuN
and
tn
l! C
oun
terv
aolon
g
Dut
y A
'uo
n'
To t
ill
48
n.n
5
3
56
1!6
76
89
88
'.1
1 7
3
n a
n
u
n a
n
u
4
n a
. n
a.
5
6 8 I! 9 2
2
7
10
5
()
0
n ·'
'Pri
ce u
nde
nal.
ing
' b
) g
ove
rnm
ent>
mig
ht b
e a
ccep
ted
an l
tcu
nl
coun
tCf\
;llh
ng d
uty
acu
on
In t
he•c
car
curn
,tan
ce\.
a g
ove
rnm
ent
wo
uld
:tg
rcc
111
dom
tnat
c o
r lt
mlt
a w
b"
d).
la
ke
t>th
cr
mca
>urc
> co
nccr
nang
'"eff
ect\
. or
rcvo
>e th
e e
xpo
rt p
rice
tn c
l1111
1nat
c th
e o
nJun
ou
' ctf
cct o
t a
>u
bs.
dy.
'T
he
EC
act
iOn�
rep
on
ed r
efer
onl
y t
o o
ther
sig
na to
ne\
uf
the
GA
rT
Sub
,id
•c'
Co
de.
•·"
o '
ub,e
quc
nt c
nun
h:rv
aih
ng d
ut}
onv
c�u
gat
ton�
too
l. p
lal·
c
1/) -1 � 1/) ::!
0
>
r
>
,
,
m
z
0
X

©International Monetary Fund. Not for Redistribution
Statistical Appendix
Table A 13. United States: Outstanding Unfair Trade Practice Cases Abroad and Safeguard Petitions, December 31, 1990
U.S. Imports. 1990 Share in 1990
Safeguard (In billions of U .S. Imports Directed Against Dumping Subsidies Retaliation• Actions2 U. S. dollars) (In percent)
Industrial countries
Canada 1 2 6 6 6 93.8 23.9 European Community l 16 2 95 5 24.3
France 9 I 1 5 13.6 3.5 Germany 1 2 8 29.0 7.4 Italy 13 6 13.4 3.4 Spain I 5 3 .5 0.9 United Kingdom 4 2 4 20.9 5.3
Japan 50 8 9 93.1 23.7
Developing countries and regions
Argentina 3 9 4 I 1 . 7 0.4 Brazil 7 6 4 2 8.6 2.2 China 1 1 3 16.3 4 . 1 Korea 9 I 6 7 19.3 4.9 Mexico 3 7 3 30.8 7.8 Taiwan Province of
China 13 I 6 7 23.9 6 . 1 Venezuela 2 2 I 9.9 2.5
Subtotal 149 35 54 69J 392.8 100.0
Other 46 36 6 J 124.2 Total 195 7 1 60 603 517.0
Sources: Office o f the U.S. Trade Representative: U .S. International Trade Commission; U .S. General Accounting Office: U.S. Department of Commerce: and General Agreement on Tariff's and Trade (GATT). semi·annual reports under Articles 2: 1 6 and 14:4 of the Agreement.
1Cases initiated under Section 301 of the U.S. Trade Act of 1974. ]Cases initiated under Section 201 of the U .S. Trade Act of 1974. 'Since the U .S. Trade Act came into force. 60 investigations have been initiated under Section 20 I . Of these, 12 affected imports from any
country. including several listed individually above.
12 1

©In
tern
atio
nal M
onet
ary
Fund
. Not
for R
edis
tribu
tion
Tab
le A
14.
Ind
us
tria
l Co
un
try
Su
bs
idie
s
I. T
ota
l Su
bsi
die
s (N
ati
on
al A
cco
un
ts D
efin
itio
n),
19
70
-8
8
(As
a p
erce
ntag
e of
GD
P a
t m
ark
et p
rice
s)
MaJ
or
Tot
al
Se•e
n O
EC
D
Uno
tcd
Uno
ted
Net
her·
N
ew
OI:.
CD
C
oun
lnes
E
uroP
" St
ates
Jo
pon
Ger
man
y F
ranc
e h
alt
Kon
gdo
m
Can
ada
Au)
lna
Bel
goum
D
enm
ark
F
inla
nd
led
and
Ir
elan
d la
nds
No
rway
Sw
eden
A
ustr
aloa
Z
eala
nd
197
0
74
1.
2
1.
1
1.9
0
.5
1.2
1.
8
2.1
2
.2
2.2
1
.1
1.8
1.
3
3.0
2
.7
3.8
4
.7
1.6
5
.4
1.9
1
.1
1.
6
197
5
79
1.
5
1.4
2
.5
0.4
1.
3
2.1
2
.5
3.2
2
.7
2.0
3
.0
1.4
3
.1
3.6
3
.6
8.0
2
.4
7.0
3
.9
1.3
2
.3
198
0-
84
1.
6
1 .4
2
.7
0.5
1.
4
2.0
2
.8
3.6
2
.3
2.6
2
.9
1.4
3
.2
3.2
3
.2
7.1
2
.8
6.4
4
.8
1.7
1.
9
198
5-
88
1.
6
1.4
2
.7
0.7
1
.1
2
.2
3.0
3
.3
1 .7
2
.2
3.0
1
.3
3.1
2
.9
2.6
7
.3
3.7
5
.6
4.7
1.
5
0.6
11.
Lnd
ust
ria
l Su
bsi
die
s (N
ati
on
al A
cco
un
ts D
efin
itio
n),
l9
70
-8
6t
rJl (A
s a p
erce
ntag
e of
sec
tora
l G
DP
at m
ark
et p
rice
s)
;! '"4
United
Un
ited
Net
her·
N
ew
rJl St
ates
Ja
pan
' G
erm
any
Fra
nce>
It
aly'
K
ingd
om
' C
onad
a A
ustn
a'
Bcl
gou
ml
Den
mar
k F
inla
nd•
Icel
and
Ir
elan
d'
land
s N
orw
ay'
Swed
en
AuM
raloa
Z
eala
nd
'"4
-4
0
N
197
0
74
S 0
.3
0.5
1
.6
1.1
3
.2
1.4
1.
7
1.2
4
.2
2.8
1.
0
1.6
)lo r
N
19
75
-7
9�
0.4
0
.8
1.9
2
.7
2.3
2
.4
2.1
3
.9
2.5
1.
9
2.2
5
.9
2.1
4
. 7
5.7
1.
2
2.1
)lo
198
0
84
S 0
.5
1.1
1.
8
2.9
2
.6
2.4
3
.1
2.7
4
.4
3.2
1.
7
2.5
2
.6
4.4
7
.5
1.6
1.
2
"Cl 19
85
-8
6�
0
.5
1.0
1.
8
1.9
2
.6
2.7
2
.8
1.5
2
.6
2.9
3
.9
7.5
1.
6
0.8
"Cl
m
z
c
m
. In
du
stri
al S
ub
sid
ies
(Na
tio
na
l Acc
oun
ts D
efin
itjo
n),
19
70
-8
61
)( (A
s a
per
cen
tag
e of
tOt
al g
ot•e
mm
e/11 o
wla
ys)
Un
oted
U
note
d N
ethe
r·
Stat
.-Ja
pm
G
erm
an)
Fil
l nee
Ital
y K
ongd
tlm
C
anad
a A
U\lrl
ll
Bel
gium
D
en m
ar!.
lc<l
ood
Ir
elan
d
land
• 'l
orw
a)
s ... ed
en
AU\
IJ'OI
II
197
0-
74
� 0
.7
2.1
3
.0
2.2
4
.7
2.4
2
.0
7.2
4
.0
3 5
19
75
-7
91
0
.9
2.6
3
.2
4.8
4
.8
4.9
3
.8
6.9
3
.1
2.9
7
.0
3.
1 7
.2
6.4
3
.4
198
0-
84
� 1
.1
3
.1
2.9
4
.7
5.0
4
.4
5.1
4
.5
7.0
3
.1
3.5
3
.4
7.2
6
.9
4.5
19
85
-8
65
1.2
2
.7
3.1
3
.3
4.1
4
.3
2.9
3
.5
4.0
6
.4
7.0
4
.1
So
urce
. F
ord
and
Suy
ker
( 19
90
). T
able
s 2
. 3, a
nd 8
, p
p. 4
3-4
5 an
d 5
4
No
te:
OE
CD
= O
rgan
izat
ion
ror
Eco
no
mic
Co
ope
rati
on
and
Dev
elo
pm
ent.
No
dat
a ar
c av
aila
ble
ror
Gre
ece.
Lux
emb
our
g. S
wit
zerl
and
. an
d T
urke
y.
'To
tal �
ub�i
dtc�
exc
lud
ing
>ub
sidi
es t
o a
gri
cult
ure
and
rood p
rocc
s�in
g.
'Bas
ed o
n in
put
·out
put
dat
a.
'Sec
1ora
l GD
P a
t mar
kel
pri
ces
base
d o
n av
erag
e va
lue
adde
d ta
x ra
te�.
'A
'> a
perc
enta
ge
of �
cc1o
ral G
OP
at
fact
or c
ost
. 'A
vera
ge
or
av;ti
lab
le y
ears
.

©International Monetary Fund. Not for Redistribution
Statistical Appendix
Table A 15. Subsidies by Sector (National Accounts Definition) (As a percentage of sectoral GDP at market prices)
Industry, of which Agriculture Transport and and Food
Year Total communications Housing' Other2 Processing To taP
United States 1986 0.5 0.7 1 .2 0.4 5 .5 0.7 Japan 1985 1 .0 4.5 0.7 5. I 1 .2 Germany 1986 1 .9 6.5 2.7 1 .2 12.7 2 . 1 Francc4 1984 3.3 7.5 2.5 6.4 3 . 1 Italy 1980 2.6 29.7 0.7 6.7 2.8 United Kingdom4 1986 1 .6 6 . 1 0.7 1 . 7 Canada 1985 2.6 7 . 1 1 . 1 2.0 10.8 2.5 Austria4 1986 2. 8 17.3 1 . 5 12.4 3.2 Belgium 1980 4.4 23.6 1 .8 5.5 4.0 Denmark 1986 2.6 9. 1 5.4 1 .0 17.7 3 . 1 Finland5 1987 1.4 3.0 Greece 1987 5.8 Iceland 1986 2.6 2.7 2.6 7.8 2.7 Ireland 1975 5.9 1 9 . 1 2 . 8 14.8 6.8 Luxembourg 1987 4.4 Netherlands 1985 2.9 13.3 15.2 0.7 13.9 3.2 Norway4 1986 4 . 1 4.5 3.4 3 . 8 28.8 5 .7 Portugal 1981 6.5 8 . 1 1 1 .5 6 . 1 3.5 5.4 Spain 1980 3 .8 16.8 2.8 2.8 3.3 Sweden 1986 7.4 12.6 18.4 4.2 2 . 1 4.8 Switzerland 1987 1 .4 Turkey 1987 0.8 Australia 1985 1 .6 9.7 0.8 1 .7 New Zealand 1985 0.8 5 . 1 0.2 1 .6 0.8
Source: Ford and Suyker ( 1990). 'Excluding mortgage interest deductibility. 2As a percentage of sectora1 GDP including housing. JAs a percentage of total GDP. •As a percentage of sectoral GDP at market prices based on average value-added tax rates. 'As a percentage of sec10ral GDP at factor cost.
123
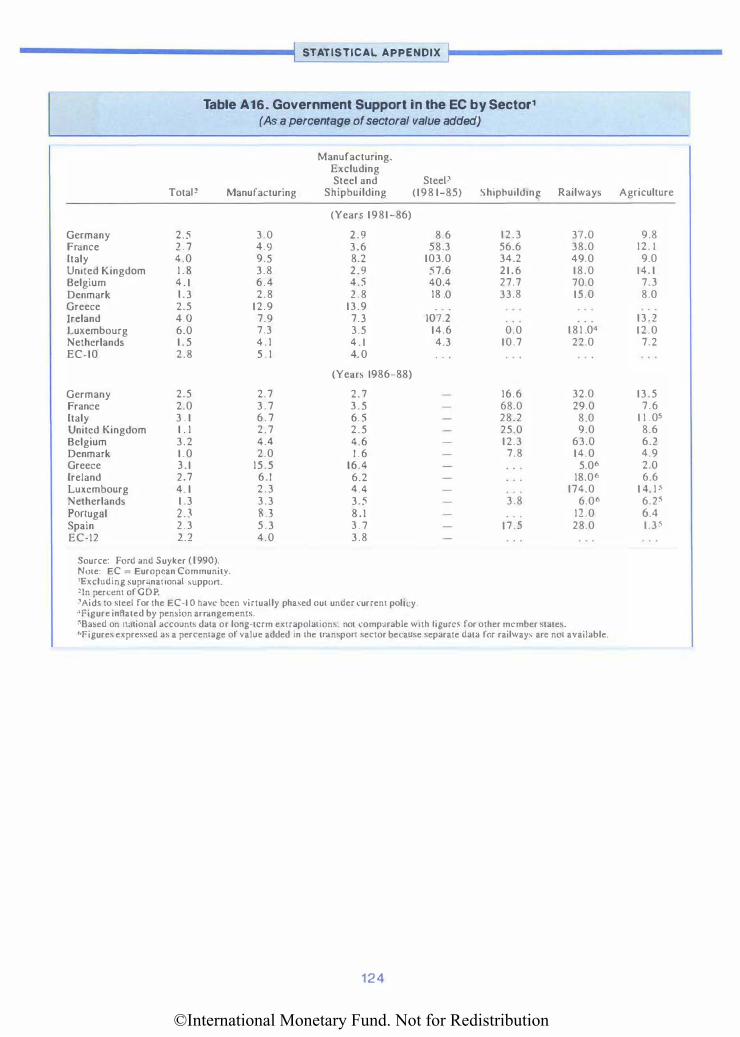
©International Monetary Fund. Not for Redistribution
STATISTICAL APPENDIX
Table A 16. Government Support in the EC by Sector1 (As a percentage of sectoral value added)
Manufacturing, Excluding Steel and SteeP
TotaP Manufacturing Shipbuilding (198 1-85)
Germany 2.5 France 2.7 Italy 4.0 United Kingdom 1 . 8 Belgium 4. 1 Denmark 1.3 Greece 2.5 Jreland 4.0 Luxembourg 6.0 Netherlands 1 .5 EC-10 2.8
Germany 2.5 France 2.0 Italy 3 . 1 United Kingdom 1 . 1 Belgium 3.2 Denmark 1.0 Greece 3.1 Ireland 2.7 Luxembourg 4. 1 Netherlands 1 .3 Portugal 2.3 Spain 2.3 EC-12 2.2
Source: Ford and Suyker (1990). Nme: EC == European Community. 'Excluding supr•nauonal suppon. 'In percent of GDP.
(Years 1981-86)
3.0 2.9 4.9 3.6 9.5 8.2 3.8 2.9 6.4 4.5 2.8 2 .8
12.9 13.9 7.9 7.3 7.3 3.5 4 . 1 4 . 1 5 . 1 4.0
(Yem 1986-88)
2.7 2.7 3 .7 3 .5 6.7 6. 5 2.7 2.5 4.4 4.6 2.0 1 .6
15.5 16.4 6.1 6.2 2.3 4.4 3.3 3.5 8.3 8.1 5 .3 3 .7 4.0 3.8
'Aids to steel for the EC-1 0 have been virtually phased out under current policy. •Figure inflated by pension arrangements.
8.6 58.3
103.0 57.6 40.4 18 0
107.2 14.6 4.3
Shipbuildin9
12.3 56.6 34.2 21.6 27.7 33.8
0.0 10.7
16.6 68.0 28.2 25.0 12.3 7.8
3.8
17.5
Railways
37.0 38.0 49.0 18.0 70.0 15.0
181 .04 22.0
32.0 29.0
8 0 9.0
63.0 14.0 5.06
18.06 174.0
6.06 12.0 28.0
$Based on ntllional accounts data or long·tcrm extrapolations: not comparable with figure� for other member states. 6figures expressed as a percentage of value added in the trnnspon sector because separate data for railway' arc not available.
124
Agriculture
9.8 12. 1 9.0
14. 1 7.3 8.0
13.2 12.0 7.2
13.5 7.6
1 1 .05 8.6 6.2 4.9 2.0 6.6
1 4. 1 � 6.2� 6.4 1.3�

©International Monetary Fund. Not for Redistribution
Statistical Appendix
Table A 17. Support to Manufacturing in the EC and EFTA Countries by lnstrument1
(As a percentage of total support)
Grants Tax Concessions Equity Participation Soft Loans Guarantees
Germany 30 63 02 6 I France 33 16 1 8 1 5 1 9 Italy 54 36 7 3 0 United Kingdom 69 6 1 6 7 2
Belgium 6 1 1 1 6 12 1 0 Denmark 70 0 0 29 I Greece 883 03 9 0 3 Ireland 52 37 6 I 4 Luxembourg 68 9 5 1 8 0 Netherlands 64 30 0 6 0 Portugal 26 60 12 2 0 Spain 78 0 19 2 1
EC-12 49 30 9 8 5
Austria 2 1 684 1 1 0 Finland 72 1 5 12 I Iceland 27 0 33 40 Norway 6 1 1 1 27 I Sweden 55 0 27 1 8 Switzerland 77 0 14 9
EFTA 58 16 18 8
Source: Ford and Suyker ( 1990). Note: EC = European Communi1y: EFTA = European Free Trade Association. 1EC countries ( 1986-88 average), excluding supranational suppon and suppon 10 energy and transpon. EFTA countries ( 1984-87 average):
including mining, quarrying, gas and electricity sectors. Data for EFTA coun1rics do not include tax concessions. 1Suppon considered to be negligible. No figures available. 'Tax expenditures included in grams. •Mainly suppon to state holding companies.
1 25

©In
tern
atio
nal M
onet
ary
Fund
. Not
for R
edis
tribu
tion
Tab
le A
18.
Go
ve
rnm
en
t-F
ina
nc
ed
Ex
pe
nd
itu
re o
n R
es
ea
rch
an
d D
ev
elo
pm
en
t in
th
e E
nte
rpri
se
Se
cto
r, 1
97
0-
88
(A
s a
per
cent
ag
e of
tota
l res
earc
h an
d d
evel
opm
ent e
xpen
dit
ure
)
Un
ilc
d
Un
llc
d
Ne
tht!
r·
513
1(''
Ja
pa
n
Gcrum
ny F
ran
ce
h
aly
K
•n�
d('
un
Ca
n•
da
AU
I\lfi
a
BelgiU
m D
cn
rnar
l
Fin
lan
d
Greec
e Ic
ela
nd
lr
cl:
tnd
la
nd
� N
of'.'
a}
P
on
ug
al
Sp
ain
s
--�
do
n
Au
,lr.
ll!.i
197
0
43
.0
1.3
4
.7
5.0
18
.3
4.0
19
71
41
.8
2.0
18
.2
27
.7
4.5
12
.6
9.6
6
.0
l.l
21.
5
2.0
4
.1
18.2
en
197
2
41.
0
2.0
5
.2
33
.1
11.
0
8.8
2
4.3
1.
8
4.0
i!
197
3
38
.3
2.0
19
.2
26
.5
5.3
15
.3
8.4
4
.4
8.5
2
.2
18.5
:!
19
74
3
5.9
1.
5
5.3
1
1.4
5
. 3
23
.0
1.
1
en 19
75
3
5.6
1.
7
17.9
2
5.4
6
.5
30
.9
12.1
9
.0
6.6
6
.0
4.7
2
1.1
15
.9
-1 0
�
197
6
35
.4
1.5
8
.1
10.2
5
.1
2.2
4
.8
>
1\J
197
7
35
.2
1.9
15
.8
21
. I
11
.0
10.1
8
.4
4.8
5
.6
23
.8
15.3
r
(1)
19
78
3
3.6
1.
5
29
.2
7.8
7
.1
4.0
10
.9
>
197
9
32
.7
1.4
18
.2
22
.1
5.8
8
.5
4.8
1
1.5
7
.7
49
.0
9.0
5
.6
23
.8
2.8
12
.8
"0 "0 19
80
3
1.5
l.
9
9.3
6
.6
7.4
5
.8
3.3
2
.9
m
198
1 3
1.6
1.
9
16.9
2
4.6
8
.8
30
.0
8.8
5
.1
12.5
9
.0
30
.6
38
.3
13.1
7
.4
24
.9
4.1
13
.6
8.8
z
0
19
82
3
1.9
2
4.2
11
.7
10.7
13
I
7.2
2
1.4
1.
6
4.8
X
19
83
3
2.4
1.
7
16.1
2
2.4
18
.1
10.8
4
.2
12.0
6
.6
6.9
10
.6
8.3
19
.8
4.0
10
.5
10.5
19
84
3
2.4
l.
7
18.0
I
I. I
10.8
10
.4
14.3
2
0.1
2
.2
9.4
19
85
3
3.9
1
.6
15.3
2
3.8
16
.9
23
.0
10.9
7
. I
5.0
9
.9
7.7
2
.2
12.4
12
.5
19.3
7
.7
J 1
.6
198
6
14.5
3
.6
5.6
19
87
1.
7
19.4
1
1.8
4
8
I 1.
8
4.6
2
0.1
13
.7
11
.2
198
8
32
.7
12.1
2
1.3
17
.9
13.8
So
urce
: F
ord
and
Su
yk
cr
( 199
0).

©International Monetary Fund. Not for Redistribution
Statistical Appendix
Table A19. Determinations Under the 1988 Amendments to Section 301 of the 1974 Trade Act of the United States1
Date
"Super'' 3012 May 1989
April 1990
"Special" 30P May 1989
April 1990
April 1991
Brazil
Japan
India
India
Countries and Regions Affected
Brazil, India, Mexico, China, Republic of Korea, Saudi Arabia, Taiwan Province of China, Thailand
Argentina, Canada. Chile, Colombia, Egypt, Greece, Indonesia, Italy, Japan, Malaysia, Pakistan, Philippines, Portugal , Spain, Turkey, Venezuela. Yugoslavia
Brazil, India, China, and Thailand
Argentina, Egypt, Canada. Chile, Colombia, Greece, Indonesia, Italy, Japan, Korea, Malaysia, Pakistan, Philippines, Spain, Saudi Arabia, Taiwan Province of China, Turkey, Venezuela, Yugoslavia
China, India, Thailand
Australia, Brazil, EC
Argentina, Canada, Chile, Colombia, Cyprus, Egypt, Germany, Greece, Hungary, Indonesia, Italy, Japan, Korea, New Zealand, Pakistan, Philippines. Spain, Taiwan Province of China. Turkey, Saudi Arabia. United Arab Emirates, Venezuela, Yugoslavia
Source: Office of the United States Trade Representative. Note: EC = European Community.
Practices or Measures
Quantitative import restrictions
Procurement of satellites and supercomputers Technical standards on forestry products
Export performance requirements Protection in insurance markets
Export performance requirements Protection in insurance markets
Designation on a Priority Watch List
Designation on a Watch List
Designation on a Priority Watch List
Designation on a Watch List
Initiated investigation of alleged violations of intellectual property rights
Designation on a Priority Watch List
Designation on a Watch List
•Section 30 I of the 1974 Trade Act gives the President broad authority to retaliate against allegedly unfair trade practices of other countries. Since 1974, just over 100 complaints against developing and industrial countries have been filed (this excludes actions under ··super'' and ··special" 30 I ) of which approximately 25 percent were rejected and less than 10 percent led to trade retaliation. Of the remainder. some cases led to trade liberalization action by trading partners. but the majority had indeterminate results. In several cases. Section 30 I actions have been followed up through General Agreement on Tariffs and Trade {GATT) dispute settlement procedures.
2Super 301, which expired in 1990, required the United States Trade Representative (USTR) to (i) identify "U.S. trade liberalization priorities" in terms of countries and practices; and {ii) initiate Section 30 I investigations with a view to seeking the elimination or reduction of the practices. or compensation from them. The case against Brazil was dropped in 1990. The Japanese cases were dealt with within the wider context of the Structural Impcdjments Initiative. India was redesignated in 1990, but no retaliatory action has been taken so far.
3Special 301 requires USTR to identify foreign countries that deny adequate intellectual property protection or fair and equitable market access to U .S. persons that rely upon intellectual property protection, and that arc not entering into good faith negotiations or making significant progress in improving intellectual property protection. The 1989 and 1990 Watch Lists did not require further action. In 1991, for the first time, investigations were initiated under Special 30 I .
127

©In
tern
atio
nal M
onet
ary
Fund
. Not
for R
edis
tribu
tion
Tab
le A
20
. Co
mm
od
ity
Co
mp
os
itio
n o
f E
xp
ort
s,
by
Se
lec
ted
Eas
tern
Eu
rop
ea
n C
ou
ntr
ies
(P
erce
ntag
e sh
are)
Mac
h�ne
ry
Cru
de
Min
eral
A
nim
al a
nd
Man
ufac
ture
d T
rans
port
M
isce
llane
ous
F
ood
Bev
erag
es
Mat
eria
ls
Fue
ls
Veg
etab
le O
ils
Ch
emic
als
Mat
eria
ls
Equ
ipm
ent
Man
ufac
ture
rs
Oth
ers
Tot
al
Cze
chos
lova
kia
So
cial
ist'
0
.9
0.5
2
.3
2.0
4
.9
12.9
6
2.1
12
.8
1.8
10
0
en
Dev
elop
ed
9.4
0
.4
7.6
10
.1
0.3
1
1.4
34
.1
12.8
13
.3
0.7
10
0
;! D
evel
op
ing
1.
4
0.9
2
.5
4.2
8
.2
2.7
7
0.6
8
.0
1.5
10
0
'-1 en
Hun
gary
-1
So
cial
ist'
14
.5
2.4
1
.8
0.6
0
.6
8.6
8
.1
49
.6
12.8
1.
1 10
0
0
1\)
Dev
elop
ed
20
.7
0.9
7
.8
8.2
I.
I 13
.6
19.5
12
.3
14.1
1.
8
100
)lo
o r-
CO
Dev
elo
pin
g
8.4
0
.5
3.3
1.
8
0.4
19
7
16.5
4
0.0
6
.4
3.1
10
0
)loo
"V
Po
land
"V
So
cial
ist'
3.6
0
.2
3.0
9
.2
7.7
14
.0
47
.0
8.5
6
.8
100
m
z
D
evel
oped
18
.3
0.5
8
.4
16.7
0
.4
6.9
2
1.5
14
.0
10.7
2
.7
100
Cl
Dev
elo
pin
g
2.3
0
.5
10.0
10
. I
0.1
7
.6
25
.0
37
.2
2.5
4
.7
100
)(
Yug
osl
avia
S
oci
alis
t•
3.2
0
.6
3.4
0
.3
0.2
1
1.3
19
.7
44
.2
17.1
0
. I
100
D
evel
oped
10
.4
1.5
6
.1
2.7
0
.1
7.6
3
3.1
2
1.8
16
.6
0. I
10
0
Dev
elo
pin
g
6.7
0
.6
5.6
0
.5
0.6
14
.8
34
.2
30
.2
6.8
0
.1
100
Sour
ce:
The
Wor
ld B
ank.
N
01c:
Dam
fo
r Cze
cho
slo
vaki
a rc
fcrt
o 1
986,
198
7 fo
r H
unga
ry a
nd P
ola
nd,
and
198
8 fo
r Yug
osl
avia
. 'S
ocia
list
co
untr
ie'
incl
ude
coun
tric
' of
the
fo
rmer
Co
unci
l fo
r M
urua
l E
cono
mic
Ass
ista
nce
(CM
EA
): A
lban
ia.
Chi
na.
Cam
bodi
a, t
he D
emo
crat
ic P
eopl
e\ R
epub
lic
of
Ko
rea,
the
Lao
P
eopl
e's
Dcm
ocr.
Hic
Re
pub
lic,
and
Yug
o�l
avin
.

©In
tern
atio
nal M
onet
ary
Fund
. Not
for R
edis
tribu
tion
Tab
le A
21.
Co
mm
od
ity
Co
mp
os
itio
n o
f Im
po
rts
, b
y S
ele
cte
d E
as
tern
Eu
rop
ea
n C
ou
ntr
ies
(P
erce
ntag
e sh
are)
Mac
hine
ry
Cru
de
Min
eral
A
nim
al a
nd
Man
ufac
ture
d T
rans
port
M
isce
llan
eous
F
ood
Bev
erag
es
Mat
eria l
s
Fue
ls
Veg
etab
le O
ils
Che
mic
als
Mat
eria
ls
Equ
i pm
ent
Man
ufac
ture
rs
Oth
ers
Tot
al
Cze
cho
slo
vaki
a S
oci
alis
t'
3.7
0
.8
6.1
3
8.7
0
.2
4.3
6
.9
32.4
4
.0
2.9
10
0
en D
evel
oped
5
. 8
0.6
9
.3
0.7
0
.8
19.0
15
.4
39.7
7
.0
1.7
10
0
- I» D
evel
opin
g 14
.5
1.1
8.5
4
.2
0.5
4
.6
12.0
3
7.8
8
.5
8.2
10
0
::! H
ung
ary
� "
.....
So
cial
ist'
2
.4
0.9
6
.7
31.
0
8.1
13
.3
31.
4
5.2
l.
O
100
!!.
1\l
D
evel
oped
4
.0
0.6
4
.7
1.0
0
.1
26
.0
20
.0
35
.9
7.6
0
.1
100
)>
(0
D
evel
op
ing
19
.4
0.8
12
.4
9.4
0
.1
7.6
14
.6
22
.0
10.6
3
.0
100
�
�
(I) P
ola
nd
:I Q. So
cial
ist•
3
.8
1.3
7
.1
33
.9
0.1
5.
4
11.5
3
0.9
5
.9
100
;c
D
evel
oped
12
.4
1.1
10.2
2
.1
1.3
19
.3
16.2
2
9.5
7
.8
lOO
D
evel
op
ing
2
3.5
1.3
13
.4
2.9
0
.2
7.6
2
0.5
2
1.4
9
.2
100
Yug
osl
avia
S
oci
alis
t' 6
.2
0.3
14
.0
24
.4
0.1
16
.3
18.6
18
.2
1.8
lO
O
Dev
elop
ed
3.0
0
.2
6.2
2
.7
0.2
2
2.5
18
.0
40
.2
7.0
10
0
Dev
elop
ing
17.5
0
.4
19.0
3
1.6
0
.3
8.0
13
.0
8.8
1.
3
100
So
urce
: T
he W
orl
d B
ank
. N
01e
: D
a1a
fo
r Cze
cho
slo
vaki
a re
fer 10
198
6,
198
7 f
or H
ung
ary
and
Po
lam
l.
an
d t
98
8 f
or Y
ugo
slav
ia.
'So
cial
iM c
oun
trie
s in
clu
de
co
untr
ies
of
the
form
er C
ou
nci
l fo
r M
utu
al E
cono
mic
Ass
i>ta
nce
(C
ME
A):
Alb
ania
. C
hina
. C
amb
od
ia.
the
Dem
ocr
atic
Pe
op
le's
Re
pu
blic
of
Ko
rea.
the
Loo
P
eop
le's
Dem
ocra
tic
Rep
ub
lic,
and
Yu
go
slav
ia.

©International Monetary Fund. Not for Redistribution
I STATISTICAL APPENDIX
Table A22. Total Transfers Associated with Agricultural Policies (In billions of U.S. dollars)
1979-81 1983-85 1990 Average 1986 1987 1988 1989 Estimate
Total transfers'
Australia 0.5 0.9 0.9 0.6 0.6 0.7 0.7 Austria 1 .2 1 . 7 2.6 3.8 3.5 2.8 3 .8 Canada 2.4 5.9 7.9 9 . 1 9.3 7.8 8.3 EC-122 43.3 58.1 102.9 120.0 1 19.6 102.4 133.4 Finland 4.8 4.4 5.0 4.9 5.9 Japan 18.5 34.7 54.1 66.4 70. 1 65.3 59.0 New Zealand 0.2 0.4 0.9 0 . 1 0.2 0.1 0.1 Norway 2.7 3.3 3 .5 3.3 4.2 Sweden 3.5 3 . 1 3.0 3 . 1 3.4 Switzerland 4.3 5.4 5 .7 5.0 6.2 United States 21 .8 69.7 88.1 8 1 .5 69.1 7 1 .3 74.1
Total 87.9 1 7 1 .4 272.8 297.5 289.6 266.7 299.1
Cost to taxpayers
Australia 0.5 0.6 0.4 0.3 0.2 0.3 0.3 Austria 0.5 0.5 0.4 1 .0 1 .0 0.8 1 . 1 Canada 1 .6 3.2 4.4 5.6 5.7 4.3 4.7 EC- 1 22 2 1 . 1 22.0 3 1 .7 38.2 45.6 4 1 .3 49.3 Finland 1 .3 1 .6 1 .8 1 . 7 2.2 Japan 10.2 10.8 13.9 17.9 19.6 18.0 14.9 New Zealand 0.2 0.3 0.9 0 . 1 0. 1 Norway 1 .5 1 .8 1 .9 1.8 2 . 1 Sweden 0.5 0.6 0.6 0.5 0.5 Switzerland 1 . 1 1 .7 1 .8 1 .8 2 .3 United States 19.4 47.1 59.4 5 1 .6 44.2 47.8 47.1
Total 53.5 84.5 1 15.5 120.4 122.5 1 18.3 124.5
Cost to consumers
Australia 0.2 0.4 0.5 0.4 0.4 0.4 0.4 Austria 1 . 1 1 .2 2.2 2.8 2.6 2.0 2.7 Canada 1.5 2.8 3.6 3.6 3.6 3.5 3.6 EC-122 36.7 36.7 7 1 . 9 82.7 75.0 6 1 .9 85.1 Finland 3.5 3 . 1 3 .3 3 .2 3 .8 Japan 17.3 29.2 48.8 60.0 65.6 59.0 54.7 New Zealand 0 . 1 0. 1 0. 1 0 . 1 0 . 1 0 . 1 Norway 1 .4 1.8 1 . 7 1.6 2.2 Sweden 3.2 2.7 2.6 2.7 3.0 Switzerland 3.8 4.5 4.7 3.9 4.9 United States 9.6 24.2 29.6 31 .4 26.0 24.2 27.9
Total 66.4 94.6 168.6 193.1 185.6 162.5 188.4
Source: Organization for Economic Cooperation and Development. Agriculmml Policies. Markers and Trade. Mo11iroring and Omlook (Paris). various issues.
'Total transfers are the sum of the cost to taxpayers and consumers less the additional budget revenue from impon taxes. The latter is small and is not shown separately here.
2EC- I 0 prior to 1986. Total transfers of EC-10 in 1986 were $97.7 billion and 3 percent of their GDP.
130

©International Monetary Fund. Not for Redistribution
Statistical Appendix
Table A23. Agriculture in National Economies, 1988
Share of Agriculture Agricultural Exports in PercentofGDP' in Percent of Merchandise Exports2
industrial countries
Australia 4.2 Austria 3 . 1 Canada 3.0 E'.C-12 2.9 Finland 5.5 Japan 2.6 New Zealand 8.4 Norway 3.0 Sweden 2.7 Switzerland 3.2 United States 2.0 OECD average 2.9
Developing countries
Sub-Saharan Africa 34.0 Of which
Cote d'Jvoire 36.0 Kenya 3 1 .0
East Asia 22.0 Of which
Indonesia 24.0 Thailand 17.0 Philippines 23.0
South Asia 33.0 Of which
India 32.0 Sri Lanka 26.0
Latin America and Caribbean 10.0 Of which
Argentina 14.0 Brazil 9.0 Uruguay 1 1 .0
Sources: Organization for Economic Cooperation and Development (1991); and World Bank ( 1990). Note: EC = European Community: SITC = Standard International Trade Classification. 'Agriculture, hunting, forestry, and fishing as a percent of total GDP by kind of economic activity. 'Agricultural exports are SJTC Revision 2, codes 0, I , 2, 4, excluding fishery and forestry products.
131
35. 1 3.7 8.2 7.6 2.9 0.4
59.1 2.0 2 . 1 3 . 1
13.2 8.0
38.0
85.0 63.0
16.0
22.0 45.0 26.0
24.0
18.0 50.0
29.0
70.0 3 1 .0 52.0

©International Monetary Fund. Not for Redistribution
STATISTICAL APPENDIX
Table A24. Factors Contributing to the Changes in Total Net Producer Subsidy Equivalents
(In percentage point contributions of total change)'
1988
Total net producer subsidy equivalent (PSE) -5.9
Quantity produced -3 . 1 Unit PSE -2. 8 Unit support not identified below 6.0 Unit direct payments 0.6 Unit market price support -9.4
Domestic prices (in terms of V. S. dollars) 8.4 World prices (in terms of U. S. dollars) - 17.8
1990 1989 Estimate
-5.4 9.1
2.9 1 . 8 -8.2 7.2
1 .5 -2.9 - 1 .9 0.8 -7.8 9.3
8.4 -3.2 - 16.2 12.5
Source: Organization for Economic Cooperation and Development, Agriculwra/ Policies, Markers and Trade. Monitoring and Owlook (Paris). various issues.
'The approximate effect on the total net PSE of the change in the component if no other change had taken place. Market price suppons for the total OECD arc expressed in U .S. dollars and while they may be affected by exchange rate change; these are not shown in this calculation although they would be in a calculation for individual countries.
Table A25. Trade in Agricultural Products of Selected Industrial Countries (In millions of U.S. dollars)
1980 1983 1 984 1985 1986 1987 1988
Exports
Australia 9.3 6.5 8.2 7.5 8 . 1 9 . 1 10.5 Canada 7.0 8.2 8.4 6.9 6.4 7.2 8.8 EC-121 27.3 23.4 24.6 24.7 26.7 30.4 29.9 New Zealand 3.5 3.4 3 .2 3.4 3.5 4.3 5.0 United States 42.3 37.1 38.9 30.1 27.4 30.8 39.9
Imports
Canada 4.6 4.4 4.9 4.6 5.0 5.4 6.0 EC-121 50.6 39.5 40.6 39.2 42.1 45.5 42.6 Other Europe (excluding Turkey) 9.9 7.8 7.9 8.0 10.2 1 1 .7 8.5 Japan 17.6 16.6 18.6 16.7 17.9 20.8 26.8 United States 19.9 19.2 22.8 23.2 24.5 24.1 22.7
Source: Organtzation for Economic Cooperation and Development ( 199 1 ). 1 E!xcludcs intra-EC trade and eastern Germany.
132

©International Monetary Fund. Not for Redistribution
Statistical Appendix
Table A26. Cereal Exports, 1978/79-1 990/911
1978-832 1983-873 1987-914
(In millions of tons per year)
Industrial countries 164.9 156.8 167.2 United States 105.5 83.2 96.8 Canada 22.5 25.1 22.9 EC-12 17 . 1 23 .0 27.4 Other Europe 1 .8 4 . 1 3 . 1 Australia 13.4 19.8 14.3
Former U.S.S.R. and Eastern Europe 4.0 4.9 3.8
Developing countries 28.9 36.4 29.0 Asia 12.6 1 8. 1 17.8
Thailand 5.8 7.7 6.0 Africa 4.4 2.0 4.0 Western Hemisphere 16.2 17.8 10.0
Argentina 15.3 16.9 8.9
Total World 197.6 197.9 200.0
(In percent of world total)
Industrial countries 83.4 79.2 83.6 United States 53.4 42.0 48.4 Canada 1 1 .4 12.7 1 1 .4 EC-12 8.7 1 1 .6 13 .7 Other Europe 0.9 2 . 1 1 . 6 Austral ia 6.8 10.0 7. 1
FormerU.S.S.R. and Eastern Europe 2.0 2.5 1 .9
Developing countries 14.6 18.4 14.5 Asia 6.4 9.1 8.9
Thailand 2.9 3.9 3.0 Africa 2.2 1 .0 2.0 Western Hemisphere 8.2 9.0 5.0
Argentina 7.7 8.5 4.5
Source: Food and Agriculture Organization. Food Outlook (Rome), various issues.
'Comprise rice, wheat, and coarse grains. 2Crop years 1978179-1982/83. JCrop years 1983/84-1986/87. •Crop years 1987/88-1990/9 1 .
Table A27. Cereal Imports, 1 978/79-1 990/911 (In millions of tons a year)
1978-832 1983-873 1987-914
Industrial countries 56.2 46.4 42.3 North America 1 . 4 1 .5 2.6 Japan 24.3 27.1 27.4 EC-12 25.0 1 2 . 1 6.9 Other Europe 3.7 2.3 2.4 Other 2.0 3.6 3 . 1
Forn1erU.S.S.R. and Eastern Europe 45.6 43.8 39.5
Former U.S.S.R. 32.2 36.5 32.8 Eastern Europe 13.4 7.2 6.7
Developing countries 96.0 109.5 1 18.9 Asia 5 1 .6 58.4 7 1 . 1
China 17 .8 13.5 20.5 Korea 5.4 7.2 9.3 Saudi Arabia 3.6 7 .6 5.7
Africa 22.0 29.5 27.4 North Africa 13.4 17.7 18.3 Sub-Saharan
Africa 8.6 1 1 .8 9 . 1
Western Hemisphere 22.4 2 1 .7 20.3
Total World 197.9 199.6 200.6
Sources: Food and Agriculture Organization, Foc>d Outlook (Rome), various issues; and World Bank, World De•·elopmem Repon (Washing10n), various issues.
•Comprise rice. wheat. and coarse grains. 2Crop years 1978/79-1982/83. lCrop years 1983/84-1986/87. •crop years !987/88-1990/91.
1 33

©International Monetary Fund. Not for Redistribution
STATISTICAL APPENDIX
Table A28. Main Agricultural Producer Support Policies for Selected Countries and Major Commodities, 1991
Commodity United States' European Community2 JapanJ Canada•
Grains
Oil seeds
Dairy
Livestock
Sugar
CCC inventory operations and commodity loans; deficiency payments; acreage reduction (set-asides); Export Enhancement Programs (EEP); marketing loans for rice
CCC inventory operations and commodity loans; EEP; marketing loans for soy beans
Price supports maintained by tariffs, quotas, and CCC inventory purchases
Beef: Tariff; quota; voluntary restraint agreements; EEP. Other: General (research and development, inspection, etc.)
Tariff quotas
Price supports maintained by intervention purchases subject to maximum guarantee quantities: variable levy; export refunds; eoresponsibility levies (negative support); land set-aside (all products)
Deficiency payments
Price supports maintained by intervention purchases; production quotas; variable levies; export funds; offset by eoresponsibility levies
Price supports maintained by intervention purchases: variable levies; export refunds
Price supports maintained by intervention purchases; variable levies; export refunds; production quotas; offset by eo-responsibility levy
State trading, including the restriction of imports: deficiency payments
Deficiency payments
Price supports through government stockholding, production quotas, and trade barriers; some deficiency payments
Beef: Tariff Pork: Variable levy Poultry: Tariff
State trading by JRSSPSC; price stabilization; variable import levy; controls on HFCS deficiency payments
GRIP and NISA
As above
Production and import quotas; deficiency payments; fluid milk premium
Beef: Tariff Pork: Tariff Poultry: Production and import quotas
Deficiency payments
Notes: This table includes only main support mechanisms and excludes support provided at the state or provincial level for all countries and at the national level for EC countries.
An overview is contained in Organization for Economic Cooperation and Development, National Policies and Agricultural Trade (Paris. 1987).
•United States. Commodity Credit Corporation (CCC) inventory operations and commodity loans for grains and oilseeds involve a program under which farmers are offered loans for their crops at a specified price, tem1ed the loan rate. The crops serve as collateral and farmers may either repay their loans and redeem their crops or not pay their loan and surrender or forfeit their crops to the CCC. The latter option is attractive when the market price is below the loan rate, but this has not occurred for cereals since 1987. The interest rate is also below the market rate. CCC support purchases are also made for dairy products. Marketing loans enable the farmer to repay the loan at the world market price if this is below the loan rate and thus are like export subsidies.
A deficiency payment is used to raise the income of producers. ll is roughly the difference between the target price and the higher of the market price or the loan rate times the program yield (which has been frozen), times the payment acreage. The payment acreage is base acreage less the set-aside less the flexible plaming acreage (at least 15 percent).
Beef is supported by the U.S. Meat Import Law, which provides for quotas on meat imports when annual imports are estimated to exceed a certain trigger level defined as 1 1 0 percent of an adjusted base quota. Quotas have not been applied since 1979. and voluntary export restraint agreements are sometimes used.
2£uropean Community. A variable levy is a levy on imports that is used to raise import prices of grains and dairy products to a threshold price, and of beef to a guide price, both of which tend to be above the domestic market price for the same commodity. thus effectively excluding imports. The European Community has argued that this is not a quantitative import restriction but a frequently adjusted tariff.
Maximum guaramee quantities result in a price reduction in the next year if a level of output for the currem year is exceeded (it does not directly limit production in the current year) and are applied on a Community-wide basis. These differ from production quotas, which arc applied to individual producers for the current year.
The current sugar regime has remained effectively the same since 1981. Domestic prices are maintained by production quotas and variable levies that effectively exclude all imports except special imports from African. Caribbean, and Pacific (ACP) coumries. The production quotas, which include high fructose corn syrup (HFCS), are divided into three categories. Production for domestic consumption ("A" quota) receives full price guarantees. Production for export ("B" quota), set at a proportion of "A" quota, receives an export restitution. The remainder of sugar production, "C" sugar, is carried over into .. A" quota for the next year. eo-responsibility levies are used to finance the sugar regime. A levy of2 percent of the intervention price is made on all sugar produced under quota. In addition, a levy of up to 37.5 percent can be made on sugar produced under the "B" quota. However, revenue generated by these levies has been insufficient to cover the heavy cost of export refunds and so an elimination levy was introduced in 1985 and a supplementary levy was approved in February 1988.
134

©International Monetary Fund. Not for Redistribution
Statistical Appendix
Table A28 (concluded)
JJapan. State trading in grains is by the Food Agency of the Ministry of Agricullure, Forestry. and Fisheries; in beef, by the Livestock Industry Promotion Corporation (LIPC); and in sugar. by the Japan Raw Silk and Sugar Price Stabilization Corporation (JRSSPSC).
The LJPC used to both stabilize the domestic price of beef and to manage the supply of imported beef by quotas, but imports were liberalized in April 1991.
The institutional framework for intervention in the sugar market has not changed greatly since I 982 when the Sugar Price Stabilization Law was amended. The operations of the JRSSPSC to stabilize the price of imported sugar entail selling a stabi/ization price ceiling bond and with it a target price. When the import pnce of sugar is below the target price. as it was during the 1980s. the JRSSPSC imposes surcharges and variable levies based on this difference. Part of these receipts is kept for rebates should the import price exceed the stabilization ceiling. To encourage domestic production, the Government fixes minimum producer prices. The JRSSPSC is obliged to buy sugar from refiners who have paid growers the minimum producer prices; the JRSSPSC rcsells the sugar to the same refiners (in a book transaction) at a lower price, which is comparable with the price of sugar made from imported r-dw sugar. The loss on this operation may be regarded as a deficiency paymelll and is financed from JRSSPSC levies and from the Government's budget. The production of HFCS is also regulated by production quotas. variable levies. and surcharges.
•canado. Canada has introduced a major reform to rationalize the suppon programs under a standard framework. The main programs are the Gross Revenue Insurance Plan (GRIP) and the Ner Income Srabilizarion Accoum (NISA), which for 1991192 have only been implemented for grains and oilseeds. The GRIP provides revenue protection that builds on the conventional crop insurance based on yield and price protection components. The yield component is based on conventional crop insurance. Price protection is based on the target prices calculated as a 15· year moving average of past market prices. and the level of support can be varied by setting the coverage ratio (the proportion of the target income that will be insured). The premiums for crop insurance arc shared 50 percent by the producer, and 25 percent for each of the federal and provincial governments. The revenue insurance pan is calculated as the difference between target revenue and market revenue. The former is calculated as the coverage ratio, times the target price, times the probable yield, times the seeded acreage. The coverage ratio can vary from 70 percent to 90 percent among provinces and crops but once set it would be fixed for five years. The cost of the revenue insurance is divided into 331/J percent to producers. 25 percent to provinces. and the rest, to the federal government.
Table A29. United States: Agricultural Support, 1 980-92
Producer Subsidy Total Public Agricultural Budget Equivalent2 Spending2 Outlays3 (Crop Year) (Fiscal Year) (Fiscal Year)
Percent Percent Percent Yeart Amount of GNP Amount of GNP Amount of GNP
(In billions (In billions (In billions of U. S. dollars) of U. S. dollars) of U. S. dollars)
1980 15.7 0.6 23.7 0.9 1 1 .2 0.4 1981 16.0 0.6 25.0 0.9 8.8 0.3 1982 19.8 0.6 34.9 0.8 1 1 .3 0.4 1983 1 9 . 2 0.9 45.3 1 . 1 15.9 0.5 1984 3 1 .4 0.7 36.6 1 .3 22.9 0.7 1985 34.8 0.7 54.3 1 . 0 13.6 0.4 1986 44.7 0.9 60.0 1 .4 3 1 .4 0.6 1987 45.1 1 .0 49.4 1 . 1 27.4 0.7 1988 37.2 0.8 42.5 0.9 17.2 0.4 1989 33.4 0.6 45.7 0.9 16.9 0.3 1990 35.9 0.7 44.9 0.8 12.0 0.2 1991 15 0 C)4 1992 15.35
Source: Organization for Economic Cooperation and Development, Moniroring and Omlook of Agricultural Policies, Markets and Trade (Paris), various issues; and United States, Executive Office of the President, Budget ofrhe U.S. Governmenr. FY 1992, and previous issues.
'Fiscal or crop years ended the year shown in the column. 2Total public spending includes all assistance to agriculture from federal and state governments. Some of this is excluded from the producer
subsidy equivalent (PSE) as it could not be allocated across crops. lfncludes outlays for farm income stabilization and for agricultural research services. •Estimate. 5projectioo.
135

©International Monetary Fund. Not for Redistribution
STATISTICAL APPENDIX
Table A30. United States: Support Programs for the Main Agricultural Commodities
Crop Year Ended t
1980 1985 1986 1987 1988 1989 1990 1991 1992
(In U. S. dollars per bushel) Wheat2
Target price 3.40 4.38 4.38 4.38 4.38 4.23 4.10 4.00 4.003 Loan rate 2.50 3.30 3.30 2.40 2.28 2.21 2.06 1.95 2.04 Average farm price 3.80 3.39 3.08 2.42 2 57 3.72 3.72 2.61 Deficiency payment 1 .00 1 . 08 1.98 1 . 8 1 0.69 0.32 1 .28 Acreage reduction program (in percent) 20.0 20.0 20.0 25.0 27.5 27.5 10.0 5.0 15.0
Corn2
Target price 2.20 3.03 3.03 3.03 3.03 2.93 2.84 2.75 2.753 Loan rate 2 . 1 0 2.55 2.55 1 .92 1.82 1 .77 1 .65 1 . 57 1 .62 Average fam1 price 2.52 2.63 2.23 1.50 1 .94 2.54 2.36 2.30 Deficiency payment 0.43 0.48 I . 1 1 1.09 0.36 0.58 0.51 Acreage reduction program (in percent) 10.0 10.0 10.0 20.0 20.0 20.0 10.0 10.0 7.5
Soy beans
Loan rate4 4.50 5.02 5.02 4.77 4.77 4.77 4.53 4.50 5.023 Average producer price 6.28 5.78 5.05 4.78 5.43 7.42 5.70 5.75
(In U.S. dollars per hundredweight) Rice
Target price 9.05 1 1 .90 1 1 .90 1 1 .90 1 1 .66 1 1 . 1 5 10.80 10.71 1 0. 7P Loan rate4 6.79 8.00 8.00 7.20 6.84 6.63 6.50 6.50 6.50 Average farm price 10.50 8.04 6.53 3.75 7.27 6.83 7.35 6.75 Deficiency payment 3.76 3.90 4.70 4.82 4.31 3.56 4.21 Acreage reduction program (in percent) 25.0 20.0 35.0 35.0 25.0 25.0 20.0 5.0
Dairy
M ilk support prices 1 3 . 1 0 1 1 .60 1 1 .60 1 1 .35 10.60 10.60 10. 1 0 1 0 . 1 0 10. 1 03 Average price of manufacturing milk 12.01 1 1 .72 1 1 .46 1 1 .37 1 1 . 15 12.38 12.29
(In U.S. cems per pound) Sugar
Loan rate (cane sugar) 18.00 18.00 18.00 18.00 18.00 18.00 18.00 18.00 1 8 .003 Average raw sugar price 30. 1 1 20.34 20.95 21.83 22.12 22.81 23.27
Cotton (upland)
Target price 57.7 8 1 . 0 8 1 .0 8 1 . 0 79.4 75.9 73.4 72.9 72.93 Loan rate 50.2 55.0 57.3 55.0 52.3 5 1 .8 50.0 50.3 50.8 Average farm price 62.3 57.5 56.8 5 1 .5 63.7 55.6 63.6 66.4 Deficiency payment 18.6 23.5 26.0 17.3 19.4 1 3 . 1 7.6 Acreage reduction program (in percent) 25.0 20.0 25.0 25.0 12.5 25.0 12.5 5.0
Source: U.S. Depanmcnt of Agriculture (USDA). 1Except for dairy and sugar, which are on a calendar year basis. USDA publications refer to crop years in terms of the beginning year. The
convemion adopted here is the one applied to financial years. 2Wheat and corn bushels arc convened into metric tons by muhtplying by factors of 36.75 and 39.37. respectively. JFixed at these levels through 1995/96 as a minimum. •Rice and soybeans benefit from a marketing loan arrangement. In the case of rice farmers to repay their loans at the higher of the world
market price or 70 percent of the loan rate if the world market price is lower than the loan rate. Loans for soy beans can be repaid at the lesser of the loan rate and the world market price.
'Suppon prices at the start of the year: they are sometimes changed during the year.
136

©International Monetary Fund. Not for Redistribution
Statistical Appendix
Table A31. United States: Budgetary Spending on Agriculture, by Commodity, 1985/86-1991/92
(In millions of U.S. dollars)
1990/91 1991/92 1985/86 1986/87 1987/88 1988/89 1989/90 Provisional Estimate
Wheat 3.440 2.836 678 53 806 2,647 2,519 Corn 10.524 12,346 8,227 2,863 2,450 2,364 2,665 Grain sorghum 1 , 1 85 1 ,203 764 467 361 298 282 Other feedgrains 502 4 1 8 62 54 -90 75 126 Rice 947 906 128 631 667 8 1 8 775 Dairy 2.337 1 . 166 1 .296 679 505 665 392 Upland conon 2 . 142 1 ,786 666 1,461 -79 389 823 Other CCC expenditures 4.764 1 .747 640 4.315 1 .851 3.588 3.497
Total CCC net outlays 25,841 22,408 12,461 10,523 6,471 10,844 11,079
Of which Deficiency payments 6,166 4,833 3,971 5,796 4 , 178 6, 1 1 7 6,574 Dairy termination 489 587 260 168 189 100 1 1 Export Enhancement Program• 10 643 1 . 199 393 234 900 1 ,200 Targeted export assistance' 1 6 68 104 122 155 40 Exports of dairy stocks 1 1 7 172 1 18 66 1 18 4 1
Agricultural credit insurance 3.234 2.564 2.618 2,987 2,241 1 . 7 1 5 835
Other income stabilization 533 -230 167 1 .307 1 ,049 894 876
Total Farm Income Stabilization 29,608 24,742 15,246 14,817 9,761 13,453 12,790
Agricultural Research and Services 1.841 1 .864 1 .964 2. 102 2 . 197 2.404 2,470
Total 31,449 26,606 17.210 16,919 1 1 ,958 15,857 15,260
Sources: United States. Executive Office of the President. Budget of till' United Swres Govemmem. various issues; U.S. Dcpartmem of Agricuhurc. Agricultural Outlook, various issues; and the U.S. Department of Agriculture.
Note: CCC = Commodity Credit Corporation. 'Value of certificates issued in that year; the certificates would be recorded us �pending when they were redeemed.
137

©In
tern
atio
nal M
onet
ary
Fund
. Not
for R
edis
tribu
tion
Tab
le A
32
. U
nit
ed
Sta
tes
: Qu
an
tita
tiv
e R
es
tric
tio
ns
on
Ag
ric
ult
ura
l Im
po
rts
Co
mm
od
ity
Bee
f and
vea
l (in
mil
lio
n m
etri
c ro
ns)'
(V
ER
s an
d un
impo
sed
quo
tas)
Mil
k,
crea
m,
fres
h (i
n m
illi
on
gall
ons)
(Q
uota
)l
Che
ese
(in
mil
lion
met
ric
rons
) (Q
uota
)2
Cot
ton
(in
rho
usa
nd m
etri
c to
ns)
(Quo
ta)2
S
ugar
(in
mil
lio
n m
etri
c to
ns)
(Tar
iff qu
ota
)3
Pea
nuts
(in
tho
usa
nd m
etri
c ro
ns)
So
urce
: U
.S.
Dep
artm
ent
of
Ag
ricu
ltur
e.
1980
0.7
6
1.5
0
0.1
1
135
179
.0
198
5
198
6
0.6
0
0.6
5
1.5
0
1.50
0.1
1
0.1
1
27
27
2.6
8
1.8
5
0.8
0
.8
No
te:
EC
= E
urop
ean
Co
mm
unit
y; V
ER
s =
vo
lunt
ary
exp
ort
res
trai
nts.
1987
0.6
5
1.50
0.1
1
27 1.00
0.8
198
8
198
9
0.6
9
0.6
2
1.5
0
1.5
0
0. I
I
0.1
1
165
27
0.7
9
1.2
4
0.8
0
.8
Impo
rts/
C
ons
ump
tion
Per
cent
in
1990
19
90
0.6
2 9
1.5
0
0.1
1
5
27 1.9
3
23
0.8
Co
untr
ies
Dir
ect ly
Aff
ecte
d
Aus
tral
ia,
New
Zea
land
. d
evel
op
ing
co
untr
ies
New
Zea
land
Aus
tria
. EC
, N
ew Z
eala
nd.
Nor
dic
coun
trie
s. S
wit
zerl
and
Eg
ypt.
Mex
ico
, P
eru
Arg
enti
na,
Aus
tral
ia,
Bra
zil.
Car
ib
bea
n, P
hilip
pin
es, T
haila
nd
Arg
enti
na,
Chi
na
'Tri
gg
er le
vel
: if
bee
f im
po
rts
are
fore
cast
to
exc
eed
this
tri
gg
er le
vel
, vo
lun
tary
exp
ort
res
trai
nts
or
quot
as a
rc im
po
sed.
In
pra
ctic
e. V
ER
s ha
ve o
nly
bee
n im
po
sed
in 1
98
2, 1
98
3, 1
987
. and
19
88
. 'P
erm
ined
un
der
Gen
eral
Agr
eem
ent
on
Tar
iffs
and
Tra
de (
GA
TT
) w
aive
r p
er S
ecti
on
22
of t
he
Ag
ricu
ltur
al A
djus
tmen
t A
ct. Q
uota
yea
r do
es n
ot c
orre
spon
d to
cal
end
ar y
ear.
'R
estr
icti
ve
quot
as w
ere
not
imp
ose
d b
efor
e M
ay
198
2.
Fro
m M
ay 1
98
2 to
Dec
embe
r 19
86
, th
e qu
ota
year
did
not
cor
resp
ond
to t
he c
alen
dar
yea
r. Q
uota
fig
ures
sh
ow
n ar
c ba
se q
uota
wit
h sp
ecia
lty.
Quo
tas
wer
e im
po
sed
und
er p
resi
den
tial
aut
ho
rity
as
a ''h
ead
note
" to
U .S
. T
arif
f Sch
edu
le.
but
wer
e ch
ange
d in
19
90
to
a t
ariff
quo
ta.
The
tar
iff
app
lied
to
im
po
rts
in e
xce
ss o
f th
e q
uota
is 1
8 ce
nts
a po
und,
whi
ch b
pro
hib
itiv
e.
en ;! -1 en �
0
J>o
r
J>o
"tt
,
m
z
!:!
X

©International Monetary Fund. Not for Redistribution
Statistical Appendix
Table A33. European Community: Average Degree of Self-Supply in Selected Agricultural Products, 1956-89,
1956-602 1968/693 19781794 1980/8iS 1983/846 1985/867 1988/89
Product Total cereals
(excluding rice) 85 86 Wheat 90 94 Rye 98 100 Barley 84 103 Grain maize 64 45
Sugar 104 82 Fresh vegetables 104 98 Fresh fruit (excluding
citrus fruits) 90 80 Wine 89 97 Fresh milk products
(excluding cream) 100 100 Cheese 100 98 Butter 101 9 1 Eggs 90 99 Total beef and veal 92 90 Poultry meat 93 101 Sheep meat and goat meat 56
97 103 108 1 1 9 108 101 1 12 1 1 3 60 66
124 136 94 100
77 83 99 1028
1009 101 10 1039 10610 I I J9 122 1 1 101 102 1 1 100 103 1 1 105 1 101 1 67 74 1 1
1 16 134 106 120
84 100 1 0 1
84 103
10 1 12 107 12 13412 103 12 10813 107 13 7613
1 10 1 13 124 123 I l l 106 1 1 9 1 18 77 95
123 124 107 106
87 84 104 91
102 107 14 104 105 14 105 8014 83
Sources: Commission of 1hc European Communities, The Agriculwra/ Siwmiou ill the Commtmity (Brussels), various issues: and data provided by the Commission of the European Communities.
1Data for 1956-60 and I 968/69 cover the six original members oft he Community, and those for 1978179 cover the six original members plus Denmark. Ireland, and the United Kingdom. Data for I 980/8 I . 1981/82. and 1983184 cover ten members of the Community (including Greece and excluding Spain and Ponugal).
'Average of the years 1956 through 1960. 'Average of crop years 1967168. 1968169. and 1969170. 4 Average of crop years 1977178. 1978179. and 1979180. SAverage ofcropycars 1979/80, 1980/81 . and 1981182. 6Average of crop years 1982183, 1983184, and 1984185. 7Average of crop years 1984/85, 1985186, and 1986/87. SExcluding Greece. 9Average ofcropyears 1976177. 1977178, and 1978/79. •oAverage of 1979, I 980. and 1981. "Average of 1980, 1981, and 1982. tlAverageof 1982, 1983. and 1984. 13Average of 1983. 1984, and 1985. ••Average of 1984. 1985. and 1986.
1 39

©International Monetary Fund. Not for Redistribution
I STATISTICAL APPENDIX
Table A34. European Community: European Agricultural Guarantee and Guidance Fund-Guarantee Section, Expenditures by Sector, 1976-90
(In millions of ECUs)
1980 1985 1986 1987 1988 1989 1990 1991 1
Cereals2 and rice3 1,714 2.360 3,485 4.237 4.512 3,340 4,6 1 1 5,261 Export subsidy 1 , 2 1 9 1 , 1 1 3 1 ,804 3 , 1 66 3 , 1 60 2,721 3,047 3,386 Intervention 509 1 ,247 1,681 1,071 1 .352 6 1 9 1 ,564 1 ,875
Milk and products2.3 4,754 5,933 5,406 5.013 5,984 5,041 4,489 5,063 Export subsidy 2.746 2,028 2,155 2,258 3,082 2,922 2,401 2,477 Intervention 2,006 3,905 3,251 2,755 2,901 2 . 1 1 8 2,088 2,586
Oils and fats 687 1 ,803 2,632 3,827 3.917 4.139 5.014 5.888 Export subsidy 4 23 32 87 88 100 167 136 Intervention 683 1 ,780 2,600 3,740 3,829 4,039 4,847 5,752
SugarJ 567 1 ,805 1 .726 2,035 2,082 1 ,980 2,127 1,885 Export subsidy 286 I ,353 1.238 1 . 5 1 6 1 .566 1,451 1 .483 1 ,21 I Intervention 289 452 487 5 1 9 5 1 6 529 644 674
Beef, veal, pigmeat, and poultry 1 .563 2,974 4,348 3,033 4.179 4,376 2,585 4,389 Export subsidy 893 1 ,504 1 ,387 1 , 142 1 , 135 I ,776 1,341 I ,337 Intervention 671 1 ,470 2.961 1,891 3,044 2,600 1 ,244 3,052
Fruits and vegetables 688 1 ,231 986 967 708 1 ,020 1 ,296 I ,439 Export subsidy 4 1 75 77 67 65 80 105 1 3 1 Intervention 646 1 , 156 909 900 643 940 1 , 1 1 9 1 .308
Other 1 ,023 3 ,41 1 3.014 3 . 1 50 4,362 4, 188 5,971 5.308
All sectors I 1 ,005 19,517 2 1,597 22,262 25.745 24.084 26,093 29,233
Accession compensatory amounts (A CAs) 6 1 8 64 42 35 35
Monetary compensatory amounts (M CAs} 298 190 476 636 505 323 136 210
All sectors, including ACAs and MCAs 1 1 ,3 1 4 19,707 22,079 22.919 26.315 24,448 26,264 29.478 Budgetary guideline4 27,500 28,624 30.630 32,5 1 1 Depreciation of intervention stocks 1 ,240 1 ,443 1 ,470 810
Others 37 I 14 259 132 - 1 8 290 907
All sectors, including ACAs, MCAs, depreciation of intervention stocks. and other 19,744 22,193 23,178 27,687 25,873 28,024 3 1 . 195
Sources: Commission of the European Communities, The Agricultural Silllation in the Community (Brussels). various issues: and Financial Report on the European Agricultural Guarantee and Guidance Fund.
'Preliminary draft budget; subsequent budget estimates indicated higher expenditures that. in the absence of corrective action. would have exceeded the guideline.
21ncluding the financial contribution from cereal and milk producers. llncluding food aid refunds. 4There arc some additional inclusions and exclusions before the above total is comparable with the basis used for the budgetary guideline. �Clearance of accounts plus interest following reform of financing arrangements, free distribution of intervention products. and set-aside of
arable land. Figure for 1987 includes clearance of the 1983. 1984. and 1985 accounts. Figure for 1990 also includes rural development schemes linked to market operation.
1 40

©In
tern
atio
nal M
onet
ary
Fund
. Not
for R
edis
tribu
tion
.f:>.
.....
Tab
leA
35
. E
uro
pe
an
Co
mm
un
ity
: Ta
rge
t P
ric
es
fo
r S
ele
cte
d C
om
mo
dit
ies
, 19
80
/81-
199
1/9
21
198
0/8
1 19
84/8
5 19
85/8
6
1986
/87
19
87/8
8 19
88/8
9
1989
/90
2 19
90
/912
19
91/
923
Cer
eals
(EC
Us
pe
r to
n)
Co
mm
on
whe
at
214
.01
259
.08
254
.98
25
6.1
6
25
6.1
0
250
.30
24
7.7
8 23
4.2
2 2
33
.26
B
arle
y 19
4.3
2
236
.30
2
32
.61
23
3.8
1 23
3.80
22
8.0
0
22
5.4
8
213
.29
2
12.3
3 R
ye
197
.31
23
8.3
7
23
4.6
1 23
3.86
2
33
.80
22
8.0
0
22
5.4
8
213
.29
2
12.3
3 R
ice.
hus
ked
(EC
Us
per
ron)
4
08
.16
53
9.4
9
548.
37
548.
37
54
8.3
7
549
.85
546
.88
546
.13
53
3.0
8 Su
gar,
wh i
t e4
(EC
Us
per
ton)
4
32.7
0
534
.70
5
41.
80
5
41.
80
54
1.8
0
54
1.8
0
53
1.0
0
53
0.1
0
530
.10
O
liv
e o
il (
EC
Us
per
ton)
2
.479
. 70
3,1
62.3
0
3,22
5.6
0
3,2
25
.60
3
,22
5.6
0
3,2
25
.60
3,
225.
60
3
,22
0.1
0
3,2
20
.10
O
i1se
eds
(EC
Us
per
ton)
S
unfl
ow
er
426
.30
58
2.20
57
3.50
58
3.50
58
3.50
58
3.50
58
3.50
58
2.50
57
3.80
C
olz
a an
d ra
pese
ed
386
.90
4
72.6
0
46
4.1
0
46
4.1
0
450
.20
4
50.2
0
450
.20
4
49
.40
4
42.
70
W
ine.
Typ
e A
ll (E
CU
s p
er
he
cro
lite
r)
55.6
9
71.
02
71.
02
71.
02
69
.60
6
9.6
0
69
.60
6
9.4
8 6
9.4
8 T
obac
co, #
2 (E
CU
s p
er k
ilo
gra
m)
3.6
03
4.6
04
4
.50
4
4.5
12
4.5
12
4.5
12
3.4
64
4
.512
C
aulifl
ow
er
14.7
5
21.
52
2
1.7
4
21.
96
26
.94
26
.94
2
7.1
1
24.2
6
Tom
atoe
s (o
pen
gro
wn)
24
.79
24
.85/
20.7
0
24.0
8/2
1.4
8
24.0
8/22
.87
23
.68
23
.68
24
.69
24
.04
O
rang
es
32
.14
119
.38
4
0.9
7/3
8.32
39
.74
39
.74
3
8.7
4
38
.74
35
.62
33.1
5
App
les
20.4
2 29
.63
29.6
3 29
.63
29.6
3 29
.63
28.0
6
28
.01
Mil
k (3
.7 p
erce
nt f
at c
onte
nt)
22
2.6
0
274
.30
27
8.4
0
278.
40
27
8.4
0
278.
40
27
8.4
0
26
8.1
0
26
8.1
0
Bee
f an
imal
s (l
ive)
1.
60
7.6
0
2,0
50.2
0
2,0
50.2
0
2,0
50.2
0
2.0
50.2
0
2,0
50.2
0
2,0
50.2
0
2,0
00
.00
2.
00
0.0
0
Por
k 1.
58
7.2
1 2.
033
.30
2.
033
.30
2.
033
.30
2.
033
.30
2,
033
.30
2.
033
.30
1.
897
.00
1.
897.
00
S
heep
and
go
at m
eat
(EC
Us
per
10
0 k
ilo
gra
ms)
S 34
5.0
0
428
.04
4
32
.32
4
32
.32
4
32
.32
4
32
.32
4
32
.32
4
31.
58
4
22.9
5
So
urce
: C
om
mis
sio
n o
f the
Eur
ope
an C
om
mun
itie
s. T
he A
Jiri
rul
wra
l S
itu
ati
on
in t
he C
om
mun
ity
(Bru
ssel
s),
vari
ous
Iss
ues.
N
ote
: E
CU
= E
uro
pean
Cur
renc
y U
nit.
'B
egin
ning
of m
arke
ting
yea
r.
1Pri
ccs
for c
ere
als,
ric
e, a
nd s
ugar
incl
ude
the
app
licat
ion
of
the
stab
ili�e
r sy>
tem
(R
egu
lati
on
1412
/89
). F
or m
ilk.
pri
ce a
lso
incl
udes
the
redu
ctio
n de
cide
d up
on a
, pa
n o
f th
e in
crca
�c in
the
m
ilk
quo
ta o
f I
perc
ent.
1 Pri
ces
for
cere
als.
ric
e, a
nd s
ugar
exc
lud
e th
e ap
plic
atio
n o
f the
sta
biliz
er �
yst
em.
·'Int
erve
ntio
n pr
ice.
'S
heep
mea
t and
go
at m
eat w
ere
not c
ove
red
by th
e C
om
mo
n A
gric
ultu
ral
Polic
y pr
ior t
o 1
98
0/8
1.
C/) iD
- ;- - ii
!!!.
)>
"0 "0 CD :I Q. )(

©International Monetary Fund. Not for Redistribution
I STATISTICAL APPENDIX
Table A36. Japan: Self-Sufficiency Rates of Major Agricultural Products1 (In percent)
1975 1980 1985 1986 1987 1988 1989
Rice 1 10 87 107 108 108 100 100 Wheat 4 10 14 14 14 1 7 1 6 Barley 10 15 15 14 14 1 5 1 4 Pulses 9 7 8 8 9 8 9 Soy beans 4 4 5 5 6 6 6 Vegetables 99 97 95 95 94 9 1 92 Fruits 84 81 77 74 74 67 67 Eggs 97 98 98 97 99 98 98 Milk and milk products 82 86 89 82 78 75 80 Meats 77 8 1 81 78 76 73 72
Beef 81 72 72 69 64 58 54 Pork 86 87 86 82 80 77 77 Poultry 97 94 92 89 88 85 84
Sugar 16 29 33 34 34 35 35 Fats and oils 23 29 32 33 30 33 30
Food totaJ2 74 72 7 1 70 Grains total 40 33 3 1 3 1 30 30 30 Food total (calorie basis) 55 53 52 S I 49 49 48 Feed total (calorie basis) 34 28 27 27 26 26 26
Source: Japanese Ministry of Agriculture, Forestry. and Fisheries, "Food Balance Sheet.'' 1986-89. 'Data relate to fiscal years. Self-sufficiency rates = domestic production/domestic utilization; domestic utilization = domestic production +
change in stocks + imports - exports. 2The ratio of the total value of domestic production to the tOtal value of domestic consumption. expressed as a percentage.
Table A37. Japan: Administrative Prices of Major Agricultural Products (In yen per kilogram)
1980 1985 1986 1987 1988 1989 1990 1991
Rice (husked) Government purchase price 295 3 1 1 3 1 1 293 279 279 275
Wheat Government purchase price 178 185 183 174 166 160 154
Barley Government purchase price 162 167 165 156 148 138 132
Sugar Government purchase price 246 241 235 213 206 194 188
Soy beans Standard price 280 287 282 266 251 251 240
Manufacturing milk Guarantee price 89 90 88 83 80 80 78 77
Butter Stabilization indicative price 1,253 1 ,276 1 ,225 1 , 100 1 ,080 1,092 1,065 1 ,051
Skimmed milk powder Stabilization indicative price 501 541 541 527 521 527 5 1 3 507
Beef Lower stabilization price 1 , 105 1 , 120 1,090 1 ,020 995 995 985 960
Pork Lower stabilization price 588 600 540 455 410 400 400 400
Source: Japanese Ministry of Agriculture. Forestry, and Fisheries. Note: Up 10 1987, lower stabilization prices for beef were established separately for Wagyu steer beef and dairy steer beef. which were
¥1 .370 and ¥ 1 .020. respectively.
142

©In
tern
atio
nal M
onet
ary
Fund
. Not
for R
edis
tribu
tion
Tab
le A
38
. J
ap
an
: Ex
pe
nd
itu
re o
n A
gri
cu
ltu
re a
nd
Ru
ral D
ev
elo
pm
en
t, 1
97
5-
911
(I
n b
illio
ns o
f ye
n)
197
5
198
0
1985
19
86
19
87
19
88
19
89
19
90
19
91
Tot
al B
udge
tary
Exp
endi
ture
2
1,2
88
.8
42
,58
8.8
5
2,4
99
.6
54,0
88.6
54
,10
1.0
5
6,6
99
.7
60,4
14.2
6
6.2
36.8
70
.34
7.4
Agr
icul
ture
, fo
rest
ry, a
nd fi
shin
g
2,1
76.8
3,
58
4.0
3
,30
0.8
3
,14
2.9
3,
028
.6
3,1
71.
9
3,1
58
.9
3,1
22
.1
3,2
65
.8
Ag
ricu
ltur
e 1.
918
.0
2,9
25
.3
2.6
46
.2
2,4
93.1
2
.38
9.1
2
.44
6.3
2
.42
0.0
2
,37
8.5
2
.49
2.0
Pri
ce P
olic
ies
850
.9
766
.5
56
9.3
4
75
.3
45
6.8
3
52
.7
316
.5
316
.7
33
5.1
F
ood
cont
rol2
8
11.5
6
52
.2
456
.1
36
3.7
35
8.0
2
62
.0
232
.0
232
.0
210
.0
Mil
k a
nd o
ther
live
stoc
k pr
oduc
ts
22
.8
49
.4
51.
2
49
.8
40
.8
34
.1
30.5
2
9.6
7
2.7
en
Veg
etab
les
8.0
l
l.2
9
.1
8.7
8.
0
7.8
7
.3
7.0
6
.8
� F
ruit
s 0
.7
1.6
0
.7
1.7
0
.9
1.1
0.0
1.
6
0.7
So
ybea
ns a
nd r
apes
eeds
l.
l 18
.1
21.
0
22
.6
23
.6
25
.2
26
.3
26
.7
25
.1
�
c;·
Sug
ar a
nd s
ugar
cro
ps
6.8
34
.0
31.
2 2
8.8
2
5.5
2
2.5
20
.4
19.8
19
.8
!!.
�
.J:>.
Pad
dy fi
eld
farm
ing
esta
blis
hmen
t 9
7.1
30
3.4
2
39.2
2
32.4
18
2.6
18
6.2
18
6.2
15
1.1
151.
1 ,.
c.
.> In
fras
truc
ture
fo
r rur
al c
om
mun
itje
s 35
9.5
8
97
.5
87
8.9
86
8.0
85
0.2
1,
00
2.2
1,0
22
.1
1.0
24.9
1,
06
9.1
'0
'0
Pro
mot
ion,
pro
duct
ion,
and
mar
keti
ng
192
.5
205.
89
132
.9
111
.4
101.
3
99
.6
97
.9
93.
6
135
.2
CD A
gri
cult
ural
str
uctu
ral
imp
rove
men
ts
81.
7
197
.3
194
.4
188
.8
186
.0
181.
3
178
.6
184
.1
188
.9
:I Q. A
gri
cult
ural
insu
ranc
e 80
.7
142
.3
157
.6
149
.5
146
.3
141.
1 13
8.2
13
8.0
13
7.8
j
( R
esea
rch
exte
nsio
n 5
5.2
9
2.6
8
9.3
89
.7
89.5
89
.0
89.6
9
0.6
9
3.0
C
once
ssio
nal l
oan
s 4
8.5
107
.7
160
.4
162
.6
161.
7
160
.2
156
.9
134
.2
135
.3
Oth
er
151.
9
212
.1
224
.2
215
.4
214
.7
234
.0
234
.0
24
5.3
2
46
.5
Ext
rabu
dget
ary
exp
endi
ture
L
ives
tock
Ind
ustr
y P
rom
otio
n C
orp
orat
ion
31.
1 19
.4
66
.7
50.4
6
1.9
4
1.7
P
rodu
ctio
n su
ppor
t 2
3.6
13
.5
56
.8
32.6
4
8.0
30
.7
Mar
keti
ng a
nd
co
nsum
pti
on
7.5
5
.9
9.9
17
. .S.
13.9
11
.0
Gra
in
84.0
59
.0
129
.0
186
.0
183
.0
165
.3
119
.5
Japa
n S
ug
ar P
rice
Sta
bili
zati
on
Age
ncy
1.0
1.
0
67
.0
67
.0
70.0
6
6.3
6
6.8
5
0.1
So
urc
e:
Jap
ane
se M
imst
ry o
f A
gri
cult
ure
. F
ore
stry
. an
d F
ish
en
es.
'D
ata
re
late
to
fisc
al y
ea
rs.
2Mai
nly
ric
e.

©International Monetary Fund. Not for Redistribution
STATISTICAL APPENDIX
Table A39. Japan: Nominal Protection Coefficients (In yen per kilogram)
1983 1984 1985 1986 1987 1988 1989 1990
Japanese support prices Rice 304 3 1 1 3 1 1 3 1 1 293 279 279 275 Wheat 185 185 185 183 174 166 160 154 Beef 1 , 120 1 , 120 1 . 120 1 ,090 1 ,020 995 995 985 Butter 1 ,302 1 ,302 1 ,276 1 ,225 1 , 100 1 ,080 1 ,092 I ,065 Sugar 250 243 241 235 2 1 3 206 194 188
World prices Rice 66 60 52 35 33 39 44 42 Wheat 37 36 32 19 16 19 23 20 Beef 580 540 514 353 345 323 354 371 Butter 583 492 534 428 362 397 451 472 Sugar 44 27 2 1 22 22 29 39 40
Nominal protection coefficients
Rice 4.6 5.2 6.0 8.8 8.8 7.2 6.3 6.6 Wheat 5.0 5 . 1 5.7 9.4 10.7 8.9 6.8 7.8 Beef 1 .9 2 . 1 2.2 3 . 1 3.0 3 . 1 2 .8 2.7 Butter 2.2 2.6 2.4 2.9 3.0 2.7 2.4 2.3 Sugar 5.6 8.9 1 1 .3 10.5 9.9 7.2 5.0 4.7
Sources: Japan, Ministry of Agriculture, Forestry, and Fisheries, Statistical Yearbook, various issues; and International Monetary Fund, lntemational Financial Statistics, various issues.
Note: The world prices in this table are only indicative of trends and generally understate import prices. World prices are f.o.b. prices and not c. i. f. In addition. the grades of the domestic products are generally different (typically higher) from the commodities used as the reference world prices. Japanese support prices are those shown in Table A37.
The world prices are: Rice: Thai milled white rice, 5 percent broken , f.o.b. Bangkok. Wheat: U .S. No. I hard red winter wheat, f.o.b. Gulf ports. Beef: Frozen boneless beef. Australian and New Zealand origin, f.o.b. U.S. ports. Butler: New Zealand, best quality. Selling price on the London Provision Exchange. Sugar: International Sugar Agreement price, which is an average of the New York contract No. 1 1 spot price and the London daily price.
f.o.b. Caribbean port.s.
1 44

©International Monetary Fund. Not for Redistribution
Statistical Appendix
Table A40. Direct, Indirect, and Total Nominal Protection Rates (In percent)
1975-79 1980-84
Country Product Direct Indirect Total Direct Indirect Total
Exported crops Argentina Wheat -25 - 16 -4 1 - 13 -37 -50 Brazil Soy beans -8 -32 -40 - 19 - 14 -33 Chile Grapes 1 22 23 0 -7 -7 Colombia Coffee -7 -25 -32 -5 -34 -39 Cote d'Ivoire Cocoa -3 1 -33 -64 -2 1 -26 -47 Dominican Republic Coffee - 15 - 1 8 -54 -32 - 1 9 -5 1 Egypt Cotton -36 - 1 8 -33 -22 - 14 -36 Ghana Cocoa 26 -66 -40 34 -89 -55 Malaysia Rubber -25 -4 -29 - 18 - 10 -28 Pakistan Cotton - 12 -48 -60 -7 -35 -42 Philippines Copra - 1 1 -27 -38 -26 -28 -54 Portugal Tomatoes 17 -5 12 17 - 13 4 Sri Lanka Rubber -29 -35 -64 -3 1 -3 1 -62 Thailand Rice -28 - 15 -43 - 15 - 19 -34 Turkey Tobacco 2 -40 -38 -28 -35 -63 Zambia Tobacco 1 -42 -41 7 -57 -50
Average All countries - 1 1 -25 -36 - 1 1 -29 -40 Lower-income developing
countries - 1 3 -33 -46 - 13 -35 -48
[mported food crops Brazil Wheat 35 -32 3 -7 - 1 4 -21 Chile Wheat 1 1 22 33 9 -7 2 Colombia Wheat 5 -25 -20 9 -34 -25 Cote d'Ivoire Rice 8 -33 -25 16 -26 - 1 0 Dominican Republic Rice 20 - 1 8 2 26 - 19 7 Egypt Wheat - 19 - 1 8 -37 -21 - 14 -35 Ghana Rice 79 -66 13 1 1 8 - 89 29 Korea Rice 91 - 1 8 73 86 - 12 74 Malaysia Rice 38 -4 34 68 - 10 58 Morocco Wheat -7 - 1 2 - 19 0 -8 -8 Pakistan Wheat - 13 -48 -61 -2 1 -35 -56 Philippines Corn 18 -27 -9 26 -28 -2 Portugal Wheat 15 -5 10 26 - 13 - 1 3 Sri Lanka Rice 18 -35 - 17 1 1 -3 1 -20 Turkey Wheat 28 -40 - 12 -3 -35 -38 Zambia Corn 13 -42 -55 -9 -57 -66
Average All countries 20 -25 -5 2 1 -27 -6 Lower-income developing
countries 1 1 -33 -22 1 3 -35 -22
Source: Krueger. Schiff. and Valdcs (1988), Tables I and 2. Note: Lower-income developing countries do not include Argentina, Brazil, Chile, Korea. Malaysia. and Ponugal.
145

©In
tern
atio
nal M
onet
ary
Fund
. Not
for R
edis
tribu
tion
.....
of:>.
0>
Tab
le A
41.
Es
tim
ate
s o
f th
e Im
pa
ct
of
Lib
era
liza
tio
n o
f A
gri
cu
ltu
ral P
olic
ies
by
In
du
str
ial C
ou
ntr
ies
Kri
sso
tf,
Kri
sso
tf,
Bu
rnia
ux
, T
ycrs
and
T
yers
and
H
uff•
Sul
liv
an,
Su
lliv
an,
Fro
hber
g,
van
dcr
A
nder
son
And
erso
n Z
ietz
an
d
and
Wai
nio
an
d W
aini
o
Fis
cher
, M
ensb
rug
ghe
. (I
) I
(2)1
an
d V
alde
s2
Mor
eddu
2 (I
)4
(2)4
an
d P
arik
hS
and
Wae
lbro
eck6
Impa
ct o
n in
tern
atio
nal c
omm
odity
pri
ces
(as
perc
ent c
hang
e fr
om b
asel
ine
scen
ario
)
Whe
at
12
-I
4
-0
.3
29
23
18
C
oars
e g
rain
s 2
-
12
-3
-
0.9
23
19
11
17
R
ice
16
-6
2
0
.2
14
-5
2
I B
eef
50
9
11
0
.9
16
7
17
10
Dai
ry p
rodu
cts
105
12
2
2.8
6
8
61
31
14
Sug
ar
22
-
14
15
2.5
3
2
15
Wei
ghte
d av
erag
e o
f all
stu
died
pro
duct
s 2
5 I
18
-I
Imp a
ct o
n ag
ricu
ltur
al t
rade
bal
ance
(ch
ange
fro
m b
asel
ine
scen
ario
in
bil
lio
ns o
f U
.S.
dolla
rs)
Lat
in A
mer
ica
25
3
5
6
0.4
7
16
M
idd
le E
ast a
nd A
fric
a 6
13
0
3
N
ort
h A
fric
a an
d M
idd
le E
ast
I 6
-
I I
Sub
-Sah
aran
Afri
ca
5 1
1 -
2 0
.1
I 2
A
sia
2 0
49
8
5 0
.2
5
6
Tot
al d
evel
opi
ng c
oun
tri e
s 5
1 9
8
17
0.7
1
1
24
10
OE
CD
-
79
-
134
-
0.8
-
5
Sour
ces:
G
old
in a
nd K
nuds
cn (
t990
): H
uff
and
Mor
eddu
( 19
90
): .
. The
Min
iste
rial
Tra
de M
and
ate
Mo
del
.. in
OE
CD
Ero
nom
ic-S
tud
ies,
No
. t3
(W
inte
r 19
89-9
0),
pp.
45-
67:
Tyc
rs a
nd
And
erse
n (1
992
).
No
te:
The
firs
t fo
ur s
tudi
es a
rc m
ulti
com
mo
dit
y, m
ulti
coun
try
mo
dels
of
the
mai
n ag
ricu
ltur
al p
rodu
cts.
and
are
ter
med
par
tial
eq
uili
briu
m m
ode
ls.
The
Zi�
tz a
nd V
alde
s an
d t
he U
SD
A
mo
dels
hav
e ad
ded
the
feed
back
of a
cha
nge
in n
atio
nal
inco
me
from
trad
e re
form
on
the
dem
and
equa
tio
ns. T
he la
st tw
o m
ode
ls a
rc g
ener
al e
qui
libri
um m
ode
ls.
1T-A
(I)
and
T-A
(2
). B
ased
on
pro
tect
ion
in 1
990
. S
cena
rio
T-A
( I)
ass
umes
tha
t in
dust
rial
co
untn
es o
nly
liber
aliz
e th
eir
food
po
licie
s in
19
90
and
tha
t de
velo
ping
co
untr
ies
perm
it p
artia
l pa
ss-t
hrou
gh o
f th
ese
pric
e eff
ects
. S
cena
rio
T-A
(2)
assu
mes
tha
t bo
th d
evel
opi
ng a
nd in
dus
tria
l co
untr
ies
liber
aliz
e th
eir
polic
ies
in 1
990
. B
oth
ass
ume
inst
anta
neo
us a
djus
tmen
t to
the
nea
r eq
uili
briu
m b
y m
akin
g us
e o
f lo
ng-r
un c
last
iciti
es.
The
net
eff
ects
on
food
tra
de r
efer
to 1
99
0 a
nd a
re e
xpre
ssed
in
1985
do
llars
, an
d a
re f
rom
a s
cena
rio
in w
hich
pri
ce-r
espo
nsiv
e pr
odu
ctiv
ity
gro
wth
is a
ssum
ed b
y in
crea
sing
pri
ce e
laM
icu
ies
of
supp
ly b
y 0
.5.
'(Z
-V)
Zie
tz a
nd
Val
dh
. B
ased
on
19
81-
83
bas
e pe
riod
and
rep
on
s pr
ices
an
d tr
ade
bala
nces
aft
er 2
0 y
ears
. A
ssum
es f
ull
pric
e tr
ansm
issi
on
to p
rodu
cers
and
co
n,ur
ner�
in
dev
elo
ping
co
untr
ies.
The
per
cem
agc-
poin
t ch
ange
in
the
cere
al im
pc>r
t bi
ll o
f th
e co
untr
y gr
oup
com
pare
d to
the
base
line
sce
nari
o in
the
year
20
00
. -'(
OE
CD
-MT
M)
Huff
an
d M
ore
dd
u. A
10
per
cent
red
uctio
n in
OE
CD
sup
port
lev
els
a' m
easu
red
by p
rodu
cer
subs
idy
equ
ival
ents
. F
igur
es a
rc a
ppro
xim
ate
as t
hey
wer
e re
ad f
rom
cha
ns.
S
imu
late
s th
e im
pac
t on
1982
-85
wor
ld p
rice
;, re
sult
ing
fro
m a
10
per
cent
red
uctio
n in
OE
CD
agr
icul
tura
l sup
port
s as
mea
sure
d by
PS
Es
and
the
dis
man
tling
of
set-
asid
e pr
ogr
ams
and
thu
s th
e m
agni
tudc
s ar
c no
t co
mpa
rabl
e to
the
oth
er rc
�uh
>. E
stim
ate�
ass
ume
the
com
ple
te p
ass-
thro
ugh
of t
he p
rice
cha
nge�
into
do
mes
tic
mar
kets
by
deve
lopi
ng c
oun
trie
� bu
t no
oth
er p
olic
y c
hang
es
by d
evel
opi
ng c
oun
trie
s. D
evel
opi
ng c
oun
trie
s in
clud
ed c
om
pris
e A
rgen
tin
a, B
razi
l, C
hina
, In
dia,
Mex
ico
, Ko
rea,
sub
-Sah
aran
Afr
ica,
and
Tha
ilan
d.
•US
DA
(1) a
nd
US
DA
(2
) K
riss
o./f
. S
ull
imn
, a
nd
Wa
inio
. S
imul
ates
im
pact
fro
m 1
986
bas
e o
f a
com
plet
e li
bera
lizat
ion
of
indu
stri
al c
oun
try
agri
cult
ural
sup
port
po
licie
s an
d as
sum
es f
ull
pass
-thr
oug
h o
f th
e re
sulti
ng p
rice
cha
nge
to p
rodu
cers
and
co
nsum
ers
in d
evel
opi
ng c
oun
trie
s. U
SD
A (
I) in
corp
ora
tes
a fe
ed b
ack
of
the
chan
ge
in a
gri
cultu
ral i
nco
me
ont
o n
atio
nal
inco
me
wit
h an
inc
om
e m
ulti
pli
er o
f o
ne (
sim
ulat
ion
IME
Y2
). U
SD
A (
2) a
lso
inc
lud
es th
e re
alig
nmen
t o
f de
velo
pang
co
untr
y ex
chan
ge r
ates
to t
he p
aral
lel m
arke
t le
vels
. as
a p
roxy
fo
r re
duc
ing
the
indi
rect
bia
ses
agai
nst a
gri
cult
ure.
'(
BL
S)
Fro
hber
g. F
ist'h
er a
nd
Par
il.lr
. M
ode
ls th
e im
pac
t of
liber
aliz
atio
n in
19
80 c
om
pare
d to
the
a r
efer
ence
sce
nari
o in
20
00
. Ag
ricu
ltur
al tr
ade
bal
ance
s ar
e at
19
70
pri
ce>.
•(
OE
CD
-WA
LRA
S)
Bu
mia
11.1. v
an
der
Men
sbru
xgh
e, a
nd
Wae
lbro
eck.
A g
ener
al e
qui
libri
um m
ode
l foc
usin
g p
rim
arily
on
the
effe
cts
of a
lib
eral
izat
ion
by O
EC
D c
oun
trie
s o
n th
emse
lves
and
th
us n
o im
pact
s re
port
ed f
or d
evel
opi
ng c
oun
trie
s . L
n te
rms
of
real
ho
useh
old
inco
me
the
mo
delle
d O
EC
D c
oun
trie
s w
oul
d ga
in $
72 b
illi
on
per
year
( 19
88
pri
ces)
or
0. 9
per
cent
.
m ;;! ..... m :::!
0
)lo
r
)lo
"D
"D
m
z
c
><

©International Monetary Fund. Not for Redistribution
Statistical Appendix
Table A42. Effects on Global Welfare of Liberalization by Industrial Countries (In billions of 1986/87 U.S. dollars a year)
Changes in Welfare
Net welfare in U.S. Consumer/ dollars
Producer taxpayer Net welfare' per capita
European Community -22 .7 36.7 14.0 43 Japan - 2 1 . 8 30.4 6.3 52 United States - 1 7.2 25.6 8.6 36 Canada - 1 .3 3.9 2.6 1 0 1 Australia 1 . 6 -0.5 1 . 1 7 1 New Zealand 1 .7 -0.4 1 .3 396 Industrial countries -65.6 104.0 35.3 5 1
Centrally planned economies 9.8 - 10.2 -0.8
Developing exporters 5 . 1 - 5 . 1 0.7 2 Newly industrializing economies 0.5 -0.8 -0.9 - 1 3 Other developing importers 1 1 .8 - 14.6 -4.4 - 2 Developing countries 17.4 -20.5 -4.5 - 2
Global -38.4 73.2 29.9 7
Source: Roningen and Dixit (1990). 1Ne1 welfare change includes bases 10 other groups, for example, quota holders.
1 47

©International Monetary Fund. Not for Redistribution
GATT Membership Status
GATT Contracting Party
I STATISTICAL APPENDIX I
Table A43. GATT Membership
Country
Antigua and Barbuda Argentina Australia Austria Bangladesh Barbados Belgium Belize Ben in Bolivia Botswana Brazil Burk.ina Faso Burundi Cameroon Canada Central African Republic Chad Chile Colombia Congo Costa Rica Cote d'Ivoire Cuba• Cyprus Czechoslovakia Denmark Dominican Republic Egypt El Salvador Finland France Gabon Gambia, The Germany Ghana Greece Guatemala Guyana Haiti Hong Kong• Hungary Iceland India Indonesia Ireland Israel Italy Jamaica Japan Kenya Korea. Republic of Kuwait Le,�olho Luxembourg Macao1 Madagascar Malawi Malaysia Maldives Malta Mauritania Mauritius Mexico
148
Date of GATT Accession/ Application
March 30, 1987 October 1 1 , 1967
January I , 1948 October 19, 1951
December 16, 1972 February 15, 1967
January I , 1948 October 7. 1983
December 12 . 1963 September 8, 1990
August 28, 1987 July 30, 1948 May 3, 1963
March 13 , 1965 May 3, 1963
January I . 1948 May 3. 1963
July 12, 1963 March 16, 1949 October3. 1981
May 3 . 1963 October 25, 1990
December 3 1 . 1963 1 anuary I . 1948
July 15, 1963 April 20. 1948 May 28. 1950 May 19, 1950
May 9, 1970 May 22. 1991 May 25, 1950
January I . 1948 May 3, 1963
February 22. 1965 October I , 195 I
October 17. 1957 March I , 1950
October 10, 1991 July 5. 1966
January I , 1950 April 23, 1986
September9, 1973 April 2 1 , 1968
July 8, 1948 February 24. 1950
December22. 1967 July 5, 1962
May 30. 1950 December 3 I , 1963 September 10, 1955
February 5, 1964 April 14. 1967
May 3, 1963 January 8, 1988 January I, 1948
January 1 1 . 1991 September 30. 1963
August 28, 1964 October 24. 1957
April l9. 1983 November 17. 1964 September 30. 1963
September 2. 1970 August 24. 1986
Date of IMF Membership
February 25, 1982 September 20. 1956
August 5, 1947 August 27, 1948 August 17. 1972
December 29, 1970 December25, 1945
March 16. 1982 July I 0, 1963
December 27, 1945 July 24. 1968
December 27, 1945 May 2, 1963
September 28. 1963 July 10, 1963
December 27. 1945 July 10. 1963 July 10. 1963
December 3 I . 1945 December 27. 1945
July 10. 1963 January 8. 1946 March 1 1 . 1963 March 14, 1946
December 2 1 , 1961 September 20, 1990
March 30, 1946 December28, 1945 December 26. 1945
March 14. 1946 January 14, 1948
December 27, 1945 September 10, 1963 September 2 1 , 1967
August 14, 1952 September 20, 1957 December 26, 1945 December 27, 1945 September 26, 1966
September 8, I953
May 6, 1982 December 27, 1945 December 27, 1945
February 2 1 , 1967 August 8, 1957
July 12, 1954 March 27, 1947
February 2 1 , 1963 August 13, 1952 February 3, 1964 August 26, 1955
September 13, 1962 July 25, 1968
December 27. 1945
September25. 1963 July 19. 1965
March 7, 1958 January 13 , 1978
September I I , 1968 September 10. 1963 September 23, 1968 December 3 1 , 1945

©International Monetary Fund. Not for Redistribution
GATT Membership Status
De facto application3
I Statistical Appendix
Table A43 (continued)
Country
Morocco Myanmar Netherlands New Zealand Nicaragua Niger Nigeria Norway Pakistan Peru Philippines Poland Ponugal Romania Rwanda Senegal Sierra Leone Singapore South Africa Spain Sri Lanka Suriname Sweden Switzerland2 Tanzania Thailand To go Trinidad and Tobago Tunisia Turkey Uganda United Kingdom United States Uruguay Venezuela Yugoslavia ZaTre Zambia Zimbabwe Algeria Angola Bahamas, The Bahrain Bruneil Cambodia Cape Verdc Dominica Equatorial Guinea Fiji Grenada Guinea-Bissau Kiribati Mali Mozambique Papua New Guinea Qatar Sao Tome and Principe Seychelles Solomon Islands St. Christophcr and Nevis St. Lucia St. Vincent and Grenadines Swaziland Tonga
149
Date of GATT Accession/ Application
June 17. 1987 July 29, 1948
January I, 1948 July 30. 1948 May 28, 1950
December 3 1 , 1963 November 18, 1960
July 10, 1948 July 30, 1948
October 7, 1951 December 27, 1979
October 18, 1967 May 6. 1962
November 14, 1971 January I. 1966
September 27, 1963 May 19, 1961
August 20. 1973 June 13 . 1948
August 29, 1963 July29, 1948
March 22, 1978 Apri130, 1950 August I. 1966
December9. 1961 November 20, 1982
March 20, 1 964 October 23, 1962 August 19, 1990
October 17, 1951 October 23, 1962
January I , I 948 January I , 1 948
December 6, 1953 August 3 I, 1990 August25, 1966
September I I , 197 I February 10, 1982
July I I , 1948
Date of IMF Membership
April 25, 1958 January 3, 1952
December 27, 1945 August 3 1 , 1961 March 14, 1946
April 24, 1963 April30. !961
December 27. 1945 July 1 1 , 1950
December 3 1 , 1945 December 27, 1945
June 12, 1986 March 29. 1961
December 15, 1972 September 30. 1963
August 3 1 , 1962 September 10. 1962
August 3, 1966 December 27. 1945 September 15 , 1958
August 29, 1950 April 27. 1978
August 3 1 , 1951
September 10, 1962 May 3, 1949
August I , 1962 September 16, 1963
April 14, 1958 March 1 1 . 1 947
September 27, 1963 December 27, 1945 December 27. 1945
March 1 1 , 1946 December 30, I 946 December27, 1 945 September28. 1963 September 23. 1965 September29, 1980
September 19, 1989 August 2 1 , 1973
September 7, 1972
December 3 1 , 1969 Novcmbcr20, 1978 December 12, 1978 December 22, 1969
May 28, 1971 August 27. 1975 March 24, 1977
June 3, 1986 September 27, 1963 September24, 1984
October 9, 1975 September 8, 1972
September 30, 1977 June 30, 1977
September 22, 1978 August 15, 1984
November 15 , 1979 December 28, 1979 September 22, 1969 September 13, 1985

©International Monetary Fund. Not for Redistribution
GATT Membership Status
Applied for GATT membership
Not a GATT member
STATISTICAL APPENDIX
Table A43 (concluded)
Country
Tuvalu• United Arab Emirates Yemen, Republic of
Bulgaria China Guatemala Honduras Mongolia Nepal Panama Paraguay Afghanistan Albania Aruba Bhutan Comoros Djibouti Ecuador Ethiopia Guinea Iran, Islamic Republic of Iraq Jordan Lao People's Democratic
Republic Lebanon Liberia Libyan Arab Jamahiriya Namibia Netherlands Antilles Oman Panama Saudi Arabia Somalia Soviet Union2. 4 Sudan Syrian Arab Republic Vanuatu Vietnam Western Samoa Yemen Arab Republic
Date of GATT Accession/ Application
September 14. 1989 February 28, 1991
October 8. 199 I June I . 1989
October 8, 1991 February 24, 1989
September25. 1990
May 16. 1990
Date of TMF Membership
September 22. 1972 September 29, 1969
September 25, 1 990 December 27. 1945 December28, 1945 December 26, 1945 February 14, 1991 September 6. 196 I
March 14, 1946 December28, 1945
July 14, I 955 October 15 , 1991
December 27, I 945 September 28, 198 I September 2 1 , 1976 December29, 1978 December 28, 1945 December 27, 1945 September28, 1963 December 29, 1945 Decembcr26, 1945
August 29, 1952
July 5, 1961 April 14, 1947
March 28. 1962 September 17, I 958
December 27, 1945 December 23. 197 l
March 14. 1946 August 26, 1957 August 3 1 , 1962
July 23. 1991 September 5. 1957
April 10, 1947 September 28. 1981 September 2 1 . I 956 December 28, 1971
May 22, 1970
Source: International Monetary Fund (IMF}; and General Agreement on Tarifl's and Trade (GATT). Activities 1989. An Annual Review of the Work of the GATT.
Note: information relates 10 the period through October 1991 and does not account for subsequent developments. particularly in Eastern Europe and the former Soviet Union.
•Not a member of the lMF. lHas applied for IMF membership. 'Countries to whose territories the GATT has been applied and which now, as independent slates. maintain a de facto application of the
GATT pending final decisions as 10 their future commercial policy. •The Soviet Union has GATT observer status.
150

©In
tern
atio
nal M
onet
ary
Fund
. Not
for R
edis
tribu
tion
Tab
le A
44
. Mu
ltila
tera
l Tra
de
Ne
go
tia
tio
n (
MT
N) A
gre
em
en
ts-
Le
ga
l Sta
tus
at
De
ce
mb
er
7,
199
0
Gen
eva
Sup
ple
men
-G
over
nmen
t S
ubsi
dies
/ Im
port
19
79
tary
19
79
T
echn
ical
P
rocu
re-
Co
unte
rvai
l-B
ovi
ne
Cus
tom
s L
icen
s-C
ivil
A
ntid
ump
-P
ro10
col1
P
roto
co12
B
arri
ersJ
m
ent�
in
g D
utie
ss
Mea
t6
Dai
ry'
Val
uati
ons
in
g9
Air
craf
t10
ing
11
Co
ntr
acti
ng
Par
ty
Ant
igua
and
Bar
bud
a A
rgen
tina
A
s
0
0
A
A
A
* s
0
A
A
ustr
alia
A
0
0
A
*
A
A
A
A
A
Aus
tria
A
A
A
A
A
A
A
A
A
B
angl
ades
h 0
0
0
0
0
0
0
0
0
B
arba
dos
Bel
giu
m
A
A
A
A
Bel
ize
p
Ben
in
Bot
swan
a A
* B
razi
l A
A
0
A
A
0
A
* 0
0
A
B
urki
na F
aso
Bur
ma
Bur
und
i 0 ..
C
amer
oon
0
0
0
Q) ..
Can
ada
A
A
A
A
A
A
0
A*
A
A
A
;·
Cen
tral
Afr
ican
..
n
01
Rep
ublic
!!.
_.
. C
had
,.
Ch
ile
A
A
0
A
0
0
0
A
0
'0
'0
Co
lom
bia
0
A
* A
0
0
0
CD
Con
go
:J Q. C
osta
Ric
a 0
)(
Co
te d
'lvo
ire
A
0
0
0
0
0
0
0
0
Cub
a 0
0
0
0
0
0
0
0
C
ypru
s A
C
zech
o:.l
ova
kia
A
A
* 0
0
A
A
0
A
D
enm
ark
A*
A*
A*
Do
min
ican
Rep
ublic
A
0
0
0
E
urop
ean
Co
mm
unit
y A
A
A
A
A
A
A
A
A
A
A
E
gypt
A
A
0
A
A
A
0
A
A
A
F
inla
nd
A
A
A
A
A
A
A
A
A
Fra
nce
A
A
A
Gab
on
0
0
0
0
0
0
0
Gam
bia
, The
G
erm
any
A*
A*
A*
G
hana
0
0
0
0
0
G
reec
e A
s
G
uyan
a H
aiti
A
0
H
ong
Kon
g A
A
A
A
A
A
H
ung
ary
A
A
* 0
0
A
A
A
A
A
Ic
elan
d A
In
dia
A
A
0
A
0
0
A*
A
0
A

©In
tern
atio
nal M
onet
ary
Fund
. Not
for R
edis
tribu
tion
Gen
eva
Sup
plem
en-
197
9
tary
19
79
T
echn
ical
P
roto
col'
P
roto
coJ2
B
arri
ersJ
Indo
nesi
a A
0
Ir
elan
d A
A
Is
rael
s
A
A
It
aly
A
A
Jam
aica
A
Ja
pan
A*
A
K
enya
K
orea
A
A
K
uwai
t L
esot
ho
Lux
embo
urg
A
A
Mad
agas
car
0
Mal
awi
Mal
aysi
a A
0
M
aldi
ves
Mal
ta
0
Mau
rita
nia
Mau
riti
us
__.
Mex
ico
(J'I
A
I\)
M
oroc
co
Net
herl
ands
A
A
N
ew Z
eala
nd
A
A
Nic
arag
ua
0
Nig
er
Nig
eria
0
N
orw
ay
A
A
Pak
ista
n A
A
P
eru
A
0
P
hilip
pine
s A
P
olan
d A
0
P
ortu
gal
A
Rom
ania
A
A
R
wan
da
s
Sene
gal
0
Sie
rra
Leo
ne
Sing
apor
e A
A
S
out
h A
fric
a A
S
pain
A
A
Sr
i Lan
ka
Sur
inam
e S
wed
en
A
A
Sw
itze
rlan
d A
A
T
anza
nia
0
Tha
iland
0
T
o go
T
rini
dad
and
Tob
ago
0
Tab
le A
44
(co
ncl
ud
ed
)
Gov
ernm
ent
Subs
idie
s/
Pro
cure
-C
oun
terv
ail-
Bo
vine
m
ent4
in
g D
utie
ss
Mea
t6
Dai
ry'
0
A*
A
A*
0
0
0
0
A
A
A
A
0
0
0
A
0
0
0
0
0
0
0
0
0
0
0
A
A
A
0
0
0
0
0
0
A
0
A
A
A
A
A
0
0
0
A*
0
A
A
0
0
A
A
0
A
0
0
0
A
A
0
0
A
A
A
A
A
A
A
A
0
0
0
0
0
0
0
0
Impo
rt
Cus
tom
s L
icen
s-V
alua
tions
in
g9
0
0
0
0
0
A
A
A*
0
A*
A*
0
0
0
A*
A
A*
A
0
0
0
A
A
A
0
A
0
0
0
A
s
A
A
A
0
0
A
A
A
A
0
A
A
A
A
0
0
0
0
0
Civ
il
Air
craf
t 10
0
A
0
A
A
A
0
A
0
A
0
A
A
0
A
0
A
A
0
Ant
idum
p-in
g11
0
0
A
A
0
Ul
0
;;! �
Ul
� A
0
,.
r- ,.
.,
A
.,
0
m
z
c
0
X
A
A
0
0
A
A
0
A
0
A
0
A
A
0
0
0

©In
tern
atio
nal M
onet
ary
Fund
. Not
for R
edis
tribu
tion
Tun
isia
A
T
urke
y 0
0
U
gan
da
Un
ite
d K
ing
do
m
A
A*
A
*
Uni
ted
Stat
es
A
A
A
Uru
gua
y A
V
enez
uela
Y
ugo
slav
ia
A
A
Zai
re
A
0
0
Zam
bia
Zim
bab
we
0
0
Oth
er C
ou
ntr
ies
Bul
gar
ia12
0
C
hina
0
0
E
cuad
or
0
0
Gua
tem
ala
Pan
ama
Para
guay
Sou
rce:
G
ener
al A
gree
men
t on
Tar
iffs
and
Tra
de (
GA
TT
), G
AIT
Act
ivit
ies,
19
89
.
0
A
A
A
0
s
0
0
0
A
0
0
0
A
A
A
A
0
0
A
A
A*
0
0
p
Not
e:
A =
Acc
epte
d; S
=Si
gned
(ac
cept
ance
pen
din
g);
0 =
Obs
erve
r; P
= P
rovi
sio
nal;
* =
Res
erva
tion
, co
nd
itio
n, o
r de
clar
atio
n.
1 Gen
eva
(19
79)
Pro
toco
lw th
e G
ener
al A
gree
men
t on
Tar
iffs
and
Tra
de (
GA
TT
).
Z Pro
toco
l Su
pple
men
tary
to
the
Gen
eva
( J 9
79)
Pro
toco
l to
the
GA
TT
. lA
gree
men
t oo
Tec
hnic
al B
arri
ers
to T
rade
. •A
gree
men
t on
Gov
ernm
ent P
rocu
rem
ent.
0
A*
A*
A
A
0
0
0
0
s Agr
eem
ent
on
Inte
rpre
tati
on a
nd A
pplic
atio
n o
f A
rtic
les
VI,
XV
I, a
nd X
XV
111 o
f th
e G
AT
T (
Cod
e o
n S
ubsi
dies
and
Co
unte
rvai
ling
Dut
ies)
. 6A
gree
men
t o
n B
ovi
ne
Mea
t.
'Int
erna
tion
al D
airy
Agr
eem
ent.
Ap
ril
12.
197
9.
0
0
A*
A
0
A
0
A*
0
0
0
0
A*
A
0
0
0
A
0
A
0
0
0
0
8Agr
eem
ent
on
Impl
emen
tati
on o
f An
icle
V 11
of
the
GA
TT
(C
usto
ms
Val
uati
on C
ode,
inc
lud
ing
Pro
toco
l). U
po
n en
try
into
for
ce o
f the
Agr
eem
ent
on
Janu
ary
I,
198
1, t
he p
rovi
sion
s o
f th
e P
roto
col
wer
e de
emed
to
be
an i
nteg
ral p
an o
f th
e A
gree
men
t. 9A
gree
men
t on
lmp
on
Lic
ensi
ng P
roce
dure
s.
•OA
gree
men
t o
n T
rade
in
Civ
il A
ircr
aft.
IIA
gree
men
t on
Im
plem
enta
tion
of
Art
icle
VI
of
the
GA
TT
(Am
endm
ents
to
the
An
tid
ump
ing
Co
de)
. 1l
BuJ
gari
a ha
s ne
goti
ated
in t
he M
TN
a s
ched
ule
of t
arif
f con
cess
ions
.

©In
tern
atio
nal M
onet
ary
Fund
. Not
for R
edis
tribu
tion
Tab
le A
45
. GA
TT
Pa
ne
ls E
sta
blis
he
d S
inc
e 1
98
5
Dat
e D
ate
Dat
e R
epor
ted
to
Ado
pted
R
eque
sted
by
Est
ablis
hed
Subj
ect o
f E
xam
inat
ion
GA
TT
Pan
el R
ulin
g
Co
unci
l by
Co
unci
l Im
plem
enta
tio
n D
ate
199
1 B
razi
l F
ebru
ary
U.S
. de
nial
of
MF
N t
reat
-m
ent
as to
impo
rts
of
non-
rubb
er f
ootw
ear
from
B
razi
l.
Uni
ted
Sta
tes
Feb
ruar
y Im
port
dis
trib
utio
n an
d sa
le
of
alco
holic
dri
nks
by p
ro-
vin
cial
mar
ket a
gen
cies
in
Can
ada.
Mex
ico
F
ebru
ary
U
.S.
impo
rt p
rohi
biti
on
of
yel
low
fin
tun
a an
d re
late
d pr
oduc
ts c
aug
ht i
n pu
rse
sein
e ne
ts.
Uni
ted
Stat
es
Mar
ch
Ger
man
y's
"hid
den
sub
-(/) i!
sid
ies·
· to
Deu
tsch
e A
irbu
s.
'-4 C
anad
a M
ay
U.S
. re
stri
ctio
ns o
n im
port
s (/)
of a
lco
holic
bev
erag
es.
::!
0
01
Eur
ope
an
July
U
.S.
gove
rnm
ent
proc
ure-
loo
�
Co
mm
u-m
ent o
f A
ntar
ctic
res
earc
h .-
nity
(E
C)
equi
pmen
t un
der
"B
uy
loo
'V
Am
eric
a·· c
laus
eo
fU.S
. 'V
trad
e ru
les.
m
z
19
90
0
Uni
ted
Sta
tes
Apr
il T
haila
nd's
impo
rt re
stri
c-P
anel
rul
ed i
n f
avor
of
the
Oct
. 19
90
N
ov.
19
90
T
he T
hai C
abin
et d
ecid
ed t
o
Oct
. 19
90
x
tio
ns a
nd in
tern
al t
axes
on
Uni
ted
Stat
es a
nd s
aid
ban
lift
its
ban
on i
mpo
rts
of
cig
aret
tes.
m
ay h
ave
been
acc
epta
ble
if
cig
aret
tes.
it
had
bee
n ·'n
eces
sary
" to
pr
otec
t hu
man
lif
e. S
ince
o
ther
mea
ns.
incl
udin
g n
on-
disc
rim
inat
ory
ban
s o
n pr
o-m
oti
on
wer
e av
aila
ble
and
cons
iste
nt w
ith G
AT
T.
the
impo
rt b
an w
as n
ot "
nece
s-sa
ry.
1989
S
wed
en
Janu
ary
U .S
. an
tid
umpi
ng d
utie
s on
P
anel
set
up
und
er A
nti-
Sep
t. 1
99
0
impo
rts
of
stai
nles
s st
eel
dum
ping
Cod
e ru
led
that
pi
pe�
and
tube
s fr
om
1987
U.S
. dec
isio
n to
S
wed
en.
impo
se d
utie
s o
n im
port
s o
f ce
rtai
n sp
ecia
lly
stee
l pro
d-uc
ts f
rom
Sw
eden
is in
vio
-la
tio
n o
f in
tern
atio
nal
trad
ing
reg
ulat
ions
. lt
is r
cc-
omm
ende
d th
at t
he U
nite
d St
ates
ret
urn
abou
t $
8 m
il-

©In
tern
atio
nal M
onet
ary
Fund
. Not
for R
edis
tribu
tion
lion
in d
utie
s to
Sw
edis
h fi
rm in
volv
ed.
Bra
zil
Feb
ruar
y U
.S. t
arifl's
on
impo
rts
of
Bra
zil
info
rmed
the
S
ept.
1989
N
ot a
pp
licab
le.
cert
ain
prod
ucts
fro
m
Dir
ecto
r-G
ener
al o
f G
AT
T
Bra
zil.
that
it w
ishe
d to
wit
hdra
w
the
com
pla
int
as t
he is
sue
that
had
led
to th
e co
mp
lain
t ha
d b
een
reso
lved
.
EC
Ja
nuar
y
U.S
. res
tric
tio
ns o
n im
po
rts
A G
AT
T d
isp
ute
sett
lem
ent
Ap
ril
199
0
No
v.
199
0
The
Uni
ted
Stat
es s
igne
d a
Sep
t. 19
90
o
f ag
ricu
ltur
al p
rodu
cts
pane
l ru
led
in f
avor
of
the
pro
clam
atio
n au
tho
rizi
ng
app
lied
unde
r th
e 19
55
U
nite
d St
ates
and
aga
inst
co
nver
sion
ofU
.S.
sug
ar
Wai
ver a
nd u
nder
the
Hea
d-th
e E
C i
n a
com
pla
int
tile
d im
po
rt q
uota
pro
gra
m in
to
note
to t
he S
ched
ule
of
tari
ff
by
the
EC
alle
gin
g t
hat
the
tari
ff-r
ate
quot
a sy
stem
, co
nces
sio
ns (
Sch
edul
e U
.S.
sug
ar im
po
rt q
uota
w
hich
wil
l ass
ign
a 16
cen
t X
X-
U.S
.) c
onc
erni
ng
syst
em r
uns
cont
rary
to
tari
ff f
or e
very
po
und
of
Cha
pter
10
. G
AT
T p
rovi
sio
ns.
sug
ar e
nter
ing
the
Uni
ted
Stat
es o
ver
trad
itio
nal q
uota
le
vels
. an
d b
ring
pro
gra
m
into
co
mp
lianc
e w
ith
GA
TT
.
Uni
ted
Stat
es
July
E
C q
uant
itat
ive
rest
rict
ions
T
he G
AT
T p
anel
rep
ort
Dec
. 19
89
F
eb.
199
0
No
t ap
plic
able
. o
n ex
po
rts
of c
op
per
scra
p.
note
d th
at th
e U
nite
d St
ates
Ul
-h
ad w
ith
draw
n it
s !!
! co
mp
lain
t.
� C
anad
a D
ecem
ber
U
.S.
imp
osi
tio
n o
f co
unte
r-A
GA
TT
dis
pute
set
tlem
ent
Sept
. 19
90
Ju
ly 1
99
1 c;
..
... va
iling
dut
y o
n po
rk .
pan
el r
uled
in
fav
or o
f Can
-!!
!.. CJ1
ad
a ag
ains
t the
levy
ing
of
)>
CJ1
coun
terv
ailin
g d
utie
s o
n ,
,
po
rk im
po
rts
by t
he U
nite
d CD :I
Stat
es; t
he a
ttem
pt t
o bl
ock
CL re
port
was
def
eate
d. P
anel
)(
aske
d th
e U
nite
d St
ates
to
re
imbu
rse
duti
es o
r re
ach
som
e fi
nanc
ial s
ettl
emen
t w
ith
Can
ada.
1988
C
anad
a M
arch
Ja
pane
se i
mpo
rts
of
spru
ce-
A G
AT
T d
ispu
te s
ettl
emen
t A
pril
1989
Ju
ly 1
989
N
ot a
pp
licab
le.
pin
e-fi
r (S
PF
) lu
mb
er.
pane
l ru
led
in f
avor
of
Jap
an, s
tati
ng t
hat t
he C
ana-
dian
com
plai
nt c
ould
not
su
ccee
d in
the
term
s in
w
hich
it h
ad b
een
intr
oduc
ed.
Uni
ted
Stat
es
Mar
ch
No
rway
's r
estr
icti
ons
on
A G
AT
T d
isp
ute
sett
lem
ent
Ap
ril
198
9
Jun
e 19
89
Alt
houg
h N
orw
ay d
id n
ot
June
19
89
impo
rts
of
appl
es a
nd p
ears
. pa
nel
rule
d in
fav
or o
f th
e ag
ree
wit
h p
anel
's c
onc
lu-
Uni
ted
Sta
tes.
find
ing
Nor
-si
ons
, it
did
not o
bjec
t to
way
's i
mp
ort
rest
rict
ions
on
ado
pti
on
of r
epor
t and
is
appl
es a
nd p
ears
inc
ons
is-
prep
ared
to
bri
ng it
s m
ea-
tent
wit
h G
AT
T r
ules
. su
res
on
appl
es a
nd p
ears
in
to c
onfo
rmit
y w
ith G
AT
T.
How
ever
, N
orw
ay h
as n
O!
yet
been
abl
e to
�pe
cify
how
th
is i
s to
be
do
ne.

©In
tern
atio
nal M
onet
ary
Fund
. Not
for R
edis
tribu
tion
Tab
le A
45
(co
nti
nu
ed
)
Dat
e D
ate
Dat
e R
epo
ned
to
Ado
pte
d R
eque
sted
by
Est
ablis
hed
Subj
ect o
f E
xam
inat
ion
GA
TT
Pan
el R
ulin
g
Co
unci
l by
Co
unci
l Im
ple
men
tati
on
Dat
e
198
8
Aus
tral
ia
May
Ja
pane
se im
po
rt r
estr
icti
ons
T
he c
om
pla
int w
as w
ith-
July
19
88
N
ot a
pp
licab
le.
on
beef
. dr
awn
follo
win
g a
bila
tera
l se
ttle
men
t co
ncer
ning
m
arke
t-o
pen
ing
ar
rang
emen
ts.
Aus
tral
ia
May
K
ore
an im
po
rt r
estr
icti
ons
A
GA
TT
pan
el r
uled
in
M
ay 1
98
9
No
v.
1989
A
ustr
alia
and
New
Zea
land
F
eb.
199
0
on
beef
. fa
vor o
f A
ustr
alia
in a
dis
-sa
y K
orea
has
don
e no
thin
g
put
e o
ver
alle
ged
So
uth
to im
ple
men
t a m
ore
liber
al
Kor
ean
rest
rict
ions
on
beef
be
ef im
po
rt p
olic
y. K
orea
im
po
rts.
The
dis
pute
is
one
belie
ves
that
ind
epen
dent
o
f a
seri
es o
f in
terl
ink
ed,
stud
y sh
oul
d be
do
ne b
efor
e bu
t te
chni
cally
sep
arat
e,
any
final
dec
isio
ns a
re t
aken
en
co
mp
lain
ts b
y A
ustr
alia
, an
d sa
ys it
wil
l inc
reas
e be
ef
i! N
ew Z
eala
nd, a
nd t
he
imp
ort
s, b
ut d
id n
ot s
pec
ify
'-4 Cii
Un
ited
Sta
tes.
by
ho
w m
uch.
::
:! _.
A
ustr
alia
M
ay
Aus
tral
ia a
nno
unce
d a
bila
t-M
ay 1
99
0
0
(]1
eral
und
erst
andi
ng w
ith
> r-
(1)
Ko
rea
that
res
olve
d th
e be
ef
>
trad
e di
sput
e. K
ore
a se
t its
,
m
inim
um im
po
rt le
vels
for
,
m
19
90
, 19
9l,
and
199
2.T
he
z
targ
et f
or
199
0 is
68,
00
0
c to
ns.
x
Chi
le
May
E
C r
estr
icti
ons
on
imp
ort
s A
GA
TT
dis
put
e se
ttle
men
t A
pri
l 19
89
June
19
89
EC
did
no
t opp
ose
repo
rt's
Ju
ne 1
989
o
f des
sert
ap
ple
s.
pane
l ru
led
in f
avo
r of
adop
tion
on
clea
r un
der-
Chi
le,
find
ing
the
EC
's
stan
ding
tha
t wha
t w
as
imp
ort
res
tric
tions
on
des-
argu
ed i
n re
port
, par
ticu
-se
rt a
pp
les
inco
nsis
tent
wit
h la
rly
in re
gard
to
Art
icle
XI
Art
icle
XI:
I an
d w
ere
not
and
its
imp
lem
enta
tio
n,
just
ifie
d by
Art
icle
XI:
2.
wo
uld
not b
e he
ld a
gai
nst
EC
and
sho
uld
in n
o w
ay
com
pro
mis
e E
C's
Uru
guay
R
oun
d ne
go
tiat
ing
po
siti
on.
Uni
ted
Sta
tes
May
C
hile
's i
mp
ort
res
tric
tio
ns
on
des
sert
ap
ple
s.
Uni
ted
Stat
es
May
Ja
pane
se i
mpo
rt r
estr
icti
ons
T
he c
om
pla
int
was
wit
h-
July
19
88
No
t ap
plic
able
. o
n be
ef a
nd c
itru
s.
draw
n fo
llow
ing
mar
ket-
op
enin
g m
easu
res
take
n by
Ja
pan
.
Uni
ted
Stat
es
May
K
ore
an im
po
rt r
estr
icti
ons
A
GA
TT
pan
el r
uled
in
M
ay
1989
N
ov.
19
89
The
Uni
ted
Sta
tes
reac
hed
Apr
il 19
90
on
bee
f.
favo
r o
f N
ew Z
eala
nd a
nd
an a
gree
men
t wit
h K
ore
a on
th
e U
nite
d S
tate
s in
a d
is-
latt
er's
impo
rt r
egim
e o
n

©In
tern
atio
nal M
onet
ary
Fund
. Not
for R
edis
tribu
tion
pu
te o
ver
alle
ged
So
uth
beef
; Ko
rea
reaffi
rmed
its
Ko
rean
res
tric
tio
ns o
n b
eef
GA
TT c
om
mitm
ent
for
imp
ort
s. A
ruli
ng i
n f
avo
r of
tr
ade
liber
aJi
zat
ion
on
an
Aus
tral
ia i
n th
e sa
me
man
er
MF
N-b
asis
, as
suri
ng
was
mad
e in
Ap
ril
198
9.
gro
wth
in
bee
f im
po
rts
thro
ugh
intr
odu
ctio
n o
f sy
s-te
rn o
f dir
ect
acce
ss f
or
buye
rs a
nd s
elle
rs o
f b
eef.
Uni
ted
Sta
tes
June
E
C p
aym
ents
and
sub
sid
ies
A G
AT
T d
isp
ute
sett
lem
ent
Dec
. 19
89
Ja
n. 1
99
0
The
EC
acc
epte
d t
he G
ATT
D
ec.
198
9
on
oils
eed
s an
d r
elat
ed a
ni-
pan
el r
ule
d in
fav
or
of
the
ruli
ng in
fav
or
of t
he U
nite
d
mal
fee
d pr
ote
ins.
U
nite
d S
tate
s, c
ond
emni
ng
Sta
tes
in a
dis
put
e o
ver
the
EC
sub
sid
y p
aym
ents
mad
e E
C's
sub
sid
ies
pro
gram
fo
r to
oils
eed
pro
duce
rs.
oils
eed
and
pro
tein
pro
duc-
tio
n an
d p
roce
ssin
g an
d w
ill
"tak
e th
e ne
cess
ary
actio
n.''
Uni
ted
Sta
tes
June
E
C a
gree
d to
co
mp
ly (
in
seco
nd h
alf
of
199
1) w
ith
May
19
91
GA
TT
pan
el r
ulin
g a
gai
nst
its
oils
eed
sup
port
reg
ime.
T
his
follo
ws
a d
ecis
ion
on
May
4,
199
1 b
y E
C's
Far
m
Min
iste
rs o
n a
farm
pri
ce
en pa
ckag
e fo
r 19
91/
92
sea
son
;
that
incl
udes
a 1.
5 p
erce
nt
- ..
cut
in o
ilse
ed su
ppo
rt
�
pri
ces.
()
_.
!.
(1l
Aus
tral
ia
Sept
emb
er
U.S
. re
stri
ctio
ns o
n im
port
s A
n in
vest
igat
ive
GA
TT
M
ay 1
98
8
June
19
89
T
he U
.S.
Tra
de R
epre
sent
a·
June
19
89
-.
..J ,.
o
f su
gar
. p
anel
rule
d i
n f
avo
rof
Aus
-ti
ve (
US
TR
) sa
id th
e U
nite
d
-a tr
alia
that
U.S
. su
gar
impo
rt
Sta
tes
acce
pts
repo
rt
-a ..
quo
tas
are
ille
gal
und
er
ado
pte
d b
y G
AT
T C
oun
cil
:::J Q. G
AT
T ru
les
and
has
cal
led
th
at f
oun
d U
.S.
sug
ar
)( o
n th
e U
nit
ed S
tate
s to
im
port
quo
tas
inco
nsis
tent
ei
ther
eli
min
ate
them
or
wit
h G
AT
T:
US
TR
sai
d
bri
ng t
hem
inw
co
nfo
rmity
re
port
"d
id n
ot
find
sug
ar
wit
h G
AT
T.
pro
gram
to v
iola
te G
AT
T.
Rat
her,
it
foun
d U
.S.
adm
inis
trat
ion
of q
uota
sys
-te
rn i
n co
ntra
vent
ion
of
GA
TT."
Aus
tral
ia
Sep
tem
ber
A
t th
e C
oun
cil
mee
ting
s in
Ja
n. 1
99
0
Janu
ary
199
0 a
nd
May
19
90
, A
ustr
alia
exp
ress
ed
conc
ern
that
the
Uni
ted
S
tate
s ha
d n
ot y
et i
mp
1c-
men
ted
the
rep
ort
.
Aus
trah
a Se
ptem
ber
T
he U
nite
d S
tate
l> S1
gned
a
Sep
t. 19
90
p
rocl
amat
ion
auth
ori
zing
co
nver
sio
n o
f U
.S.
sug
ar
imp
ort
quo
ta p
rogr
am in
to
tari
ff-r
ate
quo
ta s
yste
m,
wh
ich
wil
l ass
ign
a 16
cen
t ta
rif
f for
eve
ry p
oun
d o
f
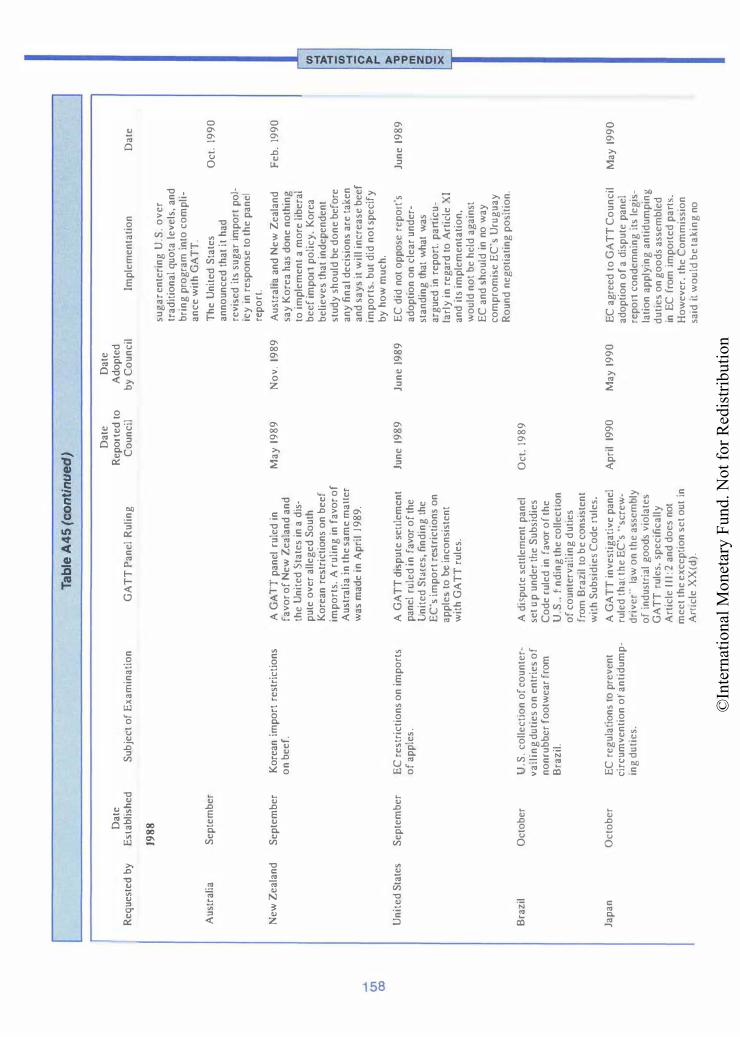
©In
tern
atio
nal M
onet
ary
Fund
. Not
for R
edis
tribu
tion
Tab
le A
45
(co
nti
nu
ed
)
Dat
e D
ate
Dat
e R
epor
ted
to
Ado
pted
R
eque
sted
by
EsL
ablis
hed
Subj
ect o
f E
xam
inat
ion
GA
TT
Pan
el R
ulin
g
Co
unci
l by
Co
unci
l Im
plem
enta
tio
n D
ate
198
8
sug
ar en
teri
ng U
.S. o
ver
tr
adit
iona
l quo
ta l
evel
s. a
nd
brin
g p
rogr
am i
nto
com
pli-
ance
wit
h G
AT
T.
Aus
tral
ia
Sept
embe
r T
he U
nite
d St
ates
O
ct.
199
0
anno
unce
d th
at it
had
re
vise
d it
s su
gar
impo
rt p
oJ-
icy
in r
espo
nse
to t
he p
anel
re
pori
. N
ew Z
eala
nd
Sep
tem
ber
Kor
ean
impo
rt r
estr
icti
ons
A G
AT
T p
anel
rul
ed in
M
ay 1
989
N
ov
. 19
89
Aus
tral
ia a
nd N
ew Z
eala
nd
Feb
. 19
90
o
n b
eef.
fa
vor o
f N
ew Z
eala
nd a
nd
say
Ko
rea
has
done
no
thin
g
the
Uni
ted
Sta
tes
in a
dis
-to
impl
emen
t a
mo
re li
bera
l pu
ie o
ver
alle
ged
Sou
th
beef
impo
rt p
oli
cy.
Kor
ea
en
Kor
ean
rest
rict
ions
on
beef
be
lieve
s th
at in
depe
nden
t ;;!
impo
rts.
A r
ulin
g in
fav
or o
f st
udy
sho
uld
be d
one
bef
ore
'"f en
Aus
tral
ia in
the
sam
e m
aner
an
y fi
nal
dec
isio
ns a
re ta
ken
-4 w
as m
ade
in A
pril
J 989
. an
d sa
ys it
wil
l inc
reas
e be
ef
0
(11
impo
rts.
but
did
no
t spe
cify
,.
r
()
) by
ho
w m
uch.
,.
U
nite
d St
ates
S
epte
mbe
r E
C r
estr
icti
ons
on
impo
rts
A G
AT
T d
ispu
te s
enle
mcn
t Ju
ne 1
98
9
Jun
e 19
89
EC
did
not
opp
ose
repo
rt's
Ju
ne 1
989
.,
.,
o
f ap
ples
. pa
nel
rule
d in
fav
or o
f th
e ad
opti
on o
n cl
ear
unde
r-m
U
nite
d S
tare
s, fi
ndin
g th
e st
andi
ng c
hat
wha
t w
as
z
EC
's im
port
rest
rict
ions
on
argu
ed i
n re
port
. pan
icu-
c ap
ples
to be
inco
nsis
tent
la
rly
in r
egar
d to
Art
icle
XI
X
wit
h G
AT
T r
ules
. an
d it
s im
plem
enta
tio
n.
wo
uld
not
be h
eld
agai
nst
EC
and
sho
uld
in n
o w
ay
com
prom
ise
EC
's U
rug
uay
Ro
und
nego
tiat
ing
posi
tio
n.
Bra
zil
Oct
ober
U
.S. c
olle
ctio
n of
co
unte
r-A
di�
pute
�ct
tlem
ent
pane
l O
ct.
198
9
va
ilin
g d
utie
s o
n e
ntri
es o
f se
t up
und
er th
e S
ubsi
dies
no
nrub
bcr
foot
wea
r fr
om
Co
de r
uled
in
favo
r o
f the
B
razi
l. U
.S ..
fin
ding
the
colle
ctio
n o
f co
unte
rvai
l ing
dut
ies
from
Bra
zil t
o b
e co
nsis
tent
w
ith
Sub
sidi
e� C
ode
rule
s.
Japa
n O
cto
ber
EC
reg
ulat
ions
to p
reve
nt
A G
AT
T in
vest
igat
ive
pane
l A
pril
1990
M
ay 1
99
0
EC
agr
eed
to G
AT
T C
oun
cil
May
19
90
ci
rcum
vent
ion
of a
ntid
ump-
rule
d th
at th
e E
C's
.. s
crew
-ad
opti
on o
f a
disp
ute
pane
l in
g d
utie
s.
driv
er''
law
on
the
asse
mbl
y re
port
con
dem
ning
its
legi
s-o
f in
dust
rial
goo
ds v
iola
tes
lati
on
appl
ying
ant
idum
ping
G
AT
T r
ules
. sp
ecifi
cally
du
ties
on
go
ods
ass
embl
ed
Art
icle
111
:2 a
nd d
oes
not
in
EC
fro
m i
mpo
rted
pam
. m
eet t
he e
xcep
tion
set
out
in
How
ever
. th
e C
om
mis
sio
n A
mcl
e X
X(d
).
said
it w
oul
d b
e ta
kin
g n
o

©In
tern
atio
nal M
onet
ary
Fund
. Not
for R
edis
tribu
tion
step
s fo
r the
mo
men
t to
w
ithd
rav
' mea
sure
s.
Unt
ted
Stat
es
Dec
embe
r C
anad
a ·s
rest
rict
ions
on
A
GA
TT
dis
put
e se
ttle
men
t O
ct.
198
9
Dec
. 19
89
T
he C
anad
ian
gove
rnm
ent
Dec
19
89
imp
ort
s o
f ice
cre
am a
nd
pane
l rule
d in
fav
oro
fa
set q
uota
leve
ls f
or 1
99
0 o
f y
og
urt.
com
pla
int b
y th
e U
nite
d 34
7 to
ns f
or ic
e cr
eam
and
St
ates
tha
t C
anad
a ·s
quot
as
332
tons
for
yo
gur
t. w
hich
on
ice
cre
am a
nd y
ogur
t do
i�
up
slig
htl
y f
rom
34
5 to
ns
not
conf
orm
wit
h A
rtic
le X
I an
d 33
0 to
ns. r
espe
ctiv
ely.
o
f the
GA
TT
. in
19
89
.
Uni
ted
Stat
es
Dec
embe
r C
anad
a ha
� ta
ken
no s
teps
to
June
19
90
co
mp
ly w
ith
its
ob
ligat
ions
to
ter
min
ate
its
imp
ort
re
stri
ctio
ns o
n ic
e cr
eam
and
yo
gur
t. m
dica
ting
thar
it
wil
l w
ait
for
the
out
com
e o
f th
e U
rug
uay
Ro
und
befo
re
even
.. de
cidm
g o
n im
ple
men
tati
on:
·
198
7
Can
ada.
EC
. F
ebru
ary
U .S
. tax
es o
n p
etro
leum
and
A
GA
TT
dis
pur
e se
ttle
mem
Ju
ne 1
98
7
Feb
. 19
88
U
.S.
Am
bass
ado
rto
GA
TT
Ju
ne 1
98
9
Mex
ico
ce
rtai
n im
port
ed s
ub-
pane
l ru
led
in f
avor
of
Can
-re
port
ed 10
Co
unci
l on
sean
ces.
ad
a. t
he E
C. a
nd M
exic
o,
Ho
use
Way
s an
d M
eans
0 -
find
ing
the
oil
impo
rt f
ee
Co
mm
iuee
app
rova
l of
ID -co
ntai
ned
in "'
Sup
erfu
nd"'
chan
ges
in U
.S.
leg
isla
tio
n ii
i le
gis
lati
on
to b
e co
ntra
ry 1
0
to e
lim
inat
e S
uper
fund
- n
�
G
AT
T ru
les.
p
etro
leum
tax
diff
eren
tial
by
!.
(}1
ra
ism
g ra
x o
n d
om
esti
c )lo
o <.0
cru
de
oil
and
lo
wer
ing
tax
'0 '0
o
n im
po
m.
both
to
9. 7
per
-•
cent
a b
arrel
. :I CL
EC
F
ebru
ary
Ja
pane
se c
usto
ms
dut
ies.
A
GA
TT
dis
put
e se
ttle
men
t N
ov
. 19
87
N
ov
. 19
87
Ja
pan
dec
1ded
on
the
bas 1
c F
eb.
198
8
;;c
taxe
s. a
nd la
bel
ing
pra
ctic
es
pan
el ru
led
in f
avor
of
the
dire
ctio
n o
f th
e li
quo
r tax
o
n im
po
rted
win
es a
nd a
lco-
EC
ag
ains
t Ja
pan'
s un
fair
re
form
. b
ur c
la1m
s ch
at th
e ho
lic b
ever
ages
. cu
srom
s du
ties
, tax
es. a
nd
revb
ion
of
rhe
liquo
r ta
x. i
n la
bel
ing
pra
ctic
es o
n im
por-
the
cont
ext
of
rhe
over
all
tax
tcd
win
es a
nd a
lco
ho
hc
bcv-
refo
rm.
inv
olv
ed a
dec
isio
n er
ages
. by
the
Die
r an
d th
eref
ore
Inev
itab
ly w
kes
tim
e.
Can
ada.
EC
M
arch
U
.S.
cust
oms
user
fee
. A
GA
TT
dis
put
e se
ttle
men
t N
ov.
198
7
Feb
. 19
88
T
he
U.S
. A
mba
ssad
or ro
Ju
ne 1
9!!
9
pan
el r
uled
in fa
vor o
f Can
-G
AT
T r
epor
ted
to t
he C
oun
-ad
a an
d th
e E
C,
findm
g t
hat
cil o
n th
e H
ouse
Way
s an
d th
e U
.S. c
usto
ms
use
r fee
of
Mea
ns C
om
mit
tee
appr
oval
0
.17
per
cent
is G
AT
T-
of c
hang
es in
U.S
. le
gis
la-
1lleg
al b
ecau
se it
e"<c
eed\
ti
on o
n CU
\tom
s us
er f
ee\.
th
e co
sts
of
serv
ice�
ren
-T
he c
hang
e IS
a o
ne-y
ear
de re
d.
inte
nm
mea
sure
reta
inin
g
the
0. 1
7 p
erce
m f
ee b
ut c
ap-
pin
g 11
at
$57
5 pe
r tr
ansa
c-ti
on.
Can
ada.
EC
M
arch
T
he U
nite
d S
tate
s st
ated
tha
t D
�.:c.
198
9
11 w
ou
ld im
ple
men
t th
e rc
c o
mm
enda
tio
ns o
f th
e p
anel

©In
tern
atio
nal M
onet
ary
Fund
. Not
for R
edis
tribu
tion
Tab
le A
45
(co
nti
nu
ed
)
Dat
e D
ate
Dat
e R
epon
ed t
o A
dopt
ed
Req
uest
ed b
y E
stab
lishe
d
Subj
ect o
f E
xam
inat
ion
GA
TT
Pan
el R
ulin
g
Co
unci
l by
Co
unci
l Im
ple
men
tati
on
Dat
e
198
7
upon
exp
iry
in O
ctob
er 1
99
0
of
the
curre
nt c
usto
ms
user
s fe
es.
Can
ada,
EC
M
arch
T
he U
nite
d S
tate
s O
ct.
199
0
anno
unce
d th
at t
he U
.S.
Cus
tom
s an
d T
rade
Act
of
199
0,
sig
ned
into
law
on
A
ug
ust2
0,
199
0, c
ont
aine
d
a p
rov
isio
n th
at h
ad b
roug
ht
the
U.S
. cus
tom
s us
ers
fee
into
con
form
ity w
ith G
AT
T.
Can
ada,
EC
M
arch
A
s ex
pres
sed
at t
he O
ctob
er
Mar
ch 1
99
1 (I)
199
0 m
eeti
ng.
the
EC
doe
s i! '-4
no
t co
nsid
er th
e ne
w U
. S.
c;;
leg
isla
tio
n to
be
fully
con
--t
sist
ent w
ith
the
pan
el r
epor
t;
0
....
it d
oes
no
t lea
d to
the
imp
o-
)loo
a>
r-0
si
t io
n o
f fe
es c
omm
ensu
rate
)lo
o to
th
e co
sts
of c
usto
ms
ser-
,
vice
s re
nder
ed f
or in
div
id-
, m
ual
tran
sact
ions
. z
U
nite
d S
tate
s C
anad
a's
rest
rict
ions
on
A G
AT
T d
ispu
te s
ettl
emen
t M
arch
19
88
M
arch
C
anad
a ac
cept
ed a
GA
TT
M
arch
19
88
c M
arch
><
ex
po
rts
of
unpr
oces
sed
Wes
t pa
nel
rule
d ag
ains
t C
anad
a's
1988
p
anel
ruli
ng
ag
ains
t its
C
oast
sal
mo
n an
d he
rrin
g.
pro
hib
itio
n on
exp
orts
of
exp
ort
pro
hib
itio
n o
f sa
lmo
n un
proc
esse
d W
est
Co
ast
and
herr
ing
. re
quir
ing
, ho
w-
salm
on
and
herr
ing
. ev
er, t
hat
sal
mo
n an
d h
er-
ring
cau
ght
of
f the
Pac
ific
coas
t be
land
ed in
Can
ada
to
ensu
re a
ccur
ate
catc
h re
port
ing/
insp
ectio
n/
gra
din
g a
nd q
ualit
y co
ntro
l. E
C
Ap
ril
Jap
an's
trad
e in
sem
ico
n-A
GA
TT
dis
put
e se
11le
men
t M
arch
19
88
May
19
88
Ja
pan
agre
ed t
o ta
ke th
e fo
l-M
arch
19
89
duct
ors.
pa
nel
rule
d in
fav
or
of th
e to
win
g s
teps
to
conf
orm
E
C a
gai
nst J
apan
ese
mea
-w
ith G
ATT
: (I
) M
oni
tori
ng
sure
s ta
ken
in th
e co
ntex
t of
of
expo
rt p
rice
s hi
ther
to
so-c
alle
d th
ird-
coun
try
unde
rtak
en p
rio
r to
exp
ort
mo
nito
ring
, co
nsti
tuti
ng
wo
uld
no
w b
e do
ne e
x po
st
exp
ort
res
tric
tions
inc
onsi
s-fa
cto,
and
(2)
The
Sup
ply
te
nt w
ith
Art
icle
XI:
I.
and
Dem
and
For
ecas
t C
om
-m
ittee
wo
uld
be
abo
lish
ed.
EC
A
pri
l A
t the
Jun
e 19
89 C
oun
cil
June
19
89
mee
ting
, Jap
an a
nnou
nced
th
at i
t ha
d im
ple
men
ted
the
mea
sure
s, e
ffec
tive
June
I.
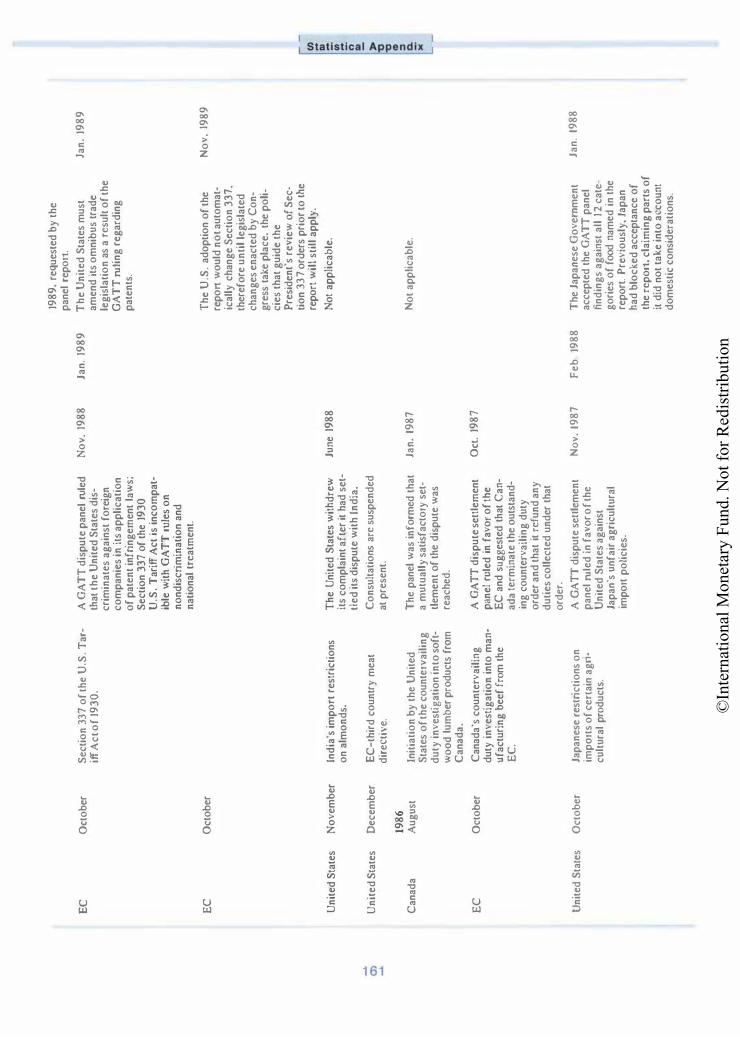
©In
tern
atio
nal M
onet
ary
Fund
. Not
for R
edis
tribu
tion
1989
. re
qu
este
d b
y t
he
p
anel
rep
ort
.
EC
O
cto
ber
S
ecti
on
337
of
the
U.S
. Tar
-A
GA
TT
dis
pu
te p
anel
rule
d
No
v.
198
8
Jan
. 19
89
T
he
Un
ite
d S
tate
s m
ust
Ja
n.
198
9
itf A
ct o
f 19
30
. th
at t
he
Un
ite
d S
tate
s d
is-
am
en
d i
ts o
mn
ibu
s tr
ade
cri
min
ate
s a
ga
inst
fo
reig
n
leg
isla
tio
n a
s a
res
ult
of
the
c
om
pa
nie
s in
its
ap
pli
ca
tio
n
GA
TT
ruli
ng
reg
ard
ing
o
f p
aten
t in
frin
ge
me
nt
law
s;
pat
ents
. S
ecti
on
337
of
the
1930
U
.S.
Tar
iff A
ct i
s in
com
pat
-ib
le w
ith
GA
TT
ru
les
on
n
on
dis
cri
min
ati
on
and
n
atio
nal
trea
tmen
t.
EC
O
cto
ber
T
he
U.S
. ad
op
tio
n o
f th
e N
ov
. \9
89
rep
ort
wo
uld
no
t au
tom
at-
ical
ly c
han
ge
Sec
tio
n 3
37.
ther
efo
re u
nti
l le
gis
late
d
chan
ges
en
ac
ted
by
Co
n-
gre
ss t
ake
pla
ce
, th
e p
oli
-c
ies
that
gu
ide
th
e
Pre
sid
ent'
s re
vie
w o
f S
ec
-t i
on
33
7 o
rder
s p
rio
r to
th
e re
po
rt w
ill
stil
l ap
ply
. Ill -
Un
ited
Sta
tes
No
ve
mb
er
Ind
ia's
imp
ort
res
tric
tio
ns
Th
e U
nite
d S
tate
s w
ith
dre
w
June
19
88
No
t a
pp
lic
ab
le.
!!!
on
alm
on
ds.
it
s c
om
pla
int
aft
er
it h
ad s
et-
iii
�
tie
d it
� d
isp
ute
wit
h I
nd
ia.
0 ..
... E
C-
thir
d c
ou
ntr
y m
eat
Co
nsu
ltat
ions
are
su
spen
ded
!.
O'l
U
nit
ed
Sta
tes
De
ce
mb
er
,.
dir
ec
tiv
e.
at p
rese
nt.
'tJ
,
19
86
• C
anad
a A
ug
ust
In
itia
tio
n b
y t
he
Un
ited
T
he
pan
el w
as in
form
ed t
hat
Ja
n.
1987
N
ot
ap
pli
ca
ble
. :I a.
Sta
tes
of
the
co
un
terv
ail
ing
a
mu
tua
lly
sat
isfa
cto
ry s
et-
;;c
du
ty i
nv
est
iga
tio
n i
nto
so
ft-
tlem
ent
of
the
dis
pu
te w
as
wo
od
lu
mb
er p
rod
uct
s fr
om
re
ach
ed.
Ca
na
da
.
EC
O
cto
ber
C
anad
a's
cou
nte
rva
ilin
g
A G
AT
T d
isp
ute
set
tlem
ent
Oct
. 19
87
du
ty i
nv
esti
gat
ion
in
to m
an
-p
anel
rul
ed i
n f
avo
r o
f th
e
ufa
ctu
rin
g b
eef
fro
m t
he
EC
and
su
gg
este
d t
hat
Ca
n-
EC
. a
da
te
rmin
ate
th
e o
uts
tan
d-
ing
co
un
terv
ail
ing
du
ty
ord
er a
nd
th
at i
t re
fun
d a
ny
d
uti
es
co
lle
cte
d u
nd
er t
hat
o
rder
.
Un
ited
Sta
res
Oct
ob
er
Jap
anes
e re
stri
cti
on
s o
n
A G
AT
T d
isp
ute
se1
1lem
ent
NO
\.
198
7
Fe
b
198
8
Th
e Ja
pan
ese
Go
vern
men
t Ja
n.
1988
im
po
rts
of
cert
ain
ag
n-
pa
ne
l ru
led
in
fa
vo
r of
the
ac
cep
ted
th
e G
AT
T p
an
el
cu
ltu
ral
pro
du
cts.
U
nit
ed
Sta
tes
agai
nst
fin
din
gs
agai
nst
all
12
cate
-Ja
pa
n's
un
fair
ag
ricu
ltu
ral
go
ries
of
food
nam
ed i
n t
he
imp
ort
po
lic
ies.
re
po
rt.
Pre
vio
usl
y,
Jap
an
h
ad
blo
ck
ed
acc
epta
nce
of
the
rep
ort
, cla
imin
g p
arts
of
it d
id n
ot
tak
e in
to a
cco
unt
d
om
esti
c co
nsid
erat
ion
s.

©In
tern
atio
nal M
onet
ary
Fund
. Not
for R
edis
tribu
tion
Tab
le A
45
(co
ncl
ud
ed
)
Dat
e D
ate
Dat
e R
epon
ed t
o
Ado
pted
R
eque
sted
by
Est
ablis
hed
S
ub J
eCt o
f Exa
min
atio
n G
AT
T P
anel
Rul
ing
C
ou
ncil
by C
oun
cil
Imp
lem
enta
tio
n D
ate
198
6
Uni
ted
Sta
tes
Oct
ober
Ja
pan
notifi
ed t
he C
oun
cil
Sep
t. 19
88
o
f m
ark
et-o
pen
ing
mea
sure
� co
ncer
ning
im
port
s o
f ce
r-ta
in a
gri
cult
ural
pro
duc
ts.
Uni
ted
Sta
tes
Oct
ober
Q
uest
ions
co
ncer
ning
the
Ju
ne 1
99
0
full
imp
lem
enta
tio
n o
f th
e re
port
wer
e ra
ised
at a
C
ou
ncil
mee
ting
.
Uni
ted
Sta
tes
Oct
ober
T
he U
.S. c
laim
s th
at Ja
pan
F
eb.
199
1 ha
s st
ill n
ot i
mp
lem
ente
d a
ll
the
refo
rms
it sa
id it
wo
uld
, pa
rtic
ular
ly c
onc
erni
ng
en
qu
alit
ativ
e re
stri
ctio
ns o
n ;;!
cert
ain
dair
y pr
oduc
ts a
nd
....
star
ch. B
ilat
eral
U.S
.-Ja
pan
en
co
nsul
tati
ons
on
how
to
�
re
solv
e th
e d
isp
ute
will
be
0
....
,.
O'l
held
. r-
1\)
1985
,.
E
C
Feb
ruar
y
Defi
niti
on
of in
dus
try
co
n-M
arch
19
86
,
,
cc
rnin
g w
ine
and
grap
e m
z
pr
oduc
ts c
ont
aine
d i
n th
e �
U
.S.
Tra
de a
nd T
ariff
Act
of
)( 19
84
.
Can
ada
Mar
ch
U.S
. re
stri
ctio
ns o
n im
po
rt�
Co
n�ul
tati
ons
hav
e b
een
of
cert
ain
prod
ucts
co
ntai
n-de
ferr
ed s
ince
the
U.S
. and
in
g s
ugar
. C
anad
a ar
e ho
ldin
g b
ilate
ral
d is
cus&
ions
on
the
mau
er.
EC
M
arch
Im
port
dis
trib
uti
on
and
�ale
A
GA
TT
dis
put
e se
ttle
men
t D
ec.
198
7
Mar
ch
Can
ada
agre
ed t
o im
ple
men
t M
arch
19
88
o
f alc
oh
oli
c d
rink
s by
pro
-p
anel
ru
led
in f
avor
of
the
198
8
the
pan
el's
rec
om
men
dat
ion
vin
caal
mar
ket a
gen
cies
in
EC a
gai
nst C
anad
a's
pro
vin-
to r
emov
e d
iscr
imin
ato
ry
Can
ada.
ci
al p
rici
ng.
listi
ng.
and
dis
-p
rov
inci
al l
iquo
r boa
rd r
eg-
tnb
uti
on
pra
ctic
es f
or b
eer
ula
tio
n� o
n w
ine
and
sp
irit
s.
and
win
e.
but
rec
omm
end
atio
n to
re
mov
e re
gu
latio
ns f
rom
b
eer
wil
l no
t be
imp
le-
men
ted
bec
ause
it w
ou
ld
giv
e U
.S. b
rew
ers
··fre
e ri
de."
EC
Mar
ch
Can
ada
repo
rted
tha
t an
ad
Dec
. 19
88
re
fere
ndum
set
tlem
ent o
n th
e i m
ple
rnen
tati
on
of
the
pan
el's
rec
om
men
dat
ions
ha
d be
en n
egot
iate
d w
ith
the
EC

©In
tern
atio
nal M
onet
ary
Fund
. Not
for R
edis
tribu
tion
EC
Nic
arag
ua
Mar
ch
Oct
ober
U
.S.
trad
e m
easu
res
affec
tin
g N
icar
agua
.
Sourc
e: G
enera
l Ag
reem
ent o
n T
ariff
� an
d T
rad
e.
A G
AT
T d
isp
ute
sett
lem
ent
Oct
. 19
86
pa
nel c
oul
d n
ot d
eter
min
e w
heth
er th
e U
nite
d S
tate
s w
as in
co
mp
lianc
e w
ith
its
GA
TT
ob
ligat
ions
bec
ause
it
was
not
per
mit
ted
to
exam
ine
whe
ther
the
Uni
ted
Sta
tes
was
just
ified
in
its u
se
of A
rtic
le X
Xl.
The
Uni
ted
Sta
tes
ques
ti
one
d th
e im
ple
men
tati
on
of
the
rep
ort
and
req
uest
ed
that
it b
e pe
rmitt
ed t
o s
us
pend
the
ap
plic
atio
n to
Can
ad
a o
f ap
prop
riat
e co
nces
sio
ns o
r ot
her
oblig
ati
ons
.
Oct
. J 9
90
en ..
� � n 11)

©International Monetary Fund. Not for Redistribution
I STATISTICAL APPENDIX
Table A46. Balance of Payments Consultations Since Introduction of 1 979 Declaration
Country 1980 1981 1982 1983 1984 1985 1986 1987 1988 1989 1990 1991
Argentina LF s E Bangladesh s s s s s s Brazil s F F s F LF s E Colombia LF s s s Czechoslovakia F Egypt s s s LF s Ghana s s F s LF SE Greece F F E F E Hungary F LF E India s s s s F F F Israel F F F F F F F Italy F E Korea s s F s F LFE Nigeria LF s s s Pakistan s s s s LF s Peru s s s LF s E Philippines F s s LF s s Portugal F F F F F F E Sri Lanka s s s LF s s Tunisia s s s s s Turkey s s s s F s Yugoslavia S . F s s s LF
Source: General Agreement on Tariffs and Trade, Balance of Payments (SOP/series). Note: F = full consultation; LF = last full consultation; S = simplified consultation; E = balance of payments measure no longer applied.
164

©International Monetary Fund. Not for Redistribution
Statistical Appendix
Table A47. Recourse to Article XIX of the General Agreement on Tariffs and Trade, 1978-91
Country Product
Australia Textile apparel items Files and rasps Textile apparel items Brandy Fixed resistors Passenger motor vehicles Selected sporting footwear Double-edged safety razor blades Round blunt chainsaw files Sheets and plates of iron and steel Wool worsted yarns Certain trucks and stackers Hoops and strips of iron and steel Certain filament lamps Nonelectrical domestic refrigerators
Austria Broken rice Prepared fowls
Canada Clothing items Footwear other than canvas and rubber Nonleather footwear Leather footwear Yellow onions Fresh. chilled, and frozen beef and veal
Chile Sugar Wheat Edible vegetable oils
European Community Raw silk (Italy) Portable televisions Preserved mushrooms Cultivated mushrooms Other cultivated mushrooms Yarn of synthetic fibers
(United Kingdom) Frozen cod fillets (Ireland.
United Kingdom) Dried grapes Certain tableware (France.
United Kingdom) Certain electronic quartz
watches (France) Morello cherries Preserved raspberries Sweet potatoes Certain steel products
(Spain) Frozen squid
Refrigerators and freezers (Portugal)
Processed cherries Certain semiprocessed red
fruits Provisionally preserved
cultivated mushrooms
Finland Women's pantyhose Porous fiberboard
Germany Hard coal and hard coal products
165
Measure
Tariff increase Quantitative restriction Tariff increase Tariff increase Licensing Quantitative restriction Quantitative restriction/licensing Quantitative restriction Quantitative restriction Quantitative restriction Tariff quota Quantitative restriction Tariff quota Tariff increase Tariff increase
Quantitative restriction Quantitative restriction
Quantitative restriction Quantitative restriction Quamitative restriction Quantitative restriction Specific surtax Quantitative restriction
Tariff surcharge Tariff increase Tariff increase
Quantitative restriction/tariff Quantitative restriction Quantitative restriction Quamitative restriction Quantitative restriction Quantitative restriction
Embargo
Compensatory tax Quantitative restriction
Quantitative restriction
Tariff Tariff Quantitative restriction Quantitative restriction
Suspension of imports at certain price levels
Quantitative restriction
Tariff Tariff
Import quality allocated by means of licensing
Tariff surcharge Tariff surcharge
Import licensing for countries outside the European Coal and Steel Community
Year Introduced
(Terminated)
1975 (1988) 1976 (1978) 1976 ( 1988) 1977 ( 1979) 1977 ( 1 979) 1977 ( 1 985) 1977 (1 982) 1978 ( 1982) 1978 ( 1978) 1978 (1 980) 1978 ( 1988) 1980 ( 1982) 1982 ( 1983) 1983 1983 ( 1985)
1987 1990
1976 ( 1 978) 1977 (1981) 19811 19822 1982 (1983) 1985 ( 1985)
1984 ( 1989) 1984 ( 1989) 1985 ( 1989)
1969 1977 (1979) 1978 (1 980) 1980 ( 1984) 1980 (1 980) 1980 ( 1980)
1981 ( 1981)
1982 1983 ( 1983)3
1984
1985 1986 1986 1987
1987
1988
1989 1991
1991
I 976 ( 1979) 1986 ( 1986)
1958

©International Monetary Fund. Not for Redistribution
STATISTICAL APPENDIX
Table A47 (concluded)
Country
Iceland
Nigeria
Norway
South Africa
Spain
Switzerland
United States
Product
Furniture, cupboards. and cabinets; windows and doors
Cement
Various textile items
Certain footwear Malic acid Certain oil fatty acids,
flasks, steel wire, plugs Optical fibers and optical
fiber bundles Synthetic rubber Cheeses
Dessert grapes
Ball bearings Footwear CB radio receivers High-carbon ferrochromium Clothespins Lag screws or bolts Porcelain-on-steel cookware Preserved mushrooms Certain speciality steels Heavyweight motorcycles
Source: General Agreement on Tarilfs and Trade. 'Partial termination in 1985. �Panial termination in 1985 and 1986. 'Replaced by expon restraint arrangement.
Measure
Import deposit
Import licenses prohibited
Quantitative restriction
Tariff increase Tariff increase Tariff increase
Suspension of tariff bindings
Tariff Quantitative restriction
Tariff increases
Tariff increases Quantitative restriction Tariff Tarift' Quantitative restriction Tariff Tariff Tariff Quantitative restriction Tariff increase
166
Year Introduced
(Terminated)
1979 ( 1 980)
1961
1979 { 1984)
1984 1985 1986
1987 ( 1 988)
1967 1980 ( 1980)3
1982 ( 1 982)
1974 ( 1978) 1977 ( 1981) 1978 ( 1981) 1978 (1982) 1979 { 1 984} 1979 ( 1 982) 1980 ( 1 984) 1980 ( 1983) 1983 1983
©International Monetary Fund. Not for Redistribution
Bibliography
Andcrson. Kym. "The International Dimension of the Political Economy of Agricultural Policy." paper presented at a conference on International Dimensions to Stntctural Adjustment: Implications for Developing Country Agriculture (Paris, 1991).
--, and Rod Tyers, "How Developing Countries Could Gain from Agricultural Trade Liberalization in the Untguay Round." in Agricultural Trade Liberalization: Implications for Developing Countries. ed. by !an Goldin and Odin Knudsen (Paris: OECD Development Center. 1990), pp. 47-75.
Australian Industry Commission, Strategic Trade Theoty: The East Asian Experience (Canberra: Industry Commission, November 1990).
Balassa, Bela, ··comparative Advantage in Manufactured Goods: A Reappraisal," Review of Economics and Statistics (May 1986). No. 68, pp. 315-19.
--. and M . Noland. Japan in rhe World Economy (Washington: Institute for International Economics, 1988).
Banks, Gary, Australia's Amidumping Experience, PRE Working Paper No. SS I (Washington: World Bank, December 1990).
Barton, John H . , "Toward an International Antitrust Code'' (mimeograph. Stanford. California: Stanford International Centcr for Law and High Technology. July l . 1990).
Baumol, William J . . and Kyu Sik Lee, "Contestable Markets. Trade, and Development," in World Bank Research Observer (Washington). Vol. 6, (January 1991), pp. 1-17.
Bell. A . . ' · Antidumping Practice of the EEC: The Japanese Dimension," Legal Issues of European lntegrarion (Devemer, Netherlands: Kluwer Law and Taxation Publishers, 1987), pp. 1 -3 1 .
Bergsten, C . Fred, and William R . Clinc, The United Swtes-Japan Economic Problem, Policy Analysis in International Economics 13 (Washington: Institute for International Economics, 1987).
Bhagwati, Jagdish, "Export-Promoting Strategy : Issues and Evidence,'' World Bank Research Observer (Washington), Vol. 3 (1988), pp. 27-56.
--, The World Trading System at Risk (Hamel Hempstead, England: Harvester Wheatsheaf. 1991 ) .
Blejer, M . . and A. Cheasty, "Fiscal Implications o f Trade Liberalization," in Fiscal Policy in Open Developing Economies, ed. by V. Tanzi (Washington: International Monetary Fund, 1990).
Boote, Amhony R., and Janos Somogyi, "Economic Reform in Hungary Since 1968:' IMF Occasional Paper. No. 83 (Washington: International Monetary Fund. July 1987).
Brander, James A .. and Barbara J. Spencer. ··Expon Subsidies and international Market Share Rivalry,'' Journal of lmernational Economics (Amsterdam), Vol. 1 8 (February 1985), pp. 83-100.
Broome. John, '·Recent Developments in Trans-Tasman Business Law ..
. paper prepared for the 17th International
Trade Law Conference (September 1990). Burniaux, Jean Marc. Dominique van der Mensbntgghe,
and Jean Waelbroeck. ·• Economy-Wide Effects of Agricultural Policies in OECD Countries: A GE Approach Using the WALRAS Model," in Agricultural Trade Uberalizarion: lmplications for Developing Countries, ed. by Jan Goldin and Odin Knudsen (Paris: OECD Development Cent er, 1990).
Calvo, Guillermo A . , and Jacob A. Frenkel. "From Centrally Planned to Market Economy;' Staff Papers. International Monetary Fund (Washington). Vol. 38 (June 1991), pp. 268-99.
Canada, Bureau of Competition Policy, Europe 1992. Working Group Report on Competition Policy (Ottawa. January 1991).
Centre for Economic Policy Research, Monitoring European Integration: nze Impact of Easrem Europe. CEPR Annual Report (London: CEPR, October 1990).
Citrin, Daniel A .. •· Agricultural Policies in Japan and Their Economic Consequences,'' in Staff Studies for the World Economic Outlook. World Economic and Financial Surveys (Washington: International Monetary Fund, September 1990).
Clinc, William, The Future of World Trade in Textiles and Apparel (Washington: Institute for International Economics, rev. ed., 1990).
--. and S. Weintraub, eds . . Economic Srabilizwion in Developing Coumries (Washington: The Brookings Institution. 1981).
Collins, Susan M . , and Dan T. Rodrik. Eastern E11rope and the Soviet Union in the World Economy, Policy Analysis in International Economics 32 (Washington: Institute for international Economics. May 1991 ) .
Collyns. Charles. and Steven Dunaway, ''The Cost o f Trade Restraints: The Case of Japanese Automobile Exports to the United States," Staff' Papers, International Monetary Fund (Washington). Vol. 34 (March 1987). pp. 150-75.
Corbo, Vittorio. Morris Goldstein, and Mohsin Khan, eds . •
Growrh-Oriemed Adjustmem Programs (Washington: International Monetary Fund and The World Bank. 1 987).
167
Corden. W.M .. Prorection and Liberalization: A Review of Analytical lssues, IMF Occasional Paper, No. 54 (Washington: International Monetary Fund, !987).
Corker. Robcn. "The Changing Structure of Japanese Trade Flows," IMF Working Paper, WP/90/107 (Washington: International Monetary Fund, 1990).

©International Monetary Fund. Not for Redistribution
BIBLIOGRAPHY
Deardortf, Alan V., "Should Patent Protection Be Extended to All Developing Countries?" in The World Economy, Vol. 1 3 (Oxford : Basil Blackwell Ltd., 1990), pp. 497-507.
--, and Robert Stern, Computational Analysis of Global Trading Arrangements (Ann Arbor, Michigan: The University of Michigan Press, 1990).
de C. Grey, Rodney, ''The Conflict between Trade Policy and Competition Policy: A Comment," in Studies in Transnarional Economic Law, The New GATT Round of Multilateral Trade Negotiations. Legal and Economic Problems, ed. by Ernst-Ulrich Pete rsmann and Meinhard Hilt', Vol. 5 (Devcnter, Netherlands: Kluwer Law and Taxation Publishers, 1988), pp. 447-53.
de la Torre, Augusto. and Margaret R. Kelly. Regional Trade Arrangements, IMF Occasional Paper, No. 93 (Washington: International Monetary Fund. 1992).
de Melo, Jaime, and David Tarr. Welfare Costs of U.S. Quotas on Textiles. Steel and Autos, PPR Working Paper, No. 83 (Washington: The World Bank, 1988).
"Economic Declaration of the London Summit." lmernational Trade Reponer (Washington). Vol. 8 (July 24. 1991), p. 1 1 28.
European Report, No. 1704 (1991) . Farhadian-Lorie , Z., and M . Katz, ''Fiscal Dimensions of
Trade Policy," in Fiscal Policy, Srabilization and Growth in Developing Coumries, ed. by M . Blcjer and Ke-Young Chu (Washington: International Monetary Fund. 1989).
Feenstra, R., "Automobile Prices and Protection: The U. S.-Japan Trade Restraint," Journal of Policy Modelling, Vol. 7 (Spring 1985), pp. 49-68.
Feketekuty, Geza ( 1991 a), "Changes in the World Economy and Implications for the World Trading System'' (mimeograph, Washingron: Office of U .S. Trade Representative, June 1991).
-- (199lb), ·'Beyond the Uruguay Round," IMF Survey (Washington). Vol. 20, (July 15. 1991). pp. 209.
Finger, J . M ichael, "Antidumping and Antisubsidy Measures," in The Uruguay Round: A Handbook on the Multilateral Trade Negotiations, ed. by J . M ichael Finger and Andrzej Olechowski (Washington: The World Bank, 1987).
--, and Patrick A. Messerlin, The Effects of Industrial Countries ' Policies on Developing Countries, Policy and Research Series (Washington: The World Bank, 1989).
Finger, J. Michael, and Julio Nogues. " International Control of Subsidies and Countervailing Duties," World Bank Economic Review (Washington), Vol. I (September 1987), pp. 707-25.
Fischer, Stanley, "Issues in Medium-Term Macroeconomic Adjustment," World Bank Research Observer (Washington). Vol. l (July 1986), pp. 163-82.
--, "Economic Growth and Economic Policy," in Growth-Oriented Adjustment Programs, ed. by Vittorio Corbo and others (Washington: International Monetary Fund and The World Bank, 1987).
--, "Comments on Lipron and Sachs,'' Brookings Papers on Economic Activity I ( 1 990), p. 147.
Ford, Robert. and Wim Suyker, "Industrial Subsidies in the OECD Economies." OECD Economic Studies (Paris). No. 15 (Autumn 1990), pp. 37-8 1 .
Frohberg, Klaus, G . Fischer. and K.S. Parikh, "World Developing Countries Benefit from Agricultural Trade Liberalization in OECD Countries,'' in Agricultural
Trade Liberalization: Implications for Developing Countries, ed. by Ian Goldin and Odin Knudsen (Paris: OECD Development Center, 1990).
Gelb, Alan H . , and Cheryl W. Gray, ''The Transformation of Economies in Central and Eastern Europe: Issues, Progress, and Prospects'' (mimeograph, Washington: The World Bank, Country Economics Department, 1991).
Genberg, Hans, "On Sequencing Reforms in Eastern Europe," IMF Working Paper, WP/9 1 / 1 3 (Washington: International Monetary Fund. February 1991).
General Agreement on Tariffs and Trade ( 1 989a). Council Overview of Developments in the International Trading Environmenl, Annual Report by the Director General, C/RM /OV / I (Geneva: GATT, 1989).
-- ( 1 989b), Trade Policy Review. Australia 1989 (Geneva: GATT, March 1989).
-- ( 1 989c), Trade Policy Review, United Stares 1989 (Geneva: GATT, November 1989).
-- ( 1990a), lnremarional Trade 89-90. Vols. I and 1J (Geneva: GATT, 1990).
-- ( 1990b), Trade Policy Review, Sweden /990 (Geneva: GATT, August 1990).
-- ( 1990c), Trade Policy Review. Canada 1990 (Geneva: GATT. November 1990).
-- ( 1990d). Trade Policy Review. Japan 1990 (Geneva: GATT, November 1990).
-- ( 1990e), Trade Policy Review, New Zealand 1990 (Geneva: GATT, November 1990).
-- (199la). Council Overview of Developments in International Trade and the Trading System, Annual Report by the Director General. C/RMIOV/1 (Geneva: GATT, June 1991).
168
-- ( 1 99 l b), Trade Policy Review, European Communities 1991 (Geneva: GATT, March 1991).
-- (199lc), Council Overview of Developments in lntemarional Trade and the Trading System. Annual Report by the Director General, C/RM/OY/2 (Geneva: GATT. Apri1 1991).
-- (199ld), Council Overview of Developments in lmemariona/ Trade and the Trading System. Annual Report by the Director General. C/RM/OV/l (Geneva: GATT. June 1991).
Goldberg, Linda, and Janusz Ordover. Nowariff Barriers and Trade and Competition: Theory and Evidence. Note forthe Secretariat(Paris: OECD, 1991).
Goldin. Ian, and Odin Knudsen, eds . • Agricullllra/ Trade Liberalization: lmpliccuions for Developing Countries (Paris: OECD Development Center, 1990).
Graham. Edward M . . and J. David Richardson. "Global Competition Policies'' (Washington: Institute for International Economics, forthcoming).
Greer, Douglas F., Efficiency and Competition: Alternative. Complementmy or Conflicting Objectives. Research Monograph 47 (Wellington, New Zealand: Institute of Economic Research !ne., March 1989).
Grossman, Gene M., Promoting New Industrial Activiries: A Survey of Recent Arguments and Evidence, OECD Economic Studies (Paris), No. 1 4 (Spring 1990), pp. 87-125.
Gruen, Fred Henry, Review of the Customs Tariff' (AntiDumping) Act /975 (Canberra, Australia: Canberra Publishing & Printing Co . . March 1986).
Harris, D. , and others, Ejj'ecrs oft he Liberalization of North

©International Monetary Fund. Not for Redistribution
Bibliography
Asian Beef Import Policies, ABARE, Discussion Paper No. 90. 1 1 (Canberra, 1990).
Havrylyshyn. Oleh, and Lanit Pritchett, " Direction of Trade After Transition in East Europe: Predictions from a Gravity Model," draft (May 1991).
Havrylyshyn. Oleh, and David G. Tarr, Trade Liberalization and the Transition to Market Economy (Washington: The World Bank, 1991).
Hufbauer, Gary C., Diane Berliner, and Kimberly Ann Elliott, Trade Protection in the United States: 31 Case Studies (Washington: institute for International Economics, 1986).
Hufbauer, Gary C., Jeffrey J. Schott, and Kimberly A. Elliott, Economic Sanctions Reconsidered: Historical Currem Policy (Washington: Institute of International Econoncics, 2d ed., 1990).
Huff, H. Bruce, and Catherine Moreddu, "The Ministerial Trade Mandate Model,'' OECD Economic Studies, No. 13 (Winter 1989-90), pp. 45-67.
International Monetary Fund, "The Role of Structural Policies in Industrial Countries," in Stajj' Srudies for the World Economic Outlook, World Economic and Financial Surveys (Washington: International Monetary Fund. August 1989).
-- ( 1 990a). World Economic Outlook (Washington: International Monetary Fund. May 1990).
-- ( 1 990b). World Economic Outlook, Staff Studies (Washington: International Monetary Fund, August 1990).
-- ( 1 990e), World Economic Outlook (Washington: International Monetary Fund, October 1990).
-- (1991a), World Economic Outlook (Washington: International Monetary Fund, May 1991).
-- ( 1 991b), World Economic Outlook (Washington: International Monetary Fund, October 1991).
--, The World Bank, Organization for Economic Cooperation and Development, and European Bank for Reconstruction Development, The Economy of USSR, a study undertaken in response to a request by the Houston Summit ( 1990).
International Trade Reporter (Washington), Vol. 8 (October2. 1991) and (July 17, 1991).
Jackson. John H .. World Trade and the Law of GATT ( l ndianapolis: Bobbs-Merrill, 1969).
--, The World Trading Sysrem: Law and Policy of InTernational Economic Relations (Cambridge. Massachusetts: The MIT Press, 1989).
Jacquemin, Alexis, and others. Merger and CompetiTion Policy in the European Community, cd. by P. H . Admiral (Oxford : Basil Blackwell, Inc., 1990).
Japan Economic Institute, "The Structure of Japan's Imports: Causes and Consequences:· JEI Report, No. 22A (Washington, June 14, 1991) .
Japan, Ministry of Agriculture. Forestry, and Fishing, "Basic Direction of Japan's Agricultural Policy Toward the 21st Century," Agricultural Review, Vol. I 5 ( I 987).
Julius, DeAn ne S. , Foreign Direct lnvesrmenr: The Neglected Twin of Trade, Occasional Papers 33 (Washington: Group of Thirty, 1991).
Junz. Helen B . , "Integration of Eastern Europe into the World Trading System," The American Economic Review, Papers and Proceedings, Vol. 8 1 (May 199 I ), pp. 176-80.
Kelly, Margarel. and others, Issues and Developments in
International Trade Policy. IMF Occasional Paper, No. 63 (Washington: International Monetary Fund, 1988).
Kenen, Peter B .. "Transitional Arrangements for Trade and Payments Among the CMEA Countries,'' Staff· Papers. International Monetary Fund (Washington), Vol. 38 (June 1991), pp. 235-67.
Koulen, Mark, "Potential Anti-Trust Liability of Exporters Participating in Various Forms of Export Restraint Arrangements," in Studies in Transnational Economic Law, The New GATT Round of Multilateral Trade Negotiations, Legal and Economic Problems, ed. by ErnstUirich Petersmann and Meinhard Hilf, Vol. 5 (Dcventcr. Netherlands: Kluwer Law and Taxation Publishers, 1988). pp. 437-46.
1 69
Krissoff, Barry, John Sullivan, and John Wainio. '·Developing Countries in an Open Economy: The Case of Agriculture." in Agriculwral Trade Liberalization: Implications for Developing Countries. cd. by Ian Goldin and Odin Knudscn (Paris: OECD Development Ccnter, 1990), pp. 159-79.
Krueger, Anne. Foreign Trade Regimes and Economic Development: Liberalization Auempts and Consequences (Cambridge, Massachusetts: Ballinger Publishing Company. 1 978).
--. "Interactions Between Inflation and Trade-Regime Objectives in Stabilization Programs,'' in Economic Stabilization in Developing Countries. ed. by W.R. Cline and S. Weintraub (Washington: The Brookings Institution, 1981) .
--, "Problems of Liberalization." in World Economic Growth, ed. by A. Harbcrger (San Francisco. California: ICS Press. 1984).
--, Mauricc Schiff. and Antonio Valdcs, "Agricultural Incentives in Developing Countries: Measuring the Effect of Sectoral and Economy Wide Policies," in World Bank Review (Washington). Vol. 2 (September 1988) pp. 255-7 1 .
Krugman, Paul R . , "Is Free Trade Passe? " Journal of Economic Perspectives, Vol. I (Fall 1987), pp. 1 3 1 -44.
Laird, S .. and R. Vossenaar, ''Why We Should Be Worried About Non-Tariff Measures:· Special lssue on Non-Tariff Measures (Madrid: lnformaci6n Comercial Espaiiola. 1991).
Laird, S . . and Alexander J . Yeats. Quantitative Methods for Trade Barrier Analysis (New York: New York University Press, 1990).
Lane, Timothy D . , and Elias Dinopoulos, Fiscal Constraints on Market-Oriellled Reform in a Socialist Economy. IMF Working Paper. WPI91175 (Washington: International Monetary Fund, August l991) .
Lawrence. Robert Z., "Imports in Japan: Closed Markets or Minds?" Brookings Papers 011 Economic Activity (U.S.), No. 2 ( 1 987), pp. 5 1 7-54.
--, "Efficient or Exclusionist? The Import Behavior of Japanese Corporate Groups: Comments and Discussion;· Brookings Papers on Economic Activity (U .S.). No. I ( 1991 ) .
--. and Charles L. Schultze. eds . . An American Trade Strategy: Options for the 1990s (Washington: The Brookings Institution, I990).
Lex economics, Inc., The Relationship Benveen Competition Policy and Anti-Dumping Laws, The Canadian Experience (Ottawa, January 1990).

©International Monetary Fund. Not for Redistribution
BIBLIOGRAPHY
Lincoln, Edward J. , Japan 's Unequal Trade (Washington: The Brookings Institution, 1990).
Lipton, D., and Jeffrey Sachs, "Creating Market Economy in Eastern Europe: The Case of Poland," Brookings Papers on Economic Activity (U.S.), No. I ( 1 990), pp. 75-147.
Low, Patrick, and Raed Safadi. ·'Trade Policy and Pollution," World Bank Discussion Paper. No. 159 (Washington: The World Bank, May 1991).
Marin. D., "Tying in International Trade: Evidence on Countertrade," in World Economy. Vol. 1 3 (September 1990), pp. 445-62.
Matsushita, Mitsuo, "Coordinating International Trade with Competition Policies.'' in Studies in Transnarional Economic Law, The New GATT Round of Multilataal Trade Negotiations. Legal and Economic Problems. ed. by Ernst-Uirich Petersmann and Meinhard Hilf, Vol. 5 (Deventer. Netherlands: Kluwer Law and Taxation Pub-1 ishers, 1988). pp. 395-432.
McCulloch. Rachel, "Investment Policies in the GATT,'' NBER Working Paper Series, No. 3672 (Cambridge , Massachusetts: National Bureau of Economic Research. 1991).
McKinnon, Ronald I., "Liberalizing Foreign Trade in a Socialist Economy: The Problem of Negative Value Added," Rivista di Politico Economia (Italy). Vol. 8 1 (June 1991), pp. 85-120.
--. and D. J . Mathieson, How ro Manage a Repressed Economy, Princeton Essays in International Finance, No. 145 (Princeton. New Jersey: Princeton University Press, December 198 I).
Mcsserlin. Pat rick A., "Antitlumping Regulations or ProCartel Law? The EC Chemical Cases," in The World Economy, ed. by David Greenaway and John Whalley. Vol. 13. No. 4 (Oxford: Basil Blackwcll Ltd., 1990), pp. 465-92.
--, "The Uruguay Negotiations on Subsidies and Countervailing Measures: Past and Future Constraints" (Washington: The World Bank, International Economics Department. 1989).
--, "The EC Antidumping Enforcement: The Procedures," paper prepared for seminars organized by the University of Wisconsin and Free University of Brussels ··Arc the Fair Trade and Safeguard Laws Operating as Intended?'' (Paris. May 1991).
Michaely, M., "Trade Liberalization Policies: Lessons of Experience," paper presented at the conference ··For a New Policy Towards Foreign Trade" (Brazil. April 1987).
--, D. Papagcorgiou, and A. Choksi, Liberalizing Foreign Trade: Lessons and Experience in the Developing World, Vol. 7 (Oxford: Basil Black well Ltd . . 1989).
Michalopoulos, Constantinc. and David Tarr. "Trade and Payments Arrangements in Post-CM EA Eastern and Central Europe," Working Paper WPS 644 (Washington: The World Bank, April 1991).
National Consumer Council, Trade and Competition Policy: The Consumer Inreresr. International Trade and the Consumer, National Consumer Council, Working Paper No. 5 (London: National Consumer Council, March 1991).
Nicolaides, Phedon, "EC Antidumping Policy," in Tokyo Club Papers, No. 4 (London: The Royal Institute of International Affairs, 1991).
Of!ice of the United States Trade Representative. 199I
Trade Policy Agenda and 1990 Annual Report of the President of the United States on the Trade Agreemems Program (Washington: U.S. Government Printing Office. 1990).
Organization for Economic Cooperation and Development, Competition and Trade Policies: Their Imeracrion (Paris:
1 70
OECD, 1984). --. The Costs of Restricting Imports: The Automobile
Industry (Paris: OECD, 1987). -- ( 1 990a) . Industrial Policy in OECD Coumries,
Annual Review 1990 (Paris: OECD, 1990). -- ( 1 990b), Reforming Agricultural Policies: Quantita
tive Restrictions on Production and Direct Income Support (Paris: OECD. 1990).
--, Agricultural Policies, Markers and Trade: Monitoring and Owlook 1991 (Paris: OECD, 1991).
Ostrom, Douglas, "The Structure of Japan's Imports: Causes and Consequences," JEI Report, No. 22A (Washington, June 14, 1991) .
Ostry, Jonathan D., "Trade Liberalization in Developing Countries: Initial Trade Distortions and Imported Intermediate Inputs," in Sra.ff Papers, International Monetary Fund (Washington), Vol. 38 (September 1991), pp. 447-79.
Ostry, Sylvia, Governmems and Corporations in a Shrinking World: Trade and Innovation Policies in the United Stares, Europe, and Japan (New York: Council on Foreign Relations Press, 1990).
Papageorgiou. D .• A. Choksi, and M. Michaely, Liberali�ing Foreign Trade in Developing Countries: Lessons of Experience (Washington: The World Bank, 1990).
Richardson, J. David, "Empirical Research on Trade Liberalization with Imperfect Competition: A Survey.'' OECD Economic Studies. No. 12 (Spring 1989), pp. 7-50.
Roningen, Vernon 0 . , and Pravccn Dixit, ··Assessing the Implications of Freer Agricultural Trade," Food Policy (U.K.) . Vol. 1 5 (February 1990), pp. 67-75.
Roningen, Vcrnon 0., and Alexander J. Yeats, ·· Nontariff Distortions of International Trade: Some Preliminary Empirical Evidence," Weltwirtschaftliches Archiv (Kiel). Vol . I 12, No. 4 ( 1 976).
Royal Institute of International Aft'airs, •· Anti-Competitive Effects of Trade Policy•· (London: Royal Institute of International Affairs. 1991).
Sachs, Jelfrey D., ·'Trade and Exchange Rate Policies in Growth-Oriented Adjustment Programs:· in GrowthOriented Adjustment Programs, ed. by Vittorio Corbo, Morris Goldstein, and Mohsin Khan (Washington: International Monetary Fund and The World Bank, 1987), pp. 291-325.
--. "Conditionality, Debt Relief, and the Developing Country Debt Crisis," NBER Working Paper, No. 2644 (Cambridge, Massachusetts: National Bureau of Economic Research, 1988).
Sandrey, R., and R. Reynolds, eds., Farming Without Subsidies, New Zealand's Recent Experience (Wellington: New Zealand Ministry of Agriculture and Fisheries, 1990).
Saxonhousc, Gary R., ·'The Micro- and Macroeconomics of Foreign Sales to Japan:· in Trade Policy in the 1980s, cd. by William R. Cline (Washington: Institute for International Economics. 1983), pp. 259-304.
--. "What's Wrong with Japanese Trade Structure'>'' Seminar Discussion Paper 166, Research Seminar in

©International Monetary Fund. Not for Redistribution
Bibliography
International Economics (Ann Arbor, Michigan: University of Michigan, 1985).
Singer, H.W., and Parvin Alizadeh, "!mpon Substimtion Revisited in a Darkening External Environment," in Policies for Development: Essays in HonorofGamani Corea, ed. by S. Dell (London: MacMillan Press. 1988), pp. 60-86.
Smith, A . . "The Market for Cars in the Enlarged European Community," CEPR Discussion Paper Series (U.K.), No. 360 (December 1989).
Smith, Murray G . , "Antidumping and Countervailing Duty Laws in North America: Negotiating Multilaterally, Trilaterally and Bilaterally" (mimeographed , Ottawa, Canada: University of Ottawa, Faculty of Law, May 1 1 , 1991).
Starrels, John M., Assisting Reform in Cemral and East em Europe (Washington: International Monetary Fund, 1991).
Stoeckel, Andrew, David Pearce. and Gary Banks, Westem Trade Blocs: Game, Set or Match for Asia-Pacific and the World Economy? (Canberra, Australia: Centre for International Economics, 1990).
Stern, Robert M., "Symposium on TRIPs and TRIMs in the Uruguay Round: Analytical and Negotiating Issues: Introduction and Overview;· in The World Economy, ed. by David Greenaway and John Whalley, Vol. 13, No. 4 (Oxford: Basil Blackwell Ltd., 1990), pp. 493-96.
Strategico, Inc., "Year Two of the Canada-U .S. Free Trade Agreement-Making It Work" (Ottawa, December 1990).
Stubbs, K., "Industry Needs a Strong Anti-Dumping Safety Net,'' Topic Paper 6 (Melbourne: Australian Chamber of Manufactures, 1989).
Subramanian, Arvind, "TRIPs and the Paradigm of the GATT: A Tropical, Temperate View," in The World Economy, ed. by David Greenaway and John Whalley. Vol. 13, No. 4 (Oxford: Basil Blackwell Ltd., 1990), pp. 509-2 1 .
Tarr, David G . , A General Equilibrium Analysis of the Welfare and Employment Effects of U.S. Quotas in Textiles, Awos. and Steel (Washington: U.S. Federal Trade Commission, 1989).
--, "The Demise of the CMEA: Implications for Eastern Europe" (mimeograph, Washington: The World Bank, July 1991).
--. and Morris E. Morkre, Aggregate Costs to the United States of Tariffs and Quotas on Imports: General Tariff Curs and Removal of Quotas on Automobiles, Steel, Sugar, and Textiles (Washington: U .S. Federal Trade Commission, 1984).
Thomas, Vinod, K. Matin, and John Nash, Lessons in Trade Policy Reform (Washington: The World Bank, 1990).
Trela, lrene, and John Whalley, ·'Global Effects of Developed Country Trade Restrictions on Textiles and Apparel," Economic Journal (December 1990), pp. 1 1 90-1205.
Tyers, Rod, and Kym Anderson, Disarray in World Food Markets (Cambridge and New York: Cambridge University Press, 1992).
United Nations Conference on Trade and Development, Handbook of Trade Control Measures of Developing Countries. 1987(Geneva: UNCTAD, 1987).
--, Trade and Development Report, 1989 (Geneva: UNCTAD, 1989).
-- ( 1 990a), Trade and Development Report, 1990 (Geneva: UNCTAD, 1990).
-- ( l 990b), Trade and Development Board, "Protectionism and Structural Adjustment," TD/B/1282 (Geneva: UNCTAD, December20, 1990).
--, Trade and Development Report, 1991 (Geneva: UNCTAD, 1991).
United States, Department of Agriculture, Office of Economics, Economic Implications of the Uruguay Round for Agriculture (Washington, May 1991).
--, Department of Justice, Antitrusr Enforcement Guidelines for International Operations, 1988 (unpublished).
--, Office of the President, The United States-Canada Free-Trade Agreement, Biennial Report, A Report from the President to the Congress Under Section 304(t) of the United States-Canada Free-Trade Agreement Implementation Act, January 1991.
1 71
UN-PAAERD, Africa's Commodity Problems: Towards a Solwion, a report by the U. N. Secretary General's Expert Group on Africa's Commodity Problems (Geneva, 1990).
USITC, .. A Review of Recent Developments in the U.S. Automobile Industry Including an Assessment of the Japanese Voluntary Restraint Agreements," Preliminary Report to the Subcommittee on Trade, Committee on Ways and Means of the U .S. House of Representatives, in Connection with Investigation No. 332-188, USITC Publication No. 1648 (Washington: USITC. February 1985).
--, The Economic Effects of Significant U. S. Import Restraints, Phase 1: Manufacturing. Report to the Committee on Finance of the U .S. Senate on Investigation No. 332-262 Under Section 332 of the Tariff Act of 1930, USITC Publication 2222 (Washington: USJTC, October 1989).
Viner. Jacob, Dumping: A Problem in International Trade (New York: Kelley, 1966).
Wade, Roben, Governing the Market Economic Theory and the Role of Govemment in East Asian lndrcstria/ization (Princeton, New Jersey : Princeton University Press, 1990).
Westphal, Larry E., "Industrial Policy in an Export Propelled Economy: Lessons from South Korea's Experience," Journal of Economic Perspectives, Vol. 4 ( I 990), pp. 41-59.
Whalley, John, Trade Liberalization Among Major World Trading Areas (Cambridge, Massachusetts: MIT Press, 1985).
--, Recem Trade Liberalization in the Developing World: What Is Behind it and Where Is lt Headed?, NBER Working Paper, No. 3057 (Cambridge, Massachusetts: National Bureau of Economic Research, August 1989).
White House, Office of the Press Secretary, ·'Trade Enhancement Initiative for Central and Eastern Europe," press release, July 12, 1991.
Williamson, John, The Economic Opening of Eastern Europe, Policy Analyses in International Economics. No. 3 1 (Washington: Institute for International Economics, May 1991).
Winters, L. Alan, ·'The So-Called Noneconomic Objectives for Agricultural Protection," OECD Economic Srudies (Paris), No. 1 3 (Winter 1989-90), pp. 237-66.
Wonnacott, Ronald J .. "U .S. Hub-and-Spoke Bilaterals and

©International Monetary Fund. Not for Redistribution
BIBLIOGRAPHY
the Multilateral Trading System;· Commentary, C.D. Howe Institute, No. 23 (October 1990).
World Bank, World Development Report, 1987 (Washington: The World Bank; New York: Oxford University Press, J 987).
-- (199ia), World Development Report, 1991 (Washington: The World Bank; New York: Oxford University Press, 1991 ).
-- (1991b), Operations Evaluation Department (OED), World Bank Support for Trade Policy Reform, Report No. 9527 (Washington, 1991).
172
Xafa, Miranda, Roger P. Kronenberg, and Joslin LandellMills "The European Community's Trade and TradeRelated Industrial Policies" (unpublished. Washington: lnternational Monetary Fund, 1992).
Zietz, Joachim, and Alberto Valdes, "International Interactions in Food and Agricultural Policies: Effects of Alternative Policies." in Agricu/wral Trade Liberalization: Implications for Developing Countries, ed. by Ian Goldin and Odin Knudsen (Paris: OECD Development Center, 1 990).

World Economic and Financial Surveys
January 1988
February 1988
April 1988
May 1988
May 1988
July 1988
October 1988
April 1989
April 1989
July 1989
August 1989
September 1989
October 1989
April 1990
May 1990
May 1990
July 1990
September 1990
October 1990
November 1990
May 1991
May 1991
October 1991
December 1991
May 1992
May 1992
August 1992
International Capital Markets: Developments and Prospects, by Maxwell Watson, Donald Mathieson,Russell Kincaid, David Folkerts-Landau, Klaus Regling, and Caroline Atkinson.
Officially Supported Export Credits: Developments and Prospects, by K. Burke Dillon and LuisDuran-Downing, with Miranda Xafa.
World Economic Outlook: A Survey by the Staff of the International Monetary Fund.
Multilateral Official Debt Rescheduling: Recent Experience, by Peter M . Keller, with Nissanke E.Weerasinghe.
Primary Commodities: Market Developments and Outlook, by the Commodities Division of theResearch Department.
Staff Studies for the World Economic Outlook, by the Research Department of the InternationalMonetary Fund.
World Economic Outlook: Revised Projections, by the Staff of the International Monetary Fund.
World Economic Outlook: A Survey by the Staff of the International Monetary Fund.
International Capital Markets: Developments and Prospects, by a Staff Team from the Exchange andTrade Relations and Research Departments.
Primary Commodities: Market Developments and Outlook, by the Commodities Division of theResearch Department.
Staff Studies for the World Economic Outlook, by the Research Department of the InternationalMonetary Fund.
Developments in International Exchange and Trade Systems, by a Staff Team from the Exchange andTrade Relations Department.
World Economic Outlook: A Survey by the Staff of the International Monetary Fund.
International Capital Markets: Developments and Prospects, by a Staff Team from the Exchange andTrade Relations and Research Departments.
Officially Supported Export Credits: Developments and Prospects, by G.G. Johnson, Matthew Fisher,and Elliott Harris.
World Economic Outlook: A Survey by the Staff of the International Monetary Fund.
Primary Commodities: Market Developments and Outlook, by the Commodities Division of theResearch Department.
Staff Studies for the World Economic Outlook, by the Research Department of the InternationalMonetary Fund.
World Economic Outlook: A Survey by the Staff of the International Monetary Fund.
Multilateral Official Debt Rescheduling: Recent Experience, by Michael G. Kuhn with Jorge P.Guzman.
International Capital Markets: Developments and Prospects, by a Staff Team from the Exchange andTrade Relations and Research Departments.
World Economic Outlook: A Survey by the Staff of the International Monetary Fund.
World Economic Outlook: A Survey by the Staff of the International Monetary Fund.
Private Market Financing for Developing Countries, by a Staff Team from the Exchange and TradeRelations Department.
World Economic Outlook: A Survey by the Staff of the International Monetary Fund.
Developments in International Exchange and Payments Systems, by a Staff Team from the Exchangeand Trade Relations Department.
Issues and Developments in International Trade Policy, by a Staff Team led by Margaret Kelly andAnne Kenny McGuirk.
Note: For information on the titles and availability of World Economic and Financial Surveys published prior to 1988, pleaseconsult the most recent IMF Publications Catalog or contact IMF Publication Services.
173
©International Monetary Fund. Not for Redistribution