Untitled - IMF eLibrary - International Monetary Fund
109
-
Upload
khangminh22 -
Category
Documents
-
view
0 -
download
0
Transcript of Untitled - IMF eLibrary - International Monetary Fund

© 2017 International Monetary Fund
IMF Country Report No. 17/54
INDIA 2017 ARTICLE IV CONSULTATION—PRESS RELEASE; STAFF REPORT; AND STATEMENT BY THE EXECUTIVE DIRECTOR FOR INDIA
Under Article IV of the IMF’s Articles of Agreement, the IMF holds bilateral discussions
with members, usually every year. In the context of the 2017 Article IV consultation with
India, the following documents have been released and are included in this package:
A Press Release summarizing the views of the Executive Board as expressed during its
January 25, 2017 consideration of the staff report that concluded the Article IV
consultation with India.
The Staff Report prepared by a staff team of the IMF for the Executive Board’s
consideration on January 25, 2017, following discussions that ended
November 16, 2016, with the officials of India on economic developments and
policies. Based on information available at the time of these discussions, the staff
report was completed on January 6, 2017.
An Informational Annex prepared by the IMF staff.
A Staff Statement updating information on recent developments.
A Statement by the Executive Director for India.
The documents listed below have been or will be separately released
Selected Issues
The IMF’s transparency policy allows for the deletion of market-sensitive information and
premature disclosure of the authorities’ policy intentions in published staff reports and
other documents.
Copies of this report are available to the public from
International Monetary Fund Publication Services
PO Box 92780 Washington, D.C. 20090
Telephone: (202) 623-7430 Fax: (202) 623-7201
E-mail: [email protected] Web: http://www.imf.org
Price: $18.00 per printed copy
International Monetary Fund
Washington, D.C.
February 2017
©International Monetary Fund. Not for Redistribution

Press Release No. 17/56
FOR IMMEDIATE RELEASE
February 22, 2017
IMF Executive Board Concludes 2017 Article IV Consultation with India
On January 25, 2017, the Executive Board of the International Monetary Fund (IMF) concluded
the Article IV consultation1 with India.
The Indian economy has recorded strong growth in recent years, helped by a large terms of trade
gain, positive policy actions including implementation of key structural reforms, a return to
normal monsoon rainfall, and reduced external vulnerabilities. Inflation has remained low after
the collapse in global commodity prices, a range of supply-side measures, and a relatively tight
monetary stance. Fiscal consolidation at the Union government level resumed in FY2016/17, and
has been complemented by measures to enhance the quality of public spending. External
vulnerabilities are in check, with the current account deficit expected to remain compressed and
international reserves standing at US$360 billion as of late-December 2016 (around 8 months of
import cover). Persistently-high household inflation expectations and large fiscal deficits remain key
macroeconomic challenges, which limit policy space for supporting growth through demand
measures. Furthermore, excess capacity in key industrial sectors and strains in financial and
corporate sector balance sheets remain a drag on private investment, and weak external demand
continues to constrain India’s exports.
The post-November 8, 2016 cash shortages and payment disruptions caused by the currency
exchange initiative have undermined consumption and business activity, posing a new challenge
to sustaining the growth momentum. Growth is projected to slow to 6.6 percent in FY2016/17,
then rebound to 7.2 percent in FY2017/18, due to temporary disruptions, primarily to private
consumption, caused by cash shortages. Tailwinds from a favorable monsoon, low oil prices and
continued progress in resolving supply-side bottlenecks, as well as robust consumer confidence,
will support near-term growth as cash shortages ease. The investment recovery is expected to
remain modest and uneven across sectors, as deleveraging takes place and industrial capacity
utilization picks up. With temporary demand disruptions and increased monsoon-driven food
supplies, inflation is expected at about 4.75 percent by early 2017—in line with the Reserve
Bank of India’s inflation target of 5 percent by March 2017. Supply-side reforms, particularly in
1 Under Article IV of the IMF's Articles of Agreement, the IMF holds bilateral discussions with members, usually
every year. A staff team visits the country, collects economic and financial information, and discusses with officials
the country's economic developments and policies. On return to headquarters, the staff prepares a report, which
forms the basis for discussion by the Executive Board.
International Monetary Fund 700 19th Street, NW Washington, D. C. 20431 USA
©International Monetary Fund. Not for Redistribution

agriculture, continued fiscal consolidation, and relieving impediments to monetary transmission
are crucial to retain low inflation in the medium term. The current account deficit is expected
widen to about 2 percent of GDP over the medium term as domestic demand strengthens further
and commodity prices gradually rebound. The FY2016/17 Union Budget deficit target of 3.5
percent of GDP (equivalent to 3.8 percent of GDP in IMF terms) will likely be achieved.
Continued progress in reforms bodes well for a marked improvement in medium-term prospects,
with the adoption of the Goods and Services Tax poised to raise India’s medium-term GDP
growth to above 8 percent.
Economic risks are tilted to the downside. On the external side, despite the reduced imbalances
and strengthened reserve buffers, the impact from global financial market volatility could be
disruptive, including from U.S. monetary policy normalization or weaker-than-expected global
growth. In the absence of disruptive global financial volatility, slower growth in China, Europe
and the United States would have only modest adverse spillovers to India, given weak trade
linkages. A key domestic risk stems from the government’s currency exchange initiative, where
the near-term adverse economic impact of accompanying cash shortages remains difficult to
gauge, while it may have a positive economic impact in the medium term. Domestic risks also
flow from a potential further deterioration of corporate and public bank balance sheets, as well as
setbacks in the reform process, including in GST design and implementation, which could weigh
on domestic demand-driven growth and undermine investor and consumer sentiment. On the
upside, larger than expected gains from GST and further structural reforms could lead to
significantly stronger growth; while a sustained period of continued-low global energy prices
would also be very beneficial to India.
Executive Board Assessment2
Executive Directors noted India’s strong economic performance of the past few years and
commended the authorities for their strong policy actions, including continued fiscal
consolidation and an anti-inflationary monetary policy, which have underpinned macroeconomic
stability. Directors recommended continued vigilance to potential domestic and external shocks,
and urged the authorities to further advance economic and structural reforms to address supply
bottlenecks, raise potential output, create jobs, and ensure inclusive growth.
Directors supported the authorities’ efforts to clamp down on illicit financial flows, but noted the
strains that have emerged from the currency exchange initiative. They called for action to
quickly restore the availability of cash to avoid further payment disruptions, and encouraged
prudent monitoring of the potential side-effects of the initiative on financial stability and growth.
2 At the conclusion of the discussion, the Managing Director, as Chairman of the Board, summarizes the views of Executive Directors, and this summary is transmitted to the country's authorities. An explanation of any qualifiers used in summings up can be found here: http://www.imf.org/external/np/sec/misc/qualifiers.htm.
©International Monetary Fund. Not for Redistribution

Directors acknowledged the authorities’ strong policy push for cleaning up bank balance sheets
and welcomed legislation establishing the new bankruptcy code. Nonetheless, they noted that
elevated corporate sector risks and heightened levels of non-performing assets in public sector
banks continue to pose risks to banks’ soundness. Directors emphasized the importance of
augmenting capital buffers and continued governance reform of these banks, strengthening the
resolution regime for distressed bank assets by augmenting the capacity of newly established
mechanisms, and further measures to develop corporate debt markets, as key to enhancing the
financial system’s ability to contribute to growth.
Directors welcomed the completion of the institutional foundation of India’s flexible inflation
targeting regime, in particular the formation of the Monetary Policy Committee. Directors agreed
that given sticky and elevated household inflation expectations and food supply constraints,
continued vigilance on upside risks to inflation is needed. Directors recommended that the
Reserve Bank of India stand ready to raise the policy rate should inflationary pressures gather
pace. They also stressed the importance of continued agricultural reforms aimed at boosting food
supplies as well as maintaining fiscal adjustment to support monetary policy in achieving low
and stable inflation. Directors noted that India’s international reserves are assessed to be
adequate, and emphasized that the flexible exchange rate should continue to act as a key shock
absorber.
Directors emphasized that continued fiscal consolidation is critical to bring down the ratio of
public debt to GDP. They noted that fiscal consolidation will enable a gradual phasing-out of
financial repression, which will help price stability and lower the cost of credit for the private
sector, and rebuild space for counter-cyclical policy responses in the future. Implementation of a
robust goods and services tax, given its growth enhancing effects, and further subsidy reforms,
should be key pillars of the authorities’ fiscal consolidation strategy. Directors encouraged the
authorities to build on the fuel subsidy reforms and advances in financial inclusion to implement
better targeting and more efficient delivery of the remaining subsidies and social spending
programs.
Directors welcomed the authorities’ strong progress on structural reforms, and encouraged them
to prioritize labor market reforms at both the center and state levels. They also urged continued
efforts to reduce poverty and inequality, increase female labor force participation, and make
further efforts to improve financial inclusion. They noted the importance of further trade
liberalization and enhancing the business environment to help boost exports and attract greater
FDI flows.
©International Monetary Fund. Not for Redistribution

India: Selected Economic Indicators, 2012/13–2017/18 1/
I. Social Indicators
GDP (2015/16) Poverty (percent of population)
Nominal GDP (in billions of U.S. dollars): 2,073 Headcount ratio at $1.90 a day (2011): 21.2
GDP per capita (U.S. dollars): 1,581 Undernourished (2015): 15.2
Population characteristics (2015/16) Income distribution (2011, WDI)
Total (in billions): 1.31 Richest 10 percent of households: 30.0
Urban population (percent of total): 33 Poorest 20 percent of households: 8.2
Life expectancy at birth (years): 68.0 Gini index (2011): 35.2
II. Economic Indicators
2012/13 2013/14 2014/15 2015/16 2016/17 2017/18
Proj. Proj.
Growth (in percent)
Real GDP (at market prices) 5.6 6.6 7.2 7.6 6.6 7.2
Industrial production 1.4 0.1 2.8 2.0 … …
Prices (percent change, period average)
Consumer prices - Combined 9.9 9.4 5.9 4.9 5.1 4.7
Saving and investment (percent of GDP)
Gross saving 2/ 33.8 33.0 33.0 31.3 30.0 29.9
Gross investment 2/ 38.6 34.7 34.2 32.4 31.1 31.3
Fiscal position (percent of GDP) 3/
Central government overall balance -5.1 -4.6 -4.2 -4.1 -3.8 -3.7
General government overall balance -7.5 -7.6 -7.3 -7.0 -6.8 -6.6
General government debt 4/ 69.1 68.0 68.3 69.8 69.7 68.6
Structural balance (% of potential GDP) -7.4 -7.5 -7.2 -6.9 -6.7 -6.5
Structural primary balance (% of potential GDP) -2.9 -2.8 -2.5 -2.0 -1.8 -1.7
Money and credit (y/y percent change, end-period)
Broad money 13.6 13.4 10.9 10.5 12.0 13.4
Credit to private sector 13.5 13.7 9.3 11.1 10.5 12.3
Financial indicators (percent, end-period)
91-day treasury bill yield (end-period) 5/ 8.2 8.9 8.3 7.3 5.9 …
10-year government bond yield (end-period) 5/ 8.0 8.8 7.8 7.5 6.2 …
Stock market (y/y percent change, end-period) 6/ 8.4 18.7 24.9 -9.4 0.0 …
External trade 7/
Merchandise exports (in billions of U.S. dollars) 306.6 318.6 316.5 266.4 274.1 301.0
(Annual percent change) -1.0 3.9 -0.6 -15.9 2.9 9.8
Merchandise imports (in billions of U.S. dollars) 502.2 466.2 461.5 396.4 407.8 453.8
(Annual percent change) 0.5 -7.2 -1.0 -14.1 2.9 11.3
Terms of trade (G&S, annual percent change) -0.2 2.2 3.2 6.5 0.9 -1.5
Balance of payments (in billions of U.S. dollars)
Current account balance -87.8 -32.3 -26.8 -22.1 -24.1 -34.0
(In percent of GDP) -4.8 -1.7 -1.3 -1.1 -1.1 -1.4
Foreign direct investment, net ("-" signifies inflow) -19.8 -21.6 -31.3 -36.0 -38.1 -40.2
Portfolio investment, net (equity and debt, "-" signifies inflow) -26.9 -4.8 -42.2 4.1 -2.7 -13.9
Overall balance -3.8 -15.5 -61.4 -17.9 -15.4 -29.4
External indicators
Gross reserves (in billions of U.S. dollars, end-period) 292.0 304.2 341.6 360.2 375.6 404.9
(In months of imports) 8/ 6.4 6.7 8.5 8.6 8.1 7.9
External debt (in billions of U.S. dollars, end-period) 409.4 446.2 474.7 485.0 512.3 553.2
External debt (percent of GDP, end-period) 22.4 23.9 23.3 23.4 22.9 22.7
Of which: Short-term debt 9/ 9.0 9.9 9.1 9.3 9.3 9.0
Ratio of gross reserves to short-term debt (end-period) 8/ 1.8 1.7 1.8 1.9 1.8 1.8
Debt service ratio 10/ 5.9 5.9 7.6 8.8 7.8 7.9
Real effective exchange rate (percent change) 11/
(based on annual average level) -2.4 -2.0 6.9 5.8 0.5 …
Exchange rate (rupee/U.S. dollar, end-period) 5/ 54.4 61.0 62.6 66.6 68.4 …
Memorandum item (in percent of GDP)
Fiscal balance under authorities' definition -4.9 -4.3 -4.0 -3.9 -3.5 -3.5
Sources: Data provided by the Indian authorities; CEIC Data Company Ltd; Bloomberg L.P.; World Bank, World Development Indicators;
and IMF staff estimates and projections.
1/ Data are for April–March fiscal years.
2/ Differs from official data, calculated with gross investment and current account. Gross investment includes errors and omissions.
3/ Divestment and license auction proceeds treated as below-the-line financing.
4/ Includes combined domestic liabilities of the center and the states, and external debt at year-end exchange rates.
5/ For 2016/17, as of 30 November 2016.
6/ For 2016/17, year-to-date as of 2 December 2016.
7/ On balance of payments basis.
8/ Imports of goods and services projected over the following 12 months.
9/ Short-term debt on residual maturity basis, including estimated short-term NRI deposits on residual maturity basis.
10/ In percent of current account receipts, excluding grants.
11/ For 2016/17, year-to-date as of November 2016.
©International Monetary Fund. Not for Redistribution
INDIA STAFF REPORT FOR THE 2017 ARTICLE IV CONSULTATION KEY ISSUES Context. The Indian economy has recorded strong growth in recent years, helped by a large terms of trade gain, positive policy actions including implementation of key structural reforms, a return to normal monsoon rainfall, and reduced external vulnerabilities. Inflation has remained low after the collapse in global commodity prices, a range of supply-side measures, and a relatively tight monetary stance. Key macroeconomic challenges include persistently-high household inflation expectations and large fiscal deficits, which limit policy space for supporting growth through demand measures. Supply bottlenecks and structural impediments are the main constraints to medium-term growth and job creation.
Outlook and Risks. Cash shortages arising from the currency exchange initiative have weakened the near-term outlook. Medium-term growth prospects have improved due to the implementation of key reforms, loosening of supply-side bottlenecks, and appropriate fiscal and monetary policies that enhance macroeconomic stability. Risks are tilted to the downside, with key external risks arising from intensified global financial volatility and slower global growth. Key domestic risks include longer-than-anticipated cash shortages from the currency exchange initiative and further weakening of bank and corporate balance sheets. Low-for-longer global oil prices and greater investor confidence due to reforms are upside risks.
Strategy. Action is needed to quickly restore cash in circulation and avoid payment disruptions. Looking beyond this immediate challenge, policies should aim to reduce banking and corporate vulnerabilities, durably lower sticky inflation expectations, continue fiscal consolidation, and maintain the strong reform effort. Key elements: Safeguarding financial stability, given elevated corporate and banking sector strains by:
ensuring full recognition of non-performing assets on banks’ balance sheets; strengthening public banks’ loss-absorbing buffers; implementing further public banking sector structural reforms; and enhancing banks’ debt recovery mechanisms.
Achieving durable disinflation. Real interest rates remain consistent with achieving the inflation target of 5 percent CPI inflation by March 2017. Given medium-term upside risks to food and CPI inflation, the authorities should stand ready to raise the policy rate if inflationary pressures gather pace.
Continuing with fiscal consolidation. The FY2015/16 Union Budget achieved its deficit target of 3.9 percent of GDP (authorities’ definition), and the FY2016/17 Budget is on track to reach the smaller deficit target of 3.5 percent of GDP. Further reductions in subsidies and tax reforms, including implementation of the recently-approved GST, are needed to achieve fiscal consolidation plans over the medium term.
Maintaining the strong reform effort. Significant progress has been made in passing the pan-India GST constitutional amendment, introducing a new bankruptcy code, using Aadhaar identification and bank accounts to make direct benefit transfers, and enhancing financial inclusion. Additional steps are needed to reduce supply bottlenecks, enhance the efficiency of labor and product markets, and pursue further agricultural sector reforms.
January 6, 2017
©International Monetary Fund. Not for Redistribution

INDIA
2 INTERNATIONAL MONETARY FUND
Approved By Kenneth Kang (APD) and Seán Nolan (SPR)
Discussions took place in Mumbai, Kolkata and New Delhi during October 31–November 16, 2016. The team comprised Mr. Cashin (head), Mr. Tulin, Ms. Das, Ms. Sodsriwiboon, Ms. Khera (all APD), Ms. Iorgova (MCM), Ms. Maslova (SPR), Mr. Bauer (Senior Resident Representative), and Messrs. Mohapatra and Kumar (Resident Representative Office). Mr. Kang (APD) joined the concluding part of the mission. Messrs. Gokarn and Joshi (OED) also participated in the discussions. The mission met with Finance Secretary Lavasa, Reserve Bank of India (RBI) Governor Patel, Securities and Exchange Board of India (SEBI) Chairman Sinha, Chief Economic Advisor Subramanian, other senior officials, and representatives of the business community, UN agencies, and nongovernment organizations. Mmes. May Inoue and Anh Le assisted in the preparation of this report.
CONTENTS
CONTEXT: A CONSUMPTION-LED RECOVERY __________________________________________________ 4
OUTLOOK AND RISKS ___________________________________________________________________________ 5
KEY POLICY ISSUES ______________________________________________________________________________ 9 A. Strengthening the Financial Sector and Reining in Risks ________________________________________9 B. Monetary Policy to Anchor Inflation ___________________________________________________________ 15 C. Continuing Fiscal Consolidation _______________________________________________________________ 17 D. Maintaining External Sustainability ____________________________________________________________ 20 E. Structural Policies to Boost Growth and Employment _________________________________________ 22 F. Other Issues ____________________________________________________________________________________ 25
STAFF APPRAISAL ______________________________________________________________________________ 26 BOXES 1. Currency Withdrawal and Exchange and its Economic Impact _______________________________ 29 2. Ujwal Discom Assurance Yojana (UDAY): Debt Restructuring for Power
Distribution Companies ______________________________________________________________________ 30 3. Developing India’s Corporate Bond Market __________________________________________________ 32 4. Financial Inclusion in India: Recent Initiatives and Policy Priorities ___________________________ 34 5. Goods and Services Tax ______________________________________________________________________ 35 6. Key Structural Reform: Economic Impact of Poor Sanitation in India ________________________ 36 7. India’s Worsening Girl Deficit ________________________________________________________________ 38 FIGURES 1. Growth and Activity __________________________________________________________________________ 40 2. External Vulnerabilities _______________________________________________________________________ 41 3. Financial Markets _____________________________________________________________________________ 42
©International Monetary Fund. Not for Redistribution
Underline

INDIA
INTERNATIONAL MONETARY FUND 3
4. Monetary Developments _____________________________________________________________________ 43 5. Fiscal Developments _________________________________________________________________________ 44 6. Fiscal Vulnerability Indicators ________________________________________________________________ 45 7. Corporate and Banking Sectors ______________________________________________________________ 46 8. Gender Inequality: Health, Education, Economic, and Political _______________________________ 47 9. Poverty, Consumption and Per Capita Incomes in India _____________________________________ 48 10. Business Environment ________________________________________________________________________ 49 11. Agricultural Sector ___________________________________________________________________________ 50 TABLES 1. Millenium Development Goals, 1990–2015 __________________________________________________ 51 2. Selected Social and Economic Indicators, 2012/13–2017/18 _________________________________ 52 3. Balance of Payments, 2012/13–2017/18 _____________________________________________________ 53 4. Reserve Money and Monetary Survey, 2012/13–2016/17 ____________________________________ 54 5. Central Government Operations, 2012/13–2017/18 _________________________________________ 55 6. General Government Operations, 2012/13–2017/18 _________________________________________ 56 7. Macroeconomic Framework, 2012/13–2021/22 ______________________________________________ 57 8. Indicators of External Vulnerability, 2012/13–2016/17 _______________________________________ 58 9. Financial Soundness Indicators, 2011/12–2015/16 ___________________________________________ 59 10. High Frequency Economic Activity Indicators ________________________________________________ 60 ANNEXES I. Key Policy Actions 2016–17 __________________________________________________________________ 61 II. Risk Assessment Matrix ______________________________________________________________________ 71 III. Public and External Debt Sustainability Analysis _____________________________________________ 72 IV. External Sector Assessment __________________________________________________________________ 82 V. Expenditure Reforms _________________________________________________________________________ 84
©International Monetary Fund. Not for Redistribution
Underline

INDIA
4 INTERNATIONAL MONETARY FUND
CONTEXT: A CONSUMPTION-LED RECOVERY 1. The Indian economy has recorded a strong growth in the recent past. After bottoming at 5.6 percent real GDP growth in FY2012/13, the economy has been on a gradual cyclical recovery, reaching 7.6 percent growth in FY2015/16.1 As a result of wide-ranging policies to correct imbalances and build buffers after the 2013 taper tantrum, which improved macroeconomic fundamentals, and spurred robust capital inflows, India’s external vulnerabilities are now in check. Since late 2014, a halving of global oil prices has boosted economic activity in India, further improved the current account and fiscal positions, and lowered inflation.2 Over the past two years, a systematic tackling of supply-side bottlenecks and structural reforms have also underpinned confidence and provided needed support to growth and macroeconomic stability.
2. Growth has been led by consumption, while investment growth has been weak. Supported by a large and durable terms of trade gain, and more recently by a favorable agricultural crop outlook (supported by normal monsoon rainfall) and decennial civil servant wage revisions, private consumption remains the driving force of the Indian growth recovery. However, investment has contracted sharply in the first half of FY2016/17, reflecting excess capacity in key industrial sectors and strains in financial and corporate sector balance sheets. The post-November 8, 2016 cash shortages and payment disruptions caused by the currency exchange initiative (withdrawal of the legal tender of Rs 500 and Rs 1000 notes, which accounted for 86 percent of the value of currency in circulation, and introduction of new Rs 500 and Rs 2000 notes) have strained consumption and business activity, posing a new challenge to sustaining the growth
1 India’s Central Statistical Office released a new series of national accounts in January 2015, with base year 2011/12. Methodological deficiencies of the revised national account statistics, as described in the 2016 Article IV Staff Report, and the lack of back-casted historical GDP data, constrain a comparison of current growth with past growth. 2 India’s terms of trade has improved significantly (jumping by 2⅓ percent in 2013/14, by 3½ percent in 2014/15 and by a further 7 percent in 2015/16), supporting output growth and raising real incomes.
2
3
4
5
6
7
8
9
10
11
2009 2010 2011 2012 2013 2014 2015
GDP Growth (In percent, Gross Domestic Product at Market Prices)
Sources: Central Statistics Office, Haver Analytics.
80
85
90
95
100
105
110
115
120
125
130
2010
Q4
2011
Q2
2011
Q4
2012
Q2
2012
Q4
2013
Q2
2013
Q4
2014
Q2
2014
Q4
2015
Q2
2015
Q4
2016
Q2
Consumer Confidence Survey: Future Expectation (Index, Neutral=100)
Sources: Reserve Bank of India, Haver Analytics.
-8
-3
2
7
12
17
2012
Q2
2012
Q3
2012
Q4
2013
Q1
2013
Q2
2013
Q3
2013
Q4
2014
Q1
2014
Q2
2014
Q3
2014
Q4
2015
Q1
2015
Q2
2015
Q3
2015
Q4
2016
Q1
2016
Q2
2016
Q3
Private Final Consumption ExpenditureGross Fixed Capital Formation
Consumption and Investment(y/y percent change, based on constant prices)
Sources: Central Statistics Office, Haver Analytics.
©International Monetary Fund. Not for Redistribution

INDIA
INTERNATIONAL MONETARY FUND 5
momentum. External demand has weakened further, with the growth of import volumes of India’s trading partners decelerating to 2½ percent in 2015 from 4½ percent in the previous year.
3. Progress on important economic and structural reforms over the past year has been impressive. Over the past year, big bang reforms, such as the legislation of a new bankruptcy code, formalization of inflation targeting framework, and a milestone constitutional amendment enabling implementation of the pan-India Goods and Services Tax (GST), have taken place alongside continued steps implementing the gradualist reform agenda of the Bharatiya Janata Party (BJP)-led government of Prime Minister Narendra Modi (see Annex I: Key Policy Actions). Notwithstanding its majority in the lower house of the national parliament, the BJP does not have control of the upper house, thus requiring consensus building for the passage of key legislation. As a result, securing passage of the GST constitutional amendment spanned several parliamentary sessions and entailed compromise with regional parties.
4. Past Fund advice and the authorities’ macroeconomic policies have been broadly aligned. Consistent with Fund advice, fiscal consolidation at the Union government (central) level resumed in FY2016/17, and has been complemented by measures to enhance the quality of public spending. Excise duties on petrol and diesel have been raised further, and kerosene and fertilizer subsidy reforms have been pursued. The stance of monetary policy in 2015–16 has been maintained consistent with achieving the interim inflation targets along the RBI’s “glide path”, in line with previous IMF advice. The passage of the Bankruptcy Act, enhancements to corporate debt restructuring and bank governance, and measures to deepen domestic corporate bond markets were also broadly in line with past IMF recommendations. The RBI has adopted a flexible inflation targeting regime with a formal inflation target band (August 2016) and introduced a statutory Monetary Policy Committee (September 2016). Progress on land, labor and agricultural market reforms, however, has been limited.
OUTLOOK AND RISKS 5. The currency exchange initiative and its associated cash shortages are weighing heavily on activity, and its impact on financial institutions should be monitored carefully. Given the dominance of cash in everyday transactions, the post-November 8, 2016 decreased availability of cash and associated payment disruptions caused by the currency exchange initiative have strained consumption and business activity and the operations of the financial system, posing a new challenge to sustaining the growth momentum (see Box 1). The supply of new banknotes in the first month following the initiative was insufficient, even as the authorities took multiple steps to ease the currency transition. The November PMI for both manufacturing and services declined sharply, reflecting a large drop in output and new orders components. While the financial system is expected to weather the currency exchange-induced temporary growth slowdown, the authorities should remain vigilant to risks—in view of the potential further build-up of NPAs, including among private banks and elevated corporate sector vulnerabilities—and ensure prudent support to the affected economic sectors.
©International Monetary Fund. Not for Redistribution

INDIA
6 INTERNATIONAL MONETARY FUND
6. The repercussions from India’s currency exchange initiative will likely persist through the first quarter of 2017. Real GDP growth is projected to slow to 6.6 percent in FY2016/17 and then rebound to 7.2 percent in FY2017/18, due to temporary disruptions (primarily to private consumption) caused by cash shortages accompanying the currency exchange initiative. These effects are expected to gradually dissipate by March 2017 as cash shortages ease and would be offset by tailwinds from a favorable monsoon and low oil prices, and continued progress in resolving supply-side bottlenecks. Consumer sentiment remains strong, which will support near-term growth recovery as cash shortages ease.3 The investment recovery is expected to remain modest and uneven across sectors as deleveraging takes place and industrial capacity utilization picks up. Headwinds from weaknesses in India’s bank balance sheets will also weigh on near-term credit growth in the economy. Confidence and policy credibility gains, including from continued fiscal consolidation and anti-inflationary monetary policy, continue to underpin macroeconomic stability. Weak external demand, however, is expected to dampen net exports.
7. GST adoption and continued progress in reforms bode well for a marked improvement in medium-term prospects. In staff’s view, the consumption-led growth path can be sustained over the medium term, as real disposable incomes rise and India continues the process of economic catch-up (given its very low per capita incomes). Although some uncertainties remain around the design and pace of implementation of the GST, its adoption is poised to help raise India’s medium-term GDP growth to above 8 percent as it will create a single national market and enhance the efficiency of intra-Indian movement of goods and services.
8. CPI inflation is expected to remain contained in the near term, but inflationary pressures are set to rise in the second half of 2017. With temporary demand disruptions and increased monsoon-driven food supplies, CPI inflation is expected at about 4¾ percent by early 2017—in line with the RBI inflation target of 5 percent by March 2017. However, inflationary pressures are likely to reappear in the second half of 2017, in part reflecting government pay
3 All macroeconomic projections in this report are based on oil-price assumptions contained in the October 2016 World Economic Outlook.
-5
0
5
10
15
20
25
30
-5
0
5
10
15
20
25
30
2001 2003 2005 2007 2009 2011 2013 2015
Bank credit, CPI-deflated
Real gross fixed capital formation
Sources: Haver Analytics; and IMF staff estimates.
India: Bank Credit Growth and Fixed Investment(Annual percent change)
-6
-5
-4
-3
-2
-1
0
1
2
3
-6
-5
-4
-3
-2
-1
0
1
2
3
Q1 Q3 Q1 Q3 Q1 Q3 Q1 Q3 Q1 Q3 Q1 Q3 Q1 Q3 Q1 Q3 Q1 Q3 Q1 Q3 Q1 Q3 Q1 Q3
2005/062006/072007/082008/092009/102010/112011/122012/132013/142014/152015/162016/17
Output gap 1/Fiscal impulse (-)Real policy interest rate 2/ [RHS]
India: Policy Stance and Output Gap(In percent)
Sources: Haver Analytics; Consensus Economics; and IMF staff estimates.1/ Negative output gap signifies below potential output.2/ Repo rate minus 1-year ahead CPI inflation expectations (Consensus).
In p
erce
nt o
f pot
entia
lGD
P
In percent
Tighter policy setting
Cumulative fiscal impulse since FY2008/19 [RHS]
©International Monetary Fund. Not for Redistribution
INDIA
INTERNATIONAL MONETARY FUND 7
reviews and the waning effects of the oil price collapse.4 Upside risks to inflation stem from supply-side factors, such as volatility of agricultural prices, including due to possible smaller harvests as a result of cash shortages inhibiting purchases of agricultural inputs.
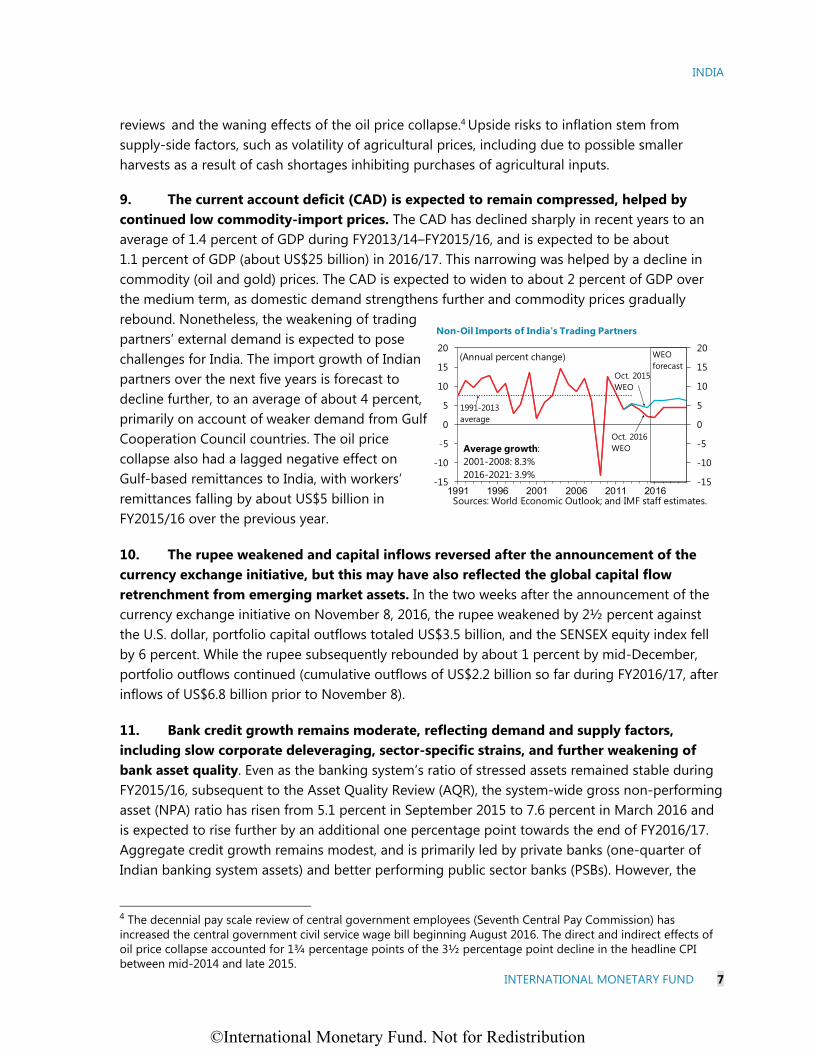
9. The current account deficit (CAD) is expected to remain compressed, helped by continued low commodity-import prices. The CAD has declined sharply in recent years to an average of 1.4 percent of GDP during FY2013/14–FY2015/16, and is expected to be about 1.1 percent of GDP (about US$25 billion) in 2016/17. This narrowing was helped by a decline in commodity (oil and gold) prices. The CAD is expected to widen to about 2 percent of GDP over the medium term, as domestic demand strengthens further and commodity prices gradually rebound. Nonetheless, the weakening of trading partners’ external demand is expected to pose challenges for India. The import growth of Indian partners over the next five years is forecast to decline further, to an average of about 4 percent, primarily on account of weaker demand from Gulf Cooperation Council countries. The oil price collapse also had a lagged negative effect on Gulf-based remittances to India, with workers’ remittances falling by about US$5 billion in FY2015/16 over the previous year.
10. The rupee weakened and capital inflows reversed after the announcement of the currency exchange initiative, but this may have also reflected the global capital flow retrenchment from emerging market assets. In the two weeks after the announcement of the currency exchange initiative on November 8, 2016, the rupee weakened by 2½ percent against the U.S. dollar, portfolio capital outflows totaled US$3.5 billion, and the SENSEX equity index fell by 6 percent. While the rupee subsequently rebounded by about 1 percent by mid-December, portfolio outflows continued (cumulative outflows of US$2.2 billion so far during FY2016/17, after inflows of US$6.8 billion prior to November 8).
11. Bank credit growth remains moderate, reflecting demand and supply factors, including slow corporate deleveraging, sector-specific strains, and further weakening of bank asset quality. Even as the banking system’s ratio of stressed assets remained stable during FY2015/16, subsequent to the Asset Quality Review (AQR), the system-wide gross non-performing asset (NPA) ratio has risen from 5.1 percent in September 2015 to 7.6 percent in March 2016 and is expected to rise further by an additional one percentage point towards the end of FY2016/17. Aggregate credit growth remains modest, and is primarily led by private banks (one-quarter of Indian banking system assets) and better performing public sector banks (PSBs). However, the
4 The decennial pay scale review of central government employees (Seventh Central Pay Commission) has increased the central government civil service wage bill beginning August 2016. The direct and indirect effects of oil price collapse accounted for 1¾ percentage points of the 3½ percentage point decline in the headline CPI between mid-2014 and late 2015.
-15
-10
-5
0
5
10
15
20
-15
-10
-5
0
5
10
15
20
1991 1996 2001 2006 2011 2016
(Annual percent change) WEO forecast
Average growth:2001-2008: 8.3%2016-2021: 3.9%
1991-2013 average
Oct. 2016 WEO
Oct. 2015 WEO
Non-Oil Imports of India's Trading Partners
Sources: World Economic Outlook; and IMF staff estimates.
©International Monetary Fund. Not for Redistribution
INDIA
8 INTERNATIONAL MONETARY FUND
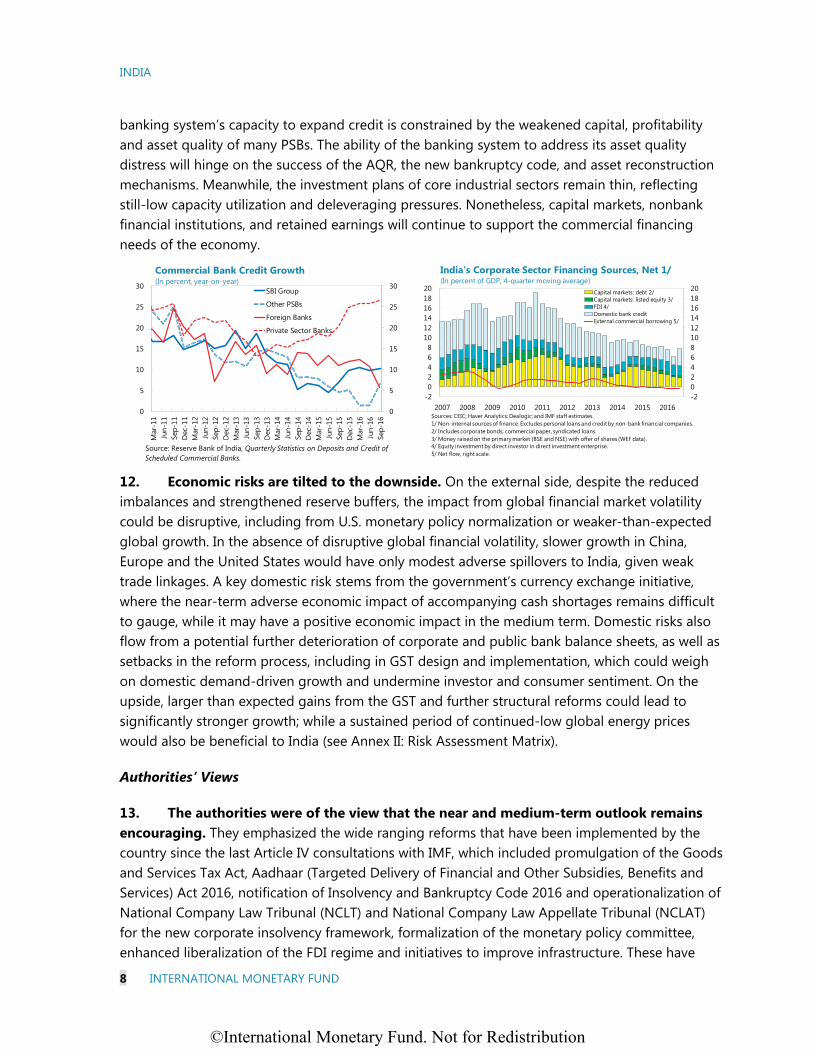
banking system’s capacity to expand credit is constrained by the weakened capital, profitability and asset quality of many PSBs. The ability of the banking system to address its asset quality distress will hinge on the success of the AQR, the new bankruptcy code, and asset reconstruction mechanisms. Meanwhile, the investment plans of core industrial sectors remain thin, reflecting still-low capacity utilization and deleveraging pressures. Nonetheless, capital markets, nonbank financial institutions, and retained earnings will continue to support the commercial financing needs of the economy.
12. Economic risks are tilted to the downside. On the external side, despite the reduced imbalances and strengthened reserve buffers, the impact from global financial market volatility could be disruptive, including from U.S. monetary policy normalization or weaker-than-expected global growth. In the absence of disruptive global financial volatility, slower growth in China, Europe and the United States would have only modest adverse spillovers to India, given weak trade linkages. A key domestic risk stems from the government’s currency exchange initiative, where the near-term adverse economic impact of accompanying cash shortages remains difficult to gauge, while it may have a positive economic impact in the medium term. Domestic risks also flow from a potential further deterioration of corporate and public bank balance sheets, as well as setbacks in the reform process, including in GST design and implementation, which could weigh on domestic demand-driven growth and undermine investor and consumer sentiment. On the upside, larger than expected gains from the GST and further structural reforms could lead to significantly stronger growth; while a sustained period of continued-low global energy prices would also be beneficial to India (see Annex II: Risk Assessment Matrix).
Authorities’ Views
13. The authorities were of the view that the near and medium-term outlook remains encouraging. They emphasized the wide ranging reforms that have been implemented by the country since the last Article IV consultations with IMF, which included promulgation of the Goods and Services Tax Act, Aadhaar (Targeted Delivery of Financial and Other Subsidies, Benefits and Services) Act 2016, notification of Insolvency and Bankruptcy Code 2016 and operationalization of National Company Law Tribunal (NCLT) and National Company Law Appellate Tribunal (NCLAT) for the new corporate insolvency framework, formalization of the monetary policy committee, enhanced liberalization of the FDI regime and initiatives to improve infrastructure. These have
-202468101214161820
-202468
101214161820
2007 2008 2009 2010 2011 2012 2013 2014 2015 2016
Capital markets: debt 2/Capital markets: listed equity 3/FDI 4/Domestic bank creditExternal commercial borrowing 5/
India's Corporate Sector Financing Sources, Net 1/(In percent of GDP, 4-quarter moving average)
Sources: CEIC; Haver Analytics; Dealogic; and IMF staff estimates.1/ Non-internal sources of finance. Excludes personal loans and credit by non-bank financial companies.2/ Includes corporate bonds, commercial paper, syndicated loans.3/ Money raised on the primary market (BSE and NSE) with offer of shares (WEF data).4/ Equity investment by direct investor in direct investment enterprise.5/ Net flow, right scale.
0
5
10
15
20
25
30
0
5
10
15
20
25
30
Mar
-11
Jun-
11Se
p-11
Dec
-11
Mar
-12
Jun-
12Se
p-12
Dec
-12
Mar
-13
Jun-
13Se
p-13
Dec
-13
Mar
-14
Jun-
14Se
p-14
Dec
-14
Mar
-15
Jun-
15Se
p-15
Dec
-15
Mar
-16
Jun-
16Se
p-16
SBI Group
Other PSBs
Foreign Banks
Private Sector Banks
Commercial Bank Credit Growth(In percent, year-on-year)
Source: Reserve Bank of India, Quarterly Statistics on Deposits and Credit of Scheduled Commercial Banks.
©International Monetary Fund. Not for Redistribution

INDIA
INTERNATIONAL MONETARY FUND 9
translated into stronger macroeconomic fundamentals and more resilient growth. The authorities also indicated the role played by Direct Benefit Transfer and JAM (Jan Dhan Yojana bank accounts, Aadhaar identification, and mobile banking) trinity in complementing efforts of the government towards achievement of inclusive growth and fiscal consolidation. They expected agricultural output to improve following the return to a normal monsoon, industrial output to firm up, and services sector growth to remain stable. They agreed that while the replacement of specific banknotes could weigh on economic activity in cash sensitive sectors in the short run, this effect would not extend beyond two quarters, and would be outweighed by the positive medium-term impact from a more efficient payments system and greater formalization of business activities. Looking ahead, the authorities agreed with staff that the overall impact of the GST on growth would be positive. More generally, the continuation of structural reforms would strengthen growth outcomes in the medium term.
14. Risks to the outlook were seen as coming more importantly from abroad. In particular, the authorities felt that though weak global growth and the potential of financial spillovers in a world characterized by highly accommodative monetary policies and negative interest rates in many advanced economies posed risks for India, the country was well prepared to navigate any accompanying turbulence. They also expressed concern about prospects for their exports, stemming from a possible upsurge in protectionism in advanced economy markets.
KEY POLICY ISSUES A. Strengthening the Financial Sector and Reining in Risks
15. The policy impetus to clean up banks’ balance sheets has led to a considerable uptick in the recognition of non-performing assets (NPAs) among Indian banks. NPA slippages, particularly among public sector banks (PSBs), accelerated considerably to 7.2 percent in FY2015/16, up from 3.4 percent in FY2014/15.5 The sharp rise in new NPAs reflects a strong policy impetus from the RBI to enforce robust asset quality recognition and a bank balance sheet clean-up by March 2017, following an AQR initiated in December 2015. The share of restructured assets in total advances receded to 4.1 percent, from 7.1 percent a year earlier, due to more active re-classification of standard restructured loans into NPAs as a result of the AQR. However, the ratio of stressed assets (restructured assets and NPAs) continued to edge up to 10.8 percent at end-FY2015/16 (from 10 percent a year earlier), in part reflecting broader recognition of NPAs and slippages in previously un-restructured exposures. Altogether, most AQR-related recognition of NPAs appears to have already materialized.
16. However, provisioning and debt recovery remain key challenges for banks. NPA recognition has led to an uptick in provisioning, accounting for a further decline in PSBs' profitability, with the ROA of PSBs turning negative in FY2015/16. However, the PSBs’ aggregate provisioning coverage ratio continues to be low, at 39 percent as of end-FY2015/16, raising
5 The NPA slippage ratio is the ratio of gross new NPAs during the year to standard assets at the beginning of the year. Estimates of NPA slippages, and shares of restructured and stressed assets are from RBI data based on OSMOS returns.
©International Monetary Fund. Not for Redistribution
INDIA
10 INTERNATIONAL MONETARY FUND
concerns about its sufficiency.6 Moreover, PSBs’ loan recovery capacity remains weak, with efforts to counteract the rise in NPAs met primarily through write-offs. Write-offs accounted for a 1.2 percentage-point offset in NPA slippage rates in FY2015/16, while loan recoveries accounted for only 0.6 percentage points (down from 0.8 percentage points a year earlier), underscoring the need for timely implementation of debt resolution reforms.
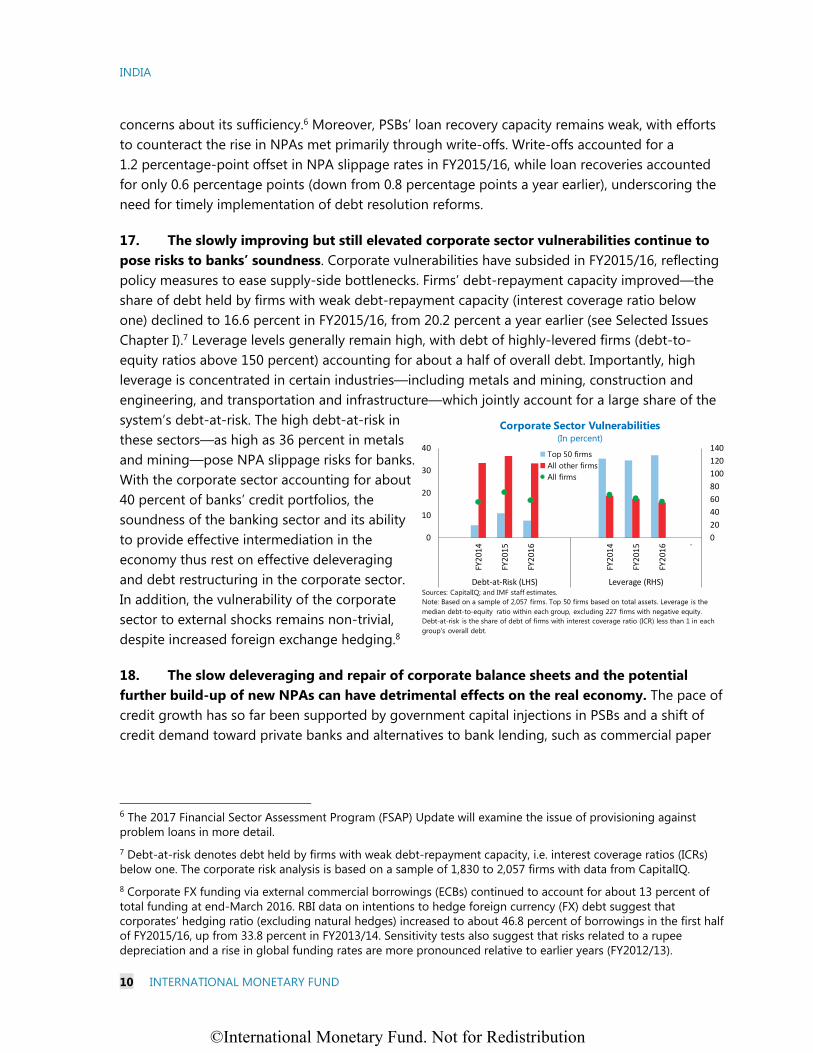
17. The slowly improving but still elevated corporate sector vulnerabilities continue to pose risks to banks’ soundness. Corporate vulnerabilities have subsided in FY2015/16, reflecting policy measures to ease supply-side bottlenecks. Firms’ debt-repayment capacity improved—the share of debt held by firms with weak debt-repayment capacity (interest coverage ratio below one) declined to 16.6 percent in FY2015/16, from 20.2 percent a year earlier (see Selected Issues Chapter I).7 Leverage levels generally remain high, with debt of highly-levered firms (debt-to-equity ratios above 150 percent) accounting for about a half of overall debt. Importantly, high leverage is concentrated in certain industries—including metals and mining, construction and engineering, and transportation and infrastructure—which jointly account for a large share of the system’s debt-at-risk. The high debt-at-risk in these sectors—as high as 36 percent in metals and mining—pose NPA slippage risks for banks. With the corporate sector accounting for about 40 percent of banks’ credit portfolios, the soundness of the banking sector and its ability to provide effective intermediation in the economy thus rest on effective deleveraging and debt restructuring in the corporate sector. In addition, the vulnerability of the corporate sector to external shocks remains non-trivial, despite increased foreign exchange hedging.8
18. The slow deleveraging and repair of corporate balance sheets and the potential further build-up of new NPAs can have detrimental effects on the real economy. The pace of credit growth has so far been supported by government capital injections in PSBs and a shift of credit demand toward private banks and alternatives to bank lending, such as commercial paper
6 The 2017 Financial Sector Assessment Program (FSAP) Update will examine the issue of provisioning against problem loans in more detail. 7 Debt-at-risk denotes debt held by firms with weak debt-repayment capacity, i.e. interest coverage ratios (ICRs) below one. The corporate risk analysis is based on a sample of 1,830 to 2,057 firms with data from CapitalIQ. 8 Corporate FX funding via external commercial borrowings (ECBs) continued to account for about 13 percent of total funding at end-March 2016. RBI data on intentions to hedge foreign currency (FX) debt suggest that corporates’ hedging ratio (excluding natural hedges) increased to about 46.8 percent of borrowings in the first half of FY2015/16, up from 33.8 percent in FY2013/14. Sensitivity tests also suggest that risks related to a rupee depreciation and a rise in global funding rates are more pronounced relative to earlier years (FY2012/13).
0
20
40
60
80
100
120
140
0
10
20
30
40
FY2
014
FY2
015
FY2
016
FY2
014
FY2
015
FY2
016 .
Debt-at-Risk (LHS) Leverage (RHS)
Corporate Sector Vulnerabilities(In percent)
Top 50 firmsAll other firmsAll firms
Sources: CapitalIQ; and IMF staff estimates.Note: Based on a sample of 2,057 firms. Top 50 firms based on total assets. Leverage is the median debt-to-equity ratio within each group, excluding 227 firms with negative equity. Debt-at-risk is the share of debt of firms with interest coverage ratio (ICR) less than 1 in each group's overall debt.
©International Monetary Fund. Not for Redistribution

INDIA
INTERNATIONAL MONETARY FUND 11
(CP) funding.9 However, the need for capital preservation has led to a marked slowdown of credit growth at PSBs, down to 4.0 percent year-on-year as of March 2016 from an average of 11.7 percent in the preceding three years (credit growth figures from RBI Financial Stability Report). Altogether, a larger-than-anticipated increase in new NPA formation due to shocks affecting corporates’ debt repayment capacity—e.g., due to weaker demand in certain sectors, or exchange rate or interest rate shocks—or PSBs’ inability to raise adequate capital, could further dampen the provision of credit to the real economy and impair growth (Figure). While the credit intensity of the Indian economy is relatively low, the risk of an increase in NPAs is exacerbated by high corporate leverage, which magnify banks’ losses in response to shocks, and has already been a drag on domestic investment. The limited monetary and fiscal space in India constrains policymakers’ capacity to counteract any additional increase in NPAs due to a long gestation of corporate projects or further domestic or external shocks.
19. PSBs’ capital augmentation needs are expected to have a modest fiscal impact. At present, all PSBs meet Basel III capital requirements, with an aggregate common equity Tier 1 (CET-1) ratio of 8.7 percent as of end-FY2015/16, above the 6.125 minimum requirement (including a capital conservation buffer, CCB) under India’s implementation schedule.10 However, further balance sheet clean-up and Basel III implementation should account for additional PSB recapitalization needs in the coming years, at about 1.5 to 2.4 percent of FY2018/19 GDP (cumulatively over the next three years) under a simulation assuming a transition of 25 percent of restructured loans to NPAs; 40 percent minimum provisioning coverage ratio; and build-up of an additional 0 to 2 percentage-point capital buffer, respectively. Under this simulation, the government share would range between 1 to 1.6 percent of FY2018/19 GDP (cumulatively over
9 The government announced in the FY2016/17 Budget injection of Rs 229 billion of capital in PSBs, 75 percent of which was disbursed immediately to support lending operations and enable PSBs to tap market funding. 10 All but one bank (a private bank) currently meet Basel III’s minimum common equity tier-1 (CET 1) and Tier-1 capital requirements. Banks’ CET-1 capital positions were also supported by the RBI’s easing of capital requirements in March 2016, permitting banks’ use of property holdings’ revaluation reserves, among others, as CET-1 capital.
©International Monetary Fund. Not for Redistribution

INDIA
12 INTERNATIONAL MONETARY FUND
the next three years).11 This estimate includes a cumulative capital injection of 0.5–0.8 percent of FY2018/19 GDP, related to the ongoing implementation of Basel III in India, expected to be finalized by March 2019. However, recapitalization costs would be considerably higher if there is a policy shift to more conservative provisioning requirements.
20. Recent policy reforms have been extensive, targeting a PSB balance sheet clean-up, and improving distressed asset resolution mechanisms. The AQR, initiated by the RBI in December 2015, prompted banks to take active steps to recognize all NPAs and ensure the achievement of clean and appropriately provisioned balance sheets by March 2017. In an effort to improve debt resolution mechanisms, a scheme permitting debt-to-equity conversions of unsustainable portions of banks' exposures was introduced by the RBI in June 2016.12 Importantly, the new Insolvency and Bankruptcy Code, adopted in May 2016, targets a drastic reduction in the timing of bad asset resolution, from an existing average of 4.3 years to about 180 days, and consolidates legal treatment of bankruptcy. Also, the regime for foreign ownership of Asset Reconstruction Companies (ARCs) was relaxed, permitting foreigners to take full stakes in ARCs. Further, the UDAY scheme, aimed at reviving distressed state-owned electricity distribution companies (DISCOMs), envisages state governments taking on 75 percent of the DISCOMs’ debt owed to banks which, together with accompanying measures to improve operational efficiency should also help rein in further bank asset quality deterioration (see Box 2). Finally, the eligibility criteria for government recapitalization support to troubled PSBs were amended in September 2016, and now focus on a PSB’s cost of operations, credit quality and ability to recover assets.
21. Ensuring adequate capitalization, full recognition of risks on PSB’s balance sheets, and NPA resolution are key to maintaining financial stability and enhancing the ability of the financial sector to contribute to growth. In this regard, staff recommends:
Ensuring Adequate PSB Capitalization. To support PSBs' current lending capacity, the authorities should consider larger government capital injections in PSBs and some divestments of banks’ non-core assets. The government’s capital injections in PSBs are thus far modest in scale (0.2 percent of projected FY2018/19 GDP cumulatively over the next three years), and largely leave recapitalizations up to affected PSBs to raise capital in the markets. The new recapitalization norms introduced by the government are welcome, as they link potential support to performance, and thus create a clear demarcation between better-performing and worse-performing banks, which can open up the way for potential restructuring, including mergers and acquisitions, in the banking sector.
NPA Resolution. A more comprehensive strategy, building on the Indian authorities’ policies to boost banks’ NPA resolution capacity, is needed. In this regard, staff recommends the following:
11 The estimate for the government’s share assumes no dilution of government ownership in PSBs, currently at about 61 percent. Implementation of the Basel III capital framework is progressing and is expected to be completed by end-March 2019. However, potential Basel III-related risk weight changes might necessitate additional capital infusions. 12 The Scheme for Sustainable Structuring of Stressed Assets (S4A).
©International Monetary Fund. Not for Redistribution

INDIA
INTERNATIONAL MONETARY FUND 13
o Continued stringent supervision. Following the conclusion of the AQR, the authorities should persist in their commitment to robust supervision of banks’ activities, including regulatory requirements for frequent in-depth reporting of NPA portfolios, ongoing monitoring of banks’ capital and profitability, intensive on-site supervision, and enhanced regulation and guidance. More robust provisioning should also be pursued.
o Corporate debt resolution. Several asset restructuring mechanisms—including 5:25 Refinance Scheme, Strategic Debt Restructuring (SDR), and S4A—have been introduced to facilitate corporate restructuring and debt resolution.13 As corporate debt restructuring thus far has been limited, the authorities should place priority on continuing to incentivize use of these mechanisms, and implementing measures to rehabilitate distressed sectors. Efforts to improve corporate debt restructuring should also ensure prompt implementation of the new Bankruptcy Code, and introduction of out-of-court corporate debt restructuring mechanisms.
o Distressed debt markets. The market for distressed debt in India is underdeveloped, and suffers from difficulties in price discovery and low capitalization of Asset Reconstruction Companies (ARCs). The authorities should follow through on recent steps taken to develop this market in India, and should examine the costs and benefits of market-based mechanisms for the rehabilitation of distressed, but viable, firms, such as corporate restructuring vehicles that rely on asset management companies with experience in corporate turnarounds.14
PSB Governance Reforms. The authorities should follow through on their commitment to structural reforms, as outlined in the Indradhanush plan (August 2015), by strengthening ongoing NPA disclosures; enhancing PSBs’ governance (including risk management practices and accountability); and considering divestments and mergers.
Banks’ Statutory Liquidity Requirement. As the general government fiscal deficit continues to contract, the Statutory Liquidity Requirement (SLR) should be reduced further to facilitate more private sector lending, which can also be positive for the further development of the corporate bond market. The Indian government has been gradually reducing the SLR rate (currently at 20.5 percent, down from 25 percent of deposit liabilities in mid-2008).
22. The authorities should continue their efforts to develop the domestic corporate debt market. Pursuant to the recommendations of the Khan Committee, Indian regulators have introduced wide-reaching reforms (see Box 3). The new measures should provide a fillip to the
13 Under the 5:25 refinance scheme, banks can extend loan repayments for up to 25 years, with an option of loan refinancing every five years. 14 These include new RBI guidelines on banks’ sales of distressed assets; and liberalization of FDI in ARCs by increasing the investment limit under the automatic route to 100 percent of the paid-up capital of an ARC (from 49 percent previously). FIIs/FPIs are now also allowed to invest up to 100 percent of each tranche of ARC-issued Security Receipts (SRs), subject to sectoral caps.
©International Monetary Fund. Not for Redistribution

INDIA
14 INTERNATIONAL MONETARY FUND
development of the Indian corporate bond market, but would be made more effective by: (i) strengthening corporate balance sheets through vigorous rehabilitation and restructuring to raise demand for corporate bond issuances; (ii) developing risk transfer mechanisms, including the CDS market, to better support domestic institutional investment; and (iii) ensuring continued coordination on developing the bond market across key relevant agencies, including the Government of India, RBI, and Securities and Exchange Board of India (SEBI).15
23. The Indian government continues to work towards enhancing financial inclusion. The financial inclusion agenda has broadened over the past two years, evolving from providing greater access to bank accounts and financial services to introducing more remunerative savings vehicles to diminish the luster of traditional gold-based savings. The government’s introduction of gold monetization schemes can boost financial intermediation by channeling domestic gold holdings to gold savings accounts, although uptake thus far has been minimal. The launch of Pradhan Mantri Jan Dhan Yojana (PMJDY) in August 2014 led to the opening of bank accounts for 254 million previously unbanked individuals (see Box 4). There is now continued emphasis on increasing transactional volumes on the PMJDY accounts (including by Aadhaar-supported direct benefit transfers). 16 The Pradhan Mantri MUDRA Yojana (PMMY) scheme has sought to facilitate access to formal finance for micro, small and medium-sized enterprises through collateral-free loans, with close to 1 percent of GDP in loans having been disbursed under this scheme. The emphasis on financial inclusion should continue to be facilitated by new technologies, making greater use of mobile phone payments technology, such as the Unified Payments Interface platform introduced earlier this year, which links use of multiple bank accounts with banking services, including person-to-person transfers and merchant payments.
Authorities’ Views
24. The authorities agreed that corporate balance sheets in some sectors remain strained, but noted that steps were being taken to address vulnerabilities, including in the banking sector. They saw early signs that the financial health of listed corporates is improving. Efforts continue to reactivate stalled investment projects in the infrastructure sector, while the UDAY scheme is contributing to balance sheet repair for electricity distribution companies. On the banking side, the AQR has imposed a homogenous loan classification standard across the system and has been triggering adequate recognition, allowing the focus to shift to the resolution of NPAs. The mechanisms put in place by the RBI allow for tailored workouts depending on the specific causes of asset impairment, and the authorities expect an increase in their use while acknowledging that the resolution process will be gradual and take time. The new insolvency regime assigns a limited role to tribunals and already ensures dialogue between debtors and
15 Regulators—including RBI and SEBI—have been active in introducing numerous measures to deepen India’s corporate bond market based on the recommendations of the inter-agency Working Group on Development of Corporate Bond Market (published in August 2016). 16 India’s Unique Identification Authority began to issue biometric identification numbers to residents in September 2010. Identities are authenticated based on the holder’s fingerprints or iris scan. As of end-December 2016, the program had enrolled over 1,100 million people (https://portal.uidai.gov.in/uidwebportal/dashboard.do).
©International Monetary Fund. Not for Redistribution

INDIA
INTERNATIONAL MONETARY FUND 15
creditors. Nonetheless, the authorities are currently looking at the draft Arbitration Act to introduce some clauses that would allow out-of-court settlement.
25. The authorities underscored their commitment to ensuring adequate bank capitalization as per prudential requirements, maintaining stringent supervision, and deepening financial inclusion efforts. They pointed out that of the estimated capital needs of public sector banks (Rs 1.8 trillion through FY2018/19), Rs 0.7 trillion was to be infused by the Government. As part of this plan, the Government has infused Rs 250 billion in FY2015/16 and is infusing Rs 229 billion in FY2016/17. Banks have raised additional AT1 and Tier II capital in the market. Remaining capital needs would be covered from these alternative sources. With regard to staff’s assessment of remaining vulnerabilities, the authorities pointed out that the interest coverage ratio as a gauge for underlying corporate balance sheet health needs to be viewed in the context of cyclically depressed profits. They also noted that the decline in the provision coverage of banks reflected the countercyclical nature of the provisioning regime. They pointed out that the leverage ratio at sample levels were quite sensitive to sample selections and that the system-level leverage of Indian corporates was not large, while it was stressed for certain sectors.
B. Monetary Policy to Anchor Inflation
26. After some pick-up earlier in the year, CPI inflation has moderated in recent months. CPI inflation declined from an average of 9.8 percent during 2011–13 to an average of 4.9 percent in FY2015/16, driven by the collapse in global commodity prices, a range of supply-side measures, and a relatively tight monetary stance. Inflation dropped to 3.6 percent in November 2016, from an average of 5.4 percent in the first half of FY2016/17, largely due to a fall in the prices of vegetables. Underlying inflation momentum remained steady, however, with core inflation averaging 4.7 percent from April to November. Given the disinflation shock from the currency exchange initiative, widening the output gap to around ¾ of one percent of GDP, inflation is expected to remain at about 4¾ percent in March 2017. In the medium term, inflation is expected to remain within the RBI’s medium-term inflation target band (4 percent CPI inflation ± 2 percent). However, given food supply constraints, sticky household inflation expectations, and demand pressures from the implementation of the decennial pay increase in the public sector (along with expected similar adjustments to follow for state government employees), inflation is likely to remain in the upper half of the target band and susceptible to volatile price movements.
27. Following the policy rate cuts in 2015–16, monetary conditions remain consistent with coming near the RBI’s interim inflation target of 5 percent by March 2017. With the real policy interest rate at about 1.25 percent, which is at the lower end of the mission’s estimated
0
2
4
6
8
10
12
14
16
18
20
Sep-
06
Mar
-07
Sep-
07
Mar
-08
Sep-
08
Mar
-09
Sep-
09
Mar
-10
Sep-
10
Mar
-11
Sep-
11
Mar
-12
Sep-
12
Mar
-13
Sep-
13
Mar
-14
Sep-
14
Mar
-15
Sep-
15
Mar
-16
Sep-
16
Expectations: 1 Year AheadCPI: Food (y/y percent change)CPI: Combined (y/y percent change)
Household Inflation Expectations and Food Inflation(In percent)
Sources: CEIC; Haver Analytics; and IMF staff calculations.
©International Monetary Fund. Not for Redistribution

INDIA
16 INTERNATIONAL MONETARY FUND
neutral range of about 1.25–1.75 percent given current external conditions, the monetary policy stance is assessed to be broadly neutral. Any inflationary effects of the GST when implemented are expected to be small and transitory—if needed, the monetary policy response should be geared toward containing potential second-round effects. Given medium-term upside risks to food and CPI inflation, the authorities should stand ready to raise the policy rate if inflationary pressures gather pace.
28. Monetary policy credibility has strengthened with the finalization of the flexible inflation targeting framework and agreement on the official medium-term inflation target. Amendments to the RBI Act and the formation of the Monetary Policy Committee (September 2016) completed the statutory underpinning of flexible inflation targeting, and the headline CPI inflation target of 4 percent with a symmetrical band of 2 percent was retained as the official inflation target for the next five years (August 2016). The RBI has taken steps to improve the operating framework and has focused on enabling greater transmission of policy rate cuts. These steps include adjusting the liquidity management framework, guidelines to ensure consistency in banks’ calculation of lending rates, and more frequent revisions of administered rates on small savings schemes.17 The increase in banking system liquidity as a result of the currency exchange initiative can reduce banks’ funding costs and thereby lead to a decline in bank lending rates. Nonetheless, bringing down inflation expectations of the general public and anchoring them at a lower level has proven challenging, as food inflation propagates rapidly into non-food inflation, and household inflation expectations remain near double digits.18 Terminating the adaptive nature of Indian household inflation expectations will likely require a prolonged period of low inflation, underpinned by a continued anti-inflationary monetary policy stance.
29. Supply-side reforms, particularly in agriculture, continued fiscal consolidation, and relieving impediments to monetary transmission are prerequisites for low inflation in the medium term. While inflation targeting has served India well over the past two years, by providing a well-defined nominal anchor and a clear policy objective and thus improving policy
17 In April 2016, the RBI announced a narrowing of the policy rate corridor from +/- 100 bps to +/- 50 bps and moved towards reducing the liquidity deficit associated with the liquidity adjustment facility (LAF). 18 See R. Anand, D. Ding and V. Tulin (2014), “Food Inflation in India: Role for Monetary Policy,” IMF WP 14/148.
3.0
3.5
4.0
4.5
5.0
5.5
6.0
6.5
7.0
3.0
3.5
4.0
4.5
5.0
5.5
6.0
6.5
7.0
2000 2002 2004 2006 2008 2010 2012 2014 2016
India: long-term (5-year ahead) inflation expectations(consensus forecasts)
Sources: Consensus Forecasts.
India: Long-term Inflation Expectations (In percent, 2-quarter moving average)
6.0
6.5
7.0
7.5
8.0
8.5
10.0
10.5
11.0
11.5
12.0
12.5
Mar
-13
Jul-
13
Nov
-13
Mar
-14
Jul-
14
Nov
-14
Mar
-15
Jul-
15
Nov
-15
Mar
-16
Jul-
16
Nov
-16
Public Bank
Private Bank
Policy repo interest rate (RHS)
India: Bank Lending Rates and Policy Repo Rate(In percent)
Sources: CEIC Data Ltd., Reserve Bank of India.
New loans: weighted average lending rates
©International Monetary Fund. Not for Redistribution

INDIA
INTERNATIONAL MONETARY FUND 17
communication, further reforms will need to complement the new framework to durably reduce inflation. Consensus Surveys show that five-year ahead inflation expectations have come down by about ¾ of one percentage point since 2014, but remain above the midpoint of the inflation target band (4 percent CPI inflation). In view of India’s large weight on food in its CPI basket and structurally-high food inflation, achieving this target on a sustained basis will require structural reforms to ramp up food supply commensurate with strong consumption demand. Staff sees scope to improve food grain buffer stock management, and for increasing investment in storage and distribution infrastructure for perishable produce. Continued fiscal consolidation to narrow public sector demand for credit remains paramount for the success of the new monetary framework, as does further reducing impediments to monetary transmission (including reductions in still-high SLR rates).19
Authorities’ Views
30. The authorities were confident about the prospects of keeping inflation close to the center of the target band in the medium-term. They considered the current monetary stance to be accommodative and noted that the future stance would be data dependent. The authorities agreed that the output gap remained negative, and they estimated that the neutral real interest rate had declined to 1.25 percent. In their view, recent reforms to the monetary policy and liquidity management framework had improved the transmission of monetary policy. Anchoring household expectations has remained a challenge, but the authorities felt that these should not be overemphasized in policy setting, as inflation expectations appeared backward-looking and closely related to food inflation at the time of the survey. The authorities agreed with staff on the importance of continued supply-side reforms to keep food inflation low and help anchor inflation expectations.
C. Continuing Fiscal Consolidation
31. The near-term fiscal policy envisages a gradual reduction in fiscal deficits. The FY2015/16 Union Budget execution was in line with the target, as a series of fuel excise hikes offset higher-than-expected food subsidies and a shortfall in corporate income tax and disinvestment proceeds. Accordingly, revenue measures allowed for a planned ¼ of one percentage point increase in the ratio of public investment to GDP, which had been on a declining trend for several years. The FY2016/17 Budget targets a fiscal deficit of 3.5 percent of GDP (equivalent to about 3.8 percent of GDP in IMF terms) and thus a return to fiscal consolidation, as has been consistently advocated by staff, and which is expected to be achieved. The key risk to the current year’s revenue target is the repercussions from the currency exchange initiative, which could dent tax collections and disinvestment receipts (which are classified as revenues under the authorities’ definition). Meeting the deficit target may necessitate expenditure cuts, including
19 On asymmetric monetary transmission, see S. Das (2015), “Monetary Policy in India: Transmission to Bank Interest Rates,” IMF WP 15/129. Transmission would benefit from reducing the SLR over time to a level in line with the liquidity coverage ratio (LCR), continued focus on increasing competition in the banking sector, and further progress on financial inclusion, which will decrease the presence of informal finance.
©International Monetary Fund. Not for Redistribution

INDIA
18 INTERNATIONAL MONETARY FUND
lower capital spending. The authorities should leverage the increase in the formal economy as a result of the currency exchange initiative, as well as associated income declaration schemes, to expand the tax revenue base. If needed, the authorities should continue to take the opportunity to raise petroleum-product taxes while oil prices remain low.
32. The authorities have made strong progress on subsidy reforms in the past two years. A major decline in the subsidy bill (down from 2.5 percent of GDP in FY2012/13 to about 1.5 percent of GDP expected in FY2016/17) has been achieved. This involved the near-elimination of fuel subsidies, and increasing use of direct benefit transfers to channel the remaining commodity subsidies (including the PAHAL scheme for cooking gas, and digitization and Aadhaar seeding of Public Distribution System food subsidy beneficiaries) and social payments. The Aadhaar Act passed in early 2016 is an important reform that enables linking of entitlements and subsidies to biometric identification of beneficiaries, thereby advancing more efficient targeting of social programs.
33. With continued delays in reaching the medium-term deficit target, India’s public debt ratio is projected to remain high and decline only gradually. Even though introduction of the GST has helped clarify the government’s medium-term fiscal plans, in the absence of major additional expenditure reforms, achievement of the Union deficit target of 3 percent of GDP by FY2017/18 and thereafter,20 may be further delayed. Such delays could undermine confidence and credibility, and reduce available fiscal space for priority spending in the medium term. Staff’s projections, which are on the basis of current policies and assume no major legislative changes, suggest that the central government will underperform against its fiscal adjustment targets. In addition, salary increases by the states will not only impede reduction of state budget deficits but will also likely entail public investment cuts in states bound by the borrowing limits. The general government fiscal deficit is thus projected to remain elevated in the range of 6–7 percent of GDP through FY2018/19. Accordingly, public debt as a share of GDP is projected to remain at almost 70 percent by end-FY2016/17, and will decline gradually over the medium term, remaining above India’s debt tolerance range (60–65 percent of GDP) for several years.21 India’s public debt, with a favorable maturity structure and currency composition, as well as a captive domestic investor base, is expected remain sustainable (see Annex III: Debt Sustainability Analysis).22
34. India has limited fiscal space given the need to reduce its high level of public debt. India’s general government deficit is high by global standards, posing a challenge to durably 20 To institutionalize financial discipline in public finances, the 2003 Fiscal Responsibility and Budget Management (FRBM) Act introduced a medium-term ceiling for the central government’s fiscal deficit of 3 percent of GDP. As per FRBM, state deficits have been effectively bound by a borrowing limit of 3 percent of any given state’s GDP, and states’ deficits have on average remained near the limits. The FRBM Review Committee is at present examining the pros and cons behind altering the fiscal rules attached to the FRBM. 21 Even though the general government primary deficit is estimated to have declined by about ¾ of one percent of GDP during FY2014/15-FY2015/16, the lower contribution of automatic debt dynamics on account of slower nominal GDP growth contributed to an increase in public debt ratio. In addition, states have issued about Rs 1.6 trillion in UDAY bonds since the launch of the scheme in November 2015, which did not count towards states’ annual borrowing limits but increased the public debt stock by over one percent of GDP. 22 India’s sovereign debt credit ratings are at the lowest investment grade (Moody’s Baa3; S&P BBB-; Fitch BBB-).
©International Monetary Fund. Not for Redistribution

INDIA
INTERNATIONAL MONETARY FUND 19
reducing inflation. In addition, the interest cost of public debt is one fourth of general government revenues, and financial repression (operating through the SLR) ensures low real interest rates on public debt and helps underpin debt sustainability. Reducing the SLR, making more room for private credit, can safely proceed only if the debt burden is reduced.
35. Staff sees merit in strengthening the fiscal responsibility framework of the center to anchor policies. To limit pro-cyclical fiscal policy, the fiscal responsibility framework could feature a ceiling on nominal expenditure growth and be underpinned by a medium-term fiscal framework to facilitate better planning and protect public investment. Staff also recommends anchoring the deficit reduction path by setting a medium-term public debt target and specifically a debt-to-GDP ratio of 60 percent, in line with staff estimates of India’s debt tolerance range.23 Rebuilding of fiscal space should be complemented by reorienting public expenditure away from untargeted subsidies towards growth-enhancing capital and social spending.
36. Implementing a robust goods and services tax (GST), enhancing fiscal federalism, and continued subsidy reforms are policy priorities. Staff recommends:
Tax reform. India’s tax revenue-to-GDP ratio (at around 17½ percent) remains considerably below its emerging market peers. Implementation of a robust GST should be a key priority given its growth-enhancing effects. The GST should have minimal exemptions, uniform cross-state rates, and as few tax rate tiers as possible (see Box 5). Key production inputs, such as energy and real estate, should be kept within the tax base to enable greater output gains and reduce the tax burden across sectors. Rationalization of the structure of direct taxes toward a lower corporate income tax rate with smaller and streamlined deductions and exemptions should continue. Efforts to improve tax administration should be stepped up as the scope for revenue gains is large.
Fiscal discipline. Rebuilding general government fiscal space and increasing the efficiency of public expenditure call for enhancing fiscal institutions of both the Union and the states. Fiscal responsibility frameworks should be strengthened to ensure compliance with fiscal targets and the quality of fiscal adjustment, including through setting up of an independent fiscal council for the center, strengthening medium-term expenditure and budget frameworks, and moving to accrual accounting (see Selected Issues Chapter III). The authorities should take advantage of the newly-created establishment of the South Asia Regional Technical Assistance and Training Center (SARTTAC), based in New Delhi, to strengthen institutional capacity and skills, including at the state level.
Subsidy reform. Overhauling India’s food and fertilizer subsidy regime via better targeting, improving efficiency, and reducing distortions can generate substantial fiscal gains. Untargeted food subsidies should be pared back, including by rationalizing the list of eligible beneficiaries and reforming the inefficient Food Corporation of India (FCI) and the Public Distribution System 23 IMF staff analysis (see Selected Issues Chapter II) suggests that India’s estimated debt-to-GDP threshold for maintaining its current level of market creditworthiness lies in the range of 65-70 percent. Inclusion of some buffer to account for uncertainty (including for the materialization of contingent liabilities), suggests a debt ratio of 60–65 percent of GDP.
©International Monetary Fund. Not for Redistribution

INDIA
20 INTERNATIONAL MONETARY FUND
(PDS) network. Wider application of the current approach to non-food subsidy payments—namely direct benefit transfers, increased financial inclusion, and use of the Aadhaar identification system to better identify beneficiaries—should continue to yield large fiscal savings (see also Selected Issues Chapter IV).
Authorities’ Views
37. The authorities reiterated their commitment to achieving the 3.5 percent of GDP deficit target (authorities’ definition) in 2016/17. They stated that any slippage in spectrum sales would be made up by buoyancy in tax receipts (including revenues from the income declaration scheme. Moreover, interest expenses were expected to be lower than budgeted owing to the recent contraction of sovereign yields.
38. Looking ahead, the authorities would continue to balance adherence to fiscal consolidation with a commitment to increase investment and social spending. Further consolidation would be achieved through higher growth and revenue mobilization from other sources. The authorities noted that the 2017/18 deficit target would be finalized once the FRBM Review Committee recommendations had been received and reviewed. The authorities were confident that the outstanding issues related to GST implementation could be settled promptly. The GST would provide for a significant improvement over the current indirect tax system. Tax reform priorities going forward include continuing the phased reduction of the corporate income tax rate from 30 to 25 percent over four years, coupled with a simultaneous reduction in tax deductions. On the expenditure side, initiatives such as the rationalization of centrally-sponsored schemes, the advancement of the Union Budget presentation by one month for better execution planning, the merger of the railways budget with the Union budget, elimination of distinction between plan and non-plan expenditure, and the gradual replacement of generalized subsidies by direct benefit transfers, would all enhance the quality of public spending (see also Annex V: Expenditure Reforms).
D. Maintaining External Stability
39. India’s external position remains broadly consistent with medium-term fundamentals and desirable policy settings, and reserves are assessed to be adequate (see Annex IV on External Sector Assessment). Following a US$55 billion increase in international reserves over FY2014/15 and FY2015/16, driven by robust capital inflows (chiefly FDI and FPI portfolio equity flows), reserves have remained close to their end-March 2016 level, standing at about US$360 billion as of late-December 2016, slightly above 150 percent of the IMF’s reserve adequacy metric and around 8 months of import cover. Foreign exchange (FX) intervention continues to be guided by the need to limit excessive volatility, and has been limited during 2015 and 2016. While positive policy settings and continued macroeconomic stability have reduced external vulnerabilities, there is a continued need for vigilance given sharp movements in global commodity prices and global financial market volatility.
©International Monetary Fund. Not for Redistribution

INDIA
INTERNATIONAL MONETARY FUND 21
40. Boosting exports remains a key challenge. Despite a sharp contraction in merchandise exports, India’s trade balance improved in 2015/16 due to an increase in the oil trade balance by about 2 percent of GDP as well as weak non-oil import growth. The contraction in merchandise exports was partly due to the collapse in commodity prices (refined petroleum products made up about one-fifth of the value of goods exports in 2014/15), weak global demand, and ongoing appreciation of the rupee real effective exchange rate.24 Nonetheless, India’s export performance was comparable to that of emerging market peers, and its share in world merchandise exports has remained relatively stable. While India’s exports are geographically diversified, given the broad-based slowdown in external demand, further trade liberalization, continued progress on supply-side reforms, and steps to reduce barriers to trade and facilitate a focus on higher value-added products have become even more pressing. India’s high import tariffs could also weigh on trade expansion by affecting the quality and availability of inputs and potentially undermine productivity growth (see Selected Issues Chapter V).25
41. Although India’s external financing requirements have declined with shrinking current account imbalances, further enhancing the environment for attracting stable, non-debt creating capital flows, particularly FDI, remains important. In the past two years, several steps have been taken toward this goal, including by liberalizing caps on FDI inflows in most sectors—this has helped FDI inflows increase from US$31 billion in FY2013/14 to over US$45 billion in FY2015/16, far exceeding the FY2015/16 CAD of US$22 billion (see Selected Issues Chapter VI). Nonetheless, a more conducive business environment is necessary to attract even greater FDI flows and help ensure the success of the “Make in India” initiative. In addition, restrictions on foreign borrowing by firms were relaxed in 2015 and limits for foreign portfolio investors’ (FPI) purchases of government bonds were increased in 2016. India’s external debt remains low at 23 percent of GDP at end-June 2016, given that net external borrowing by Indian corporates was minimal in 2014/15 and 2015/16. Further liberalization of external commercial borrowings (ECBs) should proceed cautiously and be carefully monitored by the RBI, given continuing corporate vulnerabilities.
42. In the event of a surge in global financial market volatility, India should continue to rely on exchange rate flexibility as the main shock absorber. As consistently advocated by
24 Using staff’s average estimated income elasticity of exports of 1.5, in the absence of further measures to enhance competiveness, India’s merchandise export growth will likely remain below 10 percent per annum (see M. Raissi and V. Tulin (2015), “Price and Income Elasticity of Indian Exports: Supply-Side Bottlenecks,” IMF WP 15/161). 25 According to the World Trade Organization’s 2016 World Tariff Profile, India’s tariff rate (a simple average of MFN tariff rates) is 13.4 percent for all products, 32.7 percent for agricultural products, and 10.1 percent for non-agricultural products—in all three cases India’s rates are among the highest across emerging market economies.
0
2
4
6
8
10
12
14
16
0.0
0.2
0.4
0.6
0.8
1.0
1.2
1.4
1.6
1.8
2.0
2000
2001
2002
2003
2004
2005
2006
2007
2008
2009
2010
2011
2012
2013
2014
2015
Brazil India Russia South AfricaEM-Median China (RHS) Indonesia
Sources: IMF, World Economic Outlook, and staff estimates.
Share of Non-oil Exports (In percent of World non-oil goods export)
©International Monetary Fund. Not for Redistribution

INDIA
22 INTERNATIONAL MONETARY FUND
staff, to minimize disruptive movements in the currency divorced from fundamentals, continued exchange rate flexibility could be accompanied by judicious FX intervention, either through spot and forward markets, or via liquidity provision through swaps.
Authorities’ Views
43. The authorities concurred with the assessment of the external position. They were broadly comfortable with the current level of reserves, but noted that the direction of reserves would depend on developments in capital flows. While the trade deficit was likely to widen due to weakening terms of trade and remittances have declined, the current account deficit was expected to remain relatively subdued and below its sustainable level, which they estimated at about 2⅓ percent of GDP. The authorities attributed recent export weakness mainly to sluggish external demand. They were optimistic about scope to expand exports, given the country’s small global market share, for which a number of supportive initiatives were being implemented in trade facilitation and infrastructure, including the development of coastal employment zones. The authorities underscored their commitment to an open trade regime, noting that once agricultural products are excluded, India’s tariffs were broadly comparable to those of other emerging market peers. The authorities expressed concern that India is confronting rising non-tariff barriers in export markets, though the country had refrained from increasing import restrictions except for anti-dumping measures.
E. Structural Policies to Boost Growth and Employment 44. India has made considerable progress on both the pace and the composition of reforms. While the pace of reform has decelerated for most of the countries presented in OECD’s responsiveness indicator, India was one of a few countries to retain the reform momentum in recent years. In 2016, India continued advancing a broad range of important reforms, particularly fiscal, monetary and financial, as well as trade and factor market reforms (see Annex I).
45. Among the long agenda of reforms, labor market reforms should take increasing priority. The reform agenda includes addressing long-standing supply bottlenecks, labor and product market reforms, and improving the business climate.26 A comprehensive package of structural reforms remains the preferred approach, with priority given to labor market reforms to facilitate greater and better quality job creation, and enhance the impact of recent product market reforms. Building on recent progress, key necessary measures include:
26 See IMF India Article IV Staff Reports of 2014, 2015 and 2016 for additional details. Such policy priorities for India have also been identified in the OECD 2016 report Going for Growth.
00.10.20.30.40.50.6
Ger
man
y
Japa
n
Uni
ted
Stat
es
Aus
tral
ia
Kore
a
Fran
ce
Italy
New
Zea
land
Spai
n
Port
ugal
Colo
mbi
a
Indo
nesi
a
Turk
ey
Sout
h A
fric
a
Chin
a
Indi
a
Advanced economies Emerging economiesSource: OECD Note: OECD produces a reform responsiveness indicator that measures the extent of reform in five broad areas: (i) product and labor market regulations, (ii) human capital formation, (iii) tax and benefits systems, (iv) trade and investment regulation, and (v) innovation policies. The reform responsiveness indicator reflects the share of policy recommendations from OECD's "Going for Growth" reports on which the country has taken significant action.
Structural Reforms Responsiveness Indicator (2011-2015 average)
©International Monetary Fund. Not for Redistribution

INDIA
INTERNATIONAL MONETARY FUND 23
Labor market reforms. Greater labor market flexibility and product market competition remain essential to create jobs and raise growth. More specifically, reforms to the Industrial Disputes Act (IDA) of 1947—which requires firms employing 100 or more workers to obtain government permission for layoffs, retrenchments, and closures—along with reforms to various restrictive clauses under the Factories Act of 1948, are key. In addition, reducing the numbers of labor laws, currently numbering around 250 at central and state level (these govern different aspects of the labor market such as minimum wages, resolution of industrial disputes, conditions for hiring and firing workers, and conditions for the closure of establishments), is also essential. Such reforms are key to increasing the employment of women, broadening the manufacturing base, and taking advantage of India’s favorable demographics by increasing employment in the formal sector of the economy. They are also of highest priority from a sequencing perspective, as they can enhance the positive impact of other structural reforms, strengthen the effectiveness of macroeconomic policy, and also help boost ongoing economic recovery (see Selected Issues Chapter VII).
Land reforms. Streamlining and expediting land acquisition and simplification of procedures, at both the center and state levels, remain a priority, including to facilitate and expedite infrastructure development.
Power reforms. Building on the UDAY scheme for state power distribution companies, the policy focus should now switch to implementing measures to improve the operational efficiency of the state power distribution companies, including reducing transmission losses and raising power tariffs when needed. Energy price reforms should consider regulatory policies for reducing fossil fuel use in India, including to aid achievement of India’s climate change commitments (see Selected Issues Chapter VIII).
Gender-focused reforms. Improvements in infrastructure—such as wider sanitation coverage, easier access to roads and drinking water—that lower females’ home care burden are key to increasing India’s female labor force participation that will help India achieve its economic growth potential (see Box 6). Moreover, making amendments to and strengthening implementation of various gender-specific labor laws and investing in gender-targeted skills training programs are needed to increase female employment in better quality jobs in the formal sector. Strengthening the implementation and awareness of females’ land inheritance rights and financial literacy programs could help address remaining constraints to their usage (see Box 7 and Selected Issues Chapters IX and X).
Strengthening the business climate. Both Union and state governments are making strong efforts to improve India’s business climate, and these should continue. In particular, staff
0
10
20
30
40
50
60
70
80
90
1990 2000 2006 2007 2008 2009 2010 2011 2012 2013 2014 2015
Male Female
India: Female Versus Male Labor Force Participation(In percent)
Source: National Sample Survey Organisation (NSSO), Goverment of India.
©International Monetary Fund. Not for Redistribution
INDIA
24 INTERNATIONAL MONETARY FUND
welcomes the authorities’ efforts to improve India’s ranking on the World Bank’s Doing Business indicators, particularly in the underperforming areas of resolving insolvency and enforcing contracts. Staff supports the recent introduction of state-based doing business indicators, which will continue to encourage cross-state competition in attracting domestic and foreign investment (see Selected Issues Chapter XI).
46. Agricultural sector reforms remain a policy priority for the Government, but the pace of implementation has been slow. The agricultural sector contributes around 15 percent of India’s GDP, and provides employment for about half of the Indian labor force. Some of the recent agricultural policy initiatives undertaken by the Modi Government include: the assured irrigation initiative under the Pradhan Mantri Krishi Sinchayee Yojana launched in July 2015; the comprehensive crop insurance scheme Pradhan Mantri Fasal Bima Yojana launched in February 2016; and the common electronic trading platform for National Agriculture Market (e-NAM) launched in April 2016, which aims to integrate 585 wholesale markets across India by March, 2018. These arrangements are expected to reduce production risk and improve the competitiveness of agricultural markets.
47. While these agricultural policy measures are welcome, much more needs to be done to address inherent long-term structural bottlenecks and help ease food inflation pressures. Building on recent progress, key measures should include:
Food procurement reforms. The reforms should include a revamp of government procurement processes and the public distribution system (PDS) for food. While the system of minimum support prices (backed by assured procurement) can help stabilize markets during periods of weak production or excess supply, it should be limited to correcting market failures. Past hikes in procurement prices for rice and wheat, combined with the government’s massive cereal stockpiling, have resulted in market distortions (including a shortfall in the production of legumes) and episodes of high food inflation. Implementing the recommendations of the Shanta Kumar High Level Committee (HLC) on restructuring the role of the Food Corporation of India (FCI)—including outsourcing of cereal procurement and stocking operations currently under the FCI to the states and various agencies; better price support for pulses and oilseeds; introducing cash transfers; and setting up vigilance committees to check leakages in the PDS—would improve the efficiency of the entire food grain management system.27
Reforms to the Essential Commodities Act (ECA) and state-level Agricultural Produce Marketing Committee (APMC) Act. These Acts are the key regulatory pillars empowering the central and state governments to regulate and control production, distribution, marketing and pricing of commodities identified as essential for consumers. While the intention of these Acts was to ensure that farmers were offered fair and transparent prices, it has led to multiple market intermediaries operating between the farmer and the consumer leading to market price manipulations, and higher prices for consumers while farmers continue to receive meager returns (see Selected Issues Chapter XII). Reforms pertaining to marketing in agriculture, in line with NITI (National Institution for Transforming India) Aayog’s recommendations to
27 See 2016 India Article IV Staff Report and Shanta Kumar Committee Report on FCI Reforms and Food Security.
©International Monetary Fund. Not for Redistribution

INDIA
INTERNATIONAL MONETARY FUND 25
liberalize markets by giving farmers more flexibility in the distribution and marketing of their produce, will help raise the competitiveness, efficiency and transparency in state agriculture markets.28
Subsidized water and other agricultural inputs. The government provides subsidies to the agriculture sector through free or cheap water, electricity and fertilizers. This has had a large negative impact on ground-water levels, soil fertility and production efficiency for both inputs and outputs in agriculture. Input subsidies to farmers should be administered through direct cash transfers rather than underpricing of agricultural inputs, in accordance with the recommendations of the Kumar HLC, and be directed towards small-scale farmers.
Authorities’ Views
48. The authorities highlighted the progress made in facilitating investments in road, power and coal sectors, furthering their important reform agenda, and expressed a strong commitment to continue strengthening public service delivery and enhancing the business environment. They highlighted the significant gains in targeted delivery of services through application of Direct Benefit Transfer to flagship welfare schemes and subsidy programs. They expected that the ongoing shift toward a systematic evaluation and monitoring of outcomes, rather than inputs and processes, would deliver improvements in the quality and effectiveness of public policies and services. At the level of states, the publication and ranking of policy outcomes was generating reform momentum through cross-state competition and dissemination of best practices. The authorities pointed to ongoing reform efforts in many priority areas. Labor market reforms were most effectively pursued at the level of states, with a few states already enacting such reforms. In their view, the objective should be to expand labor reforms to a critical mass of states with a strong manufacturing base. In the agricultural sector, the authorities noted that pilot programs are underway to rationalize fertilizer subsidies, while the Union government is working with state governments to integrate agricultural markets across the country.
F. Other Issues 49. Macroeconomic statistics are broadly adequate for surveillance but improvements are needed in several areas. Priority should be given to developing price indices suitable for deriving volume estimates for key economic activities in the national accounts and updating the index of industrial production, particularly given its use in compiling national accounts statistics. In addition, efforts to back-cast the revised national accounts should be stepped up. There is also scope to improve the timely reporting and dissemination of fiscal performance of the states. The authorities should take advantage of the impending establishment of SARTTAC to obtain technical assistance in enhancing the quality of Indian national accounts statistics.
28 In October 2016, NITI Aayog launched an index to rank states based on initiatives taken by them in implementing farm sector reforms. The index ranges from a score of 0 (no reforms at all) to 100 (complete implementation of reforms) and is based on three major parameters—reforms in agriculture marketing, land reforms, and reforms related to agro-forestry. While Maharashtra achieved the highest rank (with a score of 82), almost two thirds of India’s 29 states have made slow progress with an index score below 50.
©International Monetary Fund. Not for Redistribution

INDIA
26 INTERNATIONAL MONETARY FUND
STAFF APPRAISAL 50. The Indian economy has recorded strong growth in the past few years, helped by terms of trade gains, implementation of key structural reforms, and reduced external vulnerabilities. A halving of global oil prices, sound macroeconomic management, and continuous efforts to tackle supply-side bottlenecks have been key to India’s ongoing growth recovery and macroeconomic stability. Despite a weak global environment, the important structural reforms initiated over the past two years will help India continue to stand out among the world’s fastest growing EMs.
51. While the medium-term growth outlook remains favorable, the economy faces near-term challenges. In FY2017/18 economic growth is expected to rebound from a temporary slowdown caused by the currency exchange initiative, which is adversely affecting private consumption, the key growth driver of the past few years. The investment recovery is expected to remain modest and uneven across sectors as deleveraging continues and industrial capacity utilization picks up. The balance of risks is tilted to the downside. A key downside risk is the currency exchange initiative which will likely have medium-term positive benefits in curtailing tax evasion, but may have a larger-than-anticipated negative impact on the economy in the near term through weaker private consumption. Additional risks include renewed global market volatility, uncertainty in design and implementation of the GST, and continued weak corporate and public bank balance sheets. Prominent upside risks include lower-for-longer energy prices and enhanced investor confidence accompanying structural reforms.
52. Action is needed to quickly restore cash in circulation and avoid payment disruptions. The authorities should continue to enhance the supply of new banknotes, and if needed consider extending or expanding targeted temporary exemptions, including on use of old banknotes, particularly for rural and remote areas. While the financial system is expected to weather the currency exchange-induced temporary growth slowdown, the authorities should remain vigilant given the potential further build-up of NPAs and elevated corporate sector vulnerabilities, and ensure prudent support to the economic sectors affected by the currency exchange initiative.
53. Despite a strong policy push for balance sheet clean up, elevated corporate sector vulnerabilities continue to pose risks to the soundness of public banks. While India’s financial system is generally sound, the RBI should continue to ensure full recognition of non-performing assets on banks’ balance sheets and increase provisioning requirements as needed. The successful implementation of the AQR process, the new bankruptcy code, and additional debt recovery mechanisms will bridge critical gaps in the resolution of bank asset quality distress and enhance financial stability. Augmenting capital buffers in public banks, strengthening the NPA resolution regime and public sector bank governance reform, as well as further measures to develop corporate debt markets, are key to enhancing the financial system’s ability to contribute to growth. India’s strong efforts in enhancing financial inclusion should continue to be facilitated by new technologies and greater use of electronic payment technologies.
©International Monetary Fund. Not for Redistribution

INDIA
INTERNATIONAL MONETARY FUND 27
54. Monetary policy credibility has strengthened, yet achieving a low and stable rate of inflation in the medium-term hinges on further supply-side reforms and continued fiscal consolidation. The recent formalization of the flexible inflation targeting regime and formation of the Monetary Policy Committee provide the institutional foundation for strong monetary policy credibility. The current monetary policy setting is consistent with inflation remaining within the RBI’s medium-term inflation target band. However, inflation is likely to remain in the upper half of the target band over the medium-term, mainly due to food supply constraints and sticky household inflation expectations. Monetary policy should continue to be supported by fiscal consolidation and agricultural reform measures to boost food supplies.
55. The authorities should press ahead with their longer-term objective of substantially reducing fiscal deficits and the public debt burden. With continued delays in reaching medium-term deficit targets, India’s public debt ratio is likely to remain high and fiscal policy space remains limited. Implementation of a robust GST, given its growth enhancing effects, and further subsidy reforms should be key pillars of the authorities’ fiscal consolidation strategy. Building on their recent success in fuel subsidy reforms and efforts to enhance financial inclusion, the authorities should continue to pursue better targeting and greater efficiency of subsidy and social spending programs through use of direct benefit transfers. To prevent pro-cyclicality of fiscal policy and safeguard the quality of fiscal adjustment in the future, fiscal consolidation needs to be accompanied by strengthening of fiscal responsibility and medium-term expenditure and budget frameworks for both the Union government and the states. In the revised fiscal responsibility framework, the authorities should consider anchoring the deficit path by a medium-term public debt target, complemented by a nominal expenditure growth rule. Fiscal consolidation will enable a gradual phasing-out of financial repression, which will help price stability and lower the cost of credit for the private sector.
56. Boosting exports and further enhancing the environment for attracting stable capital flows are key challenges. India’s external position remains broadly consistent with fundamentals and the level of international reserves is assessed to be adequate. Nonetheless, continued vigilance is needed given potential external shocks and global financial market volatility. Exchange rate flexibility should remain the main shock absorber and could be accompanied by judicious foreign exchange intervention given India’s increased reserve buffers. As the external environment remains weak, the need to reduce trade barriers and support trade liberalization has become even more pressing. Continued efforts to revamp the business climate remain necessary to attract even greater FDI flows and help ensure the success of the “Make in India” initiative.
57. Notwithstanding considerable progress made in the past two years, advancing structural reforms remains essential for creating jobs and raising growth. Labor market reforms should be at the top of India’s to-do list, given their ability to enhance the impact of recent product market reforms, and help increase formal sector employment and the employment of women. Improvements in infrastructure, including wider sanitation coverage, are key to raising India’s female labor force participation and potential growth. Strong efforts to improve India’s business climate and to leverage and empower cross-state regulatory and economic competition will also help raise both
©International Monetary Fund. Not for Redistribution
INDIA
28 INTERNATIONAL MONETARY FUND
foreign and domestic investment. Finally, much more needs to be done to address long-standing structural bottlenecks and enhance market efficiency in the agricultural sector, which if successful would help raise food availability and consumption, enhance returns to farmers, and support macroeconomic stability by dampening food inflation pressures.
58. It is recommended that the next Article IV consultation take place on the standard 12-month cycle.
©International Monetary Fund. Not for Redistribution
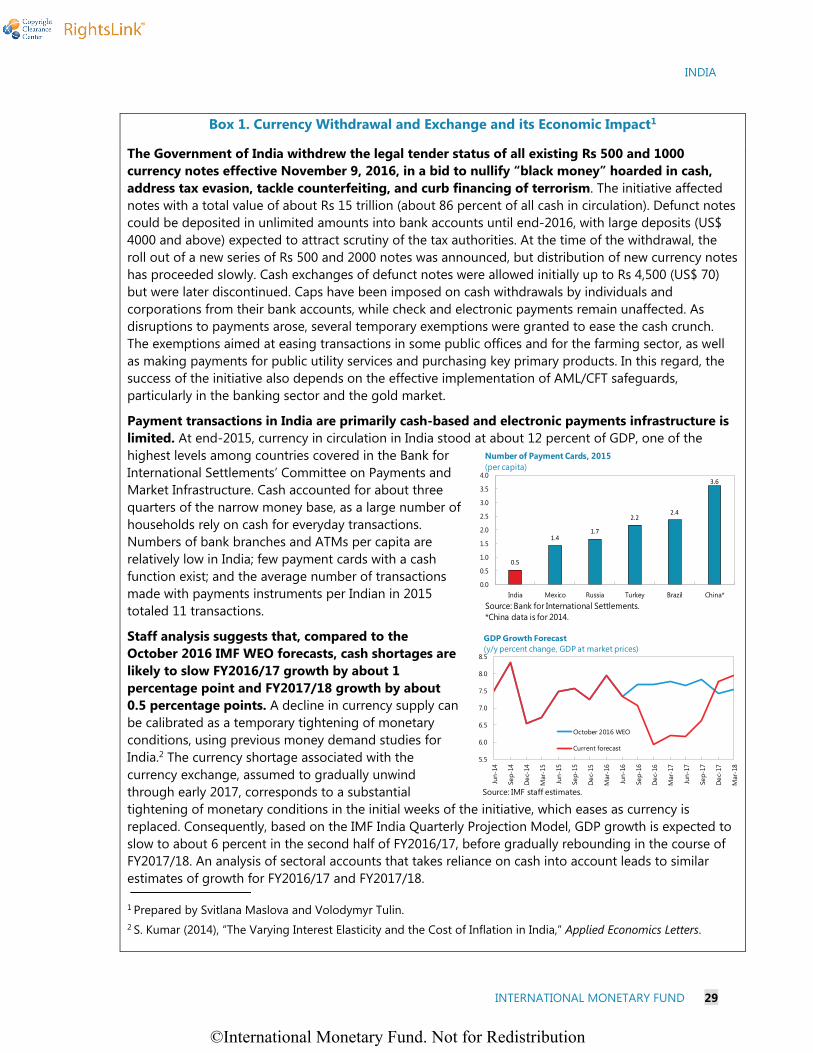
INDIA
INTERNATIONAL MONETARY FUND 29
Box 1. Currency Withdrawal and Exchange and its Economic Impact1
The Government of India withdrew the legal tender status of all existing Rs 500 and 1000 currency notes effective November 9, 2016, in a bid to nullify “black money” hoarded in cash, address tax evasion, tackle counterfeiting, and curb financing of terrorism. The initiative affected notes with a total value of about Rs 15 trillion (about 86 percent of all cash in circulation). Defunct notes could be deposited in unlimited amounts into bank accounts until end-2016, with large deposits (US$ 4000 and above) expected to attract scrutiny of the tax authorities. At the time of the withdrawal, the roll out of a new series of Rs 500 and 2000 notes was announced, but distribution of new currency notes has proceeded slowly. Cash exchanges of defunct notes were allowed initially up to Rs 4,500 (US$ 70) but were later discontinued. Caps have been imposed on cash withdrawals by individuals and corporations from their bank accounts, while check and electronic payments remain unaffected. As disruptions to payments arose, several temporary exemptions were granted to ease the cash crunch. The exemptions aimed at easing transactions in some public offices and for the farming sector, as well as making payments for public utility services and purchasing key primary products. In this regard, the success of the initiative also depends on the effective implementation of AML/CFT safeguards, particularly in the banking sector and the gold market.
Payment transactions in India are primarily cash-based and electronic payments infrastructure is limited. At end-2015, currency in circulation in India stood at about 12 percent of GDP, one of the highest levels among countries covered in the Bank for International Settlements’ Committee on Payments and Market Infrastructure. Cash accounted for about three quarters of the narrow money base, as a large number of households rely on cash for everyday transactions. Numbers of bank branches and ATMs per capita are relatively low in India; few payment cards with a cash function exist; and the average number of transactions made with payments instruments per Indian in 2015 totaled 11 transactions.
Staff analysis suggests that, compared to the October 2016 IMF WEO forecasts, cash shortages are likely to slow FY2016/17 growth by about 1 percentage point and FY2017/18 growth by about 0.5 percentage points. A decline in currency supply can be calibrated as a temporary tightening of monetary conditions, using previous money demand studies for India.2 The currency shortage associated with the currency exchange, assumed to gradually unwind through early 2017, corresponds to a substantial tightening of monetary conditions in the initial weeks of the initiative, which eases as currency is replaced. Consequently, based on the IMF India Quarterly Projection Model, GDP growth is expected to slow to about 6 percent in the second half of FY2016/17, before gradually rebounding in the course of FY2017/18. An analysis of sectoral accounts that takes reliance on cash into account leads to similar estimates of growth for FY2016/17 and FY2017/18.
1 Prepared by Svitlana Maslova and Volodymyr Tulin. 2 S. Kumar (2014), “The Varying Interest Elasticity and the Cost of Inflation in India,” Applied Economics Letters.
0.5
1.41.7
2.22.4
3.6
0.0
0.5
1.0
1.5
2.0
2.5
3.0
3.5
4.0
India Mexico Russia Turkey Brazil China*
Number of Payment Cards, 2015 (per capita)
Source: Bank for International Settlements.*China data is for 2014.
5.5
6.0
6.5
7.0
7.5
8.0
8.5
Jun-
14
Sep-
14
Dec
-14
Mar
-15
Jun-
15
Sep-
15
Dec
-15
Mar
-16
Jun-
16
Sep-
16
Dec
-16
Mar
-17
Jun-
17
Sep-
17
Dec
-17
Mar
-18
October 2016 WEO
Current forecast
GDP Growth Forecast(y/y percent change, GDP at market prices)
Source: IMF staff estimates.
©International Monetary Fund. Not for Redistribution

INDIA
30 INTERNATIONAL MONETARY FUND
Box 2. Ujwal Discom Assurance Yojana (UDAY): Debt Restructuring for Power Distribution Companies1
While improvements in fuel supply, electricity generation, and transmission capacity have occurred in India in recent years, distribution has remained problematic and become the weak link in the electricity supply chain. Electricity distribution in India occurs primarily through inefficient and financially troubled state-owned power distribution companies (DISCOMs). The DISCOMs experience operational losses2 for two main reasons: (i) aggregate technical and commercial (AT&C) losses, a part of which are losses in the process of transmission and distribution (T&D), and (ii) electricity tariffs that are low considering the cost of procuring power. Despite improvement in the past decade, India’s T&D losses, at almost 20 percent of generation, are among the highest levels of T&D losses in the world. DISCOMs have been funding operational losses with debt carrying high interest rates, compounding their financial troubles.
In November 2015, the Government of India launched the Ujwal Discom Assurance Yojana, or UDAY scheme, aimed at turning around the financially stressed and generally inefficient state-owned DISCOMs.3 At the time, the DISCOMs had together accumulated about Rs 3.8 trillion in losses (3 percent of then-GDP) and Rs 4.3 trillion in debt (3.4 percent of GDP) with interest rates as high as 15 percent. Financial losses are concentrated in several states, with losses of the worst seven states accounting for almost 90 percent of total losses.
1 Prepared by Sonali Das. 2 Aggregate technical losses refer to losses as power is transmitted through the distribution system, while commercial losses result from theft of electricity or deficiencies in metering. 3 UDAY plans a four-pronged approach to helping the DISCOMs recover and become more efficient by: (i) Improving operational efficiencies of DISCOMs; (ii) Reducing the cost of power; (iii) Reducing the interest cost of DISCOMs; and (iv) Enforcing financial discipline on DISCOMs by aligning their finances with state finances.
0 5 10 15 20
East Asia & Pacific
World
Europe & Central Asia
Middle East & North Africa
Sub-Saharan Africa
Latin America & Caribbean
India
Transmission and Distribution Losses, 2013(In percent of output)
Source: World Bank, World Development Indicators.
©International Monetary Fund. Not for Redistribution

INDIA
INTERNATIONAL MONETARY FUND 31
Box 2. Ujwal Discom Assurance Yojana (UDAY): Debt Restructuring for Power Distribution Companies (Concluded)
The key feature of the scheme is the restructuring of DISCOM debt, whereby states that join the scheme take over 75 percent of their DISCOMs’ outstanding debt as of September 2015—50 percent in FY2015/16 and 25 percent in 2016/17—funded by issuing state bonds in the market or directly to the banks originally holding the DISCOM debt. These ‘UDAY bonds’ would not count towards states’ FRBMA prescribed borrowing limits of 3 percent of gross state domestic product (GSDP). For the remaining 25 percent of outstanding DISCOM debt, the holding banks would convert the debt to loans with lower interest rate, i.e. not more than the bank’s base rate plus 10 basis points. Finally, with respect to the future financial losses of DISCOMs, states would gradually take over and fund the losses.4 These future losses would count towards the state deficit limits, thereby giving states incentive to ensure an improvement in operations at DISCOMs to prevent future financial losses. A critical mass of states has joined UDAY and restructured the DISCOM debt, relieving the financial stress of these DISCOMs. As of November 2016, nine states had issued UDAY bonds amounting to Rs 1,585 billion (or 50 percent of DISCOM debt eligible for the scheme). Six additional states and one Union territory have signaled their intention to join the scheme, by signing a tripartite agreement between the Centre, the state government and the DISCOM, committing to a significant improvement in operations and thus financial performance.5 The focus should now turn to stronger reforms aimed at improving operational efficiency, which is critical to the success of UDAY. While the DISCOMs have been bailed out by state governments in the past,6 UDAY places additional focus on improving operational efficiency, decreasing the cost of purchasing power, and enabling quarterly increases in electricity tariffs.7 In addition, measures to increase billing efficiency and decrease commercial losses will be necessary. 4 That is, they would take over 5 percent of the FY2017/18 losses in FY2018/19, 10 percent of the FY2018/19 losses the following year, 25 percent of the FY2019/20 losses the following year, and 50 percent of the FY2020/21 losses the following year. 5 In total, the 15 states and Union territory account for almost 60 percent of outstanding DISCOM debt. 6 The previous Scheme for Financial Restructuring of the State Distribution Companies was launched in October 2012. Under that scheme, DISCOMs were supposed to issue 50 percent of their short-term liabilities as state-backed bonds, which would then be taken over by state government over the next 2-5 years, while remaining within the borrowing ceilings prescribed by their respective FRBMAs. The remaining 50 percent of the DISCOMs’ short-term liabilities were to be rescheduled by lenders, with the principal and interest backed by state government guarantees. Eight states, then accounting for the majority of accumulated losses, joined the scheme. But the debt burden of the DISCOMS was not sufficiently eased as the states did not have enough room to take over the debt and, in addition, most DISCOMs did not end up meeting the requisite performance criteria. 7 The MoUs discuss states improving operating parameters and raising power tariffs to bring them in line with costs. As incentive, states that reach certain operational milestones will be offered additional funding to facilitate augmentation of distribution networks, as well as be supported with additional coal and additional low cost power from NTPC (the largest electricity generation company) and other central public sector electricity companies.
©International Monetary Fund. Not for Redistribution
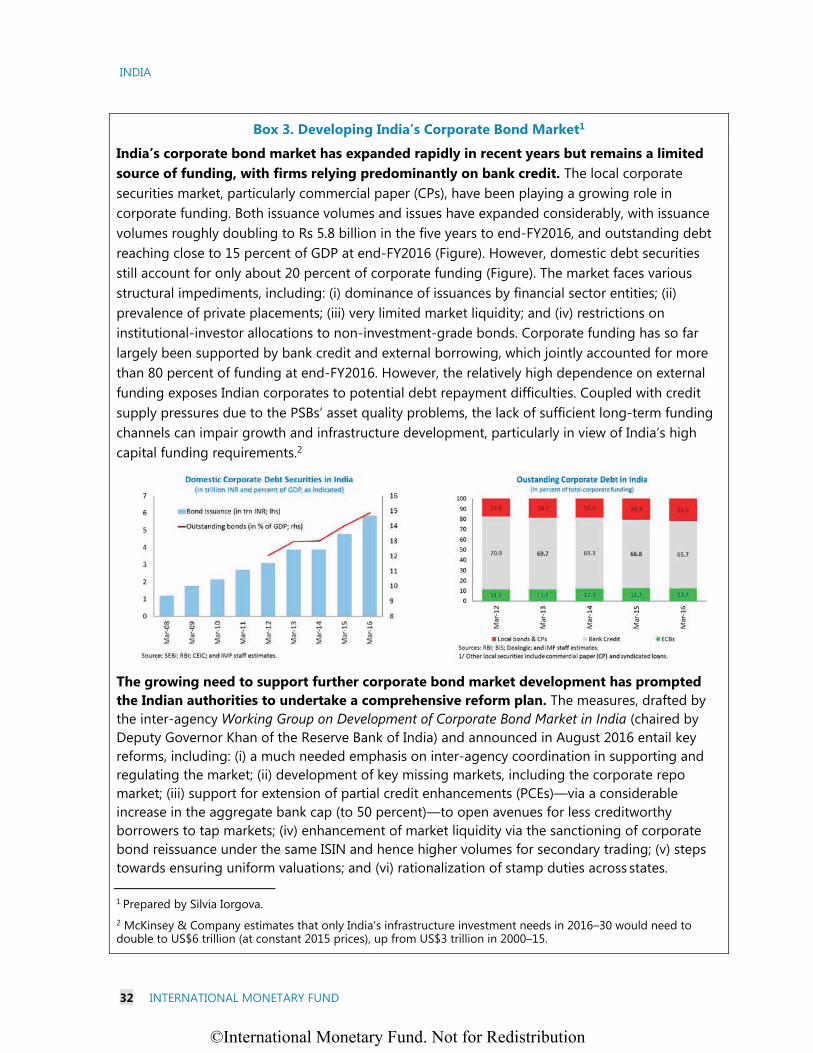
INDIA
32 INTERNATIONAL MONETARY FUND
Box 3. Developing India’s Corporate Bond Market1
India’s corporate bond market has expanded rapidly in recent years but remains a limited source of funding, with firms relying predominantly on bank credit. The local corporate securities market, particularly commercial paper (CPs), have been playing a growing role in corporate funding. Both issuance volumes and issues have expanded considerably, with issuance volumes roughly doubling to Rs 5.8 billion in the five years to end-FY2016, and outstanding debt reaching close to 15 percent of GDP at end-FY2016 (Figure). However, domestic debt securities still account for only about 20 percent of corporate funding (Figure). The market faces various structural impediments, including: (i) dominance of issuances by financial sector entities; (ii) prevalence of private placements; (iii) very limited market liquidity; and (iv) restrictions on institutional-investor allocations to non-investment-grade bonds. Corporate funding has so far largely been supported by bank credit and external borrowing, which jointly accounted for more than 80 percent of funding at end-FY2016. However, the relatively high dependence on external funding exposes Indian corporates to potential debt repayment difficulties. Coupled with credit supply pressures due to the PSBs’ asset quality problems, the lack of sufficient long-term funding channels can impair growth and infrastructure development, particularly in view of India’s high capital funding requirements.2
The growing need to support further corporate bond market development has prompted the Indian authorities to undertake a comprehensive reform plan. The measures, drafted by the inter-agency Working Group on Development of Corporate Bond Market in India (chaired by Deputy Governor Khan of the Reserve Bank of India) and announced in August 2016 entail key reforms, including: (i) a much needed emphasis on inter-agency coordination in supporting and regulating the market; (ii) development of key missing markets, including the corporate repo market; (iii) support for extension of partial credit enhancements (PCEs)—via a considerable increase in the aggregate bank cap (to 50 percent)—to open avenues for less creditworthy borrowers to tap markets; (iv) enhancement of market liquidity via the sanctioning of corporate bond reissuance under the same ISIN and hence higher volumes for secondary trading; (v) steps towards ensuring uniform valuations; and (vi) rationalization of stamp duties across states.
1 Prepared by Silvia Iorgova. 2 McKinsey & Company estimates that only India’s infrastructure investment needs in 2016–30 would need to double to US$6 trillion (at constant 2015 prices), up from US$3 trillion in 2000–15.
©International Monetary Fund. Not for Redistribution

INDIA
INTERNATIONAL MONETARY FUND 33
Box 3. Developing India’s Corporate Bond Market (Concluded)
The plan’s publication has been followed by implementation steps by relevant regulators (notably RBI and Securities and Exchange Board of India (SEBI)) to boost incentives for use of market funding (via an increase of the PCE cap, and introduction of banks’ large exposure limits); expand market participation (by permitting brokers in the corporate repo market and foreign investor direct trading in corporate bonds); and introducing and Electronic Dealing Platform in the corporate repo market). Finally, in a move to ensure market transparency, the National Stock Exchange of India (NSE) introduced a trade repository of primary- and secondary-market activities at both over the counter markets and across exchanges.
The new measures would remove key hurdles to the development of the Indian corporate bond market, but would also require addressing important constraints, including:
High leverage, particularly among large corporates, is likely to dampen issuance, at least in the short term. The encouragement of corporate funding “through market mechanism” via the introduction of limits banks’ large exposures under the new measures should shift funding away from banks and towards the debt market in the medium to long term. However, a comprehensive strategy of corporate debt restructuring is critical to help unlock funding demand and spur investment in the economy.
The domestic investor base remains limited and would benefit from better risk transfer mechanisms. Recent measures on liberalizing restrictions on foreign bond holdings— including the opening up of foreign portfolio investment (FPI) in unlisted securities under the authorities’ plan and the easing of FPI investment limits—are conducive to bringing in much-needed foreign investment. However, domestic insurance companies and pension funds, typically instrumental in absorbing demand for corporate paper in well-developed corporate markets, still play a very limited role in the market. Further efforts to develop better risk transfer mechanisms, including the dormant CDS market, would boost institutional investors’ incentives to finance riskier corporates.
A successful implementation would benefit from effective cross-agency coordination. Both the RBI and SEBI have acted swiftly to implement key elements of the new plan. However, it is important to ensure that all relevant agencies—including the Government of India, RBI, SEBI, Fixed Income Money Market and Derivatives Association of India (FIMMDA), Insurance Regulatory and Development Authority (IRDA), and the Pension Fund Regulatory and Development Authority (PFRDA)—follow through and coordinate on implementation.
©International Monetary Fund. Not for Redistribution

INDIA
34 INTERNATIONAL MONETARY FUND
Box 4. Financial Inclusion in India: Recent Initiatives and Policy Priorities1 Overcoming limited access to adequate and formal finance for a wide spectrum of Indian households and small and micro-sized businesses is a formidable challenge. Bank penetration stood at 35 percent in 2011, which is low compared to many emerging market economies, and use of financial services has been minimal. Moreover, in 2014 the account dormancy rate exceeded 40 percent, only 11 percent of those who had a bank account made deposits, and only 8 percent took out loans (World Bank, 2014). Informal finance has played an important role in funding small-scale and informal business, including in agriculture, and has often entailed predatory lending practices. Womens’ access to finance has been low, limiting womens’ entrepreneurship and empowerment.
Recent financial sector initiatives have seen some success in enhancing various aspects of financial inclusion, yet challenges remain. While more than 240 million previously unbanked individuals, among whom about two-thirds are rural Indians, have gained access to bank accounts since the launch of Pradhan Mantri Jan Dhan Yojana (PMJDY)2 in August 2014, the share of zero balance accounts exceeds 25 percent across the majority of Indian states. To complement PMJDY’s focus on unbanked households, the Pradhan Mantri MUDRA3 Yojana (PMMY) scheme launched in January 2016, aims to enable access to formal finance for micro, small and medium-sized business by providing collateral-free loans. Close to one percent of GDP in loans have been disbursed under this scheme, of which over one-third of loans have been extended to new entrepreneurs. Moreover, the PMMY has been successful in enabling women-led businesses to access finance. Such business accounted for about one-half of the total amount lent under the scheme, and about four-fifths of the number of loans, in part reflecting scheme’s support to new business undertakings led by women.
Staff analysis indicates that increasing access to affordable formal finance can raise output and improve gender equality. Using a two-sector general equilibrium model incorporating formal and informal sources of finance, staff estimates show that policies that an increase in womens’ access to formal finance improves gender equality in entrepreneurship, which in turn boosts female labor force participation and employment, leading to higher consumption and GDP (see Selected Issues Chapter IX).
While policies should continue to focus on the supply of finance, addressing constraints on the demand for formal finance should be prioritized. Strengthening financial literacy programs, holding workshops aimed at building the trust of rural communities with the banking system, and conducting surveys to understand the costs and barriers to usage of formal financial services, would help promote inclusion. In addition, technology-driven initiatives, spanning know-your-customer, mobile banking, digitalization and greater usage of direct benefit transfer schemes can help lower transaction costs. The government should measure the success of its interventions by the extent of reduction in informal employment, the rise in formal entrepreneurship and the extent of mobility of firms to medium and large sizes. 1 Prepared by Purva Khera. 2 This scheme envisages universal access to basic banking services by 2018. See http://pmjdy.gov.in/. 3 Micro Units Development and Refinance Agency.
0
10
20
30
40
50
60
70
80
90
100
1951 1981 2002 2012
Formal Sources Informal Sources
Source: All India Debt and Investment Survey, National Sample Survey (NSS).
Sources of Credit in Rural India(In percent)
0
10
20
30
40
50
60
70
All adults Males Females Poorest 40% Richest 60%
2011 2014
India: Share With an Account at a Formal Financial Institution(In percent)
Source: Global Findex Database.
©International Monetary Fund. Not for Redistribution

INDIA
INTERNATIONAL MONETARY FUND 35
Box 5. Goods and Services Tax1
The passage by the Indian Parliament of the long-awaited Goods and Services Tax (GST)
Constitutional Amendment is a landmark achievement. Proposals for a pan-India value-added
tax have been under discussion for several decades. As the consensus grew for moving to a
national level GST to be shared by the center and the states, the FY2006/07 Budget proposed a
timeframe for GST introduction for the first time. However, since the Indian Constitution
precluded the center from taxing sales and empowered it with the exclusive right to tax services, a
“grand bargain” between the center and states was necessary to enable taxation of sales by the
center in exchange for a share of GST revenues to the states. This had remained elusive until
August 2016 when the Constitutional Amendment Bill was passed. The Constitution was amended
shortly thereafter, in September 2016, after a majority of state legislatures ratified the Bill and a
GST Council was set-up to draft detailed GST laws. Several steps towards GST implementation,
which the government hopes to introduce by April 2017, now remain. First, detailed GST laws
must be drafted and passed by the Indian Parliament for the center and by each state legislature
for the states. Second, the IT infrastructure needs to be completed and tax officers and industry
professionals trained.
The GST should help secure gains in economic efficiency and growth, with favorable effects
on investment and exports. The GST will replace a plethora of cascading center, state, inter-
state, and local taxes with a single, nationwide, value-added tax on goods and services. The
destination-based GST will create, for the first time, a single Indian market, and will greatly
enhance India as an investment destination. By subsuming most of the existing indirect taxes,
such as excise, sales and services levies, the indirect tax structure of the country will become less
complex and the cost of doing business will decline. Export competitiveness will rise as logistical
costs fall with the removal of interstate tax-induced trade barriers, the tax system becomes more
efficient, and use is made of input tax credits on cross-state trade. The GST will also raise general
government tax collection, including by fostering compliance and help ensure a decline in the
share of the informal sector. Consequently, it can also support fiscal consolidation efforts which, in
addition to economic efficiency gains, should solidify recent monetary policy strides in achieving
low and stable inflation in the medium-term.
In the steps that remain towards implementing the GST, ensuring a robust design is key.
With the GST Council in place and resolutions reached on the tax brackets, compensation to
states, and turnover thresholds, decisions are still to be made on classification of goods and
services across tax brackets as well as details of exemptions. There are a couple of key
macroeconomic issues to be considered. First, the GST should have uniform cross-state rates, a
simple tax rate structure, and minimal exemptions. With the JAM (Jan Dhan Yojana bank accounts,
Aadhaar identification, mobile banking) trinity in place, the policy focus should be on enhancing
the distributional aspects of fiscal spending that a higher tax rate can enable, rather than
supporting the poor through reduced and potentially distortionary tax rates. Second, key
production inputs, such as energy and real estate, should be kept within the tax base to enable
greater output gains and reduce the tax burden across sectors. Output losses from production
inefficiencies due to cascading embodied in exemptions may be large even under a fairly low
nominal tax rate and with relatively few stages of production.2
1 Prepared by Volodymyr Tulin and Sonali Das.
2 See M. Keen (2013), “Targeting, Cascading, and Indirect Tax Design,” IMF WP 13/57.
©International Monetary Fund. Not for Redistribution
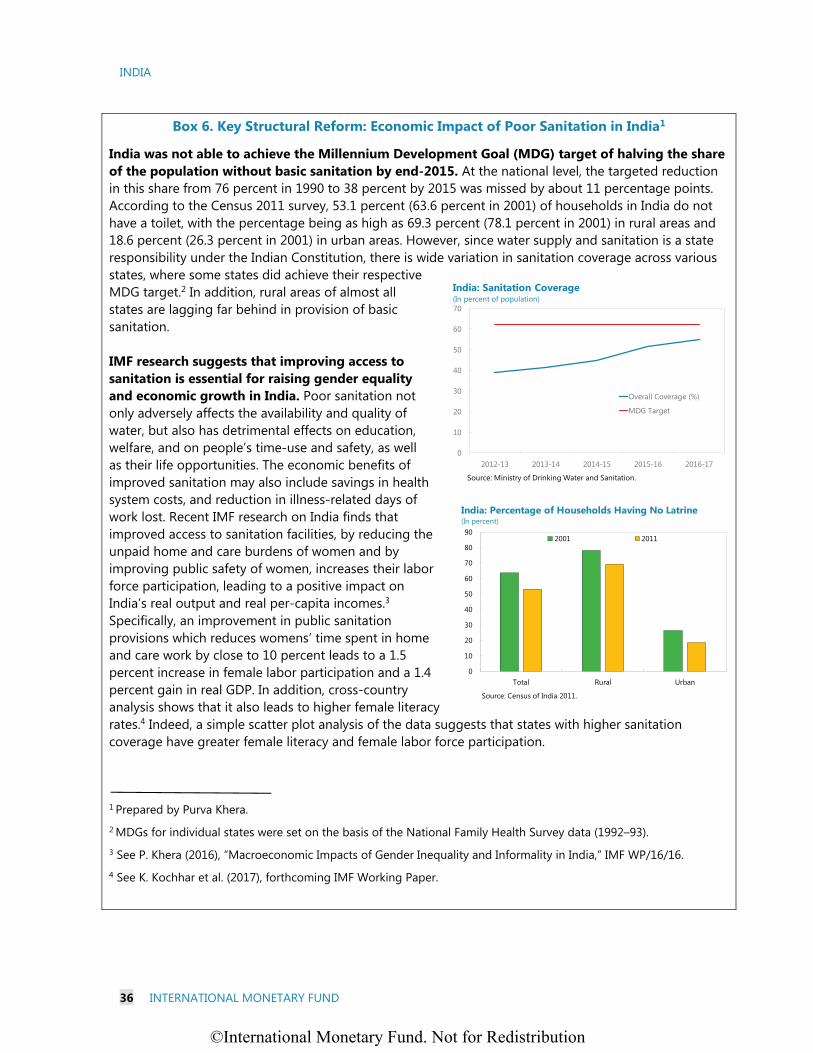
INDIA
36 INTERNATIONAL MONETARY FUND
Box 6. Key Structural Reform: Economic Impact of Poor Sanitation in India1
India was not able to achieve the Millennium Development Goal (MDG) target of halving the share of the population without basic sanitation by end-2015. At the national level, the targeted reduction in this share from 76 percent in 1990 to 38 percent by 2015 was missed by about 11 percentage points. According to the Census 2011 survey, 53.1 percent (63.6 percent in 2001) of households in India do not have a toilet, with the percentage being as high as 69.3 percent (78.1 percent in 2001) in rural areas and 18.6 percent (26.3 percent in 2001) in urban areas. However, since water supply and sanitation is a state responsibility under the Indian Constitution, there is wide variation in sanitation coverage across various states, where some states did achieve their respective MDG target.2 In addition, rural areas of almost all states are lagging far behind in provision of basic sanitation. IMF research suggests that improving access to sanitation is essential for raising gender equality and economic growth in India. Poor sanitation not only adversely affects the availability and quality of water, but also has detrimental effects on education, welfare, and on people’s time-use and safety, as well as their life opportunities. The economic benefits of improved sanitation may also include savings in health system costs, and reduction in illness-related days of work lost. Recent IMF research on India finds that improved access to sanitation facilities, by reducing the unpaid home and care burdens of women and by improving public safety of women, increases their labor force participation, leading to a positive impact on India’s real output and real per-capita incomes.3 Specifically, an improvement in public sanitation provisions which reduces womens’ time spent in home and care work by close to 10 percent leads to a 1.5 percent increase in female labor participation and a 1.4 percent gain in real GDP. In addition, cross-country analysis shows that it also leads to higher female literacy rates.4 Indeed, a simple scatter plot analysis of the data suggests that states with higher sanitation coverage have greater female literacy and female labor force participation. 1 Prepared by Purva Khera.
2 MDGs for individual states were set on the basis of the National Family Health Survey data (1992–93). 3 See P. Khera (2016), “Macroeconomic Impacts of Gender Inequality and Informality in India,” IMF WP/16/16. 4 See K. Kochhar et al. (2017), forthcoming IMF Working Paper.
0
10
20
30
40
50
60
70
2012-13 2013-14 2014-15 2015-16 2016-17
Overall Coverage (%)
MDG Target
India: Sanitation Coverage (In percent of population)
Source: Ministry of Drinking Water and Sanitation.
0
10
20
30
40
50
60
70
80
90
Total Rural Urban
2001 2011
India: Percentage of Households Having No Latrine(In percent)
Source: Census of India 2011.
©International Monetary Fund. Not for Redistribution

INDIA
INTERNATIONAL MONETARY FUND 37
Box 6. Key Structural Reform: Economic Impact of Poor Sanitation in India (Concluded)
As well, the World Bank’s Water and Sanitation Program (WSP) has pegged the economic cost of inadequate sanitation at around 6.4 per cent of India’s GDP in 2006. Sanitation should be enhanced through infrastructure investment, as well as promoting health awareness and facilitating offtake. While sanitation coverage and infrastructure have been increasing, survey and studies indicate that the use of existing toilets in both rural and urban areas remains low. Along with inadequate infrastructure, cultural and traditional barriers and a lack of knowledge of health risks have been brought forward as the prime reasons behind demand side constraints (NSS 69th round). In this regard, the Swachh Bharat (Clean India) mission,5 launched in October 2014 alongside improving sanitation infrastructure, also focuses on fostering large-scale social and behavior change to increase sanitation demand in both rural and urban India. Since the launch of the program, close to 31 million toilets have been built in rural areas, resulting in a 17.5 percent increase in the number of Indian rural households with a latrine facility. The relatively large fiscal cost of the Swachh Bharat program (estimated at about ¼ of one percent of GDP over the next 5 years) have been supported through introduction of a 0.5 percent special cess on services.6 That said, given the diverse range of cultures, languages and religion within India means that the role of the central government can be rather limited. Hence, to enable greater impact, policy interventions should continue to be tailored to community-specific factors, across particular states and districts.
5 See Ministry of Drinking Water and Sanitation website at: https://swachhbharat.mygov.in/ 6 A cess is a tax that is levied by the government to raise funds for a specific purpose. All cesses are currently proposed to be subsumed under the goods and services tax.
Bihar
Punjab
Haryana Assam
Uttar PradeshJharkhand
Delhi
West Bengal
Orissa
Gujarat
MadhyaPradesh
Goa
Uttarakhand
Kerala
Rajasthan
Karnataka
Maharashtra
Tamil Nadu
Andhra Pradesh
Himachal Pradesh
40
50
60
70
80
90
10 30 50 70 90 110
Fem
ale
liter
acy
rate
(%)
Sanitation coverage (%)Sources: Census of India (2011); IMF staff estimates.
Female Literacy Increases with Sanitation Coverage
BiharPunjab
Haryana AssamUttar PradeshJharkhand DelhiWest Bengal
OrissaGujaratMadhya Pradesh Goa
Uttarakhand KeralaRajasthanKarnataka Maharashtra
Tamil Nadu
Andhra Pradesh
Himachal Pradesh
0
10
20
30
40
50
60
10 30 50 70 90 110
Fem
ale
labo
r for
ce p
arti
cipa
tion
(%)
Sanitation coverage (%)Sources: Census of India (2011); IMF staff estimates.
Female Labor Force Participation Increases with Sanitation Coverage
©International Monetary Fund. Not for Redistribution

INDIA
38 INTERNATIONAL MONETARY FUND
Box 7. India’s Worsening Girl Deficit1
Although there has been a rise in awareness, advances in technology and an increase in literacy levels, India’s child sex ratio (number of girls per 1000 boys) continues to decline. According to the 2011 census, with just 918 girls per 1000 boys in the 0-6 years age group, the child sex ratio (CSR) has reached its lowest level since India’s first census of 1951, down from 927 girls per 1000 boys in 2001 and from 945 girls in 1991.2 While India’s overall sex ratio for the entire population improved to 943 females per 1000 males from 933 in 2001, a declining CSR poses a risk to the future overall share of women in the population. According to the Census of India (2011) report, three factors—feticide, infanticide and death in childhood due to neglect—contributed to this decline, thus indicating a lack of implementation of the Preconception and Prenatal Diagnostic Techniques Act (PCPNDT, 1994) which made fetal sex determination and selective abortion illegal. There are deep rooted socio-economic causes of the declining CSR—including patriarchal attitudes, practice of dowry, and preference for the male child due to their ability to economically support parents in old age. This creates a cycle of low investment in girl’s education and health, hurting their economic opportunities, thus further reinforcing the skewed preference towards the boy child.3 To reverse the declining CSR numbers, the Beti Bachao Beti Padhao (Celebrate Girl Child, Enable her Education) scheme was launched by Prime Minister Modi in January 2015.4 With a modest budget of Rs 199.99 crore (about US$ 28 million), this scheme, implemented in 100 selected districts low in CSR in the first phase, aims to: prevent the practice of sex selection before or after conception through better implementation of PCPNDT; mobilize local communities 1 Prepared by Purva Khera. 2 This trend is widespread across both rural and urban areas, where the former fares better with a CSR of 923 girls per 1000 boys in comparison to 905 in the latter. According to the World Health Organization, a biologically normal CSR ranges from 943–980 girls per 1000 boys. 3 See, for example, UN Women (2014), “Sex Ratios and Gender Biased Sex Selection—History, Debates and Future Directions”, UN Women Multi-Country Office for India, Bhutan, Maldives and Sri Lanka. 4 See Ministry of Women and Child Development website at: http://wcd.nic.in/BBBPScheme/main.htm
0
10
20
30
40
50
60
70
80
90
2000-01 2005-06 2006-07 2007-08 2008-09 2009-10 2010-11
SecondaryHigher Education
Source: Ministry of Human Resource Development.
India: Gender Parity in Education(Number of girls enrollment per hundred boys)
880
900
920
940
960
980
1000
1951 1961 1971 1981 1991 2001 2011
Overall Sex Ratio Child Sex Ratio
India: Trends in Share of Overall Females and Girls in the Population
Source: Census of India (2011).Note: Girls and boys refer to females and males in the age group of 0-6 years, respectively.
©International Monetary Fund. Not for Redistribution

INDIA
INTERNATIONAL MONETARY FUND 39
Box 7. India’s Worsening Girl Deficit (Concluded)
and sensitize them to the need for healthier CSRs; promote universal school enrolment; and
reduce the school dropout rates of girl children. This scheme relies on increasing awareness and
better implementation of existing schemes such as Sarva Shiksha Abhiyan (Education for All
Movement), Rashtriya Madhyamik Shiksha Abhiyan (National Mission for Secondary Education)
and the Integrated Child Development Scheme to make the initiative a success.5 In addition, a
financial incentive through the small savings scheme—Sukanya Samriddhi Yojana6—whereby an
account in the name of a girl child can be opened (and receive a favorable interest rate of
9.1 percent), is an associated scheme, with the aim of providing financial independence and
insurance to girls when they turn 18 years of age.
Increasing engagement at the state level,
deepening community participation and
long-term growth-supporting policies will
help the success of the Beti Bachao Beti
Padhao scheme. There exists a cross-state
disparity in the implementation and target
realization of various Union government-led
programs, which undermines the objectives of
such schemes (Figure). With more autonomy in
states’ spending decisions owing to higher tax
devolution, combined with a cut in Union
Budget allocation for these programs7, there is a
need to strengthen coordination and
participation across states to more equally
prioritize spending on schemes with an intended
impact on the wellbeing of the girl child. Furthermore, a more holistic policy approach oriented
towards higher growth, job creation, and financial inclusion will lead to better sex ratios in the
long run. In addition, reorienting public expenditure towards broadening the social safety net will
reduce the dependence of the old on their children, which will thereby help equalize the
preference for girls and boys.
5 See Ministry of Human Resource Development website at: http://mhrd.gov.in/sarva-shiksha-abhiyan;
http://mhrd.gov.in/rmsa; http://wcd.nic.in/schemes/integrated-child-protection-scheme-icps
6 See State Bank of India website: https://www.sbi.co.in/portal/web/govt-banking/sukanya-samriddhi-yojana
7 As per the implementation of the Fourteenth Finance Commission report, tax devolution from the center to the
states increased from 32 percent to 42 percent.
Source: Census of India (2011).
Note: Gray area reflects states where data are not available.
State-wise Child Sex Ratio
(Age group 0-6 years)
©International Monetary Fund. Not for Redistribution
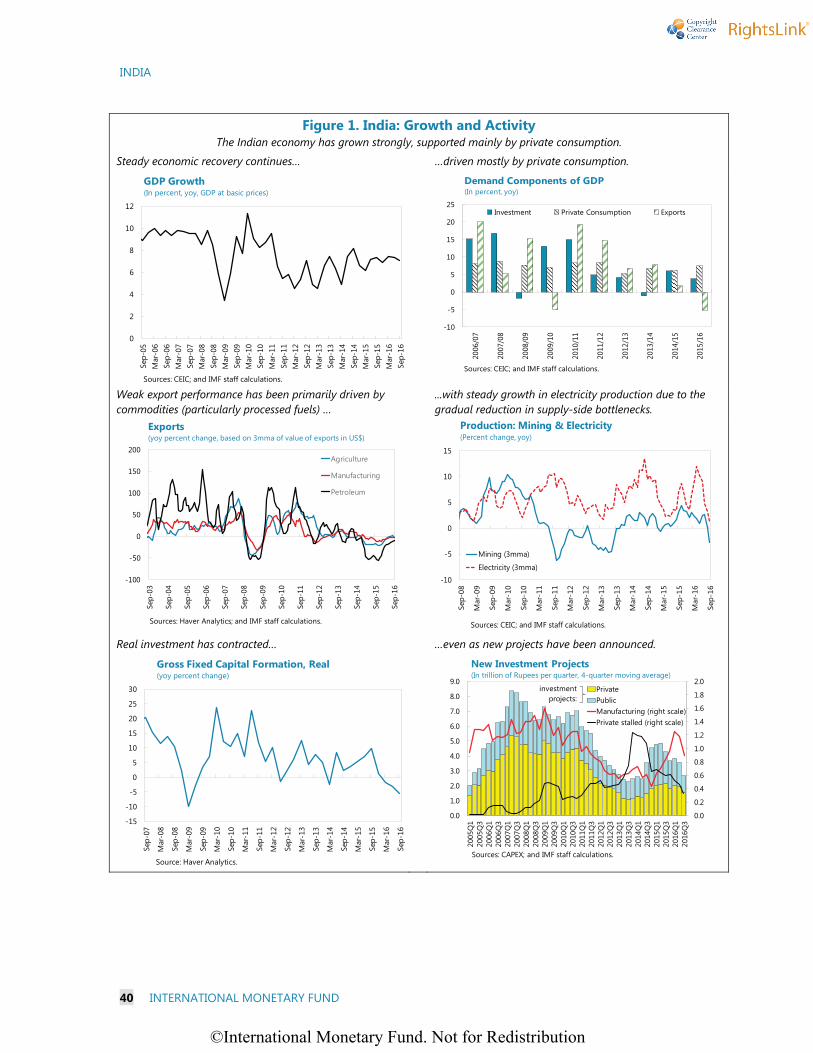
INDIA
40 INTERNATIONAL MONETARY FUND
Figure 1. India: Growth and Activity The Indian economy has grown strongly, supported mainly by private consumption.
Steady economic recovery continues… …driven mostly by private consumption.
Weak export performance has been primarily driven by commodities (particularly processed fuels) …
...with steady growth in electricity production due to the gradual reduction in supply-side bottlenecks.
Real investment has contracted… …even as new projects have been announced.
0
2
4
6
8
10
12
Sep-
05M
ar-0
6Se
p-06
Mar
-07
Sep-
07M
ar-0
8Se
p-08
Mar
-09
Sep-
09M
ar-1
0Se
p-10
Mar
-11
Sep-
11M
ar-1
2Se
p-12
Mar
-13
Sep-
13M
ar-1
4Se
p-14
Mar
-15
Sep-
15M
ar-1
6Se
p-16
GDP Growth(In percent, yoy, GDP at basic prices)
Sources: CEIC; and IMF staff calculations.
-10
-5
0
5
10
15
20
25
2006
/07
2007
/08
2008
/09
2009
/10
2010
/11
2011
/12
2012
/13
2013
/14
2014
/15
2015
/16
Investment Private Consumption Exports
Sources: CEIC; and IMF staff calculations.
Demand Components of GDP(In percent, yoy)
-100
-50
0
50
100
150
200
Sep-
03
Sep-
04
Sep-
05
Sep-
06
Sep-
07
Sep-
08
Sep-
09
Sep-
10
Sep-
11
Sep-
12
Sep-
13
Sep-
14
Sep-
15
Sep-
16
Agriculture
Manufacturing
Petroleum
Sources: Haver Analytics; and IMF staff calculations.
Exports(yoy percent change, based on 3mma of value of exports in US$)
-10
-5
0
5
10
15Se
p-08
Mar
-09
Sep-
09
Mar
-10
Sep-
10
Mar
-11
Sep-
11
Mar
-12
Sep-
12
Mar
-13
Sep-
13
Mar
-14
Sep-
14
Mar
-15
Sep-
15
Mar
-16
Sep-
16
Mining (3mma)
Electricity (3mma)
Production: Mining & Electricity(Percent change, yoy)
Sources: CEIC; and IMF staff calculations.
-15
-10
-5
0
5
10
15
20
25
30
Sep-
07
Mar
-08
Sep-
08
Mar
-09
Sep-
09
Mar
-10
Sep-
10
Mar
-11
Sep-
11
Mar
-12
Sep-
12
Mar
-13
Sep-
13
Mar
-14
Sep-
14
Mar
-15
Sep-
15
Mar
-16
Sep-
16
Gross Fixed Capital Formation, Real(yoy percent change)
Source: Haver Analytics.
0.0
0.2
0.4
0.6
0.8
1.0
1.2
1.4
1.6
1.8
2.0
0.0
1.0
2.0
3.0
4.0
5.0
6.0
7.0
8.0
9.0
2005
Q1
2005
Q3
2006
Q1
2006
Q3
2007
Q1
2007
Q3
2008
Q1
2008
Q3
2009
Q1
2009
Q3
2010
Q1
2010
Q3
2011
Q1
2011
Q3
2012
Q1
2012
Q3
2013
Q1
2013
Q3
2014
Q1
2014
Q3
2015
Q1
2015
Q3
2016
Q1
2016
Q3
PrivatePublicManufacturing (right scale)Private stalled (right scale)
New Investment Projects(In trillion of Rupees per quarter, 4-quarter moving average)
Sources: CAPEX; and IMF staff calculations.
investmentprojects:
©International Monetary Fund. Not for Redistribution

INDIA
INTERNATIONAL MONETARY FUND 41
Figure 2. India: External Vulnerabilities India’s external position remains sustainable.
The current account deficit has remained small with a sharp decline in the merchandise trade deficit…
…that resulted from sustained low commodity-importprices.
Financing of the deficit has shifted to FDI while portfolio inflows have moderated…
…and turned to outflows in late 2016.
Foreign exchange (FX) exposures of corporates are limited. International reserves are adequate.
-15
-10
-5
0
5
10
15
2009
Q1
2009
Q3
2010
Q1
2010
Q3
2011
Q1
2011
Q3
2012
Q1
2012
Q3
2013
Q1
2013
Q3
2014
Q1
2014
Q3
2015
Q1
2015
Q3
2016
Q1
2016
Q3
Trade Balance Services BalanceIncome & Transfers Balance Current Account Balance
Current Account Balance(In percent of GDP)
Sources: Haver Analytics; and IMF staff calculations.
0
2000
4000
6000
8000
10000
12000
14000
16000
Mar
-01
Mar
-02
Mar
-03
Mar
-04
Mar
-05
Mar
-06
Mar
-07
Mar
-08
Mar
-09
Mar
-10
Mar
-11
Mar
-12
Mar
-13
Mar
-14
Mar
-15
Mar
-16
Coal Gold Oil
Imports: Principle Commodities(In millions of US Dollars, 3mma)
Sources: Haver Analytics; and IMF staff calculations.
Nov
-16
-4
-2
0
2
4
6
8
10
12
2009
Q1
2009
Q3
2010
Q1
2010
Q3
2011
Q1
2011
Q3
2012
Q1
2012
Q3
2013
Q1
2013
Q3
2014
Q1
2014
Q3
2015
Q1
2015
Q3
2016
Q1
2016
Q3
Bank capital, including NRI LoansFII FDIFinancial Account Average
Financial Account(In percent of GDP)
Sources: Haver Analytics; and IMF staff calculations.
40
45
50
55
60
65
70
-10
-8
-6
-4
-2
0
2
4
6
8Ja
n-10
Aug-
10
Mar
-11
Oct
-11
May
-12
Dec
-12
Jul-
13
Feb-
14
Sep-
14
Apr-
15
Nov
-15
Jun-
16
Equity Debt Exchange Rate (NC/USD) [RHS]
Source: CEIC.
FII Flows - Equity and Debt(In billions of USD)
Dec
-16
0 50 100 150 200 250
ArgentinaIndonesia
MexicoSouth Africa
PolandSaudi Arabia
BrazilIndia
ThailandTurkey
Russian FederationCzech
MalaysiaIsrael
SingaporeHungary
Emerging MarketKoreaChile
ChinaHong Kong
LC
USD
EURO
Other
Non-Financial Corporate Debt, 2015Q4(In percent of GDP)
Sources: BIS, IIF EM Debt Monitor.
0
50
100
150
200
250
300
Turk
ey
Sout
h A
fric
a
Mex
ico
Chi
na
Kore
a
Indo
nesi
a
Indi
a
Braz
il
Thai
land
Russ
ia2015 2016
Estimated Reserve Adequacy(Official reserves as a percent of IMF country-specific metric)
Sources: IMF, International Financial Statistics; and IMF staff calculations.
Suggested adequacy range
©International Monetary Fund. Not for Redistribution
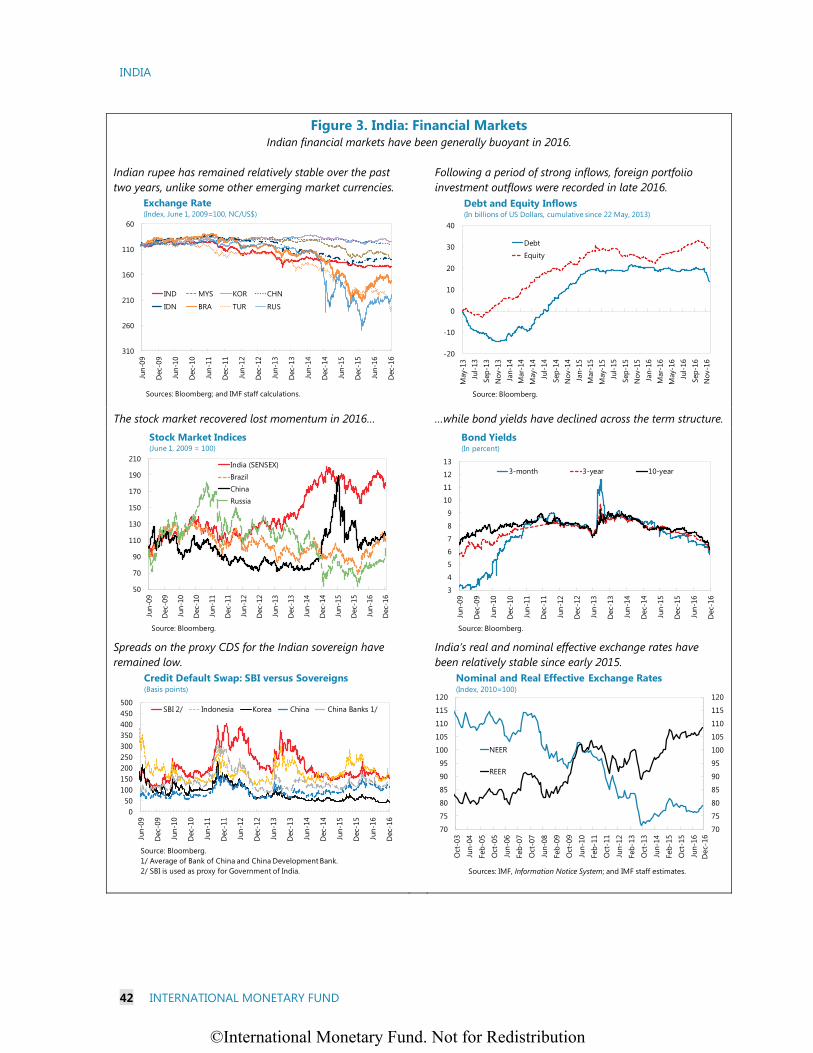
INDIA
42 INTERNATIONAL MONETARY FUND
Figure 3. India: Financial Markets Indian financial markets have been generally buoyant in 2016.
Indian rupee has remained relatively stable over the past two years, unlike some other emerging market currencies.
Following a period of strong inflows, foreign portfolio investment outflows were recorded in late 2016.
The stock market recovered lost momentum in 2016… …while bond yields have declined across the term structure.
Spreads on the proxy CDS for the Indian sovereign haveremained low.
India’s real and nominal effective exchange rates have been relatively stable since early 2015.
60
110
160
210
260
310
Jun-
09
Dec
-09
Jun-
10
Dec
-10
Jun-
11
Dec
-11
Jun-
12
Dec
-12
Jun-
13
Dec
-13
Jun-
14
Dec
-14
Jun-
15
Dec
-15
Jun-
16
Dec
-16
IND MYS KOR CHN
IDN BRA TUR RUS
Exchange Rate(Index, June 1, 2009=100, NC/US$)
Sources: Bloomberg; and IMF staff calculations.
-20
-10
0
10
20
30
40
May
-13
Jul-
13Se
p-13
Nov
-13
Jan-
14M
ar-1
4M
ay-1
4Ju
l-14
Sep-
14N
ov-1
4Ja
n-15
Mar
-15
May
-15
Jul-
15Se
p-15
Nov
-15
Jan-
16M
ar-1
6M
ay-1
6Ju
l-16
Sep-
16N
ov-1
6
Debt
Equity
Debt and Equity Inflows(In billions of US Dollars, cumulative since 22 May, 2013)
Source: Bloomberg.
50
70
90
110
130
150
170
190
210
Jun-
09
Dec
-09
Jun-
10
Dec
-10
Jun-
11
Dec
-11
Jun-
12
Dec
-12
Jun-
13
Dec
-13
Jun-
14
Dec
-14
Jun-
15
Dec
-15
Jun-
16
Dec
-16
India (SENSEX)
BrazilChinaRussia
Stock Market Indices(June 1, 2009 = 100)
Source: Bloomberg.
3
4
5
6
7
8
9
10
11
12
13Ju
n-09
Dec
-09
Jun-
10
Dec
-10
Jun-
11
Dec
-11
Jun-
12
Dec
-12
Jun-
13
Dec
-13
Jun-
14
Dec
-14
Jun-
15
Dec
-15
Jun-
16
Dec
-16
3-month 3-year 10-year
Bond Yields(In percent)
Source: Bloomberg.
050
100150200250300350400450500
Jun-
09
Dec
-09
Jun-
10
Dec
-10
Jun-
11
Dec
-11
Jun-
12
Dec
-12
Jun-
13
Dec
-13
Jun-
14
Dec
-14
Jun-
15
Dec
-15
Jun-
16
Dec
-16
SBI 2/ Indonesia Korea China China Banks 1/
Source: Bloomberg.1/ Average of Bank of China and China Development Bank.2/ SBI is used as proxy for Government of India.
Credit Default Swap: SBI versus Sovereigns(Basis points)
70
75
80
85
90
95
100
105
110
115
120
70
75
80
85
90
95
100
105
110
115
120
Oct
-03
Jun-
04
Feb-
05
Oct
-05
Jun-
06
Feb-
07
Oct
-07
Jun-
08
Feb-
09
Oct
-09
Jun-
10
Feb-
11
Oct
-11
Jun-
12
Feb-
13
Oct
-13
Jun-
14
Feb-
15
Oct
-15
Jun-
16
NEER
REER
Nominal and Real Effective Exchange Rates(Index, 2010=100)
Sources: IMF, Information Notice System; and IMF staff estimates.
Dec
-16
©International Monetary Fund. Not for Redistribution

INDIA
INTERNATIONAL MONETARY FUND 43
Figure 4. India: Monetary Developments While inflation has declined markedly, upside risks remain.
CPI inflation has been stable, following a sharp decline in late 2014…
…although household inflation expectations remainelevated, some gradual softening is taking place.
Vegetables and pulses (grain legumes) have been key drivers of food inflation volatility.
The policy repo rate has been cut by a cumulative 175basis points since early 2015.
Bank liquidity has been in surplus in the past few months. Since late-2013 international reserve buffers have been rebuilt.
0
2
4
6
8
10
12
14
16
Dec
-06
Jul-
07
Feb-
08
Sep-
08
Apr-
09
Nov
-09
Jun-
10
Jan-
11
Aug-
11
Mar
-12
Oct
-12
May
-13
Dec
-13
Jul-
14
Feb-
15
Sep-
15
Apr-
16
Nov
-16
CPI (Combined)
CPI-Core
Sources: CEIC; and IMF staffcalculations.
Inflation(In percent, yoy)
0
2
4
6
8
10
12
14
16
18
20
Sep-
06
Mar
-07
Sep-
07
Mar
-08
Sep-
08
Mar
-09
Sep-
09
Mar
-10
Sep-
10
Mar
-11
Sep-
11
Mar
-12
Sep-
12
Mar
-13
Sep-
13
Mar
-14
Sep-
14
Mar
-15
Sep-
15
Mar
-16
Sep-
16
Expectations: CurrentExpectations: 1 Year AheadCPI: Food (y/y percent change)
Household Inflation Expectations and Food Inflation(In percent)
Sources: CEIC; Haver Analytics; and IMF staff calculations.
-10
-5
0
5
10
15
20
Sep-
12
Feb-
13
Jul-
13
Dec
-13
May
-14
Oct
-14
Mar
-15
Aug-
15
Jan-
16
Jun-
16
Nov
-16
Cereals Milk Vegetables Pulses Others
Sources: CEIC; and IMF staff calculations.
CPI Food Inflation: Contributions(In percent, yoy)
5.05.56.06.57.07.58.08.59.09.510.010.511.011.512.0
5.05.56.06.57.07.58.08.59.09.5
10.010.511.011.512.0
Jun-
13Au
g-13
Oct
-13
Dec
-13
Feb-
14Ap
r-14
Jun-
14Au
g-14
Oct
-14
Dec
-14
Feb-
15Ap
r-15
Jun-
15Au
g-15
Oct
-15
Dec
-15
Feb-
16Ap
r-16
Jun-
16Au
g-16
Oct
-16
Dec
-16
Interbank call money market closing rate
MSF rate
Reverse repo (LAF)
Repo rate (LAF)
Interest Rates(In percent)
Sources: Reserve Bank of India; and IMF staff calculations.
-6000
-5000
-4000
-3000
-2000
-1000
0
1000
2000
3000
4000
Feb-
14
Apr-
14
Jun-
14
Aug-
14
Oct
-14
Dec
-14
Feb-
15
Apr-
15
Jun-
15
Aug-
15
Oct
-15
Dec
-15
Feb-
16
Apr-
16
Jun-
16
Aug-
16
Oct
-16
Dec
-16
Liquidity injection through LAF (term repo)Liquidity injection through MSFLiquidity withdrawal through LAF (reverse repo) 1/Liquidity injection through LAF (repo)LAF Access CapNet Liquidity Injection
Daily Liquidity Operations(In billions of Rupees)
Source: Reserve Bank of India.1/ Overnight and term.
Jun-
07
Jan-
08
Aug-
08
Mar
-09
Oct
-09
May
-10
Dec
-10
Jul-
11
Feb-
12
Sep-
12
Apr-
13
Nov
-13
Jun-
14
Jan-
15
Aug-
15
Mar
-16
Oct
-16
-30
-20
-10
0
10
20
3030
35
40
45
50
55
60
65
70
Spot USD purchases, net (USD bn) [RHS]Change in USD Forward Position (USD bn) [RHS]Rs/US$ (inverted)
Exchange Rate and Intervention
Sources: CEIC; Bloomberg; and IMF staff calculations
©International Monetary Fund. Not for Redistribution

INDIA
44 INTERNATIONAL MONETARY FUND
Figure 5. India: Fiscal Developments Fiscal consolidation has resumed, but medium-term challenges remain.
While still high, the general government deficit has been slowly declining...
… enabled by the small negative fiscal impulse over the past few years.
Current spending has fallen, but remains above the pre-crisis average…
…while the central government budget targets higher capital outlays.
Indirect tax measures continue to drive revenue growth… …while energy subsidies have fallen significantly, food and fertilizer subsidies remain high.
-12
-10
-8
-6
-4
-2
0
2000
/01
2001
/02
2002
/03
2003
/04
2004
/05
2005
/06
2006
/07
2007
/08
2008
/09
2009
/10
2010
/11
2011
/12
2012
/13
2013
/14
2014
/15
2015
/16
(Pro
j.)
2016
/17
(Pro
j.)
Central Government State Governments
Government Balance(In percent of GDP)
Source: IMF staff data.
-3-2-10123456
2004
/05
2005
/06
2006
/07
2007
/08
2008
/09
2009
/10
2010
/11
2011
/12
2012
/13
2013
/14
2014
/15
2015
/16
(Pro
j.)
2016
/17
(Pro
j.)
Source: IMF staff calculations.1/ Defined as difference between current and previous year budget deficits, using business cycle-adjusted revenues.
General Government Fiscal Impulse 1/(In percent of GDP)
0
5
10
15
20
25
2000
/01
2001
/02
2002
/03
2003
/04
2004
/05
2005
/06
2006
/07
2007
/08
2008
/09
2009
/10
2010
/11
2011
/12
2012
/13
2013
/14
2014
/15
2015
/16
(Pro
j.)
2016
/17
(Pro
j.)
Non-interest current spending Avg 2003/04 to 2007/08Avg 2008/09 to 2012/13
General Government Non-interest Current Spending(In percent of GDP)
Source: IMF staff data.
0
1
2
3
4
5
620
00/0
1
2001
/02
2002
/03
2003
/04
2004
/05
2005
/06
2006
/07
2007
/08
2008
/09
2009
/10
2010
/11
2011
/12
2012
/13
2013
/14
2014
/15
2015
/16
(Pro
j.)
2016
/17
(Pro
j.)
State Gov. Central Gov.Avg 2003/04 to 2007/08 Avg 2008/09 to 2012/13
Capital Spending(In percent of GDP)
Source: IMF staff data.
0
2
4
6
8
10
12
14
2000
/01
2001
/02
2002
/03
2003
/04
2004
/05
2005
/06
2006
/07
2007
/08
2008
/09
2009
/10
2010
/11
2011
/12
2012
/13
2013
/14
2014
/15
2015
/16
2016
/17
(Pro
j.)
Direct Indirect
Central Government Revenue(In percent of GDP)
Source: IMF staff data.
0.0
0.5
1.0
1.5
2.0
2.5
3.0
3.5
2000
/01
2001
/02
2002
/03
2003
/04
2004
/05
2005
/06
2006
/07
2007
/08
2008
/09
2009
/10
2010
/11
2011
/12
2012
/13
2013
/14
2014
/15
2015
/16
2016
/17
(Pro
j.)
FoodFertilizerPetroleumTotal
Government Subsidies(In percent of GDP)
Source: IMF staff data.
©International Monetary Fund. Not for Redistribution

INDIA
INTERNATIONAL MONETARY FUND 45
Figure 6. India: Fiscal Vulnerability Indicators While India’s public debt is large compared to emerging market (EM) peers, the debt profile is favorable.
India’s public debt is relatively large in comparison withother major emerging market economies…
…as is the general government fiscal deficit.
However, debt roll-over risks are mitigated by the long average maturity of Indian debt...
…and India’s automatic debt dynamics are favorable.
Currency risks affecting Indian public debt are minimal... …and exposure to non-resident investors is limited.
0
10
20
30
40
50
60
70
80
Indo
nesi
a
Turk
ey
Phili
ppin
es
Sout
h Af
rica
Indi
a
Braz
il
General government gross public debt, 2015(In percent of GDP)
Source: IMF, World Economic Outlook.
-12
-10
-8
-6
-4
-2
0
2
Braz
il
Indi
a
Mex
ico
Sout
h Af
rica
Russ
ia
Mal
aysi
a
Chin
a
Indo
nesi
a
Turk
ey
Phili
ppin
es
Thai
land
General government fiscal balance, 2015(In percent of GDP)
Source: IMF, World Economic Outlook.
0
2
4
6
8
10
12
14
0
2
4
6
8
10
12
14
Turk
ey(B
aa3)
Braz
il(B
aa2)
Indi
a(B
aa3)
Phili
ppin
es(B
aa2)
Indo
nesi
a(B
aa3)
Sout
h Af
rica
(Baa
2)
Source: Bloomberg.1/ As of December 13, 2016.
Average government debt maturity 1/(Years)
-6-5-4-3-2-1012
Braz
il(B
aa2)
Sout
h Af
rica
(Baa
2)
Indo
nesi
a(B
aa3)
Phili
ppin
es(B
aa2) Indi
a(B
aa3)
Turk
ey(B
aa3)
Projected interest-growth differential, 2015-20 1/(In percent)
Sources: IMF, World Economic Outlook; Bloomberg.1/ Calculated as the weighted average coupon rate on government debt less the average nominal GDP growth forecast over the next five years.
0
5
10
15
20
25
30
35
0
5
10
15
20
25
30
35
40
India(Baa3)
Brazil(Baa2)
SouthAfrica(Baa2)
Philippines(Baa2)
Indonesia(Baa3)
Turkey(Baa3)
Source: Bloomberg.1/ As of December 13, 2016
Government Debt in Foreign Currency 1/(In percent of total)
0
10
20
30
40
50
60
0
10
20
30
40
50
60
Indonesia(Baa3)
Turkey(Baa3)
India(Baa3)
Brazil(Baa2)
Source: Bloomberg and IMF staff estimates. Data as of December 13, 2016.
Government Debt held by Non-Residents(In percent of total)
©International Monetary Fund. Not for Redistribution

INDIA
46 INTERNATIONAL MONETARY FUND
Figure 7. India: Corporate and Banking Sectors The corporate-banking nexus continues to play a critical role in domestic financial stability.
Corporate sector vulnerabilities have persisted…. ...leading to a further increase in banks’ stressed loans (NPAs and restructured loans), in particular for PSBs.
Indian banks’ capital positions were slightly stronger in 2015, but are weak relative to other EMs...
…and credit to the corporate sector, especially to industry, has grown at a far slower pace than to other sectors.
PSBs' loan-to-deposit ratio has contracted… . …and corporate leverage has edged down, with the exception of the mining sector.
0
2
4
6
8
10
12
14
16
18
20
0
1
2
3
4
5
6
2000
2001
2002
2003
2004
2005
2006
2007
2008
2009
2010
2011
2012
2013
2014
2015
Interest coverage ratioReturn on equity [%, rhs]
Corporate Debt Repayment Capacity and Profitability(In percent)
Source: IMF, Corporate Vulnerability Utility.
02468
10121416
2012
/13
2013
/14
2014
/15
2015
/16
2012
/13
2013
/14
2014
/15
2015
/16
2012
/13
2013
/14
2014
/15
2015
/16
2012
/13
2013
/14
2014
/15
2015
/16
Public sectorbanks
Private SectorBanks
Foreign banks All banks
Gross NPA ratio Restructured loan ratio
Sources: Reserve Bank of India; and IMF staff estimates
Banks' Nonperforming and Restructured Assets(In percent of outstanding advances)
0
5
10
15
20
25
2011
2012
2013
2014
2015
2011
2012
2013
2014
2015
2011
2012
2013
2014
2015
2011
2012
2013
2014
2015
2011
2012
2013
2014
2015
Brazil China India Indonesia South Africa
Tier 1Tier 2
Source: IMF, Financial Soundness Indicators.1/ 2010 data for India are as of Q3 2010.
Capital Adequacy Ratios 1/ (In percent of risk-weighted assets)
-5
0
5
10
15
20
25
30Ju
n-13
Aug-
13
Oct
-13
Dec
-13
Feb-
14
Apr-
14
Jun-
14
Aug-
14
Oct
-14
Dec
-14
Feb-
15
Apr-
15
Jun-
15
Aug-
15
Oct
-15
Dec
-15
Feb-
16
Apr-
16
Jun-
16
Aug-
16
Oct
-16
Industry Personal Loans (excl. housing) Housing Priority
Growth of Bank Credit, by Sector(In percent, y-o-y)
Sources: RBI; and IMF staff calculations.
50
60
70
80
90
100
110
Sep-
04M
ar-0
5Se
p-05
Mar
-06
Sep-
06M
ar-0
7Se
p-07
Mar
-08
Sep-
08M
ar-0
9Se
p-09
Mar
-10
Sep-
10M
ar-1
1Se
p-11
Mar
-12
Sep-
12M
ar-1
3Se
p-13
Mar
-14
Sep-
14M
ar-1
5Se
p-15
Mar
-16
Sep-
16
All Scheduled Commercial BanksPublic BanksPrivate BanksForeign Banks
Banks' Loan to Deposit Ratio(In percent)
Sources: CEIC; and IMF staff calculations.
0
50
100
150
200
2502014
2015
Corporate Leverage Ratios, by Sector(Debt to Equity Ratio - Median, 25th and 75th percentiles)
Sources: IMF, Corporate Vulnerability Utility; and IMF staff calculations.
©International Monetary Fund. Not for Redistribution
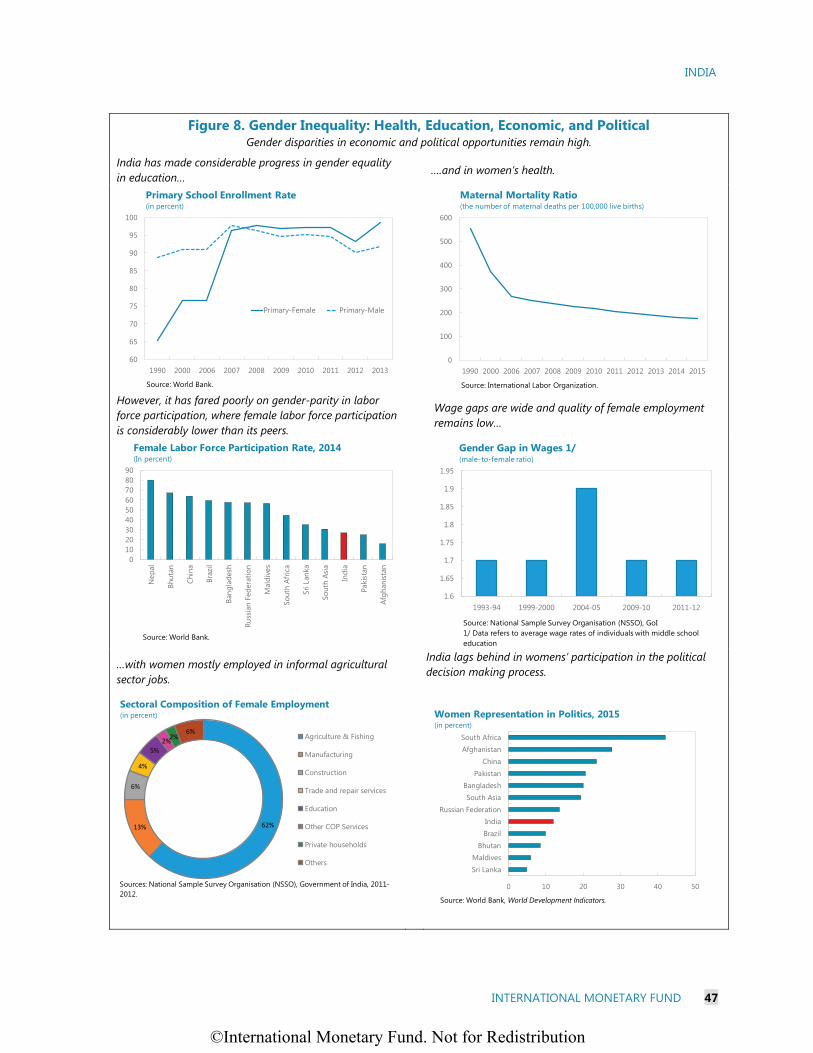
INDIA
INTERNATIONAL MONETARY FUND 47
Figure 8. Gender Inequality: Health, Education, Economic, and Political Gender disparities in economic and political opportunities remain high.
India has made considerable progress in gender equality in education…
….and in women’s health.
However, it has fared poorly on gender-parity in labor force participation, where female labor force participation is considerably lower than its peers.
Wage gaps are wide and quality of female employment remains low…
…with women mostly employed in informal agricultural sector jobs.
India lags behind in womens’ participation in the political decision making process.
60
65
70
75
80
85
90
95
100
1990 2000 2006 2007 2008 2009 2010 2011 2012 2013
Primary-Female Primary-Male
Primary School Enrollment Rate (in percent)
Source: World Bank.
0
100
200
300
400
500
600
1990 2000 2006 2007 2008 2009 2010 2011 2012 2013 2014 2015
Maternal Mortality Ratio(the number of maternal deaths per 100,000 live births)
Source: International Labor Organization.
0102030405060708090
Nep
al
Bhut
an
Chin
a
Braz
il
Bang
lade
sh
Russ
ian
Fede
ratio
n
Mal
dive
s
Sout
h Af
rica
Sri L
anka
Sout
h As
ia
Indi
a
Paki
stan
Afgh
anis
tan
Female Labor Force Participation Rate, 2014 (In percent)
Source: World Bank.
1.6
1.65
1.7
1.75
1.8
1.85
1.9
1.95
1993-94 1999-2000 2004-05 2009-10 2011-12
Gender Gap in Wages 1/(male-to-female ratio)
Source: National Sample Survey Organisation (NSSO), GoI1/ Data refers to average wage rates of individuals with middle school education
62%13%
6%
4%
5%
2%2%
6%Agriculture & Fishing
Manufacturing
Construction
Trade and repair services
Education
Other COP Services
Private households
Others
Sectoral Composition of Female Employment(in percent)
Sources: National Sample Survey Organisation (NSSO), Government of India, 2011-2012.
0 10 20 30 40 50
Sri Lanka
MaldivesBhutan
Brazil
IndiaRussian Federation
South Asia
BangladeshPakistan
China
AfghanistanSouth Africa
Women Representation in Politics, 2015 (in percent)
Source: World Bank, World Development Indicators.
©International Monetary Fund. Not for Redistribution
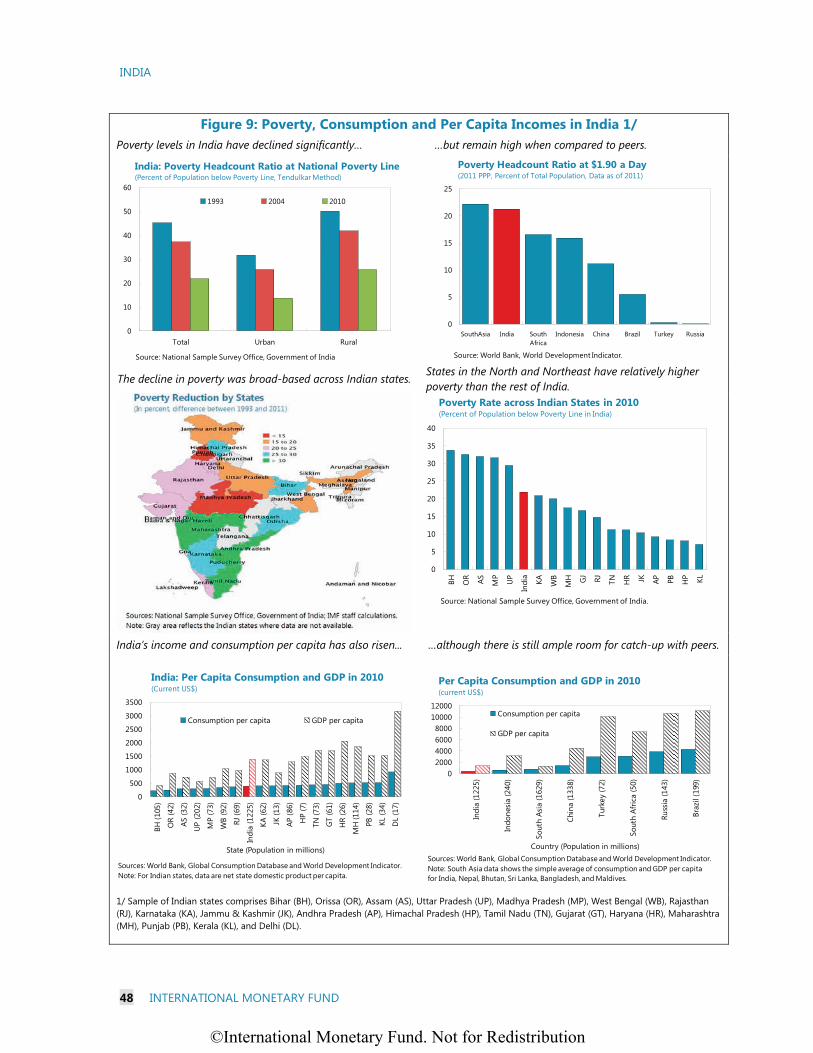
INDIA
48 INTERNATIONAL MONETARY FUND
Figure 9: Poverty, Consumption and Per Capita Incomes in India 1/ Poverty levels in India have declined significantly… …but remain high when compared to peers.
The decline in poverty was broad-based across Indian states. States in the North and Northeast have relatively higher poverty than the rest of India.
India’s income and consumption per capita has also risen... …although there is still ample room for catch-up with peers.
1/ Sample of Indian states comprises Bihar (BH), Orissa (OR), Assam (AS), Uttar Pradesh (UP), Madhya Pradesh (MP), West Bengal (WB), Rajasthan (RJ), Karnataka (KA), Jammu & Kashmir (JK), Andhra Pradesh (AP), Himachal Pradesh (HP), Tamil Nadu (TN), Gujarat (GT), Haryana (HR), Maharashtra (MH), Punjab (PB), Kerala (KL), and Delhi (DL).
0
10
20
30
40
50
60
Total Urban Rural
1993 2004 2010
India: Poverty Headcount Ratio at National Poverty Line(Percent of Population below Poverty Line, Tendulkar Method)
Source: National Sample Survey Office, Government of India
0
5
10
15
20
25
SouthAsia India SouthAfrica
Indonesia China Brazil Turkey Russia
Poverty Headcount Ratio at $1.90 a Day(2011 PPP, Percent of Total Population, Data as of 2011)
Source: World Bank, World Development Indicator.
0
5
10
15
20
25
30
35
40
BH OR AS MP
UP
Indi
a
KA WB
MH GJ RJ TN HR JK AP PB HP KL
Poverty Rate across Indian States in 2010(Percent of Population below Poverty Line in India)
Source: National Sample Survey Office, Government of India.
0
500
1000
1500
2000
2500
3000
3500
BH (1
05)
OR
(42)
AS (3
2)
UP
(202
)
MP
(73)
WB
(92)
RJ (6
9)
Indi
a (1
225)
KA (6
2)
JK (1
3)
AP (8
6)
HP
(7)
TN (7
3)
GT
(61)
HR
(26)
MH
(114
)
PB (2
8)
KL (3
4)
DL
(17)
State (Population in millions)
Consumption per capita GDP per capita
India: Per Capita Consumption and GDP in 2010(Current US$)
Sources: World Bank, Global Consumption Database and World Development Indicator.Note: For Indian states, data are net state domestic product per capita.
02000400060008000
1000012000
Indi
a (1
225)
Indo
nesi
a (2
40)
Sout
h As
ia (1
629)
Chin
a (1
338)
Turk
ey (7
2)
Sout
h Af
rica
(50)
Russ
ia (1
43)
Braz
il (1
99)
Country (Population in millions)
Consumption per capita
GDP per capita
Per Capita Consumption and GDP in 2010(current US$)
Sources: World Bank, Global Consumption Database and World Development Indicator.Note: South Asia data shows the simple average of consumption and GDP per capitafor India, Nepal, Bhutan, Sri Lanka, Bangladesh, and Maldives.
©International Monetary Fund. Not for Redistribution

INDIA
INTERNATIONAL MONETARY FUND 49
Figure 10. India: Business Environment
Thanks to recent reform measures, India’s competitiveness has improved.
Measures to enhance the licensing process, investor protection, and the new insolvency scheme contributed to the improvement in India’s ease of doing business.
India’s key advantages largely embed in its large market size as well as sound macroeconomic management and policies.
However, more needs to be done, particularly in the area of tax, labor and product market regulations.
Indian labor markets appear less efficient, due to rigid regulations and the large informal sector employment.
India’s regulatory quality shows room for improvement to further support growth.
0102030405060708090
2007-08 2016-17
Global Competitiveness Ranking: BRICS
Low
erra
nkin
g in
dica
tes
mor
e co
mpe
titive
Source: Global Competitiveness Index, World Economic Forum
155
185
26
138
44
12
172
143172
136111
184
70 112
36
33
165
79
177
137
-30
20
70
120
170
220
Star
ting
a Bu
sine
ss
Dea
ling
w/
Cons
truc
tion
Perm
its*
Get
ting
Elec
tric
ity*
Regi
ster
ing
Prop
erty
Get
ting
Cred
it
Prot
ectin
gM
inor
ity In
vest
ors
Payi
ng T
axes
Trad
ing
Acr
oss
Bord
ers
Enfo
rcin
g Co
ntra
cts
Reso
lvin
g In
solv
ency
20172008
Evolution of Doing Business Indicators Ranking: India
Source: World Bank, Doing Business Report (2017 and 2008). 2017 data are benchmarked to June 2016 survey responses.*Doing Business 2017 revised methodology (2016 numbers used instead of 2008).
Bett
er D
oing
Bus
ines
s
0123456789
Max Min India Score
India's Scores in Global Competitiveness Index2016-17
Source: Global Competitiveness Report 2016-17, World Economic Forum
Mor
e co
mpe
titiv
e
0 2 4 6 8 10 12
Inadequately educated workforceAccess to financing
Inefficient government bureaucracyPolicy Instability
Inadequate supply of infrastructureRestrictive labor regulations
Foreign currency regulationsGovernment instability
Poor work ethic in national labor forceInsufficient capacity to innovate
InflationCrime and theft
Poor public healthTax rates
CorruptionTax regulations
Most Problematic Factors for Doing Business(weighted ranking scores)
Source: World Economic Forum, Executive Opinion Survey 2016.
India
Brazil
China
South Africa
TurkeyIndonesia
Russia
05
101520253035404550
0 20 40 60 80 100 120 140
Sources: World Development Indicators (2015) and World Economic ForumGlobal Competitiveness Report (2016-17)Note: Young, defined as people younger than 15; working-age populationas 15-64.
Labor market efficiency rankingLess efficient labor market
Youn
g de
pend
ency
rat
io in
per
cent
ofw
orki
ng a
gepo
pula
tion
Labor Market Efficiency Ranking and Young Dependency Ratio: BRICS
0
10
20
30
40
50
60
70
Russia India China Brazil Indonesia SouthAfrica
Turkey
Regulatory Quality(Percentile rank)
Source: Worldwide Governance Indicator (2015)Note: Regulatory quality eflects perceptions of the ability of the government to formulate and implement sound policies and regulations that permit and promote private sector.
Bett
er g
over
nanc
e
©International Monetary Fund. Not for Redistribution
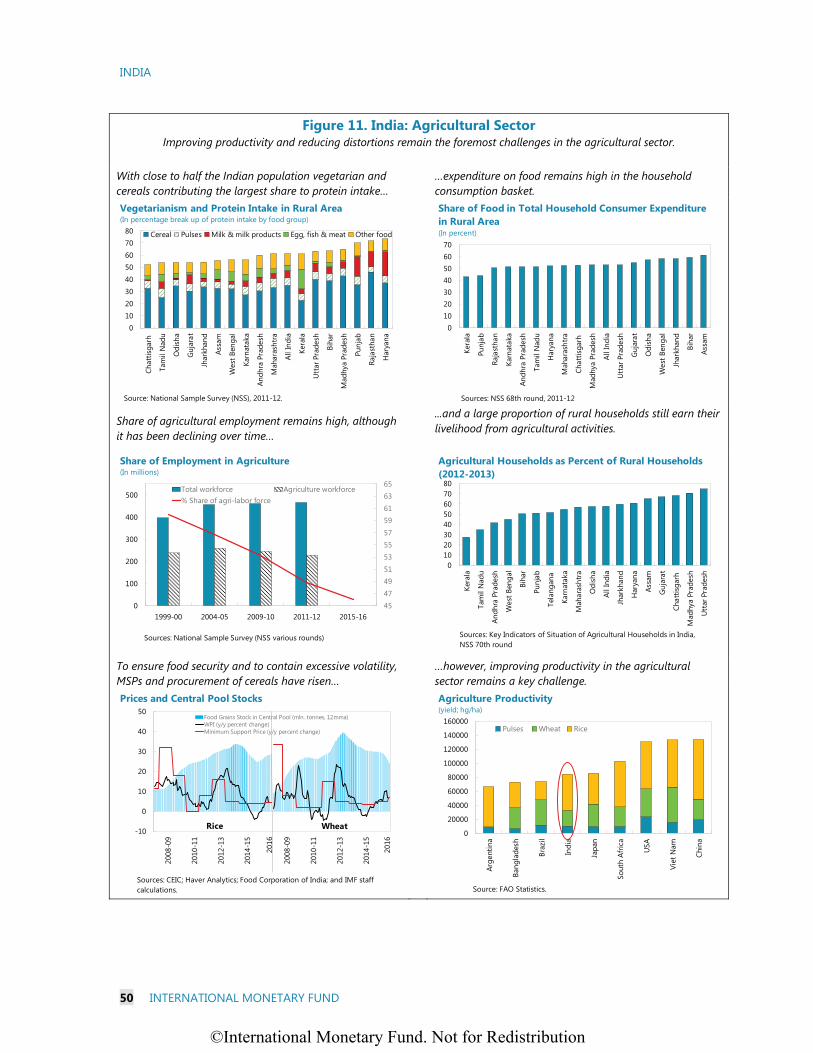
INDIA
50 INTERNATIONAL MONETARY FUND
Figure 11. India: Agricultural Sector Improving productivity and reducing distortions remain the foremost challenges in the agricultural sector.
With close to half the Indian population vegetarian and cereals contributing the largest share to protein intake…
…expenditure on food remains high in the household consumption basket.
Share of agricultural employment remains high, although it has been declining over time…
...and a large proportion of rural households still earn their livelihood from agricultural activities.
To ensure food security and to contain excessive volatility, MSPs and procurement of cereals have risen…
…however, improving productivity in the agricultural sector remains a key challenge.
01020304050607080
Chat
tisga
rh
Tam
il N
adu
Odi
sha
Guj
arat
Jhar
khan
d
Assa
m
Wes
t Ben
gal
Karn
atak
a
Andh
ra P
rade
sh
Mah
aras
htra
All I
ndia
Kera
la
Utt
ar P
rade
sh
Biha
r
Mad
hya
Prad
esh
Punj
ab
Raja
stha
n
Har
yana
Cereal Pulses Milk & milk products Egg, fish & meat Other food
Vegetarianism and Protein Intake in Rural Area (In percentage break up of protein intake by food group)
Source: National Sample Survey (NSS), 2011-12.
010203040506070
Kera
la
Punj
ab
Raja
stha
n
Karn
atak
a
Andh
ra P
rade
sh
Tam
il N
adu
Har
yana
Mah
aras
htra
Chat
tisga
rh
Mad
hya
Prad
esh
All I
ndia
Utt
ar P
rade
sh
Guj
arat
Odi
sha
Wes
t Ben
gal
Jhar
khan
d
Biha
r
Assa
m
Share of Food in Total Household Consumer Expenditure in Rural Area (In percent)
Sources: NSS 68th round, 2011-12
4547495153555759616365
0
100
200
300
400
500
1999-00 2004-05 2009-10 2011-12 2015-16
Total workforce Agriculture workforce% Share of agri-labor force
Share of Employment in Agriculture(In millions)
Sources: National Sample Survey (NSS various rounds)
01020304050607080
Kera
la
Tam
il N
adu
Andh
ra P
rade
sh
Wes
t Ben
gal
Biha
r
Punj
ab
Tela
ngan
a
Karn
atak
a
Mah
aras
htra
Odi
sha
All I
ndia
Jhar
khan
d
Har
yana
Assa
m
Guj
arat
Chat
tisga
rh
Mad
hya
Prad
esh
Utt
ar P
rade
sh
Sources: Key Indicators of Situation of Agricultural Households in India, NSS 70th round
Agricultural Households as Percent of Rural Households(2012-2013)
-10
0
10
20
30
40
50
2008
-09
2010
-11
2012
-13
2014
-15
2016
2008
-09
2010
-11
2012
-13
2014
-15
2016
Food Grains Stock in Central Pool (mln. tonnes, 12mma)WPI (y/y percent change)Minimum Support Price (y/y percent change)
Prices and Central Pool Stocks
Sources: CEIC; Haver Analytics; Food Corporation of India; and IMF staff calculations.
Rice Wheat0
20000
40000
60000
80000
100000
120000
140000
160000
Arge
ntin
a
Bang
lade
sh
Braz
il
Indi
a
Japa
n
Sout
h Af
rica
USA
Viet
Nam
Chin
a
Pulses Wheat Rice
Agriculture Productivity (yield; hg/ha)
Source: FAO Statistics.
©International Monetary Fund. Not for Redistribution

INDIA
INTERNATIONAL MONETARY FUND 51
Table 1. India: Millennium Development Goals, 1990–2015 1/
1990 1991 1993 1995 2001 2004 2006 2009 2011 2012 2013 2014 2015 Status of Progress
Goal 1: Eradicate extreme poverty and hunger 2/Poverty headcount ratio at $1.90 a day (2011 PPP) (% of population) … … 45.91 … … 38.21 … 31.10 21.23 … … … …
Poverty headcount ratio at national poverty lines (% of population) … … 45.30 … … 37.20 … 29.80 21.90 … … … …
Poverty gap at $1.90 a day (2011 PPP) (%) … … 12.06 … … 9.19 … 6.97 4.27 … … … …
Income share held by lowest 20% … … … … … … … … 8.28 … … … …
Prevalence of underweight, weight for age (% of children under 5) … … … … … … 43.50 … … … … … …
Prevalence of undernourishment (% of population) … 23.70 22.40 21.60 17.50 20.90 20.50 16.20 15.60 15.40 15.40 15.30 15.20
Goal 2: Achieve universal primary education 3/School enrollment, primary (% net) 77.45 … … … 79.63 … … 90.75 90.41 91.57 92.26 … …
Primary completion rate, total (% of relevant age group) … … … 71.87 72.43 … … 95.93 92.88 … 96.21 … …
Persistence to grade 5, total (% of cohort) … … … 57.33 61.37 … … … … … … … …
Literacy rate, youth total (% of people ages 15-24) … 61.90 … … 76.43 … 81.13 … 86.14 … … … 89.66
Goal 3: Promote gender equality 4/School enrollment, primary and secondary (gross), gender parity index (GPI) … … 0.73 0.74 0.80 … … 0.98 0.99 1.00 1.06 … …
Literacy rate, youth (ages 15-24), gender parity index (GPI) … 0.67 … … 0.80 … 0.84 … 0.91 … … … 0.95Share of women in wage employment in the nonagricultural sector (% of total nonagricultural employment) 12.70 13.00 13.70 14.40 16.80 17.90 … 19.10 … … … … …
Proportion of seats held by women in national parliaments (%) 5.00 … … … 8.80 8.30 8.30 10.80 11.00 11.00 11.00 11.40 12.00
Goal 4: Reduce child mortality 5/Mortality rate, under-5 (per 1,000) 125.80 122.20 115.40 108.70 87.70 77.70 71.50 62.70 57.20 54.50 52.10 49.80 47.70
Mortality rate, infant (per 1,000 live births) 88.30 86.10 81.70 77.50 64.20 57.80 53.90 48.20 44.40 42.60 40.90 39.30 37.90
Immunization, measles (% of children ages 12-23 months) 56.00 43.00 59.00 72.00 57.00 64.00 69.00 78.00 84.00 83.00 83.00 85.00 87.00
Goal 5: Improve maternal health 6/Maternal mortality ratio (modeled estimate, per 100,000 live births) 556.00 538.00 504.00 471.00 354.00 298.00 265.00 225.00 206.00 197.00 189.00 181.00 174.00
Births attended by skilled health staff (% of total) … … 34.20 … … … 45.50 … … … … … …
Goal 6: Combat HIV/AIDS, malaria, and other diseases 7/Prevalence of HIV, female (% ages 15-24) … … … … … … … … … … … … …
Prevalence of HIV, total (% of population ages 15-49) … … … … … … … … … … … … …
Condom use, population ages 15-24, female (% of females ages 15-24) … … … … … … 5.60 … … … … … …
Condom use, population ages 15-24, male (% of males ages 15-24) … … … … … … 14.60 … … … … … …
Incidence of tuberculosis (per 100,000 people) 217.00 216.00 216.00 216.00 216.00 212.00 205.00 191.00 180.00 176.00 171.00 167.00 …
Tuberculosis case detection rate (%, all forms) 80.00 81.00 54.00 59.00 47.00 48.00 52.00 58.00 59.00 58.00 57.00 74.00 …
Goal 7: Ensure environmental sustainability 8/CO2 emissions (metric tons per capita) 0.71 0.74 0.78 0.84 0.97 1.02 1.12 1.43 1.48 1.60 1.59 … …
Terrestrial protected areas (% of total land area) 4.71 … … … … … … … … … … 5.35 …
GDP per unit of energy use (constant 2011 PPP $ per kg of oil equivalent) 5.03 4.90 5.10 5.33 6.21 6.76 7.38 7.43 8.07 8.12 8.40 … …
Improved water source (% of population with access) 70.50 71.50 73.60 75.60 81.50 84.50 86.50 89.40 91.30 92.20 93.10 94.10 94.10
Improved sanitation facilities (% of population with access) 16.80 16.90 18.80 20.80 26.60 29.60 31.60 34.60 36.50 37.50 38.50 39.50 39.60
Percentage of slum households to urban households (slum reported towns) … … … … … … … … 22.17 … … …
Goal 8: Develop a global partnership for development 9/Debt service (public and publicly guaranteed debt and IMF only, % of exports of goods, services and primary income) 29.08 28.59 26.66 31.73 12.79 7.71 3.04 2.43 1.77 1.75 3.05 … …
Fixed telephone subscriptions (per 100 people) 0.58 0.66 0.87 1.25 3.64 4.16 3.57 3.11 2.69 2.50 2.32 2.13 1.99
Mobile cellular subscriptions (per 100 people) 0.00 0.00 0.00 0.01 0.62 4.70 14.52 44.12 73.20 69.92 70.78 74.48 78.84
Internet users (per 100 people) 0.00 … 0.00 0.03 0.66 1.98 2.81 5.12 10.07 12.58 15.10 21.00 26.00
General indicatorsFertility rate, total (births per woman) 4.04 3.96 3.80 3.65 3.24 3.04 2.90 2.69 2.56 2.51 2.47 2.43 …
Life expectancy at birth, total (years) 57.94 58.44 59.45 60.44 63.02 64.15 64.91 66.10 66.90 67.29 67.66 68.01 …
Literacy rate, adult total (% of people ages 15 and above) … 48.22 … … 61.01 … 62.75 … 69.30 … … … 72.23
GNI per capita, Atlas method (current US$) 390.00 350.00 330.00 380.00 460.00 620.00 810.00 1150.00 1400.00 1500.00 1520.00 1560.00 1590.00
Source: World Bank, World Development Indicators 2014 (October 2015 version) and Indian Ministry of Statistics and Programme Implementation. 1/ Years shown in table are those with data available for the most indicators. 2/ Halve, between 1990 and 2015, the proportion of people whose income is less than the poverty line. Halve, between 1990 and 2015, the proportion of people who suffer from hunger. 3/ Ensure that, by 2015, children everywhere, boys and girls alike, will be able to complete a full course of primary schooling. 4/ Eliminate gender disparity in primary and secondary education preferably by 2005, and at all levels of education no later than 2015. 5/ Reduce by two-thirds, between 1990 and 2015, the under-five mortality rate. 6/ Reduce by three-quarters, between 1990 and 2015, the maternal mortality ratio. 7/ Have halted by 2015, and begun to reverse, the spread of HIV/AIDS. Have halted by 2015, and begun to reverse, the incidence of malaria and other major diseases. 8/ Integrate the principles of sustainable development into country policies and programs and reverse the loss of environmental resources. Halve, by 2015, the proportion of people without sustainable access to safe drinking water. By 2020, to have achieved a significant improvement in the lives of at least 100 million slum dwellers. 9/ Develop further an open, rule-based, predictable, non-discriminatory trading and financial system. Address the Special Needs of the Least Developed Countries. Address the Special Needs of landlocked countries and small island developing states. Deal comprehensively with the debt problems of developing countries through national and international measures in order to make debt sustainable in the long term. In cooperation with developing countries, develop and implement strategies for decent and productive work for youth. In cooperation with pharmaceutical companies, provide access to affordable, essential drugs in developing countries. In cooperation with the private sector, make available the benefits of new technologies, especially information and communications.
Poverty: Achieved.
On-track for 'make
available the
benefits of new
technologies,
especially ICT'.
Off-track
On-track.
Hunger: on-track
Achieved
On-track for water;
off-track for
sanitation; unclear
for rest.
Off-track
On-track
©International Monetary Fund. Not for Redistribution

INDIA
52 INTERNATIONAL MONETARY FUND
Table 2. India: Selected Social and Economic Indicators, 2012/13–2017/18 1/ I. Social Indicators
GDP (2015/16) Poverty (percent of population)Nominal GDP (in billions of U.S. dollars): 2,073 Headcount ratio at $1.90 a day (2011): 21.2GDP per capita (U.S. dollars): 1,581 Undernourished (2015): 15.2
Population characteristics (2015/16) Income distribution (2011, WDI)Total (in billions): 1.31 Richest 10 percent of households: 30.0Urban population (percent of total): 33 Poorest 20 percent of households: 8.2Life expectancy at birth (years): 68.0 Gini index (2011): 35.2
II. Economic Indicators
2012/13 2013/14 2014/15 2015/16 2016/17 2017/18Proj. Proj.
Growth (in percent)Real GDP (at market prices) 5.6 6.6 7.2 7.6 6.6 7.2Industrial production 1.4 0.1 2.8 2.0 … …
Prices (percent change, period average)Consumer prices - Combined 9.9 9.4 5.9 4.9 5.1 4.7
Saving and investment (percent of GDP)Gross saving 2/ 33.8 33.0 33.0 31.3 30.0 29.9Gross investment 2/ 38.6 34.7 34.2 32.4 31.1 31.3
Fiscal position (percent of GDP) 3/Central government overall balance -5.1 -4.6 -4.2 -4.1 -3.8 -3.7General government overall balance -7.5 -7.6 -7.3 -7.0 -6.8 -6.6General government debt 4/ 69.1 68.0 68.3 69.8 69.7 68.6Structural balance (% of potential GDP) -7.4 -7.5 -7.2 -6.9 -6.7 -6.5Structural primary balance (% of potential GDP) -2.9 -2.8 -2.5 -2.0 -1.8 -1.7
Money and credit (y/y percent change, end-period) Broad money 13.6 13.4 10.9 10.5 12.0 13.4Credit to private sector 13.5 13.7 9.3 11.1 10.5 12.3
Financial indicators (percent, end-period)91-day treasury bill yield (end-period) 5/ 8.2 8.9 8.3 7.3 5.9 …10-year government bond yield (end-period) 5/ 8.0 8.8 7.8 7.5 6.2 …Stock market (y/y percent change, end-period) 6/ 8.4 18.7 24.9 -9.4 0.0 …
External trade 7/Merchandise exports (in billions of U.S. dollars) 306.6 318.6 316.5 266.4 274.1 301.0
(Annual percent change) -1.0 3.9 -0.6 -15.9 2.9 9.8Merchandise imports (in billions of U.S. dollars) 502.2 466.2 461.5 396.4 407.8 453.8
(Annual percent change) 0.5 -7.2 -1.0 -14.1 2.9 11.3Terms of trade (G&S, annual percent change) -0.2 2.2 3.2 6.5 0.9 -1.5
Balance of payments (in billions of U.S. dollars)Current account balance -87.8 -32.3 -26.8 -22.1 -24.1 -34.0
(In percent of GDP) -4.8 -1.7 -1.3 -1.1 -1.1 -1.4Foreign direct investment, net ("-" signifies inflow) -19.8 -21.6 -31.3 -36.0 -38.1 -40.2Portfolio investment, net (equity and debt, "-" signifies inflow) -26.9 -4.8 -42.2 4.1 -2.7 -13.9Overall balance -3.8 -15.5 -61.4 -17.9 -15.4 -29.4
External indicatorsGross reserves (in billions of U.S. dollars, end-period) 292.0 304.2 341.6 360.2 375.6 404.9
(In months of imports) 8/ 6.4 6.7 8.5 8.6 8.1 7.9External debt (in billions of U.S. dollars, end-period) 409.4 446.2 474.7 485.0 512.3 553.2External debt (percent of GDP, end-period) 22.4 23.9 23.3 23.4 22.9 22.7
Of which: Short-term debt 9/ 9.0 9.9 9.1 9.3 9.3 9.0Ratio of gross reserves to short-term debt (end-period) 8/ 1.8 1.7 1.8 1.9 1.8 1.8Debt service ratio 10/ 5.9 5.9 7.6 8.8 7.8 7.9Real effective exchange rate (percent change) 11/
(based on annual average level) -2.4 -2.0 6.9 5.8 0.5 …Exchange rate (rupee/U.S. dollar, end-period) 5/ 54.4 61.0 62.6 66.6 68.4 …
Memorandum item (in percent of GDP)Fiscal balance under authorities' definition -4.9 -4.3 -4.0 -3.9 -3.5 -3.5
Sources: Data provided by the Indian authorities; CEIC Data Company Ltd; Bloomberg L.P.; World Bank, World Development Indicators ; and IMF staff estimates and projections.1/ Data are for April–March fiscal years.2/ Differs from official data, calculated with gross investment and current account. Gross investment includes errors and omissions. 3/ Divestment and license auction proceeds treated as below-the-line financing.4/ Includes combined domestic liabilities of the center and the states, and external debt at year-end exchange rates.5/ For 2016/17, as of 30 November 2016.6/ For 2016/17, year-to-date as of 2 December 2016.7/ On balance of payments basis.8/ Imports of goods and services projected over the following 12 months.9/ Short-term debt on residual maturity basis, including estimated short-term NRI deposits on residual maturity basis. 10/ In percent of current account receipts, excluding grants. 11/ For 2016/17, year-to-date as of November 2016.
©International Monetary Fund. Not for Redistribution
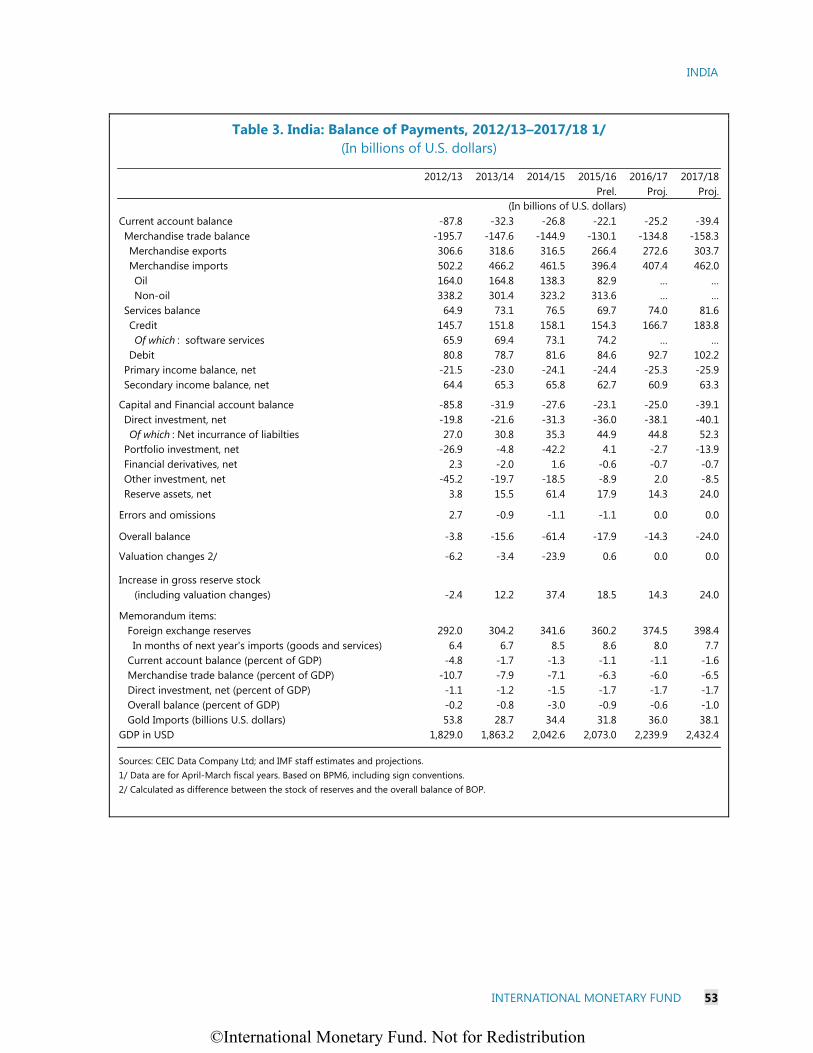
INDIA
INTERNATIONAL MONETARY FUND 53
Table 3. India: Balance of Payments, 2012/13–2017/18 1/ (In billions of U.S. dollars)
2012/13 2013/14 2014/15 2015/16 2016/17 2017/18Prel. Proj. Proj.
Current account balance -87.8 -32.3 -26.8 -22.1 -25.2 -39.4Merchandise trade balance -195.7 -147.6 -144.9 -130.1 -134.8 -158.3Merchandise exports 306.6 318.6 316.5 266.4 272.6 303.7Merchandise imports 502.2 466.2 461.5 396.4 407.4 462.0Oil 164.0 164.8 138.3 82.9 … …Non-oil 338.2 301.4 323.2 313.6 … …
Services balance 64.9 73.1 76.5 69.7 74.0 81.6Credit 145.7 151.8 158.1 154.3 166.7 183.8Of which : software services 65.9 69.4 73.1 74.2 … …
Debit 80.8 78.7 81.6 84.6 92.7 102.2Primary income balance, net -21.5 -23.0 -24.1 -24.4 -25.3 -25.9Secondary income balance, net 64.4 65.3 65.8 62.7 60.9 63.3
Capital and Financial account balance -85.8 -31.9 -27.6 -23.1 -25.0 -39.1Direct investment, net -19.8 -21.6 -31.3 -36.0 -38.1 -40.1Of which : Net incurrance of liabilties 27.0 30.8 35.3 44.9 44.8 52.3
Portfolio investment, net -26.9 -4.8 -42.2 4.1 -2.7 -13.9Financial derivatives, net 2.3 -2.0 1.6 -0.6 -0.7 -0.7Other investment, net -45.2 -19.7 -18.5 -8.9 2.0 -8.5Reserve assets, net 3.8 15.5 61.4 17.9 14.3 24.0
Errors and omissions 2.7 -0.9 -1.1 -1.1 0.0 0.0
Overall balance -3.8 -15.6 -61.4 -17.9 -14.3 -24.0
Valuation changes 2/ -6.2 -3.4 -23.9 0.6 0.0 0.0
Increase in gross reserve stock (including valuation changes) -2.4 12.2 37.4 18.5 14.3 24.0
Memorandum items: Foreign exchange reserves 292.0 304.2 341.6 360.2 374.5 398.4 In months of next year's imports (goods and services) 6.4 6.7 8.5 8.6 8.0 7.7
Current account balance (percent of GDP) -4.8 -1.7 -1.3 -1.1 -1.1 -1.6 Merchandise trade balance (percent of GDP) -10.7 -7.9 -7.1 -6.3 -6.0 -6.5 Direct investment, net (percent of GDP) -1.1 -1.2 -1.5 -1.7 -1.7 -1.7 Overall balance (percent of GDP) -0.2 -0.8 -3.0 -0.9 -0.6 -1.0 Gold Imports (billions U.S. dollars) 53.8 28.7 34.4 31.8 36.0 38.1GDP in USD 1,829.0 1,863.2 2,042.6 2,073.0 2,239.9 2,432.4
Sources: CEIC Data Company Ltd; and IMF staff estimates and projections.1/ Data are for April-March fiscal years. Based on BPM6, including sign conventions.
(In billions of U.S. dollars)
2/ Calculated as difference between the stock of reserves and the overall balance of BOP.
©International Monetary Fund. Not for Redistribution

INDIA
54 INTERNATIONAL MONETARY FUND
Table 4. India: Reserve Money and Monetary Survey, 2012/13–2016/17 1/
2012/13 2013/14 2014/15
September
Reserve money
Reserve money 15,149 17,327 19,285 19,818 19,824
Net domestic assets of RBI -432 -698 -1,988 -4,016 -4,885
Claims on government (net) 5,906 6,987 3,645 4,502 4,508
Center 5,905 6,976 3,610 4,246 6,965
States 1 11 35 256 -2,457
Claims on commercial sector 31 88 148 87 67
Claims on banks 404 486 1,877 2,159 -855
Other items (net) -6,773 -8,259 -7,658 -10,764 -8,605
Net foreign assets of RBI 15,581 18,025 21,273 23,835 24,709
Reserve money 6.2 14.4 11.3 2.8 4.0
Net domestic assets of RBI 0.2 -1.8 -7.4 -10.5 -4.4
Claims on government (net) 3.8 7.1 -19.3 4.4 1.1
Net foreign assets of RBI 6.0 16.1 18.7 13.3 8.4
Monetary survey
Broad money (M3) 83,898 95,174 105,502 116,176 125,954
Currency with public 11,411 12,458 13,862 15,973 16,557
Deposits 72,455 82,696 91,494 100,049 109,211
Non-bank deposits at RBI 32 20 146 154 186
Net domestic assets 67,532 75,934 82,995 90,839 99,739
Domestic credit 83,769 94,902 100,571 110,416 118,964
Net credit to government 27,090 30,449 30,074 32,385 37,735
Of which: RBI 5,906 6,987 3,645 4,250 6,996
Credit to commercial sector 56,679 64,453 70,497 78,031 81,228
Of which: commercial bank lending 52,605 59,941 65,364 72,496 75,739
Nonfood 51,640 58,956 64,420 71,444 74,884
Other items (net) -16,237 -18,967 -17,576 -19,577 -19,225
Net foreign assets 16,367 19,239 22,506 25,337 26,215
Broad money (M3) 13.6 13.4 10.9 10.1 14.6
Net domestic assets 15.6 12.4 9.3 9.5 16.6
Domestic credit 13.7 13.3 6.0 9.8 14.0
Net credit to government 14.1 12.4 -1.2 7.7 17.0
Credit to commercial sector 13.5 13.7 9.4 10.7 12.6
Of which: commercial bank lending 14.1 13.9 9.0 10.9 13.3
Nonfood 14.0 14.2 9.3 10.9 13.8
Net foreign assets 6.0 17.6 17.0 12.6 7.7
Sources: CEIC Data Company Ltd.; IMF International Financial Statistics; and Fund staff calculations.1/ Data are for April–March fiscal years.
(In billions of rupees, end-period)
(Twelve-month percent change)
(In billions of rupees, end-period)
2015/16 2016/17
(Contribution to twelve-month reserve money growth)
©International Monetary Fund. Not for Redistribution
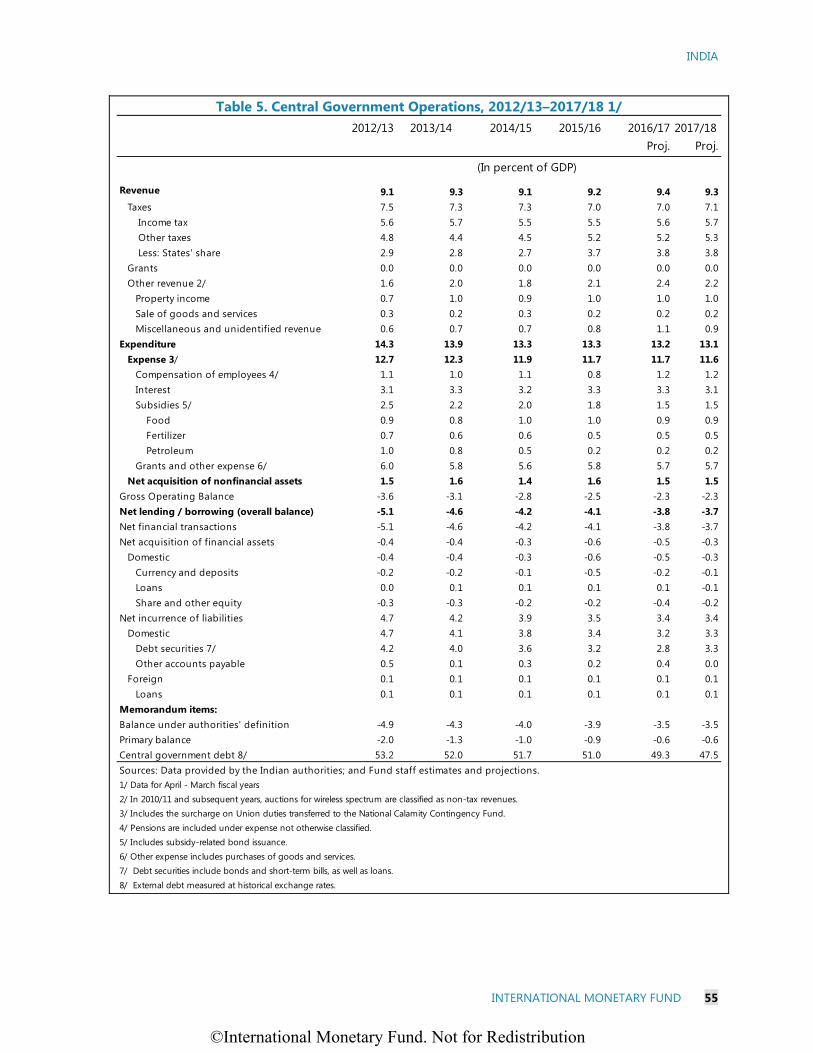
INDIA
INTERNATIONAL MONETARY FUND 55
Table 5. Central Government Operations, 2012/13–2017/18 1/
2012/13 2014/15 2015/16 2016/17 2017/18Proj. Proj.
Revenue 9.1 9.3 9.1 9.2 9.4 9.3Taxes 7.5 7.3 7.3 7.0 7.0 7.1 Income tax 5.6 5.7 5.5 5.5 5.6 5.7 Other taxes 4.8 4.4 4.5 5.2 5.2 5.3 Less: States' share 2.9 2.8 2.7 3.7 3.8 3.8Grants 0.0 0.0 0.0 0.0 0.0 0.0Other revenue 2/ 1.6 2.0 1.8 2.1 2.4 2.2 Property income 0.7 1.0 0.9 1.0 1.0 1.0 Sale of goods and services 0.3 0.2 0.3 0.2 0.2 0.2 Miscellaneous and unidentified revenue 0.6 0.7 0.7 0.8 1.1 0.9
Expenditure 14.3 13.9 13.3 13.3 13.2 13.1Expense 3/ 12.7 12.3 11.9 11.7 11.7 11.6
Compensation of employees 4/ 1.1 1.0 1.1 0.8 1.2 1.2Interest 3.1 3.3 3.2 3.3 3.3 3.1Subsidies 5/ 2.5 2.2 2.0 1.8 1.5 1.5 Food 0.9 0.8 1.0 1.0 0.9 0.9 Fertilizer 0.7 0.6 0.6 0.5 0.5 0.5 Petroleum 1.0 0.8 0.5 0.2 0.2 0.2Grants and other expense 6/ 6.0 5.8 5.6 5.8 5.7 5.7
Net acquisition of nonfinancial assets 1.5 1.6 1.4 1.6 1.5 1.5Gross Operating Balance -3.6 -3.1 -2.8 -2.5 -2.3 -2.3Net lending / borrowing (overall balance) -5.1 -4.6 -4.2 -4.1 -3.8 -3.7Net financial transactions -5.1 -4.6 -4.2 -4.1 -3.8 -3.7Net acquisition of financial assets -0.4 -0.4 -0.3 -0.6 -0.5 -0.3
Domestic -0.4 -0.4 -0.3 -0.6 -0.5 -0.3Currency and deposits -0.2 -0.2 -0.1 -0.5 -0.2 -0.1Loans 0.0 0.1 0.1 0.1 0.1 -0.1Share and other equity -0.3 -0.3 -0.2 -0.2 -0.4 -0.2
Net incurrence of liabilities 4.7 4.2 3.9 3.5 3.4 3.4Domestic 4.7 4.1 3.8 3.4 3.2 3.3
Debt securities 7/ 4.2 4.0 3.6 3.2 2.8 3.3Other accounts payable 0.5 0.1 0.3 0.2 0.4 0.0
Foreign 0.1 0.1 0.1 0.1 0.1 0.1Loans 0.1 0.1 0.1 0.1 0.1 0.1
Memorandum items:Balance under authorities' definition -4.9 -4.3 -4.0 -3.9 -3.5 -3.5Primary balance -2.0 -1.3 -1.0 -0.9 -0.6 -0.6Central government debt 8/ 53.2 52.0 51.7 51.0 49.3 47.5Sources: Data provided by the Indian authorities; and Fund staff estimates and projections.1/ Data for April - March fiscal years2/ In 2010/11 and subsequent years, auctions for wireless spectrum are classified as non-tax revenues.3/ Includes the surcharge on Union duties transferred to the National Calamity Contingency Fund.4/ Pensions are included under expense not otherwise classified.5/ Includes subsidy-related bond issuance.6/ Other expense includes purchases of goods and services.7/ Debt securities include bonds and short-term bills, as well as loans.8/ External debt measured at historical exchange rates.
2013/14
(In percent of GDP)
©International Monetary Fund. Not for Redistribution

INDIA
56 INTERNATIONAL MONETARY FUND
Table 6. General Government Operations, 2012/13–2017/18 1/
2012/13 2013/14 2014/15 2015/16 2016/17 2017/18
Proj. Proj. Proj.
Revenue 19.8 19.5 19.6 21.1 21.4 21.3Taxes 17.1 16.4 16.5 17.6 17.7 17.8
Grants 0.0 0.0 0.0 0.0 0.0 0.0
Other revenue 2.7 3.1 3.1 3.5 3.7 3.5
Expenditure 27.3 27.2 26.9 28.1 28.2 27.9Expense 23.5 23.7 22.9 23.8 24.0 23.7
of which: interest 4.6 4.7 4.7 4.9 4.9 4.8
Net acquisition of nonfinancial assets 3.8 3.4 4.0 4.3 4.2 4.2
Gross Operating Balance -3.7 -4.2 -3.3 -2.7 -2.6 -2.4
Net lending (+)/borrowing (–) (fiscal balance) -7.5 -7.6 -7.3 -7.0 -6.8 -6.6Net financial worth, transactions -7.5 -7.6 -7.3 -7.0 -6.8 -6.6
Net acquisition of financial assets -0.4 -0.4 -0.3 -0.7 -0.5 -0.3
Domestic -0.4 -0.4 -0.3 -0.7 -0.5 -0.3
Currency and deposits -0.2 -0.2 -0.1 -0.5 -0.2 -0.1
Loans 0.0 0.1 0.1 0.0 0.1 -0.1
Equity and investment fund shares -0.3 -0.3 -0.2 -0.2 -0.4 -0.2
Net incurrence of liabilities 7.1 7.3 7.0 6.3 6.3 6.3Domestic 7.0 7.2 7.0 6.2 6.2 6.1
Debt securities 5.7 5.5 5.4 5.2 4.6 4.9
Other accounts payable 1.3 1.8 1.6 1.1 1.6 1.2
Foreign 0.1 0.1 0.1 0.1 0.1 0.1
Loans 0.1 0.1 0.1 0.1 0.1 0.1
Memorandum items:Primary balance -2.9 -2.9 -2.6 -2.1 -1.9 -1.8
Nondefence capital expenditure 3.1 2.7 3.3 3.7 3.6 3.6
State and union territory governments' balance 2/ -2.4 -2.2 -3.1 -2.9 -3.0 -2.8
General government debt 3/ 69.1 68.0 68.3 69.8 69.7 68.7
2/ The authorities treat states' divestment proceeds, including land sales, above-the-line as miscellaneous capital receipts. IMF Staff definition treats divestment receipts as a below-the-line financing item.
3/ Includes combined domestic liabilities of CG and states governments, inclusive of MSS bonds, and sovereign external debt at year-end exchange rates.
Sources: Data provided by the Indian authorities; state level data from the RBI Study on State Finances; and Fund staff amalgamate and prepare projections.
1/ The consolidated general government comprises the central government (CG) and state governments. Data for April-March fiscal year.
(In percent of GDP)
©International Monetary Fund. Not for Redistribution

INDIA
INTERNATIONAL MONETARY FUND 57
Table 7. India: Macroeconomic Framework, 2012/13–2021/22 1/
Prel. Projections
2012/13 2013/14 2014/15 2015/16 2016/17 2017/18 2018/19 2019/20 2020/21 2021/22
Growth (percent change)
Real GDP (at market price) 5.6 6.6 7.2 7.6 6.6 7.2 7.7 7.8 7.9 8.1Non-agricultural sector (at basic price) 6.3 6.7 8.6 8.3 7.2 7.7 8.4 8.6 8.6 8.8
Prices (percent change, period average)Consumer prices 9.9 9.4 5.9 4.9 5.1 4.7 5.2 5.1 5.0 5.0
Saving and investment (percent of GDP)Gross saving 2/ 33.8 33.0 33.0 31.3 30.0 29.9 30.1 30.1 30.2 30.3Gross investment 3/ 38.6 34.7 34.2 32.4 31.1 31.3 31.5 31.7 32.0 32.2
Money and credit (y/y percent change, end-period) Broad money 13.6 13.4 10.9 10.5 12.0 13.4 15.0 15.1 14.0 13.9Credit to private sector 13.5 13.7 9.3 11.1 10.5 12.3 15.2 15.4 15.8 15.8
Fiscal position (percent of GDP)Central government balance 4/ -5.1 -4.6 -4.2 -4.1 -3.8 -3.7 -3.5 -3.3 -3.0 -2.8General government balance 4/ -7.5 -7.6 -7.3 -7.0 -6.8 -6.6 -6.2 -5.8 -5.5 -5.2General government debt 5/ 69.1 68.0 68.3 69.8 69.7 68.6 66.9 64.8 62.7 60.5
External trade (percent change, BOP basis) Merchandise exports (in U.S. dollars terms) -1.0 3.9 -0.6 -15.9 2.9 9.8 9.1 10.1 10.0 9.3Merchandise imports (in U.S. dollars terms) 0.5 -7.2 -1.0 -14.1 2.9 11.3 9.9 10.8 10.4 10.1
Balance of payments (in billions of U.S. dollars, BMP6)Current account balance -87.8 -32.3 -26.8 -22.1 -24.1 -34.0 -39.3 -47.7 -56.9 -68.0
(in percent of GDP) -4.8 -1.7 -1.3 -1.1 -1.1 -1.4 -1.5 -1.6 -1.8 -1.9Foreign direct investment, net 19.8 21.6 31.3 36.0 38.1 40.2 46.6 52.9 60.0 67.9Portfolio investment, net (equity and debt) 26.9 4.8 42.2 -4.1 2.7 13.9 15.2 21.2 23.3 25.7Overall balance -3.8 -15.6 -61.4 -17.9 -15.4 -29.4 -35.3 -44.0 -49.9 -53.9
External indicatorsGross reserves (in billions of U.S. dollars, end-period) 292.0 304.2 341.6 360.2 375.6 404.9 440.3 484.3 534.3 588.2
(in months of imports) 6/ 6.4 6.7 8.5 8.6 8.1 7.9 7.8 7.8 7.8 7.8External debt (in billions of U.S. dollars, end-period) 409.4 446.2 474.7 485.0 512.3 553.2 598.6 649.6 706.8 771.1External debt (percent of GDP, end-period) 22.4 23.9 23.3 23.4 22.9 22.7 22.5 22.1 21.8 21.6
Of which : short-term debt 7/ 9.0 9.9 9.1 9.3 9.3 9.0 9.3 9.5 9.7 9.8Ratio of gross reserves to short-term debt (end-period) 7/ 1.8 1.7 1.8 1.9 1.8 1.8 1.8 1.7 1.7 1.7
GDP in billion US$ 1,829.0 1,863.2 2,042.6 2,073.0 2,239.2 2,433.8 2,663.8 2,939.6 3,240.8 3,576.2
Sources: Data provided by the Indian authorities; CEIC Data Company Ltd; and IMF staff estimates and projections.1/ Data are for April-March fiscal years unless otherwise mentioned. 2/ Differs from official data, calculated with gross investment and current account.3/ Statistical discrepancy adjusted.4/ Divestment and license auction proceeds are treated as financing; includes subsidy related bond issuance.5/ Includes combined domestic liabilities of the center and the states, inclusive of MSS bonds, and sovereign external debt at year-end exchange rates.6/ Imports of goods and services projected over the following twelve months.7/ Including short-term debt on contracted maturity basis, all NRI deposits, and medium and long-term debt on residual maturity basis, different from authority's definition.
©International Monetary Fund. Not for Redistribution

INDIA
58 INTERNATIONAL MONETARY FUND
Table 8. India: Indicators of External Vulnerability, 2012/13–2016/17 1/
2012/13 2013/14 2014/15 2015/16 2016/17 Vintage 2/
Financial indicators
General government debt (percent of GDP) 69.1 68.0 68.3 69.8 69.7 (Projection)
Broad money (percent change, 12-month basis) 13.6 13.4 10.9 10.5 14.6 (Projection)
Private sector credit (percent change, 12-month basis) 13.5 13.7 9.3 11.1 10.5 (Projection)
91 day T-bill yield (percent; end-period) 8.2 8.9 8.3 7.3 6.0 (November 2016)
91 day T-bill yield (real, percent; end-period) 3/ -1.6 -0.7 2.3 2.3 2.4 (November 2016)
External indicators
Exports (percent change, 12-month basis in US$) 4/ -1.0 3.9 -0.6 -15.9 2.9 (Projection)
Export volume (percent change, 12-month basis) 4/ 1.0 4.7 4.1 -4.7 5.7 (Projection)
Imports (percent change, 12-month basis in US$) 4/ 0.5 -7.2 -1.0 -14.1 2.9 (Projection)
Import volume (percent change, 12-month basis) 4/ 1.7 -3.9 6.1 1.4 5.9 (Projection)
Terms of trade (percent change, 12 month basis) 4/ -0.2 2.2 3.2 6.5 0.9 (Projection)
Current account balance (percent of GDP) -4.8 -1.7 -1.3 -1.1 -1.1 (Projection)
Capital and financial account balance (percent of GDP) 4.7 1.8 1.4 1.1 1.1 (Projection)
Of which : Net portfolio investment (debt and equity) -1.5 -0.3 -2.0 0.2 -0.1 (Projection)
Other investment (loans, trade credits, etc.) 2.3 1.2 0.7 1.2 0.7 (Projection)
Net foreign direct investment -1.1 -1.2 -1.5 -1.7 -1.7 (Projection)
Foreign currency reserves (billions of US$) 292.0 304.2 341.6 360.2 375.6 (Projection)
Official reserves (in months of imports of goods and services) 6.4 6.7 8.5 8.6 8.1 (Projection)
Ratio of foreign currency reserves to broad money (percent) 18.9 19.5 20.2 20.8 19.7 (September 2016)
Total short-term external debt to reserves (percent) 5/ 56.3 60.5 54.2 53.3 55.3 (Projection)
Total external debt (percent of GDP) 22.4 23.9 23.3 23.4 22.9 (Projection)
Of which: public sector debt 3.8 3.7 3.5 3.4 3.2 (Projection)
Total external debt to exports of goods and services (percent) 90.5 94.8 100.1 115.3 116.2 (Projection)
External interest payments to exports of goods and services (percent) 1.7 1.7 1.8 2.4 3.4 (Projection)
External amortization payments to exports of goods and services (percent 14.7 19.2 20.6 25.6 26.9 (Projection)
Exchange rate (per US$, period average) 54.4 61.0 62.4 67.0 67.5 (November 2016)
REER (percent change; based on annual average level) -2.4 -2.0 6.9 5.8 0.5 (November 2016)
Financial market indicators
Stock market index (end-period) 18865 22386 27957 25342 26653 (November 2016)
Foreign currency debt rating
Moody's Investor Services Baa3 Baa3 Baa3 Baa3 Baa3 (November 2016)
Standard and Poor's BBB- BBB- BBB- BBB- BBB- (November 2016)
Fitch Ratings BBB- BBB- BBB- BBB- BBB- (November 2016)
Spread of benchmark bonds (basis points, end of period) 6/ 611.4 608.5 581.4 569.6 386.6 (November 2016)
1/ Data for April-March fiscal years. 2/ Latest date available or staff estimate, as noted. 3/ Equals nominal yield minus actual CPI inflation.
6/ 10-year sovereign bond spread over U.S. bond.
4/ Terms of trade including goods and services. Goods volumes are derived from partner country trade price deflators, and services volumes are derived using U.S. CPI from the WEO database.
Sources: Data provided by the Indian authorities; Bloomberg L.P.; CEIC Data Company Ltd.; IMF, Information Notice System and staff estimates and projections.
5/ Including short-term debt on contracted maturity basis, all NRI deposits, and medium and long-term debt on residual maturity basis, different from authorities' definition.
©International Monetary Fund. Not for Redistribution

INDIA
INTERNATIONAL MONETARY FUND 59
Table 9. India: Financial Soundness Indicators, 2011/12–2015/16
2011/12 2012/13 2013/14 2014/15 2015/16
Risk-weighted capital adequacy ratio (CAR) 14.2 13.9 13.0 12.9 13.3Public sector banks 13.2 12.4 11.4 11.4 11.8Private sector banks 16.1 16.6 15.9 15.1 15.7Foreign banks 16.7 17.5 17.9 16.8 16.5
Number of institutions not meeting 9 percent CAR 0 0 1 0 1Public sector banks 0 0 0 0 0Private sector banks 0 0 1 0 1Foreign banks 0 0 0 0 0
Net nonperforming loans (percent of outstanding net loans) 1/ 1.2 1.7 2.2 2.4 4.5Public sector banks 1.5 2.1 2.6 3.0 5.9Private sector banks 0.5 0.5 0.6 0.8 1.2Foreign banks 0.6 1.0 1.1 0.5 0.8
Gross nonperforming loans (percent of outstanding loans) 2.9 3.2 3.8 4.3 7.5Public sector banks 3.2 3.6 4.4 5.0 9.3Private sector banks 2.1 1.8 1.8 2.1 2.8Foreign banks 2.8 3.0 3.9 3.2 4.2
Restructured loans (percent of outstanding loans) 4.7 5.0 5.2 5.8 3.4Public sector banks 5.7 6.1 6.3 7.1 4.1Private sector banks 1.2 1.7 2.3 2.4 1.8Foreign banks 0.1 0.2 0.1 0.1 0.3
Return on assets 2/ 1.1 1.0 0.8 0.8 0.4Public sector banks 0.9 0.8 0.5 0.5 …Private sector banks 1.5 1.6 1.7 1.7 …Foreign banks 1.8 1.9 1.5 1.9 …
Balance sheet structure of all scheduled banksLoan/deposit ratio 78.0 78.0 77.8 76.6 77.7Investment in government securities/deposit ratio 29.4 29.7 28.7 29.2 28.1
1/ Gross nonperforming loans less provisions.2/ Net profit (+)/loss (-) in percent of total assets.
Source: Reserve Bank of India; Bankscope; and IMF staff estimates.
©International Monetary Fund. Not for Redistribution

Table 10. India: High Frequency Economic Activity Indicators
% y-o-y
H1 H2 H1 H2 H1 H2 Q1 Q2 Q3 Q4 Q1 Apr May Jun Jul Aug Sep Oct Nov Dec
Consumption
Domestic passenger vehicle sales 12.8 6.5 -9.7 -5.0 -2.9 4.9 3.8 6.3 6.2 14.6 2.5 11.0 6.3 2.7 16.8 16.7 19.9 4.5 1.8
Aviation: Passenger traffic 4.9 -9.1 0.1 9.8 4.3 14.2 20.1 19.5 20.4 21.4 23.5 20.1 20.6 20.2 26.3 23.5 23.8 23.6 22.0
Cellular subscribers 16.2 7.6 -0.3 1.8 9.1 6.6 -2.3 -2.3 -3.1 6.3 10.3 8.7 8.0 7.9 8.0 7.6 7.2 7.1 7.0
Consumer credit 12.4 14.1 13.3 13.6 14.1 15.0 16.3 16.5 17.4 17.0 18.9 19.7 19.1 18.5 18.8 18.1 19.7 17.0 15.2
Rural wages (male) 18.2 18.5 17.2 20.2 25.4 15.3 7.5 6.6 6.6 5.6 5.9 6.3 6.3 6.3 5.8 5.7 5.3 5.7
Domestic two-wheeler sales 10.8 1.1 -0.7 8.6 13.1 9.6 -0.2 0.6 -1.3 4.4 8.6 21.2 9.7 12.3 13.5 26.3 21.6 8.7 -5.9
Investment
Railway traffic: Net tonne km 4.1 0.5 0.3 1.9 2.2 7.1 3.5 0.9 -2.9 -6.9 -8.4 -13.3 -8.3 -4.5 -7.1 -7.6 -9.7 -7.3 -1.2
Government Capex (YTD) -18.0 8.3 13.6 26.3 -20.2 -12.6 92.2 17.6 41.1 43.3 -15.3 -20.5 -12.0 -16.4 -17.1 -0.7 5.3 -12.8 -10.4
External sector
Visitor arrivals 6.7 2.0 4.5 7.3 10.1 10.4 3.5 4.1 7.1 4.0 10.0 10.6 3.8 7.4 17.1 11.8 13.3 10.3 9.2
Exports value 0.0 -4.1 2.3 10.1 3.8 1.1 -14.7 -16.0 -18.1 -19.1 -7.8 -5.7 -0.6 2.0 -7.0 0.0 4.8 8.2 2.3
Export (ex-oil) value 0.2 -8.5 0.1 10.8 3.4 3.1 -7.7 -6.9 -10.2 -11.7 -5.6 -3.0 1.5 3.8 -5.6 1.6 5.3 7.8 2.1
Imports (ex-oil, gold) value 7.9 -5.3 -0.7 -6.4 -3.8 12.3 4.3 3.6 -3.3 -8.4 -3.6 -17.7 -4.3 -1.3 -9.7 -1.7 -3.4 1.7 9.6
Industry
Industrial production 0.2 1.3 0.7 0.5 1.9 1.7 3.3 3.3 4.8 1.7 0.2 -1.3 1.3 2.2 -2.5 -0.7 0.7 -1.9
Manufacturing PMI* 55.9 53.7 51.0 50.6 51.7 53.6 51.7 52.1 51.5 50.2 51.9 50.5 51.5 51.2 51.8 52.4 52.6 56.1 50.4 48.6
Corporate (industry) credit 18.4 15.9 14.6 16.5 13.3 7.7 6.2 6.1 5.3 5.9 6.1 3.9 3.9 3.7 4.1 4.1 7.0 2.2 0.3
Coal output 9.5 6.4 -0.8 3.2 3.3 10.8 5.2 7.0 0.9 5.5 4.7 -0.9 5.5 12.0 5.1 -9.2 -5.8 -1.6 6.4
Steel output 4.9 2.7 10.5 10.5 9.3 6.8 -1.3 2.1 -1.9 -5.6 0.0 6.1 3.2 2.4 -0.5 17.0 16.3 16.9 5.6
Cement output 10.8 5.6 5.4 3.8 5.4 7.0 -0.5 1.4 1.6 4.5 11.4 4.4 2.4 10.3 1.4 3.1 5.5 6.2 0.5
Electricity generation 5.7 3.6 2.7 6.7 9.5 9.4 3.7 2.3 6.8 7.5 8.8 14.7 4.6 8.1 1.6 0.1 2.2 2.8 10.2
Services
Services PMI* 55.3 54.3 52.7 47.5 52.9 51.3 52.5 50.9 50.5 52.5 53.0 54.3 51.4 50.4 51.1 54.4 52.2 55.0 43.1 46.3
Light commercial vehicles 18.2 -0.4 1.6 -15.2 -22.9 -7.3 -4.6 -1.3 -4.0 7.0 13.5 9.1 10.8 18.0 9.4 11.0 4.0 2.9 15.1
Medium & heavy commercial vehicles -4.5 -22.8 -27.3 -34.2 -6.3 32.5 29.1 20.4 41.0 21.9 27.6 21.7 27.7 15.2 2.2 -14.9 -32.4 23.6 16.2
Railway traffic: passenger 4.7 3.2 -0.9 -1.1 3.1 -5.6 -4.2 -8.7 2.6 1.1 2.0 -0.3 1.0 -1.2 0.6 1.9 -0.1 -0.9 7.0
Airline: cargo traffic -3.6 -5.1 -3.9 5.8 10.2 12.5 7.0 8.5 3.0 6.5 10.4 4.6 7.3 8.9 7.4 8.1 9.8 13.5 9.0
Deposits 14.5 13.5 13.4 13.7 14.4 12.0 11.4 10.7 10.9 10.1 9.3 9.5 8.9 9.2 8.4 9.0 12.8 9.8 16.0
Bank Credit 17.3 16.6 15.0 15.0 13.9 10.8 9.6 9.2 9.1 9.5 10.6 10.0 9.4 9.1 8.5 8.9 11.8 9.1 6.6
Other indicators
Service Taxes (YTD) 38.7 30.7 32.0 21.0 14.4 5.2 8.5 14.2 25.3 30.5 28.2 13.3 30.1 28.5 26.1 24.4 22.8 24.5 27.1
Gross tax (ex-service tax) (YTD) 14.2 9.9 11.2 9.4 7.6 8.6 14.7 18.1 24.0 18.5 6.9 64.3 40.2 30.9 26.8 21.4 15.6 16.9 20.6
OECD Composite leading indicators* 99.9 99.4 98.8 98.4 98.6 98.8 98.9 99.0 99.2 99.4 99.8 99.9 100.1 100.3 100.5 100.7 100.9 101.1
2012 2013 2014 2015 2016
Sources: CEIC Data Company Ltd., Haver, OECD, and IMF staff estimates.
* Index values. Note: The cell is highlighted in dark green if the growth is above average. The cell is highlighted in dark red if the growth is below average. The average for each data series covers
data points since 2012 H1 to latest month.
IND
IA
60 IN
TERNATIO
NAL M
ON
ETARY FUN
D
©International Monetary Fund. Not for Redistribution

INDIA
INTERNATIONAL MONETARY FUND 61
Annex I. Key Policy Actions 2016–171 Monetary Policy
March 3, 2016 Marginal Cost of Funds based Lending Rate (MCLR): RBI notified guidelines for MCLR for commercial banks effective April 1, 2016. MCLR would replace ‘base rate’ as the new reference point for setting lending rates for various tenures based on marginal cost of funds (= 92 percent x marginal cost of borrowings + 8 percent x return on net worth). Banks are now required to review and publish MCLR on a monthly basis based on changes in deposit rates, thus supporting quicker transmission of monetary policy moves.
April 5, 2016 Policy actions:(i) Reduced repo rate by 25 bps to 6.50 percent from 6.75 percent; (ii) Narrowed the policy rate corridor from +/-100 bps to +/- 50 bps by
reducing the marginal standing facility (MSF) rate by 75 bps and increasing the reverse repo rate by 25 bps. Consequently, the reverse repo rate was adjusted to 6.0 per cent, and MSF rate to 7.0 percent;
(iii) Progressively lower the average ex ante liquidity deficit in the system from one percent of net demand and time liabilities (NDTL) to a position closer to neutrality; and supply of durable liquidity to be smoothened over the year through open market operation (OMOs);
(iv) Reduced the minimum daily maintenance of cash reserve ratio (CRR) from 95 percent of the requirement to 90 percent, while keeping the CRR unchanged at 4.0 percent of NDTL.
May 14, 2016 Flexible Inflation Targeting & Monetary Policy Committee (MPC):Government amended RBI Act, 1934 to include flexible inflation targeting (FIT) as the new operational framework for the central bank and notified the factors that would constitute failure to achieve the inflation target, namely: (a) average inflation remains more than the upper tolerance level of the inflation target notified for any three consecutive quarters; or (b) average inflation remains less than the lower tolerance level of the inflation target notified for any three consecutive quarters, whereby the RBI would be required to explain factors responsible and spell out policy action. The amendment also provided for a six-member Monetary Policy Committee (MPC), responsible for setting monetary policy. MPC would have three members from the RBI, including the Governor, the ex-officio chairperson, the Deputy Governor in charge of monetary policy and one executive director and three outside experts to be appointed by the government for a period of 4 years and not eligible for re-appointment. Each member would have one vote and in the case of a tie, the Governor would have a second or casting vote.
August 5, 2016 Inflation target: Based on the amended RBI Act 1934 the government notified the CPI headline inflation target band for a five-year period ending March 31, 2021 to be 4 +/- 2 percent.
September 30, 2016
Monetary policy committee (MPC) formation: Government notified the formation of a six-member MPC which includes Dr. Urjit Patel, Governor RBI, Chairperson, Mr. R. Gandhi, Deputy Governor, RBI, Dr. Michael Patra, Executive Director, RBI, Dr. Chetan Ghate, Professor, Indian Statistical
1/ Prepared by Sudip Mohapatra.
©International Monetary Fund. Not for Redistribution

INDIA
62 INTERNATIONAL MONETARY FUND
Institute (ISI), Dr. Pami Dua, Director, Delhi School of Economics (DSE) and Dr. Ravindra H. Dholakia, Professor, Indian Institute of Management (IIM) with effect from September 30, 2016.
October 4, 2016 Policy rate: Monetary Policy Committee (MPC) in its first review reduced policy repo rate by 25 bps to 6.25 percent from 6.5 percent.
November 25, 2016
Oil Bonds: RBI allowed oil bonds issued by the government to qualify as eligible securities for repos, reverse repos and Marginal Standing Facility (MSF), while non-statutory liquidity requirement (SLR) status of these bonds would continue.
November 26, 2016
Cash reserve ratio (CRR): RBI asked banks to maintain an incremental CRR of 100 percent on the increase in net demand and time liabilities (NDTL) between September 16, 2016 and November 11, 2016, effective from November 26, 2016. The hike is a temporary measure to offset deposits resulting from the withdrawing of legal tender of old ₹500 and ₹1000 currency notes in circulation.
Financial Sector February 28, 2016
Banks Board Bureau (BBB): With a view to improve governance of public sector banks (PSBs), the government set up an autonomous Banks Board Bureau, responsible for selection of heads of PSBs and financial institutions, and help develop strategies and capital raising plans.
March 17, 2016 Framework for Revival and Rehabilitation of Micro, Small and Medium Enterprises (MSMEs): RBI notified changes to the framework for MSME stressed assets up to loan size of ₹250 million which would require every bank to form special committees at district/regional level to help regularize assets before turning into NPAs. Operationally banks would be required to categorize stressed assets into three sub-categories under the Special Mention Account (SMA) – SMA-0, SMA-1 and SMA-2 depending on duration of default on interest or/and principal.
March 17, 2016 Currency Futures Market: RBI permitted stand-alone primary dealers (PDs) to deal in currency futures contracts traded on recognized exchanges subject to prudential eligibility criteria, position limits and risk management practices.
March 29, 2016 Investment by Foreign Portfolio Investors (FPI) in Government Securities:RBI raised the limits for investment by FPIs in central government securities in two tranches, i.e., by ₹105 billion from April 4, 2016 and by ₹100 billion from July 5, 2016; and State Development Loans (SDL) by ₹35 billion each from April 4, 2016 and July 5, 2016.
March 30, 2016 External Commercial Borrowing (ECB): RBI allowed infrastructure companies, Non-Banking Financial Companies-Infrastructure Finance Companies (NBFC-IFCs), NBFCs-Asset Finance Companies (NBFC-AFCs), Holding Companies and Core Investment Companies (CICs) to raise ECB with minimum average maturity period of 5 years, subject to 100 percent hedging. Further, exploration, mining and refinery sectors would be deemed as infrastructure sector, and be allowed access to ECB as applicable to the sector.
May 11, 2016 Insolvency and Bankruptcy Code, 2016: Parliament passed the Insolvency and Bankruptcy Code, 2016. The Code provides a 180-day time-bound insolvency resolution process for companies, partnerships and individuals.
©International Monetary Fund. Not for Redistribution

INDIA
INTERNATIONAL MONETARY FUND 63
May 26, 2016 Strategic Debt Restructuring Mechanism for NBFCs: RBI issued fresh guidelines asking NBFCs to implement the debt-restructuring package, under the Joint Lender's Forum and multiple banking arrangements in 90 days, at par with commercial banks.
June 13, 2016 NPA resolution: RBI notified the Scheme for Sustainable Structuring of Stressed Assets (S4A) as an optional framework for the resolution of large stressed accounts (more than ₹5 billion) by bifurcating outstanding debt into two components: a sustainable portion (Part A) not less than 50% of total debt, and an unsustainable portion (Part B). While Part B portion would be classified as non-performing asset and appropriate enhanced provision be made, the sustainable portion (Part A) would be treated as ‘Standard’ upon implementation of the resolution plan by the bank. Banks could upgrade Part B to standard category and reverse the associated enhanced provisions after one year of satisfactory performance of Part A loans. To ensure transparency S4A scheme envisages the resolution plan be prepared by credible professional agencies and be reviewed by an Overseeing Committee, to be set up by the Indian Banks Association (IBA), in consultation with the RBI.
June 15, 2016 Bank consolidation: The government gave in-principle approval to a proposal for the merger of five associate banks of the State Bank of India (SBI), the largest public sector bank, with itself along with the Bharatiya Mahila Bank. SBI board has approved share swap ratio to merge five associate banks—the State Bank of Bikaner and Jaipur, State Bank of Travancore, State Bank of Patiala, State Bank of Mysore and State Bank of Hyderabad.
June 23, 2016 Over the Counter (OTC) currency options market: RBI permitted resident exporters and importers of goods and services to write (sell) standalone plain vanilla European call and put option contracts against their contracted exposure, i.e. covered call and covered put respectively.
July 28, 2016 Retail Participation Secondary Government Securities Market: RBI allowed retail demit account holders to trade in government securities.
August 1, 2016 On Tap Bank Licensing: RBI issued fresh guidelines for “on tap” licensing of universal banks in the private sector which allow individuals, private sector entities and NBFCs to apply for banking license whenever they regard as appropriate. It replaced the earlier ‘Stop and Go’ licensing policy that depended on central bank’s discretion to invite applications. A fresh applicant would need a minimum paid-up capital of ₹5 billion with the foreign investment limit pegged at 74 percent.
August 25, 2016 Corporate bond market:(i) RBI raised the aggregate exposure limit for all banks toward partial credit
enhancement (PCE) of a given bond issue size to 50 percent from 20 percent;
(ii) Masala bonds by banks: RBI allowed banks to issue Perpetual Debt Instruments (PDI) qualifying for inclusion as Additional Tier 1 capital and debt capital instruments qualifying for inclusion as Tier 2 capital, by way of rupee-denominated (Masala) bonds overseas. It is also permitted banks to issue long term Masala bonds for financing infrastructure and affordable housing (notified on November 3, 2016);
(iii) Enhancing Credit Supply for Large Borrowers through Market Mechanism: RBI issued a set of new guidelines for banks limiting any fresh lending to large borrowers beyond a specified Aggregate
©International Monetary Fund. Not for Redistribution

INDIA
64 INTERNATIONAL MONETARY FUND
Sanctioned Credit Limit (ASCL) effective FY 2017/18 and thereby nudging corporates to access market instruments, viz., bonds, debentures, redeemable preference shares and any other non-credit liability. Banks’ lending above the Normally permitted lending limit (NPLL), which is set at 50 percent of the incremental funds raised by the specified borrower over and above its ASCL would be treated as risky and invite higher risk weights and provisioning.
(iv) Allow FPIs to trade directly in corporate bonds without involving brokers; (v) Amend RBI Act to accept corporate bonds under Liquidity Adjustment
Facility (LAF) of RBI; (vi) Permit corporates to lend through the repo market, without any tenor or
counterparty restrictions; and (vii) Permitted brokers registered with SEBI and authorized as market makers
in corporate bond market to undertake repo/reverse repo contracts in corporate debt securities.
September 1, 2016
Debt recovery: Government passed and notified the Enforcement of Security Interest and Recovery of Debts Laws and Miscellaneous Provisions (Amendment) Bill, 2016, which amended four laws—SARFAESI Act, 2002; Recovery of Debts due to Banks and Financial Institutions Act, 1993; Indian Stamp Act, 1899; and Depositories Act, 1996 for expeditious recovery of bad loans by banks. Key features are: (i) empowering the District Magistrate to assist banks in taking over management of a company in default; (ii) allowing secured creditors to take over collateral within 30 days; (iii) empowering RBI to audit, inspect and regulate Asset Reconstruction Companies (ARCs) and remove the chairman or any director or impose penalties for non-compliance; and (iv) exempt stamp duty on transactions undertaken for transfer of financial assets (loans and collaterals) in favor of ARCs.
September 1, 2016
Sale of Stressed Assets: RBI allowed banks to sell stressed assets to other banks, NBFCs or financial institutions, who have the necessary capital and expertise in resolving stressed assets. Earlier sale of such assets were restricted to Securitization Companies (SCs)/ Reconstruction Companies (RCs), created under the Securitization and Reconstruction of Financial Assets and Enforcement of Security Interest Act, 2002.
September 29, 2016
The Securities and Exchange Board of India (SEBI) permitted commodity exchanges to introduce trading in options, subject to its approval.
September 28, 2016
Resolution corporation: Government released the report of the Committee to draft a Code on Resolution of Financial Firms, along with a draft Bill for public comment. The draft Bill has provision for creating a Resolution Corporation responsible for resolving insolvency of financial firms; including banks, insurance companies, and non-banking financial companies. The board of the corporation would have representatives of key regulators, RBI, SEBI, IRDA, and the central government. The corporation would categorize financial firms’ risk profile as low, moderate, material, imminent or critical by taking into account their capital, asset quality, liquidity conditions; and the resolution process for critical firms would have to be completed within two years, with an option to extend by one year in special cases.
©International Monetary Fund. Not for Redistribution

INDIA
INTERNATIONAL MONETARY FUND 65
September 30, 2016
Investment by FPIs in Government Securities: The limits for investment by FPIs were raised in two tranches: ₹100 billion each in central government securities and ₹35 billion each in state development loans (SDLs) from October 3, 2016 and January 2, 2017, respectively.
October 20, 2016
FPIs participation in government securities: RBI allowed FPIs to trade government securities in the secondary market, through the primary members of NDS-OM including the Web-module.
October 28, 2016
Money market futures: RBI introduced Interest Rate Futures based on any rupee-denominated money market interest rate or money market instrument on SEBI authorized stock exchanges. The RBI had already permitted introduction of futures based on the 91-day Treasury Bill.
November 17, 2016
FPI investment in corporate bonds: RBI permitted FPI investment in unlisted corporate debt securities and securitized debt instruments within the prescribed investment limits, currently at ₹350 billion.
Fiscal Policy February 29, 2016
Strategic disinvestment: Government asked NITI Aayog to prepare a list of central public sector enterprises (CPSEs) for strategic disinvestment—i.e., sale of equity up to 50 percent, or above along with transfer of management control. The NITI Aayog in June submitted its first list of loss-making CPSEs, subdivided into two groups—one comprising those that could be closed and the other where government could divest its stake. The government has since approved many of NITI Aayog’s recommendations; on October 27, 2016 announcing it had agreed to close the loss making Hindustan Cables Limited, Kolkata, HMT Tractor Division and strategic sale of many PSUs.
March 18, 2016 Interest rates on various Small Savings Schemes (SSS): Government notified to reset interest rates on various small savings schemes on a quarterly instead of annual basis, based on the government security yields of the previous three months—this quarterly revision would significantly address the concerns of commercial banks’ inability to reduce their deposit rates and help support monetary policy transmission. Following the notification, interest rates for various SSS came down significantly.
April 6, 2016 State fiscal deficit target: The central government accepted FourteenthFinance Commission recommendations of a fiscal deficit threshold limit of 3 percent of Gross State Domestic Product (GSDP) for the states. This nominal limit would also have year-to-year flexibility for an additional fiscal deficit of maximum of 0.5 percent in any given year for states that have a favorable debt-to-GSDP ratio and interest payments-to-revenue receipts ratio in the previous two years.
May 10, 2016 Double taxation avoidance treaty: India and Mauritius signed the Protocol for amendment of the Convention for the Avoidance of Double Taxation and the Prevention of Fiscal Evasion with respect to taxes on income and capital gains. The Protocol tackles long-standing issues of treaty abuse and round tripping of funds, curbs revenue loss, prevents double non-taxation and streamlines the flow of investment. Existing investments have been grand-fathered and would not be subject to capital gains taxation in India.
May 17, 2016 FRBM review committee: Government constituted a five-member committee to comprehensively review and give recommendations on the FRBM roadmap
©International Monetary Fund. Not for Redistribution
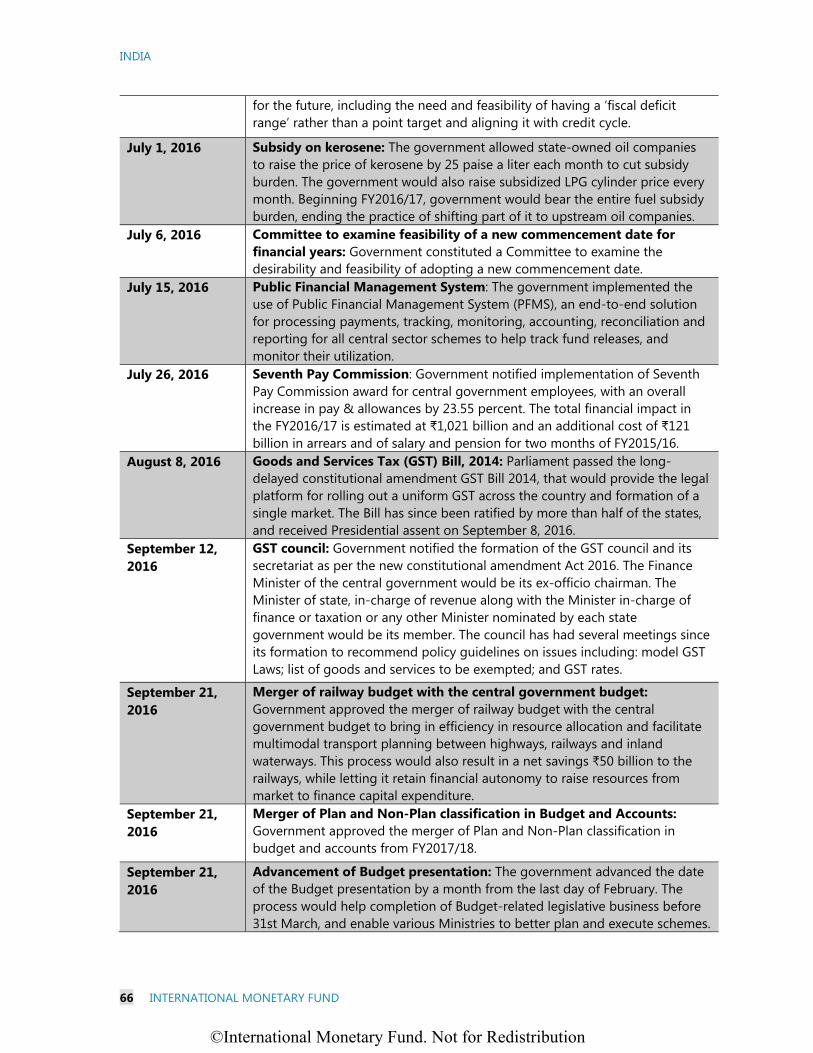
INDIA
66 INTERNATIONAL MONETARY FUND
for the future, including the need and feasibility of having a ‘fiscal deficit range’ rather than a point target and aligning it with credit cycle.
July 1, 2016 Subsidy on kerosene: The government allowed state-owned oil companies to raise the price of kerosene by 25 paise a liter each month to cut subsidy burden. The government would also raise subsidized LPG cylinder price every month. Beginning FY2016/17, government would bear the entire fuel subsidy burden, ending the practice of shifting part of it to upstream oil companies.
July 6, 2016 Committee to examine feasibility of a new commencement date forfinancial years: Government constituted a Committee to examine the desirability and feasibility of adopting a new commencement date.
July 15, 2016 Public Financial Management System: The government implemented the use of Public Financial Management System (PFMS), an end-to-end solution for processing payments, tracking, monitoring, accounting, reconciliation and reporting for all central sector schemes to help track fund releases, and monitor their utilization.
July 26, 2016 Seventh Pay Commission: Government notified implementation of Seventh Pay Commission award for central government employees, with an overall increase in pay & allowances by 23.55 percent. The total financial impact in the FY2016/17 is estimated at ₹1,021 billion and an additional cost of ₹121 billion in arrears and of salary and pension for two months of FY2015/16.
August 8, 2016 Goods and Services Tax (GST) Bill, 2014: Parliament passed the long-delayed constitutional amendment GST Bill 2014, that would provide the legal platform for rolling out a uniform GST across the country and formation of a single market. The Bill has since been ratified by more than half of the states, and received Presidential assent on September 8, 2016.
September 12, 2016
GST council: Government notified the formation of the GST council and its secretariat as per the new constitutional amendment Act 2016. The Finance Minister of the central government would be its ex-officio chairman. The Minister of state, in-charge of revenue along with the Minister in-charge of finance or taxation or any other Minister nominated by each state government would be its member. The council has had several meetings since its formation to recommend policy guidelines on issues including: model GST Laws; list of goods and services to be exempted; and GST rates.
September 21, 2016
Merger of railway budget with the central government budget: Government approved the merger of railway budget with the central government budget to bring in efficiency in resource allocation and facilitate multimodal transport planning between highways, railways and inland waterways. This process would also result in a net savings ₹50 billion to the railways, while letting it retain financial autonomy to raise resources from market to finance capital expenditure.
September 21, 2016
Merger of Plan and Non-Plan classification in Budget and Accounts:Government approved the merger of Plan and Non-Plan classification in budget and accounts from FY2017/18.
September 21, 2016
Advancement of Budget presentation: The government advanced the date of the Budget presentation by a month from the last day of February. The process would help completion of Budget-related legislative business before 31st March, and enable various Ministries to better plan and execute schemes.
©International Monetary Fund. Not for Redistribution
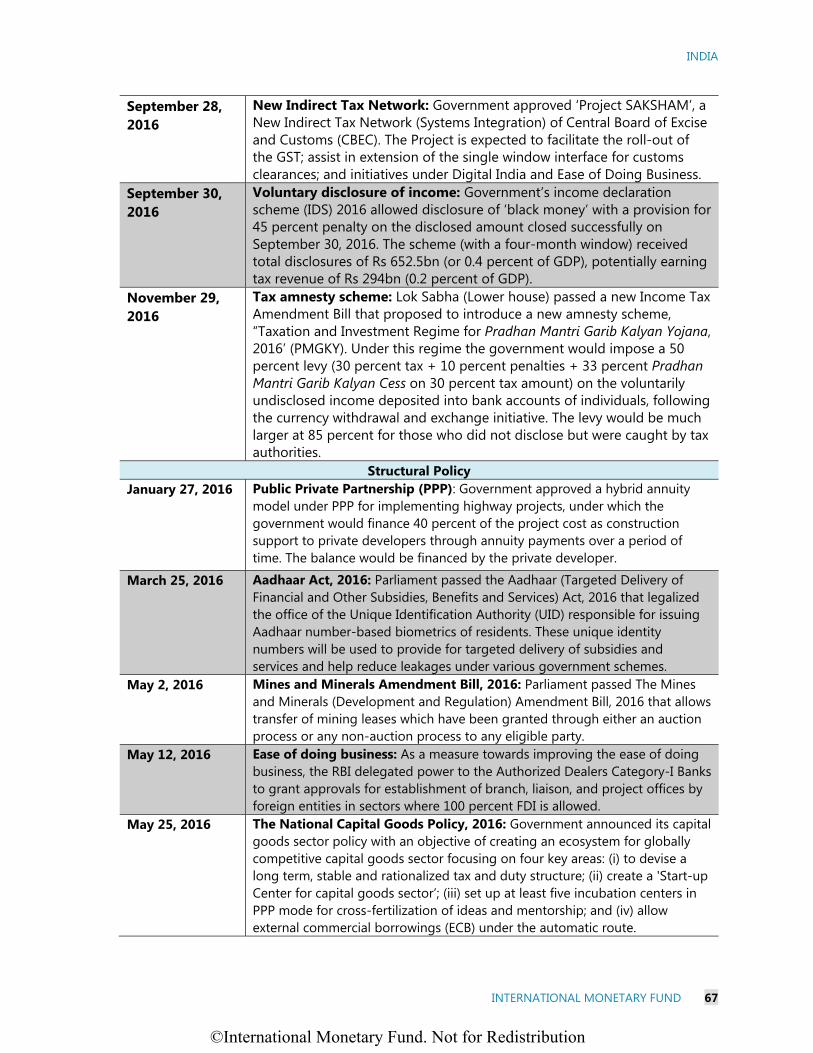
INDIA
INTERNATIONAL MONETARY FUND 67
September 28, 2016
New Indirect Tax Network: Government approved ‘Project SAKSHAM’, a New Indirect Tax Network (Systems Integration) of Central Board of Excise and Customs (CBEC). The Project is expected to facilitate the roll-out of the GST; assist in extension of the single window interface for customs clearances; and initiatives under Digital India and Ease of Doing Business.
September 30, 2016
Voluntary disclosure of income: Government’s income declaration scheme (IDS) 2016 allowed disclosure of ‘black money’ with a provision for 45 percent penalty on the disclosed amount closed successfully on September 30, 2016. The scheme (with a four-month window) received total disclosures of Rs 652.5bn (or 0.4 percent of GDP), potentially earning tax revenue of Rs 294bn (0.2 percent of GDP).
November 29, 2016
Tax amnesty scheme: Lok Sabha (Lower house) passed a new Income Tax Amendment Bill that proposed to introduce a new amnesty scheme, “Taxation and Investment Regime for Pradhan Mantri Garib Kalyan Yojana, 2016’ (PMGKY). Under this regime the government would impose a 50 percent levy (30 percent tax + 10 percent penalties + 33 percent Pradhan Mantri Garib Kalyan Cess on 30 percent tax amount) on the voluntarily undisclosed income deposited into bank accounts of individuals, following the currency withdrawal and exchange initiative. The levy would be much larger at 85 percent for those who did not disclose but were caught by tax authorities.
Structural Policy January 27, 2016
Public Private Partnership (PPP): Government approved a hybrid annuity model under PPP for implementing highway projects, under which the government would finance 40 percent of the project cost as construction support to private developers through annuity payments over a period of time. The balance would be financed by the private developer.
March 25, 2016 Aadhaar Act, 2016: Parliament passed the Aadhaar (Targeted Delivery ofFinancial and Other Subsidies, Benefits and Services) Act, 2016 that legalized the office of the Unique Identification Authority (UID) responsible for issuing Aadhaar number-based biometrics of residents. These unique identity numbers will be used to provide for targeted delivery of subsidies and services and help reduce leakages under various government schemes.
May 2, 2016 Mines and Minerals Amendment Bill, 2016: Parliament passed The Mines and Minerals (Development and Regulation) Amendment Bill, 2016 that allows transfer of mining leases which have been granted through either an auction process or any non-auction process to any eligible party.
May 12, 2016 Ease of doing business: As a measure towards improving the ease of doing business, the RBI delegated power to the Authorized Dealers Category-I Banks to grant approvals for establishment of branch, liaison, and project offices by foreign entities in sectors where 100 percent FDI is allowed.
May 25, 2016 The National Capital Goods Policy, 2016: Government announced its capital goods sector policy with an objective of creating an ecosystem for globally competitive capital goods sector focusing on four key areas: (i) to devise a long term, stable and rationalized tax and duty structure; (ii) create a 'Start-up Center for capital goods sector’; (iii) set up at least five incubation centers in PPP mode for cross-fertilization of ideas and mentorship; and (iv) allow external commercial borrowings (ECB) under the automatic route.
©International Monetary Fund. Not for Redistribution
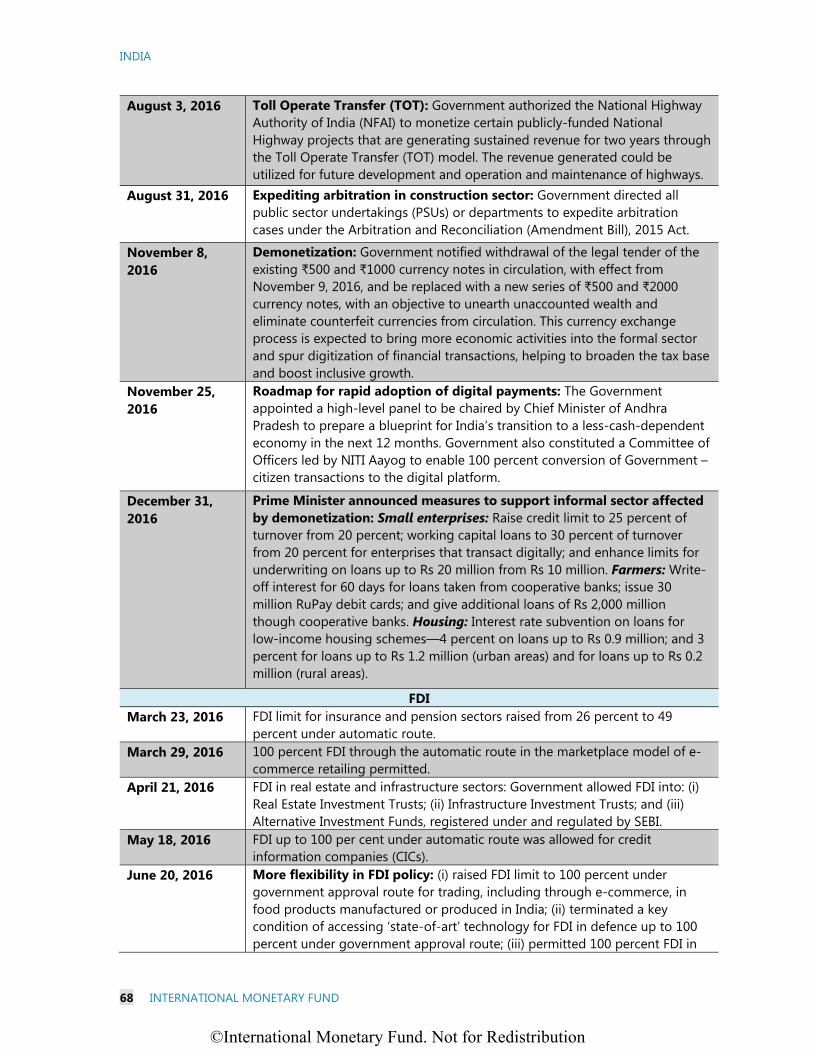
INDIA
68 INTERNATIONAL MONETARY FUND
August 3, 2016
Toll Operate Transfer (TOT): Government authorized the National Highway Authority of India (NFAI) to monetize certain publicly-funded National Highway projects that are generating sustained revenue for two years through the Toll Operate Transfer (TOT) model. The revenue generated could be utilized for future development and operation and maintenance of highways.
August 31, 2016 Expediting arbitration in construction sector: Government directed all public sector undertakings (PSUs) or departments to expedite arbitration cases under the Arbitration and Reconciliation (Amendment Bill), 2015 Act.
November 8, 2016
Demonetization: Government notified withdrawal of the legal tender of the existing ₹500 and ₹1000 currency notes in circulation, with effect from November 9, 2016, and be replaced with a new series of ₹500 and ₹2000 currency notes, with an objective to unearth unaccounted wealth and eliminate counterfeit currencies from circulation. This currency exchange process is expected to bring more economic activities into the formal sector and spur digitization of financial transactions, helping to broaden the tax base and boost inclusive growth.
November 25, 2016
Roadmap for rapid adoption of digital payments: The Government appointed a high-level panel to be chaired by Chief Minister of Andhra Pradesh to prepare a blueprint for India’s transition to a less-cash-dependent economy in the next 12 months. Government also constituted a Committee of Officers led by NITI Aayog to enable 100 percent conversion of Government – citizen transactions to the digital platform.
December 31, 2016
Prime Minister announced measures to support informal sector affected by demonetization: Small enterprises: Raise credit limit to 25 percent of turnover from 20 percent; working capital loans to 30 percent of turnover from 20 percent for enterprises that transact digitally; and enhance limits for underwriting on loans up to Rs 20 million from Rs 10 million. Farmers: Write-off interest for 60 days for loans taken from cooperative banks; issue 30 million RuPay debit cards; and give additional loans of Rs 2,000 million though cooperative banks. Housing: Interest rate subvention on loans for low-income housing schemes—4 percent on loans up to Rs 0.9 million; and 3 percent for loans up to Rs 1.2 million (urban areas) and for loans up to Rs 0.2 million (rural areas).
FDI March 23, 2016 FDI limit for insurance and pension sectors raised from 26 percent to 49
percent under automatic route. March 29, 2016 100 percent FDI through the automatic route in the marketplace model of e-
commerce retailing permitted. April 21, 2016 FDI in real estate and infrastructure sectors: Government allowed FDI into: (i)
Real Estate Investment Trusts; (ii) Infrastructure Investment Trusts; and (iii) Alternative Investment Funds, registered under and regulated by SEBI.
May 18, 2016 FDI up to 100 per cent under automatic route was allowed for credit information companies (CICs).
June 20, 2016 More flexibility in FDI policy: (i) raised FDI limit to 100 percent under government approval route for trading, including through e-commerce, in food products manufactured or produced in India; (ii) terminated a key condition of accessing ‘state-of-art’ technology for FDI in defence up to 100 percent under government approval route; (iii) permitted 100 percent FDI in
©International Monetary Fund. Not for Redistribution
INDIA
INTERNATIONAL MONETARY FUND 69
teleports, Direct to Home (DTH), cable networks, mobile TV under automatic route; (iv) permitted up to 74 percent FDI under automatic route in brownfield pharmaceuticals, and up to 100 percent under approval route; (v) permitted 100 percent FDI under automatic route in brownfield airport projects; (vi) raised FDI limit to 100 percent in Scheduled Air Transport Service/Domestic Scheduled Passenger Airline and regional Air Transport Service, up to 49 percent under automatic route and up to 100 percent through government approval route; and (vii) FDI limit for private security agencies raised to 74 percent, up to 49 percent under automatic route and up to 100 percent under government approval route.
August 31, 2016 Grant of Permanent Residency Status to Foreign Investors: Government approved the scheme for granting of Permanent Residency Status (PRS) to foreign investors that would permit multiple entry for a period of 10 years, further extendable to a period of another 10 years. Under this arrangement the foreign investor would be required to invest a minimum of ₹100 million within 18 months or ₹250 million within 36 months, that should result in employment of at least 20 resident Indians every financial year.
October 20, 2016 Foreign investment in Other Financial Services: Government permitted 100 percent foreign investment under the automatic route in ‘Other Financial Services,’ that included any financial services activities regulated by financial sector regulators, viz., RBI, SEBI, IRDA, PFRDA, NHB or any other financial sector regulator notified by the government.
Agriculture Sector January 27, 2016 Crop insurance scheme: The government introduced a new agricultural
insurance scheme, the Pradhan Mantri Fasal Bima Yojana, to provide insurance coverage to farmers for crop failure, stabilize farmers’ income, and encourage farmers to adopt modern agricultural practices. The premium payable by farmers would be (i) Kharif crops: 2 percent of sum insured (SI); (ii) Rabi crops: 1.5 percent of SI; (iii) Commercial/horticultural crops: 5 percent of SI. The balance of premium to be borne equally by the states and center.
April 14, 2016 National Agriculture Market (NAM): The government launched NAM, a pan-India electronic trading portal which seeks to network the existing wholesale markets or produce market committees (APMCs), to create a unified national market for agricultural commodities. At the inauguration 21 wholesale markets in eight states were integrated for virtual trading, while the scheme plans to integrate 585 wholesale markets by March 2018.
May 26, 2016 Krishi Kalyan cess (KKC): Government imposed a fresh 0.5 percent KKC cess on most services to support the agriculture sector.
June 1, 2016 Buffer stock for pulses: Government approved a proposal to create a buffer stock for pulses of up to 2 million tonnes, to be built through domestic procurement and imports of 1 million tonnes each. MSP for pulses: Government raised minimum support prices (MSPs) for pulses by 7-9 percent and offered a bonus of ₹425 per quintal for Kharif pulses, over and above MSP, for Arhar (Tur), Urad and Moong popular varieties for domestic consumption.
June 16, 2016 Export duty on sugar: Government imposed export duty of 20 percent on export of raw sugar, white or refined sugar, to help control domestic prices.
©International Monetary Fund. Not for Redistribution
INDIA
70 INTERNATIONAL MONETARY FUND
June 22, 2016 Reforms in textile and apparel sector: Government announced several measures to boost production and support employment generation in textile and apparel industry, including by: (a) permitted fixed term employment to address seasonal labor demand with terms and conditions at par with permanent workers; (b) raised government’s contribution by an additional 3.67 percent to 12 percent toward Employers Provident Fund (EPF) Scheme for newly-recruited employees for 3 years; (c) made employee contributions to EPF optional for those earning less than Rs 15,000 per month; and (d) enlarged the coverage for duty drawback to refund the state levies.
Factor Market Reforms August 10, 2016 Maternity benefit: Government introduced Maternity Benefit (Amendment)
Bill, 2016 in Rajya Sabha (Upper house), that would increase maternity benefit of job protection with leave from 12 weeks to 26 weeks for two surviving children and 12 weeks for more than two children; 12 weeks for a 'Commissioning mother' and 'Adopting mother'; facility to 'work from home'; and mandatory provision of crèche in an establishment having 50 or more employees. Applicable to all establishments employing 10 or more persons.
Handbook for women farmers: Government issued a ‘Farm Women Friendly Hand Book’ containing special provisions and package of assistance which women farmers can claim under various on-going missions/submissions/schemes.
September 9, 2016
Railways: Indian railways introduced a new model of surge pricing for passenger fares on an experimental basis in a few premium trains. The dynamic pricing model, in which base fares would increase by 10% with every 10% of tickets sold, is expected to fetch more passenger revenue.
October 2, 2016 Ratification of the Paris Climate Change Agreement: India accounts for about 4.5 percent of global greenhouse gas emissions, and became the 62nd country to ratify the agreement, with these countries together accounting for 52 percent of global emissions. Under the agreement, India has committed to ensuring that at least 40 percent of its electricity will be generated from non-fossil-based sources by 2030.
State Reforms April 8, 2016 Titling law: The state government of Rajasthan passed a law to provide
statutory backing to land records, effectively guaranteeing land and property ownership. This will create an efficient and transparent modern land market, provide certainty of tenure, and end litigation that often slows projects.
Night shifts for women: The state governments of Maharashtra, Tamil Nadu, Karnataka, Andhra Pradesh and Sikkim have allowed women to work night-shifts in factories by amending the laws under the Factory Act, 1948 which restricted women’s working hours from 6 a.m. to 7 p.m. Under this amendment, the factories will have to ensure adequate safety and security of their women employees, both within the factory premises and during transit from workplace to their homes.
©International Monetary Fund. Not for Redistribution

INDIA
INTERNATIONAL MONETARY FUND 71
Annex II. India: Risk Assessment Matrix
Nature/Source of Threat
Likelihood Impact Policies to Minimize Impact
Domestic Risks
Prolonged cash shortages
M M: Given the large role of cash in everyday transactions in the Indian economy, prolonged cash shortages accompanying the currency exchange initiative can weigh on economic activity, fiscal revenues, and could cause a further rise in corporate vulnerabilities and weaken bank asset quality.
Continue to enhance the supply of new banknotes, and if needed consider further sector-based exemptions, including on use of old banknotes, particularly for rural and remote areas.
Balance sheet risks M H: Failure to promptly address bank asset quality distress through asset resolution and repair of corporate balance sheets could lead to further bank and corporate balance sheet deterioration, undermining capital positions of public sector banks, reducing lending in the medium term and adversely affecting the investment recovery.
Strengthen oversight of financial and corporate risks. Enhance loss-absorbing buffers in public sector banks. Policies to incentivize corporate restructuring and implementation of new insolvency framework.
Setbacks in structural reform process
L M: Difficulty in GST implementation and passing key bills (Labor Market and Land Acquisition) and slow progress on reforming factor and product markets, including agriculture, could weigh on investment and growth, stoke inflation, and weaken investor sentiment.
Facilitate state-led reform initiatives. Enhance revenue raising efforts; continue to address long-standing supply bottlenecks through non-legislative measures; and strengthen the business climate.
Larger positive impact from GST than currently expected
L H: Higher growth will help rebuild fiscal space, facilitate balance sheet repair and investment recovery, enhance external competiveness and price stability.
Facilitate further structural reforms, particularly to labor markets. Enhance quality and scope of public investment. As fiscal deficit decline, consider faster phasing out of financial repression.
External Risks
Tighter or more volatile global financial conditions
M
M: While external vulnerabilities have declined considerably, the impact from risk re-pricing or a surge in global financial market volatility could be very disruptive, particularly against the backdrop of recent large capital inflows, maturing FCNR deposits, sluggish exports, and weak corporate balance sheets.
Enhance the environment for attracting stable non-debt creating capital flows, particularly FDI. Rupee flexibility and monetary policy tightening. Given adequate level of international reserves, provide foreign currency liquidity to prevent disorderly movements in the exchange rate.
Weaker-than expected global growth
M
M: Deterioration of economic outlook in key advanced and emerging market countries would cloud the sustainability of the recovery in India, both for exports and investment.
Structural reform will raise returns to investment, strengthen domestic sources of growth, and support export competitiveness.
Increased volatility of global energy prices
M
M: Significant effects on the current account deficit, inflation. While volatility in energy prices can have an adverse impact, persistently-low energy prices are beneficial for India given its net energy importer status.
Improve targeting of transfers to shelter the most vulnerable; accelerate reform of remaining fuel subsidies; smooth volatility of domestic fuel prices through fiscal measures; provide dollar liquidity to oil marketing companies as required, to address disruptive exchange rate volatility.
Rising regional geopolitical tensions
L
M: Financial market pressure, reduced capital inflows, and general tightening of financial conditions.
Strengthen oversight of financial and corporate risks. Rupee flexibility. Given adequate level of international reserves, provide foreign currency liquidity to prevent disorderly movements in the exchange rate.
“L”=Low; “M”=Medium; “H”=High.
This matrix shows events that could materially alter the baseline path (the scenario most likely to materialize in the view of IMF staff). The relative likelihood of risks listed is the staff’s subjective assessment of the risks surrounding the baseline. The Risk Assessment Matrix reflects staff views on the source of risks and overall level of concern as of the time of discussions with authorities.
©International Monetary Fund. Not for Redistribution

INDIA
72 INTERNATIONAL MONETARY FUND
Annex III. India: Public and External Debt Sustainability Analysis India’s public debt remains sustainable given manageable interest rate costs and robust growth outlook. 1 Under the baseline, assuming gradual fiscal consolidation and implementation of the national Goods and Services Tax, the public debt-to-GDP ratio is forecast to decline gradually to around 61 percent of GDP in the medium term from the current level of almost 70 percent, with gross financing needs also declining slightly to about 10 percent of GDP in 2021/22. Negative growth shocks represent one of the major risks to the debt outlook. In addition, realization of contingent liabilities coming from future bank recapitalization needs and further taking-on of the liabilities of the electricity distribution companies may also push the debt trajectory up above the 70 percent benchmark, before the debt-to-GDP ratio declines gradually in the medium term. On the other hand, the captive domestic investor base is likely to mitigate the impact of any real interest rate shocks. India’s external debt, currently at 23½ percent of GDP, remains sustainable. 1. India’s public debt sustainability analysis is based on the following assumptions:
Macroeconomic assumptions. Growth is forecast to slow to 6.6 percent (at market prices) in 2016/17 due temporary disruptions caused by cash shortages, and then rebound to 7.2 percent in FY2017/18, gradually rising to slightly over 8 percent in the medium term. The upward revision to medium-term real GDP growth of about 0.4 percentage points stems from implementation of the recently passed national Goods and Services tax,2 with CPI inflation projected to remain around 5 percent through 2021/22. In addition, nominal GDP growth is expected to revert from an average of 9.7 percent during 2014/15–2015/16 to an average of 12.5 percent during the next five years, in large part due to a projected pick-up in GDP deflator.3 This baseline scenario assumes a gradual global economic recovery scenario as outlined in the WEO.
Fiscal Assumptions. The 2015/16 central government fiscal deficit came in at 3.9 percent of GDP (in line with the authorities’ deficit target of 3.9 percent of GDP), which corresponds to 4.1 percent under the Fund’s definition. Over the medium term, the central government’s fiscal deficit (as per IMF definition) is expected to decline slowly toward 3.0 percent of GDP, while state government deficits should decline to about 2.5 percent of GDP. Staff projections (which are based on current policies and assume no additional major legislative changes) imply that the central government will underperform against its fiscal adjustment targets.
1 The analysis of public debt sustainability is based on the framework developed for market access countries. See Staff Guidance Note for Public Debt Sustainability Analysis in Market Access Countries, IMF, May 2013. 2 Growth-enhancing channels of GST are multiple, such as reducing cascading of taxes and creating a single national market, enhancing the efficiency of intra-Indian movement of goods and service, and boosting competitiveness of the Indian exports. The growth impact assumption is on the lower end of medium-term growth boost experienced in other countries. 3 Reflecting unwinding of base effects of the collapse in global commodity prices. For details see 2016 Article IV Staff Report, Box 1. Oil Price Collapse: Impact on Indian Inflation.
©International Monetary Fund. Not for Redistribution

INDIA
INTERNATIONAL MONETARY FUND 73
o Tax performance, especially for income taxes, is expected to increase slightly as ongoing administrative measures continue to be implemented and base broadening is expected to continue. Introduction of the Goods and Services Tax (GST) is assumed to entail a revenue neutral rate.
o At the same time, while savings from reduced fuel subsidies have already been realized as diesel prices have been deregulated, the planned gradual introduction of cash transfers should help rationalize spending over the medium term. However, the Food Security Act and fertilizer subsidies will keep the subsidy bill high.
o Public banks are expected to be recapitalized to reach Basel III targets (baseline assumes ¼ of one percent of FY2018/19 GDP cumulative over the next three years). Recent announcements indicate state governments have taken on a large portion of the debt of electricity distribution companies (around 1.1 percent of GDP) since the roll-out of the UDAY scheme in November 2015, which is the key reason behind an upward revision to 2015/16 and 2016/17 debt ratios compared to the 2016 Article IV Staff Report. The contingent liabilities shock scenario incorporates state governments assuming an additional 1 percent of GDP of power distribution companies’ debt, which corresponds to the maximum remaining eligible amount, and 3 percent for banking sector recapitalization.
2. Under the baseline projection, India’s debt ratio and gross financing needs will stay on a declining path from 2017/18. India’s primary deficit is projected to trend downward and remain below its debt-stabilizing threshold (estimated at 3.1 percent of GDP based on the 2021/22 projections) in the projection years. Therefore, gross financing needs are expected to remain at slightly below 12 percent of GDP in 2016/17 before gradually declining to about 10 percent in 2021/22. Automatic debt dynamics arising from the interest rate-growth differential will on average reduce the debt ratio by close to 2⅔ percentage points per year from 2016/17 to 2021/22, in part due to low real interest rates on public debt as a result of financial repression (through the SLR). As a result, the public debt-to-GDP ratio is expected to fall from about 69.8 percent in 2015/16 to 60.9 percent in 2021/22. The 2020/21 public debt-to-GDP ratio is about 1½ percentage points higher than the last Staff Report, reflecting an upward data revision of the historical public debt path and state government taking on of electricity distribution companies’ debt. Notably, higher projected nominal GDP growth, as a result of the growth-enhancing effects of GST, underpins the growth driver of favorable debt dynamics. 3. India faces relatively low risks to debt sustainability under the baseline, but could be vulnerable to slower real GDP growth and a contingent liability shock. The heat map suggests that the debt burden benchmark and the gross financing needs threshold are exceeded under a contingent liability shock. A contingent liability shock (which could arise from losses at
©International Monetary Fund. Not for Redistribution

INDIA
74 INTERNATIONAL MONETARY FUND
public banks and debt restructuring of electricity distribution companies)4 pushes the debt-to-GDP ratio to around 75 percent in 2017/18 and 2018/19. A one-standard deviation shock to real GDP growth increases the debt-to-GDP ratio to about 72¼ percent in 2018/19. Both shocks, however, do not change the downward debt trajectory in the medium term. Lack of fiscal adjustment is another principal risk to debt sustainability in India’s context. An unchanged primary balance would slow the debt reduction in the near term. Finally, the combined macro-fiscal shock also has a large level effect but does not change the direction of the debt trajectory. As a result, the asymmetric fan chart suggests that upside risks to debt ratio dominate in the medium term. Overall, risks are mitigated by the fact that most of the public debt is financed through a captive domestic investor base, the very small external debt is mostly from official creditors, and adequate international reserves are available in the rare case that external financing needs arise. Risks that could improve India’s public debt sustainability include better tax buoyancy, a better-than expected GST impact on growth, and a new Direct Tax Code (including improvements in tax administration) that improve efficiency and lead to near-term revenue gains. A stronger revival of the economy could also return India to the debt dynamics prevailing before the global financial crisis. 4. There is no evidence of a systematic projection bias in the baseline assumptions and the projected fiscal adjustment is in line with other countries’ experiences. India’s forecast track record exceeds that of most surveillance countries, with percentile ranks in excess of 90 (for real GDP growth) and 77 (for primary balance). India’s projected fiscal adjustment (an improvement of around three-quarters of one percentage point in cyclically-adjusted primary balance/GDP over the medium term) is modest and should be achievable. This magnitude of adjustment is also in line with other countries’ experiences, with a three-year adjustment in cyclically-adjusted primary balance at the 44th percentile among all surveillance countries with market access. The boom-bust analysis is not triggered because India had a negative output gap in 2015/16.
4 The contingent liabilities shock is customized to reflect: (i) the central government bearing the full cost of PSBs’ recapitalization in a severe stress scenario (about 3 percent of GDP), and (ii) state governments assuming 75 percent of the remaining debt of the electricity distribution companies that may become eligible for restructuring (about 1 percent of GDP).
©International Monetary Fund. Not for Redistribution

INDIA
INTERNATIONAL MONETARY FUND 75
Figure 1. India Public DSA—Risk Assessment
India
Source: IMF staff.
5/ External financing requirement is defined as the sum of current account deficit, amortization of medium and long-term total external debt, and short-term total external debt at the end of previous period.
4/ Long-term bond spread over U.S. bonds, an average over the last 3 months, 30-Aug-16 through 28-Nov-16.
2/ The cell is highlighted in green if gross financing needs benchmark of 15% is not exceeded under the specific shock or baseline, yellow if exceeded under specific shock but not baseline, red if benchmark is exceeded under baseline, white if stress test is not relevant.
200 and 600 basis points for bond spreads; 5 and 15 percent of GDP for external financing requirement; 0.5 and 1 percent for change in the share of short-term debt; 15 and 45 percent for the public debt held by non-residents; and 20 and 60 percent for the share of foreign-currency denominated debt.
Market Perception
Debt level 1/ Real GDP Growth Shock
Primary Balance Shock
3/ The cell is highlighted in green if country value is less than the lower risk-assessment benchmark, red if country value exceeds the upper risk-assessment benchmark, yellow if country value is between the lower and upper risk-assessment benchmarks. If data are unavailable or indicator is not relevant, cell is white. Lower and upper risk-assessment benchmarks are:
Change in the Share of Short-
Term Debt
Foreign Currency
Debt
Public Debt Held by Non-
Residents
Primary Balance Shock
Real Interest Rate Shock
Exchange Rate Shock
Contingent Liability Shock
Exchange Rate Shock
Contingent Liability shock
1/ The cell is highlighted in green if debt burden benchmark of 70% is not exceeded under the specific shock or baseline, yellow if exceeded under specific shock but not baseline, red if benchmark is exceeded under baseline, white if stress test is not relevant.
Real Interest Rate Shock
External Financing
Requirements
Real GDP Growth Shock
Heat Map
Upper early warning
Evolution of Predictive Densities of Gross Nominal Public Debt(in percent of GDP)
Debt profile 3/
Lower early warning(Indicators vis-à-vis risk assessment benchmarks, in 2015)
Debt Profile Vulnerabilities
Gross financing needs 2/
20
60
0%1 2
200
600 492 bp
1 2
5
15
10%
1 2
0.5
1
0%
1 2
Bond spread External Financing Requirement
Annual Change in Short-Term Public
Debt
Public Debt in Foreign Currency
(in basis points) 4/ (in percent of GDP) 5/ (in percent of total) (in percent of total)
0
10
20
30
40
50
60
70
80
2014 2015 2016 2017 2018 2019 2020 2021
10th-25th 25th-75th 75th-90thPercentiles:Baseline
Symmetric Distribution
0
10
20
30
40
50
60
70
80
2014 2015 2016 2017 2018 2019 2020 2021
Restricted (Asymmetric) Distribution
no restriction on the growth rate shockno restriction on the interest rate shock0 is the max positive pb shock (percent GDP)no restriction on the exchange rate shock
Restrictions on upside shocks:
15
45
1%
1 2
Public Debt Held by Non-Residents
(in percent of total)
©International Monetary Fund. Not for Redistribution

Figure 2. India Public DSA—Realism of Baseline Assumptions
IND
IA
76 IN
TERNATIO
NAL M
ON
ETARY FUN
D
©International Monetary Fund. Not for Redistribution

INDIA
INTERNATIONAL MONETARY FUND 77
Figure 3. India Public DSA—Baseline Scenario
As of November 28, 20162/ 2014 2015 2016 2017 2018 2019 2020 2021 Sovereign Spreads
Nominal gross public debt 72.6 68.3 69.8 69.6 68.8 67.0 65.0 63.0 60.9 10Y LT (bp) 3/ 401
Public gross financing needs 12.3 12.4 12.2 11.9 11.6 11.2 10.7 10.3 9.8 5Y CDS (bp) 163
Real GDP growth (in percent) 7.8 7.2 7.6 6.6 7.2 7.7 7.8 7.9 8.1 Ratings Foreign LocalInflation (GDP deflator, in percent) 6.6 3.3 1.1 3.9 4.3 4.3 4.5 4.3 4.2 Moody's Baa3 Baa3Nominal GDP growth (in percent) 14.9 10.8 8.7 11.2 11.8 12.3 12.7 12.6 12.7 S&Ps BBB- BBB-Effective interest rate (in percent) 4/ 7.6 7.7 7.8 7.8 7.7 7.6 7.6 7.6 7.6 Fitch BBB- BBB-
2014 2015 2016 2017 2018 2019 2020 2021 cumulativeChange in gross public sector debt -1.7 0.4 1.5 -0.2 -0.9 -1.8 -2.0 -2.0 -2.1 -8.9Identified debt-creating flows -1.9 0.6 1.5 0.3 -0.7 -1.6 -1.8 -1.8 -1.9 -7.4Primary deficit 3.1 2.8 2.3 2.1 2.0 1.7 1.5 1.4 1.2 9.9
Primary (noninterest) revenue and grants 19.3 19.4 20.9 21.2 21.1 21.3 21.5 21.6 21.8 128.5Primary (noninterest) expenditure 22.4 22.2 23.2 23.3 23.1 23.0 23.0 23.0 23.0 138.5
Automatic debt dynamics 5/ -4.7 -1.9 -0.6 -1.9 -2.5 -2.9 -3.0 -2.9 -2.8 -15.9Interest rate/growth differential 6/ -4.7 -1.9 -0.6 -1.9 -2.5 -2.9 -3.0 -2.9 -2.8 -15.9
Of which: real interest rate 0.4 2.5 4.2 2.3 1.9 1.8 1.7 1.7 1.7 11.2Of which: real GDP growth -5.1 -4.4 -4.8 -4.2 -4.5 -4.7 -4.6 -4.6 -4.5 -27.1
Exchange rate depreciation 7/ 0.0 0.0 0.0 … … … … … … …Other identified debt-creating flows -0.3 -0.2 -0.2 0.0 -0.1 -0.5 -0.3 -0.3 -0.3 -1.5
Consolidated General Govt - Domestic Financing: Privatization Receipts (Rs Billion, FY-March) (negative) -0.3 -0.2 -0.2 -0.6 -0.3 -0.5 -0.3 -0.3 -0.3 -2.3Contingent liabilities 0.0 0.0 0.0 0.0 0.0 0.0 0.0 0.0 0.0 0.0Please specify (2) (e.g., ESM and Euroarea loans) 0.0 0.0 0.0 0.7 0.2 0.0 0.0 0.0 0.0 0.8
Residual, including asset changes 8/ 0.2 -0.3 0.0 -0.5 -0.2 -0.2 -0.2 -0.2 -0.2 -1.5
Source: IMF staff.1/ Public sector is defined as general government.2/ Based on available data.3/ Long-term bond spread over U.S. bonds.4/ Defined as interest payments divided by debt stock (excluding guarantees) at the end of previous year.5/ Derived as [(r - π(1+g) - g + ae(1+r)]/(1+g+π+gπ)) times previous period debt ratio, with r = interest rate; π = growth rate of GDP deflator; g = real GDP growth rate;
a = share of foreign-currency denominated debt; and e = nominal exchange rate depreciation (measured by increase in local currency value of U.S. dollar).6/ The real interest rate contribution is derived from the numerator in footnote 5 as r - π (1+g) and the real growth contribution as -g.7/ The exchange rate contribution is derived from the numerator in footnote 5 as ae(1+r). 8/ Includes asset changes and interest revenues (if any). For projections, includes exchange rate changes during the projection period.9/ Assumes that key variables (real GDP growth, real interest rate, and other identified debt-creating flows) remain at the level of the last projection year.
-3.1balance 9/
primary
(in percent of GDP unless otherwise indicated)
Debt, Economic and Market Indicators 1/
2005-2013Actual
Projections
Contribution to Changes in Public DebtProjections
2005-2013Actual
debt-stabilizing
-12
-10
-8
-6
-4
-2
0
2
4
6
8
2005 2006 2007 2008 2009 2010 2011 2012 2013 2014 2015 2016 2017 2018 2019 2020 2021
Debt-Creating Flows
Primary deficit Real GDP growth Real interest rate Exchange rate depreciation Other debt-creating flows Residual Change in gross public sector debt
projection
(in percent of GDP)
-40
-30
-20
-10
0
10
20
30
cumulative
©International Monetary Fund. Not for Redistribution
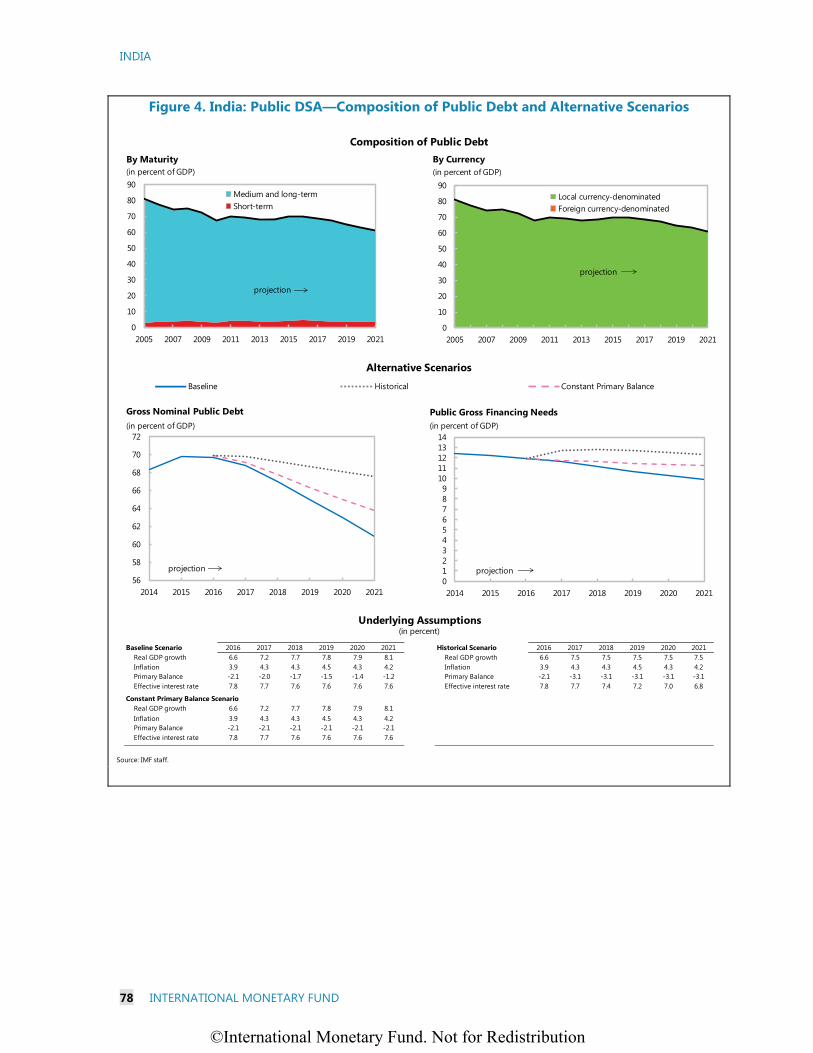
INDIA
78 INTERNATIONAL MONETARY FUND
Figure 4. India: Public DSA—Composition of Public Debt and Alternative Scenarios
Baseline Scenario 2016 2017 2018 2019 2020 2021 Historical Scenario 2016 2017 2018 2019 2020 2021Real GDP growth 6.6 7.2 7.7 7.8 7.9 8.1 Real GDP growth 6.6 7.5 7.5 7.5 7.5 7.5Inflation 3.9 4.3 4.3 4.5 4.3 4.2 Inflation 3.9 4.3 4.3 4.5 4.3 4.2Primary Balance -2.1 -2.0 -1.7 -1.5 -1.4 -1.2 Primary Balance -2.1 -3.1 -3.1 -3.1 -3.1 -3.1Effective interest rate 7.8 7.7 7.6 7.6 7.6 7.6 Effective interest rate 7.8 7.7 7.4 7.2 7.0 6.8
Constant Primary Balance ScenarioReal GDP growth 6.6 7.2 7.7 7.8 7.9 8.1Inflation 3.9 4.3 4.3 4.5 4.3 4.2Primary Balance -2.1 -2.1 -2.1 -2.1 -2.1 -2.1Effective interest rate 7.8 7.7 7.6 7.6 7.6 7.6
Source: IMF staff.
Underlying Assumptions(in percent)
Alternative Scenarios
Composition of Public Debt
Baseline Historical Constant Primary Balance
56
58
60
62
64
66
68
70
72
2014 2015 2016 2017 2018 2019 2020 2021
Gross Nominal Public Debt(in percent of GDP)
projection0123456789
1011121314
2014 2015 2016 2017 2018 2019 2020 2021
Public Gross Financing Needs(in percent of GDP)
projection
0
10
20
30
40
50
60
70
80
90
2005 2007 2009 2011 2013 2015 2017 2019 2021
By Maturity
Medium and long-termShort-term
projection
(in percent of GDP)
0
10
20
30
40
50
60
70
80
90
2005 2007 2009 2011 2013 2015 2017 2019 2021
By Currency
Local currency-denominatedForeign currency-denominated
projection
(in percent of GDP)
©International Monetary Fund. Not for Redistribution

INDIA
INTERNATIONAL MONETARY FUND 79
Figure 5. India Public DSA—Stress Tests
Primary Balance Shock 2016 2017 2018 2019 2020 2021 Real GDP Growth Shock 2016 2017 2018 2019 2020 2021Real GDP growth 6.6 7.2 7.7 7.8 7.9 8.1 Real GDP growth 6.6 5.2 5.7 7.8 7.9 8.1Inflation 3.9 4.3 4.3 4.5 4.3 4.2 Inflation 3.9 3.8 3.8 4.5 4.3 4.2Primary balance -2.1 -2.9 -2.6 -1.5 -1.4 -1.2 Primary balance -2.1 -2.6 -3.0 -1.5 -1.4 -1.2Effective interest rate 7.8 7.7 7.7 7.7 7.6 7.6 Effective interest rate 7.8 7.7 7.7 7.7 7.6 7.6
Real Interest Rate Shock Real Exchange Rate ShockReal GDP growth 6.6 7.2 7.7 7.8 7.9 8.1 Real GDP growth 6.6 7.2 7.7 7.8 7.9 8.1Inflation 3.9 4.3 4.3 4.5 4.3 4.2 Inflation 3.9 13.3 4.3 4.5 4.3 4.2Primary balance -2.1 -2.0 -1.7 -1.5 -1.4 -1.2 Primary balance -2.1 -2.0 -1.7 -1.5 -1.4 -1.2Effective interest rate 7.8 7.7 8.1 8.4 8.7 8.9 Effective interest rate 7.8 8.2 8.1 8.0 7.9 7.9
Combined Shock Contingent Liability ShockReal GDP growth 6.6 5.2 5.7 7.8 7.9 8.1 Real GDP growth 6.6 5.2 5.7 7.8 7.9 8.1Inflation 3.9 3.8 3.8 4.5 4.3 4.2 Inflation 3.9 3.8 3.8 4.5 4.3 4.2Primary balance -2.1 -2.9 -3.0 -1.5 -1.4 -1.2 Primary balance -2.1 -7.3 -1.7 -1.5 -1.4 -1.2Effective interest rate 7.8 8.2 8.6 8.8 9.1 9.3 Effective interest rate 7.8 8.3 7.8 7.8 7.7 7.7
Source: IMF staff.
(in percent)
Real Exchange Rate Shock
Combined Macro-Fiscal Shock
Additional Stress Tests
Baseline
Underlying Assumptions
Contingent Liability Shock
Macro-Fiscal Stress Tests
Baseline Primary Balance ShockReal GDP Growth Shock
Real Interest Rate Shock
50
55
60
65
70
75
2016 2017 2018 2019 2020 2021
Gross Nominal Public Debt(in percent of GDP)
250
260
270
280
290
300
310
320
330
340
2016 2017 2018 2019 2020 2021
Gross Nominal Public Debt(in percent of Revenue)
10
11
12
13
14
2016 2017 2018 2019 2020 2021
Public Gross Financing Needs(in percent of GDP)
50
55
60
65
70
75
80
2016 2017 2018 2019 2020 2021
Gross Nominal Public Debt(in percent of GDP)
250
270
290
310
330
350
370
2016 2017 2018 2019 2020 2021
Gross Nominal Public Debt(in percent of Revenue)
10
11
12
13
14
15
16
17
18
2016 2017 2018 2019 2020 2021
Public Gross Financing Needs(in percent of GDP)
©International Monetary Fund. Not for Redistribution

INDIA
80 INTERNATIONAL MONETARY FUND
Figure 6. India: External Debt Sustainability: Bound Tests 1/2/ (External debt in percent of GDP)
i-rate shock22
Baseline 22
5
10
15
20
25
30
35
40
11/12 13/14 15/16 17/18 19/20 21/22
Interest rate shock (in percent)
Sources: International Monetary Fund, Country desk data, and staff estimates.1/ Shaded areas represent actual data. Individual shocks are permanent one-half standard deviation shocks. Figures in the boxes represent average projections for the respective variables in the baseline and scenario being presented. Ten-year historical average for the variable is also shown. 2/ For historical scenarios, the historical averages are calculated over the ten-year period, and the information is used to project debt dynamics five years ahead.3/ Permanent 1/4 standard deviation shocks applied to real interest rate, growth rate, and current account balance.4/ One-time real depreciation of 30 percent occurs in 2017/18.
Historical
21
Baseline
22
0
2
4
6
8
10
12
14
16
18
5
10
15
20
25
30
35
40
11/12 13/14 15/16 17/18 19/20 21/22
Baseline and historical scenarios
CA shock 25
Baseline 22
5
10
15
20
25
30
35
40
11/12 13/14 15/16 17/18 19/20 21/22
Combined shock 24
Baseline 22
5
10
15
20
25
30
35
40
11/12 13/14 15/16 17/18 19/20 21/22
Combined shock 3/
30 % depreciation
32
Baseline 22
5
10
15
20
25
30
35
40
11/12 13/14 15/16 17/18 19/20 21/22
Real depreciation shock 4/
Gross financing need under baseline
(right scale)
Non-interest current account shock (in percent of GDP)
Growth shock 23
Baseline 22
5
10
15
20
25
30
35
40
11/12 13/14 15/16 17/18 19/20 21/22
Baseline:
Scenario:
Historical:
4.5
5.1
2.7
Baseline:
Scenario:
Historical:
7.7
6.7
7.5
Baseline:
Scenario:
Historical:
-0.8
-1.5
-1.9
Growth shock (in percent per year)
©International Monetary Fund. Not for Redistribution
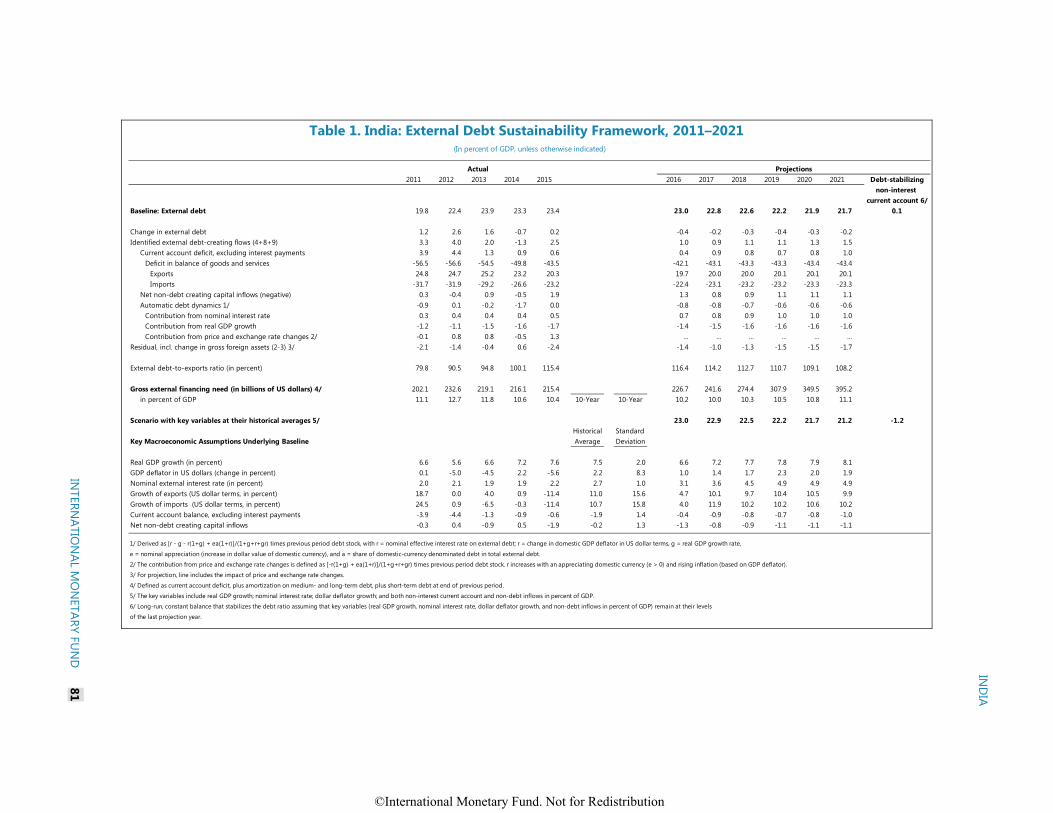
Table 1. India: External Debt Sustainability Framework, 2011–2021
Projections2011 2012 2013 2014 2015 2016 2017 2018 2019 2020 2021 Debt-stabilizing
non-interest current account 6/
Baseline: External debt 19.8 22.4 23.9 23.3 23.4 23.0 22.8 22.6 22.2 21.9 21.7 0.1
Change in external debt 1.2 2.6 1.6 -0.7 0.2 -0.4 -0.2 -0.3 -0.4 -0.3 -0.2Identified external debt-creating flows (4+8+9) 3.3 4.0 2.0 -1.3 2.5 1.0 0.9 1.1 1.1 1.3 1.5
Current account deficit, excluding interest payments 3.9 4.4 1.3 0.9 0.6 0.4 0.9 0.8 0.7 0.8 1.0Deficit in balance of goods and services -56.5 -56.6 -54.5 -49.8 -43.5 -42.1 -43.1 -43.3 -43.3 -43.4 -43.4
Exports 24.8 24.7 25.2 23.2 20.3 19.7 20.0 20.0 20.1 20.1 20.1Imports -31.7 -31.9 -29.2 -26.6 -23.2 -22.4 -23.1 -23.2 -23.2 -23.3 -23.3
Net non-debt creating capital inflows (negative) 0.3 -0.4 0.9 -0.5 1.9 1.3 0.8 0.9 1.1 1.1 1.1Automatic debt dynamics 1/ -0.9 0.1 -0.2 -1.7 0.0 -0.8 -0.8 -0.7 -0.6 -0.6 -0.6
Contribution from nominal interest rate 0.3 0.4 0.4 0.4 0.5 0.7 0.8 0.9 1.0 1.0 1.0Contribution from real GDP growth -1.2 -1.1 -1.5 -1.6 -1.7 -1.4 -1.5 -1.6 -1.6 -1.6 -1.6Contribution from price and exchange rate changes 2/ -0.1 0.8 0.8 -0.5 1.3 ... ... ... ... ... ...
Residual, incl. change in gross foreign assets (2-3) 3/ -2.1 -1.4 -0.4 0.6 -2.4 -1.4 -1.0 -1.3 -1.5 -1.5 -1.7
External debt-to-exports ratio (in percent) 79.8 90.5 94.8 100.1 115.4 116.4 114.2 112.7 110.7 109.1 108.2
Gross external financing need (in billions of US dollars) 4/ 202.1 232.6 219.1 216.1 215.4 226.7 241.6 274.4 307.9 349.5 395.2in percent of GDP 11.1 12.7 11.8 10.6 10.4 10-Year 10-Year 10.2 10.0 10.3 10.5 10.8 11.1
Scenario with key variables at their historical averages 5/ 23.0 22.9 22.5 22.2 21.7 21.2 -1.2Historical Standard
Key Macroeconomic Assumptions Underlying Baseline Average Deviation
Real GDP growth (in percent) 6.6 5.6 6.6 7.2 7.6 7.5 2.0 6.6 7.2 7.7 7.8 7.9 8.1GDP deflator in US dollars (change in percent) 0.1 -5.0 -4.5 2.2 -5.6 2.2 8.3 1.0 1.4 1.7 2.3 2.0 1.9Nominal external interest rate (in percent) 2.0 2.1 1.9 1.9 2.2 2.7 1.0 3.1 3.6 4.5 4.9 4.9 4.9Growth of exports (US dollar terms, in percent) 18.7 0.0 4.0 0.9 -11.4 11.0 15.6 4.7 10.1 9.7 10.4 10.5 9.9Growth of imports (US dollar terms, in percent) 24.5 0.9 -6.5 -0.3 -11.4 10.7 15.8 4.0 11.9 10.2 10.2 10.6 10.2Current account balance, excluding interest payments -3.9 -4.4 -1.3 -0.9 -0.6 -1.9 1.4 -0.4 -0.9 -0.8 -0.7 -0.8 -1.0Net non-debt creating capital inflows -0.3 0.4 -0.9 0.5 -1.9 -0.2 1.3 -1.3 -0.8 -0.9 -1.1 -1.1 -1.1
1/ Derived as [r - g - r(1+g) + ea(1+r)]/(1+g+r+gr) times previous period debt stock, with r = nominal effective interest rate on external debt; r = change in domestic GDP deflator in US dollar terms, g = real GDP growth rate,
e = nominal appreciation (increase in dollar value of domestic currency), and a = share of domestic-currency denominated debt in total external debt.
2/ The contribution from price and exchange rate changes is defined as [-r(1+g) + ea(1+r)]/(1+g+r+gr) times previous period debt stock. r increases with an appreciating domestic currency (e > 0) and rising inflation (based on GDP deflator).
3/ For projection, line includes the impact of price and exchange rate changes.
4/ Defined as current account deficit, plus amortization on medium- and long-term debt, plus short-term debt at end of previous period.
5/ The key variables include real GDP growth; nominal interest rate; dollar deflator growth; and both non-interest current account and non-debt inflows in percent of GDP.
6/ Long-run, constant balance that stabilizes the debt ratio assuming that key variables (real GDP growth, nominal interest rate, dollar deflator growth, and non-debt inflows in percent of GDP) remain at their levels
of the last projection year.
Actual
(In percent of GDP, unless otherwise indicated)
IND
IA
INTERN
ATION
AL MO
NETARY FU
ND
81
©International Monetary Fund. Not for Redistribution

INDIA
82 INTERNATIONAL MONETARY FUND
Annex IV. External Sector Assessment Staff assesses that India’s external position in FY2015/16 was broadly consistent with medium-term fundamentals and desirable policy settings.
Current Account and Exchange Rates
The current account (CA) deficit narrowed further in FY2015/16, to 1.1 percent of GDP, helped by lower commodity-import prices, and is projected to remain contained at about 1.1 percent of GDP in FY2016/17. As of November 2016, the real effective exchange rate (REER) has been broadly stable, appreciating by 1½ percent over the average REER in FY2015/16.
The External Balance Assessment (EBA) CA regression estimates a norm of -4.2 percent of GDP for India in FY2015/16. However, in staff’s judgment, global financial markets could not be counted on to reliably finance a deficit of that size, in light of India’s current vulnerabilities. Given the risks with global financial market volatility, staff assesses that a smaller CA deficit of about 2¼ percent of GDP is a more appropriate norm.1 The underlying CA in FY2015/16, which is the CA adjusted for temporary factors,2 is estimated to be -1.75 percent of GDP. Thus, staff assesses the CA gap to be about ½ percent of GDP, or in a range of -½ to +1½ percent of GDP.
The EBA Index REER and Level REER regression approaches estimate an overvaluation of about 8 and 13 percent for the 2015 average REER, respectively. In addition, the staff assessed CA gap implies an undervaluation of 2½ percent for the FY2015/16 average REER. Overall, staff assesses the REER to be moderately overvalued, with the REER gap in a range of -5 to +10 percent.
Capital Account Flows and International Investment Position
India’s financial account is dominated by portfolio equity and FDI flows. FDI flows as a share of GDP have been increasing since 2014/15, as the authorities have liberalized the caps on FDI in most sectors. Debt flows, particularly in the form of external commercial borrowings (ECB) by Indian corporates, have stabilized after increasing in recent years. After large net portfolio flows in 2014/15, amid easy global financial conditions, portfolio flows were moderately negative in 2015/16. Given that portfolio debt flows have been volatile and the exchange rate has been sensitive to these flows and changes in global risk aversion, attracting more stable sources of financing would reduce vulnerabilities.
1 See 2016 External Sector Report, IMF Policy Paper, July 27, 2016. The CGER-type external sustainability method estimates the CAD norm at about 2¼ percent of GDP given medium-term growth and inflation projections, assuming the NFA is stabilized at about 20 percent of GDP. See IMF (2014), India: Staff Report for 2014 Article IV Consultation, IMF Country Report No. 14/57 for additional model-based estimates and description of the CA deficit norm in India. Compared to the previous estimate of the CAD norm of about 2½ percent of GDP, the estimated norm declined slightly due largely to the lower medium-term projected nominal growth.
2 The estimated underlying CA here incorporates the EBA-estimated cyclical adjustment and also takes account of the temporary impact of higher tariffs on gold imports as well as the temporary part of the recent terms of trade gain (about ½ of one percent of GDP).
©International Monetary Fund. Not for Redistribution
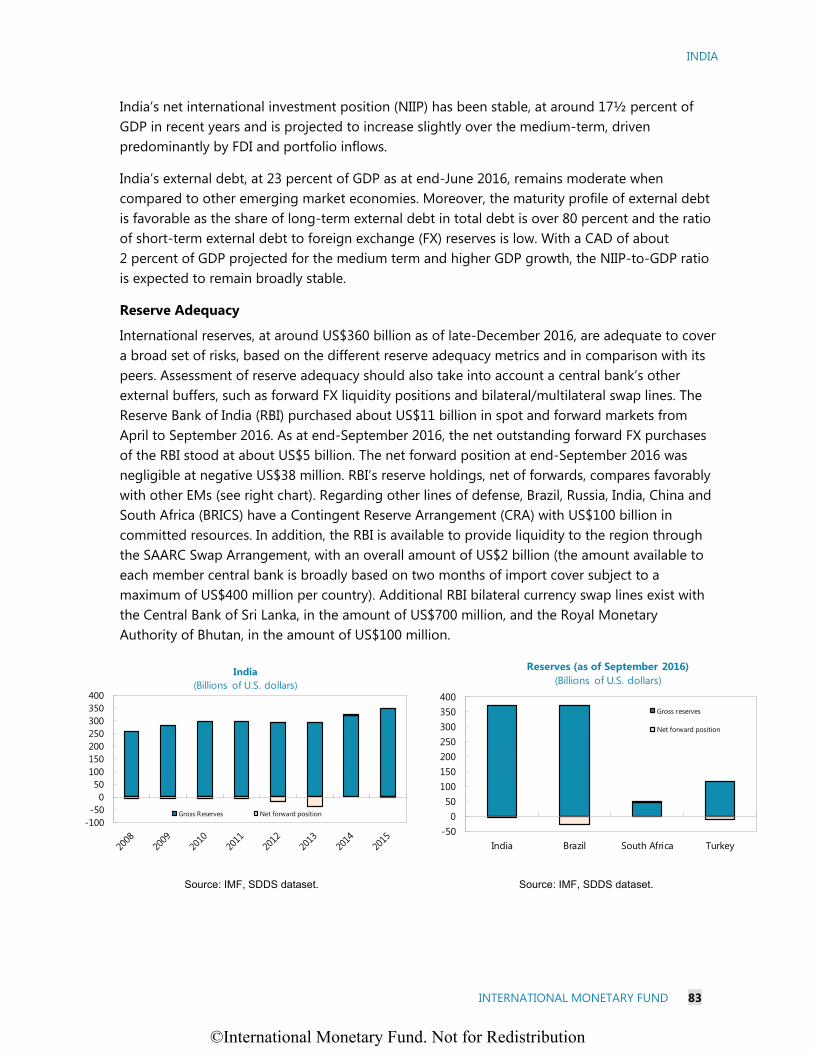
INDIA
INTERNATIONAL MONETARY FUND 83
India’s net international investment position (NIIP) has been stable, at around 17½ percent of GDP in recent years and is projected to increase slightly over the medium-term, driven predominantly by FDI and portfolio inflows.
India’s external debt, at 23 percent of GDP as at end-June 2016, remains moderate when compared to other emerging market economies. Moreover, the maturity profile of external debt is favorable as the share of long-term external debt in total debt is over 80 percent and the ratio of short-term external debt to foreign exchange (FX) reserves is low. With a CAD of about 2 percent of GDP projected for the medium term and higher GDP growth, the NIIP-to-GDP ratio is expected to remain broadly stable.
Reserve Adequacy
International reserves, at around US$360 billion as of late-December 2016, are adequate to cover a broad set of risks, based on the different reserve adequacy metrics and in comparison with its peers. Assessment of reserve adequacy should also take into account a central bank’s other external buffers, such as forward FX liquidity positions and bilateral/multilateral swap lines. The Reserve Bank of India (RBI) purchased about US$11 billion in spot and forward markets from April to September 2016. As at end-September 2016, the net outstanding forward FX purchases of the RBI stood at about US$5 billion. The net forward position at end-September 2016 was negligible at negative US$38 million. RBI’s reserve holdings, net of forwards, compares favorably with other EMs (see right chart). Regarding other lines of defense, Brazil, Russia, India, China and South Africa (BRICS) have a Contingent Reserve Arrangement (CRA) with US$100 billion in committed resources. In addition, the RBI is available to provide liquidity to the region through the SAARC Swap Arrangement, with an overall amount of US$2 billion (the amount available to each member central bank is broadly based on two months of import cover subject to a maximum of US$400 million per country). Additional RBI bilateral currency swap lines exist with the Central Bank of Sri Lanka, in the amount of US$700 million, and the Royal Monetary Authority of Bhutan, in the amount of US$100 million.
Source: IMF, SDDS dataset. Source: IMF, SDDS dataset.
-100-50
050
100150200250300350400
Gross Reserves Net forward position
India(Billions of U.S. dollars)
-500
50100150200250300350400
India Brazil South Africa Turkey
Gross reserves
Net forward position
Reserves (as of September 2016)(Billions of U.S. dollars)
©International Monetary Fund. Not for Redistribution

INDIA
84 INTERNATIONAL MONETARY FUND
Annex V. Expenditure Reforms1
The relationship between fiscal policy and growth is often explored as a dynamic multiplier of the quantum of expenditure and/or as the crowding-in crowding-out adjunct of the debt sustainability framework which governs the operation of fiscal rules. An aspect that is often forgotten is that efficiency and effectiveness of expenditure, is an even more powerful determinant of growth that needs systemic attention of policy makers.
Over the last two years, the Government of India has made a significant progress in this regard. Important dimensions of this achievement are summarized below:
Rationalization of Schemes: Over the past few decades the number of expenditure schemes and sub-schemes had multiplied inexorably, leading to fragmentation of cost centres, dis-economies of scale and poor outcomes. In consultation with the Central Implementing Ministries and Sub-group of Chief Ministers constituted by the NITI Aayog, schemes, sub-schemes and their components (with shared or common outcomes) were consolidated and brought together under a rationalized scheme architecture that brings economics of scale and a greater focus on the achievement of outcomes. As a result of this exercise the number of Centrally Sponsored Schemes (which are implemented through the State Governments) has been brought down from 66 to 30, while the number of Central Sector Schemes (implemented by the agencies authorized by the Central Government) has been brought down from 1059 to 230.
Cost Center Approach: The Expenditure Budget essentially consists of cost centres, the most prominent being the Establishments, the Schemes and the Projects. Plan Budgeting was initiated with the avowed objective of placing a greater focus on the growth-oriented cost centers. However, over the years, the plan non-plan distinction became so embedded in the budgetary and accounting framework that most natural cost centres became fragmented. With the decision to remove the plan non-plan distinction at the end of the Twelfth Five-Year Plan (2016–17 is the last year), a more cohesive, cost centre approach, with clear revenue-capital distinction, has been adopted and guidance notes have been issued to all concerned.
Appraisal and Approval Protocols: The growth impact of fiscal policy is a function of the efficiency with which schemes and projects are formulated, appraised and approved. The first move in this direction was a three-fold increase in the delegation of financial powers in August, 2014. The second critical reform was simplification of appraisal and approval protocols in August, 2016, whereby a complex web of serial circulars and annexures, which had evolved over the past four decades, was replaced by a single master circular (running into only five pages, with five annexures) that has greatly simplified the appraisal and approval protocols in accordance with the cost centre approach outlined above.
Quality of Expenditure: Studies have shown that multipliers for infrastructure investment in India, at the present stage of its development, are significantly higher (1.5 to 2.0) than the multipliers for revenue expenditure and transfers (0.90 to 1.00). Concerted efforts have been made by the Government of India to improve Cap-Ex spending over the last two years.
The budgetary support to growth is a sum of direct plan capital expenditure and the grants-in-aid for capital expenditure given to both central agencies and the State Governments.
1 Contributed by Dr Arunish Chawla, Joint Secretary, Department of Expenditure, Ministry of Finance.
©International Monetary Fund. Not for Redistribution

INDIA
INTERNATIONAL MONETARY FUND 85
What matters for growth is the sustained increase in the sum of these two expenditures. The following exposition describes these expenditures in recent years:
The sum of these two elements increased from Rs 2,35,807 crore in 2014–15 (actuals) to Rs 2,74,197 crore (revised estimates) in 2015-16 (which is a y-o-y increase of 16.2 percent in 2015-16 over 2014–15). Further, despite the ongoing fiscal consolidation, it increased to Rs 3,13,322 crore in 2016–17 (budget estimates), which is a y-o-y increase of 14.2 percent in 2016-17 over 2015–16.
An additional support to growth comes from the internal and extra-budgetary resources of public enterprises and autonomous bodies. After a 12.9 percent fall in 2014–15, this investment also recovered with a 40.4 percent increase in 2015-16, and is likely to further increase by 23.8 percent in 2016-17.
Public Financial Management System: What started as a plan scheme monitoring system, has, over the past two years, been extended to the entire universe of schemes and projects, as well as to establishment expenditures on the non-plan side. On the revenue side, it has been suitably integrated with the operational tax portals, and a non-tax revenue portal has been added to ensure all non-tax revenues are fully taken into account through the public financial management system.
To bring in just-in-time cash management practices, all implementing agencies of the Central Sector Schemes, have been asked to register and adopt the Expenditure-Advance-Transfer (EAT) Modules of the Public Financial Management System by March, 2017. Simultaneously, the States are being encouraged to design integrated financial management information systems of their own and link them to the Central Public Financial System to bring-in efficiencies at the State level, in the execution of the both State and Centrally Sponsored Schemes.
Direct Benefit Transfer: Another important milestone is the establishment of the Direct Benefit Transfer (DBT) Gateway through the National Payment Corporation of India (NPCI). As many as 74 central entitlement schemes/sub-schemes have already moved to this platform. Enactment of a new Aadhaar Law in March, 2016 has enabled linking of entitlements and subsidies to biometric authentication of the intended beneficiaries. Since September 2010, over 1084 million Aadhaar numbers have been generated, covering more than 90 percent of the adult (over 18 years) population in the country. A State DBT mechanism has been set-up through the NPCI and the State Governments are increasingly taking advantage of this critical expenditure reform to improve the targeting of their own entitlement and subsidy schemes.
Outcome-Evaluation Framework: Last but not the least, all schemes and projects will now have a medium-term expenditure and outcome framework, which will be formulated in consultation with the Implementing Ministries and the NITI Aayog. This will be placed before the Parliament through a consolidated Outcome Budget each year. Each Scheme will have a start and a sunset date, coterminous with the Finance Commission cycle over which both the Central and the State Governments have clarity over flow of resources. Third party evaluation has been formally built into the appraisal and approval framework to ensure periodic feedback, a more concerted focus on outcomes, and an enhanced overall effect on growth.
©International Monetary Fund. Not for Redistribution

INDIA STAFF REPORT FOR THE 2017 ARTICLE IV CONSULTATION—INFORMATIONAL ANNEX
Prepared By
Asia and Pacific Department
FUND RELATIONS _________________________________________________________________________ 2
RELATIONS WITH THE WORLD BANK GROUP ___________________________________________ 6
RELATIONS WITH THE ASIAN DEVELOPMENT BANK ___________________________________ 8
STATISTICAL ISSUES ______________________________________________________________________ 10
CONTENTS
January 6, 2017
©International Monetary Fund. Not for Redistribution
Underline

INDIA
2 INTERNATIONAL MONETARY FUND
FUND RELATIONS (As of November 30, 2016)
Membership Status:
Joined December 27, 1945; Article VIII.
General Resources Account SDR Million % Quota
Quota 13,114.40 100.00 Fund Holdings of Currency (Holdings Rate) 11,405.00 86.97 Reserve Tranche Position 1709.49 13.04 Lending to the Fund New Arrangements to Borrow 618.70
SDR Department: SDR Million % Allocation
Net cumulative allocation 3,978.26 100.00 Holdings 1065.39 26.78
Outstanding Purchases and Loans: None
Financial Arrangements:
Type Date of Arrangement
Expiration Date
Amount Approved (SDR Million)
Amount Drawn (SDR Million)
Stand-By 10/31/91 06/30/93 1,656.00 1,656.00
Stand-By 01/18/91 04/17/91 551.93 551.93
EFF 11/9/81 05/01/84 5,000.00 3,900.00 Projected Payments to Fund (SDR million; based on existing use of resources and present holdings of SDRs): Forthcoming
2016 2017 2018 2019 2020 Principal 0.00 0.00 0.00 0.00 Charges/interest 6.71 6.84 6.84 6.84 Total 6.71 6.84 6.84 6.84
©International Monetary Fund. Not for Redistribution

INDIA
INTERNATIONAL MONETARY FUND 3
Exchange Rate Arrangement: As per the Annual Report on Exchange Arrangements and Exchange Restrictions (AREAER), the exchange rate in India is classified as floating. The exchange rate of the rupee is determined in the interbank market, where the Reserve Bank of India (RBI) intervenes at times. The RBI’s role is to modulate excessive volatility so as to maintain orderly conditions. On August 20, 1994, India accepted the obligations of Article VIII, Sections 2, 3, and 4 of the IMF Articles of Agreement. India maintains the following restrictions on the making of payments and transfers for current international transactions, which are subject to Fund approval under Article VIII, Section 2(a): restrictions related to the nontransferability of balances under the India-Russia debt agreement; restrictions arising from unsettled balances under inoperative bilateral payments arrangements with two Eastern European countries; and a restriction on the transfer of amortization payments on loans by non-resident relatives. The Executive Board has not approved these restrictions.
Article IV Consultation: The previous Article IV consultation discussions were held in December 2015. The Staff Report (IMF Country Report No. 16/75) and associated Selected Issues (IMF Country Report No. 16/76) were discussed by the Executive Board on February 12, 2016.
FSAP Participation and ROSCs: The pilot FSSA/FSAP report was issued in January 2001; a fiscal transparency ROSC was issued in February 2001 (http://www.imf.org/external/np/rosc/ind/fiscal.htm); the data model of the ROSC (Country Report No. 04/96) was issued in April 2004. The missions for the FSAP Update took place in 2011, and concluding meetings were held in Delhi and Mumbai in January 2012—the FSSA Update report was published in January 2013 (Country Report No. 13/8). Detailed assessment reports on FSAP-related papers were issued in August 2013 and published as Country Reports No. 13/265–268. An FSAP Update is currently underway, and involves missions in December 2016 and April and June of 2017.
Technical Assistance: Dept Purpose Date of Delivery FAD State level fiscal database and debt register 11/04 FAD Pilot study on public private partnerships 12/04 STA Balance of payments statistics 9/05 LEG AML/CFT 5/08 LEG AML/CFT 10/08 STA Workshop on national accounts 03/10, 5/15 LEG Insolvency regime workshop 7/13 ICD Financial programming 11/13 STA Government finance statistics 1/14
©International Monetary Fund. Not for Redistribution

INDIA
4 INTERNATIONAL MONETARY FUND
MCM Macroeconomic modeling for inflation targeting 2/14 STA Sectoral accounts and balance sheets 3/14 MCM Technical cooperation and IMF/RBI on stress test 4/14, 3/15 APD Financial programming for Ministry of Finance 7/14, 10/14 MCM Macroprudential issues 10–12/14, 5/15 MCM Developing a forecasting and policy analysis system (FPAS) 11/14, 8/15 ICD Financial programming for Indian Economic Service staff 3/15 MCM Strengthening systemic risk analysis—Briefing at HQ 6/15 FAD Advice on GST revenue estimates 7/15 LEG Insolvency and out-of-court settlement workshop 8/15 ICD South Asia Regional Training and Technical Assistance Center discussions 10/15–10/16 MCM Currency Management 8/15 MCM Problem Banks and Resolution 12/15 ICD Financial Programming and Policies 2/16 FAD Support Development of Accounting Manual 5/16 FAD Fiscal Rules 6/16 MCM Strengthening Systemic Risk Analysis 6–7/16 FAD Macro-fiscal Frameworks 8/16 MCM FSAP Update scoping mission 12/16 ICD Macroeconomic Diagnostics course for Indian Economic Service staff 1/17 Outreach and Other Activities: Dept Purpose Date of Delivery
APD Lecture on IMF activities in India to Indian Administrative Service staff, NIPFP 2/16 APD Panel discussion on the future of economics, Jindal Global University 2/16 MCM Presentation on financial inclusion, ICRIER 3/16 MCM Presentation of the Global Financial Stability Report, Reserve Bank of India 3/16 COM Training workshop on the IMF and its work in India for journalists 3/16 APD Launch of IMF book “Taming Indian Inflation” 3/16 APD India Article IV outreach, IMF Survey 3/16 APD Advancing Asia Conference, New Delhi 3/16 APD Panel discussion on EM risks, IIF/NSE/IFC/ExIm conference 4/16 APD World Economic Outlook presentation, Macrofin Monitoring Group Ministry of Finance 4/16 APD “South Asia: Strong regional growth, tepid global growth”, South Asia Reg. Update 4/16 APD Asia-Pacific Regional Economic Outlook launch in India, NCAER 5/16 RES Conference of South Asian central bankers 5/16 APD Presentation on Brexit Impact on global economy and India, NCAER 8/16 APD ICRIER G20 Conference 8/16 APD Presentation on subnational government finances, IIM Bangalore conference 9/16 APD Panel discussion on India’s economic outlook, ASSOCHAM Global Investor conference 9/16 APD Panel discussion on macroeconomic paradigms, SBI Banking & Economics Conclave 9/16 APD Presentation on global economic outlook, Ministry of Finance 9/16
©International Monetary Fund. Not for Redistribution

INDIA
INTERNATIONAL MONETARY FUND 5
APD Panel discussion on offshore local currency bond markets, CII BRICS conference 10/16 APD Panel discussion on BRICS and financial markets, BRICS economic forum 10/16 RES World Economic Outlook presentation, Brookings India 10/16 MCM Presentation of Global Financial Stability Report, Reserve Bank of India 10/16 MCM Presentation of Global Financial Stability Report, NCAER 10/16 APD “South Asia: Strong expansion continues”, South Asia Regional Update 10/16 APD Conference presentation at Indian Statistical Institute, Delhi 10/16 APD Presentation at Indian Institute of Management, Kolkata 10/16 APD Presentation at Jain Institute of Management, Mumbai 10/16 APD Panel discussion on early warning models, SAARCFINANCE Database Seminar 11/16 APD Lecture on IMF activities in India to Indian Administrative Service staff, NIPFP 12/16
Resident Representative: A resident representative’s office was opened in November 1991. Mr. Andreas Bauer has been the Senior Resident Representative since August 2016.
©International Monetary Fund. Not for Redistribution

INDIA
6 INTERNATIONAL MONETARY FUND
RELATIONS WITH THE WORLD BANK GROUP In the World Bank Group’s FY16 (July 1, 2015–June 30, 2016), IBRD/IDA lending in India totaled US$3.8 billion (of which US$2.8 billion IBRD and US$1 billion IDA). IFC committed US$1.15 billion in FY16, bring the committed portfolio to US$5.2 billion. The World Bank Group’s (WBG) Country Partnership Strategy (CPS) for India for 2013-20171 focuses on helping India accelerate poverty reduction and boost shared prosperity, and is closely aligned the Government’s 12th Five-Year Plan, and its goal of “faster, sustainable, and more inclusive growth.” The volume of WBG support—from IBRD, IDA, and IFC—has been around US$5 billion annually over the past three years of the CPS.
Under its Strategy, the WBG aims to contribute to India’s development by deepening and strengthening engagement in three priority areas: integration, rural-urban transformation and inclusion. “Integration” seeks to increase market integration by focusing on addressing infrastructure gaps and investment climate as key measures needed to help low-income states converge more quickly with their faster-growing neighbors. With 600 million people expected to live in India’s cities by 2031, “rural-urban transformation” will require intensified engagement to improve the management and livability of medium-sized cities. “Inclusion” will entail a stronger focus on human development with improvements in healthcare systems and nutrition, on the quality of education at all levels, as well as on better access to finance and social protection for the underprivileged. A common theme across these three areas of engagement will be an emphasis on improved governance, sustainability, and gender equality.
The WBG program in India is particularly focused on increasing support to 14 low-income and formerly special category states2 (LSS). The Bank is working with the Government to rebalance its lending portfolio to increase IBRD/IDA lending towards these states, which together account for 61.5 percent of India’s 270 million people living in poverty. As of the end of 2016, nearly 22% of all commitments are towards LSS, against a CPS target of 30% by the end of FY 2017. Many of these states also have human development indicators—high infant mortality, high child malnutrition, low female literacy—on par with the poorest countries in the world. The IFC’s LSS investment portfolio covers a broad range of sectors, complemented its advisory services. Engagement in more advanced states and at the central level will focus on activities that are transformative and innovative. Urbanization presents tremendous opportunities, both for agriculture and poverty reduction, and competitiveness. WBG support focuses on government efforts at the national, state and city levels to help improve the livability of medium-sized cities.
A robust knowledge portfolio complements and underpins financing and includes: (i) focus on in-depth analytical work on key cross-sectoral questions; (ii) inform design and implementation of future interventions by drawing on impact evaluations; (iii) respond quickly and flexibly with demand-driven technical assistance and just-in-time knowledge support to help reform and
1 See http://openindia.worldbankgroup.org for a visualization on the WBG country strategy. 2 These states include: Bihar, Chhattisgarh, Jharkhand, Madhya Pradesh, Odisha, Rajasthan, Uttar Pradesh, and eight northeast states (Assam, Himachal Pradesh, Manipur, Meghalaya, Mizoram, Sikkim, and Uttarakhand). IFC excludes Himachal Pradesh and Uttarakhand. Following recommendations of the 14th Finance Commission, the Special States category is no longer used as a designation by the Government of India.
©International Monetary Fund. Not for Redistribution

INDIA
INTERNATIONAL MONETARY FUND 7
implementation; (iv) broker South-South and across-state knowledge exchanges; (v) develop flexible programmatic approaches to develop analytic and advisory activities; and (vi) scale-up training capacity. The Advisory Services and Analytical (ASA) program has been strategically realigned to enhance the implementation of the CPS and its contribution to the twin goals of poverty reduction and shared prosperity. A clustered approach enables WBG teams to work on multi-sectoral development challenges in areas such as poverty and shared prosperity, water, urban, service delivery, human development outcomes, public-private partnerships, social inclusion and gender and economic integration.
The India Performance and Learning Review (PLR)3—the mid-term assessment of the Strategy—noted that the India program has been scaled up over the last three years and is being delivered in the context of a strengthened partnership between the Government of India and WBG. In particular, stressing the importance of WBG as the “Knowledge Bank”, Prime Minister Modi and President Kim agreed to scale up support in six strategic priority areas of engagement. Cutting-edge, global knowledge and financing is being mobilized from across the “One World Bank Group” to help: rejuvenate the Ganga; develop smart cities and improve urban service delivery; improve rural sanitation and end open defecation; provide 24/7 electricity to all, including an ambitious push on solar energy; and provide youth with training and skills development. The Bank Group will also scale up engagement to help modernize India’s massive railway system and improve India’s business climate. Finally, over the remainder of the CPS period more emphasis will also be placed on addressing India’s high malnutrition rates and helping to create opportunities for greater economic and social inclusion of people belonging to Scheduled Castes and Scheduled Tribes and women.
India: World Bank Financial Operations (In millions of U.S. dollars)1/ 2015/16 Total Commitments2/ 24,776 IBRD 13,024 IDA 11,752 Disbursements 2,839 IBRD 1,443 IDA 1,396 Repayments 2,359 IBRD 912 IDA 1,447 Debt outstanding and disbursed 37,284 IBRD 12,595 IDA 24,689
Source: World Bank.
1/ On an Indian fiscal year basis beginning April 1. 2/ Based on loan approval date.
3 The India PLR was discussed at the WBG Board of Executive Directors on October 29, 2015.
©International Monetary Fund. Not for Redistribution

INDIA
8 INTERNATIONAL MONETARY FUND
RELATIONS WITH THE ASIAN DEVELOPMENT BANK The Asian Development Bank (AsDB) operations in India began in 1986. Cumulative public sector loan commitments totaled US$35.1 billion as of 30 September 2016 for 205 loans. With an additional US$4.2 billion in private sector loans (the latter without government guarantee), total loan commitments on a cumulative basis amount to US$39.3 billion. These funds have been provided from AsDB’s ordinary capital resources (OCR). Also, AsDB has approved equity investments amounting to US$0.5 billion. AsDB’s lending and equity activities are summarized below.
India: Asian Development Bank Financial Operations (sovereign and non-sovereign) (In millions of U.S. dollars, as of 30 September 2016)
Calendar OCR Loan Private Year Commitments Equity Disbursements
1986–90 2,361.3 15.9 354.3 1991–95 3,551.0 59.5 2,222.8 1996–00 3,188.0 15.5 2,963.2 2001 1,500.0 -- 269.8 2002 1,183.6 15.0 576.5 2003 1,512.0 0.6 658.2 2004 1,200.0 29.7 401.6 2005 417.3 15.0 698.3 2006 1,485.0 67.6 711.9 2007 1,311.4 -- 1,493.2 2008 2,482.6 18.6 1,655.6 2009 1,811.0 40.0 1,551.7 2010 2,119.6 -- 1,858.1 2011 2,872.9 20.0 1,544.6
2012 2,098.9 -- 1,411.8
2013 2,261.5 82.0 1,173.1
2014 2,834.7 82.0 1,631.3
2015 2,571.0 86.0 1,806.8
20161/ 2,545.0* --* 1,176.7*
Total 39,306.8 547.3 24,159.5
Source: Asian Development Bank. 1/ As of 30 September 2016.
©International Monetary Fund. Not for Redistribution

INDIA
INTERNATIONAL MONETARY FUND 9
AsDB assistance supports the Government of India's development priorities, evolving focus areas, and flagship initiatives. The India country partnership strategy (CPS), 2013–2017 provides the overarching framework for AsDB’s operations in India. The CPS objective is to help India achieve faster, more inclusive, and sustainable growth. In line with the government’s guiding principle that multilateral development partners add value beyond tangible investments, AsDB leverages knowledge, supports capacity development, and incorporates innovation and best practice into its operations. To support the government’s vision of “faster, more inclusive, and sustainable growth,” the CPS has as its key areas infrastructure development, job creation and access to jobs, regional connectivity, environmental sustainability, and enhancement of synergies across sectors. The CPS is delivered through AsDB assistance in the energy, transport, urban services, and agriculture and natural resources sectors—with crosscutting support from finance and public sector management, as well as human development.
©International Monetary Fund. Not for Redistribution
INDIA
10 INTERNATIONAL MONETARY FUND
STATISTICAL ISSUES 1. General: Data provision is broadly adequate for surveillance. However, weaknesses remain in the timeliness and coverage of certain statistical series. India has an intricate system for compiling economic and financial statistics and produces a vast quantity of data covering most sectors of the economy. India subscribed to the Special Data Dissemination Standards (SDDS) on December 27, 1996 and started posting its metadata on the Dissemination Standards Bulletin Board on October 30, 1997. It is currently in observance of the SDDS, although it uses flexibility options for timeliness of data on general government operations and on the periodicity and timeliness of labor market data.
2. The data module of the Report on Observance of Standards and Codes (ROSC, IMF Country Report No. 04/96) was published in April 2004. It assesses India’s data dissemination practices against the SDDS requirements and assesses the quality of six datasets based on the Data Quality Assessment Framework (DQAF) developed by STA.
3. National accounts and employment statistics: In January 2015 the Central Statistical Office (CSO) released a new series of national accounts, with base year 2011/12. In addition to the shift in the base year for measuring growth, the revisions reflected a review of source data and compilation methods, and implementation of 2008 SNA. Due to weaknesses in estimating taxes less subsidies on products in constant prices, and as supply-side data remain of better quality than expenditure-side data, Gross Value Added is preferred as a proxy for measuring economic growth. For current price estimates, the data sources provide adequate coverage of economic activities, and the methodology is broadly consistent with international standards and best practices. Nonetheless, a sales-tax-based extrapolation of trade turnover value from the base year does not provide an accurate gauge of growth of economy-wide value added from trade. Constant price estimates of GDP deviate from the conceptual requirements of the national accounts, in part because the Wholesale Price Index (WPI) is used to derive volume estimates for many economic activities. The WPI is not the price counterpart for GDP by type of activity because the WPI includes some product taxes whereas GDP by activity does not include product taxes. Therefore, the WPI can be influenced by changes in tax rates. Further, the WPI weights include imports but the prices for the index are collected only on domestic goods. Large revisions to historical series, the relatively short time span of the revised series, and major discrepancies between GDP by activity and GDP by expenditure complicate analysis. The current index of industrial production (base year 2004/05) has limited usefulness for compiling national accounts statistics as its weights are over ten years old and thus its use may lead to some bias in estimates. There are long-standing deficiencies in employment data: they only cover the formal sector, which accounts for a small segment of the labor market, and are available only with a substantial lag.
4. Price statistics: A revised all-India Consumer Price Index (CPI) with new weights was released in early 2011, which covers combined rural and urban India, with 2009/10 as a base year. As well, separate corresponding urban and rural CPI series are published. The CPIs are published with a lag of about one month. In early 2015, the CPI weights were updated using 2011/12 expenditure
©International Monetary Fund. Not for Redistribution
INDIA
INTERNATIONAL MONETARY FUND 11
data and the CPI series has been revised from January 2015. Since January 2006, the Labour Bureau has published a CPI for industrial workers with a 2001 base year. Presently, there also remain four CPIs, each based on the consumption basket of a narrow category of consumers (namely industrial workers, urban and non-manual employees, agricultural laborers, and rural laborers). With the exception of the industrial workers’ CPI, these other indices are based on weights that are over ten years old. The WPI has a 2004/05 base year, for which data are also subject to frequent and large revision, usually upward. A new series of the WPI, also using 2011/12 base year, are likely to be released in early 2017. The authorities have been encouraged to develop a Producer Price Index to replace the WPI. New RBI price series on residential property price indexes have helped surveillance in this area, though geographic coverage remains limited, and price data for commercial real estate are not available. The RBI has started producing a series covering rural wage data, which helps surveillance, but economy-wide wage data are scant.
5. Government finance statistics: The Ministry of Finance (MoF) is responsible for compiling and disseminating the GFS. At present, India does not report fiscal data to STA. India disseminates the budgetary central government cash flow statement within one month after the reference month and stock of liabilities within one quarter after the reference quarter. With the agreement of the authorities, STA uses these data to compile a monthly cash flow statement for publication in the International Financial Statistics, following the GFSM 2001/2014 summary presentation, with some missing breakdowns, particularly for expenditure. Data on fiscal performance at the state level are available only at annual frequency and with a considerable lag. Data on the functional and economic classification of expenditures are available with considerable lag. There is also scope to improve the analytical usefulness of the presentation of the fiscal accounts. For example, classification of government expenditure between developmental/nondevelopmental and plan/nonplan obscures the economic nature and impact of fiscal actions. The MoF reports central government data (on a cash basis) for publication in the Government Finance Statistics Yearbook (GFSY), the latest reported data corresponding to 2013. Two years after the reference year, the Ministry of Finance reports general government (Central and State government) data to STA in the GFSM 1986 format, that staff reworks to the GFSM 2001 presentation for inclusion in the GFSY (latest reported data correspond to 2008). Data on the general government operations are not internationally comparable as they exclude data on the operations of the extra-budgetary funds, local governments, and social security funds. Under the SDDS, India disseminates annual general government data within 3 quarters after the reference year, using the timeliness flexibility option. India meets the SDDS specifications for central government debt and operations.
6. Monetary and financial statistics: The RBI web site and the RBI Bulletin publish a wide array of monetary and financial statistics, including reserve money and its components, RBI’s survey, monetary survey, liquidity aggregates (outstanding amounts), interest rates, exchange rates, foreign reserves, and results of government securities auctions. In 2011, the RBI started publishing a weighted average lending interest rate and other lending rates at annual frequency. The frequency and quality of data dissemination have improved substantially in recent years.
©International Monetary Fund. Not for Redistribution

INDIA
12 INTERNATIONAL MONETARY FUND
7. Concepts and definitions used by the RBI to compile monetary statistics are in broad conformity with the guidelines provided in the Monetary and Financial Statistics Manual (MFSM). Nevertheless, the following concepts and principles deviate from the MFSM. First, the resident sector data do not provide sufficient information on the sectoral distribution of domestic credit. Specifically, under their present sectorization scheme, the authorities subdivide the resident nonbank sector data by (i) central government; (ii) state government; and (iii) the commercial sector (including other financial corporations, public and other nonfinancial corporations, and other resident sectors). Second, commercial banks add accrued interest to credit and deposit positions on a quarterly basis only (instead of the prescribed monthly basis).
8. The RBI reports monetary data for IFS with long delays and in non-standard format. As of December 12, 2016, the latest monetary statistics published in IFS refer to April 2016. In addition, data reported cover depository corporations only, i.e. other financial corporations such as insurance corporations, pension funds, investment funds, etc. are not covered in the data disseminated in IFS. As for reporting of financial soundness indicators (FSIs), all 12 core and 11 encouraged FSIs for deposit takers are reported on a quarterly basis. FSIs for other financial corporations, nonfinancial corporations, and households are not reported.
9. External sector statistics: The concepts and definitions used to compile balance of payments statistics are broadly in line with the sixth edition of the Balance of Payments and International Investment Position Manual (BPM6). However, trade data have valuation, timing, and coverage problems. Data on imports of goods in balance of payments are registered in c.i.f. prices while the BPM6 requires the f.o.b. pricing. Data on trade in goods prices, volumes, and composition are not regularly available on a timely basis. External debt statistics are available on a quarterly basis with a one quarter lag. Estimates of short-term external debt are presented on an original maturity basis. The short-term maturity attribution on a residual maturity basis is only available annually (and excludes residual maturity of medium- and long-term nonresident Indian accounts). The international investment position (IIP) statistics cover the sectors prescribed in the BPM6 and these data are disseminated within three months of the reference period in respect of quarterly data.4 Coverage of direct investment positions data is hampered by the absence of appropriate legal or institutional authority. India disseminates monthly the Data Template on International Reserves and Foreign Currency Liquidity as prescribed under the SDDS. More up-to-date information on certain variables, such as total foreign reserve assets, foreign currency assets, gold, and SDRs, are available on a weekly basis and are disseminated as part of a weekly statistical supplement on the RBI web site.
4 The IIP as published by the RBI values equity liabilities at acquisition cost, while the Fund uses market prices, resulting in substantial differences.
©International Monetary Fund. Not for Redistribution

INDIA
INTERNATIONAL MONETARY FUND 13
India: Table of Common Indicators Required for Surveillance (As of December 13, 2016)
Exchange Rates 12/07/16 12/07/16 D D D
International reserve assets and reserve liabilities of the monetary authorities 2/
11/25/16 12/02/16 W W W
Reserve/base money 11/25/16 12/02/16 W W W
Broad money 11/11/16 12/02/16 BW W W
Central bank balance sheet Nov. 2016 12/04/16 M M M
Consolidated balance sheet of the banking system
Sept. 2016 11/11/16 M M M
Interest rates 3/ 12/07/16 12/07/16 D D D
Consumer price index Oct. 2016 11/15/16 M M M
Revenue, expenditure, balance and composition of financing - General Government 4/ 5/
2014/15 08/29/16 A A A
Revenue, expenditure, balance and composition of financing - Central Government 4/ 5/
Oct. 2016 11/30/16 M M M
Stocks of central government and central government-guaranteed debt 6/
Oct. 2016 11/30/16 M M M
External current account balance June 2016 09/21/16 Q Q Q
Exports and imports of goods and services Oct. 2016 11/15/16 M M M
GDP/GNP Sept. 2016 11/30/16 Q Q Q
Gross external debt June 2016 10/02/16 Q Q Q
International Investment Position June 2016 09/30/16 Q Q Q
Date of latest observation
Date received
Frequency of Data 1/
Frequency of Reporting 1/
Frequency of Publication 1/
1/ Daily (D), Weekly (W), Biweekly (BW), Monthly (M), Quarterly (Q), Annually (A), Irregular (I); Not Available (NA)2/ Any reserve assets that are pledged or otherwise encumbered should be specified separately. Also, data should comprise short-term liabilities linked to a foreign currency but settled by other means as well as the notional values of financial derivatives to pay and to receive foreign currency, including those linked to a foreign currency but settled by other means.3/ Both market-based and officially-determined, including discount rates, money market rates, rates on treasury bills, notes andbonds.4/ Foreign, domestic bank, and domestic nonbank financing. 5/ The general government consists of the central government (budgetary funds, extra budgetary funds, and social security funds) and state governments.6/ Including currency and maturity composition.
©International Monetary Fund. Not for Redistribution

Statement by the Staff Representative on India Executive Board Meeting
January 25, 2017
This statement contains information that has become available since the staff report was circulated to the Executive Board. This information does not alter the thrust of the staff appraisal.
1. India’s Central Statistical Office (CSO) released an advance estimate of real GDP growth for FY2016/17 (April-March) at 7.1 percent, down from 7.6 percent in FY2015/16. This advance estimate, which was produced for use in the forthcoming FY2017/18 Budget, only captures data through October and thus does not include the impact from the currency exchange initiative (which commenced on November 8, 2016). In late February the CSO will release GDP data for the third quarter (October-December, 2016) of FY2016/17, which will include the effects of the currency exchange initiative.
2. The replacement of currency notes is proceeding gradually. The latest official data released by the Reserve Bank of India (RBI) suggests that as of December 19, 2016, currency notes worth about 38 percent (Rs 5.93 billion) of the value of the demonetized currency notes have been reissued. At the same time, over 80 percent of the old currency notes (Rs 12.44 billion) have been deposited into bank accounts. On January 16, 2017, the RBI increased the daily withdrawal limits for ATMs from Rs 4,500 to Rs 10,000, and the weekly withdrawal limit for current accounts from Rs 50,000 to Rs 100,000.
3. High frequency indicators generally confirm a significant slowdown in activity following the announcement of the currency exchange initiative. The index of industrial production rose by 5.7 percent in November 2016, but was driven mainly by volatile components, while the orders-to-inventory ratio contracted. After a sharp contraction in November, PMIs remained depressed in December (PMI for services at 46.3; PMI for manufacturing at 48.6). Bank credit growth has continued to decelerate, falling to a decadal low of 5.1 percent at end-December. Amid subdued domestic demand, CPI inflation softened further to 3.4 percent (year-over-year) in December from 3.6 percent in the previous month. Food prices, particularly fruits, vegetables and pulses, led the decline.
4. International reserves have declined by US$ 1.1 billion thus far in 2017, standing at US$ 359 billion as of January 6, 2017. International reserves represent about 8 months of next year’s imports of goods and services. Net portfolio investment outflows (both equity and debt) amounted to about US$ 900 million so far in January 2017. Foreign direct investment inflows have been steady, amounting to US$ 27 billion during the first eight months of FY2016/17. Official intervention data indicates that the RBI’s net spot sale of foreign currency amounted to US$ 3 billion in October and November 2016, with outstanding net forward and futures purchases of foreign currency standing at US$ 1.9 billion at end-November. The Indian rupee remains near its end-December 2016 levels, at about 68 rupees to the U.S. dollar. Although export growth recovered to 5.7 percent in December from 2.3 percent in November, a decline in import growth to 0.6 percent from 10.4 percent points to subdued domestic demand.
5. The GST Council, in its ninth meeting on January 16, 2017, reached a consensus regarding the sharing of administrative powers between the central government and state governments in assessing tax payers under the GST. However, detailed rate schedules and draft legislation still have to be finalized and approved by the Parliament and state Assemblies before the GST can be implemented, most likely by July 1, 2017.
©International Monetary Fund. Not for Redistribution

Statement by Subir Gokarn, Executive Director for India and Himanshu Joshi, Senior Advisor to Executive Director
January 25, 2017
1. On behalf of our authorities, we would like to thank staff for presenting a comprehensive and generally balanced assessment of recent macroeconomic and financial sector developments in India. The mission team has had broad-based and open discussions with our authorities, which have been appreciated. We would also like to acknowledge the wide range of analytical exercises undertaken in the Selected Issues chapters. All of them, from corporate indebtedness to gender issues, export performance to Universal Basic Income, are high on the authorities’ list of policy priorities and the staff contributions to the discussions are very valuable.
GDP growth and Outlook
2. During the first half of 2016-17 the economy recorded GDP growth of 7.2 per cent, slightly below the 7.5 per cent of the preceding year. Despite slight deceleration in economic activity, major sectors such as manufacturing and agriculture sustained steady performance. Consumption demand remains the mainstay, with investment activity continuing to be sluggish.
3. Against this backdrop, staff recently revised its growth estimate for 2016-17 sharply down from 7.6 per cent in October to 6.6 per cent in the Staff Report. The primary reason for this is the temporary disruption in consumption spending caused by the currency policy initiative announced on November 8, 2016. While we do not question the methodologies used to revise the estimates, the fact is that there isn’t very much hard data on which to base the revisions. Different assumptions about the impact will obviously lead to different conclusions. While virtually all forecasters have revised their projections for 2016-17 downwards, the range is relatively wide. The World Bank and the Asian Development Bank have pegged growth at 7 per cent after accounting for the change in currency policy. The authorities’ estimate is 7.1 per cent. In short, the authorities view the staff projection as unduly pessimistic in terms of both the magnitude of the shock and its persistence. We will say more about the policy initiative itself later in this statement. However, we do note that the longer term outlook indicates a return to the earlier growth trajectory.
Inflation and Monetary Policy
4. Headline retail inflation has been moderating since August 2016 on easing food prices, with a notable deceleration in October to 4.2 per cent and further to 3.6 per cent and 3.4 per cent respectively in November and December, on the back of lower food prices. However, despite the receding pace of consumer inflation, food prices have generally tended to be volatile. Our authorities are cognizant of the risk of resurgence of food inflation if the usual pattern of winter moderation in prices does not materialize going forward. The headline inflation is projected at 5 per cent in March 2017. The Monetary Policy Committee of the Reserve Bank of India kept the policy rate unchanged at 6.25 per cent in its December policy meeting. Reassuringly, the trends visible from the November 2016 round of households’ inflation expectations survey indicate that inflation expectations have declined for three months as well as one year ahead period. Overall, our authorities concur with staff assessment of the appropriateness of the current policy stance and the need to maintain vigilance against food price and other shocks.
Fiscal policy
©International Monetary Fund. Not for Redistribution

2
5. We want to emphasize the commitment of our authorities on medium-term fiscal consolidation. A conducive environment for improvement in state public finances has been created through suitable incentives/costs for states to renew fiscal efforts towards consolidation. The passage of the Goods and Services Tax (GST) Bill 2016 marks a new era in co-operative fiscal federalism. The GST system is most likely to be implemented at the earliest in July this year, as the GST council has finally reached consensus on rate slabs and jurisdictional issues. The GST will widen and stabilize the indirect tax base by reducing overall tax burden, eliminate cascading caused by a multitude of existing levies, remove duty exemptions and encourage tax compliance – all the while reducing tax administration costs and improving the public finances. As regards debt, India’s public debt is sustainable both because of the authorities’ commitments for fiscal consolidation and the projected interest versus growth trajectory going forward.
Financial Sector
6. Progress has been made in the implementation of the Indradhanush initiative announced by the government in 2015 for improving the functioning public sector banks by strengthening Board and management appointments, decentralizing more decisions to the professional board and finding ways to incentivize management to improve loan evaluation, monitoring and repayment.
7. To curtail deterioration in asset quality, schemes for identification, restructuring and resolution of stressed and NPLs have been put in place for revitalizing distressed assets, optimal structuring of credit facilities, change the ownership/management for reviving bad credits, deep restructuring of stressed assets and facilitating speedy exit from unviable accounts. The Reserve Bank initiated an asset quality review (AQR) in December 2015 following which banks were directed to ensure proper recognition of asset quality and create adequate provisions for all restructured loans. The tighter scrutiny led to an increase in the stressed assets ratio to 12.3 per cent by September 2016 from 11.5 per cent in March 2016. At this point, risks to the banking sector remain elevated owing to the deterioration in asset quality- and significantly so with respect to large borrowers, low profitability and liquidity. Stress tests reveal that adverse macroeconomic shocks would lead to increase in GNPA ratios of the scheduled commercial banks with larger adverse impact on public sector banks. However, despite this, capital adequacy at the system level and bank group levels is above the regulatory minimum, and has improved since March 2015.
8. To enable smooth resolution of large stressed accounts, a coordinated policy for sustainable restructuring was put in place by means of Scheme for Sustainable Structuring of Stressed assets (S4A) in November 2016. This involved financial restructuring of such accounts by way of carving out sustainable and unsustainable parts of debt - with conversion of the latter into equity. Flexible restructuring of new project loans was also permitted in all sectors including for the existing long term project loans. These measures were aimed at cleaning-up problem loans in banks and revitalizing credit delivery. The enactment of the Bankruptcy Code 2016 will enable recovery through judicial process in reasonable time. To enhance the resilience of banks, regulatory and supervisory policy responses have been initiated. These include guidelines on large exposures to contain concentration risks, Net Stable Funding Ratios and rationalization of ownership limits in private sector banks.
9. Our authorities have also taken a series of macro-prudential and regulatory measures to enhance transparency and accountability in financial markets namely, tightening of insider trading
©International Monetary Fund. Not for Redistribution

3
norms and improving policies and procedures of credit rating agencies in respect of securities market and monitoring of foreign direct investment and transfer of shares in the insurance sector. Measures related to empower customers with wider product choices and mechanisms for grievance redressal have also been implemented.
10. A distinct issue, but one which is directly related to the asset quality problem is corporate indebtedness. High leverage and consequent interest burdens hamper the viability of companies and this factor could be playing a role in aggregate investment behavior. This issue is analyzed in a Selective Issues chapter and select results are presented in the Staff Report. Staff’s assessment is mixed; it acknowledges that the situation is improving, but at a relatively slow pace. Even with the improvement, debt indicators remain uncomfortably high. However, our authorities would like to point out that this conclusion is highly sensitive to sample selection. Analysis carried out by the Reserve Bank of India using a different sample of companies indicates significantly more improvement in the indicators. The problem may not be as acute as the Staff Report assesses it to be.
External Sector
11. India has been able to contain its CAD in past two years to 1.3 per cent and 1.1 per cent of GDP in 2014-15 and 2015-16 respectively. Importantly, although exports have returned to positive growth after a long decline, our authorities observe that India faces high non-tariff barriers for exports, even as the MFN applied tariff rates on non-agricultural exports are held at reasonably low level in relation to peer countries. Notwithstanding this, the CAD is expected to be contained around at one per cent for this year as a whole. As regards the capital account, FDI inflows have been robust. During April-November 2016 net FDI inflows were US $ 25.7 billion, higher than US $ 23.7 billion in the same period last year. Foreign exchange reserves stood at US $ 359 billion in January 2017, covering around eight months of imports.
Structural Reforms
12. The Staff Report provides a comprehensive listing of reforms either implemented or in the process of being so by the authorities. They represent a broad-based effort to accelerate growth, increase productivity, reduce inequality, improve welfare and enhance transparency and compliance. In the interests of brevity, we will focus on only two – the currency policy initiative, already mentioned earlier in a different context, and the gender initiative.
The Currency Policy Initiative
13. Much coverage has been provided and opinions expressed on the dramatic decision by the authorities to withdraw high-denomination currency notes from circulation on November 8, 2016. The authorities would like to place this decision in the larger context of a series of structural reforms aimed at enhancing transparency of activity and tax compliance. The GST implementation is one of the pillars of this, but several other measures have also been initiated – a voluntary disclosure of income scheme, tracking of high-value transactions through taxpayer ID numbers and so on. Others, such as reforming the real estate registration process to ensure transparency, are being discussed.
14. The currency policy initiative was motivated by three considerations. One, the prevalence of cash transactions was contributing to widespread tax evasion and the building up of cash hoards. Two, the continuing validity of old and less secure currency notes, even as newer and more secure ones were introduced, increased the threat from counterfeit notes. Three, over the
©International Monetary Fund. Not for Redistribution
4
past few years, there has been a significant increase in the capacity and efficiency of the payments infrastructure, contributing to the emergence of a range of cash-alternative modes of payment.
15. The initiative has unquestionably caused disruptions. However, even while there is some debate on how long these would persist, there is no doubt that they are transitory. A noteworthy outcome of the policy initiative is that the payments and settlement system has been able to accommodate massive increases in the use of cash-alternatives without any sign of fragility. The very large shift of even low-value transactions to these alternatives represents a significant success of the initiative.
16. A more general point needs to be made in the context of structural reform. The steadfast advice from the Fund to member countries is to carry out structural reforms when macroeconomic conditions are hospitable, which can help in minimizing the disruptions and speeding up the return to normal. The current macroeconomic situation in India – relatively rapid growth, relatively low inflation, fiscal consolidation on track and a relatively low CAD – provides the right environment in which to launch initiatives of this kind; the impact and persistence of any disruptions are likely to be minimized in these conditions.
The Gender Initiative
17. Our authorities welcome the Fund’s piloting of analysis of gender issues as part of the Article IV process in India. We expect this analysis to increasingly contribute to the policy debate and the identification of effective policy measures for gender equity. The Staff Report and the Selected Issues Paper have both described a number of initiatives in this regard. We would like to highlight the fact that the policy takes a life-cycle approach to the issue. It recognizes that the right interventions at every stage of life will determine the success of the policy.
18. The approach therefore complements interventions at the childhood stage (Celebrate Girl Child, Educate Girl Child) with initiatives relating to skilling, livelihood and financial access. In this regard, a new National Policy on Women is being formulated to promote gender equality and to support women’s aspirations. A national fund has been established to provide micro-credit at affordable cost to poor women to support income generation activities. An electronic platform has also been provided for self-employed women to enable them to get the right value for their products/services by linking them to the markets directly. Steps are also being taken to facilitate and expand employment opportunities for female workers.
©International Monetary Fund. Not for Redistribution