ANNUAL BUDGET - City of Rio Vista California
224
ANNUAL BUDGET CITY OF RIO VISTA, CALIFORNIA FISCAL YEAR 2021-2022
-
Upload
khangminh22 -
Category
Documents
-
view
4 -
download
0
Transcript of ANNUAL BUDGET - City of Rio Vista California

ANNUAL BUDGET CITY OF RIO VISTA, CALIFORNIA
FISCAL YEAR 2021-2022

Introduc on
Page 2

Introduction
TABLE OF CONTENTS
Introduction Table of Contents ................................................................................................................................................. 3 City Manager’s Message ...................................................................................................................................... 6 Elected Officials and Executive Team ................................................................................................................ 11 GFOA Distinguished Budget Presentation Award .............................................................................................. 13 CSMFO Operating Budget Excellence Award ..................................................................................................... 14 City Organization Chart ...................................................................................................................................... 15 Rio Vista at a Glance .......................................................................................................................................... 16 Executive Summary ............................................................................................................................................ 21 Fund Structure ................................................................................................................................................... 26
Citywide Summaries Fund Balances .................................................................................................................................................... 29 Governmental Funds .......................................................................................................................................... 32 Fund Balance Summary...................................................................................................................................... 33 Operating Budget Summary ............................................................................................................................... 34 Activities by Fund Type ...................................................................................................................................... 35 Activities by Fund ‐ General Fund ...................................................................................................................... 36 Activities by Fund – Special Revenue Funds ...................................................................................................... 38 Activities by Fund – Capital Outlay Funds .......................................................................................................... 39 Activities by Fund – Fiduciary Funds .................................................................................................................. 40 Activities by Fund – Enterprise Funds ................................................................................................................ 41 Enterprise Funds Operating Budgets ................................................................................................................. 42
Revenues Revenue Summary by Fund ............................................................................................................................... 47 General Fund Revenue by Category .................................................................................................................. 50 Major Recurring Revenue Sources ..................................................................................................................... 51
Expenditures Expenditure Summary by Fund .......................................................................................................................... 62 General Fund Expenditure by Category ............................................................................................................. 65 General Fund Expenditure by Function ............................................................................................................. 66
Performance Budget Legislative ........................................................................................................................................................... 68 City Manager ...................................................................................................................................................... 71 Assistant City Manager/City Clerk...................................................................................................................... 77 Finance ............................................................................................................................................................... 83 Fire ..................................................................................................................................................................... 88 Police .................................................................................................................................................................. 93 Public Works ...................................................................................................................................................... 99 Community Development ................................................................................................................................ 110
Page 3

Introduction
Five-Year Projection and Long-Term Concerns Long‐Range Planning ........................................................................................................................................ 115 Capital Improvement Project Plan ................................................................................................................... 116
Exhibit A – Map of Proposed Water Improvements ...................................................................................................................... 117 Exhibit B – Map of Proposed Sewer Improvements ...................................................................................................................... 118
General Fund ‐ Five‐Year Projections ............................................................................................................... 119 Water Enterprise Fund ‐ Five‐Year Projections ................................................................................................ 120 Wastewater (Beach & NW) Enterprise Fund ‐ Five‐Year Projections ............................................................... 121
Capital Improvement, Capital Outlay and Major Maintenance Overview .......................................................................................................................................................... 123 Projects by Cost ................................................................................................................................................ 125 Projects by Category ........................................................................................................................................ 127 Projects by Funding Source .............................................................................................................................. 129 Capital Improvement/Outlay and Major Maintenance Programs by Name (See Below)......................... 132‐166
CC004 – Accounting Software ....................................................................................................................................................... 132 PW013 – ADA Sidewalk Repair and Replacement. ........................................................................................................................ 133 PW018 – HSIP Pedestrian Crossing ............................................................................................................................................... 134 PW019 – PW Office & Corp Yard Improvement ............................................................................................................................ 135 PW020 – Airport – Replace PAPI & REIL........................................................................................................................................ 136 PW022 – LGI – 18 Acre Community Park ...................................................................................................................................... 137 PW024 – PG&E Underground Easement Study ............................................................................................................................. 138 SW001 – City Hall Lift Station ....................................................................................................................................................... 139 SW006 – 2020 Sewer CIP Project .................................................................................................................................................. 140 SW007 – River Road Lift Station ................................................................................................................................................... 141 SW008 – CCTV Trilogy Wastewater Lines ..................................................................................................................................... 142 SW009 – Lift Station Backup Generators ..................................................................................................................................... 143 SW010 – Wastewater Plant Audit & Assessment ......................................................................................................................... 144 WT007 – Well # 16 SCADA Integration & Upgrades ..................................................................................................................... 145 WT008 – 2020 Water CIP Project ................................................................................................................................................. 146 WT009 – Well Replacement Plan .................................................................................................................................................. 147 WT010 – Waterline Replacement ................................................................................................................................................ 148
Capital Outlay .................................................................................................................................................. 149 CO001 – Software – Building Permit Module ................................................................................................................................ 151 CO007 – Transit Bus Replacement Program ................................................................................................................................. 152 CO008 – Transit Bus Shelter Improvement ................................................................................................................................... 153 CO009 – Police Station Improvement ........................................................................................................................................... 154 CO010 – Citywide Camera System ................................................................................................................................................ 155 CO018 – AWOS Upgrade .............................................................................................................................................................. 156 CO025 – Police JPA Radio System ................................................................................................................................................. 157 CO026 – Police AXON Body Cameras Package .............................................................................................................................. 158 CO027 – Airport Spill Bucket Replacement ................................................................................................................................... 159 CO028 – Fire Command Vehicle .................................................................................................................................................... 160 CO029 – Public Works Pickup Vehicle ........................................................................................................................................... 161 CO030 – Public Works Portable Air Compressor ........................................................................................................................... 162 CO031 – Public Works ½ Maintenance Truck................................................................................................................................ 163
Major Maintenance by Cost ............................................................................................................................ 164 MM001 – Wastewater Operation/Maintenance & Management Service Contract ..................................................................... 165 MM002 – Wastewater Operation/Maintenance - Additional Work ............................................................................................. 166
Page 4

Introduction
Appendix Appendix 1, Authorized Positions Salary and Benefits Listing by Department ............................................... 168 Appendix 2, Full Time Equivalent (FTE) ............................................................................................................ 171 Appendix 3, Budget Summaries ....................................................................................................................... 173 Appendix 4, Basis of Accounting and Budgeting .............................................................................................. 175 Appendix 5, Proposition 4 (GANN Limit) Analysis ............................................................................................ 176 Appendix 6, Debt Limit/Obligation .................................................................................................................. 177 Appendix 7, Schedule of Interfund Transfers .................................................................................................. 181 Appendix 8, Revenue Details by Fund ............................................................................................................. 182 Appendix 9, Contracts and Services Expenditure Details by Department ....................................................... 189 Appendix 10, Fund Descriptions ...................................................................................................................... 209 Appendix 11, Budget and Financial Policies ..................................................................................................... 213 Appendix 12, Summary of Budget Process ...................................................................................................... 217 Appendix 13, Resolution Adopting the Budget for FY2021‐22 ........................................................................ 219 Appendix 14, Resolution Approving an Appropriations Limit ......................................................................... 220 Appendix 15, Glossary of Terms ...................................................................................................................... 221
Page 5

CITY OF RIO VISTA One Main Street, Rio Vista, California 94571 Phone: (707) 374-6451 Fax: (707) 374-5531
DATE: TO: FROM:
SUBJECT:
June 15, 2021 Mayor, Council, and Citizens of Rio Vista Rob Hickey, City Manager
City of Rio Vista Fiscal Year 2021-22 Adopted Budget
Introduction
On behalf Staff, I am privileged to present you the balanced budget for Fiscal Year 2021-22 and while the budget format is similar to last year’s we continue to make adjustments to improve the readability of the budget. It is staff’s hope that you find this format more informative, easier to read and easier to understand. The format provides a narrative discussion by department, includes information on proposed capital improvement projects, adds charts and graphs to help clarify and provide perspective to aspects of the budget.
This annual budget sets forth the city’s spending plan for the fiscal year starting July 1, 2021, and ending June 30, 2022, and represents the implementation plan for executing the Council’s goals, policies, and objectives for the upcoming year. It addresses most of the known budgetary issues the City will be faced with over the coming fiscal year.
This past year, our nation and the world continued to be engulfed by the COVID-19 Pandemic. While vaccination programs are having a positive impact and hopefully, by this fall we will get back to some sense of “normal.”
While our economy, both locally and nationally has suffered during this challenging time, we can see our economy ramping up quickly and hopefully by the end of this fiscal year, the economy will be back on track. This year’s budget still has the City moving forward while recognizing the financial challenges we are facing from the pandemic.
Page 6

Fiscal Stability
Financially, the City continues to focus on fiscal sustainability while working to balance the needs to support increased staffing, increased levels of activity associated with the growing population and businesses within the City. There will continue to be challenges with growing pension benefits, post- employment obligations, and the ever-increasing operating costs.
Our auditors have again conferred an “Unmodified Audit Opinion” on our financial statements—their highest rating and our 9th Unmodified Audit Opinion!
General Fund reserves are healthy. The General Fund balance is expected to be a healthy $5,884,410 as of June 30, 2021, and $6,086,666 as of June 30, 2022.
Knowing the key to future fiscal stability rests in our continuing efforts to focus on economic development, the City will continue to focus on:
Business development throughout the City Increasing our business license collection efforts Update our fee schedules Update our storm drain fees to support needed projects Identify operational/procedural efficiencies Increase Airport revenues while decreasing expenses to eliminate the General Fund subsidy
to this activity
The City will continue to face challenges regarding:
Escalating CalPERS pension costs that will continue to increase due to decreasing discount rates Increases in health care costs Increases in insurance costs Providing salaries that are competitive in the market. We need to continue to attract and
retain top talent in all positions throughout the City
Revenues ‐ General Fund Sales Tax
Sales tax revenues, excluding Measure O, are projected to increase by 4.31% above the previously adopted budget in FY 2020-21. These revenues are also expected to increase by 6.12% in the next fiscal year.
Introduction
Page 7

Introduction
Sales and Use Tax‐ Local Measure O
On June 21, 2016, the City passed the Ordinance No. 008-2016 to extend the existing Measure O local 0.75% sales and use tax until March 31, 2022. In November 2020, the new Measure O sales and Use tax was again approved by the voters, extending Measure O for another 5 years. The Measure O sales and use tax is projected at $1,233,000 in FY 2021-22, which represents approximately 15.19% of the General Fund revenue. These funds are used primarily for funding fire positions. Property Tax
The City receives approximately 17% of the 1% countywide property tax collected in the City in FY 2020-21. Property taxes are the largest source of revenue to the City's General Fund, representing approximately $2 million in FY 2020-21.
Development Fees
There have been 11 active adult single-family dwelling permits issued in FY 2020-21 to date. We are expecting another 21 permits to be pulled by the end of June 2021, making the total number of home permits issued to be 32 for FY 2020-21. The projected revenue for FY 2021-22 of $1.46 million ($1.27 million from General Fund) is based on the issuance of an estimated 50 new active adult single-family dwelling permits, 100 building modification permits, and 10 commercial alternations permits.
Motor Vehicle In‐Lieu Tax
The Vehicle License Fee (VLF) is a statewide tax on the ownership of a registered vehicle in place of taxing vehicles as personal property. In FY 2020-21, the City expects to receive $883,070 in VLF fees that will comprise 9.97% of the General Fund Revenue.
Other City Revenue Sources Utility Services Fees
The City of Rio Vista provides water and sewer services for both residential and commercial customers within the city’s limits. The projected utility services fees in FY 2021-22 are approximately $7.94 million, 34% of total citywide revenue less agency fund, transfer in, and other financing sources. $7.83 million of which is from enterprise fund revenue, which represents 53% of the enterprise fund revenue.
Business Park Land Sales
In November 2020, the City completed the infrastructure projects and continued to move forward with selling parcels in order to pay off the interfund loans used to construct the Business Park improvements. While many of the current projects are for Cannabis business, Council has indicated they would like to attract more conventional business within the park.
Page 8

Introduction
NewRevenueOpportunities
The first Cannabis business has opened in the Business Park in June 2017. This is a new source of revenues that the City is expecting to grow in the coming years as the other dispensaries open. Each developer is required to make an annual payment per square footage of the building area in addition to the quarterly payments calculated based on the reporting gross receipts from operations. The rate of fees is determined in the Development Agreement, and it varies among developers. The rate of the annual payment is ranging from one dollar to three dollars per square‐foot, and the quarterly payments is ranging from 1% to 4% of Developer’s gross receipts.
In the Fall 2020, 6 new Cannabis businesses opened and are in operation. There are several other businesses in the process of obtaining permits to build and operate at the Business Park; however, operational dates cannot be determined at this time.
Expenditures
Salaries
Salaries and benefits make up 43% of the General Fund operating expenditures in the projected FY 2020‐21 and will increase by 0.23% over last year’s budget in the adopted budget of FY 2021‐22. This minimal increase is due to several issues, including the increase in the costs of law enforcement contracts, decrease of salaries and benefit for the two unfunded positions, full‐time Mechanic and part‐time Administrative Assistant, in public works, and decrease in costs by unfunding some of the projects carried forward from prior year. Police Services being contracted to the Solano County Sheriff’s Office, and the costs of salaries and benefits have shifted to Contractual Services. The City is working to develop the right mix of full time and temporary staffing to meet the work needs associated with a City whose population is over 10,000. The current approved staffing will reduce from 47 to 45, not including the 12 contracted Police Officers.
Pensions
Pension costs continue to increase and are up based on CalPERS rate increases resulting from change to mortality assumptions and lowered expectations for future investments. The projected increases will be phased in over the next three years. The increase of unfunded liability in FY 2021‐22 is 19.41% or $86,066 from prior year.
Self‐Insurance Cost
These costs are increasing by 5% for Liability coverage and decreasing by 1.05% for Workers Compensation. This is based on historical claims experience.
Future Risks
The City’s outlook is promising and shows great growth potential. Rio Vista is poised for significant housing, business, job, and population growth. Even so, there are future risks that need to be acknowledged.
Page 9

Introduction
Volatile revenue streams: Sales tax is one of the largest sources of the City’s revenue source and for this City is also volatile. The top 25 sales tax-paying businesses produce over 50% of the City’s sales tax revenue. The City is anticipating an increase in sales and use tax revenues in FY 2021-22, based on the expected reopening of businesses gradually in June 2021. However, economic uncertainties continue to be a concern during the recovery of the COVID-19 pandemic.
Police and Fire facilities. As the population continues to grow both police and fire departments are seeing significant increases in call volumes. Eventually the City will need to construct a new joint facility to support the increased staff needed by both departments to service our growing city.
Infrastructure. The City has made significant progress in replacing aged, failing water and wastewater lines in the core area of town. Additional work is needed along with improving sidewalks and lobbying for improvements along Highway 12.
In Summary The City is cognizant of the challenges it faces as we move forward. We have challenges in improving infrastructure, enhancing code enforcement, and needing to expand and attract new businesses. Due to the dynamic nature of the budget environment and the cyclical nature of the economy, the City will need to carefully and continuously evaluate the projects, priorities, and costs to ensure the City continues to move forward in a positive and fiscally responsible manner.
This budget was the work of Council, department leaders, and staff at all levels who work to make Rio Vista a great place to work and live. The Finance Team deserves a special recognition for continuing to receive the Distinguished Budget Presentation Award presented by Government Finance Officers Association for the third consecutive year, and the Operating Budget Excellence Award by California Society of Municipal Finance Officers for the second consecutive year, for the budget format we have transition to. It is Staff’s hope that you find the information provided to be a much clearer narrative of the annual revenues and expenditures that comprise the City budget.
Respectfully submitted,
Rob Hickey City Manager
Page 10

Introduction
ELECTED OFFICIALS Ronald Kott ............................................................................................................................. Mayor David Hampton ............................................................................................................... Vice-Mayor Rick Dolk .................................................................................................................. Council Member Debra King ............................................................................................................... Council Member Walt Stanish ............................................................................................................ Council Member
EXECUTIVE TEAM Robert Hickey ............................................................................................................... City Manager Mona Ebrahimi ............................................................................................................. City Attorney Jose Jasso .................................................................................... Assistant City Manager/City Clerk Jon Mazer ........................................................................................................................ Police Chief Scott Goodwin .................................................................................................................... Fire Chief Robin Borre .................................................................................................... Public Works Director Jen Lee .................................................................................................................... Finance Director Vacant .................................................................................................................. Planning Manager
Page 11

Page 12

PRESENTED TO
City of Rio Vista California
For the Fiscal Year Beginning
July 01, 2020
Executive Director
GOVERNMENT FINANCE OFFICERS ASSOCIATION
Distinguished Budget Presentation
Award
Page 13

California Society of Municipal Finance Officers Certificate of Award
Operating Budget Excellence Award Fiscal Year 2020-2021
Presented to the
City of Rio Vista
For meeting the criteria established to achieve the CSMFO Excellence Award in Budgeting
January 31, 2021
Marcus Pimentel Michael Manno, Chair
CSMFO President Recognition Committee Dedicated Excellence in Municipal Financial Reporting
Page 14

FISCAL YEAR 2021-2022CITY OF RIO VISTA ORGANIZATIONAL CHART
Citizens
Mayor and City Council
City Manager (1)
Assistant City Manager/City Clerk
(1)
Finance Director (1)
Accounting
Supervisor (1)
Accountant I (1)
Senior Account Clerk (1)
Account Clerk II (1)
PT Account Clerk II (1)
Public Works Director (1)
Public Works Program Manager (1)
Administrative Assistant (ATOD) (1)
PT Public Works Assistant (0.5)*
Public Works Superintendent (1)
Public Works Supervisor (1)
Water Utility Technician (2)
Sr. Maintenance Worker (2)
Maintenance
Worker II (2)
Maintenance
Worker I (4)
Mechanic (1)*
Intern Part Time (1)
Planning Manager (1)
Building Inspector (1) Planning Consultant (Contract)
Administrative Assistant II (1)
PT Administrative Assistant (0.5)
Fire Chief (1)
Battalion Chief (1)
Fire Captain (3)
Firefighter/Paramedic (3)
Fire Engineer (6)
Fire Inspector (0.5)
Intern-Firefighter (3)
Fire Volunteers (4)
Police Chief (1) Contract
Police Sergeant (2) Contract
Police Officer (9) Contract
Public Safety Support Manager (1)
Community Services Officer (1)
PT Police Record Technician (0.5)
City Attorney (Contract)
PT City Clerk Assistant (1)
Human Resource Analyst/Deputy City
Clerk (1)
Transit Manager (Contract)
Information Technology (Contract)
Citywide Organizational Chart
*FY 21/22 Unfunded Position Page 15

Introduction 12
A BRIEF HISTORY OF RIO VISTA Written by: Phil Pezzaglia
Located at the tip of Solano County, the community of Rio Vista is one of the oldest in the county.
The original settlement was established in 1858, by Col. Nathan H. Davis, and was located at the mouth of Cache Slough where it meets the Sacramento River, approximately two miles from Rio Vista’s present location. Once established, the settlement grew rapidly, and fishing became the prime industry. Robert C. Carter and his son established a salmon cannery, which would ship salmon daily to San Francisco and from that point, internationally. During the first couple of years the settlement’s name changed several times, including Los Brazos del Rio, Vista del Rio, Winds End, and eventually the wife of Postmaster Charles Kirkpatrick, re‐named their settlement, Rio Vista. In December 1861, the mighty Sacramento River swelled from heavy rains, and on January 9, 1862, Rio Vista was destroyed when twelve feet of water covered the settlement. Fortunately, not one life was lost.
However, at this point half of the citizens decided to relocate in developed communities, while the other half liked the area and could see a future if relocated on higher ground. Thus, “New” Rio Vista was established at its present location in March 1862.
This “new” settlement, located approximately halfway between San Francisco and Sacramento, soon became a popular stopover for weary travelers who enjoyed the hospitality of Rio Vista’s hotels, saloons and general merchandise stores. As more individuals settled in Rio Vista, many of which were immigrants, farming became the way of life rather than fishing. Immigrants from: Germany, Portugal, England, Sweden, Scotland, and Canada, to name but a few. Residents had each been educated in their native lands, bringing new ideas and collaboration to create fertile crops. Thirty years after the devastating
flood of 1862, the community was once again stricken with disaster. On July 20, 1892, a fire broke out in the rear of the River View Hotel. Within minutes the flames spread, eventually destroying nearly every structure from Front Street up to Third Street, and from Montezuma Avenue to Sacramento Avenue. However, the
community was strong and quickly decided to rebuild. After two decades of local debate, the residents of Rio Vista decided that in the best interest of the community, it was time to incorporate. Thus, the town of Rio Vista held its first election on December 30, 1893 and voted to officially incorporate. The Secretary of the State of California signed the Rio Vista Town incorporation papers six days later.
Seventy‐five years later, on January 4, 1968, the town of Rio Vista officially became a “City”.
Page 16

Introduction 12
COMMUNITY PROFILE
The City of Rio Vista was incorporated on December 30, 1893. With a population of approximately 10,080 in a 7 ½ square mile area, of which, 6.7 square miles of it is land, and 0.4 square miles of it, approximately 5.68%, is water. It is currently a growing suburban community.
The City of Rio Vista is a special place with an inviting mix of rural and suburban lifestyles and easy access to all the urban amenities associated with two of the nation’s most dynamic metropolitan regions, San Francisco and Sacramento. Rio Vista lies on the banks of the Sacramento River and is within an easy drive to the Napa Wine country, Sierra ski resorts and Lake Tahoe.
Population and Employment
With approximately 10,080 residents, Rio Vista is poised on the brink of even more rapid residential and commercial growth. According to the U.S. Census Bureau, between 2015 to 2019, approximately 33% of the total population of age 16 years or older are in civilian labor force. The age and sex allocation of the population are approximately 1.2% under 5 years old, 6.9% under 18 years old, 48.9% 65 years and over, and 51.1% Female. Among the 51.1% of Female residents, 28.8% are in the labor force with the age of 16 years or older. Within thirty miles, there is a diverse labor force including occupations as sales, executive, and managerial services, technical support, medical, professional, and other services. (Based on information from U.S. Census Bureau QuickFacts: Rio Vista City, California website as of April 1, 2020)
Historical Population by Census
Census Year Population % Increase 1870 319 ‐ 1880 666 108.78% 1890 648 ‐2.70% 1900 682 5.25% 1910 884 29.62% 1920 1,104 24.89% 1930 1,309 18.57% 1940 1,666 27.27% 1950 1,831 9.90% 1960 2,616 42.87% 1970 3,135 19.84% 1980 3,142 0.22% 1990 3,316 5.54% 2000 4,571 37.85% 2010 7,360 61.02% 2016 8,641 17.40% 2017 9,009 4.26% 2018 9,188 1.99% 2019 9,594 4.42% 2020 10,063 4.89% 2021 10,080 0.17%
Est. 2022 10,742 6.56%
Page 17

Introduction 12
Proximity to Markets
Within thirty minutes in any direction, there are cities with populations over 60,000 people.
Fairfield / Suisun City – 21 miles Lodi – 24 miles Vacaville – 28 miles Walnut Creek – 37 miles Sacramento – 51 miles San Francisco – 59 miles Antioch – 16 miles
Income Distribution
Rio Vista is characterized as a middle‐income suburban community with a median household income of $70,000 and per capita income in the past 12 months of $42,055 in 2019 dollars. Computer and Internet Use Households with a computer 93.30% Households with a broadband Internet subscription 87.80%
Race/Hispanic Origin and Population Characteristics
White alone 80.70% Black or African American alone 7.60% American Indian and Alaska Native alone 0.20% Asian alone 6.90% Native Hawaiian and Other Pacific Islander alone 0.90% Two or More Races 2.10% Hispanic or Latino 8.10% Veterans, number of total population 1,610 Foreign born persons 12.20% (Based on information from U.S. Census Bureau QuickFacts: Rio Vista City, California website as of April 1, 2020)
Housing
Within the City, there are approximately 4,792 housing units, with 81.10% owner‐occupied housing unit rate with a median value of $343,800 and median gross rent of $1,368. The City’s housing units are primarily single‐family detached homes. Currently developers are working with the City to build approximately 800 new homes in the next five years. (Based on information from U.S. Census Bureau QuickFacts: Rio Vista City, California website as of April 1, 2020)
Transportation / Access
AIR: Sacramento International Airport, 50 miles Oakland International Airport, 60 miles San Francisco International Airport, 75 miles
Page 18

Introduction
GENERAL AVIATION: Rio Vista Municipal Airport offers a 4,200 ft. Runway, all weather capability
TRUCK: Numerous major carriers offering overnight service to California, Nevada and Oregon.
WATER: Barge service available on deep‐water channel of Sacramento River to Sacramento/Yolo deep
water port facilities, 25 miles. Barge service is to all Bay Area ports.
RAIL: Southern Pacific Mainline – Northeast & west in Fairfield & Suisun City, 22 miles Amtrak in Suisun City, 22 miles
HIGHWAYS: Junction I‐80/SR‐12, 25 miles Junction I‐5/SR‐12, 17 miles Junction I‐80/I‐680, 28 miles Junction Hwy 99/SR‐12, 30 miles
BUS: Delta Breeze ‐ The City operates a fixed rate bus providing bus services within the city and to
surrounding cities Greyhound (Intra & Inter State) in Fairfield and Suisun, 22 miles
SPECIAL SERVICES: UPS, Federal Express, Express Mail, Taxicab, Senior van services
Education The City is served by the River Delta Unified School District. There are three schools in Rio Vista: D.H. White Elementary School (K‐5) Riverview Middle School (6‐8) Rio Vista High School (9‐12)
Higher education facilities serving the area are: Los Medanos Community College (Pittsburg) Solano College (Fairfield) San Joaquin Delta College (Stockton) University of California, Davis (Davis) California State University, Sacramento (Sacramento) University of the Pacific (Stockton)
Local Attractions Dutra Museum of Dredging Locke, California – the oldest surviving California town founded by Chinese immigrants Rio Vista Golf Club Rio Vista Museum Western Railway Museum – West of Rio Vista on CA‐12 in Suisun City Rio Vista Annual Bass Derby Festival in October
Page 19

Introduction 12
Climate
Average Temperature
Period Average High Average Low Rain Average Precipitation
(inches) January 55 38 2.70
February 61 42 2.40 March 66 45 2.10 April 72 48 0.70 May 79 53 0.30 June 86 57 0.10 July 91 59 ‐
August 90 58 ‐ September 86 57 0.20
October 77 52 0.60 November 64 44 1.60 December 55 38 2.40
Yearly Average 74 49 13.10
Source: U.S Weather Bureau and The Weather Channel
Local Business
Top 25 Sales Tax Generators (Alphabetical Order)
ABEL CHEVROLET BUICK MCDONALD'S RESTAURANTS ASTA CONSTRUCTION COMPANY, INC. NAPA AUTO PARTS BURGERLICIOUS PIZZA FACTORY CHEVRON SERVICE STATIONS RESOURCE CEMENTING LLC COUGHRAN MECHANICAL SERVICES RIO VISTA ACE DELTA PHARMACY RIO VISTA BAIT & TACKLE DISCOUNT LIQUOR & CIGARETTE RIO VISTA DODGE CHRYSLER JEEP DOLK TRACTOR COMPANY RIO VISTA FARMS LLC FAMILY DOLLAR STORES SHELL SERVICE STATIONS KENTUCKY FRIED CHICKEN/TACO BELL THE POINT RESTAURANT KWIK SERVE STATION TORTILLA FLATS LIRA'S SUPERMARKET ZENON ENVIRONMENTAL LUCY’S CAFE
Source: Avenue Insights & Analytics Rio Vista Economic Review of 2020 Q4
Page 20

Introduction 12
EXECUTIVE SUMMARY
The Operating Budget is a flexible spending plan, which serves as the legal authority granted by the City Council to commit financial resources. The total expenditure budgeted for Fiscal Year (FY) 2021‐22 is $33.84 million. This budget will decrease the City’s fund balance by $2.85 million mainly due to the infrastructure projects. The City of Rio Vista provides a full range of services, including police; fire; parks and recreation; public works; economic development; planning; building inspection; and general administrative services. The City of Rio Vista operates public water and wastewater utilities and provides refuse collection and disposal.
The General Fund is the primary operating fund for the City. The General Fund pays for most of the critical services offered to the City’s residents including police, fire, streets and transportation, and parks and recreation. Planning and Development services are funded through permit fees, while Water and Sewer utility service fees help offset the operational costs of the Public Works and Finance Department. The majority of the services included in the General Fund are funded through tax revenues. General Fund revenues are generally considered unrestricted and are allocated by the City Council through this budget. Overview of the General Fund Expenditure and Revenue:
Revenues The overall revenues in the General Fund are projected to decrease by 8.36% in comparison to the projected revenues in FY 2020‐21. This is mainly due to the decrease in transfers from the Business Park Fund for a total of $378,346, a one‐time repayment contract obligation from Delta Fire District for $298,453, and the decrease in new home building permit fees projected in FY 2021‐22.
Property Taxes Property taxes are still increasing. By comparing the FY2019‐20 audited financial statements, the City is
Community Development
8% City Administration
6%
City Clerk3%City
Manager2%
Finance2%
Fire18%
Information Technology
2%
Measure O Funded Employees
16%
Others0%
Parks & Recreation
5%
Police36%
Street2%
Expenditure$7,912,723
Taxes56%
Measure O 15%
Franchises, Licenses
and Permits
18%
Use of Money and
Property1%
Charges for Services
4%
Other Revenue1% Transfers In
5%
Revenue$ 8,114,979
Page 21

Introduction
expecting a 7.65% increase with projected secured property tax in FY2020‐21. Due to the COVID‐19 pandemic, which stalled the construction of new dwelling units and home sales during 2020, the City is proposing a 5% increase in secured property taxes in the budget of FY2021‐22.
In‐Lieu Vehicle License Fee Vehicle In‐Lieu taxes are still increasing in the projected FY 2020‐21, with an expected 7.34% increase in New Assessed Value per VLF Growth Calculation provided by the County of Solano dated October 2020. This is consistent with the trend seen in prior years (a 10.28% increase in FY 2019‐20; 8.86% increase in FY 2018‐19; 9.74% increase in FY 2017‐18; 8.67% increase in FY 2016‐17). However, due to the impact on recent pandemic, to be conservative, the City adopted the budget for FY 2021‐22 to remain the same as the anticipated receipts in FY 2020‐22.
Sales and Use Tax Sales Tax revenues – including Measure O transactions and use tax – are projected to increase by 8.14% above the projected FY 2020‐21 budget. Based on the information provided by Muni Services Economic Review Report in the 4th Quarter of 2020, the projected impacts on sales tax revenues due to the shelter‐in‐place and lockdown order, which caused the retail businesses to close during this period, are 3% decrease for Measure O and 9% decrease for local retail sales taxes from the actual receipts in FY 2018‐19. The City notices, from the percentage of decreases, local residents are shifting their buying habits from local or out‐of‐town purchases to online platform. Besides, per inquiry and review of revenues provided by the cannabis business at the Business Park, there are no impact on their sales. With the 6 new dispensaries opened and in operation in FY 2020‐21, the City is anticipating the performance of these sales tax generators can provide a new source of revenue.
Franchise Fees Franchise fees are revenues generated on cable television, natural gas, and solid waste services paid to the City by franchise holders. Franchise fee revenue is projected to remain stable compared to the prior year.
Business License Tax Due to the uncertainty of economic activities, this revenue source is expected to remain the same as the budget in FY 2020‐21, which is adjusted based on the impact of COVID‐19. The record shows an increase of 5.4% in FY 2017‐18, an increase of 14.44% in FY 2018‐19, a decrease of 3.86% in FY 2019‐20, and a decrease of 0.7% in FY 2020‐21.
Development Fee Development fees cover the cost of inspection; plan retention and review; record keeping; materials investigation; special inspection management; and overhead of the Building and Planning Divisions. The largest sources of development revenues are building permits, building plan checking fees, planning application fees, and cannabis fees. There were 55 single‐family dwelling permits issued in FY 2019‐20. The current projection for FY 2020‐21 is 32 permits due to the impact of pandemic on housing market in 2020. Staff projects approximately 50 new single‐family homes will be built in FY 2021‐22.
Expenditures
Salaries Salaries and benefits make up nearly 42% in FY 2021‐22 of the City’s General Fund operating expenditures and are expected to decrease by 4% when compared to the FY 2020‐21 adopted Mid‐Year Budget. With the Police Services being contracted to the Solano County Sheriff’s Office, the costs of salaries and benefits have shifted to Contractual Services.
Page 22

Introduction 12
Pensions Overall pension costs are expected to increase in FY 2021‐22 by 6.22% or $54,877 from FY 2020‐21. CalPERS rate continues to increase resulting from recent changes in mortality assumptions and lowered expectations for future investment returns. The normal costs of pension decrease by roughly $20,360 or 4.76%, under prior year adopted budget figures mainly due to the unfunded position in Public Works Department. There is an increase in the required contribution of unfunded liability by 19.41% or $86,066 per the Annual Valuation Report provided by CalPERS in August 2020 due to the increase in employer payment for the Classic Plan. The City expects to notice a reduction in unfunded liability in 2023 or 2024 due to the contract of Police Services as the measurement date of CalPERS valuations are two‐year behind the reporting year. Self‐Insurance Costs Self‐Insurance costs are increasing approximately 5% for Liability coverage and decreasing by 1.05% for Workers Compensation over prior year budgeted values based on the actual claims experience.
Long Term Debt Obligations As of June 30, 2020, the City had a total assessed property value of $1,618,012,492, which gives the City’s debt limit capacity of $41 million. There is no outstanding debt subject to this limit. In FY 2020‐21, September 2020, the City refinanced the energy savings equipment lease entered in March 2018, successfully reduced the effective annual rate from 3.58% to 2.07%. No new financing is expected in FY 2021‐22. The total Debt Obligations by fund are listed in the table below. The detailed debt obligation is listed in the Appendix.
Outstanding Balance
as of 6-30-2021
FY 2021-22 Budget
Principal Interest Total
General Fund 1,639,713 90,464 30,086 120,549
Capital Outlay Funds 771,824 98,077 29,947 128,024
Special Revenue Funds 68,071 23,028 2,449 25,477
Enterprise Funds 5,583,933 469,808 132,064 601,873 Total, Debt Service $ 8,063,542 $ 681,377 $ 194,546 $ 875,923
*Amount does not include interfund loan balance and debt payments
Assessment Districts (No City Liability) There are various assessment districts in the City that have Special Assessment District Bonds, pursuant to the Municipal Improvement Act of 1915, and are not reported in the City’s long‐term debt. These are special obligations payable from, and secured by, specific revenue sources described in the bond resolutions and official statements of the respective issues. The City acts merely as the collecting and paying agent for the debt issued by these districts and, as such, these bonds are not considered obligations of the City and are not reflected in the schedules above.
Capital Improvement, Capital Outlay and Major Maintenance Program Overview The City of Rio Vista prepares the Capital Budget as part of the Operating Budget, which appropriates funds for specific programs and projects. The Five‐ Year Capital Improvement Program budget is reviewed annually to enable the City Council to reassess projects in the program.
Page 23

Introduction 12
A capital project typically involves the purchase or construction of major fixed assets such as land, buildings and any permanent improvement including additions, replacements and major alterations having a long‐life expectancy. Additionally, capital projects may apply to 1) expenditures which take place over two or more years and require continuing appropriations beyond a single fiscal year; 2) systematic acquisitions over an extended period of time or 3) scheduled replacement of specific elements of physical assets. Generally, only those items costing $10,000 or more are considered as capital projects. The City also identifies projects in the Major Maintenance Program each year. Those projects mainly apply to 1) up‐grade and maintain all buildings at current, competitive standards; 2) address code and safety issues, mechanical, electrical and plumbing systems, exterior and structural shortcomings, cosmetics, and immediate landscape issues; 3) the dollars are not to be spent to alter buildings or to renovate; 4) dollars should extend the life of whatever is being corrected for cycle of life designated for the building (typically ten years).
In FY 2021‐22, the City is appropriating $9,292,896, for 17 projects in Capital Improvement, 13 projects in Capital Outlay, and 2 Major Maintenance Programs, of which, $6,543,962 in Capital Improvement, $435,612 in Capital Outlay, and $2,313,322 in Major Maintenance. In the Capital Improvement, Capital Outlay and Major Maintenance Program, the City identified three significant, nonrecurring capital expenditures: 1) Beach Wastewater River Road Lift Station Reconstruction ‐ $1,200,000, 2) Citywide Waterline Replacement ‐ $1,390,000, and 3) 2020 Water & Sewer CIP ‐ $1,830,000.
The beach wastewater river road lift station reconstruction project will be funded by the Beach Facility Fund. The project scope includes relocating and reconstructing the river road lift station currently located outside of the State Highway. The citywide waterline replacement project is to replace waterline in the following locations: Tahoe Drive, Trinity Court, Highland Drive, Bruning Avenue, St. Gertrudes, Riverview Street, and Hamilton Avenue, for $600,000 in FY 2021‐22 and $790,000 in FY 2022‐23. The 2020 Water and Sewer CIP Project involves design, construction, and management of the Highway 12 and City Hall Parking Lot waterlines and repair and rehabilitate various size of sewer lines by the City Engineer. The project is funded by the Water Fund ($1,200,000) and Beach Sewer Fund ($630,000).
The chart below indicates the projects appropriations by categories. For the detailed information, refer to the Capital Improvement, Capital Outlay, and Major Maintenance Program section on pages 132‐166.
Airport13%
Water34%
Beach Sewer34%
Northwest Sewer
5%
Public Works
1%
Park & Recreation
2%
Street6%
Other5%
Capital Improvement$6,543,962 Software
2%
Vehicle53%
Bldg Improvement
13%
Equipment32%
Capital Outlay$435,612
Page 24

Introduction
Budgeting in the Time of Recovery COVID‐19 is the most expensive pandemic and one of the costliest crises in modern world history. Even without assessing economic and health‐related impacts, the pandemic has cost governments around the world trillions of dollars with the U.S. alone providing more than $5 trillion in direct fiscal response.
American Rescue Plan Act of 2021 In March 2021, the Senate passed the American Rescue Plan Act of 2021, which provides $65 billion funding to Cities governments. The estimated allocation to the City of Rio Vista, released by the House Oversight and Reform Committee, is $1,829,201. This tentative allocation amount is included in the adopted budget revenue under Capital Projects Fund 051. Appropriations for the use of this grant have not yet been added in the budget. Distribution of the funds will be divided into two allotments, and it can be expanded by December 31st, 2026. There are six major categories of eligible use of funds, including investment in water, sewer, and broadband infrastructure.
Rio Vista Citizens are concerned about the use of this funds. It is important for the city to communicate their priorities and values to improve budget transparency, demonstrate fairness, and help justify difficult decisions. City Council should consider holding a study session to review the list of projects presented in priorities and invite all community members to engage, ensuring the City’s priorities reflected the priorities of the entire city and not just certain groups.
Budget Items Postpone or Unfunded Due to the uncertainty during the recovery from the pandemic, three items that are planned to be funded by the General Fund will be unfunded in this budget year, including (1) City Clerk database Laserfiche for $25,000, (2) Master Fees Schedule update for $35,000, and (3) Army Base Environmental Impact Report for $25,000. Other items that are postponed or unfunded until next year are replacement of two police vehicles for $120,000, Public Works Mechanic and Part‐Time Public Works Assistant Positions, Alley Naming for $120,000, Water Booster Pump Station for $1.2 million, and New Water Well for $2.5 million. These unfunded expenditures can prepare the City for any unanticipated changes in the economic condition.
Other Update
Measure O Expenditure Plan & Extension On July 7th, 2020, the City Council adopted Resolution 2020‐063, which approved the change in salaries and benefits allocation for the use of Measure O sales tax from the adopted policy in September 2016 of 42% Fire, 51% Police, and 7% Public Works, to 99% Public Safety and 1% Public Works. This update is mainly focus on the funding for the three fire engineers added in the FY 2020‐21. Besides, Public Works employees are mainly providing services on Water and Sewer maintenance and operation. To better account for their services, the costs should be charged to the utilities service fees.
On April 19, 2017, the Board of Equalization accepted Ordinance No. 008‐2016 for the extension of Measure O Sales Tax, which continues until March 31, 2022. The City Council further declared and determined on December 8th, 2020, as a result of the election in November 2020, the majority voted in favor of the measure to continue for an additional five years until March 31, 2027. Since Measure O is a voter‐approved revenue source, it is not guaranteed to continue beyond its 5‐year extension in 2027. The City is therefore tracking all Measure O funded positions separately as it may be required to absorb or eliminate these positions in future budgets.
Page 25

Introduction
FUND STRUCTURE
City of Rio Vista Budgeting Funds
Governmental Fund Type
General Fund (Major Fund)
Special Revenue Fund
Law Enforcement
Grant
Asset Forfeiture
ATOD Grant
Gas Tax
Developers Revolving
Commercial Rehabilitation
Loan
CDBG Housing Rehabilitation
Public Safety Service District
Liberty Main & Operation
Service District
Street Projects
Debt Service Fund
Capital Outlay Fund
Vehicle Replacement
Storm Drain
Capital Projects (Major Fund)
Roadway Impact
Parks & Recreation
Municipal Improvement (Major Fund)
Hazardous Waste
Landfill Closure
Army Base
Proprietary Fund Type
Enterprise Fund
Transit
Business Park (Major Fund)
Water (Major Fund)
Airport (Major Fund)
Beach Sewer (Major Fund)
NW Sewer (Major Fund)
Fiduciary FundType
Agnecy Fund
CFD 2006-1
Riverview Point Assessment
District
Riverwalk CFD
Summerset Assessment
District
CFD 2004-1
Liberty CFD
Page 26

Introduction
FUND ACCOUNTING The City uses funds to report on its financial position and the results of its operations. Fund accounting is designed to demonstrate legal compliance and to aid financial management by segregating transactions related to certain functions or activities of the City. A fund is an accounting entity with a self-balancing set of accounts established to record the financial position and results of operations of a specific activity. The City maintains the following fund types which are all subject to appropriation.
GOVERNMENTAL FUND TYPE GENERAL FUND – The general fund is the general operating fund of the City and is always classified as a major fund. It is used to account for all activities except those legally or administratively required to be accounted for in other funds. SPECIAL REVENUE FUNDS – Special revenue funds are used to account for the proceeds of specific revenue sources that are restricted or committed to expenditure for specified purposes other than debt service or capital projects. DEBT SERVICE FUND – Debt service funds are used to account for financial resources that are restricted, committed, or assigned to expenditure for principal and interest. CAPITAL PROJECT FUNDS – Capital project funds are used to account for financial resources that are restricted, committed, or assigned to expenditure for capital outlays, including the acquisition or construction of capital facilities and other capital assets.
PROPRIETARY FUND TYPE ENTERPRISE FUNDS – Enterprise funds are used to account for business-like activities provided to the general public. These activities are financed primarily by user charges and the measurement of financial activity focuses on net income measurement similar to the private sector.
FIDUCIARY FUND TYPE AGENCY FUNDS – Agency funds are clearing type funds for the collection of taxes or deposits held in trust, on behalf of individuals, private organizations, and other governments. The funds are custodial in nature (assets equal liabilities) and do not involve measurement of results of operations.
MAJOR FUNDS The City reports the following major governmental funds in the financial statements:
General Fund, Capital Project, and Municipal Improvements The City reports the following major proprietary funds in the financial statements:
Water, Beach Sewer, Northwest (NW) Sewer, Business Park, and Airport
Page 27

Citywide Summaries
Page 28

Citywide Summaries
FUND BALANCES
The City’s Fund Balances represent accumulated funds available to be spent in the future. Most of the City’s fund balances are restricted for specific purposes and are not available for general purposes. The City has established the following fund balance polices:
• Committed Fund Balance ‐ Only the City Council may have the authority to create or change afund balance commitment. Commitments may be changed or lifted only by the City Council takingthe same formal action that imposed the constraint originally.
• Assigned Fund Balance ‐ Intent is expressed by the City Council or the City Manager to which theCity Council has delegated authority to assign amounts to be used for specific purposes.
• Restricted Fund Balance ‐ City considers restricted fund balance to have been spent first when anexpenditure is incurred for purposes for which both restricted and unrestricted fund balance isavailable.
• Unassigned Fund Balance – It is the residual classification for the government's general fund andincludes all spendable amounts not contained in the other classifications.
When an expenditure is incurred for purposes for which amounts in any of the unrestricted classifications of fund balance could be used, the City considers committed amounts to be reduced first, followed by assigned amounts, and unassigned amounts.
Accounting and Budgetary Controls
Governmental Funds – The General Fund, Capital Outlay Funds, Debt Service Fund, and Special Revenue Funds are structured in this category. The City accounts for these funds on the modified accrual basis of accounting for the budgetary process and in the annual audited financial statements. Revenues are recognized in the period in which they become available and measurable, and expenditures are recognized at the time a liability is incurred pursuant to appropriation authority.
Enterprise Funds – Unlike governmental funds, Enterprise Funds are accounted for using the accrual basis of accounting in the annual audited financial statements and modified accrual basis for the budgetary process. Principal payments on long‐term debts are applied to the outstanding liability in the financial statements, while they are expensed in the budget. Depreciation expenses are recorded in the financial statements, but not in the budget schedules. Capital Assets or Improvement Projects are recorded as assets or construction in progress in the financial statements; though, they are expended on the Budget basis.
Agency Funds – Agency Funds are accounted for using the accrual basis of accounting for both the financial statements and budgetary accounting.
Fund Balances Overview
The unassigned fund balance of the General Fund continues to maintain at an average of 85% of annual General Fund 010 appropriations in both the projected FY 2020‐21 and adopted budget FY 2021‐22. The fund balance chart on the following pages summarize the total amount of fund balance – including both restricted and unassigned funds.
Page 29

Citywide Summaries
FY 19/20 Audited
FY 20/21 Projected
FY21/22 Adopted
General Fund $ 5,105,060 $ 5,884,410 $ 6,086,666
Capital Outlay Funds 8,227,629 9,470,239 11,302,013
Debt Service Fund 2,016 2,032 2,032
Special Revenue Funds 2,280,943 2,415,576 1,940,451
Enterprise Funds 10,249,713 9,221,989 4,856,649
Agency Funds 2,545,417 2,521,762 2,474,379
Total Fund Balance $ 28,410,777 $ 29,516,008 $ 26,662,190
Major Fund Balances
A Fund is classified as major if it is significantly large with respect to the whole government. A fund is “major” if:
(a) total assets, liabilities, revenues, or expenditures/expenses of the individual governmental orenterprise fund are at least 10 percent of the corresponding total of assets, liabilities, revenues,or expenditures/expenses for all funds of that category or type (total governmental or totalenterprise funds).
(b) Total assets, liabilities, revenues, or expenditures/expenses of the individual governmental fundor enterprise fund are at least 5% of the corresponding total for all governmental and enterprisefunds combined.
The following table illustrates the percentage changes in the fund balances for 8 funds, 3 governmental and 5 enterprise funds, that were classified as major in the FY19‐20 audited financial statements.
FY 19/20 Audited
% Change
FY 20/21 Projected
% Change
FY21/22 Adopted
% Change
Governmental Funds: General Fund $ 5,105,060 3% $ 5,884,410 15% $ 6,086,666 3% Capital Projects Fund 102,178 ‐74% 102,177 0% 1,891,378 1751% Municipal Improvements Fund 4,445,562 ‐20% 6,189,284 39% 6,365,828 3%
Enterprise Fund: Water System & Capital Outlay $ 4,077,406 ‐11% $ 3,290,999 ‐19% $ 1,344,672 ‐59%Airport (765,295) 4% (781,978) ‐2% (899,562) ‐15%Business Park 161,706 ‐86% 1,316,825 714% 1,560,357 18%Beach Facility & Capital Outlay 3,091,717 21% 2,927,283 ‐5% 989,391 ‐66%NW Facility & Capital Outlay 3,196,683 9% 1,981,363 ‐38% 1,514,294 ‐24%
Discussion of Major Changes in Fund Balances
General Fund – The General Fund balance continues to grow through preserving a balanced budget. The fund balance increases by 3% in FY 2019‐20, increases by 15% projected in FY 2020‐21, and increases by 3% adopted in FY 2021‐22 budget. The significant reduction in the percentage increase adopted in FY 21‐22 is due to a one‐time repayment from Delta Fire District in FY 20‐21 and the decrease in receipts from permit and license fees of new house construction. Total number of permits issued in FY 20‐21 and adopted issuance in the budget of FY 21‐22 reduce by an estimate of 29% from 70 to 50.
Page 30

Citywide Summaries
The City Council has a policy that requires 15% of the annual General Fund operating expenditures to be kept on hand as target reserve to protect the City in times of economic uncertainty or unforeseen circumstances. The current reserve is set at a very healthy 77%. City continues to maintain a separate line item in the General Fund Balance for Contingency Reserves.
Capital Projects Fund – The fund balance of capital projects decreases by 74% in FY 2019‐20, no changes projected in FY 2020‐21, and increases by 1751% adopted in FY 2021‐22 budget. The Senate passed the American Rescue Plan Act of 2021 in March. The estimated allocation of the City of Rio Vista, provided by the House Oversight and Reform Committee, is $1,829,201. This amount of federal grant is included in the budget revenue of Capital Projects Fund, which significantly increases the adopted budget fund balance in FY 2021‐22. No appropriations have been added in the adopted budget. Use of funds will be determined by the list of projects presented in priorities by the Public Works and discussed with the general public.
Water System and Capital Outlay – The fund balance of Water System and Capital Outlay decreases by 11% in FY 2019‐20, decreases by 19% projected in FY 2020‐21, and decreases by 59% adopted in FY 2021‐22 budget. The significant deficit in FY 2021‐22 is due to the one‐time Capital Improvement Projects of $2,200,000 and Capital Assets purchase of $35,500. The Capital expenditures include purchase of vehicle and equipment, improvement in public works office, funding for utility billing software, and waterline improvement. These projects are non‐recurring and the current fund balances are sufficient to cover these costs.
Business Park – The fund balance of Business Park decreases by 86% in FY 2019‐20, increases by 714% projected in FY 2020‐21, and increases by 18% adopted in FY 2021‐22 budget. The construction project at Business Park has been completed in November 2020. The significant increase of fund balance in FY 2020‐21 includes the $3 million receipts from land sales and the repayment of $1,474,719 interfund advances from Municipal Improvement. With the projection of land sales in the amount of $325,000 in the adopted budget revenue, the City continues to maintain an increase in fund balance.
Beach Facility and Capital Outlay – The fund balance of Beach Facility and Capital Outlay increases by 21% in FY 2019‐20, decreases by 5% projected in FY 2020‐21, and decreases by 66% adopted in FY 2021‐22 budget. The significant deficit is due to the one‐time Capital Improvement Projects of $2,250,000 and Capital Assets purchase of $21,750. The Capital expenditures include purchase of vehicles and equipment, improvement in public works office, expansion of existing lift station, and sewer rehabilitation. These projects are non‐recurring and the current fund balances are sufficient to cover these costs.
NW Facility and Capital Outlay ‐ The fund balance of NW Facility and Capital Outlay increases by 9% in FY 2019‐20, decreases by 38% projected in FY 2020‐21, and decreases by 24% adopted in FY 2021‐22 budget. The significant deficit is due to the one‐time Capital Improvement Projects of $330,000 and Capital Assets purchase of $21,750. The Capital expenditures include purchase of vehicle and equipment, improvement in public works office, and CCTV wastewater lines improvement. These projects are non‐recurring and the current fund balances are sufficient to cover these costs.
Airport – The fund balance deficit of Airport is caused by a $1.03 million interfund advances in prior years. The increase of deficit by 15% in adopted FY 2021‐22 budget is due to the one‐time Capital Assets purchase of $40,000 and interfund advances accrued interest payment of $19,079. The City Manager will work with the City Council in resolving this deficit in the near future.
Page 31

FY 19/20
Audited
FY 20/21
Projected
FY21/22
Adopted
Restricted
017 Law Enforcement Grant 115,936$ 77,537$ 18,237$ 018 Asset Forfeiture 1,274 1,285 1,300 019 ATOD Grant (10,180) 0 18 025 Gas Tax 446,691 433,412 7,322 031 Developers Revolving 59,689 38,814 7,864 033 Commercial Rehabilitation Loan 62,446 62,696 62,796 034 CDBG Housing Rehabilitation 127,560 128,080 128,380 038 Personnel Services District ‐ Fire 222,746 278,589 262,607 039 Personnel Services District ‐ Police 151,394 150,849 72,476 040 Firehouse Bonds 2,016 2,032 2,032 051 Capital Projects 102,178 102,177 1,891,378
076 Army Base (71,142) (69,505) (71,780) 091 Street Projects ‐ 0 0
Total Restricted 1,210,608 1,205,966 2,382,630
Committed
012 Vehicle Replacement 174,896 232,723 160,499 Total Committed 174,896 232,723 160,499
Assigned
002 Measure O ‐ (0) (1) 022 General Plan 150,943 157,685 157,685 050 Storm Drain (8,408) 89,157 81,460 052 Transient Occupancy Tax 40,342 19,115 19,115 053 Roadway Impact 361,950 280,542 374,042 054 Parks and Recreation 850,253 266,567 159,088 055 Liberty Main & Operation Svc District 1,103,386 1,244,314 1,379,451
056 Municipal Improvements 4,445,562 6,189,284 6,365,828
060 Hazardous Waste 478,022 484,087 442,939 065 Landfill Closure 1,894,319 1,895,208 1,898,559
Total Assigned 9,316,368 10,625,959 10,878,166
Unassigned
010 General Fund 4,913,775 5,707,610 5,909,866
Total Unassigned 4,913,775 5,707,610 5,909,866
Percent of Appropriations 84.36% 82.43% 88.81%
Total Governmental Fund Balance, End of Year 15,615,647$ 17,772,257$ 19,331,162$
GOVERNMENTAL FUNDS
Citywide Summaries
Page 32

Revenues Expenditures Revenues Expenditures
GENERAL FUND
002 Measure O ‐$ 1,117,000$ (1,117,000)$ (0)$ 1,233,000$ (1,233,000)$ (1)$
010 General Fund 4,913,775 7,717,732 (6,923,896) 5,707,610 6,856,645 (6,654,389) 5,909,866
Subtotal General Fund 4,913,775 8,834,732 (8,040,897) 5,707,610 8,089,645 (7,887,389) 5,909,866
022 General Plan 150,943 6,742 ‐ 157,685 5,264 (5,264) 157,685
052 Transient Occupancy Tax 40,342 13,773 (35,000) 19,115 20,070 (20,070) 19,115
Total General Fund per Audit Report 5,105,060 8,855,247 (8,075,897) 5,884,410 8,114,979 (7,912,723) 6,086,666
CAPITAL OUTLAY FUNDS
012 Vehicle Replacement 174,896 185,850 (128,024) 232,723 135,800 (208,024) 160,499
050 Storm Drain (8,408) 123,183 (25,618) 89,157 29,025 (36,722) 81,460
051 Capital Projects 102,178 3,257,701 (3,257,701) 102,177 2,703,200 (913,999) 1,891,378
053 Roadway Impact 361,950 (80,286) (1,122) 280,542 493,500 (400,000) 374,042
054 Parks and Recreation 850,253 128,545 (712,232) 266,567 53,820 (161,299) 159,088
056 Municipal Improvements 4,445,562 1,917,789 (174,067) 6,189,284 297,094 (120,550) 6,365,828
060 Hazardous Waste 478,022 144,859 (138,795) 484,087 102,400 (143,548) 442,939
065 Landfill Closure 1,894,319 375,812 (374,922) 1,895,208 379,000 (375,649) 1,898,559
076 Army Base (71,142) 15,246 (13,609) (69,505) 18,449 (20,724) (71,780)
Total Capital Outlay Funds 8,227,629 6,068,699 (4,826,089) 9,470,239 4,212,287 (2,380,513) 11,302,013
DEBT SERVICE FUND
040 Firehouse Bonds 2,016 16 ‐ 2,032 ‐ ‐ 2,032
Total Debt Service Fund 2,016 16 ‐ 2,032 ‐ ‐ 2,032
SPECIAL REVENUE FUNDS
017 Law Enforcement Grant 115,936 141,601 (180,000) 77,537 120,700 (180,000) 18,237
018 Asset Forfeiture 1,274 11 ‐ 1,285 15 ‐ 1,300
019 ATOD Grant (10,180) 72,150 (61,970) 0 57,495 (57,477) 18
025 Gas Tax 446,691 396,678 (409,956) 433,412 434,821 (860,910) 7,322
031 Developers Revolving 59,689 125 (21,000) 38,814 50 (31,000) 7,864
033 Commercial Rehabilitation Loan 62,446 250 ‐ 62,696 100 ‐ 62,796
034 CDBG Housing Rehabilitation 127,560 520 ‐ 128,080 300 ‐ 128,380
038 Personnel Services District ‐ Fire 222,746 465,137 (409,295) 278,589 488,289 (504,271) 262,607
039 Personnel Services District ‐ Police 151,394 465,970 (466,516) 150,849 489,089 (567,462) 72,476
055 Liberty Main & Operation Svc District 1,103,386 606,256 (465,328) 1,244,314 606,829 (471,693) 1,379,451
091 Street Projects ‐ 140,000 (140,000) 0 ‐ ‐ 0
Total Special Revenue Funds 2,280,943 2,288,699 (2,154,065) 2,415,576 2,197,688 (2,672,813) 1,940,451
ENTERPRISE FUNDS
032 Transit 487,498 552,865 (552,865) 487,497 708,096 (848,096) 347,497
075 Business Park 161,706 3,107,900 (1,952,780) 1,316,825 347,744 (104,212) 1,560,357
080 Water System 4,077,406 3,087,189 (3,873,596) 3,290,999 3,096,680 (5,043,007) 1,344,672
081 Water Project ‐ Capital Outlay ‐ 869,847 (869,847) ‐ 2,000,000 (2,000,000) ‐
084 Airport (765,295) 333,471 (350,154) (781,978) 1,040,615 (1,158,198) (899,562)
085 Beach Facility 3,091,716 2,783,531 (2,947,965) 2,927,282 2,850,000 (4,787,891) 989,391
086 NW Facility 3,196,683 2,076,684 (3,292,003) 1,981,364 2,074,000 (2,541,070) 1,514,294
087 NW Sewer Project ‐ Capital Outlay ‐ 1,568,785 (1,568,785) ‐ 330,000 (330,000) ‐
088 Beach Sewer Project ‐ Capital Outlay ‐ 235,196 (235,196) ‐ 2,250,000 (2,250,000) ‐
Total Enterprise Funds 10,249,713 14,615,468 (15,643,192) 9,221,989 14,697,135 (19,062,475) 4,856,649
AGENCY FUNDS
041 Community Facilities District 2006‐1 455,538 511,894 (519,803) 447,630 511,893 (525,355) 434,168
042 Riverview Point Assessment District 248,368 146,461 (152,399) 242,430 146,461 (152,190) 236,701
043 Riverview Point Bond Reserve 46,532 105 ‐ 46,637 105 ‐ 46,742
044 Riverwalk CFD 65,865 ‐ ‐ 65,865 ‐ (12,000) 53,865
045 Summerset Improvement 154,584 13 ‐ 154,597 ‐ ‐ 154,597
046 Summerset Assessment District 17,402 1 ‐ 17,404 ‐ ‐ 17,404
049 Community Facilities District 2004‐1 239,226 299,810 (304,470) 234,565 299,810 (310,490) 223,885
095 Liberty CFD 1,317,902 804,673 (809,940) 1,312,635 804,645 (810,262) 1,307,018
Total Agency Funds 2,545,417 1,762,957 (1,786,611) 2,521,762 1,762,914 (1,810,297) 2,474,379
TOTAL FUNDS 28,410,777$ 29,516,008$ 26,662,190$
CITYWIDE FUND BALANCE SUMMARY
Fund No. Fund NameFund Balance at
6/30/20
FY 20/21 Projected Fund Balance at
6/30/21
FY 21/22 Adopted Fund Balance at
6/30/22
CityofRioVista CityofRioVistaCitywide Summaries
Page 33

FY 19/20
Audited
FY 20/21
Budget
FY 20/21
Projected
FY21/22
AdoptedBudget
% Change
Revenues
Taxes 8,782,671$ 9,093,212$ 9,180,195$ 9,413,406$ 3.52%
Licenses and Permits 2,011,547 1,819,725 2,192,427 2,465,897 35.51%
Fines, Forfeitures and Penalties 105,486 97,856 103,888 101,356 3.58%
Use of Money and Property 1,209,232 3,637,647 3,525,325 818,554 ‐77.50%Intergovernmental Revenues 1,375,404 4,275,770 3,264,024 3,927,965 ‐8.13%Charges for Services 8,453,561 8,243,711 8,485,391 8,289,549 0.56%
Other Revenue 681,225 127,457 132,803 48,549 ‐61.91%Total Revenues 22,619,125 27,295,379 26,884,053 25,065,275 ‐8.17%
Other Financing Sources
Proceeds from long‐term debt 438,154 1,077,000 1,077,000 ‐ ‐Transfers In 5,025,546 9,802,779 5,630,032 5,919,728 ‐39.61%
Total Resources 28,082,825 38,175,157 33,591,085 30,985,003 ‐18.83%
Expenditures
Salaries & Benefits 6,410,185 6,375,522 6,488,701 6,311,095 ‐1.01%Insurance 338,951 451,743 447,176 460,305 1.90%
Professional Services 739,398 701,671 610,508 717,647 2.28%
Contract Services 4,158,638 6,601,248 6,306,214 7,151,730 8.34%
Lease/Rent Expense 78,262 81,716 82,129 82,166 0.55%
Maintenance & Repair 886,422 1,230,399 1,175,569 1,292,842 5.08%
Supplies & Materials 834,538 1,051,231 982,647 992,210 ‐5.61%Training, Conferences & Meetings 47,342 75,091 61,316 76,270 1.57%
Utilities 973,030 862,091 863,778 866,427 0.50%
Debt Service Expense 1,960,782 2,563,713 2,558,567 2,541,939 ‐0.85%Misc. Expense 237,648 294,722 273,568 446,888 51.63%
Total Expenditures 16,665,198 20,289,147 19,850,173 20,939,520 3.21%
CIP & Capital Outlay 1,506,666 12,344,047 7,005,648 6,979,574 ‐43.46%
Other Financing Uses
Transfers Out 5,025,546 9,802,779 5,630,032 5,919,728 39.61%
Transfer to Reserves ‐ ‐ ‐ ‐ ‐Total Use of Resources 23,197,409 42,435,972 32,485,854 33,838,821 ‐20.26%
Annual Surplus (Shortfall) 4,885,416$ (4,260,814)$ 1,105,231$ (2,853,818)$ 33.02%
Estimated Beg. Fund Balance 23,525,362 28,410,777 28,410,777 29,516,008 3.89%
Estimated Ending Fund Balance 28,410,777$ 24,149,963$ 29,516,008$ 26,662,190$ 10.40%
CITYWIDE OPERATING BUDGET SUMMARY
CityofRioVistaCitywide Summaries
Page 34

General
Fund
Enterprise
Funds
Special
Revenue
Funds
Debt
Service
Fund
Capital Outlay
Funds
Fiduciary
Funds
Total
All Funds
Revenues
Taxes 5,827,013$ ‐$ 1,825,295$ ‐$ ‐$ 1,761,098$ 9,413,406$
Licenses and Permits 1,420,328 ‐ ‐ ‐ 1,045,569 ‐ 2,465,897
Fines, Forfeitures and Penalties 26,056 75,300 ‐ ‐ ‐ ‐ 101,356
Use of Money and Property 92,529 649,719 10,865 ‐ 63,625 1,816 818,554
Intergovernmental Revenues ‐ 1,488,136 361,528 ‐ 2,078,301 ‐ 3,927,965
Charges for Services 297,249 7,863,300 ‐ ‐ 129,000 ‐ 8,289,549
Other Revenue 10,000 ‐ ‐ ‐ 38,549 ‐ 48,549
Total Revenues 7,673,174 10,076,455 2,197,688 ‐ 3,355,044 1,762,914 25,065,275
Other Financing Sources
Proceeds from long‐term debt ‐ ‐ ‐ ‐ ‐ ‐ ‐
Transfers In 441,804 4,620,680 ‐ ‐ 857,244 ‐ 5,919,728
Total Resources 8,114,979 14,697,135 2,197,688 ‐ 4,212,287 1,762,914 30,985,003
Expenditures
Salaries & Benefits 3,287,361 2,367,676 541,005 ‐ 102,942 12,111 6,311,095
Insurance 203,096 237,186 15,346 ‐ 4,676 ‐ 460,305
Professional Services 419,031 174,842 25,048 ‐ 6,213 92,513 717,647
Contract Services 2,777,944 2,304,569 1,523,594 ‐ 518,298 27,325 7,151,730
Lease/Rent Expense 32,388 47,602 676 ‐ 1,500 ‐ 82,166
Maintenance & Repair 289,050 859,792 137,000 ‐ 7,000 ‐ 1,292,842
Supplies & Materials 340,900 559,628 24,160 ‐ 55,189 12,333 992,210 Training, Conferences & Meetings 38,875 21,500 5,895 ‐ 10,000 ‐ 76,270
Utilities 183,688 612,739 70,000 ‐ ‐ ‐ 866,427
Debt Service Expense 120,549 601,873 25,477 ‐ 128,024 1,666,016 2,541,939
Misc. Expense 201,839 221,499 23,500 ‐ 50 ‐ 446,888
Total Expenditures 7,894,723 8,008,907 2,391,701 ‐ 833,891 1,810,297 20,939,520
CIP & Capital Outlay 10,000 5,879,463 96,112 ‐ 993,999 ‐ 6,979,574
Other Financing Uses
Transfers Out 8,000 5,174,105 185,000 ‐ 552,624 ‐ 5,919,728
Transfer to Reserves ‐ ‐ ‐ ‐ ‐ ‐ ‐
Total Use of Resources 7,912,723 19,062,475 2,672,813 ‐ 2,380,513 1,810,297 33,838,821
Annual Surplus (Shortfall) 202,256 (4,365,340) (475,125) ‐ 1,831,774 (47,383) (2,853,818)
Estimated Beg. Balance ‐7/1/21 5,884,410 9,221,989 2,415,576 2,032 9,470,239 2,521,762 29,516,008
Estimated Fund Balance ‐ 6/30/22 6,086,666$ 4,856,649$ 1,940,451$ 2,032$ 11,302,013$ 2,474,379$ 26,662,190$
SUMMARY OF ACTIVITIES BY FUND TYPE
Citywide Summaries
Page 35

FY 19/20
Audited
FY 20/21
Budget
FY 20/21
Projected
FY21/22
AdoptedBudget
% Change
Revenues
Taxes 5,394,952$ 5,575,395$ 5,662,365$ 5,827,013$ 4.51%
Licenses and Permits 795,568 1,237,039 1,504,015 1,420,328 14.82%
Fines, Forfeitures and Penalties 27,600 29,056 24,496 26,056 ‐10.32%Use of Money and Property 206,469 150,280 96,201 92,529 ‐38.43%Intergovernmental Revenues 6,460 123,311 123,311 ‐ ‐100.00%Charges for Services 346,963 633,601 610,446 297,249 ‐53.09%Other Revenue 61,094 17,594 36,830 10,000 ‐43.16%
Total Revenues 6,839,105 7,766,276 8,057,663 7,673,174 ‐1.20%
Other Financing Sources
Proceeds from long‐term debt ‐ ‐ ‐ ‐ ‐Transfers In 111,917 797,584 797,584 441,804 ‐44.61%
Total Resources 6,951,022 8,563,860 8,855,247 8,114,979 ‐5.24%
Expenditures
Salaries & Benefits 3,664,775 3,279,812 3,428,399 3,287,361 0.23%
Insurance 203,713 207,563 204,563 203,096 ‐2.15%Professional Services 492,863 399,376 344,668 419,031 4.92%
Contract Services 1,508,695 2,941,375 2,865,708 2,777,944 ‐5.56%Lease/Rent Expense 40,117 32,388 32,388 32,388 0.00%
Maintenance & Repair 272,372 349,810 291,531 289,050 ‐17.37%Supplies & Materials 252,334 393,694 331,548 340,900 ‐13.41%Training, Conferences & Meetings 24,437 31,675 19,200 38,875 22.73%
Utilities 186,540 180,152 184,200 183,688 1.96%
Debt Service Expense 68,917 124,238 124,238 120,549 ‐2.97%Misc. Expense 171,724 191,673 173,019 201,839 5.30%
Total Expenditures 6,886,487 8,131,756 7,999,463 7,894,723 ‐2.91%
CIP & Capital Outlay ‐ 68,077 58,077 10,000 ‐85.31%
Other Financing Uses
Transfers Out 8,000 43,356 18,357 8,000 ‐81.55%Transfer to Reserves ‐ ‐ ‐ ‐ ‐
Total Use of Resources 6,894,487 8,243,189 8,075,897 7,912,723 ‐4.01%
Annual Surplus (Shortfall) 56,535$ 320,671$ 779,350$ 202,256$ ‐36.93%
Estimated Beg. Fund Balance 5,048,525 5,105,060 5,105,060 5,884,410 15.27%
Estimated Ending Fund Balance 5,105,060$ 5,425,730$ 5,884,410$ 6,086,666$ 12.18%
SUMMARY OF ACTIVITIES
GENERAL FUND
CityofRioVistaCitywide Summaries
Page 36

Measure O General Fund General PlanTransient
Occupancy Tax
Total General
Funds
Revenues
Taxes 1,233,000$ 4,574,013$ ‐$ 20,000$ 5,827,013$
Licenses and Permits ‐ 1,420,328 ‐ ‐ 1,420,328
Fines, Forfeitures and Penalties ‐ 26,056 ‐ ‐ 26,056
Use of Money and Property ‐ 91,709 750 70 92,529
Intergovernmental Revenues ‐ ‐ ‐ ‐ ‐
Charges for Services ‐ 292,735 4,514 ‐ 297,249
Other Revenue ‐ 10,000 ‐ ‐ 10,000
Total Revenues 1,233,000 6,414,841 5,264 20,070 7,673,174
Other Financing Sources
Proceeds from long‐term debt ‐ ‐ ‐ ‐ ‐
Transfers In ‐ 441,804 ‐ ‐ 441,804
Total Resources 1,233,000 6,856,645 5,264 20,070 8,114,979
Expenditures
Salaries & Benefits 1,233,000 2,054,361 ‐ ‐ 3,287,361
Insurance ‐ 203,096 ‐ ‐ 203,096
Professional Services ‐ 419,031 ‐ ‐ 419,031
Contract Services ‐ 2,752,610 5,264 20,070 2,777,944
Lease/Rent Expense ‐ 32,388 ‐ ‐ 32,388
Maintenance & Repair ‐ 289,050 ‐ ‐ 289,050
Supplies & Materials ‐ 340,900 ‐ ‐ 340,900
Training, Conferences & Meetings ‐ 38,875 ‐ ‐ 38,875
Utilities ‐ 183,688 ‐ ‐ 183,688
Debt Service Expense ‐ 120,549 ‐ ‐ 120,549
Misc. Expense ‐ 201,839 ‐ ‐ 201,839
Total Expenditures 1,233,000 6,636,389 5,264 20,070 7,894,723
CIP & Capital Outlay ‐ 10,000 ‐ ‐ 10,000
Other Financing Uses
Transfers Out ‐ 8,000 ‐ ‐ 8,000
Transfer to Reserves ‐ ‐ ‐ ‐ ‐
Total Use of Resources 1,233,000 6,654,389 5,264 20,070 7,912,723
Annual Surplus (Shortfall) (0) 202,256 ‐ ‐ 202,256
Estimated Beg. Balance ‐7/1/21 (0) 5,707,610 157,685 19,115 5,884,410
Estimated Fund Balance ‐ 6/30/22 (1)$ 5,909,866$ 157,685$ 19,115$ 6,086,666$
SUMMARY OF ACTIVITIES BY FUND
GENERAL FUND
Citywide Summaries
Page 37

Law
Enforcement
Grant
Asset
ForfeitureATOD Grant Gas Tax
Developers
Revolving
Commercial
Rehabilitation
Loan
CDBG
Housing
Rehab
Personnel
Services
District
Fire
Personnel
Services
District
Police
Liberty M&O
Svc District
Streets
Projects
Total Special
Revenue
Funds
Revenues
Taxes ‐$ ‐$ ‐$ 248,288$ ‐$ ‐$ ‐$ 487,589$ 487,589$ 601,829$ ‐$ 1,825,295$
Licenses and Permits ‐ ‐ ‐ ‐ ‐ ‐ ‐ ‐ ‐ ‐ ‐ ‐
Fines, Forfeitures and Penalties ‐ ‐ ‐ ‐ ‐ ‐ ‐ ‐ ‐ ‐ ‐ ‐
Use of Money and Property 700 15 ‐ 2,500 50 100 300 700 1,500 5,000 ‐ 10,865
Intergovernmental Revenues 120,000 ‐ 57,495 184,033 ‐ ‐ ‐ ‐ ‐ ‐ ‐ 361,528
Charges for Services ‐ ‐ ‐ ‐ ‐ ‐ ‐ ‐ ‐ ‐ ‐ ‐
Other Revenue ‐ ‐ ‐ ‐ ‐ ‐ ‐ ‐ ‐ ‐ ‐ ‐
Total Revenues 120,700 15 57,495 434,821 50 100 300 488,289 489,089 606,829 ‐ 2,197,688
Other Financing Sources
Proceeds from long‐term debt ‐ ‐ ‐ ‐ ‐ ‐ ‐ ‐ ‐ ‐ ‐ ‐
Transfers In ‐ ‐ ‐ ‐ ‐ ‐ ‐ ‐ ‐ ‐ ‐ ‐
Total Resources 120,700 15 57,495 434,821 50 100 300 488,289 489,089 606,829 ‐ 2,197,688
Expenditures
Salaries & Benefits ‐ ‐ 13,065 72,857 ‐ ‐ ‐ 336,210 ‐ 118,874 ‐ 541,005
Insurance ‐ ‐ 941 4,775 ‐ ‐ ‐ 4,518 5,112 ‐ ‐ 15,346
Professional Services ‐ ‐ 6,000 8,600 1,000 ‐ ‐ 724 3,224 5,500 ‐ 25,048
Contract Services 180,000 ‐ 30,000 547,655 30,000 ‐ ‐ 1,943 386,678 347,319 ‐ 1,523,594
Lease/Rent Expense ‐ ‐ 76 600 ‐ ‐ ‐ ‐ ‐ ‐ ‐ 676
Maintenance & Repair ‐ ‐ ‐ 50,000 ‐ ‐ ‐ 75,000 12,000 ‐ ‐ 137,000
Supplies & Materials ‐ ‐ 1,500 4,000 ‐ ‐ ‐ 877 17,783 ‐ ‐ 24,160 Training, Conferences & Meetings ‐ ‐ 5,895 ‐ ‐ ‐ ‐ ‐ ‐ ‐ ‐ 5,895
Utilities ‐ ‐ ‐ 70,000 ‐ ‐ ‐ ‐ ‐ ‐ ‐ 70,000
Debt Service Expense ‐ ‐ ‐ 2,423 ‐ ‐ ‐ ‐ 23,054 ‐ ‐ 25,477
Misc. Expense ‐ ‐ ‐ ‐ ‐ ‐ ‐ ‐ 23,500 ‐ ‐ 23,500
Total Expenditures 180,000 ‐ 57,477 760,910 31,000 ‐ ‐ 419,271 471,350 471,693 ‐ 2,391,701
CIP & Capital Outlay ‐ ‐ ‐ ‐ ‐ ‐ ‐ ‐ 96,112 ‐ ‐ 96,112
Other Financing Uses
Transfers Out ‐ ‐ ‐ 100,000 ‐ ‐ ‐ 85,000 ‐ ‐ ‐ 185,000
Transfer to Reserves ‐ ‐ ‐ ‐ ‐ ‐ ‐ ‐ ‐ ‐ ‐ ‐
Total Use of Resources 180,000 ‐ 57,477 860,910 31,000 ‐ ‐ 504,271 567,462 471,693 ‐ 2,672,813
Annual Surplus (Shortfall) (59,300) 15 18 (426,089) (30,950) 100 300 (15,982) (78,373) 135,136 ‐ (475,125)
Estimated Beg. Balance ‐7/1/21 77,537 1,285 0 433,412 38,814 62,696 128,080 278,589 150,849 1,244,314 0 2,415,576
Estimated Fund Balance ‐ 6/30/22 18,237$ 1,300$ 18$ 7,322$ 7,864$ 62,796$ 128,380$ 262,607$ 72,476$ 1,379,451$ 0$ 1,940,451$
SUMMARY OF ACTIVITIES BY FUND
SPECIAL REVENUE FUNDS
Citywide Summaries
Page 38

Vehicle
Replacement
Storm
Drain
Capital
Projects
Roadway
Impact
Parks and
Recreation
Municipal
Improvements
Hazardous
Waste
Landfill
ClosureArmy Base
Total
Capital Outlay
Funds
Revenues
Taxes ‐$ ‐$ ‐$ ‐$ ‐$ ‐$ ‐$ ‐$ ‐$ ‐$
Licenses and Permits ‐ ‐ ‐ 492,000 43,650 139,919 ‐ 370,000 ‐ 1,045,569
Fines, Forfeitures and Penalties ‐ ‐ ‐ ‐ ‐ ‐ ‐ ‐ ‐ ‐
Use of Money and Property 800 25 ‐ 1,500 5,000 40,000 2,400 9,000 4,900 63,625
Intergovernmental Revenues ‐ ‐ 2,078,301 ‐ ‐ ‐ ‐ ‐ ‐ 2,078,301
Charges for Services ‐ 29,000 ‐ ‐ ‐ ‐ 100,000 ‐ ‐ 129,000
Other Revenue 25,000 ‐ ‐ ‐ ‐ ‐ ‐ ‐ 13,549 38,549
Total Revenues 25,800 29,025 2,078,301 493,500 48,650 179,919 102,400 379,000 18,449 3,355,044
Other Financing Sources
Proceeds from long‐term debt ‐ ‐ ‐ ‐ ‐ ‐ ‐ ‐ ‐ ‐
Transfers In 110,000 ‐ 624,899 ‐ 5,170 117,175 ‐ ‐ ‐ 857,244
Total Resources 135,800 29,025 2,703,200 493,500 53,820 297,094 102,400 379,000 18,449 4,212,287
Expenditures
Salaries & Benefits ‐ 5,184 ‐ ‐ ‐ ‐ 48,172 37,347 12,239 102,942
Insurance ‐ 2,059 ‐ ‐ ‐ ‐ 1,286 978 353 4,676
Professional Services ‐ 579 ‐ ‐ ‐ ‐ 5,000 572 62 6,213
Contract Services ‐ 10,100 ‐ 400,000 16,400 ‐ 63,630 28,000 168 518,298
Lease/Rent Expense ‐ 500 ‐ ‐ ‐ ‐ 300 200 500 1,500
Maintenance & Repair ‐ 7,000 ‐ ‐ ‐ ‐ ‐ ‐ ‐ 7,000
Supplies & Materials ‐ 11,300 ‐ ‐ ‐ ‐ 15,160 28,553 176 55,189
Training, Conferences & Meetings ‐ ‐ ‐ ‐ ‐ ‐ 10,000 ‐ ‐ 10,000
Utilities ‐ ‐ ‐ ‐ ‐ ‐ ‐ ‐ ‐ ‐
Debt Service Expense 128,024 ‐ ‐ ‐ ‐ ‐ ‐ ‐ ‐ 128,024
Misc. Expense ‐ ‐ ‐ ‐ ‐ ‐ ‐ ‐ 50 50
Total Expenditures 128,024 36,722 ‐ 400,000 16,400 ‐ 143,548 95,649 13,549 833,891
CIP & Capital Outlay 80,000 ‐ 913,999 ‐ ‐ ‐ ‐ ‐ ‐ 993,999
Other Financing Uses
Transfers Out ‐ ‐ ‐ ‐ 144,899 120,550 ‐ 280,000 7,175 552,624
Transfer to Reserves ‐ ‐ ‐ ‐ ‐ ‐ ‐ ‐ ‐ ‐
Total Use of Resources 208,024 36,722 913,999 400,000 161,299 120,550 143,548 375,649 20,724 2,380,513
Annual Surplus (Shortfall) (72,224) (7,697) 1,789,201 93,500 (107,479) 176,544 (41,148) 3,351 (2,275) 1,831,774
Estimated Beg. Balance ‐7/1/21 232,723 89,157 102,177 280,542 266,567 6,189,284 484,087 1,895,208 (69,505) 9,470,239
Estimated Fund Balance ‐ 6/30/22 160,499$ 81,460$ 1,891,378$ 374,042$ 159,088$ 6,365,828$ 442,939$ 1,898,559$ (71,780)$ 11,302,013$
SUMMARY OF ACTIVITIES BY FUND
CAPITAL OUTLAY FUNDS
Citywide Summaries
Page 39

Community
Facilities
District
2006‐1
Riverview
Point
Assessment
District
Riverview
Point Bond
Reserve
Riverwalk CFDSummerset
Improvement
Summerset
Assessment
District
Community
Facilities
District 2004‐1
Liberty CFD
2018‐1
Total Fiduciary
Funds
Revenues
Taxes 511,333$ 146,083$ ‐$ ‐$ ‐$ ‐$ 299,537$ 804,145$ 1,761,098$
Licenses and Permits ‐ ‐ ‐ ‐ ‐ ‐ ‐ ‐ ‐
Fines, Forfeitures and Penalties ‐ ‐ ‐ ‐ ‐ ‐ ‐ ‐ ‐
Use of Money and Property 560 378 105 ‐ ‐ ‐ 273 500 1,816
Intergovernmental Revenues ‐ ‐ ‐ ‐ ‐ ‐ ‐ ‐ ‐
Charges for Services ‐ ‐ ‐ ‐ ‐ ‐ ‐ ‐ ‐
Other Revenue ‐ ‐ ‐ ‐ ‐ ‐ ‐ ‐ ‐
Total Revenues 511,893 146,461 105 ‐ ‐ ‐ 299,810 804,645 1,762,914
Other Financing Sources (Uses)
Proceeds from long‐term debt ‐ ‐ ‐ ‐ ‐ ‐ ‐ ‐ ‐
Transfers In ‐ ‐ ‐ ‐ ‐ ‐ ‐ ‐ ‐
Total Resources 511,893 146,461 105 ‐ ‐ ‐ 299,810 804,645 1,762,914
Expenditures
Salaries & Benefits 3,028 3,028 ‐ ‐ ‐ ‐ 3,028 3,028 12,111
Insurance ‐ ‐ ‐ ‐ ‐ ‐ ‐ ‐ ‐
Professional Services 28,885 8,665 ‐ 12,000 ‐ ‐ 21,463 21,500 92,513
Contract Services 8,974 1,512 ‐ ‐ ‐ ‐ 8,823 8,016 27,325
Lease/Rent Expense ‐ ‐ ‐ ‐ ‐ ‐ ‐ ‐ ‐
Maintenance & Repair ‐ ‐ ‐ ‐ ‐ ‐ ‐ ‐ ‐
Supplies & Materials 4,050 682 ‐ ‐ ‐ ‐ 3,982 3,618 12,333
Training, Conferences & Meetings ‐ ‐ ‐ ‐ ‐ ‐ ‐ ‐ ‐
Utilities ‐ ‐ ‐ ‐ ‐ ‐ ‐ ‐ ‐
Debt Service Expense 480,419 138,303 ‐ ‐ ‐ ‐ 273,194 774,100 1,666,016
Misc. Expense ‐ ‐ ‐ ‐ ‐ ‐ ‐ ‐ ‐
Total Expenditures 525,355 152,190 ‐ 12,000 ‐ ‐ 310,490 810,262 1,810,297
CIP & Capital Outlay ‐ ‐ ‐ ‐ ‐ ‐ ‐ ‐ ‐
Other Financing Sources (Uses)
Transfers Out ‐ ‐ ‐ ‐ ‐ ‐ ‐ ‐ ‐
Transfer to Reserves ‐ ‐ ‐ ‐ ‐ ‐ ‐ ‐ ‐
Total Use of Resources 525,355 152,190 ‐ 12,000 ‐ ‐ 310,490 810,262 1,810,297
Annual Surplus (Shortfall) (13,462) (5,729) 105 (12,000) ‐ ‐ (10,681) (5,617) (47,383)
Estimated Beg. Balance ‐7/1/21 447,630 242,430 46,637 65,865 154,597 17,404 234,565 1,312,635 2,521,762
Estimated Fund Balance ‐ 6/30/22 434,168$ 236,701$ 46,742$ 53,865$ 154,597$ 17,404$ 223,885$ 1,307,018$ 2,474,379$
SUMMARY OF ACTIVITIES BY FUND
FIDUCIARY FUNDS
Citywide Summaries
Page 40

TransitBusiness
ParkWater System
Water
Project
Capital Outlay
Water
Fixed AssetsAirport
Beach
Facility
NW
Facility
NW Sewer
Capital
Outlay
Beach Sewer
Capital
Outlay
Total
Enterprise
Funds
Revenues
Taxes ‐$ ‐$ ‐$ ‐$ ‐$ ‐$ ‐$ ‐$ ‐$ ‐$ ‐$
Licenses and Permits ‐ ‐ ‐ ‐ ‐ ‐ ‐ ‐ ‐ ‐ ‐
Fines, Forfeitures and Penalties ‐ ‐ 40,000 ‐ ‐ 300 24,000 11,000 ‐ ‐ 75,300
Use of Money and Property 500 347,744 35,000 ‐ ‐ 220,475 26,000 20,000 ‐ ‐ 649,719
Intergovernmental Revenues 689,096 ‐ ‐ ‐ ‐ 799,040 ‐ ‐ ‐ ‐ 1,488,136
Charges for Services 10,500 ‐ 3,001,000 ‐ ‐ 20,800 2,800,000 2,031,000 ‐ ‐ 7,863,300
Other Revenue ‐ ‐ ‐ ‐ ‐ ‐ ‐ ‐ ‐ ‐ ‐
Total Revenues 700,096 347,744 3,076,000 ‐ ‐ 1,040,615 2,850,000 2,062,000 ‐ ‐ 10,076,455
Other Financing Sources
Proceeds from long‐term debt ‐ ‐ ‐ ‐ ‐ ‐ ‐ ‐ ‐ ‐ ‐
Transfers In 8,000 ‐ 20,680 2,000,000 ‐ ‐ ‐ 12,000 330,000 2,250,000 4,620,680
Total Resources 708,096 347,744 3,096,680 2,000,000 ‐ 1,040,615 2,850,000 2,074,000 330,000 2,250,000 14,697,135
Expenditures
Salaries & Benefits 27,326 51,932 1,106,041 ‐ ‐ 56,286 654,443 471,649 ‐ ‐ 2,367,676
Insurance 12,974 4,627 93,126 ‐ ‐ 20,318 51,101 55,039 ‐ ‐ 237,186
Professional Services 94,694 5,235 15,749 ‐ ‐ 30,147 14,398 14,618 ‐ ‐ 174,842
Contract Services 341,651 5,632 115,000 ‐ ‐ 39,460 1,055,339 747,487 ‐ ‐ 2,304,569
Lease/Rent Expense 2,520 500 19,614 ‐ ‐ 1,500 12,628 10,840 ‐ ‐ 47,602
Maintenance & Repair 25,100 ‐ 204,000 ‐ ‐ 38,000 195,703 396,989 ‐ ‐ 859,792
Supplies & Materials 56,981 5,285 230,076 ‐ ‐ 26,284 134,513 106,489 ‐ ‐ 559,628
Training, Conferences & Meetings ‐ ‐ 20,000 ‐ ‐ 1,500 ‐ ‐ ‐ ‐ 21,500
Utilities 3,500 1,000 242,000 ‐ ‐ 31,600 107,807 226,832 ‐ ‐ 612,739
Debt Service Expense ‐ ‐ 319,900 ‐ ‐ 18,328 137,376 126,269 ‐ ‐ 601,873
Misc. Expense 140,850 ‐ 52,000 ‐ ‐ 733 2,308 25,608 ‐ ‐ 221,499
Total Expenditures 705,596 74,212 2,417,507 ‐ ‐ 264,156 2,365,616 2,181,820 ‐ ‐ 8,008,907
CIP & Capital Outlay 130,500 15,000 235,500 2,000,000 ‐ 874,963 21,750 21,750 330,000 2,250,000 5,879,463
Other Financing Uses
Transfers Out 12,000 15,000 2,390,000 ‐ ‐ 19,079 2,400,525 337,500 ‐ ‐ 5,174,105
Transfer to Reserves ‐ ‐ ‐ ‐ ‐ ‐ ‐ ‐ ‐ ‐ ‐
Total Use of Resources 848,096 104,212 5,043,007 2,000,000 ‐ 1,158,198 4,787,891 2,541,070 330,000 2,250,000 19,062,475
Annual Surplus (Shortfall) (140,000) 243,532 (1,946,327) ‐ ‐ (117,583) (1,937,891) (467,070) ‐ ‐ (4,365,340)
Estimated Beg. Balance ‐7/1/21 487,497 1,316,825 3,290,999 ‐ ‐ (781,978) 2,927,282 1,981,364 ‐ ‐ 9,221,989
Estimated Fund Balance ‐ 6/30/22 347,497$ 1,560,357$ 1,344,672$ ‐$ ‐$ (899,562)$ 989,391$ 1,514,294$ ‐$ ‐$ 4,856,649$
SUMMARY OF ACTIVITIES BY FUND
ENTERPRISE FUNDS
Citywide Summaries
Page 41

FY 19/20
Audited
FY 20/21
Budget
FY 20/21
Projected
FY21/22
AdoptedBudget
% Change
Revenues
Taxes ‐$ ‐$ ‐$ ‐$ ‐Licenses and Permits ‐ ‐ ‐ ‐ ‐Fines, Forfeitures and Penalties 38,803 35,000 45,000 40,000 14.29%
Use of Money and Property 71,917 40,000 35,886 35,000 ‐12.50%Intergovernmental Revenues 45,000 22,500 22,500 ‐ ‐Charges for Services 3,052,154 2,806,000 2,963,123 3,001,000 6.95%
Other Revenue 124,229 ‐ ‐ ‐ ‐Total Revenues 3,332,102 2,903,500 3,066,509 3,076,000 5.94%
Other Financing Sources
Proceeds from long‐term debt ‐ ‐ ‐ ‐ ‐Transfers In 2,686,017 3,131,791 890,527 2,020,680 ‐35.48%
Total Resources 6,018,120 6,035,291 3,957,036 5,096,680 ‐15.55%
Expenditures
Salaries & Benefits 857,668 1,128,500 1,128,500 1,106,041 ‐1.99%Insurance 48,779 89,192 89,192 93,126 4.41%
Professional Services 14,856 12,249 12,249 15,749 28.57%
Contract Services 98,249 115,000 115,000 115,000 0.00%
Lease/Rent Expense 12,748 19,614 19,614 19,614 0.00%
Maintenance & Repair 229,736 174,000 174,000 204,000 17.24%
Supplies & Materials 214,103 229,601 229,601 230,076 0.21%
Training, Conferences & Meetings 5,785 20,000 20,000 20,000 0.00%
Utilities 246,273 242,000 242,000 242,000 0.00%
Debt Service Expense 81,857 326,014 326,014 319,900 ‐1.88%Misc. Expense 40,728 52,000 52,000 52,000 0.00%
Total Expenditures 1,850,781 2,408,171 2,408,171 2,417,507 0.39%
CIP & Capital Outlay ‐ 3,481,689 1,440,425 2,235,500 ‐35.79%
Other Financing Uses
Transfers Out 2,926,017 3,541,111 894,847 2,390,000 ‐32.51%Transfer to Reserves ‐ ‐ ‐ ‐ ‐
Total Use of Resources 4,776,799 9,430,971 4,743,443 7,043,007 ‐25.32%
Annual Surplus (Shortfall) 1,241,321$ (3,395,680)$ (786,407)$ (1,946,327)$ 42.68%
Estimated Beg. Fund Balance 2,836,084 4,077,406 4,077,406 3,290,999 ‐19.29%
Estimated Ending Fund Balance 4,077,406$ 681,726$ 3,290,999$ 1,344,672$ 97.25%
ENTERPRISE FUND OPERATING BUDGET SUMMARY
WATER SYSTEM & CAPITAL OUTLAY
Citywide Summaries
Page 42

FY 19/20
Audited
FY 20/21
Budget
FY 20/21
Projected
FY21/22
AdoptedBudget
% Change
Revenues
Taxes ‐$ ‐$ ‐$ ‐$ ‐Licenses and Permits ‐ ‐ ‐ ‐ ‐Fines, Forfeitures and Penalties 396 300 200 300 0.00%
Use of Money and Property 205,528 201,223 220,989 220,475 9.57%
Intergovernmental Revenues 69,250 904,177 91,250 799,040 ‐11.63%Charges for Services 21,471 20,800 21,032 20,800 0.00%
Other Revenue 24,833 13,890 ‐ ‐ ‐Total Revenues 321,478 1,140,390 333,471 1,040,615 ‐8.75%
Other Financing Sources
Proceeds from long‐term debt ‐ ‐ ‐ ‐ ‐Transfers In ‐ ‐ ‐ ‐ ‐
Total Resources 321,478 1,140,390 333,471 1,040,615 ‐8.75%
Expenditures
Salaries & Benefits 50,664 54,435 48,815 56,286 3.40%
Insurance 13,231 19,219 17,653 20,318 5.72%
Professional Services 31,500 30,147 24,038 30,147 0.00%
Contract Services 45,220 38,136 40,000 39,460 3.47%
Lease/Rent Expense 2,399 1,500 2,113 1,500 0.00%
Maintenance & Repair 15,973 28,000 23,000 38,000 35.71%
Supplies & Materials 24,190 26,083 25,744 26,284 0.77%
Training, Conferences & Meetings 200 1,500 200 1,500 0.00%
Utilities 29,363 31,600 30,239 31,600 0.00%
Debt Service Expense 7,626 19,312 18,869 18,328 ‐Misc. Expense ‐ 733 233 733 0.00%
Total Expenditures 220,365 250,666 230,904 264,156 5.38%
CIP & Capital Outlay 32,359 998,463 119,250 874,963 ‐12.37%
Other Financing Uses
Transfers Out ‐ ‐ ‐ 19,079 ‐Transfer to Reserves ‐ ‐ ‐ ‐ ‐
Total Use of Resources 252,724 1,249,129 350,154 1,158,198 ‐7.28%
Annual Surplus (Shortfall) 68,754$ (108,739)$ (16,684)$ (117,583)$ ‐8.13%
Estimated Beg. Fund Balance (834,049) (765,295) (765,295) (781,978) ‐2.18%
Estimated Ending Fund Balance (765,295)$ (874,034)$ (781,978)$ (899,562)$ ‐2.92%
ENTERPRISE FUND OPERATING BUDGET SUMMARY
AIRPORT
Citywide Summaries
Page 43

FY 19/20
Audited
FY 20/21
Budget
FY 20/21
Projected
FY21/22
AdoptedBudget
% Change
Revenues
Taxes ‐$ ‐$ ‐$ ‐$ ‐Licenses and Permits ‐ ‐ ‐ ‐ ‐Fines, Forfeitures and Penalties 26,377 24,000 24,000 24,000 0.00%
Use of Money and Property 51,843 30,000 26,647 26,000 ‐13.33%Intergovernmental Revenues ‐ 11,250 11,250 ‐ ‐Charges for Services 2,842,801 2,800,000 2,721,634 2,800,000 0.00%
Other Revenue ‐ ‐ ‐ ‐ ‐Total Revenues 2,921,020 2,865,250 2,783,531 2,850,000 ‐0.53%
Other Financing Sources
Proceeds from long‐term debt ‐ ‐ ‐ ‐ ‐Transfers In 956,970 1,125,000 235,196 2,250,000 100.00%
Total Resources 3,877,990 3,990,250 3,018,727 5,100,000 68.95%
Expenditures
Salaries & Benefits 516,261 682,093 682,093 654,443 ‐4.05%Insurance 26,387 49,696 49,696 51,101 2.83%
Professional Services 8,761 14,398 14,398 14,398 0.00%
Contract Services 989,127 1,030,156 1,030,156 1,055,339 2.44%
Lease/Rent Expense 11,062 12,628 12,628 12,628 0.00%
Maintenance & Repair 105,291 191,000 195,703 195,703 2.46%
Supplies & Materials 147,320 133,882 133,882 134,513 0.47%
Training, Conferences & Meetings ‐ ‐ ‐ ‐ ‐Utilities 114,452 107,807 107,807 107,807 0.00%
Debt Service Expense 43,515 147,025 142,322 137,376 ‐6.56%Misc. Expense 1,401 2,308 2,308 2,308 0.00%
Total Expenditures 1,963,576 2,370,994 2,370,994 2,365,616 ‐0.23%
CIP & Capital Outlay ‐ 1,181,250 291,446 2,271,750 92.32%
Other Financing Uses
Transfers Out 1,022,181 1,410,525 520,721 2,400,525 70.19%
Transfer to Reserves ‐ ‐ ‐ ‐ ‐Total Use of Resources 2,985,756 4,962,769 3,183,161 7,037,891 41.81%
Annual Surplus (Shortfall) 892,233$ (972,519)$ (164,434)$ (1,937,891)$ ‐99.27%
Estimated Beg. Fund Balance 2,199,483 3,091,716 3,091,716 2,927,282 ‐5.32%
Estimated Ending Fund Balance 3,091,716$ 2,119,197$ 2,927,282$ 989,391$ ‐53.31%
ENTERPRISE FUND OPERATING BUDGET SUMMARY
BEACH FACILITY & CAPITAL OUTLAY
Citywide Summaries
Page 44

FY 19/20
Audited
FY 20/21
Budget
FY 20/21
Projected
FY21/22
AdoptedBudget
% Change
Revenues
Taxes ‐$ ‐$ ‐$ ‐$ ‐Licenses and Permits ‐ ‐ ‐ ‐ ‐Fines, Forfeitures and Penalties 12,506 9,500 10,192 11,000 15.79%
Use of Money and Property 41,851 25,000 20,531 20,000 ‐20.00%Intergovernmental Revenues ‐ 11,250 11,250 ‐ ‐Charges for Services 2,040,264 1,847,000 2,022,711 2,031,000 9.96%
Other Revenue 12,200 ‐ ‐ ‐ ‐Total Revenues 2,106,820 1,892,750 2,064,684 2,062,000 8.94%
Other Financing Sources
Proceeds from long‐term debt ‐ 634,278 634,278 ‐ ‐Transfers In 389,775 1,056,500 946,507 342,000 ‐67.63%
Total Resources 2,496,596 3,583,528 3,645,469 2,404,000 ‐32.92%
Expenditures
Salaries & Benefits 477,775 473,713 473,713 471,649 ‐0.44%Insurance 29,773 52,543 52,543 55,039 4.75%
Professional Services 13,299 14,909 14,909 14,618 ‐1.95%Contract Services 753,446 729,361 729,361 747,487 2.49%
Lease/Rent Expense 7,434 10,840 10,840 10,840 0.00%
Maintenance & Repair 206,755 396,989 396,989 396,989 0.00%
Supplies & Materials 92,781 106,001 106,001 106,489 0.46%
Training, Conferences & Meetings ‐ ‐ ‐ ‐ ‐Utilities 326,709 226,832 226,832 226,832 0.00%
Debt Service Expense 49,879 129,213 129,213 126,269 ‐Misc. Expense 10,400 25,608 25,608 25,608 0.00%
Total Expenditures 1,968,251 2,166,009 2,166,009 2,181,820 0.73%
CIP & Capital Outlay ‐ 1,735,028 1,625,035 351,750 ‐79.73%
Other Financing Uses
Transfers Out 377,775 1,212,000 1,069,743 337,500 ‐Transfer to Reserves ‐ ‐ ‐ ‐ ‐
Total Use of Resources 2,346,026 5,113,037 4,860,787 2,871,070 ‐43.85%
Annual Surplus (Shortfall) 150,570$ (1,529,509)$ (1,215,319)$ (467,070)$ 69.46%
Estimated Beg. Fund Balance 3,046,114 3,196,683 3,196,683 1,981,364 ‐38.02%
Estimated Ending Fund Balance 3,196,683$ 1,667,174$ 1,981,364$ 1,514,294$ ‐9.17%
ENTERPRISE FUND OPERATING BUDGET SUMMARY
NW FACILITY & CAPITAL OUTLAY
Citywide Summaries
Page 45

Revenues
Page 46

GENERAL FUND8,114,979
26%
CAPITAL OUTLAY FUNDS4,212,287
14%
SPECIAL REVENUE FUNDS2,197,688
7%
ENTERPRISE FUNDS14,697,135
47%
AGENCY FUNDS1,762,914
6%
CITYWIDE REVENUE BY FUND TYPE$30,985,003
Page 47

Fund No. Fund NameFY 19/20
Audited
FY 20/21
Budget
FY 20/21
Projected
FY21/22
AdoptedBudget
% Change
GENERAL FUND
002 Measure O 1,031,077$ 1,072,000$ 1,117,000$ 1,233,000$ 15.02%
010 General Fund 5,890,356 7,463,741 7,717,732 6,856,645 ‐8.13%Subtotal General Fund 6,921,433 8,535,741 8,834,732 8,089,645 ‐5.23%
022 General Plan 7,890 7,819 6,742 5,264 ‐32.68%052 Transient Occupancy Tax 21,699 20,300 13,773 20,070 ‐1.13%
Total General Fund per Audit Report 6,951,022 8,563,860 8,855,247 8,114,979 ‐5.24%
CAPITAL OUTLAY FUNDS
012 Vehicle Replacement 215,832 238,000 185,850 135,800 ‐42.94%050 Storm Drain 75,187 28,050 123,183 29,025 3.48%
051 Capital Projects 1,128,365 4,363,751 3,257,701 2,703,200 ‐38.05%053 Roadway Impact 80,141 (59,409) (80,286) 493,500 930.68%
054 Parks and Recreation 133,016 71,280 128,545 53,820 ‐24.49%056 Municipal Improvements 349,893 1,831,416 1,917,789 297,094 ‐83.78%060 Hazardous Waste 118,420 110,500 144,859 102,400 ‐7.33%065 Landfill Closure 405,154 404,600 375,812 379,000 ‐6.33%076 Army Base 15,977 14,529 15,246 18,449 26.98%
Total Capital Outlay Funds 2,521,986 7,002,717 6,068,699 4,212,287 ‐39.85%
DEBT SERVICE FUND
040 Firehouse Bonds 40.17 ‐ 15.80 ‐ ‐Total Debt Service Fund 40.17 ‐ 15.80 ‐ ‐
SPECIAL REVENUE FUNDS
017 Law Enforcement Grant 157,422 131,000 141,601 120,700 ‐7.86%018 Asset Forfeiture 44 30 11 15 ‐50.00%019 ATOD Grant 48,463 72,364 72,150 57,495 ‐20.55%025 Gas Tax 414,457 400,187 396,678 434,821 8.65%
031 Developers Revolving 492 300 125 50 ‐83.33%033 Commercial Rehabilitation Loan 830 700 250 100 0.00%
034 CDBG Housing Rehabilitation 1,717 1,500 520 300 ‐80.00%038 Personnel Services District ‐ Fire 419,201 465,870 465,137 488,289 4.81%
039 Personnel Services District ‐ Police 420,907 466,870 465,970 489,089 4.76%
055 Liberty Main & Operation Svc District 603,975 606,829 606,256 606,829 0.00%
091 Street Projects 80,123 140,000 140,000 ‐ ‐100.00%Total Special Revenue Funds 2,147,632 2,285,650 2,288,699 2,197,688 ‐3.85%
ENTERPRISE FUNDS
032 Transit 742,225 683,365 552,865 708,096 3.62%
075 Business Park 1,232,210 3,123,288 3,107,900 347,744 ‐88.87%080 Water System 4,609,860 2,924,180 3,087,189 3,096,680 5.90%
081 Water Project ‐ Capital Outlay 1,408,260 3,111,111 869,847 2,000,000 ‐35.71%082 Water Fixed Assets ‐ ‐ ‐ ‐ ‐084 Airport 321,478 1,140,390 333,471 1,040,615 ‐8.75%085 Beach Facility 3,639,697 2,865,250 2,783,531 2,850,000 ‐0.53%086 NW Facility 2,118,820 1,904,750 2,076,684 2,074,000 8.89%
087 NW Sewer Project ‐ Capital Outlay 377,775 1,678,778 1,568,785 330,000 ‐80.34%088 Beach Sewer Project ‐ Capital Outlay 238,293 1,125,000 235,196 2,250,000 100.00%
Total Enterprise Funds 14,688,618 18,556,112 14,615,468 14,697,135 ‐20.80%
CITYWIDE REVENUE SUMMARY BY FUND
Revenues
Page 48

Fund No. Fund NameFY 19/20
Audited
FY 20/21
Budget
FY 20/21
Projected
FY21/22
AdoptedBudget
% Change
CITYWIDE REVENUE SUMMARY BY FUND
Revenues
AGENCY FUNDS
041 Community Facilities District 2006‐1 508,159 513,034 511,894 511,893 ‐0.22%042 Riverview Point Assessment District 155,292 147,633 146,461 146,461 ‐0.79%043 Riverview Point Bond Reserve 420 470 105 105 ‐77.66%044 Riverwalk CFD ‐ ‐ ‐ ‐ ‐045 Summerset Improvement 49 ‐ 13 ‐ ‐046 Summerset Assessment District 6 ‐ 1 ‐ ‐049 Community Facilities District 2004‐1 290,903 300,536 299,810 299,810 ‐0.24%095 Liberty CFD 818,697 805,145 804,673 804,645 ‐0.06%
Total Agency Funds 1,773,526 1,766,818 1,762,957 1,762,914 ‐0.22%
TOTAL FUNDS 28,082,825$ 38,175,157$ 33,591,085$ 30,985,003$ ‐18.83%
Page 49

FY 19/20
Audited
FY 20/21
Budget
FY 20/21
Projected
FY21/22
AdoptedBudget
% Change
Taxes 4,342,561$ 4,483,395$ 4,531,665$ 4,574,013$ 2.02%
Measure O 1,031,077 1,072,000 1,117,000 1,233,000 15.02%
Transient Occupancy Tax 21,315 20,000 13,700 20,000 0.00%
Franchises, Licenses and Permits 795,568 1,237,039 1,504,015 1,420,328 14.82%
Fines, Forfeitures and Penalties 27,600 29,056 24,496 26,056 ‐10.32%Use of Money and Property 206,469 150,280 96,201 92,529 ‐38.43%Intergovernmental Revenues 6,460 123,311 123,311 ‐ ‐100.00%Charges for Services 346,963 633,601 610,446 297,249 ‐53.09%Other Revenue 61,094 17,594 36,830 10,000 ‐43.16%SUBTOTAL GENERAL FUND RESOURCES 6,839,105 7,766,276 8,057,663 7,673,174 ‐1.20%
Transfers In 111,917 797,584 797,584 441,804
TOTAL GENERAL FUND RESOURCES 6,951,022$ 8,563,860$ 8,855,247$ 8,114,979$
Annual Percentage Change 27.39% ‐5.24%
GENERAL FUND REVENUE BY CATEGORY
Taxes, 4,574,013 ,
56%
Measure O , 1,233,000 ,
15%
Franchises, Licenses and Permits,
1,420,328 , 18%
Use of Money and Property, 958,165,
1%
Charges for Services, 297,249 ,
4%
Other Revenue, 56,056 ,
1%Transfers In, 441,804 , 5%
Revenues
Page 50

Major Recurring Revenue Sources
FY 19/20
Audited
% of
Revenue
FY 20/21
Projected
% of
Revenue
FY21/22
Budget
% of
Total
Revenue
Utility Service Fees 8,012,774$ 38.44% 7,814,808$ 31.11% 7,939,000$ 34.07%
Sales Tax (including Measure O) 2,309,181$ 11.08% 2,414,200$ 9.61% 2,610,800$ 11.20%
Property Tax 1,893,283$ 9.08% 1,996,179$ 7.95% 2,096,030$ 8.99%
Community Facilities District Assessments 1,429,580$ 6.86% 1,530,570$ 6.09% 1,577,007$ 6.77%
Development Fees (including Cannabis Fees) 1,558,949$ 7.48% 1,745,417$ 6.95% 1,456,080$ 6.25%
Motor Vehicle In‐Lieu Taxes 823,323$ 3.95% 883,070$ 3.52% 882,183$ 3.79%
Franchise Fees 561,492$ 2.69% 554,338$ 2.21% 557,519$ 2.39%
Gas Tax (including SB1) 385,316$ 1.85% 394,187$ 1.57% 432,321$ 1.86%
Public Safety Fees & Grants 308,786$ 1.48% 587,385$ 2.34% 274,000$ 1.18%
Interest Income 455,988$ 2.19% 197,095$ 0.78% 193,326$ 0.83%
Total Major Recurring Revenues 17,738,674$ 85.10% 18,117,248$ 72.12% 18,018,266$ 77.32%
MAJOR RECURRING REVENUE SOURCES
The City of Rio Vista relies on several major ongoing revenue sources for its annual budget. The most significant of these revenue sources, based on the percentage of the total revenue budget, are: 1) Utility Service Fees; 2) Sales and Use Tax (including Measure O); 3) Property Taxes; 4) Community Facilities District Assessments; 5) Development Fees (including Cannabis Fees); 6) Motor Vehicle In‐Lieu Taxes; 7) Franchise Fees; 8) Gas Tax (including SB1); 9) Public Safety Fees & Grants, and 10) Interest Income.
Utility Service Fees, $7,939,000
Sales Tax (including Measure O), $2,610,800
Property Tax, $2,096,030
Community Facilities District Assessments,
$1,577,007
Development Fees (including Cannabis Fees),
$1,456,080
Motor Vehicle In‐Lieu Taxes, $882,183
Franchise Fees, $557,519
Gas Tax (including SB1), $432,321
Public Safety Fees & Grants, $274,000
Interest Income, $193,326
Revenues
Page 51

Revenues
Among major recurring revenues, $7,916,816, 44% of total major recurring revenues are from Enterprise Funds, $7,294,863, 40% of total major recurring revenues are from General Funds, $2,140,193, 12% of total major recurring revenues are from Special Revenue Funds, and $666,394, 4% of total major recurring revenues are from Capital Outlay Funds.
Of $18,018,266 major recurring revenues, $7,294,863 are from General Funds, including (1) Property Taxes; (2) Development Fees (including Cannabis Fees), (3) Sales and Use Taxes; (4) Measure O Sales Taxes, (5) Motor Vehicle In-Lieu Taxes; (6) Franchise Fees; (7) Interest Income; (8) UtilityServices Fees, and (9) Public Safety Service Fees.
Of $18,018,266 major recurring revenues, $10,723,403 are from Non-General Funds, including: (1) Utility Service Fees;(2) Development Impact Fees;(3) CFD Assessments;(4) Gas Tax and SB1;(5) Franchise Fees;(6) Interest Income; and(7) Public Safety Fees.
GENERAL FUND, 7,294,863
SPECIAL REVENUE FUND,
2,140,193 CAPTAL OUTLAY FUND, 666,394
ENTERPRISE FUND,
7,916,816
MAJOR RECURRING REVENUES BY FUND TYPE
Utility Service Fees, 78,000
Sales Tax, 1,377,800
Development Fees, 1,272,512
Property Tax, 2,096,030
Measure O Sales Tax, 1,233,000
Franchise Fees, 187,519
Interest Income, 38,820
Public Safety Svc Fee, 129,000
Motor Vehicle In-Lieu Taxes,
882,183
MAJOR RECURRING REVENUES-GENERAL FUND
Enterprise Fund -Utility Service
Fees, 7,832,000
Capital Outlay Fund -
Development Fees, 183,569
Capital Outlay Fund - Franchise Fees, 370,000
Enterprise Fund -Interest Income,
84,816
Special Revenue Fund - Public Safety Grant,
120,000
Special Revenue Fund - CFD
Assessments, 1,577,007
Special Revenue Fund - Gas Tax,
432,321
Capital Outlay Fund - Utility Service Fees,
29,000
Special Revenue Fund - Interest
Income, 10,865
Capital Outlay Fund - Interest
Income, 58,825
Capital Outlay Fund - Public Safety Fee,
25,000
MAJOR RECURRING REVENUES-OTHER FUNDS
Page 52

Revenues
Utility Services Fees
The City of Rio Vista provides water and sewer services for both residential and commercial customers within the city’s limits.
The coronavirus pandemic effectively shut down most of the country and the businesses in the City of Rio Vista. Based on the utility revenues recorded in the last three quarters, the projected receipts in FY 2020-21 are 2.48% lower than prior year. As quickly as the shutdown occurred, reopening businesses will have to be at a more gradual pace. To be conservative, the projection in FY 2021-22 is lower than the actual receipts in FY 2019-20 as the City expects a slow recovery for local businesses.
In the General Fund, the City imposes a Utility Users Tax on all residential and commercial utility bills for properties within the city. The projected revenue in the General Fund is $78,000 in FY 2021-22, $79,560 in FY 2022-23, and $79,560 in FY 2023-24. Those increases are based on the assumption of an average of 2% increase in population for the new homes built within the city limits.
In the Enterprise Funds, the projected revenue is $7,832,000 in FY 2021-22, $8,066,930 in FY 2022-23, and $8,066,930 in FY 2023-24. In October 2020, the City completed phase II of the water meter project, which installed water meters for its water users, converted flat rate water billing to metered unit-based billing. There is no indication the water or sewer rates will increase in the FY 2021-22. The increases are based on the assumption of an average of 2% increase in population of new user sign up for new homes built within the city limits and the actual usage being billed after the water meter installations.
The City is projecting 50 new homes to be built in FY 2021-22 and 100 new homes in both FY 2022-23 and FY 2023-24.
$7,7
10,6
57
$7,9
05,9
14
$7,7
07,4
68
$7,8
32,0
00
$8,0
66,9
30
$8,0
66,9
30
$75,610
$77,992
$78,340
$78,000
$79,560 $79,560
$7,400,000
$7,500,000
$7,600,000
$7,700,000
$7,800,000
$7,900,000
$8,000,000
$8,100,000
$8,200,000
FY2018-19Audited
FY2019-20Audited
FY2020-21Projected
FY2021-22Budget
FY2022-23Projected
FY2023-24Projected
UTILITY SERVICES FEES
Enterprise Fund - Utility Service Fees General Fund - Utility Service Fees
Page 53

Revenues
Property Tax
Pursuant to Proposition 13, passed by California voters in 1978, countywide property taxes are set at 1% of assessed value. Upon change of ownership, the assessed value of a property is reset to the current market value (sales price). The City receives approximately 17% of the 1% countywide property tax collected in the City. Property taxes are the major source of revenue to the City's General Fund, representing approximately $2 million, 7.95% of the total citywide major recurring revenues in FY2020-21 projection.
Property taxes are collected on both secured (real property) and unsecured property (such as boats). If a property changes ownership in the middle of a tax year, the reassessment appears on the tax rolls the following year. However, the property is reassessed for a pro-rata portion of the year of sale, and an additional or "supplemental tax" is applied in that year. The supplemental tax is allocated among all cities on a countywide basis. There are often delays in the processing of reassessments, so the collection of taxes through supplemental assessments can span more than one year, causing annual fluctuations in this revenue category.
Staff has reviewed property tax revenues from the past three years and taking into account the following: a.) resale activity b.) pricing and property owner tax appeals and adjustments by the County c.) new construction and d.) Proposition 13’s annual inflation adjustment. The collection of secured property taxes is expected to increase by approximately 5%, and no change for unsecured property tax and other property taxes for FY 2021-22. Secured property taxes is projected to increase by 5% in FY 2022-23 and FY 2023-24 based on the recent activities in new home constructions and housing market.
Property Tax revenues for FY 2021-22 are based on assessed values that were enrolled on January 1, 2021, which reflect the activities in 2020, the pandemic year. The projected increase of 5% is estimated based on the 2% annual adjustment on accessed values, and the assumption that the housing market was active while the interest rates were record lows in 2020. The historical data of the receipts from real property transfer taxes supports the assumption that consumers were active in buying and selling houses during the pandemic. The assessed values are expected to step up to the market value on the date of sales, and the allocation of property taxes would reflect this adjustment.
$-
$500,000
$1,000,000
$1,500,000
$2,000,000
$2,500,000
FY2018-19 FY2019-20 FY2020-21 FY2021-22 FY2022-23 FY2023-24
$1,7
16,8
78
$1,8
93,2
83
$1,9
96,1
80
$2,0
96,0
30
$2,1
95,2
32
$2,2
99,3
94
Property Tax Trend
Page 54

Revenues
Sales and Use Tax (Not Including Measure O)
The City is projecting approximately $1.38 million sales and use taxes in FY 2021-22. The sales tax rate in Rio Vista is 8.125%. For every dollar spent on taxable goods in the City, sales tax revenue is distributed as follows: 6% State of California, 0.25% Solano County, 0.125% City Public Safety Proposition 173, 1% City General Fund, and 0.75% Local Transactions and Use Taxes – Measure O.
Staff works with a sales tax consultant in projecting sales and use tax revenue, taking into account the following: a.) Real Gross Domestic Project (GDP); b.) Unemployment (California and US); c.) Historical Holiday Retail Sales; d.) Historical Sales and Use tax Collected; 5) Performance of Local Top 25 Sales and Use Tax Contributors. T he collection of Sales and Use Tax is expected to increase by approximately 6.21% for FY 2021-22 from FY 2020-21. When the pandemic hit in last year March, sales tax impacts were unknown. Unlike anything we have experienced, we have never closed the economy before. After reviewing the changes in estimates provided by MuniServices throughout the FY 2020-21, the overall decrease was about 9% before the pandemic hit, which was less than the expected 10 to 15%. The City continues to expect an increase in sales and use tax revenues by 3.8% in FY 2022-23 and 3.3% in FY 2023-24, based on the foreseeing sales of the 6 new cannabis dispensaries and increasing population through the new home building activities within the city limits to bring more purchase power.
Sales and Use Tax‐ Local Measure O
In June 21, 2016, the City passed the Ordinance No. 008-2016 extending the existing Measure O local 0.75% sales and use tax until March 31, 2022. The City Council further declared and determined, as a result of the election in November 2020, the majority voted in favor of the measure to continue for an additional five years until March 31, 2027. The Measure O Sales and Use Tax is projected at $1,233,000, which is representing approximately 17% of the major General Fund recurring revenue.
Measure O tax revenue is projecting to increase by 10.38% in FY 2021-22 from the projected receipt in FY 2020-21. Due to the pandemic and shelter-in-place order, consumer shopping online has increased significantly across many different categories, including essential items or groceries. This change improves the revenue stream from Measure O. The trend shows the projection for local retail and Measure O sales taxes are getting closer and closer, which reflects the new normal for consumers in buying online.
$1,153,548 $1,031,077 $1,117,000 $1,233,000 $1,299,000 $1,345,000
$1,418,886 $1,278,104 $1,297,200 $1,377,800 $1,429,600 $1,477,500
$-
$500,000
$1,000,000
$1,500,000
$2,000,000
F Y 2 0 1 8 - 1 9 F Y 2 0 1 9 - 2 0 F Y 2 0 2 0 - 2 1 F Y 2 0 2 1 - 2 2 F Y 2 0 2 2 - 2 3 F Y 2 0 2 3 - 2 4
SALES & USE TAX TRENDMeasure O Taxes Sales & Use Tax
Page 55

Revenues
Development Fees (Including Cannabis Fees)
Development fees cover the cost of inspection; plan retention and review; record keeping; materials investigation; special inspection management; overhead of the Building and Planning Divisions and cannabis facilities and development. The largest sources of development revenue are building permits, building plan checking fees, and planning application fees. The current projection for FY 2020-21 shows a total of 32 permits to be issued by year end. The projected revenue for FY 2021-22 of $1.46 million is based on the issuance of an estimated 50 new single-family dwelling permits, 100 building modification permits, and 10 commercial alternations permits. FY 2022-23 and FY 2023-24 revenues are based on the issuance of an estimated 100 new single- Family dwelling permits, 100 building modification permits, and 10 commercial alternations permits.
The City’s new home development revenues are projected based on the number of single-family dwelling permits estimated to be issued in the budget period, in addition to estimated revenues from all other permits and services related to development.
In June 2017, the first cannabis business, Rio Vista Farms, LLC started its operation. This is a new source of revenues that the City is expecting to grow in the coming years as the other dispensaries open. Each developer is required to make an annual payment per square footage of the building area in addition to the quarterly payments calculated based on the reporting gross receipts from operations. The rate of fees is determined in the Development Agreement, and it varies among developers. The rate of the annual payment is ranging from one dollar to three dollars per square-foot, and the quarterly payments is ranging from 1% to 4% of Developer’s gross receipts. The City recorded a total revenue of $378,346 from cannabis fees in FY2019-20, and a projected revenue of $797,654 in FY2020-21. In Fall 2020, 6 new cannabis businesses opened and in operations. Total estimated revenues in FY2021-22 are $791,530, in which $81,530 for facilities, and $710,000 for developer gross receipts. This projection is a conservative estimate due to the uncertainties concerning about growing market of cannabis businesses throughout California. The projected revenue remains the same for FY2022-23 and FY2023-24. Adjustments will be made during the mid-year as the new businesses are in operation after a year.
$3.47M
$1.56M
$1.75M
$1.46M
$1.56M
$1.56M
FY2018-19 AUDITED
FY2019-20 AUDITED
FY2020-21 PROJECTED
FY2021-22 BUDGET
FY2022-23 PROJECTED
FY2023-24 PROJECTED
Development Fee (In Millions)
Page 56

Revenues
Motor Vehicle In‐Lieu Tax
The Motor Vehicle License Fee (VLF) is a statewide tax on the ownership of registered vehicles in place of taxing vehicles as personal property. By law, all revenues from the VLF fund city and county services, but the State Legislature controls the tax rate and the allocation among local governments. In 2004, the Legislature permanently reduced the VLF tax rate and eliminated State general fund backfill to cities and counties. Instead, cities and counties now receive additional property tax revenues in lieu of VLF. These funds are classified as property taxes. Their growth going forward is tied to the change in the City’s assessed value growth and therefore is projected to change at a similar to that for secured property taxes. From most recent FY 2020-21 VLF Growth Calculation from the Solano County, dated October 8, 2020, the City of Rio Vista is projecting a 7.34% increase from FY 2019-20 in assessed valuation. The budget for FY 2021-22 remains the same as the amount received in FY2020-21 for a total of $875,745 with a small reduction for the catch-up amount due to the uncertainty of the impact on the pandemic. For FY 2022-23 and FY 2023-24, the City is expecting a 3% growth rate in the assessed valuation based on the average in previous years.
Community Facilities District Assessments
The City uses a Special Revenue Fund to account for special benefit assessments levied on property owners to be used for mainly public safety services, purchase safety related equipment, and maintenance and operation at the Liberty Community. This revenue source has grown in line with the increasing development over the past several years. In January 2018, the City Council approved the establishment of the Community Facilities District No. 2018-1 - Liberty Community. There is an operation and maintenance special assessments levied on property owners in the liberty community to fund the costs of services for maintenance and repair in landscaping, signage and lighting of streets, roads, sidewalks, curbs, gutters, parks, parkways, recreation facilities, water tower decorative feature, and open space. In FY 2020-21, the projected allocation from property taxes for Public Safety Services is $928,740 and Liberty Community Maintenance is $601,829.
744,251 823,323 883,070 882,183 908,648 935,908
8.86% 10.62%7.26%
-0.10% 3.00% 3.00%
-2.00%0.00%2.00%4.00%6.00%8.00%10.00%12.00%
-
200,000
400,000
600,000
800,000
1,000,000
FY18-19 FY19-20 FY20-21 FY21-22 FY22-23 FY23-24
Motor Vehicle In-Lieu Trend
Total Moter Vehicle In Lieu % Growth Changes in Previous Year
Page 57

Revenues
Budgeted growth in this revenue source is driven by new development in the City, plus an annual 2% inflation increase in the existing assessment amounts. Projected new development includes 50 single-family residential permits projected to be issued in FY 2021-22 and 100 single- family residential permits in both FY 2022-23 and FY 2023-24. As the businesses start reopening in June 2021 and umemployment rate begins to drop, the City projects a 3% increase in FY 2021-22 and 5% for subsequent years.
Franchise Fees
The City has Franchise agreements with several utility companies. Those companies pay the City a Franchise fee based on the percentage of their revenue earned within the City Limits. In the General Fund, the City collects Franchise Fees from PG&E and Comcast; and in the Capital Outlay Fund, the City collects Franchise fee from Rio Vista Sanitation.
Staff projects a 1% annual increase in the franchise fees from the General Fund and from the Capital Outlay Fund based on the projected increase in population. The total projected revenues from both funds are $557,519 in FY 2021-22, $563,094 in FY 2022-23 and $568,725 in FY 2023-24.
$1,261,697
$1,429,580
$1,530,570
$1,577,007
$1,655,857
$1,738,650
$- $500,000 $1,000,000 $1,500,000 $2,000,000
FY 2018-19 AUDITED
FY 2019-20 AUDITED
FY 2020-21 PROJECTED
FY 2021-22 BUDGET
FY 2022-23 PROJECTED
FY 2023-24 PROJECTED
Community Facilities District Assessments
FY2018-19Audited
FY2019-20Audited
FY2020-21Projected
FY2021-22Budget
FY2022-23Projected
FY2023-24Projected
CAPITAL OUTLAY FUND - Franchise Fees $341,391 $381,525 $366,819 $370,000 $373,700 $377,437GENERAL FUND - Franchise Fees $141,753 $179,967 $187,519 $187,519 $189,394 $191,288
0%
10%
20%
30%
40%
50%
60%
70%
80%
90%
100%
Page 58

Revenues
Gas Tax
The State of California imposes a tax on motor vehicle and aircraft fuel, with a portion of these funds being allocated to cities to help fund street improvements and maintenance. These funds are commonly referred to as “Gas Tax” revenues. The City categorizes Gas Tax revenues as a Special Revenue Fund to support street maintenance.
City and county allocation estimates of Highway Users Tax Account (HUTA) and Road Maintenance and Rehabilitation Account (RMRA) funds are based on California Department of Finance estimates released with the Governor's May Revision to his proposed budget released on May 14, 2021. The projected increase in revenue for FY 2021-22 is 9.79% for HUTA and 9.52% for RMRA from FY 2020-21.
Interest Income
The City reviews its cash balance semi-annually and reinvests all its idle cash in accordance with the City's formal investment policy. The City’s interest income has been reduced significantly by 57% from FY 2019-20 to FY 2020-21 due to the record low interest rate during the COVID-19 pandemic. Based on the estimated average cash balances, interest income/return on investments is projected to be approximately $193,326 in FY 2021-22 and $197,193 in FY 2022-23. As the economy continues to improve, the City forecasts the average interest rates will rise in 2022. The minimal increase is estimated based on the significant amount of one-time Capital Outlay and Improvement Projects budgeted in FY 2021-22, which decreases the cash balances.
$263,069
$517,509 $455,988
$197,095
$193,326 $197,193
$-
$100,000
$200,000
$300,000
$400,000
$500,000
$600,000
FY2017-18 FY2018-19 FY2019-20 FY2020-21 FY2021-22 FY2022-23
Interest Income Trend
FY17-18 FY18-19 FY19-20 FY20-21 FY21-22Gas Tax 187,465 185,569 211,647 226,149 248,288SB1 51,827 190,125 173,670 168,038 184,033
187,465 185,569 211,647 226,149 248,288
51,827
190,125 173,670 168,038 184,033
-50,000
100,000 150,000 200,000 250,000 300,000
Gas Tax & SB1
Page 59

Revenues
Public Safety Fees & Grants The public safety services provided by the City are subsidized by other sources of revenues, including charges of services for live scan, fire inspections, and others, Citizens Option for Public Safety (COPS) supplemental law enforcement services funds, expenses reimbursement through Peace Officer Standards and Training (POST) and Justice Assistance Grant (JAG) Program, and services agreement with Delta Fire Protection District.
COPS program funds, exclusively to fund front line municipal police services, are allocated to the Cities on a population basis with a minimum allocation of $100,000 per annum. The City is contracted with the Delta Fire Districts (District) to provide all fire prevention services, emergency medical responses and rescue services, hazardous material emergency response services, and any other services relating to the protection of lives and property. The District agrees to compensate the City by the annual payment amount of at least $100,000 plus an additional $25,000 for vehicle replacement fund.
The City is projecting an increase of $60,000 additional funding from Delta Fire Districts in FY 2022-23 to subsidize the three fire engineer positions added in FY 2020-21. The significant increase of revenue in FY 2020-21 was due to the one-time repayment of $298,453 from the District per contractual obligation. An approximate 1% increase in FY2021-22, FY 2022-23, and FY 2023-24 for charges of services based on the increase in population and the number of new businesses at the Business Parks.
$361,170
$308,786
$587,385
$274,000
$336,740
$339,507
FY2018-19
FY2019-20
FY2020-21
FY2021-22
FY2022-23
FY2023-24
Public Safety Fees & Grants
Page 60

Expenditures
Page 61

GENERAL FUND7,912,723
24%
CAPITAL OUTLAY FUNDS2,380,513
7%
SPECIAL REVENUE FUNDS2,672,813
8%
ENTERPRISE FUNDS19,062,475
56%
AGENCY FUNDS1,810,297
5%
CITYWIDE EXPENDITURES BY FUND TYPE$33,838,821
Page 62

Fund No. Fund NameFY 19/20
Audited
FY 20/21
Budget
FY 20/21
Projected
FY21/22
AdoptedBudget
% Change
GENERAL FUND
002 Measure O 1,031,077$ 1,072,002$ 1,117,000$ 1,233,000$ 15.02%
010 General Fund 5,824,783 7,116,187 6,923,896 6,654,389 ‐6.49%Subtotal General Fund 6,855,860 8,188,189 8,040,897 7,887,389 ‐3.67%
022 General Plan ‐ 20,000 ‐ 5,264 ‐73.68%052 Transient Occupancy Tax 38,627 35,000 35,000 20,070 ‐42.66%
Total General Fund per Audit Report 6,894,487 8,243,189 8,075,897 7,912,723 ‐4.01%
CAPITAL OUTLAY FUNDS
012 Vehicle Replacement 232,066 208,024 128,024 208,024 0.00%
050 Storm Drain 99,607 35,618 25,618 36,722 3.10%
051 Capital Projects 1,178,693 4,363,751 3,257,701 913,999 ‐79.05%053 Roadway Impact 299 ‐ 1,122 400,000 ‐054 Parks and Recreation 276,740 917,687 712,232 161,299 ‐82.42%056 Municipal Improvements 106,678 385,079 174,067 120,550 ‐68.69%060 Hazardous Waste 70,555 138,795 138,795 143,548 3.42%
065 Landfill Closure 64,324 374,922 374,922 375,649 0.19%
076 Army Base 9,586 13,609 13,609 20,724 52.28%Total Capital Outlay Funds 2,038,548 6,437,484 4,826,089 2,380,513 ‐63.02%
DEBT SERVICE FUND
040 Firehouse Bonds ‐ ‐ ‐ ‐ ‐Total Debt Service Fund ‐ ‐ ‐ ‐ ‐
SPECIAL REVENUE FUNDS
017 Law Enforcement Grant 172,679 180,000 180,000 180,000 0.00%
019 ATOD Grant 58,277 61,970 61,970 57,477 ‐7.25%025 Gas Tax 289,999 662,114 409,956 860,910 30.02%
031 Developers Revolving 4,327 51,000 21,000 31,000 ‐39.22%038 Personnel Services District ‐ Fire 411,986 485,549 409,295 504,271 3.86%
039 Personnel Services District ‐ Police 501,817 509,616 466,516 567,462 11.35%
055 Liberty Main & Operation Svc District 81,438 465,328 465,328 471,693 1.37%
091 Street Projects 81,848 140,000 140,000 ‐ ‐100.00%Total Special Revenue Funds 1,602,371 2,555,577 2,154,065 2,672,813 4.59%
ENTERPRISE FUNDS
032 Transit 512,768 683,365 552,865 848,096 24.11%
075 Business Park 122,952 1,962,132 1,952,780 104,212 ‐94.69%080 Water System 3,499,041 6,319,860 3,873,596 5,043,007 ‐20.20%081 Water Project ‐ Capital Outlay 1,277,757 3,111,111 869,847 2,000,000 ‐35.71%082 Water Fixed Assets ‐ ‐ ‐ ‐ ‐084 Airport 252,724 1,249,129 350,154 1,158,198 ‐7.28%085 Beach Facility 2,267,079 3,837,769 2,947,965 4,787,891 24.76%
086 NW Facility 2,346,026 3,434,259 3,292,003 2,541,070 ‐26.01%087 NW Sewer Project ‐ Capital Outlay ‐ 1,678,778 1,568,785 330,000 ‐80.34%088 Beach Sewer Project ‐ Capital Outlay 718,677 1,125,000 235,196 2,250,000 100.00%
Total Enterprise Funds 10,997,024 23,401,402 15,643,192 19,062,475 ‐18.54%
CITYWIDE EXPENDITURE SUMMARY BY FUND
Expenditures
Page 63

Fund No. Fund NameFY 19/20
Audited
FY 20/21
Budget
FY 20/21
Projected
FY21/22
AdoptedBudget
% Change
CITYWIDE EXPENDITURE SUMMARY BY FUND
Expenditures
AGENCY FUNDS
041 Community Facilities District 2006‐1 492,438 519,803 519,803 525,355 1.07%
042 Riverview Point Assessment District 150,200 152,107 152,399 152,190 0.05%
044 Riverwalk CFD ‐ 12,000 ‐ 12,000 0.00%
049 Community Facilities District 2004‐1 285,751 304,470 304,470 310,490 1.98%
095 Liberty CFD 736,589 809,940 809,940 810,262 0.04%
Total Agency Funds 1,664,978 1,798,319 1,786,611 1,810,297 0.67%
TOTAL FUNDS 23,197,409$ 42,435,972$ 32,485,854$ 33,838,821$ ‐20.26%
Page 64

FY 18/19
Audited
FY 19/20
Budget
FY 19/20
Projected
FY20/21
AdoptedBudget
% Change
Expenditures
Salaries & Benefits 2,633,698$ 2,207,810$ 2,311,398$ 2,054,361$ ‐6.95%Measure O Funded Employees 1,031,077 1,072,002 1,117,000 1,233,000 15.02%
Insurance 203,713 207,563 204,563 203,096 ‐2.15%Professional Services 492,863 399,376 344,668 419,031 4.92%
Contract Services 1,508,695 2,941,375 2,865,708 2,777,944 ‐5.56%Lease/Rent Expense 40,117 32,388 32,388 32,388 0.00%
Maintenance & Repair 272,372 349,810 291,531 289,050 ‐17.37%Supplies & Materials 252,334 393,694 331,548 340,900 ‐13.41%Training, Conferences & Mtgs 24,437 31,675 19,200 38,875 22.73%
Utilities 186,540 180,152 184,200 183,688 1.96%
Debt Service Expense 68,917 124,238 124,238 120,549 ‐2.97%Misc. Expense 171,724 191,673 173,019 201,839 5.30%
SUBTOTAL GENERAL FUND OPERATIONS 6,886,487 8,131,756 7,999,463 7,894,723 ‐2.91% Capital Outlay ‐ 68,077 58,077 10,000 ‐85.31%TOTAL USE OF RESOURCES 6,886,487 8,199,833 8,057,540 7,904,723 ‐3.60%
Transfers Out 8,000 43,356 18,357 8,000 ‐81.55%
TOTAL GENERAL FUND EXPENDITURES 6,894,487$ 8,243,189$ 8,075,897$ 7,912,723$
Annual Percentage Change 17.14% ‐4.01%
GENERAL FUND EXPENDITURE BY CATEGORY
Salaries & Benefits, 2,054,361 , 26%
Measure O Funded Employees, 1,233,000 ,
16%
Insurance, 203,096 , 3%
Professional Services, 419,031 ,
5%
Contract Services, 2,777,944 , 35%
Lease/Rent Expense, 32,388 , 0.4%
Maintenance & Repair, 289,050 , 4%
Supplies & Materials, 340,900 , 4%
Training, Conferences & Mtgs, 38,875 , 0% Utilities,
183,688 , 2%
Debt Service Expense,
120,549 , 2%
Misc. Expense, 201,839 , 3%
Capital Outlay, 10,000 , 0.1%
Transfers Out, 8,000 , 0.41%
Expenditures
Page 65

FY 19/20
Audited
FY 20/21
Budget
FY 20/21
Projected
FY21/22
AdoptedBudget
% Change
Measure O Funded Employees 1,031,077$ 1,072,002$ 1,117,000$ 1,233,000$ 15.02%
City Council 101,449 93,453 86,335 99,090 6.03%
City Manager 89,403 200,063 199,698 185,933 ‐7.06%City Administration 336,482 354,304 257,475 329,829 ‐6.91%Assistant City Manager/ City Clerk 160,370 208,099 178,928 218,662 5.08%
Finance 107,474 139,963 139,963 146,221 4.47%
Information Technology 121,132 172,194 160,519 153,074 ‐11.10%Building Department 163,376 254,037 221,364 252,862 ‐0.46%Planning 290,742 291,270 267,580 277,603 ‐4.69%Code Enforcement 34,961 85,851 81,235 84,997 ‐0.99%Economic Development 7,371 34,069 34,069 32,438 ‐4.79%City Hall Bldg/Grounds 43,265 48,919 52,319 52,365 7.04%
Swimming Pool 87,399 107,771 71,653 117,126 8.68%
Youth Center 15,724 22,890 15,165 22,014 ‐3.82%Corporation Yard 72,826 145,783 161,604 62,475 ‐57.15%Senior Center 21,626 27,844 23,889 22,854 ‐17.92%Parks 123,934 250,479 250,479 124,490 ‐50.30%Street 125,061 129,123 129,123 124,895 ‐3.27%Public Works Administration 33,077 29,264 29,264 20,715 ‐29.21%Library 11,471 59,686 59,686 17,728 ‐70.30%Fire 1,660,687 1,456,610 1,575,570 1,449,519 ‐0.49%Police 2,187,301 2,904,223 2,863,438 2,812,398 ‐3.16%Recreation 21,653 56,936 46,186 39,100 ‐31.33%Transient Occupancy Tax 38,627 35,000 35,000 20,070 ‐42.66%General Plan ‐ 20,000 ‐ 5,264 ‐73.68%Transfers Out 8,000 43,356 18,357 8,000 ‐81.55%
TOTAL GENERAL FUND EXPENDITURES 6,894,487$ 8,243,189$ 8,075,897$ 7,912,723$
Annual Percentage Change 17.14% ‐4.01%
GENERAL FUND EXPENDITURE BY FUNCTION
Expenditures
Page 66

Performance Budget
Page 67

Legislative Organizational Chart
LEGISLATIVE ORGANIZATIONAL CHART
Ronald Kott Mayor
David Hampton Rick Dolk Debra King Walt Stanish Vice-Mayor Council Member Council Member Council Member
Page 68

Performance Budget
LEGISLATIVE
The Legislative Department is comprised of the members of the City Council, which is the policy‐making body for the city, as well as the city’s Commissions and Committees. Implementation of City Council policy is accomplished through the adoption of ordinances, policies and resolutions, the approval of contracts and agreements and adoption of the city budget. The City Council is composed of a directly elected Mayor and four City Council members elected at‐large. The City Council is also responsible for appointing members to City Commissions and Committees.
DEPARTMENT BUDGET SUMMARY
Expenditures by Division FY 19/20 Audited
FY 20/21 Budget
FY 20/21 Projected
FY21/22 Adopted
General Fund City Council $ 101,449 $ 93,453 $ 86,335 $ 99,090 Total $ 101,449 $ 93,453 $ 86,335 $ 99,090
Annual Percentage Change ‐15% 15%
Expenditures by Category FY 19/20 Audited
FY 20/21 Budget
FY 20/21 Projected
FY21/22 Adopted
Personnel Services $ 38,755 $ 39,770 $ 39,770 $ 41,446 Supplies and Services 62,694 53,682 46,564 57,644 Total $ 101,449 $ 93,453 $ 86,335 $ 99,090
SALARY AND BENEFIT CHANGES Ordinance No. 005‐2020, amending Section 2.04.020 of the Rio Vista Municipal Code relating to the compensation of the City Council, was adopted in January 2020. Commencing on December 1, 2020, the salaries of the members of the City Council are set at $535 per month or a 4.9% increase from the rate approved in 2018.
SERVICES AND SUPPLIES There is an increase of $3,962 from the budget of FY 20‐21 mainly due to the increase in funding share of operational costs for Solano Local Agency Formation Commission (LAFCO).
STRATEGIC PLAN
The City Council and staff are committed to providing exceptional municipal service to our citizens while ensuring the city grows in a safe, vibrant manner. Council and staff continue to work on the goals from the strategic planning session conducted. The following goals were discussed:
Page 69

Performance Budget
Goal 1.0: Improve Financial Viability Objective 1.1 The city will need to work with the Investment and Financial Review Committee to
develop recommendations regarding the appropriate level of reserves. This would include reviewing and updating the city’s investment policy and reviewing investment options for the city's cash balance.
Goal 2.0: Improve City Infrastructure Objective 1.1 The city has made significant water, wastewater and street infrastructure improvements
throughout the downtown and older parts of town; however, more improvements need to be made. The City Council has approved the updated five‐year Capital Improvement Plans (CIP) for water, wastewater, and for streets. Staff is working on a multi‐year CIP for sidewalks that will need to be approved by Council.
Goal 3.0: Improve Organization of City Records and Documents
Objective 1.1 A well‐organized records and documentation process are important for operational efficiency and for transparency. The City has made great strides in organizing this area and will continue to make improvements by adopting a Records & Information Management (RIM) Governance Policy, posting of City Council, Planning Commission and all other Council‐sanctioned board agendas, and public hearing notices on the website.
Goal 4.0: Improve Public Safety
Objective 1.1 Police: The end of 2019 saw the department significantly drop, causing the City to contract law enforcement services with the Solano County Sheriff’s Office. The City is currently contracting for 12 sworn positions that includes the Police Chief and two Sergeant positions. The department has also taken the lead in day‐to‐day code enforcement actions for the city.
Objective 1.2 Fire: The department has improved their city response times and its public services by responding with a minimum of two personnel for EMS type incidents and respond with a minimum of four personnel to Fire and Special Operations type incidents. The ratio of 90% of incidents has a travel time of five minutes and between a 60 and 80 second turnaround, depending on the type of incident. The department implemented area‐wide training that includes offering training positions to surrounding agencies. The department has increased staffing to provide for four positions per shift and continues to dispatch teams to help fight fires throughout California (The city is reimbursed for these efforts).
Goal 5.0: Improve the Quality of Life for Rio Vista Residents Objective 1.1 The City will continue to provide opportunities to support recreation events such as the
newly installed playground equipment in the park and the soon to be completed dog and skateboard parks. A new dock is being manufactured and scheduled for installation prior the 72nd Bass Fishing Derby, in October.
Goal 6.0: Enhance Economic Development and Attract New Business Objective 1.1 The City will partner with other organizations such as Rio Vision and the Chamber to
support activities to promote tourism through special events, outdoor attractions and recreational opportunities.
Goals and Initiatives
Page 70

CITY OF RIO VISTA ORGANIZATIONAL CHARTFISCAL YEAR 2021-2022
Citizens
Mayor and City Council
City Attorney (Contract) City Manager (1)
Human Resource Analyst/Deputy City
Clerk (1)Assistant City
Manager/City Clerk
(1)
Police Chief (1) (Contract) Fire Chief (1) Finance Director (1) Public Works
Director (1)Planning Manager
(1)
Transit Manager (Contract)
Information Technology (Contract)
Citywide Organizational Chart
Page 71
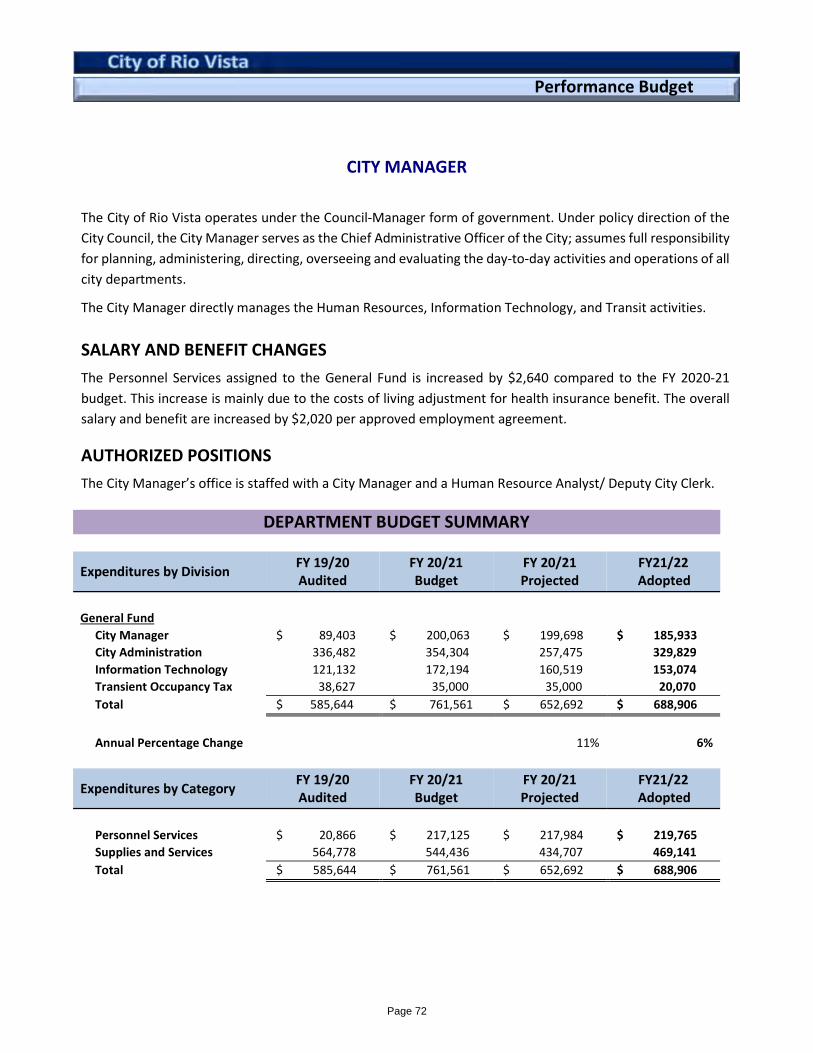
Performance Budget
CITY MANAGER
The City of Rio Vista operates under the Council‐Manager form of government. Under policy direction of the City Council, the City Manager serves as the Chief Administrative Officer of the City; assumes full responsibility for planning, administering, directing, overseeing and evaluating the day‐to‐day activities and operations of all city departments.
The City Manager directly manages the Human Resources, Information Technology, and Transit activities.
SALARY AND BENEFIT CHANGES The Personnel Services assigned to the General Fund is increased by $2,640 compared to the FY 2020‐21 budget. This increase is mainly due to the costs of living adjustment for health insurance benefit. The overall salary and benefit are increased by $2,020 per approved employment agreement.
AUTHORIZED POSITIONS The City Manager’s office is staffed with a City Manager and a Human Resource Analyst/ Deputy City Clerk.
DEPARTMENT BUDGET SUMMARY
Expenditures by Division FY 19/20 Audited
FY 20/21 Budget
FY 20/21 Projected
FY21/22 Adopted
General Fund City Manager $ 89,403 $ 200,063 $ 199,698 $ 185,933 City Administration 336,482 354,304 257,475 329,829 Information Technology 121,132 172,194 160,519 153,074 Transient Occupancy Tax 38,627 35,000 35,000 20,070 Total $ 585,644 $ 761,561 $ 652,692 $ 688,906
Annual Percentage Change 11% 6%
Expenditures by Category FY 19/20 Audited
FY 20/21 Budget
FY 20/21 Projected
FY21/22 Adopted
Personnel Services $ 20,866 $ 217,125 $ 217,984 $ 219,765 Supplies and Services 564,778 544,436 434,707 469,141 Total $ 585,644 $ 761,561 $ 652,692 $ 688,906
Page 72

Performance Budget
Goal 1.0: Key Department Goals Objective 1.1 Supported Business development throughout the city
Objective 1.2 Continued to develop business in the Business Park to bring in necessary revenues and create employment opportunities
Objective 1.3 Increased business license collection efforts
Objective 1.4 Reduced utility account aged amounts and ensured overdue accounts are placed on a lien list and filed with the County (Note: On April 2, 2020, Governor Newsom passed Executive Order N‐42‐20, which prohibits water systems from shutting off residential water service for non‐payment of bills and prohibits the same for small businesses in the critical infrastructure sectors.)
Objective 1.5 Identified operational and best practices
Objective 1.6 Supported training opportunities for staff
Objective 1.7 Provided outstanding customer support Objective 1.8 Updated business‐related ordinances as needed to support the growth of new businesses
and jobs Objective 1.9 Provided orientation training to new Planning Commissioners Objective 2.0 Updated plans and checklists to aid in the growth of new businesses and future
development Goal 2.0: Upgrade Information Technology Objective 1.1 Upgraded computers and servers throughout the city Objective 1.2 Standardized computer operating systems
PRIOR YEAR ACCOMPLISHMENTS
Improve Financial Viability: Although our financial audits have been “Unqualified”—the top rating given; staff continues to improve process as seen by this year’s budget format. Staff continues to tweak the budget format to add clarity and will continue to explore methods to better present information in a clear and understandable manner.
Assisted the Finance Department to develop metrics to analyze past‐due receivables. Online web portal for utility payments. Approximately 30% of customers have signed up. Improve City infrastructure
o Continue to work with staff to develop a five‐year Capital Improvement Plan (CIP). The CIP is a rolling document that will be updated annually to always provide a five‐year forecast of needed infrastructure projects.
o Continue to improve fire and police facilities. o Upgrading technology in all facilities.
Improved Public Safety
o Contracting with the Solano County Sheriff’s Department to provide law enforcement services o Tracking police and fire response times and call volume o Added a Battalion Chief position
Goals and Initiatives
Page 73

Performance Budget
TRANSIT
FY 2020‐21 BUDGET DESCRIPTION
(1) Mission ‐ The following are Rio Vista Delta Breeze transit system goals: Service Goal
o Provide safe, reliable, and high‐quality transportationo Evaluate, monitor, and improve transit services on an on‐going basis
Ridership Goalo Retain and attract new ridership
Customer Focus Goalo Serve the transportation needs of the communityo Undertake effective marketing, outreach, and public participation
Financial/Cost Efficiency Goalo Operate an efficient and effective system that maximizes service and minimizes cost
impacts Community and Environment Goal
o Coordinate transit system development with community planning and developmentefforts and land‐use policy
Coordination Goalo Coordinate local and intercity transit services
DEPARTMENT BUDGET SUMMARY
Expenditures by Division FY 19/20 Audited
FY 20/21 Budget
FY 20/21 Projected
FY21/22 Adopted
Enterprise Funds Transit $ 512,768 $ 683,365 $ 552,865 $ 848,096 Total $ 512,768 $ 683,365 $ 552,865 $ 848,096
Annual Percentage Change 8% 53%
Expenditures by Category FY 19/20 Audited
FY 20/21 Budget
FY 20/21 Projected
FY21/22 Adopted
Personnel Services $ 22,437 $ 26,520 $ 26,520 $ 27,326 Supplies and Services 470,331 514,345 514,345 678,270 Capital Outlay & Transfer Out 20,000 142,500 12,000 142,500 Total $ 512,768 $ 683,365 $ 552,865 $ 848,096
Rio Vista Delta Breeze
Page 74

Performance Budget
(2) Budget Summaries and Five‐Year Forecast – Transit Capital Fund and forecast comments
(includes Grants and capital expenditures).
The following table provides an overview of the Rio Vista Delta Breeze 5‐year capital plan. The primary expenditures are for replacing the fleet of four transit buses, which have a useful life of approximately 5 years. Funds for the bus replacements are available from the Federal Transit Administration though competitive grants. These grants can fund from 80% to 100% of the cost of the bus, depending on the funding program. Rio Vista provides any necessary local matching funds from its Transportation Development Act (TDA) funds. In addition to the fleet replacement, the capital plan includes limited expenditures for communication systems, tools, and other equipment. At this time, Rio Vista anticipates that these types of costs would be funded using TDA revenue. The Rio Vista Delta Breeze and the Public Works Department successfully collaborated on a grant from the Yolo Solano Air Quality Management District for a bus shelter that will be installed by Public Works at Front and Main Street.
Rio Vista Delta Breeze Capital Plan
(3) Program Description
Rio Vista initiated public transit service in July 1980 under the Rio Vista Transit brand by providing demand responsive service on weekdays to the general public. In January 2006, Rio Vista Transit evolved into Rio Vista Delta Breeze, which added deviated fixed‐route service. In an effort to address low productivity and high operating costs, in January 2007, the City reduced the level of transit service to a modest “lifeline” operation while converting Route 51 (Rio Vista/Isleton City Circulator) to a general public, dial‐ a‐ride service and eliminating the Rio Vista Vanpool program and the Delta Breeze Senior Shuttle.
FY 2020‐21 FY 2021‐22 FY 2022‐23 FY 2023‐24 FY 2024‐25Capital ExpenseCapital - Vehicles 95,500$ 190,000$ ‐$ 101,600$ ‐$ Capital: Bus Shelter ‐$ 35,000$ ‐$ ‐$ ‐$ Capital: Electrification ‐$ ‐$ 75,000$ ‐$ ‐$ Capital - Radio System, Tools, Equipment ‐$ ‐$ 45,000$ ‐$ ‐$ Capital Expense 95,500$ 225,000$ 120,000$ 101,600$ ‐$
Capital RevenueFTA Funding 75,000$ 128,208$ 94,802$ 81,280$ ‐$ TDA 20,500$ 26,792$ 25,198$ 20,320$ ‐$ STAF ‐$ ‐$ ‐$ ‐$ ‐$ Air District Grant ‐$ 30,000$ ‐$ ‐$ ‐$ Insurance / Other ‐$ 40,000$ ‐$ ‐$ ‐$ Total Revenue 95,500$ 225,000$ 120,000$ 101,600$ ‐$
Page 75

Performance Budget
There are two classifications of services that the Delta Breeze provides: Deviated Fixed Route (Routes 50 and 52) intended to provide direct service from Rio Vista
communities to health and social services agencies within Fairfield California and to access the BART commuter rail system in Antioch, that also allows deviations with advanced request.
General Dial‐A‐Ride service (Routes 51) that provides intra‐city circulation within Rio Vista and Isleton.
Delta Breeze connects to several other transit operators at transit centers and stops throughout Solano and eastern Contra Costa County: Fairfield Transportation Center: FAST, SolTrans, and VINE Solano Town Center (in Fairfield): FAST, and SolTrans Suisun City Train Depot: VINE, FAST, Greyhound, SolTrans, and Amtrak Capitol Corridor Antioch: BART, County Connection, Tri Delta Transit Rio Vista Delta Breeze is managed by the Transit Manager and operated by a transit contractor, Transportation Concepts.
OPERATIONS
FY 2020‐21 ACCOMPLISHMENT In FY 2020‐21, Rio Vista Delta Breeze:
Advocated and received $157,836 dollars in federal Coronavirus Aid, and Economic Security Act (CARES ACT).
Received a grant from the Yolo Solano Air Quality Management District to fund an electrical fuel transition study, in conjunction with the Cities of Dixon and Vacaville.
Successful FTA/Caltrans Statewide Review. Issued new safety/ cleaning procedures for the buses and facilities (COVID), which has 100%
compliance. Partnered with Uber Transit to integrate the Rio Vista Delta Breeze on the Uber platform, which will
launch September 1, 2021. Piloting a regional initiative regarding transit mapping and way finding. Participating in a fare coordination subcommittee with the Cities of Dixon and Vacaville.
Month Year Passengers Days of Service Riders Per Day Total Miles Avg. Daily Miles
July 2020 422 22 19 4,994 227 August 2020 406 21 19 4,724 224 September 2020 439 21 21 4,727 225 October 2020 436 22 20 4,872 221 November 2020 355 19 19 4,242 223
December 2020 321 21 15 4,789 228 January 2021 288 19 15 4,184 220 February 2021 337 19 18 4,115 216 March 2021 443 23 19 5,208 226 April 2021 404 22 18 4,836 219
Page 76

ASSISTANT CITY MANAGER/CITY CLERK ORGANIZATIONAL CHARTFISCAL YEAR 2021-2022
Assistant City Manager/City Clerk
(1)
PT City Clerk Assistant (1)
Assistant City Manager/City Clerk Organizational Chart
Page 77

Performance Budget
ASSISTANT CITY MANAGER/ CITY CLERK
The City Clerk is the local official who administers democratic processes such as elections, access to city records, and all legislative actions ensuring transparency to the public. The City Clerk acts as the Compliance Officer for Federal, State and local statutes including the Political Reform Act, the Brown Act and the Public Records Act. The City Clerk Department manages public inquiries and relationships and arranges for ceremonial and official functions. The City Clerk is one of the oldest positions in local government; few people realize the vital services Municipal and Deputy Clerks perform for their community. Primarily, they act as the cornerstone of their City Council. One of local government’s deep-rooted title is the Municipal Clerk, and our duties have expanded over the years. Today, modern technology assist us with the ever-increasing responsibilities such as new computer applications, latest records management techniques and other relevant information, and regularly attend classroom and conference training to increase knowledge on these issues to learn new material and sharpen old skills- all in order to give the best services possible!
DEPARTMENT BUDGET SUMMARY
Expenditures by Division FY 19/20 Audited
FY 20/21 Budget
FY 20/21 Projected
FY21/22 Adopted
General Fund City Clerk $ 160,370 $ 233,099 $ 178,928 $ 218,662 Total $ 160,370 $ 233,099 $ 178,928 $ 218,662
Annual Percentage Change 12% 22%
Expenditures by Category FY 19/20 Audited
FY 20/21 Budget
FY 20/21 Projected
FY21/22 Adopted
Personnel Services $ 96,432 $ 121,464 $ 121,464 $ 148,062 Supplies and Services 63,937 86,635 57,464 70,601 Capital Outlay & Transfer Out - 25,000 - - Total $ 160,370 $ 233,099 $ 178,928 $ 218,662
SALARY AND BENEFIT CHANGES
The Personnel Services assigned to the General Fund increases by $26,598, and the overall salaries and benefits budget for the FY 2021-22 increases by $49,846. The General Fund increase is due to the addition of a temporary part-time administrative position during the mid-year budget adjustment in FY 2020-21 for records management. Besides the addition of the temporary part-time position, the overall increase is caused by the adjustments in pension contribution. No other additional requests for an increase in the hours of part-time or temporary administrative support staff.
Page 78

Performance Budget
AUTHORIZED POSITIONS
This year’s budget does not reflect any changes in authorized full-time positions. The department is currently staffed with one Assistant City Manager/City Clerk, and two temporary part-time at 20 hours a week, for administrative support. The City Clerk’s office continues progress scanning critical historical records in anticipation of the future Laserfiche Data Records Program.
SERVICES AND SUPPLIES
A new Records Retention Policy was approved in 2020 and the remaining milestones (onsite training and implementation) are pending post COVID reopening and will resume once operations normalize. The recently approved retention policy will be a vital part of a future Electronic Document Management System (EDMS). The City needs to have a centralized repository for records.
Goal 1.0: Improve Access to City Information Objective 3.1 Schedule and complete workday(s) on annual or semi-annual basis for destruction Improve Of eligible records. Records Schedule records eligible for off-site storage workday(s) on annual or semi-annual Management basis.
Monitor staff accountability on Council-sanctioned board e-records being stored/filed on network drive versus individual workstation drive(s). Monitor staff accountability on Planning Commission hard copy records (agenda packets, adopted resolutions and adopted minutes) being stored in the City Clerk’s records room. Create inventory list of permanent records (deeds, easements, etc.) stored in Finance vault. Maintain indices for Council adopted ordinances and resolutions, post on website— Posting going forward. Development and implementation of taxonomy (city-wide standardized identification system/naming protocol for both e-records and hardcopy records; Purchase, implementation, and training for records management software. Examine savings opportunity for live streaming of Council/Planning Commission meetings and archiving of meeting records from Granicus competition vendors and make determination. Examine advantages of purchasing contract management software to monitor expiration dates and other criteria and make determination – ongoing.
Objective 3.2 Post City Council, Planning Commission, and all other Council-sanctioned board Continue to agendas, minutes, and public hearing notices on the website—Accomplished. Improve City Posting of notices on “Nextdoor” with a link to the city website. – Accomplished. Transparency
Goals and Initiatives
Page 79

Performance Budget
Provide City Council and Planning Commission adopted resolutions on website; Accomplished – executed resolutions are posted to meeting agendas.
Develop metric for Council meeting preparation and delivery of packet to capture time demand of this recurring task to available staff resources—Ongoing. Staff goal is to continue publishing the agenda the week before each meeting.
Develop metric for Council meeting follow up tasks to capture time demand of this recurring task to available staff resources. Goal is to complete follow-up by Friday after each meeting.
Objective 3.3 Elections and FFPC
Every even-numbered year, provide the following Elections Official services: o Prepare Candidate Guide and Write-In Candidate Guide. o Prepare resolution and agenda report requesting consolidation of municipal
election with November statewide general election and submit candidate statement policy for Council action.
o Coordinate needed Council action for any ballot measures. o Prepare resolution and agenda report for placement of any measures on
November ballot. Publish all required notices of election for candidates and measures. Issue candidate papers to those requesting to pull papers. Process candidate papers for those requesting to file papers. Submit required document filing to Solano County Registrar of Voters and to FPPC. Monitor required campaign filing through January following November election. Prepare resolution and agenda report for certification of election for Council
action. Swear In and present Certificates of Election to newly elected officials first meeting
in December following November election. Perform Election Official duties in compliance with all regulations for write-in
candidates, recalls, referendums and petition initiatives as they are filed and certified.
Fulfill annual Maddy Act requirement posting of Council-sanctioned Commission and Committee composition, terms, etc., by December 31 - Yearly task.
Conflict of Interest Code – Coordinate Biennial update and Council action Biennial updated on even-numbered years.
Ethics Training – Notify Conflict of Interest filers of mandated ethics training and monitor compliance-ongoing.
FPPC Monitoring and Updating – Notify Form 700 filers of annual, assuming office and leaving office filing obligation and monitor same; Notify Form 460 and Form 470 filers of annual filing obligations and monitor same; maintain official log required by FPPC.
Objective 3.4 Public Records Requests and Other Monitoring
Coordinate gathering and provisions of the California Public Records Act via the new NextRequest online Public Records Act requests electronic system.
Maintain indices for: o Master comprehensive list of contracts, agreements, and leases on file in
records room-Ongoing. o Council-sanctioned board member compliance to requirements (oaths of
allegiance, ethics training, FPPC filing, term of appointments)
Page 80

Performance Budget
KEY PERFORMANCE INDICATORS Fiscal year 20-21 performance measures are based upon the following criteria:
(1) Goal = Publish Agenda a week before a regular meeting Performance Measure = Percentage of package issued a week before the meeting Performance Indicators = 98%
(2) Goal = Publish resolutions by Friday of each Council meeting
Performance Measure = Percentage of publishing by Friday Performance Indicators = 100%
(3) Goal = Draft minutes by Friday of each Council meeting
Performance Measure = Percentage of completing the draft by Friday Performance Indicator = 100%
(4) Goal = Process/Publish notices for Ordinances by Friday of each Council meeting Performance Measure = Percentage of processing the notices by Friday Performance Indicator = 99%
RECORDS MANAGEMENT
The City Clerk is custodian of the City’s records and is responsible for administering the City’s records management system. Records management involves storage, retrieval, destruction, and responding to requests for public records. The City’s records are stored at City Hall, off-site at a records repository, and in digital form. All records are retained according to a records retention schedule, including certain records that are retained permanently.
The City Clerk is appointed by the City Manager, confirmed by the City Council, and operates under statutory provisions of the California Government Code, the Election Code, and City ordinances and policies. Rio Vista’s City Clerk is Jose Jasso, MMC, and the department is responsible for the following:
Management of City Records Public Records Requests Certifies Records Bid Openings Council, Agency and Authority Agendas Administers Oaths and Affirmations Conducts Municipal Elections Legal Notices Claims/Subpoenas
Page 81

Performance Budget
Municipal Code Contract Management Indexing all official actions of Council. Keepers of community history and vital records. Acts as key liaison between local government and its citizens.
Filing Officer for:
Campaign Disclosure Statements and Statements of Economic Interest Custodian of the Official Seal of the City of Rio Vista
FUTURE NEEDS
As the City continues to grow, the need to have data available for easy retrieval via an EDMS continues to be a priority. The demand for public records has increased and the staff time for such retrieval is a challenge at times. The City Clerk’s office will continue to explore technology to improve efficiencies and operations citywide.
Page 82

FINANCE DEPARTMENT ORGANIZATIONAL CHARTFISCAL YEAR 2021-2022
Finance Director (1)
Accounting Supervisor (1)
Accountant I (1) Senior Account Clerk (1) Account Clerk II (1) PT Account Clerk II
(1)
Finance Dept Organizational Chart
Page 83

City of Rio Vista Performance Budget
FINANCE
The Finance department provides innovative leadership in the financial management of the public resources entrusted to the City in order to enhance the quality of life in Rio Vista. It provides accountability for the taxpayer’s dollars and maintains accurate and complete financial records of the City’s financial transactions. Additionally, the department provides timely financial information to internal and external customers, seeking to improve efficiency and governance of financial record keeping and reporting.
Finance staff manage and coordinate financial functions including financial analysis, cash management and investment, debt administration, general accounting, accounts payable, payroll, cashiering, utility billing, business tax billing and collections, and participates in development and administration of the overall City budget. The department is also responsible for the implementation of Government Account Standards Board Statements and for the City’s financial reporting, including the Annual Financial Report, State Controller’s Report and the Street and Road Report. This department is the main conduit of information and records to the City’s independent auditors. It assists with other City departments on the development of operating and capital budgets, participates in group projects, and the administration of special projects and analysis.
DEPARTMENT BUDGET SUMMARY
Expenditures by Division FY 19/20 Audited
FY 20/21 Budget
FY 20/21 Projected
FY21/22 Adopted
General Fund Finance $ 107,474 $ 139,963 $ 139,963 $ 146,221 Total $ 107,474 $ 139,963 $ 139,963 $ 146,221
Annual Percentage Change 30% 4%
Expenditures by Category FY 19/20 Audited
FY 20/21 Budget
FY 20/21 Projected
FY21/22 Adopted
Personnel Services $ 61,856 $ 83,469 $ 83,469 $ 89,614 Supplies and Services 45,618 56,494 56,494 56,607 Total $ 107,474 $ 139,963 $ 139,963 $ 146,221
Page 84

City of Rio Vista Performance Budget
SALARY AND BENEFITS CHANGES The Personnel Services assigned to the General Fund increases by $6,145 and the overall salaries and benefits budget for the Finance Department in FY 2021‐22 increases by $47,307. The increases are mainly due to the adjustments for heath insurances, changes in pension contributions, and 5% step increase or longevity percentage adjustments for eligible employees. No changes to the number of employees in the budget of FY 2021‐22.
AUTHORIZED POSITIONS
The Finance Department is staffed with a Finance Director, Accounting Supervisor, Accountant I, Senior Account Clerk, Account Clerk II, and two Part‐Time Temporary Account Clerk II. The Accounting Supervisor is currently vacant, and we have started the hiring process in May 2021. It may be replaced by an Accountant I/II depending on the experiences of the applicants of the position.
Goal 1.0: Improve Financial Viability Objective 1.1 Improve General Fund Reserves for future needs by maintaining a balanced budget
annually Objective 1.2 Research and provide options to the City Council in reducing the balances of
Unfunded Liabilities for both Pension and Other Postretirement Employee Benefits (OPEB)
Objective 1.3 Improve collections: Develop metrics to analyze past due receivables. Objective 1.4 Protect City Assets by creating an updated City financial and Risk Management
Policies and Procedures. Objective 1.5 Maximize revenue collections and cost allocations to other funds by:
• Encouraging Utility Customers in utilizing the Online Bill Pay system• Tracking shutoff notices and actual shutoffs• Placing liens on aged accounts when possible• Allocating expenses based on functions to departments and related funds
Objective 1.6 Update the Procurement Policy under the new Uniform Guidance Standards to comply with the Single Audit requirements for Federal funds.
Objective 1.7 Update Master Fees Schedule to ensure all fees are accurately capturing the cost to provide any specific service provided.
Goals and Initiatives
Page 85

City of Rio Vista
Performance Budget
2020-21 ACCOMPLISHMENTS Continued to support the Emergency Operation Center (EOC) and worked with the ECO
Coordinator to apply for the Federal Emergency Management Agency (FEMA) Request for Public Assistance through Grant Portal for the additional expenditures related to the COVID‐19 pandemic.
Unanimously adopted a balanced budget for the 2020‐21 fiscal year under the economic uncertainties of COVID‐19 pandemic.
Completed the annual audit process on time and received the highest possible rating, an “unmodified opinion”, for the nineth consecutive year and received no audit findings for the fifth consecutive year.
Continued to deliver Utility Billing to the customers on the 3rd working day of the month to reduce the past due receivables.
Implemented the Financial Polices and Accounts Receivable Write off Policy adopted in prior year.
Continued to participate and receive the Operating Budget Excellence Award presented by California Society of Municipal Finance Officers for the budget of fiscal year 2020‐21.
Continued to participate and receive the Government Finance Officers Association Distinguished Budget Presentation Award for the budget of fiscal year 2020‐21
Participated and received the Certificate of Achievement for Excellence in Financial Reporting presented by the Government Finance Officers Association for the City Comprehensive Annual Financial Report (CAFR) in the fiscal year ended June 30, 2019.
OPERATIONS As of April 30, 2021, a total of 1,788 utility accounts have signed up for online services,
approximately 33% of the total connections.
Utility Billing Accounts Summary in the past year Month Number of
Active Accounts
Number of New Accounts
Disconnects Notice
Shut-Offs Number of Closed
Accounts May, 2020 5263 29 671 0 27
June, 2020 5264 38 644 0 35 July, 2020 5266 40 578 0 38
August, 2020 5264 41 600 0 41 September, 2020 5267 45 577 0 45
October, 2020 5266 53 564 0 54 November, 2020 5245 34 580 0 27 December, 2020 5283 63 772 0 32
January, 2021 5310 44 675 0 35 February, 2021 5310 53 645 0 41
March, 2021 5330 66 703 0 46 April, 2021 5350 74 572 0 66
* Shut offs were not performed during the COVID‐19 pandemic. On April 2, 2020, Governor Newsom passed Executive Order N‐42‐20, which prohibits water systems from shutting off residential water service for non‐payment of bills and prohibits the same for small businesses in the critical infrastructure sectors.
Page 86

City of Rio Vista Performance Budget
• Summary of Annual Audit Results for the past years
KEY PERFORMANCE INDICATORS Fiscal year 20‐21 performance measures are based upon the following criteria:
(1) Goal = Send utility billings to printer within 3rd working days after the month endPerformance Measure = Percentage of month reaches this goalPerformance Indicators = 92%
(2) Goal = Submit payroll to ADP by Wednesday of the payroll weekPerformance Measure = Percentage of pay periods reaches this goalPerformance Indicators = 100%
(3) Goal = Submit council meeting agenda items to the City Clerk Office by the due datePerformance Measure = Percentage of month reaches this goalPerformance Indicator = 100%
(4) Goal = Complete monthly bank reconciliation by the end of next monthPerformance Measure = Percentage of month reaches this goalPerformance Indicator = 83%
FUTURE NEEDS
Accounting Software Upgrade
The Finance Department is looking for an integrated Enterprise Resource Planning (ERP) solutions that can provide financial management and utility billing customer information services specifically for the public sector as a multi‐fund accounting system that can handle accounting, budgeting, and project performance needs. Based on the recent quotation presented by the current system provider, the budget for the upgrade is increased by $100,000 to $350,000 from FY2020‐21 budget. The funding source of this Capital Improvement (CC004) will be provided by the Water Fund 080. We plan to issue a request for proposals for this upgrade in FY2021‐22 to replace the current financial accounting software.
Fiscal Year Opinion Findings Adjustments Recommendation 2011/12 Clean 12 84 0 2012/13 Clean 6 2 2 2013/14 Clean 5 2 3 2014/15 Clean 1 0 4 2015/16 Clean 0 0 2 2016/17 Clean 0 0 1 2017/18 Clean 0 0 0 2018/19 Clean 0 0 0 2019/20 Clean 0 0 0
Page 87

FIRE DEPARTMENT ORGANIZATIONAL CHARTFISCAL YEAR 2021-2022
Fire Chief (1)
Battalion Chief (1)
Fire Captain (3)
Firefighter/Paramedic (3)
Fire Engineer (6)
Fire Inspector (0.5)
Intern-Firefighter
(3)
Fire Volunteers (4)
Fire Dept Organizational Chart
Page 88

Performance Budget
FIRE
The City of Rio Vista Fire Department (RVFD) covers the incorporated City limits of Rio Vista along with the unincorporated areas of the Delta Fire Protection District in Sacramento County. The Fire Department staff, and apparatus respond to “all-risk” incidents in these jurisdictions and the surrounding areas under mutual aid, protecting life, property and the environment from disasters, both natural and man-made. The Department also responds throughout California in support of the State Fire Mission (Master Mutual Aid/Strike Teams).
The Department provides Advance Life Support services by staffing a ‘Paramedic Assessment Engine’ with a minimum of three full-time professional firefighters every day. Our paramedics provide first responder care and/or augment the private ambulance and transport paramedics. The Department fleet consists of two Engines, two Wildland Engines, one Ladder Truck, one Water Tender, one Utility truck and two staff vehicles.
DEPARTMENT BUDGET SUMMARY
Expenditures by Division FY 19/20 Audited
FY 20/21 Budget
FY 20/21 Projected
FY21/22 Adopted
General Fund Measure O Funded Employees $ 433,052 $ 943,362 $ 982,960 $ 1,085,040 Fire 1,660,687 1,456,610 1,575,570 1,449,519 Total $ 2,093,739 $ 2,399,973 $ 2,558,530 $ 2,534,560
Annual Percentage Change 22% -1%
Expenditures by Category FY 19/20 Audited
FY 20/21 Budget
FY 20/21 Projected
FY21/22 Adopted
Personnel Services $ 1,153,997 $ 1,842,503 $ 1,987,103 $ 2,011,300 Supplies and Services 939,742 557,470 571,427 523,259 Total $ 2,093,739 $ 2,399,973 $ 2,558,530 $ 2,534,560
SALARY AND BENEFIT CHANGES The Personnel Services assigned to the General Fund for Fire Department increases by $168,797 while the overall budget for the salaries and benefits in FY2021-22 increases by $123,919. The significant increases are due to the 2% salary adjustment, effective January 1st, 2021, after Measure O passed in the November 2020 election per the Fire MOU adopted in May 2020, annual adjustments of health insurance and retirement contribution, and 5% step increases for new fire employees.
Page 89

Performance Budget
AUTHORIZED POSITIONS The Department is currently staffed with one Fire Chief, one Fire Battalion Chief, three Fire Captains, six Fire Engineers and three Firefighter/Paramedics (full time employees). The volunteer and intern-firefighter ranks fluctuate, due to “turnover” created by these individuals obtaining full time positions elsewhere. The budget reflects continuation of the volunteer program and supporting those positions with stipend pay and needed safety equipment. In FY 2021-2022, the Department seeks to add three full-time firefighter/Paramedics, one for each shift, through the Staffing for Adequate Fire and Emergency Response (SAFER) grant. The grant application was submitted on March 11th, 2021, pending review and consideration. The additional positions will allow the Department to staff two fire apparatus and create a command structure that is commensurate to the current needs of the Organization.
SERVICES AND SUPPLIES
This budget continues to support the ‘Fire Apparatus’ annual payments (Fund 12 Vehicle Replacement) and reflects modest projects on Strike Team reimbursements to off-set these costs.
Other supplies included reflect the normal operations of the Fire Department. Much of the budget is consistent with previous years; however, there are several needs addressed this Fiscal Year. Those include: a fire station alerting system, possible grant match for a station diesel exhaust system, portable radios, NFPA compliant medical physicals and an ice machine. Also addressed are new sets of personal protective equipment (PPE) that is becoming non-compliant due to age.
DEPARTMENT ACCOMPLISHMENTS Maintained staffing levels that will allows for response of two fire apparatus daily
Maintained the fire inspection program in compliance with State mandates and SB1205
Integrated technology to increase customer service, firefighter safety and situational awareness
Developed a solution for water rescue in Rio Vista and the Delta Fire District, by training existing firefighters to the Open Water Rescue- Small Vessel class.
RVFD remains active in participation on ‘Strike Teams’ under California Master Mutual Aid
Updated the City’s Emergency Operations Plan currently under review for adoption.
Maintained the EOC and served as the lead Emergency Management Agency during the COVID-19 pandemic. Finalizing paperwork required for the closure and reimbursement.
Resumed the risk management process through the development of Policies and Procedures with the assistance of Lexipol, a public safety policy organization.
Applied for grant funding for additional suppression staffing through Staffing for Adequate Fire and Emergency Response Grants (SAFER)
Page 90

Performance Budget
KEY PERFORMANCE INDICATORS Response Time
Goals: The National Fire Protection Association standard 1720 contains minimum requirements relating to the organization and deployment of fire suppression operations, emergency medical operations, and special operations to the public by combination fire departments.
Performance Measures: The fire department shall identify minimum staffing requirements to ensure that enough members are available to operate safely and effectively. This measurement is based on percentage of fire calls with a response time of 9 minutes or less from dispatch to arrival within city limits
Performance Indicators: Compliance with the response time on 90% of all responses.
Business Inspections Goals: The National Fire Protection Association standard establishes the minimum requirements for the
periodic inspection, testing, and maintenance of fire protection systems and the actions to undertake when changes in occupancy, use, process, materials, hazard, or water supply that potentially impact the performance.
Performance Measures: The fire department shall physically inspect all brick-and-mortar business within the city limits annually.
Performance Indicators: 95% of all brick-and-mortar business and 100% of state mandated inspections inspected annually.
Residential Sprinkler inspection (new construction) Goals: The California Building Standards Commission approved the State Fire Marshal's Building, Fire and
Residential Code adoption packages for the 2010 California Building Standards Codes, including its requirements for residential fire sprinklers in all new one-and two-family dwellings and townhome construction statewide
Performance Measures: The fire department shall physically inspect all new one-and two-family dwellings and townhome construction within the city limits. This inspection should occur twice during the construction of the occupancy, once in the framing stage and once before occupancy.
Performance Indicators: 95% of all requests be handled within 1 week.
Training Hours Goals: The Insurance Services Office (ISO), scores fire departments on how they are doing against its
organization's standards to determine property insurance costs. Performance Measures: The Fire Department shall complete and log 192 hours of training per year. Performance Indicators: 95% of all firefighters attend and record mandated training hours every year.
Community Outreach Goals: A community-driven emergency service organization is one that seeks to gather and utilize the
needs and expectations of its community in the development and/or improvement of the services provided. Our goal is to ensure that the community remains a focus of this organization’s direction.
Performance Measures: The fire department shall request a customer satisfaction survey from all residents who request an emergency response. The department will also post emergency and non-emergency information on to social media at least once a week.
Performance Indicators: 95% of all emergency responses to city residents will receive a customer satisfaction survey within 1 month of service. Social media posts will occur weekly 90% of the time.
Page 91

Performance Budget
OPERATIONS 2,161 incidents in 2020, this number of responses was down due to the COVID-19 restrictions.
This reduction was expected.
INCIDENT TYPE 2016 2017 2018 2019 2020 False Alarm & False Call 30 36 67 64 34 Fire 55 61 99 76 104 Good Intent Call 135 146 208 191 185 Hazardous Condition (No Fire) 19 29 42 35 27 Overpressure Rupture, Explosion, Overheat (no fire) 1 0 4 1 0 Rescue & Emergency Medical Service Incident 1,209 1,306 1,377 1,385 1,287 Service Call 324 502 407 533 521 Severe Weather & Natural Disaster 0 6 1 1 0 Special Incident Type 0 2 11 1 3 Total 1,773 2,088 2,216 2,287 2,161
FUTURE NEEDS
In 2018, the Fire Chief developed a “Staffing Analysis and Proposal” to address the future growth in the City. This report has been reviewed by the current fire chief and is still a valid document. In the report growth is defined by increased demand for services (call-volume), and increased development (community risk). The demand for services in the Fire Department is increasing with population, development, and increased traffic on area Highways. In 2020 it is noted that there was an anomaly with a slight reduction in call volume due to COVID. Staffing increases approved last year will allow the Fire Department to staff two fire companies that can handle the current call-volume. With the increased staffing and potential addition of SAFER Grant Firefighters along with the two Chief Officers, will allow the Department to get closer to meeting the National Fire Protection Association (NFPA) Standard 1710/1720, for staffing.
NFPA 1901 states apparatus that was not manufactured to the applicable NFPA fire apparatus standards or that is over 25 years old should be replaced. Truck 55 is a 1998 Aerial Platform. This Fire Apparatus is closing in on its recommended usable lifespan and is recommended to be in reserve status now. Currently it passes the annual testing for aerial ladders, but it is approaching 23 years in service. According to NFPA, “experience has also shown that refurbishing a fire apparatus that is over 20 years old, other than to paint or repair the apparatus, is a very poor investment.”
Finally, as development continues in the west end of the city, call volume and response times will continue to rise. Eventually a second fire station will need to be considered. This is a long-term commitment when considering the cost of the infrastructure and personnel.
Page 92

POLICE DEPARTMENT ORGANIZATIONAL CHARTFISCAL YEAR 2021-2022
Police Chief (1) (Contract)
Police Sergeant (2) (Contract)
Police Officer (9) (Contract)
Public Safety Support Manager (1)
Community Services Officer (1)
PT Police Record Technician (0.5)
Police Dept Organizational Chart
Page 93

Performance Budget
POLICE
The Rio Vista Police Department is a full‐time law enforcement agency with contracted services provided by the Solano County Sheriff’s Office. The 12 sworn and three non‐sworn personnel along with our volunteers, serve the residents of the City of Rio Vista and provide mutual aid assistance to surrounding jurisdictions.
The department is structured into two parts, patrol operations and administration which include the Office of the Chief, Records and Evidence.
DEPARTMENT BUDGET SUMMARY
Expenditures by Division FY 19/20 Audited
FY 20/21 Budget
FY 20/21 Projected
FY21/22 Adopted
General Fund Measure O Funded Employees $ 525,849 $ 117,920 $ 122,870 $ 135,630 Police 2,187,301 2,904,223 2,863,438 2,812,398 Total $ 2,713,150 $ 3,022,143 $ 2,986,308 $ 2,948,028
Annual Percentage Change 10% -1%
Expenditures by Category FY 19/20 Audited
FY 20/21 Budget
FY 20/21 Projected
FY21/22 Adopted
Personnel Services $ 1,454,051 $ 367,091 $ 372,041 $ 242,142 Supplies and Services 1,259,099 2,655,053 2,614,267 2,705,885 Total $ 2,713,150 $ 3,022,143 $ 2,986,308 $ 2,948,028
SALARY AND BENEFIT CHANGES
The contract governing the law enforcement services provided to the City by the County went into effect on February 1st, 2020 and is renewed on May 4th, 2021 for a 24‐month period effective July 1st, 2021 for a total of $5,652,654. The estimated costs of the FY 2021‐22 and FY 2022‐23 of this contract are $2,726,477 and $2,926,177 respectively, which includes salary and benefits, workers compensation, liability insurance, overtime/court appearances, and 2% indirect costs. This contract is set to expire on June 30th, 2023, unless chosen to be renewed.
The personal services of the Police Department assigned to the General Fund for FY 2021‐22 decreases by $124,949 mainly due to the one‐time repayment of annual compensation for a police officer in FY 2020‐21 and the change from a full‐time to part‐time position of the police records technician.
Page 94

Performance Budget
AUTHORIZED POSITIONS The Police Department proposes to no additions, but to convert a full‐time Records Technician position to part‐time. Current positions include a Chief of Police, Public Safety Support Manager, two Sergeants, eight patrol Deputies (including a canine deputy), one School Resource/Problem Oriented Policing Deputy, one Community Services Officer and one part‐time Records Technician. We also have a small but dedicated group of volunteers who are invaluable in assisting the police department in many areas.
SERVICES AND SUPPLIES The population and diversity of the City of Rio Vista continues to grow, and so does the complexity of policing the City. The department is experiencing savings in hiring costs and training. However, additional spending to place city cameras in strategic locations, in‐car cameras, and a radio JPA agreement is ongoing. Additional infrastructure costs include repairs and refurbishing the aging temporary police headquarters.
Part of the police services contract is to provide fully trained and equipped peace officers. This has caused a reduction in hiring and initial training costs. However, a new uniform specific to Rio Vista PD is required for each new Deputy and non‐sworn staff uniform needs are unchanged. Additionally, training needs such as driving under the influence and traffic investigation are still provided as a cost to the city, as they are examples or training that Deputy Sheriffs do not currently undergo.
The police fleet consists of 13 vehicles. While still reliable the vehicles are aging, four of our police vehicles were purchased in 2014. The remaining fleet of vehicles gather at least 1,000 miles per month, and many are edging closer and closer to end of life. The department has agreed to pass on the replacement of two marked police vehicles until next year. The extra wear‐and‐tear is being off‐set by marking a previously unmarked vehicle and redistributing higher mileage personnel to lower mileage vehicles. In the future, the department plans to resume alternating two vehicles in odd years and one vehicle in even years, this will allow the department to maintain dependable vehicles with updated equipment and technology.
The city began installing cameras in strategic locations in 2019. A camera network is very important in helping deter crime as well as an investigative tool following any crime. The department recently switched to a domestic (US‐based) technology company for the servicing of the camera network. The maintenance costs are expected to drop to a mere $1,200 annually, and the recalibration of cameras that “drop offline” is anticipated to occur much faster. The police department’s goal is to continue to add cameras, including license plate readers at both ends of town. The estimated cost of growing this project is $20,000 per location added.
Body‐worn cameras were purchased years ago and have been a very valuable tool for law enforcement and an accountability check for citizen complaints. The data storage for this project is challenging and becoming costly. Last year, the department switched services to Axon body‐worn cameras. This company includes the data storage in their purchase price and stores it securely offsite. It also allows other forms of digital media to be stored in the same account. Currently, no in‐car camera system exists for our patrol
Page 95

Performance Budget
vehicles. An Axon five‐year contract for $24,112 per year covers both systems. The deployment of in‐car cameras is pending the release of the next‐generation product expected this fiscal year.
The City of Rio Vista and the Police Department have taken a proactive role in portable communication. Each member of the department has a digital portable radio already. Every police agency in the county has agreed to participate in a Joint Powers Authority contract to upgrade the countywide radio system. This will allow staff to communicate with every agency in the county, region, and much of the Northern California. Because the radios are already purchased, the annual cost of $27,000 is applied toward the services.
The current police headquarters is 20 years old. The building is hardly recognizable as a police station when passing by. Our goal, for us and the public, is to take pride in our police headquarters by repairing and enhancing the building. Based on the budget limitation, in FY 2021‐22, $20,000 is added for the improvement at the front doors and to install a keyless entry system. Our recommendation in the future includes remodeling, specifically at the lobby, interior report writing area, evidence storage, and front face of the building.
DEPARTMENT ACCOMPLISHMENTS Provided some sworn staff with enhanced drug recognition training
Provide some staff with enhanced traffic and criminal investigations training
Increase targeted traffic enforcement to enhance safety and reduce collisions
Upgraded body‐worn cameras
Enhanced citywide camera with improved connection, maintenance, and lowered annual costs
Increase presence in schools
Increased community engagement and public events (as COVID restrictions began lifting)
Improved and beautified police headquarters ‐ ongoing
2021-22 STRATEGIC GOALS Build a Department Operations Center (DOC)/Classroom for coordinating departmental emergency
responses and hosting training in‐person, online, or in a hybrid format.
Establish a youth police cadet program for youth 14‐20 years interested in a career in public service
Enact a Citizen’s Academy program to educate the community about current issues and trends in law enforcement and help bridge the gap between the police and the community
Implement an in‐car camera system upon release by Axon
Reconstitute the Neighborhood Watch program
Initiate a Business Watch program
Reconstitute the volunteer Police Chaplain program
Train CAPS volunteers for extended field services such as vacation house checks, traffic control, etc.
Page 96

Performance Budget
OPERATIONS
• Metrics of police responses to the list of activities in the past four years is as follows:
KEY PERFORMANCE INDICATORS
Fiscal year 20‐21 performance measures are based upon the following criteria: 1) Rio Vista Police Cadet Program
Goal = Establish a police cadet program for Rio Vista & River‐Delta School District youth. Performance Measure = Average number of cadets on membership roster. Performance Indicators = 5 cadets average throughout the year.
2) Citizens’ Academy Goal = Create a community citizens’ academy for those who live or work in Rio Vista to educate the public about issues and trends in law enforcement. Performance Measure = Number of participants in class Performance Indicators = 30 attendees
3) Self-Initiated Activity Goal = Increase self‐initiated activity by patrol officers 10%. Performance Measure = Total number of driving under the influence stops, suspicious vehicle stops, pedestrian/bicyclist stops, suspicious person checks, and security checks (2020 total = 1495). Performance Indicator = 1645 events
Police Activity 2017 2018 2019 2020
Alarm Calls 312 304 344 317 Welfare Checks 291 234 317 294 Security Checks 621 713 383 646 Citizen Assist 690 608 563 677
Civil Standby 122 160 150 98 Suspicious Person Stops 116 91 142 165 Motor Vehicle Theft/Recovery 35 43 60 43 Accident Calls 160 129 147 98
Ped/Bicyclist Stops 167 179 140 117
Suspicious Vehicle Stops 202 352 390 521
Driving Under the Influence Stops 84 60 64 46 Domestic Violence Calls 37 35 53 40 Disturbance Calls 357 307 288 402 Burglary Calls 52 75 83 89 Theft/Fraud Calls 73 68 191 172 Vandalism Calls 58 74 89 57 Miscellaneous Calls 2,291 2,749 2,816 2,003 Total Police Calls & Incidents 9,207 9,417 9,020 9,985
Page 97

Performance Budget
KEY PERFORMANCE INDICATORS
4) Positive Police-Community Events Goal = The department to host or participate in events intended to increase relationship‐building events with the public. Performance Measure = Number of events participated in (Coffee w/ a Cop, community sports competition events, etc.) Performance Indicators = 12 per year
5) Routine Social Media Engagement Goal = The department to increase social media postings Performance Measure = Average number of weekly posts on each of the three platforms: NextDoor, Facebook, and Instagram Performance Indicators = 3 per week average
FUTURE NEEDS An administrative sergeant or second‐in‐command position to assist in daily operations while
continuing to accommodate our rapidly growing city
Continued replacement of police vehicles
New police facility
Page 98

PUBLIC WORKS ORGANIZATIONAL CHARTFISCAL YEAR 2021-2022
Public Works Director (1)
Public Works Program Manager (1)
Administrative Assistant (ATOD) (1)
PT Public Works Assistant (0.5)*
Public Works Superintendent (1)
Public Works Supervisor (1)
Water Utility Technician (2)
Sr. Maintenance Worker (2)
Maintenance Worker II (2)
Maintenance Worker I (4)
Mechanic (1)*
Intern Part Time (1)*FY 21/22 Unfunded Position
Public Works Organizational Chart
Page 99

Performance Budget
PUBLIC WORKS
The Public Works Department oversees all aspects of the City’s infrastructure and facilities including contracted services. The core services are split into Engineering Services, Operations and Maintenance, and Administration and Funding.
Engineering Services include the Capital Improvement Program Projects (CIP), Development, Traffic and Transportation, and is responsible for the design, development, and construction of public works infrastructure and facilities. The City contracts with an engineering firm to provide engineering services. Engineering services include:
American Disability Act (ADA) Infrastructure Improvements CIP Project Development and Delivery Grading and Encroachment Permits Infrastructure Master Plans New Development and Plan review Project Management and Inspection Storm Water Permit Coordination and Inspection Services
Maintenance and Operations is responsible for all maintenance and repair of city facilities as well as oversight of the associated programs. City facilities include:
Airport Boat Dock and Boat Launch Facility Area City Landfill Domestic Water System Equipment and Fleet Vehicles Facilities and City Buildings Green Waste Drop Off Site Household Hazardous Waste Events Landscaping, Graffiti Abatement and Community Enhancement Parks Recycling and Solid Waste (garbage contract) Program Street and Sidewalk Maintenance Street Sweeping Storm Drain Maintenance Swimming Pool Wastewater Collection and Treatment including the Sanitary Sewer Management Plan
(SSMP) and National Pollutant Discharge and Efficient System (NPDES)
Page 100

Performance Budget
Administration and Funding is responsible for overall department operations, strategic priorities, alternative funding programs, airport oversight, household hazardous waste programs, recreation programs, contract management, capital improvement program, master plans, park development, transit, and the City’s Alliance and Alcohol, Tobacco, and Other Drugs (ATOD) Program.
DEPARTMENT BUDGET SUMMARY
Expenditures by Division FY 19/20 Audited
FY 20/21 Budget
FY 20/21 Projected
FY21/22 Adopted
General Fund Measure O Funded Employees $ 72,175 $ 10,720 $ 11,170 $ 12,330 City Hall Bldg/Grounds 43,265 48,919 52,319 52,365 Swimming Pool 87,399 107,771 71,653 117,126 Youth Center 15,724 22,890 15,165 22,014 Corporation Yard 72,826 145,783 161,604 62,475 Senior Center 21,626 27,844 23,889 22,854 Parks 123,934 250,479 250,479 124,490 Street 125,061 129,123 129,123 124,895 Public Works Administration 33,077 29,264 29,264 20,715 Library 11,471 59,686 59,686 17,728 Recreation 21,653 56,936 46,186 39,100 Total $ 628,211 $ 889,415 $ 850,536 $ 616,093
Annual Percentage Change 35% -28%
Expenditures by Category FY 19/20 Audited
FY 20/21 Budget
FY 20/21 Projected
FY21/22 Adopted
Personnel Services $ 218,278 $ 221,495 $ 221,945 $ 156,604 Supplies and Services 409,933 667,919 628,591 459,489 Total $ 628,211 $ 889,415 $ 850,536 $ 616,093
SALARY AND BENEFIT CHANGES
The Personnel Services assigned to the General Fund decreases by $64,891, and the overall salaries and benefits budget for Public Works Department in FY 2021-22 decreases by $149,266 primarily due to the two unfunded positions, including the full-time Mechanic and part-time Public Works Administrative Assistant. The majority allocation of the public works positions are funded by the Water and Sewer Funds.
Page 101

Performance Budget
The department will have a total of 15 full-time positions as outlined in the table below and does not reflect contract staffing for the Wastewater Treatment Plans, City Engineering and Inspection Services or Solid Waste Collections, and the interns.
Director of Public Works 1 Public Works Program Manager 1 Administrative Assistant 1 Public Works Superintendent 1 Public Works Supervisor 1 Mechanic (Unfunded) 0 Water Utility Technician 2 Senior Maintenance Worker 2 Maintenance Worker II 2 Maintenance Worker I 4
Total 15
SERVICES AND SUPPLIES
The adopted budget reflects several needs for the next FY. The top requests include two new vehicles for the two vacant positions, additional equipment replacement, and funding for repairs and improvements at City facilities.
City Hall - The Public Works staff maintains the inside and outside of City Hall including the Bock Dock,Boat Launch Ramp area, building repairs, and the grounds. There are janitorial services for cleaning the offices and restrooms weekly.
Swimming Pool – The Public Works staff maintains the City Pool, and keeps the chemical levels toState requirements, and makes the repairs needed for motors, pumps, pool cover and bleacher repairs or replacements.
Youth Center - The Public Works staff maintains the Rio Vista Youth and Community Hall inside andoutside areas. There are janitorial services for cleaning the open area and restrooms.
Corporation Yard – The Public Works staff maintains and operates from the Corporation Yardlocated at 789 St. Francis Way.
Senior Center – The Public Works staff make repairs to the Senior Center building inside and out.There are janitorial services for cleaning the open area and restrooms.
Page 102

Performance Budget
Parks – The Public Works staff maintains the parks located at:
• Buena Vista Park – 700 Main Street – A park that also contains several burial sites for passengers of the “New World Steamer” that sank in the Sacramento River, and the “Steamer Yosemite” that sank in 1866.
• Brunning Park – 300 California Street • Crescent Park – 153 Crescent Drive • Drouin Drive Park – 390 Drouin Drive • Egbert Field – 700 St. Francis Way • Homecoming Park • Sierra Park – 25 Sierra Drive • Sierra Drive Park • Val de Flores Park, Dog Park, and Skateboard Park – 100 Scott Street • Liberty CFD-2018 – Landscape areas • Liberty Dog and Neighborhood Park – near completion • Liberty 18.8 acre Community Park Future Site
Streets – The Public Works staff maintains the city streets, Caltrans maintains the signal lights with a maintenance agreement, and the City contracts for the larger paving and striping projects. Library – The Public Works staff maintains the Library building inside and outside through an agreement with the County Library Services. The County provides the other library services. Recreation Administration and Community Services – The Public Works staff maintain the Teen Center located at 45 Main Street. Fund 19 - Alcohol, Tobacco, and Other Drugs (ATOD) - The ATOD Program started in 2002 with the County as part of the Tobacco Settlement. The ATOD Coordinator (contractor) and Public Works staff work close together to provide the services under current contract with the County of Solano. Fund 25 - Gas Tax – The Public Works Department use the Gas Tax Funds to operate, repair and replace the city owned streetlights. These funds are also used to pay Caltrans to maintain and operate the signal lights at Hillside Terrace, and Summerset Drive on Hwy. 12. The remaining funding is used for street repairs and striping. The new Road Maintenance and Repair Funding from SB1 has been allocated to the McCormick Road reconstruction project, that was completed by Solano County, that will be paid over time until FY 2022-23. Fund 50 - Storm Drain Funds – The City collects $.49/per household each month on the City utility bills. These funds are used by the Public Works staff for storm drain repairs throughout the cities storm drain system.
Page 103

Performance Budget
Fund 51 - Capital Gants and Project Fund – These funds are used to fund a variety of projects each year. The projects adopted for FY 2020-21 are:
ADA Sidewalk Repair and Replacement Project
City Hall Lift Station
Northwest Wastewater Treatment Plant Membrane Replacement
Well #16 Acceptance and SCADA Integration
HSIP Pedestrian Improvements
Airport PAPI and REIL Replacement
Airport Runway 7-25 Reconstruction
Upgrade AWOS
2020 Water and Wastewater CIP
Well 9 Booster Pump for Tank
New Well
ERP System – Accounting/Work Order/CIP Budget/Utility Billing/Asset Management
Lead Pipe Fitting Replacement
LGI Neighborhood Park Improvements
LGI Community Park Improvements
Fund 53 - Roadway Impact Funds - The City is using Roadway Impact Fees collected from the building permits to help design the intersection of Highway 12 and Church Road. This project has been combined into one of the other major Caltrans improvement projects on Highway 12. Cal Trans is constructing the Highway 12 Complete Highway Project from the Rio Vista Bridge to about Catty Lane in 2020-22. The City is contributing $400,000 to this $76 million project. Fund 60 – Hazardous Waste – The City is required to offer the citizens of a community a way to collect or dispose or household hazardous per State Law – AB 939. The City has chosen to take funds from the Franchise Hauler Agreement for drop-off to comply with that requirement. Additionally, the Public Works department has established HHW Drop Off events in April and October of each year and have contracted with Veolia Environmental. City staff is currently working on establishing e-waste events. Fund 65 – Landfill Closure - The City has an old landfill that has been closed and capped with clay in 2001-02. The State requires that funds be set aside each year for the maintenance and operation of these old, closed landfills. The City must keep enough funds in an account that can cover the costs of the repair and replacement of the clay cap in case of a failure of the clay cap. Fund 80 – Water – The Water utility fund is used to maintain the water hydrants, pipelines, and replacement of the water well distribution system. These funds were increased on 2009-10 through a very thorough Rate Study, and a series of public hearings and meetings. Every year the Public Works staff propose projects to be included in the annual Capital Improvement Program (CIP) Projects List.
Page 104

Performance Budget
Fund 84 – Airport – The City Public Works staff maintains and operates the Airport. Staff administers and writes the grant applications to the Federal Aviation Administration (FAA), and the California Aeronautics Division of Caltrans (Caltrans Aeronautics) to seek funds for repair and replacement projects for the Airport. The City receives an entitlement amount of $150,000 per year from the FAA, and another $10,000 per year from Caltrans Aeronautics for doing various design and repair replacement projects each year. Fund 85 – Beach Drive Wastewater Collection System – The City wastewater is divided into two (2) collections systems, the older part of the City is the Beach Collection System that flows to the Beach Wastewater Treatment Plant (WWTP). The Beach Collection System includes six (6) lift stations The Beach Collection System and WWTP are operated by Veolia Water, Inc. through a five (5) year contract as approved in 2019. The contract will expire in December 2024.
Fund 85 – Beach Drive Wastewater Treatment Plant (WWTP) – The Beach Drive Wastewater Treatment Collection System collects and flows to the Beach WWTP. The Beach Drive WWTP treats the wastewater to a Secondary Level, disinfects, and then discharges to the Sacramento River.
Fund 86 - Northwest Wastewater Collection System – The System is composed of a series of lift stations that raise the sewage to enter the gravity pipelines that flow to the Northwest Wastewater Treatment Plant (NWWTP). Fund 86 – Northwest Wastewater Treatment Plant (NWWTP) – The NWWTP is a three-stage treatment (tertiary) plant that processes the wastewater and sends the treated water to the Sacramento River. The NWWTP is operated by Veolia Water, Inc. under the same contract as the Beach Drive plant.
Goal 1.0 - Improve City Infrastructure
Objective 1.1 Water
• Develop a water main and fire hydrant flushing program in coordination with the Fire Department
• Develop a water treatment equipment maintenance schedule • Develop a water well motor, pump and rebuilding schedule • Develop a valve replacement program with each CIP project • Complete Master Water System Plan for current and future needs • Complete the Lead Pipe Replacement Program • Plan for Well Replacement and other major infrastructure needs
Objective 1.2 Storm Drainage
• Develop an annual storm drain collection system video program • Develop a storm drain cleaning schedule Pre and Post Season • Develop a drain inlet inspection schedule to reduce plugged drain inlets • Submit the annual MS4 reports
Goals and Initiatives
Page 105

Performance Budget
Objective 1.3 Wastewater
• Continue to invest in improvements at both Beach and NWWTP’s Plants • Develop an annual sewer main video inspection program • Develop a sewer lateral inspection program at time of sale • Develop a lift station motor and pump rebuilding schedule
Objective 1.4 Streets
• Partner with outside agencies to identify needed transportation infrastructure of regional significance
• Improve sidewalks, streets and bike lanes
Objective 1.5 Parks
• Maintain existing city parks • Ensure future developments include new parks • Update the Park Master Plan
Objective 1.6 Walkability/Bike Friendly City
• Create an American Disability Act (ADA) Inventory of city curb ramps and sidewalks
• Repairs and Replacement for damaged sidewalks and infill sidewalks at various locations
Objective 1.7 Public Buildings (City Hall, Fire, Police, Public Works, Senior/Youth)
• Revitalize appearance of City Hall and City Council Chambers • Establish location for City Civic Center • Complete the Corporation Yard Improvements • Complete energy efficiency upgrades at City Facilities
FY 2020-2021 ACCOMPLISHMENTS
Grant Applications Submitted and Funding Received Airport Design and Construction to Replace PADI and REIL systems and Associated
Incidentals – The City has received design funding for the next project at the Airport. Design is complete. The construction grant has been awarded in the amount of $887,257.25 Along with the replacement Construction will include replacing Runway 7-25 cabling, transformers, REILs, and PAPIs; replace Taxiway A and B cabling and transformers; replace non-standard signs. Construction will also replace Runway 15-33 cabling, transformers, REILs, and PAPIs; replace airport-wide end of life signage. The Design authorization is for $97,500 with a State match of $4,387. There is no longer a match required for the design phase of this project or construction.
Obligated HSIP Grant funding – The City received an HSIP Grant in the amount of $249,100 to improve four pedestrian crossings at South 2nd and Marina Drive (Riverview Junior High); DH White Elementary School and Thereza Way; DH White Elementary School and Laurel Way and South 7th Street and Main Street. There are no matching requirements for these funds. The project has received authorization to proceed with the design phase. The construction authorization has been submitted and it is expected construction will begin Summer 2021.
Page 106

Performance Budget
Yolo Solano Air Quality Management District Grant – Received funding for Backhoe Replacement in the amount of $45,000.
Cal Recycle Beverage Container Grant – Received $5,000 to aid in the City’s recycling efforts. Funding was approved in November 2020.
Identified PG&E Rule 20A program area – Staff has worked with PG&E to create the necessary zone to underground the rest of the electrical lines on Main Street as the priority phase of the zone. The City currently has about $800,000 in credits. Staff is working on a one time allocation of funding to fully fund the remaining underground work on Main Street. Due to the Covid 19 pandemic, this project has been delayed.
Submitted the Eligibility for the 2018 California Drought, Water, Parks, Climate, Coastal Protection, and Outdoor Access for All Bond Act (Proposition 68) Per Capita Grant Program – the target area for these per capital funds will be for the Riverfront Promenade including shade structures and other park improvements. The city received $177,952.
Submitted and received a $13,000 Airport Grant for Operations and Maintenance expenses as part of the CARES ACT funding.
Submitted and received $100,000 Pavement Management Technical Assistant Program (P-TAP22 funding) to inventory our street assets and determine the roadway Pavement Management Index (condition of our roadways).
Submitted and received $250,000 for HSIP Cycle 10 pedestrian improvements. Submitted CalRecycle Household Hazardous Waste Cycle 37 grant in the amount of $50,000. Submitted Yolo-Solano Air Quality Management District for pedestrian improvements in the
amount of $100,000. Submitted Federal Earmark projects for Wastewater Plant Consolidation and
Decommissioning, Airport Road Bike and Pedestrian Improvements, Army Base Rehabilitation Park, Flood Protection, and Runway Reconstruction and Extension of 500 feet to the main runway for a total of $203,700,000.
Submitted Local Capital Infrastructure projects for Wastewater Plant Consolidation and Decommissioning, Water Well Core A New Domestic Water Well, Water Well Core B – Capacity increasing, and Purple Pipe Infrastructure for a total amount of $41,000,000.
Submitted California Department of Justice Tobacco Grant Program in conjunction with the Police Department in the amount of $62,170.
Submitted Prop 68 Park Grant – State Park Development and Community Revitalization Program for the Regional Community Park at Liberty in the amount of $8,500,000.
Completed Items Held Ribbon Cuttings for completed projects LGI Neighborhood and the Boat Launch Facility. Purchased a new bus for Transit. Executed the MOU with the County to construct McCormick Road. Construction was
completed in FY 2020-21. Leased all hangers at the airport.
Page 107

Performance Budget
• Completed the Annual Storm Water Permit – MS4 Report.• Completed the Northwest Wastewater Membrane Replacement project.• Completed the Water Meter Phase 2 project.• Upgraded the landscaping along the promenade and installed benches and shade structure
in conjunction with Rio Vision.• Awarded the Corporation Yard Generator project.• Implemented Household Hazardous Waste (HHW) bi-annual drop off events for all HHW
items.• Public Works Equipment and Vehicle Upgrades purchased:
o Backhoeo Dump Trailero Kabota Utility Vehicleo Hanger Tie-Down and Boat Launch Facility Pay Machine Replacementso Chipper/Mulcher
• Educational report on the status of vaping and assisted with the Vaping Ordinance.• COVID-19 response including vaccination clinics.
OPERATIONS
The Public Works Operations and Maintenance crew completed an eminence amount of work this year. They are responsible to maintain and operate the City Domestic Water system, as well as maintain the wastewater lines, streets and marking, parks and landscaping, city facilities, fleet, storm drain, bike and pedestrian facilities, issued and inspected encroachment permits and development infrastructure, and kept the city moving forward. The essential services the crews provide touch every citizen in the city on a daily basis. The department has the following vacancies: a Maintenance Worker, Mechanic, Public Works Supervisor, and a Program Manager.
The Public Works Crew continued to be an interictal part of the successful COVID-19 response. They set up and assisted with all the vaccination clinics, in addition to ensuring the City infrastructure was sanitized and remained in good working order. They have gone above and beyond to ensure the safety of themselves, their co-workers and the citizens of Rio Vista.
KEY PERFORMANCE INDICATORS
Fiscal year 20-21 performance measures are based upon the following criteria:
(1) Goal = Maintain Citywide infrastructure weeklyPerformance Measure = Percentage of weekly maintenance items completed versus totalweekly maintenance completedPerformance Indicators = 98%
Page 108

Performance Budget
KEY PERFORMANCE INDICATORS
(2) Goal = Secure additional funding for the City through GrantsPerformance Measure = Amount of funding securedPerformance Indicators = Secured at least an average of $250,000 annually
(3) Goal = Provide adequate and safe drinking water to the communityPerformance Measure = Ensure our water system meets the community demand for waterand meets the state requirements through testing and the annual water reportPerformance Indicator = Number of monetary violations issued by the state was zero
(4) Goal = Ensure Capital Improvement Projects are completed in a timely mannerPerformance Measure = Number of projects identified in the Annual Budget vs the numberof projects progressing on schedulePerformance Indicator = 90%
(5) Goal = Ensure both Wastewater Facilities are functioning within standards identified inthe State PermitPerformance Measure = Ensure our wastewater system meets the community demand andthey both meets the state requirements identified in their permitsPerformance Indicator = Number of monetary violations issued by the state was zero
FUTURE NEEDS
During Fiscal Year 2019-20 Public Works staff began working to create a complete and balanced Capital Improvement Program (CIP) which will include all identified improvements with a cost over $10,000. This process has continued and shows the needs of all aspects of the City infrastructure. The budget reflects the current projects and staff plan on building additional years into the budget to reflect future planned projects. The CIP will identify all areas of infrastructure improvements needed throughout the city. There will be sections for each type of infrastructure improvement such as Airport, Parks, Streets, Signals, Street Furniture, Transit, Bike and Pedestrian, Technology, Water, Wastewater, Stormwater, Development Improvements, Facilities, and Other Agencies. This document reflects the projects that received funding. Next year we will build on the process and include more projects and will continue to identify the needs of the Citizens. The list will continue to be updated it will provide staff with a roadmap to seek grant funding and to assist in long range financial and resource planning.
The City will need several large infrastructure projects over the next 10 to 20 years. One of these projects is the decommissioning of the Beach Wastewater Plant and the consolidation of flow with the Northwest Wastewater Treatment Plant. City staff is working on pre-design and a will identify right-of-way which will be needed for the project. City staff is also working to identify the needs related to the Water infrastructure including new well replacement, new wells to meet growing demands and technologies available to improve efficiencies.
Page 109

COMMUNITY DEVELOPMENT ORGANIZATIONAL CHARTFISCAL YEAR 2021-2022
Planning Manager (1)
Administrative Assistant II (1)
PT Administrative Assistant (0.5)
Building Inspector (1) Planning Consultant (Contract)
Community Development Organizational Chart
Page 110

Performance Budget
COMMUNITY DEVELOPMENT
The role of the Community Development Department is to assist the community in the creation and implementation of its vision for the future development of the City. This vision is documented in the City's General Plan, which serves as the "Constitution for Development" for the City.
The Department is made of up of four divisions providing the following services:
1. Planning: Staff provides technical assistance to the City Council and Commissions in the creation andimplementation of city regulations, financial and administrative procedures, including review of theGeneral Plan, Zoning Ordinance, and other land-use related laws. The Planning Division is responsiblefor reviewing development activities on private as well as public land.
2. Building: Day-to-day work focuses on reviewing compliance with the Building Code to ensure thatbuildings are built and remodeled to meet life and safety requirements. The Building Division alsoworks with the Police and Fire Departments to enforce standards to protect the public welfare andto improve property values through the enforcement of nuisance abatement and other municipalcodes. Planning and Building staff help permit applicants on land uses, design criteria, anddevelopment standards.
The Department's goal is to effectively deliver the best services to residents, property owners and business owners through the permitting and design process. We want to ensure that the applicant's construction and/or development idea becomes a reality. We welcome your input on how we can further improve our services, while balancing the interests of the community at large.
3. Housing & Economic Development: Works to facilitates economic development, redevelopment,affordable housing, and assistance with planning the design of City-owned facilities.
4. Administration: Staff processes business license applications and provide overall administrativesupport to the Department.
Page 111

Performance Budget
DEPARTMENT BUDGET SUMMARY
Expenditures by Division FY 19/20 Audited
FY 20/21 Budget
FY 20/21 Projected
FY21/22 Adopted
General Fund Building Department $ 163,376 $ 254,037 $ 221,364 $ 252,862 Planning 290,742 291,270 267,580 277,603 Code Enforcement 34,961 85,851 81,235 84,997 Economic Development 7,371 34,069 34,069 32,438 General Plan - 20,000 - 5,264Total $ 496,450 $ 685,226 $ 604,248 $ 653,163
Annual Percentage Change 22% 8%
Expenditures by Category FY 19/20 Audited
FY 20/21 Budget
FY 20/21 Projected
FY21/22 Adopted
Personnel Services $ 187,487 $ 386,895 $ 384,622 $ 378,428 Supplies and Services 308,963 298,331 219,626 274,735 Total $ 496,450 $ 685,226 $ 604,248 $ 653,163
SALARY AND BENEFIT CHANGES
The Personnel Services assigned to the General Fund decreases by $8,467 and the overall salaries and benefits of Community Department for FY2021-22 decreases by $8,860. The decreases in the use of the General Fund is mainly due to an expected retirement for a long-term employee in December 2021. The City anticipates a savings from the salaries and benefits for the new hire of this Administrative Assistant Position. Other factor includes the reduction of hours for the part-time Office Assistant Position based on the limit restricted for CalPERS retired annuitant.
AUTHORIZED POSITIONS
The Department is currently budgeted with one Planning Manager, one Building Inspector, one Administrative Assistant, one part-time temporary Office Assistant, and a contract Planning/Building Consultant.
Page 112

Performance Budget
Goals 1.0
Objective 1.1 Provide outstanding customer support
Objective 1.2 Update business-related ordinances as needed to support the growth of new businesses and jobs
Objective 1.3 Provide orientation training to new Planning Commissioners
Objective 1.4 Update plans and checklists to aid in the growth of new businesses and future development
ACCOMPLISHMENTS
Amended the Cannabis Ordinance Sold parcels in the Business Park—collected over $3,000,000 in land sales Processed Cannabis-related businesses through the conditional use permit
process—the six cannabis businesses were opened, providing jobs and revenue
Acquired building, business license, and community development software to increase efficiency and ensure the accurate fees were being collected.
OPERATIONS Building Permits
Business Licenses
Fiscal Year
New Home Permits (Single-Family) Active Adult Revision
Permits TRI LGI TRI LGI SUM
2016/17 0 0 156 0 0 539
2017/18 0 151 121 0 0 474
2018/19 0 158 60 0 16 399
2019/20 0 55 0 0 44 332
Calendar Year 2016 2017 2018 2019 2020
Issued 481 428 500 541 547
Goals and Initiatives
Page 113

Five‐Year Projec on & Long‐Term Concerns
Page 114

Five-Year Projections and Long-Term Concerns
LONG-RANGE PLANNING
The five-year projections of the General Fund, Water Enterprise Fund, and Wastewater Facilities Enterprise Fund provide detailed analysis and projections of the future revenues, expenses and fund balances, which offers the City Council a tool to help in determining the financial feasibility of any priorities or goals they may choose to adopt. The projections also alert management and the City Council to potential shortfalls and affords them the time to develop practical solutions with minimal impacts to the City’s residents. Balancing the needs of the community and the vision of the City Council against the City's capacity to fund specific programs must be carefully weighed.
The current draft of the Fiscal Projections has been built using the following assumptions and impacts:
Average annual 5% increase in property taxes based on the number of new homes built Average annual 3.25% increase in sales tax revenue Average annual 2% increase in cost-of-living adjustment (COLA) for personnel costs Average annual 3% increase in utility services fees based on the continued growth in single
family housing development and increase in population Average annual 7.39% increase in law enforcement services for the same staffing level Costs of fully funded future water and sewer capital improvement program Local Measure O Sales Tax successfully extended to 2027 Assumed no changes in total number of employees Assumed the projected revenues from Cannabis Business are the same as FY2021-22
As the nation begins to recover from the COVID-19 pandemic, jurisdictions across the country are assessing the impacts. Understanding the unique impacts of the pandemic on different revenue streams is key to building accurate forecasts. These impacts are monitored by the City and addressed in the Fiscal Model by using conservative growth rates for revenues and low interest rate assumptions for investments.
Long-Term Concerns and Issues
In May 7, 2019, the City Council approved a list of future water and wastewater capital improvement projects through FY 2023-24. Public Works staff has updated this list in February 2021, based on the information gathered over the past year and anticipated that most of the streets will require paving repairs and/or replacement of pavement due to damages caused by the construction of those projects.
Public works staff has been working closely to identify infrastructure improvements that are still needed in order to compile a comprehensive list of future projects to address all of the problem areas. Also, staff used the results from the recent 2017 CCTV sewer inspection project and the recent water system evaluation project to determine future sewer and water projects in the years of 2019 and beyond. The projects, which include waterline replacements will also include pavement rehabilitation since the pavement condition indexes (PCI) of those streets are some of the lowest within the City limit and will be damaged further by the construction. The proposed five-year capital improvement projects are shown in the following table. Exhibit A and B are the maps of proposed water and sewer improvements.
Page 115

Capital Improvement Project PlanFY 21/22 Projected
FY 22/23 Projected
FY 23/24 Projected
FY 24/25 Projected
FY 25/26 Projected
Water Enterprise FundWell #16 Scada Integration & Upgrades 200,000$ HWY 12 Waterline Replacement - Virginia Dr to Hillside Terrance 1,200,000 Well Replacement Plan - Study 200,000 Booster Pump Station - Amador Circle Storage Tank (Unfunded) 1,200,000$ Tahoe Dr. Waterline Replacement 400,000 Trinity Ct. Waterline Replacement 200,000 Highland Dr. Waterline Replacement 270,000 Bruning Ave Waterline Replacement 120,000 St. Gertrudes Waterline Replacement 200,000 Riverview St. Waterline Replacement 100,000 Hamilton Ave Waterline Replacement 100,000 Water Main & Lead Service/Fitting Replacement 1,300,000$ 1,300,000$ 1,300,000$ New Well (Unfunded) 2,500,000
Total Projected Water CIP 2,200,000$ 1,990,000$ 1,300,000$ 1,300,000$ 3,800,000$
Wastewater Enterprise FundCity Hall Lift Station 270,000$ CCTV Trilogy Wastewater Lines 280,000 Lift Station Backup Generators 100,000 River Road Lift Station Reconstruction 1,200,000 HWY 12 Sewer Repairs/Rehbilitation 630,000 Watewater Plant Audit & Assessment 100,000 Alley Sewer Line Relocation/ Rehabilitation 7th to 4th St. 400,000$ Alley Sewer Rehabilitation 3rd to Front St. 150,000 Sewer Relocation - California & 7th St. 200,000 Backyard Sewer Rehabilitations - Elm St. to St. Francis Way 270,000 Beach WWTP Collection System CCTV 280,000 Sewer Repairs, Replacements and Rehabilitation (based on Current CCTV Inspection Results) 800,000$ 800,000$ 800,000$
Total Projected Wastewater CIP 2,580,000$ 1,300,000$ 800,000$ 800,000$ 800,000$
Other Improvement Project PlanFY 21/22 Projected
FY 22/23 Projected
FY 23/24 Projected
FY 24/25 Projected
FY 25/26 Projected
Airport FundReplace PAPI and REIL 834,963$ Runway 7-25 Reconstruction 433,500$ 1,127,500$ 1,127,500$ 1,127,500$ (Projects funded by Federal 90%, State 4.5% and Local 5.5%)
Park and Recreation FundLGI 18-Acre Community Park 144,899 2,125,000 2,125,000 2,125,000 2,125,000 (Pending - Proposition 68 Park Grant - $8.5 million)
Total Projected Other CIP 979,862$ 2,558,500$ 3,252,500$ 3,252,500$ 3,252,500$
Five-Year Projections and Long-Term Concerns
Page 116

Page 117

Page 118

FY 21/22 Projected
FY 22/23 Projected
FY 23/24 Projected
FY 24/25 Projected
FY 25/26 Projected
Fund Balance - Beginning 5,884,410$ 6,086,666$ 6,118,797$ 6,059,260$ 5,898,779$
Add: Revenues 7,673,175 7,857,228 8,048,999 8,248,825 8,457,059 Transfers In 441,805 415,550 415,550 415,550 415,550
Total Revenue 8,114,980 8,272,778 8,464,549 8,664,375 8,872,609
Less: Operating Expenditures 7,774,175 8,041,409 8,324,848 8,625,618 8,944,928 Debt Service 120,548 124,238 124,238 124,238 124,238 Operating Transfers Out 8,000 25,000 25,000 25,000 25,000
Total Appropriations 7,902,723 8,190,647 8,474,086 8,774,856 9,094,166
Revenue Over (Under) Appropriations 212,257 82,131 (9,537) (110,481) (221,557)
CIP & Capital Outlay 10,000 50,000 50,000 50,000 50,000
Revenue Over (Under) Appropriations 202,257 32,131 (59,537) (160,481) (271,557)
Fund Balance - Ending 6,086,666$ 6,118,797$ 6,059,260$ 5,898,779$ 5,627,222$
GENERAL FUNDFive-Year Projections
Five-Year Projections and Long-Term Concerns
Page 119

FY 21/22 Projected
FY 22/23 Projected
FY 23/24 Projected
FY 24/25 Projected
FY 25/26 Projected
Fund Balance - Beginning 3,290,999$ 1,344,672$ 76,723$ (431,089)$ (866,434)$
Add: Revenues 3,076,000 3,166,000 3,258,700 3,354,181 3,452,526 Transfers In 20,680 20,680 20,680 20,680 20,680
Total Revenue 3,096,680 3,186,680 3,279,380 3,374,861 3,473,206
Less: Expenditures 2,097,608 2,119,729 2,142,292 2,165,307 2,188,781 Debt Service 319,900 319,900 319,900 319,900 319,900 Transfers Out 390,000 25,000 25,000 25,000 25,000
Total Appropriations 2,807,508 2,464,629 2,487,192 2,510,207 2,533,681
Revenue Over (Under) Appropriations 289,172 722,051 792,188 864,654 939,525
CIP & Capital Outlay 2,235,500 1,990,000 1,300,000 1,300,000 3,800,000
Revenue Over (Under) Appropriations (1,946,328) (1,267,949) (507,812) (435,346) (2,860,475)
Fund Balance - Ending 1,344,672$ 76,723$ (431,089)$ (866,434)$ (3,726,909)$
NOTE:
WATER ENTERPRISE FUNDFive-Year Projections
There are two unfunded projects included in the total of "CIP & Capital Outlay" in FY 2022-23 and FY 2025-26. See future CIP listing for detail on Page 116. The unfunded projects are added in the total for reference only.
Five-Year Projections and Long-Term Concerns
Page 120

FY 21/22 Projected
FY 22/23 Projected
FY 23/24 Projected
FY 24/25 Projected
FY 25/26 Projected
Fund Balance - Beginning 4,908,646$ 2,503,685$ 1,559,632$ 1,241,884$ 1,054,461$
Add: Revenues 4,912,000 5,056,930 5,206,208 5,359,964 5,518,333 Other Financing Sources - - - - - Transfers In 12,000 12,000 12,000 12,000 12,000
Total Revenue 4,924,000 5,068,930 5,218,208 5,371,964 5,530,333
Less: Expenditures 4,283,791 4,306,313 4,329,285 4,352,717 4,376,617 Debt Service 263,645 263,645 263,645 263,645 263,645 Operating Transfers Out 158,025 143,025 143,025 143,025 143,025
Total Appropriations 4,705,461 4,712,983 4,735,955 4,759,387 4,783,288
Revenue Over (Under) Appropriations 218,539 355,947 482,252 612,577 747,046
CIP & Capital Outlay 2,623,500 1,300,000 800,000 800,000 800,000
Revenue Over (Under) Appropriations (2,404,961) (944,053) (317,748) (187,423) (52,955)
Fund Balance - Ending 2,503,685$ 1,559,632$ 1,241,884$ 1,054,461$ 1,001,507$
WASTEWATER (BEACH & NW) ENTERPRISE FUNDFive-Year Projections
Five-Year Projections and Long-Term Concerns
Page 121

Capital Improvement, Capital Outlay & Major Maintenance Program
Page 122

Capital Improvement, Capital Outlay & Major Maintenance Programs
CAPITAL EXPENDITURES
The City defines capital assets as assets with an initial, individual cost of more than $5,000 and an estimated useful life in excess of one year. Assets acquired with grant funds may be capitalized even though their individual costs are less than $5,000 whenever the Finance Director determines it to be necessary or advisable. Major outlays for capital assets and improvements are capitalized as projects are constructed.
Capital Improvement and Fixed Asset Budget are prepared as part of the Operating Budget, which appropriates funds for specific programs and projects. The Five-Year Capital Improvement Program budget is reviewed annually to enable the City Council to reassess projects in the program.
Capital Expenditures typically involves the purchase or construction of major fixed assets such as land, buildings, and any permanent improvements including additions, replacements, and major alternations having a long-life expectancy. Capital projects may apply to: (1) expenditure which take place over two or more years and require continuing appropriations beyond a single fiscal year; (2) systematic acquisitions over an extended period, or (3) scheduled replacement of specific elements of physical assets. Generally, only those items costing $10,000 or more are considered as capital improvement projects or Capital Outlay.
CAPITAL IMPROVEMENT PROJECTS are construction or improvements projects that requires a request for proposal (RFP), is on-going projects beyond a single fiscal year, or have multiple stages (i.e. preliminary studies, design, construction, construction management/administration).
CAPITAL OUTLAY is the capital expenditures for the purchase of fixed assets, such as vehicle, equipment, software, and improvements that can be completed within the fiscal year.
MAJOR MAINTENANCE
The city also identifies projects in the Major Maintenance Program each year. Those projects mainly apply to : (1) upgrade and maintain sewer plant and facilities at current and competitive standards; (2) address code and safety issues, mechanical, electrical and plumbing systems, exterior and structural shortcomings, and immediate landscape issues; (3) the dollars are not to be spent to alter buildings or to renovate; (4) dollars should extend the life of whatever is being corrected for cycle of life designated for the plant and facilities.
CURRENT BUDGET
In FY 2021-22, the City appropriates $9,292,896, 17 projects in Capital Improvement, 13 projects in Capital Outlay, and 2 Major Maintenance Programs, of which, $6,543,962 in Capital Improvement, $435,612 in Capital Outlay, and $2,313,322 in Major Maintenance. In the Capital Improvement Projects, the City identified three significant, nonrecurring capital expenditures: (1) Beach Wastewater River Road Lift Station Reconstruction - $1,200,000, (2) Citywide Waterline Replacement - $600,000, and (3) 2020 Water & Sewer CIP - $1,830,000.
Page 123

Capital
Project
Capital
Projects
Water Water CIP Business
Park
Airport NW Sewer
CIP
Beach
Sewer CIPTOTALS
Revenues
Intergovernmental ‐ Grants 289,100 804,040 1,093,140 Miscellaneous 30,923 30,923
289,100 ‐ ‐ ‐ 834,963 ‐ ‐ 1,124,063 Expenditures
To appropriate new fundsCC004 New Accounting System 350,000 350,000 PW013 ADA Sidewalk Repair & Replacement 140,000 140,000 PW018 Highway Safety Improvement Program ‐ Pedestrain
Crossing 249,100 249,100 PW019 Public Works Office & Corp Yard Improvement ‐ Addition 30,000 30,000 PW020 Airport ‐ Replace PAPI and REIL ‐ Design & Construction 834,963 834,963 PW022 LGI 18 Acre New Park Phase I 144,899 144,899 PW024 PG&E Underground Easement Quit Claim Preliminary
Study ‐ Business Park 15,000 15,000 SW001 City Hall Lift Station 270,000 270,000 SW006 2020 Sewer CIP 630,000 630,000 SW007 River Road Lift Station ‐ Construction 1,200,000 1,200,000 SW008 CCTV Trilogy Wastewater Lines 280,000 280,000 SW009 Backup Generators ‐ 2nd Street & Airport Road Lift Station 100,000 100,000 SW010 Wastewater Plant Audit & Assessment 50,000 50,000 100,000 WT007 Well #16 Scada Integration and Upgrades 200,000 200,000 WT008 2020 Water CIP 1,200,000 1,200,000 WT009 Well Replacement Plan ‐ Study ‐ CIP Preliminary 200,000 200,000 WT010 Waterline Replacement ‐ Tahoe Dr & Trinity Ct 600,000 600,000
913,999 200,000 2,000,000 15,000 834,963 330,000 2,250,000 6,543,962 Other Sources/Uses
Transfer in ‐ Gas Tax 2105 100,000 100,000 Transfer in ‐ Parks and Recreation 144,899 144,899 Transfer in ‐ Water 365,000 365,000 Transfer in ‐ Beach Facility 7,500 7,500 Transfer in ‐ NW Facility 7,500 7,500 Business Park 15,000 15,000 Water 200,000 2,000,000 2,200,000 NW Facility‐ Plant 330,000 330,000 Beach Facility Plant 2,250,000 2,250,000
624,899 200,000 2,000,000 15,000 ‐ 330,000 2,250,000 5,419,899 Net Annual Activity ‐ ‐ ‐ ‐ ‐ ‐ ‐ ‐
Enterprise Funds
CityofRioVista
CityofRioVista Capital Improvement Projects
Page 124

Project # Project NameSum of Prior
years‐cost
Adopted Cost FY 21‐22
Total Project
Cost
CC004 ‐ 350,000 350,000
ACCOUNTING SOFTWARE
51‐Other Costs ‐ 350,000 350,000 PW013 97,585 140,000 237,585
ADA SIDEWALK REPAIR AND REPLACEMENT
51‐Construction 92,585 140,000 232,585 51‐Design 5,000 ‐ 5,000
PW018 53,982 249,100 303,082
HSIP PEDESTRIAN CROSSING
51‐Construction ‐ 223,600 223,600 51‐Construction Admin ‐ 8,500 8,500 51‐Construction Mgmt 5,382 17,000 22,382 51‐Design 44,500 ‐ 44,500 51‐Prelim Design/Studies 4,100 ‐ 4,100
PW019 574,337 30,000 604,337
ADDITION ‐ PW CORP YARD & STORAGE
51‐Other Costs 574,337 30,000 604,337 PW020 97,500 834,963 932,463
AIRPORT ‐ REPLACE PAPI & REIL
84‐Construction ‐ 834,963 834,963 84‐Design 97,500 ‐ 97,500
PW022 12,868 144,899 157,767
LGI ‐ 18 ACRE COMMUNITY PARK
51‐Construction ‐ 94,899 94,899 51‐Construction Mgmt ‐ 30,000 30,000 51‐Design 12,868 20,000 32,868
PW024 ‐ 15,000 15,000
PG&E UNDERGROUND EASEMENT STUDY
75‐Prelim Design/Studies ‐ 15,000 15,000 SW001 30,000 270,000 300,000
CITY HALL LIFT STATION
88‐Construction ‐ 250,000 250,000 88‐Prelim Design/Studies 10,000 ‐ 10,000 88‐Design 20,000 ‐ 20,000 88‐Construction Mgmt ‐ 15,000 15,000 88‐Construction Admin ‐ 5,000 5,000
SW006 70,000 630,000 700,000
2020 SEWER CIP PROJECT
88‐Construction ‐ 546,520 546,520 88‐Design 48,800 ‐ 48,800 88‐Construction Mgmt 21,200 83,480 104,680
SW007 20,000 1,200,000 1,220,000
RIVER ROAD LIFT STATION
88‐Construction ‐ 1,200,000 1,200,000 88‐Design 20,000 ‐ 20,000
SW008 ‐ 280,000 280,000
PROJECTS BY COST
Capital Improvement Projects
Page 125

Project # Project NameSum of Prior
years‐cost
Adopted Cost FY 21‐22
Total Project
Cost
PROJECTS BY COST
Capital Improvement Projects
SW008 CCTV TRILOGY WASTEWATER LINES
87‐Construction ‐ 242,000 242,000 87‐Design ‐ 10,000 10,000 87‐Construction Mgmt ‐ 28,000 28,000
SW009 ‐ 100,000 100,000
LIFT STATION BACKUP GENERATORS
88‐Construction ‐ 100,000 100,000 SW010 ‐ 100,000 100,000
WASTEWATER PLANT AUDIT & ASSESSMENT
88‐Prelim Design/Studies ‐ 50,000 50,000 87‐Prelim Design/Studies ‐ 50,000 50,000
WT007 50,000 200,000 250,000
WELL # 16 SCADA INTEGRATION & UPGRADES
81‐Construction 50,000 200,000 250,000 WT008 100,000 1,200,000 1,300,000
2020 WATER CIP PROJECT
81‐Construction ‐ 1,104,780 1,104,780 81‐Construction Mgmt 26,800 95,220 122,020 81‐Design 73,200 ‐ 73,200
WT009 ‐ 200,000 200,000
WELL REPLACEMENT PLAN
81‐Prelim Design/Studies ‐ 200,000 200,000 WT010 ‐ 600,000 600,000
WATERLINE REPLACEMENT
81‐Construction ‐ 600,000 600,000 Grand Total 1,106,272 6,543,962 7,650,234
Page 126

Category Adopted Funding FY 21‐22Facilities: Other 30,000
Infrastructure: Other 1,084,063
Infrastructure: Parks 144,899
Infrastructure: Sewer 2,480,000
Infrastructure: Streets 140,000
Infrastructure: Water 2,000,000
Software Development 350,000
Studies/Reports 315,000
Grand Total 6,543,962
PROJECTS BY CATEGORIES
Capital Improvement Projects
Facilities: Other, 30,000
Infrastructure: Other, 1,084,063
Infrastructure: Parks, 144,899
Infrastructure: Sewer, 2,480,000
Infrastructure: Streets, 140,000
Infrastructure: Water, 2,000,000
Software Development, 350,000
Studies/Reports, 315,000
Page 127

Category Project NameAdopted Funding
FY 21‐22
Facilities: Other 30,000
PW019
ADDITION ‐ PW CORP YARD & STORAGE 30,000 Infrastructure: Other 1,084,063
PW018
HSIP PEDESTRIAN CROSSING 249,100 PW020
AIRPORT ‐ REPLACE PAPI & REIL 834,963 Infrastructure: Parks 144,899
PW022
LGI ‐ 18 ACRE COMMUNITY PARK 144,899 Infrastructure: Sewer 2,480,000
SW001
CITY HALL LIFT STATION 270,000 SW006
2020 SEWER CIP PROJECT 630,000 SW007
RIVER ROAD LIFT STATION 1,200,000
SW008
CCTV TRILOGY WASTEWATER LINES 280,000 SW009
LIFT STATION BACKUP GENERATORS 100,000 Infrastructure: Streets 140,000
PW013
ADA SIDEWALK REPAIR AND REPLACEMENT 140,000 Infrastructure: Water 2,000,000
WT007
WELL # 16 SCADA INTEGRATION & UPGRADES 200,000 WT008
2020 WATER CIP PROJECT 1,200,000
WT010
WATERLINE REPLACEMENT 600,000 Software Development 350,000
CC004
ACCOUNTING SOFTWARE 350,000 Studies/Reports 315,000
PW024
PG&E UNDERGROUND EASEMENT STUDY 15,000 WT009
WELL REPLACEMENT PLAN 200,000 SW010
WASTEWATER PLANT AUDIT & ASSESSMENT 100,000 Grand Total 6,543,962
PROJECTS BY CATEGORIES
Capital Improvement Projects
Page 128

Funding Sources Adopted Funding FY 21‐22 25 Gas Tax ‐ 2105 100,000
51 Grants/Loans/Others 289,100
54 Parks and Recreation 144,899
80 Water System 2,565,000
85 Beach Facility ‐ Plant 1,987,500
86 NW Facility ‐ Plant 330,000
84 FAA 751,466
84 CAL Aeronautics 52,574
84 Airport 30,923
75 Business Park 15,000
85 Beach Facility ‐ Lift Station 270,000
86 NW Facility ‐ Lift Station 7,500
Grand Total 6,543,962
PROJECTS BY FUNDING SOURCES
Capital Improvement Projects
25 Gas Tax ‐ 2105 , 100,000
51 Grants/Loans/Others, 289,100
54 Parks and Recreation, 144,899
80 Water System, 2,565,000
85 Beach Facility ‐ Plant, 1,987,500
86 NW Facility ‐ Plant, 330,000
84 FAA, 751,466
84 CAL Aeronautics, 52,574
84 Airport, 30,923
75 Business Park, 15,000
85 Beach Facility ‐ Lift Station, 270,000
86 NW Facility ‐ Lift Station, 7,500
Page 129

Funding Sources Project # Project NameAdopted Funding
FY 21‐22
25 Gas Tax ‐ 2105 100,000
PW013
ADA SIDEWALK REPAIR AND REPLACEMENT 100,000
51 Grants/Loans/Others 289,100
PW013
ADA SIDEWALK REPAIR AND REPLACEMENT 40,000 PW018
HSIP PEDESTRIAN CROSSING 249,100
54 Parks and Recreation 144,899
PW022
LGI ‐ 18 ACRE COMMUNITY PARK 144,899
80 Water System 2,565,000
CC004
ACCOUNTING SOFTWARE 350,000
PW019
ADDITION ‐ PW CORP YARD & STORAGE 15,000 WT007
WELL # 16 SCADA INTEGRATION & UPGRADES 200,000
WT008
2020 WATER CIP PROJECT 1,200,000 WT009
WELL REPLACEMENT PLAN 200,000
WT010
WATERLINE REPLACEMENT 600,000
85 Beach Facility ‐ Plant 1,987,500
PW019
ADDITION ‐ PW CORP YARD & STORAGE 7,500 SW006
2020 SEWER CIP PROJECT 630,000
SW007
RIVER ROAD LIFT STATION 1,200,000 SW009
LIFT STATION BACKUP GENERATORS 100,000
SW010
WASTEWATER PLANT AUDIT & ASSESSMENT 50,000 86 NW Facility ‐ Plant 330,000
SW008
CCTV TRILOGY WASTEWATER LINES 280,000
SW010
WASTEWATER PLANT AUDIT & ASSESSMENT 50,000 84 FAA 751,466
PW020
AIRPORT ‐ REPLACE PAPI & REIL 751,466
84 CAL Aeronautics 52,574
PW020
AIRPORT ‐ REPLACE PAPI & REIL 52,574 84 Airport 30,923
PW020
AIRPORT ‐ REPLACE PAPI & REIL 30,923
PROJECTS BY FUNDING SOURCES
Capital Improvement Projects
Page 130

Funding Sources Project # Project NameAdopted Funding
FY 21‐22
PROJECTS BY FUNDING SOURCES
Capital Improvement Projects
75 Business Park 15,000
PW024
PG&E UNDERGROUND EASEMENT STUDY 15,000 85 Beach Facility ‐ Lift Station 270,000
SW001
CITY HALL LIFT STATION 270,000
86 NW Facility ‐ Lift Station 7,500
PW019
ADDITION ‐ PW CORP YARD & STORAGE 7,500 Grand Total 6,543,962
Page 131

Software Development
Project Name: Project # : CC004
Project Budget: $350,000
Status: New
Department: Finance
Location:
Descriptions:
Cumulative Appropriation by
Funding SourcePrior years FY 21‐22 FY 22‐23 FY 23‐24 FY 24‐25 Total
80 Water System ‐ 350,000 350,0000000000
Total 0 350,000 0 0 0 350,000
Expenditures Prior years FY 21‐22 FY 22‐23 FY 23‐24 FY 24‐25 Total
51‐Other Costs ‐ 350,000 350,0000000000
Total 0 350,000 0 0 0 350,000
Remaining budget: ‐
Comments : Proposed budget increased from $150,000 in FY19/20 to $350,000 in FY21/22 based on the quotation from the current accounting software provider as a guideline for the market value of the services.
ACCOUNTING SOFTWARE
City HallAn integrated Enterprise Resource Planning (ERP) solutions that can provide financial management and utility billing customer information services specifically for the public sector as a multi‐fund accounting system that can handle accounting, budgeting, work orders, permits, grant managment, asset managment, human resources, and project performance needs.
Capital Improvement Projects
Page 132

Infrastructure: Streets
Project Name: Project # : PW013
Project Budget: $237,585
Status: Ongoing
Department: Public Works
Location:
Descriptions:
Cumulative Appropriation by
Funding SourcePrior years FY 21‐22 FY 22‐23 FY 23‐24 FY 24‐25 Total
25 Gas Tax ‐ 2105 97,585 100,000 197,58551 Grants/Loans/Others 40,000 40,000
000000
Total 97,585 140,000 0 0 0 237,585
Expenditures Prior years FY 21‐22 FY 22‐23 FY 23‐24 FY 24‐25 Total
51‐Design 5,000 ‐ 5,00051‐Construction 92,585 140,000 232,585
000000
Total 97,585 140,000 0 0 0 237,585
Remaining budget: ‐
Comments :
ADA SIDEWALK REPAIR AND REPLACEMENT
Citywide
This project will significantly improve the ADA access and ramps and sidewalks citywide. It will address ADA accessibility to the ADA ramps and sidewalks.
Assistance with Road Repairs issued by the State Department of Water Resources for an amount of $40,000.
Capital Improvement Projects
Page 133

Infrastructure: Other
Project Name: Project # : PW018
Project Budget: $303,082
Status: Design
Department: Public Works
Location:
Descriptions:
Cumulative Appropriation
by Funding SourcePrior years FY 21‐22 FY 22‐23 FY 23‐24 FY 24‐25 Total
91 Street Projects 9,482 ‐ 9,48251 Grants/Loans/Others 44,500 249,100 293,600
000000
Total 53,982 249,100 0 0 0 303,082
Expenditures Prior years FY 21‐22 FY 22‐23 FY 23‐24 FY 24‐25 Total
51‐Prelim Design/Studies 4,100 ‐ 4,10051‐Design 44,500 ‐ 44,50051‐Construction ‐ 223,600 223,60051‐Construction Mgmt 5,382 17,000 22,38251‐Construction Admin 8,500 8,500
000
Total 53,982 249,100 0 0 0 303,082
Remaining budget: ‐
Comments : (1) Federal Grant ‐ HSIP Cycle 9 Funding ‐ Construction = $249,100(2) Federal Grant ‐ 04‐SOL‐0‐RVS ‐ 5099(015) ‐ Design = $44,500
HSIP PEDESTRIAN CROSSING
Highway pedestrian crossingHighway Safety Improvement Program pedestrian crossing
Capital Improvement Projects
Page 134

Facilities: Other
Project Name: Project # : PW019
Project Budget: $604,337
Status: Ongoing
Department: Public Works
Location:
Descriptions:
Cumulative Appropriation by
Funding SourcePrior years FY 21‐22 FY 22‐23 FY 23‐24 FY 24‐25 Total
86 NW Facility ‐ Lift Station 135,236 7,500 142,73685 Beach Facility ‐ Plant 174,101 7,500 181,60180 Water System 215,000 15,000 230,00091 Street Projects 50,000 50,000
0000
Total 574,337 30,000 0 0 0 604,337
Expenditures Prior years FY 21‐22 FY 22‐23 FY 23‐24 FY 24‐25 Total
51‐Other Costs 574,337 30,000 604,3370000000
Total 574,337 30,000 0 0 0 604,337
Remaining budget: ‐
Comments :
ADDITION ‐ PW CORP YARD & STORAGE
789 St Francis Way
This addition includes a 30 x 30 Storage Building with concrete floor for water pipe, fittings, sewer pipe, and various other materials.
The initial corporation yard improvement project was filed for completion on December 15th, 2020 under Resolution No. 2020‐095.
30 x 30 Storage Building = $30,000
Capital Improvement Projects
Page 135

Project Name: Project # : PW020
Project Budget: $932,463
Status: Construction
Department: Public Works
Location:
Descriptions:
Cumulative Appropriation by
Funding SourcePrior years FY 21‐22 FY 22‐23 FY 23‐24 FY 24‐25 Total
84 FAA 97,500 751,466 848,96684 CAL Aeronautics 52,574 52,57484 Airport 30,923 30,923
00000
Total 97,500 834,963 0 0 0 932,463
Expenditures Prior years FY 21‐22 FY 22‐23 FY 23‐24 FY 24‐25 Total
84‐Design 97,500 ‐ 97,50084‐Construction 834,963 834,963
000000
Total 97,500 834,963 0 0 0 932,463
Remaining budget: ‐
Comments :
AIRPORT ‐ REPLACE PAPI & REIL
Airport Road
Replace PAPI and REIL funded by FAA, CAL State and City local match
Design Phase ‐ 100% Federal Funds by FAA (97,500) ‐ Completed in March 2021.
Construction Phase ‐ 90% Federal Funds by FAA (751,466), 5% State Funds ($37,574), Annual Credit from State ($10,000 + $5,000 = $15,000), and City Match by ENXCO ($30,923).
Infrastructure: Other
Capital Improvement Projects
Page 136

Infrastructure: Parks
Project Name: Project # : PW022
Project Budget: $157,767
Status: Design
Department: Public Works
Location:
Descriptions:
Cumulative Appropriation by
Funding SourcePrior years FY 21‐22 FY 22‐23 FY 23‐24 FY 24‐25 Total
54 Parks and Recreation 12,868 144,899 157,7670000000
Total 12,868 144,899 0 0 0 157,767
Expenditures Prior years FY 21‐22 FY 22‐23 FY 23‐24 FY 24‐25 Total
51‐Design 12,868 20,000 32,86851‐Construction 94,899 94,89951‐Construction Mgmt 30,000 30,000
00000
Total 12,868 144,899 0 0 0 157,767
Remaining budget: ‐
Comments :
LGI ‐ 18 ACRE COMMUNITY PARK
Lincoln Landing and Park Place in LGI Community
This project will design and construct phase 1 of the overall 18 acre park site. City staff will seek grant funding to leverage the limited local funding.
Pending updates on grants availability.
Project budget represents local available funding, not the total project costs of construction.
Capital Improvement Projects
Page 137

Studies/Reports
Project Name: Project # : PW024
Calenday Year Budget: $15,000
Status: New
Department: Public Works
Location:
Descriptions:
Cumulative Appropriation
by Funding SourcePrior years FY 21‐22 FY 22‐23 FY 23‐24 FY 24‐25 Total
75 Business Park ‐ 15,000 15,0000000000
Total 0 15,000 0 0 0 15,000
Expenditures Prior years FY 21‐22 FY 22‐23 FY 23‐24 FY 24‐25 Total
75‐Prelim Design/Studies ‐ 15,000 0 15,0000000000
Total 0 15,000 0 0 0 15,000
Remaining budget: ‐
Comments : This study is a preliminary phase of future capital improvement project. Funding roll forward.
PG&E UNDERGROUND EASEMENT STUDY
Business ParkPG&E underground service easement study for quit claim.
Capital Improvement Projects
Page 138

Infrastructure: Sewer
Project Name: Project # : SW001
Project Budget: $300,000
Status: Construction
Department: Public Works
Location:
Descriptions:
Cumulative Appropriation by
Funding SourcePrior years FY 21‐22 FY 22‐23 FY 23‐24 FY 24‐25 Total
85 Beach Facility ‐ Lift Station 30,000 270,000 300,0000000000
Total 30,000 270,000 0 0 0 300,000
Expenditures Prior years FY 21‐22 FY 22‐23 FY 23‐24 FY 24‐25 Total
88‐Prelim Design/Studies 10,000 ‐ 10,00088‐Design 20,000 ‐ 20,00088‐Construction 250,000 250,00088‐Construction Mgmt 15,000 15,00088‐Construction Admin 5,000 5,000
000
Total 30,000 270,000 0 0 0 300,000
Remaining budget: ‐
Comments :
CITY HALL LIFT STATION
4 Main Street, Rio Vista
This project is design for expansion of existing lift station.
The project scope will be to upgrade the two existing sewer pumps and to add a third sewer pump to increase the pumping capacity and reliability of the City Hall lift station.
Project design started in August 2020. Construction is expected to begin in FY2021/22.
Capital Improvement Projects
Page 139

Infrastructure: Sewer
Project Name: Project # : SW006
Project Budget: $700,000
Status: Ongoing
Department: Public Works
Location:
Descriptions:
Cumulative Appropriation by
Funding SourcePrior years FY 21‐22 FY 22‐23 FY 23‐24 FY 24‐25 Total
85 Beach Facility ‐ Plant 70,000 630,000 700,0000000000
Total 70,000 630,000 ‐ ‐ ‐ 700,000
Expenditures Prior years FY 21‐22 FY 22‐23 FY 23‐24 FY 24‐25 Total
88‐Design 48,800 ‐ 48,80088‐Construction ‐ 546,520 546,52088‐Construction Mgmt 21,200 83,480 104,680
00000
Total 70,000 630,000 ‐ ‐ ‐ 700,000
Remaining budget: ‐
Comments : Construction is going out to bid in May 2021.
Brian Is working on a map
2020 SEWER CIP PROJECT
Highway 12 from near Drouin Drive to 5th Street, 7th Street from Morgan Lane to near Main StreetRepair and rehabilitate various size sewer lines on Highway 12, abandon old sewer line in front yards and replace with new sewer line in 7th Street.
Capital Improvement Projects
Page 140

Infrastructure: Sewer
Project Name: Project # : SW007
Project Budget: $1,220,000
Status: Ongoing
Department: Public Works
Location:
Descriptions:
Cumulative Appropriation by
Funding SourcePrior years FY 21‐22 FY 22‐23 FY 23‐24 FY 24‐25 Total
85 Beach Facility ‐ Plant 20,000 1,200,000 1,220,0000000000
Total 20,000 1,200,000 ‐ ‐ ‐ 1,220,000
Expenditures Prior years FY 21‐22 FY 22‐23 FY 23‐24 FY 24‐25 Total
88‐Design 20,000 ‐ 20,00088‐Construction ‐ 1,200,000 1,200,00088‐Construction Mgmt ‐ ‐ 0
00000
Total 20,000 1,200,000 ‐ ‐ ‐ 1,220,000
Remaining budget: ‐
Comments : Design Phase will be completed in FY20/21. Construction is expected to start in FY21/22.
RIVER ROAD LIFT STATION
Brian Is working on a map
River Road
River Road lift Station Reconstruction
The project scope is to acquire a piece of land in order to relocate and reconstruct the River Road lift station on City owned land outside of the State Highway right of way in which it is currently located.
Capital Improvement Projects
Page 141

Infrastructure: Sewer
Project Name: Project # : SW008
Project Budget: $280,000
Status: New
Department: Public Works
Location:
Descriptions:
Cumulative Appropriation by
Funding SourcePrior years FY 21‐22 FY 22‐23 FY 23‐24 FY 24‐25 Total
86 NW Facility ‐ Plant ‐ 280,000 280,0000000000
Total ‐ 280,000 ‐ ‐ ‐ 280,000
Expenditures Prior years FY 21‐22 FY 22‐23 FY 23‐24 FY 24‐25 Total
87‐Design 10,000 10,00087‐Construction 242,000 242,00087‐Construction Mgmt 28,000 28,000
00000
Total ‐ 280,000 ‐ ‐ ‐ 280,000
Remaining budget: ‐
Comments :
CCTV TRILOGY WASTEWATER LINES
3000 Airport Road ‐ NW plant
NWWTP Collection System CCTV
Capital Improvement Projects
Page 142

Infrastructure: Sewer
Project Name: Project # : SW009
Project Budget: $100,000
Status: New
Department: Public Works
Location:
Descriptions:
Cumulative Appropriation by
Funding SourcePrior years FY 21‐22 FY 22‐23 FY 23‐24 FY 24‐25 Total
85 Beach Facility ‐ Plant ‐ 100,000 100,0000000000
Total ‐ 100,000 ‐ ‐ ‐ 100,000
Expenditures Prior years FY 21‐22 FY 22‐23 FY 23‐24 FY 24‐25 Total
88‐Design ‐ 088‐Construction ‐ 100,000 100,000
000000
Total ‐ 100,000 ‐ ‐ ‐ 100,000
Remaining budget: ‐
Comments :
LIFT STATION BACKUP GENERATORS
Beach Wastewater
Permanent backup generators at Airport Road and 2nd Street Lift Stations with automatic transfer switches.
Capital Improvement Projects
Page 143

Studies/Reports
Project Name: Project # : SW010
Project Budget: $100,000
Status: New
Department: Public Works
Location:
Descriptions:
Cumulative Appropriation by
Funding SourcePrior years FY 21‐22 FY 22‐23 FY 23‐24 FY 24‐25 Total
85 Beach Facility ‐ Plant ‐ 50,000 50,00086 NW Facility ‐ Plant 50,000 50,000
000000
Total 0 100,000 0 0 0 100,000
Expenditures Prior years FY 21‐22 FY 22‐23 FY 23‐24 FY 24‐25 Total
87‐Prelim Design/Studies ‐ 50,000 50,00088‐Prelim Design/Studies ‐ 50,000 50,000
000000
Total 0 100,000 0 0 0 100,000
Remaining budget: ‐
Comments :
WASTEWATER PLANT AUDIT & ASSESSMENT
Beach WWTP & Northwest WWTP
Wastewater Plant Audit and Infrastructure Assessment based on report from Sierra Controls.
Capital Improvement Projects
Page 144

Infrastructure: Water
Project Name: Project # : WT007
Project Budget: $250,000
Status: Ongoing
Department: Public Works
Location:
Descriptions:
Cumulative Appropriation by
Funding SourcePrior years FY 21‐22 FY 22‐23 FY 23‐24 FY 24‐25 Total
80 Water System 50,000 200,000 250,0000000000
Total 50,000 200,000 0 0 0 250,000
Expenditures Prior years FY 21‐22 FY 22‐23 FY 23‐24 FY 24‐25 Total
81‐Prelim Design/Studies ‐ ‐ 081‐Design ‐ ‐ 081‐Construction 50,000 200,000 250,00081‐Construction Mgmt ‐ ‐ 081‐Construction Admin ‐ ‐ 0
000
Total 50,000 200,000 0 0 0 250,000
Remaining budget: ‐
Comments :
WELL # 16 SCADA INTEGRATION & UPGRADES
Well #16
Once Well 16 is accepted the infrastructure will need to be integrated into the Citywide SCADA system which monitors our water system functionality. This project will integrate and upgrade the existing sytem at Well 16 to the current city system.
The construction cannot be completed until the developer finishes the treatment system.
Capital Improvement Projects
Page 145

Infrastructure: Water
Project Name: Project # : WT008
Project Budget: $1,300,000
Status: Construction
Department: Public Works
Location:
Descriptions:
Cumulative Appropriation by
Funding SourcePrior years FY 21‐22 FY 22‐23 FY 23‐24 FY 24‐25 Total
80 Water System 100,000.00 1,200,000 1,300,0000000000
Total 100,000 1,200,000 0 0 0 1,300,000
Expenditures Prior years FY 21‐22 FY 22‐23 FY 23‐24 FY 24‐25 Total
81‐Prelim Design/Studies ‐ ‐ 081‐Design 73,200 ‐ 73,20081‐Construction 1,104,780 1,104,78081‐Construction Mgmt 26,800 95,220 122,020
0000
Total 100,000 1,200,000 0 0 0 1,300,000
Remaining budget: ‐
Comments :
2020 WATER CIP PROJECT
Highway 12 from Hillside Terrance to Virginia Drive, 7th Street from California to Main Street, City Hall Parking lot and lower Main Street.Abandon 6" waterline and replace with 12" waterline on Highway 12, Abandon 4" waterline in front yards on 7th street and replace with 8" waterline in the street, Abandon old waterline near sewer and replace with new 8" waterline separated from sewer at City Hall/Main Street
Construction will begin in June 2021
Brian Is working on a map
Capital Improvement Projects
Page 146

Studies/Reports
Project Name: Project # : WT009
Project Budget: $200,000
Status: New
Department: Public Works
Location:
Descriptions:
Cumulative Appropriation by
Funding SourcePrior years FY 21‐22 FY 22‐23 FY 23‐24 FY 24‐25 Total
80 Water System ‐ 200,000 200,0000000000
Total 0 200,000 0 0 0 200,000
Expenditures Prior years FY 21‐22 FY 22‐23 FY 23‐24 FY 24‐25 Total
81‐Prelim Design/Studies ‐ 200,000 200,0000000000
Total 0 200,000 0 0 0 200,000
Remaining budget: ‐
Comments : This item was budgeted in FY20/21. Funding roll over.
WELL REPLACEMENT PLAN
Citywide
Complete a well replacement study and develop a replacement plan for the City wells. The city currently operates the domestic water system for the city. The plan will ensure the safe operation and distribution of drinking water to our citizens.
Capital Improvement Projects
Page 147

Infrastructure: Water
Project Name: Project # : WT010
Project Budget: $1,390,000
Status: New
Department: Public Works
Location:
Descriptions:
Cumulative Appropriation by
Funding SourcePrior years FY 21‐22 FY 22‐23 FY 23‐24 FY 24‐25 Total
80 Water System ‐ 600,000 790,000 1,390,0000000000
Total ‐ 600,000 790,000 ‐ ‐ 1,390,000
Expenditures Prior years FY 21‐22 FY 22‐23 FY 23‐24 FY 24‐25 Total
81‐Design ‐ ‐ 081‐Construction ‐ 600,000 790,000 1,390,00081‐Construction Mgmt ‐ 081‐Construction Admin ‐ 0
0000
Total ‐ 600,000 790,000 ‐ ‐ 1,390,000
Remaining budget: ‐
Comments : The project is expected to complete in FY2022/23.
WATERLINE REPLACEMENT
CityWide
Waterline Replacement for the following locations:(1) Tahoe Dr. = $400,000 ‐ FY21/22(2) Trinity Ct. = $200,000 ‐ FY21/22(3) Highland Drive = $270,000 ‐ FY22/23(4) Bruning Avenue = $120,000 ‐ FY22/23(5) St. Gertrudes = $200,000 ‐ FY22/23(6) Riverview St. = $100,000 ‐ FY22/23(7) Hamilton Avenue = $100,000 ‐ FY22/23
Capital Improvement Projects
Page 148

General
Funds
Capital
Outlay
General
Funds
Vehicle
Replacement
Personnel
Services
District
Police
Transit Water Airport
Beach
Facility
Plant
NW
Facility
Plant
TOTALS
Revenues
Intergovernmental ‐ Grants 130,500 130,500 ‐ ‐ 130,500 ‐ ‐ ‐ ‐ 130,500
ExpendituresTo appropriate new funds
CO001 Software ‐ Building Permit Module 10,000 10,000 CO007 Vehicle ‐ Transit Bus Replacement 95,500 95,500 CO008 Improvement ‐ Transit Bus Shelter 35,000 35,000 CO009 Improvement ‐ Police Station Awning
over Doors & Keyless Entry System 20,000 20,000 CO010 Equipment ‐ Citywide Surveillance
Camera System 25,000 25,000 CO018 Equipment ‐ AWOS Upgrade 15,000 15,000 CO025 Equipment ‐ Police JPA Radio System 27,000 27,000 CO026 Equipment ‐ Police AXON Body Cameras
Package 24,112 24,112 CO027 Equipment ‐ Airport Spill Bucket
Replacement 25,000 25,000 CO028 Vehicle ‐ Fire Command Vehicle 80,000 80,000 CO029 Vehicle ‐ Public Works Pickup Ford
Ranger 12,500 6,250 6,250 25,000 CO030 Equipment ‐ Public Works Portable Air
Compressor 8,000 8,000 8,000 24,000 CO031 Vehicle ‐ Public Works ½ Maintenance
Truck 15,000 7,500 7,500 30,000 10,000 80,000 96,112 130,500 35,500 40,000 21,750 21,750 435,612
Other Sources/Uses
Personnel Svc District ‐ Police 96,112 96,112 Personnel Svc District ‐ Fire 50,000 50,000 Vehicle Replacement ‐ Fire Reserve 30,000 30,000 General Fund 10,000 10,000 Water 35,500 35,500 Airport 40,000 40,000 Beach Facility Plant 21,750 21,750 NW Facility Plant 21,750 21,750
10,000 80,000 96,112 ‐ 35,500 40,000 21,750 21,750 305,112 Net Annual Activity ‐ ‐ ‐ ‐ ‐ ‐ ‐ ‐ ‐
Special
Revenue
Enterprise Funds
CityofRioVista
CityofRioVista
Capital Outlay
Page 149

Project # Project NameSum of Prior
years‐cost
Adopted Cost FY 21‐22
Total Project
Cost
CO001 10,000 10,000 20,000
SOFTWARE ‐ BUILDING PERMIT MODULE
10‐General Fund 10,000 10,000 20,000 CO007 ‐ 95,500 95,500
TRANSIT BUS REPLACEMENT PROGRAM
32‐Equipment/Vehicle ‐ 95,500 95,500 CO008 ‐ 35,000 35,000
TRANSIT BUS SHELTER IMPROVEMENT
32‐Equipment/Vehicle ‐ 35,000 35,000 CO009 ‐ 20,000 20,000
POLICE STATION IMPROVEMENT
39‐Other Costs ‐ 20,000 20,000 CO010 151,626 25,000 176,626
CITYWIDE CAMERA SYSTEM
39‐Equipment/Vehicle 151,626 25,000 176,626 CO018 ‐ 15,000 15,000
AWOS UPGRADE
84‐Other Costs ‐ 15,000 15,000 CO025 ‐ 27,000 27,000
POLICE JPA RADIO SYSTEM
39‐Other Costs ‐ 27,000 27,000 CO026 24,112 24,112 48,224
POLICE AXON BODY CAMERAS PACKAGE
39‐Other Costs 24,112 24,112 48,224 CO027 ‐ 25,000 25,000
AIRPORT SPILL BUCKET REPLACEMENT
84‐Other Costs ‐ 25,000 25,000 CO028 ‐ 80,000 80,000
FIRE COMMAND VEHICLE
12‐Vehicle Replacement ‐ 80,000 80,000 CO029 ‐ 25,000 25,000
PUBLIC WORKS PICKUP
80‐Equipment/Vehicle ‐ 12,500 12,500 85‐Equipment/Vehicle ‐ 6,250 6,250 86‐Equipment/Vehicle ‐ 6,250 6,250
CO030 ‐ 24,000 24,000
PUBLIC WORKS PORTABLE AIR COMPRESSOR
80‐Equipment/Vehicle ‐ 8,000 8,000 85‐Equipment/Vehicle ‐ 8,000 8,000 86‐Equipment/Vehicle ‐ 8,000 8,000
CO031 ‐ 30,000 30,000
PUBLIC WORKS 1/2 MAINTENANCE TRUCK
80‐Equipment/Vehicle ‐ 15,000 15,000 85‐Equipment/Vehicle ‐ 7,500 7,500 86‐Equipment/Vehicle ‐ 7,500 7,500
Grand Total 185,738 435,612 621,350
Capital Outlay by Cost
Page 150

Software Development
Project Name: Project # : CO001
Project Budget: $20,000
Status: Ongoing
Department: Community Dev/Planning
Location:
Descriptions:
Cumulative Appropriation by
Funding SourcePrior years FY 21‐22 FY 22‐23 FY 23‐24 FY 24‐25 Total
10 General Fund 10,000 10,000 20,0000000000
Total 10,000 10,000 0 0 0 20,000
Expenditures Prior years FY 21‐22 FY 22‐23 FY 23‐24 FY 24‐25 Total
10‐General Fund 10,000 10,000 20,0000000000
Total 10,000 10,000 0 0 0 20,000
Remaining budget: ‐
Comments : The planning and building department is working closely with MaintStar's representative in developing the software to meet the needs of the department since 2017.
SOFTWARE ‐ BUILDING PERMIT MODULE
City HallBuilding permit module software
Capital Outlay
Page 151

Equipment / Vehicle
Project Name: Project # : CO007
Project Budget: $95,500
Status: New
Department: Public Works
Location:
Descriptions:
Cumulative Appropriation by
Funding SourcePrior years FY 21‐22 FY 22‐23 FY 23‐24 FY 24‐25 Total
32 Transit/Grants ‐ 95,500 95,5000000000
Total 0 95,500 0 0 0 95,500
Expenditures Prior years FY 21‐22 FY 22‐23 FY 23‐24 FY 24‐25 Total
32‐Equipment/Vehicle ‐ 95,500 95,5000000000
Total 0 95,500 0 0 0 95,500
Remaining budget: ‐
Comments :
TRANSIT BUS REPLACEMENT PROGRAM
1 Harbor Center, Suite 130, Suisun City
The City of Rio Vista began providing general public dial‐a‐ride service, known as Rio Vista Transit, in 1980. Rio Vista Transit became Rio Vista Delta Breeze, a deviated fixed‐route service, in 2006. Delta Breeze operates two deviated fixed‐routes: Route 50 Express between Rio Vista/Isleton and Fairfield/Suisun and Route 52 Express to Antioch and the Pittsburg/Bay Point BART station. Service on Route 50 operates Monday through Friday 7:30 a.m. to 7:00 p.m.
Capital Outlay
Page 152

Equipment / Vehicle
Project Name: Project # : CO008
Project Budget: $35,000
Status: New
Department: Public Works
Location:
Descriptions:
Cumulative Appropriation by
Funding SourcePrior years FY 21‐22 FY 22‐23 FY 23‐24 FY 24‐25 Total
32 Transit/Grants ‐ 35,000 35,0000000000
Total 0 35,000 0 0 0 35,000
Expenditures Prior years FY 21‐22 FY 22‐23 FY 23‐24 FY 24‐25 Total
32‐Equipment/Vehicle ‐ 35,000 35,0000000000
Total 0 35,000 0 0 0 35,000
Remaining budget: ‐
Comments :
TRANSIT BUS SHELTER IMPROVEMENT
1 Harbor Center, Suite 130, Suisun City
Transit bus shelter improvement
Capital Outlay
Page 153

Facilities: Police
Project Name: Project # : CO009
Project Budget: $20,000
Status: New
Department: Police
Location:
Descriptions:
Cumulative Appropriation by
Funding SourcePrior years FY 21‐22 FY 22‐23 FY 23‐24 FY 24‐25 Total
39 Personal Service District Fun ‐ 20,000 20,0000000000
Total 0 20,000 0 0 0 20,000
Expenditures Prior years FY 21‐22 FY 22‐23 FY 23‐24 FY 24‐25 Total
39‐Other Costs ‐ 20,000 20,0000000000
Total 0 20,000 0 0 0 20,000
Remaining budget: ‐
Comments :
POLICE STATION IMPROVEMENT
50 Poppy House
Improvement of police station awning over doors and Keyless Entry System.
Awning = $12,500Keyless Entry System = $7,500
Capital Outlay
Page 154

Equipment / Vehicle
Project Name: Project # : CO010
Project Budget: $226,626
Status: Ongoing
Department: Police
Location:
Descriptions:
Cumulative Appropriation
by Funding SourcePrior years FY 21‐22 FY 22‐23 FY 23‐24 FY 24‐25 Total
75 Business Park 115,000 0 115,00039 Personal Service District 36,626 25,000 25,000 25,000 111,626
000000
Total 151,626 25,000 25,000 25,000 0 226,626
Expenditures Prior years FY 21‐22 FY 22‐23 FY 23‐24 FY 24‐25 Total
39‐Equipment/Vehicle 151,626 25,000 25,000 25,000 226,6260000000
Total 151,626 25,000 25,000 25,000 0 226,626
Remaining budget: ‐
Comments :
CITYWIDE CAMERA SYSTEM
Citywide
Surveillance cameras on Main Street, Highway 12, Promenade, parks and business park. This project will significantly improve public safety throughout the city and will assist in monitoring issues related to the cannabis industry.
Capital Outlay
Page 155

Equipment / Vehicle
Project Name: Project # : CO018
Project Budget: $15,000
Status: New
Department: Public Works
Location:
Descriptions:
.
Cumulative Appropriation by
Funding SourcePrior years FY 21‐22 FY 22‐23 FY 23‐24 FY 24‐25 Total
84 Airport ‐ 15,000 15,0000000000
Total 0 15,000 0 0 0 15,000
Expenditures Prior years FY 21‐22 FY 22‐23 FY 23‐24 FY 24‐25 Total
84‐Other Costs ‐ 15,000 15,0000000000
Total 0 15,000 0 0 0 15,000
Remaining budget: ‐
Comments :
AWOS UPGRADE
Rio Vista Airport ‐ O88
The airport currently has an Automated Weather Observing System (AWOS) that does not have all the weather information requested by the pilots at the airport. The additional information will improve the pilot's ability to navigate as well as know the weather conditions that may be present at the airport. By adding this additional information the AWOS will report all of the equivalent weather parameters of an AWOS IIIP/T.
Funding carried forward from FY2020/21 budget.
Capital Outlay
Page 156

Equipment / Vehicle
Project Name: Project # : CO025
Project Budget: $27,000
Status: New
Department: Police
Location:
Descriptions:
.
Cumulative Appropriation by
Funding SourcePrior years FY 21‐22 FY 22‐23 FY 23‐24 FY 24‐25 Total
39 Personal Service District Fun ‐ 27,000 27,0000000000
Total 0 27,000 0 0 0 27,000
Expenditures Prior years FY 21‐22 FY 22‐23 FY 23‐24 FY 24‐25 Total
39‐Other Costs ‐ 27,000 27,0000000000
Total 0 27,000 0 0 0 27,000
Remaining budget: ‐
Comments :
POLICE JPA RADIO SYSTEM
Citywide
To implement a modern digital radio communication system that would support radio communications for local, States, and Federal agencies in the event of an emergency as well as day‐to‐day use.
Budget carried forward from FY2020/21.
Capital Outlay
Page 157

Equipment / Vehicle
Project Name: Project # : CO026
Project Budget: $120,560
Status: Ongoing
Department: Police
Location:
Descriptions:
.
Cumulative Appropriation by
Funding SourcePrior years FY 21‐22 FY 22‐23 FY 23‐24 FY 24‐25 Total
39 Personal Service District Fun 24,112 24,112 24,112 24,112 24,112 120,5600000000
Total 24,112 24,112 24,112 24,112 24,112 120,560
Expenditures Prior years FY 21‐22 FY 22‐23 FY 23‐24 FY 24‐25 Total
39‐Other Costs 24,112 24,112 24,112 24,112 24,112 120,5600000000
Total 24,112 24,112 24,112 24,112 24,112 120,560
Remaining budget: ‐
Comments :
POLICE AXON BODY CAMERAS PACKAGE
Citywide
The police department is looking to put cameras in each patrol car. This upgrade can increase storage capacity, and compatibility with the County system, which can literally be shared digitally. The package offers a five‐year payment plan, including 13 Axon Body 2 cameras, extended warranty, replacement plan, docking station, professional licenses/services, and 2,600 GB of data storage.
Capital Outlay
Page 158

Facilities: Other
Project Name: Project # : CO027
Project Budget: $25,000
Status: New
Department: Public Works
Location:
Descriptions:
Cumulative Appropriation by
Funding SourcePrior years FY 21‐22 FY 22‐23 FY 23‐24 FY 24‐25 Total
84 Airport ‐ 25,000 25,0000000000
Total 0 25,000 0 0 0 25,000
Expenditures Prior years FY 21‐22 FY 22‐23 FY 23‐24 FY 24‐25 Total
84‐Other Costs ‐ 25,000 25,0000000000
Total 0 25,000 0 0 0 25,000
Remaining budget: ‐
Comments :
AIRPORT SPILL BUCKET REPLACEMENT
Rio Vista Airport O88
This replacement is to prepare for upcoming annual inspection. The City currently is not in compliance for this requirement.
Capital Outlay
Page 159

Equipment / Vehicle
Project Name: Project # : CO028
Project Budget: $80,000
Status: New
Department: Fire
Location:
Descriptions:
.
Cumulative Appropriation by
Funding SourcePrior years FY 21‐22 FY 22‐23 FY 23‐24 FY 24‐25 Total
12 Vehicle Replacement Fund ‐ 30,000 30,00038 Personal Service District Fun ‐ 50,000 50,000
000000
Total 0 80,000 0 0 0 80,000
Expenditures Prior years FY 21‐22 FY 22‐23 FY 23‐24 FY 24‐25 Total
12‐Vehicle Replacement ‐ 80,000 80,0000000000
Total 0 80,000 0 0 0 80,000
Remaining budget: ‐
Comments :
FIRE COMMAND VEHICLE
Fire Station
New Command Vehicle with equipment for Fire Battalion Chief
Capital Outlay
Page 160

Equipment / Vehicle
Project Name: Project # : CO029
Project Budget: $25,000
Status: New
Department: Public Works
Location:
Descriptions:
.
Cumulative Appropriation by
Funding SourcePrior years FY 21‐22 FY 22‐23 FY 23‐24 FY 24‐25 Total
80 Water System ‐ 12,500 12,50085 Beach Facility ‐ Plant ‐ 6,250 6,25086 NW Facility ‐ Plant ‐ 6,250 6,250
00000
Total 0 25,000 0 0 0 25,000
Expenditures Prior years FY 21‐22 FY 22‐23 FY 23‐24 FY 24‐25 Total
80‐Equipment/Vehicle ‐ 12,500 12,50085‐Equipment/Vehicle ‐ 6,250 6,25086‐Equipment/Vehicle ‐ 6,250 6,250
00000
Total 0 25,000 0 0 0 25,000
Remaining budget: ‐
Comments :
PUBLIC WORKS PICKUP
Corp Yard
New Pickup Ford Ranger for the Maintenance Worker I position, which is currently open for applications.
Capital Outlay
Page 161

Equipment / Vehicle
Project Name: Project # : CO030
Project Budget: $24,000
Status: New
Department: Public Works
Location:
Descriptions:
.
Cumulative Appropriation by
Funding SourcePrior years FY 21‐22 FY 22‐23 FY 23‐24 FY 24‐25 Total
80 Water System ‐ 8,000 8,00085 Beach Facility ‐ Plant ‐ 8,000 8,00086 NW Facility ‐ Plant ‐ 8,000 8,000
00000
Total 0 24,000 0 0 0 24,000
Expenditures Prior years FY 21‐22 FY 22‐23 FY 23‐24 FY 24‐25 Total
80‐Equipment/Vehicle ‐ 8,000 8,00085‐Equipment/Vehicle ‐ 8,000 8,00086‐Equipment/Vehicle ‐ 8,000 8,000
00000
Total 0 24,000 0 0 0 24,000
Remaining budget: ‐
Comments :
PUBLIC WORKS PORTABLE AIR COMPRESSOR
Corp Yard
It will be used with the jackhammer when the crew needs to open the street or sidewalk to dig up pipes to be fixed.
This is a replacement for the current unit, a 1999 model, which is towards the end of its useful life. The current model does not qualify for the Air District Grant due to the low horsepower.
Capital Outlay
Page 162

Equipment / Vehicle
Project Name: Project # : CO031
Project Budget: $30,000
Status: New
Department: Public Works
Location:
Descriptions:
.
Cumulative Appropriation by
Funding SourcePrior years FY 21‐22 FY 22‐23 FY 23‐24 FY 24‐25 Total
80 Water System ‐ 15,000 15,00085 Beach Facility ‐ Plant ‐ 7,500 7,50086 NW Facility ‐ Plant ‐ 7,500 7,500
00000
Total 0 30,000 0 0 0 30,000
Expenditures Prior years FY 21‐22 FY 22‐23 FY 23‐24 FY 24‐25 Total
80‐Equipment/Vehicle ‐ 15,000 15,00085‐Equipment/Vehicle ‐ 7,500 7,50086‐Equipment/Vehicle ‐ 7,500 7,500
00000
Total 0 30,000 0 0 0 30,000
Remaining budget: ‐
Comments :
PUBLIC WORKS 1/2 MAINTENANCE TRUCK
Corp Yard
New 1/2 Maintenance Truck for the Water Technician Position, which is currently open for applications.
Capital Outlay
Page 163

Project # Project NameActual Cost
FY 19‐20
Projected Cost
FY 20‐21
Adopted Cost FY 21‐22
MM001 1,597,482 1,627,364 1,663,322
WASTEWATER OPERATIONS, MAINTENANCE &
MANAGEMENT SERVICE CONTRACT
85‐Other Costs 958,490 952,017 973,052 86‐Other Costs 638,992 675,347 690,270
MM002 611,998 532,924 650,000
WASTEWATER OPERATION/MAINTENANCE ‐
ADDITIONAL WORK
85‐Other Costs 202,340 247,810 250,000 86‐Other Costs 409,658 285,114 400,000
Grand Total 2,209,480 2,160,288 2,313,322
MAJOR MAINTENANCE BY COST
Major Maintenance
Page 164

Facilities: Sewer
Project Name: Project # : MM001
Calendar Year Budget: $1,663,322
Status: Ongoing
Department: Public Works
Location:
Descriptions:
Cumulative Appropriation by
Funding SourceFY 17‐18 FY 18‐19 FY 19‐20 FY 20‐21 FY 21‐22 Total
85 Beach Facility ‐ Lift Station 932,960 888,599 958,490 952,017 973,052 4,705,11886 NW Facility ‐ Lift Station 604,700 613,590 638,992 675,347 690,270 3,222,899
000000
Total 1,537,660 1,502,189 1,597,482 1,627,364 1,663,322 7,928,017
Expenditures FY 17‐18 FY 18‐19 FY 19‐20 FY 20‐21 FY 21‐22 Total
85‐Other Costs 933,827 888,599 958,490 952,017 973,052 4,705,98586‐Other Costs 603,833 613,590 638,992 675,347 690,270 3,222,032
000000
Total 1,537,660 1,502,189 1,597,482 1,627,364 1,663,322 7,928,017
Remaining budget: ‐
Comments : List of equipment to be repaired or replaced include for Beach collection System ‐ Marina Lift Station Pumps 1 and 3; Vineyard lift station ‐ overhaul Pump 2, clean out welt sump, emergency generator servicing, instrumentation controls upgrade; Airport Road ‐ overhaul Pump 2, clean out wet sump; River Road lift Station ‐ overhaul Pump 1, clean out wet sump, instrumentation controls upgrade; City Hall Lift Station ‐ overhaul Pump 1, clean out wet sump, generator service, and instrumentation controls upgrade; Second Street Lift Station ‐ Wet sump cleaning .
WASTEWATER OPERATIONS, MAINTENANCE
& MANAGEMENT SERVICE CONTRACT
Beach and Northwest lift stations and plantsThe City Council approved a new rate structure in 2009‐10 for the Beach and the Northwest lift stations and wastewater treatment plants for the ongoing maintenance and identified certain equipment be repaired and/or replaced each fiscal year. Northwest Lift Stations ‐ Atlantic Pump Station clean out lift station each quarter, generator service, instrumentation controls upgrade, Supervisory Controls and Data Acquisition (SCADA) systems upgrade, and back up batteries (8). Riverwood Lift Station ‐ clean out wet sump, emergency generator service, and instrumentation controls.
Major Maintenance
Page 165

Facilities: Sewer
Project Name: Project # : MM002
Calenday Year Budget: $650,000
Status: Ongoing
Department: Public Works
Location:
Descriptions:
Cumulative Appropriation
by Funding SourceFY 17‐18 FY 18‐19 FY 19‐20 FY 20‐21 FY 21‐22 Total
85 Beach Facility ‐ Lift Station 493,683 253,385 202,340 247,810 250,000 1,447,21886 NW Facility ‐ Lift Station 235,419 487,819 409,658 285,114 400,000 1,818,010
000000
Total 729,102 741,204 611,998 532,924 650,000 3,265,228
Expenditures FY 17‐18 FY 18‐19 FY 19‐20 FY 20‐21 FY 21‐22 Total
85‐Other Costs 493,683 253,385 202,340 247,810 250,000 1,447,21886‐Other Costs 235,419 487,819 409,658 285,114 400,000 1,818,010
000000
Total 729,102 741,204 611,998 532,924 650,000 3,265,228
Remaining budget: 0
Comments : Solids Digestion/Solids De‐watering ‐clean Aerobic Digester, empty sludge drying beds #1 & #4, empty Sludge Drying Beds #5 & 7. Chlorination/Dechlorination ‐ Chlorine Tank and associated piping cleaning, SBS tank and associated piping cleaning, spare chemical pump repairs, flash Mixer repairs, instrumentation controls upgrade, on‐line analyzers, contact tank cleaning, and Disinfection System Upgrades. Misc. ‐ generator services, Plant Pump #2 repairs,various permit requirements and studies to renew NPDES Permit, Sanitary Management Wastewater Plan review/implementation, and various regulatory certificates (air quality, others), building maintenance, and grounds and landscaping.
WASTEWATER OPERATION/MAINTENANCE ‐
ADDITIONAL WORK
Beach and Northwest lift stations and plantsThe City Council approved a new sewer rate structure to maintain both the Beach and Northwest Wastewater Treatment Plant (NWWTP) maintenance, repairs, and replacement of various equipment for each year. The identified items for Preliminary Treatment includes new bar screen at the head works, Grit pump repairs, Grit screen (screw conveyor) repairs, new influent sampler, and electrical instrumentation. Primary Treatment includes overhaul Pumps 1, 2, and rebuild Pumps 1, and 2, and instrumentation upgrade.
Major Maintenance
Page 166
Appendix
Appendix 1 Authorized Positions Salary & Benefits Listing By Department
Appendix 2 Full Time Equivalent (FTE)
Appendix 3 Budget Summaries
Appendix 4 Basis Of Accounting & Budgeting
Appendix 5 Proposition 4 (GANN LIMIT) Analysis
Appendix 6 Debt Limit / Obligation
Appendix 7 Schedule Of Interfund Transfers
Appendix 8 Revenue Details By Fund
Appendix 9 Contracts & Services Expenditure Details By Department
Appendix 10 Fund Descriptions
Appendix 11 Budget & Financial Policies
Appendix 12 Summary Of Budget Process
Appendix 13 Resolution Adopting The Budget For FY2020-21
Appendix 14 Resolution Approving An Appropriations Limit
Appendix 15 Glossary Of Terms
Page 167

Total
Salaries
Total
Other Pay
Employer
Paid
Benefits
Total Salaries
and Benefits
Total
Salaries
Total
Other Pay
Employer
Paid
Benefits
Total Salaries
and Benefits
Mayor/City Council
MAYOR 6,120 4,800 1,168 12,088 6,420 4,800 1,203 12,423 2.77%
VICE MAYOR 6,120 ‐ 801 6,921 6,420 ‐ 836 7,256 4.84%
COUNCIL MEMBER 1 6,120 ‐ 801 6,921 6,420 ‐ 836 7,256 4.84%
COUNCIL MEMBER 2 6,120 ‐ 801 6,921 6,420 ‐ 836 7,256 4.84%
COUNCIL MEMBER 3 6,120 ‐ 801 6,921 6,420 ‐ 836 7,256 4.84%
Subtotal of Mayor/City Council 30,600 4,800 4,370 39,770 32,100 4,800 4,546 41,446 4.21%
Executive
City Manager
CITY MANAGER 186,803 4,800 39,198 230,801 188,600 4,800 39,338 232,738 0.84%
HR ADMIN 75,055 500 43,747 119,303 73,954 500 44,932 119,386 0.07%
Subtotal of City Manager 261,858 5,300 82,945 350,104 262,554 5,300 84,270 352,124 0.58%
City Clerk
ASSISTANT CITY MGR/CITY CLERK 159,059 ‐ 62,053 221,112 160,574 ‐ 71,514 232,088 4.96%
PT TEMP HR ADMIN ‐ ‐ ‐ ‐ 34,133 ‐ 4,443 38,576 100.00%
PT TEMP CITY CLERK ASSISTANT 27,804 ‐ 3,637 31,442 28,081 ‐ 3,655 31,736 0.94%
Subtotal of City Clerk 186,863 ‐ 65,691 252,554 222,788 ‐ 79,612 302,400 19.74%
Finance
FINANCE DIRECTOR 120,135 ‐ 45,393 165,528 130,588 ‐ 48,202 178,790 8.01%
ACCOUNTING SUPERVISOR 93,249 ‐ 31,160 124,409 94,181 ‐ 29,799 123,981 ‐0.34%ACCOUNTANT I 64,606 2,330 15,015 81,950 68,521 2,471 24,683 95,675 16.75%
SENIOR ACCOUNT CLERK 67,934 2,450 46,832 117,216 71,731 2,586 53,252 127,570 8.83%
ACCOUNT CLERK II 58,239 2,100 51,261 111,600 60,186 2,170 58,911 121,267 8.66%
PT TEMP ACCOUNT CLERK I 31,281 ‐ 4,092 35,373 31,591 ‐ 4,112 35,704 0.94%
PT TEMP ACCOUNT CLERK II 37,407 ‐ 4,894 42,301 37,779 ‐ 4,918 42,697 0.94%
Subtotal of Finance 472,850 6,879 198,647 678,376 494,578 7,227 223,878 725,683 6.97%
Community Development
PLANNING MANAGER 101,605 ‐ 32,898 134,503 102,623 ‐ 33,271 135,894 1.03%
CD ADMIN 61,250 2,650 44,047 107,947 61,859 2,677 38,000 102,536 ‐5.01%PT TEMP ADMIN ASSISTANT 30,712 ‐ 4,018 34,730 22,905 ‐ 2,982 25,887 ‐25.46%BLDG INSPECTOR 77,908 3,266 36,860 118,034 80,561 3,362 38,115 122,038 3.39%
Subtotal of Economic Development 271,474 5,916 117,823 395,214 267,947 6,038 112,369 386,354 ‐2.24%
%
Change
Authorized Positions Salary and Benefits Listing by Department
Authorized Position TitleDepartment
FY21/22
AdoptedFY 20/21
Adopted
Appendix 1
Page 168

Total
Salaries
Total
Other Pay
Employer
Paid
Benefits
Total Salaries
and Benefits
Total
Salaries
Total
Other Pay
Employer
Paid
Benefits
Total Salaries
and Benefits
%
Change
Authorized Positions Salary and Benefits Listing by Department
Authorized Position TitleDepartment
FY21/22
AdoptedFY 20/21
Adopted
Appendix 1
Fire
FIRE CHIEF 152,298 2,000 43,137 197,436 153,753 2,000 43,323 199,076 0.83%
FIRE BATTALION CHIEF 107,605 1,150 86,752 195,507 90,428 1,150 45,556 137,134 ‐29.86%FIRE CAPTAIN 1 106,454 10,000 97,840 214,294 114,533 9,500 135,255 259,288 21.00%
FIRE CAPTAIN 2 111,225 10,000 101,276 222,500 114,533 9,500 135,255 259,288 16.53%
FIRE CAPTAIN 3 112,798 10,000 79,846 202,644 118,204 9,500 112,889 240,593 18.73%
FIRE ENGINEER 1 84,319 10,000 87,084 181,403 88,960 9,500 115,442 213,902 17.92%
FIRE ENGINEER 2 84,319 10,000 87,084 181,403 90,551 9,500 26,602 126,653 ‐30.18%FIRE ENGINEER 3 88,819 10,000 50,086 148,904 93,460 9,500 52,399 155,358 4.33%
FIRE ENGINEER 4 69,635 2,000 28,794 100,429 71,698 9,500 46,578 127,777 27.23%
FIRE ENGINEER 5 69,635 2,000 28,794 100,429 85,329 9,500 53,954 148,782 48.15%
FIRE ENGINEER 6 69,635 2,000 28,794 100,429 71,698 2,000 29,641 103,339 2.90%
PARAMEDIC/FIREFIGHTER 1 81,107 10,000 51,869 142,976 76,184 9,500 47,782 133,465 ‐6.65%PARAMEDIC/FIREFIGHTER 2 86,519 10,000 26,025 122,544 94,312 9,500 27,607 131,419 7.24%
PARAMEDIC/FIREFIGHTER 3 74,124 10,000 30,610 114,734 79,693 2,000 31,782 113,475 ‐1.10%Subtotal of Fire 1,298,490 99,150 827,990 2,225,630 1,343,335 102,150 904,065 2,349,549 5.57%
Police *
PUBLIC SAFETY SUPPORT MANAGER 82,867 1,300 42,926 127,092 87,887 1,300 44,961 134,148 5.55%
COMMUNITY SVC OFFICER 50,524 1,300 20,648 72,471 51,031 3,140 21,118 75,289 3.89%
POLICE RECORD TECHNICIAN 45,462 ‐ 19,495 64,957 ‐ ‐ ‐ ‐ ‐100.00% **
PT TEMP POLICE RECORD TECHNICIAN ‐ ‐ ‐ ‐ 33,285 ‐ 4,333 37,618 100.00% **
Subtotal of Police 178,852 2,600 83,069 264,521 172,203 4,440 70,412 247,055 ‐6.60%
Public Works
DIRECTOR OF PW 129,218 ‐ 70,314 199,532 130,510 ‐ 79,156 209,667 5.08%
PW SUPERINTENDENT 116,305 500 82,720 199,526 120,409 500 85,823 206,732 3.61%
MECHANIC 79,297 500 56,037 135,834 ‐ ‐ ‐ ‐ ‐100.00% ***
PUBLIC WORKS PROGRAM MANAGER 113,365 ‐ 64,191 177,556 111,167 ‐ 44,186 155,354 ‐12.50%PUBLIC WORKS SUPERVISOR 83,590 500 27,463 111,554 84,428 500 27,821 112,749 1.07%
UTILITY WORKER TECHNICIAN 131,897 3,500 41,013 176,410 132,684 3,500 46,115 182,299 3.34%
UTILITY WORKER TECHNICIAN A 56,728 3,500 22,106 82,335 57,291 3,500 22,440 83,231 1.09%
SENIOR MAINT WORKER A 80,618 7,500 59,621 147,739 80,138 7,500 66,190 153,828 4.12%
SENIOR MAINT WORKER B 88,097 6,500 53,070 147,668 87,650 6,500 58,336 152,486 3.26%
MAINTENANCE WORKER II 73,524 6,500 47,442 127,466 74,145 6,500 52,339 132,984 4.33%
MAINTENANCE WORKER II A 75,294 7,500 28,622 111,416 75,873 7,500 32,061 115,433 3.61%
MAINTENANCE WORKER I 53,843 7,500 21,251 82,594 56,590 7,500 22,043 86,134 4.29%
Page 169

Total
Salaries
Total
Other Pay
Employer
Paid
Benefits
Total Salaries
and Benefits
Total
Salaries
Total
Other Pay
Employer
Paid
Benefits
Total Salaries
and Benefits
%
Change
Authorized Positions Salary and Benefits Listing by Department
Authorized Position TitleDepartment
FY21/22
AdoptedFY 20/21
Adopted
Appendix 1
MAINTENANCE WORKER I A 41,608 3,500 20,688 65,796 51,361 3,500 11,514 66,375 0.88%
MAINTENANCE WORKER I B 43,203 7,500 23,639 74,342 45,819 7,500 24,381 77,701 4.52%
MAINTENANCE WORKER I C 40,579 3,500 18,748 62,827 40,992 3,500 19,070 63,562 1.17%
ATOD ADMIN 55,530 2,002 32,110 89,642 57,450 2,072 33,238 92,760 3.48%
PT TEMP PUBLIC WORKS INTERN 12,489 ‐ 1,634 14,123 13,440 ‐ 1,749 15,189 7.55%
PT TEMP PUBLIC WORKS ASSISTANT 43,676 ‐ 5,714 49,389 ‐ ‐ ‐ ‐ ‐100.00% ***
Subtotal of Public Works 1,318,864 60,502 676,383 2,055,750 1,219,949 60,072 626,463 1,906,484 ‐7.26%
Total Salaries & Benefits 4,019,853 185,147 2,056,919 6,261,919 4,015,454 190,027 2,105,613 6,311,095 0.79%
** This position was budgeted as Full‐Time in FY20/21.*** These positions are unfunded in FY21/22.
* Police Services was contracted to the County beginning March 2020 ‐ In May 2021, the City signed the Memorandum of Agreement with the Solano County Sheriff's Office for another 24‐month periodfrom July 1, 2021 to June 30, 2023 for a total of $5,652,654. Annual service amount in FY21/22 is $2,726,477.
Page 170

2018/19 2019/20 2020/21 2021/22Approved Approved Approved Approved
City Manager1.00 1.00 1.00 1.00
1.00 1.00 1.00 1.00
City Manager FTE Total 2.00 2.00 2.00 2.00
City ClerkAssistant City Manager / City Clerk 1.00 1.00 1.00 1.00
0.73 0.73 0.46 0.92
City Clerk FTE Total 1.73 1.73 1.46 1.92
Community Development/Planning1.00 1.00 0.00 0.00
0.00 0.00 1.00 1.00
1.00 1.00 1.00 1.00
0.00 1.00 1.00 1.00
0.00 0.63 0.63 0.46
Community Development/Planning FTE Total 2.00 3.63 3.63 3.46
Finance1.00 1.00 1.00 1.00
1.00 1.00 1.00 1.00
1.00 1.00 1.00 1.00
1.00 1.00 1.00 1.00
1.73 2.73 2.45 2.45
1.00 0.00 0.00 0.00
Finance FTE Total 6.73 6.73 6.45 6.45
Fire1.00 1.00 1.00 1.00
0.00 1.00 1.00 1.00
3.00 3.00 3.00 3.00
3.00 3.00 6.00 6.00
3.00 3.00 3.00 3.00
Fire FTE Total 10.00 11.00 14.00 14.00
Police ***1.00 1.00 0.00 0.00
1.00 1.00 0.00 0.00
1.00 1.00 0.00 0.00
3.00 4.00 0.00 0.00
9.58 10.00 0.00 0.00
0.44 1.01 0.00 0.00
1.00 1.00 1.00 1.00
Police Record Technician 0.60 0.69 1.00 0.73
1.00 1.00 1.00 1.00
Police FTE Total 18.62 20.70 3.00 2.73
Public Works1.00 1.00 1.00 1.00
1.00 1.00 1.00 1.00
Public Works Program Manager 0.00 0.00 1.00 1.00
Public Works Supervisor 0.00 0.00 1.00 1.00
2.00 2.00 2.00 2.00
1.00 1.00 1.00 0.00
2.00 2.00 2.00 2.00
3.00 3.00 2.00 2.00
1.00 1.00 3.00 3.00
2.00 1.00 1.73 1.00
0.00 0.46 0.46 0.46
Public Works FTE Total 13.00 12.46 16.19 14.46
54.07 58.23 46.72 45.02
PERSONNEL SUMMARY BY DEPARTMENT
Grand FTE Total
Administrative AssistantIntern ‐ Part‐time
Maintenance Worker IIMaintenance Worker I
Mechanic
Senior Maintenance Worker
Public Works Superintendent
Utility Technician
Director of Public Works
Community Service Officer
Police InvestigatorPublic Safety Support Manager **
Police SergeantPolice Officer
Police Commander
Police Corporal
Police Chief
Fire EngineerFirefighter/Paramedic
Fire Batalion ChiefFire Captain
Fire Chief
Administrative Analyst
Senior Account ClerkAccount Clerk I/II
Accountant I/II
Director of Finance
Office Assistant II ‐ Part‐time
Planning Manager
Building InspectorAdministrative Assistant
Director of Community Development *
Deputy City Clerk/City Clerk Assistant ‐ Part‐time
Human Resource Ananlyst/Deputy City ClerkCity Manager
Accounting Supervisor
Appendix 2
Page 171

Appendix 2
2018/19 2019/20 2020/21 2021/22Approved Approved Approved Approved
Legislative ‐ Elected and Appointed Employees1.00 1.00 1.00 1.00
1.00 1.00 1.00 1.00
3.00 3.00 3.00 3.00
5.00 5.00 5.00 5.00
45.02
5.00
50.02
Description 2021/22
Unfunded
1.00
PT Temp Public Works Assistant 0.73
* Planning Manager replaced Director of Community Development
** Previously called Police Records Manager
*** Police Services was contracted to the County in March 2020
Public Works
PERSONNEL SUMMARY BY DEPARTMENT (Continued)
Public Works Mechanic
Total Unfunded Personnel in Fiscal Year 2021‐22 Department
TOTAL ELECTED AND APPOINTED EMPLOYEES
GRAND TOTALS
TOTAL AUTHORIZED FULL‐TIME EMPLOYEES
FTE Total
Vice Mayor
City Council
Mayor
Page 172

Fund Description
Estimated
Fund Balance
7/1/21 Revenues
Other
Financing
Source Transfers In
Total
Revenues
Transfers
Out
Operating
Expenses Debt Service
Capital
Outlay
Capital
Improvements
Total
Expenditures
Estimated
Fund Balance
6/30/22
Fund Balance
Increase
/(Decrease)
GENERAL FUND 002 Measure O (0) 1,233,000 1,233,000 (1,233,000) (1,233,000) (1) (0) 010 General Fund 5,707,610 6,414,841 441,804 6,856,645 (8,000) (6,515,840) (120,549) (10,000) ‐ (6,654,389) 5,909,866 202,256 General Fund Subtotal 5,707,610 7,647,841 ‐ 441,804 8,089,645 (8,000) (7,748,840) (120,549) (10,000) ‐ (7,887,389) 5,909,866 202,256 022 General Plan 157,685 5,264 5,264 (5,264) (5,264) 157,685 ‐ 052 Transient Occupancy Tax 19,115 20,070 20,070 (20,070) (20,070) 19,115 ‐ Total General Fund per Audit Report 5,884,410 7,673,174 ‐ 441,804 8,114,979 (8,000) (7,774,173) (120,549) (10,000) ‐ (7,912,723) 6,086,666 **** 202,256
CAPITAL OUTLAY FUNDS 012 Vehicle Replacement 232,723 25,800 ‐ 110,000 135,800 ‐ (128,024) (80,000) ‐ (208,024) 160,499 (72,224) 050 Storm Drain 89,157 29,025 29,025 (36,722) ‐ (36,722) 81,460 (7,697) 051 Capital Projects 102,177 2,078,301 ‐ 624,899 2,703,200 (913,999) (913,999) 1,891,378 1,789,201 053 Roadway Impact 280,542 493,500 493,500 (400,000) (400,000) 374,042 93,500 054 Parks and Recreation 266,567 48,650 5,170 53,820 (144,899) (16,400) ‐ (161,299) 159,088 (107,479) 056 Municipal Improvements 6,189,284 179,919 117,175 297,094 (120,550) ‐ (120,550) 6,365,828 176,544 060 Hazardous Waste 484,087 102,400 102,400 (143,548) (143,548) 442,939 (41,148) 065 Landfill Closure 1,895,208 379,000 379,000 (280,000) (95,649) (375,649) 1,898,559 3,351 076 Army Base (69,505) 18,449 18,449 (7,175) (13,549) (20,724) (71,780) ** (2,275) Total Capital Outlay Funds 9,470,239 3,355,044 ‐ 857,244 4,212,287 (552,624) (705,868) (128,024) (80,000) (913,999) (2,380,513) 11,302,013 1,831,774
DEBT SERVICE 040 Firehouse Bonds 2,032 ‐ ‐ ‐ ‐ 2,032 ‐ Total Debt Service Fund 2,032 ‐ ‐ ‐ ‐ ‐ ‐ ‐ ‐ ‐ ‐ 2,032 ‐
SPECIAL REVENUE FUNDS 017 Law Enforcement Grant 77,537 120,700 120,700 (180,000) ‐ (180,000) 18,237 (59,300) 018 Asset Forfeiture 1,285 15 15 ‐ ‐ 1,300 15 019 ATOD Grant 0 57,495 ‐ 57,495 (57,477) (57,477) 18 18 025 Gas Tax 433,412 434,821 ‐ 434,821 (100,000) (758,487) (2,423) ‐ (860,910) 7,322 (426,089) 031 Developers Revolving 38,814 50 50 (31,000) (31,000) 7,864 (30,950) 033 Commercial Rehabilitation Loan 62,696 100 100 ‐ ‐ 62,796 100 034 CDBG Housing Rehabilitation 128,080 300 300 ‐ ‐ 128,380 300 038 Personnel Services District ‐ Fire 278,589 488,289 488,289 (85,000) (419,271) (504,271) 262,607 (15,982) 039 Personnel Services District ‐ Police 150,849 489,089 ‐ 489,089 ‐ (448,296) (23,054) (96,112) ‐ (567,462) 72,476 (78,373) 055 Liberty Main & Operation Svc District 1,244,314 606,829 606,829 (471,693) (471,693) 1,379,451 135,136 091 Street Projects 0 ‐ ‐ ‐ ‐ ‐ 0 ‐ Total Special Revenue Funds 2,415,576 2,197,688 ‐ ‐ 2,197,688 (185,000) (2,366,224) (25,477) (96,112) ‐ (2,672,813) 1,940,451 (475,125)
City of Rio Vista
BUDGET SUMMARIESAppropriationsResources
CityofRioVistaAppendix 3
Page 173

Fund Description
Estimated
Fund Balance
7/1/21 Revenues
Other
Financing
Source Transfers In
Total
Revenues
Transfers
Out
Operating
Expenses Debt Service
Capital
Outlay
Capital
Improvements
Total
Expenditures
Estimated
Fund Balance
6/30/22
Fund Balance
Increase
/(Decrease)
City of Rio Vista
BUDGET SUMMARIESAppropriationsResources
CityofRioVistaAppendix 3
ENTERPRISE FUNDS* 032 Transit 487,497 700,096 8,000 708,096 (12,000) (705,596.10) (130,500) ‐ (848,096) 347,497 (140,000) 075 Business Park 1,316,825 347,744 ‐ 347,744 (15,000) (74,212) (15,000) (104,212) 1,560,357 243,532 080 Water System 3,290,999 3,076,000 20,680 3,096,680 (2,390,000) (2,097,607) (319,900) (35,500) (200,000) (5,043,007) 1,344,672 (1,946,327) 081 Water Project ‐ Capital Outlay ‐ ‐ ‐ 2,000,000 2,000,000 ‐ (2,000,000) (2,000,000) ‐ ‐ 082 Water Fixed Assets ‐ ‐ ‐ ‐ ‐ ‐ ‐ ‐ 084 Airport (781,978) 1,040,615 ‐ ‐ 1,040,615 (19,079) (245,828) (18,328) (40,000) (834,963) (1,158,198) (899,562) *** (117,583) 085 Beach Facility 2,927,282 2,850,000 ‐ 2,850,000 (2,400,525) (2,228,240) (137,376) (21,750) ‐ (4,787,891) 989,391 (1,937,891) 086 NW Facility 1,981,364 2,062,000 ‐ 12,000 2,074,000 (337,500) (2,055,551) (126,269) (21,750) ‐ (2,541,070) 1,514,294 (467,070) 087 NW Sewer Project ‐ Capital Outlay ‐ ‐ ‐ 330,000 330,000 ‐ (330,000) (330,000) ‐ ‐ 088 Beach Sewer Project ‐ Capital Outlay ‐ ‐ ‐ 2,250,000 2,250,000 (2,250,000) (2,250,000) ‐ ‐ Total Enterprise Funds 9,221,989 10,076,455 ‐ 4,620,680 14,697,135 (5,174,105) (7,407,034) (601,873) (249,500) (5,629,963) (19,062,475) 4,856,649 (4,365,340)
AGENCY FUNDS 041 Community Facilities District 2006‐1 447,630 511,893 511,893 (44,936) (480,419) (525,355) 434,168 (13,462) 042 Riverview Point Assessment District 242,430 146,461 146,461 (13,886) (138,303) (152,190) 236,701 (5,729) 043 Riverview Point Bond Reserve 46,637 105 105 ‐ ‐ 46,742 105 044 Riverwalk CFD 65,865 ‐ ‐ (12,000) (12,000) 53,865 (12,000) 045 Summerset Improvement 154,597 ‐ ‐ ‐ ‐ 154,597 ‐ 046 Summerset Assessment District 17,404 ‐ ‐ ‐ ‐ 17,404 ‐ 049 Community Facilities District 2004‐1 234,565 299,810 299,810 (37,296) (273,194) (310,490) 223,885 (10,681) 095 Liberty CFD 1,312,635 804,645 804,645 (36,162) (774,100) (810,262) 1,307,018 (5,617) Total Agency Funds 2,521,762 1,762,914 ‐ ‐ 1,762,914 ‐ (144,281) (1,666,016) ‐ ‐ (1,810,297) 2,474,379 (47,383)
Grand Total 29,516,008 25,065,275 ‐ 5,919,728 30,985,003 (5,919,728) (18,397,581) (2,541,939) (435,612) (6,543,962) (33,838,821) 26,662,190 (2,853,818)
****General Fund Balance in Audited Financial Statements include Transient Occupancy Tax and General Plan funds.
* Enterprise funds use Working Capital, rather than fund Balance, which is the industry standard terminology for available Fund Balance for Enterprise Funds. It is the difference between the current assets and current liabilities.
**Balance due to general fund of $80,399.50 after repayment of $6,000 principal in FY2021/22.***Balance due to general fund of $801,656, due to Muni Improvement fund $153,507, due to Beach Facility $38,705, due to Water fund $38,704. Total Interfund Advances is $1,032,572. Per City Council direction on 3/15/16, principal and interest payments are waived until such time it is deemed the Airport Fund has sufficient funds available for repayment. In Budget FY2021/22, 7 years of interest payments due to the General Fund are budgeted for a total of $19,079.
Page 174

Appendix 4
BASIS OF ACCOUNTING AND BUDGETING
BASIS OF ACCOUNTING
The accounting policies of the City conform to Generally Accepted Accounting Principles (GAAP). Accounts of the City are organized based on funds, and each of which is considered a separate accounting entity. Fund accounting segregates funds according to their purpose and is used to aid management in demonstrating compliance with finance‐related legal and contractual provision.
For financial reporting purposes, all governmental funds (i.e. General, Special Revenue, Capital Projects, and Debt Service) are accounted for on the modified accrual basis of accounting. Under this method, revenues are recognized in the accounting period in which they become both measurable and available to finance expenditures of the current period. Revenues are recorded when received in cash, except that revenues are subject to accrual (generally within 60 days after year‐end) are recognized when due. Expenditures are recorded in the accounting period when the liability is incurred, except for accumulated vacation/sick leave, which is treated as an expenditure when paid.
Proprietary Funds (e.g. Enterprise Funds) and Fiduciary Funds (i.e. Agency and Private Purpose Funds) are accounted for using the accrual basis of accounting under which revenues are recognized when earned, and expenses are recorded when the liabilities are incurred.
BUDGETARY BASIS OF ACCOUNTING
The City uses a budget basis for expenditures that differs from the basis used in reporting under Generally Accepted Accounting Principles in the following ways.
In the Governmental Funds, the city uses the modified accrual basis of accounting with the following exception:
Budget amounts are encumbered when contracts are signed for goods or services. At year‐end, amounts which are encumbered but not yet expended are carried over to be paid when the goods or services are received. These amounts are included in budget‐basis expenditures for the fiscal year in which they are encumbered, rather than the year in which goods or services are received and a liability incurred. Appropriations that are not spent or encumbered lapse at the end of the fiscal year.
In the Proprietary and Fiduciary Funds, the City uses the accrual basis of accounting with the following exceptions:
The budget basis includes expenditures for capital outlay and principal payments on long‐term debt, which are not considered expenses on the accrual basis of accounting.
Depreciation and amortization, which are considered expenses on the accrual basis of accounting, are ignored under the budget basis because these items do not require an expenditure of funds.
Page 175

PROPOSITION 4 (GANN LIMIT) ANALYSIS Section 7910 of the California Government Code and Article XIIIB of the California Constitution (commonly referred to as the “Gann Limit”) restrict the amount of revenue that cities can appropriate in any fiscal year. Annually, the City must adopt a resolution to approve the appropriations limit based on actual appropriations in FY 20‐21, adjusted by a.) the greater of growth in California per capita income or the percentage change in the local assessment roll from the preceding year due to the addition of new nonresidential construction in the City, and b.) the greater of the growth in City or County population. Section 37200 requires that the Gann limit and the total appropriations subject to the limitation be published in the annual budget. The City's limitation is calculated annually and was adopted by City Council Resolution No. 2021‐037 on June 1, 2021, as part of its annual operating budget.
For Fiscal Year 2021‐22, the City’s appropriation limit is calculated to be $17,306,527. Appropriations subject to limit have been determined to be $6,259,334. This is $11,047,193 below the calculated limit. Additional appropriations to the budget funded by non‐tax sources such as beginning fund balances, grants, or service charges are unaffected by the appropriations limit. However, any supplemental appropriations funded through increased tax sources are subject to the appropriations limit and cannot exceed $11,047,193. Any overall actual receipts from tax sources greater than the variance would result in taxes in excess of the appropriations limit and would require refunds of the excess in the next two years or voter approval of an increase in the appropriations limit. A request of voters to authorize an increase in the appropriations limit is not anticipated in the future due to the significant margin between the limit and tax revenue.
The following trend analysis of the appropriations limit versus the net proceeds of taxes for the last six years shows that the City will remain under its appropriations limit in the future.
Description 2015‐16 2016‐17 2017‐18 2018‐19 2019‐20 2020‐21 2021‐22 Appropriations Limit 11,012,986 12,090,607 13,112,187 14,044,705 15,120,711 16,327,787 17,306,527
Net Proceeds of Taxes 3,939,200 4,449,805 4,478,333 4,973,898 5,509,700 5,975,523 6,259,334 Difference 7,073,786 7,640,802 8,633,854 9,070,807 9,611,011 10,352,264 11,047,193 % of Limit 35.8% 36.8% 34.2% 35.4% 36.4% 36.6% 36.2%
Appendix 5
‐
5,000,000
10,000,000
15,000,000
20,000,000
2015‐16 2016‐17 2017‐18 2018‐19 2019‐20 2020‐21 2021‐22
GANN Limit Trend Analysis
Appropriations Limit Net Proceeds of Taxes
Page 176

CityofRioVistaAppendix
Appendix 6 DEBT LIMIT
DEBT LIMIT/OBLIGATION
State Law sets the bonded limit for General Obligation bonds at 15% of the total assessed valuation of all real and personal property within the City. As of June 30, 2020, the City’s total debt limit capacity was $41 million, but it has no outstanding debt subject to this limit.
DEBT OBLIGATION
Below is the annual debt service payments budget for Fiscal Year 2021‐22 and listing of City’s long‐term debt. The City’s existing debt levels are not expected to significantly impact current operations since the City has identifiable sources of debt repayment.
‐
50,000
100,000
150,000
200,000
250,000
300,000
350,000
General Fund VehicleReplacement
Fund
Gas Tax Fund PersonnelServicesDistrict ‐Police
Water SystemFund
Airport Fund Beach Facility North WestFacility
DEBT SERVICE PAYMENTS BY FUNDS
Principal Interest
Page 177

CityofRioVistaAppendix
Appendix 6
Principal Interest Total
General Fund
Citywide Energy Saving Project Equip Lease Purchase 810,463$ 50,426$ 16,516$ 66,942$ California Energy Commission Loan ‐ Fire Station Solar 404,616 21,951 3,992 25,942 Lease Purchase Agreement ‐ Phase II ‐ Sterling National 424,635 18,087 9,579 27,666 Subtotal, General Fund Debt 1,639,713 90,464 30,086 120,549
Vehicle Replacement Fund
PNC Fire Apparatuses Lease Purchase Agreement 771,824 98,077 29,947 128,024 Subtotal, Vehicle Replacement Fund Debt 771,824 98,077 29,947 128,024
Gas Tax Fund
PG&E Retrofit Loan 6,261 2,423 ‐ 2,423 Subtotal, Gas Fund Debt 6,261 2,423 ‐ 2,423
Personnel Services District ‐ Police
Police Records Management System Software 61,810 20,605 2,449 23,054 Subtotal, Gas Fund Debt 61,810 20,605 2,449 23,054
Water System Fund
Water Meter Installment Purchase Agreement 2,885,000 240,000 68,648 308,648 Citywide Energy Saving Project Equip Lease Purchase 63,589 3,956 1,296 5,252 2013 Land Capital Lease 69,355 6,000 ‐ 6,000 Subtotal, Water System Fund Debt 3,017,944 249,956 69,943 319,900
Airport Fund
Citywide Energy Saving Project Equip Lease Purchase 221,897 13,806 4,522 18,328 Subtotal, Airport Fund Debt 221,897 13,806 4,522 18,328
Beach Facility
Waste Water Installment Purchase Agreement 715,000 70,000 19,415 89,415 Citywide Energy Saving Project Equip Lease Purchase 165,086 10,271 3,364 13,636 New Vactor Truck ‐ KS StateBank 111,178 30,230 4,096 34,326 Subtotal, Beach Facility Fund Debt 991,264 110,501 26,875 137,376
North West Facility
Citywide Energy Saving Project Equip Lease Purchase 633,285 39,402 12,905 52,307 Lease Purchase Agreement ‐ Phase II ‐ Sterling National 608,365 25,913 13,723 39,636 New Vactor Truck ‐ KS StateBank 111,178 30,230 4,096 34,326 Subtotal, North West Facility Fund Debt 1,352,828 95,545 30,724 126,269
Total, Debt Service 8,063,542$ 681,377$ 194,546$ 875,923$
* Amount does not include interfund loan balance and debt payments
FY 2021‐22 BudgetOutstanding
Balance
as of 6‐30‐2021
Page 178

CityofRioVistaAppendix
Appendix 6
PG&E RETROFIT LOAN
In March 2014, the City entered into a loan agreement with Pacific Gas & Electric (PG&E) in the amount of $24,032 for energy efficient / demand response equipment and services. Monthly payments of $202 are due through December 2023. The loan does not bear any interest.
2013 LAND CAPITAL LEASE
The City entered a capital ground lease for the purpose of installation of Arsenic filtration equipment for Well 10. The lease has an option to purchase the property at the end of the lease. The capital lease has a 20‐year term, beginning in January 2013 and expiring in January 2033. Annual principal payments of $6,000 are made from water revenues. The land is included in capital assets at $120,000.
WASTEWATER INSTALLMENT PURCHASE AGREEMENT
In December 2015, the City entered into an installment purchase agreement for the purpose of refunding its portion of the installment payments due under the 2000 Installment Purchase Agreement and Indenture related to the 2000 Water and Wastewater Revenue Bonds. The refunding provides a net savings of approximately $181,000 with a net present value of approximately $153,000 or 14.47% of the prior bonds being refunded. The refunding also lowers overall debt service by approximately $12,431 per year from FY 2016 to FY 2029. The difference between the reacquisition price and the net carrying amount of the old debt of $47,031 has been recorded as a deferred outflow of resources on the Statement of Net Position and is being amortized over the life of the installment purchase agreement. The installment purchase agreement is secured by a pledge of net revenues from the Sewer Enterprise Fund. Installment payments of principal and interest are due annually on October 1 through October 1, 2029. Interest is charged at an effective interest rate of 3.010% per annum.
WATER METER INSTALLMENT PURCHASE AGREEMENT
In July 2016, the City entered into an installment purchase agreement for the purpose of financing the acquisition and installation of consumer water meters in the amount of $3,990,000. The installment purchase agreement is secured by a pledge of net revenues from the Water Enterprise Fund. Semi‐ annual installment payments of principal and interest are due each December 1 and June 1 through December 2031. Interest is charged at an effective interest rate of 2.43% per annum.
PNC FIRE APPARATUSES LEASE PURCHASE AGREEMENT
In February 2018, the City entered into a lease agreement with PNC financial solutions to purchase two fire apparatus from pierce manufacturing in the amount of $1,044,617. Those Fire Apparatus are needed for the Front‐Line Fire Apparatus of the Department in order to ensure continuity of emergency response. Installment payments of principal and interest are due annually on February 27 through February 27, 2028. Interest is charged at a nominal annual rate of 4.5%.
Page 179

CityofRioVistaAppendix
Appendix 6
CITYWIDE ENERGY SAVINGS PROJECT EQUIPMENT LEASE PURCHASE (REFINANCED)
In March 2018, the City entered into a lease purchase agreement in the amount of $2,077,404 and contracted with ABM Building Solutions to upgrade several selected City’s facilities to reduce its energy consumption and expenses. The facility improvements include installation of HVAC Systems, LED lighting, heat pumps, and other equipment and systems related to energy efficiency efforts. In September 2020, the City refinanced this lease purchase agreement, successfully reduced the effective annual rate from 3.58% to 2.07%. The installment payments of principal and interest are due semi‐annually in April and October through April 2033. POLICE RECORDS MANAGEMENT SYSTEM SOFTWARE LEASE PURCHASE
In December 2017, the City entered into a lease purchase agreement with Sun Ridge Systems, Inc. in the amount of $144,249 for the purchase of a police records management system. The lease has an interest rate of 4%. Annual principal and interest payments totaling $23,054 are due each June from 2018 to 2024.
NEW VACTOR TRUCK FINANCE/OWNERSHIP CONTRACT
In September 2019, the City signed a government obligation contract with KS StateBank to purchase a new vactor truck for the Public Works to perform the combination of sewer cleaning, catch basin cleaning, jetters and hydro excavation services. The purchase was financed at a fixed interest rate of 3.950% for a five‐year term with Semi‐Annual payments due each September and March in the amount of $34,325.93. The total cost of the truck was $308,739.27.
CALIFORNIA ENERGY COMMISSION LOAN
In August 2018, the City entered into a loan agreement in the amount of $422,795 with California Energy Commission at a rate of 1% per annum on the unpaid principal, computed from the date of each disbursement. Loan funds are disbursed on a reimbursement basis. Principal and interest are due and payable in semiannual installments beginning on or before December 22 of the fiscal year following the year in which the project is completed and continuing thereafter on each June 22 and December 22. The project was completed in December 2019, and the first Semi‐Annual payment is due on December 22, 2020 in the amount of $12,971.08 for a total of 36 payments through June 2038.
ENERGY SAVINGS PROJECT PHASE II ‐ EQUIPMENT LEASE PURCHASE
The City is continued to look for ways to reduce its energy consumption on facilities by replacing with energy efficient equipment. In April 2020, the City entered into a lease purchase agreement in the amount of $1,077,000 with Sterling National Bank for Phase II of energy saving project contracted with ABM Building Solutions to upgrade several selected City’s facilities. The installment payments of principal and interest are due semi‐annually in April and October through April 2035. Interest is charge at an effective annual rate of 2.280%.
Page 180

Transfer Out from Fund Transfer In to Fund Purpose
FY 20/21
Projected
FY21/22
Adopted
Transfer Out Transfer InGeneral Fund Transit Potential farebox penalty 8,000 8,000
General Fund ATOD Grant Offset expenditure not covered by grants in prior years 10,357 ‐
Gas Tax Capital Projects ADA Sidewalk Repair and Replacement 65,000 100,000
Transit NW Facility Rental for Office Space 12,000 12,000
Personnel Services District ‐ Fire Vehicle Replacement Fire Dept Vehicle Reserve 35,000 35,000
Personnel Services District ‐ Fire Vehicle Replacement Funding for Battalion Chief Command Vehicle ‐ 50,000
Parks and Recreation Capital Projects Bike & Pedestrian Pathway Montezuma Hills Rd 28,372 ‐
Parks and Recreation Capital Projects LGI Dog and Neighborhood Park Improvement 650,991 ‐
Parks and Recreation Capital Projects LGI 18 Acre New Park Phase I 12,869 144,899
Municipal Improvements General Fund Energy Saving Project Loan Payment ‐ City Hall 124,238 120,550
Municipal Improvements Capital Projects City Hall Improvement 20,000 ‐
Municipal Improvements Capital Projects Boat Launch Project ‐ City Match 29,829 ‐
Landfill Closure General Fund Excess Franchise Fee to fund General Operation 280,000 280,000
Business Park Municipal Improvements Interfund loan repayment 1,474,719 ‐
Business Park General Fund Additional support for Alcohol Tobacco & Other Drugs Education 15,000 15,000
Business Park General Fund Repayment of Cannabis Receipts in FY19/20 & FY18/19 378,346 ‐
Army Base General Fund Interfund loan repayment ‐ 7,175
Water Vehicle Replacement Fire Dept Vehicle Reserve 25,000 25,000
Water Water Project ‐ Capital Outlay Funding Source for Water CIP Projects 869,847 2,000,000
Water Capital Projects Funding for New Accounting System Software ‐ 350,000
Water Capital Projects Public Works Office & Corp Yard Improvement ‐ 15,000
Airport General Fund Interfund loan repayment ‐ 19,079
Beach Facility Capital Projects Public Works Office & Corp Yard Improvement 142,500 7,500
Beach Facility Water Interfund loan repayment 20,680 20,680
Beach Facility Parks and Recreation Interfund loan repayment 5,170 5,170
Beach Facility Municipal Improvements Interfund loan repayment 117,175 117,175
Beach Facility Beach Sewer Project ‐ Capital Outlay
Funding Source for Beach Facility CIP Projects235,196 2,250,000
NW Facility Capital Projects Public Works Office & Corp Yard Improvement 135,236 7,500
NW Facility NW Sewer Project ‐ Capital Outlay Funding Source for NW Facility CIP Projects 934,507 330,000
Total Interfund Transfers 5,630,032$ 5,919,728$
SCHEDULE OF INTERFUND TRANSFERS
Appendix 7
Page 181

REVENUE DETAILS BY FUND FY 21‐22 ADOPTED BUDGET
Appendix 8
Account Number Account Name
FY 2019‐20
Actual
FY 2020‐21
Final Budget
FY 2020‐21
Projected
FY 2021‐22
Adopted Budget Change
FUND 002 MEASURE O
002‐0530‐5324 Measure O Taxes 1,031,077 1,072,000 1,117,000 1,233,000 161,000 TOTAL 002 MEASURE O 1,031,077 1,072,000 1,117,000 1,233,000 161,000
FUND 10 GENERAL FUND
010‐0510‐5101 Secured Property Tax 1,755,289 1,896,932 1,889,561 1,984,039 87,106 010‐0510‐5103 Unsecured Property Tax 78,361 72,510 72,510 72,510 ‐ 010‐0510‐5105 Supplemental Property Tax 39,496 26,111 26,111 26,111 ‐ 010‐0510‐5110 Unitary Taxes 33,405 35,303 35,303 35,303 0 010‐0510‐5120 Property Tax Prior Year Adjustment (4,981) (15,725) (15,725) (10,353) 5,372 010‐0510‐5126 Dist. From RDA Dissolution 178,293 176,661 176,661 50,000 (126,661)010‐0510‐5199 Administration Charges by Solano County (22,928) (22,928) (26,127) (26,127) (3,199)010‐0510‐5702 Weed Abatement ‐ 10,028 10,028 ‐ (10,028)010‐0510‐5704 Vehicle License Fee ‐ SB1096 ‐ Property Tax 815,871 875,745 875,745 875,745 (0)
010‐0510‐5708 Pilt‐Payment in Lieu of Taxes 179 187 187 ‐ (187)010‐0510‐5712 Homeowners Property Tax Relief 14,641 14,547 14,547 14,547 ‐ 010‐0530‐5301 Business License 58,761 57,000 58,206 57,000 ‐ 010‐0530‐5306 Business License SB‐1186 2,300 1,300 2,400 1,300 ‐ 010‐0530‐5324 Sales & Use Tax 1,278,104 1,243,600 1,297,200 1,377,800 134,200 010‐0530‐5325 Real Property Transfer Tax 91,386 90,000 90,000 90,000 ‐ 010‐0530‐5328 Municipal Service Tax 77,992 75,000 78,340 78,000 3,000 010‐0540‐5310 Franchise Fees ‐ Cable TV 109,707 100,000 110,000 110,000 10,000 010‐0540‐5312 Franchise Fees ‐ PG&E 70,260 70,260 77,519 77,519 7,259 010‐0540‐5400 Planning Application Fees 102,614 75,000 70,000 75,000 ‐ 010‐0540‐5402 Dog License 12,966 14,996 14,996 14,996 ‐ 010‐0540‐5408 Building Permits 174,520 158,330 160,832 123,210 (35,120)010‐0540‐5410 Demolition Permits 1,200 350 430 350 ‐ 010‐0540‐5412 Electrical Permits 32,514 26,735 29,892 21,475 (5,260)010‐0540‐5413 Energy Permits 24,416 20,035 31,128 14,775 (5,260)010‐0540‐5414 Grading Permits 16,139 ‐ ‐ ‐ ‐ 010‐0540‐5418 Mechanical Permits 36,630 25,060 34,263 19,800 (5,260)010‐0540‐5422 Plumbing Permits 31,658 27,910 30,097 22,650 (5,260)010‐0540‐5423 Solar Electric 55,135 47,420 40,000 49,000 1,580 010‐0540‐5424 Special Events Permit/Application 85 200 ‐ 100 (100)010‐0540‐5426 Imaging Fee 5,812 4,480 4,974 3,720 (760)010‐0540‐5427 Public Art Fee 19,726 6,160 9,320 6,160 ‐ 010‐0540‐5428 Mapping Fee 5,810 4,480 5,103 3,720 (760)010‐0540‐5429 Training Recovery Fee 6,376 11,480 6,500 8,880 (2,600)010‐0540‐5430 Fire Code Inspections / Permits 2,041 3,000 1,000 1,500 (1,500)010‐0540‐5862 Solar Plan Check 21,409 15,809 15,809 13,643 (2,166)010‐0540‐5867 Encroachment Permit 5,596 4,000 4,000 4,000 ‐ 010‐0550‐5501 Forfeitures/Penalties 1,298 1,056 1,056 1,056 ‐ 010‐0550‐5503 Other Court Fines/Traffic 18,584 18,000 15,440 17,000 (1,000)010‐0550‐5896 Parking Fines 7,717 10,000 8,000 8,000 (2,000)010‐0560‐5303 Asset Sale 1,600 3,600 4,400 ‐ (3,600)010‐0560‐5601 Interest Income 92,314 60,000 37,600 38,000 (22,000)010‐0560‐5603 Rent ‐ Real Property 32,281 31,000 25,440 25,632 (5,368)010‐0560‐5605 Rental ‐ Comcast 44,910 17,880 17,946 18,077 197 010‐0560‐5902 Natural Gas Royalties 32,998 36,000 10,000 10,000 (26,000)010‐0570‐5704 Motor Vehicle In Lieu 7,452 5,424 7,325 6,438 1,014
REVENUES
Page 182

REVENUE DETAILS BY FUND FY 21‐22 ADOPTED BUDGET
Appendix 8
Account Number Account Name
FY 2019‐20
Actual
FY 2020‐21
Final Budget
FY 2020‐21
Projected
FY 2021‐22
Adopted Budget Change
REVENUES
010‐0570‐5734 POST Reimbursement 4,883 ‐ ‐ ‐ ‐ 010‐0570‐5740 Federal Grant ‐ FTA CARES Act ‐ 123,311 123,311 ‐ (123,311)010‐0570‐5753 Grant Revenue 1,577 ‐ ‐ ‐ ‐ 010‐0580‐5811 General Plan 2001 Reimb. Fee 5,115 4,739 4,739 3,385 (1,354)010‐0580‐5818 Swimming Pool Fees 204 10,000 170 10,000 ‐ 010‐0580‐5821 Boat Launch Fees 42,392 5,000 6,000 45,000 40,000 010‐0580‐5824 Police Service Fees 17,631 24,000 20,000 24,000 ‐ 010‐0580‐5826 Fire Services Fees 3,747 5,000 3,000 5,000 ‐ 010‐0580‐5828 Delta Fire District 100,000 458,453 398,453 100,000 (358,453)010‐0580‐5831 Engineering & Inspection Fees 30,108 20,000 35,000 30,000 10,000 010‐0580‐5832 Cannabis Facility Fee ‐ 42,034 49,337 81,530 39,496 010‐0580‐5833 Cannabis Developer Fee ‐ 521,000 748,317 710,000 189,000 010‐0580‐5861 Plan Check Fees 136,192 89,840 133,302 70,600 (19,240)010‐0580‐5862 Solar Plan Check (108) ‐ (108) ‐ ‐ 010‐0580‐5895 New Home Construction (Fire) 5,490 10,000 3,780 4,500 (5,500)010‐0590‐5920 Miscellaneous Revenue 60,944 17,594 36,830 10,000 (7,594)010‐0590‐5921 Garage Sales 174 250 2 250 ‐ 010‐0590‐5937 Donations ‐ K‐9 150 ‐ ‐ ‐ ‐ 010‐0590‐5990 Transfer In 111,917 139,238 139,238 135,550 (3,688)010‐0590‐5990 Transfer In ‐ Landfill Franchise Fee ‐ 280,000 280,000 280,000 ‐ 010‐0590‐5990 Transfer In ‐ Due from other Fund ‐ 378,346 378,346 26,254 (352,092)TOTAL FUND 010 5,890,356 7,463,741 7,717,732 6,856,645 (607,096)
‐ SUBTOTAL GENERAL FUND ‐ 002 & 010 6,921,433 8,535,741 8,834,732 8,089,645 (446,096)
FUND 22 GENERAL PLAN
022‐0560‐5601 Interest Income 1,981 1,500 742 750 (750)022‐0580‐5807 General Plan Revision Fee 5,908 6,319 6,000 4,514 (1,805)TOTAL GENERAL PLAN FUND 7,890 7,819 6,742 5,264 (2,555)
FUND 52 TRANSIENT OCCUPANCY TAX
052‐0530‐5318 Transient Occupancy Tax 21,315 20,000 13,700 20,000 ‐ 052‐0560‐5601 Interest Income 384 300 73 70 (230)TOTAL TRANSIENT OCCUPANCY TAX 21,699 20,300 13,773 20,070 (230)
TOTAL GENERAL FUND per Audit Report 6,951,022 8,563,860 8,855,247 8,114,979 (448,881)
FUND 12 VEHICLE REPLACEMENT FUND
012‐0560‐5601 Interest Income 2,596 3,000 850 800 (2,200)012‐0560‐5303 Asset Sale ‐ ‐ ‐ ‐ ‐ 012‐0580‐5827 Funding from Delta Fire District 25,000 25,000 25,000 25,000 ‐ 012‐0580‐5829 Cal OES Reimbursement 24,194 100,000 100,000 ‐ (100,000)012‐0590‐5990 Transfer In 164,043 110,000 60,000 110,000 ‐ TOTAL VEHICLE REPLACEMENT FUND 215,832 238,000 185,850 135,800 (102,200)
FUND 17 LAW ENFORCEMENT GRANT
017‐0560‐5601 Interest Income 1,474 1,000 669 700 (300)017‐0570‐5753 Grant Revenues 155,948 130,000 140,932 120,000 (10,000)TOTAL LAW ENFORCEMENT GRANT FUND 157,422 131,000 141,601 120,700 (10,300)
FUND 18 ASSET FORFEITURE
Page 183

REVENUE DETAILS BY FUND FY 21‐22 ADOPTED BUDGET
Appendix 8
Account Number Account Name
FY 2019‐20
Actual
FY 2020‐21
Final Budget
FY 2020‐21
Projected
FY 2021‐22
Adopted Budget Change
REVENUES
018‐0560‐5601 Interest Income 44 30 11 15 (15)TOTAL ASSET FORFEITURE 44 30 11 15 (15)
FUND 19 ATOD GRANT
019‐0570‐5753 Grant Revenues 48,463 62,007 61,793 57,495 (4,512)019‐0590‐5990 Transfer In ‐ 10,357 10,357 (10,357)TOTAL ATOD GRANT FUND 48,463 72,364 72,150 57,495 (14,869)
FUND 25 GAS TAX
025‐0560‐5601 Interest Income 6,774 6,000 2,491 2,500 (3,500)025‐0570‐5707 Traffic Congestion Relief Prop 42 (SB1) 10,586 ‐ ‐ ‐ ‐ 025‐0570‐5717 Gas Tax ‐ Section 2105 211,647 226,149 226,149 248,288 22,139 025‐0570‐5719 Road Main & Rehab Section 2032 (SB1) 163,084 168,038 168,038 184,033 15,995 025‐0590‐5990 Transfer In 22,366 ‐ ‐ ‐ ‐ TOTAL GAS TAX FUND 414,457 400,187 396,678 434,821 34,634
FUND 31 DEVELOPERS REVOLVING FUND
031‐0560‐5601 Interest Income 492 300 125 50 (250)TOTAL DEVELOPERS REVOLVING FUND 492 300 125 50 (250)
FUND 32 TRANSIT
032‐0560‐5601 Interest Income 1,594 2,000 535 500 (1,500)032‐0570‐5728 TDA Grant 270,890 91,605 91,605 128,805 37,200 032‐0570‐5729 TDA Grant ‐ Capital 18,046 25,500 1,465 25,500 ‐ 032‐0570‐5755 Federal Grant ‐ FTA 5311 Capital 77,186 75,000 ‐ 75,000 ‐ 032‐0570‐5756 Federal Grant ‐ FTA Section 5311 150,000 100,000 100,000 178,891 78,891 032‐0570‐5759 Federal Grant ‐ FTA Section 5310 ‐ 150,000 150,000 150,000 ‐ 032‐0570‐5760 STA FUND ‐ ‐ ‐ 15,000 15,000 032‐0570‐5739 Capital Grant ‐ YSAQMD ‐ 30,000 ‐ 30,000 ‐ 032‐0570‐5740 Federal Grant ‐ FTA CARES Act 97,748 150,000 150,000 ‐ (150,000)032‐0580‐5893 Transit Fares 13,935 8,310 8,310 10,500 2,190 032‐0570‐5731 TDA Planning & Administration 85,900 42,950 42,950 85,900 42,950 032‐0570‐5730 TDA From Other Recipients 18,925 ‐ ‐ ‐ ‐ 032‐0590‐5990 Transfer In 8,000 8,000 8,000 8,000 ‐ TOTAL TRANSIT FUND 742,225 683,365 552,865 708,096 24,731
FUND 33 COMMERCIAL REHABILITATION LOAN FUND
033‐0560‐5601 Interest Income 830 700 250 100 (600)TOTAL COM. REHABILITATION LOAN FUND 830 700 250 100 (600)
FUND 34 CDBG HOUSING REHABILIATION
034‐0560‐5601 Interest Income 1,717 1,500 520 300 (1,200)TOTAL CDBG HOUSING REHABILITATION FUND 1,717 1,500 520 300 (1,200)
FUND 38 PERSONNEL SERVICES ‐ FIRE
038‐0510‐5101 Property Tax 421,390 469,061 469,061 492,514 23,453 038‐0510‐5199 Administration Charges by Solano County (4,214) (4,691) (4,691) (4,925) (234)038‐0560‐5601 Interest Income 2,025 1,500 767 700 (800)TOTAL PERSONNEL SERVICES ‐ FIRE 419,201 465,870 465,137 488,289 22,419
Page 184

REVENUE DETAILS BY FUND FY 21‐22 ADOPTED BUDGET
Appendix 8
Account Number Account Name
FY 2019‐20
Actual
FY 2020‐21
Final Budget
FY 2020‐21
Projected
FY 2021‐22
Adopted Budget Change
REVENUES
FUND 39 PERSONNEL SERVICES ‐ POLICE
039‐0510‐5101 Property Tax 421,390 469,061 469,061 492,514 23,453 039‐0510‐5199 Administration Charges by Solano County (4,214) (4,691) (4,691) (4,925) (234)039‐0560‐5601 Interest Income 3,731 2,500 1,600 1,500 (1,000)TOTAL PERSONNEL SERVICES ‐ POLICE 420,907 466,870 465,970 489,089 22,219
FUND 40 FIREHOUSE BONDS
040‐0510‐5120 Property Tax Prior Year Adj 29 ‐ 13 ‐ ‐ 040‐0510‐5712 Homeowners Property Tax Relief (1) ‐ ‐ ‐ ‐ 040‐0560‐5601 Interest Income 12 ‐ 3 ‐ ‐ TOTAL FIREHOUSE BOND FUND 40 ‐ 16 ‐ ‐
FUND 41 COMMUNITY FACILITIES DISTRICT 2006‐1
041‐0510‐5101 Property Tax 507,533 512,871 512,871 512,871 (0)
041‐0510‐5199 Administration Charges by Solano County (2,016) (1,537) (1,537) (1,537) (0)
041‐0560‐5601 Interest Income 2,641 1,700 561 560 (1,140)TOTAL COMMUNITY FACILITIES DISTRICT 2006‐1 508,159 513,034 511,894 511,893 (1,141)
FUND 42 RIVERVIEW POINT ASSESSMENT DISTRICT
042‐0510‐5101 Property Tax 154,297 146,464 146,464 146,464 ‐ 042‐0510‐5199 Administration Charges by Solano County (512) (380) (380) (380) (0)
042‐0560‐5601 Interest Income 1,507 1,550 378 378 (1,172)TOTAL RIVERVIEW POINT ASSESSMENT DISTRICT 155,292 147,633 146,461 146,461 (1,172)
FUND 43 RIVERVIEW POINT BOND RESERVE
043‐0560‐5601 Interest Income 420 470 105 105 (365)TOTAL RIVERVIEW POINT BOND RESERVE FUND 420 470 105 105 (365)
FUND 45 SUMMERSET IMPROVEMENT
045‐0560‐5601 Interest Income 49 ‐ 13 ‐ ‐ TOTAL SUMMERSET IMPROVEMENT FUND 49 ‐ 13 ‐ ‐
FUND 46 SUMMERSET ASSESSMENT DISTRICT
046‐0560‐5601 Interest Income 6 ‐ 1 ‐ ‐ TOTAL SUMMERSET ASSESSMENT DISTRICT 6 ‐ 1 ‐ ‐
FUND 49 COMMUNITY FACILITIES DISTRICT 2004‐1
049‐0510‐5101 Property Tax 290,676 300,346 300,347 300,347 0 049‐0510‐5199 Administration Charges by Solano County (1,090) (810) (810) (810) 0 049‐0560‐5601 Interest Income 1,318 1,000 273 273 (727)TOTAL COMMUNITY FACILITIES DISTRICT 2004‐1 290,903 300,536 299,810 299,810 (727)
FUND 50 STORM DRAIN
050‐0560‐5601 Interest Income 91 50 35 25 (25)050‐0570‐5753 Grant Revenue 46,227 ‐ 94,148 ‐ ‐ 050‐0580‐5816 Utility Service Fee 28,869 28,000 29,000 29,000 1,000 TOTAL STORM DRAIN FUND 75,187 28,050 123,183 29,025 975
FUND 51 CAPITAL GRANTS AND PROJECTS FUND
051‐0560‐5601 Interest Income 1,253 ‐ ‐ ‐ ‐
Page 185

REVENUE DETAILS BY FUND FY 21‐22 ADOPTED BUDGET
Appendix 8
Account Number Account Name
FY 2019‐20
Actual
FY 2020‐21
Final Budget
FY 2020‐21
Projected
FY 2021‐22
Adopted Budget Change
REVENUES
051‐0570‐5753 Grant Revenue ‐ Bike & Pedestrian Pathway ‐ 100,000 100,000 ‐ (100,000)051‐0570‐5753 Grant Revenue ‐ American Rescure Plan Act ‐ ‐ ‐ 1,829,201 1,829,201 051‐0570‐5753 Grant Revenue ‐ Boat Launch ‐ 1,410,230 1,410,230 ‐ (1,410,230)051‐0570‐5753 Grant Revenue ‐ HSIP 2,500 245,000 42,000 249,100 4,100 051‐0570‐5753 Grant Revenue ‐ Park Shade Structures ‐ 177,952 177,952 ‐ (177,952)051‐0590‐5425 Other Financing Source ‐ Bank Loan 438,154 442,722 442,722 ‐ (442,722)051‐0590‐5990 Transfer In ‐ Laserfiche EDMS ‐ 25,000 ‐ ‐ (25,000)051‐0590‐5990 Transfer In ‐ Boat Launch Project 64,404 279,770 29,829 ‐ (279,770)051‐0590‐5990 Transfer In ‐ ADA Sidewalk Repair and 32,585 139,319 65,000 100,000 (39,319)051‐0590‐5990 Transfer In ‐ Bruning Park Restroom 182,343 ‐ ‐ ‐ ‐
051‐0590‐5990Transfer In ‐ Bike & Ped Pathway Montezuma Hills Rd 29,671 ‐ 28,372 ‐ ‐
051‐0590‐5990Transfer In ‐ City Hall ADA Remodel ‐ Council Chambers/CD Office 28,061 20,000 20,000 ‐ (20,000)
051‐0590‐5990 Transfer In ‐ New Accounting System ‐ 250,000 ‐ 350,000 100,000 051‐0590‐5990 Transfer In ‐ HSIP Pedestrian Crossing 9,482 ‐ ‐ ‐ ‐
051‐0590‐5990Transfer In ‐ Police & Fire Public Safety Facility 9,700 ‐ ‐ ‐ ‐
051‐0590‐5990Transfer In ‐ Public Works Office & Corp Yard Improvement 330,211 465,000 277,736 30,000 (435,000)
051‐0590‐5990Transfer In ‐ LGI Dog and Neighborhood Park Improvement ‐ 650,991 650,991 ‐ (650,991)
051‐0590‐5990 Transfer In ‐ LGI 18 Acre New Park Phase I ‐ 157,767 12,869 144,899 (12,869)TOTAL CAPITAL GRANTS/PROJECTS FUND 1,128,365 4,363,751 3,257,701 2,703,200 (1,660,552)
FUND 53 ROADWAY IMPACT
053‐0540‐5409 Roadway Impact Fees 75,771 (61,909) (81,909) 492,000 553,909 053‐0560‐5601 Interest Income 4,370 2,500 1,623 1,500 (1,000)TOTAL ROADWAY IMPACT FUND 80,141 (59,409) (80,286) 493,500 552,909
FUND 54 PARKS AND RECREATION
054‐0540‐5322 Development Fee 117,844 61,110 118,028 43,650 (17,460)054‐0560‐5601 Interest Income 15,172 5,000 5,347 5,000 ‐ 054‐0590‐5990 Transfer In ‐ 5,170 5,170 5,170 ‐ TOTAL PARKS AND RECREATION FUND 133,016 71,280 128,545 53,820 (17,460)
FUND 55 MAIN & OPERATION SVC DISTRICT ‐ LIBERTY
055‐0510‐5101 Property Tax 601,240 607,908 607,908 607,908 ‐ 055‐0510‐5199 Administration Charges by Solano County (6,012) (6,079) (6,079) (6,079) ‐ 055‐0560‐5601 Interest Income 8,748 5,000 4,427 5,000 ‐ TOTAL MAIN & OPERATION SVC DISTRICT ‐ LIBERTY 603,975 606,829 606,256 606,829 ‐
FUND 56 MUNICIPAL IMPROVEMENT
056‐0540‐5304 Municipal Improvement Fee 262,493 195,886 285,474 139,919 (55,967)056‐0560‐5601 Interest Income 87,400 65,000 40,421 40,000 (25,000)056‐0590‐5990 Transfer In ‐ 1,570,530 1,591,894 117,175 (1,453,355)TOTAL MUNICIPAL IMPROVEMENT FUND 349,893 1,831,416 1,917,789 297,094 (1,534,322)
FUND 60 HAZARDOUS WASTE
060‐0560‐5601 Interest Income 6,316 5,500 2,373 2,400 (3,100)
Page 186

REVENUE DETAILS BY FUND FY 21‐22 ADOPTED BUDGET
Appendix 8
Account Number Account Name
FY 2019‐20
Actual
FY 2020‐21
Final Budget
FY 2020‐21
Projected
FY 2021‐22
Adopted Budget Change
REVENUES
060‐0570‐5753 Grant Revenue 5,000 5,000 33,350 ‐ (5,000)060‐0580‐5801 HHW Collection Fee 107,104 100,000 109,136 100,000 ‐ TOTAL HAZARDOUS WASTE FUND 118,420 110,500 144,859 102,400 (8,100)
FUND 65 LANDFILL CLOSURE
065‐0540‐5316 Franchise Fees ‐ RV Sanitation 381,525 387,600 366,819 370,000 (17,600)065‐0560‐5601 Interest Income 23,629 17,000 8,993 9,000 (8,000)TOTAL LANDFILL CLOSURE FUND 405,154 404,600 375,812 379,000 (25,600)
FUND 75 BUSINESS PARK
075‐0550‐5501 Forfeitures/Penalties (194) ‐ ‐ ‐ ‐ 075‐0560‐5601 Interest Income 4,318 500 1,200 500 ‐ 075‐0560‐5303 Land Sales 409,834 3,038,100 3,022,812 325,000 (2,713,100)075‐0560‐5612 Rent ‐ Business Park Hangars 7,244 4,800 4,000 ‐ (4,800)075‐0560‐5615 Rent ‐ Miscellaneous 22,244 22,244 22,244 22,244 ‐ 075‐0580‐5832 Cannabis Facility Fee 30,788 ‐ ‐ ‐ ‐ 075‐0580‐5833 Cannabis Developer Fee 347,558 ‐ ‐ ‐ ‐ 075‐0590‐5917 Developer Reimbursement 358,400 57,644 57,644 ‐ (57,644)075‐0590‐5920 Miscellaneous Revenue 52,019 ‐ ‐ ‐ ‐ TOTAL BUSINESS PARK FUND 1,232,210 3,123,288 3,107,900 347,744 (2,775,544)
FUND 76 ARMY BASE
076‐0560‐5601 Interest Income 897 200 117 100 (100)076‐0560‐5603 Rent ‐ Real Property ‐ 1,000 1,800 4,800 3,800 076‐0590‐5920 Reimbursement ‐ Dept of Water Resources 15,080 13,329 13,329 13,549 220 TOTAL ARMY BASE FUND 15,977 14,529 15,246 18,449 3,920
FUND 80 WATER SYSTEM
080‐0550‐5501 Forfeitures/Penalties 38,803 35,000 45,000 40,000 5,000 080‐0560‐5601 Interest Income 71,917 40,000 35,886 35,000 (5,000)080‐0570‐5753 Grant Revenues 45,000 22,500 22,500 ‐ (22,500)080‐0580‐5808 Utility Service Fees 3,016,723 2,800,000 2,963,023 3,000,000 200,000 080‐0580‐5810 Interim Water Fees ‐ Construction 29,306 ‐ ‐ ‐ ‐ 080‐0580‐5814 Water Reconnect Fee 6,125 6,000 100 1,000 (5,000)080‐0590‐5920 Miscellaneous Revenue 124,229 ‐ ‐ ‐ ‐ 080‐0590‐5990 Transfer In ‐ From Fund 081 CIP 1,277,757 ‐ ‐ ‐ ‐ 080‐0590‐5990 Transfer In ‐ Interfund Loan Repayment ‐ 20,680 20,680 20,680 ‐ TOTAL WATER SYSTEM FUND 4,609,860 2,924,180 3,087,189 3,096,680 172,500
FUND 81 WATER CONSTRUCTION
081‐0590‐5990 Transfer In ‐ From Fund 080 1,408,260 3,111,111 869,847 2,000,000 (1,111,111)TOTAL WATER CONSTRUCTION FUND 1,408,260 3,111,111 869,847 2,000,000 (1,111,111)
FUND 84 AIRPORT
084‐0550‐5501 Forfeitures/Penalties 396 300 200 300 ‐ 084‐0560‐5601 Interest Income 3,396 2,500 1,400 1,000 (1,500)084‐0560‐5603 Rent ‐ Real Property 22,262 31,450 30,102 34,246 2,796 084‐0560‐5608 Rent ‐ Airport Hangars 177,211 165,773 187,987 183,630 17,857 084‐0560‐5609 Parking Permit Revenue 873 ‐ ‐ ‐ ‐ 084‐0560‐5610 Rent ‐ Airport Tie‐Downs 1,786 1,500 1,500 1,600 100
Page 187

REVENUE DETAILS BY FUND FY 21‐22 ADOPTED BUDGET
Appendix 8
Account Number Account Name
FY 2019‐20
Actual
FY 2020‐21
Final Budget
FY 2020‐21
Projected
FY 2021‐22
Adopted Budget Change
REVENUES
084‐0570‐5753 Grant Revenues 59,250 852,216 81,250 751,466 (100,750)084‐0570‐5755 Grant Revenues ‐ State Match 10,000 51,961 10,000 47,574 (4,387)084‐0580‐5907 Sales ‐ Airport Fuel 155,619 160,000 161,243 160,000 ‐ 084‐0580‐5908 Cost of Sales ‐ Fuel (134,149) (139,200) (140,211) (139,200) ‐ 084‐0590‐5920 Miscellaneous Revenue 24,833 13,890 ‐ ‐ (13,890)TOTAL AIRPORT FUND 321,478 1,140,390 333,471 1,040,615 (99,775)
FUND 85 BEACH DRIVE ‐ SEWER SYSTEM
085‐0550‐5501 Forfeitures/Penalties 26,377 24,000 24,000 24,000 ‐ 085‐0560‐5601 Interest Income 51,843 30,000 26,647 26,000 (4,000)085‐0570‐5753 Grant Revenues ‐ 11,250 11,250 ‐ (11,250)085‐0580‐5803 Utility Service Fees ‐ Residential 2,410,856 2,400,000 2,400,000 2,400,000 ‐ 085‐0580‐5804 Utility Service Fees ‐ Commercial 430,011 400,000 321,634 400,000 ‐ 085‐0580‐5806 Sewer Connection Fees 1,935 ‐ ‐ ‐ ‐ 085‐0590‐5990 Transfer In ‐ From Fund 088 CIP 718,677 ‐ ‐ ‐ ‐ TOTAL BEACH DRIVE SEWER SYSTEM FUND 3,639,697 2,865,250 2,783,531 2,850,000 (15,250)
FUND 86 NW ‐ SEWER SYSTEM
086‐0550‐5501 Forfeitures/Penalties 12,506 9,500 10,192 11,000 1,500 086‐0560‐5601 Interest Income 41,851 25,000 20,531 20,000 (5,000)086‐0570‐5753 Grant Revenues ‐ 11,250 11,250 (11,250)086‐0580‐5803 Utility Service Fees ‐ Residential 1,999,066 1,800,000 2,000,000 2,000,000 200,000 086‐0580‐5804 Utility Service Fees ‐ Commercial 41,198 47,000 22,711 31,000 (16,000)086‐0590‐5990 Transfer In ‐ Rental from Transit Fund 12,000 12,000 12,000 12,000 ‐ 086‐0590‐5920 Misc Revenue 12,200 ‐ ‐ ‐ ‐ TOTAL NW SEWER SYSTEM FUND 2,118,820 1,904,750 2,076,684 2,074,000 169,250
FUND 87 NW SEWER ‐ CAPITAL OUTLAY
087‐0590‐5425 Other Financing Source ‐ Bank Loan ‐ 634,278 634,278 ‐ (634,278)087‐0590‐5990 Transfer In ‐ From Fund 086 377,775 1,044,500 934,507 330,000 (714,500)TOTAL NW SEWER ‐ CAPITAL OUTLAY 377,775 1,678,778 1,568,785 330,000 (1,348,778)
FUND 88 BEACH SEWER ‐ CAPITAL OUTLAY
088‐0590‐5990 Transfer In ‐ From Fund 085 238,293 1,125,000 235,196 2,250,000 1,125,000 TOTAL BEACH SEWER ‐ CAPITAL OUTLAY 238,293 1,125,000 235,196 2,250,000 1,125,000
FUND 91 STREET PROJECTS
091‐0560‐5601 Interest Income 126 ‐ 0 ‐ ‐ 091‐0570‐5753 Grant Revenue 79,998 140,000 140,000 ‐ (140,000)TOTAL STREET PROJECTS 80,123 140,000 140,000 ‐ (140,000)
FUND 95 LIBERTY COMMUNITY FACILITES DISTRICT
095‐0560‐5601 Interest Income 12,751 1,000 528 500 (500)095‐0510‐5101 Property Tax 799,344 805,458 805,459 805,459 0 095‐0510‐5199 Administration Charges by Solano County (1,769) (1,314) (1,314) (1,314) (0)
095‐0590‐5920 Misc Revenue‐ From Bond Proceeds 8,371 ‐ ‐ ‐ ‐ TOTAL LIBERTY COMMUNITY FACILITIES DISTRICT 818,697 805,145 804,673 804,645 (500)
‐ TOTAL REVENUES 28,082,825 38,175,157 33,591,085 30,985,003 (7,190,154)
Page 188

CITY MANAGER
FY 21‐22 ADOPTED EXPENDITURE BUDGET
Appendix 9
Account Number Account Name
FY 2019‐20
Actual
FY 2020‐21
Final Budget
FY 2020‐21
Projected
FY 2021‐22
Adopted Budget Change
FUND 10 GENERAL FUND
ADMINISTRATION
CITY COUNCIL
010‐0100‐0100‐7213 Legal Fees 37,991 21,600 21,795 26,000 4,400 010‐0100‐0100‐7226 Printing 381 600 300 600 ‐ 010‐0100‐0100‐7235 Conferences & Meetings 659 3,100 500 3,100 ‐ 010‐0100‐0100‐7272 Equipment Rental 296 200 200 200 ‐ 010‐0100‐0100‐7277 Fuel & Mileage ‐ 800 ‐ 1,000 200 010‐0100‐0100‐7307 Liability Insurance 645 1,407 1,407 1,444 37 010‐0100‐0100‐7359 Meals 2,984 4,875 ‐ 2,000 (2,875)010‐0100‐0100‐7365 Membership Dues 19,710 19,000 20,029 22,000 3,000 010‐0100‐0100‐7367 Misc Services & Supplies 27 900 1,133 700 (200)010‐0100‐0100‐7426 Publications & Subscriptions ‐ 1,200 1,200 600 (600)TOTAL CITY COUNCIL 62,694 53,682 46,564 57,644 3,962
CITY MANAGER
010‐0100‐0105‐7213 Legal Fees 1,579 2,000 9,000 5,000 3,000 010‐0100‐0105‐7235 Conferences/ meetings 1,536 5,000 ‐ 5,000 ‐ 010‐0100‐0105‐7245 Contractual services 19,022 17,896 17,896 ‐ (17,896)010‐0100‐0105‐7272 Equipment Rental 574 400 400 400 ‐ 010‐0100‐0105‐7277 Fuel & Mileage 77 250 ‐ 250 ‐ 010‐0100‐0105‐7307 Liability Insurance 1,251 2,729 2,729 2,800 71 010‐0100‐0105‐7359 Meals 647 2,000 ‐ 2,000 ‐ 010‐0100‐0105‐7365 Membership Dues 4,258 4,514 4,514 4,514 ‐ 010‐0100‐0105‐7367 Misc Services & Supplies ‐ ‐ (60) ‐ ‐ 010‐0100‐0105‐7372 Office Supplies & Materials 883 500 500 500 ‐ 010‐0100‐0105‐7426 Publications & Subscriptions 614 350 (240) 350 ‐ 010‐0100‐0105‐7432 Telephone 1,783 1,758 1,758 1,758 ‐ TOTAL CITY MANAGER 32,226 37,397 36,497 22,572 (14,825)
CITY ADMINISTRATION
010‐0100‐0107‐7125 State Unemployment Insurance 6,497 5,000 2,000 5,000 ‐ 010‐0100‐0107‐7202 Retiree Health (OPEB) 19,256 20,016 33,258 34,229 14,213 010‐0100‐0107‐7204 Health Administrative Fee 2,521 2,200 2,200 2,200 ‐ 010‐0100‐0107‐7211 Legal Fees ‐ Potential Litigation 119,120 75,000 10,000 75,000 ‐ 010‐0100‐0107‐7213 Legal Fees 47,248 40,000 40,000 40,000 ‐ 010‐0100‐0107‐7245 Contractual services 7,000 38,000 3,000 3,000 (35,000)010‐0100‐0107‐7254 Debt Service ‐ Principal 38,145 77,412 77,412 90,464 13,052 010‐0100‐0107‐7255 Debt Service ‐ Interest 30,772 46,826 46,826 30,086 (16,740)010‐0100‐0107‐7307 Liability Insurance 83,519 ‐ ‐ ‐ ‐ 010‐0100‐0107‐7330 Janitorial Supplies 1,591 4,000 1,500 4,000 ‐ 010‐0100‐0107‐7359 Meals 7 ‐ ‐ ‐ ‐ 010‐0100‐0107‐7367 Misc Services & Supplies 1,338 1,100 1,129 1,100 ‐ 010‐0100‐0107‐7372 Office Supplies & Materials 2,142 10,650 10,650 10,650 ‐ 010‐0100‐0107‐7384 Personnel Hiring Costs 2,723 7,100 2,500 7,100 ‐ 010‐0100‐0107‐7397 Postage 11,247 18,400 18,400 18,400 ‐ 010‐0100‐0107‐7432 Telephone 8,907 8,600 8,600 8,600 ‐ TOTAL CITY ADMINISTRATION 382,032 354,304 257,475 329,829 (24,475)
INFORMATION TECHNOLOGY
010‐0100‐0136‐7245 Contractual Services 82,607 72,203 72,203 57,996 (14,207)010‐0100‐0136‐7380 Computer Hardware 4,777 21,000 9,000 12,500 (8,500)
EXPENDITURES
Page 189

CITY MANAGER
FY 21‐22 ADOPTED EXPENDITURE BUDGET
Appendix 9
Account Number Account Name
FY 2019‐20
Actual
FY 2020‐21
Final Budget
FY 2020‐21
Projected
FY 2021‐22
Adopted Budget Change
EXPENDITURES
010‐0100‐0136‐7381 Computer Software 24,509 24,533 24,533 26,175 1,642 TOTAL INFORMATION TECHNOLOGY 111,893 117,736 105,736 96,671 (21,064)
TRANSFERS OUT
010‐0100‐5990‐9000 Transfer Out 8,000 18,357 18,357 8,000 (10,357)TOTAL TRANSFERS OUT 8,000 18,357 18,357 8,000 (10,357)
TRANSIENT OCCUPANCY TAX
052‐0100‐0520‐7245 Contractual Services 38,627 35,000 35,000 20,070 (14,930)TOTAL TRANSIENT OCCUPANCY TAX 38,627 35,000 35,000 20,070 (14,930)
Page 190

TRANSITFY 21-22 ADOPTED EXPENDITURE BUDGET
Appendix 9
Account Number Account Name FY 2019-20
Actual FY 2020-21 Final Budget
FY 2020-21 Projected
FY 2021-22 Adopted
Budget Change FUND 32 TRANSIT032-0300-0320-7201 Accounting & Auditing 2,048 2,294 2,294 2,294 0 032-0300-0320-7205 Advertising - 2,500 2,500 2,500 - 032-0300-0320-7213 Legal Fees 1,863 3,000 3,000 3,000 - 032-0300-0320-7226 Printing 123 1,000 1,000 1,000 - 032-0300-0320-7234 Dispatch services 1,764 1,800 1,800 5,090 3,290 032-0300-0320-7245 Contractual Services 314,668 320,896 320,896 336,561 15,665 032-0300-0320-7253 Management Consultant Services 85,988 85,900 85,900 85,900 - 032-0300-0320-7272 Equipment Rental 2,071 2,400 2,400 2,520 120 032-0300-0320-7277 Fuel & Mileage 37,752 49,500 49,500 49,500 - 032-0300-0320-7307 Liability Insurance 5,799 12,646 12,646 12,974 328 032-0300-0320-7340 Legal Notices/Publications 93 200 200 200 - 032-0300-0320-7356 M & R Vehicles 6,811 12,000 12,000 12,600 600 032-0300-0320-7358 Emergency Incident - COVID-19 Pandemic 6,656 10,000 10,000 10,000 - 032-0300-0320-7365 Membership Dues - 550 550 550 - 032-0300-0320-7367 Misc. Services & Supplies 1,550 1,052 1,052 4,000 2,948 032-0300-0320-7372 Office Supplies & Materials - 500 500 500 - 032-0300-0320-7381 Computer Software 912 2,606 2,606 2,781 174 032-0300-0320-7385 Permits & Licenses - 100 100 100 - 032-0300-0320-7397 Postage - 100 100 100 - 032-0300-0320-7415 Signs - 100 100 100 - 032-0300-0320-7432 Telephone 2,233 2,700 2,700 3,500 800 032-0300-0320-7923 Capital Outlay - Vehicles - 95,500 - 95,500 - 032-0300-0320-7905 Capital Outlay - Bus Shelter - 35,000 - 35,000 - 032-0300-0320-7325 TDA Return - - - 140,000 140,000 032-0300-0320-7352 Facility & Equipment Maintenance - 2,500 2,500 2,500 - 032-0300-5990-9000 Transfer Out 20,000 12,000 12,000 12,000 - TOTAL TRANSIT FUND 490,331 656,845 526,345 820,770 163,925
EXPENDITURES
Page 191

ASSISTANT CITY MANAGER/ CITY CLERK FY 21-22 ADOPTED EXPENDITURE BUDGET
Appendix 9
Account Number Account Name FY 2019-20
Actual FY 2020-21 Final Budget
FY 2020-21 Projected
FY 2021-22 Adopted
Budget Change FUND 10 GENERAL FUNDADMINISTRATIONCITY CLERK/ASSISTANT CITY MANAGER010-0100-0115-7213 Legal Fees 34,725 15,000 15,000 15,000 - 010-0100-0115-7235 Conferences and Meetings 36 4,325 700 5,525 1,200 010-0100-0115-7245 Contractual Services 13,030 39,604 12,000 34,703 (4,901)010-0100-0115-7270 Election Expenses 1,531 13,200 8,655 4,000 (9,200)010-0100-0115-7272 Equipment Rental 535 550 550 550 - 010-0100-0115-7277 Fuel and Mileage 520 500 500 500 - 010-0100-0115-7307 Liability Insurance 1,166 2,541 2,541 2,608 66 010-0100-0115-7340 Legal Notices/Publications 4,456 3,000 11,803 3,000 - 010-0100-0115-7365 Membership Dues 1,064 1,055 1,055 1,055 - 010-0100-0115-7372 Office Supplies & Materials 1,835 5,200 3,000 2,000 (3,200)010-0100-0115-7367 Misc. Services & Supplies 3,930 - - - - 010-0100-0115-7432 Telephone 1,016 1,100 1,100 1,100 - 010-0100-0115-7426 Publications & Subscriptions 93 560 560 560 - 010-0100-5990-9000 Transfer Out - 25,000 - - (25,000)TOTAL CITY CLERK 63,937 111,635 57,464 70,601 (41,034)
EXPENDITURES
Page 192

FINANCEFY 21-22 ADOPTED EXPENDITURE BUDGET
Appendix 9
Account Number Account Name FY 2019-20
Actual FY 2020-21 Final Budget
FY 2020-21 Projected
FY 2021-22 Adopted
Budget Change FUND 10 GENERAL FUNDADMINISTRATIONFINANCE DEPARTMENT010-0100-0135-7201 Accounting & Auditing 19,283 21,592 21,592 21,592 0 010-0100-0135-7213 Legal Fees 736 1,000 1,000 1,000 - 010-0100-0135-7235 Conferences and Meetings - 3,600 3,600 3,600 - 010-0100-0135-7245 Contractual Services 19,143 19,000 19,000 19,000 - 010-0100-0135-7272 Equipment Rental 908 600 600 600 - 010-0100-0135-7277 Fuel and Mileage 72 900 900 900 - 010-0100-0135-7307 Liability Insurance 1,980 4,317 4,317 4,429 112 010-0100-0135-7323 Finance Charge - Collection - 200 200 200 - 010-0100-0135-7359 Meals - 300 300 300 - 010-0100-0135-7365 Membership Dues 775 560 560 560 - 010-0100-0135-7367 Misc. Services & Supplies 123 125 125 125 - 010-0100-0135-7372 Office Supplies & Materials 160 500 500 500 - 010-0100-0135-7395 Training 2,437 3,800 3,800 3,800 - TOTAL FINANCE DEPARTMENT 45,618 56,494 56,494 56,607 112
EXPENDITURES
Page 193

POLICEFY 21-22 ADOPTED EXPENDITURE BUDGET
Appendix 9
Account Number Account Name FY 2019-20
Actual FY 2020-21 Final Budget
FY 2020-21 Projected
FY 2021-22 Adopted
Budget Change FUND 10 GENERAL FUNDPUBLIC SAFETYPOLICE DEPARTMENT010-0400-0165-7125 State Unemployment Insurance 9,211 4,463 4,463 - (4,463)010-0400-0165-7208 Animal Control 78,191 97,658 97,658 98,200 542 010-0400-0165-7213 Legal Fees 55,379 55,000 55,000 55,000 - 010-0400-0165-7226 Printing 1,411 1,500 1,500 1,000 (500)010-0400-0165-7234 Dispatch Service 86,410 83,500 83,500 83,500 - 010-0400-0165-7245 Contractual Services 806,172 2,145,271 2,145,271 2,201,597 56,326 010-0400-0165-7247 Report Forms 178 2,250 - 1,750 (500)010-0400-0165-7249 Evidence & Investigation Expenses 19,805 23,735 15,000 18,000 (5,735)010-0400-0165-7272 Equipment Rental 13,730 10,588 10,588 10,588 - 010-0400-0165-7273 Equipment (Non-Capital, <$5,000) 289 - - - - 010-0400-0165-7277 Fuel & Mileage 33,550 33,644 33,644 35,000 1,356 010-0400-0165-7298 Flood & Fire Insurance 1,310 2,278 2,278 2,513 235 010-0400-0165-7307 Liability Insurance 21,535 45,606 45,606 47,038 1,431 010-0400-0165-7330 Janitorial Supplies 532 400 400 600 200 010-0400-0165-7355 M & R Property 484 2,310 2,310 5,000 2,690 010-0400-0165-7356 M & R Vehicles 28,016 35,000 30,000 35,000 - 010-0400-0165-7359 Meals 474 1,000 500 1,000 - 010-0400-0165-7366 Cable TV 1,795 800 800 800 - 010-0400-0165-7367 Misc. Services & Supplies 324 500 500 500 - 010-0400-0165-7372 Office Supplies & Materials 4,962 4,000 4,000 4,000 - 010-0400-0165-7384 Personnel Hiring Costs 15,964 3,000 3,000 3,000 - 010-0400-0165-7397 Postage 5 - - - 010-0400-0165-7398 Volunteer Services 882 99 99 100 1 010-0400-0165-7432 Telephone 39,092 30,000 30,000 30,000 - 010-0400-0165-7438 Booking Fees - 10,000 - 10,000 - 010-0400-0165-7458 Utilities - PG&E 15,691 15,000 15,000 15,000 - 010-0400-0165-7459 Utilities - Water & Sewer (City Property) 863 10,800 1,000 1,000 (9,800)010-0400-0165-7466 Canine Services 4,113 8,000 8,000 10,000 2,000 010-0400-0165-7371 Security Services 9,574 7,650 7,650 12,650 5,000 010-0400-0165-7905 Capital Outlay - Equipment 9,157 15,000 15,000 21,050 6,050 010-0400-0165-7380 Computer Hardware - 6,000 1,500 2,000 (4,000)TOTAL POLICE DEPARTMENT 1,259,099 2,655,053 2,614,267 2,705,885 50,833
FUND 17 LAW ENFORCEMENT GRANT017-0400-1170-7905 Capital Outlay - Mach & Equip 10,915 - - - - 017-0400-1170-7245 Contractual Services 59,604 - - - - 017-0400-1171-7245 Contractual Services - 180,000 180,000 180,000 - TOTAL LAW ENFORCEMENT GRANT FUND 70,519 180,000 180,000 180,000 -
FUND 39 PERSONNEL SERVICES DISTRICTPolice Department039-0400-0165-7201 Accounting & Auditing 646 724 724 724 0 039-0400-0165-7207 Ammunition & Weapons 5,161 10,000 - 2,500 (7,500)039-0400-0165-7245 Contractual Services 189,261 266,316 266,316 386,678 120,362 039-0400-0165-7254 Debt Services - Principal 20,605 20,605 20,605 20,605 - 039-0400-0165-7255 Debt Service - Interest 2,449 2,449 2,449 2,449 - 039-0400-0165-7273 Equipment (Non-Capital, <$5,000) 9,449 21,000 21,000 5,000 (16,000)039-0400-0165-7307 Liability Insurance 2,285 4,982 4,982 5,112 130 039-0400-0165-7352 M&R Machinery & Equipment 2,411 9,100 9,100 12,000 2,900 039-0400-0165-7381 Computer Software 4,060 7,728 7,728 7,783 55 039-0400-0165-7395 Police Officer Training 8,529 16,000 16,000 20,000 4,000 039-0400-0165-7398 Volunteer Services 1,710 2,500 2,500 2,500 -
EXPENDITURES
Page 194

POLICEFY 21-22 ADOPTED EXPENDITURE BUDGET
Appendix 9
Account Number Account Name FY 2019-20
Actual FY 2020-21 Final Budget
FY 2020-21 Projected
FY 2021-22 Adopted
Budget Change
EXPENDITURES
039-0400-0165-7409 Safety Equipment - 4,100 - 5,000 900 039-0400-0165-7426 Publications & Subscriptions 3,062 3,000 1,000 1,000 (2,000)039-0400-0165-9000 Transfer Out 104,043 - - - - 039-0400-0165-7909 Capital Outlay - Buildings & Imprvmts 20,351 40,000 40,000 20,000 (20,000)039-0400-0165-7905 Capital Outlay - Mach & Equip 60,882 101,112 74,112 76,112 (25,000)TOTAL POLICE DEPARTMENT 434,904 509,616 466,516 567,462 57,846
Page 195

FIREFY 21-22 ADOPTED EXPENDITURE BUDGET
Appendix 9
Account Number Account Name FY 2019-20
Actual FY 2020-21 Final Budget
FY 2020-21 Projected
FY 2021-22 Adopted
Budget Change FUND 10 GENERAL FUNDPUBLIC SAFETYFIRE DEPARTMENT010-0400-0140-7213 Legal Fees 30,461 4,000 4,000 2,000 (2,000)010-0400-0140-7226 Printing 493 1,000 - 1,000 - 010-0400-0140-7234 Dispatch Services 69,596 50,000 50,000 70,000 20,000 010-0400-0140-7235 Conferences & Meetings 8,402 1,500 1,500 5,000 3,500 010-0400-0140-7245 Contractual Services 9,609 40,000 40,000 40,000 - 010-0400-0140-7272 Equipment Rental 10,479 8,000 8,000 8,000 - 010-0400-0140-7273 Equipment (Non-Capital, <$5,000) 4,536 5,000 5,000 2,500 (2,500)010-0400-0140-7276 Firefighter Training 12,549 12,500 12,500 15,000 2,500 010-0400-0140-7277 Fuel & Mileage 24,181 20,000 20,000 25,000 5,000 010-0400-0140-7307 Liability Insurance 58,428 105,670 105,670 101,959 (3,710)010-0400-0140-7330 Janitorial Supplies 1,889 3,000 3,000 3,000 - 010-0400-0140-7352 M & R Machinery & Equipment 4,516 1,500 1,500 2,000 500 010-0400-0140-7355 M & R Real Property 9,155 30,000 30,000 20,000 (10,000)010-0400-0140-7356 M & R Vehicles 59,772 50,000 50,000 60,000 10,000 010-0400-0140-7358 Emergency Incident 52,601 25,000 32,615 - (25,000)010-0400-0140-7359 Meals 1,300 3,000 3,000 3,000 - 010-0400-0140-7363 Medical Svcs. & Supplies 16,163 50,000 50,000 22,000 (28,000)010-0400-0140-7365 Membership Dues 4,302 2,500 2,500 2,500 - 010-0400-0140-7366 Cable TV 3,426 4,000 4,000 4,000 - 010-0400-0140-7367 Misc. Services & Supplies 7,701 13,000 13,000 13,000 - 010-0400-0140-7372 Office Supplies & Materials 4,527 5,000 5,000 4,000 (1,000)010-0400-0140-7381 Computer Software 250 1,000 1,000 1,000 - 010-0400-0140-7384 Personnel Hiring Costs 3,308 10,500 17,843 2,500 (8,000)010-0400-0140-7385 Permits & Licenses 49 100 100 100 - 010-0400-0140-7398 Volunteer Services 43,283 30,000 30,000 45,000 15,000 010-0400-0140-7400 Public Education 1,212 1,200 1,200 1,200 - 010-0400-0140-7409 Safety Equipment 18,807 35,500 35,500 25,000 (10,500)010-0400-0140-7426 Publications & Subscriptions - 2,000 2,000 2,000 - 010-0400-0140-7432 Telephone 40,142 37,000 37,000 37,000 - 010-0400-0140-7458 Utilities - PG&E 5,552 5,500 5,500 5,500 - TOTAL FIRE DEPARTMENT 506,690 557,470 571,427 523,259 (34,210)
FUND 12 VEHICLE REPLACEMENT 012-0100-1120-7601 Debt Service-Interest 37,136 33,610 33,610 29,947 (3,663)012-0100-1120-7603 Debt Service-Principal 90,887 94,414 94,414 98,077 3,663 012-0100-1120-7923 Capital Outlay - Vehicle 104,043 - - - - 012-0100-1120-7924 Capital Outlay - Fire Truck Vehicle - 80,000 - 80,000 - TOTAL VEHICLE REPLACEMENT FUND 232,066 208,024 128,024 208,024 -
FUND 38 PERSONNEL SERVICES DISTRICTFire Department038-0400-0140-7201 Accounting & Auditing 646 724 724 724 0 038-0400-0140-7245 Contractual Services 59,399 1,581 1,581 1,943 362 038-0400-0140-7307 Liability Insurance 2,019 4,479 4,479 4,518 39 038-0400-0140-7355 M&R Property - - 3,746 75,000 75,000 038-0400-0140-7381 Computer Software 603 822 822 877 55 038-0400-5990-9000 Transfer Out 35,000 85,000 35,000 85,000 - TOTAL FIRE DEPARTMENT 97,667 92,606 46,352 168,061 75,455
EXPENDITURES
Page 196

COMMUNITY DEVELOPMENTFY 21-22 ADOPTED EXPENDITURE BUDGET
Appendix 9
Account Number Account Name FY 2019-20
Actual FY 2020-21 Final Budget
FY 2020-21 Projected
FY 2021-22 Adopted
Budget Change FUND 10 GENERAL FUNDCOMMUNITY DEVELOPMENTBUILDING DEPARTMENT010-0200-0130-7125 State Unemployment Insurance 550 - - - - 010-0200-0130-7213 Legal Fees 230 2,000 1,500 2,000 - 010-0200-0130-7220 SOFTWARE MAINTENANCE FEES - 4,500 - 4,500 - 010-0200-0130-7235 Conferences & Meetings 391 1,000 - 1,000 - 010-0200-0130-7245 Contractual Services 58,756 50,500 50,500 50,500 - 010-0200-0130-7272 Equipment Rental 703 600 600 600 - 010-0200-0130-7277 Fuel & Mileage 77 2,000 2,000 2,000 - 010-0200-0130-7307 Liability Insurance 1,533 3,343 3,343 3,430 87 010-0200-0130-7335 Laundry Service - 1,000 - 1,000 - 010-0200-0130-7365 Membership Dues - 200 - 200 - 010-0200-0130-7367 Misc Services & Supplies 1,588 17,500 2,500 17,500 - 010-0200-0130-7356 M&R Vehicles 719 3,000 1,000 3,000 - 010-0200-0130-7372 Office Supplies & Materials 195 450 450 450 - 010-0200-0130-7397 Postage 2 100 100 100 - 010-0200-0130-7426 Publications & Subscriptions - 1,200 - 1,200 - 010-0200-0130-7432 Telephone 1,244 1,110 1,110 1,110 - 010-0200-0130-7902 Capital outlay - software - 5,000 - 5,000 - TOTAL BUILDING DEPARTMENT 65,988 93,503 63,103 93,590 87
PLANNING010-0200-0170-7125 State Unemployment Insurance 888 - - - - 010-0200-0170-7213 Legal Fees 40,224 15,000 15,660 15,000 - 010-0200-0170-7220 SOFTWARE MAINTENANCE FEES - 4,500 - 4,500 - 010-0200-0170-7245 Contractual Services 180,504 105,000 105,000 95,000 (10,000)010-0200-0170-7272 Equipment Rental 881 600 600 600 - 010-0200-0170-7277 Fuel & Mileage 79 800 100 800 - 010-0200-0170-7307 Liability Insurance 1,985 4,280 4,280 4,403 123 010-0200-0170-7340 Legal Notices/Publications 9,451 6,500 6,500 6,500 - 010-0200-0170-7359 Meals 126 200 - 200 - 010-0200-0170-7367 Misc Services & Supplies 517 5,100 700 5,100 - 010-0200-0170-7372 Office Supplies & Materials 1,442 10,750 3,500 10,750 - 010-0200-0170-7395 Training 638 1,800 - 1,800 - 010-0200-0170-7397 Postage - 200 - 200 - 010-0200-0170-7426 Publications & Subscriptions - 100 - 100 - 010-0200-0170-7432 Telephone - 200 - 200 - 010-0200-0170-7902 Capital outlay - software - 5,000 - 5,000 - TOTAL PLANNING 236,736 160,030 136,340 150,153 (9,877)
CODE ENFORCEMENT010-0200-0240-7212 Code enforcement emergencies - 5,000 - 5,000 - 010-0200-0240-7213 Legal Fees 2,760 15,000 15,000 15,000 - 010-0200-0240-7245 Contractual Services 2,329 2,329 3,214 3,215 886 010-0200-0240-7272 Equipment Rental 228 150 150 150 - 010-0200-0240-7397 Postage - 500 - 500 - 010-0200-0240-7307 Liability Insurance 497 1,084 1,084 1,112 28 TOTAL CODE ENFORCEMENT 5,814 24,063 19,448 24,977 913
ECONOMIC DEVELOPMENT010-0200-0765-7272 Equipment Rental 134 100 100 100 - 010-0200-0765-7307 Liability Insurance 291 635 635 652 17 TOTAL ECONOMIC DEVELOPMENT 425 735 735 752 17
EXPENDITURES
Page 197

COMMUNITY DEVELOPMENTFY 21-22 ADOPTED EXPENDITURE BUDGET
Appendix 9
Account Number Account Name FY 2019-20
Actual FY 2020-21 Final Budget
FY 2020-21 Projected
FY 2021-22 Adopted
Budget Change
EXPENDITURES
FUND 22 GENERAL PLAN REVISION FUND022-0200-0220-7245 Contractual Services - 20,000 - 5,264 (14,737)TOTAL GENERAL PLAN REVISION FUND - 20,000 - 5,264 (14,737)
FUND 31 DEVELOPERS REVOLVING FUND031-0200-0310-7213 Legal Fees - Riverwalk - 1,000 - 1,000 - 031-0200-0310-7245 Contractual Services 4,327 50,000 21,000 30,000 (20,000)TOTAL DEVELOPERS REVOLVING FUND 4,327 51,000 21,000 31,000 (20,000)
FUND 75 BUSINESS PARK075-0200-0750-7201 Accounting & Auditing 210 235 235 235 0 075-0200-0750-7213 Legal Fees 1,012 5,000 1,000 5,000 - 075-0200-0750-7245 Contractual Services 622 10,515 5,000 5,632 (4,882)075-0200-0750-7252 Property Tax - 3,638 - - (3,638)075-0200-0750-7272 Equipment Rental 273 500 300 500 - 075-0200-0750-7298 Flood & Fire Insurance 1,718 (0) (0) 3,296 3,297 075-0200-0750-7307 Liability Insurance 595 1,297 1,297 1,331 34 075-0200-0750-7367 Misc. Services & Supplies 2,561 3,000 1,000 5,000 2,000 075-0200-0750-7381 Computer Software 197 267 267 285 18 075-0200-0750-7458 Utilities - PG&E - 1,000 - 1,000 - 075-0700-4108-7990 CIP - Business Park Improvement - 14,177 24,602 - (14,177)
075-0700-4137-7990Business Park Improvement - Study/Preliminary - 25,000 - 15,000 (10,000)
075-0200-5990-9000 Transfer Out 35,000 1,846,701 1,868,065 15,000 (1,831,701)TOTAL BUSINESS PARK FUND 42,187 1,911,330 1,901,766 52,280 (1,859,050)
FUND 76 ARMY BASE076-0200-0760-7201 Accounting & Auditing 56 62 62 62 0 076-0200-0760-7245 Contractual Services 165 137 137 168 31 076-0200-0760-7272 Equipment Rental 73 500 500 500 - 076-0200-0760-7307 Liability Insurance 158 344 344 353 9 076-0200-0760-7322 Interest Expense - Interfund Loan 2,938 - - - - 076-0200-0760-7367 Misc. Services & Supplies - 100 100 100 - 076-0200-0760-7381 Computer Software 11 71 71 76 5 076-0200-0760-7397 Postage - 50 50 50 - 076-0200-5990-9000 Transfer Out - - - 7,175 7,175 TOTAL ARMY BASE REUSE FUND 3,401 1,264 1,264 8,485 7,220
Page 198

PUBLIC WORKSFY 21-22 ADOPTED EXPENDITURE BUDGET
Appendix 9
Account Number Account Name FY 2019-20
Actual FY 2020-21 Final Budget
FY 2020-21 Projected
FY 2021-22 Adopted
Budget Change FUND 10 GENERAL FUNDPUBLIC WORKSCITY HALL BLDG/GROUNDS010-0300-0125-7228 Chemicals & Gases - 200 - 200 - 010-0300-0125-7245 Contractual Services 12,744 10,000 10,000 10,000 - 010-0300-0125-7298 Flood & Fire Insurance 2,664 4,634 4,634 5,111 477 010-0300-0125-7307 Liability Insurance 754 1,641 1,641 1,684 43 010-0300-0125-7323 Finance Charge - Collection 2 10 5 10 - 010-0300-0125-7330 Janitorial Supplies - 300 150 300 - 010-0300-0125-7352 M & R Machinery & Equipment 1,088 2,500 1,000 2,500 - 010-0300-0125-7355 M & R Real Property 4,027 5,000 5,000 5,000 - 010-0300-0125-7356 M & R Real Vehicles 3,393 3,500 4,556 3,500 - 010-0300-0125-7367 Misc. Services & Supplies 4,177 4,500 4,000 4,500 - 010-0300-0125-7385 Permits & Licenses 45 400 50 400 - 010-0300-0125-7458 Utilities - PG&E 11,584 12,000 15,242 12,000 - 010-0300-0125-7459 Utilities - Water & Sewer (City Property) - - 1,807 4,336 4,336 TOTAL CITY HAL/BLDG/GROUNDS 40,478 44,685 48,085 49,542 4,857
SWIMMING POOL010-0300-0155-7228 Chemicals & Gases 17,808 21,000 18,000 21,000 - 010-0300-0155-7298 Flood & Fire Insurance 61 106 106 117 11 010-0300-0155-7307 Liability Insurance 649 1,412 1,412 1,450 38 010-0300-0155-7330 Janitorial Supplies 911 1,200 1,773 1,200 - 010-0300-0155-7337 Laboratory Testing 2,117 2,000 2,000 2,000 - 010-0300-0155-7352 M & R Machinery & Equipment 7,829 14,000 1,500 14,000 - 010-0300-0155-7355 M & R Real Property 24,296 35,000 5,000 35,000 - 010-0300-0155-7356 M & R Real Vehicles 1,794 1,500 1,500 1,500 - 010-0300-0155-7367 Misc. Services & Supplies 2,374 3,000 3,000 3,000 - 010-0300-0155-7385 Permits & Licenses - 500 - 500 - 010-0300-0155-7409 Safety Equipment - 1,500 1,808 1,500 - 010-0300-0155-7432 Telephone 621 600 600 600 - 010-0300-0155-7458 Utilities - PG&E 21,931 16,000 25,000 25,000 9,000 TOTAL SWIMMING POOL 80,393 97,818 61,700 106,867 9,049
YOUTH CENTER010-0300-0160-7228 Chemicals & Gases - 100 - 100 - 010-0300-0160-7245 Contractual Services 6,000 4,800 7,075 4,800 - 010-0300-0160-7298 Flood & Fire Insurance 1,027 1,786 1,786 1,970 184 010-0300-0160-7307 Liability Insurance 167 363 363 373 10 010-0300-0160-7330 Janitorial Supplies 1,500 1,500 - 1,500 - 010-0300-0160-7352 M&R Machinery & Equipment - 500 - 500 - 010-0300-0160-7355 M & R Real Property 24 7,000 50 6,000 (1,000)010-0300-0160-7367 Misc. Service & Supplies 36 1,000 50 1,000 - 010-0300-0160-7458 Utilities - PG&E 4,903 3,807 3,807 3,807 - 010-0300-0160-7459 Utilities - Water & Sewer (City Property) 444 432 432 432 - TOTAL YOUTH CENTER 14,101 21,287 13,562 20,481 (806)
CORPORATION YARD010-0300-0180-7228 Chemicals & Gases 1,390 2,000 1,000 2,000 - 010-0300-0180-7245 Contractual Services 800 5,322 21,600 800 (4,522)010-0300-0180-7272 Equipment Rental 3,702 3,000 3,000 3,000 - 010-0300-0180-7273 Equipment (Non-Capital, <$5,000) 2,252 2,000 2,135 2,000 - 010-0300-0180-7277 Fuel & Mileage 6 417 931 - (417)010-0300-0180-7298 Flood & Fire Insurance 546 950 950 1,048 98 010-0300-0180-7307 Liability Insurance 920 1,996 1,996 2,050 54
EXPENDITURES
Page 199

PUBLIC WORKSFY 21-22 ADOPTED EXPENDITURE BUDGET
Appendix 9
Account Number Account Name FY 2019-20
Actual FY 2020-21 Final Budget
FY 2020-21 Projected
FY 2021-22 Adopted
Budget Change
EXPENDITURES
010-0300-0180-7330 Janitorial Supplies 2,028 2,000 2,000 2,000 - 010-0300-0180-7335 Laundry Service 5,504 9,000 9,347 9,000 - 010-0300-0180-7352 M & R Machinery & Equipment 1,911 3,000 500 3,000 - 010-0300-0180-7355 M&R Real Property 3,575 5,000 5,000 5,000 - 010-0300-0180-7356 M&R Vehicles 1,114 1,000 1,000 1,000 - 010-0300-0180-7367 Misc. Services & Supplies 5,316 5,000 7,047 5,000 - 010-0300-0180-7385 Permits & Licenses 2,070 2,000 2,000 2,000 - 010-0300-0180-7409 Safety Equipment 3,425 3,000 3,000 3,000 - 010-0300-0180-7432 Telephone 9,763 10,000 10,000 10,000 - 010-0300-0180-7458 Utilities - PG&E 4,694 5,000 5,000 5,000 - 010-0300-0180-7905 Capital Outlay - Mach & Equip - 58,077 58,077 - (58,077)TOTAL CORPORATION YARD 49,015 118,762 134,582 55,898 (62,864)
SENIOR CENTER010-0300-0181-7245 Contractual Services 7,800 6,500 8,545 6,500 - 010-0300-0181-7298 Flood & Fire Insurance 754 1,312 1,312 1,447 135 010-0300-0181-7307 Liability Insurance 242 527 527 541 14 010-0300-0181-7330 Janitorial Supplies 1,495 800 800 800 - 010-0300-0181-7355 M & R Real Property 453 6,500 500 1,500 (5,000)010-0300-0181-7367 Misc Services & Supplies 63 1,000 1,000 1,000 - 010-0300-0181-7458 Utilities - PG&E 4,979 6,000 6,000 6,000 - 010-0300-0181-7459 Utilities - Water & Sewer (City Property) 2,619 2,000 2,000 2,000 - TOTAL SENIOR CENTER 18,405 24,639 20,684 19,788 (4,851)
PARKS010-0300-0185-7213 Legal Fees 874 - - - - 010-0300-0185-7228 Chemicals & Gases 1,819 2,000 2,000 2,000 - 010-0300-0185-7245 Contractual Services 18,066 100,000 100,000 5,000 (95,000)010-0300-0185-7272 Equipment Rental 2,205 2,500 2,500 2,500 - 010-0300-0185-7273 Equipment (Non-Capital, <$5,000) 3,912 4,000 4,000 4,000 - 010-0300-0185-7277 Fuel & Mileage 3,724 4,000 4,000 4,000 - 010-0300-0185-7298 Flood & Fire Insurance 149 258 258 285 27 010-0300-0185-7307 Liability Insurance 1,460 3,159 3,159 3,247 88 010-0300-0185-7330 Janitorial Supplies 8,721 10,000 10,000 10,000 - 010-0300-0185-7352 M & R Machinery & Equipment 2,123 2,000 2,000 2,000 - 010-0300-0185-7355 M & R Real Property 23,287 30,000 30,000 30,000 - 010-0300-0185-7356 M & R Vehicles 505 2,500 2,500 2,500 - 010-0300-0185-7367 Misc. Services & Supplies 6,909 5,000 5,000 5,000 - 010-0300-0185-7373 Boat Launch Expenses 7,621 15,000 15,000 8,000 (7,000)010-0300-0185-7385 Permits & Licenses - 500 500 500 - 010-0300-0185-7409 Safety Equipment 1,272 1,500 1,500 1,500 - 010-0300-0185-7415 Signs 719 1,500 1,500 1,500 - 010-0300-0185-7458 Utilities - PG&E 6,313 7,500 7,500 7,500 - 010-0300-0185-7459 Utilities - Water & Sewer (City Property) 3,573 3,745 3,745 3,745 - TOTAL PARKS 93,252 195,162 195,162 93,277 (101,885)
STREETS010-0300-0190-7228 Chemicals & Gases 495 3,000 3,000 3,000 - 010-0300-0190-7245 Contractual Services 43,768 25,000 25,000 25,000 - 010-0300-0190-7272 Equipment Rental 1,817 2,500 2,500 2,500 - 010-0300-0190-7277 Fuel & Mileage 2,192 3,000 3,000 3,000 - 010-0300-0190-7307 Liability Insurance 1,006 2,179 2,179 2,240 60 010-0300-0190-7352 M & R Machinery & Equipment 748 2,000 2,000 2,000 - 010-0300-0190-7355 M & R Real Property 23,002 12,000 12,000 15,000 3,000 010-0300-0190-7356 M & R Vehicles 1,653 3,000 3,000 3,000 -
Page 200

PUBLIC WORKSFY 21-22 ADOPTED EXPENDITURE BUDGET
Appendix 9
Account Number Account Name FY 2019-20
Actual FY 2020-21 Final Budget
FY 2020-21 Projected
FY 2021-22 Adopted
Budget Change
EXPENDITURES
010-0300-0190-7367 Misc. Services & Supplies 1,641 1,500 1,500 1,500 - 010-0300-0190-7409 Safety Equipment 187 400 400 400 - 010-0300-0190-7415 Signs 3,475 3,500 3,500 3,500 - TOTAL STREETS 79,984 58,079 58,079 61,140 3,060
PUBLIC WORKS ADMINISTRATION010-0300-0300-7235 Conferences and Meetings 864 400 400 400 - 010-0300-0300-7272 Equipment Rental 3,739 2,500 2,500 2,500 - 010-0300-0300-7277 Fuel & Mileage 475 500 500 500 - 010-0300-0300-7307 Liability Insurance 739 1,599 1,599 1,644 44 010-0300-0300-7367 Misc. Services & Supplies 455 300 300 300 - 010-0300-0300-7372 Office Supplies & Materials - 300 300 300 - TOTAL PUBLIC WORKS ADMINISTRATION 6,273 5,599 5,599 5,644 44
LIBRARY010-0300-1550-7307 Liability Insurance 112 243 243 249 6 010-0300-1550-7298 Flood & Fire Insurance 1,175 2,044 2,044 2,254 210 010-0300-1550-7355 M & R Real Property 7,131 52,000 52,000 10,000 (42,000)010-0300-1550-7459 Utilities - Water & Sewer (City Property) 824 2,000 2,000 2,000 - 010-0300-1550-7367 Misc. Services & Supplies 1,048 1,500 1,500 1,500 - TOTAL LIBRARY 10,290 57,787 57,787 16,004 (41,783)
RECREATION AND COMMUNITY SERVICESRECREATION ADMINISTRATION010-0500-0150-7245 Contractual Services 3,929 15,000 15,000 5,000 (10,000)010-0500-0150-7245 Contractual Services - Community Funding 6,750 13,250 13,250 10,000 (3,250)010-0500-0150-7272 Equipment Rental 184 100 100 100 - 010-0500-0150-7372 Office Supplies & Materials - 500 - 500 - 010-0500-0150-7406 Recreation Programs - 250 - 250 - TOTAL RECREATION ADMINISTRATION 10,863 29,100 28,350 15,850 (13,250)
RECREATION - EDUCATION010-0500-0151-7245 Contractual Services 6,880 15,000 5,000 15,000 - TOTAL RECREATION EDUCATION 6,880 15,000 5,000 15,000 -
FUND 19 ATOD GRANT ATOD PAYROLL019-0500-1200-7245 Contractual Services 16,080 31,800 31,800 30,000 (1,800)019-0500-1200-7307 Liability Insurance 421 918 918 941 24 TOTAL ATOD PAYROLL 16,501 32,718 32,718 30,941 (1,776)
ATOD GRANT ADMIN COSTS019-0500-1210-7277 Fuel & Mileage 619 152 152 400 248 019-0500-1210-7235 Conferences & Meetings 700 - - - - 019-0500-1210-7359 Meals 418 300 300 600 300 019-0500-1210-7372 Office Supplies & Materials 404 500 500 500 - TOTAL ATOD GRANT ADMIN COSTS 2,141 952 952 1,500 548
OTHER PROGRAMMING019-0500-1211-7404 Program Expenses 10,697 - - - - 019-0500-1211-7213 Legal Fees 1,219 6,250 6,250 6,000 (250)019-0500-1211-7235 Conferences & Meetings 3,965 6,500 6,500 2,000 (4,500)019-0500-1211-7272 Equipment Rental 216 76 76 76 - TOTAL OTHER PROGRAMMING COSTS 16,097 12,826 12,826 8,076 (4,750)
Page 201

PUBLIC WORKSFY 21-22 ADOPTED EXPENDITURE BUDGET
Appendix 9
Account Number Account Name FY 2019-20
Actual FY 2020-21 Final Budget
FY 2020-21 Projected
FY 2021-22 Adopted
Budget Change
EXPENDITURES
Parent Program & Compliance Checks019-0500-1212-7245 Media Campaign 7,797 22,271 22,271 - (22,271)019-0500-1205-7404 Parant Project - Program Expenses 363 4,140 4,140 2,505 (1,635)019-0500-1212-7404 Compliance Checks - Program Expenses - 1,276 1,276 1,390 114 Total Compliance Checks 8,160 27,687 27,687 3,895 (23,792)TOTAL ATOD GRANT FUND 42,900 74,183 74,183 44,412 (29,770)
FUND 25 GAS TAX 025-0300-0250-7210 Asphalt - 8,600 8,600 8,600 - 025-0300-0250-7245 Contractual Services 17,893 56,945 56,945 32,500 (24,445)025-0300-0250-7256 Loan Repayment - PG&E Retrofit Loan 2,423 2,423 2,423 2,423 - 025-0300-0250-7272 Equipment Rental 984 600 600 600 - 025-0300-0250-7307 Liability Insurance 2,141 4,650 4,650 4,775 125 025-0300-0250-7352 M & R Machinery & Equipment 8,700 10,000 10,000 10,000 - 025-0300-0250-7355 M&R Property 30,749 40,000 40,000 40,000 - 025-0300-0250-7367 Misc. Services & Supplies 2,948 4,000 4,000 4,000 - 025-0300-0250-7458 Utilities - PG&E 67,462 70,000 70,000 70,000 - 025-0300-0250-7923 Capital Outlay - Vehicles 14,122 - - - - 025-0300-0250-7909 Capital Outlay - Buildings & Imprvmts 946 75,000 75,000 - (75,000)
025-0700-4133-7245McCormick Road - RMRA (SB1) County Project - 177,839 - 515,155 337,316
025-0300-5990-9000 Transfer Out 40,085 139,319 65,000 100,000 (39,319)TOTAL GAS TAX FUND 188,453 589,376 337,218 788,053 198,678
FUND 50 STORM DRAIN050-0300-0500-7213 Legal Fees 92 79 79 79 - 050-0300-0500-7226 PRINTING - 500 500 500 - 050-0300-0500-7245 Contractual Services - 10,000 - 10,100 100 050-0300-0500-7245 Contractual Services - CIP PROJECT 84,356 - - - - 050-0300-0500-7272 Equipment Rental 422 300 300 500 200 050-0300-0500-7307 Liability Insurance 920 2,007 2,007 2,059 52 050-0300-0500-7323 Finance Charge - Collection 1 - - - - 050-0300-0500-7352 M&R Machinery & Equipment 456 2,000 2,000 2,000 - 050-0300-0500-7355 M & R Real Property 514 5,000 5,000 5,000 - 050-0300-0500-7367 Misc. Services & Supplies - 1,000 1,000 1,000 - 050-0300-0500-7385 Permits & Licenses 10,295 9,800 9,800 10,300 500 TOTAL STORM DRAIN FUND 97,056 30,686 20,686 31,538 852
FUND 51 CAPITAL GRANTS AND PROJECT FUNDIMPROVEMENTS051-0600-1609-7909 Promenade Park - Shade Structures - 177,952 177,952 - (177,952)051-0600-1611-7909 Boat Launch Project 64,404 1,690,000 1,440,059 - (1,690,000)051-0700-4120-7990 Laserfiche - EDMS - 25,000 - - (25,000)051-0700-4109-7990 ABM Citywdie Energy Efficiency Program 492,236 442,722 442,722 - (442,722)051-0700-4121-7990 Bruning Park Restroom Replacement 182,343 - - - - 051-0700-4122-7990 Bike & Ped Pathway Montezuma Hills Rd 29,671 100,000 128,372 - (100,000)051-0700-4123-7990 ADA Sidewalk Repair and Replacement 32,585 139,319 65,000 140,000 681
051-0700-4124-7990City Hall ADA Remodel - Council Chambers/CD Office 28,061 20,000 20,000 - (20,000)
051-0700-4132-7990 New Accounting System Software - 250,000 - 350,000 100,000 051-0700-4130-7990 HSIP Pedestrian Crossing 9,482 245,000 42,000 249,100 4,100
051-0700-4134-7990Public Works Office & Corp Yard Improvement 330,211 465,000 277,736 30,000 (435,000)
051-0700-4135-7990LGI - Dog and Neighborhood Park Improvement - 650,991 650,991 - (650,991)
Page 202

PUBLIC WORKSFY 21-22 ADOPTED EXPENDITURE BUDGET
Appendix 9
Account Number Account Name FY 2019-20
Actual FY 2020-21 Final Budget
FY 2020-21 Projected
FY 2021-22 Adopted
Budget Change
EXPENDITURES
051-0700-4136-7990 LGI - 18 Acre New Park Phase I - 157,767 12,869 144,899 (12,869)051-0700-4131-7990 Police & Fire Public Safety Facility 9,700 - - - - TOTAL IMPROVEMENTS 1,178,693 4,363,751 3,257,701 913,999 (3,449,753)
FUND 53 ROADWAY IMPACT053-0300-0530-7213 Legal Fees 299 - - - - 053-0300-0530-7245 Contractual Services - - 1,122 400,000 400,000 TOTAL ROADWAY IMPACT FUND 299 - 1,122 400,000 400,000
FUND 54 PARKS & RECREATION054-0300-0540-7245 Contractual Services 7,823 20,000 20,000 16,400 (3,600)054-0300-0540-7990 CIP - PRELIM DESIGN/STUDIES - 50,000 - - (50,000)054-0300-5990-9000 Transfer Out 268,918 847,687 692,232 144,899 (702,789)TOTAL PARKS & RECREATION FUND 276,740 917,687 712,232 161,299 (756,389)
FUND 55 MAIN & OPERATION SVC DISTRICT - LIBERTY055-0300-0550-7245 Contractual Services 6,744 343,880 343,880 347,319 3,439 055-0300-0550-7203 Administrative Expense - 5,000 5,000 5,500 500 TOTAL MAIN & OPERATION SVC DISTRICT - LIBERTY 6,744 348,880 348,880 352,819 3,939
FUND 56 MUNICIPAL IMPROVEMENT056-0300-5990-9000 Transfer Out 68,917 124,238 124,238 120,550 (3,688)
056-0300-5990-9000Transfer Out - City Hall ADA Remodel - Council Chambers/CD Office 28,061 20,000 20,000 - (20,000)
056-0300-5990-9000 Transfer Out - Boat Launch Project - 240,841 29,829 - (240,841)
056-0300-5990-9000Transfer Out - Police & Fire Public Safety Facility 9,700 - - - -
TOTAL MUNICIPAL IMPROVEMENTS FUND 106,678 385,079 174,067 120,550 (264,529)
FUND 60 HAZARDOUS WASTE060-0300-0600-7205 Advertising 814 2,000 2,000 2,000 - 060-0300-0600-7213 Legal Fees - 1,000 1,000 1,000 - 060-0300-0600-7226 Printing 50 2,000 2,000 2,000 - 060-0300-0600-7235 Conferences & Meetings 1,194 5,000 5,000 5,000 - 060-0300-0600-7245 Contractual Services 40,374 63,000 63,000 63,630 630 060-0300-0600-7272 Equipment Rental 264 170 170 300 130 060-0300-0600-7307 Liability Insurance 575 1,253 1,253 1,286 33 060-0300-0600-7359 Meals - 60 60 60 - 060-0300-0600-7385 Permits & Licenses 75 100 100 100 - 060-0300-0600-7367 Misc. Services & Supplies 3,237 15,000 15,000 15,000 - 060-0300-0600-7404 Grant Program Expenses - 5,000 5,000 5,000 - TOTAL HAZARDOUS WASTE FUND 46,582 94,583 94,583 95,376 793
FUND 65 LANDFILL CLOSURE065-0300-0650-7245 Contractual Services 10,488 28,000 28,000 28,000 - 065-0300-0650-7272 Equipment Rental 200 200 200 200 - 065-0300-0650-7252 Property Tax 218 272 272 272 - 065-0300-0650-7213 Legal Fees - 300 300 300 - 065-0300-0650-7307 Liability Insurance 437 953 953 978 25 065-0300-5990-9000 Transfer Out - 280,000 280,000 280,000 - 065-0300-0650-7385 Permits and Licenses 26,837 28,553 28,553 28,553 - TOTAL LANDFILL CLOSURE FUND 38,181 338,278 338,278 338,303 25
FUND 80 WATER SYSTEM080-0300-0800-7125 State Unemployment Insurance 6,443 3,300 3,300 3,300 -
Page 203

PUBLIC WORKSFY 21-22 ADOPTED EXPENDITURE BUDGET
Appendix 9
Account Number Account Name FY 2019-20
Actual FY 2020-21 Final Budget
FY 2020-21 Projected
FY 2021-22 Adopted
Budget Change
EXPENDITURES
080-0300-0800-7201 Accounting & Auditing 5,582 6,249 6,249 6,249 (0)080-0300-0800-7213 Legal Fees 7,611 1,500 1,500 5,000 3,500 080-0300-0800-7226 Printing 1,560 4,000 4,000 4,000 - 080-0300-0800-7228 Chemicals & Gases 78,521 90,000 90,000 90,000 - 080-0300-0800-7235 Conferences & Meetings 5,785 20,000 20,000 20,000 - 080-0300-0800-7245 Contractual Services 98,249 115,000 115,000 115,000 - 080-0300-0800-7255 Debt Service - Interest 81,857 76,785 76,785 69,943 (6,841)080-0300-0800-7254 Debt Service - Principal - 3,229 3,229 3,956 727 080-0300-0800-7272 Equipment Rental 12,748 19,614 19,614 19,614 - 080-0300-0800-7273 Equipment (Non-Capital,<$5,000) 1,907 2,500 2,500 2,500 - 080-0300-0800-7277 Fuel & Mileage 15,090 15,000 15,000 15,000 - 080-0300-0800-7298 Flood & Fire Insurance 14,155 24,620 24,620 27,154 2,534 080-0300-0800-7307 Liability Insurance 28,181 61,272 61,272 62,672 1,400 080-0300-0800-7323 Finance Charge 103 500 500 500 - 080-0300-0800-7337 Laboratory Testing 34,335 35,000 35,000 35,000 - 080-0300-0800-7340 Legal Notices & Publications 120 5,000 5,000 5,000 - 080-0300-0800-7352 M & R Machinery & Equipment 16,060 20,000 20,000 20,000 - 080-0300-0800-7355 M & R Real Property 51,833 50,000 50,000 50,000 - 080-0300-0800-7356 M & R Vehicles 3,555 4,000 4,000 4,000 - 080-0300-0800-7365 Membership Dues 3,470 6,500 6,500 6,500 - 080-0300-0800-7367 Misc. Services & Supplies 22,565 30,000 30,000 30,000 - 080-0300-0800-7380 Computer Hardware 10,456 16,000 16,000 16,000 - 080-0300-0800-7372 Office Supplies & Materials 11,000 11,000 11,000 11,000 - 080-0300-0800-7381 Computer Software 33,056 22,101 22,101 22,576 475 080-0300-0800-7385 Permits & Licenses 38,752 40,000 40,000 40,000 - 080-0300-0800-7397 Postage 2,804 3,500 3,500 3,500 - 080-0300-0800-7409 Safety Equipment 2,756 3,000 3,000 3,000 - 080-0300-0800-7432 Telephone 13,104 12,000 12,000 12,000 - 080-0300-0800-7458 Utilities - PG&E 233,169 230,000 230,000 230,000 - 080-0300-0800-7603 Bond Principal - 240,000 240,000 240,000 - 080-0300-0800-7281 Land Lease - Well#10 - 6,000 6,000 6,000 - 080-0300-0800-7358 Emergency Repairs 158,287 100,000 100,000 130,000 30,000 080-0300-0800-7900 Miscellaneous Expense - 2,000 2,000 2,000 - 080-0700-0800-7990 Capital Construction - 200,000 - 200,000 - 080-0300-0800-7905 Capital Outlay - Mach & Equip - 130,578 130,578 8,000 (122,578)080-0300-0800-7920 Capital Outlay - Infrastructure - - 400,000 - - 080-0300-0800-7923 Capital Outlay - Vehicles - 40,000 40,000 27,500 (12,500)080-0300-5990-9000 Transfer Out - To Fund 081 CIP 1,408,260 3,111,111 869,847 2,000,000 (1,111,111)080-0300-5990-9000 Transfer Out - To Fund 051 - PW019 215,000 155,000 - 15,000 (140,000)080-0300-5990-9000 Transfer Out - To Fund 051 - CC004 - 250,000 - 350,000 100,000 080-0300-5990-9000 Transfer Out - To Fund 012 25,000 25,000 25,000 25,000 - TOTAL WATER SYSTEM FUND 2,641,374 5,191,359 2,745,095 3,936,966 (1,254,393)
FUND 81 WATER CONSTRUCTION081-0700-4110-7993 CIP - 2019 Water & Sewer CIP Project - 610,000 460,785 - (610,000)081-0700-4138-7993 CIP - 2020 Water & Sewer CIP Project - 1,300,000 100,000 1,200,000 (100,000)081-0700-4144-7993 CIP - Waterline Replacement Project - - - 600,000 600,000
081-0700-4104-7990CIP - Piezometer System - WTR Well Monitoring - 211,111 - - (211,111)
081-0700-2037-7990 CIP - Water Meter Project - 740,000 259,062 - (740,000)
081-0700-4139-7990CIP - Well#16 Scada Integration and Upgrades - 250,000 50,000 200,000 (50,000)
081-0300-5990-9000 Transfer Out - To Fund 080 1,277,757 - - - - TOTAL WATER CONSTRUCTION FUND 1,277,757 3,111,111 869,847 2,000,000 (1,111,111)
Page 204

PUBLIC WORKSFY 21-22 ADOPTED EXPENDITURE BUDGET
Appendix 9
Account Number Account Name FY 2019-20
Actual FY 2020-21 Final Budget
FY 2020-21 Projected
FY 2021-22 Adopted
Budget Change
EXPENDITURES
FUND 84 AIRPORT084-0300-0840-7201 Accounting & Auditing 2,364 2,647 2,410 2,647 (0)084-0300-0840-7213 Legal Fees 26,525 20,000 18,828 20,000 - 084-0300-0840-7226 Printing 135 5,000 300 5,000 - 084-0300-0840-7228 Chemicals & Gases 7,696 7,000 7,000 7,000 - 084-0300-0840-7235 Conferences and meetings 200 1,500 200 1,500 - 084-0300-0840-7245 Contractual Services 45,220 38,136 40,000 39,460 1,323 084-0300-0840-7254 Debt Service - Principal - 11,268 10,444 13,806 2,538 084-0300-0840-7255 Debt Service - Interest 7,626 8,044 8,425 4,522 (3,522)084-0300-0840-7252 Property Tax 2,476 2,500 2,500 2,500 - 084-0300-0840-7272 Equipment Rental 2,399 1,500 2,113 1,500 - 084-0300-0840-7273 Equipment, (non-capital <$5,000) 1,242 2,000 2,000 2,000 - 084-0300-0840-7277 Fuel & Mileage 453 1,775 1,775 1,775 - 084-0300-0840-7298 Flood & Fire Insurance 5,798 10,085 10,085 11,123 1,038 084-0300-0840-7307 Liability Insurance 7,433 9,134 7,568 9,195 61 084-0300-0840-7330 Janitorial Supplies 2,495 2,000 2,495 2,000 - 084-0300-0840-7340 Legal Notices/Publications - 500 - 500 - 084-0300-0840-7352 M & R Machinery & Equipment 8,714 20,000 15,000 20,000 - 084-0300-0840-7355 M & R Real Property 5,082 5,000 5,000 15,000 10,000 084-0300-0840-7356 M & R Vehicles 2,177 3,000 3,000 3,000 - 084-0300-0840-7367 Misc. Services & Supplies 3,116 3,000 3,000 3,000 - 084-0300-0840-7372 Office Supplies & Materials 152 - - - 084-0300-0840-7381 Computer Software 2,206 3,008 2,174 3,209 201 084-0300-0840-7385 Permits & Licenses 4,966 4,800 4,800 4,800 - 084-0300-0840-7397 Postage - 233 233 233 - 084-0300-0840-7415 Signs 1,864 2,500 2,500 2,500 - 084-0300-0840-7432 Telephone 738 1,500 1,500 1,500 - 084-0300-0840-7458 Utilities - PG&E 24,979 25,000 25,000 25,000 - 084-0300-0840-7459 Utilities - Water & Sewer (City Property) 3,646 5,100 3,739 5,100 - 084-0300-0840-7905 Capital Outlay - Mach & Equip - 66,000 51,000 40,000 (26,000)084-0300-7918-7990 Airport Improvement - Grant #18 755 - - - - 084-0300-7919-7990 Airport Improvement - Grant #19 31,604 97,500 68,250 - (97,500)084-0300-7920-7990 Airport Improvement - Grant #20 - 834,963 - 834,963 - 084-0300-5990-9000 Transfer Out - To GF - Interfund Loan - - - 19,079 TOTAL MUNICIPAL AIRPORT 252,724 1,249,129 350,154 1,158,198 (90,931)
FUND 85 BEACH DRIVE SEWER SYSTEM AND PLANTBEACH WWTP COLLECTION SYSTEM AND LIFT STATIONS085-0300-0850-7125 State Unemployment Insurance 3,866 1,650 1,650 1,650 - 085-0300-0850-7213 Legal Fees 276 4,000 4,000 4,000 - 085-0300-0850-7245 Contractual Services 66,851 15,000 15,000 15,000 - 085-0300-0850-7248 Veolia- Contractual services 55,342 116,972 116,972 119,557 2,585 085-0300-0850-7272 Equipment Rental 3,699 7,907 7,907 7,907 - 085-0300-0850-7273 Equipment (Non-Capital,<$5,000) 1,638 1,500 1,500 1,500 - 085-0300-0850-7277 Fuel & Mileage 6,977 7,000 7,000 7,000 - 085-0300-0850-7298 Flood & Fire Insurance 66 114 114 126 12 085-0300-0850-7307 Liability Insurance 4,974 10,681 10,681 10,970 289 085-0300-0850-7323 Finance Charge - Collection fee 120 100 100 100 - 085-0300-0850-7352 M & R Machinery & Equipment 16,572 30,000 30,000 30,000 - 085-0300-0850-7355 M&R Real Property 15,131 25,000 25,000 25,000 - 085-0300-0850-7356 M&R Vehicles 855 2,500 2,500 2,500 - 085-0300-0850-7365 Membership Dues - 700 700 700 - 085-0300-0850-7367 Misc. Services & Supplies 2,175 1,500 1,500 1,500 - 085-0300-0850-7372 Office Supplies & Materials 1,381 1,500 1,500 1,500 - 085-0300-0850-7385 Permits & Licenses 6,793 4,200 4,200 4,200 -
Page 205

PUBLIC WORKSFY 21-22 ADOPTED EXPENDITURE BUDGET
Appendix 9
Account Number Account Name FY 2019-20
Actual FY 2020-21 Final Budget
FY 2020-21 Projected
FY 2021-22 Adopted
Budget Change
EXPENDITURES
085-0300-0850-7397 Postage 27 100 100 100 - 085-0300-0850-7432 Telephone 3,089 4,521 4,521 4,521 - 085-0300-0850-7458 Utilities - PG&E 20,462 25,000 25,000 25,000 - 085-0300-0850-7358 Emergency Repairs 40,160 50,000 50,000 50,000 - 085-0300-0850-7254 Loan - Lease Payment - Principal - 28,786 28,786 30,230 1,444 085-0300-0850-7255 Loan - Lease Payment - Interest 4,885 5,540 5,540 4,096 (1,444)085-0300-0850-9000 Transfer Out - To Fund 051 - PW019 65,211 142,500 142,500 7,500 (135,000)085-0300-0850-9000 Transfer Out - To Fund 088 CIP 238,293 1,125,000 235,196 2,250,000 1,125,000 TOTAL SEWER SYSTEM 558,843 1,611,771 721,968 2,604,657 992,885
FUND 085 BEACH WWTP PLANT085-0300-0855-7201 Accounting & Auditing 7,411 8,298 8,298 8,298 0 085-0300-0855-7213 Legal Fees 955 2,000 2,000 2,000 - 085-0300-0855-7228 Chemicals & Gases 53,165 50,000 50,000 50,000 - 085-0300-0855-7245 Contractual Services 470,138 63,139 63,139 67,287 4,148 085-0300-0855-7248 VEOLIA- Contractual Services 396,796 835,045 835,045 853,495 18,451 085-0300-0855-7272 Equipment Rental 7,362 4,721 4,721 4,721 - 085-0300-0855-7273 Equipment (Non-Capital,<$5,000) 32,538 24,000 24,000 24,000 - 085-0300-0855-7277 Fuel and Mileage 306 500 500 500 - 085-0300-0855-7298 Flood & Fire Insurance 980 1,705 1,705 1,881 176 085-0300-0855-7307 Liability Insurance 16,501 35,546 35,546 36,475 929 085-0300-0855-7322 Interest Expense - Interfund Loan 4,703 4,703 - - (4,703)085-0300-0855-7352 M & R Machinery & Equipment 7,827 4,000 8,703 8,703 4,703 085-0300-0855-7355 M & R Real Property 15,703 29,500 29,500 29,500 - 085-0300-0855-7372 Office Supplies & Materials 5,550 5,550 5,550 5,550 - 085-0300-0855-7381 Computer Software 27,129 24,428 24,428 25,059 631 085-0300-0855-7385 Permits & Licenses 9,668 13,704 13,704 13,704 - 085-0300-0855-7397 Postage 1,374 1,508 1,508 1,508 - 085-0300-0855-7432 Telephone 10,156 13,000 13,000 13,000 - 085-0300-0855-7458 Utilities - PG&E 80,745 65,286 65,286 65,286 - 085-0300-0855-7255 Bond Interest Expense 33,926 29,614 29,614 22,779 (6,835)085-0300-0855-7254 Bond Principal - 8,383 8,383 10,271 1,888 085-0300-0855-7603 Bond Principal Retirement - 70,000 70,000 70,000 - 085-0300-0855-7358 Emergency Repairs 9,043 50,000 50,000 50,000 - 085-0300-0855-7905 Capital Outlay - Mach & Equip - 2,500 2,500 - (2,500)085-0300-0855-7905 Capital Outlay - Mach & Equip - 33,750 33,750 8,000 (25,750)085-0300-0855-7923 Capital Outlay - Vehicles - 20,000 20,000 13,750 (6,250)085-0300-0855-9000 Transfer Out - 143,025 143,025 143,025 - TOTAL SEWER TREATMENT PLANT 1,191,975 1,543,905 1,543,904 1,528,792 (15,113)TOTAL BEACH DRIVE SEWER SYSTEM AND PLANT FUND 1,750,819 3,155,676 2,265,872 4,133,449 977,773
FUND 86 NW SEWER SYSTEM AND PLANTNW WWTP COLLECTION SYSTEM AND LIFT STATIONS086-0300-0860-7125 State Unemployment Insurance 3,866 1,650 1,650 1,650 - 086-0300-0860-7213 Legal Fees 1,656 2,000 2,000 2,000 - 086-0300-0860-7215 Bond Issuance Costs 20,477 - - - - 086-0300-0860-7226 Printing 50 200 200 200 - 086-0300-0860-7245 Contractual Services 39,082 - - - - 086-0300-0860-7248 VEOLIA -CONTRACTURAL SERVICES 27,671 76,452 76,452 78,141 1,689 086-0300-0860-7249 Evidence Expenses 8,500 17,000 17,000 17,000 - 086-0300-0860-7272 Equipment Rental 1,217 7,307 7,307 7,307 - 086-0300-0860-7273 Equipment (Non-Capital,<$5,000) 1,294 1,500 1,500 1,500 - 086-0300-0860-7277 Fuel & Mileage 1,988 1,100 1,100 1,100 - 086-0300-0860-7298 Flood & Fire Insurance 1,009 1,754 1,754 1,935 181 086-0300-0860-7307 Liability Insurance 2,642 5,733 5,733 5,889 156
Page 206

PUBLIC WORKSFY 21-22 ADOPTED EXPENDITURE BUDGET
Appendix 9
Account Number Account Name FY 2019-20
Actual FY 2020-21 Final Budget
FY 2020-21 Projected
FY 2021-22 Adopted
Budget Change
EXPENDITURES
086-0300-0860-7323 Finance Charge - Collection fee 16 100 100 100 - 086-0300-0860-7352 M & R Machinery & Equipment 12,828 15,000 15,000 15,000 - 086-0300-0860-7355 M & R Real Property 4,041 5,000 5,000 5,000 - 086-0300-0860-7358 Emergency Repairs 2,400 50,000 50,000 50,000 - 086-0300-0860-7356 M&R Vehicles 210 3,500 3,500 3,500 - 086-0300-0860-7365 Membership Dues 194 1,100 1,100 1,100 - 086-0300-0860-7367 Misc. Services & Supplies 2,931 2,500 2,500 2,500 - 086-0300-0860-7372 Office Supplies & Materials 284 500 500 500 - 086-0300-0860-7385 Permits & Licenses & Testing 2,810 8,450 8,450 8,450 - 086-0300-0860-7432 Telephone 2,152 2,250 2,250 2,250 - 086-0300-0860-7458 Utilities - PG&E 40,894 41,000 41,000 41,000 - 086-0300-0860-7459 Utilities - City Water Services 172 1,032 1,032 1,032 - 086-0300-0860-7254 Loan - Lease Payment - Principal - 28,786 28,786 30,230 1,444 086-0300-0860-7255 Loan - Lease Payment - Interest 4,885 5,540 5,540 4,096 (1,444)086-0300-0860-9000 Transfer Out - To Fund 051 - PW019 - 167,500 135,236 7,500 (160,000)TOTAL SEWER SYSTEM 183,268 446,954 414,691 288,980 (157,974)
SEWER TREATMENT PLANT086-0300-0865-7201 Accounting & Auditing 5,724 6,411 6,411 6,411 (0)086-0300-0865-7213 Legal Fees 1,829 2,000 2,000 2,000 - 086-0300-0865-7228 Chemicals & Gases 34,993 23,641 23,641 23,641 - 086-0300-0865-7245 Contractual Services 388,851 54,013 54,013 57,218 3,204 086-0300-0865-7248 VEOLIA- CONTRACTURAL SERVICES 297,841 598,896 598,896 612,128 13,233 086-0300-0865-7252 Property Tax 4,025 4,198 4,198 3,907 (291)086-0300-0865-7254 Debt Service - Principal - 58,071 58,071 65,315 7,244 086-0300-0865-7255 Debt Service - Interest 24,517 36,816 36,816 26,628 (10,188)086-0300-0865-7272 Equipment Rental 6,217 3,533 3,533 3,533 - 086-0300-0865-7273 Equipment (Non-Capital,<$5,000) - 25,000 25,000 25,000 - 086-0300-0865-7277 Fuel & Mileage 7,476 2,000 2,000 2,000 - 086-0300-0865-7298 Flood & Fire Insurance 8,284 13,364 13,364 14,740 1,376 086-0300-0865-7307 Liability Insurance 13,972 30,042 30,042 30,825 783 086-0300-0865-7340 Legal Notices & Publications 304 6,000 6,000 6,000 - 086-0300-0865-7352 M & R Machinery & Equip 136,463 140,000 140,000 140,000 - 086-0300-0865-7355 M & R Real Property 16,984 153,489 153,489 153,489 - 086-0300-0865-7372 Office Supplies & Materials 6,067 6,067 6,067 6,067 - 086-0300-0865-7381 Computer Software 25,556 22,283 22,283 22,771 488 086-0300-0865-7385 Permits & Licenses & Testing 9,383 12,960 12,960 12,960 - 086-0300-0865-7397 Postage 1,401 1,508 1,508 1,508 - 086-0300-0865-7432 Telephone 21,094 22,550 22,550 22,550 - 086-0300-0865-7458 Utilities - PG&E 112,003 50,000 50,000 50,000 - 086-0300-0865-7460 Solar Energy 150,394 110,000 110,000 110,000 - 086-0300-0865-7358 Emergency Repairs 33,829 30,000 30,000 30,000 - 086-0300-0865-7905 Capital Outlay - Mach & Equip - 2,500 2,500 - (2,500)086-0300-0865-7905 Capital Outlay - Mach & Equip - 33,750 33,750 8,000 (25,750)086-0300-0865-7923 Capital Outlay - Vehicles - 20,000 20,000 13,750 (6,250)086-0300-5990-9000 Transfer Out - To Fund 087 CIP 377,775 1,044,500 934,507 330,000 (714,500)TOTAL SEWER TREATMENT PLANT 1,684,983 2,513,592 2,403,599 1,780,441 (733,151)TOTAL NW SEWER SYSTEM AND PLANT FUND 1,868,251 2,960,546 2,818,290 2,069,421 (891,125)
FUND 87 NW SEWER - CAPITAL OUTLAY087-0700-4109-7990 ABM Citywdie Energy Efficiency Program - 634,278 634,278 - (634,278)087-0700-4127-7990 CIP - NWWTP Membrane - 1,044,500 934,507 - (1,044,500)087-0700-4141-7990 CIP - CCTV Trilogy Wastewater Lines - - - 280,000 280,000 087-0700-4142-7990 Audit/assessment - - - 50,000 50,000 TOTAL NW SEWER - CAPITAL OUTLAY - 1,678,778 1,568,785 330,000 (1,348,778)
Page 207

PUBLIC WORKSFY 21-22 ADOPTED EXPENDITURE BUDGET
Appendix 9
Account Number Account Name FY 2019-20
Actual FY 2020-21 Final Budget
FY 2020-21 Projected
FY 2021-22 Adopted
Budget Change
EXPENDITURES
FUND 88 BEACH SEWER - CAPITAL OUTLAY088-0700-4126-7990 CIP - City Hall Lift Station - 300,000 30,000 270,000 (30,000)088-0700-4110-7993 CIP - 2019 Water & Sewer CIP Project - 75,000 115,196 - (75,000)088-0700-4138-7993 CIP - 2020 Water & Sewer CIP Project - 700,000 70,000 630,000 (70,000)088-0700-4142-7990 Audit/assessment - - - 50,000 50,000
088-0700-4143-7993CIP - Airport Road and 2nd Street Lift Station - - - 100,000 100,000
088-0700-4140-7993 CIP - River Road Lift Station - 50,000 20,000 1,200,000 1,150,000 088-0300-5990-9000 Transfer Out - To Fund 085 718,677 - - - - TOTAL BEACH SEWER - CAPITAL OUTLAY 718,677 1,125,000 235,196 2,250,000 1,125,000
FUND 91 STREET PROJECTS091-0300-5990-9000 Transfer Out - Funding for Street Projects 22,366 - - - - 091-0300-0910-7245 Contractual Services - 140,000 140,000 - (140,000)091-0300-5990-9000 Transfer Out - PW Corp Yard Improvement 50,000 - - - - 091-0300-5990-9000 Transfer Out - HSIP Pedestrian Crossing 9,482 - - - - TOTAL STREET PROJECTS 81,848 140,000 140,000 - (140,000)
Page 208

Appendix 10
FUND DESCRIPTIONS GOVERNMENTAL FUNDS GENERAL FUND FUND 02 – MEASURE “O” – This fund records the three-quarters (0.75%) transactions and use tax, which was initially approved by the voters in 2012, with a period of five years. An extension of an additional period of five years passed in 2016 with an expiration in April 2022. FUND 10 – GENERAL FUND – This is the City’s primary operating fund. It accounts for all financial resources of the general government, except those required to be accounted for in another fund. For the City, the general fund includes such activities as public safety, public streets and facilities, parks and recreation services, and economic development services.
FUND 22 – GENERAL PLAN REVISION – This fund was created per Resolution 2003-04 to account for the general plan revision fees received through construction permitting based on the Capital Impact Fee Schedule adopted per California Code of Regulations Title 24 (CCR T-24).
FUND 52 – TRANSIENT OCCUPANCY TAX – Per Resolution No. 2015-001, adopted on January 6th, 2015, City Council approved to set up this fund to record the revenue received from Transient Occupancy Tax for the promotion of commerce and tourism.
SPECIAL REVENUE FUNDS FUND 17 – LAW ENFORCEMENT – This fund records the three-quarters (0.75%) transactions and use tax, which was initially approved by the voters in 2012, with a period of five years. An extension of an additional period of five years passed in 2016 with an expiration in April 2022. FUND 18 – ASSET FORFEITURE – Under authority of CA Health and Safety Code Section 11489, this fund accounts for funds turned over to the City by the courts for money and property seized because of drug arrests. These funds are also used to assist in drug sting operations to arrest drug dealers.
FUND 19 – ATOD GRANT – Alcohol, Tobacco, and Other Drugs (ATOD) is a program offered by the City and County of Solano to provide educational programs to both the youth and adults within the community. The City is responsible for providing the agreed upon programs and completing the reporting requirements to the County on the progress of the program in achieving the program goals.
FUND 25 – GAS TAX – This fund accounts for the revenues and expenditures associated with the maintenance and improvements of the City’s roads and street landscaping that is funded through the receipt of the City’s share of the gas tax.
FUND 31 – DEVELOPERS REVOLVING – This fund is used to hold advance deposits and reimbursements received from the developers and to draw down from those funds as the City pays expenditures on behalf of the developers. Prior to approval of their tentative maps, the City receives an administrative fee for providing this management service to developers.
Page 209

Appendix 10
FUND 33/34 – COMMUNITY DEVELOPMENT BLOCK GRANT HOUSING REHABILITATION – This fund is used to provide and meet the capital needs of businesses located throughout the City. The intent of the program is to provide appropriate assistance to businesses with the potential to increase the overall economic base of the City. In addition, this fund accounts for loans to residents for housing rehabilitation. The loans were offered as second mortgages and were to be paid off upon sale or transfer of the home. FUND 38/39 – PERSONNEL SERVICES DISTRICT – This fund is used to account for the services portion of Community Facilities District (CFD) CFD 2006-1, which will be used to fund public safety.
FUND 55 – LIBERTY MAINTENANCE & OPERATION SERVICE DISTRICT – This fund was created for the purpose of maintaining records for the list of authorized services specified in Exhibit C under Resolution No. 2018-010 for Liberty Community – CFD No. 2018-1. The special tax will be used on the maintenance and operation services in the district.
FUND 91 – STREETS PROJECTS – This fund was created to account for the Exchange Funding Agreement with the City of Vacaville, and to be used for the repair and maintenance of local streets and roads. Vacaville agreed to reimburse the City with other less restrictive local transportation funding in exchange for the American Recovery and Reinvestment Act (ARRA) stimulus funds, which was awarded to the City.
CAPITAL PROJECT FUNDS FUND 12 – VEHICLE REPLACEMENT – This fund was created to account for the vehicle fees received from the State of California for the use of the City’s fire vehicles when responding to service calls from the Office of Emergency Services Strike Team. The City acts as a pass-through agent receiving wage revenue from the State and paying the revenue out to the Strike Team members. FUND 50 – STORM DRAIN – This fund is used to collect a fee from each water customer and is set aside to pay for future maintenance, repair, or replacement of the City’s storm drain system. The fee is collected in the monthly utility billings.
FUND 51 – CAPITAL PROJECTS – This fund is used to account for the City’s major capital projects.
FUND 53 – ROADWAY IMPACT – This fund is used to collect fees paid by developers of construction projects to be used to offset the impact of development on the City’s local streets. The fee is collected as part of the building permit process and is accumulated in this fund for use as needed for capital roadway projects.
FUND 54 – PARKS AND RECREATION – This fund is used to collect fees paid by developers of construction of projects to be used to help fund future capital park and recreation facilities. This fee, collected through the building permit process, ensures that the City’s facilities will stay proportionate to their population. FUND 56 – MUNICIPAL IMPROVEMENTS – This fund is used to collect fees paid by developers of construction projects to be used to help fund future capital municipal improvements needed as a result of current development.
Page 210

Appendix 10
FUND 60 – HAZARDOUS WASTE – This fund is used to account for revenues and expenditures incurred from offering hazardous waste disposal programs. This City collects revenues through customer’s sanitation bills to provide for special collections events such as the Household Hazardous Waste event to collect household hazardous waste.
FUND 65 – LANDFILL CLOSURE – The City collects a franchise fee from the local sanitation agency. Some of these fees are set aside in this fund to help offset the current and future cost of maintaining the landfill. In addition, the City is required to hold in reserve an amount sufficient to cover any costs due to contamination of the ground water in and around the landfill.
FUND 76 – ARMY BASE REUSE – The City is currently working with the Department of Water Resources to finance and construct a field operation laboratory/science center on the former Army Base site. The $20 million plus project is currently planned as a reuse of 12 to 14 acres of the former 28-acre Army Base at the south end of the City.
DEBT SERVICE FUNDS FUND 40 – FIREHOUSE BONDS – This fund services the 1977 Firehouse General Obligation Bonds. Property taxes are received and used to make the bond’s semi-annual interest and principal payments. The bonds have been paid off as of August 1st, 2017. The fund will be closed as soon as the prior period adjustments for this voter debt are corrected and cleared. PROPRIETARY FUNDS ENTERPRISE FUNDS FUND 32 – TRANSIT – This fund is used to account for transportation services provided to the City through Rio Vista Delta Breeze, a program of the City that provides deviated fixed route bus service on three routes serving Rio Vista, Isleton, Antioch, Pittsburgh/Bay Point BART Station, Suisun City, and Fairfield, with connections to Lodi. FUND 75 – BUSINESS PARK – This fund is used to allocate staff time and available resources from leases and sale of lands in the Business Park to finance public improvements, create development-ready land parcels, and provide incentives for development of businesses on City-owned land.
FUND 80 – WATER CONSTRUCTION – This fund is used to collect water revenue from utility user and the impact fees paid by developers to fund future expansion of, and improvements to, the City’s water facilities.
FUND 81/82 – WATER CAPITAL ASSETS – This fund is created to record the expenses for Capital Improvement Projects in the water system.
FUND 84 – MUNICIPAL AIRPORT – This fund is used to allocate staff time and available resources from leases and sales of fuel at the airport to finance public improvements.
Page 211

Appendix 10
FUND 85 – BEACH DRIVE SEWER SYSTEM AND PLANT – This fund is used to collect sewer revenue from utility user and the impact fees paid by developers to fund future expansion of, and improvements to, the City’s beach drive sewer system and plant.
FUND 86 – NORTHWEST SEWER SYSTEM AND TREATMENT PLANT – This fund is used to collect sewer revenue from utility user and the impact fees paid by developers to fund future expansion of, and improvements to, the City’s Northwest sewer system and plant.
FUND 87/88 – SEWER CAPITAL ASSETS – This fund is created to record the expenses for Capital Improvement Projects in the sewer systems.
FIDUCIARY FUNDS AGENCY FUNDS FUND 41 – COMMUNITY FACILITIES DISTRICT 2006-1 – Formed by a vote of the current property owners in July 2006, this District serves to fund a portion of the construction costs of the Northwest Wastewater Treatment Plant. Annual assessments will be placed on the tax rolls of the property owners to cover the bond principal and interest as well as related administrative expenses. Additionally, the residential units in this District will pay an annual assessment to contribute to funding for public safety services. FUND 42/43 – RIVERVIEW POINT – This fund collects assessments from homeowners for improvements within the assessment district, pays all administrative costs associated with the bond issue, and makes the bond principal and interest payments on a semi‐ annual basis.
FUND 44 – RIVERWALK COMMUNITY FACILITIES DISTRICT – This fund was created for the purpose of accepting advances of funds to be used for any authorized purpose related to any costs or expenses incurred by the City pertaining to the establishment of the Community Facilities District ("CFD") known as Riverwalk. The major tasks to be performed by the City include (1) coordination of formation of CFD and implementation of Mello‐Roos Financing, (2) preparation of rate and method of apportionment, (3) preparation of legal documentation for Mello‐Roos financing prior to issuance of bonds, and (4) preparation of appraisal.
FUND 45/46 – SUMMERSET – This fund collects assessments from homeowners for improvements within the assessment district, pays all administrative costs associated with the bond issue, and makes the bond principal and interest payments on a semi‐ annual basis.
FUND 49 – COMMUNITY FACILITIES DISTRICT 2004-1 – This fund and district were created by vote of current property owners in the 2004‐05 fiscal year to issue and repay special tax bonds to help fund the construction of a new wastewater treatment facility. Assessments will be placed on the tax rolls of the property owners each year to cover the bond principal and interest charges and related administrative expenses.
FUND 95 – LIBERTY PROJECT COMMUNITY FACILITIES DISTRICT 2018-1 – This fund was created for the purpose of accepting advances of funds to provide Community Facilities District ("CFD") formation services and collecting the special tax to be levied in each fiscal year on each assessor's Parcel of Taxable Property within CFD No. 2018‐1 to fund the annual services Special Tax Requirement.
Page 212

Appendix 11
BUDGET AND FINANCIAL POLICIES
In planning for and preparing the annual budget, many fiscal decisions are made to help sustain the long-term health and well-being of the City. Accordingly, the City Manager strives to make fiscal recommendations in the proposed budget that adhere to the following guiding principles:
Fund current operations with current year revenues. Realistically project revenue growth. Continue to address long-term debt liabilities and maintenance deficiencies. Maintain General Fund reserves at least at City Council’s 15% target reserve to protect the City in
times of economic uncertainty or unforeseen circumstances. Continuous investment in technology, systems and equipment as needed to improve
organizational efficiency, especially when staffing levels are reduced. To minimize staff turnover and maintain City productivity, compensation levels should be
maintained in line with the labor market, to the extent available resources permit. Utilize Measure O revenues to augment General Fund existing services for fire, police, and public
works.
BALANCED BUDGET
The City shall strive to balance resources with expenditure appropriations. To maintain a “balanced budget”, total expenditures in the fund cannot exceed its total of revenues. The City Council requires the City Manager to control expenses so that department expenditure do not exceed the levels that are appropriated in the annual budget and for which the City has funds to support.
GENERAL FUND BUDGET SHORTFALL
If the total resources as estimated by the Director of Finance are insufficient in a given fiscal year to support the current level of appropriations and minimum 7% reserve, the City Manager shall report the financial shortfall to the City Council and recommend actions to alleviate that shortfall. The Council shall adopt budget amendments that reduce appropriations, as necessary. If no Council action is forthcoming within 45 days of the City Manager's report, the City Manager shall reduce the total amount of General Fund departmental appropriations accordingly on a uniform percentage basis. Reductions shall be evaluated on a programmatic basis to reach the appropriation levels required within available funding. When budget reductions are necessary, departments prioritize service programs and propose reductions in areas that have the least impact upon services to the community and the overall attainment of City goals. Departments also consider the potential effects on interrelated or cross-departmental programs when developing budget reductions.
CONTINGENCY RESERVES
In the General Fund, the City shall strive to maintain a minimum of $500,000 of its operating budget as Contingency Reserves in a separate line items in the General Fund Balance. Contingency Reserves should be used to support economic uncertainties, one-time operating cost increases, special studies or reports necessary to fulfill the organization’s mission.
Page 213

Appendix 11
PURSUIT OF NEW REVENUES/MAXIMIZING USE OF NON-GENERAL FUND REVENUES
City departments shall pursue revenue sources, when reasonable, in support of department goals. Departments will maximize use of non-General Fund revenues prior to using General Fund revenues to fund programs.
COST RECOVERY THROUGH FEES
Departments must utilize fees to recover costs where reasonable, once all cost-saving options have been explored. There must be statutory authority for the City to levy a fee, and the fee must be approved by the City Council. If permissible by law, fees and charges shall recover costs of the services provided, unless otherwise directed by the City Council. Programs funded by charges for services, fees, grants, and special revenue sources should pay their full or fair share of all direct and indirect costs to the extent feasible and legally permitted, so that the users of the service bear the costs, rather than the general taxpayer.
OPERATING CARRYOVER
Operating program appropriations supported by a Purchase or Encumbrance Order. The City Manager is authorized to increase budget appropriations in the amount of the outstanding encumbrances for valid purchase orders and contracts as of June 30. The City Council re-appropriates the encumbrances in the same amounts and into the same accounts in the Funds as they existed on June 30.
USE OF “ONE-TIME” FUNDS
City Council policy states that one-time revenues shall be dedicated for use as one-time expenditures. Annual budgets are not increased to the point that ongoing operating costs become overly reliant on cyclical or one-time revenues sources. During periods of economic downturn or any significant State “take-aways”, the use of one-time sources of funds or reserves may be used to ease the transition to downsized and/or reorganized operations.
INTERGOVERNMENTAL LOAN FUND
The primary purpose of the Loan Fund is to advance funds for capital projects to permit earlier construction than would otherwise be possible. Other purposes include covering shortfalls in other funds (including the General Fund), paying for economic development projects that facilitate revenue generating projects and providing additional reserves for economic uncertainty. Generally, loans shall accrue interest at a rate approved by Council. The interest rate shall reflect the risk of the project. Funds which can repay loans with interest shall have priority in the use of the Loan Fund.
Page 214

Appendix 11
CAPITAL IMPROVEMENT PROGRAM BUDGET
Capital Improvement cost is a permanent addition to the City’s assets, including design, construction purchase of land, buildings or facilities, or major renovations. This includes installation or repair of new or existing traffic signals, roads, sewer lines and parks. To qualify as a capital improvement project, the cost of the project must exceed $10,000. The City will actively pursue grant and other outside funding sources for all capital improvement projects.
The City manager is authorized to carry-over or re-appropriate into the following fiscal year any remaining appropriations for uncompleted capital Improvement projects. City Council approval is required for capital project cost increases in excess of 10% of a project’s current total authorized budget.
Annually, completed or inactive projects will be closed, except for projects that have existing litigation or payment disputes. An inactive project is defined as one where transaction activity is less than $1,000 over the prior three years. The City Manager, or his or her designee, is authorized to close projects and to process the necessary documentation to close inactive projects.
FACILITY MAINTENANCE
Revolving funds shall be maintained to allow for the accumulation of funds for pay-as-you-go financing of preventative maintenance and major repairs to City facilities to avoid the costs of deferred maintenance. Facilities covered by these funds include City Hall, Youth/Senior Center, parks and recreation facilities, Police station and fire station.
DONATIONS
The City Manager is authorized to receive and accept on behalf of the city: a) cash donations for specific purposes, to deposit such donations in trust funds, and to expend such donations for the purpose for which the donation was made, and b) in kind/non-cash donations that would serve a useful purpose in the provision of City services.
GRANTS
The City Manager is authorized to submit grant applications for activities within the jurisdiction of the City. The City Manager is authorized to accept grants, to expend grant funds if the funds have been appropriated, and to implement the actions required by any grant for projects and programs within the City’s jurisdiction.
INVENTORY and ACCOUNTS RECEIVABLE
The City Manager is authorized to conduct a physical inventory, analyze receivables for collection, and to reconcile related financial records accordingly.
Page 215

Appendix 11
CASH MANAGEMENT AND INVESTMENT
After considering the amounts required to meet the current and pending requirements of the City, by following the City’s investment policy and recommended by the Finance and Investment Committee, the City Manager may arrange for the term deposit or investment in securities authorized by law of any balances available for such purpose, and the yield therefrom shall be credited as revenue to each fund from which investments are made.
DEBT
The City Manager, by following the City’s debt policy, is authorized to amend the Budget to reflect all required debt service requirements and payments, bond covenants or other applicable requirements, laws, and regulations.
AUTHORIZATION AND CONTROL OF EXPENDITURE
No expenditure of City funds shall be made except for the purposes and in the manner specified in an appropriation by the Council. The City Manager shall establish and direct such systems of internal control and audit as he/she may find necessary to insure the fulfillment of the purpose of this Section.
MIDYEAR BUDGET REVIEW
The Council will formally review the City’s fiscal condition and amend the budget as necessary on an annual basis, typically to be presented during the third quarter of the fiscal year.
ACCOUNTING SYSTEM
The City Manager shall direct the establishment and supervise the maintenance of a uniform system of accounting, applicable to all departments and other agencies of the City, conforming to modern and accepted practices of public and governmental accounting, which shall be adequate to account for all money on hand and for all income and expenditures in such detail as will provide complete and informative data concerning the financial affairs of the City, and in such manner as will be readily susceptible to audit and review.
AUDIT
An annual audit will be performed by an independent public accounting firm, with an audit opinion to be included with the City's published Annual Audited Financial Report. The Council will approve the audit annually.
Page 216

Appendix 12
BUDGET PROCESS
The City of Rio Vista operates on a fiscal year basis that begins on July 1 of each year and ends the following year on June 30. The City Manager’s Office and Finance Department manage the budget process, with support from each of the operating departments. The preparation of the budget takes place between March and June, culminating with the adoption of an annual budget by the City.
BUDGET GUIDELINES
The operating budget is adopted no later than June 30th for the ensuing fiscal year. Every six months after the adoption of the budget, the City Council formally reviews the City’s fiscal condition and amends appropriation as needed. The City Council may, by majority votes, amend or supplement the budget any time after its adoption.
BUDGET PRINCIPLES
The City will strive to maintain a balanced budget, with revenues covering ongoing expenditures for the duration of the budget.
Revenues are conservatively estimated. Capital Improvement and Major Maintenance costs are identified to properly consider future
financial impacts.
LEVEL OF BUDGET CONTROL
Budget control is established at the following levels: a) General Fund – Department Level, b) Other Funds – Fund level, and c) Capital Projects Department level. At any time during the fiscal year the City Manager may transfer part (or all) of any unencumbered appropriation balance among programs within a department, office, or agency up to $29,500. Also, upon written request by the City Manager, the Council, may transfer by resolution part (or all) of any unencumbered appropriation balance between one department, office or agency and another. In the same manner, the City Manager may also appropriate available funds not included in the budget.
COUNCIL APPROVAL
After submission of the budget by the City Manager, the City shall hold an open budget study session to the City Council and the Public. During the open budget study session, City staff will address City Council and the Public’s concerns and questions. If needed, additional budget study session will be held in the following week after the first open budget study session.
After the budget study session, the Council may revise the budget in any manner if necessary and shall adopt a budget for the ensuing fiscal year no later than the last day of the current fiscal year. If it fails to adopt the budget by this date, the amounts appropriated for current operation for the current fiscal year shall be adopted for the ensuing fiscal year on a month-to-month basis, with all items in it prorated accordingly, until the Council adopts a budget for the ensuing fiscal year. Adoption of the budget shall
Page 217

Appendix 12
constitute appropriations of the amounts specified therein as expenditures from the funds indicated and shall constitute a levy of the property tax therein proposed.
BUDGET PROCESS FLOWCHART
The Budget process flowchart below represents key milestones that took place during the FY 2021-22 budget process.
Feb 8 - Operating/CIP Budget Worksheet to Department Heads
Feb 22 - Operating Budget/CIP Worksheet Due to Finance
Mar 1 to 5 - Budget Meeting with Department Heads
April 15 - Existing CIP Worksheet to Department Heads
April 16 - Prior Year Budget Narrative to Department Heads
May 3 - Updated Budget Narrative to Finance
May 1 to 12 - Finance Compilation and Review
May 13 - City Manager and Assistant City Manager Draft Review
May 20 - Study Session
Jun 8 - Staff Report & Final Budget to City Clerk
Jun 15 - Public Hearing City Council Budget Adoption
Page 218

Appendix 13
Page 219

RESOLUTION NO. 2021-037
A RESOLUTION OF THE CITY COUNCIL OF THE CITY OF RIO VISTA APPROVINGAN APPROPRIATIONS LIMIT FOR FISCAL YEAR 2021/2022
WHEREAS, Article XIIIB of the California Constitution has established a procedurefor determining the maximum amount of revenue from taxes that local governmentalentities may appropriate; and
WHEREAS, the City of Rio Vista has, in accordance with direction provided by theState Department of Finance, used the population change and the change in Californiaper capita personal income (as provided by the State Department of Finance) as growthfactors in computing the FY 2021-2022 appropriations limit and has performed thecalculations for determining the amount of revenue that may be appropriated; and
WHEREAS, the City's FY 2021-2022 budget reflects a total of $6,259,334 in taxeslevied on behalf of the City that are subject to the limitation.
NOW, THEREFORE, BE IT RESOLVED BY THE CITY COUNCIL OF THE CITYOF RIO VISTA that the change in the cost of living to be used in the calculation is thepopulation change and the per capita percentage change in California Per CapitaPersonal Income as provided by the California State Department of Finance.
BE IT FURTHER RESOLVED, that the FY 2021-2022 appropriations limit shall, inaccordance with Article XIIIB of the California Constitution, and the calculations madepursuant to Exhibit A, attached, be established in the amount of $17,306,527.
PASSED AND ADOPTED this 1st day of JUNE 2021. I, JOSE JASSO, CITYCLERK OF THE CITY OF RIO VISTA, HEREBY CERTIFY the foregoing resolution wasintroduced and passed at a regular meeting of the Rio Vista City Council by the followingroll call vote:
AYES: Council Members Dolk, King, Stanish, Vftfl Hampton and Mayor Kott
NOES: None
ABSENT: None
ABSTAIN: None
ATTEST:
Jo?e Jasso,\^^1_^
JMC,^ity Clerk
.^^^.•/-'^
u • n
:?c'-%1>
^i
,il !1.
,OT, ;̂
;-^1.^n
;Lt^t^yr~;:^
/̂^f; i^v'
•/'/-
"^-'."^
\'^
^Page 220
Appendix 14

Appendix 15
GLOSSARY OF TERMS
Accrual Basis of Accounting - A method of accounting that recognizes the financial effect of transactions, events, and interfund activities when they occur, regardless of the timing of related cash flows.
Adopted Budget - The annual City budget as approved by City Council on or before June 30 for the fiscal year beginning July 1. This adopted budget establishes the legal authority for the expenditure of funds.
Annual Budget - A consolidated budget document presented on an annual basis that includes the City's Operating Budget and the City's Capital Improvement Program (CIP) Budget.
Appropriation - A legal authorization granted by the City Council to make expenditures and to incur obligations for specific purposes. For purposes of the Capital Improvement Project budget, appropriations are automatically renewed, for the life of the project, unless altered or revoked. For the operating budget, appropriations lapse at the end of the fiscal year to the extent they have not been expended or encumbered.
Assets - A probable future economic benefit obtained or controlled by a particular entity as a result of past transactions or events. This includes financial resources such as cash, receivables, inventory, and plant and equipment, net of depreciation.
Audit - A formal examination of the City’s accounts by an independent audit firm to determine whether the City’s financial statements fairly present the City’s financial position and results of operations in conformity with Generally Accepted Accounting Principles.
Balanced Budget - The budget for a fund is balanced when total budgeted resources, including revenues, transfers in from other funds, and available fund balance from the previous year, meets or exceeds total budgeted uses of resources, including expenditures and transfers out to other funds.
Beginning Fund Balance - The amount of prior year's unappropriated funds used to finance appropriated expenditures in the current budget year.
Budget - A plan of financial operation embodying an estimate of proposed expenditures for a given period and the estimated financial resources available to finance them. Used without any modifier, the term usually indicates a financial plan for a single fiscal year.
Budget Public Hearing - A public meeting at which any member of the community may appear and be heard regarding any item in the proposed budget as presented by the City Manager to the City Council.
Capital Asset - Land, buildings, equipment, improvements to buildings, and infrastructure (i.e., roads, bridges, and other immovable assets. A capital asset is defined as an asset with a useful life extending beyond a single accounting period.
Page 221

Appendix 15
Capital Improvement - A permanent addition to the City's assets, including the design, construction or purchase of land, buildings, or facilities, or major renovations of same.
Capital Improvement Program (CIP) Budget - A plan of annual appropriation for capital improvements and various kinds of major facility maintenance. These projects are often multi-year in length. The appropriations, therefore, do not lapse at the end of the fiscal year but continue until the project is completed or closed.
Depreciation - An allocation of the cost of fixed assets (buildings, plant or equipment) over the estimated useful life of the asset.
Encumbrance - Obligations in the form of purchase orders, contracts, or salary commitments which are chargeable to an appropriation and for which a part of the appropriation is reserved. They cease to be encumbrances when paid.
Expenditure - Actual cash disbursements for the cost of goods delivered or services rendered to the City.
Fund - An independent fiscal and accounting entity with a self -balancing set of accounts recording its assets, liabilities, fund equity, revenues and expenditures or expenses and other changes in residual fund equity or balances, segregated for the purpose of carrying on specific activities or attaining certain objectives in accordance with special regulations, restrictions, limitations, or public policy.
Fund Balance - The amount of financial resources immediately available for use. Generally, this represents the difference between unrestricted current assets over current liabilities.
General Fund - The primary fund of the City used to account for all revenues and expenditures of the City not accounted for in another fund. Examples of departmental operations accounted for in the General Fund include the City Council, Police and Fire Departments, Library, Parks and Recreation, and others.
Generally Accepted Accounting Principles (GAAP) - Uniform minimum standards and guidelines for financial accounting and reporting that govern the form and content of the financial statements of an entity. GAAP encompass the conventions, rules, and procedures necessary to define accepted accounting practice at a particular time. GAAP provide a standard by which to measure financial presentations. The primary authoritative body on the application of GAAP to state and local governments is the GASB (Governmental Accounting Standards Board).
Governmental Fund - A fund type to account for tax-supported activities. There are four different types of governmental funds: General Fund, special revenue funds, debt service funds, and capital projects funds.
Grant - Contributions of cash or other assets from another government entity to be used or expended for a specific purpose, activity, or facility.
Page 222

Appendix 15
Interfund Transfers - With Council approval, resources may be transferred from one City fund to another. The purpose of the majority of transfers is to reimburse a fund that has made expenditure on behalf of another fund. Less often, a transfer may be made to open or close a fund.
Liability - Probable future sacrifices of economic benefits arising from present obligations of a particular entity to transfer assets or provide services to other entities in the future as a result of past transactions or events. That is, a financial obligation or claim of financial resources of a specific fund to be liquidated at a future date.
Long-term Debt - Debt with a maturity of more than one year after the date of issue.
Mission - The overriding purpose of the department, division, or program.
Municipal Code - A compilation of City Council approved ordinances currently in effect. The Code defines City policy in various categories, for example, Civil Service rules, traffic regulations, sanitation and health standards, building regulations, and planning and zoning regulations.
Operating Budget - The portion of the budget that pertains to the City's daily operations and activities engaged in to provide services to the community. The operating budget contains appropriations for such expenditures as personnel (salaries, wages and benefits), supplies and materials, utilities, travel and fuel.
Ordinance - A formal legislative enactment by City Council. It has the full force and effect of law within City boundaries unless pre-empted by a higher form of law (State or Federal). An ordinance has a higher legal standing than a resolution. Revenue raising measures, such as the imposition of taxes, special assessments and service charges are some examples of actions that would require the enactment of an ordinance.
Reserve - An account used to earmark a portion of fund balance to indicate that it is not available for expenditure or legally segregated for a specific future use.
Resolution - A special or temporary legislative order of the City Council/Agency/Authority. If it is not in conflict with any higher form of law, such as a state statute or constitutional provision, it has the full force and effect of law within the boundaries of the City. A resolution requires less legal formality and has a lower legal status than an ordinance.
Revenue - Resources received by the government available for use in supporting services including such items as taxes, fees, permits, licenses, grants, and interest.
Sales Tax - A tax imposed by the government on retailers at the point of sale for the privilege of selling tangible personal property. It is usually calculated as a percentage of the selling price and collected by the retailer from the consumer. The rate in the City of Rio Vista is 8.125%.
Page 223

This Page Is Intended To Be Blank
Page 224