City of Missouri City, Texas Fiscal Year 2016 Proposed Budget
318
City of Missouri City, Texas Fiscal Year 2016 Proposed Budget Acting City Manager – Bill Atkinson Allen Owen – Mayor Jerry Wyatt Don Smith – Mayor Pro Tem Councilmember at Large Position 1 Councilmember District B Chris Preston Anthony Maroulis Councilmember at Large Position 2 Councilmember District C Yolanda Ford Floyd Emery Councilmember District A Councilmember District D
-
Upload
khangminh22 -
Category
Documents
-
view
2 -
download
0
Transcript of City of Missouri City, Texas Fiscal Year 2016 Proposed Budget

City of Missouri City, Texas Fiscal Year 2016 Proposed Budget
Acting City Manager – Bill Atkinson
Allen Owen – Mayor
Jerry Wyatt Don Smith – Mayor Pro Tem Councilmember at Large Position 1 Councilmember District B Chris Preston Anthony Maroulis Councilmember at Large Position 2 Councilmember District C Yolanda Ford Floyd Emery Councilmember District A Councilmember District D
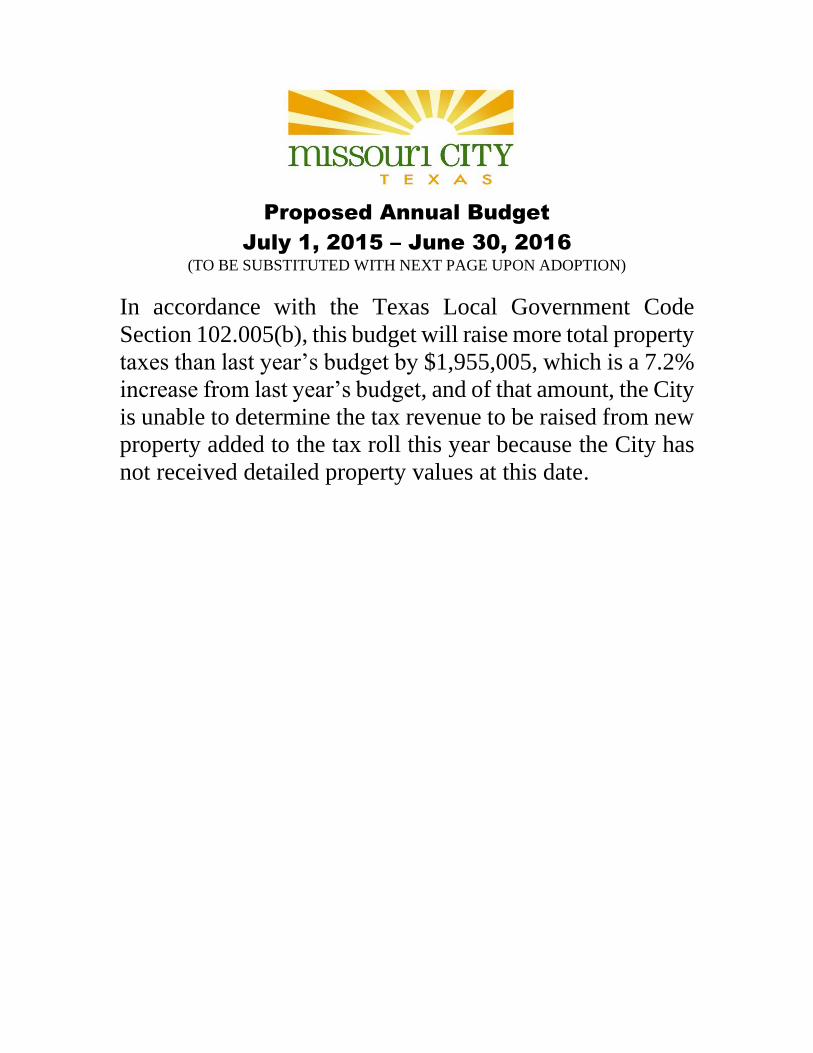
Proposed Annual Budget
July 1, 2015 – June 30, 2016
(TO BE SUBSTITUTED WITH NEXT PAGE UPON ADOPTION)
In accordance with the Texas Local Government Code
Section 102.005(b), this budget will raise more total property
taxes than last year’s budget by $1,955,005, which is a 7.2%
increase from last year’s budget, and of that amount, the City
is unable to determine the tax revenue to be raised from new
property added to the tax roll this year because the City has
not received detailed property values at this date.

Adopted Annual Budget
July 1, 2015 – June 30, 2016
This budget will raise more revenue from property taxes than last year’s budget by an
amount of $1,955,005, which is a 7.2 percent increase from last year’s budget. The
property tax revenue to be raised from new property added to the tax roll this year cannot
be calculated because the City has not received the detailed property values at this date.
CITY COUNCIL RECORD VOTE
The members of the governing body voted on the adoption of the budget as follows:
FOR:
AGAINST:
PRESENT but abstained from voting: None
ABSENT:
PROPERTY TAX RATES
Per $100 Valuation FY 2014-2015 FY 2015-2016
Property Tax Rate $0.56500 $0.56500
Effective Tax Rate $0.54477 Unknown at this time
Effective Maintenance and
Operations Tax Rate
$0.36113 Unknown at this time
Rollback Tax Rate $0.56792 Unknown at this time
Debt Tax Rate $0.17791 $0.17167
DEBT OBLIGATIONS
The total amount of municipal debt obligations: $102,517,634.
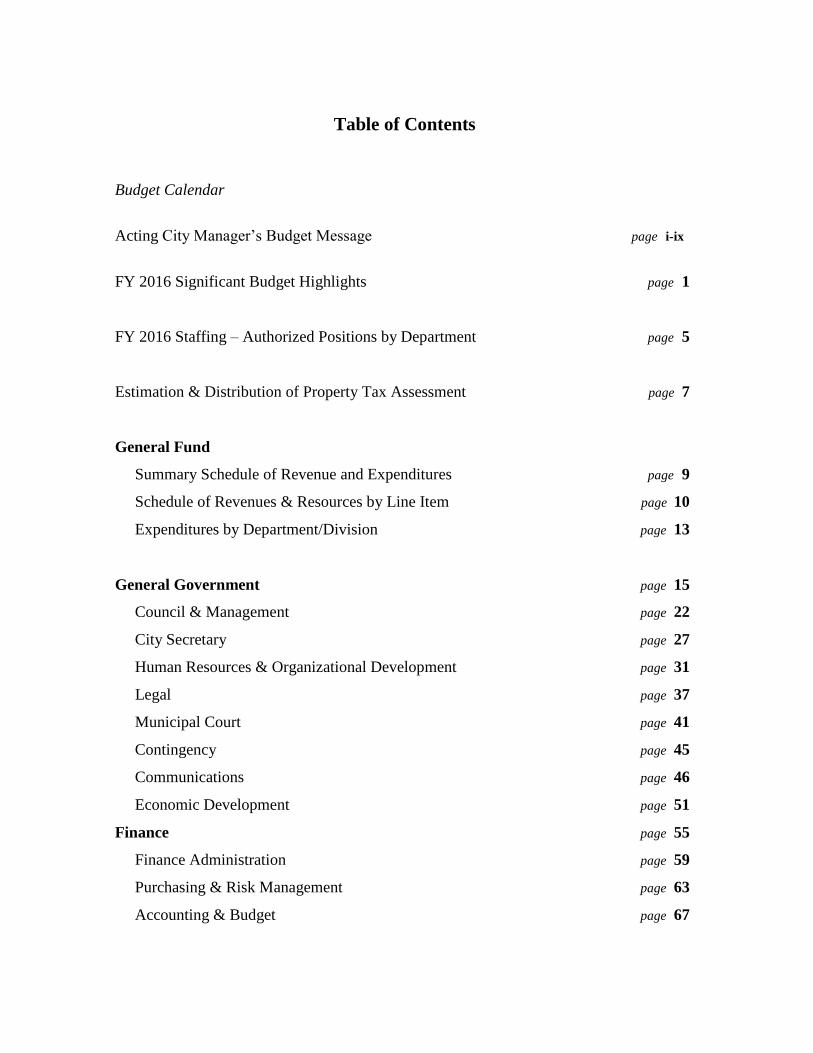
Table of Contents
Budget Calendar
Acting City Manager’s Budget Message page i-ix
FY 2016 Significant Budget Highlights page 1
FY 2016 Staffing – Authorized Positions by Department page 5
Estimation & Distribution of Property Tax Assessment page 7
General Fund
Summary Schedule of Revenue and Expenditures page 9
Schedule of Revenues & Resources by Line Item page 10
Expenditures by Department/Division page 13
General Government page 15
Council & Management page 22
City Secretary page 27
Human Resources & Organizational Development page 31
Legal page 37
Municipal Court page 41
Contingency page 45
Communications page 46
Economic Development page 51
Finance page 55
Finance Administration page 59
Purchasing & Risk Management page 63
Accounting & Budget page 67

Police page 71
Police Administration page 74
Code Enforcement page 81
Support Services page 85
Criminal Investigation Division page 89
Patrol page 93
Fire page 99
Fire Administration page 103
Fire Prevention page 107
Fire Training page 111
Fire Operations page 115
Public Works page 119
Public Works Administration page 123
Capital Projects page 127
Streets, Drainage & Traffic Operations page 131
Engineering & Utility Planning page 137
Geographic Information Systems page 141
Fleet Maintenance page 145
Facilities Maintenance page 151
Animal Services page 157
Parks and Recreation page 161
Parks page 164
Recreation page 169
Development Services page 173
Planning & Development page 177
Inspections page 181
Technology & Innovation page 185
Special Revenue Funds page 191
Parkland Dedication Fund page 195
Narcotics Fund page 199
Radio Communications Fund page 201
Court Building Security page 205

Court Technology Fund page 206
Court Juvenile Case Manager Fund page 207
Community Development Block Grants page 208
MCTV Facilities/Equipment Fund page 210
Grants Fund page 211
Donations Fund page 212
Missouri City Development Authority page 212
Tax Incremental Reinvestment Zone #1 page 214
Tax Incremental Reinvestment Zone #2 page 215
Public Improvement District #2 page 216
Tax Incremental Reinvestment Zone #3 page 217
Public Improvement District #4 page 218
Hotel Occupancy Tax Fund page 219
Debt Service Fund page 220
Debt Service Schedules page 221
Capital Improvements Funds page 249
Metro Projects Fund page 250
Other Projects Fund page 251
Capital Projects Fund page 252
Surface Water Treatment Construction Fund page 254
Capital Projects by Years page 255
Utility Funds page 259
Water/Wastewater Utility Fund page 260
Steepbank/Flatbank Regional WWTP Operational Fund page 264
Utility Certificate of Obligation Fund page 265
Surface Water Treatment Plant Utility Fund page 266
Other Enterprise Funds
Solid Waste Collections Fund page 267
Local Government Corporation (LGC) page 268
Internal Service Funds page 283
Fleet Replacement Fund page 285
Innovation & Technology Replacement Fund page 286
Compensation Plans page 287
Supplemental Budget Requests page 295

January 6 CIP Budget Kickoff Meeting coordinated by Project Administrator.
January 27 Updated and New proposed CIP projects submitted to Project Administrator.
January 30 Distribution of Budget Instructions to Directors and Assistant Directors.
February 2 Budget Kickoff Meeting.
February 4
February 4
February 6
February 11
February 16
February 23
March 2 Receive budget requests from departments - basic, supplemental, and capital requests.
March 2 - March 25
Finance Director and Finance staff to compile budget and review requests.
March 6 Departmental Narratives (Goals, Divisional Goals, Measures, and Indicators) due to Finance.
March 20 Finalize preliminary General Fund and Debt Service Fund revenue estimates.
March 20 CIP Committee presents recommended CIP Budget to City Manager.
April 6 - April 10
Department Heads meet with City Manager and Finance Director for review of Budget requests.
April 9 Review and update funds based on results of Department Head budget meetings.
April 9 Update Final Payroll current year projection and payroll proposed budget numbers.
April 17 Last revision of estimated revenues and expenditures; impact on Funds.
April 20 Complete Capital Projects and Debt Service Budgets.
April 23 Meet with Finances & Services Committee on proposed budget.
April 27 - May 22
Finalize budget - all Funds; write Transmittal Letter; prepare final Budget document.
City of Missouri City, TexasFISCAL YEAR 2016 BUDGET CALENDAR
Preliminary General Fund Revenue projections for current and next fiscal year, by Finance Director.
Building Maintenance and Repair requests submitted to Bill Cronin.
Fleet Replacement Meeting - Review replacement schedule with Police, Fire, Public Works, Planning, and Parks.
Building Repair and Maintenance Meeting - Discuss departmental building repairs with all department heads or representatives.
Departmental I.T. requests submitted to Technology and Innovation Director.
Meeting with Technology and Innovation Director to discuss departmental I.T. requests.

City of Missouri City, TexasFISCAL YEAR 2016 BUDGET CALENDAR
April 30
May 20
May 29
June 1 Presentation of proposed budget to City Council.
June 15 Public Hearing on the Budget, Budget Ordinance, and Budget Adoption.
August 31 Budget Submitted to GFOA for annual Budget Presentation award.
Proposed budget, all Funds, filed with the City Secretary and submitted to City Council with City Manager's recommendations.
Meet with Finances & Services Committee on proposed budget.
Meet with Finances & Services Committee on proposed budget.

=============================== FY 2016 ANNUAL BUDGET =================================
i
TO: Honorable Mayor Owen and City Council FROM: Bill Atkinson, Acting City Manager DATE: May 29, 2015 RE: Proposed Fiscal Year 2016 Annual Budget and Financial Plan I am pleased to present to you the Proposed Budget for Fiscal Year 2016. This document represents many months of hard work by the City departments and the Leadership Team. This document is being presented in accordance with the City of Missouri City’s Home Rule Charter, which calls for:
“On or before the first day of June of each year the city manager shall submit to the council a proposed budget and an accompanying message. The council shall review the proposed budget and revise as deemed appropriate prior to general circulation for public hearing. [Further], the council shall adopt the budget by ordinance on one reading on or before the 25th day of June of each year. Adoption of the budget shall require an affirmative vote of at least a majority of all members of the whole council. Adoption of the budget shall constitute appropriations of the amounts specified therein as expenditures from the funds indicated and shall constitute a levy of the property tax therein proposed.”
The annual budget process and the resulting document are arguably the most important responsibilities of the City Council and City staff. This document serves four key roles in conveying the work program of the City Council and City organization to the citizens, business community and those who may wish to consider investing in or moving to the City. The first of these roles is the budget serves a policy document that provides information with respect to the policies, goals and objectives for the year, and further, it provides an explanation to the reader of the budget process that is undertaken. Second, the budget serves as a financial plan that provides explanation of the financial structure and operations and as a plan regarding the City’s major revenue sources and expenditures proposed for the year. The information presented is to provide projections for current year financial activity while also comparing these programs to the past for historical comparison. Third, the budget is to act as an operations guide for the relationship between the organization’s departmental programs, structure and staffing and the goals and objectives that have been defined elsewhere in the 2029 Strategic Plan and other guiding documents. Finally and most importantly, this budget document is utilized to comprehensively communicate and provide transparency to the public about how the organization operates within prescribed guidelines and recommended and accepted practices to achieve its goals.

=============================== FY 2016 ANNUAL BUDGET =================================
ii
Key Points Influencing Fiscal Year 2016 Budget Preparation:
Providing a base salary that’s market competitive for all City staff to retain current staff and attract the most highly skilled employees to Missouri City.
Maintaining the status of being one of the safest cities in Texas.
Providing quality City facilities that serve residents, staff, and visitors to the City and promote quality appearance of City facilities.
Providing recreation activities that are unique, fun, and available to all residents of the City, and equipment that is safe, clean, and well maintained.
Expanding technological improvements, where possible, and creating an organization where staff is provided the necessary technological resources to effectively and efficiently complete their job tasks.
Maintaining the current property tax rate while drawing down reserves, where necessary, to provide for increased services and service levels.
Incorporating the necessary services to maintain a beautiful City, such as adding funding for services to maintain existing, as well as new, medians and landscaped areas around the City.
As previously mentioned, the proposed budget takes into account the Missouri City 2029 Strategic Plan adopted by City Council in October 2014. This Plan sets the priorities for the Proposed Fiscal Year 2016 Budget. The Strategic Plan that has been developed and sets forth the direction and focus on issues that are important to improving Missouri City, and the plan sets priorities and determines a course for progress. As priorities within the Plan are accomplished, new priorities will be identified annually. Most importantly, the Plan includes indicators that measure progress for each of the strategic goals. In turn, each indicator of progress must be supported by regularly reported data. The staff will be providing feedback on the progress of the plan on a quarterly basis. Using these principles to guide the strategic planning process, each Strategic Plan goal is defined by prioritized objectives, which in part provides prioritized policy actions for what must be done to realize the goal. Each prioritized objective is defined by strategic initiatives that specifically states a desired outcome. While the vision, mission and goals of the Strategic Plan are intended to be enduring, the strategies expressed in the objectives and initiatives are intended to serve for a three- to five-year period. Each of these three-to five-year perspectives are then broken into annual budget funding programs and projects for consideration in the budget process. The 2029 Vision of the City and the goals over the next five year horizon are provided.
Missouri City Vision 2029
Missouri City is a great place to live: A premier community with inclusiveness, beautiful, safe and active / enjoyable living that has successful village centers at Texas Parkway and Sienna, a vibrant
town center at Highway 6 and the toll road and thriving major corridors.
Missouri City Goals 2014-2019 • Create a great place to live: safe, beautiful and active • Maintain a financially sound city government: Effective / Quality services and infrastructure • Grow Business Investments in Missouri City: More businesses, more jobs • Develop a high performance city team: Working together, producing results • Have a quality development through build-out: Active centers, neighborhoods, housing and
mobility

=============================== FY 2016 ANNUAL BUDGET =================================
iii
Recent Strategic Plan Initiatives As noted in the past, the City of Missouri City has been going through an evolution, changing from one considered a bedroom community to one that is now seeing significant growth and diversification in land use and revenues. This is important to Missouri City since the two primary sources of revenue for the City are property taxes that constitute 49% of all revenues collected and sales tax that brings in 21% of total revenues. In regard to the property tax distribution between residential and commercial, the City has been experiencing a positive trend in that residents are seeing a shift of the City’s largest single revenue source, property taxes, from solely residential to more distribution and investment on the commercial side. This has been as a result of the City having made great strides on one of the City’s five (5) Strategic Plan Goals for the next five (5) years with increased economic development. Accomplishment for Grow Business Investments in Missouri City goal: More business, more jobs:
First, property values have rebounded nicely across the City. Also, with the growth in commercial development, the revenue from commercial customers has grown in relationship to residential property, thus lowering the homeowner’s burden.
The City has aggressively marketed and sought out investment in the community over the past five years that has resulted in 25 new companies that have generated more than 800 new jobs.
As a result of the success of Lakeview Business Park, Trammell Crow has broken ground on 127 acres at Beltway 8 and Hwy 90A to develop Park 8-90 Business Park.
Houston Community College acquired property on Texas Parkway for a new campus that will result in the single largest capital investment in the corridor in the last 30 years. It is anticipated this project will generate future investment and development in the area.
The City received legislative support for the creation of Municipal Management District #2 for the development along the Fort Bend Tollway.
The City’s single greatest expenditure and resource are the employees that provide the services to the citizens, businesses and visitors to the City. The City employs 344 full-time employees and 27 part-time employees. The salaries and benefits for employees in the General Fund are $28,266,666, or 67%, of $42,348,670 of total expenditures in the General Fund. Fifty percent of the personnel expenditures are for those employees in the area of Public Safety, consisting of Fire and Police. Recognizing the importance of the employees to the performance of the City, there were several accomplishments this past year toward a goal in the Strategic Plan: Develop a high performance city team: Working together, producing results:
City Council adopted salary structures in the Police Department that will encourage retention of
existing personnel, and boost ongoing recruitment. This new structure will: 1) Increase the
salary of all sworn personnel below the proposed minimum of their new salary range, 2) Adjust
salaries by 2% for each full year of Time in Position for sworn officers in all ranks in the MCPD,
and 3) Set Intermediate, Advanced and Master Certification Pay to reflect an increase from $30,
$60 and $90 to $50, $100 and $150, respectively and adjust Instructor’s Certificate Pay from
$30 to $50 and SWAT Certification from $50 to $100. These new salary adjustments and
certification pay will be implemented at the beginning of Fiscal Year 2016.
In the FY 2015 Budget, there was a one-time lump-sum payment to employees that was
approved by the City Council and distributed to employees in November 2014. Employees
earning between $20,434/year (lowest salary on the Pay Plan) and $49,999/year received
$2,300; employees earning between $50,000/year and $74,499/year received $1,750;

=============================== FY 2016 ANNUAL BUDGET =================================
iv
employees earning between $75,000 and $99,999/year received $1,500; and employees
earning $100,000 or above received a payment of $1,250. No part of the one-time payment
was added to the employee’s based salary.
The changes in staffing from the prior fiscal year is the following:
o The addition of two full-time Innovation & Technology positions are added as a result of
eliminating a contract for help desk assistance. The savings from the elimination of the
contract will offset the cost for the two positions.
o Four part-time Detention Officer positions are converted to four full-time Detention Officer
positions.
o The reduction of two part-time positions in Legal were reduced, as well as one part-time
position in Municipal Court. The reduction of one of the Legal part-time positions and
the part-time Municipal Court position occurred during Fiscal Year 2015.
o Three 3 part-time Bailiff positions were added during Fiscal Year 2015. Funding for
these positions is from the Court Building Security Fund.
Have quality development through build-out: Active centers, neighborhoods, housing and
mobility:
The City had developed a master plan program for Bicycle Lane Installations throughout the City. The project included the connection of the east side of the City Limits to the Recreation Center and to the City Center and then to Highway 6 and to FM1092. This program consists of the installation bike lanes, shared route markings and wayfinding dots.
Construction of Thomas Taylor Parkway to connect Texas Parkway to Scanlin Road. This
project was identified on the adopted Major Thoroughfare Plan as a major collector, however, it was not a project identified as being on the 25 year priority list. The need for the roadway was driven more by adjacent development than traffic congestion. The adjacent land is currently undeveloped. The Thomas Taylor Parkway project consists of constructing a new roadway and sidewalks, including a new traffic signal on Texas Parkway.
Reconstruction of 4,500 linear feet of Turtle Creek. The project is currently under construction
and is anticipated to be complete by May 2016.
The completion of the design of the Vicksburg Boulevard extension. This project will connect the existing Vicksburg Boulevard to the Lake Olympia Parkway and will provide additional access and traffic mobility to the area. The project is currently under construction and is anticipated to be complete by January 2016.
The Hurricane Lane extension is being built with funds from Texas Department of Transportation
(TxDOT) to provide a connection from Trammel Fresno to Lake Olympia Parkway and provide an access onto the Fort Bend Toll Road. This will be built by TxDOT utilizing 80% federal funding, with the City contributing the other 20%. The project is to be constructed in Fiscal Year 2016.
Construction of a new 5.5 mile pipeline that will connect the Riverstone subdivisions and the
Colony Lakes area to the Regional Water Treatment Plant. This project will assist the City’s Groundwater Reduction Program meet the Fort Bend Subsidence District mandates to reduce dependency on groundwater. The project is currently under construction and is anticipated to be completed by January 2016.

=============================== FY 2016 ANNUAL BUDGET =================================
v
The Utility Division secured a long term water contract with Gulf Coast Water Authority to provide surface water to the Regional Water Treatment Plant. This plant was constructed to provide treated surface water to reduce the City’s dependency on groundwater per the Groundwater Reduction Program. This program is a result of the requirements to reduce dependency on groundwater by 30%, and ultimately 60%, by the Fort Bend Subsidence District.
The Utility Division was able to work with the Steep Bank/Flat Bank Wastewater Treatment Plant
participants to amend the current agreements to reduce the requested capacity to equal the capacity of the wastewater treatment plant, and no further expansion is necessary for the existing participants.
Budget Summary The total proposed budget for Fiscal Year 2016 for the City of Missouri City is $90,190,250, for all funds. The General Fund budget of $42,348,670 accounts for 47% of the total. The Utility Funds total $12,565,363 and account for 14% of the total. Governmental and Utility Capital Improvement Funds account for $12,049,936, or 13%, of the total, and the Debt Service Fund totals $9,749,208, accounting for 11%. In the General Fund, 50% of the total expenditures are allocated to Public Safety – Police and Fire. A total of 67% of the General Fund expenditures support expenses needed to fund personnel-related costs. The largest sources of revenue to the General Fund are property taxes (49%) and sales taxes (21%). At (9%), various franchise fees make up the third largest source of revenue to the General Fund. FY 2016 Proposed Budget Strategic Plan Initiatives Items in the Proposed FY 2016 Budget have been methodically identified in part by the 2029 Strategic Plan adopted by City Council in October 2014. The specific items incorporated into this year’s proposal are derived from the five year strategic plan that prioritizes the goals to be accomplished during the five year horizon. These goals are then prioritized into the annual goals for 2016, which are the basis for many of the projects and programs in the 2016 Proposed Budget.
Strategic Plan Goal Addressed: Develop a High Performance City Team: Working Together,
Producing Results
o The proposed budget includes a pay increase for full time City employees, which excludes sworn police personnel. This proposal calls for a 3% across the board increase, which totals $493,920 and includes related benefit costs and overtime cost for all non-sworn personnel in the City. This will be for all City employees who last received an adjustment to their salaries in 2013, and were awarded a one-time lump sum pay 2014, which did not affect their base salaries. The previously adopted Police Pay Plan, adopted during Fiscal Year 2015, will be effective at the beginning of Fiscal Year 2016.
o To insure the City continues to keep pace with the salary market for non-sworn City
positions, $55,000 is added to the proposed budget for a citywide classification & compensation study of positions, other than Police. This study will be started in the October timeframe. After study is completed in Fiscal Year 2016, the City will implement the proposed adjustments in the following fiscal year.

=============================== FY 2016 ANNUAL BUDGET =================================
vi
Strategic Plan Goal Addressed: Create a great place to live: safe, beautiful and active
o A total of $108,628 is added to the proposed budget for the conversion of 4 part-time Detention Officers to 4 full-time Detention Officers to free up patrol officers to provide patrol duties in the community, instead of manning the jail. This will assist the Police Department in its efforts to meet the current goal of 50% proactive, preventative patrol.
o In order to comply with the recommendation of the ISO consultant to add one firefighter per
shift and move the EMS squad to full time status, the budget includes $187,327 to remove Kelly Days firefighters currently work. This will produce savings in operational costs and will reduce the number of responses of a large apparatus, creating an immediate savings, as well as extending the life of the larger apparatus.
o Funding totaling $14,500 for an ISO consultant for Phases II and III of the re-grading and re-
evaluation of the community is proposed in the budget. ISO attempted to conduct an evaluation of the community in 2014. The last time a rating was completed was in 2006. Phases II and III will be conducted in calendar year 2015. Without completion of these two final phases, there is a possibility of a downgrading in rating, leading to an increase in fire insurance rates of residents and businesses.
o Funding total $12,000 is added for an Emergency Notification System. This system will allow
Emergency Management the ability to record, send, and track personalized voice, email, text, and social media messages to thousands of citizens, and staff, in a matter of minutes.
o A total of $132,795 is included for 55 digital two-way handheld radios for non-public safety staff. This amount includes $4,700 for one base station radio. Staff are currently using radios that operate off an analog system, which in the future will not be able to communicate with public safety staff when public safety makes the mandated change to a digital format. The radios on the digital system can communicate with the radios on the analog system, however the radios on the analog system will not be able to communicate with the digital radios. Non-public safety departments to receive these radios include Public Works, Parks, and Permits.
Strategic Plan Goal: Maintain a financially sound city government: Effective / Quality
services and infrastructure o In Parks and Recreation, the painting of Pavilion #3 and Gazebo frames at Community Park
is funded in the proposed budget at $26,860. Also included is $20,000 for a bed maintenance contract to improve the appearance of existing and newly installed landscaped areas within the City. A total of $25,000 is added to the budget for the repair of tennis courts at the Recreation Center. This repair will provide the necessary overlay and capping of some of the courts to provide a safer and more level playing surface.
o A total of $64,400 is included for various citywide facility maintenance related projects.
o Due to the growth of the City and the ongoing day-to-day storage needs of the City, funding
for the replacement of the City’s storage is included in the I.T. Replacement Fund. The total cost of the project is $325,000, however the funding for this project will be spread out over multiple years through lease-purchase financing. This project will affect all City departments.

=============================== FY 2016 ANNUAL BUDGET =================================
vii
o Staff will continue working on the assessment of the City’s existing facilities to determine
current utilization and if current needs are being met, if there are any existing facilities that are being underutilized, and how future needs can be met. The assessment will be utilized to assist in making city-wide facility decisions for long term maintenance and programming for capital improvements. The survey and assessment will be conducted in the 2nd and 3rd quarters of Fiscal Year 2016.
o The Community Center Renovation will continue into the Fiscal Year 2016. The renovation
will consist of auditorium lighting upgrades, polished concrete flooring, ceiling upgrades, painting, and lobby upgrades. Some doors will be replaced with windows, and the administration area will be changed into a mini-conference room. Landscaping and improvements to the entryway will also be included.
o The City Hall and Planning buildings roofs are in need of repairs to mitigate various leaks through the buildings. Some funds were utilized in Fiscal Year 2015 to investigate and provide some design services. The remaining funds and additional funds budgeted in Fiscal Year 2016 will be utilized to conduct planned improvements over the Community Center. This project will coincide with the Community Center Renovation.
o In 2013, the City conducted the most recent update to the condition assessment of our roads. This program is one facet that is utilized to develop and recommend roadways for maintenance, repair, or replacement. The program has set the benchmark to evaluate the roads every 3-5 years.
o The Gregory Street project reconstructs 8,000 linear feet of Gregory Boulevard. The
roadway is approaching its expected service life. Maintenance and rehabilitation are not cost-effective at this point and a complete reconstruction will be necessary. Construction is planned for the summer of 2015.
o The Turtle Creek reconstruction project includes the reconstruction of 4,500 linear feet of
Turtle Creek Drive from Hilton Head to Mission Valley. The roadway has reached its expected service life, and maintenance and rehabilitation are no longer cost-effective. A complete reconstruction is necessary. Construction is planned for the summer of 2015.
o During Fiscal Year 2016, equipment for drainage projects will include the purchase of a
street sweeper, which will replace the two existing units that have reached the end of their useful life. The vendor of the existing sweepers has proposed to purchase both existing units and they will be used to help offset the cost of the new street sweeper.
o Another project affecting all City departments that’s included in the proposed budget is the
MPLS WAN network upgrades needed to ensure improvements are added to the City’s network as the City grows and changes. The total year 1 cost is $75,000. The year 2 cost will be the same amount. The funding for this project will be spread out over multiple years through lease-purchase financing.

=============================== FY 2016 ANNUAL BUDGET =================================
viii
Comparison of Budget for FY 2016
General Fund
FY 2013 (Actual)
FY 2014 (Actual)
FY 2015 Original Budget
FY 2015
Estimated Actual
FY 2016
Proposed Budget
Beginning of Year Fund Balance
$8,415,238 $8,419,424 $8,834,893 $8,952,169 $7,807,447
Revenues $32,456,066 $34,297,670 $38,531,087 $38,733,955 $42,086,137
Expenditures – Base Budget
($31,652,653) ($33,764,925) ($39,386,459) ($39,878,677) ($42,348,670)
Net Revenues Over/(Under) Expenditures
$4,188 $532,745 ($855,372) ($1,144,722) ($262,533)
Ending Of Year Fund Balance
$8,419,424 $8,952,169 $7,979,521 $7,807,447 $7,544,914
Percentage of Fund Balance to Budgeted Revenues
25.94% 26.10% 20.71% 20.16% 17.93%
Debt Service Fund Summary: Total budgeted expenditures from the Debt Service Funds are for payments for issued general obligation bonds and certificates of obligations, including other associated payments, which total $9,108,555. The Debt Service Fund balance is projected to be $5.3 million dollars on June 30, 2016, or 58% of the annual scheduled debt payments. Because of this healthy Debt Service Fund Balance, and due to the refunding of some bonds and certificates of obligation since the tax rate was established for the 2015 budget, the Fiscal Year 2016 budget is proposed with a slight decrease of $0.00624 to the Interest & Sinking Tax Rate.
Comparison of Budget for FY 2016
Debt Service
Fund
FY 2013 (Actual)
FY 2014 (Actual)
FY 2015 Original Budget
FY 2015 Estimated
Budget
FY 2016 Proposed
Budget
Beginning of Year Fund Balance
$6,704,908 $5,750,142 $5,269,021 $5,559,287 $5,804,147
Revenues $7,338,396 $8,360,806 $9,683,477 $8,907,336 $9,214,636
Expenditures ($8,619,322) ($8,755,751) ($8,709,016) ($9,183,650) ($9,749,208)
Other Financing Sources
$326,160 $204,089 $118,049 $521,174 $0
End of Year Fund Balance
$5,750,142 $5,559,287 $6,243,482 $5,804,147 $5,269,575


CITY OF MISSOURI CITY FY 2016 SIGNIFICANT BUDGET HIGHLIGHTS
Strategic Goal Addressed: Develop A High Performance City Team Police Salary Increase - $1,281,612
Based on the findings of a recently commissioned compensation analysis performed by Segal-Waters Consulting, the proposed budget includes pay increases for sworn MCPD employees. Funding includes benefits and related increase in overtime cost. These adjustments are needed to remain market competitive and to ensure internal equity within the department.
Police Certification Pay Increase - $100,819 The proposed budget also includes funding for Certification, Instructor, and SWAT monthly pay adjustments. For Intermediate, Advanced, and Master Certification Pay, the monthly increase is from $30, $60, and $90 to the proposed amount of $50, $100, and $150, respectively. The Instructor Certification Pay increases from $30 to $50, and SWAT Certification Pay increases from $50 to $100.
Non-Sworn Employee Pay Increase - $493,920 Included in the budget is a 3% pay increase for full time City employees, which excludes sworn Police. The budgeted amount includes related benefit costs and overtime cost. The last time City employees received an adjustment to their salaries was in 2013. In 2014, City employees were awarded a one-time lump sum pay, which did not affect their base salary.
Classification & Compensation Study - $55,000
The City will have a classification & compensation study conducted for all City positions, other than sworn Police. The study will begin in the October timeframe. After the study is completed in Fiscal Year 2016, the City will implement the proposed adjustments in the following fiscal year.
Strategic Goal Addressed: Create A Great Place To Live Conversion of Part-Time Detention Officers to Full-Time - $108,628
A total of 4 part-time Detention Officers will be converted to 4 full-time Detention Officers to free up patrol officers to provide patrol duties in the community, instead of manning the jail. This will assist the Police Department in its efforts to meet the current goal of 50% proactive, preventative patrol.
Remove Kelly Days and Move Squad to Full-Time Status - $187,327 In order to comply with the recommendation of the ISO consultant to add one firefighter per shift and move the EMS squad to full time status, the budget includes
1

funding to remove Kelly Days firefighters currently work. This will produce savings in operational costs and will reduce the number of responses of a large apparatus, creating an immediate savings, as well as extending the life of the larger apparatus.
ISO Consultant Phase II and III - $14,500 Funding for an ISO consultant for Phases II and III of the re-grading and re-evaluation of the community is proposed in the budget. ISO attempted to conduct an evaluation of the community in 2014. The last time a rating was completed was in 2006. Phases II and III will be conducted in calendar year 2015. Without completion of these two final phases, there is a possibility of a downgrading in rating, leading to an increase in fire insurance rates of residents and businesses
Emergency Notification System - $12,000 A new Emergency Notification System will allow Emergency Management the ability to record, send, and track personalized voice, email, text, and social media messages to thousands of citizens, and staff, in a matter of minutes.
Digital two-way Handheld Radios - $132,795
A total of 55 digital two-way handheld radios for non-public safety staff is included in the budget. This amount includes $4,700 for one base station radio. Staff are currently using radios that operate off an analog system, which in the future will not be able to communicate with public safety staff when public safety makes the mandated change to a digital format. The radios on the digital system can communicate with the radios on the analog system, however the radios on the analog system will not be able to communicate with the digital radios. Non-public safety departments to receive the digital radios are Public Works, Parks, and Permits.
Thermal Imaging Camera Replacement - $20,000
The replacement of two thermal imaging cameras is included in the proposed budget. These cameras have reached their useful life. They are basic pieces of life-saving equipment on fire engines. Among other things, these cameras allow firefighters to find victims in smoke filled buildings that have no visibility.
Bed Maintenance Contract - $20,000 This will allow for the improvement of the appearance of existing and newly installed landscaped areas of the City. It will also include medians on the roadways, such as Texas Parkway and Thomas Taylor Parkway.
Replace Tables & Chairs at Community Center & Rec. Center - $15,000 This funding will begin a replacement program for the replacement of tables and chairs at the Community Center and Recreation Center. These tables and chairs haven’t been replaced in five year. They are used a lot by City staff for meetings, and they’re also used for special events. Council members, as well as community groups and children uses these tables and chairs.
2

OSSI Sex Offender Registration Module - $11,488 This module will assist the Police Department’s Criminal Investigation Division in managing the City’s registered sex offenders. The module will generate required monthly reports to ensure registered sex offenders comply with the recently adopted City ordinance.
Tennis Court Repairs at Recreation Center - $25,000 Some of the tennis courts are in need of renovation to create a safer and more level playing surface. This funding will allow for a two inch overlay and capping of some of the courts.
Fitness Equipment Replacement at Recreation Center - $25,000 Some of the elliptical machines and treadmills have reached their useful life, as dictated by industry standards, and are in need of replacement. This funding will replace three elliptical machines and three treadmills.
Improvements to Parks and Parkland Areas - $195,616 In the Parkland Dedication Zone Fund, various items are funded and include South Gessner Beautification, Bicentennial Park Electrical Upgrades, Bicentennial Park Security Lights, Oyster Creek Outdoor Exercise Equipment, American Legion Park Outdoor Equipment, and Lexington Creek Park Trail Upgrades.
Police Seizure Fund Special Use Funding - $220,000 In the Narcotics Seizure Fund, funding will be utilized for general equipment/building security ($100,000), investigative/tactical equipment ($50,000), crime prevention & training ($50,000), and firearms ($20,000). Funds in this special revenue fund can only be used for law enforcement purposes.
Strategic Goal Addressed: Maintain A Financially Sound City Government
Maintenance of Various City Facilities - $64,400 Funding for various citywide facility maintenance related projects are included in the proposed budget. These projects range from the construction of an office for the Finance Director and Assistant Finance Director, to smaller projects such as installing window blinds in the Permit Division’s lobby.
Painting of Pavilion #3 and Gazebo frames at Community Park - $26,860
At the Community Park, this funding will clean, prime, and paint Pavilion #3 and the Gazebo frames. The frames have not been painted in over ten years. This will create a quality appearance of these structures.
I.T. Storage and Citywide Network Upgrades - $150,000
Due to the growth of the City and the ongoing day-to-day storage needs of the City, funding for the replacement of the City’s storage is included in the I.T. Replacement Fund. The total cost of the project is $325,000, however the funding for this project
3

will be spread out over three years through lease-purchase financing. This project will affect all City departments.
Citywide Network Upgrades - Another project affecting all City departments that’s included in the proposed budget is the MPLS WAN network upgrades needed to ensure improvements are added to the City’s network as the City grows and changes. The total year 1 cost is $75,000. The year 2 cost will be the same amount as year 1. The funding for this project will be spread out over multiple years through lease-purchase financing.
Netmotion Mobility Licenses - $15,000
This software gives City employees reliable, secure wireless connectivity. It is self-diagnosing and healing. Without this software there could be frequent connection drops that lose critical data and require repeated log-ons for restarting of applications.
4

CITY OF MISSOURI CITY, TEXAS
FY 2016 STAFFING
AUTHORIZED BY DEPARTMENT
FY 2014 FY 2015 FY 2016 FY 2016 FY 2014 FY 2015 FY 2016 FY 2016
BUDGET REVISED REQUEST PROPOSED BUDGET REVISED REQUEST PROPOSED
GENERAL GOVERNMENT101 Council and Management 3 4 4102 City Secretary 4 4 4103 Human Resources/Organ. Dev. 3 3 1 3 1 1 1104 Legal 4 4 4 2 1106 Municipal Court 6 6 6 2 1 1108 Communications 8 8 8 2 1 1109 Economic Development 1 1 1
Total General Government 29 30 1 30 7 4 0 3
FINANCE110 Finance Administration 1 1 1112 Purchasing & Risk Management 3 3 3114 Accounting & Budget 12 13 13 1 1 1
Total Finance 16 17 0 17 1 1 0 1
POLICE120 Police Administration 10 10 3 9 2 2 1122 Code Enforcement 6 7 7124 Support Services 23.2 23.2 7 23.2 1126 Criminal Investigation 28 28 6 28128 Patrol 64 64 32 69 4 (4)
Total Police 131.2 132.2 48 136.2 2 6 (4) 2
FIRE & RESCUE SERVICES130 Administration 3 3 1 3132 Fire Prevention 4 4 3 4134 Training/Education 1 1 1 1 1 1 1136 Operations 70 70 1 70
Total Fire 78 78 6 78 1 1 0 1
PUBLIC WORKS140 Administration 9 4 1 4141 Capital Projects 0 3 3142 Streets/Drainage/Traffic Control 13 13 13143 Engineering/Utilities Planning 0 3 3144 Geographic Information Services 4 4 4 1 1 1145 Fleet Maintenance 4 4 1 4146 Facilities Maintenance 4 4 2 4148 Animal Services 3 3 1 3
Total Public Works 37 38 5 38 1 1 0 1
PARKS & RECREATION150 Parks 11 11 11152 Recreation 7 7 7 13 13 13
Total Parks & Recreation 18 18 0 18 13 13 0 13
PLANNING160 Planning & Development 5 4 2 4 1 1 1162 Inspections & Permits 13 13 3 13 1 1 1
Total Planning 18 17 5 17 2 2 0 2INNOVATION & TECHNOLOGY
170 Innovation & Technology 7 7 3 9 1 1 1Total Innovation & Technology 7 7 3 9 1 1 0 1
334.2 337.2 68 343.2 28 29 -4 24
220 Radio Communications 0.8 0.8 0.8221 Court Building Security 3 3
Total Special Revenue Funds 0.8 0.8 0 0.8 0 3 0 3
TOTAL ALL FUNDS 335 338 68 344 28 32 -4 27
Part-Time Positions
GENERAL FUND
SPECIAL REVENUE FUND
TOTAL GENERAL FUND
Full-Time Positions
5

6

FY 2015 FY 2015 FY 2016
FY 2014 Original Year-End Proposed
Actual Budget Estimate Budget
TAXABLE VALUE 4,503,528,666 5,014,888,533 5,244,388,067 5,622,952,271
TIRZ #1, #2, & #3 VALUE 0 310,451,969 332,119,225 358,688,763
4,503,528,666 4,704,436,564 4,912,268,842 5,264,263,508
Collection Percentage 98.3% 95.0% 98.3% 98.3%LEVY
General Fund Levy 17,130,522 17,894,736 19,015,049 20,705,717
Debt Service Levy 8,708,473 9,096,969 8,739,270 9,037,372
Total Levy, incl. TIRZ #1, #2, #3 25,838,995 28,772,923 29,630,793 31,769,680
Current Collections - General 15,687,574 17,000,000 18,691,793 20,353,720
Current Collections - TIRZ #1 488,667 490,726 492,587 533,096
Current Collections - TIRZ #2 891,305 863,000 975,123 1,034,034
Current Collections - TIRZ #3 360,741 338,431 401,355 425,009
Current Collections - Debt Service 7,974,929 8,642,121 8,590,703 8,883,736
Total Current Collections 25,403,215 27,334,278 29,151,560 31,229,596
TAX RATE SUMMARY
General Fund 0.38038 0.38038 0.38709 0.39333
Debt Service 0.19337 0.19337 0.17791 0.17167
TOTAL 0.57375 0.57375 0.56500 0.56500
ESTIMATION AND DISTRIBUTION OF PROPERTY TAX ASSESSMENT
as of 2014 Tax Year
7

8

GENERAL FUND SUMMARY SCHEDULE OF REVENUES, EXPENDITURES
AND NET CHANGE IN FUND BALANCE
Fund 101
FY 2014
Actual
FY 2015
Original
Budget
FY 2015
Year-End
Estimate
FY 2016
Proposed
Budget
REVENUES BY SOURCE
AD VALOREM TAXES 16,099,339 18,581,850 19,120,823 20,803,755
OTHER TAXES 7,708,738 8,020,000 8,342,842 8,850,000
LICENSES & PERMITS 1,941,428 1,701,300 2,031,740 2,076,900
FINES & FORFEITURES 837,891 930,600 845,258 942,140
FRANCHISE FEES 3,867,029 3,725,000 3,852,232 3,940,000
INTERGOVERNMENTAL REVENUES 178,996 1,731,700 169,223 2,054,890
OTHER REVENUES 2,308,832 2,373,670 2,921,972 1,941,644
OTHER FINANCING RESOURCES 1,355,417 1,466,967 1,449,865 1,476,808
TOTAL REVENUES AND RESOURCES 34,297,670 38,531,087 38,733,955 42,086,137
EXPENDITURES BY DEPARTMENT
GENERAL GOVERNMENT 3,988,036 4,921,164 3,815,829 4,659,250
FINANCE 1,719,586 1,657,174 1,570,713 1,691,953
POLICE 12,078,267 11,738,852 12,025,992 13,319,186
FIRE 7,327,756 7,774,335 8,184,617 7,918,581
PUBLIC WORKS 4,089,968 6,147,816 6,565,822 6,564,556
PARKS & RECREATION 2,737,533 2,479,527 2,539,229 2,726,171
DEVELOPMENT SERVICES 1,349,109 1,372,575 1,371,181 1,259,111
INNOVATION & TECHNOLOGY - 2,173,166 2,424,760 2,715,921
OTHER FINANCING USES 474,669 1,121,850 1,380,534 1,493,941
TOTAL EXPENDITURES BY DEPARTMENT 33,764,925 39,386,459 39,878,677 42,348,670
NET REVENUES OVER/(UNDER) EXPENDITURES 532,745 (855,372) (1,144,722) (262,533)
BEGINNING FUND BALANCE, JULY 1 8,419,424 8,834,893 8,952,169 7,807,447
ENDING FUND BALANCE, JUNE 30 8,952,169 7,979,521 7,807,447 7,544,914
Fund Balance as a % of Revenues and Resources 26.10% 20.71% 20.16% 17.93%
9

Fund 101
FY 2014
Actual
FY 2015
Original
Budget
FY 2015
Revised
Budget
FY 2015
Year-End
Estimate
FY 2016
Proposed
Budget
PROPERTY TAXES & PENALTIES
41001 PROPERTY TAX - CURRENT* 15,687,574 18,121,850 19,045,936 18,691,783 20,353,755
41002 PROPERTY TAX - DELINQUENT* 242,889 250,000 250,000 251,586 260,000
41003 PROPERTY TAX - PENALTIES 118,150 150,000 150,000 129,800 135,000
41004 PROPERTY TAX - INTEREST - - -
41005 PROPERTY TAX - ATTORNEY FEES 47,594 60,000 60,000 47,654 55,000
41010 PROPERTY TAX - MISCELLANEOUS 3,132 -
TOTAL AD VALOREM TAXES 16,099,339 18,581,850 19,505,936 19,120,823 20,803,755
OTHER TAXES
42001 CITY RETAIL SALES TAX 7,760,947 8,000,000 8,000,000 8,470,244 8,980,000
42002 CITY SALES TAX - REBATE (102,026) (10,000) (10,000) (162,419) (170,000)
42003 STATE BEVERAGE TAX 49,817 30,000 30,000 35,017 40,000
TOTAL OTHER TAXES 7,708,738 8,020,000 8,020,000 8,342,842 8,850,000
LICENSES & PERMITS
43001 ZONING VARIANCES 300 600 600 500 300
43002 ZONING AMENDMENTS 16,651 20,000 20,000 16,583 20,000
43003 PLAT FEES 82,385 65,000 65,000 97,436 100,000
43004 RECALL INSPECTION FEES 17,725 15,000 15,000 7,662 16,000
43005 GENERAL FIRE INSPECTION 18,859 17,000 17,000 11,165 15,000
43006 BUILDING PERMITS 581,518 435,000 435,000 627,984 580,000
43007 CHANGE OF OCCUPANCY 9,775 8,000 8,000 8,739 9,000
43008 PLUMBING PERMITS 120,450 100,000 100,000 103,456 110,000
43009 ELECTRICAL PERMITS 110,962 100,000 100,000 103,242 110,000
43010 AIR CONDITIONING PERMITS 120,688 95,000 95,000 115,954 115,000
43011 POOL PERMITS 3,100 3,000 3,000 3,798 3,500
43012 SIGN PERMITS 26,710 25,000 25,000 23,764 25,000
43013 ELECTRICAL LICENSE (465) - - - -
43014 PLAN CHECK FEES 254,666 200,000 200,000 252,919 290,000
43015 AFTER HOURS INSPECTIONS 15,935 7,500 7,500 19,316 20,500
43016 LIQUOR LICENSES 8,075 8,000 8,000 11,814 8,900
43017 SOLICITORS LICENSES 3,200 - - 775 3,000
43018 INFRASTRUCTURE FEES 192,012 250,000 250,000 249,151 265,500
43019 LIEN REIMBURSEMENT 2,538 500 500 8,300 2,000
43020 HEALTH PERMITS 111,061 95,000 95,000 95,000 95,000
43021 HOUSING CODE INSPECTIONS - - - - -
43022 PUB WRKS AFTER HRS INSP. - - - - -
43023 SIENNA PLANTATION-PRORATION 61,449 62,000 62,000 62,350 62,000
43024 CONTRACTOR REGISTR FEE 51,961 65,000 65,000 52,485 60,000
43025 DESIGN REVIEW FEE 30,894 20,000 20,000 25,919 31,500
43026 PUB WORKS PLAN REVIEW FEE 21,320 30,000 30,000 88,890 75,000
43027 RIVERSTONE INSPECTION FEE 33,200 19,700 19,700 14,538 19,700
43028 HOUSING RENTAL REGISTRATION 46,460 60,000 60,000 30,000 40,000
TOTAL LICENSES & PERMITS 1,941,428 1,701,300 1,701,300 2,031,740 2,076,900
FINES & FORFEITURES
44001 FINES 637,413 700,000 700,000 649,930 725,000
44002 FORFEITURES - - -
44003 WARRANT FEES 47,259 60,000 60,000 43,413 50,000
44004 DDC-INSURANCE 10,528 15,000 15,000 13,285 18,500
44005 ADMINISTRATIVE FEES 16,304 32,000 32,000 10,000 10,000
44006 ARREST FEES 40,473 40,000 40,000 48,075 48,500
44007 CASH/OVER & UNDER 20 - - 40 40
44009 MISC MUNICIPAL COURT FEES 1,118 500 500 479 500
SCHEDULE OF REVENUES AND RESOURCES BY LINE ITEM
GENERAL FUND
10

Fund 101
FY 2014
Actual
FY 2015
Original
Budget
FY 2015
Revised
Budget
FY 2015
Year-End
Estimate
FY 2016
Proposed
Budget
SCHEDULE OF REVENUES AND RESOURCES BY LINE ITEM
GENERAL FUND
44010 COLLECTION AGENCY FEES 47,721 50,000 50,000 44,500 51,500
44011 JUDICIAL EFFICIENCY 3,017 4,000 4,000 3,186 3,500
44012 LOCAL-NO RESTRICTION 23,888 25,000 25,000 21,979 24,000
44013 OVER PAYMENT - - -
44014 COURT TECHNOLOGY FEE - - -
44015 MOTOR CARRIER FINES 10,251 4,000 4,000 10,371 10,500
44016 OVERWEIGHT VEHICLE FINES (100) 100 100 - 100
TOTAL FINES & FORFEITURES 837,891 930,600 930,600 845,258 942,140
FRANCHISE FEES
45001 GAS 412,869 350,000 350,000 375,071 415,000
45002 TELEPHONE 280,813 350,000 350,000 375,501 350,000
45003 ELECTRIC 2,085,433 2,000,000 2,000,000 2,062,107 2,050,000
45004 CABLE TV 828,846 675,000 675,000 720,879 775,000
45007 FRANCHISE - SOLID WASTE 259,068 350,000 350,000 318,674 350,000
TOTAL FRANCHISE FEES 3,867,029 3,725,000 3,725,000 3,852,232 3,940,000
INTERGOVERNMENTAL REVENUES46108 STEP 2013 WAVE DWI 2,071
46201 MISCELLANEOUS GRANTS
47101 FIRE DEPT REIMB. 145,107 200,000 200,000 145,107 175,000
47105 ANIMAL CONTROL REIMB. 20,088 1,700 1,700 13,959 12,500
47106 HCC LEASE REIMBURSEMENT -
47107 STA-MO LEASE REIMB. 11,730 30,000 30,000 10,157 12,240
47115 FIRE STA 5 SIENNA REIMB - 1,500,000 1,500,000 - 1,855,150
TOTAL INTERGOVERNMENTAL REVENUES 178,996 1,731,700 1,731,700 169,223 2,054,890
OTHER REVENUES - - -
49000 INTEREST INCOME 142,544 130,000 130,000 122,123 125,000
49001 CASH OVER/UNDER-CASHIERS 96 100 100 5 100
49002 MAPS 30 -
49003 MISSOURI CITY HISTORY BKS 88 20 20 41 90
49004 DONATION-50TH ANNIVERSARY - - 30
49005 CHILD SAFETY FEES 78,962 70,000 70,000 84,000 85,000
49006 CITY SECRETARY DEPT MISC - 200 200
49007 DONATION-ECONOMIC DEV -
49008 TOWER LEASE 46,415 50,000 50,000 49,675 48,500
49009 MCTV SPONSORSHIPS -
49010 ANCILLARY SERVICES REFUND 8,143
49101 NSF CHECK ALLOWANCE 840 800 800 760 800
49102 SALE OF SALVAGE 586 4,000 4,000 4,369 500
49103 INSURANCE REIMBURSEMENT 8,424 5,000 5,000 27,191 8,000
49104 LATE FEES - 200 200 67 100
49105 DISASTER REIMBURSEMENT -
49106 UNAPPLIED PERSONNEL COSTS - 350,000 350,000 350,000 350,000
49107 PCARD REBATE 119,420 120,000 120,000 115,000 115,000
49108 PURCHASING MISCELLANEOUS - 500 500 167 200
49109 PERMITTED BURGLAR FALSE ALARM 62,150 60,000 60,000 65,437 65,000
49110 UNPERM. BURGLAR FALSE ALARM 2,900 2,000 2,000 5,512 5,000
49111 ALARM PERMIT REGISTRATION FEES 353,850 350,000 350,000 350,000 355,000
49112 PERMITTED FIRE FALSE ALARMS - - -
49113 UNPERMITTED FIRE FALSE ALARMS - - - 38,113 32,500
49120 ALARM BILL COLLECTION FEE 6,285 4,000 4,000 4,965 4,800
49122 LEADERSHIP EVENTS 4,412 8,400 8,400 5,000 5,000
49123 INS TRUST PREMIUM REFUNDS 17,402 -
11

Fund 101
FY 2014
Actual
FY 2015
Original
Budget
FY 2015
Revised
Budget
FY 2015
Year-End
Estimate
FY 2016
Proposed
Budget
SCHEDULE OF REVENUES AND RESOURCES BY LINE ITEM
GENERAL FUND
49200 MISC - POLICE 12,874 14,000 14,000 11,500 22,500
49201 DONATIONS - POLICE - - - -
49202 POLICE DEPT MISCELLANEOUS 13,868 8,000 8,000 11,000
49203 POLICE SEMINARS 7,300 - - 425 500
49204 PROTECTOR MEMORIAL PAVERS (121) 50 50 1,308 350
49300 DONATIONS - FIRE - -
49301 FIRE DEPT MISCELLANEOUS 972 - -
49302 FIRE SEMINARS - - -
49303 FIRE DIST PROTECTION PMTS 989,207 850,000 850,000 1,130,418 246,654
49304 FIRE CLEAN UP FEES - - - 24,000 21,000
49400 ANIMAL LICENSE FEES 2,275 2,500 2,500 2,481 2,500
49403 TRAFFIC CONTROL OPERATION 9,900 10,800 10,800 10,800 10,800
49405 STREETS DEPT MISCELLANEOUS 57,598 - - 9,580 1,000
49406 ENGINEERING DEPT MISCELLANEOUS - -
49411 DONATIONS - ANIMAL CONTROL -
49501 REC LEISURE CLASSES 104,357 90,000 90,000 115,000 110,000
49502 ATHLETIC LEAGUE FEES 11,682 15,000 15,000 10,517 12,000
49503 RECREATION CENTER FEES 155,287 150,000 150,000 155,000 150,000
49504 SPECIAL EVENTS 8,317 8,000 8,000 8,410 8,200
49505 REC - ADVERTISING FEES -
49506 FACILITIES RENTAL 64,389 70,000 70,000 70,000 65,000
49508 RECYCLING
49509 DONATIONS - PARKS -
49510 DONATIONS-URBAN FORESTRY -
49512 PARKS DEPT MISCELLANEOUS 45
49513 RECREATION DEPT MISCELLANEOUS 1,467 300 300 890 1,350
49515 DONATION-MC DAY @ CAPITOL
49520 STORMWATER MANAGEMENT 24,000 24,000
49600 MISCELLANEOUS 25,055 - - 105,800 65,000
TOTAL OTHER REVENUES 2,308,832 2,373,670 2,373,670 2,921,972 1,941,644
OTHER FINANCING RESOURCES
49905 TRANSFER FROM FUND 220 24,785 24,785 24,785 40,011
49906 TRANSFER FROM FUND 223 31,955 41,194 41,194 41,194 41,194
49908 TRANSFER FROM FUND 260 100,000 100,000 100,000 100,000 100,000
49909 TRANSFER FROM FUND 261 46,555 24,536 24,536 24,629 24,911
49910 TRANSFER FROM FUND 262 46,949 43,150 43,150 48,756 48,927
49911 TRANSFER FROM FUND 265 29,559 16,922 16,922 20,068 20,513
49916 TRANSFER FROM FUND 401 800,000 800,000 800,000 800,000 800,000
49934 TRANSFER FROM FUND 506 (SB/FB) 26,000 40,000 40,000 40,000 40,000
49924 TRANSFER FROM FUND 540 269,011 309,080 309,080 283,133 293,952
49926 TRANSFER FROM FUND 505 45,000 45,000 45,000 45,000
49937 TRANSFER FROM FUND 575 (HOT) 5,388 6,300 6,300 6,300 6,300
49938 TRANSFER FROM FUND 580 (SOLID WASTE) 16,000 16,000 16,000 16,000
TOTAL OTHER FINANCING RESOURCES 1,355,417 1,466,967 1,466,967 1,449,865 1,476,808
TOTAL REVENUES AND RESOURCES 34,297,670 38,531,087 39,455,173 38,733,955 42,086,137
12

GENERAL FUND-SUMMARY
EXPENDITURES BY DEPARTMENT/DIVISION
Fund 101
FY 2014
Actual
FY 2015
Original
Budget
FY 2015
Revised
Budget
FY 2015
Year-End
Estimate
FY 2016
Proposed
Budget
PERSONNEL 22,737,480 26,564,185 26,558,880 25,924,420 28,266,666
COMMODITIES 3,418,055 4,076,880 4,470,563 4,406,269 4,392,139
CONTRACTUAL SERVICES 5,601,506 4,951,854 5,299,971 5,364,717 5,726,875
OTHER SERVICES 1,303,230 2,600,190 2,630,524 1,721,041 2,357,628
CAPITAL OUTLAY 229,985 71,500 1,085,696 1,081,696 111,421
OTHER FINANCING USES 474,669 1,121,850 1,121,850 1,380,534 1,493,941
TOTAL 33,764,925 39,386,459 41,167,484 39,878,677 42,348,670
101-10-101 COUNCIL & MANAGEMENT 890,999 866,397 880,043 810,983 988,953
101-10-102 CITY SECRETARY 390,208 348,484 377,041 347,214 340,632
101-10-103 HUMAN RES. & ORG DEV 507,873 561,775 599,407 576,491 645,590
101-10-104 LEGAL 618,466 625,383 609,233 560,151 583,531
101-10-106 MUNICIPAL COURT 742,245 592,649 603,539 510,732 539,221
101-10-107 CONTINGENCY 499,116 2,002,130 1,921,469 1,409,780 2,029,861
101-10-108 COMMUNICATIONS 629,964 681,007 686,721 613,120 647,799
101-10-109 ECONOMIC DEVELOPMENT 183,835 365,189 365,189 367,892 377,604
TOTAL GENERAL GOVERNMENT 4,462,706 6,043,014 6,042,642 5,196,363 6,153,191
101-12-110 FINANCE ADMINISTRATION 245,321 250,845 254,702 244,062 254,534
101-12-112 PURCHASING & RISK MNGT 239,435 214,205 216,214 201,737 216,623
101-12-114 ACCOUNTING 1,234,830 1,192,124 1,200,004 1,124,914 1,220,796
TOTAL FINANCE 1,719,586 1,657,174 1,670,920 1,570,713 1,691,953
101-13-120 POLICE ADMINISTRATION 1,134,821 1,215,365 1,281,505 1,171,987 1,210,440
101-13-122 CODE ENFORCEMENT 396,505 467,772 467,821 399,575 493,031
101-13-124 SUPPORT SERVICES 1,575,994 1,534,486 1,747,163 1,938,331 1,698,626
101-13-126 CID 2,650,308 2,568,518 2,570,566 2,521,805 2,985,354
101-13-128 PATROL 6,320,639 5,952,711 5,975,716 5,994,294 6,931,735
TOTAL POLICE 12,078,267 11,738,852 12,042,771 12,025,992 13,319,186
101-14-130 ADMINISTRATION 543,489 369,602 382,846 383,191 381,154
101-14-132 PREVENTION 528,541 451,173 453,173 457,761 453,973
101-14-134 TRAINING 274,156 311,774 313,358 266,628 294,558
101-14-136 OPERATIONS 5,981,570 6,641,786 7,556,743 7,077,037 6,788,896
TOTAL FIRE 7,327,756 7,774,335 8,706,120 8,184,617 7,918,581
101-15-140 ADMINISTRATION 1,115,292 557,038 749,197 786,291 406,564
101-15-141 CAPITAL PROJECTS* - 214,239 214,239 201,326 210,775
101-15-142 STREETS/DRAINAGE/TRAFFIC 2,397,950 2,289,769 2,383,820 2,358,802 2,427,837
101-15-143 ENGINEERING/UTILITY PLANNING* - 391,625 391,625 298,185 381,514
101-15-144 GIS 360,414 306,409 306,969 333,612 343,079
101-15-145 FLEET MAINTENANCE* - 838,789 838,789 1,022,692 1,202,499
101-15-146 FACILITIES MAINTENANCE* - 1,339,669 1,339,669 1,329,171 1,382,871
101-15-148 ANIMAL SERVICES 216,313 210,278 210,603 235,743 209,417
TOTAL PUBLIC WORKS 4,089,968 6,147,816 6,434,911 6,565,822 6,564,556
101-16-150 ADMINISTRATION 1,617,810 1,598,481 1,673,904 1,524,405 1,699,687
101-16-152 RECREATION 1,119,723 881,046 927,318 1,014,824 1,026,484
TOTAL PARKS & RECREATION 2,737,533 2,479,527 2,601,222 2,539,229 2,726,171
101-17-160 PLANNING 491,848 514,806 515,806 509,112 387,583
101-17-162 INSPECTIONS 857,261 857,769 871,695 862,069 871,528
TOTAL DEVELOPMENT SERVICES 1,349,109 1,372,575 1,387,501 1,371,181 1,259,111
101-18-170 INNOVATION & TECHNOLOGY* - 2,173,166 2,281,397 2,424,760 2,715,921
TOTAL INNOVATION & TECH. - 2,173,166 2,281,397 2,424,760 2,715,921
TOTAL GENERAL FUND 33,764,925 39,386,459 41,167,484 39,878,677 42,348,670
*Fleet Maintenance, Facilities Maintenance and Technology & Innovation were recorded in the Internal Service Funds prior to FY 2015.
*Capital Projects and Engineering/Utility Planning are split from Administration beginning FY 2015.
13

14
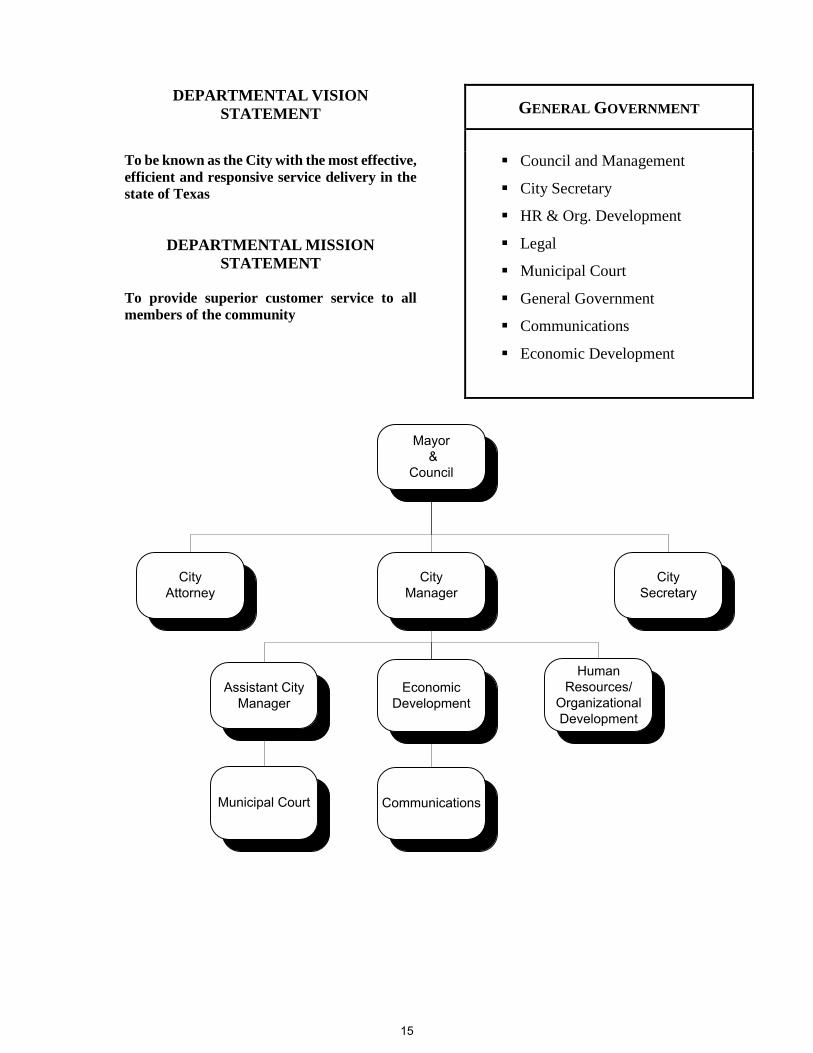
DEPARTMENTAL VISION
STATEMENT GENERAL GOVERNMENT
To be known as the City with the most effective,
efficient and responsive service delivery in the
state of Texas
DEPARTMENTAL MISSION
STATEMENT
To provide superior customer service to all
members of the community
Council and Management
City Secretary
HR & Org. Development
Legal
Municipal Court
General Government
Communications
Economic Development
Mayor &
Council
City Manager
City Secretary
CityAttorney
Economic Development
Communications
Assistant City Manager
Municipal Court
Human Resources/
Organizational Development
15

DEPARTMENT: GENERAL GOVERNMENT FUNDING SOURCE: GENERAL FUND
FY 2015 DEPARTMENTAL ACCOMPLISHMENTS
Council and Management
Completion, adoption and implementation of a Small Business Program to encourage and engage small
businesses with the City’s procurement process.
Delinquent Tax Collection: Committee selected the firm of Linebarger Goggan Blair & Sampson for
recommendation to the City Council. City Council approved the Committee’s recommendation for a five
(5) year contract. Monitoring of the contracts and an annual review against the annual goals in the contract
will continue.
TMRS Retirement – Full Contribution. Staff presented the preliminary proposed FY 2015 Budget with an
increase of 3.76% to the Ad Hoc rate of 5.24% for a total of 9%. This program is planned to be implemented
over FY17 and FY18 to achieve the full “repeating rate” projected to be approximately 16% in FY18.
GCWA Water Rights Agreement: Council approved a contract revision with GCWA. The City may
purchase up to 15 MGD of surface water from the Brazos River on a “take or pay” basis. The system rate
is approximately $117.50 per 1,000,000 gallons with the contract. The contract has a term of the later of
August 31, 2027 or the final payment of bonds issued by GCWA payable from revenues generated by the
agreement. It also provides for 5 year reviews and renegotiations, as well as assignments to successors.
The ordinance adopted on June 16, 2014 is by reference the federal Fair Housing Act and the Texas Fair
Housing Act prohibiting discrimination in the sale, rental and financing of dwellings based on color,
national origin, race, religion, disability, family status or sex.
Vicksburg Boulevard Extension: Direction and CIP Funding: Design Complete. City received bids and
the bids were over funding. Council approved funding and award is anticipated in October. The project
has been awarded and construction is in progress with an estimated completion date of January 2016. Bids
for the Hurricane Lane portion of this extension will be in June 2015. Code Enforcement Public Education/Visibility – New uniform attire for all code enforcement personnel and
schedule change to seven day and evening hours with planned operations to target “hot spots”; regular
outreach projects via HOA meetings and other community meetings; color-coded door hanger to encourage
compliance and acknowledge property owners who have taken steps to keep or bring property to city
standards; “See, Click. Fix” on-line reporting system available to all members of the community. Staff will
pursue ongoing educational opportunities as well as increasing exposure to the See, Click. Fix application.
Funding FY 2016: Reviewing the City’s compensation philosophy to determine where we want to be relative
to our market. With a July fiscal year, the City may have to adopt the Lead-Lag perspective. The funding
for needed actions to correct, adjust and maintain the approved position in the market placement will be
determined with actions and discussions forthcoming. Again, we continue to work on this project and look
forward to any feedback the executive team may provide.
Veteran’s Memorial. In October, Council was presented the final design, proposed location and mission
statement for acceptance. Fundraising committee will begin earning funds and suggested funds be budgeted
for future development of the project.
Brazos River Park: A firm has donated services to develop a conceptual plan which was presented to
Council.
“Standard of Care” Customer Service Program (CARES) continue to develop customer service surveys to
identify baseline. Identify training, evaluation and improvement of communication strategies, promote
transparency and easy access information. Repeat measurement process for continued development and
improvement for TEAM CARES.
Highway 90 A Plan Review: Presentation on the rail corridor and Metro bus ridership as it currently stands.
Staff is working on an education package to present to Council on the results of the various studies, economic
drivers, land uses, engineering issues and opportunity costs. Staff expects this package to be complete the
1st quarter FY 16.
16

Solid Waste: Action plan presented and confirmed by Council. Working with consultant on proposed
contract and bid documents to go to market March 2015.
City Hall Campus/Police Master Plan: Scope and Funding FY 2016. Staff is working on the data
collection/growth and need projection form to be distributed to Department Heads. Data collection to be
completed by the end of FY 2015. Funding for the hiring of the design professional will be part of the CIP
2016 budget process and was submitted to Council in March 2015 for consideration.
City Secretary
Effective July 1, Records Management Coordinator Vickie Berglund was promoted to Deputy City
Secretary! Vickie brings more than 16 years of experience as a municipal employee within the city secretary
department and will continue to serve as the records management coordinator. Vickie was appointed by the
city secretary with the concurrence of the city manager and will act in the absence of the city secretary.
City Secretary Maria Gonzalez was awarded the 2014 Texas Municipal Clerks Association (TMCA) Salt
Grass Chapter Municipal Clerk of the Year on December 10, 2014.
Held five Public Information Act Training Sessions for employees with assistance from City Attorney
Caroline Kelley and Police Department Records Supervisor Janice Poppenhusen.
Coordinating with Staff to provide City Council with up-to-date committee and subcommittee meeting
minutes in electronic format and paper format within Council’s Dropbox account and
committee/subcommittee folder located in the Council Meeting Room.
Coordinated the 3rd Annual City Clean Up Day held on Friday, September 19 where all non-emergency
personnel participate to work within their respective areas to better records manage paper documents as per
the City retention schedule with convenience copies destroyed and sensitive papers placed in shred bins for
proper disposal with over 7,000 pounds shred. With the assistance of the Parks staff, heavy and/or broken
equipment was picked up for disposal along with obsolete office equipment removed to storage for reuse by
other departments or public auction. Staff also worked to manage electronic documents within their email
and public drives to free up much needed shared network space where possible.
Developed a process with GIS to efficiently provide current information for updated maps based on City
Council action.
Completed annual citizen appointments/reappointments/education to City
Boards/Committees/Commission for year 2013 to 2014 and swore members in during regular City Council
meetings
Successfully coordinated the City’s Second Annual Thank You Dinner Reception for the City’s Board,
Committee, and Commission members with the Communications Department.
Digitized microfilm from the City’s Finance department ranging in years from 1973 to 1991 with general
ledger reports, payroll, retirements, and audits; and the Development Service’s department with Planning &
Zoning Committee meeting minutes from November 1963 to December 1984, the Board of Adjustment case
files from 1990 with maps and historical data for the City’s content management software, Questys.
Maintained Council’s webpage with current information, council meeting agendas and minutes.
Maintained the Local Vendor List for the small business program.
Municipal Court
Statistics show that the number of citations written have greatly increased. The police officers as well as
code enforcement have contributed to the increase. The police department has increased by 925 citations
and code enforcement has increased by 95 in comparison to last year. The new motor cycle enforcement
has contributed greatly to this increase.
The court is implementing many changes with court proceedings. We have hired permanent part time
bailiffs. The bailiff’s role is not only to ensure the safety of our citizens but they also have to be familiar
with the processes and requirements of our judges. When we have officers that are unfamiliar with the
bailiff procedures it can cause confusion and frustration to both the judges and citizens
Jurors are an essential part of our justice system. We understand the long hours and discomfort jury duty
may cause. We have worked with other departments to provide a comfortable sitting area while waiting for
17

court to preside. The jurors are provided refreshments throughout the morning and if court lasts past lunch
hours the judges often let jurors leave with a time to come back.
Trial dockets are implemented to accommodate officer schedules. This ensures that officers are performing
their regular scheduled duties, time off, and saves the city overtime expenses.
Three years ago the court began using a new software program. All of the clerks and judges have been
personally trained on the software and are very proficient at using it. Four months ago we had a trainer
come to the court to make sure we were using all of the programs the software had to offer. By doing so
we have been able to operate the court for efficiently. We continue to advance our court technology on a
regular basis. The court now has ability to notify citizens by phone if they have missed their court dates
which enables them time to take care of citations before they are put into warrants. Each of our clerks are
trained and utilizing programs to help in our collection of unpaid fines. With all of these systems in place
we have increased our revenue $28,000.00 more than last year at this budget time. The court is also
helping with our new system “See Click Fix.” This helps communicate the status of code violations once
they are handed over to the court.
We participated in the State Wide Warrant Round-Up. Our court, amongst many others, worked together
to collect fines and fees that have gone uncollected. We used the bailiffs, volunteers, the city website, as
well as many other public information systems to inform citizens before the round-up began. We provided
them the opportunity to come in and take care of their warrants before officers visited their home or job.
We collected over $21,000.00 in past due fees and fines. We will continue to stay up to date on warrants
and work with the police department to have our warrants served.
We continue to use technological advances as well as education provided to us each year by the state to
keep the court running efficiently. Our staff is well educated and work hard to make sure the municipal
court runs as efficiently as possible.
Communications
Fielded 19,235 incoming calls via the City’s main contact number; responding to inquiries on public
safety, solid waste, permits and inspections, sidewalk repairs, standing water, traffic signals, alarm
permits, car registration, establishing a dba, solicitors’ permits, pavilion rentals, recycling of hazardous
waste, employment, Comcast and City programs and events.
Processed 2,313 payments totaling $41,618,087.62; transaction categories included solid waste, PIDs, fire
protection permits, GRP Pumpage, franchise fees and retiree insurance.
Strategically increased website subscription counts by 1,419; main communications of interest: Council
Connection, Current City Projects, Happening in Missouri City, Roadway Construction, Show Me
Missouri City Newsletter, City Manager’s Update, Leadership Luncheon Series, Twitter (MissouriCityTX
and MissouriCityEM), new Instagram account and Facebook.
Drew 331,687 site visits to City website: www.missouricity.gov. Top areas of interest: Jobs, Departments,
Community, Police Department.
On average each month, the City’s Twitter account: MissouriCityTX, has shown 10,000 times with 375
impressions a day (impressions are the number of times MissouriCityTX is displayed on a user’s feed).
Managed promotional Facebook campaigns, resulting in 730 additional likes specifically from posts
created by the Communications Team. Current number of likes for the page is 1,900; this milestone has
been achieved in fewer than three years. The citywide Facebook page is on pace to continue to be the most
successfully operated presence since the City engaged in social networking.
Expanded social media outreach with the launch of a City Instagram page in February; averaging 25 posts
per month with an anticipated follower increase of 50 followers per month.
Produced 475 citizens communications, including news releases, advisories, public service
announcements, newsletter articles, and website and social media posts.
Coordinated inaugural District HOA meetings; 155 citizens attended and received City Council and Staff
presentations on public safety, economic development, code enforcement, development citywide, the
Municipal Volunteers Program, solid waste and Parks & Recreation programs. Attendance per district
respectively was: A—40; B—35; C—30; D—50.
18

In 2014, the Leadership Luncheon series continued to grow, including on-site luncheons at the City’s
major businesses such as Ben E. Keith and thought-provoking discussions from speakers such as Dr. Steve
Murdoch, an award-winning demographer from Rice University. The series continues to unite staff and
local leaders while also providing attendees the chance to learn more about the prestigious Missouri City
community. Ten luncheons were hosted with an attendance of 559 (not including City Council or Staff);
generating $8,500 in new revenue. Currently on-track to surpass revenues in FY2015-FY2016; with the
first 2015 Luncheon having already generated $2,100.
Coordinated and hosted the Second Annual Citizens’ University; graduating 15 citizens, bringing the
program total to 31. Facilitated citizen involvement in local field trips, tours and the viewing of City
projects in process. The third annual session will begin on April 30, 2015, and was launched on the City’s
social media networks, which will draw more interest from a fresh audience.
Produced 165 videos that received more than 7,000 YouTube views and more than 150 shares. Videos
included 2014 State of the City, First Tee promotional project, Citizens’ University Documentary and
Year-In-Review. Productions were also utilized for social media marketing campaigns and promotions of
City services and programs. We received the following response from First Tee managers: “THAT IS A
FANTASTIC VIDEO! We used it to entice Southwest Airlines into a contribution for a recent fundraiser.
They were impressed enough to support us.”
Won prestigious Telly Award for “Mayor-O Knows” video produced to promote the City’s participation in
the H-E-B Healthy Challenge initiative.
Responded to 180 media inquiries from local, state and national outlets.
Launched a revamped Municipal Volunteer Program (MVP) in September; since then citizens have
contributed their talents and more than 932 hours of their time to improve operations in the Police, Fire,
Public Works, Parks and Communications departments.
Secured $15,750 in donations for the Leadership Luncheon, State of the City, the Mayor’s Youth
Commission Banquet, Citizens’ University, the 10th Annual Business EXPO held at Hampton Inn &
Suites, the District HOA Meetings, the Crystle Stewart Ceremony, the E.L. Kubosh recognition, the
Lexington & Vicksburg Boulevard groundbreaking ceremonies, the FBISD Youth Leadership functions,
the Chinese Delegation visits and the Holiday “Thank-You” Luncheon.
Facilitated the implementation of the City-Council approved small business policy that will assist area
businesses and business owners who want to partner with the City and hosted the first small business
workshop drawing more than 60 vendors.
In April of 2014 the newly revised FEMA flood maps became official. Communications designed and
mailed a postcard to inform Missouri City residents of the remapping changes that affect Fort Bend
County and the potential increase to the cost of homeowner insurance rates.
Designed an app for a SeeClickFix mobile application that allows residents to report code-enforcement
violations. The innovative design shapes the overall mobile app user experience while adhering to already
established City branding standards. Estimated cost savings due to in-house design: $5,200.
Designed two highly effective portable banners that serve as branding/marketing tools to deliver a single,
consistent message at all venues. The two designs work in tandem to increase brand awareness. Estimated
cost savings due to in-house design: $10,500.
Designed cover for FY2015 General Fund Budget that graphically celebrates the City’s successes; have
created the designs since 2013. Estimated cost savings since then due to in-house design: $2,250.
Designed Municipal Solid Waste Program commercial service flier that will be distributed to all new
businesses via Development Services.
Drafted and mailed more than 180 solid waste letters to the City’s commercial customers notifying them
of rate increases and service changes.
Earned the “Creekmont Meritorious Award” in “appreciation for outstanding dedication and service above
and beyond the call of duty”.
Honored by the National Association of Professional Women for “excellence, leadership and commitment
to her profession, while encouraging the achievement of Professional Women”.
Human Resources & Organizational Development
19

The HR/OD successfully launched the City’s annual benefits enrollment for retirees for the 2015 calendar
year, using the new MUNIS system. This system allowed retirees to complete benefits selection, coverage
changes or personal information, update from any location with internet access. This almost paperless
process significantly increased overall efficiency and reduces the incidence of human error.
HR/OD staff spearheaded the City’s Annual United Way Campaign that raised $5,453.00 in contributions
from employees.
HR/OD planned, scheduled and presented medical, dental, vision and similar insurance enrollment
and/change information, for calendar year 2015, to 94% of active and retired employees during 9 sessions
at various times throughout the week during annual enrollment period.
HR/OD partnered with the City’s benefits consultants to successfully negotiate and renew medical, dental,
vision and related benefits, which resulted in a minimal increase to premiums for retired employees and
active employees.
HR/OD received 5,135 online applications to date, during this fiscal year; classified and forwarded those
applications from individuals who met the minimum qualifications of advertised jobs to hiring managers in
the City.
Responded to more than 2000 inquiries from surrounding and/or market cities on salary data, benefits,
policy, procedures, survey completion, or similar inquiries during the fiscal year.
Prepared, responded to more than 6 unemployment/separation claims during the fiscal year
Legal
Finalized Fire Station Number 5 operating agreement.
Finalized a water purchasing agreement.
Drafted easements for the provision of city utility services.
Prepared a legal analysis and submitted documentation for the maintenance of the city’s trademarks.
Drafted the city-wide legislative agenda and briefed appropriate city personnel regarding proposed
legislation.
Drafted zoning text amendments regulating signs, landscaping, and private utilities.
Finalized a cost-sharing agreement with another entity to provide sidewalks for city students.
Reviewed financial instruments including certificate of obligation issuances, refunding bond issuances, and
lease purchase agreements.
Drafted ordinances adopting and amending certain 2015 International Codes and the 2014 National
Electrical Code.
Provided legal advice related to the electricity franchise ordinance.
Provided legal advice related to the regional water agreements.
Provided legal advice and drafted policies, resolutions, ordinances, and agreements for the implementation
of the city’s economic development projects.
Economic Development
Revised City’s Tax Abatement Guidelines
Created Redevelopment incentive program for targeted areas of Missouri City
Initiated HCC relocation project as a catalyst for the redevelopment of Texas Parkway
Attracted Kobelco to locate operations in Lakeview Business Park
Amended Allied Tool incentive agreement to include additional property and increase the size of the
project to be built
Assisted SWE with tax abatement to attract the expansion of their facilities in Missouri City
Assisted Lufkin Industries with tax abatement to attract the expansion of their facilities in Missouri City
Facilitated the acquisition of 127 acres of property by Trammell Crow as the location of the next
Assisted in the attraction of a 300,000 SF FedX facility to locate in Missouri City without incentives
Assisted Conor Commercial real estate in the development planning for a 36 acre tract where they are to
build three, 100,000 SF investment grade tilt-wall industrial buildings
Supported existing business community with business retention visits
20

Represented City of Missouri City on the board of the Houston Gulf Coast Chapter of CCIM
Represented the City of Missouri City at board and membership meetings of the Greater Fort Bend
Economic Development Council
Coordinated with Legal Department on the creation and implementation of a legislative agenda for the City
DEPARTMENTAL DESCRIPTION
General Government provides overall direction and administration of the City organization through the Council
and Management Division and assists the city carrying out its service delivery with the support of the following
divisions: Legal, Information Technology, Economic Development, City Secretary, Records Management,
Human Resources & Organizational Development, Municipal Court and Communications.
STRATEGIC
GOAL 2019
DEPARTMENTAL OBJECTIVES
For budgetary purposes, the General Government Department is comprised of six separate
and distinct operating divisions (Council and Management, City Secretary, Human
Resources and Organizational Development, Legal, Municipal Court, and
Communications). Most of these divisions in many ways actually function as a department
and therefore all of the goals for the General Government Department are reflected
respectively in each of the six divisions.
21

DEPARTMENT: GENERAL GOVERNMENT FUNDING SOURCE: GENERAL FUND
COUNCIL AND MANAGEMENT FUND NUMBER: 101-10-101
DESCRIPTION OF DEPARTMENTAL OPERATIONS
Council and Management include the offices and activities of the Mayor, City Council and City Manager. The
City Council of Missouri City is composed of the Mayor and six Council members. All positions are elected
for a two-year period, with terms being staggered to provide continuity for the City.
The Mayor and Council members attend regular meetings the first and third Mondays of each month and other
special meetings as needed. They govern the City through the adoption of ordinances and policies. They make
final decisions, after considering recommendations from the Planning and Zoning Commission, on all matters
of zoning. They hold public hearings, review and adopt the Annual Budget, make decisions on bond issues,
and approve contracts.
The City Manager is the Chief Executive Officer of the City and is appointed by the Mayor and City Council.
The City Manager, under the guidelines of the City Charter, Code of Ordinances, and State Law, administers
City ordinances and the policies of the City Council. The office provides the direction, leadership, and
coordination of all departments. The City Manager appoints all department heads, with the exception of the
City Secretary, City Attorney and Municipal Court Judge, who are appointed by the City Council. He also
directs the City’s economic development activities.
Total Full-Time Employees = 5
City Manager
Executive Assistant Assistant City Manager
Office Manager
Assistant City Manager
22

DEPARTMENT: GENERAL GOVERNMENT FUNDING SOURCE: GENERAL FUND
COUNCIL AND MANAGEMENT FUND NUMBER: 101-10-101
STRATEGIC
GOAL 2019 DIVISIONAL GOALS
2 Continue completion of the utility franchise agreement with CenterPoint Energy.
Draft of contract has been sent to CenterPoint.
2
ISO report presented to Council in February 2015 with options for improved rating.
Council recommended a focus group be formed to determine what option to pursue
to move forward.
1 Extensions of Hurricane Lane, Vicksburg Blvd., and Lexington Blvd.
1 Work with area groups on the fundraising campaign for the Veterans Memorial
project.
1 Develop strategies for continued involvement with METRO, including the 90A rail
corridor project and Ft. Bend Parkway park and ride project.
1 Develop direction and land acquisition for the regional Brazos River Park.
1
Develop and move forward with the revision to the City’s Comprehensive Plan,
which will include master planning for the Texas Parkway redevelopment,
90A/Beltway 8 Corridor build-out, and Ft. Bend Parkway development.
4 Develop the scope and funding strategies for the campus master plans for City Hall
and the Public Safety Facility.
2
Continue TMRS Retirement – Full Contribution. Staff presented the preliminary
proposed FY 2015 Budget with an increase of 3.76% to the Ad Hoc rate of 5.24%
for a total of 9%. This program is planned to be implemented over FY15, FY16, and
FY17 to achieve the full “repeating rate” projected to be 16% in FY17.
Discussion continues for funding FY 2016: Reviewing the City’s compensation
philosophy to determine where we want to be relative to our market. With a July
fiscal year, the City may have to adopt the Lead-Lag perspective. The funding for
needed actions to correct, adjust and maintain the approved position in the market
placement will be determined with actions and discussions forthcoming.
1 Veteran’s Memorial Conceptual Design, Location, Next Steps pending estimated
funding of $250,000
1 Brazos River Park: A firm has donated services to develop a conceptual plan which
was presented to Council.
3
“Standard of Care” Customer Service Program (CARES) continue to develop
customer service surveys to identify baseline; such as, training, standards,
communication strategies and promote transparency module and easy access
information for website users. Repeat measurement process for continued
development and improvement for TEAM CARES.
5
Council Workshop: Highway 90 A Plan Review: Presentation on the rail corridor and
Metro bus ridership as it currently stands. Staff is working on an education package
to present to Council on the results of the various studies, economic drivers, land
uses, engineering issues and opportunity costs. Staff expects this package to be
complete the 1st quarter FY 16.
2
City Hall Campus/Police Master Plan: Scope and Funding FY 2016. Staff is working
on the data collection/growth and need projection form to be distributed to
Department Heads. Data collection to be completed by the end of FY 2015. Funding
for the hiring of the design professional will be part of the CIP 2016 budget process
and was submitted to Council in March 2015 for consideration.
23

Solid Waste: Action plan presented and confirmed by Council. Working with
consultant on proposed contract and bid documents to go to market March 2015.
PERSONNEL SCHEDULE
FY 2014
Actual
FY 2015
Budget
FY 2015
Estimate
FY 2016
Budget
Salary
Grade
City Manager 1 1 1 1 Uncl.
Assistant City Manager 1 1 1 2 Uncl.
Office Manager 1 1 1 1 15
Executive Assistant 0 1 1 1 18
Total Full-Time Employees 3 4 4 5
Mayor 1 1 1 1 $1,000/mo
Mayor Pro-Tem 1 1 1 1 $750/mo
City Council members 5 5 5 5 $500/mo
24

DEPARTMENT: GENERAL GOVERNMENT FUNDING SOURCE: GENERAL FUND
COUNCIL AND MANAGEMENT FUND NUMBER: 101-10-101
PERFORMANCE INDICATORS
FY 2014
Actual
FY 2015
Budget
FY 2015
Estimate
FY 2016
Budget
Budget implemented as adopted by City Council. Yes Yes Yes Yes
Maintain general fund operating fund balance between 15% and
25% of estimated revenues. 25%
25% 25% 25%
Overall City Organization O&M cost per capita is less than
equivalent sized cities. Yes
Yes Yes Yes
Authorized FTE per 1,000 population is less than equivalent sized
cities. Yes
Yes Yes Yes
ACTIVITY MEASURES
FY 2014
Actual
FY 2015
Budget
FY 2015
Estimate
FY 2016
Budget
Council Meeting
Regular Meetings 24 24 24 24
Special Meetings/Hearings 22 80 24 24
Committee Meetings 35 N/A 40 40
□ Ordinances Passed 52 100 55 55
□ Resolutions Passed 39 N/A 50 50
25

GENERAL FUND
CONSOLIDATED EXPENDITURES BY LINE ITEM
GENERAL GOVERNMENT - COUNCIL & MANAGEMENT 101-10-101
Object Description
FY 2014
Actual
FY 2015
Original
Budget
FY 2015
Revised
Budget
FY 2015
Year-End
Estimate
FY 2016
Proposed
Budget
51001 REGULAR SALARIES 317,368 389,318 389,318 326,753 544,743
51002 ADDITIONAL COMPENSATION 369 460 460 1,645 1,428
51003 COMPENSATED ABSENCES 11,876 - 3,166 -
51004 OVERTIME - 150 -
51103 MAYOR/COUNCIL 51,000 51,000 51,000 51,000 51,000
51106 CONTINGENCY WORKERS
51201 CAR-CLOTHING ALLOWANCE 25,770 25,800 25,800 23,243 31,800
51202 CELL PHONE ALLOWANCE 2,166 2,160 2,160 2,925 4,320
51301 LONG TERM DISABILITY 662 1,361 1,361 893 1,914
51302 TAXES, SOCIAL SECURITY 26,385 35,858 35,858 27,215 48,447
51303 HOSP-LIFE-DENT-VIS INS 28,011 55,005 55,005 30,529 34,812
51304 PRORATED HEALTH/DENT/VIS -
51305 RETIREMENT 17,983 36,462 36,462 24,358 51,272
51306 WORKERS COMPENSATION 560 591 591 471 570
TOTAL PERSONNEL 482,149 598,015 598,015 492,348 770,306
52001 OFFICE SUPPLIES 2,538 1,900 1,900 1,450 1,700
52002 MEALS & DRINKS 16,870 10,000 10,000 10,000 10,000
52003 WEARING APPAREL 263 600 600 600 600
52004 MINOR TOOLS & EQUIPMENT 75 400 400 475 400
52005 EDUC, TRAINING & SUPPLIES 346 150 150 150 150
52006 POSTAGE 243 400 400 350 350
52008 IDENTIFICATION SUPPLY/FIL - 200 200 200 200
52009 OTHER/MISC 682 100 100 100 100
52014 COMPUTER EQUIP RENTAL FEE 9,708 10,829 10,829 10,829
52083 ERC EVENTS 24,800 24,800 24,800 24,800
TOTAL COMMODITIES 30,724 49,379 49,379 48,954 38,300
53002 INSURANCE 4,264 4,931 4,931 5,177 5,567
53004 SPECIAL SERVICES & LEGAL 154,493 155,000 154,900 214,124 112,900
53005 SERVICE AGREEMENTS/REPAIR 180 1,900 200 200
53006 RADIO REPAIR/MAINTENANCE 80 80 80 80
53007 CONFERENCE EXPENSE 18,000 21,000 21,000 15,000 21,000
53008 TELEPHONE 3,732 3,732
53009 BLDG MAINTENANCE ALLOC 33,451
53010 OTHER/MISC 200 2,500
53012 COMPUTER SERVICES ALLOC 130,880
TOTAL CONTRACTUAL SERVICES 341,468 184,743 189,043 234,581 139,747
54001 PRINTING & PUBLICATIONS 1,036 850 850 1,800 850
54002 DUES & SUBSCRIPTIONS 17,521 16,260 25,480 23,200 23,000
54003 TRAINING & TRAVEL 1,274 8,000 8,000 6,300 7,500
54005 VEHICLE ALLOWANCE - MILEAGE 879 1,150 1,276 300 1,250
54006 OTHER EXPENSES 13,214 8,000 8,000 2,500 8,000
54008 COUNTY ECONOMIC DEVELOPMENT 2,733
54009 CITY ECONOMIC DEVELOPMENT
54051 MC DAY AT CAPITOL EXP 1,000
TOTAL OTHER SERVICES 36,657 34,260 43,606 35,100 40,600
TOTAL CAPITAL OUTLAY - - - - -
TOTAL EXPENDITURES 890,999 866,397 880,043 810,983 988,953
26

DEPARTMENT: GENERAL GOVERNMENT
FUNDING SOURCE: GENERAL FUND
CITY SECRETARY FUND NUMBER: 101-10-102
DESCRIPTION OF OPERATIONS
The City Secretary is an officer of the City, appointed by the Mayor and Council. The City Secretary’s Office is
responsible for the preparation and dissemination of City Council meetings agendas and packets. The City
Secretary must attend every meeting of the City Council and keep accurate minutes of the proceedings,
engrossing and enrolling all laws, ordinances and resolutions of the City Council. Regarding Council Services,
the City Secretary handles all Council meeting preparations, Council correspondence, travel, expenditures, and
calendars. This office serves as the liaison between the Mayor and Councilmembers and the public. The City
Secretary is the Records Custodian. The Office of the City Secretary is the administrative agency responsible for
the care and maintenance of all City of Missouri City records. This office houses all legal transactions, City
Council minutes, agendas, deeds, ordinances, resolutions, contracts, and a vast array of other historical and
regulatory information. The City Secretary is designated as the City's Records Management Officer by both state
law and City ordinance; and, the City Secretary is responsible for developing and administering records retention
and destruction policies, monitoring the records storage centers, overseeing the control of electronically stored
records, and upgrading technology to provide for efficient and economic storage of records. In addition to these
duties, the City Secretary's Office responds to hundreds of requests for City records filed each year under the
Texas Public Information Act. The City Secretary serves as the Chief Election Official for the City of Missouri
City and is responsible for the administration of all City elections. The City Secretary provides staff support and
guidance during Charter review processes and is responsible for submissions to the U.S. Department of Justice
for pre-clearance of election issues under the Federal Voting Rights Act. All City elections are administered
through the City Secretary, which includes the preparation and publication of all official notices and orders,
preparations for election officials and polling places, and the receipt and filing of all candidate forms and reports.
The City Secretary's Office coordinates the recruitment, application and appointment process for City Council
appointed boards, commissions and committees. This office publishes a directory of appointed officials and
volunteers serving on various panels and committees. The City Secretary’s Office is responsible for the issuance
of certain permits and licenses for various operations within the City of Missouri City. In addition to the duties
listed above, the City Secretary serves as custodian of the City corporate seal and attests the Mayor's signature
on all official documents; records and files deeds and easements; coordinates the codification of City ordinances
into the City Code of Ordinances; publishes all legal ads and notices for the City; posts all legal notices and
agendas; develops and oversees the City Secretary Department Budget; and serves on the City's Executive
Management Team. As in many other cities, the City Secretary's Office serves as a resource for citizens and a
link between citizens and the City organization.
Total Full-Time Employees = 4
City Secretary
Deputy City Secretary/Records Mngt. CoordinatorAdministrative Assistant
Records Management Assistant
27

DEPARTMENT: GENERAL GOVERNMENT FUNDING SOURCE: GENERAL FUND
CITY SECRETARY FUND NUMBER: 101-10-102
STRATEGIC
GOAL 2019
DEPARTMENTAL OBJECTIVES
1 To effectively communicate with citizens and promptly respond to requests for
public information.
4 Develop and complete an informative Records Management Manual, effectively
relay that information to City Staff, and continue compliance with the Texas State
Retention Schedule.
4 Enhance procedures regarding email processes and retention schedules with the
City’s IT department for City Staff.
4 To effectively recodifying the City’s Code of Ordinances with MuniCode.
4 Development, implement and coordinate a Public Information Act and Records
Retention Training session with City Staff on an annual basis.
1,4 Develop and implement retention of Social Media Records Policy.
4 Establish process for Records Management Day and implement a City-wide
program for FY 2016.
4 Develop training plans and schedule for all employees in utilizing the upgraded
software program, Questys CMx for ease in searching, accessing and retrieving
archived documents.
4 Develop a Records Management Liaison Retreat Session for implementation in FY
2017
PERSONNEL SCHEDULE
FY 2014
Actual
FY 2015
Budget
FY 2015
Estimate
FY 2016
Budget
Salary
Grade
City Secretary 1 1 1 1 Uncl.
Deputy City Secretary/Records Management Coordinator 0 1 1 1 Uncl.
Administrative Assistant 1 1 1 1 10
Records Management Assistant 1 1 1 1 3
Total Full-Time Employees 4 4 4 4
28

DEPARTMENT: GENERAL GOVERNMENT FUNDING SOURCE: GENERAL FUND
CITY SECRETARY FUND NUMBER: 101-10-102
PERFORMANCE INDICATORS
FY 2014
Actual
FY 2015
Budget
FY 2015
Estimate
FY 2016
Budget
Provide continued support services in educating both the public
and city employees regarding the Texas public information act
requirements, records retention and management regulations
including Council agenda process.
50%
75%
75%
75%
Provide quarterly and continued training and development in
content management software regarding State required document
control standards for new employees.
n/a
n/a
n/a
50%
Develop in-house training sessions relative to records retention,
records management—Questys software.
25%
75%
50%
75%
ACTIVITY MEASURES
FY 2014
Actual
FY 2015
Budget
FY 2015
Estimate
FY 2016
Budget
Agendas prepared 74 80 96 100
Council meeting information
Paper packets prepared 296 320 320 320
Electronic packets prepared 74 80 96 100
Total Record requests processed
City Secretary public information requests processed 161 500 300 500
Police Department public information requests processed 1500 2,600 2000 2500
Court Department public information requests processed 150 150 150 150
Fire Department public information requests processed 65 100 50 100
Alcohol licenses issued 30 30 30 30
Solicitor permits issued 15 25 20 25
Recognition awards/proclamations 49 95 60 95
Clean Out Day Results
Boxes Destroyed/Shred 32 40 40 40
Boxes classified to permanent storage 0 0 0 0
Total pounds of shredded material 19,684 20,140 20,140 20,000
Total pounds of recycled material 561 300 300 550
Record boxes to storage/maintenance 37 30 30 40
Boxes Awaiting Destruction 63 40 63 65
29

GENERAL FUND
CONSOLIDATED EXPENDITURES BY LINE ITEM
GENERAL GOVERNMENT - CITY SECRETARY 101-10-102
Object Description
FY 2014
Actual
FY 2015
Original
Budget
FY 2015
Revised
Budget
FY 2015
Year-End
Estimate
FY 2016
Proposed
Budget
51001 REGULAR SALARIES 192,649 199,141 199,141 204,753 196,469
51002 ADDITIONAL COMPENSATION 1,972 2,348 2,348 2,348 2,324
51003 COMPENSATED ABSENCES - -
51004 OVERTIME - -
51201 CAR-CLOTHING ALLOWANCE 2,962 3,000 3,000 2,982 3,000
51202 CELL PHONE ALLOWANCE 1,083 1,080 1,080 1,083 1,080
51301 LONG TERM DISABILITY 642 693 693 647 682
51302 TAXES, SOCIAL SECURITY 14,573 15,725 15,725 15,319 15,520
51303 HOSP-LIFE-DENT-VIS INS 34,723 37,569 37,569 34,296 41,931
51304 PRORATED HEALTH/DENT/VIS
51305 RETIREMENT 10,356 18,501 18,501 15,346 18,259
51306 WORKERS COMPENSATION 276 259 259 209 183
TOTAL PERSONNEL 259,238 278,316 278,316 276,983 279,448
52001 OFFICE SUPPLIES 1,438 2,000 2,000 2,000 2,500
52002 MEALS & DRINKS (64) - -
52003 WEARING APPAREL - 40 40 40 120
52004 MINOR TOOLS & EQUIPMENT 253 - -
52005 EDUC, TRAINING & SUPPLIES 56 100 100 100 100
52006 POSTAGE 770 700 700 750 800
52014 COMPUTER EQUIP RENTAL FEE 8,061 9,724 9,724 9,724
TOTAL COMMODITIES 10,513 12,564 12,564 12,614 3,520
53002 INSURANCE 684 754 754 799 689
53004 SPECIAL SERVICES & LEGAL 17,861 16,000 19,026 19,026 15,200
53005 SERVICE AGREEMENTS/REPAIR - -
53007 CONFERENCE EXPENSE 2,963 3,365 3,365 3,100 3,855
53009 BLDG MAINTENANCE ALLOC 6,299 - -
53010 OTHER/MISC - -
53012 COMPUTER SERVICES ALLOC 63,254 - -
TOTAL CONTRACTUAL SERVICES 91,061 20,119 23,145 22,925 19,744
54001 PRINTING & PUBLICATIONS 1,328 3,000 5,532 5,532 3,000
54002 DUES & SUBSCRIPTIONS 925 910 910 910 935
54003 TRAINING & TRAVEL 1,955 3,275 3,275 3,100 3,785
54005 VEHICLE ALLOWANCE - MILEAGE 664 300 300 150 200
54006 OTHER EXPENSES (3) - -
54011 ELECTION EXPENSE 24,526 30,000 52,999 25,000 30,000
TOTAL OTHER SERVICES 29,396 37,485 63,016 34,692 37,920
TOTAL CAPITAL OUTLAY - - - - -
TOTAL EXPENDITURES 390,208 348,484 377,041 347,214 340,632
30

============================ FY 2016 ANNUAL BUDGET ================================
===============================CITY OF MISSOURI CITY=================================
DEPARTMENT: GENERAL GOVERNMENT FUNDING SOURCE: GENERAL FUND
HUMAN RESOURCES & ORGANIZATIONAL DEVELOPMENT FUND NUMBER: 101-10-103
DESCRIPTION OF OPERATIONS ADMINISTRATION: The Department of Human Resources & Organizational Development (HR/OD) is responsible for the delivery of all human services for active and retired Missouri City employees, including but not limited to recruiting, selection, classification, compensation, employee development, employee relations, benefits administration, performance management, recognition programs, wellness initiatives and retirement services through the Texas Municipal Retirement System (TMRS). HR/OD aligns its service delivery with and according to the mission, vision, values and goals of the City and continuously strives to provide effective, efficient and responsive services to internal and external customers. RECRUITMENT, SELECTION & CLASSIFICATION: The City of Missouri City is committed to the recruitment, selection, classification, development and promotion of the best qualified individuals. We believe that people are our most important asset and we value diversity in the workplace. We further believe that “good people” make “great organizations.” Therefore, the HR/OD Department posts all vacant positions on the “EMPLOYMENT” section of the City’s Website. The HR/OD department accepts online applications only, and only for positions for which we are actively recruiting. Departments then carefully review a list of applicants who meets the minimum qualifications posted and make every attempt to develop and promote the best individuals. The HR/OD Department establishes and facilitates standardized practices and procedures to ensure that the City’s recruitment, selection and classification processes are in accord with existing policies, congruent with “best practices” in Human Resources and according to state and federal regulations. EMPLOYEE REWARDS: The City’s total compensation package is arguably one of the most comprehensive packages available in any comparable organization. The compensation package includes a market driven base salary and benefits, which includes but is not limited to, medical, dental, vision, life, accidental death, long term disability, defined benefit contribution, optional Health Savings Accounts, paid holidays, paid sick leave, vacation, educational reimbursement, and Employee Assistance Program, among others benefits. RECOGNITION & EMPLOYEE DEVELOPMENT: The HR/OD Department fosters individual and group development that champions the City’s Mission, Vision and Values. Furthermore, the Department develops, procures and delivers programs that foster innovation, productivity, service and individual or team accomplishments. As such, HR/OD plans, supports, develops and delivers programs such as Public Service Recognition Week events or initiatives, Service Awards, Christmas Holiday Party Celebration, Thanksgiving Luncheon and several other similar programs throughout the year. The HR/OD Department also strives to procure and deliver development opportunities through from various sources, including the International Personnel Management Association, Achieve Global, Development Dimensions International, Franklin Covey, or other recognized organizational development sources. Employees have various opportunities during the years to participate in programs such as basic supervision, performance management, strategic planning, project management, time management, delegation, supervision, etc. Our goal is to improve individual and group competence in the entire organization.
Total Full-Time Employees = 3 Total Part-Time Employees = 1
31

============================ FY 2016 ANNUAL BUDGET ================================
===============================CITY OF MISSOURI CITY=================================
DEPARTMENT: GENERAL GOVERNMENT FUNDING SOURCE: GENERAL FUND
HUMAN RESOURCES & ORGANIZATIONAL DEVELOPMENT FUND NUMBER: 101-10-103
STRATEGIC
GOAL 2019 DEPARTMENTAL OBJECTIVES
4 Develop, deliver and expand a citywide training and development plan, based on
the need, vision and projected service delivery of each department to ensure that 50% of City employees have an opportunity to learn new skills or improve existing skills (including the college classes or college degrees) to ensure the continuous improvement of the City’s human capital during FY2016.
4 4
Partner with all departments to review, revise and establish a standardized process of reclassifying existing positions, changing a position title or making a salary change, based on identified needs before the end of FY2016.
Partner with various organizations and departments to promote health and wellness initiatives quarterly throughout the organization that will ensure an overall healthier and well informed workforce.
4 Research, develop and implement an individual development plan template, with
the input and approval of the department heads and City Manager, that will target development areas for each employee, then link said plan to the overall performance of each employee during FY2016.
4
4 4 4
Begin the development of a Citywide Workforce Planning Model, including Succession Planning, based on the input of the Leadership Team, to ensure that the City is preparing its human capital for future staffing needs during the FY2016 and beyond.
Collect and compare data from Employee Satisfaction Survey FY2015 based on suggestions, recommendations, ideas or requests gathered from the 2013 Employee Satisfaction Survey.
Partner all city departments to procure, develop and deliver employee quarterly meetings designed to inform employees of relevant organizational news, events, training or development opportunities during FY2016.
Review salary data and make recommendations to the City Manager as necessary to ensure that the Missouri City compensation remains market competitive and based on an established compensation philosophy that takes into account internal equity and longevity before the end of FY2016.
32

============================ FY 2016 ANNUAL BUDGET ================================
===============================CITY OF MISSOURI CITY=================================
DEPARTMENT: GENERAL GOVERNMENT FUNDING SOURCE: GENERAL FUND
HUMAN RESOURCES & ORGANIZATIONAL DEVELOPMENT FUND NUMBER: 101-10-103
PERSONNEL SCHEDULE FY 2014
ActualFY 2015
BudgetFY 2015 Estimate
FY 2016 Budget
SalaryGrade
HR & Organ. Dev. Director 1 1 1 1 Uncl.HR/OD Manager 1 1 1 1 23HR & Organ. Dev. Technician 1 1 1 1 10 Total Full-Time Employees Part-Time HR/OD Clerk
3
1
3
1
3
1
3
1
33

============================= FY 2016 ANNUAL BUDGET ===============================
================================CITY OF MISSOURI CITY===============================
DEPARTMENT: GENERAL GOVERNMENT FUNDING SOURCE: GENERAL FUND
HUMAN RESOURCES & ORGANIZATIONAL DEVELOPMENT FUND NUMBER: 101-10-103
PERFORMANCE INDICATORS
FY 2014
Actual
FY2015 Budget
FY 2015 Estimate
FY 2016
Budget
ACTIVITY MEASURES
FY 2014 Actual
FY2015 Budget
FY 2015 Estimate
FY 2016 Budget
The rate at which the Department can prepare and post job descriptions and announcements within 2 days of initial request.
98% 100% 99% 100%
The rate at which the Department can schedule applicant testing within 5 days of initial identified need.
100% 100% 98% 100%
The rate at which the Department can notify applicants the City has filled a vacancy within 2 days of closing a search.
99% 100% 100% 100%
The rate at which the Department can prepare employee personnel actions (change to personal information, benefits or deductions) during a pay period with 100% accuracy.
94% 100% 92% 100%
The rate at which the Department can report or file workers’ comp claims within 5 days of injury.
99% 100% 96% 100%
The number of exit interview and separation checklists completed
19 25 21 20
Number of employees who receive/complete the online performance evaluation
178 300 250 300
Number of employees who participates in the City’s Employee development programs
55 50 60 100
The number of applications for employment processed 5,055 7,000 8000 7500 The number of benefits status change requested and processed 845 850 780 800 The number of Personnel Actions processed 950 1,000 983 1000 Workers’ compensation claims processed 8 10 9 5 The number of employees who complete Health Assessment 44 250 100 125 The number of job descriptions developed, revised or updated 28 50 40 50 Number of employee programs sponsored 4 10 5 5
34

GENERAL FUND
CONSOLIDATED EXPENDITURES BY LINE ITEM
GENERAL GOVERNMENT - HUMAN RESOURCES & ORG. DEV. 101-10-103
Object Description
FY 2014
Actual
FY 2015
Original
Budget
FY 2015
Revised
Budget
FY 2015
Year-End
Estimate
FY 2016
Proposed
Budget
51001 REGULAR SALARIES 151,553 187,683 187,683 159,151 202,181
51002 ADDITIONAL COMPENSATION 651 696 696 400 448
51003 COMPENSATED ABSENCES 1,978 - - 8,680 -
51004 OVERTIME - 2,000 2,000 1,000 700
51101 PART TIME: 20-29 HOURS - - -
51102 PART TIME:LESS THAN 20 HR 9,559 14,985 14,985 22,388 14,985
51201 CAR-CLOTHING ALLOWANCE 2,962 3,000 3,000 2,982 3,000
51202 CELL PHONE ALLOWANCE 1,083 1,080 1,080 1,880 2,160
51301 LONG TERM DISABILITY 481 647 647 493 698
51302 TAXES, SOCIAL SECURITY 12,196 16,022 16,022 15,243 17,096
51303 HOSP-LIFE-DENT-VIS INS 21,110 26,154 26,154 14,269 22,880
51304 PRORATED HEALTH/DENT/VIS 222 - 221 -
51305 RETIREMENT 8,242 17,501 17,501 12,654 18,764
51306 WORKERS COMPENSATION 234 261 261 210 200
51307 UNEMPLOYMENT COMPENSATION 24,124 15,500 15,500 23,000 23,000
TOTAL PERSONNEL 234,397 285,529 285,529 262,571 306,112
52001 OFFICE SUPPLIES 4,030 4,000 4,000 4,000 4,000
52002 MEALS & DRINKS 317 1,000 1,000 1,000 1,000
52003 WEARING APPAREL - 150
52004 MINOR TOOLS & EQUIPMENT 4,577 1,500 1,500 1,500 1,500
52005 EDUC, TRAINING & SUPPLIES 6,171 12,000 12,000 12,000 12,000
52006 POSTAGE 726 750 750 750 750
52009 OTHER/MISC 95 - - -
52010 EMP AWARDS/CEREMONIES 27,153 5,000 5,000 5,000 5,000
52014 COMPUTER EQUIP RENTAL FEE 1,798 1,300 1,300 1,300
TOTAL COMMODITIES 44,867 25,550 25,550 25,550 24,400
53002 INSURANCE 558 604 604 646 654
53004 SPECIAL SERVICES & LEGAL 43,382 90,000 112,891 112,891 140,538
53005 SERVICE AGREEMENTS/REPAIR - -
53007 CONFERENCE EXPENSE 204 2,000 2,000 2,000 2,000
53008 TELEPHONE - -
53009 BLDG MAINTENANCE ALLOC 11,729 - -
53012 COMPUTER SERVICES ALLOC 55,540 - -
53014 RETIREE INSURANCE 55,028 50,797 50,797 50,797 54,688
53015 FLEX/COBRA ADMIN FEES 3,193 6,800 7,241 7,241 7,241
TOTAL CONTRACTUAL SERVICES 169,633 150,201 173,533 173,575 205,121
54001 PRINTING & PUBLICATIONS 432 9,000 9,000 9,000 9,000
54002 DUES & SUBSCRIPTIONS 3,260 6,895 10,195 10,195 6,857
54003 TRAINING & TRAVEL 1,586 1,500 1,500 1,500 2,000
54004 EDUCATIONAL REIMBURSEMENT 21,070 50,000 57,984 57,984 50,000
54005 VEHICLE ALLOWANCE - MILEAGE 100 100 100 100
54006 OTHER EXPENSES - -
54012 EMPLOYMENT EXAMS 32,627 33,000 36,016 36,016 42,000
TOTAL OTHER SERVICES 58,975 100,495 114,795 114,795 109,957
TOTAL CAPITAL OUTLAY - - - - -
TOTAL EXPENDITURES 507,873 561,775 599,407 576,491 645,590
35

36

============================= FY 2016 ANNUAL BUDGET ===============================
================================CITY OF MISSOURI CITY===============================
DEPARTMENT: GENERAL GOVERNMENT FUNDING SOURCE: GENERAL FUND
DIVISION: LEGAL FUND NUMBER: 101-10-104
DESCRIPTION OF DIVISIONAL OPERATIONS
The Legal Division provides a wide range of legal services to the City, including advising City Council, City boards, and City management on legal matters; representing the City in judicial proceedings; preparing ordinances, resolutions, contracts, deeds and other legal documents; and providing prosecutorial services in the Missouri City Municipal Court. The Legal Division handles claims and litigation matters not covered by insurance and provides assistance in, to the greatest degree possible, matters handled by outside counsel, such as condemnation hearings, depositions, and mediations; preparation of witnesses; and the gathering of facts. The Legal Division provides legal services to the City Development Authority, Tax Increment Reinvestment Zones, Public Improvement Districts and City Recreation and Leisure Local Government Corporation. Additionally, the Legal Division provides legal counsel related to the City’s water and wastewater regionalization efforts, utility matters, and the acquisition and disposition of real property.
City Attorney
Assistant City Attorney (2)
First Assistant City Attorney
Total Full-Time Employees = 4
37

============================= FY 2016 ANNUAL BUDGET ===============================
================================CITY OF MISSOURI CITY===============================
DEPARTMENT: GENERAL GOVERNMENT FUNDING SOURCE: GENERAL FUND
DIVISION: LEGAL FUND NUMBER: 101-10-104
STRATEGIES DIVISIONAL OBJECTIVES
1,2,3,5
Prepare, review and revise ordinances, resolutions and contracts to be considered by City Council.
1,2,5
Provide legal research and opinions, on request, related to issues concerning utility franchising, water purchase agreements, and the regionalization of utilities.
1
1,2,5
Provide legal research and opinions and draft, as requested, documents for the procurement and management of solid waste collection services. Provide legal services, as requested, related to interlocal agreements for mutual benefit of governmental agencies, including road construction, trail development and water facility operations.
1,2,3,5
Provide legal research and opinions and draft, as requested, program elements related to the Texas Parkway Development/Redevelopment Initiative.
1
Continue to bring civil actions in county district court for enforcing the abatement of nuisances and collecting civil penalties for such nuisances, as directed by Council.
1,2,3,5 Provide legal opinions regarding the Comprehensive Plan and certain Development Services ordinances, upon request, including ordinances related to the update of the Comprehensive Plan.
1,2,3,5
Provide legal research and opinions related to economic development and prepare, as requested, tax abatement agreements and economic development agreements as administered by the Economic Development Director.
1,2,3,4
Assist with the implementation of newly adopted legislation from the 84th Session of the Texas Legislature.
1
Supply prosecutorial services to the City Municipal Court, including efforts to ensure responsiveness to a vigorous code enforcement program.
PERSONNEL SCHEDULE FY 2014
Actual FY 2015
Budget FY 2015 Estimate
FY 2016 Budget
Salary Grade
City Attorney 1 1 1 1 Uncl.First Assistant City Attorney 1 1 1 1 Uncl.Assistant City Attorney 2 2 2 2 24 Total Full Time Employees 4 4 4 4 Part-Time Admin. Asst. to Prosecutor 1 1 0 0 $15.00/hrPart-Time Assistant City Attorney 1 1 0 0 $50.00/hr
38

============================= FY 2016 ANNUAL BUDGET ===============================
================================CITY OF MISSOURI CITY===============================
DEPARTMENT: GENERAL GOVERNMENT FUNDING SOURCE: GENERAL FUND
DIVISION: LEGAL FUND NUMBER: 101-10-1004
PERFORMANCE AND ACTIVITY MEASURES FY 2014
Actual FY 2015 Budget
FY 2015 Estimate
FY 2016 Budget
Ordinances, Resolutions, Agreements, Deeds & Easements 142 150 158 150 Council meetings, subcommittees, miscellaneous board meetings attended 79 80 66 80
Municipal Court
Total Cases Filed 9,576 15,000 12,794* 14,000
Code Cases Filed 1,094 1,300 1,478 1,500
Bench Trials Tried 71 95 62 50
Jury Trials Tried 77 120 66 90
*Note: This figure varies significantly from the figure budgeted for FY 2015 because prior to FY 2015, this measure consisted of total arraignments, which may have included cases set on multiple arraignment dockets, and not total cases filed.
39

GENERAL FUND
CONSOLIDATED EXPENDITURES BY LINE ITEM
GENERAL GOVERNMENT - LEGAL 101-10-104
Object Description
FY 2014
Actual
FY 2015
Original
Budget
FY 2015
Revised
Budget
FY 2015
Year-End
Estimate
FY 2016
Proposed
Budget
51001 REGULAR SALARIES 378,353 373,510 373,510 380,333 373,510
51002 ADDITIONAL COMPENSATION 879 864 864 892 496
51003 COMPENSATED ABSENCES 217 - 6,574
51102 PART TIME:LESS THAN 20 HR 7,341 62,485 46,335
51201 CAR-CLOTHING ALLOWANCE 3,611 3,600 3,600 3,579 3,600
51202 CELL PHONE ALLOWANCE 3,249 3,240 3,240 2,408 3,240
51301 LONG TERM DISABILITY 1,109 1,281 1,281 1,076 1,282
51302 TAXES, SOCIAL SECURITY 28,144 33,943 33,943 28,234 29,180
51303 HOSP-LIFE-DENT-VIS INS 29,636 39,736 39,736 27,005 29,424
51304 PRORATED HEALTH/DENT/VIS 199 -
51305 RETIREMENT 20,114 34,309 34,309 28,900 34,329
51306 WORKERS COMPENSATION 509 559 559 384 343
51998 CONTRA LEGAL PERSONNEL COSTS (18,861) (18,861)
TOTAL PERSONNEL 473,360 534,666 518,516 479,385 475,404
52001 OFFICE SUPPLIES 820 2,500 2,500 1,826 2,000
52002 MEALS & DRINKS 150 104 150
52003 WEARING APPAREL 33 30 30 - 30
52004 MINOR TOOLS & EQUIPMENT 838 -
52005 EDUC, TRAINING & SUPPLIES 1,538 3,700 3,700 3,250 3,700
52006 POSTAGE 573 700 700 423 700
52014 COMPUTER EQUIP RENTAL FEE 2,597 2,250 2,250 2,250
TOTAL COMMODITIES 6,398 9,180 9,330 7,853 6,580
53001 MINOR EQUIP MAINT/RPR & RNT
53002 INSURANCE 744 835 835 882 815
53004 SPECIAL SERVICES & LEGAL 43,638 43,700 43,700 45,000 65,000
53005 SERVICE AGREEMENTS/REPAIR - 700 700 700
53007 CONFERENCE EXPENSE 2,642 7,350 7,200 4,170 7,200
53009 BLDG MAINTENANCE ALLOC 6,407
53012 COMPUTER SERVICES ALLOC 76,625
TOTAL CONTRACTUAL SERVICES 130,056 52,585 52,435 50,052 73,715
54001 PRINTING & PUBLICATIONS 56 100 100 100 100
54002 DUES & SUBSCRIPTIONS 2,394 13,512 13,512 12,291 13,192
54003 TRAINING & TRAVEL 6,057 14,400 14,400 10,470 13,600
54005 VEHICLE ALLOWANCE - MILEAGE 144 940 940 940
54006 OTHER EXPENSES
TOTAL OTHER SERVICES 8,651 28,952 28,952 22,861 27,832
TOTAL EXPENDITURES 618,466 625,383 609,233 560,151 583,531
40

DEPARTMENT: GENERAL GOVERNMENT FUNDING SOURCE: GENERAL FUND
MUNICIPAL COURT FUND NUMBER: 101-10-106
DESCRIPTION OF DIVISIONAL OPERATIONS
The managerial duties of the courts are carried out by the Director of Municipal Courts and staff. The court
staff works closely with other city departments, i.e. Police Department, Legal, Code Enforcement, Fire
Marshal’s Office, and Finance to insure the vision of the municipal court is carried out effectively, efficiently,
and impartially.
The functions or duties of the Court Clerks include: processing of citations; accepting and preparing
complaints; scheduling cases; preparing dockets; notifying persons of hearings scheduled; maintaining all
court records, including complaints, citations, warrants, pleadings and judgments; preparing state reports, and
preparing affidavits, appeals and sworn statements. The Clerks record and properly disburse funds for fines
collected. The Clerks maintain the failure to appear reporting program under a contract with DPS, the City
and Omnibase. They also prepare jury summons and subpoenas, complaints and other associated duties of
trial preparation. The Clerks maintain the collection agency program.
The municipal court is presided over by a magistrate who shall be known as the "judge of the municipal court."
The council also divided the municipal court into two (2) additional panels or divisions. One of the courts is
presided over by the presiding judge. The additional two (2) courts are presided over by associate judges, who each
are a magistrate with the same powers as the presiding judge. The judges are appointed for a term of two (2) years
by the council. Each judge is a licensed attorney. The municipal court judge presides over all arraignment
hearings and trials, both jury and non-jury, sets bonds, signs arrest and capias warrants, and performs
magistrate functions for prisoners and juveniles. The prosecutor for the City prosecutes violations of City
ordinances and Class C misdemeanors. The costs for the prosecutor are reflected in the Legal Division.
Director of Courts
Lead Deputy Court Clerk
Deputy Court Clerk (3) Part-Time Deputy Court Clerk Position (1)
Deputy Court Clerk/Juvenile Case Manager (1)
Total Full-Time Employees = 6
Part-Time Employees = 1
41
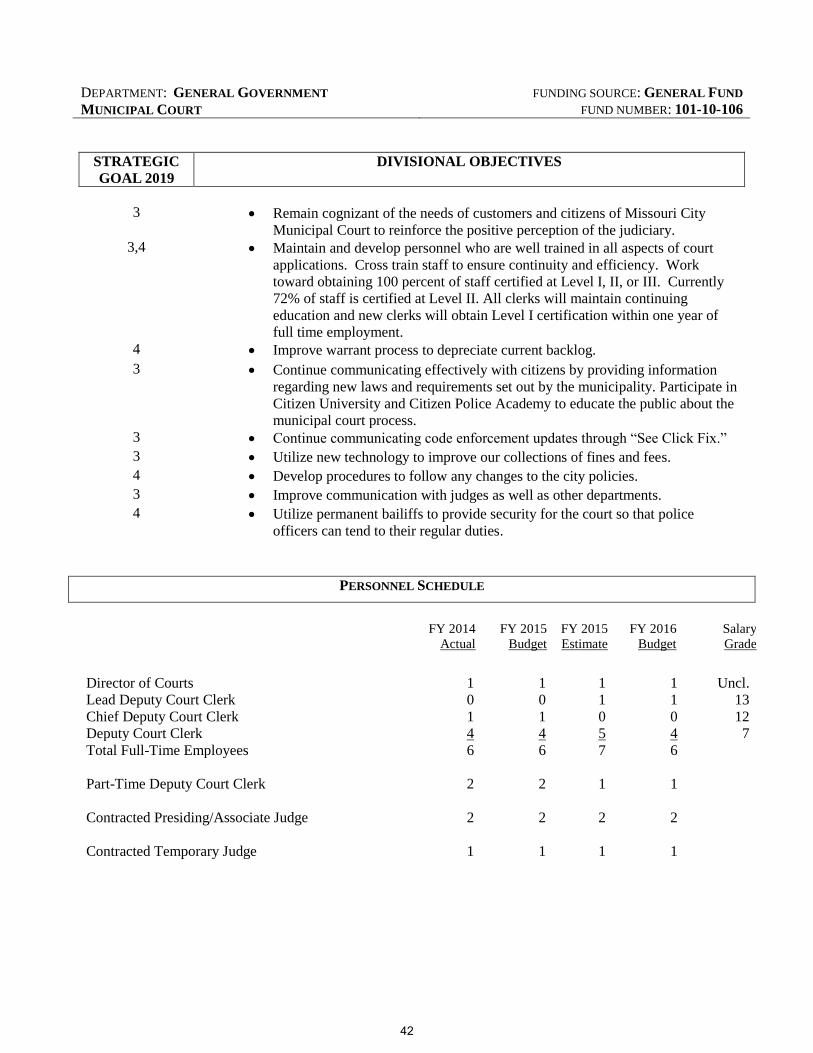
DEPARTMENT: GENERAL GOVERNMENT FUNDING SOURCE: GENERAL FUND
MUNICIPAL COURT FUND NUMBER: 101-10-106
STRATEGIC
GOAL 2019
DIVISIONAL OBJECTIVES
3 Remain cognizant of the needs of customers and citizens of Missouri City
Municipal Court to reinforce the positive perception of the judiciary.
3,4 Maintain and develop personnel who are well trained in all aspects of court
applications. Cross train staff to ensure continuity and efficiency. Work
toward obtaining 100 percent of staff certified at Level I, II, or III. Currently
72% of staff is certified at Level II. All clerks will maintain continuing
education and new clerks will obtain Level I certification within one year of
full time employment.
4 Improve warrant process to depreciate current backlog.
3 Continue communicating effectively with citizens by providing information
regarding new laws and requirements set out by the municipality. Participate in
Citizen University and Citizen Police Academy to educate the public about the
municipal court process.
3 Continue communicating code enforcement updates through “See Click Fix.”
3 Utilize new technology to improve our collections of fines and fees.
4 Develop procedures to follow any changes to the city policies.
3 Improve communication with judges as well as other departments.
4 Utilize permanent bailiffs to provide security for the court so that police
officers can tend to their regular duties.
PERSONNEL SCHEDULE
FY 2014
Actual
FY 2015
Budget
FY 2015
Estimate
FY 2016
Budget
Salary
Grade
Director of Courts 1 1 1 1 Uncl.
Lead Deputy Court Clerk
Chief Deputy Court Clerk
0
1
0
1
1
0
1
0
13
12
Deputy Court Clerk 4 4 5 4 7
Total Full-Time Employees 6 6 7 6
Part-Time Deputy Court Clerk 2 2 1 1
Contracted Presiding/Associate Judge 2 2 2 2
Contracted Temporary Judge 1 1 1 1
42
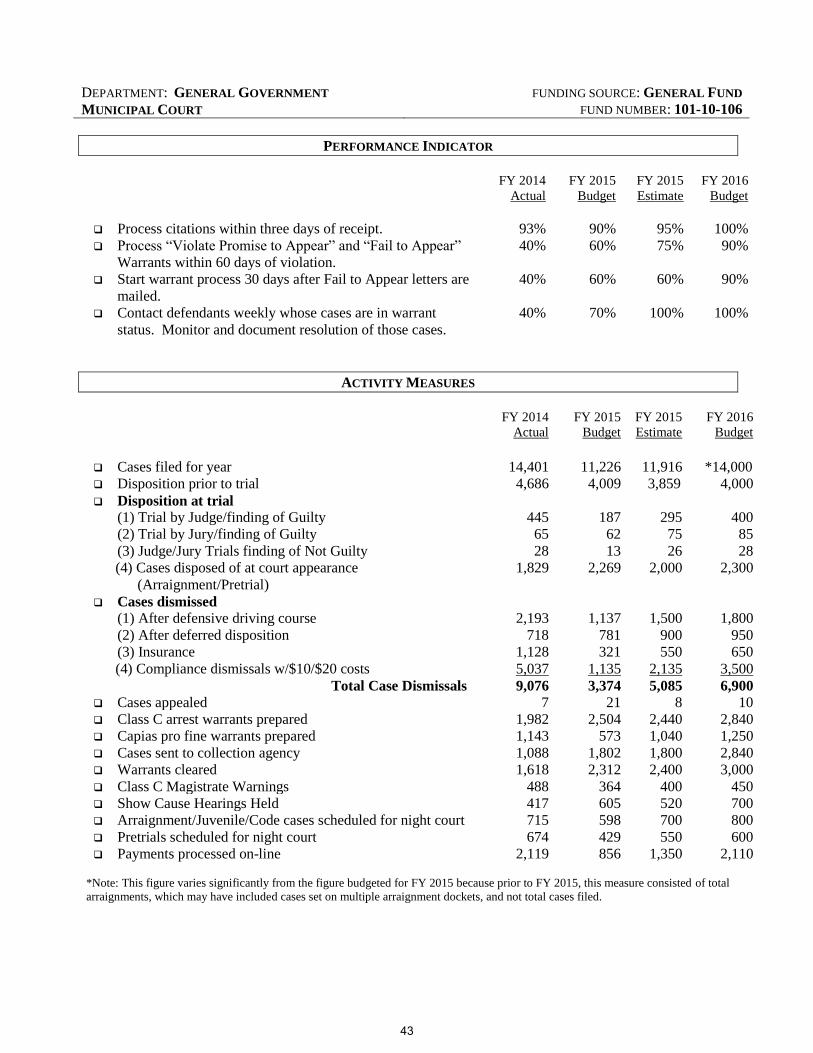
DEPARTMENT: GENERAL GOVERNMENT FUNDING SOURCE: GENERAL FUND
MUNICIPAL COURT FUND NUMBER: 101-10-106
PERFORMANCE INDICATOR
FY 2014
Actual
FY 2015
Budget
FY 2015
Estimate
FY 2016
Budget
Process citations within three days of receipt. 93% 90% 95% 100%
Process “Violate Promise to Appear” and “Fail to Appear”
Warrants within 60 days of violation.
40%
60% 75% 90%
Start warrant process 30 days after Fail to Appear letters are
mailed.
40% 60% 60% 90%
Contact defendants weekly whose cases are in warrant
status. Monitor and document resolution of those cases.
40% 70% 100% 100%
ACTIVITY MEASURES
FY 2014
Actual
FY 2015
Budget
FY 2015
Estimate
FY 2016
Budget
Cases filed for year 14,401 11,226 11,916 *14,000
Disposition prior to trial 4,686 4,009 3,859 4,000
Disposition at trial
(1) Trial by Judge/finding of Guilty 445 187 295 400
(2) Trial by Jury/finding of Guilty 65 62 75 85
(3) Judge/Jury Trials finding of Not Guilty 28 13 26 28
(4) Cases disposed of at court appearance
(Arraignment/Pretrial)
1,829 2,269 2,000 2,300
Cases dismissed
(1) After defensive driving course 2,193 1,137 1,500 1,800
(2) After deferred disposition 718 781 900 950
(3) Insurance 1,128 321 550 650
(4) Compliance dismissals w/$10/$20 costs 5,037 1,135 2,135 3,500
Total Case Dismissals 9,076 3,374 5,085 6,900
Cases appealed 7 21 8 10
Class C arrest warrants prepared 1,982 2,504 2,440 2,840
Capias pro fine warrants prepared 1,143 573 1,040 1,250
Cases sent to collection agency 1,088 1,802 1,800 2,840
Warrants cleared 1,618 2,312 2,400 3,000
Class C Magistrate Warnings 488 364 400 450
Show Cause Hearings Held 417 605 520 700
Arraignment/Juvenile/Code cases scheduled for night court 715 598 700 800
Pretrials scheduled for night court 674 429 550 600
Payments processed on-line 2,119 856 1,350 2,110
*Note: This figure varies significantly from the figure budgeted for FY 2015 because prior to FY 2015, this measure consisted of total
arraignments, which may have included cases set on multiple arraignment dockets, and not total cases filed.
43

GENERAL FUND
CONSOLIDATED EXPENDITURES BY LINE ITEM
GENERAL GOVERNMENT - MUNICIPAL COURT 101-10-106
Object Description
FY 2014
Actual
FY 2015
Original
Budget
FY 2015
Revised
Budget
FY 2015
Year-End
Estimate
FY 2016
Proposed
Budget
51001 REGULAR SALARIES 174,914 236,059 249,111 245,101 252,245
51002 ADDITIONAL COMPENSATION 2,371 2,480 2,480 2,736 1,624
51003 COMPENSATED ABSENCES 30,557 - - 1,047
51004 OVERTIME 4,076 8,100 8,100 4,500 6,000
51101 PART TIME: 20-29 HOURS 205 -
51102 PART TIME:LESS THAN 20 HR 34,011 22,527 12,860 10,502 12,537
51104 JUDGES PAY 79,034 92,784 92,784 77,000 87,000
51201 CAR-CLOTHING ALLOWANCE 1,962 3,000 3,000 2,982 3,000
51202 CELL PHONE ALLOWANCE 751 1,080 1,080 1,082 1,080
51301 LONG TERM DISABILITY 585 815 839 707 867
51302 TAXES, SOCIAL SECURITY 24,344 28,001 28,500 24,456 27,519
51303 HOSP-LIFE-DENT-VIS INS 29,977 44,790 51,132 40,681 45,688
51304 PRORATED HEALTH/DENT/VIS -
51305 RETIREMENT 11,121 21,836 22,423 18,791 23,755
51306 WORKERS COMPENSATION 458 461 469 315 318
TOTAL PERSONNEL 394,365 461,933 472,778 429,900 461,633
52001 OFFICE SUPPLIES 1,281 2,700 2,700 2,000 2,000
52002 MEALS & DRINKS 540 600 600 800 800
52003 WEARING APPAREL - 150 150 100 100
52004 MINOR TOOLS & EQUIPMENT 40 1,000 1,000 800 800
52005 EDUC, TRAINING & SUPPLIES
52006 POSTAGE 4,271 5,400 5,400 5,400 5,400
52009 OTHER/MISC
52014 COMPUTER EQUIP RENTAL FEE 8,548 7,329 7,329 7,329
TOTAL COMMODITIES 14,681 17,179 17,179 16,429 9,100
53002 INSURANCE 1,034 1,142 1,142 1,208 1,198
53004 SPECIAL SERVICES & LEGAL 8,194 9,450 9,450 9,450 7,590
53007 CONFERENCE EXPENSE 998 2,395 2,395 2,850 2,850
53009 BLDG MAINTENANCE ALLOC 48,329
53012 COMPUTER SERVICES ALLOC 227,047
53016 COLLECTION AGENCY FEE 41,251 95,000 95,045 45,000 51,500
TOTAL CONTRACTUAL SERVICES 326,853 107,987 108,032 58,508 63,138
54001 PRINTING & PUBLICATIONS 2,518 2,500 2,500 1,000 1,500
54002 DUES & SUBSCRIPTIONS 200 400 400 200 200
54003 TRAINING & TRAVEL 3,540 2,500 2,500 4,545 3,500
54005 VEHICLE ALLOWANCE - MILEAGE 87 150 150 150 150
TOTAL OTHER SERVICES 6,345 5,550 5,550 5,895 5,350
TOTAL CAPITAL OUTLAY - - - - -
TOTAL EXPENDITURES 742,245 592,649 603,539 510,732 539,221
44

DEPARTMENT: GENERAL GOVERNMENT FUNDING SOURCE: GENERAL FUND
DIVISION: CONTINGENCY FUND NUMBER: 101-10-107
MISSION STATEMENT
The General Administration Division is established to allow for unanticipated expenditures during the fiscal
year. This Division also includes General Fund related expenditures which are not specifically associated
with a particular department or division.
Contingency funds budgeted in this Division are transferred from this account to the appropriate divisional
budget as needed for unanticipated expenditures.
GENERAL GOVERNMENT - CONTINGENCY 101-10-107
Object Description
FY 2014
Actual
FY 2015
Original
Budget
FY 2015
Revised
Budget
FY 2015
Year-End
Estimate
FY 2016
Proposed
Budget
52004 MINOR TOOLS & EQUIPMENT 15,894 - 18,246 31,000
TOTAL COMMODITIES 15,894 - - 18,246 31,000
53002 INSURANCE 8,553 10,000 10,000 11,000 11,000
TOTAL CONTRACTUAL SERVICES 8,553 10,000 10,000 11,000 11,000
54013 RESERVE FOR CONTINGENCIES 250,000 169,339
54021 CONTINGENCY-SALARY ADJUST 620,280 620,280 493,920
TOTAL OTHER SERVICES - 870,280 789,619 - 493,920
90003 TRANSFER TO FUND 261 (TIRZ #1)* 325,337 325,337 337,481 368,397
90004 TRANSFER TO FUND 262 (TIRZ #2)* 572,143 572,143 668,077 722,899
90007 TRANSFER TO FUND 265 (TIRZ #3)* 224,370 224,370 274,976 302,645
90021 TRANSFER TO FUND 611 -
90023 TRANSFER TO FUND 231 22,376
90041 TRANSFER TO FUND 230 58,708
90042 TRANSFER TO LGC 393,585 100,000 100,000
TOTAL OTHER FINANCING USES 474,669 1,121,850 1,121,850 1,380,534 1,493,941
TOTAL EXPENDITURES 499,116 2,002,130 1,921,469 1,409,780 2,029,861
45

============================= FY 2016 ANNUAL BUDGET ===============================
================================CITY OF MISSOURI CITY===============================
DEPARTMENT: GENERAL GOVERNMENT FUNDING SOURCE: GENERAL FUND
COMMUNICATIONS FUND NUMBER: 101-10-108
DESCRIPTION OF OPERATIONS
There are six primary areas of responsibility managed by the Communications Department to inform and educate residents and other publics about City programs and services and to assure the consistent and transparent delivery of information. MCTV-16: Produce and air quality municipal programming 24 hours a day, seven days per week. Programming includes City Council and Planning and Zoning Commission meetings, a bimonthly news show, informational videos on programs and services and events. Creation of bulletin board information relating to City activities. Public Information: Develop and manage consistent, timely and accurate dissemination of information to the news media. Develop and distribute news releases based upon City Council action, benchmarks on major City projects and special events. Manage emergency public information upon activation of the Emergency Operation Center. Websites: Establish the City's Web presence as a distinct media platform by creating original content and implementing technical innovation. Maintain knowledge and awareness of best practices and prevailing developments in Web technologies, standards and requirements, and apply these to promote continuous improvement. Liaise with departments to assist and encourage the uploading of information and to ensure content is current, pertinent and meets user needs. Citizen Communications: Responsible for liaison with Homeowner Associations to continue to build alliances with these organizations and to educate and inform them about City policies and services. Manage City staff presence at HOA meetings. Develop and publish a citizen newsletter. Through City Reception, handle in-person and telephone inquiries to City Hall. Manage 1690AM, the City’s public television station, and the messages aired on the station as well as missouricityready.com, the City’s emergency information Web site. Social Networking and Marketing: Increase the growth of the City’s social media communities and brand awareness, improve engagement, and execute day-to-day integration efforts between digital, on-air and social media properties. Special Projects: Responsible for the overall branding program for the City and the use of the City logo. Counsel departments on their communication needs and communicating information to citizens. Manage the City’s awards program.
Total Full-Time Employee = 8 Total Part-Time Employees = 1
46

============================= FY 2016 ANNUAL BUDGET ===============================
================================CITY OF MISSOURI CITY===============================
DEPARTMENT: GENERAL GOVERNMENT FUNDING SOURCE: GENERAL FUND
COMMUNICATIONS FUND NUMBER: 101-10-108 STRATEGIC
GOAL 2019 DEPARTMENTAL OBJECTIVES
3
3 3
Implement an enhanced strategy to effectively control the City’s brand that is portrayed to employees, stakeholders, residents and media outlets. The revised strategy will: evaluate the effectiveness of the current approach as well as that of key competitors; analyze social media/web analytics to determine information-seeking behaviors and how to better reach audiences; formulate a better customer experience by making information more accessible to specific target audiences; and remain flexible. Key initiatives include, but are not limited to, revising the look-and-feel of the City’s news release template; rebranding the City’s municipal radio station including streaming radio service; implementing the City’s brand with Swagit’s white label mobile app; designing additional marketing collateral including banners, brochures and the “Show Me” Missouri City newsletter; creating a social media calendar to effectively manage the City’s growing networks; rolling-out an online form to collect requests for media coverage and overhauling the City’s website for outdated/erroneous content.
Develop second comprehensive Citizen Survey to further evaluate programs and services.
Continue to evaluate and improve the City’s HOA Program, partnering with all departments, strengthening existing relationships with Board Members, Property Managers and residents. Develop an HOA presence on the homepage of the City website and continue to assess best usage of common issues of interest in communications and tools and processes/procedures. HOA Liaison/Community Relations Coordinator will continue to develop citizen contacts in neighborhoods without HOAs to further expand the dissemination of news, alerts and advisories citywide.
3 Continue development of Leadership Luncheon series bringing together
executives, entrepreneurs, innovators and community leaders from throughout the region and the County to discuss the trends and challenges facing business leaders today. Increase sponsorships and host first annual conference with a focus on the City’s small business policy.
3 Continue quarterly publication of the “Show Me” Missouri City newsletter;
customizing one edition as a comprehensive Annual Report.
3
3
Finalize social media policy, discuss policy with Leadership Team; distribute policy to all departments. Continue to manage development of social media outlets, including Facebook, Twitter and Instagram accounts, with a focus on cross-departmental cooperation and collaboration.
Continue development of Citizens’ University to engage and educate the citizenry. Incorporate Alumni expertise and talent into City committees, boards, commissions and Volunteers programs to continuing fostering City-Citizen partnerships. Assess case studies’ format to determine if resident input/feedback yields solutions Staff can incorporate into policies, procedures and processes.
47

============================= FY 2016 ANNUAL BUDGET ===============================
================================CITY OF MISSOURI CITY===============================
3
3
Expand Municipal Volunteer Program, further engaging residents in City projects and events and seeking citizen input and feedback to improve services and programs. Implement new opportunities, increase current volunteer involvement and earn recognition for the program.
Continue revamp of Missouri City Television programming, building on popular programming: On the Agenda, Missouri City Minute, City Council meetings and promotional programs. Launching a quarterly “Restaurant Review” in 2015 with a focus on the City’s Restaurant Scores program and an updated bulletin board background. Will also work with departments to produce spotlights on operations. Goal is to continue ensuring a comprehensive, consistent and uniform presence on cable, the websites and social media.
3
Finalize development of a residents’ guide as an information resource for new homeowners.
3 Expand media partnerships thereby building Missouri City’s presence in regional, national, and international media coverage. Update media policy utilizing specific issues, discuss with Leadership Team; distribute updated policy to all departments.
3 Improve/increase citizen outreach and collaboration across all roles. Maintain
excellent customer service and cross-departmental communications; regularly review and revise policies, procedures and protocols to ensure consistency.
PERSONNEL SCHEDULE FY 2014
Actual FY 2015
Budget FY 2015 Estimate
FY 2016 Budget
SalaryGrade
Communications Director 1 1 1 1 Uncl.Marketing/Communications Specialist 1 0 0 0 22Digital Video Engineer 1 1 1 1 13Website Designer 1 1 1 1 13Community Relations Coordinator 1 1 1 1 13Media Relations Specialist 1 1 1 1 11Jr. Digital Video Engineer 1 1 1 1 8Customer Relations Specialist II 2 2 2 2 8 Total Full-Time Employees 9 8 8 8 Part-Time Employees 2 1 1 1
48

============================= FY 2016 ANNUAL BUDGET ===============================
================================CITY OF MISSOURI CITY===============================
PERFORMANCE INDICATORS FY 2014
Actual FY 2015
Budget FY 2015 Estimate
FY 2016 Budget
% of Effective “publication” of news releases in 2 print media
(publication of material in Chronicle, FB Lifestyles magazine) 90 95 95 95 Website Bounce Rate % (time visitors spend viewing content) 28 25 25 25 % of New Website Visitors (subscribers, social media, videos) 85 95 95 95 % of Returning Website Visitors 80 85 85 90 % of Social media link shares (growth of FB/Twitter/YouTube) 32 45 50 60
ACTIVITY MEASURES FY 2014
ActualFY 2015
Budget FY 2015 Estimate
FY 2016 Budget
Produce and broadcast on MCTV and city website economic development show: (projects with commercial focus) 4 4 12 16Views on City of Missouri City You Tube page 43,000 57,000 57,000 65,000Press Releases (including bulletin boards, PSAs, mass emailings) 250 250 475 500E-Subscriber List 3,100 5,000 5,000 6,000Views of City Video on website 15,000 20,000 20,000 20,000Average Monthly Website Page Views 23,650 27,640 27,640 28,000Average minutes on website 6 6 6 8
DEPARTMENT: GENERAL GOVERNMENT FUNDING SOURCE: GENERAL FUND
COMMUNICATIONS FUND NUMBER: 101-10-108
49

GENERAL FUND
CONSOLIDATED EXPENDITURES BY LINE ITEM
GENERAL GOVERNMENT - COMMUNICATIONS 101-10-108
Object Description
FY 2014
Actual
FY 2015
Original
Budget
FY 2015
Revised
Budget
FY 2015
Year-End
Estimate
FY 2016
Proposed
Budget
51001 REGULAR SALARIES 282,206 366,089 366,089 344,655 353,928
51002 ADDITIONAL COMPENSATION 393 528 528 568 872
51003 COMPENSATED ABSENCES 3,997 - -
51004 OVERTIME 16,011 15,000 15,000 13,000 15,000
51101 PART TIME: 20-29 HOURS - -
51102 PART TIME:LESS THAN 20 HR 17,252 11,988 11,988 3,739 11,988
51201 CAR-CLOTHING ALLOWANCE 2,962 3,000 3,000 2,982 3,000
51202 CELL PHONE ALLOWANCE 2,734 5,400 5,400 2,783 3,240
51301 LONG TERM DISABILITY 950 1,260 1,260 1,076 1,213
51302 TAXES, SOCIAL SECURITY 24,218 30,753 30,753 26,806 29,684
51303 HOSP-LIFE-DENT-VIS INS 37,507 67,644 67,644 41,632 57,073
51304 PRORATED HEALTH/DENT/VIS 314 314 -
51305 RETIREMENT 16,227 36,180 36,180 25,827 34,383
51306 WORKERS COMPENSATION 447 488 488 357 336
TOTAL PERSONNEL 405,218 538,330 538,330 463,739 510,717
52001 OFFICE SUPPLIES 6,309 4,000 4,000 4,000 4,000
52002 MEALS & DRINKS 3,955 3,000 11,400 11,400 11,700
52003 WEARING APPAREL 722 300 300 300 300
52004 MINOR TOOLS & EQUIPMENT 2,012 - - -
52005 EDUC, TRAINING & SUPPLIES - -
52006 POSTAGE 1,006 800 1,800 1,800 1,800
52007 BLDG MAT'L/SUPPLIES & REPAIRS - -
52008 IDENTIFICATION SUPPLY/FIL (58) - - -
52009 OTHER/MISC 167 - - 8 -
52014 COMPUTER EQUIP RENTAL FEE 3,562 2,700 2,700 2,700
52015 FLEET RENTAL FEE 3,929 5,313 5,313 5,313 5,313
52016 CENTRAL GARAGE ALLOC 2,225 - -
52017 FUEL, OIL & LUBRICANTS 2,568 3,200 3,200 3,060 3,550
TOTAL COMMODITIES 26,398 19,313 28,713 28,581 26,663
53001 MINOR EQUIP MAINT/RPR & RNT 169 400 400 400 400
53002 INSURANCE 1,243 1,385 1,385 1,466 1,371
53004 SPECIAL SERVICES & LEGAL 31,639 40,904 31,942 33,000 33,000
53005 SERVICE AGREEMENTS/REPAIR - -
53007 CONFERENCE EXPENSE 1,112 5,700 5,700 5,700 5,700
53008 TELEPHONE 294 365 365 348 348
53009 BLDG MAINTENANCE ALLOC 9,884 - -
53010 OTHER/MISC - -
53011 MISSSOURI CITY TV - -
53012 COMPUTER SERVICES ALLOC 108,252 - -
TOTAL CONTRACTUAL SERVICES 152,593 48,754 39,792 40,914 40,819
54001 PRINTING & PUBLICATIONS 474 1,500 1,500 1,500 1,500
54002 DUES & SUBSCRIPTIONS 1,990 1,720 1,720 1,720 1,720
54003 TRAINING & TRAVEL 2,846 6,000 6,000 6,000 6,000
54005 VEHICLE ALLOWANCE - MILEAGE 155 700 700 700 700
54006 OTHER EXPENSES - -
54007 COMMUNITY COMMUNICATIONS 40,289 64,690 69,966 69,966 59,680
TOTAL OTHER SERVICES 45,754 74,610 79,886 79,886 69,600
TOTAL CAPITAL OUTLAY - - - - -
TOTAL EXPENDITURES 629,964 681,007 686,721 613,120 647,799
50

============================= FY 2016 ANNUAL BUDGET ===============================
================================CITY OF MISSOURI CITY===============================
DEPARTMENT: GENERAL GOVERNMENT FUNDING SOURCE: GENERAL FUND
ECONOMIC DEVELOPMENT FUND NUMBER: 101-10-109
DESCRIPTION OF DEPARTMENTAL OPERATIONS The Executive Director of Economic Development reports to the City Manager and is responsible for prospect development, industry contact and negotiation with industry representatives to encourage business development in Missouri City. The functions of the Economic Development Director include:
Recruiting commercial and industrial business through targeted marketing; meeting with developers, brokers to encourage business development
Answer questions from prospective business partners on available properties and understanding of City zoning ordinances
Organize activities; prepare solicitation letters and information packets for distribution and proposals for specific targeted businesses.
Research state and federal economic development programs and recommend policy changes to the City Manager
Prepare presentations to City Council, public or private partners on new strategies and activities to encourage local business development
Lead negotiations on business partnerships or development agreements for commercial and industrial business development in the City
Others as directed by the City Manager
Total Full-Time Employees = 1
*The City Manager is included in the Council & Management Budget
51

============================= FY 2016 ANNUAL BUDGET ===============================
================================CITY OF MISSOURI CITY===============================
DEPARTMENT: GENERAL GOVERNMENT FUNDING SOURCE: GENERAL FUND
ECONOMIC DEVELOPMENT FUND NUMBER: 101-10-109 STRATEGIC
GOAL 2019 DIVISIONAL GOALS
2 Develop a “Strategic Investment Zone” for the Texas Parkway corridor to incorporate
economic development incentives (TIRZ #1, Ch. 380 agreements, and permit fee waivers) and code enforcement efforts to encourage redevelopment in this area.
2 Use the analysis and redevelopment strategy of the Texas Parkway corridor by a
professional third party to promote redevelopment options to interested developers and retailers.
2 Promote Missouri City at the annual International Council of Shopping Centers (ICSC) conference in Las Vegas, Nevada and annual ICSC Texas conference in Dallas, Texas.
2 Develop and implement a coordinated national business recruitment effort based around membership in the GHP’s Opportunity Houston 2.0.
2 Assess the potential of a youth sports complex. Assume a positive business potential and identify and secure a site, while creating an agreement framework and conceptual plan.
2 Develop an annual update schedule for the City Council from the major economic development partners on joint community efforts.
2 Create standardized annual departmental report including incentive tracking and agreement compliance.
2 Coordinate with related departments to negotiate a development agreement for the next business park.
2 Work with planning and development services on any needed changes in zoning to address uses and development aesthetics which do not promote a positive image of Missouri City.
2 Create a brand and image campaign for Missouri City.
2 Work with external partners such as HCC, local banks, accounting services and others to
implement a small business initiative which is recognized as a model to be rolled out County wide.
2 Work with the land owners at the intersection of Fort Bend Toll Road and Hwy 6 on a
vision for the area as a regional employment center. Craft an action plan for City Manager and Council consideration to accomplish this objective.
2 Sit for the CEcD Exam in October.
2 Work with area land owners and developers on a Municipal Management District for the Highway 90A corridor.
PERSONNEL SCHEDULE FY 2014
Actual FY 2015 Budget
FY 2015 Estimate
FY 2016 Budget
Salary Grade
Executive Director of Economic Development 1 1 1 1 25 Total Full-Time Employees 1 1 1 1
52

============================= FY 2016 ANNUAL BUDGET ===============================
================================CITY OF MISSOURI CITY===============================
DEPARTMENT: GENERAL GOVERNMENT FUNDING SOURCE: GENERAL FUND
ECONOMIC DEVELOPMENT FUND NUMBER: 101-10-109
PERFORMANCE INDICATORS FY 2014
Actual FY 2015 Budget
FY 2015 Estimate
FY 2016 Budget
Respond on Economic Development contacts provided within
three working days N/A 95% 90% 95%
Successful achievement of identified strategic plan objectives N/A 95% 95% 95%
Successful Implementation of new business recruitment N/A 95% 95% 95%
ACTIVITY MEASURES FY 2014
Actual FY 2015 Budget
FY 2015 Estimate
FY 2016 Budget
Number of Site Selector tours and Business Recruitment
Missions N/A 5 3 5 Number of business visits to assess needs of the business
community N/A 150 110 135 Achieving a minimum 10% required return to the City from
incentives provided to projects brought before Council and agreements approved N/A 85% 90% 85%
53

GENERAL GOVERNMENT - ECONOMIC DEVELOPMENT 101-10-109
Object Description
FY 2014
Actual
FY 2015
Original
Budget
FY 2015
Revised
Budget
FY 2015
Year-End
Estimate
FY 2016
Proposed
Budget
51001 REGULAR SALARIES 100,033 109,990 109,990 113,240 113,007
51002 ADDITIONAL COMPENSATION - 40 40 40 88
51201 CAR-CLOTHING ALLOWANCE - 3,000 3,000 6,000 6,000
51202 CELL PHONE ALLOWANCE 1,003 1,080 1,080 1,083 1,080
51301 LONG TERM DISABILITY 279 373 373 301 394
51302 TAXES, SOCIAL SECURITY 7,628 8,500 8,500 9,128 8,964
51303 HOSP-LIFE-DENT-VIS INS 4,868 5,825 5,825 5,551 6,168
51304 PRORATED HEALTH/DENT/VIS 213 213
51305 RETIREMENT 5,284 10,000 10,000 8,866 10,546
51306 WORKERS COMPENSATION 136 140 140 120 105
TOTAL PERSONNEL 119,445 138,948 138,948 144,542 146,352
52001 OFFICE SUPPLIES 54 2,500 2,500 2,500 2,500
TOTAL COMMODITIES 54 2,500 2,500 2,500 2,500
53001 MINOR EQUIP MAINT/RPR & RNT - 223 223 -
53002 INSURANCE - - - - 299
TOTAL CONTRACTUAL SERVICES - 223 223 - 299
54001 PRINTING & PUBLICATIONS -
54002 DUES & SUBSCRIPTIONS 1,355 54,070 54,070 52,000 55,370
54003 TRAINING & TRAVEL 5,105 32,598 32,598 32,000 20,733
54005 VEHICLE ALLOWANCE - MILEAGE 12 - 3,000
54008 COUNTY ECONOMIC DEVELOPMENT 43,450 25,000 25,000 37,500 37,500
54009 CITY ECONOMIC DEVELOPMENT 14,414 111,850 111,850 99,350 111,850
TOTAL OTHER SERVICES 64,336 223,518 223,518 220,850 228,453
TOTAL CAPITAL OUTLAY - - - - -
TOTAL EXPENDITURES 183,835 365,189 365,189 367,892 377,604
54

=============================== FY 2016 ANNUAL BUDGET===============================
================================ CITY OF MISSOURI CITY===============================
DEPARTMENTAL VISION STATEMENT
FINANCE
Recognized as a Premier Finance Organization that excels in forward thinking and innovation, maximizing efficiency while maintaining the highest integrity.
DEPARTMENTAL MISSION STATEMENT
“Dedicated to the safeguarding of public assets through sound financial practices”
Finance Administration
Purchasing
Accounting & Budget
55

=============================== FY 2016 ANNUAL BUDGET===============================
================================ CITY OF MISSOURI CITY===============================
FY 2015 DEPARTMENTAL ACCOMPLISHMENTS Conducted departmental meetings with other City departments relating to information, communication and
provide better assistance. Coordinated with staff on reasons for accounting and auditing requirements that required information. Completed 5-year agreement for new delinquent tax collection. Maintained fund balance requirements within 15%-25% for the General Fund. Assisted in the development of the Fire Station #5 agreement with Sienna MUD 1.
56

=============================== FY 2016 ANNUAL BUDGET===============================
================================ CITY OF MISSOURI CITY===============================
DEPARTMENT: FINANCE FUNDING SOURCE: GENERAL FUND
DEPARTMENTAL DESCRIPTION The Finance Department has general responsibility for the financial administration of the City. The Department is responsible for recording and documenting all financial transactions, idle fund investment, debt management, budget preparation and coordination, risk management, tax collection, centralized cash receipts, accounts receivable, contract management, payroll, purchasing goods and services for the City, and payment of all invoices.
STRATEGIC
GOAL 2019 DEPARTMENTAL GOALS
ERP
1 Design action plan based on results. 1 Utilization of new software and improvements to processes. 1 1 2
Fully utilize the functionality of the ERP. Review and analyze existing software in achieving the goals. Investigate alternatives to improve, gather and disseminate information.
Communication/Reporting 1 Evaluate the results of communication survey. 1 Determine what needs to be improved. 1 Develop a program to address the areas for improvement in communication. 1 Develop grant program outline. 1 Obtain direction from governing body for grant program. 2 Identify reports and info needed by the organization including consultation with all city
departments. 2 Establish timelines/schedules to efficiently and timely deliver information. 3 Develop video training for all individuals who need access to financial information. 3 Provide updated e-solution options for internal and external customers in conjunction
with new software development. Increase online payment options for citizens. Provide regular and timely updates of website financial data.
Policy Development/Compliance 1 Develop preventive measures and determine areas of training to non-compliant areas. 1 Develop checklists to ensure all interested parties are included in development and
administration of the project/program. 1 Implement an effective program to provide updated financial information, utilizing
electronic methods when possible. 1 Hold meetings with interested parties to notify and receive feedback on status of projects
or programs. 1 Analyze effectiveness and relevance of current activity and performance indicators 4 Establish criteria for each area of accountability, including consequences for non-
compliance
57

=============================== FY 2016 ANNUAL BUDGET===============================
================================ CITY OF MISSOURI CITY===============================
Staff Development 1 Develop employee training and development program. 1 4
4 4
Establish a program for employee development which includes succession planning. Assess training needs for various positions and develop training materials for different levels of responsibility. Create timelines for new hire/promoted employee training. Periodically review and adjust procedures as needed.
58

=============================== FY 2016 ANNUAL BUDGET===============================
================================ CITY OF MISSOURI CITY===============================
DEPARTMENT: FINANCE FUNDING SOURCE: GENERAL FUND
DIVISION: ADMINISTRATION FUND NUMBER: 101-12-110
DESCRIPTION OF DIVISIONAL OPERATIONS The Director of Finance is appointed by the City Manager, confirmed by Council, and is responsible for supervising accounting, purchasing, payroll, tax collection, accounts receivable, insurance and workers’ compensation programs; and investments to assure maximum interest earnings. The Director of Finance and entire Finance Department staff assist the City Manager in preparing and presenting budget documents to Council, assist in the annual audits, and prepare the Annual Comprehensive Financial Report and other financial reports of the City. Finance administration provides managerial, analytical, and administrative support for the Finance Department, City Manager, Assistant City Managers and other departments of the City. This division oversees the preparation of the annual budget and monitors compliance during the year.
Total Full-Time Employees = 1
59

=============================== FY 2016 ANNUAL BUDGET===============================
================================ CITY OF MISSOURI CITY===============================
DEPARTMENT: FINANCE FUNDING SOURCE: GENERAL FUND
DIVISION: ADMINISTRATION FUND NUMBER: 101-12-110
STRATEGIC
GOAL 2019 DIVISIONAL OBJECTIVES
1 1 3 3 4
Actively communicate relative financial matters to Finance Managers in a timely
manner. Discuss agenda items in advance to ensure proactive planning. Coordinate effort with HR/OD to facilitate training needs with new hires. Coordinate with staff to communicate and educate reasons for accounting and auditing
requirements that necessitate specific information. Prepare report on changing to an October 1 fiscal year
PERSONNEL SCHEDULE
FY 2014
Actual FY 2015
Budget FY 2015 Estimate
FY 2016 Budget
SalaryGrade
Director of Finance 1 1 1 1 Uncl. Total Full-Time Employees 1 1 1 1
60

=============================== FY 2016 ANNUAL BUDGET===============================
================================ CITY OF MISSOURI CITY===============================
DEPARTMENT: FINANCE FUNDING SOURCE: GENERAL FUND
DIVISION: ADMINISTRATION FUND NUMBER: 101-12-110
PERFORMANCE INDICATORS
FY 2014
Actual FY 2015
Budget FY 2015 Estimate
FY 2016 Budget
Complete budget documents within budget calendar 83% 100% 92% 100% Provide timely accurate response to requests from City Staff 95% 98% 95% 95% Complete audit report and workpapers per the audit schedule 90% 100% 95% 100% Improve the use of integrated accounting and financial management
system while implementing and developing features of current software that will increase efficiency and effectiveness 65% 80% 75% 90%
ACTIVITY MEASURES
FY 2014
Actual FY 2015
Budget FY 2015 Estimate
FY 2016 Budget
Prepare budget annually for Distinguished Budget Award
Certificate of Excellence 1
1 1 1 Prepare Comprehensive Annual Financial Statement for Certificate
of Achievement for Excellence 1
1 1 1 Five year Revenue & Expenditure Analysis 1 1 1 1 Quarterly Financial & Investment Report Presentations 4 4 4 4
61
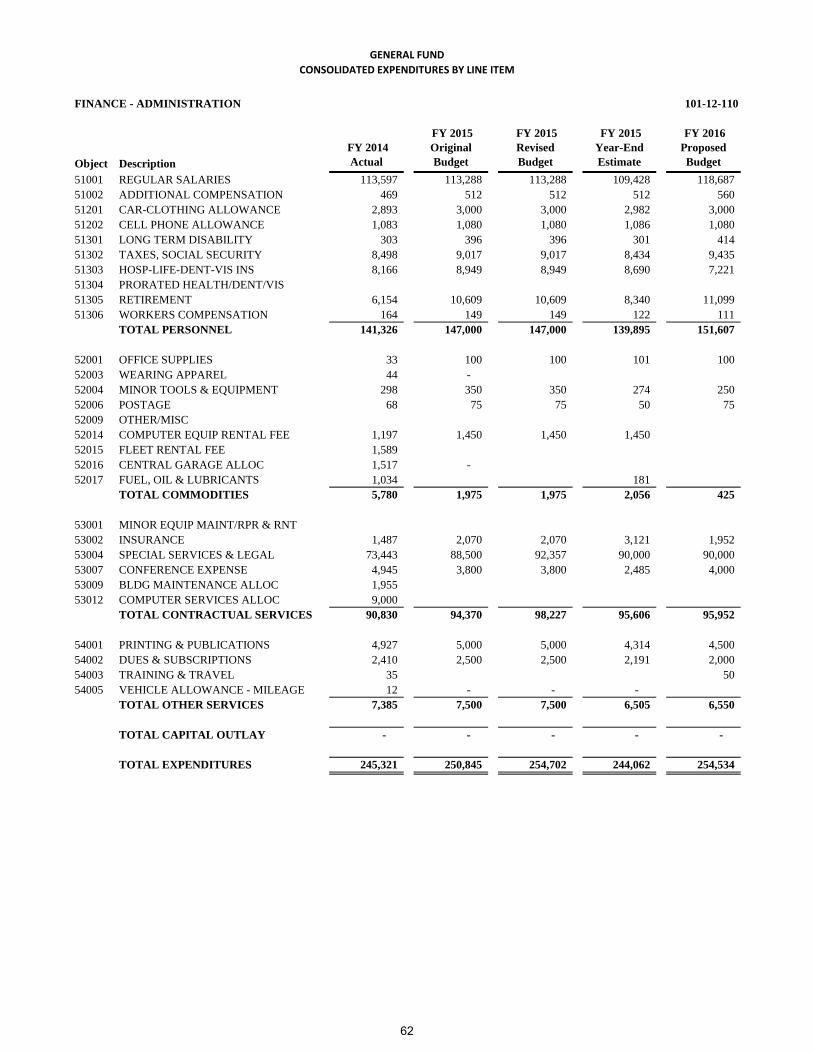
GENERAL FUND
CONSOLIDATED EXPENDITURES BY LINE ITEM
FINANCE - ADMINISTRATION 101-12-110
Object Description
FY 2014
Actual
FY 2015
Original
Budget
FY 2015
Revised
Budget
FY 2015
Year-End
Estimate
FY 2016
Proposed
Budget
51001 REGULAR SALARIES 113,597 113,288 113,288 109,428 118,687
51002 ADDITIONAL COMPENSATION 469 512 512 512 560
51201 CAR-CLOTHING ALLOWANCE 2,893 3,000 3,000 2,982 3,000
51202 CELL PHONE ALLOWANCE 1,083 1,080 1,080 1,086 1,080
51301 LONG TERM DISABILITY 303 396 396 301 414
51302 TAXES, SOCIAL SECURITY 8,498 9,017 9,017 8,434 9,435
51303 HOSP-LIFE-DENT-VIS INS 8,166 8,949 8,949 8,690 7,221
51304 PRORATED HEALTH/DENT/VIS
51305 RETIREMENT 6,154 10,609 10,609 8,340 11,099
51306 WORKERS COMPENSATION 164 149 149 122 111
TOTAL PERSONNEL 141,326 147,000 147,000 139,895 151,607
52001 OFFICE SUPPLIES 33 100 100 101 100
52003 WEARING APPAREL 44 -
52004 MINOR TOOLS & EQUIPMENT 298 350 350 274 250
52006 POSTAGE 68 75 75 50 75
52009 OTHER/MISC
52014 COMPUTER EQUIP RENTAL FEE 1,197 1,450 1,450 1,450
52015 FLEET RENTAL FEE 1,589
52016 CENTRAL GARAGE ALLOC 1,517 -
52017 FUEL, OIL & LUBRICANTS 1,034 181
TOTAL COMMODITIES 5,780 1,975 1,975 2,056 425
53001 MINOR EQUIP MAINT/RPR & RNT
53002 INSURANCE 1,487 2,070 2,070 3,121 1,952
53004 SPECIAL SERVICES & LEGAL 73,443 88,500 92,357 90,000 90,000
53007 CONFERENCE EXPENSE 4,945 3,800 3,800 2,485 4,000
53009 BLDG MAINTENANCE ALLOC 1,955
53012 COMPUTER SERVICES ALLOC 9,000
TOTAL CONTRACTUAL SERVICES 90,830 94,370 98,227 95,606 95,952
54001 PRINTING & PUBLICATIONS 4,927 5,000 5,000 4,314 4,500
54002 DUES & SUBSCRIPTIONS 2,410 2,500 2,500 2,191 2,000
54003 TRAINING & TRAVEL 35 50
54005 VEHICLE ALLOWANCE - MILEAGE 12 - - -
TOTAL OTHER SERVICES 7,385 7,500 7,500 6,505 6,550
TOTAL CAPITAL OUTLAY - - - - -
TOTAL EXPENDITURES 245,321 250,845 254,702 244,062 254,534
62

=============================== FY 2016 ANNUAL BUDGET===============================
================================ CITY OF MISSOURI CITY===============================
DEPARTMENT: FINANCE FUNDING SOURCE: GENERAL FUND
DIVISION: PURCHASING FUND NUMBER: 101-12-112
DESCRIPTION OF DIVISIONAL OPERATIONS The Purchasing and Risk Manager reports directly to the Director of Finance with the primary responsibilities of procuring all goods and services for the City, develop budget allocations, risk management, manage travel, and administer the purchasing card program. Purchasing - sources commodities and services, prepares specifications, obtains pricing, verifies references, and evaluates this information to recommend the procurement that is in the best interest of the City. Risk Management – processes liability and property damage claims, prepares annual insurance re-rate, and adds and deletes coverage for real and personal property. Contract Management – performs contract development, performance review, negotiation, legal compliance review, management, and administration of all expenditure contracts. Assists departments in administration and contractor compliance with provisions. Travel – processes requests, books air reservations, reviews reimbursement requests and reconciles travel reports submitted by employees. Budget Preparation – assists in preparation of the City’s budget by calculating allocations for expenditures in insurance, telecommunications, utilities, and defining those expenditure parameters. Purchasing Card – develops policy and procedures, administers the program and assists cardholders in using the system. Prepares and submits download of data to Accounts Payable for GMBA processing. Audits all transactions for compliance with City policy. Policy Development – assists management by developing, revising, implement, and enforcing various City policies that impact the expenditure of funds. These policies include Purchasing, Risk Management, Purchasing Card, Travel, Education, Uniform, Cell Phone, Contracts, and Vehicle Use. The Division also provides services such as centralized delivery and distribution of supplies, administration and management of commonly used equipment such as postage meter, pagers, and cell phones, disposal of surplus and salvage property, and vehicle registration.
Total Full-Time Employees = 3
*Director of Finance is included in the Administration Divisional Budget.
63

=============================== FY 2016 ANNUAL BUDGET===============================
================================ CITY OF MISSOURI CITY===============================
DEPARTMENT: FINANCE FUNDING SOURCE: GENERAL FUND
DIVISION: PURCHASING FUND NUMBER: 101-12-112 STRATEGIC
GOAL 2019 DIVISIONAL OBJECTIVES
3 Implement a Small Business program 3 Migrate to the new JP Morgan Purchasing Card website; to include updating the
Purchasing card policy and the Pcard training program. 3 Update the City’s Business Meals and Travel policies and procedures. 3 Update the City’s Purchasing Contract policies and procedures to incorporate HUB
and CDBG contract standards. 3 3
Draft new Munis training manuals and conduct train sessions as needed. Work with the City’s Secretary to post solicitations on the City’s web page.
3 Set up a process for coding vendors by classification in Munis. 3 Implement Munis Bid Module. 3 Update Purchasing Manual to accommodate changes in procedure resulting from
MUNIS software program implementation.
PERSONNEL SCHEDULE
FY 2014
Actual FY 2015 Budget
FY 2015 Estimate
FY 2016 Budget
Salary Grade
Purchasing and Risk Manager 1 1 1 1 23 Procurement Analyst 1 1 1 1 15 Buyer 1 1 1 1 7 Total Full-Time Employees 3 3 3 3
64

=============================== FY 2016 ANNUAL BUDGET===============================
================================ CITY OF MISSOURI CITY===============================
DEPARTMENT: FINANCE FUNDING SOURCE: GENERAL FUND
DIVISION: PURCHASING FUND NUMBER: 101-12-112 STRATEGIES PERFORMANCE INDICATORS
FY 2014
Actual FY 2015 Budget
FY 2015 Estimate
FY 2016 Budget
Convert approved requisitions within five business days of departmental approval
95% 99% 90% 99%
Download, reconcile, and transfer to Accounting monthly Purchasing card transactions by the 15th of each month
58% 60% 50% 83%
Issue monthly report on contract awards to small businesses
Conduct Purchasing Card (Pcard) training to new cardholders within 60 days of request
N/A
N/A
92%
N/A
17%
75%
50%
100%
ACTIVITY MEASURES
FY 2014
Actual FY 2015 Budget
FY 2015 Estimate
FY 2016 Budget
Regular Purchase Orders Issued 1,173 1,146 840 700 Insurance Claims Processed 44 64 30 40 Purchasing Card Transactions 9,738 7,009 9,500 10,000 Competitive Solicitations and Contracts Prepared & Issued 154 180 200 190 Annual Purchasing Card Transaction Volume $8.1m $6.5m $7.4m $7.3m
PCard Rebate Earned $119,420 $120,000 $111,817 $110,000 Term Contracts Issued 120 110 175 150 Dollar Value of Regular Purchase Orders Issued $11,175 $19,650 $41,621 $45,000
65

GENERAL FUND
CONSOLIDATED EXPENDITURES BY LINE ITEM
FINANCE - PURCHASING & RISK MANAGEMENT 101-12-112
Object Description
FY 2014
Actual
FY 2015
Original
Budget
FY 2015
Revised
Budget
FY 2015
Year-End
Estimate
FY 2016
Proposed
Budget
51001 REGULAR SALARIES 146,984 149,781 149,781 141,200 149,781
51002 ADDITIONAL COMPENSATION 586 940 940 724 868
51003 COMPENSATED ABSENCES -
51004 OVERTIME -
51201 CAR-CLOTHING ALLOWANCE
51202 CELL PHONE ALLOWANCE 1,083 1,080 1,080 825 1,080
51301 LONG TERM DISABILITY 495 510 510 500 510
51302 TAXES, SOCIAL SECURITY 10,937 11,613 11,613 10,438 11,607
51303 HOSP-LIFE-DENT-VIS INS 20,980 23,125 23,125 19,021 25,384
51304 PRORATED HEALTH/DENT/VIS -
51305 RETIREMENT 7,751 13,662 13,662 9,988 13,656
51306 WORKERS COMPENSATION 207 191 191 157 137
TOTAL PERSONNEL 189,022 200,902 200,902 182,853 203,023
52001 OFFICE SUPPLIES 1,313 1,000 1,000 1,000 1,000
52002 MEALS & DRINKS 93
52003 WEARING APPAREL
52004 MINOR TOOLS & EQUIPMENT 949 300 300 75 250
52005 EDUC, TRAINING & SUPPLIES 13
52006 POSTAGE 83 100 100 100 75
52009 OTHER/MISC
52014 COMPUTER EQUIP RENTAL FEE 1,265 1,150 1,150 1,150
TOTAL COMMODITIES 3,703 2,550 2,550 2,338 1,325
53001 MINOR EQUIP MAINT/RPR & RNT
53002 INSURANCE 404 448 448 475 495
53004 SPECIAL SERVICES & LEGAL 250 250 250 5,000
53007 CONFERENCE EXPENSE 510 2,000 2,357 2,673 3,000
53009 BLDG MAINTENANCE ALLOC 6,191
53010 OTHER/MISC
53012 COMPUTER SERVICES ALLOC 33,170
TOTAL CONTRACTUAL SERVICES 40,525 2,698 3,055 8,148 3,495
54001 PRINTING & PUBLICATIONS 3,852 5,335 6,087 5,020 5,000
54002 DUES & SUBSCRIPTIONS 760 670 670 974 980
54003 TRAINING & TRAVEL 1,278 2,000 2,900 2,354 2,500
54005 VEHICLE ALLOWANCE - MILEAGE 295 50 50 50 300
54006 OTHER EXPENSES
TOTAL OTHER SERVICES 6,185 8,055 9,707 8,398 8,780
TOTAL CAPITAL OUTLAY - - - - -
TOTAL EXPENDITURES 239,435 214,205 216,214 201,737 216,623
66

============================ FY 2016 ANNUAL BUDGET ================================
===============================CITY OF MISSOURI CITY=================================
DEPARTMENT: FINANCE FUNDING SOURCE: GENERAL FUND
DIVISION: ACCOUNTING & BUDGET FUND NUMBER: 101-12-114
DESCRIPTION OF OPERATIONS The Accounting & Budget Division is responsible for the preparation, oversight, and reporting of the City’s records and books. Financial reporting, annual city budgeting and audit requirements are the primary outputs of the records and books. The Assistant Finance Director provides oversight for the three (3) sub-divisions in the Accounting Division:
Accounting Budget & Financial Reporting CIP/Asset Management
The Accounting function provides direct oversight for the City’s Payroll and Revenue operations, as well as monitor the City’s cash flow to assure proper funds are available for disbursement while maximizing its interest earnings level. This function also oversees revenue billings and collections, as well as the prompt deposit of receipts, the recording of and billing of areas such as alarm permits for private burglar/fire alarms, fire calls, false alarms, Wastewater Treatment Plant (WWTP) operation reimbursements, and various miscellaneous billings. Monthly revenue projections are also a major task for the Revenue function to ensure anticipated levels of revenues are maintained during the year. The Budget & Financial Reporting function has the primary duty of coordinating and assisting in the preparation of the City’s Comprehensive Annual Financial Statements (CAFR), annual budget, audit work papers, and the monthly closing and reporting process. Other duties include grant reporting, bank reconciliations and acting as financial liaison for Tax Increment Reinvestment Zones, Public Improvement Districts, the Radio Communications Tower, the Mustang Bayou Wastewater Treatment & Water Plants and the Steepbank/Flatbank Wastewater Treatment Plant and additional water and wastewater activities. The CIP/Asset Management function monitors the City’s Accounts Payable and Capital Asset program for accurate payment of vendor invoice, inventory tracking and recording, depreciating, and the reconciling of capital assets to meet GASB 34 compliance and the City’s Capital Asset Policy. This function also prepares the CIP portion of the annual budget, and tracks the actual and projected revenues and disbursements of each project. The City’s Accounting Division excellent efforts has allowed the City to receive the Distinctive Budget Award from the Government Finance Officers Association (GFOA) for 29 consecutive years, the Certificate of Achievement for Excellence in Financial Reporting from the GFOA for 28 consecutive years, and the “Gold Star” award for Financial Transparency from the Texas Comptroller’s Office for our first year.
Assistant Finance Director
Accounting Manager
Payroll Specia list
Finance Director *
CIP Manager Budget Manager
Par t-Time Employee
Sr. Accounting Technician
Accounting Technician (2)
Accounting Clerk II
Accountant
Grants Coordinator
Sr. Accountant Budget Specialist
Total Full-Time Employees = 13 *Finance Director is included in Finance Administration Divisional Budget.
67

============================ FY 2016 ANNUAL BUDGET ================================
===============================CITY OF MISSOURI CITY=================================
DEPARTMENT: FINANCE FUNDING SOURCE: GENERAL FUND
DIVISION: ACCOUNTING & BUDGET FUND NUMBER: 101-12-114 STRATEGIC
GOAL 2019 DIVISIONAL OBJECTIVES
1 Formal documentation of procedures and policy establishment: Review and update existing procedural documentation & financial policies. Communicate to Finance managers when changes are made to procedures & policies. Notify appropriate users of updates to external and internal policies. Notify Finance Director of all policy changes. Provide electronic access to policies and procedures. Review travel reimbursement policy for efficiency using ERP (Employee Self Service)
2 Retain/Hire quality staff: Offer various alternative work schedules to meet the needs of employees; Prepare an individualized employee training program; Improving communication between staff and managers to enhance overall work environment. Through added supervisory training, better methods are intended to insure quality hiring.
3 Improve communication internally and externally: Review communication survey questions from FY2010, make appropriate updates and submit to departments for feedback.. Communications with other departments (ex: agendas, processes, purchasing)
4 Greater utilization of software: Evaluate the efficiency of citywide utilization of software that affects the Finance Department.
4 Maintain compliance of processes: Identify areas of non-compliance of processes. Obtain a sample of feedback data from non-compliant areas.
4 Aggressive coordinated grant search effort: Research and identify grant responsibilities.
Personnel Schedule FY 2014
Actual FY 2015 Budget
FY 2015 Estimate
FY 2016 Budget
Salary Grade
Assistant Director of Finance 1 1 1 1 24 Budget / Financial Manager 1 1 1 1 23 Accounting Manager 1 1 1 1 23 CIP Manager 1 1 1 1 23 Grants Coordinator 0 1 1 1 21 Budget Specialist 0 0 0 1 13 Payroll Specialist 0 0 0 1 13 Sr. Accountant 1 1 1 1 13 Accountant 3 3 3 1 11 Sr. Accounting Technician 1 1 1 1 12 Accounting Technician 2 2 2 2 8 Accounting Clerk II 1 1 1 1 5 Total Full-Time Employees 12 13 13 13 Part-Time Employee 1 1 1 1 $13.81/hr
68

=============================== FY 2016 ANNUAL BUDGET===============================
================================ CITY OF MISSOURI CITY===============================
DEPARTMENT: FINANCE FUNDING SOURCE: GENERAL FUND
DIVISION: ACCOUNTING & BUDGET FUND NUMBER: 101-12-114
PERFORMANCE INDICATORS
FY 2014 Actual
FY 2015 Budget
FY 2015 Estimate
FY 2016 Budget
Hold training sessions once a month on various Finance related topics 50% 75% 60% 83% Resubmit ACH (Vendor EFT payment or Payroll direct deposits)
returned within one business day after notified by our bank 96% 98% 100% 100% Eliminate mailed alarm permit renewal letters with emailed renewal
notices 50% 75% 75% 80% The percentage of AP invoices sent directly to Finance from vendors 95% 90% 90% 95% Maintain a goal of 5 days for department approval of vendor invoices N/A 95% 95% 97% Daily deposits prepared by noon 80% N/A 85% 90%
ACTIVITY MEASURES FY 2014
Actual FY 2015
Budget FY 2015 Estimate
FY 2016 Budget
False alarm billings 1,077 930 1,000 1,050 Miscellaneous accounts receivable statements 2,535 3,000 2,700 3,200 Alarm permits issued 5,411 6,000 6,822 6,500 Direct deposit checks (payroll) 8,609 9,610 8,870 9,000 Manual Payroll direct deposits issued 50 70 44 55 Electronic Funds Transfer (EFT) payments 1,435 1,500 1,455 1,700 Cashier transactions 25,397 30,000 35,000 45,000 Credit/Debit Card transactions 15,535 17,000 17,500 25,000 NSF(Nonsufficient Funds) items 26 30 30 30 Assets Maintained 5,484 5,550 5,540 5,600 Investment Transactions (Purchases) 12 5 15 15 Journal Entry Transactions 2,157 2,800 2,700 3,200 A/P Checks Issued 939 750 724 950 Revenue receipts scanned 29,000 33,000 35,000 40,000 Accounts Payable invoices and supporting documents scanned 17,415 18,500 17,720 18,000 Budget transfers processed 278 115 220 225
69

GENERAL FUND
CONSOLIDATED EXPENDITURES BY LINE ITEM
FINANCE - ACCOUNTING 101-12-114
Object Description
FY 2014
Actual
FY 2015
Original
Budget
FY 2015
Revised
Budget
FY 2015
Year-End
Estimate
FY 2016
Proposed
Budget
51001 REGULAR SALARIES 579,182 617,521 617,521 578,067 617,651
51002 ADDITIONAL COMPENSATION 4,675 5,148 5,148 3,646 3,847
51003 COMPENSATED ABSENCES 8,555 - 4,000
51004 OVERTIME 219 600
51101 PART TIME: 20-29 HOURS -
51102 PART TIME:LESS THAN 20 HR 7,760 6,630 6,630 11,336 13,800
51202 CELL PHONE ALLOWANCE 4,368 4,320 4,320 4,252 4,320
51301 LONG TERM DISABILITY 1,942 2,111 2,111 1,927 2,103
51302 TAXES, SOCIAL SECURITY 44,057 48,471 48,471 44,201 48,931
51303 HOSP-LIFE-DENT-VIS INS 89,640 111,947 111,947 96,446 127,063
51304 PRORATED HEALTH/DENT/VIS 1,367 - 1,251
51305 RETIREMENT 31,105 56,429 56,429 42,388 56,324
51306 WORKERS COMPENSATION 838 798 798 624 576
TOTAL PERSONNEL 773,708 853,375 853,375 788,738 874,615
52001 OFFICE SUPPLIES 4,699 3,500 3,500 4,600 3,500
52002 MEALS & DRINKS 60 62 100
52003 WEARING APPAREL 440 375 375 375 375
52004 MINOR TOOLS & EQUIPMENT 4,437 1,200 1,200 1,200 1,000
52005 EDUC, TRAINING & SUPPLIES 500 500 500 500
52006 POSTAGE 8,342 8,000 8,000 8,000 8,000
52009 OTHER/MISC
52014 COMPUTER EQUIP RENTAL FEE 6,789 6,150 6,150 6,150
TOTAL COMMODITIES 24,768 19,725 19,725 20,887 13,475
53001 MINOR EQUIP MAINT/RPR & RNT
53002 INSURANCE 1,711 1,916 1,916 2,026 2,267
53004 SPECIAL SERVICES & LEGAL 19,324 20,716 20,716 20,882 20,022
53005 SERVICE AGREEMENTS/REPAIR 1,741 1,820 9,700 9,700
53007 CONFERENCE EXPENSE 2,684 4,800 4,800 4,750 8,300
53009 BLDG MAINTENANCE ALLOC 53,685
53010 OTHER/MISC
53012 COMPUTER SERVICES ALLOC 154,793
53017 DELINQUENT ATTORNEY FEES 47,594 65,000 65,000 57,904 65,000
53018 BANK FEES 43,813 60,000 60,000 55,775 65,000
53020 SOLID WASTE MUD ADMIN FEE
53021 CENTRAL APPRAISAL DISTRIC 156,084 144,000 144,000 144,000 150,000
53022 PASS THRU GOLF COURSE INV (56,823)
TOTAL CONTRACTUAL SERVICES 424,606 298,252 306,132 295,037 310,589
54001 PRINTING & PUBLICATIONS 760 2,100 2,100 2,100 750
54002 DUES & SUBSCRIPTIONS 2,666 2,497 2,497 2,731 2,972
54003 TRAINING & TRAVEL 8,031 15,875 15,875 15,121 18,095
54005 VEHICLE ALLOWANCE - MILEAGE 291 300 300 300 300
TOTAL OTHER SERVICES 11,748 20,772 20,772 20,252 22,117
TOTAL CAPITAL OUTLAY - - - - -
TOTAL EXPENDITURES 1,234,830 1,192,124 1,200,004 1,124,914 1,220,796
70

============================ FY 2016 ANNUAL BUDGET ================================
===============================CITY OF MISSOURI CITY=================================
DEPARTMENTAL VISION STATEMENT
POLICE
The vision of the Missouri City Police Department is to make Missouri City the safest city in Texas.
DEPARTMENTAL MISSION STATEMENT
The Missouri City Police Department is a value driven organization committed to excellence and will cooperate and collaborate with the community to make Missouri City a better place to live, work, play and shop.
Administration
Support Services
Criminal Investigation Division (C.I.D)
Patrol
Radio Operations
Code Enforcement
Police
Support Services Division
PatrolCriminal
InvestigationDivision
Radio Operations *
Police Administration
Code Enforcement
* Radio Operations is included in Special Revenue Funds
71

============================ FY 2016 ANNUAL BUDGET ================================
===============================CITY OF MISSOURI CITY=================================
DEPARTMENT: POLICE FUNDING SOURCE: GENERAL FUND
FY 2015 DEPARTMENTAL ACCOMPLISHMENTS Hired Part-Time Detention Officers to oversee jail procedures which will allow patrol officers to spend
more time in the field.
Code Enforcement Division transitioned to the police department and added a Community Development Block Grant Code Enforcement Officer.
Code Enforcement began managing code violation complaints via web based SeeClickFix. Automobile Theft and Burglary Team grant awarded to the city. Continued partnership with FBISD to dispose of unwanted prescription medications. Successfully passed the Texas Crime Information Center (TCIC) audit. Facilitated Penn State University POLEX (Police Executive Development). Police department receives full-time and part-time Crime Victim liaison grants. Police Department implements program to provide citizens an option of obtaining an accident report on-
line. Captain Brandon Harris graduated from the FBI National Academy. The department hosted the Second Annual MCPD Pride Basketball Tournament. “I Choose to Follow the Rules” and Consequences programs presented to several schools in the city.
Received K94COPS grant to add an additional K-9 unit to patrol.
Missouri City Police Department’s Telecommunications Division has been designated as one of the first 4
dispatch centers that will be upgrading to the Next Generation 911G-Vesta 4x platform. This change over should be occurring in the next couple of months. One of the most important functions of the Next Generation 911, is that it will allow us to better pinpoint location of cell phone users.
Police Department in-car Coban camera conversion and full utilization and installation of the Rocket
download utility.
72

============================ FY 2016 ANNUAL BUDGET ================================
===============================CITY OF MISSOURI CITY=================================
DEPARTMENT: POLICE FUNDING SOURCE: GENERAL FUND
DEPARTMENTAL DESCRIPTION The Police Department is made up of the Police Administration Division, the Support Services Division, the Criminal Investigation Division, the Patrol Division, the Code Enforcement Division and Radio Operations. STRATEGIC
GOAL 2019 DEPARTMENTAL GOALS
1 Continue partnership with FBISD to dispose of unwanted prescription medications. 4 Send one supervisor to the Federal Bureau of Investigation National Academy. 2 Pursue grant funding to maintain existing levels, contingent on availability. Obtain
additional grants to enhance Police operations. 4
Achieve and maintain full staffing in the patrol division and communication division throughout the year.
1 Achieve a clearance rate on all Part I offense above the Texas average of 20%. 1 Reduce the number of traffic collisions, injuries and fatalities through the utilization
police motorcycles. 2 Explore the option of using stipends or car allowances to offset the purchase of units. 1 Assign a minimum of one cold case to each investigator per year to review and
determine if any new leads or advances in forensic technology have been developed to assist in clearing the case.
1 Continue with the “I Choose to Follow the Rules” and “Consequences” program while attempting to expand contingent on funding and manpower.
1,4 Expand participation in the National Night Out event by increasing the activities. 1 Work collaboratively with city community liaison representative to facilitate two town
hall meetings.
73

============================ FY 2016 ANNUAL BUDGET ================================
===============================CITY OF MISSOURI CITY=================================
DEPARTMENT: POLICE FUNDING SOURCE: GENERAL FUND
DIVISION: POLICE ADMINISTRATION FUND NUMBER: 101-13-120
DESCRIPTION OF DIVISIONAL OPERATIONS The Administrative Division of the MCPD is comprised of a total of ten (10) employees. This consists of seven (7) sworn positions and three (3) civilian employees. The sworn positions are the Chief, two (2) Assistant Chiefs, Captain, Sergeant, a Community Resource Officer and a Compliance Supervisor. The three (3) civilian employees are the Command Staff Office Manager, the Crime Victim Liaison, and the part-time Crime Victim Liaison. The Chief and Assistant Chiefs provide executive leadership and oversight to the entire department. The Captain oversees the department’s training programs, human resources, crime prevention, grants, professional standards investigations (PSI), and research. Planning, research, and accreditation include management of a written directive system and online training system for the Department. This division maintains compliance with nationally recognized accreditation standards and organizes presentation of annual award ceremonies and memorial services. Administration also partners with the Fire Department to manage the Citizen’s Police & Fire Academy.
Police Chief
Assistant Chief - Administration
Office Manager
Captain
Compliance Supervisor
Sergeant/Community
Resource Officer
Sergeant
Assistant Chief - Operations
Crime Victim Liaison
PT Victim Coordinator Liaison
Code Inspector I
(2)*
Code Enforcement Supervisor*
Code Inspector II
(2)*
Code Inspector III*
CDBG Code Inspector I*
Total Full-Time Employees = 9 Total Part-Time Employees = 1
*Code Enforcement employees are included in the Code Enforcement Division.
74
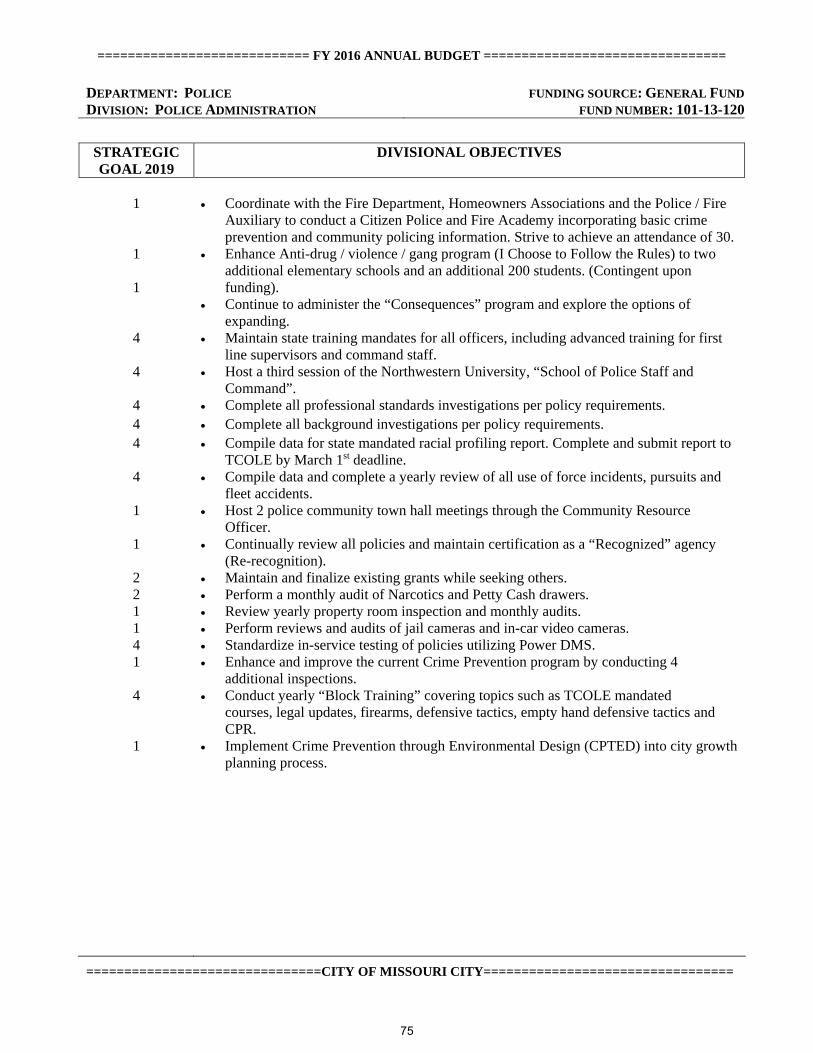
============================ FY 2016 ANNUAL BUDGET ================================
===============================CITY OF MISSOURI CITY=================================
DEPARTMENT: POLICE FUNDING SOURCE: GENERAL FUND
DIVISION: POLICE ADMINISTRATION FUND NUMBER: 101-13-120
STRATEGIC
GOAL 2019 DIVISIONAL OBJECTIVES
1 Coordinate with the Fire Department, Homeowners Associations and the Police / Fire
Auxiliary to conduct a Citizen Police and Fire Academy incorporating basic crime prevention and community policing information. Strive to achieve an attendance of 30.
1
1
Enhance Anti-drug / violence / gang program (I Choose to Follow the Rules) to two additional elementary schools and an additional 200 students. (Contingent upon funding).
Continue to administer the “Consequences” program and explore the options of expanding.
4
4
Maintain state training mandates for all officers, including advanced training for first line supervisors and command staff.
Host a third session of the Northwestern University, “School of Police Staff and Command”.
4 Complete all professional standards investigations per policy requirements. 4 Complete all background investigations per policy requirements. 4
4
Compile data for state mandated racial profiling report. Complete and submit report to TCOLE by March 1st deadline.
Compile data and complete a yearly review of all use of force incidents, pursuits and fleet accidents.
1 Host 2 police community town hall meetings through the Community Resource Officer.
1 Continually review all policies and maintain certification as a “Recognized” agency (Re-recognition).
2 2 1 1 4 1
4
1
Maintain and finalize existing grants while seeking others. Perform a monthly audit of Narcotics and Petty Cash drawers. Review yearly property room inspection and monthly audits. Perform reviews and audits of jail cameras and in-car video cameras. Standardize in-service testing of policies utilizing Power DMS. Enhance and improve the current Crime Prevention program by conducting 4
additional inspections. Conduct yearly “Block Training” covering topics such as TCOLE mandated
courses, legal updates, firearms, defensive tactics, empty hand defensive tactics and CPR.
Implement Crime Prevention through Environmental Design (CPTED) into city growth planning process.
75

============================ FY 2016 ANNUAL BUDGET ================================
===============================CITY OF MISSOURI CITY=================================
PERSONNEL SCHEDULE
FY 2014 Actual
FY 2015 Budget
FY 2015 Estimate
FY 2016 Budget
SalaryGrade
Police Chief 1 1 1 1 Uncl. Assistant Police Chief 2 2 2 2 P7 Captain 1 1 1 1 P6 Community Resource Officer 1 1 1 0 P5 Sergeant 1 1 1 2 P4 Compliance Supervisor 1 1 1 1 P3 Office Manager 1 1 1 1 15 Crime Victim Liaison 1 1 1 1 10 Crime Analyst 1 1 1 0 11 Total Full-Time Employees 10 10 10 9 Part-Time Crime Analyst 1 1 1 0Part Time Victim Coordinator Liaison 1 1 1 1 Total Part-Time Employees 2 2 2 1
76

============================ FY 2016 ANNUAL BUDGET ================================
===============================CITY OF MISSOURI CITY=================================
DEPARTMENT: POLICE FUNDING SOURCE: GENERAL FUND
DIVISION: POLICE ADMINISTRATION FUND NUMBER: 101-13-120
PERFORMANCE INDICATORS FY 2014
Actual FY 2015
Budget FY 2015 Estimate
FY 2016 Budget
Maintain staffing levels in all divisions through recruiting and increased morale, thus lowering turnover rate.
100% 100% 92% 100%
Complete all background investigations within 30 days. 80% 80% 80% 80% Complete all Professional Standards investigations within 45
days. 85% 85% 80% 80%
Maintain statutorily required police training. 100% 100% 100% 100% Percentage of reports or audits turned in on time as per Texas
Police Chief’s Recognition (TPCA) standards. 100% 100% 100% 100%
ACTIVITY MEASURES FY 2014
Actual FY 2015
Budget FY 2015 Estimate
FY 2016 Budget
Dispatched police calls for service 104,504 113,515 115,628 116,784 Reported Cases / Reports 3054 3,319 4022 4062 Assigned / Investigated Cases 2657 2,036 3896 3935 Cases Cleared 470 626 332 338 Accidents Investigated 998 1,040 1132 1143 Citations Issued 10,146 10,247 11,328 11,441 Arrests (adult & juvenile) 1653 1,664 1840 1858 Property Items Processed 2,696 2,723 3,688 3,725 Warrants Issued 3,252 3,285 240 242 HOA Presentations 324 324 312 315 Children participating in “I Choose to Follow the Rules” or
“Consequences” 1650 1,667 1728 1758 Calls for Service originating or handled at the Mini Station 78 110 66 67 HOA presentations on current crimes and crime trends 324 330 312 315
77

GENERAL FUND
CONSOLIDATED EXPENDITURES BY LINE ITEM
POLICE - ADMINISTRATION 101-13-120
Object Description
FY 2014
Actual
FY 2015
Original
Budget
FY 2015
Revised
Budget
FY 2015
Year-End
Estimate
FY 2016
Proposed
Budget
51001 REGULAR SALARIES 639,224 707,841 707,841 714,746 739,930
51002 ADDITIONAL COMPENSATION 10,683 10,526 10,526 14,166 13,406
51003 COMPENSATED ABSENCES 28,859 - 3,000
51004 OVERTIME 17,824 12,000 12,000 15,000 19,714
51101 PART TIME: 20-29 HOURS -
51102 PART TIME:LESS THAN 20 HR 19,690 49,950 29,970 7,137 14,985
51201 CAR-CLOTHING ALLOWANCE 4,349 7,800 7,800 1,755 1,800
51202 CELL PHONE ALLOWANCE 3,785 4,320 4,320 4,755 4,320
51301 LONG TERM DISABILITY 2,143 2,454 2,454 2,106 2,370
51302 TAXES, SOCIAL SECURITY 52,949 60,622 59,094 55,729 56,112
51303 HOSP-LIFE-DENT-VIS INS 64,781 87,844 87,844 64,902 70,116
51305 RETIREMENT 36,211 66,824 66,824 53,323 64,665
51306 WORKERS COMPENSATION 6,857 5,430 5,405 5,356 4,701
51999 CONTRA GRANT PERSONNEL COSTS (52,316) (80,329) (80,329) (80,329) (61,214)
TOTAL PERSONNEL 835,038 935,282 913,749 861,646 930,905
52001 OFFICE SUPPLIES 5,639 4,500 4,500 3,306 4,500
52002 MEALS & DRINKS 3,104 2,500 2,500 1,440 2,905
52003 WEARING APPAREL 4,070 6,500 6,500 5,712 6,300
52004 MINOR TOOLS & EQUIPMENT 2,474 19,000 19,000 16,000 15,000
52005 EDUC, TRAINING & SUPPLIES 14,820 15,200 15,520 24,177 20,200
52006 POSTAGE 1,079 600 600 838 600
52008 IDENTIFICATION SUPPLY/FIL -
52009 OTHER/MISC -
52011 FIREARMS 9,600 30,000 51,790 21,720 30,000
52014 COMPUTER EQUIP RENTAL FEE 5,529 6,400 6,400 6,400 -
52015 FLEET RENTAL FEE 17,091 27,838 27,838 27,838 27,838
52016 CENTRAL GARAGE ALLOC 20,359
52017 FUEL, OIL & LUBRICANTS 22,013 30,000 30,000 15,500 17,980
52019 DONATION PURCHASES 1,555 -
52027 FED GRANT EXP-TASERS -
52031 STATE GR-AUTO BURG/THEFT - 60,781 60,781
52032 FED GRANT EXP-IP CAMERAS -
52071 FED GR EXP-PANORAMIC CAM -
TOTAL COMMODITIES 107,334 142,538 225,429 183,712 125,323
53001 MINOR EQUIP MAINT/RPR & RNT 184 150 150 150 150
53002 INSURANCE 51,387 58,867 58,867 61,307 64,264
53004 SPECIAL SERVICES & LEGAL 7,374 16,595 16,665 8,717 17,000
53005 SERVICE AGREEMENTS/REPAIR -
53007 CONFERENCE EXPENSE 4,133 7,500 7,500 4,839 6,000
53008 TELEPHONE -
53009 BLDG MAINTENANCE ALLOC 27,043
53012 COMPUTER SERVICES ALLOC 60,169
53064 STORE FRONT OPERATIONS 17,038 18,200 22,852 22,852 22,852
TOTAL CONTRACTUAL SERVICES 167,328 101,312 106,034 97,865 110,266
54001 PRINTING & PUBLICATIONS 2,711 2,000 2,000 2,155 2,000 54002 DUES & SUBSCRIPTIONS 1,625 3,000 3,060 2,634 3,000
54003 TRAINING & TRAVEL 18,674 19,500 19,500 12,029 22,500
78

GENERAL FUND
CONSOLIDATED EXPENDITURES BY LINE ITEM
54005 VEHICLE ALLOWANCE - MILEAGE 100 100 100 100
54006 OTHER EXPENSES 4,500
54027 LEOSE TRAINING 6,633 6,633 6,846 6,846
54028 POLICE SEMINAR EXPENSES 611 5,000 5,000 5,000 5,000
54029 SPECIAL INVESTIGATION 1,500 -
TOTAL OTHER SERVICES 25,121 36,233 36,293 28,764 43,946
TOTAL CAPITAL OUTLAY - - - - -
TOTAL EXPENDITURES 1,134,821 1,215,365 1,281,505 1,171,987 1,210,440
79

80

DEPARTMENT: POLICE FUNDING SOURCE: GENERAL FUND
DIVISION: CODE ENFORCEMENT FUND NUMBER: 101-13-122
DESCRIPTION OF DIVISIONAL OPERATIONS
Under the Administrative Captain in the Police Department, the Code Enforcement Supervisor directly
supervises the Code Enforcement Division. The Code Enforcement Division provides information to the
public, responds to public requests for assistance and identifies and seeks corrections of code violations.
Inspectors in the Code Enforcement Division pro-actively enforce the zoning, nuisance, and housing codes,
and inspect sign construction. They work closely with residential and commercial Home Owner’s Associations
and Property Owner’s Associations to achieve quality maintenance standards for residential and commercial
properties.
Administrative Captain*
Code Inspector II (2)Code Inspector III
Code Enforcement Supervisor*
Code Inspector I (2) CDBG Code Inspector I
Total Full-Time Employees = 7
*Administrative Captain is included in the Police Administration budget.
81

DEPARTMENT: POLICE FUNDING SOURCE: GENERAL FUND
DIVISION: CODE ENFORCEMENT FUND NUMBER: 101-13-122
STRATEGIC
GOAL 2019 DIVISIONAL OBJECTIVES
1,3,4
1,34
Continue meeting each month with HOA representatives from the HOA’s to address
potential violations and to discuss Code Enforcement activities within the
neighborhood.
Continue to educate citizens on SeeClickFix to report code violations.
Create a database and establish a baseline of property conditions within the City and
utilize the information to provide increased enforcement activity to prevent the
deterioration of the condition of properties by the 3rd Quarter.
1,3,4
Increase the awareness of Code Enforcement activities to the community through four
new informational clips to run on MCTV by the 4th Quarter.
1,3,4 Develop educational pamphlets to educate citizens about common Code Enforcement
violations and reasonable methods to abate the violations.
1,3,4
Provide employees with training opportunities to insure knowledge and skills to
provide optimum customer service.
1,3,4
Continue utilization of the Location Advisory Committee to coordinate Police, Fire and
Code Enforcement information and activities to resolve enforcement problems.
1,2,4
Schedule regular inspections of commercial locations to promote proper maintenance
and pleasing appearance of the commercial areas.
1,3,4 Develop a Community Resource Team to assist with code enforcement.
PERSONNEL SCHEDULE
FY 2014
Actual
FY 2015
Budget
FY 2015
Estimate
FY 2016
Budget
Salary
Grade
Code Supervisor 1 1 1 1 22
Inspector III 1 1 1 1 13
Inspector II 2 2 2 2 12
Inspector I
CDBG Inspector I
2
0
2
1
2
1
2
1
10
10
Total Full Time Employees 6 7 7 7
82

DEPARTMENT: POLICE FUNDING SOURCE: GENERAL FUND
DIVISION: CODE ENFORCEMENT FUND NUMBER: 101-13-122
PERFORMANCE INDICATORS
FY 2014
Actual
FY 2015
Budget
FY 2015
Estimate
FY 2016
Budget
Investigation of individual code complaints within 24 hours 82% 95% 96% 95%
Lots mowed by City contractor
23 36 28 44
ACTIVITY MEASURES
FY 2014
Actual
FY 2015
Budget
FY 2015
Estimate
FY 2016
Budget
Code enforcement inspections 8214 9,500 1900 2550
Number of citations filed in Municipal Court 733 1,200 1266 1518
Number of code violations cases abated 8679 4,000 1220 1540
Signs removed from ROW 2664 1,400 356 500
Junk Vehicles 163 200 170 204
Tree limbs 906 1,200 254 306
Weeds/high grass 306 500 232 275
Trash can violations 766 900 256 306
Residential Rental Permits 541 1,200 1070 1110
Attendance at HOA meetings 34 40 36 48
83

GENERAL FUND
CONSOLIDATED EXPENDITURES BY LINE ITEM
POLICE - CODE ENFORCEMENT 101-13-122
Object Description
FY 2014
Actual
FY 2015
Original
Budget
FY 2015
Revised
Budget
FY 2015
Year-End
Estimate
FY 2016
Proposed
Budget
51001 REGULAR SALARIES 231,794 272,763 272,763 259,065 276,244
51002 ADDITIONAL COMPENSATION 2,050 2,448 2,448 2,334 2,532
51003 COMPENSATED ABSENCES 153 -
51004 OVERTIME 400 7,500 7,500 4,060 3,800
51102 PART TIME:LESS THAN 20 HR -
51201 CAR-CLOTHING ALLOWANCE - -
51202 CELL PHONE ALLOWANCE 3,004 3,780 3,780 3,247 4,320
51301 LONG TERM DISABILITY 781 936 936 607 948
51302 TAXES, SOCIAL SECURITY 17,518 21,875 21,875 17,765 21,651
51303 HOSP-LIFE-DENT-VIS INS 32,776 50,866 50,866 36,363 53,699
51304 PRORATED HEALTH/DENT/VIS - -
51305 RETIREMENT 12,354 25,061 25,061 15,399 25,381
51306 WORKERS COMPENSATION 604 360 360 513 645
TOTAL PERSONNEL 301,434 385,589 385,589 339,353 389,220
52001 OFFICE SUPPLIES 2,500 2,000 2,000 2,328 2,000
52002 MEALS & DRINKS - -
52003 WEARING APPAREL 242 4,000 4,000 2,863 3,500
52004 MINOR TOOLS & EQUIPMENT 157 4,000 4,000 5,142 12,500
52005 EDUC, TRAINING & SUPPLIES - 2,500 2,500 2,000 2,500
52006 POSTAGE 2,905 2,500 2,500 600 1,100
52008 IDENTIFICATION SUPPLY/FIL - 650 650 650 650
52013 JANITORIAL SUPPLIES - -
52014 COMPUTER EQUIP RENTAL FEE 5,724 7,950 7,950 7,950 -
52015 FLEET RENTAL FEE 10,839 16,483 16,483 16,483 16,483
52016 CENTRAL GARAGE ALLOC 7,241
52017 FUEL, OIL & LUBRICANTS 10,266 12,600 12,600 10,862 12,600
TOTAL COMMODITIES 39,874 52,683 52,683 48,878 51,333
53001 MINOR EQUIP MAINT/RPR & RNT 132 150 150 150 150
53002 INSURANCE 1,212 1,060 1,060 1,194 213
53004 SPECIAL SERVICES & LEGAL 4,557 4,800 4,800 540 4,800
53005 SERVICE AGREEMENTS/REPAIR - -
53006 RADIO REPAIR/MAINTENANCE - 100 100 100 100
53007 CONFERENCE EXPENSE - 1,800 1,800 1,800 1,800
53008 TELEPHONE - -
53009 BLDG MAINTENANCE ALLOC 4,670
53012 COMPUTER SERVICES ALLOC 35,998
53040 SUB-STANDARD STRUCTURES 5,770 14,700 14,749 4,600 14,715
TOTAL CONTRACTUAL SERVICES 52,338 22,610 22,659 8,384 21,778
54001 PRINTING & PUBLICATIONS 495 700 700 960 1,200
54002 DUES & SUBSCRIPTIONS 412 690 690 500 690
54003 TRAINING & TRAVEL 1,904 5,500 5,500 1,500 5,500
54005 VEHICLE ALLOWANCE - MILEAGE 48 -
TOTAL OTHER SERVICES 2,859 6,890 6,890 2,960 7,390
75006 VEHICLES - - - - 23,310
TOTAL CAPITAL OUTLAY - - - - 23,310
TOTAL EXPENDITURES 396,505 467,772 467,821 399,575 493,031
84

============================ FY 2016 ANNUAL BUDGET ================================
===============================CITY OF MISSOURI CITY=================================
DEPARTMENT: POLICE FUNDING SOURCE: GENERAL FUND
DIVISION: SUPPORT SERVICES FUND NUMBER: 101-13-124
DESCRIPTION OF DIVISIONAL OPERATIONS The Support Services Division consists of a Records Section and a Telecommunications Section, all of which are under the daily supervision of a Captain who reports to the Administrative Assistant Police Chief. The Records staff consists of four Records Technicians and one Records Supervisor, who report to the division Captain. This division is responsible for completing and maintaining all accident reports, offense reports and other police records and information. In addition, a Records Technician also performs receptionist duties for the police and fire department during normal business hours and answers non-emergency calls during business hours. This section also reviews, interprets, and provides statistical data for interested parties, including all police divisions and the Office of the Chief of Police. The Communication staff consists of fourteen telecommunication officers and three telecommunications supervisors who report to the Radio Systems Manager. This division provides twenty-four hour services to fire and police. It handles the police/fire computers, dispatch, and the 9-1-1 system. This division is also charged with the responsibility of staff and officer/employee paging, coordinating and communicating with other host computers such as DPS-Austin, FBI-Washington, Harris County Sheriff’s office, and the Fort Bend County Sheriff’s office. They assist as required regarding prisoner processing and provide assistance to officers when necessary after business hours.
Police Chief *
Assistant Police Chief - Administration *
RecordsTechnician (4)
Records Supervisor
Communications Officers (14)
Communications Supervisor (3)
Captain
Radio Systems Manager **
Part-Time Communications
Officer
Total Full-Time Employees = 23 Total Part-Time Employees = 1
*Police Chief and Assistant Police Chiefs are included in Police Administration Divisional Budget. ** Radio Systems Manager is included in the Special Revenue Radio Communications Fund.
85

============================ FY 2016 ANNUAL BUDGET ================================
===============================CITY OF MISSOURI CITY=================================
DEPARTMENT: POLICE FUNDING SOURCE: GENERAL FUND
DIVISION: SUPPORT SERVICES FUND NUMBER: 101-13-124 STRATEGIC
GOAL 2019 DIVISIONAL OBJECTIVES
1,4 1,4
Provide accurate UCR coding, training and policy as needed. Achieve 100% staffing in the communications center.
4 Record, disseminate and preserve all offense, accident and arrest reports generated by the Police Department and Fire Marshal’s Office.
4 Complete operational directives for the division. 4 Assist the Municipal Court and police officers in the maintenance of the city jail
and assist the judge in bonding prisoners with the use of jailers/bailiffs. 1 1
1,3
4
4 4
Lower ISO rating by adding additional TCO’s. Participate in the Prescription Drug Take Back Day as an official collection
site. Increase the security of the Public Safety Headquarters to ensure our continued
compliance with CJIS (Criminal Justice Information System) regulations. These security upgrades may include monitoring external and internal doors, and upgrading the current audio and recording systems. (NICE)
Monitor the OSSI software for potential upgrades. Conduct monthly COMPSTAT meetings with police supervisors from every
level of the organization.
PERSONNEL SCHEDULE FY 2014
ActualFY2015 Budget
FY 2015 Estimate
FY 2016 Budget
SalaryGrade
Captain 1 1 1 1 P6 Communications Supervisor 3 3 3 3 TCSRecords Supervisor 1 1 1 1 14Communications Officers 14 14 14 14 TCORecords Technician 4 4 4 4 5
Total Full-Time Employees 23 23 23 23 23 Part-Time Communication Officers 0 0 0 1 Total Part-Time Employees 0 0 0 1
86

============================ FY 2016 ANNUAL BUDGET ================================
===============================CITY OF MISSOURI CITY=================================
DEPARTMENT: POLICE FUNDING SOURCE: GENERAL FUND
DIVISION: SUPPORT SERVICES FUND NUMBER: 101-13-124
PERFORMANCE INDICATORS FY 2014
ActualFY2015 Budget
FY 2015 Estimate
FY 2016 Budget
Dispatch all priority one emergency calls within one minute of
call finish. *Due to low staffing levels the dispatch center often times operates with two TCO’s contributing to this decrease.
99% 99% 88% 95%
Process and submission of all accident reports within 24 hours after report is submitted. *An increase in the number of accidents has contributed to a decreased in this performance indicator.
95% 95% 90% 90%
Achieve 100% staffing in the Communications Center
95% 95% 95% 95%
Process all offense reports submitted to the Records Division on a daily basis. *An estimated 20% increase in reported crimes while not adding any additional records staff has created a decline in this performance indicator.
95% 90% 90% 90%
Submit UCR reports to the State within (14) days following the end of the month.
99% 99% 99% 99%
Run weekly quality assurance reports identifying officers and supervisors with delinquent reports.
99% 99% 99% 99%
ACTIVITY MEASURES
FY 2014Actual
FY2015 Budget
FY 2015 Estimate
FY 2016 Budget
Dispatched Police Calls for Service *The police department implemented new reporting software
(OSSI) which captures each officer’s actions as a new CAD event. Traffic stops, field contacts, and security checks are now captured as a call for service. This provides a more accurate representation of the officer’s activities.
104,504
113,515
115,628
116,784
Dispatched Fire Calls for Service 5,275 5,155 5,946 6,005 Cases Processed (Reported Crimes)
*To include the process of properly coding all offense reports submitted by officers, detectives and arson investigators.
3,054
3,319
4,022
4,062
Cases Processed (Accidents) 998 1,040 1,132 1,143 Cases Processed (Arrest Reports) 1,653 1,664 1,840 1,858
87

GENERAL FUND
CONSOLIDATED EXPENDITURES BY LINE ITEM
POLICE - SUPPORT SERVICES 101-13-124
Object Description
FY 2014
Actual
FY 2015
Original
Budget
FY 2015
Revised
Budget
FY 2015
Year-End
Estimate
FY 2016
Proposed
Budget
51001 REGULAR SALARIES 874,505 913,125 913,125 1,107,587 1,012,998
51002 ADDITIONAL COMPENSATION 14,128 18,617 18,617 17,642 17,899
51003 COMPENSATED ABSENCES 12,711 - 27,678
51004 OVERTIME 112,075 120,000 120,000 120,000 128,975
51101 PART TIME: 20-29 HOURS - 19,980
51102 PART TIME:LESS THAN 20 HR 34 - - 15,380 19,980
51201 CAR-CLOTHING ALLOWANCE 414 450 450 465 450
51202 CELL PHONE ALLOWANCE 713 756 756 799 756
51301 LONG TERM DISABILITY 2,845 3,082 3,082 3,199 3,372
51302 TAXES, SOCIAL SECURITY 73,618 80,551 82,079 87,136 88,694
51303 HOSP-LIFE-DENT-VIS INS 162,759 212,690 212,690 175,558 213,972
51304 PRORATED HEALTH/DENT/VIS 193 - 449
51305 RETIREMENT 52,891 94,765 94,765 80,800 108,232
51306 WORKERS COMPENSATION 2,328 1,175 1,200 1,918 935
51999 CONTRA GRANT PERSONNEL COSTS -
TOTAL PERSONNEL 1,309,216 1,445,211 1,466,744 1,638,611 1,596,263
52001 OFFICE SUPPLIES 3,207 3,500 3,461 4,350 3,000
52002 MEALS & DRINKS 375 250 226 226 226
52003 WEARING APPAREL 5,338 4,760 4,760 4,760 4,760
52004 MINOR TOOLS & EQUIPMENT 6,483 12,175 12,114 10,828 10,000
52005 EDUC, TRAINING & SUPPLIES -
52006 POSTAGE 827 800 800 800 800
52009 OTHER/MISC 24 24
52013 JANITORIAL SUPPLIES 495 61 106
52014 COMPUTER EQUIP RENTAL FEE 10,928 11,864 11,864 11,864 -
52015 FLEET RENTAL FEE 1,931 2,150 2,150 2,150 2,150
52016 CENTRAL GARAGE ALLOC 751
52017 FUEL, OIL & LUBRICANTS 1,899 2,500 2,500 1,953 2,265 52073 CHEMICALS
TOTAL COMMODITIES 32,236 37,999 37,960 37,061 23,201
53001 MINOR EQUIP MAINT/RPR & RNT 120 250 250 1,500 1,500
53002 INSURANCE 641 662 662 714 698
53004 SPECIAL SERVICES & LEGAL 1,869 5,000 5,000 3,500 11,000
53005 SERVICE AGREEMENTS/REPAIR 18,564 16,100 16,100 16,100 16,100
53006 RADIO REPAIR/MAINTENANCE -
53008 TELEPHONE 25,363 18,253 18,253 38,190 38,190
53009 BLDG MAINTENANCE ALLOC 26,066
53012 COMPUTER SERVICES ALLOC 148,879
TOTAL CONTRACTUAL SERVICES 221,502 40,265 40,265 60,004 67,488
54001 PRINTING & PUBLICATIONS 187 300 339 800 800
54002 DUES & SUBSCRIPTIONS 568 711 711 711 711
54003 TRAINING & TRAVEL 12,285 10,000 10,126 10,126 10,000
54005 VEHICLE ALLOWANCE - MILEAGE - 163 163 163
TOTAL OTHER SERVICES 13,041 11,011 11,339 11,800 11,674
75004 EQUIPMENT - 190,855 190,855 -
TOTAL CAPITAL OUTLAY - - 190,855 190,855 -
TOTAL EXPENDITURES 1,575,994 1,534,486 1,747,163 1,938,331 1,698,626
88

============================ FY 2016 ANNUAL BUDGET ================================
===============================CITY OF MISSOURI CITY=================================
DEPARTMENT: POLICE FUNDING SOURCE: GENERAL FUND
DIVISION: CRIMINAL INVESTIGATION DIVISION (CID) FUND NUMBER: 101-13-126
DESCRIPTION OF DIVISIONAL OPERATIONS
The Criminal Investigation Division operates under the supervision of the assigned Captain who reports to the Assistant Chief of Police over Operations. A Lieutenant and four Sergeants manage the daily operations of the division. The purpose of the Criminal Investigation Division is to conduct investigations of reported crimes against persons and/or property through the use of twelve detectives, three Criminalists, six Officers, and one Crimes Analyst. By doing so, each member is charged with the responsibility of preparing and completing an accurate documentation of information gathered for presentation to the County District Attorney for prosecution of the person(s) responsible, and ultimately bringing them to justice. The division has two specialized units. The Tri-City Special Crimes Unit (SCU), and The Burglary and Auto Theft Unit (BAT). The SCU unit targets areas with high crime rates and areas with unusual criminal activity. The BAT team focuses on crimes involving motor vehicles such as a burglary of motor vehicles and motor vehicle thefts. The division also consists of one officer assigned to the Fort Bend County Narcotics Task Force, and one officer assigned to the Harris County HIDTA Task Force. These officers investigate narcotics related complaints in an effort to disrupt and deter drug related crimes. The division frequently works with federal, state, and local law enforcement agencies in an effort to make Missouri City a Great Place to Live: Safe, Beautiful, and Active.
Police Chief *
Assistant Police Chief - Operations *
Captain
Sergeant
Detective (5)
Criminalist (3) Special Crimes Officer (2)
Sergeant Sergeant
BAT Team Detective (2)
BAT Team Officer (2)
Lieutenant
Sergeant
Detective (5)
Crimes Analyst
Narcotics Officer
HIDTA Officer
Total Full-Time Employees = 28
*Police Chief and Assistant Police Chief are included in Police Administration Divisional Budget
89

============================ FY 2016 ANNUAL BUDGET ================================
===============================CITY OF MISSOURI CITY=================================
DEPARTMENT: POLICE FUNDING SOURCE: GENERAL FUND
DIVISION: CRIMINAL INVESTIGATION DIVISION (CID) FUND NUMBER: 101-13-126
STRATEGIC GOAL 2019
DIVISIONAL OBJECTIVES
1,2
· Achieve a clearance rate on all Part I offenses, i.e. murder, rape, robbery, aggravated assaults, burglary, larceny and auto theft, above the Texas average of 20%. MCPD 2014 Part 1 clearance rate is 28%.
2,4 · Maintain a secure evidence/property room and conduct monthly audits accounting for 100% of received and stored property. Ensure property is continually “purged” abiding by Federal and State guidelines to eliminate overcrowding and the possible need for additional storage space.
2,4 · Attempt to serve criminal warrants within 48 hours to improve crime clearance rates.
1,2,4 · Work with our Federal, State, and local jurisdictions to facilitate the criminal investigative process. Continue monthly regional criminal investigation division meetings to share criminal intelligence and participate in multi-jurisdictional narcotics and special crimes task forces.
1,2,4 · Assign a minimum of one cold case to each investigator per year to review and determine if any new leads or advances in forensic technology have been developed to assist in clearing a case.
1,4 · Maintain and update weekly MCPD “Most Wanted” posting on department website.3,4
· Train additional detectives in fraud and cybercrimes to improve investigative
capabilities. 1,2
· Contact all reporting parties within 48 hours after receiving offense report.
PERSONNEL SCHEDULE
FY 2014
ActualFY 2015
BudgetFY 2015Estimate
FY 2016Budget
SalaryGrade
Captain 1 1 1 1 P6
Lieutenant 1 1 1 1 P5
Sergeant 2 4 4 4 P4
Detective 11 12 12 12 P3
Criminalist 3 3 3 3 P3
Police Officer 7 7 7 6 P2
Crimes Analyst 0 0 0 1 11
Total Full-/Time Employees 25 28 28 28
90

============================ FY 2016 ANNUAL BUDGET ================================
===============================CITY OF MISSOURI CITY=================================
DEPARTMENT: POLICE FUNDING SOURCE: GENERAL FUND DIVISION: CRIMINAL INVESTIGATION DIVISION (CID) FUND NUMBER: 101-13-126
PERFORMANCE INDICATORS
FY 2014
ActualFY 2015
BudgetFY 2015Estimate
FY 2016Budget
Maintain a clearance rate of Part I crimes, i.e. murder, rape,
robbery, aggravated assaults, burglary, larceny, and auto theft above the Texas average. Missouri City (28%) Texas (20%).
100% 100% 100% 100%
Complete 20 hours of specialized training annually for each person assigned to the division to aid in their investigative technique/processes.
100% 100% 100% 100%
Conduct eleven (11) monthly audits and one (1) annual inventory of all evidence in the property room. 100% 100% 100% 100%
Average less than 20 open cases per month per detective annually.
87% 80% 91% 80%
ACTIVITY MEASURES
FY 2014
ActualFY 2015
BudgetFY 2015Estimate
FY 2016Budget
Reported Cases 3,054 3,319 4,022 4,062
Assigned Cases 3,110 2,036 3,880 3,918
Cases Cleared 470 626 332 338
Not an Offense 231 274 910 N/A Unfounded 26 33 134 N/A
Other Jurisdiction 181 214 234 N/A
Suspended 1,312 1,416 1,822 N/A
Open 291 396 234 236
Arrest – Patrol/CID 1653 1,664 1840 1858
Property Items Processed 2,932 2,961 3,688 3,724
Property Items Purged N/A N/A N/A 1,500
91

GENERAL FUND
CONSOLIDATED EXPENDITURES BY LINE ITEM
POLICE - C.I.D. 101-13-126
Object Description
FY 2014
Actual
FY 2015
Original
Budget
FY 2015
Revised
Budget
FY 2015
Year-End
Estimate
FY 2016
Proposed
Budget
51001 REGULAR SALARIES 1,591,361 1,650,132 1,650,132 1,701,198 1,926,904
51002 ADDITIONAL COMPENSATION 50,958 52,592 52,592 54,776 56,484
51003 COMPENSATED ABSENCES 53,472 - 25,000
51004 OVERTIME 101,463 95,000 95,000 95,000 214,695
51201 CAR-CLOTHING ALLOWANCE 7,713 9,451 9,451 7,053 7,651
51202 CELL PHONE ALLOWANCE 10,314 11,340 11,340 10,640 10,800
51301 LONG TERM DISABILITY 5,252 5,787 5,787 5,275 5,995
51302 TAXES, SOCIAL SECURITY 130,062 137,886 137,886 128,517 142,622
51303 HOSP-LIFE-DENT-VIS INS 241,657 291,647 291,647 253,394 328,812
51305 RETIREMENT 94,592 162,219 162,219 131,974 167,790
51306 WORKERS COMPENSATION 20,938 18,521 18,521 15,303 13,430
51999 CONTRA GRANT PERSONNEL COSTS (140,904) (160,263) (160,263) (160,263) (146,363)
TOTAL PERSONNEL 2,166,877 2,274,312 2,274,312 2,267,867 2,728,820
52001 OFFICE SUPPLIES 5,577 5,079 5,079 5,000 5,657
52002 MEALS & DRINKS 588 500 500 700 750
52003 WEARING APPAREL 16,273 19,823 19,823 16,023 19,360
52004 MINOR TOOLS & EQUIPMENT 7,283 10,360 11,860 9,860 9,860
52006 POSTAGE 876 1,000 1,000 1,000 1,000
52008 IDENTIFICATION SUPPLY/FIL 8,564 6,214 6,214 6,214 7,000
52009 OTHER/MISC 1,826 1,000 1,000 1,000 1,000
52014 COMPUTER EQUIP RENTAL FEE 10,746 10,736 10,736 10,736 -
52015 FLEET RENTAL FEE 31,081 38,511 38,511 38,511 40,723
52016 CENTRAL GARAGE ALLOC 46,516
52017 FUEL, OIL & LUBRICANTS 70,270 90,000 90,000 64,655 75,000
TOTAL COMMODITIES 199,600 183,223 184,723 153,699 160,350
53001 MINOR EQUIP MAINT/RPR & RNT 587 500 500 500 500
53002 INSURANCE 1,948 1,084 1,084 1,148 1,169
53004 SPECIAL SERVICES & LEGAL 38,473 61,795 62,200 53,800 50,000
53008 TELEPHONE 3,353 4,704 4,704 3,348 3,515
53009 BLDG MAINTENANCE ALLOC 29,215
53012 COMPUTER SERVICES ALLOC 175,878
TOTAL CONTRACTUAL SERVICES 249,454 68,083 68,488 58,796 55,184
54001 PRINTING & PUBLICATIONS 1,359 1,000 1,000 1,000 500
54002 DUES & SUBSCRIPTIONS 925 800 800 1,300 1,300
54003 TRAINING & TRAVEL 22,991 25,000 25,000 25,900 25,900
54005 VEHICLE ALLOWANCE - MILEAGE (23) 100 100 100 100
54029 SPECIAL INVESTIGATION 3,549 8,000 8,000 5,000 5,000
54030 PHYSICAL EXAMS 5,577 8,000 8,143 8,143 8,200
TOTAL OTHER SERVICES 34,378 42,900 43,043 41,443 41,000
TOTAL CAPITAL OUTLAY - - - - -
TOTAL EXPENDITURES 2,650,308 2,568,518 2,570,566 2,521,805 2,985,354
92

============================ FY 2016 ANNUAL BUDGET ================================
===============================CITY OF MISSOURI CITY=================================
DEPARTMENT: POLICE FUNDING SOURCE: GENERAL FUND
DIVISION: PATROL FUND NUMBER: 101-13-128
DESCRIPTION OF DIVISIONAL OPERATIONS
The Missouri City Police Department (MCPD) Patrol Division is under the supervision of a captain. Other supervisors include a patrol lieutenant and two sergeants assigned to each shift, a sergeant assigned to the traffic unit and a Detention Supervisor for a total of twelve (12) supervisors. There are forty-seven (47) officers assigned to the patrol division that also staffs the following specialized units: Traffic Unit Motorcycle Unit Bike Patrol Unit Dive Team K-9 All-Terrain Vehicle (ATV Unit) Special Weapons & Tactical (SWAT) Unit Hostage Negotiations Unit (HNU) Traffic/Commercial Vehicle Enforcement Home Owners Association (HOA) Program
MCPD Specialized Units are used to respond to emergencies, staff special events, community policing/public relations, crime deterrence, and enforcement. The SWAT unit actively participates and provides managers for the East Fort Bend County Regional SWAT Team. Patrol also employs one full-time Detention Officer and four (4) part-time Detention Officers. The Patrol Division works closely with other city departments; e.g. Public Works, Administration, Legal, and Parks and Recreation, to ensure a coordinated and informed effort on projects and tasks.
Lieutenant
Sergeant (2)Sergeant (2)
Police Chief *
Assistant Police Chief - Operations *
Captain
Lieutenant
Patrol (15)Patrol Officer (18)
Sergeant (3)
Detention Officer Supervisor
Patrol Officer (15)
K-9 Officer (1)Motorcycle Officer
(4)
Lieutenant
Detention Officer (4)
Total Full-Time Employees = 69 *Police Chief and Assistant Police Chief are included in Police Administration Divisional Budget.
93

============================ FY 2016 ANNUAL BUDGET ================================
===============================CITY OF MISSOURI CITY=================================
DEPARTMENT: POLICE
FUNDING SOURCE: GENERAL FUND
DIVISION: PATROL FUND NUMBER: 101-13-128
STRATEGIC
GOAL 2019 DIVISIONAL OBJECTIVES
1 Deter and detect criminal activity by striving to have the officers provide
proactive preventive and directed patrols at least 50 percent of the time. This is time that the officer is not obligated to other duties.
1 Reduce vehicle accidents city wide by 5 percent through directed traffic enforcement based on statistical data obtained from ATAC Raids. This will be accomplished through education, high visibility and enforcement actions.
1 Acquire more proactive patrol time by increasing the officer’s time on the street by improving in-car video download times via collaboration with Technology and Innovations.
1,4 Continue to practice Community Oriented Policing through bike patrols. These patrols are directed at areas obtained or identified from ATAC Raids. Additional patrols are conducted focusing on commercial areas around holidays. These are typically high crime times.
1,4 Ensure patrol officers assist the police department’s Community Liaison Officer with the “I Choose to Follow the Rules” and “Consequences” program throughout the year.
1,4
Continue Police Department HOA Liaison program and solicit “Crime Watch” volunteers to increase the number of “Crime Watch” programs from 8 to 12.
PERSONNEL SCHEDULE
FY 2014
ActualFY2015 Budget
FY 2015 Estimate
FY 2016 Budget
SalaryGrade
Captain 1 1 1 1 P6Lieutenant 3 3 3 3 P5Sergeant 8 7 7 7 P4Police Officer 50 48 48 49 P2Traffic Officers 3 4 4 4 P2Detention Officer Supervisor 1 1 1 1 11Detention Officer 0 0 0 4 9 Total Full Time Employees 66 64 64 69 Part-Time Detention Officer 0 4 4 0 Total Part-Time Employees 0 4 4 0
94

============================ FY 2016 ANNUAL BUDGET ================================
===============================CITY OF MISSOURI CITY=================================
DEPARTMENT: POLICE FUNDING SOURCE: GENERAL FUND
DIVISION: PATROL FUND NUMBER: 101-13-128
PERFORMANCE INDICATORS
FY 2014
ActualFY2015 Budget
FY 2015 Estimate
FY 2016 Budget
Respond, on average, to all non-emergency calls in fifteen
(15) minutes or less.
91% 95% 92% 95%
Respond, on average, to all emergency calls (priority 1) in three (3) minutes or less.
50% 50% 53% 95%
Distribute 4000 auto burglary prevention report cards 90% 90% 90% 90% Dedicate three (3) percent of patrol officers’ work time to
traffic contacts. Conduct at least 25,000 traffic contacts throughout the
year.
N/A 79%
N/A 95%
N/A 80%
N/A 90%
Dedicate fifty (50) percent of patrol officers’ work time to preventive proactive patrol in neighborhoods and commercial districts.
25% N/A N/A N/A
Conduct 30,000 premise checks within the year. 90% 95% 90% 95% Reduce Motor Vehicle Collisions through Proactive
Traffic Enforcement of moving violations and education by 5% utilizing the newly formed Motorcycle Unit.
N/A 50% 0% 50%
ACTIVITY MEASURES
FY 2014
ActualFY2015 Budget
FY 2015 Estimate
FY 2016 Budget
Calls For Service 104,504 113,515 115,628 116,784 Accidents Investigated 998 1,040 1,132 1,143 Citations 9,557 10,247 11,328 11,441 Arrests 1,498 1,664 1,648 1,664 Alarms 5,471 5,348 5,584 5,640
95

GENERAL FUND
CONSOLIDATED EXPENDITURES BY LINE ITEM
POLICE - PATROL 101-13-128
Object Description
FY 2014
Actual
FY 2015
Original
Budget
FY 2015
Revised
Budget
FY 2015
Year-End
Estimate
FY 2016
Proposed
Budget
51001 REGULAR SALARIES 3,328,235 3,380,869 3,380,869 3,665,457 3,999,380
51002 ADDITIONAL COMPENSATION 68,005 71,787 71,787 66,564 227,641
51003 COMPENSATED ABSENCES 118,239 56,000 56,000 113,000 70,000
51004 OVERTIME 220,389 232,621 232,621 197,200 411,272
51102 PART TIME:LESS THAN 20 HR 40,560 40,560 21,539 51,948
51201 CAR-CLOTHING ALLOWANCE 1,020 900 900 707 900
51202 CELL PHONE ALLOWANCE 1,082 6,480 6,480 5,128 6,480
51301 LONG TERM DISABILITY 10,960 11,608 11,608 10,929 11,820
51302 TAXES, SOCIAL SECURITY 273,857 286,851 286,851 289,962 276,342
51303 HOSP-LIFE-DENT-VIS INS 518,195 600,555 600,555 500,305 601,398
51304 PRORATED HEALTH/DENT/VIS 1,335 - 1,200
51305 RETIREMENT 194,824 333,777 333,777 287,962 326,445
51306 WORKERS COMPENSATION 44,530 37,196 37,196 34,745 27,013
51999 CONTRA GRANT PERSONNEL COSTS (235,935) (38,471) (38,471) (125,232)
TOTAL PERSONNEL 4,544,737 5,020,733 5,020,733 5,069,466 6,010,639
52001 OFFICE SUPPLIES 8,386 4,000 4,000 4,000 4,000
52002 MEALS & DRINKS 4,583 400 400 400 400
52003 WEARING APPAREL 62,295 64,056 69,807 69,807 63,681
52004 MINOR TOOLS & EQUIPMENT 57,168 56,840 59,386 59,386 80,040
52005 EDUC, TRAINING & SUPPLIES 4,050 1,500 1,595 1,595 1,500
52006 POSTAGE 164 500 500 500 500 52007 BLDG MAT'L/SUPPLIES & REPAIRS - 59
52008 IDENTIFICATION SUPPLY/FIL 588 2,000 2,000 2,000 2,000
52009 OTHER/MISC 595 - 113
52011 FIREARMS 13,810 2,500 16,801 16,801 20,000
52014 COMPUTER EQUIP RENTAL FEE 62,001 76,150 76,150 76,150 -
52015 FLEET RENTAL FEE 250,100 346,233 346,233 346,233 339,733
52016 CENTRAL GARAGE ALLOC 209,677
52017 FUEL, OIL & LUBRICANTS 342,013 300,000 300,000 269,550 312,678
52020 RADIO SYS INDIRECT COSTS -
52021 JAIL MEDICAL 640 2,500 2,500 2,500 1,500
52022 K-9 UNIT 5,331 2,000 2,000 2,000 10,000
52023 JAIL SUPPLIES 1,304 1,000 1,000 1,000 1,000
52024 JAIL FOOD 2,032 4,000 4,000 4,000 4,000
TOTAL COMMODITIES 1,024,736 863,679 886,372 856,094 841,032
53001 MINOR EQUIP MAINT/RPR & RNT 3,409 4,000 4,000 4,000 4,000
53002 INSURANCE 7,683 2,694 2,694 2,817 2,709
53004 SPECIAL SERVICES & LEGAL 625 - 7,500
53005 SERVICE AGREEMENTS/REPAIR 275 6,550 6,550 6,550 3,500
53006 RADIO REPAIR/MAINTENANCE 713 -
53008 TELEPHONE 329 345 345 345 345
53009 BLDG MAINTENANCE ALLOC 53,000
53012 COMPUTER SERVICES ALLOC 390,840
TOTAL CONTRACTUAL SERVICES 456,874 13,589 13,589 13,712 18,054
54001 PRINTING & PUBLICATIONS 5,686 5,000 5,112 5,112 5,000
54002 DUES & SUBSCRIPTIONS 2,270 3,350 3,350 3,350 3,350
54003 TRAINING & TRAVEL 56,552 46,360 46,560 46,560 53,660
54004 EDUCATIONAL REIMBURSEMENT 480 - -
54030 PHYSICAL EXAMS (681)
TOTAL OTHER SERVICES 64,306 54,710 55,022 55,022 62,010
75006 VEHICLES 229,985
96

GENERAL FUND
CONSOLIDATED EXPENDITURES BY LINE ITEM
77007 OTHER / MISCELLANEOUS - - -
TOTAL CAPITAL OUTLAY 229,985 - - - -
TOTAL EXPENDITURES 6,320,639 5,952,711 5,975,716 5,994,294 6,931,735
97

98

============================ FY 2016 ANNUAL BUDGET ================================
===============================CITY OF MISSOURI CITY=================================
DEPARTMENTAL VISION STATEMENT FIRE AND RESCUE SERVICES
Exceptional customer service through the delivery of fire prevention, fire & medical response, and emergency preparedness that provides for a safe community and a high quality of life.
DEPARTMENTAL MISSION STATEMENT
To preserve life and property, promote a safe community and quality of life
Fire Administration
Fire Prevention
Fire Training/Education
Fire Operations
99

============================ FY 2016 ANNUAL BUDGET ================================
===============================CITY OF MISSOURI CITY=================================
FY 2015 DEPARTMENTAL ACCOMPLISHMENTS
Placed peak-time squad unit in service, saving the City approximately $80,650 for the year. The squad
is housed out of Fire Station 1 and responds to medical and other calls, thereby alleviating the Quint fire apparatus from responding to these incidents.
Conducted citizen community focus group meetings to receive citizen input, aiding the department’s strategic plan development.
Researched benchmarking and performance measures for fire departments and developed new measures to monitor. Missouri City’s performance was benchmarked with three similar fire departments in the City’s market. Finally a benchmarking report was created as shared.
With the assistance of several City Departments, negotiated the terms for the operations of Fire Station 5 and developed a contract agreement.
Hired and trained the staff necessary to open Fire Station 5. Completed the strategic planning process for the department, providing a 5 year plan. Hosted a stakeholder meeting to facilitate the fire code adoption process. Adopted the 2015 International Fire Code and revised the schedule of fees Completed the Advantage Process with the department and created the FD playbook; the focus point
for the department leadership team during the year. Successfully completed a Texas Commission on Fire Protection Compliance Inspection. Placed a new Quint fire apparatus in service in Fire Station 2, located on McClain Blvd, and moved the
Fire Engine from Station 2 to Fire Station 3 on Texas Parkway. Changed the Fire Inspector’s schedule to facilitate productivity and provide services to contractors and
other customers. Submitted an Assistance for Firefighter Grant application to upgrade the department’s self-contained
breathing apparatus (SCBA) used by firefighters in dangerous atmospheres. Developed and issued standardized Battalion Chief Expectations. Redistributed on-going departmental programs, assigning them to specific shifts, to ensure consistency
and balance the work load. Utilized cost-benefit analysis to evaluate the Knox Key System. Based on the analysis, the program
was modified and policy was updated. Established a process for the vendor to inventory and stock janitorial supplies at the fire stations,
reducing the workload and ensuring timely delivery. Conducted a Community Risk Assessment and created pre-fire plans. These systems are used to
develop fire department response plans. Coordinated a virtual emergency management exercise for the Police, Fire, Communications
Departments, a local school, and hospital. The exercise was conducted by the Emergency Management Institute’s (EMI’s) Virtual Tabletop Exercise (VTTX) program, leveraging technology to share best practices with jurisdictions across the US.
Conducted an Emergency Management Exercise in conjunction with Fort Bend County for City Employees to assist staff in preparing to respond to the aftermath of a hurricane event.
Purchased new computer and projection equipment to sustain the Emergency Operations Center (EOC) through an Urban Area Security Initiative Grant award.
Through the services of a consultant, developed a plan to improve the Insurance Service Organization (ISO) rating for Missouri City.
Through the services of a facilitator, met with community leaders of the various diverse communities within Missouri City to develop communications between the department and these citizens.
Delivered Advanced Cardiac Life Support and Pediatric Advance Life Support classes for 25 department paramedics.
Training Chief earned credentials from International Society of Fire Service Instructors to deliver Principles of Modern Fire Attack to the department during Spring of 2015.
100
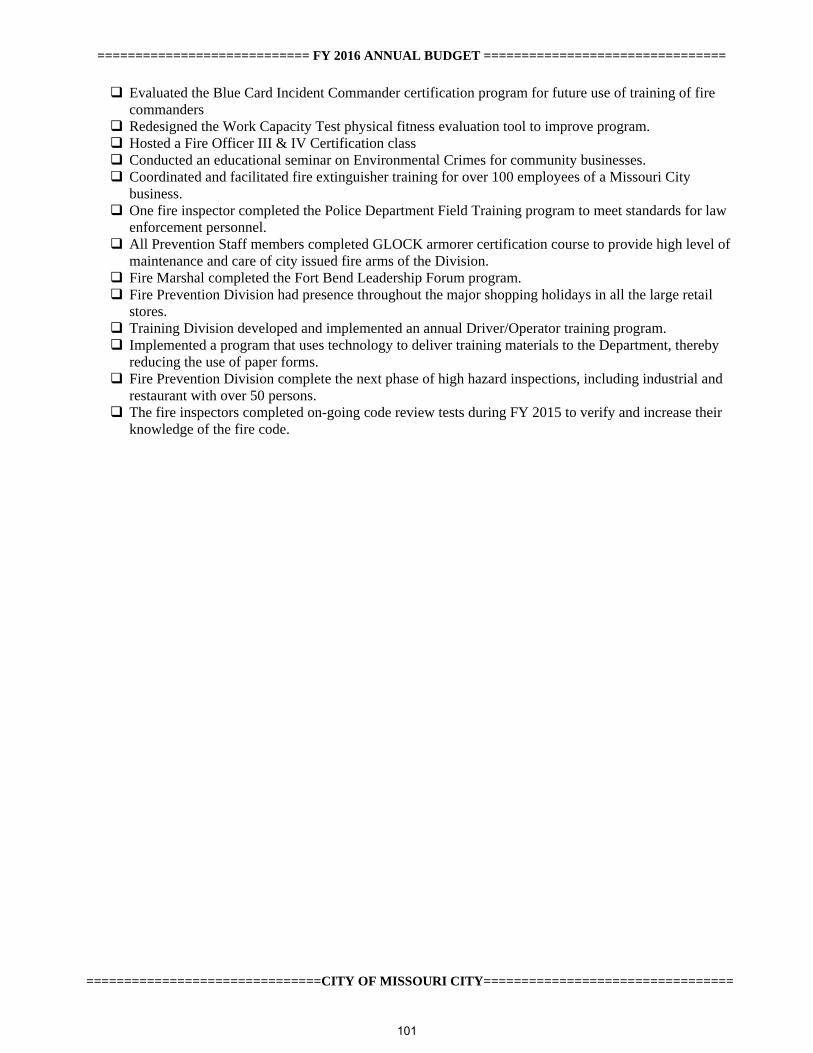
============================ FY 2016 ANNUAL BUDGET ================================
===============================CITY OF MISSOURI CITY=================================
Evaluated the Blue Card Incident Commander certification program for future use of training of fire commanders
Redesigned the Work Capacity Test physical fitness evaluation tool to improve program. Hosted a Fire Officer III & IV Certification class Conducted an educational seminar on Environmental Crimes for community businesses. Coordinated and facilitated fire extinguisher training for over 100 employees of a Missouri City
business. One fire inspector completed the Police Department Field Training program to meet standards for law
enforcement personnel. All Prevention Staff members completed GLOCK armorer certification course to provide high level of
maintenance and care of city issued fire arms of the Division. Fire Marshal completed the Fort Bend Leadership Forum program. Fire Prevention Division had presence throughout the major shopping holidays in all the large retail
stores. Training Division developed and implemented an annual Driver/Operator training program. Implemented a program that uses technology to deliver training materials to the Department, thereby
reducing the use of paper forms. Fire Prevention Division complete the next phase of high hazard inspections, including industrial and
restaurant with over 50 persons. The fire inspectors completed on-going code review tests during FY 2015 to verify and increase their
knowledge of the fire code.
101

============================ FY 2016 ANNUAL BUDGET ================================
===============================CITY OF MISSOURI CITY=================================
DEPARTMENT: FIRE & RESCUE SERVICES FUNDING SOURCE: GENERAL FUND
DEPARTMENTAL DESCRIPTION
The Missouri City Fire & Rescue Services Department emphasizes providing effective and efficient services to the citizens of Missouri City. The organization is divided into four divisions: Administration, Fire Prevention Division, Training, and Operations. Along with fire and emergency medical response, the department is charged with the emergency management functions for the city. The mission of the Missouri City Fire & Rescue Services is to prevent and mitigate emergencies for the citizens and visitors of Missouri City through dedicated professionals, bound by integrity, using technology and innovation. STRATEGIC
GOAL 2019 DEPARTMENTAL GOALS
1, 2 Seek City Council Direction to form a Citizen’s Fire Department Advisory
committee by the end of FY 2016. If approved, the committee would provide input to the department on the level of fire services provided based on the ISO improvement plan.
1 In coordination with Public Works, secure a site for the future fire station 6 by the
end of FY 2016.
1 Coordinate the ISO re-grading progress for the City fire protection services by March 1, 2016.
102

============================ FY 2016 ANNUAL BUDGET ================================
===============================CITY OF MISSOURI CITY=================================
DEPARTMENT: FIRE & RESCUE SERVICES FUNDING SOURCE: GENERAL FUND
DIVISION: ADMINISTRATION FUND NUMBER: 101-14-130 DESCRIPTION OF DIVISIONAL OPERATIONS
The Administration Division includes the Fire Chief, Division Chief of Emergency Preparedness, and the Administrative Assistant. Responsibilities of the Division include planning and managing the department, including emergency responses, fire prevention efforts, training activities, emergency management activities and maintaining accurate records. The division also schedules public relation events, coordinates operations with neighboring fire departments, Regional Task Forces, and Fort Bend EMS. Missouri City Fire & Rescue Services performs the emergency management function of the city as designated by the Mayor. The Division Chief of Emergency Preparedness is the Emergency Management Coordinator for the City and is responsible for the planning, preparation, and reduction of the impact of any type of disaster that could strike the City. Additionally, as a joint resolution city in the Fort Bend County Emergency Management Plan, the Fire Chief is responsible for coordinating activities with Fort Bend County Office of Emergency Management. Each of the City’s departments has been assigned particular responsibilities through the Emergency Operations Plan and would act according to the plan if the City experienced any disaster. The City periodically performs different types of emergency response exercises in order to meet the State and Federal guidelines and measure the preparedness level of all departments.
Fire Chief
Office Manager Emergency Management Coordinator
Total Full Time Employees = 3
103

============================ FY 2016 ANNUAL BUDGET ================================
===============================CITY OF MISSOURI CITY=================================
DEPARTMENT: FIRE & RESCUE SERVICES FUNDING SOURCE: GENERAL FUND
DIVISION: ADMINISTRATION FUND NUMBER: 101-14-130 STRATEGIC GOAL 2019 DIVISIONAL OBJECTIVES
1,2 Seek City Council Direction to form a Citizen’s Fire Department Advisory
committee by the end of FY 2016. If approved, the committee would provide input to the department on the level of fire services provided based on the ISO improvement plan.
1 Coordinate the ISO re-grading progress for the City fire protection services
by March 1, 2016.
4 Conduct an emergency management exercise for City staff assigned to the Emergency Operations Center (EOC) by end of FY 2016.
4 Implement the City’s National Incident Management System (NIMS) Continuing
Education Plan by providing/facilitating training for Incident Management Team members at least twice during FY 2016.
4 In coordination with Leadership Team, develop and disseminate written Standard
Operating Procedures for Emergencies for City staff by October 1, 2015.
4 By the end of FY 2016, formulate processes to facilitate the communication flow across all levels of the Department.
PERSONNEL SCHEDULE FY 2014
Actual FY 2015
Budget FY 2015 Estimate
FY 2016 Budget
SalaryGrade
Fire Chief 1 1 1 1 Uncl.Fire Marshal/Emergency Management Coordinator 1 1 1 1 F5Office Manager 1 1 1 1 10Total Full-Time Employees 3 3 3 3
104

============================ FY 2016 ANNUAL BUDGET ================================
===============================CITY OF MISSOURI CITY=================================
DEPARTMENT: FIRE & RESCUE SERVICES FUNDING SOURCE: GENERAL FUND
DIVISION: ADMINISTRATION FUND NUMBER: 101-14-130
PERFORMANCE INDICATORS
FY 2014
Actual FY 2015
Budget FY 2015 Estimate
FY 2016 Budget
Complete planning activities for annual hurricane season,
such as Traffic Management Plan, Debris Management Plan, Points of Distribution Matrix, Emergency Supplies Checklist, and Feeding Plan by May 1. 70% 90% 80% 80%
Compile monthly activity reports by the 12th of each month and submit to the appropriate State or Federal Agency. 100% 75% 95% 95%
Conduct 20 recruitment visits at fire academies and other locations. 40% 90% 80% 80%
ACTIVITY MEASURES
FY 2014
Actual FY 2015
Budget FY 2015 Estimate
FY 2016 Budget
Perform recruitment visits at academies and other locations. 8 18 20 20 Prepare invoices for service reimbursements to Fort Bend
County and the City of Arcola by the 10th of each month. 12 10 12 12 Provide National Incident Management System (NIMS)
refresher training to employees. N/A 2 1 2 Conduct/facilitate an emergency management exercise for
city staff. N/A 1 1 1
105

GENERAL FUND
CONSOLIDATED EXPENDITURES BY LINE ITEM
FIRE - ADMINISTRATION 101-14-130
Object Description
FY 2014
Actual
FY 2015
Original
Budget
FY 2015
Revised
Budget
FY 2015
Year-End
Estimate
FY 2016
Proposed
Budget
51001 REGULAR SALARIES 241,545 244,185 244,185 250,721 244,185
51002 ADDITIONAL COMPENSATION 6,687 7,026 7,026 7,026 6,936
51003 COMPENSATED ABSENCES 942 - -
51004 OVERTIME 581 2,000 2,000 1,200 1,200
51101 PART TIME: 20-29 HOURS - -
51102 PART TIME:LESS THAN 20 HR - - 9,880 9,652
51202 CELL PHONE ALLOWANCE 2,166 2,160 2,160 2,165 2,160
51301 LONG TERM DISABILITY 708 851 851 716 851
51302 TAXES, SOCIAL SECURITY 18,545 19,537 19,537 19,143 19,437
51303 HOSP-LIFE-DENT-VIS INS 19,256 19,022 19,022 17,605 21,021
51305 RETIREMENT 13,137 22,803 22,803 18,977 22,796
51306 WORKERS COMPENSATION 2,185 322 322 1,576 1,397
TOTAL PERSONNEL 305,752 317,906 327,786 328,781 319,983
52001 OFFICE SUPPLIES 3,170 3,000 3,000 3,000 3,000
52002 MEALS & DRINKS 157 250 250 250 250
52003 WEARING APPAREL 2,881 1,700 4,664 4,664 1,700
52004 MINOR TOOLS & EQUIPMENT 1,473 3,000 2,500 2,159 2,500
52005 EDUC, TRAINING & SUPPLIES - - -
52006 POSTAGE 174 150 150 150 150
52014 COMPUTER EQUIP RENTAL FEE 4,409 2,257 2,257 2,257 -
52015 FLEET RENTAL FEE 2,704 1,418 1,418 1,418 1,418
52016 CENTRAL GARAGE ALLOC 3,232 -
52017 FUEL, OIL & LUBRICANTS 3,669 4,750 4,750 4,100 4,856
52019 DONATION PURCHASES 94 - -
52034 EOC SUPPLIES 3,841 4,500 4,500 4,500 4,500
52072 FED GR EXP-FEDGRANT-HLS-HANDHE - - -
TOTAL COMMODITIES 25,805 21,025 23,489 22,498 18,374
53001 MINOR EQUIP MAINT/RPR & RNT - -
53002 INSURANCE 883 1,026 1,026 1,067 1,097
53004 SPECIAL SERVICES & LEGAL 265 16,515 17,015 17,015 27,720
53009 BLDG MAINTENANCE ALLOC 14,879 -
53012 COMPUTER SERVICES ALLOC 184,878 -
TOTAL CONTRACTUAL SERVICES 200,905 17,541 18,041 18,082 28,817
54001 PRINTING & PUBLICATIONS 156 400 400 400 400
54002 DUES & SUBSCRIPTIONS 10,686 12,480 12,480 12,930 13,080
54005 VEHICLE ALLOWANCE - MILEAGE 186 250 650 500 500
TOTAL OTHER SERVICES 11,028 13,130 13,530 13,830 13,980
TOTAL CAPITAL OUTLAY - - - - -
TOTAL EXPENDITURES 543,489 369,602 382,846 383,191 381,154
106

============================ FY 2016 ANNUAL BUDGET ================================
===============================CITY OF MISSOURI CITY=================================
DEPARTMENT: FIRE & RESCUE SERVICES FUNDING SOURCE: GENERAL FUND
DIVISION: PREVENTION FUND NUMBER: 101-14-132
DESCRIPTION OF DIVISIONAL OPERATIONS
The Fire Prevention Division is under the direction of the Fire Marshal, who reports directly to the Fire Chief. The division is responsible for conducting plan reviews of all new commercial construction projects. This division is an integral part of the city’s development team and participates in all appropriate meetings and other activities that provide the citizens with one stop permitting and coordination for new construction. The division conducts field inspections of all new commercial construction, processes and reviews all applications for fire permits as directed by the fire codes. In addition, the division is charged with conducting on-site fire inspections of all existing non-residential occupancies to ensure compliance with local code and take appropriate enforcement measures to correct unsafe conditions. The division also receives and responds to citizen complaints and takes action to resolve these complaints within a reasonable time. Another responsibility of the division is the investigation of every undetermined or incendiary fire occurring within the city. The division’s arson investigators, through final disposition of arrest and prosecution, investigate fires of criminal origin. The division is responsible for the investigation of all hazardous material incidents of spills, dumping or illegal use. Additionally, the division is responsible for the investigation of all illegal burning operations, fireworks violations, and juvenile fire setter activities. The division also conducts fire department prospective employee background and personal history investigations and administrative investigations when so directed by the Fire Chief.
Total Full Time Employees = 4 *Fire Chief is included in Fire Administration Budget
107

============================ FY 2016 ANNUAL BUDGET ================================
===============================CITY OF MISSOURI CITY=================================
DEPARTMENT: FIRE & RESCUE SERVICES FUNDING SOURCE: GENERAL FUND
DIVISION: PREVENTION FUND NUMBER: 101-14-132 STRATEGIC
GOAL 2019 DIVISIONAL OBJECTIVES
3 Continue inspections on existing high-hazard occupancies to reduce the potential
for a large loss fire or large loss of life incident. These inspections would further protect neighboring business from collateral damage that would result from such an incident. The Fire Prevention Division will beginning the 3rd year of high-hazard inspections, which will restart the process for bi-annual inspections of the identified existing businesses in FY2016. This will include 7 dry cleaning plants, 15 automotive repair facilities, and 13 large box retail establishments to receive the initial bi-annual inspection.
4 In cooperation with the Technology & Innovation department, continue the
development of a functional electronic field reporting system to increase staff efficiency and records management. This field reporting system shall be capable of field signature capture and report generation. This system should be operational by January 5, 2016.
5
4
In order to facilitate the continued progression of development projects, the Fire Prevention Division will complete 95% of building and fire plan reviews within ten (10) business days for initial submittals and within five (5) business days for re-submittals.
Develop Fire Prevention Inspector’s code knowledge and ensure consistent enforcement of the newly adopted 2015 ICC code family. This development will be facilitated through an initial Fire Marshal led training over the model code and City amendments in FY2015. This training will be followed with quarterly testing via a written or practical test in FY2016 to ensure consistent interpretation and enforcement; this testing will indicate areas for further training and ultimately develop a division for optimum performance.
PERSONNEL SCHEDULE
FY 2014
Actual FY 2015
Budget FY 2015 Estimate
FY 2016 Budget
SalaryGrade
Fire Marshal 1 1 1 1 F5Sr. Fire Inspector 2 2 2 2 F3Fire Inspector 1 1 1 1 F2Total Full-Time Employees 4 4 4 4
108

============================ FY 2016 ANNUAL BUDGET ================================
===============================CITY OF MISSOURI CITY=================================
DEPARTMENT: FIRE & RESCUE SERVICES FUNDING SOURCE: GENERAL FUND
DIVISION: PREVENTION FUND NUMBER: 101-14-132
PERFORMANCE INDICATORS
FY 2014Actual
FY2015 Budget
FY 2015 Estimate
FY 2016 Budget
Inspect all new commercial establishments prior to Certificate
of Occupancy. 95% 98% 96% 98%
Provide (1) major fire safety information program to the elementary school children located in Missouri City. (Fire House Clown program)
60% 75% N/A N/A
Inspect existing non-licensed commercial occupancies on a biennial basis. 15% 25% 25% 25%
Complete 15 hours of investigative training annually for all investigators assigned to the division to aid in investigative technique/processes.
50% 85% 75% 85%
Provide fire safety education to elementary school children in Missouri City.
N/A N/A 10% 25%
ACTIVITY MEASURES
FY 2014
ActualFY2015 Budget
FY 2015 Estimate
FY 2016 Budget
Site inspections and contacts 918 800 1115 1050 Public Education Presentations numbers in attendance total 5,948 6,000 570 600
Adult 507 500 120 100 Children 5,441 5,500 450 500 Plat review 27 20 10 15 Permits 216 200 149 150 Plan review 479 450 483 400 Development Meetings 231 200 315 285 Fires cause Investigations by Fire Marshal's office 18 15 20 15 Care facility complaint investigations 6 7 10 8
109

GENERAL FUND
CONSOLIDATED EXPENDITURES BY LINE ITEM
FIRE - PREVENTION 101-14-132
Object Description
FY 2014
Actual
FY 2015
Original
Budget
FY 2015
Revised
Budget
FY 2015
Year-End
Estimate
FY 2016
Proposed
Budget
51001 REGULAR SALARIES 286,149 271,517 271,517 282,379 271,517
51002 ADDITIONAL COMPENSATION 17,061 15,984 15,984 17,184 17,376
51003 COMPENSATED ABSENCES 683 - - 4,102
51004 OVERTIME 28,347 12,000 14,000 12,000 12,000
51202 CELL PHONE ALLOWANCE 2,709 2,700 2,700 2,708 2,700
51301 LONG TERM DISABILITY 1,201 975 975 1,191 980
51302 TAXES, SOCIAL SECURITY 24,030 23,119 23,119 22,028 23,225
51303 HOSP-LIFE-DENT-VIS INS 44,200 48,318 48,318 43,627 50,746
51305 RETIREMENT 17,467 26,118 26,118 22,524 26,243
51306 WORKERS COMPENSATION 3,380 2,664 2,664 2,240 1,894
TOTAL PERSONNEL 425,228 403,395 405,395 409,983 406,681
52001 OFFICE SUPPLIES 231 800 800 600 800
52002 MEALS & DRINKS (2) - -
52003 WEARING APPAREL 1,553 5,240 5,240 4,000 5,000
52004 MINOR TOOLS & EQUIPMENT 717 2,210 4,210 3,500 4,710
52005 EDUC, TRAINING & SUPPLIES 492 3,141 3,141 3,141 800
52006 POSTAGE 2 100 100 100 100
52008 IDENTIFICATION SUPPLY/FIL 190 500 500 500 600
52011 FIREARMS 3,631 3,200 3,200 3,200 3,200
52014 COMPUTER EQUIP RENTAL FEE 3,433 3,700 3,700 3,700 -
52015 FLEET RENTAL FEE 9,100 10,929 10,929 10,929 10,929
52016 CENTRAL GARAGE ALLOC 6,531 -
52017 FUEL, OIL & LUBRICANTS 9,744 11,000 11,000 9,500 11,020
TOTAL COMMODITIES 35,622 40,820 42,820 39,170 37,159
53001 MINOR EQUIP MAINT/RPR & RNT 320 350 350 350 350
53002 INSURANCE 450 553 553 572 736
53004 SPECIAL SERVICES & LEGAL 1,481 1,495 1,495 1,575 1,575
53009 BLDG MAINTENANCE ALLOC 8,037 -
53012 COMPUTER SERVICES ALLOC 54,255 -
TOTAL CONTRACTUAL SERVICES 64,542 2,398 2,398 2,497 2,661
54001 PRINTING & PUBLICATIONS 415 250 250 250 250
54002 DUES & SUBSCRIPTIONS 390 560 560 560 560
54027 TCLEOSE TRAINING 912
54031 FIRE PREVENTION 2,344 3,750 1,750 5,301 5,750
TOTAL OTHER SERVICES 3,149 4,560 2,560 6,111 7,472
TOTAL CAPITAL OUTLAY - - - - -
TOTAL EXPENDITURES 528,541 451,173 453,173 457,761 453,973
110

============================ FY 2016 ANNUAL BUDGET ================================
===============================CITY OF MISSOURI CITY=================================
DEPARTMENT: FIRE FUNDING SOURCE: GENERAL FUND
DIVISION: TRAINING FUND NUMBER: 101-14-134
DESCRIPTION OF DIVISIONAL OPERATIONS Through the staff of a full-time Training Chief, a part-time clerk, and the assistance of the operations staff, the Training Division provides basic and advanced fire, rescue, emergency medical services, hazardous materials, and technical rescue training. The Training Division is also responsible for writing policies and procedures, course development, scheduling of in-service training, implementation & delivery of new programs as directed, career development planning, administration of promotional examinations and continued professional research. The Training Chief is also responsible for ensuring departmental compliance in accordance with both state and national standards as it pertains to training, health and safety. In support of the Operations Division, the Training Chief also serves as the department’s Health and Safety Officer.
Total Full Time Employees = 1 Part-Time Employees = 1
*Fire Chief is included in Fire Administration Budget.
*Assistant Fire Chief is included in Fire Operations Budget.
111

============================ FY 2016 ANNUAL BUDGET ================================
===============================CITY OF MISSOURI CITY=================================
DEPARTMENT: FIRE FUNDING SOURCE: GENERAL FUND
DIVISION: TRAINING FUND NUMBER: 101-14-134 STRATEGIC
GOAL 2019
DIVISIONAL OBJECTIVES
4 Continue development and implementation of the annual Driver/Operator Training
Program by the end of FY 2016.
4 Implement direct delivery of EMS Training Programs by the end of FY2016.
4 Implement Supervisor Initial and Continuing Education Training by the end of FY 2016.
4 Implement a Job Competency Based Skills Assessment of Current Staff based on
MCFRS Standard Operating Guidelines, Federal and State Standards, and Fire Service Industry Best Practices by the end of FY 2016.
PERSONNEL SCHEDULE FY 2014
Actual FY 2015
Budget FY 2015 Estimate
FY 2016 Budget
SalaryGrade
Training and Education Chief 1 1 1 1 F5Total Full-Time Employees 1 1 1 1 Part-Time Clerk 1 1 1 1 $12/hrTotal Part-Time Employees 1 1 1 1
112

============================ FY 2016 ANNUAL BUDGET ================================
===============================CITY OF MISSOURI CITY=================================
DEPARTMENT: FIRE FUNDING SOURCE: GENERAL FUND
DIVISION: TRAINING FUND NUMBER: 101-14-134
PERFORMANCE INDICATORS FY 2014
Actual FY 2015
Budget FY 2015 Estimate
FY 2016 Budget
Provide each officer a minimum of two (half-day minimum)
supervisory or management courses per year 50% 50% 40% 50% Meet the ISO recommended drills, multiple-company drills, and
night drills as outlined in the Fire Suppression Rating Schedule 50% 75% 50% 75% Meet the ISO recommended training for Driver/Operator and
New Driver/Operator training as outlined in the Fire Suppression Rating Schedule 80% 50% 50% 50%
Provide EMS training for each member to meet Texas Department of State Health Services requirements based on each firefighter’s certification level. 80% 50% N/A N/AEMT-Basic N/A N/A 80% 80%EMT-Intermediate N/A N/A 80% 80%EMT-Paramedic N/A N/A 50% 50%
Provide a minimum of 120 hours of recruit training for all new hires. 60% 75% 50% 75%
ACTIVITY MEASURES
FY 2014
Actual FY 2015
Budget FY 2015 Estimate
FY 2016 Budget
Process training class requests by personnel 130 300 164 200 Staff Fire Training hours (In-house) per yr. 3,413 2,000 1,676 1,800
Basic Firefighter N/A N/A 419 450Intermediate Firefighter N/A N/A 469 500Advanced Firefighter N/A N/A 469 500Master Firefighter N/A N/A 319 350
Outside Training hours 2,157 4,000 2,051 4,000 Company Level Training hours 3,967 8,000 4,085 5,000 EMS Training hours/per year 1,392 1,500 1,107 1,200 Avg. training hrs. per member per year (EMS & Fire) 171 246 139 188
113

GENERAL FUND
CONSOLIDATED EXPENDITURES BY LINE ITEM
FIRE - TRAINING 101-14-134
Object Description
FY 2014
Actual
FY 2015
Original
Budget
FY 2015
Revised
Budget
FY 2015
Year-End
Estimate
FY 2016
Proposed
Budget
51001 REGULAR SALARIES 85,464 85,144 85,144 85,284 85,144
51002 ADDITIONAL COMPENSATION 3,355 3,392 3,392 3,392 3,440
51102 PART TIME:LESS THAN 20 HR 7,824 11,856 11,856 4,526 11,988
51202 CELL PHONE ALLOWANCE 1,084 1,080 1,080 1,083 1,080
51301 LONG TERM DISABILITY 287 301 301 284 301
51302 TAXES, SOCIAL SECURITY 7,201 7,763 7,763 7,080 7,776
51303 HOSP-LIFE-DENT-VIS INS 6,040 6,558 6,558 5,394 6,845
51305 RETIREMENT 4,682 8,065 8,065 6,668 8,070
51306 WORKERS COMPENSATION 919 833 833 657 590
TOTAL PERSONNEL 116,856 124,992 124,992 114,368 125,234
52001 OFFICE SUPPLIES 307 900 900 350 600
52002 MEALS & DRINKS 671 900 900 350 900
52003 WEARING APPAREL 766 3,301 3,301 900 847
52004 MINOR TOOLS & EQUIPMENT 12,467 7,600 7,600 4,500 5,000
52005 EDUC, TRAINING & SUPPLIES 13,190 12,000 13,005 10,000 13,400
52006 POSTAGE 43 100 100 100 100
52014 COMPUTER EQUIP RENTAL FEE 949 900 900 900 -
52015 FLEET RENTAL FEE 1,597 2,000 2,000 2,000 2,000
52016 CENTRAL GARAGE ALLOC 464 -
52017 FUEL, OIL & LUBRICANTS 432 1,800 1,800 700 812
TOTAL COMMODITIES 30,887 29,501 30,506 19,800 23,659
53001 MINOR EQUIP MAINT/RPR & RNT - - -
53002 INSURANCE 189 231 231 239 275
53009 BLDG MAINTENANCE ALLOC 12,056 -
53012 COMPUTER SERVICES ALLOC 22,628 -
TOTAL CONTRACTUAL SERVICES 34,872 231 231 239 275
54001 PRINTING & PUBLICATIONS 25 250 250 150 250
54002 DUES & SUBSCRIPTIONS 900 900 900 1,100 900
54003 TRAINING & TRAVEL 90,615 124,929 125,508 100,000 107,500
54004 EDUCATIONAL REIMBURSEMENT - -
54005 VEHICLE ALLOWANCE - MILEAGE - - -
54006 OTHER EXPENSES - - -
54027 TCLEOSE TRAINING - 971 971 971
54030 PHYSICAL EXAMS - 30,000 30,000 30,000 36,740
TOTAL OTHER SERVICES 91,540 157,050 157,629 132,221 145,390
TOTAL CAPITAL OUTLAY - - - - -
TOTAL EXPENDITURES 274,156 311,774 313,358 266,628 294,558
114

============================ FY 2016 ANNUAL BUDGET ================================
===============================CITY OF MISSOURI CITY=================================
DESCRIPTION OF DIVISIONAL OPERATIONS
The Assistant Fire Chief directs the Operations Division in which 3 Battalion Chiefs and the Training Chief report accordingly. The Assistant Chief also performs as the head of the fire department in the absence of the fire chief. The division operates five (5) fire stations, which are staffed with a minimum of one (1) Lieutenant/EMT, one Driver/Inspector and one Firefighter/EMT 365 days a year. One (1) Battalion Chief/EMT, serving as the Shift Commander, is on duty each shift. A minimum of 12 firefighters are assigned to each shift. The division provides the following services: fire suppression, basic and advanced level emergency medical care, rescue and extrication of trapped persons, vehicle extrication, and responds as members of the Fort Bend County Hazardous Materials Response Team and County Technical Rescue Team. In conjunction with the Fire Prevention and Training Divisions, members of the Operations Division cooperatively participate in community based public education / fire prevention programs, in-service training, pre-incident planning, home safety survey, facility and equipment maintenance/inspection activities as well as numerous other emergency related functions. The Assistant Fire Chief also oversees a myriad of programs and ensures the financial responsibility of program budget expenditures.
Fire Chief *
Assistant Fire Chief
Battalion Chief Battalion Chief Battalion Chief
Lieutenant (5)Lieutenant (5)Lieutenant (5)
Apparatus Operator (5) Apparatus Operator (5) Apparatus Operator (5)
Firefighter (12) Firefighter (12) Firefighter (12)
Total Full Time Employees = 70 *Fire Chief is included in the Fire Administration Divisional Budget
DEPARTMENT: FIRE & RESCUE SERVICES FUNDING SOURCE: GENERAL FUND
DIVISION: OPERATIONS FUND NUMBER: 101-14-136
115
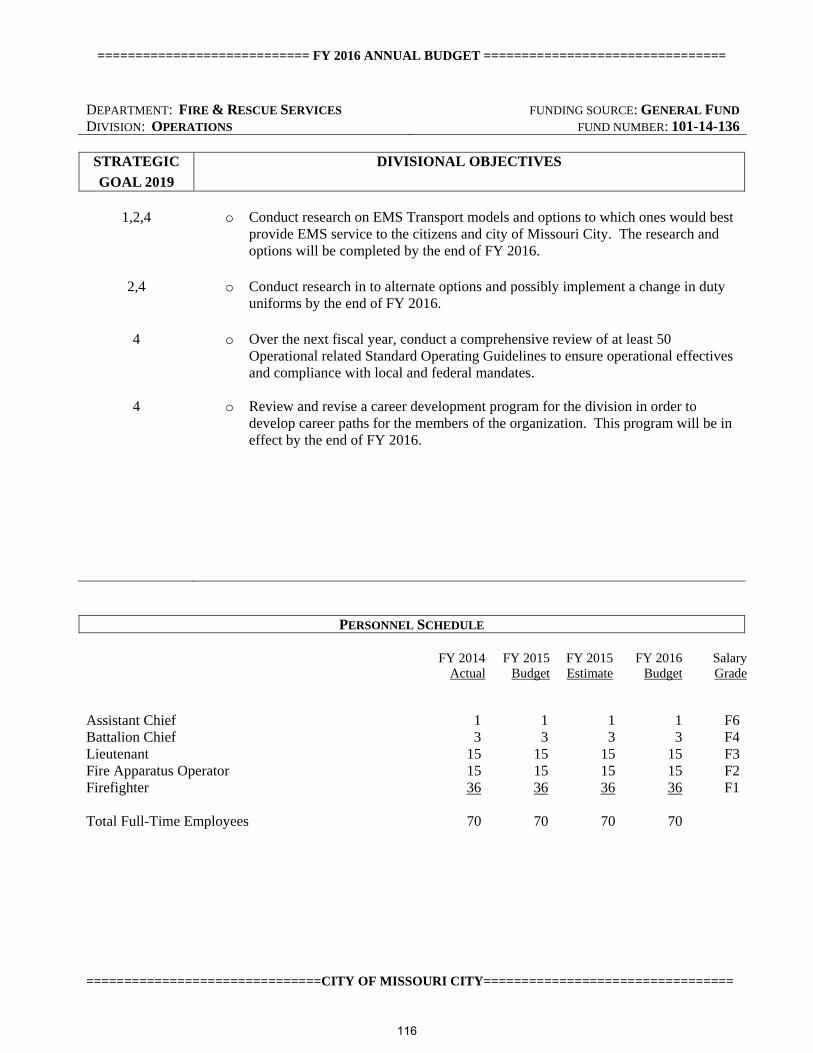
============================ FY 2016 ANNUAL BUDGET ================================
===============================CITY OF MISSOURI CITY=================================
DEPARTMENT: FIRE & RESCUE SERVICES FUNDING SOURCE: GENERAL FUND
DIVISION: OPERATIONS FUND NUMBER: 101-14-136 STRATEGIC
GOAL 2019
DIVISIONAL OBJECTIVES
1,2,4 o Conduct research on EMS Transport models and options to which ones would best
provide EMS service to the citizens and city of Missouri City. The research and options will be completed by the end of FY 2016.
2,4 o Conduct research in to alternate options and possibly implement a change in duty uniforms by the end of FY 2016.
4
4
o Over the next fiscal year, conduct a comprehensive review of at least 50 Operational related Standard Operating Guidelines to ensure operational effectives and compliance with local and federal mandates.
o Review and revise a career development program for the division in order to develop career paths for the members of the organization. This program will be in effect by the end of FY 2016.
PERSONNEL SCHEDULE FY 2014
Actual FY 2015
Budget FY 2015 Estimate
FY 2016 Budget
SalaryGrade
Assistant Chief 1 1 1 1 F6Battalion Chief 3 3 3 3 F4Lieutenant 15 15 15 15 F3Fire Apparatus Operator 15 15 15 15 F2Firefighter 36 36 36 36 F1 Total Full-Time Employees 70 70 70 70
116

============================ FY 2016 ANNUAL BUDGET ================================
===============================CITY OF MISSOURI CITY=================================
DEPARTMENT: FIRE & RESCUE SERVICES FUNDING SOURCE: GENERAL FUND
DIVISION: OPERATIONS FUND NUMBER: 101-14-136
PERFORMANCE INDICATORS FY 2014
ActualFY2015 Budget
FY 2015 Estimate
FY 2016 Budget
Respond to 90% of all fire responses within five minutes and twenty seconds
20 % 25 % 25 % 30 %
Respond to 90% of all medical responses within five minutes. 34 % 40% 37 % 40 %
Participate in City sponsored community events. 98 % 95% 95 % 95 % Conduct 100 Pre Incident Plans. 0 % 50% 300 % 50 % Assemble 15 firefighters on scene of a structure fire in 8
minutes or less.(travel time) 0%
10% 5% 10%
ACTIVITY MEASURES FY 2014
ActualFY 2015
Budget FY 2015 Estimate
FY 2016 Budget
Fire Incidents (Total) Building Fires/1000 Population Vehicle Fires/1000 Population Other Fire/1000 Population
212 0.61 0.27 0.99
216 N/A N/A N/A
194 0.67 0.38 0.59
200 0.62 0.25 0.70
EMS/Rescue Incidents (Total) o Medical calls/1000 Population
3108 29.6
3,240 N/A
3470 34.97
3500 0.36
Hazardous Conditions Incidents o Hazmat calls/1000 Population
192 2.09
270 N/A
268 2.82
275 2.84
Service Calls 359 335 390 425 Good Intent Calls 988 1,108 1060 1150 Severe Weather 1 3 4 4
False Alarms (Total) 456 486 582 625 False Alarms/1000 Population 5.0 N/A 6.13 6.44
117

GENERAL FUND
CONSOLIDATED EXPENDITURES BY LINE ITEM
FIRE - OPERATIONS 101-14-136
Object Description
FY 2014
Actual
FY 2015
Original
Budget
FY 2015
Revised
Budget
FY 2015
Year-End
Estimate
FY 2016
Proposed
Budget
51001 REGULAR SALARIES 3,406,736 3,930,626 3,930,626 3,869,452 4,024,156
51002 ADDITIONAL COMPENSATION 251,345 205,813 205,813 254,362 217,581
51003 COMPENSATED ABSENCES 4,136 - - 5,000
51004 OVERTIME 198,909 269,230 257,350 125,000 260,259
51202 CELL PHONE ALLOWANCE 2,718 4,320 4,320 4,368 3,240
51301 LONG TERM DISABILITY 17,060 13,908 13,908 17,112 14,303
51302 TAXES, SOCIAL SECURITY 281,449 332,613 332,613 309,652 341,628
51303 HOSP-LIFE-DENT-VIS INS 550,393 772,854 772,854 576,833 717,300 51304 PRORATED HEALTH/DENT/VIS 122
51305 RETIREMENT 201,424 391,310 391,310 314,628 409,826
51306 WORKERS COMPENSATION 39,013 37,782 37,782 30,461 27,500
51999 CONTRA GRANT PERSONNEL COSTS (11,606) (12,000) (12,000) (12,000) (12,000)
TOTAL PERSONNEL 4,941,699 5,946,456 5,934,576 5,494,868 6,003,793
52001 OFFICE SUPPLIES 2,129 3,850 3,850 3,850 4,813
52002 MEALS & DRINKS 3,057 1,000 1,000 1,000 1,000
52003 WEARING APPAREL 51,772 206,632 287,851 287,851 213,670
52004 MINOR TOOLS & EQUIPMENT 74,258 112,044 122,272 117,000 118,126
52005 EDUC, TRAINING & SUPPLIES - - -
52006 POSTAGE 141 150 150 175 150
52007 BLDG MAT'L/SUPPLIES & REPAIRS 777 1,000 6,000 6,000 1,000
52009 OTHER/MISC - - -
52013 JANITORIAL SUPPLIES 8,794 11,104 11,104 11,104 14,435
52014 COMPUTER EQUIP RENTAL FEE 18,459 22,450 22,450 22,450 -
52015 FLEET RENTAL FEE 25,088 12,975 12,975 12,975 13,100
52016 CENTRAL GARAGE ALLOC 258,316 -
52017 FUEL, OIL & LUBRICANTS 70,404 108,333 108,333 68,000 108,333
52020 RADIO SYS INDIRECT COSTS - - -
52025 PESTICIDE/HAZ-MAT CONTROL 3,580 9,000 9,000 9,000 9,000
52035 EMS MEDICAL SUPPLIES 33,145 23,500 23,500 23,500 30,000
TOTAL COMMODITIES 549,920 512,038 608,485 562,905 513,627
53001 MINOR EQUIP MAINT/RPR & RNT 24,235 20,313 22,813 22,813 22,813
53002 INSURANCE 9,994 7,249 7,249 8,098 12,308
53004 SPECIAL SERVICES & LEGAL 50,417 118,408 122,958 115,000 122,958
53005 SERVICE AGREEMENTS/REPAIR 16,811 8,600 8,600 8,600 8,860
53006 RADIO REPAIR/MAINTENANCE - 7,000 7,000 3,000 7,000
53008 TELEPHONE 20,186 13,559 13,559 30,250 31,763
53009 BLDG MAINTENANCE ALLOC 205,482 -
53012 COMPUTER SERVICES ALLOC 133,708 -
TOTAL CONTRACTUAL SERVICES 460,833 175,129 182,179 187,761 205,702
54001 PRINTING & PUBLICATIONS 5,184 3,300 3,300 3,300 3,300
54002 DUES & SUBSCRIPTIONS 462 2,113 2,112 2,112 2,113
54003 TRAINING & TRAVEL - -
54005 VEHICLE ALLOWANCE - MILEAGE 116 250 250 250 250
54006 OTHER EXPENSES 365 2,500 2,500 2,500 2,500
54030 PHYSICAL EXAMS 22,991 - -
TOTAL OTHER SERVICES 29,118 8,163 8,162 8,162 8,163
75004 EQUIPMENT - 198,341 198,341 57,611
75006 VEHICLES - - 625,000 625,000 -
TOTAL CAPITAL OUTLAY - - 823,341 823,341 57,611
TOTAL EXPENDITURES 5,981,570 6,641,786 7,556,743 7,077,037 6,788,896
118

============================ FY 2016 ANNUAL BUDGET ================================
===============================CITY OF MISSOURI CITY=================================
DEPARTMENTAL VISION STATEMENT PUBLIC WORKS
To define Exceptional Service in the development, implementation and management of the public infrastructure.
DEPARTMENTAL MISSION
STATEMENT
To be indispensable to our customers; they should view us as their team of professionals whom they can count on to deliver vitally needed projects and services, on-time and within budget.
Administration
Capital Projects
Engineering/Utilities Planning
Geographic Information Systems
Streets, Drainage, & Traffic
Operations
Animal Services
Fleet Maintenance
Facilities Maintenance
119

============================ FY 2016 ANNUAL BUDGET ================================
===============================CITY OF MISSOURI CITY=================================
DEPARTMENT: PUBLIC WORKS FUNDING SOURCE: GENERAL FUND
FY 2015 DEPARTMENTAL ACCOMPLISHMENTS
Mobility and Infrastructure: Established a joint Storm-water Management Program to meet NPDS five-year permitting. Way-finding signs were installed on Texas Parkway in the area of Buffalo Run Park and City Hall and on
Cartwright Road near FM 1092 in the area of the PSHQ and Municipal Court Leveraged funding of $14M – (Houston Galveston Area Council, Texas Department of Transportation,
Fort Bend County Mobility Bond) Completed the designs: Hurricane Ln Extension, Vicksburg Blvd Extension, Turtle Creek Reconstruction,
Regional Water Treatment Plant Transmission Mains PH II, Intelligent Transportation System PH II, and Gregory Blvd Reconstruction.
Started Construction: Turtle Creek Dr, from Mission Valley to Hilton Head, Transmission Main PH II into Riverstone and MUD 46, and Vicksburg Blvd to Lake Olympia Parkway
Completed construction: Thomas Taylor Parkway (dba Lexington Blvd) from Texas Parkway to Scanlin Road, 1.5 MGD ground storage tank at Regional Water Treatment Plant
Completed selection of Engineering firms for the Glenn Lakes Lane Bridge Reconstruction (over Oyster Creek), the Ashmont Road Reconstruction, and the Adams Street Reconstruction.
Installed bike/ped lanes, crossings, signs and ramps: Lexington Blvd, Thomas Taylor Parkway, Pine Hollow, Hunters Glen Park & Trail
Completed 12 Traffic Signal Box Art locations Infrastructure Ordinance updated and adopted by Council. Utilities: Developed and presented to council sub-committee a Water rate Wastewater rate; assuring adequate
revenues for operations and maintenance Completed and adopted the Mustang Bayou Service Area Impact Fees for Water/Wastewater. Adopted a Business Plan with a plan of action based on the Regional Utility Planning Study of 2011. Completed an amended agreement with the participants of the Steep Bank/Flat Bank Wastewater Treatment
facility. Executed a Raw Water System contract with the Gulf Coast Water Canal Authority (GCWA) to address
water supply Completed an analysis of the Ground Water Reduction Program: Average conversion rate = 27% of the
30% mandate by end of June 2015. Updated surface water usage data to determine trends and project compliance with the mandated 60%
conversion rate for 2025. Executed an agreement with GCWA for the design, installation, and Operation & Maintenance of
enhancements to the Briscoe Canal for raw water pump to enhance storage capabilities for the City’s Regional Water Treatment facility.
Operations: Street Sweeping Program: 1,200 miles Concrete Street Repairs = 100,000 SF; $ 790,620 Sidewalk Repairs: 50,000 SF; $561,370 Roadside Ditch Maintenance & Right of Way Mowing: 1, 776 acres Reconstructed the golf cart bridge between Eldorado Holes # 5 and #6 with Fort Bend County Road and
Bridge and in-house staff. Received 2 Texas Public Works Association awards: Professional Manager of the Year – Right of Way
Maintenance and Emergency Repair Project of the Year - < $2M (Quail Valley Effluent Pond Bank Stabilization).
Digital Message Signs: used to improve mobility with time to reach messages, used to notify/make public aware of amber/silver alerts, used for efficiency routing of traffic for special events, and used to provide public safety messages for state law compliance.
120

============================ FY 2016 ANNUAL BUDGET ================================
===============================CITY OF MISSOURI CITY=================================
Installed Uninterruptable Power Systems (battery back-ups) on the SH 6 DMS boards (Digital Message Signs).
Performed traffic signal corridor analysis on Texas Parkway, FM 1092, Sienna Parkway, and SH 6 Obtained 40 Automotive Service Excellence certifications for Automotive, Truck and Heavy Equipment
to improve Fleet Services. Installed an off-road diesel fuel tank at the Fleet Services Center Implemented the City’s Municipal Volunteer Program and maintain 10 volunteers at the Animal Shelter Implemented standard operating procedures for the volunteers at the Animal Shelter. Hosted pet adoption stations at Boo in the Run in Buffalo Run Park, Adoption Saturday at the Recreation
and Tennis Center, and Healthy Kids Day at the YMCA. Implemented an updated facilities maintenance checklist for all City facilities Implemented a demand response program to reduce energy consumption and receive proceeds for
participation. Completed a Pall Membrane (filter for raw water treatment) analysis to determine the longevity of the
system. Texas Commission on Environmental Quality approved the City’s request to perform an analysis and
testing of the existing sedimentation equipment (Plate Settlers) to increase treatment capabilities. Scheduled for July 2015.
Geographic Information Systems (GIS) created a Story Map and Interactive Map for the Traffic Signal Box Artworks Project.
Expanded available GIS web mapping applications to include an interactive web map for Parks and Recreation and web mapping applications, data analysis, and exhibits in support of the City’s Community Rating System, a FEMA program that can provide residents with discounted flood insurance rates.
Updated all fire hydrant data, waterline information, and developed a field collector application related to structural risk assessment in support of the City’s ISO certification.
Preventive Maintenance contracts for the Building Automation Systems (Metasys Controls) operation at EOC, the Building Automation Systems (Trane Tracer Controls) on the Tennis and Recreation Center, the HVAC Mechanical at the Tennis and Recreation Center, and the 4 chill water plants were successfully implemented and active. One major issue on the City Hall program has been resolved.
All preventive maintenance/inspections and repairs on ice machines, water filters, water Heaters, a/c units, heaters, fan boxes, first aid kits, gate operators, exit lights, stoves, And appliances were completed in accordance with the established schedule. All activities performed by in-house staff.
All routine preventive maintenance visits, inspections, and repairs were made to all overhead doors at all Fire Station's (4), The Sally Port and Fleet Services, and the preventive maintenance of the two chillers & boiler at the Emergency Operations Center facility were completed in accordance with the established schedule. All activities were performed with a combination of in-house staff and contract.
Performed inspections of and repaired all exhaust fans and bay heaters city- wide as part of the scheduled preventive maintenance program for these equipment.
Participated in the CoolSaver program from CleaResult and received a rebate. Completed the remodel of the Information Technology work area to provide for a more cohesive team
environment. Completed the remodel of the Council Conference Room with mostly in-house staff to create a
professional setting for staff and council to conduct business. Participated, in support of the City’s mission and strategic goals, in the City’s Special Events for
Snowfest, July 4th, and Boo in the Run. Promoted Robert Upton to City Engineer/Utilities Manager. Promoted Hung Hoang, from Mechanic II to Shop Foreman within the Fleet Services Division. Promoted Adam Sanchez and Alex Cano from Street Technician I’s to Technician II’s. Filled 8 of the 9vacant positions within the Department: 2– Street Technicians, 1–Animal Services
Officer, 1–Asst City Engineer, 1-Fleet Superintendent, and 1- GIS Tech I, 1- GIS Operations Specialist, and 1-Part-time GIS Tech.
121

============================ FY 2016 ANNUAL BUDGET ================================
===============================CITY OF MISSOURI CITY=================================
DEPARTMENT: PUBLIC WORKS FUNDING SOURCE: GENERAL FUND
DEPARTMENTAL DESCRIPTION The Assistant Directors provide direction to several Divisions: Administration, Capital Improvements, Engineering/Utilities Planning, Fleet Maintenance, Facilities Maintenance, Geographic Information Systems (GIS), Animal Services, and Streets, Drainage & Traffic Operations Divisions. The Department provides: administrative oversight of all public works infrastructure in operations and development: maintenance of the City’s infrastructure (streets, curbs, sidewalks, pavement markings, signs, traffic signals, water and wastewater plants, surface water plant, drainage structures and channels, and public right-of-way); public works operations and maintenance; Intelligent Transportation System operations; Capital Improvement Program management and implementation; Stormwater Program; fleet services operations and maintenance; the Fleet Replacement Program; building services maintenance and operations; utility operations and maintenance management; utilities planning and development; engineering services for traffic/transportation and utilities management; floodplain management; GIS operations and database maintenance; and animal control services that include implementing the City’s ordinances which include addressing dog bites, dangerous dogs and dogs running at large, working with rescue and pet adoption groups, and trapping domestic animals; Services to Missouri City’s citizens. STRATEGIC
GOAL 2019 DEPARTMENTAL GOALS
1,2,4 Convert additional service areas from ground water usage to surface water usage to
meet the minimum 30% conversion requirement mandated by the Fort Bend Subsidence District by July 1, 2016.
1,2,3,5 Complete the construction of Capital Improvement Projects identified/funded for Fiscal Year 2016 that will improve/maintain the quality/integrity of the city’s infrastructure.
1,2,3 Provide for the maintenance and operations of the City’s public infrastructure to ensure current adopted levels of condition and services are maintained.
1 Identify additional opportunities to permit and install wayfinding signs within TxDOT and local rights-of-way.
1,3,5 Identify opportunities to promote development in the 90A & Texas Parkway corridors. 1,2,3,4,5 Provide Departmental Direction for establishing Divisional Objectives in accordance
with Department Strategic Plan. 1,2,3 Maintain and continue established infrastructure and joint stormwater quality programs
to ensure an adequate level of condition rating is maintained. 1,4 Increase mobility along the major corridors by using access management techniques,
strategic planning for roadways in the Traffic Management Plan, as well as increasing safety for motorists, bicyclists and pedestrians.
1,2,3 Incorporate new water and wastewater regionalization programs into ongoing cooperative discussion, planning and implementation efforts with municipal utility districts and into the City’s Capital Improvements Program.
4 Upgrade existing GIS databases, develop new applications, and make improvements where necessary to allow the City’s GIS to coordinate with other City systems and improve delivery of information, industry standardization, processes and procedures.
2,4 Provide maintenance of the City’s fleet of vehicles, equipment, and fuel islands in a manner that meets the level of service required to meet Federal and State requirements.
2,4 Provide well-maintained City facilities and improved customer services to internal and external customers incorporating technological and energy efficient measures where cost-effective and beneficial to the operating aspects of the facilities.
1,2,4 Provide for adjustments in our operating procedures and programs to improve our customer oriented approach.
1,2,4 Provide Animal Services that will promote pet adoptions, incorporate community involvement, incorporate Municipal Volunteers and reduce the risk of disease.
122

============================ FY 2016 ANNUAL BUDGET ================================
===============================CITY OF MISSOURI CITY=================================
DEPARTMENT: PUBLIC WORKS FUNDING SOURCE: GENERAL FUND
DIVISION: PW ADMINISTRATION FUND NUMBER: 101-15-140
DESCRIPTION OF DIVISIONAL OPERATIONS The Administration Division directs, manages and oversees a comprehensive Public Works Program: infrastructure and asset management and maintenance; including streets, drainage, utilities, fleet, facilities, and traffic systems, the Capital Improvement Program, the Storm Water Program, Public Improvement construction projects, the Groundwater Reduction Plan program, the Fleet Service and Vehicle Replacement Program, Animal Services ordinance enforcement, Facilities operations and maintenance, and GIS mapping service and data management. The Division performs development services for Economic Development, and coordinates joint project activities with other public entities, including drainage districts, cities, state agencies and utility districts. In addition, the Division provides budget and strategic planning for the Department and technical assistance to the various City Departments, City Council, City Management and commissions. The Division staff act as liaisons when working and communicating with Municipal Utility District (MUD) boards and attorneys, local, state and federal groups including Homeowner Associations (HOA’s), School Districts, Houston-Galveston Area Council (H-GAC), Water Control Districts, Fort Bend Subsidence District, Drainage Districts, Levee Improvement Districts (LID), Flood Control Authorities, and Raw Water Authorities, Texas Department of Transportation, Texas Commission of Environmental Quality, Texas Water Development Board, and FEMA.
Office Manager
Asst. Director of Public Works Asst. Director of Public Works
Total Full-Time Employees = 3
123

============================ FY 2016 ANNUAL BUDGET ================================
===============================CITY OF MISSOURI CITY=================================
DEPARTMENT: PUBLIC WORKS FUNDING SOURCE: GENERAL FUND
DIVISION: PW ADMINISTRATION FUND NUMBER: 101-15-140 STRATEGIC
GOAL 2019 DIVISIONAL OBJECTIVES
1,2,5 Work simultaneously with supporting agencies such as Fort Bend County, TxDOT and H-GAC to identify funding opportunities and enter into agreements, as needed.
1,2,3 Continue joint Storm Water Management Program to stay in compliance with the NPDES five-year permit.
1,4 Complete the design for at least three of the identified projects in the FY 2016 CIP.
1 Assess and develop a prioritized listing of those areas of the city that would benefit from
the installation of wayfinding signs, and direct the installation of at least four of those locations by May 30, 2016.
1,2,4 Develop and achieve a water and wastewater rate structure in the Mustang Bayou Service
area that will assure adequate revenues for operations, maintenance, capital improvements, and ensure that the service will be self-sustaining.
1,2,4,5
Submit for council consideration, a business plan that will set forth a course of action based on the 2011 Regional Utility Planning Study to assist in identifying implementation means and methods.
1,4 Use Divisional resources to manage traffic mobility throughout the city to at least maintain the current level of services.
1,2,4 Use recommendations from the Mustang Bayou Business Plan to provide direction for the development of a plan for the future reuse of effluent within the City service area
4 Complete at least one policy and procedure manual for operations by June 30, 2016.
1,2,4 Ensure the Preventive Maintenance functions for all operations are performed and completed in accordance with the frequency schedules established by Jun 30, 2016.
PERSONNEL SCHEDULE
FY 2014 Actual
FY 2015 Budget
FY 2015 Estimate
FY 2016 Budget
SalaryGrade
Assistant City Manager 1 1 1 0 UnclAssistant Director of Public Works 2 2 2 2 24Utilities Manager 1 0 0 0 24Utilities Coordinator 1 0 0 0 22Office Manager 1 1 1 1 15Project Coordinator 1 0 0 0 12Project Manager 1 0 0 0 12Construction Inspector 1 0 0 0 12 Total Full-Time Employees 9 4 4 3
124

============================ FY 2016 ANNUAL BUDGET ================================
===============================CITY OF MISSOURI CITY=================================
DEPARTMENT: PUBLIC WORKS
FUNDING SOURCE: GENERAL FUND
DIVISION: PW ADMINISTRATION FUND NUMBER: 101-15-140
PERFORMANCE INDICATORS FY 2014
ActualFY2015Budget
FY 2015 Estimate
FY 2016 Budget
Hours to participate in meetings promoting mobility at the
regional level 190 192 190 190 Total Number of work orders to advance 95% of the Work
Request solutions within 5 days 1,222 1,847 1,260 1,250 Hours to participate in Economic Development meetings 200 208 208 200 Hours to review and finalize agreements for water/wastewater
services and capacities, raw water system capacities, and groundwater reduction requirements. 350 350 700 350
Hours spent preparing funding requests 80 80 92 80 Hours to prepare Departmental Budget 160 150 165 150 Hours to host Council Committee Meetings for Long Range
Planning and Infrastructure 96 96 124 96
ACTIVITY MEASURES FY 2014
ActualFY 2015
Budget FY 2015 Estimate
FY 2016 Budget
General Engineering Studies Performed 6 4 8 5 Citizen Requests for Public Works Services 1,283 1,940 1,323 1,312 Number of Projects Updated via City Managers Monthly Reports 45 49 49 40 Continuing Education Courses 68 30 72 55 Community Meetings 30 25 36 25
125

GENERAL FUND
CONSOLIDATED EXPENDITURES BY LINE ITEM
PUBLIC WORKS - ADMINISTRATION 101-15-140
Object Description
FY 2014
Actual
FY 2015
Original
Budget
FY 2015
Revised
Budget
FY 2015
Year-End
Estimate
FY 2016
Proposed
Budget
51001 REGULAR SALARIES 639,137 335,600 335,600 365,532 209,059
51002 ADDITIONAL COMPENSATION 4,071 2,516 2,516 2,300 1,552
51003 COMPENSATED ABSENCES 4,618 - - - -
51004 OVERTIME 291 500 500 500 500
51101 PART TIME: 20-29 HOURS - - - -
51201 CAR-CLOTHING ALLOWANCE 5,948 6,000 6,000 5,964 -
51202 CELL PHONE ALLOWANCE 6,688 3,240 3,240 5,026 2,160
51301 LONG TERM DISABILITY 2,247 1,167 1,167 1,198 715
51302 TAXES, SOCIAL SECURITY 47,300 26,611 26,611 29,202 16,315
51303 HOSP-LIFE-DENT-VIS INS 79,519 31,657 31,657 35,938 33,026
51304 PRORATED HEALTH/DENT/VIS 586 - 200
51305 RETIREMENT 34,421 31,262 31,262 30,643 19,150
51306 WORKERS COMPENSATION 920 438 438 414 191
TOTAL PERSONNEL 825,746 438,991 438,991 476,917 282,668
52001 OFFICE SUPPLIES 874 480 480 875 600
52002 MEALS & DRINKS 138 150 150 50 75
52003 WEARING APPAREL 314 - - - 150
52004 MINOR TOOLS & EQUIPMENT 2,645 100 100 75 75
52005 EDUC, TRAINING & SUPPLIES 290 75 75 50 50
52006 POSTAGE 195 100 100 220 150
52013 JANITORIAL SUPPLIES - - - -
52014 COMPUTER EQUIP RENTAL FEE 7,167 8,171 8,171 8,171
52015 FLEET RENTAL FEE 13,837 13,543 13,543 13,543 14,257
52016 CENTRAL GARAGE ALLOC 13,543 - - -
52017 FUEL, OIL & LUBRICANTS 16,999 13,200 13,200 12,630 14,651
TOTAL COMMODITIES 56,001 35,819 35,819 35,614 30,008
53001 MINOR EQUIP MAINT/RPR & RNT -
53002 INSURANCE 1,847 2,071 2,071 2,185 1,713
53004 SPECIAL SERVICES & LEGAL 24,114 7,000 184,859 184,638 10,000
53007 CONFERENCE EXPENSE 9,469 6,152 6,152 6,152 6,150
53009 BLDG MAINTENANCE ALLOC 13,250 - - -
53012 COMPUTER SERVICES ALLOC 85,625 - - -
53024 CONTRACTED ENGINEERING 82,170 40,000 50,985 50,985 48,000
53074 STORMWATER MANAGEMENT - 25,000 25,000 25,000 25,000
TOTAL CONTRACTUAL SERVICES 216,474 80,223 269,067 268,960 90,863
54001 PRINTING & PUBLICATIONS 320 150 500 650 200
54002 DUES & SUBSCRIPTIONS 4,528 1,705 3,205 3,000 1,075
54003 TRAINING & TRAVEL 11,664 - 1,465 1,000 1,600
54005 VEHICLE ALLOWANCE - MILEAGE 559 150 150 150 150
TOTAL OTHER SERVICES 17,070 2,005 5,320 4,800 3,025
TOTAL CAPITAL OUTLAY - - - - -
TOTAL EXPENDITURES 1,115,292 557,038 749,197 786,291 406,564
126

============================ FY 2016 ANNUAL BUDGET ================================
===============================CITY OF MISSOURI CITY=================================
DEPARTMENT: PUBLIC WORKS FUNDING SOURCE: GENERAL FUND
DIVISION: CAPITAL PROJECTS FUND NUMBER: 101-15-141
DESCRIPTION OF DIVISIONAL OPERATIONS The Capital Projects Division manages and oversees the Capital Improvement Program, performs project management, performs plan reviews for all proposed Public Improvement construction projects, performs development services for Economic Development, and coordinates joint project activities with other public entities, including drainage districts, cities, state agencies and utility districts. The Capital Projects Division also provides inspections services for all public infrastructure improvements constructed within the City and the extraterritorial jurisdiction. Other major activities of the Division include project development, detailed design, and contract administration of the various City Capital and Operational funded projects. These projects encompass transportation, drainage, park improvements and the construction of public buildings and facilities, and new streets. This Division also coordinates City construction and planning activities with Federal, State, and County agencies, franchised utilities, and grant funding. This Division investigates drainage, street, and other infrastructure problems when requested by citizens, and provides technical assistance to the various City Departments and commissions.
Construction InspectorProject Manager
Asst. Director of Public Works*
Project Coordinator
Total Full-Time Employees = 3
*Assistant Director of Public Works is included in the PW Administration Divisional Budget
127

============================ FY 2016 ANNUAL BUDGET ================================
===============================CITY OF MISSOURI CITY=================================
DEPARTMENT: PUBLIC WORKS FUNDING SOURCE: GENERAL FUND
DIVISION: CAPITAL PROJECTS FUND NUMBER: 101-15-141 STRATEGIC
GOAL 2019 DIVISIONAL OBJECTIVES
1,2,5 Complete construction of Turtle Creek Reconstruction and Vicksburg Extension.
1,2,5 Start construction of Hurricane Lane Extension, Trammel-Fresno Widening, ITS Phase II, and Gregory Blvd. Reconstruction.
1,2,5 Use the Traffic Management Plan (TMP), which forecasts needed roadway
improvements by growth and traffic volumes, to prioritize which corridors are in need of reconstruction, resurfacing, or maintenance.
1,2,5 Complete the design of: Trammel-Fresno Widening; continue design of Glenn
Lakes Lane Bridge over Oyster Creek, Ashmont Reconstruction, and Adams Reconstruction.
1,2,5 Coordinate joint Storm Water Management Program with 16 MUDs.
1,2,5 Complete the preliminary engineering for at least one of the identified projects in
the FY 2015 Programmatic Funding Requests through US Congressman’s Al Green’s office.
PERSONNEL SCHEDULE
FY 2014 Actual
FY 2015 Budget
FY 2015 Estimate
FY 2016 Budget
SalaryGrade
Project Manager 0 1 1 1 23Project Coordinator 0 1 1 1 12Construction Inspector 0 1 1 1 12Total Full-time Employees 0 3 3 3
128

============================ FY 2016 ANNUAL BUDGET ================================
===============================CITY OF MISSOURI CITY=================================
DEPARTMENT: PUBLIC WORKS FUNDING SOURCE: GENERAL FUND
DIVISION: CAPITAL PROJECTS FUND NUMBER: 101-15-141
PERFORMANCE INDICATORS FY 2014
ActualFY2015Budget
FY 2015 Estimate
FY 2016 Budget
Average Monthly Plats Reviewed 11 11 12 12 Average Monthly Plan Reviews Performed 44 35 47 45 Average Monthly Inspections 15 15 15 15
ACTIVITY MEASURES FY 2014
ActualFY 2015
Budget FY 2015 Estimate
FY 2016 Budget
Capital Improvement Projects Active 18 22 22 22 Value of projects (as funded in CIP) $32M $30M $30M $32M H-GAC(TIP) /County Mobility Projects Active 6 7 7 5 Value of projects $20M $21M $21M $18M Attend transportation coordination meetings with H-GAC 25 30 30 25 Continuing Education Courses 7 8 8 8
129

GENERAL FUND
CONSOLIDATED EXPENDITURES BY LINE ITEM
PUBLIC WORKS - CAPITAL PROJECTS 101-15-141
Object Description
FY 2014
Actual
FY 2015
Original
Budget
FY 2015
Revised
Budget
FY 2015
Year-End
Estimate
FY 2016
Proposed
Budget
51001 REGULAR SALARIES 147,022 147,022 149,652 147,703
51002 ADDITIONAL COMPENSATION 880 880 668 812
51004 OVERTIME 1,000 1,000 800 1,000
51202 CELL PHONE ALLOWANCE 2,160 2,160 1,554 3,240
51301 LONG TERM DISABILITY 504 504 479 506
51302 TAXES, SOCIAL SECURITY 11,556 11,556 11,092 11,603
51303 HOSP-LIFE-DENT-VIS INS 34,106 34,106 22,685 28,538
51305 RETIREMENT 13,506 13,506 11,092 13,562
51306 WORKERS COMPENSATION 190 190 149 136
TOTAL PERSONNEL - 210,924 210,924 198,171 207,100
52001 OFFICE SUPPLIES 360 360 100 200
52003 WEARING APPAREL 160 160 160 160
52004 MINOR TOOLS & EQUIPMENT 150 150 250 150
52005 EDUC, TRAINING & SUPPLIES 75 75 75 100
52014 COMPUTER EQUIP RENTAL FEE -
TOTAL COMMODITIES - 745 745 585 610
53002 INSURANCE - 495
TOTAL CONTRACTUAL SERVICES - - - - 495
54001 PRINTING & PUBLICATIONS - -
54002 DUES & SUBSCRIPTIONS - -
54003 TRAINING & TRAVEL 2,570 2,570 2,570 2,570
TOTAL OTHER SERVICES - 2,570 2,570 2,570 2,570
TOTAL EXPENDITURES - 214,239 214,239 201,326 210,775
130

============================ FY 2016 ANNUAL BUDGET ================================
===============================CITY OF MISSOURI CITY=================================
DESCRIPTION OF DIVISIONAL OPERATIONS
The Streets, Drainage, and Traffic Operations maintains 637 lane miles of roadway, 57 traffic signals, over 9000 street signs, 64 miles of road side diches, and several acres of right-of-way green space and drainage channels. The Division provides a multitude of services and the work is performed in accordance with all the applicable City ordinances governing construction, street repairs, signal operations, traffic control, and drainage/storm-water management. The most widely used documents are the Infrastructure Standards and the Texas Manual of Uniform Traffic Control Devices (TMUTCD). The majority of the work completed are Request for Services (RFS). RFS are identified and entered into a work order system. The system, Cartegraph, has been used for this as well for asset management for more than 15 years. Sources of the RFS are: emails, phone calls, online reporting, staff/council members and HOAs. There is a desire to emphasize prompt response to Work Requests by completion of a planned solution, as well as the Total Customer Service Process, from initial contact to corrective action to follow-up with customer. Citizens are contacted frequently to update them regarding work order status and request status in order to provide exemplary customer service. Government entities are required to develop a Pavement Management System (PMS) that tracks information on dollars spent to maintain an established condition rating level for public infrastructure; Financial Statements must reflect historical infrastructure costs; the Program requires condition surveys, and evaluations; An Overall Condition Rating (OCR) must be made that indicates which streets need maintenance, recapitalization, or reconstruction to prolong the life of the infrastructure. The City, as adopted by city Council, will manage its street infrastructure to the following minimum overall condition rating levels: Street Type CR Major Arterial 70 Minor Arterial 70 Major Collector 65 Minor Collector 65 Cul-de-sac 60 Residential 60 The program helps guide funds used to maintain the street infrastructure. The purpose is to place a value on infrastructure. Council adopted minimum condition ratings in 2003. As shown below, for every $1 spent on street maintenance, it would cost $4-$5 to rebuild it at some point. Routine activities include sidewalk repair, curb repair, pot-hole patching, pavement repairs, crack and joint sealing, street sweeping, mosquito spraying, removal of bandit signs, repair and replacement of traffic control devices in accordance with the TMUTCD, removing and replacing pavement markings in accordance with the TMUTCD, roadside ditch, right-of-way green space, and channel maintenance and mowing, and administering a Community Service Restitution program five days a week. . In addition, this Division provides construction contract administrative services in support of operational projects, and provides construction services in support of capital projects. The Traffic Operations section is responsible for operations of the traffic signal system, the Traffic Management Center, and helps perform various traffic and transportation studies. The major focus is to schedule a consistent execution of activities designed to prolong the service life of streets and drainage facilities, and the promotion of public safety and mobility. Scheduled in-house and outside training opportunities are pursued to educate employees and foster improvements in Divisional efficiency and effectiveness.
DEPARTMENT: PUBLIC WORKS FUNDING SOURCE: GENERAL FUND
DIVISION: STREETS, DRAINAGE & TRAFFIC OPERATIONS FUND NUMBER: 101-15-142
131

============================ FY 2016 ANNUAL BUDGET ================================
===============================CITY OF MISSOURI CITY=================================
Assistant Director of Public Works*
Street Superintendent
Crew Leader Crew Leader
Crew Leader Signs
Street Technician
II
Street Technician II
Street Technician I
Signal Technician II
ITS Technician
Street Technician II
Street Technician II
Street Supervisor
Street Technician I
Total Full-Time Employees = 13
* Assistant Director of Public Works is included in the PW Administration Divisional Budget.
132

============================ FY 2016 ANNUAL BUDGET ================================
===============================CITY OF MISSOURI CITY=================================
DEPARTMENT: PUBLIC WORKS FUNDING SOURCE: GENERAL FUND
DIVISION: STREETS, DRAINAGE AND TRAFFIC OPERATIONS FUND NUMBER: 101-15-142 STRATEGIC
GOAL 2019 DIVISIONAL OBJECTIVES
1 Maintain a schedule for the street sweeping program where in-house sweepers will
sweep all Major Thoroughfares and Collectors Streets once a month and sweep all residential streets two times a year.
1,5 Use the Pavement Management & Maintenance Program Study to prioritize work
orders for street repairs to address at least $700,000 for concrete and asphalt pavement rehabs and/or repairs.
1 Complete at least 8,000 LF of roadside ditch maintenance.
1,5 Use the Sidewalk Evaluation Study to prioritize work orders to address at least
$200,000 in sidewalk repairs.
1,4,5 Implement a Bluetooth system (data collected from cell phone) to capture real-time
roadway information with our Intelligent Transportation System (ITS) to ensure motorists are informed of roadway delays.
1,4,5 Use asphalt trailer to patch pot holes and wheel ruts throughout city within five
working days of receipt of notice.
1,4,5 Communicate clear and concise messages on the Digital Message Signs (DMS) to
allow motorists to respond promptly to the information in accordance with the DMS Policy.
1,5 Perform at least two corridor traffic signal system evaluations on SH 6, Texas
Parkway, FM 1092, Sienna Parkway, and Cartwright; implement recommendations within 45 days, as necessary, to improve mobility.
PERSONNEL SCHEDULE FY 2014
Actual FY 2015
Budget FY 2015 Estimate
FY 2016 Budget
SalaryGrade
Street Superintendent 1 1 1 1 23Intelligent Transportation System Specialist 1 1 1 1 13Street Supervisor 1 1 1 1 13Crewleader-Streets 2 2 2 2 12Crewleader-Signs 1 1 1 1 12Signal Technician II 1 1 1 1 11Street Technician II 4 4 4 4 10Street Technician I 2 2 2 2 3Total Full-Time Employees 13 13 13 13
133

============================ FY 2016 ANNUAL BUDGET ================================
===============================CITY OF MISSOURI CITY=================================
DEPARTMENT: PUBLIC WORKS FUNDING SOURCE: GENERAL FUND
DIVISION: STREETS, DRAINAGE & TRAFFIC OPERATIONS FUND NUMBER: 101-15-142
PERFORMANCE INDICATORS FY 2014
Actual FY 2015
Budget FY 2015 Estimate
FY 2016 Budget
Equipment hours to sweep major thoroughfares and collector streets once a month.
24 24 24 24
Equipment hours to sweep residential streets twice a year. 925 925 925 925 Hours to replace down or missing Regulatory Signs within 12
hours of notification. 5 5 5 5
Hours per location to replace/repair 50’ section of sidewalk 5 5 5 5 Hours per street name sign to manufacture and install 5 5 5 5 Hours per Traffic Signal to perform preventative maintenance 6 6 6 6
ACTIVITY MEASURES FY 2014
Actual FY 2015
Budget FY 2015 Estimate
FY 2016 Budget
Lane miles of street maintained Gravel streets 0.5 0.5 0.5 0.5Asphalt streets 64 64 64 64Concrete streets 573 573 573 573Total 637 637 637 637
Cost of maintenance per mile 3,724 1,284 4,655 4,960 Square feet replaced on asphalt streets 32,000 185,000 1,000 10,000 Square feet fixed on concrete streets 85,489 70,000 80,000 70,000 Square feet of sidewalk replacement 39,022 30,000 50,000 30,000 Sidewalk leveling locations 762 500 500 500 Request for service received 1,659 1,200 1,200 1,200 Request for service completed 1,179 1,000 1,000 1,000 Signs replaced/Installed 652 600 460 600 After hours call-outs made (hrs.) 240 200 300 200 Number of calls to which traffic signals section responds 145 75 180 80 Total training hours for Streets staff 80 150 125 150 Number of traffic signals maintained 54 57 55 60 Linear feet of pavement markings installed 8,842 50,000 40,000 30,000 Number of school zone crossings replaced 4 4 4 4 Number of lane miles swept 1,200 1,200 1,200 1,200 Number of bandit signs collected 556 1,000 250 500 Number of cycles of mosquito spraying (cycle = citywide) 28 36 36 36 Number of acres mowed in right-of-way 1,822 1,800 1,776 1,800 Number of community service hours 10,274 12,000 9,000 10,000
134

GENERAL FUND
CONSOLIDATED EXPENDITURES BY LINE ITEM
PUBLIC WORKS - STREETS/DRAINAGE/TRAFFIC OPERATIONS 101-15-142
Object Description
FY 2014
Actual
FY 2015
Original
Budget
FY 2015
Revised
Budget
FY 2015
Year-End
Estimate
FY 2016
Proposed
Budget
51001 REGULAR SALARIES 480,692 489,673 489,673 504,861 490,154
51002 ADDITIONAL COMPENSATION 4,065 4,320 4,320 3,542 3,935
51003 COMPENSATED ABSENCES 7,896 - - 9,657 -
51004 OVERTIME 53,825 30,000 30,000 57,000 38,000
51202 CELL PHONE ALLOWANCE 3,642 3,780 3,780 3,252 3,240
51301 LONG TERM DISABILITY 1,581 1,673 1,673 1,601 1,671
51302 TAXES, SOCIAL SECURITY 39,456 40,374 40,374 40,461 40,953
51303 HOSP-LIFE-DENT-VIS INS 111,241 140,668 140,668 106,689 143,697
51304 PRORATED HEALTH/DENT/VIS - - - 650 -
51305 RETIREMENT 28,652 44,800 44,800 40,611 44,794
51306 WORKERS COMPENSATION 16,370 14,881 14,881 10,890 10,484
TOTAL PERSONNEL 747,420 770,169 770,169 779,214 776,928
52001 OFFICE SUPPLIES 548 600 600 600 600
52002 MEALS & DRINKS 347 200 200 200 200
52003 WEARING APPAREL 5,742 6,000 6,000 6,000 6,000
52004 MINOR TOOLS & EQUIPMENT 13,631 9,600 9,600 9,600 15,600
52005 EDUC, TRAINING & SUPPLIES 180 200 200 200 200
52006 POSTAGE 2 50 50 50 50
52007 BLDG MAT'L/SUPPLIES & REPAIRS 291 - - - -
52008 IDENTIFICATION SUPPLY/FIL - - - - -
52013 JANITORIAL SUPPLIES 1,284 1,300 1,300 1,300 1,300
52014 COMPUTER EQUIP RENTAL FEE 5,874 7,125 7,125 7,125
52015 FLEET RENTAL FEE 123,071 150,504 150,504 150,504 168,350
52016 CENTRAL GARAGE ALLOC 112,845 - - -
52017 FUEL, OIL & LUBRICANTS 58,897 67,500 67,500 50,300 58,348
52025 PESTICIDE/HAZ-MAT CONTROL 658 1,000 1,000 1,000 1,000
52038 STREET MAT'L & SUPPLIES 73,142 117,000 136,997 136,997 125,000
52039 DRAINAGE MATERIALS & SUPP 458 500 500 730 500
52040 TRAFFIC SIGNS/MATERIALS 84,618 43,000 43,000 43,000 43,000
52041 PAVEMENT MARKING MATERIAL 37,577 40,000 42,046 42,046 40,000
TOTAL COMMODITIES 519,166 444,579 466,622 449,652 460,148
53001 MINOR EQUIP MAINT/RPR & RNT 2,723 2,000 2,000 2,000 2,000
53002 INSURANCE 25,275 24,561 24,561 26,163 25,519
53004 SPECIAL SERVICES & LEGAL 11,106 6,780 6,780 6,780 6,780
53005 SERVICE AGREEMENTS/REPAIR - 1,418 1,418 1,418 1,418
53006 RADIO REPAIR/MAINTENANCE 500 500 500 500 500
53009 BLDG MAINTENANCE ALLOC 87,102 - - -
53012 COMPUTER SERVICES ALLOC 43,712 - - -
53027 CONTRACTOR HIRE - STREETS 23,999 25,000 25,000 25,000 25,000
53028 CONTRACTOR HIRE - MOWING 64,892 72,000 81,853 81,853 72,000
53029 CONTRACTOR HIRE- DRAINAGE 55,533 40,000 40,000 40,000 40,000
53030 CONTRACTOR HIRE - TREE TRIM 1,947 1,000 1,014 1,014 1,000
53031 CONTRACTOR HIRE - MOSQUITO 39,030 55,000 63,320 51,320 55,000
53032 GARBAGE COLLECTION 8,872 10,246 10,246 13,142 14,456
53035 TRAFFIC SIGNAL MAINTENANC 69,366 70,000 74,068 76,000 76,000
53041 WATER UTILTIES 481 458 458 742 779
TOTAL CONTRACTUAL SERVICES 434,536 308,963 331,218 325,932 320,452
54001 PRINTING & PUBLICATIONS 50 100 100 100 100
54002 DUES & SUBSCRIPTIONS 310 200 200 200 200
54003 TRAINING & TRAVEL 5,509 3,100 3,136 3,136 3,100
54033 ST LIGHT - OPERATION 656,623 715,502 765,219 757,253 832,978
54034 TRAFFIC SIGNAL OPERATION 34,334 36,156 36,156 32,315 33,931
TOTAL OTHER SERVICES 696,827 755,058 804,811 793,004 870,309
75004 EQUIPMENT 11,000 11,000 11,000 -
TOTAL CAPITAL OUTLAY - 11,000 11,000 11,000 -
TOTAL EXPENDITURES 2,397,950 2,289,769 2,383,820 2,358,802 2,427,837
135

136

============================ FY 2016 ANNUAL BUDGET ================================
===============================CITY OF MISSOURI CITY=================================
DEPARTMENT: PUBLIC WORKS FUNDING SOURCE: GENERAL FUND
DIVISION: ENGINEERING & UTILITY PLANNING FUND NUMBER: 101-15-143
DESCRIPTION OF DIVISIONAL OPERATIONS The Engineering and Utility Planning Division manages and oversees the administration, operation and maintenance of the City’s water and wastewater infrastructure (surface water and groundwater plants, water distribution, wastewater collection, and wastewater treatment plants), oversight of the Groundwater Reduction Program, permit compliance, utilities planning and development, and capital infrastructure improvements. Additionally, this division includes assisting Development Services in the review of plats and infrastructure plans to verify compliance with the City’s Infrastructure Ordinance. Review of the plats and subsequent infrastructure plans insure that development and re-development are maintaining compliance with the transportation and traffic needs to maintain safe traffic patterns. Staff also coordinates with the Streets and Transportation Division to provide analysis of traffic impact reports to determine street and intersection improvements. Other major activities of the Division include compliance with the Fort bend Subsidence District mandates to reduce our groundwater dependency. Additionally, the Division coordinates with the various MUDs to determine impact of development to the regional water treatment plant and to the wastewater facilities. This would include reviewing plant capacities to determine impacts and future expansions. This Division also coordinates City compliance with Federal, State, and County agencies for the water and wastewater infrastructure.
Utilities Manager/City Engineer
Asst. Director of Public Works*
Utilities CoordinatorAssistant City
Engineer
Total Full-Time Employees = 3
*Assistant Director of Public Works is included in the PW Administration Divisional Budget.
137
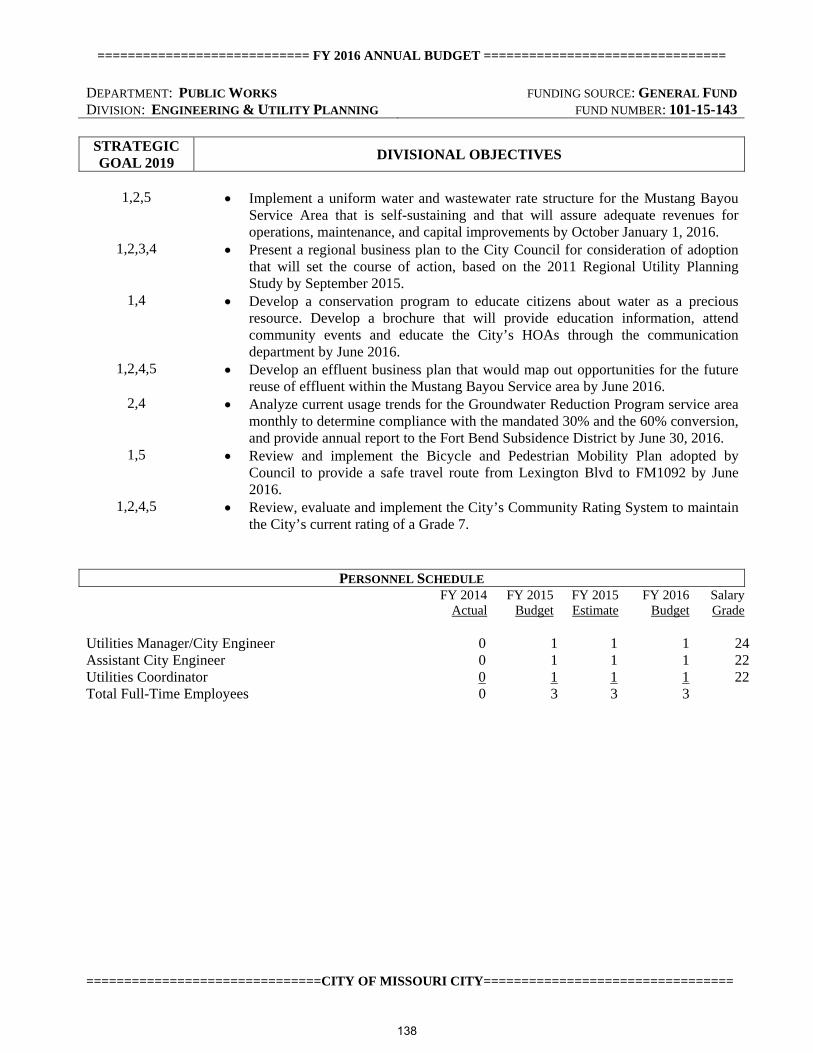
============================ FY 2016 ANNUAL BUDGET ================================
===============================CITY OF MISSOURI CITY=================================
DEPARTMENT: PUBLIC WORKS FUNDING SOURCE: GENERAL FUND
DIVISION: ENGINEERING & UTILITY PLANNING FUND NUMBER: 101-15-143 STRATEGIC
GOAL 2019 DIVISIONAL OBJECTIVES
1,2,5 Implement a uniform water and wastewater rate structure for the Mustang Bayou
Service Area that is self-sustaining and that will assure adequate revenues for operations, maintenance, and capital improvements by October January 1, 2016.
1,2,3,4 Present a regional business plan to the City Council for consideration of adoption that will set the course of action, based on the 2011 Regional Utility Planning Study by September 2015.
1,4 Develop a conservation program to educate citizens about water as a precious resource. Develop a brochure that will provide education information, attend community events and educate the City’s HOAs through the communication department by June 2016.
1,2,4,5 Develop an effluent business plan that would map out opportunities for the future reuse of effluent within the Mustang Bayou Service area by June 2016.
2,4 Analyze current usage trends for the Groundwater Reduction Program service area monthly to determine compliance with the mandated 30% and the 60% conversion, and provide annual report to the Fort Bend Subsidence District by June 30, 2016.
1,5 Review and implement the Bicycle and Pedestrian Mobility Plan adopted by Council to provide a safe travel route from Lexington Blvd to FM1092 by June 2016.
1,2,4,5 Review, evaluate and implement the City’s Community Rating System to maintain the City’s current rating of a Grade 7.
PERSONNEL SCHEDULE FY 2014
Actual FY 2015
Budget FY 2015 Estimate
FY 2016 Budget
SalaryGrade
Utilities Manager/City Engineer 0 1 1 1 24Assistant City Engineer 0 1 1 1 22Utilities Coordinator 0 1 1 1 22Total Full-Time Employees 0 3 3 3
138

============================ FY 2016 ANNUAL BUDGET ================================
===============================CITY OF MISSOURI CITY=================================
DEPARTMENT: PUBLIC WORKS FUNDING SOURCE: GENERAL FUND
DIVISION: ENGINEERING & UTILITY PLANNING FUND NUMBER: 101-15-143
PERFORMANCE INDICATORS FY 2014
ActualFY2015Budget
FY 2015 Estimate
FY 2016 Budget
Hours to prepare/educate council committees and City Council and staff on the results and recommendations of the Mustang Bayou Rate Study
N/A 75 240 200
Hours to revise and implement Infrastructure Ordinance 200 100 300 N/A
Hours to perform 95% of the traffic studies generated within 45 days of each request
500 600 550 500
Regionalization - Hours of coordination and discussion with MUDs
120 125 96 150
Reports to comply with TCEQ Standards relating to the 5 Water/Wastewater facilities owned by the City
110 110 110 110
Hours to perform analysis of Traffic Impact Studies 265 200 320 256
ACTIVITY MEASURES
FY 2014Actual
FY 2015 Budget
FY 2015 Estimate
FY 2016 Budget
General Engineering Studies Performed 5 4 10 8 Capital Improvement Projects Active 4 2 7 5 Value of projects $11.4M $11.4M $20.6 $28M Attend coordination meetings with H-GAC (Solid Waste, Flood
Management) 8 8 8 8
Citizen Requests for General Engineering Services 8 12 8 6 Citizen Requests for General Engineering Services Completed 8 15 8 6 Conceptual Plat Reviews 5 6 3 1 Preliminary Plat Reviews 12 25 17 10 Final Plat Reviews 15 15 18 15 Planned Development & Special Use Permit 17 15 15 8 Amending Plats/Replats 7 6 7 5 Review of elevation certificates 241 250 245 180 Review Traffic Impact Analysis General Traffic Studies Completed within 45 days of request
9 19
10 15
10 20
8 20
139

GENERAL FUND
CONSOLIDATED EXPENDITURES BY LINE ITEM
PUBLIC WORKS - ENGINEERING/UTILITY PLANNING 101-15-143
Object Description
FY 2014
Actual
FY 2015
Original
Budget
FY 2015
Revised
Budget
FY 2015
Year-End
Estimate
FY 2016
Proposed
Budget
51001 REGULAR SALARIES 272,042 272,042 215,545 258,236
51002 ADDITIONAL COMPENSATION 1,956 1,956 1,200 1,344
51004 OVERTIME 500 500 500 500
51202 CELL PHONE ALLOWANCE 2,160 2,160 1,554 2,700
51301 LONG TERM DISABILITY 931 931 533 879
51302 TAXES, SOCIAL SECURITY 21,164 21,164 13,206 20,061
51303 HOSP-LIFE-DENT-VIS INS 38,594 38,594 22,930 43,925
51305 RETIREMENT 24,854 24,854 13,463 23,557
51306 WORKERS COMPENSATION 349 349 179 236
TOTAL PERSONNEL - 362,550 362,550 269,110 351,438
52001 OFFICE SUPPLIES 360 360 360 500
52004 MINOR TOOLS & EQUIPMENT 150 150 1,250 1,000
TOTAL COMMODITIES - 510 510 1,610 1,500
53002 INSURANCE - 576
53004 SPECIAL SERVICES & LEGAL 8,000 7,000 3,700 4,000
53024 CONTRACTED ENGINEERING 15,000 15,000 15,000 15,000
TOTAL CONTRACTUAL SERVICES - 23,000 22,000 18,700 19,576
54001 PRINTING & PUBLICATIONS 100 100 300 500
54002 DUES & SUBSCRIPTIONS 2,895 2,895 2,895 3,000
54003 TRAINING & TRAVEL 2,570 3,570 5,570 5,500
TOTAL OTHER SERVICES - 5,565 6,565 8,765 9,000
TOTAL EXPENDITURES - 391,625 391,625 298,185 381,514
140

============================ FY 2016 ANNUAL BUDGET ================================
===============================CITY OF MISSOURI CITY=================================
DESCRIPTION OF DIVISIONAL OPERATIONS The Geographic Information Systems Division is responsible for the design, implementation, and management of GIS technology, GIS processes, and the GIS staff. The main function of the GIS Division is divided into four components. These components are:
1.) Develop and manage a Geographic Information System (GIS) to increase the City of Missouri City’s efficiency and ability to quickly and accurately collect, retrieve, and distribute geographically based information.
2.) Develop and manage a GIS that will meet the needs of all City Departments.
3.) Identify and manage a process to deliver GIS information to the general public and contractors.
4.) Develop and maintain a GIS which is flexible and compatible enough to incorporate future
applications, hardware and software.
GIS Administrator
GIS Production Specialist
GIS Tech I Part-time GIS Operations
Specialist
Assistant Director of Public Works*
Total Full-Time Employees = 4 Part-Time Employees = 1
Assistant Director of Public Works is included in the PW Administration Divisional Budget.
DEPARTMENT: PUBLIC WORKS FUNDING SOURCE: GENERAL FUND
DIVISION: GEOGRAPHIC INFORMATION SYSTEMS FUND NUMBER: 101-15-144
141

============================ FY 2016 ANNUAL BUDGET ================================
===============================CITY OF MISSOURI CITY=================================
DEPARTMENT: PUBLIC WORKS FUNDING SOURCE: GENERAL FUND
DIVISION: GEOGRAPHIC INFORMATION SYSTEMS FUND NUMBER: 101-15-144
STRATEGIC
GOAL 2019 DIVISIONAL OBJECTIVES
2,4,5 Develop a method to provide the public, consultants, and other government agencies with online access to basic GIS datasets.
1,2 Create GIS data, exhibits, and applications in support of the Storm Water Master Plan. 2,4 Develop a GIS strategic plan to insure GIS implementation and use at the City is
optimized. 2 Expand available GIS web mapping applications to include at least 3 additional maps
for City departments and the public. 2,4,5 Develop a plan to implement an internal GIS platform which will give all City
employees access to GIS data, tools, and mapping applications.
PERSONNEL SCHEDULE FY 2014
ActualFY 2015
Budget FY 2015 Estimate
FY 2016 Budget
SalaryGrade
GIS Administrator 1 1 1 1 22GIS Production Specialist 1 1 1 1 14GIS Operations Specialist 1 1 1 1 14GIS Technician I 1 1 1 1 11 Total Full-Time Employees 4 4 4 4 Part-Time Employee 1 1 1 1
142

============================ FY 2016 ANNUAL BUDGET ================================
===============================CITY OF MISSOURI CITY=================================
DEPARTMENT: PUBLIC WORKS FUNDING SOURCE: GENERAL FUND
DIVISION: GEOGRAPHIC INFORMATION SYSTEMS FUND NUMBER: 101-15-144
PERFORMANCE INDICATORS FY 2014
ActualFY2015 Budget
FY 2015 Estimate
FY 2016 Budget
Number of hours to complete 90% of map requests/exhibits
within the requested time frame 1,050 5,500* 1,100 1,200
Number of hours to update the Public Safety Map Book and the map library on the web site on a quarterly basis
420 650 390 400
Number of hours to update GIS Basemap layers within three weeks of receiving electronic plats and associated data
925 750 905 920
Number of hours to update GIS Utility layers within four weeks of receiving utility information
475 380 630 650
Number of hours to maintain and manage OSSI data 630 450 645 650 *Inaccurate calculation method adjusted in 2015 estimate
ACTIVITY MEASURES
FY 2014Actual
FY2015 Budget
FY 2015 Estimate
FY 2016 Budget
Number of hours completing GIS requests 1,165 6,000* 1,220 1,335 Updates accomplished: City Map Book 3 3 4 4 Updates accomplished: Map Library 90 80 85 75 Number of electronic plats processed 24 75 35 36 Number of utility packets processed 35 65 46 50 Number of GIS web/mobile applications developed 3 3 14 10 Number of training classes completed 15 16 13 20 Number of hours to complete OSSI updates and maintenance 715 450
646 700
*Inaccurate calculation method adjusted in 2015 estimate
143

GENERAL FUND
CONSOLIDATED EXPENDITURES BY LINE ITEM
PUBLIC WORKS - GIS 101-15-144
Object Description
FY 2014
Actual
FY 2015
Original
Budget
FY 2015
Revised
Budget
FY 2015
Year-End
Estimate
FY 2016
Proposed
Budget
51001 REGULAR SALARIES 192,441 184,602 184,602 212,926 203,134
51002 ADDITIONAL COMPENSATION 821 832 832 3,391 900
51003 COMPENSATED ABSENCES 5,305 - -
51004 OVERTIME 19,728 5,000 5,000 17,000 10,000
51102 PART TIME:LESS THAN 20 HR - 10,490 10,490 5,490 11,988
51301 LONG TERM DISABILITY 635 623 623 666 686
51302 TAXES, SOCIAL SECURITY 16,056 15,371 15,371 16,870 17,291
51303 HOSP-LIFE-DENT-VIS INS 31,930 42,859 42,859 32,102 36,277
51304 PRORATED HEALTH/DENT/VIS 222 - 220 -
51305 RETIREMENT 11,341 17,139 17,139 16,134 19,263
51306 WORKERS COMPENSATION 307 246 246 239 194
TOTAL PERSONNEL 278,785 277,162 277,162 305,038 299,733
52001 OFFICE SUPPLIES 1,416 2,000 2,000 1,900 3,270
52003 WEARING APPAREL 75 40 40 40 120
52004 MINOR TOOLS & EQUIPMENT 1,338 2,150 2,150 2,000 1,350
52005 EDUC, TRAINING & SUPPLIES - 150 150 150 150
52006 POSTAGE 3 20 11 15 20
52014 COMPUTER EQUIP RENTAL FEE 5,102 6,000 6,000 6,000
52016 CENTRAL GARAGE ALLOC 147 -
52017 FUEL, OIL & LUBRICANTS 420 850 850 600 696
TOTAL COMMODITIES 8,501 11,210 11,201 10,705 5,606
53002 INSURANCE 652 737 737 781 670
53004 SPECIAL SERVICES & LEGAL 2,975 5,000 5,025 5,000 20,000
53005 SERVICE AGREEMENTS/REPAIR 1,537 1,000 1,000 800 1,000
53007 CONFERENCE EXPENSE 3,771 2,000 2,000 2,000 3,250
53009 BLDG MAINTENANCE ALLOC 6,951 -
53012 COMPUTER SERVICES ALLOC 49,626 -
TOTAL CONTRACTUAL SERVICES 65,512 8,737 8,762 8,581 24,920
54001 PRINTING & PUBLICATIONS 75 50 59 138 50
54002 DUES & SUBSCRIPTIONS 1,000 1,000 1,000 1,000 1,000
54003 TRAINING & TRAVEL 6,495 8,000 8,535 8,000 11,570
54005 VEHICLE ALLOWANCE - MILEAGE 46 250 250 150 200
TOTAL OTHER SERVICES 7,616 9,300 9,844 9,288 12,820
75001 EQUIPMENT - COMPUTER - - -
TOTAL CAPITAL OUTLAY - - - - -
TOTAL EXPENDITURES 360,414 306,409 306,969 333,612 343,079
144

============================= FY 2016 ANNUAL BUDGET ===============================
===============================CITY OF MISSOURI CITY=================================
DEPARTMENT: PUBLIC WORKS FUNDING SOURCE: GENERAL FUND
DIVISION: FLEET MAINTENANCE FUND NUMBER: 101-15-145
DESCRIPTION OF OPERATIONS
The Fleet Maintenance Division schedules and performs preventive maintenance and repairs for 470 vehicles and equipment on a regular basis. The mechanic to vehicle/equipment ratio is 157 to 1
Class Class Description Qty PM Intervals
Specialty equipment: Miller M350 MIG Welder Miller Bobcat Portable Welder Coats HIT 5000 Truck Tire Changing Machine Coats Rim Clamp 5065AX Small Tire Changing Machine. Coats 850 Wheel Balancer Ammco 4100 Brake Rotor/Drum Lathe. (2) Gray Manufacturing WL-30 Heavy Truck Wheel Jacks (15,000 lbs. per unit) (4) Gray Manufacturing TSL-50 Heavy Truck Air Jacks (50,000 lbs. per unit) (2) Forward Manufacturing Vehicle Lifts (capacity 12,000 lbs.) Purigen 98 Genesis 1200 Nitrogen Generator. Panasonic Tough Book Autel Maxi DAS Diagnostic Computer
Software Packages
100 Administrative 25 4,000 miles Ford IDS Diagnostic
Allison Transmission
120 CID Vehicles 15 4,000 miles Detroit Diesel Diagnostic
200 Police Patrol (1 man units)
8 4,000 miles Whelen Emergency Equip. Configuration
210 Police Patrol (2 man units)
34 4,000 miles Webco Brake System Diagnostic
300 Pickup Truck (on road)
32 4,000 miles Cummins Diagnostic
301 Pickup Truck (off road)
8 4,000 miles Bendix Brake Diagnostic
302 Pickup Truck (crew cab)
4 4,000 miles Motorola Radio
310 Replaced Unit still in service (shell cars)
11 4,000 miles Certifications of Staff: 32 ASE and 1 EVT
403 Tandem Dump Truck
2 250 Hours
404 Small Dump Truck 3 250 Hours 405 Sign Truck (bucket
lift) 3 250 Hours Specialty Products:
407 Tool Carrier (front End Loader)
3 250 Hours High Life Engine Oil – 155 vehicles use
410 Street Sweeper 2 250 Hours Nitrogen Air for tires 412 Tractor 8 250 Hours 500 Riding Mower 7 250 Hours 510 Tractor Mounted
Attachment 11 250 Hours Federal & State
Regulations: 600 Fire Apparatus
(front line) 7 250 Hours Federal Stage II
Vapor Recovery 700 Trailer 31 250 Hours TECQ for
Underground Storage Tanks
801 Stationary Generator
11 Quarterly
802 Portable Generator 26 Quarterly 803 Chain Saw 30 Quarterly 804 Small Equipment 123 Quarterly
145

============================= FY 2016 ANNUAL BUDGET ===============================
===============================CITY OF MISSOURI CITY=================================
The Fleet Maintenance Division is responsible for maintaining, operating, and managing the fuel delivery systems, at the Service Center and the Fuel Island located at Fire Station 4. The division is responsible for the maintenance, operations, and repair of the automated and manual car wash facility at the service center. The Division maintains and refuels the Emergency Generators located at City Facilities. This Division is responsible for the repair and maintenance of various types of heavy equipment as well as minor tools and equipment. This Division provides emergency field assistance to City-owned vehicles and equipment that need unscheduled emergency repairs. This Division assists in maintaining, operating, and managing the Service Center and associated facilities.
The Fleet Maintenance Division annually evaluates all vehicles and equipment, using the Vehicle and Equipment Replacement Policy. This Division then makes recommendations thru the Fleet Status Report. The report gives information to all Divisions on the condition and recommended replacement year on each all piece of equipment. The fleet growth rate in the past year is 1.5%, and the vehicles were driven approximately 1.4 million miles during this period. The average age of all fleet units is 7.78 years (9.5 for all fire vehicles; 5.1 for police; 8 for pumpers; 13.5 for aerials/quints; 10.7 for municipal vehicles – 1.1 -3 years older on avg to comparison cities). The Fleet Maintenance Division is tasked with special design, fabrication and welding projects for other divisions.
Fleet Superintendent
Asst. Director of Public Works*
Mechanic II (2)
Shop Foreman
Total Full-Time Employees = 4
*Asst. Director of Public Works is included in the Department’s Admin Division
146

============================= FY 2016 ANNUAL BUDGET ===============================
===============================CITY OF MISSOURI CITY=================================
DEPARTMENT: PUBLIC WORKS FUNDING SOURCE: GENERAL FUND
DIVISION: FLEET MAINTENANCE FUND NUMBER: 101-15-145 STRATEGIC
GOAL 2019 DIVISIONAL OBJECTIVES
3,4 Complete the development of the Policy and Procedure manual for Fleet Maintenance
operations by June 30, 2016. 3,4 Provide a training program for all levels of Fleet personnel to enable them to meet the
qualifications and certifications for the changing technology and improvements to new and existing vehicles and equipment by March 30, 2016.
3,4 Increase the number of fleet warranty repairs by 6% over the 2015 levels.3,4 Research and recommend fuel efficiency programs for the economic benefits,
including: alternative fueled vehicles, existing vehicles/equipment for extended fuel economy and extended Preventive Maintenance intervals.
4 Obtain 10 additional Automotive Service Excellence and 2 Emergency Vehicle Technician certifications within the division by March 30, 2016.
PERSONNEL SCHEDULE
FY 2014
ActualFY2015 Budget
FY 2015 Estimate
FY 2016 Budget
SalaryGrade
Fleet Superintendent 1 1 1 1 22Shop Foreman 0 0 0 1 14Mechanic II 3 3 3 2 10 Total Full-time Employees 4 4 4 4
147

============================= FY 2016 ANNUAL BUDGET ===============================
===============================CITY OF MISSOURI CITY=================================
DEPARTMENT: PUBLIC WORKS FUNDING SOURCE: GENERAL FUND
DIVISION: FLEET MAINTENANCE FUND NUMBER: 101-15-145
PERFORMANCE INDICATORS
FY 2014
ActualFY2015 Budget
FY 2015 Estimate
FY 2016 Budget
Man hours to compile data to complete Fleet Report on Schedule 20.0 25.0 25.0 30.0 Man hours to Reconcile parts inventory semiannually 10.0 15.0 15.0 15.0 Police Patrol Preventive Maintenance Labor Hours per Job 1.5 1.25 1.00 1.00 Fire Apparatus Preventive Maintenance Labor Hours per Job 3.8 3.4 3.0 3.0 Non-Emergency Vehicles Preventive Maintenance Labor Hours per Job 1.5 1.2 1.2 1.0 Repair Job Orders per Mechanic per Month 59.0 53.0 51.0 53.0 Preventive Maintenance Job Orders per Mechanic per Month 16.0 14.0 16.0 17.0
ACTIVITY MEASURES
FY 2014
ActualFY2015 Budget
FY 2015 Estimate
FY 2016 Budget
Vehicles maintained-Total **162 *162 *162 *162
Public Safety **102 **102 **102 **102 Other Departments **62 *62 *62 *62
Equipment Maintained-Total *306 *306 *306 *306 Public Safety **82 **82 **82 **82 Other Departments **224 **224 **224 **224
Total vehicles/equipment maintained **470 **470 **470 *470 Vehicle Preventive maintenance operation (job orders) #600 #650 #575 #600 Vehicle repair operations (job orders) 1,653 2,550 1,800 1,900 Total Operations (job orders) 2,253 3,200 2,375 2,500 Fixed equipment maintained Vehicles & Equipment using Extended Life Oil Vehicles Removed from Fleet Report still in service
20 20 165
15
20 170
15
20 180
15
* Changes in equipment classification resulted in more accurate Inventory tracking but changes totals.
** Additions to Fleet changes totals for next fiscal year.Vehicle & Equipment totals will be reduced after City Auction.
*** Completed Small Equipment inventory removing no longer used, auctioned and or missing items.
# Extended life oil allows increased mileage between Preventive Maintenance intervals.
148

PUBLIC WORKS - FLEET MAINTENANCE 101-15-145
Object Description
FY 2014
Actual
FY 2015
Original
Budget
FY 2015
Revised
Budget
FY 2015
Year-End
Estimate
FY 2016
Proposed
Budget
51001 REGULAR SALARIES 169,728 169,728 187,585 180,102
51002 ADDITIONAL COMPENSATION 1,328 1,328 1,135 307
51003 COMPENSATED ABSENCES 22,491
51004 OVERTIME 1,000 1,000 850 1,000
51301 LONG TERM DISABILITY 575 575 594 606
51302 TAXES, SOCIAL SECURITY 13,162 13,162 15,505 13,878
51303 HOSP-LIFE-DENT-VIS INS 36,481 36,481 30,231 30,705
51305 RETIREMENT 15,395 15,395 15,477 16,238
51306 WORKERS COMPENSATION 217 217 1,686 1,465
TOTAL PERSONNEL - 237,886 237,886 275,554 244,301
52001 OFFICE SUPPLIES 200 200 200 200
52002 MEALS & DRINKS 100 100 100 100
52003 WEARING APPAREL 2,000 2,000 1,500 2,000
52004 MINOR TOOLS & EQUIPMENT 14,500 14,500 13,900 98,215
52005 EDUC, TRAINING & SUPPLIES 500 42 500 1,000
52006 POSTAGE 50 50 50 50
52013 JANITORIAL SUPPLIES 400 400 400 800
52014 COMPUTER EQUIP RENTAL FEE 2,100 2,100 2,100
52015 FLEET RENTAL FEE 7,525 7,525 7,525 7,525
52017 FUEL, OIL & LUBRICANTS 26,000 26,000 13,245 15,564
52037 FLEET REPAIR COSTS 420,000 420,000 578,000 650,000
52060 PARTS-OVER/UNDER 2,000 2,000 2,000 2,000
52090 GENERATOR MAINTENANCE - 18,000
TOTAL COMMODITIES - 475,375 474,917 619,520 795,454
53001 MINOR EQUIP MAINT/RPR & RNT - 400 400 400 400
53002 INSURANCE 88,378 88,378 95,502 124,232
53004 SPECIAL SERVICES & LEGAL 6,100 6,100 5,900 6,000
53006 RADIO REPAIR/MAINTENANCE 600 600 600 600
53034 SPECIAL PRODUCT DISPOSAL 2,500 2,500 500 2,500
53037 ELECTRIC UTILITIES 14,000 14,000 10,916 11,462
TOTAL CONTRACTUAL SERVICES - 111,978 111,978 113,818 145,194
54001 PRINTING & PUBLICATIONS 50 508 500 50
54002 DUES & SUBSCRIPTIONS 4,000 4,000 3,800 4,000
54003 TRAINING & TRAVEL 500 500 500 500
TOTAL OTHER SERVICES - 4,550 5,008 4,800 4,550
75004 EQUIPMENT - 9,000 9,000 9,000 13,000
TOTAL CAPITAL OUTLAY - 9,000 9,000 9,000 13,000
TOTAL EXPENDITURES - 838,789 838,789 1,022,692 1,202,499
149

150

============================= FY 2016 ANNUAL BUDGET ===============================
===============================CITY OF MISSOURI CITY=================================
DEPARTMENT: PUBLIC WORKS FUNDING SOURCE: GENERAL FUND
DIVISION: FACILITIES MAINTENANCE FUND NUMBER: 101-15-146
DESCRIPTION OF DIVISIONAL OPERATIONS The Facilities Maintenance Division is charged with maintenance oversight of all City buildings consisting of 293,238 Square Feet of building space with additional oversight of maintenance operations at the 25,000 square foot City Center Facility as well as the wastewater and Regional raw water treatment facilities consisting of 9 buildings in the greater Missouri City area.
The Division assures compliance with all Federal and State mandates, is responsible for keeping all mechanical systems fully operational and has implemented an aggressive Preventative Maintenance (PM) Program. This program incorporates facility inspections to maintain a clean and comfortable work environment and assures the external and interior conditions of the facilities conform to the highest standards. The Facilities Superintendent oversees all contracts associated with the maintenance of building equipment, mechanical systems, and janitorial services. The Facilities Maintenance staff performs routine building repairs and preventive maintenance functions. The Facilities Superintendent is also responsible for managing the Fire, Sprinkler, Boiler and Elevator Inspections for the city buildings and for any necessary corrections.
City Facilities by Square Footage City Hall Complex 59,284 RWTP 40,733 PSHQ 40,733 Rec & Tennis Center 24,488 City Centre 22,543 Muni Ct/EOC/Fire 20,260 Parks & Facilities Maint 12,960 Equip Pavilion 10,500 Cart Barn 9,000 FS 5 8,393 FS 2 7,864 FS4 7,740 FS3 7,740 Fleet Services 6,856 Streets 3,984 Sign Shop 3,000 Animal Shelter 2,660 Car Wash 2,200 PD Mini Station 1,250 Signal Shop 1,050
151
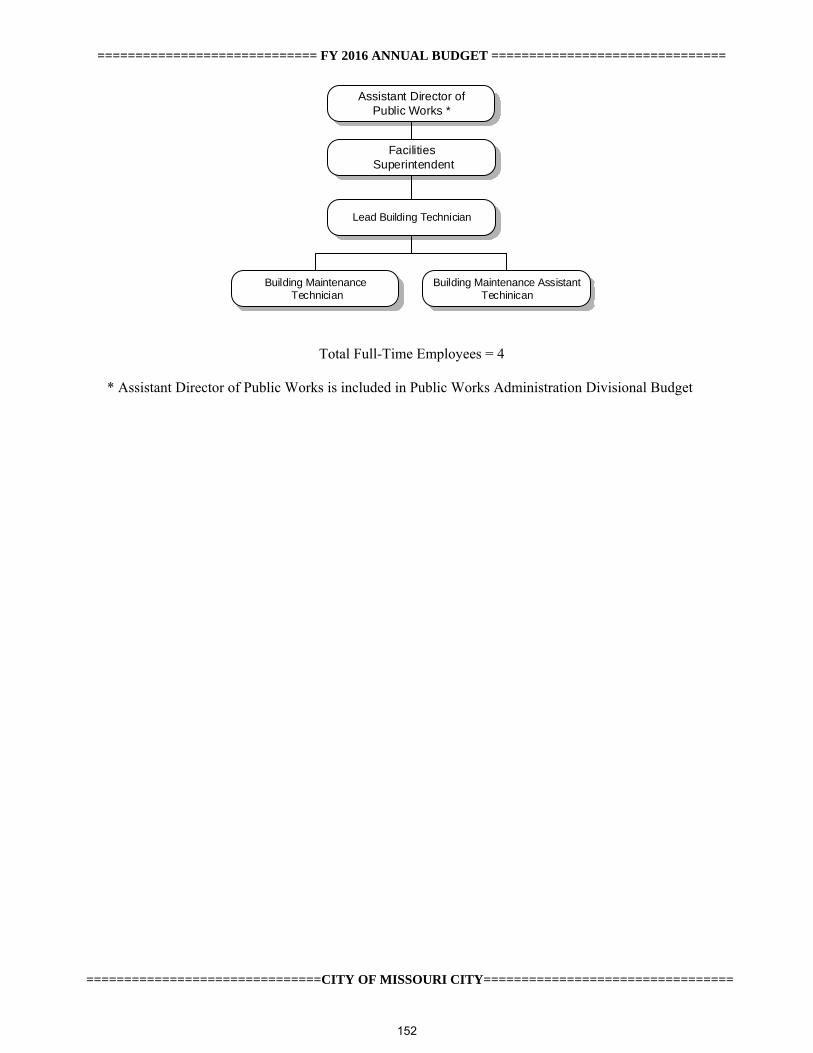
============================= FY 2016 ANNUAL BUDGET ===============================
===============================CITY OF MISSOURI CITY=================================
Facilities Superintendent
Building Maintenance Technician
Building Maintenance Assistant Techinican
Lead Building Technician
Assistant Director ofPublic Works *
Total Full-Time Employees = 4
* Assistant Director of Public Works is included in Public Works Administration Divisional Budget
152

============================= FY 2016 ANNUAL BUDGET ===============================
===============================CITY OF MISSOURI CITY=================================
DEPARTMENT: PUBLIC WORKS FUNDING SOURCE: GENERAL FUND
DIVISION: FACILITIES MAINTENANCE FUND NUMBER: 101-15-146 STRATEGIC
GOAL 2019 DIVISIONAL OBJECTIVES
1,4 Improve the quality and aesthetics of the Missouri City civic facilities while improving
customer service through the use of Munis system. □ Implement improved preventative maintenance program. □ Implement improved customer service and expectations of internal customers.
1,4 Monitor and reduce, when possible, the energy usage of the buildings city wide at a minimum of 1%.
2, 4 Implement the FY 15-16 Facilities Checklist for all Missouri City Buildings in accordance with the established frequency schedule.
2,4 Complete the Facilities Maintenance schedule for preventative maintenance on time and perform at least 75%* of the necessary repairs within budget allowances.
2,4 Participate in the Facilities Maintenance safety program with at least two staff taking four training modules.
2, 4 Train Facilities Maintenance staff in the operation of the new work order system in MUNIS and be operational in the system by July 2016
2, 4 Provide training to at least two staff and one Department personnel in the HVAC building automation system (Metasys) that is used to operate both Emergency Operations Center/Municipal Court Building and City Hall Complex, and in the Trane Tracer Convergence system at the Recreation and Tennis Center.
PERSONNEL SCHEDULE FY 2014
Actual FY 2015
Budget FY 2015 Estimate
FY 2016 Budget
SalaryGrade
Facilities Superintendent 1 1 1 1 22Lead Building Technician 1 1 1 1 13Building Maintenance Technician Building Maintenance Asst. Technician
1 1
1 1
1 1
1 1
11 5
Total Full-time Employees 4 4 4 4
153

============================= FY 2016 ANNUAL BUDGET ===============================
===============================CITY OF MISSOURI CITY=================================
DEPARTMENT: PUBLIC WORKS FUNDING SOURCE: GENERAL FUND
DIVISION: FACILITIES/MAINTENANCE FUND NUMBER: 101-15-146
PERFORMANCE MEASURES
Facility Projects FY 2014Actual
FY 2015 Budget
FY 2015 Estimate
FY 2016Budget
Electrical Utilities Yearly Usage $390,334 $400,338 $429,935 $472,929 KVA usage for all city facilities 1,096.00 1,521.77 1,139.00 1,521.77 Number of hours to perform Preventative Maintenance
in house on HVAC systems N/A 355 355 408
Number of budgeted supplemental requests completed 2 10 7 12 Number of hours to update the Facility Maintenance
Checklist FY 15 Completion 35 35 40
Utility Consumption Costs (electric, gas, & water) per Gross Square Feet. O&M Benchmarks from IFMA Report #32 for City/County Government is $2.32/GSF & average for buildings operating 7 days/week is $2.86/GSF. 8 of 15 buildings operate 7 days a week with several operating 24/7. Estimated current GSF is 252,084. **
$2.06/ GSF
$2.10/ GSF
$2.26/ GSF
$2.50/ GSF**
Total Operating Costs (operation, janitorial, maintenance and utilities) per Rentable Square Foot. O&M Benchmarks from IFMA Report #32 average $/RSF for City/County Government is $6.73/RSF & average for buildings between ages 21-30 is $7.45. Estimated current RSF is 204,793 RSF.
$6.30/ RSF
$6.42/ RSF*
$6.50/ RSF*
$6.52/ RSF*
* These numbers include the Tennis Court lighting as it shares the meter with the building. ** This is inclusive of 31,543 sq.ft. for the City Centre/Cart Barn
ACTIVITY MEASURES
FY 2014
ActualFY 2015
Budget FY 2015 Estimate
FY 2016 Budget
Number of requests for service completed by the Facilities Maintenance division. ( July 2013– June 2014)*
376 400 444 500
* Please note that the amount of work orders does not represent all the work that FM completes. Facilities Maintenance performs special repair/remodel projects that are identified through a supplemental request. Some tasks are completed as needed/necessary as staff notes/discovers and handles on the spot.
154

PUBLIC WORKS - FACILITIES MAINTENANCE 101-15-146
Object Description
FY 2014
Actual
FY 2015
Original
Budget
FY 2015
Revised
Budget
FY 2015
Year-End
Estimate
FY 2016
Proposed
Budget
51001 REGULAR SALARIES 160,126 160,126 183,414 177,411
51002 ADDITIONAL COMPENSATION 1,988 1,988 1,976 2,168
51003 COMPENSATED ABSENCES 18 -
51004 OVERTIME 4,000 4,000 4,000 4,000
51202 CELL PHONE ALLOWANCE 2,160 2,160 2,651 2,700
51301 LONG TERM DISABILITY 552 552 577 612
51302 TAXES, SOCIAL SECURITY 12,872 12,872 13,655 14,097
51303 HOSP-LIFE-DENT-VIS INS 39,763 39,763 25,715 29,156
51304 PRORATED HEALTH/DENT/VIS 199 -
51305 RETIREMENT 14,785 14,785 13,775 16,407
51306 WORKERS COMPENSATION 212 212 2,043 1,812
TOTAL PERSONNEL - 236,458 236,458 248,023 248,363
52001 OFFICE SUPPLIES 250 250 250 250
52002 MEALS & DRINKS 12,000 12,000 12,000 12,000
52003 WEARING APPAREL 1,880 1,880 1,880 1,880
52004 MINOR TOOLS & EQUIPMENT 6,500 6,500 4,000 6,750
52007 BLDG MAT'L/SUPPLIES & REPAIRS 102,999 102,999 90,000 90,000
52013 JANITORIAL SUPPLIES 3,850 3,850 2,000 2,000
52014 COMPUTER EQUIP RENTAL FEE 250 250 250
52015 FLEET RENTAL FEE 11,000 11,000 11,000 11,188
52017 FUEL, OIL & LUBRICANTS 15,400 15,400 5,845 11,100
TOTAL COMMODITIES - 154,129 154,129 127,225 135,168
53001 MINOR EQUIP MAINT/RPR & RNT - 2,500 2,500 2,500 2,500
53002 INSURANCE 85,105 85,105 87,614 82,031
53004 SPECIAL SERVICES & LEGAL 230,554 230,554 230,554 126,854
53007 CONFERENCE EXPENSE 2,995 2,995 2,995 1,500
53023 BUILDING REPAIRS 100,000 100,000 100,000 100,000
53032 GARBAGE COLLECTION - 9,145 9,145 11,382 12,520
53037 ELECTRIC UTILITIES 432,257 432,257 429,935 472,929
53041 WATER UTILTIES 20,088 20,088 23,837 25,029
53046 GAS UTILITIES 15,000 15,000 13,668 14,352
53082 CONTRACTOR HIRE - JANITORIAL - 140,100
TOTAL CONTRACTUAL SERVICES - 897,644 897,644 902,485 977,815
54001 PRINTING & PUBLICATIONS 25 25 25 25
54002 DUES & SUBSCRIPTIONS 313 313 313 400
54003 TRAINING & TRAVEL 3,500 3,500 3,500 3,500
54005 VEHICLE ALLOWANCE - MILEAGE - 100 100 100 100
TOTAL OTHER SERVICES - 3,938 3,938 3,938 4,025
75004 EQUIPMENT - 47,500 47,500 47,500 17,500
77001 PROFESSIONAL SERVICES - -
TOTAL CAPITAL OUTLAY - 47,500 47,500 47,500 17,500
TOTAL EXPENDITURES - 1,339,669 1,339,669 1,329,171 1,382,871
155

156

============================ FY 2016 ANNUAL BUDGET ================================
===============================CITY OF MISSOURI CITY=================================
DEPARTMENT: PUBLIC WORKS FUNDING SOURCE: GENERAL FUND
DIVISION: ANIMAL SERVICES FUND NUMBER: 101-15-148
DESCRIPTION OF DIVISIONAL OPERATIONS
The City employs two full-time certified Animal Services Officers and one Animal Services Supervisor. With the utilization of three Animal Services trucks, Animal Services coverage is provided to all areas within the City and special patrol to any problem areas. Animal Services include impounding loose dogs and feral cats, addressing animal bite and dangerous dog cases, placing adoptable dogs and cats, working with animal rescue groups, investigate animal cruelty cases, and assist in controlling certain of wildlife. The Division operates the animal shelter, the Adopt-a-Pet Program, works with various Rescue groups, and impounds animals when appropriate. The City of Stafford contracts with the City for the use and operation of the shelter. The Division furnishes Missouri City residents with various animal traps for the capture of domestic and feral animals. The Division provides oversight of the Animal Services Advisory panel and hosts three public meeting annually. All Animal Services Officers were re-certified as Animal Service Officers. The Missouri City Animal Shelter is a key component of the operations. The Division fully utilizes a Municipal Volunteer Program that brings in an average of 10 volunteers a week who provide shelter operation services and promotes the shelter’s animals for adoption at many community events and assists with placing animals with many rescue and foster groups.
Asst. Director of Public Works *
Animal Control Officer (2)
Animal Control Supervisor
Total Full-Time Employees = 3
*Assistant Director of Public Works is included in the Public Works Administration Divisional Budget.
157

============================ FY 2016 ANNUAL BUDGET ================================
===============================CITY OF MISSOURI CITY=================================
DEPARTMENT: PUBLIC WORKS FUNDING SOURCE: GENERAL FUND
DIVISION: ANIMAL SERVICES FUND NUMBER: 101-15-148 STRATEGIC
GOAL 2019 DIVISIONAL OBJECTIVES
1,4 Maintain an average response time of thirty minutes to Animal Services calls for
service at least 95% of the time. 1,4 Provide customer service representation at least 4 days a week (20 hrs) at the Animal
Shelter facility thru the use of a municipal volunteer program, by December 31, 2015. 1,4 Host an “Adopt-a-Pet” event at least once per quarter to provide for at least a 10%
increase in adoption rates and a marked increase in community awareness of pet ownership and responsibilities.
1,4 Host three Animal Services Advisory panel meetings and implement 80% of the recommendations by the panel by May 30, 2016.
1,2,4 Develop a Divisional Scorecard that will tell the story of the Animal Services operations and the operating philosophy by March 31, 2016
4 40*Develop and incorporate at least one other social media avenue to promote adoptable pets, community awareness and a “did you know” information stream, by December 31, 2015.
4 Review and develop a check list for Animal Service Officers to use as a reference tool when making routine calls for service by December 31, 2015.
PERSONNEL SCHEDULE FY 2014
ActualFY2015 Budget
FY 2015 Estimate
FY 2016 Budget
SalaryGrade
Animal Control Supervisor 1 1 1 1 10Animal Control Officer 2 2 2 2 7 Total Full Time Employees 3 3 3 3
158

============================ FY 2016 ANNUAL BUDGET ================================
===============================CITY OF MISSOURI CITY=================================
DEPARTMENT: PUBLIC WORKS FUNDING SOURCE: GENERAL FUND
DIVISION: ANIMAL SERVICES FUND NUMBER: 101-15-148
PERFORMANCE INDICATORS FY 2014
ActualFY2015 Budget
FY 2015 Estimate
FY 2016 Budget
Number of hours to investigate a dangerous dog case per year 12 18 16 18 Number of hours to respond to emergency calls per month 12 15 12 15 Number of hours required to maintain certifications for each
officer 10 10 10 10
Number of hours to impound per animal (dog/cat/other) 2 2 2 2 Number of volunteer hours logged per year N/A 1,040 1,200 1,300
ACTIVITY MEASURES FY 2014
ActualFY 2015
Budget FY 2015 Estimate
FY 2016 Budget
Number of Animal Services Calls for Service 2,807 3,200 3,000 3,300 Number of Impounds (dogs and cats) 960 1,200 1,250 1,300 Number of Bite Cases Reported (includes dog on dog bites) 50 50 44 50 Number of Euthanized Animals 539 540 520 500 Number of Adoptions – Adopt-a Pet 35 50 65 60 Number of Adoptions – Rescue Groups 250 180 350 275 Number of students visited 75 130 100 130 Number of Dangerous Dog Cases 5 4 5 5
159
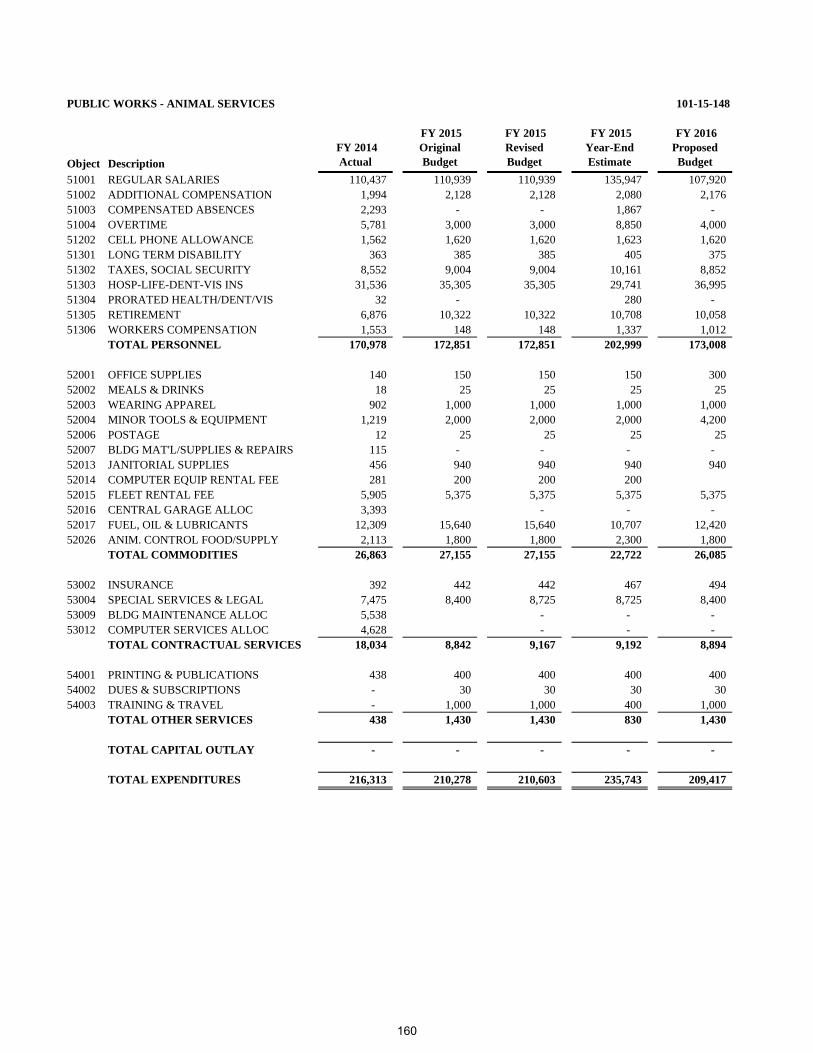
PUBLIC WORKS - ANIMAL SERVICES 101-15-148
Object Description
FY 2014
Actual
FY 2015
Original
Budget
FY 2015
Revised
Budget
FY 2015
Year-End
Estimate
FY 2016
Proposed
Budget
51001 REGULAR SALARIES 110,437 110,939 110,939 135,947 107,920
51002 ADDITIONAL COMPENSATION 1,994 2,128 2,128 2,080 2,176
51003 COMPENSATED ABSENCES 2,293 - - 1,867 -
51004 OVERTIME 5,781 3,000 3,000 8,850 4,000
51202 CELL PHONE ALLOWANCE 1,562 1,620 1,620 1,623 1,620
51301 LONG TERM DISABILITY 363 385 385 405 375
51302 TAXES, SOCIAL SECURITY 8,552 9,004 9,004 10,161 8,852
51303 HOSP-LIFE-DENT-VIS INS 31,536 35,305 35,305 29,741 36,995
51304 PRORATED HEALTH/DENT/VIS 32 - 280 -
51305 RETIREMENT 6,876 10,322 10,322 10,708 10,058
51306 WORKERS COMPENSATION 1,553 148 148 1,337 1,012
TOTAL PERSONNEL 170,978 172,851 172,851 202,999 173,008
52001 OFFICE SUPPLIES 140 150 150 150 300
52002 MEALS & DRINKS 18 25 25 25 25
52003 WEARING APPAREL 902 1,000 1,000 1,000 1,000
52004 MINOR TOOLS & EQUIPMENT 1,219 2,000 2,000 2,000 4,200
52006 POSTAGE 12 25 25 25 25
52007 BLDG MAT'L/SUPPLIES & REPAIRS 115 - - - -
52013 JANITORIAL SUPPLIES 456 940 940 940 940
52014 COMPUTER EQUIP RENTAL FEE 281 200 200 200
52015 FLEET RENTAL FEE 5,905 5,375 5,375 5,375 5,375
52016 CENTRAL GARAGE ALLOC 3,393 - - -
52017 FUEL, OIL & LUBRICANTS 12,309 15,640 15,640 10,707 12,420
52026 ANIM. CONTROL FOOD/SUPPLY 2,113 1,800 1,800 2,300 1,800
TOTAL COMMODITIES 26,863 27,155 27,155 22,722 26,085
53002 INSURANCE 392 442 442 467 494
53004 SPECIAL SERVICES & LEGAL 7,475 8,400 8,725 8,725 8,400
53009 BLDG MAINTENANCE ALLOC 5,538 - - -
53012 COMPUTER SERVICES ALLOC 4,628 - - -
TOTAL CONTRACTUAL SERVICES 18,034 8,842 9,167 9,192 8,894
54001 PRINTING & PUBLICATIONS 438 400 400 400 400
54002 DUES & SUBSCRIPTIONS - 30 30 30 30
54003 TRAINING & TRAVEL - 1,000 1,000 400 1,000
TOTAL OTHER SERVICES 438 1,430 1,430 830 1,430
TOTAL CAPITAL OUTLAY - - - - -
TOTAL EXPENDITURES 216,313 210,278 210,603 235,743 209,417
160

============================ FY 2016 ANNUAL BUDGET ================================
===============================CITY OF MISSOURI CITY=================================
DEPARTMENTAL VISION STATEMENT PARKS AND RECREATION
To be known as a superior municipal parks and recreation department with model facilities and excellence in customer service delivery in the State of Texas
DEPARTMENTAL MISSION STATEMENT
To acquire, develop program and maintain a superior parks and recreation system for all members of the community
Parks Operations
Recreation
Parks and
Recreation
RecreationParks Operations
161
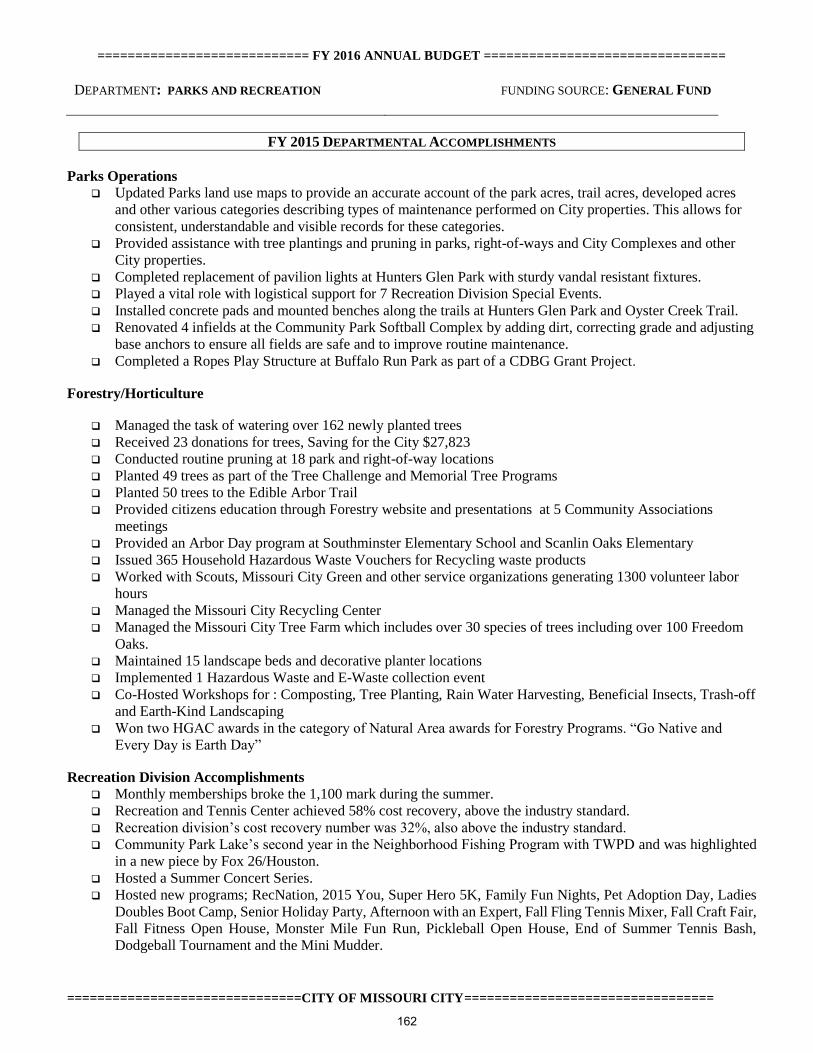
============================ FY 2016 ANNUAL BUDGET ================================
===============================CITY OF MISSOURI CITY=================================
DEPARTMENT: PARKS AND RECREATION FUNDING SOURCE: GENERAL FUND
FY 2015 DEPARTMENTAL ACCOMPLISHMENTS
Parks Operations
Updated Parks land use maps to provide an accurate account of the park acres, trail acres, developed acres
and other various categories describing types of maintenance performed on City properties. This allows for
consistent, understandable and visible records for these categories.
Provided assistance with tree plantings and pruning in parks, right-of-ways and City Complexes and other
City properties.
Completed replacement of pavilion lights at Hunters Glen Park with sturdy vandal resistant fixtures.
Played a vital role with logistical support for 7 Recreation Division Special Events.
Installed concrete pads and mounted benches along the trails at Hunters Glen Park and Oyster Creek Trail.
Renovated 4 infields at the Community Park Softball Complex by adding dirt, correcting grade and adjusting
base anchors to ensure all fields are safe and to improve routine maintenance.
Completed a Ropes Play Structure at Buffalo Run Park as part of a CDBG Grant Project.
Forestry/Horticulture
Managed the task of watering over 162 newly planted trees
Received 23 donations for trees, Saving for the City $27,823
Conducted routine pruning at 18 park and right-of-way locations
Planted 49 trees as part of the Tree Challenge and Memorial Tree Programs
Planted 50 trees to the Edible Arbor Trail
Provided citizens education through Forestry website and presentations at 5 Community Associations
meetings
Provided an Arbor Day program at Southminster Elementary School and Scanlin Oaks Elementary
Issued 365 Household Hazardous Waste Vouchers for Recycling waste products
Worked with Scouts, Missouri City Green and other service organizations generating 1300 volunteer labor
hours
Managed the Missouri City Recycling Center
Managed the Missouri City Tree Farm which includes over 30 species of trees including over 100 Freedom
Oaks.
Maintained 15 landscape beds and decorative planter locations
Implemented 1 Hazardous Waste and E-Waste collection event
Co-Hosted Workshops for : Composting, Tree Planting, Rain Water Harvesting, Beneficial Insects, Trash-off
and Earth-Kind Landscaping
Won two HGAC awards in the category of Natural Area awards for Forestry Programs. “Go Native and
Every Day is Earth Day”
Recreation Division Accomplishments
Monthly memberships broke the 1,100 mark during the summer.
Recreation and Tennis Center achieved 58% cost recovery, above the industry standard.
Recreation division’s cost recovery number was 32%, also above the industry standard.
Community Park Lake’s second year in the Neighborhood Fishing Program with TWPD and was highlighted
in a new piece by Fox 26/Houston.
Hosted a Summer Concert Series.
Hosted new programs; RecNation, 2015 You, Super Hero 5K, Family Fun Nights, Pet Adoption Day, Ladies
Doubles Boot Camp, Senior Holiday Party, Afternoon with an Expert, Fall Fling Tennis Mixer, Fall Craft Fair,
Fall Fitness Open House, Monster Mile Fun Run, Pickleball Open House, End of Summer Tennis Bash,
Dodgeball Tournament and the Mini Mudder.
162
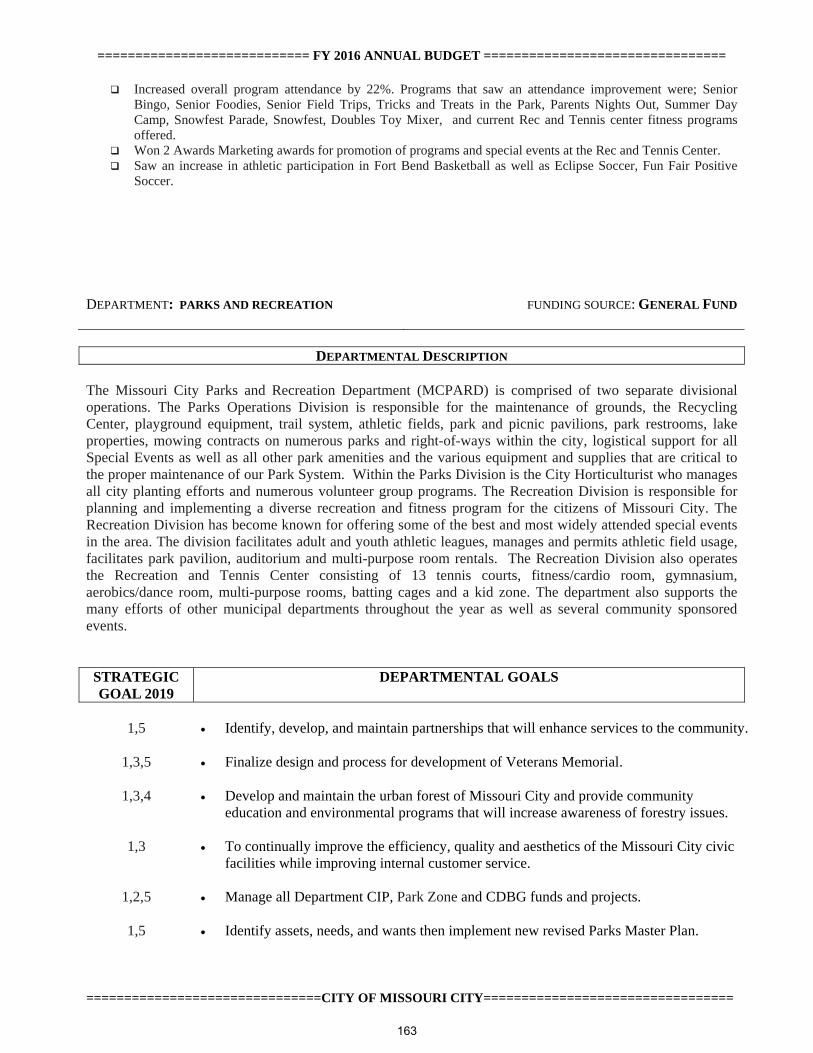
============================ FY 2016 ANNUAL BUDGET ================================
===============================CITY OF MISSOURI CITY=================================
Increased overall program attendance by 22%. Programs that saw an attendance improvement were; Senior Bingo, Senior Foodies, Senior Field Trips, Tricks and Treats in the Park, Parents Nights Out, Summer Day Camp, Snowfest Parade, Snowfest, Doubles Toy Mixer, and current Rec and Tennis center fitness programs offered.
Won 2 Awards Marketing awards for promotion of programs and special events at the Rec and Tennis Center. Saw an increase in athletic participation in Fort Bend Basketball as well as Eclipse Soccer, Fun Fair Positive
Soccer. DEPARTMENT: PARKS AND RECREATION FUNDING SOURCE: GENERAL FUND
DEPARTMENTAL DESCRIPTION The Missouri City Parks and Recreation Department (MCPARD) is comprised of two separate divisional operations. The Parks Operations Division is responsible for the maintenance of grounds, the Recycling Center, playground equipment, trail system, athletic fields, park and picnic pavilions, park restrooms, lake properties, mowing contracts on numerous parks and right-of-ways within the city, logistical support for all Special Events as well as all other park amenities and the various equipment and supplies that are critical to the proper maintenance of our Park System. Within the Parks Division is the City Horticulturist who manages all city planting efforts and numerous volunteer group programs. The Recreation Division is responsible for planning and implementing a diverse recreation and fitness program for the citizens of Missouri City. The Recreation Division has become known for offering some of the best and most widely attended special events in the area. The division facilitates adult and youth athletic leagues, manages and permits athletic field usage, facilitates park pavilion, auditorium and multi-purpose room rentals. The Recreation Division also operates the Recreation and Tennis Center consisting of 13 tennis courts, fitness/cardio room, gymnasium, aerobics/dance room, multi-purpose rooms, batting cages and a kid zone. The department also supports the many efforts of other municipal departments throughout the year as well as several community sponsored events. STRATEGIC
GOAL 2019 DEPARTMENTAL GOALS
1,5 Identify, develop, and maintain partnerships that will enhance services to the community.
1,3,5 Finalize design and process for development of Veterans Memorial.
1,3,4 Develop and maintain the urban forest of Missouri City and provide community education and environmental programs that will increase awareness of forestry issues.
1,3 To continually improve the efficiency, quality and aesthetics of the Missouri City civic
facilities while improving internal customer service.
1,2,5 Manage all Department CIP, Park Zone and CDBG funds and projects.
1,5 Identify assets, needs, and wants then implement new revised Parks Master Plan.
163

============================ FY 2016 ANNUAL BUDGET ================================
===============================CITY OF MISSOURI CITY=================================
DEPARTMENT: PARKS AND RECREATION FUNDING SOURCE: GENERAL FUND
DIVISION: PARKS OPERATIONS FUND NUMBER: 101-16-150
DESCRIPTION OF DIVISIONAL OPERATIONS
The Parks Operations Division is responsible for the maintenance and operation of all City parks and recreational facilities, turf maintenance on specific raised esplanades, rights-of-way, landscaped areas, forestry programs and projects, public facilities, and miscellaneous building maintenance tasks as well as other City projects as requested. This Division also accomplishes new construction and renovation of Park and Recreation facilities. The Parks Operations Division assists the Recreation Division in implementing numerous special events annually. The Parks Division also manages and operates the citywide Recycling Center and Tree Farms.
Total Full-Time Employees = 11
164

============================ FY 2016 ANNUAL BUDGET ================================
===============================CITY OF MISSOURI CITY=================================
DEPARTMENT: PARKS AND RECREATION FUNDING SOURCE: GENERAL FUND
DIVISION: PARKS OPERATIONS FUND NUMBER: 101-16-150
STRATEGIC
GOAL 2019 DIVISIONAL OBJECTIVES
1 Implement approved Park Zone CIP Projects (Outdoor Exercise equipment, Trail improvements, electrical upgrades and beautification projects).
1 Acquire/develop additional parklands in accordance with NRPA standards and as identified in the Missouri City Master Plan.
1 Provide a safe and enjoyable parks system with unique opportunities for residents. 3
Develop and maintain the urban forest of Missouri City and provide community
education regarding urban forestry issues with events such as Arbor Day. 3 Provide volunteers with opportunities which offer a meaningful work experience. 3 Conserve resources by utilizing volunteers, such as Missouri City Green and Men for
Change, to support and strengthen staff.
PERSONNEL SCHEDULE FY 2014
Actual FY 2015
Budget FY 2015 Estimate
FY 2016 Budget
SalaryGrade
Director of Parks & Recreation 1 1 1 1 Uncl.Assistant Director of Parks and Recreation 1 1 1 1 24Horticulturist 1 1 1 1 21Park Supervisor 1 1 1 1 13Park Caretaker III 3 3 3 3 8Park Caretaker II 1 1 1 1 6Park Caretaker I 3 3 3 3 3Total Full Time Employees 11 11 11 11
165
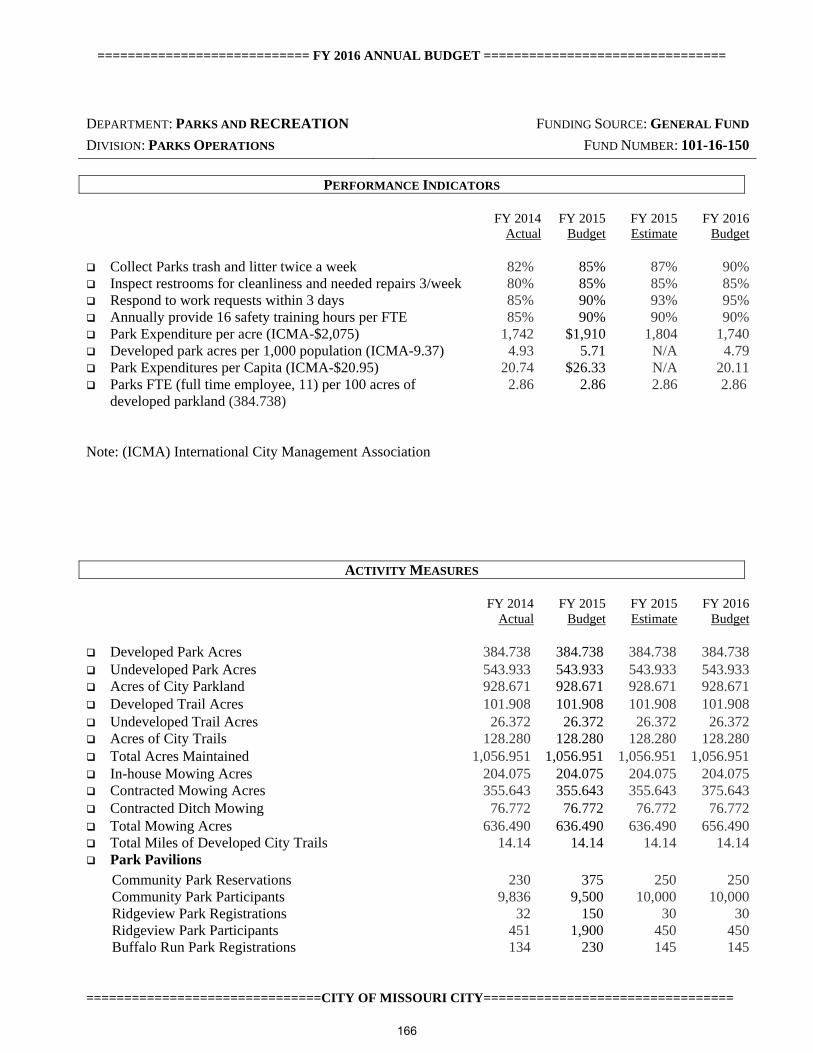
============================ FY 2016 ANNUAL BUDGET ================================
===============================CITY OF MISSOURI CITY=================================
DEPARTMENT: PARKS AND RECREATION FUNDING SOURCE: GENERAL FUND
DIVISION: PARKS OPERATIONS FUND NUMBER: 101-16-150
PERFORMANCE INDICATORS
FY 2014
ActualFY 2015
Budget FY 2015 Estimate
FY 2016 Budget
Collect Parks trash and litter twice a week 82% 85% 87% 90% Inspect restrooms for cleanliness and needed repairs 3/week 80% 85% 85% 85% Respond to work requests within 3 days 85% 90% 93% 95% Annually provide 16 safety training hours per FTE 85% 90% 90% 90% Park Expenditure per acre (ICMA-$2,075) 1,742 $1,910 1,804 1,740 Developed park acres per 1,000 population (ICMA-9.37) 4.93 5.71 N/A 4.79 Park Expenditures per Capita (ICMA-$20.95) 20.74 $26.33 N/A 20.11 Parks FTE (full time employee, 11) per 100 acres of
developed parkland (384.738) 2.86 2.86 2.86 2.86
Note: (ICMA) International City Management Association
ACTIVITY MEASURES
FY 2014 Actual
FY 2015 Budget
FY 2015 Estimate
FY 2016 Budget
Developed Park Acres 384.738 384.738 384.738 384.738 Undeveloped Park Acres 543.933 543.933 543.933 543.933 Acres of City Parkland 928.671 928.671 928.671 928.671 Developed Trail Acres 101.908 101.908 101.908 101.908 Undeveloped Trail Acres 26.372 26.372 26.372 26.372 Acres of City Trails 128.280 128.280 128.280 128.280 Total Acres Maintained 1,056.951 1,056.951 1,056.951 1,056.951 In-house Mowing Acres 204.075 204.075 204.075 204.075 Contracted Mowing Acres 355.643 355.643 355.643 375.643 Contracted Ditch Mowing 76.772 76.772 76.772 76.772 Total Mowing Acres 636.490 636.490 636.490 656.490 Total Miles of Developed City Trails 14.14 14.14 14.14 14.14 Park Pavilions
Community Park Reservations 230 375 250 250 Community Park Participants 9,836 9,500 10,000 10,000 Ridgeview Park Registrations 32 150 30 30 Ridgeview Park Participants 451 1,900 450 450 Buffalo Run Park Registrations 134 230 145 145
166

============================ FY 2016 ANNUAL BUDGET ================================
===============================CITY OF MISSOURI CITY=================================
Buffalo Run Park Participants 5,590 2,500 5,750 5,750 Hunter’s Glen Park Registrations 71 85 75 75 Hunter’s Glen Park Participants (special event use not 1,692 4,800 1,800 1,800 Included) Volunteer maintenance
Adopt-A-Spot areas Adopt-A-Roadway areas
12 16
12 16
12 16
12 16
Work Orders Completed (* July 2013– June 30, 2014)
Volunteer hours for Community Projects (January 2014-December 2014)
884
1,300
N/A
700
1,150
1,000
1,000
1,000
167

GENERAL FUND
CONSOLIDATED EXPENDITURES BY LINE ITEM
PARKS - ADMINISTRATION 101-16-150
Object Description
FY 2014
Actual
FY 2015
Original
Budget
FY 2015
Revised
Budget
FY 2015
Year-End
Estimate
FY 2016
Proposed
Budget
51001 REGULAR SALARIES 495,209 484,802 484,802 456,847 486,329
51002 ADDITIONAL COMPENSATION 4,292 4,544 4,544 4,439 4,588
51003 COMPENSATED ABSENCES 4,242 - - 3,620 -
51004 OVERTIME 13,856 17,450 17,450 13,800 14,000
51202 CELL PHONE ALLOWANCE 3,249 3,240 3,240 2,725 2,930
51301 LONG TERM DISABILITY 1,601 1,655 1,655 1,470 1,660
51302 TAXES, SOCIAL SECURITY 37,664 39,017 39,017 34,248 38,874
51303 HOSP-LIFE-DENT-VIS INS 102,841 112,678 112,678 95,019 116,621
51304 PRORATED HEALTH/DENT/VIS 1,365 - - 1,500 -
51305 RETIREMENT 27,163 44,333 44,333 34,121 44,487
51306 WORKERS COMPENSATION 4,701 643 643 2,957 2,725
TOTAL PERSONNEL 696,183 708,362 708,362 650,746 712,214
52001 OFFICE SUPPLIES 477 900 900 900 900
52002 MEALS & DRINKS 555 950 950 900 1,050
52003 WEARING APPAREL 5,147 5,000 5,000 5,000 5,600
52004 MINOR TOOLS & EQUIPMENT 8,581 14,000 14,000 11,000 37,490
52005 EDUC, TRAINING & SUPPLIES - 500 500 100 250
52006 POSTAGE 35 100 100 100 100
52007 BLDG MAT'L/SUPPLIES & REPAIRS 337 400 400 400 400
52013 JANITORIAL SUPPLIES 6,142 6,300 6,300 6,300 6,800
52014 COMPUTER EQUIP RENTAL FEE 2,218 2,325 2,325 2,325
52015 FLEET RENTAL FEE 44,378 63,111 63,111 63,111 65,427
52016 CENTRAL GARAGE ALLOC 41,071 - - -
52017 FUEL, OIL & LUBRICANTS 36,991 46,000 46,000 36,000 41,760
52019 DONATION PURCHASES - - - - -
52025 PESTICIDE/HAZ-MAT CONTROL 14,212 16,000 16,000 16,000 16,000
52048 PARK MAT'L & SUPPLIES 64,874 75,500 78,550 78,500 80,900
52050 SPECIAL EVENTS 2,015 - - -
52051 RECYCLING 472 500 500 500 550
52054 GRANT-HGAC HOUSEHLD WASTE - - - - -
TOTAL COMMODITIES 227,506 231,586 234,636 221,136 257,227
53001 MINOR EQUIP MAINT/RPR & RNT 7,347 9,500 9,500 6,500 6,500
53002 INSURANCE 21,088 20,764 20,764 22,136 20,997
53004 SPECIAL SERVICES & LEGAL 68,324 104,920 116,159 100,000 140,563
53007 CONFERENCE EXPENSE 2,447 3,090 990 990 3,090
53009 BLDG MAINTENANCE ALLOC 103,936 - - -
53012 COMPUTER SERVICES ALLOC 39,084 - - -
53032 GARBAGE COLLECTION 13,723 16,808 16,808 10,592 7,500
53036 CONTRACTOR HIRE - PARKS 256,988 256,053 318,948 318,948 321,253
53037 ELECTRIC UTILITIES 83,025 96,005 96,005 81,521 99,600
53038 STA-MO LEASE & OPERATION 55,201 80,000 80,339 52,594 68,581
53041 WATER UTILTIES 38,820 62,048 62,048 54,397 57,117
TOTAL CONTRACTUAL SERVICES 689,982 649,188 721,561 647,678 725,201
54001 PRINTING & PUBLICATIONS 46 500 500 300 200
54002 DUES & SUBSCRIPTIONS 628 845 845 545 845
54003 TRAINING & TRAVEL 3,466 4,000 4,000 4,000 4,000
54005 VEHICLE ALLOWANCE - MILEAGE - - - - -
TOTAL OTHER SERVICES 4,139 5,345 5,345 4,845 5,045
75004 EQUIPMENT - 4,000 4,000 - -
TOTAL CAPITAL OUTLAY - 4,000 4,000 - -
TOTAL EXPENDITURES 1,617,810 1,598,481 1,673,904 1,524,405 1,699,687
168

============================ FY 2016 ANNUAL BUDGET ================================
===============================CITY OF MISSOURI CITY=================================
DEPARTMENT: PARKS AND RECREATION FUNDING SOURCE: GENERAL FUND
DIVISION: RECREATION FUND NUMBER: 101-16-152
DESCRIPTION OF DIVISIONAL OPERATIONS
The Recreation Division is responsible for developing and implementing a wide variety of family oriented and multi-generational activities for the Missouri City community. The Division prides itself on providing excellence in customer service as well as diverse, affordable programs taught by qualified staff and/or instructors. Our program offerings include: leisure programs, fitness activities, youth camps, and youth and adult athletic leagues. The division hosts and assists with over eight annual city-wide special events as well as local programming done at the recreation center and our local parks. Our special events include; July 4th Festival, Snowfest, Snowfest Parade, Eggpolooza, Missouri City Clean up, Back to School Bash, Community Garage Sale, Dad & Daughter Dance and Tricks and Treats in the Park at Buffalo Run Park. The Division coordinates the rental and usage of the Civic Auditorium, the Recreation and Tennis Center with two meeting rooms, a basketball court, tennis courts as well as park pavilions, and multiple athletic fields.
Parks & Recreation Director *
Recreation SpecialistSpecial Events and Seniors
Recreation Superintendent
Recreation SpecialistFitness, Youth, and Families
Office Manager
Part Time Front Desk Attendant (6)
Part-Time Recreation Leader (3)
Recreation SpecialistTennis Pro
Recreation Attendant
Recreation Supervisor
Part-Time Weight Room Attendant (4)
Total Full-Time Employees = 7
Part-Time Employees = 13 (Does not include seasonal employees)
*Parks Director is included in Parks Divisional Budget
169

============================ FY 2016 ANNUAL BUDGET ================================
===============================CITY OF MISSOURI CITY=================================
DEPARTMENT: PARKS AND RECREATION FUNDING SOURCE: GENERAL FUND
DIVISION: RECREATION FUND NUMBER: 101-16-152
STRATEGIC
GOAL 2019 DIVISIONAL OBJECTIVES
1 Increase senior class offerings based on user feedback and senior committee
recommendations. 1 Perform Quarterly Surveys of recreation participants. 1 Provide quality recreational activities for participants of all ages. 1 To increase our overall membership by 10% through programs, lessons, and classes. 1 To continue to pursue partnerships, donations and revenue sources that will provide
other means of funding, better utilize resources and areas of expertise.
PERSONNEL SCHEDULE FY 2014
Actual FY 2015
Budget FY 2015 Estimate
FY 2016 Budget
SalaryGrade
Recreation Superintendent 1 1 1 1 22Recreation Supervisor 1 1 1 1 14Recreation Specialist 3 3 3 3 12Administrative Assistant 0 0 0 0 10Office Manager 1 1 1 1 15Recreation Attendant 1 1 1 1 8Total Full-Time Employees 7 7 7 7
Recreation Leaders 4 4 4 3 $8.50Recreation Front Desk Attendants Rental Caretakers Weight Room Attendants
6 3 0
6 3 0
6 3 0
6 0 4
$8.50 $12.00
$8.50 Total Part-Time Employees 13 13 13 13
(Does not include seasonal employees)
170

============================ FY 2016 ANNUAL BUDGET ================================
===============================CITY OF MISSOURI CITY=================================
DEPARTMENT: PARKS AND RECREATION FUNDING SOURCE: GENERAL FUND
DIVISION: RECREATION FUND NUMBER: 101-16-152
PERFORMANCE INDICATORS FY 2014
ActualFY 2015
Budget FY 2015 Estimate
FY 2016 Budget
Facilities Management – Membership totals (yearly avg.) 896 900 975 1,050 Leisure Programs – # of Classes & Camps 106 150 174 180 Athletics – # of Participants – using our fields 1,257 650 1,410 1,500 Leisure Programs – # of Participants Enrolled 1,763 1,850 2,250 2,350 Special Events – No. of Events 17 20 21 15 Recreation Cost Recovery 32% 35% 38% 38.5% Recreation Expense per Capita (ICMA avg. = $24.56) $15.95 $17.05 $13.81 $13.57 Customer Service Satisfaction Rating Special Events 89% 95% 91% 90% Customer Service Satisfaction Rating Recreation Center 90% 95% 90% 90%
ACTIVITY MEASURES FY 2014
ActualFY 2015
Budget FY 2015 Estimate
FY 2016 Budget
Civic Auditorium (includes “in house” uses) Reservations - A 741 210 830 850Participants + classes & elections in auditorium - A 6,533 5,250 6,500 6,500Weight Room Attendance - B 39,512 37,500 43,850 43,850Gymnasium Attendance - B 62,708 34,500 70,160 70,160Tennis Court Usage - B 23,964 23,500 26,310 26,310 A Reservations include in-house reservations of police and fire training, summer day camp, karate, library programs, city trainings and employee workshops. All these programs are at no cost, external rentals brought in $59,407.25 B Rec and Tennis Center is open 4,385 hrs a FY Weight room is currently averaging 10 members per hour Gymnasium is currently averaging 16 members per hour Tennis is currently averaging 6 members per hour
171

GENERAL FUND
CONSOLIDATED EXPENDITURES BY LINE ITEM
PARKS - RECREATION 101-16-152
Object Description
FY 2014
Actual
FY 2015
Original
Budget
FY 2015
Revised
Budget
FY 2015
Year-End
Estimate
FY 2016
Proposed
Budget
51001 REGULAR SALARIES 284,182 303,065 303,065 319,893 294,825
51002 ADDITIONAL COMPENSATION 867 1,448 1,448 5,621 1,628
51003 COMPENSATED ABSENCES 1,588 - - 1,860 -
51004 OVERTIME 33,336 15,500 15,500 25,500 15,500
51101 PART TIME: 20-29 HOURS - - -
51102 PART TIME:LESS THAN 20 HR 119,730 114,386 114,386 122,972 110,390
51105 SEASONAL 35,000 20,000
51202 CELL PHONE ALLOWANCE 3,061 3,240 3,240 2,916 2,700
51301 LONG TERM DISABILITY 899 1,034 1,034 955 1,005
51302 TAXES, SOCIAL SECURITY 32,854 33,479 33,479 36,495 32,516
51303 HOSP-LIFE-DENT-VIS INS 52,555 57,982 57,982 47,013 57,832
51304 PRORATED HEALTH/DENT/VIS - - -
51305 RETIREMENT 16,959 27,698 27,698 24,446 26,938
51306 WORKERS COMPENSATION 2,392 551 551 2,273 3,001
TOTAL PERSONNEL 548,423 558,383 558,383 624,944 566,335
52001 OFFICE SUPPLIES 2,212 2,500 2,500 2,250 2,250
52002 MEALS & DRINKS 128 1,000 1,000 25
52003 WEARING APPAREL - 750 1,098 1,175
52004 MINOR TOOLS & EQUIPMENT 21,738 18,550 18,550 18,550 58,550
52005 EDUC, TRAINING & SUPPLIES 125 - -
52006 POSTAGE 84 1,500 1,500 80 25
52007 BLDG MAT'L/SUPPLIES & REPAIRS 186 3,000 2,652 1,500 1,500
52008 IDENTIFICATION SUPPLY/FIL 91 600 158 200 200
52013 JANITORIAL SUPPLIES 1,126 3,500 3,500 1,500 1,500
52014 COMPUTER EQUIP RENTAL FEE 4,650 5,032 5,032 5,032
52015 FLEET RENTAL FEE 3,552 4,567 4,567 4,567 4,567
52016 CENTRAL GARAGE ALLOC 3,834 -
52017 FUEL, OIL & LUBRICANTS 972 1,200 1,200 1,093 1,268
52048 PARK MAT'L & SUPPLIES - - 17 17
52049 RECREATIONAL ACTIVITIES 137,249 57,200 70,808 98,700 100,000
52050 SPECIAL EVENTS 106,059 120,500 149,632 120,000 120,000
52052 MAYOR'S YOUTH COMMISSION 1,444 4,100 4,100 4,100 4,100
TOTAL COMMODITIES 283,451 223,999 266,314 258,789 293,960
53001 MINOR EQUIP MAINT/RPR & RNT 851 -
53002 INSURANCE 650 779 779 814 1,329
53004 SPECIAL SERVICES & LEGAL 14,568 17,500 18,933 18,933 44,000
53005 SERVICE AGREEMENTS/REPAIR - - 425 425
53007 CONFERENCE EXPENSE 1,503 2,000 4,100 3,769 4,750
53008 TELEPHONE - - -
53009 BLDG MAINTENANCE ALLOC 193,318
53010 OTHER/MISC - -
53012 COMPUTER SERVICES ALLOC 72,254
53039 WELLNESS PROGRAM - 3,000 3,000 3,000 3,000
53071 CONTRACT INSTRUCTOR PAY - 60,000 60,000 95,500 100,960
TOTAL CONTRACTUAL SERVICES 283,144 83,279 87,237 122,441 154,039
54001 PRINTING & PUBLICATIONS 213 5,000 5,000 2,000 3,000
54002 DUES & SUBSCRIPTIONS 705 4,235 4,234 2,500 3,000
54003 TRAINING & TRAVEL 3,788 6,000 6,000 4,000 6,000
54005 VEHICLE ALLOWANCE - MILEAGE - 150 150 150 150
54006 OTHER EXPENSES - -
TOTAL OTHER SERVICES 4,706 15,385 15,384 8,650 12,150
TOTAL CAPITAL OUTLAY - - - - -
TOTAL EXPENDITURES 1,119,723 881,046 927,318 1,014,824 1,026,484
172
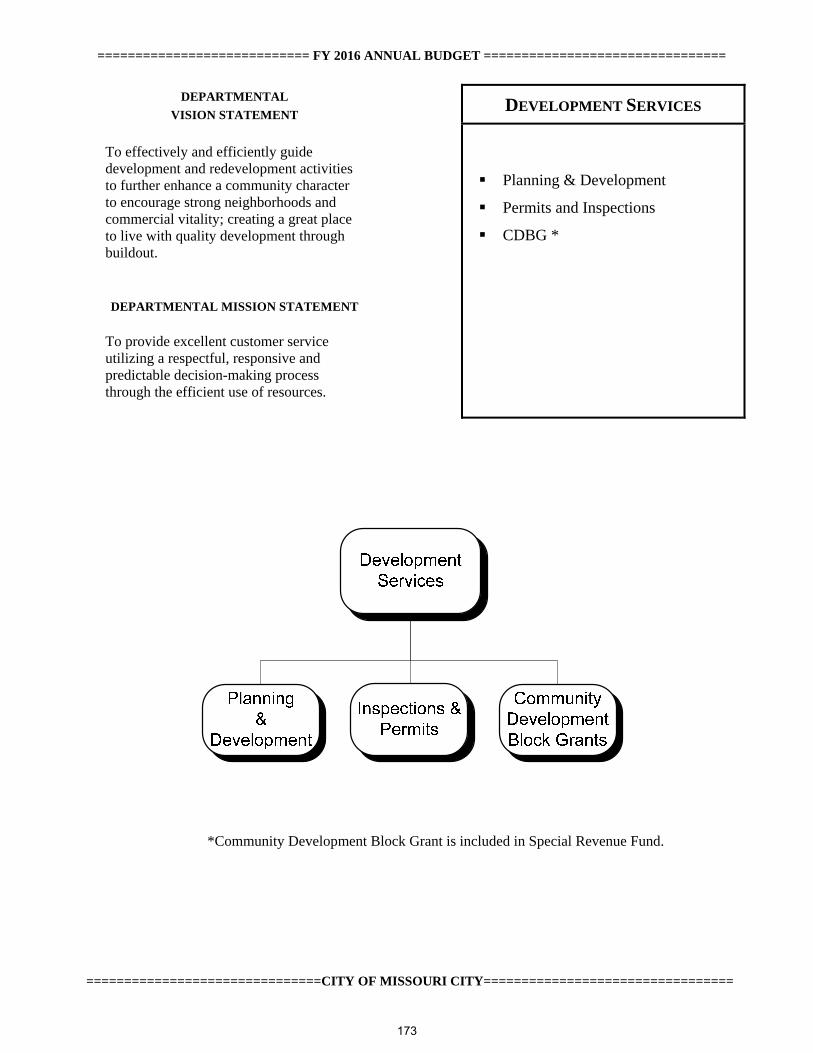
============================ FY 2016 ANNUAL BUDGET ================================
===============================CITY OF MISSOURI CITY=================================
DEPARTMENTAL VISION STATEMENT
DEVELOPMENT SERVICES
To effectively and efficiently guide development and redevelopment activities to further enhance a community character to encourage strong neighborhoods and commercial vitality; creating a great place to live with quality development through buildout.
DEPARTMENTAL MISSION STATEMENT
To provide excellent customer service utilizing a respectful, responsive and predictable decision-making process through the efficient use of resources.
Planning & Development
Permits and Inspections
CDBG *
*Community Development Block Grant is included in Special Revenue Fund.
173

============================ FY 2016 ANNUAL BUDGET ================================
===============================CITY OF MISSOURI CITY=================================
FY 2015 DEPARTMENTAL ACCOMPLISHMENTS
Hired Planner I and Planning Intern to have staff necessary to provide excellent customer service. Hired the Grants Coordinator. Adopted a Fair Housing Ordinance. Timely submission of the 2014 Annual Action Plan and 2013 CAPER to HUD with the revision of the housing rehabilitation program, the application review process, labor standards policies and procedures, and the Citizens Participation Plan. Adoption of revisions to the landscaping regulations in the Zoning ordinance. Creation of the Administrative Platting Manual. Selection of a consultant to assist with the five-year update of the Comprehensive Plan. Managed the plan review and inspection process as the development of the community accelerated. Coordination of the approval of the master plan for the mixed use development north of Lake Olympia Parkway and east of Community Park. Coordination of the development of the 10,000 acre tract commonly known as Sienna South. Amendment of the Planning & Zoning Rules to provide officers to sign plats upon approval. Adoption of the 2015 International Codes. Certification of Building Inspectors. Implementation of the MUNIS module for Permits, Inspections and Planning. Adoption of revisions to regulations of private utilities. Absorption of the LX Administrator duties related to addressing and plat recordation. Revised and utilized the agenda for predevelopment meetings. Participated in the breakfast for businesses along Texas Parkway and Cartwright Road. Provided training for Building Inspectors and Permits Service Representatives. Provided informational material and training opportunities for contractors related to the 2015 International Codes. Submitted Scenic City application to update the current Bronze level certification.
174

============================ FY 2016 ANNUAL BUDGET ================================
===============================CITY OF MISSOURI CITY=================================
DEPARTMENT: DEVELOPMENT SERVICES FUNDING SOURCE: GENERAL FUND
DEPARTMENTAL DESCRIPTION The Development Services Department is charged with managing growth and promoting desired orderly development and redevelopment activities to ensure the safety of all citizens through the protection of life and property. Successful implementation of these activities retains property values, encourages commercial development and ensures the public health, welfare & safety of our citizens. Requiring development to conform to the regulatory standards provides quality development that establishes a sense of place that is essentially Missouri City. The Director of Development Services, appointed by the City Manager and confirmed by City Council, is responsible for the oversight and direction of the three divisions: the Planning and Development Division; the Permits and Inspections Division; and the Community Development Block Grant program. To assist the Director of Development Services with the day to day operations, the Planning and Development Division reports to the Director of Development Services. The Permits and Inspection Division is supervised by the Chief Building Official. The Development Services Department provides outreach to the community through attendance at Homeowner Association meetings; meetings with developers, engineers, and architects to explain regulations and discuss proposed development and construction; and participation in the Junior Achievement program and other educational programs in the community. The outreach to the community will be enhanced in the 2016 fiscal year with the Comprehensive Plan update. The Development Services Department is responsible for coordinating and overseeing all development activity within the City by developing and maintaining the City’s Comprehensive Plan and administering land use regulations (zoning and subdivision). This is accomplished through the plan review, permitting, and inspection of all residential and nonresidential construction that occurs within the City in conjunction with the enforcement of health, nuisance, and property maintenance, and technical codes.
175

============================ FY 2016 ANNUAL BUDGET ================================
===============================CITY OF MISSOURI CITY=================================
DEPARTMENT: DEVELOPMENT SERVICES FUNDING SOURCE: GENERAL FUND
STRATEGIC
GOAL 2019 DEPARTMENTAL GOALS
1,5
Review the CDBG program policies and procedures to assure consistency with federal
regulations and expand public communication about the program. 1,3,5 Lead the process for the 5-year Comprehensive Plan review. 1,3,5 Support the development of the implementation plan for Texas Parkway
Redevelopment. 1,3,4,5 Implement Citizen Self-Service in the MUNIS module to allow customers to apply for
permits, pay fees, schedule inspections and see results of plan review and inspections on-line
4 Provide support to assist other departments’ planning, building and information functions.
1,5 Utilize third party plan-review firm to complete reviews within established guidelines. 1,5 Abate sub-standard structures within one year in accordance with the City’s Codes.
1,4,5 Increase the awareness of departmental activities and services through the continued development of informational clips to run on MCTV and through community involvement with HOAs and schools.
3,5 Improve the health inspection scores for restaurants through enhanced inspections and education.
4 Train staff and develop user manual for the use of the new MUNIS software. 4,5 Provide training opportunities for department members to enhance the service delivery
to the public. 3,4,5 Develop training for the staff and contractors for the 2015 technical codes.
176

============================ FY 2016 ANNUAL BUDGET ================================
===============================CITY OF MISSOURI CITY=================================
DEPARTMENT: DEVELOPMENT SERVICES FUNDING SOURCE: GENERAL FUND
DIVISION: PLANNING & DEVELOPMENT FUND NUMBER: 101-17-160
DESCRIPTION OF DIVISIONAL OPERATIONS The Director of Development Services is appointed by the City Manager and confirmed by City Council and is responsible for the direction of the Planning and Development Division, the Permits and Inspections Division, and the Community Development Block Grant program. The Planning and Development Division is responsible for the establishment, maintenance, and implementation and updating of the comprehensive plan. Through the implementation of the plan, the Division is charged with creating, administering, and enforcing land use regulations including both the zoning and subdivision ordinances. In addition, this division provides technical assistance and coordinates the meetings of the Planning and Zoning Commission and the Zoning Board of Adjustment. The Planning Division processes applications for rezoning and subdividing property and presents analyses and recommendations to the Planning and Zoning Commission and City Council. Requiring development to conform to the regulatory standards provides quality development that establishes a sense of place that is essentially Missouri City. Through the CDBG program the City implements the National Objectives of the U.S. Department of Housing and Urban Development, including improving safety and livability of neighborhoods, increasing access to quality facilities and services, revitalizing deteriorating neighborhoods, and conserving energy resources. The Division conducts special studies as needed and maintains the City’s population estimates.
Development Services Director
Office Manager Senior Planner
Planner I
Part-Time Planning Intern
Total Full-Time Employees = 4 Total Part-Time Employees = 1
177

============================ FY 2016 ANNUAL BUDGET ================================
===============================CITY OF MISSOURI CITY=================================
DEPARTMENT: DEVELOPMENT SERVICES FUNDING SOURCE: GENERAL FUND
DIVISION: PLANNING & DEVELOPMENT FUND NUMBER: 101-7060 STRATEGIC
GOAL 2019 DIVISIONAL OBJECTIVES
1,3,5 Conduct the 5-year review of the comprehensive plan and revise the zoning ordinance, subdivision ordinance, and land use plan to reflect the current goals of the City.
1,3,5 Utilize the predevelopment meeting agenda and materials to assure that each developer is provided accurate information relating to the development process.
1,5 Provide prompt response to inquires about developments and complete building and architectural reviews within the ten business day review period.
1,5 Continue community education efforts by conducting planning workshops with local schools, civic, Junior Achievement, and HOA organizations and develop a community education component of the Comprehensive Plan review process.
4 Provide training for staff to provide expertise necessary for optimum customer service. 1,3,5 Support the development of the implementation plan for Texas Parkway
Revitalization. 1,5 Continue to oversee the development of the 10,000 acre Sienna South.
PERSONNEL SCHEDULE
FY 2014
Actual FY 2015
Budget FY 2015 Estimate
FY 2016 Budget
SalaryGrade
Director of Development Services 1 1 1 1 Uncl.Assistant City Engineer 1 0 0 0 22Senior Planner 1 1 1 1 22Planner I 1 1 1 1 12Office Manager 1 1 1 1 15 Total Full-Time Employees 5 4 4 4
Part-Time Planning Intern 1 1 1 1 $12/hr
178

============================ FY 2016 ANNUAL BUDGET ================================
===============================CITY OF MISSOURI CITY=================================
DEPARTMENT: DEVELOPMENT SERVICES FUNDING SOURCE: GENERAL FUND
DIVISION: PLANNING & DEVELOPMENT FUND NUMBER: 101-17-160
PERFORMANCE INDICATORS FY 2014
ActualFY 2015
Budget FY 2015 Estimate
FY 2016 Budget
Meet with developers, etc., within 72 hrs. from the date of request. 97% 100% 100% 100% Perform/coordinate initial architectural plan reviews, provide
comprehensive initial comments within 5 days, & subsequent comments within 2 days. 87% 85% 50% 75%
Perform/coordinate building permit plan reviews, provide comprehensive initial comments within 10 days, and subsequent comments within 5 days. 87% 85% 25% 75%
Perform requested zoning inspections within 1 day from date of request if desired. 97% 98%
75% 90%
ACTIVITY MEASURES
FY 2014
Actual
FY 2015 Budget
FY 2015Estimate
FY 2016
Budget Zoning District Map Amendments General 3 3 1 1
Planned Developments 12 10 10 5Specific Use Permits 5 3 5 3
Zoning Ordinance Text Amendments 7 4 6 2 Zoning Variance Requests 1 1 0 1 Subdivision Ordinance Text Amendments 2 1 0 1 Conceptual Plan Reviews 6 5 3 1 Preliminary Plat Reviews 24 11 17 10 Final Plat Reviews 26 12 18 15 Amending Plats/Replats 4 7 7 5 Plat Extensions 0 1 1 1 Park Land Dedication Proposals Considered by P&Z 1 5 1 1 Architectural Design & Building Permit Reviews 143 155 200 170 Major Plan Adoptions/Revisions 3 2 0 0 DAs & SPAs & Amendments 300 hrs 200 hrs 0 hrs 0 hrs Zoning/ Architectural Design/ Weekly Field Inspections 106 90 100 100 Pre-Development Meetings 72 95 45 50 CDBG Plans (Consolidated Plan and Annual Action Plan) 3 3 2 2
179

GENERAL FUND
CONSOLIDATED EXPENDITURES BY LINE ITEM
DEVELOPMENT SERVICES - PLANNING 101-17-160
Object Description
FY 2014
Actual
FY 2015
Original
Budget
FY 2015
Revised
Budget
FY 2015
Year-End
Estimate
FY 2016
Proposed
Budget
51001 REGULAR SALARIES 305,904 247,021 247,021 254,809 248,099
51002 ADDITIONAL COMPENSATION 1,514 1,932 1,932 1,735 1,596
51004 OVERTIME 262 1,000 1,000 1,350 1,000
51102 PART TIME:LESS THAN 20 HR 325 10,490 10,490 10,096 11,988
51201 CAR-CLOTHING ALLOWANCE 2,962 3,000 3,000 2,982 3,000
51202 CELL PHONE ALLOWANCE 2,512 3,240 3,240 3,222 3,240
51301 LONG TERM DISABILITY 979 854 854 789 860
51302 TAXES, SOCIAL SECURITY 22,941 20,319 20,319 19,741 20,573
51303 HOSP-LIFE-DENT-VIS INS 32,745 29,623 29,623 30,274 36,710
51305 RETIREMENT 16,319 22,870 22,870 19,189 23,034
51306 WORKERS COMPENSATION 1,086 335 335 269 242
TOTAL PERSONNEL 387,549 340,684 340,684 344,456 350,342
52001 OFFICE SUPPLIES 3,478 3,500 3,500 3,500 3,500
52002 MEALS & DRINKS 163 400 400 286 400
52003 WEARING APPAREL 11 - -
52004 MINOR TOOLS & EQUIPMENT - 400 400 300 400
52005 EDUC, TRAINING & SUPPLIES 166 600 600 400 600
52006 POSTAGE 695 6,300 6,300 1,200 1,200
52014 COMPUTER EQUIP RENTAL FEE 6,757 8,429 8,429 8,429
52015 FLEET RENTAL FEE 1,140 1,500 1,500 1,500 1,500
52016 CENTRAL GARAGE ALLOC - - -
52017 FUEL, OIL & LUBRICANTS 237 - - -
TOTAL COMMODITIES 12,648 21,129 21,129 15,615 7,600
53002 INSURANCE 12,219 2,443 2,443 2,591 2,091
53004 SPECIAL SERVICES & LEGAL 2,348 125,200 126,200 130,000 10,200
53007 CONFERENCE EXPENSE 1,878 3,000 3,000 2,500 3,000
53009 BLDG MAINTENANCE ALLOC 25,088 -
53012 COMPUTER SERVICES ALLOC 35,998 -
TOTAL CONTRACTUAL SERVICES 77,530 130,643 131,643 135,091 15,291
54001 PRINTING & PUBLICATIONS 4,303 13,000 13,000 5,000 5,000
54002 DUES & SUBSCRIPTIONS 5,357 5,200 5,200 5,200 5,200
54003 TRAINING & TRAVEL 4,462 4,100 4,100 3,700 4,100
54005 VEHICLE ALLOWANCE - MILEAGE - 50 50 50 50
TOTAL OTHER SERVICES 14,122 22,350 22,350 13,950 14,350
75005 EQUIPMENT - OFFICE - - - - -
75006 VEHICLES - - - - -
77007 OTHER / MISCELLANEOUS - - - - -
TOTAL CAPITAL OUTLAY - - - - -
TOTAL EXPENDITURES 491,848 514,806 515,806 509,112 387,583
180

============================ FY 2016 ANNUAL BUDGET ================================
===============================CITY OF MISSOURI CITY=================================
DEPARTMENT: DEVELOPMENT SERVICES FUNDING SOURCE: GENERAL FUND
DIVISION: INSPECTIONS & PERMITS FUND NUMBER: 101-17-162
DESCRIPTION OF DIVISIONAL OPERATIONS
The Chief Building Official reports to the Director of Development Services and directly supervises the Permits and Inspection Division. The Building Official offers support in all aspects of division responsibilities. The Division reviews all construction plans, and issues all building, plumbing, electrical, mechanical, health and other major construction permits. Prior to issuing permits, Division staff ensures that all contractors doing work in Missouri City are licensed and / or registered locally or by the State of Texas. The Division is also responsible for providing information to the general public regarding building setbacks, building code requirements, and business occupancy requirements. The Division’s Commercial Plans Examiner coordinates review of all commercial plans through the Planning, Fire, and Public Works departments to ensure all private developers of a thorough review of their projects. The Health Inspector protects the health and safety of the public through enforcement of state and local health codes, and by inspecting all food establishments to assure proper handling, storage, and preparation of food being offered for consumption. The inspector reviews the plans for all new food establishments, performs pre-opening inspections of all new food establishments, and facilitates food protection management training for all food establishments.
Total Full-Time Employees = 13 Total Part-Time Employees = 1
*Development Services Director is included in Planning & Development Divisional Budget.
FUNDING SOURCE: GENERAL FUND
181

============================ FY 2016 ANNUAL BUDGET ================================
===============================CITY OF MISSOURI CITY=================================
DEPARTMENT: DEVELOPMENT SERVICES DIVISION: INSPECTIONS & PERMITS FUND NUMBER: 101-17-162
STRATEGIC
GOAL 2019 DIVISIONAL OBJECTIVES
1,3,4,5 Implement Citizen Self-Service in the MUNIS module to allow customers to apply for
permits, pay fees, schedule inspections and see results of plan review and inspections on-line.
1,3,4,5 Provide training for the staff and contractors for the 2015 technical codes. 4 Provide training opportunities for all staff to insure knowledge and skills to provide
optimum customer service. 4 Train staff and develop user manual for the use of the new MUNIS software.
1,3,5 Abate sub-standard structures in accordance with the City’s Codes. 1,4,5 Increase the awareness of departmental activities and services through the continued
development of informational clips to run on MCTV and through community involvement with HOAs and schools.
4 Provide support to assist other departments’ planning, building and information functions.
1,5 Utilize third party plan-review firm to complete reviews within established guidelines. 1 Improve the health inspection scores for restaurants through enhanced inspections and
education.
PERSONNEL SCHEDULE
FY 2014 Actual
FY 2015 Budget
FY 2015 Estimate
FY 2016 Budget
SalaryGrade
Building Official 1 1 1 1 23Deputy Building Official 1 1 1 1 22Inspector III 3 3 3 3 13Inspector II 1 1 1 1 12Health Inspector 1 1 1 1 10Permit Service Representative II 1 1 1 1 09Permit Service Representative I 5 5 5 5 06Total Full Time Employees 13 13 13 13 Part-Time Employee (Data Entry) 1 1 1 1 $8/hr.
182
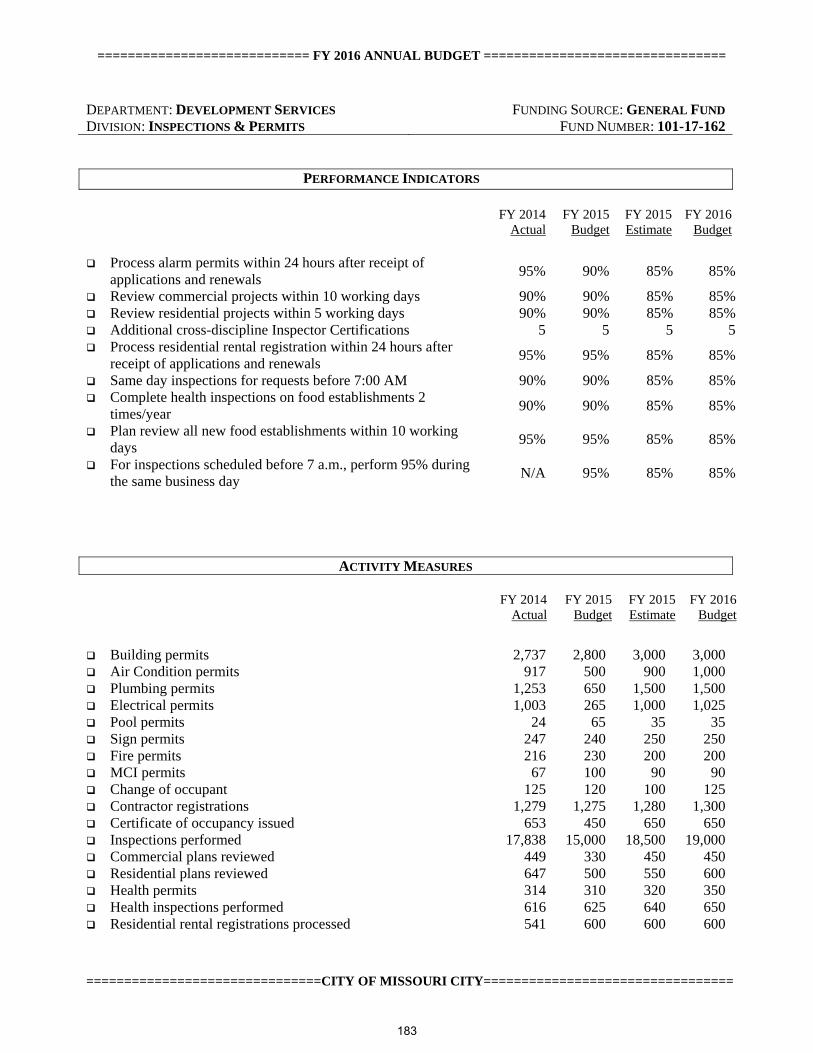
============================ FY 2016 ANNUAL BUDGET ================================
===============================CITY OF MISSOURI CITY=================================
DEPARTMENT: DEVELOPMENT SERVICES
FUNDING SOURCE: GENERAL FUND
DIVISION: INSPECTIONS & PERMITS FUND NUMBER: 101-17-162
PERFORMANCE INDICATORS FY 2014
Actual FY 2015
Budget FY 2015 Estimate
FY 2016 Budget
Process alarm permits within 24 hours after receipt of
applications and renewals 95% 90% 85% 85%
Review commercial projects within 10 working days 90% 90% 85% 85% Review residential projects within 5 working days 90% 90% 85% 85% Additional cross-discipline Inspector Certifications 5 5 5 5 Process residential rental registration within 24 hours after
receipt of applications and renewals 95% 95% 85% 85%
Same day inspections for requests before 7:00 AM 90% 90% 85% 85% Complete health inspections on food establishments 2
times/year 90% 90% 85% 85%
Plan review all new food establishments within 10 working days
95% 95% 85% 85%
For inspections scheduled before 7 a.m., perform 95% during the same business day
N/A 95% 85% 85%
ACTIVITY MEASURES FY 2014
Actual FY 2015
Budget FY 2015 Estimate
FY 2016 Budget
Building permits 2,737 2,800 3,000 3,000 Air Condition permits 917 500 900 1,000 Plumbing permits 1,253 650 1,500 1,500 Electrical permits 1,003 265 1,000 1,025 Pool permits 24 65 35 35 Sign permits 247 240 250 250 Fire permits 216 230 200 200 MCI permits 67 100 90 90 Change of occupant 125 120 100 125 Contractor registrations 1,279 1,275 1,280 1,300 Certificate of occupancy issued 653 450 650 650 Inspections performed 17,838 15,000 18,500 19,000 Commercial plans reviewed 449 330 450 450 Residential plans reviewed 647 500 550 600 Health permits 314 310 320 350 Health inspections performed 616 625 640 650 Residential rental registrations processed 541 600 600 600
183

GENERAL FUND
CONSOLIDATED EXPENDITURES BY LINE ITEM
DEVELOPMENT SERVICES - INSPECTIONS 101-17-162
Object Description
FY 2014
Actual
FY 2015
Original
Budget
FY 2015
Revised
Budget
FY 2015
Year-End
Estimate
FY 2016
Proposed
Budget
51001 REGULAR SALARIES 483,197 515,893 515,893 541,930 510,643
51002 ADDITIONAL COMPENSATION 3,636 4,543 4,543 3,616 4,144
51003 COMPENSATED ABSENCES 2,512 - - 129
51004 OVERTIME 6,145 6,000 6,000 7,800 6,000
51102 PART TIME:LESS THAN 20 HR - 10,490 10,490 4,070 10,490
51202 CELL PHONE ALLOWANCE 4,727 4,320 4,320 4,871 4,860
51301 LONG TERM DISABILITY 1,638 1,763 1,763 1,697 1,746
51302 TAXES, SOCIAL SECURITY 36,421 41,405 41,405 40,479 41,014
51303 HOSP-LIFE-DENT-VIS INS 97,183 115,116 115,116 102,384 125,010
51304 PRORATED HEALTH/DENT/VIS 471 - -
51305 RETIREMENT 26,109 47,228 47,228 40,087 46,768
51306 WORKERS COMPENSATION 1,294 682 682 1,035 889
TOTAL PERSONNEL 663,331 747,440 747,440 748,098 751,564
52001 OFFICE SUPPLIES 2,693 3,500 3,500 3,500 3,500
52002 MEALS & DRINKS 93 100 100 124 100
52003 WEARING APPAREL 1,675 2,550 2,550 2,550 2,550
52004 MINOR TOOLS & EQUIPMENT 600 550 550 200 23,790
52005 EDUC, TRAINING & SUPPLIES 3,363 5,000 5,000 5,000 5,000
52006 POSTAGE 1,002 3,000 3,000 2,000 3,000
52008 IDENTIFICATION SUPPLY/FIL 235 - -
52014 COMPUTER EQUIP RENTAL FEE 8,445 8,850 8,850 8,850
52015 FLEET RENTAL FEE 11,289 16,330 16,330 16,330 16,544
52016 CENTRAL GARAGE ALLOC 11,966 -
52017 FUEL, OIL & LUBRICANTS 12,762 12,500 12,500 11,867 13,765
TOTAL COMMODITIES 54,123 52,380 52,380 50,421 68,249
53002 INSURANCE 1,043 1,521 1,521 1,524 2,115
53004 SPECIAL SERVICES & LEGAL 20,923 35,000 48,926 48,926 35,000
53007 CONFERENCE EXPENSE 90 1,500 1,500 1,500 1,500
53008 TELEPHONE - 5,708 5,708
53009 BLDG MAINTENANCE ALLOC 16,073 -
53012 COMPUTER SERVICES ALLOC 93,339 -
53040 SUB-STANDARD STRUCTURES - 1,500 1,500 1,500
TOTAL CONTRACTUAL SERVICES 131,468 45,229 59,155 51,950 40,115
54001 PRINTING & PUBLICATIONS 321 1,000 1,000 1,000 1,000
54002 DUES & SUBSCRIPTIONS 1,451 2,720 2,720 1,600 1,600
54003 TRAINING & TRAVEL 6,566 9,000 9,000 9,000 9,000
TOTAL OTHER SERVICES 8,338 12,720 12,720 11,600 11,600
75005 EQUIPMENT - OFFICE - - - -
75006 VEHICLES - - - -
77007 OTHER / MISCELLANEOUS - - - -
TOTAL CAPITAL OUTLAY - - - - -
TOTAL EXPENDITURES 857,261 857,769 871,695 862,069 871,528
184

DEPARTMENTAL VISION
STATEMENT
To become an integral partner with our customers
and the community to enable the City to be
recognized as a leader in technology that prides
itself on innovation, transparency, and
accountability.
DEPARTMENTAL MISSION
STATEMENT
The I.T. Department delivers the best proven
technology and services available for computer,
data, telecommunications, mapping, and critical
business systems of the City to employees and
the public through excellent customer service,
continuous improvement, innovative problem-
solving, adherence to standardized Innovation &
Technology best practices, and collaborative
solutions.
DEPARTMENTAL DESCRIPTION
The Innovation & Technology Department serves other City departments through a series of services that
includes integrating computer systems, coordinating and providing training, negotiating and managing
Innovation & Technology related contracts, and technology assistance and support. The department creates
the technological environment that enables City employees to quickly access vital information using the
most efficient and cost effective system hardware and software.
I.T. Operations Manager
Desktop Services Specialist III – (Lead)
Director of Technology & Innovation
Network Administrator
(Lead)
Desktop Services
Specialist II (2)
Assistant City Manager*
Desktop Services
Specialist I (2)
PT Office Manager
Systems Administrator
Total Full-Time Employees = 9
Total Part-Time Employees = 1
*Assistant City Manager is included in the Council & Management budget.
INNOVATION & TECHNOLOGY
Innovation & Technology
185

FY 2015 DEPARTMENTAL ACCOMPLISHMENTS Upgraded Council Conference Room to provide more technological functionality. Upgraded Public Safety Training Room to provide more technological functionality. Replaced analog phone at Public Safety Mini Station for easier access.
Implemented and configured an IP network at Fire Station #5 to allow access to EOC and all
servers.
Upgraded or replaced all Macs for MCTV to give them better resources; placed Macs on corporate
domain for access to corporate resources; implemented a 10Gb network to accommodate new
storage solution for MCTV’s video and storage requirements. Implemented and updated the call tree for City Hall front desk, allowing for better functionality
and better telephone access for our citizens.
Implemented and configured new IVR server to accommodate MUNIS Go Live for Planning &
Development Services which provides access for citizens to schedule inspections through the
phone. Installed and configured HP C7000 chassis to consolidate the VMware hosts and provide more
resources to the VMware infrastructure.
Upgraded the NICE voice system that records critical 9-1-1 and non-emergency calls to record
more non-emergency extensions.
Procured Coban Edge system to complete the implementation of Coban to all Patrol units, retiring
the current Kustom system. Continued to replace large multi-function copiers with leased multi-function color copiers.
Implemented and installed G1’s for all motorcycle units, making them fully functional in the field. Implemented Kace 1000 inventory and management software solution that manages all devices that
run Windows. This system will provide a more robust internal help desk solution. Completed the remodeling of the Innovation & Technology offices. Upgraded the Wireless LAN Controller and maintain corporate and free Wi-Fi across all city
buildings to provide a new service for employees and Guests/Citizens. Implemented and installed Utility rockets in all mobile units to enable Coban remote upload
capability, giving the officer more time in the field to serve and protect the Citizens of Missouri
City. Updated Microsoft license agreement to keep access to current Office and System software which
gave users up-to-date-software to improve productivity. Reorganized the Innovation & Technology Department to bring more structure and standards to the
services provided to internal and external users while continuing development and training. Supported 450 users and over 1,735 different hardware devices, such as mainframes, personal
computers, servers, printers, scanners, modems, monitors and cash registers; to support over 85
operating systems and application software packages, such as OS/400, Windows 7, suite of
Microsoft Office 2013, Microsoft Outlook and Sungard HTE applications; to support users in the
acquisition and installation of computing equipment and software that best meets their needs. Continued to maintain a stable/secure computer environment and preserved copies of backup data
offsite. Continued to maintain and support all City servers and software, including Tyler MUNIS, OSSI,
INCODE, EPO management, Coban, Coban storage, and Solar Winds
186

DEPARTMENT: GENERAL GOVERNMENT FUNDING SOURCE: GENERAL FUND
INNOVATION & TECHNOLOGY FUND NUMBER: 101-18-170
FY 2016 DEPARTMENTAL OBJECTIVES
• Continue to align technology with the City priorities and the business goals of the organization.
• Build alliances with key decision-makers.
• Lobby for, and obtain, financial and other resources to deliver services and implement projects.
(ITSC)
• Deliver quality customer service at all times.
• Promote a commitment to excellence.
• Assist in converting business requirements to technical needs.
• Provide innovative problem-solving solutions using proven technologies.
• Maximize the City’s investment in technology.
• Develop and manage a technology infrastructure and processes to electronically preserve and share the
extensive knowledge base of City departments.
• Maintain highly skilled and motivated information technology professionals.
DEPARTMENT: GENERAL GOVERNMENT FUNDING SOURCE: GENERAL FUND
INNOVATION & TECHNOLOGY FUND NUMBER: 101-18-170
PERSONNEL SCHEDULE
FY 2014 FY 2015 FY 2015 FY 2016 Salary
Actual Budget Estimate Budget Grade
Director of Technology & Innovation 1 1 1 1 24
I.T. Manager 1 1 1 1 22
Network Administrator 1 1 1 1 15
Desktop Services Specialist III – Lead 0 1 1 1 14
Systems Administrator 1 1 1 1 14
Desktop Services Specialist II
Desktop Services Specialist I
0
0
0
0
0
0
2
2
13
12
AS/400 PC/LAN Specialist 2 2 2 0 12
Total Full-Time Employees 7 7 7 9
Part-Time Office Manager 1 1 1 1
Total Part Time Employees 1 1 1 1
187

PERFORMANCE INDICATORS
FY 2014
Actual
FY 2015
Budget
FY 2015
Estimate
FY 2016
Budget
Respond to Priority #1 help calls within two hours. 98% 98% 98% 96%
Respond to Priority #2 help calls within four hours. 98% 98% 98% 98%
Respond to Priority #3 help calls within one week. 95% 95% 95% 95%
Maintain Server Infrastructure up time 98% 99% 99% 99% Maintain the Police/Fire Dispatch on-line. 98% 99% 99% 99%
ACTIVITY MEASURES
FY 2014
Actual
FY 2015
Budget
FY 2015
Estimate
FY 2016
Budget
Infrastructure
iSeries Systems Maintained 2 0 0 0
Server Computers 124 124 124 124
Microsoft Exchange Servers 2 2 2 2
VMWare ESX Servers 6 8 8 8
SAN Systems 2 3 3 3
Software
Operating Systems 8 11 11 11
iSeries Applications N/A N/A N/A N/A
Tyler/MUNIS Applications 34 34 34 34
Computer Applications 245 250 250 250
OSSI 12 12 12 12
End Users
Workstations 331 412 412 420
Network Printers 87 91 87 87
Printers and Special Devices 229 229 210 200
Requests for Service 2000 2,200 4,000 4.500
188

GENERAL FUND
CONSOLIDATED EXPENDITURES BY LINE ITEM
INNOVATION & TECHNOLOGY 101-18-170
Object Description
FY 2014
Actual
FY 2015
Original
Budget
FY 2015
Revised
Budget
FY 2015
Year-End
Estimate
FY 2016
Proposed
Budget
51001 REGULAR SALARIES 418,779 418,779 457,118 432,955
51002 ADDITIONAL COMPENSATION 1,976 1,976 1,643 1,248
51003 COMPENSATED ABSENCES 7,721
51004 OVERTIME 7,000 7,000 13,000 9,800
51102 PART TIME:LESS THAN 20 HR 19,980 19,980 10,176 19,980
51201 CAR-CLOTHING ALLOWANCE 3,000 3,000 2,982 3,000
51202 CELL PHONE ALLOWANCE 7,560 7,560 6,571 7,560
51301 LONG TERM DISABILITY 1,449 1,449 1,253 1,494
51302 TAXES, SOCIAL SECURITY 35,060 35,060 35,648 36,303
51303 HOSP-LIFE-DENT-VIS INS 76,614 76,614 44,329 58,248
51304 PRORATED HEALTH/DENT/VIS 500
51305 RETIREMENT 39,448 39,448 33,771 40,911
51306 WORKERS COMPENSATION 569 569 541 418
TOTAL PERSONNEL - 611,435 611,435 615,253 611,917
52001 OFFICE SUPPLIES 1,000 1,000 1,000 1,000
52002 MEALS & DRINKS 250 250 82 250
52003 WEARING APPAREL 80 665 165 300
52004 MINOR TOOLS & EQUIPMENT 172,676 278,322 274,322 253,616
52005 EDUC, TRAINING & SUPPLIES 100 100 500
52006 POSTAGE 150 150 200 200
52014 COMPUTER EQUIP RENTAL FEE 106,987 106,987 106,987
52015 FLEET RENTAL FEE 2,500 2,500 2,500 2,500
52017 FUEL, OIL & LUBRICANTS 1,100 1,100 700 812
52061 COMPUTER REPAIR/REPLACEMENT 10,000 12,000 27,737 40,000
52062 COPY MACHINE SUPPLIES/RPR 60,000 60,000 69,157 60,000
TOTAL COMMODITIES - 354,843 463,074 482,850 359,178
53001 MINOR EQUIP MAINT/RPR & RNT - 100 100 175 100
53002 INSURANCE 1,664 1,664 1,759 2,050
53004 SPECIAL SERVICES & LEGAL 98,660 98,660 45,000 98,600
53005 SERVICE AGREEMENTS/REPAIR 825,309 825,309 874,705 1,176,416
53007 CONFERENCE EXPENSE 2,000 2,000 6,663 2,000
53008 TELEPHONE 265,305 265,305 393,901 451,010
TOTAL CONTRACTUAL SERVICES - 1,193,038 1,193,038 1,322,203 1,730,176
54001 PRINTING & PUBLICATIONS 50 50 59 50
54002 DUES & SUBSCRIPTIONS 100 100 100
54003 TRAINING & TRAVEL 13,500 13,500 4,295 13,500
54005 VEHICLE ALLOWANCE - MILEAGE 200 200 100 1,000
TOTAL OTHER SERVICES - 13,850 13,850 4,454 14,650
TOTAL CAPITAL OUTLAY - - - - -
TOTAL EXPENDITURES - 2,173,166 2,281,397 2,424,760 2,715,921
189

190

SPECIAL REVENUE FUNDS
PURPOSE AND KEY REVENUE ASSUMPTIONS AND TRENDS
Special revenue funds are used to account for specific revenues that are either legally restricted to expenditures for a
particular purpose or need to separately be accounted for.
Parkland Dedication Fund. In order to provide neighborhood parks, the Parkland Dedication ordinance calls for
integrating this requirement into the planning and development of subdivisions. Whenever a final plat is filed with
the County, such plat shall contain a clear fee simple dedication of an area of land for park purposes, which shall
equal one acre for each 100 proposed dwelling units. The required dedication may also be met by a payment in lieu
of land, the pledge of security guaranteeing the future dedication of park land or the provision of private
neighborhood park land when permitted or required by other provision of the subdivision ordinance. The Park Land
Dedication Fund was established for deposit of all sums paid in lieu of land dedication. The City is divided into
thirteen park zones, and the funds are accounted for by park zone. Revenue is recognized when received as
determined by the planning department during the planning process. Expenditures are made within the same park
zone for which funds are received as the accumulation allows a project to be completed.
Narcotics Fund. This fund is used to account for funds received yearly from the United States Department of
Justice through the State and seizure monies. Monies are also received periodically from the Fort Bend County
Task Force, Narcotics Seizure Fund, as a result of final conviction of offenders. Revenue is recognized only as
checks are distributed to the various governmental agencies by the Task Force. The funds are utilized exclusively to
purchase police equipment.
Radio Communications Fund. This fund was established by an internal agreement between the City of Sugar
Land and Missouri City with Sugar Land reimbursing the City for one half of the radio system tower site located at
the Missouri City Public Safety Headquarters. The Cities agreed that the City should operate the 800 MHz trunked
radio tower system and provide an operator who will provide radio-programming services and maintain the system
for the use of both Cities. Revenue is received from both governmental and private users by contract. Revenue is
recognized when due per the contract with Sugar Land and Missouri City providing one half of the operating and
maintenance costs after deducting revenue received from other users.
Municipal Court Building Security/Technology/Juvenile Case Funds. These funds are utilized to account for
the state mandated court fees to be used for Municipal Court building security, the furthering of Municipal Court
technology, and supplementing expenses for the Juvenile Case Manager. Fees are collected on all convictions and
set aside to improve building security, enhance the information technology of the City’s Municipal Court Division
and assist in paying the salary of the Juvenile Case Manager.
Community Development Block Grant Funds. The City receives a grant from the U.S. Department of Housing
and Urban Development (HUD) yearly to improve the safety and livability of our citizens, and funds are reimbursed
monthly from the HUD.
MCTV Facilities/Equipment Fund. This fund is used to account for Public, Educational, and Governmental
Access (PEG) fees collected from cable TV subscribers. The funds are to be used solely for technology, furniture
and equipment related to the City’s cable TV station programming.
Missouri City Development Authority Fund. The Development Authority was organized for the purpose of
aiding, assisting and acting on behalf of the City in the performance of its governmental functions to promote
common good and general welfare of the areas included in the City’s Public Improvement Districts (PIDs) and Tax
Increment Reinvestment Zones (TIRZs) to promote, develop, encourage and maintain housing, educational
facilities, employment, commerce and economic development in the City. The Development Authority is governed
by a board comprised of all members of the City’s governing body (City Council). This fund accounts for the
191

administrative costs associated with the Development Authority and their reimbursement by the various PIDs and
TIRZs.
Tax Increment Reinvestment Zones (TIRZs). TIRZ #1 (Fifth Street area), TIRZ #2 (Vicksburg area) and TIRZ
#3 (South Hwy 6) provide for the design and construction of required infrastructure and other project costs in order
to facilitate the development of new residential and commercial properties where necessary infrastructure is absent
and where development would not otherwise occur; for example, where major drainage improvements are
necessary. These zones are used to assist the City to promote and affect long-term comprehensive urban design and
land planning. They are also being used to improve the quality of growth and development in blighted areas where
substandard infrastructure and housing accommodations constitute an economic and social liability and a menace to
public health, safety, and welfare. The presence of substandard, deteriorated and deteriorating structures,
predominance of defective and inadequate sidewalk and street layouts, unsanitary and unsafe conditions, and
defective and complicated conditions or title substantially arrests the sound growth of those areas of the City and
constitutes a burden and threat to healthier areas of the City. These funds will be initially financed by the
developers in the area who will be reimbursed by the incremental taxes paid on the increased property values in
future years.
Public Improvements Districts (PIDs). PIDs provide an alternative to the creation of Municipal Utility Districts
(MUDs) in order to finance infrastructure for new development. PID project costs are paid by a property owner
assessment. Bonds may be issued with the assessment. The City has adopted a policy requiring the use of PIDs to
finance infrastructure for new development.
Hotel Occupancy Tax Fund (HOT). This fund was created to account for the collection of remittances from
the city’s two hotels. The first hotel, La Quinta Inn, opened in December 2012. It has 55 rooms. A second
hotel, Hampton Inn, opened in December 2013 and has 64 rooms. Hotel occupancy taxes are received
quarterly. Expenditures are governed by state law and are approved by the City Council.
Grants Fund. The Grants Fund was created to account for the administration of all federal, state, and local
grant funds received by the City, excluding CDBG. Revenues are accounted for in this Fund and the
corresponding grant expenditures are made out of this Fund.
Donations Fund. The Donations Fund is used to account for miscellaneous donations received by the City.
Donations are recorded and maintained based on the department or division that receives the donations.
192

MUNC. CT.
BLDG SEC/ MCTV
PARKLAND NARCOTICS RADIO INFO TECH/ FACILITIES/
DED. SEIZURE COMM. JUV CASE CDBG GRANTS EQUILMENT
DESCRIPTION FUND FUNDS FUND FUNDS FUNDS FUND FUND
REVENUES:
FINES & FORFEITURES
Munc Ct Building Security Fees 0 0 0 21,177 0 0 0
Munc Ct Technology Fees 0 0 0 28,248 0 0 0
Munc Ct Juvenille Case Fees 0 0 0 41,123 0 0 0
TOTAL FINES & FORFEITURES 0 0 0 90,548 0 0 0
INTERGOVERNMENTAL REVENUES
Grants 0 0 0 0 379,672 230,383 0
User Fees 0 0 0 0 0 0 0
Taxes 0 0 0 0 0 0 0
Drug Forfeitures 0 0 0 0 0 0 0
Sugar Land/Mo City Reimbursements 0 0 0 0 0 0 0
City of Houston Radio License 0 0 13,162 0 0 0 0
Public Safety Radio Use 0 0 48,501 0 0 0 0
TOTAL INTERGOVERNMENTAL
REVENUES 0 0 61,663 0 379,672 230,383 0
OTHER REVENUES
Interest Earnings 24,000 7,900 710 8,055 0 0 5,905
Cable/Video In-Kind Fees 0 0 0 0 0 0 175,600
Contributions from Developers 0 0 0 0 0 0 0
Payments in Lieu of Parkland 0 0 0 0 0 0 0
O&M Reserve Inc/(Dec) 0 0 0 0 0 0 0
ATC Reimbursement 0 0 144,245 0 0 0 0
Donations 0 0 0 0 0 0 0
Hotel Occupance Tax 0 0 0 0 0 0 0
TOTAL OTHER REVENUES 24,000 7,900 144,955 8,055 0 0 181,505
TOTAL REVENUES 24,000 7,900 206,618 98,603 379,672 230,383 181,505
OTHER FINANCING SOURCES
Proceeds from the Sale of Debt 0 0 0 0 0 0 0
Transfer from General Fund 0 0 0 0 0 0 0
Transfer from General Fund-Taxes 0 0 0 0 0 0 0
Transfer from Debt Service-Taxes 0 0 0 0 0 0 0
Transfer from TIRZ #1 Fund 0 0 0 0 0 0 0
Transfer from TIRZ #2 Fund 0 0 0 0 0 0 0
Transfer from TIRZ #3 Fund 0 0 0 0 0 0 0
Transfer from PID #2 Fund 0 0 0 0 0 0 0
Transfer from PID #3 Fund 0 0 0 0 0 0 0
Transfer from PID #4 Fund 0 0 0 0 0 0 0
Transfer from METRO Fund 0 0 0 0 0 0 0
TOTAL REVENUES & RESOURCES 24,000 7,900 206,618 98,603 379,672 230,383 181,505
EXPENDITURES
Personnel 0 0 84,651 35,236 98,785 218,833 0
Commodities 0 20,000 3,050 2,902 0 14,165 66,763
Contractual Services 0 0 93,200 3,600 208,344 0 54,000
Other Services 0 50,000 3,200 1,000 5,543 0 0
Debt Service 0 0 0 0 0 0 0
Capital Outlay 195,616 150,000 0 0 67,000 0 0
TOTAL EXPENDITURES 195,616 220,000 184,101 42,738 379,672 232,998 120,763
OTHER FINANCING USES
Transfer to General Fund 0 0 40,011 41,203 0 0 0
Transfer to Development Authority 0 0 0 0 0 0 0
Transfer to 403 (Bond Fund)
CONTINGENCY 0 0 0 0 0 0 0
TOTAL APPROPRIATIONS/
EXPENDITURES 195,616 220,000 224,112 83,941 379,672 232,998 120,763
DESIGNATED O&M RESERVE 0 0 0 0 0 0 0
REVENUES OVER/(UNDER) EXPENDITURES (171,616) (212,100) (17,494) 14,662 0 (2,615) 60,742
BEGINNING FUND BALANCE JULY 1 1,162,415 346,665 17,990 414,949 4,850 33,209 392,425
ENDING FUND BALANCE JUNE 30 990,799 134,565 496 429,611 4,850 30,594 453,167
FY 2016 BUDGET BY FUND
SPECIAL REVENUE FUNDS
SUMMARY OF REVENUES, EXPENDITURES AND
CHANGES IN FUND EQUITY
193

DEVELOP- TIRZ #1 TIRZ #2 PID #2 HOTEL
MENT (FIFTH (VICKS- TIRZ #3 (VICKS- OCCUPANCY
DONATIONS AUTHORITY STREET) BURG) (SIENNA) BURG) PID #4 TAX
FUND FUND FUND FUND FUND FUND FUND FUND TOTALS
0 0 0 0 0 0 0 0 21,177
0 0 0 0 0 0 0 0 28,248
0 0 0 0 0 0 0 0 41,123
0 0 0 0 0 0 0 0 90,548
0 0 0 0 0 0 0 0 610,055
0 0 0 0 0 537,381 390,472 0 927,853
0 0 309,235 453,378 687,017 0 0 0 1,449,630
0 0 0 0 0 0 0 0 0
0 0 0 0 0 0 0 0 0
0 0 0 0 0 0 0 0 13,162
0 0 0 0 0 0 0 0 48,501
0 0 309,235 453,378 687,017 537,381 390,472 0 3,049,201
0 0 9,500 55,975 25,800 7,600 2,820 6,175 154,440
0 0 0 0 0 0 0 0 175,600
0 0 0 0 0 0 0 0 0
0 0 0 0 0 0 0 0 0
0 0 0 0 0 0 0 0 0
0 0 0 0 0 0 0 0 144,245
60,700 0 0 0 0 0 0 0 60,700
0 0 0 0 0 0 0 223,900 223,900
60,700 0 9,500 55,975 25,800 7,600 2,820 230,075 758,885
60,700 0 318,735 509,353 712,817 544,981 393,292 230,075 3,898,634
0 0 0 0 0 0 0 0 0
0 0 0 0 0 0 0 0 0
0 0 368,397 722,899 302,645 0 0 0 1,393,941
0 0 169,315 332,243 139,095 0 0 0 640,653
0 20,000 0 0 0 0 0 0 20,000
0 20,000 0 0 0 0 0 0 20,000
0 20,000 0 0 0 0 0 0 20,000
0 20,000 0 0 0 0 0 0 20,000
0 0 0 0 0 0 0 0 0
0 20,000 0 0 0 0 0 0 20,000
0 0 0 0 0 0 0 0 0
60,700 100,000 856,447 1,564,495 1,154,557 544,981 393,292 230,075 6,033,228
0 0 0 0 0 0 0 0 437,505
65,648 0 0 0 0 0 0 0 172,528
0 0 2,077 1,000 0 0 0 0 362,221
0 0 0 0 0 500 0 0 60,243
0 0 496,678 560,770 0 305,775 388,687 0 1,751,910
0 0 0 0 619,904 0 0 0 1,032,520
65,648 0 498,755 561,770 619,904 306,275 388,687 0 3,816,927
0 100,000 26,886 52,757 22,087 0 0 6,300 289,244
0 0 20,000 20,000 20,000 20,000 20,000 0 100,000
156,000 156,000
0 0 0 0 0 0 0 0 0
65,648 100,000 545,641 790,527 661,991 326,275 408,687 6,300 4,362,171
0 0 0 0 0 0 0 0 0
(4,948) 0 310,806 773,968 492,566 218,706 (15,395) 223,775 1,671,057
82,689 0 1,267,701 2,616,298 2,067,834 622,571 158,361 366,276 9,554,233
77,741 0 1,578,509 3,390,265 2,560,400 841,277 142,966 590,051 11,225,290
SPECIAL REVENUE FUNDS
SUMMARY OF REVENUES, EXPENDITURES AND
CHANGES IN FUND EQUITY
FY 2016 BUDGET BY FUND
194

DEPARTMENT: PARKS AND RECREATION
DIVISION: PARKLAND DEDICATION
FUNDING SOURCE: PARKLAND DEDICATION FUND
FUND NUMBER: 201-0000
ORGANIZATIONAL MISSION STATEMENT
To provide superior customer service to all members of the community.
DESCRIPTION OF OPERATIONS
In order to provide neighborhood parks within convenient locations to its users, the City was divided into 13
park zones. Developers may dedicate parkland during final plat or may make cash payments in lieu of parkland
dedication to the City for purchase of parkland parks in or near the area of development. The City may also
provide park equipment for existing parks within the 13 park zones.
Whenever funds are sufficient to purchase land or equipment, the Park Board makes recommendations to the
City Council for proposed expenditures.
Revenue Assumptions
Revenue is recognized during the platting process when developers determine whether to dedicate land for a
park or to provide funds in lieu of parkland dedication. The City records the payment to the applicable park
zone.
195

FUND 201-16
FY 2015 FY 2015 FY 2015 FY 2016FY 2014 Original Revised Year-End ProposedActual Budget Budget Estimate Budget
OTHER REVENUES
270-49000 Interest Earnings 24,713 12,000 12,000 - 24,000
271-49511 Parkland Zone 1 - - - (25) -
272-49511 Parkland Zone 2 0 - - 1,355 -
273-49511 Parkland Zone 3 0 - - 1,103 -
274-49511 Parkland Zone 4 0 - - (3) -
275-49511 Parkland Zone 5 0 - - 573 -
276-49511 Parkland Zone 6 0 - - 4,095 -
277-49511 Parkland Zone 7 27,000 - - 648 -
278-49511 Parkland Zone 8 0 - - 93,075 -
279-49511 Parkland Zone 9 0 - - 12 -
280-49511 Parkland Zone 10 0 - - 5,481 -
281-49511 Parkland Zone 11 - - - 39 -
282-49511 Parkland Zone 12 158,400 - - 6,805 -
283-49511 Parkland Zone 13 - - - 12 -
TOTAL REVENUES 210,113 12,000 12,000 113,170 24,000
TOTAL REVENUES & RESOURCES 210,113 12,000 12,000 113,170 24,000
EXPENDITURES
271-52048 Parkland Zone 1 - - - - -
272-52048 Parkland Zone 2 - - - - 25,000
273-52048 Parkland Zone 3 - - - - 15,000
274-52048 Parkland Zone 4 - - 4,802 4,802 -
275-52048 Parkland Zone 5 - - - - -
276-52048 Parkland Zone 6 - 55,000 47,308 - 105,000
277-52048 Parkland Zone 7 8,825 25,000 29,742 28,772 -
278-52048 Parkland Zone 8 - - - - -
279-52048 Parkland Zone 9 - - - - 616
280-52048 Parkland Zone 10 - - - 167,873 50,000
281-52048 Parkland Zone 11 - - 2,950 2,950 -
282-52048 Parkland Zone 12 - - - - -
283-52048 Parkland Zone 13 - - - - -
TOTAL EXPENDITURES 8,825 80,000 84,802 204,397 195,616
REVENUES OVER/(UNDER) EXPENDITURES 201,288 (68,000) (72,802) (91,227) (171,616)
BEGINNING BALANCE JULY 1 1,052,354 1,025,787 1,253,642 1,253,642 1,162,415
ENDING BALANCE JUNE 30 1,253,642 957,787 1,180,840 1,162,415 990,799
SUMMARY OF REVENUES, EXPENDITURES AND
CHANGES IN FUND EQUITY
PARKLAND DEDICATION FUND
196

1
32
4
10
6 5
9
7
8
11
13
12
SH 6
TRAMMEL FRESNO RDFM 1092 RD
FONDRENRD
TEXAS PKWY
CARTWRIGHT RD
LEXINGTONBLVD
FIFTH
ST
LAKE OLYMPIAPKW Y
US 90A
UNIVERSITY BLVD
W AIRPORT BLVD
PIKE RD
COURT RD
SH 6
BUFFALO RUN
US 90A
STAFFORDSHIRE RD
LJ PKWY
MURPHY RD
STAFFO
RD RD
FM 2234 RD
FM52
1 RD
KIRKW
OODD
R
CHIMNEYROCKRD
MOORE RD
OILF IELD
RD
FORT
BEND
PKWY
MCKEEVER RD
GLENN LAKES LN
JULIFF MANVEL RD
AUSTIN PKWY
SOUTHW
ESTFW
Y
FORT BEND PKWYDULLES AVE
KNIGHT RDSIENNA PKWY
S SAM HOUSTON PKWY WBLUE RIDGE RD
SETT
LERS
WAY B
LVD
SIENN
A RAN
CHRD
Park ZonesMap By:GIS DivisionMay 2014 The information on this map is provided and maintained by various agencies, including county departments, municipal governments,
state and federal agencies. No guarantee is given as to the accuracy or currency of any of the data. The map is designed to serveas a secondary representation of real property found within this jurisdiction, and is compiled from the recorded deeds, plats, andother public records, which are primary sources for this public information. Users of this map are hereby notified that these primarysources should be consulted for verification of the information presented here. The data layers do not take the place of a legal survey or other primary source documentation. The city and its vendors assume no legal responsibility for the information on this map.
LegendMajor Thoroughfare
City Limits Line
Geographic Coordinate System North American Datum 1983 (NAD83)0 3,000 6,000 9,000 12,0001,500
Feet
»197

198

DEPARTMENT: POLICE DEPARTMENT
DIVISION: NARCOTICS SEIZURES
FUNDING SOURCE: NARCOTICS FUNDS
FUND NUMBER: 205-13-267
ORGANIZATIONAL MISSION STATEMENT
To provide superior customer service to all members of the community.
DESCRIPTION OF OPERATIONS
The Omnibus Appropriations Act of 1998 (Public Law 105-119) allowed the U.S. Department of Justice to
make grants to cities for law enforcement hiring, overtime, equipment, enhancing security, drug courts, multi-
jurisdictional task forces, crime prevention, and insurances.
Monies are distributed periodically from the Fort Bend County Task Force, narcotics seizure fund, as a result
of final conviction of offenders by the State or Federal Governments.
199

FY 2015 FY2015 FY 2015 FY 2016
FY 2014 Original Revised Year-End Proposed
Actual Budget Budget Estimate Budget
REVENUES BY SOURCE
INTERGOVERNMENTAL REVENUE
47108 State Seizures 92,191 52,900
47109 Federal Seizures 32,247 19,100
OTHER REVENUE
49000 Interest Earnings 8,226 5,000 5,000 7,275 7,900
49102 Sale of Salvage 0 0 0 2,040 0
Total Other Revenues 132,665 5,000 5,000 81,315 7,900
TOTAL REVENUES AND
RESOURCES 132,665 5,000 5,000 81,315 7,900
EXPENDITURES
COMMODITIES
52001 Office Supplies
52004 Minor Tools & Equipment
52011 Firearms 0 20,000 16,500 0 20,000
Total Commodities 0 20,000 16,500 0 20,000
CONTRACTUAL SERVICES
53004 Special Services & Legal 3,500 3,500
53008 Telephone 4,800 0 0 0 0
Total Contractual Services 4,800 0 3,500 3,500 0
OTHER SERVICES
54003 Training & Travel 12,966 50,000 50,000 15,000 50,000
Total Other Services 12,966 50,000 50,000 15,000 50,000
CAPITAL OUTLAY
75002 Information Systems 1,048
75004 Equipment 41,388 150,000 150,000 85,000 150,000
75006 Motor Vehicles 136,694 0 0 0 0
Total Capital Outlay 179,130 150,000 150,000 85,000 150,000
TOTAL EXPENDITURES 196,897 220,000 220,000 103,500 220,000
REVENUES OVER/(UNDER) EXPENDITURES (64,232) (215,000) (215,000) (22,185) (212,100)
BEGINNING BALANCE JULY 1 433,082 350,928 368,850 368,850 346,665
ENDING BALANCE JUNE 30 368,850 135,928 153,850 346,665 134,565
CHANGES IN FUND EQUITY
SUMMARY OF REVENUES, EXPENDITURES AND
FUND 205-13-267
NARCOTICS SEIZURES FUND
200

DEPARTMENT: POLICE DEPARTMENT DIVISION: RADIO COMMUNICATIONS
FUNDING SOURCE: RADIO COMMUNICATIONS FUND FUND NUMBER: 220-13-250
DESCRIPTION OF OPERATIONS
The Radio Communications Division operates and manages the jointly owned radio tower and operating
system of the City of Missouri City and Sugar Land. The Radio Systems Manager (RSM), who reports
to the Captain of the Police Support Services Division, manages the trunked radio system, radio tower,
companies who lease space and other municipal users. In addition, the RSM is responsible for
programming, purchasing, maintaining, and updating of radio equipment, and monitors all users on the
entire system. The RSM is also the Police Department's communication person for emergency
management and is responsible for maintaining radio, visual, and computer equipment in the dispatch
area.
Revenue Assumptions
Revenue is recognized monthly when billing statements are prepared and mailed to the various political
subdivisions or for the tower rental to the tower site contracted manager.
Total Full-Time Employees = 1
*Police Chief and Assistant Police Chief are included in Police Administration Divisional Budget.
**Captain is included in the Police Support Services Divisional budget.
Police Chief *
Assistant Police Chief - Administration*
Support Services Captain **
Police Support Tech Supervisor
201

DEPARTMENT: POLICE FUNDING SOURCE: RADIO COMMUNICATIONS FUND DIVISION: RADIO COMMUNICATIONS FUND NUMBER: 220-13-250
STRATEGIC
GOAL 2019 DIVISIONAL GOALS
3,4
Conduct one inspection of the radio system and tower as a preventative maintenance once a
month.
3,4
Within 10 days of receipt of a radio in need of repair, this radio will be repaired and
returned to service.
3,4
Within three days of receipt of a radio needing programming, this radio will be
programmed and returned to the customer.
3,4
Within two hours of being notified of a maintenance issue related to the security system of
the PSHQ, corrective action will be taken to resolve the matter.
3,4
Within two hours of being notified of a maintenance issue related to the mobile data
computers, the unit will be back in service.
3,4 Implement a multiple agency simultaneous radio broadcast of emergency information.
3,4 Police and Fire radio upgrade/replacement to P25 digital standards
3,4 Secure additional grant funding for upgrades to the radio system
3,4 Work with the City Parks Department to implement a video surveillance system
PERSONNEL SCHEDULE
FY 2014
Actual
FY2015
Budget
FY 2015
Estimate
FY 2016
Budget
Salary
Grade
Radio Systems Manager 1 1 1 0 P5
Police Support Tech Supervisor 0 0 0 1 P5
Total Full-time Employee 1 1 1 1
202

DEPARTMENT: POLICE FUNDING SOURCE: RADIO COMMUNICATIONS FUND DIVISION: RADIO COMMUNICATIONS FUND NUMBER: 220-13-250
PERFORMANCE INDICATORS
FY 2014
Actual
FY2015
Budget
FY 2015
Estimate
FY 2016
Budget
Customer approval rating. 99% 99% 99% 99%
Help Desk response within 2 hours. 96% 95% 95% 95%
ACTIVITY MEASURES
FY 2014
Actual
FY2015
Budget
FY 2015
Estimate
FY 2016
Budget
Training of City employees 189 200 200 200
No. of service requests 285 300 300 300
No. of preventive maintenance checks 100 110 110 110
No. of portable and mobile units 1,500 1,500 1,350 1,350
No. of users’ meetings 12 12 6 8
No. of computer service requests 50 50 50 50
No. of building safety checks 12 12 12 12
No. of safety inspections 32 35 35 35
203

FY 2015 FY 2015 FY 2015 FY 2016
FY 2014 Original Revised Year End Proposed
Actual Budget Budget Estimate Budget
REVENUES BY SOURCE
Intergovermental Revenue
47103 Public Safety Radio Use 48,501 48,986 48,986 48,501 48,501
47104 City of Houston Radio LIC 12,672 12,925 12,925 12,904 13,162
47110 MoCity / Sugar Land Reimb 0 0 0 0 0
Total Intergovernmental Revenue 61,173 61,911 61,911 61,405 61,663
OTHER REVENUE
49000 Interest Earnings 771 600 600 1,325 710
49102 Sale of Salavge 049103 Insurance Reimbursement 049205 ATC Rental Reimbursement 135,602 139,057 139,057 139,057 144,245
TOTAL OTHER REVENUE 136,373 139,657 139,657 140,382 144,955
Total Revenues 197,546 201,568 201,568 201,787 206,618
TOTAL REVENUES AND RESOURCES 197,546 201,568 201,568 201,787 206,618
EXPENDITURES
PERSONNEL51001 Regular Salaries 62,022 60,189 60,189 63,089 60,18951002 Additional Compensation 1,744 2,112 2,112 1,833 2,11251003 Compensated Absences 2,894 - 0 17,94151004 Overtime 3,849 2,000 2,000 2,300 2,00051202 Cell Phone Allowance 867 864 864 867 86451301 Long Term Disability 203 212 212 201 21251302 Taxes, Social Security 5,273 4,986 4,986 6,154 4,98551303 Hospital Insurance 6,545 7,289 7,289 6,903 7,59751304 Prorated Health/Dent/Vis 0 051305 Retirement 3,715 5,685 5,685 6,326 6,63351306 Workers Compensation 100 82 82 67 59
Total Personnel 87,212 83,419 83,419 105,681 84,651COMMODITIES
52003 Wearing Apparel 328 052004 Minor Tools & Equipment 3,009 2,600 2,600 2,600 3,00052006 Postage 12 50 50 50 50
52014 Computer Equip Rental Fee 638 850 850 850 0
Total Commodities 3,987 3,500 3,500 3,500 3,050CONTRACTUAL SERVICES
53001 Minor Equip Maint / Rpr / Rnt 19 1,63453002 Insurance 1,117 1,110 1,110 1,187 1,30553005 Service Agreements / Repair 43,795 41,000 41,000 68,773 52,00053006 Radio Repair/Maintenance 3,200 0 19,00053008 Telephone 18,699 19,634 19,634 19,900 20,89553009 Bldg Maintenance Alloc 2,994
53012 Computer Services Alloc 31,627 0 0 0 0
Total Contractual Services 101,451 61,744 61,744 91,494 93,200OTHER SERVICES
54002 Dues & Subscriptions 92 200 200 200 200
54003 Training & Travel 5,692 3,000 3,000 3,000 3,000
Total Other Services 5,784 3,200 3,200 3,200 3,200OTHER FINANCING SERVICES
90001 Transfer to 101 (General Fund) 0 24,785 24,785 24,785 40,011
Total Other Financing Services 0 24,785 24,785 24,785 40,011
TOTAL EXPENDITURES 198,434 176,648 176,648 228,660 224,112
REVENUES OVER/(UNDER) EXPENDITURES (888) 24,920 24,920 (26,873) (17,494)
BEGINNING BALANCE JULY 1 45,751 45,373 44,863 44,863 17,990
FUND BALANCE JUNE 30 44,863 70,293 69,783 17,990 496
SUMMARY OF REVENUES, EXPENDITURES AND
CHANGES IN FUND EQUITY
RADIO COMMUNICATIONS FUND
FUND 220-13-250
204

FUND 221-10-252
FY 2015 FY 2015 FY 2015 FY 2016
FY 2014 Original Revised Year-End Proposed
Actual Budget Budget Estimate Budget
REVENUES BY SOURCE
FINES & FORFEITURES
44008 Munc Court Building Security Fee 18,842 23,520 23,520 20,560 21,177
Total Intergovernmental Revenue 18,842 23,520 23,520 20,560 21,177
OTHER REVENUE
49000 Interest Earnings 4,255 4,250 4,250 4,100 4,225
49600 Other/Miscellaneous - - - - -
Total Other Revenue 4,255 4,250 4,250 4,100 4,225
Total Revenues 23,097 27,770 27,770 24,660 25,402
TOTAL REVENUES AND RESOURCES 23,097 27,770 27,770 24,660 25,402
EXPENDITURES
PERSONNEL
51001 Regular Salaries 7,302 10,800 13,885 1,385 -
51102 PT Less Than 20 Hours 17,805 32,500
51002 Additional Compensation - - - -
51003 Compensated Absences - - - - -
51004 Overtime - - - - -
51202 Cell Phone Allowance - - - - -
51301 Long Term Disability 23 - - 4 -
51302 Taxes, Social Security 542 827 827 1,362 2,486
51303 Hospital Insurance 826 1,356 1,356 171
51304 Prorated Health/Dent/Vis 15
51305 Retirement 381 972 972 74
51306 Workers Compensation 87 - - 150 250
Total Personnel 9,176 13,955 17,040 20,951 35,236
COMMODITIES
52003 Wearing Apparel 1,893
52004 Minor Tools & Equipment - - - 320 -
Total Commodities 0 0 0 2,213 0
OTHER SERVICES
54003 Training & Travel 650 3,000 3,000 1,000 -
Total Other Services 650 3,000 3,000 1,000 0
CAPITAL OUTLAY
TOTAL EXPENDITURES 9,826 16,955 20,040 24,164 35,236
REVENUES OVER/(UNDER) EXPENDITURES 13,272 10,815 7,730 496 (9,834)
BEGINNING BALANCE JULY 1 197,733 197,913 211,005 211,005 211,501
FUND BALANCE JUNE 30 211,005 208,728 218,735 211,501 201,667
SUMMARY OF REVENUES, EXPENDITURES AND
CHANGES IN FUND EQUITY
COURT BUILDING SECURITY FUND
205

FUND 222-10-256
FY 2015 FY 2015 FY 2015 FY 2016
FY 2014 Original Revised Year-End Proposed
Actual Budget Budget Estimate Budget
REVENUES BY SOURCE
FINES & FORFEITURES
44014 Munc Court Technology Fees 25,147 33,000 33,000 27,425 28,248
Total Intergovernmental Revenue 25,147 33,000 33,000 27,425 28,248
OTHER REVENUE
49000 Interest Earnings 3,746 3,600 3,600 3,560 3,750
Total Other Revenue 3,746 3,600 3,600 3,560 3,750
Total Revenues 28,892 36,600 36,600 30,985 31,998
TOTAL REVENUES AND
RESOURCES 28,892 36,600 36,600 30,985 31,998
EXPENDITURES
COMMODITIES
52004 Minor Tools & Equipment 21,981 3,360 1,100 1,100 2,902
52085 Computer Lease 562 - - - -
Total Commodities 22,542 3,360 1,100 1,100 2,902
CONTRACTUAL SERVICES
53004 Special Services & Legal 3,789 - 5,198 4,965 3,600
53005 Service Agreements/Repairs - - - - -
53008 Telephone - - - - -
Total Contractual Services 3,789 0 5,198 4,965 3,600
OTHER SERVICES
54003 Training & Travel 790 - - - 1,000
Total Other Services 790 0 0 0 1,000
CAPITAL OUTLAY
75002 Information Systems - - - - -
Total Capital Outlay 0 0 0 0 0
Total Expenditures 27,121 3,360 6,298 6,065 7,502
REVENUES OVER/(UNDER) EXPENDITURES 1,771 33,240 30,302 24,920 24,496
BEGINNING BALANCE JULY 1 176,757 163,654 178,528 178,528 203,448
ENDING BALANCE JUNE 30 178,528 196,894 208,830 203,448 227,944
COURT TECHNOLOGY FUND
SUMMARY OF REVENUES, EXPENDITURES AND
CHANGES IN FUND EQUITY
206

FUND 223-10-258
FY 2015 FY 2015 FY 2015 FY 2016
FY 2014 Original Revised Year-End Proposed
Actual Budget Budget Estimate Budget
REVENUES BY SOURCE
FINES & FORFEITURES
44017 Munc Court Juvenille Case Fees 31,015 41,000 41,000 34,025 35,046
44018 Truancy Prevention Revenue 1,672 - - 5,900 6,077
Total Intergovernmental Revenue 32,687 41,000 41,000 39,925 41,123
OTHER REVENUE
49000 Interest Earnings 128 194 194 68 80
Total Other Revenue 128 194 194 68 80
49904 Transfer From Fund 101 - - - - -
Total Intergovernmental Revenue 0 0 0 0 0
Total Revenues 32,815 41,194 41,194 39,993 41,203
TOTAL REVENUES AND
RESOURCES 32,815 41,194 41,194 39,993 41,203
OTHER FINANCING USES
90001 Transfer to General Fund 31,955 41,194 41,194 40,853 41,203
TOTAL APPROPRIATIONS/
EXPENDITURES 31,955 41,194 41,194 40,853 41,203
REVENUES OVER/(UNDER) EXPENDITURES 860 0 0 (860) 0
BEGINNING BALANCE JULY 1 0 0 860 860 0
ENDING BALANCE JUNE 30 860 0 860 0 0
SUMMARY OF REVENUES, EXPENDITURES AND
CHANGES IN FUND EQUITY
COURT JUVENILE CASE FUND
207

DEPARTMENT: PLANNING DEPARTMENT
DIVISION: COMMUNITY DEVELOPMENT BLOCK GRANT
FUNDING SOURCE: COMMUNITY DEVELOPMENT
BLOCK GRANT FUND
FUND NUMBER: 240-17-000
ORGANIZATIONAL MISSION STATEMENT
To increase awareness of the CDBG program through elected officials and local service providers in order to
benefit our low to moderate income residents thereby enhancing their quality of life.
DESCRIPTION OF OPERATIONS
The Community Development Block Grant division is directly supervised by the Coordinator of Community
Development Block Grant who in turn reports to the Director of Planning. The CDBG program is responsible
for coordinating all areas of the grant program funded each year by HUD. The Community Development Block
Grant Coordinator monitors code enforcement, clearance/demolition activities, public service agency requests,
capital improvements/drainage and the general administration of the program including reporting and
monitoring forms as required.
Revenue Assumptions
This is an expenditure driven grant whereby revenue is recognized at the end of the month when expenditures
are known and reimbursed from HUD.
208

COMMUNITY DEVELOPMENT BLOCK GRANT FUND
FUND 240-17
FY 2015 FY 2015 FY 2015 FY 2016
FY 2014 Original Revised Year-End Proposed Actual Budget Budget Estimate Budget
REVENUES BY SOURCE
INTERGOVERNMENTAL REVENUE
240-17-213 46000 Grants - 2012 Program Year 25,355 69,934 69,934 70,000 -
240-17-214 46000 Grants - 2013 Program Year 224,726 35,000 35,000 97,259
240-17-215 46000 Grants - 2014 Program Year - 330,211 330,211 358,552 51,134 240-17-216 46000 Grants - 2015 Program Year - - - - 328,538
Total Intergovernmental Revenue 250,081 435,145 435,145 525,811 379,672
OTHER REVENUE
240-17 49000 Interest Earnings 3 - - 580 -
Total Other Revenue 3 - - 580 -
TOTAL REVENUES AND
RESOURCES 250,084 435,145 435,145 526,391 379,672
EXPENDITURES
PERSONNEL
240-17-214 Grants - 2013 Program Year 32,122 -
240-17-215 Grants - 2014 Program Year - 99,500 99,500 96,444
240-17-216 Grants - 2015 Program Year - - - - 98,785
Total Personnel 32,122 99,500 99,500 96,444 98,785
COMMODITIES
240-17-214 Grants - 2013 Program Year - - - - -
240-17-215 Grants - 2014 Program Year - - - - -
240-17-216 Grants - 2015 Program Year - - - - -
Total Commodities - - - - -
CONTRACTURAL SERVICES
240-17-213 Grants - 2012 Program Year - 1,059 - -
240-17-214 Grants - 2013 Program Year 192,688 - 12,472 -
240-17-215 Grants - 2014 Program Year - 166,025 166,025 162,464 51,134
240-17-216 53004 Special Services & Legal - - - - 157,210
Total Contactual Services 192,688 166,025 179,556 162,464 208,344
OTHER SERVICES
240-17-214 Grants - 2013 Program Year - - - - -
240-17-215 Grants - 2014 Program Year - - - - -
240-17-216 54003 Training & Travel - - - - 4,993
240-17-216 54002 Dues & Subscriptions 50
240-17-216 54001 Printing & Publications - - - - 500
Total Other Services - - - - 5,543
CAPITAL OUTLAY
240-17-213 Grants - 2012 Program Year 25,356 69,934 139,934 70,000
240-17-214 Grants - 2013 Program Year - 35,000 135,000 97,259
240-17-215 Grants - 2014 Program Year - 64,686 64,686 99,644
240-17-216 77007 Other Misc - - - - 67,000
Total Capital Outlay 25,356 169,620 339,620 266,903 67,000
TOTAL EXPENDITURES 250,166 435,145 618,676 525,811 379,672
REVENUES OVER/(UNDER) EXPENDITURES (82) 0 (183,531) 580 0
BEGINNING BALANCE JULY 1 4,352 4 4,270 4,270 4,850
ENDING BALANCE JUNE 30 4,270 4 (179,261) 4,850 4,850
SUMMARY OF REVENUES, EXPENDITURES AND
CHANGES IN FUND EQUITY
209

FUND 224-10-259
FY 2015 FY 2015 FY 2015 FY 2016
FY 2014 Original Revised Year-End Proposed
Actual Budget Budget Estimate Budget
REVENUES BY SOURCE
OTHER REVENUE
45005 Cable/Video In-Kind Fees 165,053 140,000 140,000 175,600 175,600
49000 Interest Earnings 6,052 1,655 1,655 6,725 5,905
Total Other Revenue 171,105 141,655 141,655 182,325 181,505
Total Revenues 171,105 141,655 141,655 182,325 181,505
TOTAL REVENUES AND
RESOURCES 171,105 141,655 141,655 182,325 181,505
EXPENDITURES
COMMODITIES
52004 Minor Tools & Equipment 73,654 68,061 68,986 113,335 66,763
Total Commodities 73,654 68,061 68,986 113,335 66,763
CONTRACTUAL SERVICES
53005 Service Agreements/Repairs 19,998 65,000 65,000 20,651 54,000
Total Contractual Services 19,998 65,000 65,000 20,651 54,000
CAPITAL OUTLAY
75005 Furniture & Equip (Office) - 1,500 1,500 1,500 -
Total Capital Outlay 0 1,500 1,500 1,500 0
Total Expenditures 93,652 134,561 135,486 135,486 120,763
TOTAL APPROPRIATIONS/
EXPENDITURES 93,652 134,561 135,486 135,486 120,763
REVENUES OVER/(UNDER) EXPENDITURES 77,453 7,094 6,169 46,839 60,742
BEGINNING BALANCE JULY 1 268,133 331,253 345,586 345,586 392,425
ENDING BALANCE JUNE 30 345,586 338,347 351,755 392,425 453,167
MCTV FACILITIES/EQUIPMENT FUND
CHANGES IN FUND EQUITY
SUMMARY OF REVENUES, EXPENDITURES AND
210

FUND 230
FY 2015 FY 2015 FY 2015 FY 2016
FY 2014 Original Revised Year-End Proposed
Actual Budget Budget Estimate Budget
REVENUES AND RESOURCES
OTHER REVENUES
13-230-46002 Crime Victim 44,411 49,129 49,129 43,711 45,070
13-230-46005 Bullet Proof Vest 1,819 4,350 4,350 6,522 4,350
13-230-46009 FB HIDTA Overtime 6,124 5,000 5,000 7,425 6,500
13-230-46013 COPS 235,935 38,471 38,471 125,232
13-230-46018 Houston HIDTA Overtime 16,433 16,100 16,100 16,127 16,100
13-230-46019 Motorcycle Shed 10,104
13-230-46105 Auto Burglary-Theft 125,907 146,363 146,363 168,813 146,363
13-230-46111 Victim Coordinator & Liaison 7,905 21,496
13-120-46112 Tobacco Enforcement 1,200 1,875 1,875
13-120-46116 Union Pacific Railroad 3,500 3,500
13-230-49904 Transfer from Fund 101 58,708
13-230-46106 ABTPA Prog Income 4,948
14-230-46014 UASI 2013 Radios/Consolettes 292,532
14-230-46010 FB County Training 11,606 12,000 12,000 13,494 12,000
14-230-46115 Fed Grant - Homeland Sec - 2014 43,168 37,605
16-150-46113 HGAC 2015 Compost Bin Program 2,500 2,500
16-150-46114 HGAC 2015 HHW Collection Event 30,000 28,547
16-150-46115 OCDETF - - - 1,800 -
Total Other Revenues 812,684 271,413 352,456 483,595 230,383
TOTAL REVENUES AND RESOURCES 812,684 271,413 352,456 483,595 230,383
EXPENDITURES
PERSONNEL
13-230-51999 Grant Personnel Cost 429,155 247,863 247,863 371,904 206,833
14-230-51999 Grant Personnel Cost 11,606 12,000 12,000 13,494 12,000
Total Personnel 440,761 259,863 259,863 385,398 218,833
COMMODITIES
13-230-52031 Auto Burglary-Theft 27,790
13-230-52075 Motorcycle Shed 11,622
13-230-52076 Bullet Proof Vest 1,819 4,350 4,350 6,522 4,350
13-230-52080 Houston HIDTA 7,560 7,200 7,200 7,200 7,200
13-120-52082 Tobacco Enforcement 6 1,875 1,875
13-120-52084 Victim Coordinator & Liaison 5,500
13-120-52089 Union Pacific Railroad 3,500 3,500
13-120-52091 ABTPA Prog Income 2,333 2,615
14-130-52088 Fed Grant Exp - HL Security - 43,168 37,605
14-230-52077 UASI 2013 Radios/Consolettes 292,532
16-150-52086 HGAC 2015 Compost Bin Program 2,500 2,500
16-150-52087 HGAC 2015 HHW Collection Event - - 30,000 28,547 -
Total Commodities 341,329 11,550 92,593 95,582 14,165
TOTAL EXPENDITURES 782,090 271,413 352,456 480,980 232,998
REVENUES OVER/(UNDER) EXPENDITURES 30,594 0 0 2,615 (2,615)
BEGINNING BALANCE JULY 1 0 0 30,594 30,594 33,209
FUND BALANCE JUNE 30 30,594 0 30,594 33,209 30,594
SUMMARY OF REVENUES, EXPENDITURES AND
CHANGES IN FUND EQUITY
GRANTS FUND
211

FUND 231
FY 2015 FY 2015 FY 2015 FY 2016
FY 2014 Original Revised Year-End Proposed
Actual Budget Budget Estimate Budget
REVENUES AND RESOURCES
OTHER REVENUES
10-109-49007 Donations - Economic Development 13,000
13-120-49201 Donations - Police 17,530 5,000 5,000 38,772 11,000
14-130-49300 Donations - Fire 12,120 12,000 25,500 24,500 11,000
15-148-49411 Donations - Animal Services 2,500 1,000 1,000 400 700
16-150-49510 Donations - Urban Forestry 21,440 9,385 9,385 25,225 15,000
16-231-49516 Donations - Mayor's Youth Commission 8,146 5,000 5,000 2,275
16-152-49517 Donations - Recreation 5,170 1,850
15-140-49518 Donations - Public Works Admin 2,000 2,000
10-108-49519 Donations - Communications - - - 635 23,000
Total Other Revenues 79,906 34,385 47,885 93,657 60,700
OTHER FINANCING SOURCES
10-107-49904 Transfer From 101 (General Fund) 22,376 - - - -
Total Other Financing Sources 22,376 0 0 0 0
TOTAL REVENUES AND RESOURCES 102,282 34,385 47,885 93,657 60,700
EXPENDITURES
COMMODITIES
10-108-52019 Donation Purchases - Communications 635 23,000
10-109-52019 Donation Purchases - Economic Development 4,952 5,000 3,048
13-120-52019 Donation Purchases - Police 5,000 40,000 40,848 11,000
14-130-52019 Donation Purchases - Fire 10,779 12,000 25,500 13,563 11,000
15-148-52019 Donation Purchases - Animal Services 2,023 1,000 1,000 600
16-150-52081 Donation Purchases - Urban Forestry 17,100 14,282 14,282 12,341 15,000
16-152-52019 Donation Purchases - Recreation 3,431
15-140-52019 Donation Purchases - Public Works Admin 2,000 2,000
16-231-52052 Donation Purchases - Mayor's Youth Commission 2,078 5,000 5,000 500 2,000
Total Commodities 36,932 39,282 87,782 76,318 65,648
TOTAL EXPENDITURES 36,932 39,282 87,782 76,318 65,648
REVENUES OVER/(UNDER) EXPENDITURES 65,350 (4,897) (39,897) 17,339 (4,948)
BEGINNING BALANCE JULY 1 0 50,051 65,350 65,350 82,689
FUND BALANCE JUNE 30 65,350 45,154 25,453 82,689 77,741
SUMMARY OF REVENUES, EXPENDITURES AND
CHANGES IN FUND EQUITY
DONATIONS FUND
212

FUND 260-10-260
FY 2015 FY 2015 FY 2015 FY 2016
FY 2014 Original Revised Year-End Proposed
Actual Budget Budget Estimate Budget
OTHER REVENUE
49000 Interest Earnings - - - - -
Total Other Revenues 0 0 0 0 0
OTHER FINANCING RESOURCES
49909 Transfer fromTIRZ #1 Fund 261 20,000 20,000 20,000 20,000 20,000
49910 Transfer fromTIRZ #2 Fund 262 20,000 20,000 20,000 20,000 20,000
49911 Transfer fromTIRZ #3 Fund 265 20,000 20,000 20,000 20,000 20,000
49912 Transfer from PID #2 Fund 263 20,000 20,000 20,000 20,000 20,000
49914 Transfer from PID #4 Fund 266 20,000 20,000 20,000 20,000 20,000
Total Other Financing Resources 100,000 100,000 100,000 100,000 100,000
Total Revenues and Resources 100,000 100,000 100,000 100,000 100,000
OTHER FINANCING USES
90001 Transfer to General Fund-Admin/Legal 100,000 100,000 100,000 100,000 100,000
TOTAL APPROPRIATIONS/
EXPENDITURES 100,000 100,000 100,000 100,000 100,000
REVENUES OVER/(UNDER) EXPENDITURES 0 0 0 0 0
BEGINNING BALANCE JULY 1 0 0 0 0 0
ENDING BALANCE JUNE 30 0 0 0 0 0
SUMMARY OF REVENUES, EXPENDITURES AND
CHANGES IN FUND EQUITY
MISSOURI CITY DEVELOPMENT AUTHORITY
213

FUND 261-10-261
FY 2015 FY 2015 FY 2015 FY 2016
FY 2014 Original Revised Year-End Proposed
Actual Budget Budget Estimate Budget
OPERATING REVENUES
TIRZ REVENUES
48501 Fort Bend County Incremental Taxes 298,097 303,818 303,818 301,900 309,235
48503 Missouri City Incremental Taxes 488,667 - -
49000 Interest Earnings 8,972 3,500 3,500 8,026 9,500
Total TIRZ Revenues 795,735 307,318 307,318 309,926 318,735
OTHER FINANCING RESOURCES
49904 Transfer from General Fund (Incr. Taxes) - 325,337 325,337 337,481 368,397
49915 Transfer from Debt Service (Incr. Taxes) - 165,389 165,389 155,105 169,315
Total Other Financing Resoures 0 490,726 490,726 492,586 537,712
Total Revenues and Resources 795,735 798,044 798,044 802,512 856,447
OPERATING EXPENSES
BOND PRINCIPAL
60002 2006 Bond Principal 275,000 285,000 285,000 285,000 295,000
Total Bond Principal 275,000 285,000 285,000 285,000 295,000
BOND INTEREST
61002 2006 Bond Interest 224,779 213,505 213,505 213,505 201,678
Total Bond Interest 224,779 213,505 213,505 213,505 201,678
CONTRACTUAL SERVICES
53018 Bank Fees 1,855 1,855 1,855 1,961 2,077
Total Contractual Services 1,855 1,855 1,855 1,961 2,077
CAPITAL OUTLAY
77002 Construction - - - - -
Total Capital Outlay 0 - - - -
OTHER FINANCING USES
90001 Transfer to General Fund 46,556 24,536 24,536 24,629 26,886
90002 Transfer to Development Authority Fund 20,000 20,000 20,000 20,000 20,000
TOTAL APPROPRIATIONS/
EXPENDITURES 568,189 544,896 544,896 545,095 545,640
REVENUES OVER/(UNDER) EXPENDITURES 227,546 253,148 253,148 257,417 310,807
BEGINNING BALANCE JULY 1 782,738 1,018,170 1,010,284 1,010,284 1,267,701
FUND BALANCE JUNE 30 1,010,284 1,271,318 1,263,432 1,267,701 1,578,509
SUMMARY OF REVENUES, EXPENDITURES AND
CHANGES IN FUND EQUITY
TAX INCREMENTAL REINVESTMENT ZONE #1 (FIFTH STREET)
214

FUND 262-10-262
FY 2015 FY 2015 FY 2015 FY 2016FY 2014 Original Revised Year-End Proposed
Actual Budget Budget Estimate Budget
OPERATING REVENUES
TIRZ REVENUES
48501 Fort Bend County Incremental Taxes 583,472 591,972 591,972 437,643 453,378
48503 Missouri City Incremental Taxes 891,305
49000 Interest Earnings 65,707 25,000 25,000 53,823 55,975
Total TIRZ Revenues 1,540,484 616,972 616,972 491,466 509,353
OTHER FINANCING RESOURCES
49904 Transfer from General Fund (Incr. Taxes) - 572,143 572,143 668,077 722,899
49915 Transfer from Debt Service (Incr. Taxes) - 290,857 290,857 307,046 332,243
Total Other Financing Resources 0 863,000 863,000 975,123 1,055,142
Total Revenues and Resources 1,540,484 1,479,972 1,479,972 1,466,589 1,564,495
OPERATING EXPENSES
CERT OF OBLIGATION PRINCIPAL
62002 2009C Cert of Obligation Principal 275,000 215,000 215,000 215,000 225,000
62004 2010B Cert Of Obligation Principal 155,000 155,000 155,000 155,000 160,000
Total Cert of Obligation Principal 430,000 370,000 370,000 370,000 385,000
CERT OF OBLIGATION INTEREST
63002 2009C Cert of Obligation Interest 162,563 154,313 154,313 154,313 146,788
63004 2010B Cert Of Obligation Interest 34,752 32,038 32,038 32,038 28,983
Total Cert of Obligation Interest 197,314 186,351 186,351 186,351 175,770
CONTRACTUAL SERVICES
53004 Special Services & Legal 3,750
53018 Bank Fees - 1,000 1,000 - -
Total Contractual Services - 1,000 1,000 3,750 -
OTHER SERVICES
54045 Audit Services 3,350 - - - -
Total Other Services 3,350 - - - -
DEBT EXPENDITURE-OTHER
65001 Pay Agent-Register Fees - - - 1,000 1,000
Total Debt Expenditure-Other - - - 1,000 1,000
CAPITAL OUTLAY
77002 Construction 401,409 - -
76011 Reimbursement 1,000,000 - - 580,846 -
Total Capital Outlay 1,401,409 0 0 580,846 0
OTHER FINANCING USES90001 Transfer to General Fund 46,949 43,150 43,150 48,756 52,757
90002 Transfer to Development Authority Fund 20,000 20,000 20,000 20,000 20,000
90009 Transfer to 403 (Bond Fund) - 900,000 156,000
TOTAL APRORIATIONS/
EXPENDITURES 2,099,023 620,501 620,501 2,110,703 790,527
REVENUES OVER/(UNDER) EXPENDITURES (558,538) 859,471 859,471 (644,114) 773,967
BEGINNING BALANCE JULY 1 3,818,950 3,215,213 3,260,412 3,260,412 2,616,298
FUND BALANCE JUNE 30 3,260,412 4,074,684 4,119,883 2,616,298 3,390,265
SUMMARY OF REVENUES, EXPENDITURES AND
CHANGES IN FUND EQUITY
TAX INCREMENTAL REINVESTMENT ZONE #2 (VICKSBURG)
215

FUND 263-10-263
FY 2015 FY 2015 FY 2015 FY 2016
FY 2014 Original Revised Year-End Proposed
Actual Budget Budget Estimate Budget
PID REVENUES
41012 Special Assessments 503,048 521,333 521,333 521,729 537,381
49000 Interest Earnings 12,371 10,500 10,500 7,220 7,600
Total PID Revenues 515,419 531,833 531,833 528,949 544,981
OTHER FINANCING RESOURCES
48506 Developer Advances 8,960
48212 C. O. Premium - - - - -
Total Other Financing Resources 0 0 0 8,960 0
Total Revenues and Resources 515,419 531,833 531,833 537,909 544,981
OPERATING EXPENSES
CERT OF OBLIGATION PRINCIPAL
62005 2010A Certificate Of Principal 95,000 75,000 75,000 75,000 75,000
Total Cert of Obligation Principal 95,000 75,000 75,000 75,000 75,000
CERT OF OBLIGATION INTEREST
63005 2010A Certificate Of Principal Expense 234,175 232,275 232,275 232,275 230,775
Total Cert of Obligation Interest 234,175 232,275 232,275 232,275 230,775
OTHER SERVICES
53018 Bank Fees - 500 500 500 500
Total Other Services 0 500 500 500 500
CAPITAL OUTLAY
76011 Reimbursement 1,000,000 -
77002 Construction - - - - -
Total Capital Outlay 1,000,000 0 0 0 0
OTHER FINANCING USES
90002 Transfer to Development Authority Fund 20,000 20,000 20,000 20,000 20,000
TOTAL APPROPRIATIONS/
EXPENDITURES 1,349,175 327,775 327,775 327,775 326,275
REVENUES OVER/(UNDER) EXPENDITURES (833,756) 204,058 204,058 210,134 218,706
BEGINNING BALANCE JULY 1 1,246,193 413,168 412,437 412,437 622,571
FUND BALANCE JUNE 30 412,437 617,226 616,495 622,571 841,277
SUMMARY OF REVENUES, EXPENDITURES AND
CHANGES IN FUND EQUITY
PUBLIC IMPROVEMENT DISTRICT #2 (VICKSBURG)
216

FUND 265-10-265
FY 2015 FY 2015 FY 2015 FY 2016
FY 2014 Original Revised Year-End Proposed
Actual Budget Budget Estimate Budget
TIRZ REVENUES
48501 Fort Bend County Incremental Taxes 251,390 250,106 250,106 282,841 288,138 48503 Missouri City Incremental Taxes 360,741 48504 Houston Community College Incremental Taxes 54,742 63,516 63,516 71,958 79,154 48505 Sienna LID Incremental Taxes 275,378 268,171 268,171 304,500 319,725
49000 Interest Earnings 23,389 15,000 15,000 22,167 25,800
Total TIRZ Revenues 965,641 596,793 596,793 681,466 712,817
OTHER FINANCING RESOURCES
49904 Transfer from General Fund (Incr. Taxes) - 224,370 224,370 274,976 302,645
49915 Transfer from Debt Service (Incr. Taxes) - 114,061 114,061 126,379 139,095
Total Other Financing Resources 0 338,431 338,431 401,355 441,740
Total Revenues and Resources 965,641 935,224 935,224 1,082,821 1,154,557
OPERATING EXPENSES
CAPITAL OUTLAY
77002 Construction 613,123 619,228 619,228 619,228 619,904
Total Capital Outlay 613,123 619,228 619,228 619,228 619,904
OTHER FINANCING USES
90001 Transfer to General Fund 29,559 16,921 16,922 20,068 22,087
90002 Transfer to Development Authority Fund 20,000 20,000 20,000 20,000 20,000
TOTAL APPROPRIATIONS/
EXPENDITURES 662,682 656,149 656,150 659,296 661,991
REVENUES OVER/(UNDER) EXPENDITURES 302,958 279,075 279,074 423,525 492,566
BEGINNING BALANCE JULY 1 1,341,351 1,622,373 1,644,309 1,644,309 2,067,834
FUND BALANCE JUNE 30 1,644,309 1,901,448 1,923,383 2,067,834 2,560,400
SUMMARY OF REVENUES, EXPENDITURES AND
CHANGES IN FUND EQUITY
TAX INCREMENT REINVESTMENT ZONE #3
217

FUND 266-10-266
FY 2015 FY 2015 FY 2015 FY 2016
FY 2014 Original Revised Year-End Proposed
Actual Budget Budget Estimate Budget
PID REVENUES
41012 Special Assessments 397,995 400,605 400,605 390,472 390,472
49000 Interest Earnings 4,407 1,700 1,700 2,655 2,820
Total PID Revenues 402,402 402,305 402,305 393,127 393,292
OTHER FINANCING RESOURCES48211 Proceeds - Sale of Certificates of Obligation - - - - -
Total Other Financing Resources 0 0 0 0 0
Total Revenues and Resources 402,402 402,305 402,305 393,127 393,292
OPERATING EXPENSESCERT OF OBLIGATION PRINCIPAL
62003 2009A Cert of Obligation Principal 125,000 130,000 130,000 130,000 135,000
Total Cert of Obligation Principal 125,000 130,000 130,000 130,000 135,000
CERT OF OBLIGATION INTEREST
63003 2009A Cert of Obligation Interest 262,299 258,236 258,236 258,237 253,687
Total Cert of Obligation Interest 262,299 258,236 258,236 258,237 253,687
CONTRACTUAL SERVICES
53018 Bank Fees 500 - - - -
Total Contractual Services 500 - - - -
OTHER SERVICES
54044 Miscellaneous Expenses - - - - -
Total Other Services - - - - -
CAPITAL OUTLAY
77002 Construction - - - - -
Total Capital Outlay 0 0 0 0 0
OTHER FINANCING USES90002 Transfer to Development Authority Fund 20,000 20,000 20,000 20,000 20,000
TOTAL APPROPRIATIONS/
EXPENDITURES 407,799 408,236 408,236 408,237 408,687
REVENUES OVER/(UNDER) EXPENDITURES (5,397) (5,931) (5,931) (15,110) (15,395)
BEGINNING BALANCE JULY 1 178,868 173,374 173,471 173,471 158,361
FUND BALANCE JUNE 30 173,471 167,443 167,540 158,361 142,966
SUMMARY OF REVENUES, EXPENDITURES AND
CHANGES IN FUND EQUITY
PUBLIC IMPROVEMENT DISTRICT #4 (CREEKMONT)
218

FUND 575-55-575
FY 2015 FY 2015 FY 2015 FY 2016
FY 2014 Original Revised Year-End Proposed
Actual Budget Budget Estimate Budget
OPERATING REVENUES
OTHER TAXES
42006 Hotel Occupancy Tax 78,869 174,000 174,000 219,525 223,900
Total Other Taxes 78,869 174,000 174,000 219,525 223,900
OTHER INCOME
49000 Interest Income 2,158 2,600 2,600 5,225 6,175
Total Other Income 2,158 2,600 2,600 5,225 6,175
Total Revenues and Resources 81,027 176,600 176,600 224,750 230,075
OPERATING EXPENSES
OTHER FINANCING SERVICES90001 Transfer to 101 (General Fund) 5,388 6,300 6,300 6,300 6,300
Total Other Financing Services 5,388 6,300 6,300 6,300 6,300
TOTAL APPROPRIATIONS/
EXPENDITURES 5,388 6,300 6,300 6,300 6,300
REVENUES OVER/(UNDER) EXPENDITURES 75,639 170,300 170,300 218,450 223,775
BEGINNING BALANCE JULY 1 72,187 188,884 147,826 147,826 366,276
FUND BALANCE JUNE 30 147,826 359,184 318,126 366,276 590,051
SUMMARY OF REVENUES, EXPENDITURES AND
CHANGES IN FUND EQUITY
HOTEL OCCUPANCY TAX FUND
219

301-30-301
FY 2015 FY 2015 FY 2015 FY 2016
FY 2014 Original Revised Year-End Proposed
Actual Budget Budget Estimate Budget
REVENUES BY SOURCE
AD VALOREM TAXES & PENALTIES
41001 Taxes Current 7,974,929 9,212,428 9,212,428 8,590,703 8,883,736
41002 Taxes Delinquent 124,982 160,000 160,000 128,003 130,000
41003 Penalties 59,584 58,000 58,000 60,530 62,000
Total Ad Valorem Taxes & Penalties 8,159,495 9,430,428 9,430,428 8,779,236 9,075,736
OTHER REVENUE
49000 Interest Income 184,957 135,000 135,000 128,100 138,900
49602 Accrued Interest 16,354 - - - -
Total Other Revenue 201,311 135,000 135,000 128,100 138,900
TOTAL REVENUES 8,360,806 9,565,428 9,565,428 8,907,336 9,214,636
OTHER FINANCING SOURCES
48304 Reimb.from MUD's 169,672
49926 Transfer from Utility Fund Princ/Int 116,374 118,049 118,049 118,049
48212 C.O Premium 439,215 0 0 155,126 0
48201 Proceeds from Sale of Bonds (8,242,650) 0 0 0 0
48203 Proceeds - Refunding Bonds 7,891,150 0 0 78,327 0
Total Other Financing Resources 204,089 118,049 118,049 521,174 0
TOTAL REVENUES & RESOURCES 8,564,895 9,683,477 9,683,477 9,428,510 9,214,636
EXPENDITURES
65001 Paying Agent/Registrar 12,300 11,050 11,500
Bond Principal 4,881,500 4,373,250 4,373,250 4,497,829 5,087,563
Bond Interest 2,491,046 2,396,855 2,396,856 2,624,293 2,688,375
Certificates of Oblig Principal 517,938 592,281 592,281 592,282 385,692
Certificates of Oblig Interest 410,721 417,586 417,586 419,966 325,978
Tax Notes Principal 255,000 260,000 260,000 260,000 265,000
Tax Notes Interest 21,863 17,655 17,655 17,655 13,365
Capital Leases Principal 68,953 70,004 70,004 70,005 71,089
Capital Leases Interest 12,128 11,077 11,077 11,077 9,993
Debt Issuance Expense 459,655 90,963
Underwriters Discount 61,147 - - - 250,000
Total Expenditures 9,192,251 8,138,709 8,138,709 8,595,120 9,108,555
OTHER FINANCING USES
90003 Transfer to TIRZ #1 Fund 0 165,389 165,389 155,105 169,315
90004 Transfer to TIRZ #2 Fund 0 290,857 290,857 307,046 332,243
90007 Transfer to TIRZ #3 Fund 0 114,061 114,061 126,379 139,095
90033 Transfer to 505 (W & WW Util) (436,500)
TOTAL APPROPRIATIONS & EXPENDITURES 8,755,751 8,709,016 8,709,016 9,183,650 9,749,208
NET REVENUES OVER/(UNDER) EXPENDITURES (190,856) 974,461 974,461 244,860 (534,572)
BEGINNING FUND BALANCE JULY 1 5,750,143 5,269,021 5,559,287 5,559,287 5,804,147
ENDING FUND BALANCE JUNE 30 5,559,287 6,243,482 6,533,748 5,804,147 5,269,575
DEBT SERVICE FUND
DETAIL OF REVENUES, EXPENDITURES AND FUND BALANCE
220

Interest Date of Term- Maturity Original Outstanding
Description Rates Issue Years Date Issue 07-01-2015
2007 General Obligation Bonds *3.9328708 04-05-07 20 06-15-2027 9,910,000.00 6,905,000.00
2008 General Obligation Bonds *4.1202192 02-20-08 20 06-15-2028 5,700,000.00 4,300,000.00
2008 Certificates of Obligation *4.1062825 02-20-08 20 06-15-2028 2,395,000.00 1,805,000.00
2008A General Obligation Bonds *4.6536000 09-02-08 20 06-15-2028 21,084,994.40 15,625,000.00
2008A Certificates of Obligation *4.7085000 09-02-08 20 06-15-2028 14,514,997.30 5,067,918.04
2009 General Obligation *2.1919272 12-08-09 8 06-15-2016 7,570,000.00 605,000.00
Refunding Bonds
2010 General Obligation Bonds *3.7609390 03-12-10 20 06-15-2029 9,500,000.00 7,615,000.00
2010 General Obligation *2.608064 05-26-10 8 06-15-2018 4,755,000.00 2,195,000.00
Refunding Bonds
2010A General Obligation Bonds *3.443547 11-02-10 20 06-15-2031 9,405,000.00 7,520,000.00
2011 Tax Note *1.650000 11-15-11 7 06-15-2018 1,730,000.00 810,000.00
2012 General Obligation Bonds *1.949603 11-13-12 20 06-15-2032 1,400,000.00 1,205,000.00
2013 General Obligation *2.891734 08-21-13 13 06-15-2026 8,730,000.00 8,193,750.00
Refunding Bonds
2014 General Obligation Bonds *3.130914 02-18-14 20 06-15-2033 1,740,000.00 1,670,000.00
2014 General Obligation Bonds *1.543813 12-18-14 10 06-15-2024 3,530,000.00 3,371,583.91
Refunding Bonds
2014 Certificates of Obligation *3.031288 02-18-14 20 06-15-2033 990,000.00 950,000.00
2015 General Obligation Bonds *2.597758 02-03-15 19 06-15-2034 9,200,000.00 9,085,000.00
2013 Capital Lease - Defibrillators *0.000000 03-22-13 5 02-22-2018 176,768.00 82,491.84
US Bank Equipment Finance
2013 Capital Lease - Fire Truck *3.130000 01-07-13 10 01-07-2023 384,490.00 316,240.00
Oshkosh Capital
TOTAL $112,716,249.70 $77,321,983.79
*Effective Interest Rate.
**This schedule only includes debt for General Government. Other obligations are included in a separate schedule which
include 2009B Certificates of Obligation which have been issued for construction of facilities included in Enterprise Funds,
the 2006 Revenue Bonds which are paid out of the Tax Increment Reinvestment Zone (TIRZ #1) Fund, the 2009A Combination
Tax & Revenue Certificates of Obligation which are paid out of Public Improvement District (PID#4) Fund, the 2009 C
Combination Tax & Revenue Certificates of Obligation which are paid out of Tax Increment Reinvestment Zone (TIRZ #2)
Fund, the 2010A Certificates of Obligation which are paid out of Public Improvement District (PID #2) Fund, the 2010B
Certificates of Obligation which are paid out of Tax Increment Reinvestment Zone (TIRZ #2) Fund, and the 2014A Combination
& Tax Issue for utility construction. A separate schedule follows for these other debt issues.
SCHEDULE OF INDEBTEDNESS - GENERAL GOVERNMENT
AS OF JULY 1, 2015
221

AS OF JULY 1, 2015
Principal Interest TotalYear Requirements Requirements Requirements
2015-2016 5,809,342.94 3,037,712.23 8,847,055.16
2016-2017 5,610,394.32 2,848,586.62 8,458,980.93
2017-2018 5,764,331.82 2,664,805.56 8,429,137.38
2018-2019 4,826,043.00 2,473,955.03 7,299,998.04
2019-2020 5,006,525.54 2,308,298.22 7,314,823.76
2020-2021 5,185,604.37 2,125,590.92 7,311,195.29
2021-2022 5,374,234.19 1,930,671.52 7,304,905.71
2022-2023 5,582,904.83 1,719,883.09 7,302,787.91
2023-2024 5,755,929.27 1,491,132.28 7,247,061.54
2024-2025 5,333,459.45 1,246,727.71 6,580,187.16
2025-2026 5,536,698.67 1,017,318.85 6,554,017.52
2026-2027 5,037,687.89 778,110.13 5,815,798.02
2027-2028 4,506,427.11 555,330.86 5,061,757.97
2028-2029 2,412,248.46 348,961.62 2,761,210.08
2029-2030 1,760,151.95 243,340.55 2,003,492.50
2030-2031 1,335,000.00 175,562.50 1,510,562.50
2031-2032 905,000.00 117,600.00 1,022,600.00
2032-2033 870,000.00 76,562.50 946,562.50
2033-2034 710,000.00 35,500.00 745,500.00
TOTAL 77,321,983.79 25,195,650.18 102,517,633.98
Note: Includes general obligation bonds, certificates of deposit and contractual lease-purchase obligations.
SCHEDULE OF TOTAL INDEBTEDNESS AND INTEREST BY YEAR-GENERAL GOVERNMENT
222

Interest Date of Term- Maturity Original Outstanding
Description Rates Issue Years Date Issue 07-01-2015
2006 Tax Increment Contract *4.813749 07-20-06 20 06-15-2027 6,540,000.00 4,540,000.00
Revenue Bonds - TIRZ #1
2009A Combination Tax & Revenue *5.0675741 07-14-09 30 06-15-2024 5,630,000.00 5,215,000.00
Certificates of Obligation - PID #4
2009B Certificates of Obligation - *4.4624150 11-03-09 25 06-15-2035 46,595,000.00 41,755,000.00
Surface Water Treatment Plant
2009C Combination Tax & Revenue *4.0273406 12-08-09 20 06-15-2028 5,260,000.00 3,670,000.00
Certificates of Obligation - TIRZ #2
2010A Combination Tax & Revenue *4.026369 11-02-10 28 06-15-2038 6,235,000.00 5,775,000.00
Certificates of Obligation - PID #2
2010B Combination Tax & Revenue *4.026369 11-02-10 11 06-15-2021 1,660,000.00 935,000.00
Certificates of Obligation - TIRZ #2
2014A Combination Tax & Revenue *2.750472 12-02-14 20 06-15-2034 4,995,000.00 4,870,000.00
Certificates of Obligation - Utility
TOTAL $76,915,000.00 $66,760,000.00
*Effective Interest Rate.
**This schedule does not include the debt of the General Government which is outlined on a prior page in this section.
The debt listed above is paid for by either user fees in Enterprise Funds, special assessments in Public Improvement District (PID)
Funds, or incremental property tax collections in Tax Incremental Reinvestment Zone (TIRZ) Funds.
SCHEDULE OF INDEBTEDNESS - UTILITIES AND OTHER FUNDS
AS OF JULY 1, 2015
223

SCHEDULE OF TOTAL INDEBTEDNESS AND INTEREST - UTILITIES & OTHER FUNDSAS OF JULY 1, 2015
Principal Interest TotalYear Requirements Requirements Requirements
2015-2016 2,415,000.00 2,982,229.12 5,397,229.12
2016-2017 2,490,000.00 2,907,445.72 5,397,445.72
2017-2018 2,590,000.00 2,815,399.86 5,405,399.86
2018-2019 2,695,000.00 2,704,708.16 5,399,708.16
2019-2020 2,810,000.00 2,588,681.42 5,398,681.42
2020-2021 2,930,000.00 2,465,094.62 5,395,094.62
2021-2022 3,060,000.00 2,334,191.26 5,394,191.26
2022-2023 3,195,000.00 2,196,441.26 5,391,441.26
2023-2024 3,340,000.00 2,051,066.26 5,391,066.26
2024-2025 3,485,000.00 1,917,396.26 5,402,396.26
2025-2026 3,620,000.00 1,776,071.26 5,396,071.26
2026-2027 3,775,000.00 1,628,320.02 5,403,320.02
2027-2028 3,445,000.00 1,452,226.26 4,897,226.26
2028-2029 3,235,000.00 1,290,701.26 4,525,701.26
2029-2030 3,270,000.00 1,137,851.26 4,407,851.26
2030-2031 3,430,000.00 981,915.00 4,411,915.00
2031-2032 3,585,000.00 818,240.00 4,403,240.00
2032-2033 3,755,000.00 646,992.50 4,401,992.50
2033-2034 3,935,000.00 466,768.76 4,401,768.76
2034-2035 3,785,000.00 277,818.76 4,062,818.76
2035-2036 660,000.00 90,575.00 750,575.00
2036-2037 640,000.00 59,593.76 699,593.76
2037-2038 615,000.00 29,331.26 644,331.26
TOTAL 66,760,000.00 35,619,059.04 102,379,059.04
Note: Includes general obligation bonds, tax increment revenue bonds and certificates of obligation.
224

SCHEDULE OF PRINCIPAL AND INTEREST BY ISSUE2007 GENERAL OBLIGATION BONDS
Effective Interest Rate: 3.9328708%
Interest Principal InterestYear 12-15 6-15 6-15 Total
2015-2016 134,612.50 455,000.00 134,612.50 724,225.00
2016-2017 125,512.50 480,000.00 125,512.50 731,025.00
2017-2018 116,512.50 495,000.00 116,512.50 728,025.00
2018-2019 107,231.25 515,000.00 107,231.25 729,462.50
2019-2020 97,575.00 540,000.00 97,575.00 735,150.00
2020-2021 87,315.00 560,000.00 87,315.00 734,630.00
2021-2022 76,535.00 580,000.00 76,535.00 733,070.00
2022-2023 65,297.50 605,000.00 65,297.50 735,595.00
2023-2024 53,500.00 630,000.00 53,500.00 737,000.00
2024-2025 40,900.00 655,000.00 40,900.00 736,800.00
2025-2026 27,800.00 680,000.00 27,800.00 735,600.00
2026-2027 14,200.00 710,000.00 14,200.00 738,400.00
TOTALS 946,991.25 6,905,000.00 946,991.25 8,798,982.50
225

SCHEDULE OF PRINCIPAL AND INTEREST BY ISSUE2008 GENERAL OBLIGATION BONDS
Effective Interest Rate: 4.1202192%
Interest Principal InterestYear 12-15 6-15 6-15 Total
2015-2016 89,727.50 245,000.00 89,727.50 424,455.00
2016-2017 84,215.00 255,000.00 84,215.00 423,430.00
2017-2018 78,477.50 270,000.00 78,477.50 426,955.00
2018-2019 73,077.50 280,000.00 73,077.50 426,155.00
2019-2020 67,477.50 295,000.00 67,477.50 429,955.00
2020-2021 61,577.50 310,000.00 61,577.50 433,155.00
2021-2022 55,377.50 325,000.00 55,377.50 435,755.00
2022-2023 48,877.50 340,000.00 48,877.50 437,755.00
2023-2024 42,077.50 360,000.00 42,077.50 444,155.00
2024-2025 34,652.50 375,000.00 34,652.50 444,305.00
2025-2026 26,777.50 395,000.00 26,777.50 448,555.00
2026-2027 18,383.75 415,000.00 18,383.75 451,767.50
2027-2028 9,461.25 435,000.00 9,461.25 453,922.50
TOTALS 690,160.00 4,300,000.00 690,160.00 5,680,320.00
226

SCHEDULE OF PRINCIPAL AND INTEREST BY ISSUE2008 CERTIFICATES OF OBLIGATION
Effective Interest Rate: 4.1062825%
Interest Principal Interest Year 12-15 6-15 6-15 Total
2015-2016 36,356.25 100,000.00 36,356.25 172,712.50
2016-2017 34,106.25 105,000.00 34,106.25 173,212.50
2017-2018 32,268.75 110,000.00 32,268.75 174,537.50
2018-2019 30,343.75 120,000.00 30,343.75 180,687.50
2019-2020 28,093.75 125,000.00 28,093.75 181,187.50
2020-2021 25,750.00 130,000.00 25,750.00 181,500.00
2021-2022 23,150.00 135,000.00 23,150.00 181,300.00
2022-2023 20,450.00 145,000.00 20,450.00 185,900.00
2023-2024 17,550.00 150,000.00 17,550.00 185,100.00
2024-2025 14,456.25 160,000.00 14,456.25 188,912.50
2025-2026 11,156.25 165,000.00 11,156.25 187,312.50
2026-2027 7,650.00 175,000.00 7,650.00 190,300.00
2027-2028 3,931.25 185,000.00 3,931.25 192,862.50
TOTALS 285,262.50 1,805,000.00 285,262.50 2,375,525.00
227

SCHEDULE OF PRINCIPAL AND INTEREST BY ISSUE2008A GENERAL OBLIGATION BONDS
Effective Interest Rate: 4.6536%
Interest Principal InterestYear 12-15 6-15 6-15 Total
2015-2016 355,650.00 920,000.00 355,650.00 1,631,300.00
2016-2017 337,250.00 960,000.00 337,250.00 1,634,500.00
2017-2018 318,050.00 995,000.00 318,050.00 1,631,100.00
2018-2019 298,150.00 1,035,000.00 298,150.00 1,631,300.00
2019-2020 276,803.13 1,080,000.00 276,803.13 1,633,606.26
2020-2021 251,153.13 1,130,000.00 251,153.13 1,632,306.26
2021-2022 227,140.63 1,180,000.00 227,140.63 1,634,281.26
2022-2023 200,590.63 1,230,000.00 200,590.63 1,631,181.26
2023-2024 171,378.13 1,290,000.00 171,378.13 1,632,756.26
2024-2025 140,740.63 1,350,000.00 140,740.63 1,631,481.26
2025-2026 108,678.13 1,415,000.00 108,678.13 1,632,356.26
2026-2027 75,071.88 1,485,000.00 75,071.88 1,635,143.76
2027-2028 38,875.00 1,555,000.00 38,875.00 1,632,750.00
TOTALS 2,799,531.29 15,625,000.00 2,799,531.29 21,224,062.58
228

SCHEDULE OF PRINCIPAL AND INTEREST BY ISSUE2008A CERTIFICATES OF OBLIGATION
Effective Interest Rate: 4.7085%
Gov. Interest Ent. Interest Gov. Principal Ent. Principal Gov. Interest Ent. Interest Year 12-15 12-15 12-15 12-15 6-15 6-15 Total
2015-2016 113,613.44 159,233.44 245,691.99 344,308.01 113,613.44 159,233.44 1,135,693.76
2016-2017 108,595.82 152,201.06 256,102.67 358,897.33 108,595.82 152,201.06 1,136,593.76
2017-2018 103,390.82 144,906.06 264,431.21 370,568.79 103,390.82 144,906.06 1,131,593.76
2018-2019 97,977.62 137,319.26 276,924.03 388,075.97 97,977.62 137,319.26 1,135,593.76
2019-2020 92,245.62 129,285.64 287,334.70 402,665.30 92,245.62 129,285.64 1,133,062.51
2020-2021 86,003.52 120,537.11 299,827.52 420,172.48 86,003.52 120,537.11 1,133,081.26
2021-2022 79,187.57 110,984.31 314,402.47 440,597.53 79,187.57 110,984.31 1,135,343.76
2022-2023 71,950.02 100,840.61 328,977.41 461,022.59 71,950.02 100,840.61 1,135,581.26
2023-2024 64,169.85 89,936.41 343,552.36 481,447.64 64,169.85 89,936.41 1,133,212.51
2024-2025 55,813.22 78,224.29 360,209.45 504,790.55 55,813.22 78,224.29 1,133,075.01
2025-2026 47,036.29 65,923.10 378,948.67 531,051.33 47,036.29 65,923.10 1,135,918.76
2026-2027 37,690.06 52,824.01 397,687.89 557,312.11 37,690.06 52,824.01 1,136,028.13
2027-2028 27,638.55 38,736.45 416,427.11 583,572.89 27,638.55 38,736.45 1,132,750.00
2028-2029 16,968.30 23,781.70 437,248.46 612,751.54 16,968.30 23,781.70 1,131,500.00
2029-2030 5,751.53 8,060.98 460,151.95 644,848.05 5,751.53 8,060.98 1,132,625.00
TOTALS 1,008,032.20 1,412,794.42 5,067,917.89 7,102,082.11 1,008,032.20 1,412,794.42 17,011,653.24
229

SCHEDULE OF PRINCIPAL AND INTEREST BY ISSUE2009 GENERAL OBLIGATION REFUNDING BONDS
Effective Interest Rate: 2.1919272%
Interest Principal InterestYear 12-15 6-15 6-15 Total
2015-2016 10,587.50 605,000.00 10,587.50 626,175.00
TOTALS 10,587.50 605,000.00 10,587.50 626,175.00
230

SCHEDULE OF PRINCIPAL AND INTEREST BY ISSUE2010 GENERAL OBLIGATION BONDS
Effective Interest Rate: 3.7609390%
Interest Principal Interest Year 12-15 6-15 6-15 Total
2015-2016 143,896.88 400,000.00 143,896.88 687,793.76
2016-2017 137,896.88 420,000.00 137,896.88 695,793.76
2017-2018 131,596.88 440,000.00 131,596.88 703,193.76
2018-2019 124,996.88 460,000.00 124,996.88 709,993.76
2019-2020 116,946.88 480,000.00 116,946.88 713,893.76
2020-2021 108,546.88 500,000.00 108,546.88 717,093.76
2021-2022 99,171.88 525,000.00 99,171.88 723,343.76
2022-2023 88,671.88 545,000.00 88,671.88 722,343.76
2023-2024 77,771.88 570,000.00 77,771.88 725,543.76
2024-2025 66,371.88 600,000.00 66,371.88 732,743.76
2025-2026 54,371.88 625,000.00 54,371.88 733,743.76
2026-2027 41,871.88 655,000.00 41,871.88 738,743.76
2027-2028 28,771.88 680,000.00 28,771.88 737,543.76
2028-2029 14,746.88 715,000.00 14,746.88 744,493.76
TOTALS 1,235,631.32 7,615,000.00 1,235,631.32 10,086,262.64
231

SCHEDULE OF PRINCIPAL AND INTEREST BY ISSUE2010 GENERAL OBLIGATION REFUNDING BONDS
Effective Interest Rate: 2.608064%
Interest Principal InterestYear 12-15 6-15 6-15 Total
2015-2016 32,925.00 570,000.00 32,925.00 635,850.00
2016-2017 24,375.00 805,000.00 24,375.00 853,750.00
2017-2018 12,300.00 820,000.00 12,300.00 844,600.00
TOTALS 69,600.00 2,195,000.00 69,600.00 2,334,200.00
232

SCHEDULE OF PRINCIPAL AND INTEREST BY ISSUE2010A GENERAL OBLIGATION BONDS
Effective Interest Rate: 3.443547%
Interest Principal Interest Year 12-15 6-15 6-15 Total
2015-2016 136,300.00 470,000.00 136,300.00 742,600.00
2016-2017 131,600.00 470,000.00 131,600.00 733,200.00
2017-2018 124,550.00 470,000.00 124,550.00 719,100.00
2018-2019 117,500.00 470,000.00 117,500.00 705,000.00
2019-2020 110,450.00 470,000.00 110,450.00 690,900.00
2020-2021 103,400.00 470,000.00 103,400.00 676,800.00
2021-2022 94,000.00 470,000.00 94,000.00 658,000.00
2022-2023 84,600.00 470,000.00 84,600.00 639,200.00
2023-2024 75,200.00 470,000.00 75,200.00 620,400.00
2024-2025 65,800.00 470,000.00 65,800.00 601,600.00
2025-2026 56,400.00 470,000.00 56,400.00 582,800.00
2026-2027 47,000.00 470,000.00 47,000.00 564,000.00
2027-2028 37,600.00 470,000.00 37,600.00 545,200.00
2028-2029 28,200.00 470,000.00 28,200.00 526,400.00
2029-2030 18,800.00 470,000.00 18,800.00 507,600.00
2030-2031 9,400.00 470,000.00 9,400.00 488,800.00
TOTALS 1,240,800.00 7,520,000.00 1,240,800.00 10,001,600.00
233

SCHEDULE OF PRINCIPAL AND INTEREST BY ISSUE2011 TAX NOTE
Effective Interest Rate: 1.650000%
Interest Principal InterestYear 12-15 6-15 6-15 Total
2015-2016 6,682.50 265,000.00 6,682.50 278,365.00
2016-2017 4,496.25 270,000.00 4,496.25 278,992.50
2017-2018 2,268.75 275,000.00 2,268.75 279,537.50
TOTALS 13,447.50 810,000.00 13,447.50 836,895.00
234

SCHEDULE OF PRINCIPAL AND INTEREST BY ISSUE2012 GENERAL OBLIGATION BONDS
Effective Interest Rate: 1.949603%
Interest Principal Interest Year 12-15 6-15 6-15 Total
2015-2016 14,812.50 75,000.00 14,812.50 104,625.00
2016-2017 13,406.25 75,000.00 13,406.25 101,812.50
2017-2018 12,000.00 75,000.00 12,000.00 99,000.00
2018-2019 11,156.25 70,000.00 11,156.25 92,312.50
2019-2020 10,368.75 70,000.00 10,368.75 90,737.50
2020-2021 9,581.25 70,000.00 9,581.25 89,162.50
2021-2022 8,793.75 70,000.00 8,793.75 87,587.50
2022-2023 8,006.25 70,000.00 8,006.25 86,012.50
2023-2024 7,218.75 70,000.00 7,218.75 84,437.50
2024-2025 6,431.25 70,000.00 6,431.25 82,862.50
2025-2026 5,643.75 70,000.00 5,643.75 81,287.50
2026-2027 4,856.25 70,000.00 4,856.25 79,712.50
2027-2028 4,068.75 70,000.00 4,068.75 78,137.50
2028-2029 3,281.25 70,000.00 3,281.25 76,562.50
2029-2030 2,493.75 70,000.00 2,493.75 74,987.50
2030-2031 1,662.50 70,000.00 1,662.50 73,325.00
2031-2032 831.25 70,000.00 831.25 71,662.50
TOTALS 124,612.50 1,205,000.00 124,612.50 1,454,225.00
235

SCHEDULE OF PRINCIPAL AND INTEREST BY ISSUE2013 GENERAL OBLIGATION REFUNDING BONDS
Effective Interest Rate: 2.891734
Gov. Interest Ent. Interest Gov. Principal Ent. Principal Gov. Interest Ent. Interest Year 12-15 12-15 6-15 6-15 6-15 6-15 Total
2015-2016 138,830.63 7,306.88 33,250.00 1,750.00 138,830.63 7,306.88 327,275.00
2016-2017 138,498.13 7,289.38 441,750.00 23,250.00 138,498.13 7,289.38 756,575.00
2017-2018 131,871.88 6,940.63 451,250.00 23,750.00 131,871.88 6,940.63 752,625.00
2018-2019 125,103.13 6,584.38 460,750.00 24,250.00 125,103.13 6,584.38 748,375.00
2019-2020 118,191.88 6,220.63 760,000.00 40,000.00 118,191.88 6,220.63 1,048,825.00
2020-2021 106,791.88 5,620.63 1,097,250.00 57,750.00 106,791.88 5,620.63 1,379,825.00
2021-2022 90,333.13 4,754.38 1,140,000.00 60,000.00 90,333.13 4,754.38 1,390,175.00
2022-2023 73,233.13 3,854.38 1,182,750.00 62,250.00 73,233.13 3,854.38 1,399,175.00
2023-2024 52,535.00 2,765.00 1,220,750.00 64,250.00 52,535.00 2,765.00 1,395,600.00
2024-2025 28,120.00 1,480.00 698,250.00 36,750.00 28,120.00 1,480.00 794,200.00
2025-2026 14,155.00 745.00 707,750.00 37,250.00 14,155.00 745.00 774,800.00
TOTALS 1,017,663.75 53,561.25 8,193,750.00 431,250.00 1,017,663.75 53,561.25 10,767,450.00
236

SCHEDULE OF PRINCIPAL AND INTEREST BY ISSUE2014 GENERAL OBLIGATION BONDS
Effective Interest Rate: 3.130914%
Interest Principal Interest Year 12-15 6-15 6-15 Total
2015-2016 27,825.00 70,000.00 27,825.00 125,650.00
2016-2017 26,731.25 70,000.00 26,731.25 123,462.50
2017-2018 25,637.50 75,000.00 25,637.50 126,275.00
2018-2019 24,465.63 75,000.00 24,465.63 123,931.26
2019-2020 23,293.75 80,000.00 23,293.75 126,587.50
2020-2021 22,043.75 80,000.00 22,043.75 124,087.50
2021-2022 20,793.75 80,000.00 20,793.75 121,587.50
2022-2023 19,543.75 85,000.00 19,543.75 124,087.50
2023-2024 18,215.63 90,000.00 18,215.63 126,431.26
2024-2025 16,809.38 90,000.00 16,809.38 123,618.76
2025-2026 15,403.13 95,000.00 15,403.13 125,806.26
2026-2027 13,918.75 100,000.00 13,918.75 127,837.50
2027-2028 12,356.25 105,000.00 12,356.25 129,712.50
2028-2029 10,584.38 105,000.00 10,584.38 126,168.76
2029-2030 8,812.50 110,000.00 8,812.50 127,625.00
2030-2031 6,750.00 115,000.00 6,750.00 128,500.00
2031-2032 4,593.75 120,000.00 4,593.75 129,187.50
2032-2033 2,343.75 125,000.00 2,343.75 129,687.50
TOTALS 300,121.90 1,670,000.00 300,121.90 2,270,243.80
237

Effective Interest Rate: 1.543813%
Gov. Interest Ent. Interest Gov. Principal Ent. Principal Gov. Interest Ent. Interest TotalYear 12-15 12-15 6-15 6-15 6-15 6-15
2015-2016 45,569.06 2,005.94 924,312.07 40,687.93 45,569.06 2,005.94 1,060,150.00
2016-2017 31,704.38 1,395.62 560,334.26 24,665.74 31,704.38 1,395.62 651,200.00
2017-2018 23,299.37 1,025.63 593,858.53 26,141.47 23,299.37 1,025.63 668,650.00
2018-2019 14,391.49 633.51 632,171.98 27,828.02 14,391.49 633.51 690,050.00
2019-2020 8,069.77 355.23 368,766.99 16,233.01 8,069.77 355.23 401,850.00
2020-2021 4,382.10 192.90 71,837.73 3,162.27 4,382.10 192.90 84,150.00
2021-2022 3,304.54 145.46 71,837.73 3,162.27 3,304.54 145.46 81,900.00
2022-2023 2,226.97 98.03 71,837.73 3,162.27 2,226.97 98.03 79,650.00
2023-2024 1,149.40 50.60 76,626.91 3,373.09 1,149.40 50.60 82,400.00
TOTALS 134,097.09 5,902.91 3,371,583.91 148,416.09 134,097.09 5,902.91 3,800,000.00
SCHEDULE OF PRINCIPAL AND INTEREST BY ISSUE2014 GENERAL OBLIGATION REFUNDING BONDS
238
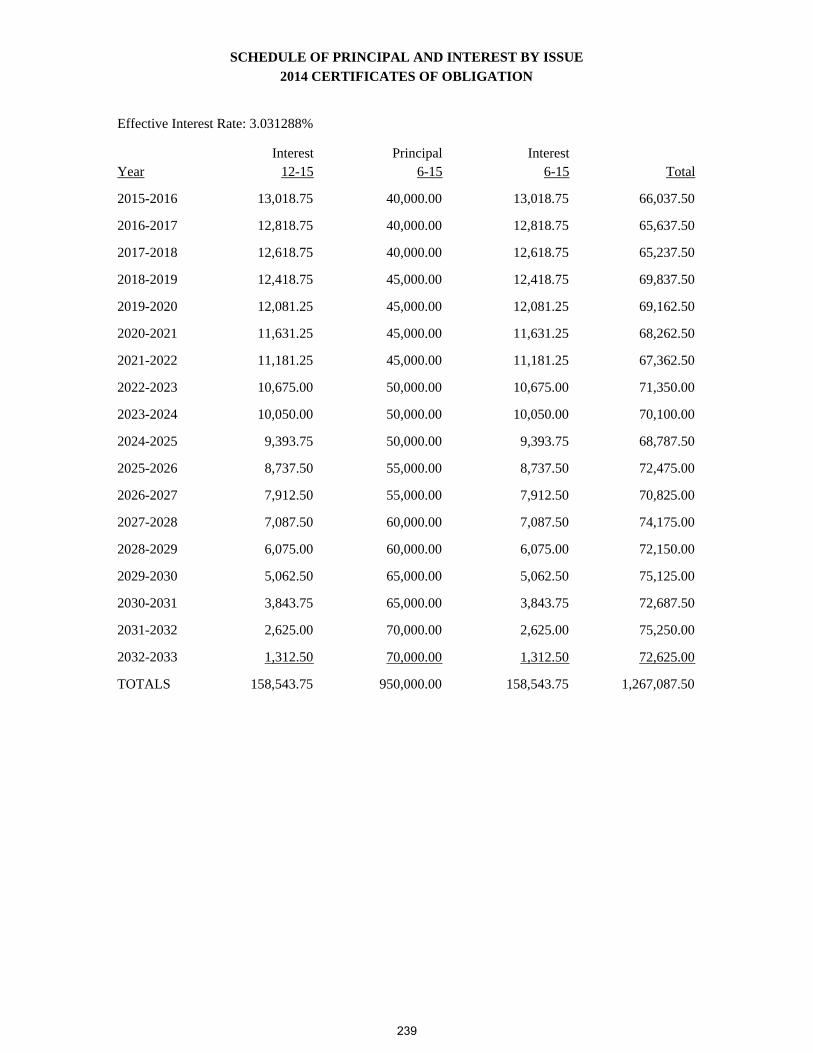
SCHEDULE OF PRINCIPAL AND INTEREST BY ISSUE
Effective Interest Rate: 3.031288%
Interest Principal Interest Year 12-15 6-15 6-15 Total
2015-2016 13,018.75 40,000.00 13,018.75 66,037.50
2016-2017 12,818.75 40,000.00 12,818.75 65,637.50
2017-2018 12,618.75 40,000.00 12,618.75 65,237.50
2018-2019 12,418.75 45,000.00 12,418.75 69,837.50
2019-2020 12,081.25 45,000.00 12,081.25 69,162.50
2020-2021 11,631.25 45,000.00 11,631.25 68,262.50
2021-2022 11,181.25 45,000.00 11,181.25 67,362.50
2022-2023 10,675.00 50,000.00 10,675.00 71,350.00
2023-2024 10,050.00 50,000.00 10,050.00 70,100.00
2024-2025 9,393.75 50,000.00 9,393.75 68,787.50
2025-2026 8,737.50 55,000.00 8,737.50 72,475.00
2026-2027 7,912.50 55,000.00 7,912.50 70,825.00
2027-2028 7,087.50 60,000.00 7,087.50 74,175.00
2028-2029 6,075.00 60,000.00 6,075.00 72,150.00
2029-2030 5,062.50 65,000.00 5,062.50 75,125.00
2030-2031 3,843.75 65,000.00 3,843.75 72,687.50
2031-2032 2,625.00 70,000.00 2,625.00 75,250.00
2032-2033 1,312.50 70,000.00 1,312.50 72,625.00
TOTALS 158,543.75 950,000.00 158,543.75 1,267,087.50
2014 CERTIFICATES OF OBLIGATION
239

Effective Interest Rate: 2.750472%
Principal Interest Interest
Year 6-15 12-15 6-15 Total
2015-2016 205,000.00 65,885.00 65,885.00 336,770.00
2016-2017 210,000.00 63,835.00 63,835.00 337,670.00
2017-2018 215,000.00 61,735.00 61,735.00 338,470.00
2018-2019 220,000.00 59,585.00 59,585.00 339,170.00
2019-2020 225,000.00 57,385.00 57,385.00 339,770.00
2020-2021 230,000.00 55,135.00 55,135.00 340,270.00
2021-2022 230,000.00 52,835.00 52,835.00 335,670.00
2022-2023 235,000.00 50,535.00 50,535.00 336,070.00
2023-2024 245,000.00 47,597.50 47,597.50 340,195.00
2024-2025 250,000.00 44,535.00 44,535.00 339,070.00
2025-2026 255,000.00 40,785.00 40,785.00 336,570.00
2026-2027 265,000.00 36,960.00 36,960.00 338,920.00
2027-2028 270,000.00 32,985.00 32,985.00 335,970.00
2028-2029 280,000.00 28,935.00 28,935.00 337,870.00
2029-2030 290,000.00 24,560.00 24,560.00 339,120.00
2030-2031 300,000.00 19,920.00 19,920.00 339,840.00
2031-2032 305,000.00 15,120.00 15,120.00 335,240.00
2032-2033 315,000.00 10,240.00 10,240.00 335,480.00
2033-2034 325,000.00 5,200.00 5,200.00 335,400.00
TOTALS 4,870,000.00 773,767.50 773,767.50 6,417,535.00
SCHEDULE OF PRINCIPAL AND INTEREST BY BOND ISSUE
2014A COMBINATION TAX & REVENUE
240
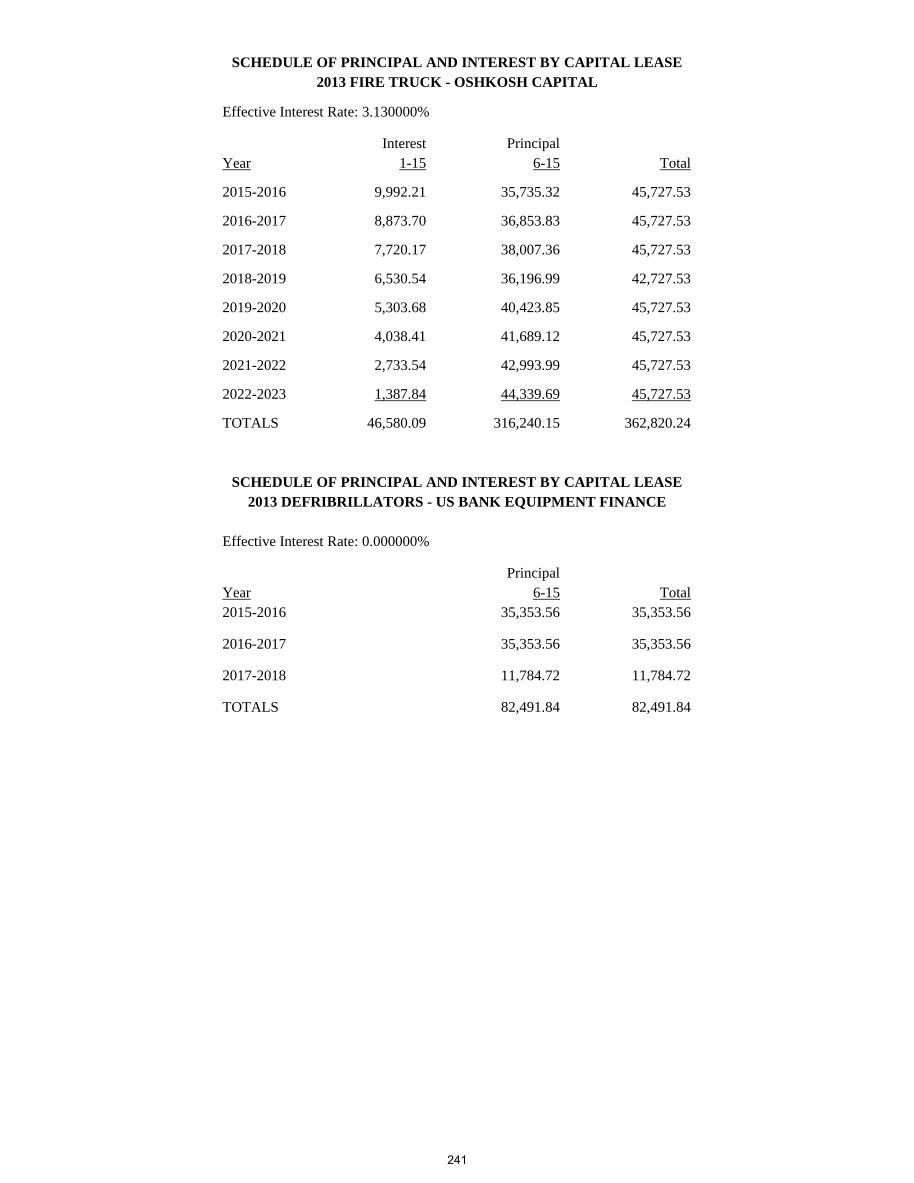
SCHEDULE OF PRINCIPAL AND INTEREST BY CAPITAL LEASE
2013 FIRE TRUCK - OSHKOSH CAPITAL
Effective Interest Rate: 3.130000%
Interest Principal
Year 1-15 6-15 Total
2015-2016 9,992.21 35,735.32 45,727.53
2016-2017 8,873.70 36,853.83 45,727.53
2017-2018 7,720.17 38,007.36 45,727.53
2018-2019 6,530.54 36,196.99 42,727.53
2019-2020 5,303.68 40,423.85 45,727.53
2020-2021 4,038.41 41,689.12 45,727.53
2021-2022 2,733.54 42,993.99 45,727.53
2022-2023 1,387.84 44,339.69 45,727.53
TOTALS 46,580.09 316,240.15 362,820.24
SCHEDULE OF PRINCIPAL AND INTEREST BY CAPITAL LEASE
2013 DEFRIBRILLATORS - US BANK EQUIPMENT FINANCE
Effective Interest Rate: 0.000000%
Principal
Year 6-15 Total
2015-2016 35,353.56 35,353.56
2016-2017 35,353.56 35,353.56
2017-2018 11,784.72 11,784.72
TOTALS 82,491.84 82,491.84
241

SCHEDULE OF PRINCIPAL AND INTEREST BY BOND ISSUE
2015 GENERAL OBLIGATION BONDS
Effective Interest Rate: 2.597758%
Principal Interest Interest
Year 6-15 6-15 12-15 Total
2015-2016 320,000.00 213,450.00 213,450.00 746,900.00
2016-2017 330,000.00 208,650.00 208,650.00 747,300.00
2017-2018 340,000.00 203,700.00 203,700.00 747,400.00
2018-2019 350,000.00 196,900.00 196,900.00 743,800.00
2019-2020 365,000.00 189,900.00 189,900.00 744,800.00
2020-2021 380,000.00 182,600.00 182,600.00 745,200.00
2021-2022 395,000.00 175,000.00 175,000.00 745,000.00
2022-2023 415,000.00 165,125.00 165,125.00 745,250.00
2023-2024 435,000.00 154,750.00 154,750.00 744,500.00
2024-2025 455,000.00 143,875.00 143,875.00 742,750.00
2025-2026 480,000.00 132,500.00 132,500.00 745,000.00
2026-2027 505,000.00 120,500.00 120,500.00 746,000.00
2027-2028 530,000.00 107,875.00 107,875.00 745,750.00
2028-2029 555,000.00 94,625.00 94,625.00 744,250.00
2029-2030 585,000.00 80,750.00 80,750.00 746,500.00
2030-2031 615,000.00 66,125.00 66,125.00 747,250.00
2031-2032 645,000.00 50,750.00 50,750.00 746,500.00
2032-2033 675,000.00 34,625.00 34,625.00 744,250.00
2033-2034 710,000.00 17,750.00 17,750.00 745,500.00
TOTAL 9,085,000.00 2,539,450.00 2,539,450.00 14,163,900.00
242

SCHEDULE OF PRINCIPAL AND INTEREST BY ISSUE2006 TIRZ #1 TAX INCREMENT REVENUE BONDS
Effective Interest Rate: 4.813749
Interest Principal InterestYear 12-15 6-15 6-15 Total
2015-2016 100,838.75 295,000.00 100,838.75 496,677.50
2016-2017 94,643.75 310,000.00 94,643.75 499,287.50
2017-2018 88,056.25 325,000.00 88,056.25 501,112.50
2018-2019 81,150.00 335,000.00 81,150.00 497,300.00
2019-2020 73,821.88 350,000.00 73,821.88 497,643.76
2020-2021 66,165.63 365,000.00 66,165.63 497,331.26
2021-2022 58,181.25 380,000.00 58,181.25 496,362.50
2022-2023 49,631.25 400,000.00 49,631.25 499,262.50
2023-2024 40,631.25 415,000.00 40,631.25 496,262.50
2024-2025 31,293.75 435,000.00 31,293.75 497,587.50
2025-2026 21,506.25 455,000.00 21,506.25 498,012.50
2026-2027 10,984.38 475,000.00 10,984.38 496,968.76
TOTALS 716,904.39 4,540,000.00 716,904.39 5,973,808.78
243

SCHEDULE OF PRINCIPAL AND INTEREST BY ISSUE
Effective Interest Rate: 5.0675741%
Interest Principal Interest Year 12-15 12-15 6-15 Total
2015-2016 126,843.13 135,000.00 126,843.13 388,686.26
2016-2017 124,143.13 140,000.00 124,143.13 388,286.26
2017-2018 121,343.13 145,000.00 121,343.13 387,686.26
2018-2019 118,443.13 150,000.00 118,443.13 386,886.26
2019-2020 115,368.13 155,000.00 115,368.13 385,736.26
2020-2021 112,074.38 160,000.00 112,074.38 384,148.76
2021-2022 108,554.38 170,000.00 108,554.38 387,108.76
2022-2023 104,729.38 175,000.00 104,729.38 384,458.76
2023-2024 100,704.38 185,000.00 100,704.38 386,408.76
2024-2025 96,356.88 195,000.00 96,356.88 387,713.76
2025-2026 91,725.63 205,000.00 91,725.63 388,451.26
2026-2027 86,703.13 215,000.00 86,703.13 388,406.26
2027-2028 81,328.13 225,000.00 81,328.13 387,656.26
2028-2029 75,703.13 235,000.00 75,703.13 386,406.26
2029-2030 69,828.13 245,000.00 69,828.13 384,656.26
2030-2031 63,550.00 260,000.00 63,550.00 387,100.00
2031-2032 56,887.50 270,000.00 56,887.50 383,775.00
2032-2033 49,968.75 285,000.00 49,968.75 384,937.50
2033-2034 42,665.63 300,000.00 42,665.63 385,331.26
2034-2035 34,978.13 315,000.00 34,978.13 384,956.26
2035-2036 26,906.25 335,000.00 26,906.25 388,812.50
2036-2037 18,321.88 350,000.00 18,321.88 386,643.76
2037-2038 9,353.13 365,000.00 9,353.13 383,706.26
TOTALS 1,836,479.47 5,215,000.00 1,836,479.47 8,887,958.94
2009A PID #4 CERTIFICATES OF OBLIGATION
244

SCHEDULE OF PRINCIPAL AND INTEREST BY ISSUE
Effective Interest Rate: 4.4624150%
Interest Principal Interest Year 12-15 12-15 6-15 Total
2015-2016 994,275.00 1,320,000.00 994,275.00 3,308,550.00
2016-2017 974,475.00 1,360,000.00 974,475.00 3,308,950.00
2017-2018 947,275.00 1,415,000.00 947,275.00 3,309,550.00
2018-2019 911,900.00 1,485,000.00 911,900.00 3,308,800.00
2019-2020 874,775.00 1,560,000.00 874,775.00 3,309,550.00
2020-2021 835,775.00 1,640,000.00 835,775.00 3,311,550.00
2021-2022 794,775.00 1,720,000.00 794,775.00 3,309,550.00
2022-2023 751,775.00 1,805,000.00 751,775.00 3,308,550.00
2023-2024 706,650.00 1,895,000.00 706,650.00 3,308,300.00
2024-2025 668,750.00 1,975,000.00 668,750.00 3,312,500.00
2025-2026 629,250.00 2,050,000.00 629,250.00 3,308,500.00
2026-2027 588,250.00 2,135,000.00 588,250.00 3,311,500.00
2027-2028 534,875.00 2,240,000.00 534,875.00 3,309,750.00
2028-2029 478,875.00 2,355,000.00 478,875.00 3,312,750.00
2029-2030 420,000.00 2,470,000.00 420,000.00 3,310,000.00
2030-2031 358,250.00 2,595,000.00 358,250.00 3,311,500.00
2031-2032 293,375.00 2,725,000.00 293,375.00 3,311,750.00
2032-2033 225,250.00 2,860,000.00 225,250.00 3,310,500.00
2033-2034 153,750.00 3,000,000.00 153,750.00 3,307,500.00
2034-2035 78,750.00 3,150,000.00 78,750.00 3,307,500.00
TOTALS 12,221,050.00 41,755,000.00 12,221,050.00 66,197,100.00
2009B SWTP (540) CERTIFICATES OF OBLIGATION
245

SCHEDULE OF PRINCIPAL AND INTEREST BY ISSUE2009C TIRZ #2 COMBINATION TAX & REVENUE CERTIFICATES OF OBLIGATION
Effective Interest Rate: 4.0273406%
Interest Principal InterestYear 12-15 6-15 6-15 Total
2015-2016 73,393.75 225,000.00 73,393.75 371,787.50
2016-2017 69,456.25 230,000.00 69,456.25 368,912.50
2017-2018 65,431.25 240,000.00 65,431.25 370,862.50
2018-2019 61,231.25 250,000.00 61,231.25 372,462.50
2019-2020 57,012.50 255,000.00 57,012.50 369,025.00
2020-2021 51,912.50 265,000.00 51,912.50 368,825.00
2021-2022 46,612.50 280,000.00 46,612.50 373,225.00
2022-2023 41,012.50 290,000.00 41,012.50 372,025.00
2023-2024 35,212.50 300,000.00 35,212.50 370,425.00
2024-2025 29,025.00 315,000.00 29,025.00 373,050.00
2025-2026 22,331.25 325,000.00 22,331.25 369,662.50
2026-2027 15,425.00 340,000.00 15,425.00 370,850.00
2027-2028 7,987.50 355,000.00 7,987.50 370,975.00
TOTALS 576,043.75 3,670,000.00 576,043.75 4,822,087.50
246

SCHEDULE OF PRINCIPAL AND INTEREST BY ISSUE
Effective Interest Rate: 4.026369%
Interest Principal Interest Year 12-15 12-15 6-15 Total
2015-2016 115,387.50 75,000.00 115,387.50 305,775.00
2016-2017 114,637.50 75,000.00 114,637.50 304,275.00
2017-2018 113,512.50 80,000.00 113,512.50 307,025.00
2018-2019 112,312.50 80,000.00 112,312.50 304,625.00
2019-2020 111,112.50 85,000.00 111,112.50 307,225.00
2020-2021 109,837.50 185,000.00 109,837.50 404,675.00
2021-2022 106,137.50 280,000.00 106,137.50 492,275.00
2022-2023 100,537.50 290,000.00 100,537.50 491,075.00
2023-2024 94,737.50 300,000.00 94,737.50 489,475.00
2024-2025 88,737.50 315,000.00 88,737.50 492,475.00
2025-2026 82,437.50 330,000.00 82,437.50 494,875.00
2026-2027 75,837.50 345,000.00 75,837.50 496,675.00
2027-2028 68,937.50 355,000.00 68,937.50 492,875.00
2028-2029 61,837.50 365,000.00 61,837.50 488,675.00
2029-2030 54,537.50 265,000.00 54,537.50 374,075.00
2030-2031 49,237.50 275,000.00 49,237.50 373,475.00
2031-2032 43,737.50 285,000.00 43,737.50 372,475.00
2032-2033 38,037.50 295,000.00 38,037.50 371,075.00
2033-2034 31,768.75 310,000.00 31,768.75 373,537.50
2034-2035 25,181.25 320,000.00 25,181.25 370,362.50
2035-2036 18,381.25 325,000.00 18,381.25 361,762.50
2036-2037 11,475.00 290,000.00 11,475.00 312,950.00
2037-2038 5,312.50 250,000.00 5,312.50 260,625.00
TOTALS 1,633,668.75 5,775,000.00 1,633,668.75 9,042,337.50
2010A PID #2 CERTIFICATES OF OBLIGATION
247

SCHEDULE OF PRINCIPAL AND INTEREST BY ISSUE
Effective Interest Rate: 4.026369%
Interest Principal Interest Year 12-15 12-15 6-15 Total
2015-2016 14,491.43 160,000.00 14,491.43 188,982.86
2016-2017 12,532.23 165,000.00 12,532.23 190,064.46
2017-2018 10,346.80 170,000.00 10,346.80 190,693.60
2018-2019 7,732.20 175,000.00 7,732.20 190,464.40
2019-2020 4,865.70 180,000.00 4,865.70 189,731.40
2020-2021 1,647.30 85,000.00 1,647.30 88,294.60
TOTALS 51,615.66 935,000.00 51,615.66 1,038,231.32
2010B TIRZ #2 CERTIFICATES OF OBLIGATION
248

DESCRIPTION
CAPITAL
PROJECT
BONDS
FUND
METRO
PROJECTS
FUND
OTHER
PROJECTS
FUND TOTALS
REVENUES:
INTERGOVERNMENTAL REVENUES
Metro - 1/2 Sales Tax Rebate 0 3,244,800 0 3,244,800
Metro St. Maintenance & Trf Control 0 0 0 0
Transportation Grants 0 0
Park Grants 0 0 0 0
TOTAL INTERGOVERNMENTAL
REVENUES 0 3,244,800 0 3,244,800
OTHER REVENUES
Interest Earnings 65,000 24,000 1,885 90,885
Contributions from Developers 0 0 0 0
Other 100,000 0 0 100,000
TOTAL OTHER REVENUES 165,000 24,000 1,885 190,885
TOTAL REVENUES 165,000 3,268,800 1,885 3,435,685
OTHER FINANCING RESOURCES
Transfer from General Fund 0 0 0 0
Transfer from Mustang Bayou Reg Water Fund 0 0 0 0
Transfer from Steepbank/Flatbank Reg WW Fund 0 0 0 0
Transfer from Surface Water Fund 0 0 0 0
Reimbursement from MUD's 0 0 0 0
Sale of Bonds 3,122,000 0 0 3,122,000
Sale of Certificates of Obligation 0 0 0 0
TOTAL REVENUES & RESOURCES 3,287,000 3,268,800 1,885 6,557,685
EXPENDITURES
Cost of Sales 45,000 0 0 45,000
Public Safety 0 0 0 0
Drainage 365,168 0 0 365,168
Transportation 2,285,000 2,970,600 0 5,255,600
Parks 305,000 0 0 305,000
Facilities 400,000 0 0 400,000
Municipal Court 0 0 0 0
Metro Projects 0 0 0 0
Other Projects 0 0 0 0
Utility Construction 0 0 0 0
TOTAL EXPENDITURES 3,400,168 2,970,600 0 6,370,768
OTHER FINANCING USES
Transfer to General Fund 0 800,000 0 800,000
TOTAL APPROPRIATIONS/
EXPENDITURES 3,400,168 3,770,600 0 7,170,768
NET REVENUES OVER/(UNDER) EXPENDITURES(113,168) (501,800) 1,885 (613,083)
BEGINNING FUND BALANCE JULY 1 698,684 1,853,066 124,693 2,676,443
ENDING FUND BALANCE JUNE 30 585,516 1,351,266 126,578 2,063,360
PROPOSED BUDGET FY 2016
CAPITAL IMPROVEMENT FUNDS - GOVERNMENTAL
CONSOLIDATED SUMMARY OF REVENUES, EXPENDITURES AND
CHANGES IN FUND EQUITY
249

FY 2015 FY 2015 FY 2016FY 2014 Original Year-End Proposed
Actual Budget Estimate Budget
REVENUES & RESOURCESInterest Income 41,025 35,000 40,750 24,000
Miscellaneous
Metro - 1/2 cent sales tax rebate 3,280,552 3,120,000 3,120,000 3,244,800
Total Revenues 3,321,577 3,155,000 3,160,750 3,268,800
TOTAL REVENUES & RESOURCES 3,321,577 3,155,000 3,160,750 3,268,800
EXPENDITURESIssuance Expense
CIP
Drainage
Facilities
Parks & Recreation
Public Safety
Transportation 2,497,491 2,562,000 3,662,901 2,970,600
Other Projects 0 0 0 0
Total Expenditures 2,497,491 2,562,000 3,662,901 2,970,600
OTHER FINANCING USESTransfer to General Fund 800,000 800,000 800,000 800,000
Total Other Financing Uses 800,000 800,000 800,000 800,000
TOTAL APPROPRIATIONS/EXPENDITURES 3,297,491 3,362,000 4,462,901 3,770,600
NET REVENUES OVER/(UNDER) EXPENDITURES 24,086 (207,000) (1,302,151) (501,800)
BEGINNING FUND BALANCE JULY 1 3,131,131 1,583,037 3,155,217 1,853,066
ENDING FUND BALANCE JUNE 30 3,155,217 1,376,037 1,853,066 1,351,266
SUMMARY OF REVENUES, EXPENDITURES AND
CHANGES IN FUND EQUITY
METRO PROJECTS FUND
401-40-401
250

FY 2015 FY 2015 FY 2016
FY 2014 Original Year-End Proposed
Actual Budget Estimate Budget
REVENUES
Proceeds-Certificates of Obligation 990,000 625,000 0 0
C.O. Premium 4,804 0 0 0
Interest Income 8,883 6,500 11,030 1,885
Total Revenues 1,003,687 631,500 11,030 1,885
OTHER FINANCING RESOURCES
Transfer from Information Tech Maintenance Fund 517,460 0 0 0
Total Other Financing Resources 517,460 0 0 0
TOTAL REVENUES & RESOURCES 1,521,146 631,500 11,030 1,885
EXPENDITURES
Issuance Expense 35,161
CIP
Drainage
Facilities
Parks & Recreation
Public Safety 625,000 36,246
Transportation
Other Projects 1,098,846 0 407,441 0
Total Expenditures 1,134,007 625,000 443,687 0
TOTAL APPROPRIATIONS/EXPENDITURES 1,134,007 625,000 443,687 0
NET REVENUES OVER/(UNDER) EXPENDITURES 387,140 6,500 (432,657) 1,885
BEGINNING FUND BALANCE JULY 1 170,210 106,247 557,350 124,693
ENDING FUND BALANCE JUNE 30 557,350 112,747 124,693 126,578
SUMMARY OF REVENUES, EXPENDITURES AND
CHANGES IN FUND EQUITY
OTHER PROJECTS FUND
402-40-402
251

FY 2015 FY 2015 FY 2016
FY 2014 Original Year-End Proposed
Actual Budget Estimate Budget
REVENUES
Bond Proceeds 1,740,000 9,200,000 9,200,000 3,122,000
Bond Premium 45,330 128,291
Interest Income 73,112 45,000 208,400 65,000
Impact Fee 12,000
Miscellaneous 40,000 100,000 100,000
Contributions - Other Gov'ts
Stafford - Animal Shelter 58,483
Sienna MUD FS #5 9,800
Sienna MUD Fire Engine 586,334 111,264
TXDOT - ITS 21,081
Ft. Bend County - 50070 Lexington 3,060,128
Ft. Bend County - 50067 Vicksburg 1,530,000
FBC MUD 47 & 48 - 50067 Vicksburg 983,309
TIRZ 2 - 50067 Vicksburg 900,000
Contributions - Developers 30,014 0 0 0
Total Revenues 2,604,154 9,245,000 16,233,392 3,287,000
TOTAL REVENUES & RESOURCES 2,604,154 9,245,000 16,233,392 3,287,000
EXPENDITURES
Issuance Expense 41,756 48,426 45,000
CIP
Drainage 426,430 250,000 405,950 365,168
Facilities 0 85,055 157,771 400,000
Parks 292,418 265,000 265,374 305,000
Public Safety 2,841,702 89,559 0
Transportation 1,187,816 9,195,000 17,486,670 2,285,000
Other Projects 0 0 0 0
Total Expenditures 4,790,121 9,795,055 18,453,751 3,400,168
TOTAL APPROPRIATIONS/EXPENDITURES 4,790,121 9,795,055 18,453,751 3,400,168
NET REVENUES OVER/(UNDER) EXPENDITURES (2,185,967) (550,055) (2,220,359) (113,168)
BEGINNING FUND BALANCE JULY 1 5,105,010 983,081 2,919,043 698,684
ENDING FUND BALANCE JUNE 30 2,919,043 433,026 698,684 585,516
SUMMARY OF REVENUES, EXPENDITURES AND
CHANGES IN FUND EQUITY
CAPITAL PROJECTS FUND
403-40-430
252

DESCRIPTION
SURFACE
WATER PLANT
CONSTRUCTION
FUND 542 TOTALS
REVENUES:
INTERGOVERNMENTAL REVENUES
Contributions from Other Govt's 0 0
Metro St. Maintenance & Trf Control 0 0
Transportation Grants 0 0
Park Grants 0 0
TOTAL INTERGOVERNMENTAL
REVENUES 0 0
OTHER REVENUES
Interest Earnings 42,600 42,600
Contributions from Developers 0 0
Other 0
TOTAL OTHER REVENUES 42,600 42,600
TOTAL REVENUES 42,600 42,600
OTHER FINANCING RESOURCES
Transfer from General Fund 0 0
Transfer from Mustang Bayou Reg Water Fund 0 0
Transfer from Steepbank/Flatbank Reg WW Fund 0 0
Transfer from Surface Water Fund 0 0
Reimbursement from MUD's 0 0
Sale of Bonds 0 0
Sale of Certificates of Obligation 2,245,900 2,245,900
TOTAL REVENUES & RESOURCES 2,288,500 2,288,500
EXPENDITURES
Cost of Sales 0 0
Public Safety 0 0
Drainage 0 0
Transportation 0 0
Parks 0 0
Facilities 0 0
Municipal Court 0 0
Metro Projects 0 0
Other Projects 0 0
Utility Construction 4,879,168 4,879,168
TOTAL EXPENDITURES 4,879,168 4,879,168
OTHER FINANCING SOURCES
Transfer from 510 (2014 CO Utility Debt) 0 0
TOTAL APPROPRIATIONS/
EXPENDITURES 4,879,168 4,879,168
NET REVENUES OVER/(UNDER) EXPENDITURES (2,590,668) (2,590,668)
BEGINNING FUND BALANCE JULY 1 3,130,489 3,130,489
ENDING FUND BALANCE JUNE 30 539,821 539,821
PROPOSED BUDGET FY 2016
CAPITAL IMPROVEMENT FUNDS - UTILITY
CONSOLIDATED SUMMARY OF REVENUES, EXPENDITURES AND
CHANGES IN FUND EQUITY
253
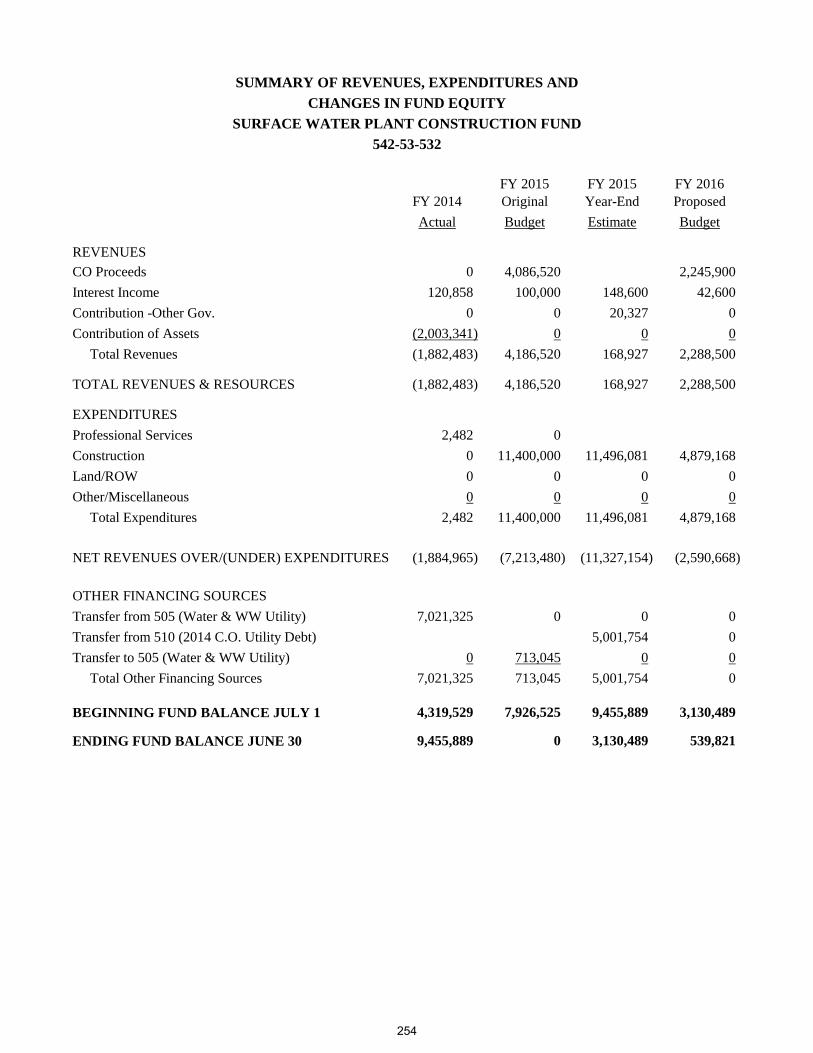
FY 2015 FY 2015 FY 2016
FY 2014 Original Year-End Proposed
Actual Budget Estimate Budget
REVENUES
CO Proceeds 0 4,086,520 2,245,900
Interest Income 120,858 100,000 148,600 42,600
Contribution -Other Gov. 0 0 20,327 0
Contribution of Assets (2,003,341) 0 0 0
Total Revenues (1,882,483) 4,186,520 168,927 2,288,500
TOTAL REVENUES & RESOURCES (1,882,483) 4,186,520 168,927 2,288,500
EXPENDITURES
Professional Services 2,482 0
Construction 0 11,400,000 11,496,081 4,879,168
Land/ROW 0 0 0 0
Other/Miscellaneous 0 0 0 0
Total Expenditures 2,482 11,400,000 11,496,081 4,879,168
NET REVENUES OVER/(UNDER) EXPENDITURES (1,884,965) (7,213,480) (11,327,154) (2,590,668)
OTHER FINANCING SOURCES
Transfer from 505 (Water & WW Utility) 7,021,325 0 0 0
Transfer from 510 (2014 C.O. Utility Debt) 5,001,754 0
Transfer to 505 (Water & WW Utility) 0 713,045 0 0
Total Other Financing Sources 7,021,325 713,045 5,001,754 0
BEGINNING FUND BALANCE JULY 1 4,319,529 7,926,525 9,455,889 3,130,489
ENDING FUND BALANCE JUNE 30 9,455,889 0 3,130,489 539,821
SURFACE WATER PLANT CONSTRUCTION FUND
542-53-532
SUMMARY OF REVENUES, EXPENDITURES AND
CHANGES IN FUND EQUITY
254

PROJECTS BY YEARS
Index
No.
Project
No. Project Name
Actual
Through
FY2014
Estimated
FY2015
Budgeted
FY2016
Projected
FY2017
Projected
FY2018
Projected
FY2019
Projected
FY2020 Project Total
DRAINAGECompleted Projects in Prior Years 5,397,415 2,450 5,399,865
001 10003 Major Equipment 564,438 373,000 365,168 1,302,606002 10018 Lower Oyster Creek 379,288 151,712 531,000003 10021 Storm Water Management 172,978 28,000 200,978004 Cangelosi Detention Facility 1,000,000 1,000,000 1,000,000 3,000,000005 Mustang Bayou Watershed - Kitty Hollow to Old Channel 3,000,000 3,000,000006 Mustang Bayou Watershed - Diversion Channel to GCWA 1,650,000 1,650,000007 Mustang Bayou Watershed - GCWA Canal to Court Road 1,650,000 1,650,000008 Pre-1987 Improvements 522,362 1,000,000 1,000,000 1,739,743 4,262,104009 Willow Waterhole 700,000 5,800,000 6,500,000
TOTAL DRAINAGE 6,514,119 403,450 365,168 5,222,362 3,650,000 3,801,712 7,539,743 27,496,553
FACILITIESCompleted Projects in Prior Years 3,649,053 3,649,053
010 20010 Facilities Needs Assessment & Upgrades 72,716 72,716011 City Hall Lobby Standing Seam Roof 50,000 50,000012 City Hall/Planning Roof 35,055 120,000 2,120,000 2,275,055013 PSHQ Roof Repairs 155,000 155,000014 Facilities Preventive Maintenance Program 75,000 75,000015 Facilities Master Plan 200,000 2,950,000 3,150,000016 PSHQ Fire Alarm System 80,000 80,000
TOTAL FACILITIES 3,649,053 157,771 400,000 2,275,000 75,000 2,950,000 9,506,824
PARKS & RECREATIONCompleted Projects in Prior Years 35,564,160 1,064 35,565,224
017 30004 Beautification 113,548 75,000 188,548018 30990 Park Improvements 1,126,868 160,000 185,000 1,471,868019 American Legion Park Improvements 220,000 220,000020 Park Signage 100,000 100,000021 Recreation Center Improvement 70,000 70,000022 MacNaughton Park Improvement 165,000 165,000023 Oak Hill Park 65,000 65,000024 Quail Valley North 80,000 80,000025 Skatepark 170,000 170,000026 Stamo Park Improvement 65,000 65,000027 Renovation at Community Center 264,310 240,000 504,310
TOTAL PARKS & RECREATION 36,804,577 265,374 305,000 1,030,000 260,000 38,664,951
PUBLIC SAFETYCompleted Porjects in Prior Years 8,045,517 8,045,517
028 40013 Renovate Fire Station #4 20,738 272,535 293,273029 40016 Fire Station #5 2,757,666 92,634 2,850,300030 40022 Fire Engine (FS#5) 709,674 (12,076) 697,598031 40024 Fire Engine 3131 953,754 36,246 990,000032 Renovate Fire Station #3 278,880 278,880033 Fire Station #6 4,000,000 4,000,000034 Fire Engine #6 989,000 989,000
OP001 To Cover FS#5 Operating Expense 439 9,000 9,439Unallocated Funds 1,284,802 1,284,802
TOTAL PUBLIC SAFETY 12,487,787 125,804 551,415 6,273,802 19,438,808
255

PROJECTS BY YEARS (Continued)
Index
No.
Project
No. Project Name
Actual
Through
FY2014
Estimated
FY2015
Budgeted
FY2016
Projected
FY2017
Projected
FY2018
Projected
FY2019
Projected
FY2020 Project Total
TRANSPORTATIONCompleted Projects in Prior Years 12,850,530 12,850,530
035 50027 Traffic Studies 1,052,168 106,536 60,000 60,000 60,000 60,000 60,000 1,458,704036 50029 Additional Traffic Signals 835,497 85,000 500,000 1,420,497037 50031 GIS-Mapping,Plotter,Flyover,Script 580,213 93,400 60,000 82,000 30,000 30,000 30,000 905,613038 50034 Signal Upgrade/Sequencing 2,875,764 134,882 200,000 400,000 400,000 400,000 400,000 4,810,646039 50040 Bridge Rehabilitation 2,958,786 175,500 175,000 125,000 3,434,286040 50046 ROW Management 240,067 150,000 390,067041 50054 Sidewalk Replacement 1,844,535 464,254 400,000 400,000 400,000 400,000 400,000 4,308,789042 50058 Lakeview Infrastructure 4,176,476 1,003,580 1,003,600 6,183,656043 50063 Pavement Maintenance & Mgmt Program 2,293,804 1,050,000 997,000 747,000 620,000 697,000 697,000 7,101,804044 50066 Hurricane Lane Extension 524,025 2,646,722 3,170,747045 50067 Vicksburg Extension 225,683 3,713,517 3,939,200046 50070 Lexington Extension 252,553 3,313,049 3,565,602047 50072 Texas Parkway Intersection Improvements 599,789 28,591 628,380048 50075 Texas Parkway Medians 180,501 1,636 182,137049 50077 Turtle Creek / Mission Valley - Hilton Head 206,447 2,433,553 2,640,000050 50078 Gregory Reconstruction 120,783 3,489,639 3,610,423051 50079 Bicycle Lane Installation 160,000 160,000052 50080 Trammel-Fresno Improvements 349,327 392,065 2,000,000 2,741,392053 50081 Ashmont Reconstruction 400,000 2,500,000 2,900,000054 50082 Adams Reconstruction 400,000 2,500,000 2,900,000055 50083 Glenn Lakes Bridge Over Oyster Creek 350,000 1,350,000 1,700,000056 50090 Texas Parkway Signal Upgrade 77,354 2,646 80,000057 50091 Intelligent Traffic System (ITS) 20,002 640,001 660,003058 Sienna Parkway Improvement 350,000 715,000 350,000 1,415,000059 Lake Olympia Parkway Extension 440,000 351,479 791,479060 Sign Shop Expansion 355,000 355,000061 Lake Olympia Parkway Roundabouts 150,000 1,000,000 1,150,000062 Glenn Lakes Lane Bridge Replacement 170,000 978,000 1,148,000063 Independence Blvd - Seg 1 555,000 3,145,000 3,700,000064 Independence Blvd - Seg 2 300,000 1,847,000 2,147,000065 Knight Road Extension 850,000 4,700,000 5,550,000066 Staffordshire Road - Sidewalks 650,000 650,000067 Park 8Ninety 1,125,000 1,125,000 1,125,000 3,375,000
50991 Transfer to Gen Fund 6,700,000 800,000 800,000 800,000 800,000 800,000 10,700,00099001 Rebate - Sienna Plantation MD 378,112 150,000 150,000 150,000 150,000 150,000 1,128,112
General Mobility Projects 636,462 636,462
TOTAL TRANSPORTATION 39,342,417 21,949,571 6,055,600 10,834,000 6,415,000 10,850,000 9,041,941 104,488,529
OTHER PROJECTS60030 ERP - Public Admin 1,114,964 332,509 1,447,47360031 ERP - Court 71,767 71,76760032 ERP - Public Safety 671,470 74,932 746,402
TOTAL OTHER PROJECTS 1,858,201 407,441 2,265,642
TOTAL GENERAL CIP 100,656,153 23,309,411 7,125,768 17,086,362 13,151,415 14,726,712 25,805,486 201,861,306
256

PROJECTS BY YEARS (Continued)
Index
No.
Project
No. Project Name
Actual
Through
Estimated
FY2015
Budgeted
FY2016
Projected
FY2017
Projected
FY2018
Projected
FY2019
Projected
FY2020 Project Total
UTILITIES CONSTRUCTION068 80011 Regional Water Treatment Plant 10 MGD 49,887,057 243,187 50,130,244069 80019 Regional Water Treatment Plant 1.5 MGD Ground Storage Tank 2,003,341 211,673 2,215,014070 80020 Regional Water Treatment Plant Transmission Mains - Riverstone 329,585 9,700,000 10,029,585071 80021 Regional Water Treatment Plant - 60 Acre Reservoir 63,585 176,220 239,805072 80022 RWTP - B-Canal Pump Station Upgrade 275,000 1,200,000 1,475,000073 80023 RWTP - Transmission Main to Sienna South* 890,000 3,679,168 4,569,168074 Mustang Bayou Wastewater Plant Lift Station Rehabilitation 770,000 770,000075 Steepbank Flatbank Lift Station Rehabilitation 670,000 670,000
TOTAL UTILITIES CONSTRUCTION 52,283,567 11,496,081 6,319,168 70,098,816
GRAND TOTAL 152,939,720 34,805,492 13,444,936 17,086,362 13,151,415 14,726,712 25,805,486 271,960,122
257

258

FY 2015 FY 2015 FY 2015 FY 2016
FY 2014 Original Revised Year-End Proposed
Actual Budget Budget Estimate Budget
OPERATING REVENUE
506-50-510 Steepbank/Flatbank-Wastewater Treatment 5,400,125 1,033,025 1,033,025 1,033,025 1,077,273
505-50-502 Hightower Wastewater Treatment 10,304 12,312 12,312 11,500 11,500
505-50-504 NE Oyster Creek Service Area-Water Production 12,915 13,900 13,900 13,940 13,910
505-50-505 NE Oyster Creek Service Area-Wastewater Treatment 10,286 11,200 11,200 11,050 11,100
505-50-506 Mustang Bayou Service Area-Water Production 1,026,532 1,093,100 1,093,100 1,117,200 1,091,965
505-50-507 Mustang Bayou Service Area-Wastewater Treatment 605,156 757,080 757,080 743,000 758,482
505-50-524 Mustang Bayou Service Area-Water Construction (532) 360,344 22,050 22,050 308,450 5,000
505-50-526 Mustang Bayou Service Area-WWTP Constr. Debt (534) 503,385 25,250 25,250 475,000 5,000
540-53-530 Surface Water Treatment 6,722,753 7,671,000 7,671,000 7,671,000 8,263,500
Total Operating Revenue 14,651,800 10,638,917 10,638,917 11,384,165 11,237,730
OPERATING EXPENSES
506-50-510 Steepbank/Flatbank-Wastewater Treatment 828,072 985,946 994,445 1,018,747 1,707,273
505-50-502 Hightower Wastewater Treatment 11,605 12,312 16,312 15,332 15,314
505-50-504 NE Oyster Creek Service Area-Water Production 4,806 7 7 7 0
505-50-505 NE Oyster Creek Service Area-Wastewater Treatment 16,136 10,785 10,785 9,917 10,675
505-50-506 Mustang Bayou Service Area-Water Production 704,952 741,980 907,568 737,171 772,960
505-50-507 Mustang Bayou Service Area-Wastewater Treatment 606,418 595,729 597,339 594,187 616,183
505-50-524 Mustang Bayou Service Area-Water Construction (532) 112,030 0 17,515 181,252 0
505-50-526 Mustang Bayou Service Area-WWTP Constr. Debt (534) 52,241 0 16,610 525 770,000
540-53-530 Surface Water Treatment 2,427,218 3,073,622 3,201,247 2,995,862 3,200,506
Total Operating Expenses 4,763,478 5,420,381 5,761,828 5,553,000 7,092,911
OPERATING INCOME 9,888,322 5,218,536 4,877,089 5,831,165 4,144,819
NON-OPERATING REVENUE/(EXPENSES)
49000 Interest Income 343,400 63,000 63,000 274,122 208,700
505-50-500 49410 Contribution of Assets 2,009,853 0 0 0 0
505-50-500 48303 Contribution Non-Cash 300 0 0 0 0
510-51-516 49211 CO Proceeds 0 0 0 5,012,787 0
540-53-530 65001 Paying Agent Fees 0 500 500 1,250 500
540-53-530 65002 Issuance Expense 112,724 0 0 (63,645) 0
506-50-510 48127 O & M Reserve Inc/(Dec)-Steepbank/Flatbank Plant 14,508 20,000 20,000 23,772 12,831
505-50-506 48127 O & M Reserve Inc/(Dec)-Mustang Bayou Water Plant 19,203 50,000 50,000 3,742 11,495
505-50-507 48127 O & M Reserve Inc/(Dec)-Mustang Bayou WWTP Plant 36,881 50,000 50,000 19,982 1,391
540-53-530 49121 Miscellaneous Reimbursement 45,133 0 0 15,884 0
505-50-506 90001 Transfer from Fund 507 636,713 0 0 0 0
505-50-524 49935 Transfer from Fund 532 1,675,464 0 0 0 0
505-50-528 49924 Transfer from Fund 540 0 713,045 713,045 715,635 723,840
505-50-526 49915 Transfer from Fund 301 436,500 0 0 0 0
505-50-506 90008 Transfer to Fund 301 0 (118,049) (118,049) (118,049) 0
505-50-507 90008 Transfer to Fund 301 (116,374) 0 0 0 0
505-50-526 90014 Transfer to Fund 534 (1,625,404) 0 0 0 0
505-50-528 90015 Transfer to Fund 542 (7,021,325) 0 0 0 0
510-51-516 90015 Transfer to Fund 542 0 0 0 (5,001,754) 0
540-53-530 90033 Transfer to Fund 505 0 (713,045) (713,045) (715,635) (723,840)
90001 Transfer to Fund 101 (295,011) (394,080) (394,080) (394,080) (378,952)
Bond/CO Interest Expense (2,091,350) (4,023,395) (4,023,395) (4,230,808) (4,370,159)
Total Non-Operating Revenue/(Expenses) (5,818,785) (4,352,024) (4,352,024) (4,456,799) (4,514,194)
NET INCOME 4,069,537 866,512 525,065 1,374,366 (369,375)
Total Net Position - Beginning 32,218,343 11,836,526 36,005,466 36,005,466 37,185,303
DESIGNATED FUND BALANCE-RESERVES 174,547 241,646 76,204 194,529 195,920
Total Net Position - Ending 36,005,466 12,944,684 36,454,327 37,185,304 36,620,008
UTILITY FUNDS SUMMARY
CHANGES IN CASH & CASH EQUIVALENTS
SUMMARY OF REVENUES, EXPENDITURES AND
259

FY 2015 FY 2015 FY 2015 FY 2016
FY 2014 Original Revised Year-End Proposed
Actual Budget Budget Estimate Budget
OPERATING REVENUE
50-502 Hightower Wastewater Treatment
48111 Maintenance Services Charged 10,304 12,312 12,312 11,500 11,500
Hightower Wastewater Treatment - Total 10,304 12,312 12,312 11,500 11,500
50-504 NE Oyster Creek Service Area-Water Production
48120 Tap/Inspection Fees 20 0 0 30 0
48121 Water Sales 10,645 12,100 12,100 12,100 12,100
48122 Reconnect Fees 1,550 1,440 1,440 1,440 1,440
48124 Deposits Forfeited 0 0 0 0
48125 Customer Service Fees 700 360 360 370 370
49401 Impact Fees 0 0 0 0
NE Oyster Creek Svce Area - Water Prod. Total 12,915 13,900 13,900 13,940 13,910
50-505 NE Oyster Creek Service Area-Wastewater Treatment
48115 Sewer Fees 10,286 11,200 11,200 11,050 11,100
48126 Late Charges 0 0 0 0 0
48118 Tex Comm Environ Quality 0 0 0 0 0
NE Oyster Creek Svce Area - WW Treatment Total 10,286 11,200 11,200 11,050 11,100
50-506 Mustang Bayou Service Area-Water Production
48111 Maintenance Services Charged 319,179 390,400 390,400 390,400 438,165
48120 Tap/Inspection Fees 191,032 85,000 85,000 130,000 60,000
48121 Water Sales 348,013 357,500 357,500 357,500 357,500
48122 Reconnect Fees 11,400 12,000 12,000 10,000 10,000
48123 GRP Fees 118,811 140,000 140,000 140,000 140,000
48125 Customer Service Fees 4,410 4,400 4,400 4,300 4,300
48126 Late Charges 18,737 21,000 21,000 17,000 17,000
48127 O & M Reserve Inc/(Dec) 19,203 50,000 50,000 3,742 11,495
48131 Contrib-Water Capacity 14,950 82,800 82,800 68,000 65,000
Mustang Bayou Svce Area - Water Production Total 1,045,735 1,143,100 1,143,100 1,120,942 1,103,460
50-507 Mustang Bayou Service Area-Wastewater Treatment
48127 O & M Reserve Inc/(Dec) 36,881 50,000 50,000 19,982 1,391
48111 Maintenance Service Charged 281,564 339,000 339,000 339,000 357,482
48115 Sewer Fees 306,042 320,880 320,880 325,500 321,000
48132 Contrib- Sewer Capacity 17,550 97,200 97,200 78,500 80,000
48124 Utility Rebate 0 0 0 0 0
Mustang Bayou Service Area-WW Treatment Total 642,037 807,080 807,080 762,982 759,873
50-511 Steepbank/Flatbank WWTP Construction
49000 Interest Income 0 0 0 0 0
Steepbank/Flatbank WWTP Construction - Total 0 0 0 0 0
50-524 Mustang Bayou Service Area Water Construction (532)
47111 Contrib-Other Gov 280,823 0 0 0 0
48129 Water Capital Recovery Fee 3,621 4,800 4,800 210,000 0
48131 Contrib-Water Capacity 75,900 17,250 17,250 98,450 5,000
SUMMARY OF REVENUES, EXPENDITURES AND
CHANGES IN NET ASSETS
WATER/WASTEWATER UTILITY FUND
FUND 505
260

FY 2015 FY 2015 FY 2015 FY 2016
FY 2014 Original Revised Year-End Proposed
Actual Budget Budget Estimate Budget
SUMMARY OF REVENUES, EXPENDITURES AND
CHANGES IN NET ASSETS
WATER/WASTEWATER UTILITY FUND
FUND 505
49000 Interest Income 0 0 0 0 0
Mustang Bayou Svce Area Water Constr. - Total 360,344 22,050 22,050 308,450 5,000
50-526 Mustang Bayou Service Area-WWTP Constr. (534)
49000 Interest Income 0 0 0 0 0
48130 Sewer Capital Recovery Fee 11,934 20,250 20,250 360,000 0
48132 Contrib- Sewer Capacity 89,100 5,000 5,000 115,000 5,000
48211 Bond Proceeds 402,351 0 0 0 0
Mustang Bayou Svce Area-WWTP Constr. - Total 503,385 25,250 25,250 475,000 5,000
50-528 Surface Water Construction 0 0 0 0 0
Surface Water Construction - Total 0 0 0 0 0
Total Operating Revenues 2,585,006 2,034,892 2,034,892 2,703,864 1,909,843
OPERATING EXPENSES
50-502 Hightower Wastewater Treatment
53002 Insurance 158 195 195 197 175
53047 Operator Fees 5,605 5,650 5,650 5,650 5,650
53008 Telephone 77 67 67 85 89
53053 Lift Station Maintenance 2,295 3,000 7,000 6,000 6,000
53062 General Maintenance & Repairs 0 0 0 0 0
53068 Landscaping Services 3,470 3,400 3,400 3,400 3,400
Hightower Wastewater Treatment Total 11,605 12,312 16,312 15,332 15,314
50-504 NE Oyster Creek Service Area-Water Production
53002 Insurance 6 7 7 7 0
53069 Water Capacity Buy-In Fees 4,800 0 0 0 0
NE Oyster Creek Svce Area-Water Prod. Total 4,806 7 7 7 0
50-505 NE Oyster Creek Service Area-Wastewater Treatment
53002 Insurance 179 217 217 221 196
53008 Telephone 652 673 673 673 673
53037 Electric Utilities 466 737 737 737 811
53041 Water Utilities 170 358 358 186 195
53047 Operator Fees 0 0 0 0
53053 Lift Station Maintenance 3,638 1,600 1,600 1,600 1,600
53062 General Maintenance & Repairs 6,231 7,200 7,200 6,500 7,200
53070 WW Capacity Buy-In Fees 4,800 0 0 0 0
NE Oyster Creek Service Area-WW Total 16,136 10,785 10,785 9,917 10,675
50-506 Mustang Bayou Service Area-Water Production
53002 Insurance 2,590 3,398 3,398 3,415 3,002
53004 Special Services & Legal 10,601 10,000 11,138 10,000 10,000
53008 Telephone 915 800 800 760 800
53018 Bank Fees 0 0 0 0
53037 Electric Utilities 71,714 79,682 79,682 82,246 86,358
53047 Operator Fees 31,527 38,400 38,400 32,000 33,000
261

FY 2015 FY 2015 FY 2015 FY 2016
FY 2014 Original Revised Year-End Proposed
Actual Budget Budget Estimate Budget
SUMMARY OF REVENUES, EXPENDITURES AND
CHANGES IN NET ASSETS
WATER/WASTEWATER UTILITY FUND
FUND 505
53049 Permit Services 2,270 3,200 3,200 2,500 2,800
53054 General Maintenance & Repairs 73,520 94,000 91,500 85,000 90,000
53055 Miscellaneous 0 0 0 0
53057 City Customer Operations 58,881 65,000 65,000 65,000 65,000
53063 GRP Pumpage Fees 348,034 356,000 356,000 356,000 400,000
53065 Laboratory Testing 7,618 10,000 8,000 7,500 8,000
53068 Landscaping Services 18,780 14,000 14,000 14,000 14,000
53072 Water Service Installation 72,700 65,000 65,000 65,000 50,000
53073 Major Equipment Replacement 0 0 164,450 2,250 0
54037 Subcontractors/Material 5,802 0 2,000 2,000 5,000
52073 Chemicals 0 2,500 5,000 9,500 5,000
Mustang Bayou Svce Area-Water Prod. Total 704,952 741,980 907,568 737,171 772,960
50-507 Mustang Bayou Service Area-Wastewater Treatment
53002 Insurance 5,828 5,226 5,226 5,799 4,720
53004 Special Services & Legal 9,958 10,000 11,138 10,000 10,000
53008 Telephone 6,345 6,600 6,600 8,250 8,250
53037 Electric Utilities 113,700 117,039 117,039 114,665 116,958
53041 Water Utilities 0 252 252 250 250
53047 Operator Fees 118,236 126,000 126,000 123,500 125,000
53048 Sludge Removal 71,916 66,000 66,000 75,000 75,000
53049 Permit Services 16,876 8,500 8,500 8,200 8,200
53053 Lift Station Maintenance 8,457 8,400 8,400 7,300 8,400
53057 City Customer Operations 70,204 76,800 76,800 72,500 74,400
53061 Garbage Utilities 1,518 1,512 1,512 1,823 2,005
53062 General Maintenance & Repairs 144,457 135,000 119,472 115,000 125,000
53065 Laboratory Testing 5,499 3,400 13,400 13,400 13,500
53068 Landscaping Services 32,016 25,000 25,000 24,000 25,000
54037 Subcontractors/Material 1,408 6,000 12,000 14,500 7,000
52073 Chemicals 0 0 0 0 12,500
Mustang Bayou Svce Area-WW Treatment Total 606,418 595,729 597,339 594,187 616,183
50-511 Steepbank/Flatbank - Construction 0 0 0 0 0
Steepbank/Flatbank Construction - Total 0 0 0 0 0
50-524 Mustang Bayou Service Area-Water Construction (532)
53004 Special Services & Legal 112,030 0 0 0 0
77001 Professional Services 0 0 12,515 11,802 0
77002 Construction 0 0 5,000 169,450 0
77007 Other - Misc 0 0 0 0 0
Mustang Bayou Svce Area-Water Constr. - Total 112,030 0 17,515 181,252 0
50-526 Mustang Bayou Service Area-WWTP Constr. (534)
53004 Special Services & Legal 52,241 0 0 0 0
77001 Professional Services 0 0 16,610 525 0
77002 Construction 770,000
Mustang Bayou Svce Area-WWTP Constr. - Total 52,241 0 16,610 525 770,000
262

FY 2015 FY 2015 FY 2015 FY 2016
FY 2014 Original Revised Year-End Proposed
Actual Budget Budget Estimate Budget
SUMMARY OF REVENUES, EXPENDITURES AND
CHANGES IN NET ASSETS
WATER/WASTEWATER UTILITY FUND
FUND 505
Total Operating Expenses 1,508,188 1,360,813 1,566,136 1,538,391 2,185,132
OPERATING INCOME (LOSS) 1,076,818 674,079 468,756 1,165,473 (275,289)
NON-OPERATING REVENUE/(EXPENSES)
50-500 49000 Interest Income 157,603 5,000 5,000 38,000 20,000
50-500 48303 Contribution - Non-Cash 300 0 0 0 0
50-500 49410 Contribution of Assets 0 0 0 0 0
50-506 90008 Transfer to 301 (Debt Service Fund) 0 (118,049) (118,049) (118,049) 0
50-506 90001 Transfer to 101 (General Fund) 0 (20,000) (20,000) (20,000) (20,000)
50-507 49936 Transfer from 507 (SB/FB WWTP Constr) 636,713 0 0 0 0
50-507 90008 Transfer to 301 (Debt Service Fund) (116,374) 0 0 0 0
50-507 90001 Transfer to 101 (General Fund) 0 (25,000) (25,000) (25,000) (25,000)
50-524 49935 Transfer from 532 (MB Water Constr.) 1,675,464 0 0 0 0
50-526 90014 Transfer to 534 (MB WWTP Constr.) (1,625,404) 0 0 0 0
50-526 49915 Transfer from 301 (Debt Service) 436,500 0 0 0 0
50-526 62001 2008A CO Principal 0 (329,719) (329,719) (329,719) (344,309)
50-526 62009 2005 CO Principal 0 (28,000) (28,000) (28,000)
50-526 63001 2008A CO Interest Expense 0 (331,948) (331,948) (331,949) (318,467)
50-526 63009 2005 CO Interest Expense (19,785) (6,980) (6,980) (6,980)
50-526 60024 2013 Refunding Bond Principal 0 (1,750) (1,750) (1,750) (1,750)
50-526 61024 2013 Refunding Bond Interest 16,585 (14,649) (14,649) (14,649) (14,614)
50-526 60026 2014 Refunding Bond Principal (422) (40,688)
50-526 61026 2014 Refunding Bond Interest (2,167) (4,012)
50-528 49924 Transfer from 540 (Surf Water Trmt) 713,045 713,045 715,635 723,840
50-528 90015 Transfer to 542 (Surf Water Constr) (7,021,325) 0 0 0 0
Total Non-Operating Revenue/(Expenses) (5,859,723) (158,049) (158,049) (125,049) (25,000)
NET INCOME (LOSS) (4,782,905) 516,030 310,707 1,040,423 (300,289)
00-000 29975 Designation - O & M Reserve 174,547 241,646 76,204 194,529 195,920
Net Position, Beginning - July 1 11,801,527 3,547,273 6,736,208 6,736,208 7,582,103
Net Position, Ending - June 30 6,736,208 4,304,949 6,970,711 7,582,103 7,085,894
Note: Does not include Depreciation expense.
263

FY 2015 FY 2015 FY 2015 FY 2016FY 2014 Original Revised Year-End ProposedActual Budget Budget Estimate Budget
OPERATING REVENUE48111 Services Charged 5,400,125 1,033,025 1,033,025 1,033,025 1,077,273
Total Operating Revenue 5,400,125 1,033,025 1,033,025 1,033,025 1,077,273
NON-OPERATING REVENUE/(EXPENSES)48127 O&M Reserve Increase/(Decrease) 14,508 20,000 20,000 23,772 12,831
49000 Interest Earnings 6,243 3,000 3,000 500 2,000
49410 Contribution of Assets 6,512 0 0 0 0
Total Non-Operating Revenue 27,263 23,000 23,000 24,272 14,831
Total Revenues and Resources 5,427,388 1,056,025 1,056,025 1,057,297 1,092,104
OPERATING EXPENSES
52073 Chemicals 7,324 12,000 12,000 8,000 10,00053002 Insurance 12,383 18,297 18,297 17,878 16,774
53004 Special Services & Legal 110,892 135,500 143,999 125,500 135,50053008 Telephone 2,542 2,362 2,362 2,435 2,56053037 Electric Utilities 302,175 295,837 295,837 328,214 351,18953041 Water Utilities 220 250 250 220 25053047 Plant Operators 144,312 154,400 154,400 145,000 152,00053048 Sludge Removal 55,045 46,300 46,300 79,500 55,000
53049 Permit Services 18,128 19,000 19,000 59,000 20,00053051 Admin/Audit/Engineering Fees 0 0 053053 Lift Station Maintenance 14,062 32,000 32,000 28,000 45,00053054 General Maintenance & Repairs 91,778 195,000 195,000 155,000 175,00053055 Miscellaneous 0 0 053065 Laboratory Testing 38,411 40,000 40,000 36,000 38,00053068 Landscaping 30,800 35,000 35,000 34,000 36,000
Total Operating Expenses 828,072 985,946 994,445 1,018,747 1,037,273
CAPITAL OUTLAY
77002 Construction 0 0 0 0 670,000Total Capital Outlay 0 0 0 0 670,000
OTHER FINANCING USES90001 Transfer to 101 (General Fund) 26,000 40,000 40,000 40,000 40,000
Total Other Financing Uses 26,000 40,000 40,000 40,000 40,000
Total Expenditures 854,072 1,025,946 1,034,445 1,058,747 1,747,273
Designation - O & M Reserve 0 246,487 248,611 264,687 269,318
REVENUES OVER EXPENDITURES 4,573,316 30,079 21,580 (1,450) (655,169)
NET POSITION, BEGINNING - JULY 1 11,033,468 226,408 15,606,784 15,606,784 15,605,334
NET POSITION, ENDING - JUNE 30 15,606,784 256,487 15,628,364 15,605,334 14,950,165
Note: Does not include Depreciation expense.
SUMMARY OF REVENUES, EXPENDITURES AND
CHANGES IN NET ASSETS
STEEP BANK/FLAT BANK REGIONAL WASTEWATER FUND
FUND 506-50-510
264

FUND 510-51-516
FY 2015 FY 2015 FY 2015 FY 2016
FY 2014 Original Revised Year-End Proposed
Actual Budget Budget Estimate Budget
OPERATING REVENUES
OTHER INCOME
48211 CO Proceeds 5,012,787
49000 Interest Income - - - 52,612 -
Total Other Income 0 0 0 5,065,399 0
Total Revenues and Resources 0 0 0 5,065,399 0
OPERATING EXPENSES
CONTRACTUAL SERVICES
65002 Issuance Expense - - - 63,645 -
Total Contractual Services 0 0 0 63,645 0
OTHER FINANCING SERVICES90015 Transfer to 542 (Surf Wtr Fund) - - - 5,001,754 -
Total Other Financing Services 0 0 0 5,001,754 0
TOTAL APPROPRIATIONS/
EXPENDITURES 0 0 0 5,065,399 0
REVENUES OVER/(UNDER) EXPENDITURES 0 0 0 0 0
Net Position, Beginning - July 1 0 0 0 0 0
Net Position, Ending - June 30 0 0 0 0 0
SUMMARY OF REVENUES, EXPENDITURES AND
CHANGES IN FUND EQUITY
UTILITY CERTIFICATE OF OBLIGATION FUND
265

FUND 540-53-530
FY 2015 FY 2015 FY 2015 FY 2016FY 2014 Original Revised Year-End ProposedActual Budget Budget Estimate Budget
OPERATING REVENUE48110 GRP Pumpage Fees 4,771,151 5,445,000 5,445,000 5,445,000 5,303,00048121 Water Sales 1,951,602 2,226,000 2,226,000 2,226,000 2,960,500
Total Operating Revenue 6,722,753 7,671,000 7,671,000 7,671,000 8,263,500
OPERATING EXPENSESCOMMODITIES
52004 Minor Tools & Equipment 6,422 60,000 60,000 30,000 60,00052057 Purchase of Water 1,005,516 1,100,000 1,100,000 1,100,000 1,175,00052073 Chemicals 371,641 450,000 450,000 400,000 450,000
Total Commodities 1,383,579 1,610,000 1,610,000 1,530,000 1,685,000
CONTRACTUAL SERVICES53002 Insurance 40,575 52,742 52,742 51,013 47,34353004 Special Services & Legal 24,436 105,000 116,977 60,000 105,00053008 Telephone 4,470 5,100 5,100 4,865 5,10853032 Garbage Collection 1,398 1,512 1,512 1,627 1,79053037 Electric Utilities 194,388 181,268 181,268 211,357 228,26553047 Plant Operators 333,108 410,000 410,000 400,000 410,00053048 Sludge Removal 46,914 62,000 62,000 62,000 68,00053049 Permit Services 101,213 115,000 115,000 72,000 80,00053054 General Maintenance & Repairs 148,932 235,000 235,000 220,000 250,000
53055 Miscellaneous 320 0 0 0
53065 Laboratory Testing 12,963 21,000 21,000 18,000 25,000
53068 Landscaping Service 75,864 75,000 75,000 75,000 75,000Total Contractual Services 984,581 1,263,622 1,275,599 1,175,862 1,295,506
OTHER54037 Subcontractors & Materials 59,058 200,000 315,648 290,000 220,00054040 Organizational Cost Reimb. 0 0 0 0
Total Other 59,058 200,000 315,648 290,000 220,000
Total Operating Expenses 2,427,218 3,073,622 3,201,247 2,995,862 3,200,506
OPERATING INCOME 4,295,535 4,597,378 4,469,753 4,675,138 5,062,994
NON-OPERATING REVENUE48209 Bond Premium 0 0 0 0 049000 Interest Income 179,554 55,000 55,000 183,010 186,70049121 Miscellaneous Reimbursement 45,133 0 0 15,884 049410 Contribution of Assets 2,003,341 0 0 0 0
Total Non-Operating Revenue 2,228,028 55,000 55,000 198,894 186,700
NON-OPERATING EXPENSES
54013 Reserve for Contingency 0 062013 2009B Cert of Obligation Principal 0 1,270,000 1,270,000 1,270,000 1,320,00063012 2009B Cert of Obligation Interest 2,088,150 2,039,350 2,039,350 2,039,350 1,988,55062015 2014A Cert of Oblig. Util. Principal 125,000 205,00063015 2014A Cert of Oblig. Util. Interest 78,324 131,77065001 Paying Agent Fees 0 500 500 1,250 50065002 Issuance Expense (112,724) 0 0 0 090033 Transfer to Fund 505 713,045 713,045 715,635 723,84090001 Transfer to Fund 101 269,011 309,080 309,080 309,080 293,952
Total Non-Operating Expenses 2,244,437 4,331,975 4,331,975 4,538,639 4,663,612
NON-OPERATING INCOME (16,409) (4,276,975) (4,276,975) (4,339,746) (4,476,912)
NET INCOME 4,279,126 320,403 192,778 335,393 586,082
Net Position, Beginning - July 1 9,383,348 8,062,845 13,662,474 13,662,474 13,997,867Net Position, Ending - June 30 13,662,474 8,383,248 13,855,252 13,997,867 14,583,949
Note: Does not include Depreciation expense.
SUMMARY OF REVENUES, EXPENDITURES AND
CHANGES IN NET ASSETS
SURFACE WATER UTILITY FUND
266

FUND 580-55-560
FY 2015 FY 2015 FY 2015 FY 2016
FY 2014 Original Revised Year-End Proposed
Actual Budget Budget Estimate Budget
OPERATING REVENUES
OTHER REVENUES
49000 Interest Earnings 5,818 5,000 5,000 7,293 6,500
49104 Late Fees 3,660 4,248 4,248 3,725 4,000
49115 Solid Waste Subscribers 119,547 114,048 114,048 107,200 110,416
49116 Solid Waste Admin Fees 18,171 18,040 18,040 15,764 16,237
49117 Solid Waste MUD Pmts 3,287,822 3,362,080 3,362,080 3,264,106 3,362,029
49119 Recycling MUD Payments 17,211 17,219 17,219 13,341 13,741
Total Other Revenues 3,452,229 3,520,635 3,520,635 3,411,429 3,512,923
Total Revenues and Resources 3,452,229 3,520,635 3,520,635 3,411,429 3,512,923
OPERATING EXPENSES
CONTRACTUAL SERVICES
53004 Special Services & Legal 49,820 69,040
53019 Solid Waste Contract 3,336,296 3,336,141 3,286,321 3,436,554 3,340,000
53042 Solid Waste Admin Fee 132,907 132,933 132,933 108,753 112,016
Total Contractual Services 3,469,203 3,469,074 3,469,074 3,614,347 3,452,016
OTHER FINANCING USES90001 Transfer to General Fund - 16,000 16,000 16,000 16,000
Total Other Financing Uses 0 16,000 16,000 16,000 16,000
TOTAL APPROPRIATIONS/
EXPENDITURES 3,469,203 3,485,074 3,485,074 3,630,347 3,468,016
REVENUES OVER/(UNDER) EXPENDITURES (16,974) 35,560 35,560 (218,918) 44,908
BEGINNING BALANCE JULY 1 238,117 266,316 221,143 221,143 2,225
FUND BALANCE JUNE 30 221,143 301,876 256,703 2,225 47,133
SUMMARY OF REVENUES, EXPENDITURES AND
CHANGES IN FUND EQUITY
SOLID WASTE COLLECTIONS
267

Missouri City Recreation & Leisure LGC
Budget Narrative
FY2015
Ken Lewis
Cesar Lopez
268

Tyson Stittleburg
Ken Lewis
Cesar Lopez
Board of Directors
Chief Administrative Officer (City Manager)
Secretary (City Attorney)
Treasurer (City Finance Director)
Assistant City Manager
General Manager
Head Golf Professional
Golf Course Maintenance
Contract
General & Administrative
Director of Catering & Grille
Operations
Assistant Golf Professionals
Golf Shop Assistants
Golf Course Starters
Golf Course Marshals
Director of Golf Instruction
Practice Range Attendants
Fleet Manager/Mechanic
Golf Cart Attendants
Assistant Event Manager/s
Assistant Grille Manager
Head Chef
Kitchen Staff
Bartenders/ Wait Staff Manager
Bussers
Beverage Cart Attendants
269

Executive Summary
Moving into FY2016 the Missouri City LGC is cautiously optimistic about the coming year. While there have
been great strides made in the Food & Beverage Department, specifically with regards to Banquets & Events,
the golf industry as a whole is still seeing declining or stagnant rounds of golf played. In FY2015 the LGC
placed a large focus on advertising towards increasing the Banquet & Event revenue. The LGC will continue to
promote through the most successful channels, there will be a renewed focus on advertising for golf rounds in
FY2016. Also, the staff of the LGC will be taking a directed approach to meeting the needs of the changing
community around the golf course. There is an increasing shift toward younger, financially stable families
utilizing the facility and now is the time to start to make the City Centre a focal point of their social activities.
This will be done with more family oriented events, a renewed focus on junior golf as well as menu and facility
improvements that will encourage families to utilize the City Centre and golf courses.
Golf Operations
The revenues for the Operations Department encompass daily green fees and annual green fees. This
department is the largest revenue producer of all of the operational areas. The largest expenses for the
Operations Department include a percentage golf shop employees and golf course starter wages, office supplies
for the golf operations, golf course maintenance (including tree maintenance), bank and credit card fees for golf
operations as well as a percentage of operational utilities. With a return to focus advertising efforts on rounds
of golf, specifically daily fee rounds, there is an anticipation for an increase in rounds played.
The golf operations department revenues are largely driven by the number of rounds played and the
corresponding fee being charged. A review of tee sheet utilization in FY2015 showed heavy usage in the early
morning hours with decreased usage as the day progressed. To address this situation many facilities are
implementing dynamic pricing controls that will adjust prices for golf based on current demand. This could
mean that people playing one tee time apart could pay a different fee based on when they booked the time.
While the long term success of this method is still being debated, the budget applies a tiered pricing structure
that will lower the green fee charged based off of historical demand versus a strict time structure. This will
result in one additional level of fee being charged, a “mid-day” fee, and moving the hours of twilight and super
twilight earlier to encourage more rounds played.
Given these adjustments, budgeted revenues in the Operations Department are $1,381,968 and budgeted
expenses of $1,474,068. This is a net operational loss of ($92,100). Even though rounds of golf are projected
to increase over the past two year history, there has also been a readjustment of the expected dollar per round.
Budgeted rounds for FY16 are 55,075. This is taking into consideration approximately 25 days lost to rain,
which is based on the last six year average of days closed. The operations department carries the load of the
expenses with the course maintenance contract. Losses in this department are recouped through the various
other golf departments.
270

Golf Cart Operations
Golf carts at a golf facility are traditionally one of the largest revenue generating areas of the operation. In
addition the expenses are traditionally low enough to allow for a healthy profit from the operation.
In FY2015 the LGC took delivery of 76 new golf carts. This brought the fleet to 50 one year old carts and 76
new carts in keeping with operational plans to keep carts under manufacturer’s warranty as much as possible.
This age of the carts, coupled with the expertise of the fleet mechanic should help to bring maintenance/repair
expenses down from previous years. This coupled with a nominal $0.50 increase in cart rentals and a 10%
increase in trail fees, will help to bolster revenues and net in the golf cart department.
Annualized revenues for the golf cart operation are $633,009. Expenses for FY2016 are projected to be
$265,973 which covers a percentage of outside services wages, mechanic wages, golf cart leases, cart
maintenance, and a percentage of facility utilities. This leaves a net positive for golf cart operations of
$367,036.
Practice Range
The practice range facility also continues to provide a consistent revenue stream for the facility. On average,
for every person that tees off, there is a little over $1 in range fees generated. In 2015 there was an increase in
range revenues primarily due to the closure of two other local practice ranges. This increase in business has
heightened wear on the practice facilities. Overtime, with increased traffic, improvements will be needed on the
practice facility, but until that time, staff will work to keep the range in usable condition.
Revenues for the practice range department are budgeted for $97,294 while expenses are expected to be
$65,237. Expenses include a percentage of outside services labor, range balls, picker lease and maintenance,
teaching fees and a percentage of facility utilities. The difference is a net positive $32,057.
Golf Shop Merchandise
In FY2015 a Head Golf Professional was hired to help oversee the Merchandise Department. Improvement
have already been seen in inventory controls and order processing. With increased tournament business the
LGC has seen increases in revenues from the Merchandise Department. Revenues for the merchandise
department are budgeted for $235,080. Expenses for merchandise include a percentage of golf shop employee
wages, cost of goods (77%) and a percentage of facility utilities. Estimated expenses for merchandise are
$224,884. This is a net positive difference of $10,195.
271

Food & Beverage – Grille Operations
As stated in the executive summary, significant improvements have been made in all Food & Beverage
departments. The Grille Department has and always will be heavily tied to the golfers coming in for a before or
after round snack. However, the Grille has found a niche with small groups coming in during the week to play
games and eat in the Grille. Additionally, promotional nights like Music on the Patio, Friday Fish and Karaoke,
have proven to be successful at bringing in additional revenue. FY2016 will see additional promotional nights
with an increased relationship with local community groups who are planning events such as outdoor movie
nights, crawfish boils and family bingo at the City Centre.
The success of the Grille is largely dependent on controlling expenses. Utilizing daily specials to move dated
product, tightly controlling work schedules and making sure staff uses downtime efficiently have helped to
improve the Grille operations. In addition, management plans to roll out a staff training program as part of the
City wide 2029 City Council Strategic Plan Initiative, that is derived from information learned from customer
service surveys and analysis. This should help to improve customer service and subsequently drive additional
revenue.
Grille revenues are highly dependant on the number of golf rounds played. In FY2015 there was $8.04 per
round in Grille revenues. This figure is up $0.33 compared to FY2014. For FY2015 projected revenues in the
Grille Department are $418,937 while expenses are $408,797. This results in a net profit of $10,141.
Food & Beverage - Banquets & Events
The Banquets & Events Department has shown great improvement over the last year. As word of mouth
continues to spread and more events bring in new possible clients, we continue to see increased interest in
groups hosting events at the City Centre. Since opening in FY2013, we have developed relationships with
many local groups that have been the basis for many of our other events. Advertising of the City Centre has
also been a factor in our success. Current advertising relationships with many local media partners have
enabled us to cast a broad reach into our market.
The Banquet and Event department is also important to the overall financial goals of the facility as it provides a
much leaner structure for cost controls versus the Bluebonnet Grille and provides a much lower cost of goods
sold. Cost of goods for the event department is typically around 31% that is again lower than the average of the
departments. Given that a higher percentage of our overall revenue comes from this department as compared to
the Grille and Beverage Cart it is important to foster this as a great revenue stream for the Golf Course and City
Centre. Other benefits of the event department are streamlined employee scheduling, efficient product
purchasing and client volume leading to potential additional sales.
Revenues for the Banquet and Event Department are budgeted to be $772,159 while expenses are budgeted for
$760,146. This provides for a net profit of $12,013. One important note is that the salary for the Director of
Catering has been split between the Banquets and Events department and the G&A Department. This is to
better reflect the responsibilities of this individual which are heavily involved in the Events Department, but
272

they also extend greatly into managing the Bluebonnet Grille and Bev Cart departments as well as facility
maintenance and operations.
Food & Beverage – Beverage Cart Operations
The beverage cart at a public golf course is very important. Not only is this a vital service provided to the golf
clientele it is also a great source of additional income for the facility as a whole. Like the Banquets and Events
Department, the Beverage Cart Department is able to control expenses due to the fact that it is primarily a
service for the golf clientele. If there are no golfers on the course, we do not need a beverage cart either. This
flexibility in scheduling provides an opportunity to cut wasted costs dramatically. Additionally, the Beverage
Cart Department sees a cost of goods sold of nearly 31% which is lower than the average of the departments as
a whole. This is primarily because the carts sell low cost items at a substantial mark up to golfers on the course.
For FY2015 the revenues for the Beverage Cart Department are budgeted to be $130,199 versus expenses of
$110,058. This leaves a net profit of $20,141. The management of the LGC plans to break out the expenses of
the Bev Cart department event further during FY2016 to more accurately represent the actual costs associated
with this department.
General & Administrative
The General & Administrative Department (G&A) covers all of the costs that are not easily allocated to
individual departments. In FY2016 half of the salary of the Catering & Events Manger has been moved to the
G&A Department to better reflect the responsibilities of this position.
Expenditures in the G&A department will closely follow those of FY2015. An exception to this is the addition
of a computer hardware lease that will allow the facility to maintain newer hardware and replace outdated or
broken items at a lower cost. Budgets for general repairs and service agreements remain higher as compared to
the past to include the increasing needs of a building that is not new and is out of warranty and agreements with
multiple vendors for necessary services such as employee screenings, inspections and public postings. There
are no revenues to offset the expenses in the G&A department. The expenses for this department are budgeted
at cost of ($358,678).
Summary Overall Operation
As operations at the Quail Valley Golf Course and City Centre have stabilized, management is now able to
concentrate on how to grow revenues and change with the developing community around it. This has been a
difficult process in the past given the amount of change that has happened in a short period of time. Working
off of a solid base and planning to grow into the future is very exciting. Capital expenditures are not included in
this budget. All capital expenditures have been included to the City of Missouri City Capital Improvement Plan
beginning in FY2016. Overall for FY2016, the LGC is budgeting for revenues of $3,668,647 and expenditures
of $3,667,842. Net for FY2016 would be $805. This is compared to the projected net loss for FY2015 of
($67,604).
273

Assumptions
- COGS for golf merchandise is 77%
- COGS for food and liquor is 35%
- Golf costs split per percentage of sales:
o Operations – 62%
o Golf Carts – 25%
o Practice Range – 4%
o Merchandise – 9%
- F&B costs split per percentage of sales:
o Grille - 31%
o Banquets & Events - 59%
o Beverage Cart - 10%
- Utilities cost split by department percentage of revenues
o Golf – 67%
o F&B – 33%
274

FY 2014 FY 2015 FY 2015 FY 2016
Actual Budget Projected Proposed Budget
Ordinary Income/Expense
Income
Operations
Green Fees - La Quinta $454,684 $534,073 $409,731 $450,690Green Fees - El Dorado $512,519 $553,226 $539,173 $550,000Annual Fees $348,218 $367,990 $348,905 $371,768Handicap Fees $10,292 $9,510 $9,661 $9,510
$1,325,713 $1,464,799 $1,307,469 $1,381,968
Range
Annual Range Fee $17,272 $18,038 $16,448 $18,425Range Fees $64,261 $53,079 $66,663 $66,869Range Teaching Fees $21,090 $12,000 $21,646 $12,000
$102,623 $83,116 $104,757 $97,294
Pro Shop
Pro Shop Sales $227,432 $221,162 $224,640 $235,080Donations - Parks $12,295 $0 $28,712 $0
$239,727 $221,162 $253,352 $235,080
Cart
Cart Rental Fees $494,657 $541,162 $471,910 $546,743Trail Fees $78,777 $62,645 $78,033 $86,267
$573,434 $603,807 $549,943 $633,009
Total Golf Revenues $2,241,497 $2,372,884 $2,215,521 $2,347,351
Food & Beverage
F&B Grille $265,553 $259,934 $260,233 $262,136LBW - Grille $137,322 $142,964 $155,239 $156,801
$402,875 $402,898 $415,471 $418,937
F&B - Banquets/Events/Rentals $574,681 $550,263 $567,149 $571,885F&B - Service Fees/Gratuities $49,670 $137,564 $113,430 $123,751LBW - Banquets/Events $50,860 $90,977 $74,732 $76,524
$675,211 $778,804 $755,310 $772,159
F&B - Golf Shop $13,496 $12,997 $12,755 $14,965LBW - Golf Shop $7,663 $12,997 $9,007 $9,910F&B - Bev Cart $53,568 $51,987 $45,270 $49,374LBW - Bev Cart $55,011 $51,987 $54,818 $55,951
$129,738 $129,967 $121,850 $130,199
Total F&B Revenues $1,207,824 $1,311,669 $1,292,632 $1,321,296
Over/Short -$2,588 $0Gross Revenues $3,446,733 $3,684,553 $3,508,153 $3,668,647
SUMMARY OF INCOME AND EXPENSES
CHANGES IN NET INCOME/(LOSS)
MISSOURI CITY RECREATION AND LEISURE LOCAL GOVERNMENT COROPRATION (LGC)
275

FY 2014 FY 2015 FY 2015 FY 2016
Actual Budget Projected Proposed Budget
SUMMARY OF INCOME AND EXPENSES
CHANGES IN NET INCOME/(LOSS)
MISSOURI CITY RECREATION AND LEISURE LOCAL GOVERNMENT COROPRATION (LGC)
Expense
Operations
Salaries & Wages $60,267 $0 $23,391 $40,000Overtime $0 $0 $0Salary Reserve $0 $0 $0Taxes, Social Security $4,716 $0 $2,015 $2,577Workers Compensation $1,014 $0 $282 $859Benefits $3,243 $0 $743 $4,020Contingency Workers $108,170 $121,826 $83,644 $94,500Overtime $5,423 $0 $4,126 $0Salary Reserve $0 $0 $0Taxes, Social Security $8,888 $8,899 $7,560 $6,088Workers Compensation $1,912 $2,966 $1,060 $2,029Benefits $6,112 $5,880 $2,788 $5,628Office Supplies $8,621 $9,500 $16,961 $14,500Wearing Apparel $514 $3,000 $775 $1,500Fuel, Oil & Lubricants $0 $0 $0Minor Tools/Small Equip $0 $0 $0Uniform & Laundry $0 $0 $0Janitorial Supplies $0 $0 $0Postage $0 $0 $0Bldg Mat/Supplies/Repr $0 $0 $0Copy Machine/Suppl/Repr $0 $0 $0Golf Course Mater/Supply $0 $0 $0Miscellaneous $405 $1,200 $0 $600Minor Equip Maintenance $0 $0 $0Handicap Service $6,202 $6,400 $6,619 $6,400Contractor Hiring/Mowing $1,191,472 $1,126,692 $1,141,272 $1,151,654Contract Hiring/TreeTrim $11,188 $15,000 $3,957 $9,000Insurance $0 $0 $0Special Services & Legal $0 $0 $0Bank Fees $47,351 $54,903 $51,313 $50,496Service Agrmts/Contracts $3,400 $3,684 $4,500Building Repairs $0 $0 $0Printing & Publications $0 $0 $0Dues & Subscriptions $1,447 $2,225 $5,821 $2,225Training & Travel $600 $653 $600Golf Equipment Rental $0 $0 $0Audit Services $0 $0 $0Donations $15,130 $0 $24,791 $0Machinery & Equipment $0 $0 $0Gas/Utilities $5,572 $5,218 $4,702 $4,979Electric Utilities $63,714 $55,953 $63,668 $59,874Water Utilities $14,537 $14,069 $10,926 $12,038
$1,565,898 $1,437,732 $1,460,751 $1,474,068
276

FY 2014 FY 2015 FY 2015 FY 2016
Actual Budget Projected Proposed Budget
SUMMARY OF INCOME AND EXPENSES
CHANGES IN NET INCOME/(LOSS)
MISSOURI CITY RECREATION AND LEISURE LOCAL GOVERNMENT COROPRATION (LGC)
Cart
Contingency Workers (Mechanic) $27,300 $31,200 $27,926 $27,300Overtime $0 $0 $0Taxes, Social Security $2,090 $2,279 $2,204 $1,759Worker's Compensation $414 $760 $302 $586Benefits $4,200 $0 $4,020Contingency Workers (Attendants) $57,025 $76,050 $53,613 $60,825Overtime $1,212 $0 $993 $0Taxes, Social Security $4,458 $5,555 $4,310 $3,919Worker's Compensation $883 $1,852 $590 $1,306Benefits $0 $0 $0Unemployment Benefits $0 $4,089 $1,200Bldg Mat/Supplies/Repairs $41,356 $2,400 $18,914 $13,800Uniforms/Laundry $1,200 $0 $250Minor Equip Maint/Rpr $26 $7,200 $0 $1,200Equipment/Cart Lease $106,982 $121,560 $124,197 $113,897Tournament Rentals $14,134 $0 $9,909 $9,000Gas/Utilities $2,090 $1,826 $1,881 $1,743Electric Utilities $23,893 $19,584 $25,401 $20,956Water Utilities $5,452 $4,924 $4,210 $4,213
$287,315 $280,590 $278,538 $265,973
Range
Contingency Workers $36,139 $40,950 $33,269 $33,420Overtime $437 $0 $405 $0Salary Reserve $0 $0 $0Taxes, Social Security $2,808 $2,991 $2,656 $2,153Workers Compensation $556 $997 $364 $718Benefits $0 $0 $0Range Ball Expense $7,717 $12,000 $6,191 $8,500Minor Tools & Equipment - Range $528 $1,800 $5,889 $1,200Instructor Fees $21,120 $12,000 $20,019 $12,000Minor Equip Maint/Rpr $1,905 $1,200 $2,546 $1,200Range Picker Lease Purchase $1,485 $2,220 $2,626 $2,202Gas/Utilities $348 $261 $302 $249Electric Utilities $3,982 $2,798 $3,974 $2,994Water Utilities $909 $703 $691 $602
$77,934 $77,921 $78,933 $65,237
Pro Shop
Contingency Workers $28,095 $30,949 $24,415 $27,560Overtime $2,074 $0 $1,854 $0Taxes, Social Security $2,455 $2,261 $2,451 $1,776Worker's Compensation $496 $754 $346 $592Benefits $2,692 $2,520 $1,484 $2,412Minor Tools & Equip $173 $0 $0 $0Bldg Mater/Supp/Repr $0 $0 $0Purchases of Merchandise $218,368 $168,083 $187,606 $181,011Telephone - Pro Shop $0 $0 $0
277

FY 2014 FY 2015 FY 2015 FY 2016
Actual Budget Projected Proposed Budget
SUMMARY OF INCOME AND EXPENSES
CHANGES IN NET INCOME/(LOSS)
MISSOURI CITY RECREATION AND LEISURE LOCAL GOVERNMENT COROPRATION (LGC)
Equipment/Cart Lease - Pro Shop $0 $0 $0Gas/Utilities $697 $783 $672 $747Electric Utilities $7,964 $8,393 $9,048 $8,981Water Utilities $1,817 $2,110 $1,446 $1,806
$264,831 $215,853 $229,322 $224,884
6104 - Food & Beverage - Grille
Salaries & Wages $38,155 $35,000 $34,465 $35,000Overtime $0 $0 $0Salary Reserve $0 $0 $0Taxes, Social Security $3,288 $2,596 $2,854 $2,274Workers Compensation $553 $865 $386 $758Benefits $1,938 $4,200 $2,090 $4,020Contingency Workers $185,388 $153,357 $126,397 $142,392Overtime $16,494 $0 $4,034 $0Salary Reserve $0 $0 $0Taxes, Social Security $17,400 $11,375 $10,801 $9,250Workers Compensation $2,926 $3,792 $1,460 $3,083Benefits $10,252 $13,104 $7,908 $9,407Unemployement Benefits $2,321 $0 $1,219 $1,200Meals/Drinks $0 $0 $0Uniforms $1,738 $1,016 $0 $750Linens $11,886 $8,058 $5,238 $5,865Supplies $10,949 $4,029 $2,633 $3,770Dishes & Glassware $2,129 $2,014 $1,118 $1,714Paper/Disposables $6,898 $6,043 $3,962 $4,380Small Tools/Equip. $146 $2,014 $0 $1,382Kitchen Equip. $870 $0 $855 $0COGS F&B $171,721 $111,772 $111,783 $91,748COGS LBW $54,218 $61,474 $31,771 $51,744Miscellaneous $202 $0 $0 $0Service Agreements $1,209 $0 $1,257Equipment Maintenance $3,638 $4,029 $3,838 $4,189Bank Fees $9,173 $4,029 $10,354 $2,933Beverage Taxes $17,539 $6,043 $13,498 $5,865Liquor Liability Insurance $1,087 $825 $0 $825Permit Services $2,128 $0 $282 $0Depreciation Expense $1,180 $0 $0 $0
Utilities - Water $4,490 $4,572 $3,124 $3,912 Utilities - Electricity $19,676 $18,185 $16,282 $19,459 Utilities - Gas $1,721 $1,696 $1,190 $1,618
$600,104 $461,299 $397,543 $408,797
Total
278

FY 2014 FY 2015 FY 2015 FY 2016
Actual Budget Projected Proposed Budget
SUMMARY OF INCOME AND EXPENSES
CHANGES IN NET INCOME/(LOSS)
MISSOURI CITY RECREATION AND LEISURE LOCAL GOVERNMENT COROPRATION (LGC)
6104 - Food & Beverage - Banquets/Events
Salaries/Wages - Dir. Of Catering $32,214 $51,840 $52,178 $27,420Commissions $19,618 $15,336 $11,678 $16,210Overtime $0 $0 $0Salary Reserve $0 $0 $0Taxes, Social Security $4,308 $4,983 $5,263 $4,616Workers Compensation $883 $1,661 $713 $1,539Benefits $2,509 $4,200 $3,843 $4,020Contingency Workers - Ass. Sales Mgr. $26,500 $38,221 $37,000Commissions $15,336 $5,839 $6,484Overtime $0 $0 $0Salary Reserve $0 $0 $0Taxes, Social Security $3,103 $3,631 $2,825Workers Compensation $1,034 $492 $942Benefits $4,200 $2,652 $4,020Contingency Workers $199,964 $239,867 $211,977 $222,716Overtime $17,837 $0 $7,960 $0Salary Reserve $0 $0 $0Taxes, Social Security $18,104 $17,792 $18,127 $14,469Workers Compensation $3,709 $5,931 $2,454 $4,823Benefits $10,545 $20,496 $13,236 $14,713Meals/Drinks $0 $0 $0Uniforms $934 $1,161 $0 $500Linens $22,570 $23,004 $21,499 $30,886Supplies $12,749 $7,668 $5,443 $6,177Dishes & Glassware $2,433 $3,834 $1,783 $2,316Paper/Disposables $7,884 $7,668 $7,071 $7,722Small Tools/Equip. $167 $3,834 $0 $2,548Kitchen Equip. $994 $0 $1,163 $0COGS F&B $194,608 $209,507 $198,170 $243,473COGS LBW $60,650 $28,203 $50,901 $25,253Miscellaneous $27,941 $15,336 $14,167 $15,443Equipment Maintenance $3,951 $5,751 $6,463 $7,722Bank Fees $462 $5,751 $0 $6,949Beverage Taxes $1,565 $7,668 $0 $9,266Liquor Liability Insurance $1,242 $1,650 $0 $1,650Permit Services $2,431 $0 $32 $0
Utilities - Water $5,131 $7,034 $4,320 $6,019 Utilities - Electricity $22,487 $27,977 $28,728 $29,937 Utilities - Gas $1,967 $2,609 $2,596 $2,489
$679,857 $770,934 $720,599 $760,146
Total
279

FY 2014 FY 2015 FY 2015 FY 2016
Actual Budget Projected Proposed Budget
SUMMARY OF INCOME AND EXPENSES
CHANGES IN NET INCOME/(LOSS)
MISSOURI CITY RECREATION AND LEISURE LOCAL GOVERNMENT COROPRATION (LGC)
6104 - Food & Beverage - Bev Cart
Contingency Workers $33,321 $40,404 $29,240 $31,360Overtime $37 $0 $59 $0Salary Reserve $0 $0 $0Taxes, Social Security $2,772 $2,997 $2,797 $2,037Workers Compensation $540 $999 $338 $679Meals/Drinks $0 $0 $0Uniforms $194 $242 $0 $242Linens $2,832 $2,599 $1,651 $2,474Supplies $2,746 $1,300 $919 $1,302Dishes & Glassware $507 $650 $322 $521Paper/Disposables $1,642 $1,300 $1,244 $1,432Small Tools/Equip. $235 $650 $260 $391Kitchen Equip. $207 $0 $225 $260COGS F&B $42,644 $20,145 $34,445 $22,518COGS LBW $12,651 $20,145 $9,195 $21,734Miscellaneous $0 $0 $0Maintenance & Repairs $823 $1,300 $1,822 $2,864Bank Fees $96 $1,300 $0 $1,172Liquor Liability Insurance $259 $275 $0 $275Permit Services $507 $580 $67 $580Beverage Cart Rental $12,898 $12,969 $13,442 $12,527
Utilities - Water $1,069 $1,407 $827 $1,204 Utilities - Electricity $4,685 $5,595 $5,001 $5,987 Utilities - Gas $410 $522 $448 $498
$121,075 $115,377 $102,300 $110,058
Total
280

FY 2014 FY 2015 FY 2015 FY 2016
Actual Budget Projected Proposed Budget
SUMMARY OF INCOME AND EXPENSES
CHANGES IN NET INCOME/(LOSS)
MISSOURI CITY RECREATION AND LEISURE LOCAL GOVERNMENT COROPRATION (LGC)
Admin
Salaries & Wages $68,000 $61,200 $100,420Taxes, Social Security $4,967 $4,599 $4,703Workers Compensation $1,656 $644 $1,568Benefits $4,200 $3,251 $4,020Pest Control $600 $0 $600Supplies $1,229 $600 $0 $600General Maint. $38,793 $36,400 $51,350 $36,400Security Monitoring $5,443 $6,000 $3,713 $6,000Cable Service $3,269 $4,800 $3,704 $4,800Fees $0 $0 $0Postage $439 $296 $381 $296Telephone $15,590 $13,200 $16,653 $13,200Auto/Travel $0 $495 $0Adv/Promo $43,612 $41,500 $28,865 $41,500Service Agreements $24,800 $21,600 $21,196 $21,600License/Permits $920 $0 $71 $0Employee Recognition $1,395 $2,000 $0 $2,000P/R Prep. $12,000 $11,127 $12,000Trash/Waste Removal $10,678 $9,600 $8,291 $9,600Property Insurance $35,783 $0 $0 $0Liability Insurance $26,400 $24,708 $26,400CH Maint. Contract $37,788 $39,600 $37,788 $39,600Facility /Capital Improvements $14,208 $0 $2,967 $0COMC Maintenance Technician/HVAC PM $22,249 $21,996 $21,834 $21,996IT Equipment Lease $5,376Elevator Maintenance $5,413 $6,000 $4,933 $6,000
$261,609 $321,415 $307,771 $358,678
Total
Gross Expenses $3,858,623 $3,681,121 $3,575,757 $3,667,842
Other Income
Other Income - Operations $16,571Other Income - RangeOther Income - Pro Shop $2,249Other Income - Food & Beverage
Total Other Income $18,820 $0 $0 $0
Net Income (Loss) -$393,070 $3,433 -$67,604 $805
281

FY 2014 FY 2015 FY 2015 FY 2016
Actual Budget Projected Proposed Budget
SUMMARY OF INCOME AND EXPENSES
CHANGES IN NET INCOME/(LOSS)
MISSOURI CITY RECREATION AND LEISURE LOCAL GOVERNMENT COROPRATION (LGC)
Total by Department
Operations
Income $1,325,713 $1,464,799 $1,307,469 $1,381,968Expenses $1,565,898 $1,437,732 $1,460,751 $1,474,068Net Income (Loss) -$240,185 $27,067 -$153,282 -$92,100
Cart
Income $573,434 $603,807 $549,943 $633,009Expenses $287,315 $280,590 $278,538 $265,973Net Income (Loss) $286,119 $323,217 $271,405 $367,036
Range
Income $102,623 $83,116 $104,757 $97,294Expenses $77,934 $77,921 $78,933 $65,237Net Income (Loss) $24,689 $5,196 $25,824 $32,057
Pro Shop
Income $239,727 $221,162 $253,352 $235,080Expenses $264,831 $215,853 $229,322 $224,884Net Income (Loss) -$25,104 $5,309 $24,030 $10,195
Food & Beverage (Grille)
Income $402,875 $402,898 $415,471 $418,937Expenses $600,104 $461,299 $397,543 $408,797Net Income (Loss) -$197,229 -$58,401 $17,928 $10,141
Food & Beverage (Banquets/Events)
Income $675,211 $778,804 $755,310 $772,159Expenses $679,857 $770,934 $720,599 $760,146Net Income (Loss) -$4,646 $7,870 $34,711 $12,013
Food & Beverage (Bev Cart)
Income $129,738 $129,967 $121,850 $130,199Expenses $121,075 $115,377 $102,300 $110,058Net Income (Loss) $8,663 $14,590 $19,550 $20,141
General & Administrative
Income $0 $1 $2 $3Expenses $261,609 $321,415 $307,771 $358,678Net Income (Loss) -$261,609 -$321,414 -$307,769 -$358,675
Total
Income $3,465,553 $3,684,553 $3,508,153 $3,668,647Expenses $3,858,623 $3,681,121 $3,575,757 $3,667,842Net Income (Loss) -$393,070 $3,433 -$67,604 $805
282

INTERNAL SERVICE FUNDS SUMMARY BY YEAR
FY 2015 FY 2015 FY 2015 FY 2016FY 2014 Original Revised Year-End Proposed
Actual Budget Budget Estimate BudgetREVENUES:
OPERATING REVENUES
Other Miscellaneous
Insurance Reimbursement 17,281 0 54,305 59,572 0
Sale of Salvage 18,946 0 0 10,235 10,000
Federal Grants 0 0 0 0 0
Services Charged 756,841 1,081,413 1,081,413 1,081,413 756,919
TOTAL OPERATING REVENUES 793,068 1,081,413 1,135,718 1,151,220 766,919
NON-OPERATING REVENUES
Interest Earnings 25,019 22,300 22,300 32,540 27,800
TOTAL NON-OPERATING REVENUES 25,019 22,300 22,300 32,540 27,800
OTHER FINANCING SOURCES
Contribution of Assets (76,207) 0 0 0 0
Transfer from General Fund 0 0 0 0 0
Transfer from C.O. Fund 0 0 0 0 0
Transfer from Fleet Maint. Fund 0 0 0 0 0
TOTAL REVENUES & RESOURCES 741,880 1,103,713 1,158,018 1,183,760 794,719
EXPENDITURES
Commodities 0 112,000 33,337 39,059 185,000
Other Services 642,013 0 0 20,000 80,000
Capital Outlay 36,813 512,000 654,230 719,494 1,714,045
TOTAL EXPENDITURES 678,826 624,000 687,567 778,553 1,979,045
TOTAL APPROPRIATIONS/
EXPENDITURES 678,826 624,000 687,567 778,553 1,979,045
NET REVENUES OVER/(UNDER) EXPENDITURES 63,054 479,713 470,451 405,207 (1,184,326)
BEGINNING FUND BALANCE JULY 1 3,081,642 3,258,989 3,144,696 3,144,696 3,549,903
ENDING FUND BALANCE JUNE 30 3,144,696 3,738,702 3,615,147 3,549,903 2,365,577
PROPOSED BUDGET FY 2016
283

INTERNAL SERVICE FUNDS SUMMARY BY FUND
INNOVATION FLEET AND TECHNOLOGY
REPLACEMENT REPLACEMENT FUND FUND TOTALS
REVENUES: OPERATING REVENUES Services Charged 756,919 0 756,919 Transfers from General Fund 0 0 0TOTAL OPERATING REVENUES 756,919 0 756,919 NON-OPERATING REVENUES Federal Grants 0 0 0 Interest Earnings 20,000 7,800 27,800 Sale of Salvage 10,000 0 10,000 Insurance Reimbursement 0 0 0 Miscellaneous 0 0 0TOTAL NON-OPERATING REVENUES 30,000 7,800 37,800
TOTAL REVENUES & RESOURCES 786,919 7,800 794,719 EXPENDITURES Personnel 0 0 0Commodities 0 185,000 185,000Contractual Services 0 0 0Other Services 80,000 0 80,000Capital Outlay 1,564,045 150,000 1,714,045TOTAL EXPENDITURES 1,644,045 335,000 1,979,045 CONTINGENCY 0 0 0
OTHER FINANCING USES Transfers to General Fund 0 0 0 Transfers to Building Maint. Fund 0 0 0
TOTAL APPROPRIATIONS/ EXPENDITURES 1,644,045 335,000 1,979,045 NET REVENUES OVER/(UNDER) EXPENDITURES (857,126) (327,200) (1,184,326)
BEGINNING FUND BALANCE JULY 1 2,894,434 655,469 3,549,903
ENDING FUND BALANCE JUNE 30 2,037,308 328,269 2,365,577
PROPOSED BUDGET FY 2016
284

FUND 606-66-606
FY 2015 FY 2015 FY 2015 FY 2016FY 2014 Original Revised Year-End ProposedActual Budget Budget Estimate Budget
WORKING CAPITAL REVENUES48112 Lease Fees Charged 498,663 739,805 739,805 739,805 756,91949000 Interest Earnings 19,256 18,000 18,000 22,490 20,000
49102 Sale of Salvage 18,926 0 0 10,235 10,000
49103 Insurance Reimbursement 17,281 0 54,305 59,572 0Total Revenues 554,126 757,805 812,110 832,102 786,919
OTHER FINANCING SOURCES49410 Contribution of Assets (76,207) 0 0 0 049904 Transfer from Fund 101 0 0 0 0
Total Revenues and Resources 477,919 757,805 812,110 832,102 786,919
WORKING CAPITAL EXPENSES
COMMODITIES52004 Minor Tools & Equipment 0 0 0 5,722 0
Total Commodities 0 0 0 5,722 0
OTHER SERVICES54013 Reserve for Contingencies 20,000 80,00054036 Depreciation 529,43654039 Gain/Loss - Disposal-Assets (29,567) 0 0 0 0
Total Other Services 499,869 0 0 20,000 80,000
CAPITAL OUTLAY75004 Equipment 2,057 23,000 23,000 23,000 075006 Motor Vehicles 34,756 299,000 362,567 448,483 1,564,045
Total Capital Outlay 36,813 322,000 385,567 471,483 1,564,045
Total Appropriations/Expenditures 536,682 322,000 385,567 497,205 1,644,045
REVENUES OVER/(UNDER) EXPENDITURES (58,763) 435,805 426,543 334,897 (857,126)
BEGINNING BALANCE JULY 1 2,618,300 2,553,130 2,559,537 2,559,537 2,894,434
ENDING BALANCE JUNE 30 2,559,537 2,988,935 2,986,080 2,894,434 2,037,308
Non Working Capital ExpensesDepreciation (See Note)
Note: Depreciation is an expense item that does not use working capital. In order to comply with Generally
Accepted Accounting Principles, depreciation needs to be recorded in enterprise and internal service funds.
FY 2015 FY 2016FLEET RENTAL FEE CHARGED Amount AmountCommunications 5,313 5,313Police Administration 27,838 27,838Police Code Enforcement 16,483 16,483Police Support Services 2,150 2,150Police C.I.D. 38,511 40,723Police Patrol 346,233 339,733Fire Administration 1,418 1,418Fire Prevention 10,929 10,929
Fire Training 2,000 2,000
Fire Operations 12,975 13,100PW Administration 13,543 14,257Streets/Drainage/Traf. Control 150,504 168,350Animal Services 5,375 5,375Parks 63,111 65,427Recreation 4,567 4,567Planning 1,500 1,500Inspection 16,330 16,544
Fleet 7,525 7,525
Facilities Maintenance 11,000 11,187
Innovation & Technology 2,500 2,500
739,805 756,919
SUMMARY OF REVENUES, EXPENDITURES AND
CHANGES IN FUND EQUITY
FLEET REPLACEMENT FUND
285

FUND 611-62-611
FY 2015 FY 2015 FY 2015 FY 2016
FY 2014 Original Revised Year-End Proposed
Actual Budget Budget Estimate Budget
OPERATING REVENUE
48112 Lease Fees Charged 258,178 341,608 341,608 341,608 0
NON-OPERATING REVENUE
49000 Interest Earnings 5,763 4,300 4,300 10,050 7,800
49102 Sale of Salvage 20 0 0 0 0
OTHER FINANCING SOURCES
49004 Transfer from General Fund 101 0 0 0 0 0
Total Revenues and Resources 263,961 345,908 345,908 351,658 7,800
OPERATING EXPENSES
COMMODITIES
52004 Minor Tools & Equipment 0 112,000 0 0
52085 Computer Lease 0 0 33,337 33,337 185,000Total Commodities 0 112,000 33,337 33,337 185,000
OTHER SERVICES
54036 Depreciation 142,144 0 0 0 0Total Other Services 142,144 0 0 0 0
CAPITAL OUTLAY
75001 Equipment - Computer 0 190,000 268,663 248,011 150,000Total Capital Outlay 0 190,000 268,663 248,011 150,000
Total Appropriations/Expenditures 142,144 302,000 302,000 281,348 335,000
REVENUES OVER/(UNDER) EXPENDITURES 121,817 43,908 43,908 70,310 (327,200)
BEGINNING BALANCE JULY 1 463,342 705,859 585,159 585,159 655,469
ENDING BALANCE JUNE 30 585,159 749,767 629,067 655,469 328,269
Non Working Capital Expenses
Depreciation (See Note)
Note: Depreciation is an expense item that does not use working capital. In order to comply with Generally
Accepted Accounting Principles, depreciation needs to be recorded in enterprise and internal service
funds.FY 2015 FY 2016
Lease Fees Charged Amount Amount
Council & Management 10,829 0
City Secretary 9,724 0
Human Resources/Org Dev. 1,300 0
Legal 2,250 0
Municipal Court 7,329 0
Communications 2,700 0
Finance Administration 1,450 0
Purchasing & Risk Management 1,150 0
Accounting 6,150 0
Police Administration 6,400 0
Police Support Services 11,864 0
Police C.I.D. 10,736 0
Police Patrol 76,150 0
Fire Administration 2,257 0
Fire Prevention 3,700 0
Fire Training 900 0
Fire Operations 22,450 0
Engineering 8,171 0
Streets/Drainage/Traf. Control 7,125 0
G.I.S. 6,000 0
Animal Services 200 0
Parks 2,325 0
Recreation 5,032 0
Planning 8,429 0
Inspection 8,850 0
Code Enforcement 7,950 0
Radio Fund 850 0
Fleet Maintenance 2,100 0
Innovation & Technology 106,987 0
Facilities Maintenance 250 0
341,608 0
SUMMARY OF REVENUES, EXPENDITURES AND
CHANGES IN FUND EQUITY
TECHNOLOGY & INNOVATION REPLACEMENT FUND
286

FY2016
COMPENSATION PLAN:
EXEMPT
NONEXEMPT
CERTIFIED POLICE & EMERGENCY
COMMUNICATIONS
CERTIFIED FIRE
INCENTIVE/CERTIFICATION PAY
Approved: May 18, 2015 (Updated: May 26, 2015)
287

GRD GRP NON-EXEMPT POSITIONS FLSA MIN MID MAX
Annual $20,434 $25,542 $30,650
01 2000 ______ VACANT ______ N Monthly $1,703 $2,129 $2,554
Hourly $9.83 $12.28 $14.74
Annual $21,251 $26,564 $31,876
02 2000 Customer Service Clerk Monthly $1,771 $2,214 $2,656
Hourly $10.22 $12.77 $15.33
Park Caretaker I Annual $22,101 $27,626 $33,151
03 2000 Records Mgmt. Asst. N Monthly $1,842 $2,302 $2,763
Street Technician I Hourly $10.63 $13.28 $15.94
Annual $22,985 $28,731 $34,478
04 2000 ____ VACANT_________ N Monthly $1,915 $2,394 $2,873
Hourly $11.05 $13.81 $16.58
Accounting Clerk II N Annual $23,904 $29,881 $35,857
05 2000 Bldg. Maintenance /Asst. Tech Monthly $1,992 $2,490 $2,988
Police Records Tech Hourly $11.49 $14.37 $17.24
Signal Technician I
Customer Relations Specialist I Annual $24,861 $31,076 $37,291
06 2000 Park Caretaker II N Monthly $2,072 $2,590 $3,108
Permit Service Rep I Hourly $11.95 $14.94 $17.93
Property Room Tech
Animal Services Officer Annual $26,101 $32,630 $39,155
07 2000 Buyer N Monthly $2,175 $2,719 $3,263
Deputy Court Clerk Hourly $12.55 $15.69 $18.83
Dep. Court Clerk/Juv. Case Mgr.
Accounting Technician
Customer Relations Specialist II Annual $27,409 $34,261 $41,113
08 2000 Mechanic I N Monthly $2,284 $2,855 $3,426
Parks Caretaker III Hourly $13.18 $16.47 $19.77
Recreation AttendantVideo Technician
Detention Officer N Annual $28,779 $35,974 $43,169
09 2000 Permit Service Rep II Monthly $2,398 $2,998 $3,597
Hourly $13.84 $17.30 $20.75
Administrative Assistant
Animal Services Supervisor
CDBG Code Inspector I
Code Enforcement Inspector I Annual $30,506 $38,133 $45,759
10 2000 Crime Victims Liaison Officer N Monthly $2,542 $3,178 $3,813
Health Inspector I Hourly $14.67 $18.33 $21.99
Human Resources/OD Tech
Mechanic II
Street Technician II
Accountant
Building Maintenance Tech.
Crimes Analyst N Monthly $2,695 $3,368 $4,042
11 2000 Detention Officer Supervisor Hourly $15.55 $19.43 $23.32
GIS Technician I Annual $32,336 $40,420 $48,505
Jr. Digital Video Engineer
Parks Crew Leader
Signal Technician II
N
288

Building Inspector II
Chief Signal Technician
Code Enforcement Inspector II
Construction Inspector Annual $34,277 $42,846 $51,415
12 2000 Crew Leader Streets & Drainage N Monthly $2,856 $3,571 $4,285
Desktop Services Specialist I Hourly $16.48 $20.60 $24.72
Planner I
Police Records Supervisor
Project Coordinator
Recreation Specialist
Senior Accounting Technician
Budget Specialist
Building Inspector III
Chief Signal Technician
Code Enforcement Inspector III
Community Relations Coord.
Crew Leader - Signs
Desktop Services Specialist II
13 2000 Digital Video Engineer Annual $36,333 $45,416 $54,500
Intelligent Transp. Syst Specialist N Monthly $3,028 $3,785 $4,542
Lead Building Maint Tech Hourly $17.47 $21.84 $26.20
Lead Deputy Court Clerk
Park Supervisor
Payroll Specialist
Planner II
Senior Accountant
Street Supervisor
Commercial Plan Examiner
Desktop Services Specialist III Annual $38,513 $48,141 $57,770
14 2000 GIS Operations Specialist N Monthly $3,209 $4,012 $4,814
GIS Production Specialist Hourly $18.52 $23.15 $27.77
Recreation Supervisor
Office Manager Annual $40,824 $51,030 $61,236
15 2000 Procurement Analyst Monthly $3,402 $4,253 $5,103
N Hourly $20 $24.53 $29.44
Annual $43,273 $54,091 $64,909
16 Executive Assitant N Monthly $3,606 $4,508 $5,409
Hourly $21 $26.01 $31.21
Annual $45,868 $57,336 $68,803
17 ______ VACANT ______ N Monthly $3,822 $4,778 $5,734
Hourly $22 $27.57 $33.08
Annual $48,620 $60,776 $72,931
18 ______ VACANT ______ N Monthly $4,052 $5,065 $6,078
Hourly $23 $29.22 $35.06
Annual $51,553 $64,442 $77,330
19 Systems Administrator N Monthly $4,296 $5,370 $6,444
Network Administrator Hourly $25 $31 $37.18
289
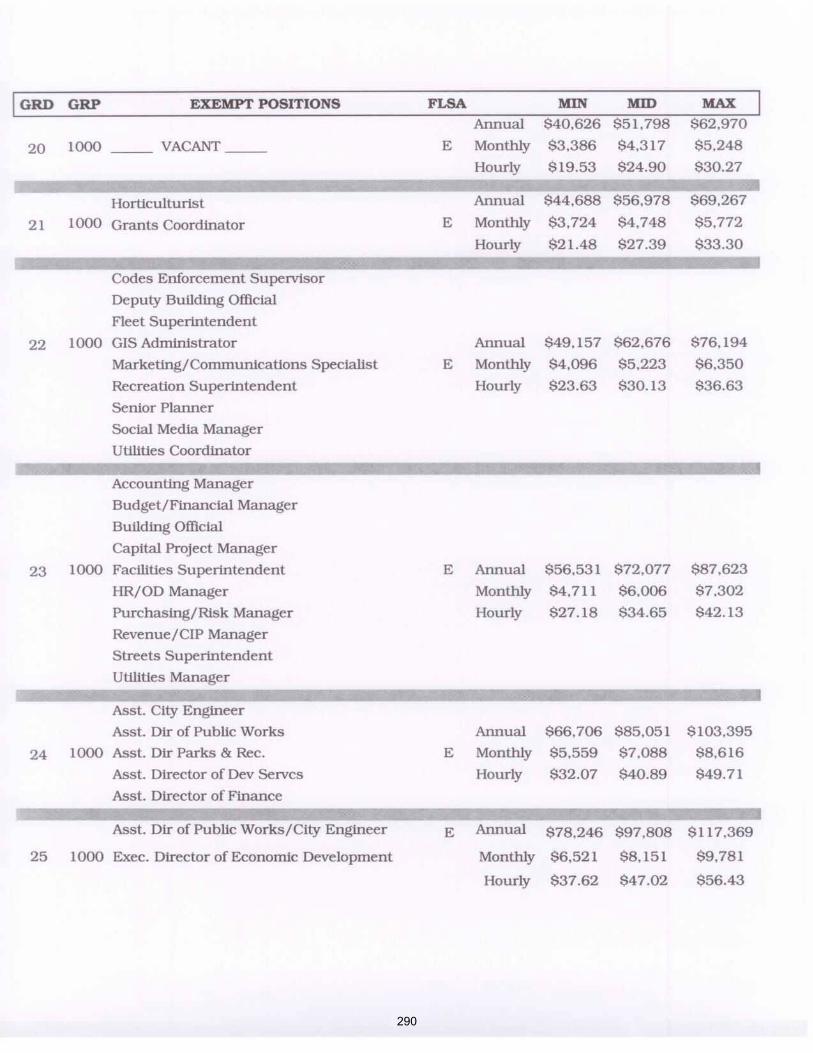
290

GRD GRP FIRE POSITIONS FLSA MIN MID MAX
Annual $46,028 $53,278 $60,529
F1 3100 Firefighter N Monthly $3,836 $4,440 $5,044
Hourly-53 $16.70 $19.33 $21.96
Annual $57,008 $63,034 $69,060
F23100
Fire/EMT App Operator N Monthly $4,751 $5,253 $5,755
Fire Inspector, Hourly-53 $20.69 $22.87 $25.06
Annual $61,319 $69,985 $78,651
Fire Lieutenant Monthly $5,110 $5,832 $6,554
F3 3100 Sr. Fire Inspector N Hourly-53 $22.25 $25.39 $28.54
Annual $76,064 $83,554 $91,043
F4 3100 Battalion Chief Monthly $6,339 $6,963 $7,587
N Hourly-53 $27.60 $30.32 $33.03
Fire MarshalAnnual $80,324 $89,805 $99,287
F5 3000 Emergency Mng Coord E Monthly $6,694 $7,484 $8,274
Training & Educ Chief Hourly-40 $38.62 $43.18 $47.73
Annual $84,431 $94,985 $105,539
F6 3000 Assistant Fire Chief E Monthly $7,036 $7,915 $8,795
Hourly-40 $40.59 $45.67 $50.74
291

GRD GRP POLICE POSITIONS FLSA MIN MID MAX
Annual $39,520 $45,448 $52,265
TCO 4100 Telecommunications Officer N Monthly $3,293 $3,787 $4,355
Hourly $19.00 $21.85 $25.13
Annual $47,905 $47,905 $47,905
P1 4100 Police Cadet N Monthly $3,992 $3,992 $3,992
Hourly $23.03 $23.03 $23.03
Annual $51,738 $61,173 $70,609
P2 4100 Police Officer N Monthly $4,311 $5,098 $5,884
Hourly $24.87 $29.41 $33.95
Annual $45,081 $56,352 $67,622
TCS 4100 Telecommunications Supervisor N Monthly $3,757 $4,696 $5,635
Hourly $21.67 $27.09 $32.51
Compliance & Accreditation Supervisor Annual $57,002 $64,834 $72,666
P3 4100 Criminalist N Monthly $4,750 $5,403 $6,056
Detective Hourly $27.40 $31.17 $34.94
Police Support Technician Annual $70,282 $78,223 $86,165
P4 4100 Sergeant N Monthly $5,857 $6,519 $7,180
Community Resource Officer Hourly $33.79 $37.61 $41.43
Lieutenant Annual $81,708 $89,242 $96,776
P5 4100 Police Technical Support Supervisor N Monthly $6,809 $7,437 $8,065
Hourly $39.28 $42.90 $46.53
P6 4000 Police Captain E Annual $96,094 $103,044 $109,994
Monthly $8,008 $8,587 $9,166
Hourly $46.20 $49.54 $52.88
P7 4000 Assistant Police Chief E Annual $99,938 $111,967 $123,997
Monthly $6,095 $7,009 $7,924
Hourly $48.05 $53.83 $59.61
292

SPECIALTY / CERTIFICATION ELIGIBLE MONTHLY
Bilingual Skill Pay (Spanish) All Employees $30
Intermediate TCO Certification Telecommunications Officers $30
Advanced TCO CertificationTelecommunications
Officers/Supervisors$30
Master TCO CertificationTelecommunications
Officers/Supervisors$30
Communications Training Officer
Certification
Telecommunications
Officers/Supervisors$50
Intermediate Firefighter Certificate Fire Dept $30
Advanced Firefighter Certificate Fire Dept $30
Instructor’s Certificate Fire Dept $30
Inspector’s Certificate Fire Dept $20
Arson Investigator Certificate Fire Dept $100
EMT Intermediate Fire Dept $120
EMT Paramedic Fire Dept $280
Intermediate Peace Officer Certificate Certified Police Officers $50 *
Advanced Peace Officer Certificate Certified Police Officers $100 *
Master Peace Officer Certificate Certified Police Officers $150 *
Instructor’s Certificate Certified Police Officers $50 *
Field Training Officer Certified Police Officers $50 *
SWAT Certification Certified Police Officers $100 *
Special Crimes Unit (SCU) Certified Police Officers $150
Updated: May 11, 2015 Approved: May 18, 2015
* An Officer shall only receive Certification pay for the higest certificate earned
293

294

ALL DIVISIONS Requested Recommended
Amount City Manager's Amount Acct
Classification of Expenditures FY 2016 Y N Comments/Other Comments FY 2016 No.
GENERAL GOVERNMENT
City Secretary
Questys Digital Signature 1,875 N Requested in I.T.
Questys Capture Form Processing Software 13,099 N Requested in I.T.
- - - - - - - - - - - - - - - - - - - - - - - - - - - - - - - - - - - - - - - - - - - - - - - - - - - - - - - - - - - - - - - - - - - - - - - - - - - - - - - - - - - - - - - - - - - - - - - - - - - - -
Total City Secretary 14,974 0
Human Resources & Organizational Development
Administrative Assistant 62,080 N
- - - - - - - - - - - - - - - - - - - - - - - - - - - - - - - - - - - - - - - - - - - - - - - - - - - - - - - - - - - - - - - - - - - - - - - - - - - - - - - - - - - - - - - - - - - - - - - - - - - - -
Total HR & OD 62,080 0
Communications
Web Master Position Reclassification N Done in FY15
- - - - - - - - - - - - - - - - - - - - - - - - - - - - - - - - - - - - - - - - - - - - - - - - - - - - - - - - - - - - - - - - - - - - - - - - - - - - - - - - - - - - - - - - - - - - - - - - - - - - -
Total Communications 0 0
TOTAL GENERAL GOVERNMENT 77,054 0
POLICE
Police Administration
2 Administrative Police Officers 157,116 N
1 Grants Coordinator 69,599 N
Body Worn Cameras 175,484 N Requested in I.T.
License Plate Recognition System 60,000 N Requested in I.T.
- - - - - - - - - - - - - - - - - - - - - - - - - - - - - - - - - - - - - - - - - - - - - - - - - - - - - - - - - - - - - - - - - - - - - - - - - - - - - - - - - - - - - - - - - - - - - - - - - - - - -
Total Police Administration 462,199 0
Code Enforcement
Vehicle for CDBG Code Enforcement Officer 23,310 Y
Cell Phone Allowance for CDBG Officer 540 Y
- - - - - - - - - - - - - - - - - - - - - - - - - - - - - - - - - - - - - - - - - - - - - - - - - - - - - - - - - - - - - - - - - - - - - - - - - - - - - - - - - - - - - - - - - - - - - - - - - - - - -
Total Code Enforcement 23,850 0
Support Services
6 Telecommunication Officers 368,304 N
1 Police Records Technician 42,867 N
- - - - - - - - - - - - - - - - - - - - - - - - - - - - - - - - - - - - - - - - - - - - - - - - - - - - - - - - - - - - - - - - - - - - - - - - - - - - - - - - - - - - - - - - - - - - - - - - - - - - -
Total Support Services 411,171 0
C.I.D.
5 Detectives 438,700 N
1 Sergeant 97,774 N
5 Unmarked Police Vehicles 105,000 N
1 Sergeant Unmarked Vehicle 21,000 N
OSSI Sex Offender Module 11,488 Y Requested in I.T.
Property Room Consultant 10,000 N
Carpet Replacement in CID 15,000 N Requested in Facilities Maintenance
- - - - - - - - - - - - - - - - - - - - - - - - - - - - - - - - - - - - - - - - - - - - - - - - - - - - - - - - - - - - - - - - - - - - - - - - - - - - - - - - - - - - - - - - - - - - - - - - - - - - -
Total C.I.D. 698,962 0
Patrol
25 Police Officers 1,898,850 N
3 Sergeants 283,017 N
16 Patrol Vehicles for 25 Officers 1,013,104 N
City of Missouri CitySupplemental Budget Requests
Fiscal Year 2016 Annual Budget
295

ALL DIVISIONS Requested Recommended
Amount City Manager's Amount Acct
Classification of Expenditures FY 2016 Y N Comments/Other Comments FY 2016 No.
City of Missouri CitySupplemental Budget Requests
Fiscal Year 2016 Annual Budget
4 Detention Officers 192,628 Y Converted 4 part-time to 4 full-time - $108,628
- - - - - - - - - - - - - - - - - - - - - - - - - - - - - - - - - - - - - - - - - - - - - - - - - - - - - - - - - - - - - - - - - - - - - - - - - - - - - - - - - - - - - - - - - - - - - - - - - - - - -
Total Patrol 3,387,599 0
TOTAL POLICE 4,983,781 0
FIRE & RESCUE SERVICES
Administration
1 Resource Manager 90,615 N
ISO Consultant to Prepare ISO Evaluation 14,500 Y
Assistant Fire Chief Reclass 7,477 N
Facilitator For Cultural Community Leaders 600 Y
Resident Emerg. Comm. Network System 12,000 Y
Emergency Preparedness Guides 1,000 N
Validate Firefighter Hiring Physical Ability Test 15,000 N
Federal Grant Match 88,573 N
- - - - - - - - - - - - - - - - - - - - - - - - - - - - - - - - - - - - - - - - - - - - - - - - - - - - - - - - - - - - - - - - - - - - - - - - - - - - - - - - - - - - - - - - - - - - - - - - - - - - -
Total Fire Administration 229,765 0
Prevention
1 Community Liaison Officer 136,158 N
1 Assistant Fire Marshal 157,246 N
1 Administrative Assistant 56,014 N
- - - - - - - - - - - - - - - - - - - - - - - - - - - - - - - - - - - - - - - - - - - - - - - - - - - - - - - - - - - - - - - - - - - - - - - - - - - - - - - - - - - - - - - - - - - - - - - - - - - - -
Total Fire Prevention 349,418 0
Fire Training
1 Fire Training Lieutenant 153,264 N
Pay adjustment for 1 part-time employee 988 N
- - - - - - - - - - - - - - - - - - - - - - - - - - - - - - - - - - - - - - - - - - - - - - - - - - - - - - - - - - - - - - - - - - - - - - - - - - - - - - - - - - - - - - - - - - - - - - - - - - - - -
Total Fire Training 154,252 0
Fire Operations
1 EMS Captain 146,738 N
Remove Kelly Days / Move Squad Prog. To FT 217,270 Y At $187,327 for 10 months
Vehicle for Squad 63,545 Y Funded out of Fleet Replacement Fund
Thermal Imaging Cameras - Replacements 20,000 Y
Exhaust Removal System 15,750 N
- - - - - - - - - - - - - - - - - - - - - - - - - - - - - - - - - - - - - - - - - - - - - - - - - - - - - - - - - - - - - - - - - - - - - - - - - - - - - - - - - - - - - - - - - - - - - - - - - - - - -
Total Fire Operations 463,303 0
TOTAL FIRE & RESCUE SERVICES 1,196,738 0
PUBLIC WORKS
Administration
1 Customer Service Clerk 48,265 N
Traffic Signal Art Box Project 5,000 Y
- - - - - - - - - - - - - - - - - - - - - - - - - - - - - - - - - - - - - - - - - - - - - - - - - - - - - - - - - - - - - - - - - - - - - - - - - - - - - - - - - - - - - - - - - - - - - - - - - - - - -
Total PW Administration 53,265 0
Capital Projects
Cell Phone Allowance for Proj. Coordinator 1,080 Y
- - - - - - - - - - - - - - - - - - - - - - - - - - - - - - - - - - - - - - - - - - - - - - - - - - - - - - - - - - - - - - - - - - - - - - - - - - - - - - - - - - - - - - - - - - - - - - - - - - - - -
296

ALL DIVISIONS Requested Recommended
Amount City Manager's Amount Acct
Classification of Expenditures FY 2016 Y N Comments/Other Comments FY 2016 No.
City of Missouri CitySupplemental Budget Requests
Fiscal Year 2016 Annual Budget
Total PW Capital Projects 1,080 0
Engineering/Utility Planning
Reclass Utility Coordinator 3,571 N
AutoCAD Licenses 2,400 Y Requested in I.T.
Cell Phone Allowance for Asst. City Engineer 540 Y
- - - - - - - - - - - - - - - - - - - - - - - - - - - - - - - - - - - - - - - - - - - - - - - - - - - - - - - - - - - - - - - - - - - - - - - - - - - - - - - - - - - - - - - - - - - - - - - - - - - - -
Total PW Engineering/Utility Planning 6,511 0
Facilities Maintenance
1 Facilities Maintenance Asst. Technician 54,197 N
Metasys Software Renewal 5,219 Y Requested in I.T.
Freestyle Extractor 5,500 N
1 Facilities Maintenance Specialist w/ vehicle 128,825 N
Access Gate Controller FS #1/PSHQ 12,000 Y
Design of storefront remodel at Parks Mntc.
Facility
10,000 N
Ice Machine Replacement at FS #3 & #4 7,000 Y Part of citywide facility maintenance items
- - - - - - - - - - - - - - - - - - - - - - - - - - - - - - - - - - - - - - - - - - - - - - - - - - - - - - - - - - - - - - - - - - - - - - - - - - - - - - - - - - - - - - - - - - - - - - - - - - - - -
Total PW Facilities Maintenance 222,741 0
Fleet Maintenance
Department-wide digital 2-way handheld radios 86,215 Y
1 EVT Tech 90,430 N
Fleet Lease Program for Non-Emergency Vehicles 816,000 N Pilot program in FY16 out of Fleet Repl. Fund
Above Ground Lift 6,500 N
180,000 LB Lift 90,000 N
- - - - - - - - - - - - - - - - - - - - - - - - - - - - - - - - - - - - - - - - - - - - - - - - - - - - - - - - - - - - - - - - - - - - - - - - - - - - - - - - - - - - - - - - - - - - - - - - - - - - -
Total PW Fleet Maintenance 1,089,145 0
Streets, Drainage & Traffic Operations
Cartegraph Cloud 177,667 N Requested in I.T.
Retrorelectometer 13,000 Y
Overtime 38,000 N
Skid Steer Loader 35,000 Y Funded out of Fleet Replacement Fund
Contractor for Hire - Streetlight Tree Trimming 87,500 N
- - - - - - - - - - - - - - - - - - - - - - - - - - - - - - - - - - - - - - - - - - - - - - - - - - - - - - - - - - - - - - - - - - - - - - - - - - - - - - - - - - - - - - - - - - - - - - - - - - - - -
Total Streets, Drainage & Traffic Control 351,167 0
GIS
Virtual GIS Server Upgrade 25,000 Y Requested in I.T.
Overtime 5,000 N
Data Plan for IPad 540 Y Requested in I.T.
Android Tablet 400 Y Requested in I.T.
- - - - - - - - - - - - - - - - - - - - - - - - - - - - - - - - - - - - - - - - - - - - - - - - - - - - - - - - - - - - - - - - - - - - - - - - - - - - - - - - - - - - - - - - - - - - - - - - - - - - -
Total G.I.S. 30,940 0
Animal Control
Overtime 4,000 N
1 Animal Services Officer w/ vehicle 91,045 N
- - - - - - - - - - - - - - - - - - - - - - - - - - - - - - - - - - - - - - - - - - - - - - - - - - - - - - - - - - - - - - - - - - - - - - - - - - - - - - - - - - - - - - - - - - - - - - - - - - - - -
Total Animal Control 95,045 0
Citywide Facilities Maintenance Items:
See Attachment 168,000 Y Total of $64,400 funded. See June for list
297

ALL DIVISIONS Requested Recommended
Amount City Manager's Amount Acct
Classification of Expenditures FY 2016 Y N Comments/Other Comments FY 2016 No.
City of Missouri CitySupplemental Budget Requests
Fiscal Year 2016 Annual Budget
TOTAL PUBLIC WORKS 2,017,894 0
PARKS & RECREATION
Parks
Reclass Parks Supervisor to Parks Superintendent 8,632 N
Paint Pavilion #3 and Gazebo frames at Comm. Park 26,860 Y
Auger for Landscaping and Maintenance 6,000 N
Bed Maintenance Contract 20,000 Y
Herbicide/Fertilization Contract 25,000 N
Hunter's Glen Trail Surfacing Material 18,500 N
Storage Container for Park Maint. Facility 3,200 Y
Tree Project (Right of Ways) 10,000 N
Concrete Bleacher Pads for Community Park Fields 9,600 N
10 Digital 2-Way Radios for Parks & Rec Staff 23,290 Y
- - - - - - - - - - - - - - - - - - - - - - - - - - - - - - - - - - - - - - - - - - - - - - - - - - - - - - - - - - - - - - - - - - - - - - - - - - - - - - - - - - - - - - - - - - - - - - - - - - - - -
Total Parks 151,082 0
Recreation
Fitness Equipment Replacement 25,000 Y
Fleet Bus Purchase 65,000 N
Table Replacement 10,000 Y
Chair Replacement 5,000 Y
Tennis Court Repair 25,000 Y
- - - - - - - - - - - - - - - - - - - - - - - - - - - - - - - - - - - - - - - - - - - - - - - - - - - - - - - - - - - - - - - - - - - - - - - - - - - - - - - - - - - - - - - - - - - - - - - - - - - - -
Total Recreation 130,000 0
TOTAL PARKS & RECREATION 281,082 0
DEVELOPMENT SERVICES
Planning
1 LX Administrator 52,806 N
1 Planner I 68,080 N
- - - - - - - - - - - - - - - - - - - - - - - - - - - - - - - - - - - - - - - - - - - - - - - - - - - - - - - - - - - - - - - - - - - - - - - - - - - - - - - - - - - - - - - - - - - - - - - - - - - - -
Total Planning & Development 120,886 0
Inspections
1 Commercial Plans Reviewer 69,095 N
10 Digital 2-Way Radios for Parks & Rec Staff 23,290 Y
1 Health Inspector I 50,069 N
1 Residential Plans Reviewer 68,169 N
- - - - - - - - - - - - - - - - - - - - - - - - - - - - - - - - - - - - - - - - - - - - - - - - - - - - - - - - - - - - - - - - - - - - - - - - - - - - - - - - - - - - - - - - - - - - - - - - - - - - -
Total Inspections 210,623 0
TOTAL DEVELOPMENT SERVICES 331,509 0
INNOVATION & TECHNOLOGY
Innovation & Technology (I.T.)
2 Desktop Service I positions 95,606 Y Funded w/ elimination of NSD help desk contract
Storage for City - Replacement 325,000 Y
~Funding Available Through Repl. Fund (160,000)
~Funding Available Through GIS Server (25,000)
298

ALL DIVISIONS Requested Recommended
Amount City Manager's Amount Acct
Classification of Expenditures FY 2016 Y N Comments/Other Comments FY 2016 No.
City of Missouri CitySupplemental Budget Requests
Fiscal Year 2016 Annual Budget
MPLS WAN Upgrade (Year 1) 75,000 Y
Mobile Device Management 20,000 N
Netmotion - for CJIS compliance 15,000 Y
1 Project Manager 77,032 N
Additional Conference Expense funding 3,000 N
Additional Computer Repair/Replacement 15,000 Y
Additional Dues & Subscription funding 1,000 N
Additional Minor Tools & Equipment 80,000 N
NICE Video Consolidation - Year 1 Pub. Safety 150,000 N
Total Innovation & Technology (I.T. Only) 671,638
Citywide I.T. Maintenance Items:
POLICE:
OSSI Sex Offender Module 11,488 Y
Body Worn Cameras 175,484 N
License Plate Recognition System 60,000 N
FIRE:
Electronic Apparatus & Equipment Solution 15,000 N
Online Fire Department Staffing Solution 8,000 N
PUBLIC WORKS:
Virtual GIS Server Upgrade 25,000 Y
Metasys Software Renewal 5,219 Y
Cartegraph Cloud 177,667 N
AutoCAD Licenses 2,400 Y
CITY SECRETARY:
Questys Digital Signature 1,875 N
Questys Capture Form Processing Software 13,099 N
Total Innovation & Technology (City-Wide Only) 495,232
- - - - - - - - - - - - - - - - - - - - - - - - - - - - - - - - - - - - - - - - - - - - - - - - - - - - - - - - - - - - - - - - - - - - - - - - - - - - - - - - - - - - - - - - - - - - - - - - - - - - -
Total Innovation & Technology Grand Total 1,166,870 0
Radio Fund
Tower Light Replacement 50,000 Y $31,000 from General Fund $19K from Radio Fund
- - - - - - - - - - - - - - - - - - - - - - - - - - - - - - - - - - - - - - - - - - - - - - - - - - - - - - - - - - - - - - - - - - - - - - - - - - - - - - - - - - - - - - - - - - - - - - - - - - - - -
Total Radio Fund 50,000
GRAND TOTAL ALL REQUEST 9,617,696
GRAND TOTAL GENERAL FUND 9,567,696
299

300