Proposed FY 2010-11 Budget - City of Hesperia
468
Proposed FY 2010-11 Budget California City of Hesperia San Gabriel Mountains Civic Plaza Park Hesperia Police Department Hesperia Civic Center Fire Station 305
-
Upload
khangminh22 -
Category
Documents
-
view
0 -
download
0
Transcript of Proposed FY 2010-11 Budget - City of Hesperia
Proposed FY 2010-11 BudgetCalifornia
City of Hesperia
San Gabriel Mountains
Civic Plaza Park
Hesperia Police Department
Hesperia Civic Center
Fire Station 305
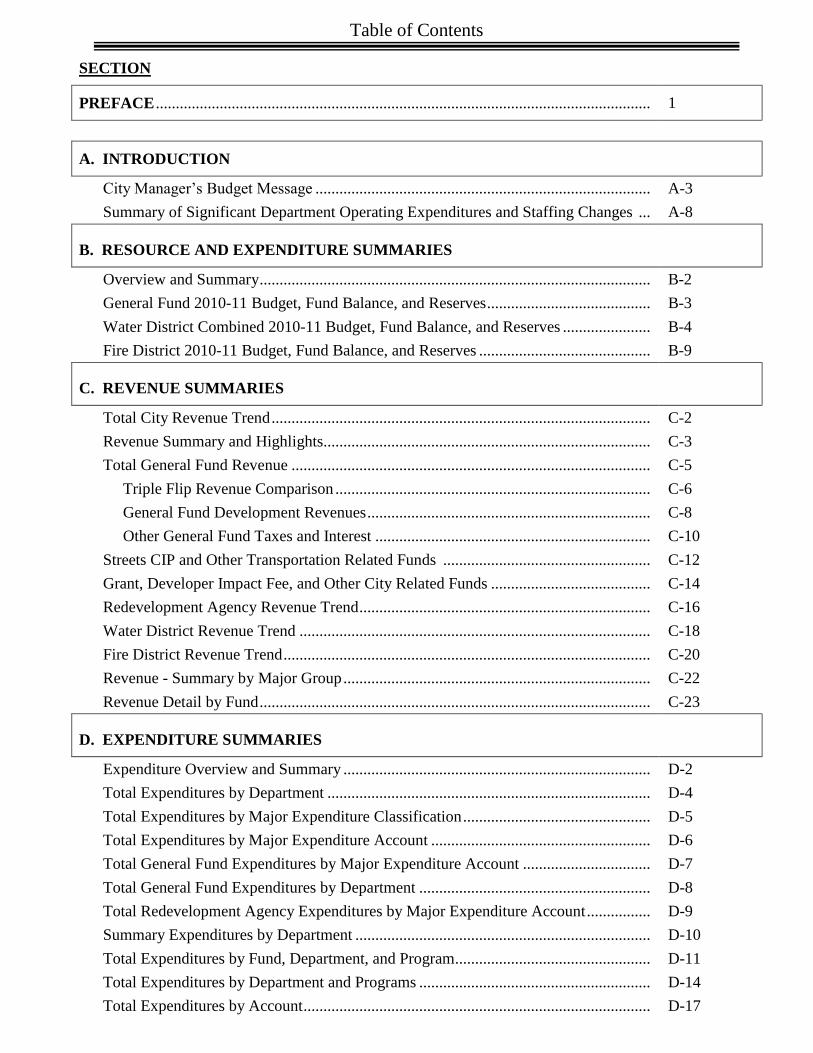
Table of Contents
SECTION
PREFACE ............................................................................................................................ 1
A. INTRODUCTION
City Manager’s Budget Message .................................................................................... A-3
Summary of Significant Department Operating Expenditures and Staffing Changes ... A-8
B. RESOURCE AND EXPENDITURE SUMMARIES
Overview and Summary .................................................................................................. B-2
General Fund 2010-11 Budget, Fund Balance, and Reserves ......................................... B-3
Water District Combined 2010-11 Budget, Fund Balance, and Reserves ...................... B-4
Fire District 2010-11 Budget, Fund Balance, and Reserves ........................................... B-9
C. REVENUE SUMMARIES
Total City Revenue Trend ............................................................................................... C-2
Revenue Summary and Highlights.................................................................................. C-3
Total General Fund Revenue .......................................................................................... C-5
Triple Flip Revenue Comparison ............................................................................... C-6
General Fund Development Revenues ....................................................................... C-8
Other General Fund Taxes and Interest ..................................................................... C-10
Streets CIP and Other Transportation Related Funds .................................................... C-12
Grant, Developer Impact Fee, and Other City Related Funds ........................................ C-14
Redevelopment Agency Revenue Trend ......................................................................... C-16
Water District Revenue Trend ........................................................................................ C-18
Fire District Revenue Trend ............................................................................................ C-20
Revenue - Summary by Major Group ............................................................................. C-22
Revenue Detail by Fund .................................................................................................. C-23
D. EXPENDITURE SUMMARIES
Expenditure Overview and Summary ............................................................................. D-2
Total Expenditures by Department ................................................................................. D-4
Total Expenditures by Major Expenditure Classification ............................................... D-5
Total Expenditures by Major Expenditure Account ....................................................... D-6
Total General Fund Expenditures by Major Expenditure Account ................................ D-7
Total General Fund Expenditures by Department .......................................................... D-8
Total Redevelopment Agency Expenditures by Major Expenditure Account ................ D-9
Summary Expenditures by Department .......................................................................... D-10
Total Expenditures by Fund, Department, and Program ................................................. D-11
Total Expenditures by Department and Programs .......................................................... D-14
Total Expenditures by Account ....................................................................................... D-17
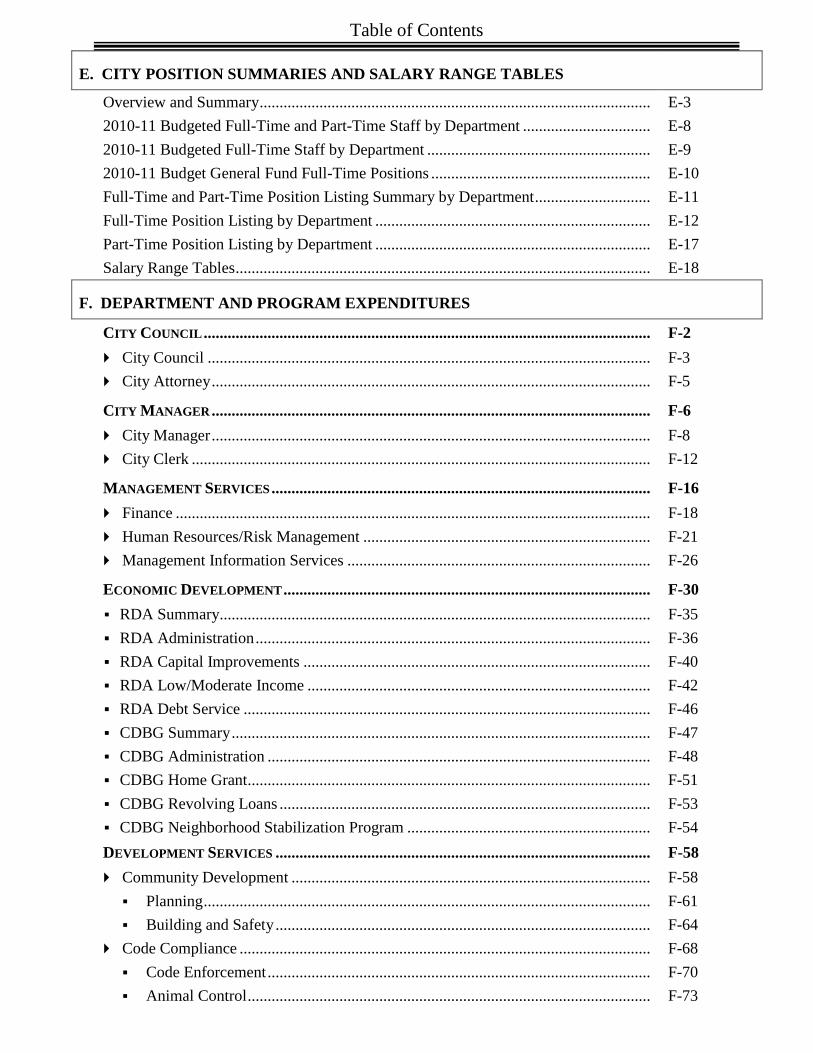
Table of Contents
E. CITY POSITION SUMMARIES AND SALARY RANGE TABLES
Overview and Summary .................................................................................................. E-3
2010-11 Budgeted Full-Time and Part-Time Staff by Department ................................ E-8
2010-11 Budgeted Full-Time Staff by Department ........................................................ E-9
2010-11 Budget General Fund Full-Time Positions ....................................................... E-10
Full-Time and Part-Time Position Listing Summary by Department ............................. E-11
Full-Time Position Listing by Department ..................................................................... E-12
Part-Time Position Listing by Department ..................................................................... E-17
Salary Range Tables ........................................................................................................ E-18
F. DEPARTMENT AND PROGRAM EXPENDITURES
CITY COUNCIL ................................................................................................................ F-2
City Council ............................................................................................................... F-3
City Attorney .............................................................................................................. F-5
CITY MANAGER .............................................................................................................. F-6
City Manager .............................................................................................................. F-8
City Clerk ................................................................................................................... F-12
MANAGEMENT SERVICES ............................................................................................... F-16
Finance ....................................................................................................................... F-18
Human Resources/Risk Management ........................................................................ F-21
Management Information Services ............................................................................ F-26
ECONOMIC DEVELOPMENT ............................................................................................ F-30
RDA Summary............................................................................................................ F-35
RDA Administration ................................................................................................... F-36
RDA Capital Improvements ....................................................................................... F-40
RDA Low/Moderate Income ...................................................................................... F-42
RDA Debt Service ...................................................................................................... F-46
CDBG Summary ......................................................................................................... F-47
CDBG Administration ................................................................................................ F-48
CDBG Home Grant..................................................................................................... F-51
CDBG Revolving Loans ............................................................................................. F-53
CDBG Neighborhood Stabilization Program ............................................................. F-54
DEVELOPMENT SERVICES .............................................................................................. F-58
Community Development .......................................................................................... F-58
Planning ................................................................................................................ F-61
Building and Safety .............................................................................................. F-64
Code Compliance ....................................................................................................... F-68
Code Enforcement ................................................................................................ F-70
Animal Control ..................................................................................................... F-73
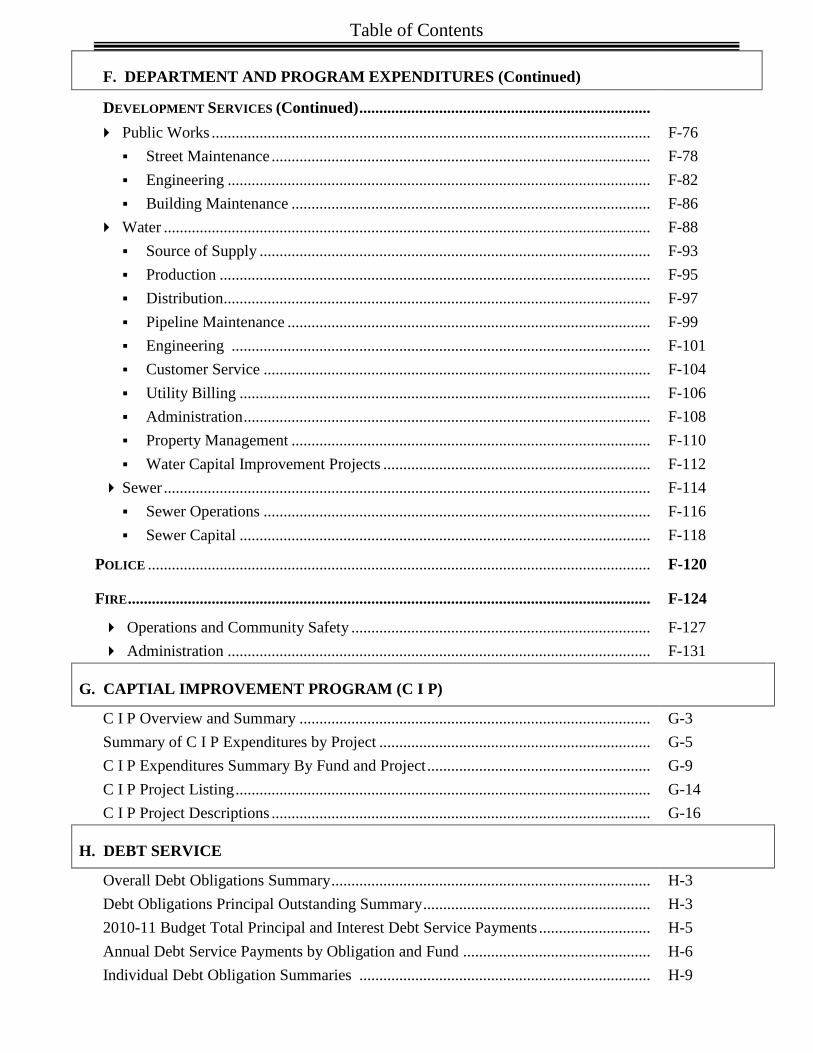
Table of Contents
F. DEPARTMENT AND PROGRAM EXPENDITURES (Continued)
DEVELOPMENT SERVICES (Continued) .........................................................................
Public Works .............................................................................................................. F-76
Street Maintenance ............................................................................................... F-78
Engineering .......................................................................................................... F-82
Building Maintenance .......................................................................................... F-86
Water .......................................................................................................................... F-88
Source of Supply .................................................................................................. F-93
Production ............................................................................................................ F-95
Distribution ........................................................................................................... F-97
Pipeline Maintenance ........................................................................................... F-99
Engineering ......................................................................................................... F-101
Customer Service ................................................................................................. F-104
Utility Billing ....................................................................................................... F-106
Administration ...................................................................................................... F-108
Property Management .......................................................................................... F-110
Water Capital Improvement Projects ................................................................... F-112
Sewer .......................................................................................................................... F-114
Sewer Operations ................................................................................................. F-116
Sewer Capital ....................................................................................................... F-118
POLICE .............................................................................................................................. F-120
FIRE ................................................................................................................................... F-124
Operations and Community Safety ........................................................................... F-127
Administration .......................................................................................................... F-131
G. CAPTIAL IMPROVEMENT PROGRAM (C I P)
C I P Overview and Summary ........................................................................................ G-3
Summary of C I P Expenditures by Project .................................................................... G-5
C I P Expenditures Summary By Fund and Project ........................................................ G-9
C I P Project Listing ........................................................................................................ G-14
C I P Project Descriptions ............................................................................................... G-16
H. DEBT SERVICE
Overall Debt Obligations Summary ................................................................................ H-3
Debt Obligations Principal Outstanding Summary ......................................................... H-3
2010-11 Budget Total Principal and Interest Debt Service Payments ............................ H-5
Annual Debt Service Payments by Obligation and Fund ............................................... H-6
Individual Debt Obligation Summaries ......................................................................... H-9
Table of Contents
I. FUND BALANCE SUMMARIES
Overview and Summary .................................................................................................. I-2
List of Funds ................................................................................................................... I-3
Fund Descriptions ........................................................................................................... I-5
2010-11 Budget – Balancing and Fund Balance Summary – By Major Grouping ........ I-10
2010-11 Budget – Balancing and Fund Balance Summary – By Individual Funds ....... I-12
Fund Balance Schedules by Fund ................................................................................... I-21
J. SUPPLEMENTAL INFORMATION
Budget Adoption Resolutions ......................................................................................... J-2
City of Hesperia – General and Administrative Allocation Plan FY 10-11 ................... J-17
Significant Accounting Policies ...................................................................................... J-18
List of Acronyms ............................................................................................................ J-20
Glossary .......................................................................................................................... J-23
Index ................................................................................................................................ J-26
P R E F A C E
Budget Document Overview
Budget Document Sections
Budget Document Financial Information
Summary Budget Process Description and Schedule
Level of Budgetary Control

- - 2
THIS PAGE INTENTIONALLY LEFT BLANK
PREFACE
- - 3
BUDGET DOCUMENT OVERVIEW
The budget document is the City of Hesperia’s annual financial plan prepared by City Management and approved by the City Council. The financial plan serves as a policy document, operations guide for City Departments and as a communication device. The audience of the budget document is citizens, local businesses, debt holders and debt rating agencies, other governmental agencies, and the City’s independent auditor. BUDGET DOCUMENT SECTIONS
The budget document sections and a brief summary of the section’s contents are as follows: A. Introduction
The introduction section includes the City Manager’s budget transmittal letter/budget message and “Summary of Significant Department Operating Expenditure and Staffing Changes.” Also included are the City’s Mission Statement and Statement of Values, Directory of Officials, City Organization Chart, and Community Profile information.
B. Resources, Expenditures and Fund Balance Summary
This section indicates how resources and expenditures are reconciled to balance the City’s annual financial plan or budget for the City’s three major operating funds. This section also presents summary level information on fund balances and reserves.
C. Revenue
This section contains Information about the City’s sources of income and is presented with summaries, graphics, and detailed revenue information by individual revenue accounts with $10,000 or greater revenue.
D. Expenditure Summaries
This section provides a variety of Citywide expenditure summaries and graphics. E. City Positions and Salary Ranges
This section includes information and graphics about City positions or staff, both full and part-time positions and also includes salary information.
F. City Department and Program Expenditures
The City is organized into the following seven departments. This section provides information for each department and their programs about their expenditures and staffing to include Fiscal Year 2009-10 accomplishments and Fiscal Year 2010-11 goals and objectives. Significant expenditure and staffing changes are highlighted:
City Council
City Manager
Management Services
Economic Development
Development Services
D.S. Community Development
D.S. Code Compliance
D.S. Public Works
D.S. Water
D.S. Sewer
Police
Fire
PREFACE
- - 4
BUDGET DOCUMENT SECTIONS (Continued)
G. Capital Improvement Program (CIP)
This section presents in one section the capital improvement projects included in the Fiscal Year 2010-11 Budget.
H. Debt Service
This section summarizes information about the City’s external, and in some situations internal, debt obligations. I. Fund Balance Summary
This section presents financial information about each City fund that is planned to have expenditures in Fiscal Year 2010-11.
J. Supplemental Information:
Resolutions adopting the City’s budget and related resolutions
General and Administrative Allocation Plan and/or Indirect Cost Allocation Plan
Significant Accounting Policies
List of Acronyms
Glossary of budget terms and abbreviations
Index BUDGET DOCUMENT FINANCIAL INFORMATION
As mandated by California State Law, the City’s fiscal year, or budget time period, is July 1st to June 30th. For example, Fiscal Year 2010-11 means July 1, 2010 through June 30, 2011. In most sections of the budget document, four years of information is provided, with two columns or versions of information reflected for the current year (Fiscal Year 2010-11). The columns typically presented are as follows:
2007-08 2008-09 2009-10 2009-10 2010-11 Actual Actual Budget Revised Budget
The financial information included in these columns is as follows: 2007-08 Actual
Actual financial information for Fiscal Year 2007-08 as reported in the City’s Comprehensive Annual Financial Report. The actual financial information is reported in the budget document on a budgetary basis. 2008-09 Actual
Same as 2007-08 Actual. 2009-10 Budget
The 2009-10 Budget as adopted by the City Council June 16, 2009. 2009-10 Revised
The 2009-10 Revised column reflects the 2009-10 Budget plus budget amendments approved by the City Council during the fiscal year. The 2009-10 Revised column is also adjusted to reflect City management’s estimate of what revenues and expenditures are estimated to be at the end of Fiscal Year 2009-10 and are typically somewhat lower than the budget and amendments.
PREFACE
- - 5
BUDGET DOCUMENT FINANCIAL INFORMATION (Continued)
2010-11 Budget
This column initially reflects the 2010-11 Proposed Budget submitted by the City Manager. After the City Council reviews and approves the Fiscal Year 2010-11 Budget, the information in the 2010-11 Budget column is changed, if necessary, to reflect the City Council actions. Major Expenditure Accounts
Major expenditure account categories are presented in the budget document, which summarizes various detailed expenditure accounts under the following seven major expenditure account categories:
Salaries
Benefits
Materials
Contractual
Other Operating
Capital Outlay
Debt Service
SUMMARY BUDGET PROCESS DESCRIPTION AND SCHEDULE
On February 16, 2010, the FY 2009-10 Mid-Year Budget Review was presented with current expenditures, revenue trends, updated reserves, as well as amendments to the 2009-10 Budget. The 2009-10 Mid-Year Budget amendments were approved at the 2010-11 Budget Goal Setting Workshop, also on February 16, 2010. The City Manager, department directors, and other staff reviewed City Council policy guidance and priorities focusing on the following:
Current goals and objectives such as debt management and refinancing, capital project priorities, etc.
New goals and program priorities, especially related to public safety and street improvements.
Resource requirements and constraints, the building development downturn, the serious reduction in revenue and the local economy, and finally potential State revenue reductions.
Staff was given broad goals and objectives for the preparation of the 2010-11 Budget.
The 2010-11 Budget process then commenced as follows:
VI. OPERATING BUDGET CALENDAR
Executive Staff Retreat January 11-12, 2010
Council FY 2009-10 Mid-Year Budget Review & 2010-11 Budget Goal-Setting Workshop
February 16, 2010
Staff Budget Workshop and 2010-11 Budget Instructions Distributed March 3, 2010
FY 2009-10 Revised Revenue & 2010-11 Proposed Budget Revenue estimates due as follows: Group A – CC, CM, MS, P, F, PW, and CD
Group B – W, S, Code, and ED
March 11, 2010 March 18, 2010
FY 2009-10 Revised Expenditure Estimates, 2010-11 Current Level (or Adjusted) Proposed Budget Expenditures and Expenditure Detail Narrative forms due as follows:
Group A – CC, CM, MS, P, F, PW, and CD Group B – W, S, Code, and ED
March 25, 2010 April 1, 2010
PREFACE
- - 6
VI. OPERATING BUDGET CALENDAR (Continued)
2010-11 Draft Division and/or Program Narratives due as follows:
Group A – CC, CM, MS, P, F, PW, and CD Group B – W, S, Code, and ED
April 6, 2010 April 8, 2010
Proposed 2010-11 CIP presented to Planning Commission April 8, 2010
2010-11 Budget Increments-“Requested Expenditures Above Current Level” due as follows: Group A – CC, CM, MS, P, F, PW, and CD
Group B – W, S, Code, and ED
April 13, 2010 April 15, 2010
2010-11 CIP presented to City Council Advisory Committee April 14, 2010
Budget Review with Departments/Divisions April 26-May 6, 2010
State Department of Finance- Population numbers May 3, 2010
2010-11 Final Proposed Budget Division and/or Program Narratives due as follows:
Group A – CC, CM, MS, P, F, PW, and CD Group B – W, S, Code, and ED
May 11, 2010 May 13, 2010
2010-11 Proposed Budget completed June 1, 2010
Council Budget Workshop June 8, 2010
Council Adopts Budget June 15, 2010
KEY: CC=City Council; CM=City Manager; MS=Management Services; ED=Economic Development;
PW=DS Public Works; Code=DS Code Compliance; W=DS Water; S=DS Sewer; P=Police; F=Fire
On June 15, 2010 the City Council/Board Members are expected to adopt the 2010-11 Budget, including the CIP and GANN Appropriations Limit for the City of Hesperia, the Hesperia Community Redevelopment Agency, the Hesperia Fire Protection District, and the Hesperia Water District. LEVEL OF BUDGETARY CONTROL Since the Budget is an estimate, from time to time it is necessary to make adjustments to fine-tune the line items within it. Various levels of budgetary control have been established to maintain the Budget’s integrity. The levels of budgetary control are as follows: The City Manager, or designee, has the authority to make budget transfers within a fund, within capital projects, and within a department’s operating budget. Such authority does not include any increase to an operating fund or to the overall adopted budget. Budget transfers from one City fund to another are submitted to the City Council for formal approval. In addition, budget adjustments, which will increase an operating fund or the overall adopted budget, are submitted to City Council for approval.
I N T R O D U C T I O N
City Manager’s Budget Message To Be Developed
Summary of Significant Department Expenditures and Staffing Changes

A - 2
THIS PAGE INTENTIONALLY LEFT BLANK
A - 3
City Manager’s Budget Message (Continued)
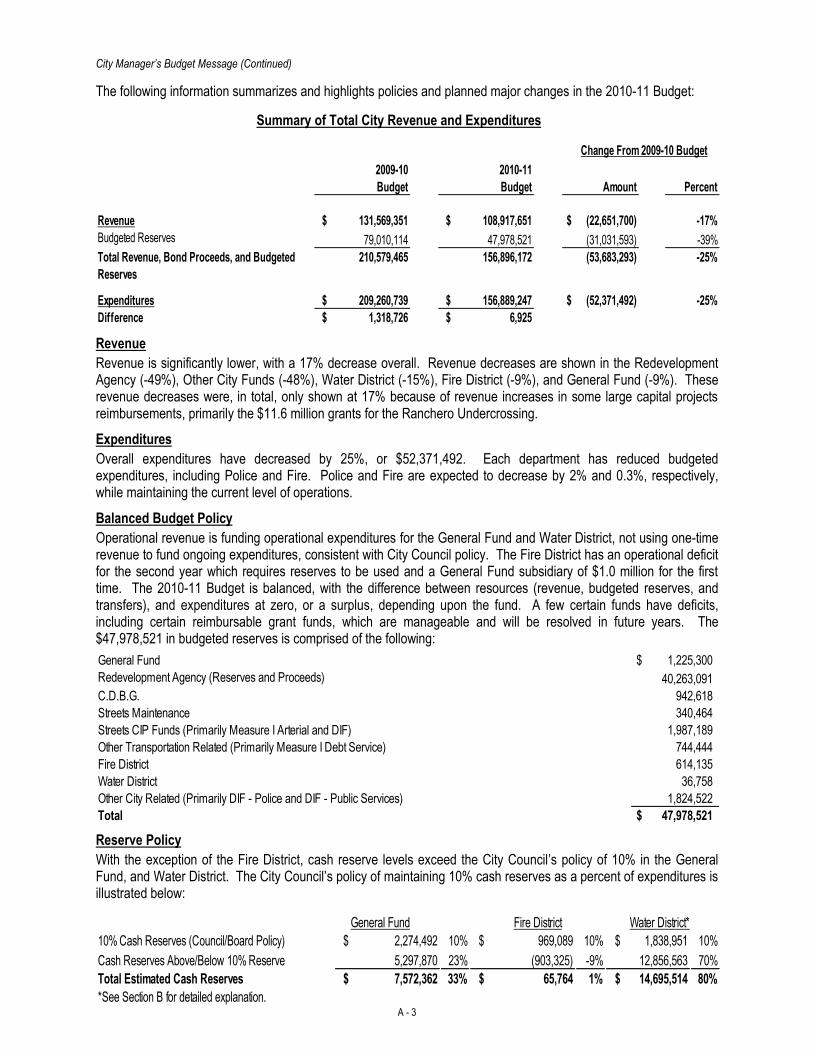
The following information summarizes and highlights policies and planned major changes in the 2010-11 Budget:
Summary of Total City Revenue and Expenditures
2009-10
Budget
2010-11
Budget Amount Percent
Revenue $ 131,569,351 $ 108,917,651 $ (22,651,700) -17%
Budgeted Reserves 79,010,114 47,978,521 (31,031,593) -39%
210,579,465 156,896,172 (53,683,293) -25%
Expenditures $ 209,260,739 $ 156,889,247 $ (52,371,492) -25%
Difference $ 1,318,726 $ 6,925
Change From 2009-10 Budget
Total Revenue, Bond Proceeds, and Budgeted
Reserves
Revenue
Revenue is significantly lower, with a 17% decrease overall. Revenue decreases are shown in the Redevelopment Agency (-49%), Other City Funds (-48%), Water District (-15%), Fire District (-9%), and General Fund (-9%). These revenue decreases were, in total, only shown at 17% because of revenue increases in some large capital projects reimbursements, primarily the $11.6 million grants for the Ranchero Undercrossing.
Expenditures
Overall expenditures have decreased by 25%, or $52,371,492. Each department has reduced budgeted expenditures, including Police and Fire. Police and Fire are expected to decrease by 2% and 0.3%, respectively, while maintaining the current level of operations.
Balanced Budget Policy
Operational revenue is funding operational expenditures for the General Fund and Water District, not using one-time revenue to fund ongoing expenditures, consistent with City Council policy. The Fire District has an operational deficit for the second year which requires reserves to be used and a General Fund subsidiary of $1.0 million for the first time. The 2010-11 Budget is balanced, with the difference between resources (revenue, budgeted reserves, and transfers), and expenditures at zero, or a surplus, depending upon the fund. A few certain funds have deficits, including certain reimbursable grant funds, which are manageable and will be resolved in future years. The $47,978,521 in budgeted reserves is comprised of the following:
General Fund $ 1,225,300
Redevelopment Agency (Reserves and Proceeds) 40,263,091
C.D.B.G. 942,618
Streets Maintenance 340,464
1,987,189
Other Transportation Related (Primarily Measure I Debt Service) 744,444
Fire District 614,135
Water District 36,758
Other City Related (Primarily DIF - Police and DIF - Public Services) 1,824,522
Total $ 47,978,521
Streets CIP Funds (Primarily Measure I Arterial and DIF)
Reserve Policy
With the exception of the Fire District, cash reserve levels exceed the City Council’s policy of 10% in the General Fund, and Water District. The City Council’s policy of maintaining 10% cash reserves as a percent of expenditures is illustrated below:
$ 2,274,492 10% $ 969,089 10% $ 1,838,951 10%
Cash Reserves Above/Below 10% Reserve 5,297,870 23% (903,325) -9% 12,856,563 70%
Total Estimated Cash Reserves $ 7,572,362 33% $ 65,764 1% $ 14,695,514 80%
*See Section B for detailed explanation.
10% Cash Reserves (Council/Board Policy)
General Fund Fire District Water District*
A - 4
City Manager’s Budget Message (Continued)
REVENUE
A - 5
City Manager’s Budget Message (Continued)
Revenue
SUMMARY and HIGHLIGHTS
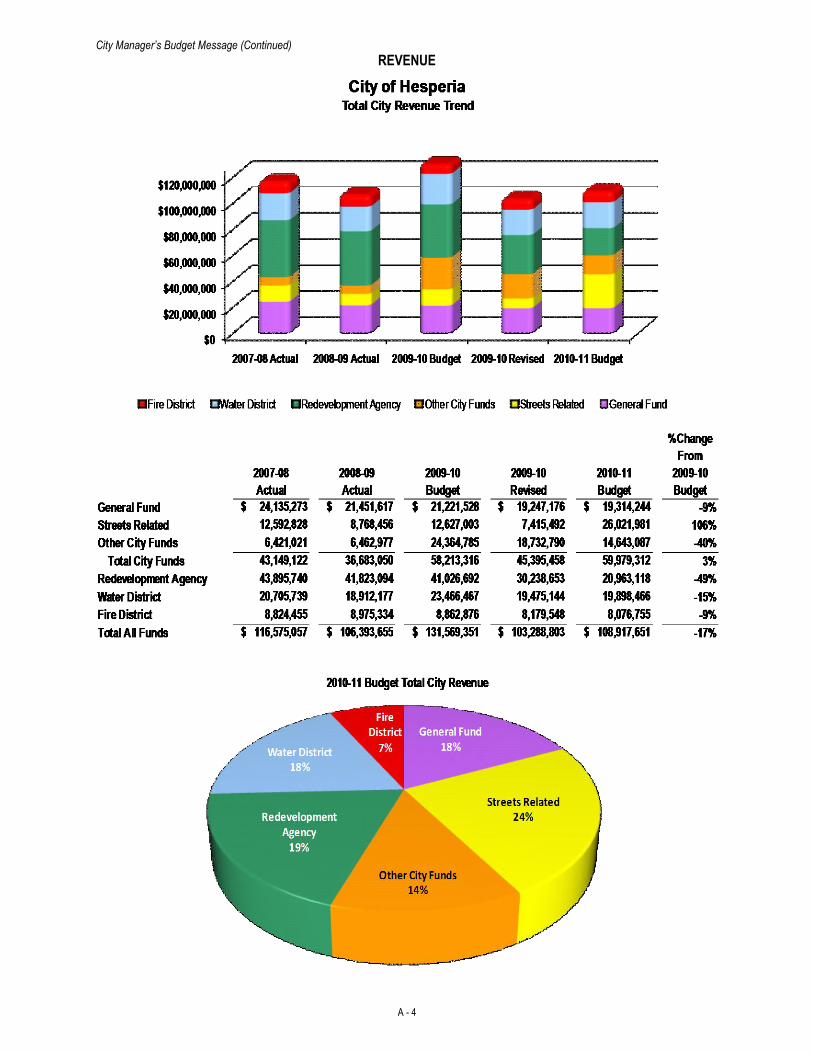
The City of Hesperia maintains the practice of matching the revenue type to the similar expenditure type. There are two basic revenue types: one-time revenue and on-going revenue. Contrary to the fiscal practices of the State of California, the City will not use one-time revenue (i.e. bond proceeds) to pay for on-going expenditures. When compared to the 2007-08 Actual revenue, the overall combined City revenue for the 2010-11 Budget is expected to decrease from $116.5 million to $108.9 million or by 6% or $7 million primarily in the Redevelopment Agency, which is projected to decrease by $23 million or 52%. Likewise, comparing the 2009-10 Budget to the 2010-11 Budget, a decrease from $131.6 million to $108.9 for about $22 million, or 17%, reflecting the effects of the national mortgage crisis, housing slump, and the current recession and their influence on the 2010-11 Budget, all of which have reduced the City's assessed valuation. There are some large capital project reimbursements that are offsetting the recession's full effects on this summary level, primarily the $11.7 million for the Ranchero Road Undercrossing and the $9 million for the High Desert Government center reimbursement from the County. Primarily, all development related revenues are down for the 2009-10 Revised and that condition is carried through into the 2010-11 Budget revenue estimates. General Fund - General Fund revenue is for the normal operations of and services provided by the City which are not specifically accounted for in other funds. The 2010-11 Budget for the General Fund is projecting a decrease in revenues of 9% or $1.9 million from the 2009-10 Budget, primarily because of the following:
Sales and Use Tax revenue is projected to increase 3%, or about $0.1 million, to just over $5.8 million.
Vehicle License Fee revenue is expecting a decrease of $1.5 million, or 20%, to $6.2 million.
Development related revenues, including Building Permit Fees, are anticipating a $0.5 million, or a 37% decrease from the 2009-10 Budget estimate.
Property Transfer Tax revenue is expecting to reach only $180,000, a decrease of 14%, or about $30,000, as a measure of the high level of real estate transactions selling at lower prices.
The Rental Housing Inspection Fee, started during 2008-09, is expected to generate $125,000 in the 2010-11 Budget.
The City will start receiving Community Facilities District 2005-1 revenue of $655,878 in the 2010-11 Budget as an offset to other revenue reductions.
Streets & Transportation Related Funds - This group is comprised of 16 street and transportation related funds. Each of these funds receive revenue that is restricted for specific uses. Some of the major highlights are:
Developer Impact Fees (DIF) for Streets and Storm Drain revenue will have decreased 53% or $0.9 million. This decrease in the combined 2010-11 DIF Budget revenue from the 2009-10 DIF Budget revenue reflects the continued nationwide housing slump and recession shown by the decrease in single residential building permits from 50 for the 2009-10 Budget, with an estimated 3 for the 2009-10 year end and anticipating 20 for the 2010-11 Budget.
Combined Measure I (Arterial, Local, and 2010 Renewal) revenue is expected to decrease to $1.8 million, or 40%, from the 2009-10 Budget of $3.0 million.
Local Transportation Fund (LTF) revenue is expected to decrease by $0.9 million or 64% to $0.5 million from the 2009-10 Budget of $1.4 million. This large decrease is due to the Victor Valley Transit Authority (VVTA) needing more of this funding source to support their operations as the State is changing how it funds transportation programs in FY 2010-11.
A - 6
City Manager’s Budget Message (Continued)
Revenue
SUMMARY and HIGHLIGHTS (Continued)
Non-Streets Related Other City Funds - This group is comprised of 16 other non-street related funds. Each of these funds receive revenue that is restricted for specific uses. Some of the major highlights are:
The High Desert Government Center is showing reimbursement revenue of $9.0 million for FY 2010-11 as the building is expected to be completed by November 2010.
Developer Impact Fee (DIF) for Fire, Police, and Public Safety revenue are expected to decrease 55% or $0.3 million. This decrease in total 2010-11 Budget DIF revenue from 2009-10 Budget DIF revenue reflects the nationwide housing slump shown by the estimated decrease in single residential building permits from 50 for the 2009-10 Budget to 20 for 2010-11.
The CDBG/HOME Housing and Urban Development (HUD) grants are expecting a combined decrease of 18%, or $2.2 million, from the 2009-10 Budget to the 2010-11 Budget of $4.3 million. The primary reason for this decrease is that some of the Neighborhood Stabilization Program (NSP) grant funds were spent in FY 2009-10, which will reduce what is available to draw for 2010-11 Budget. This NSP grant is used to buy, rehabilitate, and resell abandoned/foreclosed homes within the City.
Redevelopment Agency - These funds track the City's redevelopment revenue that is used to eliminate blight within the project areas, assist in expanding the City's business base, and assist with low and moderate income housing needs for the City. Most all of this revenue is derived from property tax increment, which has restrictions on use. The 2009-10 Budget was originally estimated at $36,600,000 and then Revised to $26,500,000, representing a decrease of $10.1 million or 28%. The 2009-10 Revised of $26.5 million is $8.1 million, or 24%, less than the $34.6 million 2008-09 Actual. The reduction was primarily due to the reduced assessed valuation of properties sold in the previous year, however the biggest reason for the reduction in assessed valuation is the County assessor’s AB 8 reductions which have lowered valuations to levels prior to 2001.
Overall Redevelopment Agency revenue is expected to decrease 49% or about $20.1 million from the 2009-10 Budget of $41.0 million to the $20.9 million of the 2010-11 Budget, primarily because of the anticipated AB 8 assessed valuation reduction by the County. Water and Sewer Operations - These funds primarily report the City's water and sewer financial operations and are most associated with the functions of a traditional business. The revenues received are to pay for the cost of purchasing and distributing the water and for the treatment of the sewage that comes from those homes/businesses on the sewer system. Some of the major highlights are:
Overall Water District revenue is expected to increase about $0.4 million or 2% from the 2009-10 Revised of $19.5 million to the 2010-11 Budget of $19.9 million. Although the Capital and Other revenues of the District are expected to decline $0.6 million, this is offset by the anticipated $1.0 million of sales revenues increases for the 2010-11 Budget.
Water and Sewer operating revenue, dominated by the Sales revenues, are anticipating a 6% and 7% increase, respectively, over the 2009-10 Revised primarily from the January 2008 approved rate increases. A dramatic reduction of Water Sales revenue occurred in fiscal year 2009-10 compared to fiscal year 2008-09 with a reduction from $9,655,325 to $8,541,573 for an 11.5% or $1,113,752 decrease. The highest estimate of $13.2 million in the 2009-10 Budget was due to complications with the related Water Availability Charge and underestimating the impact of conservation, the wet winter, some customers not watering yards because of the economy, and finally vacant houses.
The Water and Sewer Capital revenues are expected to show a decline of 13% and 7%, respectively, from the 2009-10 Revised which reflects the current economic recession and the national housing slump.
A - 7
City Manager’s Budget Message (Continued)
Revenue
SUMMARY and HIGHLIGHTS (Continued)
Fire District - The revenues for the 2010-11 Budget are projected to be $8.1 million which is $0.8 million or 9% less than the 2009-10 Budget of $8.9 million and a $0.1 million decrease from the 2009-10 Revised; primarily due to the anticipated combined property tax related revenue decline. Some of the major highlights are:
Property Tax revenue is projected to decrease 8% from the 2009-10 Budget ($4.1 million to $3.7 million) by 3% from the 2009-10 Revised ($3.8 million to $3.7 million) and decrease 13% from the 2008-09 Actual or $572,753. The assessed valuation decline and the related flow through of the valuation decrease on property tax revenues will have a negative impact on the Fire District’s revenues for many years.
Paramedic Ambulance fee revenue is expecting no change from the 2009-10 Budget to the 2010-11 Budget at $1.9 million.
Redevelopment Tax Increment Pass-Through for the 2010-11 Budget is projected to decrease by 51% from the 2009-10 Budget ($2.1 million to $1.0 million) and by 34% from the 2009-10 Revised ($1.6 million to $1.0 million). This estimated decrease reflects the anticipated affects of an additional county wide valuation decrease. The 2010-11 Budget expects to have $956,727 less revenue from Pass-Through payments compared to Fiscal Year 2008-09.
Community Facilities District 94-1 revenue is expected to increase by $0.1 million, or 23%, from the 2009-10 Budget of $432,000 to the 2010-11 Budget of $522,000. The 23% increase from the 2009-10 Budget to the 2009-10 Revised is due to the increased assessment levy primarily from the new commercial development which opened in the district during 2009-10.
Community Facilities District 2005-1. Part of the annual assessment includes a public safety portion to offset some of the costs the residential development places on the City’s public safety providers. This revenue has been collected since FY 2006-07 and held in the trust fund to ensure adequate funding to pay the debt. There are now sufficient funds to start drawing to offset the public safety costs of Police and Fire. For the 2010-11 Budget, this revenue is expected to be $536,628.
A - 8
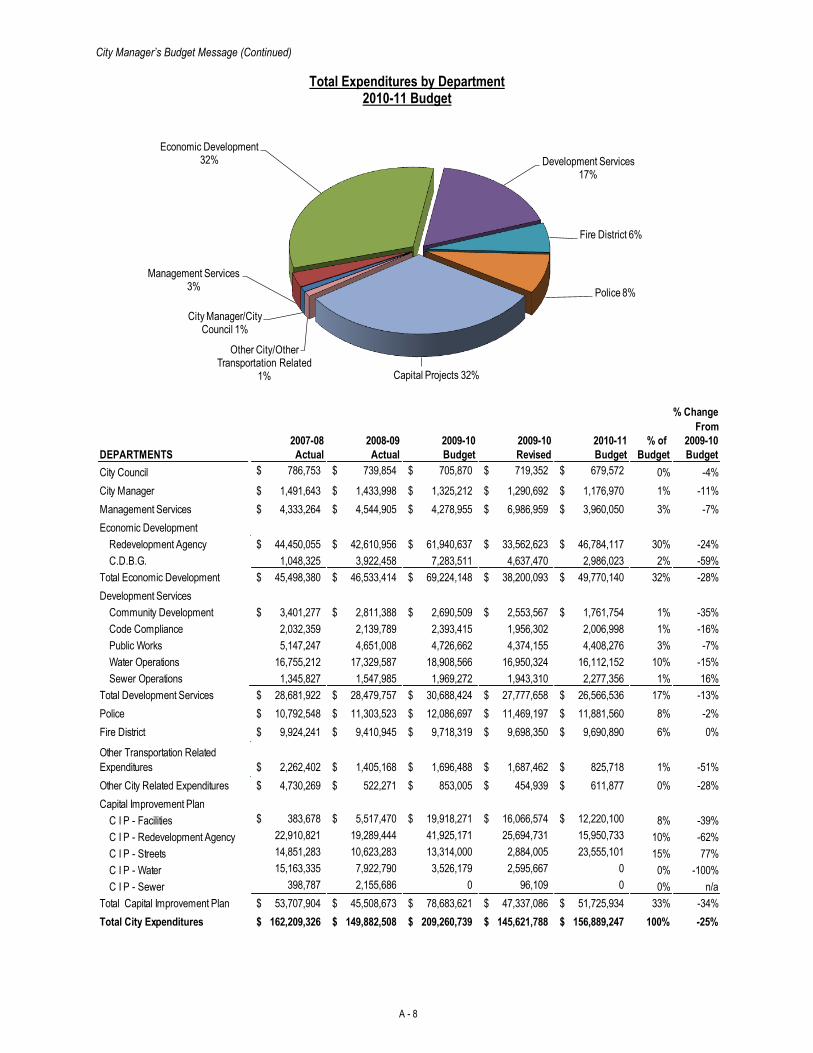
City Manager’s Budget Message (Continued)
Total Expenditures by Department 2010-11 Budget
City Manager/City Council 1%
Management Services 3%
Economic Development 32% Development Services
17%
Fire District 6%
Police 8%
Capital Projects 32%
Other City/Other Transportation Related
1%
% Change
From
2007-08 2008-09 2009-10 2009-10 2010-11 % of 2009-10
DEPARTMENTS Actual Actual Budget Revised Budget Budget Budget
City Council 786,753$ 739,854$ 705,870$ 719,352$ 679,572$ 0% -4%
City Manager 1,491,643$ 1,433,998$ 1,325,212$ 1,290,692$ 1,176,970$ 1% -11%
Management Services 4,333,264$ 4,544,905$ 4,278,955$ 6,986,959$ 3,960,050$ 3% -7%
Economic Development
Redevelopment Agency 44,450,055$ 42,610,956$ 61,940,637$ 33,562,623$ 46,784,117$ 30% -24%
C.D.B.G. 1,048,325 3,922,458 7,283,511 4,637,470 2,986,023 2% -59%
Total Economic Development 45,498,380$ 46,533,414$ 69,224,148$ 38,200,093$ 49,770,140$ 32% -28%
Development Services
Community Development 3,401,277$ 2,811,388$ 2,690,509$ 2,553,567$ 1,761,754$ 1% -35%
Code Compliance 2,032,359 2,139,789 2,393,415 1,956,302 2,006,998 1% -16%
Public Works 5,147,247 4,651,008 4,726,662 4,374,155 4,408,276 3% -7%
Water Operations 16,755,212 17,329,587 18,908,566 16,950,324 16,112,152 10% -15%
Sewer Operations 1,345,827 1,547,985 1,969,272 1,943,310 2,277,356 1% 16%
Total Development Services 28,681,922$ 28,479,757$ 30,688,424$ 27,777,658$ 26,566,536$ 17% -13%
Police 10,792,548$ 11,303,523$ 12,086,697$ 11,469,197$ 11,881,560$ 8% -2%
Fire District 9,924,241$ 9,410,945$ 9,718,319$ 9,698,350$ 9,690,890$ 6% 0%
Other Transportation Related
Expenditures 2,262,402$ 1,405,168$ 1,696,488$ 1,687,462$ 825,718$ 1% -51%
Other City Related Expenditures 4,730,269$ 522,271$ 853,005$ 454,939$ 611,877$ 0% -28%
Capital Improvement Plan
C I P - Facilities 383,678$ 5,517,470$ 19,918,271$ 16,066,574$ 12,220,100$ 8% -39%
C I P - Redevelopment Agency 22,910,821 19,289,444 41,925,171 25,694,731 15,950,733 10% -62%
C I P - Streets 14,851,283 10,623,283 13,314,000 2,884,005 23,555,101 15% 77%
C I P - Water 15,163,335 7,922,790 3,526,179 2,595,667 0 0% -100%
C I P - Sewer 398,787 2,155,686 0 96,109 0 0% n/a
Total Capital Improvement Plan 53,707,904$ 45,508,673$ 78,683,621$ 47,337,086$ 51,725,934$ 33% -34%
Total City Expenditures 162,209,326$ 149,882,508$ 209,260,739$ 145,621,788$ 156,889,247$ 100% -25%
A - 9
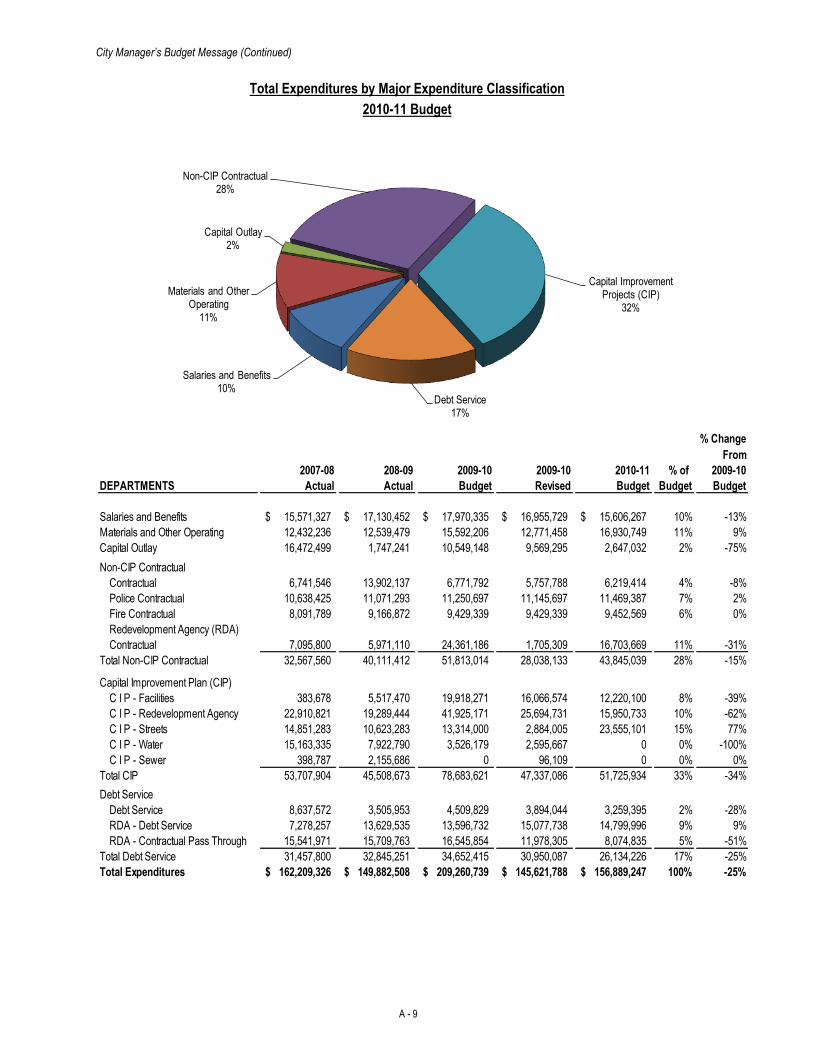
City Manager’s Budget Message (Continued)
Total Expenditures by Major Expenditure Classification
2010-11 Budget
Salaries and Benefits10%
Materials and Other Operating
11%
Capital Outlay2%
Non-CIP Contractual28%
Capital Improvement Projects (CIP)
32%
Debt Service17%
% Change
From
2007-08 208-09 2009-10 2009-10 2010-11 % of 2009-10
DEPARTMENTS Actual Actual Budget Revised Budget Budget Budget
Salaries and Benefits 15,571,327$ 17,130,452$ 17,970,335$ 16,955,729$ 15,606,267$ 10% -13%
Materials and Other Operating 12,432,236 12,539,479 15,592,206 12,771,458 16,930,749 11% 9%
Capital Outlay 16,472,499 1,747,241 10,549,148 9,569,295 2,647,032 2% -75%
Non-CIP Contractual
Contractual 6,741,546 13,902,137 6,771,792 5,757,788 6,219,414 4% -8%
Police Contractual 10,638,425 11,071,293 11,250,697 11,145,697 11,469,387 7% 2%
Fire Contractual 8,091,789 9,166,872 9,429,339 9,429,339 9,452,569 6% 0%
Redevelopment Agency (RDA)
Contractual 7,095,800 5,971,110 24,361,186 1,705,309 16,703,669 11% -31%
Total Non-CIP Contractual 32,567,560 40,111,412 51,813,014 28,038,133 43,845,039 28% -15%
Capital Improvement Plan (CIP)
C I P - Facilities 383,678 5,517,470 19,918,271 16,066,574 12,220,100 8% -39%
C I P - Redevelopment Agency 22,910,821 19,289,444 41,925,171 25,694,731 15,950,733 10% -62%
C I P - Streets 14,851,283 10,623,283 13,314,000 2,884,005 23,555,101 15% 77%
C I P - Water 15,163,335 7,922,790 3,526,179 2,595,667 0 0% -100%
C I P - Sewer 398,787 2,155,686 0 96,109 0 0% 0%
Total CIP 53,707,904 45,508,673 78,683,621 47,337,086 51,725,934 33% -34%
Debt Service
Debt Service 8,637,572 3,505,953 4,509,829 3,894,044 3,259,395 2% -28%
RDA - Debt Service 7,278,257 13,629,535 13,596,732 15,077,738 14,799,996 9% 9%
RDA - Contractual Pass Through 15,541,971 15,709,763 16,545,854 11,978,305 8,074,835 5% -51%
Total Debt Service 31,457,800 32,845,251 34,652,415 30,950,087 26,134,226 17% -25%
Total Expenditures 162,209,326$ 149,882,508$ 209,260,739$ 145,621,788$ 156,889,247$ 100% -25%
A - 10
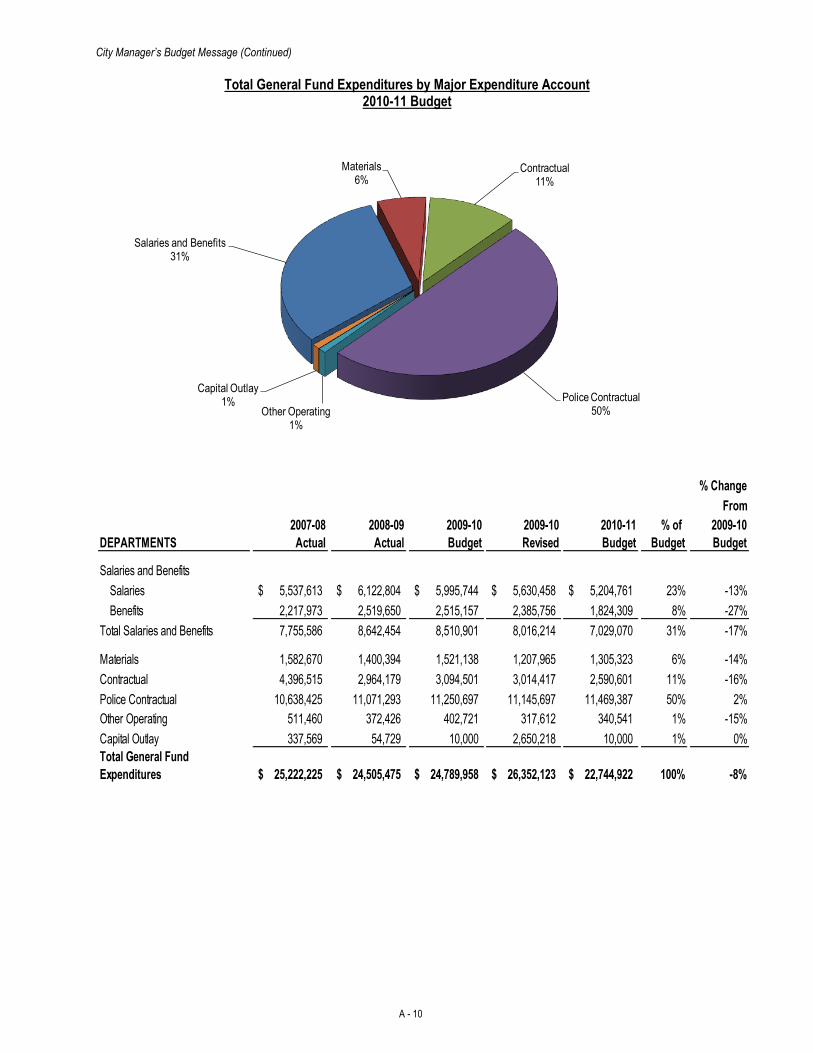
City Manager’s Budget Message (Continued)
Total General Fund Expenditures by Major Expenditure Account
2010-11 Budget
Salaries and Benefits31%
Materials6%
Contractual11%
Police Contractual50%Other Operating
1%
Capital Outlay1%
% Change
From
2007-08 2008-09 2009-10 2009-10 2010-11 % of 2009-10
DEPARTMENTS Actual Actual Budget Revised Budget Budget Budget
Salaries and Benefits
Salaries 5,537,613$ 6,122,804$ 5,995,744$ 5,630,458$ 5,204,761$ 23% -13%
Benefits 2,217,973 2,519,650 2,515,157 2,385,756 1,824,309 8% -27%
Total Salaries and Benefits 7,755,586 8,642,454 8,510,901 8,016,214 7,029,070 31% -17%
Materials 1,582,670 1,400,394 1,521,138 1,207,965 1,305,323 6% -14%
Contractual 4,396,515 2,964,179 3,094,501 3,014,417 2,590,601 11% -16%
Police Contractual 10,638,425 11,071,293 11,250,697 11,145,697 11,469,387 50% 2%
Other Operating 511,460 372,426 402,721 317,612 340,541 1% -15%
Capital Outlay 337,569 54,729 10,000 2,650,218 10,000 1% 0%
Total General Fund
Expenditures 25,222,225$ 24,505,475$ 24,789,958$ 26,352,123$ 22,744,922$ 100% -8%
A - 11
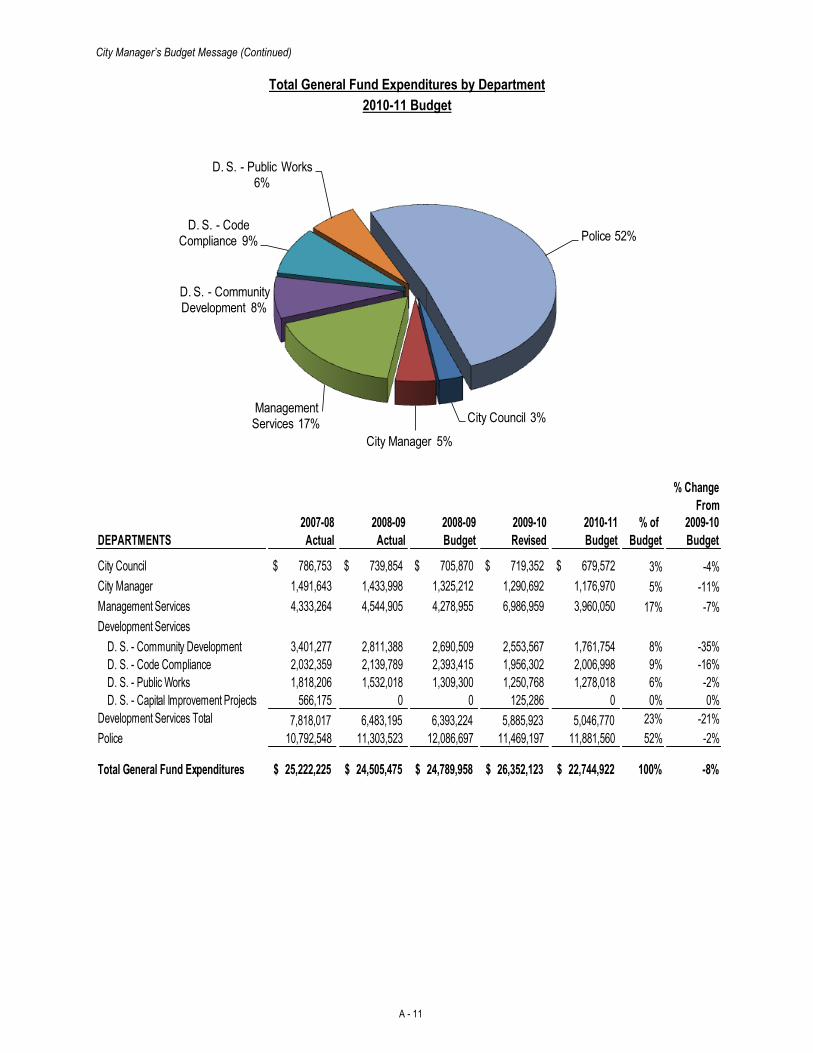
City Manager’s Budget Message (Continued)
Total General Fund Expenditures by Department
2010-11 Budget
% Change
From
2007-08 2008-09 2008-09 2009-10 2010-11 % of 2009-10
DEPARTMENTS Actual Actual Budget Revised Budget Budget Budget
City Council $ 786,753 $ 739,854 $ 705,870 $ 719,352 $ 679,572 3% -4%
City Manager 1,491,643 1,433,998 1,325,212 1,290,692 1,176,970 5% -11%
Management Services 4,333,264 4,544,905 4,278,955 6,986,959 3,960,050 17% -7%
Development Services
D. S. - Community Development 3,401,277 2,811,388 2,690,509 2,553,567 1,761,754 8% -35%
D. S. - Code Compliance 2,032,359 2,139,789 2,393,415 1,956,302 2,006,998 9% -16%
D. S. - Public Works 1,818,206 1,532,018 1,309,300 1,250,768 1,278,018 6% -2%
D. S. - Capital Improvement Projects 566,175 0 0 125,286 0 0% 0%
Development Services Total 7,818,017 6,483,195 6,393,224 5,885,923 5,046,770 23% -21%
Police 10,792,548 11,303,523 12,086,697 11,469,197 11,881,560 52% -2%
Total General Fund Expenditures 25,222,225$ 24,505,475$ 24,789,958$ 26,352,123$ 22,744,922$ 100% -8%
City Council 3%
City Manager 5%
Management Services 17%
D. S. - Community Development 8%
D. S. - Code Compliance 9%
D. S. - Public Works 6%
Police 52%
A - 12
City Manager’s Budget Message (Continued)
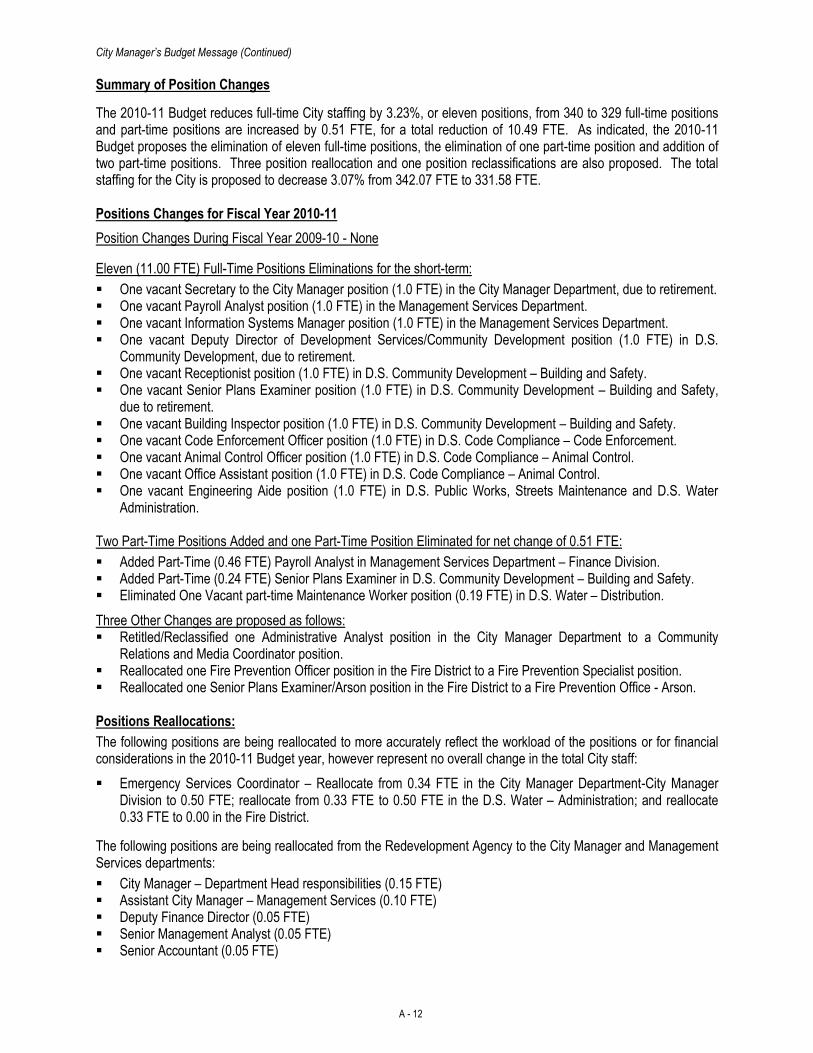
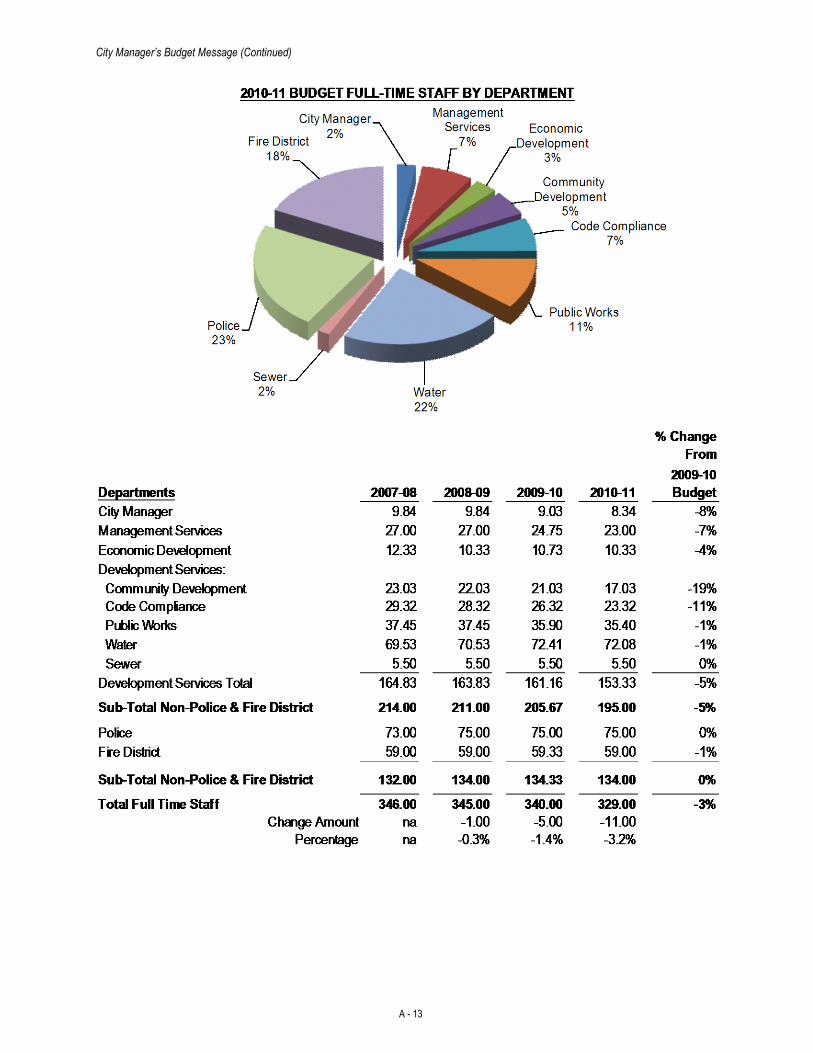
Summary of Position Changes
The 2010-11 Budget reduces full-time City staffing by 3.23%, or eleven positions, from 340 to 329 full-time positions and part-time positions are increased by 0.51 FTE, for a total reduction of 10.49 FTE. As indicated, the 2010-11 Budget proposes the elimination of eleven full-time positions, the elimination of one part-time position and addition of two part-time positions. Three position reallocation and one position reclassifications are also proposed. The total staffing for the City is proposed to decrease 3.07% from 342.07 FTE to 331.58 FTE. Positions Changes for Fiscal Year 2010-11
Position Changes During Fiscal Year 2009-10 - None
Eleven (11.00 FTE) Full-Time Positions Eliminations for the short-term:
One vacant Secretary to the City Manager position (1.0 FTE) in the City Manager Department, due to retirement. One vacant Payroll Analyst position (1.0 FTE) in the Management Services Department. One vacant Information Systems Manager position (1.0 FTE) in the Management Services Department. One vacant Deputy Director of Development Services/Community Development position (1.0 FTE) in D.S.
Community Development, due to retirement. One vacant Receptionist position (1.0 FTE) in D.S. Community Development – Building and Safety. One vacant Senior Plans Examiner position (1.0 FTE) in D.S. Community Development – Building and Safety,
due to retirement. One vacant Building Inspector position (1.0 FTE) in D.S. Community Development – Building and Safety. One vacant Code Enforcement Officer position (1.0 FTE) in D.S. Code Compliance – Code Enforcement. One vacant Animal Control Officer position (1.0 FTE) in D.S. Code Compliance – Animal Control. One vacant Office Assistant position (1.0 FTE) in D.S. Code Compliance – Animal Control. One vacant Engineering Aide position (1.0 FTE) in D.S. Public Works, Streets Maintenance and D.S. Water
Administration.
Two Part-Time Positions Added and one Part-Time Position Eliminated for net change of 0.51 FTE:
Added Part-Time (0.46 FTE) Payroll Analyst in Management Services Department – Finance Division. Added Part-Time (0.24 FTE) Senior Plans Examiner in D.S. Community Development – Building and Safety. Eliminated One Vacant part-time Maintenance Worker position (0.19 FTE) in D.S. Water – Distribution.
Three Other Changes are proposed as follows: Retitled/Reclassified one Administrative Analyst position in the City Manager Department to a Community
Relations and Media Coordinator position. Reallocated one Fire Prevention Officer position in the Fire District to a Fire Prevention Specialist position. Reallocated one Senior Plans Examiner/Arson position in the Fire District to a Fire Prevention Office - Arson.
Positions Reallocations:
The following positions are being reallocated to more accurately reflect the workload of the positions or for financial considerations in the 2010-11 Budget year, however represent no overall change in the total City staff:
Emergency Services Coordinator – Reallocate from 0.34 FTE in the City Manager Department-City Manager Division to 0.50 FTE; reallocate from 0.33 FTE to 0.50 FTE in the D.S. Water – Administration; and reallocate 0.33 FTE to 0.00 in the Fire District.
The following positions are being reallocated from the Redevelopment Agency to the City Manager and Management Services departments:
City Manager – Department Head responsibilities (0.15 FTE) Assistant City Manager – Management Services (0.10 FTE) Deputy Finance Director (0.05 FTE) Senior Management Analyst (0.05 FTE) Senior Accountant (0.05 FTE)
A - 13
City Manager’s Budget Message (Continued)
A - 14
City Manager’s Budget Message (Continued)
CAPITAL IMPROVEMENT PROGRAM (C I P) SUMMARY
The CIP projects are summarized as follows: C I P Major Categories
Projects Completed in FY 2009-10*
Projects Continued in
2010-11 Budget
New Projects Included in
2010-11 Budget
New & Continued Projects Included in
2010-11 Budget Streets C I P Projects $2,389,195 $35,785,934 $15,000 $35,800,934 Storm Drainage 34,115 900,000 0 900,000 Facilities 4,137,060 15,000,000 25,000 15,025,000 Water 2,013,097 0 0 0 Sewer 96,109 0 0 0 Total C I P Projects $8,669,576 $51,685,934 $40,000 $51,725,934 *Note – Includes projects that are not yet completed but have been suspended and may resume in future years.
Streets C I P Projects - $35,800,934 (2010-11 Budget) 2010-11 Street Improvement Project – The FY 2010-11 Budget for the major Citywide Residential Street
Improvement Program, will be considered at the Mid-Year Budget Review. $5,710,514 has been included in the FY 2010-11 Budget to complete the FY 2009-10 Street Improvement Program. The program history is as follows: Expenditures Miles Paved Slurry Seal Miles 2000-01 Street Improvement Project $ 2,226,573 18.0 0 2001-02 Street Improvement Project $ 2,148,349 19.4 0 2002-03 Street Improvement Project $ 1,993,142 16.5 0 2003-04 Street Improvement Project $ 2,033,719 17.1 0 2004-05 Street Improvement Project $ 3,166,412 18.2 12.4 2005-06 Street Improvement Project $ 6,221,264 51.1 14.2 2006-07 Street Improvement Project $11,379,826 57.0 11.0 2007-08 Street Improvement Project $20,920,267 57.0 4.0 2008-09 Street Improvement Project $10,659,895 28.0 0 2009-10 Street Improvement Project $ 5,710,514 13.9 0 Ten Year Total $66,459,961 296.1 41.6
One New Street Project – 1 Project $15,000
Ranchero Road Related Projects – 3 Projects $23,784,320
Seven Other Streets Projects – 7 Projects $6,291,100
Storm Drainage C I P Project - 1 Project $900,000
Facilities C I P Projects - 3 Projects $15,025,000
High Desert County Government Center $ 9,000,000
New Police Station 6,000,000
Park and Ride Facility 25,000
$15,025,000
Water C I P Projects - There are no water projects budgeted for FY 2010-11.
Sewer C I P Projects - There are no sewer projects budgeted for FY 2010-11.
A - 15
City Manager’s Budget Message (Continued)
Summary of Overall Debt Obligation Activity in Fiscal Year 2009-10 and 2010-11 Budget:
The Water 1987 Prop. 28 Loan from the State of California was paid in full in September 2009.
The debt obligations that would benefit from refinancing were refinanced in Fiscal Year (FY) 2004-05 or earlier. As was presented to the City Council for the refinanced debt issues, the lower interest rate environment associated with variable debt issues has resulted in the opportunity to prepay principal, through interest savings, thus lowering the overall outstanding debt more quickly. Status of Prepayments:
City Series 2004 Variable Rate Revenue Bonds (Measure I) – The lower variable rate interest environment has enabled the City to prepay a total of $2.4 million through budgetary savings during the last four years.
Water 1998 Series A Revenue Bonds – The lower variable rate interest environment enabled the Water District to prepay a total of $500,000 through budgetary savings, however no prepayments were made in FY 2009-10.
The variable rate obligations for the City, Measure I Debt, and Water District will continue to be monitored closely. If necessary, these obligations can quickly be swapped into fixed rates, as has been done with $10 million of the Water 1998 A Series.
Variable Rate Debt Letter of Credit Renewals – Due to changes in the financial markets, the number of Letter of Credit providers has significantly diminished. Therefore costs have increased substantially. These increased costs impact the Measure I debt, Civic Plaza debt, and Water 1998 A & B debt.
Fire Station 305 Debt Agreement – Upon completion of the station, a full accounting will be performed and a loan agreement will be effectuated to repay the RDA for the expansion portion of the station from Fire Development Impact Fee funds.
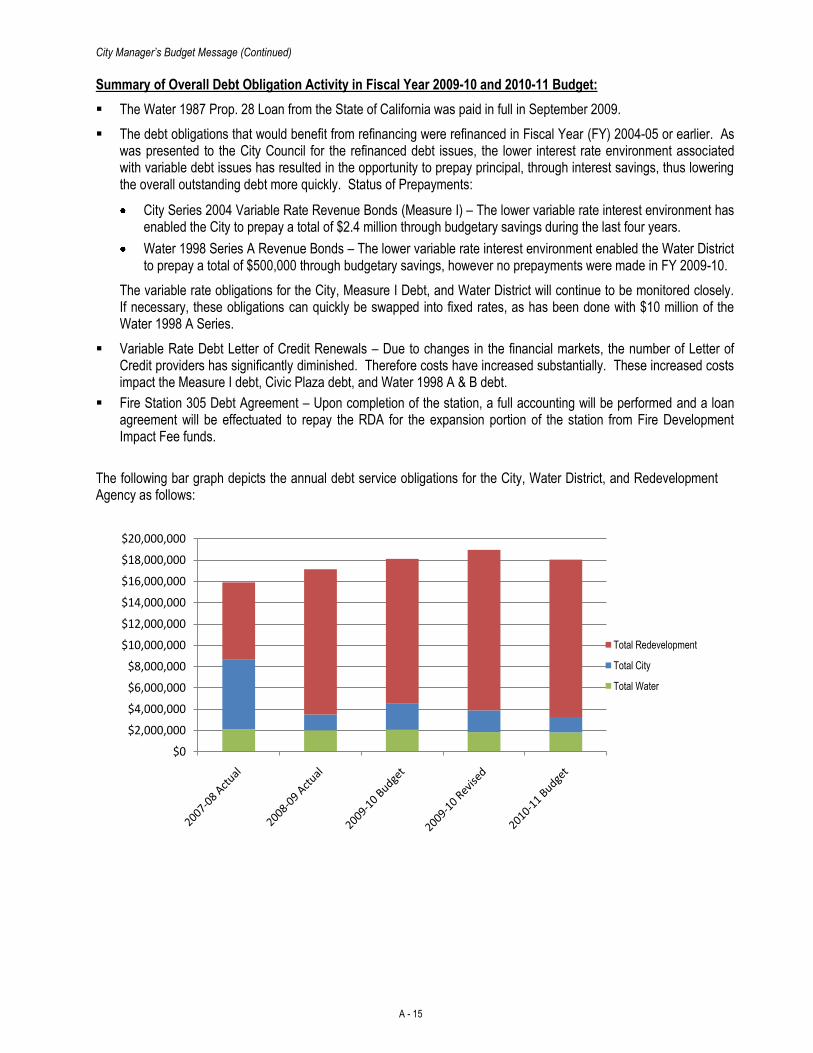
The following bar graph depicts the annual debt service obligations for the City, Water District, and Redevelopment Agency as follows:
$0
$2,000,000
$4,000,000
$6,000,000
$8,000,000
$10,000,000
$12,000,000
$14,000,000
$16,000,000
$18,000,000
$20,000,000
Total Redevelopment
Total City
Total Water
A - 16
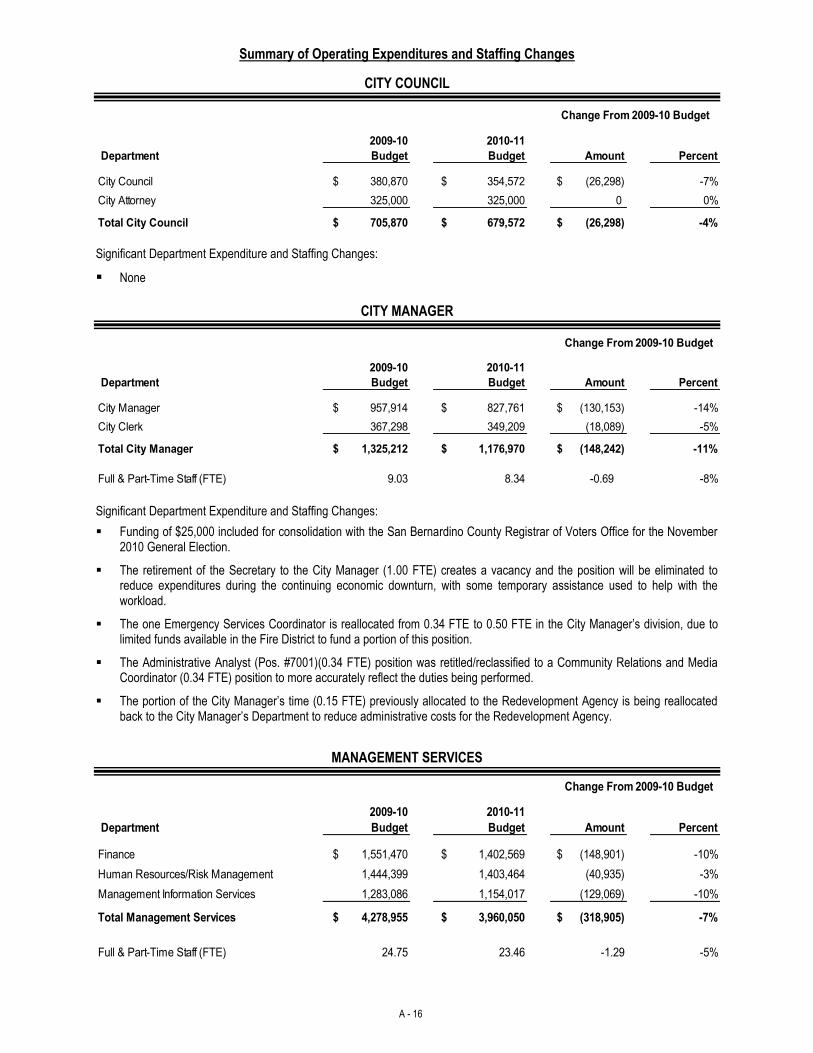
Summary of Operating Expenditures and Staffing Changes
CITY COUNCIL
Department
2009-10
Budget
2010-11
Budget Amount Percent
City Council $ 380,870 $ 354,572 $ (26,298) -7%
City Attorney 325,000 325,000 0 0%
Total City Council $ 705,870 $ 679,572 $ (26,298) -4%
Change From 2009-10 Budget
Significant Department Expenditure and Staffing Changes:
None
CITY MANAGER
Department
2009-10
Budget
2010-11
Budget Amount Percent
City Manager $ 957,914 $ 827,761 $ (130,153) -14%
City Clerk 367,298 349,209 (18,089) -5%
Total City Manager $ 1,325,212 $ 1,176,970 $ (148,242) -11%
Full & Part-Time Staff (FTE) 9.03 8.34 -0.69 -8%
Change From 2009-10 Budget
Significant Department Expenditure and Staffing Changes:
Funding of $25,000 included for consolidation with the San Bernardino County Registrar of Voters Office for the November 2010 General Election.
The retirement of the Secretary to the City Manager (1.00 FTE) creates a vacancy and the position will be eliminated to reduce expenditures during the continuing economic downturn, with some temporary assistance used to help with the workload.
The one Emergency Services Coordinator is reallocated from 0.34 FTE to 0.50 FTE in the City Manager’s division, due to limited funds available in the Fire District to fund a portion of this position.
The Administrative Analyst (Pos. #7001)(0.34 FTE) position was retitled/reclassified to a Community Relations and Media Coordinator (0.34 FTE) position to more accurately reflect the duties being performed.
The portion of the City Manager’s time (0.15 FTE) previously allocated to the Redevelopment Agency is being reallocated back to the City Manager’s Department to reduce administrative costs for the Redevelopment Agency.
MANAGEMENT SERVICES
Department
2009-10
Budget
2010-11
Budget Amount Percent
Finance $ 1,551,470 $ 1,402,569 $ (148,901) -10%
Human Resources/Risk Management 1,444,399 1,403,464 (40,935) -3%
Management Information Services 1,283,086 1,154,017 (129,069) -10%
Total Management Services $ 4,278,955 $ 3,960,050 $ (318,905) -7%
Full & Part-Time Staff (FTE) 24.75 23.46 -1.29 -5%
Change From 2009-10 Budget
A - 17
Summary of Operating Expenditures and Staffing Changes (Continued)
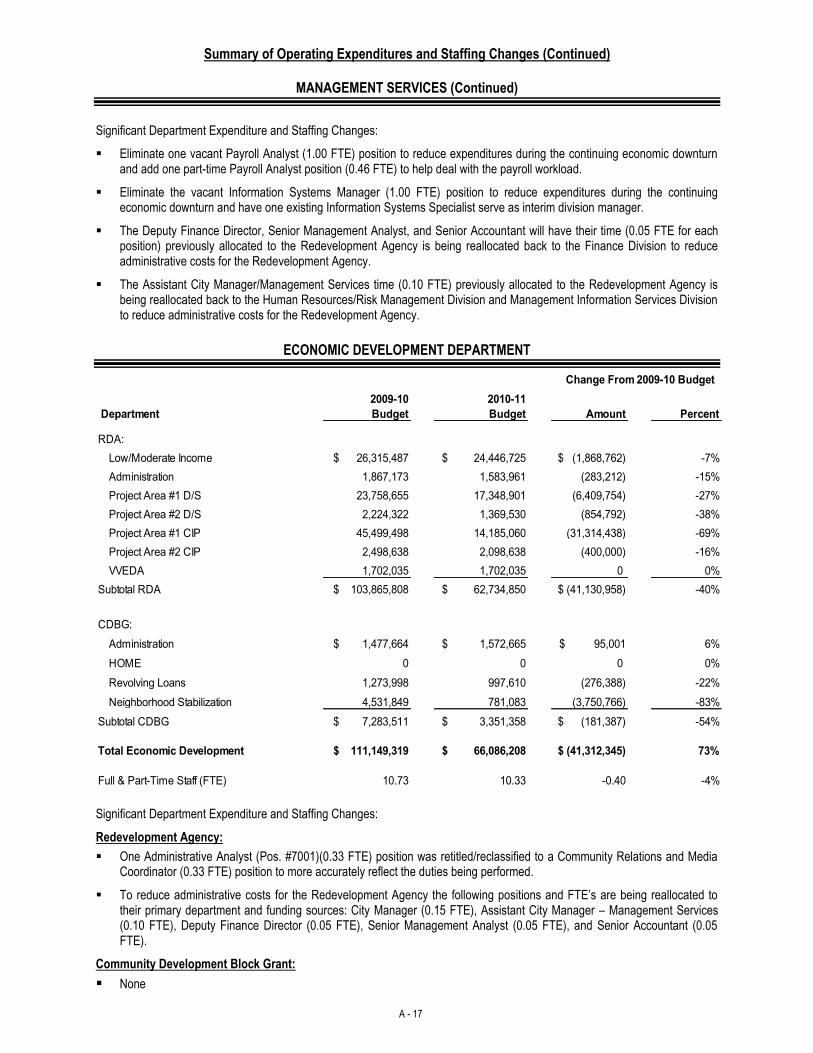
MANAGEMENT SERVICES (Continued)
Significant Department Expenditure and Staffing Changes:
Eliminate one vacant Payroll Analyst (1.00 FTE) position to reduce expenditures during the continuing economic downturn and add one part-time Payroll Analyst position (0.46 FTE) to help deal with the payroll workload.
Eliminate the vacant Information Systems Manager (1.00 FTE) position to reduce expenditures during the continuing economic downturn and have one existing Information Systems Specialist serve as interim division manager.
The Deputy Finance Director, Senior Management Analyst, and Senior Accountant will have their time (0.05 FTE for each position) previously allocated to the Redevelopment Agency is being reallocated back to the Finance Division to reduce administrative costs for the Redevelopment Agency.
The Assistant City Manager/Management Services time (0.10 FTE) previously allocated to the Redevelopment Agency is being reallocated back to the Human Resources/Risk Management Division and Management Information Services Division to reduce administrative costs for the Redevelopment Agency.
ECONOMIC DEVELOPMENT DEPARTMENT
Department
2009-10
Budget
2010-11
Budget Amount Percent
RDA:
Low/Moderate Income $ 26,315,487 $ 24,446,725 $ (1,868,762) -7%
Administration 1,867,173 1,583,961 (283,212) -15%
Project Area #1 D/S 23,758,655 17,348,901 (6,409,754) -27%
Project Area #2 D/S 2,224,322 1,369,530 (854,792) -38%
Project Area #1 CIP 45,499,498 14,185,060 (31,314,438) -69%
Project Area #2 CIP 2,498,638 2,098,638 (400,000) -16%
VVEDA 1,702,035 1,702,035 0 0%
Subtotal RDA $ 103,865,808 $ 62,734,850 $ (41,130,958) -40%
CDBG:
Administration $ 1,477,664 $ 1,572,665 $ 95,001 6%
HOME 0 0 0 0%
Revolving Loans 1,273,998 997,610 (276,388) -22%
Neighborhood Stabilization 4,531,849 781,083 (3,750,766) -83%
Subtotal CDBG $ 7,283,511 $ 3,351,358 $ (181,387) -54%
Total Economic Development $ 111,149,319 $ 66,086,208 $ (41,312,345) 73%
Full & Part-Time Staff (FTE) 10.73 10.33 -0.40 -4%
Change From 2009-10 Budget
Significant Department Expenditure and Staffing Changes:
Redevelopment Agency:
One Administrative Analyst (Pos. #7001)(0.33 FTE) position was retitled/reclassified to a Community Relations and Media Coordinator (0.33 FTE) position to more accurately reflect the duties being performed.
To reduce administrative costs for the Redevelopment Agency the following positions and FTE’s are being reallocated to their primary department and funding sources: City Manager (0.15 FTE), Assistant City Manager – Management Services (0.10 FTE), Deputy Finance Director (0.05 FTE), Senior Management Analyst (0.05 FTE), and Senior Accountant (0.05 FTE).
Community Development Block Grant:
None
A - 18
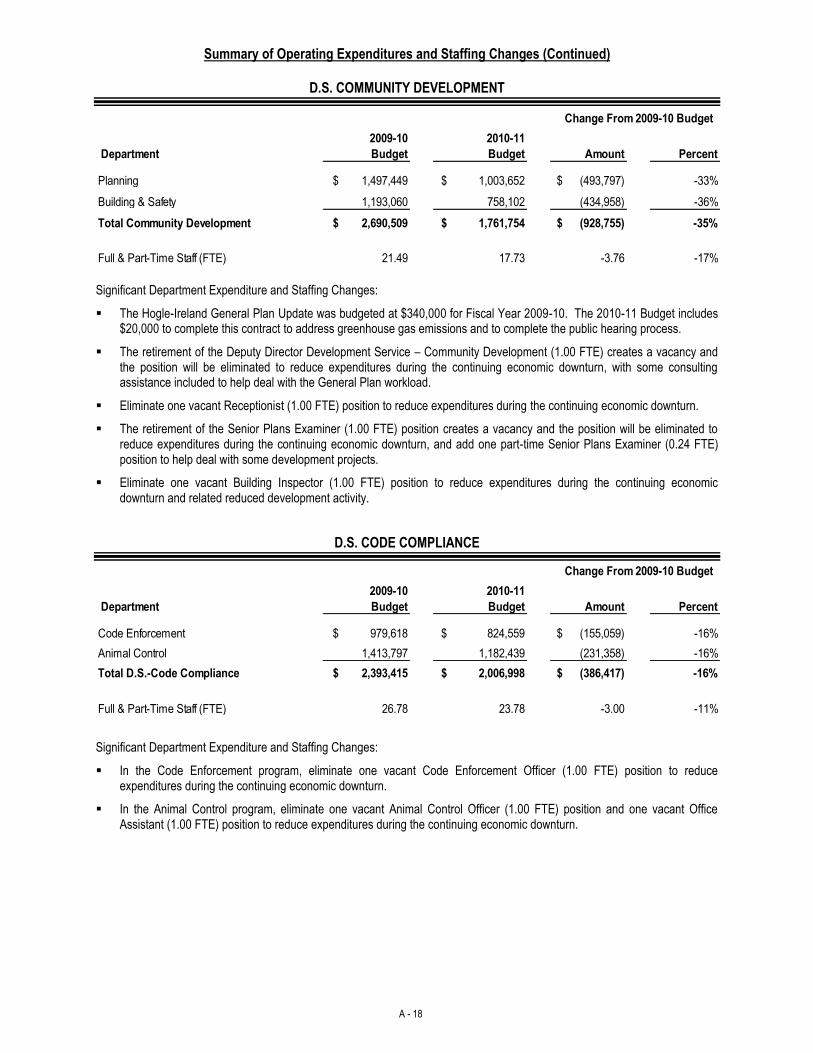
Summary of Operating Expenditures and Staffing Changes (Continued)
D.S. COMMUNITY DEVELOPMENT
Department
2009-10
Budget
2010-11
Budget Amount Percent
Planning $ 1,497,449 $ 1,003,652 $ (493,797) -33%
Building & Safety 1,193,060 758,102 (434,958) -36%
Total Community Development $ 2,690,509 $ 1,761,754 $ (928,755) -35%
Full & Part-Time Staff (FTE) 21.49 17.73 -3.76 -17%
Change From 2009-10 Budget
Significant Department Expenditure and Staffing Changes:
The Hogle-Ireland General Plan Update was budgeted at $340,000 for Fiscal Year 2009-10. The 2010-11 Budget includes $20,000 to complete this contract to address greenhouse gas emissions and to complete the public hearing process.
The retirement of the Deputy Director Development Service – Community Development (1.00 FTE) creates a vacancy and the position will be eliminated to reduce expenditures during the continuing economic downturn, with some consulting assistance included to help deal with the General Plan workload.
Eliminate one vacant Receptionist (1.00 FTE) position to reduce expenditures during the continuing economic downturn.
The retirement of the Senior Plans Examiner (1.00 FTE) position creates a vacancy and the position will be eliminated to reduce expenditures during the continuing economic downturn, and add one part-time Senior Plans Examiner (0.24 FTE) position to help deal with some development projects.
Eliminate one vacant Building Inspector (1.00 FTE) position to reduce expenditures during the continuing economic downturn and related reduced development activity.
D.S. CODE COMPLIANCE
Department
2009-10
Budget
2010-11
Budget Amount Percent
Code Enforcement $ 979,618 $ 824,559 $ (155,059) -16%
Animal Control 1,413,797 1,182,439 (231,358) -16%
Total D.S.-Code Compliance $ 2,393,415 $ 2,006,998 $ (386,417) -16%
Full & Part-Time Staff (FTE) 26.78 23.78 -3.00 -11%
Change From 2009-10 Budget
Significant Department Expenditure and Staffing Changes:
In the Code Enforcement program, eliminate one vacant Code Enforcement Officer (1.00 FTE) position to reduce expenditures during the continuing economic downturn.
In the Animal Control program, eliminate one vacant Animal Control Officer (1.00 FTE) position and one vacant Office Assistant (1.00 FTE) position to reduce expenditures during the continuing economic downturn.
A - 19
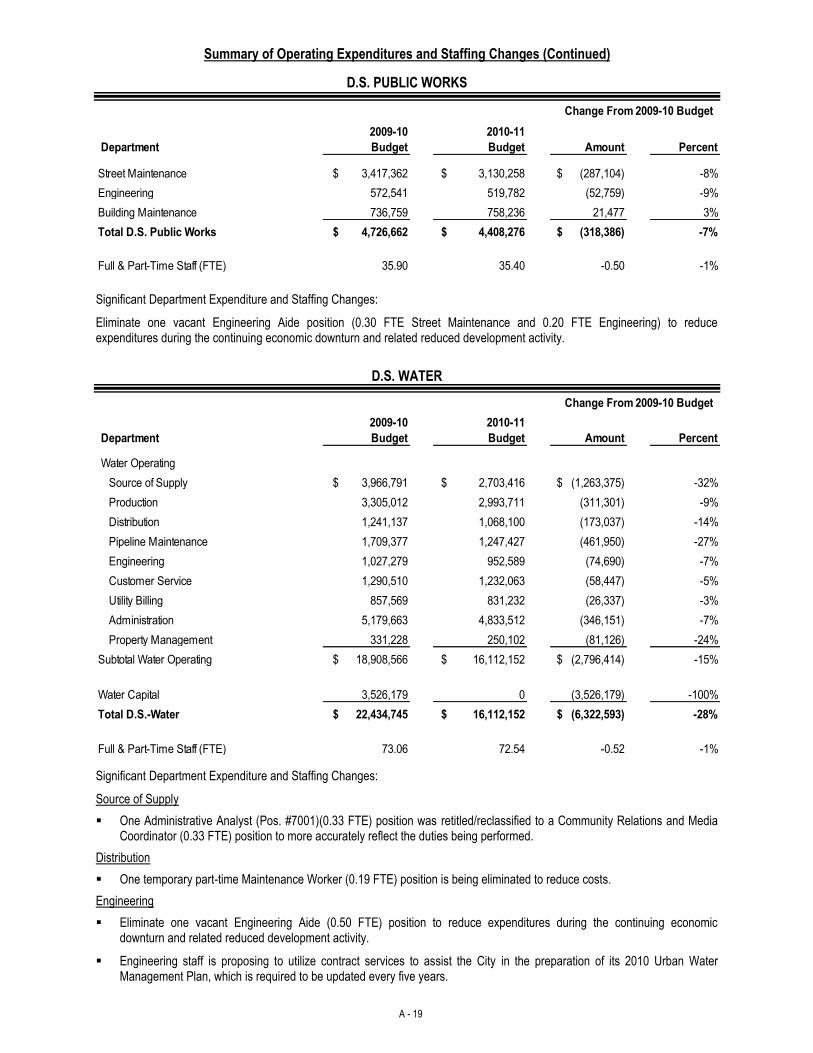
Summary of Operating Expenditures and Staffing Changes (Continued)
D.S. PUBLIC WORKS
Department
2009-10
Budget
2010-11
Budget Amount Percent
Street Maintenance $ 3,417,362 $ 3,130,258 $ (287,104) -8%
Engineering 572,541 519,782 (52,759) -9%
Building Maintenance 736,759 758,236 21,477 3%
Total D.S. Public Works $ 4,726,662 $ 4,408,276 $ (318,386) -7%
Full & Part-Time Staff (FTE) 35.90 35.40 -0.50 -1%
Change From 2009-10 Budget
Significant Department Expenditure and Staffing Changes:
Eliminate one vacant Engineering Aide position (0.30 FTE Street Maintenance and 0.20 FTE Engineering) to reduce expenditures during the continuing economic downturn and related reduced development activity.
D.S. WATER
Department
2009-10
Budget
2010-11
Budget Amount Percent
Water Operating
Source of Supply $ 3,966,791 $ 2,703,416 $ (1,263,375) -32%
Production 3,305,012 2,993,711 (311,301) -9%
Distribution 1,241,137 1,068,100 (173,037) -14%
Pipeline Maintenance 1,709,377 1,247,427 (461,950) -27%
Engineering 1,027,279 952,589 (74,690) -7%
Customer Service 1,290,510 1,232,063 (58,447) -5%
Utility Billing 857,569 831,232 (26,337) -3%
Administration 5,179,663 4,833,512 (346,151) -7%
Property Management 331,228 250,102 (81,126) -24%
Subtotal Water Operating $ 18,908,566 $ 16,112,152 $ (2,796,414) -15%
Water Capital 3,526,179 0 (3,526,179) -100%
Total D.S.-Water $ 22,434,745 $ 16,112,152 $ (6,322,593) -28%
Full & Part-Time Staff (FTE) 73.06 72.54 -0.52 -1%
Change From 2009-10 Budget
Significant Department Expenditure and Staffing Changes:
Source of Supply
One Administrative Analyst (Pos. #7001)(0.33 FTE) position was retitled/reclassified to a Community Relations and Media Coordinator (0.33 FTE) position to more accurately reflect the duties being performed.
Distribution
One temporary part-time Maintenance Worker (0.19 FTE) position is being eliminated to reduce costs.
Engineering
Eliminate one vacant Engineering Aide (0.50 FTE) position to reduce expenditures during the continuing economic downturn and related reduced development activity.
Engineering staff is proposing to utilize contract services to assist the City in the preparation of its 2010 Urban Water Management Plan, which is required to be updated every five years.
A - 20
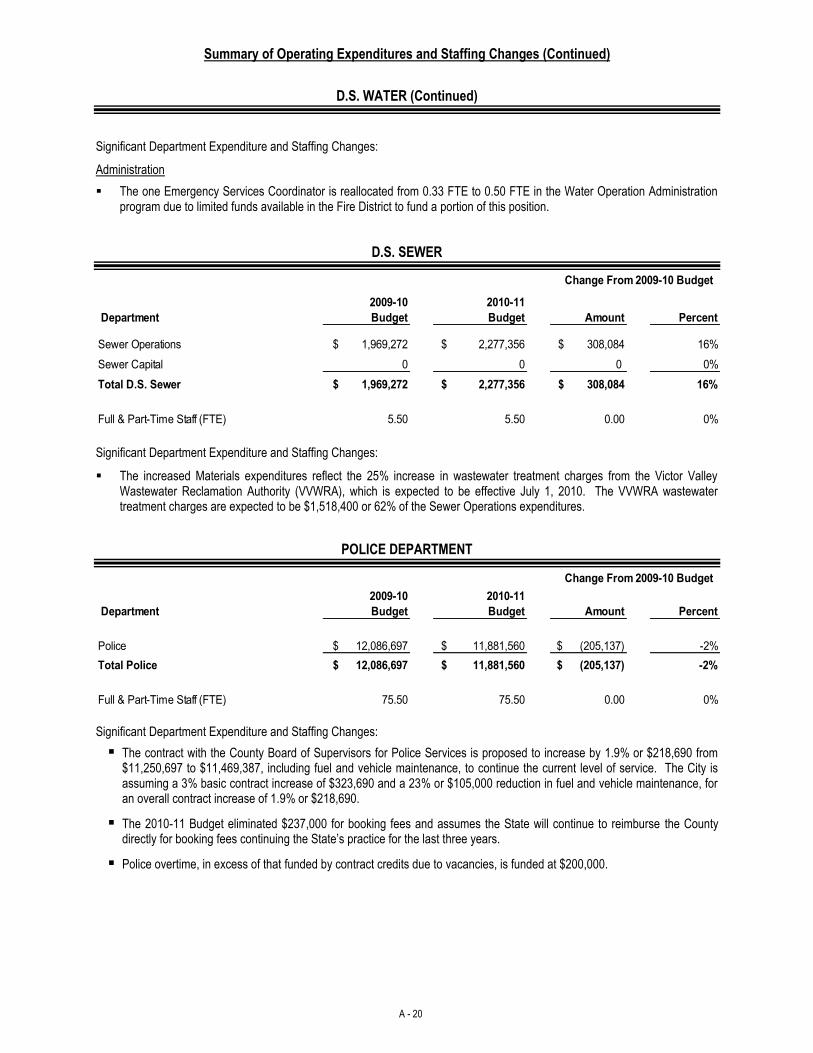
Summary of Operating Expenditures and Staffing Changes (Continued)
D.S. WATER (Continued)
Significant Department Expenditure and Staffing Changes:
Administration
The one Emergency Services Coordinator is reallocated from 0.33 FTE to 0.50 FTE in the Water Operation Administration program due to limited funds available in the Fire District to fund a portion of this position.
D.S. SEWER
Department
2009-10
Budget
2010-11
Budget Amount Percent
Sewer Operations $ 1,969,272 $ 2,277,356 $ 308,084 16%
Sewer Capital 0 0 0 0%
Total D.S. Sewer $ 1,969,272 $ 2,277,356 $ 308,084 16%
Full & Part-Time Staff (FTE) 5.50 5.50 0.00 0%
Change From 2009-10 Budget
Significant Department Expenditure and Staffing Changes:
The increased Materials expenditures reflect the 25% increase in wastewater treatment charges from the Victor Valley Wastewater Reclamation Authority (VVWRA), which is expected to be effective July 1, 2010. The VVWRA wastewater treatment charges are expected to be $1,518,400 or 62% of the Sewer Operations expenditures.
POLICE DEPARTMENT
Department
2009-10
Budget
2010-11
Budget Amount Percent
Police $ 12,086,697 $ 11,881,560 $ (205,137) -2%
Total Police $ 12,086,697 $ 11,881,560 $ (205,137) -2%
Full & Part-Time Staff (FTE) 75.50 75.50 0.00 0%
Change From 2009-10 Budget
Significant Department Expenditure and Staffing Changes:
The contract with the County Board of Supervisors for Police Services is proposed to increase by 1.9% or $218,690 from $11,250,697 to $11,469,387, including fuel and vehicle maintenance, to continue the current level of service. The City is assuming a 3% basic contract increase of $323,690 and a 23% or $105,000 reduction in fuel and vehicle maintenance, for an overall contract increase of 1.9% or $218,690.
The 2010-11 Budget eliminated $237,000 for booking fees and assumes the State will continue to reimburse the County directly for booking fees continuing the State’s practice for the last three years.
Police overtime, in excess of that funded by contract credits due to vacancies, is funded at $200,000.
A - 21
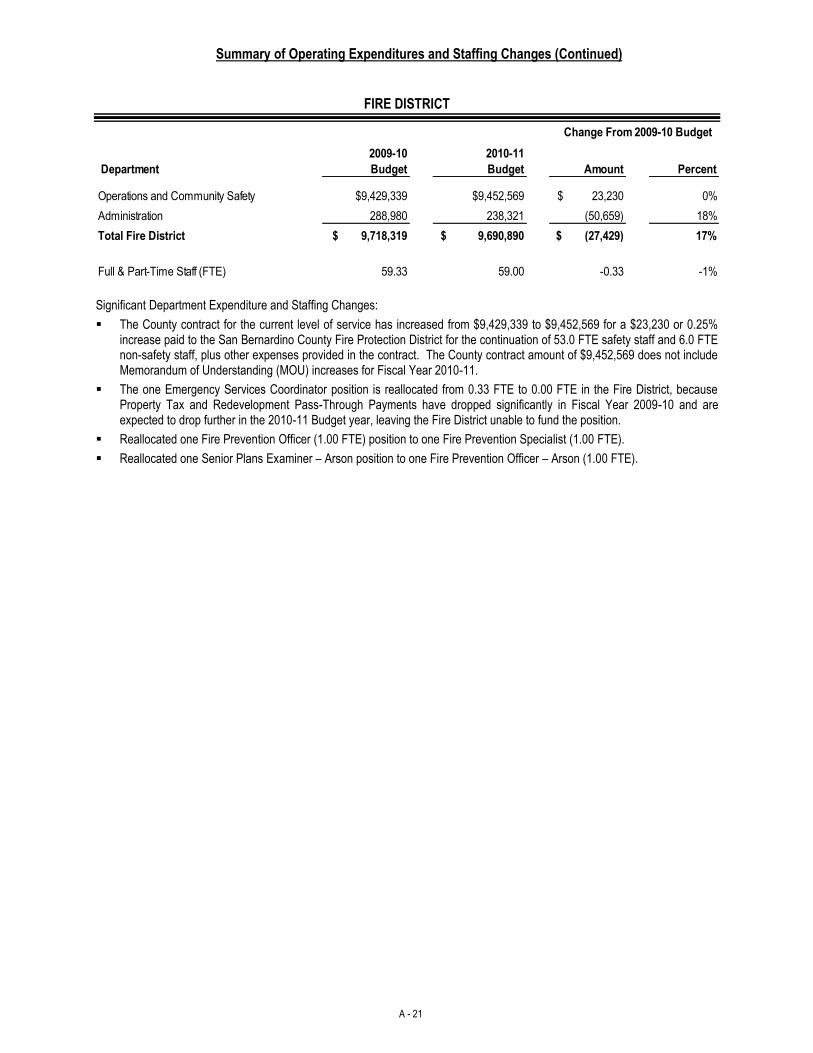
Summary of Operating Expenditures and Staffing Changes (Continued)
FIRE DISTRICT
Department
2009-10
Budget
2010-11
Budget Amount Percent
Operations and Community Safety $9,429,339 $9,452,569 $ 23,230 0%
Administration 288,980 238,321 (50,659) 18%
Total Fire District $ 9,718,319 $ 9,690,890 $ (27,429) 17%
Full & Part-Time Staff (FTE) 59.33 59.00 -0.33 -1%
Change From 2009-10 Budget
Significant Department Expenditure and Staffing Changes:
The County contract for the current level of service has increased from $9,429,339 to $9,452,569 for a $23,230 or 0.25% increase paid to the San Bernardino County Fire Protection District for the continuation of 53.0 FTE safety staff and 6.0 FTE non-safety staff, plus other expenses provided in the contract. The County contract amount of $9,452,569 does not include Memorandum of Understanding (MOU) increases for Fiscal Year 2010-11.
The one Emergency Services Coordinator position is reallocated from 0.33 FTE to 0.00 FTE in the Fire District, because Property Tax and Redevelopment Pass-Through Payments have dropped significantly in Fiscal Year 2009-10 and are expected to drop further in the 2010-11 Budget year, leaving the Fire District unable to fund the position.
Reallocated one Fire Prevention Officer (1.00 FTE) position to one Fire Prevention Specialist (1.00 FTE).
Reallocated one Senior Plans Examiner – Arson position to one Fire Prevention Officer – Arson (1.00 FTE).
■ Overview
■ Summary
R E S O U R C E S
A N D
E X P E N D I T U R E
S U M M A R I E S
■ General Fund - 2010-11 Budget, Fund Balance, and Reserves
■ Water District - 2010-11 Budget, Fund Balance, and Reserves
■ Fire District - 2010-11 Budget, Fund Balance, and Reserves
■ Streets Maintenance Fund - 2010-11 Budget, Fund Balance, and Reserves
The two primary factors considered include:
● Resources - Annual Revenues, Budgeted Reserves (i.e. the planned use of savings), and Transfers.
●
Only the City's General Fund is balanced with a surplus above the 10% reserve level where cash reserve levelssubstantially exceed the City Council/Board policy of 10% in the General Fund. The City Council’s/Board's policy ofmaintaining 10% cash reserves as a percent of expenditures is illustrated on the following schedules.
This section also shows the Fund Balance and Reserves for the four funds. The 2010-11 Budget then updates the fundbalance and a calculation is made to estimate the Cash Reserves. The City Council policy of 10% Cash Reserves andthe Reserves Above 10% are reported.
OVERVIEW
The Resources and Expenditure Summaries section of the budget document depicts the calculations or methodology for"Balancing the Budget" for the City's four primary operating funds, which include the General Fund, Water District, FireDistrict, and Streets Maintenance.
SUMMARY
The budget is balanced by matching resources and expenditures which results in a zero or surplus balance (DifferenceResources/Expenditures).
Section I, Fund Balance Summaries, provides similar balancing information for all City funds included in the 2010-11Budget.
Expenditures - Annual planned expenditures for operations, capital improvements and debt service payments.
B - 3
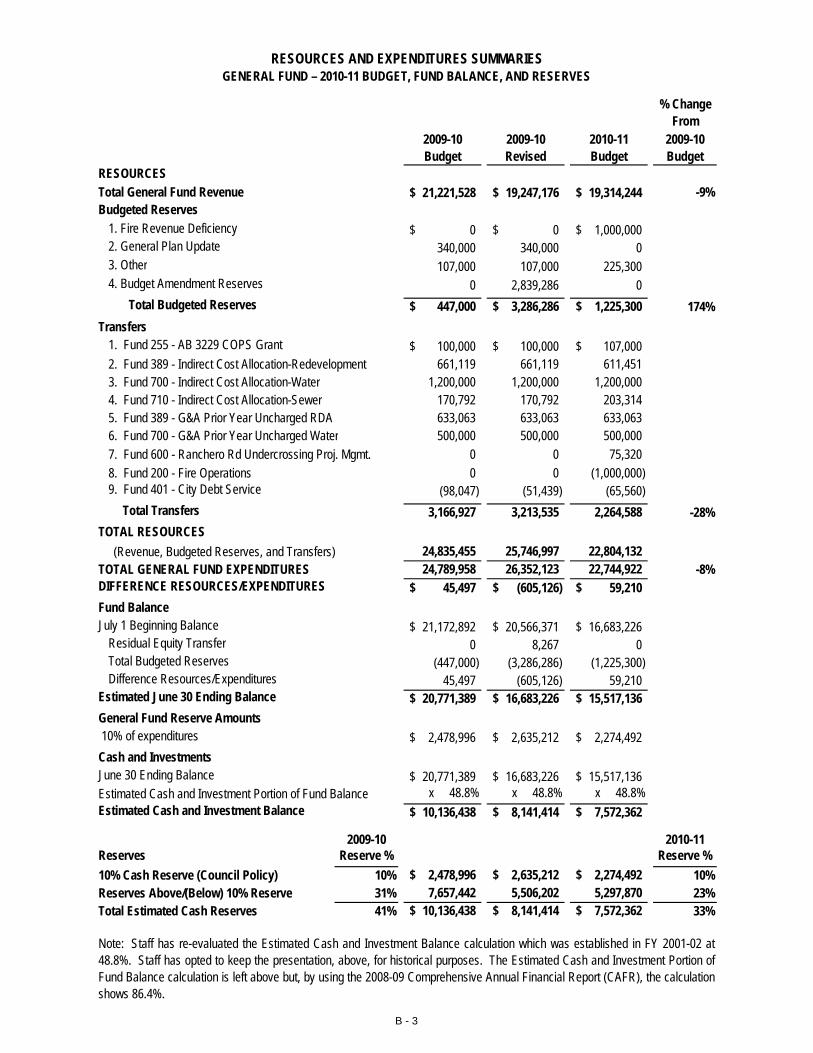
% ChangeFrom
2009-10 2009-10 2010-11 2009-10Budget Revised Budget Budget
RESOURCESTotal General Fund Revenue 21,221,528$ 19,247,176$ 19,314,244$ -9%Budgeted Reserves
1. Fire Revenue Deficiency 0$ 0$ 1,000,000$ 2. General Plan Update 340,000 340,000 0 3. Other 107,000 107,000 225,300 4. Budget Amendment Reserves 0 2,839,286 0
Total Budgeted Reserves 447,000$ 3,286,286$ 1,225,300$ 174%Transfers
1. Fund 255 - AB 3229 COPS Grant 100,000$ 100,000$ 107,000$ 2. Fund 389 - Indirect Cost Allocation-Redevelopment 661,119 661,119 611,451 3. Fund 700 - Indirect Cost Allocation-Water 1,200,000 1,200,000 1,200,000 4. Fund 710 - Indirect Cost Allocation-Sewer 170,792 170,792 203,314 5. Fund 389 - G&A Prior Year Uncharged RDA 633,063 633,063 633,063 6. Fund 700 - G&A Prior Year Uncharged Water 500,000 500,000 500,000 7. Fund 600 - Ranchero Rd Undercrossing Proj. Mgmt. 0 0 75,320 8. Fund 200 - Fire Operations 0 0 (1,000,000) 9. Fund 401 - City Debt Service (98,047) (51,439) (65,560)
Total Transfers 3,166,927 3,213,535 2,264,588 -28%TOTAL RESOURCES
RESOURCES AND EXPENDITURES SUMMARIESGENERAL FUND – 2010-11 BUDGET, FUND BALANCE, AND RESERVES
24,835,455 25,746,997 22,804,132 TOTAL GENERAL FUND EXPENDITURES 24,789,958 26,352,123 22,744,922 -8%DIFFERENCE RESOURCES/EXPENDITURES 45,497$ (605,126)$ 59,210$ Fund BalanceJuly 1 Beginning Balance 21,172,892$ 20,566,371$ 16,683,226$
Residual Equity Transfer 0 8,267 0 Total Budgeted Reserves (447,000) (3,286,286) (1,225,300) Difference Resources/Expenditures 45,497 (605,126) 59,210
Estimated June 30 Ending Balance 20,771,389$ 16,683,226$ 15,517,136$ General Fund Reserve Amounts 10% of expenditures 2,478,996$ 2,635,212$ 2,274,492$ Cash and InvestmentsJune 30 Ending Balance 20,771,389$ 16,683,226$ 15,517,136$
x 48.8% x 48.8% x 48.8%Estimated Cash and Investment Balance 10,136,438$ 8,141,414$ 7,572,362$
2009-10 2010-11Reserves Reserve % Reserve %10% Cash Reserve (Council Policy) 10% 2,478,996$ 2,635,212$ 2,274,492$ 10%Reserves Above/(Below) 10% Reserve 31% 7,657,442 5,506,202 5,297,870 23%Total Estimated Cash Reserves 41% 10,136,438$ 8,141,414$ 7,572,362$ 33%
(Revenue, Budgeted Reserves, and Transfers)
Note: Staff has re-evaluated the Estimated Cash and Investment Balance calculation which was established in FY 2001-02 at48.8%. Staff has opted to keep the presentation, above, for historical purposes. The Estimated Cash and Investment Portion ofFund Balance calculation is left above but, by using the 2008-09 Comprehensive Annual Financial Report (CAFR), the calculationshows 86.4%.
Estimated Cash and Investment Portion of Fund Balance
B - 3
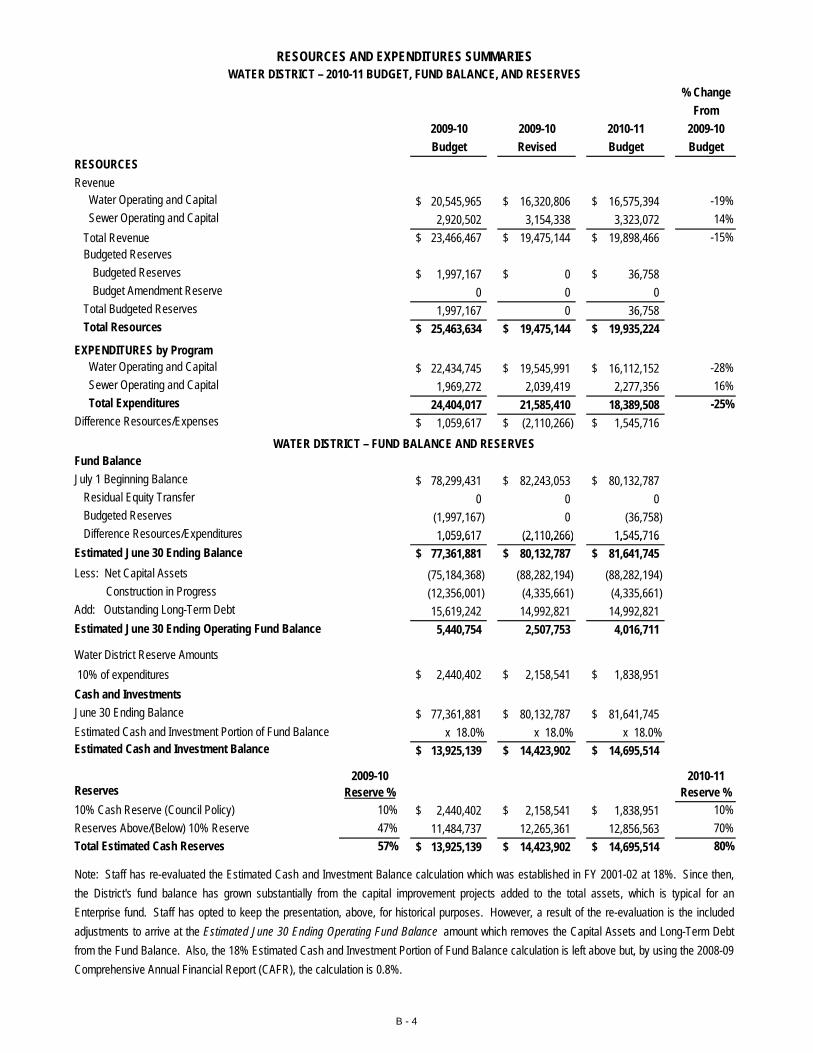
% ChangeFrom
2009-10 2009-10 2010-11 2009-10Budget Revised Budget Budget
RESOURCESRevenue Water Operating and Capital 20,545,965$ 16,320,806$ 16,575,394$ -19% Sewer Operating and Capital 2,920,502 3,154,338 3,323,072 14%
Total Revenue 23,466,467$ 19,475,144$ 19,898,466$ -15%Budgeted Reserves
Budgeted Reserves 1,997,167$ 0$ 36,758$ Budget Amendment Reserve 0 0 0
Total Budgeted Reserves 1,997,167 0 36,758 Total Resources 25,463,634$ 19,475,144$ 19,935,224$
EXPENDITURES by Program Water Operating and Capital 22,434,745$ 19,545,991$ 16,112,152$ -28% Sewer Operating and Capital 1,969,272 2,039,419 2,277,356 16% Total Expenditures 24,404,017 21,585,410 18,389,508 -25%Difference Resources/Expenses 1,059,617$ (2,110,266)$ 1,545,716$
Fund BalanceJuly 1 Beginning Balance 78,299,431$ 82,243,053$ 80,132,787$
Residual Equity Transfer 0 0 0 Budgeted Reserves (1,997,167) 0 (36,758) Difference Resources/Expenditures 1,059,617 (2,110,266) 1,545,716
RESOURCES AND EXPENDITURES SUMMARIESWATER DISTRICT – 2010-11 BUDGET, FUND BALANCE, AND RESERVES
WATER DISTRICT – FUND BALANCE AND RESERVES
p 1,059,617 (2,110,266) 1,545,716 Estimated June 30 Ending Balance 77,361,881$ 80,132,787$ 81,641,745$ Less: Net Capital Assets (75,184,368) (88,282,194) (88,282,194) Construction in Progress (12,356,001) (4,335,661) (4,335,661) Add: Outstanding Long-Term Debt 15,619,242 14,992,821 14,992,821
5,440,754 2,507,753 4,016,711
Water District Reserve Amounts 10% of expenditures 2,440,402$ 2,158,541$ 1,838,951$ Cash and InvestmentsJune 30 Ending Balance 77,361,881$ 80,132,787$ 81,641,745$
x 18.0% x 18.0% x 18.0%Estimated Cash and Investment Balance 13,925,139$ 14,423,902$ 14,695,514$
2009-10 2010-11Reserves Reserve % Reserve %10% Cash Reserve (Council Policy) 10% 2,440,402$ 2,158,541$ 1,838,951$ 10%Reserves Above/(Below) 10% Reserve 47% 11,484,737 12,265,361 12,856,563 70%Total Estimated Cash Reserves 57% 13,925,139$ 14,423,902$ 14,695,514$ 80%
Estimated Cash and Investment Portion of Fund Balance
Estimated June 30 Ending Operating Fund Balance
Note: Staff has re-evaluated the Estimated Cash and Investment Balance calculation which was established in FY 2001-02 at 18%. Since then,the District's fund balance has grown substantially from the capital improvement projects added to the total assets, which is typical for anEnterprise fund. Staff has opted to keep the presentation, above, for historical purposes. However, a result of the re-evaluation is the includedadjustments to arrive at the Estimated June 30 Ending Operating Fund Balance amount which removes the Capital Assets and Long-Term Debtfrom the Fund Balance. Also, the 18% Estimated Cash and Investment Portion of Fund Balance calculation is left above but, by using the 2008-09Comprehensive Annual Financial Report (CAFR), the calculation is 0.8%.
B - 4
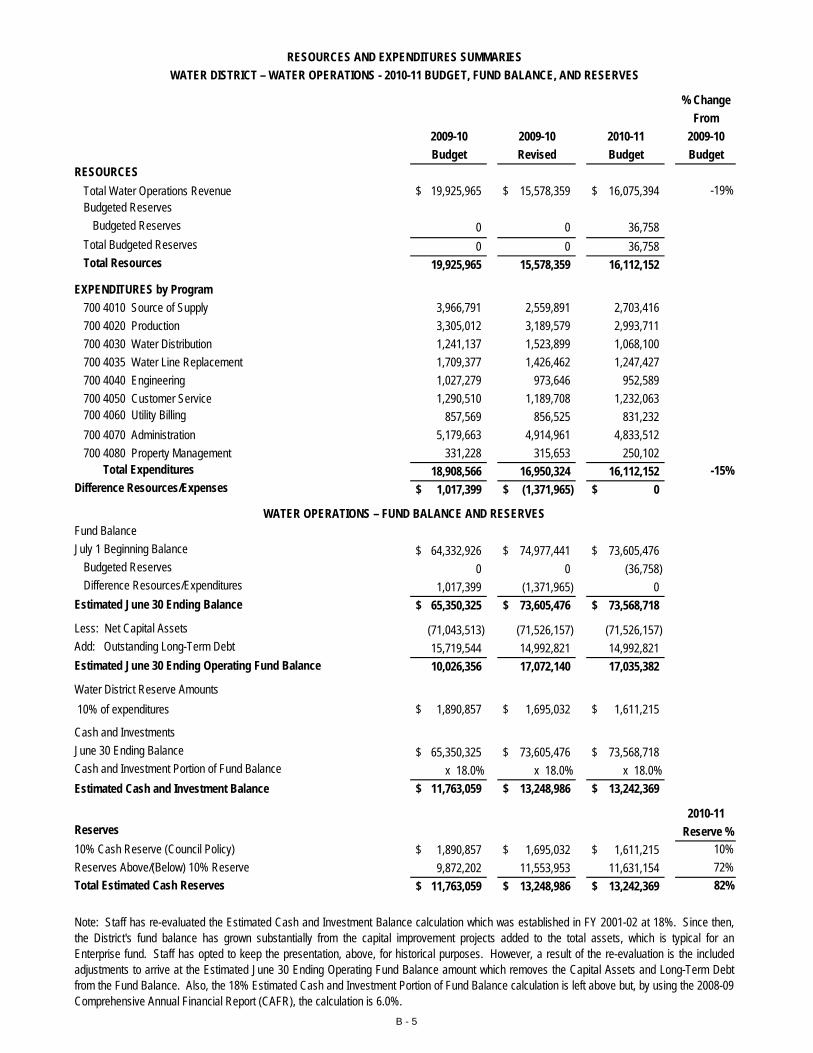
% ChangeFrom
2009-10 2009-10 2010-11 2009-10Budget Revised Budget Budget
RESOURCESTotal Water Operations Revenue 19,925,965$ 15,578,359$ 16,075,394$ -19%Budgeted Reserves
Budgeted Reserves 0 0 36,758 Total Budgeted Reserves 0 0 36,758 Total Resources 19,925,965 15,578,359 16,112,152
EXPENDITURES by Program700 4010 Source of Supply 3,966,791 2,559,891 2,703,416 700 4020 Production 3,305,012 3,189,579 2,993,711 700 4030 Water Distribution 1,241,137 1,523,899 1,068,100 700 4035 Water Line Replacement 1,709,377 1,426,462 1,247,427 700 4040 Engineering 1,027,279 973,646 952,589 700 4050 Customer Service 1,290,510 1,189,708 1,232,063 700 4060 Utility Billing 857,569 856,525 831,232 700 4070 Administration 5,179,663 4,914,961 4,833,512 700 4080 Property Management 331,228 315,653 250,102
Total Expenditures 18,908,566 16,950,324 16,112,152 -15%Difference Resources/Expenses 1,017,399$ (1,371,965)$ 0$
Fund BalanceWATER OPERATIONS – FUND BALANCE AND RESERVES
RESOURCES AND EXPENDITURES SUMMARIESWATER DISTRICT – WATER OPERATIONS - 2010-11 BUDGET, FUND BALANCE, AND RESERVES
July 1 Beginning Balance 64,332,926$ 74,977,441$ 73,605,476$ Budgeted Reserves 0 0 (36,758) Difference Resources/Expenditures 1,017,399 (1,371,965) 0
Estimated June 30 Ending Balance 65,350,325$ 73,605,476$ 73,568,718$
Less: Net Capital Assets (71,043,513) (71,526,157) (71,526,157) Add: Outstanding Long-Term Debt 15,719,544 14,992,821 14,992,821
10,026,356 17,072,140 17,035,382
Water District Reserve Amounts 10% of expenditures 1,890,857$ 1,695,032$ 1,611,215$
Cash and InvestmentsJune 30 Ending Balance 65,350,325$ 73,605,476$ 73,568,718$ Cash and Investment Portion of Fund Balance x 18.0% x 18.0% x 18.0%Estimated Cash and Investment Balance 11,763,059$ 13,248,986$ 13,242,369$
2010-11Reserves Reserve %10% Cash Reserve (Council Policy) 1,890,857$ 1,695,032$ 1,611,215$ 10%Reserves Above/(Below) 10% Reserve 9,872,202 11,553,953 11,631,154 72%Total Estimated Cash Reserves 11,763,059$ 13,248,986$ 13,242,369$ 82%
Estimated June 30 Ending Operating Fund Balance
Note: Staff has re-evaluated the Estimated Cash and Investment Balance calculation which was established in FY 2001-02 at 18%. Since then,the District's fund balance has grown substantially from the capital improvement projects added to the total assets, which is typical for anEnterprise fund. Staff has opted to keep the presentation, above, for historical purposes. However, a result of the re-evaluation is the includedadjustments to arrive at the Estimated June 30 Ending Operating Fund Balance amount which removes the Capital Assets and Long-Term Debtfrom the Fund Balance. Also, the 18% Estimated Cash and Investment Portion of Fund Balance calculation is left above but, by using the 2008-09Comprehensive Annual Financial Report (CAFR), the calculation is 6.0%.
B - 5
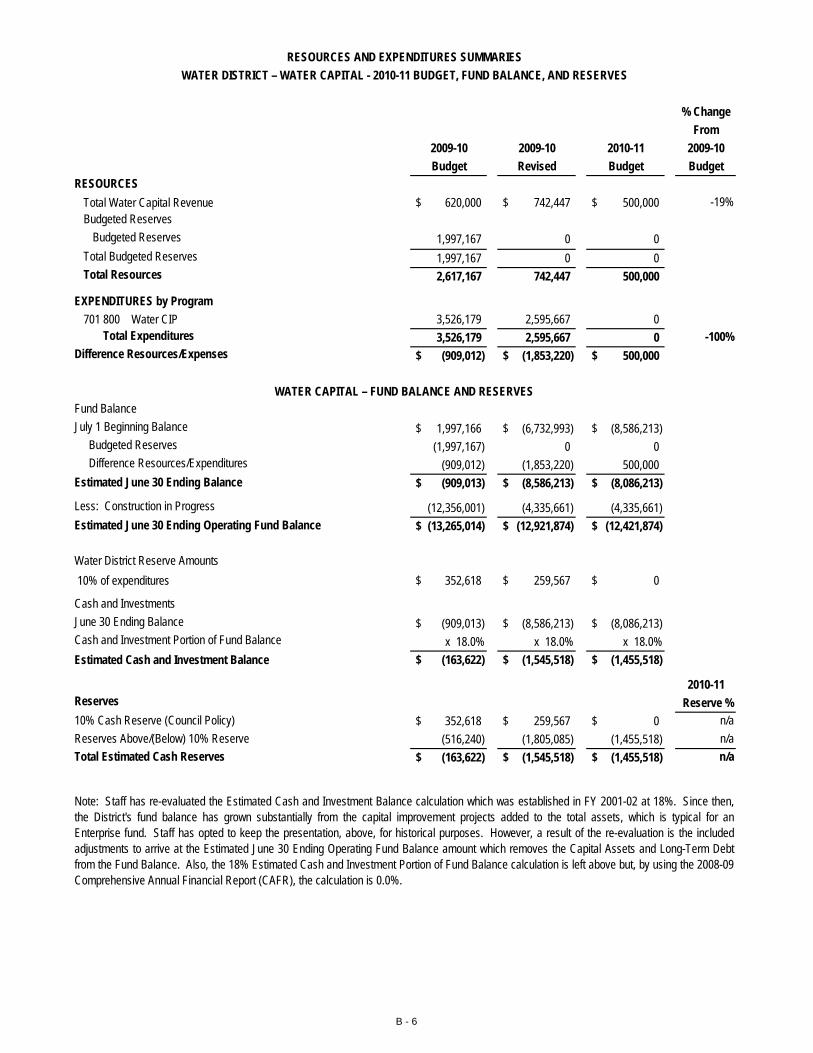
% ChangeFrom
2009-10 2009-10 2010-11 2009-10Budget Revised Budget Budget
RESOURCESTotal Water Capital Revenue 620,000$ 742,447$ 500,000$ -19%Budgeted Reserves
Budgeted Reserves 1,997,167 0 0 Total Budgeted Reserves 1,997,167 0 0 Total Resources 2,617,167 742,447 500,000
EXPENDITURES by Program701 800 Water CIP 3,526,179 2,595,667 0
Total Expenditures 3,526,179 2,595,667 0 -100%Difference Resources/Expenses (909,012)$ (1,853,220)$ 500,000$
Fund BalanceJuly 1 Beginning Balance 1,997,166$ (6,732,993)$ (8,586,213)$ Budgeted Reserves (1,997,167) 0 0 Difference Resources/Expenditures (909,012) (1,853,220) 500,000 Estimated June 30 Ending Balance (909,013)$ (8,586,213)$ (8,086,213)$
Less: Construction in Progress (12,356,001) (4,335,661) (4,335,661)(13,265,014)$ (12,921,874)$ (12,421,874)$
WATER DISTRICT – WATER CAPITAL - 2010-11 BUDGET, FUND BALANCE, AND RESERVESRESOURCES AND EXPENDITURES SUMMARIES
WATER CAPITAL – FUND BALANCE AND RESERVES
Estimated June 30 Ending Operating Fund Balance
Water District Reserve Amounts 10% of expenditures 352,618$ 259,567$ 0$
Cash and InvestmentsJune 30 Ending Balance (909,013)$ (8,586,213)$ (8,086,213)$ Cash and Investment Portion of Fund Balance x 18.0% x 18.0% x 18.0%Estimated Cash and Investment Balance (163,622)$ (1,545,518)$ (1,455,518)$
2010-11Reserves Reserve %10% Cash Reserve (Council Policy) 352,618$ 259,567$ 0$ n/aReserves Above/(Below) 10% Reserve (516,240) (1,805,085) (1,455,518) n/aTotal Estimated Cash Reserves (163,622)$ (1,545,518)$ (1,455,518)$ n/a
Note: Staff has re-evaluated the Estimated Cash and Investment Balance calculation which was established in FY 2001-02 at 18%. Since then,the District's fund balance has grown substantially from the capital improvement projects added to the total assets, which is typical for anEnterprise fund. Staff has opted to keep the presentation, above, for historical purposes. However, a result of the re-evaluation is the includedadjustments to arrive at the Estimated June 30 Ending Operating Fund Balance amount which removes the Capital Assets and Long-Term Debtfrom the Fund Balance. Also, the 18% Estimated Cash and Investment Portion of Fund Balance calculation is left above but, by using the 2008-09Comprehensive Annual Financial Report (CAFR), the calculation is 0.0%.
B - 6
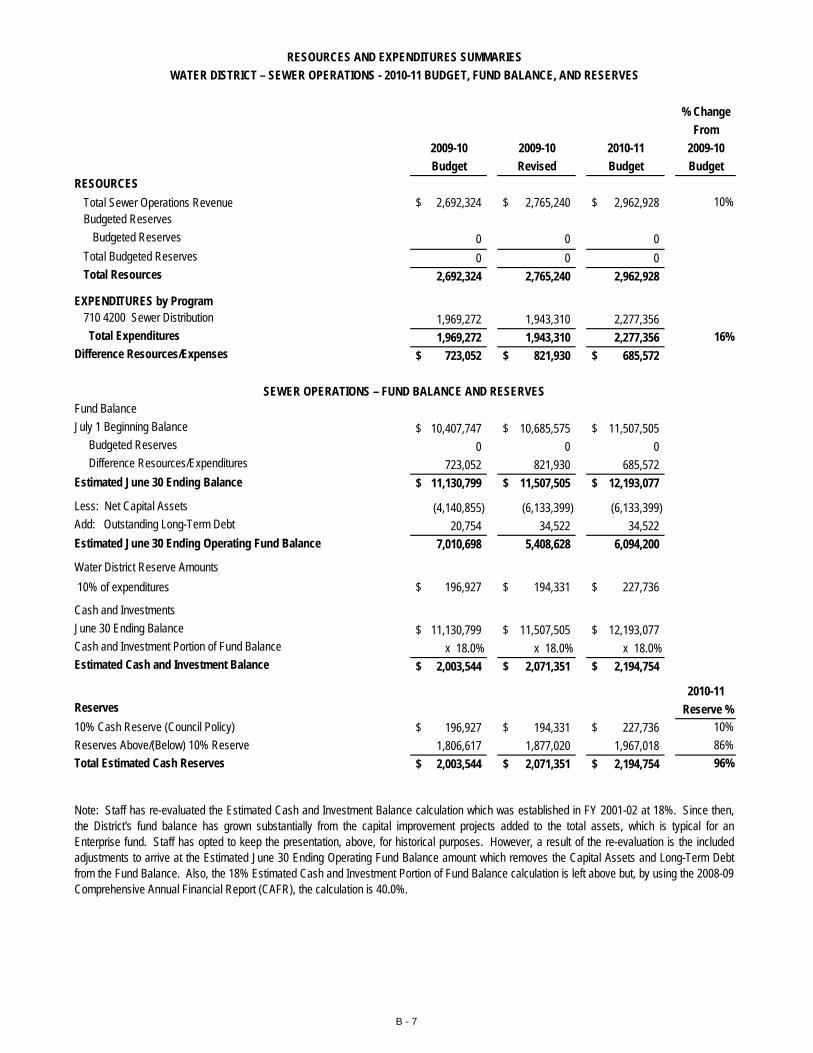
% ChangeFrom
2009-10 2009-10 2010-11 2009-10Budget Revised Budget Budget
RESOURCESTotal Sewer Operations Revenue 2,692,324$ 2,765,240$ 2,962,928$ 10%Budgeted Reserves
Budgeted Reserves 0 0 0 Total Budgeted Reserves 0 0 0 Total Resources 2,692,324 2,765,240 2,962,928
EXPENDITURES by Program710 4200 Sewer Distribution 1,969,272 1,943,310 2,277,356
Total Expenditures 1,969,272 1,943,310 2,277,356 16%Difference Resources/Expenses 723,052$ 821,930$ 685,572$
Fund BalanceJuly 1 Beginning Balance 10,407,747$ 10,685,575$ 11,507,505$ Budgeted Reserves 0 0 0 Difference Resources/Expenditures 723,052 821,930 685,572 Estimated June 30 Ending Balance 11,130,799$ 11,507,505$ 12,193,077$
Less: Net Capital Assets (4,140,855) (6,133,399) (6,133,399) Add: Outstanding Long-Term Debt 20,754 34,522 34,522
7 010 698 5 408 628 6 094 200
WATER DISTRICT – SEWER OPERATIONS - 2010-11 BUDGET, FUND BALANCE, AND RESERVESRESOURCES AND EXPENDITURES SUMMARIES
E ti t d J 30 E di O ti F d B l
SEWER OPERATIONS – FUND BALANCE AND RESERVES
7,010,698 5,408,628 6,094,200
Water District Reserve Amounts 10% of expenditures 196,927$ 194,331$ 227,736$
Cash and InvestmentsJune 30 Ending Balance 11,130,799$ 11,507,505$ 12,193,077$ Cash and Investment Portion of Fund Balance x 18.0% x 18.0% x 18.0%Estimated Cash and Investment Balance 2,003,544$ 2,071,351$ 2,194,754$
2010-11Reserves Reserve %10% Cash Reserve (Council Policy) 196,927$ 194,331$ 227,736$ 10%Reserves Above/(Below) 10% Reserve 1,806,617 1,877,020 1,967,018 86%Total Estimated Cash Reserves 2,003,544$ 2,071,351$ 2,194,754$ 96%
Estimated June 30 Ending Operating Fund Balance
Note: Staff has re-evaluated the Estimated Cash and Investment Balance calculation which was established in FY 2001-02 at 18%. Since then,the District's fund balance has grown substantially from the capital improvement projects added to the total assets, which is typical for anEnterprise fund. Staff has opted to keep the presentation, above, for historical purposes. However, a result of the re-evaluation is the includedadjustments to arrive at the Estimated June 30 Ending Operating Fund Balance amount which removes the Capital Assets and Long-Term Debtfrom the Fund Balance. Also, the 18% Estimated Cash and Investment Portion of Fund Balance calculation is left above but, by using the 2008-09Comprehensive Annual Financial Report (CAFR), the calculation is 40.0%.
B - 7
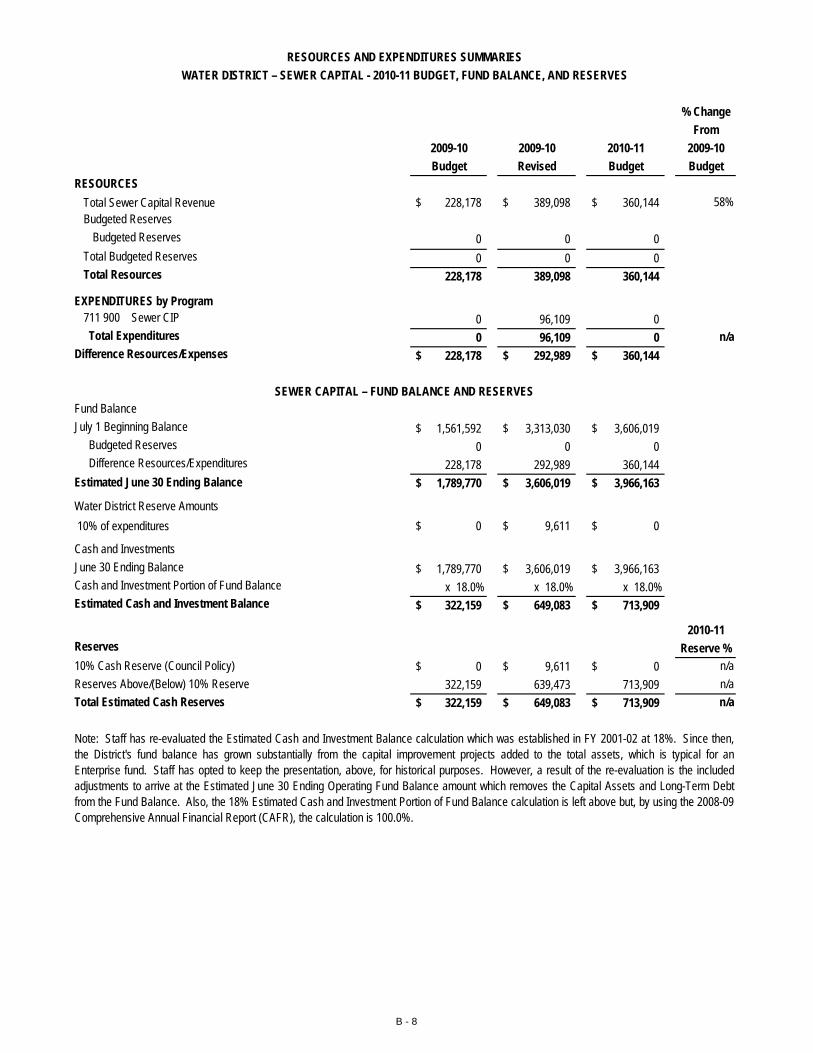
% ChangeFrom
2009-10 2009-10 2010-11 2009-10Budget Revised Budget Budget
RESOURCESTotal Sewer Capital Revenue 228,178$ 389,098$ 360,144$ 58%Budgeted Reserves
Budgeted Reserves 0 0 0 Total Budgeted Reserves 0 0 0 Total Resources 228,178 389,098 360,144
EXPENDITURES by Program711 900 Sewer CIP 0 96,109 0
Total Expenditures 0 96,109 0 n/aDifference Resources/Expenses 228,178$ 292,989$ 360,144$
Fund BalanceJuly 1 Beginning Balance 1,561,592$ 3,313,030$ 3,606,019$ Budgeted Reserves 0 0 0 Difference Resources/Expenditures 228,178 292,989 360,144 Estimated June 30 Ending Balance 1,789,770$ 3,606,019$ 3,966,163$
Water District Reserve Amounts 10% of expenditures 0$ 9,611$ 0$
SEWER CAPITAL – FUND BALANCE AND RESERVES
WATER DISTRICT – SEWER CAPITAL - 2010-11 BUDGET, FUND BALANCE, AND RESERVESRESOURCES AND EXPENDITURES SUMMARIES
Cash and InvestmentsJune 30 Ending Balance 1,789,770$ 3,606,019$ 3,966,163$ Cash and Investment Portion of Fund Balance x 18.0% x 18.0% x 18.0%Estimated Cash and Investment Balance 322,159$ 649,083$ 713,909$
2010-11Reserves Reserve %10% Cash Reserve (Council Policy) 0$ 9,611$ 0$ n/aReserves Above/(Below) 10% Reserve 322,159 639,473 713,909 n/aTotal Estimated Cash Reserves 322,159$ 649,083$ 713,909$ n/a
Note: Staff has re-evaluated the Estimated Cash and Investment Balance calculation which was established in FY 2001-02 at 18%. Since then,the District's fund balance has grown substantially from the capital improvement projects added to the total assets, which is typical for anEnterprise fund. Staff has opted to keep the presentation, above, for historical purposes. However, a result of the re-evaluation is the includedadjustments to arrive at the Estimated June 30 Ending Operating Fund Balance amount which removes the Capital Assets and Long-Term Debtfrom the Fund Balance. Also, the 18% Estimated Cash and Investment Portion of Fund Balance calculation is left above but, by using the 2008-09Comprehensive Annual Financial Report (CAFR), the calculation is 100.0%.
B - 8
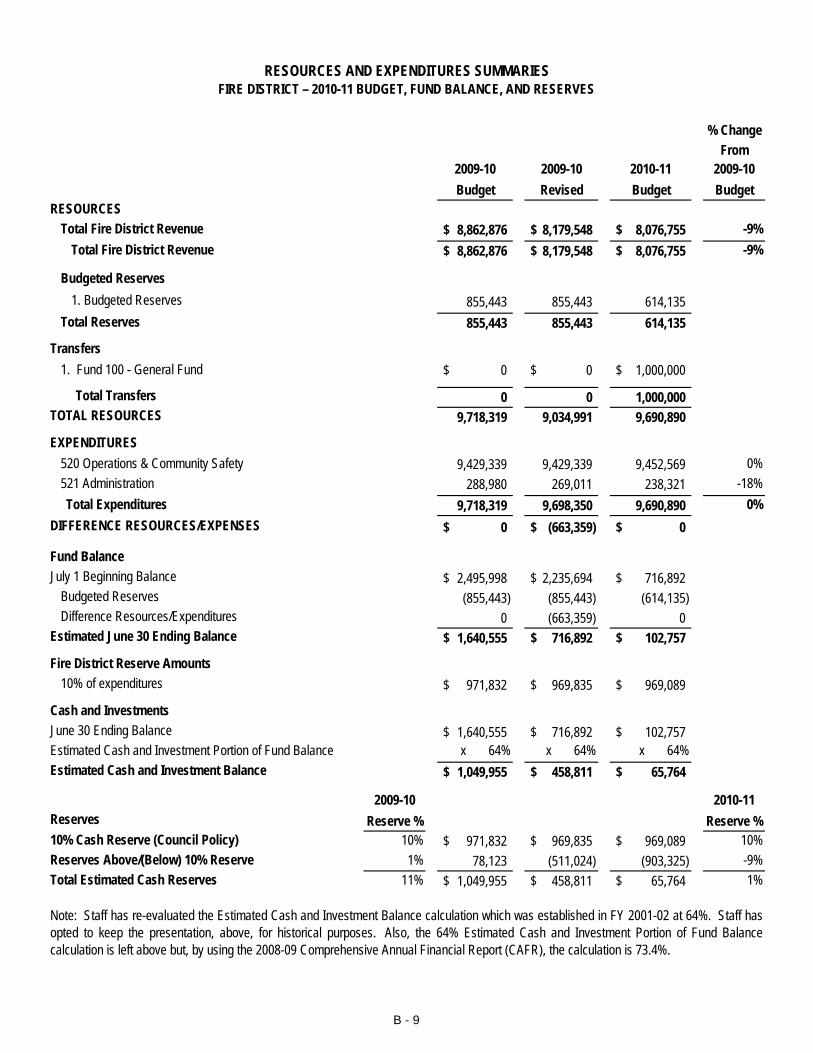
% ChangeFrom
2009-10 2009-10 2010-11 2009-10Budget Revised Budget Budget
RESOURCESTotal Fire District Revenue 8,862,876$ 8,179,548$ 8,076,755$ -9%
Total Fire District Revenue 8,862,876$ 8,179,548$ 8,076,755$ -9%
Budgeted Reserves1. Budgeted Reserves 855,443 855,443 614,135
Total Reserves 855,443 855,443 614,135
Transfers0$ 0$ 1,000,000$
Total Transfers 0 0 1,000,000 TOTAL RESOURCES 9,718,319 9,034,991 9,690,890
EXPENDITURES520 Operations & Community Safety 9,429,339 9,429,339 9,452,569 0%521 Administration 288,980 269,011 238,321 -18%
Total Expenditures 9,718,319 9,698,350 9,690,890 0%DIFFERENCE RESOURCES/EXPENSES 0$ (663,359)$ 0$
Fund Balance
RESOURCES AND EXPENDITURES SUMMARIESFIRE DISTRICT – 2010-11 BUDGET, FUND BALANCE, AND RESERVES
1. Fund 100 - General Fund
Fund BalanceJuly 1 Beginning Balance 2,495,998$ 2,235,694$ 716,892$
Budgeted Reserves (855,443) (855,443) (614,135) Difference Resources/Expenditures 0 (663,359) 0
Estimated June 30 Ending Balance 1,640,555$ 716,892$ 102,757$
Fire District Reserve Amounts10% of expenditures 971,832$ 969,835$ 969,089$
Cash and InvestmentsJune 30 Ending Balance 1,640,555$ 716,892$ 102,757$ Estimated Cash and Investment Portion of Fund Balance x 64% x 64% x 64%Estimated Cash and Investment Balance 1,049,955$ 458,811$ 65,764$
2009-10 2010-11Reserves Reserve % Reserve %10% Cash Reserve (Council Policy) 10% 971,832$ 969,835$ 969,089$ 10%Reserves Above/(Below) 10% Reserve 1% 78,123 (511,024) (903,325) -9%Total Estimated Cash Reserves 11% 1,049,955$ 458,811$ 65,764$ 1%
Note: Staff has re-evaluated the Estimated Cash and Investment Balance calculation which was established in FY 2001-02 at 64%. Staff hasopted to keep the presentation, above, for historical purposes. Also, the 64% Estimated Cash and Investment Portion of Fund Balancecalculation is left above but, by using the 2008-09 Comprehensive Annual Financial Report (CAFR), the calculation is 73.4%.
B - 9
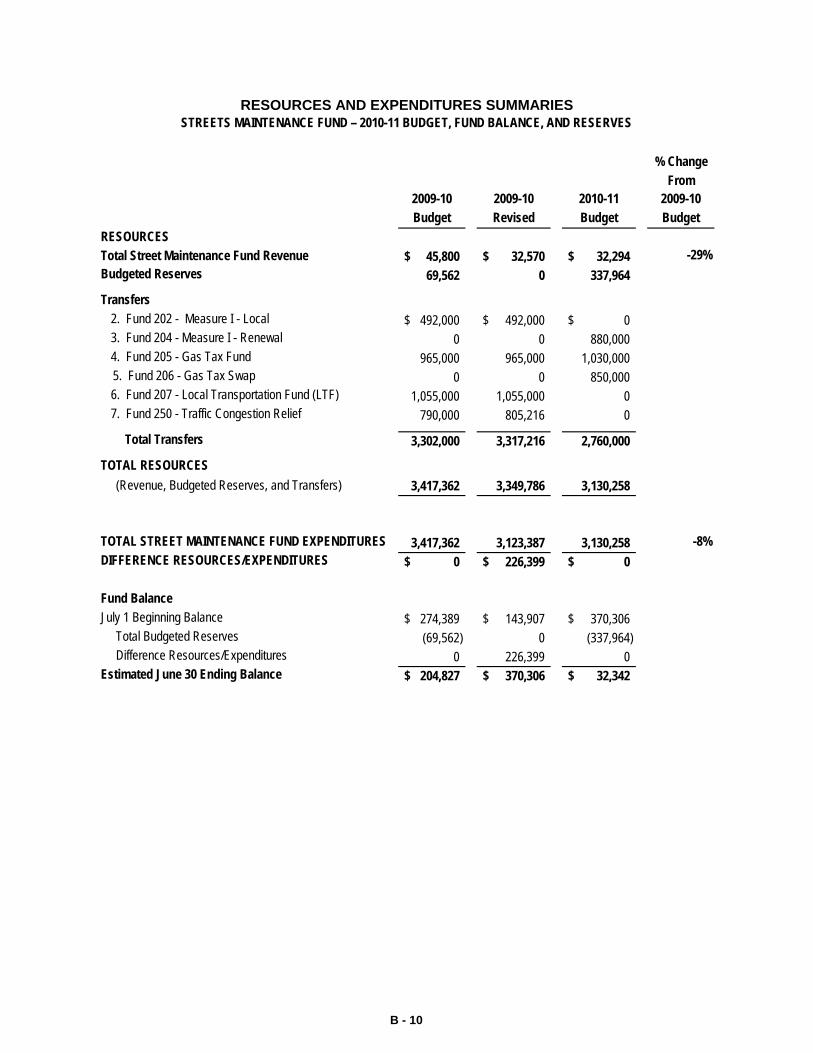
% ChangeFrom
2009-10 2009-10 2010-11 2009-10Budget Revised Budget Budget
RESOURCESTotal Street Maintenance Fund Revenue 45,800$ 32,570$ 32,294$ -29%Budgeted Reserves 69,562 0 337,964
Transfers2. Fund 202 - Measure I - Local 492,000$ 492,000$ 0$ 3. Fund 204 - Measure I - Renewal 0 0 880,000 4. Fund 205 - Gas Tax Fund 965,000 965,000 1,030,000
5. Fund 206 - Gas Tax Swap 0 0 850,000 6. Fund 207 - Local Transportation Fund (LTF) 1,055,000 1,055,000 0 7. Fund 250 - Traffic Congestion Relief 790,000 805,216 0
Total Transfers 3,302,000 3,317,216 2,760,000
TOTAL RESOURCES (Revenue, Budgeted Reserves, and Transfers) 3,417,362 3,349,786 3,130,258
TOTAL STREET MAINTENANCE FUND EXPENDITURES 3,417,362 3,123,387 3,130,258 -8%DIFFERENCE RESOURCES/EXPENDITURES 0$ 226,399$ 0$
RESOURCES AND EXPENDITURES SUMMARIESSTREETS MAINTENANCE FUND – 2010-11 BUDGET, FUND BALANCE, AND RESERVES
Fund BalanceJuly 1 Beginning Balance 274,389$ 143,907$ 370,306$ Total Budgeted Reserves (69,562) 0 (337,964) Difference Resources/Expenditures 0 226,399 0 Estimated June 30 Ending Balance 204,827$ 370,306$ 32,342$
B - 10
■ Total City Revenue Trend
■ Summary and Highlights
■ Total General Fund Revenue
R E V E N U E
S U M M A R I E S
► General Fund Summary of Major Revenues► Triple Flip Revenue Comparison► General Fund Development Revenues► Other General Fund Taxes and Interest Income
■ Streets, Transportation, and Other City Related Funds
■ Redevelopment Agency Revenue Trend
■ Water District Revenue Trend
■ Fire District Revenue Trend
■ Revenue - Summary by Major Groups
■ Revenue - Detail by Fund
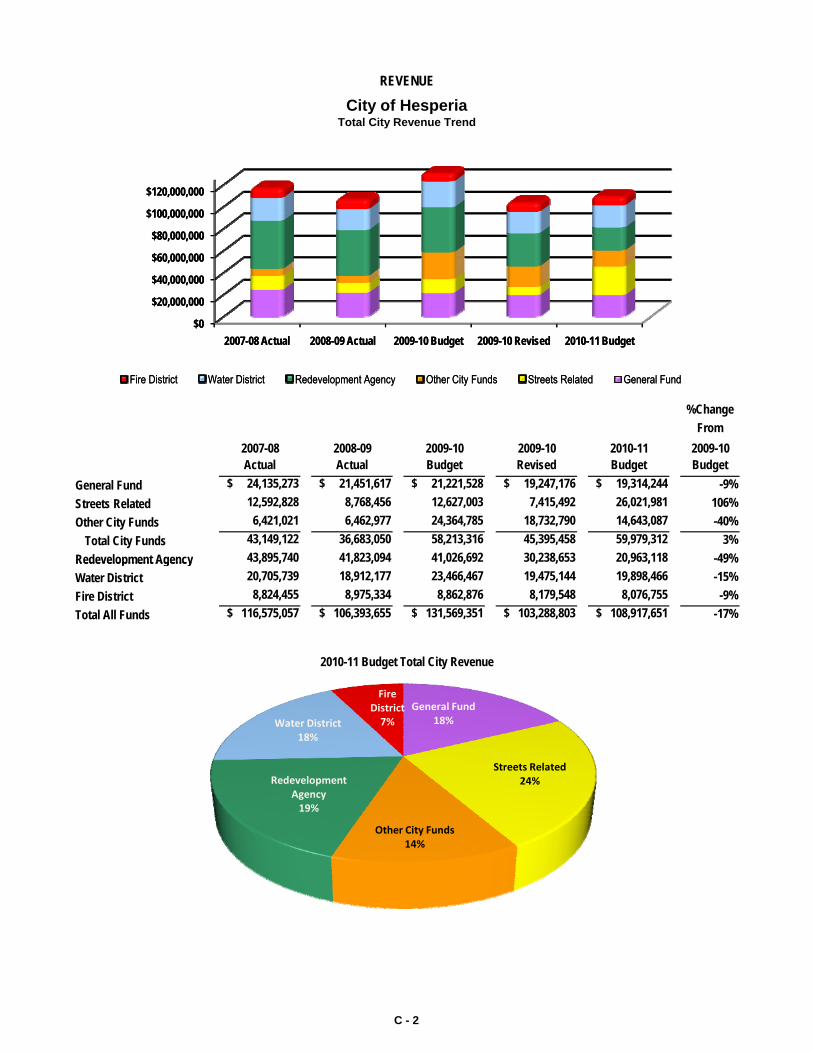
%ChangeFrom
2007-08 2008-09 2009-10 2009-10 2010-11 2009-10Actual Actual Budget Revised Budget Budget
General Fund $ 24,135,273 $ 21,451,617 $ 21,221,528 $ 19,247,176 $ 19,314,244 -9%Streets Related 12,592,828 8,768,456 12,627,003 7,415,492 26,021,981 106%Other City Funds 6,421,021 6,462,977 24,364,785 18,732,790 14,643,087 -40%
Total City Funds 43,149,122 36,683,050 58,213,316 45,395,458 59,979,312 3%Redevelopment Agency 43,895,740 41,823,094 41,026,692 30,238,653 20,963,118 -49%
REVENUE
City of HesperiaTotal City Revenue Trend
$0
$20,000,000
$40,000,000
$60,000,000
$80,000,000
$100,000,000
$120,000,000
2007-08 Actual 2008-09 Actual 2009-10 Budget 2009-10 Revised 2010-11 Budget
Fire District Water District Redevelopment Agency Other City Funds Streets Related General Fund
Redevelopment Agency , , , , , , , , , , 9%Water District 20,705,739 18,912,177 23,466,467 19,475,144 19,898,466 -15%Fire District 8,824,455 8,975,334 8,862,876 8,179,548 8,076,755 -9%Total All Funds $ 116,575,057 $ 106,393,655 $ 131,569,351 $ 103,288,803 $ 108,917,651 -17%
2010-11 Budget Total City Revenue
$0
$20,000,000
$40,000,000
$60,000,000
$80,000,000
$100,000,000
$120,000,000
2007-08 Actual 2008-09 Actual 2009-10 Budget 2009-10 Revised 2010-11 Budget
Fire District Water District Redevelopment Agency Other City Funds Streets Related General Fund
General Fund18%
Streets Related24%
Other City Funds14%
Redevelopment Agency19%
Water District18%
Fire District7%
C - 2
●●●
●
●●
REVENUE
SUMMARY and HIGHLIGHTS
The City of Hesperia maintains the practice of matching the revenue type to the similar expenditure type. There are two basicrevenue types: one-time revenue and on-going revenue. Contrary to the fiscal practices of the State of California, the City will notuse one-time revenue (i.e. bond proceeds) to pay for on-going expenditures. When compared to the 2007-08 Actual revenue, theoverall combined City revenue for the 2010-11 Budget is expected to decrease from $116.5 million to $108.9 million or by 6% or $7million primarily in the Redevelopment Agency, which is projected to decrease by $23 million or 52%. Likewise, comparing the 2009-10 Budget to the 2010-11 Budget, a decrease from $131.6 million to $108.9 for about $22 million, or 17%, reflecting the effects of thenational mortgage crisis, housing slump, and the current recession and their influence on the 2010-11 Budget, all of which havereduced the City's assessed valuation. There are some large capital project reimbursements that are offsetting the recession's fulleffects on this summary level, primarily the $11.7 million for the Ranchero Road Undercrossing and the $9 million for the High DesertGovernment center reimbursement from the County. Primarily, all development related revenues are down for the 2009-10 Revisedand that condition is carried through into the 2010-11 Budget revenue estimates.
General Fund - General Fund revenue is for the normal operations of and services provided by the City which are not specificallyaccounted for in other funds. The 2010-11 Budget for the General Fund is projecting a decrease in revenues of 9% or $1.9 millionfrom the 2009-10 Budget, primarily because of the following:
The City will start receiving Community Facilities District 2005-1 revenue of $655,878 in the 2010-11 Budget as a offset to other revenue reductions.
Sales and Use Tax revenue is projected to increase 3% or about $0.1 million to just over $5.8 million.Vehicle License Fee revenue is expecting a decrease of $1.5 million or 20% to $6.2 million.Development related revenues including Building Permit Fees, are anticipating a $0.5 million, or a 37% decrease from the 2009-10 Budget estimate.Property Transfer Tax revenue is expecting to reach only $180,000 a decrease of 14% or about $30,000 as a measure of the high level of real estate transactions selling at lower prices.The Rental Housing Inspection Fee, started during 2008-09, is expected to generate $125,000 in the 2010-11 Budget.
●
●
●
●
●
●
Local Transportation Fund (LTF) revenue is expected to decrease by $0.9 million or 64% to $0.5 million from the 2009-10 Budgetof $1.4 million. This large decrease is due to the Victor Valley Transit Authority (VVTA) needing more of this funding source tosupport their operations as the State is changing how it funds transportation programs in FY 2010-11.
The High Desert Government Center is showing reimbursement revenue of $9.0 million for FY 2010-11 as the building is expected to be completed by November 2010.Developer Impact Fee (DIF) for Fire, Police, and Public Safety revenue are expected to decrease 55% or $0.3 million. Thisdecrease in total 2010-11 Budget DIF revenue from 2009-10 Budget DIF revenue reflects the nationwide housing slump shown bythe estimated decrease in single residential building permits from 50 for the 2009-10 Budget to 20 for 2010-11.The CDBG/HOME Housing and Urban Development (HUD) grants are expecting a combined decrease of 18%, or $2.2 million,from the 2009-10 Budget to the 2010-11 Budget of $4.3 million. The primary reason for this decrease is that some of theNeighborhood Stabilization Program (NSP) grant funds were spent in FY 2009-10, which will reduce what is available to draw for2010-11 Budget. This NSP grant is used to buy, rehabilitate, and resell abandoned/foreclosed homes within the City.
Non-Streets Related Other City Funds - This group is comprised of 16 other non-street related funds. Each of these funds receiverevenue that is restricted for specific uses. Some of the major highlights are:
Streets & Transportation Related Funds - This group is comprised of 16 street and transportation related funds. Each of thesefunds receive revenue that is restricted for specific uses. Some of the major highlights are:
Developer Impact Fees (DIF) for Streets and Storm Drain revenue will have decreased 53% or $0.9 million. This decrease in thecombined 2010-11 DIF Budget revenue from the 2009-10 DIF Budget revenue reflects the continued nationwide housing slumpand recession shown by the decrease in single residential building permits from 50 for the 2009-10 Budget, with an estimated 3for the 2009-10 year end and anticipating 20 for the 2010-11 Budget.Combined Measure I (Arterial, Local, and 2010 Renewal) revenue is expected to decrease to $1.8 million or by 40% from the2009-10 Budget of $3.0 million.
C - 3
●
●
Overall Redevelopment Agency revenue is expected to decrease 49% or about $20.1 million from the 2009-10 Budget of $41.0million to the $20.9 million of the 2010-11 Budget, primarily because of the anticipated AB 8 assessed valuation reduction by theCounty.
Water and Sewer Operations - These funds primarily report the City's water and sewer financial operations and are mostassociated with the functions of a traditional business. The revenues received are to pay for the cost of purchasing and distributingthe water and for the treatment of the sewage that comes from those homes/businesses on the City's sewer system. Some of themajor highlights are:
Overall Water District revenue is expected to increase about $0.4 million or 2% from the 2009-10 Revised of $19.5 million to the2010-11 Budget of $19.9 million. Although the Capital and Other revenues of the District are expected to decline $0.6 million, thisis offset by the anticipated $1.0 million of sales revenues increases for the 2010-11 Budget.Water and Sewer operating revenue, dominated by the Sales revenues, are anticipating a 6% and 7% increase, respectively, overthe 2009-10 Revised primarily from the January 2008 approved rate increases. A dramatic reduction of Water Sales revenueoccured in fiscal year 2009-10 compared to fiscal year 2008-09 with a reduction from $9,655,325 to $8,541,573 for an 11.5% or$1,113,752 decrease. The highest estimate of $13.2 million in the 2009-10 Budget was due to complications with the relatedWater Availability Charge and underestimating the impact of conservation, the wet winter, some customers not watering yards
Redevelopment Agency - These funds track the City's redevelopment revenue that is used to eliminate blight within the projectareas, assist in expanding the City's business base, and assist with low and moderate income housing needs for the City. Most all ofthis revenue is derived from property tax increment which has restrictions on use. The 2009-10 Budget was originally estimated at$36,600,000 and then Revised to $26,500,000, representing a decrease of $10.1 million, or 28%. The 2009-10 Revised of $26.5million is $8.1 million, or 24%, less than the $34.6 million 2008-09 Actual. The reduction was primarily due to the reduced assessedvaluation of properties sold in the previous year, however the biggest reason for the reduction in assessed valuation is the CountyAssessor's AB 8 reductions which have lowered valuations to levels prior to 2001.
REVENUE
SUMMARY and HIGHLIGHTS (Continued)
●
●
●●
●
● Community Facilities District 2005-1. Part of the annual assessment includes a public safety portion to offset some of the coststhe residential development places on the City's public safety providers. This revenue has been collected since FY 2006-07 andheld in the trust fund to ensure adequate funding to pay the debt. There are now sufficient funds to start drawing to offset thepublic safety costs of Police and Fire. For the 2010-11 Budget, this revenue is expected to be $536,628.
Paramedic Ambulance fee revenue is expecting no change from the 2009-10 Budget to the 2010-11 Budget at $1.9 million.Redevelopment Tax Increment Pass Through for the 2010-11 Budget is projected to decrease by 51% from the 2009-10 Budget($2.1 million to $1.0 million) and by 34% from the 2009-10 Revised ($1.6 million to $1.0 million). This estimated decrease reflectsthe anticipated affects of an additional county wide valuation decrease. The 2010-11 Budget expects to have $956,727 lessrevenue from Pass Through payments compared to Fiscal Year 2008-09.Community Facilities District 94-1 revenue is expected to increase by $0.1 million, or 23%, from the 2009-10 Budget of $432,000to the 2010-11 Budget of $522,000. The 23% increase from the 2009-10 Budget to the 2009-10 Revised is due to the increasedassessment levy primarily from the new commercial development which opened in the district during 2009-10.
The Water and Sewer Capital revenues are expected to show a decline of 13% and 7%, respectively, from the 2009-10 Revisedwhich reflects the current economic recession and the national housing slump.
Fire District - The revenues for the 2010-11 Budget are projected to be $8.1 million which is $0.8 million or 9% less than the 2009-10 Budget of $8.9 million and a $0.1 million decrease from the 2009-10 Revised; primarily due to the anticipated combined propertytax related revenue decline. Some of the major highlights are:
because of the economy, and finally vacant houses.
Property Tax revenue is projected to decrease by 8% from the 2009-10 Budget ($4.1 million to $3.7 million) by 3% from the 2009-10 Revised ($3.8 million to $3.7 million) and decrease 13% from the 2008-09 Actual or $572,753. The assessed valuation declineand the related flow through of the valuation decrease on property tax revenues will have a negative impact on the Fire District'srevenues for many years.
C - 4
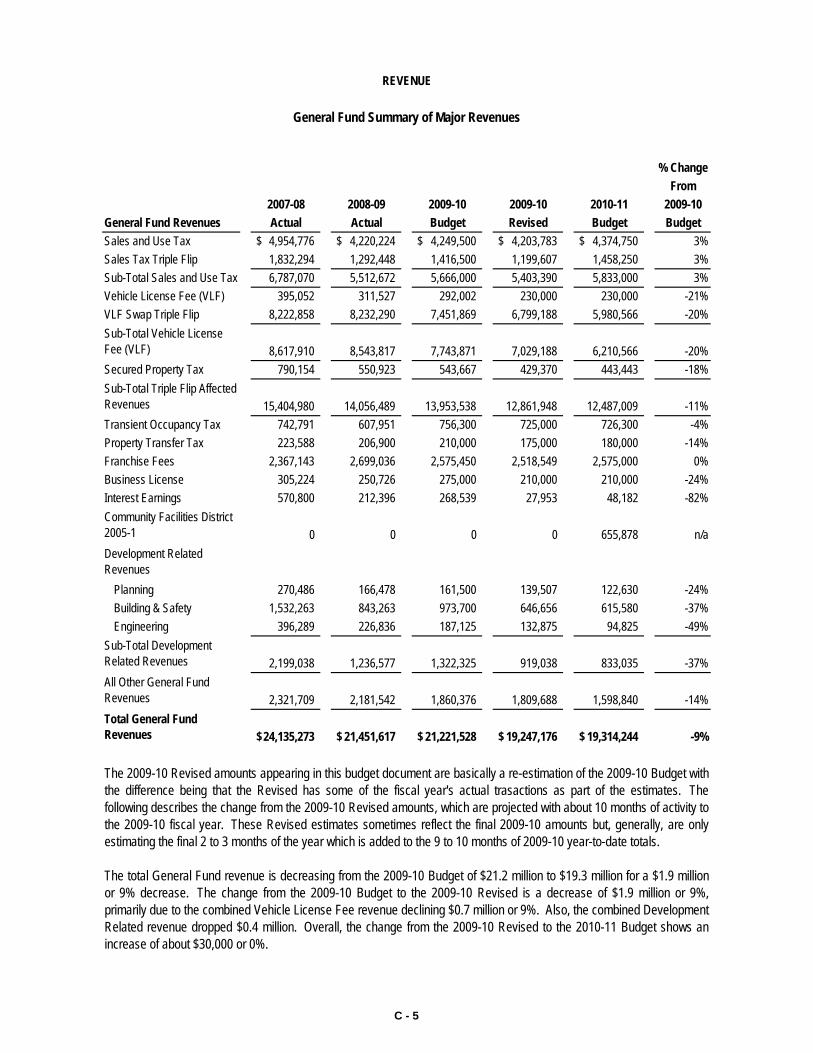
% ChangeFrom
2007-08 2008-09 2009-10 2009-10 2010-11 2009-10General Fund Revenues Actual Actual Budget Revised Budget BudgetSales and Use Tax 4,954,776$ 4,220,224$ 4,249,500$ 4,203,783$ 4,374,750$ 3%Sales Tax Triple Flip 1,832,294 1,292,448 1,416,500 1,199,607 1,458,250 3%Sub-Total Sales and Use Tax 6,787,070 5,512,672 5,666,000 5,403,390 5,833,000 3%Vehicle License Fee (VLF) 395,052 311,527 292,002 230,000 230,000 -21%VLF Swap Triple Flip 8,222,858 8,232,290 7,451,869 6,799,188 5,980,566 -20%Sub-Total Vehicle License Fee (VLF) 8,617,910 8,543,817 7,743,871 7,029,188 6,210,566 -20%Secured Property Tax 790,154 550,923 543,667 429,370 443,443 -18%Sub-Total Triple Flip Affected Revenues 15,404,980 14,056,489 13,953,538 12,861,948 12,487,009 -11%Transient Occupancy Tax 742,791 607,951 756,300 725,000 726,300 -4%Property Transfer Tax 223,588 206,900 210,000 175,000 180,000 -14%Franchise Fees 2,367,143 2,699,036 2,575,450 2,518,549 2,575,000 0%Business License 305,224 250,726 275,000 210,000 210,000 -24%Interest Earnings 570,800 212,396 268,539 27,953 48,182 -82%Community Facilities District 2005-1 0 0 0 0 655,878 n/aDevelopment Related Revenues
Planning 270,486 166,478 161,500 139,507 122,630 -24%Building & Safety 1,532,263 843,263 973,700 646,656 615,580 -37%Engineering 396,289 226,836 187,125 132,875 94,825 -49%
Sub-Total Development Related Revenues 2,199,038 1,236,577 1,322,325 919,038 833,035 -37%All Other General Fund Revenues 2,321,709 2,181,542 1,860,376 1,809,688 1,598,840 -14%Total General Fund Revenues 24,135,273$ 21,451,617$ 21,221,528$ 19,247,176$ 19,314,244$ -9%
REVENUE
The 2009-10 Revised amounts appearing in this budget document are basically a re-estimation of the 2009-10 Budget withthe difference being that the Revised has some of the fiscal year's actual trasactions as part of the estimates. Thefollowing describes the change from the 2009-10 Revised amounts, which are projected with about 10 months of activity tothe 2009-10 fiscal year. These Revised estimates sometimes reflect the final 2009-10 amounts but, generally, are onlyestimating the final 2 to 3 months of the year which is added to the 9 to 10 months of 2009-10 year-to-date totals.
The total General Fund revenue is decreasing from the 2009-10 Budget of $21.2 million to $19.3 million for a $1.9 millionor 9% decrease. The change from the 2009-10 Budget to the 2009-10 Revised is a decrease of $1.9 million or 9%,primarily due to the combined Vehicle License Fee revenue declining $0.7 million or 9%. Also, the combined DevelopmentRelated revenue dropped $0.4 million. Overall, the change from the 2009-10 Revised to the 2010-11 Budget shows anincrease of about $30,000 or 0%.
General Fund Summary of Major Revenues
C - 5
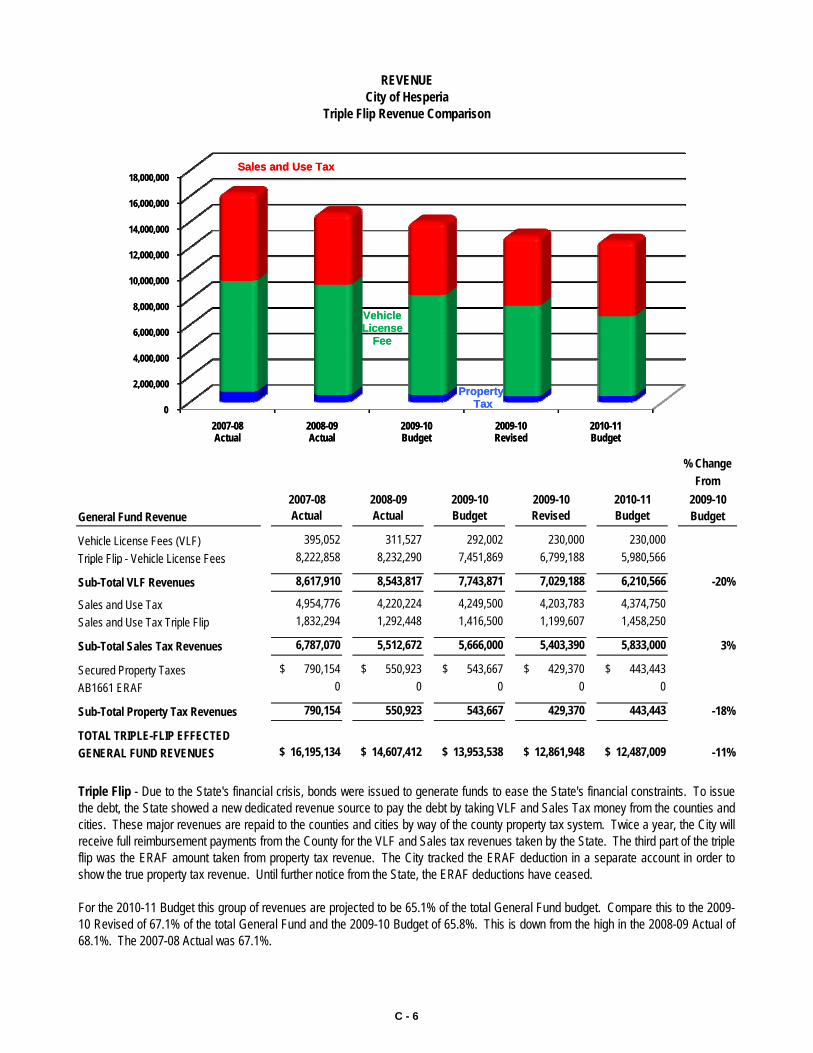
% ChangeFrom
2007-08 2008-09 2009-10 2009-10 2010-11 2009-10General Fund Revenue Actual Actual Budget Revised Budget Budget
Vehicle License Fees (VLF) 395,052 311,527 292,002 230,000 230,000 Triple Flip - Vehicle License Fees 8,222,858 8,232,290 7,451,869 6,799,188 5,980,566
REVENUECity of Hesperia
Triple Flip Revenue Comparison
0
2,000,000
4,000,000
6,000,000
8,000,000
10,000,000
12,000,000
14,000,000
16,000,000
18,000,000
2007-08Actual
2008-09Actual
2009-10Budget
2009-10Revised
2010-11Budget
Sales and Use Tax
VehicleLicense
Fee
PropertyTax
Triple Flip Vehicle License Fees , , , , , , , , , ,
Sub-Total VLF Revenues 8,617,910 8,543,817 7,743,871 7,029,188 6,210,566 -20%
Sales and Use Tax 4,954,776 4,220,224 4,249,500 4,203,783 4,374,750 Sales and Use Tax Triple Flip 1,832,294 1,292,448 1,416,500 1,199,607 1,458,250
Sub-Total Sales Tax Revenues 6,787,070 5,512,672 5,666,000 5,403,390 5,833,000 3%
Secured Property Taxes $ 790,154 $ 550,923 $ 543,667 $ 429,370 $ 443,443 AB1661 ERAF 0 0 0 0 0
Sub-Total Property Tax Revenues 790,154 550,923 543,667 429,370 443,443 -18%
TOTAL TRIPLE-FLIP EFFECTEDGENERAL FUND REVENUES $ 16,195,134 $ 14,607,412 $ 13,953,538 $ 12,861,948 $ 12,487,009 -11%
Triple Flip - Due to the State's financial crisis, bonds were issued to generate funds to ease the State's financial constraints. To issuethe debt, the State showed a new dedicated revenue source to pay the debt by taking VLF and Sales Tax money from the counties andcities. These major revenues are repaid to the counties and cities by way of the county property tax system. Twice a year, the City willreceive full reimbursement payments from the County for the VLF and Sales tax revenues taken by the State. The third part of the tripleflip was the ERAF amount taken from property tax revenue. The City tracked the ERAF deduction in a separate account in order toshow the true property tax revenue. Until further notice from the State, the ERAF deductions have ceased.
For the 2010-11 Budget this group of revenues are projected to be 65.1% of the total General Fund budget. Compare this to the 2009-10 Revised of 67.1% of the total General Fund and the 2009-10 Budget of 65.8%. This is down from the high in the 2008-09 Actual of68.1%. The 2007-08 Actual was 67.1%.
0
2,000,000
4,000,000
6,000,000
8,000,000
10,000,000
12,000,000
14,000,000
16,000,000
18,000,000
2007-08Actual
2008-09Actual
2009-10Budget
2009-10Revised
2010-11Budget
Sales and Use Tax
VehicleLicense
Fee
PropertyTax
C - 6
REVENUECity of Hesperia
Triple Flip Revenue Comparison (Continued)
Secured Property Tax - Property owners pay a basic tax of 1% of their property's valuation to the County annually. Of this 1% tax levy,the City's General Fund receives approximately 1.5 cents of every property tax dollar. The 2010-11 Budget of $443,443 is 18% lowerthan the 2009-10 Budget, a decrease of $100,224. For the 2010-11 Budget, this revenue source is estimated to be 2.3% of the totalGeneral Fund revenues The highest was for the 2007-08 Actual of 3 3% of the total General Fund revenues
Sales and Use Tax - In San Bernardino County, Sales Tax is currently 8.75% on various purchased items, with the City's share being1.00% of the 8.75% (7.00% goes to the State, 0.50% is for Measure I, and 0.25% Local Transportation funding). The combined 2010-11Budget estimate for Sales and Use Tax and the Sales Tax Triple Flip revenues, representing the City's total Sales Tax revenue, is $5.8million or an 8% increase of about $430,000 from the 2009-10 Revised. The $5.8 million of the 2010-11 Budget is about 3%, or about$170,000 more than the 2009-10 Budget estimate. The 1% is similar to the state-wide change in sales tax revenue as projected by theCity's sales tax analysts.
The combined Sales Tax revenue, for the 2010-11 Budget, is 30.4% of the total General Fund estimated revenue. This is the high pointin the presented numbers of this budget document. The lowest point, in the presented data, was the 2008-09 Actual at 25.7% of theGeneral Fund total.
Vehicle License Fee (VLF) - Since the first two years of the State's 'Triple Flip' program, the growth of the City's Triple Flip - VehicleLicense Fees is tied to the City's growth of assessed valuation. Through the 2008-09 Actual, this revenue grew substantially as theCity's increase in assessed valuation reflected the dramatic growth of the housing boom. However, since then, as the assessedvaluation has been lowered by the County's Assessor, this revenue has shrunk at the same pace. The combined 2010-11 Budget forVLF and VLF Swap Triple Flip revenues estimate is $6.2 million, a decrease of $0.8 million or 12% from the 2009-10 Revised. The $6.2million is $1.5 million or 20% less than the 2009-10 Budget.
The combined VLF revenues are 32.4% of the 2010-11 Budget down from the high point of the 2008-09 Actual, which was 39.8% of theGeneral Fund total. The 2009-10 Budget was 36.5% of the General Fund's total estimated revenue.
General Fund revenues. The highest was for the 2007-08 Actual of 3.3% of the total General Fund revenues.
C - 7
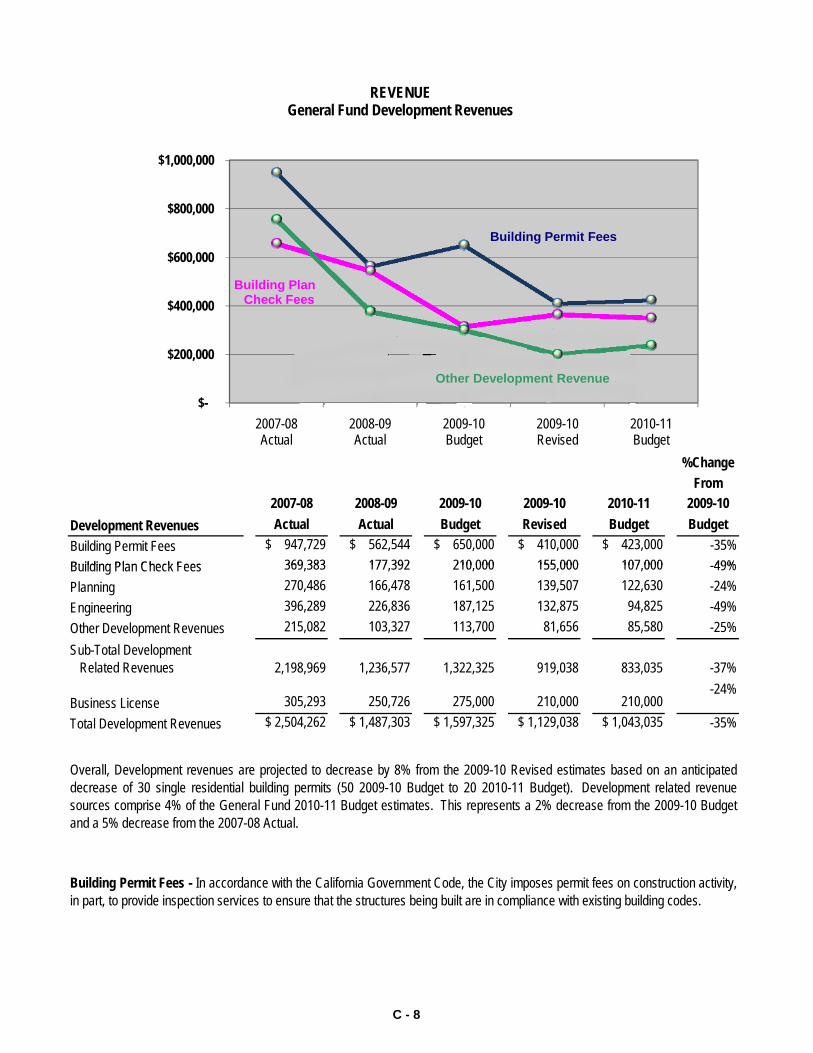
%ChangeFrom
2007-08 2008-09 2009-10 2009-10 2010-11 2009-10Development Revenues Actual Actual Budget Revised Budget BudgetBuilding Permit Fees $ 947,729 $ 562,544 $ 650,000 $ 410,000 $ 423,000 -35%Building Plan Check Fees 369 383 177 392 210 000 155 000 107 000 49%
$-
$200,000
$400,000
$600,000
$800,000
$1,000,000
2007-08Actual
2008-09Actual
2009-10Budget
2009-10Revised
2010-11Budget
REVENUEGeneral Fund Development Revenues
Building Permit Fees
Building Plan Check Fees
Other Development Revenue
Building Plan Check Fees 369,383 177,392 210,000 155,000 107,000 -49%Planning 270,486 166,478 161,500 139,507 122,630 -24%Engineering 396,289 226,836 187,125 132,875 94,825 -49%Other Development Revenues 215,082 103,327 113,700 81,656 85,580 -25%Sub-Total Development Related Revenues 2,198,969 1,236,577 1,322,325 919,038 833,035 -37%
Business License 305,293 250,726 275,000 210,000 210,000 -24%
Total Development Revenues $ 2,504,262 $ 1,487,303 $ 1,597,325 $ 1,129,038 $ 1,043,035 -35%
Building Permit Fees - In accordance with the California Government Code, the City imposes permit fees on construction activity,in part, to provide inspection services to ensure that the structures being built are in compliance with existing building codes.
Overall, Development revenues are projected to decrease by 8% from the 2009-10 Revised estimates based on an anticipateddecrease of 30 single residential building permits (50 2009-10 Budget to 20 2010-11 Budget). Development related revenuesources comprise 4% of the General Fund 2010-11 Budget estimates. This represents a 2% decrease from the 2009-10 Budgetand a 5% decrease from the 2007-08 Actual.
C - 8
Other Development Revenues - This classification captures the remaining development revenues into one group As a group
Building Permit Fees represent 2.2% of the General Fund 2010-11 Budget revenue, which is down from 3.1% for the 2009-10Budget. The 2010-11 Budget revenue projection estimates that 20 single residential building permits will be issued during the newfiscal year. This decline in residential development activity is unprecedented in Hesperia's history. The 2009-10 Revised SingleFamily Residence permits, projected at 3, are down from the 12 issued in FY 2008-09, the 106 issued for FY 2007-08, 634 for FY2006-07, 1,659 for FY 2005-06, 1,263 for FY 2004-05, 1,459 for FY 2003-04, and 736 for FY 2002-03.
Building Plan Check Fees - The purpose of these fees are to offset the cost of verifying that the proposed structures will be incompliance with existing building codes and zoning requirements.
The 2010-11 Budget projects revenue of $107,000, representing a 31% decrease from the 2009-10 Revised estimate reflective ofthe continued stagnation of residential development activity in the City. Compared to the 2007-08 Actual, this revenue hasdecreased by 71% for the General Fund's 2010-11 Budget.
Planning related revenues, excluding the Business License revenue, for the 2010-11 Budget are estimated to be 12% less thanthe 2009-10 Revised and 24% less than the 2009-10 Budget. Planning related revenues for the 2010-11 Budget are projected tobe 26% less than the 2008-09 Actual and 55% less than the 2007-08 Actual.
Engineering related revenues are estimated to be 29% less for than 2009-10 Revised and 49% less than the 2009-10 Budget.Compared to the 2008-09 Actual, these revenues are expected to be 58% less and 76% less than the 2007-08 Actual.
REVENUEGeneral Fund Development Revenues (Continued)
C - 9
Business License - This revenue is paid by each business in the City for doing business in the City. For 2010-11, this revenue isexpecting to decline 24% from the 2009-10 Budget reflecting the closing of some businesses due to the current recession.
Other Development Revenues - This classification captures the remaining development revenues into one group. As a groupthese revenues are 0.4% of the total General Fund 2010-11 Budget. For the 2010-11 Budget, these revenues are projected toincrease by 5% from the 2009-10 Revised, but has decreased by 60% from the 2007-08 Actual.
C - 9
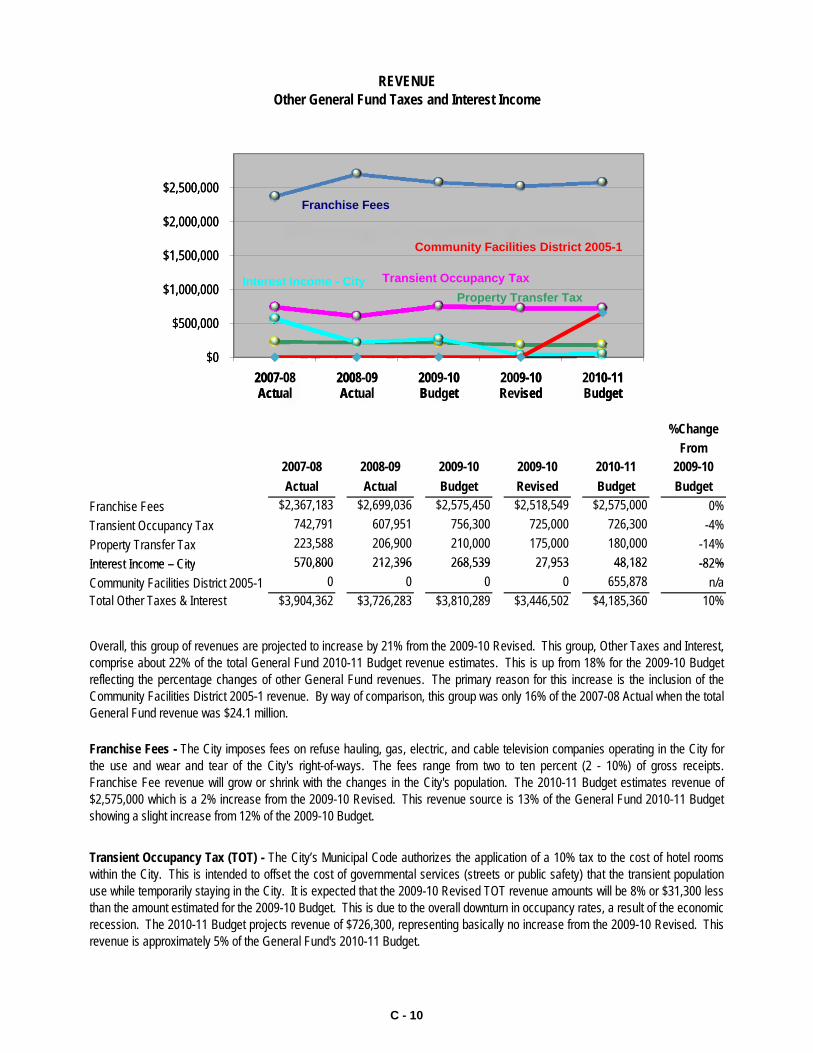
%ChangeFrom
2007-08 2008-09 2009-10 2009-10 2010-11 2009-10Actual Actual Budget Revised Budget Budget
Franchise Fees $2,367,183 $2,699,036 $2,575,450 $2,518,549 $2,575,000 0%Transient Occupancy Tax 742,791 607,951 756,300 725,000 726,300 -4%Property Transfer Tax 223,588 206,900 210,000 175,000 180,000 -14%Interest Income – City 570 800 212 396 268 539 27 953 48 182 -82%
REVENUEOther General Fund Taxes and Interest Income
$0
$500,000
$1,000,000
$1,500,000
$2,000,000
$2,500,000
2007-08Actual
2008-09Actual
2009-10Budget
2009-10Revised
2010-11Budget
Transient Occupancy Tax
Franchise Fees
Property Transfer TaxInterest Income - City
Community Facilities District 2005-1
Interest Income – City 570,800 212,396 268,539 27,953 48,182 -82%Community Facilities District 2005-1 0 0 0 0 655,878 n/aTotal Other Taxes & Interest $3,904,362 $3,726,283 $3,810,289 $3,446,502 $4,185,360 10%
Overall, this group of revenues are projected to increase by 21% from the 2009-10 Revised. This group, Other Taxes and Interest,comprise about 22% of the total General Fund 2010-11 Budget revenue estimates. This is up from 18% for the 2009-10 Budgetreflecting the percentage changes of other General Fund revenues. The primary reason for this increase is the inclusion of theCommunity Facilities District 2005-1 revenue. By way of comparison, this group was only 16% of the 2007-08 Actual when the totalGeneral Fund revenue was $24.1 million.
Franchise Fees - The City imposes fees on refuse hauling, gas, electric, and cable television companies operating in the City forthe use and wear and tear of the City's right-of-ways. The fees range from two to ten percent (2 - 10%) of gross receipts.Franchise Fee revenue will grow or shrink with the changes in the City's population. The 2010-11 Budget estimates revenue of$2,575,000 which is a 2% increase from the 2009-10 Revised. This revenue source is 13% of the General Fund 2010-11 Budgetshowing a slight increase from 12% of the 2009-10 Budget.
Transient Occupancy Tax (TOT) - The City’s Municipal Code authorizes the application of a 10% tax to the cost of hotel roomswithin the City. This is intended to offset the cost of governmental services (streets or public safety) that the transient populationuse while temporarily staying in the City. It is expected that the 2009-10 Revised TOT revenue amounts will be 8% or $31,300 lessthan the amount estimated for the 2009-10 Budget. This is due to the overall downturn in occupancy rates, a result of the economicrecession. The 2010-11 Budget projects revenue of $726,300, representing basically no increase from the 2009-10 Revised. Thisrevenue is approximately 5% of the General Fund's 2010-11 Budget.
$0
$500,000
$1,000,000
$1,500,000
$2,000,000
$2,500,000
2007-08Actual
2008-09Actual
2009-10Budget
2009-10Revised
2010-11Budget
Transient Occupancy Tax
Franchise Fees
Property Transfer TaxInterest Income - City
Community Facilities District 2005-1
C - 10
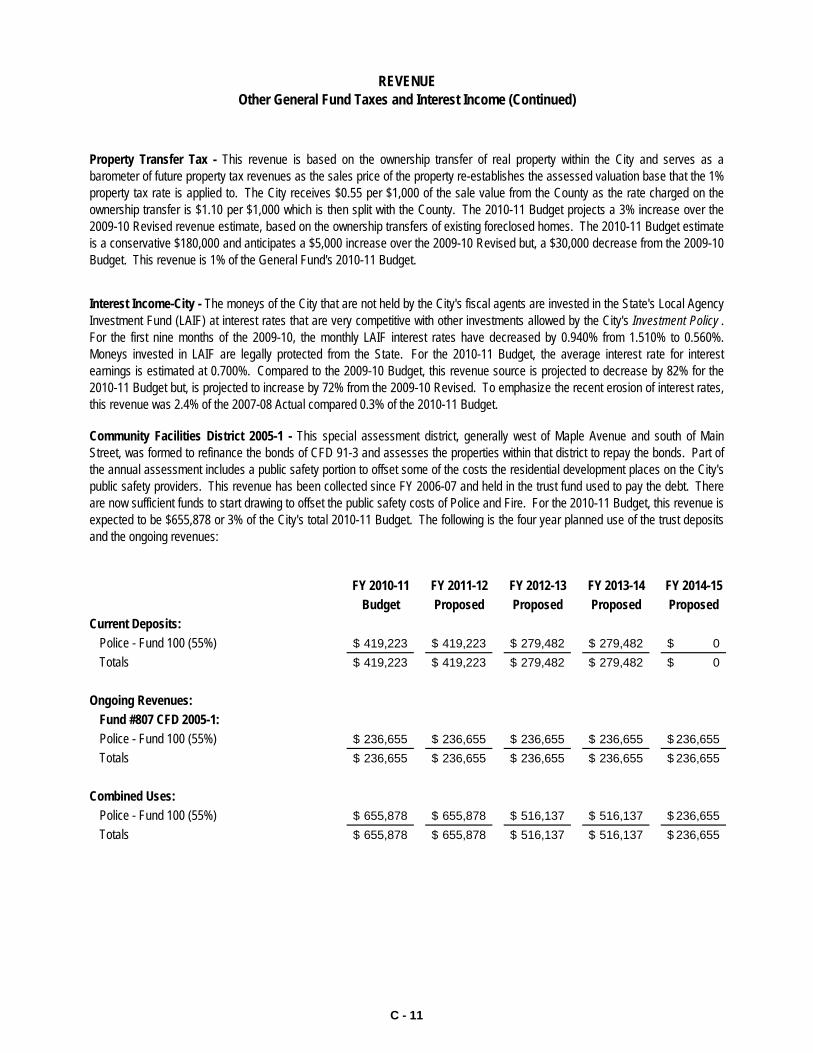
Community Facilities District 2005-1 - This special assessment district, generally west of Maple Avenue and south of MainStreet, was formed to refinance the bonds of CFD 91-3 and assesses the properties within that district to repay the bonds. Part ofthe annual assessment includes a public safety portion to offset some of the costs the residential development places on the City'spublic safety providers. This revenue has been collected since FY 2006-07 and held in the trust fund used to pay the debt. Thereare now sufficient funds to start drawing to offset the public safety costs of Police and Fire. For the 2010-11 Budget, this revenue isexpected to be $655,878 or 3% of the City's total 2010-11 Budget. The following is the four year planned use of the trust depositsand the ongoing revenues:
Property Transfer Tax - This revenue is based on the ownership transfer of real property within the City and serves as abarometer of future property tax revenues as the sales price of the property re-establishes the assessed valuation base that the 1%property tax rate is applied to. The City receives $0.55 per $1,000 of the sale value from the County as the rate charged on theownership transfer is $1.10 per $1,000 which is then split with the County. The 2010-11 Budget projects a 3% increase over the2009-10 Revised revenue estimate, based on the ownership transfers of existing foreclosed homes. The 2010-11 Budget estimateis a conservative $180,000 and anticipates a $5,000 increase over the 2009-10 Revised but, a $30,000 decrease from the 2009-10Budget. This revenue is 1% of the General Fund's 2010-11 Budget.
Interest Income-City - The moneys of the City that are not held by the City's fiscal agents are invested in the State's Local AgencyInvestment Fund (LAIF) at interest rates that are very competitive with other investments allowed by the City's Investment Policy . For the first nine months of the 2009-10, the monthly LAIF interest rates have decreased by 0.940% from 1.510% to 0.560%.Moneys invested in LAIF are legally protected from the State. For the 2010-11 Budget, the average interest rate for interestearnings is estimated at 0.700%. Compared to the 2009-10 Budget, this revenue source is projected to decrease by 82% for the2010-11 Budget but, is projected to increase by 72% from the 2009-10 Revised. To emphasize the recent erosion of interest rates,this revenue was 2.4% of the 2007-08 Actual compared 0.3% of the 2010-11 Budget.
REVENUEOther General Fund Taxes and Interest Income (Continued)
FY 2010-11 FY 2011-12 FY 2012-13 FY 2013-14 FY 2014-15Budget Proposed Proposed Proposed Proposed
Current Deposits:Police - Fund 100 (55%) 419,223$ 419,223$ 279,482$ 279,482$ 0$ Totals 419,223$ 419,223$ 279,482$ 279,482$ 0$
Ongoing Revenues:Fund #807 CFD 2005-1:Police - Fund 100 (55%) 236,655$ 236,655$ 236,655$ 236,655$ 236,655$ Totals 236,655$ 236,655$ 236,655$ 236,655$ 236,655$
Combined Uses:Police - Fund 100 (55%) 655,878$ 655,878$ 516,137$ 516,137$ 236,655$ Totals 655,878$ 655,878$ 516,137$ 516,137$ 236,655$
C - 11
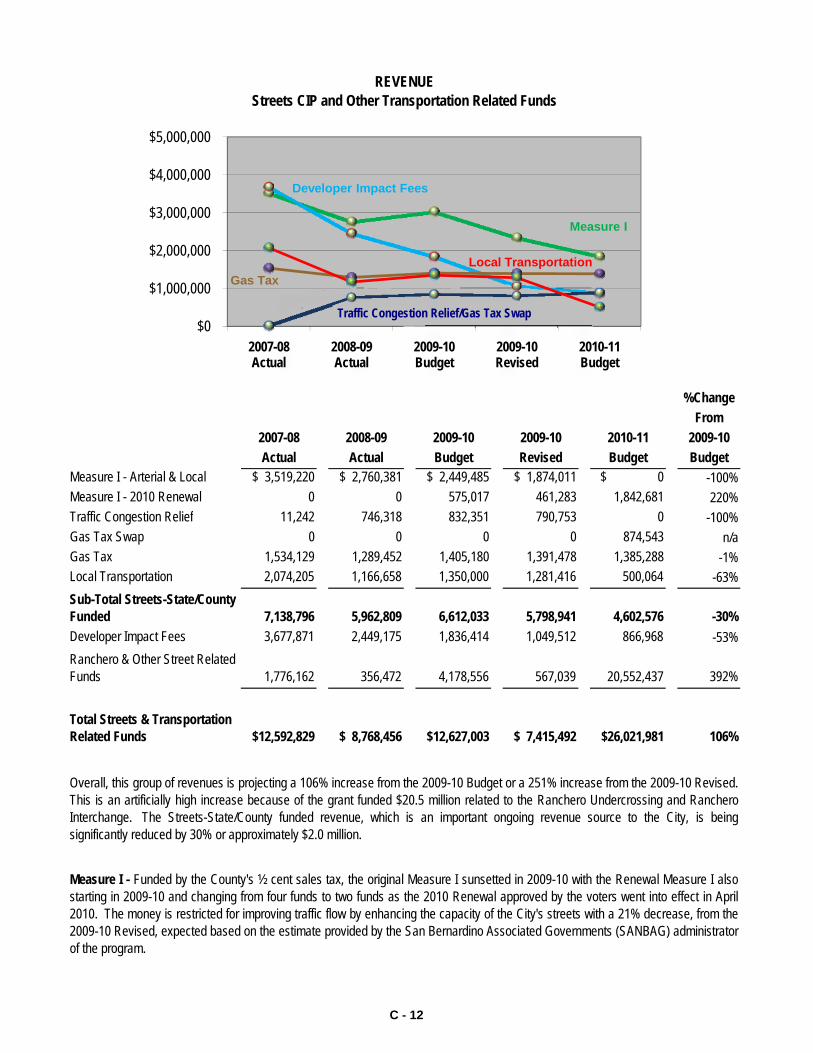
%ChangeFrom
2007-08 2008-09 2009-10 2009-10 2010-11 2009-10Actual Actual Budget Revised Budget Budget
Measure I - Arterial & Local $ 3,519,220 $ 2,760,381 $ 2,449,485 $ 1,874,011 $ 0 -100%Measure I - 2010 Renewal 0 0 575,017 461,283 1,842,681 220%Traffic Congestion Relief 11,242 746,318 832,351 790,753 0 -100%Gas Tax Swap 0 0 0 0 874,543 n/aGas Tax 1,534,129 1,289,452 1,405,180 1,391,478 1,385,288 -1%
REVENUEStreets CIP and Other Transportation Related Funds
$0
$1,000,000
$2,000,000
$3,000,000
$4,000,000
$5,000,000
2007-08Actual
2008-09Actual
2009-10Budget
2009-10Revised
2010-11Budget
Measure I
Traffic Congestion Relief/Gas Tax Swap
Developer Impact Fees
Gas TaxLocal Transportation
, , , , , , , , , ,Local Transportation 2,074,205 1,166,658 1,350,000 1,281,416 500,064 -63%Sub-Total Streets-State/County Funded 7,138,796 5,962,809 6,612,033 5,798,941 4,602,576 -30%Developer Impact Fees 3,677,871 2,449,175 1,836,414 1,049,512 866,968 -53%Ranchero & Other Street Related Funds 1,776,162 356,472 4,178,556 567,039 20,552,437 392%
Total Streets & Transportation Related Funds $12,592,829 $ 8,768,456 $12,627,003 $ 7,415,492 $26,021,981 106%
Overall, this group of revenues is projecting a 106% increase from the 2009-10 Budget or a 251% increase from the 2009-10 Revised.This is an artificially high increase because of the grant funded $20.5 million related to the Ranchero Undercrossing and RancheroInterchange. The Streets-State/County funded revenue, which is an important ongoing revenue source to the City, is beingsignificantly reduced by 30% or approximately $2.0 million.
Measure I - Funded by the County's ½ cent sales tax, the original Measure I sunsetted in 2009-10 with the Renewal Measure I alsostarting in 2009-10 and changing from four funds to two funds as the 2010 Renewal approved by the voters went into effect in April2010. The money is restricted for improving traffic flow by enhancing the capacity of the City's streets with a 21% decrease, from the2009-10 Revised, expected based on the estimate provided by the San Bernardino Associated Governments (SANBAG) administratorof the program.
C - 12
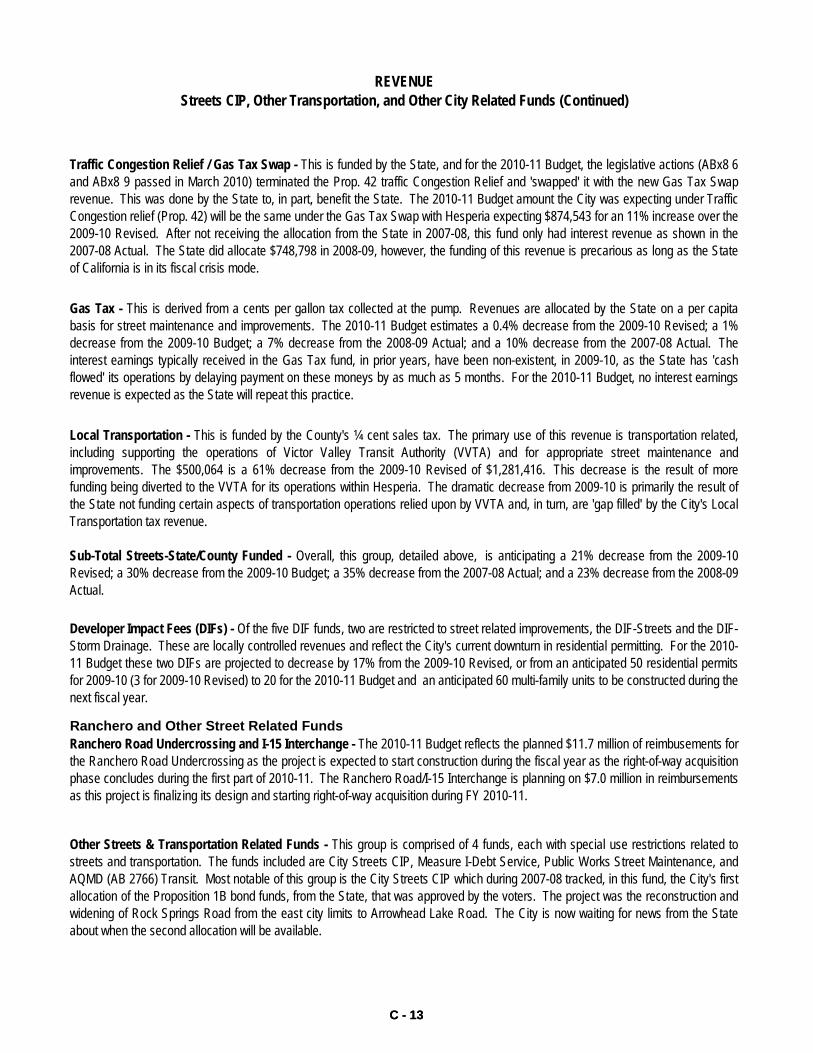
Streets CIP, Other Transportation, and Other City Related Funds (Continued)
Gas Tax - This is derived from a cents per gallon tax collected at the pump. Revenues are allocated by the State on a per capitabasis for street maintenance and improvements. The 2010-11 Budget estimates a 0.4% decrease from the 2009-10 Revised; a 1%decrease from the 2009-10 Budget; a 7% decrease from the 2008-09 Actual; and a 10% decrease from the 2007-08 Actual. Theinterest earnings typically received in the Gas Tax fund, in prior years, have been non-existent, in 2009-10, as the State has 'cashflowed' its operations by delaying payment on these moneys by as much as 5 months. For the 2010-11 Budget, no interest earningsrevenue is expected as the State will repeat this practice.
Local Transportation - This is funded by the County's ¼ cent sales tax. The primary use of this revenue is transportation related,including supporting the operations of Victor Valley Transit Authority (VVTA) and for appropriate street maintenance andimprovements. The $500,064 is a 61% decrease from the 2009-10 Revised of $1,281,416. This decrease is the result of morefunding being diverted to the VVTA for its operations within Hesperia. The dramatic decrease from 2009-10 is primarily the result ofthe State not funding certain aspects of transportation operations relied upon by VVTA and, in turn, are 'gap filled' by the City's LocalTransportation tax revenue.
Sub-Total Streets-State/County Funded - Overall, this group, detailed above, is anticipating a 21% decrease from the 2009-10
REVENUE
Traffic Congestion Relief / Gas Tax Swap - This is funded by the State, and for the 2010-11 Budget, the legislative actions (ABx8 6and ABx8 9 passed in March 2010) terminated the Prop. 42 traffic Congestion Relief and 'swapped' it with the new Gas Tax Swaprevenue. This was done by the State to, in part, benefit the State. The 2010-11 Budget amount the City was expecting under TrafficCongestion relief (Prop. 42) will be the same under the Gas Tax Swap with Hesperia expecting $874,543 for an 11% increase over the2009-10 Revised. After not receiving the allocation from the State in 2007-08, this fund only had interest revenue as shown in the2007-08 Actual. The State did allocate $748,798 in 2008-09, however, the funding of this revenue is precarious as long as the Stateof California is in its fiscal crisis mode.
C - 13
Ranchero and Other Street Related Funds
Other Streets & Transportation Related Funds - This group is comprised of 4 funds, each with special use restrictions related tostreets and transportation. The funds included are City Streets CIP, Measure I-Debt Service, Public Works Street Maintenance, andAQMD (AB 2766) Transit. Most notable of this group is the City Streets CIP which during 2007-08 tracked, in this fund, the City's firstallocation of the Proposition 1B bond funds, from the State, that was approved by the voters. The project was the reconstruction andwidening of Rock Springs Road from the east city limits to Arrowhead Lake Road. The City is now waiting for news from the Stateabout when the second allocation will be available.
Ranchero Road Undercrossing and I-15 Interchange - The 2010-11 Budget reflects the planned $11.7 million of reimbusements forthe Ranchero Road Undercrossing as the project is expected to start construction during the fiscal year as the right-of-way acquisitionphase concludes during the first part of 2010-11. The Ranchero Road/I-15 Interchange is planning on $7.0 million in reimbursementsas this project is finalizing its design and starting right-of-way acquisition during FY 2010-11.
y g p p gRevised; a 30% decrease from the 2009-10 Budget; a 35% decrease from the 2007-08 Actual; and a 23% decrease from the 2008-09Actual.
Developer Impact Fees (DIFs) - Of the five DIF funds, two are restricted to street related improvements, the DIF-Streets and the DIF-Storm Drainage. These are locally controlled revenues and reflect the City's current downturn in residential permitting. For the 2010-11 Budget these two DIFs are projected to decrease by 17% from the 2009-10 Revised, or from an anticipated 50 residential permitsfor 2009-10 (3 for 2009-10 Revised) to 20 for the 2010-11 Budget and an anticipated 60 multi-family units to be constructed during thenext fiscal year.
C - 13
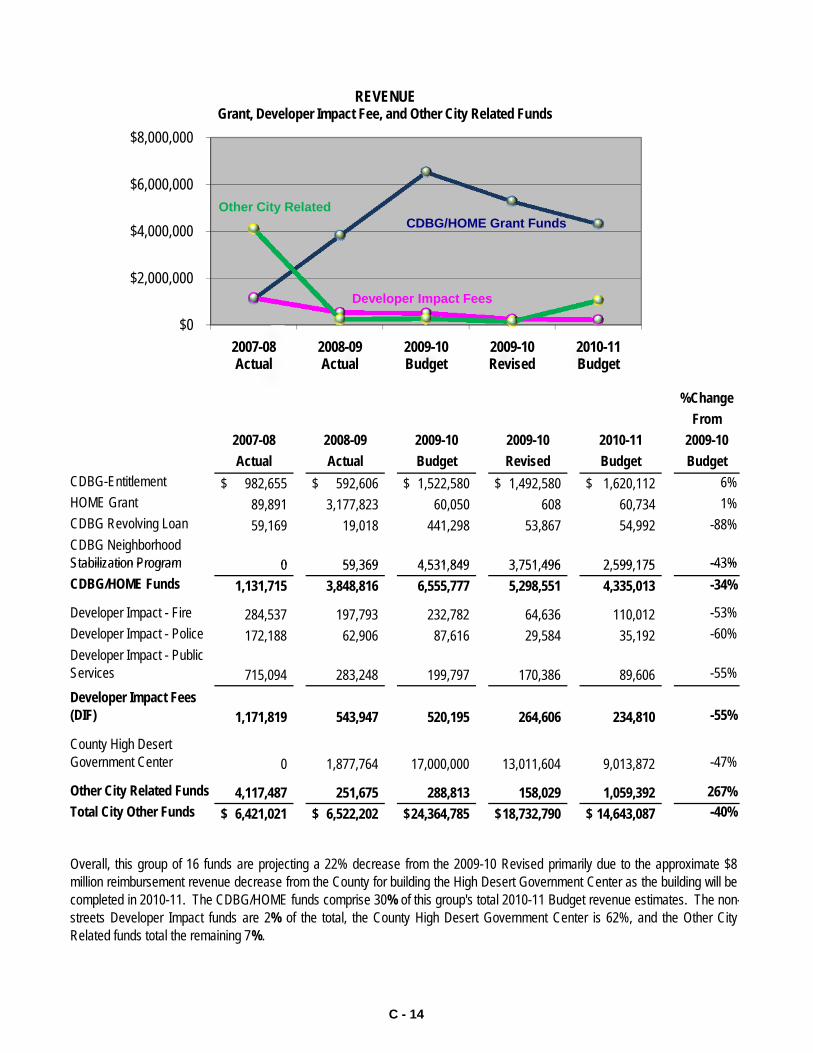
%ChangeFrom
2007-08 2008-09 2009-10 2009-10 2010-11 2009-10Actual Actual Budget Revised Budget Budget
CDBG-Entitlement 982,655$ 592,606$ 1,522,580$ 1,492,580$ 1,620,112$ 6%HOME Grant 89,891 3,177,823 60,050 608 60,734 1%CDBG Revolving Loan 59,169 19,018 441,298 53,867 54,992 -88%CDBG Neighborhood Stabilization Program 0 59 369 4 531 849 3 751 496 2 599 175 -43%
$0
$2,000,000
$4,000,000
$6,000,000
$8,000,000
2007-08Actual
2008-09Actual
2009-10Budget
2009-10Revised
2010-11Budget
REVENUEGrant, Developer Impact Fee, and Other City Related Funds
CDBG/HOME Grant Funds Other City Related
Developer Impact Fees
Stabilization Program 0 59,369 4,531,849 3,751,496 2,599,175 -43%CDBG/HOME Funds 1,131,715 3,848,816 6,555,777 5,298,551 4,335,013 -34%
Developer Impact - Fire 284,537 197,793 232,782 64,636 110,012 -53%Developer Impact - Police 172,188 62,906 87,616 29,584 35,192 -60%Developer Impact - Public Services 715,094 283,248 199,797 170,386 89,606 -55%Developer Impact Fees (DIF) 1,171,819 543,947 520,195 264,606 234,810 -55%
County High Desert Government Center 0 1,877,764 17,000,000 13,011,604 9,013,872 -47%
Other City Related Funds 4,117,487 251,675 288,813 158,029 1,059,392 267%Total City Other Funds 6,421,021$ 6,522,202$ 24,364,785$ 18,732,790$ 14,643,087$ -40%
Overall, this group of 16 funds are projecting a 22% decrease from the 2009-10 Revised primarily due to the approximate $8million reimbursement revenue decrease from the County for building the High Desert Government Center as the building will becompleted in 2010-11. The CDBG/HOME funds comprise 30% of this group's total 2010-11 Budget revenue estimates. The non-streets Developer Impact funds are 2% of the total, the County High Desert Government Center is 62%, and the Other CityRelated funds total the remaining 7%.
C - 14

CDBG/HOME - These are grants received from Housing and Urban Development (HUD) and the State with the purpose ofimproving areas of the City and the supply of low income housing within the City. The 2010-11 Budget is 18% less than the 2009-10 Revised primarily due to less Neighborhood Stabilization Program (NSP) reimbursements available as some were drawnduring 2009-10, which are used to buy, rehabilitate, and resell abandoned/foreclosed homes within the city.
Developer Impact Fees - These non-street related Developer Impact Fees (DIFs) are made up of the Fire, Police, and PublicServices DIF funds. Again, due to the slowdown in residential permitting activity (50 budgeted permits for 2009-10; 3 permits forthe 2009-10 Revised), 2010-11 Budget (anticipating 20 Residential permits) is anticipating a 9% decrease from the 2009-10Revised. The revenue of this group is received at the end of the building process and must be paid before occupancy.
Other City Related Funds - This group of 5 funds make up 7% of the 2010-11 Budget of this Grant, Developer Impact Fee, andOther City Related Funds group. The funds in this group include: the AB3229 Supplemental Law Enforcement grant fund; theEnvironmental Programs grant fund; the Reimbursable Grants fund, the Disaster Preparedness grant fund; the City Debt Servicefund; the Assessment District 91-1 fund; the Community Facilities District 91-3 fund; and the Fire Station Building fund. Each ofthese funds have restrictions limiting how its money can be spent.
REVENUEGrant, Developer Impact Fee, and Other City Related Funds (Continued)
County High Desert Government Center - This fund tracks the reimbursements from the County of San Bernardino for thecosts to build a new 66,700 square feet facility next to the Hesperia Civic Plaza. The approximately $9 million reimbursementrevenue from the County for this project is the primary reason why the overall 2010-11 Budget totals are not showing a greaterdecline from the 2009-10 Budget. The project completion is expected in 2010-11.
C - 15
The largest fund in this group is the Reimbursable Grants fund which is expecting to receive $775,100 from the Federalgovernment in 2010-11. This fund's revenue, a grant, will be used to defray the majority of the costs of the solar panels for theCity's new Police Station.
C - 15
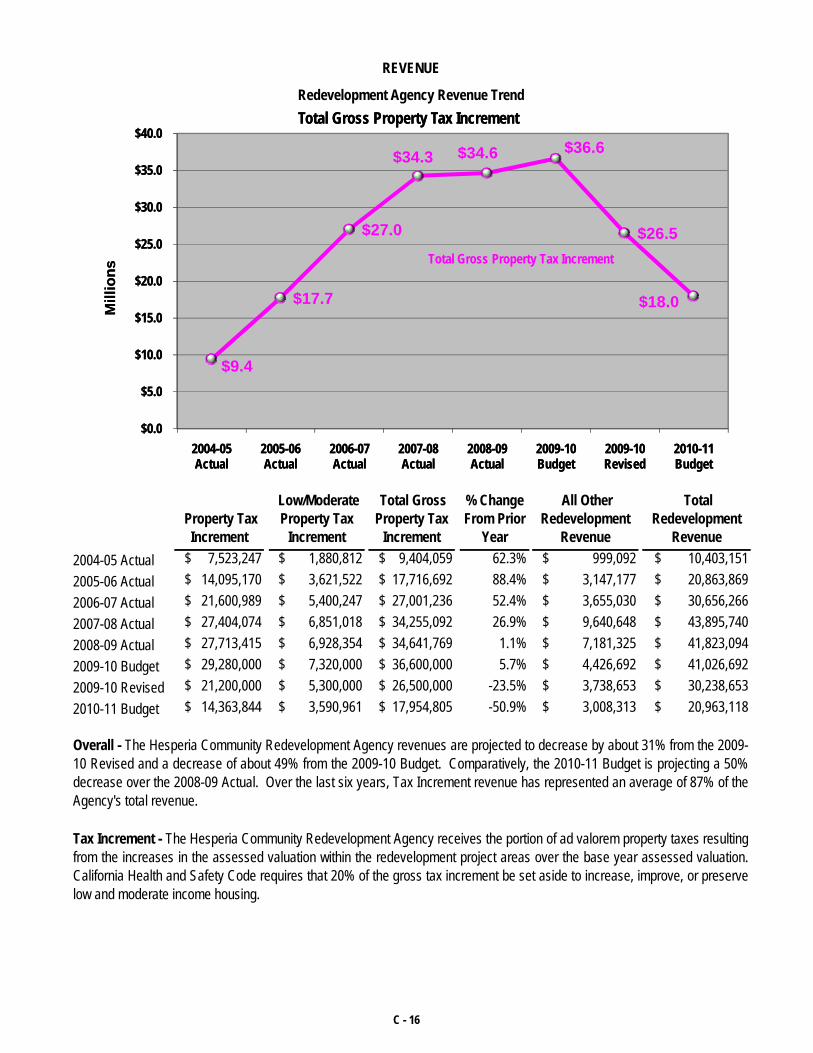
Property Tax Increment
Low/Moderate Property Tax
Increment
Total Gross Property Tax
Increment
% Change From Prior
Year
All Other Redevelopment
Revenue
Total Redevelopment
Revenue
REVENUE
Redevelopment Agency Revenue Trend
$9.4
$17.7
$27.0
$34.3 $34.6 $36.6
$26.5
$18.0
$0.0
$5.0
$10.0
$15.0
$20.0
$25.0
$30.0
$35.0
$40.0
2004-05Actual
2005-06Actual
2006-07Actual
2007-08Actual
2008-09Actual
2009-10Budget
2009-10Revised
2010-11Budget
Mill
ions
Total Gross Property Tax Increment
Total Gross Property Tax Increment
2004-05 Actual $ 7,523,247 $ 1,880,812 $ 9,404,059 62.3% $ 999,092 $ 10,403,151 2005-06 Actual $ 14,095,170 $ 3,621,522 $ 17,716,692 88.4% $ 3,147,177 $ 20,863,869 2006-07 Actual $ 21,600,989 $ 5,400,247 $ 27,001,236 52.4% $ 3,655,030 $ 30,656,266 2007-08 Actual $ 27,404,074 $ 6,851,018 $ 34,255,092 26.9% $ 9,640,648 $ 43,895,740 2008-09 Actual $ 27,713,415 $ 6,928,354 $ 34,641,769 1.1% $ 7,181,325 $ 41,823,094 2009-10 Budget $ 29,280,000 $ 7,320,000 $ 36,600,000 5.7% $ 4,426,692 $ 41,026,692 2009-10 Revised $ 21,200,000 $ 5,300,000 $ 26,500,000 -23.5% $ 3,738,653 $ 30,238,653 2010-11 Budget $ 14,363,844 $ 3,590,961 $ 17,954,805 -50.9% $ 3,008,313 $ 20,963,118
Tax Increment - The Hesperia Community Redevelopment Agency receives the portion of ad valorem property taxes resultingfrom the increases in the assessed valuation within the redevelopment project areas over the base year assessed valuation.California Health and Safety Code requires that 20% of the gross tax increment be set aside to increase, improve, or preservelow and moderate income housing.
Overall - The Hesperia Community Redevelopment Agency revenues are projected to decrease by about 31% from the 2009-10 Revised and a decrease of about 49% from the 2009-10 Budget. Comparatively, the 2010-11 Budget is projecting a 50%decrease over the 2008-09 Actual. Over the last six years, Tax Increment revenue has represented an average of 87% of theAgency's total revenue.
$9.4
$17.7
$27.0
$34.3 $34.6 $36.6
$26.5
$18.0
$0.0
$5.0
$10.0
$15.0
$20.0
$25.0
$30.0
$35.0
$40.0
2004-05Actual
2005-06Actual
2006-07Actual
2007-08Actual
2008-09Actual
2009-10Budget
2009-10Revised
2010-11Budget
Mill
ions
Total Gross Property Tax Increment
Total Gross Property Tax Increment
C - 16
REVENUE
All Other Redevelopment Revenue Composition In Fiscal Year 2010-11 - Interest revenue represents about 8% of therevenue of this group at $242,080. About 13% of this revenue group is Victor Valley Economic Development Authority(VVEDA) tax increment revenue. The Agency is a participating member in a joint powers authority that was formed to create areuse of the former George Air Force Base. This revenue is expected to grow, but at a lesser pace than the Agency's primarytax increment. The majority of this group, at $2 million, is the grant for the City's Industrial Lead Track project. In prior yearsthe primary revenue source of this group has primarily been interest income.
Redevelopment Agency Revenue Trend (Continued)
The 2009-10 Budget was originally estimated at $36,600,000 and then Revised to $26,500,000, representing a decrease of$10.1 million, or 28%. The 2009-10 Revised of $26.5 million is $8.1 million, or 24%, less than the $34.6 million 2008-09Actual. The reduction was primarily due to the reduced assessed valuation of properties sold in the previous year, howeverthe biggest reason for the reduction in assessed valuation is the County Assessor's AB 8 reductions which have loweredvaluations to levels prior to 2001. The 2010-11 Budget projects a 32% decrease in Tax Increment revenue from the 2009-10Revised; a 51% decrease from the 2009-10 Budget; and a 48% decrease from the 2008-09 Actual.
C - 17
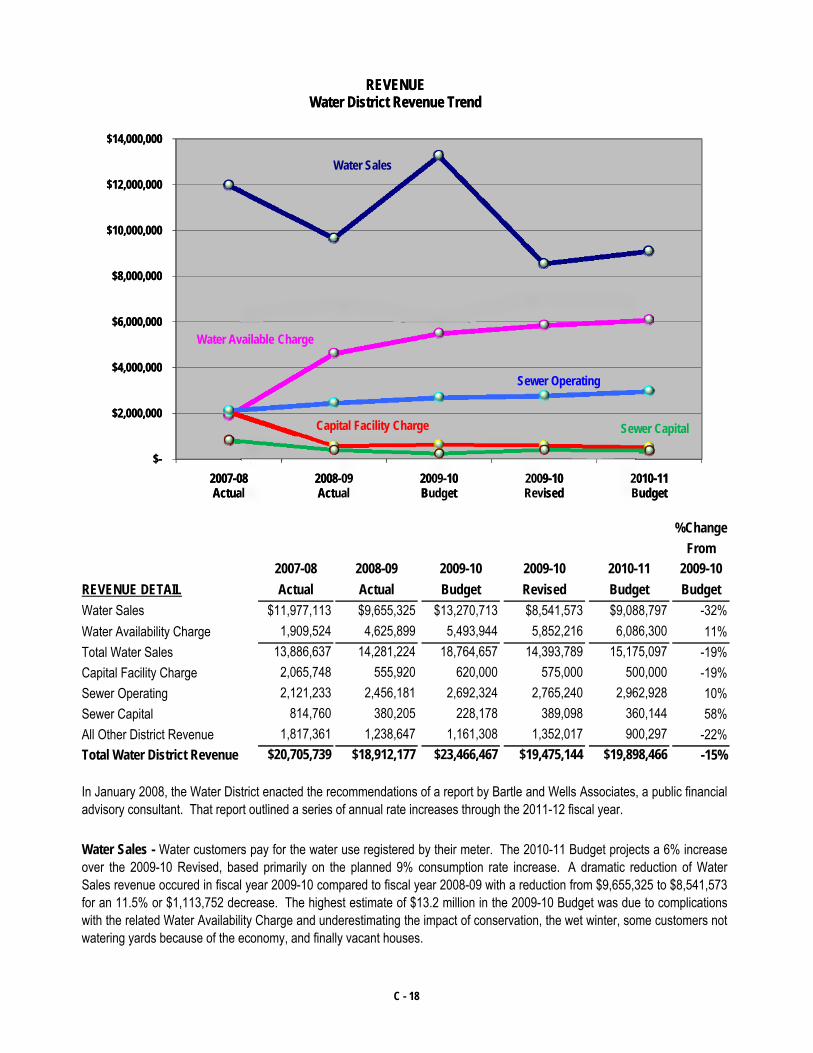
%Change
$-
$2,000,000
$4,000,000
$6,000,000
$8,000,000
$10,000,000
$12,000,000
$14,000,000
2007-08Actual
2008-09Actual
2009-10Budget
2009-10Revised
2010-11Budget
REVENUEWater District Revenue Trend
Sewer Operating
Water Available Charge
Capital Facility Charge
Water Sales
Sewer Capital
From2007-08 2008-09 2009-10 2009-10 2010-11 2009-10
REVENUE DETAIL Actual Actual Budget Revised Budget BudgetWater Sales $11,977,113 $9,655,325 $13,270,713 $8,541,573 $9,088,797 -32%Water Availability Charge 1,909,524 4,625,899 5,493,944 5,852,216 6,086,300 11%Total Water Sales 13,886,637 14,281,224 18,764,657 14,393,789 15,175,097 -19%Capital Facility Charge 2,065,748 555,920 620,000 575,000 500,000 -19%Sewer Operating 2,121,233 2,456,181 2,692,324 2,765,240 2,962,928 10%Sewer Capital 814,760 380,205 228,178 389,098 360,144 58%All Other District Revenue 1,817,361 1,238,647 1,161,308 1,352,017 900,297 -22%Total Water District Revenue $20,705,739 $18,912,177 $23,466,467 $19,475,144 $19,898,466 -15%
In January 2008, the Water District enacted the recommendations of a report by Bartle and Wells Associates, a public financialadvisory consultant. That report outlined a series of annual rate increases through the 2011-12 fiscal year.
Water Sales - Water customers pay for the water use registered by their meter. The 2010-11 Budget projects a 6% increaseover the 2009-10 Revised, based primarily on the planned 9% consumption rate increase. A dramatic reduction of WaterSales revenue occured in fiscal year 2009-10 compared to fiscal year 2008-09 with a reduction from $9,655,325 to $8,541,573for an 11.5% or $1,113,752 decrease. The highest estimate of $13.2 million in the 2009-10 Budget was due to complicationswith the related Water Availability Charge and underestimating the impact of conservation, the wet winter, some customers notwatering yards because of the economy, and finally vacant houses.
$-
$2,000,000
$4,000,000
$6,000,000
$8,000,000
$10,000,000
$12,000,000
$14,000,000
2007-08Actual
2008-09Actual
2009-10Budget
2009-10Revised
2010-11Budget
REVENUEWater District Revenue Trend
Sewer Operating
Water Available Charge
Capital Facility Charge
Water Sales
Sewer Capital
C - 18
Sewer Capital - Like Water Capital, this group of revenue reflects the development activity within the City. However, this isprimarily occuring in the western side of Hesperia. As the 2009-10 Budget anticipated a higher level of development activity,the 2010-11 Budget is expecting revenue that is 58% higher than the 2009-10 Budget.
Sewer Operating - Sewer services are primarily available along the Main Street corridor and the western portion of the Cityand comprises of about 20% of the District's water customers. Overall this group reflects a 7% increase from 2009-10 Revisedattributed to Sewer Billing revenue, in spite of the decrease of development related revenues which are a reflection of theexpected continued housing slump. The primary revenue of this group is Sewer Billing. The Sewer Billing revenue is expectedto reach $2,962,928 in the 2010-11 Budget, an increase of $197,688 or 7% over the 2009-10 Revised amount of $2,765,240.
Water Availability Charge - This is a standard charge on a customer's bill based on the size of the water meter at the serviceaddress. The meters range in size from ⅝ inch to 8 inches. The 2010-11 Budget projects a 4% increase from the 2009-10Revised, primarily due to a planned rate increase of 4%.
Capital Facility Charge - This is the charge for new water installations based on the set-up of new services. The graph on thepreceeding page shows the decline in development activity reflected by this revenue source (the red line). The 2010-11Budget projects a 19% decrease from the 2009-10 Budget, based on an anticipated reduction in development activity fromabout 200 permits (50 Single Family Residential (SFR) and 150 Multi-Family Residential (MFR)) in FY 2009-10 to 80 (20 SFRand 60 MFR) in FY 2010-11. The 2009-10 Revised development activity is expecting 3 SFR permits issued.
REVENUEWater District Revenue Trend (Continued)
All Other District Revenue - This group is the remainder of the Water District Operating and Capital revenue of whichproperty rental revenue and property tax revenue are 53% of this group and are projected to be $477,153 a decrease of 16%from the 2009-10 Budget. However, this group is projected to decrease by 35% from the 2009-10 Revised. This group isprojected to decrease by $491,303 from the 2009-10 Revised to the 2010-11 Budget primarily due to: Grants declining by$207,000 and Miscellaneous Revenue declining by $197,000 highlighted by a one-time electricity refund.
C - 19
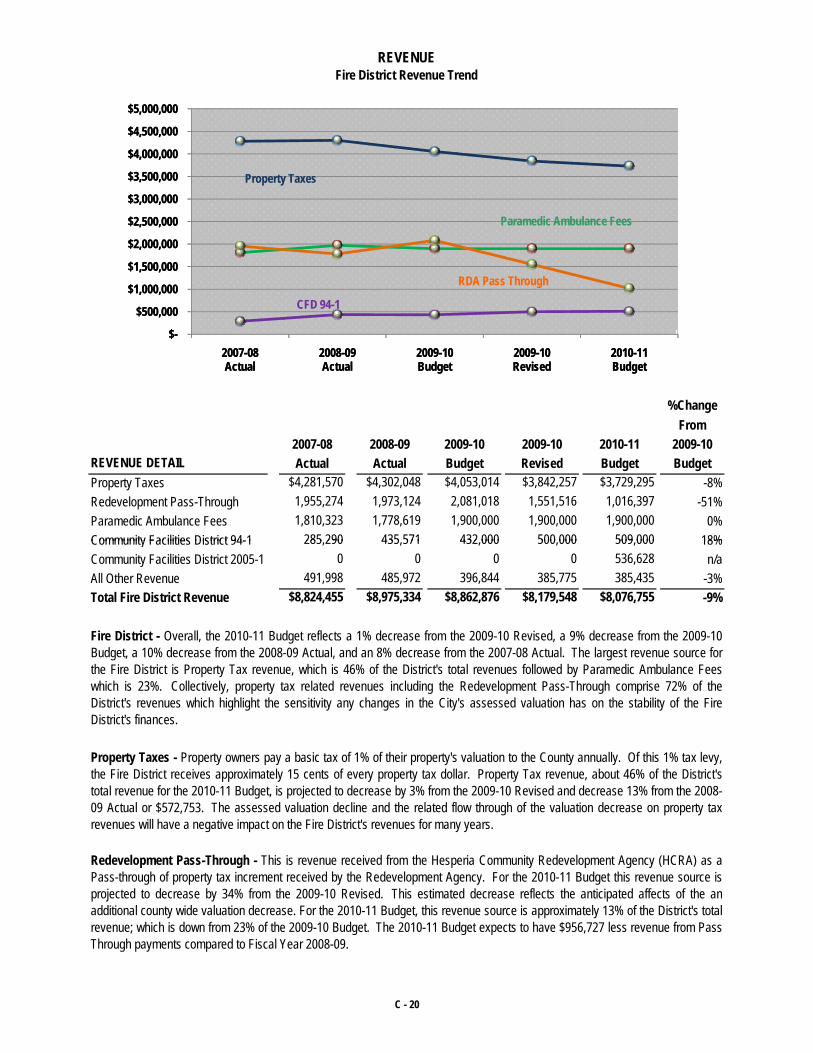
%ChangeFrom
2007-08 2008-09 2009-10 2009-10 2010-11 2009-10REVENUE DETAIL Actual Actual Budget Revised Budget BudgetProperty Taxes $4,281,570 $4,302,048 $4,053,014 $3,842,257 $3,729,295 -8%Redevelopment Pass-Through 1,955,274 1,973,124 2,081,018 1,551,516 1,016,397 -51%Paramedic Ambulance Fees 1,810,323 1,778,619 1,900,000 1,900,000 1,900,000 0%Community Facilities District 94-1 285 290 435 571 432 000 500 000 509 000 18%
REVENUEFire District Revenue Trend
$-
$500,000
$1,000,000
$1,500,000
$2,000,000
$2,500,000
$3,000,000
$3,500,000
$4,000,000
$4,500,000
$5,000,000
2007-08Actual
2008-09Actual
2009-10Budget
2009-10Revised
2010-11Budget
Property Taxes
RDA Pass Through
Paramedic Ambulance Fees
CFD 94-1
Community Facilities District 94-1 285,290 435,571 432,000 500,000 509,000 18%Community Facilities District 2005-1 0 0 0 0 536,628 n/aAll Other Revenue 491,998 485,972 396,844 385,775 385,435 -3%Total Fire District Revenue $8,824,455 $8,975,334 $8,862,876 $8,179,548 $8,076,755 -9%
Property Taxes - Property owners pay a basic tax of 1% of their property's valuation to the County annually. Of this 1% tax levy,the Fire District receives approximately 15 cents of every property tax dollar. Property Tax revenue, about 46% of the District'stotal revenue for the 2010-11 Budget, is projected to decrease by 3% from the 2009-10 Revised and decrease 13% from the 2008-09 Actual or $572,753. The assessed valuation decline and the related flow through of the valuation decrease on property taxrevenues will have a negative impact on the Fire District's revenues for many years.
Fire District - Overall, the 2010-11 Budget reflects a 1% decrease from the 2009-10 Revised, a 9% decrease from the 2009-10Budget, a 10% decrease from the 2008-09 Actual, and an 8% decrease from the 2007-08 Actual. The largest revenue source forthe Fire District is Property Tax revenue, which is 46% of the District's total revenues followed by Paramedic Ambulance Feeswhich is 23%. Collectively, property tax related revenues including the Redevelopment Pass-Through comprise 72% of theDistrict's revenues which highlight the sensitivity any changes in the City's assessed valuation has on the stability of the FireDistrict's finances.
Redevelopment Pass-Through - This is revenue received from the Hesperia Community Redevelopment Agency (HCRA) as aPass-through of property tax increment received by the Redevelopment Agency. For the 2010-11 Budget this revenue source isprojected to decrease by 34% from the 2009-10 Revised. This estimated decrease reflects the anticipated affects of the anadditional county wide valuation decrease. For the 2010-11 Budget, this revenue source is approximately 13% of the District's totalrevenue; which is down from 23% of the 2009-10 Budget. The 2010-11 Budget expects to have $956,727 less revenue from PassThrough payments compared to Fiscal Year 2008-09.
$-
$500,000
$1,000,000
$1,500,000
$2,000,000
$2,500,000
$3,000,000
$3,500,000
$4,000,000
$4,500,000
$5,000,000
2007-08Actual
2008-09Actual
2009-10Budget
2009-10Revised
2010-11Budget
Property Taxes
RDA Pass Through
Paramedic Ambulance Fees
CFD 94-1
C - 20
FY 2010-11 FY 2011-12 FY 2012-13 FY 2013-14 FY 2014-15Budget Proposed Proposed Proposed Proposed
Current Deposits:
REVENUE
Community Facilities District 2005-1 - This special assessment district, generally west of Maple Avenue and south of MainStreet, was formed to refinance the bonds of CFD 91-3 and assesses the properties within that district to repay the bonds. Part ofthe annual assessment includes a public safety portion to offset some of the costs the residential development places on the City'spublic safety providers. This revenue has been collected since FY 2006-07 and held in the trust fund used to pay the debt. Thereare now sufficient funds to start drawing to offset the public safety costs of Police and Fire. For the 2010-11 Budget, this revenueis expected to be $536,628 or 7% of the District's total 2010-11 Budget. The following is the four year planned use of the trustdeposits and the ongoing revenues:
Community Facilities District 94-1 - This special assessment district, generally west of Maple Avenue, was formed to assessnew development for the increased cost burden on the Fire District for providing service. For the 2010-11 Budget, this revenue isexpected to increase by 2% over the 2009-10 Revised and 18% over the 2009-10 Budget because of the timing difference between preparing the budget and preparing the annual assessment levy which, for 2009-10, reflects additions to a large retail center withinthe Assessment District. This revenue source comprises 6% of the District's revenue for the 2010-11 Budget.
Paramedic Ambulance Fees - This is revenue received from ambulance transportation billing. The 2010-11 Budget estimates nogrowth from the 2009-10 Revised. In light of the new National Healthcare Law, the impact remains to be seen on this revenue andhow its affect on Medicare billing/rates. Therefore, the 2010-11 Budget estimate is $1.9 million. Because of the decrease ofproperty tax related revenues, this revenue source has grown to 23% of the District's total revenue, up from 21% of the 2009-10Budget.
Fire District Revenue Trend
Fire - Fund 200 (45%) 343,001$ 343,001$ 228,667$ 228,667$ 0$ Totals 343,001$ 343,001$ 228,667$ 228,667$ 0$
Ongoing Revenues:Fund #807 CFD 2005-1:Fire (45%) 193,627$ 193,627$ 193,627$ 193,627$ 193,627$ Totals 193,627$ 193,627$ 193,627$ 193,627$ 193,627$
Combined Uses:Fire - Fund 200 (45%) 536,628$ 536,628$ 422,294$ 422,294$ 193,627$ Totals 536,628$ 536,628$ 422,294$ 422,294$ 193,627$
All Other Revenue - This group of revenues comprise 5% of the District's 2010-11 Budget. The single largest revenue is thereimbursement of running the household hazardous waste center paid by Advance Disposal. Other revenues in this group arethose related to fire prevention, fire inspections, others related to the ambulance function, and interest earnings.
C - 21
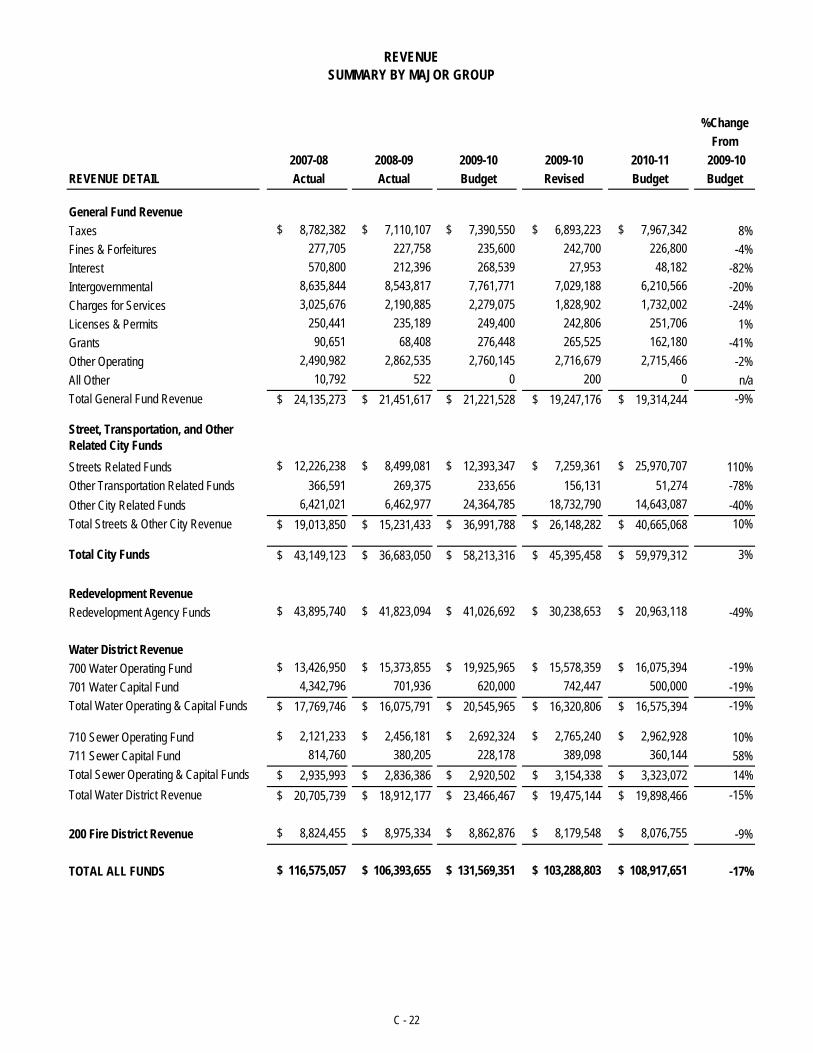
%ChangeFrom
2007-08 2008-09 2009-10 2009-10 2010-11 2009-10 REVENUE DETAIL Actual Actual Budget Revised Budget Budget
General Fund RevenueTaxes $ 8,782,382 $ 7,110,107 $ 7,390,550 $ 6,893,223 $ 7,967,342 8%Fines & Forfeitures 277,705 227,758 235,600 242,700 226,800 -4%Interest 570,800 212,396 268,539 27,953 48,182 -82%Intergovernmental 8,635,844 8,543,817 7,761,771 7,029,188 6,210,566 -20%Charges for Services 3,025,676 2,190,885 2,279,075 1,828,902 1,732,002 -24%Licenses & Permits 250,441 235,189 249,400 242,806 251,706 1%Grants 90,651 68,408 276,448 265,525 162,180 -41%Other Operating 2,490,982 2,862,535 2,760,145 2,716,679 2,715,466 -2%All Other 10,792 522 0 200 0 n/aTotal General Fund Revenue $ 24,135,273 $ 21,451,617 $ 21,221,528 $ 19,247,176 $ 19,314,244 -9%
Street, Transportation, and Other Related City FundsStreets Related Funds $ 12,226,238 $ 8,499,081 $ 12,393,347 $ 7,259,361 $ 25,970,707 110%Other Transportation Related Funds 366,591 269,375 233,656 156,131 51,274 -78%Other City Related Funds 6,421,021 6,462,977 24,364,785 18,732,790 14,643,087 -40%Total Streets & Other City Revenue $ 19,013,850 $ 15,231,433 $ 36,991,788 $ 26,148,282 $ 40,665,068 10%
REVENUESUMMARY BY MAJOR GROUP
Total City Funds $ 43,149,123 $ 36,683,050 $ 58,213,316 $ 45,395,458 $ 59,979,312 3%
Redevelopment RevenueRedevelopment Agency Funds $ 43,895,740 $ 41,823,094 $ 41,026,692 $ 30,238,653 $ 20,963,118 -49%
Water District Revenue700 Water Operating Fund $ 13,426,950 $ 15,373,855 $ 19,925,965 $ 15,578,359 $ 16,075,394 -19%701 Water Capital Fund 4,342,796 701,936 620,000 742,447 500,000 -19%Total Water Operating & Capital Funds $ 17,769,746 $ 16,075,791 $ 20,545,965 $ 16,320,806 $ 16,575,394 -19%
710 Sewer Operating Fund $ 2,121,233 $ 2,456,181 $ 2,692,324 $ 2,765,240 $ 2,962,928 10%711 Sewer Capital Fund 814,760 380,205 228,178 389,098 360,144 58%Total Sewer Operating & Capital Funds $ 2,935,993 $ 2,836,386 $ 2,920,502 $ 3,154,338 $ 3,323,072 14%Total Water District Revenue $ 20,705,739 $ 18,912,177 $ 23,466,467 $ 19,475,144 $ 19,898,466 -15%
200 Fire District Revenue $ 8,824,455 $ 8,975,334 $ 8,862,876 $ 8,179,548 $ 8,076,755 -9%
TOTAL ALL FUNDS $ 116,575,057 $ 106,393,655 $ 131,569,351 $ 103,288,803 $ 108,917,651 -17%
C - 22
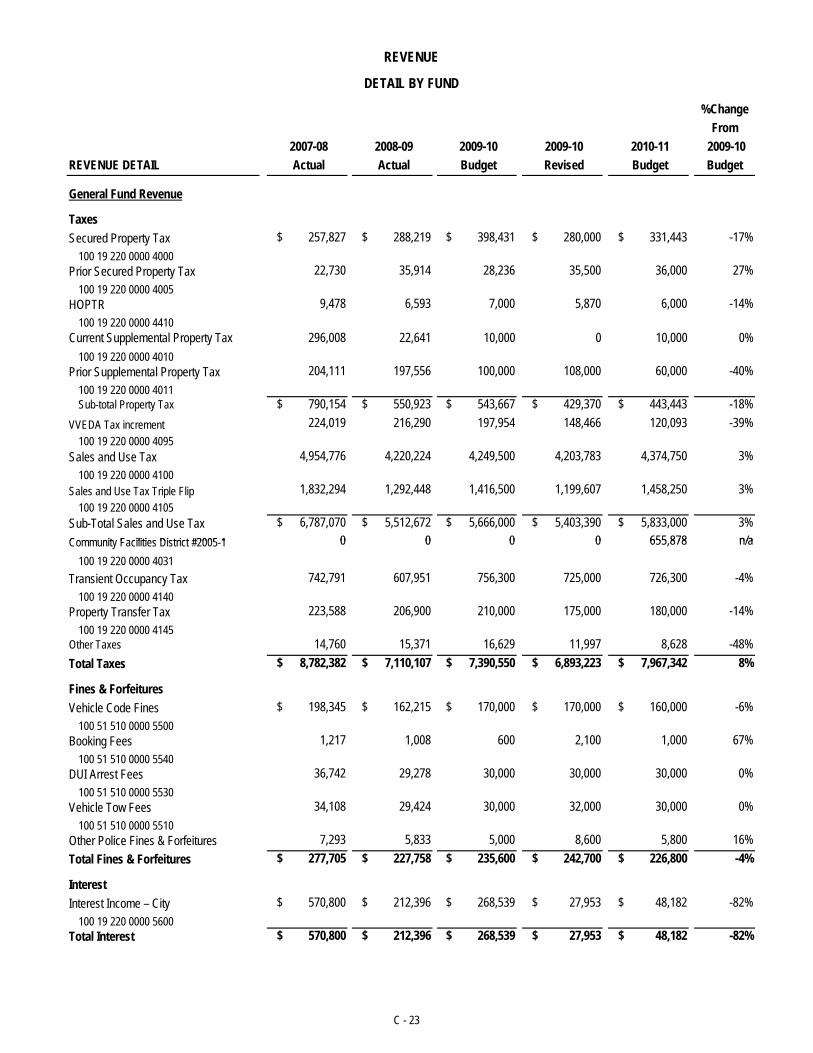
%ChangeFrom
2007-08 2008-09 2009-10 2009-10 2010-11 2009-10 REVENUE DETAIL Actual Actual Budget Revised Budget Budget
General Fund Revenue
TaxesSecured Property Tax $ 257,827 $ 288,219 $ 398,431 $ 280,000 $ 331,443 -17%
100 19 220 0000 4000Prior Secured Property Tax 22,730 35,914 28,236 35,500 36,000 27%
100 19 220 0000 4005HOPTR 9,478 6,593 7,000 5,870 6,000 -14%
100 19 220 0000 4410Current Supplemental Property Tax 296,008 22,641 10,000 0 10,000 0%
100 19 220 0000 4010Prior Supplemental Property Tax 204,111 197,556 100,000 108,000 60,000 -40%
100 19 220 0000 4011Sub-total Property Tax $ 790,154 $ 550,923 $ 543,667 $ 429,370 $ 443,443 -18%
VVEDA Tax increment 224,019 216,290 197,954 148,466 120,093 -39%100 19 220 0000 4095
Sales and Use Tax 4,954,776 4,220,224 4,249,500 4,203,783 4,374,750 3%100 19 220 0000 4100
Sales and Use Tax Triple Flip 1,832,294 1,292,448 1,416,500 1,199,607 1,458,250 3%100 19 220 0000 4105
Sub-Total Sales and Use Tax $ 6,787,070 $ 5,512,672 $ 5,666,000 $ 5,403,390 $ 5,833,000 3%Community Facilities District #2005 1 0 0 0 0 655 878 n/a
DETAIL BY FUND
REVENUE
Community Facilities District #2005-1 0 0 0 0 655,878 n/a100 19 220 0000 4031
Transient Occupancy Tax 742,791 607,951 756,300 725,000 726,300 -4%100 19 220 0000 4140
Property Transfer Tax 223,588 206,900 210,000 175,000 180,000 -14%100 19 220 0000 4145
Other Taxes 14,760 15,371 16,629 11,997 8,628 -48%Total Taxes $ 8,782,382 $ 7,110,107 $ 7,390,550 $ 6,893,223 $ 7,967,342 8%
Fines & ForfeituresVehicle Code Fines $ 198,345 $ 162,215 $ 170,000 $ 170,000 $ 160,000 -6%
100 51 510 0000 5500Booking Fees 1,217 1,008 600 2,100 1,000 67%
100 51 510 0000 5540DUI Arrest Fees 36,742 29,278 30,000 30,000 30,000 0%
100 51 510 0000 5530Vehicle Tow Fees 34,108 29,424 30,000 32,000 30,000 0%
100 51 510 0000 5510Other Police Fines & Forfeitures 7,293 5,833 5,000 8,600 5,800 16%Total Fines & Forfeitures $ 277,705 $ 227,758 $ 235,600 $ 242,700 $ 226,800 -4%
InterestInterest Income – City $ 570,800 $ 212,396 $ 268,539 $ 27,953 $ 48,182 -82%
100 19 220 0000 5600Total Interest $ 570,800 $ 212,396 $ 268,539 $ 27,953 $ 48,182 -82%
C - 23
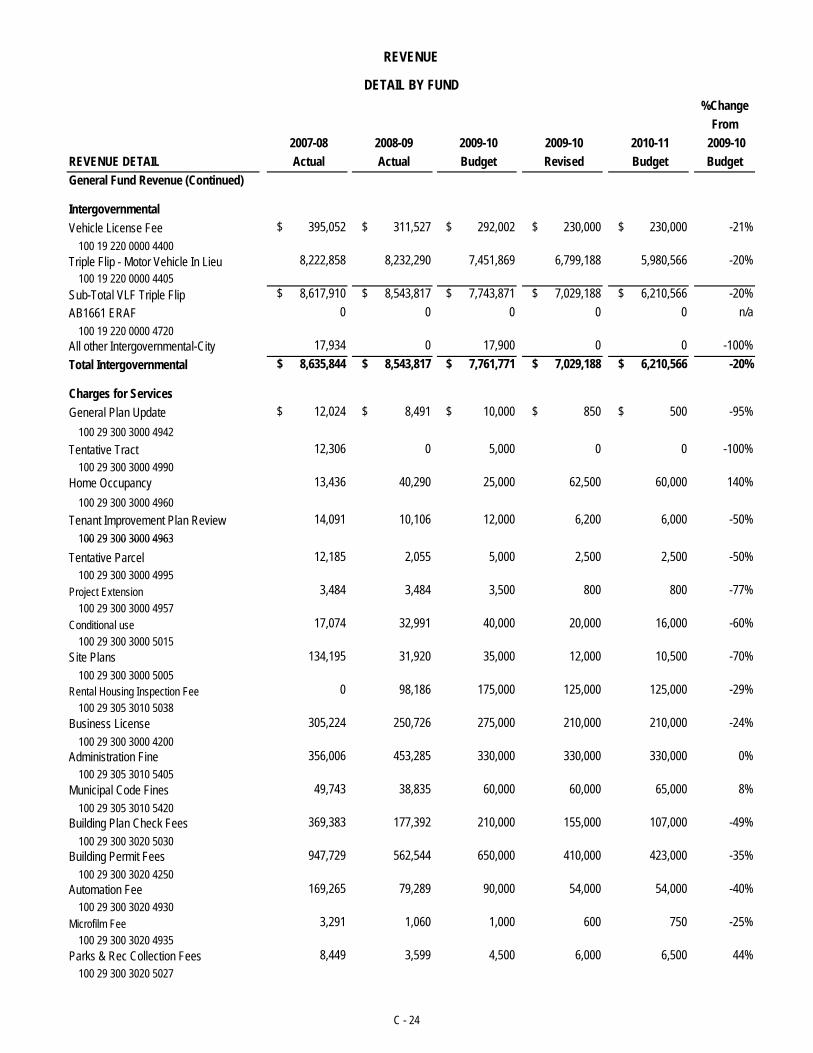
%ChangeFrom
2007-08 2008-09 2009-10 2009-10 2010-11 2009-10 REVENUE DETAIL Actual Actual Budget Revised Budget Budget
IntergovernmentalVehicle License Fee $ 395,052 $ 311,527 $ 292,002 $ 230,000 $ 230,000 -21%
100 19 220 0000 4400Triple Flip - Motor Vehicle In Lieu 8,222,858 8,232,290 7,451,869 6,799,188 5,980,566 -20%
100 19 220 0000 4405Sub-Total VLF Triple Flip $ 8,617,910 $ 8,543,817 $ 7,743,871 $ 7,029,188 $ 6,210,566 -20%AB1661 ERAF 0 0 0 0 0 n/a
100 19 220 0000 4720All other Intergovernmental-City 17,934 0 17,900 0 0 -100%Total Intergovernmental $ 8,635,844 $ 8,543,817 $ 7,761,771 $ 7,029,188 $ 6,210,566 -20%
Charges for ServicesGeneral Plan Update $ 12,024 $ 8,491 $ 10,000 $ 850 $ 500 -95%
100 29 300 3000 4942Tentative Tract 12,306 0 5,000 0 0 -100%
100 29 300 3000 4990Home Occupancy 13,436 40,290 25,000 62,500 60,000 140%
100 29 300 3000 4960Tenant Improvement Plan Review 14,091 10,106 12,000 6,200 6,000 -50%
100 29 300 3000 4963
DETAIL BY FUND
General Fund Revenue (Continued)
REVENUE
100 29 300 3000 4963Tentative Parcel 12,185 2,055 5,000 2,500 2,500 -50%
100 29 300 3000 4995Project Extension 3,484 3,484 3,500 800 800 -77%
100 29 300 3000 4957Conditional use 17,074 32,991 40,000 20,000 16,000 -60%
100 29 300 3000 5015Site Plans 134,195 31,920 35,000 12,000 10,500 -70%
100 29 300 3000 5005Rental Housing Inspection Fee 0 98,186 175,000 125,000 125,000 -29%
100 29 305 3010 5038Business License 305,224 250,726 275,000 210,000 210,000 -24%
100 29 300 3000 4200Administration Fine 356,006 453,285 330,000 330,000 330,000 0%
100 29 305 3010 5405Municipal Code Fines 49,743 38,835 60,000 60,000 65,000 8%
100 29 305 3010 5420Building Plan Check Fees 369,383 177,392 210,000 155,000 107,000 -49%
100 29 300 3020 5030Building Permit Fees 947,729 562,544 650,000 410,000 423,000 -35%
100 29 300 3020 4250Automation Fee 169,265 79,289 90,000 54,000 54,000 -40%
100 29 300 3020 4930Microfilm Fee 3,291 1,060 1,000 600 750 -25%
100 29 300 3020 4935Parks & Rec Collection Fees 8,449 3,599 4,500 6,000 6,500 44%
100 29 300 3020 5027
C - 24
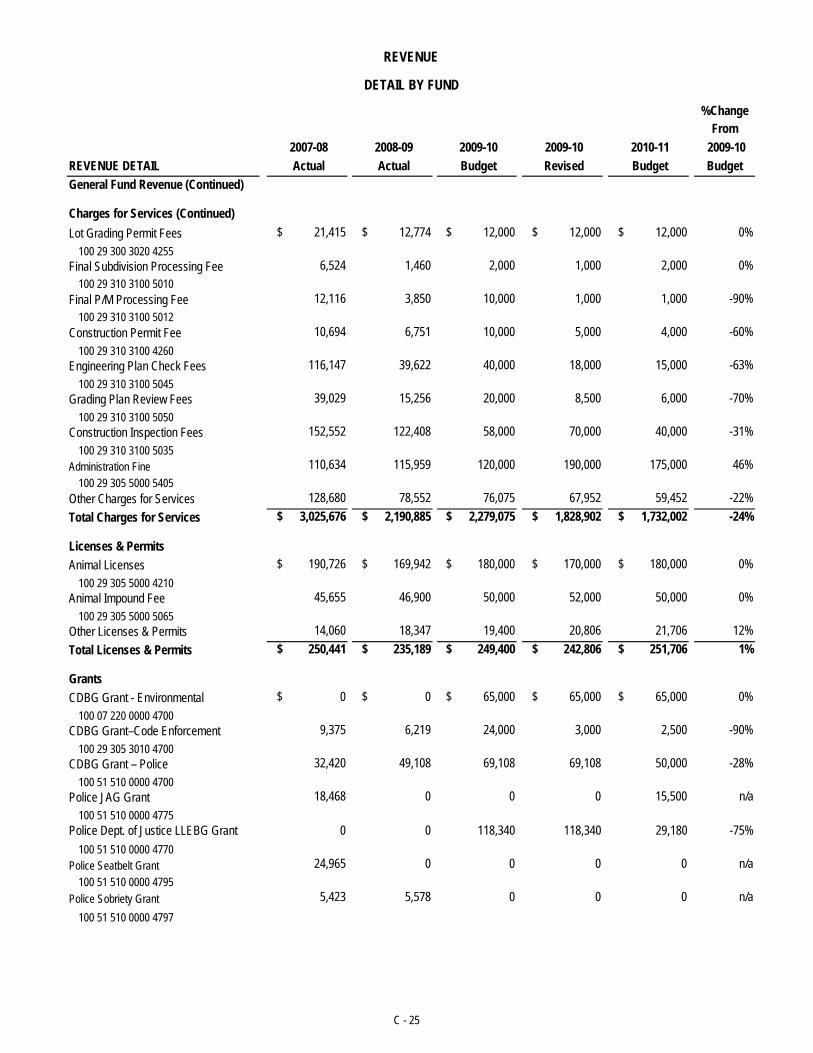
%ChangeFrom
2007-08 2008-09 2009-10 2009-10 2010-11 2009-10 REVENUE DETAIL Actual Actual Budget Revised Budget BudgetGeneral Fund Revenue (Continued)
Charges for Services (Continued)Lot Grading Permit Fees $ 21,415 $ 12,774 $ 12,000 $ 12,000 $ 12,000 0%
100 29 300 3020 4255Final Subdivision Processing Fee 6,524 1,460 2,000 1,000 2,000 0%
100 29 310 3100 5010Final P/M Processing Fee 12,116 3,850 10,000 1,000 1,000 -90%
100 29 310 3100 5012Construction Permit Fee 10,694 6,751 10,000 5,000 4,000 -60%
100 29 310 3100 4260Engineering Plan Check Fees 116,147 39,622 40,000 18,000 15,000 -63%
100 29 310 3100 5045Grading Plan Review Fees 39,029 15,256 20,000 8,500 6,000 -70%
100 29 310 3100 5050Construction Inspection Fees 152,552 122,408 58,000 70,000 40,000 -31%
100 29 310 3100 5035Administration Fine 110,634 115,959 120,000 190,000 175,000 46%
100 29 305 5000 5405Other Charges for Services 128,680 78,552 76,075 67,952 59,452 -22%Total Charges for Services $ 3,025,676 $ 2,190,885 $ 2,279,075 $ 1,828,902 $ 1,732,002 -24%
REVENUE
DETAIL BY FUND
Licenses & PermitsAnimal Licenses $ 190,726 $ 169,942 $ 180,000 $ 170,000 $ 180,000 0%
100 29 305 5000 4210Animal Impound Fee 45,655 46,900 50,000 52,000 50,000 0%
100 29 305 5000 5065Other Licenses & Permits 14,060 18,347 19,400 20,806 21,706 12%Total Licenses & Permits $ 250,441 $ 235,189 $ 249,400 $ 242,806 $ 251,706 1%
GrantsCDBG Grant - Environmental $ 0 $ 0 $ 65,000 $ 65,000 $ 65,000 0%
100 07 220 0000 4700CDBG Grant–Code Enforcement 9,375 6,219 24,000 3,000 2,500 -90%
100 29 305 3010 4700CDBG Grant – Police 32,420 49,108 69,108 69,108 50,000 -28%
100 51 510 0000 4700Police JAG Grant 18,468 0 0 0 15,500 n/a
100 51 510 0000 4775Police Dept. of Justice LLEBG Grant 0 0 118,340 118,340 29,180 -75%
100 51 510 0000 4770Police Seatbelt Grant 24,965 0 0 0 0 n/a
100 51 510 0000 4795Police Sobriety Grant 5,423 5,578 0 0 0 n/a
100 51 510 0000 4797
C - 25
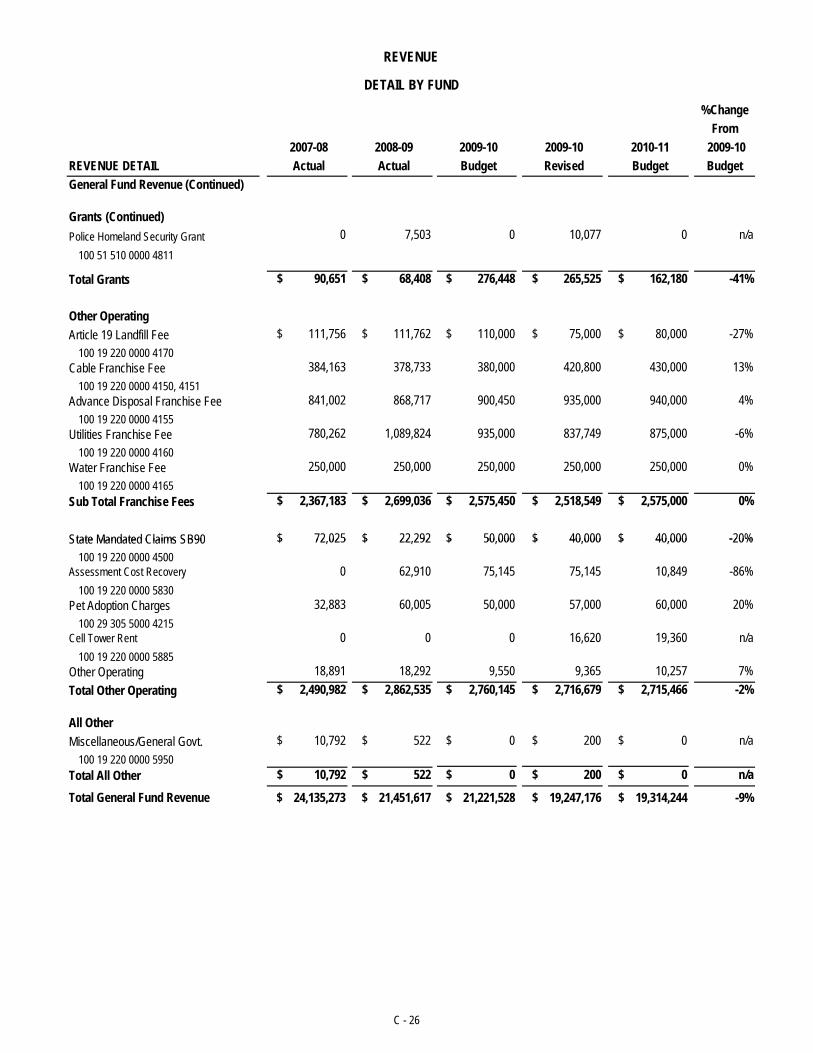
%ChangeFrom
2007-08 2008-09 2009-10 2009-10 2010-11 2009-10 REVENUE DETAIL Actual Actual Budget Revised Budget BudgetGeneral Fund Revenue (Continued)
Grants (Continued)Police Homeland Security Grant 0 7,503 0 10,077 0 n/a
100 51 510 0000 4811
Total Grants $ 90,651 $ 68,408 $ 276,448 $ 265,525 $ 162,180 -41%
Other OperatingArticle 19 Landfill Fee $ 111,756 $ 111,762 $ 110,000 $ 75,000 $ 80,000 -27%
100 19 220 0000 4170Cable Franchise Fee 384,163 378,733 380,000 420,800 430,000 13%
100 19 220 0000 4150, 4151Advance Disposal Franchise Fee 841,002 868,717 900,450 935,000 940,000 4%
100 19 220 0000 4155Utilities Franchise Fee 780,262 1,089,824 935,000 837,749 875,000 -6%
100 19 220 0000 4160Water Franchise Fee 250,000 250,000 250,000 250,000 250,000 0%
100 19 220 0000 4165Sub Total Franchise Fees $ 2,367,183 $ 2,699,036 $ 2,575,450 $ 2,518,549 $ 2,575,000 0%
State Mandated Claims SB90 $ 72 025 $ 22 292 $ 50 000 $ 40 000 $ 40 000 -20%
REVENUE
DETAIL BY FUND
State Mandated Claims SB90 $ 72,025 $ 22,292 $ 50,000 $ 40,000 $ 40,000 -20%100 19 220 0000 4500
Assessment Cost Recovery 0 62,910 75,145 75,145 10,849 -86%100 19 220 0000 5830
Pet Adoption Charges 32,883 60,005 50,000 57,000 60,000 20%100 29 305 5000 4215
Cell Tower Rent 0 0 0 16,620 19,360 n/a100 19 220 0000 5885
Other Operating 18,891 18,292 9,550 9,365 10,257 7%Total Other Operating $ 2,490,982 $ 2,862,535 $ 2,760,145 $ 2,716,679 $ 2,715,466 -2%
All OtherMiscellaneous/General Govt. $ 10,792 $ 522 $ 0 $ 200 $ 0 n/a
100 19 220 0000 5950Total All Other $ 10,792 $ 522 $ 0 $ 200 $ 0 n/a
Total General Fund Revenue $ 24,135,273 $ 21,451,617 $ 21,221,528 $ 19,247,176 $ 19,314,244 -9%
C - 26
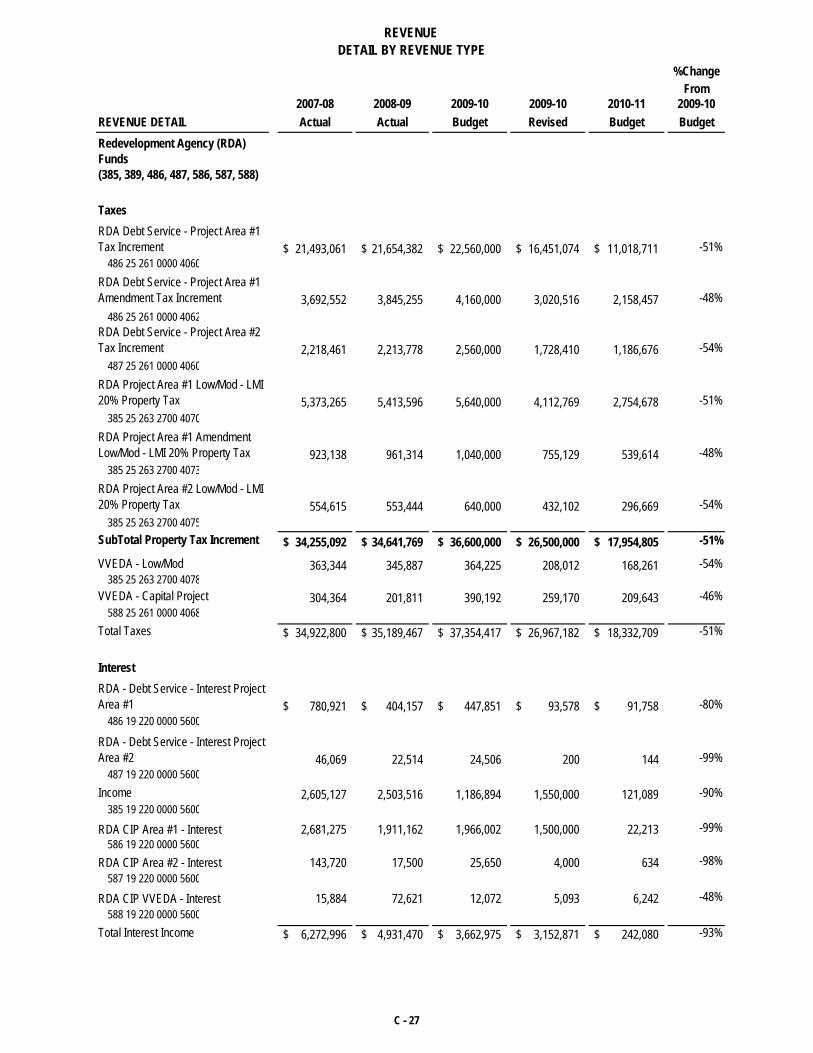
%ChangeFrom
2007-08 2008-09 2009-10 2009-10 2010-11 2009-10REVENUE DETAIL Actual Actual Budget Revised Budget Budget
TaxesRDA Debt Service - Project Area #1 Tax Increment 21,493,061$ 21,654,382$ 22,560,000$ 16,451,074$ 11,018,711$ -51%
486 25 261 0000 4060RDA Debt Service - Project Area #1 Amendment Tax Increment 3,692,552 3,845,255 4,160,000 3,020,516 2,158,457 -48%
486 25 261 0000 4062RDA Debt Service - Project Area #2 Tax Increment 2,218,461 2,213,778 2,560,000 1,728,410 1,186,676 -54%
487 25 261 0000 4060RDA Project Area #1 Low/Mod - LMI 20% Property Tax 5,373,265 5,413,596 5,640,000 4,112,769 2,754,678 -51%
385 25 263 2700 4070RDA Project Area #1 Amendment Low/Mod - LMI 20% Property Tax 923,138 961,314 1,040,000 755,129 539,614 -48%
385 25 263 2700 4073RDA Project Area #2 Low/Mod - LMI 20% Property Tax 554,615 553,444 640,000 432,102 296,669 -54%
385 25 263 2700 4075SubTotal Property Tax Increment 34,255,092$ 34,641,769$ 36,600,000$ 26,500,000$ 17,954,805$ -51%
VVEDA - Low/Mod 363,344 345,887 364,225 208,012 168,261 -54%385 25 263 2700 4078
VVEDA - Capital Project 304,364 201,811 390,192 259,170 209,643 -46%588 25 261 0000 4068
Total Taxes 34,922,800$ 35,189,467$ 37,354,417$ 26,967,182$ 18,332,709$ -51%
InterestRDA - Debt Service - Interest Project Area #1 780,921$ 404,157$ 447,851$ 93,578$ 91,758$ -80%
486 19 220 0000 5600
RDA - Debt Service - Interest Project Area #2 46,069 22,514 24,506 200 144 -99%
487 19 220 0000 5600Income 2,605,127 2,503,516 1,186,894 1,550,000 121,089 -90%
385 19 220 0000 5600
RDA CIP Area #1 - Interest 2,681,275 1,911,162 1,966,002 1,500,000 22,213 -99%586 19 220 0000 5600
RDA CIP Area #2 - Interest 143,720 17,500 25,650 4,000 634 -98%587 19 220 0000 5600
RDA CIP VVEDA - Interest 15,884 72,621 12,072 5,093 6,242 -48%588 19 220 0000 5600
Total Interest Income 6,272,996$ 4,931,470$ 3,662,975$ 3,152,871$ 242,080$ -93%
REVENUE
Redevelopment Agency (RDA) Funds(385, 389, 486, 487, 586, 587, 588)
DETAIL BY REVENUE TYPE
C - 27
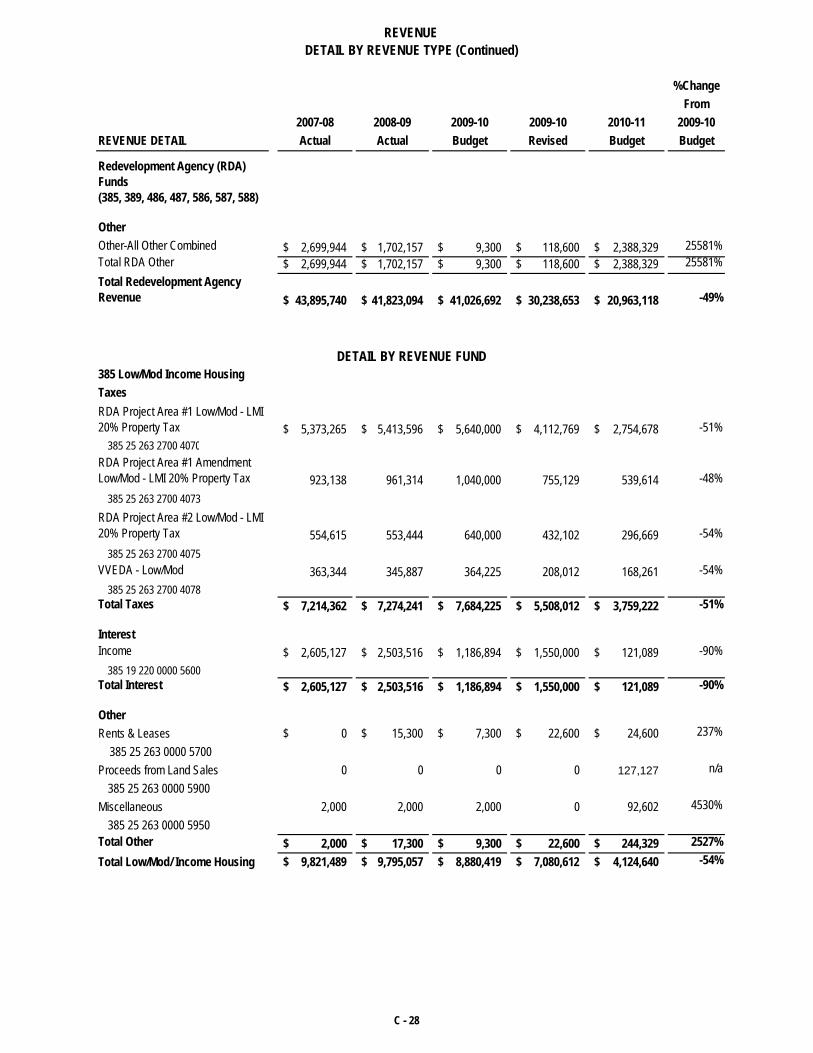
%ChangeFrom
2007-08 2008-09 2009-10 2009-10 2010-11 2009-10REVENUE DETAIL Actual Actual Budget Revised Budget Budget
OtherOther-All Other Combined 2,699,944$ 1,702,157$ 9,300$ 118,600$ 2,388,329$ 25581%Total RDA Other 2,699,944$ 1,702,157$ 9,300$ 118,600$ 2,388,329$ 25581%Total Redevelopment Agency Revenue 43,895,740$ 41,823,094$ 41,026,692$ 30,238,653$ 20,963,118$ -49%
385 Low/Mod Income HousingTaxesRDA Project Area #1 Low/Mod - LMI 20% Property Tax 5,373,265$ 5,413,596$ 5,640,000$ 4,112,769$ 2,754,678$ -51%
385 25 263 2700 4070RDA Project Area #1 Amendment Low/Mod - LMI 20% Property Tax 923,138 961,314 1,040,000 755,129 539,614 -48%
385 25 263 2700 4073RDA Project Area #2 Low/Mod - LMI 20% Property Tax 554,615 553,444 640,000 432,102 296,669 -54%
385 25 263 2700 4075VVEDA - Low/Mod 363,344 345,887 364,225 208,012 168,261 -54%
385 25 263 2700 4078Total Taxes 7,214,362$ 7,274,241$ 7,684,225$ 5,508,012$ 3,759,222$ -51%
InterestIncome 2,605,127$ 2,503,516$ 1,186,894$ 1,550,000$ 121,089$ -90%
385 19 220 0000 5600Total Interest 2,605,127$ 2,503,516$ 1,186,894$ 1,550,000$ 121,089$ -90%
OtherRents & Leases 0$ 15,300$ 7,300$ 22,600$ 24,600$ 237% 385 25 263 0000 5700Proceeds from Land Sales 0 0 0 0 127,127 n/a
385 25 263 0000 5900Miscellaneous 2,000 2,000 2,000 0 92,602 4530%
385 25 263 0000 5950Total Other 2,000$ 17,300$ 9,300$ 22,600$ 244,329$ 2527%Total Low/Mod/ Income Housing 9,821,489$ 9,795,057$ 8,880,419$ 7,080,612$ 4,124,640$ -54%
DETAIL BY REVENUE FUND
REVENUEDETAIL BY REVENUE TYPE (Continued)
Redevelopment Agency (RDA) Funds(385, 389, 486, 487, 586, 587, 588)
C - 28
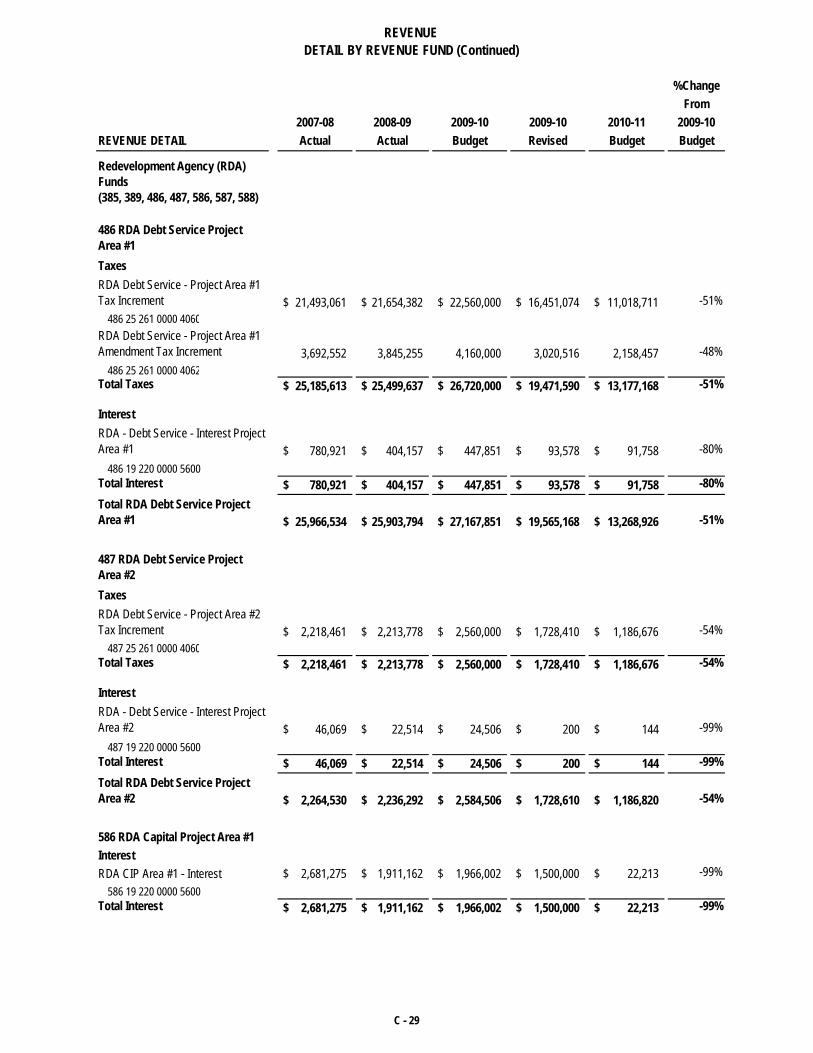
%ChangeFrom
2007-08 2008-09 2009-10 2009-10 2010-11 2009-10REVENUE DETAIL Actual Actual Budget Revised Budget Budget
486 RDA Debt Service Project Area #1TaxesRDA Debt Service - Project Area #1 Tax Increment 21,493,061$ 21,654,382$ 22,560,000$ 16,451,074$ 11,018,711$ -51%
486 25 261 0000 4060RDA Debt Service - Project Area #1 Amendment Tax Increment 3,692,552 3,845,255 4,160,000 3,020,516 2,158,457 -48%
486 25 261 0000 4062Total Taxes 25,185,613$ 25,499,637$ 26,720,000$ 19,471,590$ 13,177,168$ -51%
InterestRDA - Debt Service - Interest Project Area #1 780,921$ 404,157$ 447,851$ 93,578$ 91,758$ -80%
486 19 220 0000 5600Total Interest 780,921$ 404,157$ 447,851$ 93,578$ 91,758$ -80%Total RDA Debt Service Project Area #1 25,966,534$ 25,903,794$ 27,167,851$ 19,565,168$ 13,268,926$ -51%
487 RDA Debt Service Project Area #2TaxesRDA Debt Service - Project Area #2 Tax Increment 2,218,461$ 2,213,778$ 2,560,000$ 1,728,410$ 1,186,676$ -54%
487 25 261 0000 4060Total Taxes 2,218,461$ 2,213,778$ 2,560,000$ 1,728,410$ 1,186,676$ -54%
InterestRDA - Debt Service - Interest Project Area #2 46,069$ 22,514$ 24,506$ 200$ 144$ -99%
487 19 220 0000 5600Total Interest 46,069$ 22,514$ 24,506$ 200$ 144$ -99%Total RDA Debt Service Project Area #2 2,264,530$ 2,236,292$ 2,584,506$ 1,728,610$ 1,186,820$ -54%
586 RDA Capital Project Area #1InterestRDA CIP Area #1 - Interest 2,681,275$ 1,911,162$ 1,966,002$ 1,500,000$ 22,213$ -99%
586 19 220 0000 5600Total Interest 2,681,275$ 1,911,162$ 1,966,002$ 1,500,000$ 22,213$ -99%
REVENUEDETAIL BY REVENUE FUND (Continued)
Redevelopment Agency (RDA) Funds(385, 389, 486, 487, 586, 587, 588)
C - 29
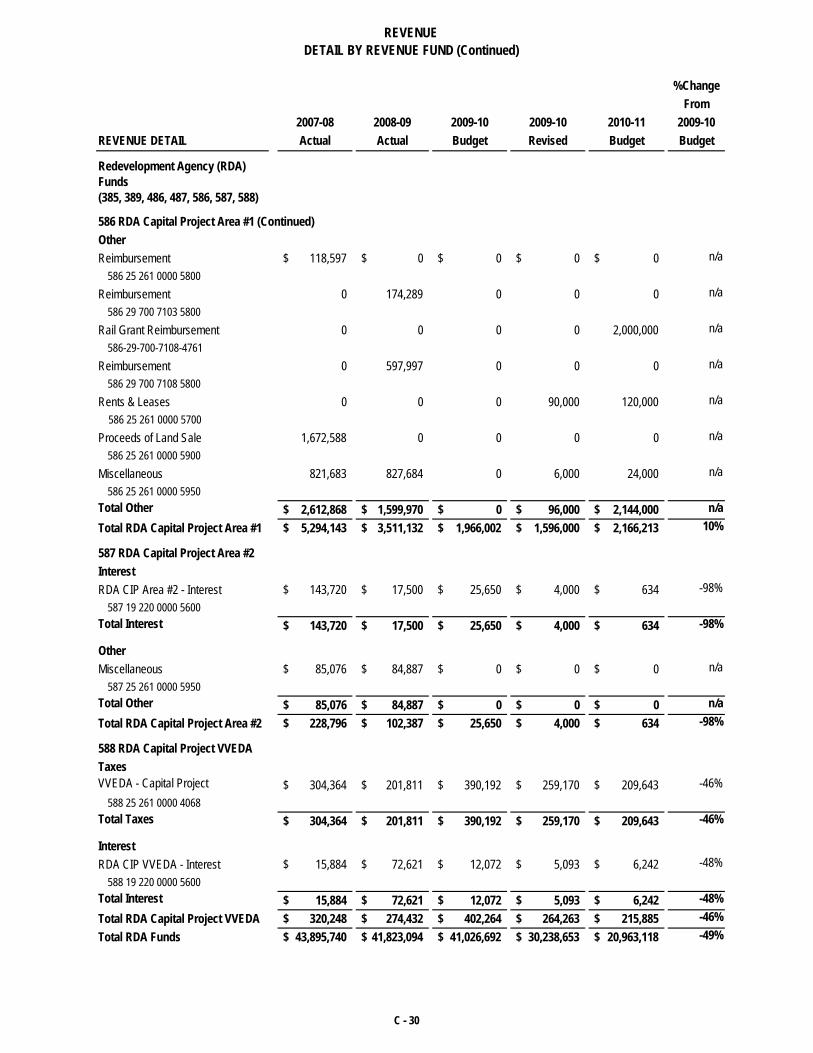
%ChangeFrom
2007-08 2008-09 2009-10 2009-10 2010-11 2009-10REVENUE DETAIL Actual Actual Budget Revised Budget Budget
586 RDA Capital Project Area #1 (Continued)OtherReimbursement 118,597$ 0$ 0$ 0$ 0$ n/a
586 25 261 0000 5800Reimbursement 0 174,289 0 0 0 n/a
586 29 700 7103 5800Rail Grant Reimbursement 0 0 0 0 2,000,000 n/a
586-29-700-7108-4761Reimbursement 0 597,997 0 0 0 n/a
586 29 700 7108 5800Rents & Leases 0 0 0 90,000 120,000 n/a 586 25 261 0000 5700Proceeds of Land Sale 1,672,588 0 0 0 0 n/a
586 25 261 0000 5900Miscellaneous 821,683 827,684 0 6,000 24,000 n/a
586 25 261 0000 5950Total Other 2,612,868$ 1,599,970$ 0$ 96,000$ 2,144,000$ n/aTotal RDA Capital Project Area #1 5,294,143$ 3,511,132$ 1,966,002$ 1,596,000$ 2,166,213$ 10%
587 RDA Capital Project Area #2InterestRDA CIP Area #2 - Interest 143,720$ 17,500$ 25,650$ 4,000$ 634$ -98%
587 19 220 0000 5600Total Interest 143,720$ 17,500$ 25,650$ 4,000$ 634$ -98%
OtherMiscellaneous 85,076$ 84,887$ 0$ 0$ 0$ n/a
587 25 261 0000 5950Total Other 85,076$ 84,887$ 0$ 0$ 0$ n/aTotal RDA Capital Project Area #2 228,796$ 102,387$ 25,650$ 4,000$ 634$ -98%
588 RDA Capital Project VVEDATaxesVVEDA - Capital Project 304,364$ 201,811$ 390,192$ 259,170$ 209,643$ -46%
588 25 261 0000 4068Total Taxes 304,364$ 201,811$ 390,192$ 259,170$ 209,643$ -46%
InterestRDA CIP VVEDA - Interest 15,884$ 72,621$ 12,072$ 5,093$ 6,242$ -48%
588 19 220 0000 5600Total Interest 15,884$ 72,621$ 12,072$ 5,093$ 6,242$ -48%Total RDA Capital Project VVEDA 320,248$ 274,432$ 402,264$ 264,263$ 215,885$ -46%Total RDA Funds 43,895,740$ 41,823,094$ 41,026,692$ 30,238,653$ 20,963,118$ -49%
Redevelopment Agency (RDA) Funds(385, 389, 486, 487, 586, 587, 588)
REVENUEDETAIL BY REVENUE FUND (Continued)
C - 30
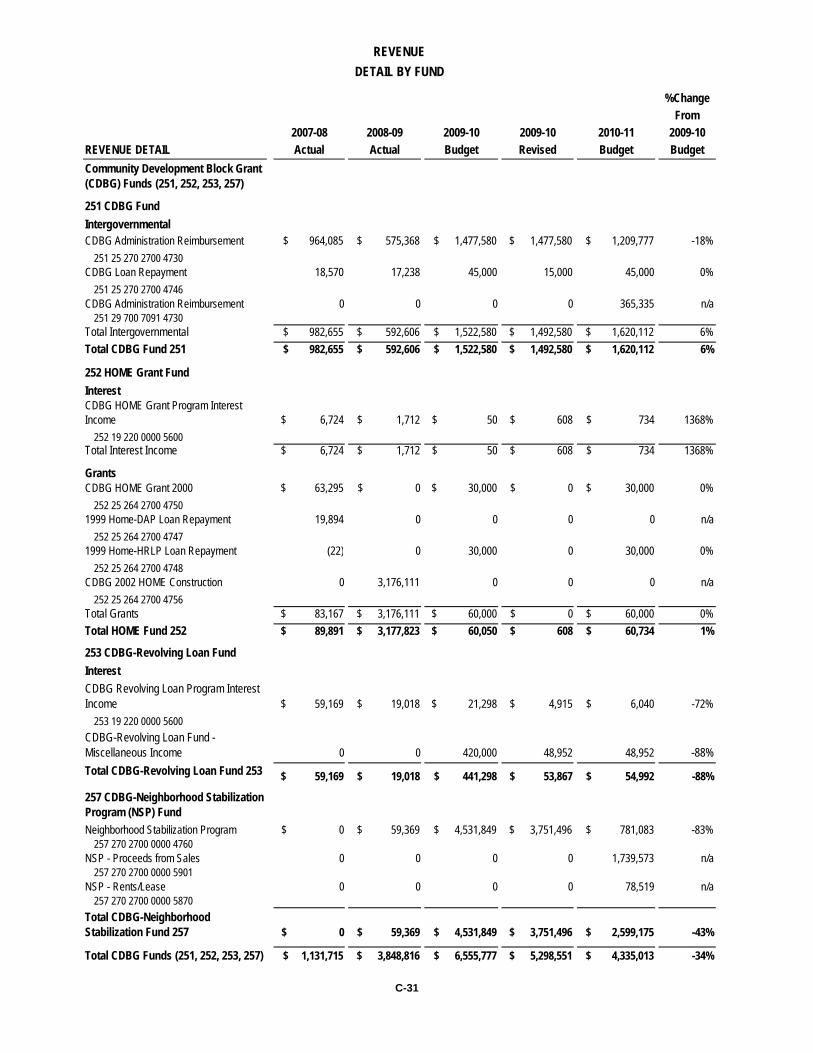
%ChangeFrom
2007-08 2008-09 2009-10 2009-10 2010-11 2009-10REVENUE DETAIL Actual Actual Budget Revised Budget Budget
251 CDBG FundIntergovernmentalCDBG Administration Reimbursement $ 964,085 $ 575,368 $ 1,477,580 $ 1,477,580 $ 1,209,777 -18%
251 25 270 2700 4730CDBG Loan Repayment 18,570 17,238 45,000 15,000 45,000 0%
251 25 270 2700 4746CDBG Administration Reimbursement 0 0 0 0 365,335 n/a
251 29 700 7091 4730Total Intergovernmental $ 982,655 $ 592,606 $ 1,522,580 $ 1,492,580 $ 1,620,112 6%Total CDBG Fund 251 $ 982,655 $ 592,606 $ 1,522,580 $ 1,492,580 $ 1,620,112 6%
252 HOME Grant FundInterestCDBG HOME Grant Program Interest Income $ 6,724 $ 1,712 $ 50 $ 608 $ 734 1368%
252 19 220 0000 5600Total Interest Income $ 6,724 $ 1,712 $ 50 $ 608 $ 734 1368%
GrantsCDBG HOME Grant 2000 $ 63,295 $ 0 $ 30,000 $ 0 $ 30,000 0%
252 25 264 2700 47501999 Home-DAP Loan Repayment 19,894 0 0 0 0 n/a
252 25 264 2700 47471999 Home-HRLP Loan Repayment (22) 0 30,000 0 30,000 0%
252 25 264 2700 4748CDBG 2002 HOME Construction 0 3,176,111 0 0 0 n/a
252 25 264 2700 4756Total Grants $ 83,167 $ 3,176,111 $ 60,000 $ 0 $ 60,000 0%Total HOME Fund 252 $ 89,891 $ 3,177,823 $ 60,050 $ 608 $ 60,734 1%
253 CDBG-Revolving Loan FundInterest CDBG Revolving Loan Program Interest Income $ 59,169 $ 19,018 $ 21,298 $ 4,915 $ 6,040 -72%
253 19 220 0000 5600CDBG-Revolving Loan Fund - Miscellaneous Income 0 0 420,000 48,952 48,952 -88%Total CDBG-Revolving Loan Fund 253 $ 59,169 $ 19,018 $ 441,298 $ 53,867 $ 54,992 -88%
257 CDBG-Neighborhood Stabilization Program (NSP) FundNeighborhood Stabilization Program $ 0 $ 59,369 $ 4,531,849 $ 3,751,496 $ 781,083 -83%
257 270 2700 0000 4760NSP - Proceeds from Sales 0 0 0 0 1,739,573 n/a
257 270 2700 0000 5901NSP - Rents/Lease 0 0 0 0 78,519 n/a
257 270 2700 0000 5870Total CDBG-Neighborhood Stabilization Fund 257 $ 0 $ 59,369 $ 4,531,849 $ 3,751,496 $ 2,599,175 -43%
Total CDBG Funds (251, 252, 253, 257) $ 1,131,715 $ 3,848,816 $ 6,555,777 $ 5,298,551 $ 4,335,013 -34%
Community Development Block Grant (CDBG) Funds (251, 252, 253, 257)
REVENUEDETAIL BY FUND
C-31
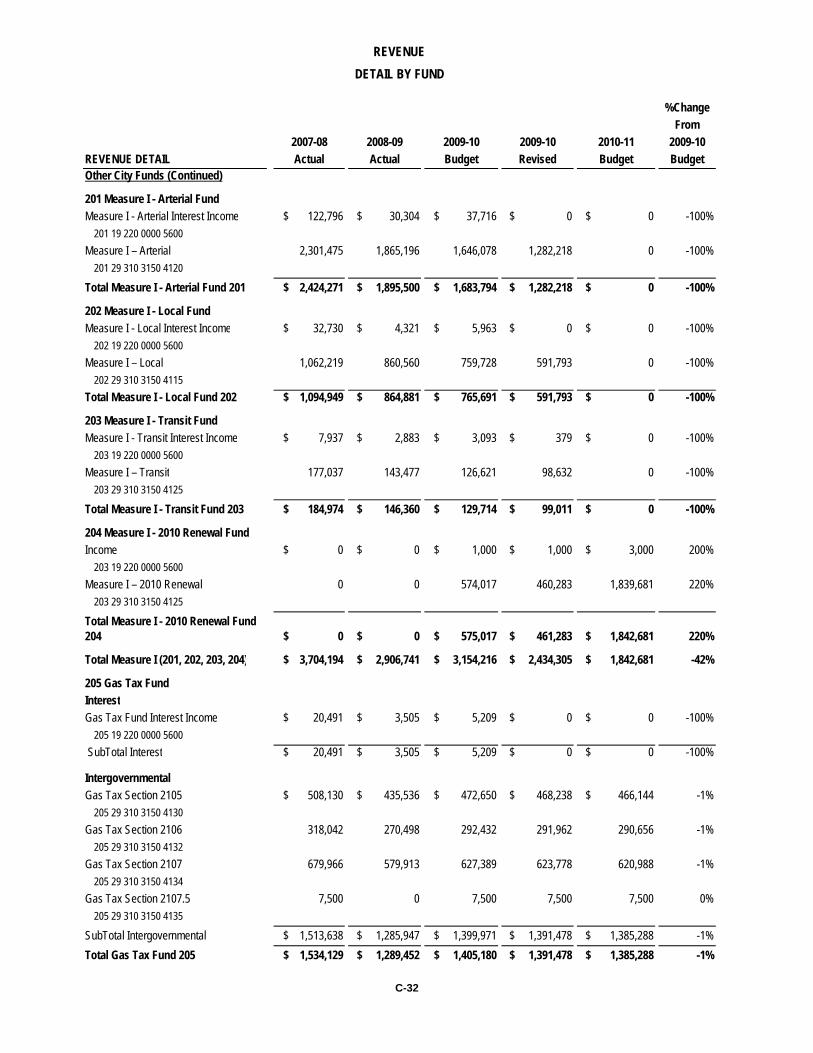
%ChangeFrom
2007-08 2008-09 2009-10 2009-10 2010-11 2009-10REVENUE DETAIL Actual Actual Budget Revised Budget BudgetOther City Funds (Continued)
201 Measure I - Arterial FundMeasure I - Arterial Interest Income $ 122,796 $ 30,304 $ 37,716 $ 0 $ 0 -100%
201 19 220 0000 5600Measure I – Arterial 2,301,475 1,865,196 1,646,078 1,282,218 0 -100%
201 29 310 3150 4120
Total Measure I - Arterial Fund 201 $ 2,424,271 $ 1,895,500 $ 1,683,794 $ 1,282,218 $ 0 -100%
202 Measure I - Local FundMeasure I - Local Interest Income $ 32,730 $ 4,321 $ 5,963 $ 0 $ 0 -100%
202 19 220 0000 5600Measure I – Local 1,062,219 860,560 759,728 591,793 0 -100%
202 29 310 3150 4115Total Measure I - Local Fund 202 $ 1,094,949 $ 864,881 $ 765,691 $ 591,793 $ 0 -100%
203 Measure I - Transit FundMeasure I - Transit Interest Income $ 7,937 $ 2,883 $ 3,093 $ 379 $ 0 -100%
203 19 220 0000 5600Measure I – Transit 177,037 143,477 126,621 98,632 0 -100%
203 29 310 3150 4125
Total Measure I - Transit Fund 203 $ 184,974 $ 146,360 $ 129,714 $ 99,011 $ 0 -100%
204 Measure I - 2010 Renewal FundIncome $ 0 $ 0 $ 1,000 $ 1,000 $ 3,000 200%
203 19 220 0000 5600Measure I – 2010 Renewal 0 0 574,017 460,283 1,839,681 220%
203 29 310 3150 4125
Total Measure I - 2010 Renewal Fund 204 $ 0 $ 0 $ 575,017 $ 461,283 $ 1,842,681 220%
Total Measure I (201, 202, 203, 204) $ 3,704,194 $ 2,906,741 $ 3,154,216 $ 2,434,305 $ 1,842,681 -42%
205 Gas Tax FundInterestGas Tax Fund Interest Income $ 20,491 $ 3,505 $ 5,209 $ 0 $ 0 -100%
205 19 220 0000 5600 SubTotal Interest $ 20,491 $ 3,505 $ 5,209 $ 0 $ 0 -100%
IntergovernmentalGas Tax Section 2105 $ 508,130 $ 435,536 $ 472,650 $ 468,238 $ 466,144 -1%
205 29 310 3150 4130Gas Tax Section 2106 318,042 270,498 292,432 291,962 290,656 -1%
205 29 310 3150 4132Gas Tax Section 2107 679,966 579,913 627,389 623,778 620,988 -1%
205 29 310 3150 4134Gas Tax Section 2107.5 7,500 0 7,500 7,500 7,500 0%
205 29 310 3150 4135
SubTotal Intergovernmental $ 1,513,638 $ 1,285,947 $ 1,399,971 $ 1,391,478 $ 1,385,288 -1%Total Gas Tax Fund 205 $ 1,534,129 $ 1,289,452 $ 1,405,180 $ 1,391,478 $ 1,385,288 -1%
REVENUEDETAIL BY FUND
C-32
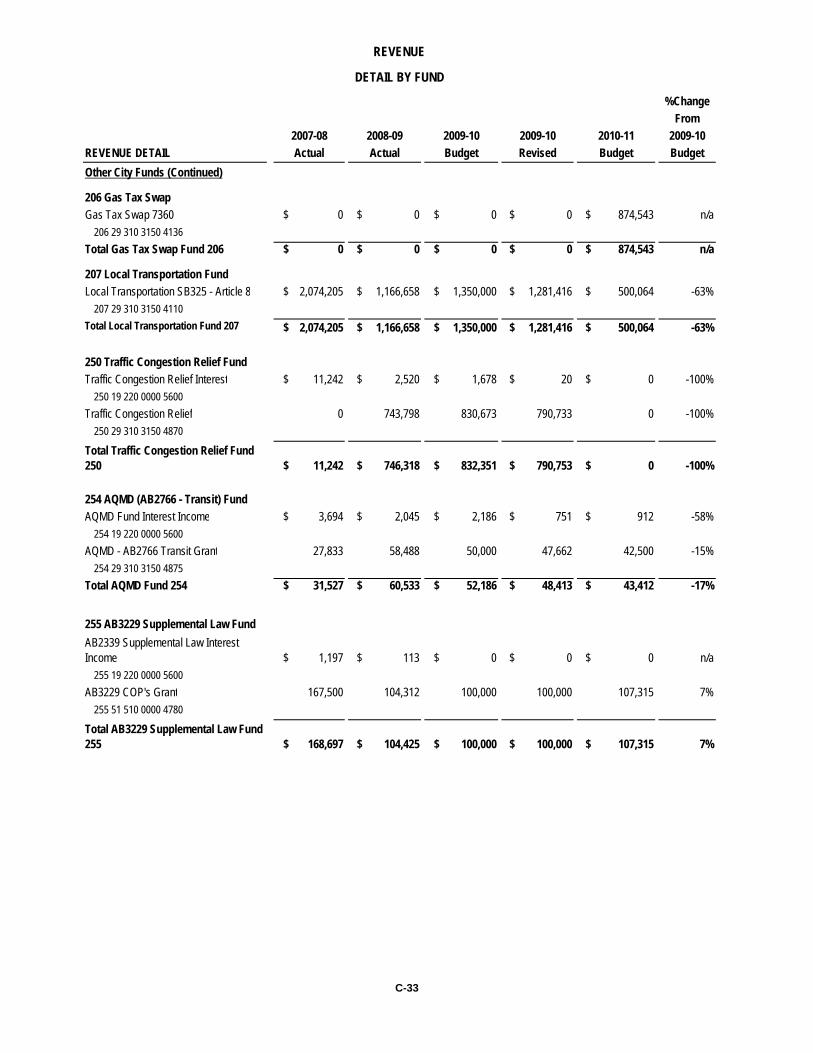
%ChangeFrom
2007-08 2008-09 2009-10 2009-10 2010-11 2009-10REVENUE DETAIL Actual Actual Budget Revised Budget BudgetOther City Funds (Continued)
206 Gas Tax SwapGas Tax Swap 7360 $ 0 $ 0 $ 0 $ 0 $ 874,543 n/a
206 29 310 3150 4136Total Gas Tax Swap Fund 206 $ 0 $ 0 $ 0 $ 0 $ 874,543 n/a
207 Local Transportation FundLocal Transportation SB325 - Article 8 $ 2,074,205 $ 1,166,658 $ 1,350,000 $ 1,281,416 $ 500,064 -63%
207 29 310 3150 4110Total Local Transportation Fund 207 $ 2,074,205 $ 1,166,658 $ 1,350,000 $ 1,281,416 $ 500,064 -63%
250 Traffic Congestion Relief FundTraffic Congestion Relief Interest $ 11,242 $ 2,520 $ 1,678 $ 20 $ 0 -100%
250 19 220 0000 5600Traffic Congestion Relief 0 743,798 830,673 790,733 0 -100%
250 29 310 3150 4870
Total Traffic Congestion Relief Fund 250 $ 11,242 $ 746,318 $ 832,351 $ 790,753 $ 0 -100%
254 AQMD (AB2766 - Transit) FundAQMD Fund Interest Income $ 3,694 $ 2,045 $ 2,186 $ 751 $ 912 -58%
254 19 220 0000 5600AQMD - AB2766 Transit Grant 27,833 58,488 50,000 47,662 42,500 -15%
254 29 310 3150 4875Total AQMD Fund 254 $ 31,527 $ 60,533 $ 52,186 $ 48,413 $ 43,412 -17%
AB2339 Supplemental Law Interest Income $ 1,197 $ 113 $ 0 $ 0 $ 0 n/a
255 19 220 0000 5600AB3229 COP's Grant 167,500 104,312 100,000 100,000 107,315 7%
255 51 510 0000 4780
Total AB3229 Supplemental Law Fund 255 $ 168,697 $ 104,425 $ 100,000 $ 100,000 $ 107,315 7%
255 AB3229 Supplemental Law Fund
DETAIL BY FUND
REVENUE
C-33
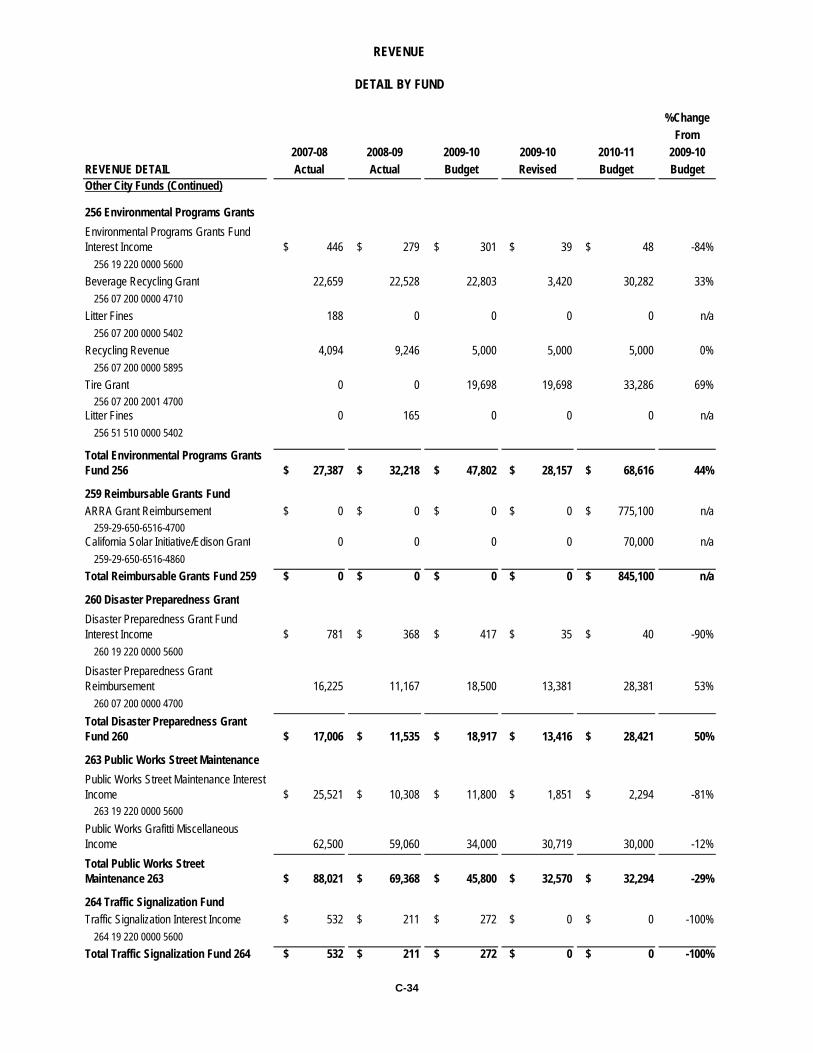
%ChangeFrom
2007-08 2008-09 2009-10 2009-10 2010-11 2009-10REVENUE DETAIL Actual Actual Budget Revised Budget BudgetOther City Funds (Continued)
256 Environmental Programs GrantsEnvironmental Programs Grants Fund Interest Income $ 446 $ 279 $ 301 $ 39 $ 48 -84%
256 19 220 0000 5600Beverage Recycling Grant 22,659 22,528 22,803 3,420 30,282 33%
256 07 200 0000 4710Litter Fines 188 0 0 0 0 n/a
256 07 200 0000 5402Recycling Revenue 4,094 9,246 5,000 5,000 5,000 0%
256 07 200 0000 5895Tire Grant 0 0 19,698 19,698 33,286 69%
256 07 200 2001 4700Litter Fines 0 165 0 0 0 n/a
256 51 510 0000 5402
Total Environmental Programs Grants Fund 256 $ 27,387 $ 32,218 $ 47,802 $ 28,157 $ 68,616 44%
259 Reimbursable Grants FundARRA Grant Reimbursement $ 0 $ 0 $ 0 $ 0 $ 775,100 n/a
259-29-650-6516-4700California Solar Initiative/Edison Grant 0 0 0 0 70,000 n/a
259-29-650-6516-4860Total Reimbursable Grants Fund 259 $ 0 $ 0 $ 0 $ 0 $ 845,100 n/a
260 Disaster Preparedness GrantDisaster Preparedness Grant Fund Interest Income $ 781 $ 368 $ 417 $ 35 $ 40 -90%
260 19 220 0000 5600
Disaster Preparedness Grant Reimbursement 16,225 11,167 18,500 13,381 28,381 53%
260 07 200 0000 4700Total Disaster Preparedness Grant Fund 260 $ 17,006 $ 11,535 $ 18,917 $ 13,416 $ 28,421 50%
263 Public Works Street MaintenancePublic Works Street Maintenance Interest Income $ 25,521 $ 10,308 $ 11,800 $ 1,851 $ 2,294 -81%
263 19 220 0000 5600Public Works Grafitti Miscellaneous Income 62,500 59,060 34,000 30,719 30,000 -12%Total Public Works Street Maintenance 263 $ 88,021 $ 69,368 $ 45,800 $ 32,570 $ 32,294 -29%
264 Traffic Signalization FundTraffic Signalization Interest Income $ 532 $ 211 $ 272 $ 0 $ 0 -100%
264 19 220 0000 5600Total Traffic Signalization Fund 264 $ 532 $ 211 $ 272 $ 0 $ 0 -100%
REVENUE
DETAIL BY FUND
C-34
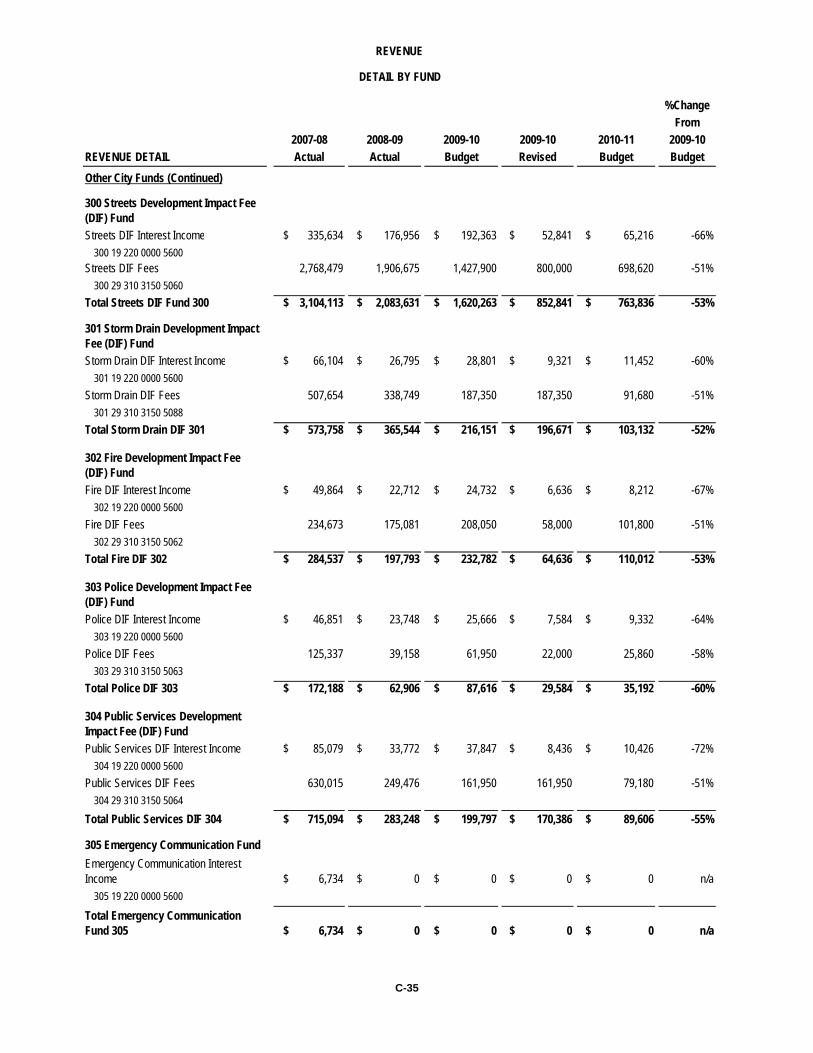
%ChangeFrom
2007-08 2008-09 2009-10 2009-10 2010-11 2009-10REVENUE DETAIL Actual Actual Budget Revised Budget BudgetOther City Funds (Continued)
300 Streets Development Impact Fee (DIF) FundStreets DIF Interest Income $ 335,634 $ 176,956 $ 192,363 $ 52,841 $ 65,216 -66%
300 19 220 0000 5600Streets DIF Fees 2,768,479 1,906,675 1,427,900 800,000 698,620 -51%
300 29 310 3150 5060Total Streets DIF Fund 300 $ 3,104,113 $ 2,083,631 $ 1,620,263 $ 852,841 $ 763,836 -53%
301 Storm Drain Development Impact Fee (DIF) FundStorm Drain DIF Interest Income $ 66,104 $ 26,795 $ 28,801 $ 9,321 $ 11,452 -60%
301 19 220 0000 5600Storm Drain DIF Fees 507,654 338,749 187,350 187,350 91,680 -51%
301 29 310 3150 5088Total Storm Drain DIF 301 $ 573,758 $ 365,544 $ 216,151 $ 196,671 $ 103,132 -52%
302 Fire Development Impact Fee (DIF) FundFire DIF Interest Income $ 49,864 $ 22,712 $ 24,732 $ 6,636 $ 8,212 -67%
302 19 220 0000 5600Fire DIF Fees 234,673 175,081 208,050 58,000 101,800 -51%
302 29 310 3150 5062Total Fire DIF 302 $ 284,537 $ 197,793 $ 232,782 $ 64,636 $ 110,012 -53%
303 Police Development Impact Fee (DIF) FundPolice DIF Interest Income $ 46,851 $ 23,748 $ 25,666 $ 7,584 $ 9,332 -64%
303 19 220 0000 5600Police DIF Fees 125,337 39,158 61,950 22,000 25,860 -58%
303 29 310 3150 5063Total Police DIF 303 $ 172,188 $ 62,906 $ 87,616 $ 29,584 $ 35,192 -60%
304 Public Services Development Impact Fee (DIF) FundPublic Services DIF Interest Income $ 85,079 $ 33,772 $ 37,847 $ 8,436 $ 10,426 -72%
304 19 220 0000 5600Public Services DIF Fees 630,015 249,476 161,950 161,950 79,180 -51%
304 29 310 3150 5064
Total Public Services DIF 304 $ 715,094 $ 283,248 $ 199,797 $ 170,386 $ 89,606 -55%
305 Emergency Communication FundEmergency Communication Interest Income $ 6,734 $ 0 $ 0 $ 0 $ 0 n/a
305 19 220 0000 5600
Total Emergency Communication Fund 305 $ 6,734 $ 0 $ 0 $ 0 $ 0 n/a
REVENUE
DETAIL BY FUND
C-35
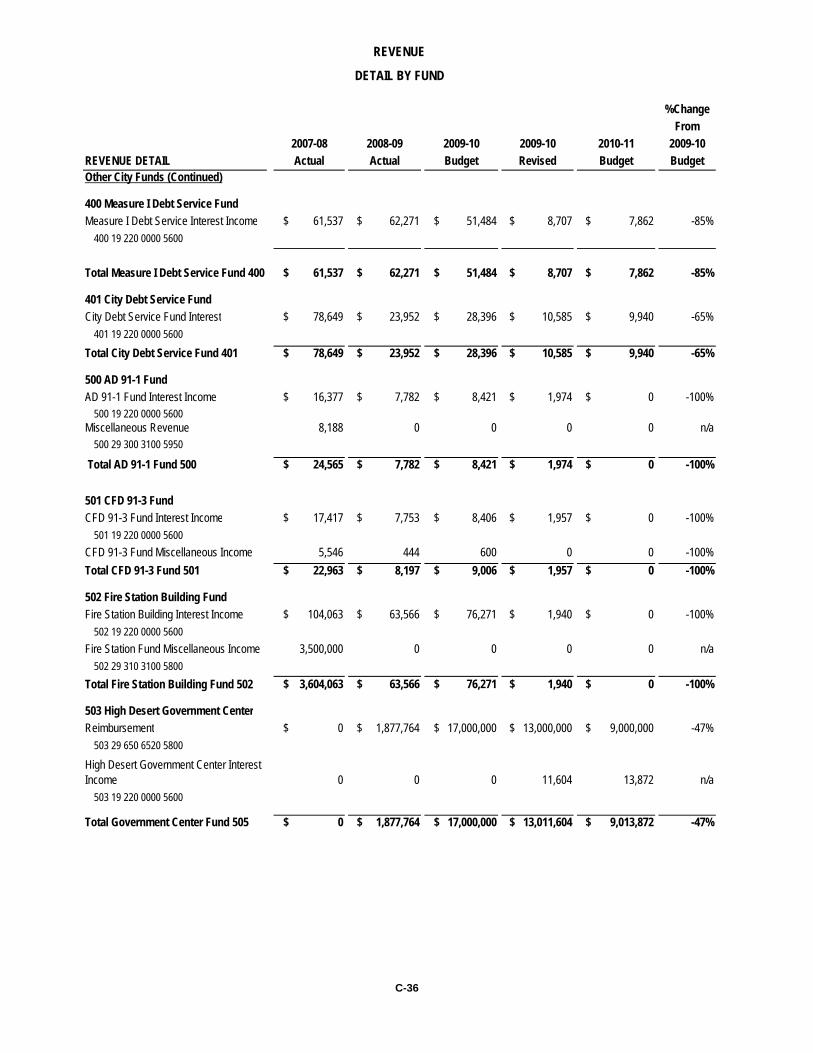
%ChangeFrom
2007-08 2008-09 2009-10 2009-10 2010-11 2009-10REVENUE DETAIL Actual Actual Budget Revised Budget BudgetOther City Funds (Continued)
400 Measure I Debt Service FundMeasure I Debt Service Interest Income $ 61,537 $ 62,271 $ 51,484 $ 8,707 $ 7,862 -85%
400 19 220 0000 5600
Total Measure I Debt Service Fund 400 $ 61,537 $ 62,271 $ 51,484 $ 8,707 $ 7,862 -85%
401 City Debt Service FundCity Debt Service Fund Interest $ 78,649 $ 23,952 $ 28,396 $ 10,585 $ 9,940 -65%
401 19 220 0000 5600
Total City Debt Service Fund 401 $ 78,649 $ 23,952 $ 28,396 $ 10,585 $ 9,940 -65%
500 AD 91-1 FundAD 91-1 Fund Interest Income $ 16,377 $ 7,782 $ 8,421 $ 1,974 $ 0 -100%
500 19 220 0000 5600Miscellaneous Revenue 8,188 0 0 0 0 n/a
500 29 300 3100 5950
Total AD 91-1 Fund 500 $ 24,565 $ 7,782 $ 8,421 $ 1,974 $ 0 -100%
501 CFD 91-3 FundCFD 91-3 Fund Interest Income $ 17,417 $ 7,753 $ 8,406 $ 1,957 $ 0 -100%
501 19 220 0000 5600CFD 91-3 Fund Miscellaneous Income 5,546 444 600 0 0 -100%Total CFD 91-3 Fund 501 $ 22,963 $ 8,197 $ 9,006 $ 1,957 $ 0 -100%
502 Fire Station Building FundFire Station Building Interest Income $ 104,063 $ 63,566 $ 76,271 $ 1,940 $ 0 -100%
502 19 220 0000 5600Fire Station Fund Miscellaneous Income 3,500,000 0 0 0 0 n/a
502 29 310 3100 5800Total Fire Station Building Fund 502 $ 3,604,063 $ 63,566 $ 76,271 $ 1,940 $ 0 -100%
503 High Desert Government CenterReimbursement $ 0 $ 1,877,764 $ 17,000,000 $ 13,000,000 $ 9,000,000 -47%
503 29 650 6520 5800
High Desert Government Center Interest Income 0 0 0 11,604 13,872 n/a
503 19 220 0000 5600
Total Government Center Fund 505 $ 0 $ 1,877,764 $ 17,000,000 $ 13,011,604 $ 9,013,872 -47%
REVENUE
DETAIL BY FUND
C-36
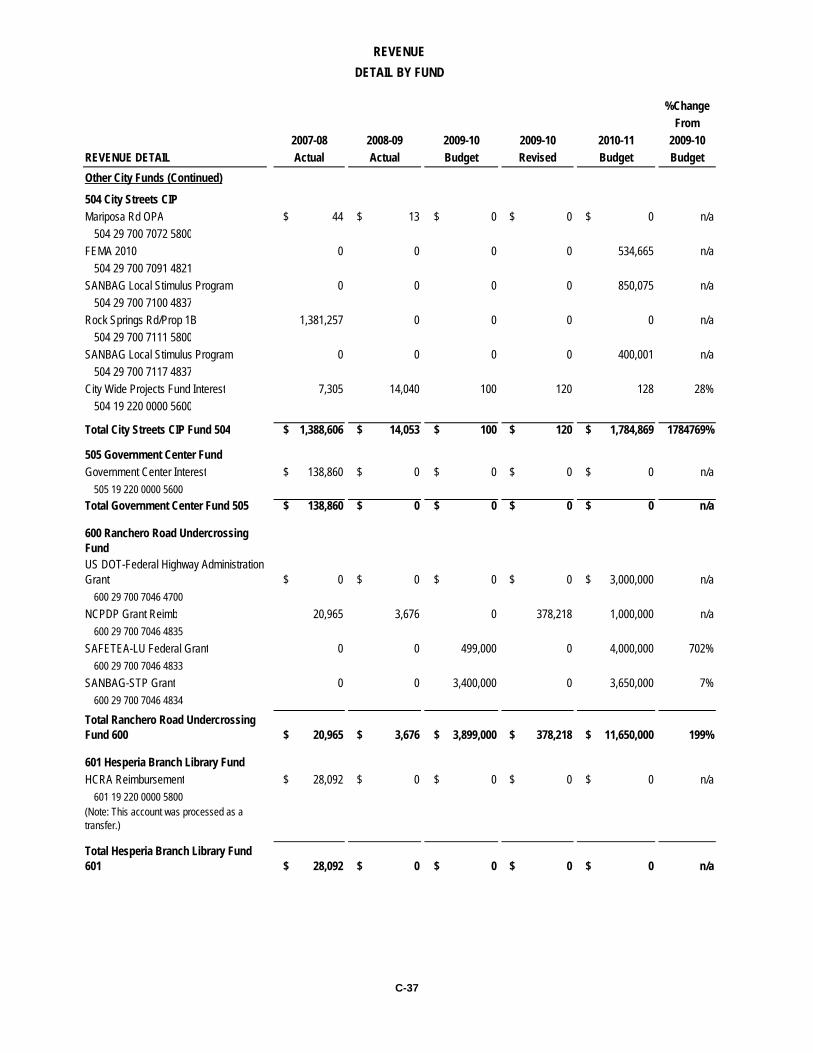
%ChangeFrom
2007-08 2008-09 2009-10 2009-10 2010-11 2009-10REVENUE DETAIL Actual Actual Budget Revised Budget BudgetOther City Funds (Continued)
504 City Streets CIPMariposa Rd OPA $ 44 $ 13 $ 0 $ 0 $ 0 n/a
504 29 700 7072 5800FEMA 2010 0 0 0 0 534,665 n/a
504 29 700 7091 4821SANBAG Local Stimulus Program 0 0 0 0 850,075 n/a
504 29 700 7100 4837Rock Springs Rd/Prop 1B 1,381,257 0 0 0 0 n/a
504 29 700 7111 5800SANBAG Local Stimulus Program 0 0 0 0 400,001 n/a
504 29 700 7117 4837City Wide Projects Fund Interest 7,305 14,040 100 120 128 28%
504 19 220 0000 5600
Total City Streets CIP Fund 504 $ 1,388,606 $ 14,053 $ 100 $ 120 $ 1,784,869 1784769%
505 Government Center FundGovernment Center Interest $ 138,860 $ 0 $ 0 $ 0 $ 0 n/a
505 19 220 0000 5600Total Government Center Fund 505 $ 138,860 $ 0 $ 0 $ 0 $ 0 n/a
600 Ranchero Road Undercrossing FundUS DOT-Federal Highway Administration Grant $ 0 $ 0 $ 0 $ 0 $ 3,000,000 n/a
600 29 700 7046 4700NCPDP Grant Reimb 20,965 3,676 0 378,218 1,000,000 n/a
600 29 700 7046 4835SAFETEA-LU Federal Grant 0 0 499,000 0 4,000,000 702%
600 29 700 7046 4833SANBAG-STP Grant 0 0 3,400,000 0 3,650,000 7%
600 29 700 7046 4834
Total Ranchero Road Undercrossing Fund 600 $ 20,965 $ 3,676 $ 3,899,000 $ 378,218 $ 11,650,000 199%
601 Hesperia Branch Library FundHCRA Reimbursement $ 28,092 $ 0 $ 0 $ 0 $ 0 n/a
601 19 220 0000 5800(Note: This account was processed as a transfer.)
Total Hesperia Branch Library Fund 601 $ 28,092 $ 0 $ 0 $ 0 $ 0 n/a
DETAIL BY FUNDREVENUE
C-37
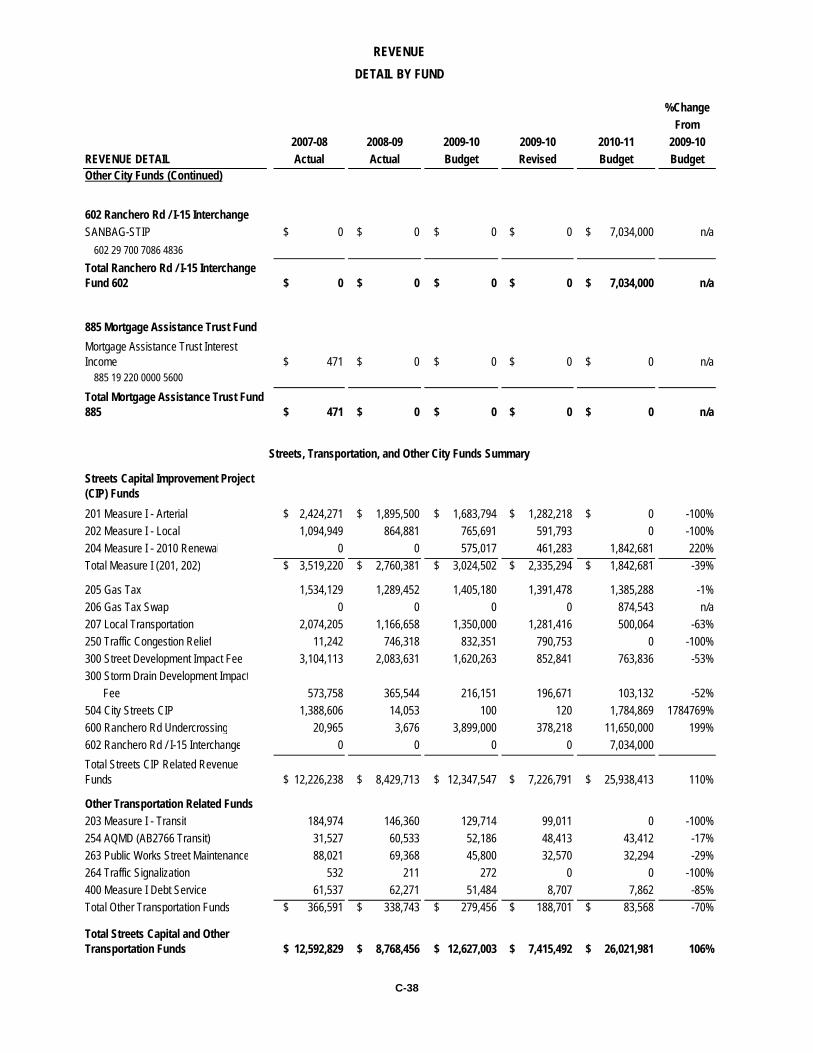
%ChangeFrom
2007-08 2008-09 2009-10 2009-10 2010-11 2009-10REVENUE DETAIL Actual Actual Budget Revised Budget BudgetOther City Funds (Continued)
602 Ranchero Rd / I-15 InterchangeSANBAG-STIP $ 0 $ 0 $ 0 $ 0 $ 7,034,000 n/a
602 29 700 7086 4836Total Ranchero Rd / I-15 Interchange Fund 602 $ 0 $ 0 $ 0 $ 0 $ 7,034,000 n/a
885 Mortgage Assistance Trust Fund Mortgage Assistance Trust Interest Income $ 471 $ 0 $ 0 $ 0 $ 0 n/a
885 19 220 0000 5600
Total Mortgage Assistance Trust Fund 885 $ 471 $ 0 $ 0 $ 0 $ 0 n/a
Streets Capital Improvement Project (CIP) Funds201 Measure I - Arterial $ 2,424,271 $ 1,895,500 $ 1,683,794 $ 1,282,218 $ 0 -100%202 Measure I - Local 1,094,949 864,881 765,691 591,793 0 -100%204 Measure I - 2010 Renewal 0 0 575,017 461,283 1,842,681 220%Total Measure I (201, 202) $ 3,519,220 $ 2,760,381 $ 3,024,502 $ 2,335,294 $ 1,842,681 -39%
205 Gas Tax 1,534,129 1,289,452 1,405,180 1,391,478 1,385,288 -1%206 Gas Tax Swap 0 0 0 0 874,543 n/a207 Local Transportation 2,074,205 1,166,658 1,350,000 1,281,416 500,064 -63%250 Traffic Congestion Relief 11,242 746,318 832,351 790,753 0 -100%300 Street Development Impact Fee 3,104,113 2,083,631 1,620,263 852,841 763,836 -53%300 Storm Drain Development Impact
Fee 573,758 365,544 216,151 196,671 103,132 -52%504 City Streets CIP 1,388,606 14,053 100 120 1,784,869 1784769%600 Ranchero Rd Undercrossing 20,965 3,676 3,899,000 378,218 11,650,000 199%602 Ranchero Rd / I-15 Interchange 0 0 0 0 7,034,000 Total Streets CIP Related Revenue Funds $ 12,226,238 $ 8,429,713 $ 12,347,547 $ 7,226,791 $ 25,938,413 110%
Other Transportation Related Funds203 Measure I - Transit 184,974 146,360 129,714 99,011 0 -100%254 AQMD (AB2766 Transit) 31,527 60,533 52,186 48,413 43,412 -17%263 Public Works Street Maintenance 88,021 69,368 45,800 32,570 32,294 -29%264 Traffic Signalization 532 211 272 0 0 -100%400 Measure I Debt Service 61,537 62,271 51,484 8,707 7,862 -85%Total Other Transportation Funds $ 366,591 $ 338,743 $ 279,456 $ 188,701 $ 83,568 -70%
Total Streets Capital and Other Transportation Funds $ 12,592,829 $ 8,768,456 $ 12,627,003 $ 7,415,492 $ 26,021,981 106%
Streets, Transportation, and Other City Funds Summary
REVENUEDETAIL BY FUND
C-38
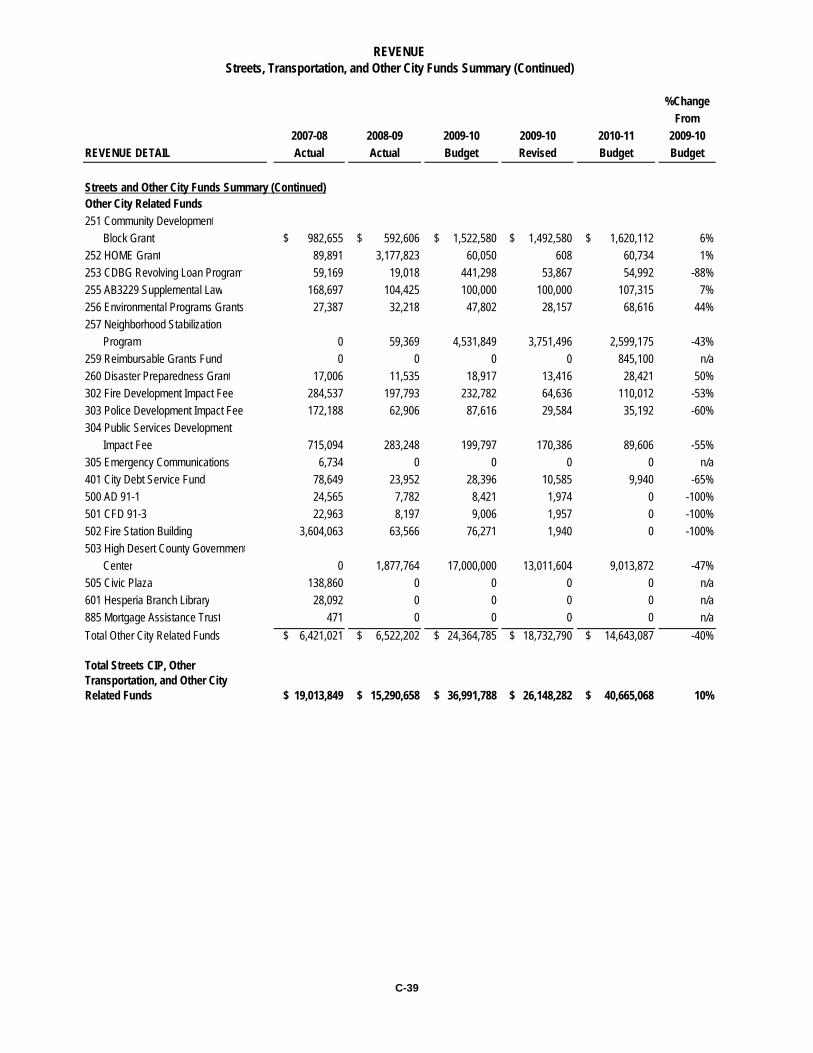
%ChangeFrom
2007-08 2008-09 2009-10 2009-10 2010-11 2009-10REVENUE DETAIL Actual Actual Budget Revised Budget Budget
Other City Related Funds251 Community Development
Block Grant $ 982,655 $ 592,606 $ 1,522,580 $ 1,492,580 $ 1,620,112 6%252 HOME Grant 89,891 3,177,823 60,050 608 60,734 1%253 CDBG Revolving Loan Program 59,169 19,018 441,298 53,867 54,992 -88%255 AB3229 Supplemental Law 168,697 104,425 100,000 100,000 107,315 7%256 Environmental Programs Grants 27,387 32,218 47,802 28,157 68,616 44%257 Neighborhood Stabilization
Program 0 59,369 4,531,849 3,751,496 2,599,175 -43%259 Reimbursable Grants Fund 0 0 0 0 845,100 n/a260 Disaster Preparedness Grant 17,006 11,535 18,917 13,416 28,421 50%302 Fire Development Impact Fee 284,537 197,793 232,782 64,636 110,012 -53%303 Police Development Impact Fee 172,188 62,906 87,616 29,584 35,192 -60%304 Public Services Development
Impact Fee 715,094 283,248 199,797 170,386 89,606 -55%305 Emergency Communications 6,734 0 0 0 0 n/a401 City Debt Service Fund 78,649 23,952 28,396 10,585 9,940 -65%500 AD 91-1 24,565 7,782 8,421 1,974 0 -100%501 CFD 91-3 22,963 8,197 9,006 1,957 0 -100%502 Fire Station Building 3,604,063 63,566 76,271 1,940 0 -100%503 High Desert County Government
Center 0 1,877,764 17,000,000 13,011,604 9,013,872 -47%505 Civic Plaza 138,860 0 0 0 0 n/a601 Hesperia Branch Library 28,092 0 0 0 0 n/a885 Mortgage Assistance Trust 471 0 0 0 0 n/aTotal Other City Related Funds $ 6,421,021 $ 6,522,202 $ 24,364,785 $ 18,732,790 $ 14,643,087 -40%
Total Streets CIP, Other Transportation, and Other City Related Funds $ 19,013,849 $ 15,290,658 $ 36,991,788 $ 26,148,282 $ 40,665,068 10%
Streets and Other City Funds Summary (Continued)
REVENUEStreets, Transportation, and Other City Funds Summary (Continued)
C-39
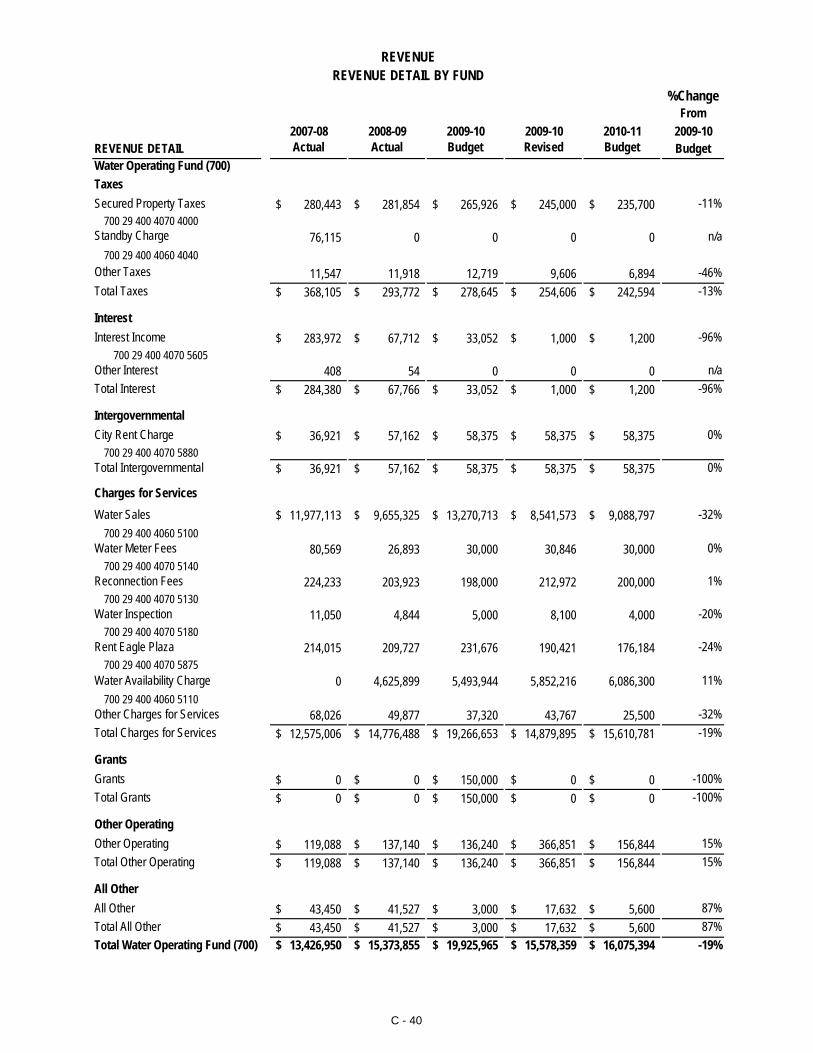
%ChangeFrom
2007-08 2008-09 2009-10 2009-10 2010-11 2009-10REVENUE DETAIL Actual Actual Budget Revised Budget BudgetWater Operating Fund (700)TaxesSecured Property Taxes 280,443$ 281,854$ 265,926$ 245,000$ 235,700$ -11%
700 29 400 4070 4000Standby Charge 76,115 0 0 0 0 n/a
700 29 400 4060 4040Other Taxes 11,547 11,918 12,719 9,606 6,894 -46%Total Taxes 368,105$ 293,772$ 278,645$ 254,606$ 242,594$ -13%
InterestInterest Income 283,972$ 67,712$ 33,052$ 1,000$ 1,200$ -96%
700 29 400 4070 5605Other Interest 408 54 0 0 0 n/aTotal Interest 284,380$ 67,766$ 33,052$ 1,000$ 1,200$ -96%
IntergovernmentalCity Rent Charge 36,921$ 57,162$ 58,375$ 58,375$ 58,375$ 0%
700 29 400 4070 5880Total Intergovernmental 36,921$ 57,162$ 58,375$ 58,375$ 58,375$ 0%
Charges for ServicesWater Sales 11,977,113$ 9,655,325$ 13,270,713$ 8,541,573$ 9,088,797$ -32%
700 29 400 4060 5100Water Meter Fees 80,569 26,893 30,000 30,846 30,000 0%
700 29 400 4070 5140Reconnection Fees 224,233 203,923 198,000 212,972 200,000 1%
700 29 400 4070 5130Water Inspection 11,050 4,844 5,000 8,100 4,000 -20%
700 29 400 4070 5180Rent Eagle Plaza 214,015 209,727 231,676 190,421 176,184 -24%
700 29 400 4070 5875Water Availability Charge 0 4,625,899 5,493,944 5,852,216 6,086,300 11%
700 29 400 4060 5110Other Charges for Services 68,026 49,877 37,320 43,767 25,500 -32%Total Charges for Services 12,575,006$ 14,776,488$ 19,266,653$ 14,879,895$ 15,610,781$ -19%
GrantsGrants 0$ 0$ 150,000$ 0$ 0$ -100%Total Grants 0$ 0$ 150,000$ 0$ 0$ -100%
Other OperatingOther Operating 119,088$ 137,140$ 136,240$ 366,851$ 156,844$ 15%Total Other Operating 119,088$ 137,140$ 136,240$ 366,851$ 156,844$ 15%
All OtherAll Other 43,450$ 41,527$ 3,000$ 17,632$ 5,600$ 87%Total All Other 43,450$ 41,527$ 3,000$ 17,632$ 5,600$ 87%Total Water Operating Fund (700) 13,426,950$ 15,373,855$ 19,925,965$ 15,578,359$ 16,075,394$ -19%
REVENUEREVENUE DETAIL BY FUND
C - 40
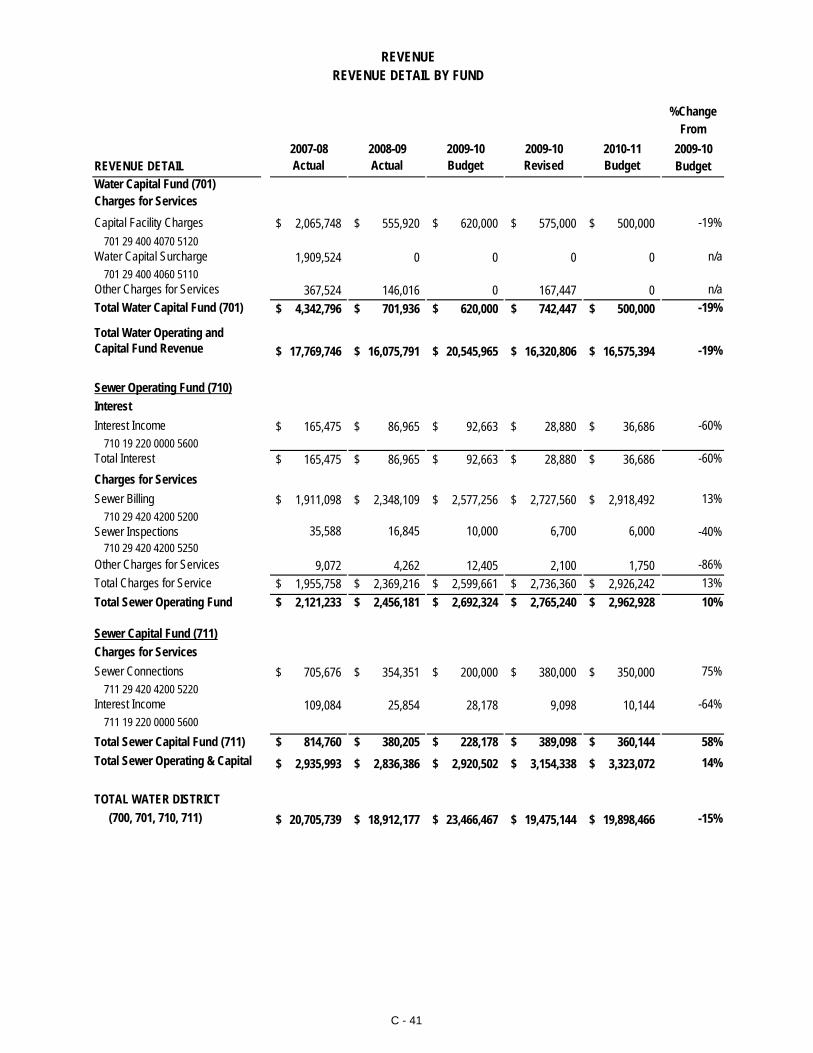
REVENUE DETAIL BY FUNDREVENUE
%ChangeFrom
2007-08 2008-09 2009-10 2009-10 2010-11 2009-10REVENUE DETAIL Actual Actual Budget Revised Budget BudgetWater Capital Fund (701)Charges for ServicesCapital Facility Charges 2,065,748$ 555,920$ 620,000$ 575,000$ 500,000$ -19%
701 29 400 4070 5120Water Capital Surcharge 1,909,524 0 0 0 0 n/a
701 29 400 4060 5110Other Charges for Services 367,524 146,016 0 167,447 0 n/aTotal Water Capital Fund (701) 4,342,796$ 701,936$ 620,000$ 742,447$ 500,000$ -19%
Total Water Operating andCapital Fund Revenue 17,769,746$ 16,075,791$ 20,545,965$ 16,320,806$ 16,575,394$ -19%
Sewer Operating Fund (710)InterestInterest Income 165,475$ 86,965$ 92,663$ 28,880$ 36,686$ -60%
710 19 220 0000 5600Total Interest 165,475$ 86,965$ 92,663$ 28,880$ 36,686$ -60%Charges for ServicesSewer Billing 1,911,098$ 2,348,109$ 2,577,256$ 2,727,560$ 2,918,492$ 13%
710 29 420 4200 5200Sewer Inspections 35,588 16,845 10,000 6,700 6,000 -40%
710 29 420 4200 5250Other Charges for Services 9,072 4,262 12,405 2,100 1,750 -86%Total Charges for Service 1,955,758$ 2,369,216$ 2,599,661$ 2,736,360$ 2,926,242$ 13%Total Sewer Operating Fund 2,121,233$ 2,456,181$ 2,692,324$ 2,765,240$ 2,962,928$ 10%
Sewer Capital Fund (711)Charges for Services Sewer Connections 705,676$ 354,351$ 200,000$ 380,000$ 350,000$ 75%
711 29 420 4200 5220Interest Income 109,084 25,854 28,178 9,098 10,144 -64%
711 19 220 0000 5600Total Sewer Capital Fund (711) 814,760$ 380,205$ 228,178$ 389,098$ 360,144$ 58%Total Sewer Operating & Capital 2,935,993$ 2,836,386$ 2,920,502$ 3,154,338$ 3,323,072$ 14%
TOTAL WATER DISTRICT (700, 701, 710, 711) 20,705,739$ 18,912,177$ 23,466,467$ 19,475,144$ 19,898,466$ -15%
C - 41
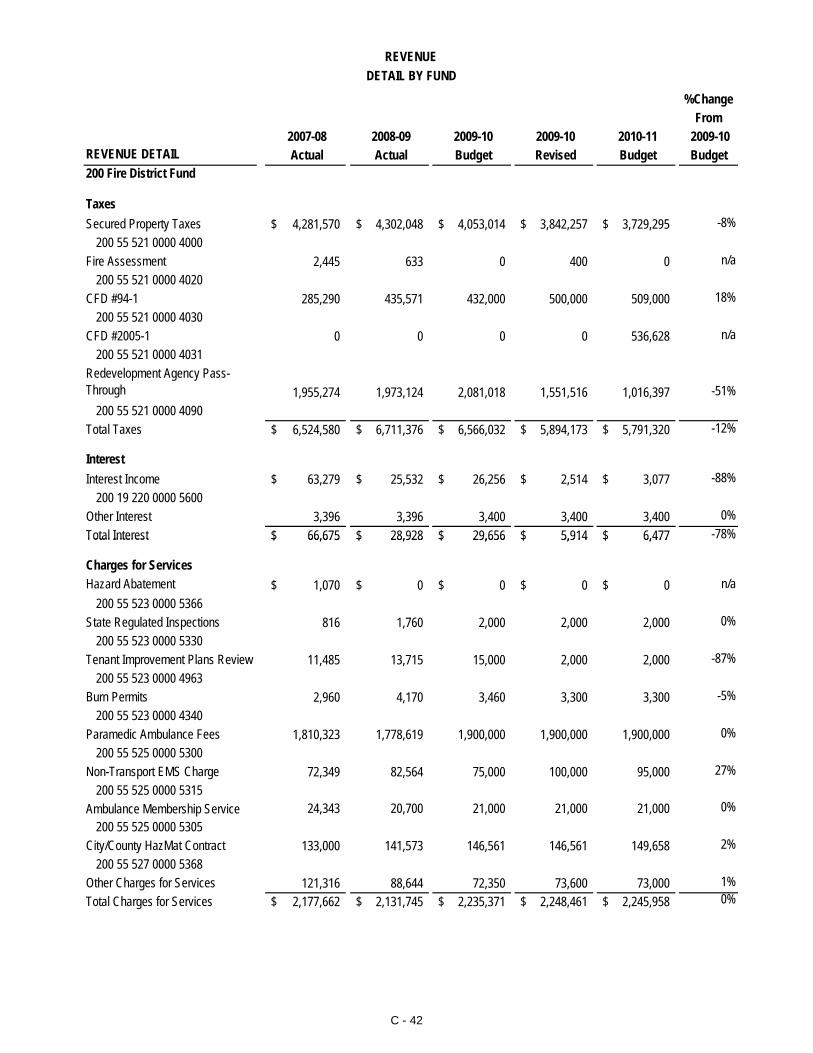
%ChangeFrom
2007-08 2008-09 2009-10 2009-10 2010-11 2009-10 REVENUE DETAIL Actual Actual Budget Revised Budget Budget200 Fire District Fund
TaxesSecured Property Taxes 4,281,570$ 4,302,048$ 4,053,014$ 3,842,257$ 3,729,295$ -8%
200 55 521 0000 4000Fire Assessment 2,445 633 0 400 0 n/a
200 55 521 0000 4020CFD #94-1 285,290 435,571 432,000 500,000 509,000 18%
200 55 521 0000 4030CFD #2005-1 0 0 0 0 536,628 n/a
200 55 521 0000 4031Redevelopment Agency Pass-Through 1,955,274 1,973,124 2,081,018 1,551,516 1,016,397 -51%
200 55 521 0000 4090Total Taxes 6,524,580$ 6,711,376$ 6,566,032$ 5,894,173$ 5,791,320$ -12%
InterestInterest Income 63,279$ 25,532$ 26,256$ 2,514$ 3,077$ -88%
200 19 220 0000 5600Other Interest 3,396 3,396 3,400 3,400 3,400 0%Total Interest 66,675$ 28,928$ 29,656$ 5,914$ 6,477$ -78%
REVENUEDETAIL BY FUND
Total Interest 66,675$ 28,928$ 29,656$ 5,914$ 6,477$ %
Charges for ServicesHazard Abatement 1,070$ 0$ 0$ 0$ 0$ n/a
200 55 523 0000 5366State Regulated Inspections 816 1,760 2,000 2,000 2,000 0%
200 55 523 0000 5330Tenant Improvement Plans Review 11,485 13,715 15,000 2,000 2,000 -87%
200 55 523 0000 4963Burn Permits 2,960 4,170 3,460 3,300 3,300 -5%
200 55 523 0000 4340Paramedic Ambulance Fees 1,810,323 1,778,619 1,900,000 1,900,000 1,900,000 0%
200 55 525 0000 5300Non-Transport EMS Charge 72,349 82,564 75,000 100,000 95,000 27%
200 55 525 0000 5315Ambulance Membership Service 24,343 20,700 21,000 21,000 21,000 0%
200 55 525 0000 5305City/County HazMat Contract 133,000 141,573 146,561 146,561 149,658 2%
200 55 527 0000 5368Other Charges for Services 121,316 88,644 72,350 73,600 73,000 1%Total Charges for Services 2,177,662$ 2,131,745$ 2,235,371$ 2,248,461$ 2,245,958$ 0%
C - 42
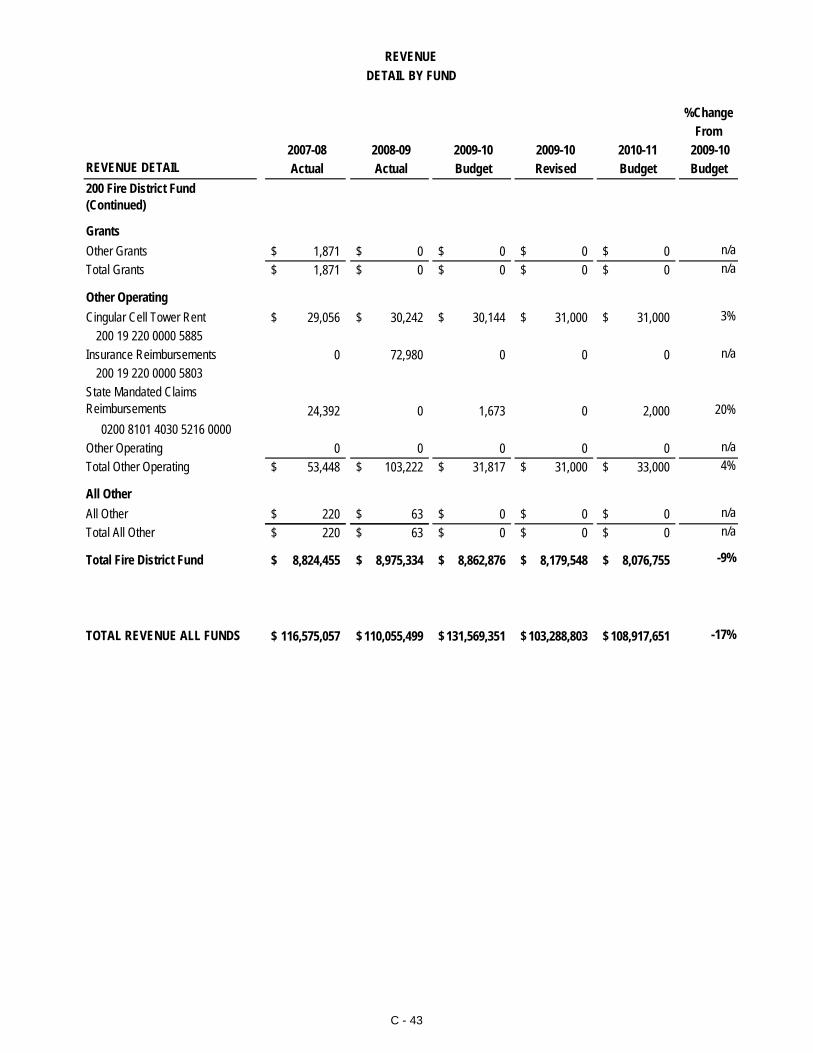
%ChangeFrom
2007-08 2008-09 2009-10 2009-10 2010-11 2009-10 REVENUE DETAIL Actual Actual Budget Revised Budget Budget200 Fire District Fund (Continued)
GrantsOther Grants 1,871$ 0$ 0$ 0$ 0$ n/aTotal Grants 1,871$ 0$ 0$ 0$ 0$ n/a
Other OperatingCingular Cell Tower Rent 29,056$ 30,242$ 30,144$ 31,000$ 31,000$ 3%
200 19 220 0000 5885Insurance Reimbursements 0 72,980 0 0 0 n/a
200 19 220 0000 5803State Mandated Claims Reimbursements 24,392 0 1,673 0 2,000 20% 0200 8101 4030 5216 0000Other Operating 0 0 0 0 0 n/aTotal Other Operating 53,448$ 103,222$ 31,817$ 31,000$ 33,000$ 4%
All OtherAll Other 220$ 63$ 0$ 0$ 0$ n/aTotal All Other 220$ 63$ 0$ 0$ 0$ n/a
DETAIL BY FUNDREVENUE
$ $ $ $ $
Total Fire District Fund 8,824,455$ 8,975,334$ 8,862,876$ 8,179,548$ 8,076,755$ -9%
116,575,057$ 110,055,499$ 131,569,351$ 103,288,803$ 108,917,651$ -17%TOTAL REVENUE ALL FUNDS
C - 43

THIS PAGE INTENTIONALLY LEFT BLANK
C - 44
E X P E N D I T U R E
S U M M A R Y
Overview and Summary Total Expenditures by Department Total Expenditures by Major Expenditure Account Total Expenditures by Major Expenditure Classification Total General Fund Expenditures by Department Total General Fund Expenditures by Major Expenditure Account Total Redevelopment Agency Expenditures by Major Expenditure Account Summary Expenditures by Department Total Expenditures by Fund, Department, and Program Total Expenditures by Department and Programs Total Expenditures by Account
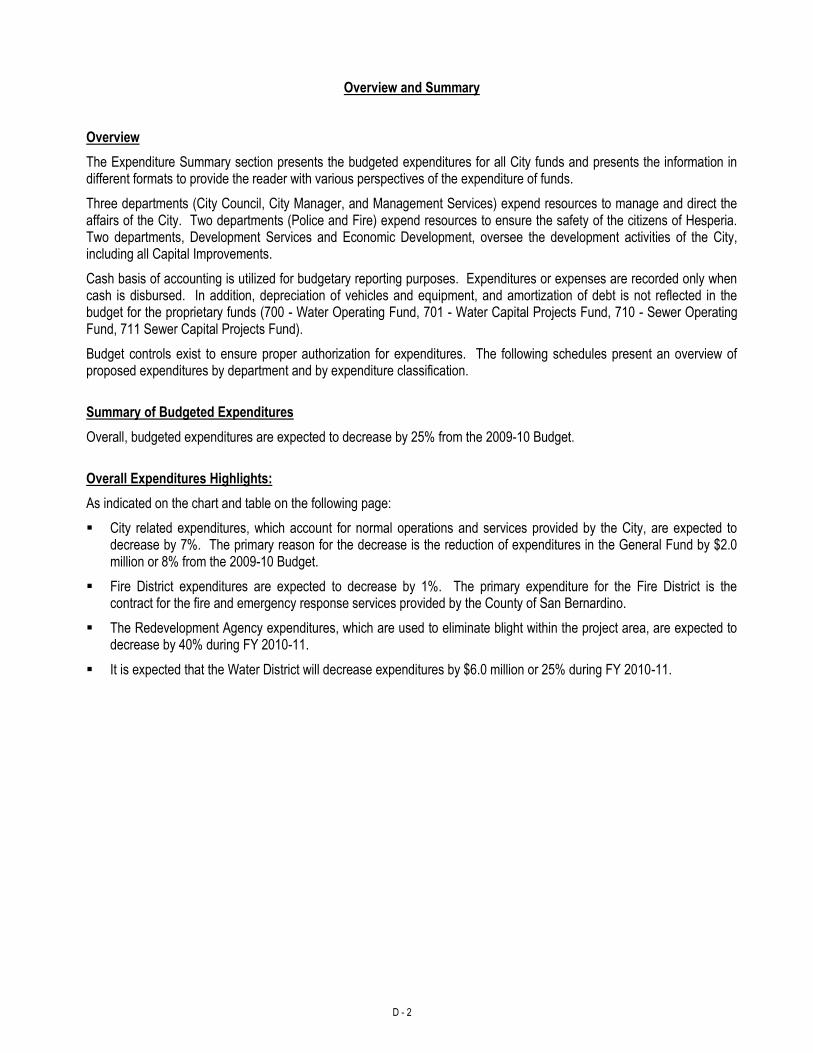
D - 2
Overview and Summary
Overview
The Expenditure Summary section presents the budgeted expenditures for all City funds and presents the information in different formats to provide the reader with various perspectives of the expenditure of funds.
Three departments (City Council, City Manager, and Management Services) expend resources to manage and direct the affairs of the City. Two departments (Police and Fire) expend resources to ensure the safety of the citizens of Hesperia. Two departments, Development Services and Economic Development, oversee the development activities of the City, including all Capital Improvements.
Cash basis of accounting is utilized for budgetary reporting purposes. Expenditures or expenses are recorded only when cash is disbursed. In addition, depreciation of vehicles and equipment, and amortization of debt is not reflected in the budget for the proprietary funds (700 - Water Operating Fund, 701 - Water Capital Projects Fund, 710 - Sewer Operating Fund, 711 Sewer Capital Projects Fund).
Budget controls exist to ensure proper authorization for expenditures. The following schedules present an overview of proposed expenditures by department and by expenditure classification.
Summary of Budgeted Expenditures
Overall, budgeted expenditures are expected to decrease by 25% from the 2009-10 Budget.
Overall Expenditures Highlights:
As indicated on the chart and table on the following page:
City related expenditures, which account for normal operations and services provided by the City, are expected to decrease by 7%. The primary reason for the decrease is the reduction of expenditures in the General Fund by $2.0 million or 8% from the 2009-10 Budget.
Fire District expenditures are expected to decrease by 1%. The primary expenditure for the Fire District is the contract for the fire and emergency response services provided by the County of San Bernardino.
The Redevelopment Agency expenditures, which are used to eliminate blight within the project area, are expected to decrease by 40% during FY 2010-11.
It is expected that the Water District will decrease expenditures by $6.0 million or 25% during FY 2010-11.
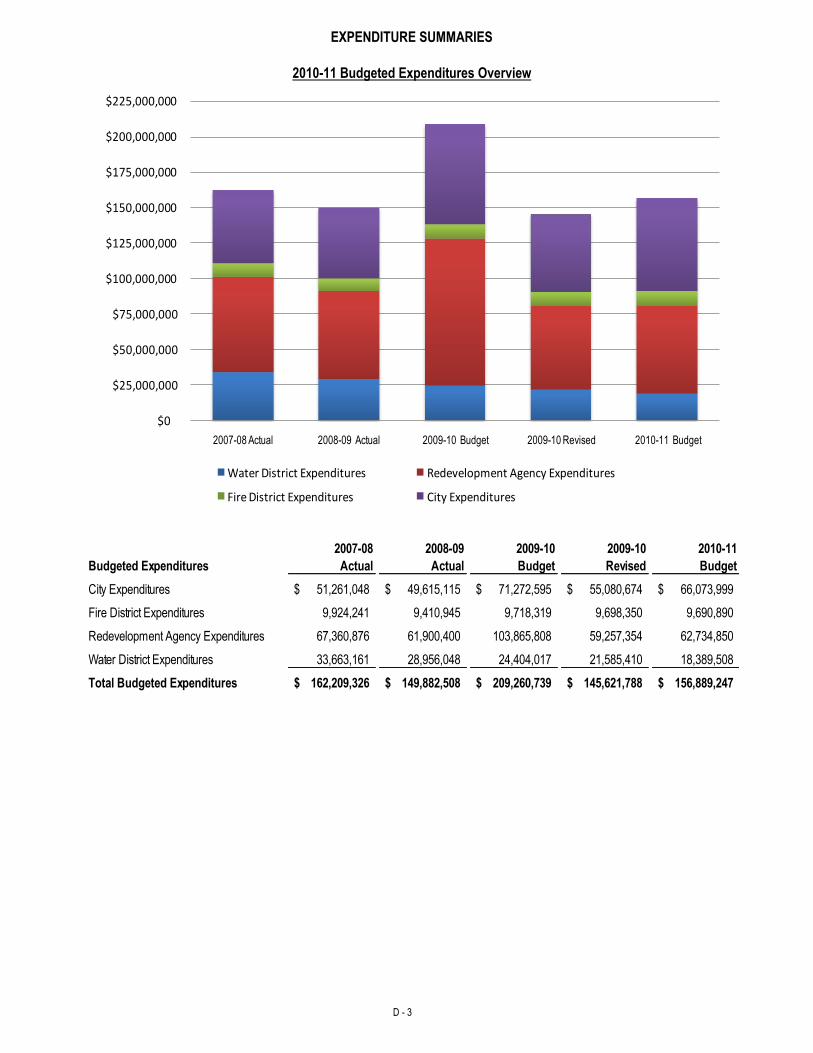
EXPENDITURE SUMMARIES
D - 3
2010-11 Budgeted Expenditures Overview
$0
$25,000,000
$50,000,000
$75,000,000
$100,000,000
$125,000,000
$150,000,000
$175,000,000
$200,000,000
$225,000,000
2007-08 Actual 2008-09 Actual 2009-10 Budget 2009-10 Revised 2010-11 Budget
Water District Expenditures Redevelopment Agency Expenditures
Fire District Expenditures City Expenditures
Budgeted Expenditures
2007-08
Actual
2008-09
Actual
2009-10
Budget
2009-10
Revised
2010-11
Budget
City Expenditures 51,261,048$ 49,615,115$ 71,272,595$ 55,080,674$ 66,073,999$
Fire District Expenditures 9,924,241 9,410,945 9,718,319 9,698,350 9,690,890
Redevelopment Agency Expenditures 67,360,876 61,900,400 103,865,808 59,257,354 62,734,850
Water District Expenditures 33,663,161 28,956,048 24,404,017 21,585,410 18,389,508
Total Budgeted Expenditures 162,209,326$ 149,882,508$ 209,260,739$ 145,621,788$ 156,889,247$
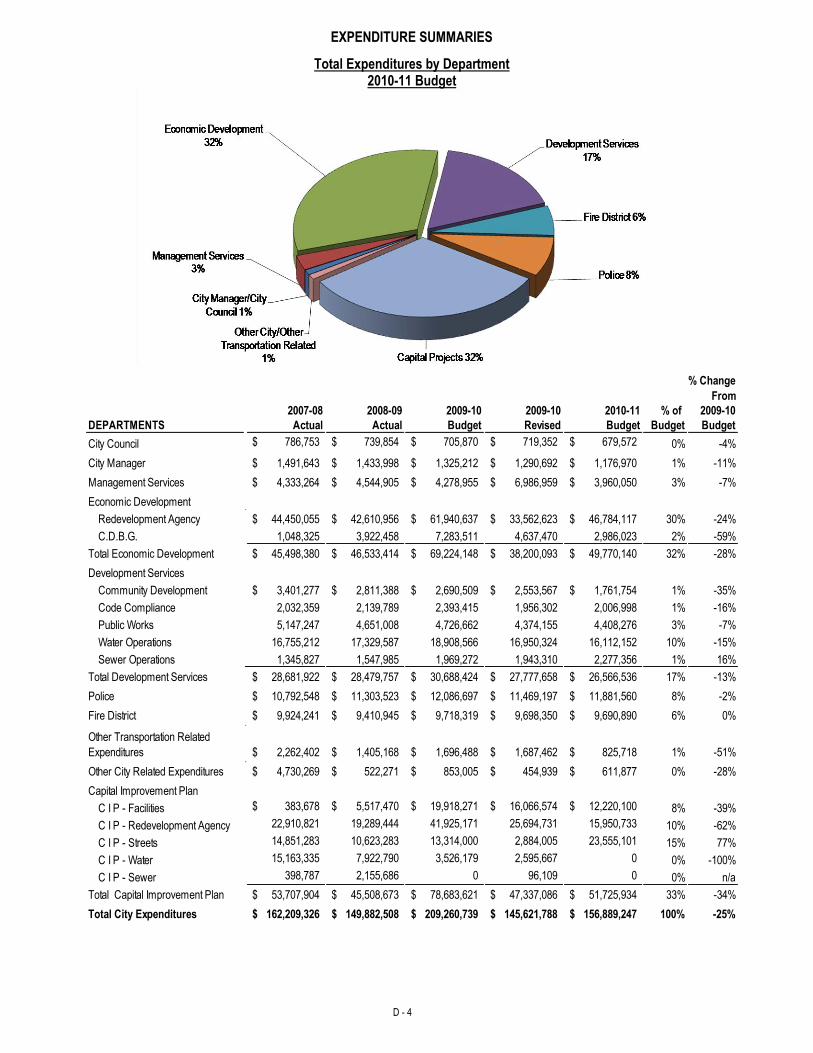
EXPENDITURE SUMMARIES
D - 4
Total Expenditures by Department 2010-11 Budget
% Change
From
2007-08 2008-09 2009-10 2009-10 2010-11 % of 2009-10
DEPARTMENTS Actual Actual Budget Revised Budget Budget Budget
City Council 786,753$ 739,854$ 705,870$ 719,352$ 679,572$ 0% -4%
City Manager 1,491,643$ 1,433,998$ 1,325,212$ 1,290,692$ 1,176,970$ 1% -11%
Management Services 4,333,264$ 4,544,905$ 4,278,955$ 6,986,959$ 3,960,050$ 3% -7%
Economic Development
Redevelopment Agency 44,450,055$ 42,610,956$ 61,940,637$ 33,562,623$ 46,784,117$ 30% -24%
C.D.B.G. 1,048,325 3,922,458 7,283,511 4,637,470 2,986,023 2% -59%
Total Economic Development 45,498,380$ 46,533,414$ 69,224,148$ 38,200,093$ 49,770,140$ 32% -28%
Development Services
Community Development 3,401,277$ 2,811,388$ 2,690,509$ 2,553,567$ 1,761,754$ 1% -35%
Code Compliance 2,032,359 2,139,789 2,393,415 1,956,302 2,006,998 1% -16%
Public Works 5,147,247 4,651,008 4,726,662 4,374,155 4,408,276 3% -7%
Water Operations 16,755,212 17,329,587 18,908,566 16,950,324 16,112,152 10% -15%
Sewer Operations 1,345,827 1,547,985 1,969,272 1,943,310 2,277,356 1% 16%
Total Development Services 28,681,922$ 28,479,757$ 30,688,424$ 27,777,658$ 26,566,536$ 17% -13%
Police 10,792,548$ 11,303,523$ 12,086,697$ 11,469,197$ 11,881,560$ 8% -2%
Fire District 9,924,241$ 9,410,945$ 9,718,319$ 9,698,350$ 9,690,890$ 6% 0%
Other Transportation Related
Expenditures 2,262,402$ 1,405,168$ 1,696,488$ 1,687,462$ 825,718$ 1% -51%
Other City Related Expenditures 4,730,269$ 522,271$ 853,005$ 454,939$ 611,877$ 0% -28%
Capital Improvement Plan
C I P - Facilities 383,678$ 5,517,470$ 19,918,271$ 16,066,574$ 12,220,100$ 8% -39%
C I P - Redevelopment Agency 22,910,821 19,289,444 41,925,171 25,694,731 15,950,733 10% -62%
C I P - Streets 14,851,283 10,623,283 13,314,000 2,884,005 23,555,101 15% 77%
C I P - Water 15,163,335 7,922,790 3,526,179 2,595,667 0 0% -100%
C I P - Sewer 398,787 2,155,686 0 96,109 0 0% n/a
Total Capital Improvement Plan 53,707,904$ 45,508,673$ 78,683,621$ 47,337,086$ 51,725,934$ 33% -34%
Total City Expenditures 162,209,326$ 149,882,508$ 209,260,739$ 145,621,788$ 156,889,247$ 100% -25%
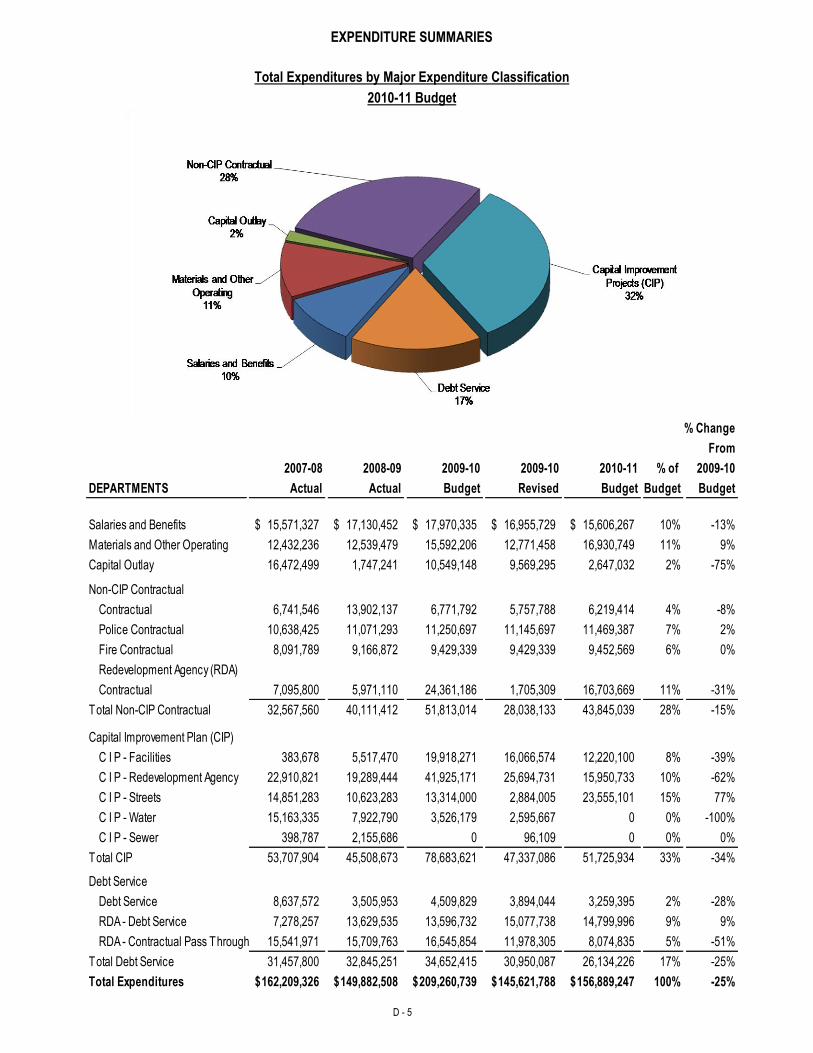
EXPENDITURE SUMMARIES
D - 5
Total Expenditures by Major Expenditure Classification
2010-11 Budget
% Change
From
2007-08 2008-09 2009-10 2009-10 2010-11 % of 2009-10
DEPARTMENTS Actual Actual Budget Revised Budget Budget Budget
Salaries and Benefits 15,571,327$ 17,130,452$ 17,970,335$ 16,955,729$ 15,606,267$ 10% -13%
Materials and Other Operating 12,432,236 12,539,479 15,592,206 12,771,458 16,930,749 11% 9%
Capital Outlay 16,472,499 1,747,241 10,549,148 9,569,295 2,647,032 2% -75%
Non-CIP Contractual
Contractual 6,741,546 13,902,137 6,771,792 5,757,788 6,219,414 4% -8%
Police Contractual 10,638,425 11,071,293 11,250,697 11,145,697 11,469,387 7% 2%
Fire Contractual 8,091,789 9,166,872 9,429,339 9,429,339 9,452,569 6% 0%
Redevelopment Agency (RDA)
Contractual 7,095,800 5,971,110 24,361,186 1,705,309 16,703,669 11% -31%
Total Non-CIP Contractual 32,567,560 40,111,412 51,813,014 28,038,133 43,845,039 28% -15%
Capital Improvement Plan (CIP)
C I P - Facilities 383,678 5,517,470 19,918,271 16,066,574 12,220,100 8% -39%
C I P - Redevelopment Agency 22,910,821 19,289,444 41,925,171 25,694,731 15,950,733 10% -62%
C I P - Streets 14,851,283 10,623,283 13,314,000 2,884,005 23,555,101 15% 77%
C I P - Water 15,163,335 7,922,790 3,526,179 2,595,667 0 0% -100%
C I P - Sewer 398,787 2,155,686 0 96,109 0 0% 0%
Total CIP 53,707,904 45,508,673 78,683,621 47,337,086 51,725,934 33% -34%
Debt Service
Debt Service 8,637,572 3,505,953 4,509,829 3,894,044 3,259,395 2% -28%
RDA - Debt Service 7,278,257 13,629,535 13,596,732 15,077,738 14,799,996 9% 9%
RDA - Contractual Pass Through 15,541,971 15,709,763 16,545,854 11,978,305 8,074,835 5% -51%
Total Debt Service 31,457,800 32,845,251 34,652,415 30,950,087 26,134,226 17% -25%
Total Expenditures 162,209,326$ 149,882,508$ 209,260,739$ 145,621,788$ 156,889,247$ 100% -25%
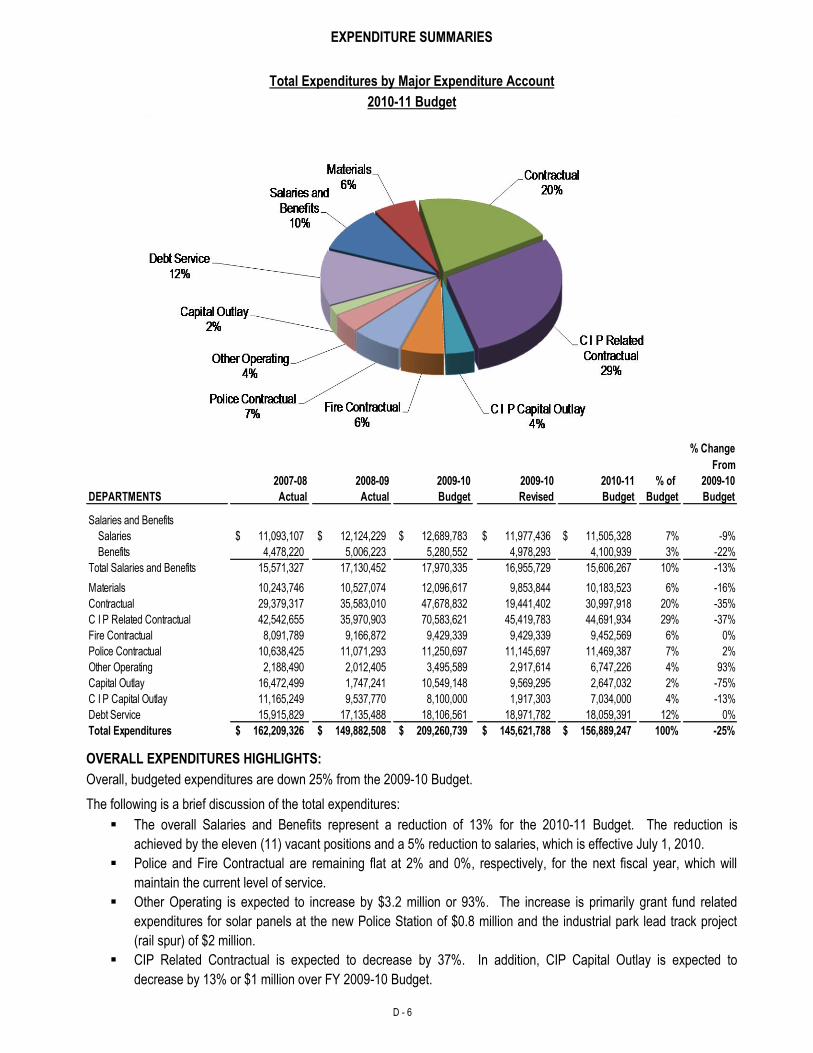
EXPENDITURE SUMMARIES
D - 6
Total Expenditures by Major Expenditure Account
2010-11 Budget
% Change
From
2007-08 2008-09 2009-10 2009-10 2010-11 % of 2009-10
DEPARTMENTS Actual Actual Budget Revised Budget Budget Budget
Salaries and Benefits
Salaries 11,093,107$ 12,124,229$ 12,689,783$ 11,977,436$ 11,505,328$ 7% -9%
Benefits 4,478,220 5,006,223 5,280,552 4,978,293 4,100,939 3% -22%
Total Salaries and Benefits 15,571,327 17,130,452 17,970,335 16,955,729 15,606,267 10% -13%
Materials 10,243,746 10,527,074 12,096,617 9,853,844 10,183,523 6% -16%
Contractual 29,379,317 35,583,010 47,678,832 19,441,402 30,997,918 20% -35%
C I P Related Contractual 42,542,655 35,970,903 70,583,621 45,419,783 44,691,934 29% -37%
Fire Contractual 8,091,789 9,166,872 9,429,339 9,429,339 9,452,569 6% 0%
Police Contractual 10,638,425 11,071,293 11,250,697 11,145,697 11,469,387 7% 2%
Other Operating 2,188,490 2,012,405 3,495,589 2,917,614 6,747,226 4% 93%
Capital Outlay 16,472,499 1,747,241 10,549,148 9,569,295 2,647,032 2% -75%
C I P Capital Outlay 11,165,249 9,537,770 8,100,000 1,917,303 7,034,000 4% -13%
Debt Service 15,915,829 17,135,488 18,106,561 18,971,782 18,059,391 12% 0%
Total Expenditures 162,209,326$ 149,882,508$ 209,260,739$ 145,621,788$ 156,889,247$ 100% -25%
OVERALL EXPENDITURES HIGHLIGHTS:
Overall, budgeted expenditures are down 25% from the 2009-10 Budget.
The following is a brief discussion of the total expenditures:
The overall Salaries and Benefits represent a reduction of 13% for the 2010-11 Budget. The reduction is
achieved by the eleven (11) vacant positions and a 5% reduction to salaries, which is effective July 1, 2010.
Police and Fire Contractual are remaining flat at 2% and 0%, respectively, for the next fiscal year, which will
maintain the current level of service.
Other Operating is expected to increase by $3.2 million or 93%. The increase is primarily grant fund related
expenditures for solar panels at the new Police Station of $0.8 million and the industrial park lead track project
(rail spur) of $2 million.
CIP Related Contractual is expected to decrease by 37%. In addition, CIP Capital Outlay is expected to
decrease by 13% or $1 million over FY 2009-10 Budget.
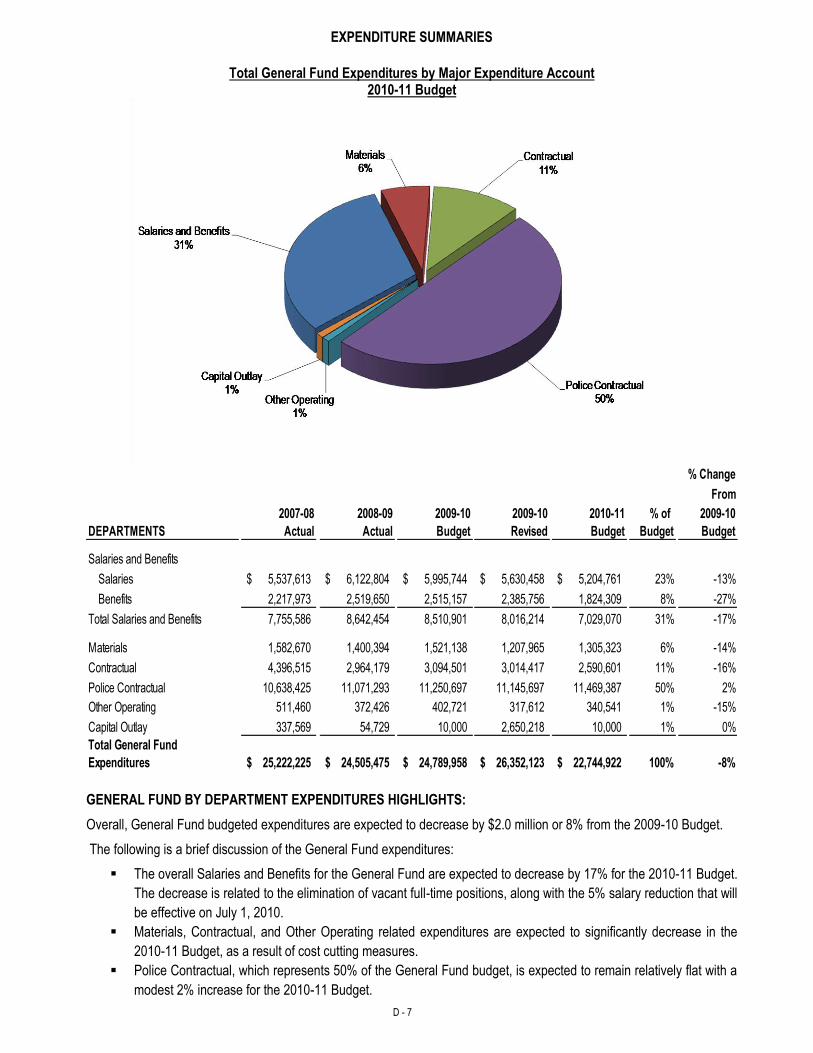
EXPENDITURE SUMMARIES
D - 7
Total General Fund Expenditures by Major Expenditure Account
2010-11 Budget
% Change
From
2007-08 2008-09 2009-10 2009-10 2010-11 % of 2009-10
DEPARTMENTS Actual Actual Budget Revised Budget Budget Budget
Salaries and Benefits
Salaries 5,537,613$ 6,122,804$ 5,995,744$ 5,630,458$ 5,204,761$ 23% -13%
Benefits 2,217,973 2,519,650 2,515,157 2,385,756 1,824,309 8% -27%
Total Salaries and Benefits 7,755,586 8,642,454 8,510,901 8,016,214 7,029,070 31% -17%
Materials 1,582,670 1,400,394 1,521,138 1,207,965 1,305,323 6% -14%
Contractual 4,396,515 2,964,179 3,094,501 3,014,417 2,590,601 11% -16%
Police Contractual 10,638,425 11,071,293 11,250,697 11,145,697 11,469,387 50% 2%
Other Operating 511,460 372,426 402,721 317,612 340,541 1% -15%
Capital Outlay 337,569 54,729 10,000 2,650,218 10,000 1% 0%
Total General Fund
Expenditures 25,222,225$ 24,505,475$ 24,789,958$ 26,352,123$ 22,744,922$ 100% -8%
GENERAL FUND BY DEPARTMENT EXPENDITURES HIGHLIGHTS:
Overall, General Fund budgeted expenditures are expected to decrease by $2.0 million or 8% from the 2009-10 Budget.
The following is a brief discussion of the General Fund expenditures:
The overall Salaries and Benefits for the General Fund are expected to decrease by 17% for the 2010-11 Budget.
The decrease is related to the elimination of vacant full-time positions, along with the 5% salary reduction that will
be effective on July 1, 2010.
Materials, Contractual, and Other Operating related expenditures are expected to significantly decrease in the
2010-11 Budget, as a result of cost cutting measures.
Police Contractual, which represents 50% of the General Fund budget, is expected to remain relatively flat with a
modest 2% increase for the 2010-11 Budget.
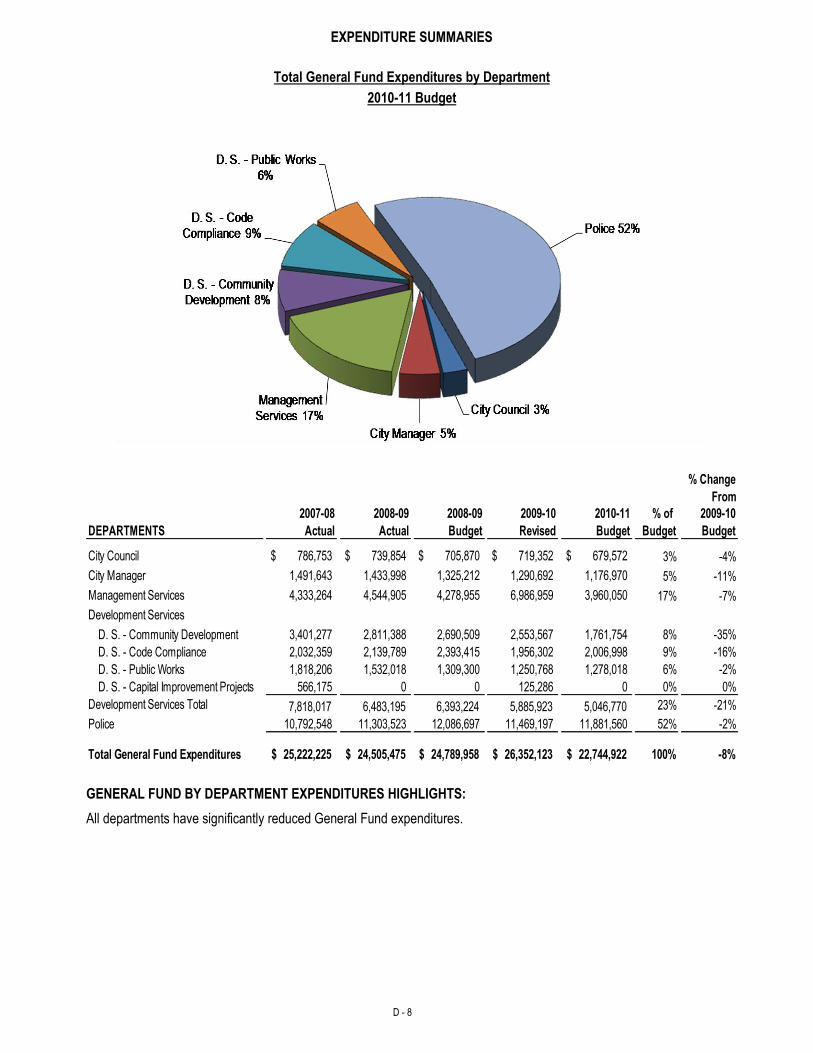
EXPENDITURE SUMMARIES
D - 8
Total General Fund Expenditures by Department
2010-11 Budget
% Change
From
2007-08 2008-09 2008-09 2009-10 2010-11 % of 2009-10
DEPARTMENTS Actual Actual Budget Revised Budget Budget Budget
City Council $ 786,753 $ 739,854 $ 705,870 $ 719,352 $ 679,572 3% -4%
City Manager 1,491,643 1,433,998 1,325,212 1,290,692 1,176,970 5% -11%
Management Services 4,333,264 4,544,905 4,278,955 6,986,959 3,960,050 17% -7%
Development Services
D. S. - Community Development 3,401,277 2,811,388 2,690,509 2,553,567 1,761,754 8% -35%
D. S. - Code Compliance 2,032,359 2,139,789 2,393,415 1,956,302 2,006,998 9% -16%
D. S. - Public Works 1,818,206 1,532,018 1,309,300 1,250,768 1,278,018 6% -2%
D. S. - Capital Improvement Projects 566,175 0 0 125,286 0 0% 0%
Development Services Total 7,818,017 6,483,195 6,393,224 5,885,923 5,046,770 23% -21%
Police 10,792,548 11,303,523 12,086,697 11,469,197 11,881,560 52% -2%
Total General Fund Expenditures 25,222,225$ 24,505,475$ 24,789,958$ 26,352,123$ 22,744,922$ 100% -8%
GENERAL FUND BY DEPARTMENT EXPENDITURES HIGHLIGHTS:
All departments have significantly reduced General Fund expenditures.
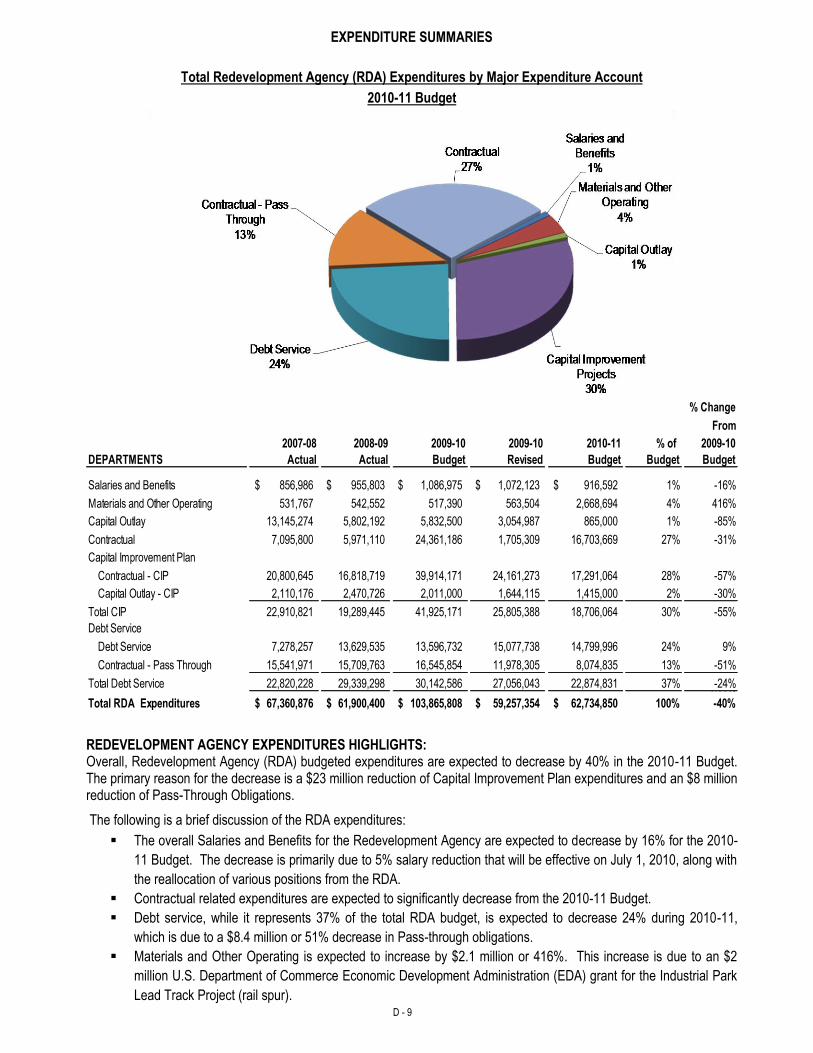
EXPENDITURE SUMMARIES
D - 9
Total Redevelopment Agency (RDA) Expenditures by Major Expenditure Account
2010-11 Budget
% Change
From
2007-08 2008-09 2009-10 2009-10 2010-11 % of 2009-10
DEPARTMENTS Actual Actual Budget Revised Budget Budget Budget
Salaries and Benefits 856,986$ 955,803$ 1,086,975$ 1,072,123$ 916,592$ 1% -16%
Materials and Other Operating 531,767 542,552 517,390 563,504 2,668,694 4% 416%
Capital Outlay 13,145,274 5,802,192 5,832,500 3,054,987 865,000 1% -85%
Contractual 7,095,800 5,971,110 24,361,186 1,705,309 16,703,669 27% -31%
Capital Improvement Plan
Contractual - CIP 20,800,645 16,818,719 39,914,171 24,161,273 17,291,064 28% -57%
Capital Outlay - CIP 2,110,176 2,470,726 2,011,000 1,644,115 1,415,000 2% -30%
Total CIP 22,910,821 19,289,445 41,925,171 25,805,388 18,706,064 30% -55%
Debt Service
Debt Service 7,278,257 13,629,535 13,596,732 15,077,738 14,799,996 24% 9%
Contractual - Pass Through 15,541,971 15,709,763 16,545,854 11,978,305 8,074,835 13% -51%
Total Debt Service 22,820,228 29,339,298 30,142,586 27,056,043 22,874,831 37% -24%0.00%
Total RDA Expenditures 67,360,876$ 61,900,400$ 103,865,808$ 59,257,354$ 62,734,850$ 100% -40%
REDEVELOPMENT AGENCY EXPENDITURES HIGHLIGHTS: Overall, Redevelopment Agency (RDA) budgeted expenditures are expected to decrease by 40% in the 2010-11 Budget. The primary reason for the decrease is a $23 million reduction of Capital Improvement Plan expenditures and an $8 million reduction of Pass-Through Obligations.
The following is a brief discussion of the RDA expenditures:
The overall Salaries and Benefits for the Redevelopment Agency are expected to decrease by 16% for the 2010-
11 Budget. The decrease is primarily due to 5% salary reduction that will be effective on July 1, 2010, along with
the reallocation of various positions from the RDA.
Contractual related expenditures are expected to significantly decrease from the 2010-11 Budget.
Debt service, while it represents 37% of the total RDA budget, is expected to decrease 24% during 2010-11,
which is due to a $8.4 million or 51% decrease in Pass-through obligations.
Materials and Other Operating is expected to increase by $2.1 million or 416%. This increase is due to an $2
million U.S. Department of Commerce Economic Development Administration (EDA) grant for the Industrial Park
Lead Track Project (rail spur).
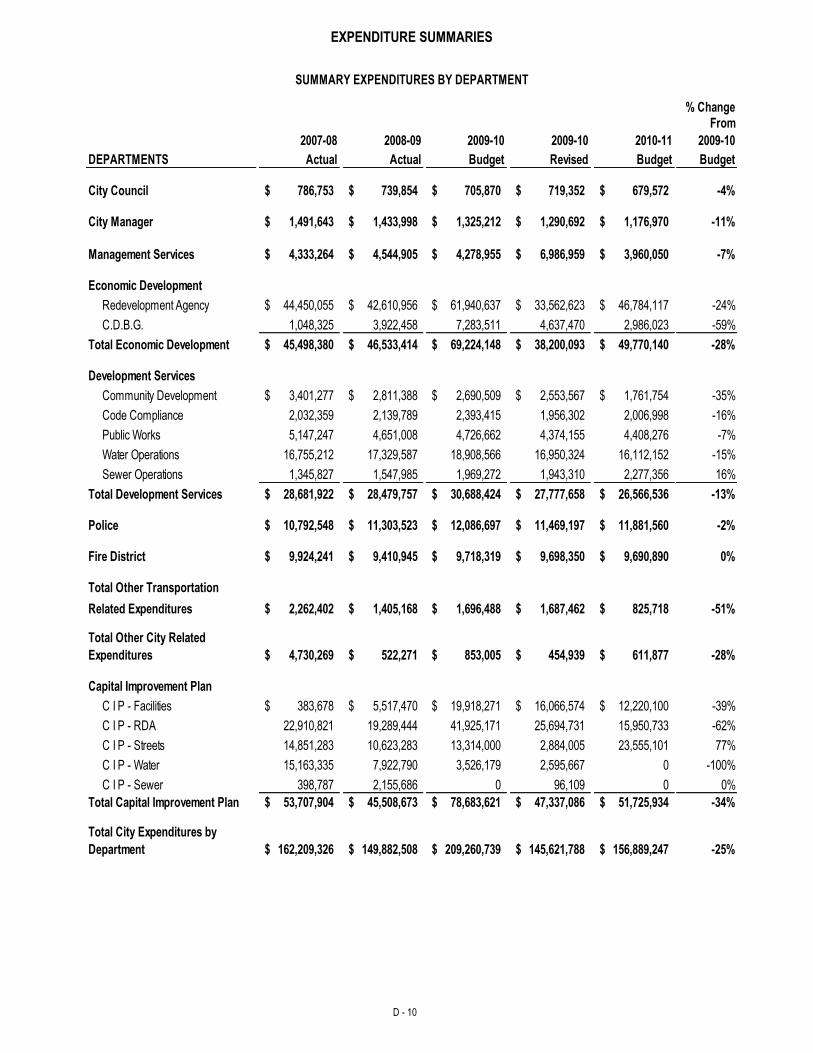
EXPENDITURE SUMMARIES
D - 10
% ChangeFrom
2007-08 2008-09 2009-10 2009-10 2010-11 2009-10
DEPARTMENTS Actual Actual Budget Revised Budget Budget
City Council 786,753$ 739,854$ 705,870$ 719,352$ 679,572$ -4%
City Manager 1,491,643$ 1,433,998$ 1,325,212$ 1,290,692$ 1,176,970$ -11%
Management Services 4,333,264$ 4,544,905$ 4,278,955$ 6,986,959$ 3,960,050$ -7%
Economic Development
Redevelopment Agency 44,450,055$ 42,610,956$ 61,940,637$ 33,562,623$ 46,784,117$ -24%
C.D.B.G. 1,048,325 3,922,458 7,283,511 4,637,470 2,986,023 -59%
Total Economic Development 45,498,380$ 46,533,414$ 69,224,148$ 38,200,093$ 49,770,140$ -28%
Development Services
Community Development 3,401,277$ 2,811,388$ 2,690,509$ 2,553,567$ 1,761,754$ -35%
Code Compliance 2,032,359 2,139,789 2,393,415 1,956,302 2,006,998 -16%
Public Works 5,147,247 4,651,008 4,726,662 4,374,155 4,408,276 -7%
Water Operations 16,755,212 17,329,587 18,908,566 16,950,324 16,112,152 -15%
Sewer Operations 1,345,827 1,547,985 1,969,272 1,943,310 2,277,356 16%
Total Development Services 28,681,922$ 28,479,757$ 30,688,424$ 27,777,658$ 26,566,536$ -13%
Police 10,792,548$ 11,303,523$ 12,086,697$ 11,469,197$ 11,881,560$ -2%
Fire District 9,924,241$ 9,410,945$ 9,718,319$ 9,698,350$ 9,690,890$ 0%
Total Other Transportation
Related Expenditures 2,262,402$ 1,405,168$ 1,696,488$ 1,687,462$ 825,718$ -51%
Total Other City Related
Expenditures 4,730,269$ 522,271$ 853,005$ 454,939$ 611,877$ -28%
Capital Improvement Plan
C I P - Facilities 383,678$ 5,517,470$ 19,918,271$ 16,066,574$ 12,220,100$ -39%
C I P - RDA 22,910,821 19,289,444 41,925,171 25,694,731 15,950,733 -62%
C I P - Streets 14,851,283 10,623,283 13,314,000 2,884,005 23,555,101 77%
C I P - Water 15,163,335 7,922,790 3,526,179 2,595,667 0 -100%
C I P - Sewer 398,787 2,155,686 0 96,109 0 0%
Total Capital Improvement Plan 53,707,904$ 45,508,673$ 78,683,621$ 47,337,086$ 51,725,934$ -34%
Total City Expenditures by
Department 162,209,326$ 149,882,508$ 209,260,739$ 145,621,788$ 156,889,247$ -25%
SUMMARY EXPENDITURES BY DEPARTMENT
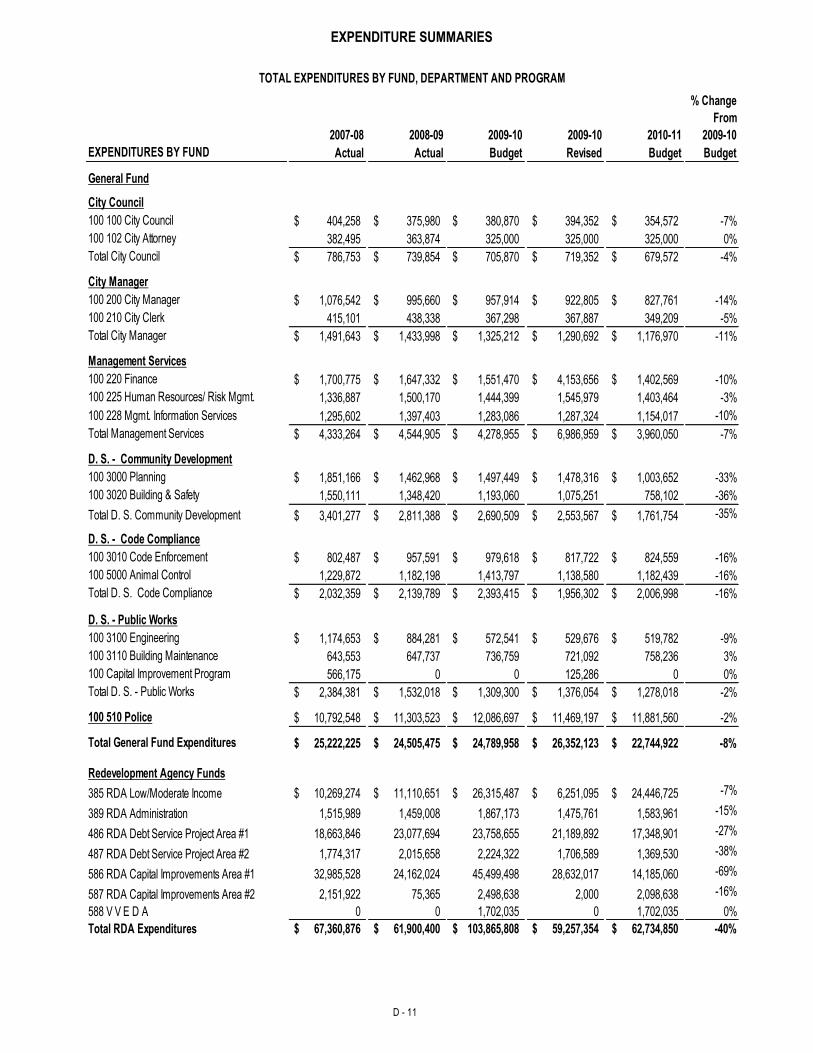
EXPENDITURE SUMMARIES
D - 11
% Change
From
2007-08 2008-09 2009-10 2009-10 2010-11 2009-10
EXPENDITURES BY FUND Actual Actual Budget Revised Budget Budget
General Fund
City Council
100 100 City Council 404,258$ 375,980$ 380,870$ 394,352$ 354,572$ -7%
100 102 City Attorney 382,495 363,874 325,000 325,000 325,000 0%
Total City Council 786,753$ 739,854$ 705,870$ 719,352$ 679,572$ -4%
City Manager
100 200 City Manager 1,076,542$ 995,660$ 957,914$ 922,805$ 827,761$ -14%
100 210 City Clerk 415,101 438,338 367,298 367,887 349,209 -5%
Total City Manager 1,491,643$ 1,433,998$ 1,325,212$ 1,290,692$ 1,176,970$ -11%
Management Services
100 220 Finance 1,700,775$ 1,647,332$ 1,551,470$ 4,153,656$ 1,402,569$ -10%
100 225 Human Resources/ Risk Mgmt. 1,336,887 1,500,170 1,444,399 1,545,979 1,403,464 -3%
100 228 Mgmt. Information Services 1,295,602 1,397,403 1,283,086 1,287,324 1,154,017 -10%
Total Management Services 4,333,264$ 4,544,905$ 4,278,955$ 6,986,959$ 3,960,050$ -7%
D. S. - Community Development
100 3000 Planning 1,851,166$ 1,462,968$ 1,497,449$ 1,478,316$ 1,003,652$ -33%
100 3020 Building & Safety 1,550,111 1,348,420 1,193,060 1,075,251 758,102 -36%
Total D. S. Community Development 3,401,277$ 2,811,388$ 2,690,509$ 2,553,567$ 1,761,754$ -35%
D. S. - Code Compliance
100 3010 Code Enforcement 802,487$ 957,591$ 979,618$ 817,722$ 824,559$ -16%
100 5000 Animal Control 1,229,872 1,182,198 1,413,797 1,138,580 1,182,439 -16%
Total D. S. Code Compliance 2,032,359$ 2,139,789$ 2,393,415$ 1,956,302$ 2,006,998$ -16%
D. S. - Public Works
100 3100 Engineering 1,174,653$ 884,281$ 572,541$ 529,676$ 519,782$ -9%
100 3110 Building Maintenance 643,553 647,737 736,759 721,092 758,236 3%
100 Capital Improvement Program 566,175 0 0 125,286 0 0%
Total D. S. - Public Works 2,384,381$ 1,532,018$ 1,309,300$ 1,376,054$ 1,278,018$ -2%
100 510 Police 10,792,548$ 11,303,523$ 12,086,697$ 11,469,197$ 11,881,560$ -2%
Total General Fund Expenditures 25,222,225$ 24,505,475$ 24,789,958$ 26,352,123$ 22,744,922$ -8%
Redevelopment Agency Funds
385 RDA Low/Moderate Income 10,269,274$ 11,110,651$ 26,315,487$ 6,251,095$ 24,446,725$ -7%
389 RDA Administration 1,515,989 1,459,008 1,867,173 1,475,761 1,583,961 -15%
486 RDA Debt Service Project Area #1 18,663,846 23,077,694 23,758,655 21,189,892 17,348,901 -27%
487 RDA Debt Service Project Area #2 1,774,317 2,015,658 2,224,322 1,706,589 1,369,530 -38%
586 RDA Capital Improvements Area #1 32,985,528 24,162,024 45,499,498 28,632,017 14,185,060 -69%
587 RDA Capital Improvements Area #2 2,151,922 75,365 2,498,638 2,000 2,098,638 -16%
588 V V E D A 0 0 1,702,035 0 1,702,035 0%
Total RDA Expenditures 67,360,876$ 61,900,400$ 103,865,808$ 59,257,354$ 62,734,850$ -40%
TOTAL EXPENDITURES BY FUND, DEPARTMENT AND PROGRAM
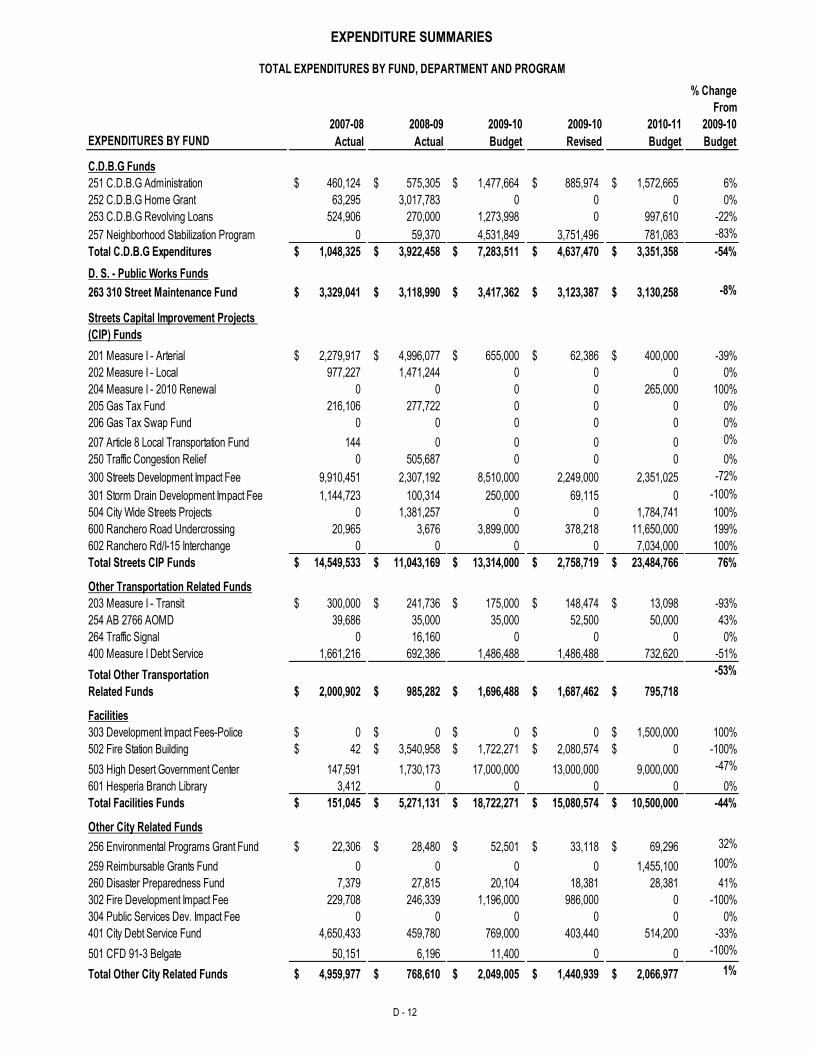
EXPENDITURE SUMMARIES
D - 12
% Change
From
2007-08 2008-09 2009-10 2009-10 2010-11 2009-10
EXPENDITURES BY FUND Actual Actual Budget Revised Budget Budget
C.D.B.G Funds
251 C.D.B.G Administration 460,124$ 575,305$ 1,477,664$ 885,974$ 1,572,665$ 6%
252 C.D.B.G Home Grant 63,295 3,017,783 0 0 0 0%
253 C.D.B.G Revolving Loans 524,906 270,000 1,273,998 0 997,610 -22%
257 Neighborhood Stabilization Program 0 59,370 4,531,849 3,751,496 781,083 -83%
Total C.D.B.G Expenditures 1,048,325$ 3,922,458$ 7,283,511$ 4,637,470$ 3,351,358$ -54%
D. S. - Public Works Funds
263 310 Street Maintenance Fund 3,329,041$ 3,118,990$ 3,417,362$ 3,123,387$ 3,130,258$ -8%
Streets Capital Improvement Projects
(CIP) Funds
201 Measure I - Arterial 2,279,917$ 4,996,077$ 655,000$ 62,386$ 400,000$ -39%
202 Measure I - Local 977,227 1,471,244 0 0 0 0%
204 Measure I - 2010 Renewal 0 0 0 0 265,000 100%
205 Gas Tax Fund 216,106 277,722 0 0 0 0%
206 Gas Tax Swap Fund 0 0 0 0 0 0%
207 Article 8 Local Transportation Fund 144 0 0 0 0 0%
250 Traffic Congestion Relief 0 505,687 0 0 0 0%
300 Streets Development Impact Fee 9,910,451 2,307,192 8,510,000 2,249,000 2,351,025 -72%
301 Storm Drain Development Impact Fee 1,144,723 100,314 250,000 69,115 0 -100%
504 City Wide Streets Projects 0 1,381,257 0 0 1,784,741 100%
600 Ranchero Road Undercrossing 20,965 3,676 3,899,000 378,218 11,650,000 199%
602 Ranchero Rd/I-15 Interchange 0 0 0 0 7,034,000 100%
Total Streets CIP Funds 14,549,533$ 11,043,169$ 13,314,000$ 2,758,719$ 23,484,766$ 76%
Other Transportation Related Funds
203 Measure I - Transit 300,000$ 241,736$ 175,000$ 148,474$ 13,098$ -93%
254 AB 2766 AOMD 39,686 35,000 35,000 52,500 50,000 43%
264 Traffic Signal 0 16,160 0 0 0 0%
400 Measure I Debt Service 1,661,216 692,386 1,486,488 1,486,488 732,620 -51%
Total Other Transportation
Related Funds 2,000,902$ 985,282$ 1,696,488$ 1,687,462$ 795,718$
-53%
Facilities
303 Development Impact Fees-Police 0$ 0$ 0$ 0$ 1,500,000$ 100%
502 Fire Station Building 42$ 3,540,958$ 1,722,271$ 2,080,574$ 0$ -100%
503 High Desert Government Center 147,591 1,730,173 17,000,000 13,000,000 9,000,000 -47%
601 Hesperia Branch Library 3,412 0 0 0 0 0%
Total Facilities Funds 151,045$ 5,271,131$ 18,722,271$ 15,080,574$ 10,500,000$ -44%
Other City Related Funds
256 Environmental Programs Grant Fund 22,306$ 28,480$ 52,501$ 33,118$ 69,296$ 32%
259 Reimbursable Grants Fund 0 0 0 0 1,455,100 100%
260 Disaster Preparedness Fund 7,379 27,815 20,104 18,381 28,381 41%
302 Fire Development Impact Fee 229,708 246,339 1,196,000 986,000 0 -100%
304 Public Services Dev. Impact Fee 0 0 0 0 0 0%
401 City Debt Service Fund 4,650,433 459,780 769,000 403,440 514,200 -33%
501 CFD 91-3 Belgate 50,151 6,196 11,400 0 0 -100%
Total Other City Related Funds 4,959,977$ 768,610$ 2,049,005$ 1,440,939$ 2,066,977$ 1%
TOTAL EXPENDITURES BY FUND, DEPARTMENT AND PROGRAM
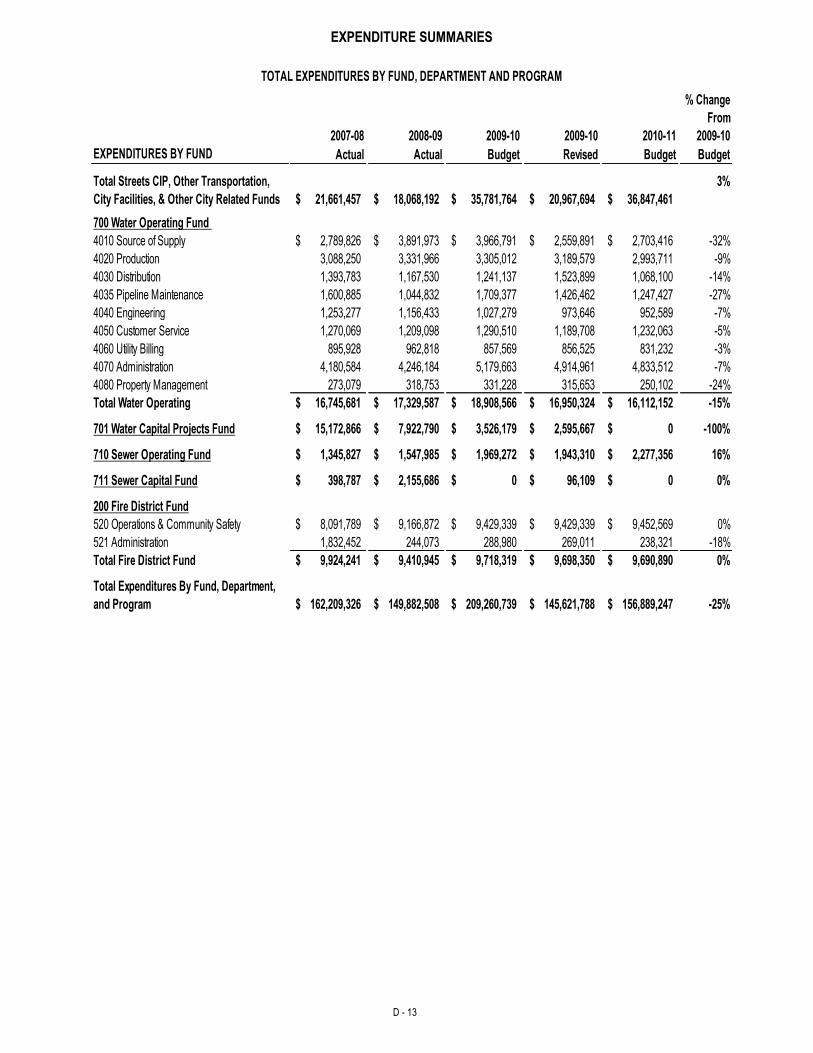
EXPENDITURE SUMMARIES
D - 13
% Change
From
2007-08 2008-09 2009-10 2009-10 2010-11 2009-10
EXPENDITURES BY FUND Actual Actual Budget Revised Budget Budget
Total Streets CIP, Other Transportation,
City Facilities, & Other City Related Funds 21,661,457$ 18,068,192$ 35,781,764$ 20,967,694$ 36,847,461$
3%
700 Water Operating Fund
4010 Source of Supply 2,789,826$ 3,891,973$ 3,966,791$ 2,559,891$ 2,703,416$ -32%
4020 Production 3,088,250 3,331,966 3,305,012 3,189,579 2,993,711 -9%
4030 Distribution 1,393,783 1,167,530 1,241,137 1,523,899 1,068,100 -14%
4035 Pipeline Maintenance 1,600,885 1,044,832 1,709,377 1,426,462 1,247,427 -27%
4040 Engineering 1,253,277 1,156,433 1,027,279 973,646 952,589 -7%
4050 Customer Service 1,270,069 1,209,098 1,290,510 1,189,708 1,232,063 -5%
4060 Utility Billing 895,928 962,818 857,569 856,525 831,232 -3%
4070 Administration 4,180,584 4,246,184 5,179,663 4,914,961 4,833,512 -7%
4080 Property Management 273,079 318,753 331,228 315,653 250,102 -24%
Total Water Operating 16,745,681$ 17,329,587$ 18,908,566$ 16,950,324$ 16,112,152$ -15%
701 Water Capital Projects Fund 15,172,866$ 7,922,790$ 3,526,179$ 2,595,667$ 0$ -100%
710 Sewer Operating Fund 1,345,827$ 1,547,985$ 1,969,272$ 1,943,310$ 2,277,356$ 16%
711 Sewer Capital Fund 398,787$ 2,155,686$ 0$ 96,109$ 0$ 0%
200 Fire District Fund
520 Operations & Community Safety 8,091,789$ 9,166,872$ 9,429,339$ 9,429,339$ 9,452,569$ 0%
521 Administration 1,832,452 244,073 288,980 269,011 238,321 -18%
Total Fire District Fund 9,924,241$ 9,410,945$ 9,718,319$ 9,698,350$ 9,690,890$ 0%
Total Expenditures By Fund, Department,
and Program 162,209,326$ 149,882,508$ 209,260,739$ 145,621,788$ 156,889,247$ -25%
TOTAL EXPENDITURES BY FUND, DEPARTMENT AND PROGRAM
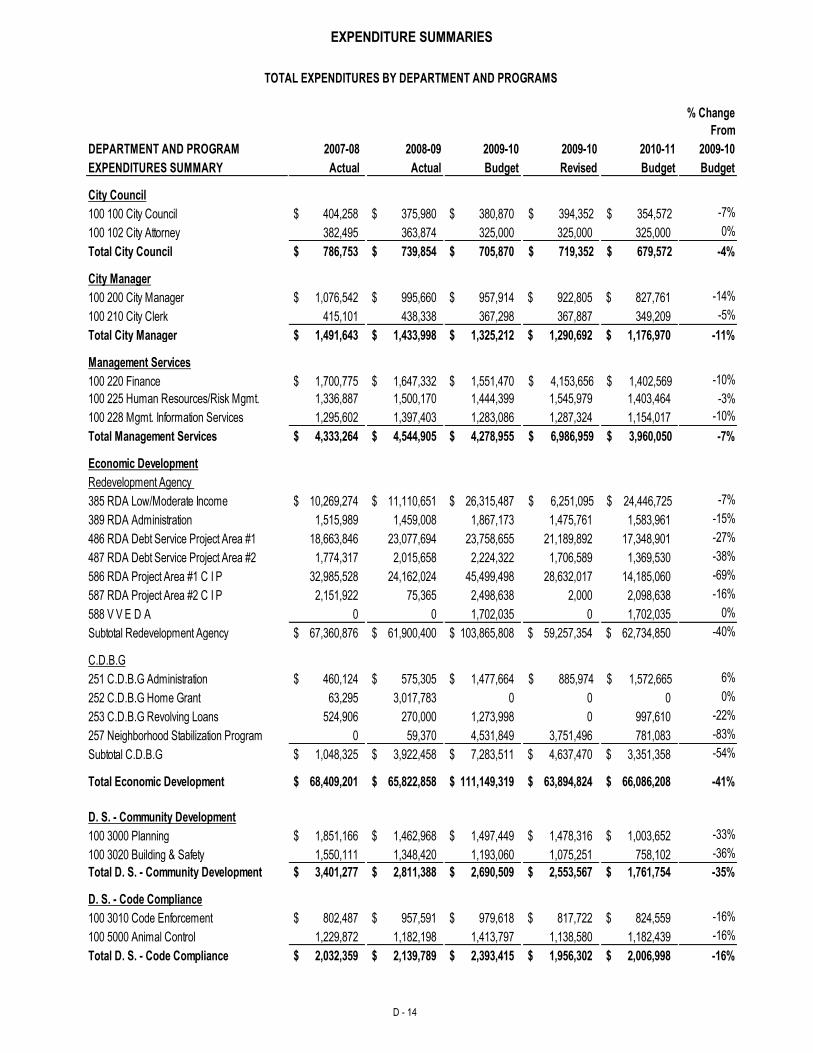
EXPENDITURE SUMMARIES
D - 14
% Change
From
DEPARTMENT AND PROGRAM 2007-08 2008-09 2009-10 2009-10 2010-11 2009-10
EXPENDITURES SUMMARY Actual Actual Budget Revised Budget Budget
City Council
100 100 City Council $ 404,258 $ 375,980 $ 380,870 394,352$ 354,572$ -7%
100 102 City Attorney 382,495 363,874 325,000 325,000 325,000 0%
Total City Council $ 786,753 $ 739,854 $ 705,870 719,352$ 679,572$ -4%
City Manager
100 200 City Manager $ 1,076,542 $ 995,660 $ 957,914 $ 922,805 $ 827,761 -14%
100 210 City Clerk 415,101 438,338 367,298 367,887 349,209 -5%
Total City Manager $ 1,491,643 $ 1,433,998 $ 1,325,212 $ 1,290,692 $ 1,176,970 -11%
Management Services
100 220 Finance $ 1,700,775 $ 1,647,332 $ 1,551,470 4,153,656$ 1,402,569$ -10%
100 225 Human Resources/Risk Mgmt. 1,336,887 1,500,170 1,444,399 1,545,979 1,403,464 -3%
100 228 Mgmt. Information Services 1,295,602 1,397,403 1,283,086 1,287,324 1,154,017 -10%
Total Management Services $ 4,333,264 $ 4,544,905 $ 4,278,955 6,986,959$ 3,960,050$ -7%
Economic Development
Redevelopment Agency
385 RDA Low/Moderate Income $ 10,269,274 $ 11,110,651 $ 26,315,487 6,251,095$ 24,446,725$ -7%
389 RDA Administration 1,515,989 1,459,008 1,867,173 1,475,761 1,583,961 -15%
486 RDA Debt Service Project Area #1 18,663,846 23,077,694 23,758,655 21,189,892 17,348,901 -27%
487 RDA Debt Service Project Area #2 1,774,317 2,015,658 2,224,322 1,706,589 1,369,530 -38%
586 RDA Project Area #1 C I P 32,985,528 24,162,024 45,499,498 28,632,017 14,185,060 -69%
587 RDA Project Area #2 C I P 2,151,922 75,365 2,498,638 2,000 2,098,638 -16%
588 V V E D A 0 0 1,702,035 0 1,702,035 0%
Subtotal Redevelopment Agency $ 67,360,876 $ 61,900,400 $ 103,865,808 $ 59,257,354 $ 62,734,850 -40%
C.D.B.G
251 C.D.B.G Administration $ 460,124 $ 575,305 $ 1,477,664 885,974$ 1,572,665$ 6%
252 C.D.B.G Home Grant 63,295 3,017,783 0 0 0 0%
253 C.D.B.G Revolving Loans 524,906 270,000 1,273,998 0 997,610 -22%
257 Neighborhood Stabilization Program 0 59,370 4,531,849 3,751,496 781,083 -83%
Subtotal C.D.B.G $ 1,048,325 $ 3,922,458 $ 7,283,511 $ 4,637,470 $ 3,351,358 -54%
Total Economic Development $ 68,409,201 $ 65,822,858 $ 111,149,319 $ 63,894,824 $ 66,086,208 -41%
D. S. - Community Development
100 3000 Planning $ 1,851,166 $ 1,462,968 $ 1,497,449 $ 1,478,316 $ 1,003,652 -33%
100 3020 Building & Safety 1,550,111 1,348,420 1,193,060 1,075,251 758,102 -36%
Total D. S. - Community Development $ 3,401,277 $ 2,811,388 $ 2,690,509 $ 2,553,567 $ 1,761,754 -35%
D. S. - Code Compliance
100 3010 Code Enforcement $ 802,487 $ 957,591 $ 979,618 $ 817,722 $ 824,559 -16%
100 5000 Animal Control 1,229,872 1,182,198 1,413,797 1,138,580 1,182,439 -16%
Total D. S. - Code Compliance $ 2,032,359 $ 2,139,789 $ 2,393,415 $ 1,956,302 $ 2,006,998 -16%
TOTAL EXPENDITURES BY DEPARTMENT AND PROGRAMS
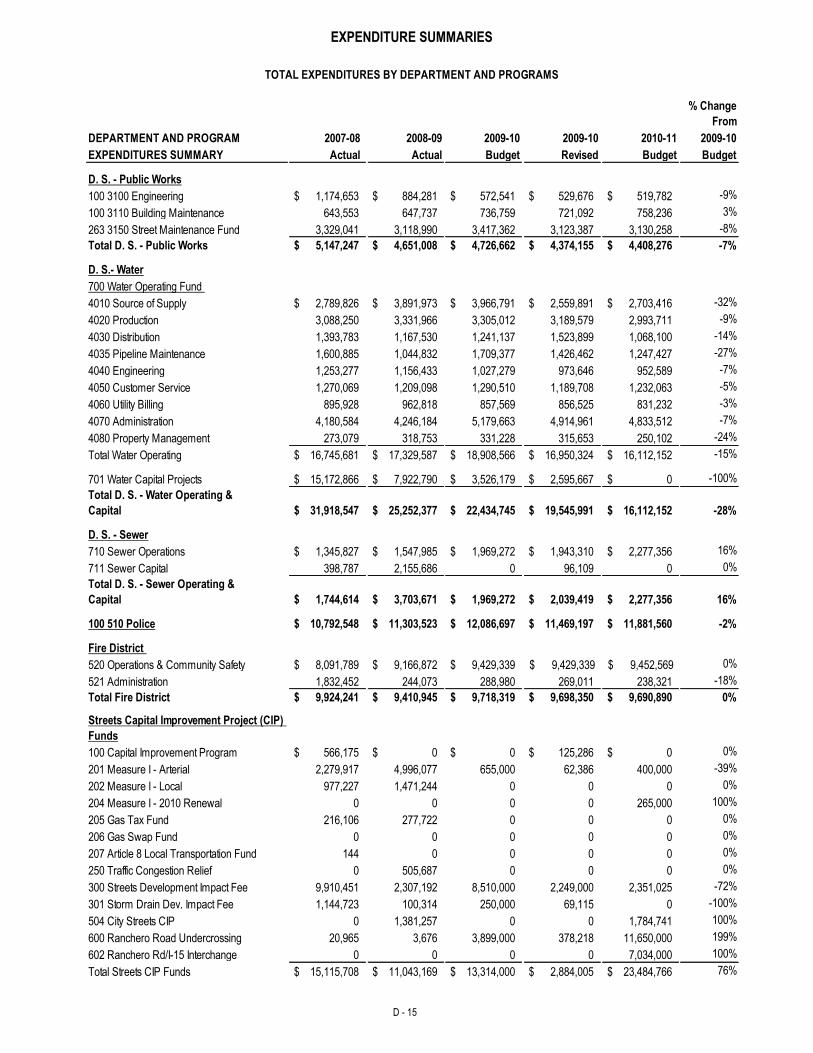
EXPENDITURE SUMMARIES
D - 15
% Change
From
DEPARTMENT AND PROGRAM 2007-08 2008-09 2009-10 2009-10 2010-11 2009-10
EXPENDITURES SUMMARY Actual Actual Budget Revised Budget Budget
D. S. - Public Works
100 3100 Engineering $ 1,174,653 $ 884,281 $ 572,541 $ 529,676 $ 519,782 -9%
100 3110 Building Maintenance 643,553 647,737 736,759 721,092 758,236 3%
263 3150 Street Maintenance Fund 3,329,041 3,118,990 3,417,362 3,123,387 3,130,258 -8%
Total D. S. - Public Works $ 5,147,247 $ 4,651,008 $ 4,726,662 $ 4,374,155 $ 4,408,276 -7%
D. S.- Water
700 Water Operating Fund
4010 Source of Supply $ 2,789,826 $ 3,891,973 $ 3,966,791 $ 2,559,891 $ 2,703,416 -32%
4020 Production 3,088,250 3,331,966 3,305,012 3,189,579 2,993,711 -9%
4030 Distribution 1,393,783 1,167,530 1,241,137 1,523,899 1,068,100 -14%
4035 Pipeline Maintenance 1,600,885 1,044,832 1,709,377 1,426,462 1,247,427 -27%
4040 Engineering 1,253,277 1,156,433 1,027,279 973,646 952,589 -7%
4050 Customer Service 1,270,069 1,209,098 1,290,510 1,189,708 1,232,063 -5%
4060 Utility Billing 895,928 962,818 857,569 856,525 831,232 -3%
4070 Administration 4,180,584 4,246,184 5,179,663 4,914,961 4,833,512 -7%
4080 Property Management 273,079 318,753 331,228 315,653 250,102 -24%
Total Water Operating $ 16,745,681 $ 17,329,587 $ 18,908,566 $ 16,950,324 $ 16,112,152 -15%
701 Water Capital Projects $ 15,172,866 $ 7,922,790 $ 3,526,179 $ 2,595,667 $ 0 -100%
Total D. S. - Water Operating &
Capital $ 31,918,547 $ 25,252,377 $ 22,434,745 $ 19,545,991 $ 16,112,152 -28%
D. S. - Sewer
710 Sewer Operations $ 1,345,827 $ 1,547,985 $ 1,969,272 $ 1,943,310 $ 2,277,356 16%
711 Sewer Capital 398,787 2,155,686 0 96,109 0 0%
Total D. S. - Sewer Operating &
Capital $ 1,744,614 $ 3,703,671 $ 1,969,272 $ 2,039,419 $ 2,277,356 16%
100 510 Police $ 10,792,548 $ 11,303,523 $ 12,086,697 $ 11,469,197 $ 11,881,560 -2%
Fire District
520 Operations & Community Safety $ 8,091,789 $ 9,166,872 $ 9,429,339 9,429,339$ 9,452,569$ 0%
521 Administration 1,832,452 244,073 288,980 269,011 238,321 -18%
Total Fire District $ 9,924,241 $ 9,410,945 $ 9,718,319 $ 9,698,350 $ 9,690,890 0%
Streets Capital Improvement Project (CIP)
Funds
100 Capital Improvement Program $ 566,175 $ 0 $ 0 $ 125,286 $ 0 0%
201 Measure I - Arterial 2,279,917 4,996,077 655,000 62,386 400,000 -39%
202 Measure I - Local 977,227 1,471,244 0 0 0 0%
204 Measure I - 2010 Renewal 0 0 0 0 265,000 100%
205 Gas Tax Fund 216,106 277,722 0 0 0 0%
206 Gas Swap Fund 0 0 0 0 0 0%
207 Article 8 Local Transportation Fund 144 0 0 0 0 0%
250 Traffic Congestion Relief 0 505,687 0 0 0 0%
300 Streets Development Impact Fee 9,910,451 2,307,192 8,510,000 2,249,000 2,351,025 -72%
301 Storm Drain Dev. Impact Fee 1,144,723 100,314 250,000 69,115 0 -100%
504 City Streets CIP 0 1,381,257 0 0 1,784,741 100%
600 Ranchero Road Undercrossing 20,965 3,676 3,899,000 378,218 11,650,000 199%
602 Ranchero Rd/I-15 Interchange 0 0 0 0 7,034,000 100%
Total Streets CIP Funds $ 15,115,708 $ 11,043,169 $ 13,314,000 $ 2,884,005 $ 23,484,766 76%
TOTAL EXPENDITURES BY DEPARTMENT AND PROGRAMS
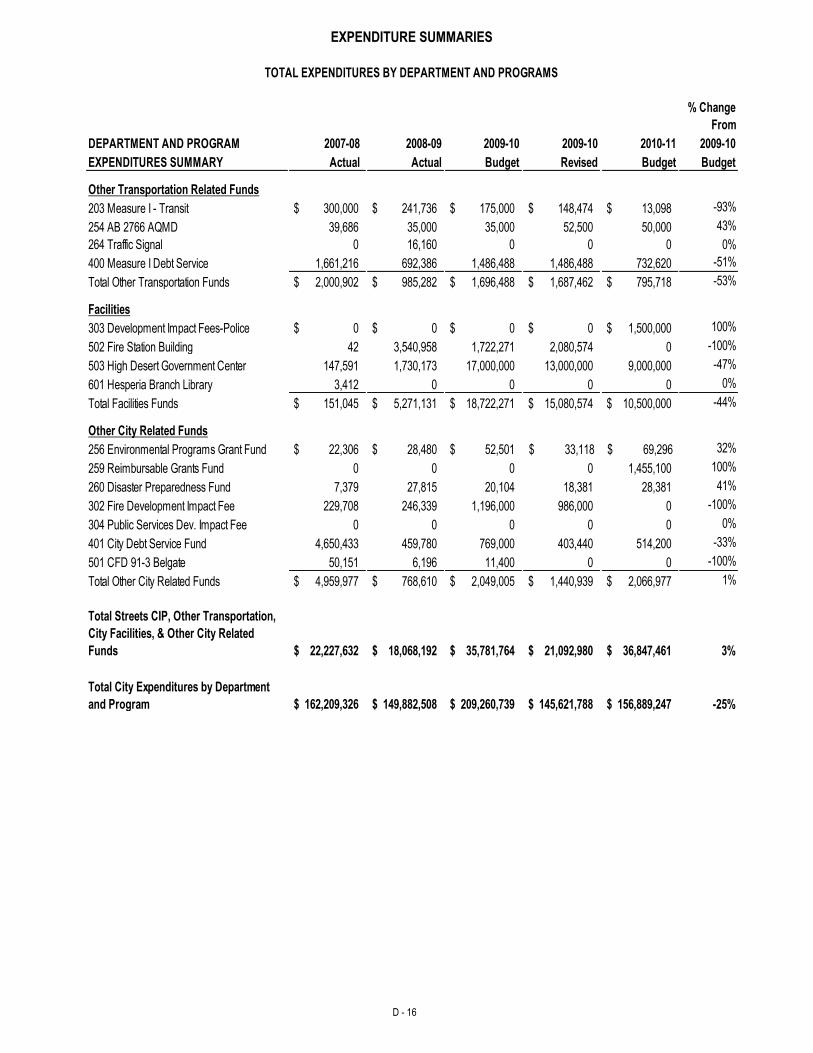
EXPENDITURE SUMMARIES
D - 16
% Change
From
DEPARTMENT AND PROGRAM 2007-08 2008-09 2009-10 2009-10 2010-11 2009-10
EXPENDITURES SUMMARY Actual Actual Budget Revised Budget Budget
Other Transportation Related Funds
203 Measure I - Transit $ 300,000 $ 241,736 $ 175,000 $ 148,474 $ 13,098 -93%
254 AB 2766 AQMD 39,686 35,000 35,000 52,500 50,000 43%
264 Traffic Signal 0 16,160 0 0 0 0%
400 Measure I Debt Service 1,661,216 692,386 1,486,488 1,486,488 732,620 -51%
Total Other Transportation Funds $ 2,000,902 $ 985,282 $ 1,696,488 $ 1,687,462 $ 795,718 -53%
Facilities
303 Development Impact Fees-Police $ 0 $ 0 $ 0 $ 0 $ 1,500,000 100%
502 Fire Station Building 42 3,540,958 1,722,271 2,080,574 0 -100%
503 High Desert Government Center 147,591 1,730,173 17,000,000 13,000,000 9,000,000 -47%
601 Hesperia Branch Library 3,412 0 0 0 0 0%
Total Facilities Funds $ 151,045 $ 5,271,131 $ 18,722,271 $ 15,080,574 $ 10,500,000 -44%
Other City Related Funds
256 Environmental Programs Grant Fund $ 22,306 $ 28,480 $ 52,501 33,118$ 69,296$ 32%
259 Reimbursable Grants Fund 0 0 0 0 1,455,100 100%
260 Disaster Preparedness Fund 7,379 27,815 20,104 18,381 28,381 41%
302 Fire Development Impact Fee 229,708 246,339 1,196,000 986,000 0 -100%
304 Public Services Dev. Impact Fee 0 0 0 0 0 0%
401 City Debt Service Fund 4,650,433 459,780 769,000 403,440 514,200 -33%
501 CFD 91-3 Belgate 50,151 6,196 11,400 0 0 -100%
Total Other City Related Funds $ 4,959,977 $ 768,610 $ 2,049,005 $ 1,440,939 $ 2,066,977 1%
Total Streets CIP, Other Transportation,
City Facilities, & Other City Related
Funds $ 22,227,632 $ 18,068,192 $ 35,781,764 $ 21,092,980 $ 36,847,461 3%
Total City Expenditures by Department
and Program $ 162,209,326 $ 149,882,508 $ 209,260,739 $ 145,621,788 $ 156,889,247 -25%
TOTAL EXPENDITURES BY DEPARTMENT AND PROGRAMS
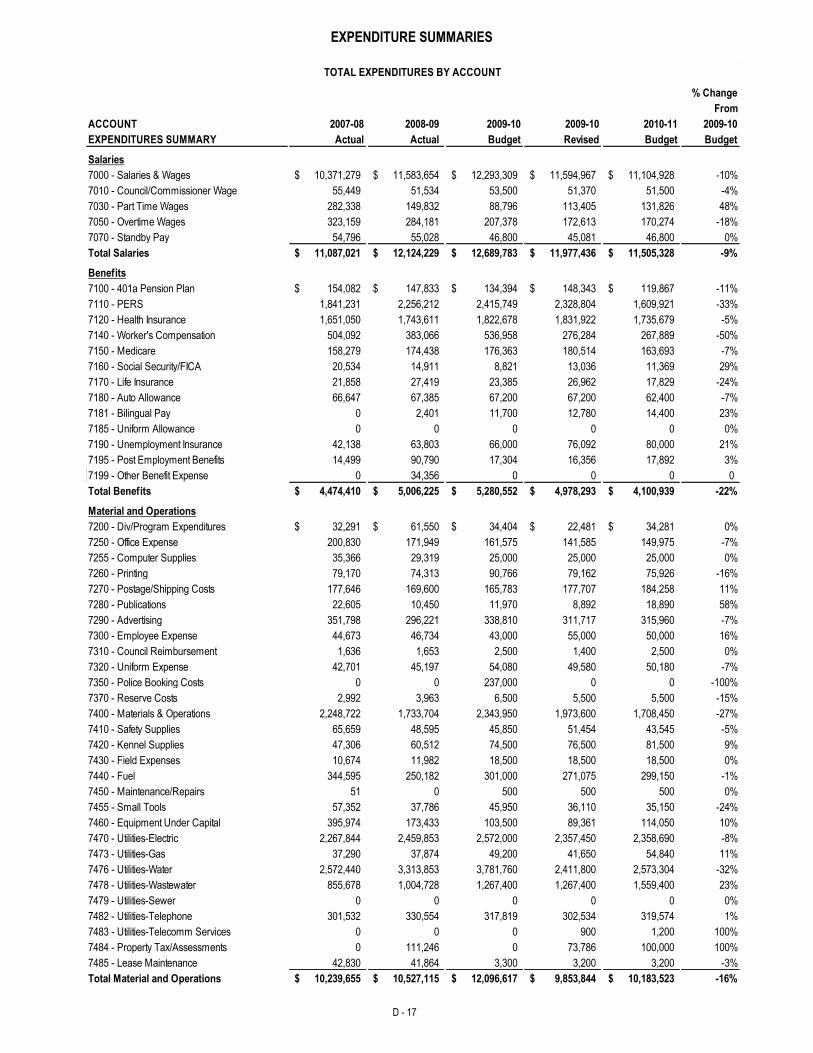
EXPENDITURE SUMMARIES
D - 17
% Change
From
ACCOUNT 2007-08 2008-09 2009-10 2009-10 2010-11 2009-10
EXPENDITURES SUMMARY Actual Actual Budget Revised Budget Budget
Salaries
7000 - Salaries & Wages 10,371,279$ 11,583,654$ 12,293,309$ 11,594,967$ 11,104,928$ -10%
7010 - Council/Commissioner Wage 55,449 51,534 53,500 51,370 51,500 -4%
7030 - Part Time Wages 282,338 149,832 88,796 113,405 131,826 48%
7050 - Overtime Wages 323,159 284,181 207,378 172,613 170,274 -18%
7070 - Standby Pay 54,796 55,028 46,800 45,081 46,800 0%
Total Salaries 11,087,021$ 12,124,229$ 12,689,783$ 11,977,436$ 11,505,328$ -9%
Benefits
7100 - 401a Pension Plan 154,082$ 147,833$ 134,394$ 148,343$ 119,867$ -11%
7110 - PERS 1,841,231 2,256,212 2,415,749 2,328,804 1,609,921 -33%
7120 - Health Insurance 1,651,050 1,743,611 1,822,678 1,831,922 1,735,679 -5%
7140 - Worker's Compensation 504,092 383,066 536,958 276,284 267,889 -50%
7150 - Medicare 158,279 174,438 176,363 180,514 163,693 -7%
7160 - Social Security/FICA 20,534 14,911 8,821 13,036 11,369 29%
7170 - Life Insurance 21,858 27,419 23,385 26,962 17,829 -24%
7180 - Auto Allowance 66,647 67,385 67,200 67,200 62,400 -7%
7181 - Bilingual Pay 0 2,401 11,700 12,780 14,400 23%
7185 - Uniform Allowance 0 0 0 0 0 0%
7190 - Unemployment Insurance 42,138 63,803 66,000 76,092 80,000 21%
7195 - Post Employment Benefits 14,499 90,790 17,304 16,356 17,892 3%
7199 - Other Benefit Expense 0 34,356 0 0 0 0
Total Benefits 4,474,410$ 5,006,225$ 5,280,552$ 4,978,293$ 4,100,939$ -22%
Material and Operations
7200 - Div/Program Expenditures 32,291$ 61,550$ 34,404$ 22,481$ 34,281$ 0%
7250 - Office Expense 200,830 171,949 161,575 141,585 149,975 -7%
7255 - Computer Supplies 35,366 29,319 25,000 25,000 25,000 0%
7260 - Printing 79,170 74,313 90,766 79,162 75,926 -16%
7270 - Postage/Shipping Costs 177,646 169,600 165,783 177,707 184,258 11%
7280 - Publications 22,605 10,450 11,970 8,892 18,890 58%
7290 - Advertising 351,798 296,221 338,810 311,717 315,960 -7%
7300 - Employee Expense 44,673 46,734 43,000 55,000 50,000 16%
7310 - Council Reimbursement 1,636 1,653 2,500 1,400 2,500 0%
7320 - Uniform Expense 42,701 45,197 54,080 49,580 50,180 -7%
7350 - Police Booking Costs 0 0 237,000 0 0 -100%
7370 - Reserve Costs 2,992 3,963 6,500 5,500 5,500 -15%
7400 - Materials & Operations 2,248,722 1,733,704 2,343,950 1,973,600 1,708,450 -27%
7410 - Safety Supplies 65,659 48,595 45,850 51,454 43,545 -5%
7420 - Kennel Supplies 47,306 60,512 74,500 76,500 81,500 9%
7430 - Field Expenses 10,674 11,982 18,500 18,500 18,500 0%
7440 - Fuel 344,595 250,182 301,000 271,075 299,150 -1%
7450 - Maintenance/Repairs 51 0 500 500 500 0%
7455 - Small Tools 57,352 37,786 45,950 36,110 35,150 -24%
7460 - Equipment Under Capital 395,974 173,433 103,500 89,361 114,050 10%
7470 - Utilities-Electric 2,267,844 2,459,853 2,572,000 2,357,450 2,358,690 -8%
7473 - Utilities-Gas 37,290 37,874 49,200 41,650 54,840 11%
7476 - Utilities-Water 2,572,440 3,313,853 3,781,760 2,411,800 2,573,304 -32%
7478 - Utilities-Wastewater 855,678 1,004,728 1,267,400 1,267,400 1,559,400 23%
7479 - Utilities-Sewer 0 0 0 0 0 0%
7482 - Utilities-Telephone 301,532 330,554 317,819 302,534 319,574 1%
7483 - Utilities-Telecomm Services 0 0 0 900 1,200 100%
7484 - Property Tax/Assessments 0 111,246 0 73,786 100,000 100%
7485 - Lease Maintenance 42,830 41,864 3,300 3,200 3,200 -3%
Total Material and Operations 10,239,655$ 10,527,115$ 12,096,617$ 9,853,844$ 10,183,523$ -16%
TOTAL EXPENDITURES BY ACCOUNT
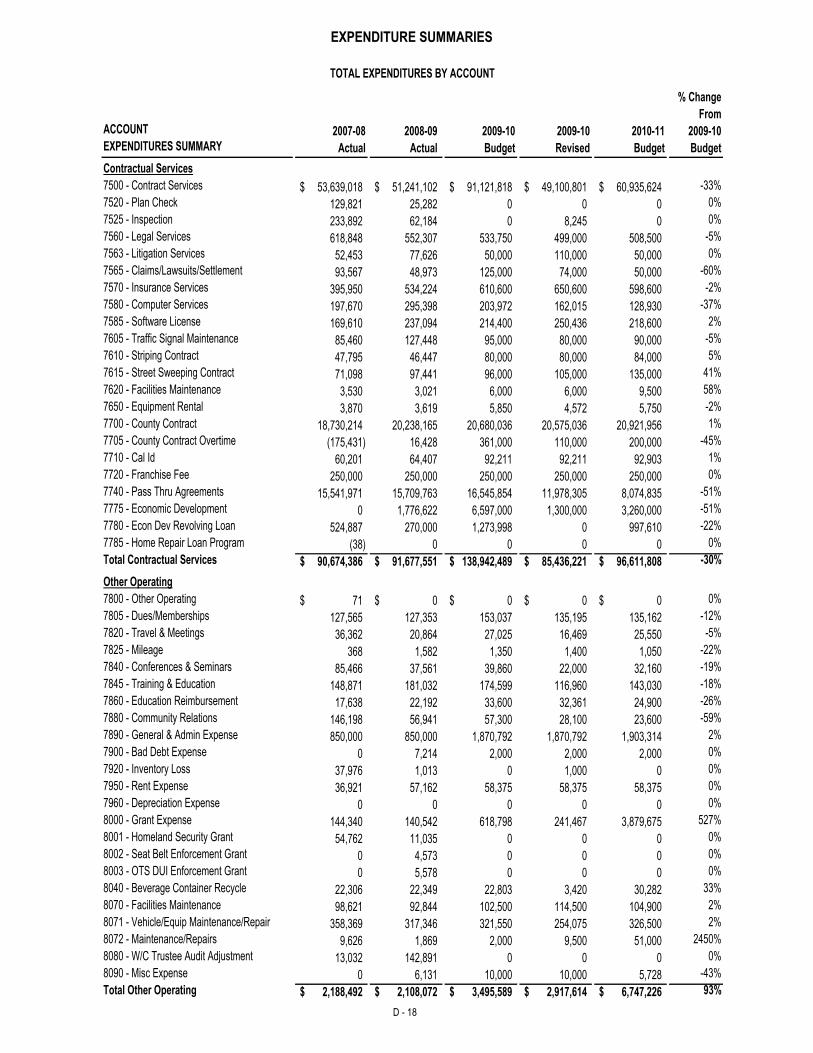
EXPENDITURE SUMMARIES
D - 18
% Change
From
ACCOUNT 2007-08 2008-09 2009-10 2009-10 2010-11 2009-10
EXPENDITURES SUMMARY Actual Actual Budget Revised Budget Budget
Contractual Services
7500 - Contract Services 53,639,018$ 51,241,102$ 91,121,818$ 49,100,801$ 60,935,624$ -33%
7520 - Plan Check 129,821 25,282 0 0 0 0%
7525 - Inspection 233,892 62,184 0 8,245 0 0%
7560 - Legal Services 618,848 552,307 533,750 499,000 508,500 -5%
7563 - Litigation Services 52,453 77,626 50,000 110,000 50,000 0%
7565 - Claims/Lawsuits/Settlement 93,567 48,973 125,000 74,000 50,000 -60%
7570 - Insurance Services 395,950 534,224 610,600 650,600 598,600 -2%
7580 - Computer Services 197,670 295,398 203,972 162,015 128,930 -37%
7585 - Software License 169,610 237,094 214,400 250,436 218,600 2%
7605 - Traffic Signal Maintenance 85,460 127,448 95,000 80,000 90,000 -5%
7610 - Striping Contract 47,795 46,447 80,000 80,000 84,000 5%
7615 - Street Sweeping Contract 71,098 97,441 96,000 105,000 135,000 41%
7620 - Facilities Maintenance 3,530 3,021 6,000 6,000 9,500 58%
7650 - Equipment Rental 3,870 3,619 5,850 4,572 5,750 -2%
7700 - County Contract 18,730,214 20,238,165 20,680,036 20,575,036 20,921,956 1%
7705 - County Contract Overtime (175,431) 16,428 361,000 110,000 200,000 -45%
7710 - Cal Id 60,201 64,407 92,211 92,211 92,903 1%
7720 - Franchise Fee 250,000 250,000 250,000 250,000 250,000 0%
7740 - Pass Thru Agreements 15,541,971 15,709,763 16,545,854 11,978,305 8,074,835 -51%
7775 - Economic Development 0 1,776,622 6,597,000 1,300,000 3,260,000 -51%
7780 - Econ Dev Revolving Loan 524,887 270,000 1,273,998 0 997,610 -22%
7785 - Home Repair Loan Program (38) 0 0 0 0 0%
Total Contractual Services 90,674,386$ 91,677,551$ 138,942,489$ 85,436,221$ 96,611,808$ -30%
Other Operating
7800 - Other Operating 71$ 0$ 0$ 0$ 0$ 0%
7805 - Dues/Memberships 127,565 127,353 153,037 135,195 135,162 -12%
7820 - Travel & Meetings 36,362 20,864 27,025 16,469 25,550 -5%
7825 - Mileage 368 1,582 1,350 1,400 1,050 -22%
7840 - Conferences & Seminars 85,466 37,561 39,860 22,000 32,160 -19%
7845 - Training & Education 148,871 181,032 174,599 116,960 143,030 -18%
7860 - Education Reimbursement 17,638 22,192 33,600 32,361 24,900 -26%
7880 - Community Relations 146,198 56,941 57,300 28,100 23,600 -59%
7890 - General & Admin Expense 850,000 850,000 1,870,792 1,870,792 1,903,314 2%
7900 - Bad Debt Expense 0 7,214 2,000 2,000 2,000 0%
7920 - Inventory Loss 37,976 1,013 0 1,000 0 0%
7950 - Rent Expense 36,921 57,162 58,375 58,375 58,375 0%
7960 - Depreciation Expense 0 0 0 0 0 0%
8000 - Grant Expense 144,340 140,542 618,798 241,467 3,879,675 527%
8001 - Homeland Security Grant 54,762 11,035 0 0 0 0%
8002 - Seat Belt Enforcement Grant 0 4,573 0 0 0 0%
8003 - OTS DUI Enforcement Grant 0 5,578 0 0 0 0%
8040 - Beverage Container Recycle 22,306 22,349 22,803 3,420 30,282 33%
8070 - Facilities Maintenance 98,621 92,844 102,500 114,500 104,900 2%
8071 - Vehicle/Equip Maintenance/Repair 358,369 317,346 321,550 254,075 326,500 2%
8072 - Maintenance/Repairs 9,626 1,869 2,000 9,500 51,000 2450%
8080 - W/C Trustee Audit Adjustment 13,032 142,891 0 0 0 0%
8090 - Misc Expense 0 6,131 10,000 10,000 5,728 -43%
Total Other Operating 2,188,492$ 2,108,072$ 3,495,589$ 2,917,614$ 6,747,226$ 93%
TOTAL EXPENDITURES BY ACCOUNT
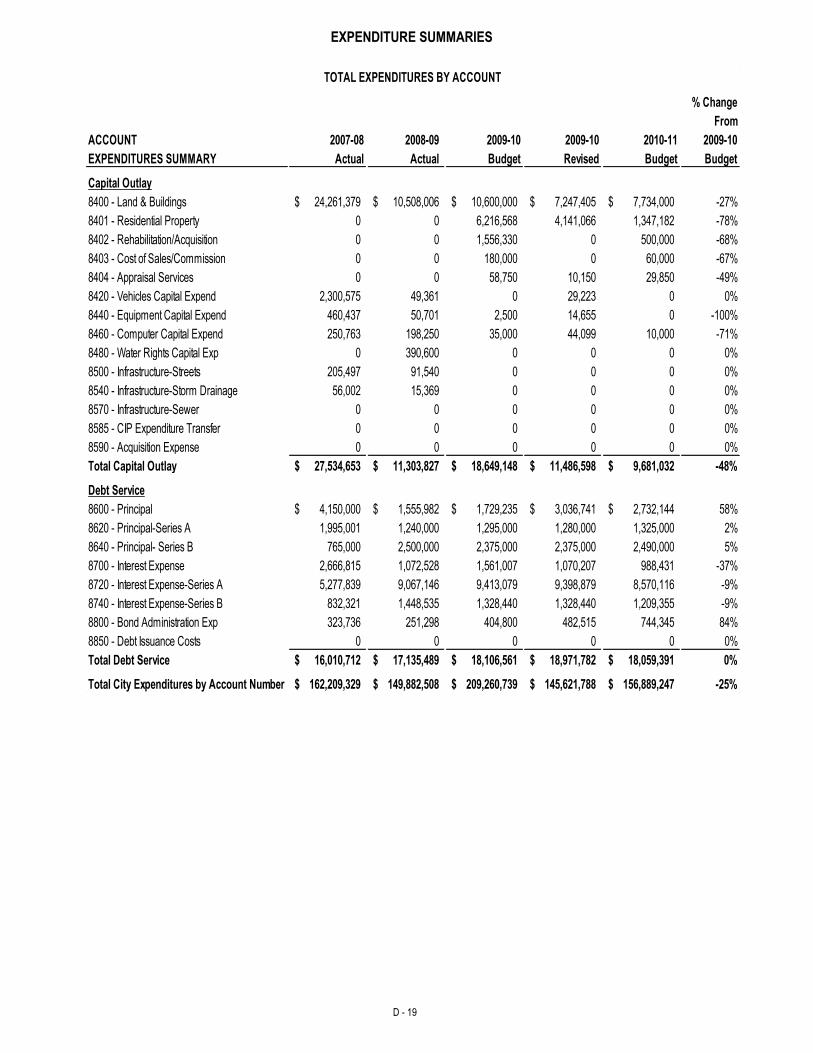
EXPENDITURE SUMMARIES
D - 19
% Change
From
ACCOUNT 2007-08 2008-09 2009-10 2009-10 2010-11 2009-10
EXPENDITURES SUMMARY Actual Actual Budget Revised Budget Budget
Capital Outlay
8400 - Land & Buildings 24,261,379$ 10,508,006$ 10,600,000$ 7,247,405$ 7,734,000$ -27%
8401 - Residential Property 0 0 6,216,568 4,141,066 1,347,182 -78%
8402 - Rehabilitation/Acquisition 0 0 1,556,330 0 500,000 -68%
8403 - Cost of Sales/Commission 0 0 180,000 0 60,000 -67%
8404 - Appraisal Services 0 0 58,750 10,150 29,850 -49%
8420 - Vehicles Capital Expend 2,300,575 49,361 0 29,223 0 0%
8440 - Equipment Capital Expend 460,437 50,701 2,500 14,655 0 -100%
8460 - Computer Capital Expend 250,763 198,250 35,000 44,099 10,000 -71%
8480 - Water Rights Capital Exp 0 390,600 0 0 0 0%
8500 - Infrastructure-Streets 205,497 91,540 0 0 0 0%
8540 - Infrastructure-Storm Drainage 56,002 15,369 0 0 0 0%
8570 - Infrastructure-Sewer 0 0 0 0 0 0%
8585 - CIP Expenditure Transfer 0 0 0 0 0 0%
8590 - Acquisition Expense 0 0 0 0 0 0%
Total Capital Outlay 27,534,653$ 11,303,827$ 18,649,148$ 11,486,598$ 9,681,032$ -48%
Debt Service
8600 - Principal 4,150,000$ 1,555,982$ 1,729,235$ 3,036,741$ 2,732,144$ 58%
8620 - Principal-Series A 1,995,001 1,240,000 1,295,000 1,280,000 1,325,000 2%
8640 - Principal- Series B 765,000 2,500,000 2,375,000 2,375,000 2,490,000 5%
8700 - Interest Expense 2,666,815 1,072,528 1,561,007 1,070,207 988,431 -37%
8720 - Interest Expense-Series A 5,277,839 9,067,146 9,413,079 9,398,879 8,570,116 -9%
8740 - Interest Expense-Series B 832,321 1,448,535 1,328,440 1,328,440 1,209,355 -9%
8800 - Bond Administration Exp 323,736 251,298 404,800 482,515 744,345 84%
8850 - Debt Issuance Costs 0 0 0 0 0 0%
Total Debt Service 16,010,712$ 17,135,489$ 18,106,561$ 18,971,782$ 18,059,391$ 0%
Total City Expenditures by Account Number 162,209,329$ 149,882,508$ 209,260,739$ 145,621,788$ 156,889,247$ -25%
TOTAL EXPENDITURES BY ACCOUNT

D - 20
THIS PAGE INTENTIONALLY LEFT BLANK
CITY POSITION SUMMARIES AND SALARY RANGE TABLES
CITY POSITION SUMMARIES
AND
SALARY RANGE TABLES
Overview and Summary 2010-11 Budget Full-Time and Part-Time Positions by Department 2010-11 Budget Full-Time Positions by Department 2010-11 Budget Full-Time and Part-Time Positions by Fund Full-Time and Part-Time Position Listing Summary by Department Full-Time Position Listing by Department Part-Time Position Listing by Department Salary Range Tables

E- 2
THIS PAGE INTENTIONALLY LEFT BLANK
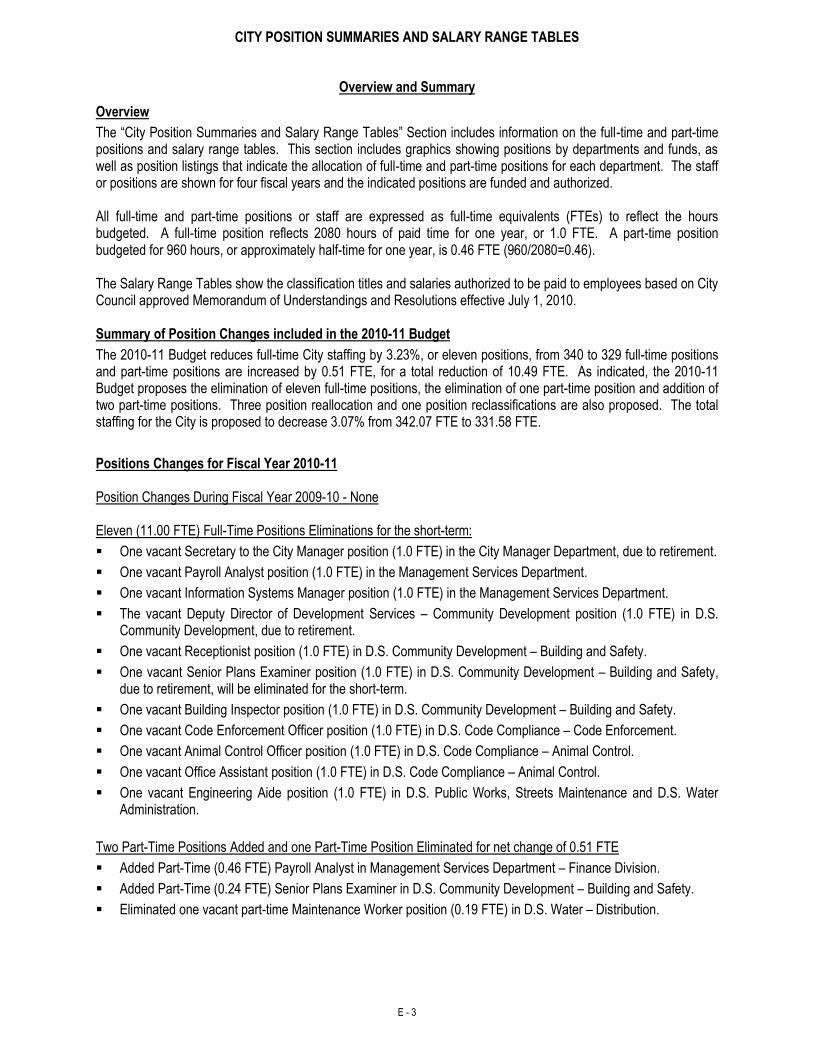
CITY POSITION SUMMARIES AND SALARY RANGE TABLES
E - 3
Overview and Summary
Overview
The “City Position Summaries and Salary Range Tables” Section includes information on the full-time and part-time positions and salary range tables. This section includes graphics showing positions by departments and funds, as well as position listings that indicate the allocation of full-time and part-time positions for each department. The staff or positions are shown for four fiscal years and the indicated positions are funded and authorized. All full-time and part-time positions or staff are expressed as full-time equivalents (FTEs) to reflect the hours budgeted. A full-time position reflects 2080 hours of paid time for one year, or 1.0 FTE. A part-time position budgeted for 960 hours, or approximately half-time for one year, is 0.46 FTE (960/2080=0.46). The Salary Range Tables show the classification titles and salaries authorized to be paid to employees based on City Council approved Memorandum of Understandings and Resolutions effective July 1, 2010. Summary of Position Changes included in the 2010-11 Budget
The 2010-11 Budget reduces full-time City staffing by 3.23%, or eleven positions, from 340 to 329 full-time positions and part-time positions are increased by 0.51 FTE, for a total reduction of 10.49 FTE. As indicated, the 2010-11 Budget proposes the elimination of eleven full-time positions, the elimination of one part-time position and addition of two part-time positions. Three position reallocation and one position reclassifications are also proposed. The total staffing for the City is proposed to decrease 3.07% from 342.07 FTE to 331.58 FTE.
Positions Changes for Fiscal Year 2010-11 Position Changes During Fiscal Year 2009-10 - None Eleven (11.00 FTE) Full-Time Positions Eliminations for the short-term:
One vacant Secretary to the City Manager position (1.0 FTE) in the City Manager Department, due to retirement.
One vacant Payroll Analyst position (1.0 FTE) in the Management Services Department.
One vacant Information Systems Manager position (1.0 FTE) in the Management Services Department.
The vacant Deputy Director of Development Services – Community Development position (1.0 FTE) in D.S. Community Development, due to retirement.
One vacant Receptionist position (1.0 FTE) in D.S. Community Development – Building and Safety.
One vacant Senior Plans Examiner position (1.0 FTE) in D.S. Community Development – Building and Safety, due to retirement, will be eliminated for the short-term.
One vacant Building Inspector position (1.0 FTE) in D.S. Community Development – Building and Safety.
One vacant Code Enforcement Officer position (1.0 FTE) in D.S. Code Compliance – Code Enforcement.
One vacant Animal Control Officer position (1.0 FTE) in D.S. Code Compliance – Animal Control.
One vacant Office Assistant position (1.0 FTE) in D.S. Code Compliance – Animal Control.
One vacant Engineering Aide position (1.0 FTE) in D.S. Public Works, Streets Maintenance and D.S. Water Administration.
Two Part-Time Positions Added and one Part-Time Position Eliminated for net change of 0.51 FTE
Added Part-Time (0.46 FTE) Payroll Analyst in Management Services Department – Finance Division.
Added Part-Time (0.24 FTE) Senior Plans Examiner in D.S. Community Development – Building and Safety.
Eliminated one vacant part-time Maintenance Worker position (0.19 FTE) in D.S. Water – Distribution.
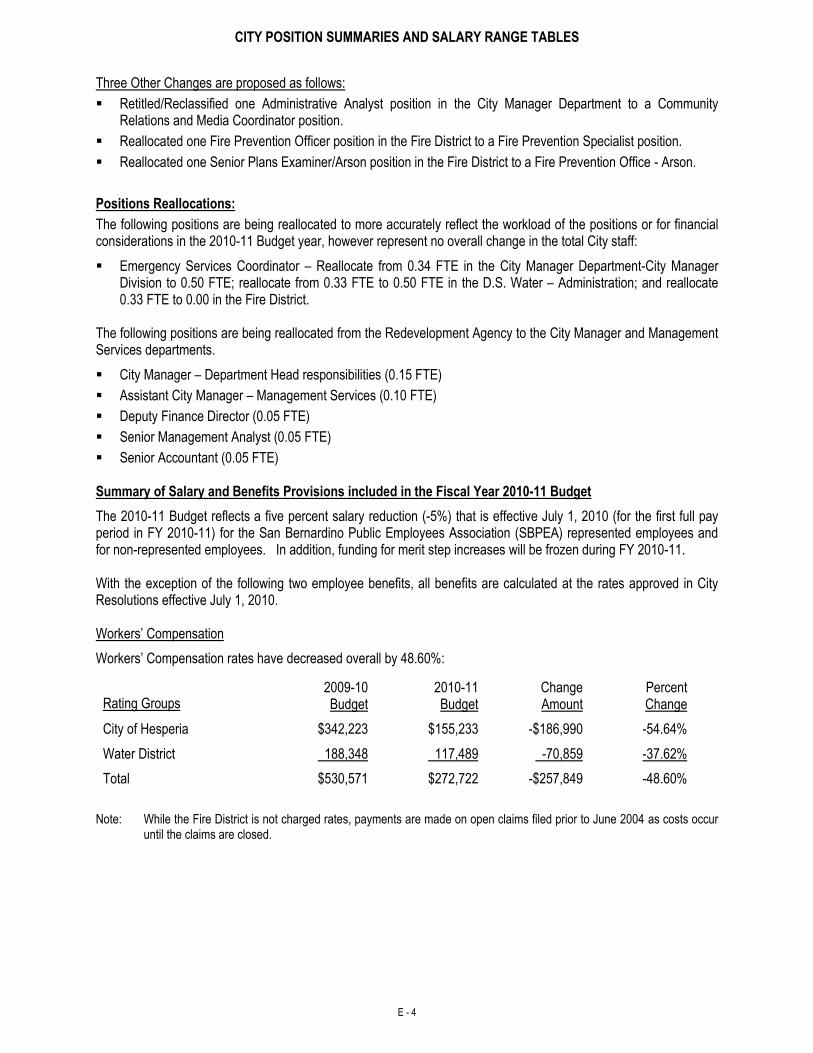
CITY POSITION SUMMARIES AND SALARY RANGE TABLES
E - 4
Three Other Changes are proposed as follows:
Retitled/Reclassified one Administrative Analyst position in the City Manager Department to a Community Relations and Media Coordinator position.
Reallocated one Fire Prevention Officer position in the Fire District to a Fire Prevention Specialist position.
Reallocated one Senior Plans Examiner/Arson position in the Fire District to a Fire Prevention Office - Arson.
Positions Reallocations:
The following positions are being reallocated to more accurately reflect the workload of the positions or for financial considerations in the 2010-11 Budget year, however represent no overall change in the total City staff:
Emergency Services Coordinator – Reallocate from 0.34 FTE in the City Manager Department-City Manager Division to 0.50 FTE; reallocate from 0.33 FTE to 0.50 FTE in the D.S. Water – Administration; and reallocate 0.33 FTE to 0.00 in the Fire District.
The following positions are being reallocated from the Redevelopment Agency to the City Manager and Management Services departments.
City Manager – Department Head responsibilities (0.15 FTE)
Assistant City Manager – Management Services (0.10 FTE)
Deputy Finance Director (0.05 FTE)
Senior Management Analyst (0.05 FTE)
Senior Accountant (0.05 FTE)
Summary of Salary and Benefits Provisions included in the Fiscal Year 2010-11 Budget
The 2010-11 Budget reflects a five percent salary reduction (-5%) that is effective July 1, 2010 (for the first full pay period in FY 2010-11) for the San Bernardino Public Employees Association (SBPEA) represented employees and for non-represented employees. In addition, funding for merit step increases will be frozen during FY 2010-11. With the exception of the following two employee benefits, all benefits are calculated at the rates approved in City Resolutions effective July 1, 2010. Workers’ Compensation
Workers’ Compensation rates have decreased overall by 48.60%:
Rating Groups 2009-10 Budget
2010-11 Budget
Change Amount
Percent Change
City of Hesperia $342,223 $155,233 -$186,990 -54.64%
Water District 188,348 117,489 -70,859 -37.62%
Total $530,571 $272,722 -$257,849 -48.60%
Note: While the Fire District is not charged rates, payments are made on open claims filed prior to June 2004 as costs occur
until the claims are closed.
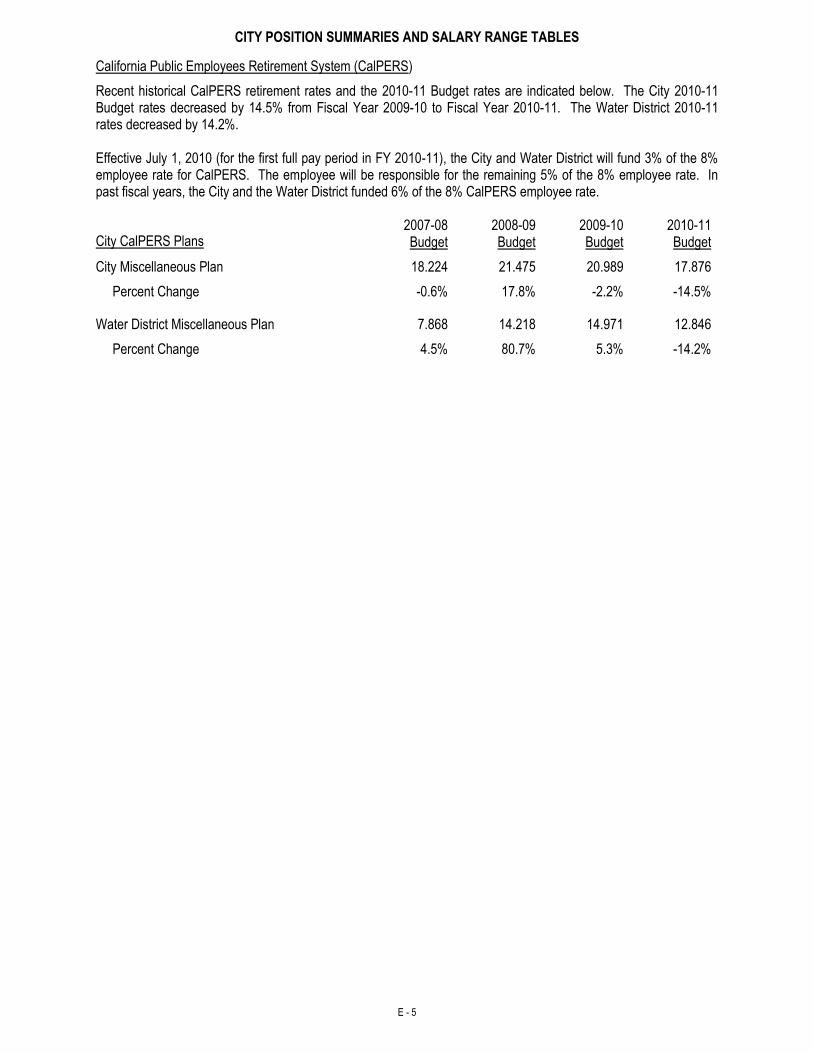
CITY POSITION SUMMARIES AND SALARY RANGE TABLES
E - 5
California Public Employees Retirement System (CalPERS)
Recent historical CalPERS retirement rates and the 2010-11 Budget rates are indicated below. The City 2010-11 Budget rates decreased by 14.5% from Fiscal Year 2009-10 to Fiscal Year 2010-11. The Water District 2010-11 rates decreased by 14.2%. Effective July 1, 2010 (for the first full pay period in FY 2010-11), the City and Water District will fund 3% of the 8% employee rate for CalPERS. The employee will be responsible for the remaining 5% of the 8% employee rate. In past fiscal years, the City and the Water District funded 6% of the 8% CalPERS employee rate.
City CalPERS Plans 2007-08 Budget
2008-09 Budget
2009-10 Budget
2010-11 Budget
City Miscellaneous Plan 18.224 21.475 20.989 17.876
Percent Change -0.6% 17.8% -2.2% -14.5%
Water District Miscellaneous Plan 7.868 14.218 14.971 12.846
Percent Change 4.5% 80.7% 5.3% -14.2%
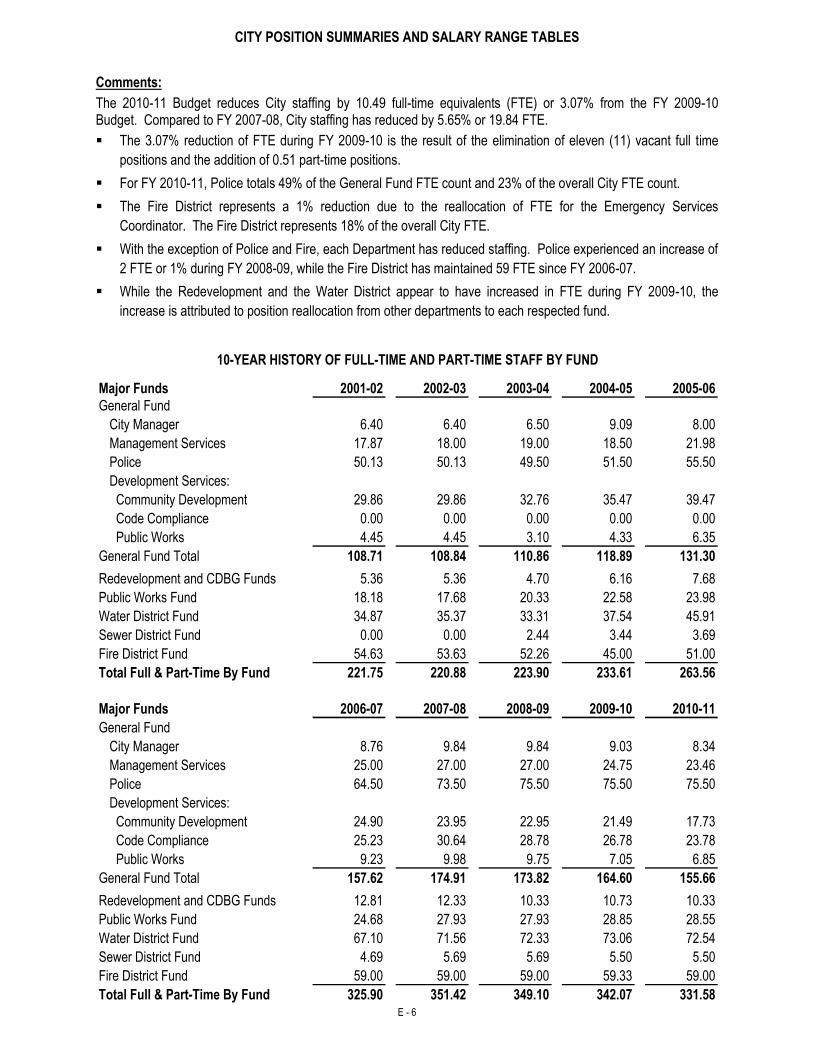
CITY POSITION SUMMARIES AND SALARY RANGE TABLES
E - 6
Comments:
The 2010-11 Budget reduces City staffing by 10.49 full-time equivalents (FTE) or 3.07% from the FY 2009-10 Budget. Compared to FY 2007-08, City staffing has reduced by 5.65% or 19.84 FTE.
The 3.07% reduction of FTE during FY 2009-10 is the result of the elimination of eleven (11) vacant full time
positions and the addition of 0.51 part-time positions.
For FY 2010-11, Police totals 49% of the General Fund FTE count and 23% of the overall City FTE count.
The Fire District represents a 1% reduction due to the reallocation of FTE for the Emergency Services
Coordinator. The Fire District represents 18% of the overall City FTE.
With the exception of Police and Fire, each Department has reduced staffing. Police experienced an increase of
2 FTE or 1% during FY 2008-09, while the Fire District has maintained 59 FTE since FY 2006-07.
While the Redevelopment and the Water District appear to have increased in FTE during FY 2009-10, the
increase is attributed to position reallocation from other departments to each respected fund.
Major Funds 2001-02 2002-03 2003-04 2004-05 2005-06
General Fund
City Manager 6.40 6.40 6.50 9.09 8.00
Management Services 17.87 18.00 19.00 18.50 21.98
Police 50.13 50.13 49.50 51.50 55.50
Development Services:
Community Development 29.86 29.86 32.76 35.47 39.47
Code Compliance 0.00 0.00 0.00 0.00 0.00
Public Works 4.45 4.45 3.10 4.33 6.35
General Fund Total 108.71 108.84 110.86 118.89 131.30
Redevelopment and CDBG Funds 5.36 5.36 4.70 6.16 7.68
Public Works Fund 18.18 17.68 20.33 22.58 23.98
Water District Fund 34.87 35.37 33.31 37.54 45.91
Sewer District Fund 0.00 0.00 2.44 3.44 3.69
Fire District Fund 54.63 53.63 52.26 45.00 51.00
Total Full & Part-Time By Fund 221.75 220.88 223.90 233.61 263.56
Major Funds 2006-07 2007-08 2008-09 2009-10 2010-11
General Fund
City Manager 8.76 9.84 9.84 9.03 8.34
Management Services 25.00 27.00 27.00 24.75 23.46
Police 64.50 73.50 75.50 75.50 75.50
Development Services:
Community Development 24.90 23.95 22.95 21.49 17.73
Code Compliance 25.23 30.64 28.78 26.78 23.78
Public Works 9.23 9.98 9.75 7.05 6.85
General Fund Total 157.62 174.91 173.82 164.60 155.66
Redevelopment and CDBG Funds 12.81 12.33 10.33 10.73 10.33
Public Works Fund 24.68 27.93 27.93 28.85 28.55
Water District Fund 67.10 71.56 72.33 73.06 72.54
Sewer District Fund 4.69 5.69 5.69 5.50 5.50
Fire District Fund 59.00 59.00 59.00 59.33 59.00
Total Full & Part-Time By Fund 325.90 351.42 349.10 342.07 331.58
10-YEAR HISTORY OF FULL-TIME AND PART-TIME STAFF BY FUND
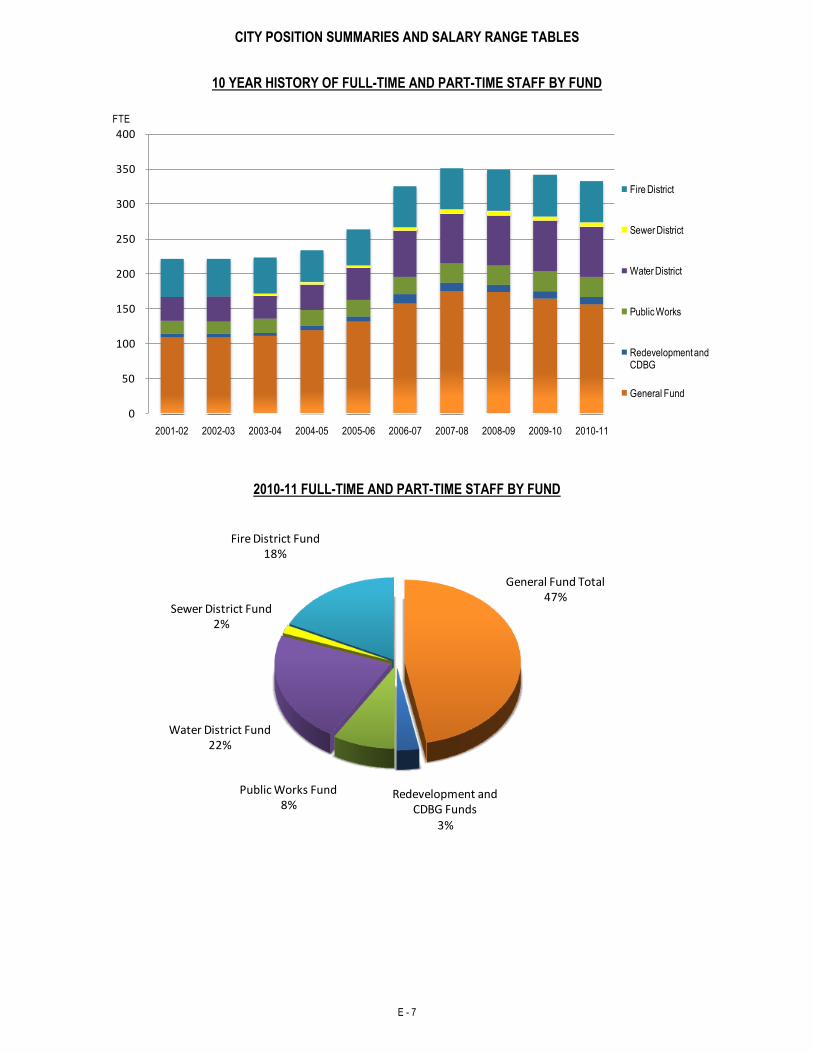
CITY POSITION SUMMARIES AND SALARY RANGE TABLES
E - 7
10 YEAR HISTORY OF FULL-TIME AND PART-TIME STAFF BY FUND
0
50
100
150
200
250
300
350
400
2001-02 2002-03 2003-04 2004-05 2005-06 2006-07 2007-08 2008-09 2009-10 2010-11
Fire District
Sewer District
Water District
Public Works
Redevelopment and CDBG
General Fund
FTE
2010-11 FULL-TIME AND PART-TIME STAFF BY FUND
General Fund Total 47%
Redevelopment and CDBG Funds
3%
Public Works Fund8%
Water District Fund22%
Sewer District Fund2%
Fire District Fund18%
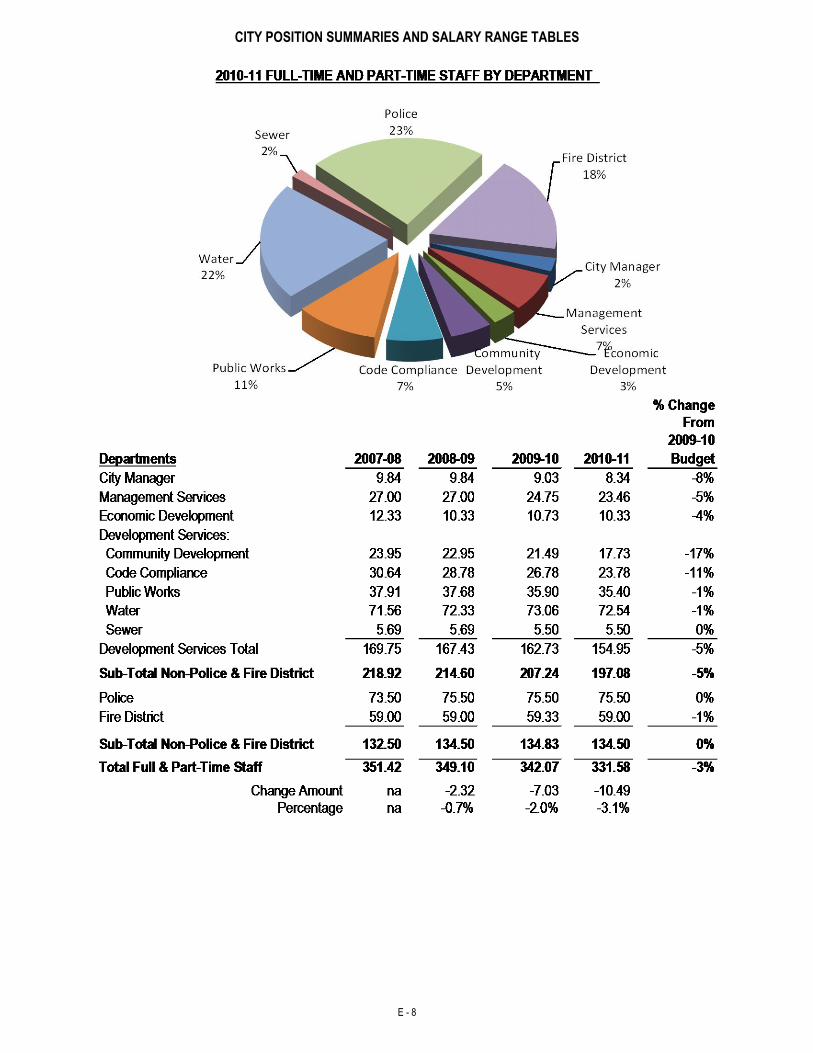
CITY POSITION SUMMARIES AND SALARY RANGE TABLES
E - 8
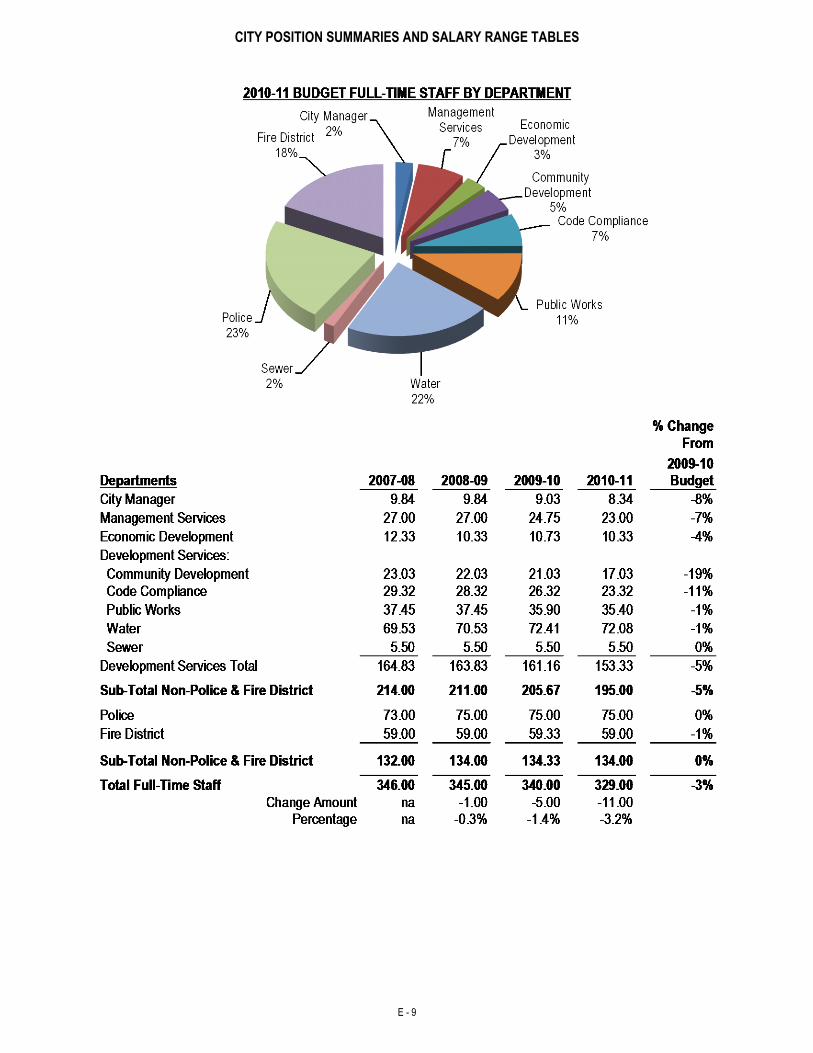
CITY POSITION SUMMARIES AND SALARY RANGE TABLES
E - 9
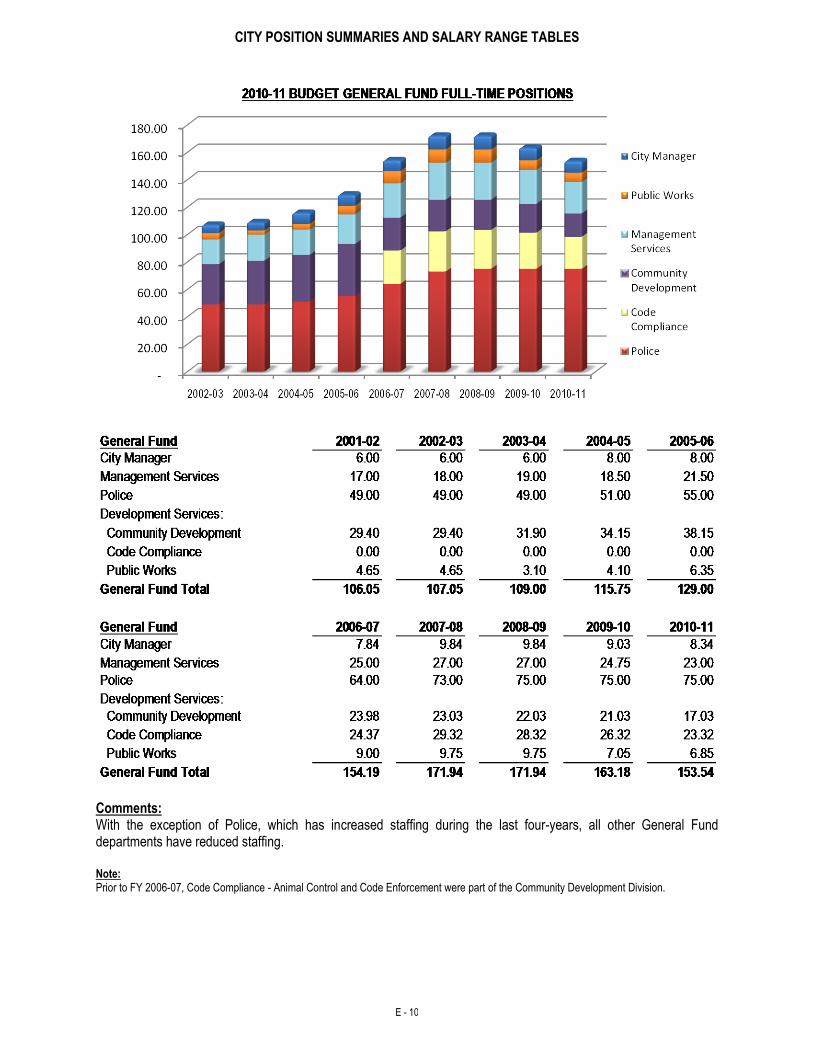
CITY POSITION SUMMARIES AND SALARY RANGE TABLES
E - 10
Comments: With the exception of Police, which has increased staffing during the last four-years, all other General Fund departments have reduced staffing. Note: Prior to FY 2006-07, Code Compliance - Animal Control and Code Enforcement were part of the Community Development Division.
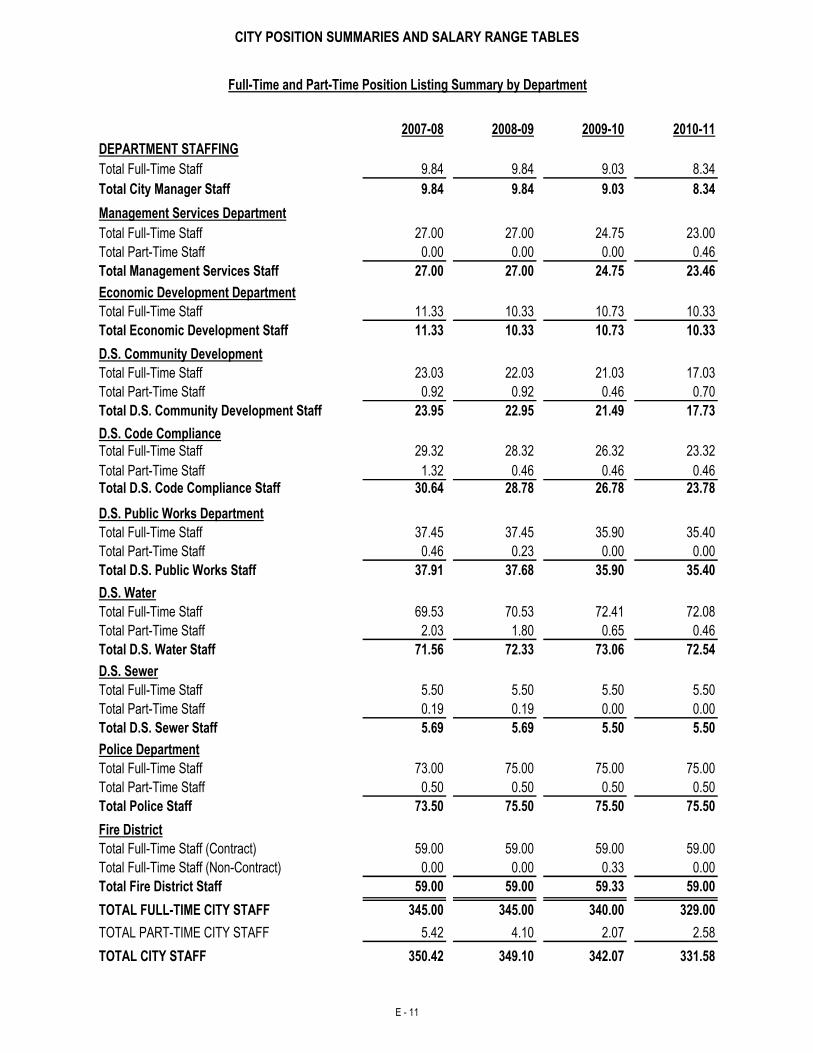
CITY POSITION SUMMARIES AND SALARY RANGE TABLES
E - 11
2007-08 2008-09 2009-10 2010-11
DEPARTMENT STAFFING
Total Full-Time Staff 9.84 9.84 9.03 8.34
9.84 9.84 9.03 8.34
Management Services Department
Total Full-Time Staff 27.00 27.00 24.75 23.00
0.00 0.00 0.00 0.46
27.00 27.00 24.75 23.46
Economic Development Department
Total Full-Time Staff 11.33 10.33 10.73 10.33
11.33 10.33 10.73 10.33
D.S. Community Development
Total Full-Time Staff 23.03 22.03 21.03 17.03
0.92 0.92 0.46 0.70
23.95 22.95 21.49 17.73
D.S. Code ComplianceTotal Full-Time Staff 29.32 28.32 26.32 23.32
1.32 0.46 0.46 0.4630.64 28.78 26.78 23.78
D.S. Public Works Department
Total Full-Time Staff 37.45 37.45 35.90 35.40
0.46 0.23 0.00 0.00
37.91 37.68 35.90 35.40
D.S. Water
Total Full-Time Staff 69.53 70.53 72.41 72.08
2.03 1.80 0.65 0.46
71.56 72.33 73.06 72.54
D.S. Sewer
Total Full-Time Staff 5.50 5.50 5.50 5.50
0.19 0.19 0.00 0.00
5.69 5.69 5.50 5.50
Police Department
Total Full-Time Staff 73.00 75.00 75.00 75.00
0.50 0.50 0.50 0.50
73.50 75.50 75.50 75.50
Fire District
Total Full-Time Staff (Contract) 59.00 59.00 59.00 59.00
0.00 0.00 0.33 0.00
59.00 59.00 59.33 59.00
345.00 345.00 340.00 329.00
5.42 4.10 2.07 2.58
350.42 349.10 342.07 331.58
Total Management Services Staff
Total City Manager Staff
Total Part-Time Staff
Total Police Staff
Total D.S. Water Staff
Total Part-Time Staff
Total Part-Time StaffTotal D.S. Code Compliance Staff
Total D.S. Sewer Staff
Total Part-Time Staff
Full-Time and Part-Time Position Listing Summary by Department
TOTAL CITY STAFF
Total Full-Time Staff (Non-Contract)
Total Fire District Staff
Total Part-Time Staff
Total D.S. Public Works Staff
TOTAL PART-TIME CITY STAFF
Total Part-Time Staff
Total D.S. Community Development Staff
Total Economic Development Staff
TOTAL FULL-TIME CITY STAFF
Total Part-Time Staff
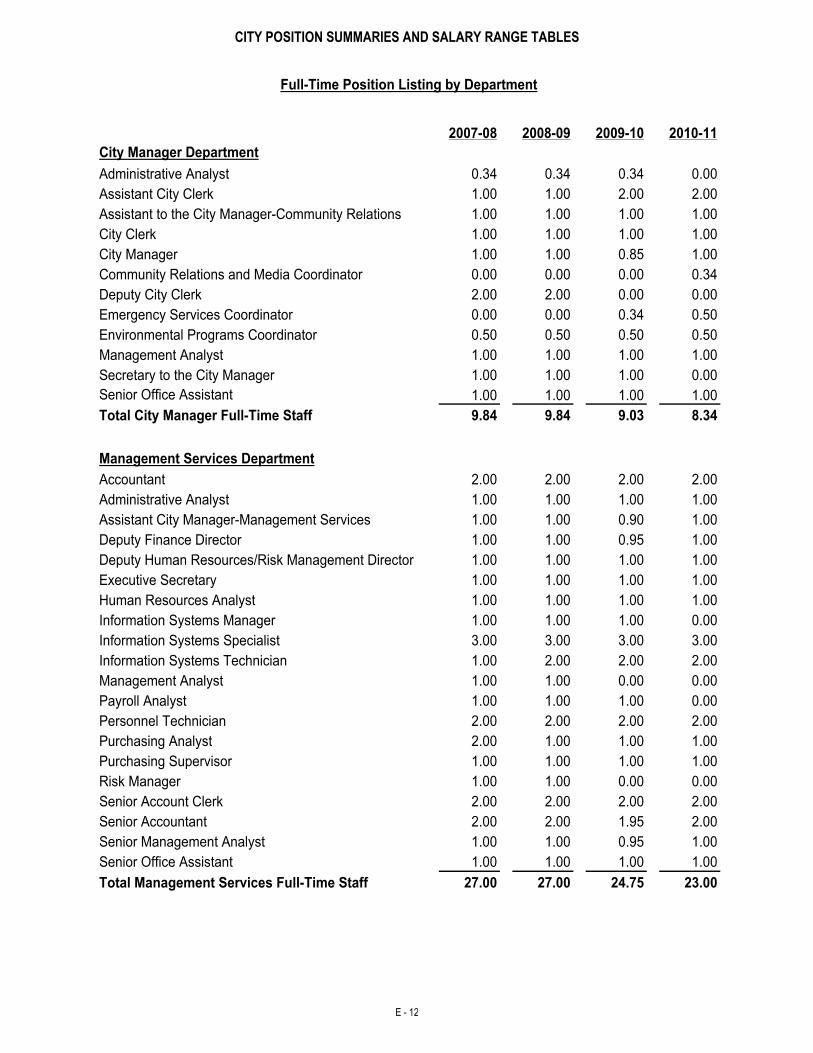
CITY POSITION SUMMARIES AND SALARY RANGE TABLES
E - 12
2007-08 2008-09 2009-10 2010-11
City Manager Department
Administrative Analyst 0.34 0.34 0.34 0.00
Assistant City Clerk 1.00 1.00 2.00 2.00
Assistant to the City Manager-Community Relations 1.00 1.00 1.00 1.00
City Clerk 1.00 1.00 1.00 1.00
City Manager 1.00 1.00 0.85 1.00
Community Relations and Media Coordinator 0.00 0.00 0.00 0.34
Deputy City Clerk 2.00 2.00 0.00 0.00
Emergency Services Coordinator 0.00 0.00 0.34 0.50
Environmental Programs Coordinator 0.50 0.50 0.50 0.50
Management Analyst 1.00 1.00 1.00 1.00
Secretary to the City Manager 1.00 1.00 1.00 0.00
Senior Office Assistant 1.00 1.00 1.00 1.00
Total City Manager Full-Time Staff 9.84 9.84 9.03 8.34
Management Services Department
Accountant 2.00 2.00 2.00 2.00
Administrative Analyst 1.00 1.00 1.00 1.00
Assistant City Manager-Management Services 1.00 1.00 0.90 1.00
Deputy Finance Director 1.00 1.00 0.95 1.00
Deputy Human Resources/Risk Management Director 1.00 1.00 1.00 1.00
Executive Secretary 1.00 1.00 1.00 1.00
Human Resources Analyst 1.00 1.00 1.00 1.00
Information Systems Manager 1.00 1.00 1.00 0.00
Information Systems Specialist 3.00 3.00 3.00 3.00
Information Systems Technician 1.00 2.00 2.00 2.00
Management Analyst 1.00 1.00 0.00 0.00
Payroll Analyst 1.00 1.00 1.00 0.00
Personnel Technician 2.00 2.00 2.00 2.00
Purchasing Analyst 2.00 1.00 1.00 1.00
Purchasing Supervisor 1.00 1.00 1.00 1.00
Risk Manager 1.00 1.00 0.00 0.00
Senior Account Clerk 2.00 2.00 2.00 2.00
Senior Accountant 2.00 2.00 1.95 2.00
Senior Management Analyst 1.00 1.00 0.95 1.00
Senior Office Assistant 1.00 1.00 1.00 1.00
Total Management Services Full-Time Staff 27.00 27.00 24.75 23.00
Full-Time Position Listing by Department
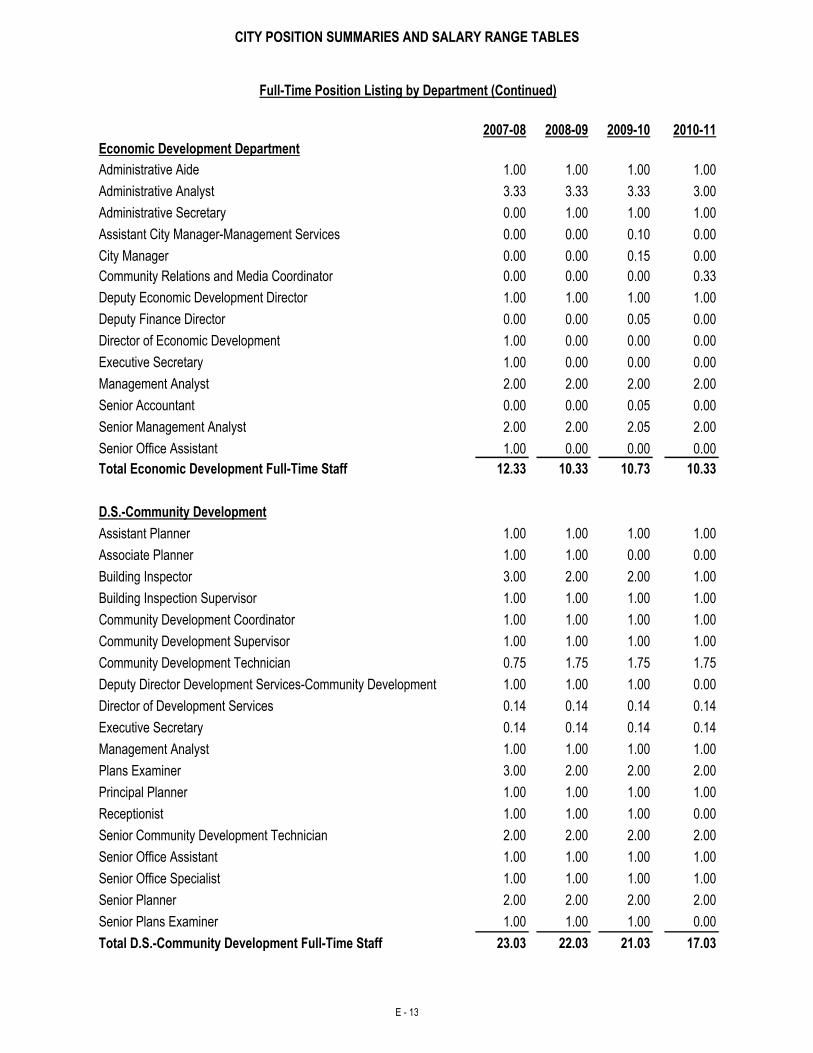
CITY POSITION SUMMARIES AND SALARY RANGE TABLES
E - 13
2007-08 2008-09 2009-10 2010-11
Economic Development Department
Administrative Aide 1.00 1.00 1.00 1.00
Administrative Analyst 3.33 3.33 3.33 3.00
Administrative Secretary 0.00 1.00 1.00 1.00
Assistant City Manager-Management Services 0.00 0.00 0.10 0.00
City Manager 0.00 0.00 0.15 0.00
Community Relations and Media Coordinator 0.00 0.00 0.00 0.33
Deputy Economic Development Director 1.00 1.00 1.00 1.00
Deputy Finance Director 0.00 0.00 0.05 0.00
Director of Economic Development 1.00 0.00 0.00 0.00
Executive Secretary 1.00 0.00 0.00 0.00
Management Analyst 2.00 2.00 2.00 2.00
Senior Accountant 0.00 0.00 0.05 0.00
Senior Management Analyst 2.00 2.00 2.05 2.00
Senior Office Assistant 1.00 0.00 0.00 0.00
Total Economic Development Full-Time Staff 12.33 10.33 10.73 10.33
D.S.-Community Development
Assistant Planner 1.00 1.00 1.00 1.00
Associate Planner 1.00 1.00 0.00 0.00
Building Inspector 3.00 2.00 2.00 1.00
Building Inspection Supervisor 1.00 1.00 1.00 1.00
Community Development Coordinator 1.00 1.00 1.00 1.00
Community Development Supervisor 1.00 1.00 1.00 1.00
Community Development Technician 0.75 1.75 1.75 1.75
Deputy Director Development Services-Community Development 1.00 1.00 1.00 0.00
Director of Development Services 0.14 0.14 0.14 0.14
Executive Secretary 0.14 0.14 0.14 0.14
Management Analyst 1.00 1.00 1.00 1.00
Plans Examiner 3.00 2.00 2.00 2.00
Principal Planner 1.00 1.00 1.00 1.00
Receptionist 1.00 1.00 1.00 0.00
Senior Community Development Technician 2.00 2.00 2.00 2.00
Senior Office Assistant 1.00 1.00 1.00 1.00
Senior Office Specialist 1.00 1.00 1.00 1.00
Senior Planner 2.00 2.00 2.00 2.00
Senior Plans Examiner 1.00 1.00 1.00 0.00
Total D.S.-Community Development Full-Time Staff 23.03 22.03 21.03 17.03
Full-Time Position Listing by Department (Continued)
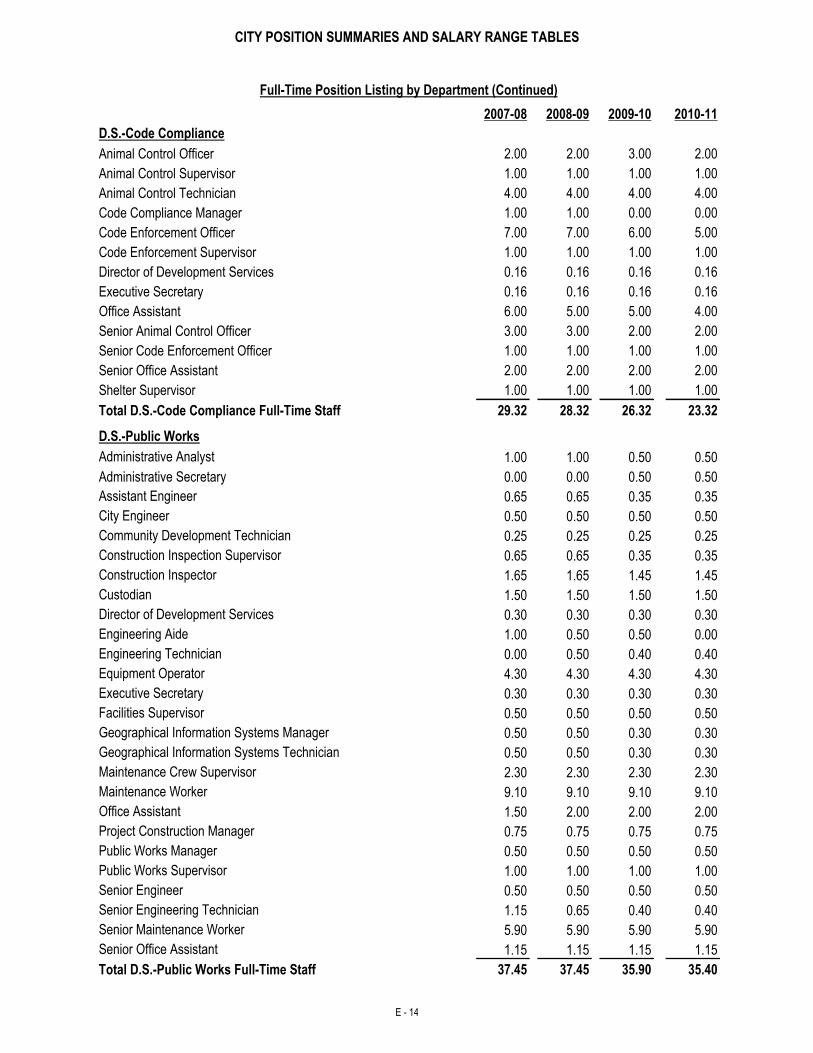
CITY POSITION SUMMARIES AND SALARY RANGE TABLES
E - 14
2007-08 2008-09 2009-10 2010-11
D.S.-Code Compliance
Animal Control Officer 2.00 2.00 3.00 2.00
Animal Control Supervisor 1.00 1.00 1.00 1.00
Animal Control Technician 4.00 4.00 4.00 4.00
Code Compliance Manager 1.00 1.00 0.00 0.00
Code Enforcement Officer 7.00 7.00 6.00 5.00
Code Enforcement Supervisor 1.00 1.00 1.00 1.00
Director of Development Services 0.16 0.16 0.16 0.16
Executive Secretary 0.16 0.16 0.16 0.16
Office Assistant 6.00 5.00 5.00 4.00
Senior Animal Control Officer 3.00 3.00 2.00 2.00
Senior Code Enforcement Officer 1.00 1.00 1.00 1.00
Senior Office Assistant 2.00 2.00 2.00 2.00
Shelter Supervisor 1.00 1.00 1.00 1.00
Total D.S.-Code Compliance Full-Time Staff 29.32 28.32 26.32 23.32
D.S.-Public Works
Administrative Analyst 1.00 1.00 0.50 0.50
Administrative Secretary 0.00 0.00 0.50 0.50
Assistant Engineer 0.65 0.65 0.35 0.35
City Engineer 0.50 0.50 0.50 0.50
Community Development Technician 0.25 0.25 0.25 0.25
Construction Inspection Supervisor 0.65 0.65 0.35 0.35
Construction Inspector 1.65 1.65 1.45 1.45
Custodian 1.50 1.50 1.50 1.50
Director of Development Services 0.30 0.30 0.30 0.30
Engineering Aide 1.00 0.50 0.50 0.00
Engineering Technician 0.00 0.50 0.40 0.40
Equipment Operator 4.30 4.30 4.30 4.30
Executive Secretary 0.30 0.30 0.30 0.30
Facilities Supervisor 0.50 0.50 0.50 0.50
Geographical Information Systems Manager 0.50 0.50 0.30 0.30
Geographical Information Systems Technician 0.50 0.50 0.30 0.30
Maintenance Crew Supervisor 2.30 2.30 2.30 2.30
Maintenance Worker 9.10 9.10 9.10 9.10
Office Assistant 1.50 2.00 2.00 2.00
Project Construction Manager 0.75 0.75 0.75 0.75
Public Works Manager 0.50 0.50 0.50 0.50
Public Works Supervisor 1.00 1.00 1.00 1.00
Senior Engineer 0.50 0.50 0.50 0.50
Senior Engineering Technician 1.15 0.65 0.40 0.40
Senior Maintenance Worker 5.90 5.90 5.90 5.90
Senior Office Assistant 1.15 1.15 1.15 1.15
Total D.S.-Public Works Full-Time Staff 37.45 37.45 35.90 35.40
Full-Time Position Listing by Department (Continued)
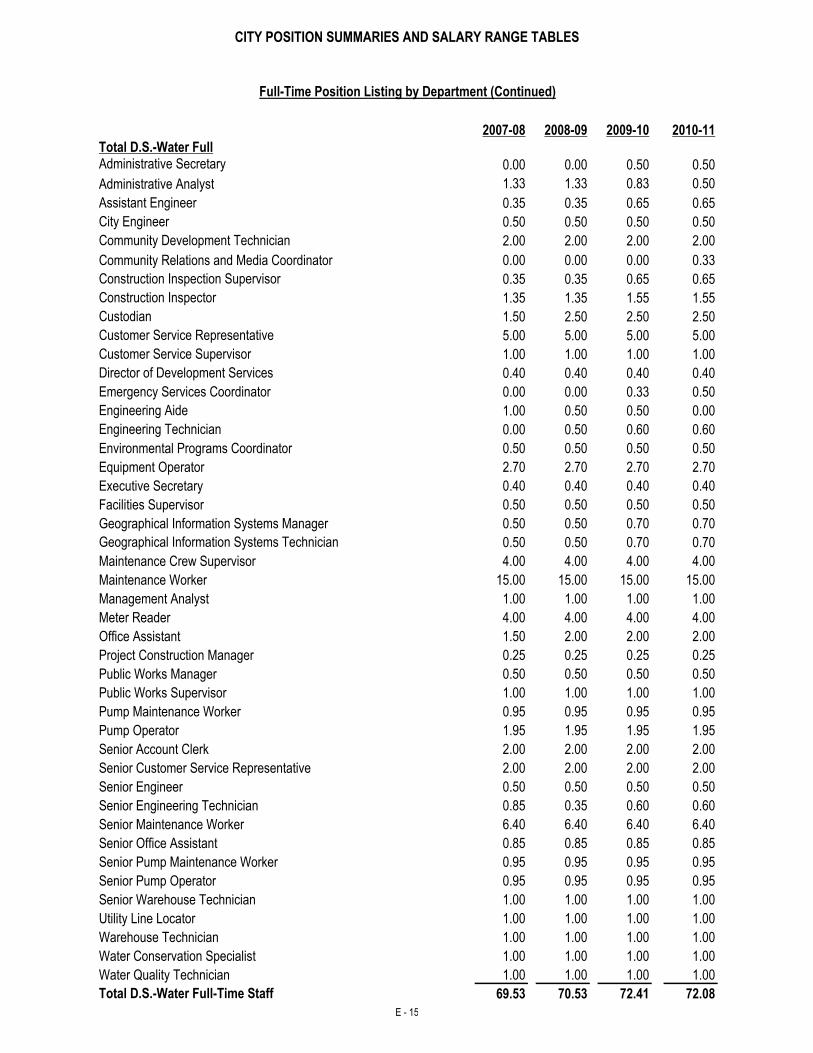
CITY POSITION SUMMARIES AND SALARY RANGE TABLES
E - 15
2007-08 2008-09 2009-10 2010-11
Total D.S.-Water FullAdministrative Secretary 0.00 0.00 0.50 0.50
Administrative Analyst 1.33 1.33 0.83 0.50
Assistant Engineer 0.35 0.35 0.65 0.65
City Engineer 0.50 0.50 0.50 0.50
Community Development Technician 2.00 2.00 2.00 2.00
Community Relations and Media Coordinator 0.00 0.00 0.00 0.33
Construction Inspection Supervisor 0.35 0.35 0.65 0.65
Construction Inspector 1.35 1.35 1.55 1.55
Custodian 1.50 2.50 2.50 2.50
Customer Service Representative 5.00 5.00 5.00 5.00
Customer Service Supervisor 1.00 1.00 1.00 1.00
Director of Development Services 0.40 0.40 0.40 0.40
Emergency Services Coordinator 0.00 0.00 0.33 0.50
Engineering Aide 1.00 0.50 0.50 0.00
Engineering Technician 0.00 0.50 0.60 0.60
Environmental Programs Coordinator 0.50 0.50 0.50 0.50
Equipment Operator 2.70 2.70 2.70 2.70
Executive Secretary 0.40 0.40 0.40 0.40
Facilities Supervisor 0.50 0.50 0.50 0.50
Geographical Information Systems Manager 0.50 0.50 0.70 0.70
Geographical Information Systems Technician 0.50 0.50 0.70 0.70
Maintenance Crew Supervisor 4.00 4.00 4.00 4.00
Maintenance Worker 15.00 15.00 15.00 15.00
Management Analyst 1.00 1.00 1.00 1.00
Meter Reader 4.00 4.00 4.00 4.00
Office Assistant 1.50 2.00 2.00 2.00
Project Construction Manager 0.25 0.25 0.25 0.25
Public Works Manager 0.50 0.50 0.50 0.50
Public Works Supervisor 1.00 1.00 1.00 1.00
Pump Maintenance Worker 0.95 0.95 0.95 0.95
Pump Operator 1.95 1.95 1.95 1.95
Senior Account Clerk 2.00 2.00 2.00 2.00
Senior Customer Service Representative 2.00 2.00 2.00 2.00
Senior Engineer 0.50 0.50 0.50 0.50
Senior Engineering Technician 0.85 0.35 0.60 0.60
Senior Maintenance Worker 6.40 6.40 6.40 6.40
Senior Office Assistant 0.85 0.85 0.85 0.85
Senior Pump Maintenance Worker 0.95 0.95 0.95 0.95
Senior Pump Operator 0.95 0.95 0.95 0.95
Senior Warehouse Technician 1.00 1.00 1.00 1.00
Utility Line Locator 1.00 1.00 1.00 1.00
Warehouse Technician 1.00 1.00 1.00 1.00
Water Conservation Specialist 1.00 1.00 1.00 1.00
Water Quality Technician 1.00 1.00 1.00 1.00
Total D.S.-Water Full-Time Staff 69.53 70.53 72.41 72.08
Full-Time Position Listing by Department (Continued)
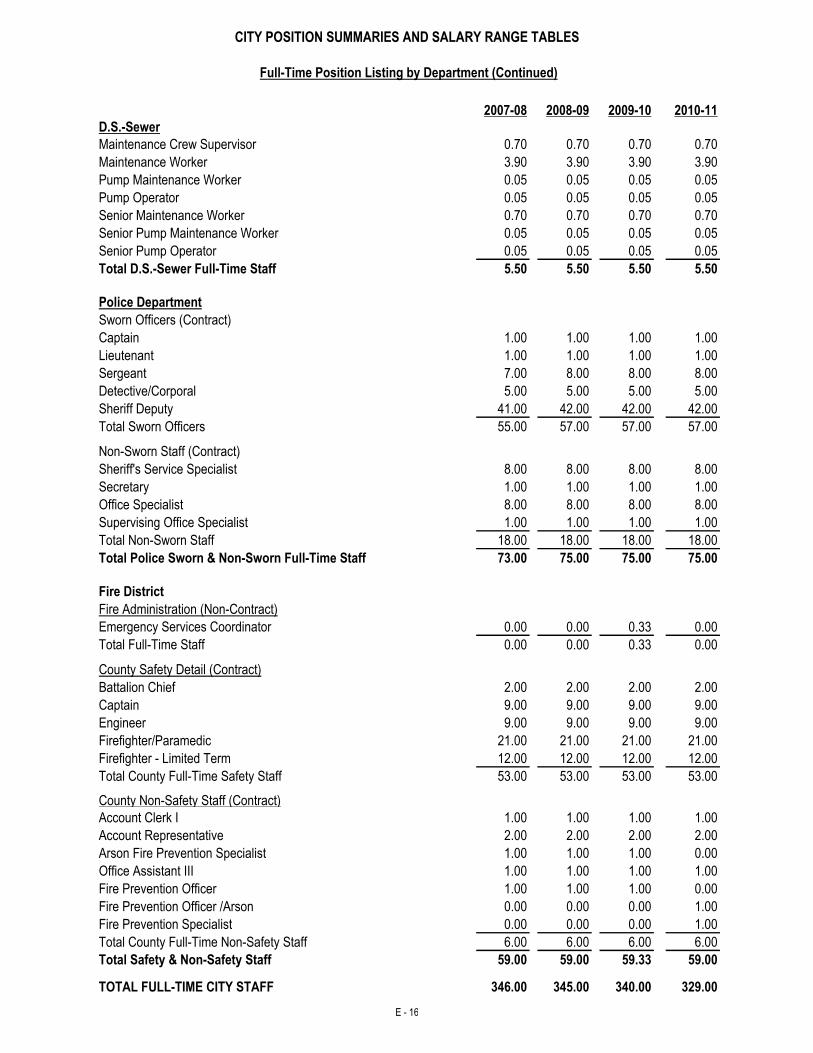
CITY POSITION SUMMARIES AND SALARY RANGE TABLES
E - 16
2007-08 2008-09 2009-10 2010-11
D.S.-Sewer
Maintenance Crew Supervisor 0.70 0.70 0.70 0.70
Maintenance Worker 3.90 3.90 3.90 3.90
Pump Maintenance Worker 0.05 0.05 0.05 0.05
Pump Operator 0.05 0.05 0.05 0.05
Senior Maintenance Worker 0.70 0.70 0.70 0.70
Senior Pump Maintenance Worker 0.05 0.05 0.05 0.05
Senior Pump Operator 0.05 0.05 0.05 0.05
Total D.S.-Sewer Full-Time Staff 5.50 5.50 5.50 5.50
Police Department
Sworn Officers (Contract)
Captain 1.00 1.00 1.00 1.00
Lieutenant 1.00 1.00 1.00 1.00
Sergeant 7.00 8.00 8.00 8.00
Detective/Corporal 5.00 5.00 5.00 5.00
Sheriff Deputy 41.00 42.00 42.00 42.00
Total Sworn Officers 55.00 57.00 57.00 57.00
Non-Sworn Staff (Contract)
Sheriff's Service Specialist 8.00 8.00 8.00 8.00
Secretary 1.00 1.00 1.00 1.00
Office Specialist 8.00 8.00 8.00 8.00
Supervising Office Specialist 1.00 1.00 1.00 1.00
Total Non-Sworn Staff 18.00 18.00 18.00 18.00
Total Police Sworn & Non-Sworn Full-Time Staff 73.00 75.00 75.00 75.00
Fire District
Fire Administration (Non-Contract)
Emergency Services Coordinator 0.00 0.00 0.33 0.00
Total Full-Time Staff 0.00 0.00 0.33 0.00
County Safety Detail (Contract)
Battalion Chief 2.00 2.00 2.00 2.00
Captain 9.00 9.00 9.00 9.00
Engineer 9.00 9.00 9.00 9.00
Firefighter/Paramedic 21.00 21.00 21.00 21.00
Firefighter - Limited Term 12.00 12.00 12.00 12.00
Total County Full-Time Safety Staff 53.00 53.00 53.00 53.00
County Non-Safety Staff (Contract)
Account Clerk I 1.00 1.00 1.00 1.00
Account Representative 2.00 2.00 2.00 2.00
Arson Fire Prevention Specialist 1.00 1.00 1.00 0.00
Office Assistant III 1.00 1.00 1.00 1.00
Fire Prevention Officer 1.00 1.00 1.00 0.00
Fire Prevention Officer /Arson 0.00 0.00 0.00 1.00
Fire Prevention Specialist 0.00 0.00 0.00 1.00
Total County Full-Time Non-Safety Staff 6.00 6.00 6.00 6.00
Total Safety & Non-Safety Staff 59.00 59.00 59.33 59.00
TOTAL FULL-TIME CITY STAFF 346.00 345.00 340.00 329.00
Full-Time Position Listing by Department (Continued)
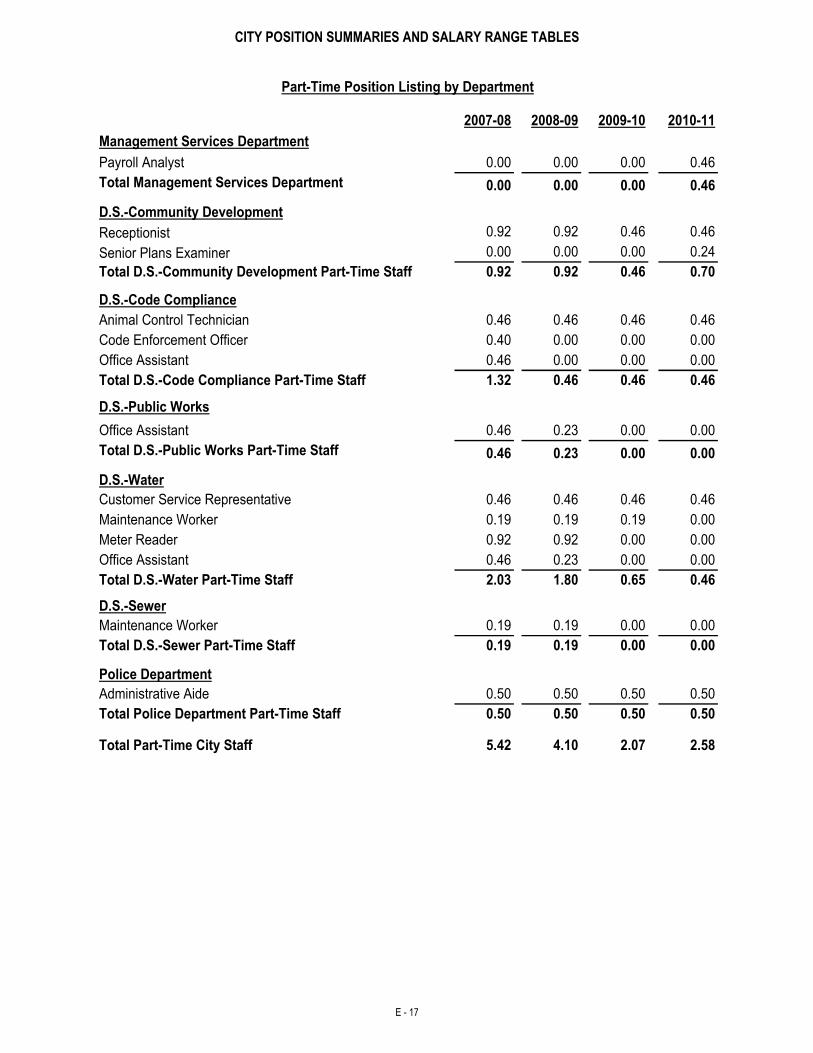
CITY POSITION SUMMARIES AND SALARY RANGE TABLES
E - 17
2007-08 2008-09 2009-10 2010-11
Management Services Department
Payroll Analyst 0.00 0.00 0.00 0.46
Total Management Services Department 0.00 0.00 0.00 0.46
D.S.-Community Development
Receptionist 0.92 0.92 0.46 0.46
Senior Plans Examiner 0.00 0.00 0.00 0.24
Total D.S.-Community Development Part-Time Staff 0.92 0.92 0.46 0.70
D.S.-Code Compliance
Animal Control Technician 0.46 0.46 0.46 0.46
Code Enforcement Officer 0.40 0.00 0.00 0.00
Office Assistant 0.46 0.00 0.00 0.00
Total D.S.-Code Compliance Part-Time Staff 1.32 0.46 0.46 0.46
D.S.-Public Works
Office Assistant 0.46 0.23 0.00 0.00
Total D.S.-Public Works Part-Time Staff 0.46 0.23 0.00 0.00
D.S.-Water
Customer Service Representative 0.46 0.46 0.46 0.46
Maintenance Worker 0.19 0.19 0.19 0.00
Meter Reader 0.92 0.92 0.00 0.00
Office Assistant 0.46 0.23 0.00 0.00
Total D.S.-Water Part-Time Staff 2.03 1.80 0.65 0.46
D.S.-Sewer
Maintenance Worker 0.19 0.19 0.00 0.00
Total D.S.-Sewer Part-Time Staff 0.19 0.19 0.00 0.00
Police Department
Administrative Aide 0.50 0.50 0.50 0.50
Total Police Department Part-Time Staff 0.50 0.50 0.50 0.50
Total Part-Time City Staff 5.42 4.10 2.07 2.58
Part-Time Position Listing by Department
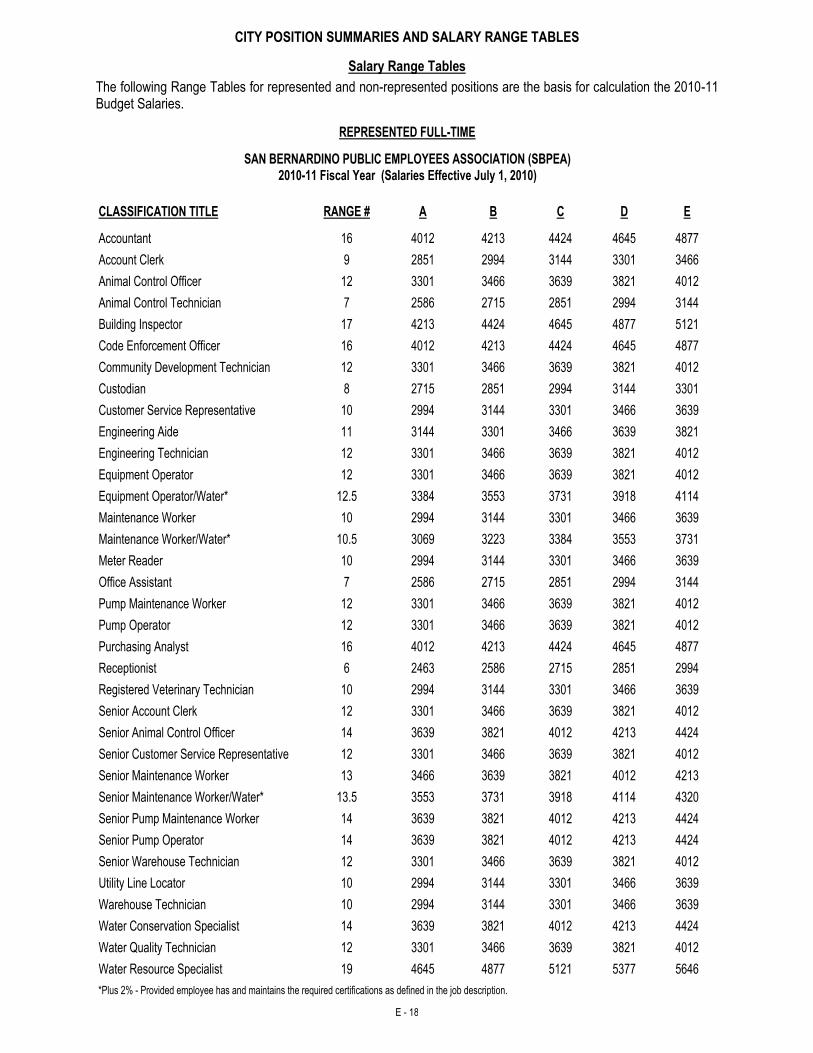
CITY POSITION SUMMARIES AND SALARY RANGE TABLES
E - 18
Salary Range Tables
The following Range Tables for represented and non-represented positions are the basis for calculation the 2010-11 Budget Salaries.
CLASSIFICATION TITLE RANGE # A B C D E
Accountant 16 4012 4213 4424 4645 4877
Account Clerk 9 2851 2994 3144 3301 3466
Animal Control Officer 12 3301 3466 3639 3821 4012
Animal Control Technician 7 2586 2715 2851 2994 3144
Building Inspector 17 4213 4424 4645 4877 5121
Code Enforcement Officer 16 4012 4213 4424 4645 4877
Community Development Technician 12 3301 3466 3639 3821 4012
Custodian 8 2715 2851 2994 3144 3301
Customer Service Representative 10 2994 3144 3301 3466 3639
Engineering Aide 11 3144 3301 3466 3639 3821
Engineering Technician 12 3301 3466 3639 3821 4012
Equipment Operator 12 3301 3466 3639 3821 4012
Equipment Operator/Water* 12.5 3384 3553 3731 3918 4114
Maintenance Worker 10 2994 3144 3301 3466 3639
Maintenance Worker/Water* 10.5 3069 3223 3384 3553 3731
Meter Reader 10 2994 3144 3301 3466 3639
Office Assistant 7 2586 2715 2851 2994 3144
Pump Maintenance Worker 12 3301 3466 3639 3821 4012
Pump Operator 12 3301 3466 3639 3821 4012
Purchasing Analyst 16 4012 4213 4424 4645 4877
Receptionist 6 2463 2586 2715 2851 2994
Registered Veterinary Technician 10 2994 3144 3301 3466 3639
Senior Account Clerk 12 3301 3466 3639 3821 4012
Senior Animal Control Officer 14 3639 3821 4012 4213 4424
Senior Customer Service Representative 12 3301 3466 3639 3821 4012
Senior Maintenance Worker 13 3466 3639 3821 4012 4213
Senior Maintenance Worker/Water* 13.5 3553 3731 3918 4114 4320
Senior Pump Maintenance Worker 14 3639 3821 4012 4213 4424
Senior Pump Operator 14 3639 3821 4012 4213 4424
Senior Warehouse Technician 12 3301 3466 3639 3821 4012
Utility Line Locator 10 2994 3144 3301 3466 3639
Warehouse Technician 10 2994 3144 3301 3466 3639
Water Conservation Specialist 14 3639 3821 4012 4213 4424
Water Quality Technician 12 3301 3466 3639 3821 4012
Water Resource Specialist 19 4645 4877 5121 5377 5646
*Plus 2% - Provided employee has and maintains the required certifications as defined in the job description.
2010-11 Fiscal Year (Salaries Effective July 1, 2010)SAN BERNARDINO PUBLIC EMPLOYEES ASSOCIATION (SBPEA)
REPRESENTED FULL-TIME
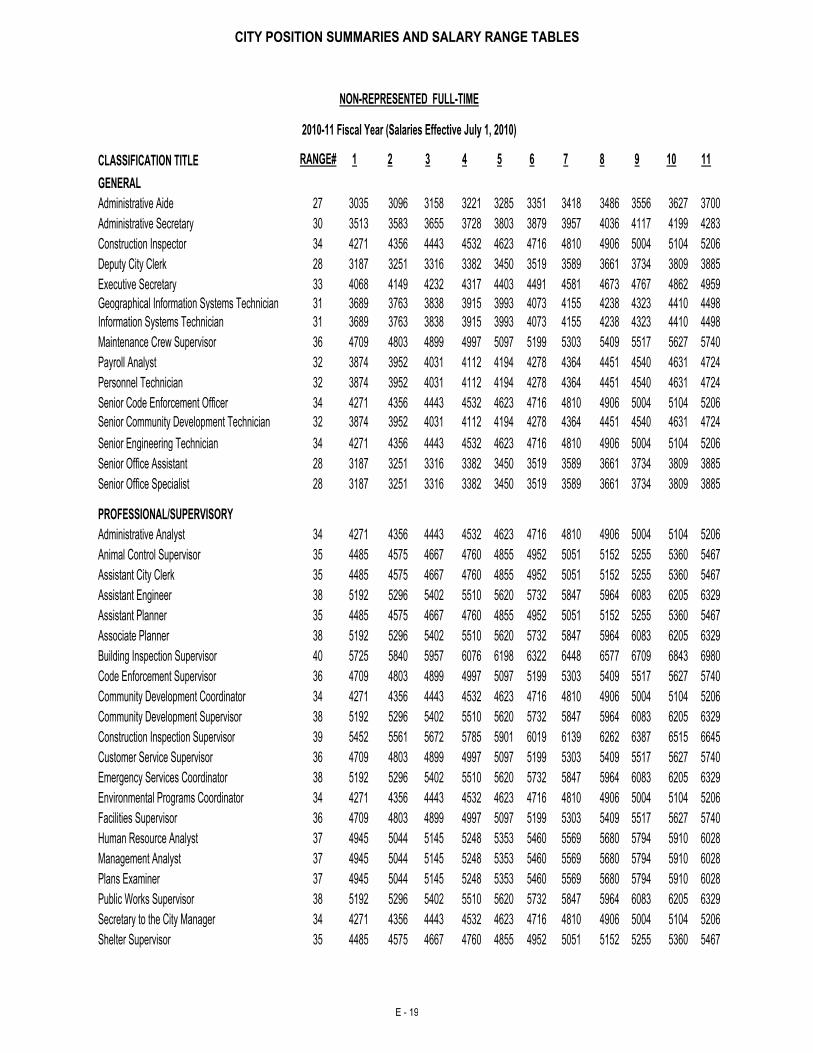
CITY POSITION SUMMARIES AND SALARY RANGE TABLES
E - 19
CLASSIFICATION TITLE RANGE# 1 2 3 4 5 6 7 8 9 10 11
Administrative Aide 27 3035 3096 3158 3221 3285 3351 3418 3486 3556 3627 3700
Administrative Secretary 30 3513 3583 3655 3728 3803 3879 3957 4036 4117 4199 4283
Construction Inspector 34 4271 4356 4443 4532 4623 4716 4810 4906 5004 5104 5206
Deputy City Clerk 28 3187 3251 3316 3382 3450 3519 3589 3661 3734 3809 3885
Executive Secretary 33 4068 4149 4232 4317 4403 4491 4581 4673 4767 4862 4959
Geographical Information Systems Technician 31 3689 3763 3838 3915 3993 4073 4155 4238 4323 4410 4498
Information Systems Technician 31 3689 3763 3838 3915 3993 4073 4155 4238 4323 4410 4498
Maintenance Crew Supervisor 36 4709 4803 4899 4997 5097 5199 5303 5409 5517 5627 5740
Payroll Analyst 32 3874 3952 4031 4112 4194 4278 4364 4451 4540 4631 4724
Personnel Technician 32 3874 3952 4031 4112 4194 4278 4364 4451 4540 4631 4724
Senior Code Enforcement Officer 34 4271 4356 4443 4532 4623 4716 4810 4906 5004 5104 5206
Senior Community Development Technician 32 3874 3952 4031 4112 4194 4278 4364 4451 4540 4631 4724
Senior Engineering Technician 34 4271 4356 4443 4532 4623 4716 4810 4906 5004 5104 5206
Senior Office Assistant 28 3187 3251 3316 3382 3450 3519 3589 3661 3734 3809 3885
Senior Office Specialist 28 3187 3251 3316 3382 3450 3519 3589 3661 3734 3809 3885
Administrative Analyst 34 4271 4356 4443 4532 4623 4716 4810 4906 5004 5104 5206
Animal Control Supervisor 35 4485 4575 4667 4760 4855 4952 5051 5152 5255 5360 5467
Assistant City Clerk 35 4485 4575 4667 4760 4855 4952 5051 5152 5255 5360 5467
Assistant Engineer 38 5192 5296 5402 5510 5620 5732 5847 5964 6083 6205 6329
Assistant Planner 35 4485 4575 4667 4760 4855 4952 5051 5152 5255 5360 5467
Associate Planner 38 5192 5296 5402 5510 5620 5732 5847 5964 6083 6205 6329
Building Inspection Supervisor 40 5725 5840 5957 6076 6198 6322 6448 6577 6709 6843 6980
Code Enforcement Supervisor 36 4709 4803 4899 4997 5097 5199 5303 5409 5517 5627 5740
Community Development Coordinator 34 4271 4356 4443 4532 4623 4716 4810 4906 5004 5104 5206
Community Development Supervisor 38 5192 5296 5402 5510 5620 5732 5847 5964 6083 6205 6329
Construction Inspection Supervisor 39 5452 5561 5672 5785 5901 6019 6139 6262 6387 6515 6645
Customer Service Supervisor 36 4709 4803 4899 4997 5097 5199 5303 5409 5517 5627 5740
Emergency Services Coordinator 38 5192 5296 5402 5510 5620 5732 5847 5964 6083 6205 6329
Environmental Programs Coordinator 34 4271 4356 4443 4532 4623 4716 4810 4906 5004 5104 5206
Facilities Supervisor 36 4709 4803 4899 4997 5097 5199 5303 5409 5517 5627 5740
Human Resource Analyst 37 4945 5044 5145 5248 5353 5460 5569 5680 5794 5910 6028
Management Analyst 37 4945 5044 5145 5248 5353 5460 5569 5680 5794 5910 6028
Plans Examiner 37 4945 5044 5145 5248 5353 5460 5569 5680 5794 5910 6028
Public Works Supervisor 38 5192 5296 5402 5510 5620 5732 5847 5964 6083 6205 6329
Secretary to the City Manager 34 4271 4356 4443 4532 4623 4716 4810 4906 5004 5104 5206
Shelter Supervisor 35 4485 4575 4667 4760 4855 4952 5051 5152 5255 5360 5467
NON-REPRESENTED FULL-TIME
2010-11 Fiscal Year (Salaries Effective July 1, 2010)
PROFESSIONAL/SUPERVISORY
GENERAL
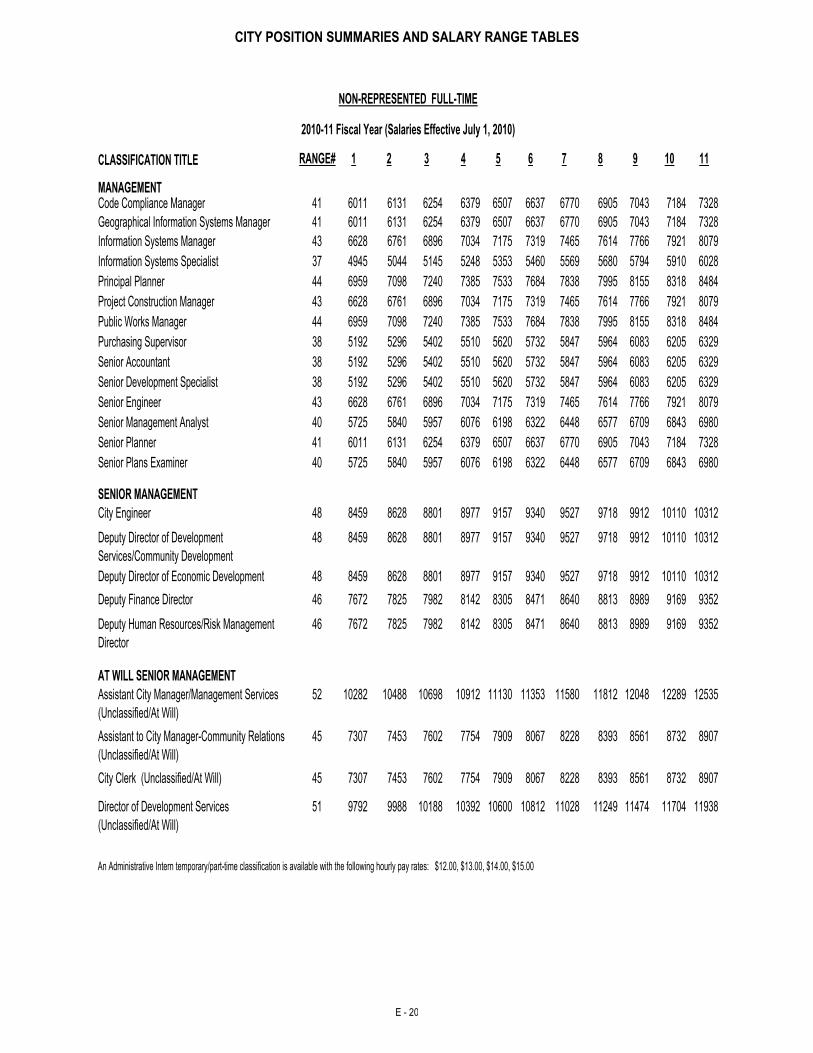
CITY POSITION SUMMARIES AND SALARY RANGE TABLES
E - 20
CLASSIFICATION TITLE RANGE# 1 2 3 4 5 6 7 8 9 10 11
Code Compliance Manager 41 6011 6131 6254 6379 6507 6637 6770 6905 7043 7184 7328
Geographical Information Systems Manager 41 6011 6131 6254 6379 6507 6637 6770 6905 7043 7184 7328
Information Systems Manager 43 6628 6761 6896 7034 7175 7319 7465 7614 7766 7921 8079
Information Systems Specialist 37 4945 5044 5145 5248 5353 5460 5569 5680 5794 5910 6028
Principal Planner 44 6959 7098 7240 7385 7533 7684 7838 7995 8155 8318 8484
Project Construction Manager 43 6628 6761 6896 7034 7175 7319 7465 7614 7766 7921 8079
Public Works Manager 44 6959 7098 7240 7385 7533 7684 7838 7995 8155 8318 8484
Purchasing Supervisor 38 5192 5296 5402 5510 5620 5732 5847 5964 6083 6205 6329
Senior Accountant 38 5192 5296 5402 5510 5620 5732 5847 5964 6083 6205 6329
Senior Development Specialist 38 5192 5296 5402 5510 5620 5732 5847 5964 6083 6205 6329
Senior Engineer 43 6628 6761 6896 7034 7175 7319 7465 7614 7766 7921 8079
Senior Management Analyst 40 5725 5840 5957 6076 6198 6322 6448 6577 6709 6843 6980
Senior Planner 41 6011 6131 6254 6379 6507 6637 6770 6905 7043 7184 7328
Senior Plans Examiner 40 5725 5840 5957 6076 6198 6322 6448 6577 6709 6843 6980
City Engineer 48 8459 8628 8801 8977 9157 9340 9527 9718 9912 10110 10312
Deputy Director of Development
Services/Community Development
48 8459 8628 8801 8977 9157 9340 9527 9718 9912 10110 10312
Deputy Director of Economic Development 48 8459 8628 8801 8977 9157 9340 9527 9718 9912 10110 10312
Deputy Finance Director 46 7672 7825 7982 8142 8305 8471 8640 8813 8989 9169 9352
Deputy Human Resources/Risk Management
Director
46 7672 7825 7982 8142 8305 8471 8640 8813 8989 9169 9352
Assistant City Manager/Management Services
(Unclassified/At Will)
52 10282 10488 10698 10912 11130 11353 11580 11812 12048 12289 12535
Assistant to City Manager-Community Relations
(Unclassified/At Will)
45 7307 7453 7602 7754 7909 8067 8228 8393 8561 8732 8907
City Clerk (Unclassified/At Will) 45 7307 7453 7602 7754 7909 8067 8228 8393 8561 8732 8907
Director of Development Services
(Unclassified/At Will)
51 9792 9988 10188 10392 10600 10812 11028 11249 11474 11704 11938
An Administrative Intern temporary/part-time classification is available with the following hourly pay rates: $12.00, $13.00, $14.00, $15.00
NON-REPRESENTED FULL-TIME
2010-11 Fiscal Year (Salaries Effective July 1, 2010)
SENIOR MANAGEMENT
MANAGEMENT
AT WILL SENIOR MANAGEMENT
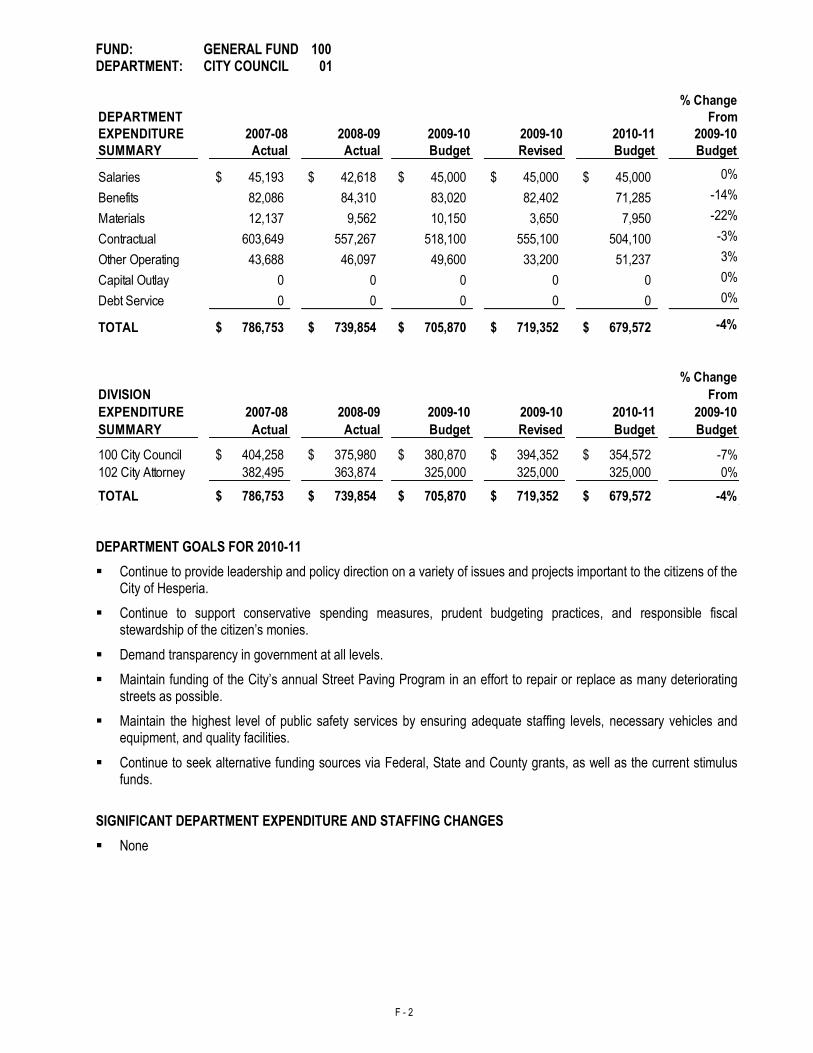
F - 2
FUND: GENERAL FUND 100 DEPARTMENT: CITY COUNCIL 01
% Change
DEPARTMENT From
EXPENDITURE 2007-08 2008-09 2009-10 2009-10 2010-11 2009-10
SUMMARY Actual Actual Budget Revised Budget Budget
Salaries 45,193$ 42,618$ 45,000$ 45,000$ 45,000$ 0%
Benefits 82,086 84,310 83,020 82,402 71,285 -14%
Materials 12,137 9,562 10,150 3,650 7,950 -22%
Contractual 603,649 557,267 518,100 555,100 504,100 -3%
Other Operating 43,688 46,097 49,600 33,200 51,237 3%
Capital Outlay 0 0 0 0 0 0%
Debt Service 0 0 0 0 0 0%
TOTAL 786,753$ 739,854$ 705,870$ 719,352$ 679,572$ -4%
% Change
DIVISION From
EXPENDITURE 2007-08 2008-09 2009-10 2009-10 2010-11 2009-10
SUMMARY Actual Actual Budget Revised Budget Budget
100 City Council 404,258$ 375,980$ 380,870$ 394,352$ 354,572$ -7%
102 City Attorney 382,495 363,874 325,000 325,000 325,000 0%
TOTAL 786,753$ 739,854$ 705,870$ 719,352$ 679,572$ -4%
DEPARTMENT GOALS FOR 2010-11
Continue to provide leadership and policy direction on a variety of issues and projects important to the citizens of the City of Hesperia.
Continue to support conservative spending measures, prudent budgeting practices, and responsible fiscal stewardship of the citizen’s monies.
Demand transparency in government at all levels.
Maintain funding of the City’s annual Street Paving Program in an effort to repair or replace as many deteriorating streets as possible.
Maintain the highest level of public safety services by ensuring adequate staffing levels, necessary vehicles and equipment, and quality facilities.
Continue to seek alternative funding sources via Federal, State and County grants, as well as the current stimulus funds.
SIGNIFICANT DEPARTMENT EXPENDITURE AND STAFFING CHANGES
None
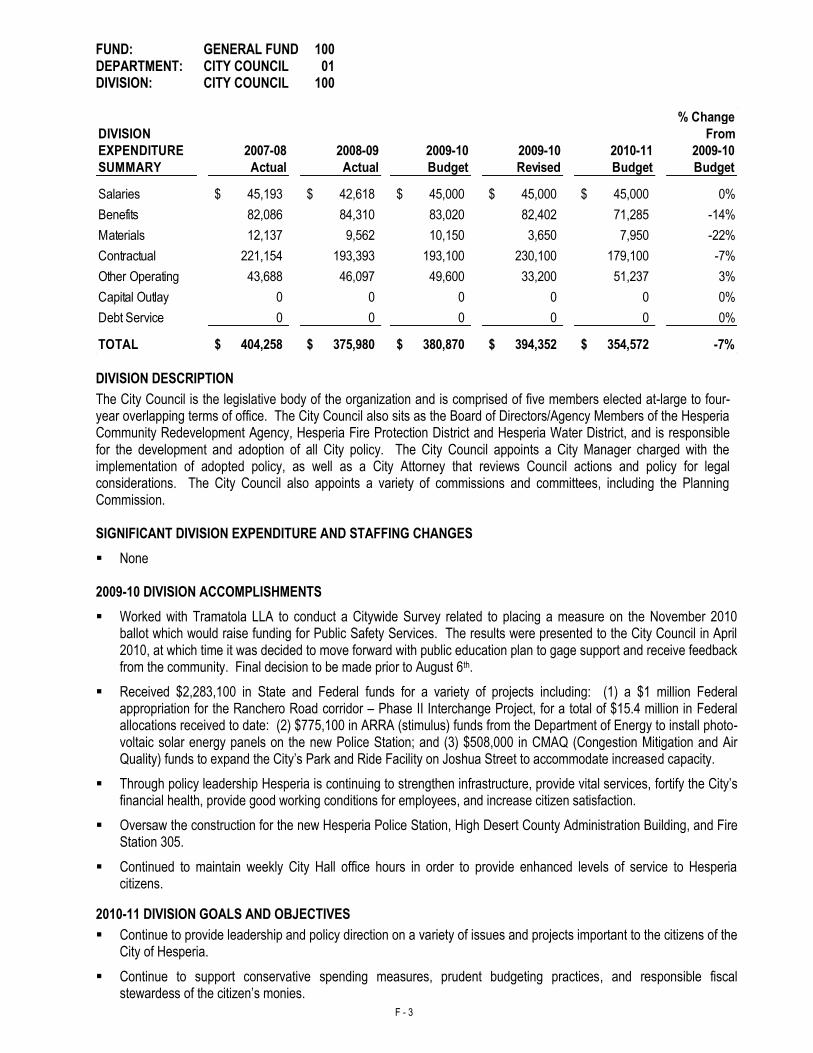
F - 3
FUND: GENERAL FUND 100 DEPARTMENT: CITY COUNCIL 01 DIVISION: CITY COUNCIL 100
% Change
DIVISION From
EXPENDITURE 2007-08 2008-09 2009-10 2009-10 2010-11 2009-10
SUMMARY Actual Actual Budget Revised Budget Budget
Salaries 45,193$ 42,618$ 45,000$ 45,000$ 45,000$ 0%
Benefits 82,086 84,310 83,020 82,402 71,285 -14%
Materials 12,137 9,562 10,150 3,650 7,950 -22%
Contractual 221,154 193,393 193,100 230,100 179,100 -7%
Other Operating 43,688 46,097 49,600 33,200 51,237 3%
Capital Outlay 0 0 0 0 0 0%
Debt Service 0 0 0 0 0 0%
TOTAL 404,258$ 375,980$ 380,870$ 394,352$ 354,572$ -7% DIVISION DESCRIPTION
The City Council is the legislative body of the organization and is comprised of five members elected at-large to four-year overlapping terms of office. The City Council also sits as the Board of Directors/Agency Members of the Hesperia Community Redevelopment Agency, Hesperia Fire Protection District and Hesperia Water District, and is responsible for the development and adoption of all City policy. The City Council appoints a City Manager charged with the implementation of adopted policy, as well as a City Attorney that reviews Council actions and policy for legal considerations. The City Council also appoints a variety of commissions and committees, including the Planning Commission. SIGNIFICANT DIVISION EXPENDITURE AND STAFFING CHANGES
None 2009-10 DIVISION ACCOMPLISHMENTS
Worked with Tramatola LLA to conduct a Citywide Survey related to placing a measure on the November 2010 ballot which would raise funding for Public Safety Services. The results were presented to the City Council in April 2010, at which time it was decided to move forward with public education plan to gage support and receive feedback from the community. Final decision to be made prior to August 6th.
Received $2,283,100 in State and Federal funds for a variety of projects including: (1) a $1 million Federal appropriation for the Ranchero Road corridor – Phase II Interchange Project, for a total of $15.4 million in Federal allocations received to date: (2) $775,100 in ARRA (stimulus) funds from the Department of Energy to install photo-voltaic solar energy panels on the new Police Station; and (3) $508,000 in CMAQ (Congestion Mitigation and Air Quality) funds to expand the City’s Park and Ride Facility on Joshua Street to accommodate increased capacity.
Through policy leadership Hesperia is continuing to strengthen infrastructure, provide vital services, fortify the City’s financial health, provide good working conditions for employees, and increase citizen satisfaction.
Oversaw the construction for the new Hesperia Police Station, High Desert County Administration Building, and Fire Station 305.
Continued to maintain weekly City Hall office hours in order to provide enhanced levels of service to Hesperia citizens.
2010-11 DIVISION GOALS AND OBJECTIVES
Continue to provide leadership and policy direction on a variety of issues and projects important to the citizens of the City of Hesperia.
Continue to support conservative spending measures, prudent budgeting practices, and responsible fiscal stewardess of the citizen’s monies.
F - 4
FUND: GENERAL FUND 100 DEPARTMENT: CITY COUNCIL 01 DIVISION: CITY COUNCIL 100 2010-11 DIVISION GOALS AND OBJECTIVES (Continued)
Demand transparency in government at all levels.
Maintain funding of the City’s annual Street Paving Program in an effort to repair or replace as many deteriorating streets as possible.
Maintain the highest level of public safety services by ensuring adequate staffing levels, necessary vehicles and equipment.
Continue to seek alternative funding sources via Federal, State, and County grants, as well as the current stimulus funds.
Launch a new educational outreach program, Citizen Academy, which invites residents to get involved in local government.
Host the 5th Annual Youth in Government Day.
Adopt General Plan update that includes a comprehensive update of all seven elements of the General Plan text, the land use map, the Transportation Plan, and a non-vehicular Circulation Plan.
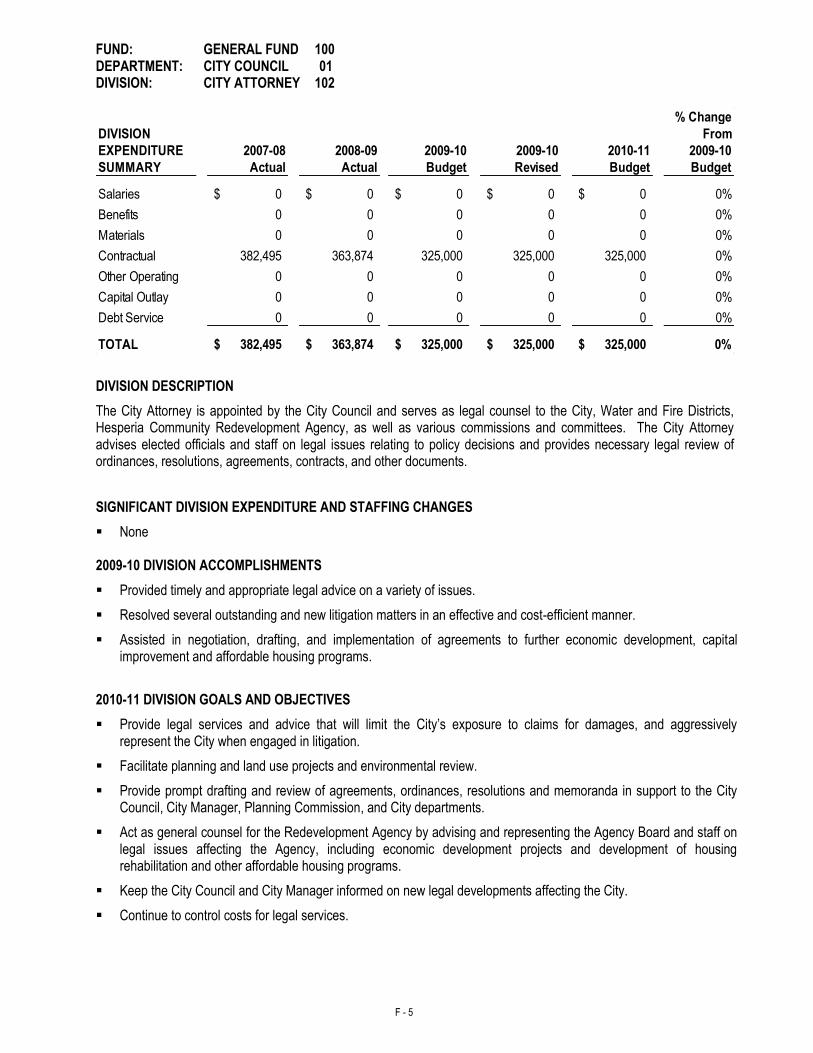
F - 5
FUND: GENERAL FUND 100 DEPARTMENT: CITY COUNCIL 01 DIVISION: CITY ATTORNEY 102
% Change
DIVISION From
EXPENDITURE 2007-08 2008-09 2009-10 2009-10 2010-11 2009-10
SUMMARY Actual Actual Budget Revised Budget Budget
Salaries 0$ 0$ 0$ 0$ 0$ 0%
Benefits 0 0 0 0 0 0%
Materials 0 0 0 0 0 0%
Contractual 382,495 363,874 325,000 325,000 325,000 0%
Other Operating 0 0 0 0 0 0%
Capital Outlay 0 0 0 0 0 0%
Debt Service 0 0 0 0 0 0%
TOTAL 382,495$ 363,874$ 325,000$ 325,000$ 325,000$ 0%
DIVISION DESCRIPTION
The City Attorney is appointed by the City Council and serves as legal counsel to the City, Water and Fire Districts, Hesperia Community Redevelopment Agency, as well as various commissions and committees. The City Attorney advises elected officials and staff on legal issues relating to policy decisions and provides necessary legal review of ordinances, resolutions, agreements, contracts, and other documents.
SIGNIFICANT DIVISION EXPENDITURE AND STAFFING CHANGES
None
2009-10 DIVISION ACCOMPLISHMENTS
Provided timely and appropriate legal advice on a variety of issues.
Resolved several outstanding and new litigation matters in an effective and cost-efficient manner.
Assisted in negotiation, drafting, and implementation of agreements to further economic development, capital improvement and affordable housing programs.
2010-11 DIVISION GOALS AND OBJECTIVES
Provide legal services and advice that will limit the City’s exposure to claims for damages, and aggressively represent the City when engaged in litigation.
Facilitate planning and land use projects and environmental review.
Provide prompt drafting and review of agreements, ordinances, resolutions and memoranda in support to the City Council, City Manager, Planning Commission, and City departments.
Act as general counsel for the Redevelopment Agency by advising and representing the Agency Board and staff on legal issues affecting the Agency, including economic development projects and development of housing rehabilitation and other affordable housing programs.
Keep the City Council and City Manager informed on new legal developments affecting the City.
Continue to control costs for legal services.
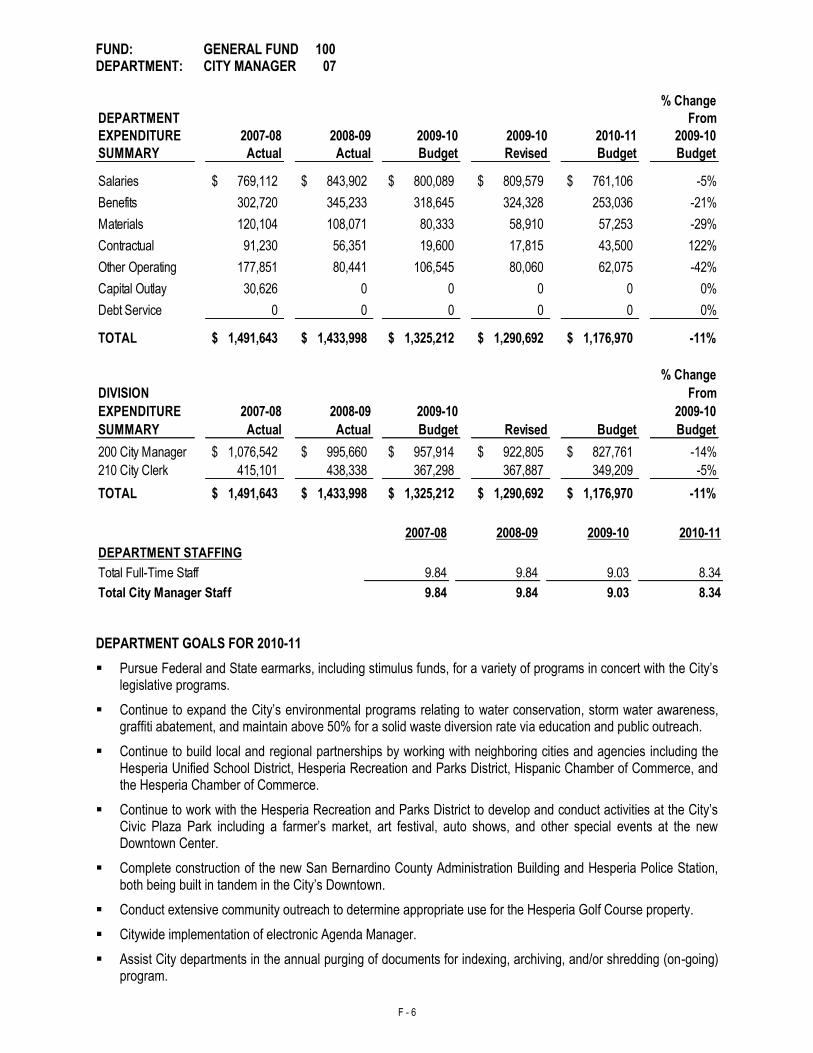
F - 6
FUND: GENERAL FUND 100 DEPARTMENT: CITY MANAGER 07
% Change
DEPARTMENT From
EXPENDITURE 2007-08 2008-09 2009-10 2009-10 2010-11 2009-10
SUMMARY Actual Actual Budget Revised Budget Budget
Salaries 769,112$ 843,902$ 800,089$ 809,579$ 761,106$ -5%
Benefits 302,720 345,233 318,645 324,328 253,036 -21%
Materials 120,104 108,071 80,333 58,910 57,253 -29%
Contractual 91,230 56,351 19,600 17,815 43,500 122%
Other Operating 177,851 80,441 106,545 80,060 62,075 -42%
Capital Outlay 30,626 0 0 0 0 0%
Debt Service 0 0 0 0 0 0%
TOTAL 1,491,643$ 1,433,998$ 1,325,212$ 1,290,692$ 1,176,970$ -11%
% Change
DIVISION From
EXPENDITURE 2007-08 2008-09 2009-10 2009-10
SUMMARY Actual Actual Budget Revised Budget Budget
200 City Manager 1,076,542$ 995,660$ 957,914$ 922,805$ 827,761$ -14%
210 City Clerk 415,101 438,338 367,298 367,887 349,209 -5%
TOTAL 1,491,643$ 1,433,998$ 1,325,212$ 1,290,692$ 1,176,970$ -11%
2007-08 2008-09 2009-10 2010-11
DEPARTMENT STAFFING
Total Full-Time Staff 9.84 9.84 9.03 8.34
9.84 9.84 9.03 8.34Total City Manager Staff
DEPARTMENT GOALS FOR 2010-11
Pursue Federal and State earmarks, including stimulus funds, for a variety of programs in concert with the City’s legislative programs.
Continue to expand the City’s environmental programs relating to water conservation, storm water awareness, graffiti abatement, and maintain above 50% for a solid waste diversion rate via education and public outreach.
Continue to build local and regional partnerships by working with neighboring cities and agencies including the Hesperia Unified School District, Hesperia Recreation and Parks District, Hispanic Chamber of Commerce, and the Hesperia Chamber of Commerce.
Continue to work with the Hesperia Recreation and Parks District to develop and conduct activities at the City’s Civic Plaza Park including a farmer’s market, art festival, auto shows, and other special events at the new Downtown Center.
Complete construction of the new San Bernardino County Administration Building and Hesperia Police Station, both being built in tandem in the City’s Downtown.
Conduct extensive community outreach to determine appropriate use for the Hesperia Golf Course property.
Citywide implementation of electronic Agenda Manager.
Assist City departments in the annual purging of documents for indexing, archiving, and/or shredding (on-going) program.
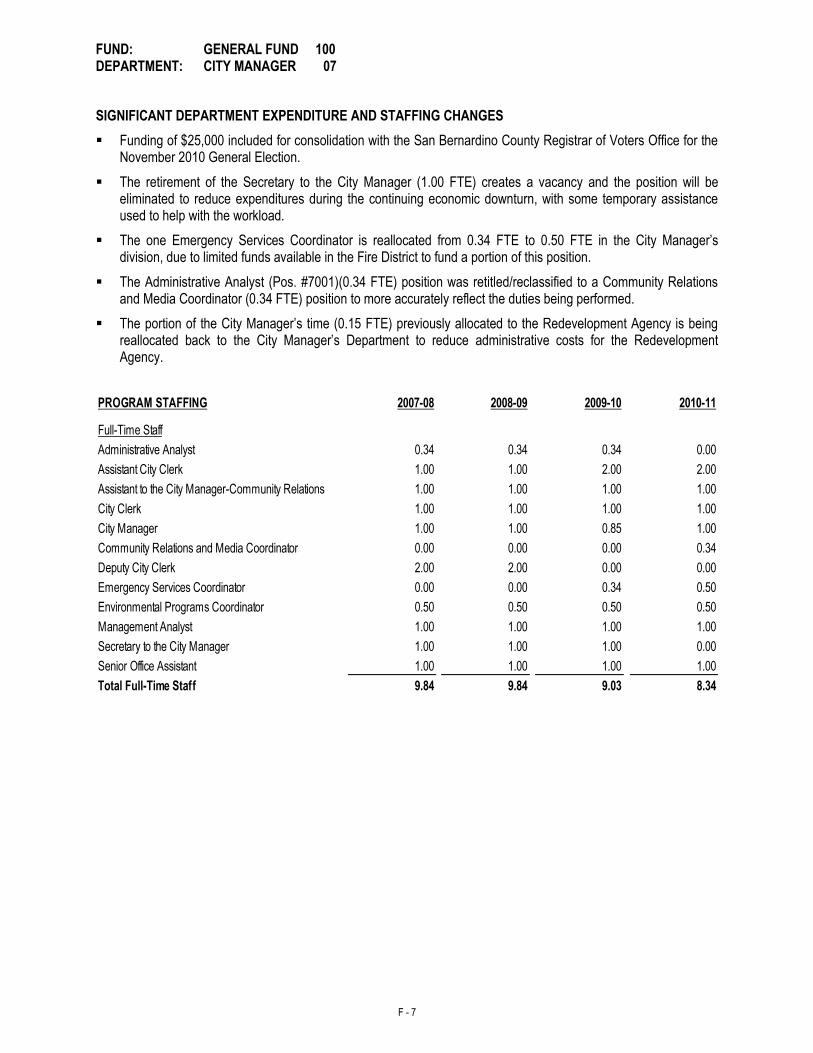
F - 7
FUND: GENERAL FUND 100 DEPARTMENT: CITY MANAGER 07
SIGNIFICANT DEPARTMENT EXPENDITURE AND STAFFING CHANGES
Funding of $25,000 included for consolidation with the San Bernardino County Registrar of Voters Office for the November 2010 General Election.
The retirement of the Secretary to the City Manager (1.00 FTE) creates a vacancy and the position will be eliminated to reduce expenditures during the continuing economic downturn, with some temporary assistance used to help with the workload.
The one Emergency Services Coordinator is reallocated from 0.34 FTE to 0.50 FTE in the City Manager’s division, due to limited funds available in the Fire District to fund a portion of this position.
The Administrative Analyst (Pos. #7001)(0.34 FTE) position was retitled/reclassified to a Community Relations and Media Coordinator (0.34 FTE) position to more accurately reflect the duties being performed.
The portion of the City Manager’s time (0.15 FTE) previously allocated to the Redevelopment Agency is being reallocated back to the City Manager’s Department to reduce administrative costs for the Redevelopment Agency.
PROGRAM STAFFING 2007-08 2008-09 2009-10 2010-11
Full-Time Staff
Administrative Analyst 0.34 0.34 0.34 0.00
Assistant City Clerk 1.00 1.00 2.00 2.00
Assistant to the City Manager-Community Relations 1.00 1.00 1.00 1.00
City Clerk 1.00 1.00 1.00 1.00
City Manager 1.00 1.00 0.85 1.00
Community Relations and Media Coordinator 0.00 0.00 0.00 0.34
Deputy City Clerk 2.00 2.00 0.00 0.00
Emergency Services Coordinator 0.00 0.00 0.34 0.50
Environmental Programs Coordinator 0.50 0.50 0.50 0.50
Management Analyst 1.00 1.00 1.00 1.00
Secretary to the City Manager 1.00 1.00 1.00 0.00
Senior Office Assistant 1.00 1.00 1.00 1.00
Total Full-Time Staff 9.84 9.84 9.03 8.34
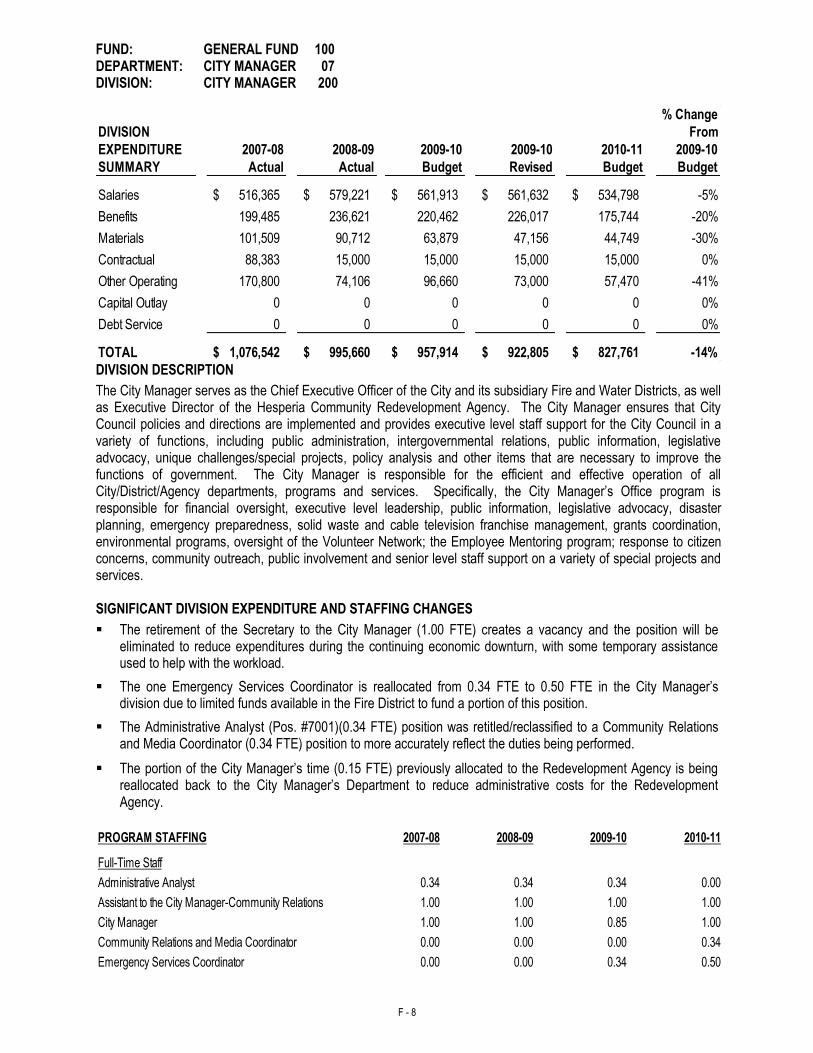
F - 8
FUND: GENERAL FUND 100 DEPARTMENT: CITY MANAGER 07 DIVISION: CITY MANAGER 200
% Change
DIVISION From
EXPENDITURE 2007-08 2008-09 2009-10 2009-10 2010-11 2009-10
SUMMARY Actual Actual Budget Revised Budget Budget
Salaries 516,365$ 579,221$ 561,913$ 561,632$ 534,798$ -5%
Benefits 199,485 236,621 220,462 226,017 175,744 -20%
Materials 101,509 90,712 63,879 47,156 44,749 -30%
Contractual 88,383 15,000 15,000 15,000 15,000 0%
Other Operating 170,800 74,106 96,660 73,000 57,470 -41%
Capital Outlay 0 0 0 0 0 0%
Debt Service 0 0 0 0 0 0%
TOTAL 1,076,542$ 995,660$ 957,914$ 922,805$ 827,761$ -14% DIVISION DESCRIPTION
The City Manager serves as the Chief Executive Officer of the City and its subsidiary Fire and Water Districts, as well as Executive Director of the Hesperia Community Redevelopment Agency. The City Manager ensures that City Council policies and directions are implemented and provides executive level staff support for the City Council in a variety of functions, including public administration, intergovernmental relations, public information, legislative advocacy, unique challenges/special projects, policy analysis and other items that are necessary to improve the functions of government. The City Manager is responsible for the efficient and effective operation of all City/District/Agency departments, programs and services. Specifically, the City Manager’s Office program is responsible for financial oversight, executive level leadership, public information, legislative advocacy, disaster planning, emergency preparedness, solid waste and cable television franchise management, grants coordination, environmental programs, oversight of the Volunteer Network; the Employee Mentoring program; response to citizen concerns, community outreach, public involvement and senior level staff support on a variety of special projects and services. SIGNIFICANT DIVISION EXPENDITURE AND STAFFING CHANGES
The retirement of the Secretary to the City Manager (1.00 FTE) creates a vacancy and the position will be eliminated to reduce expenditures during the continuing economic downturn, with some temporary assistance used to help with the workload.
The one Emergency Services Coordinator is reallocated from 0.34 FTE to 0.50 FTE in the City Manager’s division due to limited funds available in the Fire District to fund a portion of this position.
The Administrative Analyst (Pos. #7001)(0.34 FTE) position was retitled/reclassified to a Community Relations and Media Coordinator (0.34 FTE) position to more accurately reflect the duties being performed.
The portion of the City Manager’s time (0.15 FTE) previously allocated to the Redevelopment Agency is being reallocated back to the City Manager’s Department to reduce administrative costs for the Redevelopment Agency.
PROGRAM STAFFING 2007-08 2008-09 2009-10 2010-11
Administrative Analyst 0.34 0.34 0.34 0.00
Assistant to the City Manager-Community Relations 1.00 1.00 1.00 1.00
1.00 1.00 0.85 1.00
Community Relations and Media Coordinator 0.00 0.00 0.00 0.34
Emergency Services Coordinator 0.00 0.00 0.34 0.50
Full-Time Staff
City Manager
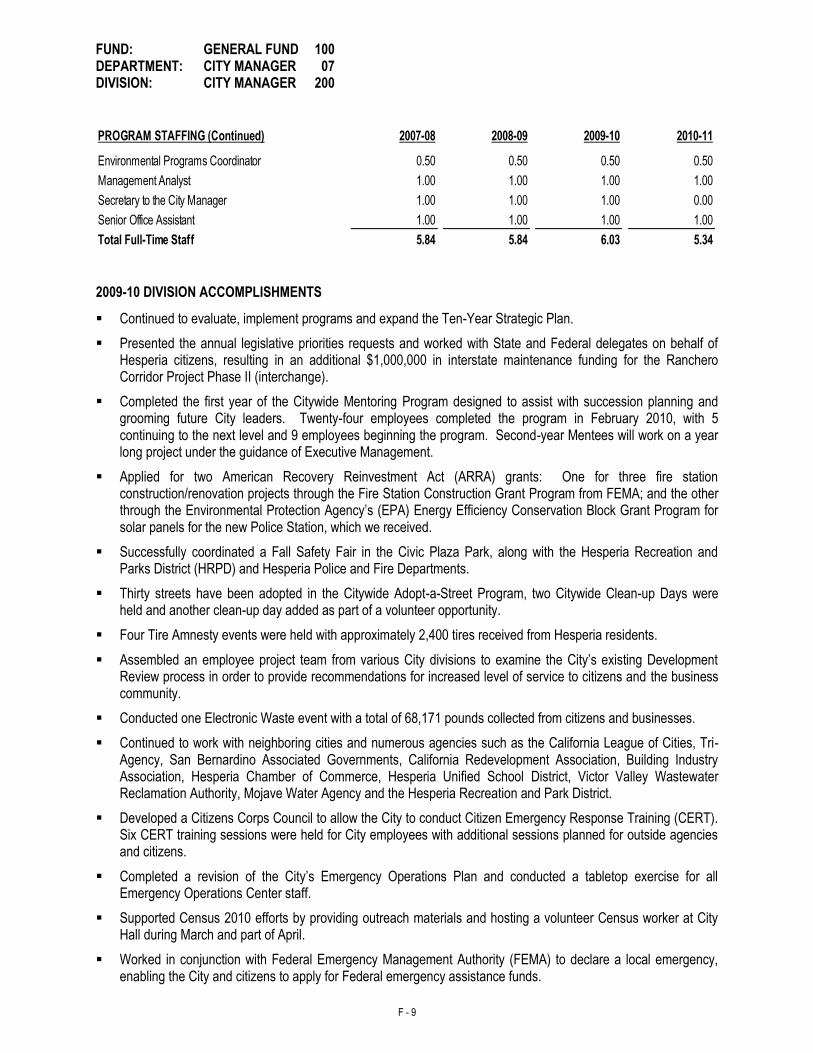
F - 9
FUND: GENERAL FUND 100 DEPARTMENT: CITY MANAGER 07 DIVISION: CITY MANAGER 200
PROGRAM STAFFING (Continued) 2007-08 2008-09 2009-10 2010-11
Environmental Programs Coordinator 0.50 0.50 0.50 0.50
Management Analyst 1.00 1.00 1.00 1.00
Secretary to the City Manager 1.00 1.00 1.00 0.00
Senior Office Assistant 1.00 1.00 1.00 1.00
Total Full-Time Staff 5.84 5.84 6.03 5.34
2009-10 DIVISION ACCOMPLISHMENTS
Continued to evaluate, implement programs and expand the Ten-Year Strategic Plan.
Presented the annual legislative priorities requests and worked with State and Federal delegates on behalf of Hesperia citizens, resulting in an additional $1,000,000 in interstate maintenance funding for the Ranchero Corridor Project Phase II (interchange).
Completed the first year of the Citywide Mentoring Program designed to assist with succession planning and grooming future City leaders. Twenty-four employees completed the program in February 2010, with 5 continuing to the next level and 9 employees beginning the program. Second-year Mentees will work on a year long project under the guidance of Executive Management.
Applied for two American Recovery Reinvestment Act (ARRA) grants: One for three fire station construction/renovation projects through the Fire Station Construction Grant Program from FEMA; and the other through the Environmental Protection Agency’s (EPA) Energy Efficiency Conservation Block Grant Program for solar panels for the new Police Station, which we received.
Successfully coordinated a Fall Safety Fair in the Civic Plaza Park, along with the Hesperia Recreation and Parks District (HRPD) and Hesperia Police and Fire Departments.
Thirty streets have been adopted in the Citywide Adopt-a-Street Program, two Citywide Clean-up Days were held and another clean-up day added as part of a volunteer opportunity.
Four Tire Amnesty events were held with approximately 2,400 tires received from Hesperia residents.
Assembled an employee project team from various City divisions to examine the City’s existing Development Review process in order to provide recommendations for increased level of service to citizens and the business community.
Conducted one Electronic Waste event with a total of 68,171 pounds collected from citizens and businesses.
Continued to work with neighboring cities and numerous agencies such as the California League of Cities, Tri-Agency, San Bernardino Associated Governments, California Redevelopment Association, Building Industry Association, Hesperia Chamber of Commerce, Hesperia Unified School District, Victor Valley Wastewater Reclamation Authority, Mojave Water Agency and the Hesperia Recreation and Park District.
Developed a Citizens Corps Council to allow the City to conduct Citizen Emergency Response Training (CERT). Six CERT training sessions were held for City employees with additional sessions planned for outside agencies and citizens.
Completed a revision of the City’s Emergency Operations Plan and conducted a tabletop exercise for all Emergency Operations Center staff.
Supported Census 2010 efforts by providing outreach materials and hosting a volunteer Census worker at City Hall during March and part of April.
Worked in conjunction with Federal Emergency Management Authority (FEMA) to declare a local emergency, enabling the City and citizens to apply for Federal emergency assistance funds.
F - 10
FUND: GENERAL FUND 100 DEPARTMENT: CITY MANAGER 07 DIVISION: CITY MANAGER 200 2009-10 DIVISION ACCOMPLISHMENTS (Continued)
Completed implementation of a new, interactive website that provides citizens with a variety of new options aimed at supplying information in a fast, intuitive manner.
Introduced the Hesperia Volunteer Network, an online program integrated into the City’s website which allows citizens to be matched with local non-profit agencies requiring assistance. In addition, the City was named a participant in the national Disney Give a Day, Get a Day Program which allowed volunteers to earn a free Disney pass.
Hosted an End of Summer Concert in the Hesperia Civic Plaza Park.
Collaborated with staff from Water Distribution and Utility Billing to issue a Lead Public Information campaign to Hesperia residents as required by the California Department of Public Health.
Produced the annual State of the City video completely in-house, saving production costs of $8,000.
Staff coordinated joint events with the County of San Bernardino for the groundbreaking of the High Desert Government Center and for the grand opening of Fire Station 305.
2010-11 DIVISION GOALS AND OBJECTIVES
Continue to manage citizen requests and complaints.
Pursue Federal and State earmarks, including stimulus funds, for a variety of programs in concert with the City’s legislative programs.
Plan, develop, and implement the City Budget.
Continue working with the City Council, staff and citizens on strategic planning efforts.
Further develop the City’s emergency preparedness plans and procedures so as to be suitably prepared in case of a disaster.
Coordinate with Advance Disposal to further improve solid waste services in the City.
Explore alternative energy options for City facilities.
Continue to expand the City’s environmental programs relating to water conservation, storm water awareness, graffiti abatement, and maintain above 50% for a solid waste diversion rate via education and public outreach.
Continue to build local and regional partnerships by working with neighboring cities and agencies including the Hesperia Unified School District, Hesperia Recreation and Parks District, Hispanic Chamber of Commerce, and the Hesperia Chamber of Commerce.
Continue to work with the Hesperia Recreation and Parks District to develop and conduct activities at the City’s Civic Plaza Park including a farmer’s market, art festival, auto shows, and other special events at the new Downtown Center.
Oversee completion of the new San Bernardino County Administration Building and Hesperia Police Station, both being built in tandem in the City’s Downtown.
Oversee a Golf Course Feasibility Study including community meetings and surveys.
CERT Training for each City staff member.
Implementation of a City Council Candidate Orientation workshop to familiarize candidates with City functions.
F - 11
FUND: GENERAL FUND 100 DEPARTMENT: CITY MANAGER 07 DIVISION: CITY MANAGER 200
PERFORMANCE AND WORKLOAD INDICATORS 2007-08 2008-09
2009-10
2010-11
Number of community events 17 15 27 20
Number of legislative letters n/a 10 20 20
Number of website hits 405,863 667,612 553,232 668,000
Number of environmental school programs presented n/a 12 15 12
Number of recycling/clean-up events held n/a 32 36 32
Number of Mentoring participants n/a n/a 24 15
Number of Volunteers referred n/a n/a 110 120
Number of CERT trainings held n/a n/a 6 6
F - 12
FUND: GENERAL FUND 100 DEPARTMENT: CITY MANAGER 07 DIVISION: CITY CLERK 210
% Change
DIVISION From
EXPENDITURE 2007-08 2008-09 2009-10 2009-10 2010-11 2009-10
SUMMARY Actual Actual Budget Revised Budget Budget
Salaries 252,747$ 264,681$ 238,176$ 247,947$ 226,308$ -5%
Benefits 103,235 108,612 98,183 98,311 77,292 -21%
Materials 18,595 17,359 16,454 11,754 12,504 -24%
Contractual 2,847 41,351 4,600 2,815 28,500 520%
Other Operating 7,051 6,335 9,885 7,060 4,605 -53%
Capital Outlay 30,626 0 0 0 0 0%
Debt Service 0 0 0 0 0 0%
TOTAL 415,101$ 438,338$ 367,298$ 367,887$ 349,209$ -5% DIVISION DESCRIPTION
The City Clerk serves as the legislative support staff to the City Council, City staff, and the public, and also serves as the elections official, filing officer for Conflict of Interest Statements, and the records manager. Duties for the City Clerk include the preparation of the legislative agenda (Council, Fire Protection District, Redevelopment Agency and Water District), attendance at Council/Agency/Board meetings, publication/posting of legal notices, as well as preparation of meeting minutes. As the election official, the Clerk administers Federal, State, and local procedures and legal requirements to ensure a fair and impartial election, prepares the election handbook, and assists candidates in meeting their legal responsibilities before, during, and after an election (Fair Political Practices Commission and campaign filings). As the records manager, by statute, the Clerk is responsible for the preservation and protection of the public record and is required to maintain and index the minutes, ordinances, and resolutions adopted by the legislative body. The City Clerk also ensures that other municipal records (contracts, recorded documents, claims, etc.) are readily accessible to the public. The public record under the conservatorship of the City Clerk provides fundamental integrity to all Council/Agency/Board actions and records. The City Clerk also oversees the Citywide Records Retention Program and is responsible for maintaining archived record storage and destruction of records. SIGNIFICANT DIVISION EXPENDITURE AND STAFFING CHANGES
Funding of $25,000 included for consolidation with the San Bernardino County Registrar of Voters Office for the November 2010 General Election.
PROGRAM STAFFING 2007-08 2008-09 2009-10 2010-11
Full-Time Staff
Assistant City Clerk 1.00 1.00 2.00 2.00
City Clerk 1.00 1.00 1.00 1.00
Deputy City Clerk 2.00 2.00 0.00 0.00
Total Full-Time Staff 4.00 4.00 3.00 3.00
F - 13
FUND: GENERAL FUND 100 DEPARTMENT: CITY MANAGER 07 DIVISION: CITY CLERK 210 2009-10 DIVISION ACCOMPLISHMENTS
Transitioned information to the City’s new website which also allows for electronic submittals of records requests.
Created City Council Procedures Manual and public information brochure for City Council meetings.
Facilitated the set-up of Laserfiche directories and staff training for Utility Billing, Accounts Payable, Purchasing, and Payroll for electronic storage of documents.
Maintained off-site Records Storage Center housing 1,400+ boxes of indexed City records.
Transferred over 350 archived records boxes to the off-site Records Storage Center.
Purged and shredded 400 boxes of archived records per the City’s Retention/Destruction schedule.
Scanned over 10,000 pages of historical documents into the City’s Optical Imaging Program.
Completed electronic procedures manual for the City Clerk’s Division.
Complied with the provisions of the Political Reform Act and managed 2009-2010 Statement of Economic Interests and Campaign Statements.
Completed annual codification of the Hesperia Municipal Code and monthly updates on the City’s website.
Completed a Request For Proposal for Citywide legal publications with an adjudicated newspaper.
Completed data for mandated cost reimbursement for Fiscal Year 2005 through 2009.
Prepared Candidates Handbook for the November 2, 2010 Municipal Election.
Continued to facilitate the codification of Water District ordinances into the Hesperia Municipal Code.
Continued to work with Management Information Services (MIS) on the implementation of Agenda Manager (electronic agenda) and integration with Granicus.
2010-11 DIVISION GOALS AND OBJECTIVES
Citywide implementation of Agenda Manager (electronic agenda) and integration with Granicus.
Completion of Water Code codification.
Create and implement a Legal Hold Policy for City records.
Create and implement an Electronic Records Policy.
Complete a Request For Proposal for codification of the Municipal Code and possible transition to new vendor.
Complete annual codification of Municipal Code with monthly updates on the City’s website.
Assist departments in the annual purging of documents for indexing, archiving and shredding.
Comply with provisions of the Political Reform Act managed 2009-2010 Statement of Economic Interests and Campaign Statements.
Conduct the November 2, 2010 Municipal Election and prepare associated resolutions, public notices, etc.
Posting of all campaign filings for the November 2, 2010 Municipal Election to the City Clerk’s webpage.
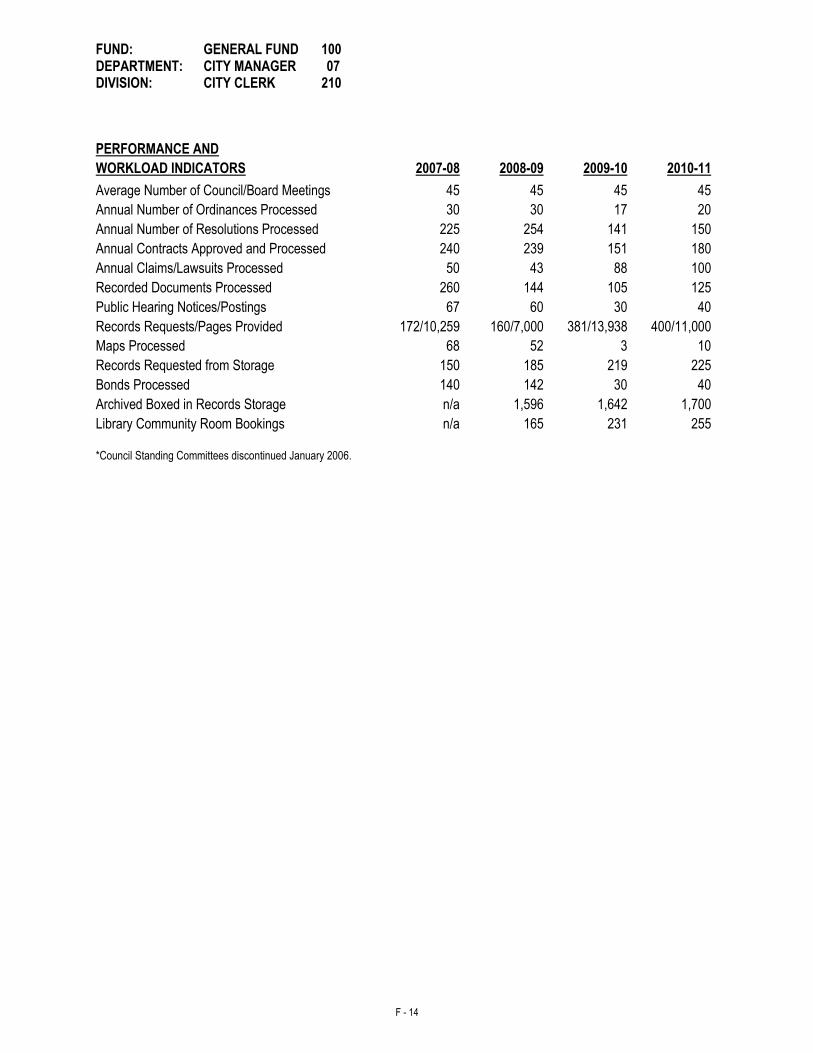
F - 14
FUND: GENERAL FUND 100 DEPARTMENT: CITY MANAGER 07 DIVISION: CITY CLERK 210
*Council Standing Committees discontinued January 2006.
PERFORMANCE AND
WORKLOAD INDICATORS
2007-08
2008-09
2009-10
2010-11
Average Number of Council/Board Meetings 45 45 45 45
Annual Number of Ordinances Processed 30 30 17 20
Annual Number of Resolutions Processed 225 254 141 150
Annual Contracts Approved and Processed 240 239 151 180
Annual Claims/Lawsuits Processed 50 43 88 100
Recorded Documents Processed 260 144 105 125
Public Hearing Notices/Postings 67 60 30 40
Records Requests/Pages Provided 172/10,259 160/7,000 381/13,938 400/11,000
Maps Processed 68 52 3 10
Records Requested from Storage 150 185 219 225
Bonds Processed 140 142 30 40
Archived Boxed in Records Storage n/a 1,596 1,642 1,700
Library Community Room Bookings n/a 165 231 255

F - 15
THIS PAGE INTENTIONALLY LEFT BLANK
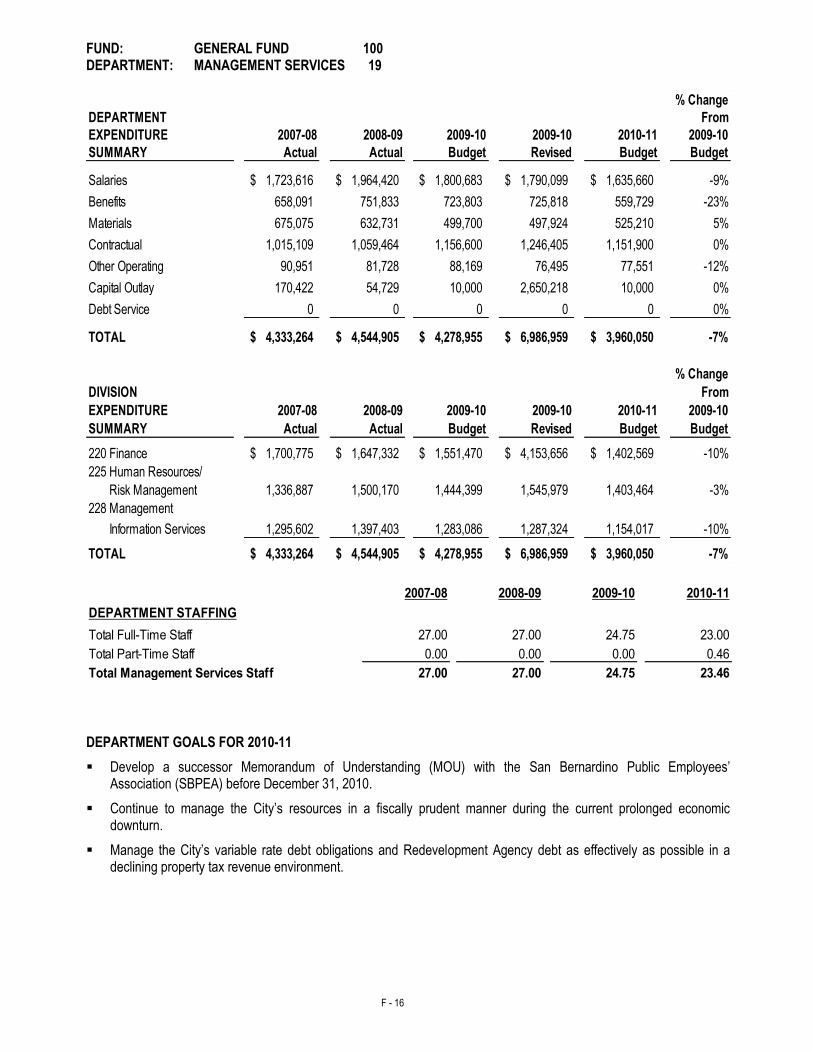
F - 16
FUND: GENERAL FUND 100 DEPARTMENT: MANAGEMENT SERVICES 19
% Change
DEPARTMENT From
EXPENDITURE 2007-08 2008-09 2009-10 2009-10 2010-11 2009-10
SUMMARY Actual Actual Budget Revised Budget Budget
Salaries 1,723,616$ 1,964,420$ 1,800,683$ 1,790,099$ 1,635,660$ -9%
Benefits 658,091 751,833 723,803 725,818 559,729 -23%
Materials 675,075 632,731 499,700 497,924 525,210 5%
Contractual 1,015,109 1,059,464 1,156,600 1,246,405 1,151,900 0%
Other Operating 90,951 81,728 88,169 76,495 77,551 -12%
Capital Outlay 170,422 54,729 10,000 2,650,218 10,000 0%
Debt Service 0 0 0 0 0 0%
TOTAL 4,333,264$ 4,544,905$ 4,278,955$ 6,986,959$ 3,960,050$ -7%
% Change
DIVISION From
EXPENDITURE 2007-08 2008-09 2009-10 2009-10 2010-11 2009-10
SUMMARY Actual Actual Budget Revised Budget Budget
220 Finance 1,700,775$ 1,647,332$ 1,551,470$ 4,153,656$ 1,402,569$ -10%
225 Human Resources/
Risk Management 1,336,887 1,500,170 1,444,399 1,545,979 1,403,464 -3%
228 Management
Information Services 1,295,602 1,397,403 1,283,086 1,287,324 1,154,017 -10%
TOTAL 4,333,264$ 4,544,905$ 4,278,955$ 6,986,959$ 3,960,050$ -7%
2007-08 2008-09 2009-10 2010-11
DEPARTMENT STAFFING
Total Full-Time Staff 27.00 27.00 24.75 23.00
0.00 0.00 0.00 0.46
27.00 27.00 24.75 23.46
Total Part-Time Staff
Total Management Services Staff
DEPARTMENT GOALS FOR 2010-11
Develop a successor Memorandum of Understanding (MOU) with the San Bernardino Public Employees’ Association (SBPEA) before December 31, 2010.
Continue to manage the City’s resources in a fiscally prudent manner during the current prolonged economic downturn.
Manage the City’s variable rate debt obligations and Redevelopment Agency debt as effectively as possible in a declining property tax revenue environment.
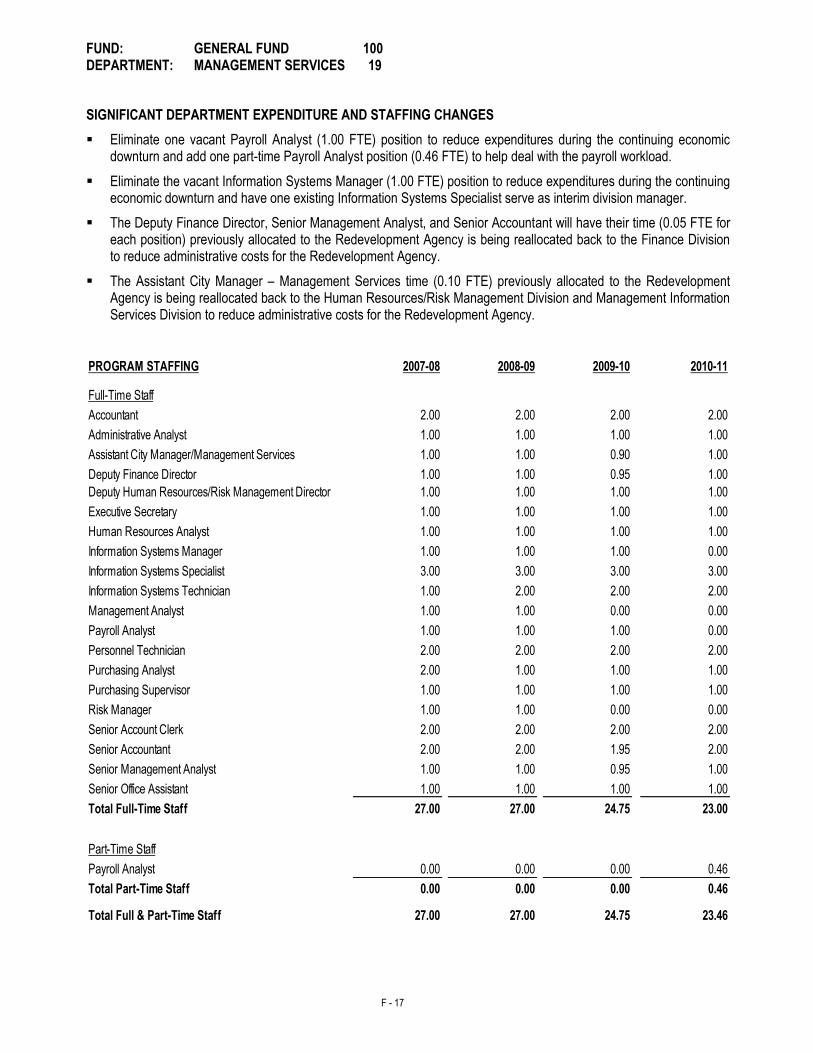
F - 17
FUND: GENERAL FUND 100 DEPARTMENT: MANAGEMENT SERVICES 19
SIGNIFICANT DEPARTMENT EXPENDITURE AND STAFFING CHANGES
Eliminate one vacant Payroll Analyst (1.00 FTE) position to reduce expenditures during the continuing economic downturn and add one part-time Payroll Analyst position (0.46 FTE) to help deal with the payroll workload.
Eliminate the vacant Information Systems Manager (1.00 FTE) position to reduce expenditures during the continuing economic downturn and have one existing Information Systems Specialist serve as interim division manager.
The Deputy Finance Director, Senior Management Analyst, and Senior Accountant will have their time (0.05 FTE for each position) previously allocated to the Redevelopment Agency is being reallocated back to the Finance Division to reduce administrative costs for the Redevelopment Agency.
The Assistant City Manager – Management Services time (0.10 FTE) previously allocated to the Redevelopment Agency is being reallocated back to the Human Resources/Risk Management Division and Management Information Services Division to reduce administrative costs for the Redevelopment Agency.
PROGRAM STAFFING 2007-08 2008-09 2009-10 2010-11
Full-Time Staff
2.00 2.00 2.00 2.00
1.00 1.00 1.00 1.00
1.00 1.00 0.90 1.00
1.00 1.00 0.95 1.00
1.00 1.00 1.00 1.00
1.00 1.00 1.00 1.00
1.00 1.00 1.00 1.00
1.00 1.00 1.00 0.00
3.00 3.00 3.00 3.00
1.00 2.00 2.00 2.00
1.00 1.00 0.00 0.00
1.00 1.00 1.00 0.00
2.00 2.00 2.00 2.00
2.00 1.00 1.00 1.00
1.00 1.00 1.00 1.00
1.00 1.00 0.00 0.00
2.00 2.00 2.00 2.00
2.00 2.00 1.95 2.00
1.00 1.00 0.95 1.00
1.00 1.00 1.00 1.00
27.00 27.00 24.75 23.00
Part-Time Staff
Payroll Analyst 0.00 0.00 0.00 0.46
Total Part-Time Staff 0.00 0.00 0.00 0.46
Total Full & Part-Time Staff 27.00 27.00 24.75 23.46
Payroll Analyst
Purchasing Supervisor
Personnel Technician
Purchasing Analyst
Risk Manager
Senior Account Clerk
Senior Accountant
Senior Office Assistant
Management Analyst
Information Systems Specialist
Information Systems Technician
Senior Management Analyst
Total Full-Time Staff
Accountant
Executive Secretary
Information Systems Manager
Deputy Human Resources/Risk Management Director
Deputy Finance Director
Assistant City Manager/Management Services
Human Resources Analyst
Administrative Analyst
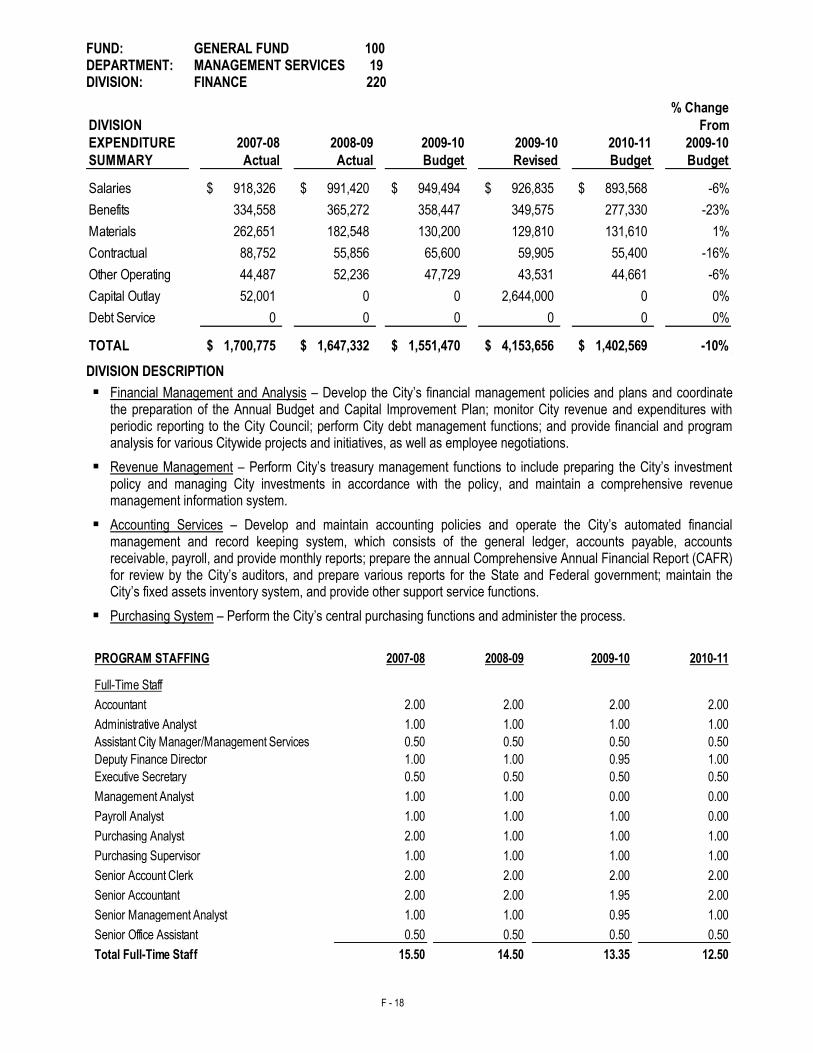
F - 18
FUND: GENERAL FUND 100 DEPARTMENT: MANAGEMENT SERVICES 19 DIVISION: FINANCE 220
% Change
DIVISION From
EXPENDITURE 2007-08 2008-09 2009-10 2009-10 2010-11 2009-10
SUMMARY Actual Actual Budget Revised Budget Budget
Salaries 918,326$ 991,420$ 949,494$ 926,835$ 893,568$ -6%
Benefits 334,558 365,272 358,447 349,575 277,330 -23%
Materials 262,651 182,548 130,200 129,810 131,610 1%
Contractual 88,752 55,856 65,600 59,905 55,400 -16%
Other Operating 44,487 52,236 47,729 43,531 44,661 -6%
Capital Outlay 52,001 0 0 2,644,000 0 0%
Debt Service 0 0 0 0 0 0%
TOTAL 1,700,775$ 1,647,332$ 1,551,470$ 4,153,656$ 1,402,569$ -10%
DIVISION DESCRIPTION
Financial Management and Analysis – Develop the City’s financial management policies and plans and coordinate the preparation of the Annual Budget and Capital Improvement Plan; monitor City revenue and expenditures with periodic reporting to the City Council; perform City debt management functions; and provide financial and program analysis for various Citywide projects and initiatives, as well as employee negotiations.
Revenue Management – Perform City’s treasury management functions to include preparing the City’s investment policy and managing City investments in accordance with the policy, and maintain a comprehensive revenue management information system.
Accounting Services – Develop and maintain accounting policies and operate the City’s automated financial management and record keeping system, which consists of the general ledger, accounts payable, accounts receivable, payroll, and provide monthly reports; prepare the annual Comprehensive Annual Financial Report (CAFR) for review by the City’s auditors, and prepare various reports for the State and Federal government; maintain the City’s fixed assets inventory system, and provide other support service functions.
Purchasing System – Perform the City’s central purchasing functions and administer the process.
PROGRAM STAFFING 2007-08 2008-09 2009-10 2010-11
2.00 2.00 2.00 2.00
1.00 1.00 1.00 1.00
0.50 0.50 0.50 0.50
1.00 1.00 0.95 1.00
0.50 0.50 0.50 0.50
1.00 1.00 0.00 0.00
1.00 1.00 1.00 0.00
2.00 1.00 1.00 1.00
1.00 1.00 1.00 1.00
2.00 2.00 2.00 2.00
2.00 2.00 1.95 2.00
1.00 1.00 0.95 1.00
0.50 0.50 0.50 0.50
15.50 14.50 13.35 12.50
Full-Time Staff
Accountant
Deputy Finance Director
Assistant City Manager/Management Services
Administrative Analyst
Executive Secretary
Management Analyst
Senior Account Clerk
Senior Accountant
Senior Office Assistant
Total Full-Time Staff
Payroll Analyst
Purchasing Analyst
Purchasing Supervisor
Senior Management Analyst
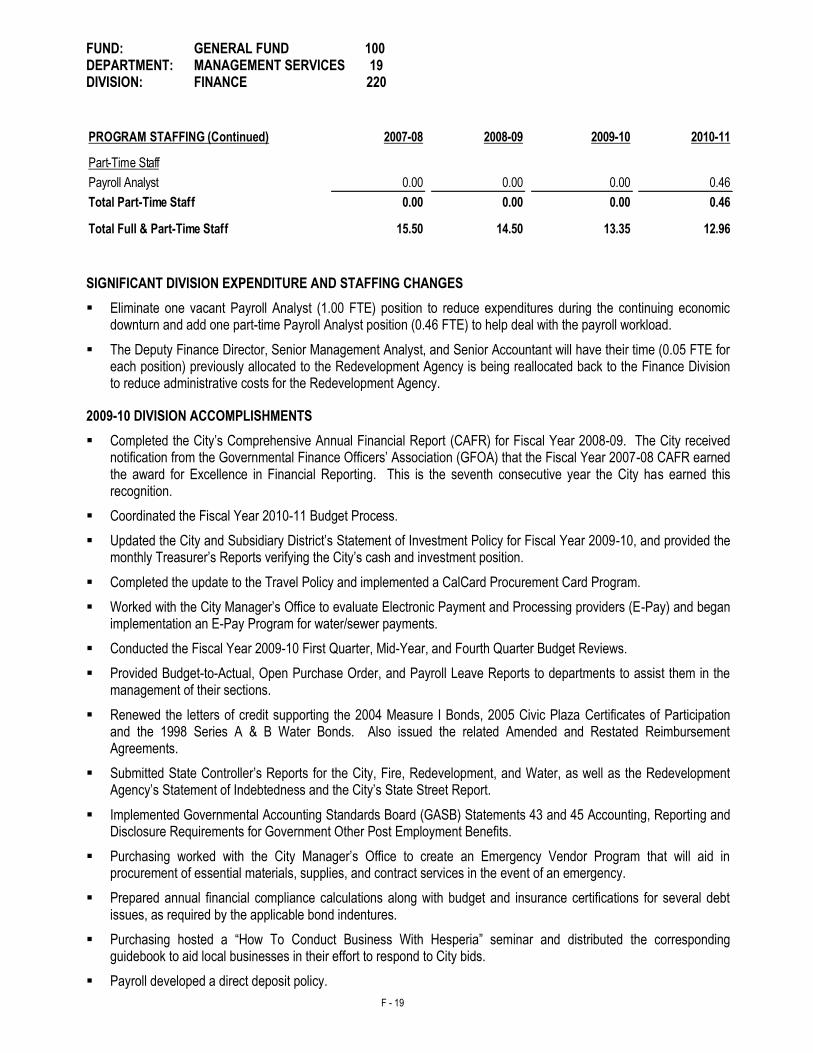
F - 19
FUND: GENERAL FUND 100 DEPARTMENT: MANAGEMENT SERVICES 19 DIVISION: FINANCE 220
PROGRAM STAFFING (Continued) 2007-08 2008-09 2009-10 2010-11
Part-Time Staff
Payroll Analyst 0.00 0.00 0.00 0.46
Total Part-Time Staff 0.00 0.00 0.00 0.46
Total Full & Part-Time Staff 15.50 14.50 13.35 12.96
SIGNIFICANT DIVISION EXPENDITURE AND STAFFING CHANGES
Eliminate one vacant Payroll Analyst (1.00 FTE) position to reduce expenditures during the continuing economic downturn and add one part-time Payroll Analyst position (0.46 FTE) to help deal with the payroll workload.
The Deputy Finance Director, Senior Management Analyst, and Senior Accountant will have their time (0.05 FTE for each position) previously allocated to the Redevelopment Agency is being reallocated back to the Finance Division to reduce administrative costs for the Redevelopment Agency.
2009-10 DIVISION ACCOMPLISHMENTS
Completed the City’s Comprehensive Annual Financial Report (CAFR) for Fiscal Year 2008-09. The City received notification from the Governmental Finance Officers’ Association (GFOA) that the Fiscal Year 2007-08 CAFR earned the award for Excellence in Financial Reporting. This is the seventh consecutive year the City has earned this recognition.
Coordinated the Fiscal Year 2010-11 Budget Process.
Updated the City and Subsidiary District’s Statement of Investment Policy for Fiscal Year 2009-10, and provided the monthly Treasurer’s Reports verifying the City’s cash and investment position.
Completed the update to the Travel Policy and implemented a CalCard Procurement Card Program.
Worked with the City Manager’s Office to evaluate Electronic Payment and Processing providers (E-Pay) and began implementation an E-Pay Program for water/sewer payments.
Conducted the Fiscal Year 2009-10 First Quarter, Mid-Year, and Fourth Quarter Budget Reviews.
Provided Budget-to-Actual, Open Purchase Order, and Payroll Leave Reports to departments to assist them in the management of their sections.
Renewed the letters of credit supporting the 2004 Measure I Bonds, 2005 Civic Plaza Certificates of Participation and the 1998 Series A & B Water Bonds. Also issued the related Amended and Restated Reimbursement Agreements.
Submitted State Controller’s Reports for the City, Fire, Redevelopment, and Water, as well as the Redevelopment Agency’s Statement of Indebtedness and the City’s State Street Report.
Implemented Governmental Accounting Standards Board (GASB) Statements 43 and 45 Accounting, Reporting and Disclosure Requirements for Government Other Post Employment Benefits.
Purchasing worked with the City Manager’s Office to create an Emergency Vendor Program that will aid in procurement of essential materials, supplies, and contract services in the event of an emergency.
Prepared annual financial compliance calculations along with budget and insurance certifications for several debt issues, as required by the applicable bond indentures.
Purchasing hosted a “How To Conduct Business With Hesperia” seminar and distributed the corresponding guidebook to aid local businesses in their effort to respond to City bids.
Payroll developed a direct deposit policy.
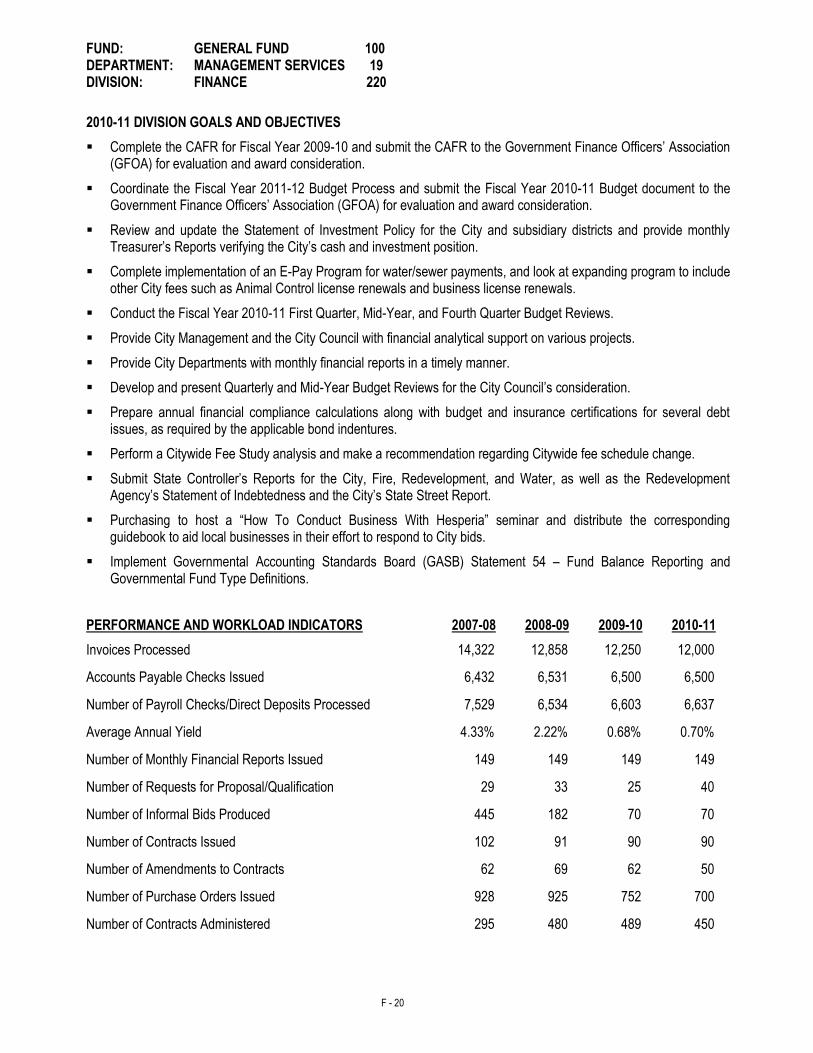
F - 20
FUND: GENERAL FUND 100 DEPARTMENT: MANAGEMENT SERVICES 19 DIVISION: FINANCE 220
2010-11 DIVISION GOALS AND OBJECTIVES
Complete the CAFR for Fiscal Year 2009-10 and submit the CAFR to the Government Finance Officers’ Association (GFOA) for evaluation and award consideration.
Coordinate the Fiscal Year 2011-12 Budget Process and submit the Fiscal Year 2010-11 Budget document to the Government Finance Officers’ Association (GFOA) for evaluation and award consideration.
Review and update the Statement of Investment Policy for the City and subsidiary districts and provide monthly Treasurer’s Reports verifying the City’s cash and investment position.
Complete implementation of an E-Pay Program for water/sewer payments, and look at expanding program to include other City fees such as Animal Control license renewals and business license renewals.
Conduct the Fiscal Year 2010-11 First Quarter, Mid-Year, and Fourth Quarter Budget Reviews.
Provide City Management and the City Council with financial analytical support on various projects.
Provide City Departments with monthly financial reports in a timely manner.
Develop and present Quarterly and Mid-Year Budget Reviews for the City Council’s consideration.
Prepare annual financial compliance calculations along with budget and insurance certifications for several debt issues, as required by the applicable bond indentures.
Perform a Citywide Fee Study analysis and make a recommendation regarding Citywide fee schedule change.
Submit State Controller’s Reports for the City, Fire, Redevelopment, and Water, as well as the Redevelopment Agency’s Statement of Indebtedness and the City’s State Street Report.
Purchasing to host a “How To Conduct Business With Hesperia” seminar and distribute the corresponding guidebook to aid local businesses in their effort to respond to City bids.
Implement Governmental Accounting Standards Board (GASB) Statement 54 – Fund Balance Reporting and Governmental Fund Type Definitions.
PERFORMANCE AND WORKLOAD INDICATORS 2007-08 2008-09 2009-10 2010-11
Invoices Processed 14,322 12,858 12,250 12,000
Accounts Payable Checks Issued 6,432 6,531 6,500 6,500
Number of Payroll Checks/Direct Deposits Processed 7,529 6,534 6,603 6,637
Average Annual Yield 4.33% 2.22% 0.68% 0.70%
Number of Monthly Financial Reports Issued 149 149 149 149
Number of Requests for Proposal/Qualification 29 33 25 40
Number of Informal Bids Produced 445 182 70 70
Number of Contracts Issued 102 91 90 90
Number of Amendments to Contracts 62 69 62 50
Number of Purchase Orders Issued 928 925 752 700
Number of Contracts Administered 295 480 489 450
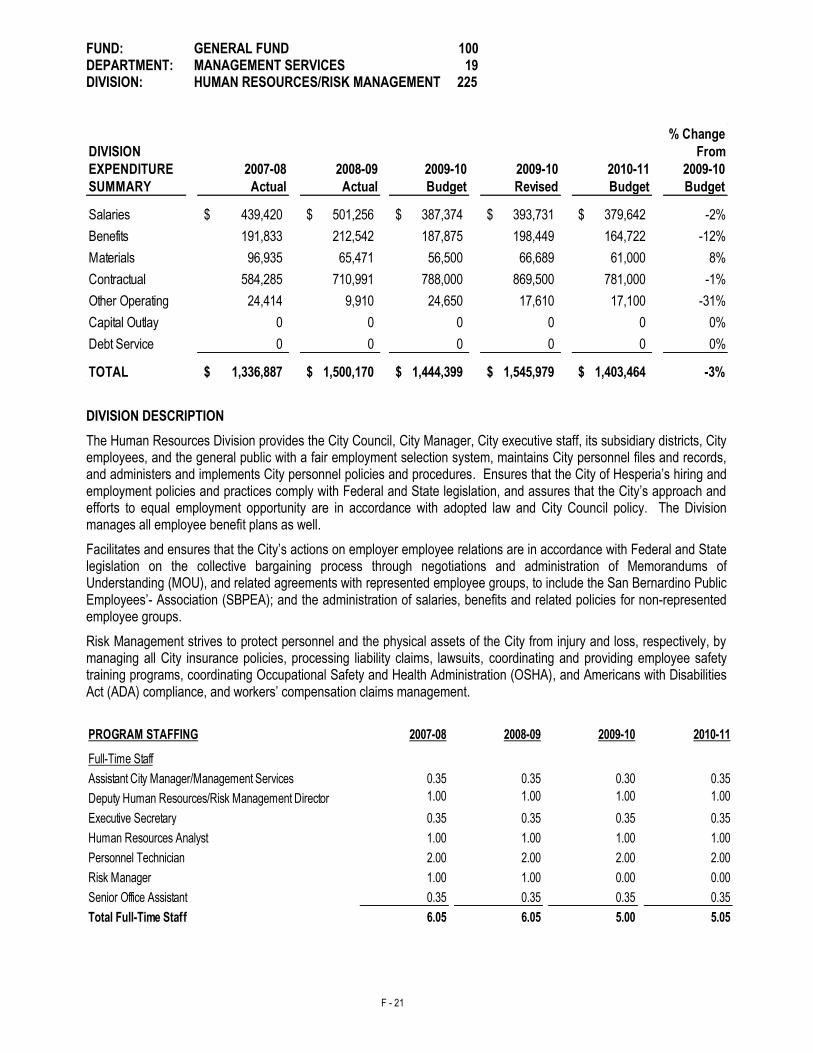
F - 21
FUND: GENERAL FUND 100 DEPARTMENT: MANAGEMENT SERVICES 19 DIVISION: HUMAN RESOURCES/RISK MANAGEMENT 225
% Change
DIVISION From
EXPENDITURE 2007-08 2008-09 2009-10 2009-10 2010-11 2009-10
SUMMARY Actual Actual Budget Revised Budget Budget
Salaries 439,420$ 501,256$ 387,374$ 393,731$ 379,642$ -2%
Benefits 191,833 212,542 187,875 198,449 164,722 -12%
Materials 96,935 65,471 56,500 66,689 61,000 8%
Contractual 584,285 710,991 788,000 869,500 781,000 -1%
Other Operating 24,414 9,910 24,650 17,610 17,100 -31%
Capital Outlay 0 0 0 0 0 0%
Debt Service 0 0 0 0 0 0%
TOTAL 1,336,887$ 1,500,170$ 1,444,399$ 1,545,979$ 1,403,464$ -3%
DIVISION DESCRIPTION
The Human Resources Division provides the City Council, City Manager, City executive staff, its subsidiary districts, City employees, and the general public with a fair employment selection system, maintains City personnel files and records, and administers and implements City personnel policies and procedures. Ensures that the City of Hesperia’s hiring and employment policies and practices comply with Federal and State legislation, and assures that the City’s approach and efforts to equal employment opportunity are in accordance with adopted law and City Council policy. The Division manages all employee benefit plans as well.
Facilitates and ensures that the City’s actions on employer employee relations are in accordance with Federal and State legislation on the collective bargaining process through negotiations and administration of Memorandums of Understanding (MOU), and related agreements with represented employee groups, to include the San Bernardino Public Employees’- Association (SBPEA); and the administration of salaries, benefits and related policies for non-represented employee groups.
Risk Management strives to protect personnel and the physical assets of the City from injury and loss, respectively, by managing all City insurance policies, processing liability claims, lawsuits, coordinating and providing employee safety training programs, coordinating Occupational Safety and Health Administration (OSHA), and Americans with Disabilities Act (ADA) compliance, and workers’ compensation claims management.
PROGRAM STAFFING 2007-08 2008-09 2009-10 2010-11
0.35 0.35 0.30 0.35
1.00 1.00 1.00 1.00
0.35 0.35 0.35 0.35
1.00 1.00 1.00 1.00
2.00 2.00 2.00 2.00
1.00 1.00 0.00 0.00
0.35 0.35 0.35 0.35
6.05 6.05 5.00 5.05
Full-Time Staff
Executive Secretary
Deputy Human Resources/Risk Management Director
Assistant City Manager/Management Services
Risk Manager
Senior Office Assistant
Total Full-Time Staff
Personnel Technician
Human Resources Analyst
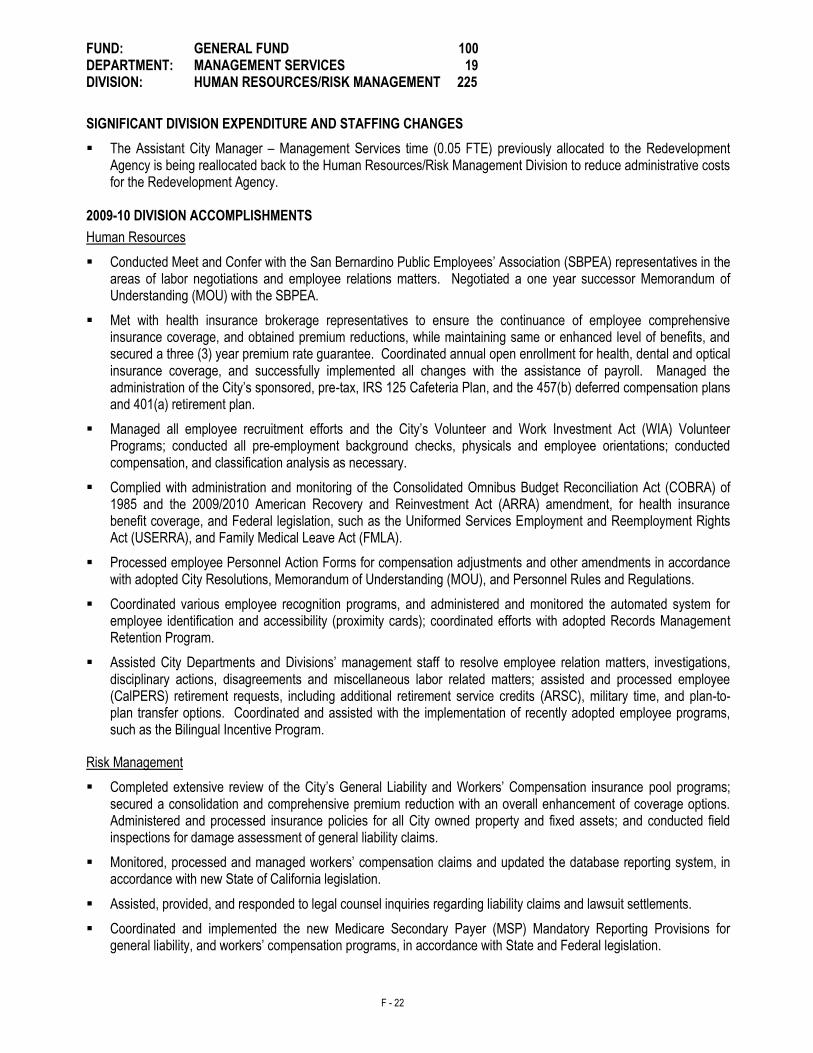
F - 22
FUND: GENERAL FUND 100 DEPARTMENT: MANAGEMENT SERVICES 19 DIVISION: HUMAN RESOURCES/RISK MANAGEMENT 225
SIGNIFICANT DIVISION EXPENDITURE AND STAFFING CHANGES
The Assistant City Manager – Management Services time (0.05 FTE) previously allocated to the Redevelopment Agency is being reallocated back to the Human Resources/Risk Management Division to reduce administrative costs for the Redevelopment Agency.
2009-10 DIVISION ACCOMPLISHMENTS
Human Resources
Conducted Meet and Confer with the San Bernardino Public Employees’ Association (SBPEA) representatives in the areas of labor negotiations and employee relations matters. Negotiated a one year successor Memorandum of Understanding (MOU) with the SBPEA.
Met with health insurance brokerage representatives to ensure the continuance of employee comprehensive insurance coverage, and obtained premium reductions, while maintaining same or enhanced level of benefits, and secured a three (3) year premium rate guarantee. Coordinated annual open enrollment for health, dental and optical insurance coverage, and successfully implemented all changes with the assistance of payroll. Managed the administration of the City’s sponsored, pre-tax, IRS 125 Cafeteria Plan, and the 457(b) deferred compensation plans and 401(a) retirement plan.
Managed all employee recruitment efforts and the City’s Volunteer and Work Investment Act (WIA) Volunteer Programs; conducted all pre-employment background checks, physicals and employee orientations; conducted compensation, and classification analysis as necessary.
Complied with administration and monitoring of the Consolidated Omnibus Budget Reconciliation Act (COBRA) of 1985 and the 2009/2010 American Recovery and Reinvestment Act (ARRA) amendment, for health insurance benefit coverage, and Federal legislation, such as the Uniformed Services Employment and Reemployment Rights Act (USERRA), and Family Medical Leave Act (FMLA).
Processed employee Personnel Action Forms for compensation adjustments and other amendments in accordance with adopted City Resolutions, Memorandum of Understanding (MOU), and Personnel Rules and Regulations.
Coordinated various employee recognition programs, and administered and monitored the automated system for employee identification and accessibility (proximity cards); coordinated efforts with adopted Records Management Retention Program.
Assisted City Departments and Divisions’ management staff to resolve employee relation matters, investigations, disciplinary actions, disagreements and miscellaneous labor related matters; assisted and processed employee (CalPERS) retirement requests, including additional retirement service credits (ARSC), military time, and plan-to-plan transfer options. Coordinated and assisted with the implementation of recently adopted employee programs, such as the Bilingual Incentive Program.
Risk Management
Completed extensive review of the City’s General Liability and Workers’ Compensation insurance pool programs; secured a consolidation and comprehensive premium reduction with an overall enhancement of coverage options. Administered and processed insurance policies for all City owned property and fixed assets; and conducted field inspections for damage assessment of general liability claims.
Monitored, processed and managed workers’ compensation claims and updated the database reporting system, in accordance with new State of California legislation.
Assisted, provided, and responded to legal counsel inquiries regarding liability claims and lawsuit settlements.
Coordinated and implemented the new Medicare Secondary Payer (MSP) Mandatory Reporting Provisions for general liability, and workers’ compensation programs, in accordance with State and Federal legislation.
F - 23
FUND: GENERAL FUND 100 DEPARTMENT: MANAGEMENT SERVICES 19 DIVISION: HUMAN RESOURCES/RISK MANAGEMENT 225 2009-10 DIVISION ACCOMPLISHMENTS (Continued)
Risk Management (Continued)
Received Council adoption for the proposed updated Employee Injury and Illness Prevention Program (EIIPP); and completed two additional employee programs: Heat Illness Prevention Program and Employee Return to Work Program, in accordance with the State of California OSHA, and workers’ compensation mandated guidelines and new legislation.
Administered and managed comprehensive employee training program, in compliance with City, State, and Federal requirements.
2010-11 DIVISION GOALS AND OBJECTIVES
Human Resources
Conduct and process employee annual open enrollment for City sponsored medical, health, IRS 125 Cafeteria Plan, and optional insurance benefits; continue to manage City’s sponsored 457(b) and 401(a) deferred compensation plans; coordinate all requested modifications or adjustments with payroll and outside agencies.
Revise and update all employee comprehensive benefits as necessary and monitor and process employee worksheets and retiree insurance benefits and premiums. Assist with reconciliation of related budget accounts; and process monthly insurance payments.
Monitor and manage the City’s Volunteer Program and coordinate the Work Investment Act (WIA) Volunteer Program; continue to work with outside agencies for the successful management of the City’s Employee Wellness Program and Bilingual Incentive Program.
Coordinate, administer, and comply with the Consolidated Omnibus Budget Reconciliation Act of 1985 (COBRA) for insurance benefits for non-active employees and qualified family members. Manage the administration of Federal legislation for employee military deployments (USERRA) and employee leaves under FMLA, including administrative, workers’ compensation, short/long-term disability, illnesses, and disciplinary.
Monitor, implement, and process reporting requirements in accordance with new Federal legislation of the Patient Protection and Affordable Care Act and the Health Care and Education Affordability Reconciliation Act of 2010.
Monitor and update Citywide, departmental and divisional policies, procedures, and programs in compliance with City rules and regulations, and State and Federal laws; assist with employee relations, discipline matters, and investigative efforts; monitor, revise, update, and implement changes to forms to ensure consistency and adherence to City policies, procedures, rules and regulations, and programs, and continue to support and coordinate the Records Management Retention Program.
Maximize the use of the City’s Intranet for easy employee accessibility of Memorandum of Understanding (MOU), policies, procedures, programs, job classification specifications, salary schedules, job recruitment, and other related employee information.
Risk Management
Maintain and manage the City’s general liability and workers’ compensation insurance policies; update procedures for handling subpoenas, general liability claims and lawsuits, and conduct field inspections relating to liability claims for damage assessment.
Manage and process workers’ compensation claims, in accordance with the State of California legislation; coordinate and participate with employee interactive process in support of the Employee Return to Work Program. Manage and update the workers’ compensation database reporting system.
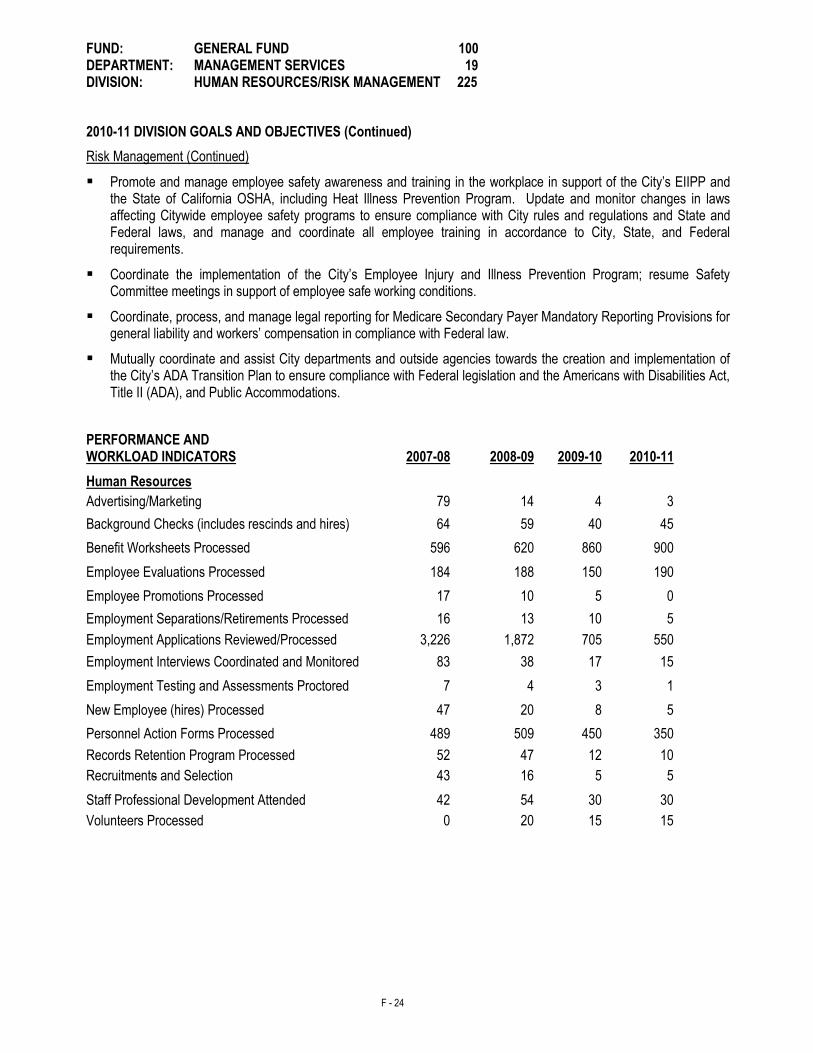
F - 24
FUND: GENERAL FUND 100 DEPARTMENT: MANAGEMENT SERVICES 19 DIVISION: HUMAN RESOURCES/RISK MANAGEMENT 225
2010-11 DIVISION GOALS AND OBJECTIVES (Continued)
Risk Management (Continued)
Promote and manage employee safety awareness and training in the workplace in support of the City’s EIIPP and the State of California OSHA, including Heat Illness Prevention Program. Update and monitor changes in laws affecting Citywide employee safety programs to ensure compliance with City rules and regulations and State and Federal laws, and manage and coordinate all employee training in accordance to City, State, and Federal requirements.
Coordinate the implementation of the City’s Employee Injury and Illness Prevention Program; resume Safety Committee meetings in support of employee safe working conditions.
Coordinate, process, and manage legal reporting for Medicare Secondary Payer Mandatory Reporting Provisions for general liability and workers’ compensation in compliance with Federal law.
Mutually coordinate and assist City departments and outside agencies towards the creation and implementation of the City’s ADA Transition Plan to ensure compliance with Federal legislation and the Americans with Disabilities Act, Title II (ADA), and Public Accommodations.
PERFORMANCE AND WORKLOAD INDICATORS 2007-08
2008-09
2009-10
2010-11
Human Resources
Advertising/Marketing 79 14 4 3
Background Checks (includes rescinds and hires) 64 59 40 45
Benefit Worksheets Processed 596 620 860 900
Employee Evaluations Processed 184 188 150 190
Employee Promotions Processed 17 10 5 0
Employment Separations/Retirements Processed 16 13 10 5
Employment Applications Reviewed/Processed 3,226 1,872 705 550
Employment Interviews Coordinated and Monitored 83 38 17 15
Employment Testing and Assessments Proctored 7 4 3 1
New Employee (hires) Processed 47 20 8 5
Personnel Action Forms Processed 489 509 450 350
Records Retention Program Processed 52 47 12 10
Recruitments and Selection 43 16 5 5
Staff Professional Development Attended 42 54 30 30
Volunteers Processed 0 20 15 15
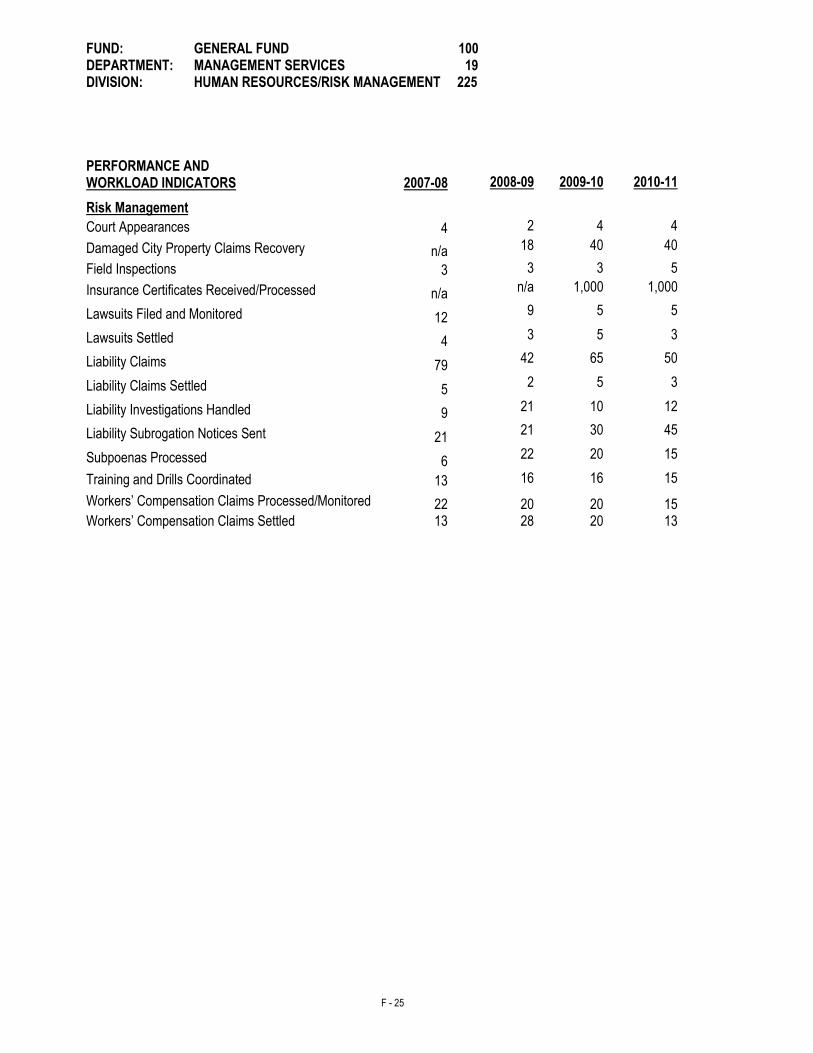
F - 25
FUND: GENERAL FUND 100 DEPARTMENT: MANAGEMENT SERVICES 19 DIVISION: HUMAN RESOURCES/RISK MANAGEMENT 225
PERFORMANCE AND WORKLOAD INDICATORS 2007-08
2008-09
2009-10
2010-11
Risk Management
Court Appearances 4 2 4 4
Damaged City Property Claims Recovery n/a 18 40 40
Field Inspections 3 3 3 5
Insurance Certificates Received/Processed n/a n/a 1,000 1,000
Lawsuits Filed and Monitored 12 9 5 5
Lawsuits Settled 4 3 5 3
Liability Claims 79 42 65 50
Liability Claims Settled 5 2 5 3
Liability Investigations Handled 9 21 10 12
Liability Subrogation Notices Sent 21 21 30 45
Subpoenas Processed 6 22 20 15
Training and Drills Coordinated 13 16 16 15
Workers’ Compensation Claims Processed/Monitored 22 20 20 15 Workers’ Compensation Claims Settled 13 28 20 13
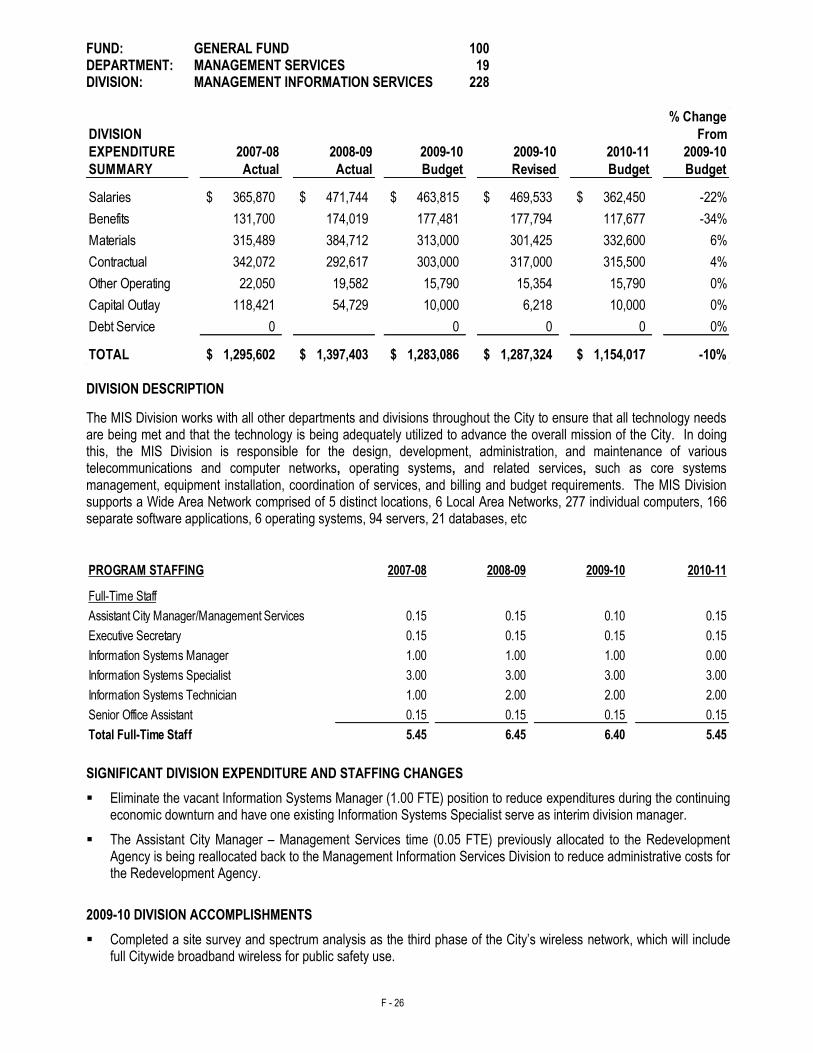
F - 26
FUND: GENERAL FUND 100 DEPARTMENT: MANAGEMENT SERVICES 19 DIVISION: MANAGEMENT INFORMATION SERVICES 228
% Change
DIVISION From
EXPENDITURE 2007-08 2008-09 2009-10 2009-10 2010-11 2009-10
SUMMARY Actual Actual Budget Revised Budget Budget
Salaries 365,870$ 471,744$ 463,815$ 469,533$ 362,450$ -22%
Benefits 131,700 174,019 177,481 177,794 117,677 -34%
Materials 315,489 384,712 313,000 301,425 332,600 6%
Contractual 342,072 292,617 303,000 317,000 315,500 4%
Other Operating 22,050 19,582 15,790 15,354 15,790 0%
Capital Outlay 118,421 54,729 10,000 6,218 10,000 0%
Debt Service 0 0 0 0 0%
TOTAL 1,295,602$ 1,397,403$ 1,283,086$ 1,287,324$ 1,154,017$ -10% DIVISION DESCRIPTION
The MIS Division works with all other departments and divisions throughout the City to ensure that all technology needs are being met and that the technology is being adequately utilized to advance the overall mission of the City. In doing this, the MIS Division is responsible for the design, development, administration, and maintenance of various telecommunications and computer networks, operating systems, and related services, such as core systems management, equipment installation, coordination of services, and billing and budget requirements. The MIS Division supports a Wide Area Network comprised of 5 distinct locations, 6 Local Area Networks, 277 individual computers, 166 separate software applications, 6 operating systems, 94 servers, 21 databases, etc
PROGRAM STAFFING 2007-08 2008-09 2009-10 2010-11
0.15 0.15 0.10 0.15
0.15 0.15 0.15 0.15
1.00 1.00 1.00 0.00
3.00 3.00 3.00 3.00
1.00 2.00 2.00 2.00
0.15 0.15 0.15 0.15
5.45 6.45 6.40 5.45Total Full-Time Staff
Information Systems Technician
Senior Office Assistant
Full-Time Staff
Executive Secretary
Information Systems Manager
Information Systems Specialist
Assistant City Manager/Management Services
SIGNIFICANT DIVISION EXPENDITURE AND STAFFING CHANGES
Eliminate the vacant Information Systems Manager (1.00 FTE) position to reduce expenditures during the continuing economic downturn and have one existing Information Systems Specialist serve as interim division manager.
The Assistant City Manager – Management Services time (0.05 FTE) previously allocated to the Redevelopment Agency is being reallocated back to the Management Information Services Division to reduce administrative costs for the Redevelopment Agency.
2009-10 DIVISION ACCOMPLISHMENTS
Completed a site survey and spectrum analysis as the third phase of the City’s wireless network, which will include full Citywide broadband wireless for public safety use.
F - 27
FUND: GENERAL FUND 100 DEPARTMENT: MANAGEMENT SERVICES 19 DIVISION: MANAGEMENT INFORMATION SERVICES 228
2009-10 DIVISION ACCOMPLISHMENTS (Continued)
Coordinated with the General Contractor and the County to ensure that all communication and technology needs were addressed in the design and construction of the Police Headquarters building.
Upgraded the City’s Supervisory Control and Data Acquisition (SCADA) servers with newer, more robust systems, and additional data storage capabilities.
Continued working with Community Development on the implementation of Accela and its integration with the New World System’s financial package.
Worked collaboratively with Utility Billing to acquire an online bill pay system that allows City residents to pay their water bill online.
Implemented a new Call Center solution for Utility Billing that allows them to automatically track and report on incoming call volumes, while at the same time providing a queuing functionality that automatically routes incoming calls to any available Customer Service Representative.
Worked collaboratively with the Public Information Officer (PIO) to migrate the City’s website to a newer, more secure web platform.
Implemented an enhancement to the City’s phone system that integrates an internal instant messaging solution with the City’s phone and email systems for internal collaboration.
Implemented Symantec’s Altiris solution, which allows full remote helpdesk support capabilities and automatic monitoring/reporting on the health of all of the City’s workstations and servers.
Updated the Information Technology Strategic Plan.
Conducted a configuration and security assessment of the City’s Information Systems.
Provided various technology training classes to City staff, particularly in regard to the Microsoft Office Suite.
Continued providing full operational support to City staff with regard to all technology needs, including workstations, laptops, printers, peripherals, software applications, databases, core operational systems, and special projects.
2010-11 DIVISION GOALS AND OBJECTIVES
Continue to work with Community Development on managing and streamlining workflows within the Accela system, with an eventual integration with the City’s New World System’s financial package and online bill pay system.
Implementation of the next phase of the City’s wireless network.
Implementation of an energy saving software system that will integrate with the City’s computer network to turn power off to phones and computer systems during nights, weekends, and holidays in order to reduce the City’s carbon footprint and power consumption.
Relocation of the telephone system and all associated circuits from the existing Police Headquarters to their new building.
Integration of Service Level Objectives with the MIS Helpdesk in order to improve service levels to City staff.
Establish a Remote Access Policy for vendors and City staff to remotely access the City’s network.
Continue providing training classes to City staff on the various technology products in use at the City.
Continued providing full operational support to City staff in regard to all technology needs, including workstations, laptops, printers, peripherals, software applications, databases, core operational systems, and special projects.
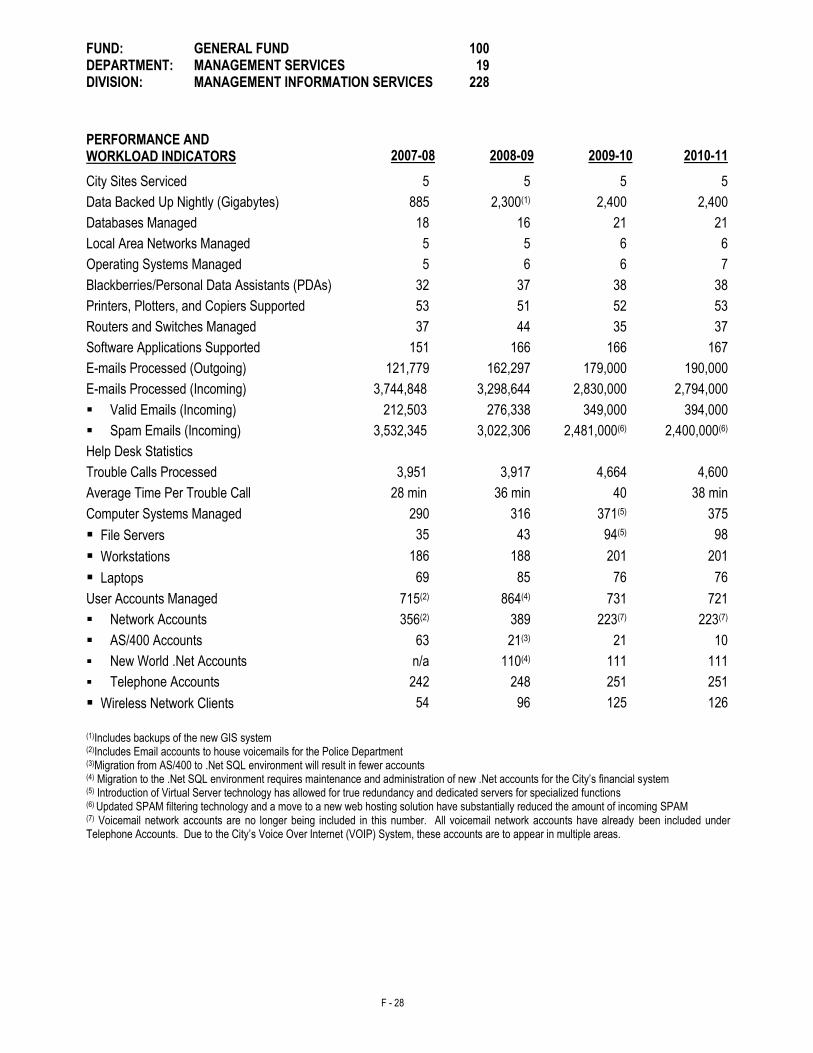
F - 28
FUND: GENERAL FUND 100 DEPARTMENT: MANAGEMENT SERVICES 19 DIVISION: MANAGEMENT INFORMATION SERVICES 228
(1)Includes backups of the new GIS system (2)Includes Email accounts to house voicemails for the Police Department (3)Migration from AS/400 to .Net SQL environment will result in fewer accounts (4) Migration to the .Net SQL environment requires maintenance and administration of new .Net accounts for the City’s financial system (5) Introduction of Virtual Server technology has allowed for true redundancy and dedicated servers for specialized functions (6) Updated SPAM filtering technology and a move to a new web hosting solution have substantially reduced the amount of incoming SPAM (7) Voicemail network accounts are no longer being included in this number. All voicemail network accounts have already been included under Telephone Accounts. Due to the City’s Voice Over Internet (VOIP) System, these accounts are to appear in multiple areas.
PERFORMANCE AND WORKLOAD INDICATORS 2007-08 2008-09 2009-10 2010-11
City Sites Serviced 5 5 5 5
Data Backed Up Nightly (Gigabytes) 885 2,300(1) 2,400 2,400
Databases Managed 18 16 21 21
Local Area Networks Managed 5 5 6 6
Operating Systems Managed 5 6 6 7
Blackberries/Personal Data Assistants (PDAs) 32 37 38 38
Printers, Plotters, and Copiers Supported 53 51 52 53
Routers and Switches Managed 37 44 35 37
Software Applications Supported 151 166 166 167
E-mails Processed (Outgoing) 121,779 162,297 179,000 190,000
E-mails Processed (Incoming) 3,744,848 3,298,644 2,830,000 2,794,000
Valid Emails (Incoming) 212,503 276,338 349,000 394,000
Spam Emails (Incoming) 3,532,345 3,022,306 2,481,000(6) 2,400,000(6)
Help Desk Statistics
Trouble Calls Processed 3,951 3,917 4,664 4,600
Average Time Per Trouble Call 28 min 36 min 40 38 min
Computer Systems Managed 290 316 371(5) 375
File Servers 35 43 94(5) 98
Workstations 186 188 201 201
Laptops 69 85 76 76
User Accounts Managed 715(2) 864(4) 731 721
Network Accounts 356(2) 389 223(7) 223(7)
AS/400 Accounts 63 21(3) 21 10
New World .Net Accounts n/a 110(4) 111 111
Telephone Accounts 242 248 251 251
Wireless Network Clients 54 96 125 126

F - 29
THIS PAGE INTENTIONALLY LEFT BLANK
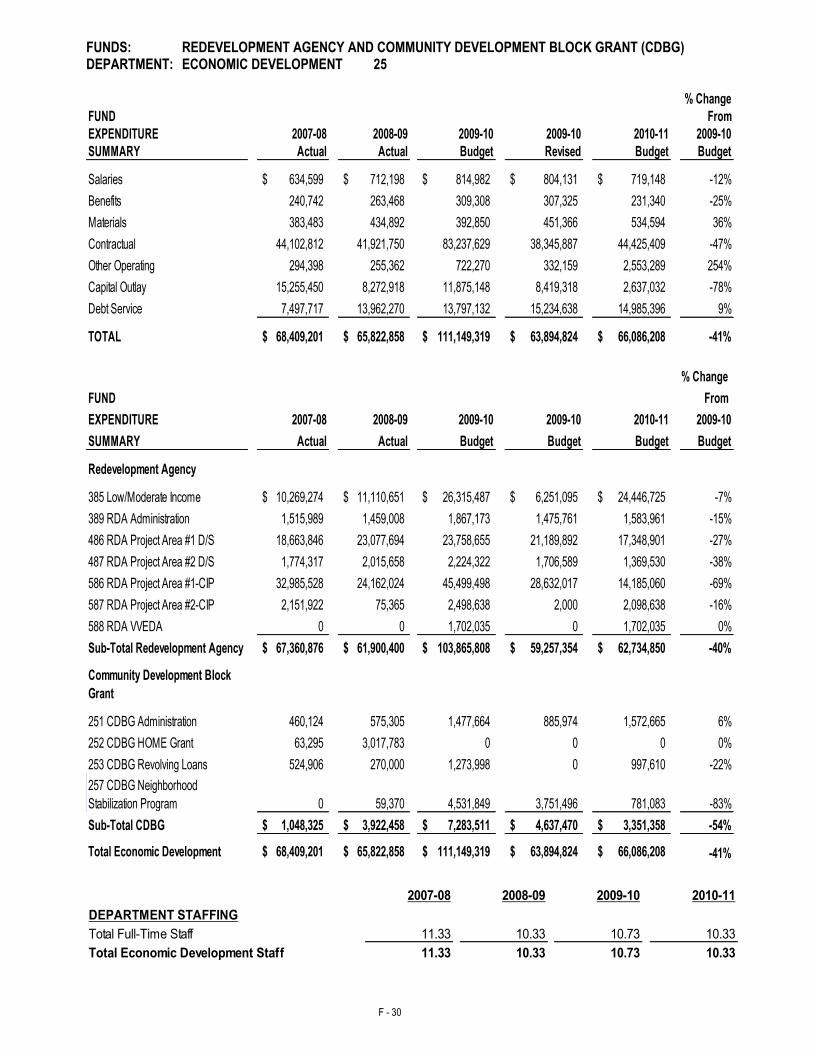
F - 30
FUNDS: REDEVELOPMENT AGENCY AND COMMUNITY DEVELOPMENT BLOCK GRANT (CDBG) DEPARTMENT: ECONOMIC DEVELOPMENT 25
% Change
FUND From
EXPENDITURE 2007-08 2008-09 2009-10 2009-10 2010-11 2009-10
SUMMARY Actual Actual Budget Revised Budget Budget
Salaries 634,599$ 712,198$ 814,982$ 804,131$ 719,148$ -12%
Benefits 240,742 263,468 309,308 307,325 231,340 -25%
Materials 383,483 434,892 392,850 451,366 534,594 36%
Contractual 44,102,812 41,921,750 83,237,629 38,345,887 44,425,409 -47%
Other Operating 294,398 255,362 722,270 332,159 2,553,289 254%
Capital Outlay 15,255,450 8,272,918 11,875,148 8,419,318 2,637,032 -78%
Debt Service 7,497,717 13,962,270 13,797,132 15,234,638 14,985,396 9%
TOTAL 68,409,201$ 65,822,858$ 111,149,319$ 63,894,824$ 66,086,208$ -41%
% Change
FUND From
EXPENDITURE 2007-08 2008-09 2009-10 2009-10 2010-11 2009-10
SUMMARY Actual Actual Budget Budget Budget Budget
Redevelopment Agency
385 Low/Moderate Income 10,269,274$ 11,110,651$ 26,315,487$ 6,251,095$ 24,446,725$ -7%
389 RDA Administration 1,515,989 1,459,008 1,867,173 1,475,761 1,583,961 -15%
486 RDA Project Area #1 D/S 18,663,846 23,077,694 23,758,655 21,189,892 17,348,901 -27%
487 RDA Project Area #2 D/S 1,774,317 2,015,658 2,224,322 1,706,589 1,369,530 -38%
586 RDA Project Area #1-CIP 32,985,528 24,162,024 45,499,498 28,632,017 14,185,060 -69%
587 RDA Project Area #2-CIP 2,151,922 75,365 2,498,638 2,000 2,098,638 -16%
588 RDA VVEDA 0 0 1,702,035 0 1,702,035 0%
Sub-Total Redevelopment Agency 67,360,876$ 61,900,400$ 103,865,808$ 59,257,354$ 62,734,850$ -40%
Community Development Block
Grant
251 CDBG Administration 460,124 575,305 1,477,664 885,974 1,572,665 6%
252 CDBG HOME Grant 63,295 3,017,783 0 0 0 0%
253 CDBG Revolving Loans 524,906 270,000 1,273,998 0 997,610 -22%
257 CDBG Neighborhood
Stabilization Program 0 59,370 4,531,849 3,751,496 781,083 -83%
Sub-Total CDBG 1,048,325$ 3,922,458$ 7,283,511$ 4,637,470$ 3,351,358$ -54%
Total Economic Development 68,409,201$ 65,822,858$ 111,149,319$ 63,894,824$ 66,086,208$ -41%
2007-08 2008-09 2009-10 2010-11
DEPARTMENT STAFFING
Total Full-Time Staff 11.33 10.33 10.73 10.33
11.33 10.33 10.73 10.33Total Economic Development Staff
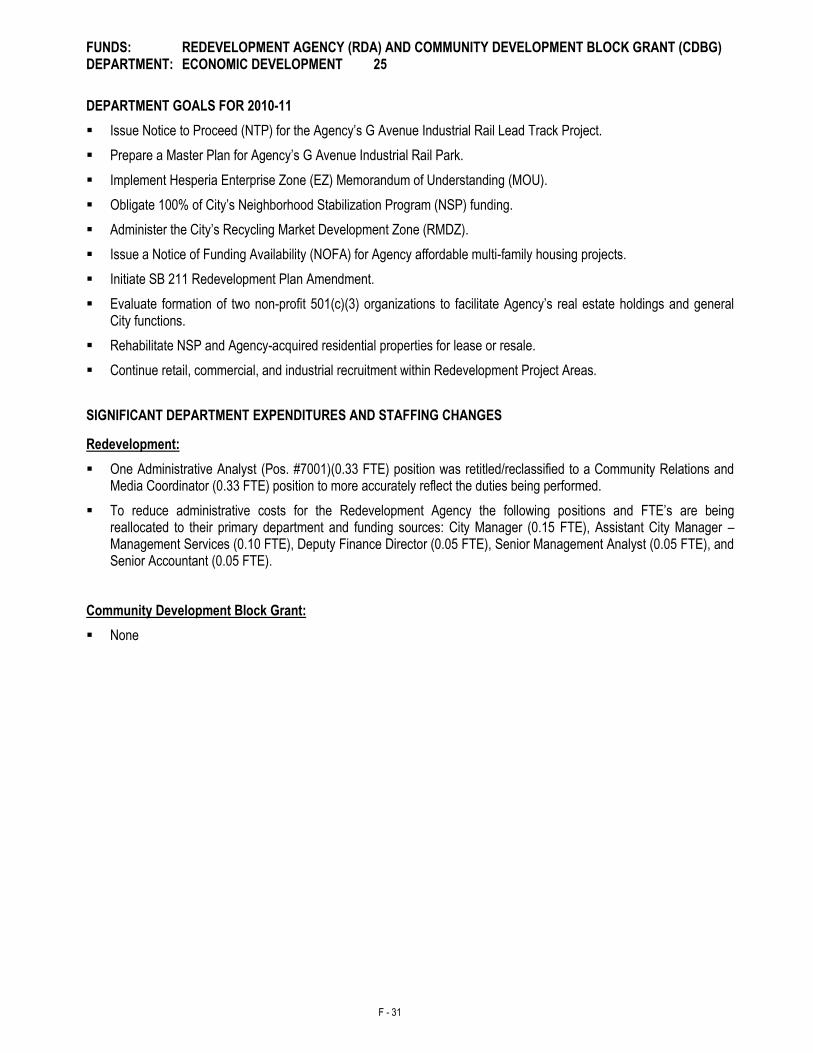
F - 31
FUNDS: REDEVELOPMENT AGENCY (RDA) AND COMMUNITY DEVELOPMENT BLOCK GRANT (CDBG) DEPARTMENT: ECONOMIC DEVELOPMENT 25
DEPARTMENT GOALS FOR 2010-11
Issue Notice to Proceed (NTP) for the Agency’s G Avenue Industrial Rail Lead Track Project.
Prepare a Master Plan for Agency’s G Avenue Industrial Rail Park.
Implement Hesperia Enterprise Zone (EZ) Memorandum of Understanding (MOU).
Obligate 100% of City’s Neighborhood Stabilization Program (NSP) funding.
Administer the City’s Recycling Market Development Zone (RMDZ).
Issue a Notice of Funding Availability (NOFA) for Agency affordable multi-family housing projects.
Initiate SB 211 Redevelopment Plan Amendment.
Evaluate formation of two non-profit 501(c)(3) organizations to facilitate Agency’s real estate holdings and general City functions.
Rehabilitate NSP and Agency-acquired residential properties for lease or resale.
Continue retail, commercial, and industrial recruitment within Redevelopment Project Areas.
SIGNIFICANT DEPARTMENT EXPENDITURES AND STAFFING CHANGES
Redevelopment:
One Administrative Analyst (Pos. #7001)(0.33 FTE) position was retitled/reclassified to a Community Relations and Media Coordinator (0.33 FTE) position to more accurately reflect the duties being performed.
To reduce administrative costs for the Redevelopment Agency the following positions and FTE’s are being reallocated to their primary department and funding sources: City Manager (0.15 FTE), Assistant City Manager – Management Services (0.10 FTE), Deputy Finance Director (0.05 FTE), Senior Management Analyst (0.05 FTE), and Senior Accountant (0.05 FTE).
Community Development Block Grant:
None
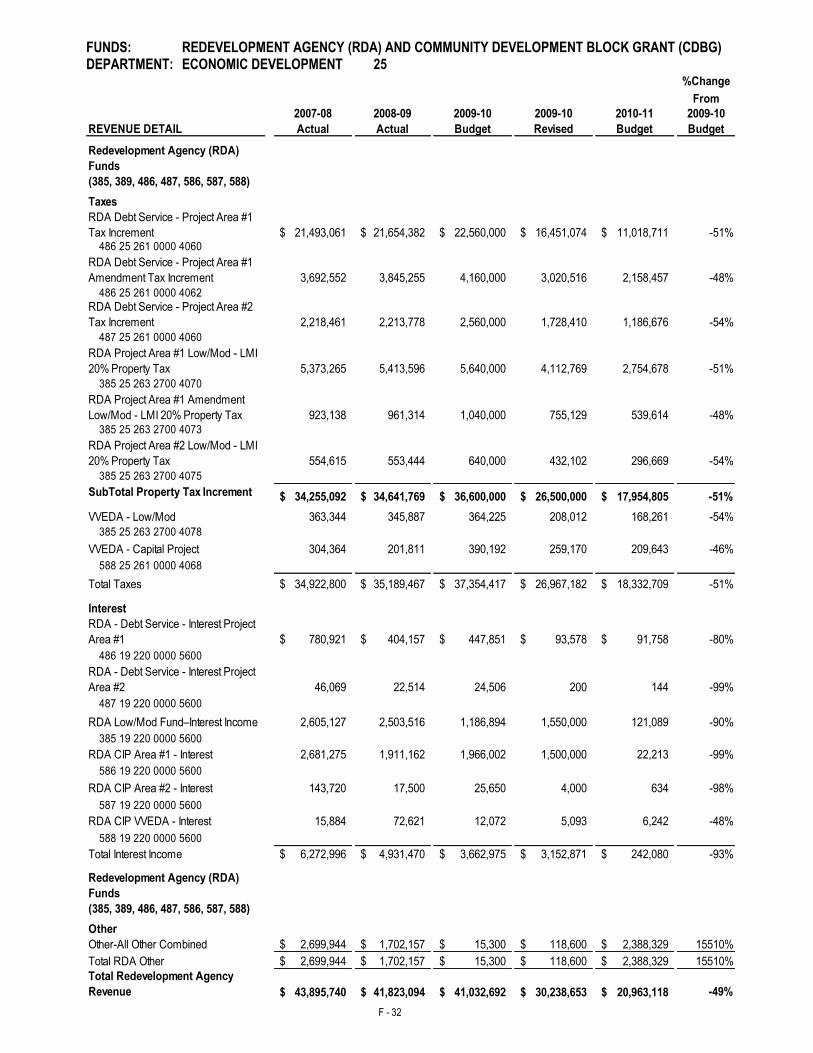
F - 32
FUNDS: REDEVELOPMENT AGENCY (RDA) AND COMMUNITY DEVELOPMENT BLOCK GRANT (CDBG) DEPARTMENT: ECONOMIC DEVELOPMENT 25
%Change
From
2007-08 2008-09 2009-10 2009-10 2010-11 2009-10
REVENUE DETAIL Actual Actual Budget Revised Budget Budget
Taxes
RDA Debt Service - Project Area #1
Tax Increment 21,493,061$ 21,654,382$ 22,560,000$ 16,451,074$ 11,018,711$ -51%486 25 261 0000 4060
RDA Debt Service - Project Area #1
Amendment Tax Increment 3,692,552 3,845,255 4,160,000 3,020,516 2,158,457 -48%
486 25 261 0000 4062
RDA Debt Service - Project Area #2
Tax Increment 2,218,461 2,213,778 2,560,000 1,728,410 1,186,676 -54%
487 25 261 0000 4060
RDA Project Area #1 Low/Mod - LMI
20% Property Tax 5,373,265 5,413,596 5,640,000 4,112,769 2,754,678 -51%
385 25 263 2700 4070
RDA Project Area #1 Amendment
Low/Mod - LMI 20% Property Tax 923,138 961,314 1,040,000 755,129 539,614 -48%385 25 263 2700 4073
RDA Project Area #2 Low/Mod - LMI
20% Property Tax 554,615 553,444 640,000 432,102 296,669 -54%
385 25 263 2700 4075
SubTotal Property Tax Increment 34,255,092$ 34,641,769$ 36,600,000$ 26,500,000$ 17,954,805$ -51%
VVEDA - Low/Mod 363,344 345,887 364,225 208,012 168,261 -54%
385 25 263 2700 4078
VVEDA - Capital Project 304,364 201,811 390,192 259,170 209,643 -46%
588 25 261 0000 4068
Total Taxes 34,922,800$ 35,189,467$ 37,354,417$ 26,967,182$ 18,332,709$ -51%
Interest
RDA - Debt Service - Interest Project
Area #1 780,921$ 404,157$ 447,851$ 93,578$ 91,758$ -80%
486 19 220 0000 5600
RDA - Debt Service - Interest Project
Area #2 46,069 22,514 24,506 200 144 -99%
487 19 220 0000 5600
RDA Low/Mod Fund–Interest Income 2,605,127 2,503,516 1,186,894 1,550,000 121,089 -90%
385 19 220 0000 5600
RDA CIP Area #1 - Interest 2,681,275 1,911,162 1,966,002 1,500,000 22,213 -99%
586 19 220 0000 5600
RDA CIP Area #2 - Interest 143,720 17,500 25,650 4,000 634 -98%
587 19 220 0000 5600
RDA CIP VVEDA - Interest 15,884 72,621 12,072 5,093 6,242 -48%
588 19 220 0000 5600
Total Interest Income 6,272,996$ 4,931,470$ 3,662,975$ 3,152,871$ 242,080$ -93%
Other
Other-All Other Combined 2,699,944$ 1,702,157$ 15,300$ 118,600$ 2,388,329$ 15510%
Total RDA Other 2,699,944$ 1,702,157$ 15,300$ 118,600$ 2,388,329$ 15510%
Total Redevelopment Agency
Revenue 43,895,740$ 41,823,094$ 41,032,692$ 30,238,653$ 20,963,118$ -49%
Redevelopment Agency (RDA)
Funds
(385, 389, 486, 487, 586, 587, 588)
Redevelopment Agency (RDA)
Funds
(385, 389, 486, 487, 586, 587, 588)
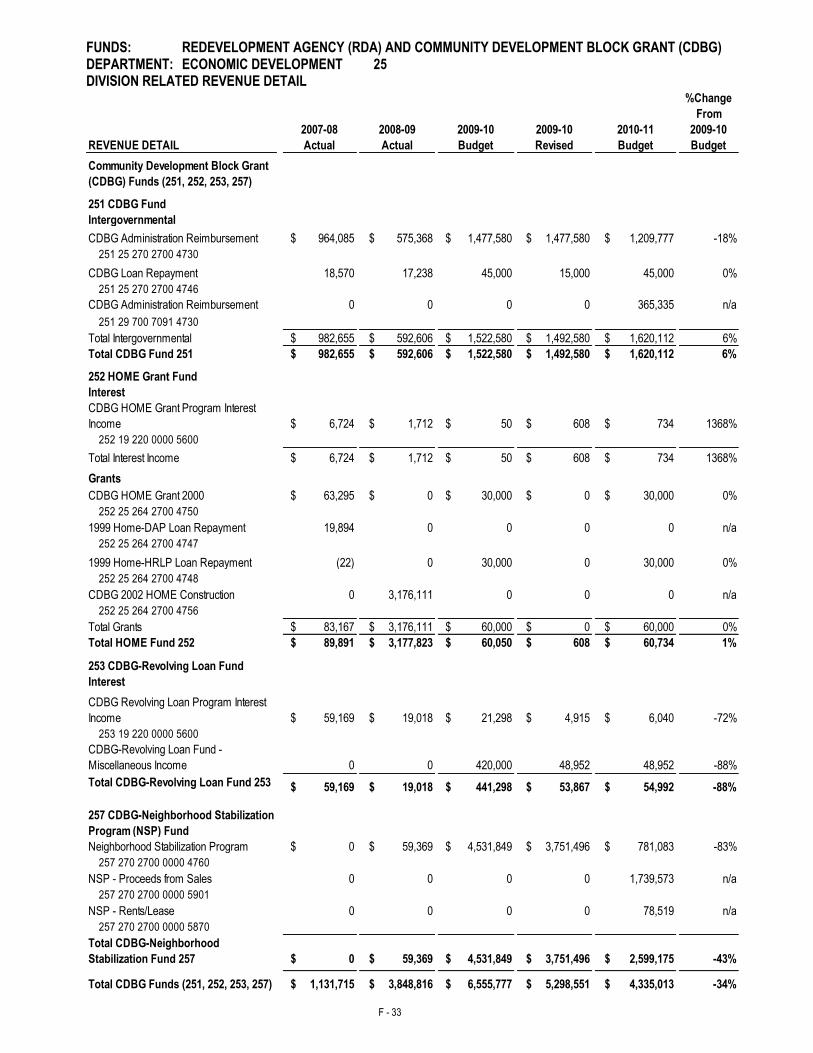
F - 33
FUNDS: REDEVELOPMENT AGENCY (RDA) AND COMMUNITY DEVELOPMENT BLOCK GRANT (CDBG) DEPARTMENT: ECONOMIC DEVELOPMENT 25 DIVISION RELATED REVENUE DETAIL
%Change
From
2007-08 2008-09 2009-10 2009-10 2010-11 2009-10
REVENUE DETAIL Actual Actual Budget Revised Budget Budget
251 CDBG Fund
Intergovernmental
CDBG Administration Reimbursement $ 964,085 $ 575,368 $ 1,477,580 $ 1,477,580 $ 1,209,777 -18%
251 25 270 2700 4730
CDBG Loan Repayment 18,570 17,238 45,000 15,000 45,000 0%
251 25 270 2700 4746
CDBG Administration Reimbursement 0 0 0 0 365,335 n/a
251 29 700 7091 4730
Total Intergovernmental $ 982,655 $ 592,606 $ 1,522,580 $ 1,492,580 $ 1,620,112 6%
Total CDBG Fund 251 $ 982,655 $ 592,606 $ 1,522,580 $ 1,492,580 $ 1,620,112 6%
252 HOME Grant Fund
Interest
CDBG HOME Grant Program Interest
Income $ 6,724 $ 1,712 $ 50 $ 608 $ 734 1368%
252 19 220 0000 5600
Total Interest Income $ 6,724 $ 1,712 $ 50 $ 608 $ 734 1368%
Grants
CDBG HOME Grant 2000 $ 63,295 $ 0 $ 30,000 $ 0 $ 30,000 0%
252 25 264 2700 4750
1999 Home-DAP Loan Repayment 19,894 0 0 0 0 n/a
252 25 264 2700 4747
1999 Home-HRLP Loan Repayment (22) 0 30,000 0 30,000 0%
252 25 264 2700 4748
CDBG 2002 HOME Construction 0 3,176,111 0 0 0 n/a
252 25 264 2700 4756
Total Grants $ 83,167 $ 3,176,111 $ 60,000 $ 0 $ 60,000 0%
Total HOME Fund 252 $ 89,891 $ 3,177,823 $ 60,050 $ 608 $ 60,734 1%
253 CDBG-Revolving Loan Fund
Interest
CDBG Revolving Loan Program Interest
Income $ 59,169 $ 19,018 $ 21,298 $ 4,915 $ 6,040 -72%
253 19 220 0000 5600
CDBG-Revolving Loan Fund -
Miscellaneous Income 0 0 420,000 48,952 48,952 -88%
Total CDBG-Revolving Loan Fund 253 $ 59,169 $ 19,018 $ 441,298 $ 53,867 $ 54,992 -88%
257 CDBG-Neighborhood Stabilization
Program (NSP) Fund
Neighborhood Stabilization Program $ 0 $ 59,369 $ 4,531,849 $ 3,751,496 $ 781,083 -83%
257 270 2700 0000 4760
NSP - Proceeds from Sales 0 0 0 0 1,739,573 n/a
257 270 2700 0000 5901
NSP - Rents/Lease 0 0 0 0 78,519 n/a
257 270 2700 0000 5870
Total CDBG-Neighborhood
Stabilization Fund 257 $ 0 $ 59,369 $ 4,531,849 $ 3,751,496 $ 2,599,175 -43%
Total CDBG Funds (251, 252, 253, 257) $ 1,131,715 $ 3,848,816 $ 6,555,777 $ 5,298,551 $ 4,335,013 -34%
Community Development Block Grant
(CDBG) Funds (251, 252, 253, 257)
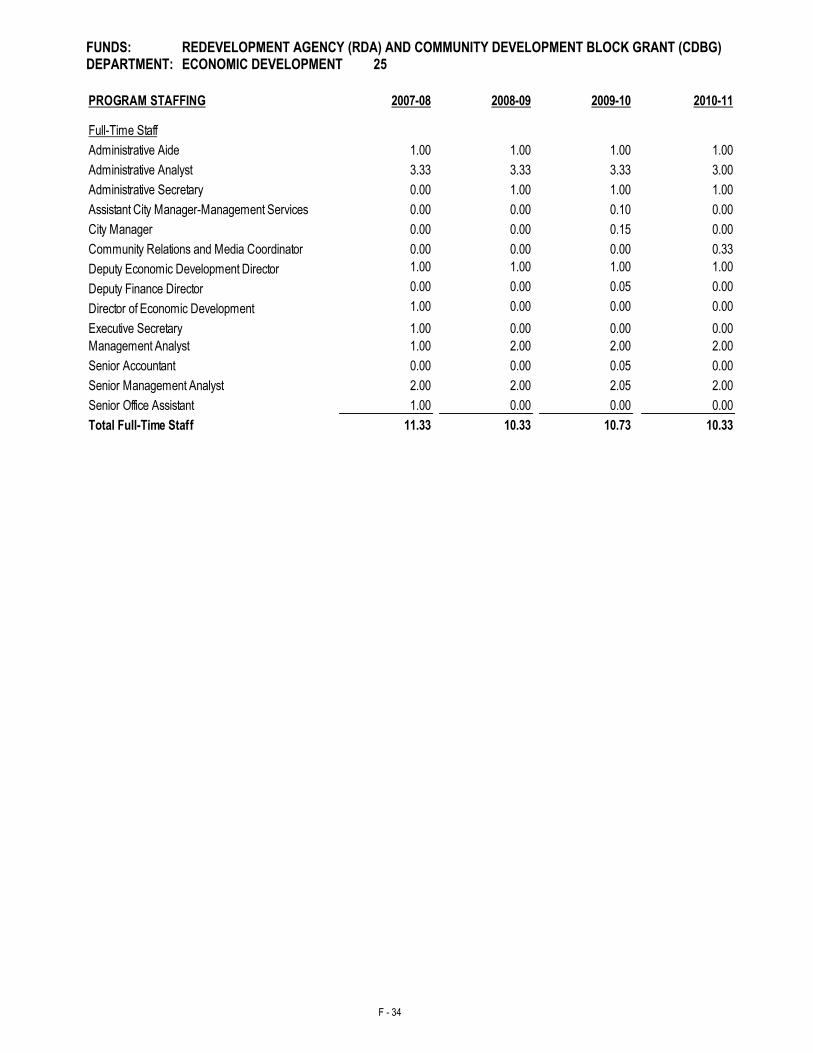
F - 34
FUNDS: REDEVELOPMENT AGENCY (RDA) AND COMMUNITY DEVELOPMENT BLOCK GRANT (CDBG) DEPARTMENT: ECONOMIC DEVELOPMENT 25
PROGRAM STAFFING 2007-08 2008-09 2009-10 2010-11
1.00 1.00 1.00 1.00
3.33 3.33 3.33 3.00
0.00 1.00 1.00 1.00
0.00 0.00 0.10 0.00
0.00 0.00 0.15 0.00
Community Relations and Media Coordinator 0.00 0.00 0.00 0.33
1.00 1.00 1.00 1.00
Deputy Finance Director 0.00 0.00 0.05 0.00
1.00 0.00 0.00 0.00
1.00 0.00 0.00 0.00
1.00 2.00 2.00 2.00
Senior Accountant 0.00 0.00 0.05 0.00
2.00 2.00 2.05 2.00
1.00 0.00 0.00 0.00
11.33 10.33 10.73 10.33
Full-Time Staff
Administrative Analyst
Administrative Aide
Deputy Economic Development Director
Administrative Secretary
Assistant City Manager-Management Services
City Manager
Senior Office Assistant
Executive Secretary
Director of Economic Development
Management Analyst
Senior Management Analyst
Total Full-Time Staff
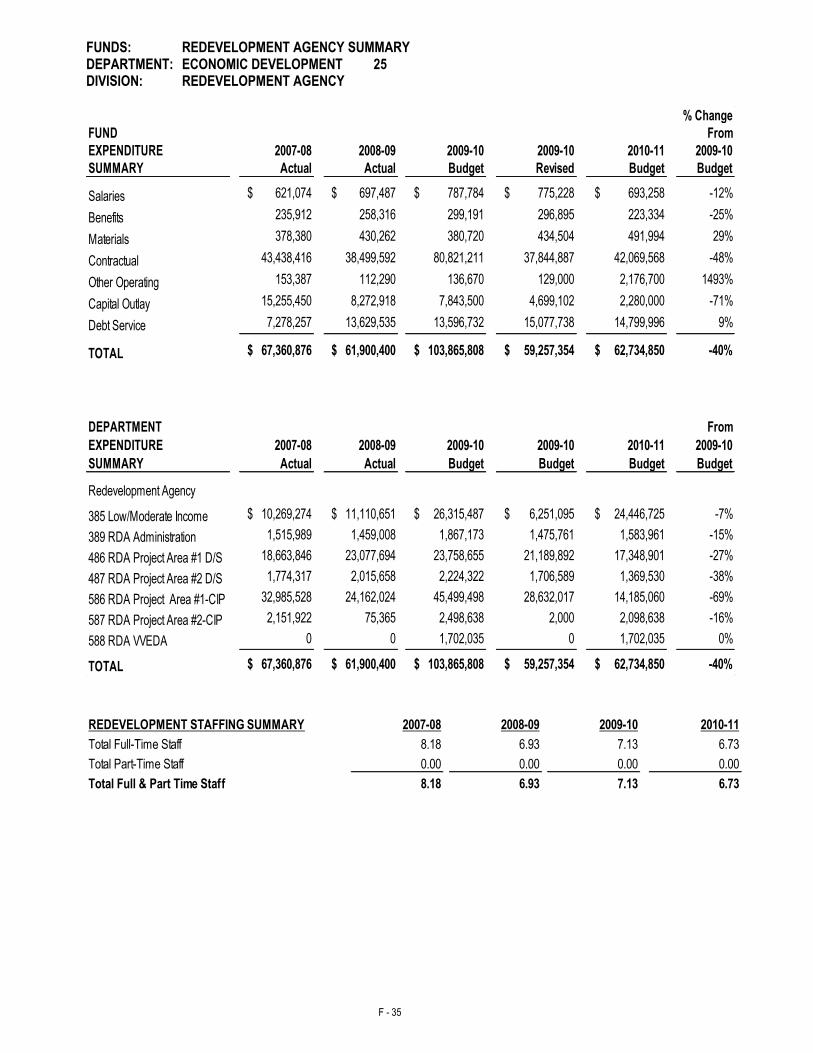
F - 35
FUNDS: REDEVELOPMENT AGENCY SUMMARY DEPARTMENT: ECONOMIC DEVELOPMENT 25 DIVISION: REDEVELOPMENT AGENCY
% Change
FUND From
EXPENDITURE 2007-08 2008-09 2009-10 2009-10 2010-11 2009-10
SUMMARY Actual Actual Budget Revised Budget Budget
Salaries $ 621,074 $ 697,487 $ 787,784 $ 775,228 $ 693,258 -12%
Benefits 235,912 258,316 299,191 296,895 223,334 -25%
Materials 378,380 430,262 380,720 434,504 491,994 29%
Contractual 43,438,416 38,499,592 80,821,211 37,844,887 42,069,568 -48%
Other Operating 153,387 112,290 136,670 129,000 2,176,700 1493%
Capital Outlay 15,255,450 8,272,918 7,843,500 4,699,102 2,280,000 -71%
Debt Service 7,278,257 13,629,535 13,596,732 15,077,738 14,799,996 9%
TOTAL $ 67,360,876 $ 61,900,400 $ 103,865,808 $ 59,257,354 $ 62,734,850 -40%
DEPARTMENT From
EXPENDITURE 2007-08 2008-09 2009-10 2009-10 2010-11 2009-10
SUMMARY Actual Actual Budget Budget Budget Budget
Redevelopment Agency
385 Low/Moderate Income $ 10,269,274 $ 11,110,651 $ 26,315,487 $ 6,251,095 $ 24,446,725 -7%
389 RDA Administration 1,515,989 1,459,008 1,867,173 1,475,761 1,583,961 -15%
486 RDA Project Area #1 D/S 18,663,846 23,077,694 23,758,655 21,189,892 17,348,901 -27%
487 RDA Project Area #2 D/S 1,774,317 2,015,658 2,224,322 1,706,589 1,369,530 -38%
586 RDA Project Area #1-CIP 32,985,528 24,162,024 45,499,498 28,632,017 14,185,060 -69%
587 RDA Project Area #2-CIP 2,151,922 75,365 2,498,638 2,000 2,098,638 -16%
588 RDA VVEDA 0 0 1,702,035 0 1,702,035 0%
TOTAL $ 67,360,876 $ 61,900,400 $ 103,865,808 $ 59,257,354 $ 62,734,850 -40%
2007-08 2008-09 2009-10 2010-11
8.18 6.93 7.13 6.73
0.00 0.00 0.00 0.00
8.18 6.93 7.13 6.73
REDEVELOPMENT STAFFING SUMMARY
Total Full-Time Staff
Total Part-Time Staff
Total Full & Part Time Staff
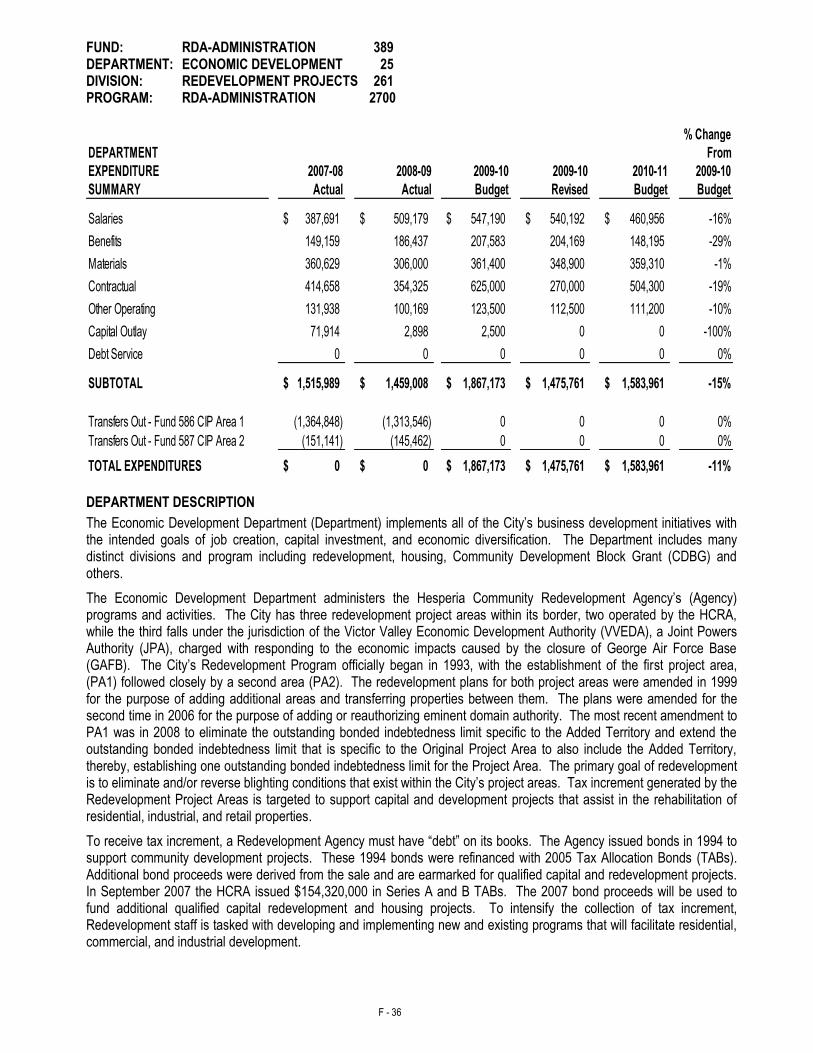
F - 36
FUND: RDA-ADMINISTRATION 389 DEPARTMENT: ECONOMIC DEVELOPMENT 25 DIVISION: REDEVELOPMENT PROJECTS 261 PROGRAM: RDA-ADMINISTRATION 2700
% Change
DEPARTMENT From
EXPENDITURE 2007-08 2008-09 2009-10 2009-10 2010-11 2009-10
SUMMARY Actual Actual Budget Revised Budget Budget
Salaries 387,691$ 509,179$ 547,190$ 540,192$ 460,956$ -16%
Benefits 149,159 186,437 207,583 204,169 148,195 -29%
Materials 360,629 306,000 361,400 348,900 359,310 -1%
Contractual 414,658 354,325 625,000 270,000 504,300 -19%
Other Operating 131,938 100,169 123,500 112,500 111,200 -10%
Capital Outlay 71,914 2,898 2,500 0 0 -100%
Debt Service 0 0 0 0 0 0%
SUBTOTAL 1,515,989$ 1,459,008$ 1,867,173$ 1,475,761$ 1,583,961$ -15%
Transfers Out - Fund 586 CIP Area 1 (1,364,848) (1,313,546) 0 0 0 0%
Transfers Out - Fund 587 CIP Area 2 (151,141) (145,462) 0 0 0 0%
TOTAL EXPENDITURES 0$ 0$ 1,867,173$ 1,475,761$ 1,583,961$ -11% DEPARTMENT DESCRIPTION
The Economic Development Department (Department) implements all of the City’s business development initiatives with the intended goals of job creation, capital investment, and economic diversification. The Department includes many distinct divisions and program including redevelopment, housing, Community Development Block Grant (CDBG) and others.
The Economic Development Department administers the Hesperia Community Redevelopment Agency’s (Agency) programs and activities. The City has three redevelopment project areas within its border, two operated by the HCRA, while the third falls under the jurisdiction of the Victor Valley Economic Development Authority (VVEDA), a Joint Powers Authority (JPA), charged with responding to the economic impacts caused by the closure of George Air Force Base (GAFB). The City’s Redevelopment Program officially began in 1993, with the establishment of the first project area, (PA1) followed closely by a second area (PA2). The redevelopment plans for both project areas were amended in 1999 for the purpose of adding additional areas and transferring properties between them. The plans were amended for the second time in 2006 for the purpose of adding or reauthorizing eminent domain authority. The most recent amendment to PA1 was in 2008 to eliminate the outstanding bonded indebtedness limit specific to the Added Territory and extend the outstanding bonded indebtedness limit that is specific to the Original Project Area to also include the Added Territory, thereby, establishing one outstanding bonded indebtedness limit for the Project Area. The primary goal of redevelopment is to eliminate and/or reverse blighting conditions that exist within the City’s project areas. Tax increment generated by the Redevelopment Project Areas is targeted to support capital and development projects that assist in the rehabilitation of residential, industrial, and retail properties.
To receive tax increment, a Redevelopment Agency must have “debt” on its books. The Agency issued bonds in 1994 to support community development projects. These 1994 bonds were refinanced with 2005 Tax Allocation Bonds (TABs). Additional bond proceeds were derived from the sale and are earmarked for qualified capital and redevelopment projects. In September 2007 the HCRA issued $154,320,000 in Series A and B TABs. The 2007 bond proceeds will be used to fund additional qualified capital redevelopment and housing projects. To intensify the collection of tax increment, Redevelopment staff is tasked with developing and implementing new and existing programs that will facilitate residential, commercial, and industrial development.
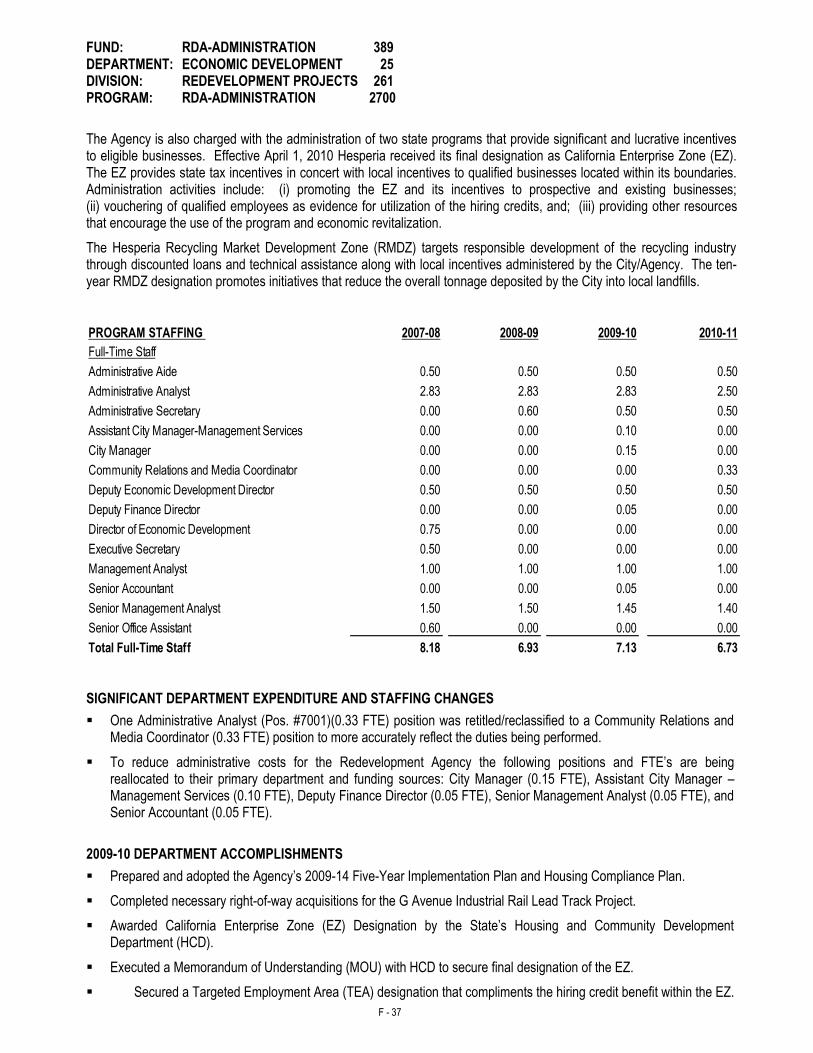
F - 37
FUND: RDA-ADMINISTRATION 389 DEPARTMENT: ECONOMIC DEVELOPMENT 25 DIVISION: REDEVELOPMENT PROJECTS 261 PROGRAM: RDA-ADMINISTRATION 2700
The Agency is also charged with the administration of two state programs that provide significant and lucrative incentives to eligible businesses. Effective April 1, 2010 Hesperia received its final designation as California Enterprise Zone (EZ). The EZ provides state tax incentives in concert with local incentives to qualified businesses located within its boundaries. Administration activities include: (i) promoting the EZ and its incentives to prospective and existing businesses; (ii) vouchering of qualified employees as evidence for utilization of the hiring credits, and; (iii) providing other resources that encourage the use of the program and economic revitalization.
The Hesperia Recycling Market Development Zone (RMDZ) targets responsible development of the recycling industry through discounted loans and technical assistance along with local incentives administered by the City/Agency. The ten-year RMDZ designation promotes initiatives that reduce the overall tonnage deposited by the City into local landfills.
PROGRAM STAFFING 2007-08 2008-09 2009-10 2010-11
Administrative Aide 0.50 0.50 0.50 0.50
2.83 2.83 2.83 2.50
0.00 0.60 0.50 0.50
0.00 0.00 0.10 0.00
0.00 0.00 0.15 0.00
Community Relations and Media Coordinator 0.00 0.00 0.00 0.33
0.50 0.50 0.50 0.50
0.00 0.00 0.05 0.00
0.75 0.00 0.00 0.00
0.50 0.00 0.00 0.00
1.00 1.00 1.00 1.00
Senior Accountant 0.00 0.00 0.05 0.00
1.50 1.50 1.45 1.40
0.60 0.00 0.00 0.00
8.18 6.93 7.13 6.73
Deputy Economic Development Director
Deputy Finance Director
Total Full-Time Staff
Director of Economic Development
Management Analyst
Senior Office Assistant
Executive Secretary
Senior Management Analyst
Full-Time Staff
Administrative Analyst
City Manager
Administrative Secretary
Assistant City Manager-Management Services
SIGNIFICANT DEPARTMENT EXPENDITURE AND STAFFING CHANGES
One Administrative Analyst (Pos. #7001)(0.33 FTE) position was retitled/reclassified to a Community Relations and Media Coordinator (0.33 FTE) position to more accurately reflect the duties being performed.
To reduce administrative costs for the Redevelopment Agency the following positions and FTE’s are being reallocated to their primary department and funding sources: City Manager (0.15 FTE), Assistant City Manager – Management Services (0.10 FTE), Deputy Finance Director (0.05 FTE), Senior Management Analyst (0.05 FTE), and Senior Accountant (0.05 FTE).
2009-10 DEPARTMENT ACCOMPLISHMENTS
Prepared and adopted the Agency’s 2009-14 Five-Year Implementation Plan and Housing Compliance Plan.
Completed necessary right-of-way acquisitions for the G Avenue Industrial Rail Lead Track Project.
Awarded California Enterprise Zone (EZ) Designation by the State’s Housing and Community Development Department (HCD).
Executed a Memorandum of Understanding (MOU) with HCD to secure final designation of the EZ.
Secured a Targeted Employment Area (TEA) designation that compliments the hiring credit benefit within the EZ.
F - 38
FUND: RDA-ADMINISTRATION 389 DEPARTMENT: ECONOMIC DEVELOPMENT 25 DIVISION: REDEVELOPMENT PROJECTS 261 PROGRAM: RDA-ADMINISTRATION 2700
2009-10 DEPARTMENT ACCOMPLISHMENTS (Continued)
Facilitated the rehabilitation and reopening of a shuttered Sizzler restaurant via the Agency’s Franchise Founders Program.
Approved two Façade Improvement Program (FIP) loans resulting in the conversion of blighted properties into locations for productive commercial enterprises.
Implemented the “Feet on the Street” retention and expansion program, linking existing businesses to the economic development services and small business resources.
Successfully sited two businesses in Hesperia as a result of the consulting services supported by the Inland Empire Small Business Development Center (IE SBDC).
Approved Agency’s first “Broker Incentive” for the land purchase resulting in the construction of the Golden Corral Restaurant at the High Desert Gateway Shopping Center.
Negotiated and executed an Owner Participation Agreement (OPA) enabling The Litzenberger Company to increase its manufacturing space by 240%.
Facilitated the lease of two junior anchors (Rue 21 and Radio Shack) and two large spaces (Ross Dress for Less and Marshalls) tenants in the High Desert Gateway retail center.
Prepared and submitted an application for designation as a Recycling Market Development Zone which was ultimately approved by the California Integrated Waste Management Board (CIWMB).
Negotiated and executed a Program Management Agreements (PMA) between the City, County of San Bernardino, and Griffin Structures to cause the installation of solar power system on new San Bernardino County High Desert Government Center.
Redesigned the City’s Economic Development Department website as a function of the overall City website reconstruction.
Assumed management responsibilities of the Eagle Plaza Shopping Center for the Hesperia Water District.
Negotiated and executed four revenue producing licenses for cellular towers constructed on City/Agency/Water District property.
Partnered with the Hesperia Chamber of Commerce in a business retention task force.
Entered into an Exclusive Negotiation Agreement (ENA) with Lewis Investment Company (LIC) for development of Agency-owned property adjacent to the High Desert Gateway Shopping Center.
Continued master planning efforts of Auto Mall concept.
Negotiated an owner participation agreement for a 3,292 square foot Farmer Boys restaurant through Restaurant Rewards Program.
Sponsored the “How to Grow your Business in a Declining Market” seminar benefitting the Boys and Girls Club.
2010-11 DEPARTMENT GOALS AND OBJECTIVES
Issue Notice to Proceed (NTP) for the Agency’s G Avenue Industrial Rail Lead Track Project.
Prepare a Master Plan for Agency’s G Avenue Industrial Rail Park.
Formulate a “Small Cap” Revolving Loan Fund Program to facilitate small business formation, expansion, or location.
Implement Hesperia Enterprise Zone (EZ) Memorandum of Understanding (MOU).
Administer the City’s Recycling Market Development Zone (RMDZ) Program.
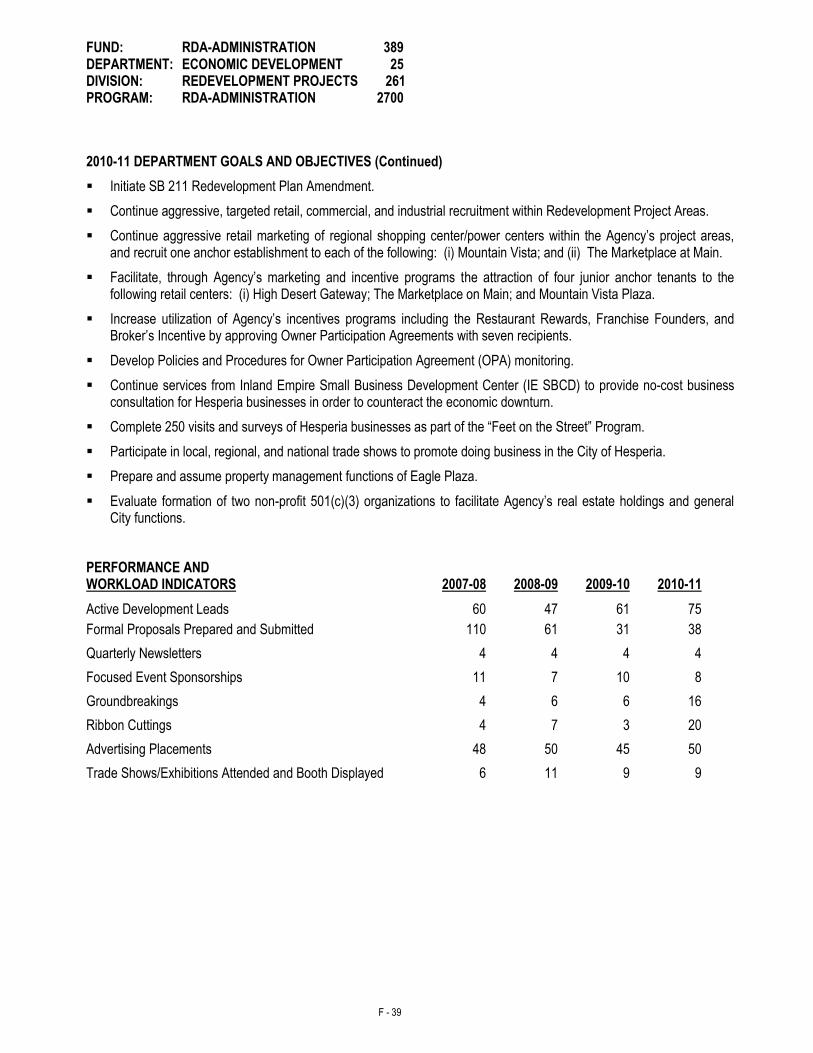
F - 39
FUND: RDA-ADMINISTRATION 389 DEPARTMENT: ECONOMIC DEVELOPMENT 25 DIVISION: REDEVELOPMENT PROJECTS 261 PROGRAM: RDA-ADMINISTRATION 2700
2010-11 DEPARTMENT GOALS AND OBJECTIVES (Continued)
Initiate SB 211 Redevelopment Plan Amendment.
Continue aggressive, targeted retail, commercial, and industrial recruitment within Redevelopment Project Areas.
Continue aggressive retail marketing of regional shopping center/power centers within the Agency’s project areas, and recruit one anchor establishment to each of the following: (i) Mountain Vista; and (ii) The Marketplace at Main.
Facilitate, through Agency’s marketing and incentive programs the attraction of four junior anchor tenants to the following retail centers: (i) High Desert Gateway; The Marketplace on Main; and Mountain Vista Plaza.
Increase utilization of Agency’s incentives programs including the Restaurant Rewards, Franchise Founders, and Broker’s Incentive by approving Owner Participation Agreements with seven recipients.
Develop Policies and Procedures for Owner Participation Agreement (OPA) monitoring.
Continue services from Inland Empire Small Business Development Center (IE SBCD) to provide no-cost business consultation for Hesperia businesses in order to counteract the economic downturn.
Complete 250 visits and surveys of Hesperia businesses as part of the “Feet on the Street” Program.
Participate in local, regional, and national trade shows to promote doing business in the City of Hesperia.
Prepare and assume property management functions of Eagle Plaza.
Evaluate formation of two non-profit 501(c)(3) organizations to facilitate Agency’s real estate holdings and general City functions.
PERFORMANCE AND WORKLOAD INDICATORS
2007-08
2008-09
2009-10
2010-11
Active Development Leads 60 47 61 75
Formal Proposals Prepared and Submitted 110 61 31 38
Quarterly Newsletters 4 4 4 4
Focused Event Sponsorships 11 7 10 8
Groundbreakings 4 6 6 16
Ribbon Cuttings 4 7 3 20
Advertising Placements 48 50 45 50
Trade Shows/Exhibitions Attended and Booth Displayed 6 11 9 9
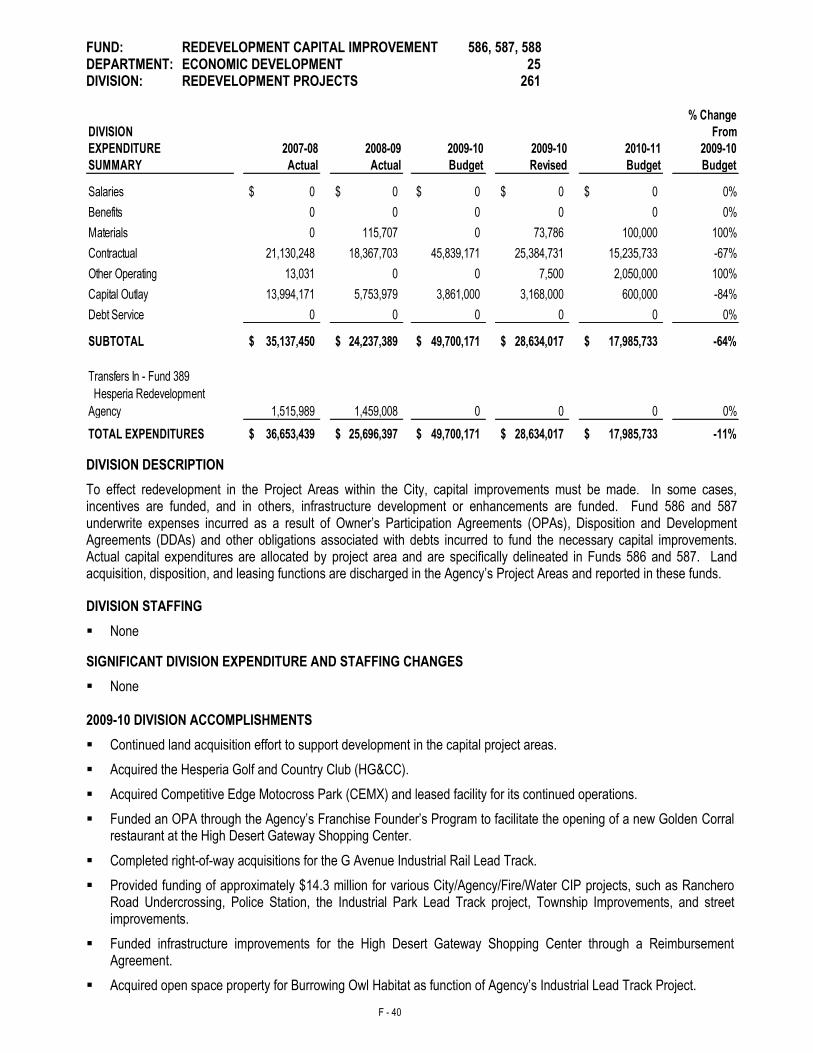
F - 40
FUND: REDEVELOPMENT CAPITAL IMPROVEMENT 586, 587, 588 DEPARTMENT: ECONOMIC DEVELOPMENT 25 DIVISION: REDEVELOPMENT PROJECTS 261
% Change
DIVISION From
EXPENDITURE 2007-08 2008-09 2009-10 2009-10 2010-11 2009-10
SUMMARY Actual Actual Budget Revised Budget Budget
Salaries 0$ 0$ 0$ 0$ 0$ 0%
Benefits 0 0 0 0 0 0%
Materials 0 115,707 0 73,786 100,000 100%
Contractual 21,130,248 18,367,703 45,839,171 25,384,731 15,235,733 -67%
Other Operating 13,031 0 0 7,500 2,050,000 100%
Capital Outlay 13,994,171 5,753,979 3,861,000 3,168,000 600,000 -84%
Debt Service 0 0 0 0 0 0%
SUBTOTAL 35,137,450$ 24,237,389$ 49,700,171$ 28,634,017$ 17,985,733$ -64%
Transfers In - Fund 389
Hesperia Redevelopment
Agency 1,515,989 1,459,008 0 0 0 0%
TOTAL EXPENDITURES 36,653,439$ 25,696,397$ 49,700,171$ 28,634,017$ 17,985,733$ -11%
DIVISION DESCRIPTION
To effect redevelopment in the Project Areas within the City, capital improvements must be made. In some cases, incentives are funded, and in others, infrastructure development or enhancements are funded. Fund 586 and 587 underwrite expenses incurred as a result of Owner’s Participation Agreements (OPAs), Disposition and Development Agreements (DDAs) and other obligations associated with debts incurred to fund the necessary capital improvements. Actual capital expenditures are allocated by project area and are specifically delineated in Funds 586 and 587. Land acquisition, disposition, and leasing functions are discharged in the Agency’s Project Areas and reported in these funds.
DIVISION STAFFING
None
SIGNIFICANT DIVISION EXPENDITURE AND STAFFING CHANGES
None 2009-10 DIVISION ACCOMPLISHMENTS
Continued land acquisition effort to support development in the capital project areas.
Acquired the Hesperia Golf and Country Club (HG&CC).
Acquired Competitive Edge Motocross Park (CEMX) and leased facility for its continued operations.
Funded an OPA through the Agency’s Franchise Founder’s Program to facilitate the opening of a new Golden Corral restaurant at the High Desert Gateway Shopping Center.
Completed right-of-way acquisitions for the G Avenue Industrial Rail Lead Track.
Provided funding of approximately $14.3 million for various City/Agency/Fire/Water CIP projects, such as Ranchero Road Undercrossing, Police Station, the Industrial Park Lead Track project, Township Improvements, and street improvements.
Funded infrastructure improvements for the High Desert Gateway Shopping Center through a Reimbursement Agreement.
Acquired open space property for Burrowing Owl Habitat as function of Agency’s Industrial Lead Track Project.
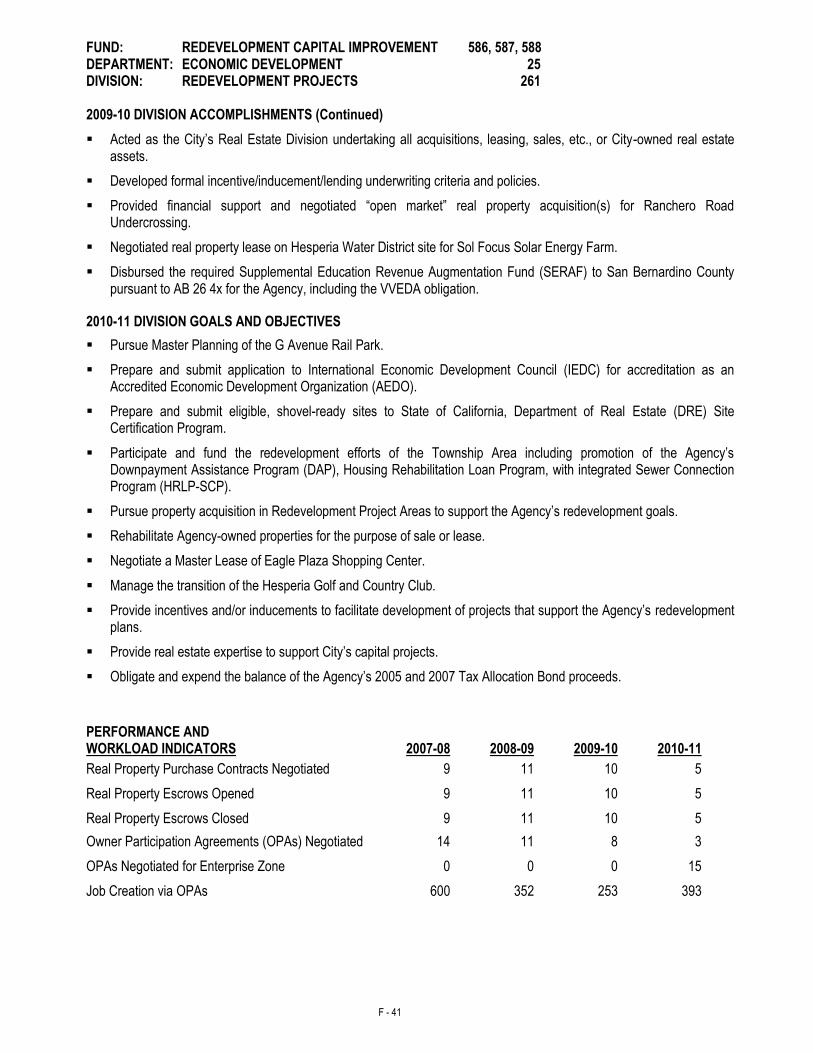
F - 41
FUND: REDEVELOPMENT CAPITAL IMPROVEMENT 586, 587, 588 DEPARTMENT: ECONOMIC DEVELOPMENT 25 DIVISION: REDEVELOPMENT PROJECTS 261 2009-10 DIVISION ACCOMPLISHMENTS (Continued)
Acted as the City’s Real Estate Division undertaking all acquisitions, leasing, sales, etc., or City-owned real estate assets.
Developed formal incentive/inducement/lending underwriting criteria and policies.
Provided financial support and negotiated “open market” real property acquisition(s) for Ranchero Road Undercrossing.
Negotiated real property lease on Hesperia Water District site for Sol Focus Solar Energy Farm.
Disbursed the required Supplemental Education Revenue Augmentation Fund (SERAF) to San Bernardino County pursuant to AB 26 4x for the Agency, including the VVEDA obligation.
2010-11 DIVISION GOALS AND OBJECTIVES
Pursue Master Planning of the G Avenue Rail Park.
Prepare and submit application to International Economic Development Council (IEDC) for accreditation as an Accredited Economic Development Organization (AEDO).
Prepare and submit eligible, shovel-ready sites to State of California, Department of Real Estate (DRE) Site Certification Program.
Participate and fund the redevelopment efforts of the Township Area including promotion of the Agency’s Downpayment Assistance Program (DAP), Housing Rehabilitation Loan Program, with integrated Sewer Connection Program (HRLP-SCP).
Pursue property acquisition in Redevelopment Project Areas to support the Agency’s redevelopment goals.
Rehabilitate Agency-owned properties for the purpose of sale or lease.
Negotiate a Master Lease of Eagle Plaza Shopping Center.
Manage the transition of the Hesperia Golf and Country Club.
Provide incentives and/or inducements to facilitate development of projects that support the Agency’s redevelopment plans.
Provide real estate expertise to support City’s capital projects.
Obligate and expend the balance of the Agency’s 2005 and 2007 Tax Allocation Bond proceeds.
PERFORMANCE AND WORKLOAD INDICATORS
2007-08
2008-09
2009-10
2010-11
Real Property Purchase Contracts Negotiated 9 11 10 5
Real Property Escrows Opened 9 11 10 5
Real Property Escrows Closed 9 11 10 5
Owner Participation Agreements (OPAs) Negotiated 14 11 8 3
OPAs Negotiated for Enterprise Zone 0 0 0 15
Job Creation via OPAs 600 352 253 393
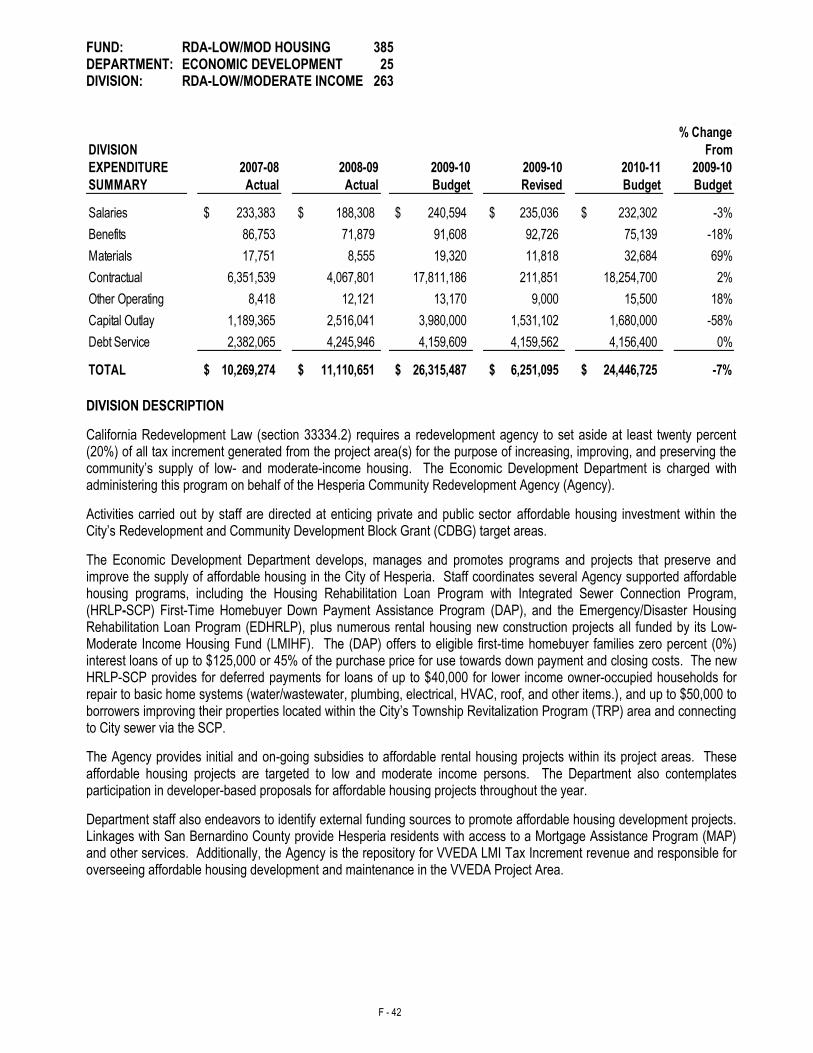
F - 42
FUND: RDA-LOW/MOD HOUSING 385 DEPARTMENT: ECONOMIC DEVELOPMENT 25 DIVISION: RDA-LOW/MODERATE INCOME 263
% Change
DIVISION From
EXPENDITURE 2007-08 2008-09 2009-10 2009-10 2010-11 2009-10
SUMMARY Actual Actual Budget Revised Budget Budget
Salaries 233,383$ 188,308$ 240,594$ 235,036$ 232,302$ -3%
Benefits 86,753 71,879 91,608 92,726 75,139 -18%
Materials 17,751 8,555 19,320 11,818 32,684 69%
Contractual 6,351,539 4,067,801 17,811,186 211,851 18,254,700 2%
Other Operating 8,418 12,121 13,170 9,000 15,500 18%
Capital Outlay 1,189,365 2,516,041 3,980,000 1,531,102 1,680,000 -58%
Debt Service 2,382,065 4,245,946 4,159,609 4,159,562 4,156,400 0%
TOTAL 10,269,274$ 11,110,651$ 26,315,487$ 6,251,095$ 24,446,725$ -7% DIVISION DESCRIPTION
California Redevelopment Law (section 33334.2) requires a redevelopment agency to set aside at least twenty percent (20%) of all tax increment generated from the project area(s) for the purpose of increasing, improving, and preserving the community’s supply of low- and moderate-income housing. The Economic Development Department is charged with administering this program on behalf of the Hesperia Community Redevelopment Agency (Agency).
Activities carried out by staff are directed at enticing private and public sector affordable housing investment within the City’s Redevelopment and Community Development Block Grant (CDBG) target areas.
The Economic Development Department develops, manages and promotes programs and projects that preserve and improve the supply of affordable housing in the City of Hesperia. Staff coordinates several Agency supported affordable housing programs, including the Housing Rehabilitation Loan Program with Integrated Sewer Connection Program, (HRLP-SCP) First-Time Homebuyer Down Payment Assistance Program (DAP), and the Emergency/Disaster Housing Rehabilitation Loan Program (EDHRLP), plus numerous rental housing new construction projects all funded by its Low-Moderate Income Housing Fund (LMIHF). The (DAP) offers to eligible first-time homebuyer families zero percent (0%) interest loans of up to $125,000 or 45% of the purchase price for use towards down payment and closing costs. The new HRLP-SCP provides for deferred payments for loans of up to $40,000 for lower income owner-occupied households for repair to basic home systems (water/wastewater, plumbing, electrical, HVAC, roof, and other items.), and up to $50,000 to borrowers improving their properties located within the City’s Township Revitalization Program (TRP) area and connecting to City sewer via the SCP.
The Agency provides initial and on-going subsidies to affordable rental housing projects within its project areas. These affordable housing projects are targeted to low and moderate income persons. The Department also contemplates participation in developer-based proposals for affordable housing projects throughout the year.
Department staff also endeavors to identify external funding sources to promote affordable housing development projects. Linkages with San Bernardino County provide Hesperia residents with access to a Mortgage Assistance Program (MAP) and other services. Additionally, the Agency is the repository for VVEDA LMI Tax Increment revenue and responsible for overseeing affordable housing development and maintenance in the VVEDA Project Area.
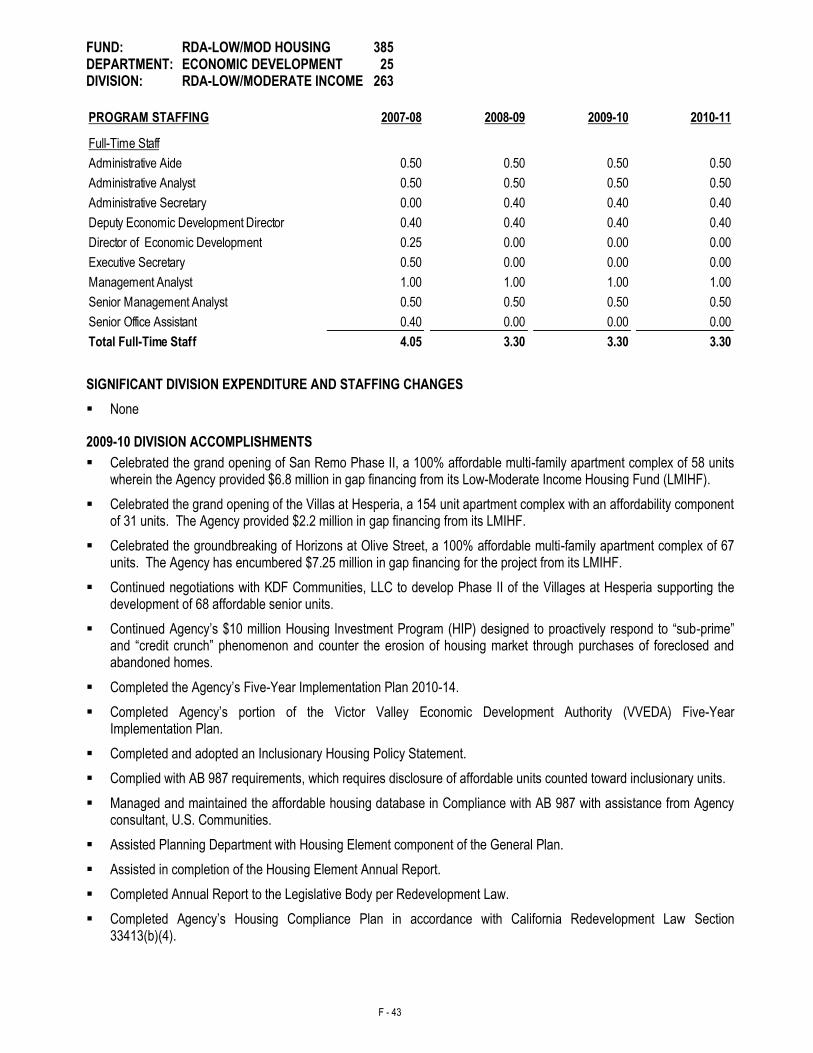
F - 43
FUND: RDA-LOW/MOD HOUSING 385 DEPARTMENT: ECONOMIC DEVELOPMENT 25 DIVISION: RDA-LOW/MODERATE INCOME 263
PROGRAM STAFFING 2007-08 2008-09 2009-10 2010-11
0.50 0.50 0.50 0.50
0.50 0.50 0.50 0.50
0.00 0.40 0.40 0.40
0.40 0.40 0.40 0.40
0.25 0.00 0.00 0.00
0.50 0.00 0.00 0.00
1.00 1.00 1.00 1.00
0.50 0.50 0.50 0.50
0.40 0.00 0.00 0.00
4.05 3.30 3.30 3.30Total Full-Time Staff
Full-Time Staff
Administrative Aide
Administrative Analyst
Administrative Secretary
Deputy Economic Development Director
Director of Economic Development
Executive Secretary
Senior Office Assistant
Management Analyst
Senior Management Analyst
SIGNIFICANT DIVISION EXPENDITURE AND STAFFING CHANGES
None
2009-10 DIVISION ACCOMPLISHMENTS
Celebrated the grand opening of San Remo Phase II, a 100% affordable multi-family apartment complex of 58 units wherein the Agency provided $6.8 million in gap financing from its Low-Moderate Income Housing Fund (LMIHF).
Celebrated the grand opening of the Villas at Hesperia, a 154 unit apartment complex with an affordability component of 31 units. The Agency provided $2.2 million in gap financing from its LMIHF.
Celebrated the groundbreaking of Horizons at Olive Street, a 100% affordable multi-family apartment complex of 67 units. The Agency has encumbered $7.25 million in gap financing for the project from its LMIHF.
Continued negotiations with KDF Communities, LLC to develop Phase II of the Villages at Hesperia supporting the development of 68 affordable senior units.
Continued Agency’s $10 million Housing Investment Program (HIP) designed to proactively respond to “sub-prime” and “credit crunch” phenomenon and counter the erosion of housing market through purchases of foreclosed and abandoned homes.
Completed the Agency’s Five-Year Implementation Plan 2010-14.
Completed Agency’s portion of the Victor Valley Economic Development Authority (VVEDA) Five-Year Implementation Plan.
Completed and adopted an Inclusionary Housing Policy Statement.
Complied with AB 987 requirements, which requires disclosure of affordable units counted toward inclusionary units.
Managed and maintained the affordable housing database in Compliance with AB 987 with assistance from Agency consultant, U.S. Communities.
Assisted Planning Department with Housing Element component of the General Plan.
Assisted in completion of the Housing Element Annual Report.
Completed Annual Report to the Legislative Body per Redevelopment Law.
Completed Agency’s Housing Compliance Plan in accordance with California Redevelopment Law Section 33413(b)(4).
F - 44
FUND: RDA-LOW/MOD HOUSING 385 DEPARTMENT: ECONOMIC DEVELOPMENT 25 DIVISION: RDA-LOW/MODERATE INCOME 263
2009-10 DIVISION ACCOMPLISHMENTS (Continued)
Continued efforts to identify and provide financial support to affordable housing developments within the Agency’s project areas.
Evaluated inclusionary housing production requirements for Hesperia’s VVEDA project area.
Developed and implemented affordable housing monitoring guidelines for affordable units restricted by HOME regulations.
Completed annual on-site monitoring of affordable HOME units and RDA units.
Established monitoring database through U.S. Communities Housing Compliance Services Software.
Trained property managers from four affordable housing projects on U.S. Communities Housing Compliance Services software for bi-annual reporting.
Underwrote DAP applications in-house as opposed to contracting for service.
Closed escrow on four acre R-3 site for future affordable housing development.
2010-11 DIVISION GOALS AND OBJECTIVES
Issue a Notice of Funding Availability (NOFA) for Agency affordable multi-family housing projects.
Continue efforts to identify and provide financial support to affordable housing developments within the Agency’s project areas.
Facilitate production of affordable housing units by providing subsidized financing to qualified developers currently in discussions with the Agency including AMCAL, The Related Companies of California, and The Northridge Group, Inc.
Negotiate an OPA with KDF Communities, LLC to develop Phase II of the Villages at Hesperia supporting the development of 68 affordable senior units.
Negotiate an OPA with AmCal to develop a 100% affordable apartment complex.
Negotiate an OPA with The Related Companies of California to develop a 100% affordable apartment complex.
Manage and maintain the affordable housing database in compliance with AB 987 with assistance from U.S. Communities.
Complete annual on-site monitoring of affordable HOME units and RDA units.
Complete bi-annual review and monitoring of HOME and RDA unit reports through U.S. Communities Housing Compliance Services software.
Establish accounts receivable for affordable housing new construction, downpayment assistance and housing rehabilitation loan repayments.
Underwrite HRLP applications in-house as opposed to contracting for service.
Develop housing underwriting policies and procedures.
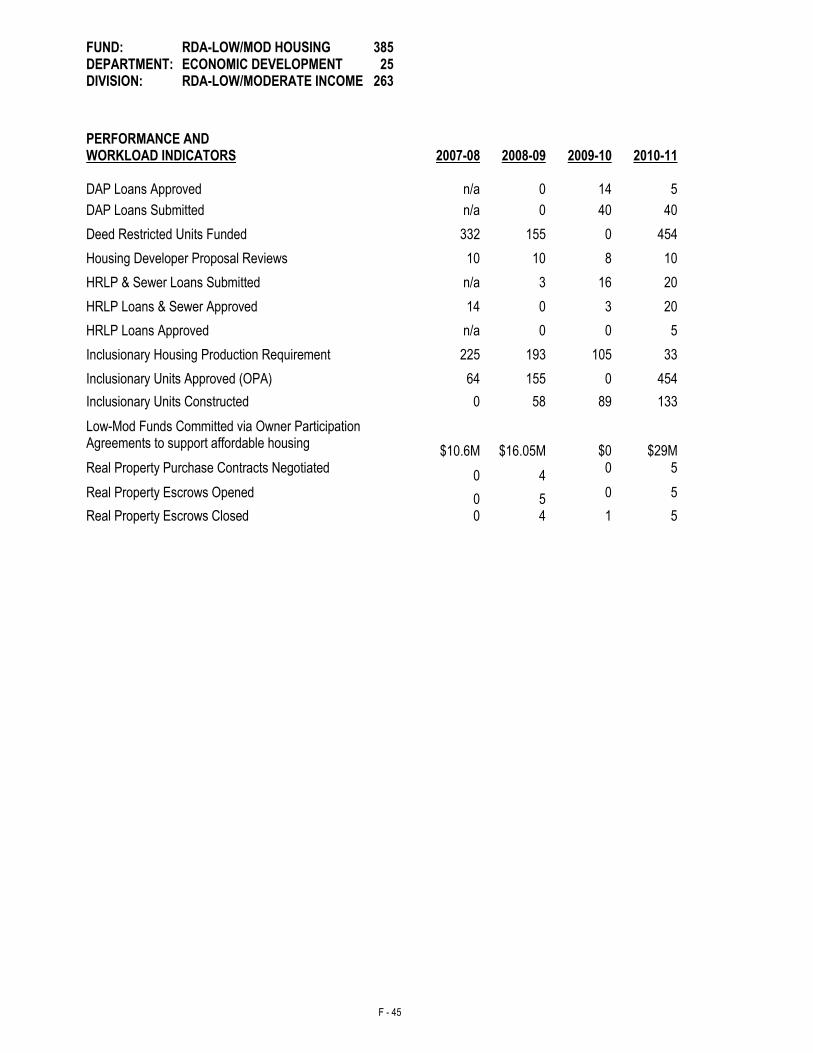
F - 45
FUND: RDA-LOW/MOD HOUSING 385 DEPARTMENT: ECONOMIC DEVELOPMENT 25 DIVISION: RDA-LOW/MODERATE INCOME 263
PERFORMANCE AND WORKLOAD INDICATORS 2007-08 2008-09
2009-10
2010-11
DAP Loans Approved n/a 0 14 5
DAP Loans Submitted n/a 0 40 40
Deed Restricted Units Funded 332 155 0 454
Housing Developer Proposal Reviews 10 10 8 10
HRLP & Sewer Loans Submitted n/a 3 16 20
HRLP Loans & Sewer Approved 14 0 3 20
HRLP Loans Approved n/a 0 0 5
Inclusionary Housing Production Requirement 225 193 105 33
Inclusionary Units Approved (OPA) 64 155 0 454
Inclusionary Units Constructed 0 58 89 133
Low-Mod Funds Committed via Owner Participation Agreements to support affordable housing
$10.6M $16.05M
$0
$29M
Real Property Purchase Contracts Negotiated 0 4
0 5
Real Property Escrows Opened 0 5 0 5
Real Property Escrows Closed 0 4 1 5
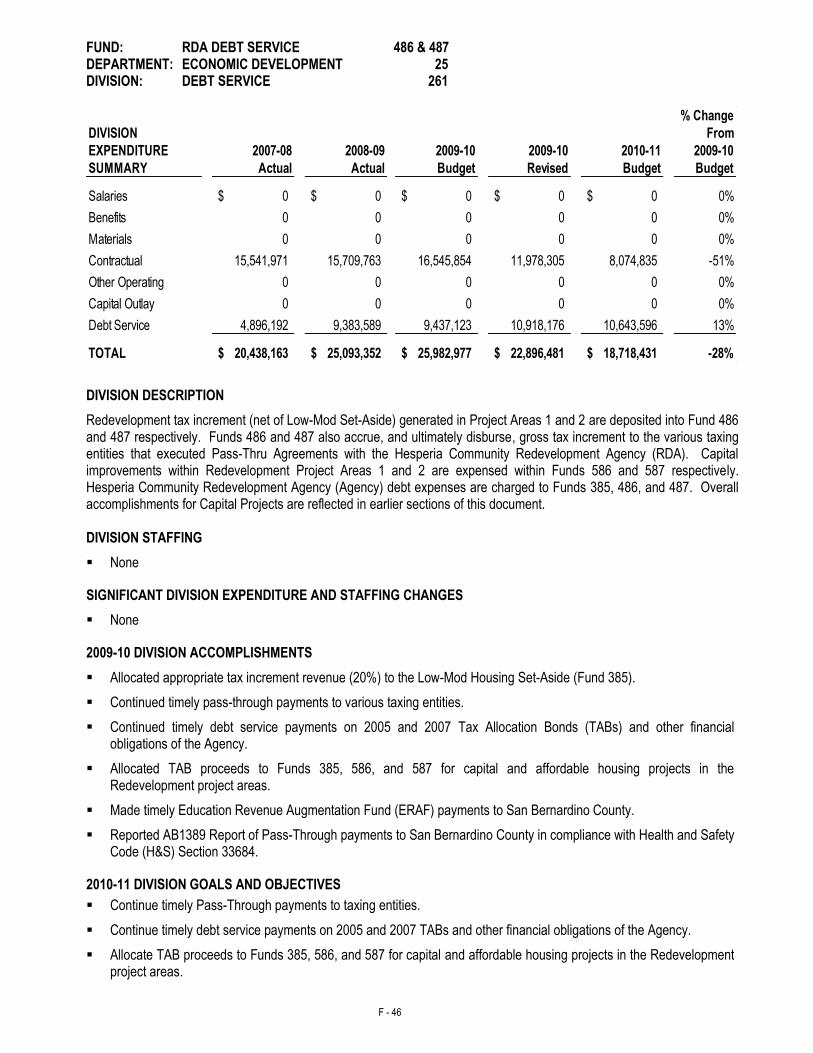
F - 46
FUND: RDA DEBT SERVICE 486 & 487 DEPARTMENT: ECONOMIC DEVELOPMENT 25 DIVISION: DEBT SERVICE 261
% Change
DIVISION From
EXPENDITURE 2007-08 2008-09 2009-10 2009-10 2010-11 2009-10
SUMMARY Actual Actual Budget Revised Budget Budget
Salaries 0$ 0$ 0$ 0$ 0$ 0%
Benefits 0 0 0 0 0 0%
Materials 0 0 0 0 0 0%
Contractual 15,541,971 15,709,763 16,545,854 11,978,305 8,074,835 -51%
Other Operating 0 0 0 0 0 0%
Capital Outlay 0 0 0 0 0 0%
Debt Service 4,896,192 9,383,589 9,437,123 10,918,176 10,643,596 13%
TOTAL 20,438,163$ 25,093,352$ 25,982,977$ 22,896,481$ 18,718,431$ -28%
DIVISION DESCRIPTION
Redevelopment tax increment (net of Low-Mod Set-Aside) generated in Project Areas 1 and 2 are deposited into Fund 486 and 487 respectively. Funds 486 and 487 also accrue, and ultimately disburse, gross tax increment to the various taxing entities that executed Pass-Thru Agreements with the Hesperia Community Redevelopment Agency (RDA). Capital improvements within Redevelopment Project Areas 1 and 2 are expensed within Funds 586 and 587 respectively. Hesperia Community Redevelopment Agency (Agency) debt expenses are charged to Funds 385, 486, and 487. Overall accomplishments for Capital Projects are reflected in earlier sections of this document. DIVISION STAFFING
None
SIGNIFICANT DIVISION EXPENDITURE AND STAFFING CHANGES
None
2009-10 DIVISION ACCOMPLISHMENTS
Allocated appropriate tax increment revenue (20%) to the Low-Mod Housing Set-Aside (Fund 385).
Continued timely pass-through payments to various taxing entities.
Continued timely debt service payments on 2005 and 2007 Tax Allocation Bonds (TABs) and other financial obligations of the Agency.
Allocated TAB proceeds to Funds 385, 586, and 587 for capital and affordable housing projects in the Redevelopment project areas.
Made timely Education Revenue Augmentation Fund (ERAF) payments to San Bernardino County.
Reported AB1389 Report of Pass-Through payments to San Bernardino County in compliance with Health and Safety Code (H&S) Section 33684.
2010-11 DIVISION GOALS AND OBJECTIVES
Continue timely Pass-Through payments to taxing entities.
Continue timely debt service payments on 2005 and 2007 TABs and other financial obligations of the Agency.
Allocate TAB proceeds to Funds 385, 586, and 587 for capital and affordable housing projects in the Redevelopment project areas.
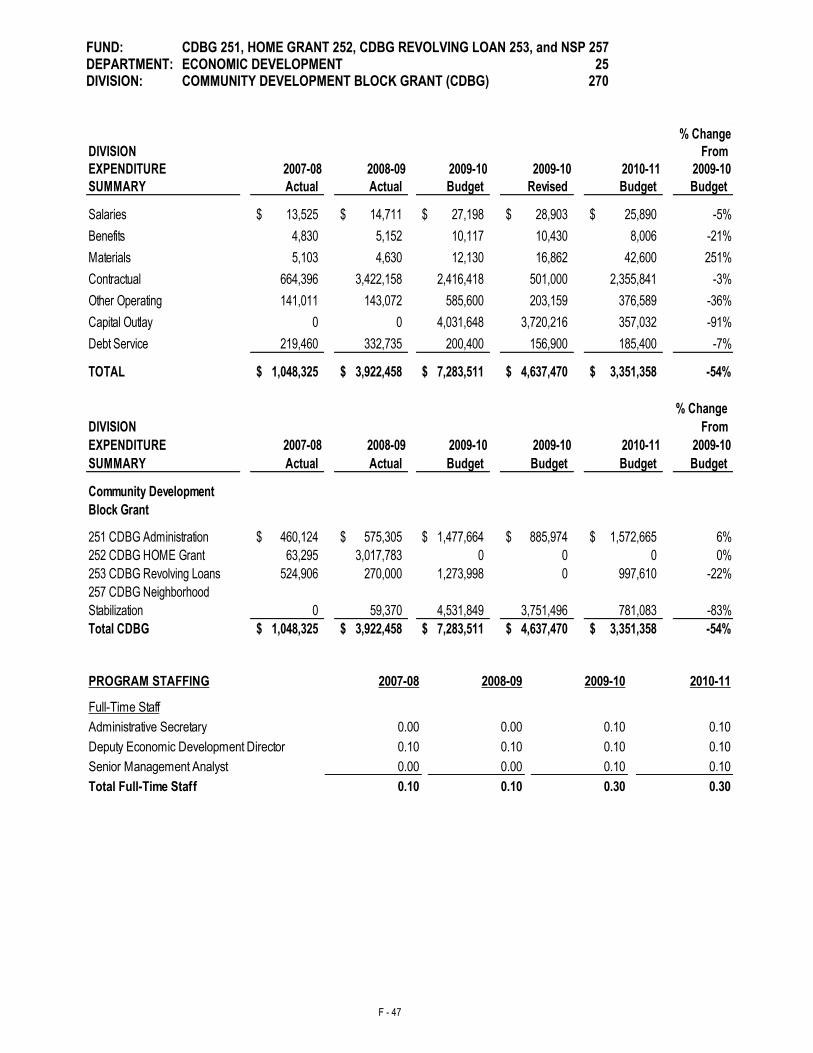
F - 47
FUND: CDBG 251, HOME GRANT 252, CDBG REVOLVING LOAN 253, and NSP 257 DEPARTMENT: ECONOMIC DEVELOPMENT 25 DIVISION: COMMUNITY DEVELOPMENT BLOCK GRANT (CDBG) 270
% Change
DIVISION From
EXPENDITURE 2007-08 2008-09 2009-10 2009-10 2010-11 2009-10
SUMMARY Actual Actual Budget Revised Budget Budget
Salaries 13,525$ 14,711$ 27,198$ 28,903$ 25,890$ -5%
Benefits 4,830 5,152 10,117 10,430 8,006 -21%
Materials 5,103 4,630 12,130 16,862 42,600 251%
Contractual 664,396 3,422,158 2,416,418 501,000 2,355,841 -3%
Other Operating 141,011 143,072 585,600 203,159 376,589 -36%
Capital Outlay 0 0 4,031,648 3,720,216 357,032 -91%
Debt Service 219,460 332,735 200,400 156,900 185,400 -7%
TOTAL 1,048,325$ 3,922,458$ 7,283,511$ 4,637,470$ 3,351,358$ -54%
% Change
DIVISION From
EXPENDITURE 2007-08 2008-09 2009-10 2009-10 2010-11 2009-10
SUMMARY Actual Actual Budget Budget Budget Budget
Community Development
Block Grant
251 CDBG Administration 460,124$ 575,305$ 1,477,664$ 885,974$ 1,572,665$ 6%
252 CDBG HOME Grant 63,295 3,017,783 0 0 0 0%
253 CDBG Revolving Loans 524,906 270,000 1,273,998 0 997,610 -22%
257 CDBG Neighborhood
Stabilization 0 59,370 4,531,849 3,751,496 781,083 -83%
Total CDBG 1,048,325$ 3,922,458$ 7,283,511$ 4,637,470$ 3,351,358$ -54%
PROGRAM STAFFING 2007-08 2008-09 2009-10 2010-11
0.00 0.00 0.10 0.10
0.10 0.10 0.10 0.10
0.00 0.00 0.10 0.10
0.10 0.10 0.30 0.30Total Full-Time Staff
Senior Management Analyst
Full-Time Staff
Administrative Secretary
Deputy Economic Development Director
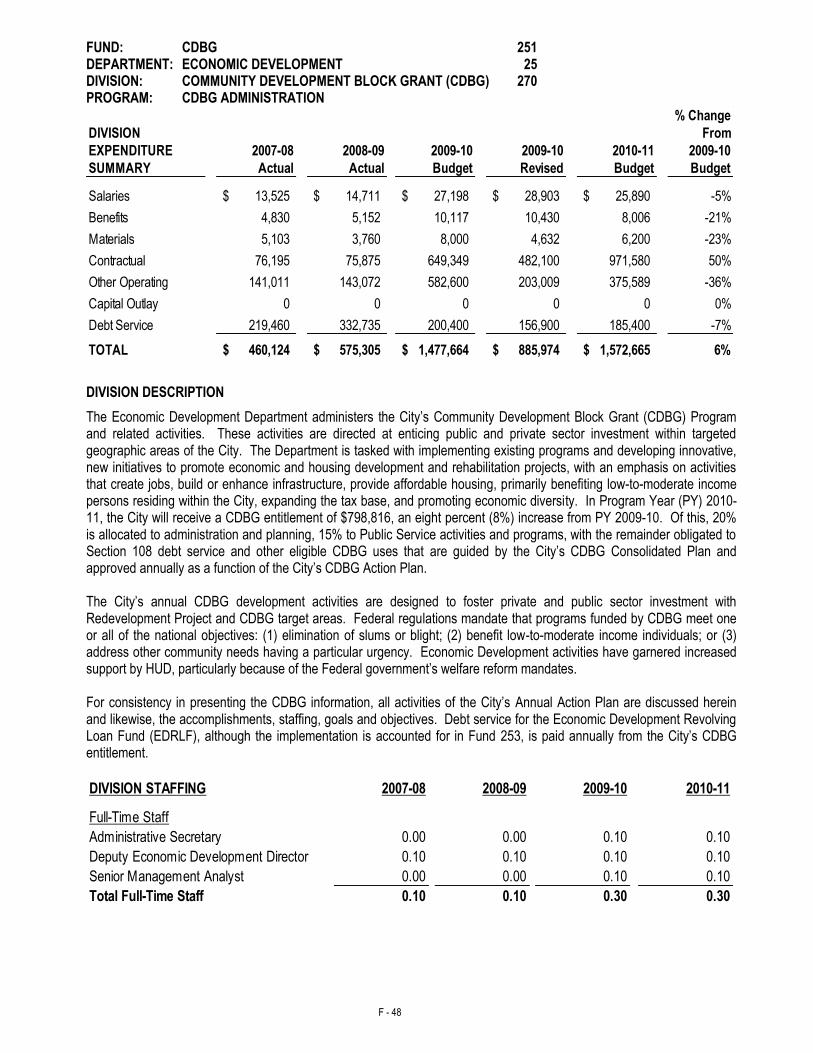
F - 48
FUND: CDBG 251 DEPARTMENT: ECONOMIC DEVELOPMENT 25 DIVISION: COMMUNITY DEVELOPMENT BLOCK GRANT (CDBG) 270 PROGRAM: CDBG ADMINISTRATION
% Change
DIVISION From
EXPENDITURE 2007-08 2008-09 2009-10 2009-10 2010-11 2009-10
SUMMARY Actual Actual Budget Revised Budget Budget
Salaries 13,525$ 14,711$ 27,198$ 28,903$ 25,890$ -5%
Benefits 4,830 5,152 10,117 10,430 8,006 -21%
Materials 5,103 3,760 8,000 4,632 6,200 -23%
Contractual 76,195 75,875 649,349 482,100 971,580 50%
Other Operating 141,011 143,072 582,600 203,009 375,589 -36%
Capital Outlay 0 0 0 0 0 0%
Debt Service 219,460 332,735 200,400 156,900 185,400 -7%
TOTAL 460,124$ 575,305$ 1,477,664$ 885,974$ 1,572,665$ 6%
DIVISION DESCRIPTION
The Economic Development Department administers the City’s Community Development Block Grant (CDBG) Program and related activities. These activities are directed at enticing public and private sector investment within targeted geographic areas of the City. The Department is tasked with implementing existing programs and developing innovative, new initiatives to promote economic and housing development and rehabilitation projects, with an emphasis on activities that create jobs, build or enhance infrastructure, provide affordable housing, primarily benefiting low-to-moderate income persons residing within the City, expanding the tax base, and promoting economic diversity. In Program Year (PY) 2010-11, the City will receive a CDBG entitlement of $798,816, an eight percent (8%) increase from PY 2009-10. Of this, 20% is allocated to administration and planning, 15% to Public Service activities and programs, with the remainder obligated to Section 108 debt service and other eligible CDBG uses that are guided by the City’s CDBG Consolidated Plan and approved annually as a function of the City’s CDBG Action Plan. The City’s annual CDBG development activities are designed to foster private and public sector investment with Redevelopment Project and CDBG target areas. Federal regulations mandate that programs funded by CDBG meet one or all of the national objectives: (1) elimination of slums or blight; (2) benefit low-to-moderate income individuals; or (3) address other community needs having a particular urgency. Economic Development activities have garnered increased support by HUD, particularly because of the Federal government’s welfare reform mandates. For consistency in presenting the CDBG information, all activities of the City’s Annual Action Plan are discussed herein and likewise, the accomplishments, staffing, goals and objectives. Debt service for the Economic Development Revolving Loan Fund (EDRLF), although the implementation is accounted for in Fund 253, is paid annually from the City’s CDBG entitlement.
DIVISION STAFFING 2007-08 2008-09 2009-10 2010-11
0.00 0.00 0.10 0.10
0.10 0.10 0.10 0.10
0.00 0.00 0.10 0.10
0.10 0.10 0.30 0.30
Full-Time Staff
Deputy Economic Development Director
Administrative Secretary
Senior Management Analyst
Total Full-Time Staff
F - 49
FUND: CDBG 251 DEPARTMENT: ECONOMIC DEVELOPMENT 25 DIVISION: COMMUNITY DEVELOPMENT BLOCK GRANT (CDBG) 270 PROGRAM: CDBG ADMINISTRATION SIGNIFICANT DIVISION EXPENDITURE AND STAFFING CHANGES
None
2009-10 DIVISION ACCOMPLISHMENTS
Developed and submitted 2010-11 CDBG Action Plan to U.S. Department of Housing and Urban Development (HUD).
Prepared the City’s 2010-14 Five-Year CDBG Consolidated Plan.
Reprogrammed prior years’ unspent CDBG entitlements.
Met HUD timeliness test for Program Year (PY) 2009-10.
Submitted 2008-09 Consolidated Annual Performance and Evaluation Report (CAPER).
Implemented programs and projects consistent with the City’s CDBG Five-Year Consolidated Plan.
Submitted timely required financial and performance reports to HUD, including the Section 3 Report.
Supported capital/public improvement projects in CDBG target area.
Continued implementation of the CDBG Housing Rehabilitation Loan Program (HRLP).
Provided staffing support to the City’s HOME Programs (Fund 252) and Housing Rehabilitation Loan Program (HRLP).
Provided staff support for Economic Development Revolving Loan Fund (253) efforts.
Prepared and submitted a substantial amendment to the City’s 2009-10 Action Plan to appropriate $365,334 funds for an “urgent need” need project to reconstruct Third Avenue.
Applied and received $197,549 CDBG-R for economic development through a Substantial Amendment to Action Plan 2008-09.
Supported Golden Corral with the CDBG-R funding.
2010-11 DIVISION GOALS AND OBJECTIVES
Support the rehabilitation of Neighborhood Stabilization Program (NSP) purchased properties.
Identify unspent prior years’ CDBG entitlements and initiate appropriate reprogramming.
Support capital/public improvement projects in CDBG target areas.
Continue timely draw-down CDBG resources.
Submit 2009-10 Consolidated Annual Performance and Evaluation Report (CAPER).
Continue land acquisition efforts within the CDBG target areas.
Support the development of affordable, safe, and decent housing within the CDBG target areas.
Continue funding and support of CDBG Housing Rehabilitation Loan Program (HRLP).
Continue staffing support for the City’s HOME Grant Program (Fund 252) and Economic Development Revolving Loan Fund (Fund 253).
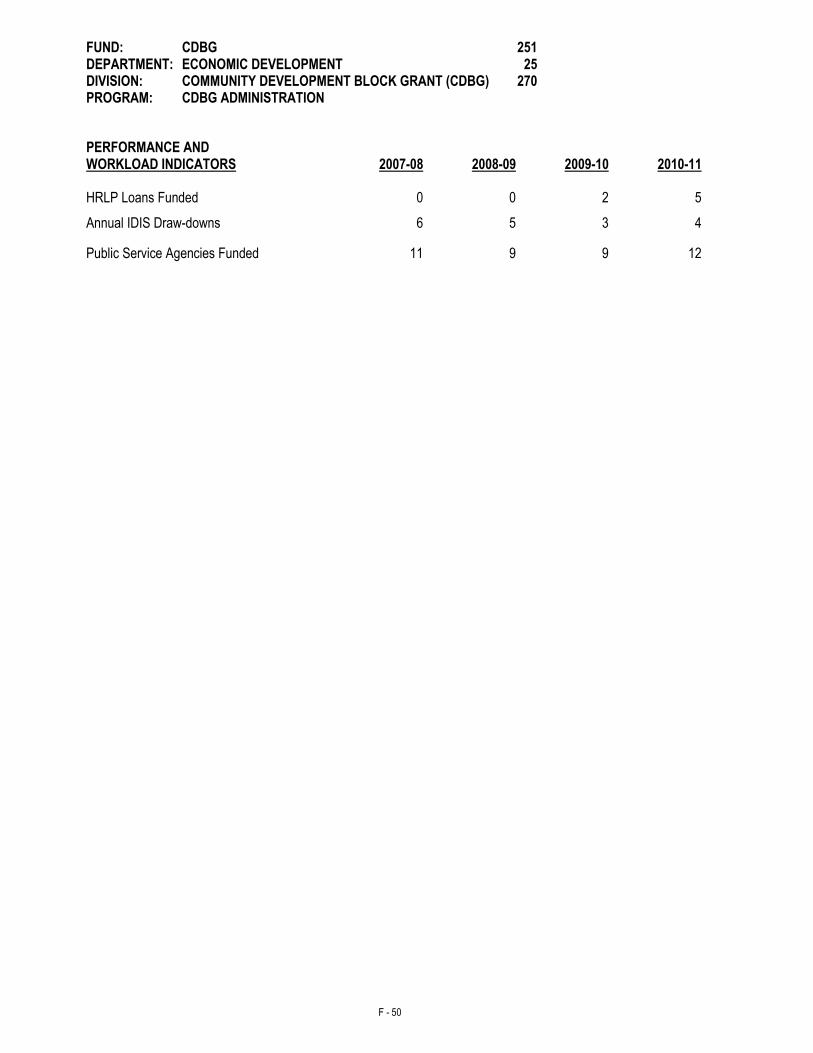
F - 50
FUND: CDBG 251 DEPARTMENT: ECONOMIC DEVELOPMENT 25 DIVISION: COMMUNITY DEVELOPMENT BLOCK GRANT (CDBG) 270 PROGRAM: CDBG ADMINISTRATION
PERFORMANCE AND WORKLOAD INDICATORS 2007-08 2008-09
2009-10
2010-11
HRLP Loans Funded 0 0 2 5
Annual IDIS Draw-downs 6 5 3 4
Public Service Agencies Funded 11 9 9 12
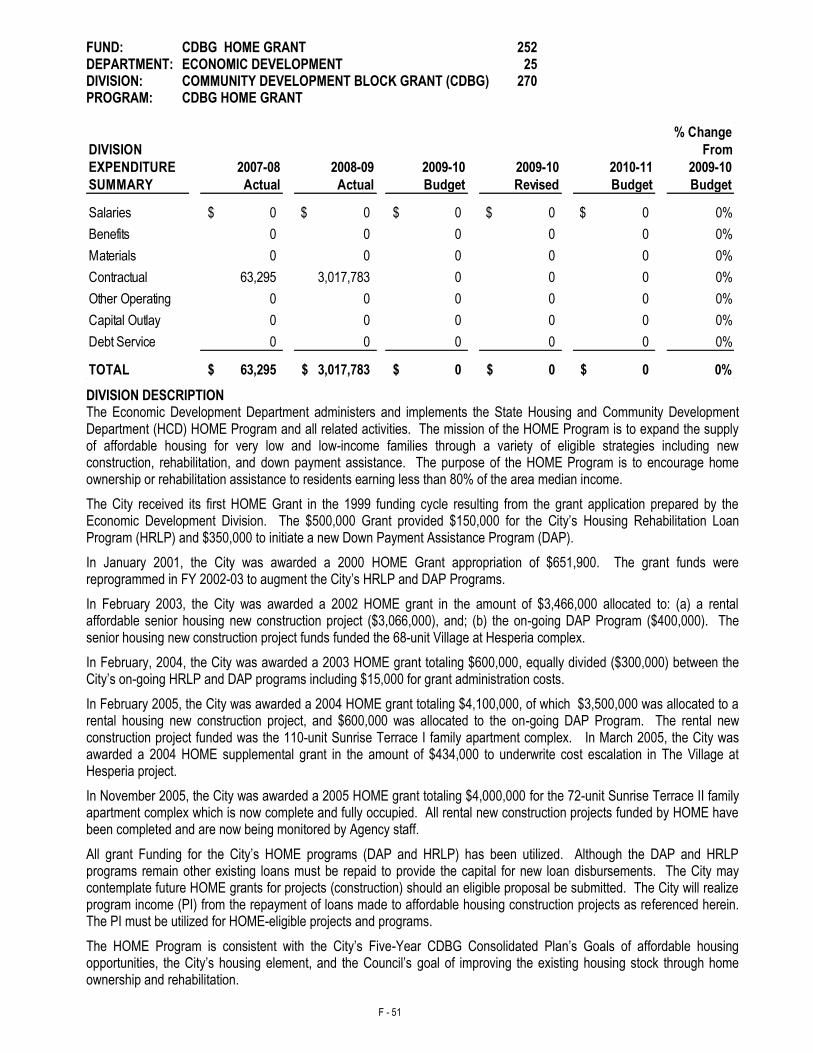
F - 51
FUND: CDBG HOME GRANT 252 DEPARTMENT: ECONOMIC DEVELOPMENT 25 DIVISION: COMMUNITY DEVELOPMENT BLOCK GRANT (CDBG) 270 PROGRAM: CDBG HOME GRANT
% Change
DIVISION From
EXPENDITURE 2007-08 2008-09 2009-10 2009-10 2010-11 2009-10
SUMMARY Actual Actual Budget Revised Budget Budget
Salaries 0$ 0$ 0$ 0$ 0$ 0%
Benefits 0 0 0 0 0 0%
Materials 0 0 0 0 0 0%
Contractual 63,295 3,017,783 0 0 0 0%
Other Operating 0 0 0 0 0 0%
Capital Outlay 0 0 0 0 0 0%
Debt Service 0 0 0 0 0 0%
TOTAL 63,295$ 3,017,783$ 0$ 0$ 0$ 0%
DIVISION DESCRIPTION The Economic Development Department administers and implements the State Housing and Community Development Department (HCD) HOME Program and all related activities. The mission of the HOME Program is to expand the supply of affordable housing for very low and low-income families through a variety of eligible strategies including new construction, rehabilitation, and down payment assistance. The purpose of the HOME Program is to encourage home ownership or rehabilitation assistance to residents earning less than 80% of the area median income.
The City received its first HOME Grant in the 1999 funding cycle resulting from the grant application prepared by the Economic Development Division. The $500,000 Grant provided $150,000 for the City’s Housing Rehabilitation Loan Program (HRLP) and $350,000 to initiate a new Down Payment Assistance Program (DAP).
In January 2001, the City was awarded a 2000 HOME Grant appropriation of $651,900. The grant funds were reprogrammed in FY 2002-03 to augment the City’s HRLP and DAP Programs.
In February 2003, the City was awarded a 2002 HOME grant in the amount of $3,466,000 allocated to: (a) a rental affordable senior housing new construction project ($3,066,000), and; (b) the on-going DAP Program ($400,000). The senior housing new construction project funds funded the 68-unit Village at Hesperia complex.
In February, 2004, the City was awarded a 2003 HOME grant totaling $600,000, equally divided ($300,000) between the City’s on-going HRLP and DAP programs including $15,000 for grant administration costs.
In February 2005, the City was awarded a 2004 HOME grant totaling $4,100,000, of which $3,500,000 was allocated to a rental housing new construction project, and $600,000 was allocated to the on-going DAP Program. The rental new construction project funded was the 110-unit Sunrise Terrace I family apartment complex. In March 2005, the City was awarded a 2004 HOME supplemental grant in the amount of $434,000 to underwrite cost escalation in The Village at Hesperia project.
In November 2005, the City was awarded a 2005 HOME grant totaling $4,000,000 for the 72-unit Sunrise Terrace II family apartment complex which is now complete and fully occupied. All rental new construction projects funded by HOME have been completed and are now being monitored by Agency staff.
All grant Funding for the City’s HOME programs (DAP and HRLP) has been utilized. Although the DAP and HRLP programs remain other existing loans must be repaid to provide the capital for new loan disbursements. The City may contemplate future HOME grants for projects (construction) should an eligible proposal be submitted. The City will realize program income (PI) from the repayment of loans made to affordable housing construction projects as referenced herein. The PI must be utilized for HOME-eligible projects and programs.
The HOME Program is consistent with the City’s Five-Year CDBG Consolidated Plan’s Goals of affordable housing opportunities, the City’s housing element, and the Council’s goal of improving the existing housing stock through home ownership and rehabilitation.
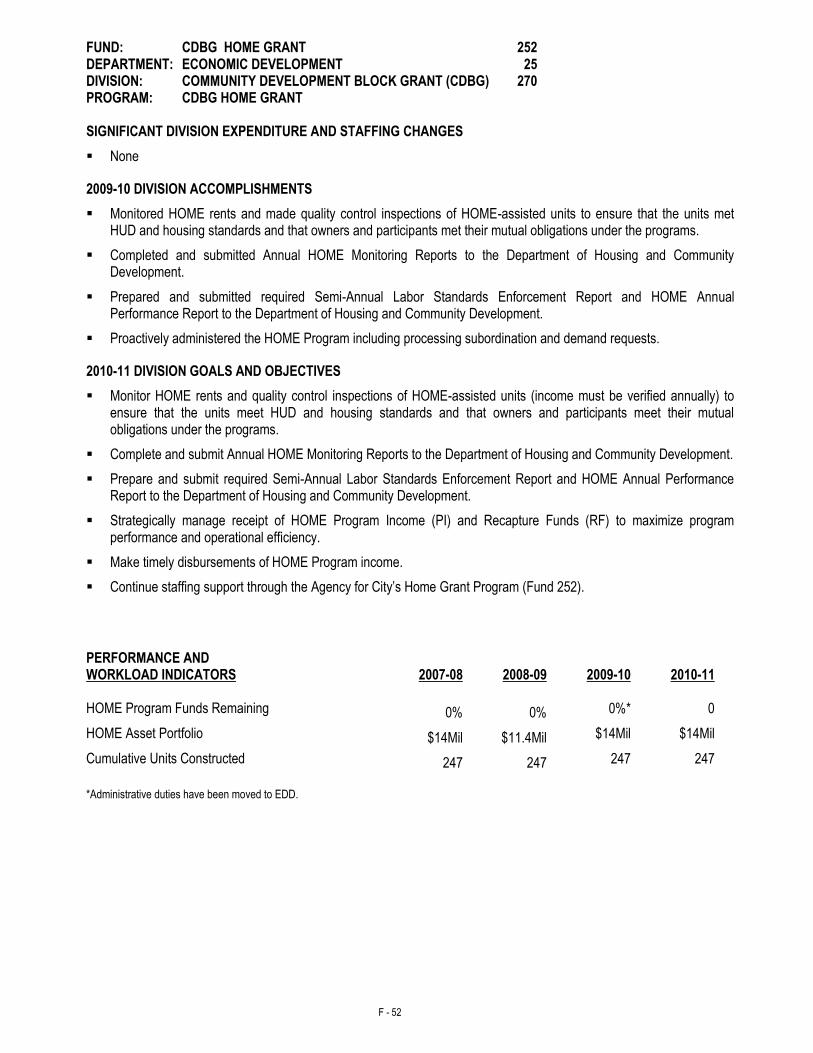
F - 52
FUND: CDBG HOME GRANT 252 DEPARTMENT: ECONOMIC DEVELOPMENT 25 DIVISION: COMMUNITY DEVELOPMENT BLOCK GRANT (CDBG) 270 PROGRAM: CDBG HOME GRANT SIGNIFICANT DIVISION EXPENDITURE AND STAFFING CHANGES
None
2009-10 DIVISION ACCOMPLISHMENTS
Monitored HOME rents and made quality control inspections of HOME-assisted units to ensure that the units met HUD and housing standards and that owners and participants met their mutual obligations under the programs.
Completed and submitted Annual HOME Monitoring Reports to the Department of Housing and Community Development.
Prepared and submitted required Semi-Annual Labor Standards Enforcement Report and HOME Annual Performance Report to the Department of Housing and Community Development.
Proactively administered the HOME Program including processing subordination and demand requests.
2010-11 DIVISION GOALS AND OBJECTIVES
Monitor HOME rents and quality control inspections of HOME-assisted units (income must be verified annually) to ensure that the units meet HUD and housing standards and that owners and participants meet their mutual obligations under the programs.
Complete and submit Annual HOME Monitoring Reports to the Department of Housing and Community Development.
Prepare and submit required Semi-Annual Labor Standards Enforcement Report and HOME Annual Performance Report to the Department of Housing and Community Development.
Strategically manage receipt of HOME Program Income (PI) and Recapture Funds (RF) to maximize program performance and operational efficiency.
Make timely disbursements of HOME Program income.
Continue staffing support through the Agency for City’s Home Grant Program (Fund 252).
*Administrative duties have been moved to EDD.
PERFORMANCE AND WORKLOAD INDICATORS 2007-08 2008-09
2009-10
2010-11
HOME Program Funds Remaining 0% 0% 0%* 0
HOME Asset Portfolio $14Mil $11.4Mil $14Mil $14Mil
Cumulative Units Constructed 247 247 247 247
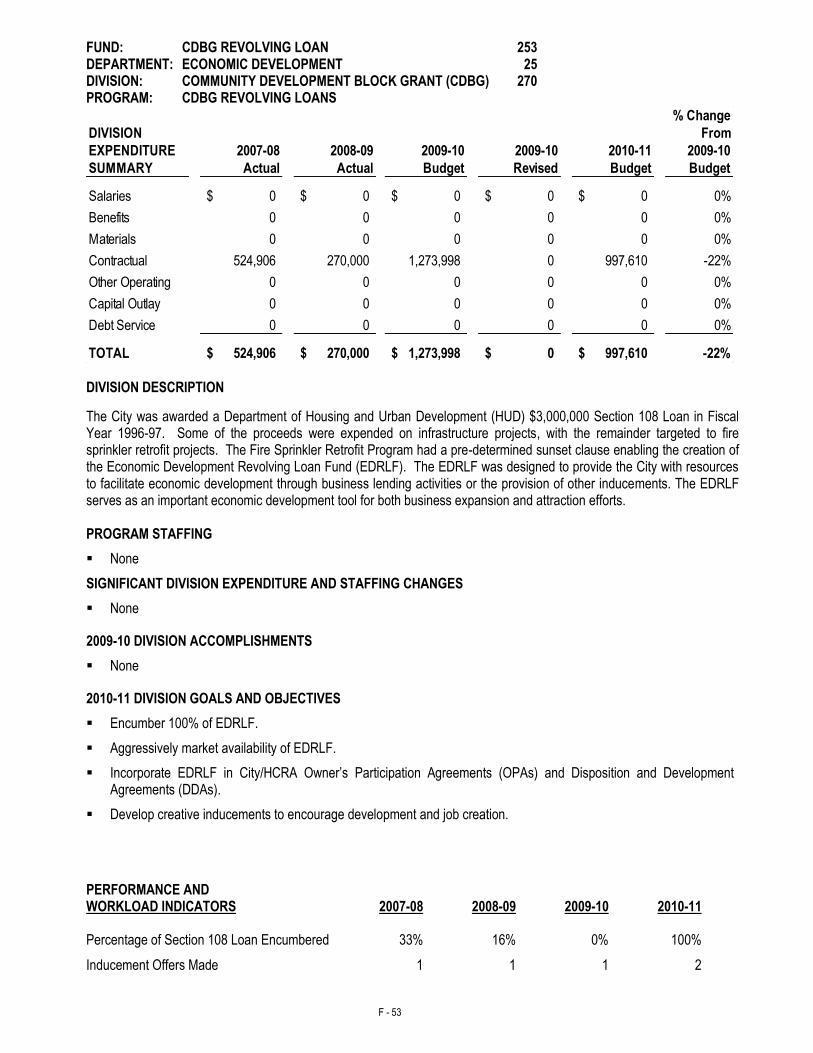
F - 53
FUND: CDBG REVOLVING LOAN 253 DEPARTMENT: ECONOMIC DEVELOPMENT 25 DIVISION: COMMUNITY DEVELOPMENT BLOCK GRANT (CDBG) 270 PROGRAM: CDBG REVOLVING LOANS
% Change
DIVISION From
EXPENDITURE 2007-08 2008-09 2009-10 2009-10 2010-11 2009-10
SUMMARY Actual Actual Budget Revised Budget Budget
Salaries 0$ 0$ 0$ 0$ 0$ 0%
Benefits 0 0 0 0 0 0%
Materials 0 0 0 0 0 0%
Contractual 524,906 270,000 1,273,998 0 997,610 -22%
Other Operating 0 0 0 0 0 0%
Capital Outlay 0 0 0 0 0 0%
Debt Service 0 0 0 0 0 0%
TOTAL 524,906$ 270,000$ 1,273,998$ 0$ 997,610$ -22% DIVISION DESCRIPTION
The City was awarded a Department of Housing and Urban Development (HUD) $3,000,000 Section 108 Loan in Fiscal Year 1996-97. Some of the proceeds were expended on infrastructure projects, with the remainder targeted to fire sprinkler retrofit projects. The Fire Sprinkler Retrofit Program had a pre-determined sunset clause enabling the creation of the Economic Development Revolving Loan Fund (EDRLF). The EDRLF was designed to provide the City with resources to facilitate economic development through business lending activities or the provision of other inducements. The EDRLF serves as an important economic development tool for both business expansion and attraction efforts. PROGRAM STAFFING
None
SIGNIFICANT DIVISION EXPENDITURE AND STAFFING CHANGES
None
2009-10 DIVISION ACCOMPLISHMENTS
None
2010-11 DIVISION GOALS AND OBJECTIVES
Encumber 100% of EDRLF.
Aggressively market availability of EDRLF.
Incorporate EDRLF in City/HCRA Owner’s Participation Agreements (OPAs) and Disposition and Development Agreements (DDAs).
Develop creative inducements to encourage development and job creation.
PERFORMANCE AND WORKLOAD INDICATORS 2007-08 2008-09
2009-10
2010-11 Percentage of Section 108 Loan Encumbered 33% 16% 0% 100%
Inducement Offers Made 1 1 1 2
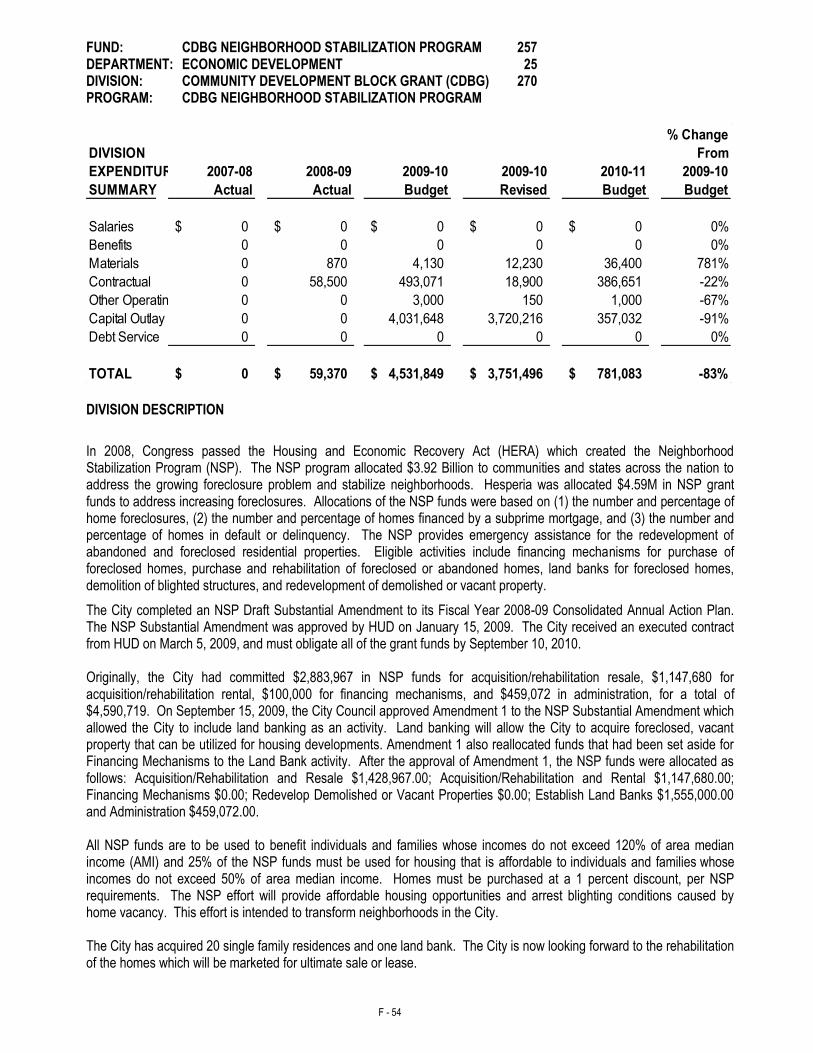
F - 54
FUND: CDBG NEIGHBORHOOD STABILIZATION PROGRAM 257 DEPARTMENT: ECONOMIC DEVELOPMENT 25 DIVISION: COMMUNITY DEVELOPMENT BLOCK GRANT (CDBG) 270 PROGRAM: CDBG NEIGHBORHOOD STABILIZATION PROGRAM
% Change
DIVISION From
EXPENDITURE 2007-08 2008-09 2009-10 2009-10 2010-11 2009-10
SUMMARY Actual Actual Budget Revised Budget Budget
Salaries 0$ 0$ 0$ 0$ 0$ 0%
Benefits 0 0 0 0 0 0%
Materials 0 870 4,130 12,230 36,400 781%
Contractual 0 58,500 493,071 18,900 386,651 -22%
Other Operating 0 0 3,000 150 1,000 -67%
Capital Outlay 0 0 4,031,648 3,720,216 357,032 -91%
Debt Service 0 0 0 0 0 0%
TOTAL 0$ 59,370$ 4,531,849$ 3,751,496$ 781,083$ -83% DIVISION DESCRIPTION
In 2008, Congress passed the Housing and Economic Recovery Act (HERA) which created the Neighborhood Stabilization Program (NSP). The NSP program allocated $3.92 Billion to communities and states across the nation to address the growing foreclosure problem and stabilize neighborhoods. Hesperia was allocated $4.59M in NSP grant funds to address increasing foreclosures. Allocations of the NSP funds were based on (1) the number and percentage of home foreclosures, (2) the number and percentage of homes financed by a subprime mortgage, and (3) the number and percentage of homes in default or delinquency. The NSP provides emergency assistance for the redevelopment of abandoned and foreclosed residential properties. Eligible activities include financing mechanisms for purchase of foreclosed homes, purchase and rehabilitation of foreclosed or abandoned homes, land banks for foreclosed homes, demolition of blighted structures, and redevelopment of demolished or vacant property.
The City completed an NSP Draft Substantial Amendment to its Fiscal Year 2008-09 Consolidated Annual Action Plan. The NSP Substantial Amendment was approved by HUD on January 15, 2009. The City received an executed contract from HUD on March 5, 2009, and must obligate all of the grant funds by September 10, 2010. Originally, the City had committed $2,883,967 in NSP funds for acquisition/rehabilitation resale, $1,147,680 for acquisition/rehabilitation rental, $100,000 for financing mechanisms, and $459,072 in administration, for a total of $4,590,719. On September 15, 2009, the City Council approved Amendment 1 to the NSP Substantial Amendment which allowed the City to include land banking as an activity. Land banking will allow the City to acquire foreclosed, vacant property that can be utilized for housing developments. Amendment 1 also reallocated funds that had been set aside for Financing Mechanisms to the Land Bank activity. After the approval of Amendment 1, the NSP funds were allocated as follows: Acquisition/Rehabilitation and Resale $1,428,967.00; Acquisition/Rehabilitation and Rental $1,147,680.00; Financing Mechanisms $0.00; Redevelop Demolished or Vacant Properties $0.00; Establish Land Banks $1,555,000.00 and Administration $459,072.00. All NSP funds are to be used to benefit individuals and families whose incomes do not exceed 120% of area median income (AMI) and 25% of the NSP funds must be used for housing that is affordable to individuals and families whose incomes do not exceed 50% of area median income. Homes must be purchased at a 1 percent discount, per NSP requirements. The NSP effort will provide affordable housing opportunities and arrest blighting conditions caused by home vacancy. This effort is intended to transform neighborhoods in the City. The City has acquired 20 single family residences and one land bank. The City is now looking forward to the rehabilitation of the homes which will be marketed for ultimate sale or lease.
F - 55
FUND: CDBG NEIGHBORHOOD STABILIZATION PROGRAM 257 DEPARTMENT: ECONOMIC DEVELOPMENT 25 DIVISION: COMMUNITY DEVELOPMENT BLOCK GRANT (CDBG) 270 PROGRAM: CDBG NEIGHBORHOOD STABILIZATION PROGRAM
SIGNIFICANT DIVISION EXPENDITURE AND STAFFING CHANGES
None
2009-10 DIVISION ACCOMPLISHMENTS
Obligated $4,090,065.06 of NSP funds.
Completed and submitted Amendment 1 to the NSP Substantial Amendment to the Department of Housing and Urban Development (HUD), adding Land Banking as an activity.
Received approval from HUD on Amendment 1 to the NSP Substantial Amendment.
Purchased 10.69 acres of foreclosed, vacant land in accordance with NSP Land Bank activity for future affordable housing project.
Acquired twenty foreclosed properties in accordance with NSP acquisition/rehabilitation/resale and acquisition/rehabilitation/lease activities.
Issued Request for Qualifications for NSP Housing Rehabilitation General Contractor.
Issued Request for Bids for rehabilitation on homes purchased through the NSP.
Identified homes acquired for lease to households earning 50% or less of AMI.
Completed NSP Policies and Procedures.
Submitted timely quarterly reports on the DRGR reporting system.
Completed two draws on the DRGR System.
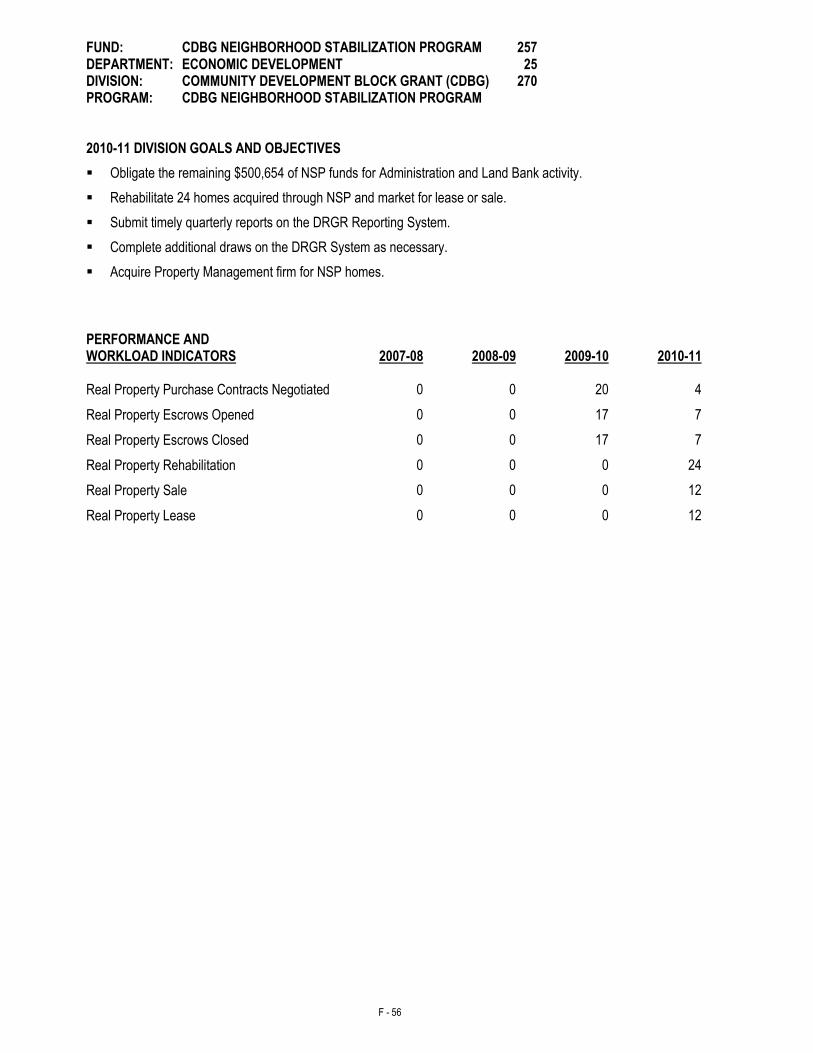
F - 56
FUND: CDBG NEIGHBORHOOD STABILIZATION PROGRAM 257 DEPARTMENT: ECONOMIC DEVELOPMENT 25 DIVISION: COMMUNITY DEVELOPMENT BLOCK GRANT (CDBG) 270 PROGRAM: CDBG NEIGHBORHOOD STABILIZATION PROGRAM 2010-11 DIVISION GOALS AND OBJECTIVES
Obligate the remaining $500,654 of NSP funds for Administration and Land Bank activity.
Rehabilitate 24 homes acquired through NSP and market for lease or sale.
Submit timely quarterly reports on the DRGR Reporting System.
Complete additional draws on the DRGR System as necessary.
Acquire Property Management firm for NSP homes.
PERFORMANCE AND WORKLOAD INDICATORS 2007-08 2008-09
2009-10
2010-11 Real Property Purchase Contracts Negotiated 0 0 20 4
Real Property Escrows Opened 0 0 17 7
Real Property Escrows Closed 0 0 17 7
Real Property Rehabilitation 0 0 0 24
Real Property Sale 0 0 0 12
Real Property Lease 0 0 0 12

F - 57
THIS PAGE INTENTIONALLY LEFT BLANK
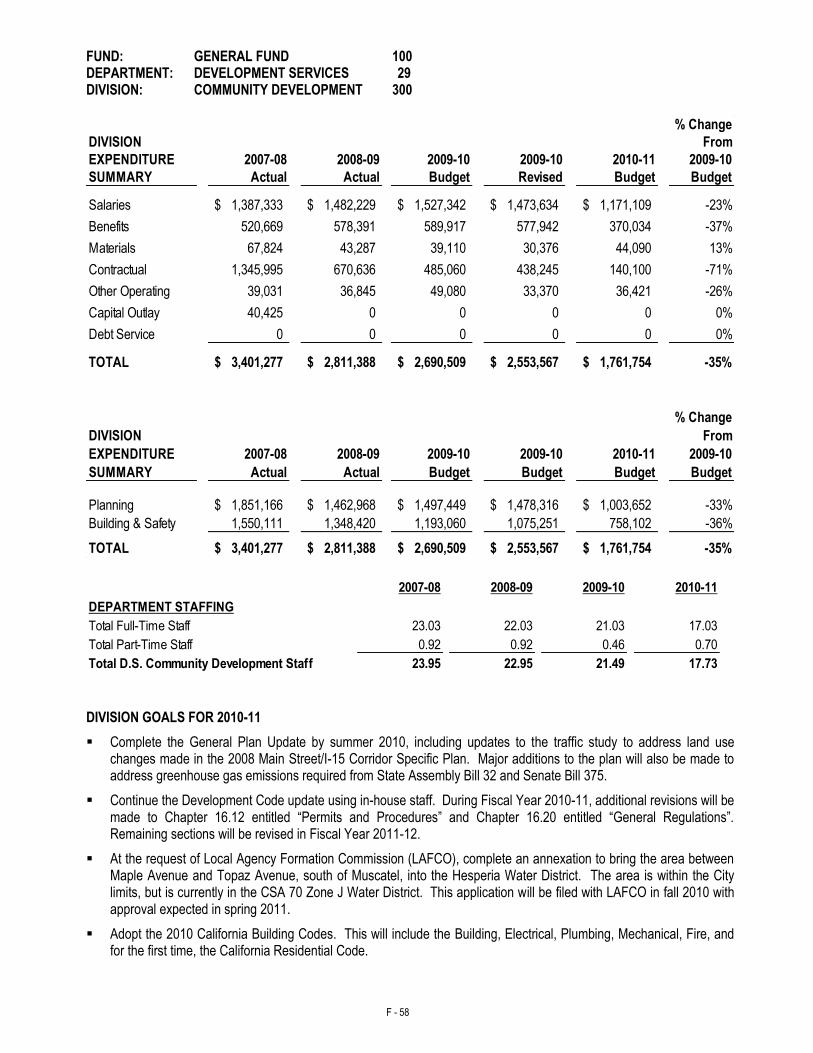
F - 58
FUND: GENERAL FUND 100 DEPARTMENT: DEVELOPMENT SERVICES 29 DIVISION: COMMUNITY DEVELOPMENT 300
% Change
DIVISION From
EXPENDITURE 2007-08 2008-09 2009-10 2009-10 2010-11 2009-10
SUMMARY Actual Actual Budget Revised Budget Budget
Salaries 1,387,333$ 1,482,229$ 1,527,342$ 1,473,634$ 1,171,109$ -23%
Benefits 520,669 578,391 589,917 577,942 370,034 -37%
Materials 67,824 43,287 39,110 30,376 44,090 13%
Contractual 1,345,995 670,636 485,060 438,245 140,100 -71%
Other Operating 39,031 36,845 49,080 33,370 36,421 -26%
Capital Outlay 40,425 0 0 0 0 0%
Debt Service 0 0 0 0 0 0%
TOTAL 3,401,277$ 2,811,388$ 2,690,509$ 2,553,567$ 1,761,754$ -35%
% Change
DIVISION From
EXPENDITURE 2007-08 2008-09 2009-10 2009-10 2010-11 2009-10
SUMMARY Actual Actual Budget Budget Budget Budget
Planning 1,851,166$ 1,462,968$ 1,497,449$ 1,478,316$ 1,003,652$ -33%
Building & Safety 1,550,111 1,348,420 1,193,060 1,075,251 758,102 -36%
TOTAL 3,401,277$ 2,811,388$ 2,690,509$ 2,553,567$ 1,761,754$ -35%
2007-08 2008-09 2009-10 2010-11
DEPARTMENT STAFFING
Total Full-Time Staff 23.03 22.03 21.03 17.03
0.92 0.92 0.46 0.70
23.95 22.95 21.49 17.73Total D.S. Community Development Staff
Total Part-Time Staff
DIVISION GOALS FOR 2010-11
Complete the General Plan Update by summer 2010, including updates to the traffic study to address land use changes made in the 2008 Main Street/I-15 Corridor Specific Plan. Major additions to the plan will also be made to address greenhouse gas emissions required from State Assembly Bill 32 and Senate Bill 375.
Continue the Development Code update using in-house staff. During Fiscal Year 2010-11, additional revisions will be made to Chapter 16.12 entitled “Permits and Procedures” and Chapter 16.20 entitled “General Regulations”. Remaining sections will be revised in Fiscal Year 2011-12.
At the request of Local Agency Formation Commission (LAFCO), complete an annexation to bring the area between Maple Avenue and Topaz Avenue, south of Muscatel, into the Hesperia Water District. The area is within the City limits, but is currently in the CSA 70 Zone J Water District. This application will be filed with LAFCO in fall 2010 with approval expected in spring 2011.
Adopt the 2010 California Building Codes. This will include the Building, Electrical, Plumbing, Mechanical, Fire, and for the first time, the California Residential Code.
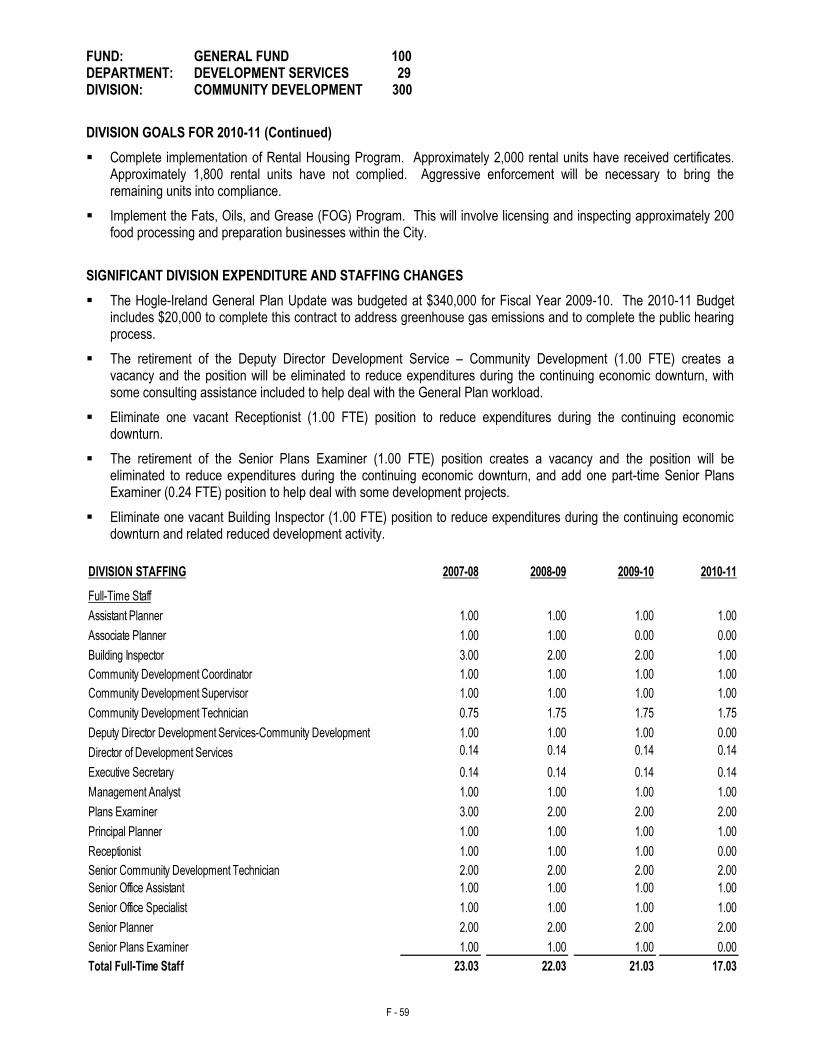
F - 59
FUND: GENERAL FUND 100 DEPARTMENT: DEVELOPMENT SERVICES 29 DIVISION: COMMUNITY DEVELOPMENT 300
DIVISION GOALS FOR 2010-11 (Continued)
Complete implementation of Rental Housing Program. Approximately 2,000 rental units have received certificates. Approximately 1,800 rental units have not complied. Aggressive enforcement will be necessary to bring the remaining units into compliance.
Implement the Fats, Oils, and Grease (FOG) Program. This will involve licensing and inspecting approximately 200 food processing and preparation businesses within the City.
SIGNIFICANT DIVISION EXPENDITURE AND STAFFING CHANGES
The Hogle-Ireland General Plan Update was budgeted at $340,000 for Fiscal Year 2009-10. The 2010-11 Budget includes $20,000 to complete this contract to address greenhouse gas emissions and to complete the public hearing process.
The retirement of the Deputy Director Development Service – Community Development (1.00 FTE) creates a vacancy and the position will be eliminated to reduce expenditures during the continuing economic downturn, with some consulting assistance included to help deal with the General Plan workload.
Eliminate one vacant Receptionist (1.00 FTE) position to reduce expenditures during the continuing economic downturn.
The retirement of the Senior Plans Examiner (1.00 FTE) position creates a vacancy and the position will be eliminated to reduce expenditures during the continuing economic downturn, and add one part-time Senior Plans Examiner (0.24 FTE) position to help deal with some development projects.
Eliminate one vacant Building Inspector (1.00 FTE) position to reduce expenditures during the continuing economic downturn and related reduced development activity.
DIVISION STAFFING 2007-08 2008-09 2009-10 2010-11
1.00 1.00 1.00 1.00
1.00 1.00 0.00 0.00
3.00 2.00 2.00 1.00
1.00 1.00 1.00 1.00
1.00 1.00 1.00 1.00
0.75 1.75 1.75 1.75
1.00 1.00 1.00 0.00
0.14 0.14 0.14 0.14
0.14 0.14 0.14 0.14
1.00 1.00 1.00 1.00
3.00 2.00 2.00 2.00
1.00 1.00 1.00 1.00
Receptionist 1.00 1.00 1.00 0.00
2.00 2.00 2.00 2.00
1.00 1.00 1.00 1.00
1.00 1.00 1.00 1.00
2.00 2.00 2.00 2.00
1.00 1.00 1.00 0.00
23.03 22.03 21.03 17.03
Senior Plans Examiner
Senior Community Development Technician
Senior Planner
Total Full-Time Staff
Senior Office Specialist
Community Development Technician
Director of Development Services
Full-Time Staff
Community Development Supervisor
Associate Planner
Community Development Coordinator
Assistant Planner
Building Inspector
Deputy Director Development Services-Community Development
Executive Secretary
Plans Examiner
Management Analyst
Principal Planner
Senior Office Assistant
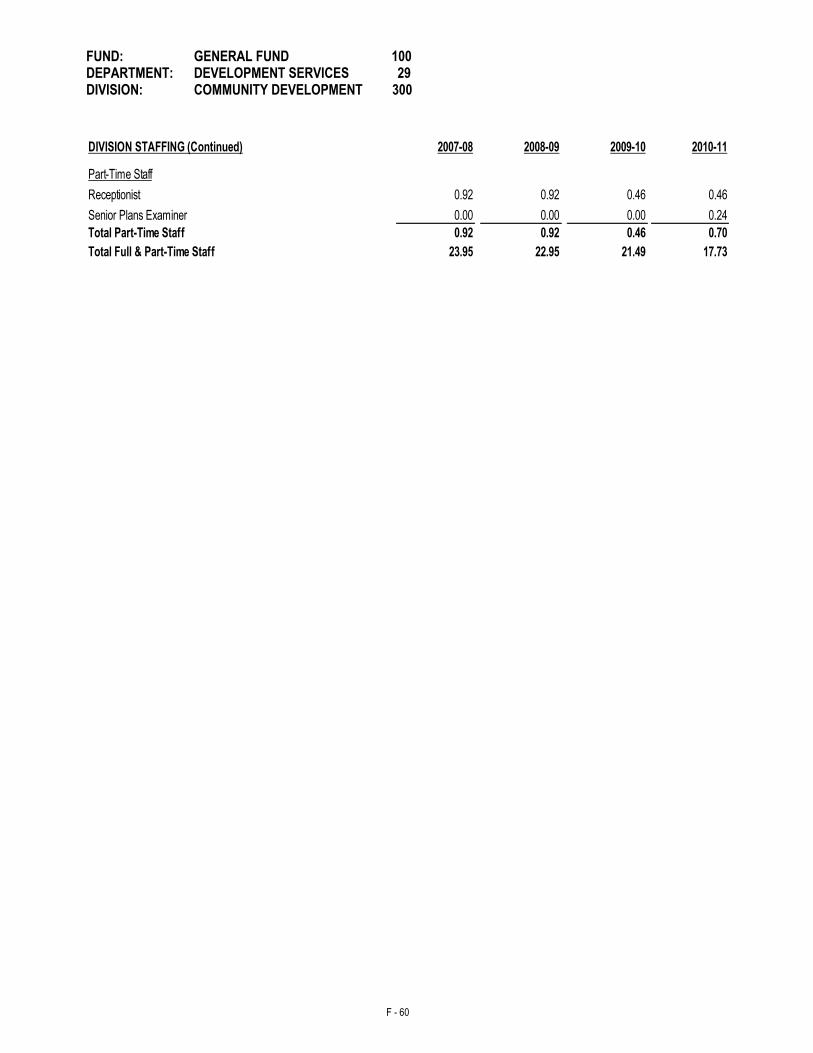
F - 60
FUND: GENERAL FUND 100 DEPARTMENT: DEVELOPMENT SERVICES 29 DIVISION: COMMUNITY DEVELOPMENT 300
DIVISION STAFFING (Continued) 2007-08 2008-09 2009-10 2010-11
Receptionist 0.92 0.92 0.46 0.46
0.00 0.00 0.00 0.24
0.92 0.92 0.46 0.70
23.95 22.95 21.49 17.73
Senior Plans Examiner
Part-Time Staff
Total Part-Time Staff
Total Full & Part-Time Staff
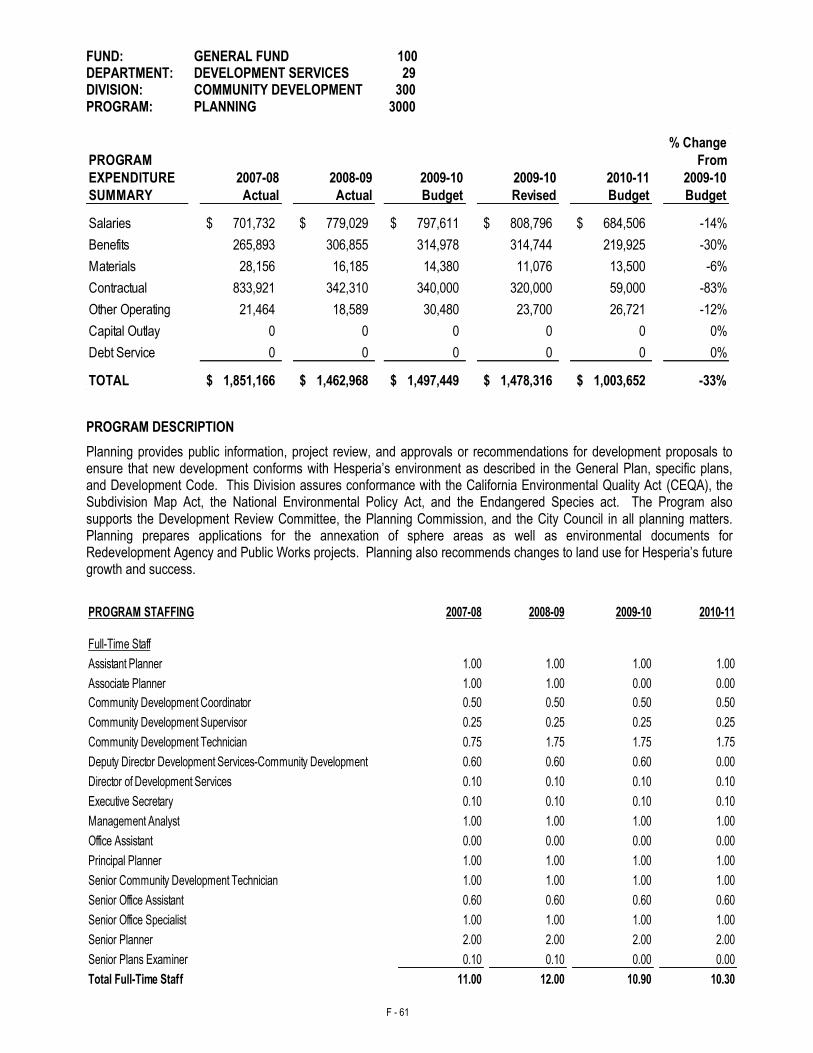
F - 61
FUND: GENERAL FUND 100 DEPARTMENT: DEVELOPMENT SERVICES 29 DIVISION: COMMUNITY DEVELOPMENT 300 PROGRAM: PLANNING 3000
% Change
PROGRAM From
EXPENDITURE 2007-08 2008-09 2009-10 2009-10 2010-11 2009-10
SUMMARY Actual Actual Budget Revised Budget Budget
Salaries 701,732$ 779,029$ 797,611$ 808,796$ 684,506$ -14%
Benefits 265,893 306,855 314,978 314,744 219,925 -30%
Materials 28,156 16,185 14,380 11,076 13,500 -6%
Contractual 833,921 342,310 340,000 320,000 59,000 -83%
Other Operating 21,464 18,589 30,480 23,700 26,721 -12%
Capital Outlay 0 0 0 0 0 0%
Debt Service 0 0 0 0 0 0%
TOTAL 1,851,166$ 1,462,968$ 1,497,449$ 1,478,316$ 1,003,652$ -33%
PROGRAM DESCRIPTION
Planning provides public information, project review, and approvals or recommendations for development proposals to ensure that new development conforms with Hesperia’s environment as described in the General Plan, specific plans, and Development Code. This Division assures conformance with the California Environmental Quality Act (CEQA), the Subdivision Map Act, the National Environmental Policy Act, and the Endangered Species act. The Program also supports the Development Review Committee, the Planning Commission, and the City Council in all planning matters. Planning prepares applications for the annexation of sphere areas as well as environmental documents for Redevelopment Agency and Public Works projects. Planning also recommends changes to land use for Hesperia’s future growth and success.
PROGRAM STAFFING 2007-08 2008-09 2009-10 2010-11
1.00 1.00 1.00 1.00
1.00 1.00 0.00 0.00
0.50 0.50 0.50 0.50
0.25 0.25 0.25 0.25
0.75 1.75 1.75 1.75
0.60 0.60 0.60 0.00
0.10 0.10 0.10 0.10
0.10 0.10 0.10 0.10
1.00 1.00 1.00 1.00
0.00 0.00 0.00 0.00
1.00 1.00 1.00 1.00
1.00 1.00 1.00 1.00
0.60 0.60 0.60 0.60
1.00 1.00 1.00 1.00
2.00 2.00 2.00 2.00
0.10 0.10 0.00 0.00
11.00 12.00 10.90 10.30
Full-Time Staff
Executive Secretary
Office Assistant
Community Development Technician
Assistant Planner
Associate Planner
Community Development Coordinator
Community Development Supervisor
Deputy Director Development Services-Community Development
Director of Development Services
Management Analyst
Senior Community Development Technician
Principal Planner
Senior Office Specialist
Senior Plans Examiner
Total Full-Time Staff
Senior Planner
Senior Office Assistant
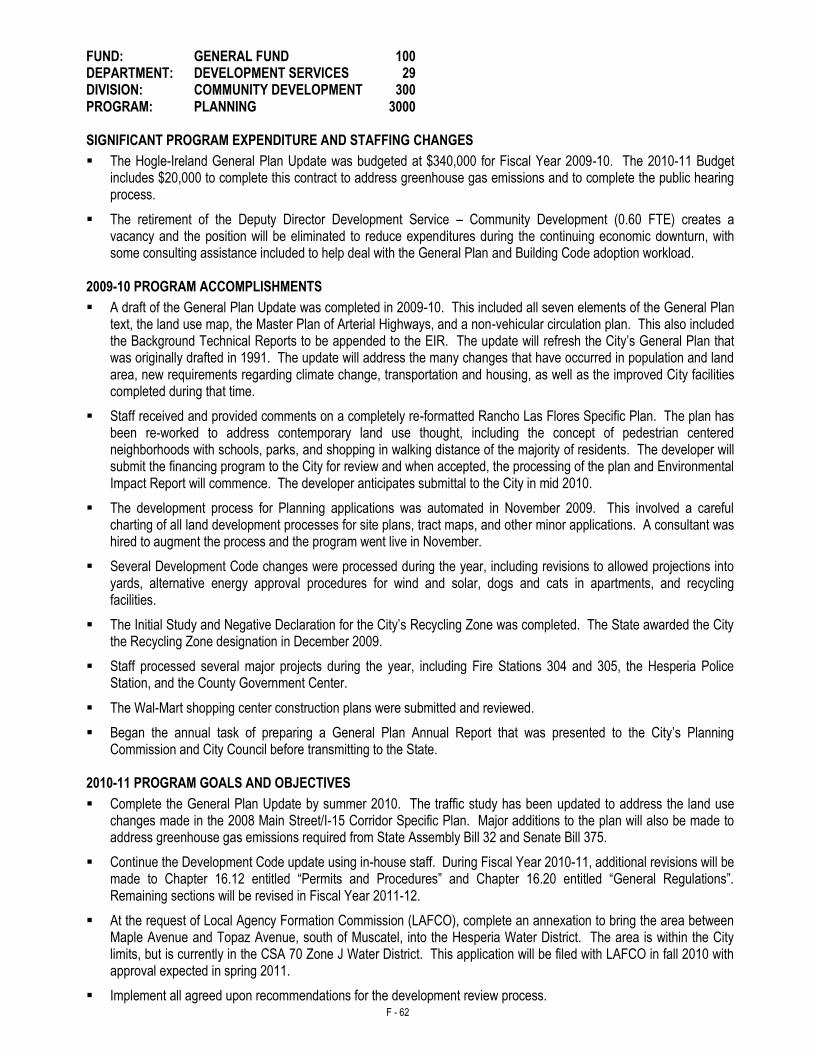
F - 62
FUND: GENERAL FUND 100 DEPARTMENT: DEVELOPMENT SERVICES 29 DIVISION: COMMUNITY DEVELOPMENT 300 PROGRAM: PLANNING 3000 SIGNIFICANT PROGRAM EXPENDITURE AND STAFFING CHANGES
The Hogle-Ireland General Plan Update was budgeted at $340,000 for Fiscal Year 2009-10. The 2010-11 Budget includes $20,000 to complete this contract to address greenhouse gas emissions and to complete the public hearing process.
The retirement of the Deputy Director Development Service – Community Development (0.60 FTE) creates a vacancy and the position will be eliminated to reduce expenditures during the continuing economic downturn, with some consulting assistance included to help deal with the General Plan and Building Code adoption workload.
2009-10 PROGRAM ACCOMPLISHMENTS
A draft of the General Plan Update was completed in 2009-10. This included all seven elements of the General Plan text, the land use map, the Master Plan of Arterial Highways, and a non-vehicular circulation plan. This also included the Background Technical Reports to be appended to the EIR. The update will refresh the City’s General Plan that was originally drafted in 1991. The update will address the many changes that have occurred in population and land area, new requirements regarding climate change, transportation and housing, as well as the improved City facilities completed during that time.
Staff received and provided comments on a completely re-formatted Rancho Las Flores Specific Plan. The plan has been re-worked to address contemporary land use thought, including the concept of pedestrian centered neighborhoods with schools, parks, and shopping in walking distance of the majority of residents. The developer will submit the financing program to the City for review and when accepted, the processing of the plan and Environmental Impact Report will commence. The developer anticipates submittal to the City in mid 2010.
The development process for Planning applications was automated in November 2009. This involved a careful charting of all land development processes for site plans, tract maps, and other minor applications. A consultant was hired to augment the process and the program went live in November.
Several Development Code changes were processed during the year, including revisions to allowed projections into yards, alternative energy approval procedures for wind and solar, dogs and cats in apartments, and recycling facilities.
The Initial Study and Negative Declaration for the City’s Recycling Zone was completed. The State awarded the City the Recycling Zone designation in December 2009.
Staff processed several major projects during the year, including Fire Stations 304 and 305, the Hesperia Police Station, and the County Government Center.
The Wal-Mart shopping center construction plans were submitted and reviewed.
Began the annual task of preparing a General Plan Annual Report that was presented to the City’s Planning Commission and City Council before transmitting to the State.
2010-11 PROGRAM GOALS AND OBJECTIVES
Complete the General Plan Update by summer 2010. The traffic study has been updated to address the land use changes made in the 2008 Main Street/I-15 Corridor Specific Plan. Major additions to the plan will also be made to address greenhouse gas emissions required from State Assembly Bill 32 and Senate Bill 375.
Continue the Development Code update using in-house staff. During Fiscal Year 2010-11, additional revisions will be made to Chapter 16.12 entitled “Permits and Procedures” and Chapter 16.20 entitled “General Regulations”. Remaining sections will be revised in Fiscal Year 2011-12.
At the request of Local Agency Formation Commission (LAFCO), complete an annexation to bring the area between Maple Avenue and Topaz Avenue, south of Muscatel, into the Hesperia Water District. The area is within the City limits, but is currently in the CSA 70 Zone J Water District. This application will be filed with LAFCO in fall 2010 with approval expected in spring 2011.
Implement all agreed upon recommendations for the development review process.
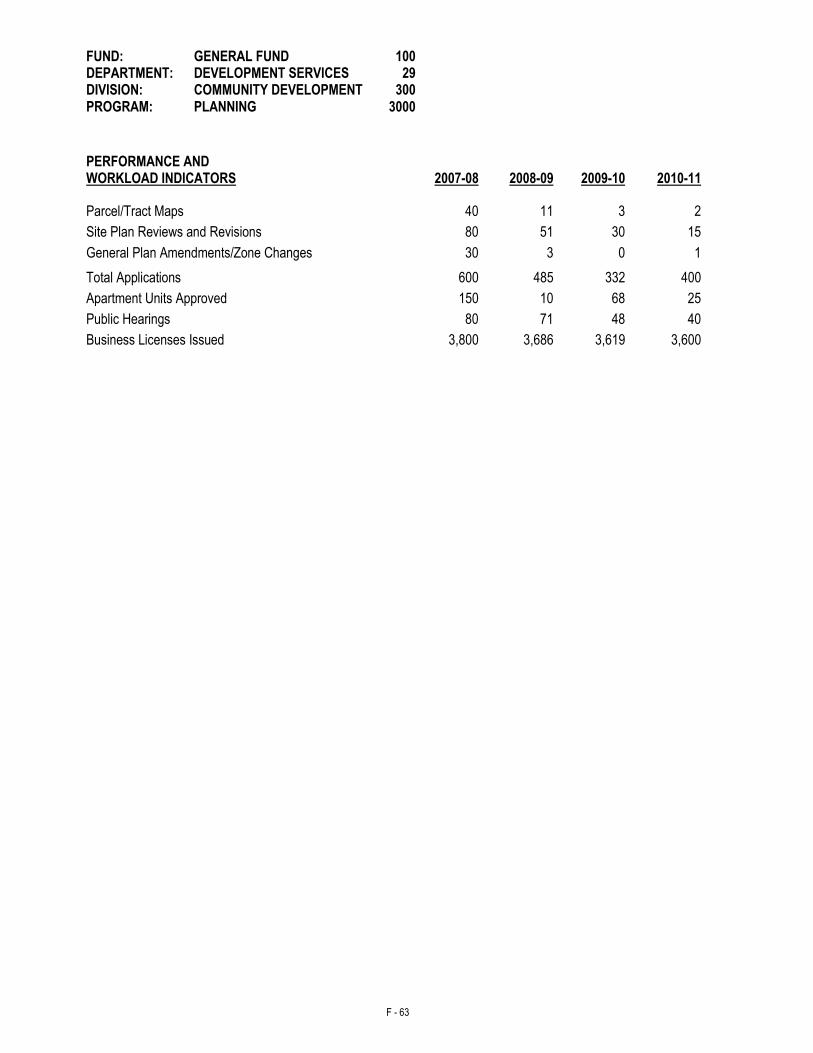
F - 63
FUND: GENERAL FUND 100 DEPARTMENT: DEVELOPMENT SERVICES 29 DIVISION: COMMUNITY DEVELOPMENT 300 PROGRAM: PLANNING 3000
PERFORMANCE AND WORKLOAD INDICATORS 2007-08 2008-09
2009-10
2010-11
Parcel/Tract Maps 40 11 3 2
Site Plan Reviews and Revisions 80 51 30 15
General Plan Amendments/Zone Changes 30 3 0 1
Total Applications 600 485 332 400
Apartment Units Approved 150 10 68 25
Public Hearings 80 71 48 40
Business Licenses Issued 3,800 3,686 3,619 3,600
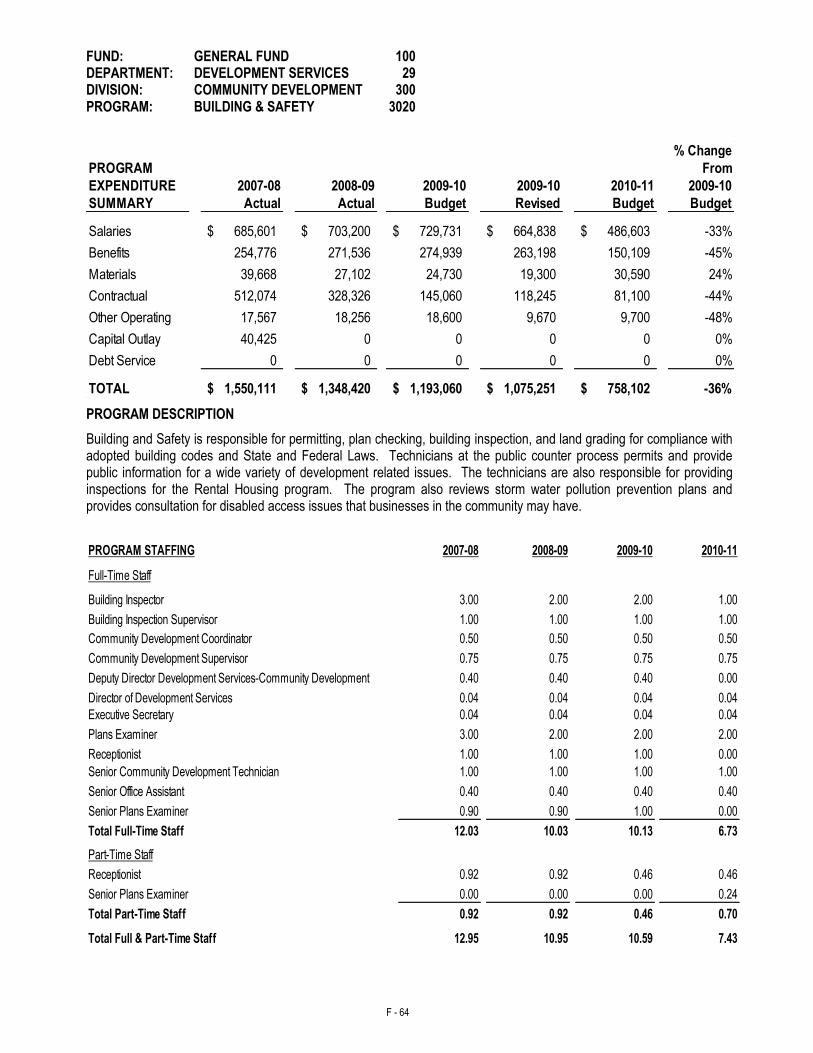
F - 64
FUND: GENERAL FUND 100 DEPARTMENT: DEVELOPMENT SERVICES 29 DIVISION: COMMUNITY DEVELOPMENT 300 PROGRAM: BUILDING & SAFETY 3020
% Change
PROGRAM From
EXPENDITURE 2007-08 2008-09 2009-10 2009-10 2010-11 2009-10
SUMMARY Actual Actual Budget Revised Budget Budget
Salaries 685,601$ 703,200$ 729,731$ 664,838$ 486,603$ -33%
Benefits 254,776 271,536 274,939 263,198 150,109 -45%
Materials 39,668 27,102 24,730 19,300 30,590 24%
Contractual 512,074 328,326 145,060 118,245 81,100 -44%
Other Operating 17,567 18,256 18,600 9,670 9,700 -48%
Capital Outlay 40,425 0 0 0 0 0%
Debt Service 0 0 0 0 0 0%
TOTAL 1,550,111$ 1,348,420$ 1,193,060$ 1,075,251$ 758,102$ -36%
PROGRAM DESCRIPTION
Building and Safety is responsible for permitting, plan checking, building inspection, and land grading for compliance with adopted building codes and State and Federal Laws. Technicians at the public counter process permits and provide public information for a wide variety of development related issues. The technicians are also responsible for providing inspections for the Rental Housing program. The program also reviews storm water pollution prevention plans and provides consultation for disabled access issues that businesses in the community may have.
PROGRAM STAFFING 2007-08 2008-09 2009-10 2010-11
3.00 2.00 2.00 1.00
1.00 1.00 1.00 1.00
0.50 0.50 0.50 0.50
0.75 0.75 0.75 0.75
0.40 0.40 0.40 0.00
0.04 0.04 0.04 0.04
0.04 0.04 0.04 0.04
3.00 2.00 2.00 2.00
Receptionist 1.00 1.00 1.00 0.00
Senior Community Development Technician 1.00 1.00 1.00 1.00
0.40 0.40 0.40 0.40
0.90 0.90 1.00 0.00
12.03 10.03 10.13 6.73
Receptionist 0.92 0.92 0.46 0.46
0.00 0.00 0.00 0.24
0.92 0.92 0.46 0.70
12.95 10.95 10.59 7.43
Executive Secretary
Deputy Director Development Services-Community Development
Director of Development Services
Total Full & Part-Time Staff
Total Part-Time Staff
Plans Examiner
Part-Time Staff
Senior Office Assistant
Senior Plans Examiner
Total Full-Time Staff
Senior Plans Examiner
Full-Time Staff
Building Inspection Supervisor
Building Inspector
Community Development Supervisor
Community Development Coordinator
F - 65
FUND: GENERAL FUND 100 DEPARTMENT: DEVELOPMENT SERVICES 29 DIVISION: COMMUNITY DEVELOPMENT 300 PROGRAM: BUILDING & SAFETY 3020
SIGNIFICANT PROGRAM EXPENDITURE AND STAFFING CHANGE
The retirement of the Deputy Director Development Service – Community Development (0.40 FTE) position creates a vacancy and the position will be eliminated to reduce expenditures during the continuing economic downturn, with some consulting assistance included to help deal with the General Plan and Building Code adoption workload.
Eliminate one vacant Receptionist (1.00 FTE) position to reduce expenditures during the continuing economic downturn.
The retirement of the Senior Plans Examiner (1.00 FTE) position creates a vacancy and the position will be eliminated to reduce expenditures during the continuing economic downturn, and add one part-time Senior Plans Examiner (0.24 FTE) position to help deal with some development projects.
Eliminate one vacant Building Inspector (1.00 FTE) position to reduce expenditures during the continuing economic downturn and related reduced development activity.
2009-10 PROGRAM ACCOMPLISHMENTS
Fire Station 305 (Caliente) was completed and a Certificate of Occupancy was issued. The Police Station and County Government Center are nearing completion. They should be completed in the first half of 2010-11.
Senate Bill 1608 requires that every California building department have a State certified accessibility specialist on staff. This certification is granted through the Division of the State Architect’s Certified Access Specialist program (CASp). The City’s Building Inspection Supervisor has attained his Certified Access Specialist certification and the City is now compliant with Senate Bill 1608.
The Rental Housing Program transitioned fully to Building and Safety. Technicians are reviewing rental properties to verify compliance.
During Fiscal Year 2009-10, 12 policies for Building and Safety were reviewed, updated, or re-written to concur with current practice. Included in the 12 are new policies for the Police Party Response Program, Essential Facilities, the Rental Housing Program, Private Water Wells in the City, State Required Certification, and Title 24 Compliance for HVAC Replacement.
2010-11 PROGRAM GOALS AND OBJECTIVES
Adopt the 2010 California Building Codes. This will include the Building, Electrical, Plumbing, Mechanical, Fire, and for the first time, the California Residential Code.
Complete implementation of Rental Housing Program. Approximately 2,000 rental units have received certificates. Approximately 1,800 rental units have not complied. Aggressive enforcement will be necessary to bring the remaining units into compliance.
Implement the Fats, Oils, and Grease (FOG) Program. This will involve licensing and inspecting approximately 200 food processing and preparation businesses within the City.
Develop the survey procedures and complete the survey for the City’s Transition Plan. This plan will include all City owned facilities and develop a plan to bring them into compliance with the Americans with Disabilities Act (ADA).
Complete inspections on major public projects including the Hesperia Police Station, the County Government Center, and the Victor Valley Transit Authority.
Complete inspections on major private projects including Ross, Marshalls, and Golden Corral.
Complete plan review (in-house) of the Wal-Mart superstore. Permits should be issued by mid-year and inspections will be conducted during the second half of the year. Completion is not anticipated until 2011-12.
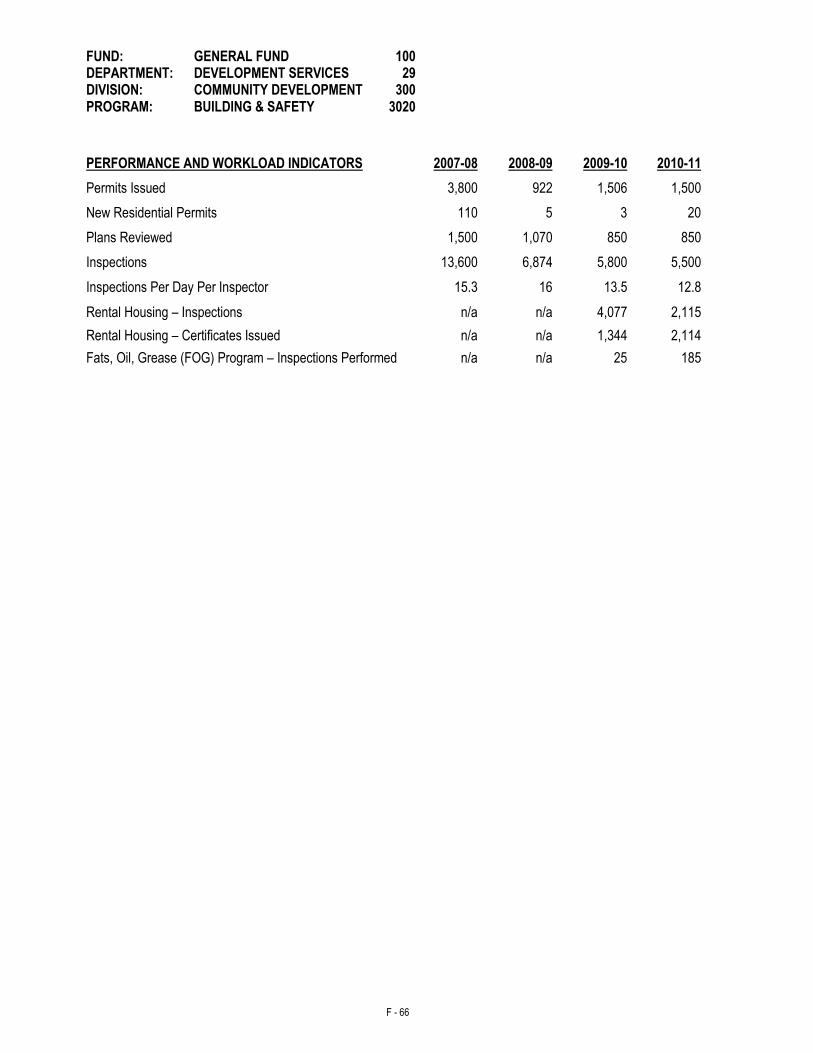
F - 66
FUND: GENERAL FUND 100 DEPARTMENT: DEVELOPMENT SERVICES 29 DIVISION: COMMUNITY DEVELOPMENT 300 PROGRAM: BUILDING & SAFETY 3020
PERFORMANCE AND WORKLOAD INDICATORS 2007-08 2008-09
2009-10
2010-11
Permits Issued 3,800 922 1,506 1,500
New Residential Permits 110 5 3 20
Plans Reviewed 1,500 1,070 850 850
Inspections 13,600 6,874 5,800 5,500
Inspections Per Day Per Inspector 15.3 16 13.5 12.8
Rental Housing – Inspections n/a n/a 4,077 2,115
Rental Housing – Certificates Issued n/a n/a 1,344 2,114
Fats, Oil, Grease (FOG) Program – Inspections Performed n/a n/a 25 185

F - 67
THIS PAGE INTENTIONALLY LEFT BLANK
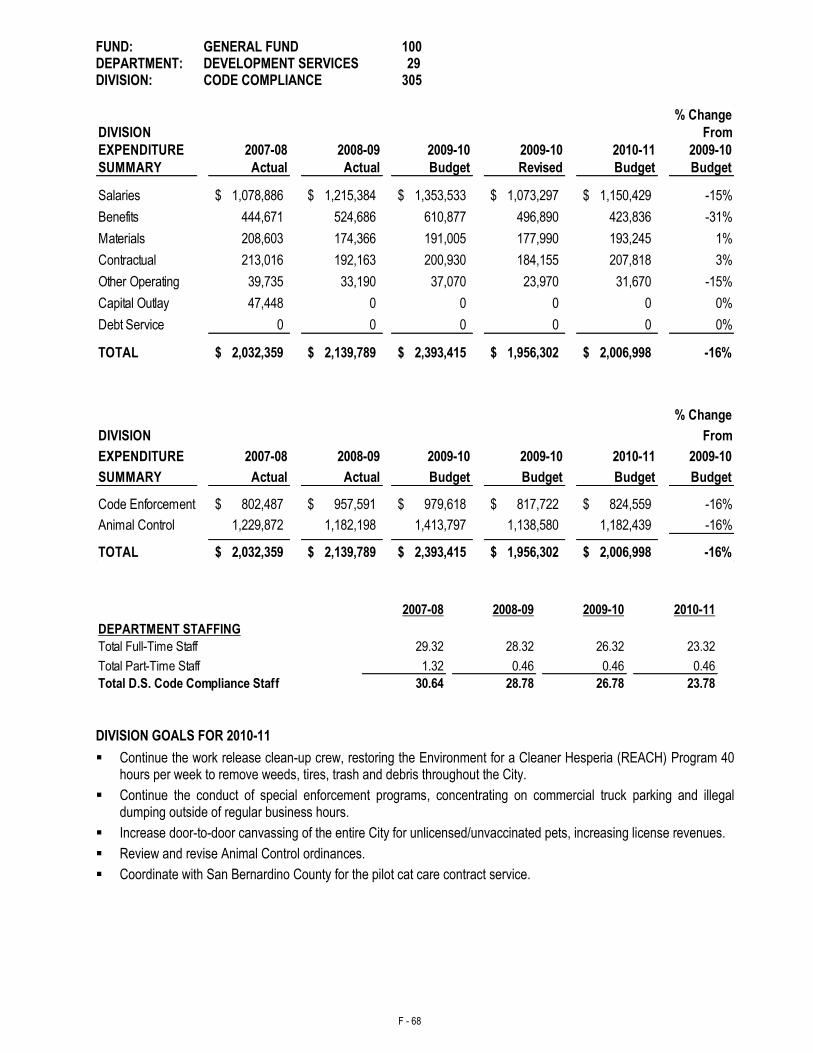
F - 68
FUND: GENERAL FUND 100 DEPARTMENT: DEVELOPMENT SERVICES 29 DIVISION: CODE COMPLIANCE 305
% Change
DIVISION From
EXPENDITURE 2007-08 2008-09 2009-10 2009-10 2010-11 2009-10
SUMMARY Actual Actual Budget Revised Budget Budget
Salaries 1,078,886$ 1,215,384$ 1,353,533$ 1,073,297$ 1,150,429$ -15%
Benefits 444,671 524,686 610,877 496,890 423,836 -31%
Materials 208,603 174,366 191,005 177,990 193,245 1%
Contractual 213,016 192,163 200,930 184,155 207,818 3%
Other Operating 39,735 33,190 37,070 23,970 31,670 -15%
Capital Outlay 47,448 0 0 0 0 0%
Debt Service 0 0 0 0 0 0%
TOTAL 2,032,359$ 2,139,789$ 2,393,415$ 1,956,302$ 2,006,998$ -16%
% Change
DIVISION From
EXPENDITURE 2007-08 2008-09 2009-10 2009-10 2010-11 2009-10
SUMMARY Actual Actual Budget Budget Budget Budget
Code Enforcement 802,487$ 957,591$ 979,618$ 817,722$ 824,559$ -16%
Animal Control 1,229,872 1,182,198 1,413,797 1,138,580 1,182,439 -16%
TOTAL 2,032,359$ 2,139,789$ 2,393,415$ 1,956,302$ 2,006,998$ -16%
2007-08 2008-09 2009-10 2010-11
DEPARTMENT STAFFING
Total Full-Time Staff 29.32 28.32 26.32 23.32
1.32 0.46 0.46 0.46
30.64 28.78 26.78 23.78
Total Part-Time Staff
Total D.S. Code Compliance Staff
DIVISION GOALS FOR 2010-11
Continue the work release clean-up crew, restoring the Environment for a Cleaner Hesperia (REACH) Program 40 hours per week to remove weeds, tires, trash and debris throughout the City.
Continue the conduct of special enforcement programs, concentrating on commercial truck parking and illegal dumping outside of regular business hours.
Increase door-to-door canvassing of the entire City for unlicensed/unvaccinated pets, increasing license revenues.
Review and revise Animal Control ordinances.
Coordinate with San Bernardino County for the pilot cat care contract service.
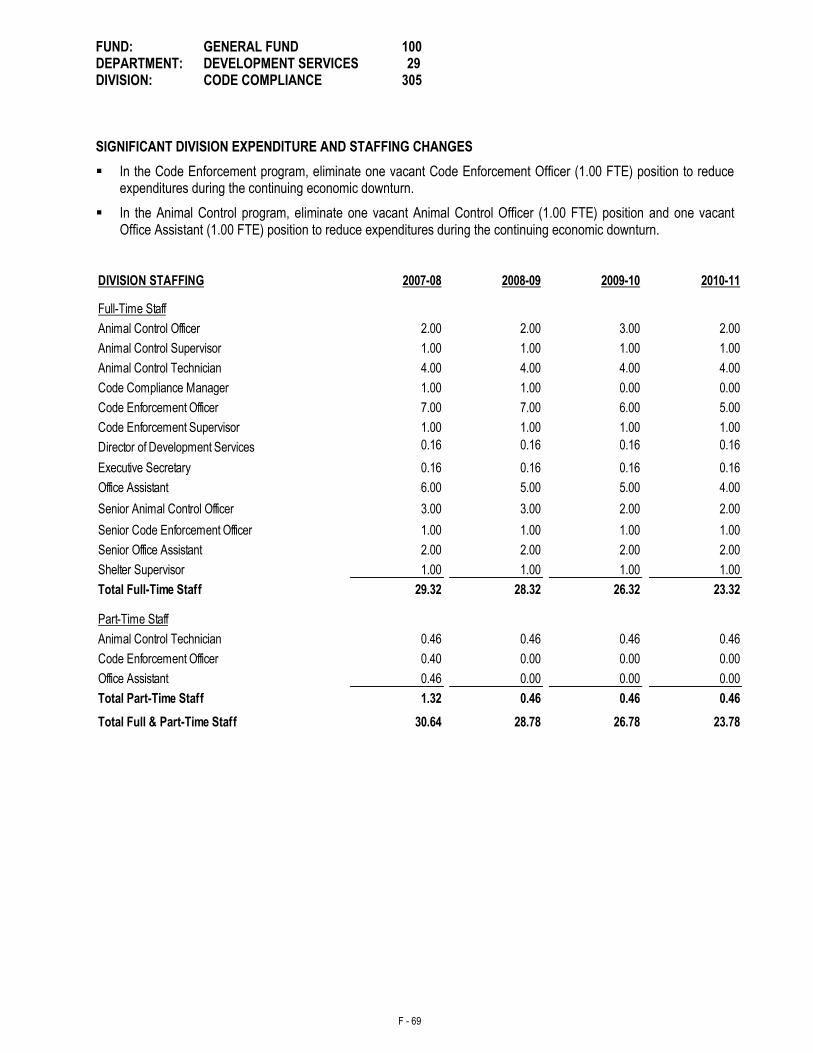
F - 69
FUND: GENERAL FUND 100 DEPARTMENT: DEVELOPMENT SERVICES 29 DIVISION: CODE COMPLIANCE 305
SIGNIFICANT DIVISION EXPENDITURE AND STAFFING CHANGES
In the Code Enforcement program, eliminate one vacant Code Enforcement Officer (1.00 FTE) position to reduce expenditures during the continuing economic downturn.
In the Animal Control program, eliminate one vacant Animal Control Officer (1.00 FTE) position and one vacant Office Assistant (1.00 FTE) position to reduce expenditures during the continuing economic downturn.
DIVISION STAFFING 2007-08 2008-09 2009-10 2010-11
2.00 2.00 3.00 2.00
1.00 1.00 1.00 1.00
4.00 4.00 4.00 4.00
1.00 1.00 0.00 0.00
7.00 7.00 6.00 5.00
1.00 1.00 1.00 1.00
0.16 0.16 0.16 0.16
0.16 0.16 0.16 0.16
6.00 5.00 5.00 4.00
3.00 3.00 2.00 2.00
1.00 1.00 1.00 1.00
2.00 2.00 2.00 2.00
1.00 1.00 1.00 1.00
29.32 28.32 26.32 23.32
0.46 0.46 0.46 0.46
0.40 0.00 0.00 0.00
0.46 0.00 0.00 0.00
1.32 0.46 0.46 0.46
30.64 28.78 26.78 23.78
Code Enforcement Officer
Animal Control Technician
Total Part-Time Staff
Office Assistant
Code Enforcement Officer
Code Enforcement Supervisor
Director of Development Services
Shelter Supervisor
Part-Time Staff
Senior Code Enforcement Officer
Office Assistant
Executive Secretary
Senior Animal Control Officer
Senior Office Assistant
Total Full-Time Staff
Full-Time Staff
Animal Control Officer
Animal Control Supervisor
Animal Control Technician
Code Compliance Manager
Total Full & Part-Time Staff
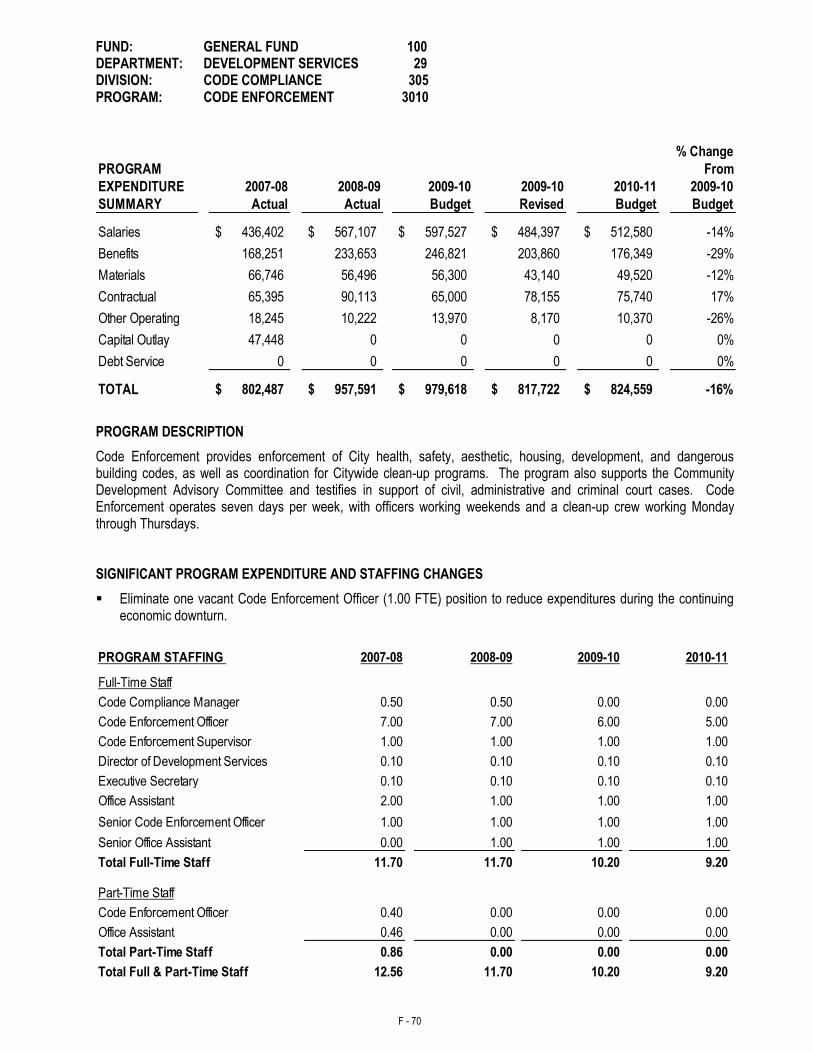
F - 70
FUND: GENERAL FUND 100 DEPARTMENT: DEVELOPMENT SERVICES 29 DIVISION: CODE COMPLIANCE 305 PROGRAM: CODE ENFORCEMENT 3010
% Change
PROGRAM From
EXPENDITURE 2007-08 2008-09 2009-10 2009-10 2010-11 2009-10
SUMMARY Actual Actual Budget Revised Budget Budget
Salaries 436,402$ 567,107$ 597,527$ 484,397$ 512,580$ -14%
Benefits 168,251 233,653 246,821 203,860 176,349 -29%
Materials 66,746 56,496 56,300 43,140 49,520 -12%
Contractual 65,395 90,113 65,000 78,155 75,740 17%
Other Operating 18,245 10,222 13,970 8,170 10,370 -26%
Capital Outlay 47,448 0 0 0 0 0%
Debt Service 0 0 0 0 0 0%
TOTAL 802,487$ 957,591$ 979,618$ 817,722$ 824,559$ -16%
PROGRAM DESCRIPTION
Code Enforcement provides enforcement of City health, safety, aesthetic, housing, development, and dangerous building codes, as well as coordination for Citywide clean-up programs. The program also supports the Community Development Advisory Committee and testifies in support of civil, administrative and criminal court cases. Code Enforcement operates seven days per week, with officers working weekends and a clean-up crew working Monday through Thursdays. SIGNIFICANT PROGRAM EXPENDITURE AND STAFFING CHANGES
Eliminate one vacant Code Enforcement Officer (1.00 FTE) position to reduce expenditures during the continuing economic downturn.
PROGRAM STAFFING 2007-08 2008-09 2009-10 2010-11
0.50 0.50 0.00 0.00
7.00 7.00 6.00 5.00
1.00 1.00 1.00 1.00
0.10 0.10 0.10 0.10
0.10 0.10 0.10 0.10
2.00 1.00 1.00 1.00
1.00 1.00 1.00 1.00
0.00 1.00 1.00 1.00
11.70 11.70 10.20 9.20
0.40 0.00 0.00 0.00
0.46 0.00 0.00 0.00
0.86 0.00 0.00 0.00
12.56 11.70 10.20 9.20
Executive Secretary
Office Assistant
Code Enforcement Officer
Total Full-Time Staff
Senior Office Assistant
Senior Code Enforcement Officer
Total Part-Time Staff
Office Assistant
Part-Time Staff
Total Full & Part-Time Staff
Full-Time Staff
Code Enforcement Supervisor
Code Enforcement Officer
Code Compliance Manager
Director of Development Services
F - 71
FUND: GENERAL FUND 100 DEPARTMENT: DEVELOPMENT SERVICES 29 DIVISION: CODE COMPLIANCE 305 PROGRAM: CODE ENFORCEMENT 3010
2009-10 PROGRAM ACCOMPLISHMENTS
Assisted Advance Disposal in the removal of trash and debris during the two City clean-up days held in October 2009 and April 2010.
Utilized the Code Enforcement staff to secure vacant properties and pump abandoned pools that would normally be performed by contractors. This had an average savings of sixty percent per property abated.
Provided seven-day per week coverage of the City, with proactive code enforcement focusing on reducing illegal street vending, illegal subdivision signage, non-permitted yard/garage sales, and illegally parked commercial vehicles.
Assisted in a mattress clean-up day where illegally dumped mattress were picked up by the REACH clean-up crew throughout the City, a drop off point for the public to drop off mattresses, which were either recycled or legally disposed of.
Assisted in four tire amnesty days and utilized the REACH clean-up crew to pick-up and dispose of illegally discarded tires throughout the City.
Conducted two special enforcement programs concentrating on illegal dumping outside of regular business hours.
In conjunction with the Police Department, continued proactive enforcement in Neighborhood Enhancement Program (NEP) area. Assisted Police Department in nighttime sweeps throughout NEP area.
Caused seven abandoned, unsecured houses that were being used for illegal activity in northwest Hesperia to be demolished by the property owners.
2010-11 PROGRAM GOALS AND OBJECTIVES
Continue the work release clean-up crew, restoring the Environment for a Cleaner Hesperia (REACH) Program 40 hours per week to remove weeds, tires, trash and debris throughout the City.
Participate in a mattress clean-up day by removing mattresses from desert areas and providing a drop off location.
Assist Advance Disposal staff in removal of trash and debris during the two City clean-up days.
Assist in the City’s four tire amnesty days. Utilize the clean-up crew from Restoring the Environment for a Cleaner Hesperia (REACH) to pick-up and dispose of illegally discarded tires throughout the City.
Continue the conduct of special enforcement programs concentrating on commercial truck parking and illegal dumping outside of regular business hours.
Participate in multi-agency graffiti task force with City Public Works staff, Sheriff’s department, and Hesperia Unified School District to address enforcement and prevention measures.
Continue proactive enforcement on a seven-day service, focusing on reducing street vendors, illegal subdivision signs, unpermitted yard/garage sales, and illegal dumping.
Make bullet-resistant vests available to field officers in order to enhance staff protection and safety.
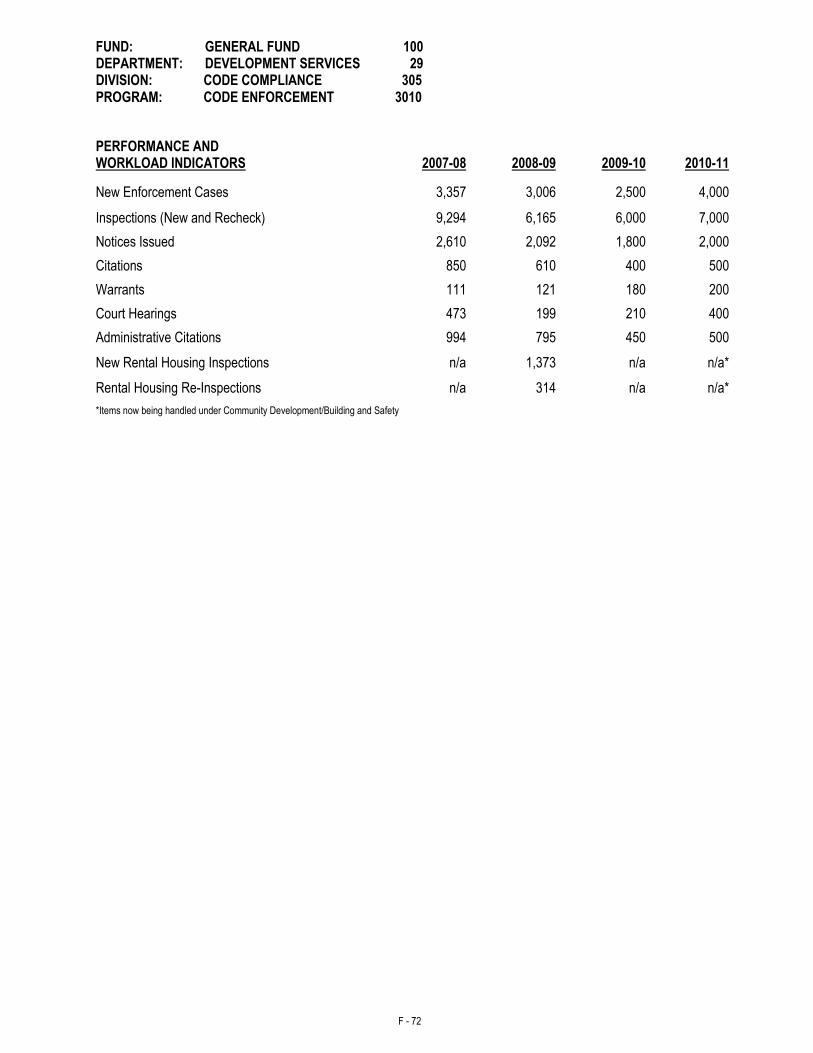
F - 72
FUND: GENERAL FUND 100 DEPARTMENT: DEVELOPMENT SERVICES 29 DIVISION: CODE COMPLIANCE 305 PROGRAM: CODE ENFORCEMENT 3010
PERFORMANCE AND WORKLOAD INDICATORS 2007-08 2008-09
2009-10
2010-11
New Enforcement Cases 3,357 3,006 2,500 4,000
Inspections (New and Recheck) 9,294 6,165 6,000 7,000
Notices Issued 2,610 2,092 1,800 2,000
Citations 850 610 400 500
Warrants 111 121 180 200
Court Hearings 473 199 210 400
Administrative Citations 994 795 450 500
New Rental Housing Inspections n/a 1,373 n/a n/a*
Rental Housing Re-Inspections n/a 314 n/a n/a*
*Items now being handled under Community Development/Building and Safety
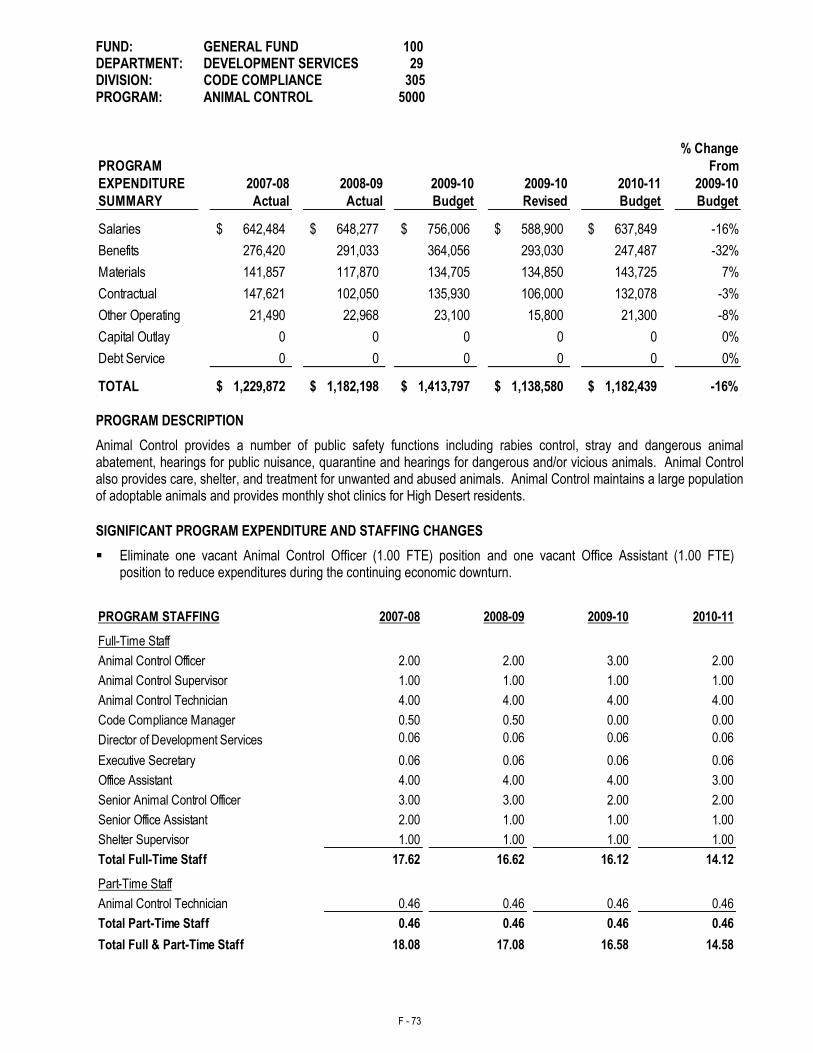
F - 73
FUND: GENERAL FUND 100 DEPARTMENT: DEVELOPMENT SERVICES 29 DIVISION: CODE COMPLIANCE 305 PROGRAM: ANIMAL CONTROL 5000
% Change
PROGRAM From
EXPENDITURE 2007-08 2008-09 2009-10 2009-10 2010-11 2009-10
SUMMARY Actual Actual Budget Revised Budget Budget
Salaries 642,484$ 648,277$ 756,006$ 588,900$ 637,849$ -16%
Benefits 276,420 291,033 364,056 293,030 247,487 -32%
Materials 141,857 117,870 134,705 134,850 143,725 7%
Contractual 147,621 102,050 135,930 106,000 132,078 -3%
Other Operating 21,490 22,968 23,100 15,800 21,300 -8%
Capital Outlay 0 0 0 0 0 0%
Debt Service 0 0 0 0 0 0%
TOTAL 1,229,872$ 1,182,198$ 1,413,797$ 1,138,580$ 1,182,439$ -16%
PROGRAM DESCRIPTION
Animal Control provides a number of public safety functions including rabies control, stray and dangerous animal abatement, hearings for public nuisance, quarantine and hearings for dangerous and/or vicious animals. Animal Control also provides care, shelter, and treatment for unwanted and abused animals. Animal Control maintains a large population of adoptable animals and provides monthly shot clinics for High Desert residents.
SIGNIFICANT PROGRAM EXPENDITURE AND STAFFING CHANGES
Eliminate one vacant Animal Control Officer (1.00 FTE) position and one vacant Office Assistant (1.00 FTE) position to reduce expenditures during the continuing economic downturn.
PROGRAM STAFFING 2007-08 2008-09 2009-10 2010-11
2.00 2.00 3.00 2.00
1.00 1.00 1.00 1.00
4.00 4.00 4.00 4.00
0.50 0.50 0.00 0.00
0.06 0.06 0.06 0.06
0.06 0.06 0.06 0.06
4.00 4.00 4.00 3.00
3.00 3.00 2.00 2.00
2.00 1.00 1.00 1.00
Shelter Supervisor 1.00 1.00 1.00 1.00
17.62 16.62 16.12 14.12
0.46 0.46 0.46 0.46
0.46 0.46 0.46 0.46
18.08 17.08 16.58 14.58
Animal Control Supervisor
Animal Control Officer
Code Compliance Manager
Animal Control Technician
Full-Time Staff
Director of Development Services
Senior Animal Control Officer
Executive Secretary
Office Assistant
Senior Office Assistant
Total Full & Part-Time Staff
Total Full-Time Staff
Part-Time Staff
Animal Control Technician
Total Part-Time Staff
F - 74
FUND: GENERAL FUND 100 DEPARTMENT: DEVELOPMENT SERVICES 29 DIVISION: CODE COMPLIANCE 305 PROGRAM: ANIMAL CONTROL 5000
2009-10 PROGRAM ACCOMPLISHMENTS
Increased investigation of aggressive animals resulting in increased number of hearings being held for potentially dangerous or vicious dogs.
Revised a new written procedure manual for kennel technician staff, eliminating confusion and increasing productivity.
Coordinated with Code Enforcement for door-to door canvassing of a “targeted” neighborhood to comply with dog licensing.
Increased number of volunteers who were instrumental in supplementing Shelter operation needs while reducing manpower costs.
Increased number of foster homes which enabled litters of puppies and kittens to be saved for adoption, which otherwise would be euthanized.
Increased offsite adoption program with PetSmart Adoption Charities, which resulted in monies paid to the City’s, adoption program fund. To date the City has received over $2,300. Other adoption events include Orange County Pet Expo, Hesperia Days, and Rodeo.
Increased number of animals rescued, due in part to an Orange County rescue volunteer who selected Hesperia Animal Control as a participant in this program. Since coordinating with this person in February 2010, 114 animals have been saved and rescued.
Increased adoption statistics and revenues from last year at $32,883 to over $50,000 this year.
Coordinated with local veterinarian to assist with monthly after-hours vaccination/microchip/licensing clinics, which brought increased revenues.
Enhanced advertising for pet adoptions through “Pet of the Week” radio show.
Increased Community outreach though education with Boy Scout and Girl Scout tours.
Increased Community outreach through Disaster Preparedness with the First Baptist Church regarding animal evacuations.
2010-11 PROGRAM GOALS AND OBJECTIVES
Continue the established Volunteer Program to assist with shelter operations.
Increase door-to-door canvassing of the entire City for unlicensed/unvaccinated pets, increasing license revenues.
Continue to develop a written training protocol for new and existing staff.
Develop a written procedure manual for staff, eliminating confusion and increasing productivity.
Review and revise Animal Control ordinances.
Revise all fees, especially those pertaining to cost recovery.
Increase community outreach and education for animal control issues.
Hire an in-shelter veterinarian to perform spays/neuters on shelter animals, treatment of injured animals and provide low-cost spay/neuter services to High Desert residents to reduce animal over population.
Coordinate with San Bernardino County for the pilot cat care contract service.
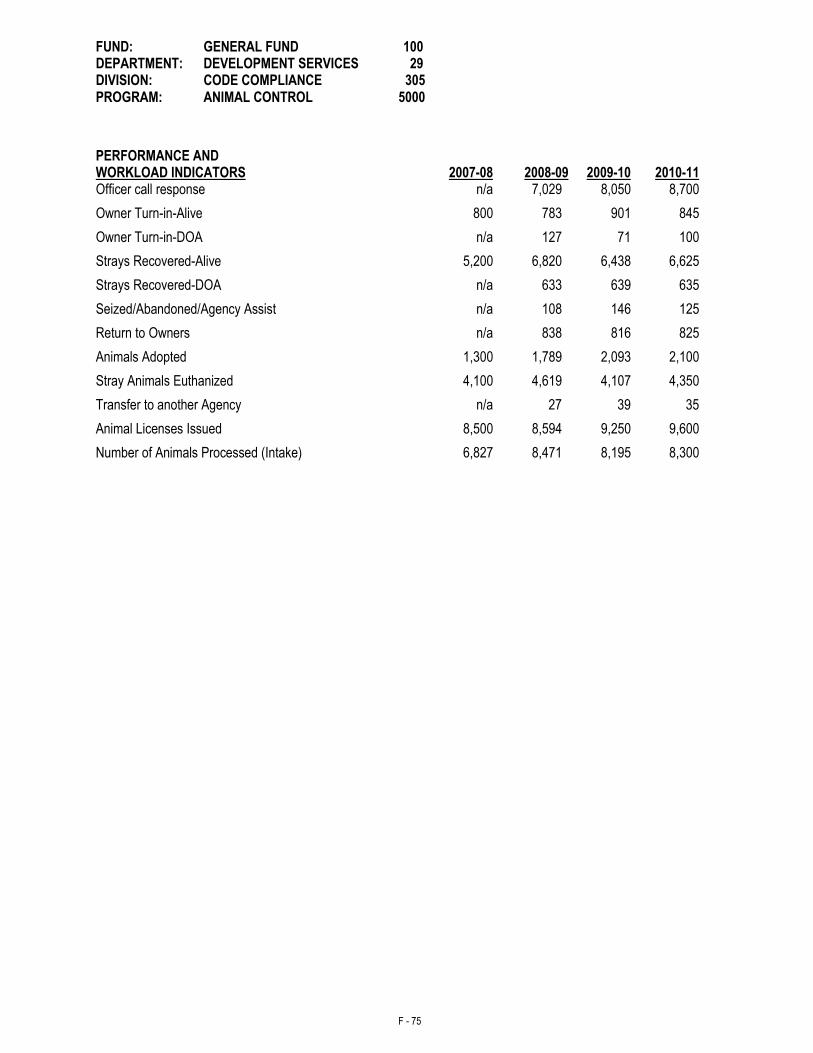
F - 75
FUND: GENERAL FUND 100 DEPARTMENT: DEVELOPMENT SERVICES 29 DIVISION: CODE COMPLIANCE 305 PROGRAM: ANIMAL CONTROL 5000
PERFORMANCE AND WORKLOAD INDICATORS 2007-08 2008-09
2009-10
2010-11
Officer call response n/a 7,029 8,050 8,700
Owner Turn-in-Alive 800 783 901 845
Owner Turn-in-DOA n/a 127 71 100
Strays Recovered-Alive 5,200 6,820 6,438 6,625
Strays Recovered-DOA n/a 633 639 635
Seized/Abandoned/Agency Assist n/a 108 146 125
Return to Owners n/a 838 816 825
Animals Adopted 1,300 1,789 2,093 2,100
Stray Animals Euthanized 4,100 4,619 4,107 4,350
Transfer to another Agency n/a 27 39 35
Animal Licenses Issued 8,500 8,594 9,250 9,600
Number of Animals Processed (Intake) 6,827 8,471 8,195 8,300
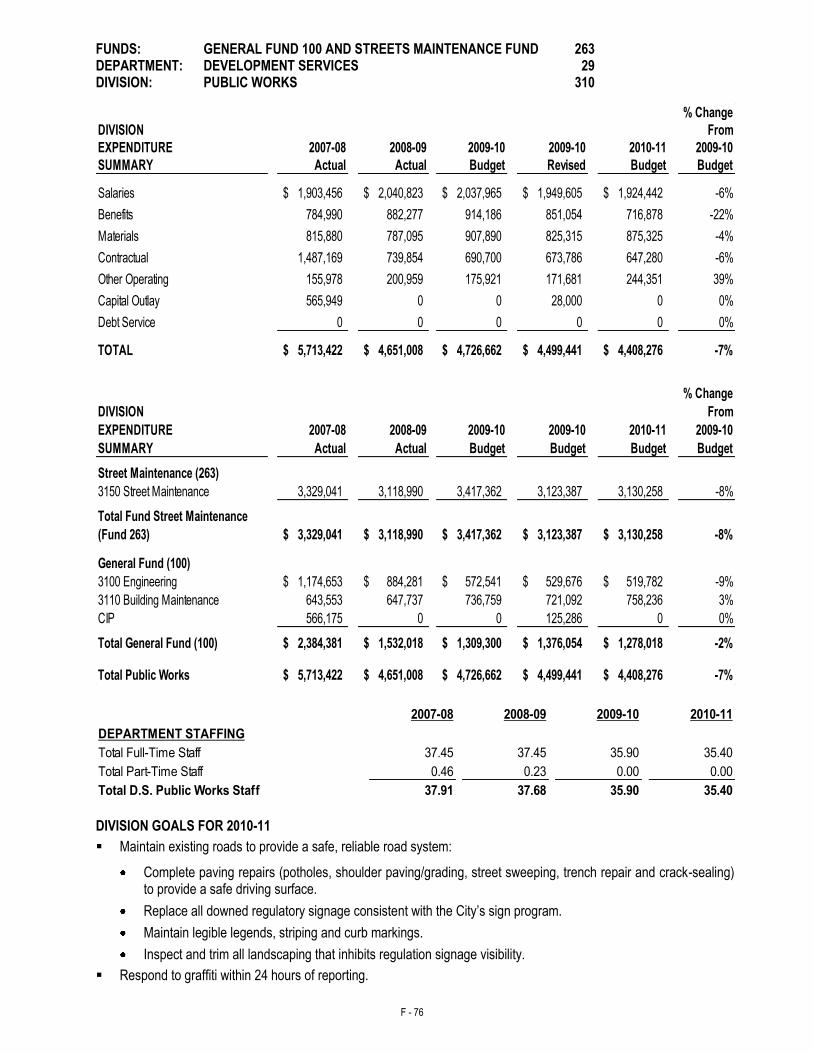
F - 76
FUNDS: GENERAL FUND 100 AND STREETS MAINTENANCE FUND 263 DEPARTMENT: DEVELOPMENT SERVICES 29 DIVISION: PUBLIC WORKS 310
% Change
DIVISION From
EXPENDITURE 2007-08 2008-09 2009-10 2009-10 2010-11 2009-10
SUMMARY Actual Actual Budget Revised Budget Budget
Salaries 1,903,456$ 2,040,823$ 2,037,965$ 1,949,605$ 1,924,442$ -6%
Benefits 784,990 882,277 914,186 851,054 716,878 -22%
Materials 815,880 787,095 907,890 825,315 875,325 -4%
Contractual 1,487,169 739,854 690,700 673,786 647,280 -6%
Other Operating 155,978 200,959 175,921 171,681 244,351 39%
Capital Outlay 565,949 0 0 28,000 0 0%
Debt Service 0 0 0 0 0 0%
TOTAL 5,713,422$ 4,651,008$ 4,726,662$ 4,499,441$ 4,408,276$ -7%
% Change
DIVISION From
EXPENDITURE 2007-08 2008-09 2009-10 2009-10 2010-11 2009-10
SUMMARY Actual Actual Budget Budget Budget Budget
Street Maintenance (263)
3150 Street Maintenance 3,329,041 3,118,990 3,417,362 3,123,387 3,130,258 -8%
Total Fund Street Maintenance
(Fund 263) 3,329,041$ 3,118,990$ 3,417,362$ 3,123,387$ 3,130,258$ -8%
General Fund (100)
3100 Engineering 1,174,653$ 884,281$ 572,541$ 529,676$ 519,782$ -9%
3110 Building Maintenance 643,553 647,737 736,759 721,092 758,236 3%
CIP 566,175 0 0 125,286 0 0%
Total General Fund (100) 2,384,381$ 1,532,018$ 1,309,300$ 1,376,054$ 1,278,018$ -2%
Total Public Works 5,713,422$ 4,651,008$ 4,726,662$ 4,499,441$ 4,408,276$ -7%
2007-08 2008-09 2009-10 2010-11
DEPARTMENT STAFFING
Total Full-Time Staff 37.45 37.45 35.90 35.40
0.46 0.23 0.00 0.00
37.91 37.68 35.90 35.40
Total Part-Time Staff
Total D.S. Public Works Staff
DIVISION GOALS FOR 2010-11
Maintain existing roads to provide a safe, reliable road system:
Complete paving repairs (potholes, shoulder paving/grading, street sweeping, trench repair and crack-sealing) to provide a safe driving surface.
Replace all downed regulatory signage consistent with the City’s sign program.
Maintain legible legends, striping and curb markings.
Inspect and trim all landscaping that inhibits regulation signage visibility.
Respond to graffiti within 24 hours of reporting.
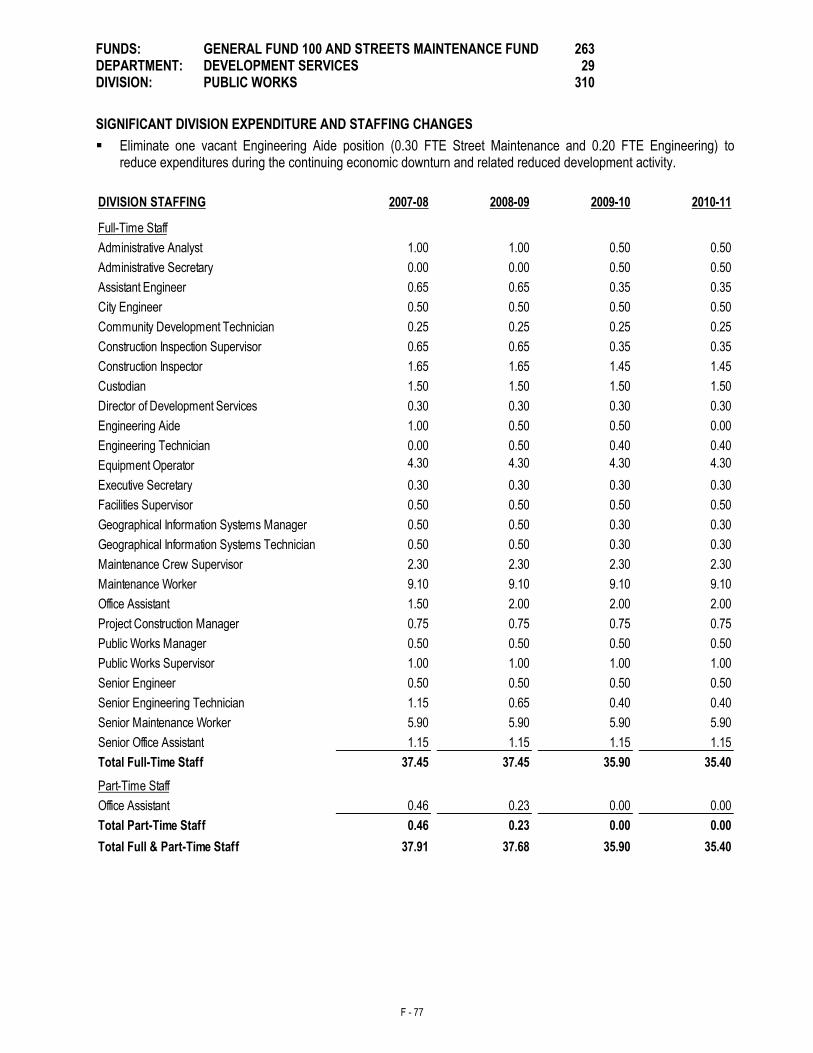
F - 77
FUNDS: GENERAL FUND 100 AND STREETS MAINTENANCE FUND 263 DEPARTMENT: DEVELOPMENT SERVICES 29 DIVISION: PUBLIC WORKS 310
SIGNIFICANT DIVISION EXPENDITURE AND STAFFING CHANGES
Eliminate one vacant Engineering Aide position (0.30 FTE Street Maintenance and 0.20 FTE Engineering) to reduce expenditures during the continuing economic downturn and related reduced development activity.
DIVISION STAFFING 2007-08 2008-09 2009-10 2010-11
1.00 1.00 0.50 0.50
0.00 0.00 0.50 0.50
0.65 0.65 0.35 0.35
0.50 0.50 0.50 0.50
0.25 0.25 0.25 0.25
0.65 0.65 0.35 0.35
1.65 1.65 1.45 1.45
1.50 1.50 1.50 1.50
0.30 0.30 0.30 0.30
1.00 0.50 0.50 0.00
0.00 0.50 0.40 0.40
4.30 4.30 4.30 4.30
0.30 0.30 0.30 0.30
0.50 0.50 0.50 0.50
0.50 0.50 0.30 0.30
0.50 0.50 0.30 0.30
2.30 2.30 2.30 2.30
9.10 9.10 9.10 9.10
1.50 2.00 2.00 2.00
0.75 0.75 0.75 0.75
0.50 0.50 0.50 0.50
1.00 1.00 1.00 1.00
0.50 0.50 0.50 0.50
1.15 0.65 0.40 0.40
5.90 5.90 5.90 5.90
1.15 1.15 1.15 1.15
37.45 37.45 35.90 35.40
0.46 0.23 0.00 0.00
0.46 0.23 0.00 0.00
37.91 37.68 35.90 35.40
Senior Engineer
Total Part-Time Staff
Total Full & Part-Time Staff
Full-Time Staff
Total Full-Time Staff
Executive Secretary
Equipment Operator
Senior Office Assistant
Senior Maintenance Worker
Senior Engineering Technician
Engineering Aide
Director of Development Services
Administrative Analyst
Custodian
Construction Inspection Supervisor
Community Development Technician
City Engineer
Assistant Engineer
Administrative Secretary
Office Assistant
Maintenance Worker
Maintenance Crew Supervisor
Geographical Information Systems Technician
Geographical Information Systems Manager
Facilities Supervisor
Part-Time Staff
Office Assistant
Construction Inspector
Engineering Technician
Public Works Supervisor
Public Works Manager
Project Construction Manager
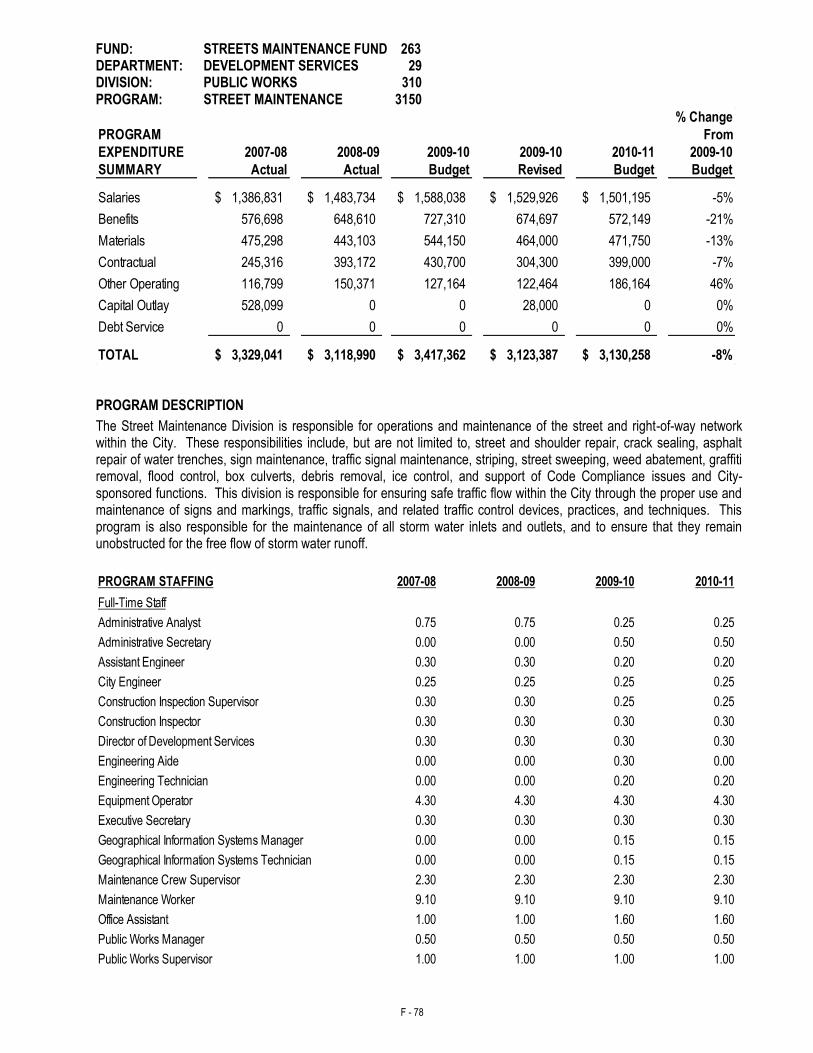
F - 78
FUND: STREETS MAINTENANCE FUND 263 DEPARTMENT: DEVELOPMENT SERVICES 29 DIVISION: PUBLIC WORKS 310 PROGRAM: STREET MAINTENANCE 3150
% Change
PROGRAM From
EXPENDITURE 2007-08 2008-09 2009-10 2009-10 2010-11 2009-10
SUMMARY Actual Actual Budget Revised Budget Budget
Salaries 1,386,831$ 1,483,734$ 1,588,038$ 1,529,926$ 1,501,195$ -5%
Benefits 576,698 648,610 727,310 674,697 572,149 -21%
Materials 475,298 443,103 544,150 464,000 471,750 -13%
Contractual 245,316 393,172 430,700 304,300 399,000 -7%
Other Operating 116,799 150,371 127,164 122,464 186,164 46%
Capital Outlay 528,099 0 0 28,000 0 0%
Debt Service 0 0 0 0 0 0%
TOTAL 3,329,041$ 3,118,990$ 3,417,362$ 3,123,387$ 3,130,258$ -8%
PROGRAM DESCRIPTION
The Street Maintenance Division is responsible for operations and maintenance of the street and right-of-way network within the City. These responsibilities include, but are not limited to, street and shoulder repair, crack sealing, asphalt repair of water trenches, sign maintenance, traffic signal maintenance, striping, street sweeping, weed abatement, graffiti removal, flood control, box culverts, debris removal, ice control, and support of Code Compliance issues and City-sponsored functions. This division is responsible for ensuring safe traffic flow within the City through the proper use and maintenance of signs and markings, traffic signals, and related traffic control devices, practices, and techniques. This program is also responsible for the maintenance of all storm water inlets and outlets, and to ensure that they remain unobstructed for the free flow of storm water runoff.
PROGRAM STAFFING 2007-08 2008-09 2009-10 2010-11
0.75 0.75 0.25 0.25
0.00 0.00 0.50 0.50
0.30 0.30 0.20 0.20
0.25 0.25 0.25 0.25
0.30 0.30 0.25 0.25
0.30 0.30 0.30 0.30
0.30 0.30 0.30 0.30
Engineering Aide 0.00 0.00 0.30 0.00
0.00 0.00 0.20 0.20
4.30 4.30 4.30 4.30
0.30 0.30 0.30 0.30
0.00 0.00 0.15 0.15
0.00 0.00 0.15 0.15
2.30 2.30 2.30 2.30
9.10 9.10 9.10 9.10
1.00 1.00 1.60 1.60
0.50 0.50 0.50 0.50
1.00 1.00 1.00 1.00
Engineering Technician
Equipment Operator
Construction Inspector
Public Works Supervisor
Maintenance Worker
Executive Secretary
Maintenance Crew Supervisor
Geographical Information Systems Manager
Geographical Information Systems Technician
Full-Time Staff
Assistant Engineer
Administrative Analyst
Director of Development Services
Construction Inspection Supervisor
Administrative Secretary
City Engineer
Office Assistant
Public Works Manager
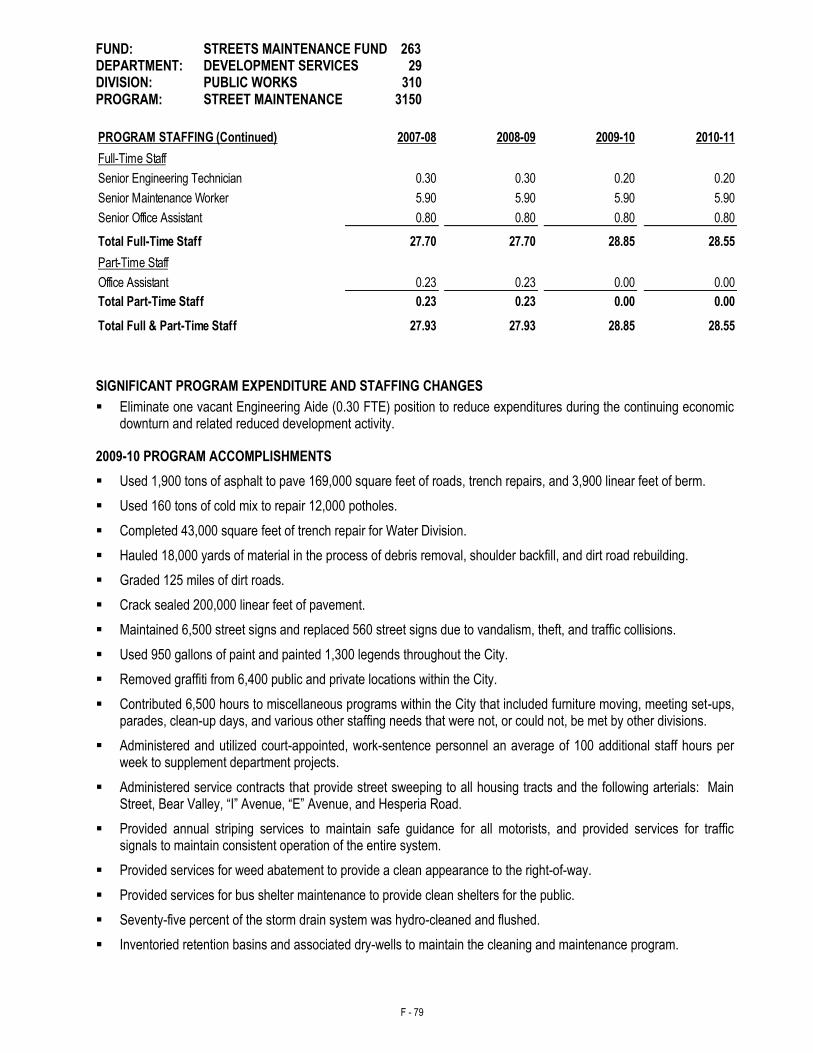
F - 79
FUND: STREETS MAINTENANCE FUND 263 DEPARTMENT: DEVELOPMENT SERVICES 29 DIVISION: PUBLIC WORKS 310 PROGRAM: STREET MAINTENANCE 3150
PROGRAM STAFFING (Continued) 2007-08 2008-09 2009-10 2010-11
0.30 0.30 0.20 0.20
5.90 5.90 5.90 5.90
0.80 0.80 0.80 0.80
27.70 27.70 28.85 28.55
Part-Time Staff
Office Assistant 0.23 0.23 0.00 0.00
0.23 0.23 0.00 0.00
27.93 27.93 28.85 28.55
Full-Time Staff
Total Full & Part-Time Staff
Total Part-Time Staff
Senior Office Assistant
Total Full-Time Staff
Senior Maintenance Worker
Senior Engineering Technician
SIGNIFICANT PROGRAM EXPENDITURE AND STAFFING CHANGES
Eliminate one vacant Engineering Aide (0.30 FTE) position to reduce expenditures during the continuing economic downturn and related reduced development activity.
2009-10 PROGRAM ACCOMPLISHMENTS
Used 1,900 tons of asphalt to pave 169,000 square feet of roads, trench repairs, and 3,900 linear feet of berm.
Used 160 tons of cold mix to repair 12,000 potholes.
Completed 43,000 square feet of trench repair for Water Division.
Hauled 18,000 yards of material in the process of debris removal, shoulder backfill, and dirt road rebuilding.
Graded 125 miles of dirt roads.
Crack sealed 200,000 linear feet of pavement.
Maintained 6,500 street signs and replaced 560 street signs due to vandalism, theft, and traffic collisions.
Used 950 gallons of paint and painted 1,300 legends throughout the City.
Removed graffiti from 6,400 public and private locations within the City.
Contributed 6,500 hours to miscellaneous programs within the City that included furniture moving, meeting set-ups, parades, clean-up days, and various other staffing needs that were not, or could not, be met by other divisions.
Administered and utilized court-appointed, work-sentence personnel an average of 100 additional staff hours per week to supplement department projects.
Administered service contracts that provide street sweeping to all housing tracts and the following arterials: Main Street, Bear Valley, “I” Avenue, “E” Avenue, and Hesperia Road.
Provided annual striping services to maintain safe guidance for all motorists, and provided services for traffic signals to maintain consistent operation of the entire system.
Provided services for weed abatement to provide a clean appearance to the right-of-way.
Provided services for bus shelter maintenance to provide clean shelters for the public.
Seventy-five percent of the storm drain system was hydro-cleaned and flushed.
Inventoried retention basins and associated dry-wells to maintain the cleaning and maintenance program.
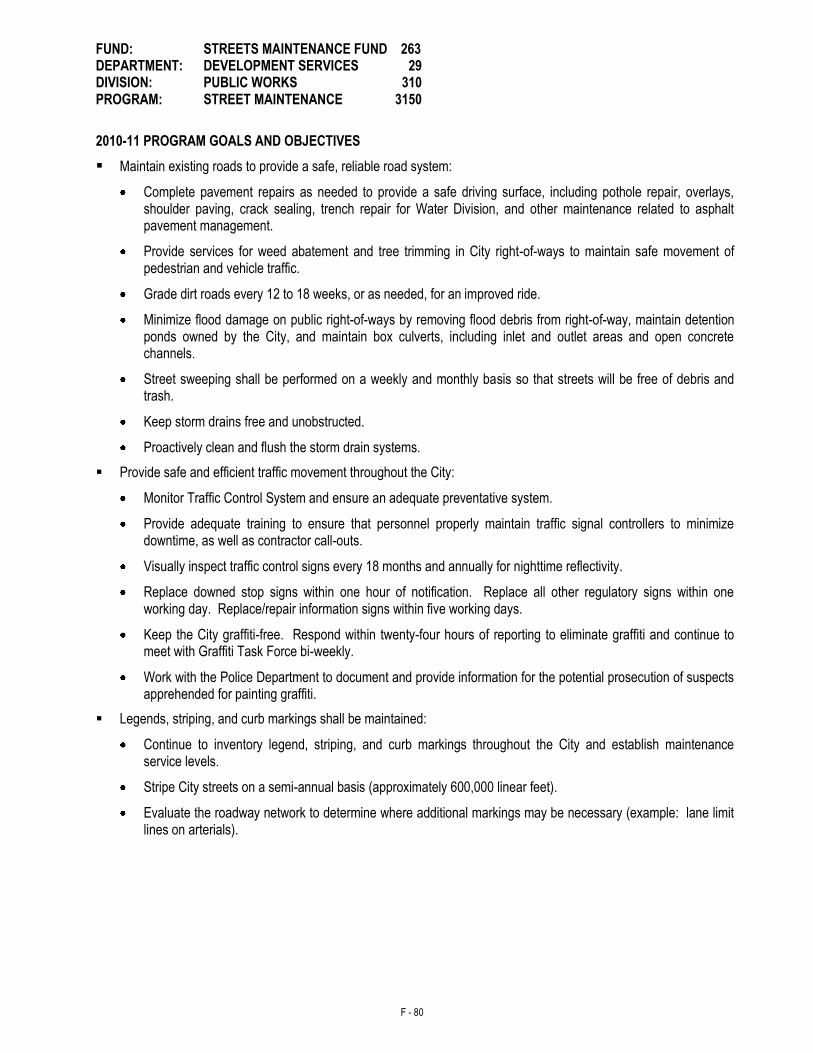
F - 80
FUND: STREETS MAINTENANCE FUND 263 DEPARTMENT: DEVELOPMENT SERVICES 29 DIVISION: PUBLIC WORKS 310 PROGRAM: STREET MAINTENANCE 3150
2010-11 PROGRAM GOALS AND OBJECTIVES
Maintain existing roads to provide a safe, reliable road system:
Complete pavement repairs as needed to provide a safe driving surface, including pothole repair, overlays, shoulder paving, crack sealing, trench repair for Water Division, and other maintenance related to asphalt pavement management.
Provide services for weed abatement and tree trimming in City right-of-ways to maintain safe movement of pedestrian and vehicle traffic.
Grade dirt roads every 12 to 18 weeks, or as needed, for an improved ride.
Minimize flood damage on public right-of-ways by removing flood debris from right-of-way, maintain detention ponds owned by the City, and maintain box culverts, including inlet and outlet areas and open concrete channels.
Street sweeping shall be performed on a weekly and monthly basis so that streets will be free of debris and trash.
Keep storm drains free and unobstructed.
Proactively clean and flush the storm drain systems.
Provide safe and efficient traffic movement throughout the City:
Monitor Traffic Control System and ensure an adequate preventative system.
Provide adequate training to ensure that personnel properly maintain traffic signal controllers to minimize downtime, as well as contractor call-outs.
Visually inspect traffic control signs every 18 months and annually for nighttime reflectivity.
Replace downed stop signs within one hour of notification. Replace all other regulatory signs within one working day. Replace/repair information signs within five working days.
Keep the City graffiti-free. Respond within twenty-four hours of reporting to eliminate graffiti and continue to meet with Graffiti Task Force bi-weekly.
Work with the Police Department to document and provide information for the potential prosecution of suspects apprehended for painting graffiti.
Legends, striping, and curb markings shall be maintained:
Continue to inventory legend, striping, and curb markings throughout the City and establish maintenance service levels.
Stripe City streets on a semi-annual basis (approximately 600,000 linear feet).
Evaluate the roadway network to determine where additional markings may be necessary (example: lane limit lines on arterials).
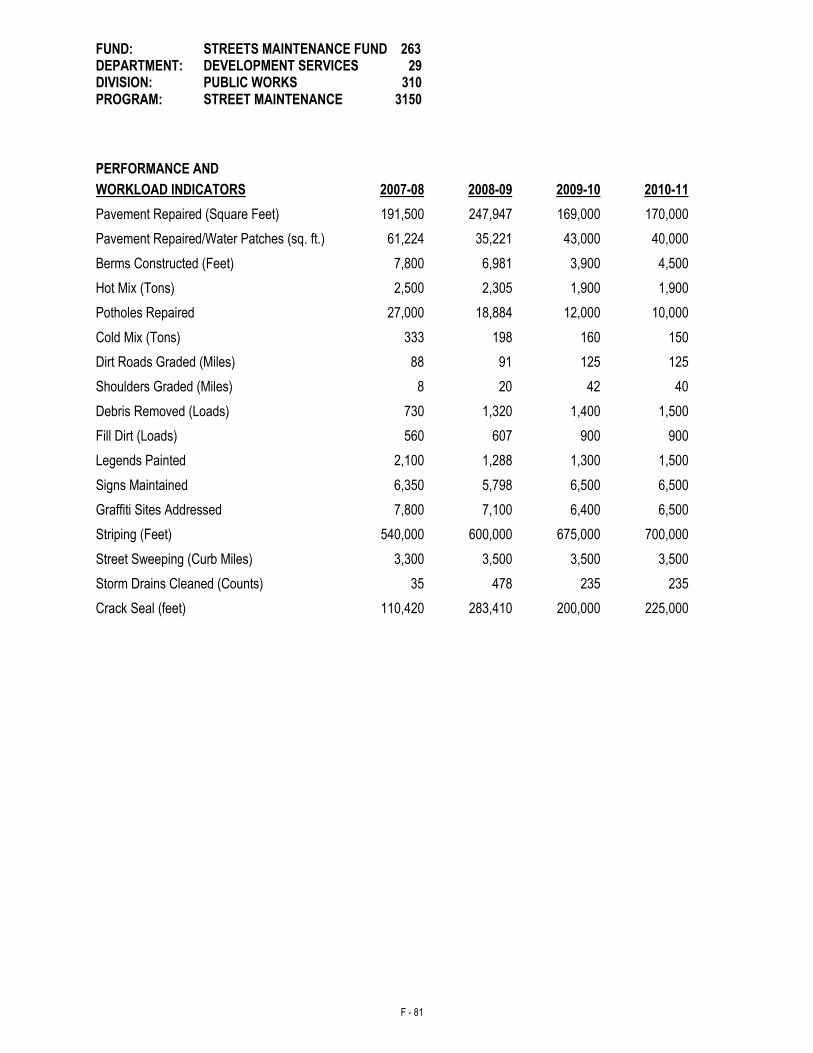
F - 81
FUND: STREETS MAINTENANCE FUND 263 DEPARTMENT: DEVELOPMENT SERVICES 29 DIVISION: PUBLIC WORKS 310 PROGRAM: STREET MAINTENANCE 3150
PERFORMANCE AND
WORKLOAD INDICATORS 2007-08 2008-09
2009-10
2010-11
Pavement Repaired (Square Feet) 191,500 247,947 169,000 170,000
Pavement Repaired/Water Patches (sq. ft.) 61,224 35,221 43,000 40,000
Berms Constructed (Feet) 7,800 6,981 3,900 4,500
Hot Mix (Tons) 2,500 2,305 1,900 1,900
Potholes Repaired 27,000 18,884 12,000 10,000
Cold Mix (Tons) 333 198 160 150
Dirt Roads Graded (Miles) 88 91 125 125
Shoulders Graded (Miles) 8 20 42 40
Debris Removed (Loads) 730 1,320 1,400 1,500
Fill Dirt (Loads) 560 607 900 900
Legends Painted 2,100 1,288 1,300 1,500
Signs Maintained 6,350 5,798 6,500 6,500
Graffiti Sites Addressed 7,800 7,100 6,400 6,500
Striping (Feet) 540,000 600,000 675,000 700,000
Street Sweeping (Curb Miles) 3,300 3,500 3,500 3,500
Storm Drains Cleaned (Counts) 35 478 235 235
Crack Seal (feet) 110,420 283,410 200,000 225,000
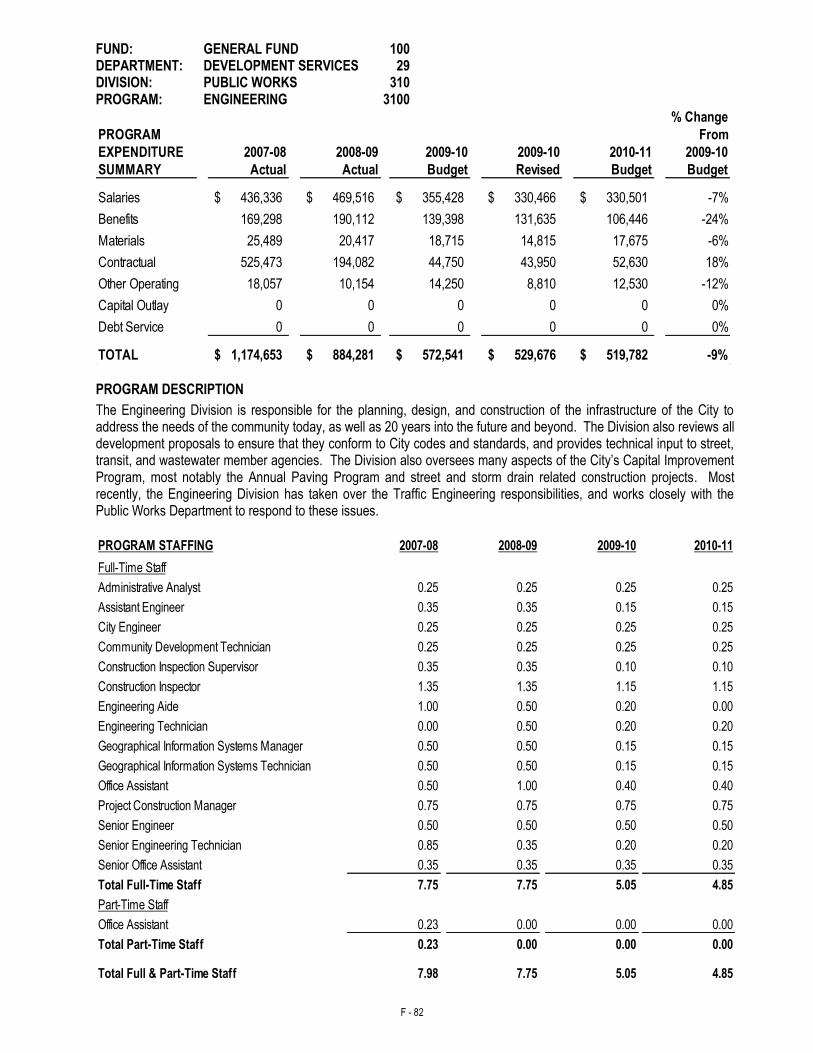
F - 82
FUND: GENERAL FUND 100 DEPARTMENT: DEVELOPMENT SERVICES 29 DIVISION: PUBLIC WORKS 310 PROGRAM: ENGINEERING 3100
% Change
PROGRAM From
EXPENDITURE 2007-08 2008-09 2009-10 2009-10 2010-11 2009-10
SUMMARY Actual Actual Budget Revised Budget Budget
Salaries 436,336$ 469,516$ 355,428$ 330,466$ 330,501$ -7%
Benefits 169,298 190,112 139,398 131,635 106,446 -24%
Materials 25,489 20,417 18,715 14,815 17,675 -6%
Contractual 525,473 194,082 44,750 43,950 52,630 18%
Other Operating 18,057 10,154 14,250 8,810 12,530 -12%
Capital Outlay 0 0 0 0 0 0%
Debt Service 0 0 0 0 0 0%
TOTAL 1,174,653$ 884,281$ 572,541$ 529,676$ 519,782$ -9%
PROGRAM DESCRIPTION
The Engineering Division is responsible for the planning, design, and construction of the infrastructure of the City to address the needs of the community today, as well as 20 years into the future and beyond. The Division also reviews all development proposals to ensure that they conform to City codes and standards, and provides technical input to street, transit, and wastewater member agencies. The Division also oversees many aspects of the City’s Capital Improvement Program, most notably the Annual Paving Program and street and storm drain related construction projects. Most recently, the Engineering Division has taken over the Traffic Engineering responsibilities, and works closely with the Public Works Department to respond to these issues.
PROGRAM STAFFING 2007-08 2008-09 2009-10 2010-11
0.25 0.25 0.25 0.25
0.35 0.35 0.15 0.15
0.25 0.25 0.25 0.25
0.25 0.25 0.25 0.25
0.35 0.35 0.10 0.10
1.35 1.35 1.15 1.15
1.00 0.50 0.20 0.00
0.00 0.50 0.20 0.20
0.50 0.50 0.15 0.15
0.50 0.50 0.15 0.15
0.50 1.00 0.40 0.40
0.75 0.75 0.75 0.75
0.50 0.50 0.50 0.50
0.85 0.35 0.20 0.20
0.35 0.35 0.35 0.35
7.75 7.75 5.05 4.85
Part-Time Staff
Office Assistant 0.23 0.00 0.00 0.00
0.23 0.00 0.00 0.00
7.98 7.75 5.05 4.85
Full-Time Staff
Assistant Engineer
Administrative Analyst
Construction Inspection Supervisor
Community Development Technician
City Engineer
Construction Inspector
Total Full & Part-Time Staff
Senior Engineer
Geographical Information Systems Technician
Project Construction Manager
Engineering Aide
Engineering Technician
Total Part-Time Staff
Senior Office Assistant
Total Full-Time Staff
Office Assistant
Senior Engineering Technician
Geographical Information Systems Manager
F - 83
FUND: GENERAL FUND 100 DEPARTMENT: DEVELOPMENT SERVICES 29 DIVISION: PUBLIC WORKS 310 PROGRAM: ENGINEERING 3100 SIGNIFICANT PROGRAM EXPENDITURE AND STAFFING CHANGES
Eliminate one vacant Engineering Aide (0.20 FTE) position to reduce expenditures during the continuing economic downturn and related reduced development activity.
2009-10 PROGRAM ACCOMPLISHMENTS
Prepared the Capital Improvement Program, utilizing the City’s Master Plans for Water and Wastewater and Public Safety Needs Report.
Continued the City’s Annual Pavement Rehabilitation Program by paving and maintaining over 20 miles of roadways throughout the City, including rehabilitation and widening work on several key roadways such as Arrowhead Lake Road to Hesperia Lakes, Mariposa Road south of Bear Valley Road, and ultimate improvements to Bear Valley Road east of Mariposa Avenue.
Completed improvements to eight VVTA bus stops making the stops more compliant with ADA accessibility requirements. The work was funded through an Article 3 transportation grant, which can only be utilized for these types of improvements.
Continued to implement the City’s Non-Motorized Transportation Plan by striping miles of Class II bike trails throughout the City, including Arrowhead Lake Road (which completes the connection from Main Street to Hesperia Lakes) and Willow Street, which links three schools along the bike path.
With a fully functional Geographical Information Systems (GIS) Map and Public Works utilizing the Cityworks program to generate, track, and execute work orders within the City’s GIS Map, the Storeroom Program was brought on-line. This next component of Cityworks tracks material levels at the Public Works Warehouse in real-time as work orders are issued. The information is compiled and linked with Finance’s software to maintain a real-world inventory at the warehouse.
The Geoviewer Program, which enables the balance of City staff outside of Public Works to access and utilize the GIS Map from their desktop computers, was upgraded to a more user-friendly platform, which makes accessing the plethora of information available easier to manipulate and maintain. The database, which Geoviewer accesses to provide its information, was brought in-house with the purchase of a new server. Having this database at City Hall will make is possible to integrate this database with other City programs such as Accela.
Worked in conjunction with the Victor Valley Transit Authority (VVTA) to improve the transit routes throughout the City. Interlining of the highly successful Route 48 with the Victor Valley College-bound Route 45, enabled the route to remain on schedule even during the high traffic times along Main Street, and eliminated the required transfer for students heading to the college.
Continued to support the various departments and divisions throughout the City through the production of maps, exhibits, standards, and other documents required.
Coordinated with Parsons Engineering, the project management firm for several large CIP projects such as the aqueduct crossing bridges at Main Street and Ranchero Road, the Ranchero Road interchange, a sewer tributary area study south of Ranchero Road, and several other large projects.
Completed the design of a fully-signalized intersection at Rock Springs Road and Main Street. It is anticipated that the right-of-way acquisition will be completed by the end of FY 2009-10 and that construction will begin in Summer, 2010.
The contract for new signal work and upgrades at several intersections was awarded as a design build project. The project includes a new traffic signal at the intersection of Seventh Avenue and Smoketree Street to handle the additional traffic generated by the opening of the County Government Center and the new Police Station as well as a signalized pedestrian crossing at the Eighth Avenue paseo into the City Civic Park. Signal equipment upgrades are also planned for the intersection of Main Street and “C” Avenue.
F - 84
FUND: GENERAL FUND 100 DEPARTMENT: DEVELOPMENT SERVICES 29 DIVISION: PUBLIC WORKS 310 PROGRAM: ENGINEERING 3100
2009-10 PROGRAM ACCOMPLISHMENTS (Continued)
The long-anticipated completion of the infrastructure and street improvements within Spruce and Smoketree Streets occurred as part of the Township Rehabilitation Project. Landscaping and the installation of the fencing is anticipated to carry-over into FY 2010-11, but all work should be complete in the summer of 2010. Future phases of the Township Project will be designed in-house utilizing the master plan document for the project.
Worked with the City’s Finance Department to update the next Five Year Waterline replacement plan, as well as the Five Year Pavement Rehabilitation Schedules based upon projected funding levels over this time frame. These documents will guide the Engineering Staff in making determinations of where to commit the limited funds allocated by the City Council for these projects.
Continued the implementation of the City’s Flood Hazard Protection Ordinance through the acquisition of drainage easements where required, and reviewed all development that is potentially impacted by storm water run-off.
Completed the fifth and final year of the Annual Report for compliance with the City’s general storm water permit. Staff is actively working with the Mojave River Watershed Group and the Regional Water Quality Control Board (Lahontan) to examine the potential requirements of the new permit and its impact to City operations. Staff also reviewed the new General Stormwater Construction Permit to determine any new requirements which the City will need to implement in order to comply with this new permit.
Engineering staff continued to expand its in-house design capacity in order to save City funds on contract services. Examples of projects completed in-house include the rehabilitation and expansion of Arrowhead Lake Road, continuation of the H-01 storm drain to Third Avenue, Main Street storm drain crossing along the A-04 drain line, intersection improvements at Escondido Avenue and Sultana Street, interim widening plans for Hesperia Road from Bear Valley Road to Sequoia Avenue, including the addition of a double left turn pocket at Bear Valley Road, and paseo improvements along Eighth Avenue from Willow Street to the Civic Park. The emergency repairs to Seventh Avenue necessitated by a long term water leak were also completed by the Engineering staff working closely with a local contractor.
The City Engineer assumed the duties of the City Traffic Engineer and was able to integrate traffic collision data into the “Crossroads” Program to track and query accidents throughout the City which enables response to questions regarding the safety of intersections within the City.
2010-11 PROGRAM GOALS AND OBJECTIVES
Complete the FY 2010-11 annual Pavement Rehabilitation Program on a reduced scale from previous years. Maximize the limited funding which is available for this program by prioritizing those roads affected by new water line installation while coordinating efforts with the Public Works Department to increase the maintenance on those roadways paved over the last 20 years.
Utilize the in-house design of the H-01 storm drain facility from the completed outlet structure to Third Avenue in order to construct the most economically feasible facility to control and dissipate the voluminous storm flows. Construction of this facility would reduce or eliminate the erosive impact to the existing residences that are downstream of the newly constructed outlet basin.
Continue to implement the City’s Non-Motorized Transportation Plan by actively pursuing all grants which may be utilized to construct Class I or II bike lanes, or safe routes to school grants.
Continue to improve and update the features of the City’s fully-functional Geographical Information System (GIS) Map by maintaining the new version of “Geoviewer” and expanding its use by City staff through additional training. Depending on funding levels, future integration with New World (Finance software) and Accela (project tracking software) will provide a seamless integration between departments throughout the City.
F - 85
FUND: GENERAL FUND 100 DEPARTMENT: DEVELOPMENT SERVICES 29 DIVISION: PUBLIC WORKS 310 PROGRAM: ENGINEERING 3100
2010-11 PROGRAM GOALS AND OBJECTIVES (Continued)
In light of dwindling transit funding levels, examine ways to maintain service levels within the City’s public transit system while protecting a portion of the City’s local transportation funds for roadway maintenance. This may be performed by tracking the productivity of the City’s fixed transit routes and realigning or eliminating the least productive routes.
Continue to support the various departments and divisions throughout the City through the production of maps, exhibits, and applications through Geoviewer and Cityworks to make the best productive use of the City’s GIS Map while meeting the demands of all City staff.
Work with Parsons Engineering, the CIP Program management firm, to complete studies and design of the infrastructure projects identified by the City Council and senior staff as high priority projects for this fiscal year, including the Main Street Aqueduct Crossing and the Ranchero Road Corridor Improvements.
Continue to implement the City’s Flood Hazard Protection Ordinance through the acquisition of drainage easements where required, and review all development that is potentially impacted by storm water run-off.
Continue to provide timely and professional plan checking and inspection services to the development community utilizing existing City staff.
Work with the Mojave River Watershed Group and the Regional Water Quality Control Board (Lahontan) to develop the next general storm water permit. General permits developed in other watershed areas have requirements which would not be practicable in this area, so staff will work with other agencies (especially Lahontan) to preclude a “one-size fits all” general permit.
Construct a fully-signalized intersection at Rocks Springs Road and Main Street, which will complete the improvements of the Rock Springs Road and Main Street corridor.
Complete the landscaping and fence installation along Spruce and Smoketree Streets which will complete the first two streets of the Township Rehabilitation Program. Monitor the condition of the newly installed improvements to determine levels of improvement for the future streets in the Township area. Hire a consultant to provide design survey services for the next two streets which will be designed in-house by the Engineering Staff.
Design the A-04 storm water crossing of Main Street utilizing the street plans prepared by Parsons Engineering for Main Street. The project will include catch basins, the underground culvert, and street improvements to accommodate the ultimate configuration of the culvert.
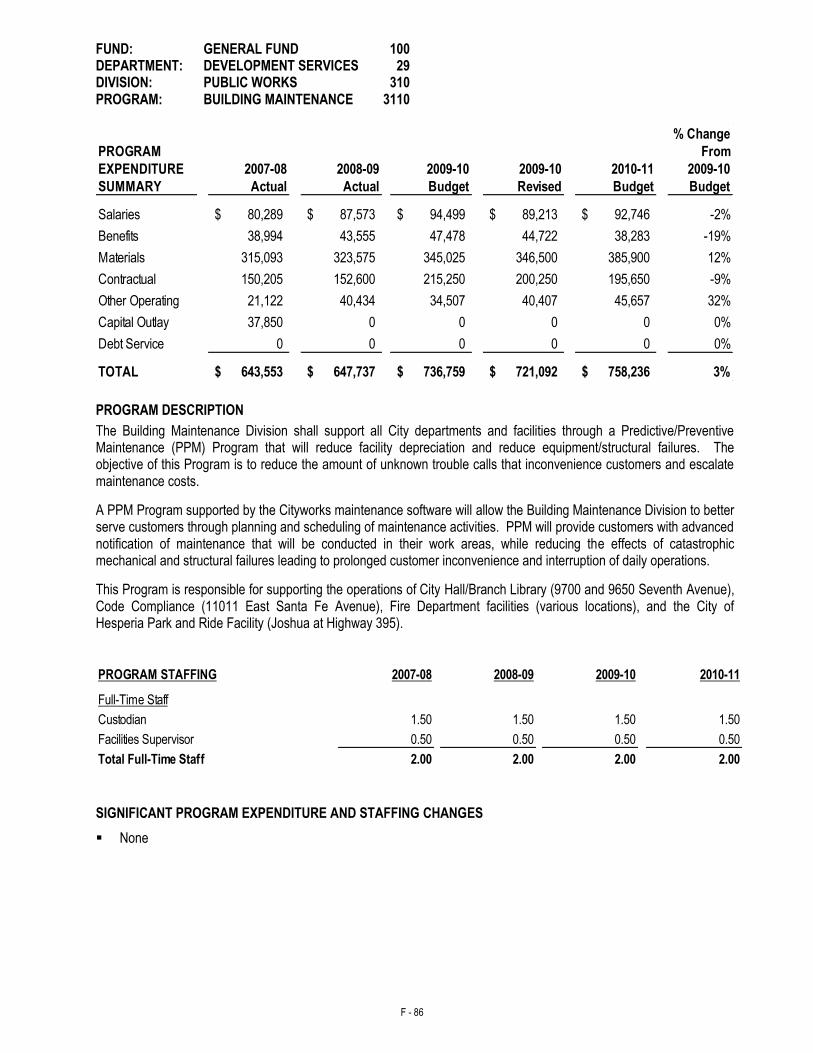
F - 86
FUND: GENERAL FUND 100 DEPARTMENT: DEVELOPMENT SERVICES 29 DIVISION: PUBLIC WORKS 310 PROGRAM: BUILDING MAINTENANCE 3110
% Change
PROGRAM From
EXPENDITURE 2007-08 2008-09 2009-10 2009-10 2010-11 2009-10
SUMMARY Actual Actual Budget Revised Budget Budget
Salaries 80,289$ 87,573$ 94,499$ 89,213$ 92,746$ -2%
Benefits 38,994 43,555 47,478 44,722 38,283 -19%
Materials 315,093 323,575 345,025 346,500 385,900 12%
Contractual 150,205 152,600 215,250 200,250 195,650 -9%
Other Operating 21,122 40,434 34,507 40,407 45,657 32%
Capital Outlay 37,850 0 0 0 0 0%
Debt Service 0 0 0 0 0 0%
TOTAL 643,553$ 647,737$ 736,759$ 721,092$ 758,236$ 3%
PROGRAM DESCRIPTION
The Building Maintenance Division shall support all City departments and facilities through a Predictive/Preventive Maintenance (PPM) Program that will reduce facility depreciation and reduce equipment/structural failures. The objective of this Program is to reduce the amount of unknown trouble calls that inconvenience customers and escalate maintenance costs.
A PPM Program supported by the Cityworks maintenance software will allow the Building Maintenance Division to better serve customers through planning and scheduling of maintenance activities. PPM will provide customers with advanced notification of maintenance that will be conducted in their work areas, while reducing the effects of catastrophic mechanical and structural failures leading to prolonged customer inconvenience and interruption of daily operations.
This Program is responsible for supporting the operations of City Hall/Branch Library (9700 and 9650 Seventh Avenue), Code Compliance (11011 East Santa Fe Avenue), Fire Department facilities (various locations), and the City of Hesperia Park and Ride Facility (Joshua at Highway 395).
PROGRAM STAFFING 2007-08 2008-09 2009-10 2010-11
1.50 1.50 1.50 1.50
0.50 0.50 0.50 0.50
2.00 2.00 2.00 2.00
Full-Time Staff
Total Full-Time Staff
Custodian
Facilities Supervisor
SIGNIFICANT PROGRAM EXPENDITURE AND STAFFING CHANGES
None
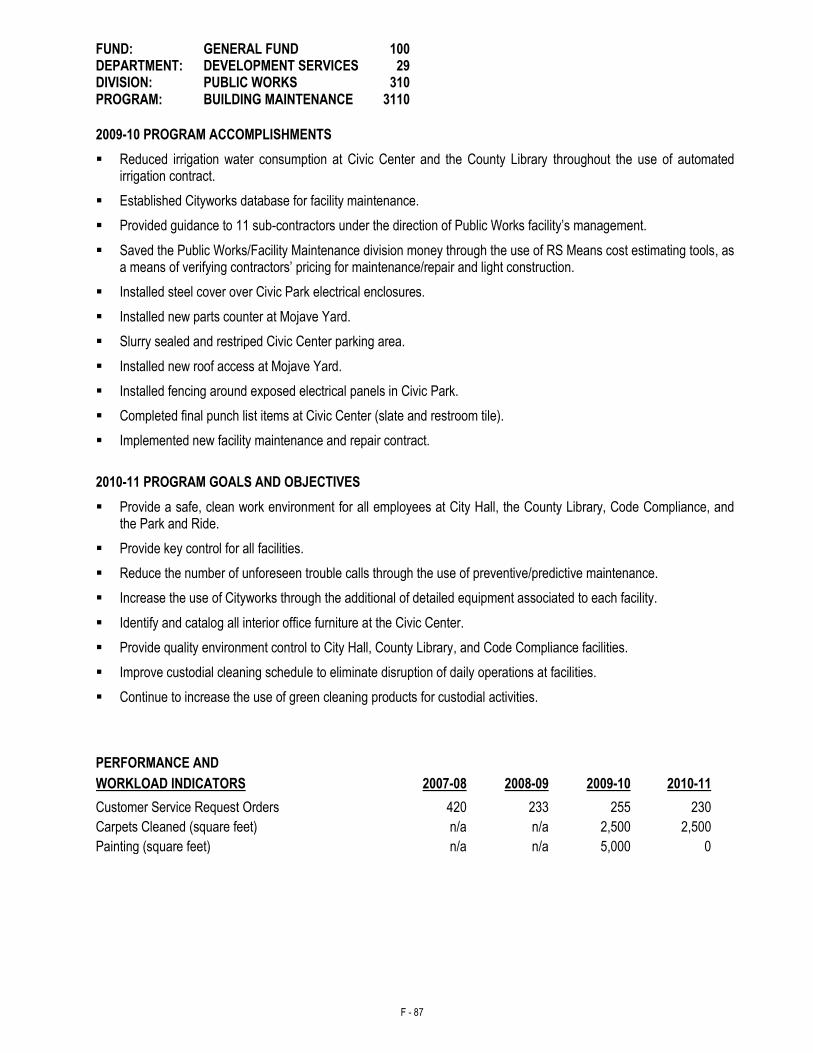
F - 87
FUND: GENERAL FUND 100 DEPARTMENT: DEVELOPMENT SERVICES 29 DIVISION: PUBLIC WORKS 310 PROGRAM: BUILDING MAINTENANCE 3110
2009-10 PROGRAM ACCOMPLISHMENTS
Reduced irrigation water consumption at Civic Center and the County Library throughout the use of automated irrigation contract.
Established Cityworks database for facility maintenance.
Provided guidance to 11 sub-contractors under the direction of Public Works facility’s management.
Saved the Public Works/Facility Maintenance division money through the use of RS Means cost estimating tools, as a means of verifying contractors’ pricing for maintenance/repair and light construction.
Installed steel cover over Civic Park electrical enclosures.
Installed new parts counter at Mojave Yard.
Slurry sealed and restriped Civic Center parking area.
Installed new roof access at Mojave Yard.
Installed fencing around exposed electrical panels in Civic Park.
Completed final punch list items at Civic Center (slate and restroom tile).
Implemented new facility maintenance and repair contract.
2010-11 PROGRAM GOALS AND OBJECTIVES
Provide a safe, clean work environment for all employees at City Hall, the County Library, Code Compliance, and the Park and Ride.
Provide key control for all facilities.
Reduce the number of unforeseen trouble calls through the use of preventive/predictive maintenance.
Increase the use of Cityworks through the additional of detailed equipment associated to each facility.
Identify and catalog all interior office furniture at the Civic Center.
Provide quality environment control to City Hall, County Library, and Code Compliance facilities.
Improve custodial cleaning schedule to eliminate disruption of daily operations at facilities.
Continue to increase the use of green cleaning products for custodial activities.
PERFORMANCE AND
WORKLOAD INDICATORS 2007-08 2008-09
2009-10
2010-11
Customer Service Request Orders 420 233 255 230
Carpets Cleaned (square feet) n/a n/a 2,500 2,500
Painting (square feet) n/a n/a 5,000 0
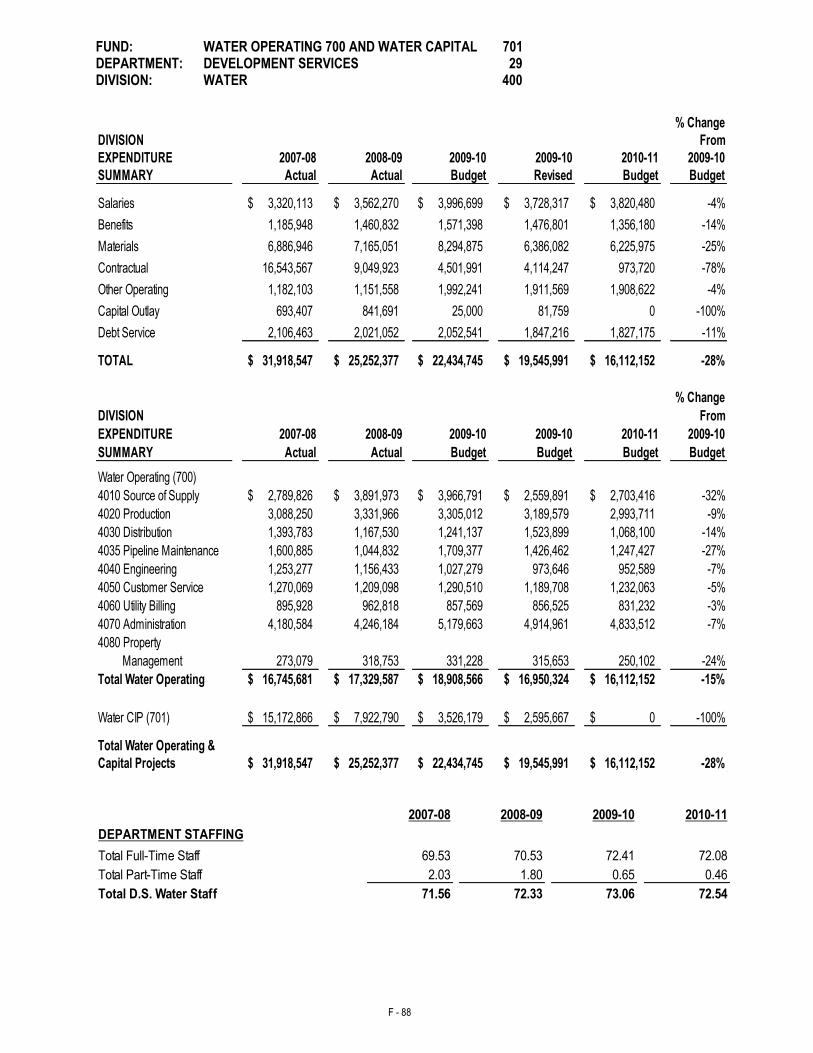
F - 88
FUND: WATER OPERATING 700 AND WATER CAPITAL 701 DEPARTMENT: DEVELOPMENT SERVICES 29 DIVISION: WATER 400
% Change
DIVISION From
EXPENDITURE 2007-08 2008-09 2009-10 2009-10 2010-11 2009-10
SUMMARY Actual Actual Budget Revised Budget Budget
Salaries 3,320,113$ 3,562,270$ 3,996,699$ 3,728,317$ 3,820,480$ -4%
Benefits 1,185,948 1,460,832 1,571,398 1,476,801 1,356,180 -14%
Materials 6,886,946 7,165,051 8,294,875 6,386,082 6,225,975 -25%
Contractual 16,543,567 9,049,923 4,501,991 4,114,247 973,720 -78%
Other Operating 1,182,103 1,151,558 1,992,241 1,911,569 1,908,622 -4%
Capital Outlay 693,407 841,691 25,000 81,759 0 -100%
Debt Service 2,106,463 2,021,052 2,052,541 1,847,216 1,827,175 -11%
TOTAL 31,918,547$ 25,252,377$ 22,434,745$ 19,545,991$ 16,112,152$ -28%
% Change
DIVISION From
EXPENDITURE 2007-08 2008-09 2009-10 2009-10 2010-11 2009-10
SUMMARY Actual Actual Budget Budget Budget Budget
Water Operating (700)
4010 Source of Supply 2,789,826$ 3,891,973$ 3,966,791$ 2,559,891$ 2,703,416$ -32%
4020 Production 3,088,250 3,331,966 3,305,012 3,189,579 2,993,711 -9%
4030 Distribution 1,393,783 1,167,530 1,241,137 1,523,899 1,068,100 -14%
4035 Pipeline Maintenance 1,600,885 1,044,832 1,709,377 1,426,462 1,247,427 -27%
4040 Engineering 1,253,277 1,156,433 1,027,279 973,646 952,589 -7%
4050 Customer Service 1,270,069 1,209,098 1,290,510 1,189,708 1,232,063 -5%
4060 Utility Billing 895,928 962,818 857,569 856,525 831,232 -3%
4070 Administration 4,180,584 4,246,184 5,179,663 4,914,961 4,833,512 -7%
4080 Property
Management 273,079 318,753 331,228 315,653 250,102 -24%
Total Water Operating 16,745,681$ 17,329,587$ 18,908,566$ 16,950,324$ 16,112,152$ -15%
Water CIP (701) 15,172,866$ 7,922,790$ 3,526,179$ 2,595,667$ 0$ -100%
Total Water Operating &
Capital Projects 31,918,547$ 25,252,377$ 22,434,745$ 19,545,991$ 16,112,152$ -28%
2007-08 2008-09 2009-10 2010-11
DEPARTMENT STAFFING
Total Full-Time Staff 69.53 70.53 72.41 72.08
2.03 1.80 0.65 0.46
71.56 72.33 73.06 72.54Total D.S. Water Staff
Total Part-Time Staff
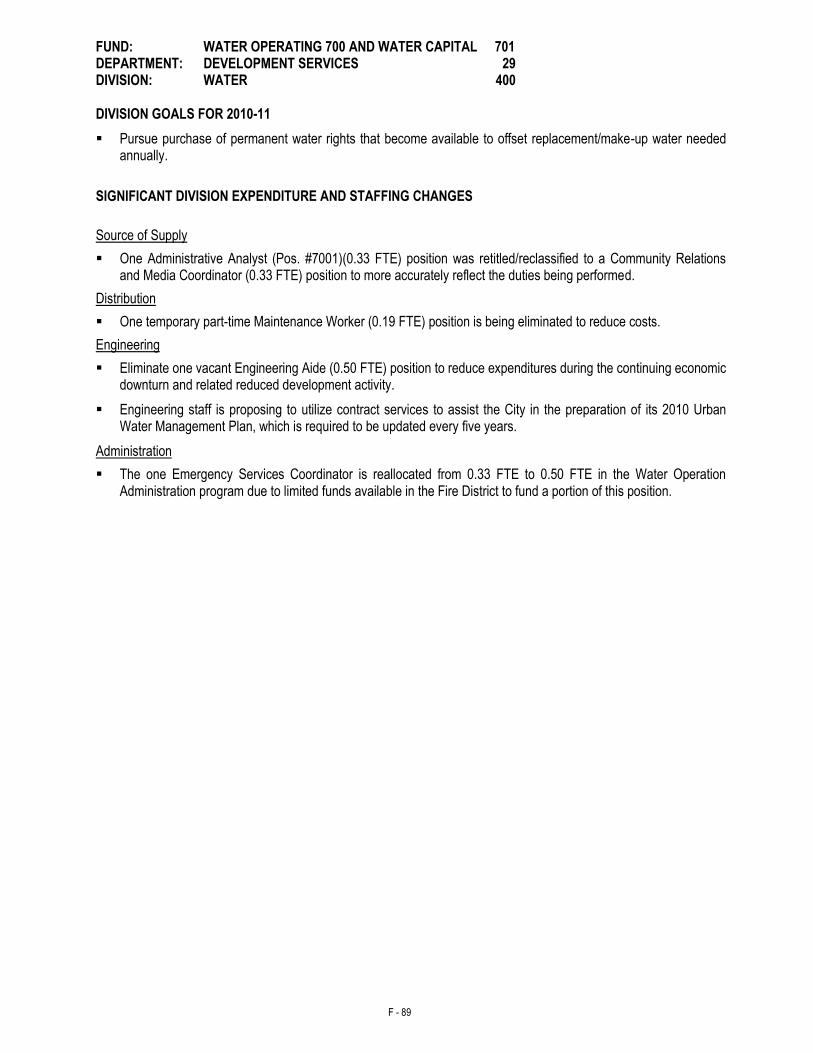
F - 89
FUND: WATER OPERATING 700 AND WATER CAPITAL 701 DEPARTMENT: DEVELOPMENT SERVICES 29 DIVISION: WATER 400 DIVISION GOALS FOR 2010-11
Pursue purchase of permanent water rights that become available to offset replacement/make-up water needed annually.
SIGNIFICANT DIVISION EXPENDITURE AND STAFFING CHANGES
Source of Supply
One Administrative Analyst (Pos. #7001)(0.33 FTE) position was retitled/reclassified to a Community Relations and Media Coordinator (0.33 FTE) position to more accurately reflect the duties being performed.
Distribution
One temporary part-time Maintenance Worker (0.19 FTE) position is being eliminated to reduce costs.
Engineering
Eliminate one vacant Engineering Aide (0.50 FTE) position to reduce expenditures during the continuing economic downturn and related reduced development activity.
Engineering staff is proposing to utilize contract services to assist the City in the preparation of its 2010 Urban Water Management Plan, which is required to be updated every five years.
Administration
The one Emergency Services Coordinator is reallocated from 0.33 FTE to 0.50 FTE in the Water Operation Administration program due to limited funds available in the Fire District to fund a portion of this position.
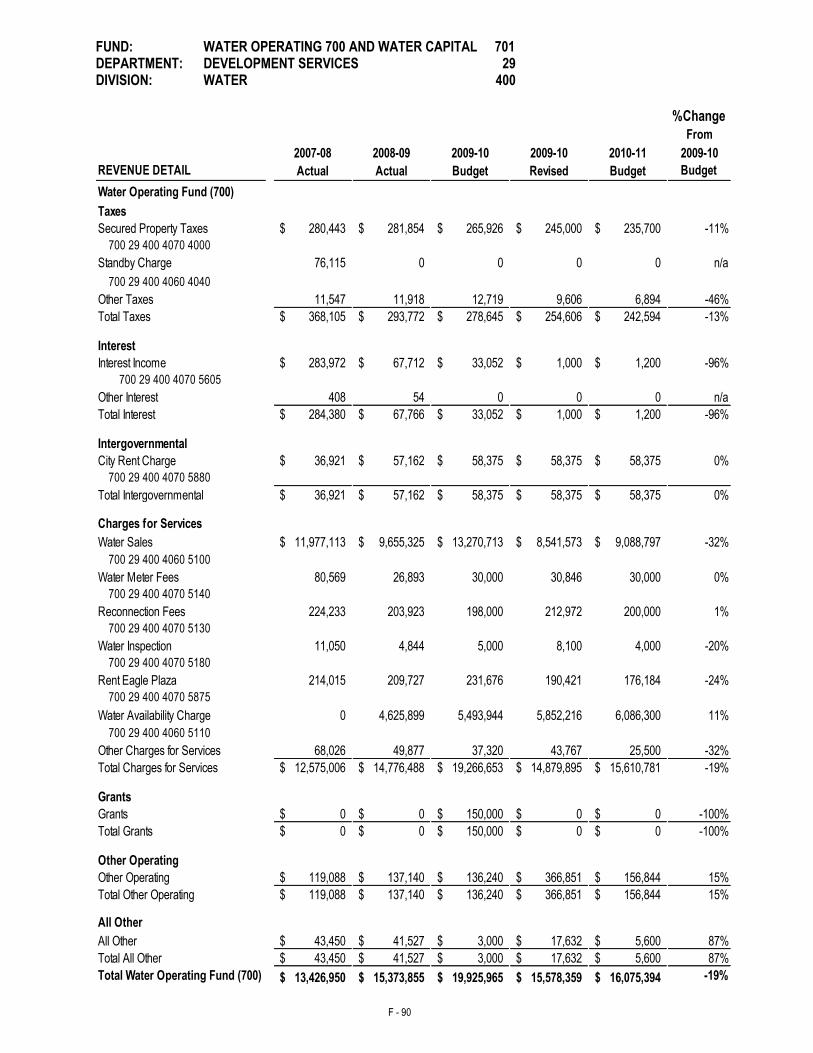
F - 90
FUND: WATER OPERATING 700 AND WATER CAPITAL 701 DEPARTMENT: DEVELOPMENT SERVICES 29 DIVISION: WATER 400
%Change
From
2007-08 2008-09 2009-10 2009-10 2010-11 2009-10
REVENUE DETAIL Actual Actual Budget Revised Budget Budget
Water Operating Fund (700)
Taxes
Secured Property Taxes 280,443$ 281,854$ 265,926$ 245,000$ 235,700$ -11%
700 29 400 4070 4000
Standby Charge 76,115 0 0 0 0 n/a
700 29 400 4060 4040
Other Taxes 11,547 11,918 12,719 9,606 6,894 -46%
Total Taxes 368,105$ 293,772$ 278,645$ 254,606$ 242,594$ -13%
Interest
Interest Income 283,972$ 67,712$ 33,052$ 1,000$ 1,200$ -96%
700 29 400 4070 5605
Other Interest 408 54 0 0 0 n/a
Total Interest 284,380$ 67,766$ 33,052$ 1,000$ 1,200$ -96%
Intergovernmental
City Rent Charge 36,921$ 57,162$ 58,375$ 58,375$ 58,375$ 0%
700 29 400 4070 5880
Total Intergovernmental 36,921$ 57,162$ 58,375$ 58,375$ 58,375$ 0%
Charges for Services
Water Sales 11,977,113$ 9,655,325$ 13,270,713$ 8,541,573$ 9,088,797$ -32%
700 29 400 4060 5100
Water Meter Fees 80,569 26,893 30,000 30,846 30,000 0%
700 29 400 4070 5140
Reconnection Fees 224,233 203,923 198,000 212,972 200,000 1%
700 29 400 4070 5130
Water Inspection 11,050 4,844 5,000 8,100 4,000 -20%
700 29 400 4070 5180
Rent Eagle Plaza 214,015 209,727 231,676 190,421 176,184 -24%
700 29 400 4070 5875
Water Availability Charge 0 4,625,899 5,493,944 5,852,216 6,086,300 11%
700 29 400 4060 5110
Other Charges for Services 68,026 49,877 37,320 43,767 25,500 -32%
Total Charges for Services 12,575,006$ 14,776,488$ 19,266,653$ 14,879,895$ 15,610,781$ -19%
Grants
Grants 0$ 0$ 150,000$ 0$ 0$ -100%
Total Grants 0$ 0$ 150,000$ 0$ 0$ -100%
Other Operating
Other Operating 119,088$ 137,140$ 136,240$ 366,851$ 156,844$ 15%
Total Other Operating 119,088$ 137,140$ 136,240$ 366,851$ 156,844$ 15%
All Other
All Other 43,450$ 41,527$ 3,000$ 17,632$ 5,600$ 87%
Total All Other 43,450$ 41,527$ 3,000$ 17,632$ 5,600$ 87%
Total Water Operating Fund (700) 13,426,950$ 15,373,855$ 19,925,965$ 15,578,359$ 16,075,394$ -19%
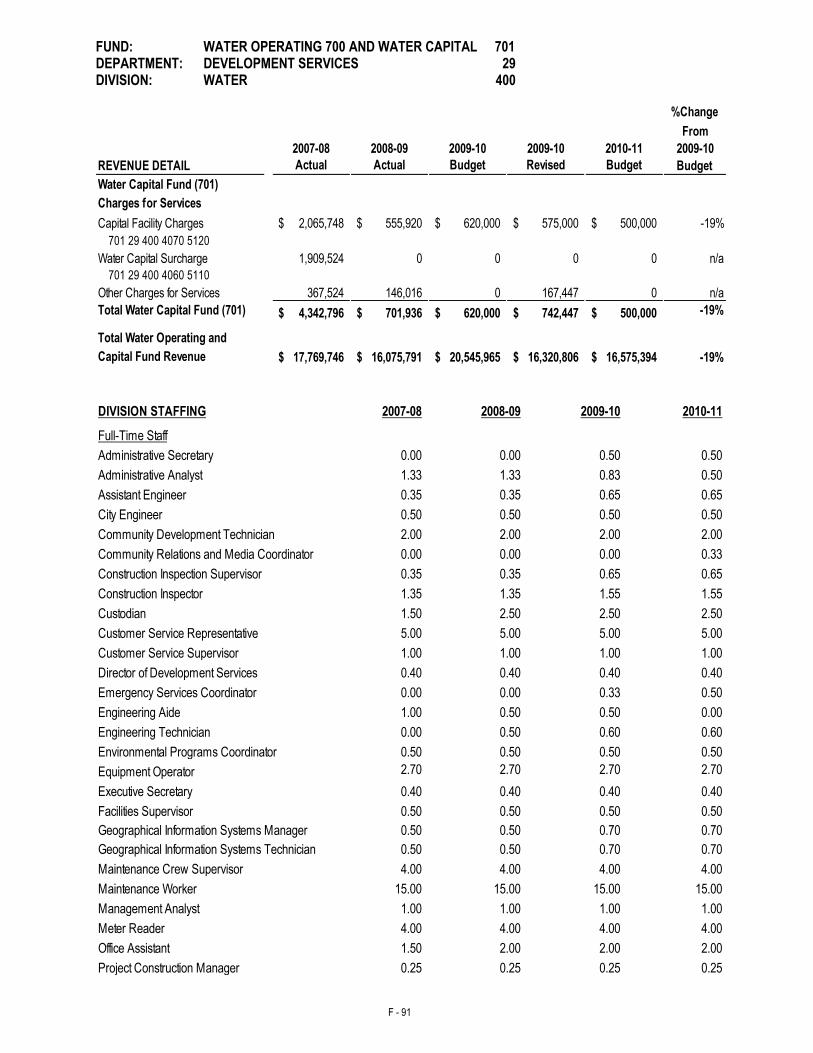
F - 91
FUND: WATER OPERATING 700 AND WATER CAPITAL 701 DEPARTMENT: DEVELOPMENT SERVICES 29 DIVISION: WATER 400
%Change
From
2007-08 2008-09 2009-10 2009-10 2010-11 2009-10
REVENUE DETAIL Actual Actual Budget Revised Budget Budget
Water Capital Fund (701)
Charges for Services
Capital Facility Charges 2,065,748$ 555,920$ 620,000$ 575,000$ 500,000$ -19%
701 29 400 4070 5120
Water Capital Surcharge 1,909,524 0 0 0 0 n/a
701 29 400 4060 5110
Other Charges for Services 367,524 146,016 0 167,447 0 n/a
Total Water Capital Fund (701) 4,342,796$ 701,936$ 620,000$ 742,447$ 500,000$ -19%
Total Water Operating and
Capital Fund Revenue 17,769,746$ 16,075,791$ 20,545,965$ 16,320,806$ 16,575,394$ -19%
DIVISION STAFFING 2007-08 2008-09 2009-10 2010-11
0.00 0.00 0.50 0.50
1.33 1.33 0.83 0.50
0.35 0.35 0.65 0.65
0.50 0.50 0.50 0.50
2.00 2.00 2.00 2.00
Community Relations and Media Coordinator 0.00 0.00 0.00 0.33
0.35 0.35 0.65 0.65
1.35 1.35 1.55 1.55
1.50 2.50 2.50 2.50
5.00 5.00 5.00 5.00
1.00 1.00 1.00 1.00
0.40 0.40 0.40 0.40
0.00 0.00 0.33 0.50
1.00 0.50 0.50 0.00
0.00 0.50 0.60 0.60
0.50 0.50 0.50 0.50
2.70 2.70 2.70 2.70
0.40 0.40 0.40 0.40
0.50 0.50 0.50 0.50
0.50 0.50 0.70 0.70
0.50 0.50 0.70 0.70
4.00 4.00 4.00 4.00
15.00 15.00 15.00 15.00
1.00 1.00 1.00 1.00
4.00 4.00 4.00 4.00
1.50 2.00 2.00 2.00
0.25 0.25 0.25 0.25
Full-Time Staff
Administrative Analyst
Assistant Engineer
Community Development Technician
City Engineer
Administrative Secretary
Construction Inspector
Custodian
Executive Secretary
Emergency Services Coordinator
Construction Inspection Supervisor
Environmental Programs Coordinator
Geographical Information Systems Manager
Customer Service Representative
Maintenance Worker
Office Assistant
Project Construction Manager
Customer Service Supervisor
Director of Development Services
Engineering Aide
Geographical Information Systems Technician
Engineering Technician
Equipment Operator
Maintenance Crew Supervisor
Facilities Supervisor
Management Analyst
Meter Reader
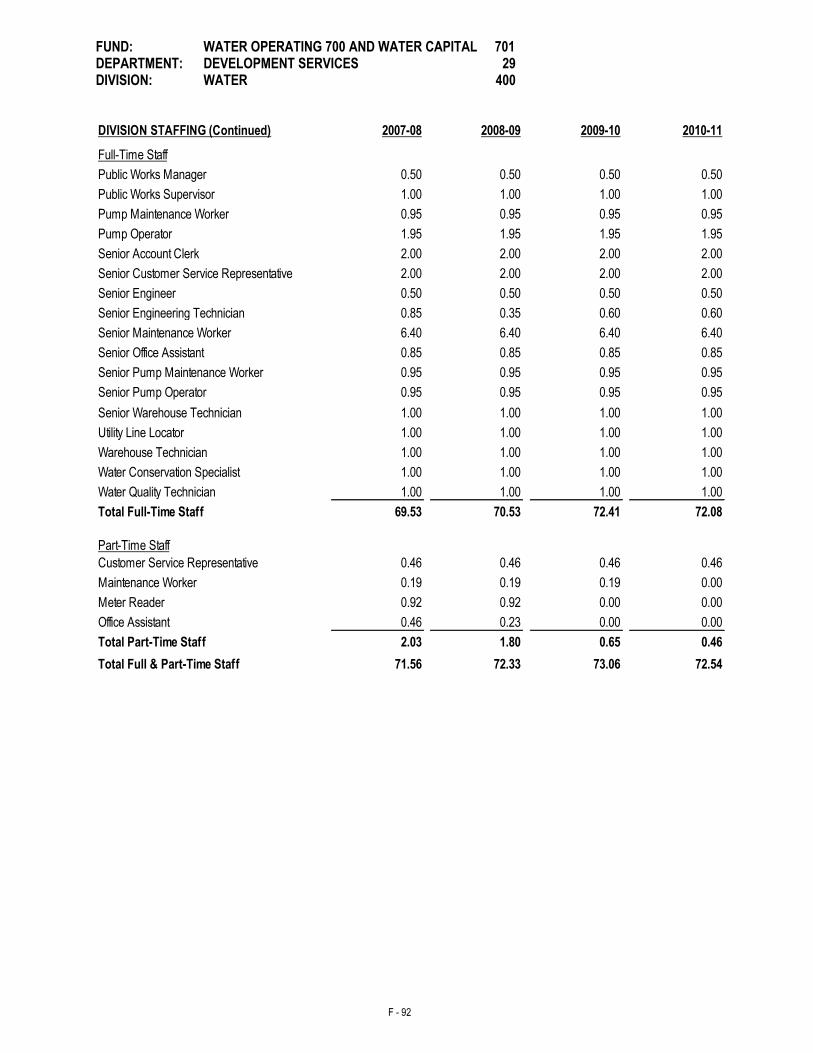
F - 92
FUND: WATER OPERATING 700 AND WATER CAPITAL 701 DEPARTMENT: DEVELOPMENT SERVICES 29 DIVISION: WATER 400 DIVISION STAFFING (Continued) 2007-08 2008-09 2009-10 2010-11
0.50 0.50 0.50 0.50
1.00 1.00 1.00 1.00
0.95 0.95 0.95 0.95
1.95 1.95 1.95 1.95
2.00 2.00 2.00 2.00
2.00 2.00 2.00 2.00
0.50 0.50 0.50 0.50
0.85 0.35 0.60 0.60
6.40 6.40 6.40 6.40
0.85 0.85 0.85 0.85
0.95 0.95 0.95 0.95
0.95 0.95 0.95 0.95
1.00 1.00 1.00 1.00
1.00 1.00 1.00 1.00
1.00 1.00 1.00 1.00
1.00 1.00 1.00 1.00
1.00 1.00 1.00 1.00
69.53 70.53 72.41 72.08
0.46 0.46 0.46 0.46
0.19 0.19 0.19 0.00
0.92 0.92 0.00 0.00
0.46 0.23 0.00 0.00
2.03 1.80 0.65 0.46
71.56 72.33 73.06 72.54
Senior Engineering Technician
Senior Maintenance Worker
Pump Operator
Senior Office Assistant
Senior Engineer
Senior Warehouse Technician
Total Full-Time Staff
Customer Service Representative
Total Full & Part-Time Staff
Office Assistant
Water Quality Technician
Maintenance Worker
Meter Reader
Part-Time Staff
Total Part-Time Staff
Water Conservation Specialist
Warehouse Technician
Full-Time Staff
Senior Pump Maintenance Worker
Senior Account Clerk
Utility Line Locator
Senior Pump Operator
Pump Maintenance Worker
Senior Customer Service Representative
Public Works Manager
Public Works Supervisor
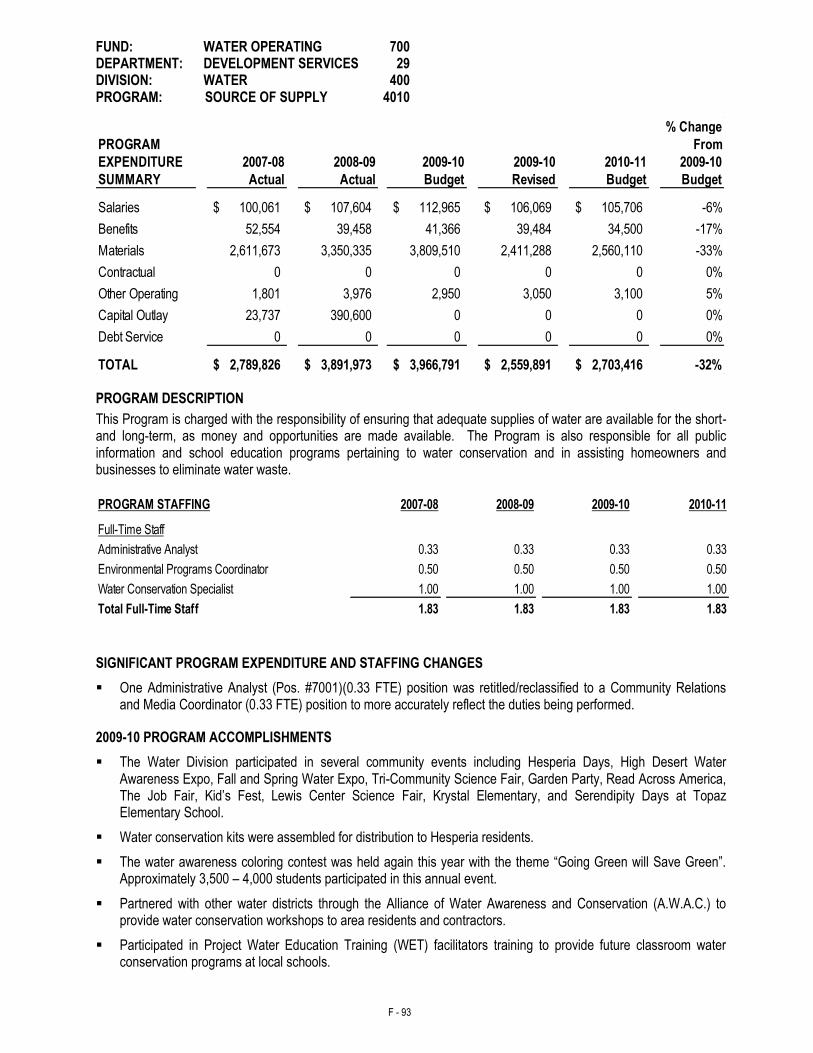
F - 93
FUND: WATER OPERATING 700 DEPARTMENT: DEVELOPMENT SERVICES 29 DIVISION: WATER 400 PROGRAM: SOURCE OF SUPPLY 4010
% Change
PROGRAM From
EXPENDITURE 2007-08 2008-09 2009-10 2009-10 2010-11 2009-10
SUMMARY Actual Actual Budget Revised Budget Budget
Salaries 100,061$ 107,604$ 112,965$ 106,069$ 105,706$ -6%
Benefits 52,554 39,458 41,366 39,484 34,500 -17%
Materials 2,611,673 3,350,335 3,809,510 2,411,288 2,560,110 -33%
Contractual 0 0 0 0 0 0%
Other Operating 1,801 3,976 2,950 3,050 3,100 5%
Capital Outlay 23,737 390,600 0 0 0 0%
Debt Service 0 0 0 0 0 0%
TOTAL 2,789,826$ 3,891,973$ 3,966,791$ 2,559,891$ 2,703,416$ -32%
PROGRAM DESCRIPTION
This Program is charged with the responsibility of ensuring that adequate supplies of water are available for the short- and long-term, as money and opportunities are made available. The Program is also responsible for all public information and school education programs pertaining to water conservation and in assisting homeowners and businesses to eliminate water waste.
PROGRAM STAFFING 2007-08 2008-09 2009-10 2010-11
Administrative Analyst 0.33 0.33 0.33 0.33
0.50 0.50 0.50 0.50
1.00 1.00 1.00 1.00
1.83 1.83 1.83 1.83
Full-Time Staff
Environmental Programs Coordinator
Water Conservation Specialist
Total Full-Time Staff
SIGNIFICANT PROGRAM EXPENDITURE AND STAFFING CHANGES
One Administrative Analyst (Pos. #7001)(0.33 FTE) position was retitled/reclassified to a Community Relations and Media Coordinator (0.33 FTE) position to more accurately reflect the duties being performed.
2009-10 PROGRAM ACCOMPLISHMENTS
The Water Division participated in several community events including Hesperia Days, High Desert Water Awareness Expo, Fall and Spring Water Expo, Tri-Community Science Fair, Garden Party, Read Across America, The Job Fair, Kid’s Fest, Lewis Center Science Fair, Krystal Elementary, and Serendipity Days at Topaz Elementary School.
Water conservation kits were assembled for distribution to Hesperia residents.
The water awareness coloring contest was held again this year with the theme “Going Green will Save Green”. Approximately 3,500 – 4,000 students participated in this annual event.
Partnered with other water districts through the Alliance of Water Awareness and Conservation (A.W.A.C.) to provide water conservation workshops to area residents and contractors.
Participated in Project Water Education Training (WET) facilitators training to provide future classroom water conservation programs at local schools.
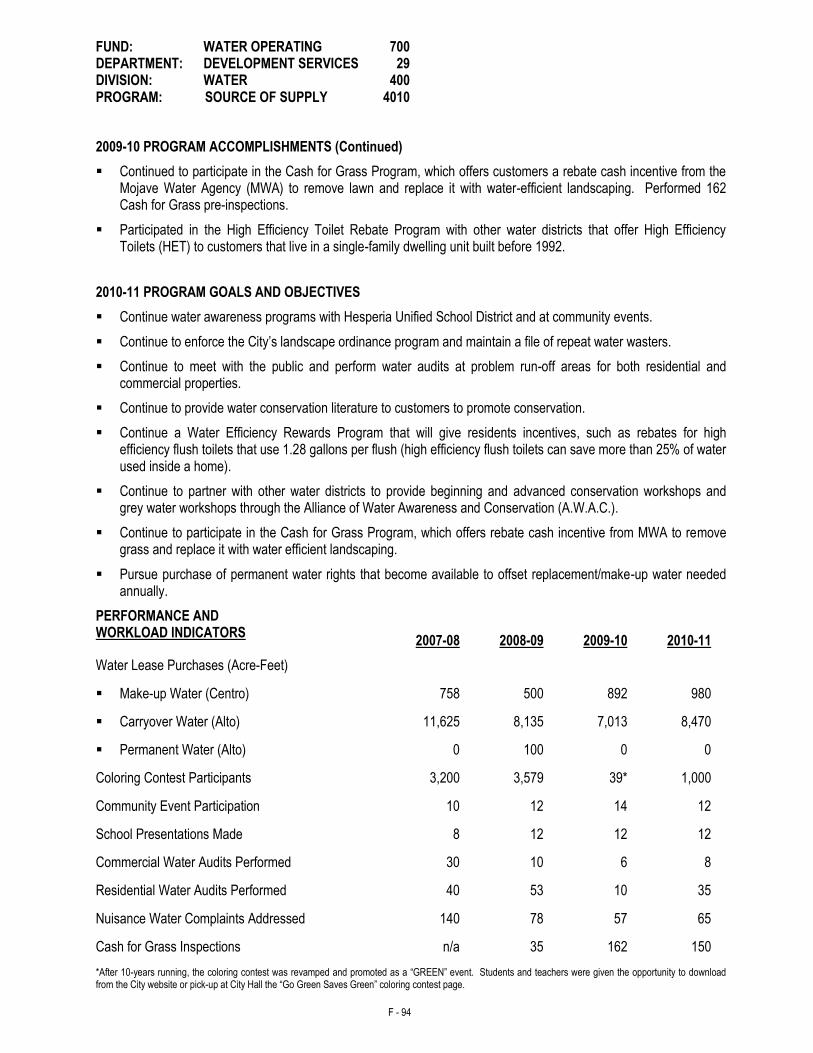
F - 94
FUND: WATER OPERATING 700 DEPARTMENT: DEVELOPMENT SERVICES 29 DIVISION: WATER 400 PROGRAM: SOURCE OF SUPPLY 4010
2009-10 PROGRAM ACCOMPLISHMENTS (Continued)
Continued to participate in the Cash for Grass Program, which offers customers a rebate cash incentive from the Mojave Water Agency (MWA) to remove lawn and replace it with water-efficient landscaping. Performed 162 Cash for Grass pre-inspections.
Participated in the High Efficiency Toilet Rebate Program with other water districts that offer High Efficiency Toilets (HET) to customers that live in a single-family dwelling unit built before 1992.
2010-11 PROGRAM GOALS AND OBJECTIVES
Continue water awareness programs with Hesperia Unified School District and at community events.
Continue to enforce the City’s landscape ordinance program and maintain a file of repeat water wasters.
Continue to meet with the public and perform water audits at problem run-off areas for both residential and commercial properties.
Continue to provide water conservation literature to customers to promote conservation.
Continue a Water Efficiency Rewards Program that will give residents incentives, such as rebates for high efficiency flush toilets that use 1.28 gallons per flush (high efficiency flush toilets can save more than 25% of water used inside a home).
Continue to partner with other water districts to provide beginning and advanced conservation workshops and grey water workshops through the Alliance of Water Awareness and Conservation (A.W.A.C.).
Continue to participate in the Cash for Grass Program, which offers rebate cash incentive from MWA to remove grass and replace it with water efficient landscaping.
Pursue purchase of permanent water rights that become available to offset replacement/make-up water needed annually.
PERFORMANCE AND WORKLOAD INDICATORS
2007-08 2008-09
2009-10
2010-11
Water Lease Purchases (Acre-Feet)
Make-up Water (Centro) 758 500 892 980
Carryover Water (Alto) 11,625 8,135 7,013 8,470
Permanent Water (Alto) 0 100 0 0
Coloring Contest Participants 3,200 3,579 39* 1,000
Community Event Participation 10 12 14 12
School Presentations Made 8 12 12 12
Commercial Water Audits Performed 30 10 6 8
Residential Water Audits Performed 40 53 10 35
Nuisance Water Complaints Addressed 140 78 57 65
Cash for Grass Inspections n/a 35 162 150
*After 10-years running, the coloring contest was revamped and promoted as a “GREEN” event. Students and teachers were given the opportunity to download from the City website or pick-up at City Hall the “Go Green Saves Green” coloring contest page.
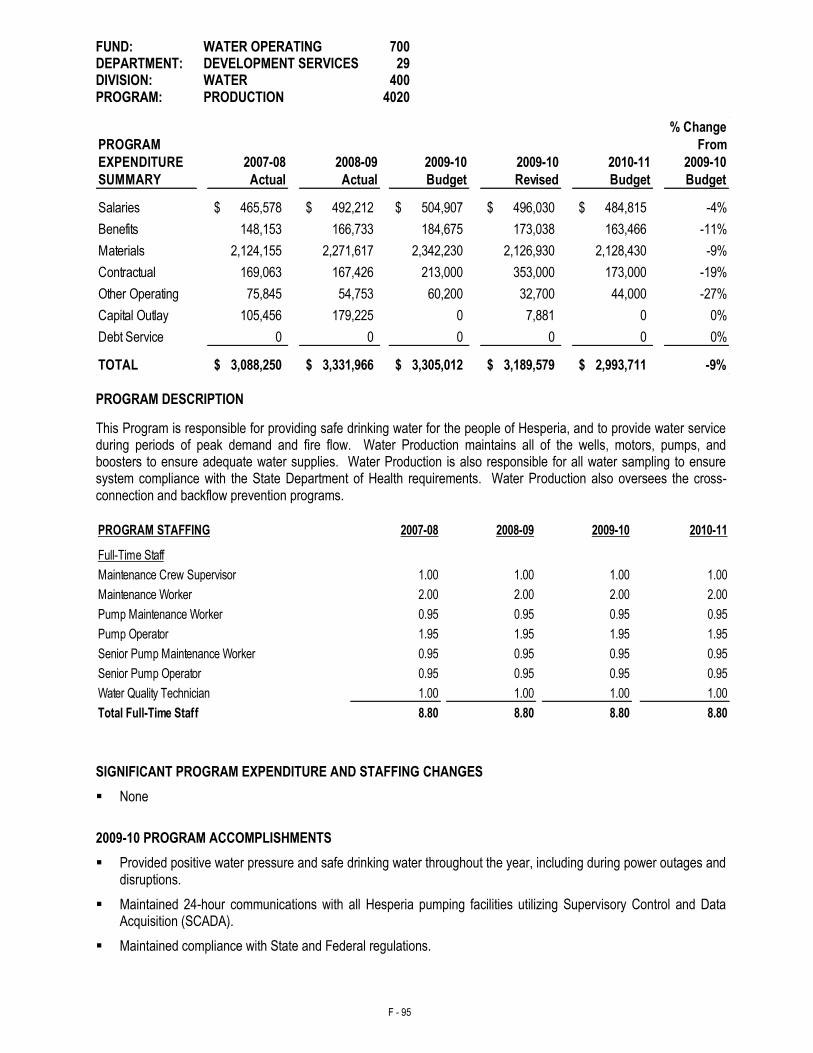
F - 95
FUND: WATER OPERATING 700 DEPARTMENT: DEVELOPMENT SERVICES 29 DIVISION: WATER 400 PROGRAM: PRODUCTION 4020
% Change
PROGRAM From
EXPENDITURE 2007-08 2008-09 2009-10 2009-10 2010-11 2009-10
SUMMARY Actual Actual Budget Revised Budget Budget
Salaries 465,578$ 492,212$ 504,907$ 496,030$ 484,815$ -4%
Benefits 148,153 166,733 184,675 173,038 163,466 -11%
Materials 2,124,155 2,271,617 2,342,230 2,126,930 2,128,430 -9%
Contractual 169,063 167,426 213,000 353,000 173,000 -19%
Other Operating 75,845 54,753 60,200 32,700 44,000 -27%
Capital Outlay 105,456 179,225 0 7,881 0 0%
Debt Service 0 0 0 0 0 0%
TOTAL 3,088,250$ 3,331,966$ 3,305,012$ 3,189,579$ 2,993,711$ -9%
PROGRAM DESCRIPTION
This Program is responsible for providing safe drinking water for the people of Hesperia, and to provide water service during periods of peak demand and fire flow. Water Production maintains all of the wells, motors, pumps, and boosters to ensure adequate water supplies. Water Production is also responsible for all water sampling to ensure system compliance with the State Department of Health requirements. Water Production also oversees the cross-connection and backflow prevention programs.
PROGRAM STAFFING 2007-08 2008-09 2009-10 2010-11
1.00 1.00 1.00 1.00
2.00 2.00 2.00 2.00
0.95 0.95 0.95 0.95
1.95 1.95 1.95 1.95
0.95 0.95 0.95 0.95
0.95 0.95 0.95 0.95
1.00 1.00 1.00 1.00
8.80 8.80 8.80 8.80
Water Quality Technician
Total Full-Time Staff
Full-Time Staff
Maintenance Crew Supervisor
Senior Pump Maintenance Worker
Senior Pump Operator
Pump Maintenance Worker
Pump Operator
Maintenance Worker
SIGNIFICANT PROGRAM EXPENDITURE AND STAFFING CHANGES
None
2009-10 PROGRAM ACCOMPLISHMENTS
Provided positive water pressure and safe drinking water throughout the year, including during power outages and disruptions.
Maintained 24-hour communications with all Hesperia pumping facilities utilizing Supervisory Control and Data Acquisition (SCADA).
Maintained compliance with State and Federal regulations.
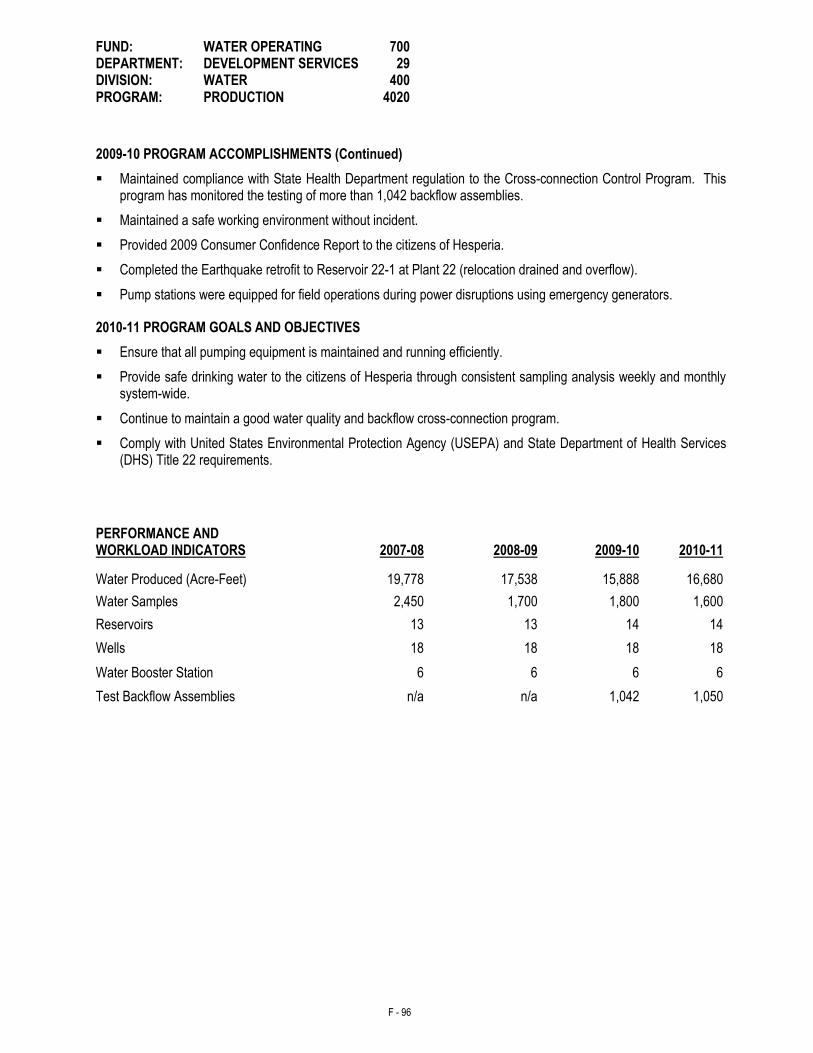
F - 96
FUND: WATER OPERATING 700 DEPARTMENT: DEVELOPMENT SERVICES 29 DIVISION: WATER 400 PROGRAM: PRODUCTION 4020
2009-10 PROGRAM ACCOMPLISHMENTS (Continued)
Maintained compliance with State Health Department regulation to the Cross-connection Control Program. This program has monitored the testing of more than 1,042 backflow assemblies.
Maintained a safe working environment without incident.
Provided 2009 Consumer Confidence Report to the citizens of Hesperia.
Completed the Earthquake retrofit to Reservoir 22-1 at Plant 22 (relocation drained and overflow).
Pump stations were equipped for field operations during power disruptions using emergency generators.
2010-11 PROGRAM GOALS AND OBJECTIVES
Ensure that all pumping equipment is maintained and running efficiently.
Provide safe drinking water to the citizens of Hesperia through consistent sampling analysis weekly and monthly system-wide.
Continue to maintain a good water quality and backflow cross-connection program.
Comply with United States Environmental Protection Agency (USEPA) and State Department of Health Services (DHS) Title 22 requirements.
PERFORMANCE AND WORKLOAD INDICATORS 2007-08 2008-09
2009-10
2010-11
Water Produced (Acre-Feet) 19,778 17,538 15,888 16,680
Water Samples 2,450 1,700 1,800 1,600
Reservoirs 13 13 14 14
Wells 18 18 18 18
Water Booster Station 6 6 6 6
Test Backflow Assemblies n/a n/a 1,042 1,050
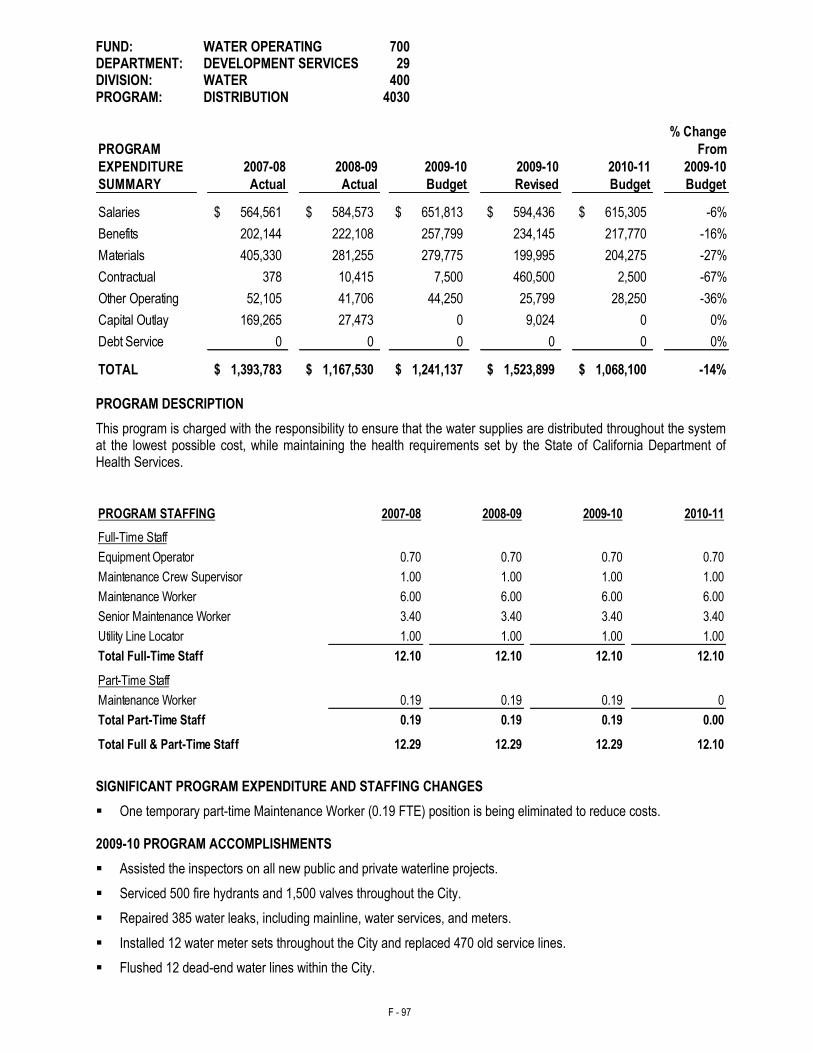
F - 97
FUND: WATER OPERATING 700 DEPARTMENT: DEVELOPMENT SERVICES 29 DIVISION: WATER 400 PROGRAM: DISTRIBUTION 4030
% Change
PROGRAM From
EXPENDITURE 2007-08 2008-09 2009-10 2009-10 2010-11 2009-10
SUMMARY Actual Actual Budget Revised Budget Budget
Salaries 564,561$ 584,573$ 651,813$ 594,436$ 615,305$ -6%
Benefits 202,144 222,108 257,799 234,145 217,770 -16%
Materials 405,330 281,255 279,775 199,995 204,275 -27%
Contractual 378 10,415 7,500 460,500 2,500 -67%
Other Operating 52,105 41,706 44,250 25,799 28,250 -36%
Capital Outlay 169,265 27,473 0 9,024 0 0%
Debt Service 0 0 0 0 0 0%
TOTAL 1,393,783$ 1,167,530$ 1,241,137$ 1,523,899$ 1,068,100$ -14% PROGRAM DESCRIPTION
This program is charged with the responsibility to ensure that the water supplies are distributed throughout the system at the lowest possible cost, while maintaining the health requirements set by the State of California Department of Health Services.
PROGRAM STAFFING 2007-08 2008-09 2009-10 2010-11
0.70 0.70 0.70 0.70
1.00 1.00 1.00 1.00
6.00 6.00 6.00 6.00
3.40 3.40 3.40 3.40
1.00 1.00 1.00 1.00
12.10 12.10 12.10 12.10
0.19 0.19 0.19 0
0.19 0.19 0.19 0.00
12.29 12.29 12.29 12.10
Full-Time Staff
Maintenance Crew Supervisor
Maintenance Worker
Senior Maintenance Worker
Total Full & Part-Time Staff
Maintenance Worker
Total Part-Time Staff
Part-Time Staff
Total Full-Time Staff
Utility Line Locator
Equipment Operator
SIGNIFICANT PROGRAM EXPENDITURE AND STAFFING CHANGES
One temporary part-time Maintenance Worker (0.19 FTE) position is being eliminated to reduce costs.
2009-10 PROGRAM ACCOMPLISHMENTS
Assisted the inspectors on all new public and private waterline projects.
Serviced 500 fire hydrants and 1,500 valves throughout the City.
Repaired 385 water leaks, including mainline, water services, and meters.
Installed 12 water meter sets throughout the City and replaced 470 old service lines.
Flushed 12 dead-end water lines within the City.
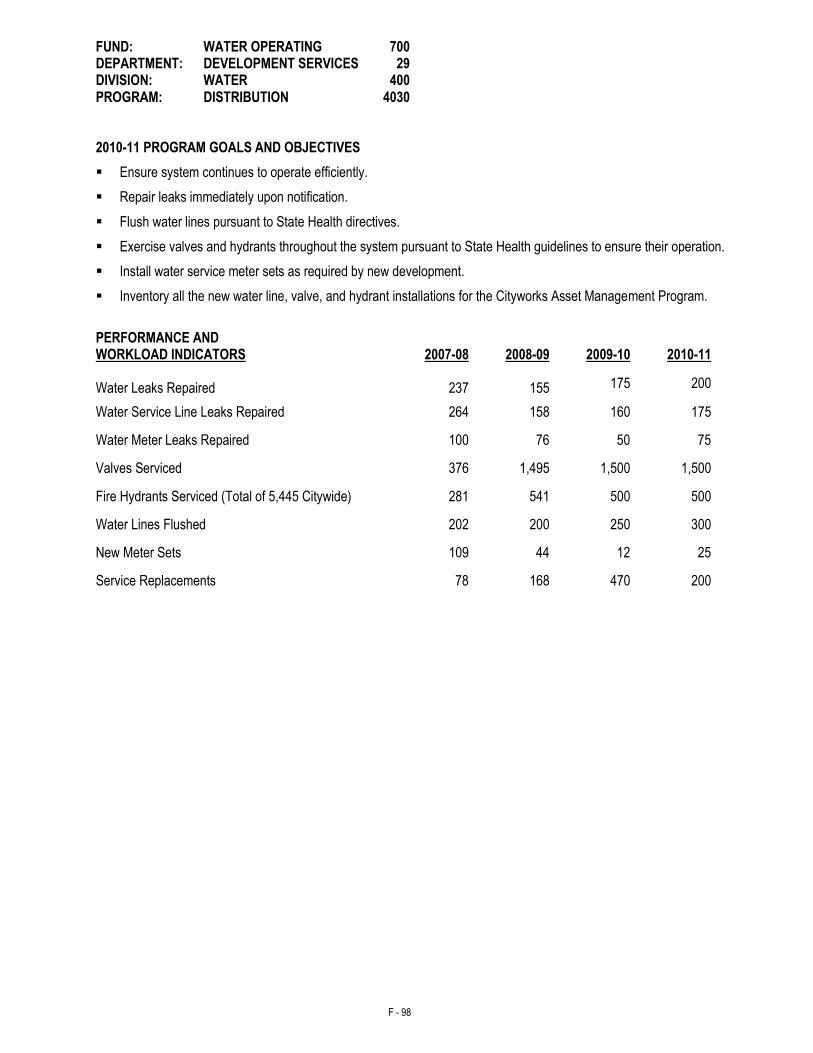
F - 98
FUND: WATER OPERATING 700 DEPARTMENT: DEVELOPMENT SERVICES 29 DIVISION: WATER 400 PROGRAM: DISTRIBUTION 4030 2010-11 PROGRAM GOALS AND OBJECTIVES
Ensure system continues to operate efficiently.
Repair leaks immediately upon notification.
Flush water lines pursuant to State Health directives.
Exercise valves and hydrants throughout the system pursuant to State Health guidelines to ensure their operation.
Install water service meter sets as required by new development.
Inventory all the new water line, valve, and hydrant installations for the Cityworks Asset Management Program.
PERFORMANCE AND WORKLOAD INDICATORS 2007-08 2008-09 2009-10 2010-11 Water Leaks Repaired
237
155 175 200
Water Service Line Leaks Repaired 264 158 160 175
Water Meter Leaks Repaired 100 76 50 75
Valves Serviced 376 1,495 1,500 1,500
Fire Hydrants Serviced (Total of 5,445 Citywide) 281 541 500 500
Water Lines Flushed 202 200 250 300
New Meter Sets 109 44 12 25
Service Replacements 78 168 470 200
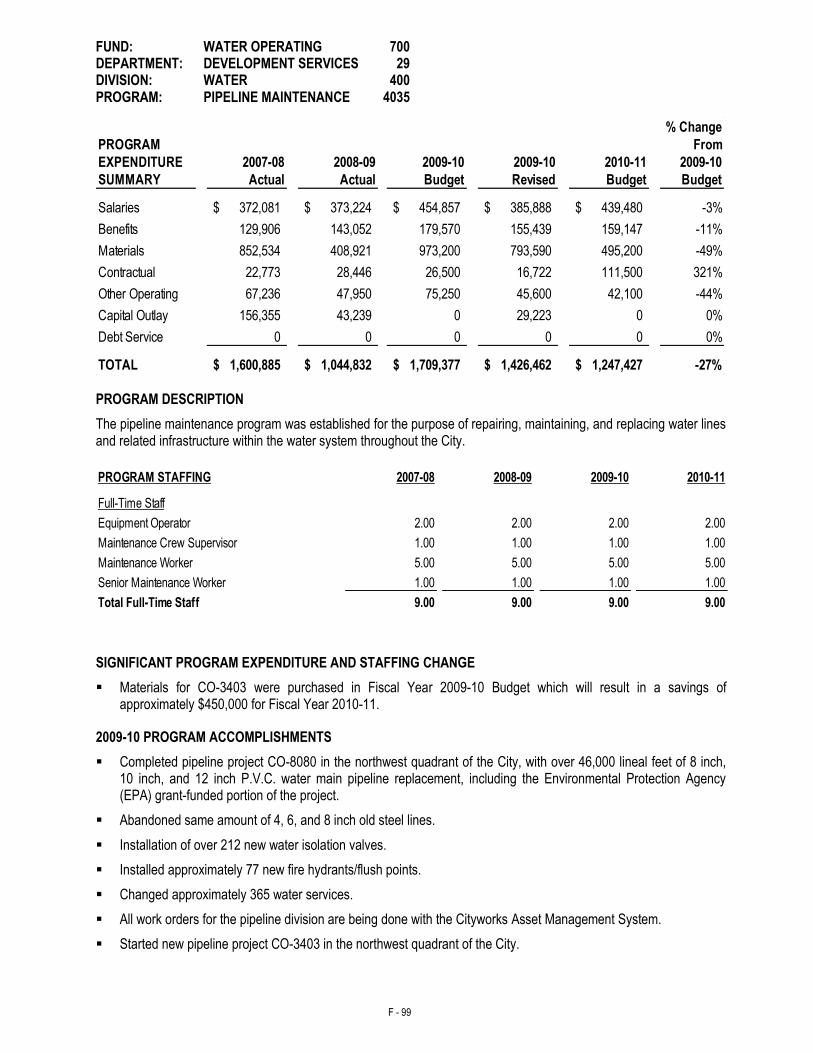
F - 99
FUND: WATER OPERATING 700 DEPARTMENT: DEVELOPMENT SERVICES 29 DIVISION: WATER 400 PROGRAM: PIPELINE MAINTENANCE 4035
% Change
PROGRAM From
EXPENDITURE 2007-08 2008-09 2009-10 2009-10 2010-11 2009-10
SUMMARY Actual Actual Budget Revised Budget Budget
Salaries 372,081$ 373,224$ 454,857$ 385,888$ 439,480$ -3%
Benefits 129,906 143,052 179,570 155,439 159,147 -11%
Materials 852,534 408,921 973,200 793,590 495,200 -49%
Contractual 22,773 28,446 26,500 16,722 111,500 321%
Other Operating 67,236 47,950 75,250 45,600 42,100 -44%
Capital Outlay 156,355 43,239 0 29,223 0 0%
Debt Service 0 0 0 0 0 0%
TOTAL 1,600,885$ 1,044,832$ 1,709,377$ 1,426,462$ 1,247,427$ -27% PROGRAM DESCRIPTION
The pipeline maintenance program was established for the purpose of repairing, maintaining, and replacing water lines and related infrastructure within the water system throughout the City.
PROGRAM STAFFING 2007-08 2008-09 2009-10 2010-11
2.00 2.00 2.00 2.00
1.00 1.00 1.00 1.00
5.00 5.00 5.00 5.00
1.00 1.00 1.00 1.00
9.00 9.00 9.00 9.00
Senior Maintenance Worker
Total Full-Time Staff
Full-Time Staff
Equipment Operator
Maintenance Crew Supervisor
Maintenance Worker
SIGNIFICANT PROGRAM EXPENDITURE AND STAFFING CHANGE
Materials for CO-3403 were purchased in Fiscal Year 2009-10 Budget which will result in a savings of approximately $450,000 for Fiscal Year 2010-11.
2009-10 PROGRAM ACCOMPLISHMENTS
Completed pipeline project CO-8080 in the northwest quadrant of the City, with over 46,000 lineal feet of 8 inch, 10 inch, and 12 inch P.V.C. water main pipeline replacement, including the Environmental Protection Agency (EPA) grant-funded portion of the project.
Abandoned same amount of 4, 6, and 8 inch old steel lines.
Installation of over 212 new water isolation valves.
Installed approximately 77 new fire hydrants/flush points.
Changed approximately 365 water services.
All work orders for the pipeline division are being done with the Cityworks Asset Management System.
Started new pipeline project CO-3403 in the northwest quadrant of the City.
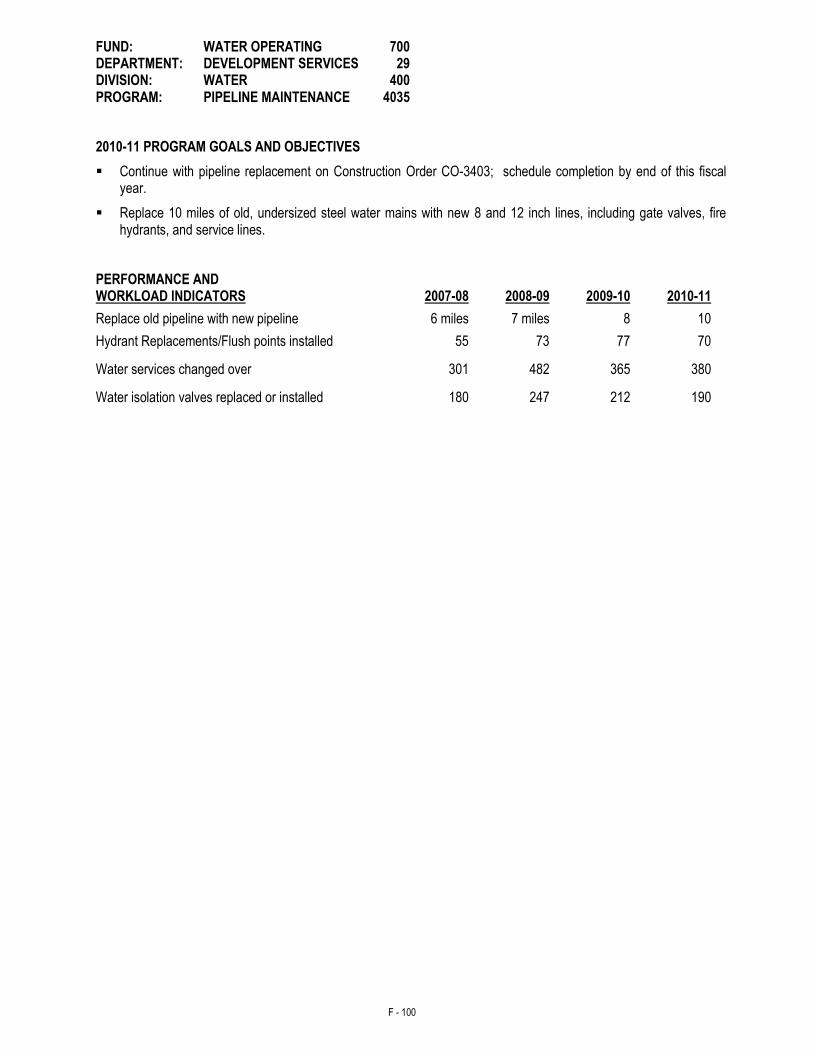
F - 100
FUND: WATER OPERATING 700 DEPARTMENT: DEVELOPMENT SERVICES 29 DIVISION: WATER 400 PROGRAM: PIPELINE MAINTENANCE 4035
2010-11 PROGRAM GOALS AND OBJECTIVES
Continue with pipeline replacement on Construction Order CO-3403; schedule completion by end of this fiscal year.
Replace 10 miles of old, undersized steel water mains with new 8 and 12 inch lines, including gate valves, fire hydrants, and service lines.
PERFORMANCE AND WORKLOAD INDICATORS 2007-08 2008-09 2009-10 2010-11
Replace old pipeline with new pipeline 6 miles 7 miles 8 10
Hydrant Replacements/Flush points installed 55 73 77 70
Water services changed over 301 482 365 380
Water isolation valves replaced or installed 180 247 212 190
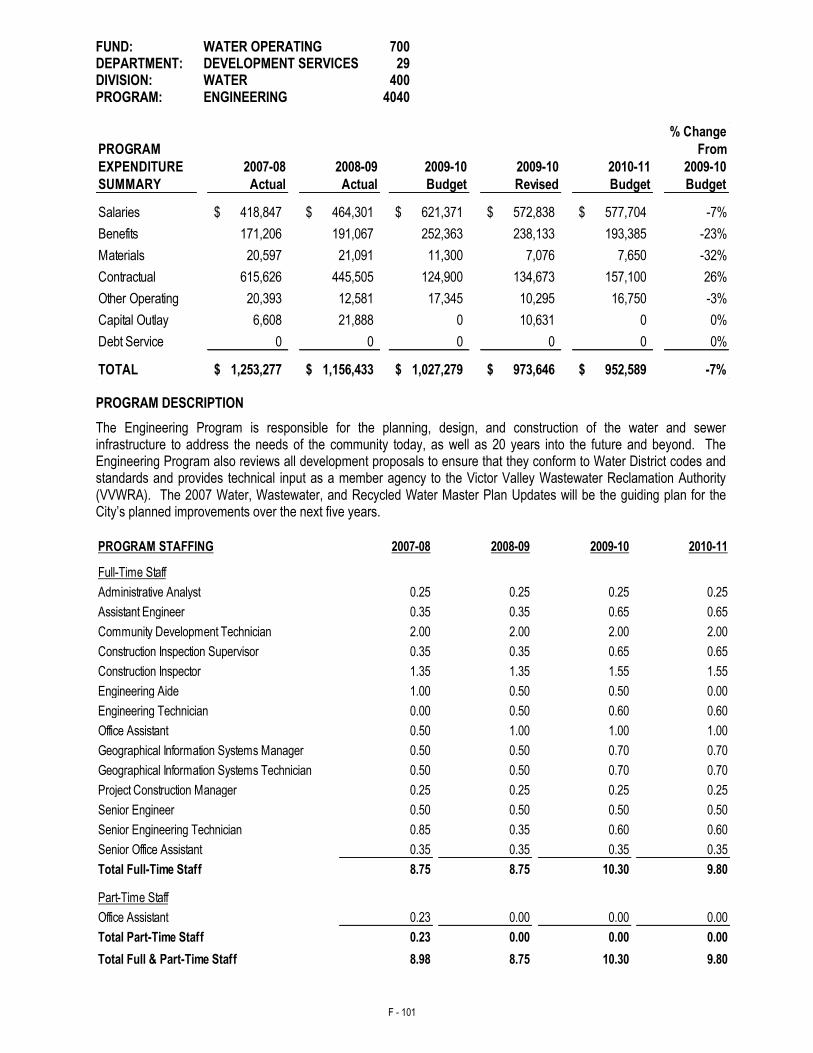
F - 101
FUND: WATER OPERATING 700 DEPARTMENT: DEVELOPMENT SERVICES 29 DIVISION: WATER 400 PROGRAM: ENGINEERING 4040
% Change
PROGRAM From
EXPENDITURE 2007-08 2008-09 2009-10 2009-10 2010-11 2009-10
SUMMARY Actual Actual Budget Revised Budget Budget
Salaries 418,847$ 464,301$ 621,371$ 572,838$ 577,704$ -7%
Benefits 171,206 191,067 252,363 238,133 193,385 -23%
Materials 20,597 21,091 11,300 7,076 7,650 -32%
Contractual 615,626 445,505 124,900 134,673 157,100 26%
Other Operating 20,393 12,581 17,345 10,295 16,750 -3%
Capital Outlay 6,608 21,888 0 10,631 0 0%
Debt Service 0 0 0 0 0 0%
TOTAL 1,253,277$ 1,156,433$ 1,027,279$ 973,646$ 952,589$ -7%
PROGRAM DESCRIPTION
The Engineering Program is responsible for the planning, design, and construction of the water and sewer infrastructure to address the needs of the community today, as well as 20 years into the future and beyond. The Engineering Program also reviews all development proposals to ensure that they conform to Water District codes and standards and provides technical input as a member agency to the Victor Valley Wastewater Reclamation Authority (VVWRA). The 2007 Water, Wastewater, and Recycled Water Master Plan Updates will be the guiding plan for the City’s planned improvements over the next five years.
PROGRAM STAFFING 2007-08 2008-09 2009-10 2010-11
0.25 0.25 0.25 0.25
0.35 0.35 0.65 0.65
2.00 2.00 2.00 2.00
0.35 0.35 0.65 0.65
1.35 1.35 1.55 1.55
1.00 0.50 0.50 0.00
0.00 0.50 0.60 0.60
0.50 1.00 1.00 1.00
0.50 0.50 0.70 0.70
0.50 0.50 0.70 0.70
0.25 0.25 0.25 0.25
0.50 0.50 0.50 0.50
0.85 0.35 0.60 0.60
0.35 0.35 0.35 0.35
8.75 8.75 10.30 9.80
Part-Time Staff
Office Assistant 0.23 0.00 0.00 0.00
0.23 0.00 0.00 0.00
8.98 8.75 10.30 9.80
Full-Time Staff
Administrative Analyst
Assistant Engineer
Community Development Technician
Construction Inspection Supervisor
Geographical Information Systems Technician
Senior Engineer
Project Construction Manager
Total Full & Part-Time Staff
Senior Engineering Technician
Total Part-Time Staff
Total Full-Time Staff
Senior Office Assistant
Geographical Information Systems Manager
Office Assistant
Engineering Aide
Engineering Technician
Construction Inspector
F - 102
FUND: WATER OPERATING 700 DEPARTMENT: DEVELOPMENT SERVICES 29 DIVISION: WATER 400 PROGRAM: ENGINEERING 4040 SIGNIFICANT PROGRAM EXPENDITURE AND STAFFING CHANGES
Eliminate one vacant Engineering Aide (0.50 FTE) position to reduce expenditures during the continuing economic downturn and related reduced development activity.
Engineering staff is proposing to utilize contract services to assist the City in the preparation of its 2010 Urban Water Management Plan, which is required to be updated every five years.
2009-10 PROGRAM ACCOMPLISHMENTS
Prepared the Capital Improvement Program, utilizing the City’s General Plan and Master Plan for Water and Wastewater, and the Public Safety Needs Report.
The Engineering Division continued to provide timely project review for new developer projects and continues to provide professional and prompt plan review services on commercial and industrial projects.
The City’s Storm Water Construction Inspection Program continued to set the standard for National Pollutant Discharge Elimination System (NPDES) compliance in the Victor Valley to ensure that there will be minimal impact from construction projects to the City’s groundwater supply during storm events.
With a fully functional Geographical Information Systems (GIS) Map, and Public Works utilizing the Cityworks Program to track and execute work orders within the City’s GIS Map, the Storeroom Program was brought on-line. This next component of Cityworks tracks material levels at the Public Works Warehouse in real time as work orders are issued. This information is compiled and linked with Finance’s software to maintain a real-world inventory at the warehouse.
The Geoviewer Program, which enables the balance of City staff outside of Public Works to access and utilize the GIS Map from their desktop computers, was upgraded to a more user-friendly platform, which makes accessing the plethora of information available easier to manipulate and maintain. The database which Geoviewer accesses to provide its information was brought in-house with the purchase of a new computer server. Having the database at City Hall will make it possible to integrate this database with other City programs such as Accela.
The Engineering Division, once again, designed the City’s Annual Pipeline Replacement Program in-house. Engineering staff will continue the design activities on this program into FY 2010-11, with the plans being completed by the end of the 2010 calendar year. This project will be constructed by the City’s in-house Pipeline Maintenance crew beginning in Spring, 2011.
Engineering staff continued to work with representatives from Victor Valley Wastewater Reclamation Authority (VVWRA) to finalize the design of the Santa Fe Avenue Relief Interceptor (SAFARI) and initiate the design of the City’s subregional treatment plant, which will be located on the west end of the City.
The Engineering GIS staff continued to work with Public Works staff to ensure that the new GIS based water and sewer atlases have the most accurate information possible based on actual field conditions.
Continued to support the various departments and divisions throughout the City through the production of maps, exhibits, standards and other documents required.
Completed the installation of the underground utilities for Spruce Street and Smoketree Street as part of the Township Revitalization Project. Assisted the City’s in-house pipeline replacement crew, through inspection services, in the water service conversion of the homes along these streets. This process moved the water meters off of the old easement lines located behind their homes onto the newly installed water lines within the streets.
Worked with representatives from County Special Districts (CSD) to finalize and clarify several outstanding agreements. The first was the completion and acceptance of the Zone J disconnect project. Completion of this project resulted in a clear demarcation between County and City facilities along Highway 395 from Main Street to Joshua Street.
F - 103
FUND: WATER OPERATING 700 DEPARTMENT: DEVELOPMENT SERVICES 29 DIVISION: WATER 400 PROGRAM: ENGINEERING 4040
2010-11 PROGRAM GOALS AND OBJECTIVES
Continue to provide timely project review for new developer projects and continue to provide professional and prompt plan review services on commercial, industrial, and residential projects utilizing City staff only.
Continue to perform timely and professional Public Works inspection service utilizing only City inspectors. There will be no contract inspection services in this fiscal year. City construction inspectors will take over the role of Storm Water Construction Inspectors to ensure City compliance with its National Pollutant Discharge Elimination System (NPDES) requirements and ensure that there will be minimal impact from construction projects to the City’s ground water supply during storm events.
Continue to improve and update the features of the City’s fully functional Geographical Information System (GIS) Map by maintaining the new version of Geoviewer and expanding its use by City staff through additional training. Depending on funding levels, future integration with New World (Finance software) and Accela (project tracking software) will provide a seamless integration between departments throughout the City.
In an effort to be more efficient, the Engineering Division will once again design the Annual Pipeline Replacement Program utilizing in-house engineering staff. The design survey work has been completed on the Fiscal Year 2009-10 Water Pipeline Replacement Program and the Engineering staff anticipates having the design completed before the end of calendar year 2010.
The City’s GIS Division will expand its collection of detailed information related to water meters and sewer laterals by utilizing its new GPS data collector that it acquired in Fiscal Year 2009-10. The new data collector is accurate to approximately six inches compared to a nine-foot accuracy with the old unit.
Continue to support other City departments and divisions by providing data and mapping services through the ever-expanding GIS System.
It is anticipated that Engineering staff will design the infrastructure and street improvement plans for the next two streets of the Township Project. Once a determination is made and the next two streets are chosen, staff will contract with a local surveying firm to provide a thorough and detailed survey of the two streets and the Engineering staff will begin with the design of the sewer and water lines.
Work with Parsons Engineering as the CIP Program Engineer to complete the Ranchero Road sewer tributary study. This study will relate to the expansion of the “I” Avenue lift station and determine pumping requirements and main sizing to and from the lift station.
Another project which will be designed by the Engineering staff is in support of the Ranchero Road interchange. The City’s in-house design team will utilize the street plans prepared by Parsons Engineering for the Ranchero Road Interchange project and complete the water and sewer plans for the relocation of water and sewer within this portion of Mariposa and Caliente Roads.
Complete the Urban Water Management Plan update. There are many new requirements being imposed by the State of California as part of this new plan. Due to the new reporting conditions under the plan, the State has extended the deadline for the submittal of the new plan to June, 2011.
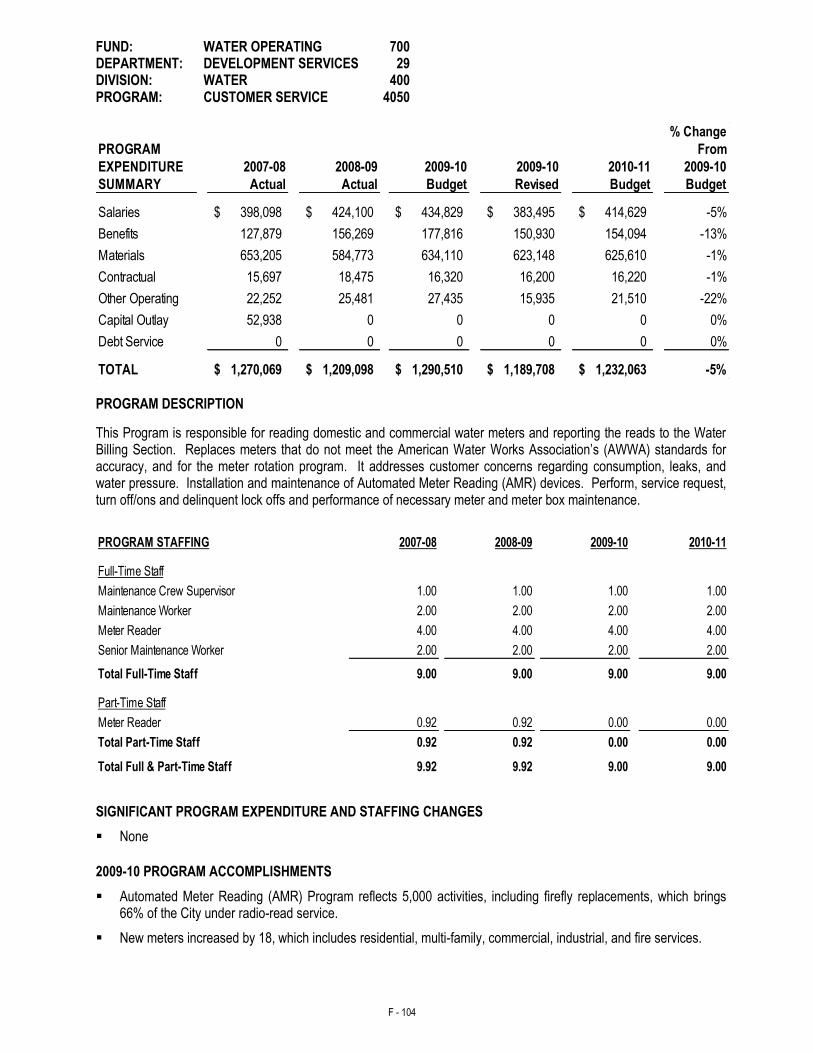
F - 104
FUND: WATER OPERATING 700 DEPARTMENT: DEVELOPMENT SERVICES 29 DIVISION: WATER 400 PROGRAM: CUSTOMER SERVICE 4050
% Change
PROGRAM From
EXPENDITURE 2007-08 2008-09 2009-10 2009-10 2010-11 2009-10
SUMMARY Actual Actual Budget Revised Budget Budget
Salaries 398,098$ 424,100$ 434,829$ 383,495$ 414,629$ -5%
Benefits 127,879 156,269 177,816 150,930 154,094 -13%
Materials 653,205 584,773 634,110 623,148 625,610 -1%
Contractual 15,697 18,475 16,320 16,200 16,220 -1%
Other Operating 22,252 25,481 27,435 15,935 21,510 -22%
Capital Outlay 52,938 0 0 0 0 0%
Debt Service 0 0 0 0 0 0%
TOTAL 1,270,069$ 1,209,098$ 1,290,510$ 1,189,708$ 1,232,063$ -5% PROGRAM DESCRIPTION
This Program is responsible for reading domestic and commercial water meters and reporting the reads to the Water Billing Section. Replaces meters that do not meet the American Water Works Association’s (AWWA) standards for accuracy, and for the meter rotation program. It addresses customer concerns regarding consumption, leaks, and water pressure. Installation and maintenance of Automated Meter Reading (AMR) devices. Perform, service request, turn off/ons and delinquent lock offs and performance of necessary meter and meter box maintenance.
PROGRAM STAFFING 2007-08 2008-09 2009-10 2010-11
1.00 1.00 1.00 1.00
2.00 2.00 2.00 2.00
4.00 4.00 4.00 4.00
2.00 2.00 2.00 2.00
9.00 9.00 9.00 9.00
Part-Time Staff
Meter Reader 0.92 0.92 0.00 0.00
0.92 0.92 0.00 0.00
9.92 9.92 9.00 9.00
Full-Time Staff
Maintenance Worker
Meter Reader
Maintenance Crew Supervisor
Total Full-Time Staff
Senior Maintenance Worker
Total Full & Part-Time Staff
Total Part-Time Staff
SIGNIFICANT PROGRAM EXPENDITURE AND STAFFING CHANGES
None
2009-10 PROGRAM ACCOMPLISHMENTS
Automated Meter Reading (AMR) Program reflects 5,000 activities, including firefly replacements, which brings 66% of the City under radio-read service.
New meters increased by 18, which includes residential, multi-family, commercial, industrial, and fire services.
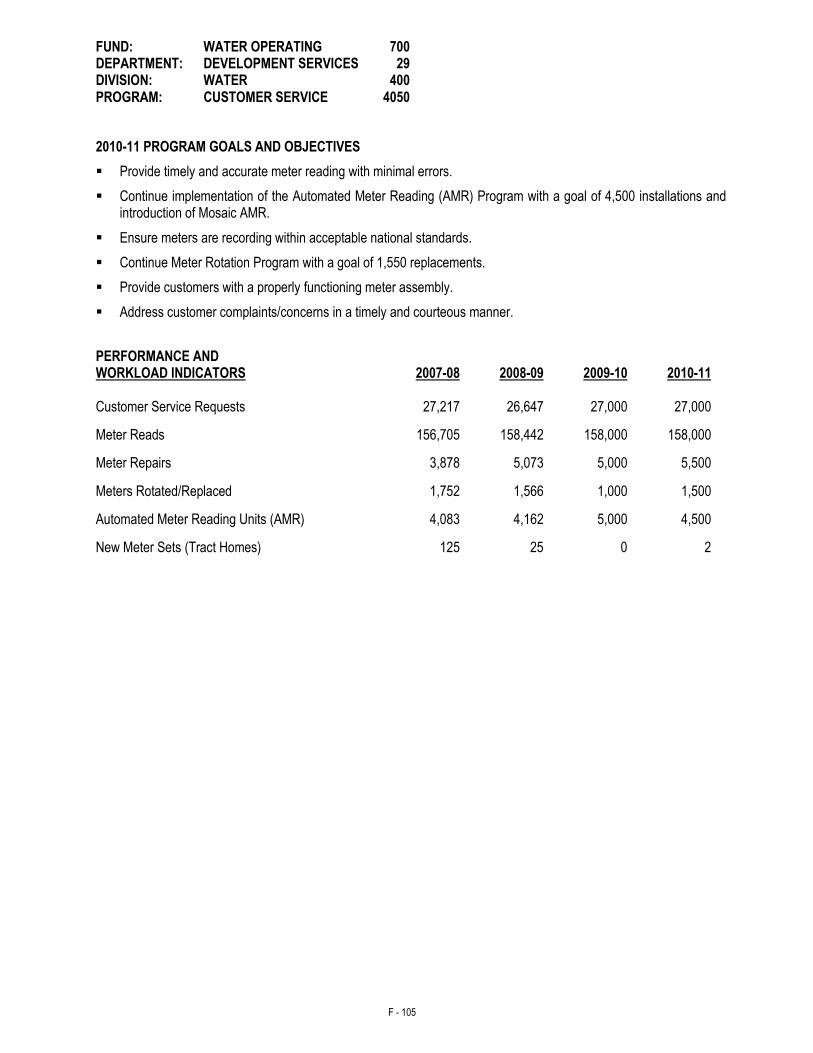
F - 105
FUND: WATER OPERATING 700 DEPARTMENT: DEVELOPMENT SERVICES 29 DIVISION: WATER 400 PROGRAM: CUSTOMER SERVICE 4050
2010-11 PROGRAM GOALS AND OBJECTIVES
Provide timely and accurate meter reading with minimal errors.
Continue implementation of the Automated Meter Reading (AMR) Program with a goal of 4,500 installations and introduction of Mosaic AMR.
Ensure meters are recording within acceptable national standards.
Continue Meter Rotation Program with a goal of 1,550 replacements.
Provide customers with a properly functioning meter assembly.
Address customer complaints/concerns in a timely and courteous manner.
PERFORMANCE AND WORKLOAD INDICATORS 2007-08 2008-09 2009-10 2010-11 Customer Service Requests 27,217 26,647 27,000 27,000
Meter Reads 156,705 158,442 158,000 158,000
Meter Repairs 3,878 5,073 5,000 5,500
Meters Rotated/Replaced 1,752 1,566 1,000 1,500
Automated Meter Reading Units (AMR) 4,083 4,162 5,000 4,500
New Meter Sets (Tract Homes) 125 25 0 2
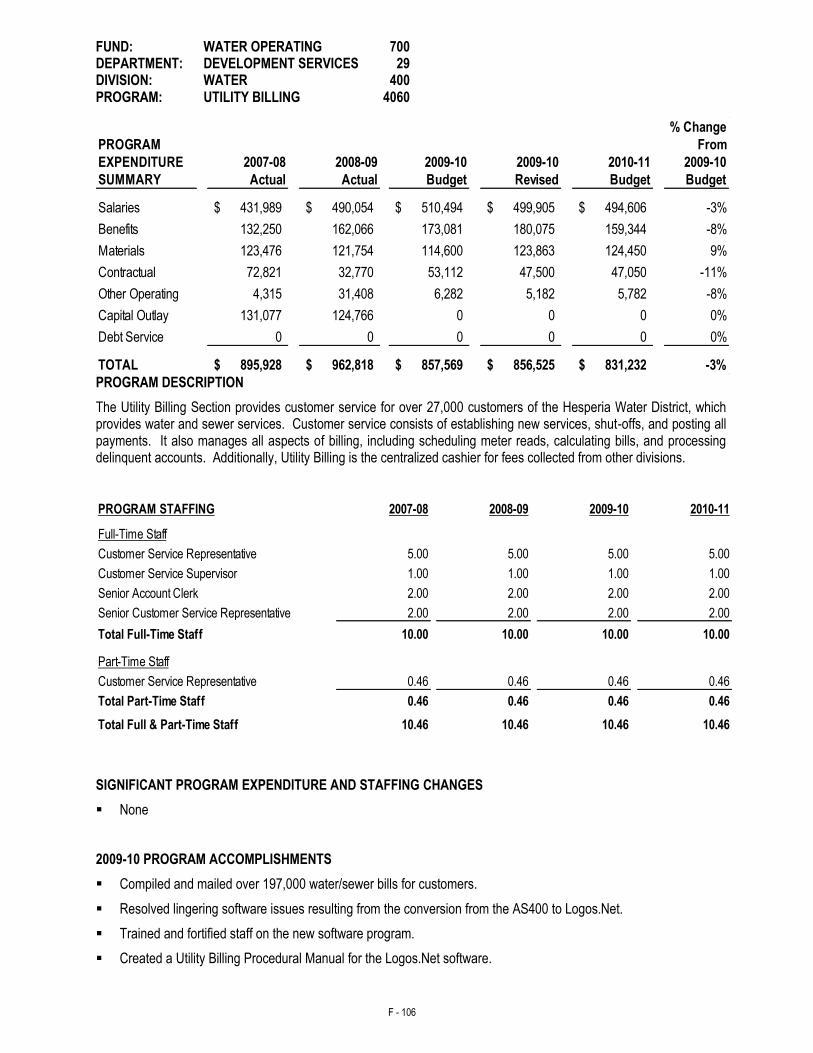
F - 106
FUND: WATER OPERATING 700 DEPARTMENT: DEVELOPMENT SERVICES 29 DIVISION: WATER 400 PROGRAM: UTILITY BILLING 4060
% Change
PROGRAM From
EXPENDITURE 2007-08 2008-09 2009-10 2009-10 2010-11 2009-10
SUMMARY Actual Actual Budget Revised Budget Budget
Salaries 431,989$ 490,054$ 510,494$ 499,905$ 494,606$ -3%
Benefits 132,250 162,066 173,081 180,075 159,344 -8%
Materials 123,476 121,754 114,600 123,863 124,450 9%
Contractual 72,821 32,770 53,112 47,500 47,050 -11%
Other Operating 4,315 31,408 6,282 5,182 5,782 -8%
Capital Outlay 131,077 124,766 0 0 0 0%
Debt Service 0 0 0 0 0 0%
TOTAL 895,928$ 962,818$ 857,569$ 856,525$ 831,232$ -3% PROGRAM DESCRIPTION
The Utility Billing Section provides customer service for over 27,000 customers of the Hesperia Water District, which provides water and sewer services. Customer service consists of establishing new services, shut-offs, and posting all payments. It also manages all aspects of billing, including scheduling meter reads, calculating bills, and processing delinquent accounts. Additionally, Utility Billing is the centralized cashier for fees collected from other divisions.
PROGRAM STAFFING 2007-08 2008-09 2009-10 2010-11
5.00 5.00 5.00 5.00
1.00 1.00 1.00 1.00
2.00 2.00 2.00 2.00
2.00 2.00 2.00 2.00
10.00 10.00 10.00 10.00
Part-Time Staff
0.46 0.46 0.46 0.46
0.46 0.46 0.46 0.46
10.46 10.46 10.46 10.46
Full-Time Staff
Total Full-Time Staff
Senior Account Clerk
Senior Customer Service Representative
Customer Service Representative
Customer Service Supervisor
Total Full & Part-Time Staff
Customer Service Representative
Total Part-Time Staff
SIGNIFICANT PROGRAM EXPENDITURE AND STAFFING CHANGES
None
2009-10 PROGRAM ACCOMPLISHMENTS
Compiled and mailed over 197,000 water/sewer bills for customers.
Resolved lingering software issues resulting from the conversion from the AS400 to Logos.Net.
Trained and fortified staff on the new software program.
Created a Utility Billing Procedural Manual for the Logos.Net software.
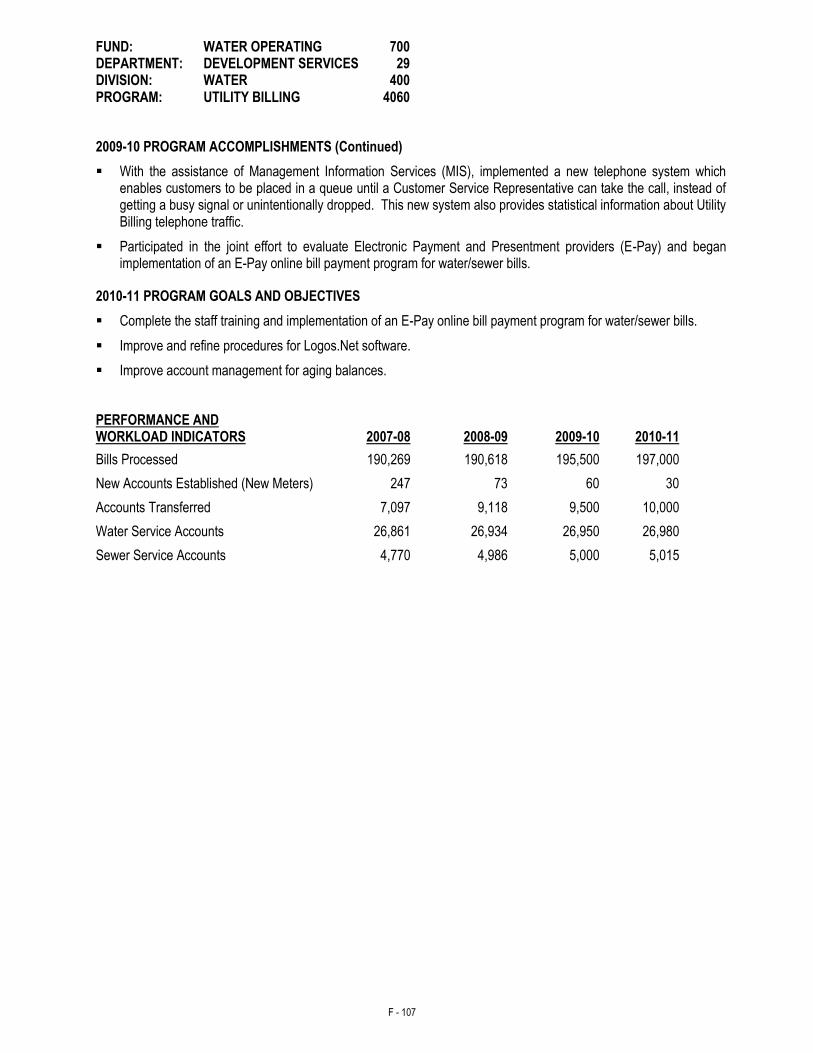
F - 107
FUND: WATER OPERATING 700 DEPARTMENT: DEVELOPMENT SERVICES 29 DIVISION: WATER 400 PROGRAM: UTILITY BILLING 4060
2009-10 PROGRAM ACCOMPLISHMENTS (Continued)
With the assistance of Management Information Services (MIS), implemented a new telephone system which enables customers to be placed in a queue until a Customer Service Representative can take the call, instead of getting a busy signal or unintentionally dropped. This new system also provides statistical information about Utility Billing telephone traffic.
Participated in the joint effort to evaluate Electronic Payment and Presentment providers (E-Pay) and began implementation of an E-Pay online bill payment program for water/sewer bills.
2010-11 PROGRAM GOALS AND OBJECTIVES
Complete the staff training and implementation of an E-Pay online bill payment program for water/sewer bills.
Improve and refine procedures for Logos.Net software.
Improve account management for aging balances.
PERFORMANCE AND WORKLOAD INDICATORS
2007-08
2008-09
2009-10
2010-11
Bills Processed 190,269 190,618 195,500 197,000
New Accounts Established (New Meters) 247 73 60 30
Accounts Transferred 7,097 9,118 9,500 10,000
Water Service Accounts 26,861 26,934 26,950 26,980
Sewer Service Accounts 4,770 4,986 5,000 5,015
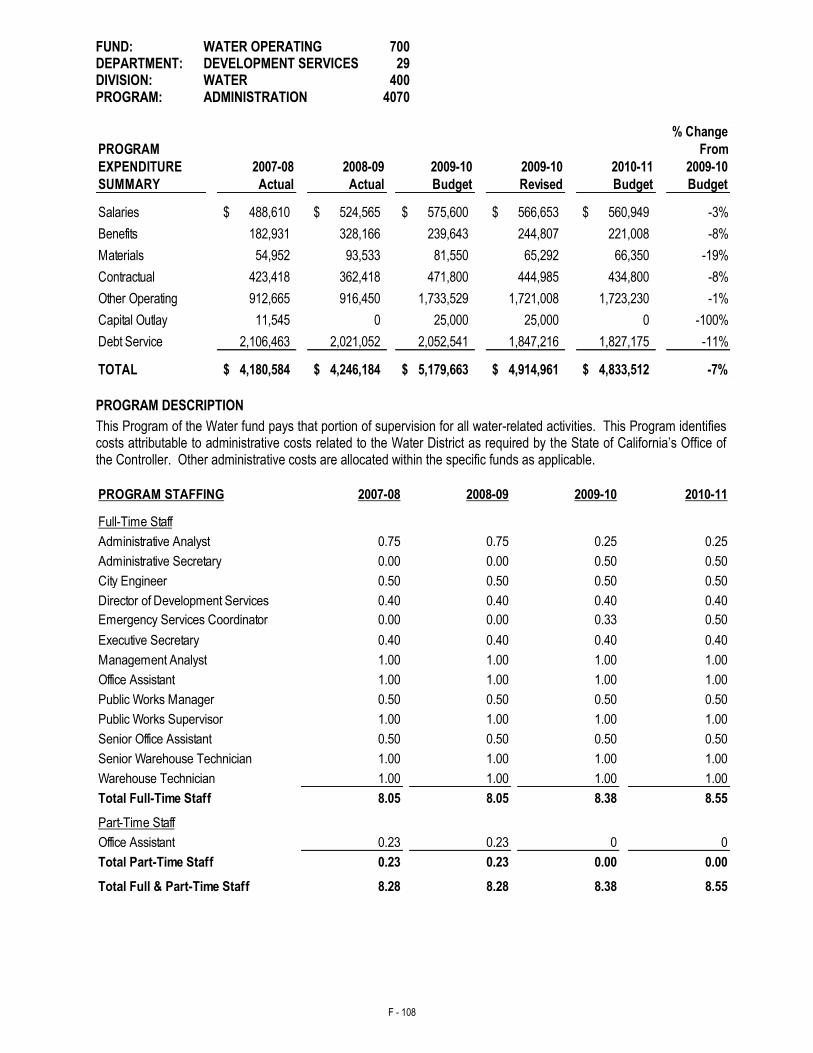
F - 108
FUND: WATER OPERATING 700 DEPARTMENT: DEVELOPMENT SERVICES 29 DIVISION: WATER 400 PROGRAM: ADMINISTRATION 4070
% Change
PROGRAM From
EXPENDITURE 2007-08 2008-09 2009-10 2009-10 2010-11 2009-10
SUMMARY Actual Actual Budget Revised Budget Budget
Salaries 488,610$ 524,565$ 575,600$ 566,653$ 560,949$ -3%
Benefits 182,931 328,166 239,643 244,807 221,008 -8%
Materials 54,952 93,533 81,550 65,292 66,350 -19%
Contractual 423,418 362,418 471,800 444,985 434,800 -8%
Other Operating 912,665 916,450 1,733,529 1,721,008 1,723,230 -1%
Capital Outlay 11,545 0 25,000 25,000 0 -100%
Debt Service 2,106,463 2,021,052 2,052,541 1,847,216 1,827,175 -11%
TOTAL 4,180,584$ 4,246,184$ 5,179,663$ 4,914,961$ 4,833,512$ -7% PROGRAM DESCRIPTION
This Program of the Water fund pays that portion of supervision for all water-related activities. This Program identifies costs attributable to administrative costs related to the Water District as required by the State of California’s Office of the Controller. Other administrative costs are allocated within the specific funds as applicable.
PROGRAM STAFFING 2007-08 2008-09 2009-10 2010-11
0.75 0.75 0.25 0.25
0.00 0.00 0.50 0.50
0.50 0.50 0.50 0.50
0.40 0.40 0.40 0.40
Emergency Services Coordinator 0.00 0.00 0.33 0.50
0.40 0.40 0.40 0.40
1.00 1.00 1.00 1.00
1.00 1.00 1.00 1.00
0.50 0.50 0.50 0.50
1.00 1.00 1.00 1.00
0.50 0.50 0.50 0.50
1.00 1.00 1.00 1.00
1.00 1.00 1.00 1.00
8.05 8.05 8.38 8.55
Part-Time Staff
Office Assistant 0.23 0.23 0 0
0.23 0.23 0.00 0.00
8.28 8.28 8.38 8.55
Senior Warehouse Technician
Warehouse Technician
Total Full & Part-Time Staff
Total Part-Time Staff
Total Full-Time Staff
Administrative Secretary
Full-Time Staff
Administrative Analyst
Director of Development Services
City Engineer
Public Works Supervisor
Senior Office Assistant
Executive Secretary
Public Works Manager
Management Analyst
Office Assistant
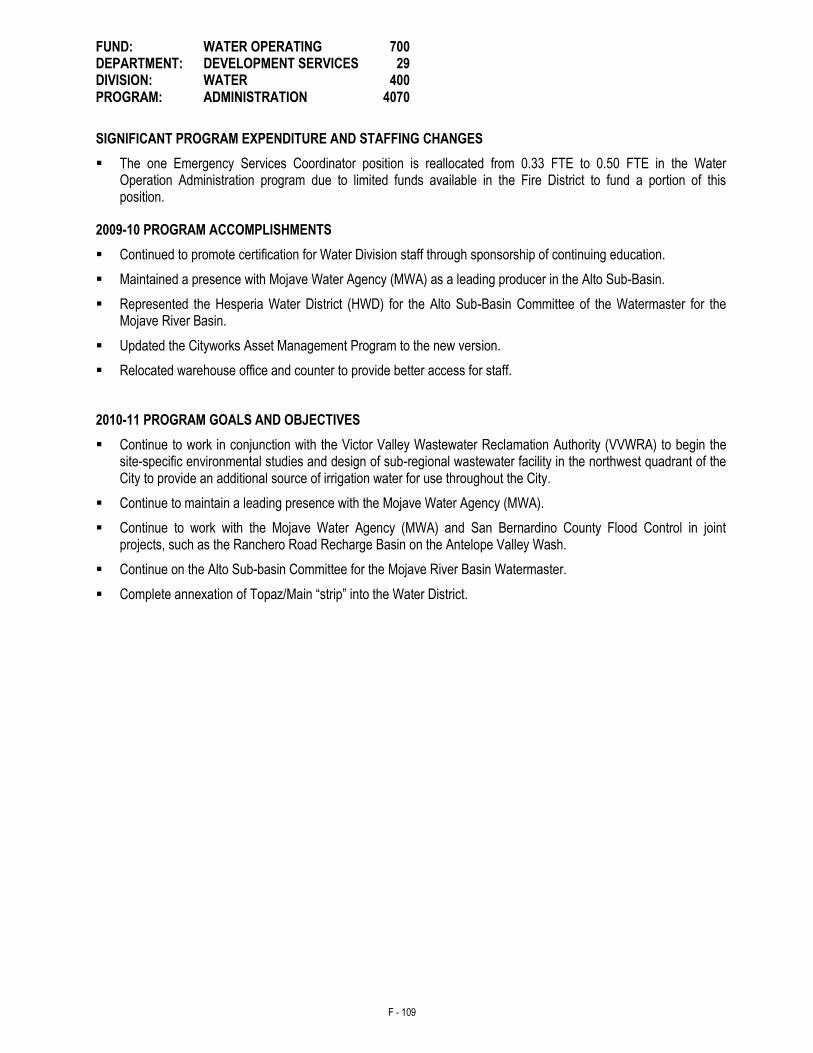
F - 109
FUND: WATER OPERATING 700 DEPARTMENT: DEVELOPMENT SERVICES 29 DIVISION: WATER 400 PROGRAM: ADMINISTRATION 4070
SIGNIFICANT PROGRAM EXPENDITURE AND STAFFING CHANGES
The one Emergency Services Coordinator position is reallocated from 0.33 FTE to 0.50 FTE in the Water Operation Administration program due to limited funds available in the Fire District to fund a portion of this position.
2009-10 PROGRAM ACCOMPLISHMENTS
Continued to promote certification for Water Division staff through sponsorship of continuing education.
Maintained a presence with Mojave Water Agency (MWA) as a leading producer in the Alto Sub-Basin.
Represented the Hesperia Water District (HWD) for the Alto Sub-Basin Committee of the Watermaster for the Mojave River Basin.
Updated the Cityworks Asset Management Program to the new version.
Relocated warehouse office and counter to provide better access for staff.
2010-11 PROGRAM GOALS AND OBJECTIVES
Continue to work in conjunction with the Victor Valley Wastewater Reclamation Authority (VVWRA) to begin the site-specific environmental studies and design of sub-regional wastewater facility in the northwest quadrant of the City to provide an additional source of irrigation water for use throughout the City.
Continue to maintain a leading presence with the Mojave Water Agency (MWA).
Continue to work with the Mojave Water Agency (MWA) and San Bernardino County Flood Control in joint projects, such as the Ranchero Road Recharge Basin on the Antelope Valley Wash.
Continue on the Alto Sub-basin Committee for the Mojave River Basin Watermaster.
Complete annexation of Topaz/Main “strip” into the Water District.
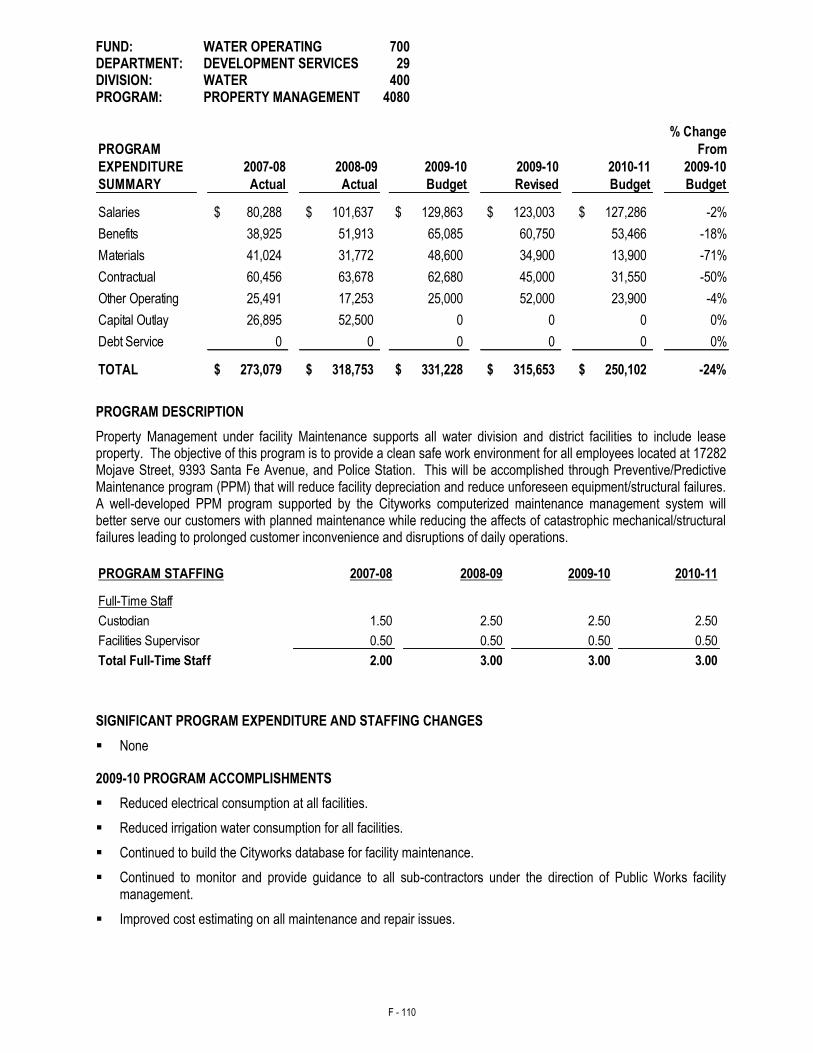
F - 110
FUND: WATER OPERATING 700 DEPARTMENT: DEVELOPMENT SERVICES 29 DIVISION: WATER 400 PROGRAM: PROPERTY MANAGEMENT 4080
% Change
PROGRAM From
EXPENDITURE 2007-08 2008-09 2009-10 2009-10 2010-11 2009-10
SUMMARY Actual Actual Budget Revised Budget Budget
Salaries 80,288$ 101,637$ 129,863$ 123,003$ 127,286$ -2%
Benefits 38,925 51,913 65,085 60,750 53,466 -18%
Materials 41,024 31,772 48,600 34,900 13,900 -71%
Contractual 60,456 63,678 62,680 45,000 31,550 -50%
Other Operating 25,491 17,253 25,000 52,000 23,900 -4%
Capital Outlay 26,895 52,500 0 0 0 0%
Debt Service 0 0 0 0 0 0%
TOTAL 273,079$ 318,753$ 331,228$ 315,653$ 250,102$ -24%
PROGRAM DESCRIPTION
Property Management under facility Maintenance supports all water division and district facilities to include lease property. The objective of this program is to provide a clean safe work environment for all employees located at 17282 Mojave Street, 9393 Santa Fe Avenue, and Police Station. This will be accomplished through Preventive/Predictive Maintenance program (PPM) that will reduce facility depreciation and reduce unforeseen equipment/structural failures. A well-developed PPM program supported by the Cityworks computerized maintenance management system will better serve our customers with planned maintenance while reducing the affects of catastrophic mechanical/structural failures leading to prolonged customer inconvenience and disruptions of daily operations.
PROGRAM STAFFING 2007-08 2008-09 2009-10 2010-11
1.50 2.50 2.50 2.50
0.50 0.50 0.50 0.50
2.00 3.00 3.00 3.00
Full-Time Staff
Facilities Supervisor
Custodian
Total Full-Time Staff
SIGNIFICANT PROGRAM EXPENDITURE AND STAFFING CHANGES
None
2009-10 PROGRAM ACCOMPLISHMENTS
Reduced electrical consumption at all facilities.
Reduced irrigation water consumption for all facilities.
Continued to build the Cityworks database for facility maintenance.
Continued to monitor and provide guidance to all sub-contractors under the direction of Public Works facility management.
Improved cost estimating on all maintenance and repair issues.
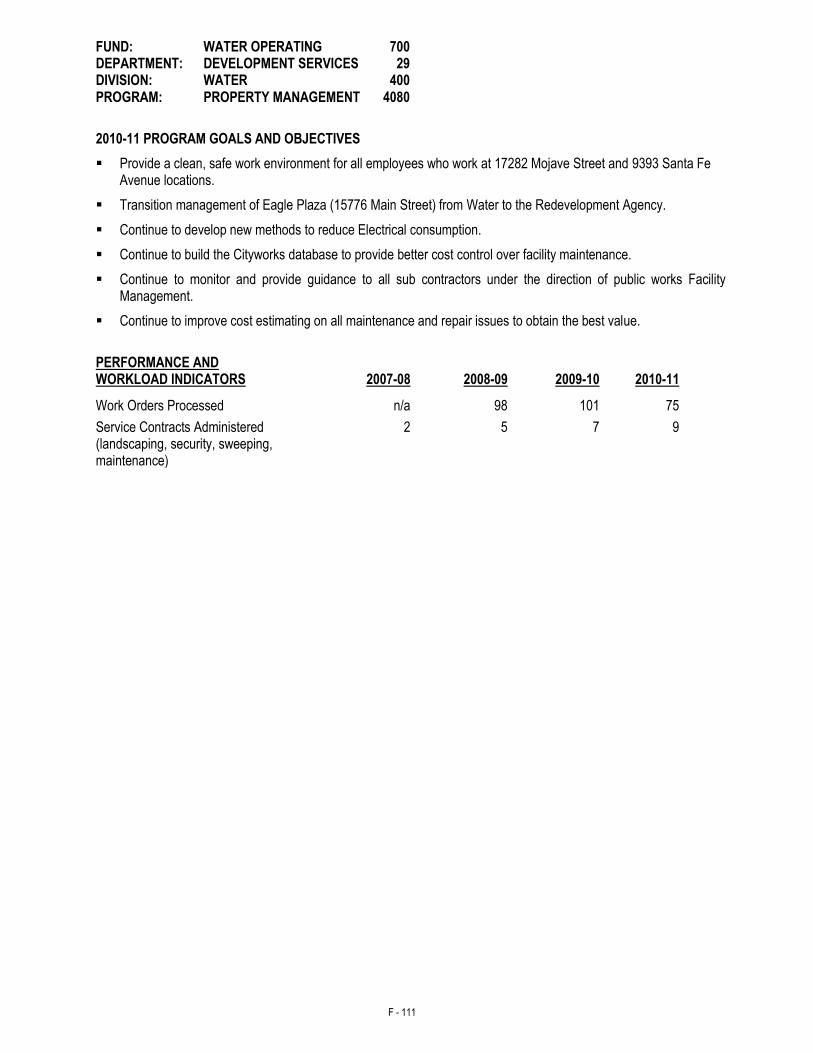
F - 111
FUND: WATER OPERATING 700 DEPARTMENT: DEVELOPMENT SERVICES 29 DIVISION: WATER 400 PROGRAM: PROPERTY MANAGEMENT 4080
2010-11 PROGRAM GOALS AND OBJECTIVES
Provide a clean, safe work environment for all employees who work at 17282 Mojave Street and 9393 Santa Fe Avenue locations.
Transition management of Eagle Plaza (15776 Main Street) from Water to the Redevelopment Agency.
Continue to develop new methods to reduce Electrical consumption.
Continue to build the Cityworks database to provide better cost control over facility maintenance.
Continue to monitor and provide guidance to all sub contractors under the direction of public works Facility Management.
Continue to improve cost estimating on all maintenance and repair issues to obtain the best value.
PERFORMANCE AND WORKLOAD INDICATORS
2007-08
2008-09
2009-10
2010-11
Work Orders Processed n/a 98 101 75
Service Contracts Administered (landscaping, security, sweeping, maintenance)
2 5 7 9
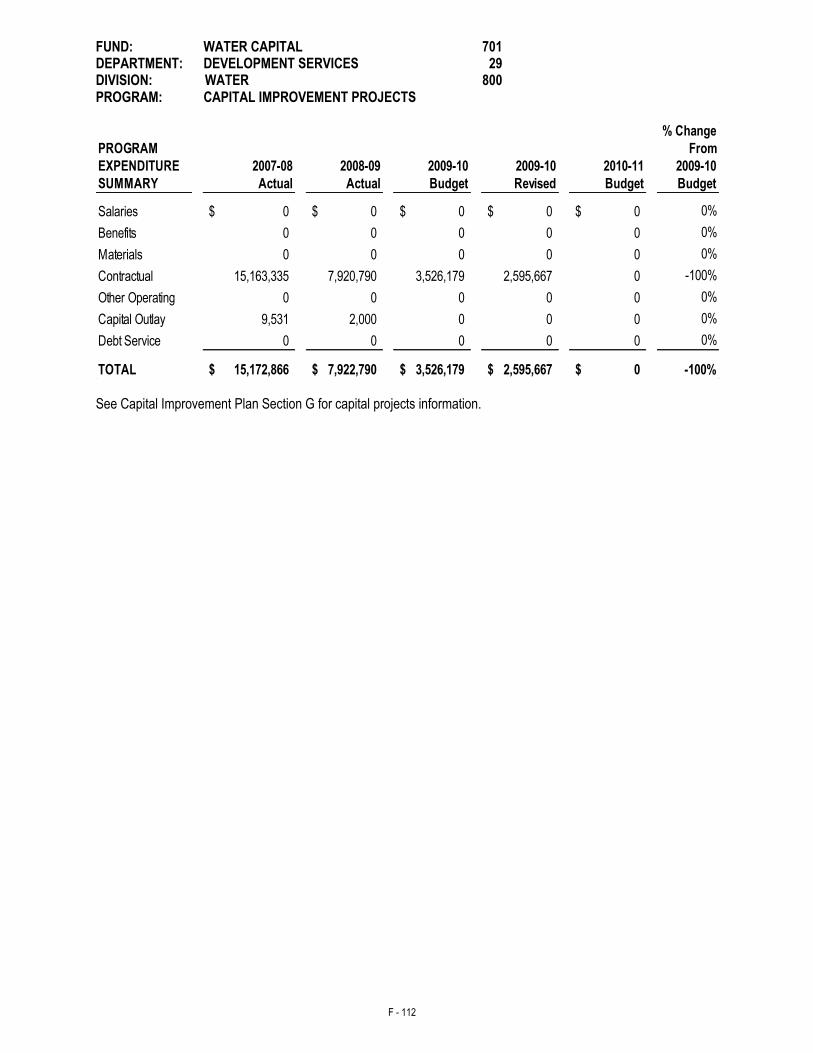
F - 112
FUND: WATER CAPITAL 701 DEPARTMENT: DEVELOPMENT SERVICES 29 DIVISION: WATER 800 PROGRAM: CAPITAL IMPROVEMENT PROJECTS
% Change
PROGRAM From
EXPENDITURE 2007-08 2008-09 2009-10 2009-10 2010-11 2009-10
SUMMARY Actual Actual Budget Revised Budget Budget
Salaries 0$ 0$ 0$ 0$ 0$ 0%
Benefits 0 0 0 0 0 0%
Materials 0 0 0 0 0 0%
Contractual 15,163,335 7,920,790 3,526,179 2,595,667 0 -100%
Other Operating 0 0 0 0 0 0%
Capital Outlay 9,531 2,000 0 0 0 0%
Debt Service 0 0 0 0 0 0%
TOTAL 15,172,866$ 7,922,790$ 3,526,179$ 2,595,667$ 0$ -100% See Capital Improvement Plan Section G for capital projects information.

F - 113
THIS PAGE INTENTIONALLY LEFT BLANK
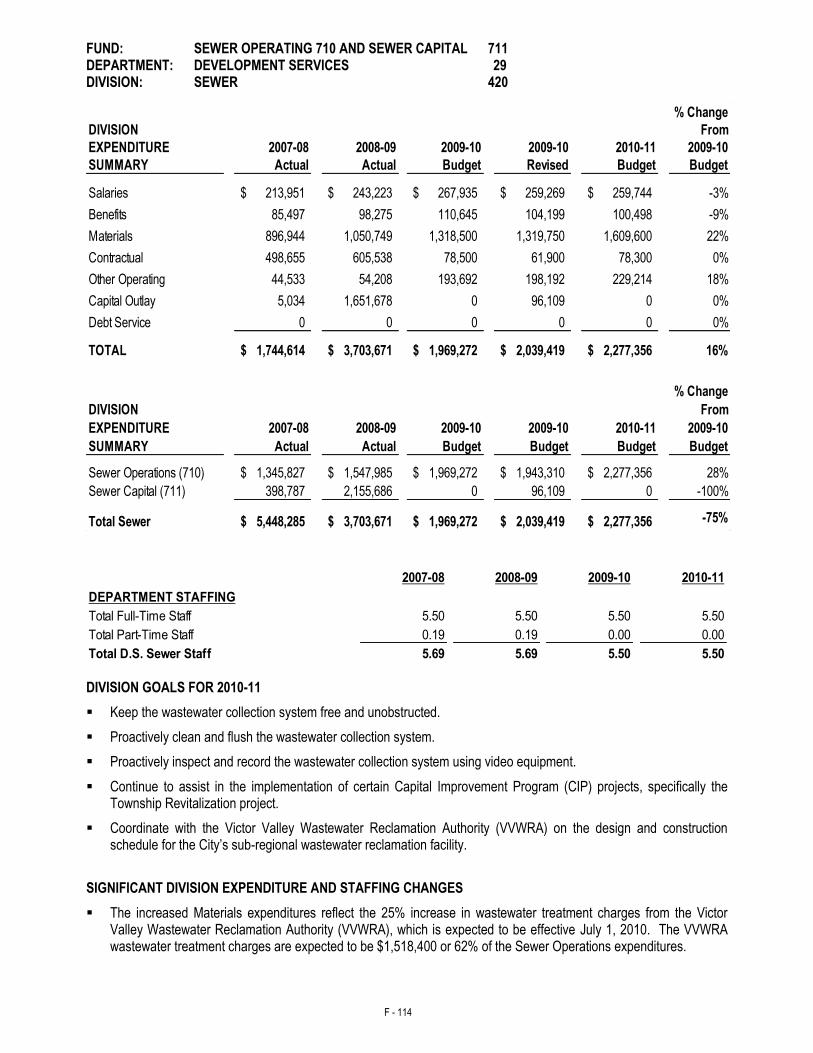
F - 114
FUND: SEWER OPERATING 710 AND SEWER CAPITAL 711 DEPARTMENT: DEVELOPMENT SERVICES 29 DIVISION: SEWER 420
% Change
DIVISION From
EXPENDITURE 2007-08 2008-09 2009-10 2009-10 2010-11 2009-10
SUMMARY Actual Actual Budget Revised Budget Budget
Salaries 213,951$ 243,223$ 267,935$ 259,269$ 259,744$ -3%
Benefits 85,497 98,275 110,645 104,199 100,498 -9%
Materials 896,944 1,050,749 1,318,500 1,319,750 1,609,600 22%
Contractual 498,655 605,538 78,500 61,900 78,300 0%
Other Operating 44,533 54,208 193,692 198,192 229,214 18%
Capital Outlay 5,034 1,651,678 0 96,109 0 0%
Debt Service 0 0 0 0 0 0%
TOTAL 1,744,614$ 3,703,671$ 1,969,272$ 2,039,419$ 2,277,356$ 16%
% Change
DIVISION From
EXPENDITURE 2007-08 2008-09 2009-10 2009-10 2010-11 2009-10
SUMMARY Actual Actual Budget Budget Budget Budget
Sewer Operations (710) 1,345,827$ 1,547,985$ 1,969,272$ 1,943,310$ 2,277,356$ 28%
Sewer Capital (711) 398,787 2,155,686 0 96,109 0 -100%
Total Sewer 5,448,285$ 3,703,671$ 1,969,272$ 2,039,419$ 2,277,356$ -75%
2007-08 2008-09 2009-10 2010-11
DEPARTMENT STAFFING
Total Full-Time Staff 5.50 5.50 5.50 5.50
0.19 0.19 0.00 0.00
5.69 5.69 5.50 5.50
Total Part-Time Staff
Total D.S. Sewer Staff DIVISION GOALS FOR 2010-11
Keep the wastewater collection system free and unobstructed.
Proactively clean and flush the wastewater collection system.
Proactively inspect and record the wastewater collection system using video equipment.
Continue to assist in the implementation of certain Capital Improvement Program (CIP) projects, specifically the Township Revitalization project.
Coordinate with the Victor Valley Wastewater Reclamation Authority (VVWRA) on the design and construction schedule for the City’s sub-regional wastewater reclamation facility.
SIGNIFICANT DIVISION EXPENDITURE AND STAFFING CHANGES
The increased Materials expenditures reflect the 25% increase in wastewater treatment charges from the Victor Valley Wastewater Reclamation Authority (VVWRA), which is expected to be effective July 1, 2010. The VVWRA wastewater treatment charges are expected to be $1,518,400 or 62% of the Sewer Operations expenditures.
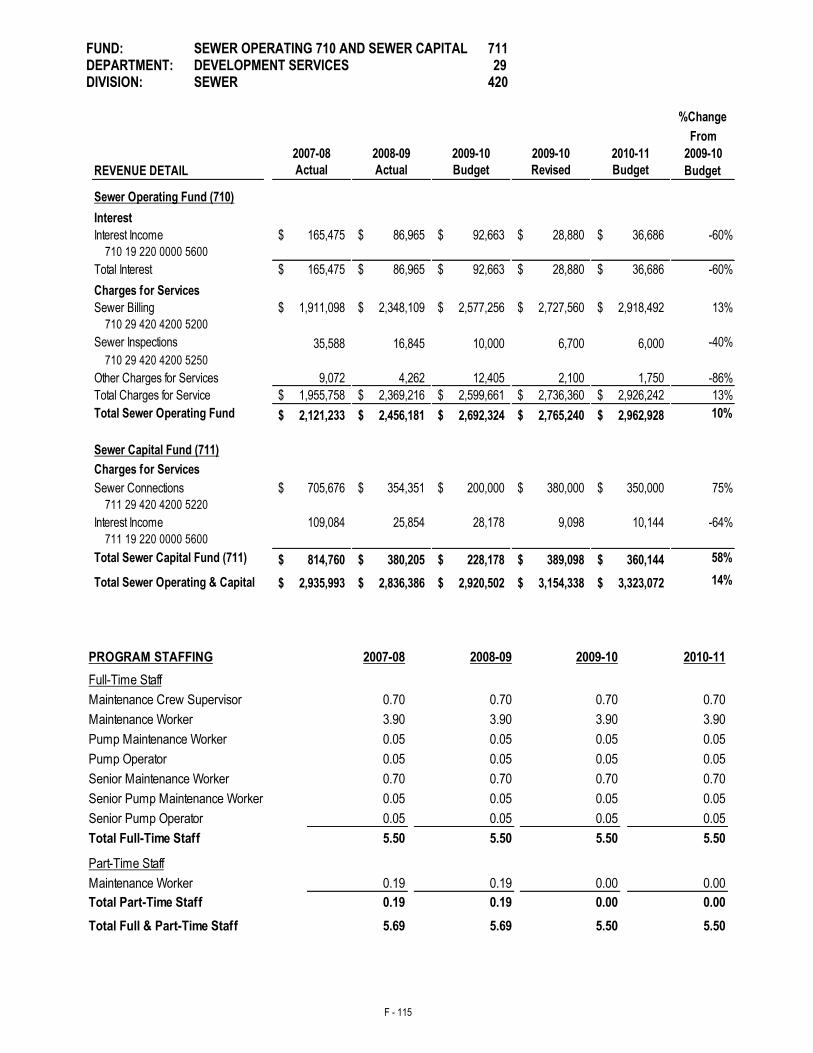
F - 115
FUND: SEWER OPERATING 710 AND SEWER CAPITAL 711 DEPARTMENT: DEVELOPMENT SERVICES 29 DIVISION: SEWER 420
%Change
From
2007-08 2008-09 2009-10 2009-10 2010-11 2009-10
REVENUE DETAIL Actual Actual Budget Revised Budget Budget
Sewer Operating Fund (710)
Interest
Interest Income 165,475$ 86,965$ 92,663$ 28,880$ 36,686$ -60%
710 19 220 0000 5600
Total Interest 165,475$ 86,965$ 92,663$ 28,880$ 36,686$ -60%
Charges for Services
Sewer Billing 1,911,098$ 2,348,109$ 2,577,256$ 2,727,560$ 2,918,492$ 13%
710 29 420 4200 5200
Sewer Inspections 35,588 16,845 10,000 6,700 6,000 -40%
710 29 420 4200 5250
Other Charges for Services 9,072 4,262 12,405 2,100 1,750 -86%
Total Charges for Service 1,955,758$ 2,369,216$ 2,599,661$ 2,736,360$ 2,926,242$ 13%
Total Sewer Operating Fund
(710)2,121,233$ 2,456,181$ 2,692,324$ 2,765,240$ 2,962,928$ 10%
Sewer Capital Fund (711)
Charges for Services
Sewer Connections 705,676$ 354,351$ 200,000$ 380,000$ 350,000$ 75%
711 29 420 4200 5220
Interest Income 109,084 25,854 28,178 9,098 10,144 -64%
711 19 220 0000 5600
Total Sewer Capital Fund (711) 814,760$ 380,205$ 228,178$ 389,098$ 360,144$ 58%
Total Sewer Operating & Capital 2,935,993$ 2,836,386$ 2,920,502$ 3,154,338$ 3,323,072$ 14%
PROGRAM STAFFING 2007-08 2008-09 2009-10 2010-11
0.70 0.70 0.70 0.70
3.90 3.90 3.90 3.90
0.05 0.05 0.05 0.05
0.05 0.05 0.05 0.05
0.70 0.70 0.70 0.70
0.05 0.05 0.05 0.05
0.05 0.05 0.05 0.05
5.50 5.50 5.50 5.50
0.19 0.19 0.00 0.00
0.19 0.19 0.00 0.00
5.69 5.69 5.50 5.50
Full-Time Staff
Maintenance Crew Supervisor
Maintenance Worker
Pump Maintenance Worker
Total Full & Part-Time Staff
Pump Operator
Senior Maintenance Worker
Senior Pump Maintenance Worker
Total Part-Time Staff
Maintenance Worker
Senior Pump Operator
Total Full-Time Staff
Part-Time Staff
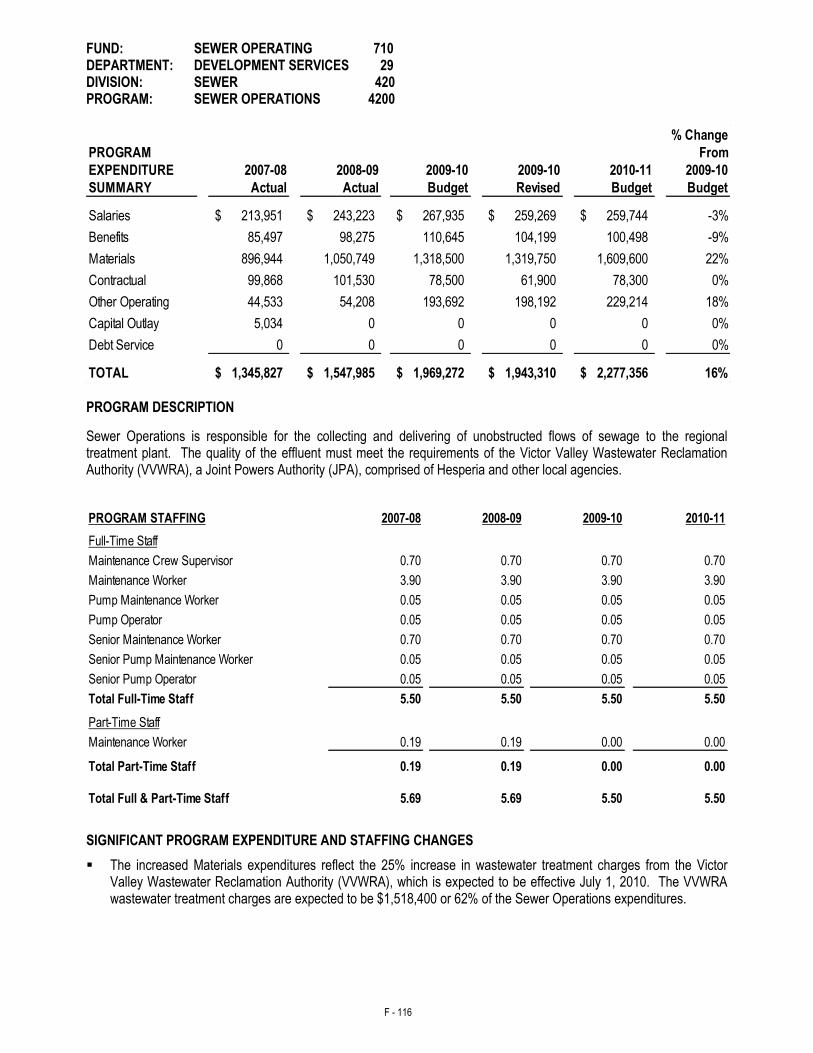
F - 116
FUND: SEWER OPERATING 710 DEPARTMENT: DEVELOPMENT SERVICES 29 DIVISION: SEWER 420 PROGRAM: SEWER OPERATIONS 4200
% Change
PROGRAM From
EXPENDITURE 2007-08 2008-09 2009-10 2009-10 2010-11 2009-10
SUMMARY Actual Actual Budget Revised Budget Budget
Salaries 213,951$ 243,223$ 267,935$ 259,269$ 259,744$ -3%
Benefits 85,497 98,275 110,645 104,199 100,498 -9%
Materials 896,944 1,050,749 1,318,500 1,319,750 1,609,600 22%
Contractual 99,868 101,530 78,500 61,900 78,300 0%
Other Operating 44,533 54,208 193,692 198,192 229,214 18%
Capital Outlay 5,034 0 0 0 0 0%
Debt Service 0 0 0 0 0 0%
TOTAL 1,345,827$ 1,547,985$ 1,969,272$ 1,943,310$ 2,277,356$ 16% PROGRAM DESCRIPTION
Sewer Operations is responsible for the collecting and delivering of unobstructed flows of sewage to the regional treatment plant. The quality of the effluent must meet the requirements of the Victor Valley Wastewater Reclamation Authority (VVWRA), a Joint Powers Authority (JPA), comprised of Hesperia and other local agencies.
PROGRAM STAFFING 2007-08 2008-09 2009-10 2010-11
0.70 0.70 0.70 0.70
3.90 3.90 3.90 3.90
0.05 0.05 0.05 0.05
0.05 0.05 0.05 0.05
0.70 0.70 0.70 0.70
0.05 0.05 0.05 0.05
0.05 0.05 0.05 0.05
5.50 5.50 5.50 5.50
0.19 0.19 0.00 0.00
0.19 0.19 0.00 0.00
5.69 5.69 5.50 5.50
Part-Time Staff
Senior Pump Operator
Total Full-Time Staff
Total Full & Part-Time Staff
Maintenance Worker
Total Part-Time Staff
Senior Maintenance Worker
Full-Time Staff
Senior Pump Maintenance Worker
Maintenance Worker
Maintenance Crew Supervisor
Pump Maintenance Worker
Pump Operator
SIGNIFICANT PROGRAM EXPENDITURE AND STAFFING CHANGES
The increased Materials expenditures reflect the 25% increase in wastewater treatment charges from the Victor Valley Wastewater Reclamation Authority (VVWRA), which is expected to be effective July 1, 2010. The VVWRA wastewater treatment charges are expected to be $1,518,400 or 62% of the Sewer Operations expenditures.
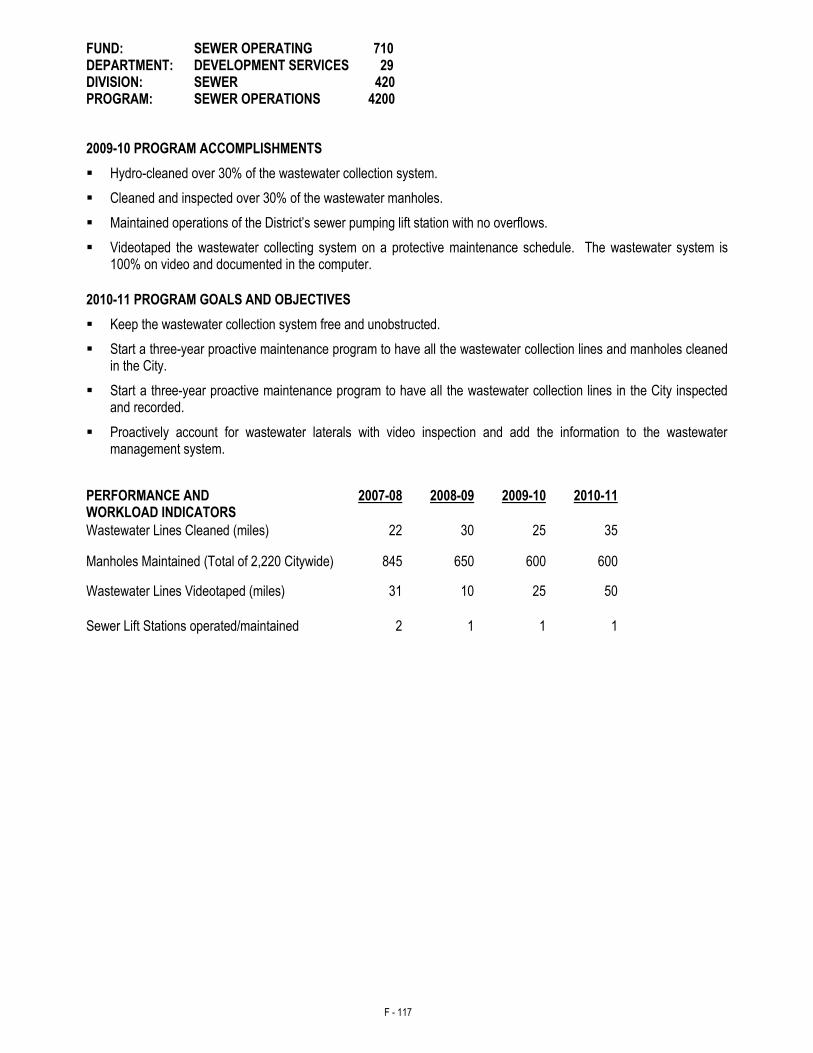
F - 117
FUND: SEWER OPERATING 710 DEPARTMENT: DEVELOPMENT SERVICES 29 DIVISION: SEWER 420 PROGRAM: SEWER OPERATIONS 4200
2009-10 PROGRAM ACCOMPLISHMENTS
Hydro-cleaned over 30% of the wastewater collection system.
Cleaned and inspected over 30% of the wastewater manholes.
Maintained operations of the District’s sewer pumping lift station with no overflows.
Videotaped the wastewater collecting system on a protective maintenance schedule. The wastewater system is 100% on video and documented in the computer.
2010-11 PROGRAM GOALS AND OBJECTIVES
Keep the wastewater collection system free and unobstructed.
Start a three-year proactive maintenance program to have all the wastewater collection lines and manholes cleaned in the City.
Start a three-year proactive maintenance program to have all the wastewater collection lines in the City inspected and recorded.
Proactively account for wastewater laterals with video inspection and add the information to the wastewater management system.
PERFORMANCE AND WORKLOAD INDICATORS
2007-08 2008-09 2009-10 2010-11
Wastewater Lines Cleaned (miles) 22 30 25 35
Manholes Maintained (Total of 2,220 Citywide) 845 650 600 600
Wastewater Lines Videotaped (miles) 31 10 25 50
Sewer Lift Stations operated/maintained 2 1 1 1
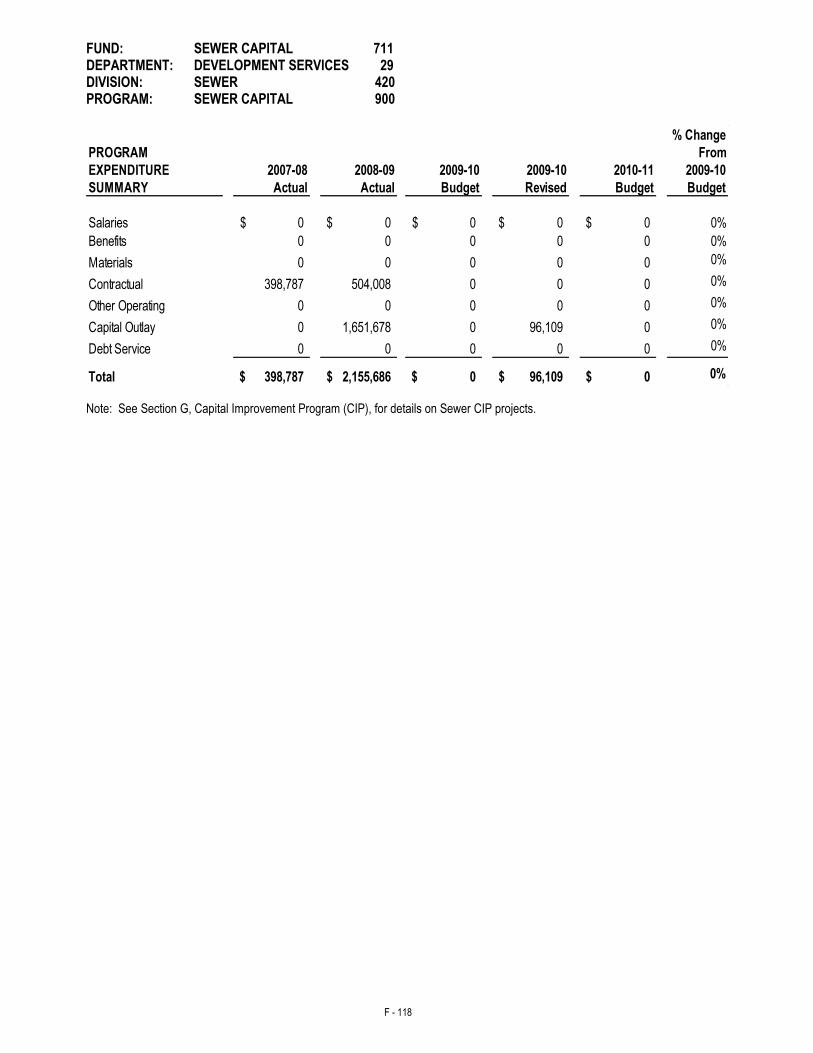
F - 118
FUND: SEWER CAPITAL 711 DEPARTMENT: DEVELOPMENT SERVICES 29
DIVISION: SEWER 420 PROGRAM: SEWER CAPITAL 900
% Change
PROGRAM From
EXPENDITURE 2007-08 2008-09 2009-10 2009-10 2010-11 2009-10
SUMMARY Actual Actual Budget Revised Budget Budget
Salaries 0$ 0$ 0$ 0$ 0$ 0%
Benefits 0 0 0 0 0 0%
Materials 0 0 0 0 0 0%
Contractual 398,787 504,008 0 0 0 0%
Other Operating 0 0 0 0 0 0%
Capital Outlay 0 1,651,678 0 96,109 0 0%
Debt Service 0 0 0 0 0 0%
Total 398,787$ 2,155,686$ 0$ 96,109$ 0$ 0%
Note: See Section G, Capital Improvement Program (CIP), for details on Sewer CIP projects.

F - 119
THIS PAGE INTENTIONALLY LEFT BLANK
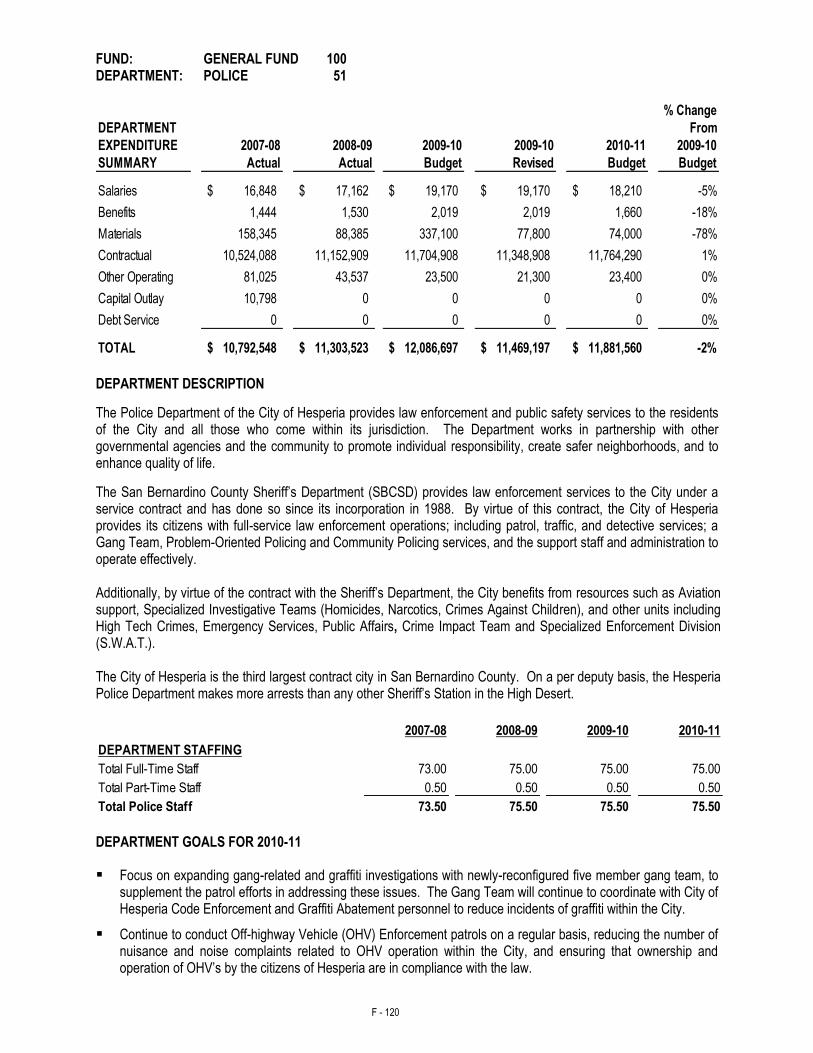
F - 120
FUND: GENERAL FUND 100 DEPARTMENT: POLICE 51
% Change
DEPARTMENT From
EXPENDITURE 2007-08 2008-09 2009-10 2009-10 2010-11 2009-10
SUMMARY Actual Actual Budget Revised Budget Budget
Salaries 16,848$ 17,162$ 19,170$ 19,170$ 18,210$ -5%
Benefits 1,444 1,530 2,019 2,019 1,660 -18%
Materials 158,345 88,385 337,100 77,800 74,000 -78%
Contractual 10,524,088 11,152,909 11,704,908 11,348,908 11,764,290 1%
Other Operating 81,025 43,537 23,500 21,300 23,400 0%
Capital Outlay 10,798 0 0 0 0 0%
Debt Service 0 0 0 0 0 0%
TOTAL 10,792,548$ 11,303,523$ 12,086,697$ 11,469,197$ 11,881,560$ -2% DEPARTMENT DESCRIPTION
The Police Department of the City of Hesperia provides law enforcement and public safety services to the residents of the City and all those who come within its jurisdiction. The Department works in partnership with other governmental agencies and the community to promote individual responsibility, create safer neighborhoods, and to enhance quality of life.
The San Bernardino County Sheriff‟s Department (SBCSD) provides law enforcement services to the City under a service contract and has done so since its incorporation in 1988. By virtue of this contract, the City of Hesperia provides its citizens with full-service law enforcement operations; including patrol, traffic, and detective services; a Gang Team, Problem-Oriented Policing and Community Policing services, and the support staff and administration to operate effectively. Additionally, by virtue of the contract with the Sheriff‟s Department, the City benefits from resources such as Aviation support, Specialized Investigative Teams (Homicides, Narcotics, Crimes Against Children), and other units including High Tech Crimes, Emergency Services, Public Affairs, Crime Impact Team and Specialized Enforcement Division (S.W.A.T.). The City of Hesperia is the third largest contract city in San Bernardino County. On a per deputy basis, the Hesperia Police Department makes more arrests than any other Sheriff‟s Station in the High Desert.
2007-08 2008-09 2009-10 2010-11
DEPARTMENT STAFFING
Total Full-Time Staff 73.00 75.00 75.00 75.00
0.50 0.50 0.50 0.50
73.50 75.50 75.50 75.50
Total Part-Time Staff
Total Police Staff
DEPARTMENT GOALS FOR 2010-11
Focus on expanding gang-related and graffiti investigations with newly-reconfigured five member gang team, to supplement the patrol efforts in addressing these issues. The Gang Team will continue to coordinate with City of Hesperia Code Enforcement and Graffiti Abatement personnel to reduce incidents of graffiti within the City.
Continue to conduct Off-highway Vehicle (OHV) Enforcement patrols on a regular basis, reducing the number of nuisance and noise complaints related to OHV operation within the City, and ensuring that ownership and operation of OHV‟s by the citizens of Hesperia are in compliance with the law.
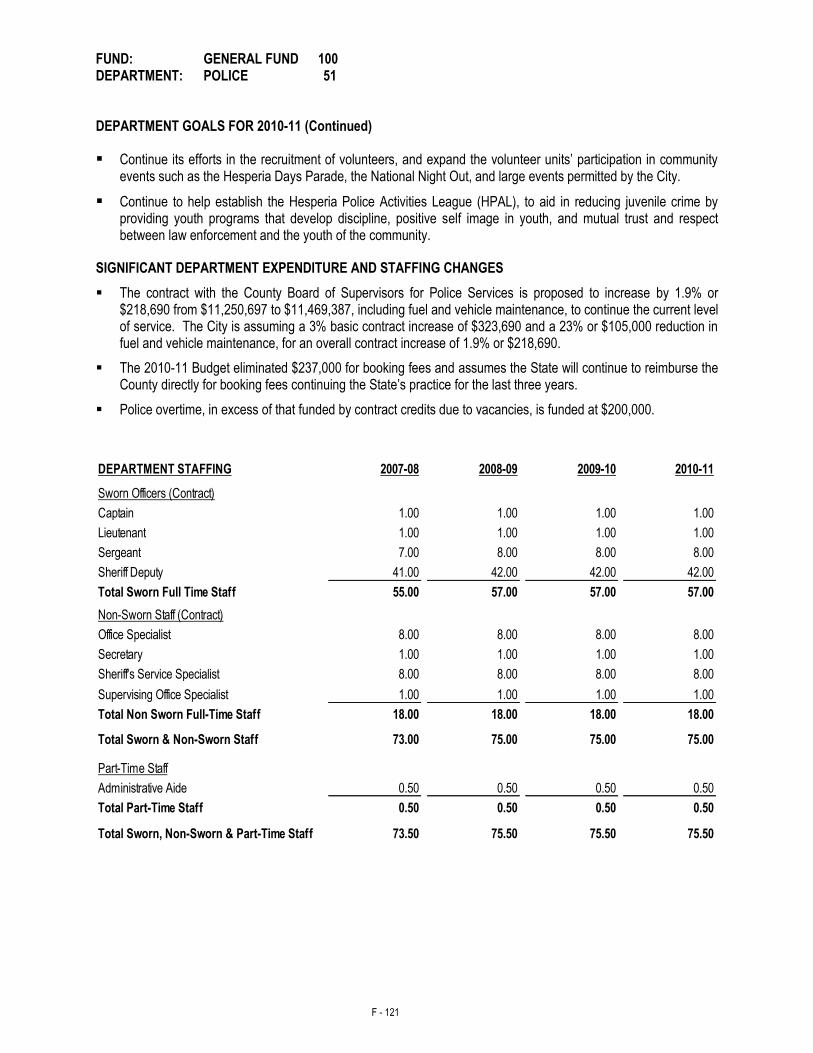
F - 121
FUND: GENERAL FUND 100 DEPARTMENT: POLICE 51 DEPARTMENT GOALS FOR 2010-11 (Continued)
Continue its efforts in the recruitment of volunteers, and expand the volunteer units‟ participation in community events such as the Hesperia Days Parade, the National Night Out, and large events permitted by the City.
Continue to help establish the Hesperia Police Activities League (HPAL), to aid in reducing juvenile crime by providing youth programs that develop discipline, positive self image in youth, and mutual trust and respect between law enforcement and the youth of the community.
SIGNIFICANT DEPARTMENT EXPENDITURE AND STAFFING CHANGES
The contract with the County Board of Supervisors for Police Services is proposed to increase by 1.9% or $218,690 from $11,250,697 to $11,469,387, including fuel and vehicle maintenance, to continue the current level of service. The City is assuming a 3% basic contract increase of $323,690 and a 23% or $105,000 reduction in fuel and vehicle maintenance, for an overall contract increase of 1.9% or $218,690.
The 2010-11 Budget eliminated $237,000 for booking fees and assumes the State will continue to reimburse the County directly for booking fees continuing the State‟s practice for the last three years.
Police overtime, in excess of that funded by contract credits due to vacancies, is funded at $200,000.
DEPARTMENT STAFFING 2007-08 2008-09 2009-10 2010-11
Sworn Officers (Contract)
1.00 1.00 1.00 1.00
1.00 1.00 1.00 1.00
7.00 8.00 8.00 8.00
41.00 42.00 42.00 42.00
55.00 57.00 57.00 57.00
Non-Sworn Staff (Contract)
8.00 8.00 8.00 8.00
1.00 1.00 1.00 1.00
8.00 8.00 8.00 8.00
1.00 1.00 1.00 1.00
18.00 18.00 18.00 18.00
73.00 75.00 75.00 75.00
Part-Time Staff
0.50 0.50 0.50 0.50
0.50 0.50 0.50 0.50
73.50 75.50 75.50 75.50Total Sworn, Non-Sworn & Part-Time Staff
Total Part-Time Staff
Sheriff's Service Specialist
Total Sworn & Non-Sworn Staff
Administrative Aide
Supervising Office Specialist
Secretary
Office Specialist
Total Non Sworn Full-Time Staff
Total Sworn Full Time Staff
Captain
Sheriff Deputy
Lieutenant
Sergeant
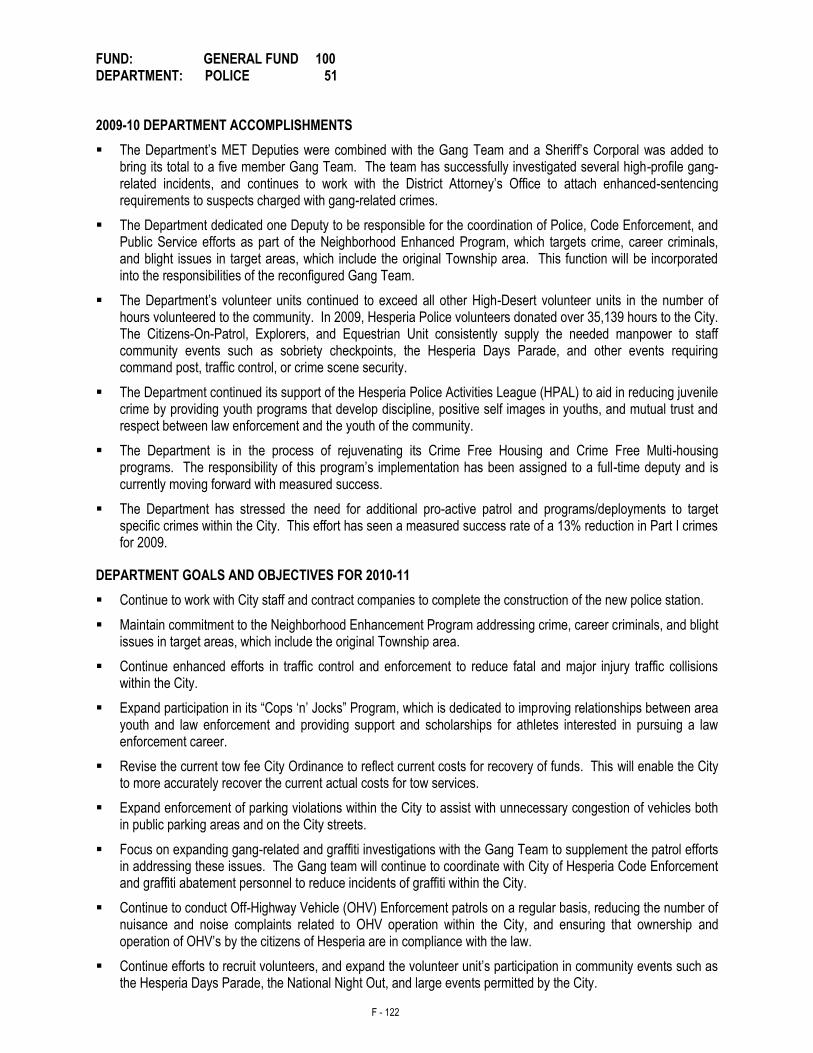
F - 122
FUND: GENERAL FUND 100 DEPARTMENT: POLICE 51
2009-10 DEPARTMENT ACCOMPLISHMENTS
The Department‟s MET Deputies were combined with the Gang Team and a Sheriff‟s Corporal was added to bring its total to a five member Gang Team. The team has successfully investigated several high-profile gang-related incidents, and continues to work with the District Attorney‟s Office to attach enhanced-sentencing requirements to suspects charged with gang-related crimes.
The Department dedicated one Deputy to be responsible for the coordination of Police, Code Enforcement, and Public Service efforts as part of the Neighborhood Enhanced Program, which targets crime, career criminals, and blight issues in target areas, which include the original Township area. This function will be incorporated into the responsibilities of the reconfigured Gang Team.
The Department‟s volunteer units continued to exceed all other High-Desert volunteer units in the number of hours volunteered to the community. In 2009, Hesperia Police volunteers donated over 35,139 hours to the City. The Citizens-On-Patrol, Explorers, and Equestrian Unit consistently supply the needed manpower to staff community events such as sobriety checkpoints, the Hesperia Days Parade, and other events requiring command post, traffic control, or crime scene security.
The Department continued its support of the Hesperia Police Activities League (HPAL) to aid in reducing juvenile crime by providing youth programs that develop discipline, positive self images in youths, and mutual trust and respect between law enforcement and the youth of the community.
The Department is in the process of rejuvenating its Crime Free Housing and Crime Free Multi-housing programs. The responsibility of this program‟s implementation has been assigned to a full-time deputy and is currently moving forward with measured success.
The Department has stressed the need for additional pro-active patrol and programs/deployments to target specific crimes within the City. This effort has seen a measured success rate of a 13% reduction in Part I crimes for 2009.
DEPARTMENT GOALS AND OBJECTIVES FOR 2010-11
Continue to work with City staff and contract companies to complete the construction of the new police station.
Maintain commitment to the Neighborhood Enhancement Program addressing crime, career criminals, and blight issues in target areas, which include the original Township area.
Continue enhanced efforts in traffic control and enforcement to reduce fatal and major injury traffic collisions within the City.
Expand participation in its “Cops „n‟ Jocks” Program, which is dedicated to improving relationships between area youth and law enforcement and providing support and scholarships for athletes interested in pursuing a law enforcement career.
Revise the current tow fee City Ordinance to reflect current costs for recovery of funds. This will enable the City to more accurately recover the current actual costs for tow services.
Expand enforcement of parking violations within the City to assist with unnecessary congestion of vehicles both in public parking areas and on the City streets.
Focus on expanding gang-related and graffiti investigations with the Gang Team to supplement the patrol efforts in addressing these issues. The Gang team will continue to coordinate with City of Hesperia Code Enforcement and graffiti abatement personnel to reduce incidents of graffiti within the City.
Continue to conduct Off-Highway Vehicle (OHV) Enforcement patrols on a regular basis, reducing the number of nuisance and noise complaints related to OHV operation within the City, and ensuring that ownership and operation of OHV‟s by the citizens of Hesperia are in compliance with the law.
Continue efforts to recruit volunteers, and expand the volunteer unit‟s participation in community events such as the Hesperia Days Parade, the National Night Out, and large events permitted by the City.
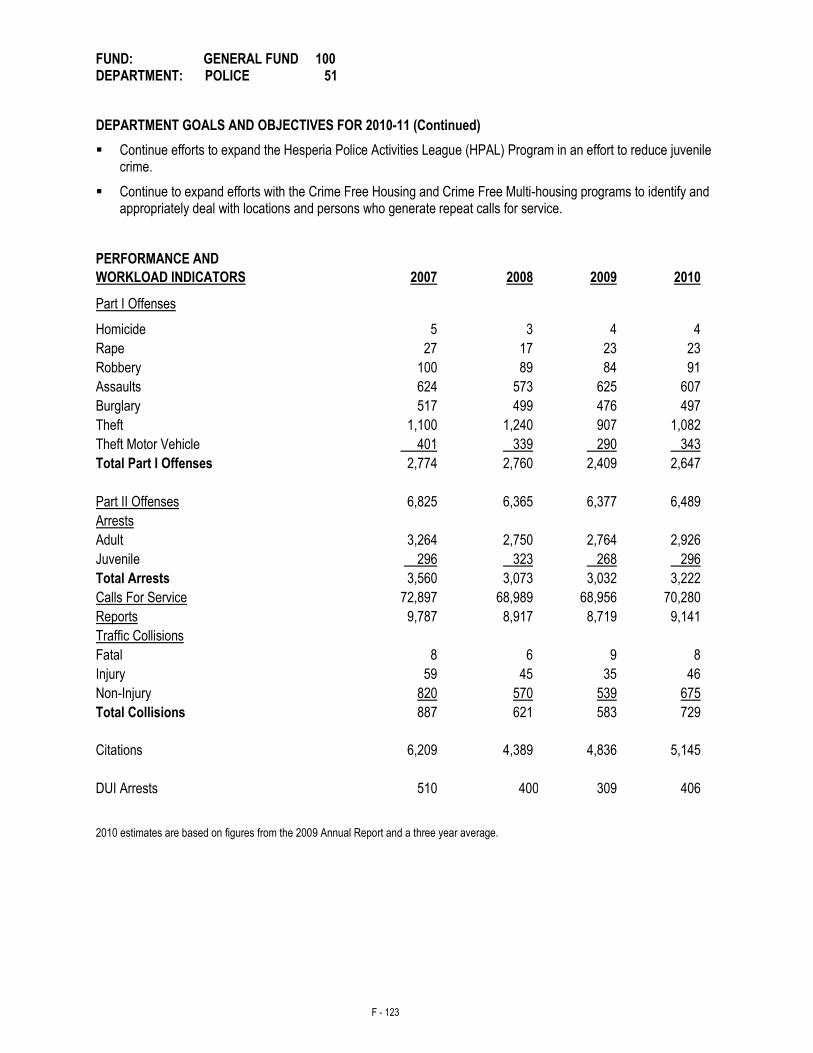
F - 123
FUND: GENERAL FUND 100 DEPARTMENT: POLICE 51
DEPARTMENT GOALS AND OBJECTIVES FOR 2010-11 (Continued)
Continue efforts to expand the Hesperia Police Activities League (HPAL) Program in an effort to reduce juvenile crime.
Continue to expand efforts with the Crime Free Housing and Crime Free Multi-housing programs to identify and appropriately deal with locations and persons who generate repeat calls for service.
PERFORMANCE AND
WORKLOAD INDICATORS 2007 2008 2009 2010
Part I Offenses
Homicide 5 3 4 4
Rape 27 17 23 23
Robbery 100 89 84 91
Assaults 624 573 625 607
Burglary 517 499 476 497
Theft 1,100 1,240 907 1,082
Theft Motor Vehicle 401 339 290 343
Total Part I Offenses 2,774 2,760 2,409 2,647
Part II Offenses 6,825 6,365 6,377 6,489
Arrests
Adult 3,264 2,750 2,764 2,926
Juvenile 296 323 268 296
Total Arrests 3,560 3,073 3,032 3,222
Calls For Service 72,897 68,989 68,956 70,280
Reports 9,787 8,917 8,719 9,141
Traffic Collisions
Fatal 8 6 9 8
Injury 59 45 35 46
Non-Injury 820 570 539 675
Total Collisions 887 621 583 729
Citations 6,209 4,389 4,836 5,145
DUI Arrests 510 400 309 406
2010 estimates are based on figures from the 2009 Annual Report and a three year average.
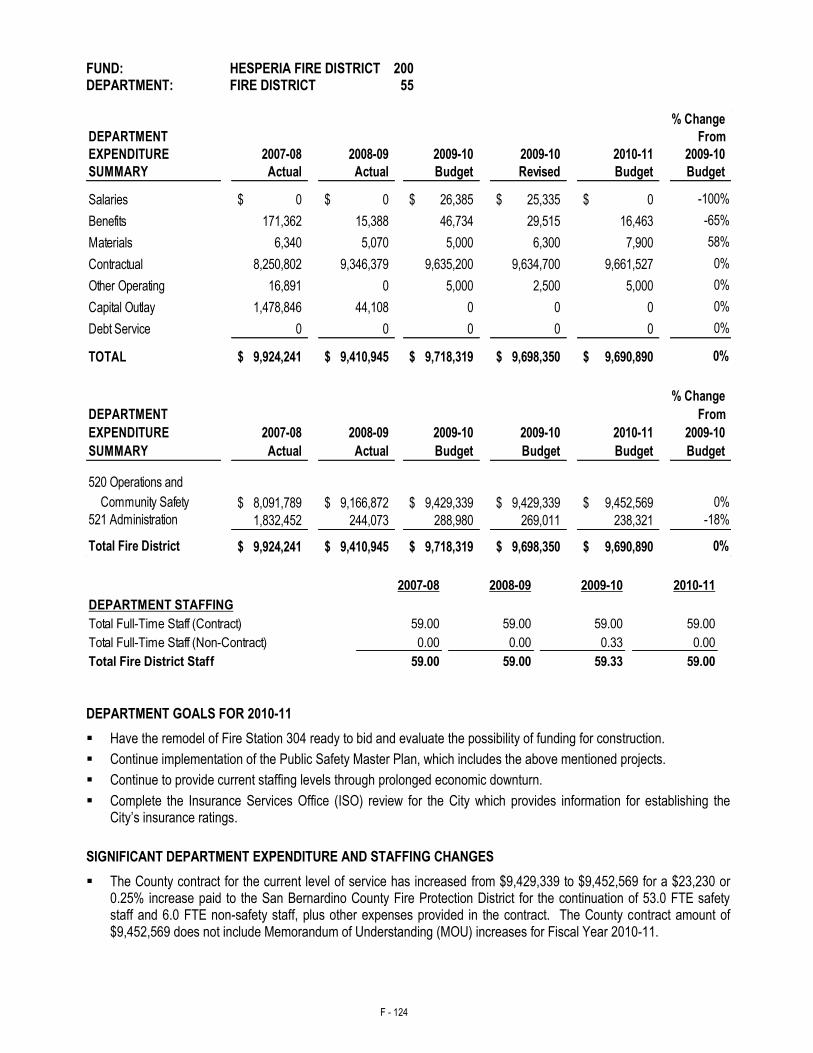
F - 124
FUND: HESPERIA FIRE DISTRICT 200 DEPARTMENT: FIRE DISTRICT 55
% Change
DEPARTMENT From
EXPENDITURE 2007-08 2008-09 2009-10 2009-10 2010-11 2009-10
SUMMARY Actual Actual Budget Revised Budget Budget
Salaries 0$ 0$ 26,385$ 25,335$ 0$ -100%
Benefits 171,362 15,388 46,734 29,515 16,463 -65%
Materials 6,340 5,070 5,000 6,300 7,900 58%
Contractual 8,250,802 9,346,379 9,635,200 9,634,700 9,661,527 0%
Other Operating 16,891 0 5,000 2,500 5,000 0%
Capital Outlay 1,478,846 44,108 0 0 0 0%
Debt Service 0 0 0 0 0 0%
TOTAL 9,924,241$ 9,410,945$ 9,718,319$ 9,698,350$ 9,690,890$ 0%
% Change
DEPARTMENT From
EXPENDITURE 2007-08 2008-09 2009-10 2009-10 2010-11 2009-10
SUMMARY Actual Actual Budget Budget Budget Budget
520 Operations and
Community Safety 8,091,789$ 9,166,872$ 9,429,339$ 9,429,339$ 9,452,569$ 0%
521 Administration 1,832,452 244,073 288,980 269,011 238,321 -18%
Total Fire District 9,924,241$ 9,410,945$ 9,718,319$ 9,698,350$ 9,690,890$ 0%
2007-08 2008-09 2009-10 2010-11
DEPARTMENT STAFFING
Total Full-Time Staff (Contract) 59.00 59.00 59.00 59.00
0.00 0.00 0.33 0.00
59.00 59.00 59.33 59.00
Total Full-Time Staff (Non-Contract)
Total Fire District Staff
DEPARTMENT GOALS FOR 2010-11
Have the remodel of Fire Station 304 ready to bid and evaluate the possibility of funding for construction.
Continue implementation of the Public Safety Master Plan, which includes the above mentioned projects.
Continue to provide current staffing levels through prolonged economic downturn.
Complete the Insurance Services Office (ISO) review for the City which provides information for establishing the City’s insurance ratings.
SIGNIFICANT DEPARTMENT EXPENDITURE AND STAFFING CHANGES
The County contract for the current level of service has increased from $9,429,339 to $9,452,569 for a $23,230 or 0.25% increase paid to the San Bernardino County Fire Protection District for the continuation of 53.0 FTE safety staff and 6.0 FTE non-safety staff, plus other expenses provided in the contract. The County contract amount of $9,452,569 does not include Memorandum of Understanding (MOU) increases for Fiscal Year 2010-11.
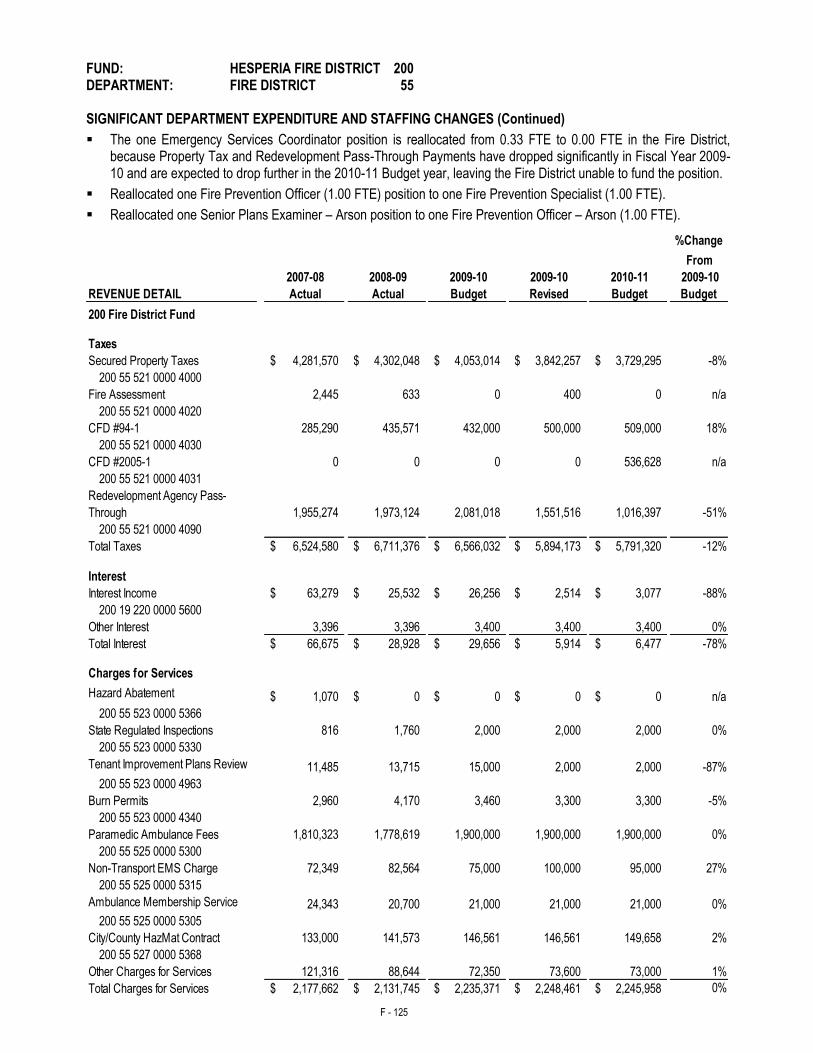
F - 125
FUND: HESPERIA FIRE DISTRICT 200 DEPARTMENT: FIRE DISTRICT 55 SIGNIFICANT DEPARTMENT EXPENDITURE AND STAFFING CHANGES (Continued)
The one Emergency Services Coordinator position is reallocated from 0.33 FTE to 0.00 FTE in the Fire District, because Property Tax and Redevelopment Pass-Through Payments have dropped significantly in Fiscal Year 2009-10 and are expected to drop further in the 2010-11 Budget year, leaving the Fire District unable to fund the position.
Reallocated one Fire Prevention Officer (1.00 FTE) position to one Fire Prevention Specialist (1.00 FTE).
Reallocated one Senior Plans Examiner – Arson position to one Fire Prevention Officer – Arson (1.00 FTE).
%Change
From
2007-08 2008-09 2009-10 2009-10 2010-11 2009-10
REVENUE DETAIL Actual Actual Budget Revised Budget Budget
200 Fire District Fund
Taxes
Secured Property Taxes 4,281,570$ 4,302,048$ 4,053,014$ 3,842,257$ 3,729,295$ -8%
200 55 521 0000 4000
Fire Assessment 2,445 633 0 400 0 n/a
200 55 521 0000 4020
CFD #94-1 285,290 435,571 432,000 500,000 509,000 18%
200 55 521 0000 4030
CFD #2005-1 0 0 0 0 536,628 n/a
200 55 521 0000 4031
Redevelopment Agency Pass-
Through 1,955,274 1,973,124 2,081,018 1,551,516 1,016,397 -51%
200 55 521 0000 4090
Total Taxes 6,524,580$ 6,711,376$ 6,566,032$ 5,894,173$ 5,791,320$ -12%
Interest
Interest Income 63,279$ 25,532$ 26,256$ 2,514$ 3,077$ -88%
200 19 220 0000 5600
Other Interest 3,396 3,396 3,400 3,400 3,400 0%
Total Interest 66,675$ 28,928$ 29,656$ 5,914$ 6,477$ -78%
Charges for Services
Hazard Abatement
Reimbursements1,070$ 0$ 0$ 0$ 0$ n/a
200 55 523 0000 5366
State Regulated Inspections 816 1,760 2,000 2,000 2,000 0%
200 55 523 0000 5330
Tenant Improvement Plans Review 11,485 13,715 15,000 2,000 2,000 -87%
200 55 523 0000 4963
Burn Permits 2,960 4,170 3,460 3,300 3,300 -5%
200 55 523 0000 4340
Paramedic Ambulance Fees 1,810,323 1,778,619 1,900,000 1,900,000 1,900,000 0%
200 55 525 0000 5300
Non-Transport EMS Charge 72,349 82,564 75,000 100,000 95,000 27%
200 55 525 0000 5315
Ambulance Membership Service 24,343 20,700 21,000 21,000 21,000 0%
200 55 525 0000 5305
City/County HazMat Contract 133,000 141,573 146,561 146,561 149,658 2%
200 55 527 0000 5368
Other Charges for Services 121,316 88,644 72,350 73,600 73,000 1%
Total Charges for Services 2,177,662$ 2,131,745$ 2,235,371$ 2,248,461$ 2,245,958$ 0%
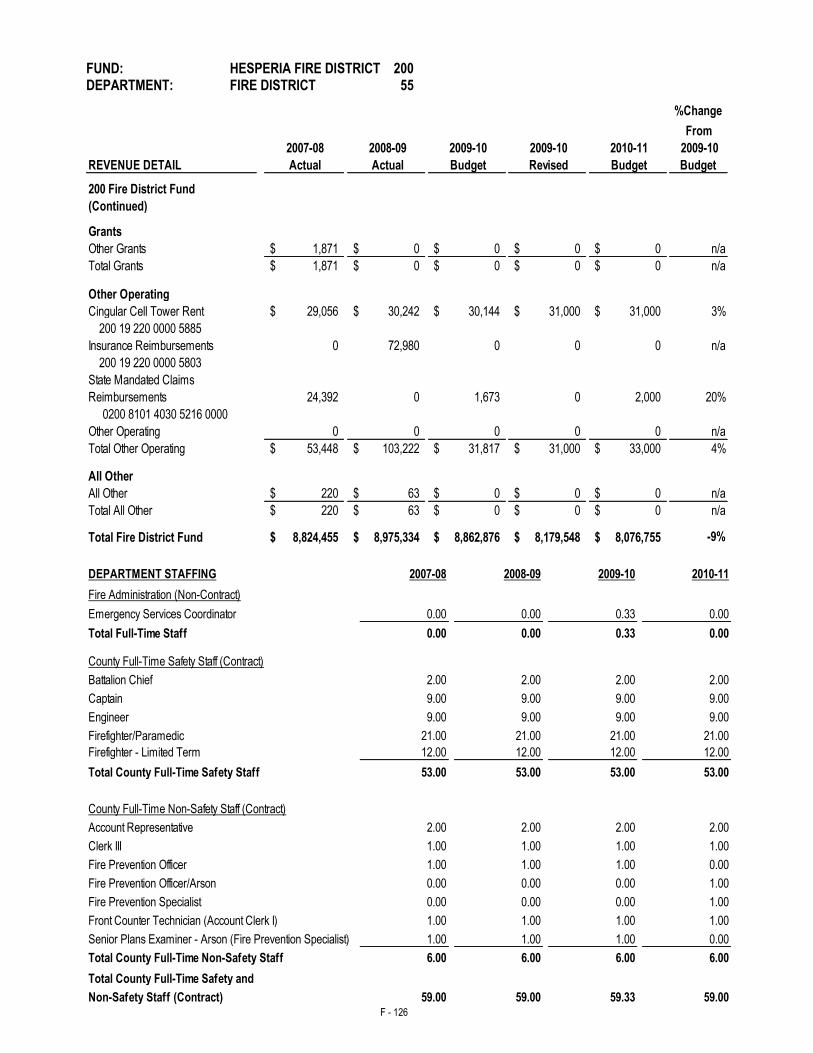
F - 126
FUND: HESPERIA FIRE DISTRICT 200 DEPARTMENT: FIRE DISTRICT 55
%Change
From
2007-08 2008-09 2009-10 2009-10 2010-11 2009-10
REVENUE DETAIL Actual Actual Budget Revised Budget Budget
200 Fire District Fund
(Continued)
Grants
Other Grants 1,871$ 0$ 0$ 0$ 0$ n/a
Total Grants 1,871$ 0$ 0$ 0$ 0$ n/a
Other Operating
Cingular Cell Tower Rent 29,056$ 30,242$ 30,144$ 31,000$ 31,000$ 3%
200 19 220 0000 5885
Insurance Reimbursements 0 72,980 0 0 0 n/a
200 19 220 0000 5803
State Mandated Claims
Reimbursements 24,392 0 1,673 0 2,000 20%
0200 8101 4030 5216 0000
Other Operating 0 0 0 0 0 n/a
Total Other Operating 53,448$ 103,222$ 31,817$ 31,000$ 33,000$ 4%
All Other
All Other 220$ 63$ 0$ 0$ 0$ n/a
Total All Other 220$ 63$ 0$ 0$ 0$ n/a
Total Fire District Fund 8,824,455$ 8,975,334$ 8,862,876$ 8,179,548$ 8,076,755$ -9% DEPARTMENT STAFFING 2007-08 2008-09 2009-10 2010-11
Fire Administration (Non-Contract)
0.00 0.00 0.33 0.00
0.00 0.00 0.33 0.00
County Full-Time Safety Staff (Contract)
2.00 2.00 2.00 2.00
9.00 9.00 9.00 9.00
9.00 9.00 9.00 9.00
21.00 21.00 21.00 21.00
12.00 12.00 12.00 12.00
53.00 53.00 53.00 53.00
County Full-Time Non-Safety Staff (Contract)
2.00 2.00 2.00 2.00
Clerk III 1.00 1.00 1.00 1.00
1.00 1.00 1.00 0.00
0.00 0.00 0.00 1.00
0.00 0.00 0.00 1.00
1.00 1.00 1.00 1.00
1.00 1.00 1.00 0.00
6.00 6.00 6.00 6.00
59.00 59.00 59.33 59.00
Account Representative
Fire Prevention Officer/Arson
Fire Prevention Specialist
Front Counter Technician (Account Clerk I)
Senior Plans Examiner - Arson (Fire Prevention Specialist)
Emergency Services Coordinator
Total Full-Time Staff
Battalion Chief
Firefighter - Limited Term
Firefighter/Paramedic
Engineer
Total County Full-Time Safety Staff
Fire Prevention Officer
Total County Full-Time Safety and
Total County Full-Time Non-Safety Staff
Captain
Non-Safety Staff (Contract)
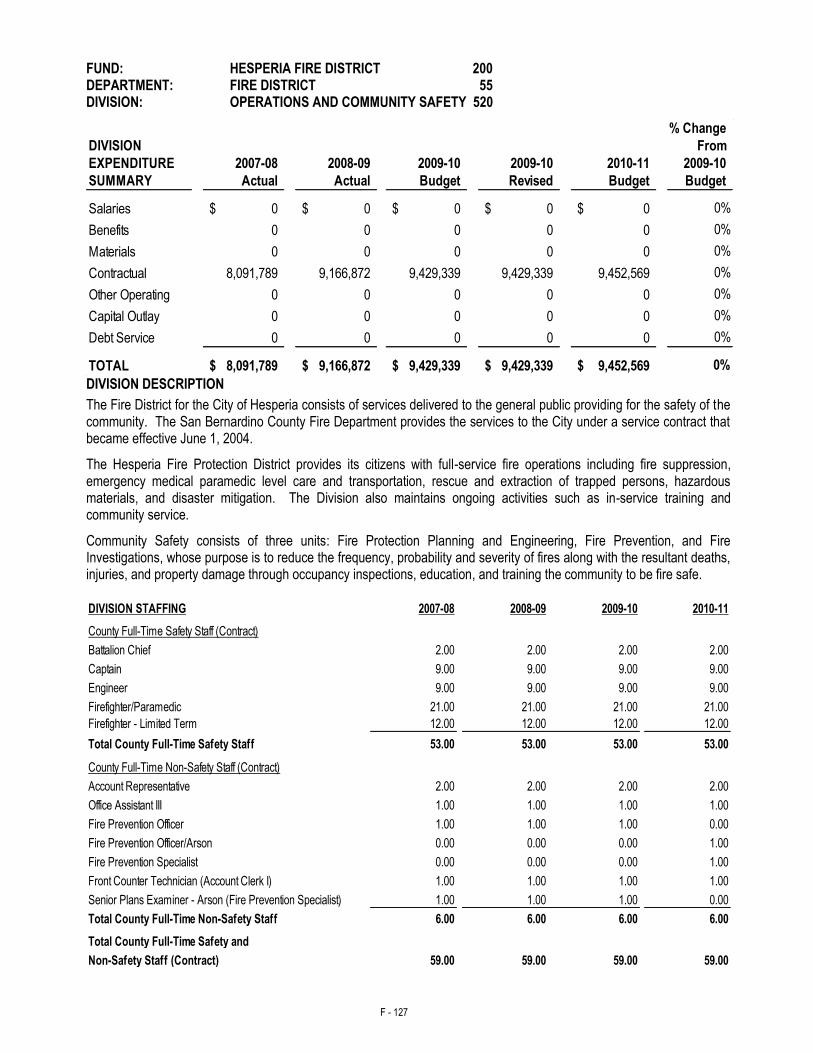
F - 127
FUND: HESPERIA FIRE DISTRICT 200 DEPARTMENT: FIRE DISTRICT 55 DIVISION: OPERATIONS AND COMMUNITY SAFETY 520
% Change
DIVISION From
EXPENDITURE 2007-08 2008-09 2009-10 2009-10 2010-11 2009-10
SUMMARY Actual Actual Budget Revised Budget Budget
Salaries 0$ 0$ 0$ 0$ 0$ 0%
Benefits 0 0 0 0 0 0%
Materials 0 0 0 0 0 0%
Contractual 8,091,789 9,166,872 9,429,339 9,429,339 9,452,569 0%
Other Operating 0 0 0 0 0 0%
Capital Outlay 0 0 0 0 0 0%
Debt Service 0 0 0 0 0 0%
TOTAL 8,091,789$ 9,166,872$ 9,429,339$ 9,429,339$ 9,452,569$ 0% DIVISION DESCRIPTION
The Fire District for the City of Hesperia consists of services delivered to the general public providing for the safety of the community. The San Bernardino County Fire Department provides the services to the City under a service contract that became effective June 1, 2004.
The Hesperia Fire Protection District provides its citizens with full-service fire operations including fire suppression, emergency medical paramedic level care and transportation, rescue and extraction of trapped persons, hazardous materials, and disaster mitigation. The Division also maintains ongoing activities such as in-service training and community service.
Community Safety consists of three units: Fire Protection Planning and Engineering, Fire Prevention, and Fire Investigations, whose purpose is to reduce the frequency, probability and severity of fires along with the resultant deaths, injuries, and property damage through occupancy inspections, education, and training the community to be fire safe. DIVISION STAFFING 2007-08 2008-09 2009-10 2010-11
County Full-Time Safety Staff (Contract)
2.00 2.00 2.00 2.00
9.00 9.00 9.00 9.00
9.00 9.00 9.00 9.00
21.00 21.00 21.00 21.00
12.00 12.00 12.00 12.00
53.00 53.00 53.00 53.00
County Full-Time Non-Safety Staff (Contract)
2.00 2.00 2.00 2.00
Office Assistant III 1.00 1.00 1.00 1.00
1.00 1.00 1.00 0.00
0.00 0.00 0.00 1.00
0.00 0.00 0.00 1.00
Front Counter Technician (Account Clerk I) 1.00 1.00 1.00 1.00
1.00 1.00 1.00 0.00
6.00 6.00 6.00 6.00
59.00 59.00 59.00 59.00
Total County Full-Time Non-Safety Staff
Fire Prevention Officer
Senior Plans Examiner - Arson (Fire Prevention Specialist)
Total County Full-Time Safety and
Non-Safety Staff (Contract)
Fire Prevention Specialist
Fire Prevention Officer/Arson
Total County Full-Time Safety Staff
Account Representative
Battalion Chief
Captain
Firefighter/Paramedic
Firefighter - Limited Term
Engineer
F - 128
FUND: HESPERIA FIRE DISTRICT 200 DEPARTMENT: FIRE DISTRICT 55 DIVISION: OPERATIONS AND COMMUNITY SAFETY 520 SIGNIFICANT DIVISION EXPENDITURE AND STAFFING CHANGES
The County contract for the current level of service has increased from $9,429,339 to $9,452,569 for a $23,230 or 0.25% increase paid to the San Bernardino County Fire Protection District for the continuation of 53.0 FTE safety staff and 6.0 FTE non-safety staff, plus other expenses provided in the contract. The County contract amount of $9,452,569 does not include Memorandum of Understanding (MOU) increases for Fiscal Year 2010-11.
Reallocated one Fire Prevention Officer (1.00 FTE) position to one Fire Prevention Specialist (1.00 FTE).
Reallocated one Senior Plans Examiner – Arson position to one Fire Prevention Officer – Arson (1.00 FTE).
2009-10 DIVISION ACCOMPLISHMENTS
Completed construction of Fire Station 305, a joint project between the City of Hesperia and the San Bernardino County Fire Department.
Continued to provide the current level of service despite the economic difficulties encountered.
Continued to work towards full implementation of the Public Safety Master Plan.
Maintained a positive relationship with City Council, City Senior Staff and all departments within the City of Hesperia.
Maintained a positive relationship with the business community, citizens and other agencies working within the City of Hesperia.
2010-11 DIVISION GOALS AND OBJECTIVES
Have the remodel of Fire Station 304 ready to bid and evaluate the possibility of funding for construction.
Continue to provide current level of staffing during economic difficulties.
Continue to work toward full implementation of the Public Safety Master Plan.
Continue positive working relationship with City Council, Senior Staff and all departments with the City of Hesperia.
Continue positive working relationship with the business community, citizens and other agencies working within the City of Hesperia.
Complete the Insurance Services Office (ISO) review for the City which provides information for establishing the City’s insurance ratings.
F - 129
FUND: HESPERIA FIRE DISTRICT 200 DEPARTMENT: FIRE DISTRICT 55 DIVISION: OPERATIONS AND COMMUNITY SAFETY 520 PERFORMANCE AND WORKLOAD INDICATORS
2007
2008
2009
2010
Fire Prevention
Classes and Talks n/a 0 0 0 Juvenile Fire Setters Counseled 2 26 22 30 Inspections Outside Normal Hours n/a 0 0 0 New Business Inspections 81 119 113 106 Model Rocket Launching Site Inspection n/a 0 0 0 Day Care and Adult Care Facility Inspections 8 43 9 5 State Regulated Inspections-Apartments Under 100 Units n/a n/a 75 51 State Regulated Inspections-Apartments Over 100 Units n/a n/a n/a n/a School Site Inspections n/a n/a n/a n/a School Programs Attendance n/a n/a n/a n/a
Inspections
Assembly (Churches, Assembly Inspections) 65 28 79 80 Auto Wrecking Yards 6 2 7 9 Christmas Tree Lot Inspections/Permits 4 4 5 4 Dust-Producing Inspections/Permits 8 5 7 10 Haunted House Inspections/Permits 0 0 0 0 High-Piles Combustible Storage Inspections 23 10 26 23 Lumber Yard Inspections/Permits 2 5 5 0 Motor Vehicle Fuel Dispensing Station Inspections 31 12 28 15 Tents, Canopies/Temporary Membrane 8 8 3 3 Special Event 10 2 19 15
Permits Assembly (Churches, Assembly Inspections) 65 113 55 53 Auto Wrecking Yards 6 10 9 9 Christmas Tree Lot Inspections/Permits 4 4 5 4 Dust-Producing Inspections/Permits 8 22 15 15 Haunted House Inspections/Permits 0 0 0 0 High-Piles Combustible Storage Inspections 23 22 23 23 Lumber Yard Inspections/Permits 2 4 0 0 Motor Vehicle Fuel Dispensing Station Inspections 31 39 4 4 Tents, Canopies/Temporary Membrane 8 8 3 3 Special Event n/a 2 19 15 Battery Systems n/a n/a 2 2 Compressed Gases n/a n/a 9 9 Dry Cleaning Plants n/a n/a 1 2 Flammable/Combustible Liquids n/a n/a 36 36 Hot Works Operations n/a n/a 81 81 Ovens, Baking, Drying n/a n/a 4 4 Pallet Yards n/a n/a 5 5 Repair Garages n/a n/a 111 111 Spraying/Dipping n/a n/a 27 27 Tire Storage n/a n/a 13 13 ESS Spray Booth/Hood & Duct Systems n/a n/a 71 71 Refrigeration Equipment n/a n/a 2 2
*Calendar year, not fiscal year
F - 130
FUND: HESPERIA FIRE DISTRICT 200 DEPARTMENT: FIRE DISTRICT 55 DIVISION: OPERATIONS AND COMMUNITY SAFETY 520
PERFORMANCE AND WORKLOAD INDICATORS (Continued)
2007
2008
2009
2010
Fire Plan Review
Modification of Sprinklers 17 28 15 17 Parcel Map n/a 34 29 10 Plan Review Alarm System 43 39 24 18 Plan Review Spray Booth 2 13 15 15 Plan Review Sprinkler System 23 21 14 9 Site Plan Review 360 111 72 16 Structural Plans Review/Inspection 61 55 27 7 Tenant Improvement Plans Inspection 44 72 52 38
Vegetation Management
Burn Permits 275 346 361 518 Public Service Station Tours/Public Education 85 90 94 94 Total 360 436 455 612
Emergency Responses:
Advanced Life Support (ALS) 5,259 5,835 6,068 6,068 Basic Life Support (BLS) n/a n/a n/a n/a Bomb Threats 1 2 2 2 Fire Alarm Systems 95 105 109 109 Fires-Grass 129 58 65 65 Fires-Miscellaneous 15 11 12 12 Fires-Refuse 45 12 13 13 Fires-Structure 60 51 54 54 Fires-Truck 12 12 13 13 Fires-Vehicle 63 41 43 43 Hazardous Conditions 15 18 20 20 Hazardous Materials 13 12 19 19 Investigations 468 509 530 530 Mass Casualty Incidents 2 2 2 2 Mutual Aids 1,930 1,855 1,929 1,929 Public Service 485 525 546 546 Rescues 2 2 2 2 Strike Team n/a n/a n/a n/a Traffic Collisions 890 725 754 754 Traffic Extrications 37 55 57 57 Total 9,521 9,830 10,238 10,238
Household Collection Center
Number of Participants 3,689 3,468 2,355 2,770 Used Oil Collection 11,880 66,492 32,499 38,226 E-waste Only (Pounds-includes CRTs + Misc. Elec.) 110,277 71,031 59,180 69,597 Waste Materials Collected (Pounds-includes oil and E-wastes) 353,065 267,032 176,625 207,750
Hazardous Materials
Underground Tank Operation Inspections 71 15 45 48 Hazardous Materials Inspections 101 43 110 105 Certified Unified Program Agency (CUPA) Inspections 162 65 147 149
*Calendar year, not fiscal year
F - 131
FUND: HESPERIA FIRE DISTRICT 200 DEPARTMENT: FIRE DISTRICT 55 DIVISION: ADMINISTRATION 521
% Change
DIVISION From
EXPENDITURE 2007-08 2008-09 2009-10 2009-10 2010-11 2009-10
SUMMARY Actual Actual Budget Revised Budget Budget
Salaries 0$ 0$ 26,385$ 25,335$ 0$ -100%
Benefits 171,362 15,388 46,734 29,515 16,463 -65%
Materials 6,340 5,070 5,000 6,300 7,900 58%
Contractual 159,013 179,507 205,861 205,361 208,958 2%
Other Operating 16,891 0 5,000 2,500 5,000 0%
Capital Outlay 1,478,846 44,108 0 0 0 0%
Debt Service 0 0 0 0 0 0%
TOTAL 1,832,452$ 244,073$ 288,980$ 269,011$ 238,321$ -18%
DIVISION DESCRIPTION
Starting in the 2004-05 Budget, this program will reflect Fire District initiatives and expenditures that are non-County contract expenditures.
DIVISION STAFFING 2007-08 2008-09 2009-10 2010-11
Full-Time Staff
0.00 0.00 0.33 0.00
0.00 0.00 0.33 0.00
Emergency Services Coordinator
Total Full-Time Staff
SIGNIFICANT DIVISION EXPENDITURE AND STAFFING CHANGES
The one Emergency Services Coordinator position is reallocated from 0.33 FTE to 0.00 FTE in the Fire District, because Property Tax and Redevelopment Pass-Through Payments have dropped significantly in Fiscal Year 2009-10 and are expected to drop further in the 2010-11 Budget year, leaving the Fire District unable to fund the position.
2009-10 DIVISION ACCOMPLISHMENTS
Managed the County of San Bernardino Fire services contract issues and expenditures.
Monitored Fire District revenues.
Managed the Fire District expenditures for non-contract costs and issues related to old workers’ compensation claims and CalPERS.
Adopted the Fire Prevention fee schedule of the San Bernardino County Fire Department.
2010-11 DIVISION GOALS AND OBJECTIVES
Manage County of San Bernardino Fire services contract issues and expenditures.
Monitor the Fire District revenues.
Managed the Fire District expenditures and non-contract costs and issues related to old workers’ compensation claims and CalPERS.
CAPITAL IMPROVEMENT
PROGRAM
(C I P)
Overview and Summary
C I P Expenditures by Project
C I P Expenditures By Fund and Project
C I P Project Listing
C I P Project Descriptions

G - 2
THIS PAGE INTENTIONALLY LEFT BLANK
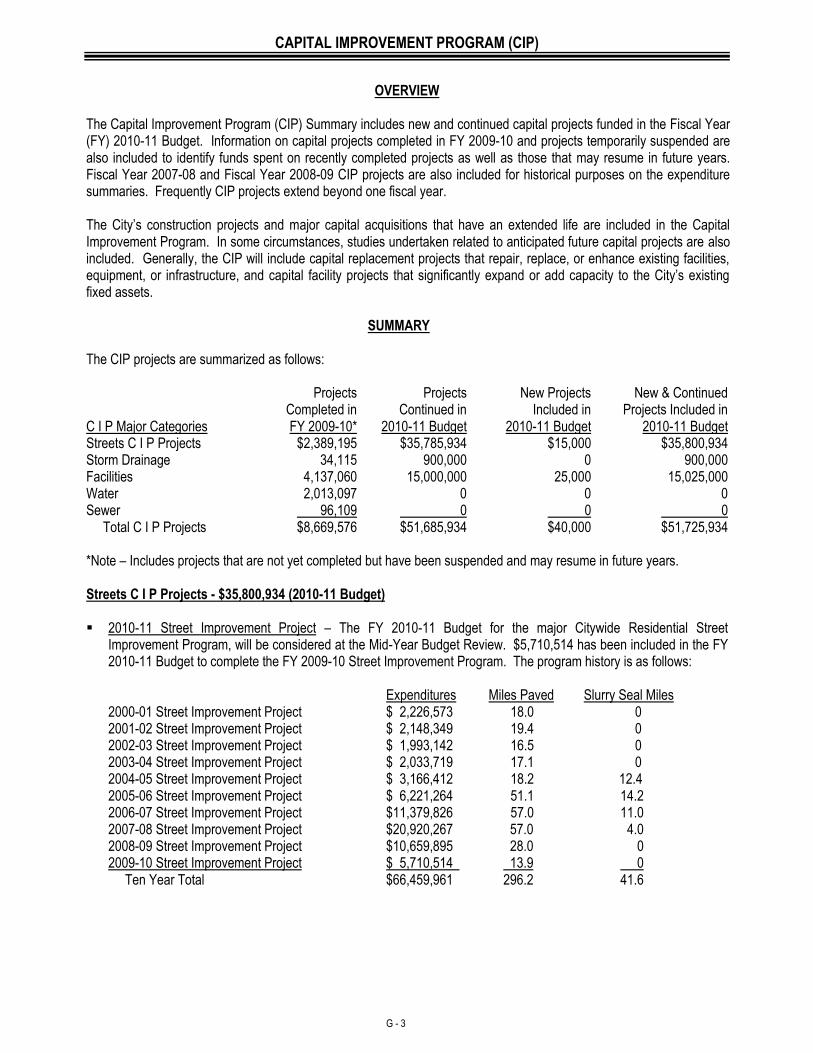
CAPITAL IMPROVEMENT PROGRAM (CIP)
G - 3
OVERVIEW
The Capital Improvement Program (CIP) Summary includes new and continued capital projects funded in the Fiscal Year (FY) 2010-11 Budget. Information on capital projects completed in FY 2009-10 and projects temporarily suspended are also included to identify funds spent on recently completed projects as well as those that may resume in future years. Fiscal Year 2007-08 and Fiscal Year 2008-09 CIP projects are also included for historical purposes on the expenditure summaries. Frequently CIP projects extend beyond one fiscal year. The City’s construction projects and major capital acquisitions that have an extended life are included in the Capital Improvement Program. In some circumstances, studies undertaken related to anticipated future capital projects are also included. Generally, the CIP will include capital replacement projects that repair, replace, or enhance existing facilities, equipment, or infrastructure, and capital facility projects that significantly expand or add capacity to the City’s existing fixed assets.
SUMMARY The CIP projects are summarized as follows: C I P Major Categories
Projects Completed in FY 2009-10*
Projects Continued in
2010-11 Budget
New Projects Included in
2010-11 Budget
New & Continued Projects Included in
2010-11 Budget Streets C I P Projects $2,389,195 $35,785,934 $15,000 $35,800,934 Storm Drainage 34,115 900,000 0 900,000 Facilities 4,137,060 15,000,000 25,000 15,025,000 Water 2,013,097 0 0 0 Sewer 96,109 0 0 0 Total C I P Projects $8,669,576 $51,685,934 $40,000 $51,725,934 *Note – Includes projects that are not yet completed but have been suspended and may resume in future years. Streets C I P Projects - $35,800,934 (2010-11 Budget) 2010-11 Street Improvement Project – The FY 2010-11 Budget for the major Citywide Residential Street
Improvement Program, will be considered at the Mid-Year Budget Review. $5,710,514 has been included in the FY 2010-11 Budget to complete the FY 2009-10 Street Improvement Program. The program history is as follows:
Expenditures Miles Paved Slurry Seal Miles 2000-01 Street Improvement Project $ 2,226,573 18.0 0 2001-02 Street Improvement Project $ 2,148,349 19.4 0 2002-03 Street Improvement Project $ 1,993,142 16.5 0 2003-04 Street Improvement Project $ 2,033,719 17.1 0 2004-05 Street Improvement Project $ 3,166,412 18.2 12.4 2005-06 Street Improvement Project $ 6,221,264 51.1 14.2 2006-07 Street Improvement Project $11,379,826 57.0 11.0 2007-08 Street Improvement Project $20,920,267 57.0 4.0 2008-09 Street Improvement Project $10,659,895 28.0 0 2009-10 Street Improvement Project $ 5,710,514 13.9 0 Ten Year Total $66,459,961 296.2 41.6
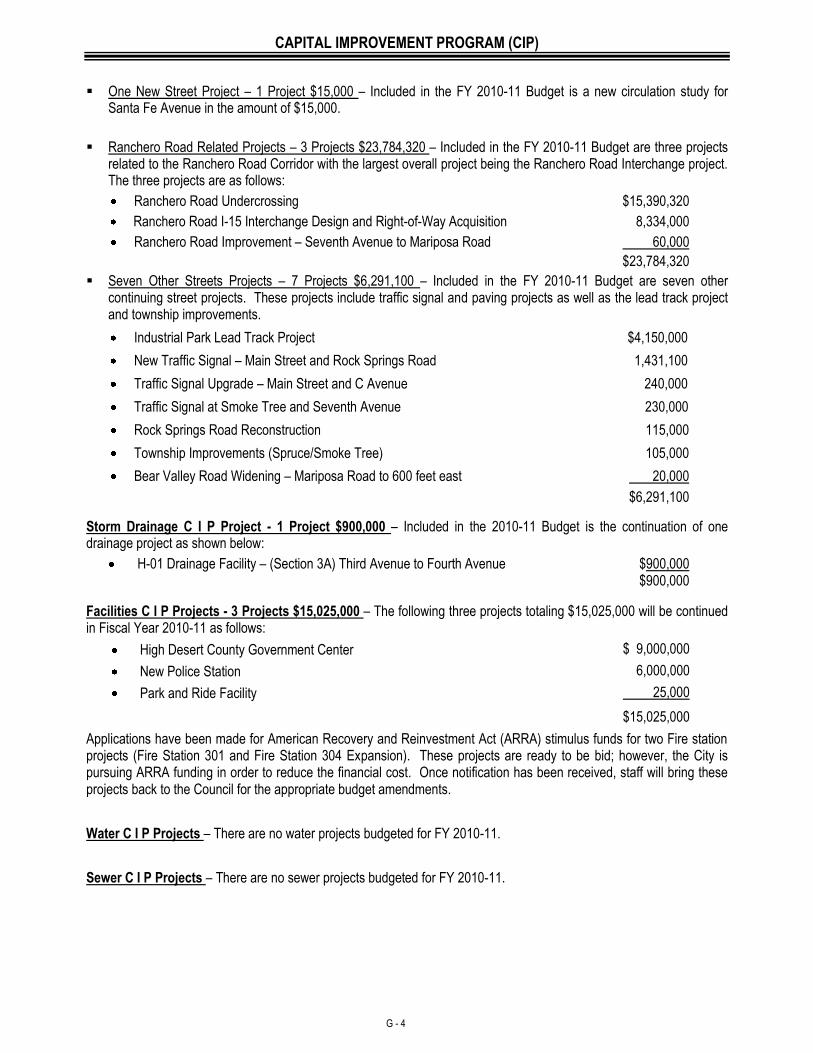
CAPITAL IMPROVEMENT PROGRAM (CIP)
G - 4
One New Street Project – 1 Project $15,000 – Included in the FY 2010-11 Budget is a new circulation study for Santa Fe Avenue in the amount of $15,000.
Ranchero Road Related Projects – 3 Projects $23,784,320 – Included in the FY 2010-11 Budget are three projects related to the Ranchero Road Corridor with the largest overall project being the Ranchero Road Interchange project. The three projects are as follows:
Ranchero Road Undercrossing $15,390,320
Ranchero Road I-15 Interchange Design and Right-of-Way Acquisition 8,334,000
Ranchero Road Improvement – Seventh Avenue to Mariposa Road 60,000
$23,784,320
Seven Other Streets Projects – 7 Projects $6,291,100 – Included in the FY 2010-11 Budget are seven other continuing street projects. These projects include traffic signal and paving projects as well as the lead track project and township improvements.
Industrial Park Lead Track Project $4,150,000
New Traffic Signal – Main Street and Rock Springs Road 1,431,100
Traffic Signal Upgrade – Main Street and C Avenue 240,000
Traffic Signal at Smoke Tree and Seventh Avenue 230,000
Rock Springs Road Reconstruction 115,000
Township Improvements (Spruce/Smoke Tree) 105,000
Bear Valley Road Widening – Mariposa Road to 600 feet east 20,000
$6,291,100
Storm Drainage C I P Project - 1 Project $900,000 – Included in the 2010-11 Budget is the continuation of one drainage project as shown below:
H-01 Drainage Facility – (Section 3A) Third Avenue to Fourth Avenue $900,000 $900,000
Facilities C I P Projects - 3 Projects $15,025,000 – The following three projects totaling $15,025,000 will be continued in Fiscal Year 2010-11 as follows:
High Desert County Government Center $ 9,000,000
New Police Station 6,000,000
Park and Ride Facility 25,000
$15,025,000
Applications have been made for American Recovery and Reinvestment Act (ARRA) stimulus funds for two Fire station projects (Fire Station 301 and Fire Station 304 Expansion). These projects are ready to be bid; however, the City is pursuing ARRA funding in order to reduce the financial cost. Once notification has been received, staff will bring these projects back to the Council for the appropriate budget amendments.
Water C I P Projects – There are no water projects budgeted for FY 2010-11.
Sewer C I P Projects – There are no sewer projects budgeted for FY 2010-11.
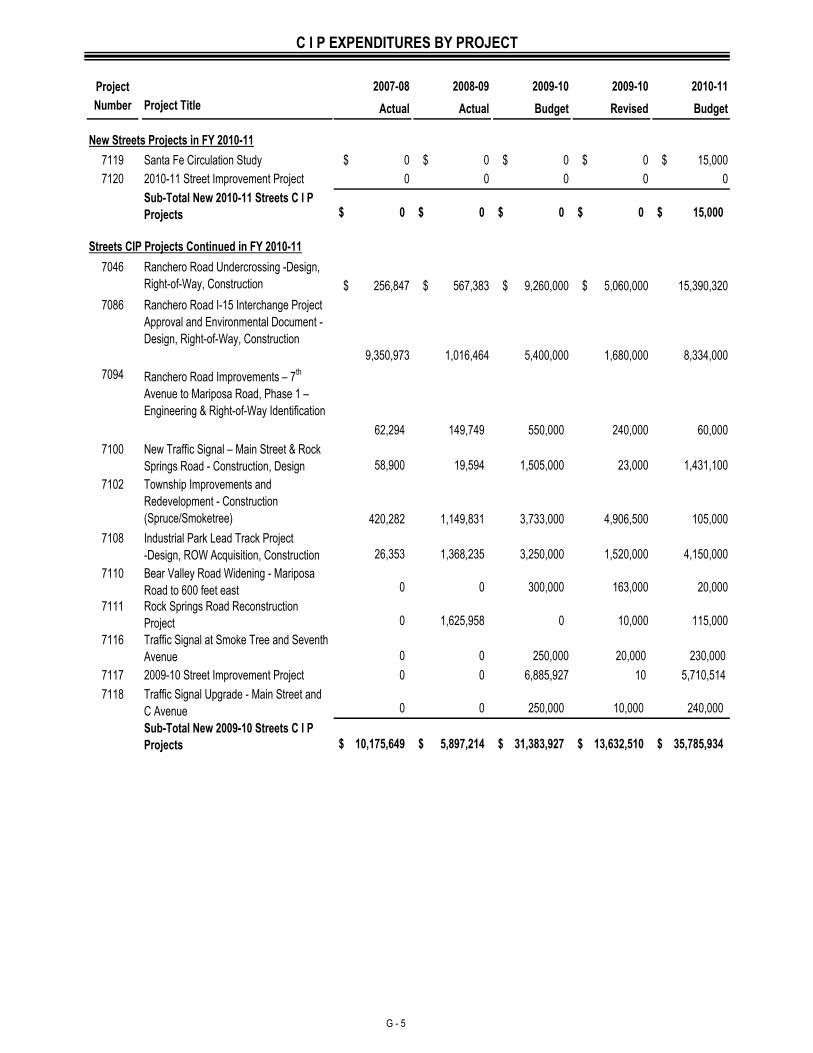
C I P EXPENDITURES BY PROJECT
G - 5
Project 2007-08 2008-09 2009-10 2009-10 2010-11
Number Project Title Actual Actual Budget Revised Budget
7119 Santa Fe Circulation Study $ 0 $ 0 $ 0 $ 0 $ 15,000
7120 2010-11 Street Improvement Project 0 0 0 0 0
Sub-Total New 2010-11 Streets C I P
Projects $ 0 $ 0 $ 0 $ 0 $ 15,000
7046 Ranchero Road Undercrossing -Design,
Right-of-Way, Construction $ 256,847 $ 567,383 $ 9,260,000 $ 5,060,000 15,390,320
7086 Ranchero Road I-15 Interchange Project
Approval and Environmental Document -
Design, Right-of-Way, Construction
9,350,973 1,016,464 5,400,000 1,680,000 8,334,000
7094 Ranchero Road Improvements – 7th
Avenue to Mariposa Road, Phase 1 –
Engineering & Right-of-Way Identification
62,294 149,749 550,000 240,000 60,000
7100 New Traffic Signal – Main Street & Rock
Springs Road - Construction, Design 58,900 19,594 1,505,000 23,000 1,431,100
7102 Township Improvements and
Redevelopment - Construction
(Spruce/Smoketree) 420,282 1,149,831 3,733,000 4,906,500 105,000
7108 Industrial Park Lead Track Project
-Design, ROW Acquisition, Construction 26,353 1,368,235 3,250,000 1,520,000 4,150,000
7110 Bear Valley Road Widening - Mariposa
Road to 600 feet east 0 0 300,000 163,000 20,000
7111 Rock Springs Road Reconstruction
Project 0 1,625,958 0 10,000 115,000
7116 Traffic Signal at Smoke Tree and Seventh
Avenue 0 0 250,000 20,000 230,000
7117 2009-10 Street Improvement Project 0 0 6,885,927 10 5,710,514
7118 Traffic Signal Upgrade - Main Street and
C Avenue 0 0 250,000 10,000 240,000
Sub-Total New 2009-10 Streets C I P
Projects $ 10,175,649 $ 5,897,214 $ 31,383,927 $ 13,632,510 $ 35,785,934
Streets CIP Projects Continued in FY 2010-11
New Streets Projects in FY 2010-11
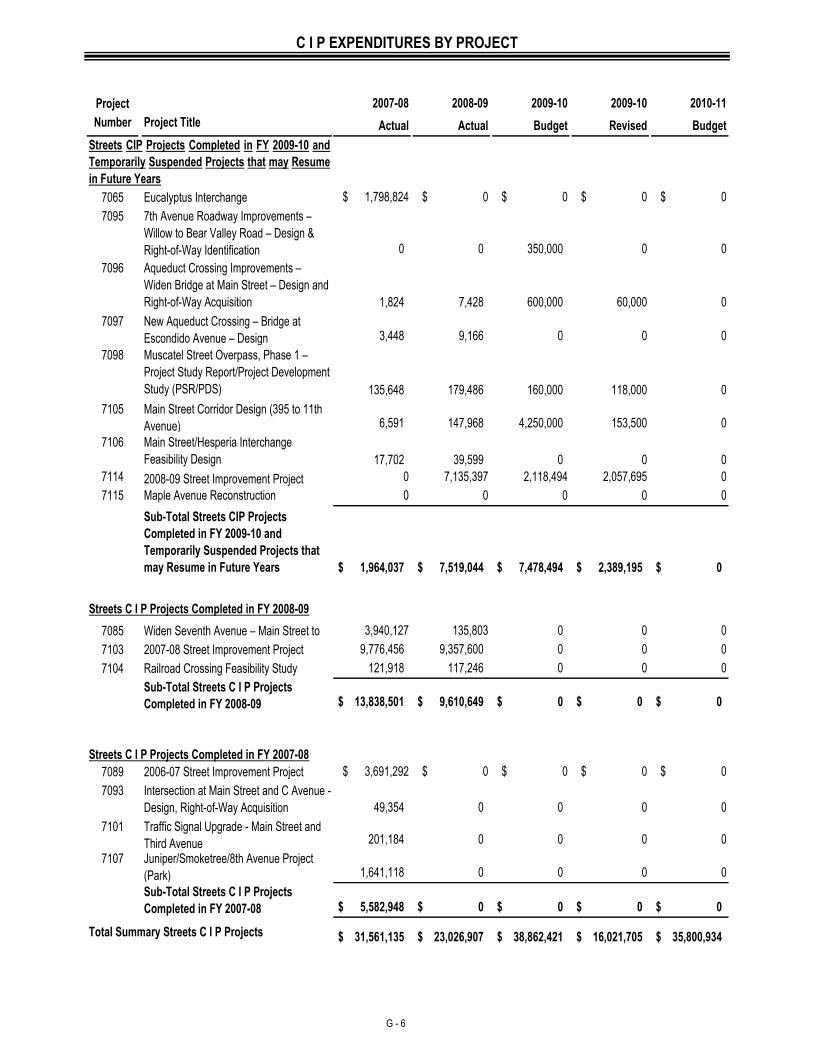
C I P EXPENDITURES BY PROJECT
G - 6
Project 2007-08 2008-09 2009-10 2009-10 2010-11
Number Project Title Actual Actual Budget Revised Budget
7065 Eucalyptus Interchange $ 1,798,824 $ 0 $ 0 $ 0 $ 0
7095 7th Avenue Roadway Improvements –
Willow to Bear Valley Road – Design &
Right-of-Way Identification 0 0 350,000 0 0
7096 Aqueduct Crossing Improvements –
Widen Bridge at Main Street – Design and
Right-of-Way Acquisition 1,824 7,428 600,000 60,000 0
7097 New Aqueduct Crossing – Bridge at
Escondido Avenue – Design 3,448 9,166 0 0 0
7098 Muscatel Street Overpass, Phase 1 –
Project Study Report/Project Development
Study (PSR/PDS) 135,648 179,486 160,000 118,000 0
7105 Main Street Corridor Design (395 to 11th
Avenue) 6,591 147,968 4,250,000 153,500 0
7106 Main Street/Hesperia Interchange
Feasibility Design 17,702 39,599 0 0 0
7114 2008-09 Street Improvement Project 0 7,135,397 2,118,494 2,057,695 0
7115 Maple Avenue Reconstruction 0 0 0 0 0
Sub-Total Streets CIP Projects
Completed in FY 2009-10 and
Temporarily Suspended Projects that
may Resume in Future Years $ 1,964,037 $ 7,519,044 $ 7,478,494 $ 2,389,195 $ 0
7085 Widen Seventh Avenue – Main Street to
Willow Street
3,940,127 135,803 0 0 0
7103 2007-08 Street Improvement Project 9,776,456 9,357,600 0 0 0
7104 Railroad Crossing Feasibility Study
Eucalyptus/Lemon/Mojave
121,918 117,246 0 0 0
Sub-Total Streets C I P Projects
Completed in FY 2008-09 $ 13,838,501 $ 9,610,649 $ 0 $ 0 $ 0
7089 2006-07 Street Improvement Project $ 3,691,292 $ 0 $ 0 $ 0 $ 0
7093 Intersection at Main Street and C Avenue -
Design, Right-of-Way Acquisition 49,354 0 0 0 0
7101 Traffic Signal Upgrade - Main Street and
Third Avenue 201,184 0 0 0 0
7107 Juniper/Smoketree/8th Avenue Project
(Park) 1,641,118 0 0 0 0
Sub-Total Streets C I P Projects
Completed in FY 2007-08 $ 5,582,948 $ 0 $ 0 $ 0 $ 0
$ 31,561,135 $ 23,026,907 $ 38,862,421 $ 16,021,705 $ 35,800,934 Total Summary Streets C I P Projects
Streets CIP Projects Completed in FY 2009-10 and
Temporarily Suspended Projects that may Resume
in Future Years
Streets C I P Projects Completed in FY 2007-08
Streets C I P Projects Completed in FY 2008-09
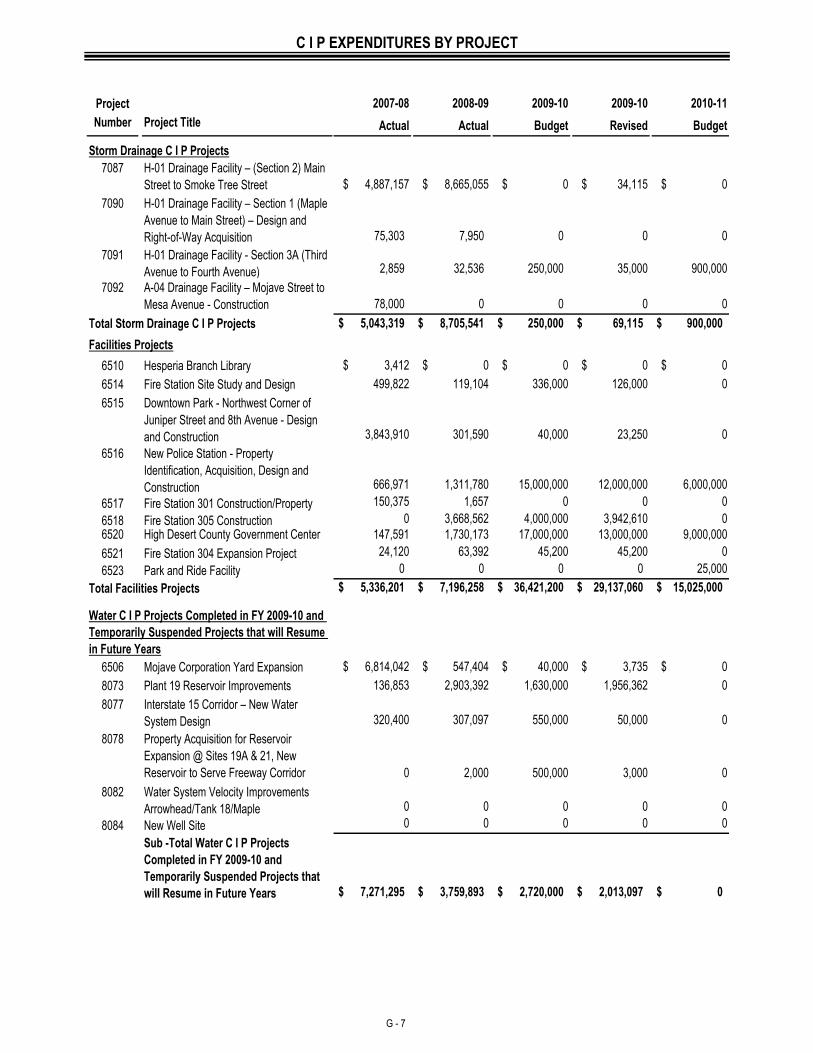
C I P EXPENDITURES BY PROJECT
G - 7
Project 2007-08 2008-09 2009-10 2009-10 2010-11
Number Project Title Actual Actual Budget Revised Budget
7087 H-01 Drainage Facility – (Section 2) Main
Street to Smoke Tree Street $ 4,887,157 $ 8,665,055 $ 0 $ 34,115 $ 0
7090 H-01 Drainage Facility – Section 1 (Maple
Avenue to Main Street) – Design and
Right-of-Way Acquisition 75,303 7,950 0 0 0
7091 H-01 Drainage Facility - Section 3A (Third
Avenue to Fourth Avenue) 2,859 32,536 250,000 35,000 900,000
7092 A-04 Drainage Facility – Mojave Street to
Mesa Avenue - Construction 78,000 0 0 0 0
$ 5,043,319 $ 8,705,541 $ 250,000 $ 69,115 $ 900,000
6510 Hesperia Branch Library $ 3,412 $ 0 $ 0 $ 0 $ 0
6514 Fire Station Site Study and Design 499,822 119,104 336,000 126,000 0
6515 Downtown Park - Northwest Corner of
Juniper Street and 8th Avenue - Design
and Construction 3,843,910 301,590 40,000 23,250 0
6516 New Police Station - Property
Identification, Acquisition, Design and
Construction 666,971 1,311,780 15,000,000 12,000,000 6,000,000
6517 Fire Station 301 Construction/Property 150,375 1,657 0 0 0
6518 Fire Station 305 Construction 0 3,668,562 4,000,000 3,942,610 0
6520 High Desert County Government Center 147,591 1,730,173 17,000,000 13,000,000 9,000,000
6521 Fire Station 304 Expansion Project 24,120 63,392 45,200 45,200 0
6523 Park and Ride Facility 0 0 0 0 25,000
$ 5,336,201 $ 7,196,258 $ 36,421,200 $ 29,137,060 $ 15,025,000
6506 Mojave Corporation Yard Expansion $ 6,814,042 $ 547,404 $ 40,000 $ 3,735 $ 0
8073 Plant 19 Reservoir Improvements
Design, Tank Construction (2 Tanks)
136,853 2,903,392 1,630,000 1,956,362 0
8077 Interstate 15 Corridor – New Water
System Design 320,400 307,097 550,000 50,000 0
8078 Property Acquisition for Reservoir
Expansion @ Sites 19A & 21, New
Reservoir to Serve Freeway Corridor 0 2,000 500,000 3,000 0
8082 Water System Velocity Improvements
Arrowhead/Tank 18/Maple 0 0 0 0 0
8084 New Well Site 0 0 0 0 0
Sub -Total Water C I P Projects
Completed in FY 2009-10 and
Temporarily Suspended Projects that
will Resume in Future Years $ 7,271,295 $ 3,759,893 $ 2,720,000 $ 2,013,097 $ 0
Water C I P Projects Completed in FY 2009-10 and
Temporarily Suspended Projects that will Resume
in Future Years
Storm Drainage C I P Projects
Total Storm Drainage C I P Projects
Facilities Projects
Total Facilities Projects
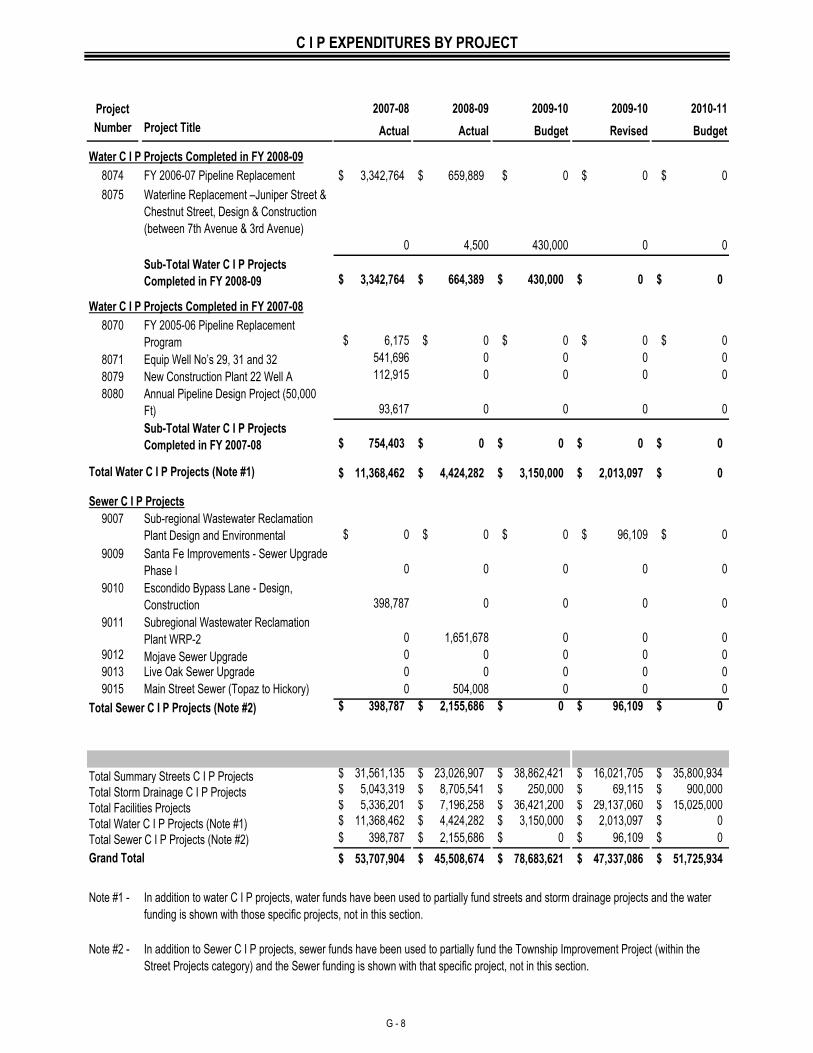
C I P EXPENDITURES BY PROJECT
G - 8
Project 2007-08 2008-09 2009-10 2009-10 2010-11
Number Project Title Actual Actual Budget Revised Budget
8074 FY 2006-07 Pipeline Replacement $ 3,342,764 $ 659,889 $ 0 $ 0 $ 0
8075 Waterline Replacement –Juniper Street &
Chestnut Street, Design & Construction
(between 7th Avenue & 3rd Avenue)
0 4,500 430,000 0 0
Sub-Total Water C I P Projects
Completed in FY 2008-09 $ 3,342,764 $ 664,389 $ 430,000 $ 0 $ 0
8070 FY 2005-06 Pipeline Replacement
Program $ 6,175 $ 0 $ 0 $ 0 $ 0
8071 Equip Well No’s 29, 31 and 32 541,696 0 0 0 0
8079 New Construction Plant 22 Well A 112,915 0 0 0 0
8080 Annual Pipeline Design Project (50,000
Ft) 93,617 0 0 0 0
Sub-Total Water C I P Projects
Completed in FY 2007-08 $ 754,403 $ 0 $ 0 $ 0 $ 0
$ 11,368,462 $ 4,424,282 $ 3,150,000 $ 2,013,097 $ 0
9007 Sub-regional Wastewater Reclamation
Plant Design and Environmental $ 0 $ 0 $ 0 $ 96,109 $ 0
9009 Santa Fe Improvements - Sewer Upgrade
Phase I 0 0 0 0 0
9010 Escondido Bypass Lane - Design,
Construction 398,787 0 0 0 0
9011 Subregional Wastewater Reclamation
Plant WRP-2 0 1,651,678 0 0 0
9012 Mojave Sewer Upgrade 0 0 0 0 0
9013 Live Oak Sewer Upgrade 0 0 0 0 0
9015 Main Street Sewer (Topaz to Hickory) 0 504,008 0 0 0
$ 398,787 $ 2,155,686 $ 0 $ 96,109 $ 0
$ 31,561,135 $ 23,026,907 $ 38,862,421 $ 16,021,705 $ 35,800,934
$ 5,043,319 $ 8,705,541 $ 250,000 $ 69,115 $ 900,000
$ 5,336,201 $ 7,196,258 $ 36,421,200 $ 29,137,060 $ 15,025,000
$ 11,368,462 $ 4,424,282 $ 3,150,000 $ 2,013,097 $ 0
$ 398,787 $ 2,155,686 $ 0 $ 96,109 $ 0
$ 53,707,904 $ 45,508,674 $ 78,683,621 $ 47,337,086 $ 51,725,934
Note #1 -
Note #2 -
Total Water C I P Projects (Note #1)
Total Sewer C I P Projects (Note #2)
Grand Total
In addition to water C I P projects, water funds have been used to partially fund streets and storm drainage projects and the water
funding is shown with those specific projects, not in this section.
In addition to Sewer C I P projects, sewer funds have been used to partially fund the Township Improvement Project (within the
Street Projects category) and the Sewer funding is shown with that specific project, not in this section.
Sewer C I P Projects
Total Sewer C I P Projects (Note #2)
Total Summary Streets C I P Projects
Total Storm Drainage C I P Projects
Total Facilities Projects
Water C I P Projects Completed in FY 2007-08
Total Water C I P Projects (Note #1)
Water C I P Projects Completed in FY 2008-09
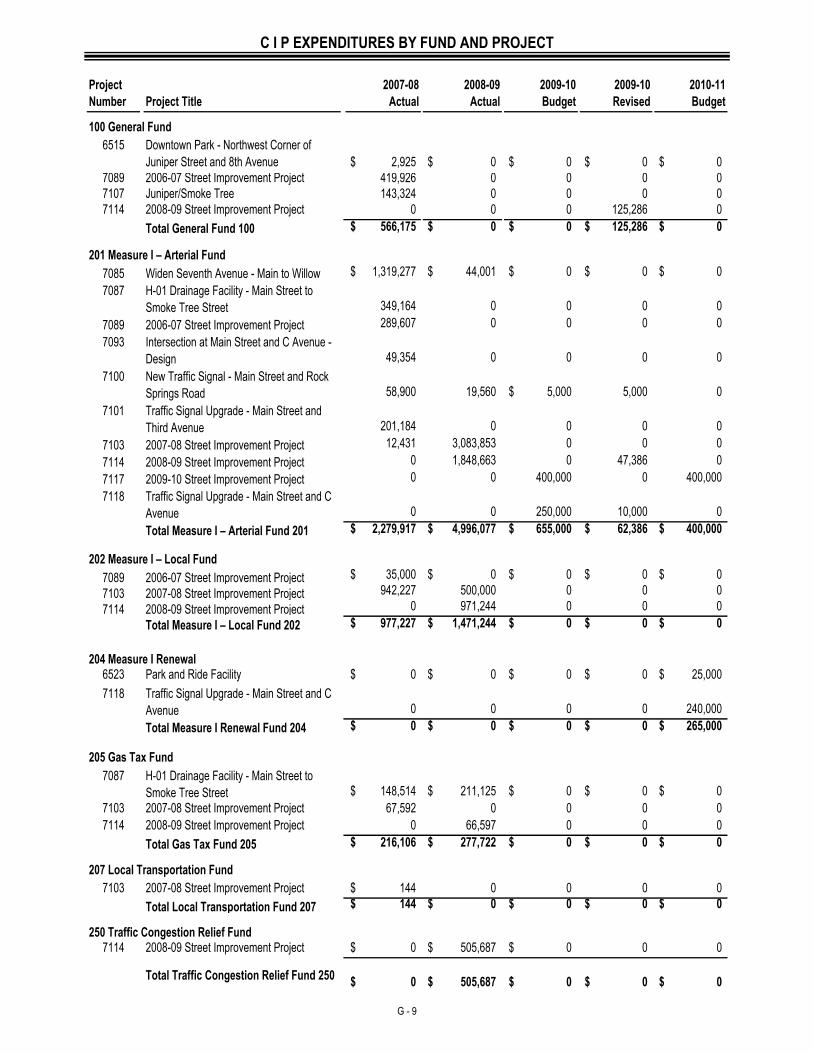
C I P EXPENDITURES BY FUND AND PROJECT
G - 9
Project 2007-08 2008-09 2009-10 2009-10 2010-11
Number Project Title Actual Actual Budget Revised Budget
6515 Downtown Park - Northwest Corner of
Juniper Street and 8th Avenue $ 2,925 $ 0 $ 0 $ 0 $ 0
7089 2006-07 Street Improvement Project 419,926 0 0 0 0
7107 Juniper/Smoke Tree 143,324 0 0 0 0
7114 2008-09 Street Improvement Project 0 0 0 125,286 0
Total General Fund 100 $ 566,175 $ 0 $ 0 $ 125,286 $ 0
7085 Widen Seventh Avenue - Main to Willow $ 1,319,277 $ 44,001 $ 0 $ 0 $ 0
7087 H-01 Drainage Facility - Main Street to
Smoke Tree Street 349,164 0 0 0 0
7089 2006-07 Street Improvement Project 289,607 0 0 0 0
7093 Intersection at Main Street and C Avenue -
Design 49,354 0 0 0 0
7100 New Traffic Signal - Main Street and Rock
Springs Road 58,900 19,560 $ 5,000 5,000 0
7101 Traffic Signal Upgrade - Main Street and
Third Avenue 201,184 0 0 0 0
7103 2007-08 Street Improvement Project 12,431 3,083,853 0 0 0
7114 2008-09 Street Improvement Project 0 1,848,663 0 47,386 0
7117 2009-10 Street Improvement Project 0 0 400,000 0 400,000
7118 Traffic Signal Upgrade - Main Street and C
Avenue 0 0 250,000 10,000 0
Total Measure I – Arterial Fund 201 $ 2,279,917 $ 4,996,077 $ 655,000 $ 62,386 $ 400,000
7089 2006-07 Street Improvement Project $ 35,000 $ 0 $ 0 $ 0 $ 0
7103 2007-08 Street Improvement Project 942,227 500,000 0 0 0
7114 2008-09 Street Improvement Project 0 971,244 0 0 0
Total Measure I – Local Fund 202 $ 977,227 $ 1,471,244 $ 0 $ 0 $ 0
6523 Park and Ride Facility $ 0 $ 0 $ 0 $ 0 $ 25,000
7118 Traffic Signal Upgrade - Main Street and C
Avenue 0 0 0 0 240,000
Total Measure I Renewal Fund 204 $ 0 $ 0 $ 0 $ 0 $ 265,000
7087 H-01 Drainage Facility - Main Street to
Smoke Tree Street $ 148,514 $ 211,125 $ 0 $ 0 $ 0
7103 2007-08 Street Improvement Project 67,592 0 0 0 0
7114 2008-09 Street Improvement Project 0 66,597 0 0 0
Total Gas Tax Fund 205 $ 216,106 $ 277,722 $ 0 $ 0 $ 0
7103 2007-08 Street Improvement Project $ 144 0 0 0 0
Total Local Transportation Fund 207 $ 144 $ 0 $ 0 $ 0 $ 0
7114 2008-09 Street Improvement Project $ 0 $ 505,687 $ 0 0 0
Total Traffic Congestion Relief Fund 250 $ 0 $ 505,687 $ 0 $ 0 $ 0
100 General Fund
201 Measure I – Arterial Fund
202 Measure I – Local Fund
205 Gas Tax Fund
207 Local Transportation Fund
204 Measure I Renewal
250 Traffic Congestion Relief Fund
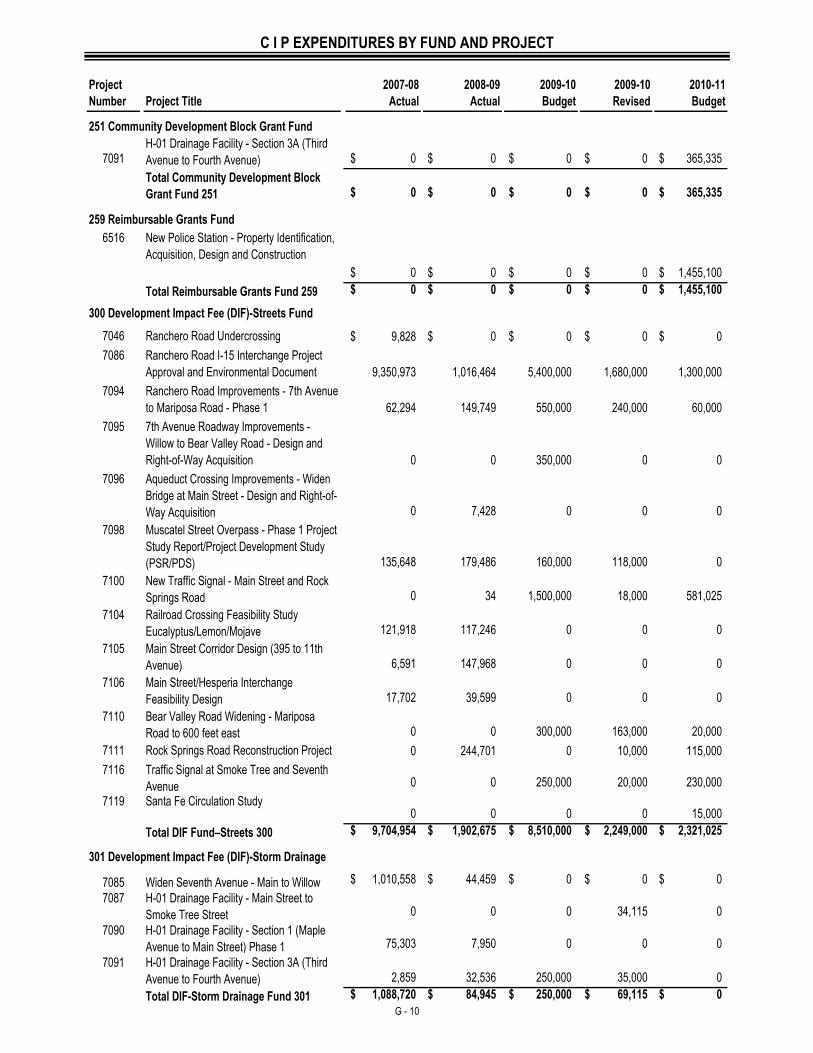
C I P EXPENDITURES BY FUND AND PROJECT
G - 10
Project 2007-08 2008-09 2009-10 2009-10 2010-11
Number Project Title Actual Actual Budget Revised Budget
7091H-01 Drainage Facility - Section 3A (Third
Avenue to Fourth Avenue) $ 0 $ 0 $ 0 $ 0 $ 365,335
Total Community Development Block
Grant Fund 251 $ 0 $ 0 $ 0 $ 0 $ 365,335
6516 New Police Station - Property Identification,
Acquisition, Design and Construction
$ 0 $ 0 $ 0 $ 0 $ 1,455,100
Total Reimbursable Grants Fund 259 $ 0 $ 0 $ 0 $ 0 $ 1,455,100
7046 Ranchero Road Undercrossing $ 9,828 $ 0 $ 0 $ 0 $ 0
7086 Ranchero Road I-15 Interchange Project
Approval and Environmental Document 9,350,973 1,016,464 5,400,000 1,680,000 1,300,000
7094 Ranchero Road Improvements - 7th Avenue
to Mariposa Road - Phase 1 62,294 149,749 550,000 240,000 60,000
7095 7th Avenue Roadway Improvements -
Willow to Bear Valley Road - Design and
Right-of-Way Acquisition 0 0 350,000 0 0
7096 Aqueduct Crossing Improvements - Widen
Bridge at Main Street - Design and Right-of-
Way Acquisition 0 7,428 0 0 0
7098 Muscatel Street Overpass - Phase 1 Project
Study Report/Project Development Study
(PSR/PDS) 135,648 179,486 160,000 118,000 0
7100 New Traffic Signal - Main Street and Rock
Springs Road 0 34 1,500,000 18,000 581,025
7104 Railroad Crossing Feasibility Study
Eucalyptus/Lemon/Mojave 121,918 117,246 0 0 0
7105 Main Street Corridor Design (395 to 11th
Avenue) 6,591 147,968 0 0 0
7106 Main Street/Hesperia Interchange
Feasibility Design 17,702 39,599 0 0 0
7110 Bear Valley Road Widening - Mariposa
Road to 600 feet east 0 0 300,000 163,000 20,000
7111 Rock Springs Road Reconstruction Project 0 244,701 0 10,000 115,000
7116 Traffic Signal at Smoke Tree and Seventh
Avenue 0 0 250,000 20,000 230,000
7119 Santa Fe Circulation Study 0 0 0 0 15,000
Total DIF Fund–Streets 300 $ 9,704,954 $ 1,902,675 $ 8,510,000 $ 2,249,000 $ 2,321,025
7085 Widen Seventh Avenue - Main to Willow $ 1,010,558 $ 44,459 $ 0 $ 0 $ 0
7087 H-01 Drainage Facility - Main Street to
Smoke Tree Street 0 0 0 34,115 0
7090 H-01 Drainage Facility - Section 1 (Maple
Avenue to Main Street) Phase 1 75,303 7,950 0 0 0
7091 H-01 Drainage Facility - Section 3A (Third
Avenue to Fourth Avenue) 2,859 32,536 250,000 35,000 0
Total DIF-Storm Drainage Fund 301 $ 1,088,720 $ 84,945 $ 250,000 $ 69,115 $ 0
300 Development Impact Fee (DIF)-Streets Fund
301 Development Impact Fee (DIF)-Storm Drainage
259 Reimbursable Grants Fund
251 Community Development Block Grant Fund
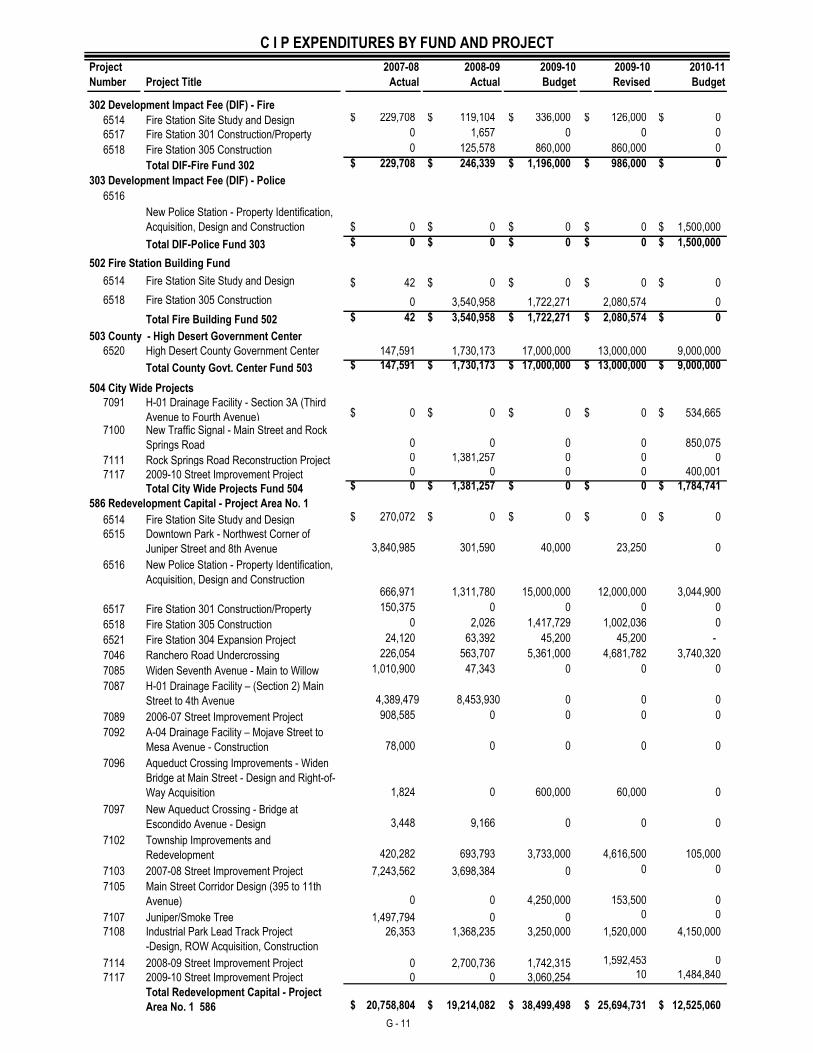
C I P EXPENDITURES BY FUND AND PROJECT
G - 11
Project 2007-08 2008-09 2009-10 2009-10 2010-11
Number Project Title Actual Actual Budget Revised Budget
6514 Fire Station Site Study and Design $ 229,708 $ 119,104 $ 336,000 $ 126,000 $ 0
6517 Fire Station 301 Construction/Property 0 1,657 0 0 0
6518 Fire Station 305 Construction 0 125,578 860,000 860,000 0
Total DIF-Fire Fund 302 $ 229,708 $ 246,339 $ 1,196,000 $ 986,000 $ 0
6516
New Police Station - Property Identification,
Acquisition, Design and Construction $ 0 $ 0 $ 0 $ 0 $ 1,500,000
Total DIF-Police Fund 303 $ 0 $ 0 $ 0 $ 0 $ 1,500,000
6514 Fire Station Site Study and Design $ 42 $ 0 $ 0 $ 0 $ 0
6518 Fire Station 305 Construction 0 3,540,958 1,722,271 2,080,574 0
Total Fire Building Fund 502 $ 42 $ 3,540,958 $ 1,722,271 $ 2,080,574 $ 0
6520 High Desert County Government Center 147,591 1,730,173 17,000,000 13,000,000 9,000,000
Total County Govt. Center Fund 503 $ 147,591 $ 1,730,173 $ 17,000,000 $ 13,000,000 $ 9,000,000
7091 H-01 Drainage Facility - Section 3A (Third
Avenue to Fourth Avenue) $ 0 $ 0 $ 0 $ 0 $ 534,665
7100 New Traffic Signal - Main Street and Rock
Springs Road 0 0 0 0 850,075
7111 Rock Springs Road Reconstruction Project 0 1,381,257 0 0 0
7117 2009-10 Street Improvement Project 0 0 0 0 400,001
Total City Wide Projects Fund 504 $ 0 $ 1,381,257 $ 0 $ 0 $ 1,784,741
6514 Fire Station Site Study and Design $ 270,072 $ 0 $ 0 $ 0 $ 0
6515 Downtown Park - Northwest Corner of
Juniper Street and 8th Avenue 3,840,985 301,590 40,000 23,250 0
6516 New Police Station - Property Identification,
Acquisition, Design and Construction 666,971 1,311,780 15,000,000 12,000,000 3,044,900
6517 Fire Station 301 Construction/Property 150,375 0 0 0 0
6518 Fire Station 305 Construction 0 2,026 1,417,729 1,002,036 0
6521 Fire Station 304 Expansion Project 24,120 63,392 45,200 45,200 -
7046 Ranchero Road Undercrossing 226,054 563,707 5,361,000 4,681,782 3,740,320
7085 Widen Seventh Avenue - Main to Willow 1,010,900 47,343 0 0 0
7087 H-01 Drainage Facility – (Section 2) Main
Street to 4th Avenue 4,389,479 8,453,930 0 0 0
7089 2006-07 Street Improvement Project 908,585 0 0 0 0
7092 A-04 Drainage Facility – Mojave Street to
Mesa Avenue - Construction 78,000 0 0 0 0
7096 Aqueduct Crossing Improvements - Widen
Bridge at Main Street - Design and Right-of-
Way Acquisition 1,824 0 600,000 60,000 0
7097 New Aqueduct Crossing - Bridge at
Escondido Avenue - Design 3,448 9,166 0 0 0
7102 Township Improvements and
Redevelopment 420,282 693,793 3,733,000 4,616,500 105,000
7103 2007-08 Street Improvement Project 7,243,562 3,698,384 0 0 0
7105 Main Street Corridor Design (395 to 11th
Avenue) 0 0 4,250,000 153,500 0
7107 Juniper/Smoke Tree 1,497,794 0 0 0 0
7108 Industrial Park Lead Track Project
-Design, ROW Acquisition, Construction
26,353 1,368,235 3,250,000 1,520,000 4,150,000
7114 2008-09 Street Improvement Project 0 2,700,736 1,742,315 1,592,453 0
7117 2009-10 Street Improvement Project 0 0 3,060,254 10 1,484,840
Total Redevelopment Capital - Project
Area No. 1 586 $ 20,758,804 $ 19,214,082 $ 38,499,498 $ 25,694,731 $ 12,525,060
503 County - High Desert Government Center
302 Development Impact Fee (DIF) - Fire
502 Fire Station Building Fund
303 Development Impact Fee (DIF) - Police
504 City Wide Projects
586 Redevelopment Capital - Project Area No. 1
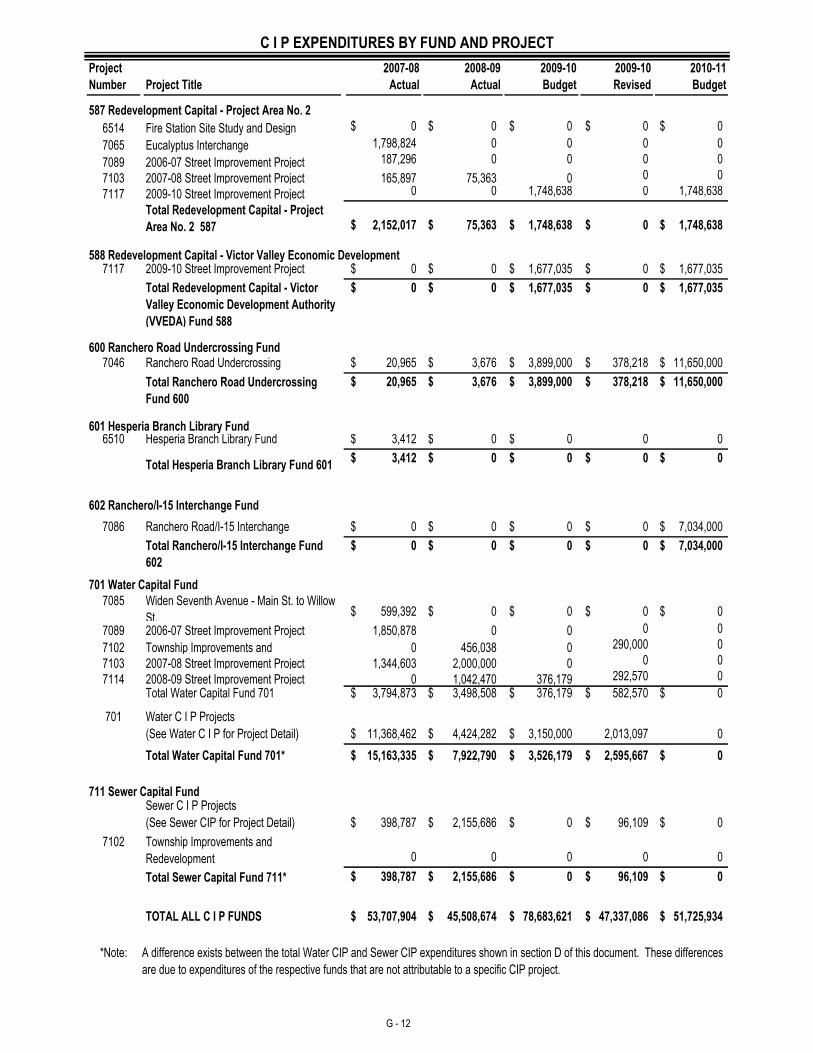
C I P EXPENDITURES BY FUND AND PROJECT
G - 12
Project 2007-08 2008-09 2009-10 2009-10 2010-11
Number Project Title Actual Actual Budget Revised Budget
6514 Fire Station Site Study and Design $ 0 $ 0 $ 0 $ 0 $ 0
7065 Eucalyptus Interchange 1,798,824 0 0 0 0
7089 2006-07 Street Improvement Project 187,296 0 0 0 0
7103 2007-08 Street Improvement Project 165,897 75,363 0 0 0
7117 2009-10 Street Improvement Project 0 0 1,748,638 0 1,748,638
Total Redevelopment Capital - Project
Area No. 2 587 $ 2,152,017 $ 75,363 $ 1,748,638 $ 0 $ 1,748,638
7117 2009-10 Street Improvement Project $ 0 $ 0 $ 1,677,035 $ 0 $ 1,677,035
Total Redevelopment Capital - Victor
Valley Economic Development Authority
(VVEDA) Fund 588
$ 0 $ 0 $ 1,677,035 $ 0 $ 1,677,035
7046 Ranchero Road Undercrossing $ 20,965 $ 3,676 $ 3,899,000 $ 378,218 $ 11,650,000
Total Ranchero Road Undercrossing
Fund 600
$ 20,965 $ 3,676 $ 3,899,000 $ 378,218 $ 11,650,000
6510 Hesperia Branch Library Fund $ 3,412 $ 0 $ 0 0 0
Total Hesperia Branch Library Fund 601 $ 3,412 $ 0 $ 0 $ 0 $ 0
7086 Ranchero Road/I-15 Interchange $ 0 $ 0 $ 0 $ 0 $ 7,034,000
Total Ranchero/I-15 Interchange Fund
602
$ 0 $ 0 $ 0 $ 0 $ 7,034,000
7085 Widen Seventh Avenue - Main St. to Willow
St. $ 599,392 $ 0 $ 0 $ 0 $ 0
7089 2006-07 Street Improvement Project 1,850,878 0 0 0 0
7102 Township Improvements and 0 456,038 0 290,000 0
7103 2007-08 Street Improvement Project 1,344,603 2,000,000 0 0 0
7114 2008-09 Street Improvement Project 0 1,042,470 376,179 292,570 0
Total Water Capital Fund 701 $ 3,794,873 $ 3,498,508 $ 376,179 $ 582,570 $ 0
701 Water C I P Projects
(See Water C I P for Project Detail) $ 11,368,462 $ 4,424,282 $ 3,150,000 2,013,097 0
Total Water Capital Fund 701* $ 15,163,335 $ 7,922,790 $ 3,526,179 $ 2,595,667 $ 0
Sewer C I P Projects
(See Sewer CIP for Project Detail) $ 398,787 $ 2,155,686 $ 0 $ 96,109 $ 0
7102 Township Improvements and
Redevelopment 0 0 0 0 0
Total Sewer Capital Fund 711* $ 398,787 $ 2,155,686 $ 0 $ 96,109 $ 0
TOTAL ALL C I P FUNDS $ 53,707,904 $ 45,508,674 $ 78,683,621 $ 47,337,086 $ 51,725,934
600 Ranchero Road Undercrossing Fund
601 Hesperia Branch Library Fund
701 Water Capital Fund
711 Sewer Capital Fund
587 Redevelopment Capital - Project Area No. 2
*Note: A difference exists between the total Water CIP and Sewer CIP expenditures shown in section D of this document. These differences
are due to expenditures of the respective funds that are not attributable to a specific CIP project.
588 Redevelopment Capital - Victor Valley Economic Development
602 Ranchero/I-15 Interchange Fund
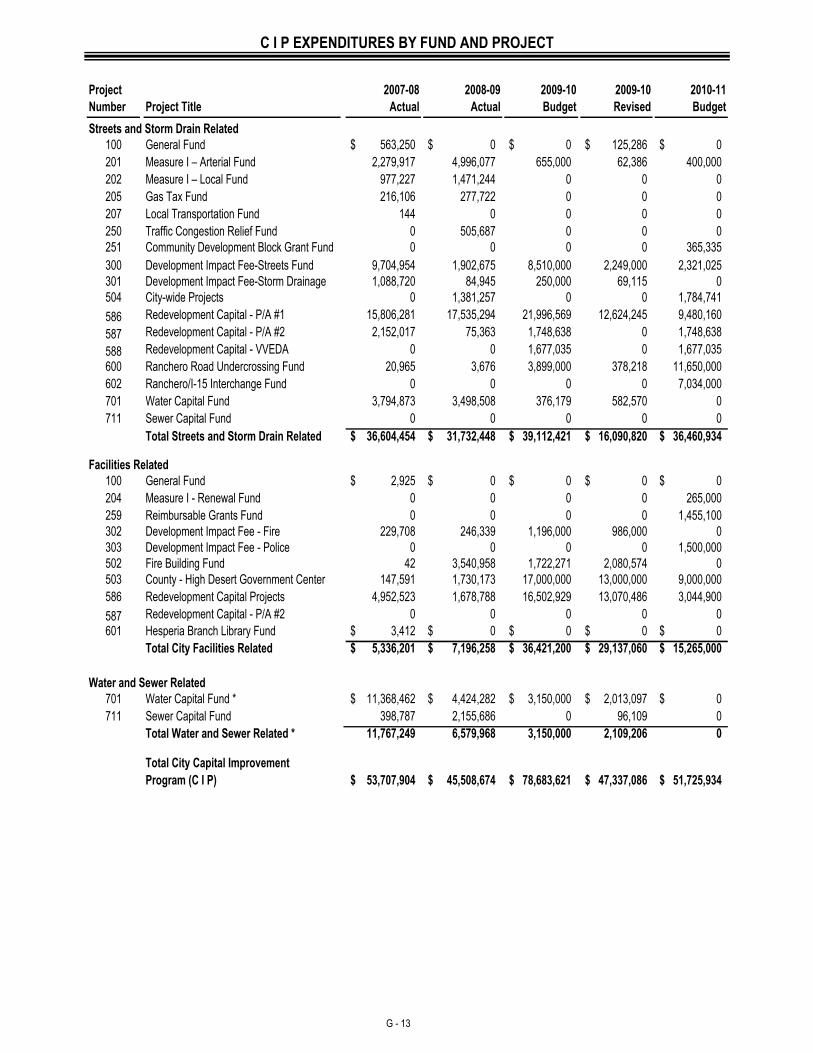
C I P EXPENDITURES BY FUND AND PROJECT
G - 13
Project 2007-08 2008-09 2009-10 2009-10 2010-11
Number Project Title Actual Actual Budget Revised Budget
100 General Fund $ 563,250 $ 0 $ 0 $ 125,286 $ 0
201 Measure I – Arterial Fund 2,279,917 4,996,077 655,000 62,386 400,000
202 Measure I – Local Fund 977,227 1,471,244 0 0 0
205 Gas Tax Fund 216,106 277,722 0 0 0
207 Local Transportation Fund 144 0 0 0 0
250 Traffic Congestion Relief Fund 0 505,687 0 0 0
251 Community Development Block Grant Fund 0 0 0 0 365,335
300 Development Impact Fee-Streets Fund 9,704,954 1,902,675 8,510,000 2,249,000 2,321,025
301 Development Impact Fee-Storm Drainage 1,088,720 84,945 250,000 69,115 0
504 City-wide Projects 0 1,381,257 0 0 1,784,741
586 Redevelopment Capital - P/A #1 15,806,281 17,535,294 21,996,569 12,624,245 9,480,160
587 Redevelopment Capital - P/A #2 2,152,017 75,363 1,748,638 0 1,748,638
588 Redevelopment Capital - VVEDA 0 0 1,677,035 0 1,677,035
600 Ranchero Road Undercrossing Fund 20,965 3,676 3,899,000 378,218 11,650,000
602 Ranchero/I-15 Interchange Fund 0 0 0 0 7,034,000
701 Water Capital Fund 3,794,873 3,498,508 376,179 582,570 0
711 Sewer Capital Fund 0 0 0 0 0
Total Streets and Storm Drain Related $ 36,604,454 $ 31,732,448 $ 39,112,421 $ 16,090,820 $ 36,460,934
100 General Fund $ 2,925 $ 0 $ 0 $ 0 $ 0
204 Measure I - Renewal Fund 0 0 0 0 265,000
259 Reimbursable Grants Fund 0 0 0 0 1,455,100
302 Development Impact Fee - Fire 229,708 246,339 1,196,000 986,000 0
303 Development Impact Fee - Police 0 0 0 0 1,500,000
502 Fire Building Fund 42 3,540,958 1,722,271 2,080,574 0
503 County - High Desert Government Center 147,591 1,730,173 17,000,000 13,000,000 9,000,000
586 Redevelopment Capital Projects 4,952,523 1,678,788 16,502,929 13,070,486 3,044,900
587 Redevelopment Capital - P/A #2 0 0 0 0 0
601 Hesperia Branch Library Fund $ 3,412 $ 0 $ 0 $ 0 $ 0
Total City Facilities Related $ 5,336,201 $ 7,196,258 $ 36,421,200 $ 29,137,060 $ 15,265,000
701 Water Capital Fund * $ 11,368,462 $ 4,424,282 $ 3,150,000 $ 2,013,097 $ 0
711 Sewer Capital Fund 398,787 2,155,686 0 96,109 0
Total Water and Sewer Related * 11,767,249 6,579,968 3,150,000 2,109,206 0
Total City Capital Improvement
Program (C I P) $ 53,707,904 $ 45,508,674 $ 78,683,621 $ 47,337,086 $ 51,725,934
Streets and Storm Drain Related
Facilities Related
Water and Sewer Related
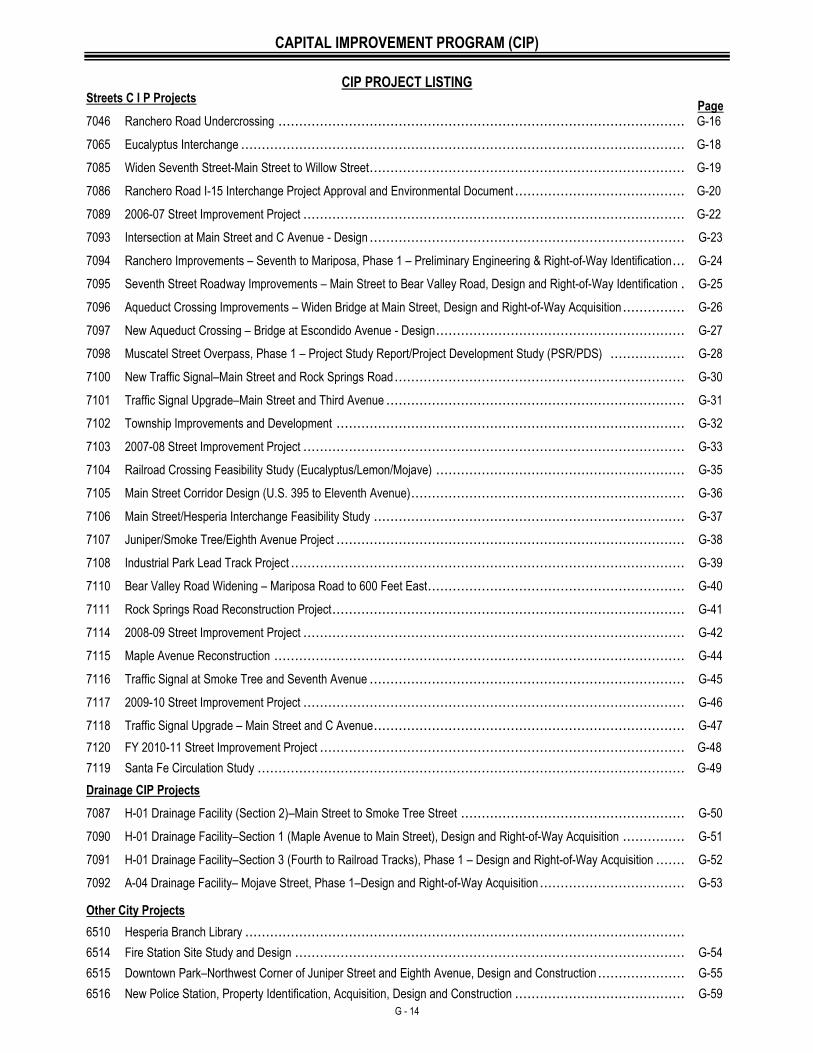
CAPITAL IMPROVEMENT PROGRAM (CIP)
G - 14
CIP PROJECT LISTING Streets C I P Projects
Page 7046 Ranchero Road Undercrossing ................................................................................................................ G-16
7065 Eucalyptus Interchange ......................................................................................................................... G-18
7085 Widen Seventh Street-Main Street to Willow Street .......................................................................................... G-19
7086 Ranchero Road I-15 Interchange Project Approval and Environmental Document ....................................................... G-20
7089 2006-07 Street Improvement Project .......................................................................................................... G-22
7093 Intersection at Main Street and C Avenue - Design .......................................................................................... G-23
7094 Ranchero Improvements – Seventh to Mariposa, Phase 1 – Preliminary Engineering & Right-of-Way Identification ................. G-24
7095 Seventh Street Roadway Improvements – Main Street to Bear Valley Road, Design and Right-of-Way Identification ............... G-25
7096 Aqueduct Crossing Improvements – Widen Bridge at Main Street, Design and Right-of-Way Acquisition ............................. G-26
7097 New Aqueduct Crossing – Bridge at Escondido Avenue - Design .......................................................................... G-27
7098 Muscatel Street Overpass, Phase 1 – Project Study Report/Project Development Study (PSR/PDS) ................................ G-28
7100 New Traffic Signal–Main Street and Rock Springs Road .................................................................................... G-30
7101 Traffic Signal Upgrade–Main Street and Third Avenue ...................................................................................... G-31
7102 Township Improvements and Development .................................................................................................. G-32
7103 2007-08 Street Improvement Project .......................................................................................................... G-33
7104 Railroad Crossing Feasibility Study (Eucalyptus/Lemon/Mojave) .......................................................................... G-35
7105 Main Street Corridor Design (U.S. 395 to Eleventh Avenue) ................................................................................ G-36
7106 Main Street/Hesperia Interchange Feasibility Study ......................................................................................... G-37
7107 Juniper/Smoke Tree/Eighth Avenue Project .................................................................................................. G-38
7108 Industrial Park Lead Track Project ............................................................................................................. G-39
7110 Bear Valley Road Widening – Mariposa Road to 600 Feet East............................................................................ G-40
7111 Rock Springs Road Reconstruction Project ................................................................................................... G-41
7114 2008-09 Street Improvement Project .......................................................................................................... G-42
7115 Maple Avenue Reconstruction ................................................................................................................. G-44
7116 Traffic Signal at Smoke Tree and Seventh Avenue .......................................................................................... G-45
7117 2009-10 Street Improvement Project .......................................................................................................... G-46
7118 Traffic Signal Upgrade – Main Street and C Avenue ......................................................................................... G-47
7120 FY 2010-11 Street Improvement Project ...................................................................................................... G-48
7119 Santa Fe Circulation Study ..................................................................................................................... G-49
Drainage CIP Projects
7087 H-01 Drainage Facility (Section 2)–Main Street to Smoke Tree Street .................................................................... G-50
7090 H-01 Drainage Facility–Section 1 (Maple Avenue to Main Street), Design and Right-of-Way Acquisition ............................. G-51
7091 H-01 Drainage Facility–Section 3 (Fourth to Railroad Tracks), Phase 1 – Design and Right-of-Way Acquisition ..................... G-52
7092 A-04 Drainage Facility– Mojave Street, Phase 1–Design and Right-of-Way Acquisition ................................................. G-53
Other City Projects
6510 Hesperia Branch Library ........................................................................................................................
6514 Fire Station Site Study and Design ............................................................................................................ G-54
6515 Downtown Park–Northwest Corner of Juniper Street and Eighth Avenue, Design and Construction ................................... G-55
6516 New Police Station, Property Identification, Acquisition, Design and Construction ....................................................... G-59
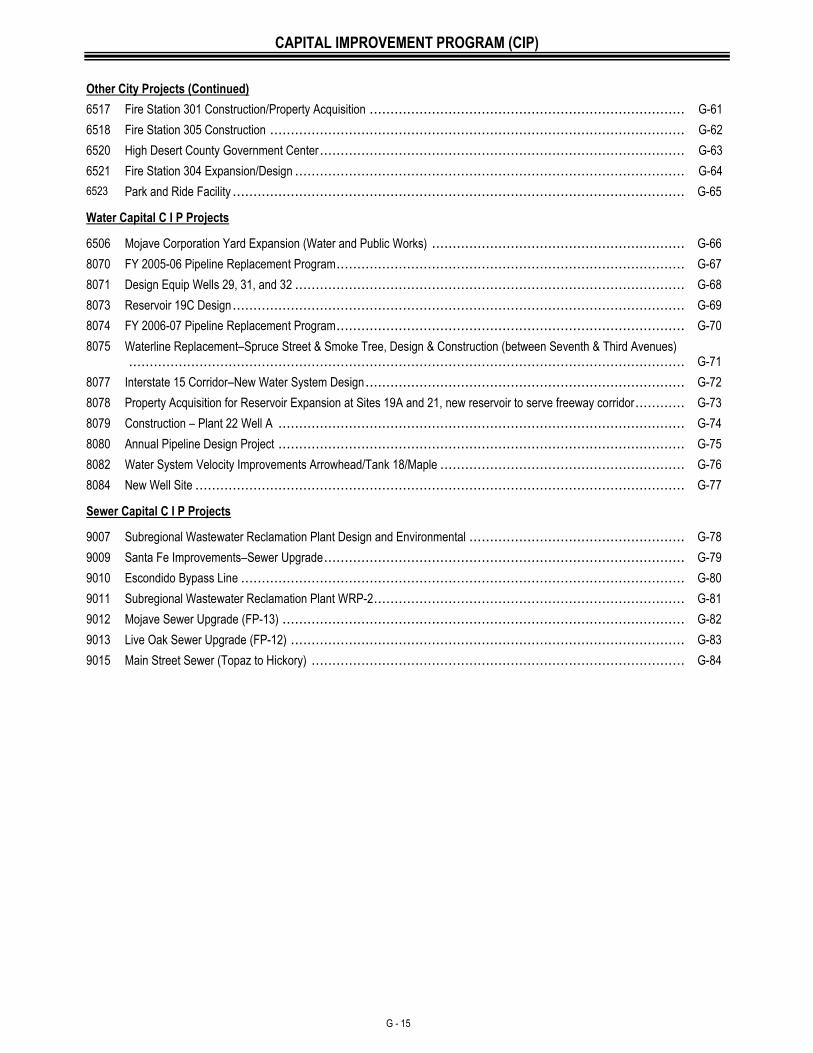
CAPITAL IMPROVEMENT PROGRAM (CIP)
G - 15
Other City Projects (Continued)
6517 Fire Station 301 Construction/Property Acquisition .......................................................................................... G-61
6518 Fire Station 305 Construction .................................................................................................................. G-62
6520 High Desert County Government Center ...................................................................................................... G-63
6521 Fire Station 304 Expansion/Design ............................................................................................................ G-64
6523 Park and Ride Facility ........................................................................................................................... G-65
Water Capital C I P Projects
6506 Mojave Corporation Yard Expansion (Water and Public Works) ........................................................................... G-66
8070 FY 2005-06 Pipeline Replacement Program .................................................................................................. G-67
8071 Design Equip Wells 29, 31, and 32 ............................................................................................................ G-68
8073 Reservoir 19C Design ........................................................................................................................... G-69
8074 FY 2006-07 Pipeline Replacement Program .................................................................................................. G-70
8075 Waterline Replacement–Spruce Street & Smoke Tree, Design & Construction (between Seventh & Third Avenues) .................................................................................................................................................... G-71
8077 Interstate 15 Corridor–New Water System Design ........................................................................................... G-72
8078 Property Acquisition for Reservoir Expansion at Sites 19A and 21, new reservoir to serve freeway corridor .......................... G-73
8079 Construction – Plant 22 Well A ................................................................................................................ G-74
8080 Annual Pipeline Design Project ................................................................................................................ G-75
8082 Water System Velocity Improvements Arrowhead/Tank 18/Maple ......................................................................... G-76
8084 New Well Site .................................................................................................................................... G-77
Sewer Capital C I P Projects
9007 Subregional Wastewater Reclamation Plant Design and Environmental .................................................................. G-78
9009 Santa Fe Improvements–Sewer Upgrade ..................................................................................................... G-79
9010 Escondido Bypass Line ......................................................................................................................... G-80
9011 Subregional Wastewater Reclamation Plant WRP-2 ......................................................................................... G-81
9012 Mojave Sewer Upgrade (FP-13) ............................................................................................................... G-82
9013 Live Oak Sewer Upgrade (FP-12) ............................................................................................................. G-83
9015 Main Street Sewer (Topaz to Hickory) ........................................................................................................ G-84
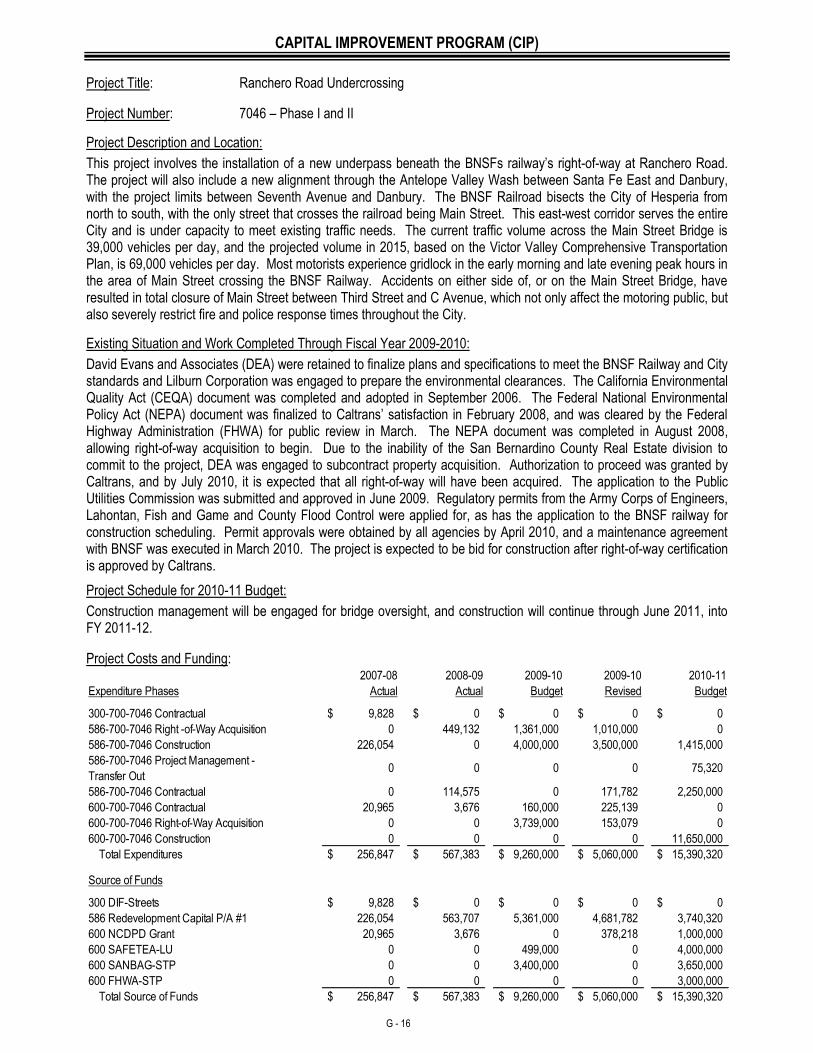
CAPITAL IMPROVEMENT PROGRAM (CIP)
G - 16
Project Title: Ranchero Road Undercrossing
Project Number: 7046 – Phase I and II
Project Description and Location:
This project involves the installation of a new underpass beneath the BNSFs railway’s right-of-way at Ranchero Road. The project will also include a new alignment through the Antelope Valley Wash between Santa Fe East and Danbury, with the project limits between Seventh Avenue and Danbury. The BNSF Railroad bisects the City of Hesperia from north to south, with the only street that crosses the railroad being Main Street. This east-west corridor serves the entire City and is under capacity to meet existing traffic needs. The current traffic volume across the Main Street Bridge is 39,000 vehicles per day, and the projected volume in 2015, based on the Victor Valley Comprehensive Transportation Plan, is 69,000 vehicles per day. Most motorists experience gridlock in the early morning and late evening peak hours in the area of Main Street crossing the BNSF Railway. Accidents on either side of, or on the Main Street Bridge, have resulted in total closure of Main Street between Third Street and C Avenue, which not only affect the motoring public, but also severely restrict fire and police response times throughout the City.
Existing Situation and Work Completed Through Fiscal Year 2009-2010:
David Evans and Associates (DEA) were retained to finalize plans and specifications to meet the BNSF Railway and City standards and Lilburn Corporation was engaged to prepare the environmental clearances. The California Environmental Quality Act (CEQA) document was completed and adopted in September 2006. The Federal National Environmental Policy Act (NEPA) document was finalized to Caltrans’ satisfaction in February 2008, and was cleared by the Federal Highway Administration (FHWA) for public review in March. The NEPA document was completed in August 2008, allowing right-of-way acquisition to begin. Due to the inability of the San Bernardino County Real Estate division to commit to the project, DEA was engaged to subcontract property acquisition. Authorization to proceed was granted by Caltrans, and by July 2010, it is expected that all right-of-way will have been acquired. The application to the Public Utilities Commission was submitted and approved in June 2009. Regulatory permits from the Army Corps of Engineers, Lahontan, Fish and Game and County Flood Control were applied for, as has the application to the BNSF railway for construction scheduling. Permit approvals were obtained by all agencies by April 2010, and a maintenance agreement with BNSF was executed in March 2010. The project is expected to be bid for construction after right-of-way certification is approved by Caltrans.
Project Schedule for 2010-11 Budget:
Construction management will be engaged for bridge oversight, and construction will continue through June 2011, into FY 2011-12.
Project Costs and Funding: 2007-08 2008-09 2009-10 2009-10 2010-11
Expenditure Phases Actual Actual Budget Revised Budget
9,828$ 0$ 0$ 0$ 0$
0 449,132 1,361,000 1,010,000 0
226,054 0 4,000,000 3,500,000 1,415,000
586-700-7046 Project Management -
Transfer Out0 0 0 0 75,320
586-700-7046 Contractual 0 114,575 0 171,782 2,250,000
20,965 3,676 160,000 225,139 0
0 0 3,739,000 153,079 0
0 0 0 0 11,650,000
256,847$ 567,383$ 9,260,000$ 5,060,000$ 15,390,320$
Source of Funds
9,828$ 0$ 0$ 0$ 0$
226,054 563,707 5,361,000 4,681,782 3,740,320
20,965 3,676 0 378,218 1,000,000
0 0 499,000 0 4,000,000
0 0 3,400,000 0 3,650,000
0 0 0 0 3,000,000
256,847$ 567,383$ 9,260,000$ 5,060,000$ 15,390,320$
600-700-7046 Right-of-Way Acquisition
600-700-7046 Construction
Total Expenditures
300 DIF-Streets
586 Redevelopment Capital P/A #1
600 NCDPD Grant
600 SAFETEA-LU
600 SANBAG-STP
600 FHWA-STP
Total Source of Funds
300-700-7046 Contractual
586-700-7046 Right -of-Way Acquisition
586-700-7046 Construction
600-700-7046 Contractual
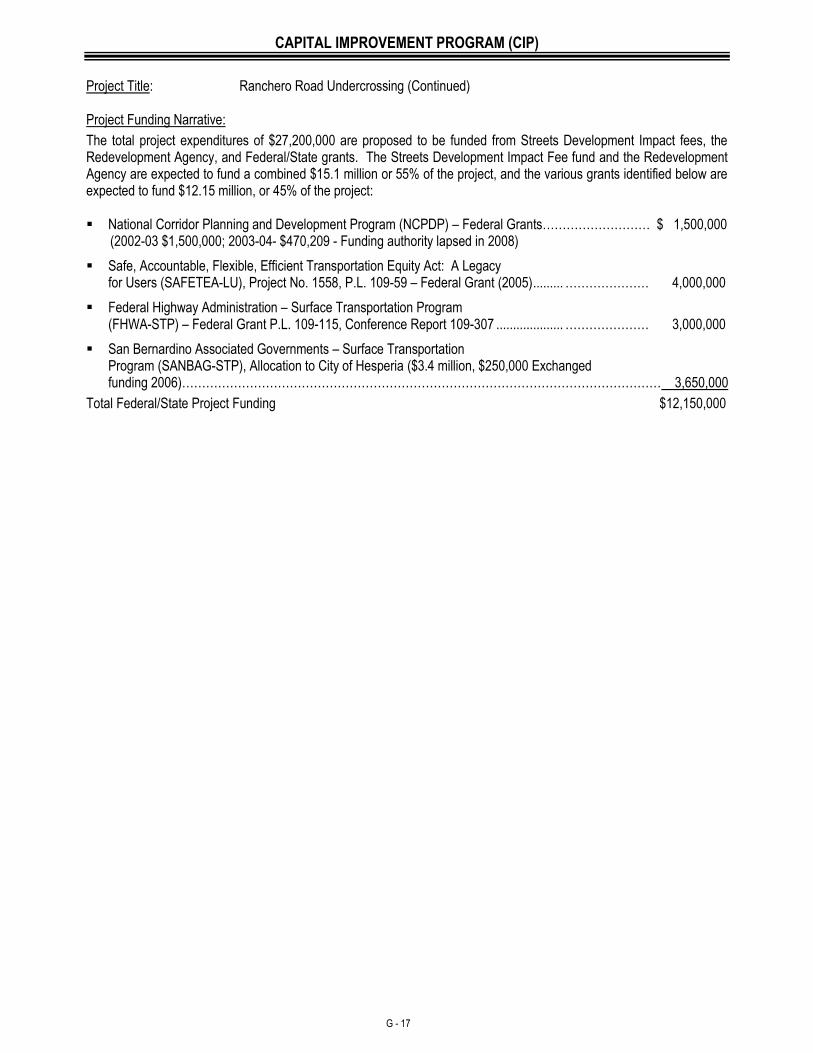
CAPITAL IMPROVEMENT PROGRAM (CIP)
G - 17
Project Title: Ranchero Road Undercrossing (Continued) Project Funding Narrative:
The total project expenditures of $27,200,000 are proposed to be funded from Streets Development Impact fees, the Redevelopment Agency, and Federal/State grants. The Streets Development Impact Fee fund and the Redevelopment Agency are expected to fund a combined $15.1 million or 55% of the project, and the various grants identified below are expected to fund $12.15 million, or 45% of the project: National Corridor Planning and Development Program (NCPDP) – Federal Grants……………………… $ 1,500,000
(2002-03 $1,500,000; 2003-04- $470,209 - Funding authority lapsed in 2008)
Safe, Accountable, Flexible, Efficient Transportation Equity Act: A Legacy for Users (SAFETEA-LU), Project No. 1558, P.L. 109-59 – Federal Grant (2005) ......... ………………… 4,000,000
Federal Highway Administration – Surface Transportation Program (FHWA-STP) – Federal Grant P.L. 109-115, Conference Report 109-307 .................... ………………… 3,000,000
San Bernardino Associated Governments – Surface Transportation Program (SANBAG-STP), Allocation to City of Hesperia ($3.4 million, $250,000 Exchanged funding 2006)………………………………………………………………………………………………………… 3,650,000
Total Federal/State Project Funding $12,150,000
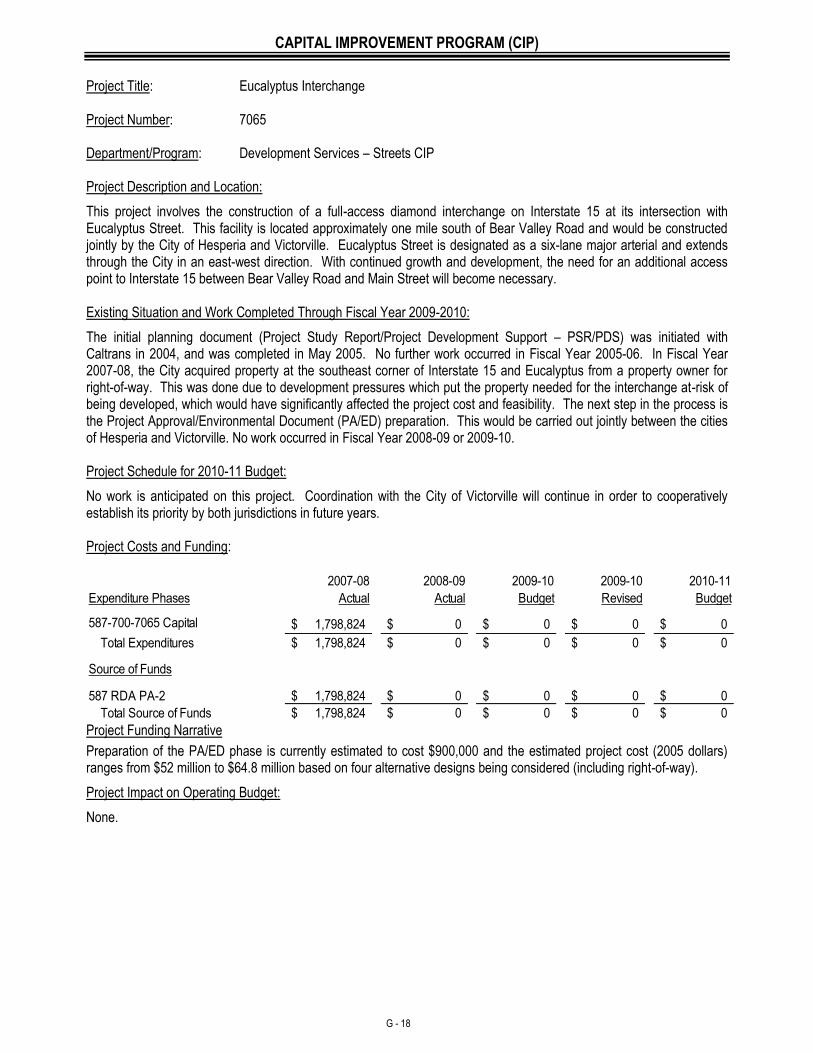
CAPITAL IMPROVEMENT PROGRAM (CIP)
G - 18
Project Title: Eucalyptus Interchange Project Number: 7065 Department/Program: Development Services – Streets CIP Project Description and Location:
This project involves the construction of a full-access diamond interchange on Interstate 15 at its intersection with Eucalyptus Street. This facility is located approximately one mile south of Bear Valley Road and would be constructed jointly by the City of Hesperia and Victorville. Eucalyptus Street is designated as a six-lane major arterial and extends through the City in an east-west direction. With continued growth and development, the need for an additional access point to Interstate 15 between Bear Valley Road and Main Street will become necessary. Existing Situation and Work Completed Through Fiscal Year 2009-2010:
The initial planning document (Project Study Report/Project Development Support – PSR/PDS) was initiated with Caltrans in 2004, and was completed in May 2005. No further work occurred in Fiscal Year 2005-06. In Fiscal Year 2007-08, the City acquired property at the southeast corner of Interstate 15 and Eucalyptus from a property owner for right-of-way. This was done due to development pressures which put the property needed for the interchange at-risk of being developed, which would have significantly affected the project cost and feasibility. The next step in the process is the Project Approval/Environmental Document (PA/ED) preparation. This would be carried out jointly between the cities of Hesperia and Victorville. No work occurred in Fiscal Year 2008-09 or 2009-10. Project Schedule for 2010-11 Budget:
No work is anticipated on this project. Coordination with the City of Victorville will continue in order to cooperatively establish its priority by both jurisdictions in future years. Project Costs and Funding:
2007-08 2008-09 2009-10 2009-10 2010-11
Expenditure Phases Actual Actual Budget Revised Budget
1,798,824$ 0$ 0$ 0$ 0$
1,798,824$ 0$ 0$ 0$ 0$
Source of Funds
1,798,824$ 0$ 0$ 0$ 0$
1,798,824$ 0$ 0$ 0$ 0$ Total Source of Funds
587-700-7065 Capital
Total Expenditures
587 RDA PA-2
Project Funding Narrative
Preparation of the PA/ED phase is currently estimated to cost $900,000 and the estimated project cost (2005 dollars) ranges from $52 million to $64.8 million based on four alternative designs being considered (including right-of-way).
Project Impact on Operating Budget:
None.
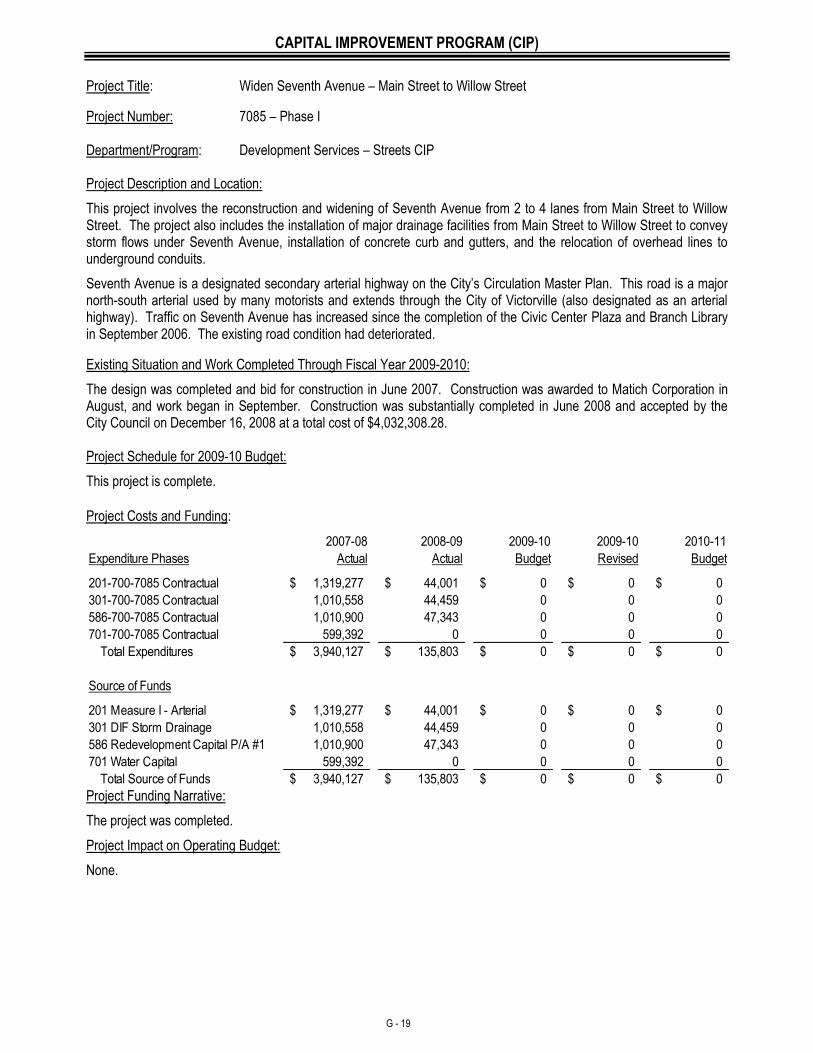
CAPITAL IMPROVEMENT PROGRAM (CIP)
G - 19
Project Title: Widen Seventh Avenue – Main Street to Willow Street
Project Number: 7085 – Phase I Department/Program: Development Services – Streets CIP Project Description and Location:
This project involves the reconstruction and widening of Seventh Avenue from 2 to 4 lanes from Main Street to Willow Street. The project also includes the installation of major drainage facilities from Main Street to Willow Street to convey storm flows under Seventh Avenue, installation of concrete curb and gutters, and the relocation of overhead lines to underground conduits.
Seventh Avenue is a designated secondary arterial highway on the City’s Circulation Master Plan. This road is a major north-south arterial used by many motorists and extends through the City of Victorville (also designated as an arterial highway). Traffic on Seventh Avenue has increased since the completion of the Civic Center Plaza and Branch Library in September 2006. The existing road condition had deteriorated.
Existing Situation and Work Completed Through Fiscal Year 2009-2010:
The design was completed and bid for construction in June 2007. Construction was awarded to Matich Corporation in August, and work began in September. Construction was substantially completed in June 2008 and accepted by the City Council on December 16, 2008 at a total cost of $4,032,308.28. Project Schedule for 2009-10 Budget:
This project is complete.
Project Costs and Funding:
2007-08 2008-09 2009-10 2009-10 2010-11
Expenditure Phases Actual Actual Budget Revised Budget
1,319,277$ 44,001$ 0$ 0$ 0$
1,010,558 44,459 0 0 0
1,010,900 47,343 0 0 0
599,392 0 0 0 0
3,940,127$ 135,803$ 0$ 0$ 0$
Source of Funds
1,319,277$ 44,001$ 0$ 0$ 0$
1,010,558 44,459 0 0 0
1,010,900 47,343 0 0 0
599,392 0 0 0 0
3,940,127$ 135,803$ 0$ 0$ 0$
201-700-7085 Contractual
301-700-7085 Contractual
586-700-7085 Contractual
701-700-7085 Contractual
Total Expenditures
201 Measure I - Arterial
301 DIF Storm Drainage
586 Redevelopment Capital P/A #1
701 Water Capital
Total Source of Funds Project Funding Narrative:
The project was completed.
Project Impact on Operating Budget:
None.
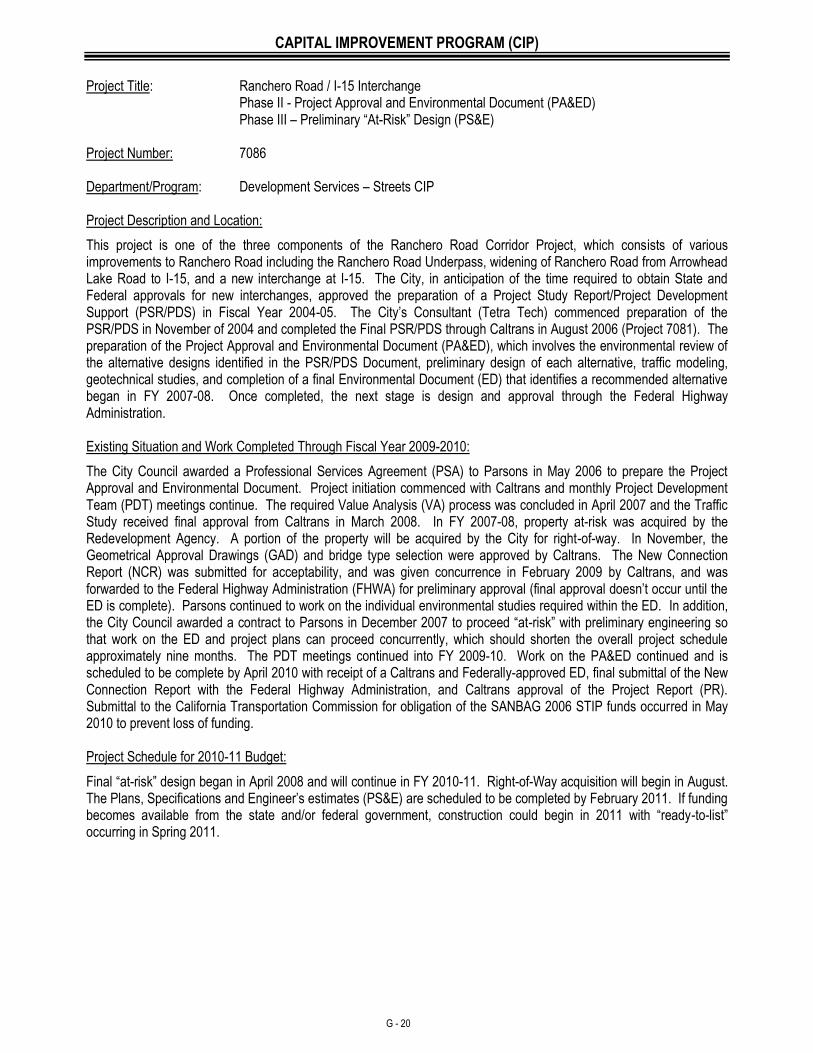
CAPITAL IMPROVEMENT PROGRAM (CIP)
G - 20
Project Title: Ranchero Road / I-15 Interchange Phase II - Project Approval and Environmental Document (PA&ED) Phase III – Preliminary “At-Risk” Design (PS&E) Project Number: 7086 Department/Program: Development Services – Streets CIP Project Description and Location:
This project is one of the three components of the Ranchero Road Corridor Project, which consists of various improvements to Ranchero Road including the Ranchero Road Underpass, widening of Ranchero Road from Arrowhead Lake Road to I-15, and a new interchange at I-15. The City, in anticipation of the time required to obtain State and Federal approvals for new interchanges, approved the preparation of a Project Study Report/Project Development Support (PSR/PDS) in Fiscal Year 2004-05. The City’s Consultant (Tetra Tech) commenced preparation of the PSR/PDS in November of 2004 and completed the Final PSR/PDS through Caltrans in August 2006 (Project 7081). The preparation of the Project Approval and Environmental Document (PA&ED), which involves the environmental review of the alternative designs identified in the PSR/PDS Document, preliminary design of each alternative, traffic modeling, geotechnical studies, and completion of a final Environmental Document (ED) that identifies a recommended alternative began in FY 2007-08. Once completed, the next stage is design and approval through the Federal Highway Administration. Existing Situation and Work Completed Through Fiscal Year 2009-2010:
The City Council awarded a Professional Services Agreement (PSA) to Parsons in May 2006 to prepare the Project Approval and Environmental Document. Project initiation commenced with Caltrans and monthly Project Development Team (PDT) meetings continue. The required Value Analysis (VA) process was concluded in April 2007 and the Traffic Study received final approval from Caltrans in March 2008. In FY 2007-08, property at-risk was acquired by the Redevelopment Agency. A portion of the property will be acquired by the City for right-of-way. In November, the Geometrical Approval Drawings (GAD) and bridge type selection were approved by Caltrans. The New Connection Report (NCR) was submitted for acceptability, and was given concurrence in February 2009 by Caltrans, and was forwarded to the Federal Highway Administration (FHWA) for preliminary approval (final approval doesn’t occur until the ED is complete). Parsons continued to work on the individual environmental studies required within the ED. In addition, the City Council awarded a contract to Parsons in December 2007 to proceed “at-risk” with preliminary engineering so that work on the ED and project plans can proceed concurrently, which should shorten the overall project schedule approximately nine months. The PDT meetings continued into FY 2009-10. Work on the PA&ED continued and is scheduled to be complete by April 2010 with receipt of a Caltrans and Federally-approved ED, final submittal of the New Connection Report with the Federal Highway Administration, and Caltrans approval of the Project Report (PR). Submittal to the California Transportation Commission for obligation of the SANBAG 2006 STIP funds occurred in May 2010 to prevent loss of funding. Project Schedule for 2010-11 Budget:
Final “at-risk” design began in April 2008 and will continue in FY 2010-11. Right-of-Way acquisition will begin in August. The Plans, Specifications and Engineer’s estimates (PS&E) are scheduled to be completed by February 2011. If funding becomes available from the state and/or federal government, construction could begin in 2011 with “ready-to-list” occurring in Spring 2011.
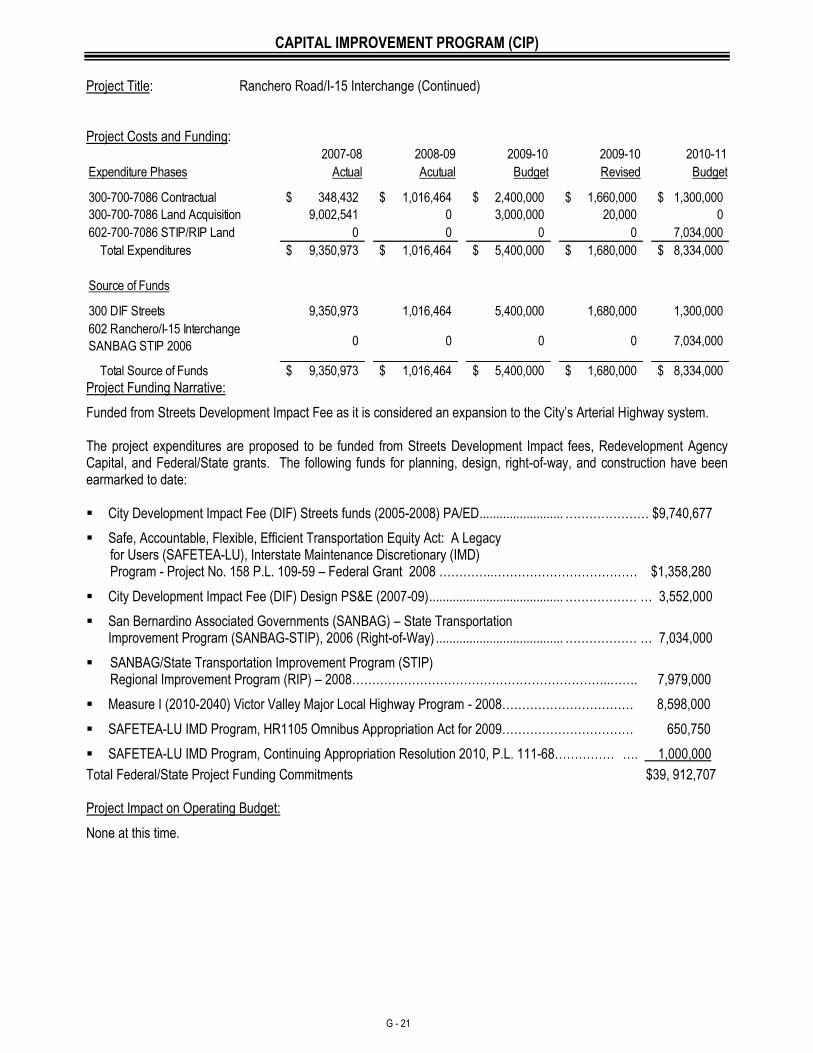
CAPITAL IMPROVEMENT PROGRAM (CIP)
G - 21
Project Title: Ranchero Road/I-15 Interchange (Continued) Project Costs and Funding:
2007-08 2008-09 2009-10 2009-10 2010-11
Expenditure Phases Actual Acutual Budget Revised Budget
348,432$ 1,016,464$ 2,400,000$ 1,660,000$ 1,300,000$
9,002,541 0 3,000,000 20,000 0
0 0 0 0 7,034,000
9,350,973$ 1,016,464$ 5,400,000$ 1,680,000$ 8,334,000$
Source of Funds
9,350,973 1,016,464 5,400,000 1,680,000 1,300,000
0 0 0 0 7,034,000
9,350,973$ 1,016,464$ 5,400,000$ 1,680,000$ 8,334,000$
300 DIF Streets
602 Ranchero/I-15 Interchange
SANBAG STIP 2006
Total Source of Funds
300-700-7086 Contractual
300-700-7086 Land Acquisition
602-700-7086 STIP/RIP Land
Total Expenditures
Project Funding Narrative:
Funded from Streets Development Impact Fee as it is considered an expansion to the City’s Arterial Highway system. The project expenditures are proposed to be funded from Streets Development Impact fees, Redevelopment Agency Capital, and Federal/State grants. The following funds for planning, design, right-of-way, and construction have been earmarked to date: City Development Impact Fee (DIF) Streets funds (2005-2008) PA/ED ......................... ………………… $9,740,677
Safe, Accountable, Flexible, Efficient Transportation Equity Act: A Legacy for Users (SAFETEA-LU), Interstate Maintenance Discretionary (IMD) Program - Project No. 158 P.L. 109-59 – Federal Grant 2008 …………..……………………………… $1,358,280
City Development Impact Fee (DIF) Design PS&E (2007-09) ........................................ ……………… … 3,552,000
San Bernardino Associated Governments (SANBAG) – State Transportation Improvement Program (SANBAG-STIP), 2006 (Right-of-Way) ...................................... ……………… … 7,034,000
SANBAG/State Transportation Improvement Program (STIP) Regional Improvement Program (RIP) – 2008………………………………………………………..……. 7,979,000
Measure I (2010-2040) Victor Valley Major Local Highway Program - 2008…………………………… 8,598,000
SAFETEA-LU IMD Program, HR1105 Omnibus Appropriation Act for 2009…………………………… 650,750
SAFETEA-LU IMD Program, Continuing Appropriation Resolution 2010, P.L. 111-68…………… …. 1,000,000
Total Federal/State Project Funding Commitments $39, 912,707 Project Impact on Operating Budget:
None at this time.
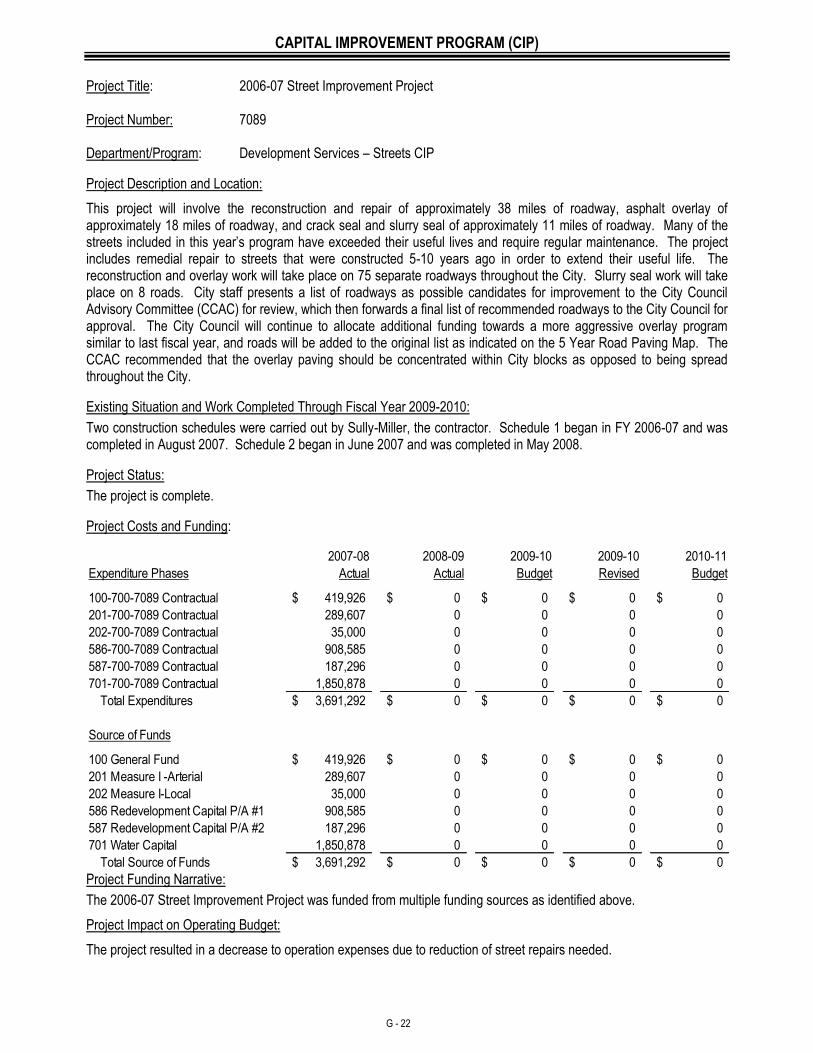
CAPITAL IMPROVEMENT PROGRAM (CIP)
G - 22
Project Title: 2006-07 Street Improvement Project Project Number: 7089 Department/Program: Development Services – Streets CIP
Project Description and Location:
This project will involve the reconstruction and repair of approximately 38 miles of roadway, asphalt overlay of approximately 18 miles of roadway, and crack seal and slurry seal of approximately 11 miles of roadway. Many of the streets included in this year’s program have exceeded their useful lives and require regular maintenance. The project includes remedial repair to streets that were constructed 5-10 years ago in order to extend their useful life. The reconstruction and overlay work will take place on 75 separate roadways throughout the City. Slurry seal work will take place on 8 roads. City staff presents a list of roadways as possible candidates for improvement to the City Council Advisory Committee (CCAC) for review, which then forwards a final list of recommended roadways to the City Council for approval. The City Council will continue to allocate additional funding towards a more aggressive overlay program similar to last fiscal year, and roads will be added to the original list as indicated on the 5 Year Road Paving Map. The CCAC recommended that the overlay paving should be concentrated within City blocks as opposed to being spread throughout the City.
Existing Situation and Work Completed Through Fiscal Year 2009-2010:
Two construction schedules were carried out by Sully-Miller, the contractor. Schedule 1 began in FY 2006-07 and was completed in August 2007. Schedule 2 began in June 2007 and was completed in May 2008.
Project Status:
The project is complete.
Project Costs and Funding:
2007-08 2008-09 2009-10 2009-10 2010-11
Expenditure Phases Actual Actual Budget Revised Budget
419,926$ 0$ 0$ 0$ 0$
289,607 0 0 0 0
35,000 0 0 0 0
908,585 0 0 0 0
187,296 0 0 0 0
1,850,878 0 0 0 0
3,691,292$ 0$ 0$ 0$ 0$
Source of Funds
419,926$ 0$ 0$ 0$ 0$
289,607 0 0 0 0
35,000 0 0 0 0
908,585 0 0 0 0
187,296 0 0 0 0
1,850,878 0 0 0 0
3,691,292$ 0$ 0$ 0$ 0$
586 Redevelopment Capital P/A #1
587 Redevelopment Capital P/A #2
701 Water Capital
Total Source of Funds
701-700-7089 Contractual
Total Expenditures
100 General Fund
201 Measure I -Arterial
202 Measure I-Local
100-700-7089 Contractual
201-700-7089 Contractual
202-700-7089 Contractual
586-700-7089 Contractual
587-700-7089 Contractual
Project Funding Narrative:
The 2006-07 Street Improvement Project was funded from multiple funding sources as identified above.
Project Impact on Operating Budget:
The project resulted in a decrease to operation expenses due to reduction of street repairs needed.
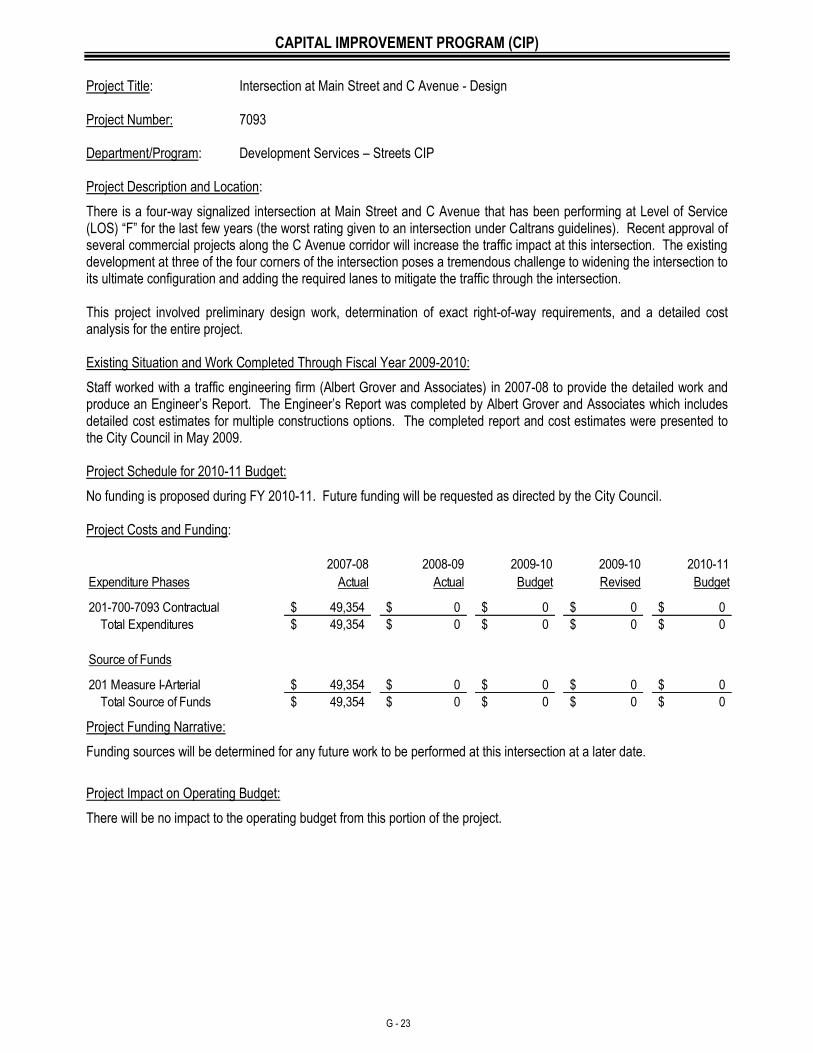
CAPITAL IMPROVEMENT PROGRAM (CIP)
G - 23
Project Title: Intersection at Main Street and C Avenue - Design Project Number: 7093 Department/Program: Development Services – Streets CIP Project Description and Location:
There is a four-way signalized intersection at Main Street and C Avenue that has been performing at Level of Service (LOS) “F” for the last few years (the worst rating given to an intersection under Caltrans guidelines). Recent approval of several commercial projects along the C Avenue corridor will increase the traffic impact at this intersection. The existing development at three of the four corners of the intersection poses a tremendous challenge to widening the intersection to its ultimate configuration and adding the required lanes to mitigate the traffic through the intersection. This project involved preliminary design work, determination of exact right-of-way requirements, and a detailed cost analysis for the entire project. Existing Situation and Work Completed Through Fiscal Year 2009-2010:
Staff worked with a traffic engineering firm (Albert Grover and Associates) in 2007-08 to provide the detailed work and produce an Engineer’s Report. The Engineer’s Report was completed by Albert Grover and Associates which includes detailed cost estimates for multiple constructions options. The completed report and cost estimates were presented to the City Council in May 2009. Project Schedule for 2010-11 Budget:
No funding is proposed during FY 2010-11. Future funding will be requested as directed by the City Council. Project Costs and Funding:
2007-08 2008-09 2009-10 2009-10 2010-11
Expenditure Phases Actual Actual Budget Revised Budget
49,354$ 0$ 0$ 0$ 0$
49,354$ 0$ 0$ 0$ 0$
Source of Funds
49,354$ 0$ 0$ 0$ 0$
49,354$ 0$ 0$ 0$ 0$
201-700-7093 Contractual
Total Expenditures
201 Measure I-Arterial
Total Source of Funds
Project Funding Narrative:
Funding sources will be determined for any future work to be performed at this intersection at a later date.
Project Impact on Operating Budget:
There will be no impact to the operating budget from this portion of the project.
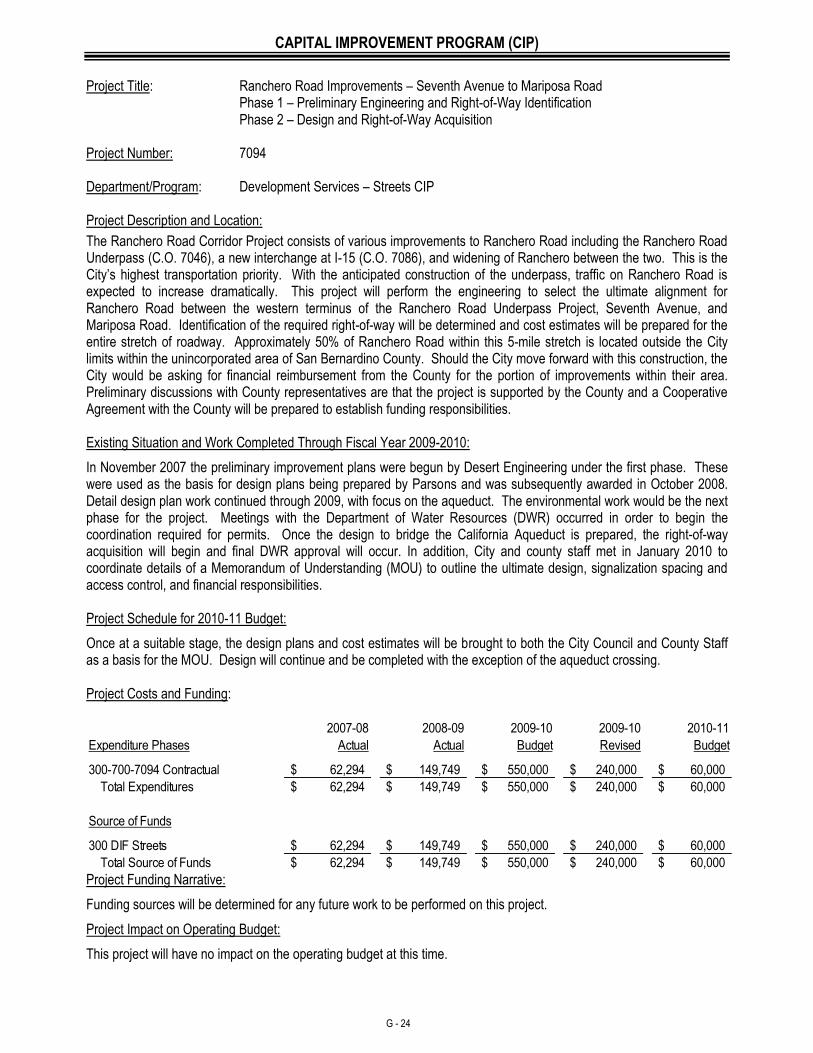
CAPITAL IMPROVEMENT PROGRAM (CIP)
G - 24
Project Title: Ranchero Road Improvements – Seventh Avenue to Mariposa Road Phase 1 – Preliminary Engineering and Right-of-Way Identification Phase 2 – Design and Right-of-Way Acquisition Project Number: 7094 Department/Program: Development Services – Streets CIP Project Description and Location:
The Ranchero Road Corridor Project consists of various improvements to Ranchero Road including the Ranchero Road Underpass (C.O. 7046), a new interchange at I-15 (C.O. 7086), and widening of Ranchero between the two. This is the City’s highest transportation priority. With the anticipated construction of the underpass, traffic on Ranchero Road is expected to increase dramatically. This project will perform the engineering to select the ultimate alignment for Ranchero Road between the western terminus of the Ranchero Road Underpass Project, Seventh Avenue, and Mariposa Road. Identification of the required right-of-way will be determined and cost estimates will be prepared for the entire stretch of roadway. Approximately 50% of Ranchero Road within this 5-mile stretch is located outside the City limits within the unincorporated area of San Bernardino County. Should the City move forward with this construction, the City would be asking for financial reimbursement from the County for the portion of improvements within their area. Preliminary discussions with County representatives are that the project is supported by the County and a Cooperative Agreement with the County will be prepared to establish funding responsibilities. Existing Situation and Work Completed Through Fiscal Year 2009-2010:
In November 2007 the preliminary improvement plans were begun by Desert Engineering under the first phase. These were used as the basis for design plans being prepared by Parsons and was subsequently awarded in October 2008. Detail design plan work continued through 2009, with focus on the aqueduct. The environmental work would be the next phase for the project. Meetings with the Department of Water Resources (DWR) occurred in order to begin the coordination required for permits. Once the design to bridge the California Aqueduct is prepared, the right-of-way acquisition will begin and final DWR approval will occur. In addition, City and county staff met in January 2010 to coordinate details of a Memorandum of Understanding (MOU) to outline the ultimate design, signalization spacing and access control, and financial responsibilities. Project Schedule for 2010-11 Budget:
Once at a suitable stage, the design plans and cost estimates will be brought to both the City Council and County Staff as a basis for the MOU. Design will continue and be completed with the exception of the aqueduct crossing. Project Costs and Funding:
2007-08 2008-09 2009-10 2009-10 2010-11
Expenditure Phases Actual Actual Budget Revised Budget
62,294$ 149,749$ 550,000$ 240,000$ 60,000$
62,294$ 149,749$ 550,000$ 240,000$ 60,000$
Source of Funds
62,294$ 149,749$ 550,000$ 240,000$ 60,000$
62,294$ 149,749$ 550,000$ 240,000$ 60,000$
300-700-7094 Contractual
Total Expenditures
300 DIF Streets
Total Source of Funds Project Funding Narrative:
Funding sources will be determined for any future work to be performed on this project.
Project Impact on Operating Budget:
This project will have no impact on the operating budget at this time.
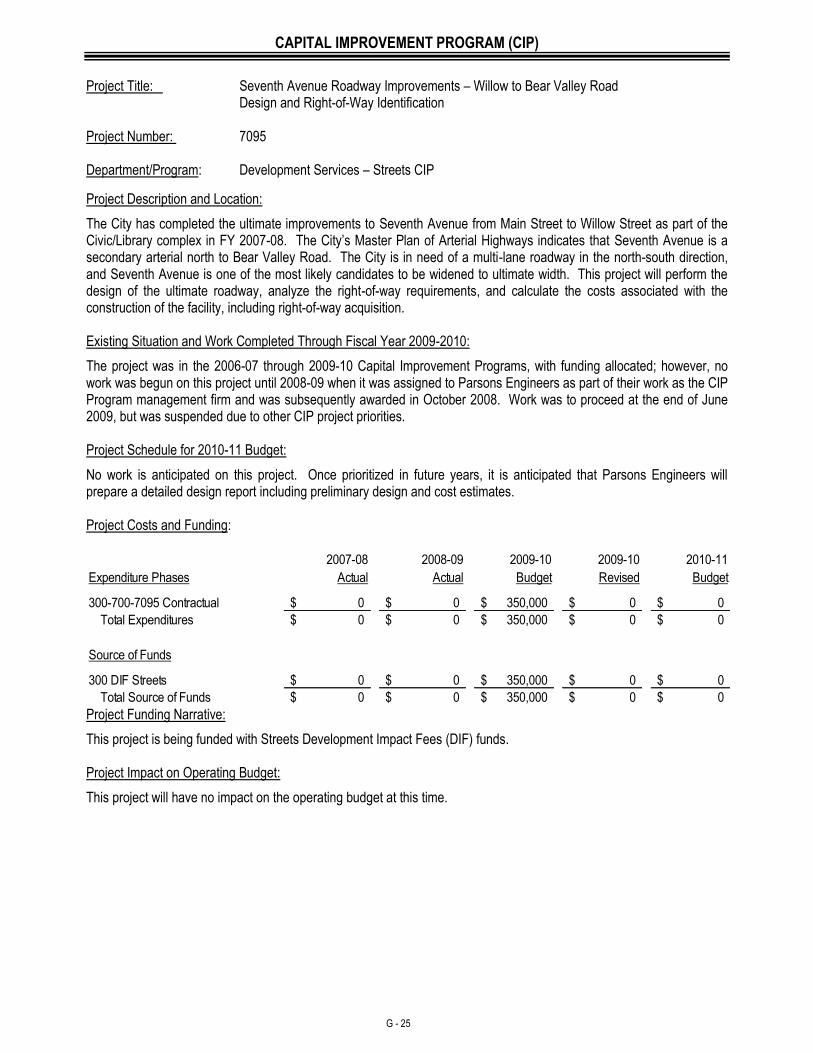
CAPITAL IMPROVEMENT PROGRAM (CIP)
G - 25
Project Title: Seventh Avenue Roadway Improvements – Willow to Bear Valley Road Design and Right-of-Way Identification Project Number: 7095 Department/Program: Development Services – Streets CIP
Project Description and Location:
The City has completed the ultimate improvements to Seventh Avenue from Main Street to Willow Street as part of the Civic/Library complex in FY 2007-08. The City’s Master Plan of Arterial Highways indicates that Seventh Avenue is a secondary arterial north to Bear Valley Road. The City is in need of a multi-lane roadway in the north-south direction, and Seventh Avenue is one of the most likely candidates to be widened to ultimate width. This project will perform the design of the ultimate roadway, analyze the right-of-way requirements, and calculate the costs associated with the construction of the facility, including right-of-way acquisition. Existing Situation and Work Completed Through Fiscal Year 2009-2010:
The project was in the 2006-07 through 2009-10 Capital Improvement Programs, with funding allocated; however, no work was begun on this project until 2008-09 when it was assigned to Parsons Engineers as part of their work as the CIP Program management firm and was subsequently awarded in October 2008. Work was to proceed at the end of June 2009, but was suspended due to other CIP project priorities. Project Schedule for 2010-11 Budget:
No work is anticipated on this project. Once prioritized in future years, it is anticipated that Parsons Engineers will prepare a detailed design report including preliminary design and cost estimates. Project Costs and Funding:
2007-08 2008-09 2009-10 2009-10 2010-11
Expenditure Phases Actual Actual Budget Revised Budget
0$ 0$ 350,000$ 0$ 0$
0$ 0$ 350,000$ 0$ 0$
Source of Funds
0$ 0$ 350,000$ 0$ 0$
0$ 0$ 350,000$ 0$ 0$
300-700-7095 Contractual
Total Expenditures
300 DIF Streets
Total Source of Funds Project Funding Narrative:
This project is being funded with Streets Development Impact Fees (DIF) funds. Project Impact on Operating Budget:
This project will have no impact on the operating budget at this time.
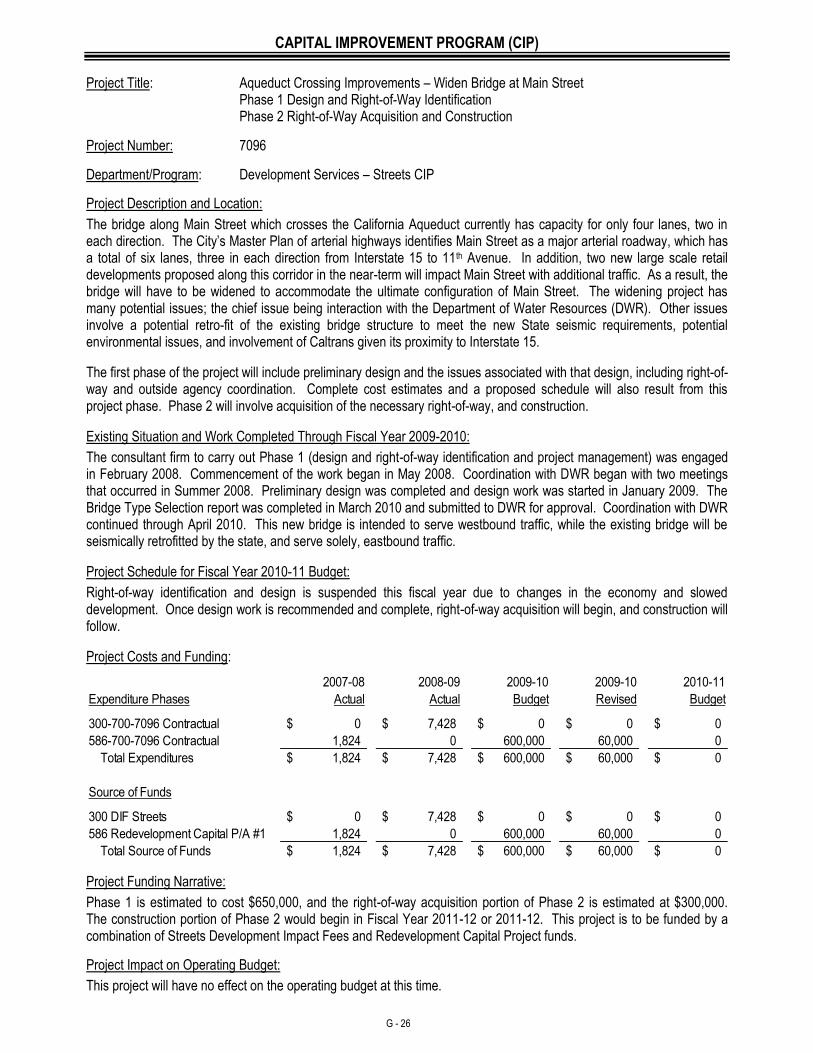
CAPITAL IMPROVEMENT PROGRAM (CIP)
G - 26
Project Title: Aqueduct Crossing Improvements – Widen Bridge at Main Street Phase 1 Design and Right-of-Way Identification Phase 2 Right-of-Way Acquisition and Construction
Project Number: 7096
Department/Program: Development Services – Streets CIP
Project Description and Location:
The bridge along Main Street which crosses the California Aqueduct currently has capacity for only four lanes, two in each direction. The City’s Master Plan of arterial highways identifies Main Street as a major arterial roadway, which has a total of six lanes, three in each direction from Interstate 15 to 11th Avenue. In addition, two new large scale retail developments proposed along this corridor in the near-term will impact Main Street with additional traffic. As a result, the bridge will have to be widened to accommodate the ultimate configuration of Main Street. The widening project has many potential issues; the chief issue being interaction with the Department of Water Resources (DWR). Other issues involve a potential retro-fit of the existing bridge structure to meet the new State seismic requirements, potential environmental issues, and involvement of Caltrans given its proximity to Interstate 15.
The first phase of the project will include preliminary design and the issues associated with that design, including right-of-way and outside agency coordination. Complete cost estimates and a proposed schedule will also result from this project phase. Phase 2 will involve acquisition of the necessary right-of-way, and construction.
Existing Situation and Work Completed Through Fiscal Year 2009-2010:
The consultant firm to carry out Phase 1 (design and right-of-way identification and project management) was engaged in February 2008. Commencement of the work began in May 2008. Coordination with DWR began with two meetings that occurred in Summer 2008. Preliminary design was completed and design work was started in January 2009. The Bridge Type Selection report was completed in March 2010 and submitted to DWR for approval. Coordination with DWR continued through April 2010. This new bridge is intended to serve westbound traffic, while the existing bridge will be seismically retrofitted by the state, and serve solely, eastbound traffic.
Project Schedule for Fiscal Year 2010-11 Budget:
Right-of-way identification and design is suspended this fiscal year due to changes in the economy and slowed development. Once design work is recommended and complete, right-of-way acquisition will begin, and construction will follow.
Project Costs and Funding:
2007-08 2008-09 2009-10 2009-10 2010-11
Expenditure Phases Actual Actual Budget Revised Budget
0$ 7,428$ 0$ 0$ 0$
1,824 0 600,000 60,000 0
1,824$ 7,428$ 600,000$ 60,000$ 0$
Source of Funds
0$ 7,428$ 0$ 0$ 0$
1,824 0 600,000 60,000 0
1,824$ 7,428$ 600,000$ 60,000$ 0$ Total Source of Funds
300-700-7096 Contractual
586-700-7096 Contractual
Total Expenditures
300 DIF Streets
586 Redevelopment Capital P/A #1
Project Funding Narrative:
Phase 1 is estimated to cost $650,000, and the right-of-way acquisition portion of Phase 2 is estimated at $300,000. The construction portion of Phase 2 would begin in Fiscal Year 2011-12 or 2011-12. This project is to be funded by a combination of Streets Development Impact Fees and Redevelopment Capital Project funds.
Project Impact on Operating Budget:
This project will have no effect on the operating budget at this time.
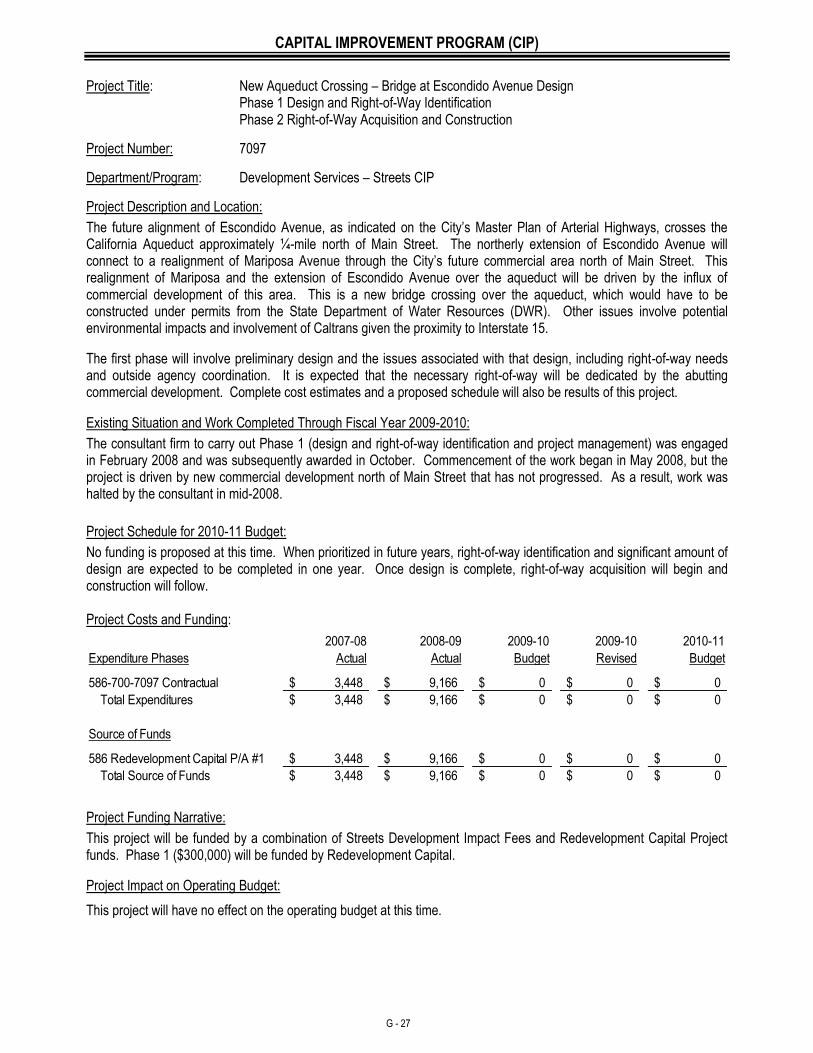
CAPITAL IMPROVEMENT PROGRAM (CIP)
G - 27
Project Title: New Aqueduct Crossing – Bridge at Escondido Avenue Design Phase 1 Design and Right-of-Way Identification Phase 2 Right-of-Way Acquisition and Construction
Project Number: 7097
Department/Program: Development Services – Streets CIP
Project Description and Location:
The future alignment of Escondido Avenue, as indicated on the City’s Master Plan of Arterial Highways, crosses the California Aqueduct approximately ¼-mile north of Main Street. The northerly extension of Escondido Avenue will connect to a realignment of Mariposa Avenue through the City’s future commercial area north of Main Street. This realignment of Mariposa and the extension of Escondido Avenue over the aqueduct will be driven by the influx of commercial development of this area. This is a new bridge crossing over the aqueduct, which would have to be constructed under permits from the State Department of Water Resources (DWR). Other issues involve potential environmental impacts and involvement of Caltrans given the proximity to Interstate 15.
The first phase will involve preliminary design and the issues associated with that design, including right-of-way needs and outside agency coordination. It is expected that the necessary right-of-way will be dedicated by the abutting commercial development. Complete cost estimates and a proposed schedule will also be results of this project.
Existing Situation and Work Completed Through Fiscal Year 2009-2010:
The consultant firm to carry out Phase 1 (design and right-of-way identification and project management) was engaged in February 2008 and was subsequently awarded in October. Commencement of the work began in May 2008, but the project is driven by new commercial development north of Main Street that has not progressed. As a result, work was halted by the consultant in mid-2008.
Project Schedule for 2010-11 Budget:
No funding is proposed at this time. When prioritized in future years, right-of-way identification and significant amount of design are expected to be completed in one year. Once design is complete, right-of-way acquisition will begin and construction will follow. Project Costs and Funding:
2007-08 2008-09 2009-10 2009-10 2010-11
Expenditure Phases Actual Actual Budget Revised Budget
3,448$ 9,166$ 0$ 0$ 0$
3,448$ 9,166$ 0$ 0$ 0$
Source of Funds
3,448$ 9,166$ 0$ 0$ 0$
3,448$ 9,166$ 0$ 0$ 0$ Total Source of Funds
586-700-7097 Contractual
Total Expenditures
586 Redevelopment Capital P/A #1
Project Funding Narrative:
This project will be funded by a combination of Streets Development Impact Fees and Redevelopment Capital Project funds. Phase 1 ($300,000) will be funded by Redevelopment Capital.
Project Impact on Operating Budget:
This project will have no effect on the operating budget at this time.
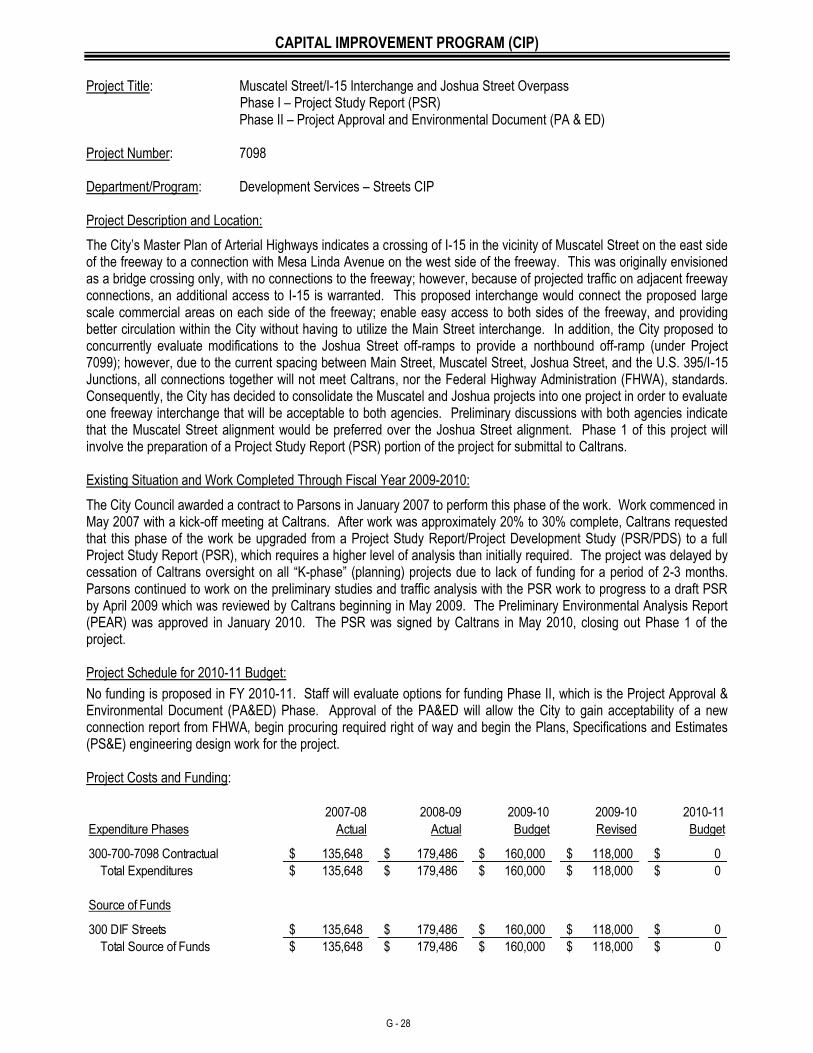
CAPITAL IMPROVEMENT PROGRAM (CIP)
G - 28
Project Title: Muscatel Street/I-15 Interchange and Joshua Street Overpass Phase I – Project Study Report (PSR) Phase II – Project Approval and Environmental Document (PA & ED) Project Number: 7098 Department/Program: Development Services – Streets CIP Project Description and Location:
The City’s Master Plan of Arterial Highways indicates a crossing of I-15 in the vicinity of Muscatel Street on the east side of the freeway to a connection with Mesa Linda Avenue on the west side of the freeway. This was originally envisioned as a bridge crossing only, with no connections to the freeway; however, because of projected traffic on adjacent freeway connections, an additional access to I-15 is warranted. This proposed interchange would connect the proposed large scale commercial areas on each side of the freeway; enable easy access to both sides of the freeway, and providing better circulation within the City without having to utilize the Main Street interchange. In addition, the City proposed to concurrently evaluate modifications to the Joshua Street off-ramps to provide a northbound off-ramp (under Project 7099); however, due to the current spacing between Main Street, Muscatel Street, Joshua Street, and the U.S. 395/I-15 Junctions, all connections together will not meet Caltrans, nor the Federal Highway Administration (FHWA), standards. Consequently, the City has decided to consolidate the Muscatel and Joshua projects into one project in order to evaluate one freeway interchange that will be acceptable to both agencies. Preliminary discussions with both agencies indicate that the Muscatel Street alignment would be preferred over the Joshua Street alignment. Phase 1 of this project will involve the preparation of a Project Study Report (PSR) portion of the project for submittal to Caltrans. Existing Situation and Work Completed Through Fiscal Year 2009-2010:
The City Council awarded a contract to Parsons in January 2007 to perform this phase of the work. Work commenced in May 2007 with a kick-off meeting at Caltrans. After work was approximately 20% to 30% complete, Caltrans requested that this phase of the work be upgraded from a Project Study Report/Project Development Study (PSR/PDS) to a full Project Study Report (PSR), which requires a higher level of analysis than initially required. The project was delayed by cessation of Caltrans oversight on all “K-phase” (planning) projects due to lack of funding for a period of 2-3 months. Parsons continued to work on the preliminary studies and traffic analysis with the PSR work to progress to a draft PSR by April 2009 which was reviewed by Caltrans beginning in May 2009. The Preliminary Environmental Analysis Report (PEAR) was approved in January 2010. The PSR was signed by Caltrans in May 2010, closing out Phase 1 of the project. Project Schedule for 2010-11 Budget:
No funding is proposed in FY 2010-11. Staff will evaluate options for funding Phase II, which is the Project Approval & Environmental Document (PA&ED) Phase. Approval of the PA&ED will allow the City to gain acceptability of a new connection report from FHWA, begin procuring required right of way and begin the Plans, Specifications and Estimates (PS&E) engineering design work for the project. Project Costs and Funding:
2007-08 2008-09 2009-10 2009-10 2010-11
Expenditure Phases Actual Actual Budget Revised Budget
135,648$ 179,486$ 160,000$ 118,000$ 0$
135,648$ 179,486$ 160,000$ 118,000$ 0$
Source of Funds
135,648$ 179,486$ 160,000$ 118,000$ 0$
135,648$ 179,486$ 160,000$ 118,000$ 0$
300-700-7098 Contractual
Total Expenditures
300 DIF Streets
Total Source of Funds
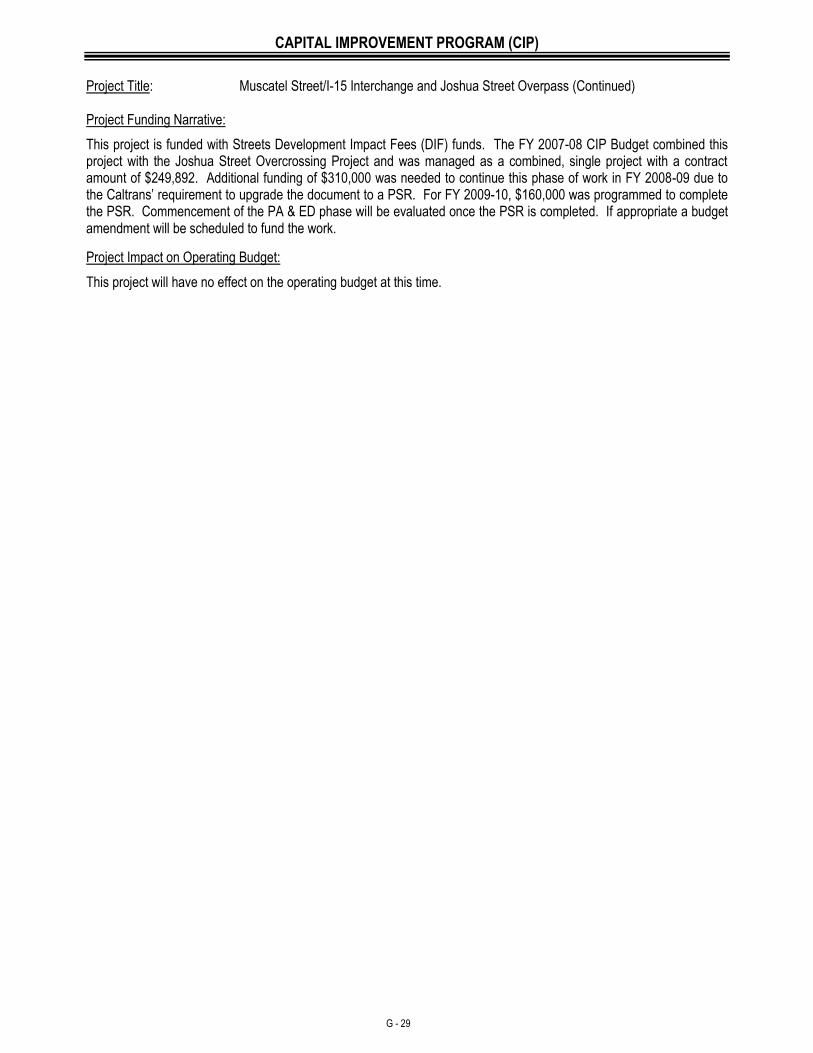
CAPITAL IMPROVEMENT PROGRAM (CIP)
G - 29
Project Title: Muscatel Street/I-15 Interchange and Joshua Street Overpass (Continued) Project Funding Narrative:
This project is funded with Streets Development Impact Fees (DIF) funds. The FY 2007-08 CIP Budget combined this project with the Joshua Street Overcrossing Project and was managed as a combined, single project with a contract amount of $249,892. Additional funding of $310,000 was needed to continue this phase of work in FY 2008-09 due to the Caltrans’ requirement to upgrade the document to a PSR. For FY 2009-10, $160,000 was programmed to complete the PSR. Commencement of the PA & ED phase will be evaluated once the PSR is completed. If appropriate a budget amendment will be scheduled to fund the work.
Project Impact on Operating Budget:
This project will have no effect on the operating budget at this time.
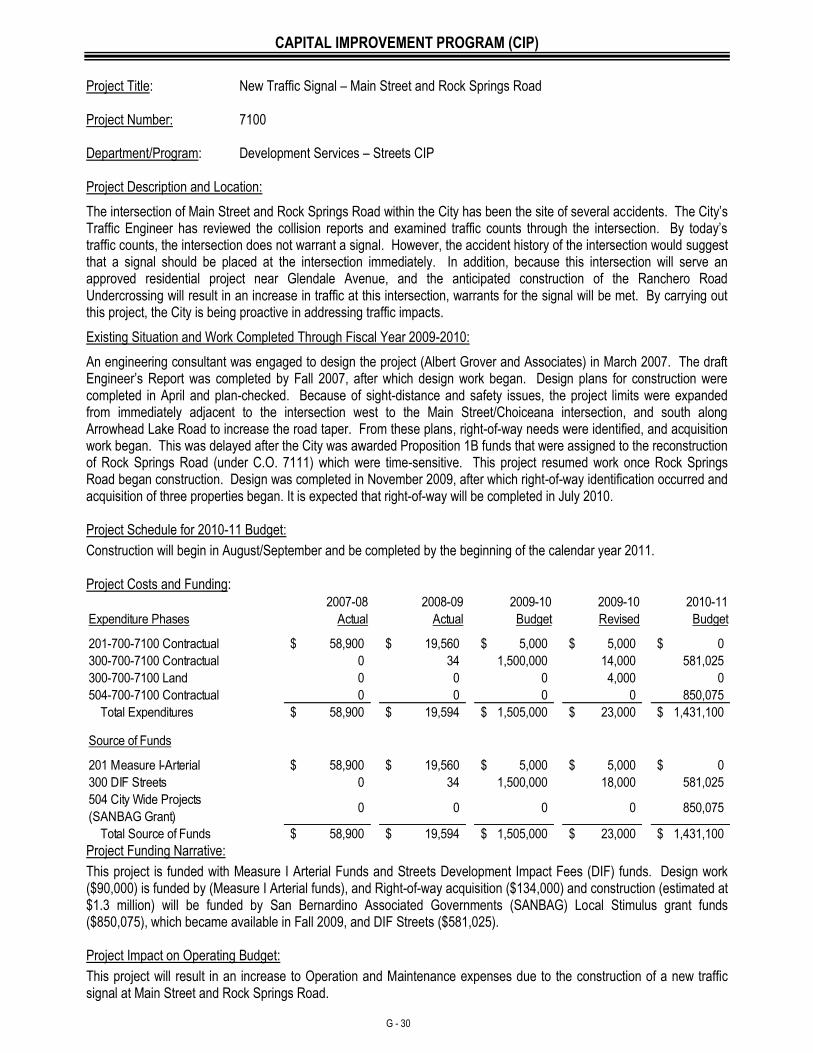
CAPITAL IMPROVEMENT PROGRAM (CIP)
G - 30
Project Title: New Traffic Signal – Main Street and Rock Springs Road Project Number: 7100 Department/Program: Development Services – Streets CIP Project Description and Location:
The intersection of Main Street and Rock Springs Road within the City has been the site of several accidents. The City’s Traffic Engineer has reviewed the collision reports and examined traffic counts through the intersection. By today’s traffic counts, the intersection does not warrant a signal. However, the accident history of the intersection would suggest that a signal should be placed at the intersection immediately. In addition, because this intersection will serve an approved residential project near Glendale Avenue, and the anticipated construction of the Ranchero Road Undercrossing will result in an increase in traffic at this intersection, warrants for the signal will be met. By carrying out this project, the City is being proactive in addressing traffic impacts.
Existing Situation and Work Completed Through Fiscal Year 2009-2010:
An engineering consultant was engaged to design the project (Albert Grover and Associates) in March 2007. The draft Engineer’s Report was completed by Fall 2007, after which design work began. Design plans for construction were completed in April and plan-checked. Because of sight-distance and safety issues, the project limits were expanded from immediately adjacent to the intersection west to the Main Street/Choiceana intersection, and south along Arrowhead Lake Road to increase the road taper. From these plans, right-of-way needs were identified, and acquisition work began. This was delayed after the City was awarded Proposition 1B funds that were assigned to the reconstruction of Rock Springs Road (under C.O. 7111) which were time-sensitive. This project resumed work once Rock Springs Road began construction. Design was completed in November 2009, after which right-of-way identification occurred and acquisition of three properties began. It is expected that right-of-way will be completed in July 2010. Project Schedule for 2010-11 Budget:
Construction will begin in August/September and be completed by the beginning of the calendar year 2011. Project Costs and Funding:
2007-08 2008-09 2009-10 2009-10 2010-11
Expenditure Phases Actual Actual Budget Revised Budget
58,900$ 19,560$ 5,000$ 5,000$ 0$
0 34 1,500,000 14,000 581,025
300-700-7100 Land 0 0 0 4,000 0
504-700-7100 Contractual 0 0 0 0 850,075
58,900$ 19,594$ 1,505,000$ 23,000$ 1,431,100$
Source of Funds
58,900$ 19,560$ 5,000$ 5,000$ 0$
0 34 1,500,000 18,000 581,025
504 City Wide Projects
(SANBAG Grant)0 0 0 0 850,075
58,900$ 19,594$ 1,505,000$ 23,000$ 1,431,100$
300 DIF Streets
Total Source of Funds
201-700-7100 Contractual
300-700-7100 Contractual
Total Expenditures
201 Measure I-Arterial
Project Funding Narrative:
This project is funded with Measure I Arterial Funds and Streets Development Impact Fees (DIF) funds. Design work ($90,000) is funded by (Measure I Arterial funds), and Right-of-way acquisition ($134,000) and construction (estimated at $1.3 million) will be funded by San Bernardino Associated Governments (SANBAG) Local Stimulus grant funds ($850,075), which became available in Fall 2009, and DIF Streets ($581,025). Project Impact on Operating Budget:
This project will result in an increase to Operation and Maintenance expenses due to the construction of a new traffic signal at Main Street and Rock Springs Road.
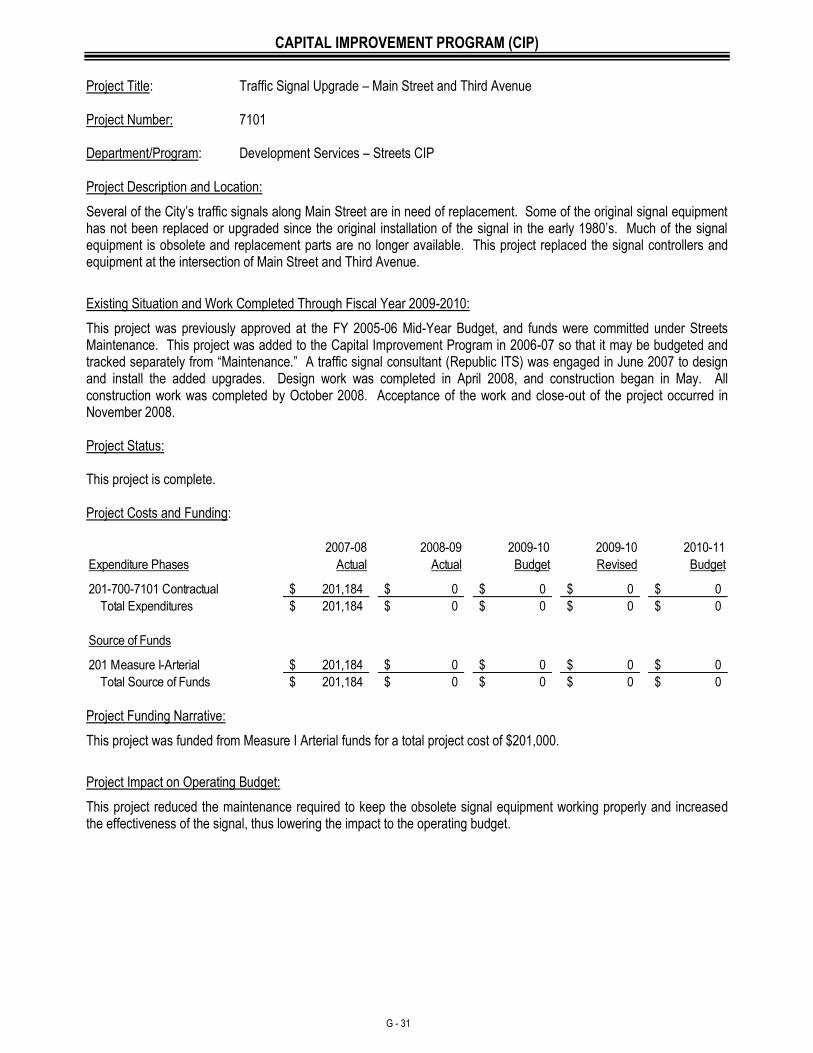
CAPITAL IMPROVEMENT PROGRAM (CIP)
G - 31
Project Title: Traffic Signal Upgrade – Main Street and Third Avenue Project Number: 7101 Department/Program: Development Services – Streets CIP Project Description and Location:
Several of the City’s traffic signals along Main Street are in need of replacement. Some of the original signal equipment has not been replaced or upgraded since the original installation of the signal in the early 1980’s. Much of the signal equipment is obsolete and replacement parts are no longer available. This project replaced the signal controllers and equipment at the intersection of Main Street and Third Avenue.
Existing Situation and Work Completed Through Fiscal Year 2009-2010:
This project was previously approved at the FY 2005-06 Mid-Year Budget, and funds were committed under Streets Maintenance. This project was added to the Capital Improvement Program in 2006-07 so that it may be budgeted and tracked separately from “Maintenance.” A traffic signal consultant (Republic ITS) was engaged in June 2007 to design and install the added upgrades. Design work was completed in April 2008, and construction began in May. All construction work was completed by October 2008. Acceptance of the work and close-out of the project occurred in November 2008. Project Status: This project is complete. Project Costs and Funding:
2007-08 2008-09 2009-10 2009-10 2010-11
Expenditure Phases Actual Actual Budget Revised Budget
201,184$ 0$ 0$ 0$ 0$
201,184$ 0$ 0$ 0$ 0$
Source of Funds
201,184$ 0$ 0$ 0$ 0$
201,184$ 0$ 0$ 0$ 0$
201-700-7101 Contractual
Total Expenditures
201 Measure I-Arterial
Total Source of Funds Project Funding Narrative:
This project was funded from Measure I Arterial funds for a total project cost of $201,000.
Project Impact on Operating Budget:
This project reduced the maintenance required to keep the obsolete signal equipment working properly and increased the effectiveness of the signal, thus lowering the impact to the operating budget.
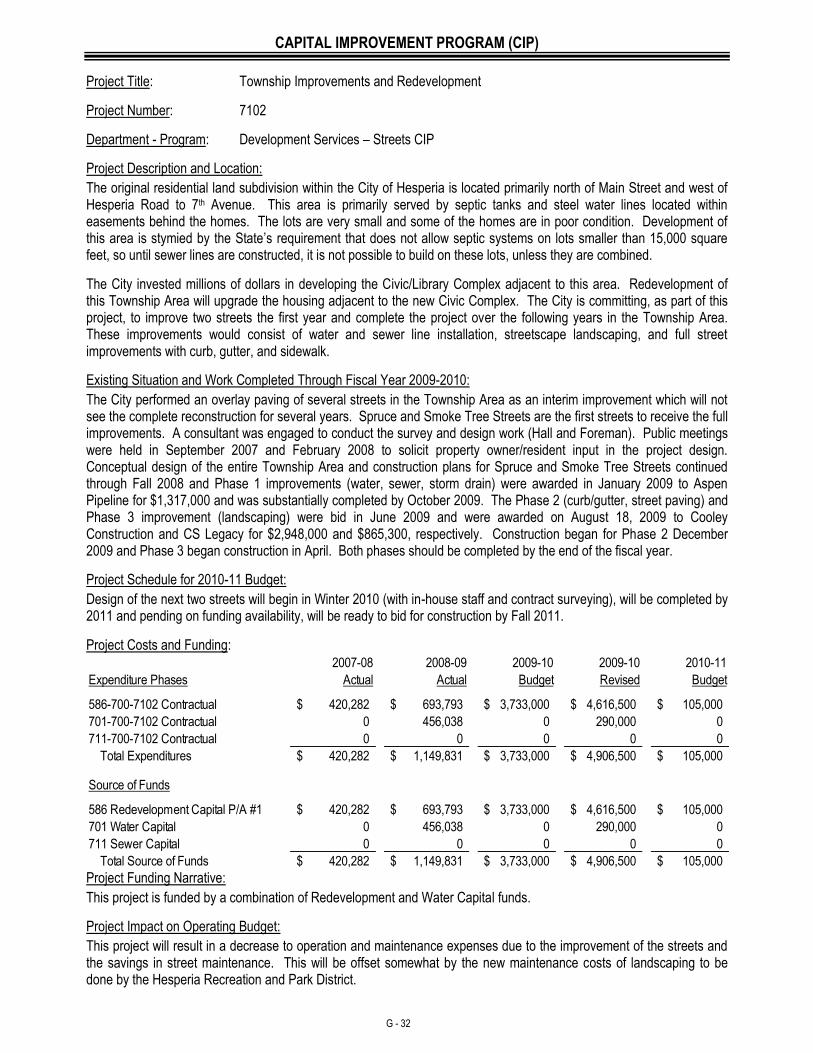
CAPITAL IMPROVEMENT PROGRAM (CIP)
G - 32
Project Title: Township Improvements and Redevelopment
Project Number: 7102
Department - Program: Development Services – Streets CIP
Project Description and Location:
The original residential land subdivision within the City of Hesperia is located primarily north of Main Street and west of Hesperia Road to 7th Avenue. This area is primarily served by septic tanks and steel water lines located within easements behind the homes. The lots are very small and some of the homes are in poor condition. Development of this area is stymied by the State’s requirement that does not allow septic systems on lots smaller than 15,000 square feet, so until sewer lines are constructed, it is not possible to build on these lots, unless they are combined.
The City invested millions of dollars in developing the Civic/Library Complex adjacent to this area. Redevelopment of this Township Area will upgrade the housing adjacent to the new Civic Complex. The City is committing, as part of this project, to improve two streets the first year and complete the project over the following years in the Township Area. These improvements would consist of water and sewer line installation, streetscape landscaping, and full street improvements with curb, gutter, and sidewalk.
Existing Situation and Work Completed Through Fiscal Year 2009-2010:
The City performed an overlay paving of several streets in the Township Area as an interim improvement which will not see the complete reconstruction for several years. Spruce and Smoke Tree Streets are the first streets to receive the full improvements. A consultant was engaged to conduct the survey and design work (Hall and Foreman). Public meetings were held in September 2007 and February 2008 to solicit property owner/resident input in the project design. Conceptual design of the entire Township Area and construction plans for Spruce and Smoke Tree Streets continued through Fall 2008 and Phase 1 improvements (water, sewer, storm drain) were awarded in January 2009 to Aspen Pipeline for $1,317,000 and was substantially completed by October 2009. The Phase 2 (curb/gutter, street paving) and Phase 3 improvement (landscaping) were bid in June 2009 and were awarded on August 18, 2009 to Cooley Construction and CS Legacy for $2,948,000 and $865,300, respectively. Construction began for Phase 2 December 2009 and Phase 3 began construction in April. Both phases should be completed by the end of the fiscal year.
Project Schedule for 2010-11 Budget:
Design of the next two streets will begin in Winter 2010 (with in-house staff and contract surveying), will be completed by 2011 and pending on funding availability, will be ready to bid for construction by Fall 2011.
Project Costs and Funding:
2007-08 2008-09 2009-10 2009-10 2010-11
Expenditure Phases Actual Actual Budget Revised Budget
420,282$ 693,793$ 3,733,000$ 4,616,500$ 105,000$
0 456,038 0 290,000 0
0 0 0 0 0
420,282$ 1,149,831$ 3,733,000$ 4,906,500$ 105,000$
Source of Funds
420,282$ 693,793$ 3,733,000$ 4,616,500$ 105,000$
0 456,038 0 290,000 0
0 0 0 0 0
420,282$ 1,149,831$ 3,733,000$ 4,906,500$ 105,000$
586 Redevelopment Capital P/A #1
701 Water Capital
711 Sewer Capital
Total Source of Funds
586-700-7102 Contractual
701-700-7102 Contractual
711-700-7102 Contractual
Total Expenditures
Project Funding Narrative:
This project is funded by a combination of Redevelopment and Water Capital funds.
Project Impact on Operating Budget:
This project will result in a decrease to operation and maintenance expenses due to the improvement of the streets and the savings in street maintenance. This will be offset somewhat by the new maintenance costs of landscaping to be done by the Hesperia Recreation and Park District.
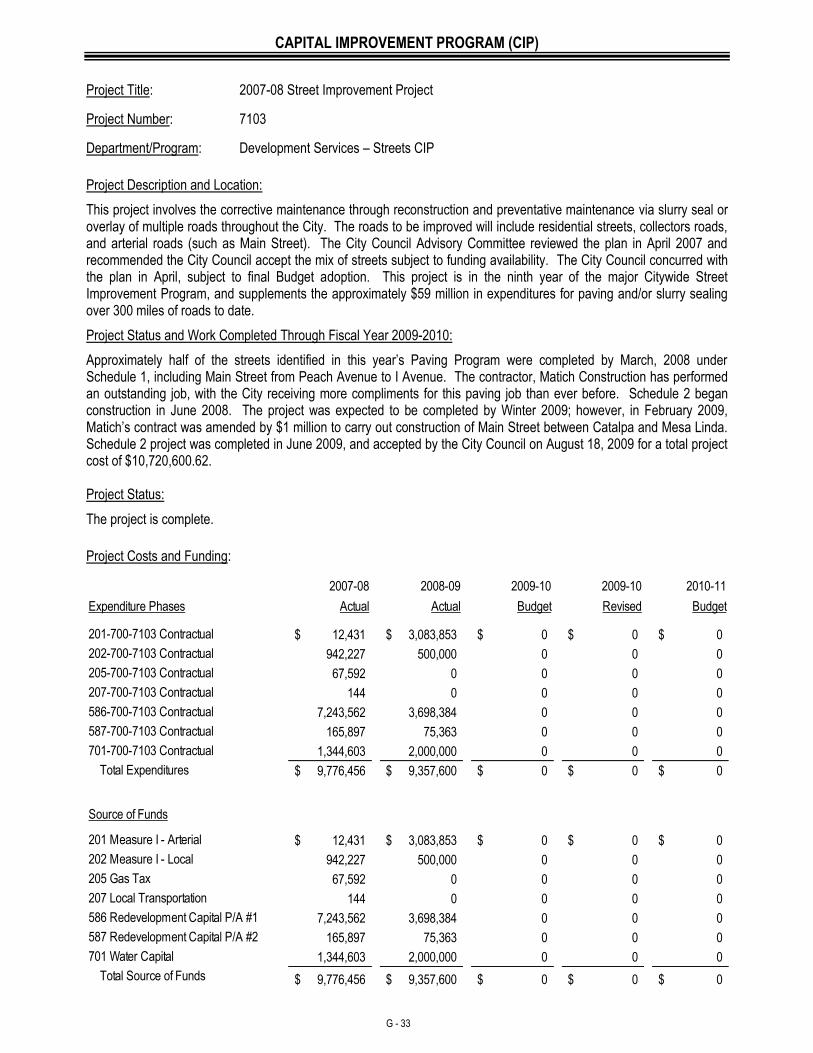
CAPITAL IMPROVEMENT PROGRAM (CIP)
G - 33
Project Title: 2007-08 Street Improvement Project
Project Number: 7103
Department/Program: Development Services – Streets CIP
Project Description and Location:
This project involves the corrective maintenance through reconstruction and preventative maintenance via slurry seal or overlay of multiple roads throughout the City. The roads to be improved will include residential streets, collectors roads, and arterial roads (such as Main Street). The City Council Advisory Committee reviewed the plan in April 2007 and recommended the City Council accept the mix of streets subject to funding availability. The City Council concurred with the plan in April, subject to final Budget adoption. This project is in the ninth year of the major Citywide Street Improvement Program, and supplements the approximately $59 million in expenditures for paving and/or slurry sealing over 300 miles of roads to date.
Project Status and Work Completed Through Fiscal Year 2009-2010:
Approximately half of the streets identified in this year’s Paving Program were completed by March, 2008 under Schedule 1, including Main Street from Peach Avenue to I Avenue. The contractor, Matich Construction has performed an outstanding job, with the City receiving more compliments for this paving job than ever before. Schedule 2 began construction in June 2008. The project was expected to be completed by Winter 2009; however, in February 2009, Matich’s contract was amended by $1 million to carry out construction of Main Street between Catalpa and Mesa Linda. Schedule 2 project was completed in June 2009, and accepted by the City Council on August 18, 2009 for a total project cost of $10,720,600.62. Project Status:
The project is complete.
Project Costs and Funding:
2007-08 2008-09 2009-10 2009-10 2010-11
Expenditure Phases Actual Actual Budget Revised Budget
12,431$ 3,083,853$ 0$ 0$ 0$
942,227 500,000 0 0 0
67,592 0 0 0 0
144 0 0 0 0
7,243,562 3,698,384 0 0 0
165,897 75,363 0 0 0
1,344,603 2,000,000 0 0 0
9,776,456$ 9,357,600$ 0$ 0$ 0$
Source of Funds
12,431$ 3,083,853$ 0$ 0$ 0$
942,227 500,000 0 0 0
67,592 0 0 0 0
144 0 0 0 0
7,243,562 3,698,384 0 0 0
165,897 75,363 0 0 0
1,344,603 2,000,000 0 0 0
9,776,456$ 9,357,600$ 0$ 0$ 0$
201 Measure I - Arterial
202 Measure I - Local
205 Gas Tax
207 Local Transportation
586 Redevelopment Capital P/A #1
701 Water Capital
Total Source of Funds
586-700-7103 Contractual
587-700-7103 Contractual
701-700-7103 Contractual
Total Expenditures
587 Redevelopment Capital P/A #2
201-700-7103 Contractual
202-700-7103 Contractual
205-700-7103 Contractual
207-700-7103 Contractual
CAPITAL IMPROVEMENT PROGRAM (CIP)
G - 34
Project Title: 2007-08 Street Improvement Project (Continued)
Project Funding Narrative:
The completion of the 2007-08 Street Improvement Project was funded from multiple funding sources as noted above.
Project Impact on Operating Budget:
The project will result in a decrease in operational/maintenance expenses due to the reduction in street repairs to certain roads.
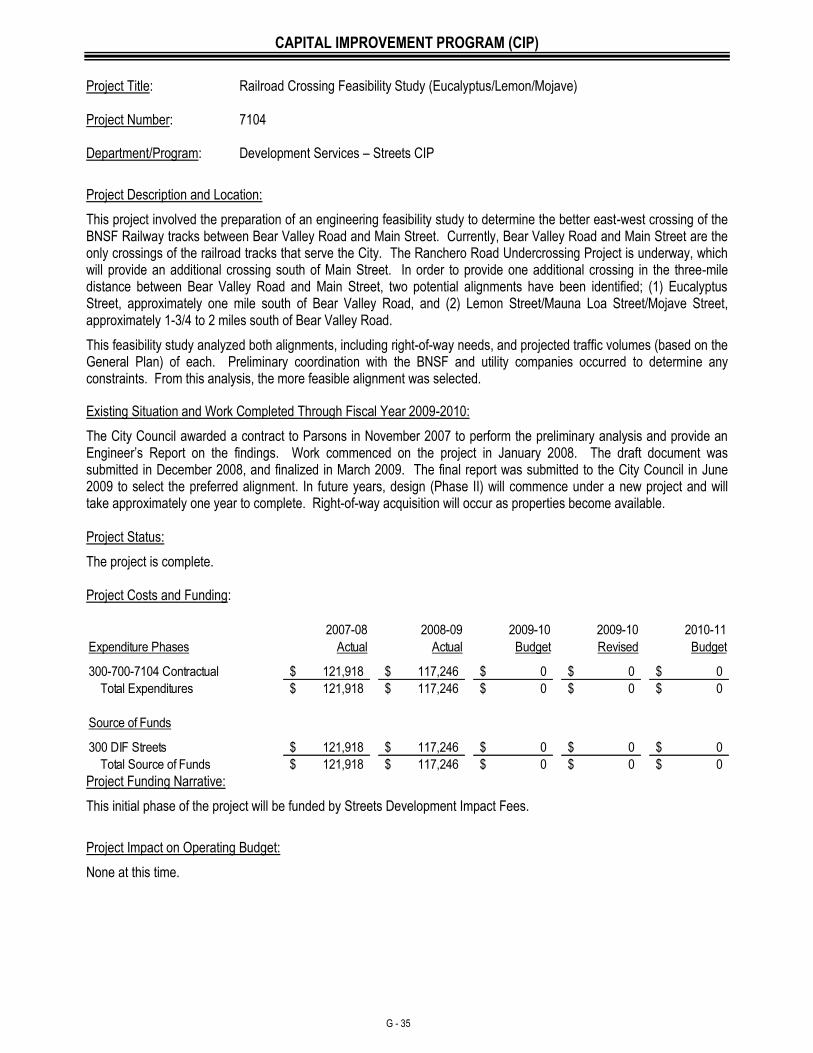
CAPITAL IMPROVEMENT PROGRAM (CIP)
G - 35
Project Title: Railroad Crossing Feasibility Study (Eucalyptus/Lemon/Mojave) Project Number: 7104 Department/Program: Development Services – Streets CIP
Project Description and Location:
This project involved the preparation of an engineering feasibility study to determine the better east-west crossing of the BNSF Railway tracks between Bear Valley Road and Main Street. Currently, Bear Valley Road and Main Street are the only crossings of the railroad tracks that serve the City. The Ranchero Road Undercrossing Project is underway, which will provide an additional crossing south of Main Street. In order to provide one additional crossing in the three-mile distance between Bear Valley Road and Main Street, two potential alignments have been identified; (1) Eucalyptus Street, approximately one mile south of Bear Valley Road, and (2) Lemon Street/Mauna Loa Street/Mojave Street, approximately 1-3/4 to 2 miles south of Bear Valley Road.
This feasibility study analyzed both alignments, including right-of-way needs, and projected traffic volumes (based on the General Plan) of each. Preliminary coordination with the BNSF and utility companies occurred to determine any constraints. From this analysis, the more feasible alignment was selected.
Existing Situation and Work Completed Through Fiscal Year 2009-2010:
The City Council awarded a contract to Parsons in November 2007 to perform the preliminary analysis and provide an Engineer’s Report on the findings. Work commenced on the project in January 2008. The draft document was submitted in December 2008, and finalized in March 2009. The final report was submitted to the City Council in June 2009 to select the preferred alignment. In future years, design (Phase II) will commence under a new project and will take approximately one year to complete. Right-of-way acquisition will occur as properties become available. Project Status:
The project is complete. Project Costs and Funding:
2007-08 2008-09 2009-10 2009-10 2010-11
Expenditure Phases Actual Actual Budget Revised Budget
121,918$ 117,246$ 0$ 0$ 0$
121,918$ 117,246$ 0$ 0$ 0$
Source of Funds
121,918$ 117,246$ 0$ 0$ 0$
121,918$ 117,246$ 0$ 0$ 0$
300-700-7104 Contractual
Total Expenditures
300 DIF Streets
Total Source of Funds Project Funding Narrative:
This initial phase of the project will be funded by Streets Development Impact Fees.
Project Impact on Operating Budget:
None at this time.
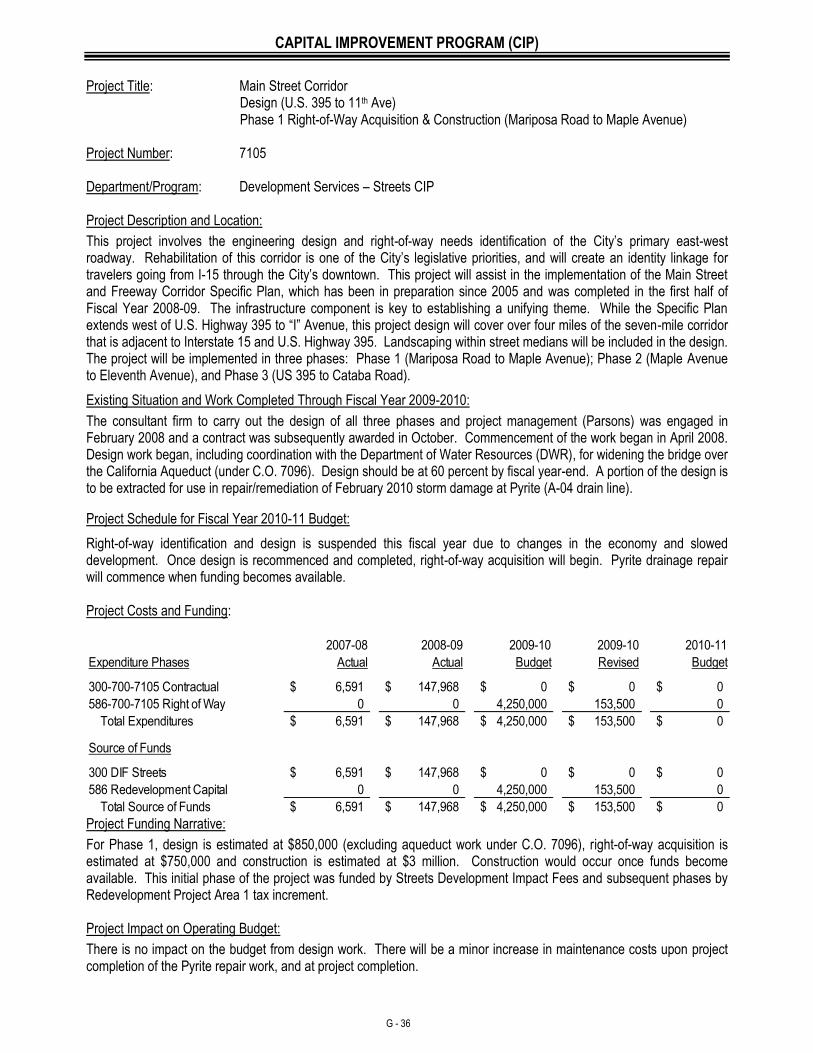
CAPITAL IMPROVEMENT PROGRAM (CIP)
G - 36
Project Title: Main Street Corridor
Design (U.S. 395 to 11th Ave) Phase 1 Right-of-Way Acquisition & Construction (Mariposa Road to Maple Avenue)
Project Number: 7105 Department/Program: Development Services – Streets CIP Project Description and Location:
This project involves the engineering design and right-of-way needs identification of the City’s primary east-west roadway. Rehabilitation of this corridor is one of the City’s legislative priorities, and will create an identity linkage for travelers going from I-15 through the City’s downtown. This project will assist in the implementation of the Main Street and Freeway Corridor Specific Plan, which has been in preparation since 2005 and was completed in the first half of Fiscal Year 2008-09. The infrastructure component is key to establishing a unifying theme. While the Specific Plan extends west of U.S. Highway 395 to “I” Avenue, this project design will cover over four miles of the seven-mile corridor that is adjacent to Interstate 15 and U.S. Highway 395. Landscaping within street medians will be included in the design. The project will be implemented in three phases: Phase 1 (Mariposa Road to Maple Avenue); Phase 2 (Maple Avenue to Eleventh Avenue), and Phase 3 (US 395 to Cataba Road).
Existing Situation and Work Completed Through Fiscal Year 2009-2010:
The consultant firm to carry out the design of all three phases and project management (Parsons) was engaged in February 2008 and a contract was subsequently awarded in October. Commencement of the work began in April 2008. Design work began, including coordination with the Department of Water Resources (DWR), for widening the bridge over the California Aqueduct (under C.O. 7096). Design should be at 60 percent by fiscal year-end. A portion of the design is to be extracted for use in repair/remediation of February 2010 storm damage at Pyrite (A-04 drain line).
Project Schedule for Fiscal Year 2010-11 Budget:
Right-of-way identification and design is suspended this fiscal year due to changes in the economy and slowed development. Once design is recommenced and completed, right-of-way acquisition will begin. Pyrite drainage repair will commence when funding becomes available. Project Costs and Funding:
2007-08 2008-09 2009-10 2009-10 2010-11
Expenditure Phases Actual Actual Budget Revised Budget
6,591$ 147,968$ 0$ 0$ 0$
0 0 4,250,000 153,500 0
6,591$ 147,968$ 4,250,000$ 153,500$ 0$
Source of Funds
6,591$ 147,968$ 0$ 0$ 0$
0 0 4,250,000 153,500 0
6,591$ 147,968$ 4,250,000$ 153,500$ 0$
300-700-7105 Contractual
586-700-7105 Right of Way
Total Expenditures
300 DIF Streets
586 Redevelopment Capital
Total Source of Funds Project Funding Narrative:
For Phase 1, design is estimated at $850,000 (excluding aqueduct work under C.O. 7096), right-of-way acquisition is estimated at $750,000 and construction is estimated at $3 million. Construction would occur once funds become available. This initial phase of the project was funded by Streets Development Impact Fees and subsequent phases by Redevelopment Project Area 1 tax increment. Project Impact on Operating Budget:
There is no impact on the budget from design work. There will be a minor increase in maintenance costs upon project completion of the Pyrite repair work, and at project completion.
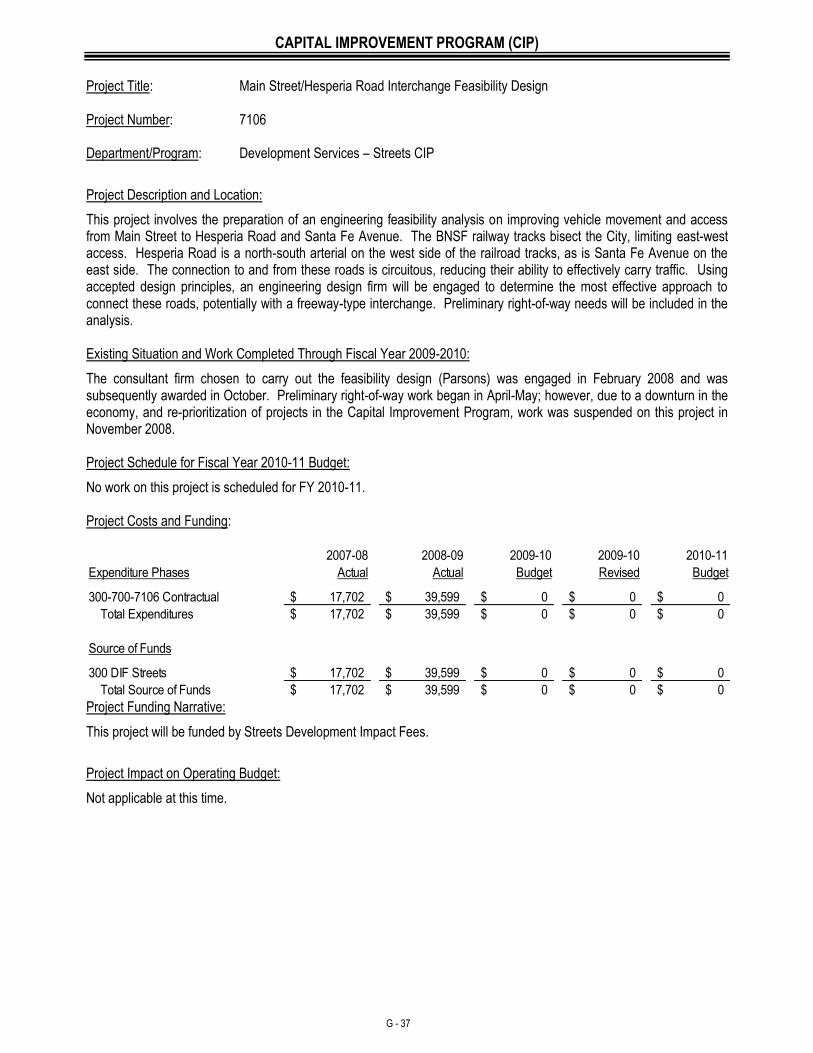
CAPITAL IMPROVEMENT PROGRAM (CIP)
G - 37
Project Title: Main Street/Hesperia Road Interchange Feasibility Design Project Number: 7106 Department/Program: Development Services – Streets CIP
Project Description and Location:
This project involves the preparation of an engineering feasibility analysis on improving vehicle movement and access from Main Street to Hesperia Road and Santa Fe Avenue. The BNSF railway tracks bisect the City, limiting east-west access. Hesperia Road is a north-south arterial on the west side of the railroad tracks, as is Santa Fe Avenue on the east side. The connection to and from these roads is circuitous, reducing their ability to effectively carry traffic. Using accepted design principles, an engineering design firm will be engaged to determine the most effective approach to connect these roads, potentially with a freeway-type interchange. Preliminary right-of-way needs will be included in the analysis. Existing Situation and Work Completed Through Fiscal Year 2009-2010:
The consultant firm chosen to carry out the feasibility design (Parsons) was engaged in February 2008 and was subsequently awarded in October. Preliminary right-of-way work began in April-May; however, due to a downturn in the economy, and re-prioritization of projects in the Capital Improvement Program, work was suspended on this project in November 2008. Project Schedule for Fiscal Year 2010-11 Budget:
No work on this project is scheduled for FY 2010-11. Project Costs and Funding:
2007-08 2008-09 2009-10 2009-10 2010-11
Expenditure Phases Actual Actual Budget Revised Budget
17,702$ 39,599$ 0$ 0$ 0$
17,702$ 39,599$ 0$ 0$ 0$
Source of Funds
17,702$ 39,599$ 0$ 0$ 0$
17,702$ 39,599$ 0$ 0$ 0$
300-700-7106 Contractual
Total Expenditures
300 DIF Streets
Total Source of Funds Project Funding Narrative:
This project will be funded by Streets Development Impact Fees.
Project Impact on Operating Budget:
Not applicable at this time.
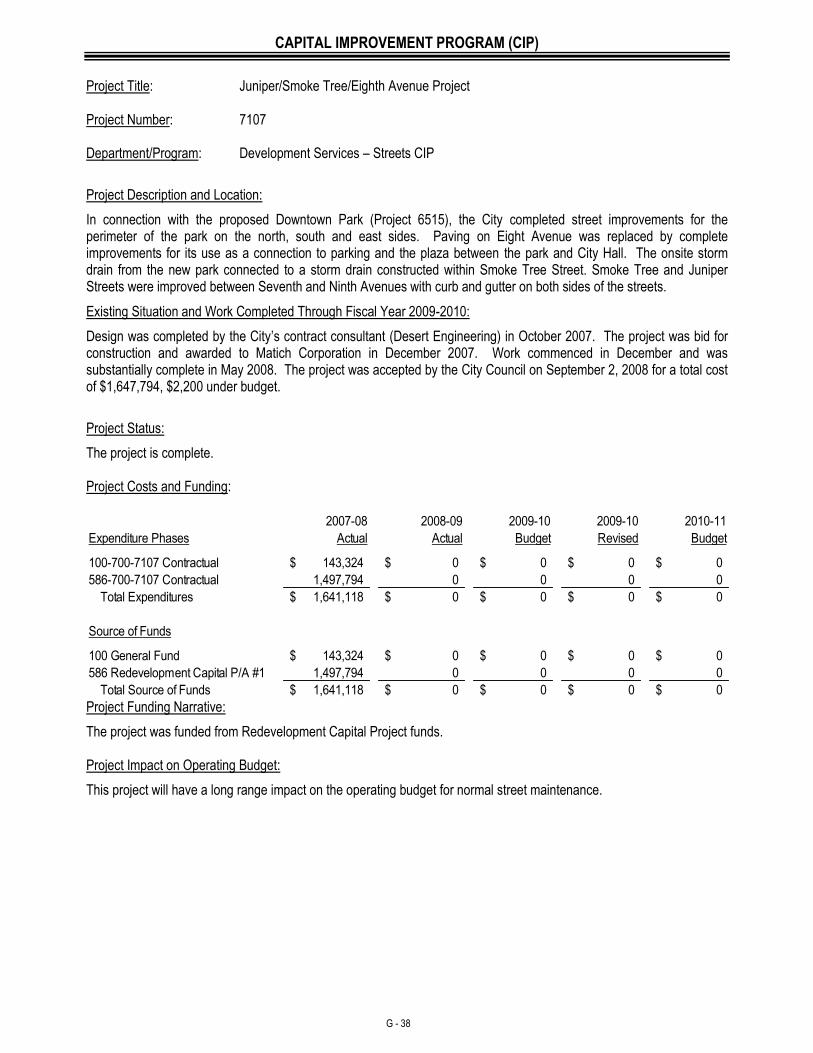
CAPITAL IMPROVEMENT PROGRAM (CIP)
G - 38
Project Title: Juniper/Smoke Tree/Eighth Avenue Project Project Number: 7107 Department/Program: Development Services – Streets CIP
Project Description and Location:
In connection with the proposed Downtown Park (Project 6515), the City completed street improvements for the perimeter of the park on the north, south and east sides. Paving on Eight Avenue was replaced by complete improvements for its use as a connection to parking and the plaza between the park and City Hall. The onsite storm drain from the new park connected to a storm drain constructed within Smoke Tree Street. Smoke Tree and Juniper Streets were improved between Seventh and Ninth Avenues with curb and gutter on both sides of the streets.
Existing Situation and Work Completed Through Fiscal Year 2009-2010:
Design was completed by the City’s contract consultant (Desert Engineering) in October 2007. The project was bid for construction and awarded to Matich Corporation in December 2007. Work commenced in December and was substantially complete in May 2008. The project was accepted by the City Council on September 2, 2008 for a total cost of $1,647,794, $2,200 under budget.
Project Status:
The project is complete. Project Costs and Funding:
2007-08 2008-09 2009-10 2009-10 2010-11
Expenditure Phases Actual Actual Budget Revised Budget
143,324$ 0$ 0$ 0$ 0$
1,497,794 0 0 0 0
1,641,118$ 0$ 0$ 0$ 0$
Source of Funds
143,324$ 0$ 0$ 0$ 0$
1,497,794 0 0 0 0
1,641,118$ 0$ 0$ 0$ 0$
586 Redevelopment Capital P/A #1
Total Source of Funds
100-700-7107 Contractual
586-700-7107 Contractual
Total Expenditures
100 General Fund
Project Funding Narrative:
The project was funded from Redevelopment Capital Project funds. Project Impact on Operating Budget:
This project will have a long range impact on the operating budget for normal street maintenance.
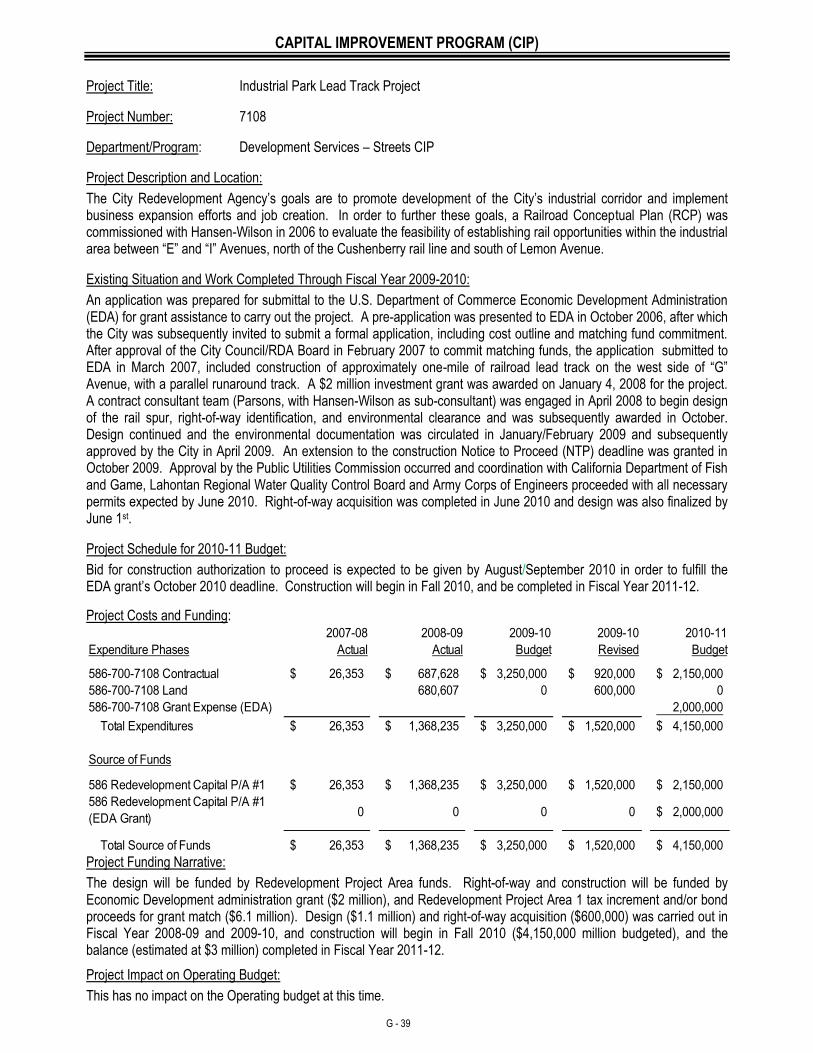
CAPITAL IMPROVEMENT PROGRAM (CIP)
G - 39
Project Title: Industrial Park Lead Track Project
Project Number: 7108
Department/Program: Development Services – Streets CIP
Project Description and Location:
The City Redevelopment Agency’s goals are to promote development of the City’s industrial corridor and implement business expansion efforts and job creation. In order to further these goals, a Railroad Conceptual Plan (RCP) was commissioned with Hansen-Wilson in 2006 to evaluate the feasibility of establishing rail opportunities within the industrial area between “E” and “I” Avenues, north of the Cushenberry rail line and south of Lemon Avenue.
Existing Situation and Work Completed Through Fiscal Year 2009-2010:
An application was prepared for submittal to the U.S. Department of Commerce Economic Development Administration (EDA) for grant assistance to carry out the project. A pre-application was presented to EDA in October 2006, after which the City was subsequently invited to submit a formal application, including cost outline and matching fund commitment. After approval of the City Council/RDA Board in February 2007 to commit matching funds, the application submitted to EDA in March 2007, included construction of approximately one-mile of railroad lead track on the west side of “G” Avenue, with a parallel runaround track. A $2 million investment grant was awarded on January 4, 2008 for the project. A contract consultant team (Parsons, with Hansen-Wilson as sub-consultant) was engaged in April 2008 to begin design of the rail spur, right-of-way identification, and environmental clearance and was subsequently awarded in October. Design continued and the environmental documentation was circulated in January/February 2009 and subsequently approved by the City in April 2009. An extension to the construction Notice to Proceed (NTP) deadline was granted in October 2009. Approval by the Public Utilities Commission occurred and coordination with California Department of Fish and Game, Lahontan Regional Water Quality Control Board and Army Corps of Engineers proceeded with all necessary permits expected by June 2010. Right-of-way acquisition was completed in June 2010 and design was also finalized by June 1st.
Project Schedule for 2010-11 Budget:
Bid for construction authorization to proceed is expected to be given by August/September 2010 in order to fulfill the EDA grant’s October 2010 deadline. Construction will begin in Fall 2010, and be completed in Fiscal Year 2011-12.
Project Costs and Funding: 2007-08 2008-09 2009-10 2009-10 2010-11
Expenditure Phases Actual Actual Budget Revised Budget
26,353$ 687,628$ 3,250,000$ 920,000$ 2,150,000$
680,607 0 600,000 0
586-700-7108 Grant Expense (EDA) 2,000,000
26,353$ 1,368,235$ 3,250,000$ 1,520,000$ 4,150,000$
Source of Funds
26,353$ 1,368,235$ 3,250,000$ 1,520,000$ 2,150,000$
0 0 0 0 2,000,000$
26,353$ 1,368,235$ 3,250,000$ 1,520,000$ 4,150,000$
586 Redevelopment Capital P/A #1
(EDA Grant)
Total Source of Funds
586-700-7108 Contractual
586-700-7108 Land
Total Expenditures
586 Redevelopment Capital P/A #1
Project Funding Narrative:
The design will be funded by Redevelopment Project Area funds. Right-of-way and construction will be funded by Economic Development administration grant ($2 million), and Redevelopment Project Area 1 tax increment and/or bond proceeds for grant match ($6.1 million). Design ($1.1 million) and right-of-way acquisition ($600,000) was carried out in Fiscal Year 2008-09 and 2009-10, and construction will begin in Fall 2010 ($4,150,000 million budgeted), and the balance (estimated at $3 million) completed in Fiscal Year 2011-12.
Project Impact on Operating Budget:
This has no impact on the Operating budget at this time.
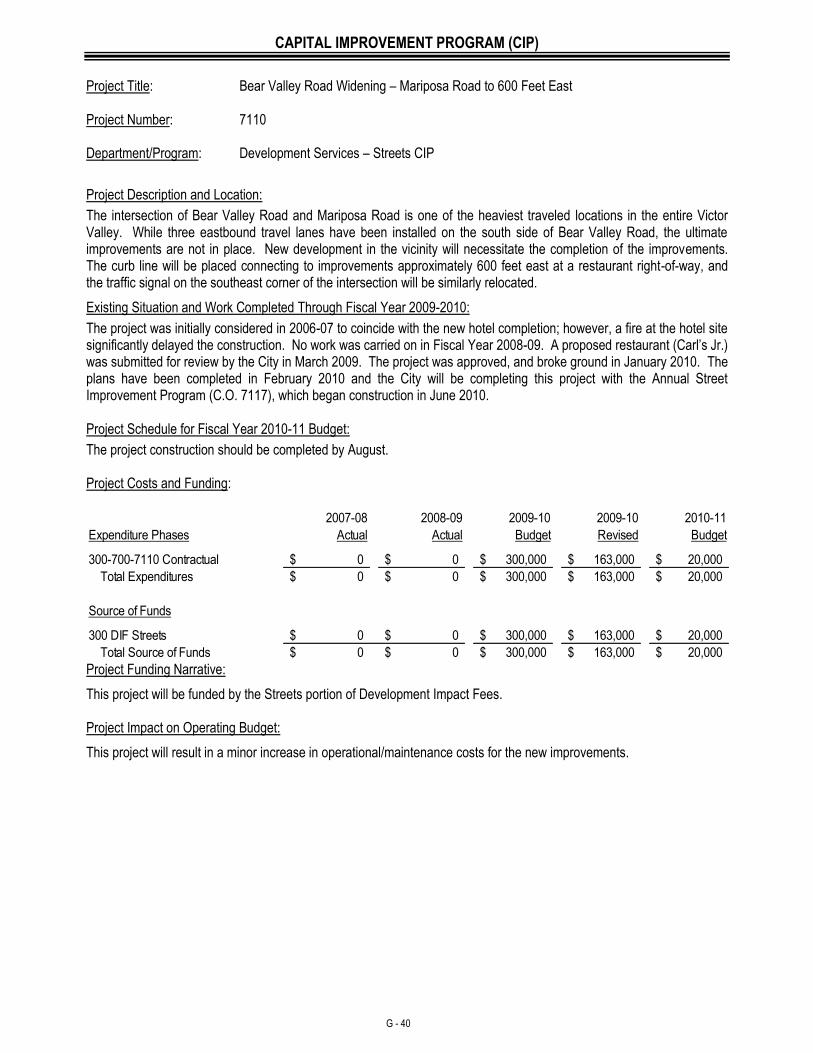
CAPITAL IMPROVEMENT PROGRAM (CIP)
G - 40
Project Title: Bear Valley Road Widening – Mariposa Road to 600 Feet East Project Number: 7110 Department/Program: Development Services – Streets CIP
Project Description and Location:
The intersection of Bear Valley Road and Mariposa Road is one of the heaviest traveled locations in the entire Victor Valley. While three eastbound travel lanes have been installed on the south side of Bear Valley Road, the ultimate improvements are not in place. New development in the vicinity will necessitate the completion of the improvements. The curb line will be placed connecting to improvements approximately 600 feet east at a restaurant right-of-way, and the traffic signal on the southeast corner of the intersection will be similarly relocated.
Existing Situation and Work Completed Through Fiscal Year 2009-2010:
The project was initially considered in 2006-07 to coincide with the new hotel completion; however, a fire at the hotel site significantly delayed the construction. No work was carried on in Fiscal Year 2008-09. A proposed restaurant (Carl’s Jr.) was submitted for review by the City in March 2009. The project was approved, and broke ground in January 2010. The plans have been completed in February 2010 and the City will be completing this project with the Annual Street Improvement Program (C.O. 7117), which began construction in June 2010. Project Schedule for Fiscal Year 2010-11 Budget:
The project construction should be completed by August. Project Costs and Funding:
2007-08 2008-09 2009-10 2009-10 2010-11
Expenditure Phases Actual Actual Budget Revised Budget
0$ 0$ 300,000$ 163,000$ 20,000$
0$ 0$ 300,000$ 163,000$ 20,000$
Source of Funds
0$ 0$ 300,000$ 163,000$ 20,000$
0$ 0$ 300,000$ 163,000$ 20,000$
300-700-7110 Contractual
Total Expenditures
300 DIF Streets
Total Source of Funds Project Funding Narrative:
This project will be funded by the Streets portion of Development Impact Fees. Project Impact on Operating Budget:
This project will result in a minor increase in operational/maintenance costs for the new improvements.
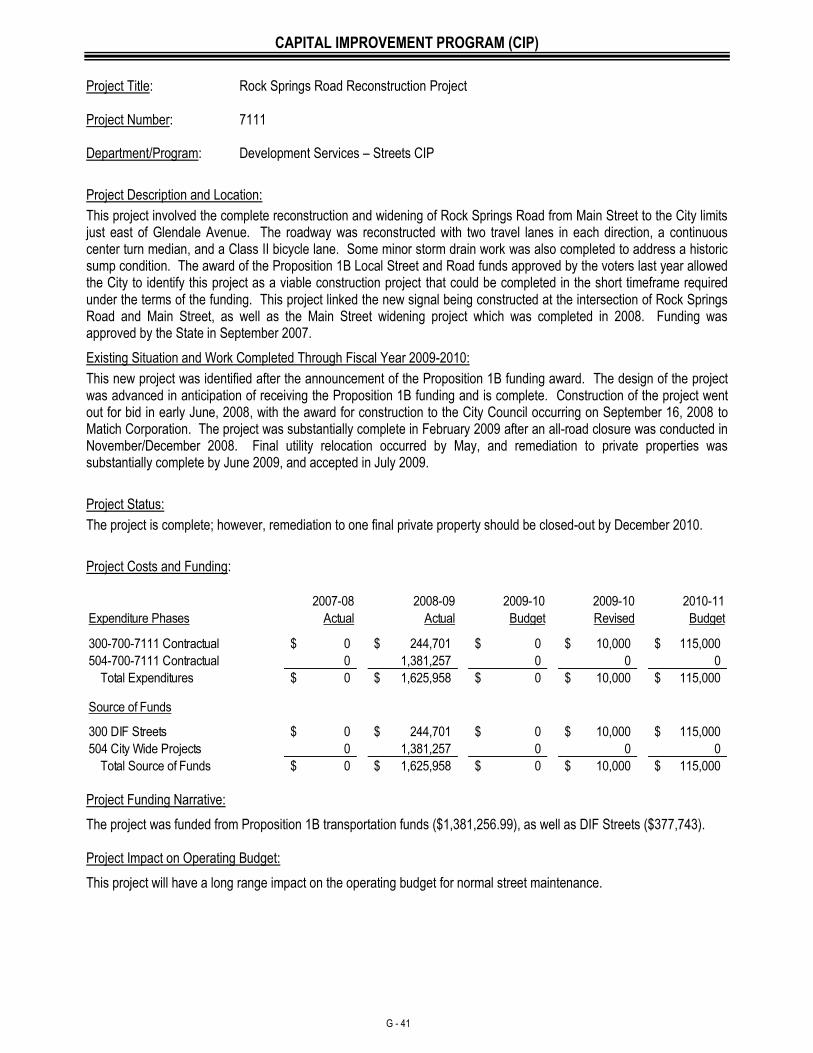
CAPITAL IMPROVEMENT PROGRAM (CIP)
G - 41
Project Title: Rock Springs Road Reconstruction Project Project Number: 7111 Department/Program: Development Services – Streets CIP
Project Description and Location:
This project involved the complete reconstruction and widening of Rock Springs Road from Main Street to the City limits just east of Glendale Avenue. The roadway was reconstructed with two travel lanes in each direction, a continuous center turn median, and a Class II bicycle lane. Some minor storm drain work was also completed to address a historic sump condition. The award of the Proposition 1B Local Street and Road funds approved by the voters last year allowed the City to identify this project as a viable construction project that could be completed in the short timeframe required under the terms of the funding. This project linked the new signal being constructed at the intersection of Rock Springs Road and Main Street, as well as the Main Street widening project which was completed in 2008. Funding was approved by the State in September 2007.
Existing Situation and Work Completed Through Fiscal Year 2009-2010:
This new project was identified after the announcement of the Proposition 1B funding award. The design of the project was advanced in anticipation of receiving the Proposition 1B funding and is complete. Construction of the project went out for bid in early June, 2008, with the award for construction to the City Council occurring on September 16, 2008 to Matich Corporation. The project was substantially complete in February 2009 after an all-road closure was conducted in November/December 2008. Final utility relocation occurred by May, and remediation to private properties was substantially complete by June 2009, and accepted in July 2009.
Project Status:
The project is complete; however, remediation to one final private property should be closed-out by December 2010.
Project Costs and Funding:
2007-08 2008-09 2009-10 2009-10 2010-11
Expenditure Phases Actual Actual Budget Revised Budget
0$ 244,701$ 0$ 10,000$ 115,000$
0 1,381,257 0 0 0
0$ 1,625,958$ 0$ 10,000$ 115,000$
Source of Funds
0$ 244,701$ 0$ 10,000$ 115,000$
504 City Wide Projects 0 1,381,257 0 0 0
0$ 1,625,958$ 0$ 10,000$ 115,000$ Total Source of Funds
300-700-7111 Contractual
504-700-7111 Contractual
Total Expenditures
300 DIF Streets
Project Funding Narrative:
The project was funded from Proposition 1B transportation funds ($1,381,256.99), as well as DIF Streets ($377,743). Project Impact on Operating Budget:
This project will have a long range impact on the operating budget for normal street maintenance.
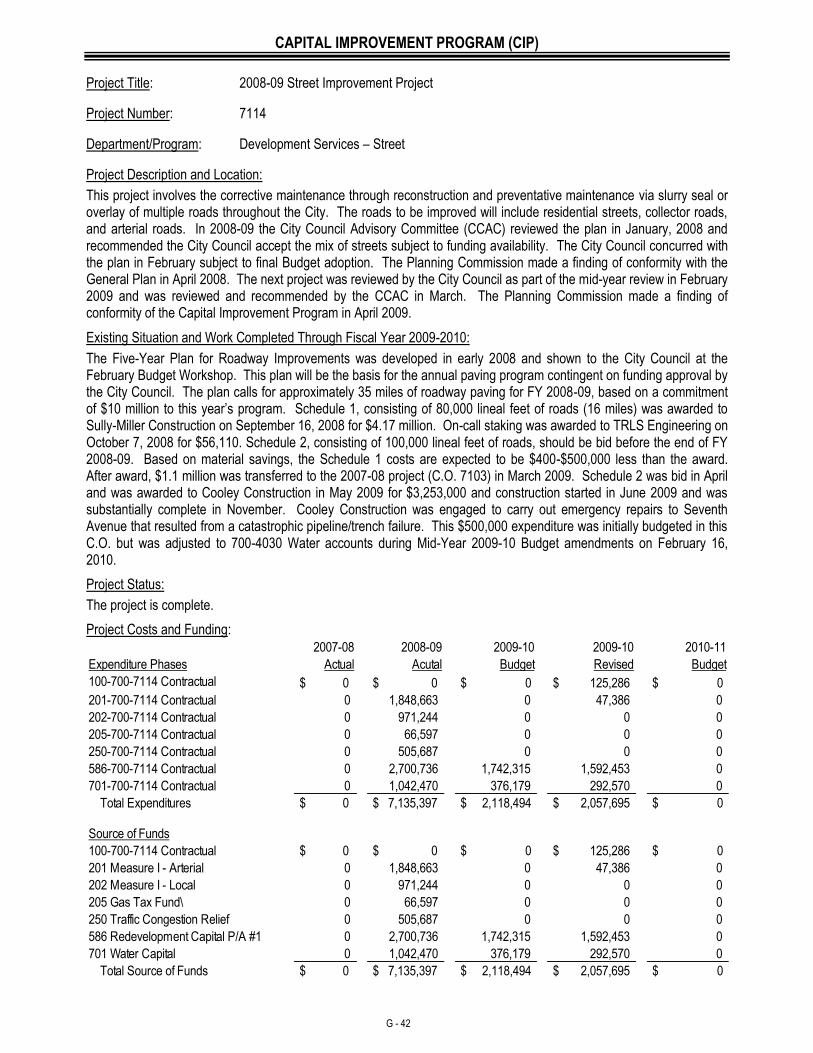
CAPITAL IMPROVEMENT PROGRAM (CIP)
G - 42
Project Title: 2008-09 Street Improvement Project
Project Number: 7114
Department/Program: Development Services – Street
Project Description and Location:
This project involves the corrective maintenance through reconstruction and preventative maintenance via slurry seal or overlay of multiple roads throughout the City. The roads to be improved will include residential streets, collector roads, and arterial roads. In 2008-09 the City Council Advisory Committee (CCAC) reviewed the plan in January, 2008 and recommended the City Council accept the mix of streets subject to funding availability. The City Council concurred with the plan in February subject to final Budget adoption. The Planning Commission made a finding of conformity with the General Plan in April 2008. The next project was reviewed by the City Council as part of the mid-year review in February 2009 and was reviewed and recommended by the CCAC in March. The Planning Commission made a finding of conformity of the Capital Improvement Program in April 2009.
Existing Situation and Work Completed Through Fiscal Year 2009-2010:
The Five-Year Plan for Roadway Improvements was developed in early 2008 and shown to the City Council at the February Budget Workshop. This plan will be the basis for the annual paving program contingent on funding approval by the City Council. The plan calls for approximately 35 miles of roadway paving for FY 2008-09, based on a commitment of $10 million to this year’s program. Schedule 1, consisting of 80,000 lineal feet of roads (16 miles) was awarded to Sully-Miller Construction on September 16, 2008 for $4.17 million. On-call staking was awarded to TRLS Engineering on October 7, 2008 for $56,110. Schedule 2, consisting of 100,000 lineal feet of roads, should be bid before the end of FY 2008-09. Based on material savings, the Schedule 1 costs are expected to be $400-$500,000 less than the award. After award, $1.1 million was transferred to the 2007-08 project (C.O. 7103) in March 2009. Schedule 2 was bid in April and was awarded to Cooley Construction in May 2009 for $3,253,000 and construction started in June 2009 and was substantially complete in November. Cooley Construction was engaged to carry out emergency repairs to Seventh Avenue that resulted from a catastrophic pipeline/trench failure. This $500,000 expenditure was initially budgeted in this C.O. but was adjusted to 700-4030 Water accounts during Mid-Year 2009-10 Budget amendments on February 16, 2010.
Project Status:
The project is complete.
Project Costs and Funding:
2007-08 2008-09 2009-10 2009-10 2010-11
Expenditure Phases Actual Acutal Budget Revised Budget
$ 0 $ 0 $ 0 $ 125,286 $ 0
0 1,848,663 0 47,386 0
0 971,244 0 0 0
0 66,597 0 0 0
0 505,687 0 0 0
0 2,700,736 1,742,315 1,592,453 0
0 1,042,470 376,179 292,570 0
$ 0 $ 7,135,397 $ 2,118,494 $ 2,057,695 $ 0
Source of Funds
$ 0 $ 0 $ 0 $ 125,286 $ 0
0 1,848,663 0 47,386 0
0 971,244 0 0 0
205 Gas Tax Fund\ 0 66,597 0 0 0
0 505,687 0 0 0
0 2,700,736 1,742,315 1,592,453 0
701 Water Capital 0 1,042,470 376,179 292,570 0
$ 0 $ 7,135,397 $ 2,118,494 $ 2,057,695 $ 0
100-700-7114 Contractual
250-700-7114 Contractual
586-700-7114 Contractual
701-700-7114 Contractual
Total Expenditures
100-700-7114 Contractual
201-700-7114 Contractual
202-700-7114 Contractual
205-700-7114 Contractual
Total Source of Funds
201 Measure I - Arterial
202 Measure I - Local
250 Traffic Congestion Relief
586 Redevelopment Capital P/A #1

CAPITAL IMPROVEMENT PROGRAM (CIP)
G - 43
Project Title: 2008-09 Street Improvement Project (Continued)
Project Funding Narrative:
The construction of the FY 2008-09 Street Improvement Project initially was funded at $10.66 million and from multiple funding sources as noted above. The project was reduced by $1.1 million, resulting in a revised funding of $9.6 million.
Project Impact on Operating Budget:
The project will result in a decrease in operational/maintenance expenses due to the reduction in street repairs to certain roads.
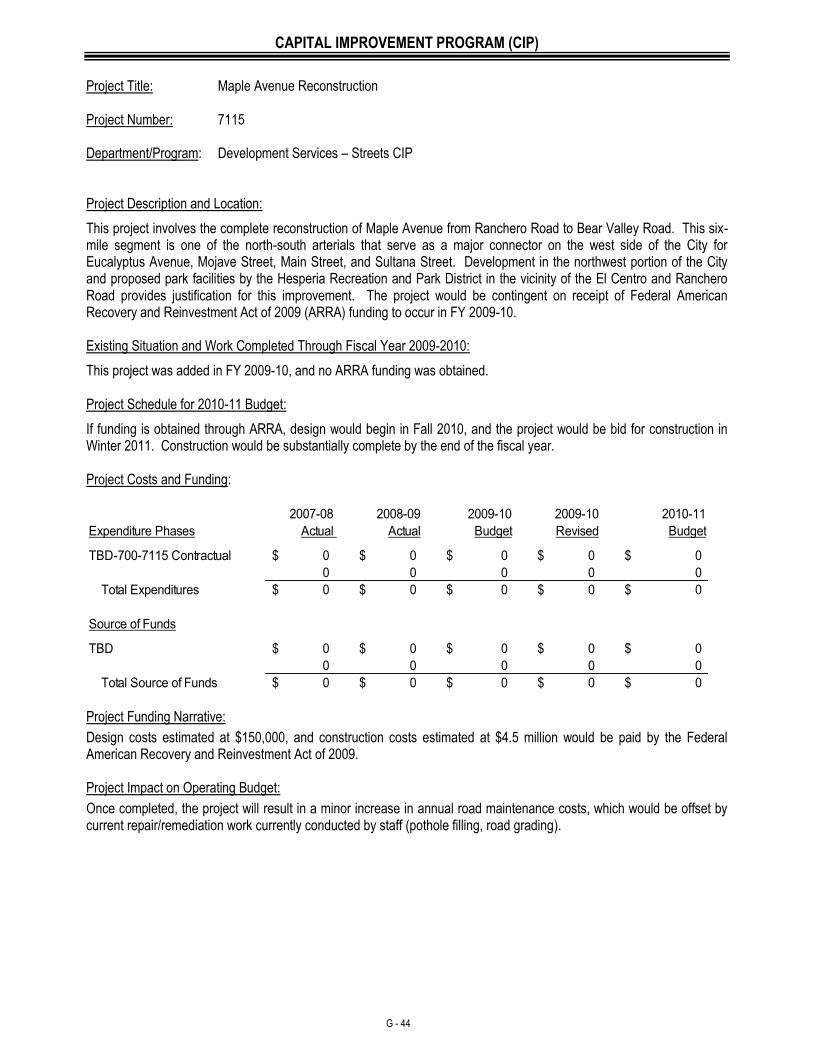
CAPITAL IMPROVEMENT PROGRAM (CIP)
G - 44
Project Title: Maple Avenue Reconstruction Project Number: 7115 Department/Program: Development Services – Streets CIP Project Description and Location:
This project involves the complete reconstruction of Maple Avenue from Ranchero Road to Bear Valley Road. This six-mile segment is one of the north-south arterials that serve as a major connector on the west side of the City for Eucalyptus Avenue, Mojave Street, Main Street, and Sultana Street. Development in the northwest portion of the City and proposed park facilities by the Hesperia Recreation and Park District in the vicinity of the El Centro and Ranchero Road provides justification for this improvement. The project would be contingent on receipt of Federal American Recovery and Reinvestment Act of 2009 (ARRA) funding to occur in FY 2009-10. Existing Situation and Work Completed Through Fiscal Year 2009-2010:
This project was added in FY 2009-10, and no ARRA funding was obtained. Project Schedule for 2010-11 Budget:
If funding is obtained through ARRA, design would begin in Fall 2010, and the project would be bid for construction in Winter 2011. Construction would be substantially complete by the end of the fiscal year. Project Costs and Funding:
2007-08 2008-09 2009-10 2009-10 2010-11
Expenditure Phases Actual Actual Budget Revised Budget
0$ 0$ 0$ 0$ 0$
0 0 0 0 0
0$ 0$ 0$ 0$ 0$
Source of Funds
0$ 0$ 0$ 0$ 0$
0 0 0 0 0
0$ 0$ 0$ 0$ 0$ Total Source of Funds
TBD-700-7115 Contractual
Total Expenditures
TBD
Project Funding Narrative:
Design costs estimated at $150,000, and construction costs estimated at $4.5 million would be paid by the Federal American Recovery and Reinvestment Act of 2009. Project Impact on Operating Budget:
Once completed, the project will result in a minor increase in annual road maintenance costs, which would be offset by current repair/remediation work currently conducted by staff (pothole filling, road grading).
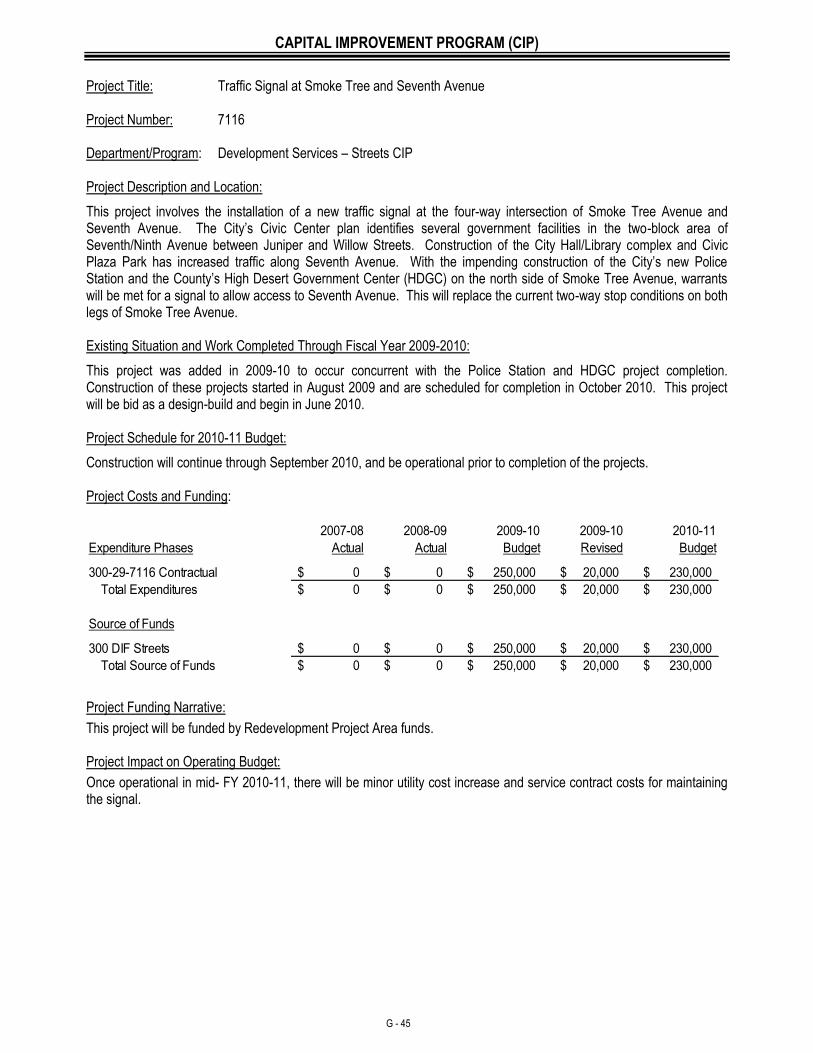
CAPITAL IMPROVEMENT PROGRAM (CIP)
G - 45
Project Title: Traffic Signal at Smoke Tree and Seventh Avenue Project Number: 7116 Department/Program: Development Services – Streets CIP Project Description and Location:
This project involves the installation of a new traffic signal at the four-way intersection of Smoke Tree Avenue and Seventh Avenue. The City’s Civic Center plan identifies several government facilities in the two-block area of Seventh/Ninth Avenue between Juniper and Willow Streets. Construction of the City Hall/Library complex and Civic Plaza Park has increased traffic along Seventh Avenue. With the impending construction of the City’s new Police Station and the County’s High Desert Government Center (HDGC) on the north side of Smoke Tree Avenue, warrants will be met for a signal to allow access to Seventh Avenue. This will replace the current two-way stop conditions on both legs of Smoke Tree Avenue. Existing Situation and Work Completed Through Fiscal Year 2009-2010:
This project was added in 2009-10 to occur concurrent with the Police Station and HDGC project completion. Construction of these projects started in August 2009 and are scheduled for completion in October 2010. This project will be bid as a design-build and begin in June 2010. Project Schedule for 2010-11 Budget:
Construction will continue through September 2010, and be operational prior to completion of the projects. Project Costs and Funding:
2007-08 2008-09 2009-10 2009-10 2010-11
Expenditure Phases Actual Actual Budget Revised Budget
0$ 0$ 250,000$ 20,000$ 230,000$
0$ 0$ 250,000$ 20,000$ 230,000$
Source of Funds
0$ 0$ 250,000$ 20,000$ 230,000$
0$ 0$ 250,000$ 20,000$ 230,000$ Total Source of Funds
300-29-7116 Contractual
Total Expenditures
300 DIF Streets
Project Funding Narrative:
This project will be funded by Redevelopment Project Area funds. Project Impact on Operating Budget:
Once operational in mid- FY 2010-11, there will be minor utility cost increase and service contract costs for maintaining the signal.
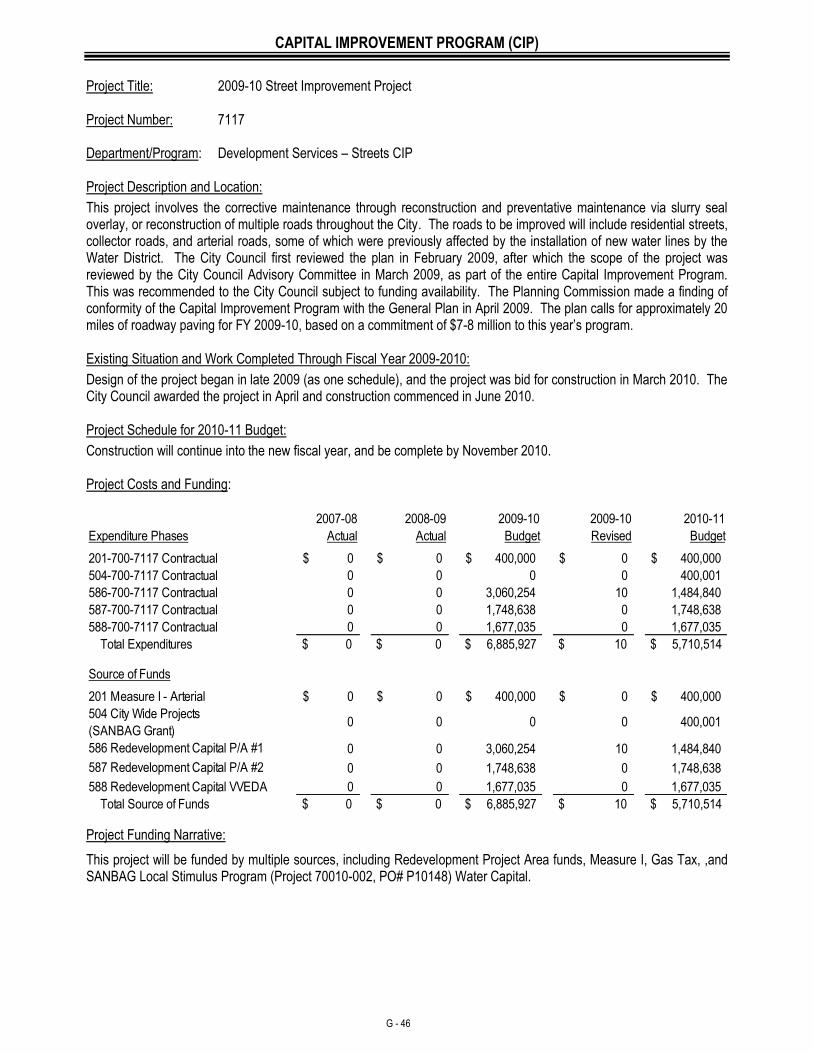
CAPITAL IMPROVEMENT PROGRAM (CIP)
G - 46
Project Title: 2009-10 Street Improvement Project Project Number: 7117 Department/Program: Development Services – Streets CIP Project Description and Location:
This project involves the corrective maintenance through reconstruction and preventative maintenance via slurry seal overlay, or reconstruction of multiple roads throughout the City. The roads to be improved will include residential streets, collector roads, and arterial roads, some of which were previously affected by the installation of new water lines by the Water District. The City Council first reviewed the plan in February 2009, after which the scope of the project was reviewed by the City Council Advisory Committee in March 2009, as part of the entire Capital Improvement Program. This was recommended to the City Council subject to funding availability. The Planning Commission made a finding of conformity of the Capital Improvement Program with the General Plan in April 2009. The plan calls for approximately 20 miles of roadway paving for FY 2009-10, based on a commitment of $7-8 million to this year’s program. Existing Situation and Work Completed Through Fiscal Year 2009-2010:
Design of the project began in late 2009 (as one schedule), and the project was bid for construction in March 2010. The City Council awarded the project in April and construction commenced in June 2010. Project Schedule for 2010-11 Budget:
Construction will continue into the new fiscal year, and be complete by November 2010. Project Costs and Funding:
2007-08 2008-09 2009-10 2009-10 2010-11
Expenditure Phases Actual Actual Budget Revised Budget
0$ 0$ 400,000$ 0$ 400,000$
0 0 0 0 400,001
0 0 3,060,254 10 1,484,840
0 0 1,748,638 0 1,748,638
0 0 1,677,035 0 1,677,035
$ 0 $ 0 $ 6,885,927 $ 10 $ 5,710,514
Source of Funds
0$ 0$ 400,000$ 0$ 400,000$
504 City Wide Projects
(SANBAG Grant)0 0 0 0 400,001
0 0 3,060,254 10 1,484,840
0 0 1,748,638 0 1,748,638
0 0 1,677,035 0 1,677,035
$ 0 $ 0 $ 6,885,927 $ 10 $ 5,710,514
586-700-7117 Contractual
587-700-7117 Contractual
201-700-7117 Contractual
504-700-7117 Contractual
Total Source of Funds
586 Redevelopment Capital P/A #1
587 Redevelopment Capital P/A #2
588 Redevelopment Capital VVEDA
588-700-7117 Contractual
Total Expenditures
201 Measure I - Arterial
Project Funding Narrative:
This project will be funded by multiple sources, including Redevelopment Project Area funds, Measure I, Gas Tax, ,and SANBAG Local Stimulus Program (Project 70010-002, PO# P10148) Water Capital.
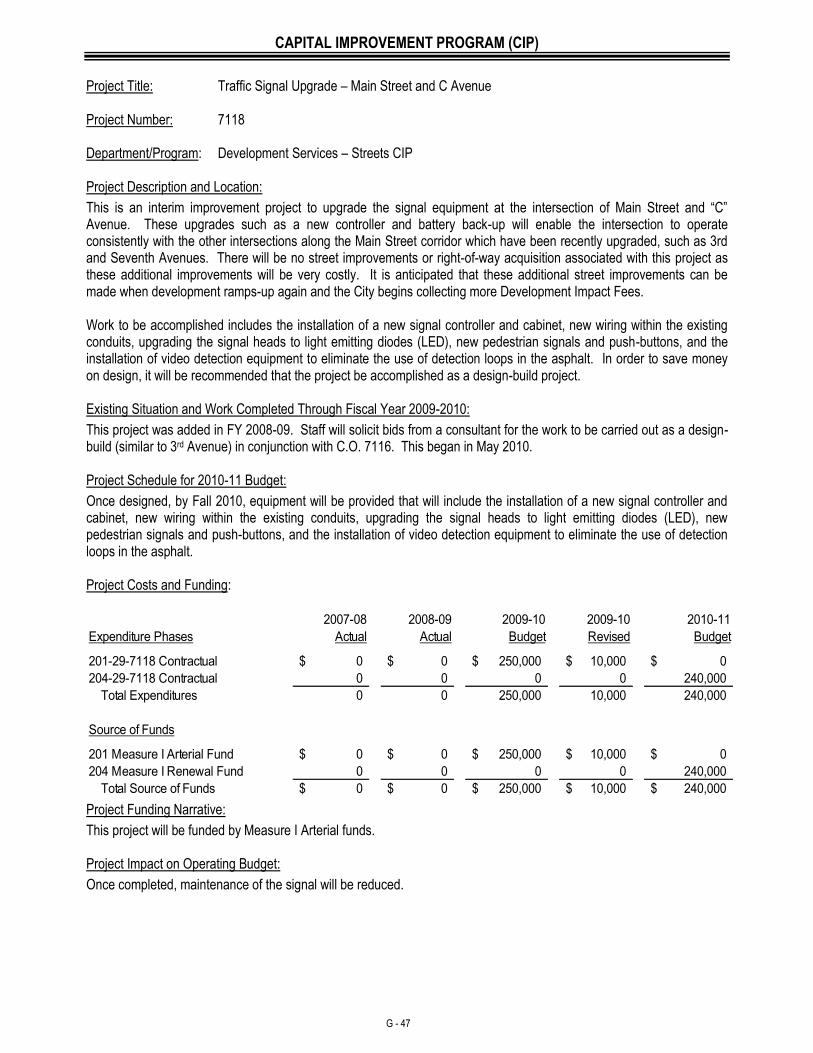
CAPITAL IMPROVEMENT PROGRAM (CIP)
G - 47
Project Title: Traffic Signal Upgrade – Main Street and C Avenue Project Number: 7118 Department/Program: Development Services – Streets CIP Project Description and Location:
This is an interim improvement project to upgrade the signal equipment at the intersection of Main Street and “C” Avenue. These upgrades such as a new controller and battery back-up will enable the intersection to operate consistently with the other intersections along the Main Street corridor which have been recently upgraded, such as 3rd and Seventh Avenues. There will be no street improvements or right-of-way acquisition associated with this project as these additional improvements will be very costly. It is anticipated that these additional street improvements can be made when development ramps-up again and the City begins collecting more Development Impact Fees. Work to be accomplished includes the installation of a new signal controller and cabinet, new wiring within the existing conduits, upgrading the signal heads to light emitting diodes (LED), new pedestrian signals and push-buttons, and the installation of video detection equipment to eliminate the use of detection loops in the asphalt. In order to save money on design, it will be recommended that the project be accomplished as a design-build project. Existing Situation and Work Completed Through Fiscal Year 2009-2010:
This project was added in FY 2008-09. Staff will solicit bids from a consultant for the work to be carried out as a design-build (similar to 3rd Avenue) in conjunction with C.O. 7116. This began in May 2010. Project Schedule for 2010-11 Budget:
Once designed, by Fall 2010, equipment will be provided that will include the installation of a new signal controller and cabinet, new wiring within the existing conduits, upgrading the signal heads to light emitting diodes (LED), new pedestrian signals and push-buttons, and the installation of video detection equipment to eliminate the use of detection loops in the asphalt. Project Costs and Funding:
2007-08 2008-09 2009-10 2009-10 2010-11
Expenditure Phases Actual Actual Budget Revised Budget
0$ 0$ 250,000$ 10,000$ 0$
0 0 0 0 240,000
0 0 250,000 10,000 240,000
Source of Funds
0$ 0$ 250,000$ 10,000$ 0$
0 0 0 0 240,000
0$ 0$ 250,000$ 10,000$ 240,000$ Total Source of Funds
201-29-7118 Contractual
Total Expenditures
201 Measure I Arterial Fund
204-29-7118 Contractual
204 Measure I Renewal Fund
Project Funding Narrative:
This project will be funded by Measure I Arterial funds. Project Impact on Operating Budget:
Once completed, maintenance of the signal will be reduced.
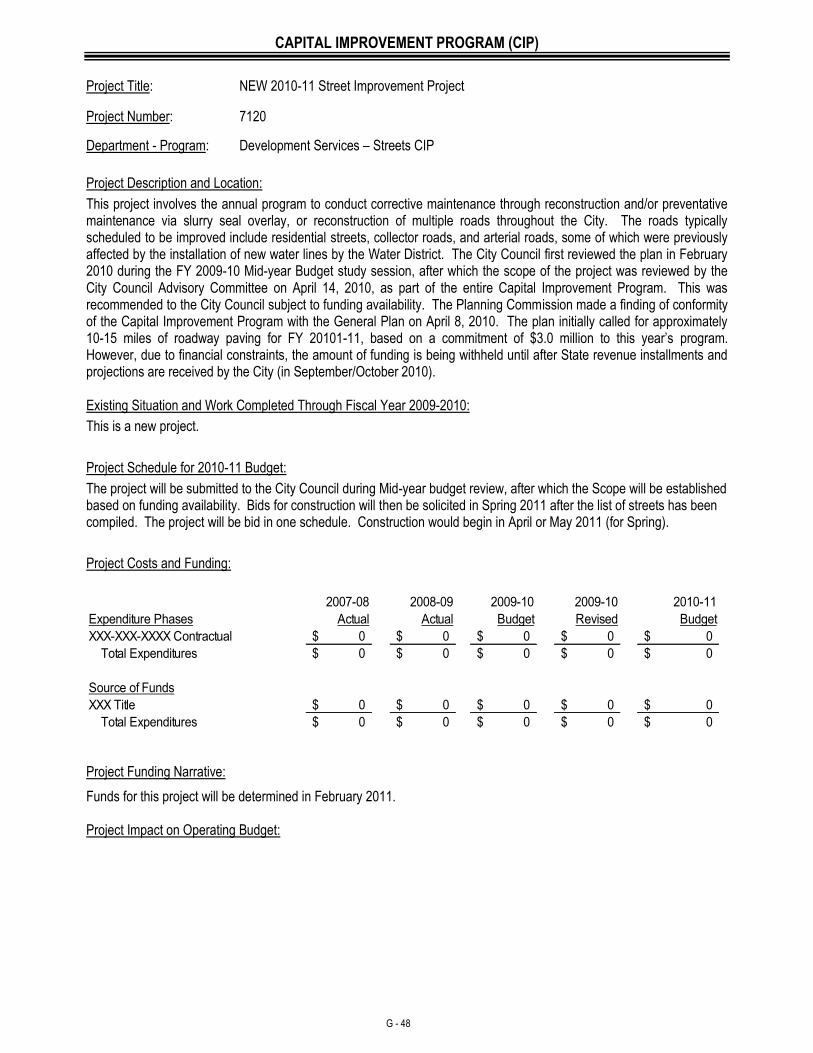
CAPITAL IMPROVEMENT PROGRAM (CIP)
G - 48
Project Title: NEW 2010-11 Street Improvement Project
Project Number: 7120
Department - Program: Development Services – Streets CIP
Project Description and Location:
This project involves the annual program to conduct corrective maintenance through reconstruction and/or preventative maintenance via slurry seal overlay, or reconstruction of multiple roads throughout the City. The roads typically scheduled to be improved include residential streets, collector roads, and arterial roads, some of which were previously affected by the installation of new water lines by the Water District. The City Council first reviewed the plan in February 2010 during the FY 2009-10 Mid-year Budget study session, after which the scope of the project was reviewed by the City Council Advisory Committee on April 14, 2010, as part of the entire Capital Improvement Program. This was recommended to the City Council subject to funding availability. The Planning Commission made a finding of conformity of the Capital Improvement Program with the General Plan on April 8, 2010. The plan initially called for approximately 10-15 miles of roadway paving for FY 20101-11, based on a commitment of $3.0 million to this year’s program. However, due to financial constraints, the amount of funding is being withheld until after State revenue installments and projections are received by the City (in September/October 2010). Existing Situation and Work Completed Through Fiscal Year 2009-2010:
This is a new project.
Project Schedule for 2010-11 Budget:
The project will be submitted to the City Council during Mid-year budget review, after which the Scope will be established based on funding availability. Bids for construction will then be solicited in Spring 2011 after the list of streets has been compiled. The project will be bid in one schedule. Construction would begin in April or May 2011 (for Spring).
Project Costs and Funding:
2007-08 2008-09 2009-10 2009-10 2010-11
Expenditure Phases Actual Actual Budget Revised Budget
0$ 0$ 0$ 0$ 0$
0$ 0$ 0$ 0$ 0$
Source of Funds
0$ 0$ 0$ 0$ 0$
0$ 0$ 0$ 0$ 0$ Total Expenditures
Total Expenditures
XXX Title
XXX-XXX-XXXX Contractual
Project Funding Narrative:
Funds for this project will be determined in February 2011. Project Impact on Operating Budget:
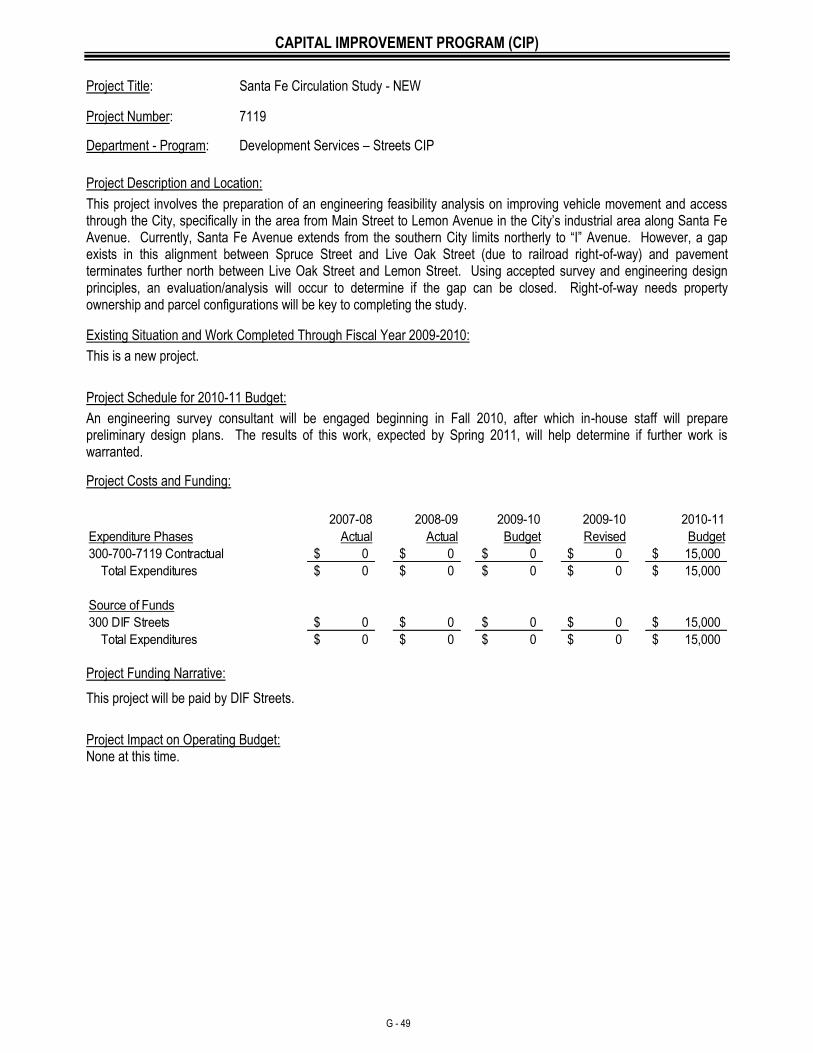
CAPITAL IMPROVEMENT PROGRAM (CIP)
G - 49
Project Title: Santa Fe Circulation Study - NEW
Project Number: 7119
Department - Program: Development Services – Streets CIP
Project Description and Location:
This project involves the preparation of an engineering feasibility analysis on improving vehicle movement and access through the City, specifically in the area from Main Street to Lemon Avenue in the City’s industrial area along Santa Fe Avenue. Currently, Santa Fe Avenue extends from the southern City limits northerly to “I” Avenue. However, a gap exists in this alignment between Spruce Street and Live Oak Street (due to railroad right-of-way) and pavement terminates further north between Live Oak Street and Lemon Street. Using accepted survey and engineering design principles, an evaluation/analysis will occur to determine if the gap can be closed. Right-of-way needs property ownership and parcel configurations will be key to completing the study.
Existing Situation and Work Completed Through Fiscal Year 2009-2010:
This is a new project.
Project Schedule for 2010-11 Budget:
An engineering survey consultant will be engaged beginning in Fall 2010, after which in-house staff will prepare preliminary design plans. The results of this work, expected by Spring 2011, will help determine if further work is warranted.
Project Costs and Funding:
2007-08 2008-09 2009-10 2009-10 2010-11
Expenditure Phases Actual Actual Budget Revised Budget
0$ 0$ 0$ 0$ 15,000$
0$ 0$ 0$ 0$ 15,000$
Source of Funds
0$ 0$ 0$ 0$ 15,000$
0$ 0$ 0$ 0$ 15,000$ Total Expenditures
300-700-7119 Contractual
Total Expenditures
300 DIF Streets
Project Funding Narrative:
This project will be paid by DIF Streets.
Project Impact on Operating Budget: None at this time.
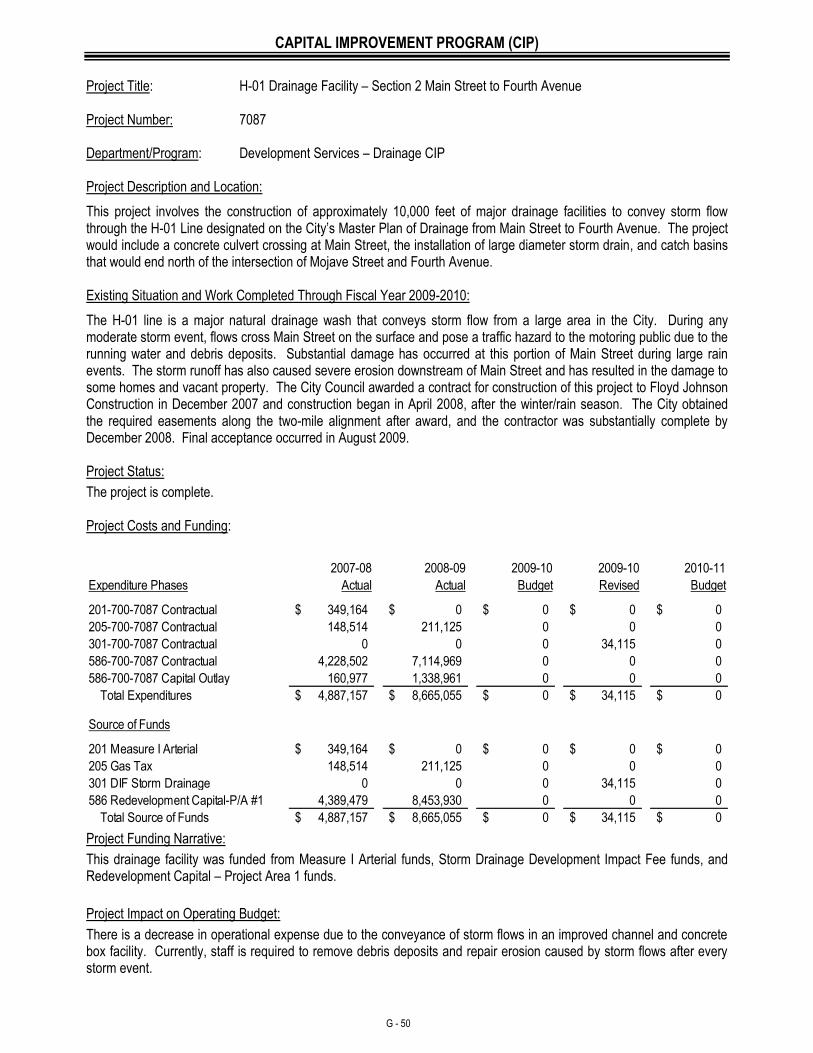
CAPITAL IMPROVEMENT PROGRAM (CIP)
G - 50
Project Title: H-01 Drainage Facility – Section 2 Main Street to Fourth Avenue Project Number: 7087 Department/Program: Development Services – Drainage CIP Project Description and Location:
This project involves the construction of approximately 10,000 feet of major drainage facilities to convey storm flow through the H-01 Line designated on the City’s Master Plan of Drainage from Main Street to Fourth Avenue. The project would include a concrete culvert crossing at Main Street, the installation of large diameter storm drain, and catch basins that would end north of the intersection of Mojave Street and Fourth Avenue. Existing Situation and Work Completed Through Fiscal Year 2009-2010:
The H-01 line is a major natural drainage wash that conveys storm flow from a large area in the City. During any moderate storm event, flows cross Main Street on the surface and pose a traffic hazard to the motoring public due to the running water and debris deposits. Substantial damage has occurred at this portion of Main Street during large rain events. The storm runoff has also caused severe erosion downstream of Main Street and has resulted in the damage to some homes and vacant property. The City Council awarded a contract for construction of this project to Floyd Johnson Construction in December 2007 and construction began in April 2008, after the winter/rain season. The City obtained the required easements along the two-mile alignment after award, and the contractor was substantially complete by December 2008. Final acceptance occurred in August 2009. Project Status:
The project is complete. Project Costs and Funding:
2007-08 2008-09 2009-10 2009-10 2010-11
Expenditure Phases Actual Actual Budget Revised Budget
349,164$ 0$ 0$ 0$ 0$
148,514 211,125 0 0 0
0 0 0 34,115 0
4,228,502 7,114,969 0 0 0
160,977 1,338,961 0 0 0
4,887,157$ 8,665,055$ 0$ 34,115$ 0$
Source of Funds
349,164$ 0$ 0$ 0$ 0$
148,514 211,125 0 0 0
0 0 0 34,115 0
4,389,479 8,453,930 0 0 0
4,887,157$ 8,665,055$ 0$ 34,115$ 0$
201-700-7087 Contractual
205-700-7087 Contractual
586-700-7087 Contractual
301-700-7087 Contractual
586 Redevelopment Capital-P/A #1
Total Source of Funds
586-700-7087 Capital Outlay
Total Expenditures
201 Measure I Arterial
205 Gas Tax
301 DIF Storm Drainage
Project Funding Narrative:
This drainage facility was funded from Measure I Arterial funds, Storm Drainage Development Impact Fee funds, and Redevelopment Capital – Project Area 1 funds.
Project Impact on Operating Budget:
There is a decrease in operational expense due to the conveyance of storm flows in an improved channel and concrete box facility. Currently, staff is required to remove debris deposits and repair erosion caused by storm flows after every storm event.
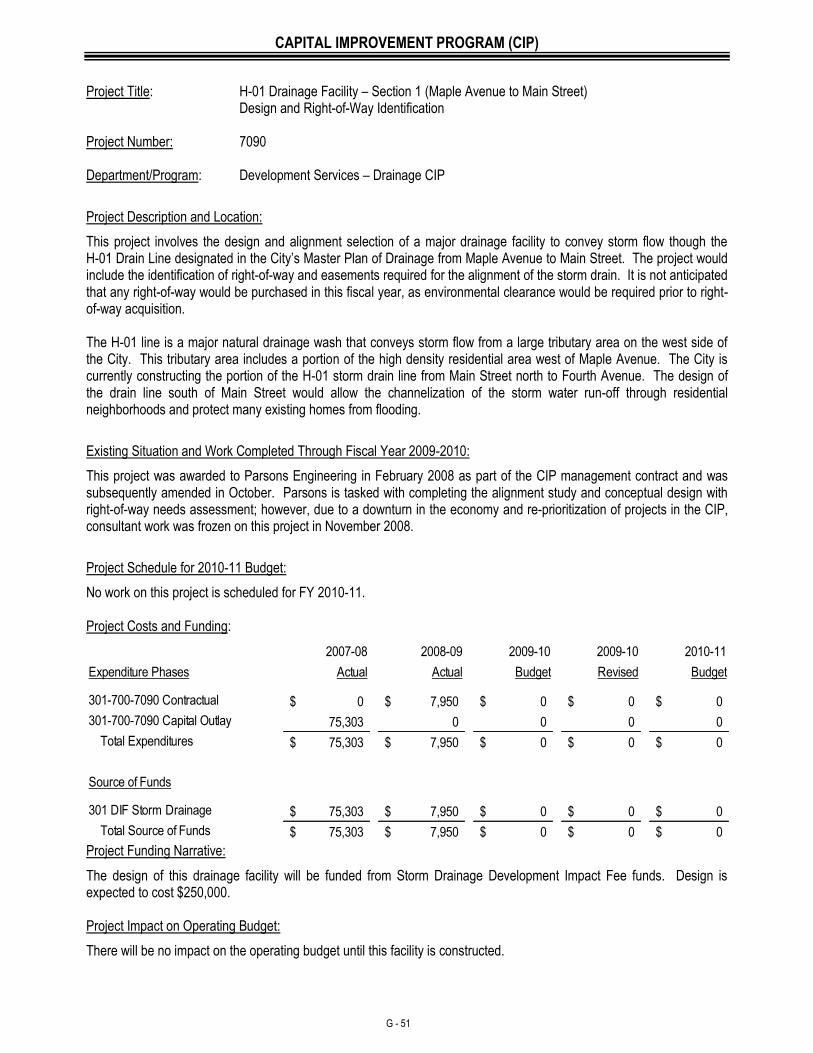
CAPITAL IMPROVEMENT PROGRAM (CIP)
G - 51
Project Title: H-01 Drainage Facility – Section 1 (Maple Avenue to Main Street) Design and Right-of-Way Identification Project Number: 7090 Department/Program: Development Services – Drainage CIP
Project Description and Location:
This project involves the design and alignment selection of a major drainage facility to convey storm flow though the H-01 Drain Line designated in the City’s Master Plan of Drainage from Maple Avenue to Main Street. The project would include the identification of right-of-way and easements required for the alignment of the storm drain. It is not anticipated that any right-of-way would be purchased in this fiscal year, as environmental clearance would be required prior to right-of-way acquisition. The H-01 line is a major natural drainage wash that conveys storm flow from a large tributary area on the west side of the City. This tributary area includes a portion of the high density residential area west of Maple Avenue. The City is currently constructing the portion of the H-01 storm drain line from Main Street north to Fourth Avenue. The design of the drain line south of Main Street would allow the channelization of the storm water run-off through residential neighborhoods and protect many existing homes from flooding.
Existing Situation and Work Completed Through Fiscal Year 2009-2010:
This project was awarded to Parsons Engineering in February 2008 as part of the CIP management contract and was subsequently amended in October. Parsons is tasked with completing the alignment study and conceptual design with right-of-way needs assessment; however, due to a downturn in the economy and re-prioritization of projects in the CIP, consultant work was frozen on this project in November 2008.
Project Schedule for 2010-11 Budget:
No work on this project is scheduled for FY 2010-11. Project Costs and Funding:
2007-08 2008-09 2009-10 2009-10 2010-11
Expenditure Phases Actual Actual Budget Revised Budget
0$ 7,950$ 0$ 0$ 0$
75,303 0 0 0 0
75,303$ 7,950$ 0$ 0$ 0$
Source of Funds
75,303$ 7,950$ 0$ 0$ 0$
75,303$ 7,950$ 0$ 0$ 0$
301-700-7090 Contractual
301-700-7090 Capital Outlay
Total Expenditures
301 DIF Storm Drainage
Total Source of Funds Project Funding Narrative:
The design of this drainage facility will be funded from Storm Drainage Development Impact Fee funds. Design is expected to cost $250,000. Project Impact on Operating Budget:
There will be no impact on the operating budget until this facility is constructed.
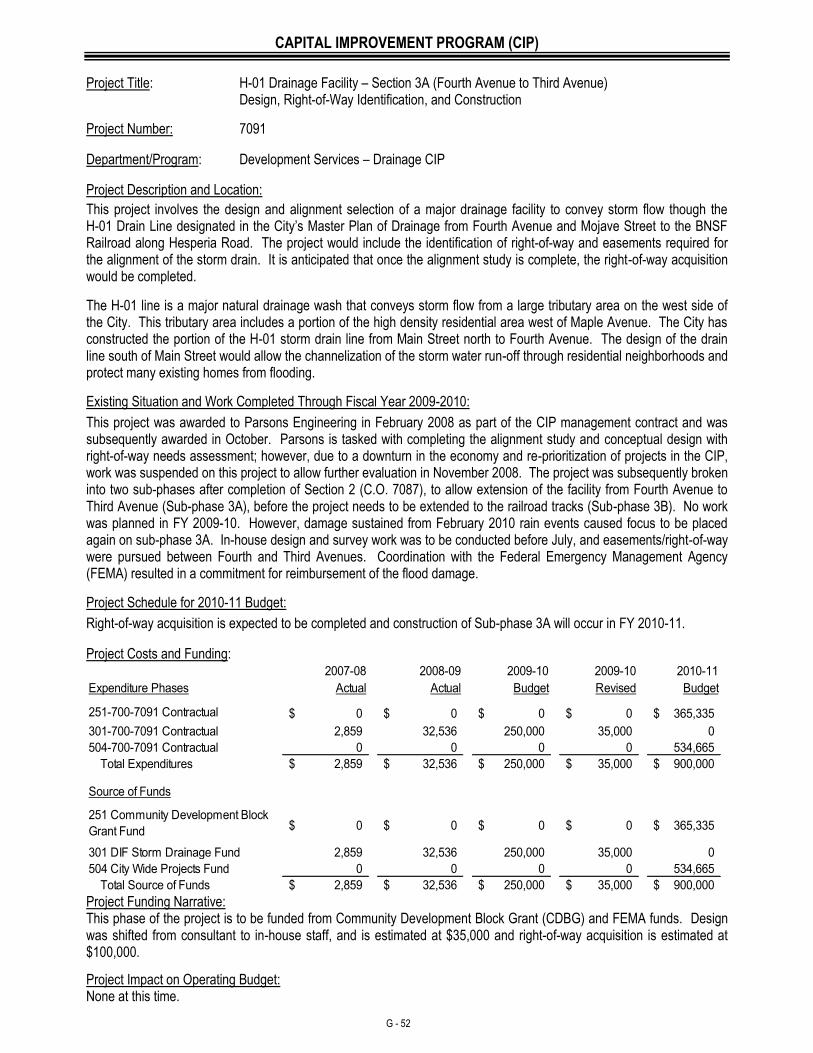
CAPITAL IMPROVEMENT PROGRAM (CIP)
G - 52
Project Title: H-01 Drainage Facility – Section 3A (Fourth Avenue to Third Avenue) Design, Right-of-Way Identification, and Construction
Project Number: 7091
Department/Program: Development Services – Drainage CIP
Project Description and Location:
This project involves the design and alignment selection of a major drainage facility to convey storm flow though the H-01 Drain Line designated in the City’s Master Plan of Drainage from Fourth Avenue and Mojave Street to the BNSF Railroad along Hesperia Road. The project would include the identification of right-of-way and easements required for the alignment of the storm drain. It is anticipated that once the alignment study is complete, the right-of-way acquisition would be completed.
The H-01 line is a major natural drainage wash that conveys storm flow from a large tributary area on the west side of the City. This tributary area includes a portion of the high density residential area west of Maple Avenue. The City has constructed the portion of the H-01 storm drain line from Main Street north to Fourth Avenue. The design of the drain line south of Main Street would allow the channelization of the storm water run-off through residential neighborhoods and protect many existing homes from flooding.
Existing Situation and Work Completed Through Fiscal Year 2009-2010:
This project was awarded to Parsons Engineering in February 2008 as part of the CIP management contract and was subsequently awarded in October. Parsons is tasked with completing the alignment study and conceptual design with right-of-way needs assessment; however, due to a downturn in the economy and re-prioritization of projects in the CIP, work was suspended on this project to allow further evaluation in November 2008. The project was subsequently broken into two sub-phases after completion of Section 2 (C.O. 7087), to allow extension of the facility from Fourth Avenue to Third Avenue (Sub-phase 3A), before the project needs to be extended to the railroad tracks (Sub-phase 3B). No work was planned in FY 2009-10. However, damage sustained from February 2010 rain events caused focus to be placed again on sub-phase 3A. In-house design and survey work was to be conducted before July, and easements/right-of-way were pursued between Fourth and Third Avenues. Coordination with the Federal Emergency Management Agency (FEMA) resulted in a commitment for reimbursement of the flood damage.
Project Schedule for 2010-11 Budget:
Right-of-way acquisition is expected to be completed and construction of Sub-phase 3A will occur in FY 2010-11.
Project Costs and Funding: 2007-08 2008-09 2009-10 2009-10 2010-11
Expenditure Phases Actual Actual Budget Revised Budget
0$ 0$ 0$ 0$ 365,335$
2,859 32,536 250,000 35,000 0
504-700-7091 Contractual 0 0 0 0 534,665
2,859$ 32,536$ 250,000$ 35,000$ 900,000$
Source of Funds
0$ 0$ 0$ 0$ 365,335$
2,859 32,536 250,000 35,000 0
504 City Wide Projects Fund 0 0 0 0 534,665
2,859$ 32,536$ 250,000$ 35,000$ 900,000$ Total Source of Funds
301-700-7091 Contractual
Total Expenditures
301 DIF Storm Drainage Fund
251-700-7091 Contractual
251 Community Development Block
Grant Fund
Project Funding Narrative: This phase of the project is to be funded from Community Development Block Grant (CDBG) and FEMA funds. Design was shifted from consultant to in-house staff, and is estimated at $35,000 and right-of-way acquisition is estimated at $100,000.
Project Impact on Operating Budget: None at this time.
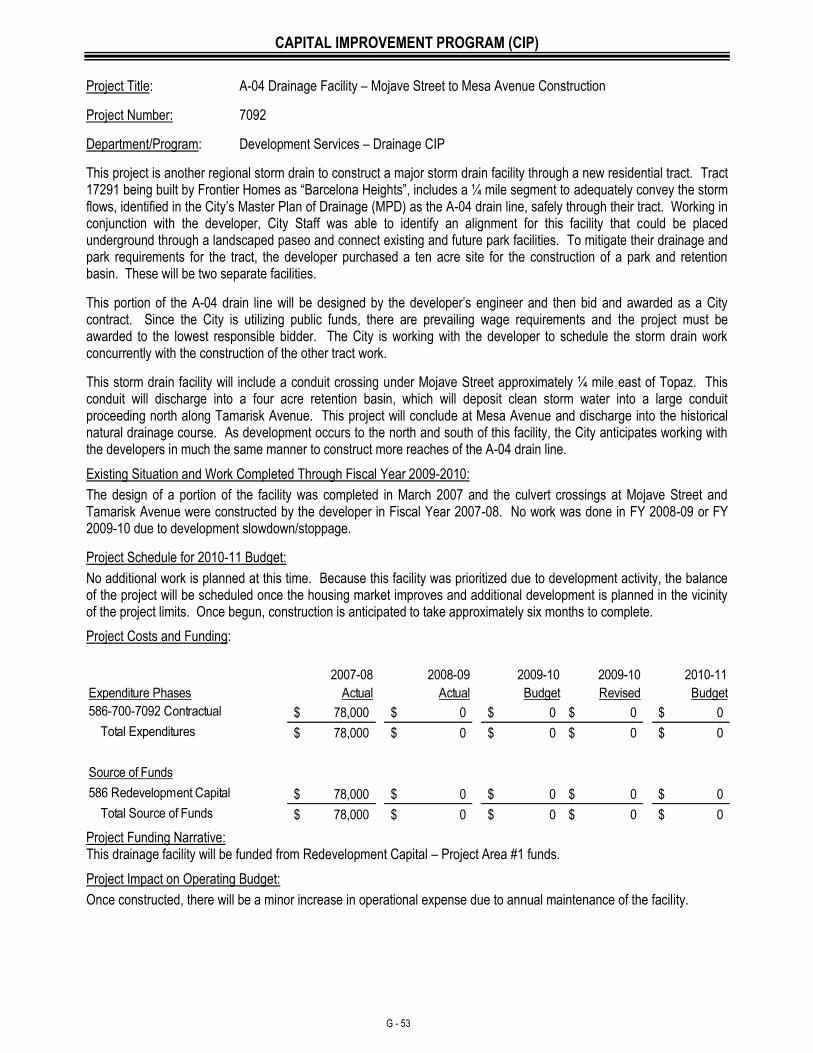
CAPITAL IMPROVEMENT PROGRAM (CIP)
G - 53
Project Title: A-04 Drainage Facility – Mojave Street to Mesa Avenue Construction
Project Number: 7092
Department/Program: Development Services – Drainage CIP
This project is another regional storm drain to construct a major storm drain facility through a new residential tract. Tract 17291 being built by Frontier Homes as “Barcelona Heights”, includes a ¼ mile segment to adequately convey the storm flows, identified in the City’s Master Plan of Drainage (MPD) as the A-04 drain line, safely through their tract. Working in conjunction with the developer, City Staff was able to identify an alignment for this facility that could be placed underground through a landscaped paseo and connect existing and future park facilities. To mitigate their drainage and park requirements for the tract, the developer purchased a ten acre site for the construction of a park and retention basin. These will be two separate facilities.
This portion of the A-04 drain line will be designed by the developer’s engineer and then bid and awarded as a City contract. Since the City is utilizing public funds, there are prevailing wage requirements and the project must be awarded to the lowest responsible bidder. The City is working with the developer to schedule the storm drain work concurrently with the construction of the other tract work.
This storm drain facility will include a conduit crossing under Mojave Street approximately ¼ mile east of Topaz. This conduit will discharge into a four acre retention basin, which will deposit clean storm water into a large conduit proceeding north along Tamarisk Avenue. This project will conclude at Mesa Avenue and discharge into the historical natural drainage course. As development occurs to the north and south of this facility, the City anticipates working with the developers in much the same manner to construct more reaches of the A-04 drain line.
Existing Situation and Work Completed Through Fiscal Year 2009-2010:
The design of a portion of the facility was completed in March 2007 and the culvert crossings at Mojave Street and Tamarisk Avenue were constructed by the developer in Fiscal Year 2007-08. No work was done in FY 2008-09 or FY 2009-10 due to development slowdown/stoppage.
Project Schedule for 2010-11 Budget:
No additional work is planned at this time. Because this facility was prioritized due to development activity, the balance of the project will be scheduled once the housing market improves and additional development is planned in the vicinity of the project limits. Once begun, construction is anticipated to take approximately six months to complete.
Project Costs and Funding:
2007-08 2008-09 2009-10 2009-10 2010-11
Expenditure Phases Actual Actual Budget Revised Budget
78,000$ 0$ 0$ 0$ 0$
78,000$ 0$ 0$ 0$ 0$
Source of Funds
78,000$ 0$ 0$ 0$ 0$
78,000$ 0$ 0$ 0$ 0$
586-700-7092 Contractual
Total Expenditures
586 Redevelopment Capital
Total Source of Funds Project Funding Narrative: This drainage facility will be funded from Redevelopment Capital – Project Area #1 funds.
Project Impact on Operating Budget:
Once constructed, there will be a minor increase in operational expense due to annual maintenance of the facility.
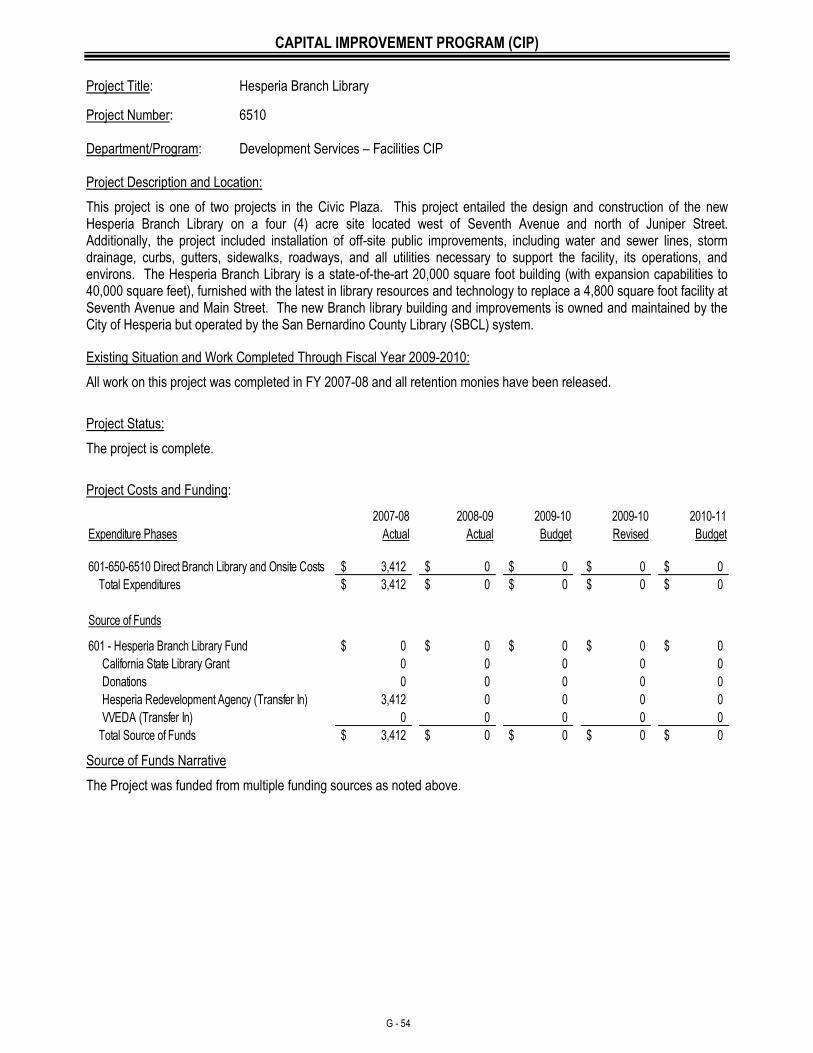
CAPITAL IMPROVEMENT PROGRAM (CIP)
G - 54
Project Title: Hesperia Branch Library
Project Number: 6510 Department/Program: Development Services – Facilities CIP Project Description and Location:
This project is one of two projects in the Civic Plaza. This project entailed the design and construction of the new Hesperia Branch Library on a four (4) acre site located west of Seventh Avenue and north of Juniper Street. Additionally, the project included installation of off-site public improvements, including water and sewer lines, storm drainage, curbs, gutters, sidewalks, roadways, and all utilities necessary to support the facility, its operations, and environs. The Hesperia Branch Library is a state-of-the-art 20,000 square foot building (with expansion capabilities to 40,000 square feet), furnished with the latest in library resources and technology to replace a 4,800 square foot facility at Seventh Avenue and Main Street. The new Branch library building and improvements is owned and maintained by the City of Hesperia but operated by the San Bernardino County Library (SBCL) system.
Existing Situation and Work Completed Through Fiscal Year 2009-2010:
All work on this project was completed in FY 2007-08 and all retention monies have been released.
Project Status:
The project is complete.
Project Costs and Funding:
2007-08 2008-09 2009-10 2009-10 2010-11
Expenditure Phases Actual Actual Budget Revised Budget
3,412$ 0$ 0$ 0$ 0$
3,412$ 0$ 0$ 0$ 0$
Source of Funds
0$ 0$ 0$ 0$ 0$
0 0 0 0 0
0 0 0 0 0
3,412 0 0 0 0
0 0 0 0 0
3,412$ 0$ 0$ 0$ 0$
601-650-6510 Direct Branch Library and Onsite Costs
VVEDA (Transfer In)
Total Source of Funds
Total Expenditures
601 - Hesperia Branch Library Fund
California State Library Grant
Donations
Hesperia Redevelopment Agency (Transfer In)
Source of Funds Narrative
The Project was funded from multiple funding sources as noted above.
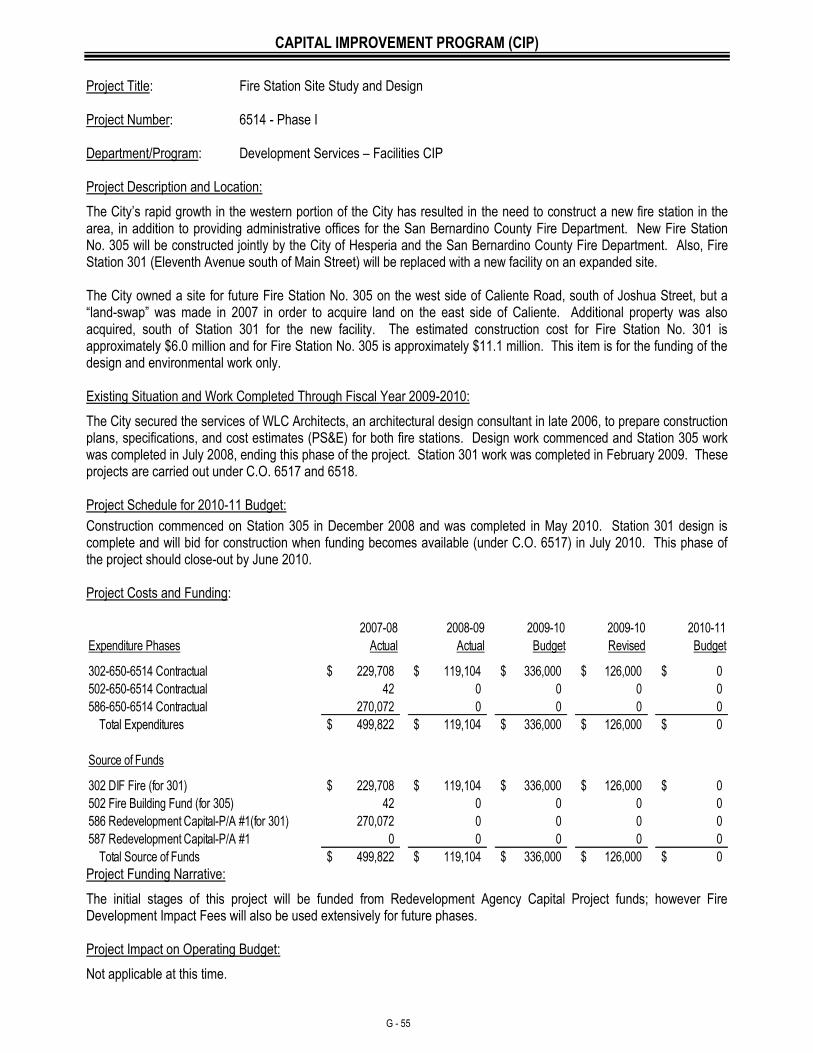
CAPITAL IMPROVEMENT PROGRAM (CIP)
G - 55
Project Title: Fire Station Site Study and Design Project Number: 6514 - Phase I Department/Program: Development Services – Facilities CIP Project Description and Location:
The City’s rapid growth in the western portion of the City has resulted in the need to construct a new fire station in the area, in addition to providing administrative offices for the San Bernardino County Fire Department. New Fire Station No. 305 will be constructed jointly by the City of Hesperia and the San Bernardino County Fire Department. Also, Fire Station 301 (Eleventh Avenue south of Main Street) will be replaced with a new facility on an expanded site. The City owned a site for future Fire Station No. 305 on the west side of Caliente Road, south of Joshua Street, but a “land-swap” was made in 2007 in order to acquire land on the east side of Caliente. Additional property was also acquired, south of Station 301 for the new facility. The estimated construction cost for Fire Station No. 301 is approximately $6.0 million and for Fire Station No. 305 is approximately $11.1 million. This item is for the funding of the design and environmental work only. Existing Situation and Work Completed Through Fiscal Year 2009-2010:
The City secured the services of WLC Architects, an architectural design consultant in late 2006, to prepare construction plans, specifications, and cost estimates (PS&E) for both fire stations. Design work commenced and Station 305 work was completed in July 2008, ending this phase of the project. Station 301 work was completed in February 2009. These projects are carried out under C.O. 6517 and 6518. Project Schedule for 2010-11 Budget:
Construction commenced on Station 305 in December 2008 and was completed in May 2010. Station 301 design is complete and will bid for construction when funding becomes available (under C.O. 6517) in July 2010. This phase of the project should close-out by June 2010. Project Costs and Funding:
2007-08 2008-09 2009-10 2009-10 2010-11
Expenditure Phases Actual Actual Budget Revised Budget
229,708$ 119,104$ 336,000$ 126,000$ 0$
42 0 0 0 0
270,072 0 0 0 0
499,822$ 119,104$ 336,000$ 126,000$ 0$
Source of Funds
229,708$ 119,104$ 336,000$ 126,000$ 0$
42 0 0 0 0
270,072 0 0 0 0
587 Redevelopment Capital-P/A #1 0 0 0 0 0
499,822$ 119,104$ 336,000$ 126,000$ 0$
Total Expenditures
302 DIF Fire (for 301)
502 Fire Building Fund (for 305)
586 Redevelopment Capital-P/A #1(for 301)
Total Source of Funds
302-650-6514 Contractual
502-650-6514 Contractual
586-650-6514 Contractual
Project Funding Narrative:
The initial stages of this project will be funded from Redevelopment Agency Capital Project funds; however Fire Development Impact Fees will also be used extensively for future phases. Project Impact on Operating Budget:
Not applicable at this time.
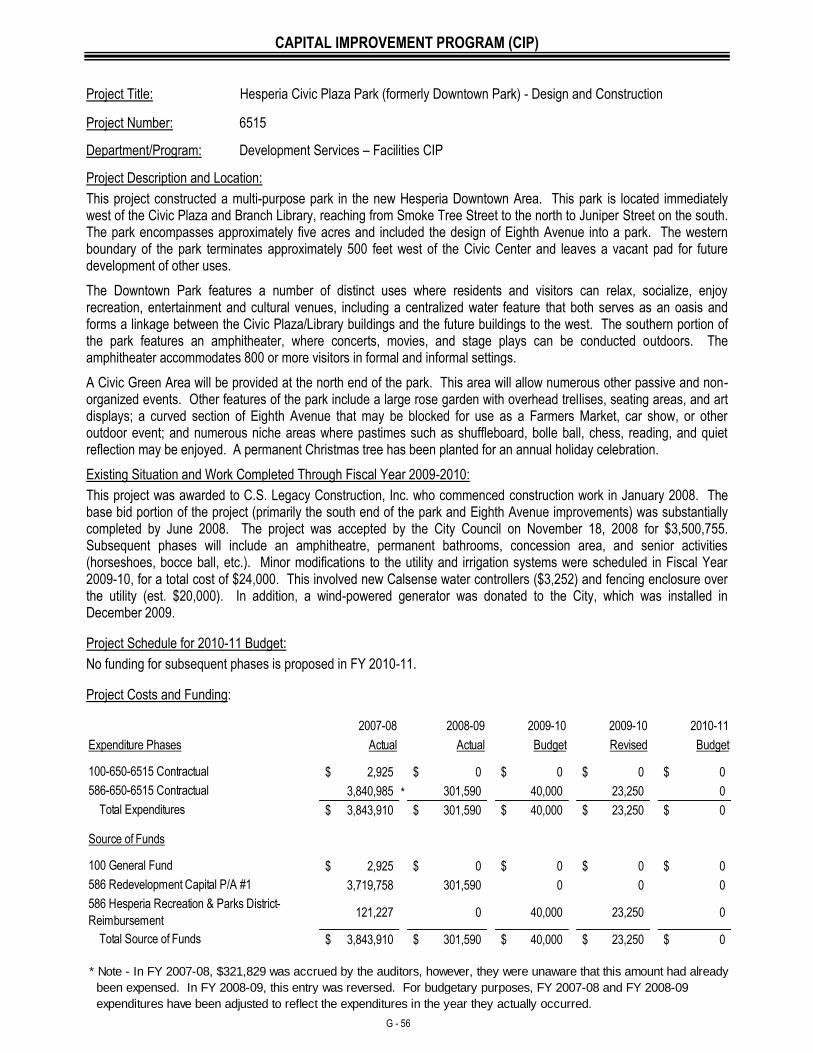
CAPITAL IMPROVEMENT PROGRAM (CIP)
G - 56
Project Title: Hesperia Civic Plaza Park (formerly Downtown Park) - Design and Construction
Project Number: 6515
Department/Program: Development Services – Facilities CIP
Project Description and Location:
This project constructed a multi-purpose park in the new Hesperia Downtown Area. This park is located immediately west of the Civic Plaza and Branch Library, reaching from Smoke Tree Street to the north to Juniper Street on the south. The park encompasses approximately five acres and included the design of Eighth Avenue into a park. The western boundary of the park terminates approximately 500 feet west of the Civic Center and leaves a vacant pad for future development of other uses.
The Downtown Park features a number of distinct uses where residents and visitors can relax, socialize, enjoy recreation, entertainment and cultural venues, including a centralized water feature that both serves as an oasis and forms a linkage between the Civic Plaza/Library buildings and the future buildings to the west. The southern portion of the park features an amphitheater, where concerts, movies, and stage plays can be conducted outdoors. The amphitheater accommodates 800 or more visitors in formal and informal settings.
A Civic Green Area will be provided at the north end of the park. This area will allow numerous other passive and non-organized events. Other features of the park include a large rose garden with overhead trellises, seating areas, and art displays; a curved section of Eighth Avenue that may be blocked for use as a Farmers Market, car show, or other outdoor event; and numerous niche areas where pastimes such as shuffleboard, bolle ball, chess, reading, and quiet reflection may be enjoyed. A permanent Christmas tree has been planted for an annual holiday celebration.
Existing Situation and Work Completed Through Fiscal Year 2009-2010:
This project was awarded to C.S. Legacy Construction, Inc. who commenced construction work in January 2008. The base bid portion of the project (primarily the south end of the park and Eighth Avenue improvements) was substantially completed by June 2008. The project was accepted by the City Council on November 18, 2008 for $3,500,755. Subsequent phases will include an amphitheatre, permanent bathrooms, concession area, and senior activities (horseshoes, bocce ball, etc.). Minor modifications to the utility and irrigation systems were scheduled in Fiscal Year 2009-10, for a total cost of $24,000. This involved new Calsense water controllers ($3,252) and fencing enclosure over the utility (est. $20,000). In addition, a wind-powered generator was donated to the City, which was installed in December 2009.
Project Schedule for 2010-11 Budget:
No funding for subsequent phases is proposed in FY 2010-11.
Project Costs and Funding:
2007-08 2008-09 2009-10 2009-10 2010-11
Expenditure Phases Actual Actual Budget Revised Budget
2,925$ 0$ 0$ 0$ 0$
3,840,985 * 301,590 40,000 23,250 0
3,843,910$ 301,590$ 40,000$ 23,250$ 0$
Source of Funds
2,925$ 0$ 0$ 0$ 0$
3,719,758 301,590 0 0 0
121,227 0 40,000 23,250 0
3,843,910$ 301,590$ 40,000$ 23,250$ 0$
expenditures have been adjusted to reflect the expenditures in the year they actually occurred.
* Note - In FY 2007-08, $321,829 was accrued by the auditors, however, they were unaware that this amount had already
been expensed. In FY 2008-09, this entry was reversed. For budgetary purposes, FY 2007-08 and FY 2008-09
100 General Fund
586 Redevelopment Capital P/A #1
586 Hesperia Recreation & Parks District-
Reimbursement
Total Source of Funds
100-650-6515 Contractual
586-650-6515 Contractual
Total Expenditures
CAPITAL IMPROVEMENT PROGRAM (CIP)
G - 57
Project Title: Hesperia Civic Plaza Park (formerly Downtown Park) - Design and Construction
Project Number: 6515
Project Funding Narrative:
One-half of the project was funded by the City from the General Fund and Redevelopment Capital Project funds. The other half of the project was to be funded by the Hesperia Recreation and Park District. Agreement for re-payment by the District is still pending (FY 2009-10) and to establish operational responsibilities.
Project Impact on Operating Budget:
The park has been operated and maintained by the Hesperia Recreation and Park District. An operating agreement between the City and District is still pending negotiation/execution (FY 2009-10), but is expected to be completed by the start of FY 2010-11.
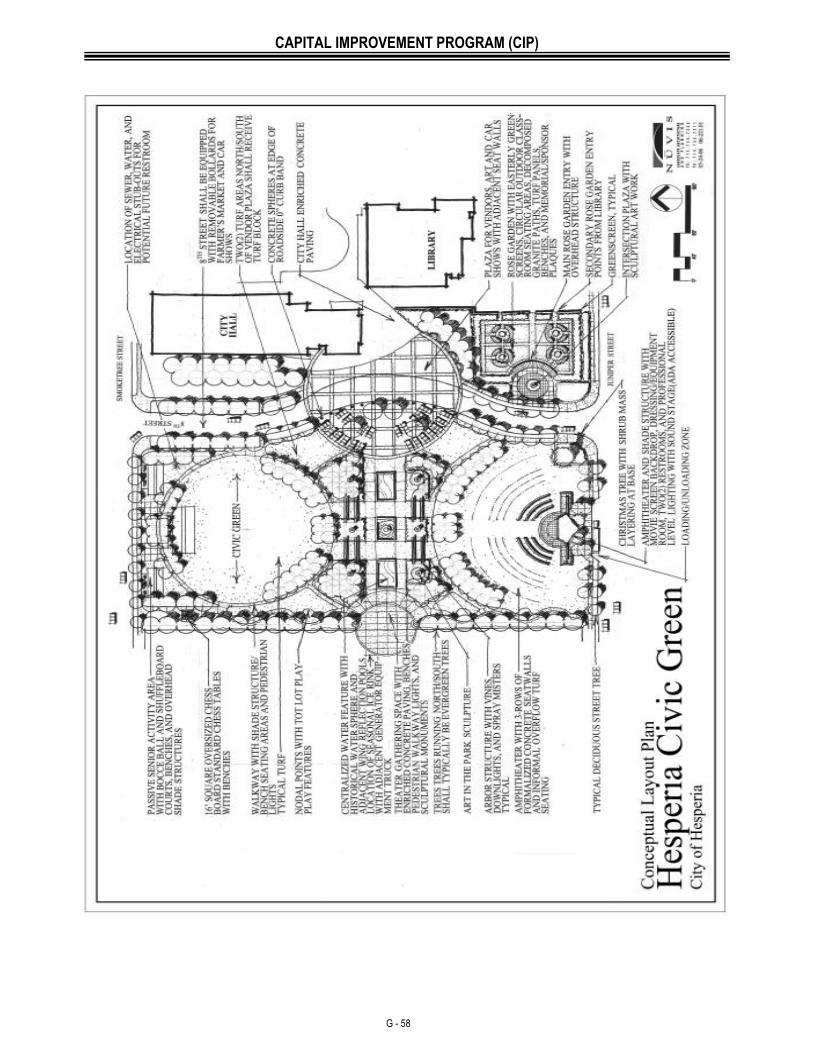
CAPITAL IMPROVEMENT PROGRAM (CIP)
G - 58
CAPITAL IMPROVEMENT PROGRAM (CIP)
G - 59
Project Title: New Police Station Property Identification, Acquisition, Design, and Construction Project Number: 6516 Department/Program: Development Services – Facilities C I P Project Description and Location:
The City’s rapid growth has necessitated the need to augment the City’s police force. Because of this increase in the number of police officers and support staff serving our citizens, the City has identified the need to construct a new police station. The existing police station is technologically outdated and the size of the facility on Santa Fe Avenue is inadequate for the needs of the City’s existing and future police force. The City Council formed the Public Safety Ad Hoc Committee to guide this new police station project effort. One of the primary goals of this project is to re-locate the police station to a more centralized site within the City in order to better serve our citizens. The Ad Hoc Committee indicated a desire to locate the new police station within one mile of the new City Hall, if possible, and is a guiding force in selecting a suitable site. Phase I of this project involves evaluating multiple proposed sites and then ultimately identifying and purchasing the most appropriate site. The second phase involves engaging a design consultant and, through use of the City’s Public Safety Needs Report (revised in December 2006), which established a service level of 0.75 sworn officers per 1,000 population, complete design to construct the project. Existing Situation and Work Completed Through Fiscal Year 2009-2010:
Phase 1 of the project is complete, as a site was identified on Smoke Tree between Eight and Ninth Avenues in 2007. Phase II started in Fiscal Year 2006-07 when the City awarded a contract to Griffin Structures as Program Manager at Risk to provide plans, specifications, and cost estimate (PS&E) up to the “design development” level and submit a Guaranteed Maximum Price (GMP) proposal for finalizing the plans and constructing the police station. In January 2009, the contract was amended to complete the plans prior to GMP. The GMP was submitted to the City in March/April 2009, and was bid for construction concurrently with the High Desert Government Center (C.O. 6520) in June 2009 in order to provide cost efficiencies. The Griffin Structures/McCarthy Builders Team managed the bidding process and bids were opened on July 19, 2009 and subsequently awarded more than 25% below bid estimates. Construction began on August 15, 2009.
In response to the City Council’s desire to incorporate renewable energy technologies in all City facilities where feasible, the City pursued a photovoltaic system for the project. In September 2009, the City received a $775,100 American Recovery and Reinvestment Act of 2009 (ARRA) Grant through the U.S. Department of Energy for installation of a Photovoltaic Solar Energy (PSE) System at the new Police Station. In addition, the PSE System qualifies for an estimated $680,000 in rebates through the California Solar Initiative (CSI) program and administered by the State, which is paid over five years ($136,000/year).
On December 1, 2009, Council approved the award of a Program Management agreement in the amount of $2,428,705 to Griffin Structures, Inc. to manage the design, installation, and commissioning of a complete turnkey PSE System at the New Police Station. The addition of the PSE System does not affect the overall budget for this project due to the fact that there were sufficient savings during the bidding process of the project to cover the matching City costs for the PSE System.
Project Schedule for 2010-11 Budget:
Construction is expected to continue through August 2010 and be substantially complete in September/October. Construction of the PSE System is estimated to be complete in October/November 2010.
CAPITAL IMPROVEMENT PROGRAM (CIP)
G - 60
Project Title: New Police Station (Continued) Property Identification, Acquisition, Design, and Construction Project Number: 6516 Project Costs and Funding:
2007-08 2008-09 2009-10 2009-10 2010-11
Expenditure Phases Actual Actual Budget Revised Budget
259-650-6516 Capital 0$ 0$ 0$ 0$ 1,455,100$
303-650-6516 Capital 0 0 0 0 1,500,000
666,971 1,311,780 0 0 0
586-650-6516 Capital 0 0 15,000,000 12,000,000 3,044,900
666,971$ 1,311,780$ 15,000,000$ 12,000,000$ 6,000,000$
Source of Funds
0$ 0$ 0$ 0$ 775,100$
0 0 0 0 * 680,000
303 DIF - Police Fund 0 0 0 0 1,500,000
666,971 1,311,780 15,000,000 12,000,000 3,044,900
666,971$ 1,311,780$ 15,000,000$ 12,000,000$ 6,000,000$
* Note - The CSI (Edison) Grant is reimbursed over 5 years. Fund 259 cash will run negative until year five, when the grant funds
are received in full.
586-650-6516 Contractual
Total Expenditures
586 Redevelopment Capital P/A #1
Total Source of Funds
259 Reimbursable Grants Fund -
ARRA Grant
259 Reimbursable Grants Fund - CSI
(Edison) Grant
Project Funding Narrative:
This project is estimated to cost $20 million and is expected to be funded from Redevelopment Capital Project funds, Police Department Impact Fee funds and Federal/State energy grants. Three-fourths of the funding ($12 million) was expended in FY 2009-10, with the balance being funded in FY 2010-11. The budget has been reduced to reflect cost savings from competitive bids.
Project Impact on Operating Budget:
None at this time. Construction of the larger police station will result in an increase in operation and maintenance expenses when completed in FY 2010-11.
CAPITAL IMPROVEMENT PROGRAM (CIP)
G - 61
Project Title: Fire Station 301 Construction/Property Acquisition Project Number: 6517 Department/Program: Development Services – Facilities CIP
Project Description and Location:
This project is the next phase of addressing the City’s master-planned fire service needs that began in Project 6514. Existing Station 301, located on the west side of Eleventh Avenue, south of Main Street (9430 Eleventh Avenue) contains approximately 3,700 square feet of building space. In order to fulfill the City’s Public Safety Needs Report requirements, the facility needs to be expanded/reconstructed to 12,000 square feet.
Existing Situation and Work Completed Through Fiscal Year 2009-2010:
In FY 2006-07, the City sent a Request for Qualifications to architectural firms to provide architectural and construction support services. Wolff/Lang/Christopher (WLC) Architects was selected as the firm most qualified to meeting the needs of the City. WLC Architects was engaged in November 2006 to prepare the necessary construction and architectural plans. By March 2007, the Public Safety Ad Hoc Committee had reached consensus on the floor plan and building elevations. City staff has completed the process of acquiring the necessary property south of the current facility. WLC Architects prepared working drawings and completed design work in February 2009. The Planning Commission approved the facility design in April 2007. Bidding of the project was scheduled for March 2009, but was delayed due to Notice of Funding from the Federal American Recovery and Reinvestment Act (ARRA Economic Stimulus Plan) which was signed into law in February 2009. The City pursued funding from this law in order to reduce the financial cost to the DIF and RDA funds. An application submittal was made for this C.O. and C.O. 6521 in July 2009. The City was not successful in the first two funding award rounds in October 2009 and February 2010. Project Schedule for Fiscal Year 2010-11 Budget:
If the City does not receive a Notice of Award by July 2010, the project will be put in suspense until it is determined that adequate funds are available to construct without grant funds. Project administration by WLC will be included at that time as well.
Project Costs and Funding:
2007-08 2008-09 2009-10 2009-10 2010-11
Expenditure Phases Actual Actual Budget Revised Budget
0$ 1,657$ 0$ 0$ 0$
150,375 * 0 0 0 0
0 0 0 0 0
150,375$ 1,657$ 0$ 0$ 0$
Source of Funds
0$ 1,657$ 0$ 0$ 0$
150,375 0 0 0 0
150,375$ 1,657$ 0$ 0$ 0$
302-650-6517 Contractual
586-650-6517 Land
586-650-6517 Contractual
Total Expenditures
302 DIF Fire
586 Redevelopment Capital
Total Source of Funds
* Note - Budgetary Basis Adjustment - This number was not reflected under the CO when the FY 2008-09 Budget was adopted.
Project Funding Narrative:
The estimated cost of construction is $6.1 million, which will be funded, in part, by Redevelopment Project Area 1 Capital and Development Impact Fees if federal ARRA funds are not acquired. Project Impact on Operating Budget:
Not applicable at this time.
CAPITAL IMPROVEMENT PROGRAM (CIP)
G - 62
Project Title: Fire Station 305 Construction Project Number: 6518 Department/Program: Development Services – Facilities CIP Project Description and Location:
This project is the next phase of addressing the City’s master-planned fire service needs that began in Project 6514. In order to meet the City’s needs within the developing I-15 freeway corridor, as well as provide space for the San Bernardino County Fire Department, the County and City are jointly participating in the development of Station 305, to be located on the west side of Interstate 15, east of Caliente Road and south of Joshua Street. The City’s Public Safety Needs Report identifies a station that will be approximately 22,000 square feet in size. In June 2006, the City sent a Request for Qualifications to architectural firms to provide architectural and construction support services. Wolff/Lang/Christopher (WLC) Architects was selected as most qualified to meeting the needs of the City. The City previously owned property in the same area, but west of Caliente Road. A “land-swap” agreement was made with another property owner in early 2007 in order to establish a preferred location for the new station.
Existing Situation and Work Completed Through Fiscal Year 2009-2010:
City staff has completed the process of securing the necessary property east of Caliente Road, with the recordation of a Parcel Map in December 2007, and land purchase in April 2008. WLC Architects was engaged in November 2006 to prepare the necessary construction and architectural plans. By March 2007, the Public Safety Ad Hoc Committee had reached consensus on building elevations and a floor plan of approximately 18,000 square feet. WLC Architects began preparing working drawings and completed design work in August 2008. The County provided its contribution ($3.5 million) in February 2008. Bidding and award of contracts occurred in October 2008 to R.C. Construction Services for $6.46 million. Construction commenced and a grand opening occurred on November 30, 2009. Final improvements were completed by March 2010 and the project was closed out in June 2010. Project Schedule for Fiscal Year 2010-11 Budget:
The project is complete.
Project Costs and Funding:
2007-08 2008-09 2009-10 2009-10 2010-11
Expenditure Phases Actual Actual Budget Revised Budget
0$ 125,578$ 860,000$ 860,000$ 0$
0 3,540,958 1,722,271 2,080,574 0
0 0 1,417,729 1,002,036 0
0 2,026 0 0 0
0$ 3,668,562$ 4,000,000$ 3,942,610$ 0$
Source of Funds
0$ 125,578$ 860,000$ 860,000$ 0$
0 3,540,958 1,722,271 2,080,574 0
0 2,026 1,417,729 1,002,036 0
0$ 3,668,562$ 4,000,000$ 3,942,610$ 0$
302-650-6518 Contractual
502-650-6518 Contractual
586-650-6518 Contractual
586-650-6518 Land
Total Expenditures
302 Fire DIF
502 Fire Station Building
586 Redevelopment Capital
Total Source of Funds
Project Funding Narrative:
The cost of construction of under $6.8 million ($4.7 million under original estimates) was funded, in part, by Redevelopment Capital, Development Impact Fees. Assessment Districts 91-1 and 91-3 funds ($1 million), and contribution from the County of San Bernardino ($3.5 million).
Project Impact on Operating Budget:
Not applicable at this time.
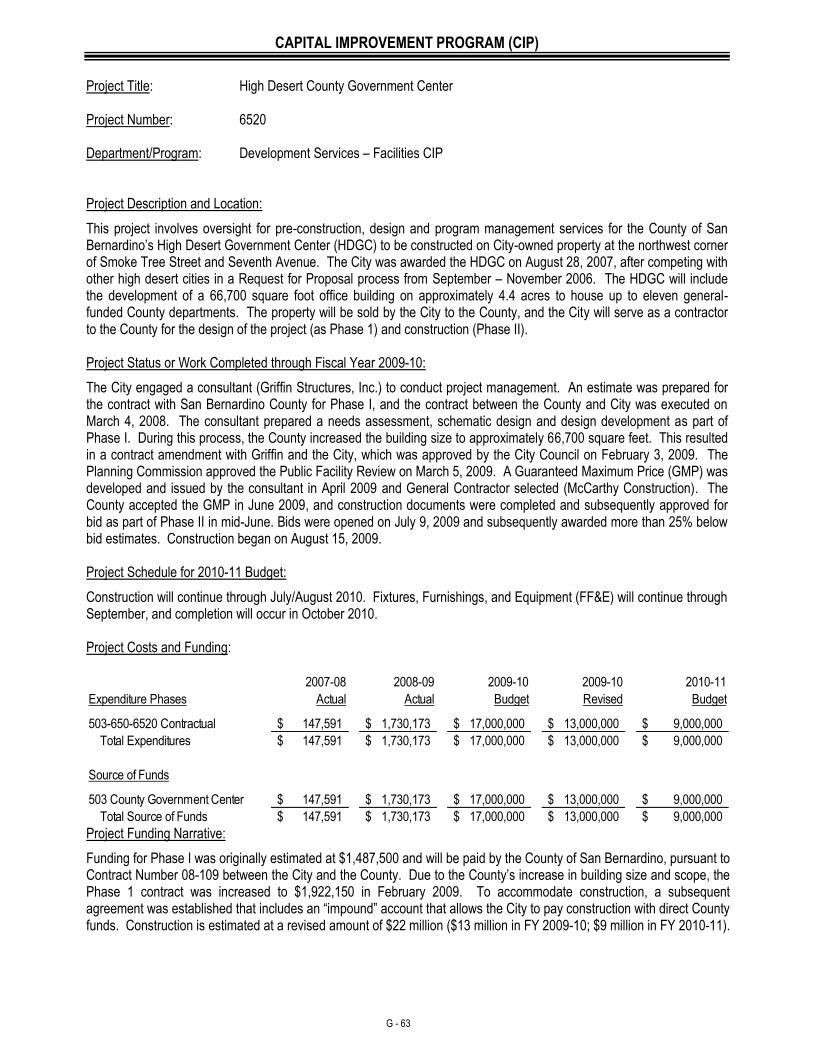
CAPITAL IMPROVEMENT PROGRAM (CIP)
G - 63
Project Title: High Desert County Government Center Project Number: 6520 Department/Program: Development Services – Facilities CIP Project Description and Location:
This project involves oversight for pre-construction, design and program management services for the County of San Bernardino’s High Desert Government Center (HDGC) to be constructed on City-owned property at the northwest corner of Smoke Tree Street and Seventh Avenue. The City was awarded the HDGC on August 28, 2007, after competing with other high desert cities in a Request for Proposal process from September – November 2006. The HDGC will include the development of a 66,700 square foot office building on approximately 4.4 acres to house up to eleven general-funded County departments. The property will be sold by the City to the County, and the City will serve as a contractor to the County for the design of the project (as Phase 1) and construction (Phase II). Project Status or Work Completed through Fiscal Year 2009-10:
The City engaged a consultant (Griffin Structures, Inc.) to conduct project management. An estimate was prepared for the contract with San Bernardino County for Phase I, and the contract between the County and City was executed on March 4, 2008. The consultant prepared a needs assessment, schematic design and design development as part of Phase I. During this process, the County increased the building size to approximately 66,700 square feet. This resulted in a contract amendment with Griffin and the City, which was approved by the City Council on February 3, 2009. The Planning Commission approved the Public Facility Review on March 5, 2009. A Guaranteed Maximum Price (GMP) was developed and issued by the consultant in April 2009 and General Contractor selected (McCarthy Construction). The County accepted the GMP in June 2009, and construction documents were completed and subsequently approved for bid as part of Phase II in mid-June. Bids were opened on July 9, 2009 and subsequently awarded more than 25% below bid estimates. Construction began on August 15, 2009. Project Schedule for 2010-11 Budget:
Construction will continue through July/August 2010. Fixtures, Furnishings, and Equipment (FF&E) will continue through September, and completion will occur in October 2010. Project Costs and Funding:
2007-08 2008-09 2009-10 2009-10 2010-11
Expenditure Phases Actual Actual Budget Revised Budget
147,591$ 1,730,173$ 17,000,000$ 13,000,000$ 9,000,000$
147,591$ 1,730,173$ 17,000,000$ 13,000,000$ 9,000,000$
Source of Funds
147,591$ 1,730,173$ 17,000,000$ 13,000,000$ 9,000,000$
147,591$ 1,730,173$ 17,000,000$ 13,000,000$ 9,000,000$ Total Source of Funds
503-650-6520 Contractual
Total Expenditures
503 County Government Center
Project Funding Narrative:
Funding for Phase I was originally estimated at $1,487,500 and will be paid by the County of San Bernardino, pursuant to Contract Number 08-109 between the City and the County. Due to the County’s increase in building size and scope, the Phase 1 contract was increased to $1,922,150 in February 2009. To accommodate construction, a subsequent agreement was established that includes an “impound” account that allows the City to pay construction with direct County funds. Construction is estimated at a revised amount of $22 million ($13 million in FY 2009-10; $9 million in FY 2010-11).
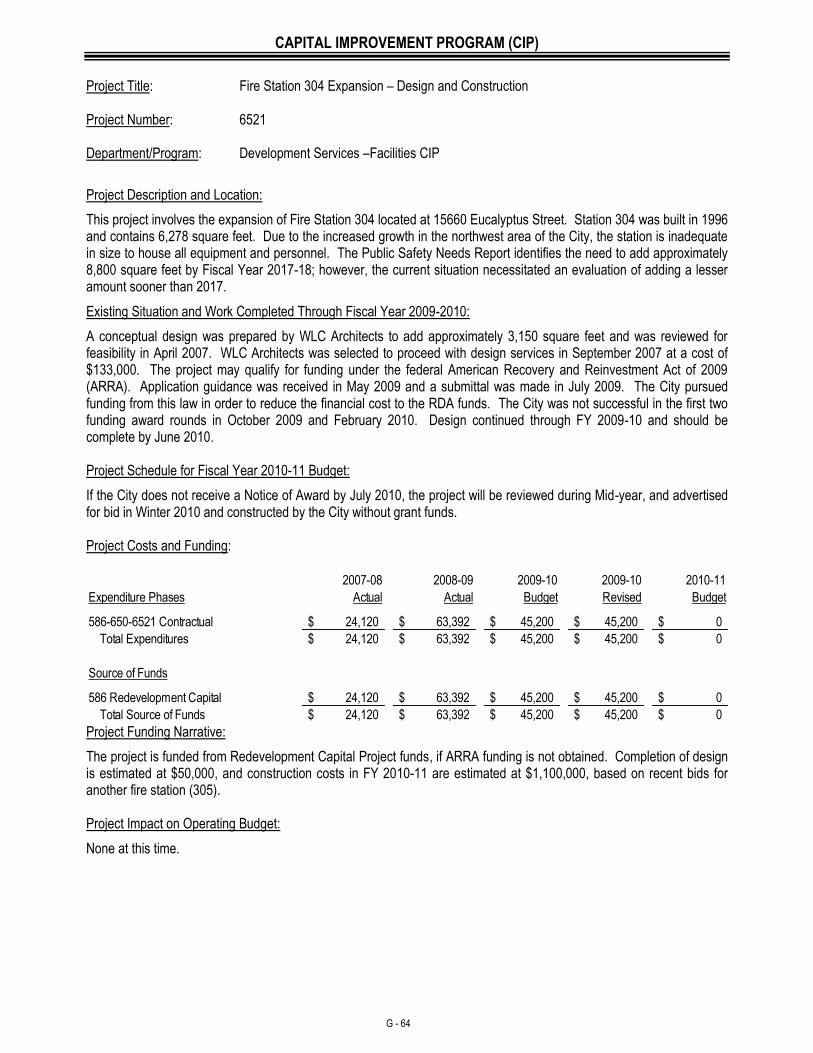
CAPITAL IMPROVEMENT PROGRAM (CIP)
G - 64
Project Title: Fire Station 304 Expansion – Design and Construction Project Number: 6521 Department/Program: Development Services –Facilities CIP
Project Description and Location:
This project involves the expansion of Fire Station 304 located at 15660 Eucalyptus Street. Station 304 was built in 1996 and contains 6,278 square feet. Due to the increased growth in the northwest area of the City, the station is inadequate in size to house all equipment and personnel. The Public Safety Needs Report identifies the need to add approximately 8,800 square feet by Fiscal Year 2017-18; however, the current situation necessitated an evaluation of adding a lesser amount sooner than 2017.
Existing Situation and Work Completed Through Fiscal Year 2009-2010:
A conceptual design was prepared by WLC Architects to add approximately 3,150 square feet and was reviewed for feasibility in April 2007. WLC Architects was selected to proceed with design services in September 2007 at a cost of $133,000. The project may qualify for funding under the federal American Recovery and Reinvestment Act of 2009 (ARRA). Application guidance was received in May 2009 and a submittal was made in July 2009. The City pursued funding from this law in order to reduce the financial cost to the RDA funds. The City was not successful in the first two funding award rounds in October 2009 and February 2010. Design continued through FY 2009-10 and should be complete by June 2010. Project Schedule for Fiscal Year 2010-11 Budget:
If the City does not receive a Notice of Award by July 2010, the project will be reviewed during Mid-year, and advertised for bid in Winter 2010 and constructed by the City without grant funds. Project Costs and Funding:
2007-08 2008-09 2009-10 2009-10 2010-11
Expenditure Phases Actual Actual Budget Revised Budget
24,120$ 63,392$ 45,200$ 45,200$ 0$
24,120$ 63,392$ 45,200$ 45,200$ 0$
Source of Funds
586 Redevelopment Capital 24,120$ 63,392$ 45,200$ 45,200$ 0$
24,120$ 63,392$ 45,200$ 45,200$ 0$
586-650-6521 Contractual
Total Expenditures
Total Source of Funds Project Funding Narrative:
The project is funded from Redevelopment Capital Project funds, if ARRA funding is not obtained. Completion of design is estimated at $50,000, and construction costs in FY 2010-11 are estimated at $1,100,000, based on recent bids for another fire station (305). Project Impact on Operating Budget:
None at this time.
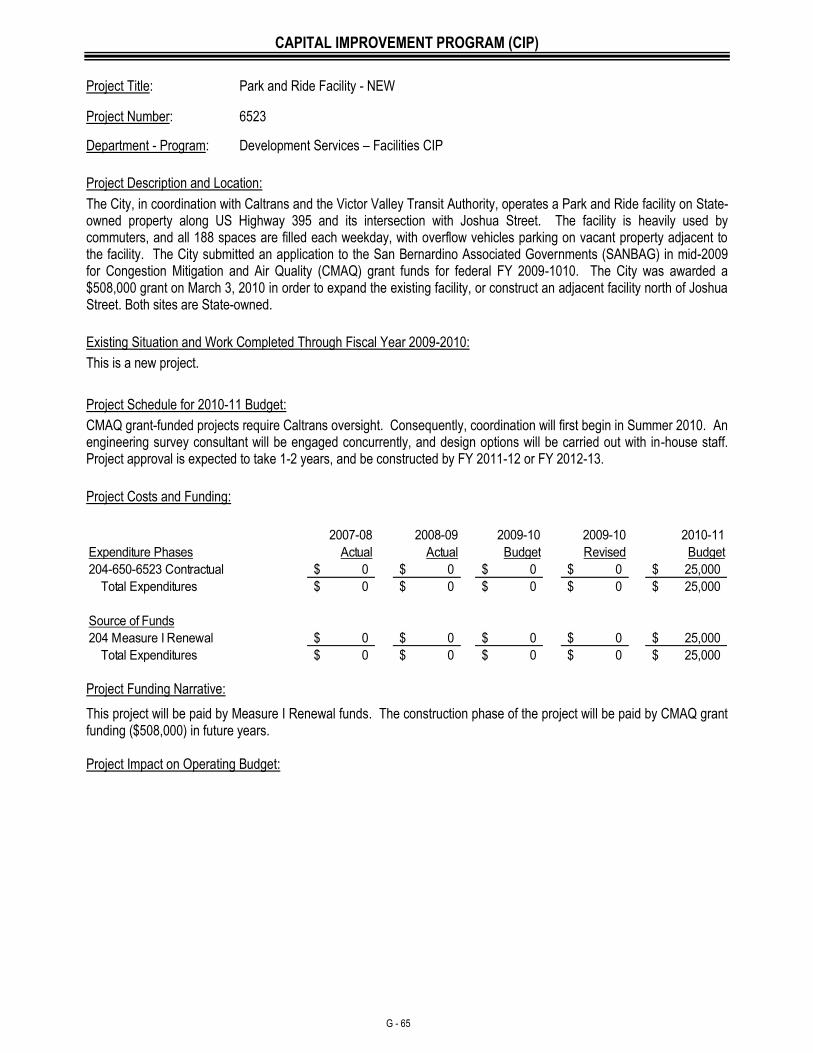
CAPITAL IMPROVEMENT PROGRAM (CIP)
G - 65
Project Title: Park and Ride Facility - NEW
Project Number: 6523
Department - Program: Development Services – Facilities CIP
Project Description and Location:
The City, in coordination with Caltrans and the Victor Valley Transit Authority, operates a Park and Ride facility on State-owned property along US Highway 395 and its intersection with Joshua Street. The facility is heavily used by commuters, and all 188 spaces are filled each weekday, with overflow vehicles parking on vacant property adjacent to the facility. The City submitted an application to the San Bernardino Associated Governments (SANBAG) in mid-2009 for Congestion Mitigation and Air Quality (CMAQ) grant funds for federal FY 2009-1010. The City was awarded a $508,000 grant on March 3, 2010 in order to expand the existing facility, or construct an adjacent facility north of Joshua Street. Both sites are State-owned.
Existing Situation and Work Completed Through Fiscal Year 2009-2010:
This is a new project.
Project Schedule for 2010-11 Budget:
CMAQ grant-funded projects require Caltrans oversight. Consequently, coordination will first begin in Summer 2010. An engineering survey consultant will be engaged concurrently, and design options will be carried out with in-house staff. Project approval is expected to take 1-2 years, and be constructed by FY 2011-12 or FY 2012-13.
Project Costs and Funding:
2007-08 2008-09 2009-10 2009-10 2010-11
Expenditure Phases Actual Actual Budget Revised Budget
0$ 0$ 0$ 0$ 25,000$
0$ 0$ 0$ 0$ 25,000$
Source of Funds
0$ 0$ 0$ 0$ 25,000$
0$ 0$ 0$ 0$ 25,000$
204-650-6523 Contractual
Total Expenditures
204 Measure I Renewal
Total Expenditures Project Funding Narrative:
This project will be paid by Measure I Renewal funds. The construction phase of the project will be paid by CMAQ grant funding ($508,000) in future years. Project Impact on Operating Budget:
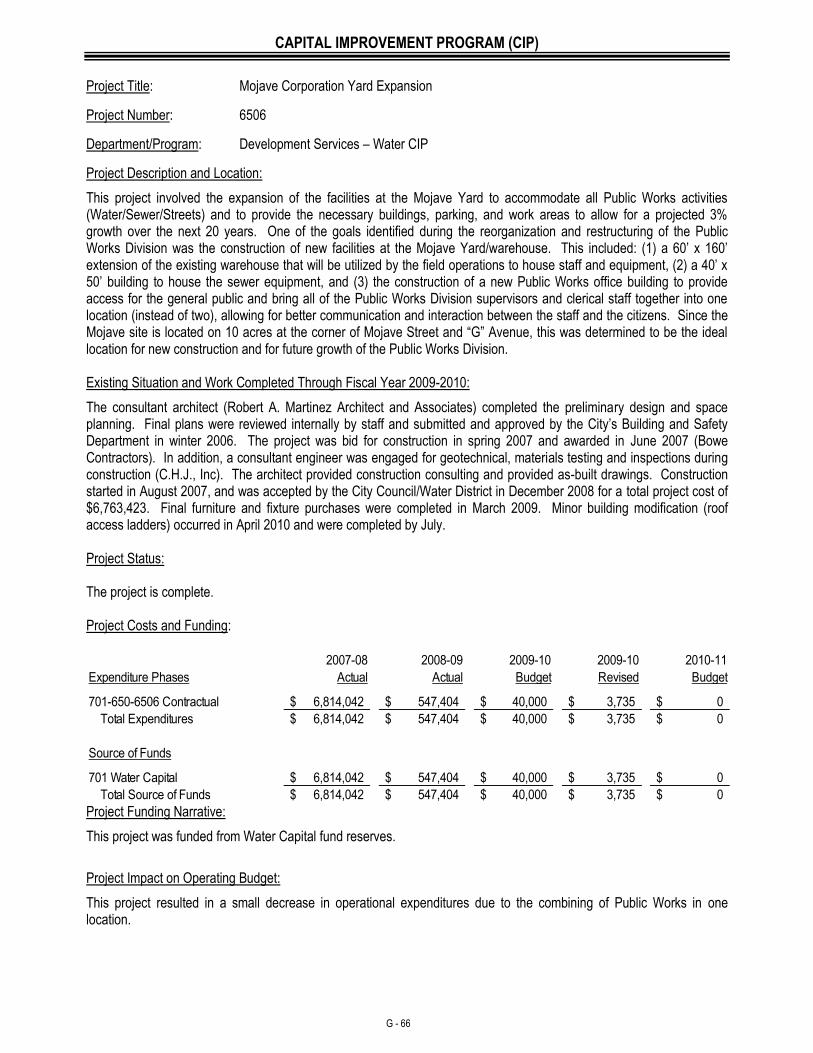
CAPITAL IMPROVEMENT PROGRAM (CIP)
G - 66
Project Title: Mojave Corporation Yard Expansion
Project Number: 6506
Department/Program: Development Services – Water CIP
Project Description and Location:
This project involved the expansion of the facilities at the Mojave Yard to accommodate all Public Works activities (Water/Sewer/Streets) and to provide the necessary buildings, parking, and work areas to allow for a projected 3% growth over the next 20 years. One of the goals identified during the reorganization and restructuring of the Public Works Division was the construction of new facilities at the Mojave Yard/warehouse. This included: (1) a 60’ x 160’ extension of the existing warehouse that will be utilized by the field operations to house staff and equipment, (2) a 40’ x 50’ building to house the sewer equipment, and (3) the construction of a new Public Works office building to provide access for the general public and bring all of the Public Works Division supervisors and clerical staff together into one location (instead of two), allowing for better communication and interaction between the staff and the citizens. Since the Mojave site is located on 10 acres at the corner of Mojave Street and “G” Avenue, this was determined to be the ideal location for new construction and for future growth of the Public Works Division. Existing Situation and Work Completed Through Fiscal Year 2009-2010:
The consultant architect (Robert A. Martinez Architect and Associates) completed the preliminary design and space planning. Final plans were reviewed internally by staff and submitted and approved by the City’s Building and Safety Department in winter 2006. The project was bid for construction in spring 2007 and awarded in June 2007 (Bowe Contractors). In addition, a consultant engineer was engaged for geotechnical, materials testing and inspections during construction (C.H.J., Inc). The architect provided construction consulting and provided as-built drawings. Construction started in August 2007, and was accepted by the City Council/Water District in December 2008 for a total project cost of $6,763,423. Final furniture and fixture purchases were completed in March 2009. Minor building modification (roof access ladders) occurred in April 2010 and were completed by July. Project Status: The project is complete. Project Costs and Funding:
2007-08 2008-09 2009-10 2009-10 2010-11
Expenditure Phases Actual Actual Budget Revised Budget
6,814,042$ 547,404$ 40,000$ 3,735$ 0$
6,814,042$ 547,404$ 40,000$ 3,735$ 0$
Source of Funds
6,814,042$ 547,404$ 40,000$ 3,735$ 0$
6,814,042$ 547,404$ 40,000$ 3,735$ 0$ Total Source of Funds
701-650-6506 Contractual
Total Expenditures
701 Water Capital
Project Funding Narrative:
This project was funded from Water Capital fund reserves.
Project Impact on Operating Budget:
This project resulted in a small decrease in operational expenditures due to the combining of Public Works in one location.
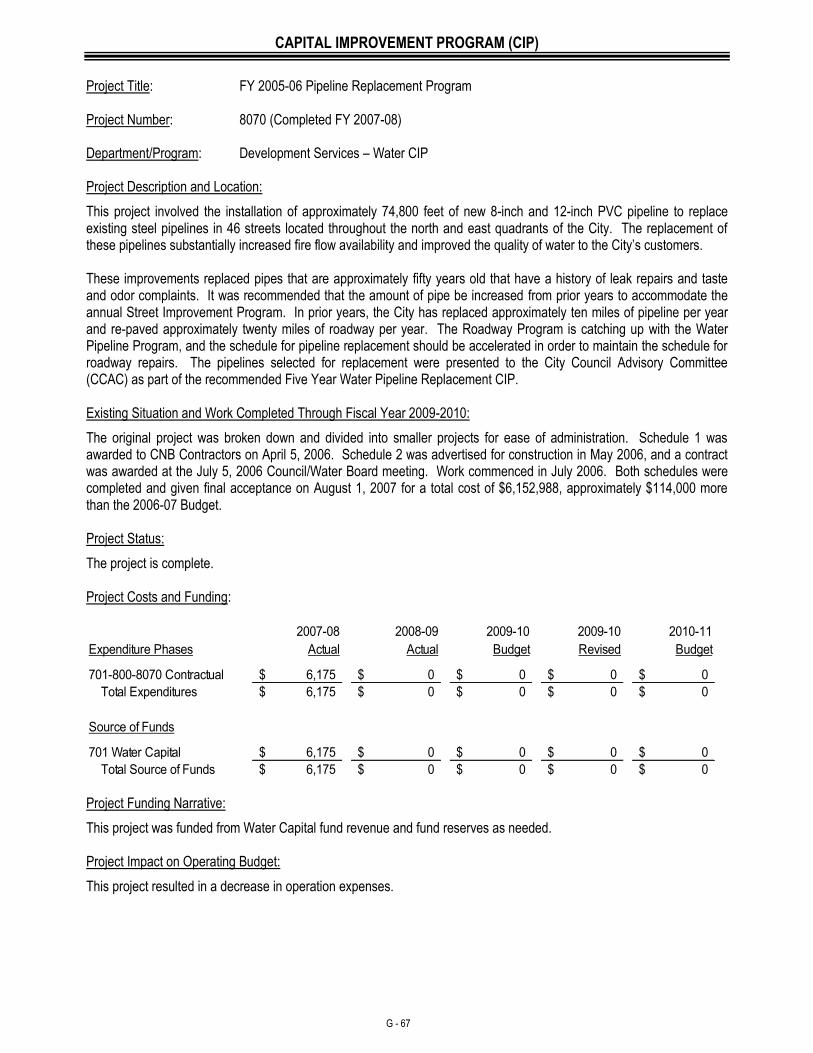
CAPITAL IMPROVEMENT PROGRAM (CIP)
G - 67
Project Title: FY 2005-06 Pipeline Replacement Program Project Number: 8070 (Completed FY 2007-08) Department/Program: Development Services – Water CIP Project Description and Location:
This project involved the installation of approximately 74,800 feet of new 8-inch and 12-inch PVC pipeline to replace existing steel pipelines in 46 streets located throughout the north and east quadrants of the City. The replacement of these pipelines substantially increased fire flow availability and improved the quality of water to the City’s customers. These improvements replaced pipes that are approximately fifty years old that have a history of leak repairs and taste and odor complaints. It was recommended that the amount of pipe be increased from prior years to accommodate the annual Street Improvement Program. In prior years, the City has replaced approximately ten miles of pipeline per year and re-paved approximately twenty miles of roadway per year. The Roadway Program is catching up with the Water Pipeline Program, and the schedule for pipeline replacement should be accelerated in order to maintain the schedule for roadway repairs. The pipelines selected for replacement were presented to the City Council Advisory Committee (CCAC) as part of the recommended Five Year Water Pipeline Replacement CIP. Existing Situation and Work Completed Through Fiscal Year 2009-2010:
The original project was broken down and divided into smaller projects for ease of administration. Schedule 1 was awarded to CNB Contractors on April 5, 2006. Schedule 2 was advertised for construction in May 2006, and a contract was awarded at the July 5, 2006 Council/Water Board meeting. Work commenced in July 2006. Both schedules were completed and given final acceptance on August 1, 2007 for a total cost of $6,152,988, approximately $114,000 more than the 2006-07 Budget. Project Status:
The project is complete. Project Costs and Funding:
2007-08 2008-09 2009-10 2009-10 2010-11
Expenditure Phases Actual Actual Budget Revised Budget
6,175$ 0$ 0$ 0$ 0$
6,175$ 0$ 0$ 0$ 0$
Source of Funds
6,175$ 0$ 0$ 0$ 0$
6,175$ 0$ 0$ 0$ 0$ Total Source of Funds
701-800-8070 Contractual
Total Expenditures
701 Water Capital
Project Funding Narrative:
This project was funded from Water Capital fund revenue and fund reserves as needed. Project Impact on Operating Budget:
This project resulted in a decrease in operation expenses.
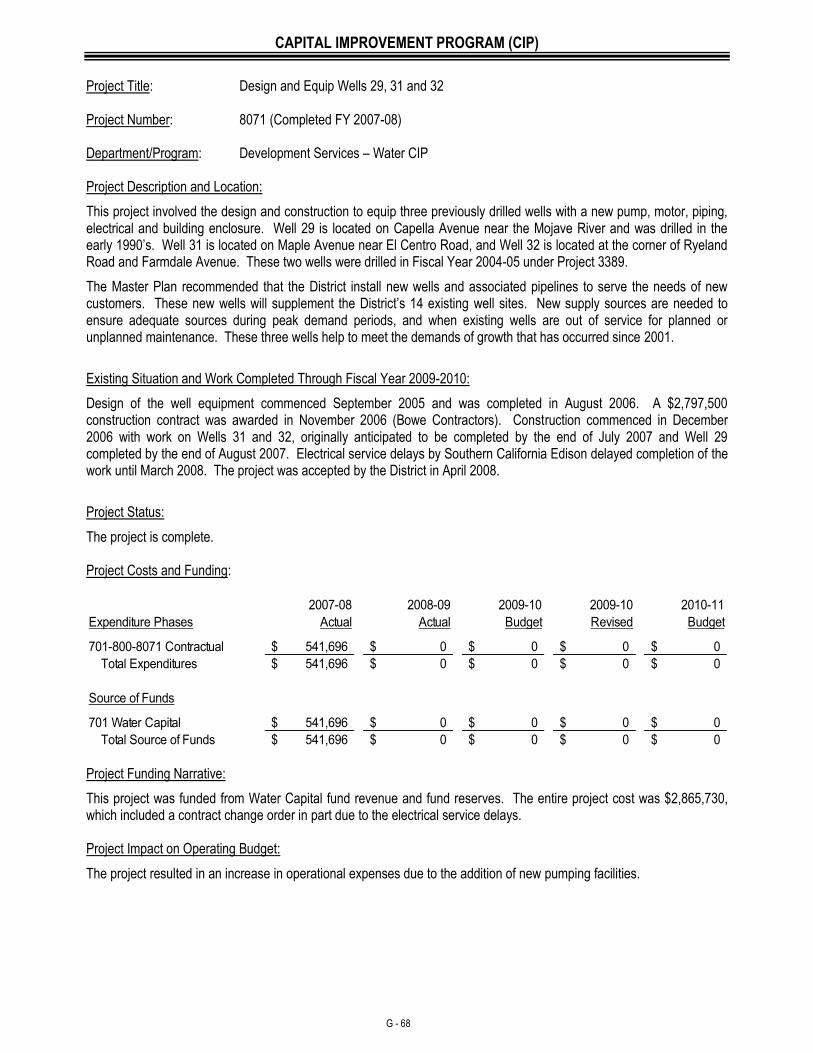
CAPITAL IMPROVEMENT PROGRAM (CIP)
G - 68
Project Title: Design and Equip Wells 29, 31 and 32 Project Number: 8071 (Completed FY 2007-08) Department/Program: Development Services – Water CIP Project Description and Location:
This project involved the design and construction to equip three previously drilled wells with a new pump, motor, piping, electrical and building enclosure. Well 29 is located on Capella Avenue near the Mojave River and was drilled in the early 1990’s. Well 31 is located on Maple Avenue near El Centro Road, and Well 32 is located at the corner of Ryeland Road and Farmdale Avenue. These two wells were drilled in Fiscal Year 2004-05 under Project 3389.
The Master Plan recommended that the District install new wells and associated pipelines to serve the needs of new customers. These new wells will supplement the District’s 14 existing well sites. New supply sources are needed to ensure adequate sources during peak demand periods, and when existing wells are out of service for planned or unplanned maintenance. These three wells help to meet the demands of growth that has occurred since 2001.
Existing Situation and Work Completed Through Fiscal Year 2009-2010:
Design of the well equipment commenced September 2005 and was completed in August 2006. A $2,797,500 construction contract was awarded in November 2006 (Bowe Contractors). Construction commenced in December 2006 with work on Wells 31 and 32, originally anticipated to be completed by the end of July 2007 and Well 29 completed by the end of August 2007. Electrical service delays by Southern California Edison delayed completion of the work until March 2008. The project was accepted by the District in April 2008.
Project Status:
The project is complete. Project Costs and Funding:
2007-08 2008-09 2009-10 2009-10 2010-11
Expenditure Phases Actual Actual Budget Revised Budget
541,696$ 0$ 0$ 0$ 0$
541,696$ 0$ 0$ 0$ 0$
Source of Funds
541,696$ 0$ 0$ 0$ 0$
541,696$ 0$ 0$ 0$ 0$
701-800-8071 Contractual
Total Expenditures
701 Water Capital
Total Source of Funds Project Funding Narrative:
This project was funded from Water Capital fund revenue and fund reserves. The entire project cost was $2,865,730, which included a contract change order in part due to the electrical service delays. Project Impact on Operating Budget:
The project resulted in an increase in operational expenses due to the addition of new pumping facilities.
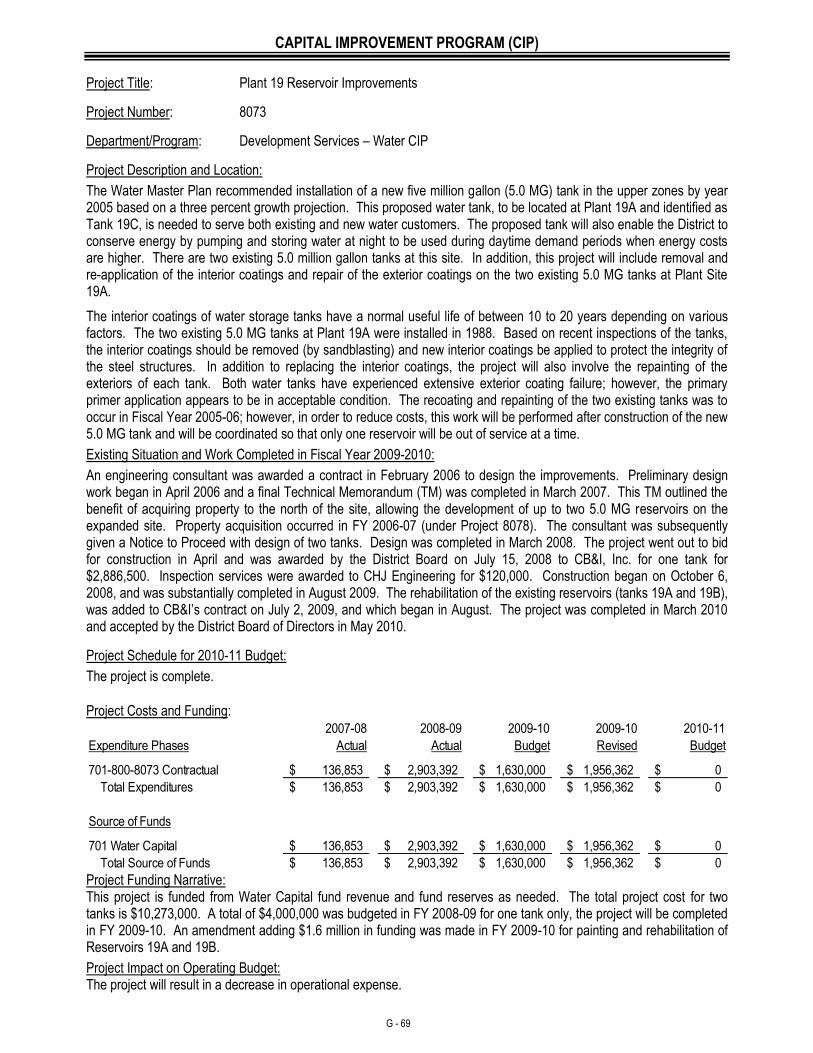
CAPITAL IMPROVEMENT PROGRAM (CIP)
G - 69
Project Title: Plant 19 Reservoir Improvements
Project Number: 8073
Department/Program: Development Services – Water CIP
Project Description and Location:
The Water Master Plan recommended installation of a new five million gallon (5.0 MG) tank in the upper zones by year 2005 based on a three percent growth projection. This proposed water tank, to be located at Plant 19A and identified as Tank 19C, is needed to serve both existing and new water customers. The proposed tank will also enable the District to conserve energy by pumping and storing water at night to be used during daytime demand periods when energy costs are higher. There are two existing 5.0 million gallon tanks at this site. In addition, this project will include removal and re-application of the interior coatings and repair of the exterior coatings on the two existing 5.0 MG tanks at Plant Site 19A.
The interior coatings of water storage tanks have a normal useful life of between 10 to 20 years depending on various factors. The two existing 5.0 MG tanks at Plant 19A were installed in 1988. Based on recent inspections of the tanks, the interior coatings should be removed (by sandblasting) and new interior coatings be applied to protect the integrity of the steel structures. In addition to replacing the interior coatings, the project will also involve the repainting of the exteriors of each tank. Both water tanks have experienced extensive exterior coating failure; however, the primary primer application appears to be in acceptable condition. The recoating and repainting of the two existing tanks was to occur in Fiscal Year 2005-06; however, in order to reduce costs, this work will be performed after construction of the new 5.0 MG tank and will be coordinated so that only one reservoir will be out of service at a time.
Existing Situation and Work Completed in Fiscal Year 2009-2010:
An engineering consultant was awarded a contract in February 2006 to design the improvements. Preliminary design work began in April 2006 and a final Technical Memorandum (TM) was completed in March 2007. This TM outlined the benefit of acquiring property to the north of the site, allowing the development of up to two 5.0 MG reservoirs on the expanded site. Property acquisition occurred in FY 2006-07 (under Project 8078). The consultant was subsequently given a Notice to Proceed with design of two tanks. Design was completed in March 2008. The project went out to bid for construction in April and was awarded by the District Board on July 15, 2008 to CB&I, Inc. for one tank for $2,886,500. Inspection services were awarded to CHJ Engineering for $120,000. Construction began on October 6, 2008, and was substantially completed in August 2009. The rehabilitation of the existing reservoirs (tanks 19A and 19B), was added to CB&I’s contract on July 2, 2009, and which began in August. The project was completed in March 2010 and accepted by the District Board of Directors in May 2010.
Project Schedule for 2010-11 Budget:
The project is complete.
Project Costs and Funding:
2007-08 2008-09 2009-10 2009-10 2010-11
Expenditure Phases Actual Actual Budget Revised Budget
136,853$ 2,903,392$ 1,630,000$ 1,956,362$ 0$
136,853$ 2,903,392$ 1,630,000$ 1,956,362$ 0$
Source of Funds
136,853$ 2,903,392$ 1,630,000$ 1,956,362$ 0$
136,853$ 2,903,392$ 1,630,000$ 1,956,362$ 0$ Total Source of Funds
701-800-8073 Contractual
Total Expenditures
701 Water Capital
Project Funding Narrative: This project is funded from Water Capital fund revenue and fund reserves as needed. The total project cost for two tanks is $10,273,000. A total of $4,000,000 was budgeted in FY 2008-09 for one tank only, the project will be completed in FY 2009-10. An amendment adding $1.6 million in funding was made in FY 2009-10 for painting and rehabilitation of Reservoirs 19A and 19B.
Project Impact on Operating Budget: The project will result in a decrease in operational expense.
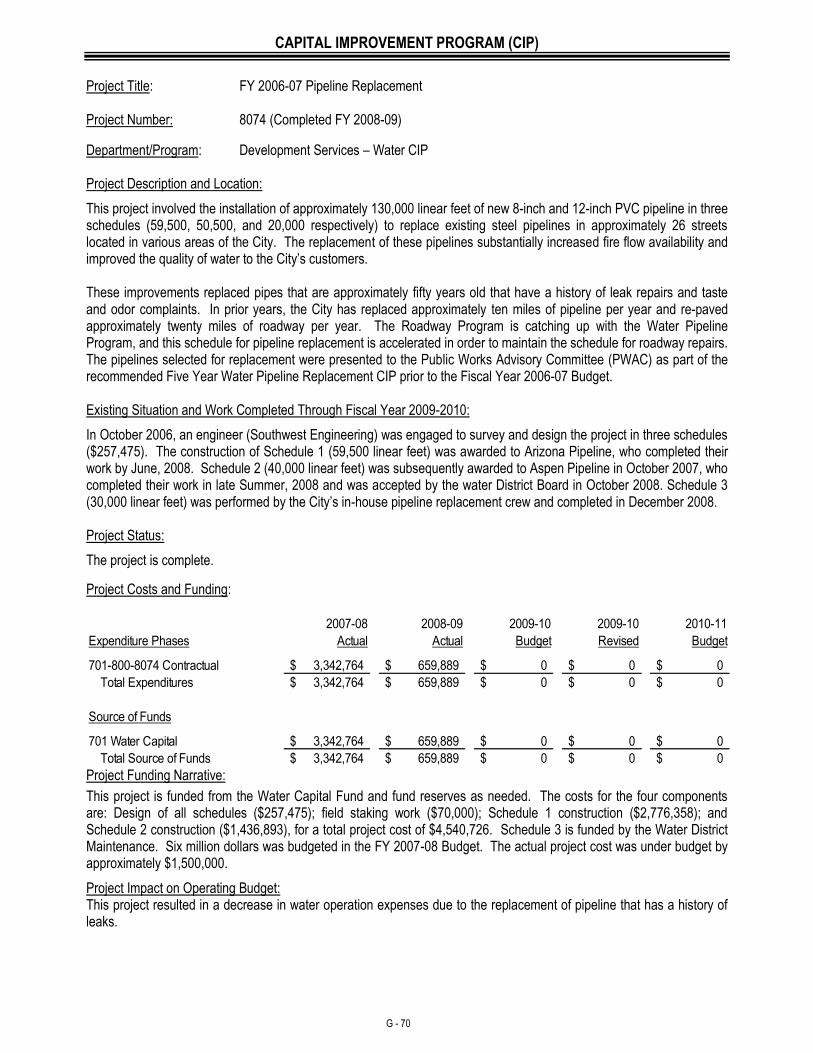
CAPITAL IMPROVEMENT PROGRAM (CIP)
G - 70
Project Title: FY 2006-07 Pipeline Replacement Project Number: 8074 (Completed FY 2008-09)
Department/Program: Development Services – Water CIP Project Description and Location:
This project involved the installation of approximately 130,000 linear feet of new 8-inch and 12-inch PVC pipeline in three schedules (59,500, 50,500, and 20,000 respectively) to replace existing steel pipelines in approximately 26 streets located in various areas of the City. The replacement of these pipelines substantially increased fire flow availability and improved the quality of water to the City’s customers. These improvements replaced pipes that are approximately fifty years old that have a history of leak repairs and taste and odor complaints. In prior years, the City has replaced approximately ten miles of pipeline per year and re-paved approximately twenty miles of roadway per year. The Roadway Program is catching up with the Water Pipeline Program, and this schedule for pipeline replacement is accelerated in order to maintain the schedule for roadway repairs. The pipelines selected for replacement were presented to the Public Works Advisory Committee (PWAC) as part of the recommended Five Year Water Pipeline Replacement CIP prior to the Fiscal Year 2006-07 Budget. Existing Situation and Work Completed Through Fiscal Year 2009-2010:
In October 2006, an engineer (Southwest Engineering) was engaged to survey and design the project in three schedules ($257,475). The construction of Schedule 1 (59,500 linear feet) was awarded to Arizona Pipeline, who completed their work by June, 2008. Schedule 2 (40,000 linear feet) was subsequently awarded to Aspen Pipeline in October 2007, who completed their work in late Summer, 2008 and was accepted by the water District Board in October 2008. Schedule 3 (30,000 linear feet) was performed by the City’s in-house pipeline replacement crew and completed in December 2008. Project Status:
The project is complete.
Project Costs and Funding:
2007-08 2008-09 2009-10 2009-10 2010-11
Expenditure Phases Actual Actual Budget Revised Budget
3,342,764$ 659,889$ 0$ 0$ 0$
3,342,764$ 659,889$ 0$ 0$ 0$
Source of Funds
3,342,764$ 659,889$ 0$ 0$ 0$
3,342,764$ 659,889$ 0$ 0$ 0$ Total Source of Funds
701-800-8074 Contractual
Total Expenditures
701 Water Capital
Project Funding Narrative:
This project is funded from the Water Capital Fund and fund reserves as needed. The costs for the four components are: Design of all schedules ($257,475); field staking work ($70,000); Schedule 1 construction ($2,776,358); and Schedule 2 construction ($1,436,893), for a total project cost of $4,540,726. Schedule 3 is funded by the Water District Maintenance. Six million dollars was budgeted in the FY 2007-08 Budget. The actual project cost was under budget by approximately $1,500,000.
Project Impact on Operating Budget: This project resulted in a decrease in water operation expenses due to the replacement of pipeline that has a history of leaks.
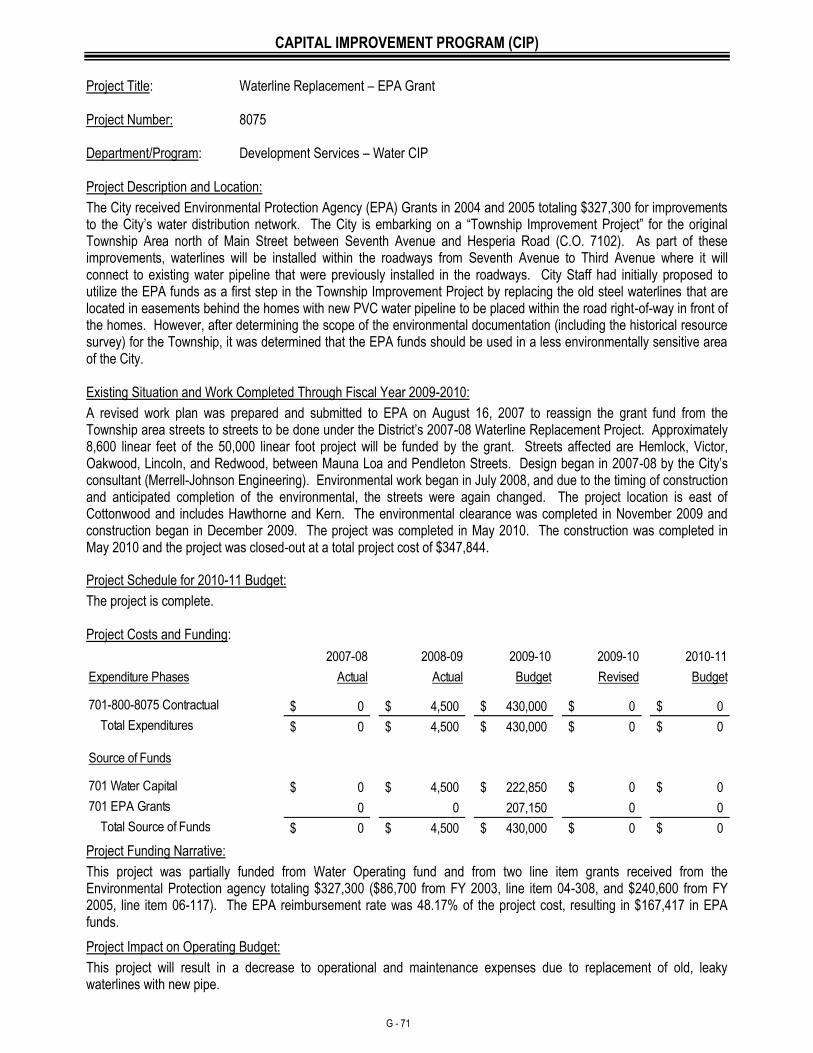
CAPITAL IMPROVEMENT PROGRAM (CIP)
G - 71
Project Title: Waterline Replacement – EPA Grant Project Number: 8075 Department/Program: Development Services – Water CIP Project Description and Location:
The City received Environmental Protection Agency (EPA) Grants in 2004 and 2005 totaling $327,300 for improvements to the City’s water distribution network. The City is embarking on a “Township Improvement Project” for the original Township Area north of Main Street between Seventh Avenue and Hesperia Road (C.O. 7102). As part of these improvements, waterlines will be installed within the roadways from Seventh Avenue to Third Avenue where it will connect to existing water pipeline that were previously installed in the roadways. City Staff had initially proposed to utilize the EPA funds as a first step in the Township Improvement Project by replacing the old steel waterlines that are located in easements behind the homes with new PVC water pipeline to be placed within the road right-of-way in front of the homes. However, after determining the scope of the environmental documentation (including the historical resource survey) for the Township, it was determined that the EPA funds should be used in a less environmentally sensitive area of the City. Existing Situation and Work Completed Through Fiscal Year 2009-2010:
A revised work plan was prepared and submitted to EPA on August 16, 2007 to reassign the grant fund from the Township area streets to streets to be done under the District’s 2007-08 Waterline Replacement Project. Approximately 8,600 linear feet of the 50,000 linear foot project will be funded by the grant. Streets affected are Hemlock, Victor, Oakwood, Lincoln, and Redwood, between Mauna Loa and Pendleton Streets. Design began in 2007-08 by the City’s consultant (Merrell-Johnson Engineering). Environmental work began in July 2008, and due to the timing of construction and anticipated completion of the environmental, the streets were again changed. The project location is east of Cottonwood and includes Hawthorne and Kern. The environmental clearance was completed in November 2009 and construction began in December 2009. The project was completed in May 2010. The construction was completed in May 2010 and the project was closed-out at a total project cost of $347,844.
Project Schedule for 2010-11 Budget:
The project is complete. Project Costs and Funding:
2007-08 2008-09 2009-10 2009-10 2010-11
Expenditure Phases Actual Actual Budget Revised Budget
0$ 4,500$ 430,000$ 0$ 0$
0$ 4,500$ 430,000$ 0$ 0$
Source of Funds
0$ 4,500$ 222,850$ 0$ 0$
701 EPA Grants 0 0 207,150 0 0
0$ 4,500$ 430,000$ 0$ 0$ Total Source of Funds
701-800-8075 Contractual
Total Expenditures
701 Water Capital
Project Funding Narrative:
This project was partially funded from Water Operating fund and from two line item grants received from the Environmental Protection agency totaling $327,300 ($86,700 from FY 2003, line item 04-308, and $240,600 from FY 2005, line item 06-117). The EPA reimbursement rate was 48.17% of the project cost, resulting in $167,417 in EPA funds.
Project Impact on Operating Budget:
This project will result in a decrease to operational and maintenance expenses due to replacement of old, leaky waterlines with new pipe.
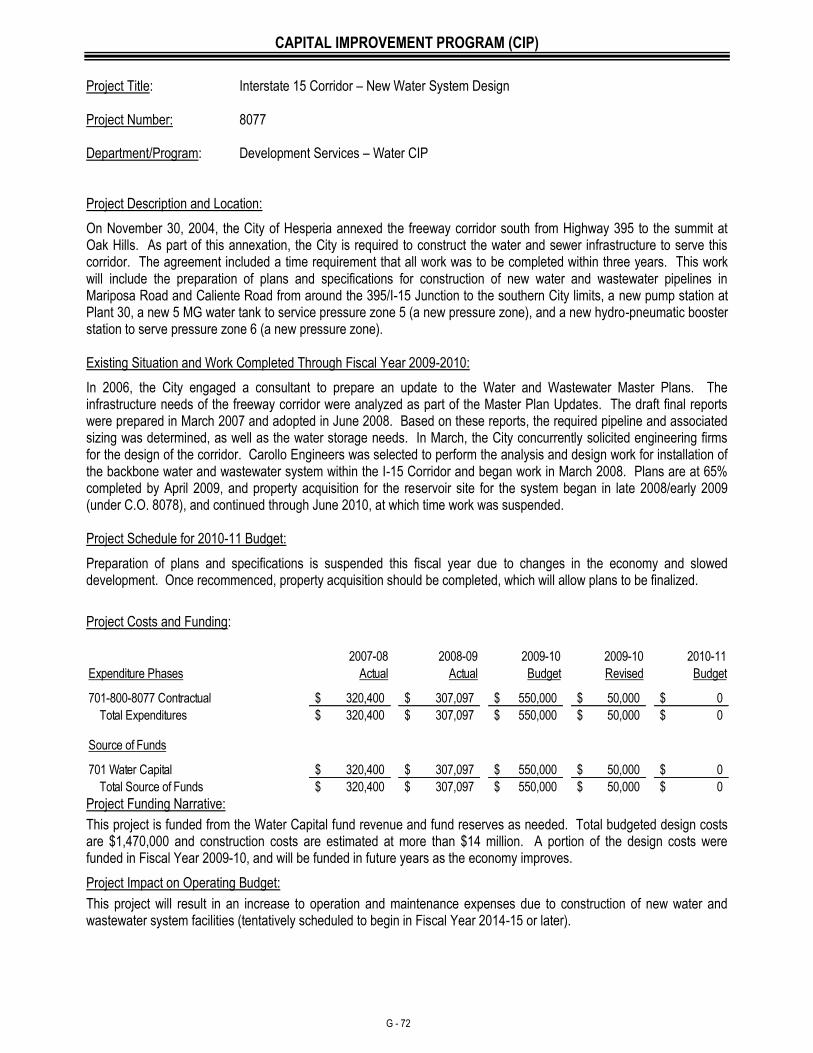
CAPITAL IMPROVEMENT PROGRAM (CIP)
G - 72
Project Title: Interstate 15 Corridor – New Water System Design Project Number: 8077 Department/Program: Development Services – Water CIP Project Description and Location:
On November 30, 2004, the City of Hesperia annexed the freeway corridor south from Highway 395 to the summit at Oak Hills. As part of this annexation, the City is required to construct the water and sewer infrastructure to serve this corridor. The agreement included a time requirement that all work was to be completed within three years. This work will include the preparation of plans and specifications for construction of new water and wastewater pipelines in Mariposa Road and Caliente Road from around the 395/I-15 Junction to the southern City limits, a new pump station at Plant 30, a new 5 MG water tank to service pressure zone 5 (a new pressure zone), and a new hydro-pneumatic booster station to serve pressure zone 6 (a new pressure zone). Existing Situation and Work Completed Through Fiscal Year 2009-2010:
In 2006, the City engaged a consultant to prepare an update to the Water and Wastewater Master Plans. The infrastructure needs of the freeway corridor were analyzed as part of the Master Plan Updates. The draft final reports were prepared in March 2007 and adopted in June 2008. Based on these reports, the required pipeline and associated sizing was determined, as well as the water storage needs. In March, the City concurrently solicited engineering firms for the design of the corridor. Carollo Engineers was selected to perform the analysis and design work for installation of the backbone water and wastewater system within the I-15 Corridor and began work in March 2008. Plans are at 65% completed by April 2009, and property acquisition for the reservoir site for the system began in late 2008/early 2009 (under C.O. 8078), and continued through June 2010, at which time work was suspended. Project Schedule for 2010-11 Budget:
Preparation of plans and specifications is suspended this fiscal year due to changes in the economy and slowed development. Once recommenced, property acquisition should be completed, which will allow plans to be finalized.
Project Costs and Funding:
2007-08 2008-09 2009-10 2009-10 2010-11
Expenditure Phases Actual Actual Budget Revised Budget
320,400$ 307,097$ 550,000$ 50,000$ 0$
320,400$ 307,097$ 550,000$ 50,000$ 0$
Source of Funds
320,400$ 307,097$ 550,000$ 50,000$ 0$
320,400$ 307,097$ 550,000$ 50,000$ 0$
701 Water Capital
Total Source of Funds
701-800-8077 Contractual
Total Expenditures
Project Funding Narrative:
This project is funded from the Water Capital fund revenue and fund reserves as needed. Total budgeted design costs are $1,470,000 and construction costs are estimated at more than $14 million. A portion of the design costs were funded in Fiscal Year 2009-10, and will be funded in future years as the economy improves.
Project Impact on Operating Budget:
This project will result in an increase to operation and maintenance expenses due to construction of new water and wastewater system facilities (tentatively scheduled to begin in Fiscal Year 2014-15 or later).
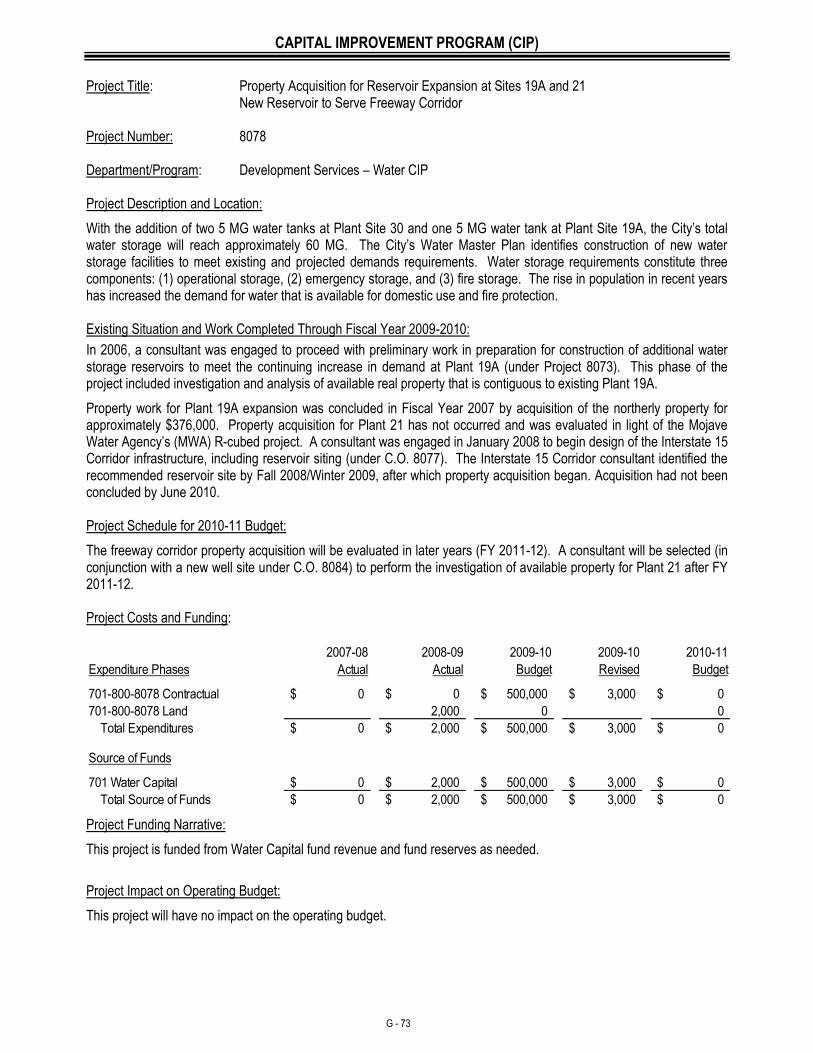
CAPITAL IMPROVEMENT PROGRAM (CIP)
G - 73
Project Title: Property Acquisition for Reservoir Expansion at Sites 19A and 21 New Reservoir to Serve Freeway Corridor Project Number: 8078 Department/Program: Development Services – Water CIP Project Description and Location:
With the addition of two 5 MG water tanks at Plant Site 30 and one 5 MG water tank at Plant Site 19A, the City’s total water storage will reach approximately 60 MG. The City’s Water Master Plan identifies construction of new water storage facilities to meet existing and projected demands requirements. Water storage requirements constitute three components: (1) operational storage, (2) emergency storage, and (3) fire storage. The rise in population in recent years has increased the demand for water that is available for domestic use and fire protection. Existing Situation and Work Completed Through Fiscal Year 2009-2010:
In 2006, a consultant was engaged to proceed with preliminary work in preparation for construction of additional water storage reservoirs to meet the continuing increase in demand at Plant 19A (under Project 8073). This phase of the project included investigation and analysis of available real property that is contiguous to existing Plant 19A.
Property work for Plant 19A expansion was concluded in Fiscal Year 2007 by acquisition of the northerly property for approximately $376,000. Property acquisition for Plant 21 has not occurred and was evaluated in light of the Mojave Water Agency’s (MWA) R-cubed project. A consultant was engaged in January 2008 to begin design of the Interstate 15 Corridor infrastructure, including reservoir siting (under C.O. 8077). The Interstate 15 Corridor consultant identified the recommended reservoir site by Fall 2008/Winter 2009, after which property acquisition began. Acquisition had not been concluded by June 2010. Project Schedule for 2010-11 Budget:
The freeway corridor property acquisition will be evaluated in later years (FY 2011-12). A consultant will be selected (in conjunction with a new well site under C.O. 8084) to perform the investigation of available property for Plant 21 after FY 2011-12. Project Costs and Funding:
2007-08 2008-09 2009-10 2009-10 2010-11
Expenditure Phases Actual Actual Budget Revised Budget
0$ 0$ 500,000$ 3,000$ 0$
2,000 0 0
0$ 2,000$ 500,000$ 3,000$ 0$
Source of Funds
0$ 2,000$ 500,000$ 3,000$ 0$
0$ 2,000$ 500,000$ 3,000$ 0$
701 Water Capital
Total Source of Funds
701-800-8078 Contractual
701-800-8078 Land
Total Expenditures
Project Funding Narrative:
This project is funded from Water Capital fund revenue and fund reserves as needed.
Project Impact on Operating Budget:
This project will have no impact on the operating budget.
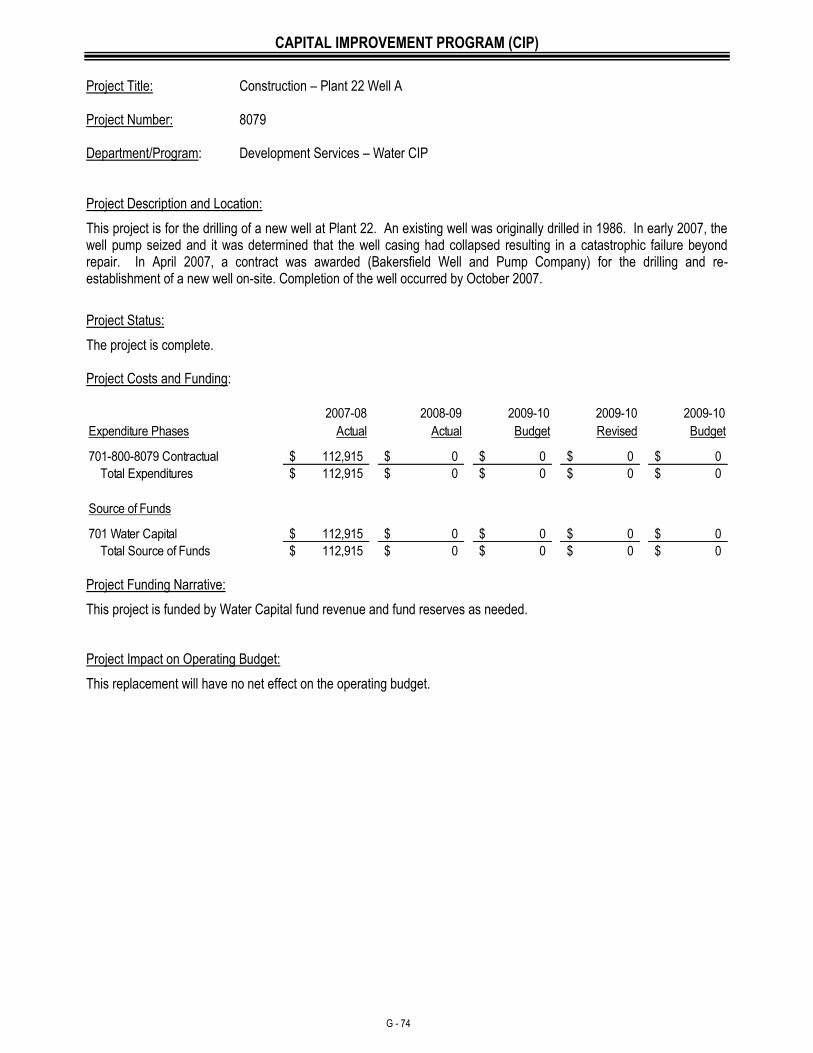
CAPITAL IMPROVEMENT PROGRAM (CIP)
G - 74
Project Title: Construction – Plant 22 Well A Project Number: 8079 Department/Program: Development Services – Water CIP Project Description and Location:
This project is for the drilling of a new well at Plant 22. An existing well was originally drilled in 1986. In early 2007, the well pump seized and it was determined that the well casing had collapsed resulting in a catastrophic failure beyond repair. In April 2007, a contract was awarded (Bakersfield Well and Pump Company) for the drilling and re-establishment of a new well on-site. Completion of the well occurred by October 2007.
Project Status:
The project is complete. Project Costs and Funding:
2007-08 2008-09 2009-10 2009-10 2009-10
Expenditure Phases Actual Actual Budget Revised Budget
112,915$ 0$ 0$ 0$ 0$
112,915$ 0$ 0$ 0$ 0$
Source of Funds
112,915$ 0$ 0$ 0$ 0$
112,915$ 0$ 0$ 0$ 0$ Total Source of Funds
701-800-8079 Contractual
Total Expenditures
701 Water Capital
Project Funding Narrative:
This project is funded by Water Capital fund revenue and fund reserves as needed.
Project Impact on Operating Budget:
This replacement will have no net effect on the operating budget.
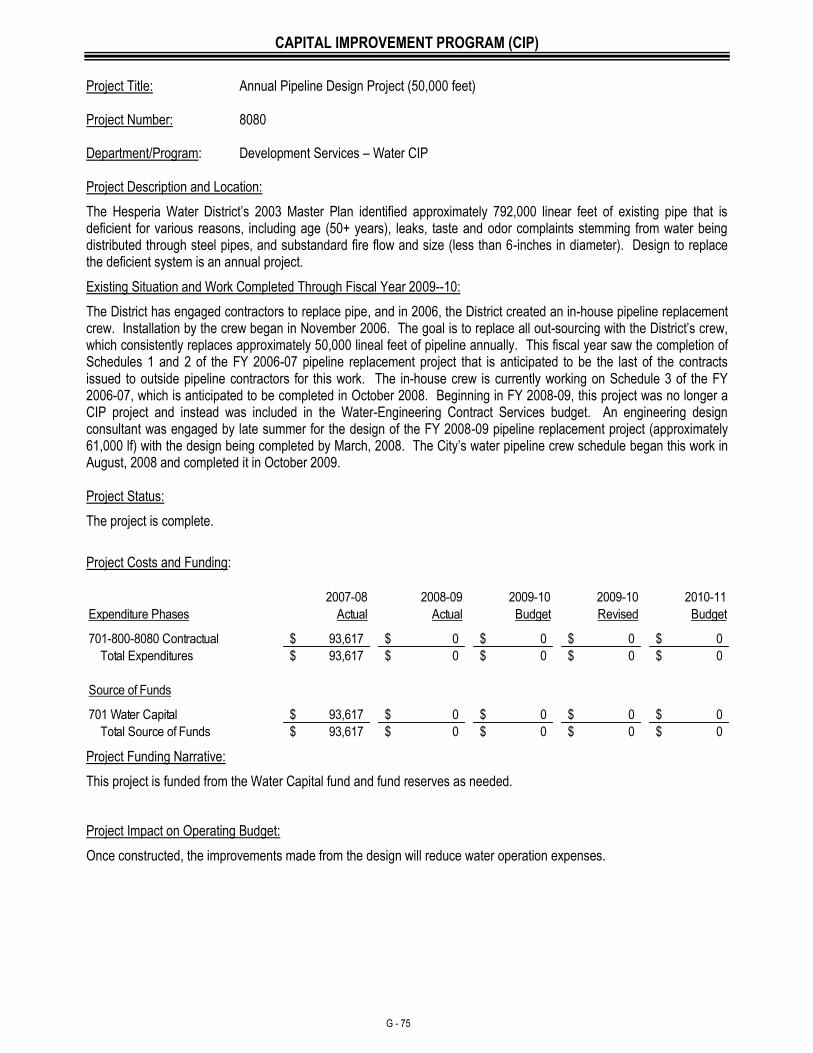
CAPITAL IMPROVEMENT PROGRAM (CIP)
G - 75
Project Title: Annual Pipeline Design Project (50,000 feet) Project Number: 8080 Department/Program: Development Services – Water CIP Project Description and Location:
The Hesperia Water District’s 2003 Master Plan identified approximately 792,000 linear feet of existing pipe that is deficient for various reasons, including age (50+ years), leaks, taste and odor complaints stemming from water being distributed through steel pipes, and substandard fire flow and size (less than 6-inches in diameter). Design to replace the deficient system is an annual project.
Existing Situation and Work Completed Through Fiscal Year 2009--10:
The District has engaged contractors to replace pipe, and in 2006, the District created an in-house pipeline replacement crew. Installation by the crew began in November 2006. The goal is to replace all out-sourcing with the District’s crew, which consistently replaces approximately 50,000 lineal feet of pipeline annually. This fiscal year saw the completion of Schedules 1 and 2 of the FY 2006-07 pipeline replacement project that is anticipated to be the last of the contracts issued to outside pipeline contractors for this work. The in-house crew is currently working on Schedule 3 of the FY 2006-07, which is anticipated to be completed in October 2008. Beginning in FY 2008-09, this project was no longer a CIP project and instead was included in the Water-Engineering Contract Services budget. An engineering design consultant was engaged by late summer for the design of the FY 2008-09 pipeline replacement project (approximately 61,000 lf) with the design being completed by March, 2008. The City’s water pipeline crew schedule began this work in August, 2008 and completed it in October 2009. Project Status:
The project is complete.
Project Costs and Funding:
2007-08 2008-09 2009-10 2009-10 2010-11
Expenditure Phases Actual Actual Budget Revised Budget
93,617$ 0$ 0$ 0$ 0$
93,617$ 0$ 0$ 0$ 0$
Source of Funds
93,617$ 0$ 0$ 0$ 0$
93,617$ 0$ 0$ 0$ 0$ Total Source of Funds
701-800-8080 Contractual
Total Expenditures
701 Water Capital
Project Funding Narrative:
This project is funded from the Water Capital fund and fund reserves as needed.
Project Impact on Operating Budget:
Once constructed, the improvements made from the design will reduce water operation expenses.
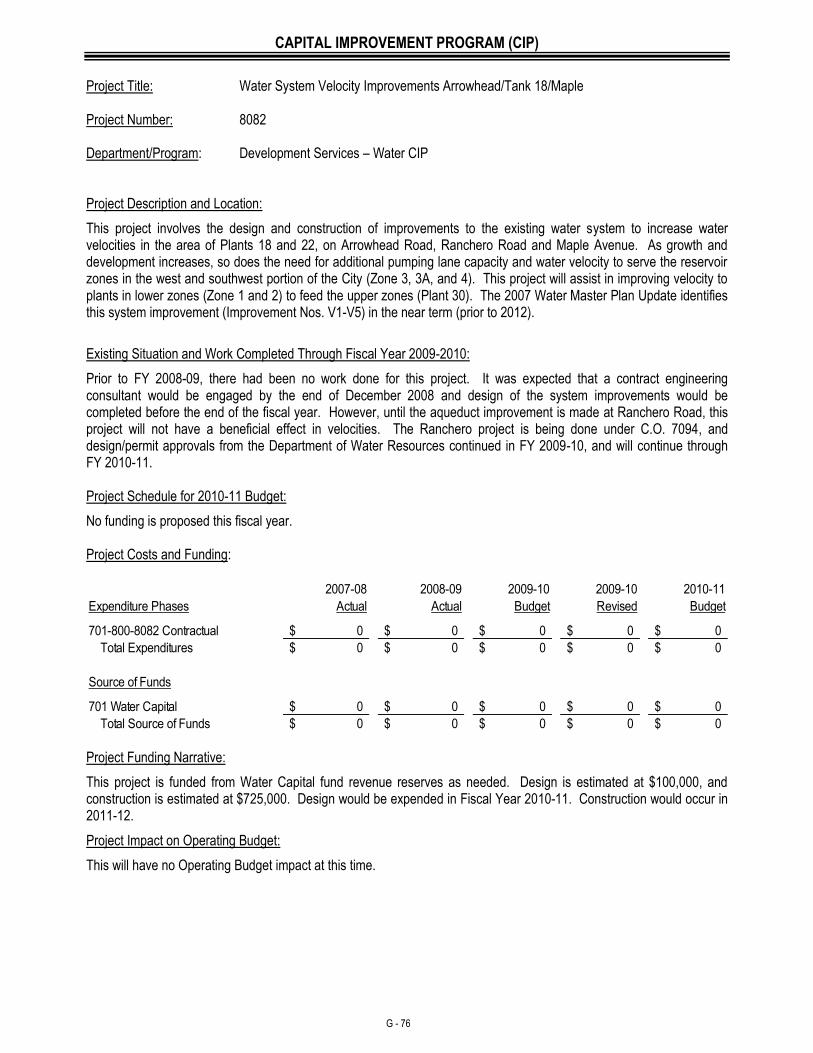
CAPITAL IMPROVEMENT PROGRAM (CIP)
G - 76
Project Title: Water System Velocity Improvements Arrowhead/Tank 18/Maple Project Number: 8082 Department/Program: Development Services – Water CIP Project Description and Location:
This project involves the design and construction of improvements to the existing water system to increase water velocities in the area of Plants 18 and 22, on Arrowhead Road, Ranchero Road and Maple Avenue. As growth and development increases, so does the need for additional pumping lane capacity and water velocity to serve the reservoir zones in the west and southwest portion of the City (Zone 3, 3A, and 4). This project will assist in improving velocity to plants in lower zones (Zone 1 and 2) to feed the upper zones (Plant 30). The 2007 Water Master Plan Update identifies this system improvement (Improvement Nos. V1-V5) in the near term (prior to 2012).
Existing Situation and Work Completed Through Fiscal Year 2009-2010:
Prior to FY 2008-09, there had been no work done for this project. It was expected that a contract engineering consultant would be engaged by the end of December 2008 and design of the system improvements would be completed before the end of the fiscal year. However, until the aqueduct improvement is made at Ranchero Road, this project will not have a beneficial effect in velocities. The Ranchero project is being done under C.O. 7094, and design/permit approvals from the Department of Water Resources continued in FY 2009-10, and will continue through FY 2010-11. Project Schedule for 2010-11 Budget:
No funding is proposed this fiscal year. Project Costs and Funding:
2007-08 2008-09 2009-10 2009-10 2010-11
Expenditure Phases Actual Actual Budget Revised Budget
0$ 0$ 0$ 0$ 0$
0$ 0$ 0$ 0$ 0$
Source of Funds
0$ 0$ 0$ 0$ 0$
0$ 0$ 0$ 0$ 0$ Total Source of Funds
701-800-8082 Contractual
Total Expenditures
701 Water Capital
Project Funding Narrative:
This project is funded from Water Capital fund revenue reserves as needed. Design is estimated at $100,000, and construction is estimated at $725,000. Design would be expended in Fiscal Year 2010-11. Construction would occur in 2011-12.
Project Impact on Operating Budget:
This will have no Operating Budget impact at this time.
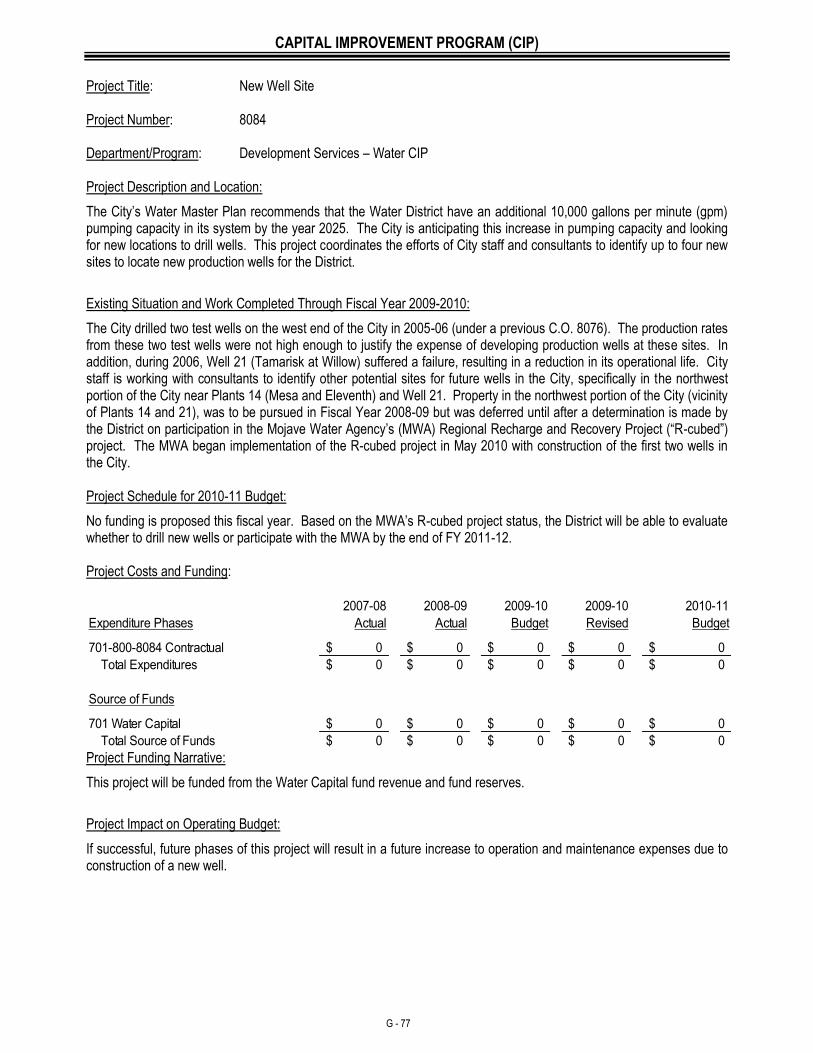
CAPITAL IMPROVEMENT PROGRAM (CIP)
G - 77
Project Title: New Well Site Project Number: 8084 Department/Program: Development Services – Water CIP Project Description and Location:
The City’s Water Master Plan recommends that the Water District have an additional 10,000 gallons per minute (gpm) pumping capacity in its system by the year 2025. The City is anticipating this increase in pumping capacity and looking for new locations to drill wells. This project coordinates the efforts of City staff and consultants to identify up to four new sites to locate new production wells for the District.
Existing Situation and Work Completed Through Fiscal Year 2009-2010:
The City drilled two test wells on the west end of the City in 2005-06 (under a previous C.O. 8076). The production rates from these two test wells were not high enough to justify the expense of developing production wells at these sites. In addition, during 2006, Well 21 (Tamarisk at Willow) suffered a failure, resulting in a reduction in its operational life. City staff is working with consultants to identify other potential sites for future wells in the City, specifically in the northwest portion of the City near Plants 14 (Mesa and Eleventh) and Well 21. Property in the northwest portion of the City (vicinity of Plants 14 and 21), was to be pursued in Fiscal Year 2008-09 but was deferred until after a determination is made by the District on participation in the Mojave Water Agency’s (MWA) Regional Recharge and Recovery Project (“R-cubed”) project. The MWA began implementation of the R-cubed project in May 2010 with construction of the first two wells in the City. Project Schedule for 2010-11 Budget:
No funding is proposed this fiscal year. Based on the MWA’s R-cubed project status, the District will be able to evaluate whether to drill new wells or participate with the MWA by the end of FY 2011-12. Project Costs and Funding:
2007-08 2008-09 2009-10 2009-10 2010-11
Expenditure Phases Actual Actual Budget Revised Budget
701-800-8084 Contractual 0$ 0$ 0$ 0$ 0$
0$ 0$ 0$ 0$ 0$
Source of Funds
0$ 0$ 0$ 0$ 0$
0$ 0$ 0$ 0$ 0$ Total Source of Funds
Total Expenditures
701 Water Capital
Project Funding Narrative:
This project will be funded from the Water Capital fund revenue and fund reserves.
Project Impact on Operating Budget:
If successful, future phases of this project will result in a future increase to operation and maintenance expenses due to construction of a new well.
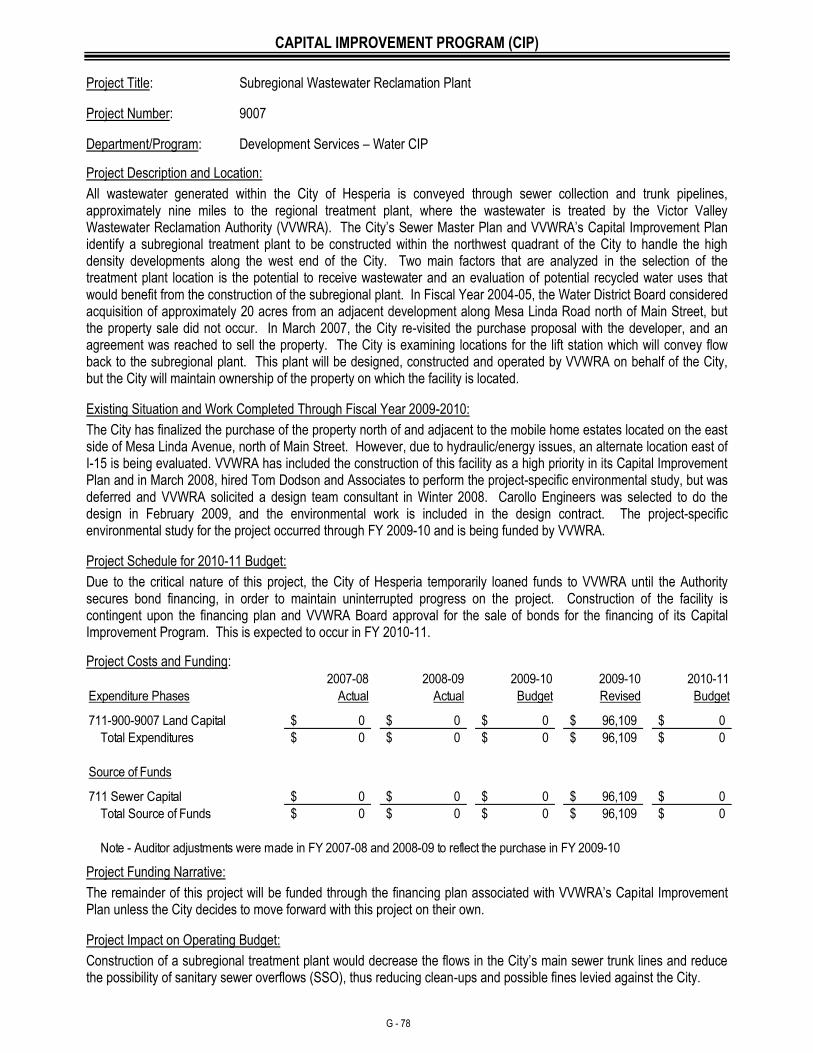
CAPITAL IMPROVEMENT PROGRAM (CIP)
G - 78
Project Title: Subregional Wastewater Reclamation Plant
Project Number: 9007
Department/Program: Development Services – Water CIP
Project Description and Location:
All wastewater generated within the City of Hesperia is conveyed through sewer collection and trunk pipelines, approximately nine miles to the regional treatment plant, where the wastewater is treated by the Victor Valley Wastewater Reclamation Authority (VVWRA). The City’s Sewer Master Plan and VVWRA’s Capital Improvement Plan identify a subregional treatment plant to be constructed within the northwest quadrant of the City to handle the high density developments along the west end of the City. Two main factors that are analyzed in the selection of the treatment plant location is the potential to receive wastewater and an evaluation of potential recycled water uses that would benefit from the construction of the subregional plant. In Fiscal Year 2004-05, the Water District Board considered acquisition of approximately 20 acres from an adjacent development along Mesa Linda Road north of Main Street, but the property sale did not occur. In March 2007, the City re-visited the purchase proposal with the developer, and an agreement was reached to sell the property. The City is examining locations for the lift station which will convey flow back to the subregional plant. This plant will be designed, constructed and operated by VVWRA on behalf of the City, but the City will maintain ownership of the property on which the facility is located.
Existing Situation and Work Completed Through Fiscal Year 2009-2010:
The City has finalized the purchase of the property north of and adjacent to the mobile home estates located on the east side of Mesa Linda Avenue, north of Main Street. However, due to hydraulic/energy issues, an alternate location east of I-15 is being evaluated. VVWRA has included the construction of this facility as a high priority in its Capital Improvement Plan and in March 2008, hired Tom Dodson and Associates to perform the project-specific environmental study, but was deferred and VVWRA solicited a design team consultant in Winter 2008. Carollo Engineers was selected to do the design in February 2009, and the environmental work is included in the design contract. The project-specific environmental study for the project occurred through FY 2009-10 and is being funded by VVWRA.
Project Schedule for 2010-11 Budget:
Due to the critical nature of this project, the City of Hesperia temporarily loaned funds to VVWRA until the Authority secures bond financing, in order to maintain uninterrupted progress on the project. Construction of the facility is contingent upon the financing plan and VVWRA Board approval for the sale of bonds for the financing of its Capital Improvement Program. This is expected to occur in FY 2010-11.
Project Costs and Funding: 2007-08 2008-09 2009-10 2009-10 2010-11
Expenditure Phases Actual Actual Budget Revised Budget
0$ 0$ 0$ 96,109$ 0$
0$ 0$ 0$ 96,109$ 0$
Source of Funds
0$ 0$ 0$ 96,109$ 0$
0$ 0$ 0$ 96,109$ 0$
Note - Auditor adjustments were made in FY 2007-08 and 2008-09 to reflect the purchase in FY 2009-10
711 Sewer Capital
Total Source of Funds
711-900-9007 Land Capital
Total Expenditures
Project Funding Narrative:
The remainder of this project will be funded through the financing plan associated with VVWRA’s Capital Improvement Plan unless the City decides to move forward with this project on their own.
Project Impact on Operating Budget:
Construction of a subregional treatment plant would decrease the flows in the City’s main sewer trunk lines and reduce the possibility of sanitary sewer overflows (SSO), thus reducing clean-ups and possible fines levied against the City.
CAPITAL IMPROVEMENT PROGRAM (CIP)
G - 79
Project Title: Santa Fe Improvements – Sewer Upgrade Phase 1 - Design Project Number: 9009 Department/Program: Development Services – Wastewater CIP Project Description and Location:
The City’s current Public Works and Code Compliance is one building of many located on Santa Fe Avenue that is not being served by the City’s sewer collection system. Buildings constructed in the area north of Lemon Avenue were constructed with a septic system and are in operation on septic. With the high use of the City’s building and the future expansion of Animal Control and kennel services projected for the building, it will be necessary to connect this building to sewer. The nearest connection point for sewer is over a mile away, to the north.
Existing Situation and Work Completed Through Fiscal Year 2009-2010:
This project is being taken over as a Capital Improvement Project by the Victor Valley Wastewater Reclamation Authority (VVWRA). The I Avenue interceptor which collects the majority of sewer flows in the City of Hesperia is reaching its capacity. Instead of expanding the size of the I Avenue interceptor or running a parallel line, it was determined that a new interceptor along Santa Fe Avenue would be easier to construct. VVWRA awarded the design of the Santa Fe Avenue Regional Interceptor (SAFARI) project to RBF Consultants in 2008. Design and environmental clearance occurred throughout the year.
Project Schedule for 2010-11 Budget:
VVWRA expects to be under construction by the Fall of 2010 subject to VVWRA’s approval of the financing plan and sale of bonds (see CO 9007) with an anticipated construction period of six months. Project Costs and Funding:
2007-08 2008-09 2009-10 2009-10 2010-11
Expenditure Phases Actual Actual Budget Revised Budget
0$ 0$ 0$ 0$ 0$
0$ 0$ 0$ 0$ 0$
Source of Funds
0$ 0$ 0$ 0$ 0$
0$ 0$ 0$ 0$ 0$ Total Source of Funds
711-900-9009 Contractual
Total Expenditures
711 Sewer Capital
Project Funding Narrative:
This project will not be funded by the City.
Project Impact on Operating Budget:
This improvement being done by VVWRA will relieve the City Wastewater budget from having to carry it out in future years.
CAPITAL IMPROVEMENT PROGRAM (CIP)
G - 80
Project Title: Escondido Bypass Line Project Number: 9010 Department/Program: Development Services – Wastewater CIP Project Description and Location:
The City updated its Wastewater Master Plan and as part of that plan, one deficiency in the existing system needing to be addressed was identified in the western side of the City where new development is occurring. Identified as FP-11, this project installed a bypass sewer line to intercept the flows that are currently collected from the corner of Sultana Street and Escondido Avenue and flows east on Main Street to Maple Avenue. These flows are directed north in a new 10-inch line to connect to the system north of Main Street.
Existing Situation and Work Completed Through Fiscal Year 2009-2010:
Design began in August 2007 and was completed in October. Bid for construction occurred in November 2007, and was awarded to Karl Scanlon Company, Inc. in January 2008. Construction commenced in February, with completion by April 2008. Project Status:
The project is complete. Project Costs and Funding:
2007-08 2008-09 2009-10 2009-10 2010-11
Expenditure Phases Actual Actual Budget Revised Budget
398,787$ 0$ 0$ 0$ 0$
398,787$ 0$ 0$ 0$ 0$
Source of Funds
398,787$ 0$ 0$ 0$ 0$
398,787$ 0$ 0$ 0$ 0$ Total Source of Funds
711-900-9010 Contractual
Total Expenditures
711 Sewer Capital
Project Funding Narrative:
This project was funded by Sewer Capital fund revenue reserves and the construction cost was $393,590. This included an initial award of $297,710 plus an additional contract Change Order due to catastrophic trench failure.
Project Impact on Operating Budget:
This project reduced the potential for sanitary sewer overflows, thus reducing the potential for administrative fines by the regulatory agency (Lahontan) on the City.
CAPITAL IMPROVEMENT PROGRAM (CIP)
G - 81
Project Title: Subregional Wastewater Reclamation Plant WRP-2 Project Number: 9011 Department/Program: Development Services – Wastewater CIP Project Description and Location:
The City recently updated its Wastewater Master Plan. As part of that plan, three wastewater treatment facilities are identified to be needed in the City by build-out. Wastewater Reclamation Plant (WRP)-1 is to be located west of Interstate 15, and WRP-2 is to be located in the northeastern portion, south of Bear Valley Road and east of the BNSF Railway. For WRP-2, the District owns property in this area along the Mojave River; however topographical constraints that affect future use/distribution of reclaimed water, and wastewater discharge regulations established since this property was acquired make this property less desirable for this use than property closer to I Avenue. As a result, optional sites are being evaluated for locating WRP-2.
Existing Situation and Work Completed Through Fiscal Year 2009-2010:
Preliminary site investigations have occurred. This resulted in a recommended site being identified for acquisition which was considered by the District Board in May 2008. A parcel on Osbrink Drive was acquired by July 2008 for $1,651,678. Project Status:
The project is complete. Future use of the property is contingent on the Victor Valley Wastewater Reclamation Authority’s Capital Improvement Program schedule. Project Costs and Funding:
2007-08 2008-09 2009-10 2009-10 2010-11
Expenditure Phases Actual Actual Budget Revised Budget
0$ 1,651,678$ 0$ 0$ 0$
0$ 1,651,678$ 0$ 0$ 0$
Source of Funds
0$ 1,651,678$ 0$ 0$ 0$
0$ 1,651,678$ 0$ 0$ 0$
Note - Deposit on land was made in FY 2007-08, however transaction closed in FY 2008-09.
Total Source of Funds
711-900-9011 Contractual
Total Expenditures
711 Sewer Capital
Project Funding Narrative:
This project is funded by Sewer Capital fund revenue reserves as needed. Acquisition cost was estimated at $1,100,000 and was finalized for $1,651,678.
Project Impact on Operating Budget:
This phase of the project will have no impact on the budget.
CAPITAL IMPROVEMENT PROGRAM (CIP)
G - 82
Project Title: Mojave Sewer Upgrade Phase I - Design Phase II - Construction Project Number: 9012 Department/Program: Development Services – Wastewater CIP Project Description and Location:
The City recently updated its Wastewater Master Plan. As part of that plan, deficiencies were identified to improve the existing collection system over the “near term” (needed as soon as possible), “mid-term” (2007-2012) and “long term” (2013-2017). One of the near-term deficiencies in the existing system needing to be addressed was identified in the western side of the City where new development is occurring. Identified as “FP-13,” this project would install a parallel 15-inch gravity main sewer line approximately 6,000 feet in Mojave Avenue, from approximately 800 feet west of Blanchard Road to Maple Avenue. Once the Wastewater Reclamation Plant WRP-1 is constructed by the Victor Valley Wastewater Reclamation Authority, a lift station will be constructed at this location to push all flows collected at this junction back to the Plant.
Existing Situation and Work Completed Through Fiscal Year 2009-2010:
This project was added in FY 2007-08; however, development slowed with the economy, reducing the need for the project in the near term. No work was done in FY 2009-10. The project will be proposed in future years. Phase I (design of the system) should begin with the Live Oak Sewer Upgrade project (CO 9013). Project Schedule for 2010-11 Budget:
No funding is proposed in this fiscal year. Time permitting, design work may begin by in-house staff during fiscal year 2010-11. Project Costs and Funding:
2007-08 2008-09 2009-10 2009-10 2010-11
Expenditure Phases Actual Actual Budget Revised Budget
0$ 0$ 0$ 0$ 0$
0$ 0$ 0$ 0$ 0$
Source of Funds
0$ 0$ 0$ 0$ 0$
0$ 0$ 0$ 0$ 0$
711 Sewer Capital
Total Source of Funds
711-900-9012 Contractual
Total Expenditures
Project Funding Narrative:
This project is funded by Sewer Capital fund revenue reserves as needed. Design is estimated at $150,000. Construction is estimated at $1,607,000. Depending on the level of development over the next year, and construction of WRP-1, construction would be scheduled to begin either in Fiscal Year 2011-12 or 2012-13, and be completed in the following fiscal year.
Project Impact on Operating Budget:
This project will reduce the potential for sanitary sewer overflows, thus reducing the potential for administrative fines by the regulatory agencies.
CAPITAL IMPROVEMENT PROGRAM (CIP)
G - 83
Project Title: Live Oak Sewer Upgrade Phase I – Design Phase II – Construction Project Number: 9013 Department/Program: Development Services – Wastewater CIP Project Description and Location:
The City recently updated its Wastewater Master Plan. As part of that plan, deficiencies were identified to improve the existing collection system over the “near term” (needed as soon as possible), “mid-term” (2007-12) and “long term” (2013-17). One of the near-term deficiencies in the existing system needing to be addressed was identified in the western side of the City where new development is occurring. Identified as “FP-12,” this project would install a parallel 10-inch gravity main sewer line approximately 7,000 feet, starting near Escondido at the California Aqueduct, extend north to Live Oak Street, and meander north to Avenal and the Southern California Edison transmission lines, terminating on Mojave Street, approximately 850 feet west of Blanchard Road.
Existing Situation and Work Completed Through Fiscal Year 2009-2010:
This project was added in FY 2007-08; however, development slowed with the economy, reducing the need for the project in the near term. No work was done in FY 2009-10. The project will be proposed in future years. Phase I (design of the system) should begin with the Mojave Sewer Upgrade project CO 9012. Project Schedule for 2010-11 Budget:
No funding is proposed in this fiscal year. Time permitting, design work may begin by in-house staff during fiscal year 2010-11. Project Costs and Funding:
2007-08 2008-09 2009-10 2009-10 2010-11
Expenditure Phases Actual Actual Budget Revised Budget
0$ 0$ 0$ 0$ 0$
0$ 0$ 0$ 0$ 0$
Source of Funds
0$ 0$ 0$ 0$ 0$
0$ 0$ 0$ 0$ 0$ Total Source of Funds
711-900-9013 Contractual
Total Expenditures
711 Sewer Capital
Project Funding Narrative:
This project is funded by Sewer Capital fund revenue reserves as needed. Design is estimated at $75,000. Construction is estimated at $1,726,000. Depending on the level of development over the next year, construction would be scheduled to begin either in Fiscal Year 2011-12 or 2012-13, and be completed in the following fiscal year.
Project Impact on Operating Budget:
This project will reduce the potential for sanitary sewer overflows, thus reducing the potential for administrative fines by the regulatory agencies.
CAPITAL IMPROVEMENT PROGRAM (CIP)
G - 84
Project Title: Main Street Sewer (Topaz to Hickory) Project Number: 9015 Department/Program: Development Services – Wastewater CIP Project Description and Location:
The District’s wastewater system includes collection lines on Main Street between Maple Avenue and Interstate 15, and between Eleventh/Hickory Avenues and I Avenue. This left a gap in sewer along Main Street, without which commercial development could not occur. In order to facilitate development in this area, the District installed a sewer collection line in Main Street generally from Topaz Avenue and Eleventh/Hickory.
Existing Situation and Work Completed Through Fiscal Year 2009-2010:
The City’s contract engineering consultant (Desert Engineering) began design of this sewer line in December 2007, and completed it in May 2008. The project was bid for construction in July 2008. Aspen Pipeline was awarded the 5,700 foot pipeline project on August 19, 2008. The project was substantially complete by December 2008, and was accepted by June 2009, after paving of Main Street. Project Status:
The project is complete. Project Costs and Funding:
2007-08 2008-09 2009-10 2009-10 2010-11
Expenditure Phases Actual Actual Budget Revised Budget
0$ 504,008$ 0$ 0$ 0$
0$ 504,008$ 0$ 0$ 0$
Source of Funds
0$ 504,008$ 0$ 0$ 0$
0$ 504,008$ 0$ 0$ 0$ Total Source of Funds
711-900-9015 Contractual
Total Expenditures
711 Sewer Capital
Project Funding Narrative:
This project was funded by Sewer Capital fund revenue reserves as needed. The construction cost was $495,400, approximately $100,000 less than the original estimate of $600,000. Design and survey work was contracted for $5,000. Project Impact on Operating Budget: This project resulted in a fractional increase in sewer line maintenance, which will be offset by user fees from development connecting to the line. The first user was Kids Planet, which connected upon completion of the project in 2009.
DEBT
SERVICE
Overall Debt Obligations Summary Debt Obligations Principal Outstanding Summary 2010-11 Budget Total Principal and Interest Debt Service Payments Annual Debt Service Payments by Obligation and Fund Individual Debt Obligation Summaries

H - 2
THIS PAGE INTENTIONALLY LEFT BLANK
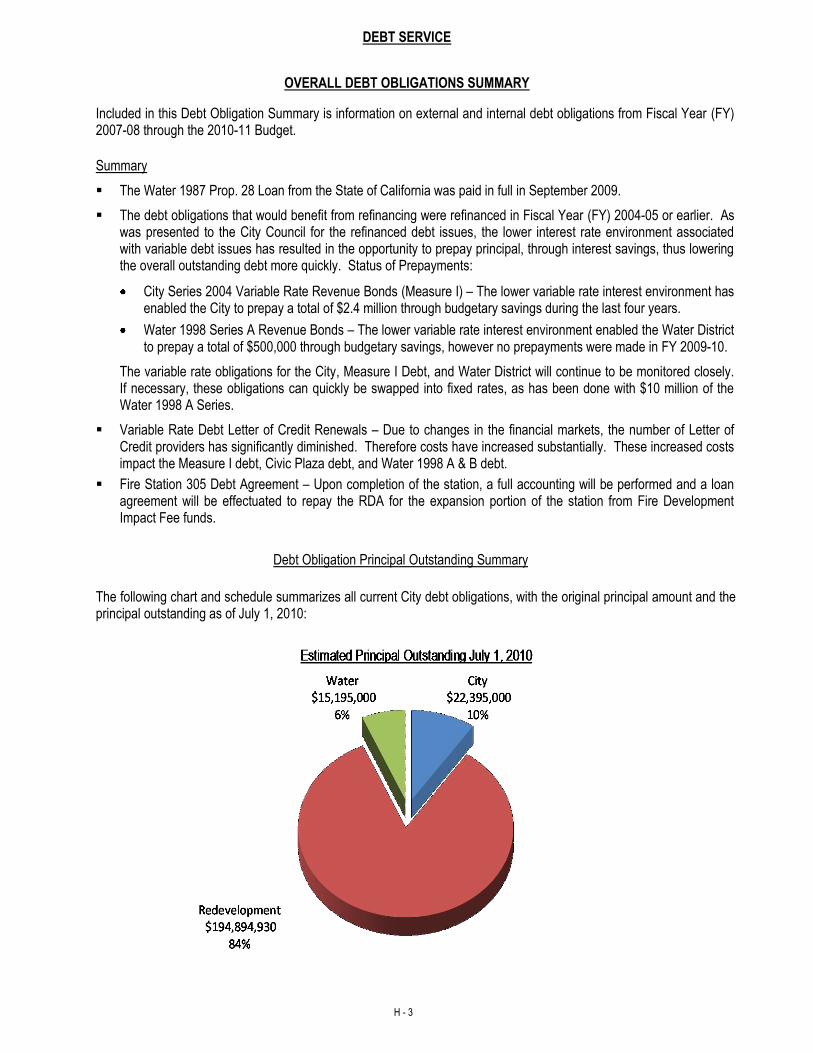
DEBT SERVICE
H - 3
OVERALL DEBT OBLIGATIONS SUMMARY
Included in this Debt Obligation Summary is information on external and internal debt obligations from Fiscal Year (FY) 2007-08 through the 2010-11 Budget.
Summary
The Water 1987 Prop. 28 Loan from the State of California was paid in full in September 2009.
The debt obligations that would benefit from refinancing were refinanced in Fiscal Year (FY) 2004-05 or earlier. As was presented to the City Council for the refinanced debt issues, the lower interest rate environment associated with variable debt issues has resulted in the opportunity to prepay principal, through interest savings, thus lowering the overall outstanding debt more quickly. Status of Prepayments:
City Series 2004 Variable Rate Revenue Bonds (Measure I) – The lower variable rate interest environment has enabled the City to prepay a total of $2.4 million through budgetary savings during the last four years.
Water 1998 Series A Revenue Bonds – The lower variable rate interest environment enabled the Water District to prepay a total of $500,000 through budgetary savings, however no prepayments were made in FY 2009-10.
The variable rate obligations for the City, Measure I Debt, and Water District will continue to be monitored closely. If necessary, these obligations can quickly be swapped into fixed rates, as has been done with $10 million of the Water 1998 A Series.
Variable Rate Debt Letter of Credit Renewals – Due to changes in the financial markets, the number of Letter of Credit providers has significantly diminished. Therefore costs have increased substantially. These increased costs impact the Measure I debt, Civic Plaza debt, and Water 1998 A & B debt.
Fire Station 305 Debt Agreement – Upon completion of the station, a full accounting will be performed and a loan agreement will be effectuated to repay the RDA for the expansion portion of the station from Fire Development Impact Fee funds.
Debt Obligation Principal Outstanding Summary
The following chart and schedule summarizes all current City debt obligations, with the original principal amount and the principal outstanding as of July 1, 2010:
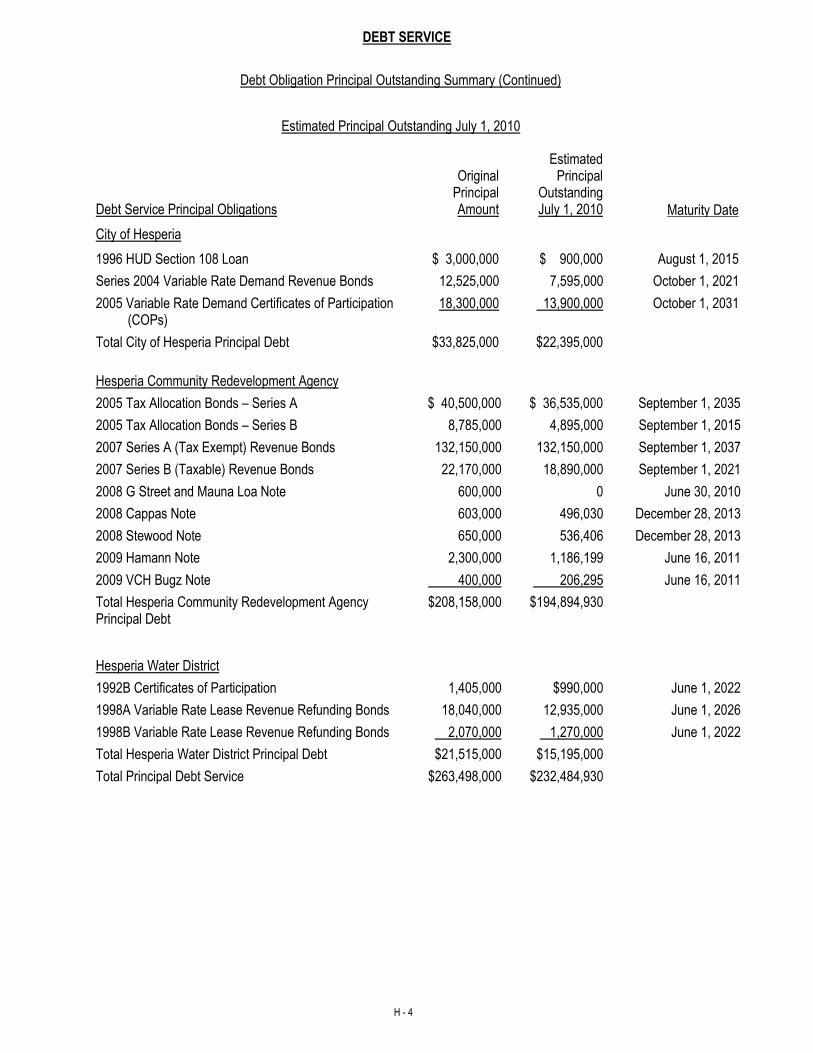
DEBT SERVICE
H - 4
Debt Obligation Principal Outstanding Summary (Continued)
Estimated Principal Outstanding July 1, 2010
Original
Principal Amount
Estimated Principal
Outstanding July 1, 2010 Maturity Date
Debt Service Principal Obligations
City of Hesperia
1996 HUD Section 108 Loan $ 3,000,000 $ 900,000 August 1, 2015
Series 2004 Variable Rate Demand Revenue Bonds 12,525,000 7,595,000 October 1, 2021
2005 Variable Rate Demand Certificates of Participation (COPs)
18,300,000 13,900,000 October 1, 2031
Total City of Hesperia Principal Debt $33,825,000 $22,395,000
Hesperia Community Redevelopment Agency
2005 Tax Allocation Bonds – Series A $ 40,500,000 $ 36,535,000 September 1, 2035
2005 Tax Allocation Bonds – Series B 8,785,000 4,895,000 September 1, 2015
2007 Series A (Tax Exempt) Revenue Bonds 132,150,000 132,150,000 September 1, 2037
2007 Series B (Taxable) Revenue Bonds 22,170,000 18,890,000 September 1, 2021
2008 G Street and Mauna Loa Note 600,000 0 June 30, 2010
2008 Cappas Note 603,000 496,030 December 28, 2013
2008 Stewood Note 650,000 536,406 December 28, 2013
2009 Hamann Note 2,300,000 1,186,199 June 16, 2011
2009 VCH Bugz Note 400,000 206,295 June 16, 2011
Total Hesperia Community Redevelopment Agency Principal Debt
$208,158,000 $194,894,930
Hesperia Water District
1992B Certificates of Participation 1,405,000 $990,000 June 1, 2022
1998A Variable Rate Lease Revenue Refunding Bonds 18,040,000 12,935,000 June 1, 2026
1998B Variable Rate Lease Revenue Refunding Bonds 2,070,000 1,270,000 June 1, 2022
Total Hesperia Water District Principal Debt $21,515,000 $15,195,000
Total Principal Debt Service $263,498,000 $232,484,930
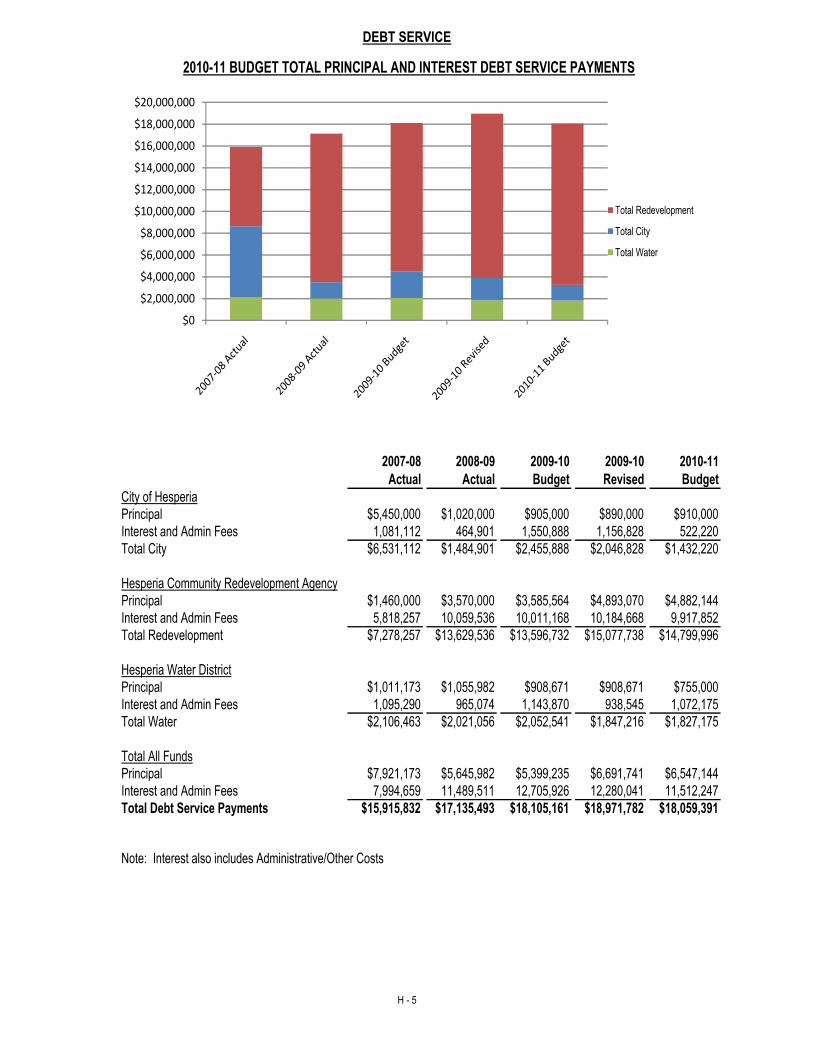
DEBT SERVICE
H - 5
2007-08
Actual
2008-09
Actual
2009-10
Budget
2009-10
Revised
2010-11
Budget
City of Hesperia
Principal $5,450,000 $1,020,000 $905,000 $890,000 $910,000
Interest and Admin Fees 1,081,112 464,901 1,550,888 1,156,828 522,220
Total City $6,531,112 $1,484,901 $2,455,888 $2,046,828 $1,432,220
Hesperia Community Redevelopment Agency
Principal $1,460,000 $3,570,000 $3,585,564 $4,893,070 $4,882,144
Interest and Admin Fees 5,818,257 10,059,536 10,011,168 10,184,668 9,917,852
Total Redevelopment $7,278,257 $13,629,536 $13,596,732 $15,077,738 $14,799,996
Hesperia Water District
Principal $1,011,173 $1,055,982 $908,671 $908,671 $755,000
Interest and Admin Fees 1,095,290 965,074 1,143,870 938,545 1,072,175
Total Water $2,106,463 $2,021,056 $2,052,541 $1,847,216 $1,827,175
Total All Funds
Principal $7,921,173 $5,645,982 $5,399,235 $6,691,741 $6,547,144
Interest and Admin Fees 7,994,659 11,489,511 12,705,926 12,280,041 11,512,247
Total Debt Service Payments $15,915,832 $17,135,493 $18,105,161 $18,971,782 $18,059,391
Note: Interest also includes Administrative/Other Costs
2010-11 BUDGET TOTAL PRINCIPAL AND INTEREST DEBT SERVICE PAYMENTS
$0
$2,000,000
$4,000,000
$6,000,000
$8,000,000
$10,000,000
$12,000,000
$14,000,000
$16,000,000
$18,000,000
$20,000,000
Total Redevelopment
Total City
Total Water
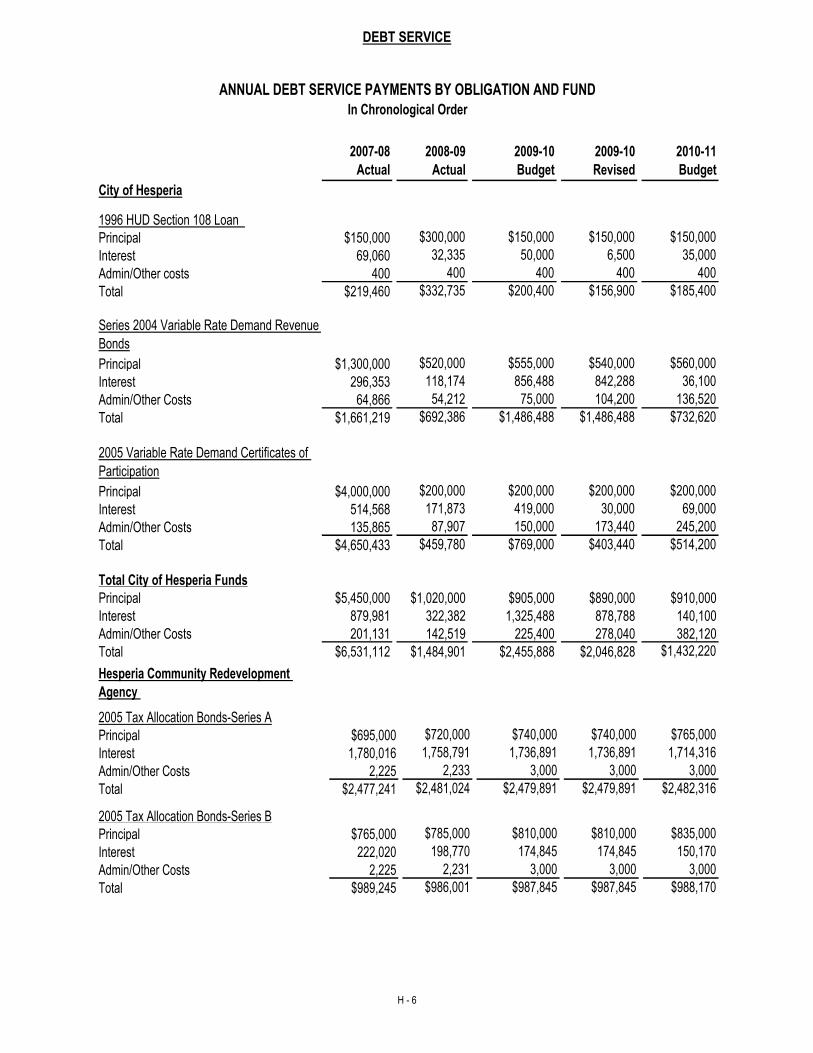
DEBT SERVICE
H - 6
2007-08
Actual
2008-09
Actual
2009-10
Budget
2009-10
Revised
2010-11
Budget
City of Hesperia
Principal $150,000 $300,000 $150,000 $150,000 $150,000
Interest 69,060 32,335 50,000 6,500 35,000
Admin/Other costs 400 400 400 400 400
Total $219,460 $332,735 $200,400 $156,900 $185,400
Series 2004 Variable Rate Demand Revenue
Bonds
Principal $1,300,000 $520,000 $555,000 $540,000 $560,000
Interest 296,353 118,174 856,488 842,288 36,100
Admin/Other Costs 64,866 54,212 75,000 104,200 136,520
Total $1,661,219 $692,386 $1,486,488 $1,486,488 $732,620
2005 Variable Rate Demand Certificates of
Participation
Principal $4,000,000 $200,000 $200,000 $200,000 $200,000
Interest 514,568 171,873 419,000 30,000 69,000
Admin/Other Costs 135,865 87,907 150,000 173,440 245,200
Total $4,650,433 $459,780 $769,000 $403,440 $514,200
Total City of Hesperia Funds
Principal $5,450,000 $1,020,000 $905,000 $890,000 $910,000
Interest 879,981 322,382 1,325,488 878,788 140,100
Admin/Other Costs 201,131 142,519 225,400 278,040 382,120
Total $6,531,112 $1,484,901 $2,455,888 $2,046,828 $1,432,220
1996 HUD Section 108 Loan
ANNUAL DEBT SERVICE PAYMENTS BY OBLIGATION AND FUND
In Chronological Order
Hesperia Community Redevelopment
Agency
2005 Tax Allocation Bonds-Series A
Principal $695,000 $720,000 $740,000 $740,000 $765,000
Interest 1,780,016 1,758,791 1,736,891 1,736,891 1,714,316
Admin/Other Costs 2,225 2,233 3,000 3,000 3,000
Total $2,477,241 $2,481,024 $2,479,891 $2,479,891 $2,482,316
2005 Tax Allocation Bonds-Series B
Principal $765,000 $785,000 $810,000 $810,000 $835,000
Interest 222,020 198,770 174,845 174,845 150,170
Admin/Other Costs 2,225 2,231 3,000 3,000 3,000
Total $989,245 $986,001 $987,845 $987,845 $988,170
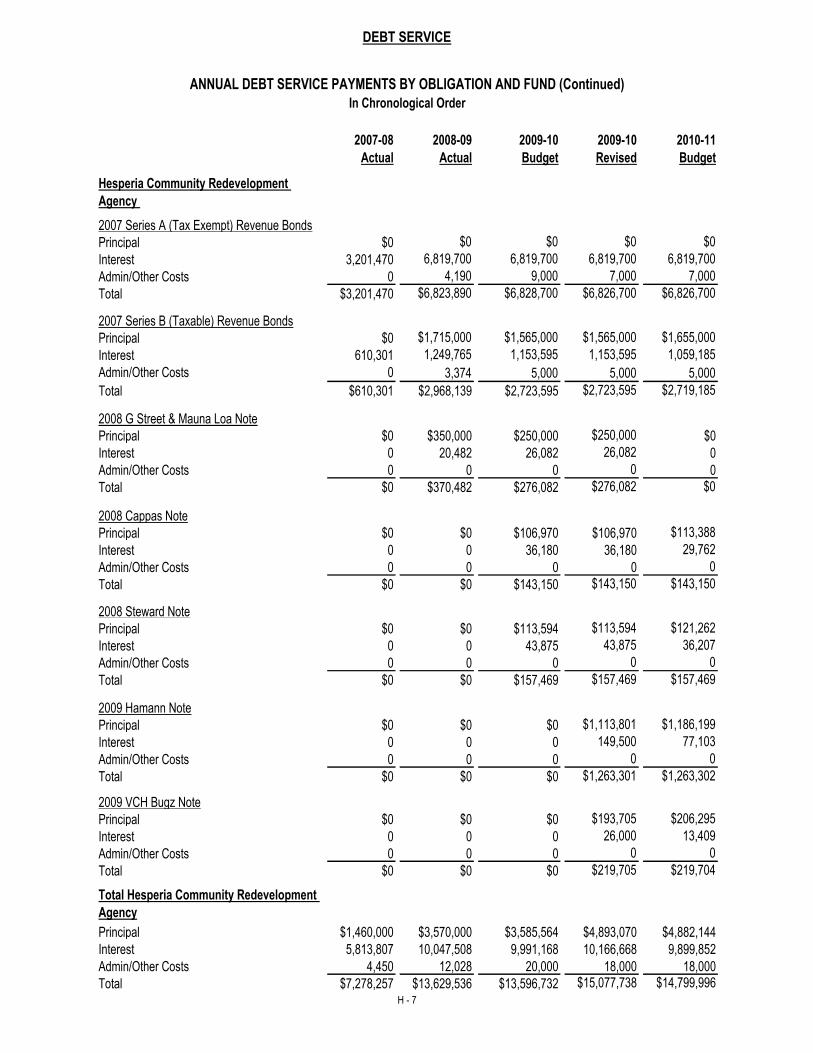
DEBT SERVICE
H - 7
2007-08
Actual
2008-09
Actual
2009-10
Budget
2009-10
Revised
2010-11
Budget
Hesperia Community Redevelopment
Agency
2007 Series A (Tax Exempt) Revenue Bonds
Principal $0 $0 $0 $0 $0
Interest 3,201,470 6,819,700 6,819,700 6,819,700 6,819,700
Admin/Other Costs 0 4,190 9,000 7,000 7,000
Total $3,201,470 $6,823,890 $6,828,700 $6,826,700 $6,826,700
2007 Series B (Taxable) Revenue Bonds
Principal $0 $1,715,000 $1,565,000 $1,565,000 $1,655,000
Interest 610,301 1,249,765 1,153,595 1,153,595 1,059,185
Admin/Other Costs 0 3,374 5,000 5,000 5,000
Total $610,301 $2,968,139 $2,723,595 $2,723,595 $2,719,185
2008 G Street & Mauna Loa Note
Principal $0 $350,000 $250,000 $250,000 $0
Interest 0 20,482 26,082 26,082 0
Admin/Other Costs 0 0 0 0 0
Total $0 $370,482 $276,082 $276,082 $0
2008 Cappas Note
Principal $0 $0 $106,970 $106,970 $113,388
Interest 0 0 36,180 36,180 29,762
Admin/Other Costs 0 0 0 0 0
Total $0 $0 $143,150 $143,150 $143,150
2008 Steward Note
Principal $0 $0 $113,594 $113,594 $121,262
Interest 0 0 43,875 43,875 36,207
Admin/Other Costs 0 0 0 0 0
Total $0 $0 $157,469 $157,469 $157,469
2009 Hamann Note
Principal $0 $0 $0 $1,113,801 $1,186,199
Interest 0 0 0 149,500 77,103
Admin/Other Costs 0 0 0 0 0
Total $0 $0 $0 $1,263,301 $1,263,302
2009 VCH Bugz Note
Principal $0 $0 $0 $193,705 $206,295
Interest 0 0 0 26,000 13,409
Admin/Other Costs 0 0 0 0 0
Total $0 $0 $0 $219,705 $219,704
Total Hesperia Community Redevelopment
Agency
Principal $1,460,000 $3,570,000 $3,585,564 $4,893,070 $4,882,144
Interest 5,813,807 10,047,508 9,991,168 10,166,668 9,899,852
Admin/Other Costs 4,450 12,028 20,000 18,000 18,000
Total $7,278,257 $13,629,536 $13,596,732 $15,077,738 $14,799,996
ANNUAL DEBT SERVICE PAYMENTS BY OBLIGATION AND FUND (Continued)
In Chronological Order
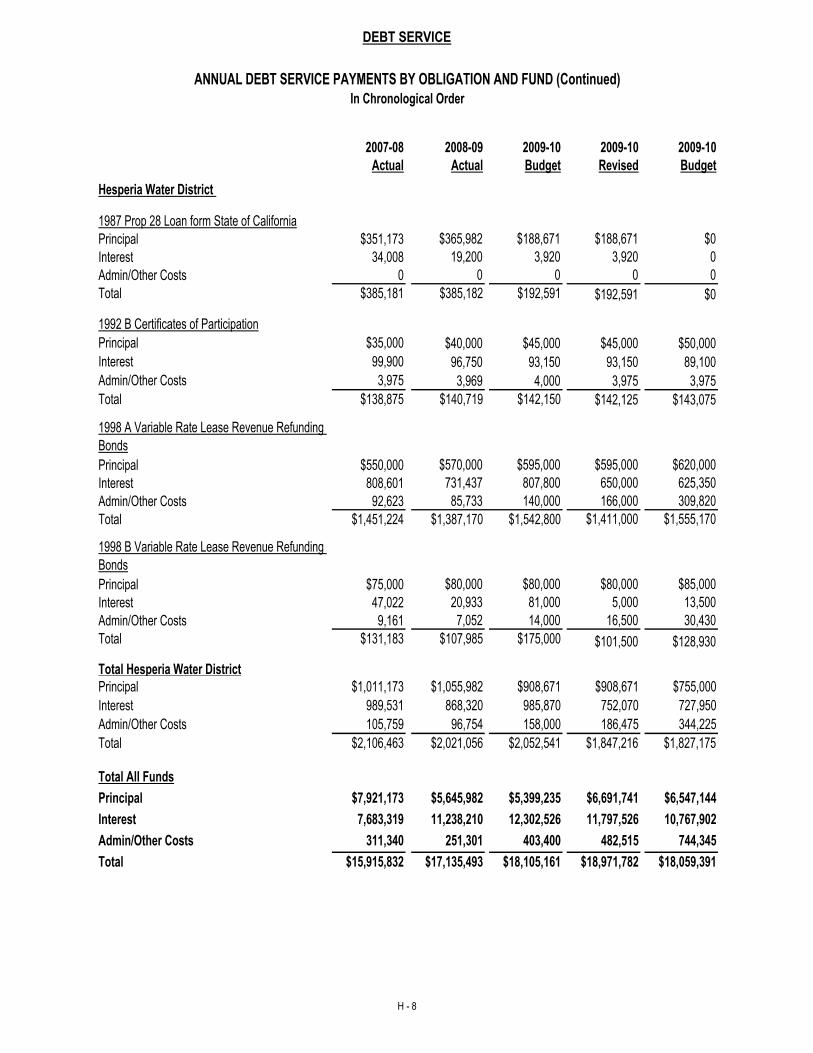
DEBT SERVICE
H - 8
2007-08
Actual
2008-09
Actual
2009-10
Budget
2009-10
Revised
2009-10
Budget
Hesperia Water District
1987 Prop 28 Loan form State of California
Principal $351,173 $365,982 $188,671 $188,671 $0
Interest 34,008 19,200 3,920 3,920 0
Admin/Other Costs 0 0 0 0 0
Total $385,181 $385,182 $192,591 $192,591 $0
1992 B Certificates of Participation
Principal $35,000 $40,000 $45,000 $45,000 $50,000
Interest 99,900 96,750 93,150 93,150 89,100
Admin/Other Costs 3,975 3,969 4,000 3,975 3,975
Total $138,875 $140,719 $142,150 $142,125 $143,075
1998 A Variable Rate Lease Revenue Refunding
Bonds
Principal $550,000 $570,000 $595,000 $595,000 $620,000
Interest 808,601 731,437 807,800 650,000 625,350
Admin/Other Costs 92,623 85,733 140,000 166,000 309,820
Total $1,451,224 $1,387,170 $1,542,800 $1,411,000 $1,555,170
1998 B Variable Rate Lease Revenue Refunding
Bonds
Principal $75,000 $80,000 $80,000 $80,000 $85,000
Interest 47,022 20,933 81,000 5,000 13,500
Admin/Other Costs 9,161 7,052 14,000 16,500 30,430
Total $131,183 $107,985 $175,000 $101,500 $128,930
Total Hesperia Water District
Principal $1,011,173 $1,055,982 $908,671 $908,671 $755,000
Interest 989,531 868,320 985,870 752,070 727,950
Admin/Other Costs 105,759 96,754 158,000 186,475 344,225
Total $2,106,463 $2,021,056 $2,052,541 $1,847,216 $1,827,175
Total All Funds
Principal $7,921,173 $5,645,982 $5,399,235 $6,691,741 $6,547,144
Interest 7,683,319 11,238,210 12,302,526 11,797,526 10,767,902
Admin/Other Costs 311,340 251,301 403,400 482,515 744,345
Total $15,915,832 $17,135,493 $18,105,161 $18,971,782 $18,059,391
ANNUAL DEBT SERVICE PAYMENTS BY OBLIGATION AND FUND (Continued)
In Chronological Order
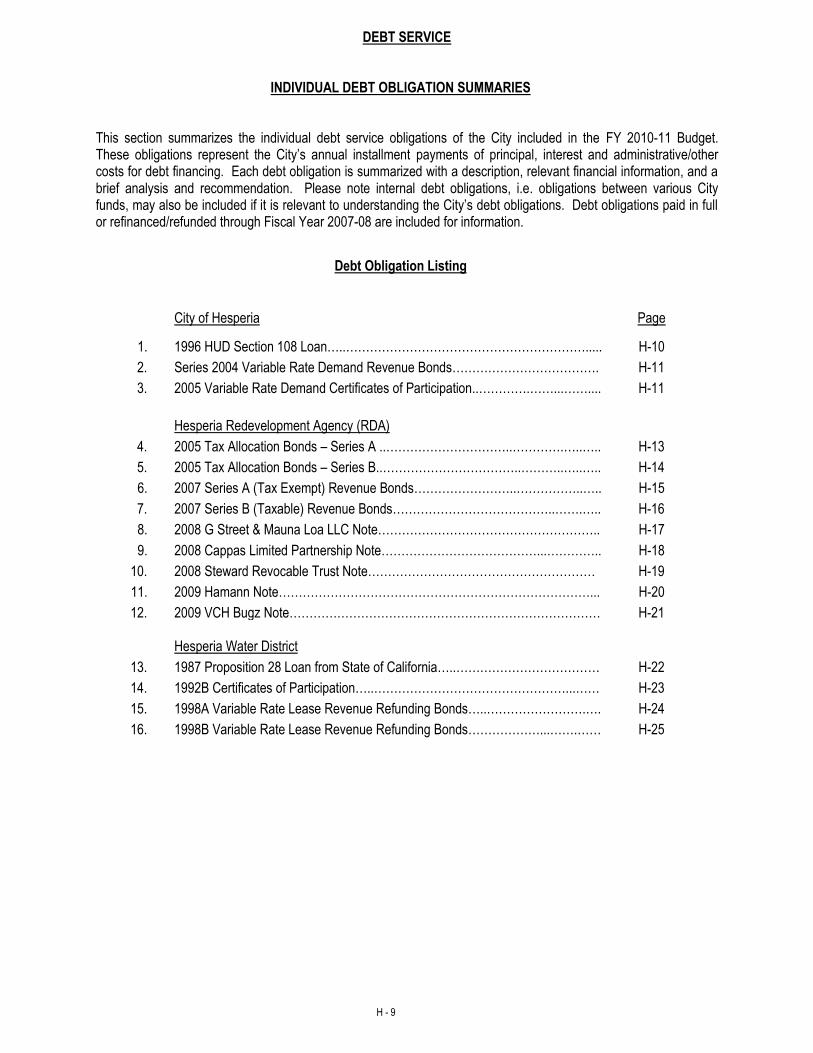
DEBT SERVICE
H - 9
INDIVIDUAL DEBT OBLIGATION SUMMARIES
This section summarizes the individual debt service obligations of the City included in the FY 2010-11 Budget. These obligations represent the City’s annual installment payments of principal, interest and administrative/other costs for debt financing. Each debt obligation is summarized with a description, relevant financial information, and a brief analysis and recommendation. Please note internal debt obligations, i.e. obligations between various City funds, may also be included if it is relevant to understanding the City’s debt obligations. Debt obligations paid in full or refinanced/refunded through Fiscal Year 2007-08 are included for information.
Debt Obligation Listing
City of Hesperia Page
1. 1996 HUD Section 108 Loan…..……………………………………………………..... H-10
2. Series 2004 Variable Rate Demand Revenue Bonds………………………………. H-11
3. 2005 Variable Rate Demand Certificates of Participation..………….……...…….... H-11
Hesperia Redevelopment Agency (RDA)
4. 2005 Tax Allocation Bonds – Series A ..…………………………..………….…..….. H-13
5. 2005 Tax Allocation Bonds – Series B..……………………………..………..…..….. H-14
6. 2007 Series A (Tax Exempt) Revenue Bonds……………………..……………..….. H-15
7. 2007 Series B (Taxable) Revenue Bonds…………………………………..…….….. H-16
8. 2008 G Street & Mauna Loa LLC Note……………………………………………….. H-17
9. 2008 Cappas Limited Partnership Note…………………………………...………….. H-18
10. 2008 Steward Revocable Trust Note………………………………………………… H-19
11. 2009 Hamann Note……………………………………………………………………... H-20
12. 2009 VCH Bugz Note…………………………………………………………………… H-21 Hesperia Water District
13. 1987 Proposition 28 Loan from State of California…..……………………………… H-22
14. 1992B Certificates of Participation…..…………………………………………...…… H-23
15. 1998A Variable Rate Lease Revenue Refunding Bonds…..…………………….…. H-24
16. 1998B Variable Rate Lease Revenue Refunding Bonds………………...…….…… H-25
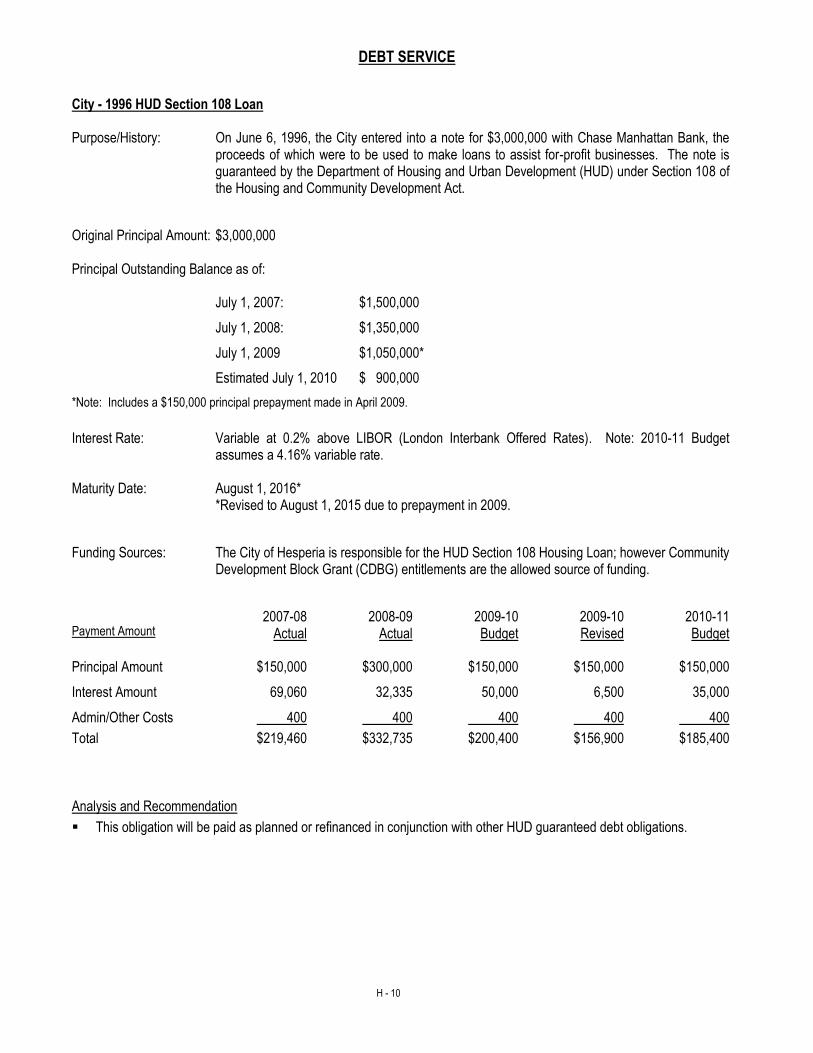
DEBT SERVICE
H - 10
City - 1996 HUD Section 108 Loan Purpose/History: On June 6, 1996, the City entered into a note for $3,000,000 with Chase Manhattan Bank, the
proceeds of which were to be used to make loans to assist for-profit businesses. The note is guaranteed by the Department of Housing and Urban Development (HUD) under Section 108 of the Housing and Community Development Act.
Original Principal Amount: $3,000,000
Principal Outstanding Balance as of:
July 1, 2007: $1,500,000
July 1, 2008: $1,350,000
July 1, 2009 $1,050,000*
Estimated July 1, 2010 $ 900,000
*Note: Includes a $150,000 principal prepayment made in April 2009.
Interest Rate: Variable at 0.2% above LIBOR (London Interbank Offered Rates). Note: 2010-11 Budget assumes a 4.16% variable rate. Maturity Date: August 1, 2016* *Revised to August 1, 2015 due to prepayment in 2009.
Funding Sources: The City of Hesperia is responsible for the HUD Section 108 Housing Loan; however Community
Development Block Grant (CDBG) entitlements are the allowed source of funding.
2007-08 2008-09 2009-10 2009-10 2010-11 Payment Amount Actual Actual Budget Revised Budget Principal Amount $150,000 $300,000 $150,000 $150,000 $150,000
Interest Amount 69,060 32,335 50,000 6,500 35,000
Admin/Other Costs 400 400 400 400 400
Total $219,460 $332,735 $200,400 $156,900 $185,400
Analysis and Recommendation
This obligation will be paid as planned or refinanced in conjunction with other HUD guaranteed debt obligations.
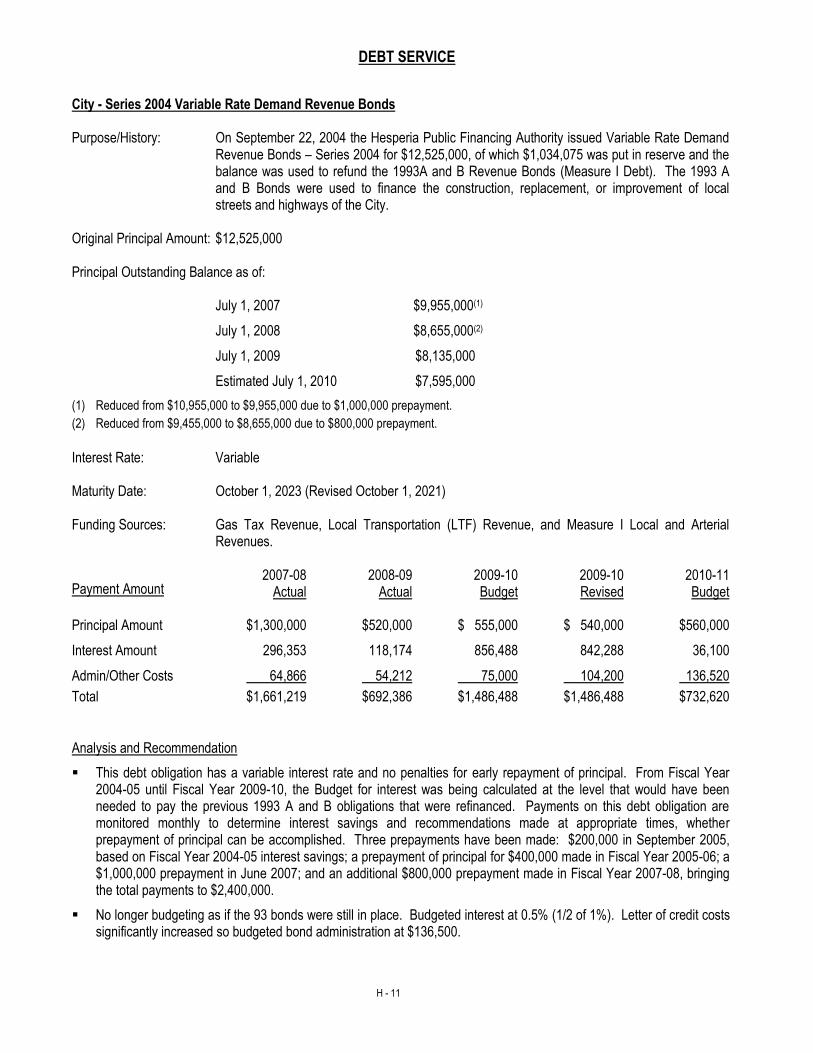
DEBT SERVICE
H - 11
City - Series 2004 Variable Rate Demand Revenue Bonds Purpose/History: On September 22, 2004 the Hesperia Public Financing Authority issued Variable Rate Demand
Revenue Bonds – Series 2004 for $12,525,000, of which $1,034,075 was put in reserve and the balance was used to refund the 1993A and B Revenue Bonds (Measure I Debt). The 1993 A and B Bonds were used to finance the construction, replacement, or improvement of local streets and highways of the City.
Original Principal Amount: $12,525,000
Principal Outstanding Balance as of:
July 1, 2007 $9,955,000(1)
July 1, 2008 $8,655,000(2)
July 1, 2009 $8,135,000
Estimated July 1, 2010 $7,595,000
(1) Reduced from $10,955,000 to $9,955,000 due to $1,000,000 prepayment.
(2) Reduced from $9,455,000 to $8,655,000 due to $800,000 prepayment.
Interest Rate: Variable
Maturity Date: October 1, 2023 (Revised October 1, 2021)
Funding Sources: Gas Tax Revenue, Local Transportation (LTF) Revenue, and Measure I Local and Arterial Revenues.
2007-08 2008-09 2009-10 2009-10 2010-11 Payment Amount Actual Actual Budget Revised Budget Principal Amount $1,300,000 $520,000 $ 555,000 $ 540,000 $560,000
Interest Amount 296,353 118,174 856,488 842,288 36,100
Admin/Other Costs 64,866 54,212 75,000 104,200 136,520
Total $1,661,219 $692,386 $1,486,488 $1,486,488 $732,620
Analysis and Recommendation
This debt obligation has a variable interest rate and no penalties for early repayment of principal. From Fiscal Year 2004-05 until Fiscal Year 2009-10, the Budget for interest was being calculated at the level that would have been needed to pay the previous 1993 A and B obligations that were refinanced. Payments on this debt obligation are monitored monthly to determine interest savings and recommendations made at appropriate times, whether prepayment of principal can be accomplished. Three prepayments have been made: $200,000 in September 2005, based on Fiscal Year 2004-05 interest savings; a prepayment of principal for $400,000 made in Fiscal Year 2005-06; a $1,000,000 prepayment in June 2007; and an additional $800,000 prepayment made in Fiscal Year 2007-08, bringing the total payments to $2,400,000.
No longer budgeting as if the 93 bonds were still in place. Budgeted interest at 0.5% (1/2 of 1%). Letter of credit costs significantly increased so budgeted bond administration at $136,500.
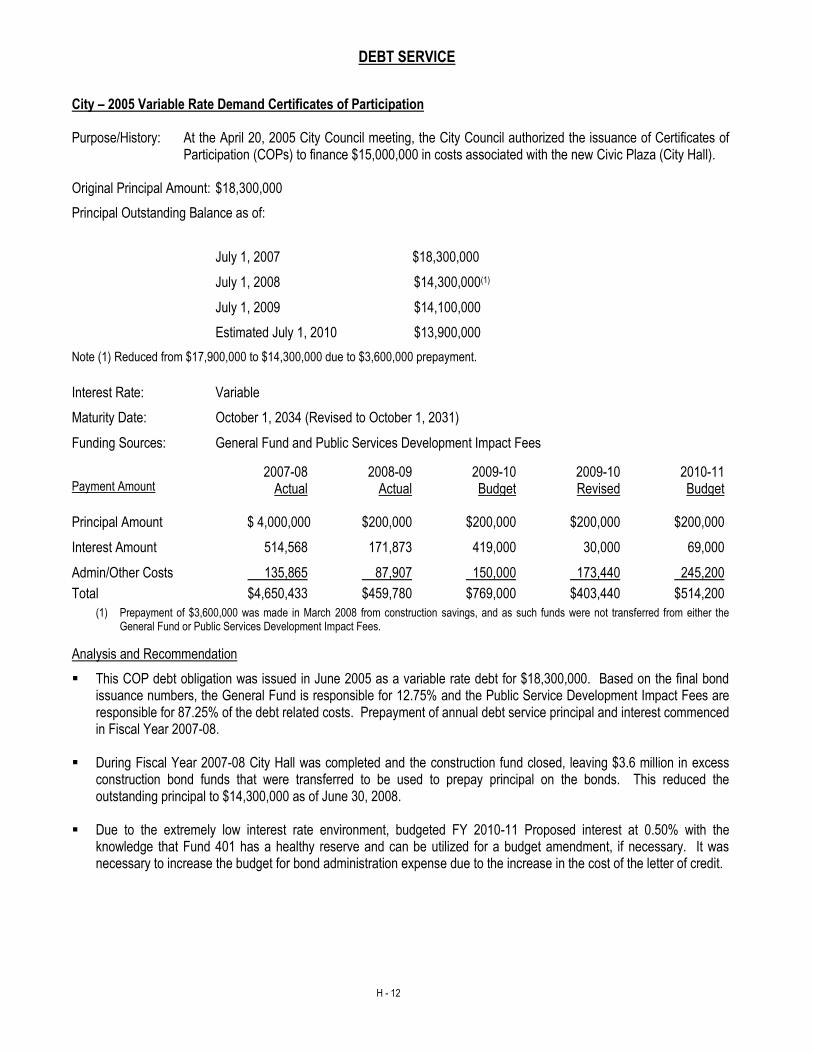
DEBT SERVICE
H - 12
City – 2005 Variable Rate Demand Certificates of Participation Purpose/History: At the April 20, 2005 City Council meeting, the City Council authorized the issuance of Certificates of
Participation (COPs) to finance $15,000,000 in costs associated with the new Civic Plaza (City Hall).
Original Principal Amount: $18,300,000
Principal Outstanding Balance as of:
July 1, 2007 $18,300,000
July 1, 2008 $14,300,000(1)
July 1, 2009 $14,100,000
Estimated July 1, 2010 $13,900,000
Note (1) Reduced from $17,900,000 to $14,300,000 due to $3,600,000 prepayment.
Interest Rate: Variable
Maturity Date: October 1, 2034 (Revised to October 1, 2031)
Funding Sources: General Fund and Public Services Development Impact Fees
2007-08 2008-09 2009-10 2009-10 2010-11 Payment Amount Actual Actual Budget Revised Budget Principal Amount $ 4,000,000 $200,000 $200,000 $200,000 $200,000
Interest Amount 514,568 171,873 419,000 30,000 69,000
Admin/Other Costs 135,865 87,907 150,000 173,440 245,200
Total $4,650,433 $459,780 $769,000 $403,440 $514,200
(1) Prepayment of $3,600,000 was made in March 2008 from construction savings, and as such funds were not transferred from either the General Fund or Public Services Development Impact Fees.
Analysis and Recommendation
This COP debt obligation was issued in June 2005 as a variable rate debt for $18,300,000. Based on the final bond issuance numbers, the General Fund is responsible for 12.75% and the Public Service Development Impact Fees are responsible for 87.25% of the debt related costs. Prepayment of annual debt service principal and interest commenced in Fiscal Year 2007-08.
During Fiscal Year 2007-08 City Hall was completed and the construction fund closed, leaving $3.6 million in excess
construction bond funds that were transferred to be used to prepay principal on the bonds. This reduced the outstanding principal to $14,300,000 as of June 30, 2008.
Due to the extremely low interest rate environment, budgeted FY 2010-11 Proposed interest at 0.50% with the knowledge that Fund 401 has a healthy reserve and can be utilized for a budget amendment, if necessary. It was necessary to increase the budget for bond administration expense due to the increase in the cost of the letter of credit.
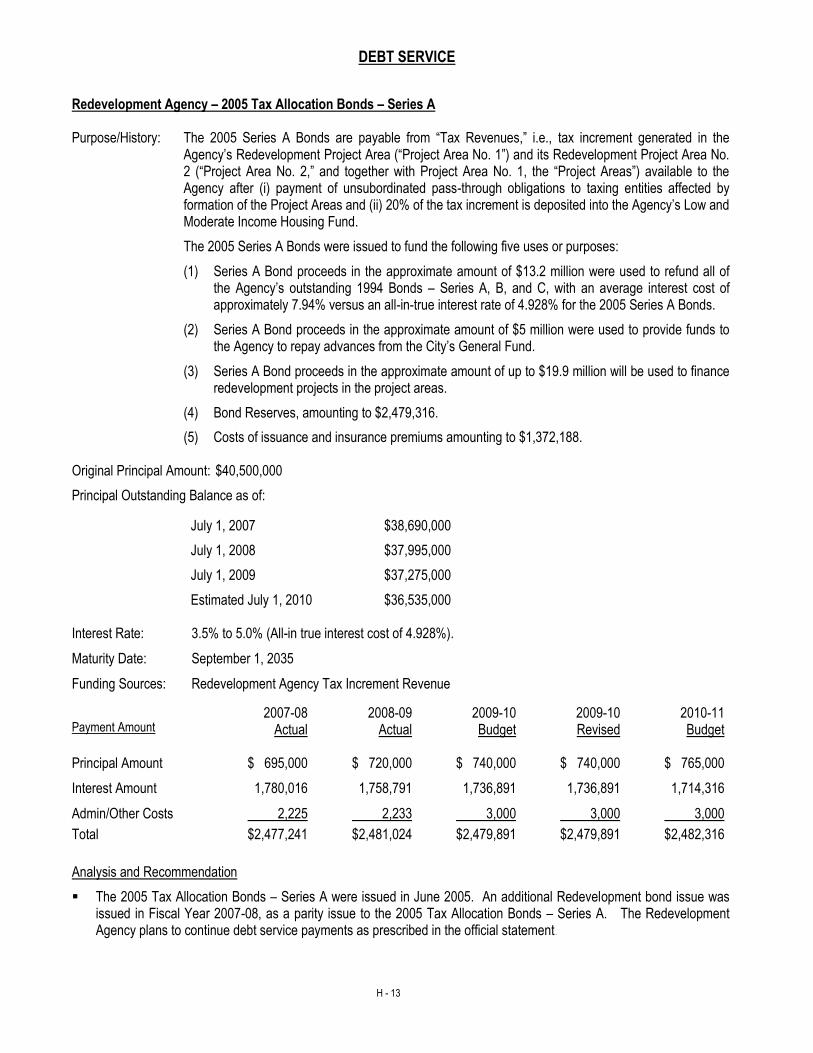
DEBT SERVICE
H - 13
Redevelopment Agency – 2005 Tax Allocation Bonds – Series A Purpose/History: The 2005 Series A Bonds are payable from “Tax Revenues,” i.e., tax increment generated in the
Agency’s Redevelopment Project Area (“Project Area No. 1”) and its Redevelopment Project Area No. 2 (“Project Area No. 2,” and together with Project Area No. 1, the “Project Areas”) available to the Agency after (i) payment of unsubordinated pass-through obligations to taxing entities affected by formation of the Project Areas and (ii) 20% of the tax increment is deposited into the Agency’s Low and Moderate Income Housing Fund.
The 2005 Series A Bonds were issued to fund the following five uses or purposes:
(1) Series A Bond proceeds in the approximate amount of $13.2 million were used to refund all of the Agency’s outstanding 1994 Bonds – Series A, B, and C, with an average interest cost of approximately 7.94% versus an all-in-true interest rate of 4.928% for the 2005 Series A Bonds.
(2) Series A Bond proceeds in the approximate amount of $5 million were used to provide funds to the Agency to repay advances from the City’s General Fund.
(3) Series A Bond proceeds in the approximate amount of up to $19.9 million will be used to finance redevelopment projects in the project areas.
(4) Bond Reserves, amounting to $2,479,316.
(5) Costs of issuance and insurance premiums amounting to $1,372,188.
Original Principal Amount: $40,500,000
Principal Outstanding Balance as of:
July 1, 2007 $38,690,000
July 1, 2008 $37,995,000
July 1, 2009 $37,275,000
Estimated July 1, 2010 $36,535,000
Interest Rate: 3.5% to 5.0% (All-in true interest cost of 4.928%).
Maturity Date: September 1, 2035
Funding Sources: Redevelopment Agency Tax Increment Revenue
2007-08 2008-09 2009-10 2009-10 2010-11 Payment Amount Actual Actual Budget Revised Budget Principal Amount $ 695,000 $ 720,000 $ 740,000 $ 740,000 $ 765,000
Interest Amount 1,780,016 1,758,791 1,736,891 1,736,891 1,714,316
Admin/Other Costs 2,225 2,233 3,000 3,000 3,000
Total $2,477,241 $2,481,024 $2,479,891 $2,479,891 $2,482,316
Analysis and Recommendation
The 2005 Tax Allocation Bonds – Series A were issued in June 2005. An additional Redevelopment bond issue was issued in Fiscal Year 2007-08, as a parity issue to the 2005 Tax Allocation Bonds – Series A. The Redevelopment Agency plans to continue debt service payments as prescribed in the official statement.
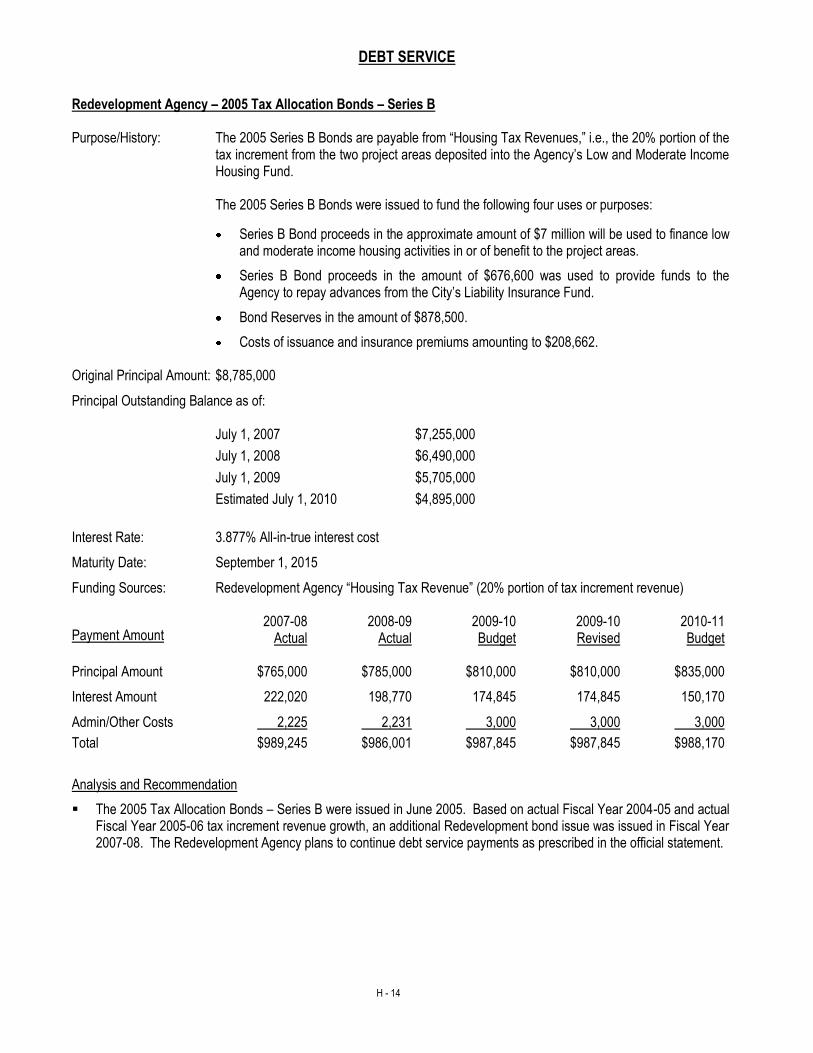
DEBT SERVICE
H - 14
Redevelopment Agency – 2005 Tax Allocation Bonds – Series B Purpose/History: The 2005 Series B Bonds are payable from “Housing Tax Revenues,” i.e., the 20% portion of the
tax increment from the two project areas deposited into the Agency’s Low and Moderate Income Housing Fund.
The 2005 Series B Bonds were issued to fund the following four uses or purposes:
Series B Bond proceeds in the approximate amount of $7 million will be used to finance low and moderate income housing activities in or of benefit to the project areas.
Series B Bond proceeds in the amount of $676,600 was used to provide funds to the Agency to repay advances from the City’s Liability Insurance Fund.
Bond Reserves in the amount of $878,500.
Costs of issuance and insurance premiums amounting to $208,662. Original Principal Amount: $8,785,000
Principal Outstanding Balance as of:
July 1, 2007 $7,255,000
July 1, 2008 $6,490,000
July 1, 2009 $5,705,000
Estimated July 1, 2010 $4,895,000
Interest Rate: 3.877% All-in-true interest cost
Maturity Date: September 1, 2015
Funding Sources: Redevelopment Agency “Housing Tax Revenue” (20% portion of tax increment revenue) 2007-08 2008-09 2009-10 2009-10 2010-11 Payment Amount Actual Actual Budget Revised Budget Principal Amount $765,000 $785,000 $810,000 $810,000 $835,000
Interest Amount 222,020 198,770 174,845 174,845 150,170
Admin/Other Costs 2,225 2,231 3,000 3,000 3,000
Total $989,245 $986,001 $987,845 $987,845 $988,170
Analysis and Recommendation
The 2005 Tax Allocation Bonds – Series B were issued in June 2005. Based on actual Fiscal Year 2004-05 and actual Fiscal Year 2005-06 tax increment revenue growth, an additional Redevelopment bond issue was issued in Fiscal Year 2007-08. The Redevelopment Agency plans to continue debt service payments as prescribed in the official statement.
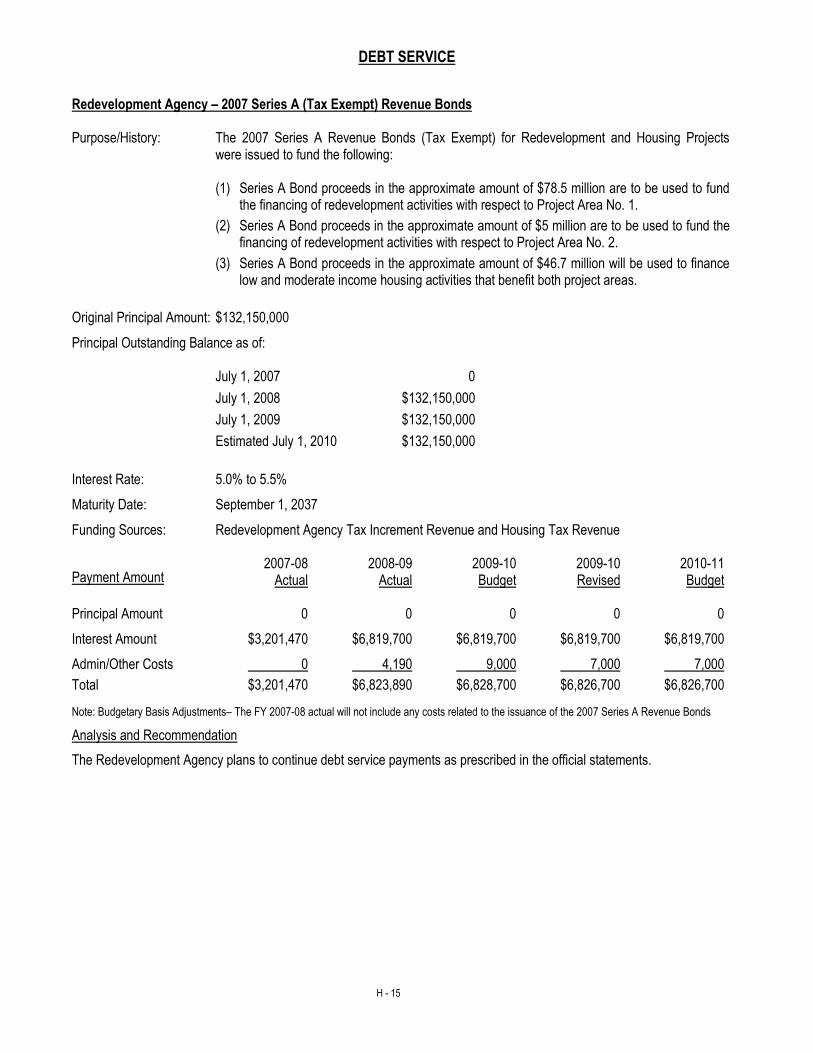
DEBT SERVICE
H - 15
Redevelopment Agency – 2007 Series A (Tax Exempt) Revenue Bonds Purpose/History: The 2007 Series A Revenue Bonds (Tax Exempt) for Redevelopment and Housing Projects
were issued to fund the following:
(1) Series A Bond proceeds in the approximate amount of $78.5 million are to be used to fund the financing of redevelopment activities with respect to Project Area No. 1.
(2) Series A Bond proceeds in the approximate amount of $5 million are to be used to fund the financing of redevelopment activities with respect to Project Area No. 2.
(3) Series A Bond proceeds in the approximate amount of $46.7 million will be used to finance low and moderate income housing activities that benefit both project areas.
Original Principal Amount: $132,150,000
Principal Outstanding Balance as of:
July 1, 2007 0
July 1, 2008 $132,150,000
July 1, 2009 $132,150,000
Estimated July 1, 2010 $132,150,000
Interest Rate: 5.0% to 5.5%
Maturity Date: September 1, 2037
Funding Sources: Redevelopment Agency Tax Increment Revenue and Housing Tax Revenue 2007-08 2008-09 2009-10 2009-10 2010-11 Payment Amount Actual Actual Budget Revised Budget Principal Amount 0 0 0 0 0
Interest Amount $3,201,470 $6,819,700 $6,819,700 $6,819,700 $6,819,700
Admin/Other Costs 0 4,190 9,000 7,000 7,000
Total $3,201,470 $6,823,890 $6,828,700 $6,826,700 $6,826,700
Note: Budgetary Basis Adjustments– The FY 2007-08 actual will not include any costs related to the issuance of the 2007 Series A Revenue Bonds
Analysis and Recommendation
The Redevelopment Agency plans to continue debt service payments as prescribed in the official statements.
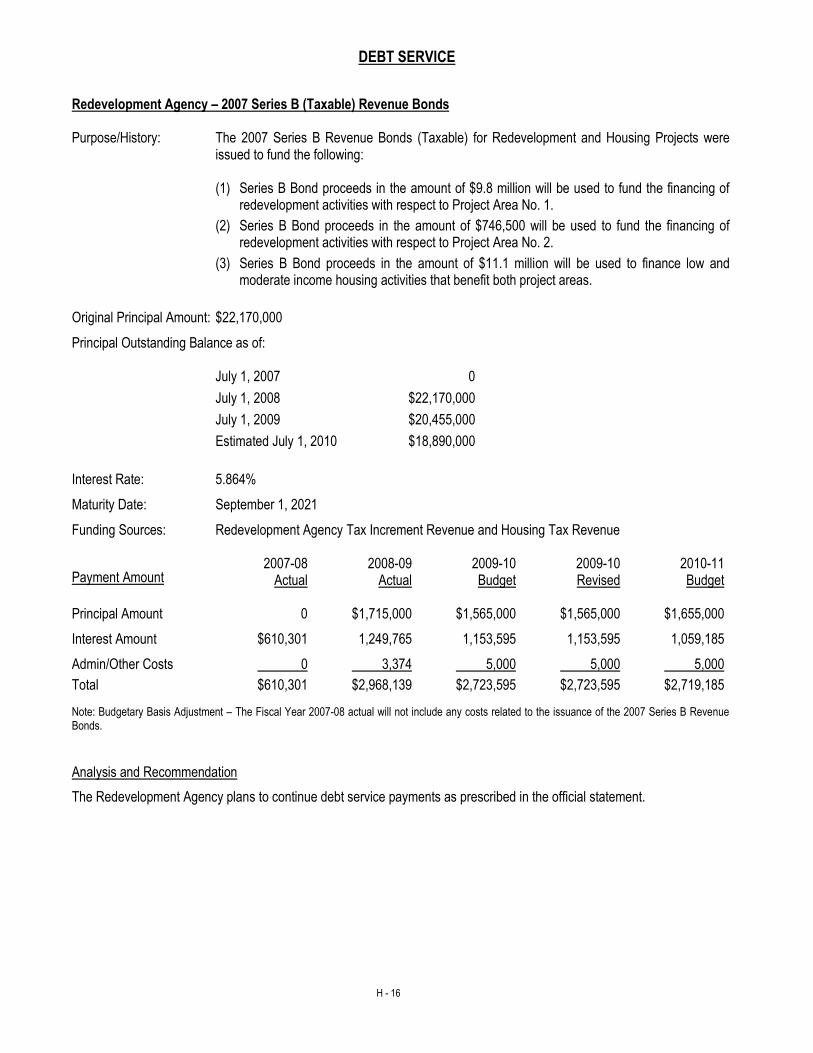
DEBT SERVICE
H - 16
Redevelopment Agency – 2007 Series B (Taxable) Revenue Bonds Purpose/History: The 2007 Series B Revenue Bonds (Taxable) for Redevelopment and Housing Projects were
issued to fund the following:
(1) Series B Bond proceeds in the amount of $9.8 million will be used to fund the financing of redevelopment activities with respect to Project Area No. 1.
(2) Series B Bond proceeds in the amount of $746,500 will be used to fund the financing of redevelopment activities with respect to Project Area No. 2.
(3) Series B Bond proceeds in the amount of $11.1 million will be used to finance low and moderate income housing activities that benefit both project areas.
Original Principal Amount: $22,170,000
Principal Outstanding Balance as of:
July 1, 2007 0
July 1, 2008 $22,170,000
July 1, 2009 $20,455,000
Estimated July 1, 2010 $18,890,000
Interest Rate: 5.864%
Maturity Date: September 1, 2021
Funding Sources: Redevelopment Agency Tax Increment Revenue and Housing Tax Revenue 2007-08 2008-09 2009-10 2009-10 2010-11 Payment Amount Actual Actual Budget Revised Budget Principal Amount 0 $1,715,000 $1,565,000 $1,565,000 $1,655,000
Interest Amount $610,301 1,249,765 1,153,595 1,153,595 1,059,185
Admin/Other Costs 0 3,374 5,000 5,000 5,000
Total $610,301 $2,968,139 $2,723,595 $2,723,595 $2,719,185
Note: Budgetary Basis Adjustment – The Fiscal Year 2007-08 actual will not include any costs related to the issuance of the 2007 Series B Revenue Bonds.
Analysis and Recommendation
The Redevelopment Agency plans to continue debt service payments as prescribed in the official statement.
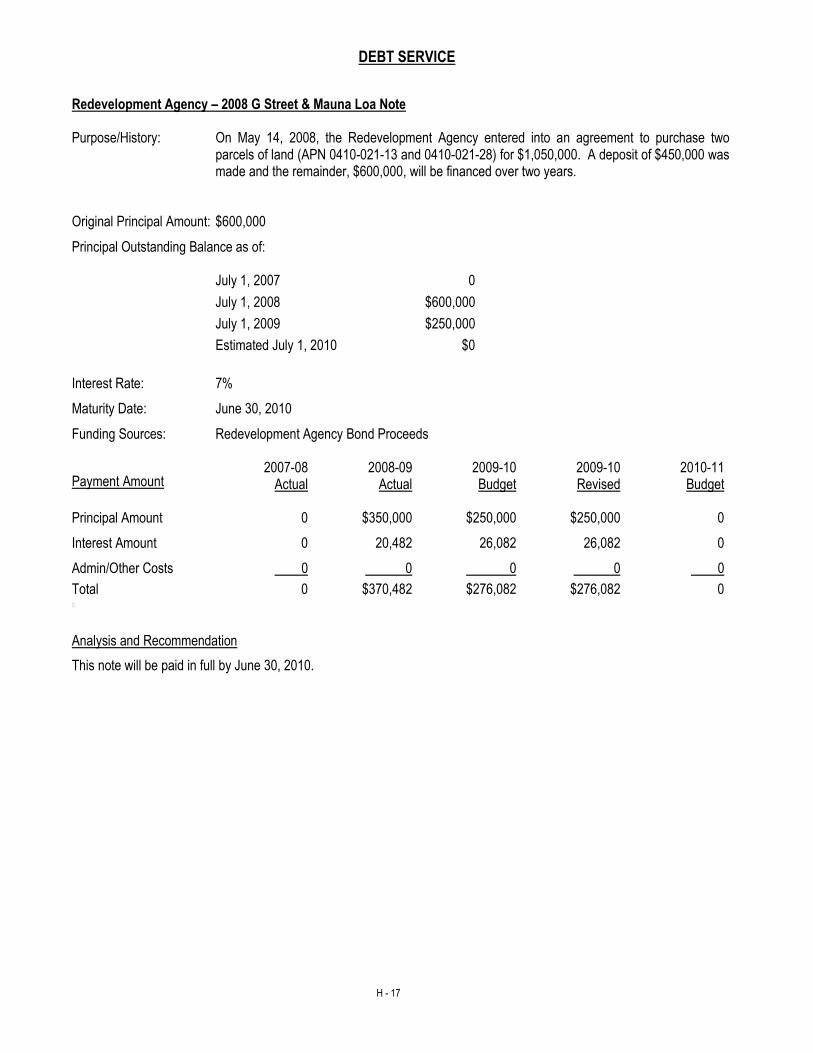
DEBT SERVICE
H - 17
Redevelopment Agency – 2008 G Street & Mauna Loa Note Purpose/History: On May 14, 2008, the Redevelopment Agency entered into an agreement to purchase two
parcels of land (APN 0410-021-13 and 0410-021-28) for $1,050,000. A deposit of $450,000 was made and the remainder, $600,000, will be financed over two years.
Original Principal Amount: $600,000
Principal Outstanding Balance as of:
July 1, 2007 0
July 1, 2008 $600,000
July 1, 2009 $250,000
Estimated July 1, 2010 $0
Interest Rate: 7%
Maturity Date: June 30, 2010
Funding Sources: Redevelopment Agency Bond Proceeds 2007-08 2008-09 2009-10 2009-10 2010-11 Payment Amount Actual Actual Budget Revised Budget Principal Amount 0 $350,000 $250,000 $250,000 0
Interest Amount 0 20,482 26,082 26,082 0
Admin/Other Costs 0 0 0 0 0
Total 0 $370,482 $276,082 $276,082 0 0
Analysis and Recommendation
This note will be paid in full by June 30, 2010.
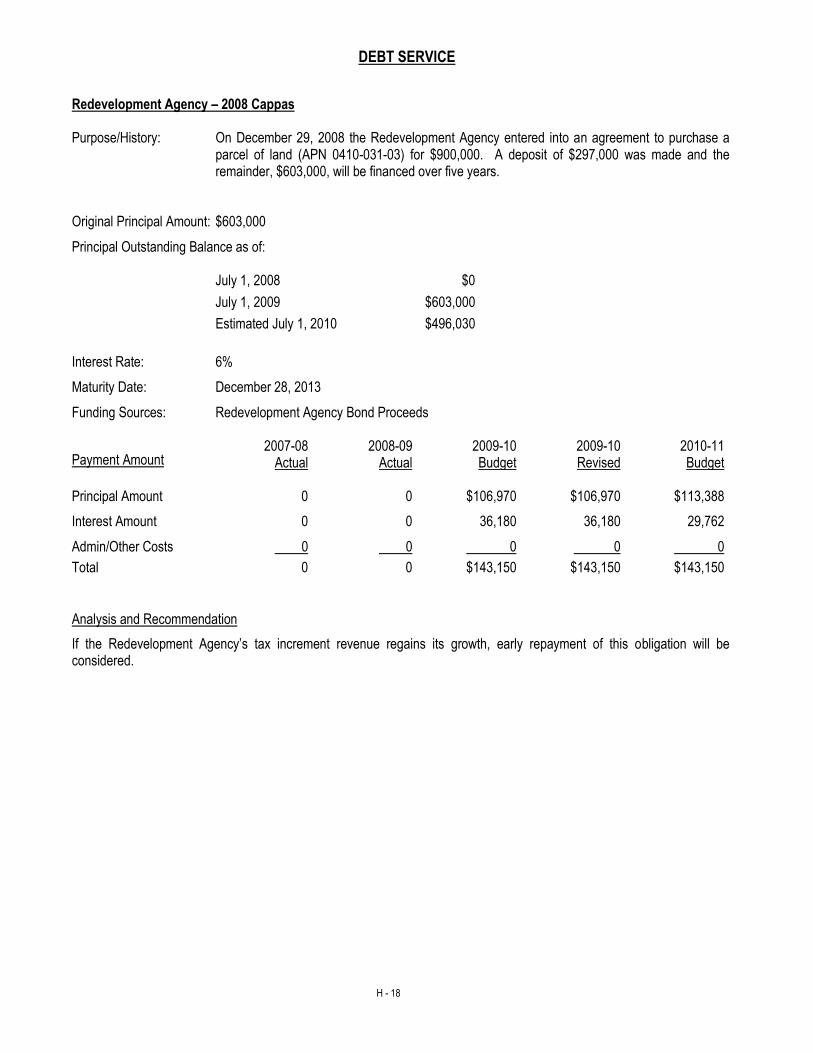
DEBT SERVICE
H - 18
Redevelopment Agency – 2008 Cappas Purpose/History: On December 29, 2008 the Redevelopment Agency entered into an agreement to purchase a
parcel of land (APN 0410-031-03) for $900,000. A deposit of $297,000 was made and the remainder, $603,000, will be financed over five years.
Original Principal Amount: $603,000
Principal Outstanding Balance as of:
July 1, 2008 $0
July 1, 2009 $603,000
Estimated July 1, 2010 $496,030
Interest Rate: 6%
Maturity Date: December 28, 2013
Funding Sources: Redevelopment Agency Bond Proceeds 2007-08 2008-09 2009-10 2009-10 2010-11 Payment Amount Actual Actual Budget Revised Budget Principal Amount 0 0 $106,970 $106,970 $113,388
Interest Amount 0 0 36,180 36,180 29,762
Admin/Other Costs 0 0 0 0 0
Total 0 0 $143,150 $143,150 $143,150
Analysis and Recommendation
If the Redevelopment Agency’s tax increment revenue regains its growth, early repayment of this obligation will be considered.
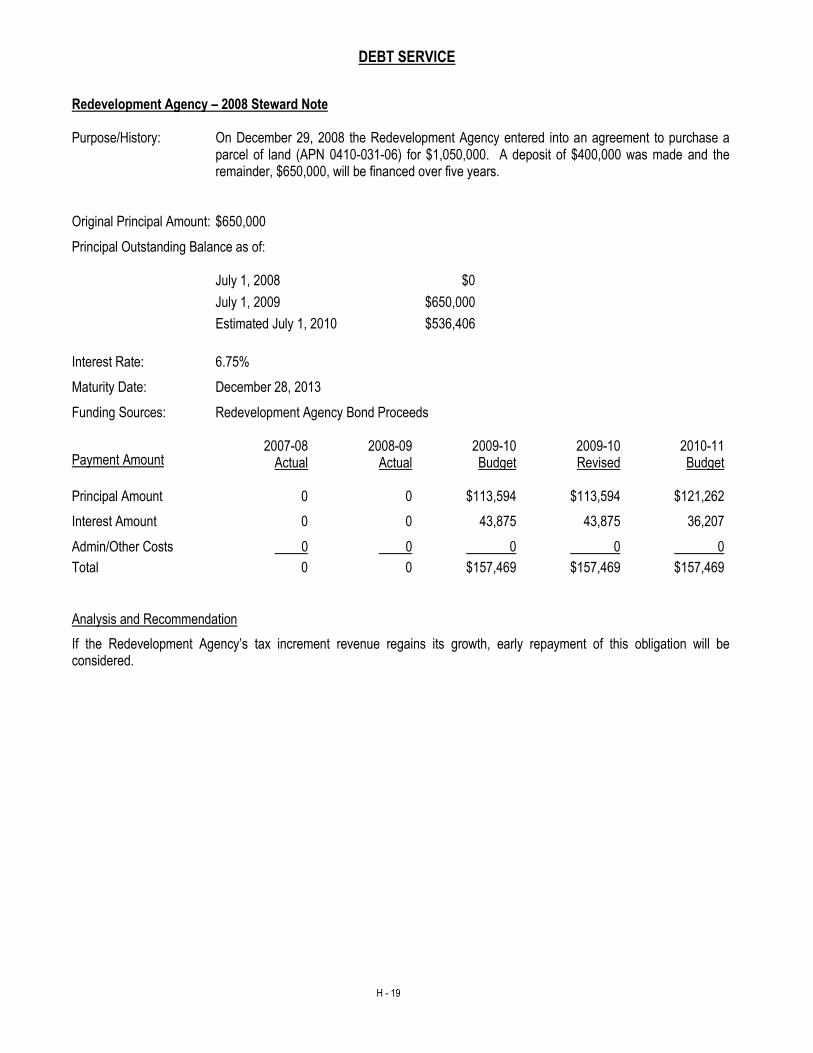
DEBT SERVICE
H - 19
Redevelopment Agency – 2008 Steward Note Purpose/History: On December 29, 2008 the Redevelopment Agency entered into an agreement to purchase a
parcel of land (APN 0410-031-06) for $1,050,000. A deposit of $400,000 was made and the remainder, $650,000, will be financed over five years.
Original Principal Amount: $650,000
Principal Outstanding Balance as of:
July 1, 2008 $0
July 1, 2009 $650,000
Estimated July 1, 2010 $536,406
Interest Rate: 6.75%
Maturity Date: December 28, 2013
Funding Sources: Redevelopment Agency Bond Proceeds 2007-08 2008-09 2009-10 2009-10 2010-11 Payment Amount Actual Actual Budget Revised Budget Principal Amount 0 0 $113,594 $113,594 $121,262
Interest Amount 0 0 43,875 43,875 36,207
Admin/Other Costs 0 0 0 0 0
Total 0 0 $157,469 $157,469 $157,469
Analysis and Recommendation
If the Redevelopment Agency’s tax increment revenue regains its growth, early repayment of this obligation will be considered.
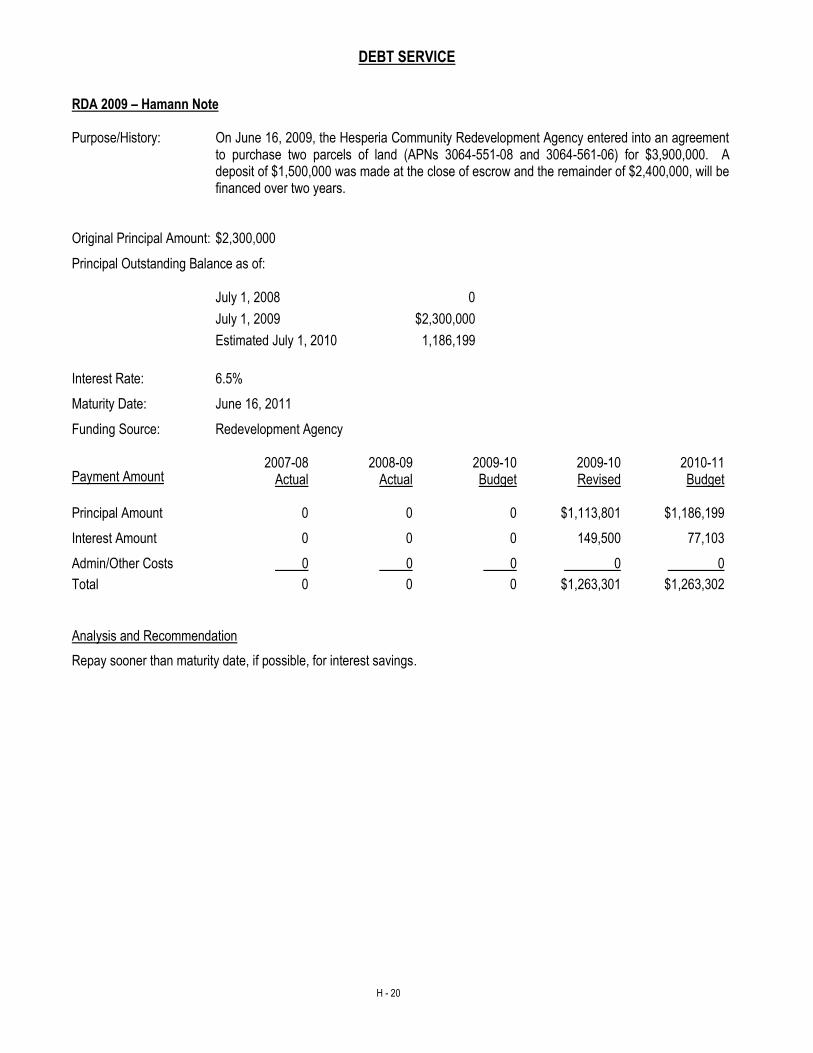
DEBT SERVICE
H - 20
RDA 2009 – Hamann Note Purpose/History: On June 16, 2009, the Hesperia Community Redevelopment Agency entered into an agreement
to purchase two parcels of land (APNs 3064-551-08 and 3064-561-06) for $3,900,000. A deposit of $1,500,000 was made at the close of escrow and the remainder of $2,400,000, will be financed over two years.
Original Principal Amount: $2,300,000
Principal Outstanding Balance as of:
July 1, 2008 0
July 1, 2009 $2,300,000
Estimated July 1, 2010 1,186,199
Interest Rate: 6.5%
Maturity Date: June 16, 2011
Funding Source: Redevelopment Agency 2007-08 2008-09 2009-10 2009-10 2010-11 Payment Amount Actual Actual Budget Revised Budget Principal Amount 0 0 0 $1,113,801 $1,186,199
Interest Amount 0 0 0 149,500 77,103
Admin/Other Costs 0 0 0 0 0
Total 0 0 0 $1,263,301 $1,263,302
Analysis and Recommendation
Repay sooner than maturity date, if possible, for interest savings.
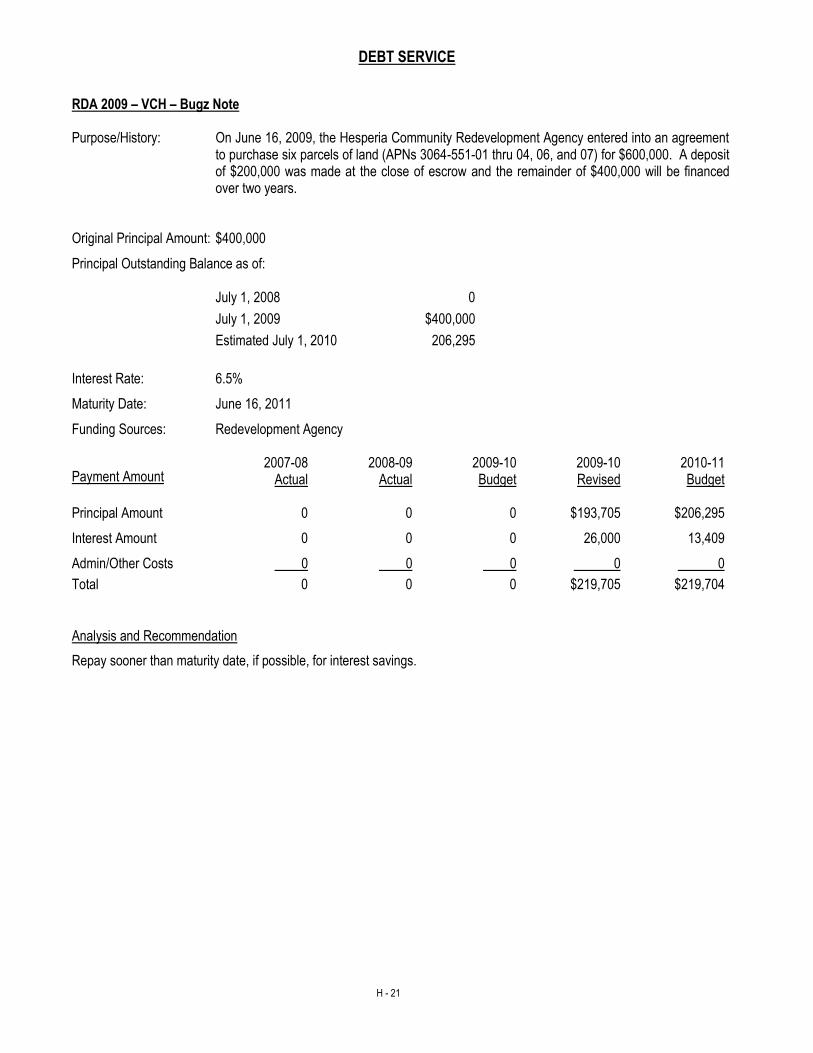
DEBT SERVICE
H - 21
RDA 2009 – VCH – Bugz Note Purpose/History: On June 16, 2009, the Hesperia Community Redevelopment Agency entered into an agreement
to purchase six parcels of land (APNs 3064-551-01 thru 04, 06, and 07) for $600,000. A deposit of $200,000 was made at the close of escrow and the remainder of $400,000 will be financed over two years.
Original Principal Amount: $400,000
Principal Outstanding Balance as of:
July 1, 2008 0
July 1, 2009 $400,000
Estimated July 1, 2010 206,295
Interest Rate: 6.5%
Maturity Date: June 16, 2011
Funding Sources: Redevelopment Agency 2007-08 2008-09 2009-10 2009-10 2010-11 Payment Amount Actual Actual Budget Revised Budget Principal Amount 0 0 0 $193,705 $206,295
Interest Amount 0 0 0 26,000 13,409
Admin/Other Costs 0 0 0 0 0
Total 0 0 0 $219,705 $219,704
Analysis and Recommendation
Repay sooner than maturity date, if possible, for interest savings.

DEBT SERVICE
H - 22
Water District - 1987 Prop. 28 Loan from State of California Purpose/History: On May 30, 1987, the City of Hesperia entered into contract #E53203 with the State of
California, Department of Water Resources, to borrow $5,000,000 under the California Safe Drinking Water Bond Law of 1984 (City Council Resolution 87-9). The loan was made to assist in financing construction of a project that would enable the City to meet safe drinking water standards established pursuant to Chapter 7 (commencing with Section 4010) of Part 1 of Division 5 of the Health and Safety Code.
Original Principal Amount: $5,000,000
Principal Outstanding Balance as of:
July 1, 2007: $ 905,826
July 1, 2008 $ 554,652
July 1, 2009 $ 188,671
Estimated July 1, 2010 $ 0
Interest Rate: 4.1439%
Maturity Date: October 1, 2009
Funding Source: Hesperia Water District User Taxes – The supplier agrees that it will levy and collect assessments and user charges as may be necessary to operate and to maintain the project and to meet the payments of the loan when it becomes due. If, for any reason gross revenues prove insufficient to service the loan contract, supplier agrees to raise sufficient funds through increased user charges or assessments or any other legal means available to it to meet loan payments and to operate and to maintain the project.
2007-08 2008-09 2009-10 2009-10 2010-11 Payment Amount Actual Actual Budget Revised Budget Principal Amount $351,173 $365,982 $188,671 $188,671 0
Interest Amount 34,008 19,200 3,920 3,920 0
Admin/Other Costs 0 0 0 0 0
Total $385,181 $385,182 $192,591 $192,591 0
Note: Budgetary Basis Adjustment – The principal payments are reflected in the actual columns. The CAFR shows an interest accrual.
Analysis and Recommendation
The 1987 Proposition 28 Loan was paid in full in September 2009.
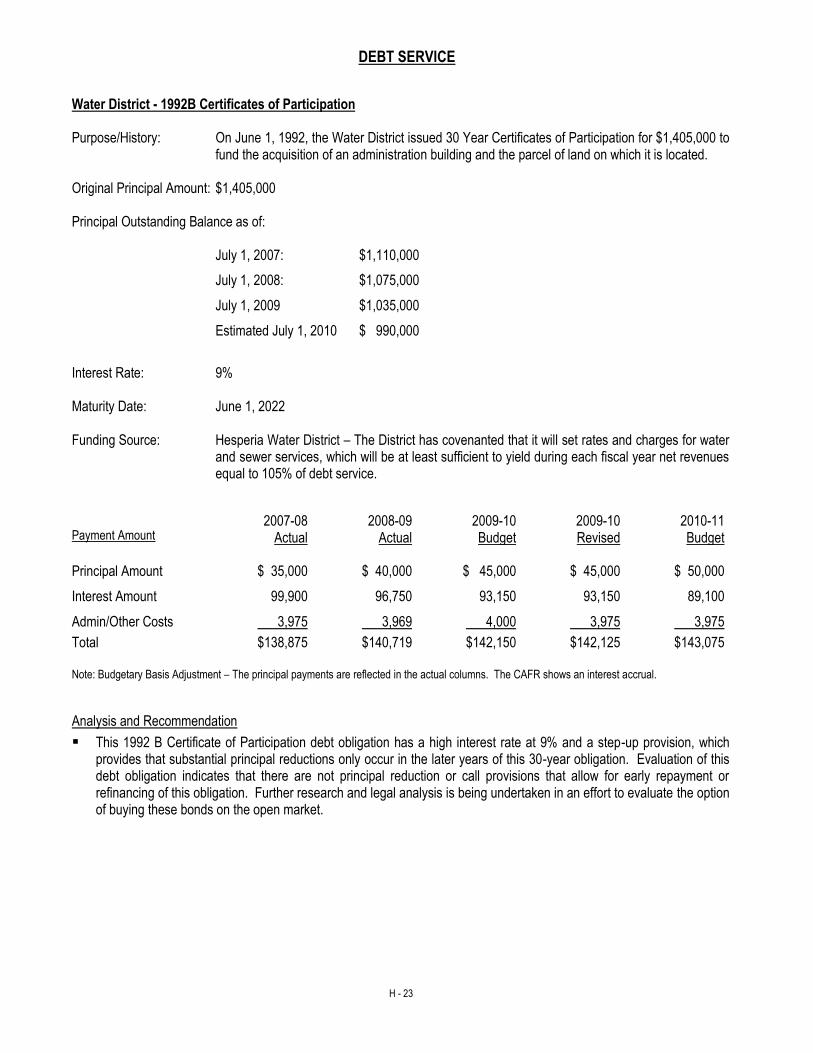
DEBT SERVICE
H - 23
Water District - 1992B Certificates of Participation Purpose/History: On June 1, 1992, the Water District issued 30 Year Certificates of Participation for $1,405,000 to
fund the acquisition of an administration building and the parcel of land on which it is located. Original Principal Amount: $1,405,000
Principal Outstanding Balance as of:
July 1, 2007: $1,110,000
July 1, 2008: $1,075,000
July 1, 2009 $1,035,000
Estimated July 1, 2010 $ 990,000
Interest Rate: 9%
Maturity Date: June 1, 2022
Funding Source: Hesperia Water District – The District has covenanted that it will set rates and charges for water and sewer services, which will be at least sufficient to yield during each fiscal year net revenues equal to 105% of debt service.
2007-08 2008-09 2009-10 2009-10 2010-11 Payment Amount Actual Actual Budget Revised Budget Principal Amount $ 35,000 $ 40,000 $ 45,000 $ 45,000 $ 50,000
Interest Amount 99,900 96,750 93,150 93,150 89,100
Admin/Other Costs 3,975 3,969 4,000 3,975 3,975
Total $138,875 $140,719 $142,150 $142,125 $143,075 Note: Budgetary Basis Adjustment – The principal payments are reflected in the actual columns. The CAFR shows an interest accrual.
Analysis and Recommendation
This 1992 B Certificate of Participation debt obligation has a high interest rate at 9% and a step-up provision, which provides that substantial principal reductions only occur in the later years of this 30-year obligation. Evaluation of this debt obligation indicates that there are not principal reduction or call provisions that allow for early repayment or refinancing of this obligation. Further research and legal analysis is being undertaken in an effort to evaluate the option of buying these bonds on the open market.
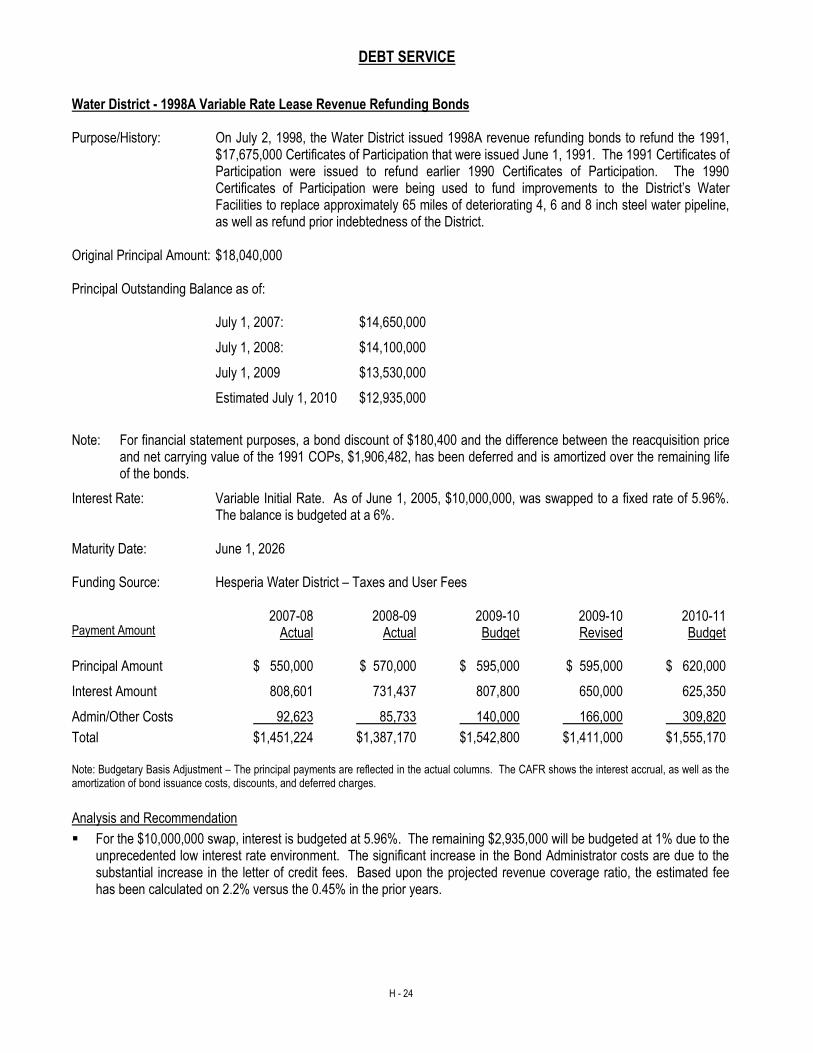
DEBT SERVICE
H - 24
Water District - 1998A Variable Rate Lease Revenue Refunding Bonds Purpose/History: On July 2, 1998, the Water District issued 1998A revenue refunding bonds to refund the 1991,
$17,675,000 Certificates of Participation that were issued June 1, 1991. The 1991 Certificates of Participation were issued to refund earlier 1990 Certificates of Participation. The 1990 Certificates of Participation were being used to fund improvements to the District’s Water Facilities to replace approximately 65 miles of deteriorating 4, 6 and 8 inch steel water pipeline, as well as refund prior indebtedness of the District.
Original Principal Amount: $18,040,000
Principal Outstanding Balance as of:
July 1, 2007: $14,650,000
July 1, 2008: $14,100,000
July 1, 2009 $13,530,000
Estimated July 1, 2010 $12,935,000
Note: For financial statement purposes, a bond discount of $180,400 and the difference between the reacquisition price
and net carrying value of the 1991 COPs, $1,906,482, has been deferred and is amortized over the remaining life of the bonds.
Interest Rate: Variable Initial Rate. As of June 1, 2005, $10,000,000, was swapped to a fixed rate of 5.96%. The balance is budgeted at a 6%.
Maturity Date: June 1, 2026
Funding Source: Hesperia Water District – Taxes and User Fees 2007-08 2008-09 2009-10 2009-10 2010-11 Payment Amount Actual Actual Budget Revised Budget Principal Amount $ 550,000 $ 570,000 $ 595,000 $ 595,000 $ 620,000
Interest Amount 808,601 731,437 807,800 650,000 625,350
Admin/Other Costs 92,623 85,733 140,000 166,000 309,820
Total $1,451,224 $1,387,170 $1,542,800 $1,411,000 $1,555,170 Note: Budgetary Basis Adjustment – The principal payments are reflected in the actual columns. The CAFR shows the interest accrual, as well as the amortization of bond issuance costs, discounts, and deferred charges.
Analysis and Recommendation
For the $10,000,000 swap, interest is budgeted at 5.96%. The remaining $2,935,000 will be budgeted at 1% due to the unprecedented low interest rate environment. The significant increase in the Bond Administrator costs are due to the substantial increase in the letter of credit fees. Based upon the projected revenue coverage ratio, the estimated fee has been calculated on 2.2% versus the 0.45% in the prior years.
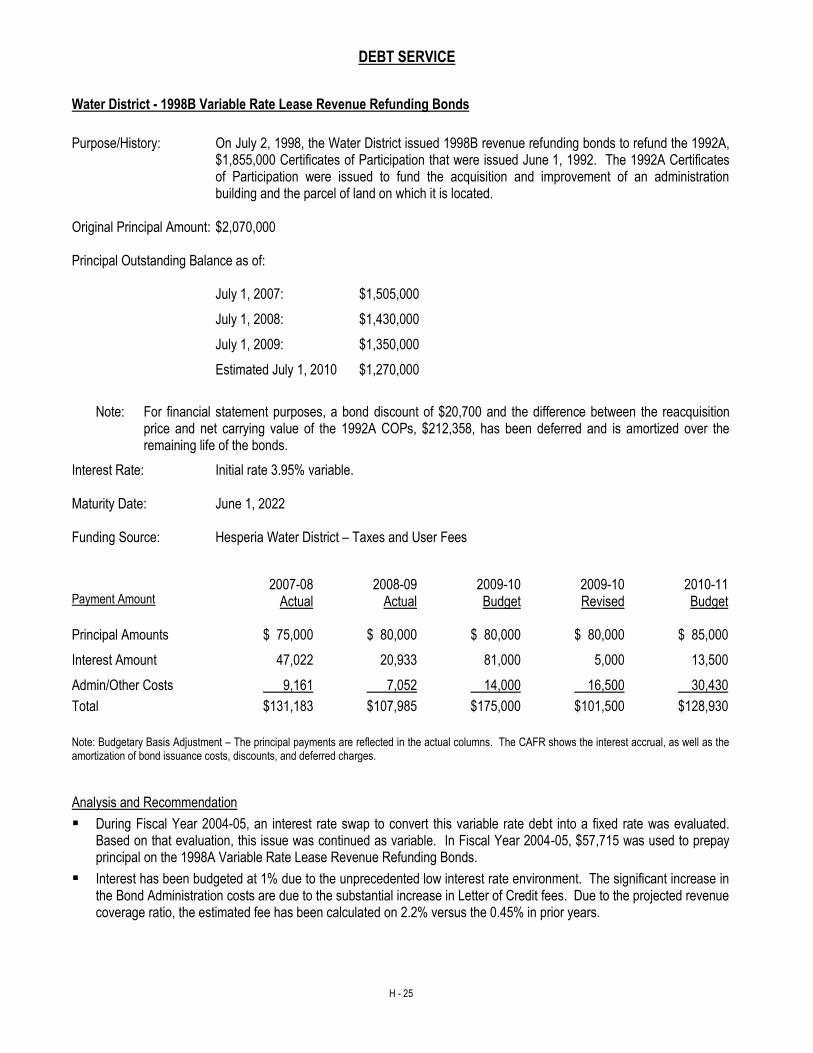
DEBT SERVICE
H - 25
Water District - 1998B Variable Rate Lease Revenue Refunding Bonds
Purpose/History: On July 2, 1998, the Water District issued 1998B revenue refunding bonds to refund the 1992A,
$1,855,000 Certificates of Participation that were issued June 1, 1992. The 1992A Certificates of Participation were issued to fund the acquisition and improvement of an administration building and the parcel of land on which it is located.
Original Principal Amount: $2,070,000
Principal Outstanding Balance as of:
July 1, 2007: $1,505,000
July 1, 2008: $1,430,000
July 1, 2009: $1,350,000
Estimated July 1, 2010 $1,270,000
Note: For financial statement purposes, a bond discount of $20,700 and the difference between the reacquisition
price and net carrying value of the 1992A COPs, $212,358, has been deferred and is amortized over the remaining life of the bonds.
Interest Rate: Initial rate 3.95% variable. Maturity Date: June 1, 2022
Funding Source: Hesperia Water District – Taxes and User Fees
2007-08 2008-09 2009-10 2009-10 2010-11 Payment Amount Actual Actual Budget Revised Budget Principal Amounts $ 75,000 $ 80,000 $ 80,000 $ 80,000 $ 85,000
Interest Amount 47,022 20,933 81,000 5,000 13,500
Admin/Other Costs 9,161 7,052 14,000 16,500 30,430
Total $131,183 $107,985 $175,000 $101,500 $128,930
Note: Budgetary Basis Adjustment – The principal payments are reflected in the actual columns. The CAFR shows the interest accrual, as well as the amortization of bond issuance costs, discounts, and deferred charges.
Analysis and Recommendation
During Fiscal Year 2004-05, an interest rate swap to convert this variable rate debt into a fixed rate was evaluated. Based on that evaluation, this issue was continued as variable. In Fiscal Year 2004-05, $57,715 was used to prepay principal on the 1998A Variable Rate Lease Revenue Refunding Bonds.
Interest has been budgeted at 1% due to the unprecedented low interest rate environment. The significant increase in the Bond Administration costs are due to the substantial increase in Letter of Credit fees. Due to the projected revenue coverage ratio, the estimated fee has been calculated on 2.2% versus the 0.45% in prior years.

H - 26
THIS PAGE INTENTIONALLY LEFT BLANK
■ Overview and Summary
■ List of Funds
■ Fund Descriptions
■ 2010-11 Budget - Balancing and Fund Balance Summary - By Major Grouping
F U N D B A L A N C E
S U M M A R I E S
■ 2010-11 Budget - Balancing and Fund Balance Summary - By Individual Funds
■ Fund Balance Schedules by Fund
FUND BALANCE SUMMARY
Occasionally a fund will draw on reserves, which were budgeted for a specific purpose, even thoughtotal resources will exceed total uses. This is done to acknowledge that the budgeted expenditure isnot being funded by the current year operating revenue but, instead, by a prior year(s) savings.
For the 2010-11 Budget June 30th Ending Balance, some funds are reporting an anticipated negativefund balance. A brief explanation for each negative fund balance is provided on the individual fundpage.
OVERVIEW
The Fund Balance Summary is the primary balancing mechanism used in the preparation of thebudget. This section displays the projected fund balance for each budgeted fund presented in theFiscal Year 2010-11 Budget. Each page presents the budgeted revenues and other resources that areanticipated to be available to fund the budgeted expenditures and other uses of a particular fund.Budgeted Reserves are occasionally required to finance some of a fund's planned expenditures and,where appropriate, comments are noted. The fund balance portion of each fund's actual columnscorrespond to the City's Comprehensive Annual Financial Report (CAFR).
SUMMARY
The Fund Balance section on each page displays the fiscal period's beginning balance, a deduction forthe use of any reserves, an increase for the surplus of resources over uses, and finally the period'sending balance. Occasionally, a fund will expend resources in advance of a subsequentreimbursement, thus producing a temporary negative ending fund balance condition.
I - 2
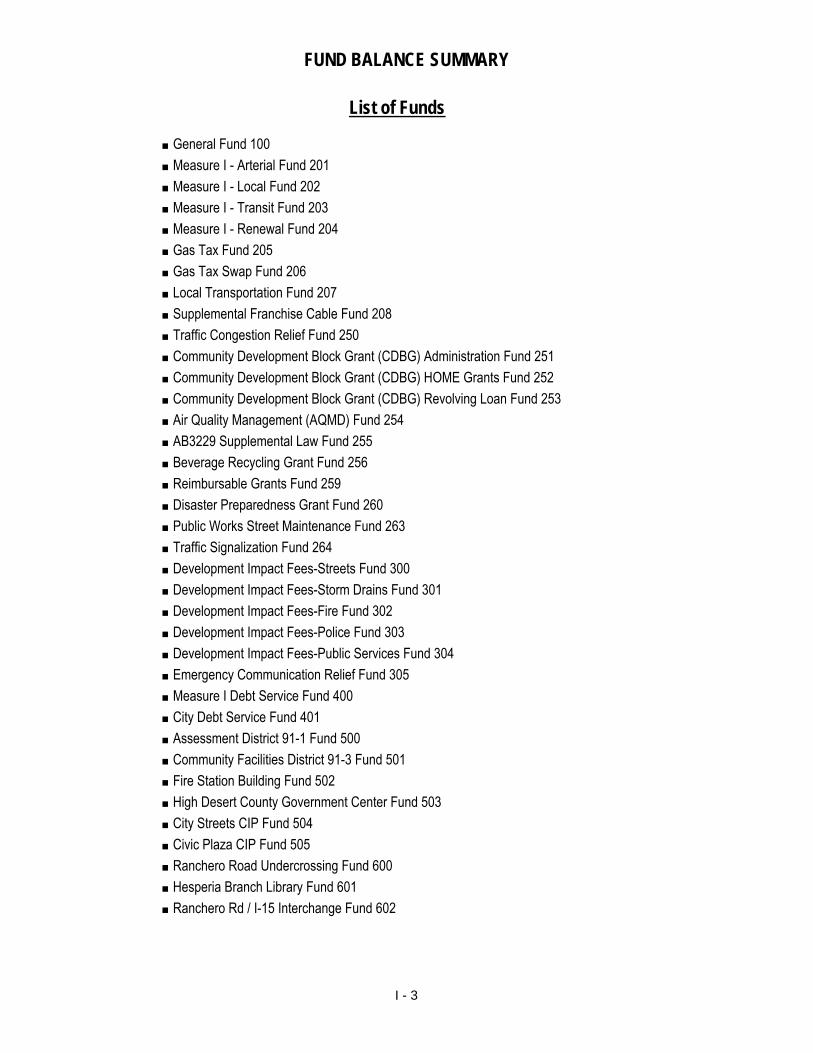
FUND BALANCE SUMMARY
■ General Fund 100■ Measure I - Arterial Fund 201■ Measure I - Local Fund 202■ Measure I - Transit Fund 203■ Measure I - Renewal Fund 204■ Gas Tax Fund 205■ Gas Tax Swap Fund 206■ Local Transportation Fund 207■ Supplemental Franchise Cable Fund 208■ Traffic Congestion Relief Fund 250■ Community Development Block Grant (CDBG) Administration Fund 251■ Community Development Block Grant (CDBG) HOME Grants Fund 252■ Community Development Block Grant (CDBG) Revolving Loan Fund 253■ Air Quality Management (AQMD) Fund 254■ AB3229 Supplemental Law Fund 255■ Beverage Recycling Grant Fund 256■ Reimbursable Grants Fund 259■ Disaster Preparedness Grant Fund 260■ Public Works Street Maintenance Fund 263■ Traffic Signalization Fund 264■ Development Impact Fees-Streets Fund 300■ Development Impact Fees-Storm Drains Fund 301■ Development Impact Fees-Fire Fund 302■ Development Impact Fees-Police Fund 303■ Development Impact Fees-Public Services Fund 304■ Emergency Communication Relief Fund 305■ Measure I Debt Service Fund 400■ City Debt Service Fund 401■ Assessment District 91-1 Fund 500■ Community Facilities District 91-3 Fund 501■ Fire Station Building Fund 502■ High Desert County Government Center Fund 503■ City Streets CIP Fund 504■ Civic Plaza CIP Fund 505■ Ranchero Road Undercrossing Fund 600■ Hesperia Branch Library Fund 601■ Ranchero Rd / I-15 Interchange Fund 602
List of Funds
I - 3
FUND BALANCE SUMMARY
■ Mortgage Assistance Trust Fund 885■ Redevelopment Agency (RDA) Low/Moderate Housing Fund 385■ Redevelopment Agency (RDA) Administration Fund 389■ Redevelopment Agency (RDA) Debt Service Project Area #1 Fund 486■ Redevelopment Agency (RDA) Debt Service Project Area #2 Fund 487■ Redevelopment Agency (RDA) Capital Improvements Area #1 Fund 586■ Redevelopment Agency (RDA) Capital Improvements Area #2 Fund 587■ Redevelopment Agency (RDA) Capital Improvements VVEDA Fund 588■ Fire District Fund 200■ Water District - Water Operations Fund 700■ Water District - Water Capital Fund 701■ Water District - Sewer Operations Fund 710■ Water District - Sewer Capital Fund 711
List of Funds
I - 4
FUND BALANCE SUMMARY
I - 5
FUND DESCRIPTIONS For budgeting purposes the City’s funds are grouped by functional classifications. These classifications are General City Operations and Maintenance; Redevelopment Agency; Community Development Block Grant (CDBG); Street Related; Other Transportation Related; City Facilities; Other City Related; Water District; and Fire District. The City of Hesperia budgets for revenues and expenditures in the following Governmental fund types: The General Fund accounts for all financial resources traditionally associated with government, which are not required legally or by sound financial management to be accounted for in another fund. The Special Revenue funds are used to account for specific revenues that are legally restricted to expenditures for particular purposes. The Debt Service funds are used to account for the accumulation of resources and the payment of general obligation bond principal and interest from governmental resources, and special assessment bond principal and interest from special assessment levies, when the government is obligated in some manner for the payment. The Capital Project funds are used to account for the acquisition and construction of major capital facilities other than those financed by proprietary funds. In addition, the City of Hesperia budgets for Revenue and Expenditure in the following Proprietary fund types: Enterprise funds are used to account for operations that are financed and operated in a manner similar to private business enterprises where the intent of the City Council is that the costs of providing goods or services to the general public, on a continuing basis, be financed or recovered primarily through user charges. Internal Service funds are used to account for the financing of goods or services provided by one department or agency to other departments or agencies of the City and to other government units, on a cost reimbursement basis. GENERAL FUNDS General Fund (100) – This fund accounts for the majority of financial resources and uses of the City such as Legislative, Administrative, Community Development, Police, and capital expenditures. REDEVELOPMENT AGENCY FUNDS Redevelopment Agency Low/Moderate Housing (385) – This Special Revenue fund accounts for the Agency's combined 20% tax increment set-aside monies to be used to increase and improve the community's supply of low and moderate income housing in the Redevelopment project areas. Redevelopment Agency Administration (389) - To account for expenditures that are general or overhead in nature to the Redevelopment Agency for its general operations. These expenditures are to be allocated to the Low/Mod and capital project funds at the end of the fiscal year. Redevelopment Agency Debt Service Project Area #1 (486) – This Debt Service fund accounts for the tax increment receipts and payment of the Redevelopment Agency Project Area #1’s portion of the bonded indebtedness and tax increment pass-through obligations. Redevelopment Agency Debt Service Project Area #2 (487) – This Debt Service fund accounts for the tax increment receipts and payment of the Redevelopment Agency Project Area #2’s portion of the bonded indebtedness and tax increment pass-through obligations.
FUND BALANCE SUMMARY
I - 6
FUND DESCRIPTIONS REDEVELOPMENT AGENCY FUNDS (Continued) Redevelopment Agency Capital Improvements Project Area #1 (586) – This Capital Project fund accounts for the revenues and expenditures of Project Area #1. Bond proceeds provide the principal financing. Redevelopment Agency Capital Improvements Project Area #2 (587) – This Capital Project fund accounts for the revenues and expenditures of Project Area #2. Bond proceeds provide the principal financing. Redevelopment Agency Capital Improvements (Victor Valley Economic Development Authority (VVEDA) 588) – This Capital Project fund accounts for the revenues and expenditures of the VVEDA project area. VVEDA pass-through funds provide the principal financing. COMMUNITY DEVELOPMENT BLOCK GRANT (CDBG) FUNDS CDBG Administration (251) - This Special Revenue fund accounts for the receipts and expenditures of the City's entitlements under Federal Community Development Block Grant (CDBG) programs of the US Department of Housing and Urban Development (HUD). CDBG Home Grants (252) - This Special Revenue fund accounts for miscellaneous Federal and State grants requiring segregated fund accounting for CDBG grants of the HOME program. CDBG Revolving Loan (253) - This Special Revenue fund accounts for the Section 108 loan proceeds from the Federal government (HUD) used to assist with business expansion within the City. CDBG Neighborhood Stabilization Program (257) - This Special Revenue fund accounts for the federal grant used to purchase, rehabilitate, and resell abandoned and foreclosed homes within the City. STREETS MAINTENANCE Public Works Street Maintenance (263) - This Special Revenue fund accounts for funds expended to repair and maintain the City’s streets. STREET CAPITAL IMPROVEMENT PROJECTS (CIP) FUNDS Measure I Arterial (201) - This Special Revenue fund accounts for 65% of the receipt of voter-approved (Measure I) tax revenue relating to the relief of arterial and regional traffic congestion through maintenance and upkeep of streets and highways. Measure I Local (202) - This Special Revenue fund accounts for 30% of the receipt of voter-approved (Measure I) tax revenue relating to the relief of local traffic congestion through maintenance and upkeep of streets and highways. Measure I Renewal (204) - This Special Revenue fund accounts for the receipt of voter-approved renewal of Measure I tax (½ cent sales tax) revenue relating to the relief of traffic congestion through maintenance and upkeep of streets and highways. Gas Tax (205) - This Special Revenue fund accounts for receipts and expenditures of money apportioned by the State and Highway Code §'s 2105, 2106, 2107 and 2107.5. Gas Tax monies can only be used to construct and maintain streets and highways.
FUND BALANCE SUMMARY
I - 7
FUND DESCRIPTIONS STREET CAPITAL IMPROVEMENT PROJECTS (CIP) FUNDS (Continued) Gas Tax Swap (206) - This Special Revenue fund, new for FY 2010-11, accounts for the replacement revenue from the State for Proposition 42 the Traffic Congestion Relief moneys received into fund #250. Local Transportation Fund (LTF) Article 8 (207) - This Special Revenue fund accounts for the ¼ cent of the 8¾ cent sales tax which, in turn, are expended for the City’s participation in the Victor Valley Transit Authority and maintenance of streets and roads in accordance with AB 325. Traffic Congestion Relief (250) - This Special Revenue fund accounts for a State (Proposition 42) comprehensive funding measure of almost $5 billion to enhance traffic flow. Development Impact - Streets (300) - This Special Revenue fund accounts for the fees paid during the building permit process for the expansion and improvement of the capacity of the City’s streets. Development Impact – Storm Drainage (301) - This Special Revenue fund accounts for the fees paid during the building permit process for the expansion and improvement of the capacity of the City’s storm drains. City Streets Projects (504) - This Capital Project fund accounts for funds designated for various streets and storm drainage related capital projects throughout the City funded primarily by grants. Ranchero Road Undercrossing (600) - This Capital Project fund accounts for the costs associated with building a railroad crossing under the Burlington Northern Santa Fe tracks at Ranchero Road. Ranchero Rd / I-15 Interchange (602) - This Capital Project fund accounts for the costs associated with building an interchange at Interstate 15 and Ranchero Road. OTHER TRANSPORTATION RELATED FUNDS Measure I Transit (203) - This Special Revenue fund accounts for 5% of the receipt of voter-approved (Measure I) tax revenue relating to aid the elderly and disabled with transportation services and fare reductions. Air Quality Management (254) - This Special Revenue fund accounts for receipts from the Mojave Desert Air Quality Management District (AQMD) used for the purpose of reducing air pollution from motor vehicles. Traffic Signalization (264) - This Special Revenue fund accounts for funds designated to improve traffic flow by enhancing the coordination of traffic signals throughout the City. Measure-I Debt Service (400) - This Debt Service fund accounts for debt service payments on the Marks-Roos Measure I Revenue bonds. FACILITIES Fire Building (502) - This Capital Project fund accounts for development impact fees to fund capital improvements of fire facilities. High Desert Government Center (503) - This Capital Project fund accounts for monies expended on building the County of San Bernardino’s High Desert Government Center just north of the City of Hesperia Civic Plaza. Hesperia Civic Plaza CIP (505) - This Capital Project fund accounts for monies expended on building the Civic Plaza (City Hall) City of Hesperia. This fund is closed.
FUND BALANCE SUMMARY
I - 8
FUND DESCRIPTIONS FACILITIES (Continued) Hesperia Branch Library (601) - This Capital Project fund accounts for the costs associated with building the Hesperia Branch Library operated by the County of San Bernardino Library System. This fund is closed. OTHER CITY RELATED FUNDS Supplemental Franchise Cable (208) - This Special Revenue fund accounts for funds received from the cable franchise as a supplemental fee. This fund is closed. AB 3229 Supplemental Law (255) - This Special Revenue fund accounts for State grant funds used to enhance policing services. Environmental Programs (256) - This Special Revenue fund accounts for State grant funds used to enhance recycling efforts of beverage containers in the community. Reimbursable Grants (259) - This Special Revenue fund accounts for, during the 2010-11 fiscal year, a Federal grant fund used to defray the majority of the costs of the solar panels for the new police Station.. Disaster Preparedness Grant (260) - This Special Revenue fund accounts for State grant funds used to prepare City staff for quick and correct techniques for proper response and assistance to the citizens in times of emergencies. Development Impact – Fire (302) - This Special Revenue fund accounts for the fees paid during the building permit process for the expansion and improvement of the capacity of the City’s Fire Department with expanded facilities and equipment. Development Impact – Police (303) - This Special Revenue fund accounts for the fees paid during the building permit process for the expansion and improvement of the capacity of the City’s Police Department with expanded facilities and equipment. Development Impact – Public Services (304) - This Special Revenue fund accounts for the fees paid during the building permit process for the expansion and improvement of the capacity of the City’s facilities to better serve the growing populace. Emergency Communications (305) - This Special Revenue fund accounts for funds designated for enhancing radio communications through improved technology and equipment. This fund is closed. City Debt Service (401) - This Debt Service fund accounts for debt service payments on the City’s general debt. Assessment District 91-1 (500) –This Capital Project fund accounts for bond proceeds used to finance infrastructure improvements in the Joshua/West Main Street Assessment District area. Community Facilities District 91-3 – Belgate (501) –This Capital Project fund accounts for bond proceeds used to finance infrastructure improvements in the Belgate Community Facilities District area. Mortgage Assistance Trust Fund (885) – This fund is to account for miscellaneous Federal, State, and County grants requiring segregated fund accounting. This fund is closed.
FUND BALANCE SUMMARY
I - 9
FUND DESCRIPTIONS FIRE DISTRICT FUND Fire District (200) - This Special Revenue fund accounts for revenues from special tax assessments and other service charges and for expenditures relating to the Hesperia Fire Protection District’s prevention and protection. WATER DISTRICT FUNDS Water Operations (700) – This Enterprise fund accounts for the operation and maintenance of the Hesperia Water District’s operations, which is funded by user changes and other fees. Water Capital (701) - This Enterprise fund accounts for the expenditures needed to expand or repair the Hesperia Water District’s system and the revenues required to fund those expenditures. Sewer Operations (710) - This Enterprise fund accounts for the operation and maintenance of the Hesperia Water District’s system, which is funded by user changes and other fees. Sewer Capital (711) - This Enterprise fund accounts for the expenditures needed to expand or repair the Hesperia Water District’s system and the revenues required to fund those expenditures.
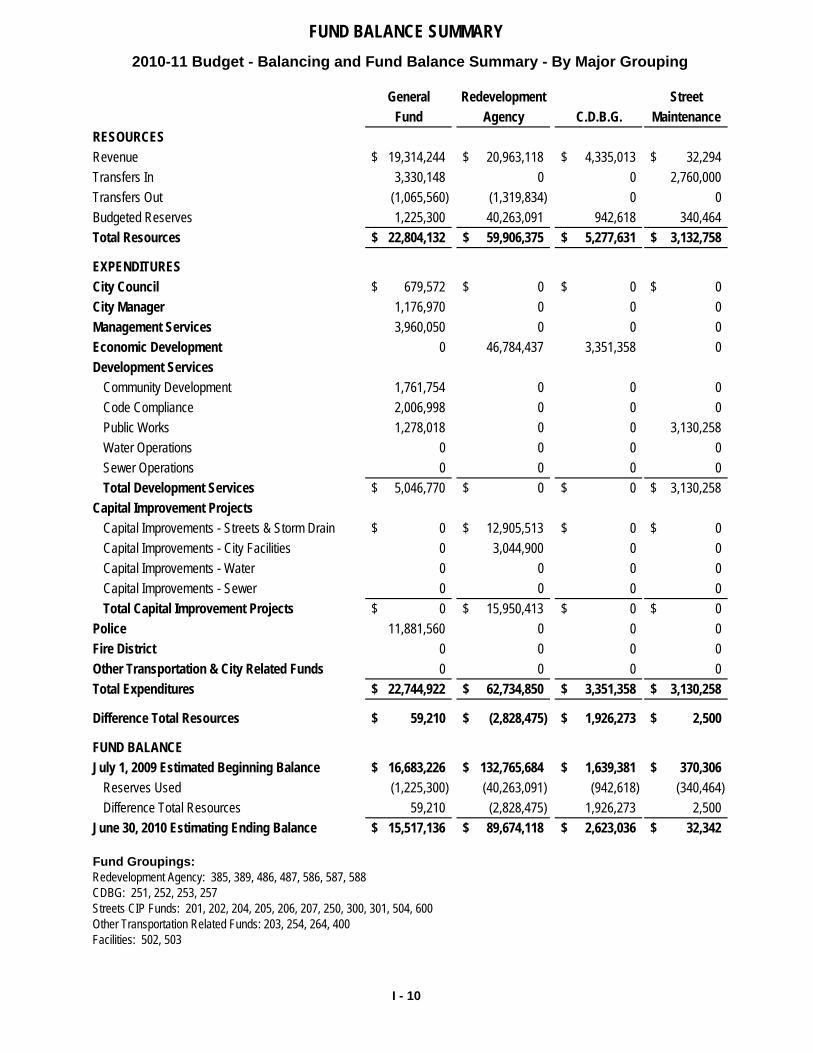
FUND BALANCE SUMMARY
General Redevelopment StreetFund Agency C.D.B.G. Maintenance
RESOURCESRevenue 19,314,244$ 20,963,118$ 4,335,013$ 32,294$ Transfers In 3,330,148 0 0 2,760,000 Transfers Out (1,065,560) (1,319,834) 0 0 Budgeted Reserves 1,225,300 40,263,091 942,618 340,464 Total Resources 22,804,132$ 59,906,375$ 5,277,631$ 3,132,758$
EXPENDITURESCity Council 679,572$ 0$ 0$ 0$ City Manager 1,176,970 0 0 0 Management Services 3,960,050 0 0 0 Economic Development 0 46,784,437 3,351,358 0 Development Services
Community Development 1,761,754 0 0 0 Code Compliance 2,006,998 0 0 0 Public Works 1,278,018 0 0 3,130,258 Water Operations 0 0 0 0 Sewer Operations 0 0 0 0 Total Development Services 5,046,770$ 0$ 0$ 3,130,258$
Capital Improvement ProjectsCapital Improvements - Streets & Storm Drain 0$ 12,905,513$ 0$ 0$ Capital Improvements - City Facilities 0 3,044,900 0 0 Capital Improvements - Water 0 0 0 0 Capital Improvements - Sewer 0 0 0 0 Total Capital Improvement Projects 0$ 15,950,413$ 0$ 0$
Police 11,881,560 0 0 0 Fire District 0 0 0 0 Other Transportation & City Related Funds 0 0 0 0 Total Expenditures 22,744,922$ 62,734,850$ 3,351,358$ 3,130,258$
Difference Total Resources 59,210$ (2,828,475)$ 1,926,273$ 2,500$
FUND BALANCEJuly 1, 2009 Estimated Beginning Balance 16,683,226$ 132,765,684$ 1,639,381$ 370,306$
Reserves Used (1,225,300) (40,263,091) (942,618) (340,464) Difference Total Resources 59,210 (2,828,475) 1,926,273 2,500
June 30, 2010 Estimating Ending Balance 15,517,136$ 89,674,118$ 2,623,036$ 32,342$
Fund Groupings:Redevelopment Agency: 385, 389, 486, 487, 586, 587, 588CDBG: 251, 252, 253, 257Streets CIP Funds: 201, 202, 204, 205, 206, 207, 250, 300, 301, 504, 600Other Transportation Related Funds: 203, 254, 264, 400Facilities: 502, 503
2010-11 Budget - Balancing and Fund Balance Summary - By Major Grouping
I - 10
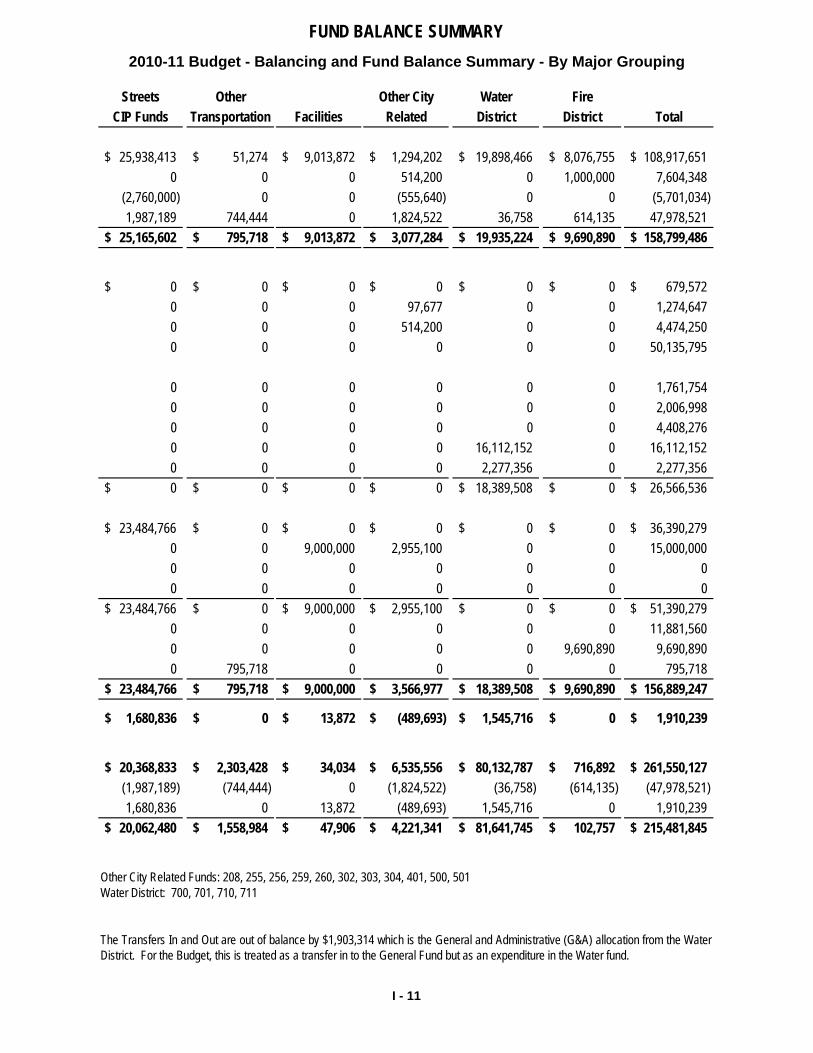
FUND BALANCE SUMMARY
Streets Other Other City Water FireCIP Funds Transportation Facilities Related District District Total
25,938,413$ 51,274$ 9,013,872$ 1,294,202$ 19,898,466$ 8,076,755$ 108,917,651$ 0 0 0 514,200 0 1,000,000 7,604,348
(2,760,000) 0 0 (555,640) 0 0 (5,701,034) 1,987,189 744,444 0 1,824,522 36,758 614,135 47,978,521
25,165,602$ 795,718$ 9,013,872$ 3,077,284$ 19,935,224$ 9,690,890$ 158,799,486$
0$ 0$ 0$ 0$ 0$ 0$ 679,572$ 0 0 0 97,677 0 0 1,274,647 0 0 0 514,200 0 0 4,474,250 0 0 0 0 0 0 50,135,795
0 0 0 0 0 0 1,761,754 0 0 0 0 0 0 2,006,998 0 0 0 0 0 0 4,408,276 0 0 0 0 16,112,152 0 16,112,152 0 0 0 0 2,277,356 0 2,277,356 0$ 0$ 0$ 0$ 18,389,508$ 0$ 26,566,536$
23,484,766$ 0$ 0$ 0$ 0$ 0$ 36,390,279$ 0 0 9,000,000 2,955,100 0 0 15,000,000 0 0 0 0 0 0 0 0 0 0 0 0 0 0
23,484,766$ 0$ 9,000,000$ 2,955,100$ 0$ 0$ 51,390,279$ 0 0 0 0 0 0 11,881,560 0 0 0 0 0 9,690,890 9,690,890 0 795,718 0 0 0 0 795,718
23,484,766$ 795,718$ 9,000,000$ 3,566,977$ 18,389,508$ 9,690,890$ 156,889,247$
1,680,836$ 0$ 13,872$ (489,693)$ 1,545,716$ 0$ 1,910,239$
20,368,833$ 2,303,428$ 34,034$ 6,535,556$ 80,132,787$ 716,892$ 261,550,127$ (1,987,189) (744,444) 0 (1,824,522) (36,758) (614,135) (47,978,521) 1,680,836 0 13,872 (489,693) 1,545,716 0 1,910,239
20,062,480$ 1,558,984$ 47,906$ 4,221,341$ 81,641,745$ 102,757$ 215,481,845$
Other City Related Funds: 208, 255, 256, 259, 260, 302, 303, 304, 401, 500, 501Water District: 700, 701, 710, 711
The Transfers In and Out are out of balance by $1,903,314 which is the General and Administrative (G&A) allocation from the WaterDistrict. For the Budget, this is treated as a transfer in to the General Fund but as an expenditure in the Water fund.
2010-11 Budget - Balancing and Fund Balance Summary - By Major Grouping
I - 11
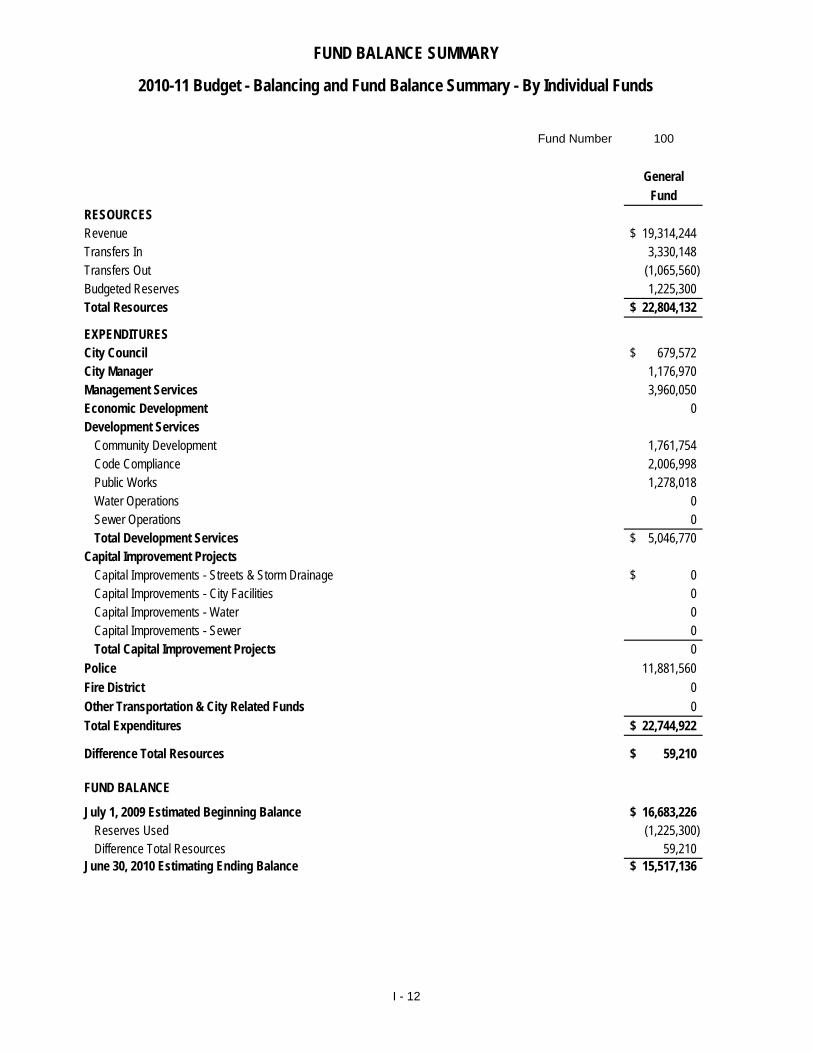
FUND BALANCE SUMMARY
Fund Number 100
GeneralFund
RESOURCESRevenue 19,314,244$ Transfers In 3,330,148 Transfers Out (1,065,560) Budgeted Reserves 1,225,300 Total Resources 22,804,132$
EXPENDITURESCity Council 679,572$ City Manager 1,176,970 Management Services 3,960,050 Economic Development 0 Development Services
Community Development 1,761,754 Code Compliance 2,006,998 Public Works 1,278,018 Water Operations 0 Sewer Operations 0 Total Development Services 5,046,770$
Capital Improvement ProjectsCapital Improvements - Streets & Storm Drainage 0$ Capital Improvements - City Facilities 0 Capital Improvements - Water 0 Capital Improvements - Sewer 0 Total Capital Improvement Projects 0
Police 11,881,560 Fire District 0 Other Transportation & City Related Funds 0 Total Expenditures 22,744,922$
Difference Total Resources 59,210$
FUND BALANCE
July 1, 2009 Estimated Beginning Balance 16,683,226$ Reserves Used (1,225,300) Difference Total Resources 59,210
June 30, 2010 Estimating Ending Balance 15,517,136$
2010-11 Budget - Balancing and Fund Balance Summary - By Individual Funds
I - 12
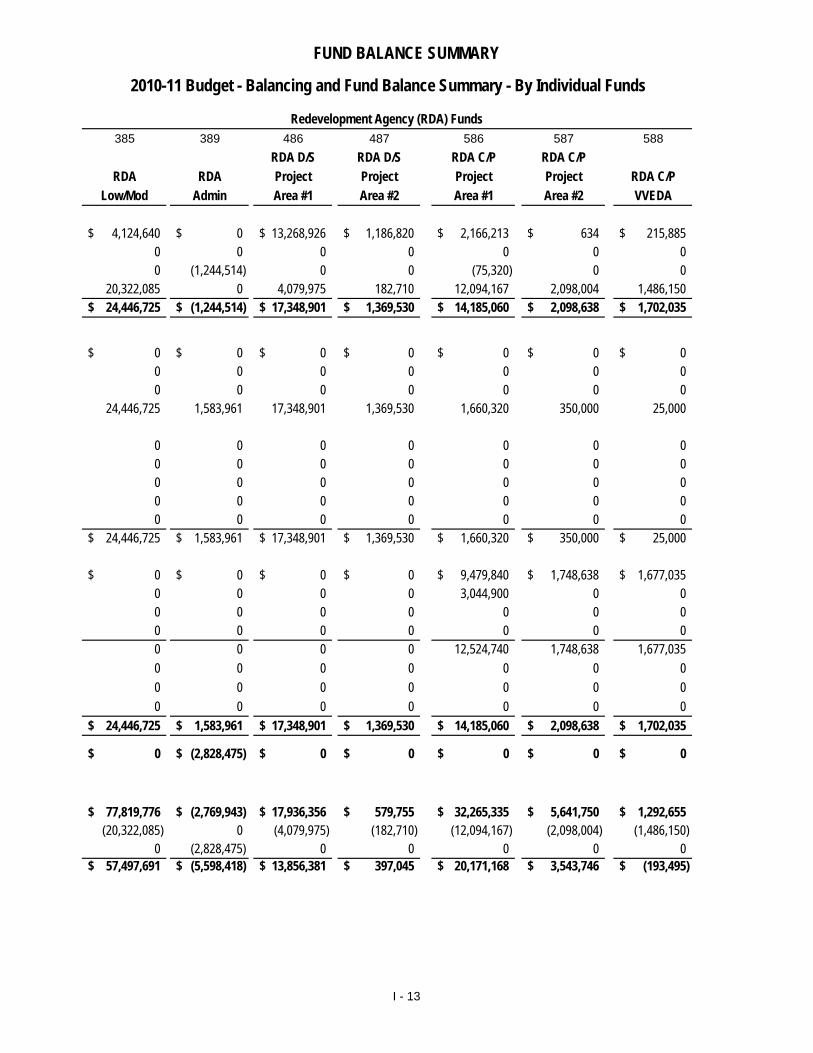
FUND BALANCE SUMMARY
385 389 486 487 586 587 588RDA D/S RDA D/S RDA C/P RDA C/P
RDA RDA Project Project Project Project RDA C/PLow/Mod Admin Area #1 Area #2 Area #1 Area #2 VVEDA
4,124,640$ 0$ 13,268,926$ 1,186,820$ 2,166,213$ 634$ 215,885$ 0 0 0 0 0 0 0 0 (1,244,514) 0 0 (75,320) 0 0
20,322,085 0 4,079,975 182,710 12,094,167 2,098,004 1,486,150 24,446,725$ (1,244,514)$ 17,348,901$ 1,369,530$ 14,185,060$ 2,098,638$ 1,702,035$
0$ 0$ 0$ 0$ 0$ 0$ 0$ 0 0 0 0 0 0 0 0 0 0 0 0 0 0
24,446,725 1,583,961 17,348,901 1,369,530 1,660,320 350,000 25,000
0 0 0 0 0 0 0 0 0 0 0 0 0 0 0 0 0 0 0 0 0 0 0 0 0 0 0 0 0 0 0 0 0 0 0
24,446,725$ 1,583,961$ 17,348,901$ 1,369,530$ 1,660,320$ 350,000$ 25,000$
0$ 0$ 0$ 0$ 9,479,840$ 1,748,638$ 1,677,035$ 0 0 0 0 3,044,900 0 0 0 0 0 0 0 0 0 0 0 0 0 0 0 0 0 0 0 0 12,524,740 1,748,638 1,677,035 0 0 0 0 0 0 0 0 0 0 0 0 0 0 0 0 0 0 0 0 0
24,446,725$ 1,583,961$ 17,348,901$ 1,369,530$ 14,185,060$ 2,098,638$ 1,702,035$
0$ (2,828,475)$ 0$ 0$ 0$ 0$ 0$
77,819,776$ (2,769,943)$ 17,936,356$ 579,755$ 32,265,335$ 5,641,750$ 1,292,655$ (20,322,085) 0 (4,079,975) (182,710) (12,094,167) (2,098,004) (1,486,150)
0 (2,828,475) 0 0 0 0 0 57,497,691$ (5,598,418)$ 13,856,381$ 397,045$ 20,171,168$ 3,543,746$ (193,495)$
Redevelopment Agency (RDA) Funds
2010-11 Budget - Balancing and Fund Balance Summary - By Individual Funds
I - 13
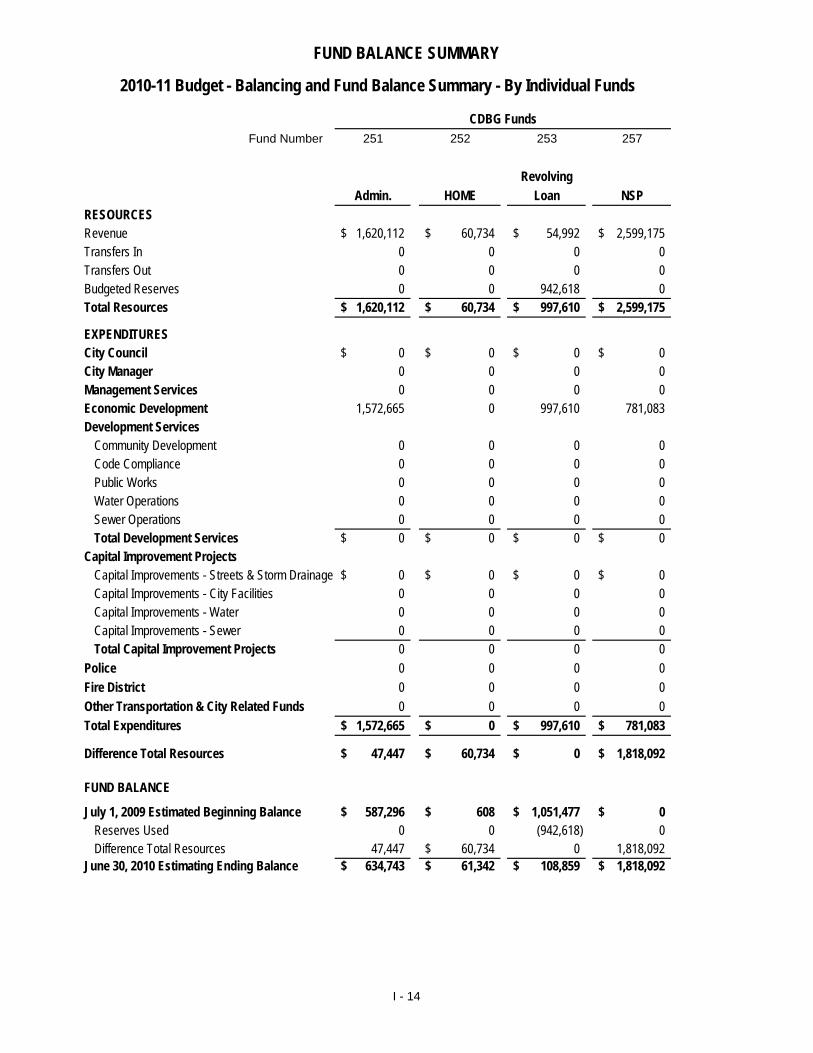
FUND BALANCE SUMMARY
Fund Number 251 252 253 257
RevolvingAdmin. HOME Loan NSP
RESOURCESRevenue 1,620,112$ 60,734$ 54,992$ 2,599,175$ Transfers In 0 0 0 0 Transfers Out 0 0 0 0 Budgeted Reserves 0 0 942,618 0 Total Resources 1,620,112$ 60,734$ 997,610$ 2,599,175$
EXPENDITURESCity Council 0$ 0$ 0$ 0$ City Manager 0 0 0 0 Management Services 0 0 0 0 Economic Development 1,572,665 0 997,610 781,083 Development Services
Community Development 0 0 0 0 Code Compliance 0 0 0 0 Public Works 0 0 0 0 Water Operations 0 0 0 0 Sewer Operations 0 0 0 0 Total Development Services 0$ 0$ 0$ 0$
Capital Improvement ProjectsCapital Improvements - Streets & Storm Drainage 0$ 0$ 0$ 0$ Capital Improvements - City Facilities 0 0 0 0 Capital Improvements - Water 0 0 0 0 Capital Improvements - Sewer 0 0 0 0 Total Capital Improvement Projects 0 0 0 0
Police 0 0 0 0 Fire District 0 0 0 0 Other Transportation & City Related Funds 0 0 0 0 Total Expenditures 1,572,665$ 0$ 997,610$ 781,083$
Difference Total Resources 47,447$ 60,734$ 0$ 1,818,092$
FUND BALANCE
July 1, 2009 Estimated Beginning Balance 587,296$ 608$ 1,051,477$ 0$ Reserves Used 0 0 (942,618) 0 Difference Total Resources 47,447 60,734$ 0 1,818,092
June 30, 2010 Estimating Ending Balance 634,743$ 61,342$ 108,859$ 1,818,092$
CDBG Funds
2010-11 Budget - Balancing and Fund Balance Summary - By Individual Funds
I - 14
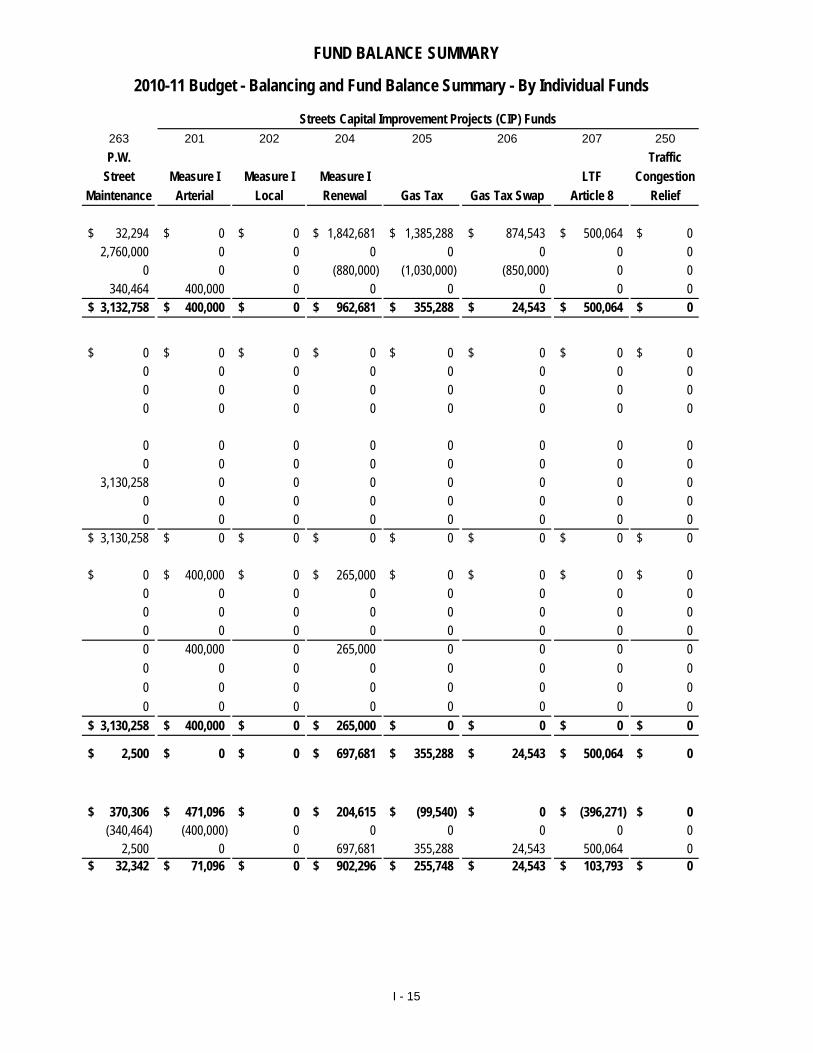
FUND BALANCE SUMMARY
263 201 202 204 205 206 207 250P.W. Traffic
Street Measure I Measure I Measure I LTF CongestionMaintenance Arterial Local Renewal Gas Tax Gas Tax Swap Article 8 Relief
32,294$ 0$ 0$ 1,842,681$ 1,385,288$ 874,543$ 500,064$ 0$ 2,760,000 0 0 0 0 0 0 0
0 0 0 (880,000) (1,030,000) (850,000) 0 0 340,464 400,000 0 0 0 0 0 0
3,132,758$ 400,000$ 0$ 962,681$ 355,288$ 24,543$ 500,064$ 0$
0$ 0$ 0$ 0$ 0$ 0$ 0$ 0$ 0 0 0 0 0 0 0 0 0 0 0 0 0 0 0 0 0 0 0 0 0 0 0 0
0 0 0 0 0 0 0 0 0 0 0 0 0 0 0 0
3,130,258 0 0 0 0 0 0 0 0 0 0 0 0 0 0 0 0 0 0 0 0 0 0 0
3,130,258$ 0$ 0$ 0$ 0$ 0$ 0$ 0$
0$ 400,000$ 0$ 265,000$ 0$ 0$ 0$ 0$ 0 0 0 0 0 0 0 0 0 0 0 0 0 0 0 0 0 0 0 0 0 0 0 0 0 400,000 0 265,000 0 0 0 0 0 0 0 0 0 0 0 0 0 0 0 0 0 0 0 0 0 0 0 0 0 0 0 0
3,130,258$ 400,000$ 0$ 265,000$ 0$ 0$ 0$ 0$
2,500$ 0$ 0$ 697,681$ 355,288$ 24,543$ 500,064$ 0$
370,306$ 471,096$ 0$ 204,615$ (99,540)$ 0$ (396,271)$ 0$ (340,464) (400,000) 0 0 0 0 0 0
2,500 0 0 697,681 355,288 24,543 500,064 0 32,342$ 71,096$ 0$ 902,296$ 255,748$ 24,543$ 103,793$ 0$
Streets Capital Improvement Projects (CIP) Funds
2010-11 Budget - Balancing and Fund Balance Summary - By Individual Funds
I - 15
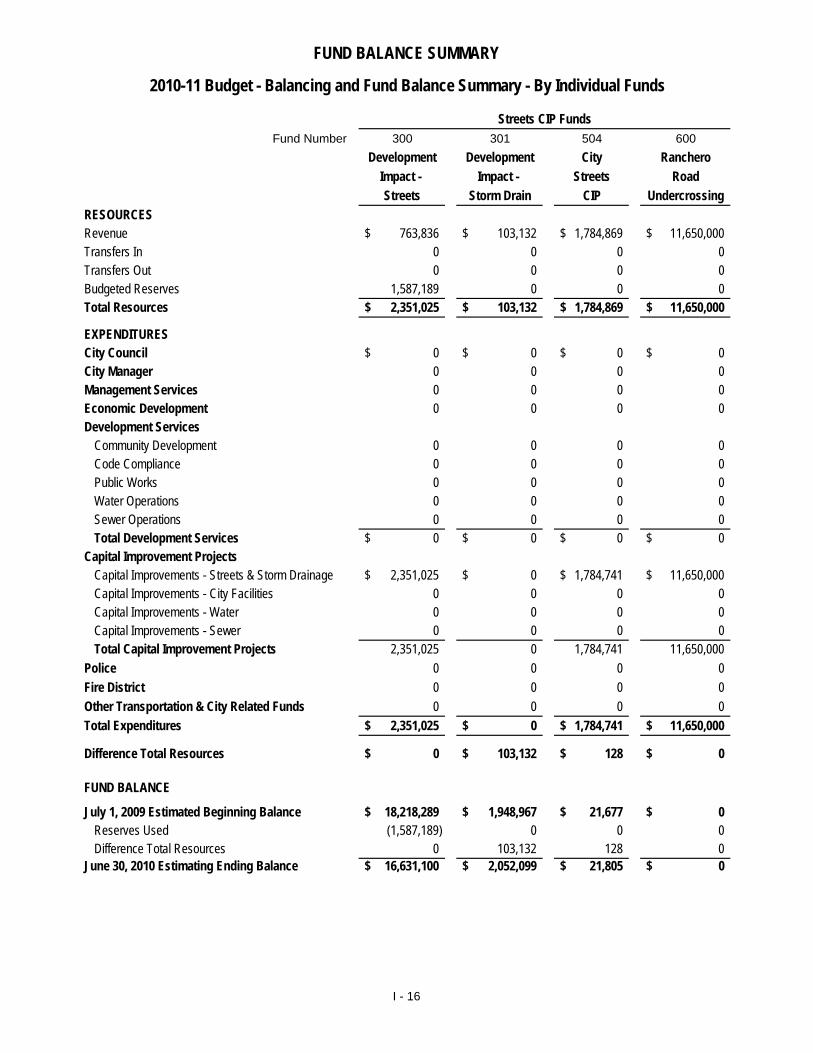
FUND BALANCE SUMMARY
Fund Number 300 301 504 600Development Development City Ranchero
Impact - Impact - Streets RoadStreets Storm Drain CIP Undercrossing
RESOURCESRevenue 763,836$ 103,132$ 1,784,869$ 11,650,000$ Transfers In 0 0 0 0 Transfers Out 0 0 0 0 Budgeted Reserves 1,587,189 0 0 0 Total Resources 2,351,025$ 103,132$ 1,784,869$ 11,650,000$
EXPENDITURESCity Council 0$ 0$ 0$ 0$ City Manager 0 0 0 0 Management Services 0 0 0 0 Economic Development 0 0 0 0 Development Services
Community Development 0 0 0 0 Code Compliance 0 0 0 0 Public Works 0 0 0 0 Water Operations 0 0 0 0 Sewer Operations 0 0 0 0 Total Development Services 0$ 0$ 0$ 0$
Capital Improvement ProjectsCapital Improvements - Streets & Storm Drainage 2,351,025$ 0$ 1,784,741$ 11,650,000$ Capital Improvements - City Facilities 0 0 0 0 Capital Improvements - Water 0 0 0 0 Capital Improvements - Sewer 0 0 0 0 Total Capital Improvement Projects 2,351,025 0 1,784,741 11,650,000
Police 0 0 0 0 Fire District 0 0 0 0 Other Transportation & City Related Funds 0 0 0 0 Total Expenditures 2,351,025$ 0$ 1,784,741$ 11,650,000$
Difference Total Resources 0$ 103,132$ 128$ 0$
FUND BALANCE
July 1, 2009 Estimated Beginning Balance 18,218,289$ 1,948,967$ 21,677$ 0$ Reserves Used (1,587,189) 0 0 0 Difference Total Resources 0 103,132 128 0
June 30, 2010 Estimating Ending Balance 16,631,100$ 2,052,099$ 21,805$ 0$
Streets CIP Funds
2010-11 Budget - Balancing and Fund Balance Summary - By Individual Funds
I - 16
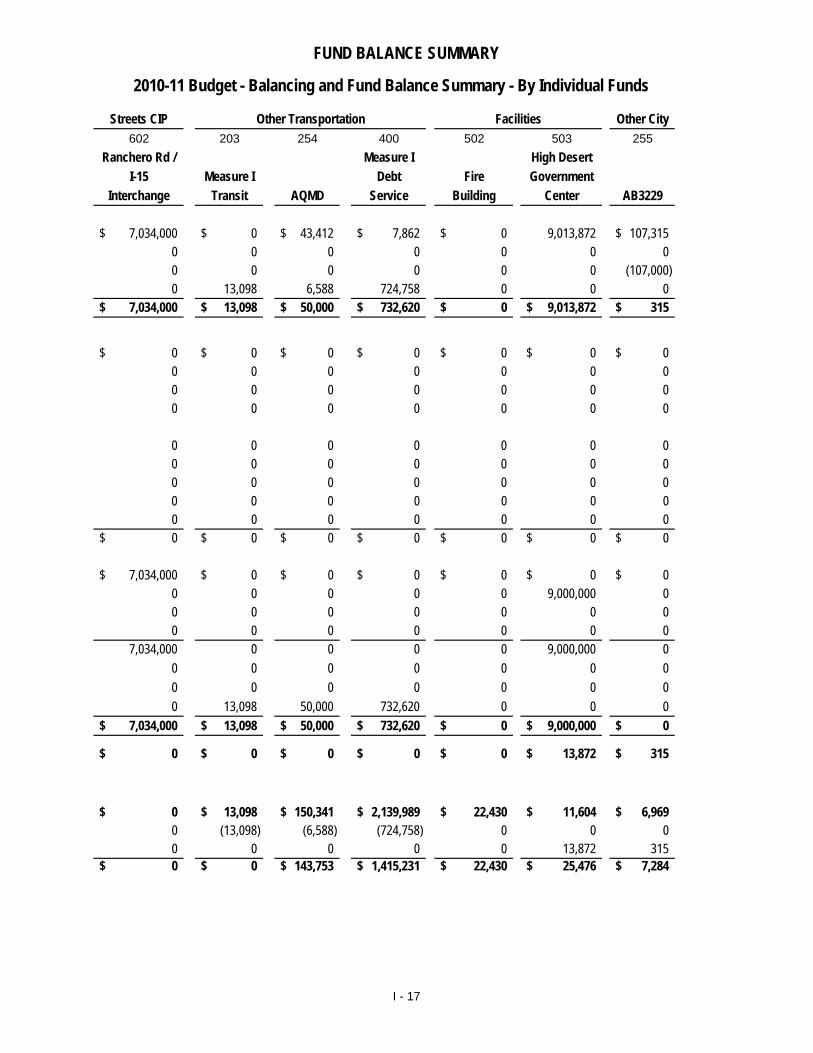
FUND BALANCE SUMMARY
Streets CIP Other City602 203 254 400 502 503 255
Ranchero Rd / Measure I High DesertI-15 Measure I Debt Fire Government
Interchange Transit AQMD Service Building Center AB3229
7,034,000$ 0$ 43,412$ 7,862$ 0$ 9,013,872 107,315$ 0 0 0 0 0 0 0 0 0 0 0 0 0 (107,000) 0 13,098 6,588 724,758 0 0 0
7,034,000$ 13,098$ 50,000$ 732,620$ 0$ 9,013,872$ 315$
0$ 0$ 0$ 0$ 0$ 0$ 0$ 0 0 0 0 0 0 0 0 0 0 0 0 0 0 0 0 0 0 0 0 0
0 0 0 0 0 0 0 0 0 0 0 0 0 0 0 0 0 0 0 0 0 0 0 0 0 0 0 0 0 0 0 0 0 0 0 0$ 0$ 0$ 0$ 0$ 0$ 0$
7,034,000$ 0$ 0$ 0$ 0$ 0$ 0$ 0 0 0 0 0 9,000,000 0 0 0 0 0 0 0 0 0 0 0 0 0 0 0
7,034,000 0 0 0 0 9,000,000 0 0 0 0 0 0 0 0 0 0 0 0 0 0 0 0 13,098 50,000 732,620 0 0 0
7,034,000$ 13,098$ 50,000$ 732,620$ 0$ 9,000,000$ 0$
0$ 0$ 0$ 0$ 0$ 13,872$ 315$
0$ 13,098$ 150,341$ 2,139,989$ 22,430$ 11,604$ 6,969$ 0 (13,098) (6,588) (724,758) 0 0 0 0 0 0 0 0 13,872 315 0$ 0$ 143,753$ 1,415,231$ 22,430$ 25,476$ 7,284$
FacilitiesOther Transportation
2010-11 Budget - Balancing and Fund Balance Summary - By Individual Funds
I - 17
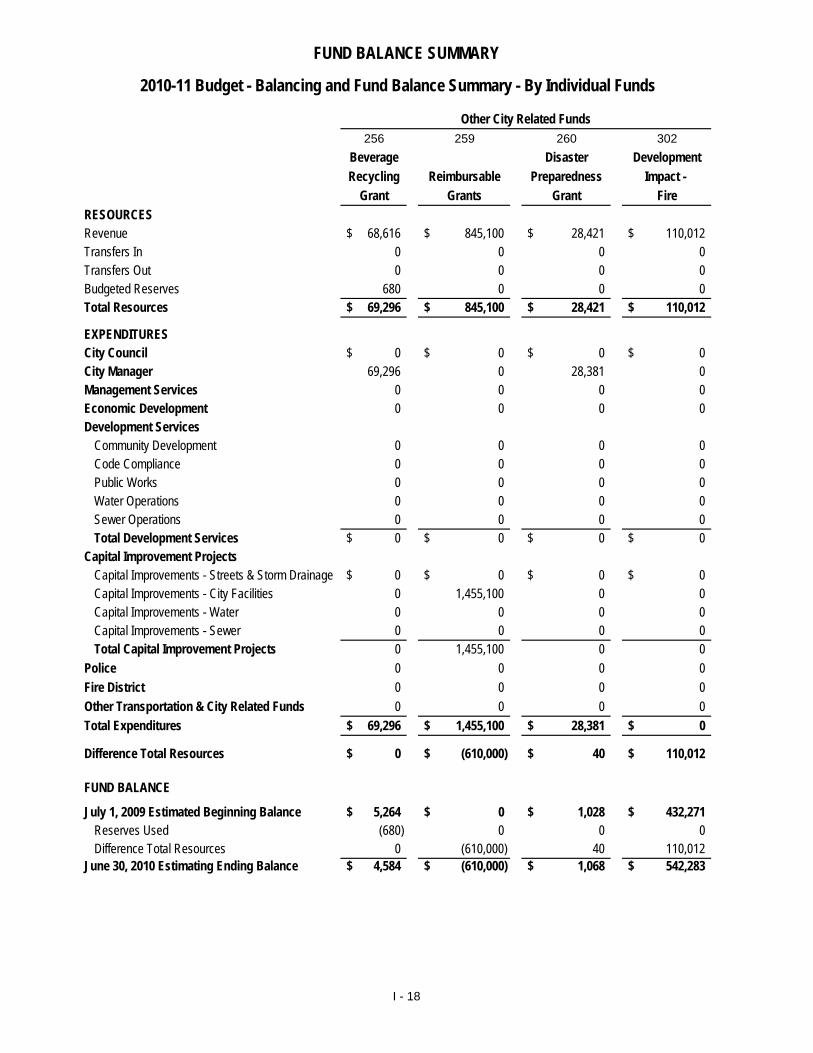
FUND BALANCE SUMMARY
256 259 260 302Beverage Disaster DevelopmentRecycling Reimbursable Preparedness Impact -
Grant Grants Grant FireRESOURCESRevenue 68,616$ 845,100$ 28,421$ 110,012$ Transfers In 0 0 0 0 Transfers Out 0 0 0 0 Budgeted Reserves 680 0 0 0 Total Resources 69,296$ 845,100$ 28,421$ 110,012$
EXPENDITURESCity Council 0$ 0$ 0$ 0$ City Manager 69,296 0 28,381 0 Management Services 0 0 0 0 Economic Development 0 0 0 0 Development Services
Community Development 0 0 0 0 Code Compliance 0 0 0 0 Public Works 0 0 0 0 Water Operations 0 0 0 0 Sewer Operations 0 0 0 0 Total Development Services 0$ 0$ 0$ 0$
Capital Improvement ProjectsCapital Improvements - Streets & Storm Drainage 0$ 0$ 0$ 0$ Capital Improvements - City Facilities 0 1,455,100 0 0 Capital Improvements - Water 0 0 0 0 Capital Improvements - Sewer 0 0 0 0 Total Capital Improvement Projects 0 1,455,100 0 0
Police 0 0 0 0 Fire District 0 0 0 0 Other Transportation & City Related Funds 0 0 0 0 Total Expenditures 69,296$ 1,455,100$ 28,381$ 0$
Difference Total Resources 0$ (610,000)$ 40$ 110,012$
FUND BALANCE
July 1, 2009 Estimated Beginning Balance 5,264$ 0$ 1,028$ 432,271$ Reserves Used (680) 0 0 0 Difference Total Resources 0 (610,000) 40 110,012
June 30, 2010 Estimating Ending Balance 4,584$ (610,000)$ 1,068$ 542,283$
Other City Related Funds
2010-11 Budget - Balancing and Fund Balance Summary - By Individual Funds
I - 18
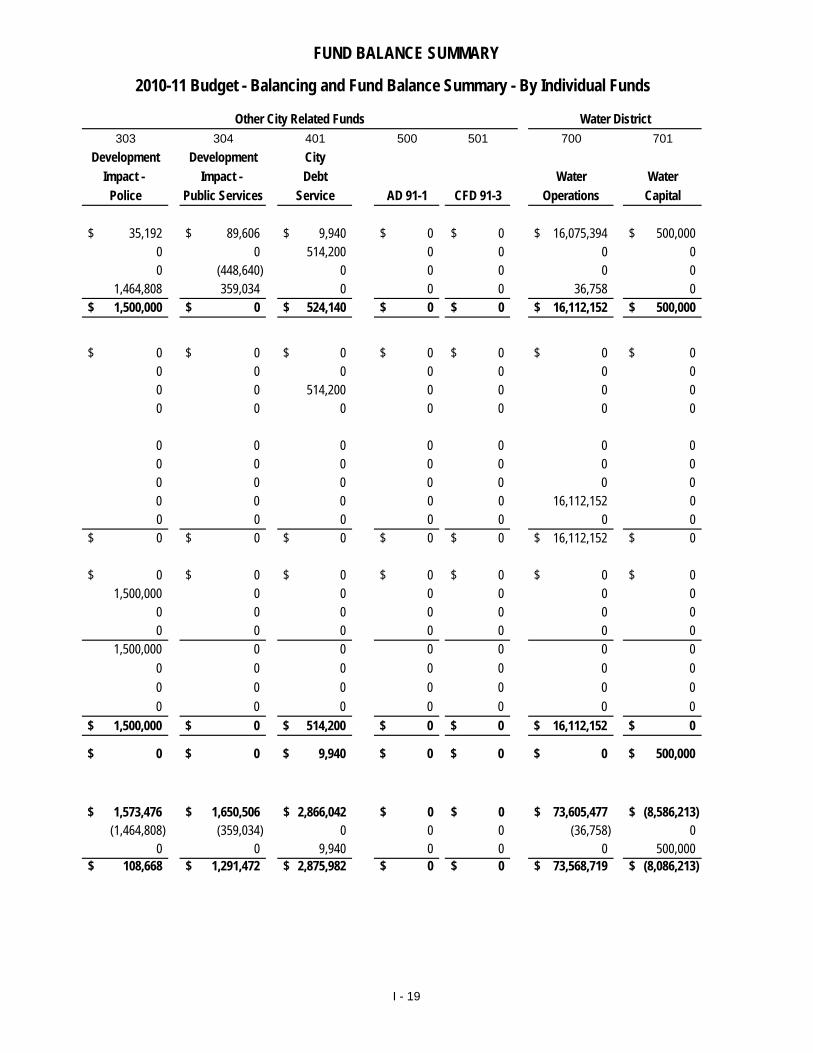
FUND BALANCE SUMMARY
303 304 401 500 501 700 701Development Development City
Impact - Impact - Debt Water WaterPolice Public Services Service AD 91-1 CFD 91-3 Operations Capital
35,192$ 89,606$ 9,940$ 0$ 0$ 16,075,394$ 500,000$ 0 0 514,200 0 0 0 0 0 (448,640) 0 0 0 0 0
1,464,808 359,034 0 0 0 36,758 0 1,500,000$ 0$ 524,140$ 0$ 0$ 16,112,152$ 500,000$
0$ 0$ 0$ 0$ 0$ 0$ 0$ 0 0 0 0 0 0 0 0 0 514,200 0 0 0 0 0 0 0 0 0 0 0
0 0 0 0 0 0 0 0 0 0 0 0 0 0 0 0 0 0 0 0 0 0 0 0 0 0 16,112,152 0 0 0 0 0 0 0 0 0$ 0$ 0$ 0$ 0$ 16,112,152$ 0$
0$ 0$ 0$ 0$ 0$ 0$ 0$ 1,500,000 0 0 0 0 0 0
0 0 0 0 0 0 0 0 0 0 0 0 0 0
1,500,000 0 0 0 0 0 0 0 0 0 0 0 0 0 0 0 0 0 0 0 0 0 0 0 0 0 0 0
1,500,000$ 0$ 514,200$ 0$ 0$ 16,112,152$ 0$
0$ 0$ 9,940$ 0$ 0$ 0$ 500,000$
1,573,476$ 1,650,506$ 2,866,042$ 0$ 0$ 73,605,477$ (8,586,213)$ (1,464,808) (359,034) 0 0 0 (36,758) 0
0 0 9,940 0 0 0 500,000 108,668$ 1,291,472$ 2,875,982$ 0$ 0$ 73,568,719$ (8,086,213)$
Other City Related Funds Water District
2010-11 Budget - Balancing and Fund Balance Summary - By Individual Funds
I - 19
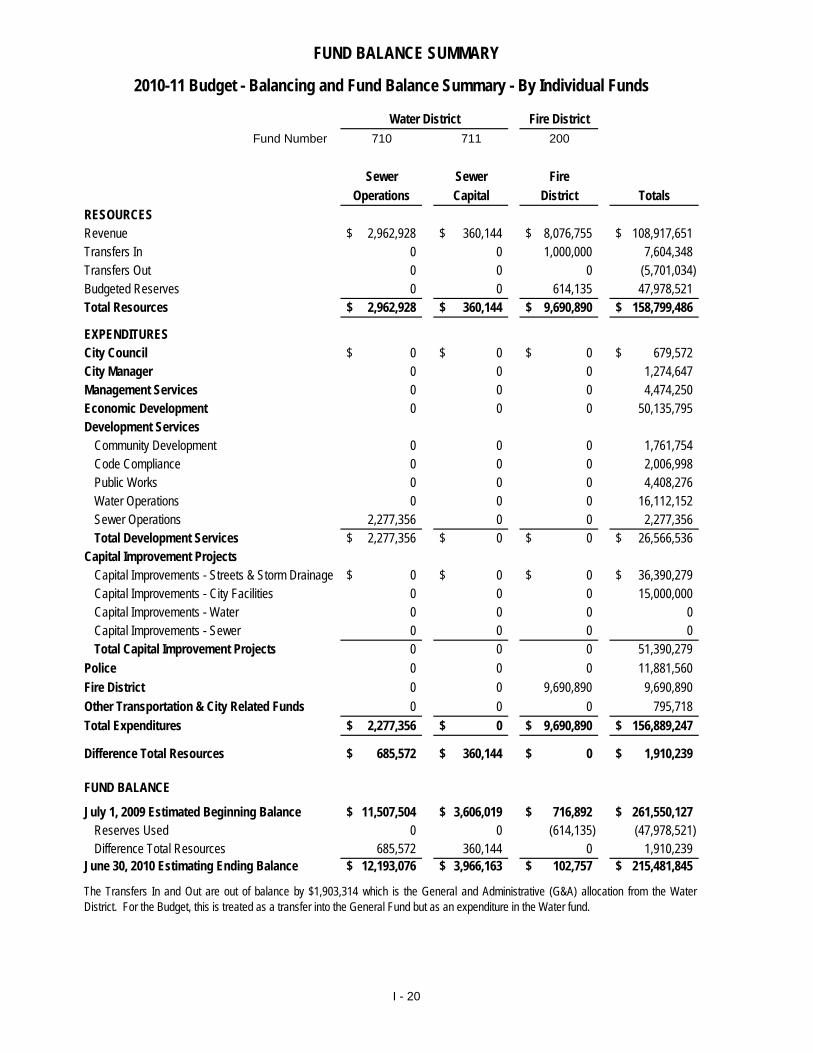
FUND BALANCE SUMMARY
Fire DistrictFund Number 710 711 200
Sewer Sewer FireOperations Capital District Totals
RESOURCESRevenue 2,962,928$ 360,144$ 8,076,755$ 108,917,651$ Transfers In 0 0 1,000,000 7,604,348 Transfers Out 0 0 0 (5,701,034) Budgeted Reserves 0 0 614,135 47,978,521 Total Resources 2,962,928$ 360,144$ 9,690,890$ 158,799,486$
EXPENDITURESCity Council 0$ 0$ 0$ 679,572$ City Manager 0 0 0 1,274,647 Management Services 0 0 0 4,474,250 Economic Development 0 0 0 50,135,795 Development Services
Community Development 0 0 0 1,761,754 Code Compliance 0 0 0 2,006,998 Public Works 0 0 0 4,408,276 Water Operations 0 0 0 16,112,152 Sewer Operations 2,277,356 0 0 2,277,356 Total Development Services 2,277,356$ 0$ 0$ 26,566,536$
Capital Improvement ProjectsCapital Improvements - Streets & Storm Drainage 0$ 0$ 0$ 36,390,279$ Capital Improvements - City Facilities 0 0 0 15,000,000 Capital Improvements - Water 0 0 0 0 Capital Improvements - Sewer 0 0 0 0 Total Capital Improvement Projects 0 0 0 51,390,279
Police 0 0 0 11,881,560 Fire District 0 0 9,690,890 9,690,890 Other Transportation & City Related Funds 0 0 0 795,718 Total Expenditures 2,277,356$ 0$ 9,690,890$ 156,889,247$
Difference Total Resources 685,572$ 360,144$ 0$ 1,910,239$
FUND BALANCE
July 1, 2009 Estimated Beginning Balance 11,507,504$ 3,606,019$ 716,892$ 261,550,127$ Reserves Used 0 0 (614,135) (47,978,521) Difference Total Resources 685,572 360,144 0 1,910,239
June 30, 2010 Estimating Ending Balance 12,193,076$ 3,966,163$ 102,757$ 215,481,845$
The Transfers In and Out are out of balance by $1,903,314 which is the General and Administrative (G&A) allocation from the WaterDistrict. For the Budget, this is treated as a transfer into the General Fund but as an expenditure in the Water fund.
2010-11 Budget - Balancing and Fund Balance Summary - By Individual Funds
Water District
I - 20
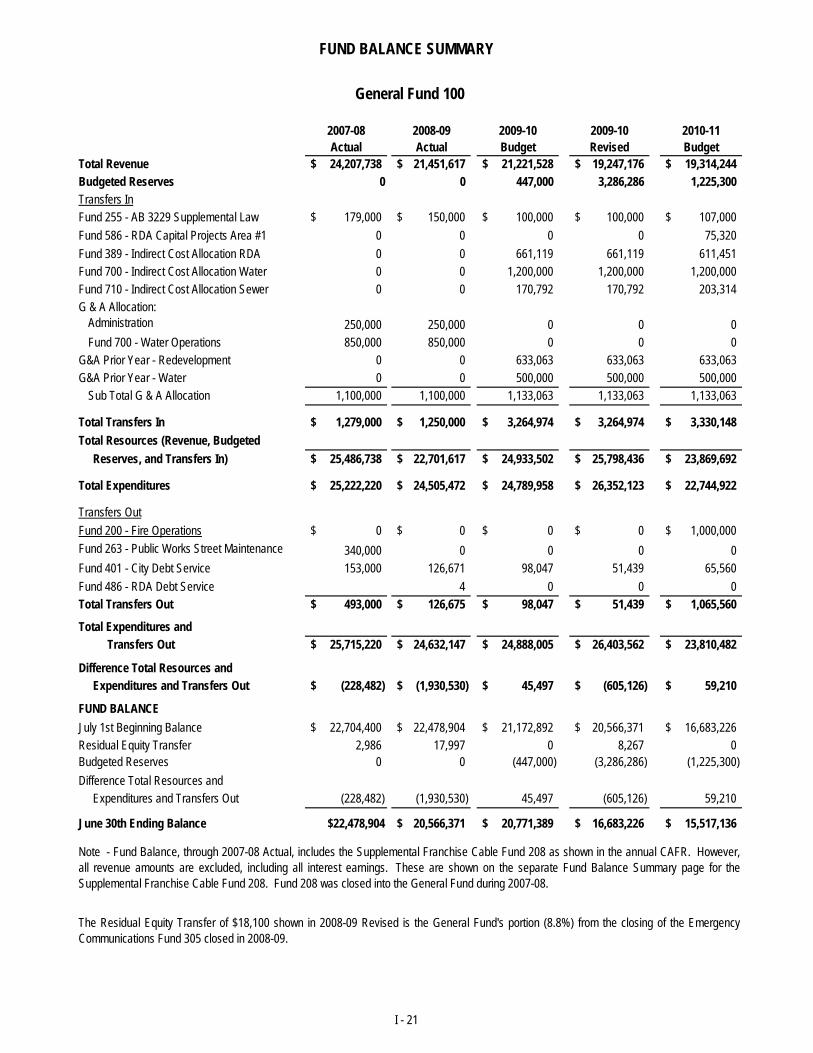
FUND BALANCE SUMMARY
2007-08 2008-09 2009-10 2009-10 2010-11Actual Actual Budget Revised Budget
Total Revenue 24,207,738$ 21,451,617$ 21,221,528$ 19,247,176$ 19,314,244$ Budgeted Reserves 0 0 447,000 3,286,286 1,225,300Transfers InFund 255 - AB 3229 Supplemental Law 179,000$ 150,000$ 100,000$ 100,000$ 107,000$ Fund 586 - RDA Capital Projects Area #1 0 0 0 0 75,320Fund 389 - Indirect Cost Allocation RDA 0 0 661,119 661,119 611,451Fund 700 - Indirect Cost Allocation Water 0 0 1,200,000 1,200,000 1,200,000Fund 710 - Indirect Cost Allocation Sewer 0 0 170,792 170,792 203,314G & A Allocation:
Administration 250,000 250,000 0 0 0Fund 700 - Water Operations 850,000 850,000 0 0 0
G&A Prior Year - Redevelopment 0 0 633,063 633,063 633,063G&A Prior Year - Water 0 0 500,000 500,000 500,000
Sub Total G & A Allocation 1,100,000 1,100,000 1,133,063 1,133,063 1,133,063
Total Transfers In 1,279,000$ 1,250,000$ 3,264,974$ 3,264,974$ 3,330,148$ Total Resources (Revenue, Budgeted Reserves, and Transfers In) 25,486,738$ 22,701,617$ 24,933,502$ 25,798,436$ 23,869,692$
Total Expenditures 25,222,220$ 24,505,472$ 24,789,958$ 26,352,123$ 22,744,922$
Transfers OutFund 200 - Fire Operations 0$ 0$ 0$ 0$ 1,000,000$ Fund 263 - Public Works Street Maintenance 340,000 0 0 0 0Fund 401 - City Debt Service 153,000 126,671 98,047 51,439 65,560
General Fund 100
yFund 486 - RDA Debt Service 4 0 0 0Total Transfers Out 493,000$ 126,675$ 98,047$ 51,439$ 1,065,560$
Total Expenditures and Transfers Out 25,715,220$ 24,632,147$ 24,888,005$ 26,403,562$ 23,810,482$
Difference Total Resources and Expenditures and Transfers Out (228,482)$ (1,930,530)$ 45,497$ (605,126)$ 59,210$
FUND BALANCEJuly 1st Beginning Balance 22,704,400$ 22,478,904$ 21,172,892$ 20,566,371$ 16,683,226$ Residual Equity Transfer 2,986 17,997 0 8,267 0Budgeted Reserves 0 0 (447,000) (3,286,286) (1,225,300)Difference Total Resources and Expenditures and Transfers Out (228,482) (1,930,530) 45,497 (605,126) 59,210
June 30th Ending Balance $22,478,904 20,566,371$ 20,771,389$ 16,683,226$ 15,517,136$
Note - Fund Balance, through 2007-08 Actual, includes the Supplemental Franchise Cable Fund 208 as shown in the annual CAFR. However,all revenue amounts are excluded, including all interest earnings. These are shown on the separate Fund Balance Summary page for theSupplemental Franchise Cable Fund 208. Fund 208 was closed into the General Fund during 2007-08.
The Residual Equity Transfer of $18,100 shown in 2008-09 Revised is the General Fund's portion (8.8%) from the closing of the EmergencyCommunications Fund 305 closed in 2008-09.
I - 21
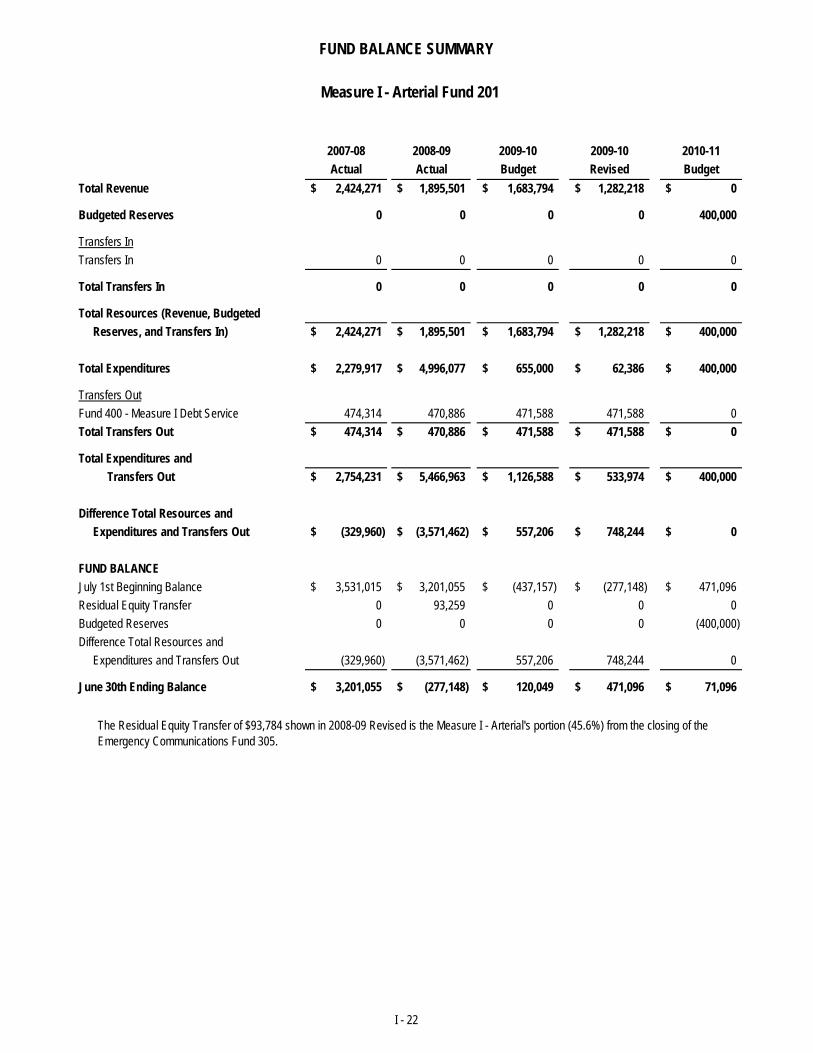
FUND BALANCE SUMMARY
2007-08 2008-09 2009-10 2009-10 2010-11Actual Actual Budget Revised Budget
Total Revenue 2,424,271$ 1,895,501$ 1,683,794$ 1,282,218$ 0$
Budgeted Reserves 0 0 0 0 400,000
Transfers InTransfers In 0 0 0 0 0
Total Transfers In 0 0 0 0 0
Total Resources (Revenue, Budgeted Reserves, and Transfers In) 2,424,271$ 1,895,501$ 1,683,794$ 1,282,218$ 400,000$
Total Expenditures 2,279,917$ 4,996,077$ 655,000$ 62,386$ 400,000$
Transfers OutFund 400 - Measure I Debt Service 474,314 470,886 471,588 471,588 0Total Transfers Out 474,314$ 470,886$ 471,588$ 471,588$ 0$
Total Expenditures and Transfers Out 2,754,231$ 5,466,963$ 1,126,588$ 533,974$ 400,000$
Difference Total Resources and Expenditures and Transfers Out (329,960)$ (3,571,462)$ 557,206$ 748,244$ 0$
FUND BALANCE
Measure I - Arterial Fund 201
July 1st Beginning Balance 3,531,015$ 3,201,055$ (437,157)$ (277,148)$ 471,096$ Residual Equity Transfer 0 93,259 0 0 0Budgeted Reserves 0 0 0 0 (400,000)Difference Total Resources and Expenditures and Transfers Out (329,960) (3,571,462) 557,206 748,244 0
June 30th Ending Balance 3,201,055$ (277,148)$ 120,049$ 471,096$ 71,096$
The Residual Equity Transfer of $93,784 shown in 2008-09 Revised is the Measure I - Arterial's portion (45.6%) from the closing of the Emergency Communications Fund 305.
I - 22
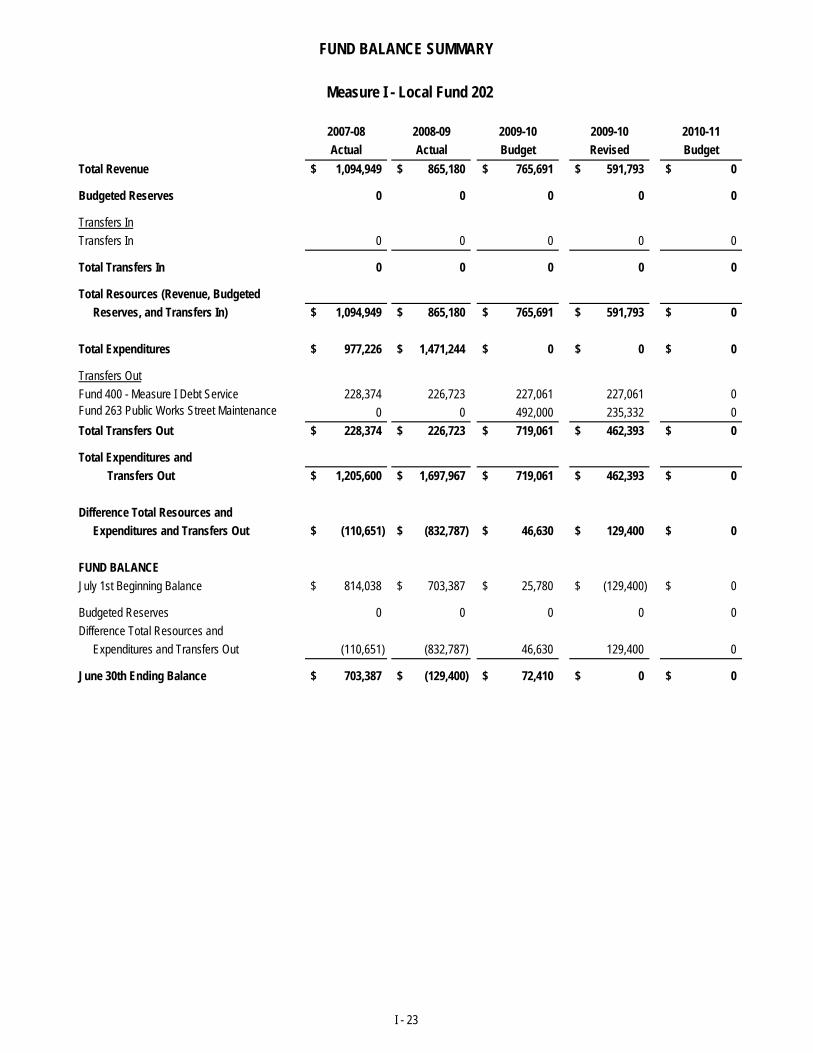
FUND BALANCE SUMMARY
2007-08 2008-09 2009-10 2009-10 2010-11Actual Actual Budget Revised Budget
Total Revenue 1,094,949$ 865,180$ 765,691$ 591,793$ 0$
Budgeted Reserves 0 0 0 0 0
Transfers InTransfers In 0 0 0 0 0
Total Transfers In 0 0 0 0 0
Total Resources (Revenue, Budgeted Reserves, and Transfers In) 1,094,949$ 865,180$ 765,691$ 591,793$ 0$
Total Expenditures 977,226$ 1,471,244$ 0$ 0$ 0$
Transfers OutFund 400 - Measure I Debt Service 228,374 226,723 227,061 227,061 0Fund 263 Public Works Street Maintenance 0 0 492,000 235,332 0Total Transfers Out 228,374$ 226,723$ 719,061$ 462,393$ 0$
Total Expenditures and Transfers Out 1,205,600$ 1,697,967$ 719,061$ 462,393$ 0$
Difference Total Resources and Expenditures and Transfers Out (110,651)$ (832,787)$ 46,630$ 129,400$ 0$
FUND BALANCE
Measure I - Local Fund 202
July 1st Beginning Balance 814,038$ 703,387$ 25,780$ (129,400)$ 0$
Budgeted Reserves 0 0 0 0 0Difference Total Resources and Expenditures and Transfers Out (110,651) (832,787) 46,630 129,400 0
June 30th Ending Balance 703,387$ (129,400)$ 72,410$ 0$ 0$
I - 23
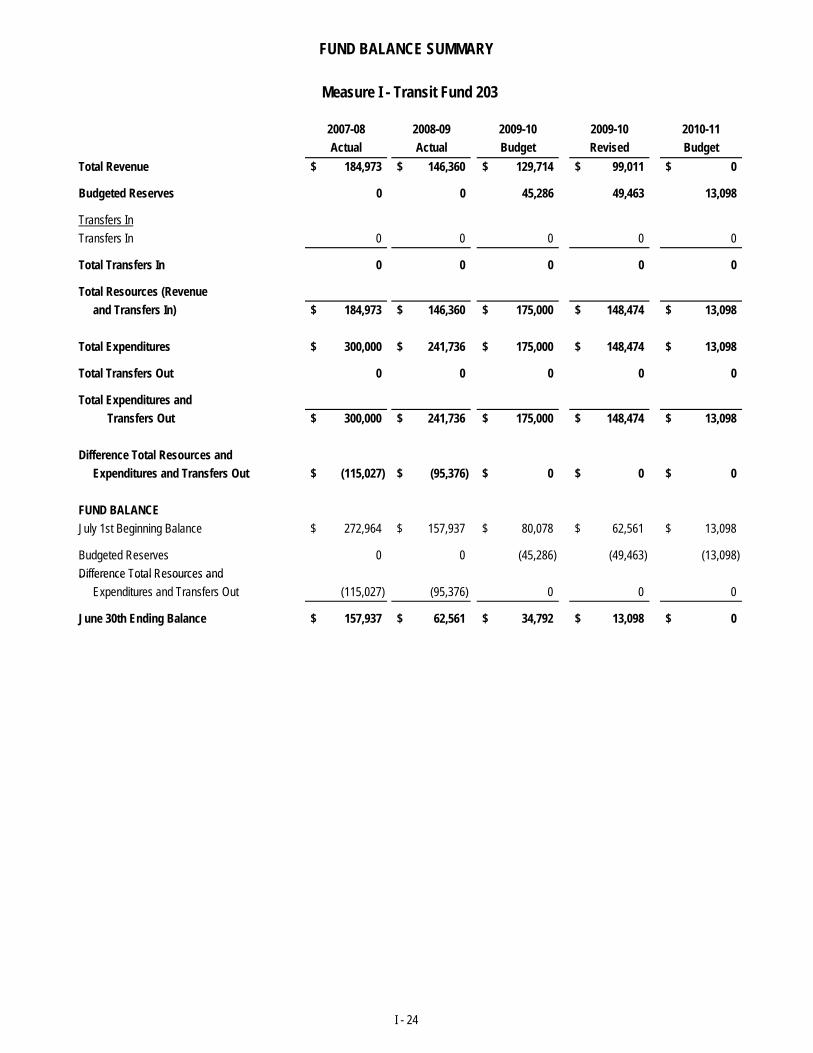
FUND BALANCE SUMMARY
2007-08 2008-09 2009-10 2009-10 2010-11Actual Actual Budget Revised Budget
Total Revenue 184,973$ 146,360$ 129,714$ 99,011$ 0$
Budgeted Reserves 0 0 45,286 49,463 13,098
Transfers InTransfers In 0 0 0 0 0
Total Transfers In 0 0 0 0 0
Total Resources (Revenue and Transfers In) 184,973$ 146,360$ 175,000$ 148,474$ 13,098$
Total Expenditures 300,000$ 241,736$ 175,000$ 148,474$ 13,098$
Total Transfers Out 0 0 0 0 0
Total Expenditures and Transfers Out 300,000$ 241,736$ 175,000$ 148,474$ 13,098$
Difference Total Resources and Expenditures and Transfers Out (115,027)$ (95,376)$ 0$ 0$ 0$
FUND BALANCEJuly 1st Beginning Balance 272,964$ 157,937$ 80,078$ 62,561$ 13,098$
Budgeted Reserves 0 0 (45,286) (49,463) (13,098)Difference Total Resources and
Measure I - Transit Fund 203
Difference Total Resources and Expenditures and Transfers Out (115,027) (95,376) 0 0 0
June 30th Ending Balance 157,937$ 62,561$ 34,792$ 13,098$ 0$
I - 24
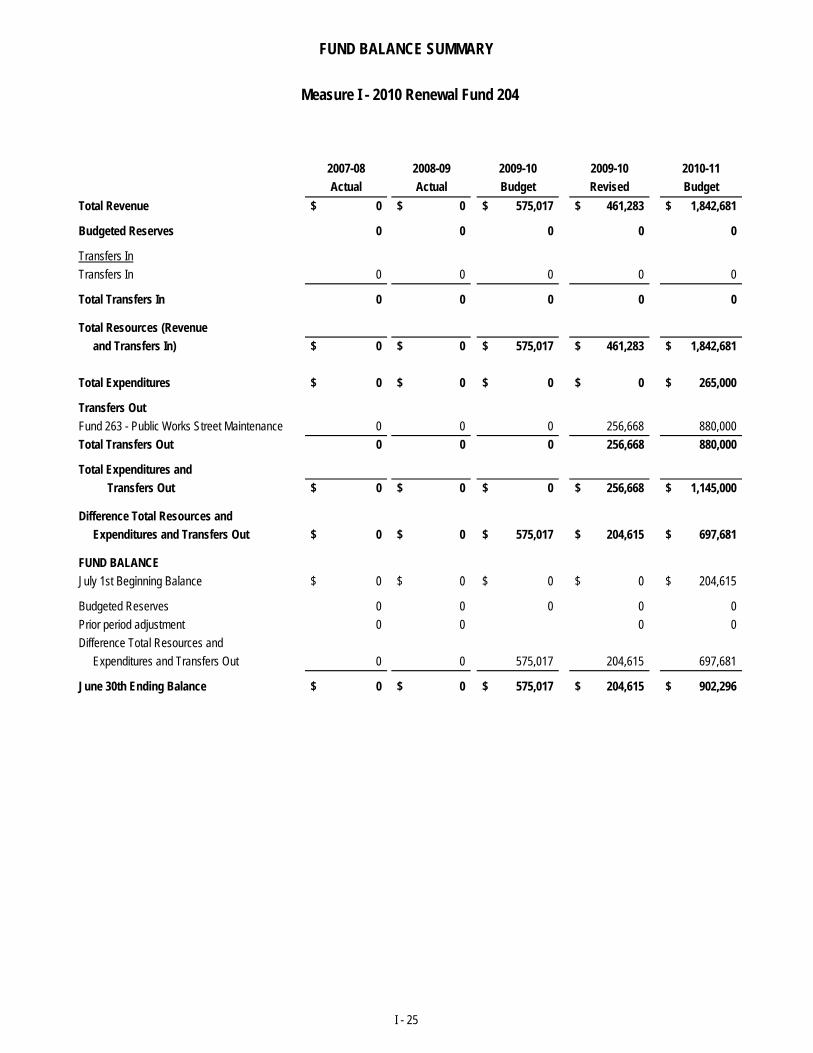
FUND BALANCE SUMMARY
2007-08 2008-09 2009-10 2009-10 2010-11Actual Actual Budget Revised Budget
Total Revenue 0$ 0$ 575,017$ 461,283$ 1,842,681$
Budgeted Reserves 0 0 0 0 0
Transfers InTransfers In 0 0 0 0 0
Total Transfers In 0 0 0 0 0
Total Resources (Revenue and Transfers In) 0$ 0$ 575,017$ 461,283$ 1,842,681$
Total Expenditures 0$ 0$ 0$ 0$ 265,000$
Transfers OutFund 263 - Public Works Street Maintenance 0 0 0 256,668 880,000Total Transfers Out 0 0 0 256,668 880,000
Total Expenditures and Transfers Out 0$ 0$ 0$ 256,668$ 1,145,000$
Difference Total Resources and Expenditures and Transfers Out 0$ 0$ 575,017$ 204,615$ 697,681$
FUND BALANCEJ l 1 t B i i B l 0$ 0$ 0$ 0$ 204 615$
Measure I - 2010 Renewal Fund 204
July 1st Beginning Balance 0$ 0$ 0$ 0$ 204,615$
Budgeted Reserves 0 0 0 0 0Prior period adjustment 0 0 0 0Difference Total Resources and Expenditures and Transfers Out 0 0 575,017 204,615 697,681
June 30th Ending Balance 0$ 0$ 575,017$ 204,615$ 902,296$
I - 25
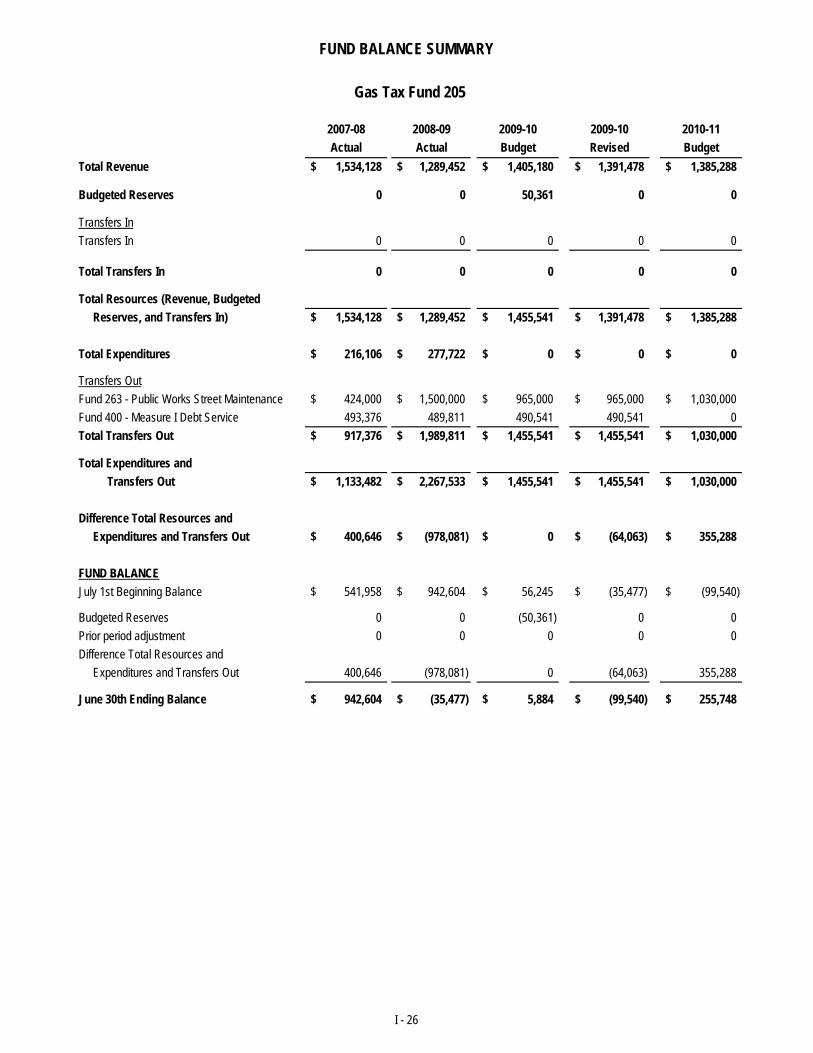
FUND BALANCE SUMMARY
2007-08 2008-09 2009-10 2009-10 2010-11Actual Actual Budget Revised Budget
Total Revenue 1,534,128$ 1,289,452$ 1,405,180$ 1,391,478$ 1,385,288$
Budgeted Reserves 0 0 50,361 0 0
Transfers InTransfers In 0 0 0 0 0
Total Transfers In 0 0 0 0 0
Total Resources (Revenue, Budgeted Reserves, and Transfers In) 1,534,128$ 1,289,452$ 1,455,541$ 1,391,478$ 1,385,288$
Total Expenditures 216,106$ 277,722$ 0$ 0$ 0$
Transfers OutFund 263 - Public Works Street Maintenance 424,000$ 1,500,000$ 965,000$ 965,000$ 1,030,000$ Fund 400 - Measure I Debt Service 493,376 489,811 490,541 490,541 0Total Transfers Out 917,376$ 1,989,811$ 1,455,541$ 1,455,541$ 1,030,000$
Total Expenditures and Transfers Out 1,133,482$ 2,267,533$ 1,455,541$ 1,455,541$ 1,030,000$
Difference Total Resources and Expenditures and Transfers Out 400,646$ (978,081)$ 0$ (64,063)$ 355,288$
FUND BALANCE
Gas Tax Fund 205
FUND BALANCEJuly 1st Beginning Balance 541,958$ 942,604$ 56,245$ (35,477)$ (99,540)$
Budgeted Reserves 0 0 (50,361) 0 0Prior period adjustment 0 0 0 0 0Difference Total Resources and Expenditures and Transfers Out 400,646 (978,081) 0 (64,063) 355,288
June 30th Ending Balance 942,604$ (35,477)$ 5,884$ (99,540)$ 255,748$
I - 26
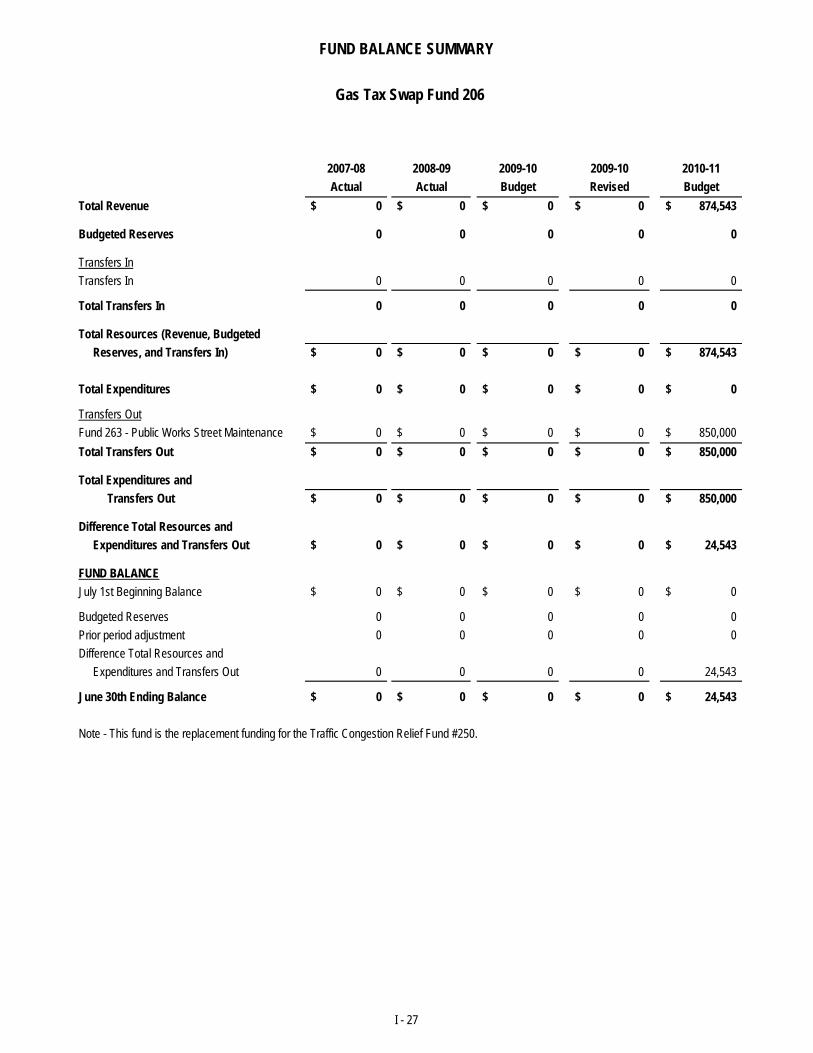
FUND BALANCE SUMMARY
2007-08 2008-09 2009-10 2009-10 2010-11Actual Actual Budget Revised Budget
Total Revenue 0$ 0$ 0$ 0$ 874,543$
Budgeted Reserves 0 0 0 0 0
Transfers InTransfers In 0 0 0 0 0
Total Transfers In 0 0 0 0 0
Total Resources (Revenue, Budgeted Reserves, and Transfers In) 0$ 0$ 0$ 0$ 874,543$
Total Expenditures 0$ 0$ 0$ 0$ 0$
Transfers OutFund 263 - Public Works Street Maintenance 0$ 0$ 0$ 0$ 850,000$ Total Transfers Out 0$ 0$ 0$ 0$ 850,000$
Total Expenditures and Transfers Out 0$ 0$ 0$ 0$ 850,000$
Difference Total Resources and Expenditures and Transfers Out 0$ 0$ 0$ 0$ 24,543$
FUND BALANCE
Gas Tax Swap Fund 206
FUND BALANCEJuly 1st Beginning Balance 0$ 0$ 0$ 0$ 0$
Budgeted Reserves 0 0 0 0 0Prior period adjustment 0 0 0 0 0Difference Total Resources and Expenditures and Transfers Out 0 0 0 0 24,543
June 30th Ending Balance 0$ 0$ 0$ 0$ 24,543$
Note - This fund is the replacement funding for the Traffic Congestion Relief Fund #250.
I - 27
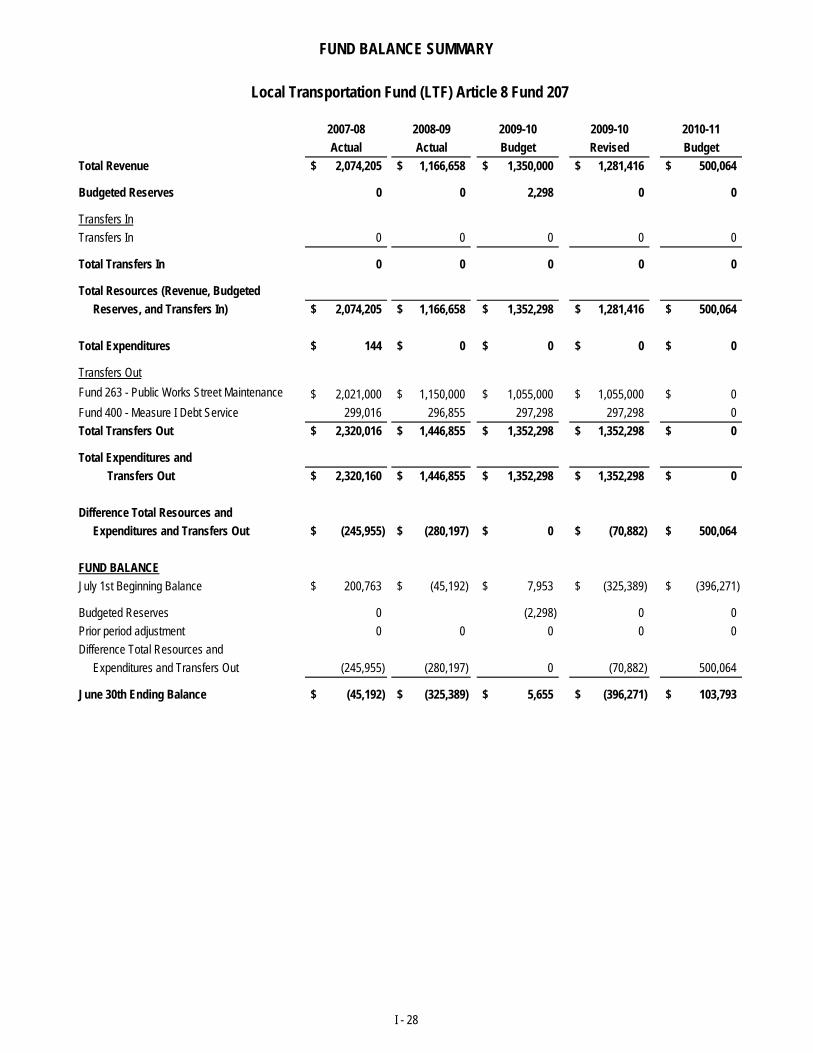
FUND BALANCE SUMMARY
2007-08 2008-09 2009-10 2009-10 2010-11Actual Actual Budget Revised Budget
Total Revenue 2,074,205$ 1,166,658$ 1,350,000$ 1,281,416$ 500,064$
Budgeted Reserves 0 0 2,298 0 0
Transfers InTransfers In 0 0 0 0 0
Total Transfers In 0 0 0 0 0
Total Resources (Revenue, Budgeted Reserves, and Transfers In) 2,074,205$ 1,166,658$ 1,352,298$ 1,281,416$ 500,064$
Total Expenditures 144$ 0$ 0$ 0$ 0$
Transfers OutFund 263 - Public Works Street Maintenance 2,021,000$ 1,150,000$ 1,055,000$ 1,055,000$ 0$ Fund 400 - Measure I Debt Service 299,016 296,855 297,298 297,298 0Total Transfers Out 2,320,016$ 1,446,855$ 1,352,298$ 1,352,298$ 0$
Total Expenditures and Transfers Out 2,320,160$ 1,446,855$ 1,352,298$ 1,352,298$ 0$
Difference Total Resources and Expenditures and Transfers Out (245,955)$ (280,197)$ 0$ (70,882)$ 500,064$
FUND BALANCE
Local Transportation Fund (LTF) Article 8 Fund 207
July 1st Beginning Balance 200,763$ (45,192)$ 7,953$ (325,389)$ (396,271)$
Budgeted Reserves 0 (2,298) 0 0Prior period adjustment 0 0 0 0 0Difference Total Resources and Expenditures and Transfers Out (245,955) (280,197) 0 (70,882) 500,064
June 30th Ending Balance (45,192)$ (325,389)$ 5,655$ (396,271)$ 103,793$
I - 28
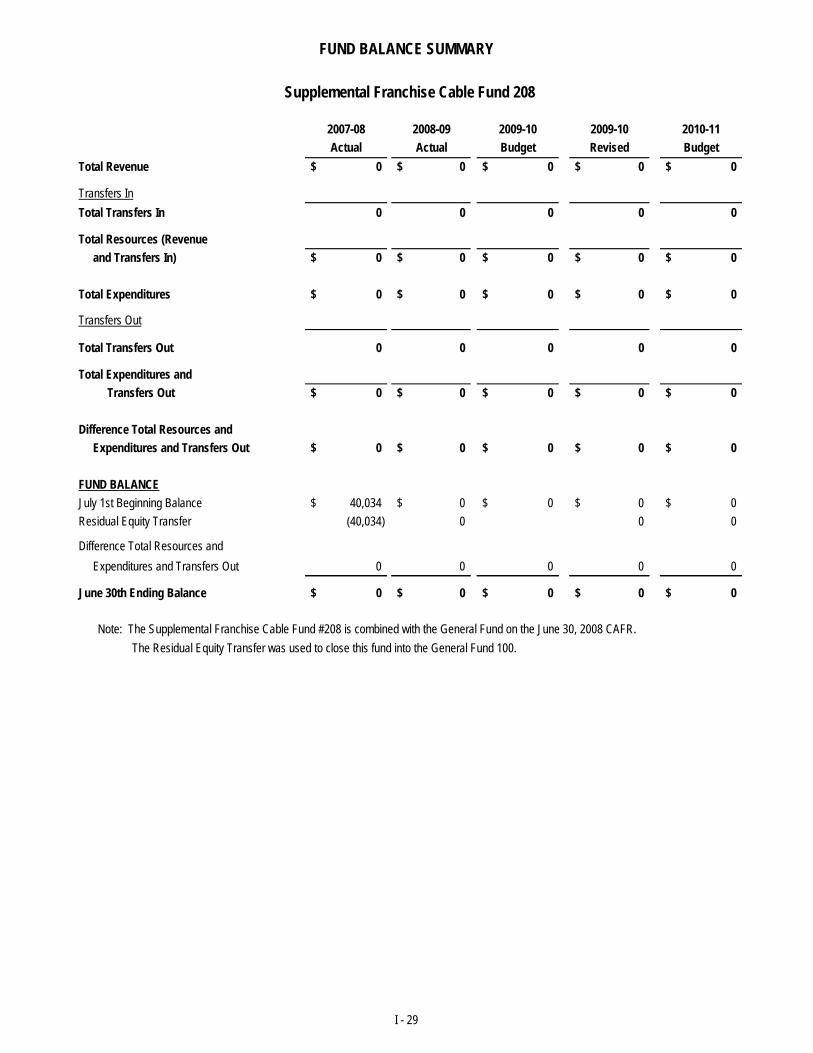
FUND BALANCE SUMMARY
2007-08 2008-09 2009-10 2009-10 2010-11Actual Actual Budget Revised Budget
Total Revenue 0$ 0$ 0$ 0$ 0$
Transfers InTotal Transfers In 0 0 0 0 0
Total Resources (Revenue and Transfers In) 0$ 0$ 0$ 0$ 0$
Total Expenditures 0$ 0$ 0$ 0$ 0$
Transfers Out
Total Transfers Out 0 0 0 0 0
Total Expenditures and Transfers Out 0$ 0$ 0$ 0$ 0$
Difference Total Resources and Expenditures and Transfers Out 0$ 0$ 0$ 0$ 0$
FUND BALANCEJuly 1st Beginning Balance 40,034$ 0$ 0$ 0$ 0$ Residual Equity Transfer (40,034) 0 0 0
Difference Total Resources and Expenditures and Transfers Out 0 0 0 0 0
Supplemental Franchise Cable Fund 208
June 30th Ending Balance 0$ 0$ 0$ 0$ 0$
Note: The Supplemental Franchise Cable Fund #208 is combined with the General Fund on the June 30, 2008 CAFR. The Residual Equity Transfer was used to close this fund into the General Fund 100.
I - 29
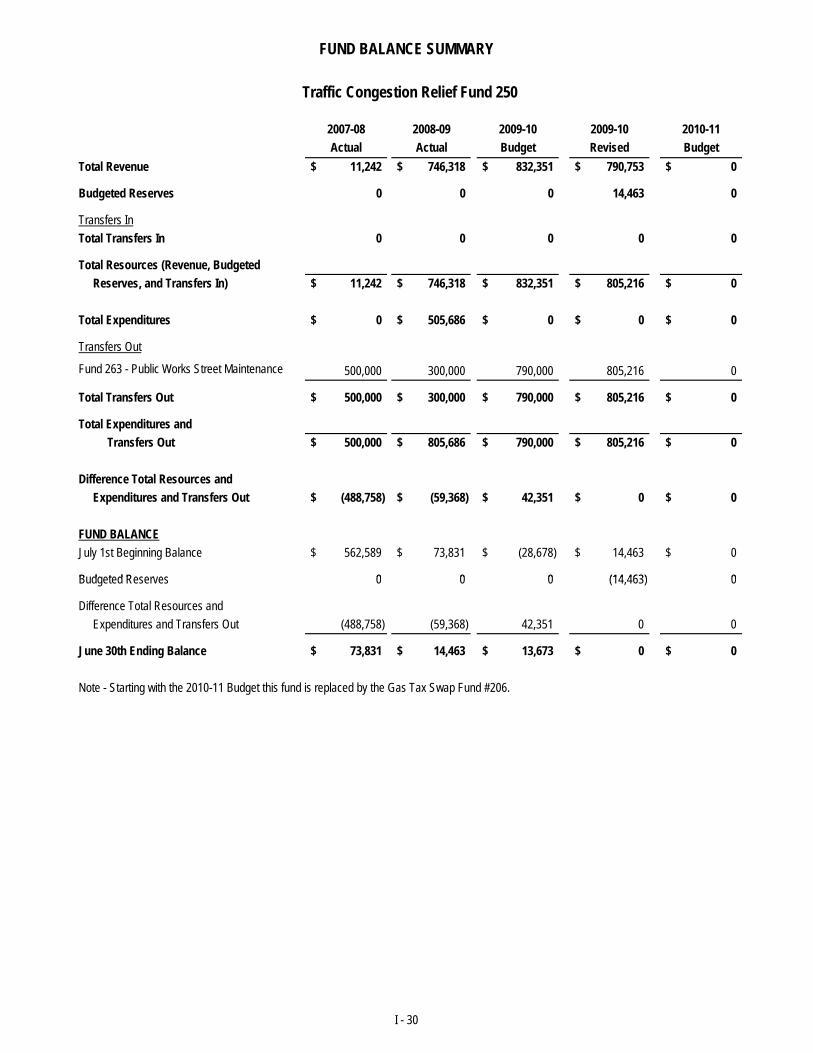
FUND BALANCE SUMMARY
2007-08 2008-09 2009-10 2009-10 2010-11Actual Actual Budget Revised Budget
Total Revenue 11,242$ 746,318$ 832,351$ 790,753$ 0$
Budgeted Reserves 0 0 0 14,463 0
Transfers InTotal Transfers In 0 0 0 0 0
Total Resources (Revenue, Budgeted Reserves, and Transfers In) 11,242$ 746,318$ 832,351$ 805,216$ 0$
Total Expenditures 0$ 505,686$ 0$ 0$ 0$
Transfers Out
Fund 263 - Public Works Street Maintenance 500,000 300,000 790,000 805,216 0
Total Transfers Out 500,000$ 300,000$ 790,000$ 805,216$ 0$
Total Expenditures and Transfers Out 500,000$ 805,686$ 790,000$ 805,216$ 0$
Difference Total Resources and Expenditures and Transfers Out (488,758)$ (59,368)$ 42,351$ 0$ 0$
FUND BALANCEJuly 1st Beginning Balance 562,589$ 73,831$ (28,678)$ 14,463$ 0$
Budgeted Reserves 0 0 0 (14 463) 0
Traffic Congestion Relief Fund 250
Budgeted Reserves 0 0 0 (14,463) 0
Difference Total Resources and Expenditures and Transfers Out (488,758) (59,368) 42,351 0 0
June 30th Ending Balance 73,831$ 14,463$ 13,673$ 0$ 0$
Note - Starting with the 2010-11 Budget this fund is replaced by the Gas Tax Swap Fund #206.
I - 30
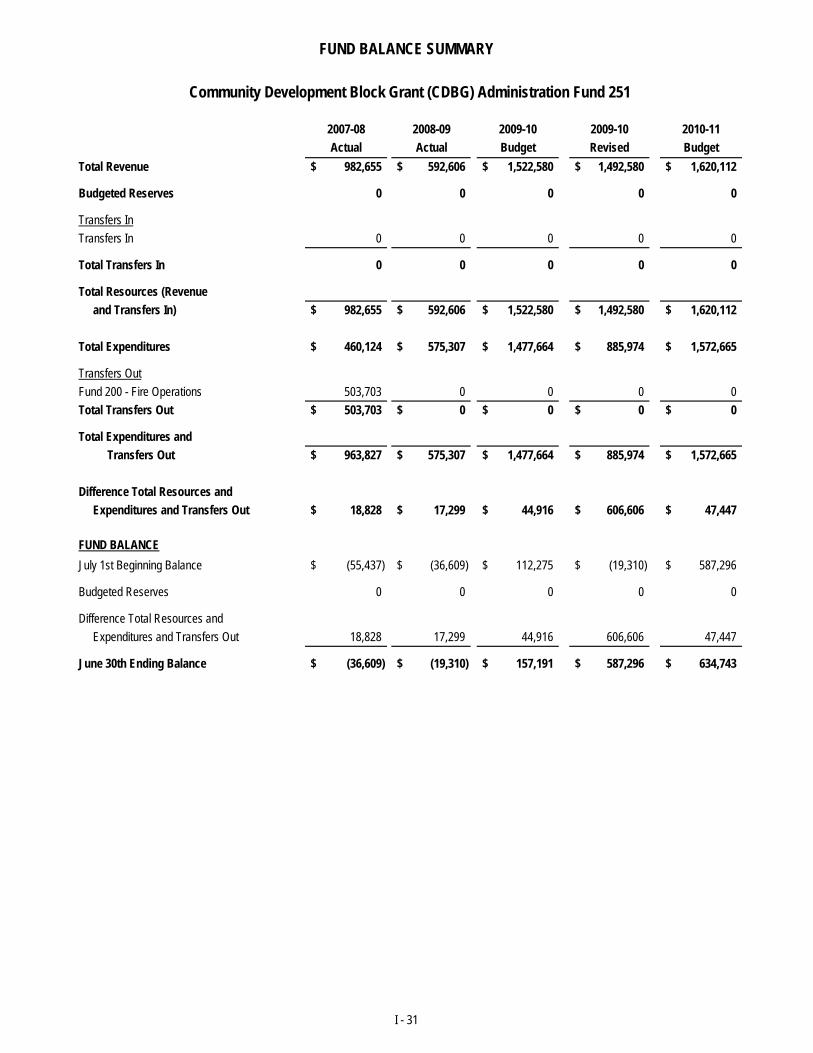
FUND BALANCE SUMMARY
2007-08 2008-09 2009-10 2009-10 2010-11Actual Actual Budget Revised Budget
Total Revenue 982,655$ 592,606$ 1,522,580$ 1,492,580$ 1,620,112$
Budgeted Reserves 0 0 0 0 0
Transfers InTransfers In 0 0 0 0 0
Total Transfers In 0 0 0 0 0
Total Resources (Revenue and Transfers In) 982,655$ 592,606$ 1,522,580$ 1,492,580$ 1,620,112$
Total Expenditures 460,124$ 575,307$ 1,477,664$ 885,974$ 1,572,665$
Transfers OutFund 200 - Fire Operations 503,703 0 0 0 0Total Transfers Out 503,703$ 0$ 0$ 0$ 0$
Total Expenditures and Transfers Out 963,827$ 575,307$ 1,477,664$ 885,974$ 1,572,665$
Difference Total Resources and Expenditures and Transfers Out 18,828$ 17,299$ 44,916$ 606,606$ 47,447$
FUND BALANCEJuly 1st Beginning Balance (55,437)$ (36,609)$ 112,275$ (19,310)$ 587,296$
Community Development Block Grant (CDBG) Administration Fund 251
Budgeted Reserves 0 0 0 0 0
Difference Total Resources and Expenditures and Transfers Out 18,828 17,299 44,916 606,606 47,447
June 30th Ending Balance (36,609)$ (19,310)$ 157,191$ 587,296$ 634,743$
I - 31
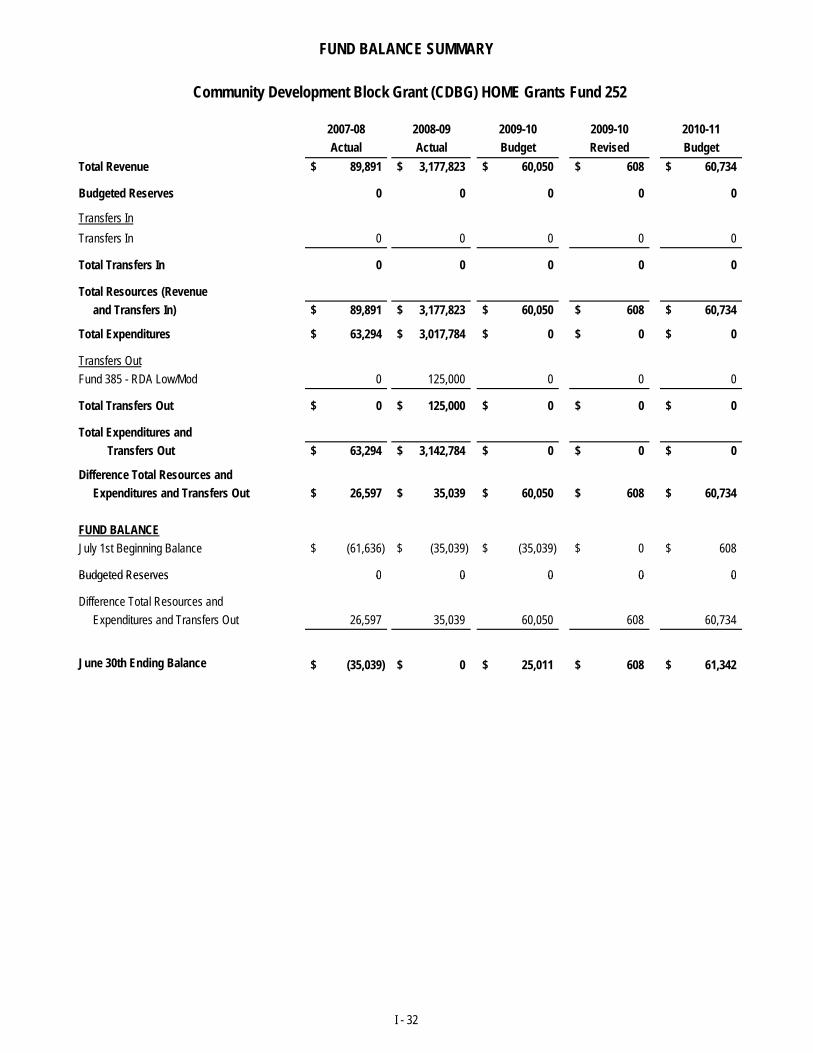
FUND BALANCE SUMMARY
2007-08 2008-09 2009-10 2009-10 2010-11Actual Actual Budget Revised Budget
Total Revenue 89,891$ 3,177,823$ 60,050$ 608$ 60,734$
Budgeted Reserves 0 0 0 0 0
Transfers InTransfers In 0 0 0 0 0
Total Transfers In 0 0 0 0 0
Total Resources (Revenue and Transfers In) 89,891$ 3,177,823$ 60,050$ 608$ 60,734$
Total Expenditures 63,294$ 3,017,784$ 0$ 0$ 0$
Transfers OutFund 385 - RDA Low/Mod 0 125,000 0 0 0
Total Transfers Out 0$ 125,000$ 0$ 0$ 0$
Total Expenditures and Transfers Out 63,294$ 3,142,784$ 0$ 0$ 0$
Difference Total Resources and Expenditures and Transfers Out 26,597$ 35,039$ 60,050$ 608$ 60,734$
FUND BALANCEJuly 1st Beginning Balance (61,636)$ (35,039)$ (35,039)$ 0$ 608$
Budgeted Reserves 0 0 0 0 0
Community Development Block Grant (CDBG) HOME Grants Fund 252
Budgeted Reserves 0 0 0 0 0
Difference Total Resources and Expenditures and Transfers Out 26,597 35,039 60,050 608 60,734
June 30th Ending Balance (35,039)$ 0$ 25,011$ 608$ 61,342$
I - 32
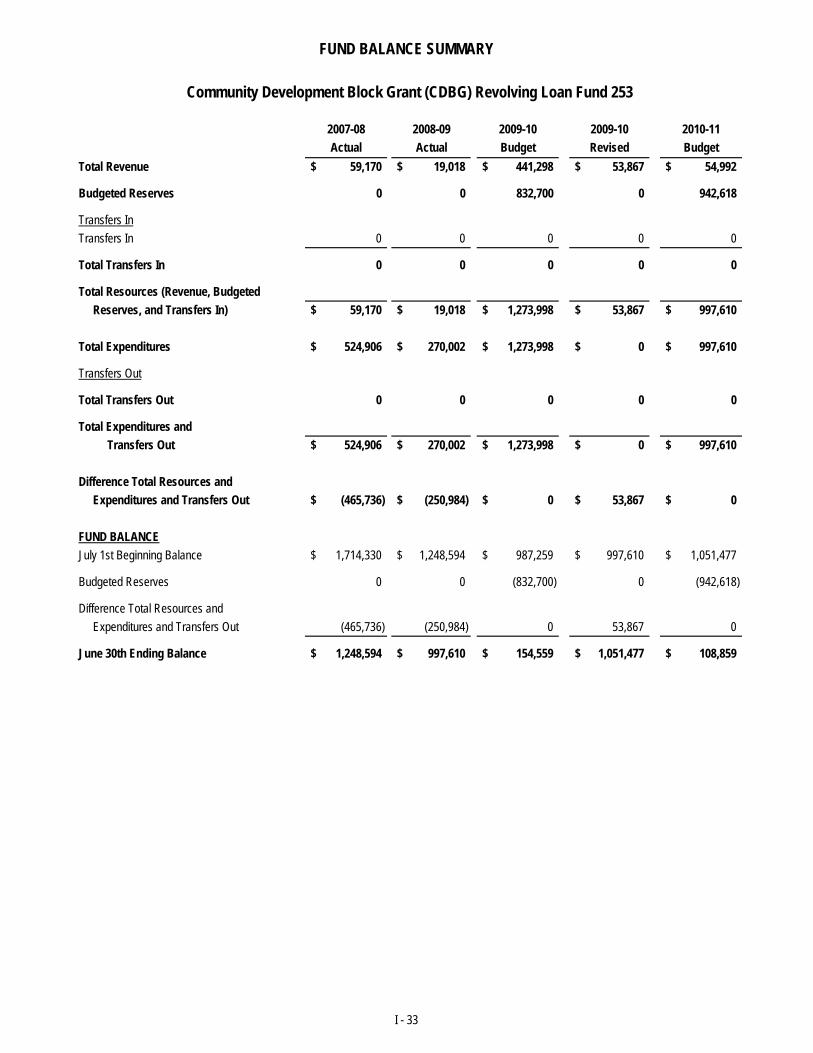
FUND BALANCE SUMMARY
2007-08 2008-09 2009-10 2009-10 2010-11Actual Actual Budget Revised Budget
Total Revenue 59,170$ 19,018$ 441,298$ 53,867$ 54,992$
Budgeted Reserves 0 0 832,700 0 942,618
Transfers InTransfers In 0 0 0 0 0
Total Transfers In 0 0 0 0 0
Total Resources (Revenue, Budgeted Reserves, and Transfers In) 59,170$ 19,018$ 1,273,998$ 53,867$ 997,610$
Total Expenditures 524,906$ 270,002$ 1,273,998$ 0$ 997,610$
Transfers Out
Total Transfers Out 0 0 0 0 0
Total Expenditures and Transfers Out 524,906$ 270,002$ 1,273,998$ 0$ 997,610$
Difference Total Resources and Expenditures and Transfers Out (465,736)$ (250,984)$ 0$ 53,867$ 0$
FUND BALANCEJuly 1st Beginning Balance 1,714,330$ 1,248,594$ 987,259$ 997,610$ 1,051,477$
0 0 (832 00) 0 (9 2 618)
Community Development Block Grant (CDBG) Revolving Loan Fund 253
Budgeted Reserves 0 0 (832,700) 0 (942,618)
Difference Total Resources and Expenditures and Transfers Out (465,736) (250,984) 0 53,867 0
June 30th Ending Balance 1,248,594$ 997,610$ 154,559$ 1,051,477$ 108,859$
I - 33
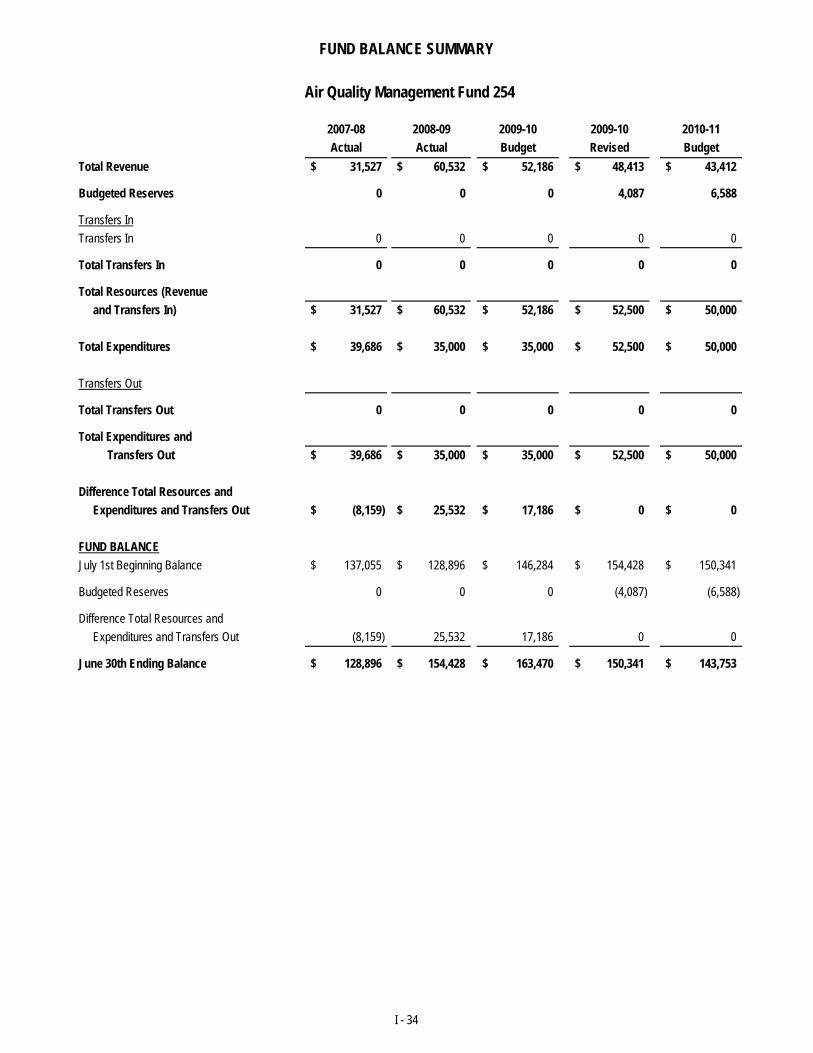
FUND BALANCE SUMMARY
2007-08 2008-09 2009-10 2009-10 2010-11Actual Actual Budget Revised Budget
Total Revenue 31,527$ 60,532$ 52,186$ 48,413$ 43,412$
Budgeted Reserves 0 0 0 4,087 6,588
Transfers InTransfers In 0 0 0 0 0
Total Transfers In 0 0 0 0 0
Total Resources (Revenue and Transfers In) 31,527$ 60,532$ 52,186$ 52,500$ 50,000$
Total Expenditures 39,686$ 35,000$ 35,000$ 52,500$ 50,000$
Transfers Out
Total Transfers Out 0 0 0 0 0
Total Expenditures and Transfers Out 39,686$ 35,000$ 35,000$ 52,500$ 50,000$
Difference Total Resources and Expenditures and Transfers Out (8,159)$ 25,532$ 17,186$ 0$ 0$
FUND BALANCEJuly 1st Beginning Balance 137,055$ 128,896$ 146,284$ 154,428$ 150,341$
Air Quality Management Fund 254
Budgeted Reserves 0 0 0 (4,087) (6,588)
Difference Total Resources and Expenditures and Transfers Out (8,159) 25,532 17,186 0 0
June 30th Ending Balance 128,896$ 154,428$ 163,470$ 150,341$ 143,753$
I - 34
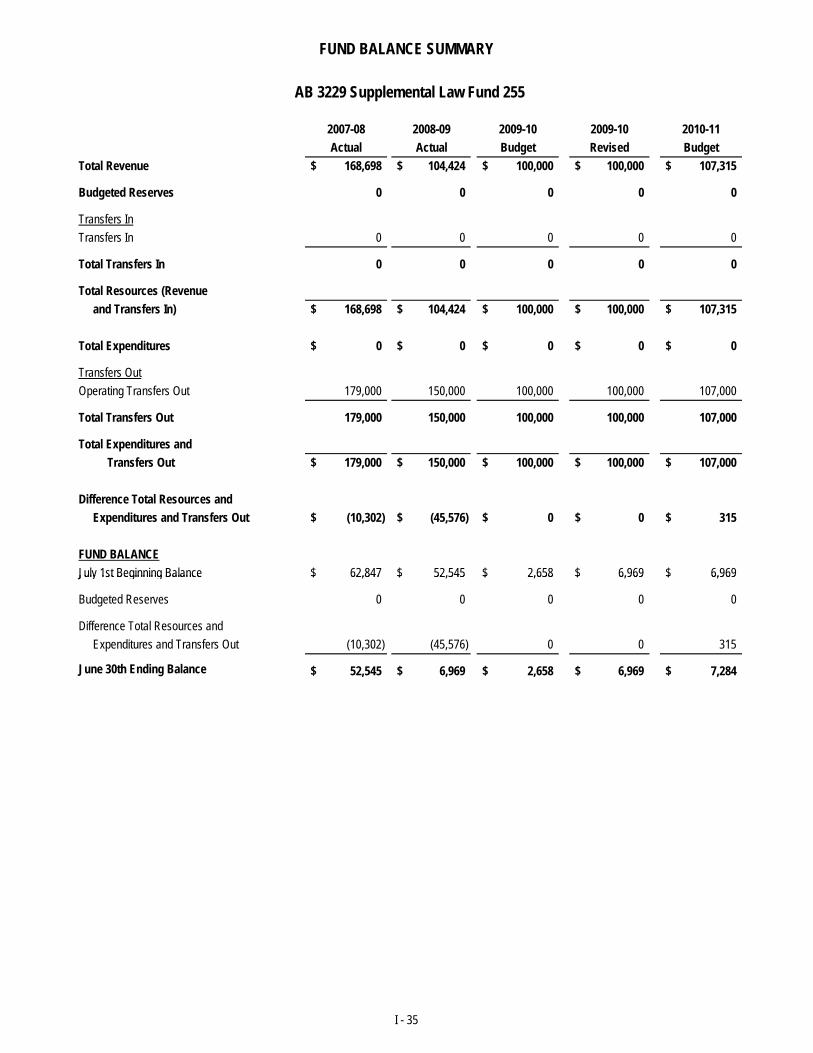
FUND BALANCE SUMMARY
2007-08 2008-09 2009-10 2009-10 2010-11Actual Actual Budget Revised Budget
Total Revenue 168,698$ 104,424$ 100,000$ 100,000$ 107,315$
Budgeted Reserves 0 0 0 0 0
Transfers InTransfers In 0 0 0 0 0
Total Transfers In 0 0 0 0 0
Total Resources (Revenue and Transfers In) 168,698$ 104,424$ 100,000$ 100,000$ 107,315$
Total Expenditures 0$ 0$ 0$ 0$ 0$
Transfers OutOperating Transfers Out 179,000 150,000 100,000 100,000 107,000
Total Transfers Out 179,000 150,000 100,000 100,000 107,000
Total Expenditures and Transfers Out 179,000$ 150,000$ 100,000$ 100,000$ 107,000$
Difference Total Resources and Expenditures and Transfers Out (10,302)$ (45,576)$ 0$ 0$ 315$
FUND BALANCEJuly 1st Beginning Balance 62,847$ 52,545$ 2,658$ 6,969$ 6,969$
AB 3229 Supplemental Law Fund 255
July 1st Beginning Balance 62,847$ 52,545$ 2,658$ 6,969$ 6,969$
Budgeted Reserves 0 0 0 0 0
Difference Total Resources and Expenditures and Transfers Out (10,302) (45,576) 0 0 315
June 30th Ending Balance 52,545$ 6,969$ 2,658$ 6,969$ 7,284$
I - 35
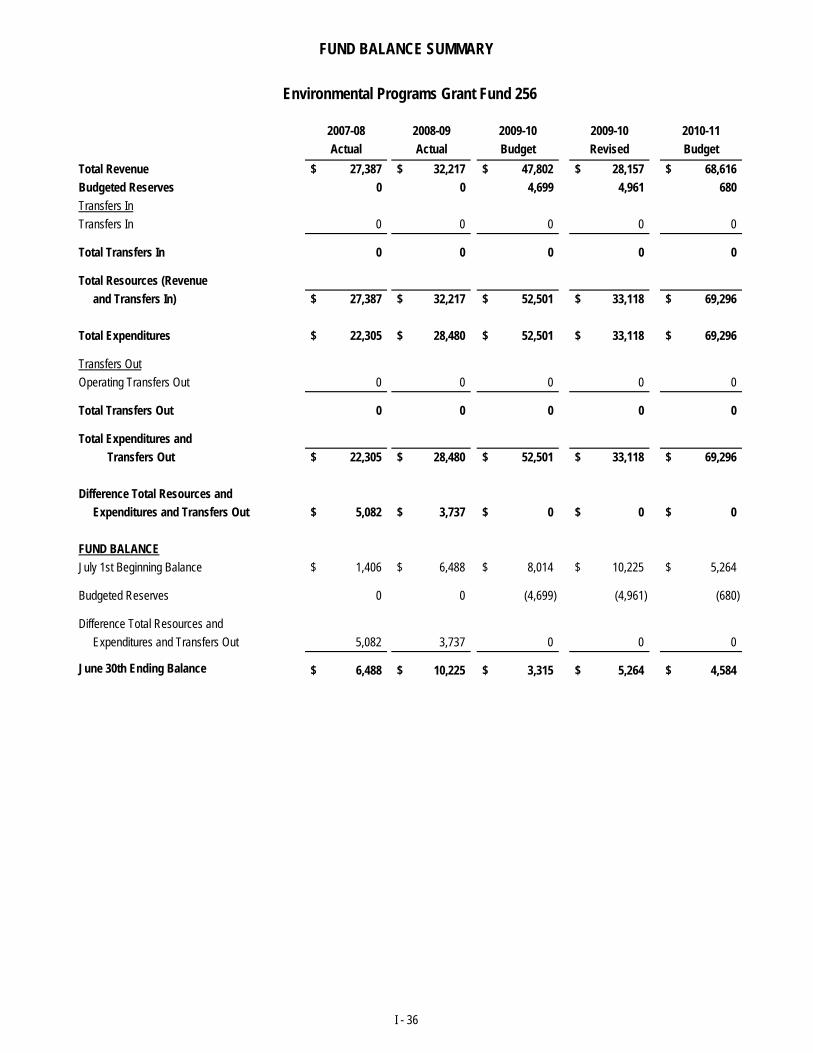
FUND BALANCE SUMMARY
2007-08 2008-09 2009-10 2009-10 2010-11Actual Actual Budget Revised Budget
Total Revenue 27,387$ 32,217$ 47,802$ 28,157$ 68,616$ Budgeted Reserves 0 0 4,699 4,961 680Transfers InTransfers In 0 0 0 0 0
Total Transfers In 0 0 0 0 0
Total Resources (Revenue and Transfers In) 27,387$ 32,217$ 52,501$ 33,118$ 69,296$
Total Expenditures 22,305$ 28,480$ 52,501$ 33,118$ 69,296$
Transfers OutOperating Transfers Out 0 0 0 0 0
Total Transfers Out 0 0 0 0 0
Total Expenditures and Transfers Out 22,305$ 28,480$ 52,501$ 33,118$ 69,296$
Difference Total Resources and Expenditures and Transfers Out 5,082$ 3,737$ 0$ 0$ 0$
FUND BALANCEJuly 1st Beginning Balance 1,406$ 6,488$ 8,014$ 10,225$ 5,264$
Environmental Programs Grant Fund 256
Budgeted Reserves 0 0 (4,699) (4,961) (680)
Difference Total Resources and Expenditures and Transfers Out 5,082 3,737 0 0 0
June 30th Ending Balance 6,488$ 10,225$ 3,315$ 5,264$ 4,584$
I - 36
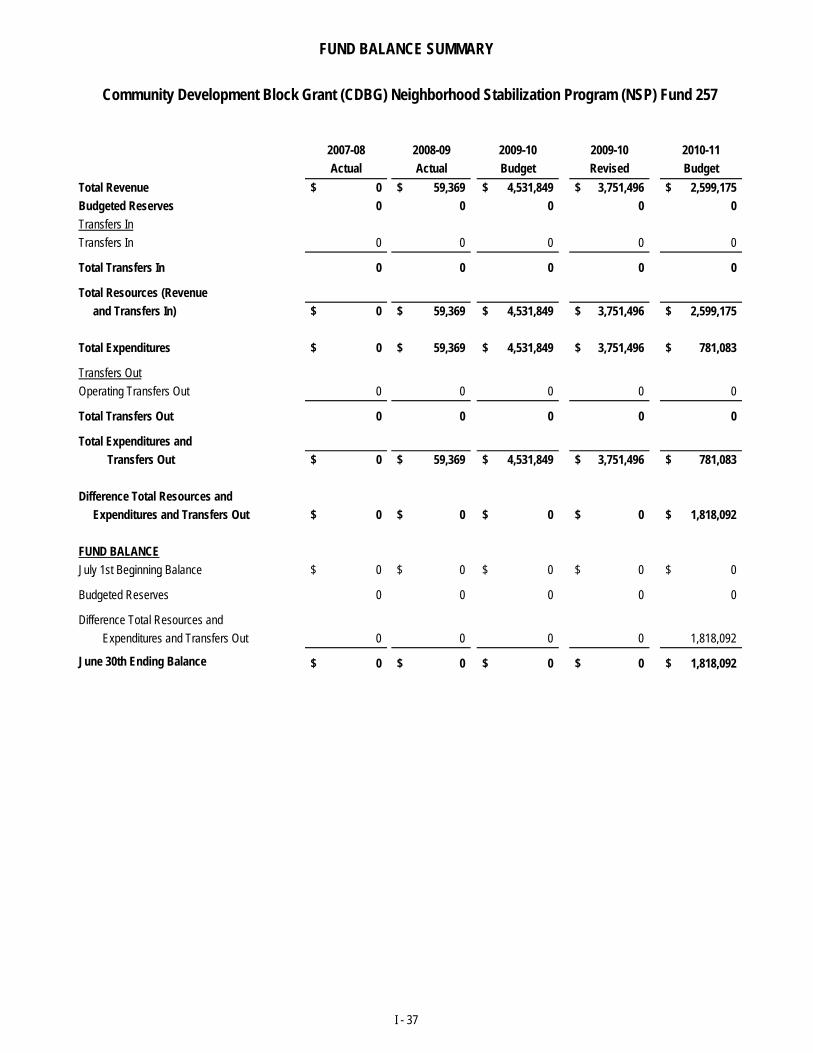
FUND BALANCE SUMMARY
2007-08 2008-09 2009-10 2009-10 2010-11Actual Actual Budget Revised Budget
Total Revenue 0$ 59,369$ 4,531,849$ 3,751,496$ 2,599,175$ Budgeted Reserves 0 0 0 0 0Transfers InTransfers In 0 0 0 0 0
Total Transfers In 0 0 0 0 0
Total Resources (Revenue and Transfers In) 0$ 59,369$ 4,531,849$ 3,751,496$ 2,599,175$
Total Expenditures 0$ 59,369$ 4,531,849$ 3,751,496$ 781,083$
Transfers OutOperating Transfers Out 0 0 0 0 0
Total Transfers Out 0 0 0 0 0
Total Expenditures and Transfers Out 0$ 59,369$ 4,531,849$ 3,751,496$ 781,083$
Difference Total Resources and Expenditures and Transfers Out 0$ 0$ 0$ 0$ 1,818,092$
FUND BALANCEJuly 1st Beginning Balance 0$ 0$ 0$ 0$ 0$
Community Development Block Grant (CDBG) Neighborhood Stabilization Program (NSP) Fund 257
y g g $ $ $ $ $
Budgeted Reserves 0 0 0 0 0
Difference Total Resources and Expenditures and Transfers Out 0 0 0 0 1,818,092
June 30th Ending Balance 0$ 0$ 0$ 0$ 1,818,092$
I - 37
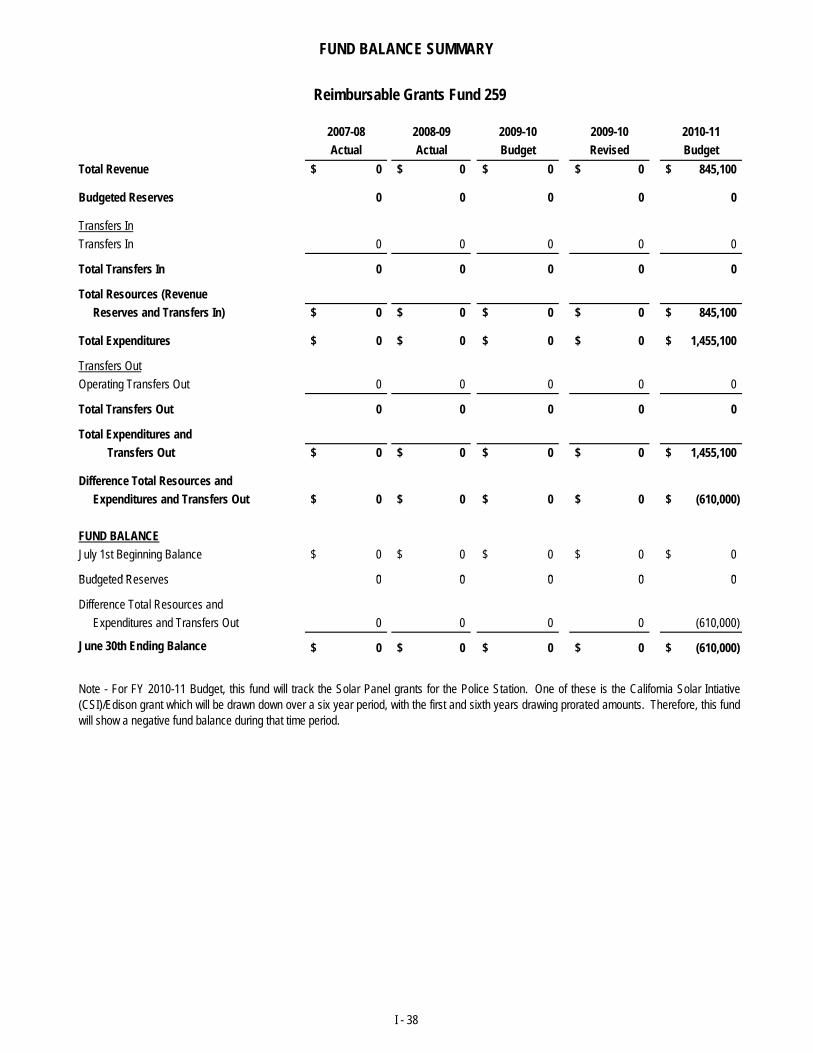
FUND BALANCE SUMMARY
2007-08 2008-09 2009-10 2009-10 2010-11Actual Actual Budget Revised Budget
Total Revenue 0$ 0$ 0$ 0$ 845,100$
Budgeted Reserves 0 0 0 0 0
Transfers InTransfers In 0 0 0 0 0
Total Transfers In 0 0 0 0 0
Total Resources (Revenue Reserves and Transfers In) 0$ 0$ 0$ 0$ 845,100$
Total Expenditures 0$ 0$ 0$ 0$ 1,455,100$
Transfers OutOperating Transfers Out 0 0 0 0 0
Total Transfers Out 0 0 0 0 0
Total Expenditures and Transfers Out 0$ 0$ 0$ 0$ 1,455,100$
Difference Total Resources and Expenditures and Transfers Out 0$ 0$ 0$ 0$ (610,000)$
FUND BALANCEJuly 1st Beginning Balance 0$ 0$ 0$ 0$ 0$
B dgeted Reser es 0 0 0 0 0
Reimbursable Grants Fund 259
Budgeted Reserves 0 0 0 0 0
Difference Total Resources and Expenditures and Transfers Out 0 0 0 0 (610,000)
June 30th Ending Balance 0$ 0$ 0$ 0$ (610,000)$
Note - For FY 2010-11 Budget, this fund will track the Solar Panel grants for the Police Station. One of these is the California Solar Intiative(CSI)/Edison grant which will be drawn down over a six year period, with the first and sixth years drawing prorated amounts. Therefore, this fundwill show a negative fund balance during that time period.
I - 38
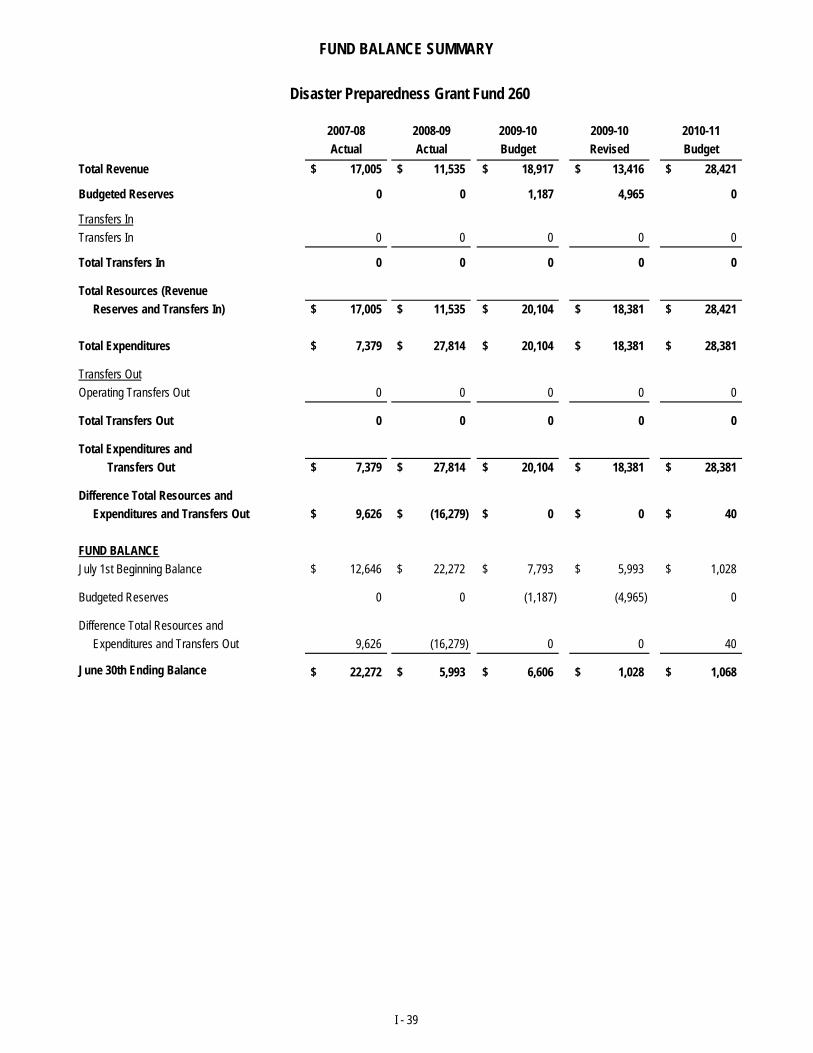
FUND BALANCE SUMMARY
2007-08 2008-09 2009-10 2009-10 2010-11Actual Actual Budget Revised Budget
Total Revenue 17,005$ 11,535$ 18,917$ 13,416$ 28,421$
Budgeted Reserves 0 0 1,187 4,965 0
Transfers InTransfers In 0 0 0 0 0
Total Transfers In 0 0 0 0 0
Total Resources (Revenue Reserves and Transfers In) 17,005$ 11,535$ 20,104$ 18,381$ 28,421$
Total Expenditures 7,379$ 27,814$ 20,104$ 18,381$ 28,381$
Transfers OutOperating Transfers Out 0 0 0 0 0
Total Transfers Out 0 0 0 0 0
Total Expenditures and Transfers Out 7,379$ 27,814$ 20,104$ 18,381$ 28,381$
Difference Total Resources and Expenditures and Transfers Out 9,626$ (16,279)$ 0$ 0$ 40$
FUND BALANCEJuly 1st Beginning Balance 12,646$ 22,272$ 7,793$ 5,993$ 1,028$
Disaster Preparedness Grant Fund 260
y g g , , , , ,
Budgeted Reserves 0 0 (1,187) (4,965) 0
Difference Total Resources and Expenditures and Transfers Out 9,626 (16,279) 0 0 40
June 30th Ending Balance 22,272$ 5,993$ 6,606$ 1,028$ 1,068$
I - 39
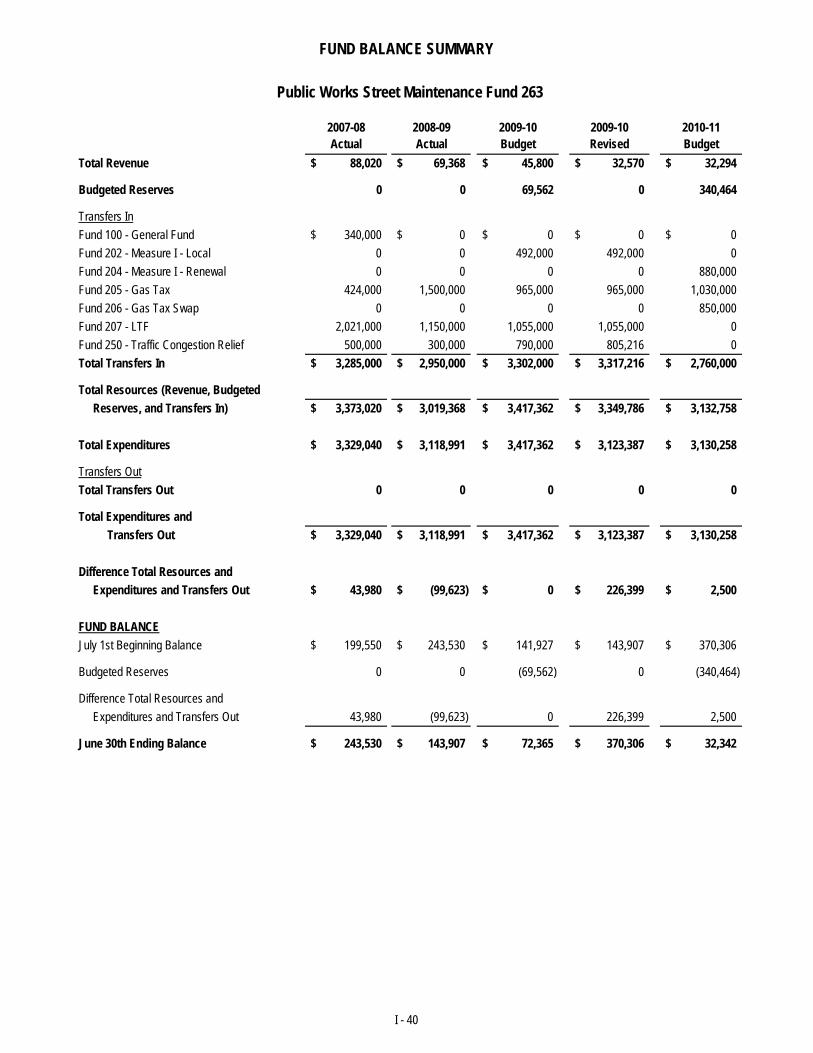
FUND BALANCE SUMMARY
2007-08 2008-09 2009-10 2009-10 2010-11Actual Actual Budget Revised Budget
Total Revenue 88,020$ 69,368$ 45,800$ 32,570$ 32,294$
Budgeted Reserves 0 0 69,562 0 340,464
Transfers InFund 100 - General Fund 340,000$ 0$ 0$ 0$ 0$ Fund 202 - Measure I - Local 0 0 492,000 492,000 0Fund 204 - Measure I - Renewal 0 0 0 0 880,000Fund 205 - Gas Tax 424,000 1,500,000 965,000 965,000 1,030,000Fund 206 - Gas Tax Swap 0 0 0 0 850,000Fund 207 - LTF 2,021,000 1,150,000 1,055,000 1,055,000 0Fund 250 - Traffic Congestion Relief 500,000 300,000 790,000 805,216 0Total Transfers In 3,285,000$ 2,950,000$ 3,302,000$ 3,317,216$ 2,760,000$
Total Resources (Revenue, Budgeted Reserves, and Transfers In) 3,373,020$ 3,019,368$ 3,417,362$ 3,349,786$ 3,132,758$
Total Expenditures 3,329,040$ 3,118,991$ 3,417,362$ 3,123,387$ 3,130,258$
Transfers OutTotal Transfers Out 0 0 0 0 0
Total Expenditures and Transfers Out 3,329,040$ 3,118,991$ 3,417,362$ 3,123,387$ 3,130,258$
Difference Total Resources and
Public Works Street Maintenance Fund 263
Difference Total Resources and Expenditures and Transfers Out 43,980$ (99,623)$ 0$ 226,399$ 2,500$
FUND BALANCEJuly 1st Beginning Balance 199,550$ 243,530$ 141,927$ 143,907$ 370,306$
Budgeted Reserves 0 0 (69,562) 0 (340,464)
Difference Total Resources and Expenditures and Transfers Out 43,980 (99,623) 0 226,399 2,500
June 30th Ending Balance 243,530$ 143,907$ 72,365$ 370,306$ 32,342$
I - 40
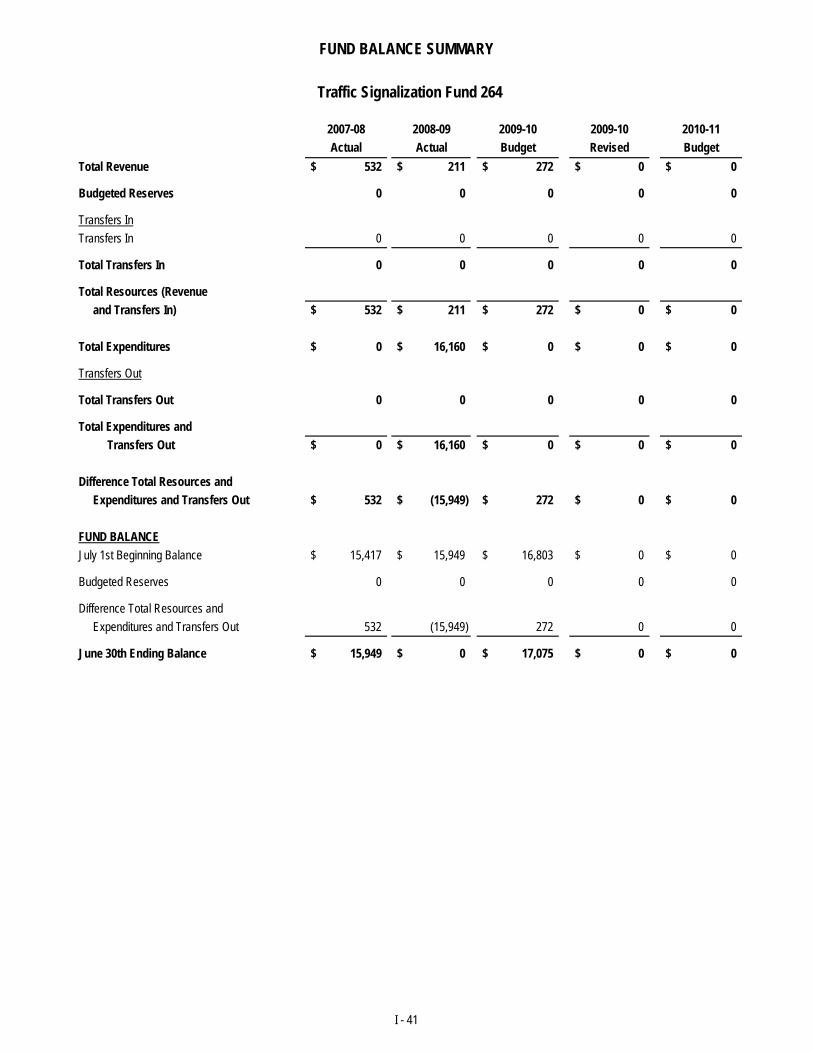
FUND BALANCE SUMMARY
2007-08 2008-09 2009-10 2009-10 2010-11Actual Actual Budget Revised Budget
Total Revenue 532$ 211$ 272$ 0$ 0$
Budgeted Reserves 0 0 0 0 0
Transfers InTransfers In 0 0 0 0 0
Total Transfers In 0 0 0 0 0
Total Resources (Revenue and Transfers In) 532$ 211$ 272$ 0$ 0$
Total Expenditures 0$ 16,160$ 0$ 0$ 0$
Transfers Out
Total Transfers Out 0 0 0 0 0
Total Expenditures and Transfers Out 0$ 16,160$ 0$ 0$ 0$
Difference Total Resources and Expenditures and Transfers Out 532$ (15,949)$ 272$ 0$ 0$
FUND BALANCEJuly 1st Beginning Balance 15,417$ 15,949$ 16,803$ 0$ 0$
0 0 0 0 0
Traffic Signalization Fund 264
Budgeted Reserves 0 0 0 0 0
Difference Total Resources and Expenditures and Transfers Out 532 (15,949) 272 0 0
June 30th Ending Balance 15,949$ 0$ 17,075$ 0$ 0$
I - 41

FUND BALANCE SUMMARY
2007-08 2008-09 2009-10 2009-10 2010-11Actual Actual Budget Revised Budget
Total Revenue 4,849,690$ 2,993,122$ 2,356,609$ 1,314,118$ 1,101,778$
Budgeted Reserves 0 0 8,357,960 2,499,138 3,411,031
Transfers InTransfers In 0 0 0 0 0
Total Transfers In 0 0 0 0 0
Total Resources (Revenue Reserves and Transfers In) 4,849,690$ 2,993,122$ 10,714,569$ 3,813,256$ 4,512,809$
Total Expenditures 2,282,339$ 2,653,846$ 9,956,000$ 3,304,115$ 3,851,025$
Transfers OutFund 401 - City Debt Service 1,047,000$ 866,829$ 670,953$ 352,001$ 448,640$ Total Transfers Out 1,047,000$ 866,829$ 670,953$ 352,001$ 448,640$
Total Expenditures and Transfers Out 3,329,339$ 3,520,675$ 10,626,953$ 3,656,116$ 4,299,665$
Difference Total Resources and Expenditures and Transfers Out 1,520,351$ (527,553)$ 87,616$ 157,140$ 213,144$
FUND BALANCEJuly 1st Beginning Balance 25,172,709$ 26,693,060$ 24,176,627$ 26,165,507$ 23,823,509$
B d t d R 0 0 (8 357 960) (2 499 138) (3 411 031)
Development Impact Fees - Summary (300, 301, 302, 303, 304)
Budgeted Reserves 0 0 (8,357,960) (2,499,138) (3,411,031)
Difference Total Resources and Expenditures and Transfers Out 1,520,351 (527,553) 87,616 157,140 213,144
June 30th Ending Balance 26,693,060$ 26,165,507$ 15,906,283$ 23,823,509$ 20,625,622$
Less: Land Held For Resale (9,002,541) (9,002,541) (9,002,541) (9,002,541) (9,002,541)June 30th Ending Operating Fund Balance 17,690,519$ 17,162,966$ 6,903,742$ 14,820,968$ 11,623,081$
Note: Rates for Development Impact Fees were approved in total as a group (Streets, Storm Drainage, Fire, Police, and Public Services).Therefore, any temporary deficit in one Development Impact Fee fund will be offset by the overall surplus of the Development Impact Fee fundstaken as a whole.
I - 42
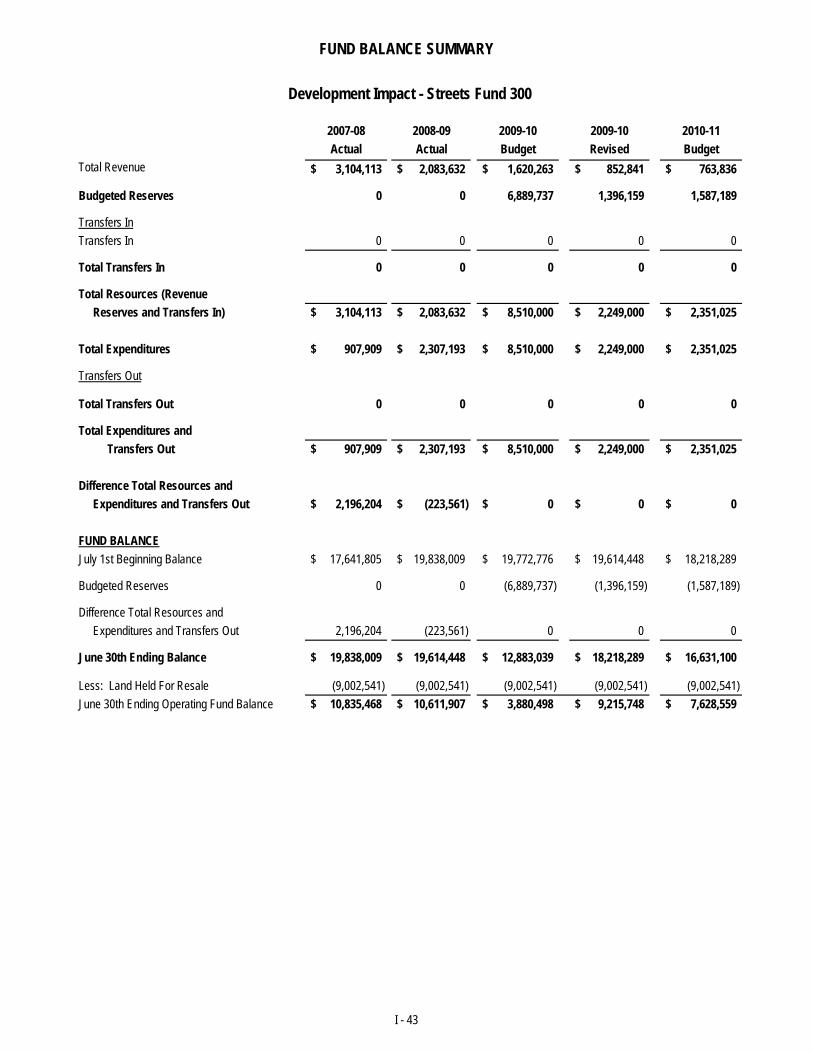
FUND BALANCE SUMMARY
2007-08 2008-09 2009-10 2009-10 2010-11Actual Actual Budget Revised Budget
Total Revenue 3,104,113$ 2,083,632$ 1,620,263$ 852,841$ 763,836$
Budgeted Reserves 0 0 6,889,737 1,396,159 1,587,189
Transfers InTransfers In 0 0 0 0 0
Total Transfers In 0 0 0 0 0
Total Resources (Revenue Reserves and Transfers In) 3,104,113$ 2,083,632$ 8,510,000$ 2,249,000$ 2,351,025$
Total Expenditures 907,909$ 2,307,193$ 8,510,000$ 2,249,000$ 2,351,025$
Transfers Out
Total Transfers Out 0 0 0 0 0
Total Expenditures and Transfers Out 907,909$ 2,307,193$ 8,510,000$ 2,249,000$ 2,351,025$
Difference Total Resources and Expenditures and Transfers Out 2,196,204$ (223,561)$ 0$ 0$ 0$
FUND BALANCEJuly 1st Beginning Balance 17,641,805$ 19,838,009$ 19,772,776$ 19,614,448$ 18,218,289$
Development Impact - Streets Fund 300
Budgeted Reserves 0 0 (6,889,737) (1,396,159) (1,587,189)
Difference Total Resources and Expenditures and Transfers Out 2,196,204 (223,561) 0 0 0
June 30th Ending Balance 19,838,009$ 19,614,448$ 12,883,039$ 18,218,289$ 16,631,100$
Less: Land Held For Resale (9,002,541) (9,002,541) (9,002,541) (9,002,541) (9,002,541)June 30th Ending Operating Fund Balance 10,835,468$ 10,611,907$ 3,880,498$ 9,215,748$ 7,628,559$
I - 43
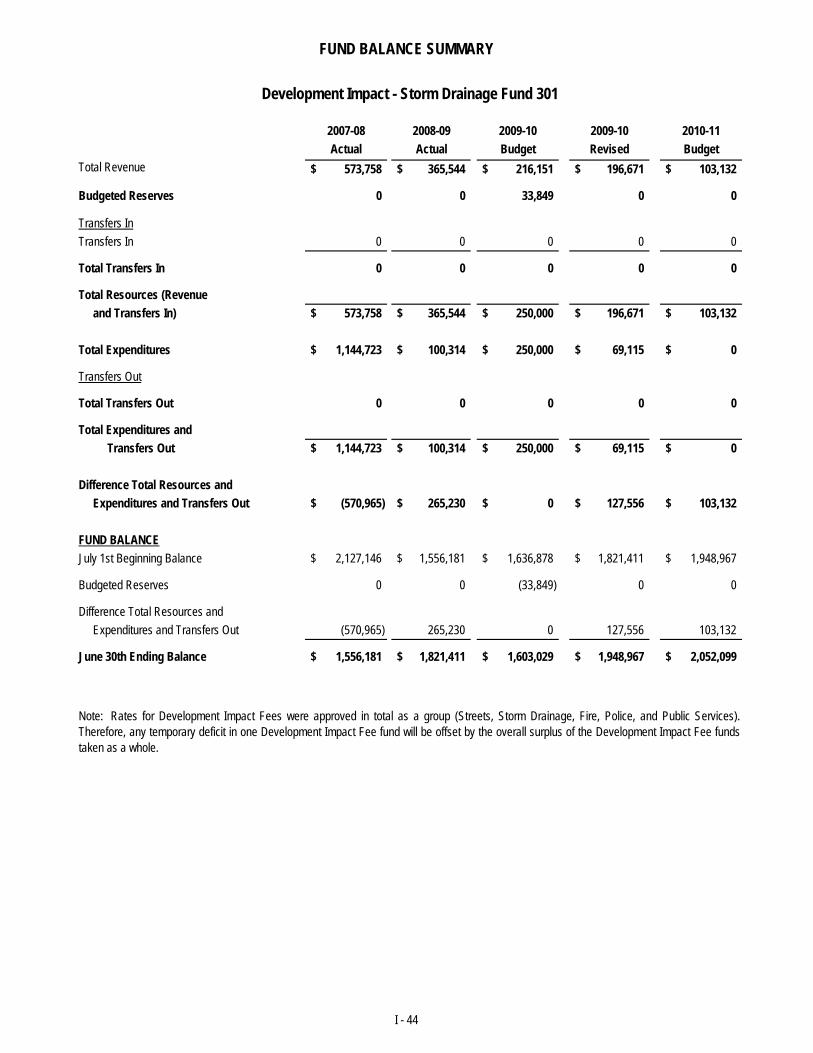
FUND BALANCE SUMMARY
2007-08 2008-09 2009-10 2009-10 2010-11Actual Actual Budget Revised Budget
Total Revenue 573,758$ 365,544$ 216,151$ 196,671$ 103,132$
Budgeted Reserves 0 0 33,849 0 0
Transfers InTransfers In 0 0 0 0 0
Total Transfers In 0 0 0 0 0
Total Resources (Revenue and Transfers In) 573,758$ 365,544$ 250,000$ 196,671$ 103,132$
Total Expenditures 1,144,723$ 100,314$ 250,000$ 69,115$ 0$
Transfers Out
Total Transfers Out 0 0 0 0 0
Total Expenditures and Transfers Out 1,144,723$ 100,314$ 250,000$ 69,115$ 0$
Difference Total Resources and Expenditures and Transfers Out (570,965)$ 265,230$ 0$ 127,556$ 103,132$
FUND BALANCEJuly 1st Beginning Balance 2,127,146$ 1,556,181$ 1,636,878$ 1,821,411$ 1,948,967$
Development Impact - Storm Drainage Fund 301
Budgeted Reserves 0 0 (33,849) 0 0
Difference Total Resources and Expenditures and Transfers Out (570,965) 265,230 0 127,556 103,132
June 30th Ending Balance 1,556,181$ 1,821,411$ 1,603,029$ 1,948,967$ 2,052,099$
Note: Rates for Development Impact Fees were approved in total as a group (Streets, Storm Drainage, Fire, Police, and Public Services).Therefore, any temporary deficit in one Development Impact Fee fund will be offset by the overall surplus of the Development Impact Fee fundstaken as a whole.
I - 44
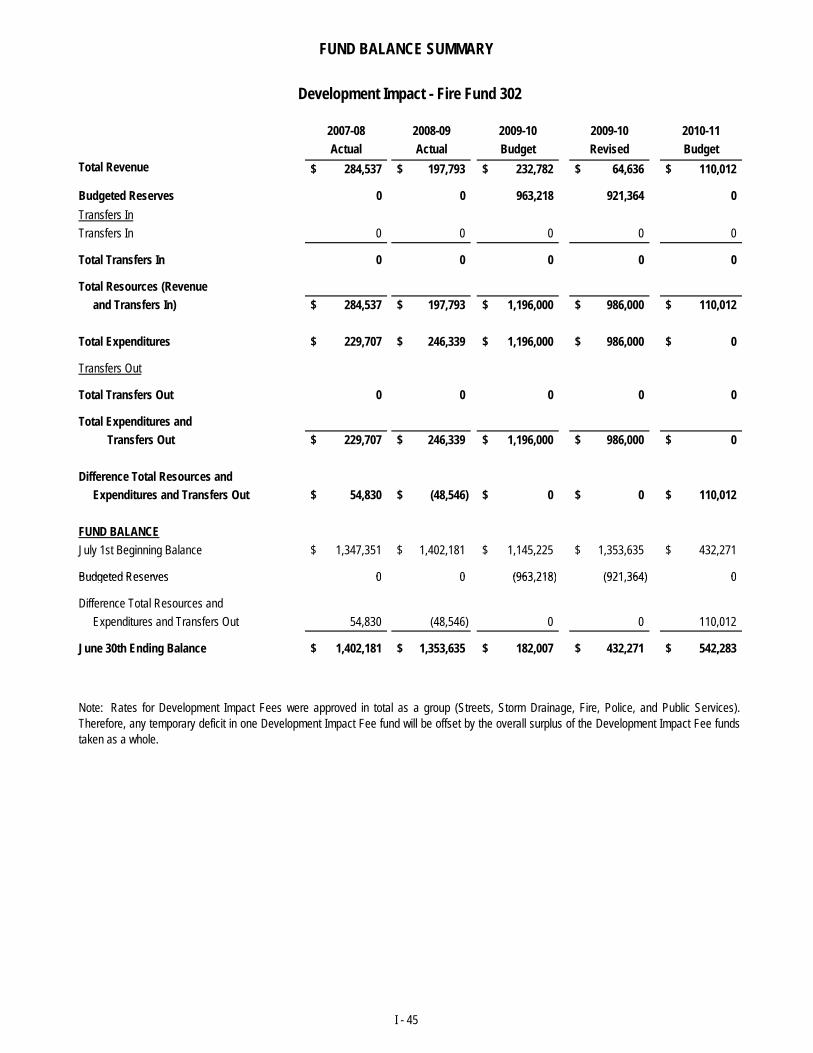
FUND BALANCE SUMMARY
2007-08 2008-09 2009-10 2009-10 2010-11Actual Actual Budget Revised Budget
Total Revenue 284,537$ 197,793$ 232,782$ 64,636$ 110,012$
Budgeted Reserves 0 0 963,218 921,364 0Transfers InTransfers In 0 0 0 0 0
Total Transfers In 0 0 0 0 0
Total Resources (Revenue and Transfers In) 284,537$ 197,793$ 1,196,000$ 986,000$ 110,012$
Total Expenditures 229,707$ 246,339$ 1,196,000$ 986,000$ 0$
Transfers Out
Total Transfers Out 0 0 0 0 0
Total Expenditures and Transfers Out 229,707$ 246,339$ 1,196,000$ 986,000$ 0$
Difference Total Resources and Expenditures and Transfers Out 54,830$ (48,546)$ 0$ 0$ 110,012$
FUND BALANCEJuly 1st Beginning Balance 1,347,351$ 1,402,181$ 1,145,225$ 1,353,635$ 432,271$
Budgeted Reserves 0 0 (963 218) (921 364) 0
Development Impact - Fire Fund 302
Budgeted Reserves 0 0 (963,218) (921,364) 0
Difference Total Resources and Expenditures and Transfers Out 54,830 (48,546) 0 0 110,012
June 30th Ending Balance 1,402,181$ 1,353,635$ 182,007$ 432,271$ 542,283$
Note: Rates for Development Impact Fees were approved in total as a group (Streets, Storm Drainage, Fire, Police, and Public Services).Therefore, any temporary deficit in one Development Impact Fee fund will be offset by the overall surplus of the Development Impact Fee fundstaken as a whole.
I - 45
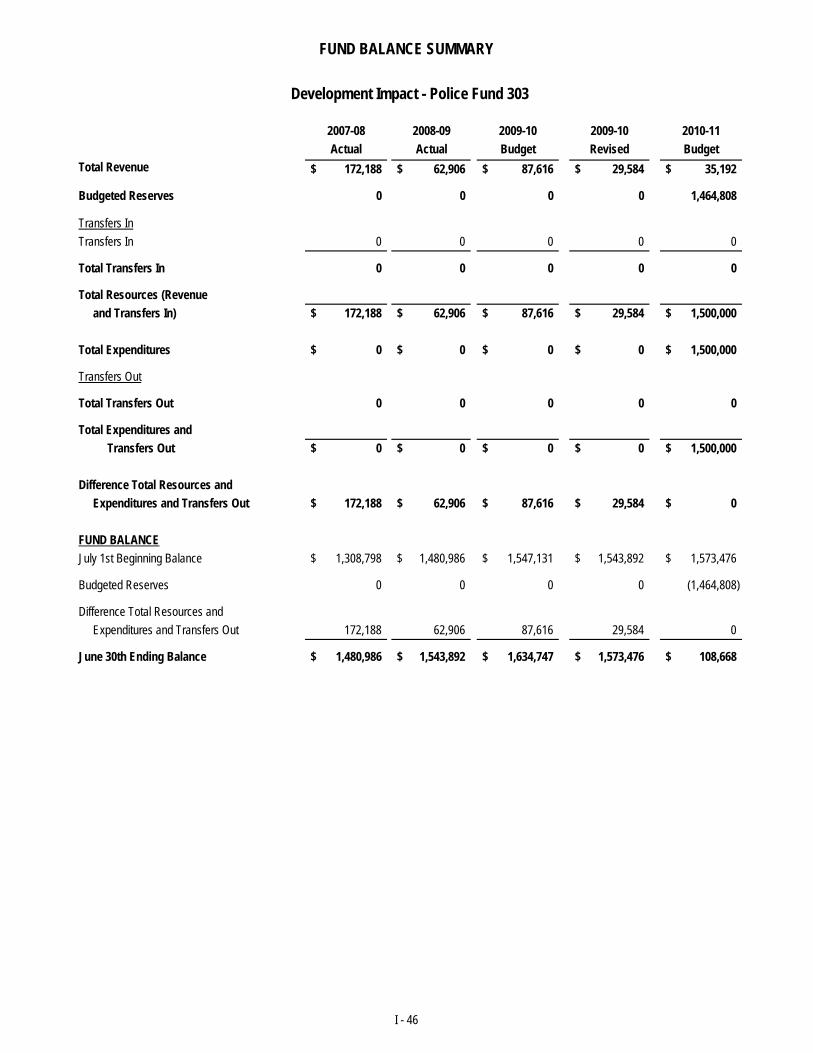
FUND BALANCE SUMMARY
2007-08 2008-09 2009-10 2009-10 2010-11Actual Actual Budget Revised Budget
Total Revenue 172,188$ 62,906$ 87,616$ 29,584$ 35,192$
Budgeted Reserves 0 0 0 0 1,464,808
Transfers InTransfers In 0 0 0 0 0
Total Transfers In 0 0 0 0 0
Total Resources (Revenue and Transfers In) 172,188$ 62,906$ 87,616$ 29,584$ 1,500,000$
Total Expenditures 0$ 0$ 0$ 0$ 1,500,000$
Transfers Out
Total Transfers Out 0 0 0 0 0
Total Expenditures and Transfers Out 0$ 0$ 0$ 0$ 1,500,000$
Difference Total Resources and Expenditures and Transfers Out 172,188$ 62,906$ 87,616$ 29,584$ 0$
FUND BALANCEJuly 1st Beginning Balance 1,308,798$ 1,480,986$ 1,547,131$ 1,543,892$ 1,573,476$
Development Impact - Police Fund 303
Budgeted Reserves 0 0 0 0 (1,464,808)
Difference Total Resources and Expenditures and Transfers Out 172,188 62,906 87,616 29,584 0
June 30th Ending Balance 1,480,986$ 1,543,892$ 1,634,747$ 1,573,476$ 108,668$
I - 46
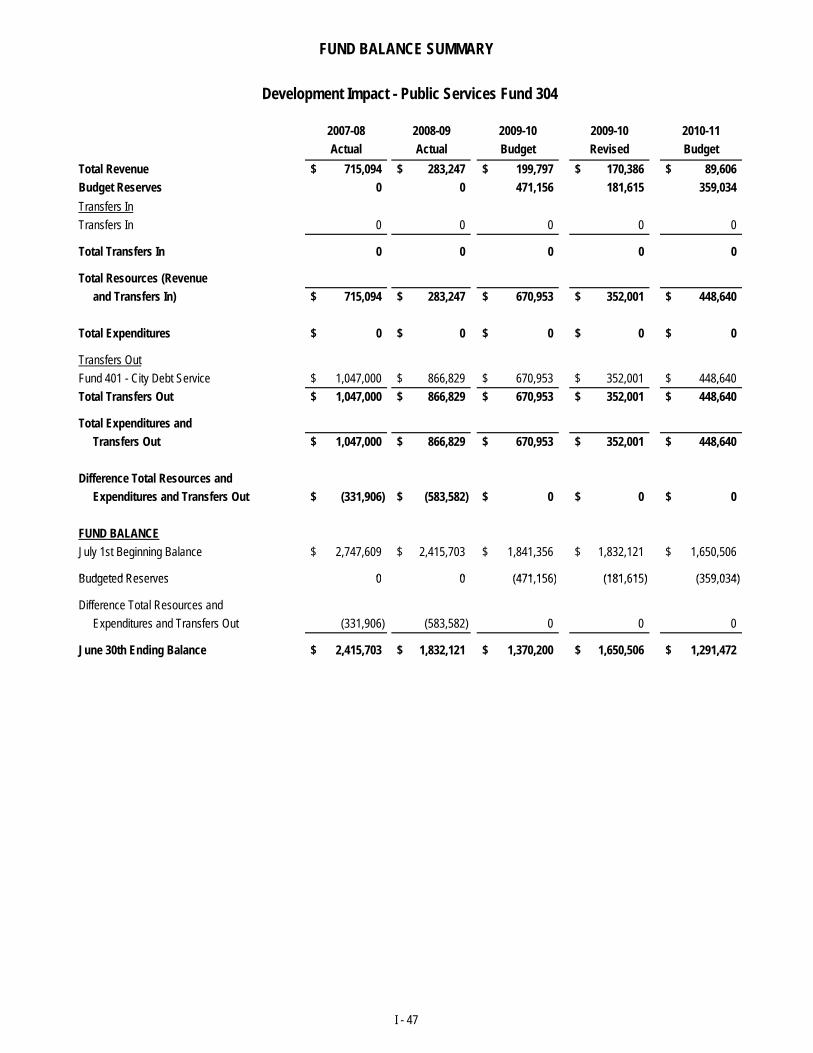
FUND BALANCE SUMMARY
2007-08 2008-09 2009-10 2009-10 2010-11Actual Actual Budget Revised Budget
Total Revenue 715,094$ 283,247$ 199,797$ 170,386$ 89,606$ Budget Reserves 0 0 471,156 181,615 359,034Transfers InTransfers In 0 0 0 0 0
Total Transfers In 0 0 0 0 0
Total Resources (Revenue and Transfers In) 715,094$ 283,247$ 670,953$ 352,001$ 448,640$
Total Expenditures 0$ 0$ 0$ 0$ 0$
Transfers OutFund 401 - City Debt Service 1,047,000$ 866,829$ 670,953$ 352,001$ 448,640$ Total Transfers Out 1,047,000$ 866,829$ 670,953$ 352,001$ 448,640$
Total Expenditures and Transfers Out 1,047,000$ 866,829$ 670,953$ 352,001$ 448,640$
Difference Total Resources and Expenditures and Transfers Out (331,906)$ (583,582)$ 0$ 0$ 0$
FUND BALANCEJuly 1st Beginning Balance 2,747,609$ 2,415,703$ 1,841,356$ 1,832,121$ 1,650,506$
Budgeted Reserves 0 0 (471 156) (181 615) (359 034)
Development Impact - Public Services Fund 304
Budgeted Reserves 0 0 (471,156) (181,615) (359,034)
Difference Total Resources and Expenditures and Transfers Out (331,906) (583,582) 0 0 0
June 30th Ending Balance 2,415,703$ 1,832,121$ 1,370,200$ 1,650,506$ 1,291,472$
I - 47
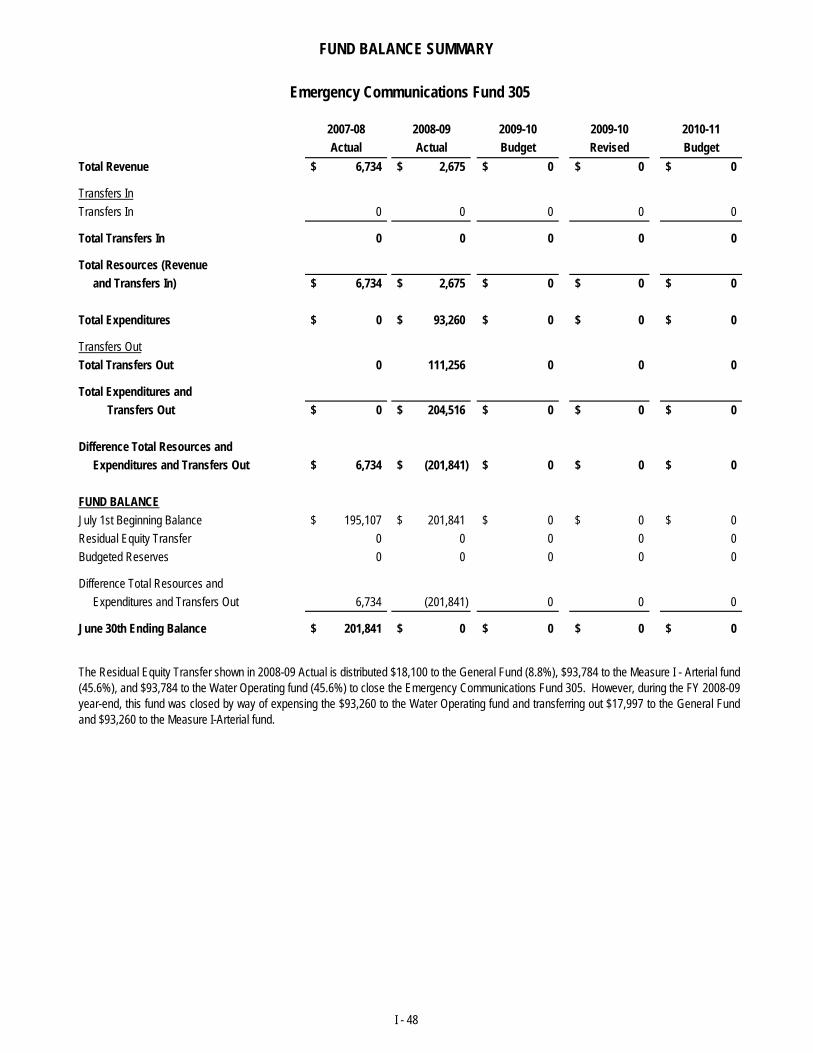
FUND BALANCE SUMMARY
2007-08 2008-09 2009-10 2009-10 2010-11Actual Actual Budget Revised Budget
Total Revenue 6,734$ 2,675$ 0$ 0$ 0$
Transfers InTransfers In 0 0 0 0 0
Total Transfers In 0 0 0 0 0
Total Resources (Revenue and Transfers In) 6,734$ 2,675$ 0$ 0$ 0$
Total Expenditures 0$ 93,260$ 0$ 0$ 0$
Transfers OutTotal Transfers Out 0 111,256 0 0 0
Total Expenditures and Transfers Out 0$ 204,516$ 0$ 0$ 0$
Difference Total Resources and Expenditures and Transfers Out 6,734$ (201,841)$ 0$ 0$ 0$
FUND BALANCEJuly 1st Beginning Balance 195,107$ 201,841$ 0$ 0$ 0$ Residual Equity Transfer 0 0 0 0 0Budgeted Reserves 0 0 0 0 0
Emergency Communications Fund 305
Difference Total Resources and Expenditures and Transfers Out 6,734 (201,841) 0 0 0
June 30th Ending Balance 201,841$ 0$ 0$ 0$ 0$
The Residual Equity Transfer shown in 2008-09 Actual is distributed $18,100 to the General Fund (8.8%), $93,784 to the Measure I - Arterial fund(45.6%), and $93,784 to the Water Operating fund (45.6%) to close the Emergency Communications Fund 305. However, during the FY 2008-09year-end, this fund was closed by way of expensing the $93,260 to the Water Operating fund and transferring out $17,997 to the General Fundand $93,260 to the Measure I-Arterial fund.
I - 48
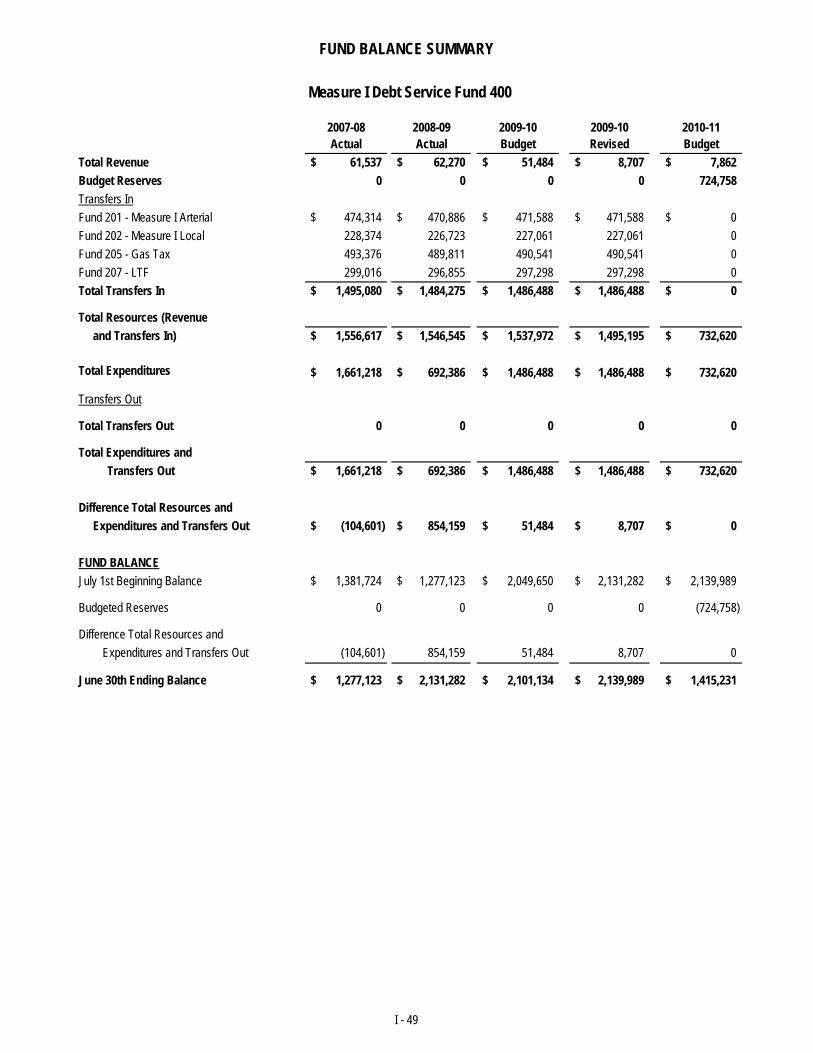
FUND BALANCE SUMMARY
2007-08 2008-09 2009-10 2009-10 2010-11Actual Actual Budget Revised Budget
Total Revenue 61,537$ 62,270$ 51,484$ 8,707$ 7,862$ Budget Reserves 0 0 0 0 724,758Transfers InFund 201 - Measure I Arterial 474,314$ 470,886$ 471,588$ 471,588$ 0$ Fund 202 - Measure I Local 228,374 226,723 227,061 227,061 0Fund 205 - Gas Tax 493,376 489,811 490,541 490,541 0Fund 207 - LTF 299,016 296,855 297,298 297,298 0Total Transfers In 1,495,080$ 1,484,275$ 1,486,488$ 1,486,488$ 0$
Total Resources (Revenue and Transfers In) 1,556,617$ 1,546,545$ 1,537,972$ 1,495,195$ 732,620$
Total Expenditures 1,661,218$ 692,386$ 1,486,488$ 1,486,488$ 732,620$
Transfers Out
Total Transfers Out 0 0 0 0 0
Total Expenditures and Transfers Out 1,661,218$ 692,386$ 1,486,488$ 1,486,488$ 732,620$
Difference Total Resources and Expenditures and Transfers Out (104,601)$ 854,159$ 51,484$ 8,707$ 0$
FUND BALANCEJ l 1 t B i i B l 1 381 724$ 1 277 123$ 2 049 650$ 2 131 282$ 2 139 989$
Measure I Debt Service Fund 400
July 1st Beginning Balance 1,381,724$ 1,277,123$ 2,049,650$ 2,131,282$ 2,139,989$
Budgeted Reserves 0 0 0 0 (724,758)
Difference Total Resources and Expenditures and Transfers Out (104,601) 854,159 51,484 8,707 0
June 30th Ending Balance 1,277,123$ 2,131,282$ 2,101,134$ 2,139,989$ 1,415,231$
I - 49
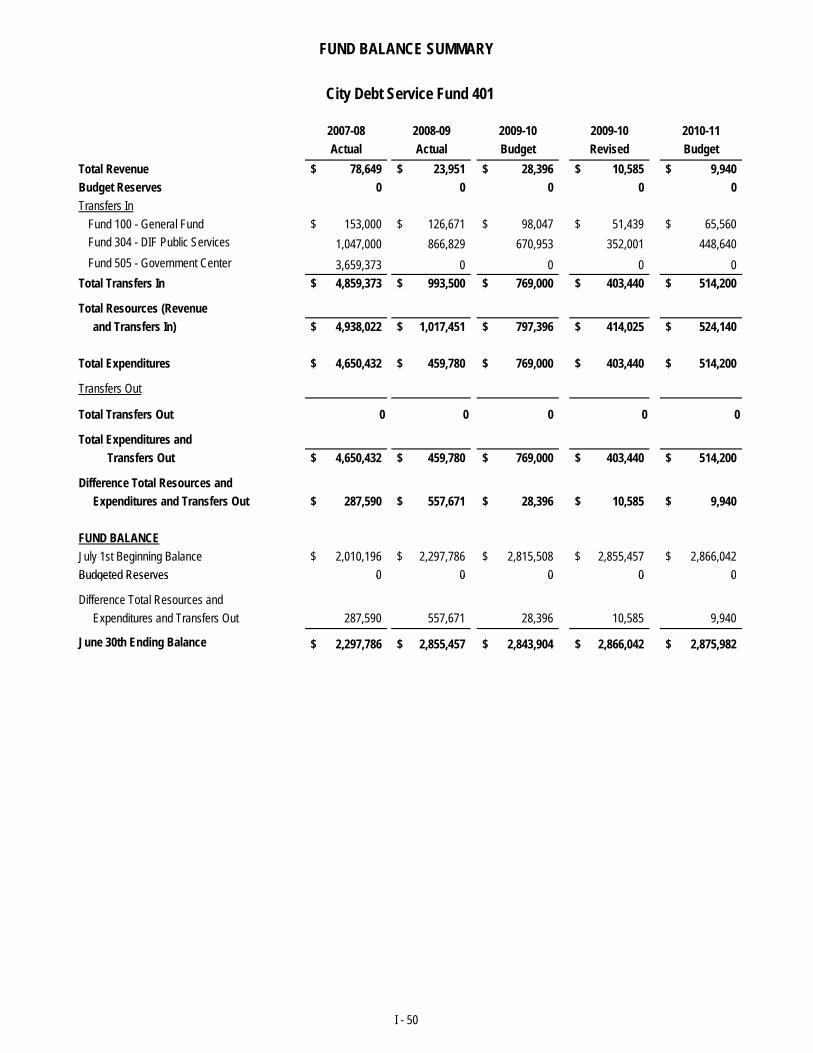
FUND BALANCE SUMMARY
2007-08 2008-09 2009-10 2009-10 2010-11Actual Actual Budget Revised Budget
Total Revenue 78,649$ 23,951$ 28,396$ 10,585$ 9,940$ Budget Reserves 0 0 0 0 0Transfers In
Fund 100 - General Fund 153,000$ 126,671$ 98,047$ 51,439$ 65,560$ Fund 304 - DIF Public Services 1,047,000 866,829 670,953 352,001 448,640Fund 505 - Government Center 3,659,373 0 0 0 0
Total Transfers In 4,859,373$ 993,500$ 769,000$ 403,440$ 514,200$
Total Resources (Revenue and Transfers In) 4,938,022$ 1,017,451$ 797,396$ 414,025$ 524,140$
Total Expenditures 4,650,432$ 459,780$ 769,000$ 403,440$ 514,200$
Transfers Out
Total Transfers Out 0 0 0 0 0
Total Expenditures and Transfers Out 4,650,432$ 459,780$ 769,000$ 403,440$ 514,200$
Difference Total Resources and Expenditures and Transfers Out 287,590$ 557,671$ 28,396$ 10,585$ 9,940$
FUND BALANCEJuly 1st Beginning Balance 2,010,196$ 2,297,786$ 2,815,508$ 2,855,457$ 2,866,042$ Budgeted Reserves 0 0 0 0 0
City Debt Service Fund 401
Budgeted Reserves 0 0 0 0 0
Difference Total Resources and Expenditures and Transfers Out 287,590 557,671 28,396 10,585 9,940
June 30th Ending Balance 2,297,786$ 2,855,457$ 2,843,904$ 2,866,042$ 2,875,982$
I - 50
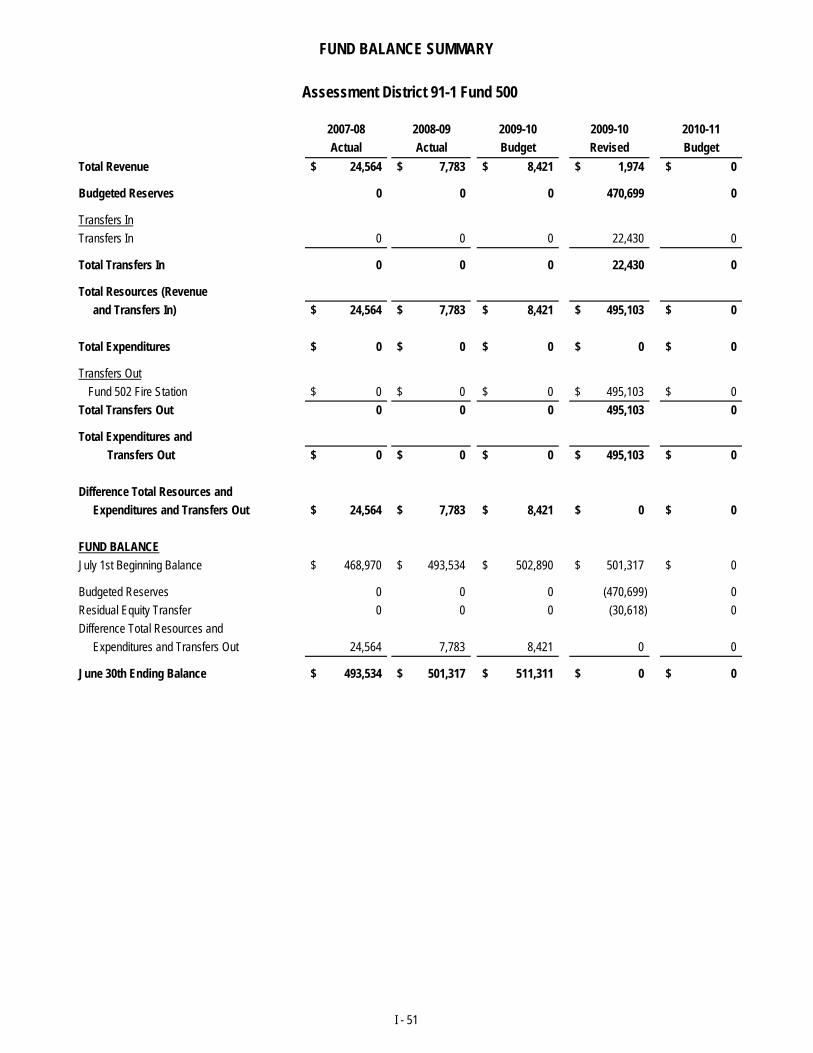
FUND BALANCE SUMMARY
2007-08 2008-09 2009-10 2009-10 2010-11Actual Actual Budget Revised Budget
Total Revenue 24,564$ 7,783$ 8,421$ 1,974$ 0$
Budgeted Reserves 0 0 0 470,699 0
Transfers InTransfers In 0 0 0 22,430 0
Total Transfers In 0 0 0 22,430 0
Total Resources (Revenue and Transfers In) 24,564$ 7,783$ 8,421$ 495,103$ 0$
Total Expenditures 0$ 0$ 0$ 0$ 0$
Transfers OutFund 502 Fire Station 0$ 0$ 0$ 495,103$ 0$
Total Transfers Out 0 0 0 495,103 0
Total Expenditures and Transfers Out 0$ 0$ 0$ 495,103$ 0$
Difference Total Resources and Expenditures and Transfers Out 24,564$ 7,783$ 8,421$ 0$ 0$
FUND BALANCEJuly 1st Beginning Balance 468,970$ 493,534$ 502,890$ 501,317$ 0$
Assessment District 91-1 Fund 500
Budgeted Reserves 0 0 0 (470,699) 0Residual Equity Transfer 0 0 0 (30,618) 0Difference Total Resources and Expenditures and Transfers Out 24,564 7,783 8,421 0 0
June 30th Ending Balance 493,534$ 501,317$ 511,311$ 0$ 0$
I - 51
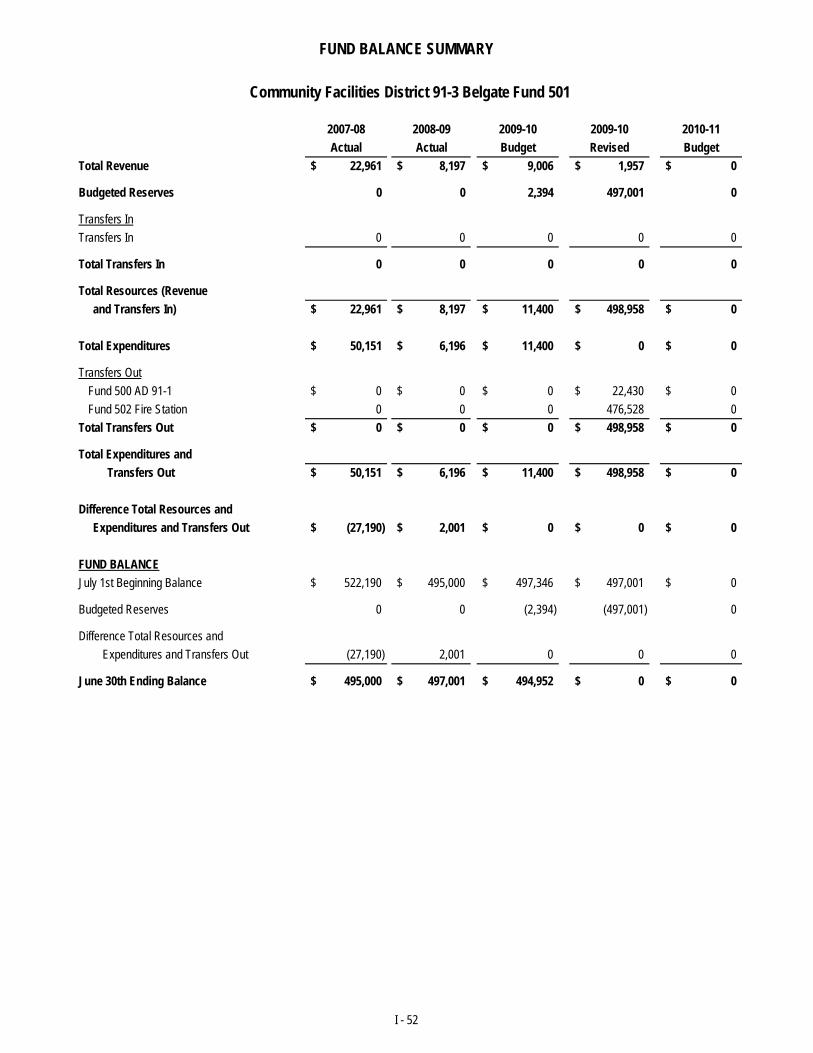
FUND BALANCE SUMMARY
2007-08 2008-09 2009-10 2009-10 2010-11Actual Actual Budget Revised Budget
Total Revenue 22,961$ 8,197$ 9,006$ 1,957$ 0$
Budgeted Reserves 0 0 2,394 497,001 0
Transfers InTransfers In 0 0 0 0 0
Total Transfers In 0 0 0 0 0
Total Resources (Revenue and Transfers In) 22,961$ 8,197$ 11,400$ 498,958$ 0$
Total Expenditures 50,151$ 6,196$ 11,400$ 0$ 0$
Transfers OutFund 500 AD 91-1 0$ 0$ 0$ 22,430$ 0$ Fund 502 Fire Station 0 0 0 476,528 0
Total Transfers Out 0$ 0$ 0$ 498,958$ 0$
Total Expenditures and Transfers Out 50,151$ 6,196$ 11,400$ 498,958$ 0$
Difference Total Resources and Expenditures and Transfers Out (27,190)$ 2,001$ 0$ 0$ 0$
FUND BALANCE
Community Facilities District 91-3 Belgate Fund 501
July 1st Beginning Balance 522,190$ 495,000$ 497,346$ 497,001$ 0$
Budgeted Reserves 0 0 (2,394) (497,001) 0
Difference Total Resources and Expenditures and Transfers Out (27,190) 2,001 0 0 0
June 30th Ending Balance 495,000$ 497,001$ 494,952$ 0$ 0$
I - 52
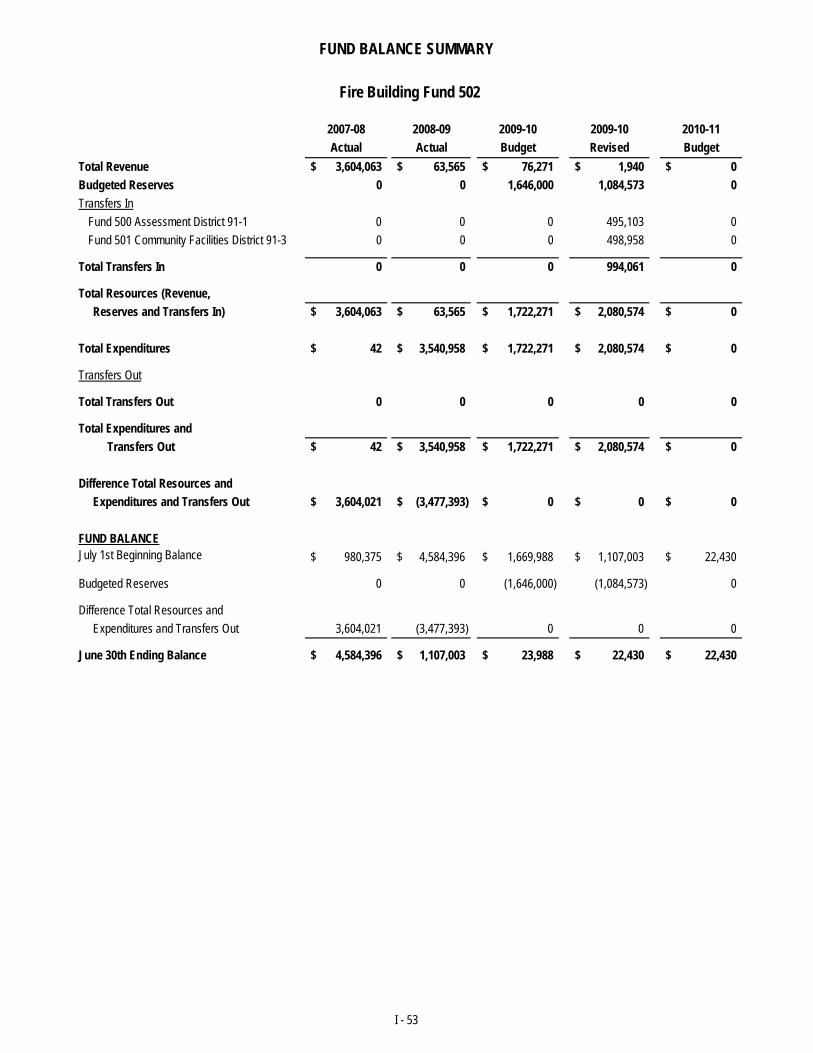
FUND BALANCE SUMMARY
2007-08 2008-09 2009-10 2009-10 2010-11Actual Actual Budget Revised Budget
Total Revenue 3,604,063$ 63,565$ 76,271$ 1,940$ 0$ Budgeted Reserves 0 0 1,646,000 1,084,573 0Transfers In
Fund 500 Assessment District 91-1 0 0 0 495,103 0Fund 501 Community Facilities District 91-3 0 0 0 498,958 0
Total Transfers In 0 0 0 994,061 0
Total Resources (Revenue, Reserves and Transfers In) 3,604,063$ 63,565$ 1,722,271$ 2,080,574$ 0$
Total Expenditures 42$ 3,540,958$ 1,722,271$ 2,080,574$ 0$
Transfers Out
Total Transfers Out 0 0 0 0 0
Total Expenditures and Transfers Out 42$ 3,540,958$ 1,722,271$ 2,080,574$ 0$
Difference Total Resources and Expenditures and Transfers Out 3,604,021$ (3,477,393)$ 0$ 0$ 0$
FUND BALANCEJuly 1st Beginning Balance 980,375$ 4,584,396$ 1,669,988$ 1,107,003$ 22,430$
Fire Building Fund 502
Budgeted Reserves 0 0 (1,646,000) (1,084,573) 0
Difference Total Resources and Expenditures and Transfers Out 3,604,021 (3,477,393) 0 0 0
June 30th Ending Balance 4,584,396$ 1,107,003$ 23,988$ 22,430$ 22,430$
I - 53
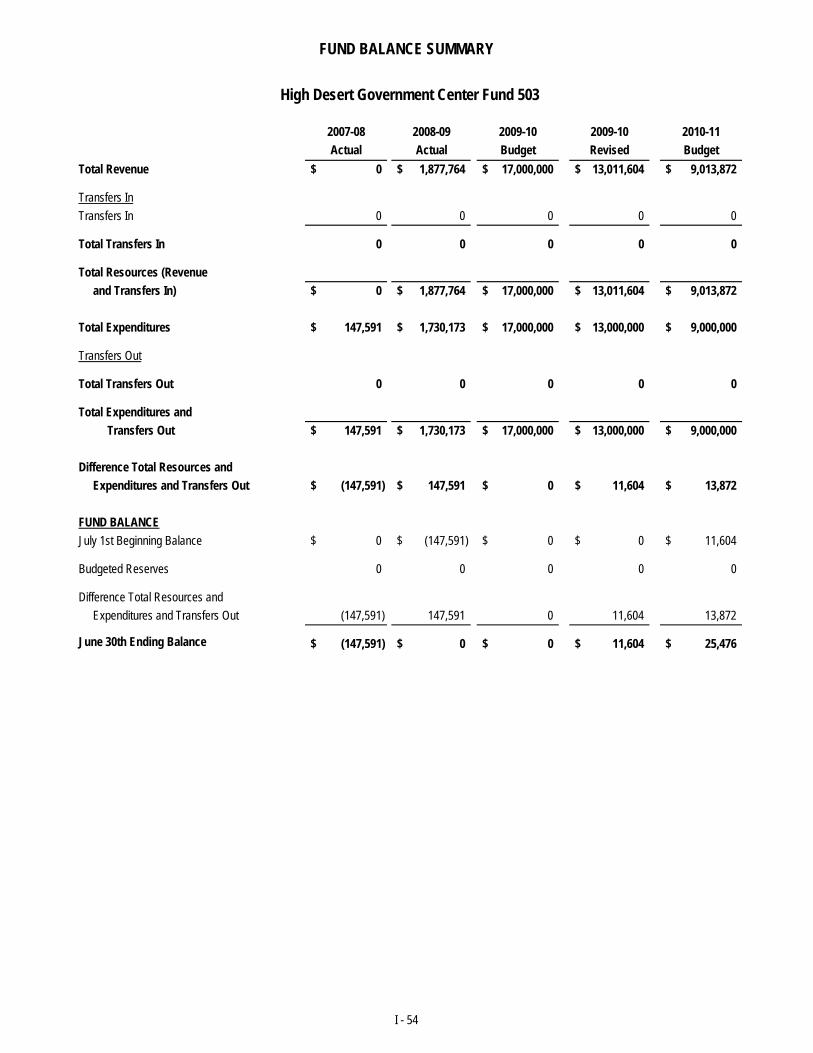
FUND BALANCE SUMMARY
2007-08 2008-09 2009-10 2009-10 2010-11Actual Actual Budget Revised Budget
Total Revenue 0$ 1,877,764$ 17,000,000$ 13,011,604$ 9,013,872$
Transfers InTransfers In 0 0 0 0 0
Total Transfers In 0 0 0 0 0
Total Resources (Revenue and Transfers In) 0$ 1,877,764$ 17,000,000$ 13,011,604$ 9,013,872$
Total Expenditures 147,591$ 1,730,173$ 17,000,000$ 13,000,000$ 9,000,000$
Transfers Out
Total Transfers Out 0 0 0 0 0
Total Expenditures and Transfers Out 147,591$ 1,730,173$ 17,000,000$ 13,000,000$ 9,000,000$
Difference Total Resources and Expenditures and Transfers Out (147,591)$ 147,591$ 0$ 11,604$ 13,872$
FUND BALANCEJuly 1st Beginning Balance 0$ (147,591)$ 0$ 0$ 11,604$
Budgeted Reserves 0 0 0 0 0
High Desert Government Center Fund 503
g
Difference Total Resources and Expenditures and Transfers Out (147,591) 147,591 0 11,604 13,872
June 30th Ending Balance (147,591)$ 0$ 0$ 11,604$ 25,476$
I - 54
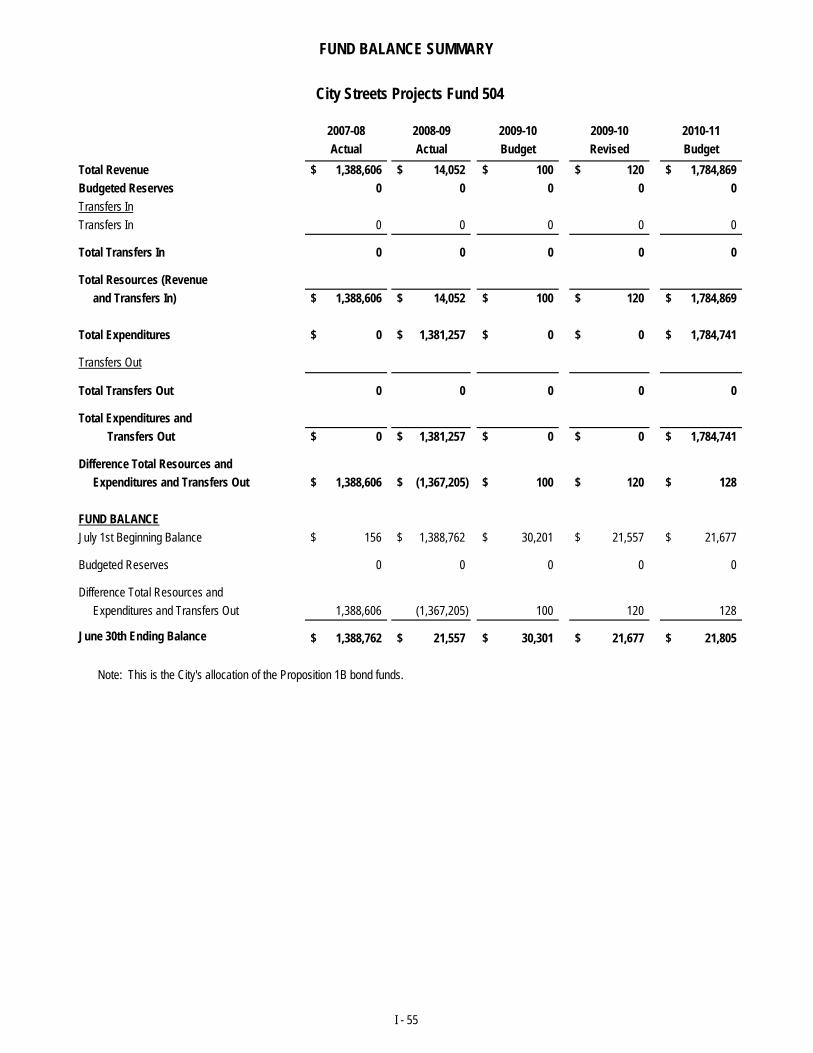
FUND BALANCE SUMMARY
2007-08 2008-09 2009-10 2009-10 2010-11Actual Actual Budget Revised Budget
Total Revenue 1,388,606$ 14,052$ 100$ 120$ 1,784,869$ Budgeted Reserves 0 0 0 0 0Transfers InTransfers In 0 0 0 0 0
Total Transfers In 0 0 0 0 0
Total Resources (Revenue and Transfers In) 1,388,606$ 14,052$ 100$ 120$ 1,784,869$
Total Expenditures 0$ 1,381,257$ 0$ 0$ 1,784,741$
Transfers Out
Total Transfers Out 0 0 0 0 0
Total Expenditures and Transfers Out 0$ 1,381,257$ 0$ 0$ 1,784,741$
Difference Total Resources and Expenditures and Transfers Out 1,388,606$ (1,367,205)$ 100$ 120$ 128$
FUND BALANCEJuly 1st Beginning Balance 156$ 1,388,762$ 30,201$ 21,557$ 21,677$
Budgeted Reserves 0 0 0 0 0
City Streets Projects Fund 504
Difference Total Resources and Expenditures and Transfers Out 1,388,606 (1,367,205) 100 120 128
June 30th Ending Balance 1,388,762$ 21,557$ 30,301$ 21,677$ 21,805$
Note: This is the City's allocation of the Proposition 1B bond funds.
I - 55
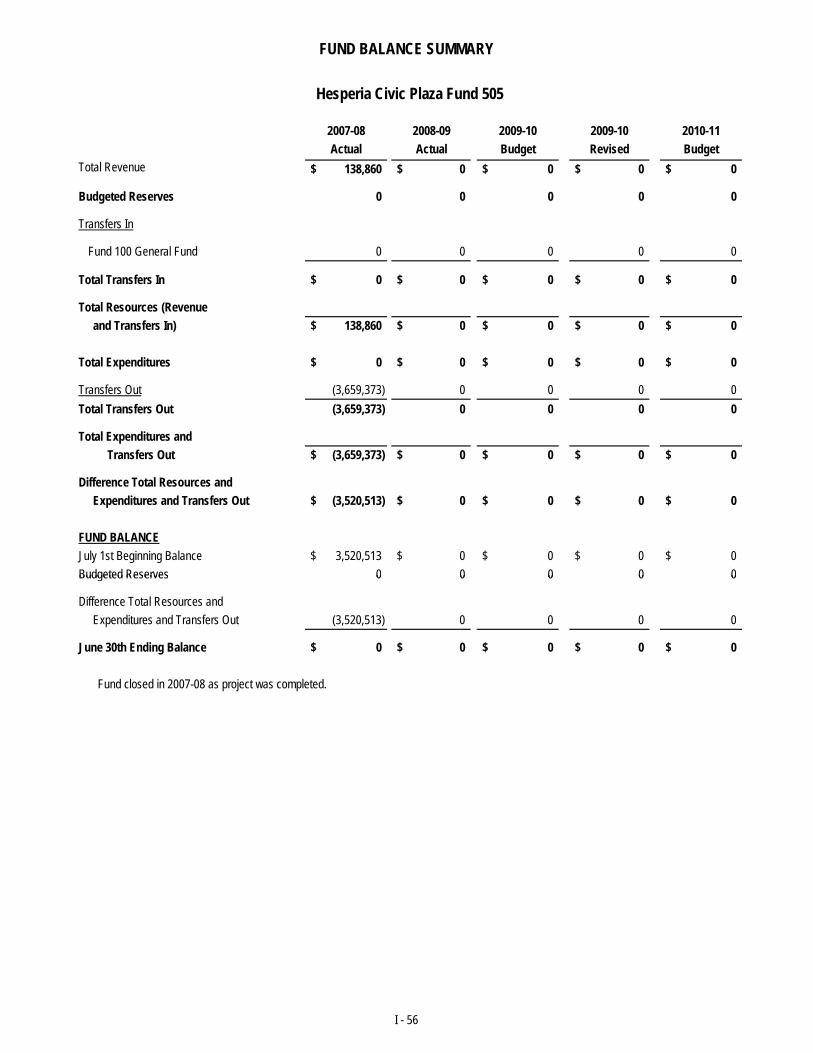
FUND BALANCE SUMMARY
2007-08 2008-09 2009-10 2009-10 2010-11Actual Actual Budget Revised Budget
Total Revenue 138,860$ 0$ 0$ 0$ 0$
Budgeted Reserves 0 0 0 0 0
Transfers In
Fund 100 General Fund 0 0 0 0 0
Total Transfers In 0$ 0$ 0$ 0$ 0$
Total Resources (Revenue and Transfers In) 138,860$ 0$ 0$ 0$ 0$
Total Expenditures 0$ 0$ 0$ 0$ 0$
Transfers Out (3,659,373) 0 0 0 0Total Transfers Out (3,659,373) 0 0 0 0
Total Expenditures and Transfers Out (3,659,373)$ 0$ 0$ 0$ 0$
Difference Total Resources and Expenditures and Transfers Out (3,520,513)$ 0$ 0$ 0$ 0$
FUND BALANCEJuly 1st Beginning Balance 3,520,513$ 0$ 0$ 0$ 0$ Budgeted Reserves 0 0 0 0 0
Hesperia Civic Plaza Fund 505
Budgeted Reserves 0 0 0 0 0
Difference Total Resources and Expenditures and Transfers Out (3,520,513) 0 0 0 0
June 30th Ending Balance 0$ 0$ 0$ 0$ 0$
Fund closed in 2007-08 as project was completed.
I - 56
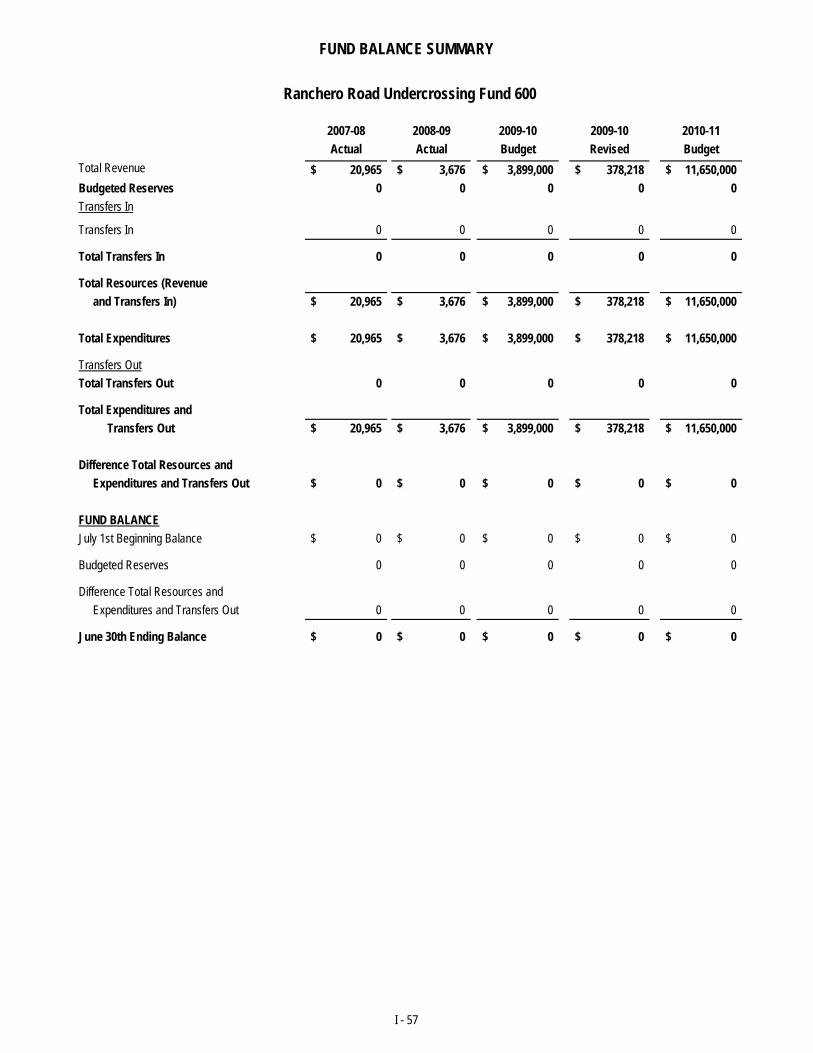
FUND BALANCE SUMMARY
2007-08 2008-09 2009-10 2009-10 2010-11Actual Actual Budget Revised Budget
Total Revenue 20,965$ 3,676$ 3,899,000$ 378,218$ 11,650,000$ Budgeted Reserves 0 0 0 0 0Transfers In
Transfers In 0 0 0 0 0
Total Transfers In 0 0 0 0 0
Total Resources (Revenue and Transfers In) 20,965$ 3,676$ 3,899,000$ 378,218$ 11,650,000$
Total Expenditures 20,965$ 3,676$ 3,899,000$ 378,218$ 11,650,000$
Transfers OutTotal Transfers Out 0 0 0 0 0
Total Expenditures and Transfers Out 20,965$ 3,676$ 3,899,000$ 378,218$ 11,650,000$
Difference Total Resources and Expenditures and Transfers Out 0$ 0$ 0$ 0$ 0$
FUND BALANCEJuly 1st Beginning Balance 0$ 0$ 0$ 0$ 0$
Budgeted Reserves 0 0 0 0 0
Ranchero Road Undercrossing Fund 600
Difference Total Resources and Expenditures and Transfers Out 0 0 0 0 0
June 30th Ending Balance 0$ 0$ 0$ 0$ 0$
I - 57
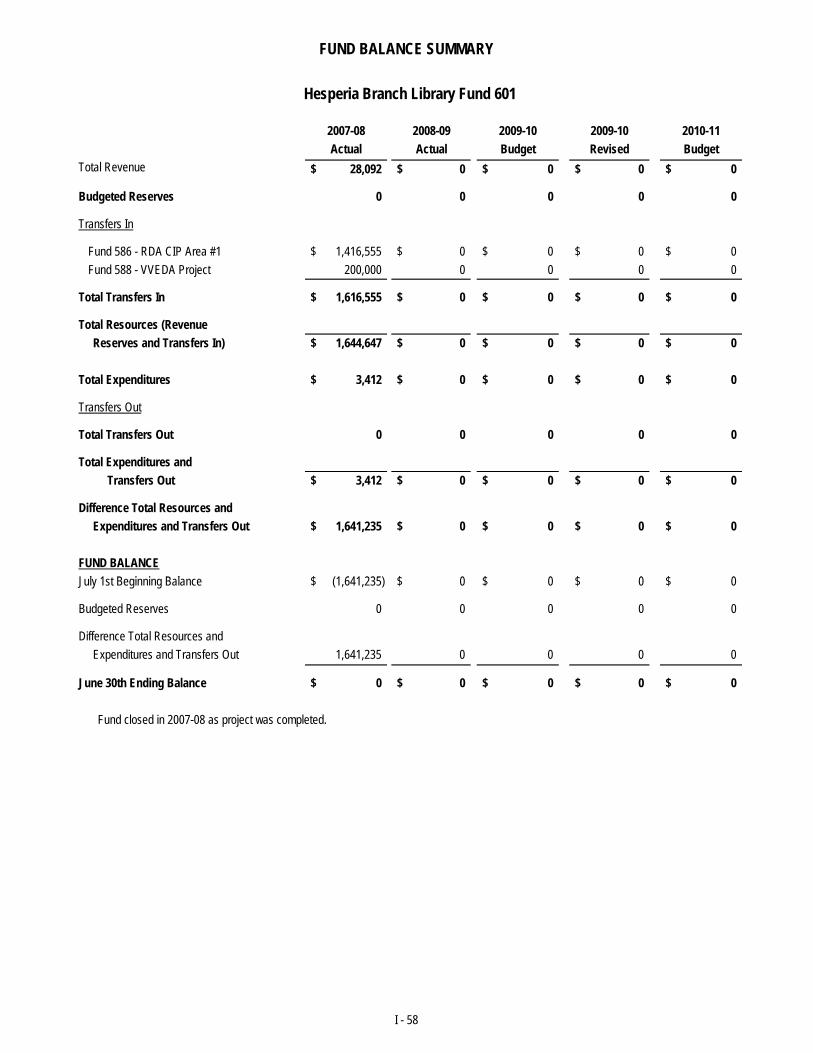
FUND BALANCE SUMMARY
2007-08 2008-09 2009-10 2009-10 2010-11Actual Actual Budget Revised Budget
Total Revenue 28,092$ 0$ 0$ 0$ 0$
Budgeted Reserves 0 0 0 0 0
Transfers In
Fund 586 - RDA CIP Area #1 1,416,555$ 0$ 0$ 0$ 0$ Fund 588 - VVEDA Project 200,000 0 0 0 0
Total Transfers In 1,616,555$ 0$ 0$ 0$ 0$
Total Resources (Revenue Reserves and Transfers In) 1,644,647$ 0$ 0$ 0$ 0$
Total Expenditures 3,412$ 0$ 0$ 0$ 0$
Transfers Out
Total Transfers Out 0 0 0 0 0
Total Expenditures and Transfers Out 3,412$ 0$ 0$ 0$ 0$
Difference Total Resources and Expenditures and Transfers Out 1,641,235$ 0$ 0$ 0$ 0$
FUND BALANCEJ l 1 t B i i B l (1 641 235)$ 0$ 0$ 0$ 0$
Hesperia Branch Library Fund 601
July 1st Beginning Balance (1,641,235)$ 0$ 0$ 0$ 0$
Budgeted Reserves 0 0 0 0 0
Difference Total Resources and Expenditures and Transfers Out 1,641,235 0 0 0 0
June 30th Ending Balance 0$ 0$ 0$ 0$ 0$
Fund closed in 2007-08 as project was completed.
I - 58
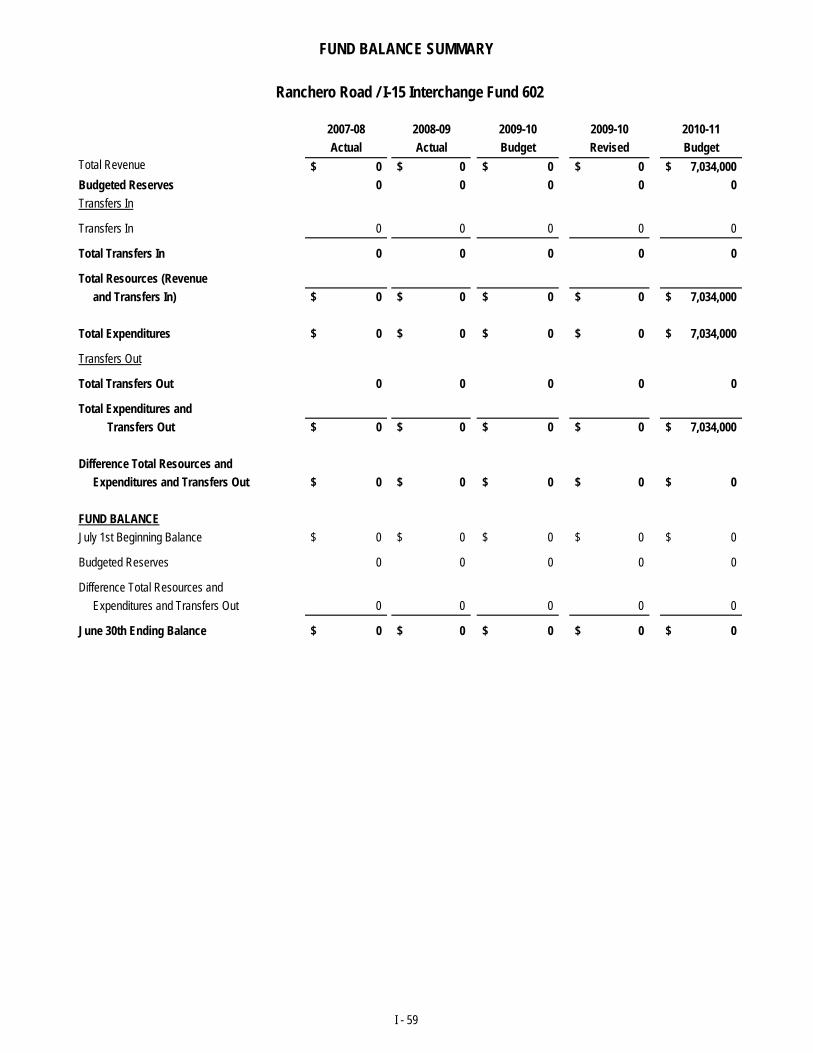
FUND BALANCE SUMMARY
2007-08 2008-09 2009-10 2009-10 2010-11Actual Actual Budget Revised Budget
Total Revenue 0$ 0$ 0$ 0$ 7,034,000$ Budgeted Reserves 0 0 0 0 0Transfers In
Transfers In 0 0 0 0 0
Total Transfers In 0 0 0 0 0
Total Resources (Revenue and Transfers In) 0$ 0$ 0$ 0$ 7,034,000$
Total Expenditures 0$ 0$ 0$ 0$ 7,034,000$
Transfers Out
Total Transfers Out 0 0 0 0 0
Total Expenditures and Transfers Out 0$ 0$ 0$ 0$ 7,034,000$
Difference Total Resources and Expenditures and Transfers Out 0$ 0$ 0$ 0$ 0$
FUND BALANCEJuly 1st Beginning Balance 0$ 0$ 0$ 0$ 0$
Budgeted Reserves 0 0 0 0 0
Ranchero Road / I-15 Interchange Fund 602
Difference Total Resources and Expenditures and Transfers Out 0 0 0 0 0
June 30th Ending Balance 0$ 0$ 0$ 0$ 0$
I - 59
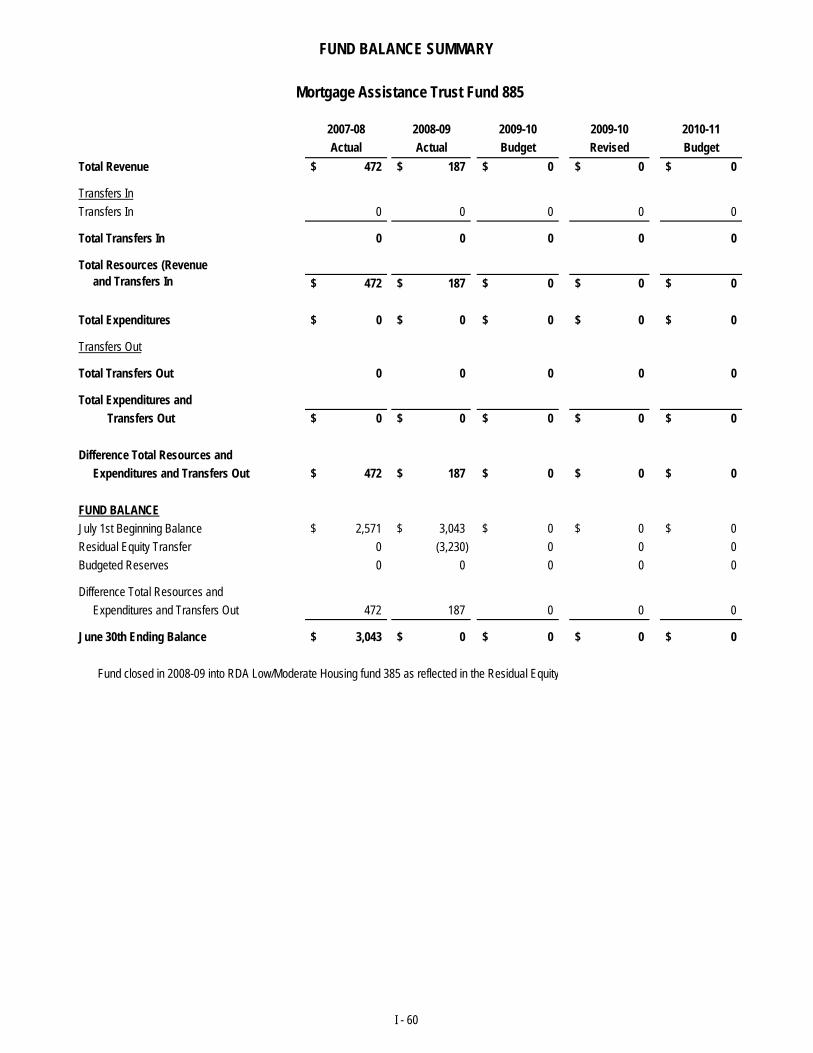
FUND BALANCE SUMMARY
2007-08 2008-09 2009-10 2009-10 2010-11Actual Actual Budget Revised Budget
Total Revenue 472$ 187$ 0$ 0$ 0$
Transfers InTransfers In 0 0 0 0 0
Total Transfers In 0 0 0 0 0
Total Resources (Revenue and Transfers In 472$ 187$ 0$ 0$ 0$
Total Expenditures 0$ 0$ 0$ 0$ 0$
Transfers Out
Total Transfers Out 0 0 0 0 0
Total Expenditures and Transfers Out 0$ 0$ 0$ 0$ 0$
Difference Total Resources and Expenditures and Transfers Out 472$ 187$ 0$ 0$ 0$
FUND BALANCEJuly 1st Beginning Balance 2,571$ 3,043$ 0$ 0$ 0$ Residual Equity Transfer 0 (3,230) 0 0 0Budgeted Reserves 0 0 0 0 0
Mortgage Assistance Trust Fund 885
Difference Total Resources and Expenditures and Transfers Out 472 187 0 0 0
June 30th Ending Balance 3,043$ 0$ 0$ 0$ 0$
Fund closed in 2008-09 into RDA Low/Moderate Housing fund 385 as reflected in the Residual Equity
I - 60
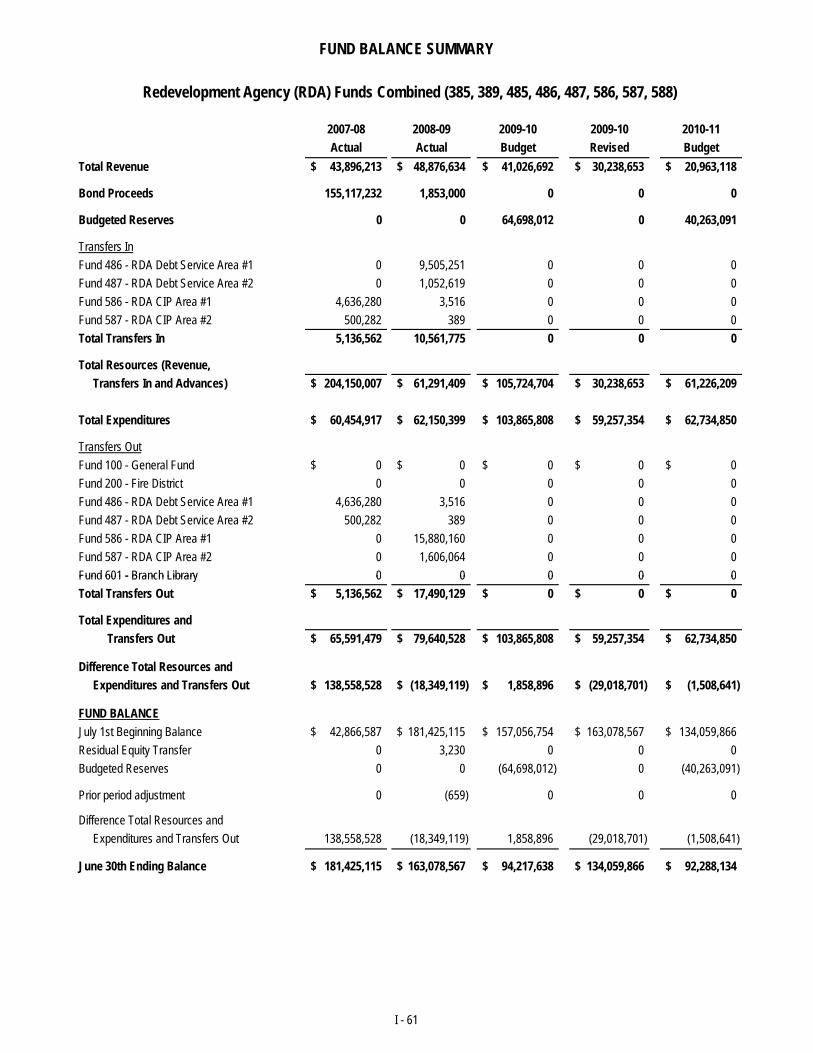
FUND BALANCE SUMMARY
2007-08 2008-09 2009-10 2009-10 2010-11Actual Actual Budget Revised Budget
Total Revenue 43,896,213$ 48,876,634$ 41,026,692$ 30,238,653$ 20,963,118$
Bond Proceeds 155,117,232 1,853,000 0 0 0
Budgeted Reserves 0 0 64,698,012 0 40,263,091
Transfers InFund 486 - RDA Debt Service Area #1 0 9,505,251 0 0 0Fund 487 - RDA Debt Service Area #2 0 1,052,619 0 0 0Fund 586 - RDA CIP Area #1 4,636,280 3,516 0 0 0Fund 587 - RDA CIP Area #2 500,282 389 0 0 0Total Transfers In 5,136,562 10,561,775 0 0 0
Total Resources (Revenue, Transfers In and Advances) 204,150,007$ 61,291,409$ 105,724,704$ 30,238,653$ 61,226,209$
Total Expenditures 60,454,917$ 62,150,399$ 103,865,808$ 59,257,354$ 62,734,850$
Transfers OutFund 100 - General Fund 0$ 0$ 0$ 0$ 0$ Fund 200 - Fire District 0 0 0 0 0Fund 486 - RDA Debt Service Area #1 4,636,280 3,516 0 0 0Fund 487 - RDA Debt Service Area #2 500,282 389 0 0 0Fund 586 - RDA CIP Area #1 0 15,880,160 0 0 0Fund 587 - RDA CIP Area #2 0 1,606,064 0 0 0Fund 601 - Branch Library 0 0 0 0 0
Redevelopment Agency (RDA) Funds Combined (385, 389, 485, 486, 487, 586, 587, 588)
Fund 601 - Branch Library 0 0 0 0 0Total Transfers Out 5,136,562$ 17,490,129$ 0$ 0$ 0$
Total Expenditures and Transfers Out 65,591,479$ 79,640,528$ 103,865,808$ 59,257,354$ 62,734,850$
Difference Total Resources and Expenditures and Transfers Out 138,558,528$ (18,349,119)$ 1,858,896$ (29,018,701)$ (1,508,641)$
FUND BALANCEJuly 1st Beginning Balance 42,866,587$ 181,425,115$ 157,056,754$ 163,078,567$ 134,059,866$ Residual Equity Transfer 0 3,230 0 0 0Budgeted Reserves 0 0 (64,698,012) 0 (40,263,091)
Prior period adjustment 0 (659) 0 0 0
Difference Total Resources and Expenditures and Transfers Out 138,558,528 (18,349,119) 1,858,896 (29,018,701) (1,508,641)
June 30th Ending Balance 181,425,115$ 163,078,567$ 94,217,638$ 134,059,866$ 92,288,134$
I - 61
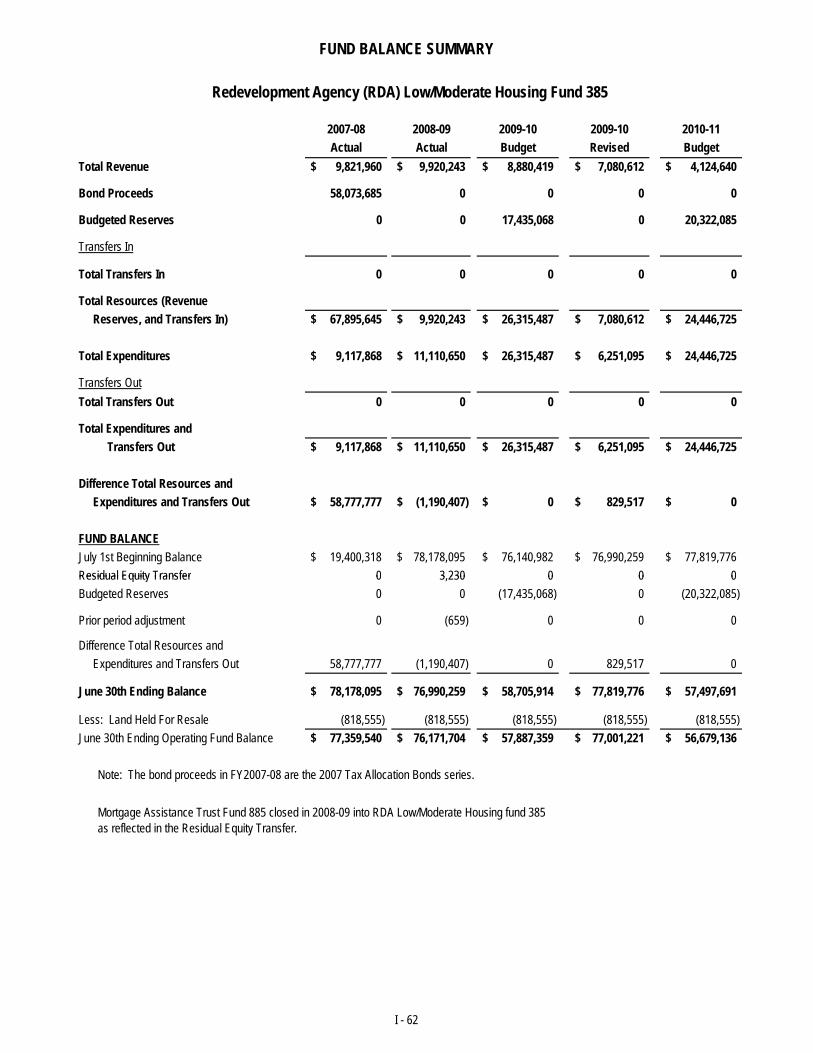
FUND BALANCE SUMMARY
2007-08 2008-09 2009-10 2009-10 2010-11Actual Actual Budget Revised Budget
Total Revenue 9,821,960$ 9,920,243$ 8,880,419$ 7,080,612$ 4,124,640$
Bond Proceeds 58,073,685 0 0 0 0
Budgeted Reserves 0 0 17,435,068 0 20,322,085
Transfers In
Total Transfers In 0 0 0 0 0
Total Resources (Revenue Reserves, and Transfers In) 67,895,645$ 9,920,243$ 26,315,487$ 7,080,612$ 24,446,725$
Total Expenditures 9,117,868$ 11,110,650$ 26,315,487$ 6,251,095$ 24,446,725$
Transfers OutTotal Transfers Out 0 0 0 0 0
Total Expenditures and Transfers Out 9,117,868$ 11,110,650$ 26,315,487$ 6,251,095$ 24,446,725$
Difference Total Resources and Expenditures and Transfers Out 58,777,777$ (1,190,407)$ 0$ 829,517$ 0$
FUND BALANCEJuly 1st Beginning Balance 19,400,318$ 78,178,095$ 76,140,982$ 76,990,259$ 77,819,776$ Residual Equity Transfer 0 3 230 0 0 0
Redevelopment Agency (RDA) Low/Moderate Housing Fund 385
Residual Equity Transfer 0 3,230 0 0 0Budgeted Reserves 0 0 (17,435,068) 0 (20,322,085)
Prior period adjustment 0 (659) 0 0 0
Difference Total Resources and Expenditures and Transfers Out 58,777,777 (1,190,407) 0 829,517 0
June 30th Ending Balance 78,178,095$ 76,990,259$ 58,705,914$ 77,819,776$ 57,497,691$
Less: Land Held For Resale (818,555) (818,555) (818,555) (818,555) (818,555)June 30th Ending Operating Fund Balance 77,359,540$ 76,171,704$ 57,887,359$ 77,001,221$ 56,679,136$
Note: The bond proceeds in FY2007-08 are the 2007 Tax Allocation Bonds series.
Mortgage Assistance Trust Fund 885 closed in 2008-09 into RDA Low/Moderate Housing fund 385 as reflected in the Residual Equity Transfer.
I - 62
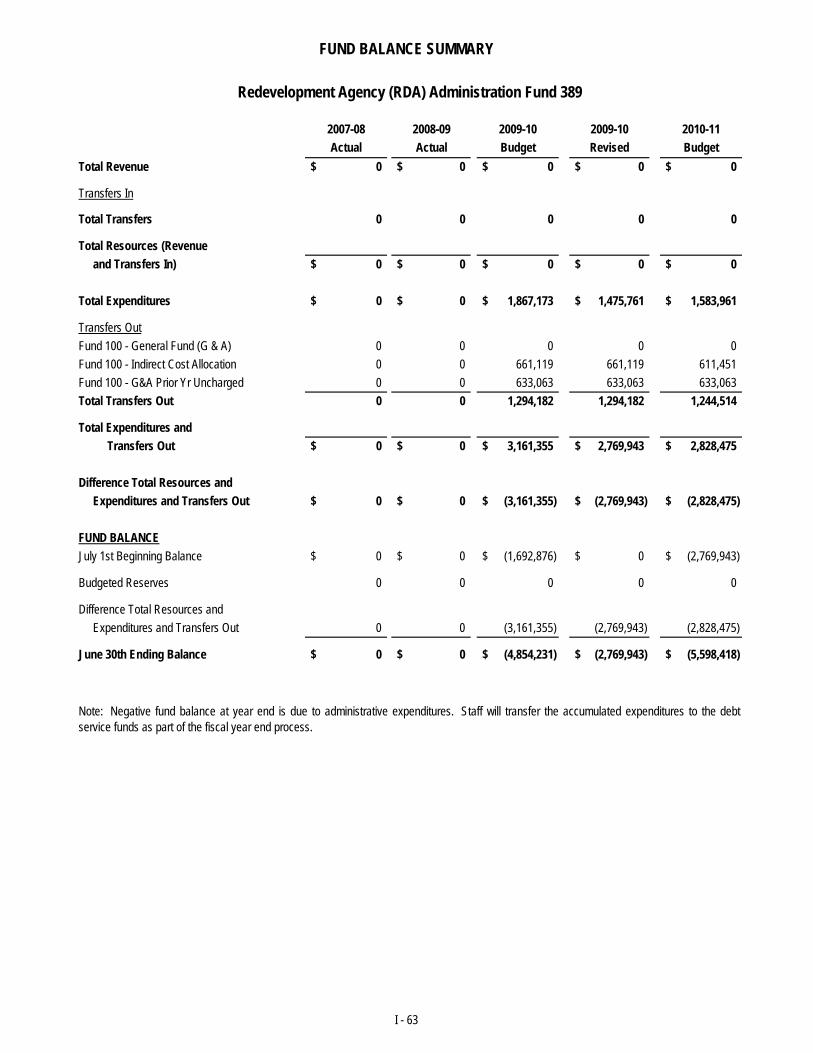
FUND BALANCE SUMMARY
2007-08 2008-09 2009-10 2009-10 2010-11Actual Actual Budget Revised Budget
Total Revenue 0$ 0$ 0$ 0$ 0$
Transfers In
Total Transfers 0 0 0 0 0
Total Resources (Revenue and Transfers In) 0$ 0$ 0$ 0$ 0$
Total Expenditures 0$ 0$ 1,867,173$ 1,475,761$ 1,583,961$
Transfers OutFund 100 - General Fund (G & A) 0 0 0 0 0Fund 100 - Indirect Cost Allocation 0 0 661,119 661,119 611,451Fund 100 - G&A Prior Yr Uncharged 0 0 633,063 633,063 633,063Total Transfers Out 0 0 1,294,182 1,294,182 1,244,514
Total Expenditures and Transfers Out 0$ 0$ 3,161,355$ 2,769,943$ 2,828,475$
Difference Total Resources and Expenditures and Transfers Out 0$ 0$ (3,161,355)$ (2,769,943)$ (2,828,475)$
FUND BALANCEJuly 1st Beginning Balance 0$ 0$ (1,692,876)$ 0$ (2,769,943)$
Redevelopment Agency (RDA) Administration Fund 389
Budgeted Reserves 0 0 0 0 0
Difference Total Resources and Expenditures and Transfers Out 0 0 (3,161,355) (2,769,943) (2,828,475)
June 30th Ending Balance 0$ 0$ (4,854,231)$ (2,769,943)$ (5,598,418)$
Note: Negative fund balance at year end is due to administrative expenditures. Staff will transfer the accumulated expenditures to the debtservice funds as part of the fiscal year end process.
I - 63
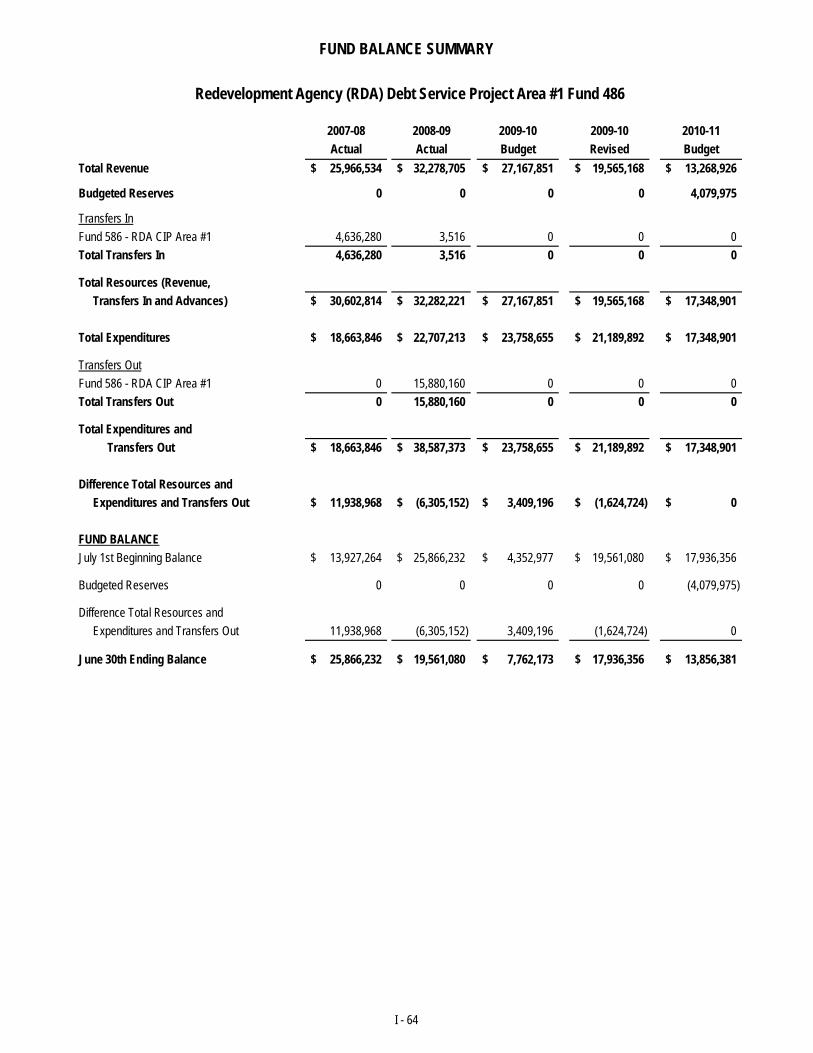
FUND BALANCE SUMMARY
2007-08 2008-09 2009-10 2009-10 2010-11Actual Actual Budget Revised Budget
Total Revenue 25,966,534$ 32,278,705$ 27,167,851$ 19,565,168$ 13,268,926$
Budgeted Reserves 0 0 0 0 4,079,975
Transfers InFund 586 - RDA CIP Area #1 4,636,280 3,516 0 0 0Total Transfers In 4,636,280 3,516 0 0 0
Total Resources (Revenue, Transfers In and Advances) 30,602,814$ 32,282,221$ 27,167,851$ 19,565,168$ 17,348,901$
Total Expenditures 18,663,846$ 22,707,213$ 23,758,655$ 21,189,892$ 17,348,901$
Transfers OutFund 586 - RDA CIP Area #1 0 15,880,160 0 0 0Total Transfers Out 0 15,880,160 0 0 0
Total Expenditures and Transfers Out 18,663,846$ 38,587,373$ 23,758,655$ 21,189,892$ 17,348,901$
Difference Total Resources and Expenditures and Transfers Out 11,938,968$ (6,305,152)$ 3,409,196$ (1,624,724)$ 0$
FUND BALANCEJuly 1st Beginning Balance 13,927,264$ 25,866,232$ 4,352,977$ 19,561,080$ 17,936,356$
Redevelopment Agency (RDA) Debt Service Project Area #1 Fund 486
Budgeted Reserves 0 0 0 0 (4,079,975)
Difference Total Resources and Expenditures and Transfers Out 11,938,968 (6,305,152) 3,409,196 (1,624,724) 0
June 30th Ending Balance 25,866,232$ 19,561,080$ 7,762,173$ 17,936,356$ 13,856,381$
I - 64
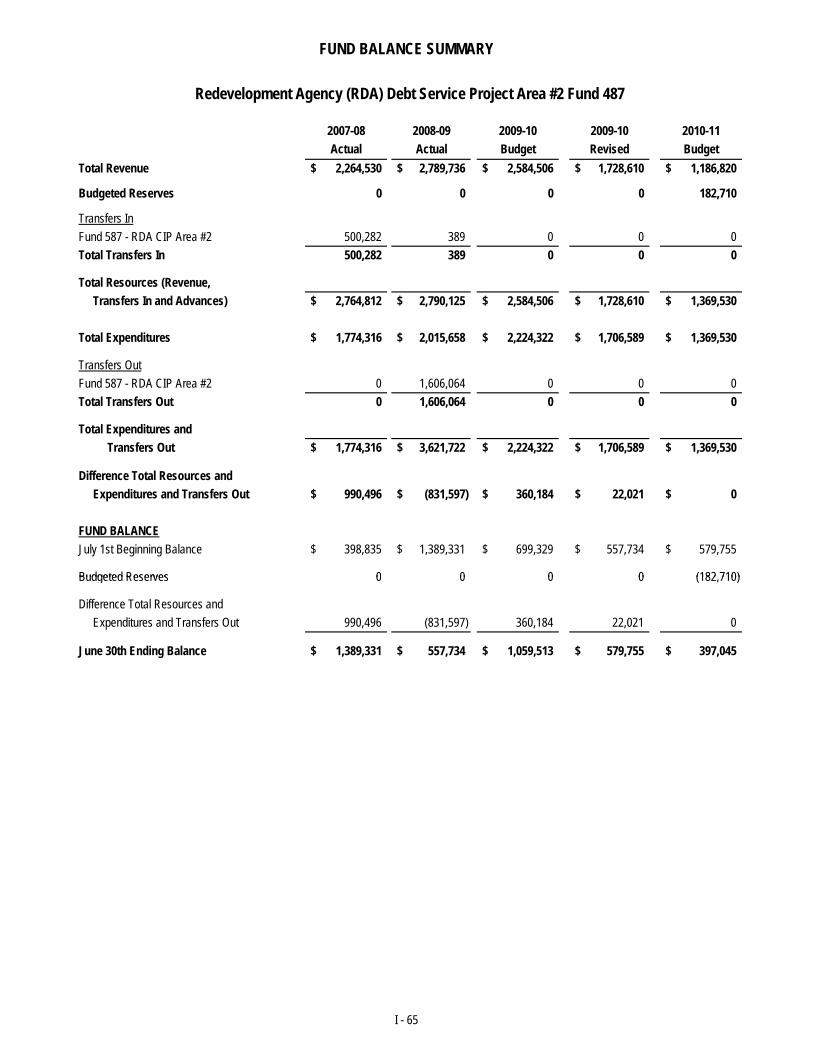
FUND BALANCE SUMMARY
2007-08 2008-09 2009-10 2009-10 2010-11Actual Actual Budget Revised Budget
Total Revenue 2,264,530$ 2,789,736$ 2,584,506$ 1,728,610$ 1,186,820$
Budgeted Reserves 0 0 0 0 182,710
Transfers InFund 587 - RDA CIP Area #2 500,282 389 0 0 0Total Transfers In 500,282 389 0 0 0
Total Resources (Revenue, Transfers In and Advances) 2,764,812$ 2,790,125$ 2,584,506$ 1,728,610$ 1,369,530$
Total Expenditures 1,774,316$ 2,015,658$ 2,224,322$ 1,706,589$ 1,369,530$
Transfers OutFund 587 - RDA CIP Area #2 0 1,606,064 0 0 0Total Transfers Out 0 1,606,064 0 0 0
Total Expenditures and Transfers Out 1,774,316$ 3,621,722$ 2,224,322$ 1,706,589$ 1,369,530$
Difference Total Resources and Expenditures and Transfers Out 990,496$ (831,597)$ 360,184$ 22,021$ 0$
FUND BALANCEJuly 1st Beginning Balance 398,835$ 1,389,331$ 699,329$ 557,734$ 579,755$
Budgeted Reserves 0 0 0 0 (182 710)
Redevelopment Agency (RDA) Debt Service Project Area #2 Fund 487
Budgeted Reserves 0 0 0 0 (182,710)
Difference Total Resources and Expenditures and Transfers Out 990,496 (831,597) 360,184 22,021 0
June 30th Ending Balance 1,389,331$ 557,734$ 1,059,513$ 579,755$ 397,045$
I - 65
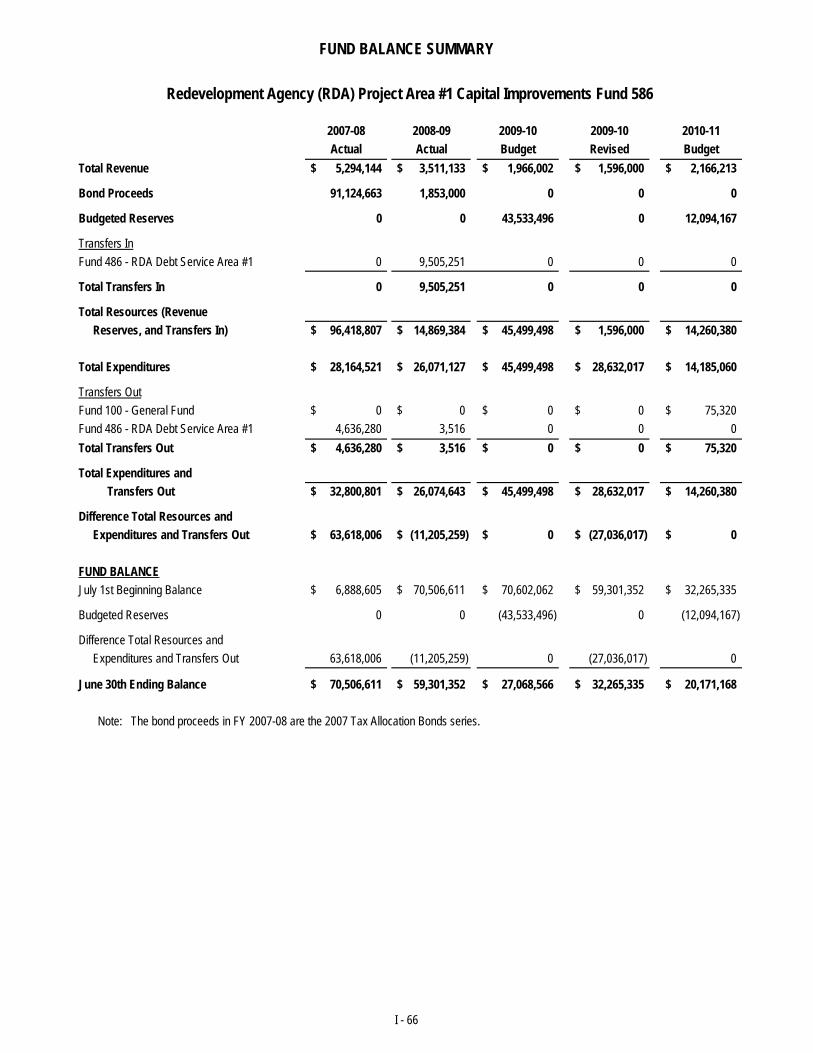
FUND BALANCE SUMMARY
2007-08 2008-09 2009-10 2009-10 2010-11Actual Actual Budget Revised Budget
Total Revenue 5,294,144$ 3,511,133$ 1,966,002$ 1,596,000$ 2,166,213$
Bond Proceeds 91,124,663 1,853,000 0 0 0
Budgeted Reserves 0 0 43,533,496 0 12,094,167
Transfers InFund 486 - RDA Debt Service Area #1 0 9,505,251 0 0 0
Total Transfers In 0 9,505,251 0 0 0
Total Resources (Revenue Reserves, and Transfers In) 96,418,807$ 14,869,384$ 45,499,498$ 1,596,000$ 14,260,380$
Total Expenditures 28,164,521$ 26,071,127$ 45,499,498$ 28,632,017$ 14,185,060$
Transfers OutFund 100 - General Fund 0$ 0$ 0$ 0$ 75,320$ Fund 486 - RDA Debt Service Area #1 4,636,280 3,516 0 0 0Total Transfers Out 4,636,280$ 3,516$ 0$ 0$ 75,320$
Total Expenditures and Transfers Out 32,800,801$ 26,074,643$ 45,499,498$ 28,632,017$ 14,260,380$
Difference Total Resources and Expenditures and Transfers Out 63,618,006$ (11,205,259)$ 0$ (27,036,017)$ 0$
FUND BALANCE
Redevelopment Agency (RDA) Project Area #1 Capital Improvements Fund 586
FUND BALANCEJuly 1st Beginning Balance 6,888,605$ 70,506,611$ 70,602,062$ 59,301,352$ 32,265,335$
Budgeted Reserves 0 0 (43,533,496) 0 (12,094,167)
Difference Total Resources and Expenditures and Transfers Out 63,618,006 (11,205,259) 0 (27,036,017) 0
June 30th Ending Balance 70,506,611$ 59,301,352$ 27,068,566$ 32,265,335$ 20,171,168$
Note: The bond proceeds in FY 2007-08 are the 2007 Tax Allocation Bonds series.
I - 66
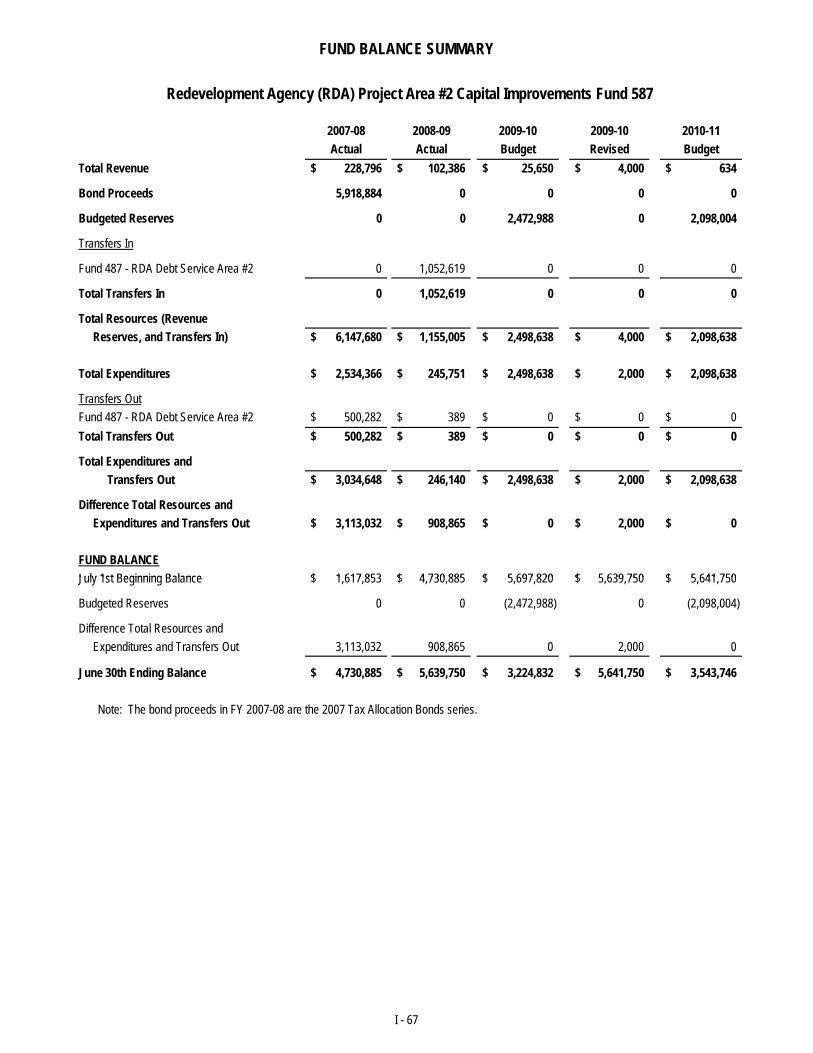
FUND BALANCE SUMMARY
2007-08 2008-09 2009-10 2009-10 2010-11Actual Actual Budget Revised Budget
Total Revenue 228,796$ 102,386$ 25,650$ 4,000$ 634$
Bond Proceeds 5,918,884 0 0 0 0
Budgeted Reserves 0 0 2,472,988 0 2,098,004
Transfers In
Fund 487 - RDA Debt Service Area #2 0 1,052,619 0 0 0
Total Transfers In 0 1,052,619 0 0 0
Total Resources (Revenue Reserves, and Transfers In) 6,147,680$ 1,155,005$ 2,498,638$ 4,000$ 2,098,638$
Total Expenditures 2,534,366$ 245,751$ 2,498,638$ 2,000$ 2,098,638$
Transfers OutFund 487 - RDA Debt Service Area #2 500,282$ 389$ 0$ 0$ 0$ Total Transfers Out 500,282$ 389$ 0$ 0$ 0$
Total Expenditures and Transfers Out 3,034,648$ 246,140$ 2,498,638$ 2,000$ 2,098,638$
Difference Total Resources and Expenditures and Transfers Out 3,113,032$ 908,865$ 0$ 2,000$ 0$
FUND BALANCEJuly 1st Beginning Balance 1 617 853$ 4 730 885$ 5 697 820$ 5 639 750$ 5 641 750$
Redevelopment Agency (RDA) Project Area #2 Capital Improvements Fund 587
July 1st Beginning Balance 1,617,853$ 4,730,885$ 5,697,820$ 5,639,750$ 5,641,750$
Budgeted Reserves 0 0 (2,472,988) 0 (2,098,004)
Difference Total Resources and Expenditures and Transfers Out 3,113,032 908,865 0 2,000 0
June 30th Ending Balance 4,730,885$ 5,639,750$ 3,224,832$ 5,641,750$ 3,543,746$
Note: The bond proceeds in FY 2007-08 are the 2007 Tax Allocation Bonds series.
I - 67
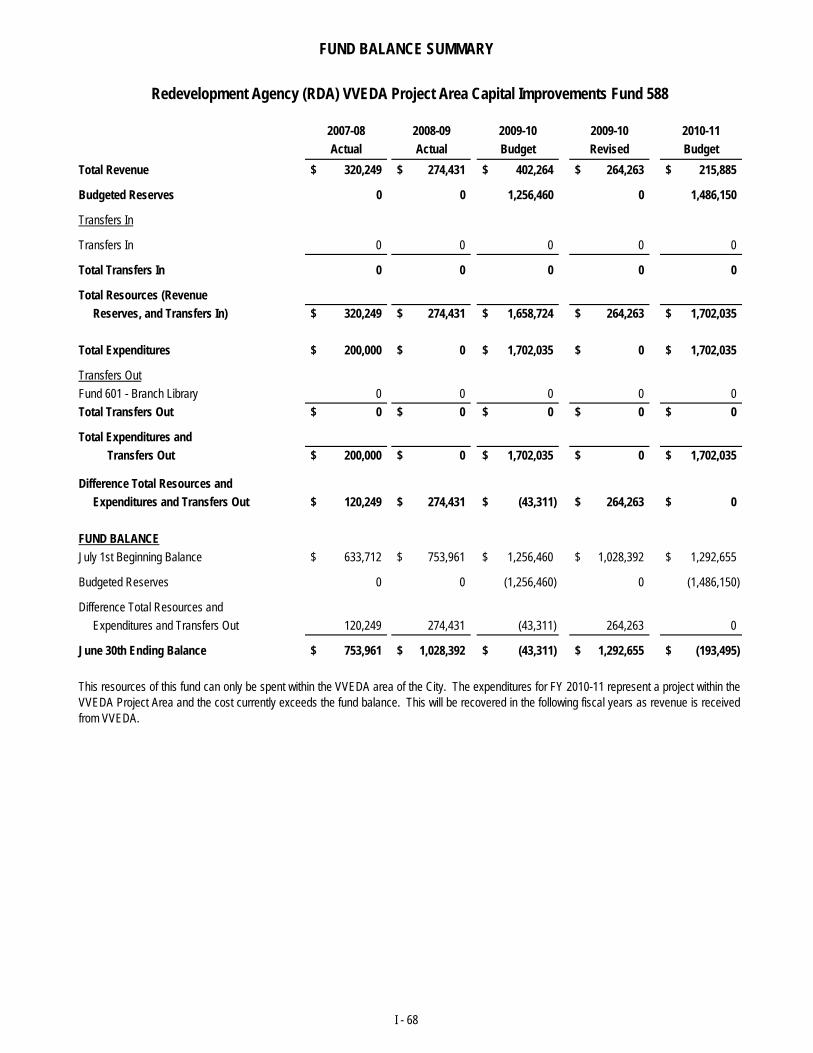
FUND BALANCE SUMMARY
2007-08 2008-09 2009-10 2009-10 2010-11Actual Actual Budget Revised Budget
Total Revenue 320,249$ 274,431$ 402,264$ 264,263$ 215,885$
Budgeted Reserves 0 0 1,256,460 0 1,486,150
Transfers In
Transfers In 0 0 0 0 0
Total Transfers In 0 0 0 0 0
Total Resources (Revenue Reserves, and Transfers In) 320,249$ 274,431$ 1,658,724$ 264,263$ 1,702,035$
Total Expenditures 200,000$ 0$ 1,702,035$ 0$ 1,702,035$
Transfers OutFund 601 - Branch Library 0 0 0 0 0Total Transfers Out 0$ 0$ 0$ 0$ 0$
Total Expenditures and Transfers Out 200,000$ 0$ 1,702,035$ 0$ 1,702,035$
Difference Total Resources and Expenditures and Transfers Out 120,249$ 274,431$ (43,311)$ 264,263$ 0$
FUND BALANCEJuly 1st Beginning Balance 633,712$ 753,961$ 1,256,460$ 1,028,392$ 1,292,655$
Redevelopment Agency (RDA) VVEDA Project Area Capital Improvements Fund 588
Budgeted Reserves 0 0 (1,256,460) 0 (1,486,150)
Difference Total Resources and Expenditures and Transfers Out 120,249 274,431 (43,311) 264,263 0
June 30th Ending Balance 753,961$ 1,028,392$ (43,311)$ 1,292,655$ (193,495)$
This resources of this fund can only be spent within the VVEDA area of the City. The expenditures for FY 2010-11 represent a project within theVVEDA Project Area and the cost currently exceeds the fund balance. This will be recovered in the following fiscal years as revenue is receivedfrom VVEDA.
I - 68
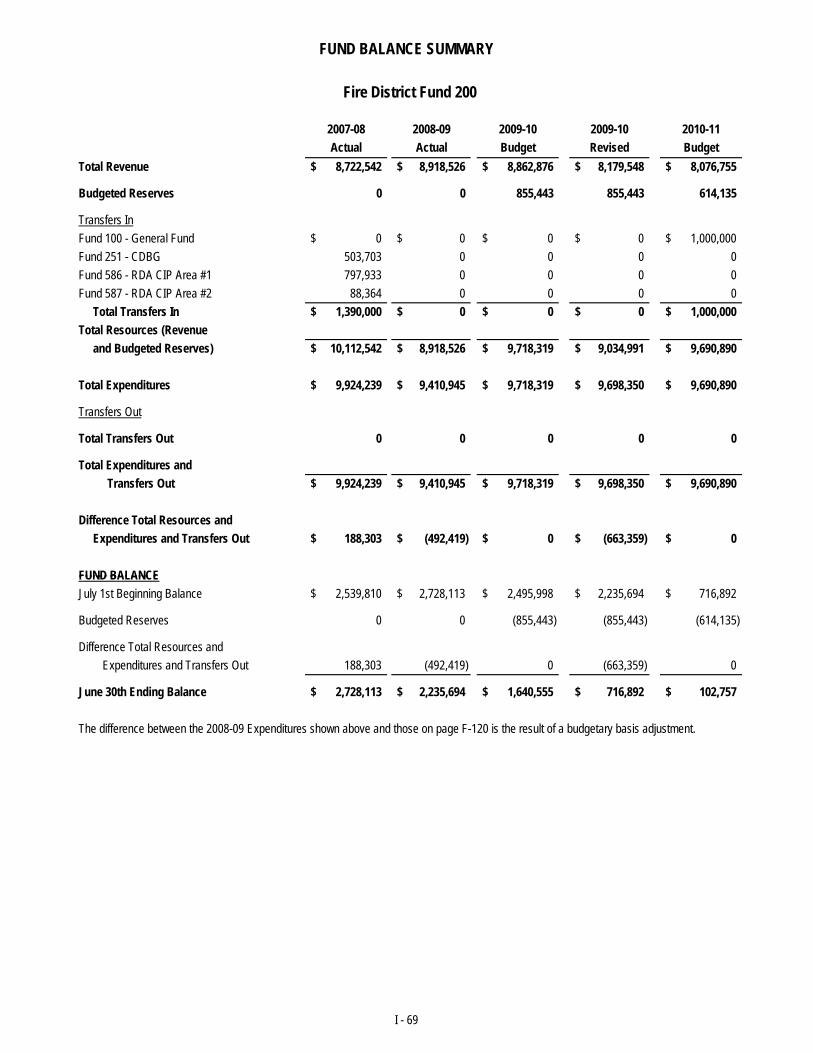
FUND BALANCE SUMMARY
2007-08 2008-09 2009-10 2009-10 2010-11Actual Actual Budget Revised Budget
Total Revenue 8,722,542$ 8,918,526$ 8,862,876$ 8,179,548$ 8,076,755$
Budgeted Reserves 0 0 855,443 855,443 614,135
Transfers InFund 100 - General Fund 0$ 0$ 0$ 0$ 1,000,000$ Fund 251 - CDBG 503,703 0 0 0 0Fund 586 - RDA CIP Area #1 797,933 0 0 0 0Fund 587 - RDA CIP Area #2 88,364 0 0 0 0 Total Transfers In 1,390,000$ 0$ 0$ 0$ 1,000,000$ Total Resources (Revenue and Budgeted Reserves) 10,112,542$ 8,918,526$ 9,718,319$ 9,034,991$ 9,690,890$
Total Expenditures 9,924,239$ 9,410,945$ 9,718,319$ 9,698,350$ 9,690,890$
Transfers Out
Total Transfers Out 0 0 0 0 0
Total Expenditures and Transfers Out 9,924,239$ 9,410,945$ 9,718,319$ 9,698,350$ 9,690,890$
Difference Total Resources and Expenditures and Transfers Out 188,303$ (492,419)$ 0$ (663,359)$ 0$
FUND BALANCE
Fire District Fund 200
FUND BALANCEJuly 1st Beginning Balance 2,539,810$ 2,728,113$ 2,495,998$ 2,235,694$ 716,892$
Budgeted Reserves 0 0 (855,443) (855,443) (614,135)
Difference Total Resources and Expenditures and Transfers Out 188,303 (492,419) 0 (663,359) 0
June 30th Ending Balance 2,728,113$ 2,235,694$ 1,640,555$ 716,892$ 102,757$
The difference between the 2008-09 Expenditures shown above and those on page F-120 is the result of a budgetary basis adjustment.
I - 69
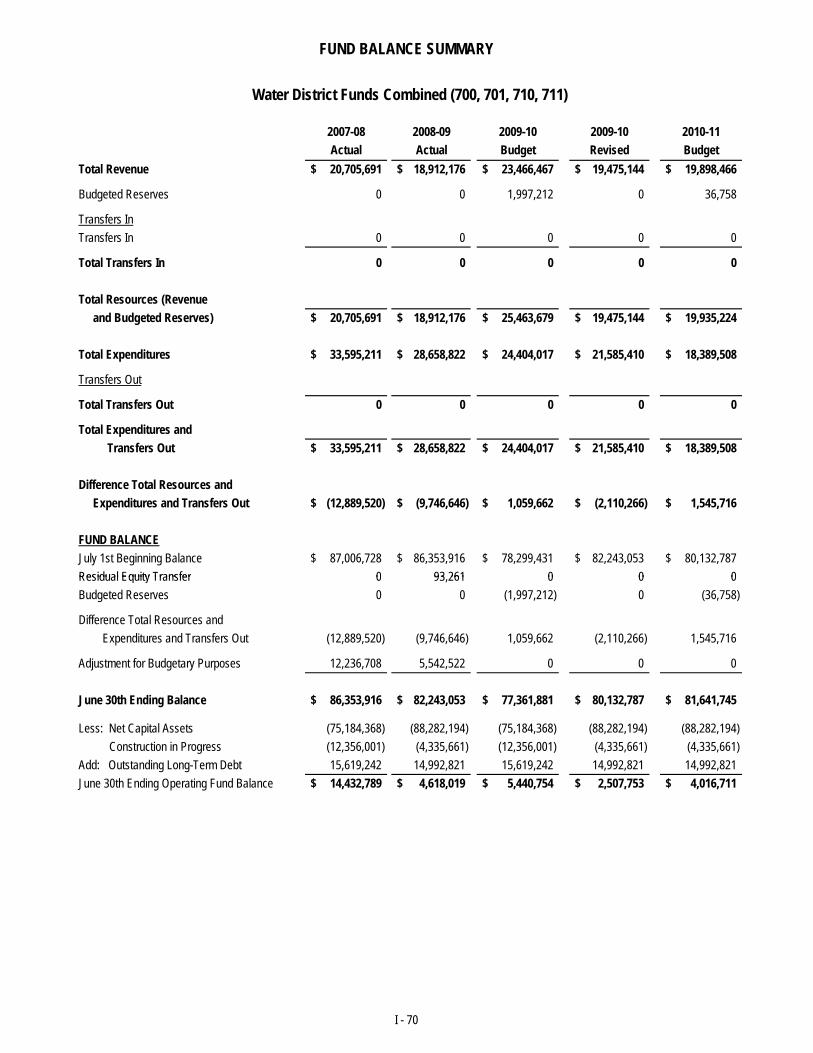
FUND BALANCE SUMMARY
2007-08 2008-09 2009-10 2009-10 2010-11Actual Actual Budget Revised Budget
Total Revenue 20,705,691$ 18,912,176$ 23,466,467$ 19,475,144$ 19,898,466$
Budgeted Reserves 0 0 1,997,212 0 36,758
Transfers InTransfers In 0 0 0 0 0
Total Transfers In 0 0 0 0 0
Total Resources (Revenue and Budgeted Reserves) 20,705,691$ 18,912,176$ 25,463,679$ 19,475,144$ 19,935,224$
Total Expenditures 33,595,211$ 28,658,822$ 24,404,017$ 21,585,410$ 18,389,508$
Transfers Out
Total Transfers Out 0 0 0 0 0
Total Expenditures and Transfers Out 33,595,211$ 28,658,822$ 24,404,017$ 21,585,410$ 18,389,508$
Difference Total Resources and Expenditures and Transfers Out (12,889,520)$ (9,746,646)$ 1,059,662$ (2,110,266)$ 1,545,716$
FUND BALANCEJuly 1st Beginning Balance 87,006,728$ 86,353,916$ 78,299,431$ 82,243,053$ 80,132,787$ Residual Equity Transfer 0 93 261 0 0 0
Water District Funds Combined (700, 701, 710, 711)
Residual Equity Transfer 0 93,261 0 0 0Budgeted Reserves 0 0 (1,997,212) 0 (36,758)
Difference Total Resources and Expenditures and Transfers Out (12,889,520) (9,746,646) 1,059,662 (2,110,266) 1,545,716
Adjustment for Budgetary Purposes 12,236,708 5,542,522 0 0 0
June 30th Ending Balance 86,353,916$ 82,243,053$ 77,361,881$ 80,132,787$ 81,641,745$
Less: Net Capital Assets (75,184,368) (88,282,194) (75,184,368) (88,282,194) (88,282,194) Construction in Progress (12,356,001) (4,335,661) (12,356,001) (4,335,661) (4,335,661)
Add: Outstanding Long-Term Debt 15,619,242 14,992,821 15,619,242 14,992,821 14,992,821June 30th Ending Operating Fund Balance 14,432,789$ 4,618,019$ 5,440,754$ 2,507,753$ 4,016,711$
I - 70
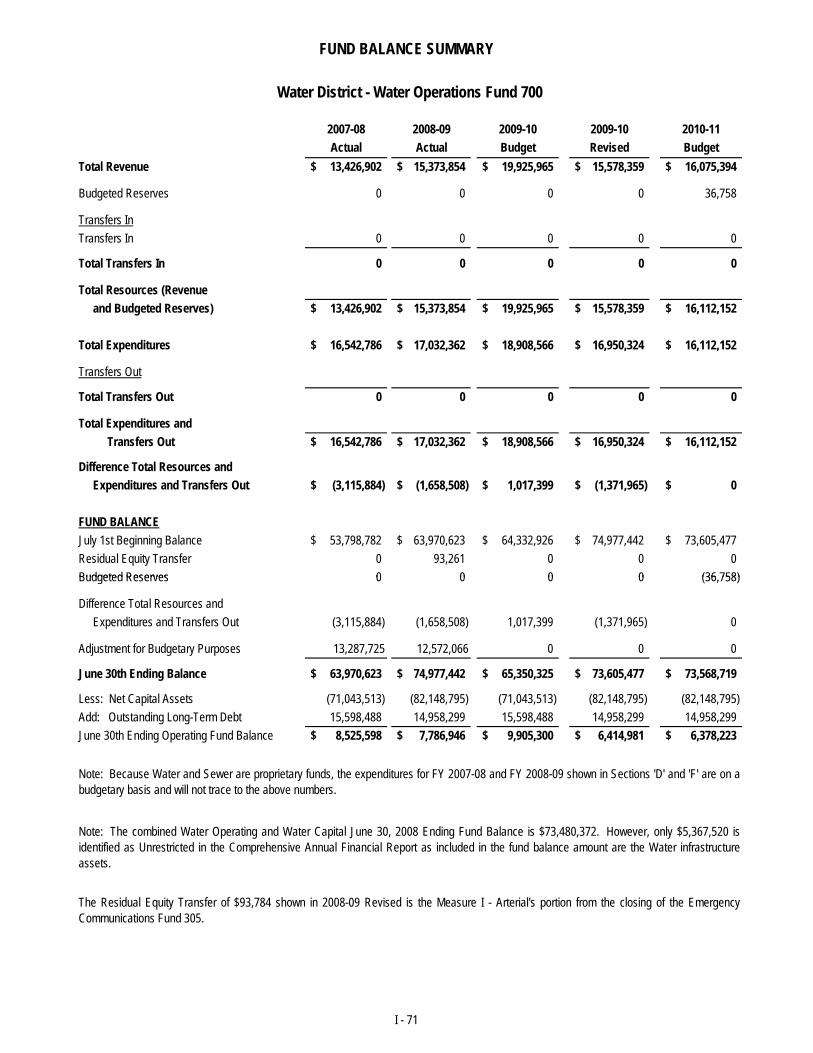
FUND BALANCE SUMMARY
2007-08 2008-09 2009-10 2009-10 2010-11Actual Actual Budget Revised Budget
Total Revenue 13,426,902$ 15,373,854$ 19,925,965$ 15,578,359$ 16,075,394$
Budgeted Reserves 0 0 0 0 36,758
Transfers InTransfers In 0 0 0 0 0
Total Transfers In 0 0 0 0 0
Total Resources (Revenue and Budgeted Reserves) 13,426,902$ 15,373,854$ 19,925,965$ 15,578,359$ 16,112,152$
Total Expenditures 16,542,786$ 17,032,362$ 18,908,566$ 16,950,324$ 16,112,152$
Transfers Out
Total Transfers Out 0 0 0 0 0
Total Expenditures and Transfers Out 16,542,786$ 17,032,362$ 18,908,566$ 16,950,324$ 16,112,152$
Difference Total Resources and Expenditures and Transfers Out (3,115,884)$ (1,658,508)$ 1,017,399$ (1,371,965)$ 0$
FUND BALANCEJuly 1st Beginning Balance 53,798,782$ 63,970,623$ 64,332,926$ 74,977,442$ 73,605,477$ Residual Equity Transfer 0 93,261 0 0 0Budgeted Reserves 0 0 0 0 (36 758)
Water District - Water Operations Fund 700
Budgeted Reserves 0 0 0 0 (36,758)
Difference Total Resources and Expenditures and Transfers Out (3,115,884) (1,658,508) 1,017,399 (1,371,965) 0
Adjustment for Budgetary Purposes 13,287,725 12,572,066 0 0 0
June 30th Ending Balance 63,970,623$ 74,977,442$ 65,350,325$ 73,605,477$ 73,568,719$
Less: Net Capital Assets (71,043,513) (82,148,795) (71,043,513) (82,148,795) (82,148,795)Add: Outstanding Long-Term Debt 15,598,488 14,958,299 15,598,488 14,958,299 14,958,299June 30th Ending Operating Fund Balance 8,525,598$ 7,786,946$ 9,905,300$ 6,414,981$ 6,378,223$
The Residual Equity Transfer of $93,784 shown in 2008-09 Revised is the Measure I - Arterial's portion from the closing of the EmergencyCommunications Fund 305.
Note: Because Water and Sewer are proprietary funds, the expenditures for FY 2007-08 and FY 2008-09 shown in Sections 'D' and 'F' are on abudgetary basis and will not trace to the above numbers.
Note: The combined Water Operating and Water Capital June 30, 2008 Ending Fund Balance is $73,480,372. However, only $5,367,520 isidentified as Unrestricted in the Comprehensive Annual Financial Report as included in the fund balance amount are the Water infrastructureassets.
I - 71
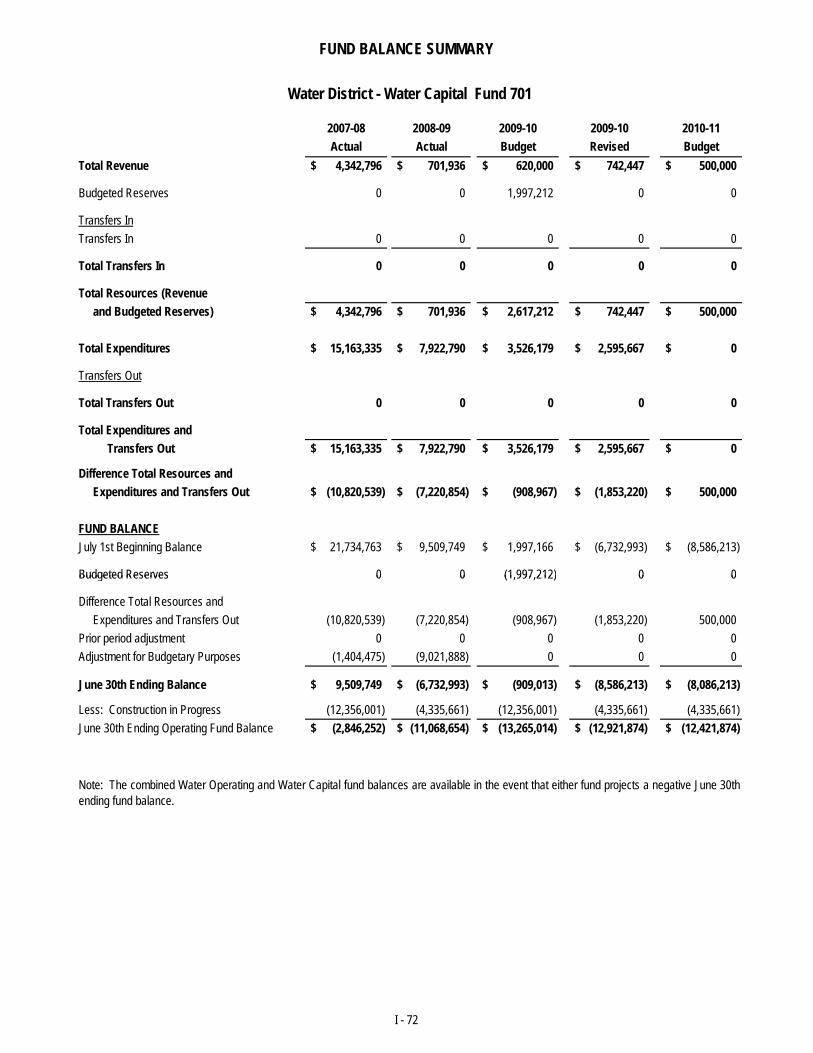
FUND BALANCE SUMMARY
2007-08 2008-09 2009-10 2009-10 2010-11Actual Actual Budget Revised Budget
Total Revenue 4,342,796$ 701,936$ 620,000$ 742,447$ 500,000$
Budgeted Reserves 0 0 1,997,212 0 0
Transfers InTransfers In 0 0 0 0 0
Total Transfers In 0 0 0 0 0
Total Resources (Revenue and Budgeted Reserves) 4,342,796$ 701,936$ 2,617,212$ 742,447$ 500,000$
Total Expenditures 15,163,335$ 7,922,790$ 3,526,179$ 2,595,667$ 0$
Transfers Out
Total Transfers Out 0 0 0 0 0
Total Expenditures and Transfers Out 15,163,335$ 7,922,790$ 3,526,179$ 2,595,667$ 0$
Difference Total Resources and Expenditures and Transfers Out (10,820,539)$ (7,220,854)$ (908,967)$ (1,853,220)$ 500,000$
FUND BALANCEJuly 1st Beginning Balance 21,734,763$ 9,509,749$ 1,997,166$ (6,732,993)$ (8,586,213)$
Budgeted Reserves 0 0 (1 997 212) 0 0
Water District - Water Capital Fund 701
Budgeted Reserves 0 0 (1,997,212) 0 0
Difference Total Resources and Expenditures and Transfers Out (10,820,539) (7,220,854) (908,967) (1,853,220) 500,000Prior period adjustment 0 0 0 0 0Adjustment for Budgetary Purposes (1,404,475) (9,021,888) 0 0 0
June 30th Ending Balance 9,509,749$ (6,732,993)$ (909,013)$ (8,586,213)$ (8,086,213)$
Less: Construction in Progress (12,356,001) (4,335,661) (12,356,001) (4,335,661) (4,335,661)June 30th Ending Operating Fund Balance (2,846,252)$ (11,068,654)$ (13,265,014)$ (12,921,874)$ (12,421,874)$
Note: The combined Water Operating and Water Capital fund balances are available in the event that either fund projects a negative June 30thending fund balance.
I - 72
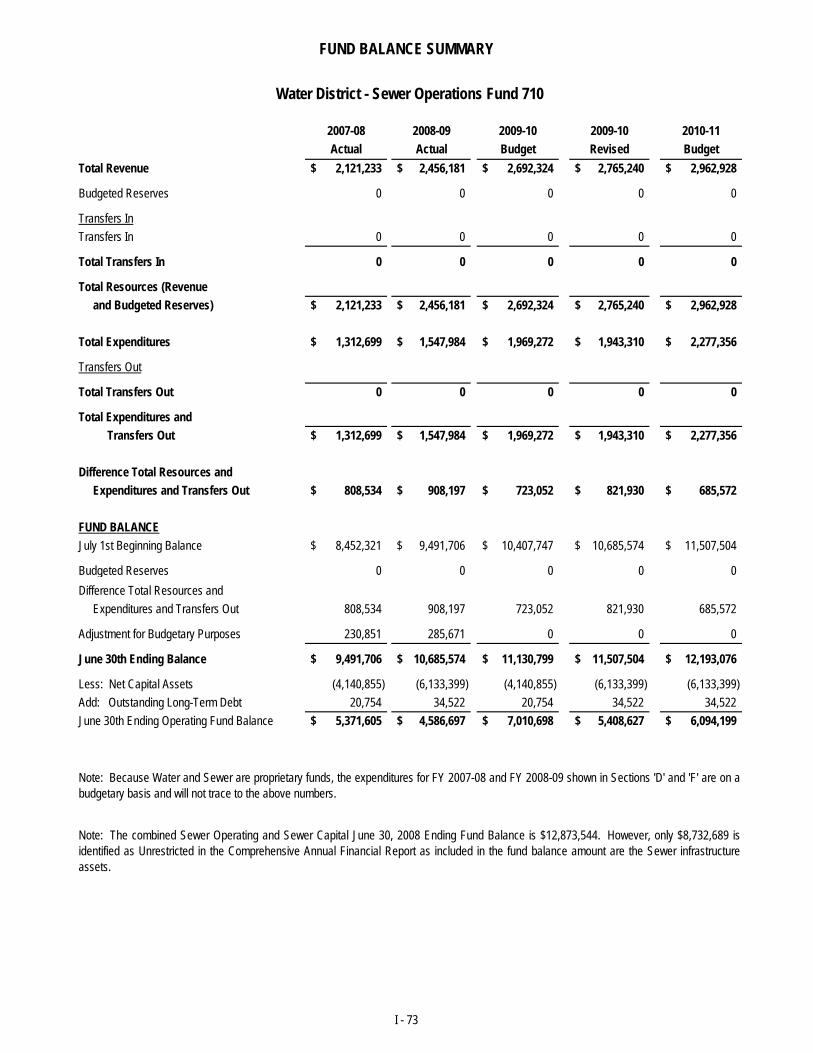
FUND BALANCE SUMMARY
2007-08 2008-09 2009-10 2009-10 2010-11Actual Actual Budget Revised Budget
Total Revenue 2,121,233$ 2,456,181$ 2,692,324$ 2,765,240$ 2,962,928$
Budgeted Reserves 0 0 0 0 0
Transfers InTransfers In 0 0 0 0 0
Total Transfers In 0 0 0 0 0
Total Resources (Revenue and Budgeted Reserves) 2,121,233$ 2,456,181$ 2,692,324$ 2,765,240$ 2,962,928$
Total Expenditures 1,312,699$ 1,547,984$ 1,969,272$ 1,943,310$ 2,277,356$
Transfers Out
Total Transfers Out 0 0 0 0 0
Total Expenditures and Transfers Out 1,312,699$ 1,547,984$ 1,969,272$ 1,943,310$ 2,277,356$
Difference Total Resources and Expenditures and Transfers Out 808,534$ 908,197$ 723,052$ 821,930$ 685,572$
FUND BALANCEJuly 1st Beginning Balance 8,452,321$ 9,491,706$ 10,407,747$ 10,685,574$ 11,507,504$
Budgeted Reserves 0 0 0 0 0
Water District - Sewer Operations Fund 710
udgeted ese es 0 0 0 0 0Difference Total Resources and Expenditures and Transfers Out 808,534 908,197 723,052 821,930 685,572
Adjustment for Budgetary Purposes 230,851 285,671 0 0 0
June 30th Ending Balance 9,491,706$ 10,685,574$ 11,130,799$ 11,507,504$ 12,193,076$
Less: Net Capital Assets (4,140,855) (6,133,399) (4,140,855) (6,133,399) (6,133,399)Add: Outstanding Long-Term Debt 20,754 34,522 20,754 34,522 34,522June 30th Ending Operating Fund Balance 5,371,605$ 4,586,697$ 7,010,698$ 5,408,627$ 6,094,199$
Note: Because Water and Sewer are proprietary funds, the expenditures for FY 2007-08 and FY 2008-09 shown in Sections 'D' and 'F' are on abudgetary basis and will not trace to the above numbers.
Note: The combined Sewer Operating and Sewer Capital June 30, 2008 Ending Fund Balance is $12,873,544. However, only $8,732,689 isidentified as Unrestricted in the Comprehensive Annual Financial Report as included in the fund balance amount are the Sewer infrastructureassets.
I - 73
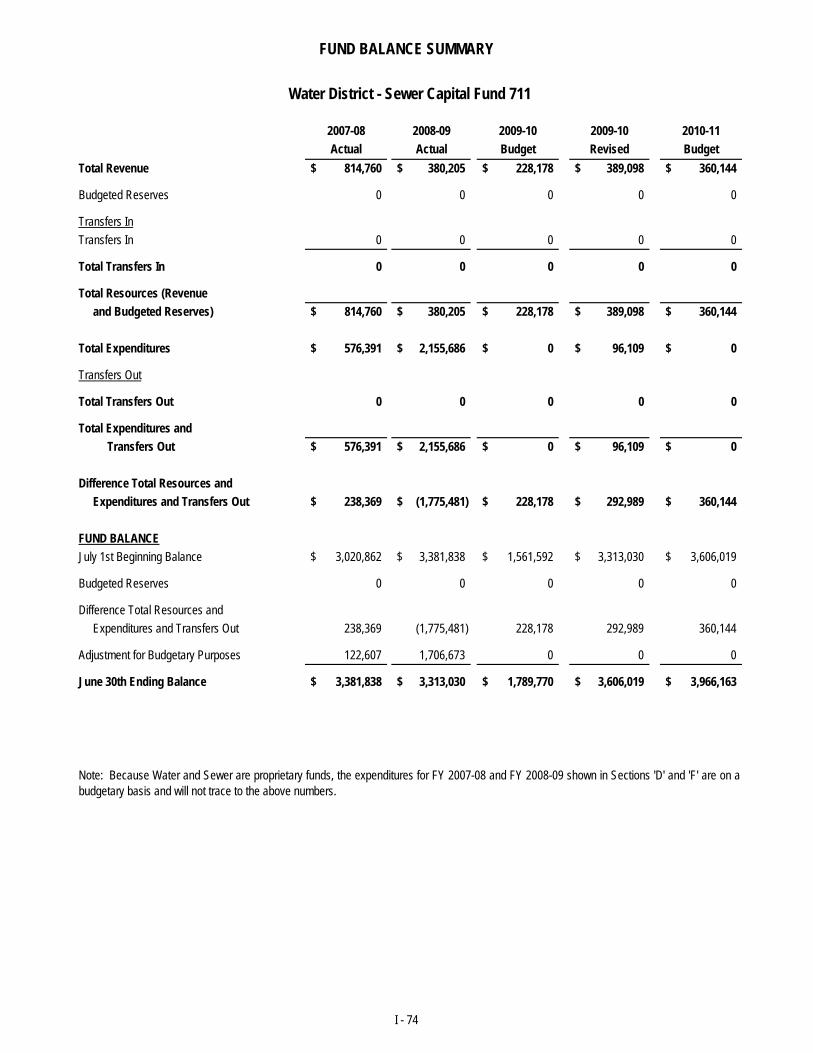
FUND BALANCE SUMMARY
2007-08 2008-09 2009-10 2009-10 2010-11Actual Actual Budget Revised Budget
Total Revenue 814,760$ 380,205$ 228,178$ 389,098$ 360,144$
Budgeted Reserves 0 0 0 0 0
Transfers InTransfers In 0 0 0 0 0
Total Transfers In 0 0 0 0 0
Total Resources (Revenue and Budgeted Reserves) 814,760$ 380,205$ 228,178$ 389,098$ 360,144$
Total Expenditures 576,391$ 2,155,686$ 0$ 96,109$ 0$
Transfers Out
Total Transfers Out 0 0 0 0 0
Total Expenditures and Transfers Out 576,391$ 2,155,686$ 0$ 96,109$ 0$
Difference Total Resources and Expenditures and Transfers Out 238,369$ (1,775,481)$ 228,178$ 292,989$ 360,144$
FUND BALANCEJuly 1st Beginning Balance 3,020,862$ 3,381,838$ 1,561,592$ 3,313,030$ 3,606,019$
Water District - Sewer Capital Fund 711
Budgeted Reserves 0 0 0 0 0
Difference Total Resources and Expenditures and Transfers Out 238,369 (1,775,481) 228,178 292,989 360,144
Adjustment for Budgetary Purposes 122,607 1,706,673 0 0 0
June 30th Ending Balance 3,381,838$ 3,313,030$ 1,789,770$ 3,606,019$ 3,966,163$
Note: Because Water and Sewer are proprietary funds, the expenditures for FY 2007-08 and FY 2008-09 shown in Sections 'D' and 'F' are on abudgetary basis and will not trace to the above numbers.
I - 74
S U P P L E M E N T A L
I N F O R M A T I O N
Budget Adoption Resolutions – The following six resolutions were approved by the City Council to
adopt the Fiscal Year 2010-11 Budget and Gann Appropriations Limits for the City and its subsidiary districts:
Resolution No. 2010-041 - Adopting the City General Fund and Other Related Funds Fiscal Year 2010-11 Budget.
Resolution No. 2010-049 - Adopting the City of Hesperia Gann Appropriations Limit for Fiscal
Year 2010-11.
Resolution No. HCRA 2010-011 - Adopting the Hesperia Community Redevelopment Agency Fiscal Year 2010-11 Budget.
Resolution No. HFPD 2010-008 - Adopting the Hesperia Fire Protection District for Fiscal Year
2010-11 Budget.
Resolution No. HFPD 2010-009 - Adopting the Hesperia Fire Protection District Gann Appropriations Limit for Fiscal Year 2010-11.
Resolution No. HWD 2010-011 - Adopting the Hesperia Water District Fiscal Year 2010-11
Budget.
City of Hesperia - General and Administrative Allocation Plan Fiscal Year 2010-11
Significant Accounting Policies
List of Acronyms
Glossary
Index
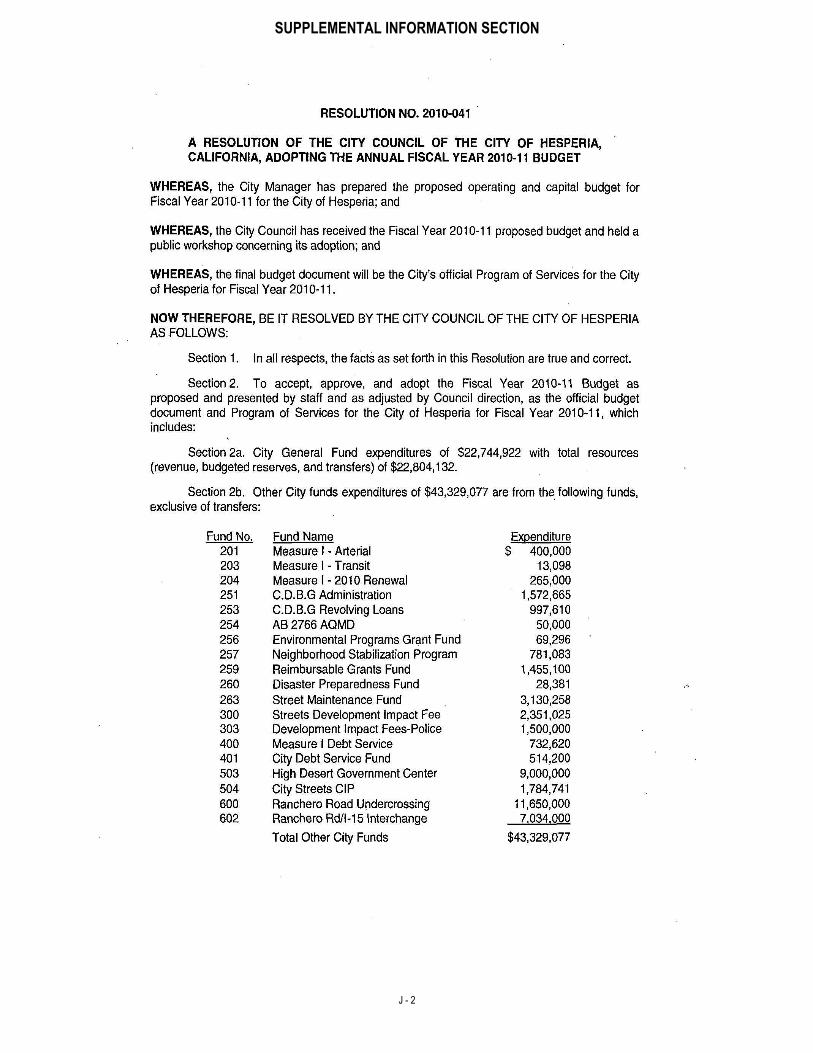
SUPPLEMENTAL INFORMATION SECTION
J - 2
SUPPLEMENTAL INFORMATION SECTION
J - 3
SUPPLEMENTAL INFORMATION SECTION
J - 4
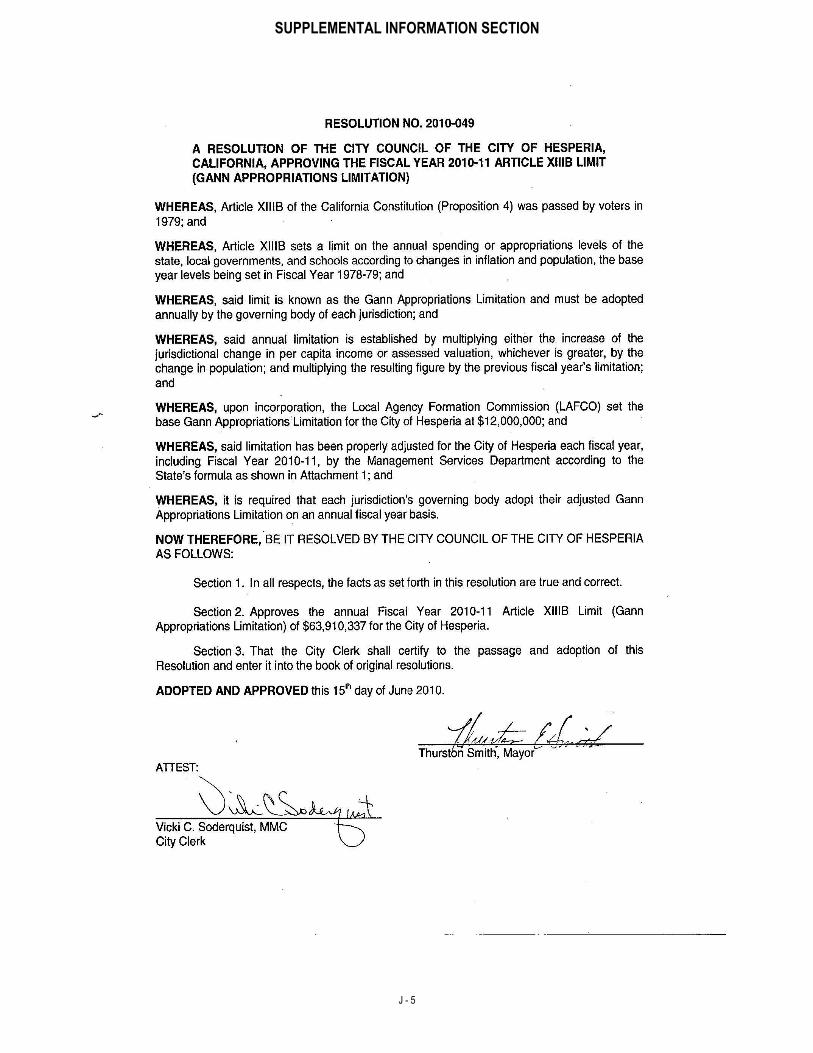
SUPPLEMENTAL INFORMATION SECTION
J - 5
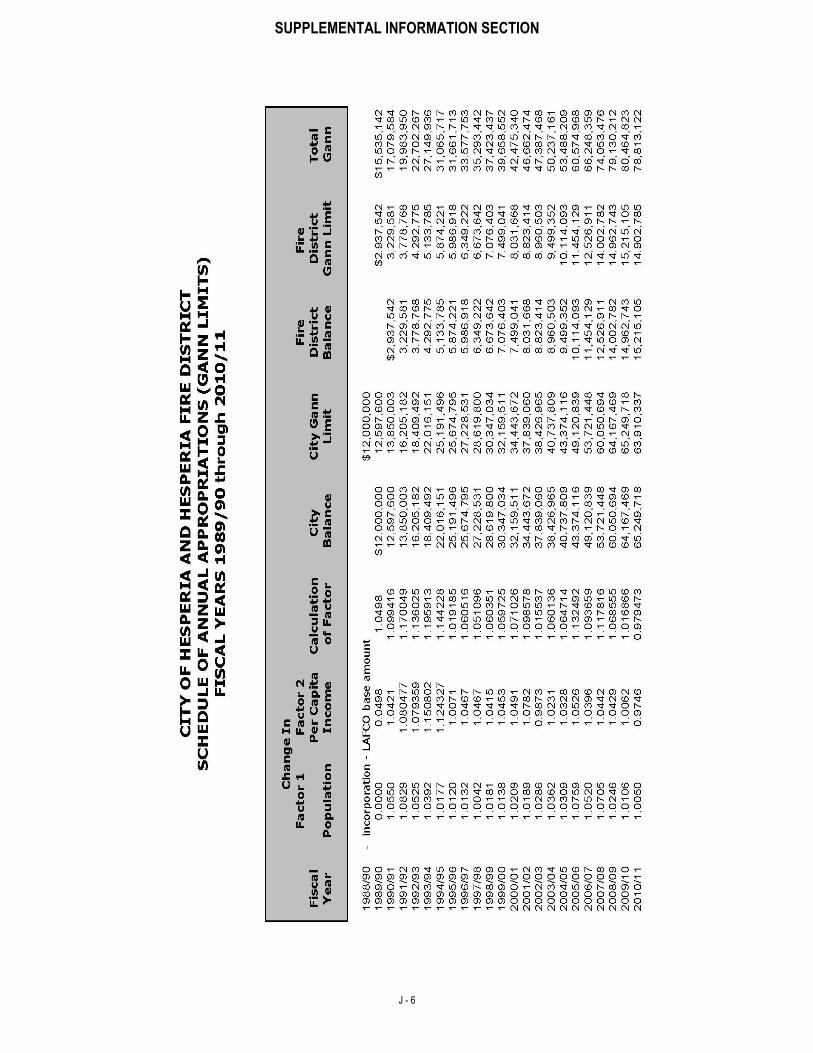
SUPPLEMENTAL INFORMATION SECTION
J - 6
SUPPLEMENTAL INFORMATION SECTION
J - 7
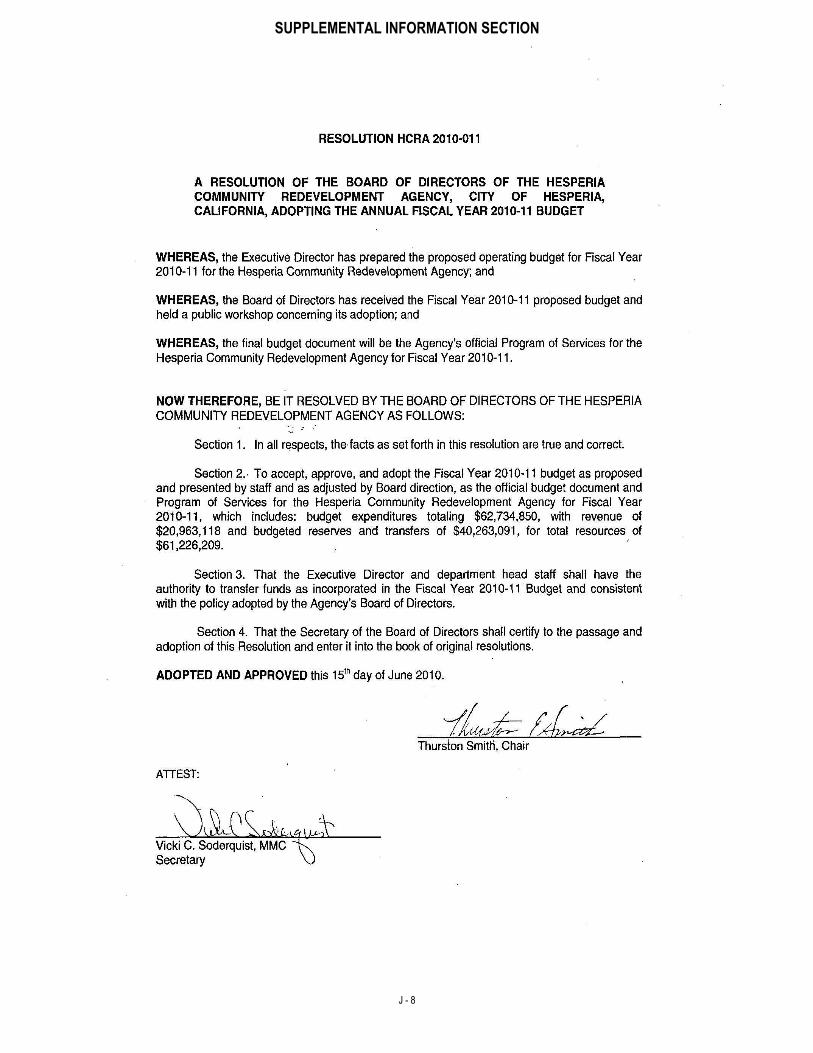
SUPPLEMENTAL INFORMATION SECTION
J - 8
SUPPLEMENTAL INFORMATION SECTION
J - 9
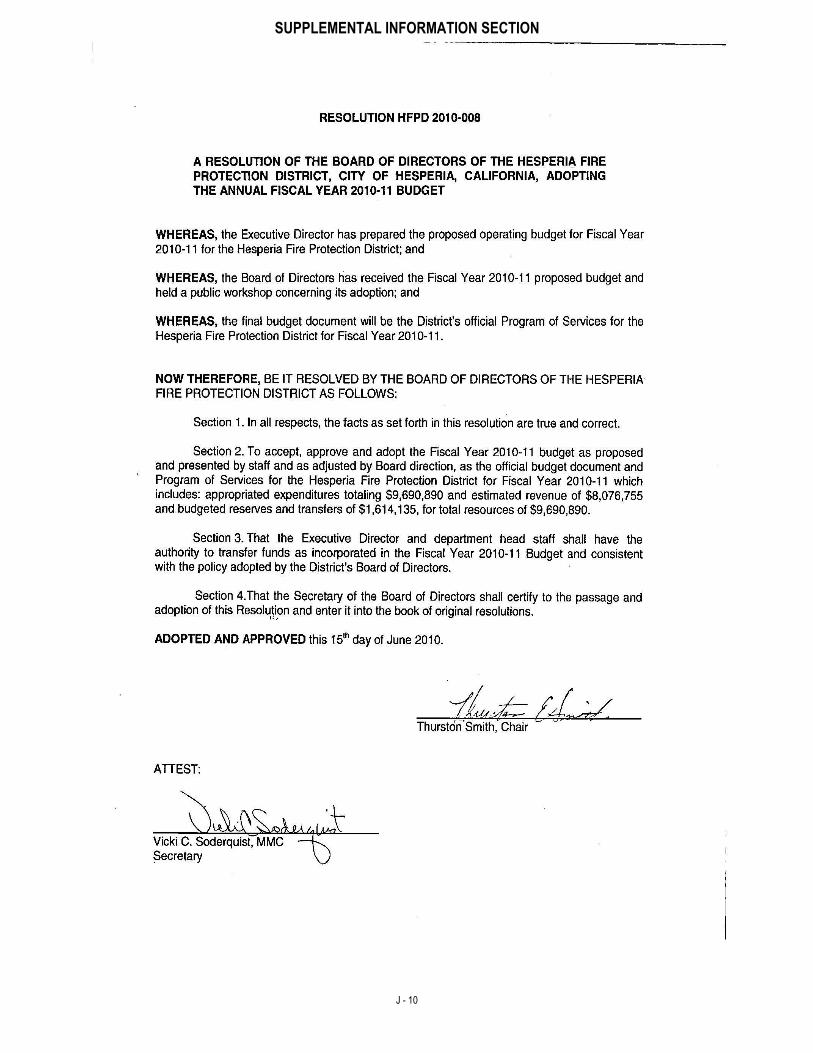
SUPPLEMENTAL INFORMATION SECTION
J - 10
SUPPLEMENTAL INFORMATION SECTION
J - 11
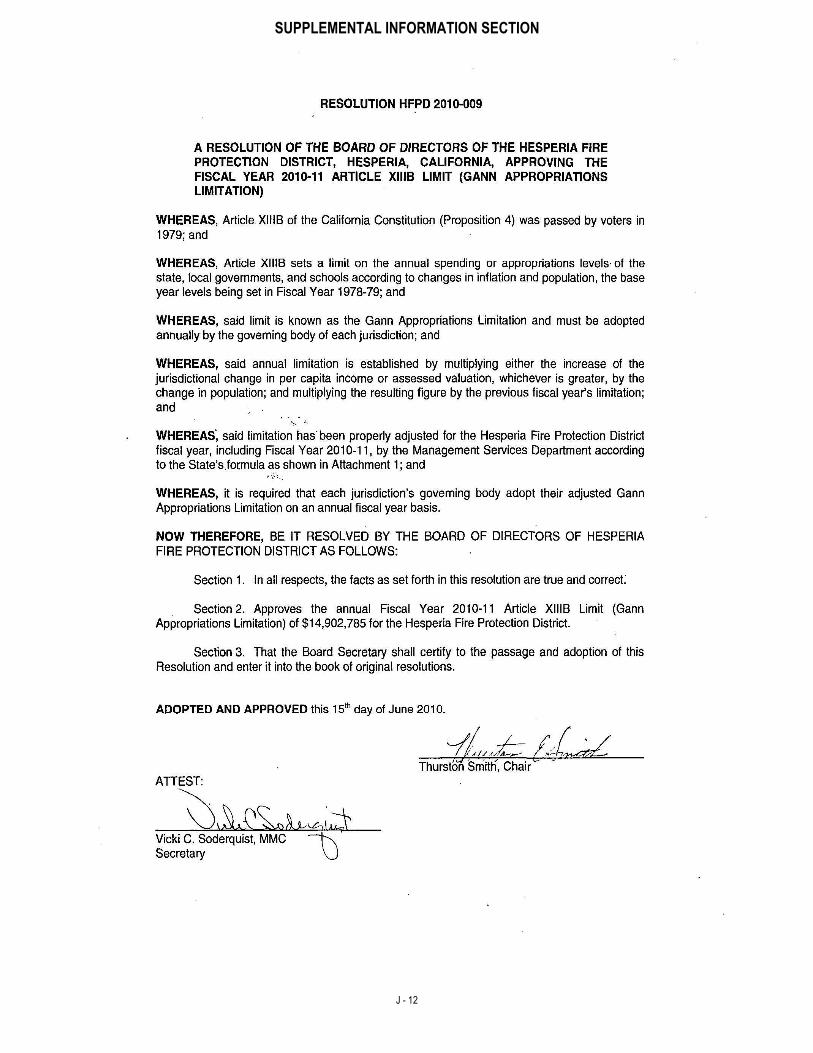
SUPPLEMENTAL INFORMATION SECTION
J - 12
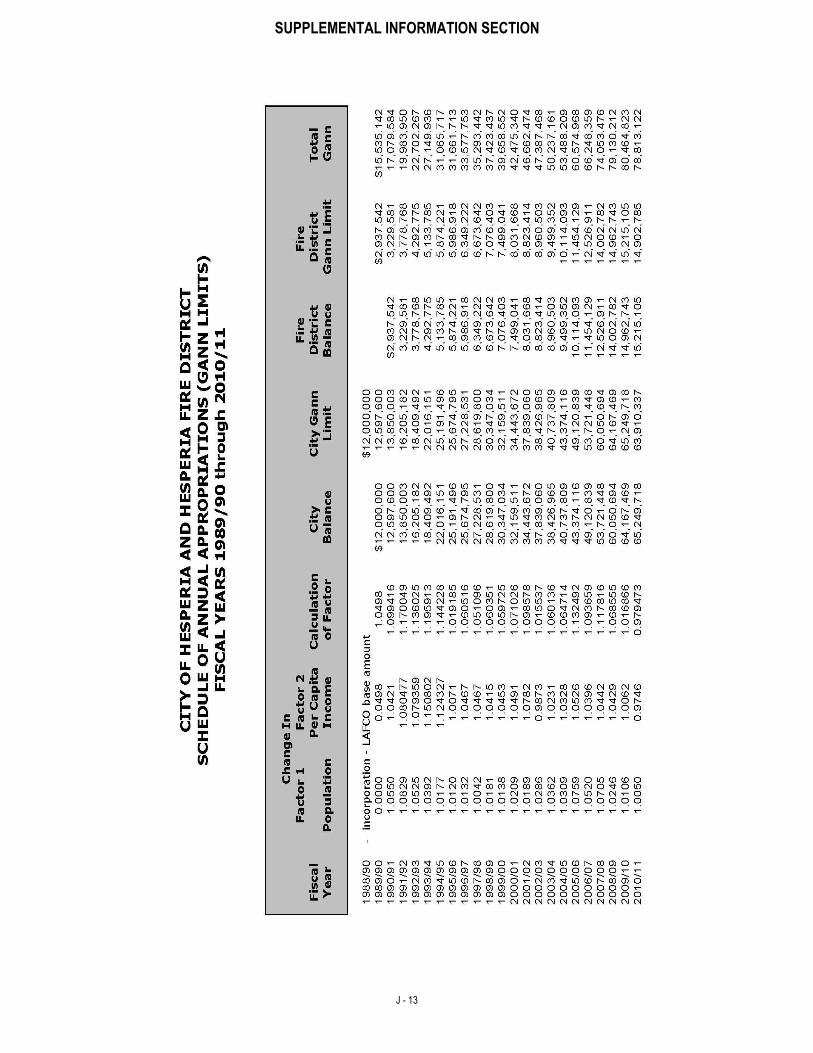
SUPPLEMENTAL INFORMATION SECTION
J - 13
SUPPLEMENTAL INFORMATION SECTION
J - 14
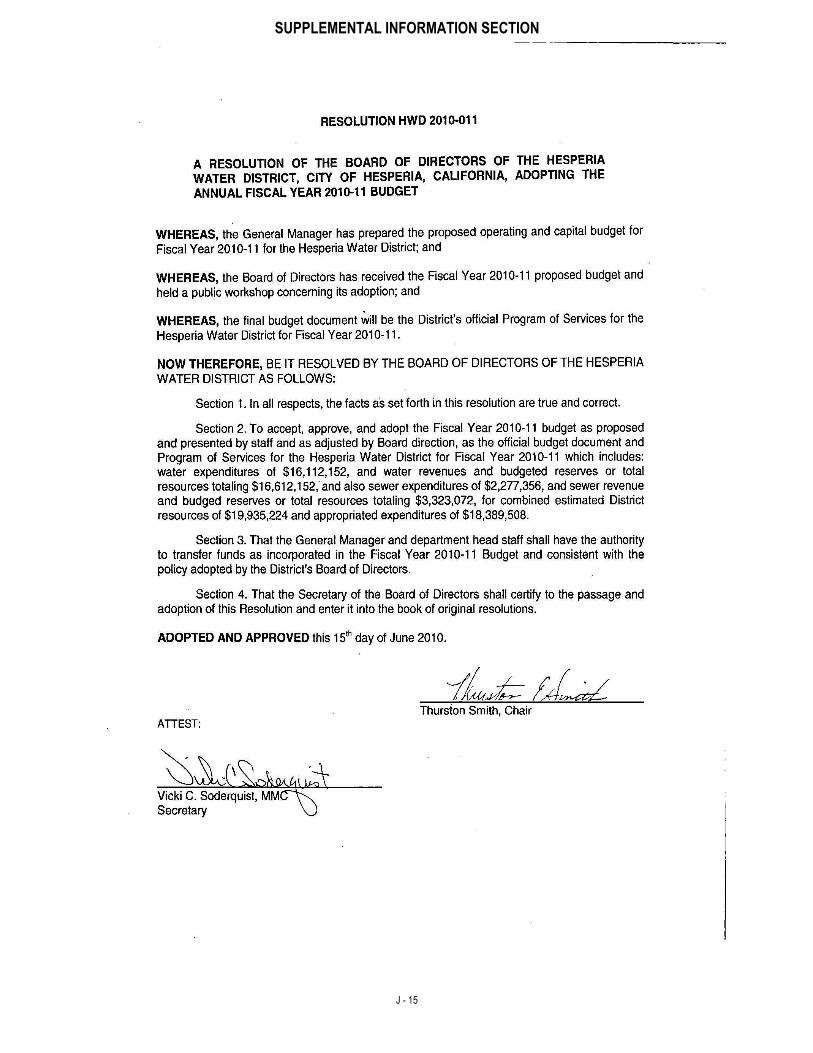
SUPPLEMENTAL INFORMATION SECTION
J - 15
SUPPLEMENTAL INFORMATION SECTION
J - 16
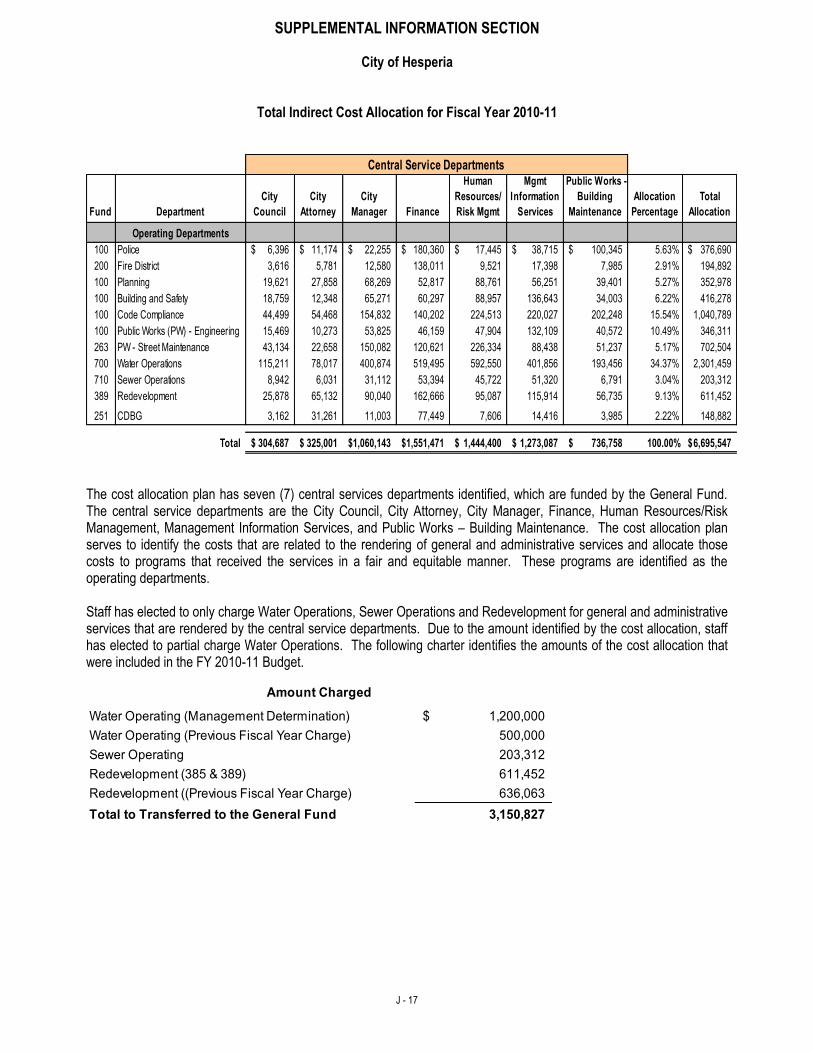
SUPPLEMENTAL INFORMATION SECTION
J - 17
City of Hesperia
Total Indirect Cost Allocation for Fiscal Year 2010-11
Fund Department
City
Council
City
Attorney
City
Manager Finance
Human
Resources/
Risk Mgmt
Mgmt
Information
Services
Public Works -
Building
Maintenance
Allocation
Percentage
Total
Allocation
Operating Departments
100 Police 6,396$ 11,174$ 22,255$ 180,360$ 17,445$ 38,715$ 100,345$ 5.63% 376,690$
200 Fire District 3,616 5,781 12,580 138,011 9,521 17,398 7,985 2.91% 194,892
100 Planning 19,621 27,858 68,269 52,817 88,761 56,251 39,401 5.27% 352,978
100 Building and Safety 18,759 12,348 65,271 60,297 88,957 136,643 34,003 6.22% 416,278
100 Code Compliance 44,499 54,468 154,832 140,202 224,513 220,027 202,248 15.54% 1,040,789
100 Public Works (PW) - Engineering 15,469 10,273 53,825 46,159 47,904 132,109 40,572 10.49% 346,311
263 PW - Street Maintenance 43,134 22,658 150,082 120,621 226,334 88,438 51,237 5.17% 702,504
700 Water Operations 115,211 78,017 400,874 519,495 592,550 401,856 193,456 34.37% 2,301,459
710 Sewer Operations 8,942 6,031 31,112 53,394 45,722 51,320 6,791 3.04% 203,312
389 Redevelopment 25,878 65,132 90,040 162,666 95,087 115,914 56,735 9.13% 611,452
251 CDBG 3,162 31,261 11,003 77,449 7,606 14,416 3,985 2.22% 148,882
Total 304,687$ 325,001$ 1,060,143$ 1,551,471$ 1,444,400$ 1,273,087$ 736,758$ 100.00% 6,695,547$
Central Service Departments
The cost allocation plan has seven (7) central services departments identified, which are funded by the General Fund. The central service departments are the City Council, City Attorney, City Manager, Finance, Human Resources/Risk Management, Management Information Services, and Public Works – Building Maintenance. The cost allocation plan serves to identify the costs that are related to the rendering of general and administrative services and allocate those costs to programs that received the services in a fair and equitable manner. These programs are identified as the operating departments. Staff has elected to only charge Water Operations, Sewer Operations and Redevelopment for general and administrative services that are rendered by the central service departments. Due to the amount identified by the cost allocation, staff has elected to partial charge Water Operations. The following charter identifies the amounts of the cost allocation that were included in the FY 2010-11 Budget.
203,312
611,452
3,150,827
Water Operating (Management Determination) 1,200,000$
Amount Charged
Water Operating (Previous Fiscal Year Charge)
Sewer Operating
Redevelopment (385 & 389)
Total to Transferred to the General Fund
500,000
636,063 Redevelopment ((Previous Fiscal Year Charge)
SUPPLEMENTAL INFORMATION SECTION
J - 18
SIGNIFICANT ACCOUNTING POLICIES
DESCRIPTION OF FUNDS Fund Accounting System
The City uses funds and account groups to report on its financial position and the results of its operations. Fund accounting is designed to demonstrate legal compliance and to aid financial management by segregating transactions related to certain City functions or activities. A fund is an accounting entity with a self-balancing set of accounts established to record the financial position and results of operations of a specific governmental activity. An account group is a financial reporting device designed to provide accountability for certain assets and liabilities that are not recorded in the funds because they do not directly affect net expendable available financial resources. The City maintains the following fund types and account groups:
Types of Funds
Governmental Fund Types
General Fund is the general operating fund of the City and accounts for all unrestricted financial resources except those required to be accounted for in another fund. Special Revenue Funds account for the proceeds of specific revenue sources (other than special assessments, expendable trusts or capital projects) that are restricted by law or administrative action to expenditures for specified purposes. Debt Service Funds account for the accumulation of resources for, and the payment of, interest and principal on general long-term and related costs. Capital Projects Funds account for financial resources segregated for the acquisition of major capital projects facilities (other than those financed by proprietary funds types).
Proprietary Fund Types
Enterprise Funds account for operations in a manner similar to private business enterprises where the intent is that the costs (expenses, including depreciation) of providing goods or services to the general public on a continuing basis is to be financed or recovered primarily through user charges.
Fiduciary Fund Types Agency Funds account for assets held by the City as trustee or agent for individuals, private organizations, other governmental units, and/or other funds. These funds are custodial in nature (assets correspond with liabilities) and do not involve measurement of results of operations. Account Groups General Fixed Assets Account Group accounts for all City general fixed assets, other than those in the proprietary funds, of long-term character such as land, building and structures, and major equipment. General Long- Term Debt Account Group accounts for the City’s outstanding long-term liabilities that are expected to be paid from future revenues of the governmental funds.
SUPPLEMENTAL INFORMATION SECTION
J-19
SIGNIFICANT ACCOUNTING POLICIES (Continued)
Basis of Accounting Basis of accounting refers to when revenues and expenditures or expenses are recognized in the accounts and reported in the financial statements. Specifically, it relates to the timing of the measurements made, regardless of the nature of the measurement. All governmental funds use the flow of current financial resources measurement focus and the modified accrual basis of accounting. Their revenues are recognized when they become measurable and available as net current assets. Agency funds are purely custodial (assets equal liabilities) and thus do not involve measurement of results of operations. For governmental type funds, expenditures are generally recognized under the modified accrual basis accounting when the related fund liability is incurred; principal and interest on general long-term debt is recognized when due. All proprietary funds are accounted for on the flow of economic resources measurement focus and use the accrual basis of accounting. Their revenues are recognized when they are earned and become measurable, expenses are recognized when they are incurred if measurable. Budget Basis of Accounting Budgets for governmental funds are adopted on a basis consistent with generally accepted accounting practices (GAAP), except that, for budgeting purposes only, depreciation is not budgeted.
SUPPLEMENTAL INFORMATION SECTION
J-20
LIST OF ACRONYMS
The budget document includes acronyms and abbreviations. This list of acronyms is provided to assist the reader in identifying the organization, term, etc. meant by the acronym. ADA American Disabilities Act. The Federal Americans with Disability Act requires accessibility of public
facilities for handicap persons and various accommodations for persons with disabilities. ALS Advanced Life Support. AMR Automated Meter Reading. AQMD Air Quality Maintenance District. AS Assessment District. AWWA American Water Works Association. BLS Basic Life Support. CAFR Comprehensive Annual Financial Report. The CAFR is prepared in conformity with Generally
Accepted Account Principals (GAAP) as set forth by the Governmental Accounting Standards Boards (GASB).
CALTRANS The State of California Transportation Department. CCHOA California Cities Home Ownership Authority. CDBG Community Development Block Grant. The Community Development Block Grant program is funded
by the Federal Department of Housing and Urban Development. CEQA California Environmental Quality Act. CFD Community Facilities District. A CFD is established as a funding mechanism for infrastructure
improvements for a specific geographic area of development. CIP Capital Improvements Program or Plan. The CIP identifies the infrastructure capital improvement
projects of the City. CSMFO California Society of Municipal Finance Officers. The CSMFO is a non-profit organization to promote
professional administration of municipal finance in California. CUPA Certified Unified Program Agency. DAP Down Payment Assistance Program – A City Community Development Block Grant Program. DDA Dispensation and Development Agreements. DUI Driving Under the Influence. EDA Economic Development Administration. EDU Equivalent Dwelling Unit. EDRLF Economic Development Revolving Loan Fund.
SUPPLEMENTAL INFORMATION SECTION
J-21
LIST OF ACRONYMS (Continued)
EIR Environmental Impact Report. EOC Emergency Operations Center. EMS Emergency Medical Response. EPA Environmental Protection Agency. ERAF Educational Revenue Augmentation Fund. ERAF is the fund where State mandated property tax
revenue is shifted to schools. FEMA Federal Emergency Management Agency. FEMA is the Federal agency for emergency services and
disaster aid funding nationwide. FETN Fire and Emergency Television Network. FTE Full-Time Equivalent. The FTE is a term used to measure staffing and is 2,080 hours per year (1.0
FTE) or 1040 hours (0.5 FTE). GAAP Generally Accepted Accounting Principles. GASB Governmental Accounting Standards Board. GFOA Government Finance Officers Association is a non-profit professional association of government
finance professionals throughout North America. HAZMAT Hazardous Materials. HCD Department of Housing and Community Development. HCD is a State of California Department. HCRA Hesperia Community Redevelopment Agency. HFMA Hesperia Fire Management Association. HPF Hesperia Professional Firefighters. HRLP Housing Rehabilitation Loan Program – A City Community Development Block Grant Program. GIS Geographic Information System. HUD Federal Department of Housing and Urban Development. HVAC Heating, Ventilation, and Air Conditioning System.
IDIS Integrated Disbursement and Information System.
ISTEA Intermodel Surface Transportation Efficiency Act. The ISTEA Federal funds provide the City funding
for various street and traffic signal projects. JPA Joint Powers Authority. LAIF Local Agency Investment Fund. The LAIF is the State of California investment pool that the City of
Hesperia invests City funds to receive interest income.
SUPPLEMENTAL INFORMATION SECTION
J-22
LIST OF ACRONYMS (Continued)
LMI Low-Moderate Income – Affordable Housing Programs. MAP Mortgage Assistance Program. MGD Millions of gallons per day. MGD is the rating used in water infrastructure projects. MOE Maintenance of Effort. The MOE is the criteria that must be med in certain street improvements
mandated by the State. MOU Memorandum of Understanding – Typically a contractual agreement between the City and an
employee union or association. NEPA National Environmental Policy Act. NFPA National Environmental Policy Act. OES State Office of Emergency Services. OHV Off Highway Vehicles. OPA Owner Participation Agreements. OSHA Occupational Safety and Health Administration. PAD Public Access Defibrillator. RDA Redevelopment Agency. The Hesperia Community Redevelopment Agency. RTIP Regional Transportation Improvement Program. The RTIP is coordinated by the Southern California
Association of Governments (SCAG) in cooperation with the State (Caltrans), County Transportation Commissions (CTC and public transit operators). The program consists of a listing and identification of proposed transportation projects and recommended funding sources.
SANBAG San Bernardino Associated Governments. SANBAG is the clearinghouse for the intergovernmental
agency review of capital facilities and other local government activities. SBPEA San Bernardino Public Employees Association. SBSD San Bernardino County Sheriff’s Department. SCBA Self-Contained Breathing Apparatus. SCADA Supervised Control and Data Acquisition System – Automated radio system to monitor water wells,
booster pumps, and reservoirs. SCAG Southern California Association of Governments. SEMS Standardized Emergency Management System. VVCC Victor Valley Community College. VVEDA Victor Valley Economic Development Authority. VVWRA Victor Valley Wastewater Reclamation Authority.
SUPPLEMENTAL INFORMATION SECTION
J-23
GLOSSARY OF TERMS
ACCRUAL BASIS – The recording of the financial effects on a government of transactions and other events and circumstances that have cash consequences for the government in the periods in which those transactions, events, and circumstances occur, rather than only in the periods in which cash is received or paid by the government. ACTUAL – Represents the actual costs from the results of operations. ADOPTED – Represents the budget as approved by the City Council. APPROPRIATION – A legal authorization granted by the City Council to make expenditures and incur obligations for specific purposes. AUDIT – A systematic collection of the sufficient, competent evidential matter needed to attest to the fairness of management’s assertions in the financial statements or to evaluate whether management has efficiently and effectively carried out its responsibilities. BALANCE SHEET – The financial statement disclosing the assets, liabilities, and equity of an entity at a specified date. BUDGET – A plan of financial operation embodying an estimate of proposed expenditures for a given period and the proposed means of financing them. Used without any modifier, the term usually indicates a financial plan for a single fiscal year. BUDGETARY CONTROL – The control or management of a government or enterprise in accordance with an approved budget for the purpose of keeping expenditures within the limitations of available appropriations and revenues. CAPITAL EXPENDITURES – Expenditures resulting in the acquisition of or addition to the government’s general fixed assets having a unit cost of greater than $5,000 and a useful life exceeding one year. CAPITAL IMPROVEMENT PROGRAM (CIP) – A comprehensive plan which projects the capital needs of the community. Generally, it is a cyclical process that projects the needs for a set number of years. Capital improvement plans are essential to sound infrastructure and financial planning. The annual capital budget is derived from the long-term CIP. CAPITAL OUTLAY – Expenditures which qualify as capital costs according to accounting standards. This includes furniture, fixtures, machinery, equipment, and other relatively minor fixed assets. COMMUNITY DEVELOPMENT BLOCK GRANT (CDBG) – Funds allocated to local government from the federal government, based on a formula, but required to be applied for and required to be used within a broad functional area such as community development. DEBT SERVICE FUND – A fund established to account for the accumulation of resources for, and the payment of, general long-term debt principal and interest. Sometimes referred to as a Sinking Fund. ENCUMBRANCE – Obligations in the form of purchase orders, contracts, or other commitments. They cease to be encumbrances when paid, cancelled, or when the actual liability is set up. ESTIMATED (OR REVISED) – Represents the original adopted budget plus any approved changes and anticipated year-end adjustments. EXPENDITURES – Decreases in net financial resources that include current operating expenses that require the current or future use of net current assets, debt services, and capital outlays. FEES – Charges for specific services.
SUPPLEMENTAL INFORMATION SECTION
J-24
GLOSSARY OF TERMS (Continued)
FISCAL YEAR – The period designated by the City for the beginning and ending of financial transactions. The fiscal year begins July 1 and ends June 30. FRANCHISE – A special privilege granted by a government, permitting the continued use of public property, such as refuse disposal and cable television, and usually involving the elements of monopoly and regulation. FULL-TIME EQUIVALENTS (FTE) – The amount of time a position has been budgeted for in terms of the amount of time a regular, full-time employee normally works in a year. Most full-time employees are paid for 2,080 hours in a year. FUND – A fiscal and accounting entity with a self-balancing set of accounts recording cash and other financial resources together with all related liabilities and residual equities or balances and changes therein which are segregated for the purpose of carrying on specific activities or attaining certain objectives in accordance with special regulations, restrictions, or limitations. FUND BALANCE – The balance of net financial resources that is spendable or available for appropriation. GANN APPROPRIATIONS LIMIT – This term refers to Article XIIIB of the California State Constitution that places limits on the amount of proceeds from taxes that state and local governmental agencies can receive and spend each year. GENERAL FUND – The fund used to account for all financial resources except those required to be accounted for in another fund (i.e., enterprise or grant funds). Usually the General Fund is the largest fund in a municipality. GENERALLY ACCEPTED ACCOUNTING PRINCIPALS (GAAP) – The uniform minimum standards of and guidelines to financial accounting and reporting. They govern the form and content of the basic financial statements of an entity. GAAP encompass the conventions, rules, and procedures necessary to define the accepted accounting practices at a particular time. They include both broad guidelines of general application and detailed practices and procedures. GAAP provides a standard by which to measure financial presentations. GOALS – The desired result of accomplishments within a given time frame. GRANTS – Contributions or gifts of cash or other assets from another government to be used or expended for a specified purpose, activity, or facility. MODIFIED ACCRUAL BASIS – The accrual basis of accounting adapted to the governmental fund-type measurement focus. Under it, revenues and other financial resource increments are recognized when they become susceptible to accrual, that is when they become both “measurable” and “available” to finance expenditures of the current period. Expenditures are recognized when the fund liability is incurred except for inventories of materials and supplies that may be considered expenditures either when purchased or when used. All governmental funds, expendable trust funds and agency funds are accounted for using the modified accrual basis for accounting. OBJECTIVES – The necessary steps that need to be accomplished to achieve a desired goal. OPERATING BUDGET – Plans of current expenditures and the proposed means of financing them. The annual operating budget is the primary means by which most of the financing, acquisition, spending and service delivery activities of a government are controlled. OPERATIONS & MAINTENANCE – Supplies and other materials used in the normal operations of City departments. Includes items such as staff costs, maintenance materials, and contractual services. REVENUES – The yield of taxes and other sources of income that a governmental unit collects and receives for public use. SPECIAL ASSESSMENT – A compulsory levy made against certain properties to defray all or part of the cost of a specific capital improvement or service deemed to benefit primarily those properties.

SUPPLEMENTAL INFORMATION SECTION
J-25
GLOSSARY OF TERMS (Continued)
TAXES – Compulsory charges levied by a government to finance services performed for the common benefit. This term does not include specific charges made against particular persons or property for current or permanent benefits, such as special assessments. Neither does the term include charges for services rendered only to those paying such charges. TRANSFERS – Authorized exchanges of cash or other resources between funds. USER CHARGES/FEES – The payment of a fee for direct receipt of a public service by the party benefiting from the service (i.e., building permit fees, engineering plan check fees).
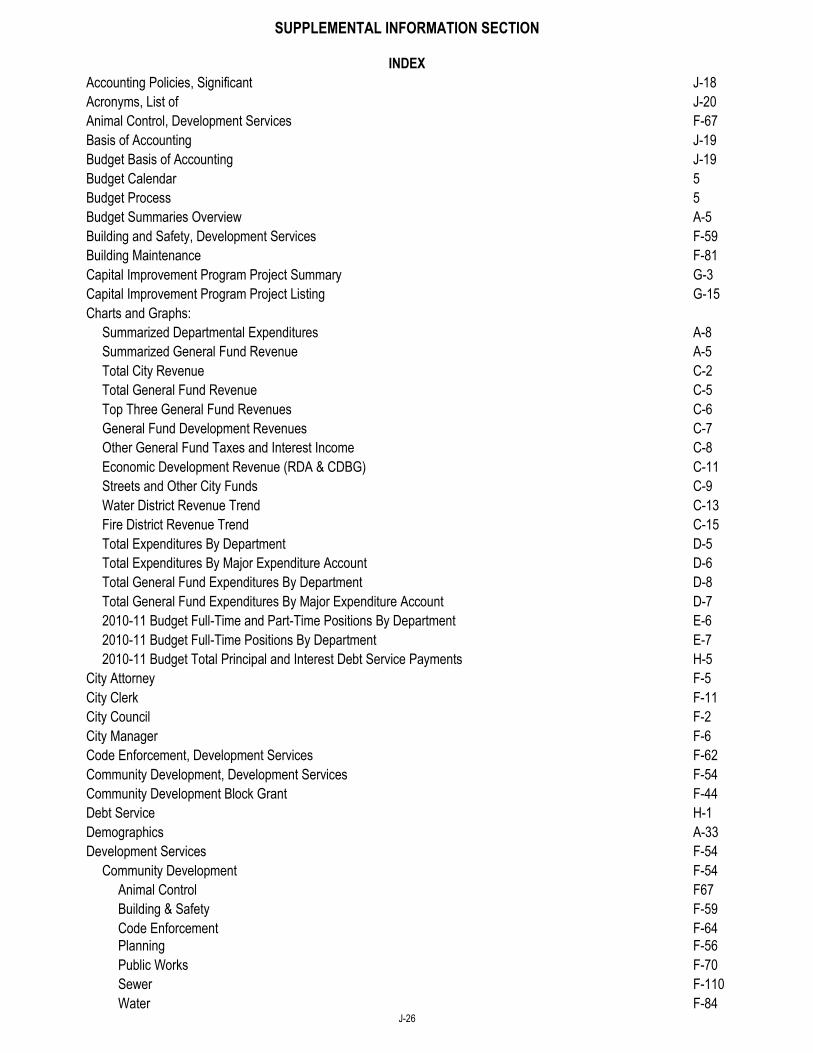
SUPPLEMENTAL INFORMATION SECTION
J-26
INDEX
Accounting Policies, Significant J-18
Acronyms, List of J-20
Animal Control, Development Services F-67
Basis of Accounting J-19
Budget Basis of Accounting J-19
Budget Calendar 5
Budget Process 5
Budget Summaries Overview A-5
Building and Safety, Development Services F-59
Building Maintenance F-81
Capital Improvement Program Project Summary G-3
Capital Improvement Program Project Listing G-15
Charts and Graphs:
Summarized Departmental Expenditures A-8
Summarized General Fund Revenue A-5
Total City Revenue C-2
Total General Fund Revenue C-5
Top Three General Fund Revenues C-6
General Fund Development Revenues C-7
Other General Fund Taxes and Interest Income C-8
Economic Development Revenue (RDA & CDBG) C-11
Streets and Other City Funds C-9
Water District Revenue Trend C-13
Fire District Revenue Trend C-15
Total Expenditures By Department D-5
Total Expenditures By Major Expenditure Account D-6
Total General Fund Expenditures By Department D-8
Total General Fund Expenditures By Major Expenditure Account D-7
2010-11 Budget Full-Time and Part-Time Positions By Department E-6
2010-11 Budget Full-Time Positions By Department E-7
2010-11 Budget Total Principal and Interest Debt Service Payments H-5
City Attorney F-5
City Clerk F-11
City Council F-2
City Manager F-6
Code Enforcement, Development Services F-62
Community Development, Development Services F-54
Community Development Block Grant F-44
Debt Service H-1
Demographics A-33
Development Services F-54
Community Development F-54
Animal Control F67
Building & Safety F-59
Code Enforcement F-64
Planning F-56
Public Works F-70
Sewer F-110
Water F-84
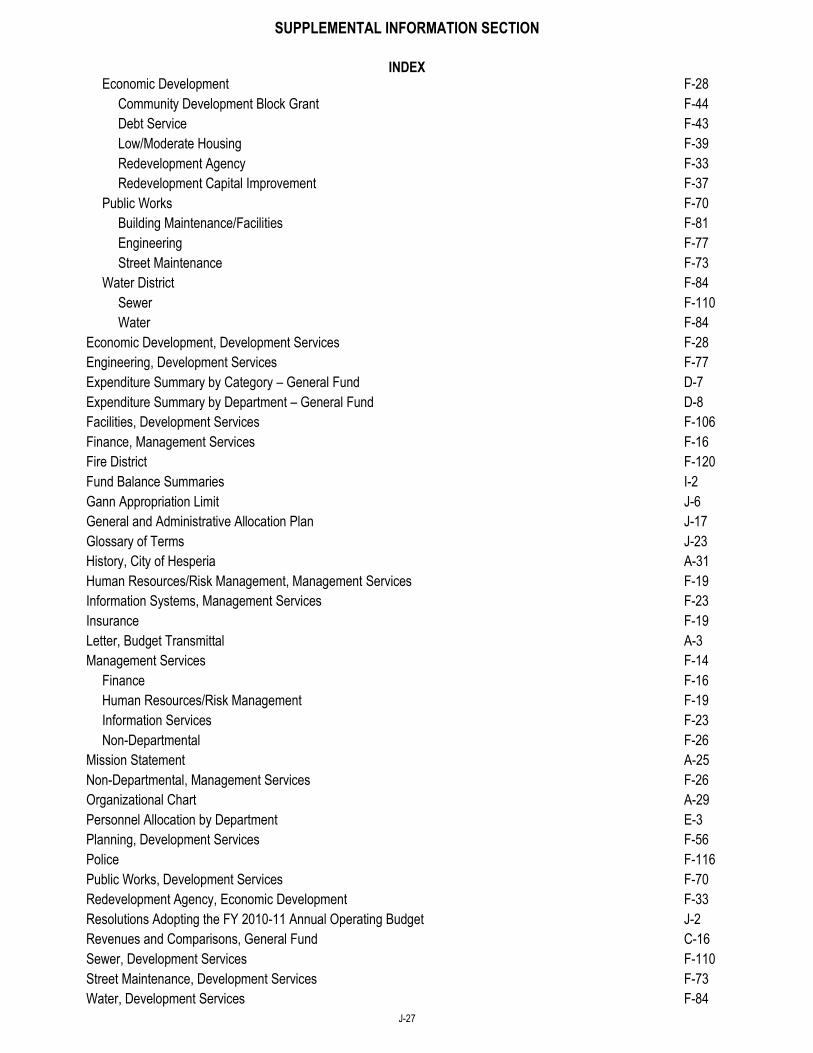
SUPPLEMENTAL INFORMATION SECTION
J-27
INDEX
Economic Development F-28
Community Development Block Grant F-44
Debt Service F-43
Low/Moderate Housing F-39
Redevelopment Agency F-33
Redevelopment Capital Improvement F-37
Public Works F-70
Building Maintenance/Facilities F-81
Engineering F-77
Street Maintenance F-73
Water District F-84
Sewer F-110
Water F-84
Economic Development, Development Services F-28
Engineering, Development Services F-77
Expenditure Summary by Category – General Fund D-7
Expenditure Summary by Department – General Fund D-8
Facilities, Development Services F-106
Finance, Management Services F-16
Fire District F-120
Fund Balance Summaries I-2
Gann Appropriation Limit J-6
General and Administrative Allocation Plan J-17
Glossary of Terms J-23
History, City of Hesperia A-31
Human Resources/Risk Management, Management Services F-19
Information Systems, Management Services F-23
Insurance F-19
Letter, Budget Transmittal A-3
Management Services F-14
Finance F-16
Human Resources/Risk Management F-19
Information Services F-23
Non-Departmental F-26
Mission Statement A-25
Non-Departmental, Management Services F-26
Organizational Chart A-29
Personnel Allocation by Department E-3
Planning, Development Services F-56
Police F-116
Public Works, Development Services F-70
Redevelopment Agency, Economic Development F-33
Resolutions Adopting the FY 2010-11 Annual Operating Budget J-2
Revenues and Comparisons, General Fund C-16
Sewer, Development Services F-110
Street Maintenance, Development Services F-73
Water, Development Services F-84

J-28
THIS PAGE INTENTIONALLY LEFT BLANK