FY 2018 Executive Budget - Message of the Mayor - NYC.gov
240
The City of New York Executive Budget Fiscal Year 2018 Bill de Blasio, Mayor Mayor's Office of Management and Budget Dean Fuleihan, Director Message of the Mayor
-
Upload
khangminh22 -
Category
Documents
-
view
1 -
download
0
Transcript of FY 2018 Executive Budget - Message of the Mayor - NYC.gov

The City of New YorkExecutive BudgetFiscal Year 2018
Bill de Blasio, Mayor
Mayor's Office of Management and BudgetDean Fuleihan, Director
Message ofthe Mayor

The City of New YorkExecutive BudgetFiscal Year 2018
Bill de Blasio, MayorMayor’s Office of Management and Budget
Dean Fuleihan, DirectorApril 26, 2017
Message ofthe Mayor
BUDGET AND FINANCIAL PLAN SUMMARY Budget and Financial Plan Overview .......................................................................... 3 State and Federal Agenda ........................................................................................................... 4 Sandy Recovery .......................................................................................................................... 5 Citywide Savings Program ......................................................................................................... 9 Contract Budget .......................................................................................................................... 13 Community Board Participation in the Budget Process ............................................................ 14 Economic Outlook .................................................................................................. 15 Tax Revenue .......................................................................................................... 28 Miscellaneous Receipts ............................................................................................ 47 Capital Budget ........................................................................................................ 53 Financing Program .................................................................................................. 71ANALYSIS OF AGENCY BUDGETS Department of Education ............................................................................................................ 83 Administration of Justice .......................................................................................... 92 Police Department ................................................................................................... 96 Department of Correction ........................................................................................................... 102 Departments of Social and Homeless Services:
Department of Social Services ............................................................................. 106 Department of Homeless Services ........................................................................ 115
Administration for Children’s Services ........................................................................ 121 Department of Youth and Community Development ................................................................ 128 Department for the Aging ......................................................................................... 133 Department of Health and Mental Hygiene .................................................................. 137 Fire Department ...................................................................................................... 148 Department of Sanitation .......................................................................................... 152 Department of Parks and Recreation ........................................................................... 158 Department of Environmental Protection ..................................................................... 163 Department of Transportation .................................................................................... 171 Housing Preservation and Development ...................................................................... 176 Department of Citywide Administrative Services .......................................................... 181 Department of Information Technology and Telecommunications .......................... 188 Economic Development ........................................................................................... 192 Libraries ................................................................................................................ 198 Department of Cultural Affairs .................................................................................. 203 City University of New York ....................................................................................................... 207 Pensions and Other Fringe Benefits ............................................................................ 213 Judgments and Claims ............................................................................................. 216COVERED ORGANIZATIONS New York City Health + Hospitals ............................................................................. 219 New York City Transit ............................................................................................. 222APPENDIX Exhibit 1: Expenditure Assumptions Fiscal Years 2017-2021 ........................................ 229 Exhibit 2: Fiscal Year 2018 Executive Budget & Projections, FY 2019-2021 ................... 234 Exhibit 3: Actual Revenue: Fiscal Years 2013-2016 .................................................... 236 Exhibit 4: Revenue Estimates: Fiscal Years 2017-2021 ................................................ 237 Exhibit 5: Full-Time and Part-Time Positions (FTEs) ................................................... 239 Exhibit 6: Fiscal Year 2018 Citywide Savings Program ......................................................... 240
Contents

Printed on paper containing 30% post-consumer material.

Budget and FinancialPlan Summary

1
35¢ Education
Where the 2018 Dollar Comes From
Capital IFA 1¢
Federal 9¢CategoricalAid
State 16¢CategoricalAid
Other 1¢CategoricalAid
29¢ Property Tax
40¢ Other Taxes and Local Revenues
Prior Year 4¢Resources
Where the 2018 Dollar Goes To1
Health 3¢
Miscellaneous 5¢Budget2
All Other 13¢Agencies
Higher 1¢Education
18¢ Social Services
5¢ Fire
15¢ Administration of Justice
5¢ Environmental Protection
1 Reflects the allocation of Fringe Benefits, Pensions and Debt Service to the agencies. Excludes the impact of prepayments.2 Includes Labor Reserve, General Reserve, Capital Stabilization Reserve, Judgments and Claims, MTA Subsidies and Other Contractual Services.

Budget and Financial Plan Summary Fiscal Year 2018
3
BUDGET AND FINANCIAL PLAN OVERVIEW
The Fiscal Year 2018 Executive Expense Budget is $84.9 billion. This is the thirty-eighth consecutive budget which is balanced under Generally Accepted Accounting Principles (GAAP), except for the application of Statement No. 49 of the Government Accounting Standards Board (“GASB 49”) which prescribes the accounting treatment of pollution remediation costs. The following chart details the revenues and expenditures for the five year financial plan.
($ in Millions)__________________________________________________________________________________________________________________________________________________________________________________________
FY 2017 FY 2018 FY 2019 FY 2020 FY 2021__________________________________________________________________________________________________________________________________________________________________________________________
Revenues Taxes: General Property Tax ............... $24,402 $25,629 $27,292 $28,618 $29,929 Other Taxes .............................. 29,193 29,989 31,237 32,453 33,685 Tax Audit Revenue ................... 1,251 850 721 721 721 _____ ____________ _____ ____________ _____ ____________ _____ ____________ _____ ____________
Subtotal - Taxes ........................ $54,846 $56,468 $59,250 $61,792 $64,335 Miscellaneous Revenues ................ 7,011 6,480 6,640 6,854 6,841 Unrestricted Intergovernmental Aid 57 — — — — Less: Intra-City Revenues .............. (2,065) (1,815) (1,737) (1,739) (1,744) Disallowances Against Categorical Grants ...................... 613 (15) (15) (15) (15) _____ ____________ _____ ____________ _____ ____________ _____ ____________ _____ ____________
Subtotal - City Funds ............... $60,462 $61,118 $64,138 $66,892 $69,417 Other Categorical Grants ............... 976 880 868 859 856 Inter-Fund Revenues ...................... 641 667 662 599 597 Federal Categorical Grants ............. 8,937 7,799 7,002 6,897 6,879 State Categorical Grants ................ 14,437 14,396 14,849 15,347 15,702 _____ ____________ _____ ____________ _____ ____________ _____ ____________ _____ ____________
Total Revenues ............................... $85,453 $84,860 $87,519 $90,594 $93,451 =========== ========== ========== ========== ==========
Expenditures Personal Service Salaries and Wages .................. $25,759 $27,306 $28,625 $29,425 $30,064 Pensions ................................... 9,395 9,572 9,866 9,936 10,001 Fringe Benefits2 ....................... 9,456 10,119 10,795 11,694 12,483 _____ ____________ _____ ____________ _____ ____________ _____ ____________ _____ ____________
Subtotal – Personal Service ..... $44,610 $46,997 $49,286 $51,055 $52,548 Other Than Personal Service Medical Assistance .................. 5,915 5,915 5,915 5,915 5,915 Public Assistance ..................... 1,584 1,594 1,605 1,617 1,617 All Other1 ................................. 29,138 28,118 27,565 27,571 27,789 _____ ____________ _____ ____________ _____ ____________ _____ ____________ _____ ____________
Subtotal – Other Than Personal Service ..................... $36,637 $35,627 $35,085 $35,103 $35,321 Debt Service1,2 ................................ 6,282 6,528 7,225 7,908 8,396 FY 2016 Budget Stabilization & Discretionary Transfers1 ........... (4,038) — — — — FY 2017 Budget Stabilization & Discretionary Transfers2 ............... 3,727 (3,727) — — — Capital Stabilization Reserve ......... — 250 250 250 250 General Reserve ............................. 300 1,000 1,000 1,000 1,000 _____ ____________ _____ ____________ _____ ____________ _____ ____________ _____ ____________
Subtotal .................................... $87,518 $86,675 $92,846 $95,316 $97,515 Less: Intra-City Expenses .............. (2,065) (1,815) (1,737) (1,739) (1,744) _____ ____________ _____ ____________ _____ ____________ _____ ____________ _____ ____________
Total Expenditures ......................... $85,453 $84,860 $91,109 $93,577 $95,771 =========== ========== ========== ========== ==========
Gap To Be Closed ............................... $- $- $(3,590) $(2,983) $(2,320)_______________________________________________________________________________________________________________________________________________________________________________________________________________
1 Fiscal Year 2016 Budget Stabilization and Discretionary Transfers total $4.038 billion, including GO of $1.760 billion, TFA-PIT of $1.734 billion, lease debt service of $100 million, net equity contribution in bond refunding of $44 million and subsidies of $400 million.
2 Fiscal Year 2017 Budget Stabilization and Discretionary Transfers total $3.727 billion, including GO of $1.418 billion, TFA-PIT of $1.909 billion and Retiree Health Benefits of $400 million.

Budget and Financial Plan Summary Fiscal Year 2018
4
STATE AND FEDERAL AGENDA
STATE
On April 10th, the Legislature passed the State Fiscal Year 2017-18 Budget. Several of the most significant actions impacting New York City in the State Budget are indicated below.
In education, the Enacted State Budget provides an increase of $387 million in school aid which includes $337 million growth in Foundation Aid from the State Fiscal Year 2016-17 Budget of which $60 million is set aside for community schools wrap around services. The State Budget also maintains $300 million for full-day universal pre-kindergarten. The State provides an additional $12.2 million in funding for community colleges, of that, the largest is an increase of $11 million for operating aid.
Within human services, state reimbursement for
foster care services was reduced by $44 million in City Fiscal Year 2018 which includes the elimination, for New York City only, of State tuition payments for special education students in foster care attending private schools. The State Budget also reduces State support of care and maintenance services for students in private special education settings with an estimated cost of $20 million in City Fiscal Year 2018.
On housing, the Enacted State Budget provides $2.5 billion in capital funding statewide for supportive and affordable housing that includes the release of $2 billion in funding from last year. Funding for New York City will include, but not be limited to, $200 million for the New York City Housing Authority (an increase of $100 million), $75 million for Mitchell-Lama Preservation programs, and $100 million for the development of affordable housing in New York City for households earning up to 60% of Area Median Income.
The Enacted State Budget establishes the Clean Water Infrastructure Act that will provide $2.5 billion statewide, of which $200 million is set aside for New York City to support investments in drinking water infrastructure, wastewater infrastructure, source water protection, and other safeguards that protect water resources.
The Governor’s Budget proposed a number of costs shifts that are excluded from the Enacted Budget. The Enacted Budget rejects the Governor’s proposal to eliminate the commitment to the Campaign for Fiscal Equity, and maintains the Foundation Aid formula phase in. The Enacted Budget does not unfreeze the charter school tuition formula in City Fiscal Year 2018. It also omits the proposal to cut $50 million in State Medicaid administration payments unless the City develops a plan to achieve additional federal Medicaid revenue in the school supportive health services program. The final budget agreement also rejects the Governor’s proposal to reduce the state’s Article 6 public health funding to New York City by $32.5 million in City Fiscal Year 2018.
FEDERAL
The President’s budget justification will be presented to Congress in mid-May. In March, the President presented a preliminary, or “skinny” Federal Fiscal Year 2018 budget that set spending levels and proposed drastic cuts to discretionary programs that could impact city programs, if adopted by Congress. These cuts would impact many programs serving children, seniors and economically disadvantaged people. The President’s “skinny” proposal would completely eliminate the Community Development Block Grant, the HOME Investment Partnership Program, the Low Income Heat Energy Assistance Program, TIGER and Transit Capital grants for transportation, Title IIA grants for teacher instruction and imposes major cuts to public housing funds, among other eliminations and cuts.
Also, Congress has not yet adopted a Federal Fiscal
Year 2017 spending plan, allowing programs to operate at Federal Fiscal Year 2016 levels since October 1st, 2016 under two successive Continuing Resolutions, the latest of which expires on April 28th.
If Congress does not pass the remaining legislation
covering Federal Fiscal Year 2017 before April 28th, it will need to continue to pass Continuing Resolutions covering specific periods or for the remainder of the fiscal year, until September 30th.

Budget and Financial Plan Summary Fiscal Year 2018
5
SANDY RECOVERY AND RESILIENCY
Sandy’s Impact on the City and its Communities
When Hurricane Sandy made landfall on October 29, 2012, it caused devastation in all five boroughs of New York City and claimed the lives of 44 people. The damage Sandy wrought upon the City’s infrastructure systems was unprecedented, and demonstrated the City’s dependence on such systems and their vulnerability. Due to climate change, extreme weather events like Sandy are expected to increase in frequency and intensity. By constructing new resilient infrastructure and incorporating new resiliency measures into most Sandy repair work, the City is maximizing its ability to withstand future disasters and minimize the risk to life and property.
The City has made substantial and meaningful progress in its Sandy recovery over the four-and-a-half years since the storm occurred. Through the leadership of the de Blasio administration, the City is well underway in the process of repairing and rebuilding City infrastructure, residents’ homes, businesses and communities, as well as planning and designing major resiliency measures to be incorporated into the municipal infrastructure.
Funding for Sandy Recovery: Infrastructure and Community Investment
Funding for Sandy Recovery comes primarily from two sources, the Federal Emergency Management Agency (FEMA), and the U.S. Department of Housing and Urban Development (HUD). FEMA funding supports the City’s costs for emergency response and repairs to damaged infrastructure including resiliency improvements. HUD provides funding through the Community Development Block Grant – Disaster Recovery program. This funding supports unmet recovery needs remaining after all other funding sources are accounted for. HUD’s Community Development Block Grant – Disaster Recovery funding supports repairs to privately-owned housing, assistance for businesses, and long-term resiliency improvements.
Emergency Response and Infrastructure Recovery
Much has been accomplished in the four-and-a-half years since Sandy. The overall cost of the City’s FEMA-funded emergency response and infrastructure recovery is projected to be about $10.1 billion. The cost for emergency response activities is projected to be about $2.0 billion, and the cost for the long-term infrastructure repairs and resiliency investments is projected to be about $8.1 billion. The City has secured $9.7 billion in FEMA Public Assistance grants and other federal Sandy recovery grants, and is currently working with FEMA to develop grants for an additional estimated $500 million in funding. The $9.7 billion includes $3.1 billion for NYCHA, $1.9 billion for H+H, and $259 million for other non-Mayoral entities. Of the $9.7 billion in federal grants secured, the City has been reimbursed over $2.0 billion to date.
The expense-budgeted emergency response activities conducted by City agencies are largely over. The City is now entering into a new phase of its recovery from Sandy – the execution of long-term infrastructure repair and resiliency projects. The City has partnered with FEMA to implement new and innovative approaches in order to improve this long term recovery efforts.
The City is the largest participant in FEMA’s 428 Public Assistance Alternative Procedures pilot program, a new FEMA initiative authorized under the Sandy Recovery Improvement Act (“SRIA”) designed to expedite disaster recovery. With its participation in FEMA’s new 428 pilot program, the City was awarded both the largest and second largest disaster assistance grants in the history of the FEMA Public Assistance program.
FEMA funding for Sandy repairs comes with a requirement to obtain and maintain insurance for the Federal investments in City infrastructure. To meet this requirement, the City has implemented an insurance program that will be fully executed by June 30, 2017 at an estimated annual cost of approximately $3 million. In addition, the City is focused on compliance and developing proper documentation to ensure full reimbursement from FEMA for recovery activities.
Budget and Financial Plan Summary Fiscal Year 2018
6
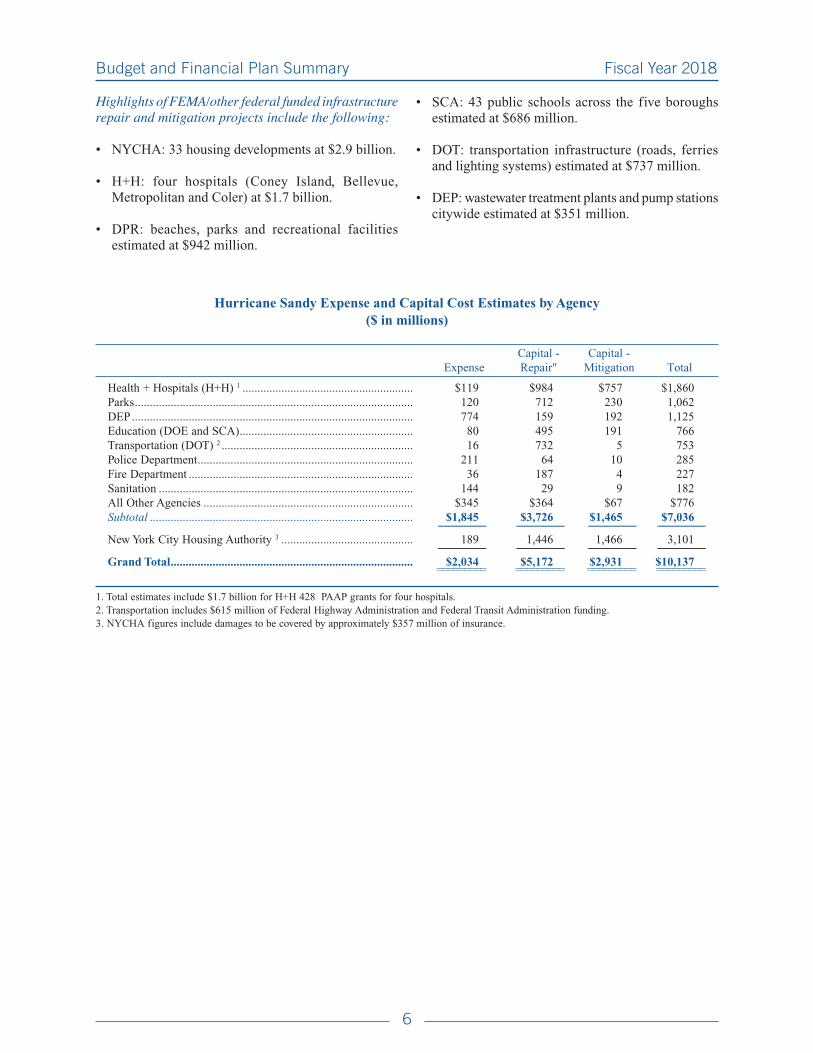
Highlights of FEMA/other federal funded infrastructure repair and mitigation projects include the following:
• NYCHA: 33 housing developments at $2.9 billion.
• H+H: four hospitals (Coney Island, Bellevue, Metropolitan and Coler) at $1.7 billion.
• DPR: beaches, parks and recreational facilities estimated at $942 million.
• SCA: 43 public schools across the five boroughs estimated at $686 million.
• DOT: transportation infrastructure (roads, ferries and lighting systems) estimated at $737 million.
• DEP: wastewater treatment plants and pump stations citywide estimated at $351 million.
Hurricane Sandy Expense and Capital Cost Estimates by Agency ($ in millions)
Capital - Capital - Expense Repair" Mitigation Total
Health + Hospitals (H+H) 1 ......................................................... $119 $984 $757 $1,860 Parks ............................................................................................. 120 712 230 1,062DEP .............................................................................................. 774 159 192 1,125Education (DOE and SCA) .......................................................... 80 495 191 766Transportation (DOT) 2 ................................................................ 16 732 5 753Police Department ........................................................................ 211 64 10 285Fire Department ........................................................................... 36 187 4 227Sanitation ..................................................................................... 144 29 9 182All Other Agencies ...................................................................... $345 $364 $67 $776 Subtotal ........................................................................................ $1,845 $3,726 $1,465 $7,036
------------------ ------------------ ------------------ ------------------New York City Housing Authority 3 ............................................ 189 1,446 1,466 3,101
------------------ ------------------ ------------------ ------------------Grand Total ................................................................................. $2,034 $5,172 $2,931 $10,137
========= ========= ========= =========
1. Total estimates include $1.7 billion for H+H 428 PAAP grants for four hospitals.2. Transportation includes $615 million of Federal Highway Administration and Federal Transit Administration funding.3. NYCHA figures include damages to be covered by approximately $357 million of insurance.

Budget and Financial Plan Summary Fiscal Year 2018
7
Funding for Community Recovery
The City was awarded $4.2 billion of HUD funding for the purpose of making sure all New York City communities impacted by Hurricane Sandy recover fully and recover quickly. This HUD funding comes in the form of Community Development Block Grant – Disaster Recovery (CDBG-DR), which the City is using to support a wide variety of disaster recovery activities that are not covered by traditional disaster recovery funding. These initiatives include restoring private housing stock, assisting businesses, and investing in long-term resiliency improvements to infrastructure.
CDBG-DR Funding($ in millions)
Program Area Total Funding
Housing $3,018 Build It Back Single Family 2,213 Build It Back Multifamily 476 NYCHA 317 Other 12 Business $91 Infrastructure and Other City Services $419 Coastal Resiliency $448 Rebuild by Design - East Side Coastal Resiliency 338 Rebuild by Design - Hunts Point 45 Other 65 Planning/Admin $238 ___________Total $4,214
Source: CDBG-DR Action Plan, www.nyc.gov/cdbg

Budget and Financial Plan Summary Fiscal Year 2018
8
Significant Increase in Build It Back Activity and Cost Controls
The third quarter of 2016 and first half of 2017 represents the highest production period for single family repair and reconstruction projects under the Build It Back program. Currently, 93 percent of all homeowners have been served through construction start or reimbursement check. This represents the significant efforts on the part of the City to address a particularly complicated endeavor, and those efforts are paying off. With increased design and construction capacity, the City tripled its rate of construction completion since the first year of the program completing almost 2,000 homes in the last year.
HUD approved an amendment to the City’s CDBG-DR Action Plan, which allocated more federal funding to the Build It Back program. HUD also approved measures that provided greater flexibility for buyouts, protective infrastructure, and other options for beneficiaries that are less expensive than certain high-cost reconstruction and elevation options.
While the program is accelerating recovery for homeowners and renters, it is also implementing cost controls and cost savings measures, which include value engineering, pre-award design review, the deployment of modular home construction, and reassigning homes to different contractors to achieve the right balance of capacity and cost. As of the end of the first quarter of 2017 Build It Back has:
• Disbursed over 5,900 homeowner reimbursement checks totaling $129 million.
• Started over 4,500 home repairs, reconstructions, and elevations (up from about 2,700 last year).
• Completed construction on 3,600 homes (up from about 1,600 last year).
• Almost 700 households are anticipated to take advantage of acquisition and buyout options offered by the State and the City, building on new incentives for acquisition offered by the City.
Protected City, Resilient Neighborhoods
The City is implementing a comprehensive $20 billion resiliency program that is continuing to build a stronger, more resilient New York by bolstering coastal defenses, protecting infrastructure,
strengthening communities and businesses, and adapting buildings. For example, the City is utilizing berms, stationary walls, deployable flood walls, and drainage improvements to accomplish the ambitious goal of protecting Lower Manhattan residents and businesses from future storm events. Investment in resilient infrastructure and protection systems are being integrated throughout the City to strengthen vulnerable neighborhoods.
• East Side Coastal Resiliency: runs along the east side of Manhattan from 25th St. to Montgomery Street. This $760 million project, which is developing a coastal flood protection system, includes $338 million in funding from HUD’s Rebuild by Design program and additional City funding commitments.
• Lower Manhattan Coastal Resiliency – Two Bridges: runs along the side of Manhattan from Montgomery Street down to the Brooklyn Bridge where the City is extending further coastal flood protection measures. In January 2017, the City signed a grant agreement with HUD for $176 million to reflect its award from the National Disaster Resilience Competition and the City has committed an additional $27.5 million of City capital funding as leverage for the Federal investment in this area.
• Lower Manhattan Coastal Resiliency – Manhattan Tip: runs from the Brooklyn Bridge to the Island’s southern tip. With $108 million in City capital funding as a down payment, this project will allow the City to complete a full line of protection for Lower Manhattan’s east side down to the Battery.
• Hunts Point: focused on the City’s food distribution hub, $45 million is being invested in resiliency measures and long-term planning to ensure the long-term viability of the City’s food supply. This project is also utilizing HUD’s Rebuild by Design funds.
• RISE:NYC and Business PREP: will provide Sandy-impacted small businesses throughout the City with strategies and innovative technologies to better prepare for and respond to future disasters.
• Additional investments: coastal protection work is also being done for the Rockaways, Coney Island, the South Shore of Staten Island and other vulnerable shorelines across the City.
For more information on Sandy recovery, including detailed performance metrics, please visit www.nyc.gov/recovery .

9
Budget and Financial Plan Summary Fiscal Year 2018
CITYWIDE SAVINGS PROGRAM
Serving as a good steward of the City’s finances requires long term planning and a search for innovation. To identify and implement financial best practices, OMB teamed up with City agencies to reexamine internal processes and policies, explore cost avoidance measures, re-estimate expenses, and find more efficient ways to utilize City resources.
The 2017 Citywide Savings Plan in the Executive Budget expands on work started in November and Preliminary plans. Across all three plans, collaborative efforts between OMB and City agencies have resulted in $1.5 billion and $1.3 billion dollars for 2017 and 2018, respectively. These three plans have led to the creation of 298 savings initiatives, including 259 from the agencies and 39 central.
Efficiencies change agency practices and decrease City spending without reducing services. There are a total of 129 efficiency initiatives for the 2018 November, Preliminary, and Executive budgets. Agencies submitted 118 efficiency initiatives in addition to the 11 efficiency initiatives implemented Citywide. These allow agencies to use fewer resources while working at the same or increased capacity.
CITYWIDE SAVINGS INITIATIVES – EFFICIENCIES 2017 – 2021
150
200
250
300
350
400
20212020201920182017
Fiscal Year
$ in
Mil
lion
s
11% 21% 28% 29% 31%
Efficiencies

10
Budget and Financial Plan Summary Fiscal Year 2018
Agency Designed Savings Initiatives Highlights – November, Preliminary, and Executive Budget
In the November, Preliminary, and Executive budgets, 43 agencies have designed 259 savings initiatives including 118 efficiencies. Five core strategies drive savings: redesigning business practices, reducing use and repurposing assets, implementing IT solutions, improving the use of City space and deployment of personnel, and maximizing revenues.
Business Process Redesign: changing operations in areas such as procurement and coordination
• The Financial Information Services Agency (FISA) negotiated lower rental costs in the November plan.
• The Office of Payroll Administration (OPA) and FISA shared office resources through space consolidation in the November plan.
• The Department of Information Technology & Telecommunications (DoITT) renewed contracts at more favorable terms for the City in the Preliminary Budget.
• The Taxi & Limousine Commission (TLC) eliminated mailings contract through insourcing in the Preliminary budget.
Reduce and Repurpose: using resources more efficiently and reusing existing City assets
• The Department of Transportation (DOT) upgraded lights in parks and on highways in the November plan.
• The City University of New York (CUNY) expanded preventative maintenance and energy reduction efforts in the Preliminary budget.
• The Department of Environmental Protection (DEP) upgraded lighting and equipment and switched to natural gas in the Executive budget.
IT Solutions: using technology to improve efficiency
• The Police Department (NYPD) implemented Citytime access in the Executive budget.
• DoITT decommissioned equipment reaching end-of-life, moved to more efficient servers or storage solutions, and removed software with redundant functionality in the November plan.
People and Space: improving personnel deployment and using space more efficiently and effectively
• The Department of Education (DOE) consolidated small schools for better utilization of support staff in the November plan.
• DOT created night shifts for bridge workers to reduce overtime demands in the Preliminary budget.
• The Department of Health and Mental Hygiene (DOHMH) eliminated contracted fiscal agent and performed contract management functions internally in the Preliminary budget.
• The Department of Parks and Recreation (DPR) efficiently deployed seasonal employees in the Executive budget.
• DOE reduced the use and reliance on consultants through insourcing in the Executive budget.
Reimbursements: maximizing Federal, State, and Private grants and Miscellaneous revenue
• DOHMH shifted eligible City Tax Levy (CTL) expenses to maximize State funding in the November plan.
• DOE increased claiming of State Aid for eligible students in the Preliminary budget.
• The Administration of Children’s Services (ACS) claimed Federal Aid at an improved rate for administrative employees in the Preliminary budget.
• The Department of Citywide Administrative Services (DCAS) collected additional revenue through purchasing card (p-card) rebates in the Executive budget.

11
Budget and Financial Plan Summary Fiscal Year 2018
Citywide Savings Initiatives
Citywide Savings Initiatives are reductions to City spending that span across multiple agencies, making use of shared resources and economies of scale, while driving the most critical savings approaches across the entire City.
Citywide Savings Initiatives – 2018 November Plan and Preliminary Budget
The following initiatives were announced in the November and Preliminary budgets with central Citywide targets of $30 million in 2018, $42 million in 2019, $47 million in 2020, and $47 million in 2021. The 2018 target has been allocated to 23 agencies in the Executive budget.
Fleet Optimization
Savings will be achieved through City fleet reduction, the reduction of rentals and increased use of the Citywide car-sharing program, continued auction of salvaged vehicles, downsizing larger vehicles to sedans, and capitalizing large vehicle purchases.
Paper Check Reform
This initiative will reduce the number of paper checks circulating Citywide through increased use of direct deposit, paying vendors through EFT, and elimination of inter/intra agency checks.
Printing Reform
Savings are achieved through a 15 percent cap on color printing across agencies, implemented via Enterprise Print Management.
CITYWIDE SAVINGS INITIATIVES – EFFICIENCIES BY TYPE 2017 – 2021
$366.2
37.1
110.6
351.6
572.1
$1,437.6
Program Savings
($ in Millions)
Business Process Redesign
Reduce and Repurpose
IT Solutions
People and Space
Reimbursements
Total
Peopleand
Space
Reimbursements
BusinessProcess
Redesign
Reduce andRepurpose
IT Solutions

12
Budget and Financial Plan Summary Fiscal Year 2018
Reverse Auctions
This program allows qualified vendors to enter an auction process, and bid against each other on City contracts and bulk goods. A savings of five percent is expected on the price of goods bought through auctions; this target was met or exceeded by similar test programs in Philadelphia, Chicago and LA.
Skilled Trades Overtime
Savings are achieved through capping agency skilled trades overtime at 12 percent (omitting those that are assigned to a fixed post), and capping individual skilled trades overtime at 50 percent.
Civilian Overtime Cap Waivers
The Citywide Civilian overtime cap will be more thoroughly enforced, including an additional level of central budget review for all waiver requests.
Space Management
The City will undertake a more thorough review process for all present and future space requests, matching needs with existing space as well as exploring less costly options.
Citywide Savings Initiatives – 2018 Executive Budget
The following initiatives were announced in the Executive budget with central Citywide targets of $32 million in 2019, $55 million in 2020, and $88 million in 2021.
Procurement Reform
Citywide procurement reform has led to the creation of an online Vendor Management tool to streamline the vendor registration process. The tool enables vendor self-service, automates vendor and principal questionnaires, promotes better enrollment, incorporates performance evaluation review, and allows for better transparency into the process.
Enhanced Space Management
A new space management team and an enhanced computer platform will integrate all 37 million square feet of City leased and owned space. The City will track and manage the entire portfolio to make strategic decisions on space requests. Savings will be created through a thorough review of all future space requests in order to match needs with existing space as well as exploring less costly options.
Centralized Skilled Trades Pool
Many agencies have a backlog of critical maintenance projects that must be completed through overtime. This initiative will establish a centrally deployed team of Skilled Trades workers based in DCAS in order to address serious agency backlogs on maintenance work and promote the efficient use of Skilled Trades employees. This will eliminate the need for smaller agencies to maintain full time Skilled Trades staff when the work does not require it.
Redeploy
Employees eligible for retirement may be asked by their agency to continue working on a part-time basis while they collect their pension. The agency may claim savings credit if savings can be demonstrated.

Budget and Financial Plan Summary Fiscal Year 2018
13
CONTRACT BUDGET
The Contract Budget is presented as part of the 2018 Executive Budget submission. The Contract Budget includes all projected expenditures for contracts that are personal service, technical or consulting in nature, as defined in Section 104 of the City Charter. Purchase orders and open market orders, as well as small purchases that do not require registration by the Comptroller’s Office, are included in the Contract Budget. Contracts for the purchase of supplies, materials and equipment are not included.
The 2018 Executive Contract Budget contains an estimated 17,693 contracts totaling over $15.3 billion. Over 74 percent of the total contract budget dollars will be entered into by the Department of Social Services, the Administration for Children’s Services, the Department of Homeless Services, the Department of Health and Mental Hygiene and the Department of Education. The Administration for Children’s Services has over $1.92 billion in contracts, approximately 68 percent of which represents contracts allocated for Children’s Charitable Institutions ($460 million) and Day Care ($839 million). Of the over $6.68 billion in Department of Education contracts, approximately 47 percent of the contracts are allocated for Transportation of Pupils ($1.19 billion) and Charter Schools ($1.94 billion).
Each agency’s Contract Budget is delineated by object code within the agency’s other than personal service units of appropriation. The Executive Budget Supporting Schedules further break down the Contract Budget by budget code within unit of appropriation. All object codes in the 600 object code series are included in the Contract Budget. In addition, the Executive Budget Supporting Schedules reference the 2017 Modified Budget condition for these contract object codes.
Agencies in preparing their contract budgets were requested to categorize their contracts into 51 specific contract objects. The distribution of these contracts is summarized as follows:
__________________________________________________________________________________________________________________________________________________________________________________________
Est # of Dollars % Total Contracts (Millions) Dollars __________________________________________________________________________________________________________________________________________________________________________________________
Social Service Related and Health Services ............. 4,575 $4,923 32.1%• Home Care, Child Welfare, Employment Services,
Public Assistance, Day Care, Family Services, Homeless Programs, AIDS, Senior Citizen Programs, Health, Mental Hygiene & Prison Health, etc.
Youth and Student Related Services ......................... 3,085 5,011 32.7%• (including Transportation of Pupils and Payments
to Contract Schools)
Other Services ........................................................... 3,108 1,970 12.9%• Custodial, Security Services, Secretarial, Cultural
Related, Employee Related, Economic Development, Transportation, Municipal Waste Exporting, etc.
Professional Services/Consultant .............................. 3,523 1,884 12.3%• Accounting, Auditing, Actuarial, Education,
Investment Analysis, Legal Engineering & Architectural, System Development & Management Analysis, etc.
Maintenance & Operation of Infrastructure ............. 1,682 1,155 7.6%• Lighting, Street Repair, Buildings, Parks, Water
Supply, Sewage and Waste Disposal, etc.
Maintenance of Equipment ....................................... 1,720 368 2.4%• Data Processing, Office Equipment,
Telecommunications & Motorized Equipment, etc. _________________ ________________ __________________
TOTAL ............................................................... 17,693 $15,311 100.00% ================ =============== =================

Budget and Financial Plan Summary Fiscal Year 2018
14
COMMUNITY BOARDS
New York City’s 59 community boards provide a formal structure for local citizen involvement in the budget process as well as other areas of City decision making. Each board represents up to 250,000 residents in a community district. The Charter mandates that the community boards play an advisory role in three areas: changes in zoning and land use, monitoring the delivery of City services in the community district and participating in the development of the City’s capital and expense budgets.
Each community board receives an annual budget to support a district manager, additional staff, and other operating expenses. In FY 2018 the uniform base budget for each community board is $233,911. This excludes the cost of office rent and heat, light and power, which are in a separate unit of appropriation.
Each Borough President appoints board members for staggered two year terms. City Council members in proportion to each member’s share of the district’s population select nominees from which half the appointments are made. All fifty members of the community board either live or work in the district.
Each year agencies that deliver local services consult with community boards about budget issues and the needs of the districts, prior to preparing their departmental estimates. The boards then develop and prioritize their up to 40 capital budget requests and their up to 25 expense budget requests. For FY 2018 community boards submitted 1,859 capital requests and 1,823 expense requests to 34 agencies. Two-thirds of the community board capital budget requests seek improvements to streets, sewers and parks. Community board expense budget requests concentrate on local services and personnel increases.
District specific budget information is available in the following geographic budget reports, which accompany the release of the FY 2018 budget.
Register of Community Board Budget Requests for the Executive Budget, Fiscal Year 2018 – lists the funding status for all community board proposals in priority order within community district.
Geographic Report for the Executive Expense Budget for Fiscal Year 2018 – details the expense budgets of fourteen agencies that deliver local services by borough and service district. Includes FY 2018 Executive Budget information as well as FY 2017 current modified budget and budgeted headcount data.
Executive Capital Budget for Fiscal Year 2018 – details the Mayor’s Capital Budget by project within agency. Budget data is presented by community district and by agency within borough.
Geographic Fiscal Year 2018 Executive Budget Commitment Plan – presents information on capital appropriations and commitments by community board, including implementation schedules for the current year and four plan years for all active projects by budget line.

Budget and Financial Plan Summary Fiscal Year 2018
15
ECONOMIC OUTLOOK
Overview
The national economy continues to grow sluggishly, but persistently, with the current expansion becoming the third longest in the post-WW II period. While the results of the presidential election raised expectations of stronger growth due to proposed tax cuts, looser regulatory oversight, and infrastructure spending, these projections have now been tempered due to the initial difficulties encountered by the new administration. Real GDP in 2016 grew at the slowest pace in five years, supported by consistent consumption spending, but impeded by weak investment and a drag from net exports. Growth is projected to rebound, however, with the pace accelerating in 2017 and 2018.
While survey-based sentiment measures such as consumer confidence have been enthusiastic – with many indicators hitting cyclical highs – the “hard” data has been more ambiguous. With the economy near full employment, job gains are slowing, potentially limiting growth ahead. The unemployment rate is now at a ten-year low and stands just above the trough of the housing-boom expansion. However, the absence of stronger wage growth continues to be a puzzle, with compensation plateauing in the most recent data. Judging from durable goods orders, the path of business spending has not changed yet either, offering little evidence that investment is picking up.
The tight labor market and signs of building inflation motivated another Fed rate hike in March following its last action in December. With the Fed’s preferred inflation measure now passing its two percent target in the first quarter, the central bank is likely to maintain a tighter monetary stance for the next few years. Two more quarter-point hikes are expected this year followed by three in 2018. The bump that financial markets experienced after Election Day has faded with small-cap and banking shares – which surged in December – suffering losses at the start of 2017. At the same time, volatility has dropped to near-record lows. Bond yields, which jumped at the end of 2016, have retracted some of the gains. The low-rate environment has extended the boom in corporate bond issuance as firms lock in cheap borrowing. The favorable conditions in 2016 supported Wall Street banks, which generated their highest profits in five years. Initial evidence from first quarter earnings reports suggests that these conditions persisted into 2017.
The NYC economy continues to grow robustly, albeit with signs of slowing. In 2016, total employment gains exceeded two percent for the sixth consecutive year. However, like the nation, recent data for the first quarter of 2017 indicates a deceleration of job growth due to tighter labor markets. This slowdown
is projected to continue through the forecast horizon. Despite the strong hiring in 2016, wage growth was sluggish due to declines in bonuses in the securities and professional and business service sectors. However, compensation should strengthen in the near future, driven by competition for workers, a rebound in bonuses, and a boost from the State minimum wage law. Wage growth should more than offset slower hiring, resulting in accelerating wage earnings growth over the next two years.
Other sectors of the NYC economy are also decelerating. Residential real estate activity slowed in 2016 with the first decline in transactions since 2011, driven by drops in condo and co-op sales. Nevertheless, average prices are still growing strongly, skewed by the outsized influence of gains in luxury condo prices while co-op prices declined. Commercial rent growth also softened in 2016, although leasing activity at the start of 2017 appears to be strong with corresponding declines in vacancy rates. Tourism continues to be a major contributor to the local economy, with growing rooms nights sold, but falling average room rates. While international tourism is expected to contract in 2017 for the first time since the recession, strength from domestic visitors is projected to help support the industry.
* All economic data are reported on a calendar year basis.

Budget and Financial Plan Summary Fiscal Year 2018
16
THE U.S. ECONOMY
The national economy lumbered out of March – the 93rd month of expansion – securing the position as the third longest recovery in the post-WW II period. The latest available GDP estimates (for the fourth quarter 2016) reported growth of just 2.1 percent, constrained by a drag from net exports and continued weakness in nonresidential fixed investment. Full-year 2016 growth was only 1.6 percent, the slowest pace in five years. On the bright side, the American consumer persisted as the engine of the expansion with consumption contributing over 1.9 percentage points to GDP growth. However, this annual growth was eroded by negative contributions totaling nearly -0.4 percentage points due to declines in investment and net exports. Looking forward, the pace of real GDP is projected to pick up to 2.3 percent in 2017 and accelerate further to 2.5 percent in 2018.
The weak fourth quarter results were partly an artifact of the unexpected jump in net exports in the third when U.S. agricultural exports soared due to crop failures in Latin America. Since the boost was temporary, a resulting payback occurred in the fourth quarter when net exports contracted by -4.5 percent. Excluding this external volatility, domestic activity
was robust. Growth in gross domestic purchases, which omit net exports, was 3.9 percent in the fourth quarter. More concerning, however, is the ongoing weakness in nonresidential investment, which grew only 0.9 percent in the fourth quarter, extending the deceleration of investment spending exacerbated by the 2014 tumble in energy prices. As a result, most of the growth in fourth quarter investment came from residential investment and inventory changes. The former grew 9.6 percent, rebounding from two quarters of contraction and contributing 0.35 percentage points to growth. Changes in private inventories provided a full percentage point boost, but this temporary tailwind is expected to flip to a small headwind in 2017.
The election of President Trump initially prompted forecasters to raise their projections due to proposed cuts in corporate and other taxes and to looser regulatory oversight on industry and finance. In addition, the proposed increase in infrastructure spending was expected to provide a fiscal boost. However, the events of the first quarter have started to temper these projections. As a result, estimates of first quarter 2017 growth are being revised down. The Blue Chip and
GDP GROWTH AND CONTRIBUTION OF CONSUMPTION
Forecast
0.0%
0.5%
1.0%
1.5%
2.0%
2.5%
3.0%
0.0
0.5
1.0
1.5
2.0
2.5
3.0
2019201820172016201520142013201220112010
Consumption accounted for more than 70 percent of GDP growth since the last recession and contributed more than 100 percent in 2016. The
forecasted share of consumption in GDP is expected to remain elevated.
Ann
ual G
row
th R
ate
Percentage Point Contribution to G
rowth
Contribution of Consumption (Right)
GDP Growth (Left)
Source: U.S. Bureau of Economic Analysis, NYC OMB

Budget and Financial Plan Summary Fiscal Year 2018
17
Wall Street Journal consensus estimates both fell from above two percent in December to 1.4 percent in April. Likewise, real-time GDP trackers at the New York Fed and Atlanta Fed have slumped over the same period.
Recent economic data is reflecting the ambiguity about the economy’s near-term direction. While survey-based sentiment data has been extremely positive, “hard” quantifiable data such as durable goods orders and retail sales has been much more muted. The most commonly reported gauges of consumer outlooks, the University of Michigan consumer sentiment index and Conference Board consumer confidence index have recently jumped. Since the election, the consumer sentiment index has hit 98 or higher in three months (and has only been this elevated on one other occasion in the current expansion). Likewise, the consumer confidence index surged to a 16 year high at the end of March. The Small Business Optimism index has soared to levels not seen since the height of the housing boom, hitting a 12-year high in January.
However, the hard data has diverged from these enthusiastic views. Consumer spending has been stable, but nowhere as strong as consumer confidence would imply. First quarter growth in retail sales rose four percent, down from 7.8 percent in the fourth quarter of 2016 and slightly below the six-year average of 4.4 percent. Particularly problematic is the fact that auto sales appear to have peaked. After two consecutive record years in 2015 and 2016, first quarter light vehicle sales declined to a seasonally adjusted 17.2 million, down from 18 million in the prior quarter.
Business spending has also had an ambiguous start in 2017. Manufacturers’ new durable goods orders climbed at a monthly average of two percent in the first two months of the year, much stronger than the average 0.1 percent monthly pace of 2016. However, the core measure of new orders, which is a proxy for business investment spending, was flat in January and February, compared to a 0.25 percent monthly average in 2016. Nevertheless, the ISM purchasing managers’ index jumped from an average of about 51.5 in 2016 – just above the 50-mark dividing expansion from contraction – to a six-year high of 57 in the first quarter.
The most recent employment data has also been indecisive. Job growth has been fairly consistent for several years, with monthly gains averaging 187,000
in 2016. In the first quarter, this pace dropped slightly to 178,000 due to a weak report of 98,000 in March. Part of this deceleration was attributed to winter weather during the survey period. At the same time, the unemployment rate fell to a ten-year low of 4.5 percent, just 0.1 percentage point away from the lowest level of the last expansion and below the Fed’s projected long-run median rate of 4.7 percent. However, given the tight labor market, the lack of stronger wage growth remains a puzzle. From 2011 through 2015, average hourly earnings growth hovered around two percent (year-over-year). Thereafter, compensation started to climb, hitting 2.7 percent by mid-2016. However, it has plateaued at that pace and, with headline CPI inflation running at about 2.4 percent, real wage growth has been weak. Given the demographics, job growth is projected to slow over the forecast horizon, dropping from 1.8 percent in 2016 to 1.6 percent (2.2 million jobs) in 2017.
The Federal Reserve is implicitly assuming that the rate of jobs growth will decline as labor markets approach full employment. In the FOMC summary economic projections released in March, the forecasted median unemployment rate remains unchanged at 4.5 percent over the next three years. According to the Atlanta Fed’s jobs calculator, assuming no changes to growth in immigration, population and labor force participation rates, this implies a monthly gain in payroll employment of about 120,000. With the current job market expanding faster than this pace, the Fed felt comfortable raising its benchmark Federal Funds Rate (FFR) by 25 basis points (bps) in its March meeting to the range of 0.75-1.00 percent. The rate hike in March comes on the heels of December’s increase (also of 25bps) and is only the third rate increase since the global financial crisis and the ensuing quantitative easing program.
Until recently, global energy prices and a strong US dollar had kept domestic price levels suppressed – the first half of 2016 saw average PCE inflation of 0.9 percent and average core inflation (excluding energy and food prices) of 1.6 percent. Energy prices have made a partial recovery but remain well below their pre-2015 levels. Nevertheless, domestic prices for items such as shelter, transportation, and medical care have risen and have helped push PCE inflation (the Fed’s preferred measure) above two percent in February for the first time in almost five years.

Budget and Financial Plan Summary Fiscal Year 2018
18
In its March statement, the FOMC noted it expects inflation to stabilize around its two percent target over the medium term. Businesses largely agree, with the Atlanta Fed’s Business Inflation Expectations survey indicating firms expect 1.9 percent inflation one year from now. Consumers, however, are anticipating inflation to overshoot the two percent target – the New York Fed’s survey of consumer expectations put expected inflation 12 months ahead at 2.7 percent. Market based measures of expected inflation are less sanguine. The ten-year breakeven inflation rate – the expected inflation rate measured by the gap between 10-year Treasury yields and their inflation-indexed counterparts – recently fell to 1.85 percent after fluctuating above two percent for most of the first quarter.
With economic activity on the rise, a tightening labor market, and projections of stable inflation, the Fed is maintaining an accommodative policy stance in the months ahead. The FOMC vows to remain data-dependent going forward but has noted it will likely raise rates by 25 bps at least twice more this year, with some committee members calling for a third increase should inflation overshoot for an extended period. In April, market estimates from the fed funds futures
market show that investors expect between one to two additional rate changes this year, with no hikes until July or September. NYC OMB’s forecast assumes two more rate increases this year followed by three in 2018.
The enthusiasm that animated financial markets after the presidential election has faded in the beginning of 2017, despite evidence that corporate profits are on the mend. Between Election Day and the end of 2016, the S&P 500 and Dow Jones Industrial Average jumped five and 8.2 percent, respectively. Even more revealing was the pattern of price gains that reflected the new administration’s promises for tax cuts and regulatory rollbacks. Financial stocks soared, with the S&P 500 bank sector index gaining 23 percent through the end of 2016. Shares of small-cap firms in the Russell 2000 index also jumped nearly 14 percent over the same period.
However, uncertainty on the scope and speed of the policy changes has increased. While the S&P has continued to gain 4.0 percent year-to-date through mid-April, the banking component of the S&P 500 dropped 3.2 percent over the same period, with much of the losses occurring in March when the healthcare bill failed in
PERSONAL CONSUMPTION EXPENDITURES (PCE) INFLATION
Forecast
0.0%
0.5%
1.0%
1.5%
2.0%
2.5%
3.0%
20192018201720162015201420132012
The Federal Reserve’s preferred measure of inflation recently surpassed the target of two percent for the first time in almost 5 years.
Ann
ual P
erce
nt C
hang
e
Headline PCE
Core PCE
Source: U.S. Bureau of Economic Analysis, NYC OMB

Budget and Financial Plan Summary Fiscal Year 2018
19
Congress. Likewise, the Russell 2000 is down nearly a full percentage point year-to-date. Nevertheless, despite the uncertainty during President Trump’s first three months, equity markets have been composed. Expected volatility in the S&P 500, measured by the Chicago Board Options Exchange’s volatility index (VIX) dropped to 11.7 in the first quarter, the second-lowest quarterly average since the start of the index in 1990. The only quieter period was the fourth quarter of 2006, during the height of the housing market boom when the VIX averaged 11. Likewise, the share of trading days with S&P index swings in excess of one percent – the trading day ratio – dropped to just 3.2 percent in the first quarter, well below the 25-year average of 26 percent.
Judging from flows of funds into mutual funds and ETFs, investor sentiment was initially cautious prior to the election, but switched to a riskier stance in November. According to the Investment Company Institute, from January through October 2016, $117 billion was withdrawn from equity funds. Much of this was recycled into safer bond funds, with inflows of $208 billion over the same period. However, after the election equity fund flows rebounded strongly, adding an estimated $127 billion in the five months through March, while flows into fixed income slowed. The early data from April shows signs that this may have flipped yet again after the failed healthcare vote. Equity mutual funds and ETFs suffered outflows of $1.5 billion in the first two weeks of April, while bond funds added $15 billion.
Washington politics notwithstanding, the recent path of corporate profits is supportive of further price growth. After suffering from five consecutive quarters of year-over-year contraction, corporate profits turned the corner in the third quarter of 2016 with a 2.1 percent expansion. This strength persisted in the fourth quarter, accelerating to 9.3 percent growth. Furthermore, the fourth quarter profit statistics were lowered by BEA by about $20 billion to account for the one-time Volkswagen buyback deal, effectively shaving off a full
percentage point from the earnings figures. The S&P earnings data also reflects the rebound. Earnings per share jumped from 9.3 percent (year-over-year) in the third quarter to over 29 percent in the fourth. The first quarter earnings season has just begun, but earnings estimates published by S&P point to further strength in 2017.
Bond markets have benefitted from the relatively low interest rates and gradually increasing trading volumes. Corporations continue to lock in cheap borrowing ahead of anticipated rate increases. Over the past five consecutive years, corporate debt has set new records for issuance and the trend appears to be continuing into 2017, despite the 60 bps jump in ten-year Treasury yields just after the election. In the first quarter, companies sold $469 billion of new debt, up 17.9 percent from a year-ago and the highest quarterly level in the current expansion. Average trading volume has likewise grown, up 3.1 percent from first quarter 2016.
The favorable conditions helped Wall Street finish 2016 on a strong note. NYSE-member firms earned profits of $2.3 billion in the fourth quarter bringing full-year profits to $17.3 billion, the highest since 2012. This was a jump of 21.1 percent over 2015 profits, which were suppressed by a slowdown in the second half of the year. The robust results continue to depend on strict cost controls. Revenue growth in 2016 was 2.9 percent, while expenses grew by only 1.2 percent, primarily due to a drop in compensation (down -1.6 percent) and other expenses (down -6.2 percent). This latter category includes legal expenses, which have been declining steeply as litigation stemming from the housing crash tapers off. First quarter 2017 results for Wall Street will not be available until the conclusion of the earnings season now getting underway. However, early evidence from the Big Five banks is suggesting a strong start. First quarter net income is up nearly 11 percent from the fourth quarter of 2016 and jumped 57 percent compared to the (weak) first quarter a year ago.

Budget and Financial Plan Summary Fiscal Year 2018
20
With the administration proposing looser financial market regulations, banks could see a potential acceleration of earnings. However, they could still face potential headwinds in 2017. Longer-term Treasury yields have retracted some of last year’s increases, with the ten-year Treasury dropping by 38 bps from the 2017 high in March through mid-April. At the same time, the Fed has raised short-term rates twice and is signaling that more hikes are likely. As a result, the benefits from the steeper yield curve that banks enjoyed at the end of last year have all but vanished. The yield spread between 10-year and 3-month Treasuries
peaked at 2.09 percentage points in mid-December, but has since dropped to 1.43 in April, two basis points below the spread on Election Day. Another potential pothole is a worrisome drop in business lending. The total volume of loans and leases made by commercial banks has dropped from an annual pace of 7.3 percent growth just prior to the election to just 3.8 percent at the end of March. Potential factors behind the slowdown include the displacement of bank loans by corporate bond borrowing, a decline in energy company loans as energy prices remain soft, and a slowdown in commercial real estate lending.
U.S. INTEREST RATES
Forecast
0%
1%
2%
3%
4%
5%
6%
7%
201920182017201620152014
Interest and borrowing rates jumped at the end of 2016 due to the election and Fed rate hikes, and yields are expected to trend higher over the next few years.
Ann
ual I
nter
est R
ate
30-Year Mortgage
10-Year Treasury
Federal Funds
Source: Federal Reserve Bank of St. Louis, NYC OMB

Budget and Financial Plan Summary Fiscal Year 2018
21
THE NEW YORK CITY ECONOMY
In 2016, the New York City economy posted another strong year of growth. Total employment grew by over two percent for the sixth consecutive year, continuing the best period of job growth in the City’s history. There are, however, signs of slowing. Job growth decelerated significantly from the break-neck pace in 2014 and 2015, while wages, pulled down by weak bonuses, are expected to increase by just 1.1 percent. Total residential transactions declined for the first time since 2011, and primary market office asking rents increased modestly by 2.2 percent, down from 4.1 percent in 2015. Nevertheless, tourism posted another record year with 60.3 million visitors, and Wall Street finished 2016 with pre-tax profits of $17.3 billion – highest since 2012. Looking ahead, the City’s economy is projected to grow moderately in line with recent data and an economy with little slack.
The City’s labor market added 342,300 total jobs over the last three years – the second strongest three year period in history. Additionally, the unemployment rate hit a multi-decade low of 4.0 percent in March of 2017. While the City’s job growth exceeded the country’s for the tenth straight year, gains have decelerated more recently. After averaging annual growth of 2.3 percent through the first three quarters of 2016, year-over-year employment growth slowed to 1.2 and 1.5 percent in the fourth quarter of 2016 and the first quarter of 2017, respectively. This trend
is expected to continue in the short-run and NYC OMB projects total job growth of 1.2 percent and one percent in 2017 and 2018, respectively.
A decline in bonuses in the securities and professional and business services sectors pulled down wages in the first half of 2016. Through the first three quarters of 2016, total average wages increased by 0.7 percent and are expected to finish the year up 1.1 percent.
Going forward, wage growth will improve due to several factors. First, bonuses are projected to return to positive territory after declining for two straight years. Secondly, the unemployment rate is at a record low and labor force participation rates are near record highs. This suggests that there is little slack in the job market, which will put upward pressure on wages. Furthermore, the minimum wage increased to $11 per hour from $9 per hour in December of last year, a 22.2 percent increase that will benefit a significant portion of the City’s workforce.
These three factors are expected to result in 2.8 percent wage growth in 2017 and 3.7 percent in 2018. Thus wages will offset the deceleration of employment growth resulting in wage earnings growth of 4.1 percent and 4.7 percent in 2017 and 2018, respectively.

Budget and Financial Plan Summary Fiscal Year 2018
22
From 2014-2016, all major industries, except manufacturing, added jobs. However, gains were concentrated in three sectors: professional and business services, education and health services, and leisure and hospitality. In 2016, these industries accounted for nearly 80 percent of the private sector job gains and nearly 70 percent over the last three years. In the short run, these industries will continue to drive the City’s job growth.
Healthcare employment has been propelled by an aging population and a rising insured population. In 2016, the sector added 28,000 jobs and over 70,000 from 2014-2016. The Affordable Care Act (ACA) has benefitted New Yorkers by reducing the number of uninsured in the City. Based on data from the American Community Survey (ACS), the share of NYC residents in 2009 with any type of insurance was 86 percent. By 2015, that number increased to 91 percent. But uncertainty over the future of the ACA poses a downside risk for future employment growth in the industry. NYC OMB projects employment growth to decelerate to 7,000 in both 2017 and 2018.
One industry that came to a standstill in 2016 was retail trade. From 2010 through 2014, the industry added
an average of 11,600 jobs per year, before slowing to just 1,800 in 2015 and shrinking by 3,000 in 2016. Last year’s decline is consistent with the performance of the retail sector in the nation, as online competition has started to pressure brick and mortar stores. Additionally, high operating costs have contributed to weakness in the sector. In the short run, rising consumption should help retail employment growth return to positive territory, but it is not expected to return to the levels seen during 2010-2014.
Unlike retail trade, the securities industry was a positive surprise in 2016 – adding 3,800 new jobs for its third consecutive year of growth. Employment grew in the industry despite a -1.6 percent decline in compensation at NYSE-member firms. Looking forward, there are many uncertainties facing the industry including the future of Dodd-Frank, corporate tax reform, and Brexit. These could benefit or hinder future employment growth. Deregulation could result in higher but more volatile profits leading to more cyclical employment changes. Lower corporate tax rates would reduce costs faced by financial firms and could lead to new hires. Prospects for tax reform, however, are uncertain. Brexit could benefit the financial sector, if firms decide to move certain operations from London
NYC EMPLOYMENT VS. WAGE GROWTH
Forecast
With little slack in the local labor market, employment growth is expected to slow, while wage growth is projected to accelerate.
Ann
ual P
erce
nt C
hang
e to
Em
ploy
men
tA
nnual Percent Change to W
ages
Wages (Right)
Total Employment (Left)
-5.0%
-2.5%
0.0%
2.5%
5.0%
-10%
-5%
0%
5%
10%
1918171615141312111009080706050403020100
Source: NYS DOL, NYC OMB

Budget and Financial Plan Summary Fiscal Year 2018
23
to their NYC offices. Cognizant of these uncertainties, NYC OMB expects the industry to grow moderately, remaining below its 2007 peak until 2021.
Although employment growth in the securities industry is picking up, professional and business services remains the engine of office-using employment growth. Over the last six years, job gains have averaged nearly 25,000 per year. In 2016, the sector added 23,000 positions. With domestic and global growth expected to accelerate in the near term, the sector is projected to continue driving office-using employment growth with 19,000 jobs this year and 14,000 in 2018.
In the first quarter, office-using employment (comprising financial activities, professional and business services, and information) was up 1.8 percent from a year earlier. This was a gain of 9,800 office-using jobs, about 15 percent higher than the same period in 2016. Accordingly, commercial real estate leasing activity has seen a strong start to the year. Data from Cushman and Wakefield shows that new leasing
activity is up 5.9 million square feet (msf) in the first two months of the year, a 35 percent increase on a year-over-year basis. The primary market Manhattan vacancy rate fell -0.3 percentage points in January and -0.1 percentage points in February, while the occupancy rate rose 0.6 percent and 0.4 percent, respectively. Likewise, asking rents were up by an average of 0.9 percent over the two months.
Office-using employment gains are expected to decelerate over the next few years. In addition, a substantial inventory expansion will affect the market – between 2016 and 2020, approximately 13 msf of new office space in Manhattan alone will become available (mostly in the World Trade Center and Hudson Yards), putting upward pressure on vacancy rates and suppressing asking rents. Total inventory is expected to rise by 1.5 msf, 4 msf, and 6 msf in the period 2017-2019. As a result, asking rents are estimated to rise mildly in 2017 (2.0 percent) and fall in 2018 and 2019 (by -0.4 percent and -0.5 percent, respectively).
PRIMARY MARKET OCCUPANCY AND ASKING RENTS
Forecast
Even as the overall occupancy level is expected to rise, the surge in new office inventory will keep asking rents supressed.
Mil
lion
Squ
are
Feet
Asking R
ents
200
205
210
215
220
225
230
235
240
$60
$80
$100
1918171615141312111009
Source: Cushman and Wakefield, NYC OMB
Asking Rents (Right)
Occupied Inventory (Left)

Budget and Financial Plan Summary Fiscal Year 2018
24
Similar to the commercial and labor markets, activity in the residential market slowed in 2016. Transactions declined for the first time since 2011, falling by -1.2 percent to 51,941. Co-op sales were a significant drag, declining by -7.6 percent, while condos fell by -1.5 percent and Class-one sales increased by 3.3 percent.
Despite the decline in sales, average prices increased by 6.2 percent. Growth, however, was skewed by a 13.6 percent increase in average condo prices. Furthermore, many of the ultra-luxury condo sales that closed last year were legacy contracts negotiated in prior years. Class-one average prices also increased, rising by 3.4 percent down from 6.4 percent in 2015. Average co-op sales prices, however, declined by -2.9 percent – the second consecutive annual decline.
The residential market has been hampered by inventory constrains. Furthermore, new developments have been biased towards the luxury market due to high land and construction costs, while demand is stronger for more affordable, middle-market properties. This mismatch is one factor behind strong sales in the suburbs surrounding New York City.
Supply constraints are expected to mitigate over the next two years as some of the 56,000 permits issued in 2015 start to hit the market. The growth in supply and higher wages will boost demand for real estate. Thus, sales are projected to grow by 0.7 percent in 2017 and 1.5 percent in 2018, while average prices are projected to increase by 0.4 percent in both 2017 and 2018.
Since the recession, tourism has been a pillar of the NYC economy. However, the new political environment is creating unforeseen risks and challenges ahead for NYC’s tourism sector. The new administration’s travel ban, along with anti-immigrant and anti-trade rhetoric has resulted in negative perceptions of travel to the US among foreign visitors, particularly Europeans. The first few weeks of the new administration were accompanied by a drop in flight searches to the US
from abroad in all but a few countries. Even after accounting for seasonal factors, the drop in interest for US travel has been significant.
As a result of these pressures, NYC & Co, the city’s tourism marketing agency, recently lowered its forecast for international visitors to NYC in 2017 by -2.1 percent to 12.4 million. This would be the first decline in international visitors to the city since 2009 (during the global financial crisis). The outlook remains robust for domestic travel, however, with an estimated 49.3 million US visitors expected to visit the city in 2017. While the estimate for total travelers (61.7 million) would represent yet another record year, there are economic repercussions to a drop in international visitors. As foreign tourists tend to stay longer and spend more on each visit than domestic visitors, NYC & Co estimates that the drop in foreign visitors would result in a total (direct, indirect and induced) decline in economic activity of $900 million in the City.
So far, however, the most recent data seem to indicate that 2017 is off to a strong start. The leisure and hospitality employment category added an average of 3,100 jobs in the first three months of the year on a seasonally-adjusted (SA) basis, a notable improvement on the 1,100 jobs created in the same period of 2016. In addition, hotel figures for January and February have been favorable, with the average number of room nights sold at 3.1 million (SA), 5.2 percent higher than the monthly average for 2016 of 2.9 million. Despite this increase in demand, a higher supply of hotel rooms coming on the market has continued putting downward pressure on room rates. The average room rate in January and February was $267 on an SA basis, five percent below the $282 average in 2016. Going forward, the average number of occupied rooms per night is expected to drop slightly in 2017, partially recover in 2018, and remain stable in 2019. In addition, new hotel inventory will keep average nightly room rates below $300.

Budget and Financial Plan Summary Fiscal Year 2018
25
Domestically, policy uncertainty remains a key risk to the forecast. The forecast assumes the new administration will follow through on promises to lower both the corporate and personal tax rates. A Blue Chip poll places even odds on corporate or personal tax reform by the end of 2017. If tax reform does not meet expectations, there could be significant backlash in financial markets and a lower path of domestic growth. Congressional deadlock continues to be a concern under the new administration despite the GOP’s majority in the House and the Senate. Republicans
failed to unite over healthcare reform and have still not agreed to raise the debt ceiling. Additionally, the Administration’s stance on trade has become increasingly opaque, recently softening its rhetoric on China. If the administration enacts protectionist policies, such as the proposed Border Adjustment Tax, relationships with major trading partners may become strained and domestic firms dependent on imports will be adversely affected. Overseas, elections in France and Germany could threaten the future stability of the European Union (EU).
AVERAGE NIGHTLY ROOM RATE
Forecast
A decline in foreign visitors is expected to drop the average number of room nights sold in 2017, while a larger supply
of hotel rooms will keep average nightly room rates subdued.
Ave
rage
Num
ber
of O
ccup
ied
Roo
ms
(in
Tho
usan
ds)
Average N
ightly Room
Rate
0
20
40
60
80
100
120
$200
$250
$300
$350
19181716151413121110090807Source: Cushman and Wakefield, NYC OMB
Average Nightly Room Rate (Right)
Average Number of Occupied Rooms Per Night (Left)
Risks to the Forecast

Budget and Financial Plan Summary Fiscal Year 2018
26
New York City Job Growth Forecast
Forecast 2016 2017 2018Industry Level Level Change Level ChangeTotal 4,341 53 45 Private 3,789 52 45 Financial Activities 466 3 3 Securities 177 2 2 Professional & Business Services 723 19 14 Information 193 1 1 Education 247 3 4 Health & Social Services 684 7 7 Leisure & Hospitality 438 9 7 Wholesale & Retail Trade 495 3 3 Transportation & Utilities 135 — — Construction 146 4 2 Manufacturing 76 — — Other Services 187 2 3Government 552 — —Source: NYC OMB Note: Total may not add up due to rounding.

Budget and Financial Plan Summary Fiscal Year 2018
27
Forecasts of Selected Economic Indicators for the United States and New York City Calendar Year 2016-2021
_________________________________________________________________________________________________________________________________
1979- 2016 2017 2018 2019 2020 2021 2015*
_________________________________________________________________________________________________________________________________NATIONAL ECONOMY Real GDP Billions of 2009 Dollars ......................... 16,660 17,036 17,466 17,868 18,283 18,686 Percent Change ...................................... 1.6 2.3 2.5 2.3 2.3 2.2 2.6% Non-Agricultural Employment Millions of Jobs ...................................... 144.3 146.5 148.4 149.9 151.4 152.5 Level Change .......................................... 2.5 2.2 1.8 1.5 1.4 1.1 Percent Change ....................................... 1.8 1.6 1.3 1.0 1.0 0.7 1.3% Consumer Price Index All Urban (1982-84=100) ....................... 240.0 246.1 250.9 256.7 263.8 271.0 Percent Change ...................................... 1.3 2.5 2.0 2.3 2.8 2.7 3.3% Wage Rate Dollars Per Year ...................................... 56,750 58,644 61,017 63,534 66,146 69,017 Percent Change ....................................... 2.5 3.3 4.0 4.1 4.1 4.3 3.9% Personal Income Billions of Dollars .................................. 16,012 16,729 17,586 18,506 19,442 20,382 Percent Change ....................................... 3.6 4.5 5.1 5.2 5.1 4.8 5.7% Before-Tax Corporate Profits Billions of Dollars .................................. 2,195 2,345 2,482 2,522 2,538 2,588 Percent Change ....................................... 2.7 6.8 5.8 1.6 0.6 2.0 5.6% Unemployment Rate Percent .................................................. 4.9 4.6 4.3 4.1 4.2 4.3 6.4% avg 10-Year Treasury Note Percent .................................................... 1.8 2.8 3.4 3.9 4.1 4.1 6.5% avg Federal Funds Rate Percent .................................................... 0.4 1.0 1.7 2.6 3.0 3.0 5.2% avg
Real Gross City Product** Billions of 2009 Dollars ......................... 739.2 751.4 765.1 777.5 791.8 806.9 Percent Change ....................................... 1.0 1.7 1.8 1.6 1.8 1.9 2.6% Non-Agricultural Employment*** Thousands of Jobs .................................. 4,341 4,394 4,439 4,474 4,508 4,542 Level Change .......................................... 86 53 45 35 34 34 Percent Change ...................................... 2.0 1.2 1.0 0.8 0.8 0.8 0.7% Consumer Price Index All Urban (1982-84=100) ....................... 263.4 269.8 275.3 281.8 289.5 297.3 Percent Change ....................................... 1.1 2.5 2.0 2.4 2.7 2.7 3.6% Wage Rate Dollars Per Year ...................................... 86,757 89,193 92,537 95,991 99,716 103,750 Percent Change ....................................... 1.1 2.8 3.7 3.7 3.9 4.0 4.8% Personal Income Billions of Dollars .................................. 556.7 577.2 599.7 625.0 651.2 676.3 Percent Change ....................................... 3.0 3.7 3.9 4.2 4.2 3.9 5.8%
NEW YORK CITY REAL ESTATE MARKET Manhattan Primary Office Market Asking Rental Rate**** Dollars per Square Feet .......................... 78.4 80.0 79.7 79.3 79.4 78.9 Percent Change ....................................... 2.2 2.0 -0.4 -0.5 0.2 -0.6 2.5% Vacancy Rate**** Percent .................................................... 10.0 9.5 10.2 12.1 12.0 11.7 10.6% avg_________________________________________________________________________________________________________________________________ * Compound annual growth rates for 1979-2015. Compound growth rate for Real Gross City Product covers the period 1980-2015 ** GCP estimated by OMB. *** Employment levels are annual averages. **** Office market statistics are based on 1985-2016 data published by Cushman & Wakefield.

Budget and Financial Plan Summary Fiscal Year 2018
28
TAX REVENUE 1
OVERVIEW
Total tax revenue, including audits, is forecast to increase 2.3 percent in 2017 and 3.0 percent in 2018.
Forecast Summary for 2017
Non-property tax revenues are forecast to decline by 1.0 percent in 2017. This is the second consecutive year of sub-par growth. The slowdown in non-property tax revenue is caused by weak personal income tax collections and a significant drop in investment sales.
Personal income tax revenue is expected to grow 2.1 percent in 2017. Growth reflects higher collections due to the fact that the School Tax Relief (STAR) credit has become a State credit. Adjusting for this change, PIT growth is essentially flat in fiscal year 2017 as withholding growth is offset by a decline in estimated payments.
Business tax revenue are expected to grow 2.8 percent following the 6.4 percent decline seen the previous year.
Sales tax revenue is forecast to increase 1.2 percent, or 3.4 percent prior to the $200 million intercept by New York State, as gains from local employment and wage growth lift consumer spending. Hotel room occupancy tax increases 1.0 percent, reflecting the impact on international tourism of global economic concerns and the strong U.S. dollar.
Real property transfer tax revenue is forecast to decline 24.2 percent in 2017 and mortgage recording tax revenue is forecast to decline 12.9 percent, as commercial activity has stalled while residential activity growth has weakened.
Commercial rent tax revenue is forecast to increase 4.8 percent, supported by higher asking rents and new inventory in the New York City office market.
Property tax revenue is forecast to increase 6.2 percent, based upon 6.8 percent growth in billable assessed value.
Forecast Summary for 2018
Non-property tax revenues are not expected to pick-up significantly in 2018 as personal, business and transaction taxes remain a drag.
Personal income tax revenue is expected to grow 6.4 percent in 2018. However, this growth rate includes additional changes to the New York State STAR rate cut reimbursement. Beginning in tax year 2017 NYS has converted the STAR rate cut into a NYS tax credit, which will be reflected in higher NYC withholding. After adjusting for the change in the STAR program, PIT growth increases 3.2 percent, with steady withholding growth and stable estimated payments.
Business tax revenue is expected to grow 3.6 percent as profitability remains restrained.
Sales tax revenue is forecast to increase 5.4 percent, or 4.5 percent prior to the $150 million intercept by New York State, as gains from local employment and wage growth support consumer spending. Hotel room occupancy tax remains flat, reflecting continued global economic concerns and the strong U.S. dollar.
Real property transfer tax revenue is forecast to grow 1.4 percent in 2018. Mortgage recording tax revenue is forecast to decline 13.0 percent, as the high levels of commercial refinancing activity from the prior year are not expected to continue and mortgage rates rise.
Commercial rent tax revenue is forecast to increase 3.9 percent, supported by a combination of steady asking rents and new inventory in the New York City office market.
Property tax revenue is forecast to increase 5.0 percent, based upon 6.7 percent growth in billable assessed value.
1 All years referenced in the Tax section are City fiscal years unless otherwise noted.

Budget and Financial Plan Summary Fiscal Year 2018
29
2017 and 2018 Tax Revenue Forecast($ in Millions)
Increase/(Decrease) 2017 2018 From 2017 to 2018 Tax Amount Percent Change
Real Property $24,402 $25,629 $1,227 5.0% Commercial Rent 816 848 32 3.9% Real Property Transfer 1,345 1,364 19 1.4% Mortgage Recording 1,074 934 (140) (13.0%) Personal Income 10,958 11,655 697 6.4% Business Corporation1 3,794 3,890 96 2.5% Unincorporated Business 2,026 2,137 111 5.5% Sales and Use 6,994 7,369 375 5.4% Utility 377 382 5 1.3% Cigarette 44 42 (2) (4.5%) Hotel 571 570 (1) (0.2%) All Other 638 596 (42) (6.6%) ––––––––– ––––––––– ––––––––– ––––––––– Subtotal $53,039 $55,416 $2,377 4.5%
STAR Aid 556 202 (354) (63.7%) Tax Audit Revenue 1,251 850 (401) (32.1%) ––––––––– ––––––––– ––––––––– ––––––––– Total (After Tax Program)† $54,846 $56,468 $1,622 3.0%
1. Business Corporation Tax Includes both General Corporation and Banking Corporation tax revenues.
† Totals may not add due to rounding.

Budget and Financial Plan Summary Fiscal Year 2018
30
REAL PROPERTY TAX
REAL PROPERTY TAX 2008 - 2018
$ in
Bil
lion
s
Fiscal Year
12
14
16
18
20
22
24
26
28
20182017201620152014201320122011201020092008

Budget and Financial Plan Summary Fiscal Year 2018
31
Real property tax revenue is projected to account for 45.4 percent of total tax revenue in 2018, or $25.629 billion.
2017 Forecast: Property tax revenue is forecast at $24.402 billion, growth of 6.2 percent over the prior year, an increase of $206 million over the January 2017 Plan. The plan change resulted from the strength in collections observed year-to-date, as well as expected collections through the remainder of the year. The 2017 revenue growth mirrors the growth of 6.8 percent in billable assessed value seen on the 2017 final roll (before accounting for the veterans’ and STAR exemptions). The plan change is attributed primarily to a reduction in the reserve for uncollectible taxes amounting to $156 million (revisions to cancellations, delinquency and lien sale) and a lower than expected refunds of $50 million.
Distribution of Property Parcels by Class
Parcels* Percentage Share
Class 1 698,927 66.11% Class 2 260,779 24.67% Class 3 294 0.03% Class 4 97,177 9.19%
Citywide 1,057,177 100.00%
* FY 2017 final roll
2018 Forecast: Property tax revenue is forecast at $25.629 billion, growth of 5.0 percent over the current year, no change from the January 2017 Plan.
In 2018, the levy is expected to increase by
$1.735 billion to $27.530 billion, growth of 6.7 percent over the current year. The property tax levy forecast is based on the 2018 tentative roll released by the Department of Finance on January 15, 2017. Citywide, total billable assessed value (after accounting for the veteran’s and STAR exemptions) increased by $17.6 billion to $226.2 billion, growth of 8.5 percent. The tentative roll is expected to be reduced on the final roll by $3.5 billion as a result of tax commission actions, Department of Finance change-by-notice, and completion of exemption processing. The final roll is expected to be released by the Department of Finance on May 25, 2017. Citywide, total billable assessed
value on the 2018 final roll (before accounting for the veterans’ and STAR exemptions) is forecast to increase by $14.1 billion over 2017 to $224.3 billion, growth of 6.7 percent.
Property tax revenue, after accounting for the reserve for the uncollectible taxes is forecast at $25.629 billion, an increase of $1.227 billion over the current year.
In the out-years, with a forecast rise in long-term interest rates, capitalization rates are projected to increase, putting downward pressure on future market value growth. As a result, Class 2 and Class 4 market value growths are forecast to moderate. This slower market value growth partially offsets the existing ‘pipeline’ of deferred assessment increases yet to be phased in from prior years, resulting in property tax levy growth that is expected to average 5.1 percent from 2019 through 2021. Tax revenue growth is forecast to average 5.3 percent during the same period.

Budget and Financial Plan Summary Fiscal Year 2018
32
COMMERCIAL RENT TAX
The commercial rent tax is projected to account for 1.5 percent of total tax revenue in 2018, or $848 million.
2017 Forecast:
Commercial rent tax revenue is forecast at $816 million, growth of 4.8 percent over the prior year. Growth rate has decelerated from 6.0 percent seen last year as the year-over-year growth in asking rent slowed in 2017.
2018 Forecast:
Commercial rent tax revenue is forecast at $848 million, an increase of 3.9 percent over the current year. Market conditions are expected to improve only moderately in 2018. Asking rents are expected to remain flat while the vacancy rate is forecast to increase - as more new primary office inventory comes on line.
Commercial rent tax revenue is projected to grow at an average of 4.0 percent from 2019 through 2021, reflecting continued improvement in the commercial real estate market as the local economy continues to expand. Primary Market asking rents remain stable, but vacancy rates are forecast to increase as new inventory continues to enter the market outpacing the growth in office using employment.
COMMERCIAL RENT TAX 2008 - 2018
300
400
500
600
700
800
900
20182017201620152014201320122011201020092008
Fiscal Year
$ in
Mil
lion
s

Budget and Financial Plan Summary Fiscal Year 2018
33
REAL PROPERTY TRANSFER TAX
The real property transfer tax is projected to account for 2.4 percent of total tax revenue in 2018, or $1.364 billion.
2017 Forecast: Real property transfer tax revenue is forecast at $1.345 billion, a decline of 24.2 percent from the prior year. Total tax collections (year-to-date through March) declined by 21.0 percent over the prior year, caused by a precipitous 37.5 percent decrease in revenue from commercial transactions, offset slightly by a 2.9 percent growth in revenue from residential transactions.
Revenue from residential transactions is forecast to grow 1.0 percent, while revenue from commercial transactions is forecast to decline 41.9 percent – first double digit decline seen since 2010. The decline comes after the revenue grew by more than 500 percent from 2010 to 2015. The first noticeable decline in collections came in the 4th quarter of 2016. Price reductions were
noticeable across rental, hotel and store property types, while the office market held its ground with some modest price increase. Even with the price reductions offered for some property types, transaction counts saw double digit declines in calendar year 2016 across all the property types, including office.
2018 Forecast: Real property transfer tax is forecast at $1.364 billion, an increase of 1.4 percent from the current year. Revenue from residential transactions is forecast to grow 0.8 percent from the current year. Revenue from commercial transactions is forecast to grow only modestly by 2.1 percent from the current year, as the commercial market stabilizes. Residential transfer tax collections are expected to grow at an annual average rate of 3.3 percent from 2019 through 2021 as both price and volume are expected to grow. Commercial transfer tax collections are expected to grow slightly at an annual average rate of 2.7 percent from 2019 through 2021.
REAL PROPERTY TRANSFER TAX 2008 - 2018
0
500
1,000
1,500
2,000
20182017201620152014201320122011201020092008
Fiscal Year
$ in
Mil
lion
s

Budget and Financial Plan Summary Fiscal Year 2018
34
MORTGAGE RECORDING TAX
The mortgage recording tax is projected to account for 1.7 percent of total tax revenue in 2018, or $934 million.
2017 Forecast: Mortgage recording tax revenue is forecast at $1.074 billion, a 12.9 percent decrease over the prior year. Total tax collections (year-to-date through March) decreased by 10.9 percent over the prior year, reflecting a 7.2 percent increase in revenue from residential mortgages and a 19.9 percent decline in revenue from commercial mortgages.
Revenue from residential mortgage recordings is forecast to grow 5.4 percent, while revenue from commercial mortgage recordings is forecast to decline 22.1 percent. The decline seen in commercial mortgage recording tax is less severe than the one observed on the commercial transfer tax, as large volumes of 10-year loans issued in 2006 - 2007 are now coming due in 2016 - 2017 and are now refinanced.1 With the interest rates expected to rise further, borrowers are locking in
at current rates. Furthermore, an increase in property values seen during the recent years now allows them to borrow more by taking more equity out of the property and still maintain a healthy debt-to-equity ratio.2
2018 Forecast: Mortgage recording tax is forecast at $934 million, a decline of 13.0 percent from the current year. Revenue from residential mortgage recordings is forecast to grow 3.2 percent and revenue from commercial mortgage recordings is forecast to decline 24.0 percent as the commercial mortgage refinancing activities slow-down and mortgage financing drops back to a long-term trend averages as interest rates rise. Residential mortgage recording tax collections are expected to average 3.3 percent growth from 2019 through 2021, while the commercial mortgage recording tax collections are expected to grow at an annual average rate of 2.7 percent from 2019 through 2021.
MORTGAGE RECORDING TAX 2008 - 2018
0
500
1,000
1,500
2,000
20182017201620152014201320122011201020092008
Fiscal Year
$ in
Mil
lion
s
1 Mulholland, Sarah. “A $90 Billion Debt Wave Shows Cracks in U.S. Property Boom” Bloomberg 24 Jan. 2017. Web. 18.Apr. 20172 Ahmad, Ali. “Commercial/Multifamily Mortgage Debt Ends Year Strong, Despite CMBS Decline” Mortgage Bankers Association
2017 press release 21 Mar. 2017. Web 18.Apr. 2017

Budget and Financial Plan Summary Fiscal Year 2018
35
PERSONAL INCOME TAX
The personal income tax (PIT) is projected to account for 20.6 percent of tax revenue in 2018, or $11.655 billion.
2017 Forecast: PIT revenue is forecast at $10.958 billion, an increase of $225 million over the prior year, growth of 2.1 percent. This 2.1 percent growth rate is inflated due to a change in the New York State STAR (School Tax Relief) program. Previously, NYC PIT payers received a tax credit on their local income taxes and the City was paid by the State for the cost of offering this tax credit. Beginning in tax year 2016, NYC PIT payers will have this credit applied to their NYS taxes and the reimbursement payment will be eliminated. After adjusting for the change in STAR, personal income tax growth is essentially flat in fiscal year 2017 as withholding remains strong, but non-wage income declines.
Withholding is forecast to grow by 5.2 percent in 2017. Withholding grew by 3.5 percent for the first two quarters of 2017 and picked up in the third quarter, which
saw a 7.2 percent increase in collections over the third quarter in 2016. The Executive Budget’s withholding forecast was revised upward by $63 million as a result of this growth. The driver behind this growth appears to be an acceleration of wages and stronger than expected bonuses. Average weekly earnings grew 4.0 percent in January and 1.7 percent in February, year over year. Year-end bonuses grew 1.8 percent, slightly higher than expected. While this year’s bonus payments were more than expected, it represents the third straight year of effectively stable bonus payments, an unusual event for a revenue source that is notoriously volatile.
For the f inal quarter, April-through-June, withholding collections are expected to grow 6.0 percent from the same prior year period.
Estimated payments in 2017 are forecast to decrease 12.2 percent over the prior year. Typically these taxpayers make installment payments on 110 percent of their prior year’s total liability in order to avoid penalties. This is known as the Safe Harbor
PERSONAL INCOME TAX 2008 - 2018
6
7
8
9
10
11
12
20182017201620152014201320122011201020092008
Fiscal Year
$ in
Bil
lion
s

Budget and Financial Plan Summary Fiscal Year 2018
36
rule. Weak installment payments indicate that estimated payment remitters have earned less in liability year 2016 than they did in liability year 2015. Fiscal year 2017 to date estimated payments are 13.9 percent below the same period last year as both the number of filers and the average payment per filer has declined.
As residents settle their 2016 liabilities they typically either file final returns and make a payment or request a refund by April 18, 2017. For more complicated returns, filers may seek a six month extension, as long as they pay their expected liability.
These spring settlement payments (finals, extensions, offsets and refunds) are expected to be up 12.2 percent in fiscal year 2017, boosted by lower refunds due to the conversion of the STAR credit. Extension payments are expected to be well below last year.
2018 Forecast: Personal income tax revenue is forecast at $11.655 billion, a growth of 6.4 percent over the current year. However, the 6.4 percent growth rate is again artificially inflated due to another change in the New York State STAR program. Applicable in tax year 2017, NYS has ended a NYC PIT rate cut
SETTLEMENT PAYMENTS
-800
-600
-400
-200
0
200
400
600
800
1,000
1,200
17f16f15141312111009080706050403020100
Note: Adjusted for the City/State final return reconciliation.f = Forecast
$ in
Mil
lion
s
Tax Year

Budget and Financial Plan Summary Fiscal Year 2018
37
and corresponding payments made to NYC in order to compensate the City for lower revenues. From now on, NYC PIT rates will be raised and the State payments eliminated. NYC PIT filers will instead be able to claim a credit on their NYS tax returns valued at the exact increase caused by this change. This change is revenue neutral for taxpayers and the City, but withholding tax collections are expected to increase by approximately $333 million in 2018. After adjusting for the change in STAR, personal income tax growth is 3.2 percent in fiscal year 2018 as withholding remains strong, and non-wage income remains weak.
Withholding in 2018 is forecast to increase 9.7 percent over the prior year, boosted by elimination of the STAR rate cut. For the July-November base withholding calculation period, collections are forecast to increase 9.4 percent. In the December-through-March bonus period, withholding is forecast to increase by
7.4 percent. This growth is due primarily to base withholding which is expected to grow 8.1 percent, again as a result of the STAR change. For the final April-through-June 2018 quarter, withholding collections are forecast to grow 11.6 percent over the same prior year period.
Estimated payments in 2018 are expected to increase 1.8 percent from the prior year’s level as capital gains stabilize. Extension payments are forecast to increase over the prior year. Total settlements (final returns, extension payments, City/State offsets, and refunds) are expected to be slightly lower than the previous year.
Personal income tax revenue is forecast to average growth of 4.2 percent from 2019 through 2021 with steady withholding growth and stable non-wage income growth.
Personal Income Tax Collections By Component($ in Millions)
2010 2011 2012 2013 2014 2015 2016 2017 f 2018 f
Withholding $5,754 $6,096 $6,157 $6,542 $6,976 $7,513 $7,753 $8,159 $8,953 Estimated Payments 1 1,691 2,110 2,109 2,893 2,680 3,167 3,021 2,653 2,702Final Returns 288 317 327 382 380 429 439 425 407Other 2 427 302 527 576 810 837 896 848 723 Gross Collections $8,159 $8,825 $9,119 $10,393 $10,846 $11,946 $12,109 $12,085 $12,785 Refunds (1,301) (1,181) (1,166) (1,225) (1,307) (1,317) (1,376) (1,127) (1,130) Net Collections $6,858 $7,644 $7,953 $9,168 $9,539 $10,629 $10,733 $10,958 $11,655 Less TFA Retention Total $6,858 $7,644 $7,953 $9,168 $9,539 $10,629 $10,733 $10,958 $11,655
1 Includes extension payments.
2 Offsets, charges, assessments less City audits.
f = Forecast.
Totals may not add due to rounding.

Budget and Financial Plan Summary Fiscal Year 2018
38
BUSINESS CORPORATION TAX
The business corporation tax1 is projected to account for 6.9 percent of tax revenue in 2018, or $3.890 billion. Major changes in State law merged the general corporation and banking corporation taxes for corporations into the business corporation tax effective tax year 2015. This results in nearly all general corporation and banking corporation tax payments beginning in fiscal year 2016 and thereafter being reported as business corporation tax payments2.
2017 Forecast: Business corporation tax revenue is forecast at $3.794 billion, a 4.7 percent increase over the prior year.
In 2017, tax collections year-to-date through February declined 9.5 percent from the prior year.3 It
is apparent that many firms, due to uncertainty related to corporate business tax reform, overpaid and/or did not take refunds during tax year 2015. This uncertainty has led to weak finance sector tax payments for the current fiscal year regardless of the high level of Wall Street profitability and moderate growth in non-finance sector tax payments in calendar year 2016. A number of firms after having better estimated their 2015 tax liability have determined they already have the funds on account to cover tax year 2016 liability through the first three quarters of the fiscal year. Tax payments are expected to rebound for the remainder of the fiscal year reflecting payments on finalized 2016 liability in April and the first tax payments on tax year 2017 estimated liabilities in June.
1 Business corporation tax collections for reporting purposes include S-corporations under the general corporation tax.2 In March 2014, the State of New York’s enacted budget for State Fiscal Year 14-15 imposed major changes to the State Corporate
tax structure. These changes included the merging of the NYS franchise tax with the NYS banking franchise tax as well as modifications to other sections of the NYS corporate tax code. On April 1, 2015, the New York State Legislature passed a bill that aligned the NYC corporate tax structure to the State’s corporate tax structure with revisions to ensure that the effects of corporate tax reform on NYC are revenue neutral. These changes were signed into law by the Governor on April 13, 2015 as Part D of Chapter 60 of the Laws of 2015 and are effective for tax years beginning on or after January 1, 2015.
3 YTD collections through March are not comparable due to a change in the filing deadline for final returns which are now due April 18th this year compared to March 15th the prior year.
BUSINESS CORPORATION TAX 2008 - 2018
2.0
2.5
3.0
3.5
4.0
4.5
20182017201620152014201320122011201020092008
Fiscal Year
$ in
Bil
lion
s

Budget and Financial Plan Summary Fiscal Year 2018
39
2018 Forecast: In fiscal year 2018, the business corporation tax is forecast at $3.890 billion, 2.5 percent growth over the current year. In 2018, tax payments from finance sector firms are expected to be constrained by a decrease in calendar year 2017 Wall Street profitability. Tax payments from non-finance sector firms are forecast to grow moderately, consistent with continued economic growth.
Business corporation tax growth is forecast to average 1.9 percent from 2019 through 2021, paralleling steady growth in the national and local economies.

Budget and Financial Plan Summary Fiscal Year 2018
40
UNINCORPORATED BUSINESS TAX
The unincorporated business tax is projected to account for 3.8 percent of tax revenue in 2018, or $2.137 billion.
2017 Forecast: Unincorporated business tax revenue is forecast at $2.026 billion, a decline of nearly one percent from the prior year. Net collections year-to-date through February declined 3.1 percent from the prior year.1 After the four-year long steady recovery since 2012, finance sector tax payments are forecast to decline 2.1 percent in 2017, reflecting a broad-based slow-down in the financial industry for most of calendar year 2016. Revenues from hedge fund’s assets under management are still at an all-time high, preventing the level of finance sector tax payments from a steeper decline. Following above-average growth in 2016, non-finance sector tax payments are forecast to remain relatively flat in 2017, reflecting a stable business environment. The level of refunds paid
out year-to-date through March—twice as much as the historical average—has shown the pattern seen last year and is the result of firms adjusting their tax liabilities and consequently reducing overpayments on account. The increased level of refunds has been a drag on tax revenue growth in 2017.
2018 Forecast: Unincorporated business tax revenue is forecast at $2.137 billion, growth of 5.5 percent over the current year. Finance sector payments are forecast to increase 2.4 percent on the expectation of continued expansion of hedge fund assets under management and stronger financial returns. After the flat growth seen in 2017 tax payments, non-finance sector firm’s tax payments are forecast to increase 5.0 percent growth over the prior year. In 2019 through 2021, unincorporated business tax revenue growth is forecast to return to trend, with annualized average growth of 5.4 percent.
1 Collections through March are not comparable due to a change in the due date of final returns from April to March, causing taxpayers to file their final returns in March, rather than paying the taxes in April as in previous years. This change in filing deadline resulted in over $200 million of tax payments moving from April into March.
UNINCORPORATED BUSINESS TAX 2008 - 2018
800
1,000
1,200
1,400
1,600
1,800
2,000
2,200
20182017201620152014201320122011201020092008
Fiscal Year
$ in
Mil
lion
s

Budget and Financial Plan Summary Fiscal Year 2018
41
SALES AND USE TAX
The sales and use tax is projected to account for 13.0 percent of total tax revenue in 2018, or $7.369 billion after the $150 million intercept by NYS regarding Sales Tax Assets Receivable Corporation (STARC) bonds.1
2017 Forecast: Sales tax revenue is forecast at $6.994 billion, growth of 1.2 percent over the prior year.2 Excluding the STARC reduction, sales tax revenue is forecast to grow 3.4 percent. Sales tax collections year-to-date through March inclusive of STARC reductions of $150 million were nearly flat at 0.8 percent growth over the prior year. Prior STARC reductions, year-to-date tax collections grew 3.7 percent.
Consumer spending has been supported by steady local job growth, low levels of unemployment, and strong consumer confidence. Visitor spending continues to remain strong as 2016 welcomed a record 60 million tourists. Retail sales were modest for the holiday season as strong e-commerce sales compensated for
decreased spending at brick and mortar vendors. Sales tax revenue is forecast to exhibit subdued growth in the fourth quarter reflecting uncertainty regarding overall consumer spending.
2018 Forecast: Sales tax revenue is forecast
at $7.369 billion, growth of 5.4 percent over the current year.3 Excluding the STARC reduction, sales tax is forecast to grow 4.5 percent. Growth in consumer spending reflects anticipated local wage and employment growth, along with a continued high level of tourism. International tourism may begin to slow, impacted by the strong dollar and increased political tension, but that is expected to be offset by an increase in domestic tourists.
Sales tax revenue growth is forecast to average
5.3 percent from 2019 through 2021, reflecting continued gains in employment and wage growth and the local economy.
1 The 2016-17 NYS Enacted Budget legislation enables New York State to reduce collections by $150 million in City Fiscal Year 2018 in order to recoup the savings New York City achieved through refinancing STARC bonds. Prior STARC reductions, sales tax revenue are forecast at $7.519 billion in 2018, growth of 4.5 percent over the prior year.
2 The 2016-17 NYS Enacted Budget legislation enables New York State to reduce collections by $200 million in City Fiscal Year 2017 in order to recoup the savings New York City achieved through refinancing STARC bonds. As a result, sales tax revenue prior STARC reductions are forecast at $7.194 billion, growth of 3.4 percent over the prior year.
3 See footnote 1.
SALES TAX 2008 - 2018
4.0
4.5
5.0
5.5
6.0
6.5
7.0
7.5
20182017201620152014201320122011201020092008
Fiscal Year
$ in
Bil
lion
s

Budget and Financial Plan Summary Fiscal Year 2018
42
UTILITY TAX
The utility tax is projected to account for 0.7 percent of total tax revenue in 2018, or $382 million.
2017 Forecast: Utility tax revenue is forecast at $377 million, a 6.5 percent increase over the prior year. Year-to-date collections through March increased 3.8 percent over the prior year, the result of colder winter weather than last year and a sharp increase in natural gas prices in recent months.
In addition, fourth quarter utility tax revenue is forecast to be significantly higher than last year’s levels, due to colder late-winter weather than last year and the elevated natural gas prices.
2018 Forecast: Utility tax revenue is forecast at $382 million, growth of 1.3 percent over the current year, the result of an increase in electricity prices offset by a decrease in natural gas prices.
Utility tax collections are forecast to average annual growth of 2.3 percent from 2019 through 2021.
UTILITY TAX 2008 - 2018
0
100
200
300
400
500
20182017201620152014201320122011201020092008
Fiscal Year
$ in
Mil
lion
s

Budget and Financial Plan Summary Fiscal Year 2018
43
CIGARETTE TAX
Cigarette tax is projected to account for 0.1 percent of total tax revenue in 2018, or $42 million.
2017 Forecast: Cigarette tax revenue is forecast at $44 million in 2017, a decline of 1.4 percent over the prior year.
2018 Forecast: Cigarette tax is forecast at $42 million, a decline of 4.5 percent over the current year. From 2019 through 2021, cigarette tax collections are projected to average a decrease of 2.4 percent. Currently, the combined City/State cigarette taxes paid in the City are $5.85 per pack, the highest City/State cigarette tax levied in the country. The high tax burden has led to a decline in the number of packs sold within the City, both from the diversion of purchases to jurisdictions outside the City with a lower cigarette tax rate as well as smoking cessation or reduction.
CIGARETTE TAX 2008 - 2018
0
40
80
120
160
200
20182017201620152014201320122011201020092008
Fiscal Year
$ in
Mil
lion
s

Budget and Financial Plan Summary Fiscal Year 2018
44
HOTEL TAX
The hotel room occupancy tax is projected to account for 1.0 percent of tax revenue in 2018, or $570 million.
2017 Forecast: Hotel tax revenue is forecast at $571 million, a 1.0 percent increase over the prior year. Collections year-to-date through March grew 3.1 percent over the same prior year period. Calendar year 2016 saw another record-breaking number with over 60 million visitors to New York City. The moderate growth in collections can be explained by the continued rise in visitors coupled with increased hotel room inventory and stable room rates at hotels throughout the City. The forecast assumes a decline in collections through the remainder of the fiscal year. Geo-political uncertainty together with a strong U.S. dollar lead to an expected decline in international visitors which will likely dampen occupancy and room rate growth.
2018 Forecast: Hotel tax revenue is forecast at $570 million, nearly flat from the current year. Continued concerns about the global economy, geo-political uncertainty, and the strong U.S. dollar are
forecast to suppress international tourist spending growth. The increased supply of hotel rooms will continue to cause downward pressure on room rates and occupancy rates, which are forecast to decline 0.3 percent and 3.4 percent, respectively.
From 2019 through 2021, hotel tax revenue is forecast to average growth of 2.2 percent, a return to a more stable global economy.
HOTEL TAX 2008 - 2018
200
300
400
500
600
20182017201620152014201320122011201020092008
Fiscal Year
$ in
Mil
lion
s

Budget and Financial Plan Summary Fiscal Year 2018
45
OTHER TAXES
All other taxes are projected to account for 1.1 percent of total tax revenue in 2018, or $595.8 million.
2017–2018 Other Taxes ForecastExcluding Tax Audit Revenue
($000s)
Increase/(Decrease) 2017 2018 From 2017 to 2018 Percent Tax Amount Change
Auto Related Taxes ..................................... Auto Use ................................................... $29,000 $29,000 - 0.0% Commercial Motor Vehicle....................... 60,000 60,000 - 0.0% Taxi Medallion Transfer ............................ 1,600 200 (1,400) (87.5%) Excise Taxes................................................ Beer and Liquor ........................................ 25,000 25,000 - 0.0% Liquor License Surcharge ......................... 6,000 6,000 - 0.0% Horse Race Admissions ............................ 50 50 - 0.0% Medical Marijuana Excise Tax ................. 51 80 29 57.4% Off-Track Betting Surtax .......................... 1,000 1,220 220 22.0% Miscellaneous ............................................. Other Refunds ........................................... (40,000) (33,000) 7,000 (17.5%) Payment in Lieu of Taxes (PILOTs) ......... 350,280 297,200 (53,080) (15.2%) Section 1127 (Waiver) .............................. 151,000 156,000 5,000 3.3% Penalty and Interest Real Estate ............... ...........................................(Current Year) 21,000 21,000 - 0.0% Penalty and Interest Real Estate ............... ............................................... (Prior Year) 37,000 37,000 - 0.0% Penalty and Interest - Other Refunds ........ (4,000) (4,000) - 0.0% Total ........................................................... $637,981 $595,750 ($42,231) (6.6%)

Budget and Financial Plan Summary Fiscal Year 2018
46
Auto Use Tax: This tax is expected to generate $29.0 million in both 2017 and 2018.
Commercial Motor Vehicle Tax: This tax is expected to generate $60.0 million in both 2017 and 2018.
Taxi Medallion Transfer Tax: This tax is expected to generate $1.6 million in 2017 and $0.2 million in 2018, reflecting a part year impact in 2017 and a full year impact thereafter of the rate reduction from 5.0 percent to 0.5 percent beginning March 2017.
EXCISE TAXES
Beer and Liquor Excise Tax: This tax is expected to generate $25.0 million in both 2017 and 2018.
Horse Race Admissions Tax: This tax is expected to generate $50 thousand in both 2017 and 2018.
Liquor License Surcharge: This tax is expected to generate $6.0 million in both 2017 and 2018.
Medical Marijuana Excise Tax: Since July 2016, NYC has received the payments from the NYS medical marihuana trust fund, which represents 22.5% of the NYS Medical Marijuana Excise Tax revenue. This tax is expected to generate $51 thousand in 2017 and $80 thousand in 2018.
Off-Track Betting Surtax: This tax is expected to generate $1.0 million in 2017 and $1.2 million 2018.
MISCELLANEOUS
Other Refunds: These refunds are primarily paid out on the commercial rent tax and Section 1127 (waiver) and are projected to be $40.0 million in 2017 and $33.0 million in 2018.
Payments in Lieu of Taxes (PILOTs): PILOTs are contractual agreements between public agencies and private property owners. There are three primary sponsor agencies that serve as intermediaries between the City and the property owner: the New York City Economic Development Corporation, the New York City Industrial Development Agency and the Battery Park City Authority. These agencies administer projects that comprise approximately 83 percent of PILOT payments received. PILOT revenue is expected to be $350.3 million in 2017 and $297.2 million in 2018.
Section 1127 (Waiver): Under Section 1127 of the New York City Charter, the City may collect payments from non-resident employees of the City, or any of its agencies, in an amount which is equal to what their personal income tax liability would be if they were City residents. Revenue is projected to be $151.0 million in 2017 and $156.0 million in 2018.
Prior Year and Current Year Penalty and Interest - Real Estate: Taxpayers who do not pay their real property tax on time are liable for interest charges on outstanding balances. Penalties and interest received against current year delinquencies are expected to be $21.0 million in both 2017 and 2018, while penalty and interest collections from prior year delinquencies are expected to be $37.0 million in both 2017 and 2018.
Penalty and Interest - Other Refunds: The City pays interest on refunds claimed for overpayment against business income taxes and on audits of Business Corporation and Unincorporated Business Tax collections that have been subsequently overturned by Federal or State rulings. The cost of all these payments is projected at $4.0 million in both 2017 and 2018.
TAX ENFORCEMENT REVENUE
As part of the City’s tax enforcement efforts, the Department of Finance targets delinquent taxpayers through agency audit activities, the selected use of collection agencies, and computer matches. Audit revenue is forecast at $1.251 billion in 2017. The audit revenue for 2018 is forecast at $850 million.
AUTO RELATED TAXES

Budget and Financial Plan Summary Fiscal Year 2018
47
MISCELLANEOUS RECEIPTS
Forecast of Miscellaneous Receipts
The non-tax revenue portion of City Funds is referred to as miscellaneous revenues. The 2018 Executive Budget includes eleven classes of miscellaneous revenues which are discussed below.
Miscellaneous revenues are estimated at $4,665 million in 2018, a decrease of $281 million from 2017, exclusive of private grants and intra-city revenues. The revenue classes listed above are regrouped and described in the following four areas: Cost-based Charges (Licenses, Permits, and Charges for Services); Water and Sewer Revenues; Fines and Forfeitures; and Other Income (Interest Income, Franchises, Rental Income, and Miscellaneous).
Miscellaneous Revenues($ in Millions)
__________________________________________________________________________________________________________________________________________________________________________________________
Forecast to Executive 2017 2018 Budget Forecast Executive Increase Budget (Decrease) __________________________________________________________________________________________________________________________________________________________________________________________
Licenses ..................................................................................... $95 $67 (28)Permits....................................................................................... 275 252 (23)Franchises and Privileges .......................................................... 368 355 (13) Interest Income .......................................................................... 75 110 35 Tuition and Charges for Services .............................................. 1,007 989 (18)Water and Sewer Revenues ....................................................... 1,389 1,400 11Rental Income ........................................................................... 254 251 (3)Fines and Forfeitures ................................................................. 956 908 (48)Miscellaneous ............................................................................ 527 333 (194)
_________________ ________________ ________________
Total Miscellaneous Revenues .................................................. $4,946 $4,665 (281) ============= ============ ============__________________________________________________________________________________________________________________________________________________________________________________________
Cost-based Charges
Cost-based Charges are revenues collected as a result of the City providing a service (copies of official records, or inspections and reviews) and may be related to the government’s police or regulatory functions (pistol permits, restaurant permits, building plan examination fees). In the absence of specific State legislative authorization for the City to impose a specific fee, the City may, where otherwise allowed by law, impose a user fee to recover the cost of providing services.
Licenses
The City issues approximately 588,000 licenses. About 92,000 are non-recurring, 110,000 are renewed annually, 184,000 biennially, and 202,000 triennially. The major sources of license revenue are taxi and limousine licenses, pistol licenses, private carter licenses, marriage licenses, and various business licenses under the jurisdiction of the Department of Consumer Affairs.
The 2018 forecast for license revenue is $67 million, $28 million less than 2017. This decline is attributable to the cyclical renewal of certain licenses and a surge in licenses issued by the Taxi and Limousine Commission in 2017.

Budget and Financial Plan Summary Fiscal Year 2018
48
Permits
Permits are issued to 1,383,000 individuals or entities for the use of facilities, premises or equipment. Approximately 346,000 permits are renewable on an annual, biennial or triennial basis. Seasonal or single occurrence permits, such as tennis and building permits, account for 1,037,000 additional permits, all of which are issued and regulated by twelve City agencies.
The major sources of revenue are permits for building construction and alterations, street openings, restaurants, hazardous materials, and air pollution control. The 2018 forecast for permit revenue is $252 million, $23 million less than 2017. The decrease is due to a decline in receipts for construction-related permits issued by the Department of Buildings and the Department of Transportation.
Tuition and Charges for Services
The City collects tuition from students enrolled at community colleges. In addition, the City collects money from charges to the public and other governmental agencies for services rendered. There are over 100 different service fees in this category, including fees for parking, towing, provision of school lunches, copies of certificates, processing applications, searches, and performing fire and building inspections. The 2018 forecast for tuition and charges for services is $989 million, $18 million less than 2017. This decline is due to a drop in revenue from 421-a tax exemption applications due to the expiration of the tax abatement program partially offset by an increase in charges collected by the Departments of Parks and Recreation, Finance and Transportation.
COMPONENTS OF MISCELLANEOUS REVENUES
Water and Sewer
Tuition and Charges for Services
Fines and Forfeitures
Licenses, Permits and Franchises
Miscellaneous
Rental Income
Interest Income
30%
21%
20%
15%
7%
5%
2%
Water and Sewer
Tuition andCharges
for Services
Fines and Forfeitures
Licenses, Permits
and Franchises
Miscellaneous
As a Percentage of 2018
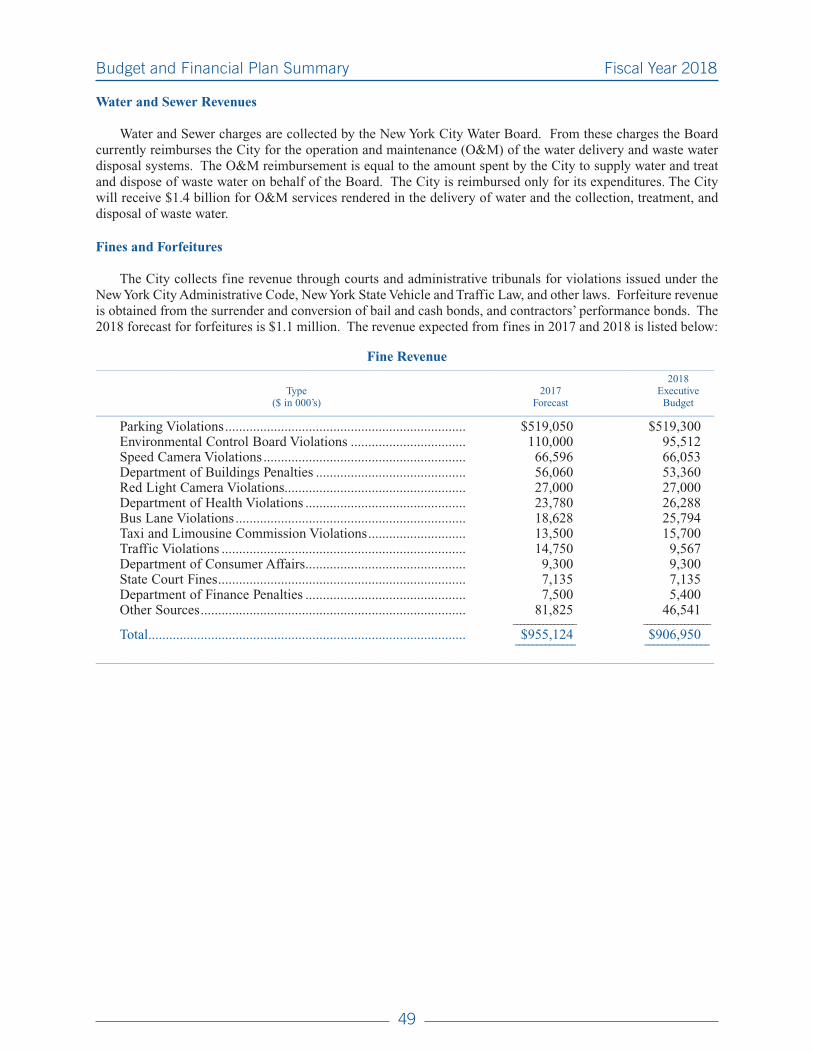
Budget and Financial Plan Summary Fiscal Year 2018
49
Water and Sewer Revenues
Water and Sewer charges are collected by the New York City Water Board. From these charges the Board currently reimburses the City for the operation and maintenance (O&M) of the water delivery and waste water disposal systems. The O&M reimbursement is equal to the amount spent by the City to supply water and treat and dispose of waste water on behalf of the Board. The City is reimbursed only for its expenditures. The City will receive $1.4 billion for O&M services rendered in the delivery of water and the collection, treatment, and disposal of waste water.
Fines and Forfeitures
The City collects fine revenue through courts and administrative tribunals for violations issued under the New York City Administrative Code, New York State Vehicle and Traffic Law, and other laws. Forfeiture revenue is obtained from the surrender and conversion of bail and cash bonds, and contractors’ performance bonds. The 2018 forecast for forfeitures is $1.1 million. The revenue expected from fines in 2017 and 2018 is listed below:
Fine Revenue__________________________________________________________________________________________________________________________________________________________________________________________
2018 Type 2017 Executive ($ in 000’s) Forecast Budget__________________________________________________________________________________________________________________________________________________________________________________________
Parking Violations ..................................................................... $519,050 $519,300Environmental Control Board Violations ................................. 110,000 95,512Speed Camera Violations .......................................................... 66,596 66,053Department of Buildings Penalties ........................................... 56,060 53,360Red Light Camera Violations.................................................... 27,000 27,000Department of Health Violations .............................................. 23,780 26,288Bus Lane Violations .................................................................. 18,628 25,794Taxi and Limousine Commission Violations ............................ 13,500 15,700Traffic Violations ...................................................................... 14,750 9,567Department of Consumer Affairs .............................................. 9,300 9,300State Court Fines ....................................................................... 7,135 7,135Department of Finance Penalties .............................................. 7,500 5,400Other Sources ............................................................................ 81,825 46,541
_________________ __________________
Total ........................................................................................... $955,124 $906,950 ============== ===============
__________________________________________________________________________________________________________________________________________________________________________________________

Budget and Financial Plan Summary Fiscal Year 2018
50
The Parking Violation division of the Department of Finance is forecasted to collect $638 million in parking, red light, bus lane, and speed camera fines in 2018, $7 million more than in 2017.
The Parking Violation division processes and adjudicates enforcement camera violations. The red light camera program is designed to promote safe, responsible driving by photographing and fining registrants of vehicles “running” red lights. The Department of Transportation currently has 211 red light cameras operating at 150 intersections. Red light camera violations will generate $27 million in 2018. In addition, the Department has implemented a bus lane camera enforcement program along MTA Select Service Bus Routes. Bus lane photo devices can only operate on designated bus lanes that are select bus service lanes within the bus rapid transit demonstration program and only during weekdays from 7:00 am to 7:00 p.m. The Department will generate approximately $25.8 million in 2018. In January 2014, the Department was authorized to use speed camera enforcement in 140 school zones. Currently, 197 fixed and 40 mobile cameras are operational within the authorized zones. Speed cameras must be placed within a quarter mile of a school and can operate on days when school is in session (one hour before and one hour after the school day) and during student activities at the school (up to thirty minutes immediately before and up to thirty minutes immediately after such student activities). Collections are expected to be $66.1 million in 2018.
The Office of Administrative Trials and Hearings is comprised of several administrative tribunals: Health, Taxi and Limousine Commission, and the Environmental Control Board. The Environmental Control Board adjudicates violations issued by over a dozen City agencies for infractions of the City’s Administrative Code related to street cleanliness, waste disposal, street peddling, fire prevention, air, water
and noise pollution, building safety and construction, and other quality of life issues. Revenue from these violations is expected to generate $127 million in 2018.
The Department of Consumer Affairs enforces the City’s consumer protection, licensing, weights and measures, and Truth-in-Pricing Laws. In 2018, the Department will generate $9.3 million in fine revenue, equal to 2017. The Department of Consumer Affairs will continue its enforcement strategy which includes an emphasis on education and outreach.
The Department of Finance assesses penalties for failure to timely file Real Property Income and Expense statements and Real Property Transfer documents. The Department’s enforcement efforts are expected to improve compliance with filing guidelines and it is anticipated that penalties issued will drop to $5.4 million in 2018.
New York City’s “Forgiving Fines” Amnesty Program for Environmental Control Board judgment violations allowed participants to resolve violations they received from the Departments of Sanitation, Buildings, Transportation, Fire Department, Landmarks, Parks and other agencies which had gone into judgment. During the three-month amnesty period, the Department of Finance forgave interest and 100 percent of default penalties for debtors who complied with the program’s terms and conditions. As a result, the Department of Finance collected $44 million associated with 128,000 paid violations.
Revenue is also collected from the adjudication of traffic violations issued in the City of New York, certain fines adjudicated through the State-operated Criminal and Supreme Court system, and fines collected by the City for administrative code violations, and building code violations.

Budget and Financial Plan Summary Fiscal Year 2018
51
Other Income
Other income includes interest earned on the City’s cash balances, concession and franchise payments, rental income, and income from other areas in which productivity may have a positive effect on the amount of revenue collected. Each of the sources included in this area has its own unique basis for management and improvement, some of which are directly affected by the City’s policy toward such varied items as housing, economic development, and transportation issues.
Interest Income
The City earns interest income by investing funds from four sources: overnight cash balances, debt service accounts, sales tax, and cash bail balances. Overnight cash balances are invested and historically earn interest at approximately the federal funds rate. Property tax receipts are held by the State Comptroller to satisfy City debt service payments, and earnings are forwarded to the City monthly based on bond payment schedules. The determinants of the value of this revenue source are the value of cash balances, tax receipts, available investment instruments, and the interest rate.
The 2018 forecast for interest earnings is $110 million, an increase of $35 million from 2017. This increase is attributable to the expectation that the Federal Reserve will continue a steady increase to the federal funds rate in 2018.
Franchises and Privileges
This revenue consists of franchise fees for the public use of City property and privilege and concession fees for the private use of City property. These uses include conduits that run under City streets, concessions in public parks and buildings, and payments from utility companies for transformers on City property.
The 2018 forecast for franchise revenue is $355 million, $13 million less than in 2017.
Rental Income
Rental income is derived from both long and short-term agreements for the occupancy of City-owned property, including condemnation sites and in rem buildings. Roughly 2,500 properties are rented from the City. Approximately 500 are in rem or condemnation sites, 200 are covered by long term agreements, and nearly 1,800 are schools that are rented on a per event basis after school hours.
The 2018 forecast for rental income is $251 million, $3 million less than in 2017. The decrease is a result of declining rental income from HPD and DCAS managed properties partially offset by an increase in the minimum rent paid by the Port Authority on the airport lease.
Miscellaneous
Miscellaneous revenue is composed of a variety of revenues not otherwise classified in the City’s Chart of Accounts. The primary items are the sale of City property, mortgages, cash recoveries from litigation and audits, E-911 telephone surcharges, revenue from Police Department Property Clerk auctions, refunds of prior year expenditures, the sale of the City Record and other publications, and subpoena fees. This source of revenue has, at times, contributed significantly to the miscellaneous receipts.
The 2018 forecast for miscellaneous revenue is $333 million, $194 million less than in 2017. The decrease is primarily related to one-time revenue in 2017 from asset sales, the recoupment of prior year expenditures and the release of funds from the health stabilization reserve.

Budget and Financial Plan Summary Fiscal Year 2018
52
Private Grants
The Executive Budget includes $880 million in private grants in 2018, $96 million less than 2017. Additional private grant funding will be modified into the budget during the course of the year, as additional funding sources are identified and grants are defined.
Interfund Revenues
Interfund Revenues (IFA’s) are reimbursements from the Capital Fund to the General Fund for authorized first-line architectural, engineering, and design costs incurred by the City’s own engineering and support staff. These costs also include employee costs for expenses incurred in connection with eligible capital projects for the development of computer software, networks and systems. All IFA costs are assigned to particular capital projects and are valid capital charges under generally accepted accounting principles. In 2018 expected reimbursements will be $667 million.

Budget and Financial Plan Summary Fiscal Year 2018
53
CAPITAL BUDGET
The Executive Capital Budget and Four-Year Plan, 2018-2021
The 2018 Executive Capital Budget includes new appropriations of $15.1 billion, of which $13.4 billion are to be funded from City sources. These appropriations, together with available balances from prior years, authorize total commitments of $20.7 billion for 2018, of which $18.4 billion will be City-funded. City funds include proceeds from the New York City Municipal Water Finance Authority and the New York City Transitional Finance Authority as well as City general obligation bonds.
Four-Year Plan Highlights
The 2018-2021 Capital Plan totals $58.8 billion for the construction and rehabilitation of the City’s infrastructure. This will provide funding targeted to building and improving schools, investments in housing, rehabilitating our parks and open spaces, improving transportation, and maintaining the sewer system. In addition, damages to critical infrastructure throughout New York City caused by Hurricane Sandy are estimated at $3.0 billion in the 2018-2021 Capital Program.
The Capital Plan provides $10.5 billion for new school construction and expansion, as well as the modernization, rehabilitation and improvements to existing school buildings. The City will also provide $4.1 billion for the preservation and construction of
affordable housing for low to moderate incomes and those with special needs. An investment of $3.2 billion will support the reconstruction of the City’s parks, playgrounds, and other facilities to provide clean, safe, attractive and functional public spaces. The City will invest $1.0 billion for the continued rehabilitation of the four East River Bridges. The City will also invest $671.6 million for the repair and construction of City tunnels and upstate aqueducts to ensure critical redundancy and provide optimal delivery of sufficient drinking water. This will include the excavation of the two remaining shafts for the Brooklyn/Queens section of City Tunnel No. 3, the optimization of the Upper Catskill Aqueduct, and the boring of a tunnel between the Kensico Reservoir and Catskill/Delaware Ultraviolet Light Disinfection Facility.

Budget and Financial Plan Summary Fiscal Year 2018
54
FY 2017 - 2021 Commitment Plan($ in Millions)
2017 2018 2019 2020 2021 ________________________ _______________________ ________________________ ________________________ _______________________
City All City All City All City All City All Funds Funds Funds Funds Funds Funds Funds Funds Funds Funds
Environmental Protection Equipment ............................ $101 $102 $125 $125 $89 $89 $76 $76 $54 $54 Sewers ................................... 893 912 853 880 699 699 685 685 344 344 Water Mains, Sources & Treatment .......................... 1,002 1,017 1,064 1,067 512 512 551 551 342 342 Water Pollution Control ........ 901 958 949 1,124 1,286 1,291 1,111 1,111 737 737 Water Supply ........................ 225 225 198 198 79 79 260 260 135 135
________________________ _______________________ ________________________ ________________________ _______________________
Subtotal ...................................... $3,122 $3,214 $3,189 $3,394 $2,664 $2,670 $2,682 $2,682 $1,612 $1,612
Transportation Mass Transit.......................... $285 $307 $125 $125 $125 $125 $125 $125 $40 $40 Bridges .................................. 800 1,096 1,318 1,598 553 596 1,386 1,476 2,095 2,333 Highways .............................. 795 990 878 1,058 943 1,161 754 915 534 623
________________________ _______________________ ________________________ ________________________ _______________________
Subtotal ...................................... $1,879 $2,394 $2,322 $2,781 $1,621 $1,881 $2,266 $2,516 $2,670 $2,996
Education Education .............................. $3,416 $3,918 $2,604 $3,275 $2,708 $2,903 $2,166 $2,166 $1,421 $2,166 Higher Education .................. 288 298 139 139 59 60 24 24 23 23
________________________ _______________________ ________________________ ________________________ _______________________
Subtotal ...................................... $3,704 $4,215 $2,743 $3,415 $2,767 $2,962 $2,190 $2,190 $1,445 $2,189
Housing & Economic Development Economic Development ....... $1,053 $1,268 $1,137 $1,177 $617 $646 $509 $593 $338 $338 Housing ................................ 1,208 1,250 1,095 1,134 999 1,031 974 1,006 937 969
________________________ _______________________ ________________________ ________________________ _______________________
Subtotal ...................................... $2,261 $2,518 $2,232 $2,311 $1,615 $1,676 $1,483 $1,599 $1,274 $1,306
Administration of Justice Corrections ........................... $315 $389 $1,411 $1,411 $233 $233 $28 $28 $53 $53 Courts ................................... 161 166 290 298 265 267 233 233 176 176 Police .................................... 605 622 453 490 484 484 411 411 36 36
________________________ _______________________ ________________________ ________________________ _______________________
Subtotal ...................................... $1,082 $1,177 $2,155 $2,198 $983 $984 $671 $671 $265 $265
City Operations and Facilities Cultural Institutions .............. $420 $542 $371 $371 $21 $21 $15 $15 $4 $4 Fire ........................................ 234 277 205 257 127 178 109 109 120 120 Health & Hospitals ............... 582 1,018 635 953 407 770 280 490 144 243 Parks ..................................... 838 972 1,298 1,647 794 859 485 485 200 200 Public Buildings ................... 222 231 525 525 496 496 159 160 78 78 Sanitation .............................. 351 355 333 346 404 404 788 788 332 332 Resiliency, Technology & Equipment ........................ 714 724 958 958 769 1,004 882 1,082 445 445 Other ..................................... 1,314 1,601 1,386 1,555 605 702 537 584 294 333
________________________ _______________________ ________________________ ________________________ _______________________
Subtotal ...................................... $4,676 $5,719 $5,710 $6,613 $3,623 $4,435 $3,255 $3,712 $1,616 $1,754
Total Commitments ................... $16,725 $19,238 $18,351 $20,711 $13,274 $14,609 $12,547 $13,370 $8,882 $10,123
Reserve for Unattained Commitments ............................ ($4,761) ($4,761) ($2,212) ($2,212) ($114) ($114) $215 $215 $1,358 $1,358
Commitment Plan ..................... $11,964 $14,477 $16,139 $18,499 $13,160 $14,495 $12,762 $13,585 $10,240 $11,481
Total Expenditures .................... $7,490 $8,804 $9,000 $10,487 $11,262 $12,847 $11,723 $13,128 $11,389 $12,769
Note: Individual items may not add to totals due to rounding.

Budget and Financial Plan Summary Fiscal Year 2018
55
Non-City capital funding sources include $2.4 billion in the 2018 plan and $5.8 billion over the 2018-2021 four-year plan period. The majority of non-City funding supports Education, Transportation, Hospitals, Resiliency and Sustainability Measures, and Parks.
Education programs anticipate receiving $1.6 billion in State funding over the 2018-2021 period. Transportation programs are projected to receive non-City funding of $1.5 billion over the 2018-2021 period, with $1.2 billion from the Federal government, $256.4
million from the State, and $61.0 million from private funds. Hospital programs are projected to receive $983.0 million in Federal funding over the 2018-2021 period. Resiliency and Sustainability Measures programs are projected to receive $434.7 million from the Federal government over the 2018-2021 period. Parks programs are projected to receive $414.5 million over the 2018-2021 period, with $332.4 million in Federal funding, $72.5 million in Private funding, and $9.6 million in State funding.
FY 2013 - 2021 CAPITAL COMMITMENTS BY FUNDING SOURCE
0
5
10
15
20
20212020201920182017*2016201520142013
Fiscal Year* Projected
Actual Commitment 2018 Executive Commitment Plan
$ in
Bil
lion
s
Non-City Funding
Water Authority Funding
Other City Funding
Non-City Funding Sources

Budget and Financial Plan Summary Fiscal Year 2018
56
The Capital Program since 2013
The table below illustrates the changes in the size of the City’s capital program over the 2013-2016 period.
FY 2013-2016 Commitments($ in Millions)
2013 2014 2015 2016 ________________ _______________ _______________ _______________ City All City All City All City All Funds Funds Funds Funds Funds Funds Funds Funds
Environmental Protection Equipment ..................................................... $65 $58 $84 $84 $91 $91 $93 $93 Sewers ............................................................ 279 288 300 302 344 355 352 353 Water Mains, Sources and Treatment ............ 402 402 343 345 553 553 418 419 Water Pollution Control ................................. 454 456 412 408 367 367 709 708 Water Supply ................................................. 316 316 21 21 737 737 17 17 _______________ _______________ _______________ _______________
Subtotal ............................................................... $1,516 $1,521 $1,160 $1,160 $2,091 $2,103 $1,590 $1,590
Transportation Mass Transit................................................... $125 $133 $35 $35 $125 $125 $229 $237 Bridges ........................................................... 249 361 131 234 300 735 288 436 Highways ....................................................... 298 438 325 415 329 421 415 544 _______________ _______________ _______________ _______________
Subtotal ............................................................... $672 $931 $491 $684 $755 $1,280 $932 $1,217
Education Education ....................................................... $1,282 $2,345 $1,040 $2,060 $1,546 $2,884 $2,455 $2,504 Higher Education ........................................... 48 48 74 74 55 55 40 41 _______________ _______________ _______________ _______________
Subtotal ............................................................... $1,330 $2,394 $1,113 $2,134 $1,601 $2,940 $2,496 $2,545
Housing & Economic Development Economic Development ................................ $272 $282 $255 $278 $152 $163 $168 $185 Housing ......................................................... 308 376 336 415 376 413 647 634 _______________ _______________ _______________ _______________
Subtotal ............................................................... $580 $657 $590 $694 $528 $576 $815 $820
Administration of Justice Correction ...................................................... $104 $104 $114 $125 $153 $154 $79 $81 Courts ............................................................ 17 17 123 123 10 10 36 47 Police ............................................................. 83 89 164 170 140 141 190 191 _______________ _______________ _______________ _______________Subtotal .......................................................... $204 $210 $401 $418 $303 $304 $305 $320
City Operations & Facilities Cultural Institutions ....................................... $172 $176 $211 $215 $151 $154 $105 $114 Fire ................................................................. 143 157 52 63 70 71 144 133 Health & Hospitals ........................................ 264 315 244 307 143 157 138 228 Parks .............................................................. 310 533 255 365 465 646 201 359 Public Buildings ............................................ 190 190 144 144 94 94 121 121 Sanitation ....................................................... 392 400 276 277 255 274 177 176 Technology & Equipment .............................. 277 279 571 573 258 258 344 340 Other .............................................................. 147 215 216 356 278 404 369 494 _______________ _______________ _______________ _______________
Subtotal ............................................................... $1,894 $2,265 $1,969 $2,298 $1,714 $2,056 $1,600 $1,965
Total Commitments ............................................ $6,196 $7,978 $5,725 $7,387 $6,992 $9,260 $7,738 $8,457
Total Expenditures ............................................. $6,888 $8,385 $7,468 $7,903 $5,949 $7,836 $6,676 $8,080
Note: Individual items may not add to totals due to rounding.
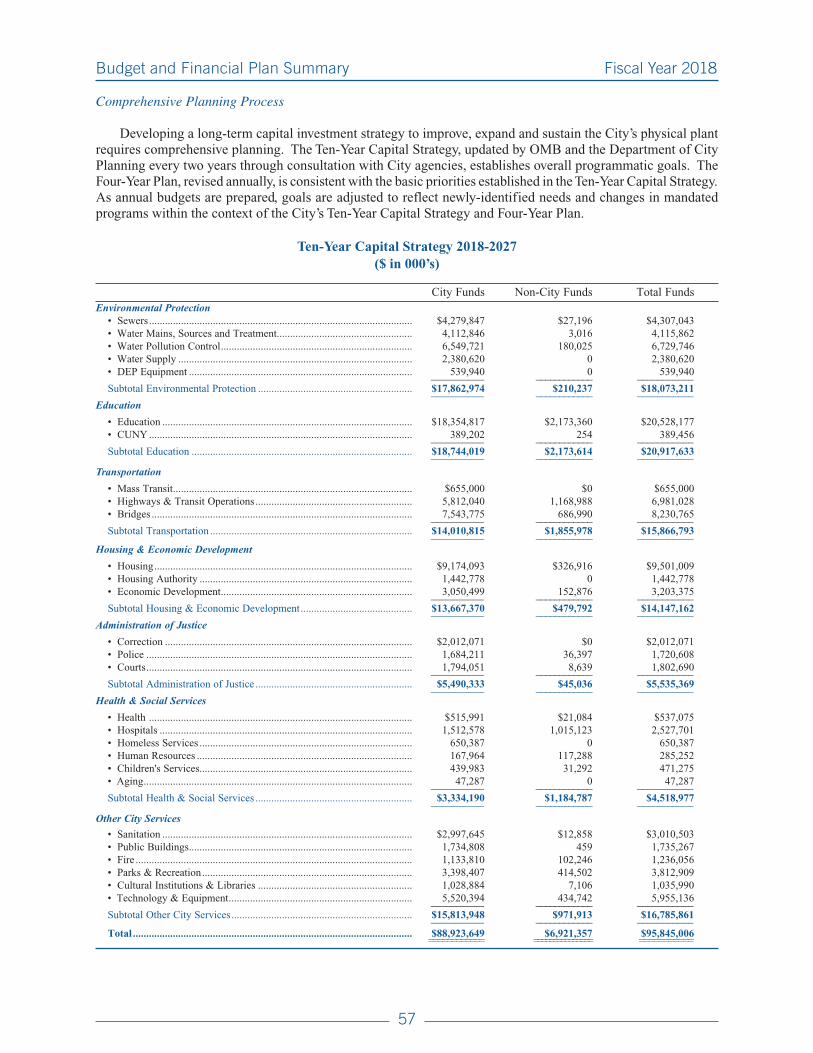
Budget and Financial Plan Summary Fiscal Year 2018
57
Comprehensive Planning Process
Developing a long-term capital investment strategy to improve, expand and sustain the City’s physical plant requires comprehensive planning. The Ten-Year Capital Strategy, updated by OMB and the Department of City Planning every two years through consultation with City agencies, establishes overall programmatic goals. The Four-Year Plan, revised annually, is consistent with the basic priorities established in the Ten-Year Capital Strategy. As annual budgets are prepared, goals are adjusted to reflect newly-identified needs and changes in mandated programs within the context of the City’s Ten-Year Capital Strategy and Four-Year Plan.
Ten-Year Capital Strategy 2018-2027($ in 000’s)
City Funds Non-City Funds Total FundsEnvironmental Protection
• Sewers ................................................................................................... $4,279,847 $27,196 $4,307,043• Water Mains, Sources and Treatment................................................... 4,112,846 3,016 4,115,862• Water Pollution Control ........................................................................ 6,549,721 180,025 6,729,746• Water Supply ........................................................................................ 2,380,620 0 2,380,620• DEP Equipment .................................................................................... 539,940 0 539,940 __________ ____________ ___________ Subtotal Environmental Protection .......................................................... $17,862,974 $210,237 $18,073,211 __________ ____________ ___________
Education
• Education .............................................................................................. $18,354,817 $2,173,360 $20,528,177• CUNY ................................................................................................... 389,202 254 389,456 __________ ____________ ___________ Subtotal Education ................................................................................... $18,744,019 $2,173,614 $20,917,633 __________ ____________ ___________
Transportation
• Mass Transit .......................................................................................... $655,000 $0 $655,000• Highways & Transit Operations ........................................................... 5,812,040 1,168,988 6,981,028• Bridges .................................................................................................. 7,543,775 686,990 8,230,765 __________ ____________ ___________ Subtotal Transportation ............................................................................ $14,010,815 $1,855,978 $15,866,793 __________ ____________ ___________
Housing & Economic Development
• Housing ................................................................................................. $9,174,093 $326,916 $9,501,009• Housing Authority ................................................................................ 1,442,778 0 1,442,778• Economic Development ........................................................................ 3,050,499 152,876 3,203,375 __________ ____________ ___________ Subtotal Housing & Economic Development .......................................... $13,667,370 $479,792 $14,147,162 __________ ____________ ___________
Administration of Justice
• Correction ............................................................................................. $2,012,071 $0 $2,012,071• Police .................................................................................................... 1,684,211 36,397 1,720,608• Courts .................................................................................................... 1,794,051 8,639 1,802,690 __________ ____________ ___________ Subtotal Administration of Justice ........................................................... $5,490,333 $45,036 $5,535,369 __________ ____________ ___________
Health & Social Services
• Health ................................................................................................... $515,991 $21,084 $537,075• Hospitals ............................................................................................... 1,512,578 1,015,123 2,527,701• Homeless Services ................................................................................ 650,387 0 650,387• Human Resources ................................................................................. 167,964 117,288 285,252• Children's Services................................................................................ 439,983 31,292 471,275• Aging ..................................................................................................... 47,287 0 47,287 __________ ____________ ___________ Subtotal Health & Social Services ........................................................... $3,334,190 $1,184,787 $4,518,977 __________ ____________ ___________
Other City Services
• Sanitation .............................................................................................. $2,997,645 $12,858 $3,010,503• Public Buildings .................................................................................... 1,734,808 459 1,735,267• Fire ........................................................................................................ 1,133,810 102,246 1,236,056• Parks & Recreation ............................................................................... 3,398,407 414,502 3,812,909• Cultural Institutions & Libraries .......................................................... 1,028,884 7,106 1,035,990• Technology & Equipment ..................................................................... 5,520,394 434,742 5,955,136 __________ ____________ ___________Subtotal Other City Services .................................................................... $15,813,948 $971,913 $16,785,861 __________ ____________ ___________
Total ......................................................................................................... $88,923,649 $6,921,357 $95,845,006 ============ =============== ===========

Budget and Financial Plan Summary Fiscal Year 2018
58
2018 Ten–Year Capital Strategy Highlights
Technology
TEN-YEAR CAPITAL STRATEGY FOR 2018 - 2027
21%
19%
16%
11%
6%
4%
4%
3%
3%
13%
$20,528
18,073
15,212
10,944
5,535
3,916
3,813
3,203
3,065
11,556
% of Plan ProgramFY 2018
to FY 2027
Total $95,845
Parks
Bridges &Highways
EnvironmentalProtection
EducationEconomic
Development
Adminof Justice
Housing
Health & Hospitals
Resiliency& Energy Efficiency
Other City
Services
($ in Millions - All Funds)
Education
Environmental Protection
Bridges & Highways
Housing
Administration of Justice
Resiliency & Energy Efficiency
Parks
Economic Development
Health & Hospitals
Other City Services
• Information and Communication Systems: as part of IT security, hardware and software security upgrades required to safeguard the City’s information technology assets ($113.2 million); 911/Emergency Communications Transformation Program (ECTP) facilities, software, and equipment to update and integrate the City’s computer aided dispatch capabilities ($87.0 million); and Broadband Initiative including expansion of wireless access for low-income residents ($65.0 million).
Environmental Protection and Sanitation
• Sewers: replacement and augmentation of the City’s sewer system ($1.9 billion), including the emergency replacement of malfunctioning or collapsed cement combined sewers ($623.3 million); Southeast Queens sewer work ($1.5 billion); purchase property and provide construction for the Staten Island Bluebelt program ($353.6 million); and the Neighborhood Development Fund to help provide for critical water and sewer related infrastructure work for re-zonings proposed in neighborhood plans developed by the
Department of City Planning ($329.0 million). The total Sewers program for 2018-2027 is $4.3 billion.
• Water Mains, Sources and Treatment: continued improvements and repairs to infrastructure in the City’s upstate watersheds ($2.1 billion), including the rehabilitation of the Ashokan Reservoir, Olive Bridge Dam, and Dividing Weir Bridge ($733.0 million), projects related to the Filtration Avoidance Determination ($185.2 million), and the construction of the New Croton Dam ($145.0 million); and replace and extend trunk and distribution water mains and ancillary work ($1.6 billion), including replacement and rehabilitation of below ground infrastructure specifically related to the accelerated replacement schedule for aging water mains ($190.6 million) and work in Southeast Queens ($57.8 million). The total Water Mains, Sources and Treatment program for 2018-2027 is $4.1 billion.
• Wastewater Treatment: investments to maintain the operational integrity of existing wastewater treatment facilities ($3.6 billion); optimization

Budget and Financial Plan Summary Fiscal Year 2018
59
of existing and construction of new traditional sewer overflow controls to prevent the release of combined sewer overflow ($1.9 billion); combined sewer overflow (CSO) capture through the use of Green Infrastructure projects such as bioswales, tree pits, and constructed wetlands in combined sewer areas ($936.1 million); enhancement of the existing chlorination system at various WWTP in order to meet stricter chlorine discharge limits ($193.7 million); studies and facility upgrades to reduce nitrogen levels in treated wastewater ($88.0 million); and ongoing stabilization and upgrades of in-City wastewater treatment plants (WWTP) and systems to ensure compliance with State and Federal mandates for operating permit requirements ($61.6 million). The total Wastewater Treatment program for 2018-2027 is $6.7 billion.
• Water Supply: construction of a tunnel connecting the Kensico Reservoir to the Catskill/Delaware Ultraviolet Light Facility, necessary to provide redundancy in the water supply system ($1.2 billion); modification of chambers at Hillview Reservoir ($339.5 million); and the optimization of the Catskill Aqueduct ($155.0 million). The total Water Supply program for 2018-2027 is $2.4 billion.
• Equipment: management information systems ($168.0 million), including agency-wide upgrade of security systems ($139.9 million); and continued water conservation programs ($72.2 million), including the installation of large water meters ($26.3 million). The total Equipment program for 2018-2027 is $539.9 million.
• Sanitation: replacement of vehicles ($1.6 billion); component rehabilitation at garages and other facilities, Citywide ($358.9 million); construction of a new garage for Bronx Community Districts 9, 10, and 11 ($247.6 million); construction of a new garage for Manhattan Community Districts 6 and 8 ($195.0 million); construction of a new garage for Brooklyn Community District 3 ($144.4 million); construction of a new garage for Queens Community District 1 ($142.6 million); construction of a new garage for Staten Island Community Districts 1 and 3 ($126.9 million); construction and renovation of transfer stations and other facilities in accordance with the City’s Long Term Solid Waste Management Plan ($120.1 million); and purchases of information technology and telecommunications equipment ($51.7 million).
Transportation
• Bridges: rehabilitation of bridges in fair or good condition ($3.7 billion), including Brooklyn-Queens Expressway (BQE) – Triple Cantilever Bridge ($1.5 billion) and Shore Road Bridge over Hutchinson River ($345.0 million); bridge life extension rehabilitation projects ($3.0 billion), including Grand Street Bridge over Newtown Creek ($138.5 million) and FDR Drive Northbound from East 42nd to 49th Street ($86.1 million); continued reconstruction and rehabilitation for the East River bridges ($1.3 billion); bridge protective coating projects ($254.7 million); bridge equipment and vehicles ($24.8 million); and bridge facilities ($5.4 million). The total Bridge Program for 2018-2027 is $8.2 billion.
• Highways: street reconstruction of approximately 673 lane miles ($2.7 billion), which includes reconstruction of Queens Boulevard ($220.2 million) and Woodhaven Boulevard Select Bus Service routes ($183.6 million); street and arterial resurfacing of 7,640 lane miles ($1.6 billion); installation and rehabilitation of pedestrian ramps ($804.0 million); and replacement of approximately 24 million square feet of sidewalk ($506.8 million). The total Highways Program for 2018-2027 is $5.9 billion.
• Traffic: signal installation and maintenance ($285.6 million); upgrade and replacement of lampposts, luminaires, and associated infrastructure ($195.4 million); and installation of streetlights, signals and lane markings associated with the Highway and Bridge Programs ($54.8 million). The total Traffic Program for 2018-2027 is $656.3 million.
• Ferries: ferry terminal building improvements ($230.3 million); and ferry boats ($70.5 million). The total Ferries Program for 2018-2027 is $319.3 million.
• Transit: contribution to the MTA’s capital program, including subway and bus fleet enhancements, infrastructure improvements, in-house track rehabilitations, and reconstruction of bus and subway lines for New York City. The Transit program for 2018-2027 is $655.0 million.

Budget and Financial Plan Summary Fiscal Year 2018
60
Education, Health and Social Services
• Education: rehabilitate, replace, and upgrade building components ($7.6 billion); construct new schools ($4.5 billion); cover emergency projects, research and development, and prior plan completion costs ($3.2 billion); expand facilities through leases, building additions, athletic fields, and playgrounds ($3.2 billion); capital improvements that enhance educational programs ($1.3 billion); provide technological enhancements, expansion of pre-kindergarten capacity, and remove transportable classroom units with the Smart Schools Bond Act ($390.0 million); and address the need for security systems, emergency lighting, and code compliance ($331.2 million). The total Education program from 2018-2027 is $20.5 billion
• Higher Education: miscellaneous reconstruction ($374.6 million); data processing and other equipment ($11.5 million); and energy conservation projects ($3.2 million). The total Higher Education program from 2018-2027 is $389.3 million.
• Health: NYC Health + Hospitals (H+H) system-wide equipment purchases, facility infrastructure improvements, and IT infrastructure upgrades ($642.1 million); ambulance purchases ($427.0 million); H+H electronic medical record system ($207.0 million); the Public Health Laboratory renovation ($177.5 million); H+H’s new revenue cycle management system ($147.3 million); various public health facility renovations and rehabilitation ($107.4 million); animal care centers and other animal welfare investments ($94.7 million); technology infrastructure improvements for the Department of Health and Mental Hygiene ($70.0 million); and technology and laboratory equipment upgrades for the Office of the Chief Medical Examiner ($28.6 million).
• Aging: rehabilitation of senior centers, with focus on structural and accessibility issues ($32.3 million); computer and network upgrade and equipment purchases ($12.6 million); and vehicle purchases ($2.4 million).
• Administration for Children’s Services: renovation and upgrades of Juvenile Detention Facilities ($318.4 million); telecommunications and data infrastructure upgrades and improvements ($55.6 million); renovation and upgrades of facilities ($52.6 million); and renovation and code compliance at various child care centers ($38.2 million).
• Homeless Services: renovation and upgrade of adult shelters ($352.9 million); renovation and upgrade of family shelters ($246.9 million); and computer network upgrade and equipment purchases ($50.5 million).
• Human Resources: data infrastructure upgrades and improvements ($155.3 million); construction and initial outfitting for citywide facilities ($92.9 million); telecommunications upgrades and improvements ($34.3 million); and automotive equipment ($2.8 million).
Housing and Development
• Housing: provision of low-interest loans to finance the rehabilitation and preservation of affordable housing in privately-owned buildings through preservation ($3.7 billion), new construction ($3.1 billion), supportive housing ($2.0 billion), and disposition programs ($413.2 million); and funding for technology, infrastructure, demolition and other ancillary investments to fulfill the goals of the Housing New York plan ($227.6 million).
• Housing Authority: upgrades to building exteriors and systems, including roof work and mold remediation, facades, elevators, conversion to instantaneous hot water heaters, exterior lighting, and other general capital maintenance ($1.4 billion).
• Economic Development: Neighborhood Development Fund to help provide for critical infrastructure work for re-zonings proposed in neighborhood plans developed by the Department of City Planning ($630.8 million); infrastructure work to support affordable housing sites in the five boroughs ($505.7 million); various development and infrastructure improvements at the Brooklyn Navy Yard, including the rehabilitation of Building 77 to create new spaces for manufacturing and industrial tenants ($288.9 million); infrastructure improvements in the southwest Bronx ($194.3 million); development, management and rehabilitation of City owned waterfront, industrial and other properties, Citywide ($161.0 million); funding for the Mayor’s Life Sciences Initiative ($150.0 million); funding for the Made in New York Campus at Bush Terminal, Brooklyn ($136.4 million); development, management and rehabilitation of the City’s industrial properties ($131.6 million); infrastructure improvements at Governors Island ($119.0 million); infrastructure improvements in the Rockaways, Queens ($91.0 million); and purchase of ferries for the citywide Ferry Service ($84.4 million).
Budget and Financial Plan Summary Fiscal Year 2018
61
Administration of Justice and Public Safety
• Correction: new jail facilities ($1.1 billion); improvements to building systems, infrastructure and support space including a new training academy ($778.7 million); and lifecycle replacement of equipment ($167.7 million).
• Courts: infrastructure and operational improvements of courts facilities ($1.1 billion); fire/life safety work ($426.5 million); exterior renovations ($79.0 million); HVAC improvements ($67.9 million); electrical upgrades ($67.4 million); and elevator upgrades ($44.3 million).
• Police: construction, rehabilitation and relocation of facilities, Citywide ($1.1 billion); replacement and upgrade of portable radios, radio equipment, infrastructure and systems ($220.1 million); replacement and upgrade of critical network infrastructure equipment and data management systems ($215.5 million); lifecycle replacement of vehicles ($169.8 million); and replacement and upgrade of general equipment, Citywide ($42.0 million).
• Fire: replacement of front-line fire-fighting apparatus according to mandated replacement cycles as well as support vehicles and equipment ($650.0 million); renovation of firehouse components such as boilers, electrical systems, kitchens, roofs, bathrooms, waterproofing, apparatus doors, floors, and windows, and support facility reconstruction ($327.0 million); replacement of conduit and wiring in inundation zones for the Department’s outside cable plant that was damaged during Hurricane Sandy ($113.5 million); replacement of end of life information technology and communications equipment ($76.9 million); upgrade of 9-1-1 communications system infrastructure as it approaches the end of its useful life ($57.5 million); replacement of the telemetry radio system used by EMS Units ($6.3 million); and replacement of the building information and billing system used by Fire Prevention ($4.8 million).
Recreation and Culturals
• Parks: rehabilitation of Parks-owned pedestrian bridges, Citywide ($887.0 million); planting of new street trees and park trees and the reforestation and restoration of natural areas, Citywide ($238.2 million); continued implementation of phases one and two of the Community Parks Initiative (CPI), which directs capital funding to historically underfunded parks in areas with high population density, high concentration of poverty, and above average population growth ($189.9 million); reconstruction of recreation centers, Citywide ($153.1 million); continued implementation of the Anchor Parks Initiative, which builds off of the Community Parks Initiative and directs capital funding to historically underfunded larger parks that are greater than six acres ($141.9 million); and funding to continue closing the Walk to a Park gap, including the renovation of schoolyards to allow them to be opened to the public outside of school hours, and the acquisition and development of public partnership and private sites as parkland ($40.3 million).
• Public Libraries: comprehensive renovations of the New Lots, New Utrecht, Canarsie, Brownsville, and Eastern Parkway Branch Libraries, Brooklyn ($98.0 million); comprehensive renovations of the Fort Washington and 125th St. Branch Libraries, Manhattan, Hunts Point and Melrose Branch Libraries, the Bronx, and Port Richmond Branch Library, Staten Island ($90.0 million); and upgrades of Branch libraries in Queens, including expansion, exterior/interior renovations, and security upgrades ($90.0 million).
• Department of Cultural Affairs: renovation of the Thalia Spanish Theatre ($7.4 million); various upgrades and improvements at the Staten Island Museum ($5.8 million); renovation of the lobby, café and patron spaces at the Symphony Space ($4.2 million); renovations of the Children’s Adventure Garden at the New York Botanical Gardens ($4.0 million); and renovation of the auditorium at the Brooklyn Botanic Garden ($1.4 million).

Budget and Financial Plan Summary Fiscal Year 2018
62
Department of Citywide Administrative Services
2018 AUTHORIZED CAPITAL COMMITMENTS, BY PROGRAM
16%
16%
14%
11%
8%
7%
6%
5%
3%
14%
$3,394
3,275
2,946
2,198
1,647
1,350
1,177
953
707
3,064
% of Plan Program 2018 Plan
Total $20,711
Parks
Bridges &Highways
EnvironmentalProtection
Education
EconomicDevelopment
Adminof Justice
Housing
Health & Hospitals
Culturals& Libraries
Other City Services
($ in Millions - All Funds)
Environmental Protection
Education
Bridges & Highways
Administration of Justice
Parks
Housing
Economic Development
Health & Hospitals
Culturals & Libraries
Other City Services
• Public Buildings: legal mandates ($545.1 million), including fire/life safety upgrades to ensure Local Law 5 compliance ($287.7 million) and fuel tank replacement and remediation ($180.4 million); rehabilitation of City-owned space ($506.4 million), including projects at 345 Adams in Brooklyn ($95.3 million), the Brooklyn Municipal Building ($52.6 million), the Manhattan Municipal Building ($44.5 million), 1932 Arthur Avenue in the Bronx ($20.5 million), a Computerized Testing and Applications Center in the Bronx ($15.0 million), and Queens Borough Hall ($13.5 million); renovation of leased space ($281.1 million), including expansion of Department of Emergency Management leased space in Brooklyn ($85.0 million); reconstruction of waterfront properties and non-waterfront properties ($139.7 million); equipment and interagency services ($108.6 million), including the development of a replacement system for the Integrated Property Information System ($9.3 million); renovation of other City-owned facilities
($70.1 million); miscellaneous construction in other facilities ($40.5 million); acquisition of real property ($32.0 million), including parkland for the development of the Staten Island levee ($32.0 million); communications equipment ($0.9 million); and rehabilitation of court buildings ($0.3 million).
• Energy Efficiency and Sustainability: energy efficiency measures and building retrofits ($2.7 billion), including the Accelerated Conservation and Efficiency (ACE) Program ($110.3 million), Solar panels at facilities, Citywide ($86.0 million), and Local Law 87 deep retrofits ($69.9 million).
• Citywide Agency Facility and Operational Protective Measures: citywide agency resiliency and agency facility and operational protective measures ($1.2 billion), including East Side Coastal Resiliency ($512.0 million) and rehabilitation projects across the City’s portfolio of coastal and waterfront assets ($292.4 million).

Budget and Financial Plan Summary Fiscal Year 2018
63
Technology
• Information and Communication Systems: 911/Emergency Communications Transformation Program (ECTP) facilities, software, and equipment to update and integrate the City’s computer aided dispatch capabilities ($50.0 million); Broadband Initiative including the expansion of wireless access for low-income residents ($32.5 million); and as part of IT security, hardware and software security upgrades required to safeguard the City’s information technology assets ($22.5 million).
Environmental Protection and Sanitation
• Sewers: reconstruction and augmentation of the City’s sewer system ($385.9 million), of which $222.7 million was allocated to the Southeast Queens Infrastructure build out; continued replacement of chronically failing components ($209.6 million); and Staten Island Bluebelt build out ($140.9 million). The total Sewers program for 2018 is $880.4 million.
• Water Mains, Sources and Treatment: continued in-City water main construction and ancillary work ($646.3 million), including various state-of-good-repair projects, Citywide ($281.3 million), water main rehabilitation in partnership with DOT street reconstruction and Vision Zero projects ($153.4 million), and accelerated replacement schedule for aging water mains ($111.7 million); and continued improvements and repairs to infrastructure in the City’s upstate watersheds ($420.3 million), including projects related to the Filtration Avoidance Determination ($89.9 million) and rehabilitation of the Ashokan Reservoir, Olive Bridge Dam, and associated facilities ($87.0 million). The total Water Mains, Sources and Treatment program for 2018 is $1.1 billion.
• Wastewater Treatment: conduct essential projects at water pollution control plants and related infrastructure to sustain uninterrupted wastewater treatment operation ($681.6 million); addressing water quality problems attributed to combined sewer overflow discharges into the City’s surrounding waterways during wet weather conditions ($221.2 million); and working with multiple City agencies to construct, install, and maintain various Green Infrastructure projects for stormwater capture, such as bioswales, tree pits, constructed wetlands, and
green roofs ($106.6 million). The total Wastewater Treatment program for 2018 is $1.1 billion.
• Water Supply: increasing the capacity of the Upper Catskill Aqueduct in preparation of the temporary shutdown of the Delaware Aqueduct in 2022 ($155.0 million); and construction of a tunnel connecting the Kensico Reservoir and Catskill/Delaware Ultraviolet Light Disinfection Facility ($27.0 million). The total Water Supply program for 2018 is $197.6 million.
• Equipment: management information systems ($32.6 million), including agency-wide upgrade of security systems ($20.0 million); and continued water conservation programs ($28.8 million), including the installation of large water meters ($21.1 million). The total Equipment program for 2018 is $125.2 million.
• Sanitation: replacement of vehicles and equipment ($168.0 million); component rehabilitation and construction of garages, Citywide ($129.6 million); construction and renovation of transfer stations and other facilities in accordance with the City’s Long Term Solid Waste Management Plan ($33.1 million); and information technology and telecommunications projects ($15.1 million).
Transportation
• Bridges: continued reconstruction and rehabilitation for the East River bridges, including Queensboro bridge ($342.5 million); bridge life extension rehabilitation projects, including Broadway Bridge over Harlem River ($178.8 million); rehabilitation of bridges in fair or good condition, including Riverside Drive Bridge over West 158th Street ($153.0 million); and bridge protective coating projects, including Henry Hudson Parkway Bridge over West 158th Street ($9.6 million). The total Bridge Program for 2018 is $1.6 billion.
• Highways: street reconstruction of 145 lane miles ($585.6 million), which includes various projects to address the needs of South East Queens ($68.7 million) and reconstruction of the second phase of Tillary Street ($42.1 million); primary and arterial street resurfacing of 1,300 lane miles of streets ($276.5 million); and reconstruction of sidewalks and pedestrian ramps ($161.3 million). The total Highways Program for 2018 is $1.1 billion.
2018 Agency Highlights

Budget and Financial Plan Summary Fiscal Year 2018
64
• Traffic: signal installation and maintenance ($84.9 million); expansion of Midtown in Motion within Midtown and to lower Manhattan ($12.3 million); installation of streetlights, signals and lane markings associated with the Highway and Bridge Programs ($11.8 million); and installation of an additional 1,000 street lights on high risk crash intersections ($3.9 million). The total Traffic Program for 2018 is $175.4 million.
• Ferries: construction of flex barges, which could be used to dock ferry vessels at temporary locations during emergencies ($11.0 million). The total ferries program for 2018 is $63.2 million.
• Transit: contribution to the MTA’s capital program, including subway and bus fleet enhancements, infrastructure improvements, in-house track rehabilitations, and reconstruction of bus and subway lines for New York City. The Transit program for 2018 is $125.0 million.
Education, Health and Social Services
• Education: rehabilitate, replace, and upgrade building components ($910.9 million); construct new schools ($892.2 million); expand facilities through leases, building additions, athletic fields, and playgrounds ($678.8 million); cover emergency projects, research and development, and prior plan completion costs ($343.9 million); provide technological enhancements, expansion of pre-kindergarten capacity, and remove transportable classroom units with the Smart Schools Bond Act ($195.0 million); capital improvements that enhance educational programs ($194.5 million); and address the need for security systems, emergency lighting, and code compliance ($60.1 million). The total Education program for 2018 is $3.3 billion.
• Higher Education: miscellaneous reconstruction ($126.2 million); data processing and other equipment ($11.1 million); and energy conservation projects ($1.8 million). The total Higher Education program for 2018 is $139.1 million.
• Health: NYC Health + Hospitals (H+H) electronic health record system ($83.3 million); the Public Health Laboratory renovation ($72.5 million); H+H revenue cycle management system ($59.2 million); H+H primary care expansion ($26.2 million); ambulance purchases ($26.2 million); unsafe facade remediation work on various H+H facilities ($25.5
million); and animal care centers and other animal welfare investments ($18.1 million).
• Aging: rehabilitation of senior centers ($14.4 million); computer and network upgrades and equipment purchases ($4.8 million); and vehicle purchases ($1.0 million).
• Administration for Children’s Services: renovation and upgrades of Juvenile Detention Facilities ($309.6 million); telecommunications and data infrastructure upgrades and improvements ($21.9 million); renovation and code compliance at various child care centers ($19.1 million); and renovation and upgrades of facilities ($18.0 million).
• Homeless Services: renovation and upgrade of adult shelters ($75.8 million); computer network upgrade and equipment purchases ($33.9 million); and renovation and upgrade of family shelters ($26.4 million).
• Human Resources: data infrastructure upgrades and improvements ($77.3 million); construction and initial outfitting for citywide facilities ($64.0 million); and telecommunications ($12.4 million).
Housing and Development
• Housing: provision of low-interest loans to finance the rehabilitation and preservation of approximately 20,000 units in privately-owned buildings through new construction ($517.0 million), preservation ($408.0 million), supportive housing ($144.0 million) and disposition programs ($29.0 million); and funding for technology, infrastructure, demolition and other ancillary investments ($37.0 million).
• Housing Authority: upgrades to building exteriors and systems, including roof work and mold remediation, facades, elevators, conversion to instantaneous hot water heaters, exterior lighting, and other general capital maintenance ($216.4 million).
• Economic Development: purchase of ferries for the citywide Ferry Service ($84.4 million); infrastructure work to support affordable housing sites, Citywide ($82.1 million); infrastructure improvements in the Rockaways, Queens ($71.0 million); funding for the Made in New York Campus at Bush Terminal, Brooklyn ($62.1 million); Neighborhood

Budget and Financial Plan Summary Fiscal Year 2018
65
Development Fund to help provide for critical infrastructure work for re-zonings proposed in neighborhood plans developed by the Department of City Planning, Citywide ($60.0 million); development, management and rehabilitation of the City’s industrial properties ($55.9 million); funding to support the redevelopment of the Stapleton neighborhood in Staten Island ($55.2 million); funding for the Mayor’s Life Sciences Initiative ($55.0 million); various development and infrastructure improvements at the Brooklyn Navy Yard, including the rehabilitation of Building 77 to create new spaces for manufacturing and industrial tenants ($45.4 million); infrastructure improvements in the southwest Bronx ($37.2 million); and infrastructure improvements at Governors Island ($32.7 million).
Administration of Justice and Public Safety
• Correction: new jail facilities ($1.1 billion); improvements to building systems, infrastructure and support space ($316.5 million); and lifecycle replacement of equipment ($29.2 million).
• Courts: infrastructure and operational improvements of courts facilities ($163.4 million); fire/life safety work ($54.9 million); electrical upgrades ($46.9 million); exterior renovations ($20.6 million); HVAC improvements ($8.2 million); and elevator upgrades ($3.5 million).
• Police: construction, rehabilitation and relocation of facilities, Citywide ($251.8 million); replacement and upgrade of critical network infrastructure equipment and data management systems ($111.7 million); replacement and upgrade of portable radios, radio equipment, infrastructure and systems ($84.5 million); lifecycle replacement of vehicles ($21.2 million); and replacement and upgrade of general equipment, Citywide ($20.2 million).
• Fire: replacement of front-line fire-fighting apparatus according to mandated replacement cycles as well as support vehicles and equipment ($81.8 million); renovation of firehouse components such as boilers, electrical systems, kitchens, roofs, bathrooms, waterproofing, apparatus doors, floors, and windows, and support facility reconstruction ($63.5 million); replacement of conduit and wiring in inundation zones for the Department’s outside cable plant that was damaged during Hurricane Sandy ($56.7 million); replacement of end of life information
technology and communications equipment ($24.0 million); upgrade of 9-1-1 communications system infrastructure as it approaches the end of its useful life ($19.5 million); replacement of the telemetry radio system used by EMS Units ($6.3 million); and replacement of the building information and billing system used by Fire Prevention ($4.8 million).
Recreation and Culturals
• Parks: planting of new street trees and park trees and the construction of greenstreets, Citywide ($81.9 million); continued implementation of the Community Parks Initiative ($72.4 million); reconstruction work along the East River Esplanade in Manhattan ($27.5 million); continued demolition and site preparation work for Bushwick Inlet Park in Brooklyn ($23.3 million); reconstruction of Stapleton Playground in Staten Island ($9.1 million); reconstruction of the Porpoise Bridge and Tide Gate System in Queens ($7.1 million); and reconstruction of Echo Park in the Bronx ($3.5 million).
• Public Libraries: renovation of the Midtown
Campus ($133.3 million) and comprehensive renovations of the Fort Washington branch ($4.0 million) and 125th Street branch ($4.0 million), Manhattan; expansion and furnishing of the Baisley Park branch ($6.5 million) and expansion of the Arverne branch ($6.2 million), Queens; interior and exterior rehabilitation of the Arlington branch ($5.4 million) and the Borough Park branch ($2.9 million), Brooklyn; comprehensive renovations of the Hunts Point branch ($4.0 million) and the Melrose branch ($4.0 million), the Bronx; and comprehensive renovation of the Port Richmond branch ($4.0 million), Staten Island.
• Department of Cultural Affairs: construction of the new Gilder Center for Science, Education, and Innovation at the American Museum of Natural History ($62.4 million); expansion and various upgrades at the Queens Museum ($14.0 million); campus-wide upgrades and improvements at the Snug Harbor Cultural Center & Botanical Garden ($13.7 million); improvements to the South Wing Atrium at the Bronx Museum of the Arts ($5.5 million); and auditorium renovations and construction of the Brooklyn Center for Sustainable Gardening at the Brooklyn Botanic Garden ($3.6 million).

Budget and Financial Plan Summary Fiscal Year 2018
66
Department of Citywide Administrative Services
• Public Buildings: rehabilitation of City-owned space ($212.5 million), including projects at 345 Adams in Brooklyn ($91.8 million), the Brooklyn Municipal Building ($52.6 million), 1932 Arthur Avenue in the Bronx ($5.1 million), Queens Borough Hall ($5.0 million), the Manhattan Municipal Building ($4.8 million), and a Computerized Testing and Applications Center in the Bronx ($2.0 million); renovation of leased space ($101.7 million), including expansion of leased space for the Law Department’s Torts Division ($16.9 million); legal mandates ($93.8 million), including fuel tank replacement and remediation ($66.0 million) and fire/life safety upgrades to ensure Local Law 5 compliance ($10.8 million); acquisition of real property ($32.0 million), including parkland for the development of the Staten Island levee ($32.0 million); renovation of other City-owned facilities ($30.4 million); reconstruction of waterfront properties and non-waterfront properties ($30.2 million); equipment and interagency services ($28.3 million), including the development of a replacement system for the Integrated Property Information System ($9.3 million); miscellaneous construction in other facilities ($25.4 million); communications equipment ($0.8 million); and rehabilitation of court buildings ($0.3 million).
• Energy Efficiency and Sustainability: energy efficiency measures and building retrofits ($315.0 million), including the Accelerated Conservation and Efficiency (ACE) Program ($98.0 million), Local Law 87 deep retrofits ($48.1 million), and Solar panels at facilities, Citywide ($31.6 million).
• Citywide Agency Facility and Operational Protective Measures: citywide agency resiliency and agency facility and operational protective measures ($226.4 million), including construction of additional bulkheads, revetments, and living shorelines to protect against sea level rise through the Raised Shorelines program ($102.0 million), and Lower Manhattan Two Bridges ($27.5 million).

Budget and Financial Plan Summary Fiscal Year 2018
67
Borough Presidents’ Allocations
The Charter requires an amount equal to five percent of the proposed new capital appropriations for the ensuing four years to be allocated to the Borough Presidents. This allocation is to be distributed to each borough based upon a formula that equally weighs population and land area. The tables below indicate the amounts added by the Borough Presidents for each programmatic area.
FY 2018-2021 Borough Presidents’ Allocations*(City Funded Appropriations $ in 000’s)
2018 2019 2020 2021
Bronx ProgramCultural Affairs ................................................. $1,750 — — —Education. ......................................................... 15,476 — — —Fire .................................................................... 250 — — —Health ............................................................... 647 — — —Higher Education .............................................. 1,625 — — —Hospitals ........................................................... 951 — — —Housing ............................................................. 6,250 — — —Housing Authority ............................................ 2,589 — — —Human Resources........... .................................. 50 — — —Parks ................................................................. 5,800 — — —Public Buildings ............................................... 3,185 — — — GRAND TOTAL: BRONX .......................... $38,573 $0 $0 $0
Brooklyn ProgramAging ................................................................ $500 — — —Brooklyn Public Library ................................... 1,000 — — —Children's Services ........................................... — — — —Cultural Affairs ................................................. 5,364 1,000 — —Economic Development ................................... 500 — — —Education. ......................................................... 30,902 — — —Health ............................................................... 367 — — —Higher Education .............................................. 2,000 — — —Highways .......................................................... 500 — — —Hospitals ........................................................... 351 — — —Housing ............................................................. 2,225 — — —Housing Authority ............................................ 1,000 — — —Human Resources. ............................................ 211 — — —Parks ................................................................. 2,750 — — —Public Buildings ............................................... 1,188 — — —Traffic ............................................................... — 1,000 — — GRAND TOTAL: BROOKLYN .................. $48,858 $2,000 $0 $0
* Appropriations include reallocation of prior amounts recommended by the borough presidents.**Note: Individual items may not add to totals due to rounding

Budget and Financial Plan Summary Fiscal Year 2018
68
FY 2018-2021 Borough Presidents’ Allocations*(City Funded Appropriations $ in 000’s)
2018 2019 2020 2021
Manhattan ProgramCultural Affairs ................................................. $5,615 — — —Economic Development ................................... 150 — — —Education........................................................ .. 16,474 — — —Fire............................................................. ....... 250 — — —Higher Education .............................................. 1,600 109 — —Homeless .......................................................... 34 — — —Hospitals ........................................................... 488 — — —Housing ............................................................. 1,030 — — —Housing Authority ............................................ 450 — — —Human Resources........... .................................. 46 — — —Parks ................................................................. 4,279 5,950 — —Public Buildings ............................................... 499 — — — GRAND TOTAL: MANHATTAN ............... $30,915 $6,059 $0 $0
Queens ProgramChildren’s Services ........................................... $1,538 — — —Cultural Affairs ................................................. 5,900 — — —Education ......................................................... 14,193 — — —Fire .................................................................... 644 — — —Health ............................................................... 4,461 — — —Higher Education .............................................. 8,057 — — —Hospitals ........................................................... 3,000 — — —Housing ............................................................. 5,401 — — —Housing Authority ............................................ 350 — — —Human Resources ............................................. 167 — — —Parks ................................................................. 20,334 4,090 — —Public Buildings ............................................... 350 — — —Queens Public Library ...................................... 10,272 — — —Traffic ............................................................... 820 — — — GRAND TOTAL: QUEENS ........................ $75,487 $4,090 $0 $0
Staten Island ProgramChildren’s Services ........................................... $500 — — —Cultural Affairs ................................................. 2,850 — — —Education .......................................................... 14,764 — — —Fire .................................................................... 500 — — —Health ............................................................... 1,482 — — —Higher Education .............................................. 1,000 — — —Highways .......................................................... 250 — — —New York Public Library .................................. 1,450 — — —Parks ................................................................. 4,220 — — — GRAND TOTAL: STATEN ISLAND .......... $27,016 $0 $0 $0
* Appropriations include reallocation of prior amounts recommended by the borough presidents.**Note: Individual items may not add to totals due to rounding

Budget and Financial Plan Summary Fiscal Year 2018
69
Management Initiatives
Management initiatives continue to be developed and implemented to enhance the administration and advancement of the capital program. These include:
• Continued improvements to capital program management.
• Updating the charter-mandated capital asset condition assessment.
• Application of value engineering to reduce capital and operating costs.
Capital Program Management
The Department of Design and Construction was created in October 1995 by Local Law 77, which authorized it to assume responsibility for construction projects performed by the Departments of Transportation, Environmental Protection and General Services. The Department delivers the City’s construction projects in an expeditious, cost-effective manner, while maintaining the highest degree of architectural, engineering and construction quality. The Department performs design and construction functions related to streets and highways; sewers; water mains; correctional and court facilities; cultural buildings; libraries; and other public buildings, facilities and structures.
The consolidation of design and construction into a single agency allows for the elimination of duplicative program units within agencies; the standardization of construction procedures and practices; the implementation of reforms of current practices relating to procurement for construction projects; and the expansion of the use of construction-related technology, including Computer-Aided Drafting and Design (CADD); and a project management information system. The Department also enables the city to coordinate a wide variety of construction projects with utilities, community representatives, and private industry, thus minimizing the disruption to individual neighborhoods caused by water-main projects, sewer construction, and road work, as well as reducing the costs associated with such projects. The Department of Design and Construction serves more than 22 client agencies.
Capital Project Scope Development and Cost Estimation
Some capital projects contain significant risks and uncertainties that can lead to cost escalation. Construction or site complexity, unclear or evolving programmatic requirements, regulatory or legal issues, and conflicting stakeholder objectives are some of the factors which can result in projects exceeding their budgets. In an effort to control cost overruns, capital projects will undergo more intensive scope development and cost estimation prior to being included in the capital plan.
Capital Asset Inventory and Maintenance Program
The Charter requires an annual assessment of the City’s major assets including buildings, piers, bulkheads, marinas, bridges, streets and highways, and the preparation of maintenance schedules for these assets. This assessment report (AIMS), based on field surveys by technical professionals, details state-of-good-repair needs and is used by agencies for capital planning purposes. A separate volume, published as a reconciliation, reports on the amounts recommended in the annual condition surveys with amounts funded in budget. To incorporate current technology and standards into the Maintenance Program, the City conducts ongoing reviews of the methodologies used in surveying and estimating the cost of maintaining its fixed assets in a state of good repair.
The AIMS Program was enhanced by an intranet portal that allows for more agency access to asset data. This provides the client agencies with additional information with which to improve management of their facilities.
Value Engineering
Value Engineering (VE) is a systematic analytical methodology directed toward analyzing the functions of projects for the purpose of achieving the best value at the lowest life-cycle project cost. From its inception in 1982 OMB’s VE program has utilized innovations in value management methodology to evaluate an ever-expanding group of projects, widening the scope and depth of project reviews to include Value Analysis (VA) reviews of the City’s operational processes and functions to assist agencies in streamlining their procedures to effect increased efficiency and improvements.

Budget and Financial Plan Summary Fiscal Year 2018
70
Value Engineering is a collaborative effort between all concerned city agencies with budgetary and operational jurisdiction over a project, and outside consultants with expertise on critical project components. The City has utilized VE effectively in the last 35 years to review complex and costly capital projects to ensure they meet functional requirements and are cost effective and timely. These Value Management reviews enable agency decision makers to reach informed conclusions about projects’ scope, cost and schedule. In addition to defining potential cost reductions, the VE process frequently generates project improvements, and anticipates project risks and solves functional problems by raising relevant issues which adversely compromise the project’s development, cost and schedule early in the design process. OMB’s Value Management Program continues to be successful, both as an operational and capital management tool. The benefits of VE and the overall returns on the reviewed projects have proven to be effective in terms of both significant capital and life cycle cost reductions while protecting projects’ required functionality and mission. VA enables improvements to operational processes and more efficient service delivery. Studies scheduled for upcoming VE reviews include environmental projects, parks, bridges, water tunnel structures, hospitals, garages, and operational reviews such as revenue enhancements and space analyses.

Budget and Financial Plan Summary Fiscal Year 2018
71
FINANCING PROGRAM
The City financing program projects $48.6 billion of long-term borrowing for the period fiscal years 2017 through 2021 to support the City current capital program. The portion of the capital program not financed by the New York City Municipal Water Finance Authority (NYW or the Authority) will be split between General Obligation (GO) bonds of the City and Future Tax Secured (FTS) bonds of the New York City Transitional Finance Authority (TFA). Given the TFA is approaching its statutory limit on Building Aid Revenue Bonds (BARB) debt outstanding, the financing program reflects BARB issuance so as to remain under the limit.
Figures below do not include state funded financing for education capital purposes through BARBs:
Financing Program($ in Millions)
__________________________________________________________________________________________________________________________________________________________________________________________
2017 2018 2019 2020 2021 Total__________________________________________________________________________________________________________________________________________________________________________________________
City General Obligation Bonds ................ $2,281 $3,250 $4,500 $4,730 $4,610 $19,371TFA Bonds1 ............................................... 3,300 3,250 4,500 4,730 4,610 20,390Water Authority Bonds2 ............................ 1,767 1,418 1,868 1,913 1,890 8,856 ______________ ______________ ______________ _____________ _______________ ______________
Total .......................................................... $7,348 $7,918 $10,868 $11,373 $11,110 $48,617 ______________ ______________ ______________ _____________ _______________ ______________
1 TFA Bonds do not include BARBs issued for education capital purposes. TFA expects to continue to issue BARBs under the current legislative authorization.
2 Includes commercial paper and revenue bonds issued for the water and sewer system’s capital program. Figures do not include bonds that defease commercial paper or refunding bonds.

Budget and Financial Plan Summary Fiscal Year 2018
72
Overview of the Financing Program
The following three tables show statistical information on debt issued and expected to be issued by the financing entities described above, other than BARBs to be issued by the TFA.
Debt Outstanding($ in Millions at Year End)
__________________________________________________________________________________________________________________________________________________________________________________________
2017 2018 2019 2020 2021__________________________________________________________________________________________________________________________________________________________________________________________
City General Obligation Bonds .................................. $38,020 $39,076 $41,413 $43,801 $46,048TFA Bonds1 ................................................................ 31,714 33,984 37,155 40,529 43,667TSASC Bonds ............................................................. 1,090 1,071 1,053 1,023 993Conduit Debt ............................................................... 1,365 1,284 1,206 1,121 1,033 ______________ ______________ _____________ _______________ ______________
Total ........................................................................... $72,189 $75,415 $80,827 $86,474 $91,741 ______________ ______________ _____________ _______________ ______________
Water Authority Bonds ............................................... $30,930 $32,240 $33,783 $35,313 $36,798__________________________________________________________________________________________________________________________________________________________________________________________
1 Figures above do not include state funded financing for education capital purposes through the TFA BARBs.
Annual Debt Service Costs($ in Millions, Before Prepayments)
__________________________________________________________________________________________________________________________________________________________________________________________
2017 2018 2019 2020 2021__________________________________________________________________________________________________________________________________________________________________________________________
City General Obligation Bonds .................................. $3,893 $4,103 $4,177 $4,520 $4,707TFA Bonds1 ................................................................ 2,181 2,201 2,830 3,122 3,405TSASC Bonds ............................................................. 65 73 72 82 82Conduit Debt2 .............................................................. 207 224 218 267 284 ______________ ______________ _____________ _______________ ______________
Total Debt Service ..................................................... $6,346 $6,601 $7,297 $7,991 $8,478 ______________ ______________ _____________ _______________ ______________
Water Authority Bonds3 .............................................. $1,532 $1,726 $1,880 $2,045 $2,174__________________________________________________________________________________________________________________________________________________________________________________________
1 Figures above do not include state funded financing for education capital purposes through the TFA BARBs.2 Conduit Debt debt service includes interest on the $3 billion Hudson Yards Infrastructure Corporation (HYIC) debt issued in
December 2006 and October 2011. Such debt is not included in the "Debt Outstanding" table above because the City is not required to pay principal of the HYIC debt.
3 Includes First Resolution debt service and Second Resolution debt service net of subsidy payments from the NYS Environmental Facilities Corporation.
Debt Burden__________________________________________________________________________________________________________________________________________________________________________________________
2017 2018 2019 2020 2021__________________________________________________________________________________________________________________________________________________________________________________________
Total Debt Service1 as % of:a. Total Revenue ......................................................... 7.4% 7.7% 8.3% 8.7% 9.0%b. Total Taxes ............................................................. 11.5% 11.6% 12.2% 12.8% 13.1%c. Total NYC Personal Income ................................... 1.1% 1.1% 1.2% 1.2% 1.3%
Total Debt Outstanding1 as % of:a. Total NYC Personal Income ................................... 12.5% 12.6% 13.0% 13.4% 13.7%__________________________________________________________________________________________________________________________________________________________________________________________
1 Total Debt Service and Debt Outstanding include GO, conduit debt and TFA bonds other than BARBs.

Budget and Financial Plan Summary Fiscal Year 2018
73
The financing of the City capital program is split among GO, TFA FTS and NYW bond issuance. The City and TFA expect to issue $19.4 billion and $20.4 billion, respectively, during the plan period. The City issuance supports 40 percent of the total, while TFA FTS issuance supports 42 percent of the total. NYW will issue, excluding refundings, approximately $8.9 billion.
The City, TFA, and NYW have enjoyed continued strong investor demand which has allowed the City capital program to be financed at reasonable interest rates. All of the issuers financing the City capital program have maintained credit ratings in the AA category or better by Moody’s, Standard & Poor’s, and Fitch, as indicated in the table below.
Ratings
Issuer Moody’s Standards and Poor’s Fitch
NYC GO Aa2 AA AA TFA Senior Aaa AAA AAATFA Subordinate Aa1 AAA AAA TFA BARBs Aa2 AA AA NYW First Resolution Aa1 AAA AA+NYW Second Resolution Aa1 AA+ AA+ EFC Senior SRF Bonds Aaa AAA AAAEFC Subordinated SRF Bonds Aaa AAA AA+
New York City General Obligation Bonds
Since July l, 2016, the City has issued approximately $2.3 billion in bonds for capital purposes and $900 million in refunding bonds. The dates and principal amounts are as follows:
NYC GO Issuances($ in Millions)
(N)ew $/ Issue Tax Exempt Taxable Total ParSeries (R)efunding Date Amount Amount Amount2017 A N 8/18/16 $1,181 $250 $1,4312017 B N 12/20/16 650 200 $8502017 CD R 2/22/17 900 0 $900 _______ _____ ______Total $2,731 $450 $3,181

Budget and Financial Plan Summary Fiscal Year 2018
74
The refunding transaction the City has completed to date in fiscal year 2017 generated approximately $130 million of debt service savings during the financial plan period.
In addition to the total issuance mentioned above, the City took steps to manage its outstanding floating rate debt. The City reoffered four subseries of floating rate bonds amounting to over $200 million. Of those reoffered issues, two subseries of publicly offered floating rate notes amounting to approximately $150 million and two subseries of variable rate demand bonds amounting to approximately $50 million were converted to fixed rates.
The City plans to issue GO bonds for capital purposes of approximately $3.3 billion, $4.5 billion, $4.7 billion, and $4.6 billion in fiscal years 2018 through 2021, respectively.
Currently the debt service for the City, TFA FTS, and City appropriation debt, or conduit debt, excluding the effect of pre-payments, is 7.4 percent of the City’s total budgeted revenues in fiscal year 2017. That ratio is projected to rise to 9.0 percent in fiscal year 2021. As a percentage of tax revenues, the debt service ratio is 11.5 percent in fiscal year 2017 and is projected to increase to 13.1 percent in fiscal year 2021.
New York City Related Issuers - Variable Rate Debt
Floating rate bonds have been a reliable source of cost savings in the City financing program. In considering the proportion of the City’s debt which is in variable rather than fixed rates, it is useful to consider all sources of financing with the exception of NYW, which is typically considered separately for such purposes. Included would be not only City GO bonds but also TFA FTS, TSASC bonds and conduit debt. The City and its related entities have approximately $10.9 billion of floating rate exposure.
Despite changes in the floating rate market, the City and other issuers supporting the City capital program have maintained floating rate exposure to minimize interest costs. The City and related financing entities have managed bank facility expirations by obtaining renewals from existing providers or replacement
facilities from new providers. In addition, the City and related financing entities have explored new floating rate structures not requiring bank facilities. The City and TFA entered into private placements and public offerings of index floating rate bonds bearing all-in costs comparable to variable rate demand bonds with bank facilities. The City and TFA continue to explore these and other debt instruments which confer the benefit of floating rate exposure.
The City has not entered into any new interest rate swaps to date in fiscal year 2017. The total notional amount of swaps outstanding as of March 31, 2017 was $1.28 billion, on which the termination value was negative $86.9 million. This is the theoretical amount which the City would pay if all of the swaps terminated under market conditions as of March 31, 2017.
The following table shows the City’s and its related issuers’ floating rate exposure. Floating rate exposure is of note because certain events can cause unexpected increased costs. Those events would include rising interest rates, a change in the tax code (in the case of tax-exempt debt), and the deterioration of the City’s credit. Additionally, the deterioration of the credit of a related credit or liquidity provider can also have an impact on interest costs. By contrast, the cost of outstanding fixed rate debt does not increase if any of the previously mentioned events takes place. On the other hand, fixed rate borrowing locks in a higher borrowing cost if interest rates do not change materially or if they decline. Overall, floating rate exposure benefits the City because it reduces the cost of financing. In short, interest costs on short term debt are almost always lower than long term debt. The City has assumed floating rate exposure using a variety of instruments including tax exempt floating rate debt, taxable floating rate debt, basis swaps, and certain types of synthetic fixed rate debt. The basis swaps and certain synthetic fixed rate debt provide exposure to changes in the tax code but are largely insensitive to changes in interest rates and changes in the City’s credit. Given that those instruments provide only limited floating rate exposure, they are counted as variable rate exposure at less than the full amount of par or notional amount. Instruments that provide exposure only to changes in the tax code are counted at 25 percent of par or notional amount in the table below.

Budget and Financial Plan Summary Fiscal Year 2018
75
NYC Floating-Rate Exposure1
($ in Millions)
GO TFA Conduit TSASC Total ___________ __________ ______________ ____________ ______________
Floating Rate Bonds ........................................ $6,252 $4,224 $30 $0 10,506Synthetic Fixed ................................................ 191 0 31 0 222Enhanced Basis Swap ...................................... 125 0 0 0 125 ___________ __________ ___________ ____________ ______________
Total Floating-Rate ......................................... $6,568 $4,224 $61 $0 $10,853
Total Debt Outstanding .................................... $38,020 $31,714 $1,365 $1,090 $72,189
% of Floating-Rate / Total Debt Outstanding ........................................ 15.0%Total Floating-Rate Less $6.9 Billion Balance in General Fund (Floating-Rate Assets) ...................................................3,954 % of Net Floating Rate / Total Debt Outstanding .................................... 5.5%__________________________________________________________________________________________________________________________________________________________________________________________
1 End of Fiscal Year Debt Outstanding as of the 2018 Executive Budget excluding NYW, HYIC, and TFA BARBs.
The 15 percent floating rate exposure, including the risk from the synthetic fixed rate swaps and the basis swaps, is even more manageable after taking into account the 10 year average balance of $6.9 billion of short-term assets in the City’s General Fund which are an offset to these floating rate liabilities. Net of these floating rate assets, the floating rate exposure of the City, excluding NYW, is 5.5 percent of its outstanding debt. Moreover, the City uses conservative assumptions in budgeting expenses from floating rate instruments.
During fiscal year 2017, short-term interest rates relating to floating rate debt have been 0.66 percent on average for tax-exempt and 1.01 percent for taxable floating rate debt. These rates have continued to provide extremely attractive financing costs relative to fixed rate debt. Tax exempt floating rate debt has traded recently at rates that are approximately 270 basis points lower than those for long term fixed-rate debt, resulting in an annual savings of over $290 million.
The New York City Municipal Water Finance Authority
The New York City Municipal Water Finance Authority (NYW) was created in 1985 to finance capital improvements to the City’s water and sewer system. Since its first bond sale in November 1985, the Authority has sold $63.1 billion in bonds. These bond issuances included a combination of general (first) resolution, second general resolution and subordinated special resolution crossover refunding water and sewer system revenue bonds.
Of the aggregate bond par amount sold, $30.8 billion is outstanding, $23.7 billion was refinanced with lower cost debt, $3.5 billion was defeased with Authority funds prior to maturity, and $5.1 billion was retired with revenues as it matured. In addition to this long-term debt, NYW uses a $600 million tax-exempt commercial paper program and bond anticipation notes (BANs) issued to the New York State Environmental Facilities Corporation (EFC) as a source of flexible short-term financing. As of April 13, 2017, $209 million of BAN draws are outstanding. The commercial paper includes $400 million of unenhanced extendible municipal commercial paper (EMCP) notes and $200 million of notes backed by a line of credit from a bank.
NYW’s outstanding debt also includes floating rate bonds, which have been a reliable source of cost effective financing. NYW has $5.2 billion of floating rate bonds or 17 percent of its outstanding debt, including $401 million which was swapped to a fixed rate. NYW’s floating rate exposure includes tax-exempt floating rate debt supported by liquidity facilities.
NYW participates in the State Revolving Fund (SRF) program administered by the EFC. The SRF provides a source of long-term below-market interest rate borrowing, subsidized by federal capitalization grants, state matching funds, and other funds held by EFC.
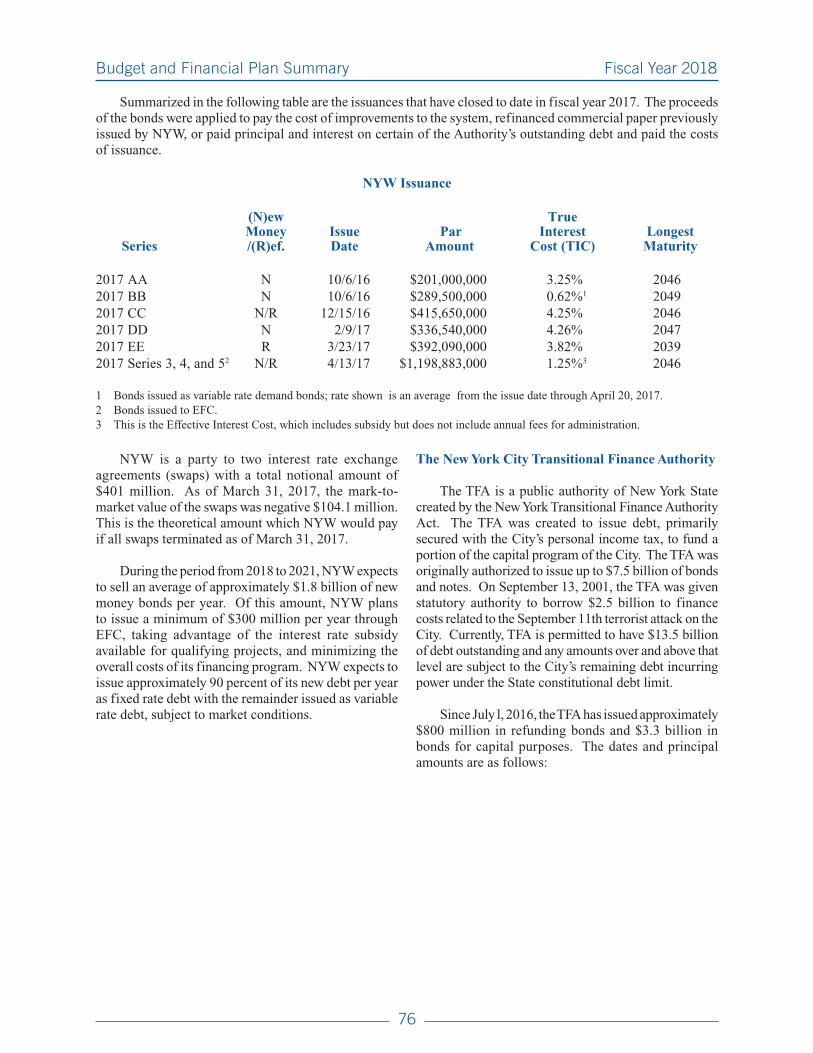
Budget and Financial Plan Summary Fiscal Year 2018
76
Summarized in the following table are the issuances that have closed to date in fiscal year 2017. The proceeds of the bonds were applied to pay the cost of improvements to the system, refinanced commercial paper previously issued by NYW, or paid principal and interest on certain of the Authority’s outstanding debt and paid the costs of issuance.
NYW Issuance
(N)ew True Money Issue Par Interest Longest Series /(R)ef. Date Amount Cost (TIC) Maturity
2017 AA N 10/6/16 $201,000,000 3.25% 20462017 BB N 10/6/16 $289,500,000 0.62%1 20492017 CC N/R 12/15/16 $415,650,000 4.25% 20462017 DD N 2/9/17 $336,540,000 4.26% 20472017 EE R 3/23/17 $392,090,000 3.82% 20392017 Series 3, 4, and 52 N/R 4/13/17 $1,198,883,000 1.25%3 2046
1 Bonds issued as variable rate demand bonds; rate shown is an average from the issue date through April 20, 2017.2 Bonds issued to EFC.3 This is the Effective Interest Cost, which includes subsidy but does not include annual fees for administration.
NYW is a party to two interest rate exchange agreements (swaps) with a total notional amount of $401 million. As of March 31, 2017, the mark-to-market value of the swaps was negative $104.1 million. This is the theoretical amount which NYW would pay if all swaps terminated as of March 31, 2017.
During the period from 2018 to 2021, NYW expects to sell an average of approximately $1.8 billion of new money bonds per year. Of this amount, NYW plans to issue a minimum of $300 million per year through EFC, taking advantage of the interest rate subsidy available for qualifying projects, and minimizing the overall costs of its financing program. NYW expects to issue approximately 90 percent of its new debt per year as fixed rate debt with the remainder issued as variable rate debt, subject to market conditions.
The New York City Transitional Finance Authority
The TFA is a public authority of New York State created by the New York Transitional Finance Authority Act. The TFA was created to issue debt, primarily secured with the City’s personal income tax, to fund a portion of the capital program of the City. The TFA was originally authorized to issue up to $7.5 billion of bonds and notes. On September 13, 2001, the TFA was given statutory authority to borrow $2.5 billion to finance costs related to the September 11th terrorist attack on the City. Currently, TFA is permitted to have $13.5 billion of debt outstanding and any amounts over and above that level are subject to the City’s remaining debt incurring power under the State constitutional debt limit.
Since July l, 2016, the TFA has issued approximately $800 million in refunding bonds and $3.3 billion in bonds for capital purposes. The dates and principal amounts are as follows:

Budget and Financial Plan Summary Fiscal Year 2018
77
NYC TFA Issuances($ in Millions)
New$/ Issue Tax Exempt Taxable Total ParSeries Refunding Date Amount Amount Amount2017 A N 7/28/16 $800 $250 $1,0502017 B N 9/22/16 900 250 1,1502017 CD R 3/22/17 795 0 7952017 E N 4/19/17 800 300 1,100 _____ _____ _______Total $3,295 $800 $4,095
The $800 million refunding transaction the TFA completed during fiscal year 2017 generated approximately $84 million of debt service savings during the financial plan period.
Additionally, the TFA converted approximately $40 million of floating rate bonds to a fixed rate mode.
Beyond the financings described above, the TFA plans to issue TFA FTS bonds for capital purposes of approximately $3.3 billion, $4.5 billion, $4.7 billion and $4.6 billion in years 2018 through 2021, respectively.
In April 2006, the State enacted legislation authorizing issuance by the TFA of an additional $9.4 billion of bonds to be used to fund capital costs for the Department of Education. This legislation also provided for the assignment to TFA of State building aid that had previously been paid directly to the City. The TFA currently has approximately $7.9 billion of BARBs outstanding which fund the capital program of the Department of Education. The financing program reflects BARB issuance projections to remain under the statutory cap. The TFA plans to issue BARBs of approximately $750 million, $163 million, $77 million, and $295 million in fiscal years 2018 through 2021, respectively. The reduction of BARB issuance is offset by an increase in GO and TFA FTS bond issuance.
Hudson Yards Infrastructure Corporation
Hudson Yards Infrastructure Corporation (HYIC), a not-for-profit local development corporation, was established to provide financing for infrastructure improvements to facilitate economic development on Manhattan’s far west side. Improvements include the extension of the No. 7 subway line west and south, construction of a system of parks, streets, and open spaces, as well as the acquisition of development rights over the MTA rail yards.
In December 2006, HYIC, issued its first series of bonds in the principal amount of $2 billion. HYIC issued its second issuance of $1 billion of bonds in October 2011. Principal on the HYIC bonds will be repaid from revenues generated by this new development, notably payments-in-lieu-of-property taxes (PILOT) on the commercial development and various developer payments. To the extent these revenues are not sufficient to cover interest payments, the City has agreed to make interest support payments to HYIC subject to appropriation.
Given the ongoing development in the Manhattan’s far west side, revenues received by HYIC have accelerated. Collections of PILOT revenue and tax equivalency payments continue to increase. Additionally, since January 2017 HYIC received over $20 million from payments in lieu of mortgage recording tax and district improvement bonus. These revenues, along with other revenues, will eliminate the interest support the City would have to provide on the HYIC bonds for fiscal years 2017 and 2018. However, some of these revenues are not ongoing, and the City financial plan reflects appropriation for interest support on the HYIC bonds in the future should recurring revenues be insufficient to cover interest on HYIC bonds.
The No. 7 Subway extension was constructed by the MTA and began service in September 2015. The secondary entrance to this station is currently under construction and is expected to open in the third quarter of calendar year 2018.
Phase I of Hudson Park and Boulevard completed construction and opened to the public in August 2015 and is managed by the Hudson Yards Hell’s Kitchen Alliance Business Improvement District.

Analysis of Agency Budgets

Analysis of Agency Budgets Fiscal Year 2018
81
The following table reflects the allocation of fringe benefits, pensions, and debt service costs against the City to each agency to derive the total cost of agency operations.
Full Agency Costs for FY 2018 ($ in Millions)
Personal Service Costs Other Than Personal Service Costs Gross Total Net Total Salaries PA, MA All Funds All Funds City & Fringe PS Agency & Other Debt OTPS (Includes (Excludes FundsAgency Wages Benefits Pensions Subtotal OTPS Mandates Service Subtotal Intra-City) Intra-City) Total
UNIFORMED AGENCIES Police ................................ $5,002 $2,149 $2,624 $9,775 $491 $— $164 $655 $10,430 $10,159 $9,981 Fire .................................... 1,777 739 1,275 3,791 215 — 151 366 4,157 4,157 3,859 Correction .......................... 1,240 614 404 2,258 164 — 184 348 2,606 2,606 2,576 Sanitation ........................... 938 439 312 1,689 698 — 410 1,108 2,797 2,786 2,753
Subtotal ........................... $8,957 $3,941 $4,615 $17,513 $1,568 $— $909 $2,477 $19,990 $19,708 $19,169
HEALTH AND WELFARE Admin. for Children’s Services ......... $493 $160 $70 $723 $2,578 $— $— $2,578 $3,301 $3,224 $1,134 Social Services .................. 847 372 144 1,363 1,502 7,509 72 9,083 10,446 10,438 7,981 Homeless Services ............ 157 59 25 241 1,450 — — 1,450 1,691 1,690 960 Health and Mental Hygiene 461 150 67 678 1,104 — 49 1,153 1,831 1,826 947 Health + Hospitals ............. — 36 — 36 872 — 198 1,070 1,106 1,013 968
Subtotal ........................... $1,958 $777 $306 $3,041 $7,506 $7,509 $319 $15,334 $18,375 $18,191 $11,990
EDUCATION Education ........................... $11,468 $3,904 $3,883 $19,255 $9,080 $696 $1,754 $11,530 $30,785 $30,773 $17,408 City University ................... 605 183 82 870 343 — 55 398 1,268 1,255 942
Subtotal ........................... $12,073 $4,087 $3,965 $20,125 $9,423 $696 $1,809 $11,928 $32,053 $32,028 $18,350
OTHER AGENCIES .............. $3,054 $1,032 $485 $4,571 $6,310 $— $3,010 $9,320 $13,891 $12,782 $9,969
ELECTED OFFICIALS ........ $587 $163 $89 $839 $124 $— $— $124 $963 $955 $877
MISCELLANEOUS .............. $677 $119 $112 $908 $— $3,741 (1) $333 $4,074 $4,982 $4,775 $4,414
DEBT SERVICE (Unallocated) .................. $— $— $— $— $— $— $148 $148 $148 $148 $76
ALL FUNDS TOTAL (2) ....... $27,306 $10,119 $9,572 $46,997 $24,931 $11,946 $6,528 $43,405 $90,402 $88,587
CITY FUNDS TOTAL (2) ...... $18,897 $7,726 $9,427 $36,050 $12,619 $9,912 $6,264 $28,795 $64,845
Less: Prepayments ................ $— $400 $— $400 $— $— $3,327 $3,327 $3,727 $3,727 $3,727
Total After Prepayments ....... $27,306 $9,719 $9,572 $46,597 $24,931 $11,946 $3,201 $40,078 $86,675 $84,860 $61,118
(1) Includes General Reserve, Capital Stabilization Reserve, Judgments and Claims, MTA Subsidies and Other Contractual Services. (2) Excludes the impact of prepayments.

Analysis of Agency Budgets Fiscal Year 2018
83
DEPARTMENT OF EDUCATION
The New York City Department of Education provides primary and secondary education for over one million school-age children. Through a network of elementary, junior high, intermediate, and high schools as well as full day pre-kindergarten programs and special education schools, the Department provides basic instructional services, offering students special education, instruction for English Language Learners and career and technical training. Support services include free and subsidized transportation, breakfast and lunch services, and the operation and maintenance of approximately 1,800 schools.
Financial Review
The Department of Education’s 2018 operating budget is $24,278 million, an increase of $871 million over the 2017 forecast of $23,406 million. In addition, education-related pension, debt service, and other fringe costs of $6,508 million are budgeted in separate agencies. These additional costs include an increase of $191 million. City funds including pensions, debt service and other fringe support $17,408 million of the Department of Education’s expense budget in 2018, an increase of $570 million, or 3.4 percent. State funds
support $11,378 million, an increase of $467 million. The balance of the education budget is supported by $1,816 million in Federal aid, an increase of $93 million from the 2017 forecast, $12 million in intra-city funds and $171 million in other categorical funds. Including those funds budgeted centrally; total funds budgeted on behalf of the Department of Education increase from $29,723 million in the 2017 forecast to $30,785 million in the 2018 Executive Budget.
Total Department of Education Expenses2011-2018
($ in Millions)_______________________________________________________________________________________________________________________________________________________________________________________________________________
Executive Change Change Forecast Budget 2017 to 2011 to 2011 2012 2013 2014 2015 2016 2017 2018 2018 2018_______________________________________________________________________________________________________________________________________________________________________________________________________________
Department Of Education Operating Budget City .................................................................... $7,737 $9,076 $9,081 $9,548 $9,740 $10,607 $11,108 $11,599 $490 $3,861 Other Categorical ............................................. 253 215 246 309 309 287 204 171 (33) (82)State ................................................................... 8,123 8,033 7,982 8,480 9,189 9,735 10,325 10,680 356 2,557 Federal ............................................................... 2,794 1,918 1,894 1,714 1,716 1,744 1,723 1,816 93 (979)Intra-City .......................................................... 31 42 30 35 45 48 46 12 (34) (19) ____________ ____________ ____________ ____________ ____________ ____________ ____________ ____________ ____________ ____________
Total Operating Expenditures ...................... $18,939 $19,283 $19,232 $20,085 $20,999 $22,422 $23,406 $24,278 $871 $5,339 =========== =========== =========== =========== =========== =========== =========== =========== =========== ===========
Other City Funds Supporting EducationPensions ........................................................... $2,457 $2,672 $2,830 $2,971 $3,273 $3,700 $3,919 $3,883 ($37) $1,426 State Aid for Pensions ....................................... (5) 0 0 0 0 0 0 0 0 5 Federal Aid for Pensions ................................... (0) 0 0 0 0 0 0 0 0 0 Other Fringe ...................................................... 102 113 126 133 146 159 156 175 19 73 G.O. Bond Debt Service .................................. 934 1,085 944 885 903 1,029 1,079 1,170 92 237 State Aid for Debt Service ............................... (3) (222) (146) (3) (3) (3) (3) (3) 0 0 TFA Debt Service ............................................ 720 637 816 912 1,027 1,082 1,162 1,280 117 560 State Aid for TFA Debt Service ........................ (416) (209) (345) (518) (561) (606) (584) (696) (112) (279) ____________ ____________ ____________ ____________ ____________ ____________ ____________ ____________ ____________ ____________
Total Additional City Funds .......................... $3,787 $4,076 $4,226 $4,379 $4,785 $5,361 $5,730 $5,810 $80 $2,022 =========== =========== =========== =========== =========== =========== =========== =========== =========== ===========
TOTAL CITY FUNDS FOR EDUCATION .......................................... $11,525 $13,152 $13,307 $13,927 $14,525 $15,969 $16,838 $17,408 $570 $5,884 =========== =========== =========== =========== =========== =========== =========== =========== =========== ===========
TOTAL STATE FUNDS FOR EDUCATION .......................................... $8,547 $8,464 $8,472 $9,000 $9,753 $10,343 $10,911 $11,378 $467 $2,831 =========== =========== =========== =========== =========== =========== =========== =========== =========== ===========__________________________________________________________________________________________________________________________________________________________________________________________
The amounts shown for 2011 through 2016 represent actual expenditures including pensions and debt service funds budgeted in other agencies. Numbers may not add due to rounding.

Analysis of Agency Budgets Fiscal Year 2018
84
Expense Budget Highlights
The 2018 Executive Budget includes funding for new policy initiatives, previously announced policies and mandated support services for NYC children.
Investing in Early Childhood Education
3-K for All
In 2014, Mayor de Blasio launched Pre-K for All to guarantee a pre-k seat to every four-year-old. Three years into the investment, New York City serves approximately 70,000 four-year-olds in free, full-day, high-quality pre-k programs. Pre-K for All gives children stronger math and reading skills in elementary school and generates long-term positive returns and outcomes over the life of the child. With this historic achievement we recognize that investments in early childhood education must continue. As part of a broader effort to create a continuum of early care and education programs for New York City children from birth to four years old, this Executive budget funds the first step towards 3-K for All, which would be the most ambitious effort in New York State to provide free, full-day high-quality early childhood education to three-year-olds.
Beginning in September 2017, New York City will provide 3-K for All in School Districts 7 (South Bronx) and 23 (Brownsville), two of the City’s highest-need districts. This will cost $16 million, and builds on substantial investments the City has made in these two communities, including the Single Shepherd program, which aims to support every child on a path to high school graduation and college readiness. DOE will continue the expansion by investing $157 million to expand to six additional school districts by fall of 2021, for a total of eight districts. This investment will also enhance quality for the over 10,400 three-year-olds currently enrolled in EarlyLearn programs - providing the same quality as our Pre-K for All Programs in curriculum development, improvements to teacher training and development, and increased support and outreach for families.
Early Childhood Education
EarlyLearn is the contracted care education system currently managed by the Administration for Children’s Services (ACS) serving children from six weeks through four years old. As part of the broader effort to standardize quality across the spectrum of all EarlyLearn programs, as of 2019 all of ACS’ EarlyLearn programs will be shifted to the Department of Education (DOE). Bringing education programs that serve children from birth to four under the control of a single agency will create a more seamless and high-quality experience for children, families, and educators. The integration will enable consistent high-quality standards beginning from birth through elementary school, greater curricular alignment through second grade, a single contracting relationship for early childhood education providers, integrated data collection, and greater connectivity between the early childhood system and the K-12 system. This budget invests an additional $20 million to enhance services, outreach, and supports for children from birth to three years old, as the system to provide care and education for these children moves from ACS to DOE.
Technology
The Mayor is committed to ensuring that NYC students and educators have access to the technology tools and services crucial to their success. Initiatives such as Computer Science for All and expansion of STEM-focused programs are all dependent on a technology infrastructure that can provide reliable internet speeds and bandwidth. In the 2018 Preliminary Plan, the City invested $24 million in 2017 and $16 million in 2018 to provide high-speed broadband capacity to all schools. This investment enables DOE to support faster internet speeds at the recommended bandwidth rate of 100 Mbps per 1,000 students.

Analysis of Agency Budgets Fiscal Year 2018
85
Other Initiatives
In addition to 3-K, Early Childhood Education expansion and Technology, several other initiatives will be funded or expanded in the Executive Budget. These include:
• Students in Shelters: Continues $10.3 million to fund a series of initiatives to support schools and shelters with the highest concentration of students in shelters. Targets chronic absenteeism by placing social workers in elementary schools with high concentrations of students in shelters and provides literacy support through after-school tutoring at shelters. Schools with the highest population of students in shelters will also receive health and mental health support services.
• Air Conditioners: Provides for the installation of air conditioners in every classroom that is currently without one by 2022. In 2018, work will begin for 2,000 classrooms at approximately 114 buildings, and each subsequent year at least another 2,200 classrooms will receive an air conditioner.
• Pre-K for All: Continues the unprecedented expansion of the Pre-K for All program, guaranteeing a high-quality, full-day seat to every four-year-old in the City.
• Summer in the City Expansion: Funds additional enhancements to DOE’s Summer in the City program, including extending the instructional day, adding additional seats for at-risk 2nd graders, expanding STEM programming for non-mandated students and incorporating full-day programming through the Department of Youth and Community Development COMPASS program for additional elementary students.

Analysis of Agency Budgets Fiscal Year 2018
86
2017 20182016
Actual2017
ForecastPreliminary
BudgetExecutive
Budget Forecast Preliminary
BudgetExpenditures
Salary and Wages ………………… $11,031,036 $10,921,237 $11,558,652 $11,468,347 $547,110 ($90,305)Fringe Benefits …………………… 3,439,342 3,580,271 3,740,091 3,729,270 148,999 (10,821) OTPS ……………………………… 7,951,184 8,904,951 9,026,984 9,080,110 175,159 53,126 Total ……………………………… $22,421,562 $23,406,459 $24,325,727 $24,277,727 $871,268 ($48,000)
FundingCity …………………………………$10,607,314 $11,108,494 $11,565,515 $11,598,758 $490,264 $33,243Other Categorical Grants ………… 286,816 204,362 151,952 170,952 (33,410) 19,000 IFA ………………………………… — — — — — — State ……………………………… 9,734,936 10,324,701 10,810,148 10,680,244 355,543 (129,904) Federal CD ………………………… 5,967 19,733 12,700 28,200 8,467 15,500 Federal Other ……………………… 1,738,488 1,702,796 1,776,127 1,787,385 84,589 11,258 Intra-City Other …………………… 48,041 46,373 9,285 12,188 (34,185) 2,903 Total ……………………………… $22,421,562 $23,406,459 $24,325,727 $24,277,727 $871,268 ($48,000)
Additional Costs Centrally FundedPersonal Services (PS) Fringe Benefits …………………… $158,750 $156,058 $179,111 $174,998 $18,940 ($4,113) Pensions ………………………… 3,699,812 3,919,347 4,098,344 3,882,533 (36,814) ($215,811)Other Than Personal Service (OTPS) Debt Service (incl. BARBs) ……… 2,111,143 2,241,028 2,462,954 2,450,109 209,081 (12,845) Total Additional Costs …………… $5,969,705 $6,316,433 $6,740,409 $6,507,640 $191,207 ($232,769)
FundingCity ………………………………… 5,361,251 5,729,991 6,044,700 5,809,525 79,534 ($235,175)Non-City …………………………… 608,454 586,442 695,709 698,115 111,673 $2,406
Full Agency Costs (including Central Accounts)Salary and Wages ………………… $11,031,036 $10,921,237 $11,558,652 $11,468,347 $547,110 ($90,305)Fringe Benefits …………………… 3,598,092 3,736,329 3,919,202 3,904,268 167,939 (14,934) Pensions …………………………… 3,699,812 3,919,347 4,098,344 3,882,533 (36,814) (215,811) Total PS ………………………… $18,328,940 $18,576,913 $19,576,198 $19,255,148 $678,235 ($321,050)
OTPS ……………………………… $7,951,184 $8,904,951 $9,026,984 $9,080,110 $175,159 $53,126Debt Service (incl. BARBs) ……… 2,111,143 2,241,028 2,462,954 2,450,109 209,081 (12,845) Total OTPS ……………………… $10,062,327 $11,145,979 $11,489,938 $11,530,219 $384,240 $40,281
Total Agency Costs ……………… $28,391,267 $29,722,892 $31,066,136 $30,785,367 $1,062,475 ($280,769)Less Intra-City …………………… $48,041 $46,373 $9,285 $12,188 ($34,185) $2,903Net Agency Cost ……………………$28,343,226 $29,676,519 $31,056,851 $30,773,179 $1,096,660 ($283,672)
FundingCity ………………………………… 15,968,565 16,838,485 17,610,215 17,408,283 569,798 (201,932) Non-City …………………………… 12,374,661 12,838,034 13,446,636 13,364,896 526,862 (81,740)
Personnel (includes FTEs at fiscal year-end)City ………………………………… 114,717 113,848 114,024 114,405 557 381 Non-City …………………………… 26,594 30,259 30,913 30,913 654 — Total ……………………………… 141,311 144,107 144,937 145,318 1,211 381
Summary of Agency Financial Data The following table compares 2018 Executive Budget with the 2018 Preliminary Budget, the 2017 forecast and actual expenditures for 2016, including fringe benefits, pensions, and debt service.
2018Increase/(Decrease)($ in 000's)
Education Agency: Education 4/23/2017 5:18 PM

Analysis of Agency Budgets Fiscal Year 2018
87
New York City Public School EnrollmentSchool Year 2014-2018
__________________________________________________________________________________________________________________________________________________________________________________________
2014 2015 2016 2017 2018 Actual Actual Actual Projections Projections__________________________________________________________________________________________________________________________________________________________________________________________
DOE Facilities Enrollment General Education* .......................... 845,086 832,516 819,055 808,453 798,202 Special Education** ........................ 123,272 131,472 140,120 146,652 154,958 Full Day Pre-K***............................ 16,204 20,913 28,963 29,563 30,718 Half Day Pre-K*** ........................... 6,831 4,999 0 0 0
Subtotal ................................................ 991,393 989,900 988,138 984,668 983,878 Non-DOE Facilities Enrollment Charter Schools ............................... 70,882 83,545 93,186 102,695 114,618 Contract Schools .............................. 7,343 7,181 7,188 6,961 7,171 Full Day Pre-K at NYCEECs*** ..... 3,083 32,207 39,684 39,947 40,782 Half Day Pre-K at NYCEECs*** .... 29,394 8,444 2,945 2,666 2,648 Special Ed Pre-K .............................. 37,642 38,164 38,589 38,491 38,222
Subtotal ................................................ 148,344 169,541 181,592 190,760 203,441
TOTAL ................................................ 1,139,737 1,159,441 1,169,730 1,175,428 1,187,319
__________________________________________________________________________________________________________________________________________________________________________________________
* General Education enrollment includes General Education students served in ICT settings as well as those in regular classrooms.** Special Education enrollment includes Community School District and High School Special Education students in self-contained
classrooms, Citywide, Home and Hospital Instruction, and Special Education students served in ICT settings.*** Students who turn four years old during the calendar year of admission.
FUNDING SOURCES 2011 - 2018
0
5
10
15
20
20182017201620152014201320122011Forecast Budget * City funds include TFA and GO debt service, pensions and other fringe.
** State funds include debt service and pensions.
$ in
Bil
lion
s
City*
State**
Federal
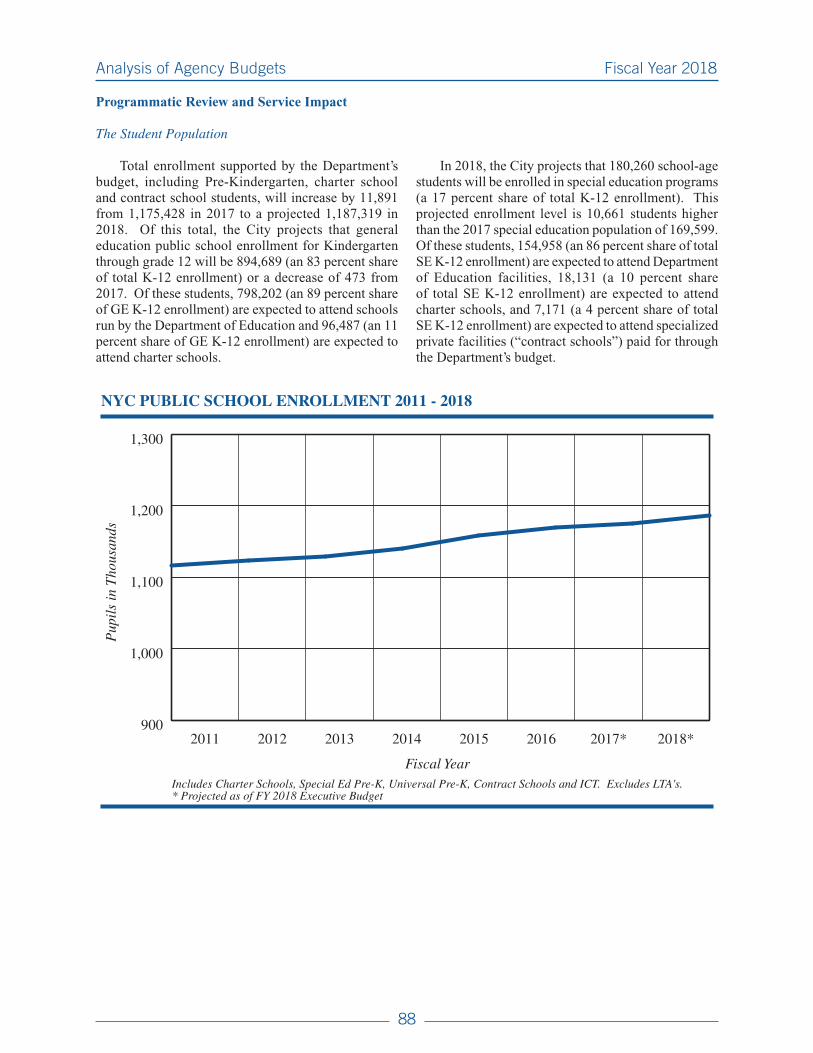
Analysis of Agency Budgets Fiscal Year 2018
88
Total enrollment supported by the Department’s budget, including Pre-Kindergarten, charter school and contract school students, will increase by 11,891 from 1,175,428 in 2017 to a projected 1,187,319 in 2018. Of this total, the City projects that general education public school enrollment for Kindergarten through grade 12 will be 894,689 (an 83 percent share of total K-12 enrollment) or a decrease of 473 from 2017. Of these students, 798,202 (an 89 percent share of GE K-12 enrollment) are expected to attend schools run by the Department of Education and 96,487 (an 11 percent share of GE K-12 enrollment) are expected to attend charter schools.
In 2018, the City projects that 180,260 school-age students will be enrolled in special education programs (a 17 percent share of total K-12 enrollment). This projected enrollment level is 10,661 students higher than the 2017 special education population of 169,599. Of these students, 154,958 (an 86 percent share of total SE K-12 enrollment) are expected to attend Department of Education facilities, 18,131 (a 10 percent share of total SE K-12 enrollment) are expected to attend charter schools, and 7,171 (a 4 percent share of total SE K-12 enrollment) are expected to attend specialized private facilities (“contract schools”) paid for through the Department’s budget.
NYC PUBLIC SCHOOL ENROLLMENT 2011 - 2018
900
1,000
1,100
1,200
1,300
2018*2017*201620152014201320122011
Includes Charter Schools, Special Ed Pre-K, Universal Pre-K, Contract Schools and ICT. Excludes LTA's.* Projected as of FY 2018 Executive Budget
Fiscal Year
Pup
ils
in T
hous
ands
Programmatic Review and Service Impact
The Student Population

Analysis of Agency Budgets Fiscal Year 2018
89
Staffing Levels
In 2018 the City’s financial plan supports a staffing level of 145,318. Of this count, 131,787 are full-time and 13,531 are Full Time Equivalents (FTEs). Pedagogical employees (which include teachers, superintendents, principals, assistant principals, guidance counselors, school secretaries, educational paraprofessionals and other school support staff) make up 120,378 of the full-time employees and 857 of the FTEs. Civilian employees represent 11,409 of the full-time employees and 12,674 of the FTEs.
FULL TIME AND FULL TIME EQUIVALENTDEPARTMENT OF EDUCATION EMPLOYEES 2011 - 2018
130,000
133,000
136,000
139,000
142,000
145,000
148,000
2018*2017*201620152014201320122011
* Projected as of FY18 Executive Budget
Fiscal Year
Em
ploy
ees

Analysis of Agency Budgets Fiscal Year 2018
90
Capital Review
The 2018-2027 Ten-Year Capital Strategy totals $20.5 billion, which includes $10.5 billion in the 2018-2021 Four-Year Plan. The table below reflects planned capital commitments by program area over the 2017-2021 period.
Capital Commitments($ in 000’s)
_______________________________________________________________________________________________________________________________________________________________________________________________________________
2017 2018 2019 2020 2021 Plan Plan Plan Plan Plan ________________________ ___________ ____________ ________________________ _______________________ ________________________ _______________________
City All City All City All City All City All Funds Funds Funds Funds Funds Funds Funds Funds Funds Funds_______________________________________________________________________________________________________________________________________________________________________________________________________________
System Expansion New Schools .......................... $330,344 $330,344 $742,252 $892,207 $1,068,495 $1,068,495 $294,561 $294,561 $195,320 $249,565System Expansion Other ....................................... 858,244 858,244 594,618 678,826 328,032 328,032 325,567 325,567 414,439 647,601Rehabilitation of School Components .................. 1,104,811 1,074,734 752,286 910,880 772,801 772,801 1,019,246 1,019,246 466,565 729,051Educational Enhancements ................................... 136,646 136,646 161,842 194,538 193,038 193,038 90,212 90,212 80,122 125,198Emergency, Unspecified and Miscellaneous ........ 929,807 1,071,920 302,622 343,897 283,121 283,121 419,407 419,407 261,583 408,748Safety and Security ............................................... 55,774 55,774 50,003 60,105 62,392 62,392 16,576 16,576 3,460 5,406Smart Schools Bond Act ....................................... 0 390,000 0 195,000 0 195,000 0 0 0 0 ____________ ____________ _____________ _____________ ____________ ____________ ____________ ____________ ____________ ____________ ____________ ____________
Total ............................................................................... $3,415,626 $3,917,662 $2,603,623 $3,275,453 $2,707,879 $2,902,879 $2,165,569 $2,165,569 $1,421,489 $2,165,569 ========== ========== =========== =========== ========== ========== ========== ========== ========== ========== ========== ==========
_______________________________________________________________________________________________________________________________________________________________________________________________________________
TOTAL DEPARTMENT OF EDUCATION EXPENDITURES 2011 - 2018
0
7,000
14,000
21,000
28,000
35,000
20182017201620152014201320122011
* Total DOE expenditures include pensions, other fringe, TFA and GO debt service.
Fiscal YearForecast Budget
$ in
Mil
lion
s

Analysis of Agency Budgets Fiscal Year 2018
91
The 2018-2027 Ten-Year Capital Strategy is consistent with the final two years of the School Construction Authority’s 2015-2019 Five-Year Capital Plan. This $15.5 billion plan provides:
• Funding of $5.9 billion for capacity. This includes 44,324 planned seats for K-12 classrooms in an estimated 84 buildings (14,661 in Brooklyn; 5,480 in the Bronx; 3,842 in Manhattan; 18,260 in Queens; and 2,081 in Staten Island). An additional 4,900 seats will be built to help reduce class sizes system-wide. More than 8,300 seats will be added to support the historic expansion of pre-kindergarten. This funding also includes $142 million to replace seats that must be relocated during the Plan, an increase of $80 million from the 2017 Executive Budget.
• Funding of $405 million to continue the removal of transportable classroom units (TCUs).
• Funding of $3.8 billion for the capital improvement program, allowing for exterior and interior building upgrades and other necessary capital repairs to school buildings.
• Funding of $1.5 billion for school enhancement projects. This category contains funding to support technology projects, realignment of existing facilities, bathroom upgrades, physical fitness projects, science labs, accessibility, and other necessary improvements.
• Funding of $3.6 billion for mandated programs such as remediation, building code compliance, insurance, and emergencies.
The 2018-2027 Ten-Year Capital Strategy also keeps the Mayor’s commitment to fund over 38,000 seats between 2020 and 2024 by allocating $4.7 billion for system expansion between these years. This funding is sufficient to eliminate the unfunded seat need in the School Construction Authority’s 2015-2019 Five-Year Capital Plan.

Analysis of Agency Budgets Fiscal Year 2018
92
ADMINISTRATION OF JUSTICE
Overview
Based on the FBI’s total index crime statistics for cities that have reported data for the first six months of calendar year 2016, New York City remains the safest large city in the United States, with the lowest rate of crime per capita, among the 10 largest U.S. cities. The New York City Police Department’s (NYPD’s) index crime data for calendar year 2016 indicates that overall major felony crime decreased by 3.6 percent compared to calendar year 2015. In calendar year 2016, murder decreased by 4.8 percent (335 vs. 352), robberies dropped by 8.5 percent, burglaries dropped by 14.1 percent, and New York City saw the fewest number of shootings since modern record-keeping began in calendar year 1994. The calendar year 2016 index crime total of 101,716 incidents was the lowest total since calendar year 1960.
Arrests totaled 311,729 in calendar year 2016, decreasing by 24,756 from calendar year 2015. In calendar year 2016, the distribution of arrests was 30.3 percent felony arrests, 66.3 percent misdemeanors, and 3.4 percent violations.
NEW YORK CITY FBI INDEX CRIMES
0
40
80
120
160
200
Motor VehicleTheft
LarcenyBurglaryAggravatedAssault
RobberyExpandedRape***
ForcibleRape
Murder
Calendar Years 2001* - 2016**
Tho
usan
ds
* In 2001, for Murder and Aggravated Assault, the unshaded portion represents World Trade Center victims. ** Preliminary estimates based on data from NYPD.*** Expanded Rape category added in 2013.
0
1
2
3
4
Expanded RapeForcible RapeMurder
2016
2015
2013
2011
2009
2007
2001

Analysis of Agency Budgets Fiscal Year 2018
93
In calendar year 2016, the overall arrest level decreased by 7.4 percent from calendar year 2015; felony arrests increased by 3.1 percent, misdemeanor arrests decreased by 6.1 percent, and violation arrests decreased by 57 percent.
POLICE DEPARTMENT
NEW YORK CITY FELONY & MISDEMEANOR ARRESTS
0
50
100
150
200
250
300
350
400
161514131211100908070605040302010099989796
Tho
usan
ds
Calendar Years 1996 - 2016
Misdemeanor
Felony
Under the leadership of NYPD’s new Police Commissioner James P. O’Neill, the NYPD continues to reduce crime to historic lows, while also improving community/police relations and ensuring partnerships that are built on trust and shared responsibility.
On May 18, 2015, the NYPD initiated the Neighborhood Policing model in four precincts to provide the highest quality police service tailored to individual community needs. Neighborhood Policing has been systematically expanded since then, and is now implemented in 43 precincts and all of the City’s nine Police Service Areas (PSAs). The keys to achieving Neighborhood Policing are sector integrity, which gives individual officers responsibility for particular sectors, and community engagement, with police officers collaborating with community members to identify crime and quality-of-life problems, and to develop and implement strategies to address these problems.
Each sector has a team of officers assigned to provide services on a permanent basis. There are two Neighborhood Coordination Officers (NCOs) permanently assigned to each sector. These officers engage the community in addressing crime and conditions in their sector. They participate in community meetings, engage with the public, become experts on crime and conditions in their sector, and coordinate police, community, and other City resources to combat crime and resolve problems. Two sector car teams per sector are also permanently assigned to each of the three eight-hour shifts. Officers assigned to sectors are able to familiarize themselves with members of the community, become experts in their geographical areas, and serve the community with greater levels of concern.

Analysis of Agency Budgets Fiscal Year 2018
94
The Department of Correction’s core mission is to provide a safe and secure environment for both staff and persons accused of crimes or convicted and sentenced to one year or less of jail time. Officially launched in 2015, the Department embarked on a historic transformation effort and developed a reform agenda to make New York City a national leader in best correctional practices. The Department has identified a 14-point reform plan to aggressively combat violence and promote a culture of safety in its jail facilities. The key areas of focus of the reform plan are to ensure weapons, drugs and contraband are kept out of the jail facilities, create an integrated classification and housing strategy, provide comprehensive security camera coverage, design effective inmate education opportunities and program services to reduce idle time, and redefine first line incident response.
In support of that goal, the Department has enhanced its recruitment process, which will result in approximately 1,600 recruits entering DOC’s facilities in 2017 and over 2,000 additional recruits anticipated to enter DOC’s facilities in 2018. The DOC will strive to integrate the newly hired personnel with experienced staff to create a balanced workforce that helps move the Department forward while maintaining its institutional knowledge.
Additionally, DOC’s staff leadership development and training is paramount to the reform agenda. Combined with the Department’s targeted custody management approach and the implementation of pro-social behavioral models, enhanced programming and staffing ratios specified for each population, DOC’s transformation and culture change is well on its way.
OTHER CRIMINAL JUSTICE PROGRAMS
The Mayor’s Office of Criminal Justice (MOCJ) works with law enforcement and City agencies, non-profits, foundations, and others to design, deploy, and evaluate citywide strategies to drive down crime, reduce unnecessary arrests and incarceration, and improve the system’s fairness. To ensure effective results, the office draws on various disciplines, such as behavioral economics to “nudge” conduct and machine learning to develop reliable predictive analytics. Examples of MOCJ’s work include:
• Justice Reboot, making the system fairer and more efficient by safely driving down the jail population.
These reforms include reducing case processing times in the courts and making the summons process easier and more transparent;
• The Mayor’s Action Plan on Behavioral Health and the Criminal Justice System, a set of interlocking public health and public safety strategies that aim to reduce the number of people with behavioral health needs cycling through the criminal justice system;
• The Mayor’s Action Plan for Neighborhood Safety, a comprehensive initiative to reduce crime and strengthen neighborhoods in and around the 15 New York City Housing Authority developments that account for 20 percent of all violent crime in the City’s public housing; and
• The Mayor’s Citywide Initiative to Reduce Gun Violence, a comprehensive, neighborhood-based strategy to prevent gun violence in 17 precincts that account for 50 percent of shootings in New York City.
Understanding the need for a system-wide view, the Mayor’s Office is partnering with City agencies and service providers across the criminal justice system to: develop strategies that reduce unnecessary jail time for defendants, improve a broad range of public safety strategies in neighborhoods struggling with violence, and concentrate law enforcement resources on drivers of violent crime. At multiple intervention points throughout the criminal justice system, these initiatives use 21st century evidence-based practices and technology to increase fairness while also driving gains in public safety and crime reduction.
In 2016, the Mayor’s Office expanded supervised release citywide — to cut unnecessary detention and reduce reliance on monetary bail — after piloting supervised release programs in Brooklyn, Manhattan, and Queens. Supervised release uses risk-driven screening to identify individuals eligible to remain in the community with individualized supervision — rather than go to jail — while waiting for trial. These individuals are also offered voluntary stabilizing services such as vocational programs, housing opportunities, and mental health and substance abuse treatment. The program, part of New York City’s bail reform strategy, was developed in close partnership with the Office of Court Administration, the five District Attorneys’ offices, the defense bar, and national experts to ensure that it is both evidence-driven and tailored to New
DEPARTMENT OF CORRECTION

Analysis of Agency Budgets Fiscal Year 2018
95
York City’s unique criminal justice system. Citywide supervised release is funded through $4.4 million from the City, $13.8 million from asset forfeiture money pledged by Manhattan District Attorney Cyrus Vance Jr.’s office, and $8.0 million from asset forfeiture money pledged by the City.

Analysis of Agency Budgets Fiscal Year 2018
96
POLICE DEPARTMENT
The principal mission of the Police Department is to maintain public safety and security, to respond to calls for emergency aid, and to conduct investigations of criminal activity.
Financial Review
The New York Police Department’s 2018 Executive Budget provides for an operating budget of $5.6 billion, a decrease of $116 million from the $5.7 billion forecast for 2017. This decrease is primarily attributed to annual State, Federal, and private grant funding not yet recognized for 2018. Capital commitments of $489.5 million are also provided in 2018.
Revenue Forecast
The Police Department collects revenue from fees charged for pistol licenses, rifle permits, fingerprint fees, tow fees, and unclaimed cash and property that is abandoned or confiscated as a consequence of the commission of a crime. The City also collects an E-911 surcharge imposed on all New York City cellular telephones, land line telephones and voice over internet protocol service (VoIP). In addition, the Department is recouping traffic control costs from non-charitable athletic parades. In 2018, the revenue estimate for the Police Department is $100.1 million.
Expense Budget Highlights
Budgetary Priorities: Providing Core Services
• In 2018, the Department will maintain an average uniformed headcount of approximately 36,400.
• The Department expects to receive up to $25.6 million for the protection of Foreign Missions as part of a short-term Continuing Resolution to maintain Federal government operations through April 28, 2017 under the Federal Fiscal Year 2016 Appropriation Act.
Streamlining and Restructuring
• The Department received $16 million in City funds for an additional 84 detectives and 50 Criminalists to combat New York City’s opioid crisis.
• The Department received $6.3 million in City funds to hire an additional 100 full-time School Crossing Guard Supervisors and 200 part-time School Crossing Guards to ensure 100 percent coverage at all school crossing posts Citywide.
• The Department received $2.5 million in City funds to create a Management Team, consisting of 22 uniformed members of service to help oversee the management of security at Department of Homeless Services’ shelters.
• The Department received $2.5 million in City funds for 25 uniformed members of service to provide new recruit and in-service training to all Peace Officers at the Department of Homeless Services.
• The Department received $700 thousand in City funds for the expansion of the gunshot detection system.

Analysis of Agency Budgets Fiscal Year 2018
97
2017 20182016
Actual2017
ForecastPreliminary
BudgetExecutive
Budget Forecast Preliminary
BudgetExpenditures
Salary and Wages ……….. $4,664,724 $4,907,217 $4,768,614 $5,002,312 $95,095 $233,698Fringe Benefits …………… 78,832 79,834 75,703 75,169 (4,665) (534) OTPS ……………...……… 585,094 697,025 420,977 490,540 (206,485) 69,563 Total ……………...……… $5,328,650 $5,684,076 $5,265,294 $5,568,021 ($116,055) $302,727
FundingCity ……………...………… $4,799,701 $5,078,532 $4,943,948 $5,185,149 $106,617 $241,201Other Categorical Grants … 30,981 15,482 — — (15,482) — IFA ……………...………… — — — — — — State ……………...……… 52,862 102,116 28,326 28,504 (73,612) 178 Federal CD ……………...… — — — — — — Federal Other ……………. 198,207 225,345 27,208 83,327 (142,018) 56,119 Intra-City Other …………… 246,899 262,601 265,812 271,041 8,440 5,229 Total ……………...……… $5,328,650 $5,684,076 $5,265,294 $5,568,021 ($116,055) $302,727
Additional Costs Centrally FundedPersonal Services (PS) Fringe Benefits ………… $1,803,145 $1,902,814 $2,137,244 $2,073,951 $171,137 ($63,293) Pensions ……………...… 2,634,766 2,531,669 2,636,448 2,624,461 92,792 (11,987) Other Than Personal Service (OTPS) Debt Service ……………. 131,795 159,683 167,139 163,559 3,876 (3,580) Total Additional Costs $4,569,706 $4,594,166 $4,940,831 $4,861,971 $267,805 ($78,860)
FundingCity ……………...………… 4,494,141 4,520,491 4,873,447 4,795,871 275,380 (77,576) Non-City ……………...…… 75,565 73,675 67,384 66,100 (7,575) (1,284)
Full Agency Costs (including Central Accounts)Salary and Wages ………… $4,664,724 $4,907,217 $4,768,614 $5,002,312 $95,095 $233,698Fringe Benefits …………… 1,881,977 1,982,648 2,212,947 2,149,120 166,472 (63,827) Pensions ……………...…… 2,634,766 2,531,669 2,636,448 2,624,461 92,792 (11,987) Total PS ……………...…… $9,181,467 $9,421,534 $9,618,009 $9,775,893 $354,359 $157,884
OTPS ……………...……… $585,094 $697,025 $420,977 $490,540 ($206,485) $69,563Debt Service …………….. 131,795 159,683 167,139 163,559 3,876 (3,580) Total OTPS $716,889 $856,708 $588,116 $654,099 ($202,609) $65,983
Total Agency Costs ……… $9,898,356 $10,278,242 $10,206,125 $10,429,992 $151,750 $223,867Less Intra-City …………… $246,899 $262,601 $265,812 $271,041 $8,440 $5,229Net Agency Cost ………… $9,651,457 $10,015,641 $9,940,313 $10,158,951 $143,310 $218,638
FundingCity ……………...………… 9,293,842 9,599,023 9,817,395 9,981,020 381,997 163,625 Non-City ……………...…… 357,615 416,618 122,918 177,931 (238,687) 55,013
Personnel (includes FTEs at fiscal year-end)City ……………...………… 51,830 53,875 53,776 53,756 (119) (20) Non-City ……………...…… 99 110 20 81 (29) 61 Total ……………...……… 51,929 53,985 53,796 53,837 (148) 41
Summary of Agency Financial Data The following table compares 2018 Executive Budget with the 2018 Preliminary Budget, the 2017 forecast and actual expenditures for 2016, including fringe benefits, pensions, and debt service.
2018Increase/(Decrease)($ in 000's)
Standard 4/23/2017 7:48 PMAgency: Police Department

Analysis of Agency Budgets Fiscal Year 2018
98
Based on the FBI’s total index crime statistics for cities that have reported data for the first six months of calendar year 2016, New York City remains the safest large city in the United States, with the lowest rate of crime per capita, among the 10 largest U.S. cities. The New York City Police Department’s (NYPD’s) index crime data for calendar year 2016 indicates that overall major felony crime decreased by 3.6 percent compared to calendar year 2015. In calendar year 2016, murder decreased by 4.8 percent (335 vs. 352), robberies dropped by 8.5 percent, burglaries dropped by 14.1 percent, and New York City saw the fewest number of shootings since modern record-keeping began in calendar year 1994. The calendar year 2016 index crime total of 101,716 incidents was the lowest total since calendar year 1960.
Precision policing, the term the NYPD uses to describe targeted investigations, has been helping to push down crime by focusing resources on the relatively small percentage of the population responsible for committing violence. In calendar year 2016, the Department conducted approximately 100 takedowns of individuals, gangs, and crews, and apprehended approximately 1,000 high value subjects known to be involved in violence and serious crimes. These subjects were responsible for robberies, shootings, murders, buying and selling guns, and conducting wholesale drug-dealing in New York City’s communities. The Department has continued to conduct several additional takedowns in calendar year 2017, including one in March that netted 24 individuals who were charged by the Brooklyn District Attorney’s Office, in a 627-count indictment, with weapons offenses and conspiracy for trafficking guns purchased in Virginia, transporting them up the “Iron Pipeline”, and selling them on the streets of New York City. The more than 200 weapons recovered by police included assault weapons, a machine gun, rifles, and handguns with extended magazines and high-capacity ammunition drums. After most takedowns, the NYPD holds a community debriefing session to confer with community leaders at a time convenient for people who live and work in that area. At these sessions, NYPD personnel explain who they arrested, and why, and ask for an ongoing, open line of communication so they can keep doing the important work that keeps all of New York City’s communities safe.
The NYPD plays a vital role in public safety by enforcing traffic laws and educating the public regarding traffic safety. The Department is collaborating with the City’s Department of Transportation to reduce traffic fatalities. Traffic fatalities in calendar year 2016 dropped to the lowest number ever recorded. Over one million moving summonses were issued in calendar year 2016, with 137,256 summonses issued for speeding and 122,527 summonses issued for texting or using a cell phone while driving. The Department recently completed the “Dusk and Darkness” campaign designed to reduce collision and fatalities during the dark winter months. Fatalities dropped 26 percent in the winter of 2016, and the issuance of summonses to drivers increased for violations like speeding and failure-to-yield.
Citywide, the Department is continuing to leverage every tool available to keep the City safe, including the use of new and innovative technology. The Department is keenly focused on technological advances and how they can be applied to fighting crime and creating safer and more efficient ways for police officers to do their jobs of keeping all New Yorkers safe.
The Department is also moving ahead with a body-worn camera program in the Patrol Services Bureau, Transit Bureau, and Housing Bureau. About 1,200 cameras are being distributed in 20 precincts in calendar year 2016; 5,000 cameras will be in use by the end of calendar year 2018, and 22,000 will be in use by the end of calendar year 2019. NYPD anticipates that all patrol officers will be wearing cameras in the years ahead. Every NYPD officer has a Department-issued smartphone, putting police databases in the palms of their hands. New and novel applications for those smartphones and tablets will be implemented by summer 2017. Additionally, a revolutionary Neighborhood Policing application will soon allow quality-of-life tasks to be managed and discussed by the groups of officers responsible for specific sectors of the City.
In May 2016, a new performance evaluation system will be up and running and available on each NYPD uniformed member of service’s department-issued smartphone. It allows self-reporting, so officers can record the deeds and interactions that comprise their work days. It also allows supervisors in the field
Programmatic Review and Service Impact

Analysis of Agency Budgets Fiscal Year 2018
99
to make notations about individual officers who may or may not be under their direct command. The system has been implemented to allow quarterly evaluations that ensure that police officers – and on a wider scale, precincts, PSAs, and transit districts – are performing at their full potential.
ARRESTS VERSUS CRIME
0
100,000
200,000
300,000
400,000
500,000
600,000
16**151413121110090807060504030201*0099989796
Calendar Year
* In 2001, Index Crime data excludes World Trade Center victims.** Preliminary estimates based on data from NYPD.
Index Crime
Total Arrests

Analysis of Agency Budgets Fiscal Year 2018
100
Uniformed Headcount
The Department’s recruitment of qualified and diverse individuals is on the rise. The July 2016 recruit class of approximately 600 recruits, of which 539 graduated, is 52.9 percent minorities. One hundred and twenty-four were born in foreign countries and 200 speak a foreign language. The October 2016 recruit class of 712 recruits, of which 649 graduated, is 59 percent minorities. One hundred and fifty were born in foreign countries and 240 speak a foreign language. Of the 439 recruits hired for the January 2017 Police Officer class, 59.4 percent are minorities. One hundred and four were born in foreign countries and 138 speak a foreign language. The April 2017 class has 474 new recruits. In 2018, the Department will hire four classes and maintain an average headcount of approximately 36,400.
TOTAL CITY, TRANSIT AND HOUSING POLICE FORCE
0
5,000
10,000
15,000
20,000
25,000
30,000
35,000
40,000
45,000
2018*2017*201620152014201320122011201020092008200720062005200420032002
Fiscal Year
Ave
rage
Hea
dcou
nt
* Projection

Analysis of Agency Budgets Fiscal Year 2018
101
Capital Review
The Ten-Year Capital Strategy for the Police Department in total provides the Department with $1.7 billion for the replacement, reconstruction, and maintenance of facilities Citywide; replacement and upgrade of computer and communication equipment; and the replacement of transportation equipment. Of this amount, $1.4 billion is allocated in the Four-Year Plan, which covers 2018 through 2021.
The table below shows capital plan commitments by program area over the 2016-2021 period.
Capital Commitments($ in 000’s)
_______________________________________________________________________________________________________________________________________________________________________________________________________________
2016 2017 2018 2019 2020 2021 Actual Plan Plan Plan Plan Plan ________________________ _______________________ ________________________ _______________________ ________________________ _______________________
City All City All City All City All City All City All Funds Funds Funds Funds Funds Funds Funds Funds Funds Funds Funds Funds _______________________________________________________________________________________________________________________________________________________________________________________________________________
Police Facilities .......................... $70,295 $71,316 $296,203 $313,090 $215,386 $251,783 $387,807 $387,807 $335,131 $335,131 $14,500 $14,500 Computer Equipment ................. 88,848 88,848 170,529 170,529 111,736 111,736 27,602 27,602 14,972 14,972 4,500 4,500 Communications ........................ 16,723 16,723 85,371 85,371 84,537 84,537 35,169 35,169 29,771 29,771 6,500 6,500 Equipment .................................. 5,550 5,550 19,055 19,055 20,241 20,241 11,261 11,261 3,875 3,875 3,739 3,739 Vehicles ...................................... 8,623 8,641 34,020 34,155 21,213 21,213 21,973 21,973 26,763 26,763 6,426 6,426 ___________ ___________ ___________ ___________ ___________ ___________ ___________ ___________ ___________ ___________ ___________ ___________
Total ........................................... $190,039 $191,078 $605,178 $622,200 $453,113 $489,510 $483,812 $483,812 $410,512 $410,512 $35,665 $35,665 ========= ========= ========= ========= ========= ========= ========= ========= ========= ========= ========= =========
_______________________________________________________________________________________________________________________________________________________________________________________________________________
Highlights of the 2018-2021 Four Year Capital Commitment Plan
Police Facilities (total commitment, $989.2 million)
• Construction of a new consolidated Property Clerk warehouse facility ($367 million).
• Construction of the Rodman’s Neck Firearms Training Facility ($274.6 million).
• Construction of a new 116th Precinct in Southeast Queens ($70 million).
• Renovation of facility locker rooms Department-wide ($45.5 million).
• Renovation of precinct bathrooms Department-wide ($26.4 million).
• Renovation of the Brooklyn North Narcotics facility in Brooklyn ($18.7 million).
• Renovation of the 13th Precinct in Midtown Manhattan ($18 million).
• Facility maintenance and reconstruction Department-wide ($169 million).
Communications and Computer Equipment (total commitment, $314.8 million)
• Purchase and upgrade of miscellaneous computer equipment as a part of Phase Two of the Sustainable Technology Initiative ($106.4 million).
• Lifecycle replacement of core radio infrastructure ($51 million) and portable radios ($30.2 million).
• Replacement of radio repeater sites ($25 million) and radio system ($18.2 million).
• Replacement and upgrade of various Department technologies and equipment ($84 million).
Miscellaneous Equipment (total commitment, $39.1 million)
• Purchase and upgrade of miscellaneous equipment such as facility security camera upgrades, forensic lab equipment and diesel marine engines ($39.1 million).
Vehicles (total commitment, $76.4 million)
• Purchase of medium tow trucks ($12.5 million).
• Lifecycle replacement of all other vehicles ($63.9 million).

Analysis of Agency Budgets Fiscal Year 2018
102
DEPARTMENT OF CORRECTION
The Department of Correction provides custody, care, control, and discharge preparation for detainees awaiting trial or sentencing and misdemeanants or felons sentenced to one year or less. It also detains State prisoners with court appearances in New York City; newly sentenced felons awaiting transportation to State correctional facilities; and alleged parole violators awaiting revocation hearings.
Financial Review
The Department of Correction’s 2018 Executive Budget provides for operating expenses of $1.4 billion, an increase of $23.1 million from the amount forecast in 2017. Capital commitments of $1.4 billion are also planned in 2018.
Revenue Forecast
The Department of Correction collects revenue from jail commissary operations, vending machines and surcharges on inmate telephone calls. In 2018, the Department expects to collect approximately $20.5 million from all revenue sources.
Expense Budget Highlights
Budgetary Priorities: Providing Core Services
• well-functioning recruitment processes are central to the Department’s ability to remain optimally staffed. Two recruit classes will graduate from the Department’s training academy in 2018, resulting in approximately 2,000 new officers on duty.
• expansion of the Enhanced Supervision Housing (ESH) to closely monitor the most dangerous inmates in the Department’s custody. Baseline funding of $4 million and 46 positions will allow the Department to continue to keep inmates and staff safe and reduce the need for punitive segregation.

Analysis of Agency Budgets Fiscal Year 2018
103
2017 20182016
Actual2017
ForecastPreliminary
BudgetExecutive
Budget Forecast Preliminary
BudgetExpenditures
Salary and Wages ……….. $1,116,082 $1,166,024 $1,256,437 $1,239,935 $73,911 ($16,502)Fringe Benefits …………… 23,411 24,088 24,088 24,088 — — OTPS ……………...……… 168,138 215,153 160,246 164,303 (50,850) 4,057 Total ……………...……… $1,307,631 $1,405,265 $1,440,771 $1,428,326 $23,061 ($12,445)
FundingCity ……………...………… $1,293,463 $1,387,428 $1,430,505 $1,418,019 $30,591 ($12,486)Other Categorical Grants … 2,365 489 — — (489) — IFA ……………...………… 870 776 778 778 2 — State ……………...……… 829 1,109 1,109 1,109 — — Federal CD ……………...… — — — — — — Federal Other ……………. 9,180 14,004 8,286 8,327 (5,677) 41 Intra-City Other …………… 924 1,459 93 93 (1,366) — Total ……………...……… $1,307,631 $1,405,265 $1,440,771 $1,428,326 $23,061 ($12,445)
Additional Costs Centrally FundedPersonal Services (PS) Fringe Benefits ………… $470,931 $537,401 $585,747 $590,167 $52,766 $4,420 Pensions ……………...… 414,539 402,997 423,721 403,806 809 (19,915) Other Than Personal Service (OTPS) Debt Service ……………. 181,059 193,268 202,292 184,441 (8,827) (17,851) Total Additional Costs $1,066,529 $1,133,666 $1,211,760 $1,178,414 $44,748 ($33,346)
FundingCity ……………...………… 1,049,310 1,113,440 1,191,564 1,158,314 44,874 (33,250) Non-City ……………...…… 17,219 20,226 20,196 20,100 (126) (96)
Full Agency Costs (including Central Accounts)Salary and Wages ………… $1,116,082 $1,166,024 $1,256,437 $1,239,935 $73,911 ($16,502)Fringe Benefits …………… 494,342 561,489 609,835 614,255 52,766 4,420 Pensions ……………...…… 414,539 402,997 423,721 403,806 809 (19,915) Total PS ……………...…… $2,024,963 $2,130,510 $2,289,993 $2,257,996 $127,486 ($31,997)
OTPS ……………...……… $168,138 $215,153 $160,246 $164,303 ($50,850) $4,057Debt Service …………….. 181,059 193,268 202,292 184,441 (8,827) (17,851) Total OTPS $349,197 $408,421 $362,538 $348,744 ($59,677) ($13,794)
Total Agency Costs ……… $2,374,160 $2,538,931 $2,652,531 $2,606,740 $67,809 ($45,791)Less Intra-City …………… $924 $1,459 $93 $93 ($1,366) $—Net Agency Cost ………… $2,373,236 $2,537,472 $2,652,438 $2,606,647 $69,175 ($45,791)
FundingCity ……………...………… 2,342,773 2,500,868 2,622,069 2,576,333 75,465 (45,736) Non-City ……………...…… 30,463 36,604 30,369 30,314 (6,290) (55)
Personnel (includes FTEs at fiscal year-end)City ……………...………… 11,500 12,569 12,650 12,655 86 5 Non-City ……………...…… 8 8 8 8 — — Total ……………...……… 11,508 12,577 12,658 12,663 86 5
Summary of Agency Financial Data The following table compares 2018 Executive Budget with the 2018 Preliminary Budget, the 2017 forecast and actual expenditures for 2016, including fringe benefits, pensions, and debt service.
2018Increase/(Decrease)($ in 000's)
Standard 4/23/2017 7:52 PMAgency: Department of Corrections

Analysis of Agency Budgets Fiscal Year 2018
104
AVERAGE LENGTH OF STAY (By Fiscal Year)
30
40
50
60
70
80
FY17*FY16FY15FY14FY13FY12FY11FY10FY09FY08FY07FY06
(In
Day
s)
* YTD through March 31, 2017
Detainee
System
AVERAGE DAILY INMATE POPULATION
0
5,000
10,000
15,000
20,000
FY17*FY16FY15FY14FY13FY12FY11FY10FY09FY08FY07FY06
By Fiscal Year
*YTD through March 31, 2107
9,790 9,590
13,454 13,985 13,851 13,364 13,050 12,795 12,290 11,813 11,40810,435
StateSentencedDetainee
Programmatic Review

Analysis of Agency Budgets Fiscal Year 2018
105
The average daily population through the first nine months of 2017 was 9,590, which is 2.1 percent lower than the same period in 2016. System admissions are down 10.0 percent and overall system length of stay for the first eight months increased from 56.4 to 60.9 days.
Capital Review
The Ten-Year Capital Strategy totals $2 billion for the design and construction of new jail facilities, for support space, including a new training academy, for building systems and infrastructure, and for the lifecycle replacement of equipment.
The table below shows capital plan commitments by program area over the 2016-2021 period.
Capital Commitments($ in 000’s)
_______________________________________________________________________________________________________________________________________________________________________________________________________________
2016 2017 2018 2019 2020 2021 Actual Plan Plan Plan Plan Plan ________________________ ___________ ____________ ________________________ _______________________ ________________________ _______________________
City All City All City All City All City All City All Funds Funds Funds Funds Funds Funds Funds Funds Funds Funds Funds Funds_______________________________________________________________________________________________________________________________________________________________________________________________________________
New Jail Facilities ................. $0 $0 $0 $0 $1,065,627 $1,065,627 $0 $0 $0 $0 $0 $0Capacity Replacement .......... 144 144 292 292 0 0 0 0 0 0 0 0Support Space ....................... 149 149 13,264 13,264 20,227 20,227 90,500 90,500 500 500 500 500Building Systems and Infrastructure ........................ 57,474 59,779 233,602 307,072 296,281 296,281 127,911 127,911 20,300 20,300 34,550 34,550Equipment ............................. 21,416 21,416 68,245 68,245 29,122 29,122 14,998 14,998 6,899 6,899 18,311 18,311 ___________ ___________ ___________ ___________ ___________ ___________ ___________ ___________ ___________ ___________ ___________ ___________
Total ...................................... $79,183 $81,488 $315,403 $388,873 $1,411,257 $1,411,257 $233,409 $233,409 $27,699 $27,699 $53,361 $53,361 ========= ========= ========= ========= ========= ========= ========= ========= ========= ========= ========= =========
__________________________________________________________________________________________________________________________________________________________________________________________
Highlights of the 2018-2021 Four Year Capital Commitment Plan
New Jail Facilities (total commitment, $1.1 billion)
The Department’s plan includes $1.1 billion for the design and construction of new jail facilities.
Building Systems, Infrastructure and Support Space (total commitment, $590.8 million)
The Department will undertake $590.8 million in improvements to building systems, infrastructure and support space during the Four-Year Plan. Projects include:
• Continuation of fire life safety upgrades ($114.3 million).
• Roof, façade, window and courtyard reconstruction and repair ($108.3 million).
• Heating, cooling, ductwork and ventilation upgrades ($101.6 million).
• Design and construction of a new training academy ($100 million).
• Modification of facility entrances for ADA compliance ($30.4 million).
Information Technology, Equipment, and Vehicles (total commitment, $69.3 million)
The Four-Year Plan provides $69.3 million for vehicles, computers, security equipment and communication systems. Priorities include:
• Various information technology upgrades ($19.8 million).
• Vehicle replacement ($15.7 million).

Analysis of Agency Budgets Fiscal Year 2018
106
DEPARTMENTS OF SOCIAL AND HOMELESS SERVICESDEPARTMENT OF SOCIAL SERVICES
The Department of Social Services / Human Resources Administration (“DSS” or “HRA”) provides a range of services and programs to fight poverty, inequality and homelessness and to increase the economic well-being of families and individuals.
In April 2016, a comprehensive plan to improve the delivery of effective and efficient homeless services in New York City was announced, subsequent to a 90-day review of homeless services across City agencies. As an outcome of the review, an integrated management structure was created in DSS with HRA and the Department of Homeless Services (DHS) reporting to a single Commissioner for Social Services. Administrative support services have been streamlined through a shared services model that consolidates functions, including finance, human resources, contracting and information technology under the Department of Social Services. Homeless Prevention and Rehousing services have also been transferred to HRA.
The Human Resources Administration administers benefit programs including Cash Assistance (CA), Emergency Assistance, Supplemental Nutrition Assistance (SNAP), Medical Assistance, and child support assistance to support low-income New Yorkers. The Agency assists individuals returning to or entering the workforce by providing a variety of employment-related services, including access to education and job training, and assistance with job search and placement. HRA also provides services and support to prevent and alleviate homelessness, including one-time emergency rent arrears grants, ongoing rental assistance and supportive housing, as well as community-based prevention and legal services to prevent harassment and eviction, obtain federal disability benefits and address immigration-related issues. Programs for survivors of domestic violence, people with symptomatic HIV or AIDS, the frail and elderly, and individuals with disabilities provide a safety net for those permanently or temporarily unable to work.
Financial Review
The Department’s 2018 Executive Budget provides for operating expenses of $9.9 billion, of which $7.5 billion are City funds. A capital budget of $154.5 million is also provided, of which $90.4 million are City funds, in 2018.
Expense Budget Highlights
• An additional $15.1 million in 2018, increasing to $93.3 million when fully implemented over five years, will provide access to counsel for all tenants facing eviction in Housing Court, making the City of New York the first city in the United States to do so. This will bring total anti-eviction legal services funding to an unprecedented level of $77 million in 2018, increasing to $155 million over five years.
• Beginning in 2018, $16.4 million will be provided for legal counsel for immigrants. This funding will cover representation for New Yorkers facing deportation and other pressing immigration challenges, including those who are in detention, unaccompanied children and asylum seekers.
• In 2018, $165 million will support the Department’s rental assistance and rehousing programs, developed and expanded in coordination with DHS and New York State, which have helped nearly 55,500 New Yorkers move out of shelter or avoid homelessness since calendar year 2014.
• In 2018, 17 positions and $1.9 million in City funds will provide additional support in the Homelessness Prevention Administration for housing placement support for homeless families and adults in DHS and HRA shelters.

Analysis of Agency Budgets Fiscal Year 2018
107
2017 20182016
Actual2017
ForecastPreliminary
BudgetExecutive
Budget Forecast Preliminary
BudgetExpenditures
Salary and Wages ……… $777,963 $829,985 $848,631 $846,924 $16,939 ($1,707)Fringe Benefits ………… 664 913 913 913 — — Medical Assistance ……… 5,937,185 5,914,753 5,914,753 5,914,753 — — Public Assistance ……… 1,473,354 1,584,367 1,594,496 1,594,496 10,129 — Other OTPS …………… 1,208,824 1,359,826 1,474,127 1,501,528 141,702 27,401 Total …………………… $9,397,990 $9,689,844 $9,832,920 $9,858,614 $168,770 $25,694
FundingCity ……………………… $7,367,845 $7,308,554 $7,521,881 $7,539,335 $230,781 $17,454Other Categorical Grants 140 — — — — — IFA ……………………… — — — — — — State …………………… 570,620 712,502 714,000 714,710 2,208 710 Federal CD ……………… 24,475 5,581 — — (5,581) — Federal Other …………… 1,424,722 1,649,463 1,586,225 1,596,851 (52,612) 10,626 Intra-City Other ………… 10,188 13,744 10,814 7,718 (6,026) (3,096) Total …………………… $9,397,990 $9,689,844 $9,832,920 $9,858,614 $168,770 $25,694
Additional Costs Centrally FundedPersonal Services (PS) Fringe Benefits ………… $317,139 $338,295 $388,619 $370,918 $32,623 ($17,701) Pensions ……………… 146,051 147,118 152,548 143,759 (3,359) (8,789) Other Than Personal Service (OTPS) Debt Service …………… 73,896 76,626 80,204 72,211 (4,415) (7,993) Total Additional Costs $537,086 $562,039 $621,371 $586,888 $24,849 ($34,483)
FundingCity ……………………… 352,850 393,556 475,658 441,419 47,863 (34,239) Non-City ………………… 184,236 168,483 145,713 145,469 (23,014) (244)
Full Agency Costs (including Central Accounts)Salary and Wages ……… $777,963 $829,985 $848,631 $846,924 $16,939 ($1,707)Fringe Benefits ………… 317,803 339,208 389,532 371,831 32,623 (17,701) Pensions ………………… 146,051 147,118 152,548 143,759 (3,359) (8,789) Total PS ……………… $1,241,817 $1,316,311 $1,390,711 $1,362,514 $46,203 ($28,197)
Medical Assistance ……… $5,937,185 $5,914,753 $5,914,753 $5,914,753 $— $—Public Assistance ……… 1,473,354 1,584,367 1,594,496 1,594,496 10,129 — Other OTPS …………… 1,208,824 1,359,826 1,474,127 1,501,528 141,702 27,401 Debt Service …………… 73,896 76,626 80,204 72,211 (4,415) (7,993) Total OTPS …………… $8,693,259 $8,935,572 $9,063,580 $9,082,988 $147,416 $19,408
Total Agency Costs …… $9,935,076 $10,251,883 $10,454,291 $10,445,502 $193,619 ($8,789)Less Intra-City ………… $10,188 $13,744 $10,814 $7,718 ($6,026) ($3,096)Net Agency Cost ……… $9,924,888 $10,238,139 $10,443,477 $10,437,784 $199,645 ($5,693)
FundingCity ……………………… 7,720,695 7,702,110 7,997,539 7,980,754 278,644 (16,785) Non-City ………………… 2,204,193 2,536,029 2,445,938 2,457,030 (78,999) 11,092
Personnel (includes FTEs at fiscal year-end)City ……………………… 10,427 11,680 11,299 11,289 (391) (10) Non-City ………………… 2,974 3,407 3,406 3,407 — 1 Total …………………… 13,401 15,087 14,705 14,696 (391) (9)
Summary of Agency Financial Data The following table compares 2018 Executive Budget with the 2018 Preliminary Budget, the 2017 forecast and actual expenditures for 2016, including fringe benefits, pensions, and debt service.
2018Increase/(Decrease)($ in 000's)
DSS MA_PA Agency: Dept of Social Services 4/23/2017 5:27 PM

Analysis of Agency Budgets Fiscal Year 2018
108
The Family Independence Administration (FIA) administers Cash Assistance (CA) and the Supplemental Nutrition Assistance Program (SNAP). FIA assists individuals to obtain employment, provides access to education and training and provides support services including childcare and carfare for working families; and one-time grants for emergencies, including rent and utility arrears, security deposits, and moving expenses.
Cash Assistance (CA)
The Department projects expenditures of $1.6 billion on Cash Assistance (CA) benefits in 2018, of which $708 million will be City funds.
While the number of CA recipients fluctuates slightly month-to-month, the annual unduplicated 12-month caseload receiving recurring CA was approximately 495,600 in 2016. The unduplicated number of persons receiving recurring assistance has been stable at approximately 500,000 since Fiscal 2014 and remains lower than the average for years prior to 2014. The annual 12-month unduplicated number receiving non-recurring benefits to prevent evictions and utility shutoffs in 2016 was approximately 109,000, an increase of over 6,000, or 6 percent, since January 2014.
In February 2017, 358,679 individuals were in receipt of recurring CA benefits and 6,833 received one-time assistance, primarily emergency funds to prevent eviction and homelessness. About half of these recipients are children, and many of the others are seniors or individuals with permanent or temporary disabilities.
The Family Assistance (FA) program, which is funded entirely with Federal Temporary Assistance for Needy Families (TANF) funds, assisted 134,973 adults and children in February 2017. Projected FA expenditures in 2018 are $558 million.
The Safety Net Assistance (SNA) program, which is supported with City (71 percent) and State (29 percent) funds, serves families who have reached the five-year time limit for TANF-funded benefits or who do not otherwise meet federal eligibility rules; single adults; and childless couples. In February 2017, 230,539 individuals received SNA, of whom 88,745 were adults and children who had reached the TANF time limit. In 2018, the Department projects spending $1,037 million on SNA, of which $708 million are City funds.
CASH ASSISTANCE CASELOAD 2009 - 2017
Fiscal Year
300
330
360
390
420
450
171615141312111009
FA a
nd S
NA
Per
sons
(in
Tho
usan
ds)
Programmatic Review and Service Impact
Family Independence Administration (FIA)

Analysis of Agency Budgets Fiscal Year 2018
109
Supplemental Nutrition Assistance Program (SNAP)
The Supplemental Nutrition Assistance Program (SNAP), formerly known as food stamps, is a federally-funded benefit intended to supplement food costs for low-income families and individuals. The Department administers the SNAP program on behalf of New York State. The City is responsible for 50 percent of the administrative cost of the program, with the federal government paying the other half. In 2018, approximately $3.0 billion will provide benefits to an average of 1.7 million individuals per month, including more than 650,000 children. Compared to one year ago, the SNAP caseload increased by 8,371 cases (0.9%) and 11,192 recipients (0.7%).
To ensure that all eligible New Yorkers are able to access these benefits, the Department has made system improvements to allow clients to apply and recertify for certain benefits and programs in a more efficient and accessible means online. In addition, the Department continues to enhance its SNAP outreach activities through collaboration with community-based organizations (CBOs) and other City agencies, such as the New York City Housing Authority (NYCHA), to target groups who are likely eligible to receive SNAP benefits but may not be currently accessing them.
Client Benefits Re-Engineering
The Department is redesigning its business processes and implementing advanced technology solutions through its Client Benefits Re-engineering initiative, which allows the Department to manage its workload more efficiently while improving the client experience. In 2017 the Department rolled out on-demand SNAP interviews citywide, allowing clients to conduct benefits recertification interviews at their convenience. In addition, all but one of HRA’s SNAP centers have self-service PC Bank terminals that allow clients to complete an submit SNAP applications and recertifications online. In 2017 the Department launched the HRA mobile app, allowing clients to upload relevant documents on mobile devices, rather than visiting a SNAP center or sending documents via mail or fax. In 2018 the Department will add additional features to the app that will give clients the ability to use their smartphones or tablets to view case status and benefits issued, read electronic notices, see upcoming appointments and receive text messages or email alerts about their case. Clients who need to submit documents will be able to see which have been requested from them, take pictures and upload the documents, and then view when they are added to their case file.
AVERAGE FOOD STAMP RECIPIENTS 2009 - 2017
0
500
1,000
1,500
2,000
2017*20162015201420132012201120102009
Fiscal Year
* Year to date through February 2017
(Rec
ipie
nts
(in
Tho
usan
ds)
Non-Cash Assistance
Cash Assistance

Analysis of Agency Budgets Fiscal Year 2018
110
Employment Services
FIA offers a wide array of employment programs and services to help families and individuals improve their economic prospects. Services include basic education, training, job search, placement, and retention services. FIA also provides targeted services for those with barriers to employment. At the end of February 2017, 33,000 cases were engaged in employment, training or other related activities and 27,000 were working full- or part-time but still making so little that they remain eligible for CA.
Comprehensive employment services reform is embodied in the Department’s biennial Employment Plan, which was approved by New York State in December 2014. In December 2016 the Department ended the Work Experience Program (WEP) as the WEP program did not lead to sustained work and movement off of the HRA caseload. As part of the reform, in 2017 the Department will launch a new set of employment services contracts, including CareerCompass, which focuses on assessing and matching clients aged 25 and over with employment, sector-based training, adult literacy or other programming to lead to long-term employment; CareerAdvance, which focuses on providing expert sector-based training and employment in target industries; and YouthPathways, which will provide assessment, training, education and job placement services to clients ages 18–24, with a particular focus on the needs and potential of young people.
Homelessness Prevention and Rehousing Services
The Homeless Prevention Administration (HPA) administers and coordinates homelessness prevention, housing placement and rental assistance initiatives for HRA and DHS. HPA works to prevent the entry of families and individuals into shelter though the provision of diversion services, including short-term financial supports, across the City. In addition, HPA conducts targeted outreach to families and individuals identified by the Housing Court as potentially needing legal assistance or emergency rental assistance.
In 2017 HRA and DHS merged their homeless prevention programs in order to improve client experiences and outcomes through consolidation and improved targeting. Enhancing current prevention efforts and reorienting the system toward a “prevention first” model will help families avoid the trauma of homelessness. In 2018 HPA will manage the Homebase prevention services contracts, which had been part of
DHS, after selection of a new procurement that will expand the program to include community-based Aftercare and other services.
With the implementation of universal access to legal services for tenants facing eviction in New York City Housing Court as part of the Executive Budget, the HRA tenant legal services budget will increase to $77.1 million in 2018, growing to $155 million by 2023, an 150% increase since 2013. At full implementation the City believes this funding will serve 400,000 individuals annually. Legal services have proven effective at reducing unlawful evictions and preventing displacement. Since beginning an unprecedented expansion of tenant legal assistance in 2014, evictions have dropped by 24 percent Citywide.
This prevention first strategy streamlines and focuses already successful initiatives recognizing the many benefits of keeping New Yorkers stably housed and in their communities. These proven models represent a comprehensive set of tools aimed at achieving better outcomes for those who are most at risk of eviction and homelessness in New York City
HPA also manages HRA’s rental assistance programs, targeted to homeless families and individuals residing in DHS shelters and HRA-run domestic violence facilities and to prevent shelter entry. In 2018, $165 million will support HRA’s rental assistance programs, including Living in Communities (LINC), the City Family Eviction Supplement Program (CFEPS), and the Special Exit and Prevention Supplement (SEPS). Federal funding is also provided for the Tenant Based Rental Assistance Program (TBRA). Through these programs, HRA helps families with children and adults without children, including working people, survivors of domestic violence and seniors avoid entry into or move out of shelter. From July 2014 through February 2017, 20,180 households comprised of nearly 55,500 individuals averted entry into or have exited shelter through one of these programs or through Section 8 and NYCHA.HPA also assists HRA domestic violence shelter providers and DHS and its network of shelter providers to facilitate moves from shelter to permanent housing, including making client eligibility determinations, matching clients with appropriate housing and interfacing with landlords and management companies that provide apartments to households eligible for rental assistance.

Analysis of Agency Budgets Fiscal Year 2018
111
Office of Child Support Enforcement (OCSE)
The Office of Child Support Enforcement (OCSE) puts children first by helping both parents provide for the economic and social well-being of their children. OCSE provides a range of services including locating noncustodial parents, establishing paternity, establishing and modifying child support and medical orders, and collecting and distributing child support payments. Custodial parents receiving Cash Assistance are required to comply with OCSE pursuant to federal and New York State statutes. All other custodial parents may apply for OCSE services on a voluntary basis.
In calendar year 2016, there were 280,819 cases with support orders, including 33,424 CA cases and 247,395 non-Cash Assistance (NCA) cases. Of the NCA cases, 122,843 were former CA recipients. Child support collections in calendar year 2016 totaled $769 million, benefitting a quarter of a million children. In 2016, over 92 percent of support collections went directly to families, and more than $405 million was collected on behalf of families who formerly received CA.
Medical Assistance Program (MAP)
The Medicaid public health insurance program provides a wide range of services including primary care, hospital inpatient, emergency room, physician, pharmacy, clinic, nursing home, personal care, dental, rehabilitation, transportation, vision care, laboratory services and x-rays. Over 1.9 million New York City residents received Medicaid through HRA as of February 2017, with the Medical Assistance Program (MAP) responsible for more than 1.2 million Medicaid-Only (non-CA) enrollees. Another approximately 1.5 million New Yorkers were enrolled in Medicaid through the New York State Health Exchange. With the development of the Exchange under the Affordable Care Act (ACA), a new category of Medicaid, the Modified Adjusted Gross Income (MAGI) group, was created. These clients no longer apply through the Department, resulting in the decline in the HRA-administered Medicaid caseload of 37 percent since December of 2013.
As part of the implementation of the Exchange, NYS is transitioning responsibility for the administration of Medicaid away from the counties, including New York City, to the State. During the transition, the Department is expected to continue to determine Medicaid eligibility for non-MAGI clients through 2018, and will provide Certified Application Counselor
(CAC) services in HRA locations to assist individuals who fit MAGI criteria with applications for Medicaid facilitated through the Health Exchange.
Home Care Services Program (HCSP)
The Department’s Home Care Services Program (HCSP) assists individuals who are frail, elderly, and/or have disabilities to remain safely in their homes with non-institutional alternatives to nursing home care. In February 2017, HCSP delivered personal care services to 4,400 personal care cases and provided Medicaid financial eligibility review to approximately 149,563 participants in the Managed Long Term Care Program (MLTC), a program that also transitioned to NYS as part of the ACA changes. HCSP reviews and authorizes service plans for participants in the Long Term Home Health Care Program (LTHHCP), as well as for approximately 570 children in the Care-at-Home Waiver Program.
The HCSP personal care services are also provided to participants in special federal waiver programs, including Traumatic Brain Injury, Home and Community Based Services, and the Nursing Home Transitional and Diversion waivers and Office of Mental Retardation and Developmental Delays (OMRDD) participants.
Customized Assistance Services (CAS)
Customized Assistance Services (CAS) provides clinically-oriented services in the areas of health, mental health, substance use treatment and rehabilitation for clients served by the Department’s programs. CAS programs provide comprehensive and individualized services to help individuals with medical or mental health conditions achieve their maximum degree of self-reliance.
The Wellness, Comprehensive Assessment, Rehabilitation and Employment (WeCARE) program works with Cash Assistance recipients who have medical or mental health conditions that pose barriers to employment, providing integrated services that include assessment, diagnosis, comprehensive service and wellness planning, linkages to treatment, case management, disability benefits assistance, and vocational rehabilitation, training and education, and job placement through two performance-based contracts. From July 2016 through January 2017, 2,086 WeCARE clients obtained jobs and 2,099 were approved for federal disability benefits.

Analysis of Agency Budgets Fiscal Year 2018
112
CAS also administers the Substance Use Policy Planning and Monitoring (SUPPM) Program providing assessments, referrals and monitoring of substance use treatment and case management services to CA clients; oversees 8,400 clients at any given time through Comprehensive Service Model contracts providing case management to better support retention in substance use treatment and assist with clients with intensive support needs; and the Placement Assessment and Client Tracking (PACT) unit reviews applications for supportive housing units across the City. In calendar year 2016, PACT reviewed 23,527 supportive housing applications to determine eligibility for placement into a continuum of housing alternatives. CAS also contains the Visiting Psychiatric Service Program (VPS), providing home-based psychiatric assessments and crisis intervention services to clients served by HRA and other agencies; the Office of Reasonable Accommodations (ORA), which reviews and makes determinations on Reasonable Accommodation Requests (RAR) submitted by clients with disabilities; and the Disability Service Program, which files federal disability benefit applications, pursues administrative appeals on denied claims, and performs eligibility determinations for Medicaid Aged, Blind and Disabled clients.
HIV/AIDS Services Administration (HASA)
The HIV/AIDS Services Administration (HASA) provides comprehensive services to individuals and families with HIV and AIDS. HASA clients receive case management, assessments and referrals, housing and homemaking services. In 2017, medical eligibility for the HASA program expanded to permit all financially-eligible New York City residents with HIV to voluntarily seek and obtain HASA services. As of February 2017, HASA served over 32,000 individuals, compared with 31,000 individuals in February 2016.
Over 17,000 HASA households receive ongoing rental assistance to facilitate and maintain housing stability, typically in private market apartments. HASA also provides emergency housing placements in supportive transitional facilities and single room occupancy (SRO) units for homeless clients. Non-emergency supportive housing is provided in congregate facilities and scattered site apartments. These programs are operated by community-based organizations that provide case management and support services. In February 2017, HASA supported over 3,300 units in its emergency housing portfolio and over 4,800 units in its non-emergency supportive housing stock, including units developed under the New York/New York III agreement.
Adult Protective Services (APS)
The Department’s Adult Protective Services (APS) program assists adults with mental and/or physical impairments who are unable to care for or protect themselves from abuse, neglect, or exploitation, and who have no one willing and able to responsibly assist them. Services include referrals for psychiatric and medical examinations, assistance in obtaining and recertifying for benefits and entitlements, eviction prevention and financial management. APS also petitions the State Supreme Court for community guardians to manage financial and domestic issues for clients who lack capacity to manage their own affairs.
Through February2017, APS received 17,905 referrals. Forty-five percent of the referrals involved eviction, 16 percent included allegations of abuse, 17 percent included allegations of neglect and 15 percent included allegations of financial exploitation. During this period, APS assessed 14,597 individuals and maintained an average monthly undercare caseload of 7,152. The average monthly Community Guardian caseload was 1,985 during 2017.
Office of Domestic Violence (ODV)
The Office of Domestic Violence Services (ODV) provides emergency shelter and social services to survivors of domestic violence.
ODV administers State-licensed emergency domestic violence shelters, including one directly operated by the Department. These shelters have a total capacity of 2,378 beds for survivors of domestic violence and their children, which will increase to 2,500 with expected new contracted capacity coming on-line over the next fiscal year. ODV also administers seven Tier II shelters with 245 family units for clients who require additional services before transitioning back to the community. HRA’s Tier II capacity will increase to 645 through a procurement that was released in 2017.
Approximately 1,100 families are served by the shelters every day. Shelters provide safe environments and a range of additional domestic violence support services including counseling, advocacy and referrals. In addition, nine community-based non-residential programs provide information, counseling, advocacy, legal services, and referrals to other supportive services to help domestic violence survivors navigate the challenges of living in their own communities. These programs maintain an average monthly caseload of
Analysis of Agency Budgets Fiscal Year 2018
113
approximately 1,900 individuals. The Teen Relationship Abuse Prevention Program (RAPP) provides classes and counseling to teenagers in 87 public schools across the City to help stop relationship violence before it occurs.
Home Energy Assistance Program (HEAP) and Other Utility Assistance Programs
The Home Energy Assistance Program (HEAP) is a federally funded program that assists low-income homeowners and renters to pay energy costs and heating equipment repair bills. HEAP serves over 700,000 households annually during the heating season, which runs from November to March of each year. Most benefits are provided to CA, SNAP, and SSI recipients who receive automatic payments. HEAP provides emergency benefits for assistance with gas and other utility bills and shut-offs, helps obtain service extensions, and pays for emergency oil deliveries and furnace repairs and replacements to other income eligible households through an application process.
Additional programs include Heat-Line, which offers HEAP applications and other public benefits to the homebound population; the Utility Assistance Program, which offers similar benefits to those identified as eligible through the utility companies, and the Department of Environmental Conservation’s Safety Net program which assists low- income home owners with their water bills.
Emergency Food and Nutrition Assistance Program
The Emergency Food and Nutrition Assistance Program (EFNAP) administers the Emergency Food Assistance Program (EFAP) which provides food, funding and technical assistance to approximately 500 food pantries and soup kitchens. EFNAP also provides SNAP materials, education, trainings, pre-screenings and application assistance to the general public, other government agencies and community-based organizations throughout the five boroughs of New York City.
Crisis and Disaster Unit
The Crisis and Disaster Unit responds to City-wide disasters and emergencies. The unit is responsible for the Disaster Task Force consisting of 450 Department-trained volunteers who respond under the unit’s direction to provide services during emergencies and disasters. The unit helps to coordinate the Agency response to emergencies and works with the Office of Emergency Management (OEM) to implement the citywide human services response to emergencies.

Analysis of Agency Budgets Fiscal Year 2018
114
Capital Review
The Department’s Ten-Year Capital Strategy for 2018-2027 totals $285.3 million, of which $168 million are City funds. This includes $206.2 million, of which $122.1 million are City funds, in the 2018-2021 Four-Year Plan. The 10-Year Capital Strategy includes $155.3 million for technology to streamline Department operations, including key investments related to Client Services Re-engineering. This will feature the continued development of a virtual client service center which leverages ACCESSHRA, an on-line benefits portal, to provide expanded client accounts. These accounts will include automated functionality, such as online client notices and benefits information. On-line applications and re-certifications will be enhanced and On-Demand telephone interviews for SNAP will be expanded Citywide.
Additional technology projects include an upgrade to HRA One-Number that will enhance the Department’s Interactive Voice Response (IVR) system; the development of a Landlord Management System that will allow for electronic funds transfers (EFT) to better serve landlords and reduce errors and inefficiencies in payment processes; and an upgraded client management system (CMS) that will standardize the Department’s tracking of employment services and CA client employability. Capital investments of $92.9 million are included for facilities maintenance, equipment and improvements; $34.3 million is included for the installation of telecommunications equipment; and $2.8 million is provided for vehicles.
Capital Commitments
($ in 000’s)_______________________________________________________________________________________________________________________________________________________________________________________________________________
2016 2017 2018 2019 2020 2021 Actual Plan Plan Plan Plan Plan ________________________ _______________________ ________________________ _______________________ ________________________ _______________________
City All City All City All City All City All City All Funds Funds Funds Funds Funds Funds Funds Funds Funds Funds Funds Funds_______________________________________________________________________________________________________________________________________________________________________________________________________________
Data Processing ..................... $12,927 $14,977 $26,233 $36,448 $47,380 $77,310 $23,129 $40,303 $- $- $- $- Telecommunications ............. 1,396 2,805 4,081 8,259 6,325 12,446 552 1,089 624 1,273 635 1,296 Automotive ............................ 499 499 1,423 1,652 616 668 190 388 98 200 100 204 Equipment ............................. 1,240 1,506 3,211 3,399 15,010 27,604 - - - - - - Buildings ............................... 208 203 17,004 22,664 21,096 36,450 5,828 6,440 514 514 - - ___________ ___________ ___________ ___________ ___________ ___________ ___________ ___________ ___________ ___________ ___________ ___________
Total ...................................... $16,271 $19,991 $51,952 $72,422 $90,427 $154,478 $29,699 $48,220 $1,236 $1,987 $735 $1,500 ========= ========= ========= ========= ========= ========= ========= ========= ========= ========= ========= =========
__________________________________________________________________________________________________________________________________________________________________________________________
Highlights of the 10 Year Capital Strategy
• Enhancements to HRA One-Number, the Department’s Interactive Voice Response (IVR) system, that will ensure adequate support for all programs and avoid additional maintenance costs, ($9 million). This upgrade will support the integration of HRA and DHS administrative functions under DSS, compliance with lawsuit settlements related to disability access, and a multi-agency public awareness campaign that will be launched in 2017 around public benefits like SNAP.
• Development of a Landlord Management System to better serve landlords and reduce payment errors ($8.7 million). This will allow the Department to pay landlords via electronic funds transfer (EFT); offer a public facing portal for landlords and clients; reduce lost and missed payments; ensure that all landlord information and client addresses are updated and consistent across the Department’s systems; and simplify functions for Department staff.
• Design and construction improvements for domestic violence shelters ($6 million).
• Design and construction improvements at other HRA facilities ($85 million).
Analysis of Agency Budgets Fiscal Year 2018
115
DEPARTMENTS OF SOCIAL AND HOMELESS SERVICESDEPARTMENT OF HOMELESS SERVICES
The Department of Homeless Services (DHS) works to prevent homelessness whenever possible, provides safe and service-rich emergency shelter when needed, assists individuals and families transition to permanent housing, and provides outreach, drop-in and housing placement services to street homeless individuals.
In 2016, a comprehensive model to more effectively and efficiently administer homeless services in New York City was announced, subsequent to a 90-day review of these services across City agencies. As an outcome of the review, an integrated management structure was created in the Department of Social Services (DSS) with HRA and DHS reporting to a single Commissioner for Social Services. Administrative support services have been streamlined through a shared services model that consolidates functions, including finance, human resources, contracting and information technology under the Department of Social Services. Homeless Prevention and Rehousing services have also been transferred to HRA.
In February 2017, the City released “Turning the Tide on Homelessness”, which outlines the City’s plan to address homelessness over the next five years, providing a blueprint for DHS and HRA operations under the new model. This three-fold plan is intended keep people in their homes by reducing evictions and making housing more affordable; improve shelter conditions and increase shelter security; and shrink the footprint of DHS by 45 percent by closing 360 cluster sites and commercial hotel locations and replacing them with a smaller number of 90 new effective, borough-based shelters.
The Department will also continue to work with HRA and other City partners to help shelter clients transition into permanent housing. Beginning in 2015 through February 2017, 20,180 households comprised of nearly 55,500 individuals averted entry into or have exited DHS and HRA shelter through rental assistance programs, including Living in Communities (LINC), the City Family Eviction Supplement Program (CFEPS), and the Special Exit and Prevention Supplement (SEPS), or through Section 8 and NYCHA.
Financial Review
The Department’s 2018 Executive Budget provides for operating expenses of $1.6 billion, of which $882 million are City funds. A capital budget of $136 million is also provided in 2018.
Expense Budget Highlights
• An additional $376.5 million will support shelter capacity in 2018. In March 2017 there was an average of 59,562 individuals in DHS family, adult family and single adult shelters.
• In 2018 an additional $111 million, and growing to $146 million in 2020, will support shelter rate reform and the conversion of non-contracted facilities to contract. This is expected to rationalize reimbursement rates across programs and providers to improve the quality of shelters and services, as well as increase accountability.
• An additional $1.1 million will support additional DHS staff to facilitate the placement of homeless clients into subsidized permanent housing.
• In 2017 and beyond $20 million will support an additional 78 Peace Officer positions to provide increased security, under the direction of the NYPD, at DHS administered shelter sites.
• An additional 17 positions and $1.9 million will support additional responsibilities in the Division of Street Homeless Solutions. Street Solutions oversees HOME-STAT, the most comprehensive street homeless outreach effort in any U.S. city and administers outreach, Safe Haven, drop-in and other specialized services for street homeless.
• The Department will streamline certain skilled trades operations, generating $1.6 million in overtime savings.

Analysis of Agency Budgets Fiscal Year 2018
116
2017 20182016
Actual2017
ForecastPreliminary
BudgetExecutive
Budget Forecast Preliminary
BudgetExpenditures
Salary and Wages ……….. $145,845 $171,047 $153,605 $157,236 ($13,811) $3,631Fringe Benefits …………… 1,430 1,566 1,566 1,566 — — OTPS ……………...……… 1,253,354 1,579,824 1,276,713 1,450,488 (129,336) 173,775 Total ……………...……… $1,400,629 $1,752,437 $1,431,884 $1,609,290 ($143,147) $177,406
FundingCity ……………...………… $798,076 $1,001,924 $772,283 $882,739 ($119,185) $110,456Other Categorical Grants … 3,053 3,000 — — (3,000) — IFA ……………...………… — — — — — — State ……………...……… 159,781 152,393 144,312 156,997 4,604 12,685 Federal CD ……………...… 4,098 4,098 4,098 4,722 624 624 Federal Other ……………. 433,584 581,696 510,340 563,981 (17,715) 53,641 Intra-City Other …………… 2,037 9,326 851 851 (8,475) — Total ……………...……… $1,400,629 $1,752,437 $1,431,884 $1,609,290 ($143,147) $177,406
Additional Costs Centrally FundedPersonal Services (PS) Fringe Benefits ………… $46,975 $53,957 $55,990 $57,310 $3,353 $1,320 Pensions ……………...… 21,782 21,300 26,265 24,565 3,265 (1,700) Other Than Personal Service (OTPS) Debt Service ……………. — — — — — — Total Additional Costs $68,757 $75,257 $82,255 $81,875 $6,618 ($380)
FundingCity ……………...………… 64,747 70,739 78,226 77,742 7,003 (484) Non-City ……………...…… 4,010 4,518 4,029 4,133 (385) 104
Full Agency Costs (including Central Accounts)Salary and Wages ………… $145,845 $171,047 $153,605 $157,236 ($13,811) $3,631Fringe Benefits …………… 48,405 55,523 57,556 58,876 3,353 1,320 Pensions ……………...…… 21,782 21,300 26,265 24,565 3,265 (1,700) Total PS ……………...…… $216,032 $247,870 $237,426 $240,677 ($7,193) $3,251
OTPS ……………...……… $1,253,354 $1,579,824 $1,276,713 $1,450,488 ($129,336) $173,775Debt Service …………….. — — — — — — Total OTPS $1,253,354 $1,579,824 $1,276,713 $1,450,488 ($129,336) $173,775
Total Agency Costs ……… $1,469,386 $1,827,694 $1,514,139 $1,691,165 ($136,529) $177,026Less Intra-City …………… $2,037 $9,326 $851 $851 ($8,475) $—Net Agency Cost ………… $1,467,349 $1,818,368 $1,513,288 $1,690,314 ($128,054) $177,026
FundingCity ……………...………… 862,823 1,072,663 850,509 960,481 (112,182) 109,972 Non-City ……………...…… 604,526 745,705 662,779 729,833 (15,872) 67,054
Personnel (includes FTEs at fiscal year-end)City ……………...………… 2,363 2,387 2,394 2,474 87 80 Non-City ……………...…… 41 61 — 10 (51) 10 Total ……………...……… 2,404 2,448 2,394 2,484 36 90
Summary of Agency Financial Data The following table compares 2018 Executive Budget with the 2018 Preliminary Budget, the 2017 forecast and actual expenditures for 2016, including fringe benefits, pensions, and debt service.
2018Increase/(Decrease)($ in 000's)
Standard 4/23/2017 7:51 PMAgency: Department of Homeless Services

Analysis of Agency Budgets Fiscal Year 2018
117
The Department provides a variety of directly operated and contracted services for homeless adults, including general and specialized transitional shelter, housing assistance and placement into subsidized and supportive housing. DHS, along with not-for-profit providers, operates six assessment programs, over 40 general shelters, and more than 60 specialized shelters for single adults. Specialized shelters include those providing mental health, substance use and employment services. The DHS Division of Adult Services also provides shelter to adult couples and families without minor children in contracted and directly operated shelters.
In 2018, the Department will continue to operate literacy, job training and programming during the day
at both directly operated and contracted shelters and to partner with HRA to connect adults in shelter to employment opportunities, including public and private market subsidized employment programs, so that they can transition to permanent housing.
DHS single adults and adult families exit shelter through one of the rental assistance or subsidized housing programs that placed over 55,000 people in permanent housing since 2015. In addition, single adults also have access to supportive housing, which provides permanent housing combined with on-site services for clients with special needs. The City’s plan to fund 15,000 additional supportive housing units over the next 15 years will bring the first 550 units online during calendar 2017 and will be available to homeless adults.
Programmatic Review and Service Impact
Adult Services
HOMELESS INDIVIDUALS - PROGRAM EXPENDITURES: 2011 - 2017*
0
100
200
300
400
500
600
700
800
2017 Forecast201620152014201320122011Fiscal Year
* Excludes Advantage expenditures
Pro
gram
Exp
endi
ture
s($
in M
illi
ons)
$725
$346
$417 $432
$609
$376
$475

Analysis of Agency Budgets Fiscal Year 2018
118
The Department serves homeless families with children through a network of shelters run by not-for-profit providers and by DHS directly. Families are provided with social services, access to child day care and other supports and rehousing services, designed to maximize family stability and to help them move to permanency in the community.
Eligible families are also required to apply for Cash Assistance (CA) through HRA and, as part of this process, receive access to a full range of employment and education programs to help prepare for and obtain employment. CA eligibility also provides access to many rental assistance programs that allow families to move into permanent housing. Through its network of providers, DHS also helps families access SNAP benefits, child support, tax credits and work supports, including day care and Universal Pre-Kindergarten programs.
As part of ThriveNYC, the City’s comprehensive plan to address the mental health needs of New Yorkers, DHS is adding Licensed Social Workers in 2017 in all contracted family shelters to serve as Client Care Coordinators. These Coordinators provide supports to families that are multi-system involved, develop on-site social services and programming as well as coordinate care and services between City agencies and community-based organizations that serve these families.
In 2017, DHS, partnering with other City agencies including the Department of Education, the Administration for Children’s Services (ACS) and the Department of Health and Mental Hygiene (DOHMH), will continue and expand its focus on child well-being. The Department monitors school attendance, promotes infant safe sleeping, and is collaborating with ACS to coordinate services to families with child welfare involvement and with DOHMH on programs for maternal and infant health.
Family Services
HOMELESS FAMILIES - PROGRAM EXPENDITURES: 2011 - 2017*
0
200
400
600
800
1,000
1,200
2017 Forecast201620152014201320122011Fiscal Year
* Excludes Advantage expenditures
Pro
gram
Exp
endi
ture
s($
in M
illi
ons)
$498 $490
$611$694
$567
$792
$1,025
Analysis of Agency Budgets Fiscal Year 2018
119
In 2016 the Department placed the New York City Police Department (NYPD) in charge of security at DHS shelters, standardizing security, surveillance and training across the shelter system. In calendar 2016 the Department conducted almost 16,000 shelter inspections and fixed more than 14,000 code violations in partnership with nonprofit shelter providers and the Shelter Repair Squad. The number of outstanding violations within traditional shelters has dropped 83 percent since January 2016.
Street Solutions
The Department is committed to providing robust programming and increasing permanency options for individuals on the street. DHS provides an array of services to meet this goal, including street outreach programs, safe havens, drop-in centers and stabilization beds.
In 2016, the Department launched HomeSTAT (Homeless Outreach and Mobile Engagement Street Action Team), a street homeless effort that partners existing homeless response and prevention programs with a series of new innovations designed to better identify, engage and transition homeless New Yorkers from the streets to appropriate services and permanent housing.
HomeSTAT created new street canvassing teams and enhanced tools for outreach teams to bring people in from the streets, including nearly doubling the number of outreach staff, increased capacity in safe havens and drop in centers, and implemented case conferencing across multiple City agencies in support of helping street homeless individuals. The Department’s online HOMEStat dashboards offer consistent and transparent data tracking the City’s efforts in reducing street homelessness and improving lives for New Yorkers. In February 2017 HomeSTAT served over 3,000 clients.
The Department’s safe havens, which are low-threshold transitional residential programs, drop-in centers and short-term stabilization beds, comprise a system of specialized programs that provide additional services to street homeless clients and help them transition from the streets to more permanent settings. In January 2017, an average of approximately 1,400 clients was served each day in drop in centers, safe havens and stabilization beds.
Shelter Security & Safety

Analysis of Agency Budgets Fiscal Year 2018
120
• Significant investment of $300 million for critical upgrades at family and adult shelter facilities, including over $123 million specifically allocated to the development of new shelter sites.
• Continued funding for exterior and interior building upgrades at Bellevue Men’s Shelter of $55 million.
Capital Review
The Department’s 10-Year Capital Plan for 2018-2027 totals $650.4 million in City and total funds, of which $437.3 million funds projects between 2018 and 2021. $241.5 million is provided for homeless family facilities, $353.3 million for single adult facilities, $50.3 million is allocated for computer systems and equipment purchases and $5.2 million is proved for City Council and Borough President items. The table below reflects capital commitments by program area over the 2016-2021 period.
Capital Commitments
($ in 000’s)_______________________________________________________________________________________________________________________________________________________________________________________________________________
2016 2017 2018 2019 2020 2021 Actual Plan Plan Plan Plan Plan ________________________ ___________ ____________ ________________________ _______________________ ________________________ _______________________
City All City All City All City All City All City All Funds Funds Funds Funds Funds Funds Funds Funds Funds Funds Funds Funds _______________________________________________________________________________________________________________________________________________________________________________________________________________
Homeless Family Facilities ... $1,028 $1,028 $25,150 $25,150 $23,778 $23,778 $18,775 $18,775 $44,223 $44,223 $30,786 $30,786Single Adult Facilities ........... 10,209 10,209 40,641 40,641 76,221 76,221 102,931 102,931 74,960 74,960 16,354 16,354Information Technology and Equipment .................... 650 650 9,698 9,698 33,843 33,843 5,817 5,817 4,318 4,318 0 0City Council and Borough President .............. 443 443 5,146 5,146 2,218 2,218 2,347 2,347 697 697 0 0 ___________ ___________ ___________ ___________ ___________ ___________ ___________ ___________ ___________ ___________ ___________ ___________
Total ...................................... $12,330 $12,330 $80,635 $80,635 $136,060 $136,060 $129,870 $129,870 $124,198 $124,198 $47,140 $47,140 ========= ========= ========= ========= ========= ========= ========= ========= ========= ========= ========= =========
__________________________________________________________________________________________________________________________________________________________________________________________
Highlights of the 10-Year Capital Strategy

Analysis of Agency Budgets Fiscal Year 2018
121
ADMINISTRATION FOR CHILDREN’S SERVICES
The Administration for Children’s Services (ACS) provides a broad range of programs that protects and promotes safety and well-being of New York City’s children and families by providing child welfare, juvenile justice, and early care and education services. The Department investigates allegations of child abuse and neglect, supports preventive services to families and children, provides foster care and adoption services for children who cannot safely remain in their homes, and provides custody and care for children who are involved in the juvenile justice system. The Department also administers early childhood education programs through the Division of Early Care and Education.
Financial ReviewThe Department’s 2018 Executive Budget provides
for operating expenses of $3.07 billion, $985 million of which are City funds. Capital commitments of $471 million are provided, of which $440 million are City funds.
Expense Budget Highlights
• In 2018, ACS will invest $24 million in training, preventive services referral and case conferencing, and Children’s Center staffing. ACS will implement mandated training for preventive provider staff and coaches to work with Child Protection Supervisors to strengthen management and reduce worker attrition. In addition, referral management staff and preventive service conference facilitators will expedite referrals to preventive services as well as smoothly transition families no longer in need of services. Finally, ACS will increase staffing at the Children’s Center to address an increased population.
• In 2017, the Department will also continue to expand evidence-based family support services, phase in child welfare investments added during the 2017 Executive budget, address the needs of children and families at multiple intervention points, and avoid the unnecessary removal of children from their homes. $20.8 million in 2018, growing to $31.2 million in 2019, will support this effort.
• In 2018, the Fostering College Success will continue to ramp up, from $1.4 million in 2017 to $1.8 million supporting college experiences for 200 foster youth. This program enables collaboration between the Department and the City University of New York (CUNY) to reduce the financial burden and other barriers for foster youth to attend college.
• In 2018, $19.7 million will support a comprehensive agreement reached between Day Care Council of New York and District Council of New York/Local 205. The agreement increases salaries for employees of contracted day care programs, and provides a career ladder and access to low cost and high quality health insurance for all eligible employees.
State Budget Impact
• $34 million in 2017 and $68 million in 2018 and out will offset funding reductions included in the enacted State budget, in order to maintain current service levels. These include reductions in the State’s contribution for housing and tuition costs for foster youth, and for child care subsidies for low-income families.

Analysis of Agency Budgets Fiscal Year 2018
122
2017 20182016
Actual2017
ForecastPreliminary
BudgetExecutive
Budget Forecast Preliminary
BudgetExpenditures
Salary and Wages ………… $419,767 $451,228 $491,048 $492,937 $41,709 $1,889Fringe Benefits …………… 140 36 1 1 (35) — OTPS ……………………… 2,455,212 2,583,078 2,542,502 2,578,451 (4,627) 35,949 Total ……………………… $2,875,119 $3,034,342 $3,033,551 $3,071,389 $37,047 $37,838
FundingCity ……………………… $924,121 $813,256 $899,287 $985,358 $172,102 $86,071Other Categorical Grants … — — — — — — IFA ………………………… — — — — — — State ……………………… 631,323 826,909 775,968 729,439 (97,470) (46,529) Federal CD ………………… 2,963 2,963 2,963 2,963 — — Federal Other ……………… 1,240,741 1,314,612 1,278,731 1,277,027 (37,585) (1,704) Intra-City Other …………… 75,971 76,602 76,602 76,602 — — Total ……………………… $2,875,119 $3,034,342 $3,033,551 $3,071,389 $37,047 $37,838
Additional Costs Centrally FundedPersonal Services (PS) Fringe Benefits ………… $130,147 $143,051 $165,353 $160,293 $17,242 ($5,060) Pensions ………………… 70,952 71,816 74,886 70,040 (1,776) (4,846) Other Than Personal Service (OTPS) Debt Service …………… — — — — — — Total Additional Costs … $201,099 $214,867 $240,239 $230,333 $15,466 ($9,906)
FundingCity ……………………… 89,811 114,010 158,506 148,464 34,454 (10,042) Non-City ………………… 111,288 100,857 81,733 81,869 (18,988) 136
Full Agency Costs (including Central Accounts)Salary and Wages ………… $419,767 $451,228 $491,048 $492,937 $41,709 $1,889Fringe Benefits …………… 130,287 143,087 165,354 160,294 17,207 (5,060) Pensions …………………… 70,952 71,816 74,886 70,040 (1,776) (4,846) Total PS ………………… $621,006 $666,131 $731,288 $723,271 $57,140 ($8,017)
OTPS …………………… $2,455,212 $2,583,078 $2,542,502 $2,578,451 ($4,627) $35,949Debt Service ……………… — — — — — — Total OTPS ……………… $2,455,212 $2,583,078 $2,542,502 $2,578,451 ($4,627) $35,949
Total Agency Costs ……… $3,076,218 $3,249,209 $3,273,790 $3,301,722 $52,513 $27,932Less Intra-City …………… $75,971 $76,602 $76,602 $76,602 $— $—Net Agency Cost ………… $3,000,247 $3,172,607 $3,197,188 $3,225,120 $52,513 $27,932
FundingCity ……………………… 1,013,932 927,266 1,057,793 1,133,822 206,556 76,029 Non-City ………………… 1,986,315 2,245,341 2,139,395 2,091,298 (154,043) (48,097)
Personnel (includes FTEs at fiscal year-end)City ……………………… 5,919 7,008 7,006 7,038 30 32 Non-City ………………… 81 168 168 168 — — Total ……………………… 6,000 7,176 7,174 7,206 30 32
Summary of Agency Financial Data The following table compares 2018 Executive Budget with the 2018 Preliminary Budget, the 2017 forecast and actual expenditures for 2016, including fringe benefits, pensions, and debt service.
2018Increase/(Decrease)($ in 000's)
Standard + MA 4/23/2017 5:22 PMAgency: Admin Child Serv

Analysis of Agency Budgets Fiscal Year 2018
123
Division of Child Protection (DCP)
DCP investigates allegations of child abuse and neglect and makes determinations about the safety and risk to children. The DCP’s Family Services Unit (FSU) monitors children and families in court-ordered supervision cases until a judge determines that a child may remain safely in their home without the intervention of ACS, or in need of placement in foster care. DCP also conducts Family Meetings, which are an informal meeting scheduled to engage the family and address risk issues and/or develop or modify a service plan. Organized by DCP, Child Safety Conferences are formal meetings scheduled when court intervention is being considered in order to address existing safety issues. It is facilitated by the Child and Family Specialist (CFS). Family supports, service providers and resources are encouraged to attend both Family Meetings and Child Safety Conferences.
The protective/diagnostic unit of DCP is the core unit tasked with investigating the majority of the approximately 60,000 reports of abuse and neglect that ACS receives each year. Protective/diagnostic field offices are located in each of the five boroughs and child protective personnel oversee on average 11,187 active cases each month in 2016.
Beginning in 2017, ACS began to implement a number of reforms to improve and strengthen case practice. These include enhancing Child Advocacy Centers (CAC) with additional Child Family Specialists (CFS), Child Protective Supervisors, and Family Court Legal Services attorneys and managers, re-establishing liaisons to each District Attorney Offices at the Child Protection Offices to facilitate information sharing between the District Attorneys, Detectives, and ACS Child Protective investigators; creating a new accountability unit outside of the Division of Child Protection to improve case practice, and adding additional headcount to support the Employment Law Unit to handle CPS disciplinary referrals and case practice reviews.
In addition, ACS will add Investigative Consultants that will be responsible for conducting database searches, such as the sex offender registry and domestic violence offender database on all individuals named in the SCR reports; ACS will add a new applications unit to cover night and weekend shifts at ECS to conduct
timely clearances on SCR abuse and maltreatment reports and strengthen casework.
Preventive Services for Children and Families
ACS provides contracted preventive services, which are designed to keep youth from entering foster care placement and also to reduce the length of time that children spend in foster care. Preventive services include general preventive services, specialized programs for teens, programs for youth with juvenile justice involvement, the Family Treatment/Rehabilitation Program (FT/R) for families with substance abuse issues, and programs for families with special needs. Services include parenting education, domestic violence counseling, housing subsidies, employment and job training services, substance abuse treatment, and mental health guidance. Preventive services also include evidence-based and evidence-informed practice models. Providers are required to help families connect to other services in their communities and are encouraged to engage families in achieving their service goals within 12 months in order to increase the availability of programs to all families in need. In 2016, an average of 837 preventive cases opened monthly; 10,540 preventive service cases were opened in total.
In 2017, ACS began to roll out the preventive expansion; an historical expansion of preventive services, focusing on high needs families, particularly court-ordered supervision families. ACS will continue to roll out nearly 3,000 slots to expand the preventive portfolio to up to 15,877 slots by FY19, serving 31,000 families annually. ACS plans to increase investments in a broad spectrum of contract-agency preventive services. The preventive expansion initiative works to increase the city’s capacity to strengthen families, address trauma associated with severe poverty, and prevent child maltreatment. In 2017, ACS also expanded the Clinical Consultation Program (CCP), now widened to provide assessment services to Foster Care and Preventive Service agencies. ACS has established a six-month (beginning three months prior to and continuing throughout trial discharge) enhanced family support services for families discharging from foster care. In spring 2017, ACS will launch three Family Enrichment Centers, an innovative research-informed and family-centered primary prevention strategy to support families before any harm occurs to children and build community capacity to engage
Programmatic Review and Service Impact

Analysis of Agency Budgets Fiscal Year 2018
124
families. These efforts are expected to help address the needs of children and families at multiple intervention points, avoid the unnecessary removal of children from their homes and support children being re-unified with their families after foster care placement.
In 2018, ACS will build upon these reforms by streamlining the placement process for families referred to preventive programs by adding an additional 17 staff to the referral management team. This additional staff will accelerate the time in which families are placed and ensure that the most appropriate placement is made. Preventive providers will also add MSW level conference facilitators to coordinate and oversee all family conferences, including case termination conferences, to ensure that cases are closed appropriately and in a timely manner. Finally, ACS will offer 12 days of mandated onboarding training when preventive case planners begin employment and 42 hours per year of recurring training for all staff.
Foster Care
Placements in family foster care, residential settings or specialized care facilities are provided on a temporary basis until children can be reunified with their families. If reunification is not a viable option, children receive services that will lead to adoption or development of independent living skills. The number of children living in out-of-home placements has continued to decline and is currently 8,796. The Nicholas Scoppetta Children’s Center serves as the foster care pre-placement intake facility for approximately 3,804 children entering foster care. These children are assessed and provided with necessary medical, mental health and any other required services during their stay at the Children’s Center.
CHILDREN IN FOSTER CARE AND PREVENTIVE SERVICES 2006 - 2017
0
5
10
15
20
25
30
35
40
171615141312111009080706
Fiscal Year
Chi
ldre
n in
Car
e(i
n T
hous
ands
)
Preventive Services
Foster Care

Analysis of Agency Budgets Fiscal Year 2018
125
RESIDENTIAL CASELOADS 2006 - 2017
0
1,000
2,000
3,000
4,000
5,000
171615141312111009080706
Note: Starting in 2012, the residential caseload no longer includes adjudicated juvenile delinquents in congregate settings operated by private not-for-profit agencies.
Fiscal Year
Chi
ldre
n in
Car
e
In 2018, the Department will continue to leverage additional federal funds it is receiving under a federal Title IV-E Waiver to reinvest federal savings generated by the declining foster care census into ChildSuccessNYC (CSNYC), an enhanced foster care model that includes reduced caseloads and enhanced supports for youth, birth and foster parents, aimed at improving family stability and well-being, expediting permanency and further reducing the overall foster care census.
Adoption Services and KinGAP
Adoption provides a stable and permanent home for children who cannot return to their birth parents. In 2016, more than 17,000 children were living in adoptive homes. ACS’ efforts to recruit adoptive parents, including the adoption hotline and the award winning “Wednesday’s Child” television segment, have contributed to continued placement of children in adoptive homes.
Additionally, the implementation of the Kinship
Guardianship Subsidy Assistance Program (KinGAP), enacted in New York State in 2011, has resulted in permanency for 1,119 New York City children through
January 2017. This permanency option allows a child to continue to reside with an approved relative outside of the foster care system with financial and medical assistance provided through an ACS subsidy.
Division of Youth and Family Justice
The Division of Youth and Family Justice (DYFJ) provides Secure (SD) and Non-Secure Detention (NSD) services for alleged juvenile delinquents and offenders whose cases are pending in Family or Criminal Court. ACS operates two secure detention facilities and oversees a network of non-secure detention group homes across the City. Currently DYFJ oversees 11 NSD sites through contracts with private non-profit social service organizations. While in detention, residents receive support services including education, health and mental health care, recreation, and case management.
Under the Close to Home Initiative launched in 2012, DYFJ assumed custody of adjudicated juvenile delinquents placed in non-secure settings. DYFJ provides care through a new system of non-profit providers located within, and just outside of New York City. Providers offer an array of general and specialized
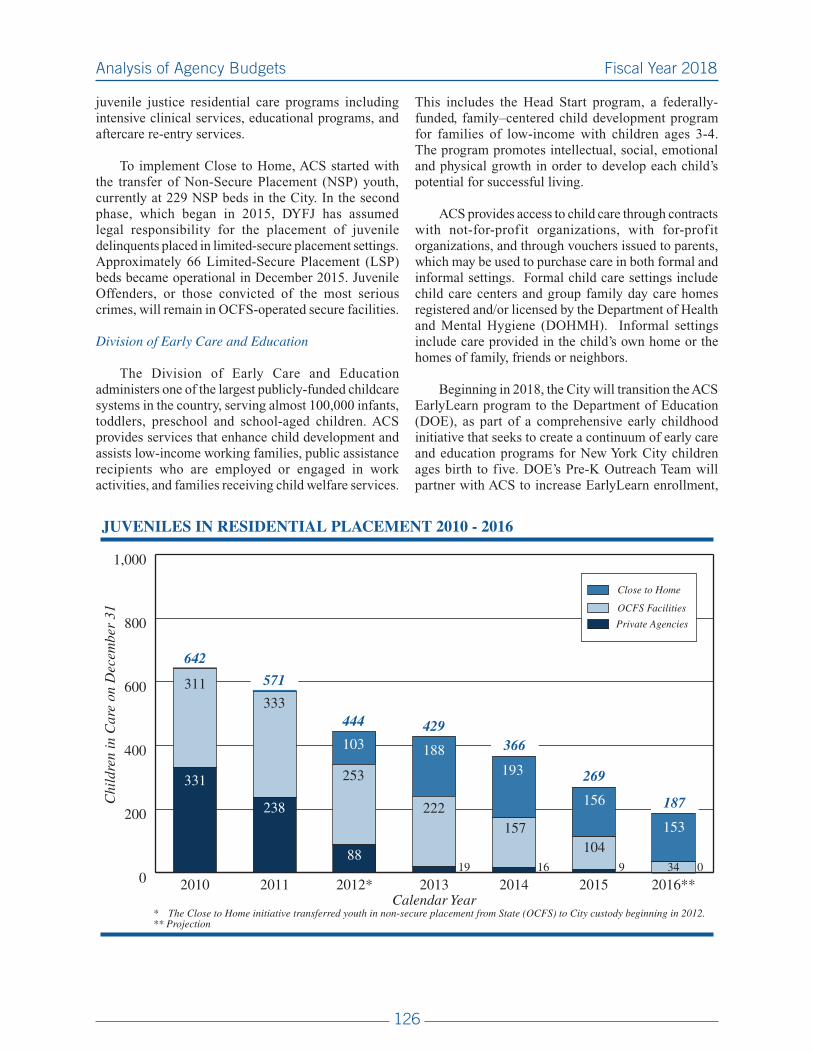
Analysis of Agency Budgets Fiscal Year 2018
126
juvenile justice residential care programs including intensive clinical services, educational programs, and aftercare re-entry services.
To implement Close to Home, ACS started with the transfer of Non-Secure Placement (NSP) youth, currently at 229 NSP beds in the City. In the second phase, which began in 2015, DYFJ has assumed legal responsibility for the placement of juvenile delinquents placed in limited-secure placement settings. Approximately 66 Limited-Secure Placement (LSP) beds became operational in December 2015. Juvenile Offenders, or those convicted of the most serious crimes, will remain in OCFS-operated secure facilities.
Division of Early Care and Education
The Division of Early Care and Education administers one of the largest publicly-funded childcare systems in the country, serving almost 100,000 infants, toddlers, preschool and school-aged children. ACS provides services that enhance child development and assists low-income working families, public assistance recipients who are employed or engaged in work activities, and families receiving child welfare services.
This includes the Head Start program, a federally-funded, family–centered child development program for families of low-income with children ages 3-4. The program promotes intellectual, social, emotional and physical growth in order to develop each child’s potential for successful living.
ACS provides access to child care through contracts with not-for-profit organizations, with for-profit organizations, and through vouchers issued to parents, which may be used to purchase care in both formal and informal settings. Formal child care settings include child care centers and group family day care homes registered and/or licensed by the Department of Health and Mental Hygiene (DOHMH). Informal settings include care provided in the child’s own home or the homes of family, friends or neighbors.
Beginning in 2018, the City will transition the ACS EarlyLearn program to the Department of Education (DOE), as part of a comprehensive early childhood initiative that seeks to create a continuum of early care and education programs for New York City children ages birth to five. DOE’s Pre-K Outreach Team will partner with ACS to increase EarlyLearn enrollment,
JUVENILES IN RESIDENTIAL PLACEMENT 2010 - 2016
0
200
400
600
800
1,000
2016**2015201420132012*20112010Calendar Year
* The Close to Home initiative transferred youth in non-secure placement from State (OCFS) to City custody beginning in 2012.** Projection
Chi
ldre
n in
Car
e on
Dec
embe
r 31
Close to Home
OCFS Facilities
Private Agencies
153
331
238
8819 16 9 034
311333
253
222157
104
103 188193
156
642
444 429
269
571
366
187

Analysis of Agency Budgets Fiscal Year 2018
127
Capital Review
The Department’s 2018-2027 Ten Year Capital Strategy totals $471 million, of which $440 million are City funds. The Ten-Year Capital Plan includes $38.2 million for child care, $318.4 million for DYFJ programs, $52.6 million for administrative offices, $55.6 million for equipment and information systems, $4.5 million for City Council child care and child welfare projects, $2 million for Borough President and child welfare projects.
Capital Commitments
($ in 000’s)_______________________________________________________________________________________________________________________________________________________________________________________________________________
2016 2017 2018 2019 2020 2021 Actual Plan Plan Plan Plan Plan ________________________ _______________________ ________________________ _______________________ ________________________ _______________________
City All City All City All City All City All City All Funds Funds Funds Funds Funds Funds Funds Funds Funds Funds Funds Funds_______________________________________________________________________________________________________________________________________________________________________________________________________________
Child Welfare ........................ $- $- $30,832 $30,832 $311,255 $315,256 $- $- $- $- $- $- Child Care ............................. 6,280 6,280 20,275 20,275 22,003 22,003 7,146 7,146 1,767 1,767 1,267 1,267Buildings ............................... 1,711 1,711 4,690 5,552 4,544 11,139 7,085 15,525 1,975 1,975 0 0MIS ....................................... 2,178 2,215 17,580 27,326 17,261 23,701 6,338 7,254 8,236 8,236 8,467 8,467 ___________ ___________ ___________ ___________ ___________ ___________ ___________ ___________ ___________ ___________ ___________ ___________
Total ...................................... $10,169 $10,206 $73,377 $83,985 $355,063 $372,099 $20,569 $29,925 $11,978 $11,978 $9,734 $9,734 ========= ========= ========= ========= ========= ========= ========= ========= ========= ========= ========= =========
__________________________________________________________________________________________________________________________________________________________________________________________
Highlights of the Ten-Year Capital Plan
• $55.6 million will support telecommunications and data infrastructure upgrades and improvements.
• $38.2 million will support the renovation of child care centers City wide including correction of code violations and providing for handicapped accessibility.
• $52.6 million will support the renovation of administrative and field offices.
• $318.4 million will support the Department’s juvenile justice operations including the renovation of the Department’s two secure detention facilities – Crossroads and Horizon.
connecting more children to care by filling empty seats. EarlyLearn providers will also receive additional support from DOE, including assistance recruiting high-quality teachers for the 2017-18 school year. ACS’ Division of Early Care and Education will continue to
manage the EarlyLearn contracts during the transition, and in the coming year, multiple City agencies will develop a comprehensive set of supports to improve the quality of care child care for children served in other settings.

Analysis of Agency Budgets Fiscal Year 2018
128
DEPARTMENT OF YOUTH AND COMMUNITY DEVELOPMENT
The Department of Youth and Community Development (DYCD) supports programs for families and youth in neighborhoods throughout the five boroughs. DYCD provides a wide range of high-quality youth and community development programs, including the Comprehensive Afterschool System of NYC (including School’s Out NYC), Beacon Community Centers, Cornerstone Programs at NYCHA Community Centers, the Summer Youth Employment Program, Runaway and Homeless Youth Programs, Immigration Programs, and Literacy Services. DYCD is also the designated Community Action Agency for New York City, which is the local grantee for the federal Community Services Block Grant (CSBG). CSBG funding supports a variety of programs that promote self-sufficiency and healthy communities.
Financial Review
The Department’s 2018 Executive Budget provides for operating expenses of $680M million, of which $454 million are City funds.
Expense Budget Highlights
Budgetary Priorities: Expanded Services For Youth and Families • In 2018, the Department will continue its
commitment to the Universal Afterschool for Middle School initiative, School’s Out New York City (SONYC). This year, the City is slated to serve more than 116,000 middle school students with robust afterschool programming in public schools as well as other settings. The Executive Budget includes an additional $10.7 million investment in the SONYC program to expand to new schools, making it more accessible to the City’s middle school students.
• In addition, the Executive Budget includes $15 million dollars for 22,800 slots for SONYC summer programs, allowing the Department to serve the same number of youth as last year. Across all DYCD middle school summer programs, which include SONYC, Beacon and Cornerstone, the Department expects to serve nearly 40,000 youth this summer.
• In 2018, DYCD will build upon the significant investments that this administration and the City Council have already made to the Summer Youth Employment Program. Last summer over 60,000 youth participated in SYEP. This summer we will be adding 5,000 slots to SYEP, bringing the total to 65,000. Since the beginning of this administration, we have almost doubled the program.
• Beginning in 2018, the Department will invest an additional $6 million to add eleven new Beacon programs in previously underserved communities. The eleven new Beacon sites will expand the reach of these comprehensive school-based community centers to thousands of additional New Yorkers in the boroughs with the highest numbers of young people, and in underserved schools and communities. In addition, the City will continue the second phase of the previously announced commitment to address the shortfalls in the rate of reimbursement for Beacon programs. In 2018, a total of $16.8 million will bring every Beacon program to a rate of $550,000 per program, an increase from the previous average rate of $330,000. Prior to this initiative, the rate had declined almost 20% since the program was created in 1991.

Analysis of Agency Budgets Fiscal Year 2018
129
2017 20182016
Actual2017
ForecastPreliminary
BudgetExecutive
Budget Forecast Preliminary
BudgetExpenditures
Salary and Wages ……….. $37,063 $38,784 $39,728 $39,998 $1,214 $270Fringe Benefits …………… — — — — — — OTPS ……………...……… 627,652 708,834 598,769 639,821 (69,013) 41,052 Total ……………...……… $664,715 $747,618 $638,497 $679,819 ($67,799) $41,322
FundingCity ……………...………… $420,795 $482,336 $405,650 $453,956 ($28,380) $48,306Other Categorical Grants … 2,181 2,301 — 16 (2,285) 16 IFA ……………...………… — — — — — — State ……………...……… 6,971 8,086 5,308 5,308 (2,778) — Federal CD ……………...… 7,517 7,519 7,145 7,145 (374) — Federal Other ……………. 70,673 88,834 53,081 53,081 (35,753) — Intra-City Other …………… 156,578 158,542 167,313 160,313 1,771 (7,000) Total ……………...……… $664,715 $747,618 $638,497 $679,819 ($67,799) $41,322
Additional Costs Centrally FundedPersonal Services (PS) Fringe Benefits ………… $10,421 $11,447 $12,776 $12,547 $1,100 ($229) Pensions ……………...… 4,856 5,588 6,610 6,182 594 (428) Other Than Personal Service (OTPS) Debt Service ……………. — — — — — — Total Additional Costs $15,277 $17,035 $19,386 $18,729 $1,694 ($657)
FundingCity ……………...………… 14,814 16,452 18,868 18,209 1,757 (659) Non-City ……………...…… 463 583 518 520 (63) 2
Full Agency Costs (including Central Accounts)Salary and Wages ………… $37,063 $38,784 $39,728 $39,998 $1,214 $270Fringe Benefits …………… 10,421 11,447 12,776 12,547 1,100 (229) Pensions ……………...…… 4,856 5,588 6,610 6,182 594 (428) Total PS ……………...…… $52,340 $55,819 $59,114 $58,727 $2,908 ($387)
OTPS ……………...……… $627,652 $708,834 $598,769 $639,821 ($69,013) $41,052Debt Service …………….. — — — — — — Total OTPS $627,652 $708,834 $598,769 $639,821 ($69,013) $41,052
Total Agency Costs ……… $679,992 $764,653 $657,883 $698,548 ($66,105) $40,665Less Intra-City …………… $156,578 $158,542 $167,313 $160,313 $1,771 ($7,000)Net Agency Cost ………… $523,414 $606,111 $490,570 $538,235 ($67,876) $47,665
FundingCity ……………...………… 435,609 498,788 424,518 472,165 (26,623) 47,647 Non-City ……………...…… 87,805 107,323 66,052 66,070 (41,253) 18
Personnel (includes FTEs at fiscal year-end)City ……………...………… 457 481 445 450 (31) 5 Non-City ……………...…… 68 87 74 74 (13) — Total ……………...……… 525 568 519 524 (44) 5
Summary of Agency Financial Data The following table compares 2018 Executive Budget with the 2018 Preliminary Budget, the 2017 forecast and actual expenditures for 2016, including fringe benefits, pensions, and debt service.
2018Increase/(Decrease)($ in 000's)
Standard 4/23/2017 7:54 PMAgency: Department of Youth and Community Services

Analysis of Agency Budgets Fiscal Year 2018
130
Programmatic Review and Service Impact
Comprehensive Afterschool System of New York City (COMPASS)
The Comprehensive Afterschool System of NYC (COMPASS), formerly known as the Out-of-School Time (OST) program, began in 2005 and provides a mix of academic, recreational and cultural activities for young people after school, during school closing days and in the summer. These programs, which are operated by community-based organizations, serve young people from elementary through high school and are primarily located in public and non-public schools, community centers, public housing and parks recreational facilities.
COMPASS is comprised of over 924 total programs serving more than 100,000 young people in grades K-12, including more than 48,000 in elementary schools and more than 2,000 in high schools. Through its network of providers, COMPASS offers high quality programs that offer a strong balance of academics, recreation, enrichment, and cultural activities to support and strengthen the overall development of youth. COMPASS includes the School’s Out NYC (SONYC) program, the Mayor’s signature Universal Afterschool for Middle School initiative, which aims to keep youth safe, foster competencies, and allow young people to explore interests and creativity while building confidence and leadership skills. In 2017, SONYC’s 517 programs in public and non-public schools and other settings, including homeless shelters, provide more than 49,000 seats serving more than 60,000 middle school youth. Including other DYCD programs and programs funded by the Department of Education, the City provides a total of more than 116,000 middle school youth with afterschool programming.
Beacon Community Centers
Pioneered in 1991 under Mayor Dinkins, these collaborative, school-based community centers have been replicated nationally, including as a model for Cornerstone Community Centers and Community Schools. Beacon programs are designed based on the needs of their communities, and tailor activities to serve young people and adults in the areas of academic enhancement, life skills, career awareness, civic engagement and community building, recreation, health and fitness, and culture. Research has demonstrated that Beacons have a positive impact on academic achievement and social development, reducing risky adolescent behaviors, empowering community residents
and providing a forum for local problem solving. In 2017, Beacons will serve over 96,000 participants of all ages, in 80 programs across the City. With the addition of 11 new Beacon programs, DYCD projects that over 110,000 will be served in 2018.
Cornerstone Program
Cornerstone Community Centers (Cornerstones) provide engaging activities year-round for adults and young people at New York City Housing Authority (NYCHA) developments in the five boroughs. Cornerstone programming is shaped by input from young people, NYCHA residents, Resident Association leaders, elected officials, and school principals. Cornerstone youth programs are designed to help participants acquire the skills they need to graduate from high school, succeed in their chosen careers, and give back to the community. Cornerstone adult programs are designed to enhance skills and promote social interaction, community engagement, and physical activity. Beginning in 2016, DYCD operated Cornerstone programs in 94 NYCHA developments, an increase from 70 programs in 2015.
As part of the Mayor’s Action Plan for Neighborhood Safety, beginning in 2014 summer hours of service were extended to 11 p.m. daily to allow community residents evening access to a safe place for recreation and learning when school is out. The extended hours will continue in 2018.
Runaway and Homeless Youth Services
DYCD funds programs to protect runaway and homeless youth and, whenever possible, reunite them with their families. For youth in need of shelter and care, Crisis Shelters offer safe and welcoming environments on a short-term basis, while Transitional Independent Living (TIL) facilities combine longer-term shelter with the necessary support designed to place formerly homeless youth on the path to independence. Charged with giving vulnerable young people the resources they need to stabilize their lives, services also include Street Outreach and Drop-In Centers. In January 2015, the first City-funded 24/7 Runaway and Homeless Youth drop-in center opened, specializing in services for LGBTQ youth as well as a specialized TIL program for transgender youth. LGBTQ youth face a much higher risk of homelessness than their heterosexual peers.

Analysis of Agency Budgets Fiscal Year 2018
131
In 2018, DYCD will further expand residential services, and will provide funding for 653 beds. By 2019, DYCD will have added $22.2 million to bring the total RHY shelter capacity to 753 beds, an increase of 500 beds over the 2013 level. Additionally, as part of ThriveNYC, DYCD will continue to support enhanced mental health services in all DYCD-funded RHY programs, with the addition of licensed clinical social workers, psychiatric services, and other emotional wellness programs.
Youth Workforce Development
DYCD operates several workforce development programs for youth between the ages of 14 to 24. These include the Summer Youth Employment Program (SYEP), the year-round Work, Learn and Grow program, the Anti-Gun Violence program, the Center for Economic Opportunity’s (CEO) and Young Men’s Initiative (YMI)-funded Young Adult Internship Program (YAIP) and the Workforce Innovation and Opportunity Act (WIOA)-funded In-School Youth and Out-of-School Youth programs.
SYEP provides New York City youth between the ages of 14 to 24 with summer employment and educational experiences. Participants work in a variety of entry-level jobs at community-based organizations, government agencies and private sector businesses and are paid for up to 25 hours per week for up to six weeks at the current minimum wage of $11 per hour. This past summer over 60,000 youth and young adults worked in SYEP across 10,850 worksites. The Executive Budget supports continued growth in the program to 65,000 slots in summer 2017, with an investment of $118 million.
YAIP targets youth who are between 16 and 24 that are not in school or working. The program provides short-term paid internships that promote social and professional skills and features a combination of educational workshops and counseling. YAIP operates three 14-week cycles each year. In 2017, DYCD received a total of $11.9 million from CEO and YMI to serve 1,750 participants.
In 2017, DYCD received approximately $24.2 million in Workforce Innovation and Opportunity Act (WIOA) funding to support the In-School Youth (ISY) and Out-of-School Youth (OSY) programs. The ISY program helps to prevent high school juniors and seniors from dropping out before attaining a high school degree. The program also helps improve literacy, job readiness, and other workplace preparation skills. The OSY program helps youth between the ages of 16 and
21 who are not in school and not employed to refocus on achieving educational goals and to find employment or advanced occupational training. In 2018, DYCD projects that ISY and OSY will serve 1,260 and 1,371, respectively.
Literacy Services
Adult Literacy programs are designed to assist adults and older youth to become literate and to obtain the knowledge and skills necessary for further education, employment and self-sufficiency. Adult Basic Education (ABE) programs provide instruction in reading, writing and mathematics to native English speakers. High School Equivalency (HSE) test preparation classes are designed to help students prepare for HSE tests in reading, writing, social studies, science and math. English for Speakers of Other Languages (ESOL) programs provide English language courses to immigrants to increase their communication skills. In 2018, $6.1 million will enable DYCD to provide these services to 6,500 individuals.
The Young Adult Literacy Program is funded through CEO and YMI for a total budget of nearly $4 million supporting programs across 16 sites hosted by community-based organizations and the library systems. The program provides intensive instruction in reading, writing and math to youth ages 16-24 who are not currently employed or in school. Additionally, $1 million will support the Adolescent Literacy Program to help 179 middle school youth ages 13-15 needing assistance in developing their reading, writing and communication skills.
Neighborhood Development Programs
DYCD administers the federal Community Services Block Grant (CSBG) program to fund anti-poverty initiatives in 42 designated low-income Neighborhood Development Areas (NDAs) across the five boroughs of New York City. The NDA programs are designed to allow individual neighborhoods to fund the social services they determine best meet their particular needs. DYCD’s mission in administering the Community Action Program is to assist low income individuals and families to attain the skills, knowledge, motivation and opportunities they need to become self-sufficient. In 2017, the Department received $15.7 million in CSBG funding for these programs, which provided immigrant services, family support services, youth development, senior support, and housing assistance to 14,583 participants.

Analysis of Agency Budgets Fiscal Year 2018
132
Fatherhood Programs
By promoting positive involvement of fathers in the lives of their children, DYCD’s 10 CSBG-funded Fatherhood programs strengthen family relationships and encourage fathers to fulfill their financial responsibilities. Fatherhood services include individual, family and group counseling, father-to-father mentoring, parent and child rearing classes, visitation arrangements, and mediation and conflict resolution training. Support activities include independent living skills training, college preparation classes, and adult basic education and English instruction for speakers of other languages. DYCD also encourages program providers to form linkages with other organizations to address the comprehensive needs of fathers, including job training and placement, health care, and housing. In 2017, the Department received $2.9 million in CSBG funding to provide services to over 1,160 participants.

Analysis of Agency Budgets Fiscal Year 2018
133
DEPARTMENT FOR THE AGING
The Department for the Aging (DFTA) administers a wide range of programs that enhance the independence and quality of life for the City’s elderly population. The Department’s services include senior centers, home delivered meals, case management services, homecare services, transportation services, caregiver services, employment counseling and placement for older New Yorkers and an array of social and legal services. DFTA serves as an advocate for the City’s elderly population through legislative activity and public policy initiatives.
Financial Review
The Department’s 2018 Executive Budget provides for operating expenses of $310 million, of which $194.6 million are City funds. In addition, the Department’s Ten-Year Capital Plan includes $47.3 million.
Expense Budget Highlights
• In 2018, DFTA will implement the PROTECT (Providing Options to Elderly Clients Together) program, which will provide vital mental health services to victims of elder abuse. This program will screen elder abuse victims for depression and other complicated inter-connected issues that arise from victimization and abuse.

Analysis of Agency Budgets Fiscal Year 2018
134
2017 20182016
Actual2017
ForecastPreliminary
BudgetExecutive
Budget Forecast Preliminary
BudgetExpenditures
Salary and Wages ……….. $24,334 $27,678 $29,229 $28,474 $796 ($755)Fringe Benefits …………… — — — — — — OTPS ……………...……… 281,045 314,259 277,238 281,637 (32,622) 4,399 Total ……………...……… $305,379 $341,937 $306,467 $310,111 ($31,826) $3,644
FundingCity ……………...………… $186,582 $215,648 $191,015 $194,634 ($21,014) $3,619Other Categorical Grants … — 552 — — (552) — IFA ……………...………… — — — — — — State ……………...……… 43,046 43,071 42,907 42,907 (164) — Federal CD ……………...… 2,625 2,890 2,241 2,241 (649) — Federal Other ……………. 70,989 77,096 69,934 69,959 (7,137) 25 Intra-City Other …………… 2,137 2,680 370 370 (2,310) — Total ……………...……… $305,379 $341,937 $306,467 $310,111 ($31,826) $3,644
Additional Costs Centrally FundedPersonal Services (PS) Fringe Benefits ………… $6,784 $7,902 $8,724 $8,763 $861 $39 Pensions ……………...… 4,067 3,986 4,340 4,059 73 (281) Other Than Personal Service (OTPS) Debt Service ……………. — — — — — — Total Additional Costs $10,851 $11,888 $13,064 $12,822 $934 ($242)
FundingCity ……………...………… 10,217 11,051 12,466 12,225 1,174 (241) Non-City ……………...…… 634 837 598 597 (240) (1)
Full Agency Costs (including Central Accounts)Salary and Wages ………… $24,334 $27,678 $29,229 $28,474 $796 ($755)Fringe Benefits …………… 6,784 7,902 8,724 8,763 861 39 Pensions ……………...…… 4,067 3,986 4,340 4,059 73 (281) Total PS ……………...…… $35,185 $39,566 $42,293 $41,296 $1,730 ($997)
OTPS ……………...……… $281,045 $314,259 $277,238 $281,637 ($32,622) $4,399Debt Service …………….. — — — — — — Total OTPS $281,045 $314,259 $277,238 $281,637 ($32,622) $4,399
Total Agency Costs ……… $316,230 $353,825 $319,531 $322,933 ($30,892) $3,402Less Intra-City …………… $2,137 $2,680 $370 $370 ($2,310) $—Net Agency Cost ………… $314,093 $351,145 $319,161 $322,563 ($28,582) $3,402
FundingCity ……………...………… 196,799 226,699 203,481 206,859 (19,840) 3,378 Non-City ……………...…… 117,294 124,446 115,680 115,704 (8,742) 24
Personnel (includes FTEs at fiscal year-end)City ……………...………… 188 233 235 235 2 — Non-City ……………...…… 543 473 485 453 (20) (32) Total ……………...……… 731 706 720 688 (18) (32)
Summary of Agency Financial Data The following table compares 2018 Executive Budget with the 2018 Preliminary Budget, the 2017 forecast and actual expenditures for 2016, including fringe benefits, pensions, and debt service.
2018Increase/(Decrease)($ in 000's)
Standard 4/23/2017 7:53 PMAgency: Department of Aging
Analysis of Agency Budgets Fiscal Year 2018
135
Programmatic Review and Service Impact
Senior Centers
The core of DFTA’s service portfolio is a citywide network of 246 senior centers, which offer over 29,000 New Yorkers opportunities for meals, socialization, recreation, and participation in a wide array of activities designed to improve their health and quality of life. Sixteen of the 246 senior centers are Innovative Senior Centers, which provide enhanced programming, robust wellness programs, technology education as well as arts and culture activities.
Case Management, Home Delivered Meals, and Homecare
Case management services connect homebound seniors to resources and benefits so that they may continue to live independently and safely in their homes. Following a case management assessment, eligible seniors may receive home delivered meals, Homecare, and other benefits or services. Seniors are referred to case management providers from senior centers, meal providers, hospitals and other community-based social service and health care agencies. In 2018, $34 million will support case management services for approximately 19,000 clients. Over 18,000 of the 19,000 case management clients benefit from home-delivered meals services five days a week each year. DFTA has 23 contracts for home delivered meals, which offer seniors the option of frozen or hot meal deliveries. In 2018, $37 million will support 4.6 million home delivered meals for about 18,400 seniors. In addition, in 2018 approximately 2,500 clients will benefit from Homecare services.
Senior Employment and Foster Grandparent Services
DFTA addresses the employment needs and skills of older New Yorkers through its Senior Community Service Employment Program. This program provides part-time on-the-job training to about 400 low income participants. Clients serve their communities while receiving job training and other support services to facilitate re-entry into the workforce. Placements are made in City agencies and with not-for-profit employers.
The Foster Grandparent program is a volunteer based program enlisting approximately 400 seniors each year to work as mentors and tutors for at risk or troubled children and youth. Foster grandparents work in hospitals, day care programs, schools, and afterschool programs. In 2018, $2 million is provided for the Foster grandparent program.
Naturally Occurring Retirement Communities Naturally Occurring Retirement Communities
(NORCs) are on-site collaborations among housing entities, social service providers, and healthcare networks to provide supportive services for senior residents to help them remain independent and safe in their own homes. In 2018, $6.5 million will support 28 NORC programs for over 11,000 residents in the Bronx, Brooklyn, Manhattan, and Queens. NORC services include case assistance, transportation, health promotion, education and recreation, and nursing services.
Transportation Services
DFTA’s independent transportation program aims to serve seniors who are unable to travel or access public transportation from becoming socially isolated and/or declining physically by assisting them in getting to and from places they need to go in their communities. Moreover, DFTA’s transportation services program offers group transportation to enhance community engagement for seniors by offering recreational, social and educational trips. Each year, DFTA’s $4.7M transportation program provides over 250,000 one-way trips citywide.
Caregiver Services
DFTA oversees a $4 million caregiver support program that offers support groups, counseling, outreach and information services to unpaid caregivers. The caregiver program also offers options for respite care through home care or temporary placement in Social Adult Day Care, for families and other unpaid caregivers.

Analysis of Agency Budgets Fiscal Year 2018
136
Capital Review
The Department’s Ten-Year Capital Strategy for 2018-2027 totals $47.3 million. The Ten-Year Capital Strategy includes funding for information technology projects to improve operations as well as funding for rehabilitation of senior centers throughout the City, including new funding to perform significant renovations and interior upgrades to the Leonard Covello senior center.
Capital Commitments
($ in 000’s)_______________________________________________________________________________________________________________________________________________________________________________________________________________
2016 2017 2018 2019 2020 2021 Actual Plan Plan Plan Plan Plan ________________________ _______________________ ________________________ _______________________ ________________________ _______________________
City All City All City All City All City All City All Funds Funds Funds Funds Funds Funds Funds Funds Funds Funds Funds Funds_______________________________________________________________________________________________________________________________________________________________________________________________________________
Elec. Data Processing ........... $208 $208 $4,359 $4,359 $8,469 $8,469 $5,955 $5,955 $2,129 $2,129 $- $- Building Renovationsand Vehicles .......................... $1,023 $1,023 $13,957 $13,957 $11,779 $11,779 $6,133 $6,133 $3,908 $3,908 $1,228 $1,228 ___________ ___________ ___________ ___________ ___________ ___________ ___________ ___________ ___________ ___________ ___________ ___________
Total ...................................... $1,231 $1,231 $18,316 $18,316 $20,248 $20,248 $12,088 $12,088 $6,037 $6,037 $1,228 $1,228 ========= ========= ========= ========= ========= ========= ========= ========= ========= ========= ========= =========
_______________________________________________________________________________________________________________________________________________________________________________________________________________
Ten-Year Capital Strategy Highlights
• The Department’s Ten-Year Capital Strategy includes rehabilitation of senior centers, with focus on structural and accessibility issues ($32.3 million); computer and network upgrade and equipment purchase ($12.6 million); and vehicle expenses ($2.4 million).
Analysis of Agency Budgets Fiscal Year 2018
137
DEPARTMENT OF HEALTH AND MENTAL HYGIENE
The mission of the New York City Department of Health and Mental Hygiene (DOHMH) is to protect and promote the health of all New Yorkers. The Department is committed to maintaining core public health services and continues to introduce new programs and technologies to improve the health status of all New Yorkers and to reduce health inequities between New York City neighborhoods.
The Department will continue to target its public health activities towards those communities that bear a disproportionate share of physical and mental illness and premature death, relying on evidence-based and evidence- informed programs and interventions. The Department will pursue active engagement with communities, their organizations, institutions and members, to continue to tackle the leading causes of death and disability. In 2018, the Department will expand outreach and services to combat the opioid epidemic, as part of HealingNYC.
The Office of the Chief Medical Examiner (OCME) determines the cause and manner of deaths occurring in the City, and operates the county mortuaries and the accredited Forensic Biology Laboratory.
Financial Review
The Department’s 2018 Executive Budget provides for operating expenses of $1.6 billion, of which $713 million are City funds. The Department will add additional funding of approximately $80 million to the budget during the fiscal year when federal and State award notifications are received. Capital commitments of $163.3 million are also provided to fund agency initiatives.
Revenue Forecast
The Department generates revenue from licenses, permits, inspection and service fees. In 2018, the Department will generate $31.4 million in revenue from these sources.
Expense Budget Highlights
Budgetary Priorities: Providing Core Services
• $8.4 million will increase prevention efforts, treatment services and public awareness to combat opioid addiction within the Department
• $1.1 million for additional Intensive Mobile Teams, a flexible treatment model that serves individuals with serious mental illness
• $1.6 million will increase capacity for toxicology testing, medical examination, and forensic investigations connected to the opioids epidemic within the Office of the Chief Medical Examiner

Analysis of Agency Budgets Fiscal Year 2018
138
2017 20182016
Actual2017
ForecastPreliminary
BudgetExecutive
Budget Forecast Preliminary
BudgetExpenditures
Salary and Wages ………… $399,823 $452,546 $458,728 $461,447 $8,901 $2,719Fringe Benefits …………… 1,051 2,084 305 395 (1,689) 90 OTPS ……………………… 1,049,801 1,224,187 1,051,938 1,104,365 (119,822) 52,427 Total ……………………… $1,450,675 $1,678,817 $1,510,971 $1,566,207 ($112,610) $55,236
FundingCity ……………………… $579,516 $657,823 $662,642 $713,249 $55,426 $50,607Other Categorical Grants … 2,727 21,594 1,247 1,746 (19,848) 499 IFA ………………………… — — — — — — State ……………………… 559,073 628,801 553,736 547,975 (80,826) (5,761) Federal CD ………………… — — — — — — Federal Other ……………… 290,971 350,194 288,480 298,394 (51,800) 9,914 Intra-City Other …………… 18,388 20,405 4,866 4,843 (15,562) (23) Total ……………………… $1,450,675 $1,678,817 $1,510,971 $1,566,207 ($112,610) $55,236
Additional Costs Centrally FundedPersonal Services (PS) Fringe Benefits ………… $120,434 $136,559 $151,918 $149,865 $13,306 ($2,053) Pensions ………………… 67,007 66,357 71,491 66,865 508 (4,626) Other Than Personal Service (OTPS) Debt Service …………… 48,985 55,464 58,053 48,630 (6,834) (9,423) Total Additional Costs … $236,426 $258,380 $281,462 $265,360 $6,980 ($16,102)
FundingCity ……………………… 206,476 226,958 249,900 234,117 7,159 (15,783) Non-City ………………… 29,950 31,422 31,562 31,243 (179) (319)
Full Agency Costs (including Central Accounts)Salary and Wages ………… $399,823 $452,546 $458,728 $461,447 $8,901 $2,719Fringe Benefits …………… 121,485 138,643 152,223 150,260 11,617 (1,963) Pensions …………………… 67,007 66,357 71,491 66,865 508 (4,626) Total PS ………………… $588,315 $657,546 $682,442 $678,572 $21,026 ($3,870)
OTPS …………………… $1,049,801 $1,224,187 $1,051,938 $1,104,365 ($119,822) $52,427Debt Service ……………… 48,985 55,464 58,053 48,630 (6,834) (9,423) Total OTPS ……………… $1,098,786 $1,279,651 $1,109,991 $1,152,995 ($126,656) $43,004
Total Agency Costs ……… $1,687,101 $1,937,197 $1,792,433 $1,831,567 ($105,630) $39,134Less Intra-City …………… $18,388 $20,405 $4,866 $4,843 ($15,562) ($23)Net Agency Cost ………… $1,668,713 $1,916,792 $1,787,567 $1,826,724 ($90,068) $39,157
FundingCity ……………………… 785,992 884,781 912,542 947,366 62,585 34,824 Non-City ………………… 882,721 1,032,011 875,025 879,358 (152,653) 4,333
Personnel (includes FTEs at fiscal year-end)City ……………………… 4,603 5,352 5,256 5,291 (61) 35 Non-City ………………… 1,255 1,505 1,249 1,287 (218) 38 Total ……………………… 5,858 6,857 6,505 6,578 (279) 73
Summary of Agency Financial Data The following table compares 2018 Executive Budget with the 2018 Preliminary Budget, the 2017 forecast and actual expenditures for 2016, including fringe benefits, pensions, and debt service.
2018Increase/(Decrease)($ in 000's)
Standard + MA 4/23/2017 5:25 PMAgency: Dept Health Men Hyg

Analysis of Agency Budgets Fiscal Year 2018
139
Programmatic Review and Service Impact
Take Care New York (TCNY) is a comprehensive health policy for New York City laying out the Department’s plans to reduce health disparities and promote health equity, advance health promoting policies and activities, and to create, sustain, and strengthen collaborations with partners.
The Department first launched TCNY in 2004. By 2008, the City had achieved significant improvements in health, and had surpassed goals in four of the TCNY priority areas. In 2009, the Department launched TCNY 2012 to build on those successes. The Department made progress or surpassed goals in all 10 of its priority areas.
In 2015, the Department released its new iteration, TCNY 2020, setting new targets to achieve by the year 2020. Its focus is to improve every community’s health and to make greater strides in groups with the worst health outcomes, so that our City becomes a more equitable place for everyone. Unlike previous plans, TCNY 2020 includes not only health factors, but also social factors that impact health, such as high school graduation. It also includes equity targets to ensure special attention is given to reducing health disparities.
During the fall and winter of 2015 and 2016, the Department held events in dozens of neighborhoods across the five boroughs to share TCNY 2020 and to speak with community members about their neighborhood’s health priorities. This input will help guide how the Department continues to strategically collaborate with partners to plan for action and to develop strategies for achieving the 2020 targets.
Mental Hygiene Services The Department seeks to prevent and address mental
illness, substance use, and developmental disabilities and delays among New York City’s children and adults. The Department is involved in planning, and provides funding and oversight to mental health, developmental disabilities, and alcohol and drug abuse prevention services. Hundreds of thousands of consumers are served annually through contracts and agreements with community-based provider agencies, hospitals and other City agencies. Key activities include, but are not limited to, continued implementation of supportive housing through the New York-New York III initiative, improved care coordination for individuals with serious
mental illness and children with serious emotional challenges, addressing the epidemic of opioid overdoses due to prescription opioids and heroin, and planning for the transition of Medicaid behavioral health services to Medicaid Managed Care. Additionally, the Department is a leader in ThriveNYC, a Road Map for mental health services in the City. ThriveNYC is an unprecedented strategy and set of initiatives by the City to approach mental health as a comprehensive public health challenge involving many City agencies, including the Department of Health and Mental Hygiene.
Mental Health
Through contracting directly with New York City service providers, the Division manages the development, implementation, and oversight of the delivery of treatment, housing, crisis, advocacy, care coordination, and mental health rehabilitation services. The Department also administers the Assisted Outpatient Treatment program (mandated by Kendra’s law). For children and their families, the Department provides oversight to a continuum of mental health services including prevention, mental health promotion, treatment, case management, crisis, family support, and school-based mental health services. Through these contracted programs and through its policy, planning and advocacy work, the Department seeks to facilitate access, improve the quality of care, and promote resilience and recovery for New Yorkers with mental illness.
Alcohol and Drug Use Prevention, Care and Treatment
The Department seeks to prevent the development of alcohol and drug use problems, to educate and assist individuals to reduce problem use, to access long-term treatment for substance use disorders, and to prevent health risks related to use. The 2018 budget reflects continued commitment to prevent the problems of opioid addiction and overdose through its naloxone distribution program, expansion of effective treatment of opioid addiction, and educating prescribers and the public. Through its work with contracted programs and stakeholders, and policy and planning work, the Department seeks to improve care and treatment of people with substance use disorders (addiction) in a continuum of settings: community, primary care, specialty (addiction) care, and harm reduction.

Analysis of Agency Budgets Fiscal Year 2018
140
Developmental Disabilities
The Department oversees locally contracted services supporting the needs of children and adults with intellectual disabilities, autism spectrum disorders, cerebral palsy, epilepsy and other developmental disabilities. Contracted programs provide recreation, afterschool, respite and other family support services, as well as clinic and employment support services.
Public Health Services
Center for Healthy Equity
The Center for Health Equity aims to strengthen and amplify the Health Department’s work to eliminate health inequities rooted in historical and contemporary injustices and discrimination, including racism. The Center for Health Equity works in collaboration with community-based partners to build on work the District Public Health Offices and others have pursued over the years. The Center for Health Equity has five distinct approaches: 1) Support the Health Department’s internal reform in becoming a racial justice organization, 2) Make injustice visible through data and storytelling. 3) Invest in key neighborhoods whose health inequities are a result of the historical, political, social and physical factors that affect it. 4) Advance a health equity perspective in all policy approaches. 5) Amplify community power via collective action and volunteerism.
As part of its approach to invest in key
neighborhoods via place- based efforts, the Center for Health Equity’s Neighborhood Health Action Center initiative is revitalizing underutilized DOHMH buildings by co-locating federally qualified health centers, public hospital clinical services, community-based organizations and service providers who will move beyond current models of collaboration to better serve community members, act as an engine of improved asset linkages, and identify gaps in coverage and reduce duplication.
The Center for Health Equity’s Office of Faith
Based Initiatives (OFBIs) leads the Department’s City-wide effort to incorporate faith-based organizations into its programming, planning and advocacy efforts. As one of the Center for Health Equity’s collective action approach, OFBI aims to create sustainable partnerships within the faith community to better coordinate a neighborhood response that aims to address health inequities in New York City.
The Shop Healthy initiative seeks to translate healthy eating work to meaningful practice by engaging communities - including residents, food retailers, and food suppliers and distributors - to increase access to healthy foods. Shop Healthy is aligning itself to be a convener of organizations working in the food retail world. Shop Healthy NYC’s main focus is on those neighborhoods with high rates of obesity and limited access to nutritious foods. Shop Healthy NYC Neighborhoods include: Fordham, West Farms, Hunts Point, Mott Haven Longwood, East Tremont and Claremont-Morrisania in the Bronx; East New York, Brownsville and Bed-Stuy in Brooklyn; and East Harlem in Manhattan.
The Harlem Health Advocacy Partners initiative
was created to reduce disparities in chronic diseases among public housing residents and to improve their long-term health and quality-of-life. The program trains Harlem residents and others with strong neighborhood ties to serve as community health workers and health advocates. Community health workers help residents set health goals, manage existing chronic diseases and address barriers to good health. Health advocates help residents find affordable or low-cost health insurance, understand medical bills and review health plan options. The initiative has begun in five New York City Housing Authority developments in East and Central Harlem.
Cure Violence (CV) is an evidence-based anti-violence program that uses a public health prevention approach to reduce shootings and killings among high-risk youth, and change social norms that reinforce violence. The approach employs violence interrupters and outreach workers who have themselves experienced violence to act as “credible messengers” of anti-violence messages. Program staff works within the community to identify and resolve conflicts before they escalate, to prevent retaliation when violence erupts, and to re-direct the highest-risk youth away from life on the streets. CV programs also mobilize community residents to raise awareness about violence and to promote community norms that reject violence. Select CV programs include a unique hospital component which brings the violence interruption and mediation service to the hospital to reduce the risk for retaliatory violence. Currently, there are 18 CV replication programs in 17 neighborhoods in New York City, and partnerships with 4 hospitals in place.
Disease Control
The Department safeguards the health of New Yorkers through the identification, surveillance,

Analysis of Agency Budgets Fiscal Year 2018
141
treatment, control, and prevention of infectious diseases and protects the health of citizens during disease outbreaks.
HIV/AIDS Prevention and Control remains a critical focus of the Department. Increasing HIV testing among New York City (NYC) residents, linking HIV/AIDS patients to care and helping them to achieve viral suppression, and providing combination prevention methods, remain priorities of the Department and are in alignment with the City’s Ending the Epidemic (EtE) in New York by 2020.
As part of the citywide New York Knows initiative, the Department works to provide voluntary HIV testing to City residents, make HIV testing a routine part of health care, identify the undiagnosed and link them to care, and connect those that test negative to prevention services as needed. The Department is focusing on a combination of prevention services including the continued provision of condoms citywide and the simultaneous promotion of biomedical prevention methods such as pre- and post-exposure prophylaxis.
For City residents living with HIV, the Department works to link them to care and achieve viral suppression. In order to address heath disparities, the Department works closely with populations with disproportionate rates of HIV infection through a variety of educational, outreach, and prevention strategies. The Department has adopted an HIV neutral strategy, focusing less on HIV-status and more on the use of both treatment and biomedical prevention methods to prevent HIV acquisition. In 2018, the Department will continue work to improve the quality of HIV care in the City and decrease HIV related mortality, promote a bill of rights for LGBTQ persons, and increase uptake of pre-exposure prophylaxis among women.
Sexually Transmitted Disease Control provides direct clinical and partner services for sexually transmitted infections (STIs) and HIV, monitors and reports disease trends for STIs, provides education and training to providers and community groups, and conducts research and develops policies to improve New Yorkers’ sexual health. The Department operates eight sexual health clinics citywide that serve anyone 12 years or older regardless of ability to pay, parental involvement, insurance coverage or immigration status. Sexual health clinics provide low to no-cost STI and HIV testing, treatment and prevention services; immunizations; cancer prevention, reproductive health
and contraceptive services; behavioral health services; and navigation for referrals and follow-up care. As part of the City’s EtE efforts, sexual health clinics have expanded hours, services and access to “Express Visits” for all New Yorkers, which means that individuals can receive screening services without waiting to see a doctor. Through EtE, sexual health clinics now also offer Pre-Exposure Prophylaxis (PrEP) and Post-Exposure Prophylaxis (PEP), which are biomedical interventions to prevent new HIV infections among patients at risk of infection. For newly identified infections, immediate initiation of anti-retroviral treatment is provided through the JumpstART program. The Bureau also convenes a Sexual Health Advisory Group with the goal of informing best practices in sexual health and related policy and strengthening bi-directional communication between the Department, providers and community networks to foster a culture of accountability in service delivery and access.
Tuberculosis (TB) cases have dramatically declined since the City’s 1990 TB epidemic; however, the rate of decline has slowed and the City continues to have one of the highest rates of TB in the US. Today, the majority of TB cases in the City emerge from the reservoir of infected individuals in the community who may be unaware of their risk for developing tuberculosis. TB disproportionately affects foreign-born New Yorkers and U.S.-born minorities. The Bureau of Tuberculosis Control provides direct patient care for TB in four Health Department clinics throughout the City. Services in the TB clinics include TB testing, chest radiograph, treatment and monitoring, and testing HIV. Patients diagnosed with tuberculosis are case-managed through the duration of treatment – generally six to nine months – regardless of where they are treated, to ensure completion of appropriate treatment. Further, the Bureau identifies and evaluates persons at high risk for TB and offers preventive treatment, if appropriate. The public health activities of the Bureau include surveillance, case management and contact investigation, directly observed therapy, medical consultation, outbreak detection, evaluation of newly arrived immigrants and refugees, education and outreach. The Bureau is increasing its collaborative efforts with medical providers and communities to raise awareness and reduce disparities. Further, the Bureau is expanding the use of latest technology in TB testing and diagnosis, providing more effective treatment options, and offering more efficient and patient-centered methods for delivering services.

Analysis of Agency Budgets Fiscal Year 2018
142
Established in 1892 to control a diphtheria outbreak, the New York City Public Health Laboratory (PHL) was the world's first Municipal Bacteriological Laboratory. Since its inception, the PHL has expanded to provide a wide variety of clinical and environmental laboratory testing services. The laboratory continues to safe-guard the health of all City residents by providing testing that addresses the needs of the Department and its community partners. The laboratory also collaborates with other city agencies, as well as State and federal partners to respond to public health challenges in the City and beyond.
In addition to its role as a national leader in public health laboratory science and biosafety in laboratory diagnostics, one focus of the PHL is testing for pathogens of public health significance. PHL tests for traditional infectious diseases such as HIV and other sexually transmitted infections, tuberculosis, influenza, and agents of foodborne illnesses, and also responds to any public health emergencies that threaten the City. In 2014, the PHL was one of the first laboratories to implement Ebola testing and diagnosed the City’s first case. The PHL was integral in pinpointing the source of the Legionella outbreak in the summer of 2015. The PHL was also on the forefront of the Zika virus response and the response to the recent outbreak of avian influenza H7N2 in cats in the animal shelter system.
The Bureau of Immunization conducts activities to promote the vaccination of all New Yorkers and prevent the occurrence and transmission of vaccine-preventable diseases. Key activities include vaccine distribution, clinical services, provider outreach and support, public communication, monitoring immunization coverage and school immunization compliance, prevention of perinatal hepatitis B infection, surveillance of vaccine-preventable diseases, outbreak response to prevent or control the spread of disease, and maintaining the Citywide Immunization Registry (CIR). The Bureau will continue to conduct vaccine accountability activities, promote influenza vaccination, work to increase coverage with HPV vaccine, which remains underutilized, promote CIR online tools to help achieve on-time vaccination of children and adolescents, and implement expanded school vaccine requirements. In addition, the Bureau will promote a recently deployed secure internet-based portal, MyVaccineRecord, which allows parents and guardians to access official reports of their children’s immunization records.
The Bureau of Communicable Diseases (BCD) monitors and investigates more than 70 infectious
diseases in New York City in order to rapidly detect, characterize and respond to infectious disease threats and to prevent or control ongoing transmission. BCD is responsible for a wide range of diseases (from anthrax to Zika virus), including those transmitted person to person, by contaminated food or water, animal contact, mosquito and tick bites as well as the potential threat of bioterrorism or novel influenza strains (e.g., avian influenza viruses such as H7N2). Key activities include case, contact and outbreak investigations to determine source of exposures and prevent spread to others. The Bureau also conducts routine, systematic analyses of notifiable disease data to rapidly detect outbreaks and track disease trends, characterizes clinical and local epidemiologic features and identifies common exposures and populations at risk to prioritize prevention efforts and shares summary data with both internal and external partners. Additionally, the Bureau provides consultation to the medical and animal health communities and the public on the recognition, prevention and control of communicable diseases. Lastly, the Bureau maintains timely and informative syndromic surveillance systems to routinely monitor illness patterns and to provide situational awareness during public health emergencies.
In 2017, a major priority is hepatitis C, which infects an estimated 146,000 New Yorkers. The Bureau is working to improve tracking of the hepatitis C epidemic, promote testing, educate providers and patients, and advance new models of linking patients with chronic hepatitis C to medical care and treatment, now that curative oral drug regimens are readily available.
Environmental Health Services
The Department’s Division of Environmental Health Services (EHS) assesses, investigates, and acts on a wide range of environmental concerns to protect the health of New Yorkers. EHS conducts surveillance of environmental-related disease; assesses risk from exposure to potential environmental and occupational hazards; inspects child care facilities, restaurants, mobile food carts and other permitted entities to protect the public, children and diners from safety and health hazards. EHS responds to complaints and provides data and education to stakeholders throughout the City to understand the risks from environmental exposures and promote actions and policies to improve the City’s air quality, maintain safe drinking and recreational water, control mosquitoes and rats, and promote housing quality. In 2017, 92 percent of the City’s restaurants

Analysis of Agency Budgets Fiscal Year 2018
143
are posting ‘A’ grades, municipal animal shelters are funded at record levels, contributing to a live release rate of 89%, and the City continues to make improvements in outdoor air quality by implementing measures in the City’s sustainability plan, OneNYC. The Department continues to create and improve upon easy-to-read guides in multiple languages to help small businesses comply with agency regulations.
The 2018 budget reflects continued commitment to these and other initiatives. As part of the Mayor’s effort to provide parents with information on the health and safety of child care centers, the Department will begin displaying child care inspection results at City-regulated centers in 2018. The Department will also collaborate with the Department of Education to monitor water quality in City schools.
Emergency Preparedness and Response
The Department seeks to promote the City’s ability to prevent, prepare for, respond to, and recover from health emergencies. The Department’s Office of Emergency Preparedness and Response (OEPR) prepares the agency for emergency responses that impact the public’s health and over the past two years the Department has activated its Incident Command System (ICS) in response to Legionella, Ebola, Zika and most recently the H7N2 Animal Shelter Outbreak. To increase the City’s capacity to address infectious disease threats, DOHMH partners with the City healthcare system to ensure the ability to assess/treat patients with emerging infectious disease and strengthening the capacity for prevention of healthcare associated infections. The Department also continues to strengthen the general capacity of the healthcare system, including hospitals, healthcare coalitions, long term care and primary care facilities, to effectively respond to emergencies in a manner that promotes continuity of care for some of the most vulnerable New Yorkers.
Additionally, the Department continues to build the City’s capacity to stand up a post-emergency canvassing operation (PECO) for New Yorkers sheltering in place after an emergency through conducting field exercises and trainings, and developing a small-scale operational plan and Citywide staffing list that includes thousands of staff from over 30 agencies. The Department continues to build its capacity to rapidly distribute lifesaving medication to all New Yorkers, including training thousands of City employees to ensure rapid
opening of points of dispensing (PODs) in the event of an emergency requiring mass prophylaxis. The Department continues to enhance community resilience through building sector-based networks via partnerships with community-based organizations serving as a preparedness lead for their sector (e.g. faith-based and social services organizations). Through these efforts, the agency will continue to build the City’s ability to recover from any emergency that impacts the health of New Yorkers.
Epidemiology
The Division of Epidemiology provides epidemiologic information, support and training to inform policy and program decision-making, monitor health conditions, and improve delivery of public health services in New York City. Key activities in the Division include:
• Systematic collection, analysis, and dissemination of data on health issues citywide and among special populations and provision of training and support for specialized analyses and targeted studies;
• Registration, processing and analysis of all vital events in New York City, including births, deaths, and spontaneous and induced terminations of pregnancy;
• Enhancement of public health knowledge and skills of public health staff, students and trainees through in-person and e-learning courses, internships and lecture series;
• Education of healthcare providers in New York City and training of medical students and clinical residents to improve public health knowledge and skills; and
• Establishment and maintenance of the World Trade Center Health Registry - a cohort of more than 71,000 people directly exposed to the WTC disaster - to identify and track the long-term physical and mental health effects and unmet health needs of 9/11.
In the coming year, the Division of Epidemiology will work in collaboration with other programs within the Department to conduct a child health survey; develop infrastructure for linkage of administrative data; and finalize the development of eVital, the agency’s new electronic vital events reporting system.

Analysis of Agency Budgets Fiscal Year 2018
144
Family and Child Health
The Department’s Division of Family and Child Health is charged with the creation and oversight of programs, policies, services, and environments that support physical and socio-emotional health, and promote primary and reproductive health services, health equity, social justice, safety and well-being for New York City families and children. The Division is comprised of the Bureau of Maternal, Infant and Reproductive Health (BMIRH), the Office of School Health (OSH), a Bureau of Administration, and the Bureau of Early Intervention (BEI).
The vision of the Division of Family and Child Health is that every child, woman and family in New York City is given the opportunity to reach their full health and developmental potential. To advance this vision, the Division implements evidence-based and evidence-informed programs, services and policies, and conducts innovative research and ongoing surveillance to achieve equitable and improved maternal, infant and reproductive health outcomes; promote early childhood health and development and reduce adverse childhood experiences for young children; and assure that schoolchildren are healthy and ready to learn every day.
As part of its focus on improving maternal, infant and reproductive health, the Division continues to work with City hospitals through the New York City Breastfeeding Hospital Collaborative to implement evidence-based practices to increase breastfeeding initiation, duration and exclusivity. The Division provides home visiting services for mothers, infants and families, including those residing in homeless shelters, through Nurse Family Partnership, the Newborn Home Visiting Program and the Newborn Home Visiting Program’s Shelter Initiative Model, which was fully implemented in 2016. The Division also partners with over 50 community based organizations through its Sexual and Reproductive Justice Community Engagement Group, to implement initiatives to assure that all people have the power and resources to make healthy decisions about their bodies, sexuality and reproduction. A NYC Birth Equity Initiative was launched in 2017 to implement a multifaceted strategy to achieve the OneNYC goal of reducing racial disparities in infant mortality and to reduce disparities in severe maternal morbidity and maternal mortality. The Division maintains its multifaceted approach to ensuring that all individuals have access to quality, comprehensive services, including the full range of FDA-approved contraceptive methods, and resources
so that they can make informed decisions about their sexual and reproductive health. This includes working with hospitals through the Quality Improvement Network for Contraceptive Access to increase access to contraception in post-partum, post-abortion and primary care settings.
The Office of School Health (OSH) is a joint
Program of the Department of Education and the Department of Health and Mental Hygiene responsible for promoting the health of the 1.3 million school children enrolled in approximately 1,800 public and non –public schools in the New York City. Services to students include case management of chronic health problems, preventive health screening, urgent care, medication administration, preventive counseling, health education, referral for care and assurance of ongoing effective treatment.
The Division maintains its multifaceted approach to reduce unintended pregnancy, including providing school-located services to increase the number of adolescents receiving high quality reproductive health services via the School-Based Health Center Reproductive Health Project and Connecting Adolescents to Comprehensive Healthcare (CATCH) program. Both of these programs provide critical school-located reproductive health services to high school students. The Office of School Health Community Schools initiative, which increases vital school-located services in 130 schools serving high-need students, also provides on-site expanded vision, asthma case management, oral health, and mental health services.
The Early Intervention (EI) program identifies and serves children from birth to age three years with developmental delays or disabilities and supports families to manage their children’s needs and support their development. The Division coordinates the development of each family’s Individualized Family Service Plan and authorizes all services such as speech therapy, special instruction, and physical and occupational therapy to more than 30,000 children and their families annually. All EI services are voluntary and provided at no cost to families, regardless of income, immigration or insurance status.
Prevention and Primary Care
The Department’s Division of Prevention and Primary Care works to advance population health through supporting access to quality health services and introducing system changes that promote disease
Analysis of Agency Budgets Fiscal Year 2018
145
prevention and control, with an emphasis on pursuing opportunities to integrate clinical and population health strategies. Division initiatives include a diverse portfolio such as electronic health record implementation and clinical quality care improvement, Medicaid enrollment assistance and advocacy for overcoming barriers to health care access, and innovative nutrition and tobacco control policy development and implementation. The Division also focuses on key issues including hypertension and equitable access to health care.
The Primary Care Information Project’s (PCIP)
empowers healthcare providers to prevent and mitigate the burden of chronic disease through data, evidence-based guidelines, payment reform and technology. PCIP’s analytic and technological expertise enables timely feedback on quality measures (e.g. Prevention and Primary Care Dashboards) to 1,500 clinicians serving over a million patients. Since 2010, PCIP has served as the New York City Regional Electronic Adoption Center for Health (NYC REACH) providing the experience and backbone support to adopt delivery models that emphasize care coordination, patient engagement, and community resource linkages to over 23,000 provider members across a network of organizations, including over 1,400 independent practices, 114 community health centers, and 68 hospital-based ambulatory clinics.
The Bureau of Primary Care Access and Planning
(PCAP) creates and implements policy, program and research interventions that maximize health insurance coverage opportunities and increase access to affordable, high quality, and coordinated primary care with a strong focus on health equity. The bureau comprises two offices: the Office of Health Insurance Services for on-the-ground programmatic work related to health coverage and access, and the Office of Health Planning for policy, data and research activities. PCAP serves as the agency’s subject matter experts on healthcare reform, including post-election impacts on the Affordable Care Act.
The Bureau of Chronic Disease Prevention and
Tobacco Control (BCDPTC) strives to reduce the burden of chronic disease on New Yorkers, including heart disease, cancer, and diabetes, with a particular focus on reducing gaps in health equity. The Bureau leads changes to systems, policies, and environments and provides New Yorkers with information and resources to help them make healthy choices. The Bureau focuses on addressing three key risk factors
that lead to chronic disease - poor nutrition, inadequate physical activity, and tobacco use - while also working to leverage clinical tools and settings to promote public health. The Bureau will continue to support increased access to fruits and vegetables and healthy beverages while educating New Yorkers on the risks of consuming high-sodium menu items. The Bureau promotes opportunities for physical activity by integrating health centric approaches into the design of housing, schools, transportation, and public/community spaces. The Bureau will continue to prevent and reduce the use of tobacco and improve access to smoking cessation resources, by developing and disseminating campaigns to educate New Yorkers, working to include cessation support in health care systems, and protecting City residents from second-hand smoke. The Bureau is also working on Worksite Wellness initiatives in partnership with the Office of Labor Relations aimed at leveraging the worksite to promote health for all city employees and their dependents. The Bureau leverages evidence-based clinical tools and provider engagement in order to increase risk factor awareness and chronic disease prevention and management.
Office of Chief Medical Examiner
Working closely with the New York Police Department (NYPD) and the District Attorney’s Offices, the independent Office of Chief Medical Examiner (OCME) is responsible for the investigation of persons who die within New York City from criminal violence; by casualty or by suicide; suddenly, when in apparent good health; when unattended by a physician; in a correctional facility; or in any suspicious or unusual manner. The OCME is also responsible for coordinating the burial of unclaimed or unidentified bodies of adults and children each year.
The OCME is on the forefront of identifying trends in the patterns of death and provides the data needed to monitor potential public health outbreaks and the spread of infectious diseases. More routinely Medical Examiners discover undiagnosed tuberculosis and meningitis at autopsy and provide vital statistics on deaths related to HIV and AIDS, Sudden Infant Death Syndrome (SIDS), and alcohol and drug-related deaths, including opioids. In 2018, the OCME will receive $1.6 million under HealingNYC to provide the city with more accurate data on the opioid epidemic through additional toxicology testing, medical examination, and forensic investigations.

Analysis of Agency Budgets Fiscal Year 2018
146
Capital Review
The 2018-2027 Ten-Year Capital Strategy totals $537.1 million which includes $379.2 million in the 2018-2021 Four-Year Plan. The plan includes allocations for renovating facilities, new construction, information technology improvements, and the purchase of equipment. The focus of the Department’s 2018-2027 Ten-Year Capital Strategy is to identify, prioritize and support immediate needs for code compliance and other renovations at the City’s public health facilities and technology investments that are essential in providing critical public health services.
The table below shows capital commitments by program area over the 2016 - 2021 period.
Capital Commitments($ in 000’s)
_______________________________________________________________________________________________________________________________________________________________________________________________________________
2016 2017 2018 2019 2020 2021 Actual Plan Plan Plan Plan Plan ________________________ ___________ ____________ ________________________ _______________________ ________________________ _______________________
City All City All City All City All City All City All Funds Funds Funds Funds Funds Funds Funds Funds Funds Funds Funds Funds _______________________________________________________________________________________________________________________________________________________________________________________________________________
Administration ........................... $-66 $-66 $- $- $- $- $- $- $- $- $- $- Animal Care ............................... 239 239 4,572 4,572 18,115 18,115 44,576 44,576 27,530 27,530 4,000 4,000 Information Technology ............. 4,494 5,943 8,722 12,369 10,178 12,978 4,779 6,542 2,589 3,556 3,500 5,000 Laboratories ............................... -75 -75 - - 75 75 - - - - - - OCME ........................................ 3,841 3,841 12,384 12,720 17,614 17,614 17,099 17,099 6,518 6,518 4,463 4,463 Equipment .................................. 11,898 11,882 69,599 70,508 16,662 16,952 6,654 6,954 1,780 1,780 700 1,000 Renovation ................................. 2,138 2,138 36,527 36,527 97,590 97,590 33,060 33,060 29,092 29,092 24,659 24,659 ___________ ___________ ___________ ___________ ___________ ___________ ___________ ___________ ___________ ___________ ___________ ___________
Total ........................................... $22,469 $23,902 $131,804 $136,696 $160,234 $163,324 $106,168 $108,231 $67,509 $68,476 $37,322 $39,122 ========= ========= ========= ========= ========= ========= ========= ========= ========= ========= ========= =========
_______________________________________________________________________________________________________________________________________________________________________________________________________________
The OCME houses the nation’s largest public forensic DNA laboratory, responsible for performing DNA analysis on nearly every category of crime occurring in the City, including homicide, rape, property crime, and weapons cases. Due to the large volume of casework the laboratory processes each year, the OCME is the largest contributor of forensic crime scene DNA profiles in the country. These profiles are uploaded to the national FBI DNA database, CODIS. The DNA Laboratory is also the only public laboratory in the country accredited to perform High Sensitivity Testing, a test requiring a very small amount of DNA. The OCME provides this type of test to other jurisdictions in the country that do not have the capabilities of OCME’s laboratory.
The OCME also plays a key role in planning and leading efforts in the event of a mass fatality incident.
Working closely with the NYPD, OEM, DEP, and FDNY, the OCME has developed inter-agency teams and protocols to respond to and mitigate the effects of a mass fatality disaster. To this end the OCME is spearheading a multi-state effort to prepare the region in the event there is another large scale incident in the Metropolitan New York area such as a plane crash, terrorist attack, or an outbreak of pandemic influenza. In the case of an infectious disease outbreak, the health of survivors and the family members of the deceased are of paramount importance to stem possible spread.
Finally, the OCME is the custodian of all unclaimed or unidentified World Trade Center (WTC) remains and will continue to identify additional victims of the World Trade Center Disaster.

Analysis of Agency Budgets Fiscal Year 2018
147
Highlights of the 2018 Capital Commitment Plan
The Department’s 2018 Capital Commitment Plan features several important projects, including:
• The renovation of the Public Health Laboratory ($72.5 million).
• Two new full-service animal care centers in the Bronx and Queens, upgrades to the Brooklyn animal care center and other animal welfare investments ($18.1 million).
Highlights of the 2018-2027 Ten-Year Plan Capital Strategy
The Department’s 2018-2027 Ten-Year Capital Strategy features several important projects, including:
• The renovation of the Public Health Laboratory ($177.5 million).
• The renovation of various public health facilities ($107.4 million).
• Two new full-service animal care centers in the Bronx and Queens, upgrades to the Brooklyn animal care center and other animal welfare investments ($94.7 million).
• Information technology improvements, which include upgrades to the Department’s network and security systems, and the purchase of critical technologies needed to maintain and improve services ($70 million).
• Purchase of equipment and vehicles, and upgrades of IT infrastructure within the Office of Chief Medical Examiner ($28.6 million).

Analysis of Agency Budgets Fiscal Year 2018
148
FIRE DEPARTMENT
The Fire Department is responsible for protecting the lives and property of the citizens of New York City while responding to fire, medical and other emergencies, and investigating building hazards. The Fire Department extinguishes fires, promotes fire prevention awareness, investigates suspicious fires, provides ambulance and emergency medical services, and conducts building safety inspections. The Department currently has 357 fire units that provide fire, rescue, and emergency medical services. The agency also promotes fire prevention through public outreach and enforcement of New York City’s Fire Code. The Department’s Fire Marshals investigate fires and apprehend arsonists. The Bureau of Emergency Medical Services (EMS), assisted by the Certified First Responder (CFR) trained personnel responding from engine companies, provides pre-hospital emergency medical care and ambulance transport, where required.
Financial Review
The Fire Department’s 2018 Executive Budget provides for operating expenses of $2.0 billion, a decrease of $42 million from the amount forecasted for 2017. This variance is driven largely by Federal grant funding that has not been reflected in 2018.
Capital commitments of $256.6 million are also provided in 2018. This represents a decrease of $20.3 million from the amount forecasted for 2017. The 2017 forecast is higher due to the anticipated completion of a greater number of facility projects in 2017.
Revenue Forecast
The Fire Department issues permits and collects fees for the inspection of fire suppression and electrical systems, places of public assembly, laboratories, high-rise buildings, and the storage and use of combustible materials. In addition, the Department realizes revenues from fees charged to out-of-state fire insurers that issue policies in New York City and to private fire alarm companies. In 2018, the revenue estimate for the Fire Department is $96.9 million.
The Department also collects revenue from Emergency Medical Services (EMS) ambulance transports. In 2018, total EMS revenue is projected at $205.1 million.
Expense Budget Highlights
Budgetary Priorities: Providing Core Services
• Continue to provide fire extinguishment and rescue services, investigate suspicious fires, promote fire prevention, and conduct building safety inspections.
• Continue to provide on-site emergency medical care and ambulance transport services Citywide.
• Maintain the Department’s public CPR training program through 2018, in partnership with NYC Service.
• Add 9 replacement ambulance tours previously run by Montefiore Medical Center, at a cost of $2.2 million.
• Provide funding for resources to support growing EMS operations including instructors and training materials for the EMS Academy and mandated medications, at a cost of $0.7 million.
• Provide 15 positions for Fleet Services, at a cost of $1.1 million.
• Provide 8 positions for a court mandated Fire Cadet program, along with OTPS funding for replacement radios, replacement electronic Patient Care Report (ePCR) system and mandated bunker gear and breathing apparatus cylinders, at a cost of $19.9 million.

Analysis of Agency Budgets Fiscal Year 2018
149
2017 20182016
Actual2017
ForecastPreliminary
BudgetExecutive
Budget Forecast Preliminary
BudgetExpenditures
Salary and Wages ……….. $1,731,873 $1,762,165 $1,763,168 $1,776,653 $14,488 $13,485Fringe Benefits …………… 16,873 37,447 28,706 28,799 (8,648) 93 OTPS ……………...……… 225,771 263,554 188,656 215,232 (48,322) 26,576 Total ……………...……… $1,974,517 $2,063,166 $1,980,530 $2,020,684 ($42,482) $40,154
FundingCity ……………...………… $1,707,700 $1,791,350 $1,732,148 $1,766,906 ($24,444) $34,758Other Categorical Grants … 181,437 175,063 205,104 205,104 30,041 — IFA ……………...………… 433 602 703 703 101 — State ……………...……… 2,067 2,187 1,800 1,800 (387) — Federal CD ……………...… — — — — — — Federal Other ……………. 82,275 92,042 40,775 46,171 (45,871) 5,396 Intra-City Other …………… 605 1,922 — — (1,922) — Total ……………...……… $1,974,517 $2,063,166 $1,980,530 $2,020,684 ($42,482) $40,154
Additional Costs Centrally FundedPersonal Services (PS) Fringe Benefits ………… $617,770 $655,459 $727,404 $710,389 $54,930 ($17,015) Pensions ……………...… 1,165,798 1,179,333 1,210,080 1,274,611 95,278 64,531 Other Than Personal Service (OTPS) Debt Service ……………. 126,919 144,468 150,014 151,085 6,617 1,071 Total Additional Costs $1,910,487 $1,979,260 $2,087,498 $2,136,085 $156,825 $48,587
FundingCity ……………...………… 1,852,598 1,934,594 2,044,327 2,092,236 157,642 47,909 Non-City ……………...…… 57,889 44,666 43,171 43,849 (817) 678
Full Agency Costs (including Central Accounts)Salary and Wages ………… $1,731,873 $1,762,165 $1,763,168 $1,776,653 $14,488 $13,485Fringe Benefits …………… 634,643 692,906 756,110 739,188 46,282 (16,922) Pensions ……………...…… 1,165,798 1,179,333 1,210,080 1,274,611 95,278 64,531 Total PS ……………...…… $3,532,314 $3,634,404 $3,729,358 $3,790,452 $156,048 $61,094
OTPS ……………...……… $225,771 $263,554 $188,656 $215,232 ($48,322) $26,576Debt Service …………….. 126,919 144,468 150,014 151,085 6,617 1,071 Total OTPS $352,690 $408,022 $338,670 $366,317 ($41,705) $27,647
Total Agency Costs ……… $3,885,004 $4,042,426 $4,068,028 $4,156,769 $114,343 $88,741Less Intra-City …………… $605 $1,922 $— $— ($1,922) $—Net Agency Cost ………… $3,884,399 $4,040,504 $4,068,028 $4,156,769 $116,265 $88,741
FundingCity ……………...………… 3,560,298 3,725,944 3,776,475 3,859,142 133,198 82,667 Non-City ……………...…… 324,101 314,560 291,553 297,627 (16,933) 6,074
Personnel (includes FTEs at fiscal year-end)City ……………...………… 16,768 16,926 16,915 17,010 84 95 Non-City ……………...…… 77 29 25 26 (3) 1 Total ……………...……… 16,845 16,955 16,940 17,036 81 96
Summary of Agency Financial Data The following table compares 2018 Executive Budget with the 2018 Preliminary Budget, the 2017 forecast and actual expenditures for 2016, including fringe benefits, pensions, and debt service.
2018Increase/(Decrease)($ in 000's)
Standard 4/23/2017 7:50 PMAgency: Fire Department

Analysis of Agency Budgets Fiscal Year 2018
150
Programmatic Review and Service Impact
Capital Review
The 2018-2027 Ten-Year Capital Strategy totals $1.2 billion, which includes $663.7 million in the 2018-2021 Four-Year Plan. This funding will be used for the purchase of fire-fighting apparatus, support vehicles, fire suppression and emergency medical equipment, the renovation and modernization of firehouses and other facilities, and the upgrade and replacement of computer and communications systems. The table below reflects capital commitments by program area over the 2017-2021 period.
Capital Commitments($ in 000’s)
_______________________________________________________________________________________________________________________________________________________________________________________________________________
2016 2017 2018 2019 2020 2021 Actual Plan Plan Plan Plan Plan ________________________ ___________ ____________ ________________________ _______________________ ________________________ _______________________
City All City All City All City All City All City All Funds Funds Funds Funds Funds Funds Funds Funds Funds Funds Funds Funds_______________________________________________________________________________________________________________________________________________________________________________________________________________
Communications ................... $189 -$338 $52,323 $92,337 $20,080 $71,148 $6,374 $57,442 $10,195 $10,195 $727 $727Electronic Data Processing ... 23,654 23,648 53,792 53,792 40,185 40,185 18,000 18,000 13,000 13,000 13,050 13,050Reconstruction/Modernization of Facilities ......................... 94,308 92,094 86,345 88,179 63,390 63,500 48,250 48,250 30,250 30,250 25,000 25,000Vehicles and Equipment ....... 26,283 18,091 41,211 42,658 81,820 81,820 54,440 54,440 55,151 55,151 81,551 81,551 ___________ ___________ ___________ ___________ ___________ ___________ ___________ ___________ ___________ ___________ ___________ ___________
Total ...................................... $144,435 $133,495 $233,671 $276,966 $205,475 $256,653 $127,064 $178,132 $108,596 $108,596 $120,328 $120,328 ========= ========= ========= ========= ========= ========= ========= ========= ========= ========= ========= =========
_______________________________________________________________________________________________________________________________________________________________________________________________________________
In 2018 the Department expects that 89 percent of the responses by fire companies will be to potentially life threatening medical and other non-fire emergencies. The Department’s Citywide response time to structural fires is projected to be about four minutes and 12 seconds in 2018. The Department anticipates that its ambulances will respond to over 1.4 million medical incidents in 2018.
Fire Extinguishment
The Fire Department currently provides fire and rescue operations via 357 units consisting of 198 engine companies, 143 ladder companies, seven squads, five rescue units, three marine companies, and one hazardous materials unit.
Emergency Medical Services
The Department is budgeted for 785 daily ambulance tours. Engine company personnel have received CFR training, and re-certification continues for those whose initial certification will expire.
Fire Prevention
The Bureau of Fire Prevention is responsible for enforcing the City’s Fire Code through the inspection of public and private properties.
Fire Investigation
The Bureau of Fire Investigation is responsible for investigating and determining the cause and origin of all suspicious fires, and for the apprehension of arsonists. The Department will deploy 110 City-funded Fire Marshals and 26 City-funded Supervising Fire Marshals to field duty in 2018.
Emergency Communication
The City continues work on Stage 2 of planned upgrades and enhancements to its 9-1-1 Emergency System. The majority of the capital funding for this initiative, known as the Emergency Communications Transformation Program (ECTP), is contained within DoITT’s budget. In December 2011, in collaboration with the Police Department and the Fire Department, the Office of Citywide Emergency Communications completed Stage 1, which included significant upgrades to the call-taking systems and telecommunications infrastructure, as well as co-location of the Police, Fire and EMS call taking and dispatch operations into the Public Safety Answering Center in Brooklyn. ECTP’s work on Stage 2 continues as the City develops a new, consolidated Fire and EMS dispatch system in a second, fully redundant Public Safety Answering Center (PSAC2) in the Bronx. As previously committed, NYPD call taking operations commenced at PSAC2 in June 2016, and are being followed by continued implementations of public safety systems.

Analysis of Agency Budgets Fiscal Year 2018
151
Highlights of the 2018-2027 Ten-Year Capital Strategy and 2018-2021 Four-Year Plan
• The replacement of front-line fire-fighting apparatus according to mandated replacement cycles as well as support vehicles and equipment ($650 million), inclusive of $273 million in the 2018-2021 Four-Year Plan.
• The renovation of firehouse components such as boilers, electrical systems, kitchens, roofs, bathrooms, waterproofing, apparatus doors, floors, and windows; construction, and renovation; and support facility reconstruction ($327 million), inclusive of $167 million in the 2018-2021 Four-Year Plan.
• The replacement of the building information and billing system used by Fire Prevention ($4.8 million).
• The replacement of conduit and wiring in inundation zones for the Department’s outside cable plant that was damaged during Hurricane Sandy ($113.5 million).
• The upgrade of 9-1-1 communications system infrastructure as it approaches the end of its useful life ($57.5 million), inclusive of $48 million in the 2018-2021 Four-Year Plan.
• The replacement of the telemetry radio system used by EMS Units ($6.3 million).
• The replacement of end of life information technology and communications equipment ($76.9 million), inclusive of $51.1 million in the 2018-2021 Four-Year Plan.
The 2018 Plan for the Department totals $256.6 million and highlights include:
• The replacement of front-line fire-fighting apparatus according to mandated replacement cycles as well as support vehicles and equipment ($81.8 million).
• The renovation of firehouse components such as boilers, electrical systems, kitchens, roofs, bathrooms, waterproofing, apparatus doors, floors, and windows; construction, and renovation; and support facility reconstruction ($63.5 million).
• The replacement of the building information and billing system used by Fire Prevention ($4.8 million).
• The replacement of conduit and wiring in inundation zones for the Department’s outside cable plant that was damaged during Hurricane Sandy ($56.7 million).
• The upgrade of 9-1-1 communications system infrastructure as it approaches the end of its useful life ($19.5 million).
• The replacement of the telemetry radio system used by EMS Units ($6.3 million)
• The replacement of end of life information technology and communications equipment ($24 million).

Analysis of Agency Budgets Fiscal Year 2018
152
DEPARTMENT OF SANITATION
As one of the oldest and largest public solid waste organizations in the United States, the Department of Sanitation maintains sanitary conditions and enforces sanitary compliance through street cleaning and the collection, management, recycling, and disposal of municipal solid waste in the City’s 59 Community Districts.
Financial Review
The Department of Sanitation’s 2018 Executive Budget provides for operating expenses of $1.67 billion, an increase of $66 million from the 2017 forecast, primarily due to the phase in of collective bargaining agreements, implementation of long-term waste export contracts, expansion of the curbside organics collection program, and higher costs for landfill closure construction work at Fresh Kills.
Capital commitments of $346 million are also provided in 2018, a decrease of $9 million from the 2017 Plan amount, primarily due to lower planned commitments for construction of marine transfer stations.
Revenue ForecastThe Department of Sanitation generates revenue
from contracts for the removal of abandoned vehicles from City streets and property, from concession fees on methane gas extracted from the Fresh Kills landfill, from the sale of recycled paper and metal to private processors, and from an assortment of miscellaneous fees and minor sales. The Department’s 2018 revenue estimate is $23.8 million from these sources.
Expense Budget Highlights
Budgetary Priorities: Providing Core Services
• Continue to provide curbside and containerized refuse and recycling collection service to residential properties and eligible institutions.
• Continue maintaining the cleanliness of the City by sweeping approximately 6,300 miles of streets and collecting waste from 25,000 litter baskets located at street corners Citywide.
• Respond to winter weather emergencies and keep the City’s streets clear of snow and ice. Due to a heavy snow season, the cost of clearing snow and ice was higher than the previous five-year spending average. As a result, the 2017 snow budget has been increased to $100 million. The Department’s 2018 snow removal budget is $84 million, based on the previous five-year spending average, as required by the City Charter.
Budgetary Priorities: Zero Waste
• Continue and expand curbside by appointment electronic waste collection program to all low and medium density districts by fall of calendar year 2019. The 2018 budget includes $1.1 million for this program.
• Continue and expand the organics program, which will serve all New Yorkers by the end of calendar year 2018. The 2018 budget includes an additional $10.6 million for bins, outreach, and drop-off sites for this program.

Analysis of Agency Budgets Fiscal Year 2018
153
2017 20182016
Actual2017
ForecastPreliminary
BudgetExecutive
Budget Forecast Preliminary
BudgetExpenditures
Salary and Wages ……….. $860,500 $906,766 $949,155 $937,935 $31,169 ($11,220)Fringe Benefits …………… 34,292 38,247 38,362 38,414 167 52 OTPS ……………...……… 605,885 662,669 688,245 697,680 35,011 9,435 Total ……………...……… $1,500,677 $1,607,682 $1,675,762 $1,674,029 $66,347 ($1,733)
FundingCity ……………...………… $1,474,974 $1,577,268 $1,642,804 $1,656,571 $79,303 $13,767Other Categorical Grants … 4,106 1,776 750 750 (1,026) — IFA ……………...………… 3,395 4,694 5,330 5,330 636 — State ……………...……… 25 25 25 25 — — Federal CD ……………...… 14,886 15,201 15,500 — (15,201) (15,500) Federal Other ……………. 392 1,092 — — (1,092) — Intra-City Other …………… 2,899 7,626 11,353 11,353 3,727 — Total ……………...……… $1,500,677 $1,607,682 $1,675,762 $1,674,029 $66,347 ($1,733)
Additional Costs Centrally FundedPersonal Services (PS) Fringe Benefits ………… $343,046 $366,504 $410,087 $400,649 $34,145 ($9,438) Pensions ……………...… 309,680 306,712 318,764 311,759 5,047 (7,005) Other Than Personal Service (OTPS) Debt Service ……………. 364,713 382,278 400,128 409,745 27,467 9,617 Total Additional Costs $1,017,439 $1,055,494 $1,128,979 $1,122,153 $66,659 ($6,826)
FundingCity ……………...………… 991,128 1,027,881 1,100,064 1,096,729 68,848 (3,335) Non-City ……………...…… 26,311 27,613 28,915 25,424 (2,189) (3,491)
Full Agency Costs (including Central Accounts)Salary and Wages ………… $860,500 $906,766 $949,155 $937,935 $31,169 ($11,220)Fringe Benefits …………… 377,338 404,751 448,449 439,063 34,312 (9,386) Pensions ……………...…… 309,680 306,712 318,764 311,759 5,047 (7,005) Total PS ……………...…… $1,547,518 $1,618,229 $1,716,368 $1,688,757 $70,528 ($27,611)
OTPS ……………...……… $605,885 $662,669 $688,245 $697,680 $35,011 $9,435Debt Service …………….. 364,713 382,278 400,128 409,745 27,467 9,617 Total OTPS $970,598 $1,044,947 $1,088,373 $1,107,425 $62,478 $19,052
Total Agency Costs ……… $2,518,116 $2,663,176 $2,804,741 $2,796,182 $133,006 ($8,559)Less Intra-City …………… $2,899 $7,626 $11,353 $11,353 $3,727 $—Net Agency Cost ………… $2,515,217 $2,655,550 $2,793,388 $2,784,829 $129,279 ($8,559)
FundingCity ……………...………… 2,466,102 2,605,149 2,742,868 2,753,300 148,151 10,432 Non-City ……………...…… 49,115 50,401 50,520 31,529 (18,872) (18,991)
Personnel (includes FTEs at fiscal year-end)City ……………...………… 9,567 9,743 9,965 10,128 385 163 Non-City ……………...…… 197 224 224 58 (166) (166) Total ……………...……… 9,764 9,967 10,189 10,186 219 (3)
Summary of Agency Financial Data The following table compares 2018 Executive Budget with the 2018 Preliminary Budget, the 2017 forecast and actual expenditures for 2016, including fringe benefits, pensions, and debt service.
2018Increase/(Decrease)($ in 000's)
Standard 4/23/2017 7:57 PMAgency: Department of Sanitation

Analysis of Agency Budgets Fiscal Year 2018
154
Programmatic Review and Service Impact
The Department’s main administrative and planning divisions include the Bureau Financial Management and Administration and the Bureau of Recycling and Sustainability. The two operational divisions are the Bureau of Cleaning and Collection (BCC) and the Bureau of Solid Waste Management (SWM). The Bureau of Motor Equipment (BME) and the Bureau of Building Management (BBM) provide support operations.
Long Term Solid Waste Management
In accordance with the 2006 Solid Waste Management Plan (SWMP), the Department is nearing completion of a sustainable, resilient, and equitable five borough solid waste management system to replace existing short-term contracts and reduce truck traffic and greenhouse gas emissions by relying on barge or rail export of waste in clean, sealed containers. The Department has opened the first of four converted Marine Transfer Stations at North Shore in College Point, Queens, and the other three stations are expected to open in the next three years. The Department is currently procuring long-term waste transport and disposal services for the two Brooklyn Marine Transfer stations, the last long-term contract necessary to carry out the SWMP.
For Staten Island waste, the Department operates a facility at the closed Fresh Kills landfill that containerizes waste for rail transport via a rail link connecting Staten Island to the national rail freight network. In addition, the Department maintains long term solid waste management contracts with vendors to export refuse by rail for all of the Bronx, a portion of Brooklyn, and a portion of Queens.
Bureau of Recycling and Sustainability
The Department continues its efforts to reduce the quantity of solid waste that must be disposed, consistent with the ambitious goal in OneNYC of a 90 percent reduction in residential waste disposal by 2030. The Department currently operates a dual-stream recycling program that requires residents to separate metal, glass, and plastic (MGP) from paper and place it in bins, bags or bundles. To further support the City’s recycling goals, the Department is placing additional recycling baskets at street corners and public spaces throughout the City and engaging agency partners, including the New York
City Housing Authority and Department of Education, to expand recycling in New York City schools, public housing developments, and institutions.
In 2017, the paper recycling program is anticipated to generate an average of $12.16 of revenue per ton from various vendors, or $5.8 million. The City is paying $75.79 per ton for MGP.
On January 1, 2015, a State ban of the disposal of electronic waste took effect. To carry out this law, the Department ceased collecting electronic waste with refuse at the curb. As an alternative, the Department has created the e-cycleNYC program to collect and recycle electronic waste from apartment buildings with 10 or more units. To date, more than 4,000 buildings have signed up for this program. In addition, starting in calendar year 2015 the Department expanded the number of SAFE (Solvents, Automotive, Flammables, and Electronics) disposal events from five to ten, two in each borough. In 2017 the Department began a pilot program to collect electronic waste from residential buildings on Staten Island. In 2018 the Department will continue and expand the program, which will reach low and medium density districts by fall of calendar year 2019.
In 2018, the Department will continue its school organics collection program and will expand its curbside organics collection program. The organics collection programs will divert additional waste from landfills by establishing a separate waste stream for food scraps, yard waste, and other compostable materials.
Bureau of Cleaning and Collection
The Bureau of Cleaning and Collection (BCC) is primarily responsible for collecting household refuse and recyclables, cleaning City streets, and enforcing recycling regulations and portions of the City’s health and administrative codes. During the winter, BCC is also responsible for the removal of snow from City streets.
Currently, BCC provides refuse collection services two to three times a week depending on the population density of the community. Through February 2017, the Department’s curbside refuse collection program has averaged 9.9 tons per truck.

Analysis of Agency Budgets Fiscal Year 2018
155
Bureau of Solid Waste Management
The Bureau of Solid Waste Management (BSWM) is responsible for the receipt, transfer, transportation, and final disposal of approximately 11,000 daily tons of waste through its waste export contracts.
BSWM is also responsible for the Fresh Kills landfill closure activities. The Financial Plan includes funds for closure activities including final capping of the landfill, leachate treatment and control, methane gas collection and flaring, maintenance and security of the site and waterways, and environmental monitoring.
Bureau of Motor Equipment
The Bureau of Motor Equipment (BME) provides services related to the acquisition, repair, and maintenance of the Department’s equipment including collection trucks, street sweepers, salt spreaders, snow melters, front-end loaders, and other vehicles and equipment. BME operates an extensive network of repair and maintenance facilities. This Bureau researches and develops equipment specifications to improve productivity, vehicle design, and to take advantage of the newest technologies including alternative fuel vehicles and emissions-reducing exhaust after-treatments. As part of the City’s fleet consolidation initiative, BME also maintains heavy-duty vehicles for other City agencies.
Sanitation FacilitiesThe Bureau of Building Management (BBM)
provides facility management services. BBM provides maintenance and emergency repair work for the Department’s over 200 facilities. BBM continues to work in conjunction with the New York Power Authority to reduce the Department’s overall electrical consumption, particularly peak loads during high temperature summer days.
The Bureau of Facilities Planning and Engineering oversees Sanitation’s capital construction and reconstruction projects. Over the next four years, the Department will initiate designs to replace the aging Bronx 9, 10, and 11 garage complex and relocate the undersized Staten Island 1 garage from a densely populated residential neighborhood to land near the former Fresh Kills landfill; the Department will also make improvements to the Staten Island 3 Garage and combine districts 1 and 3 into a single garage complex. In addition, the Department will pursue construction of a new garage in Manhattan to house Districts 6 and 8. The Department will also begin construction of a new garage for Queens 1 on a site located within that district, which will improve service and alleviate Sanitation truck parking concerns where the garage is currently located.

Analysis of Agency Budgets Fiscal Year 2018
156
_______________________________________________________________________________________________________________________________________________________________________________________________________________
2016 2017 2018 2019 2020 2021 Actual Plan Plan Plan Plan Plan ________________________ ___________ ____________ ________________________ _______________________ ________________________ _______________________
City All City All City All City All City All City All Funds Funds Funds Funds Funds Funds Funds Funds Funds Funds Funds Funds_______________________________________________________________________________________________________________________________________________________________________________________________________________
Solid Waste Management ..... $22,915 $22,915 $66,835 $66,888 $33,072 $33,072 $3,231 $3,231 $55,222 $55,222 $1,689 $1,689 Garages and Facilities ........... 13,684 13,684 70,049 73,727 116,703 129,561 243,988 243,988 578,249 578,249 172,281 172,281 Equipment ............................. 123,319 122,938 186,153 186,153 168,030 168,030 149,531 149,531 151,466 151,466 154,334 154,334 Information Technology and Telecommunications 16,827 16,827 28,318 28,318 15,132 15,132 7,464 7,464 3,215 3,215 3,500 3,500 ___________ ___________ ___________ ___________ ___________ ___________ ___________ ___________ ___________ ___________ ___________ ___________
Total ...................................... $176,745 $176,364 $351,355 $355,086 $332,937 $345,795 $404,214 $404,214 $788,152 $788,152 $331,804 $331,804 ========= ========= ========= ========= ========= ========= ========= ========= ========= ========= ========= =========
__________________________________________________________________________________________________________________________________________________________________________________________
Highlights of the 2018-2027 Ten-Year Capital Strategy and 2018-2021 Four-Year Capital Plan
Capital Review
The Department’s 2018-2027 Ten-Year Capital Strategy totals $3 billion. The Ten-Year Plan provides the Department with funding to construct, rehabilitate, purchase, and develop the necessary infrastructure and assets to support refuse collection, recycling, cleaning, waste disposal, and support operations. The Department’s Ten-Year Plan consists of four components — equipment purchases; marine transfer station renovation and construction; garage rehabilitation, site acquisition, and construction; and information technology and telecommunications.
To support the Department’s collection and cleaning operations, garages and facilities will be constructed and rehabilitated. In accordance with the City’s Long Term Solid Waste Management Plan, the Department is renovating and constructing marine transfer stations. These containerized facilities will enable the City to export its refuse via barge or rail. The Department continues to replenish its fleet, including collection trucks, dual-bin trucks, mechanical brooms, and salt spreaders in order to support operations.
The 2018-2027 Capital Strategy totals $3 billion, which includes $1.87 billion in the 2018-2021 Four-Year Plan. The table below shows capital commitments by program area over the 2018-2021 period.
Capital Commitments
($ in 000’s)
• Construction of a new garage for Bronx Community Districts 9, 10, and 11 ($247.6 million), all of which is included in the 2018-2021 Four-Year Plan.
• Construction of a new garage for Queens Community District 1 ($142.6 million), all of which is included in the 2018-2021 Four-Year Plan.
• Construction of a new garage for Staten Island Community Districts 1 and 3 ($126.9 million), all of which is included in the 2018-2021 Four-Year Plan.
• Construction of a new garage for Manhattan Community Districts 6 and 8 ($195 million), all of which is included in the 2018-2021 Four-Year Plan.
• Construction of a new garage for Brooklyn Community District 3 ($144.4 million), all of which is included in the 2018-2021 Four-Year Plan.
• Component rehabilitation at garages and other facilities Citywide ($358.9 million), $267.5 million of which is included in the 2018-2021 Four-Year Plan.
• Construction and renovation of transfer stations and other facilities in accordance with the City’s Long Term Solid Waste Management Plan ($120.1 million), $93.2 million of which is included in the 2018-2021 Four-Year Plan.
• Replacement of vehicles and other equipment ($1.6 billion), $623.4 million of which is included in the 2018-2021 Four-Year Plan.
• Information technology and telecommunications ($51.7 million), $29.3 million of which is included in the 2018-2021 Four-Year Plan.

Analysis of Agency Budgets Fiscal Year 2018
157
The 2018 Capital Plan provides $345.8 million in 2018 including:
• Component rehabilitation and construction of garages and other facilities Citywide ($129.6 million).
• Construction and renovation of transfer stations and other facilities in accordance with the City’s Long Term Solid Waste Management Plan ($33.1 million).
• Replacement of mechanical brooms, collection trucks, salt spreaders and other vehicles ($168 million).
• Information technology and telecommunications projects ($15.1 million)
Analysis of Agency Budgets Fiscal Year 2018
158
DEPARTMENT OF PARKS AND RECREATION
The Department of Parks and Recreation (DPR) is the steward of more than 29,000 acres of land, including nearly 5,000 individual properties, ranging from the Coney Island Boardwalk and Central Park to community gardens and greenstreets. The Department maintains and operates approximately 800 athletic fields, 1,000 playgrounds, and 700 tennis courts. It also maintains and operates 67 public pools, 52 recreational facilities, 15 nature centers, 14 miles of beaches, 148 miles of waterfront parkland, and 14 golf courses. The Department is also responsible for nearly 850 monuments, 23 historic house museums and the care and maintenance of street and park trees, including over 1,000,000 new trees planted as part of the MillionTreesNYC initiative.
Financial Review
The 2018 Executive Budget for the Department provides for operating expenses of $493.3 million. This represents a net decrease of $60.1 million from the amount forecasted for 2017. The 2017 forecast is greater because it includes Federal, State and Private funding not reflected in 2018. Capital commitments of $1.6 billion are also provided in 2018.
Revenue Forecast
The Department of Parks and Recreation issues recreational permits, collects revenue from marina rentals, and receives revenue generated by concessions operated on Parks property. The Department will collect $70.5 million from these sources in 2018.
Expense Budget Highlights
Budgetary Priorities: Providing Core Services
• Maintaining the City’s parks, playgrounds, infrastructure, and safety equipment, while ensuring acceptable ratings for the cleanliness and overall condition of parks.
• Sustaining parks through workforce transformation programs. Parks maintenance funding is also provided through the City’s Human Resources Administration for the Parks Opportunity Program. This program provides a workforce to assist in the maintenance and operation of park facilities and helps to train and employ public assistance recipients.
• Operating and employing lifeguards at pools and beaches during the summer months.
• Maintaining street trees, park flora and fauna including tree pruning, dead tree removal, reforestation, foresters, contract inspection, and administration to support a variety of forestry initiatives, including increasing the City’s tree inventory.
• Designing and supervising park construction. The 2018 budget includes the continuation of full-time positions in the Capital Projects Division for the design and construction of hundreds of parks projects, including parks, playgrounds, recreational and athletic fields, and tree planting.

Analysis of Agency Budgets Fiscal Year 2018
159
2017 20182016
Actual2017
ForecastPreliminary
BudgetExecutive
Budget Forecast Preliminary
BudgetExpenditures
Salary and Wages ……….. $361,950 $385,506 $376,376 $376,825 ($8,681) $449Fringe Benefits …………… 2,565 6,638 2,790 2,916 (3,722) 126 OTPS ……………...……… 111,589 161,233 108,317 113,568 (47,665) 5,251 Total ……………...……… $476,104 $553,377 $487,483 $493,309 ($60,068) $5,826
FundingCity ……………...………… $355,286 $414,273 $379,601 $384,781 ($29,492) $5,180Other Categorical Grants … 18,769 17,327 2,792 2,792 (14,535) — IFA ……………...………… 45,445 52,080 50,403 50,590 (1,490) 187 State ……………...……… 825 3,249 — 396 (2,853) 396 Federal CD ……………...… 2,467 8,513 4,524 4,524 (3,989) — Federal Other ……………. 2,463 4,097 — 63 (4,034) 63 Intra-City Other …………… 50,849 53,838 50,163 50,163 (3,675) — Total ……………...……… $476,104 $553,377 $487,483 $493,309 ($60,068) $5,826
Additional Costs Centrally FundedPersonal Services (PS) Fringe Benefits ………… $115,953 $129,463 $141,187 $139,409 $9,946 ($1,778) Pensions ……………...… 57,065 58,249 65,007 60,800 2,551 (4,207) Other Than Personal Service (OTPS) Debt Service ……………. 359,035 401,969 420,738 417,627 15,658 (3,111) Total Additional Costs $532,053 $589,681 $626,932 $617,836 $28,155 ($9,096)
FundingCity ……………...………… 511,341 560,900 596,022 586,609 25,709 (9,413) Non-City ……………...…… 20,712 28,781 30,910 31,227 2,446 317
Full Agency Costs (including Central Accounts)Salary and Wages ………… $361,950 $385,506 $376,376 $376,825 ($8,681) $449Fringe Benefits …………… 118,518 136,101 143,977 142,325 6,224 (1,652) Pensions ……………...…… 57,065 58,249 65,007 60,800 2,551 (4,207) Total PS ……………...…… $537,533 $579,856 $585,360 $579,950 $94 ($5,410)
OTPS ……………...……… $111,589 $161,233 $108,317 $113,568 ($47,665) $5,251Debt Service …………….. 359,035 401,969 420,738 417,627 15,658 (3,111) Total OTPS $470,624 $563,202 $529,055 $531,195 ($32,007) $2,140
Total Agency Costs ……… $1,008,157 $1,143,058 $1,114,415 $1,111,145 ($31,913) ($3,270)Less Intra-City …………… $50,849 $53,838 $50,163 $50,163 ($3,675) $—Net Agency Cost ………… $957,308 $1,089,220 $1,064,252 $1,060,982 ($28,238) ($3,270)
FundingCity ……………...………… 866,627 975,173 975,623 971,390 (3,783) (4,233) Non-City ……………...…… 90,681 114,047 88,629 89,592 (24,455) 963
Personnel (includes FTEs at fiscal year-end)City ……………...………… 6,946 7,222 6,779 6,757 (465) (22) Non-City ……………...…… 621 720 692 706 (14) 14 Total ……………...……… 7,567 7,942 7,471 7,463 (479) (8)
Summary of Agency Financial Data The following table compares 2018 Executive Budget with the 2018 Preliminary Budget, the 2017 forecast and actual expenditures for 2016, including fringe benefits, pensions, and debt service.
2018Increase/(Decrease)($ in 000's)
Standard 4/23/2017 7:58 PMAgency: Deparmtent of Parks and Recreation

Analysis of Agency Budgets Fiscal Year 2018
160
Programmatic Review and Service Impact
The Department of Parks and Recreation provides clean, safe, attractive, and functional parks and public spaces for all New Yorkers to use and enjoy, with a range of recreational facilities and opportunities for all ages.
Caring for Parks
The Parks Department’s mission is not simply maintaining the city’s parks and green spaces, but caring for them as well. Through the Parks Inspection Program, the Parks Department conducts 6,000 detailed park inspections throughout the year, as a way to consistently observe conditions encountered by the public. The results of these inspections are shared with senior management on a regular basis, guiding decisions regarding resource allocation, with the goal of improving the efficiency and effectiveness of daily operations. As measured by PIP, park and playground conditions are rated at 86% acceptable for overall condition and 92% acceptable for cleanliness in Fiscal Year 2017 To Date, exceeding the targets set in the Mayor’s Management Report.
The Parks Department is dedicated to strategic planning guided by a clear principle: distribute city resources in a fair and focused manner that reflects this administration’s commitment to equity. The Parks Department’s signature effort and the centerpiece of this strategic blueprint is the Community Parks Initiative (or CPI), with more than $285 million dollars dedicated to delivering capital funding, enhanced programming, maintenance and community partnership building to the neighborhood parks that need it the most, in a way that is inclusive and equitable. The initial phase of CPI is on schedule, and the first 35 capital projects, all located in high-need neighborhoods, have completed the design phase and are now entering construction. Recent expansion of CPI funding will allow the Parks Department to reimagine and recreate an additional 32 neighborhood parks in the coming years, and the Parks Department has begun design shaped by community scoping sessions for the first 21 of these projects.
As the Parks Department looks for our city’s outdoor spaces to be part of the fabric of the community, a new planning effort to make parks more welcoming is underway in the form of “Parks Without Borders,” an exciting new design initiative which was unveiled in the Mayor’s “One NYC” strategic plan. This program focuses on the edges, entrances and adjacent spaces
of city parks, where they most directly interact with the surrounding community. The Parks Department is focused on creating more access to parks and creating more parkland by opening up entrances and edges and reclaiming unused park space. The Parks Department has announced eight signature projects where this design approach will have a transformative impact on communities throughout New York City. Design on the showcase projects should conclude by the end of calendar year 2017, and the Parks Department looks forward to introducing these reimagined spaces to the public soon.
Given the needs of a fast growing city, a commitment to equity also means a need to continue improving our parks and playgrounds in all neighborhoods by updating aging infrastructure and adding green space to areas most in need. The Parks Department announced a Mayoral investment of $150 million for major improvements at five large parks, one in each borough, known as the new Anchor Parks Initiative. These parks act as anchors to their surrounding communities by providing large, diverse recreational resources. The Anchor Parks Initiative will invest in new resources like soccer fields, comfort stations, running tracks and walking paths, transforming these parks for the 750,000 New Yorkers who live in the neighborhoods that surround them, and make these older parks feel new again. All five Anchor Parks projects are well into design for their initial phases, and have benefitted from well-attended public input meetings, so that the priority improvements at each park can be shaped by the local residents that know these parks best.
Recreational Services
The Recreation Division operates 36 fee-based recreation centers, 11 field houses, and six centers programmed by Community Based Organizations. With amenities such as pools, weight rooms, gymnasiums, tracks, art and dance studios, game rooms and computer classrooms, the Parks Department’s recreation centers offer a wide range of programs, most of which are free or low-cost, for seniors, adults and children. These services are complemented by other signature programs, including Shape Up NYC and Kids in Motion, which enable New Yorkers to lead active, healthier lifestyles.
As of December 2016, there are 158,037 active members enrolled at Parks Department recreation centers, enjoying over 4 million visits to our centers

Analysis of Agency Budgets Fiscal Year 2018
161
over the course of the year. The recent fee structure, which reduced the rate of membership for military veterans and people with disabilities to $25 for an annual recreation membership, has been a tremendous success, resulting in new memberships for over 2,000 members of these underserved communities.
Shape Up NYC offers more than 270 classes per week at 175 locations. Class offerings are varied and include Yoga, Pilates, Zumba, Kickboxing and Cardio Sculpt. In 2016, the Kids in Motion program offered free activities at 102 sites citywide, including games, organized play, sports drills, and water activities. From 2015 to date, the Kids in Motion program has received more than one million visits, and nearly 40,000 free summer meals were served at 31 Kids in Motion sites in 2016.
Engaging the Community
The Department of Parks and Recreation works closely with residents, community partners and volunteers across the city to improve the park experience. Thanks to the efforts of the Parks Department divisions that focus on community engagement, such as Partnerships for Parks and GreenThumb, in coordination with nearly 2,000 community groups, organizations and companies, the Parks Department is engaging New Yorkers in planning for the future of the park system, fostering broader community engagement in the design process, employing creative placemaking to develop dynamic community spaces and developing local stewardship of green spaces. Each year, tens of thousands of individuals volunteer to beautify parks, plant trees and flowers and support other park improvement projects.
Capital Review
The 2018-2027 Ten-Year Capital Strategy totals $3.8 billion which includes $3.2 billion in the 2018-2021 Four-Year Plan. The table below reflects capital commitments by program area over the 2017-2021 period.
Capital Commitments
($ in 000’s)_______________________________________________________________________________________________________________________________________________________________________________________________________________
2016 2017 2018 2019 2020 2021 Actual Plan Plan Plan Plan Plan ________________________ ___________ ____________ ________________________ _______________________ ________________________ _______________________
City All City All City All City All City All City All Funds Funds Funds Funds Funds Funds Funds Funds Funds Funds Funds Funds_______________________________________________________________________________________________________________________________________________________________________________________________________________
Beaches and Boardwalks ...... ($1,030) ($470) $13,109 $15,302 $6,458 $6,965 $0 $0 $18,100 $18,100 $2,901 $2,901Land Acquisition and Tree Planting ....................... 32,019 36,020 199,913 206,972 98,660 101,932 88,683 88,683 54,994 54,994 6,645 6,645Major Recreation Facilities and Facility Reconstruction 12,946 14,957 37,638 59,455 212,398 258,041 149,918 202,096 64,647 64,647 8,372 8,372Neighborhood Parks and Playgrounds ........................ 68,060 191,337 297,420 368,379 435,923 675,963 167,640 174,135 61,947 61,947 51,490 51,490Vehicles and Equipment ....... 7,434 7,465 18,565 19,475 44,391 44,454 21,570 21,570 22,948 22,948 24,178 24,178Large, Major and Regional Park Reconstruction ............ 82,203 110,074 261,113 291,971 479,845 540,070 359,967 366,046 259,231 259,231 105,356 105,356Zoos ....................................... (322) (322) 10,524 10,524 20,007 20,007 6,542 6,542 2,803 2,803 1,106 1,106 ___________ ___________ ___________ ___________ ___________ ___________ ___________ ___________ ___________ ___________ ___________ ___________
Total ...................................... $201,310 $359,061 $838,282 $972,078 $1,297,682 $1,647,432 $794,320 $859,072 $484,670 $484,670 $200,048 $200,048 ========= ========= ========= ========= ========= ========= ========= ========= ========= ========= ========= =========
_______________________________________________________________________________________________________________________________________________________________________________________________________________

Analysis of Agency Budgets Fiscal Year 2018
162
Highlights of the 2018-2027 Ten-Year Capital Strategy and 2018-2021 Four-Year Plan
• Continued implementation of phases one and two of the Community Parks Initiative (CPI), which directs capital funding to historically underfunded parks in areas with high population density, high concentration of poverty, and above average population growth ($189.9 million). This funding is in addition to $42.4 million committed in 2014-2016, $129.5 million in planned commitments in 2017, and $36.3 million in DEP funding for green infrastructure improvements.
• Continued implementation of the Anchor Parks Initiative, which builds off of the Community Parks Initiative and directs capital funding to historically underfunded larger parks that are greater than six acres ($141.9 million). This funding is in addition to $15.1 million in planned commitments in 2017.
• Funding to continue closing the Walk to a Park gap, including the renovation of schoolyards to allow them to be opened to the public outside of school hours, and the acquisition and development as parkland of public partnership and private sites ($40.3 million). This funding is in addition to $1.8 million in planned commitments in 2017.
• Rehabilitation of Parks-owned pedestrian bridges Citywide ($887.0 million), including $313.0 million for the reconstruction of the promenade over the FDR from East 81st Street to East 90th Street in Manhattan, $142.6 million for the reconstruction of the Brooklyn Promenade, $114.9 million for the reconstruction of the Passerelle Pedestrian Bridge in Queens, and $80.2 million for the reconstruction of the 79th Street Traffic Circle over the West 79th Street Plaza.
• Planting of new street trees and park trees and the reforestation and restoration of natural areas Citywide ($238.2 million).
• Reconstruction of recreation centers Citywide ($153.1 million), including $17.2 million for the reconstruction of Brownsville Recreation Center in Brooklyn, $4.6 million for the Lost Battalion Recreation Center in Queens, $4.4 million for the reconstruction of Hansborough Recreation Center in Manhattan, $3.9 million for the St. Mary’s Recreation Center in the Bronx, and $123.0 million for the reconstruction of various recreation centers Citywide.
The 2018 Plan for the Department totals $1.6 billion and highlights include:
• Planting of new street trees and park trees and the construction of greenstreets Citywide ($81.9 million).
• Continued implementation of the Community Parks Initiative ($72.4 million).
• Reconstruction work along the East River Esplanade in Manhattan ($27.5 million).
• Continued demolition and site preparation work for Bushwick Inlet Park in Brooklyn ($23.3 million).
• Reconstruction of Stapleton Playground in Staten Island ($9.1 million).
• Reconstruction of the Porpoise Bridge and Tide Gate System in Queens ($7.1 million).
• Reconstruction of Echo Park in the Bronx ($3.5 million).

Analysis of Agency Budgets Fiscal Year 2018
163
DEPARTMENT OF ENVIRONMENTAL PROTECTION
The primary mission of the Department of Environmental Protection (DEP) is to deliver drinking water; manage stormwater; treat wastewater; regulate air, noise, and asbestos pollution; and protect the environmental health, welfare, and natural resources of New York City and its residents. This includes managing the New York City water and sewer system. The New York City water system consists of 19 collecting reservoirs and three controlled lakes located within the 2,000 square miles of the Croton, Catskill, and Delaware watersheds, along with 7,000 miles of aqueducts, tunnels and water mains that deliver more than 1.0 billion gallons of water per day, and seven upstate water pollution control plants. The New York City sewer system comprises a comprehensive network of 7,500 miles of sewers, 14 in-City Wastewater Treatment Plants (WWTPs), and 96 pump stations to convey and treat approximately 1.3 billion gallons per day of captured sewage to standards established by State and Federal law before releasing the effluent into receiving waters.
Financial Review
The Department of Environmental Protection’s 2018 Executive Budget provides for operating expenses of $1.4 billion. It also provides capital commitments of $17.9 billion to be financed by Water Finance Authority funds and $210.2 million in non-City funds.
Revenue Forecast
The Department collects revenue from the sale of hydro-energy to upstate power utilities, property rentals, and other fees. The Department also regulates air and noise, performs inspections, issues licenses and permits, and reviews technical plans related to asbestos control, air quality and noise abatement laws, and the storage of hazardous substances. The revenue estimate for 2018 is $24.8 million.
Expense Budget Highlights
Budgetary Priorities: Providing Core Services
• DEP supplies approximately 1.0 billion gallons of drinking water per day to eight million City residents and one million upstate residents, and maintains the City’s water main and sewer infrastructure. Approximately 2,258 personnel and $508.8 million are dedicated to this function. In addition, there are 298 police and security force personnel ($35.5 million), including 241 environmental police officers, who protect the upstate watershed and respond to hazardous materials emergencies.
• DEP treats an average of 1.3 billion gallons of dry-weather sewage per day at the City’s 14 WWTPs. Approximately 1,862 personnel and $449.0 million are dedicated to this function.
• The Department continues to use various chemicals to ensure high quality drinking water for City and upstate residents and to protect the quality of waterbodies surrounding the City ($56.0 million).
• The Department will continue to fund contracts for biosolids removal, transport, and disposal ($51.3 million).
• The Department continues to meet the terms under the Surface Water Treatment Rule for a Filtration Avoidance Determination (FAD) in the Catskill and Delaware Watersheds ($48.3 million). The City’s FAD includes programs which focus on agriculture and forestry, land management, flood hazard mitigation, and stormwater, stream, and wastewater management.
• The Department enforces the City’s air and noise codes in addition to asbestos regulations with 191 positions and $14.5 million dedicated to this function.
• The Department will continue implementation of the City’s Green Infrastructure Plan with 111 positions and $13.4 million dedicated to the purchase, installation, and maintenance of green infrastructure components.
• The Department will ensure that the City is in compliance with the requirements set forth in the Municipal Separate Storm Sewer System (MS4) permit, which mandates the City to enforce inspections programs that address stormwater runoff from construction and development sites, and from industrial or commercial facilities. The City will also develop computer tracking systems to facilitate the inspection programs and meet annual reporting requirements outlined in the permit ($6.2 million).

Analysis of Agency Budgets Fiscal Year 2018
164
• The Department will hire staff to implement a preventive maintenance plan to reduce sewer backups in Queens, Brooklyn, and Staten Island as per an Environmental Protection Agency compliance order ($3.4 million).
Restructuring and Streamlining
The Department expects to achieve a savings of $25.3 million identified from refinement of agency contractual needs, procurement and programmatic efficiencies, and evaluation of program budgetary needs.
• The Department has identified surpluses and re-estimates for various agency operations totaling $11.7 million.
• The Department expects to save $1.9 million at Citywide wastewater treatment plants by utilizing digester gas and natural gas and upgrading to energy efficient equipment.
• The Department will pursue the sale of nitrogen removal credits to upstate communities that cannot meet their required nitrogen levels under State law due to ongoing construction at their wastewater treatment plants ($1.4 million).
• The Department expects to achieve chemical savings of $8.9 million due to lower contract bids, reduced input prices, and updated operational needs.
• The Department will save $1.0 million under the Citywide Fleet Reduction initiative. Savings are achieved through vehicle sharing and transfers, downsizing larger vehicles to sedans, and capitalizing larger vehicle purchases.
• The Department will save $341,000 under the Skilled Trades Overtime initiative. Savings are achieved through capping agency skilled trades overtime at 12 percent based on the Citywide median and capping individual skilled trade overtime at 50 percent.
• The Department will save $65,000 under the Color Printing initiative. Savings are achieved through capping color printing usage at 15 percent of total printing at the agency level.

Analysis of Agency Budgets Fiscal Year 2018
165
2017 20182016
Actual2017
ForecastPreliminary
BudgetExecutive
Budget Forecast Preliminary
BudgetExpenditures
Salary and Wages ……….. $489,420 $513,224 $512,934 $531,046 $17,822 $18,112Fringe Benefits …………… 2,857 4,595 3,295 3,295 (1,300) — OTPS ……………...……… 774,881 1,005,981 701,406 873,761 (132,220) 172,355 Total ……………...……… $1,267,158 $1,523,800 $1,217,635 $1,408,102 ($115,698) $190,467
FundingCity ……………...………… $1,039,951 $1,177,033 $1,146,974 $1,182,617 $5,584 $35,643Other Categorical Grants … 10,608 9,087 — — (9,087) — IFA ……………...………… 63,391 62,846 66,484 66,484 3,638 — State ……………...……… 481 3,641 — — (3,641) — Federal CD ……………...… 147,665 256,060 2,698 157,498 (98,562) 154,800 Federal Other ……………. 3,427 7,411 123 134 (7,277) 11 Intra-City Other …………… 1,635 7,722 1,356 1,369 (6,353) 13 Total ……………...……… $1,267,158 $1,523,800 $1,217,635 $1,408,102 ($115,698) $190,467
Additional Costs Centrally FundedPersonal Services (PS) Fringe Benefits ………… $164,912 $183,964 $197,479 $199,993 $16,029 $2,514 Pensions ……………...… 92,022 81,204 87,792 82,111 907 (5,681) Other Than Personal Service (OTPS) Debt Service ……………. 72,260 57,836 60,536 63,236 5,400 2,700 Total Additional Costs $329,194 $323,004 $345,807 $345,340 $22,336 ($467)
FundingCity ……………...………… 317,014 302,946 329,482 324,593 21,647 (4,889) Non-City ……………...…… 12,180 20,058 16,325 20,747 689 4,422
Full Agency Costs (including Central Accounts)Salary and Wages ………… $489,420 $513,224 $512,934 $531,046 $17,822 $18,112Fringe Benefits …………… 167,769 188,559 200,774 203,288 14,729 2,514 Pensions ……………...…… 92,022 81,204 87,792 82,111 907 (5,681) Total PS ……………...…… $749,211 $782,987 $801,500 $816,445 $33,458 $14,945
OTPS ……………...……… $774,881 $1,005,981 $701,406 $873,761 ($132,220) $172,355Debt Service …………….. 72,260 57,836 60,536 63,236 5,400 2,700 Total OTPS $847,141 $1,063,817 $761,942 $936,997 ($126,820) $175,055
Total Agency Costs ……… $1,596,352 $1,846,804 $1,563,442 $1,753,442 ($93,362) $190,000Less Intra-City …………… $1,635 $7,722 $1,356 $1,369 ($6,353) $13Net Agency Cost ………… $1,594,717 $1,839,082 $1,562,086 $1,752,073 ($87,009) $189,987
FundingCity ……………...………… 1,356,965 1,479,979 1,476,456 1,507,210 27,231 30,754 Non-City ……………...…… 237,752 359,103 85,630 244,863 (114,240) 159,233
Personnel (includes FTEs at fiscal year-end)City ……………...………… 214 249 249 269 20 20 Non-City ……………...…… 5,732 6,121 6,078 6,139 18 61 Total ……………...……… 5,946 6,370 6,327 6,408 38 81
Summary of Agency Financial Data The following table compares 2018 Executive Budget with the 2018 Preliminary Budget, the 2017 forecast and actual expenditures for 2016, including fringe benefits, pensions, and debt service.
2018Increase/(Decrease)($ in 000's)
Standard 4/23/2017 7:56 PMAgency: Department of Environmental Protection

Analysis of Agency Budgets Fiscal Year 2018
166
Programmatic Review and Service Impact
Water Supply Strategies
The Department will continue the implementation of programs related to the Filtration Avoidance Determination (FAD) for the City’s Catskill and Delaware water supplies. In 2007, the Environmental Protection Agency issued an administrative determination providing the City with a waiver from filtering the Catskill and Delaware water supplies through 2017. The ten-year FAD calls for a midterm assessment and revision of the City’s programs and commitments, which was issued in May 2014. The current FAD is based on DEP’s ongoing long-term watershed protection program. As part of the FAD, and in compliance with revised Federal regulations, DEP commenced full operation of an ultraviolet light disinfection facility to further purify water from the Catskill and Delaware watersheds and will continue its upstate land acquisition program to protect the water entering the City’s reservoirs. As the current FAD ends in 2017 and DEP awaits further guidance from the Environmental Protection Agency and the NYS Department of Health, the Department will continue the operation and maintenance of its upstate programs to maintain water quality.
The Department will also continue the Water for the Future Program to address leaks in the Rondout-West Branch Tunnel (RWBT), a 45-mile portion of the Delaware Aqueduct that conveys about 50 percent of the City’s daily water supply. A major component of this program is the construction of a 2.5-mile bypass tunnel around the areas of significant leakage. During the connection of this bypass tunnel to the Delaware Aqueduct, the RWBT will need to be shut down for a single six to ten-month period in 2022. In order to compensate for this shutdown, the Department will continue to pursue several water supply conservation and augmentation projects.
The Department will also begin construction of a tunnel connecting the Kensico Reservoir to the Catskill/Delaware Ultraviolet Light Disinfection Facility (CDUV). Historically, for purposes of water quality and redundancy, both the Delaware and Catskill Aqueducts conveyed water from the Kensico Reservoir. However, because the Catskill Aqueduct is not sufficiently pressurized to move water through the CDUV, only the Delaware Aqueduct can deliver water from the Kensico Reservoir to the facility. The new tunnel will replace the section of the Catskill Aqueduct
between the Kensico Reservoir and the CDUV and restore needed redundancy.
The Department will begin the construction of the remaining two shafts for the Brooklyn/Queens section of City Tunnel No. 3. Completion of these shafts will enable full operation of the Brooklyn/Queens section, allowing for the full inspection of City Tunnels No. 1 and 2, and providing critical water delivery redundancy in Brooklyn, Queens, and Staten Island. As part of the work on the Brooklyn/Queens section of City Tunnel No. 3, the Department will fully inspect, flush, clean, and pressurize the existing tunnel, as well as install flow control and chemical dosing instrumentation so that the tunnel is prepared to be activated if an emergency occurs before the two shafts are complete.
Additionally, the Department will conduct rehabilitation work at the Ashokan Reservoir in the Catskill System of the City’s watershed. Projects include reconstruction of the Olive Bridge Dam and reservoir dikes, as well as replacement of the Dividing Weir Bridge and overall site restoration. This rehabilitation work will bring several key infrastructure pieces up to State and Federal safety standards, and continue the Department’s efforts to strengthen infrastructure in preparation for severe storms.
Wastewater Treatment Initiatives
According to recent harbor surveys issued by the Department, water quality in the harbor and surrounding waters continues to improve to levels not experienced in the last 100 years. Coliform bacterial counts, which are indicators of water pollution from sewage, continue on a downward trend. Improvements have also been realized in the measure of dissolved oxygen as concentration levels in most harbor areas have been notably higher than in past years. These advancements are attributed to the following DEP initiatives: continued reconstruction and upgrades at in-City WWTPs, implementation of advanced treatment technologies for nitrogen removal, the abatement of illegal discharges, improved sewer maintenance, and increased capture of wet weather flows.
To build upon these improvements, DEP continues to implement the NYC Green Infrastructure Plan. This mandated program supplements existing Combined Sewer Overflow (CSO) controls with a mix of “green infrastructure” (natural and permeable surfaces) and

Analysis of Agency Budgets Fiscal Year 2018
167
the optimization of “grey infrastructure” (construction, modification, and cleaning of tanks and tunnels) that will more cost-effectively reduce CSOs in waterways, while also improving air quality. Upon meeting the requirement under the consent order, this program will manage one inch of precipitation on 10 percent of impervious surfaces.
In addition to the above, DEP is implementing a CSO Long-Term Control Plan phase which will further improve water quality in City waterbodies. This is still in the planning stage, but will encompass a number of strategies including disinfection of CSO before being released into receiving waterbodies.
Water Distribution and Wastewater Collection System
The Department operates, maintains, and protects the City’s vast water and sewer network by ensuring residents have an adequate supply of potable water, maintaining sewers for a properly functioning wastewater system, and providing emergency services during water main breaks, leaks, sewer backups, and more.
As of August 2015, the City is mandated to comply with the Municipal Separate Storm Sewer System (MS4) permit issued by the New York State Department of Environmental Conservation to manage stormwater runoff in a way that prevents flooding and improves water quality. The permit requires the City to develop a Citywide Stormwater Management Plan that outlines measures to meet the permit obligations.
The Department is amending the City’s drainage plan to show the locations, course, size, and elevation of the existing and proposed sewers for each of the drainage districts. This will allow the Department to provide an adequate water and sewer system as new developments take place throughout the City.
In 2015, the Department began constructing a comprehensive storm sewer system in the neighborhoods represented by Community Boards 12 and 13 in Southeast Queens to mitigate chronic flooding experienced by the communities. Recognizing that the build-out of the full sewer system in Southeast Queens remains a long-term project, the Department has developed a number of strategies to provide short-term flooding relief while construction is underway, including public education on grease management, installation of green infrastructure, utilization of Bluebelts, and more.
Customer Services Programs
As required by the New York State Department of Environmental Conservation and the NYC Water Board, the Department is progressing towards its goal of universally metering all properties. The major objectives of universal metering include water conservation, improved water supply system management and rate equity. DEP services approximately 835,000 water and sewer customer accounts, of which 35,200 are billed on a flat-rate system. Currently, more than 827,000 accounts are metered, while just over 7,500 remain unmetered.
Starting in 2013, frontage billing expired for multi-family dwellings. Impacted customers were automatically enrolled in the Multiple-Family Conservation Program (MCP) with the option of switching to metered charges.
DEP continues to conduct lien sales of delinquent water and sewer charges independent of other delinquencies, provided that the water and sewer charges have been delinquent for at least one year and equal or exceed $1,000 for Tax Class 2 properties and over $2,000 for Tax Class 1 two– and three–family properties.
In January of 2013, DEP introduced a Water and Sewer Service Line Protection Program offered by American Water Resources (AWR). The purpose of this voluntary program is to protect homeowners from the unexpected high costs of water and sewer service line repairs. In exchange for a relatively small monthly program fee, AWR provides DEP customers with unlimited coverage for water and/or sewer service line leaks and breaks due to normal wear and tear. As of April 2017, 246,400 customers have enrolled in the program and entered into service contracts with AWR. AWR was selected by the Water Board to offer the program, following a competitive Request for Proposal (RFP) process.
Environmental Compliance
The Bureau of Environmental Compliance reviews and inspects asbestos abatement projects; investigates air quality and noise complaints; monitors emissions and environmental impacts from alternative fuel vehicles; issues permits for boilers, other combustion equipment, and other potential sources of air pollution.

Analysis of Agency Budgets Fiscal Year 2018
168
The Bureau is also responsible for enforcing the City’s noise code. Along with establishing rules, guidelines, and standards for governing noise in the City, the Bureau promulgates construction rules that require a site-specific noise mitigation plan for each construction site, offering alternatives for contractors to continue construction while reducing the noise impact on the surrounding environment.
Energy Policy
The Department works in conjunction with the Department of Citywide Administrative Services and the Mayor’s Office on coordinating the City’s strategic goals on energy policy. Given that DEP is one of the City’s largest energy users, this policy role is closely linked with a number of objectives in the Department’s strategic plan. This role is in addition to over $711.5
million in capital projects with energy reduction components where DEP expects to invest in clean distributed generation, energy efficiency, and hydro-electric generation.
Bureau of Police and Security
The Bureau of Police and Security is responsible for protecting the New York City water supply and the associated critical infrastructure from terrorism, pollution, and crime. Since February 1, 2010, the Bureau has been responsible for responding to hazardous material emergencies within the City by evaluating the characteristics of the materials involved and making technical decisions concerning containment, abatement, and disposal. The DEP Police Department patrols the upstate water supply, with 241 officers dedicated to this function.
Capital Review
Overview
The Ten-Year Capital Plan for 2018 through 2027 provides a total of $18.1 billion from the following sources: $17.9 billion financed by Water Finance Authority funds and $210.2 million in non-City funds.
The table below shows capital commitments by program area over the 2016-2021 period.
Capital Commitments($ in 000’s)
_______________________________________________________________________________________________________________________________________________________________________________________________________________
2016 2017 2018 2019 2020 2021 Actual Plan Plan Plan Plan Plan __________________________ ___________ __ ___________ ______________ ___________ _________________________ _________________________ ________________________
City All City All City All City All City All City All Funds Funds Funds Funds Funds Funds Funds Funds Funds Funds Funds Funds_____________________________________________________________________________________________________________________________________________________________________________________________________________________________
Water Pollution .............................. $709,326 $707,628 $901,233 $957,818 $949,317 $1,123,942 $1,285,652 $1,291,052 $1,111,005 $1,111,005 $737,466 $737,466Water Mains ................................... 418,388 419,209 1,001,567 1,016,720 1,063,619 1,066,635 511,760 511,760 550,517 550,517 342,333 342,333Sewers ............................................ 351,933 353,282 893,286 911,664 853,225 880,421 699,095 699,095 684,807 684,807 343,776 343,776Water Supply .................................. 16,819 16,819 225,147 225,147 197,647 197,647 78,925 78,925 260,000 260,000 135,048 135,048Equipment ...................................... 93,173 93,173 101,209 102,227 125,223 125,223 89,020 89,020 76,008 76,008 53,712 53,712 ___________ ___________ ___________ ___________ ___________ ___________ ___________ ___________ ___________ ___________ ___________ ___________
Total ............................................... $1,589,639 $1,590,111 $3,122,442 $3,213,576 $3,189,031 $3,393,868 $2,664,452 $2,669,852 $2,682,337 $2,682,337 $1,612,335 $1,612,335 ========= ========= ========= ========= ========= ========= ========= ========= ========= ========= ========= =========
__________________________________________________________________________________________________________________________________________________________________________________________
Analysis of Agency Budgets Fiscal Year 2018
169
The major elements of the Ten-Year Capital Plan include:
• Extend and reconstruct storm, sanitary, and combined sewers ($4.3 billion, of which $2.6 billion is planned for 2018 to 2021).
• Investments to maintain the operational integrity of existing wastewater treatment facilities ($3.6 billion, of which $2.5 billion is planned for 2018 to 2021). The total includes the hardening of infrastructure based on findings of the New York City Wastewater Resiliency Plan assessment and Federal grant funding for Sandy-related recovery work ($341.0 million).
• Replace and extend trunk and distribution water mains and ancillary work ($2.1 billion, of which $1.4 billion is planned for 2018 to 2021).
• Disinfection and mitigation of Combined Sewer Overflow (CSO) to achieve waterbody-specific water quality standards ($1.8 billion, of which $694.2 million is planned for 2018 to 2021). This includes the construction of CSO holding tanks to improve water quality in the Gowanus Canal ($735.5 million).
• Construction of a comprehensive sewer system in Southeast Queens, including strategically selected projects to deliver some near-term flooding relief ($1.6 billion, of which $810.6 million is planned for 2018 to 2021 and $267.4 million for 2018 alone). In addition, there is $172.3 million in 2017 for this purpose.
• Construction of a tunnel connecting the Kensico Reservoir to the Catskill/Delaware Ultraviolet Light Disinfection Facility, necessary to provide redundancy in the water supply system ($1.2 billion, of which $124.0 million is planned for 2018 to 2021).
• Implementation of the NYC Green Infrastructure Plan, a strategy for CSO reduction through the optimization of existing grey infrastructure ($42.3 million, all of which is planned for 2018 to 2021) and the use of green infrastructure ($946.6 million, of which $771.1 million is planned for 2018 to 2021), such as right-of-way bioswales and stormwater greenstreets, porous pavement, constructed wetlands, onsite stormwater management practices, and green roofs.
• Rehabilitation of Ashokan Reservoir structures, including reconstruction of the Olive Bridge Dam, reservoir dikes, Dividing Weir Bridge, and overall
site restoration ($733.0 million, of which $103.0 million is planned for 2018 to 2021).
• Continuation of numerous small projects to keep the wastewater system in a state of good repair ($538.6 million, of which $208.1 million is planned from 2018 to 2021).
• Construction of shafts related to the activation of the Brooklyn/Queens section of City Tunnel No. 3 ($600.0 million, of which $300 million is planned for 2018 to 2021). This total includes the excavation of the remaining two shafts necessary for full operation of the tunnel ($300.0 million). Additionally, there is $53.4 million in 2017 for the cleaning and flushing of the Brooklyn/Queens section in order to allow for activation in the case of an unexpected failure to City Tunnel No. 2 and the construction of an interconnection to the Richmond Tunnel in Staten Island.
• Continuation of land acquisition for and construction of the award-winning Staten Island Bluebelt program ($415.2 million, of which $308.9 million is planned for 2018 to 2021).
• Structural improvements at the North River Wastewater Treatment Plant ($360.0 million, of which $75.0 million is planned for 2018 to 2021).
• Reconstruction of Hillview Reservoir chambers ($339.5 million, of which $18.5 million is planned for 2018 to 2021).
• Reconstruction of upstate and in-City dams (in addition to the Olive Bridge Dam mentioned above) in order to ensure long-term reliability ($362.0 million, of which $227.0 million is planned for 2018 to 2021).
• Ongoing stabilization and upgrade of in-City wastewater treatment plants (WWTPS) and systems to ensure compliance with State and Federal mandates for: operating permit requirements ($61.6 million, all of which is planned from 2018 to 2021); mandated studies and facility upgrades to reduce nitrogen levels in treated wastewater ($88.0 million, all of which is planned from 2018 to 2021); and enhancement of the existing chlorination system at various WWTPs in order to meet stricter chlorine discharge limits ($121.2 million, of which $36.2 million is planned from 2018 to 2021).

Analysis of Agency Budgets Fiscal Year 2018
170
• Continuation of various filtration avoidance measures and land acquisition in the upstate watershed ($185.2 million, of which $164.2 million is planned for 2018 to 2021).
• Design and installation of a unified agency-wide security system to include access control, intrusion detection, cameras, and other security items needed to protect the water supply, distribution, and wastewater systems, Citywide and in various upstate communities ($139.9 million, of which $95.0 million is planned for 2018 to 2021).
• Reconstruction of the Lower Catskill Aqueduct connecting the Catskill/Delaware Ultraviolet Facility with Hillview Reservoir ($126.0 million, all of which is planned for 2018 to 2021).

Analysis of Agency Budgets Fiscal Year 2018
171
DEPARTMENT OF TRANSPORTATION
The Department of Transportation (DOT) maintains and reconstructs City bridges, plans and funds street reconstruction, oversees ferry operations, manages traffic signals and street lighting networks, maintains and collects revenue from parking meters, operates parking facilities, and coordinates transportation planning within the five boroughs. It is DOT’s goal to create a transportation network that will be reliable, safe, sustainable, and accessible, meeting the needs of all New Yorkers and supporting the City’s growing economy.
Financial Review
The Department of Transportation’s 2018 Executive Budget provides for operating expenses of $961.5 million. Capital commitments of approximately $15.2 billion are also provided from 2018-2027, including $1.9 billion in Federal, State, and private funding.
Revenue Forecast
The Department of Transportation collects revenue from parking meters and parking garages, franchises, concessions, and street opening permits. In 2018, the Department will collect $368.1 million in revenue.
Expense Budget Highlights
Budgetary Priorities: Providing Core Services
• Funding of $357.9 million for the traffic program, including $58.5 million for energy costs associated with all streetlights and traffic signals throughout the City, and $102.8 million for the maintenance of approximately 13,035 traffic signalized intersections and over 333,670 streetlights Citywide.
• Funding of $195.1 million for the in-house costs associated with resurfacing 1,300 lane miles of streets and the repair of approximately 345,000 street defects (potholes).
• Funding of $98.8 million for the operation of the Staten Island Ferry and overseeing private ferry service.
• Funding of $43.9 million for preventive maintenance, cleaning, and spot and splash zone painting of City bridges including Federal funding for the maintenance of the East River Bridges.
• Funding of $26.0 million for the in-house bridge flag/corrective repair program.
Restructuring and Streamlining
• The Department expects to save $4.0 million in capital costs by overseeing milling contracts for street repaving through in-house staff instead of contracting.
• The Department expects to save $3.8 million in 2018 and 2019 by conducting underwater inspections of Staten Island Ferry vessels in lieu of dry-docking.
• The Department expects to experience capital and expense savings through the implementation of a facilities preventive maintenance program.
• The Department expects to experience savings in energy and maintenance costs by replacing high pressure sodium luminaires with LED luminaires on highways, in parks, and at the Staten Island Ferry terminals.

Analysis of Agency Budgets Fiscal Year 2018
172
2017 20182016
Actual2017
ForecastPreliminary
BudgetExecutive
Budget Forecast Preliminary
BudgetExpenditures
Salary and Wages ……….. $423,119 $450,120 $460,147 $458,808 $8,688 ($1,339)Fringe Benefits …………… 5,194 5,304 4,979 4,979 (325) — OTPS ……………...……… 481,966 549,446 491,352 497,745 (51,701) 6,393 Total ……………...……… $910,279 $1,004,870 $956,478 $961,532 ($43,338) $5,054
FundingCity ……………...………… $541,026 $557,380 $561,799 $556,711 ($669) ($5,088)Other Categorical Grants … 7,446 1,455 1,371 1,371 (84) — IFA ……………...………… 180,710 220,736 229,760 231,626 10,890 1,866 State ……………...……… 94,830 108,299 97,295 99,363 (8,936) 2,068 Federal CD ……………...… — — — — — — Federal Other ……………. 81,807 112,047 63,370 69,070 (42,977) 5,700 Intra-City Other …………… 4,460 4,953 2,883 3,391 (1,562) 508 Total ……………...……… $910,279 $1,004,870 $956,478 $961,532 ($43,338) $5,054
Additional Costs Centrally FundedPersonal Services (PS) Fringe Benefits ………… $139,958 $155,687 $175,122 $170,476 $14,789 ($4,646) Pensions ……………...… 71,800 70,246 76,384 71,442 1,196 (4,942) Other Than Personal Service (OTPS) Debt Service ……………. 719,874 745,131 779,923 706,206 (38,925) (73,717) Total Additional Costs $931,632 $971,064 $1,031,429 $948,124 ($22,940) ($83,305)
FundingCity ……………...………… 846,835 879,778 941,602 860,097 (19,681) (81,505) Non-City ……………...…… 84,797 91,286 89,827 88,027 (3,259) (1,800)
Full Agency Costs (including Central Accounts)Salary and Wages ………… $423,119 $450,120 $460,147 $458,808 $8,688 ($1,339)Fringe Benefits …………… 145,152 160,991 180,101 175,455 14,464 (4,646) Pensions ……………...…… 71,800 70,246 76,384 71,442 1,196 (4,942) Total PS ……………...…… $640,071 $681,357 $716,632 $705,705 $24,348 ($10,927)
OTPS ……………...……… $481,966 $549,446 $491,352 $497,745 ($51,701) $6,393Debt Service …………….. 719,874 745,131 779,923 706,206 (38,925) (73,717) Total OTPS $1,201,840 $1,294,577 $1,271,275 $1,203,951 ($90,626) ($67,324)
Total Agency Costs ……… $1,841,911 $1,975,934 $1,987,907 $1,909,656 ($66,278) ($78,251)Less Intra-City …………… $4,460 $4,953 $2,883 $3,391 ($1,562) $508Net Agency Cost ………… $1,837,451 $1,970,981 $1,985,024 $1,906,265 ($64,716) ($78,759)
FundingCity ……………...………… 1,387,861 1,437,158 1,503,401 1,416,808 (20,350) (86,593) Non-City ……………...…… 449,590 533,823 481,623 489,457 (44,366) 7,834
Personnel (includes FTEs at fiscal year-end)City ……………...………… 2,344 2,634 2,566 2,551 (83) (15) Non-City ……………...…… 2,971 2,854 2,840 2,878 24 38 Total ……………...……… 5,315 5,488 5,406 5,429 (59) 23
Summary of Agency Financial Data The following table compares 2018 Executive Budget with the 2018 Preliminary Budget, the 2017 forecast and actual expenditures for 2016, including fringe benefits, pensions, and debt service.
2018Increase/(Decrease)($ in 000's)
Standard 4/23/2017 7:58 PMAgency: Department of Transporation

Analysis of Agency Budgets Fiscal Year 2018
173
Programmatic Review and Service Impact
Bridges
The Bureau of Bridges is responsible for the reconstruction, repair, maintenance and operation of approximately 794 City-owned bridge and tunnel structures. In 2018, the Bureau of Bridges will be staffed with 833 positions and have an operating budget of $108.6 million.
The Bridge program in the 2018 Executive Budget continues the City’s commitment to preserve and maintain its infrastructure. The Bridge “Flag” and Correction Repair program corrects mostly structural (“red” and “yellow” flags, in descending order of priority) and safety deficiencies on bridges by using both in-house and contract forces. Furthermore, the Bridge Preventive Maintenance program includes the oiling, sweeping, cleaning, washing, electrical maintenance and spot and salt splash zone painting of the City’s bridges.
Highway Operations
The Roadway Repair and Maintenance Division is responsible for maintaining approximately 19,324 lane miles of streets of which 1,175 lane miles of arterial highways are within the five boroughs, 70 percent of which are in good condition as of 2016. The Permits Management and Construction Control programs are responsible for regulating the excavation and various other uses of City streets and sidewalks. In 2018, Highway Operations will be staffed by approximately 1,536 full-time and approximately 419 seasonal positions with a budget totaling $282.8 million.
The Department also manages the New York City Plaza program, a community-based program to improve the public realm by creating pedestrians plazas. In total, the Department oversees 73 plazas that are now in various phases of planning, design, construction, or complete. Fifty-six of these are currently open to the public.
Traffic Operations
The Division of Traffic Operations maintains and collects revenue from approximately 88,844 metered spaces and operates 38 municipal parking facilities. It also installs and maintains an estimated one million traff ic signs, approximately 13,035 signalized intersections and over 333,670 streetlights. The 2018 Executive Budget for the Division of Traffic Operations provides for 1,484 positions and $357.9 million.
The Division of Traffic Operations continues to plan and implement projects to further the goals of providing safe, sustainable and attractive transportation options to New Yorkers and ensuring the reliability and high quality of our transportation network. Projects implemented under the Safe Streets for Seniors, Safe Routes to Schools, Neighborhood Slow Zone, Safe Routes to Transit and Bus Stops under Elevated Lines programs, as well as redesigns of high-crash corridors, and Arterial Slow Zones that reduce speed limits on high-crash two-way corridors, improve safety for all street users. Select Bus Service program, carried out in partnership with the Metropolitan Transportation Authority, provides new transit opportunities for travelers in areas underserved by the subway. The Midtown in Motion project reduces congestion and greenhouse gas emissions in Manhattan. Expansion of the bike network increases safety and convenience of cycling; leading to the number of people who commute by bicycle more than doubling. Installation of pedestrian plazas throughout the City uses existing streets and sidewalks to provide valuable open space in areas in need of new passive recreation space.
Transit Operations (Ferries)
The Department of Transportation operates and maintains the Staten Island Ferry and its terminals, as well as regulates private ferry operations. The 2018 Executive Budget for Ferries provides for 691 positions and an operating budget of $98.8 million.
The Staten Island Ferry is expected to carry approximately 23 million passengers and the Department anticipates that the Ferry program will achieve an on-time performance rate of 96 percent in 2018. The Department currently estimates annual ridership on privately operated commuter ferries to be approximately 10 million passengers.

Analysis of Agency Budgets Fiscal Year 2018
174
• Complete reconstruction or rehabilitation of approximately 60 bridge structures currently rated “fair” or “good” ($3.7 billion), including $1.5 billion for Brooklyn-Queens Expressway (BQE) – Triple Cantilever Bridge and $345.0 million for the Shore Road Bridge over Hutchinson River.
• Complete rehabilitative work of bridge structures scheduled for life extension ($3.0 billion), including $138.5 million for Grand Street Bridge over Newtown Creek and $86.1 million for FDR Northbound from East 42nd to 49th Street.
• Street reconstruction of approximately 673 lane miles ($2.7 billion); including various projects to address the needs of Southeast Queens ($264.2 million), reconstruction of Queens Boulevard ($220.2 million) and Woodhaven Boulevard Select Bus Service ($183.6 million).
• Street and arterial resurfacing of 7,640 lane miles ($1.6 billion).
• Continued reconstruction and rehabilitation for the East River Bridges ($1.3 billion), including $342.5 million for Queensboro Bridge, $329.5 million for the Manhattan Bridge, $308.0 million for Williamsburg Bridge and $277.9 million for Brooklyn Bridge
• Installation and reconstruction of pedestrian ramps at approximately 37,535 corners ($804.0 million) and replacement of approximately 24 million square feet of sidewalk ($506.8 million).
• Signal installation and maintenance, as well as the computerization and modernization of signalized intersections ($285.6 million).
• Ferry terminal and facility improvements ($248.8 million).
• Upgrade and replacement of lampposts, luminaires, and associated infrastructure ($195.4 million).
• Replacement of ferry racks and construction of ferry arrestors at Staten Island Ferry Terminals ($89.1 million).
• Installation of approximately 109 million linear feet of thermoplastic markings for traffic control ($65.6 million).
• Signal and streetlight installation and lane markings associated with the Highway Reconstruction and Bridge Programs ($54.8 million).
• Replacement of approximately 320,000 linear feet of electrical distribution systems along the City’s streets ($32.0 million).
Capital Review
The Department of Transportation’s 2018-2027 Capital Commitment Plan totals $15.2 billion for the reconstruction of transportation infrastructure, of which approximately 88 percent is City-funded. The table below shows commitments by program area between 2016-2021.
Capital Commitments($ in 000’s)
_______________________________________________________________________________________________________________________________________________________________________________________________________________
2016 2017 2018 2019 2020 2021 Actual Plan Plan Plan Plan Plan ________________________ ___________ ____________ ________________________ _______________________ ________________________ _______________________
City All City All City All City All City All City All Funds Funds Funds Funds Funds Funds Funds Funds Funds Funds Funds Funds _______________________________________________________________________________________________________________________________________________________________________________________________________________
Highways and Streets ................ $414,984 $543,568 $794,760 $990,219 $878,339 $1,057,710 $943,035 $1,160,628 $754,424 $914,946 $534,417 $622,915Highway Bridges ....................... 176,098 289,022 602,127 898,377 608,337 858,903 301,905 344,624 1,385,143 1,475,059 1,815,168 2,053,309 Waterway Bridges ...................... 112,102 147,451 197,627 197,777 709,840 739,251 250,931 250,931 1,300 1,300 280,000 280,000 Traffic ......................................... 92,324 131,646 78,544 122,394 124,789 175,428 62,597 100,697 43,710 68,607 10,593 43,593 Vehicles/Equipment ................... 14,397 20,830 46,969 48,365 49,109 51,948 38,539 38,539 9,334 9,334 4,337 4,337 Ferries ........................................ 10,111 19,162 158,370 358,906 28,524 63,205 57,028 82,685 110,660 131,406 10,503 15,417 ___________ ___________ ___________ ___________ ___________ ___________ ___________ ___________ ___________ ___________ ___________ ___________
Total ............................................. $820,015 $1,151,679 $1,878,397 $2,616,038 $2,398,938 $2,946,445 $1,654,035 $1,978,104 $2,304,571 $2,600,652 $2,655,018 $3,019,571 ========= ========= ========= ========== ========== ========== ========== ========== ========== ========== ========== ==========
_______________________________________________________________________________________________________________________________________________________________________________________________________________
The Highlights of the 2018-2027 Capital Plan include:

Analysis of Agency Budgets Fiscal Year 2018
175
• Purchase of vehicles and pieces of equipment ($15.0 million) for life cycle replacement, resulting in a more efficient fleet.
The Highlights of the 2018 Capital Plan include:
• Street reconstruction of approximately 145 lane miles ($585.6 million), which includes the second phase of Tillary Street reconstruction ($42.1 million) and various projects to address the reconstruction needs in Southeast Queens ($68.7 million).
• Rehabilitation of bridges rated “fair” ($465.7 million), including the Riverside Drive Bridge over West 158th Street ($153.0 million) and Grand Concourse Bridge over Metro-North Railroad ($59.6 million).
• Rehabilitative work of bridge projects scheduled for life extension ($378.2 million), including Broadway Bridge over Harlem River ($178.8 million).
• Rehabilitation of the Queensboro Bridge ($342.5 million).
• Street and arterial resurfacing of 1,300 lane miles of streets ($276.5 million).
• Reconstruction of sidewalks and pedestrian ramps ($161.3 million).
• Construction of flex barges, which could be used to dock ferry vessels at temporary locations during emergencies ($11.0 million).
• Purchase of information technology and telecommunications systems for better agency coordination to improve the management of roadways and sidewalks ($4.7 million).
• Replacement of two way radio communication system in accordance with Federal regulations ($4.4 million).

Analysis of Agency Budgets Fiscal Year 2018
176
HOUSING PRESERVATION AND DEVELOPMENT
The New York City Department of Housing Preservation and Development (HPD) is the largest municipal housing preservation and development agency in the nation. The agency’s mission is to make strategic investments to improve and strengthen neighborhoods while preserving the stability and affordability of the City’s existing housing stock.
HPD is responsible for carrying out Mayor Bill de Blasio’s Housing New York: A Five-Borough, Ten-Year Plan, which is a citywide initiative to build or preserve 200,000 affordable housing units, and to help both tenants and landlords preserve the quality and affordability of their homes. In addition to financing affordable housing projects, HPD is responsible for:
• Ensuring that the entire City’s housing stock complies with the health and safety requirements of the Housing Maintenance Code.
• Monitoring the fiscal health and ongoing affordability of more than 5,250 buildings containing more than 129,000 units in its Asset Management portfolio.
• Providing more than 39,500 households with Federal rental subsidies to support stable affordable housing in the private market.
Through the above goals, HPD works to ensure that all New Yorkers live in safe and habitable homes.
Financial Review
HPD’s 2018 Executive Budget provides for operating expenses of $1.1 billion, of which nearly $131 million is City funds. The budgeted headcount of 2,515 full-time positions is funded at $178 million while other than personal services are projected at $954 million. Nearly $881 million, or 78 percent of the agency’s expense budget, is supported by Federal and State assistance programs. In addition, HPD has planned City capital commitments of $1.1 billion in 2018.
Revenue Forecast
HPD collects fees for processing tax abatement and exemption applications, multiple dwelling registrations, document searches, and administrative fees. HPD also collects revenue from residential and commercial tenants occupying in rem buildings and from the sale of in rem buildings to the private sector. The agency will generate $27.2 million in 2018.
Expense Budget Highlights
Providing Core Services
In 2018, the agency will continue to provide core services that include the enforcement of the Housing Maintenance Code, administration of Federal rent subsidies, preservation and development of quality affordable housing, and management of affordable housing assets.
• Through its Code Enforcement team, the agency will continue to respond promptly to housing maintenance complaints, assess conditions, and develop appropriate strategies to correct violations citywide.
• HPD will use various enforcement tools to ensure compliance with legal and regulatory obligations while working with responsible owners and community partners, and with support from Federal Community Development Block Grant (CDBG) funds. The agency will bring enforcement proceedings against non-compliant owners and will remove hazardous conditions in private distressed buildings.

Analysis of Agency Budgets Fiscal Year 2018
177
• HPD will administer a portion of New York City’s allotment of Federal housing choice vouchers to eligible New Yorkers through the nation’s fifth largest Section 8 program. In 2017, the agency supported over 39,500 households. Another $437 million in subsidy payments are planned for 2018.
• HPD will engage in planning and project development activities to, (1) preserve existing housing stock, (2) leverage private investments, and (3) create new affordable units.
HPD will continue to focus on the financial and physical health of a portfolio of over 5,250 rental and co-op buildings in which the City has previously invested.

Analysis of Agency Budgets Fiscal Year 2018
178
2017 20182016
Actual2017
ForecastPreliminary
BudgetExecutive
Budget Forecast Preliminary
BudgetExpenditures
Salary and Wages ……….. $149,329 $171,658 $173,605 $177,963 $6,305 $4,358Fringe Benefits …………… 45 — — — — — OTPS ……………...……… 700,659 1,167,946 729,436 954,000 (213,946) 224,564 Total ……………...……… $850,033 $1,339,604 $903,041 $1,131,963 ($207,641) $228,922
FundingCity ……………...………… $83,503 $183,729 $116,080 $130,760 ($52,969) $14,680Other Categorical Grants … 6,145 21,704 1,856 1,931 (19,773) 75 IFA ……………...………… 17,550 20,156 23,448 23,448 3,292 — State ……………...……… 15,164 21,922 1,075 1,075 (20,847) — Federal CD ……………...… 232,273 578,859 258,991 469,127 (109,732) 210,136 Federal Other ……………. 491,615 509,194 499,507 503,619 (5,575) 4,112 Intra-City Other …………… 3,783 4,040 2,084 2,003 (2,037) (81) Total ……………...……… $850,033 $1,339,604 $903,041 $1,131,963 ($207,641) $228,922
Additional Costs Centrally FundedPersonal Services (PS) Fringe Benefits ………… $56,310 $61,103 $67,166 $66,667 $5,564 ($499) Pensions ……………...… 23,422 24,102 26,639 24,915 813 (1,724) Other Than Personal Service (OTPS) Debt Service ……………. 583,823 612,405 641,000 664,490 52,085 23,490 Total Additional Costs $663,555 $697,610 $734,805 $756,072 $58,462 $21,267
FundingCity ……………...………… 608,425 640,764 674,265 692,701 51,937 18,436 Non-City ……………...…… 55,130 56,846 60,540 63,371 6,525 2,831
Full Agency Costs (including Central Accounts)Salary and Wages ………… $149,329 $171,658 $173,605 $177,963 $6,305 $4,358Fringe Benefits …………… 56,355 61,103 67,166 66,667 5,564 (499) Pensions ……………...…… 23,422 24,102 26,639 24,915 813 (1,724) Total PS ……………...…… $229,106 $256,863 $267,410 $269,545 $12,682 $2,135
OTPS ……………...……… $700,659 $1,167,946 $729,436 $954,000 ($213,946) $224,564Debt Service …………….. 583,823 612,405 641,000 664,490 52,085 23,490 Total OTPS $1,284,482 $1,780,351 $1,370,436 $1,618,490 ($161,861) $248,054
Total Agency Costs ……… $1,513,588 $2,037,214 $1,637,846 $1,888,035 ($149,179) $250,189Less Intra-City …………… $3,783 $4,040 $2,084 $2,003 ($2,037) ($81)Net Agency Cost ………… $1,509,805 $2,033,174 $1,635,762 $1,886,032 ($147,142) $250,270
FundingCity ……………...………… 691,928 824,493 790,345 823,461 (1,032) 33,116 Non-City ……………...…… 817,877 1,208,681 845,417 1,062,571 (146,110) 217,154
Personnel (includes FTEs at fiscal year-end)City ……………...………… 704 780 772 786 6 14 Non-City ……………...…… 1,542 1,752 1,762 1,764 12 2 Total ……………...……… 2,246 2,532 2,534 2,550 18 16
Summary of Agency Financial Data The following table compares 2018 Executive Budget with the 2018 Preliminary Budget, the 2017 forecast and actual expenditures for 2016, including fringe benefits, pensions, and debt service.
2018Increase/(Decrease)($ in 000's)
Standard 4/23/2017 7:55 PMAgency: Housing Preservation and Development

Analysis of Agency Budgets Fiscal Year 2018
179
Programmatic Review and Service Impact
HPD administers the above-described core services through the following offices: Enforcement and Neighborhood Services; Asset and Property Management; Technology and Strategic Development; Financial Management and Tenant Resources; Strategy, Research and Communications; Neighborhood Strategies; Development; and Legal Affairs. The Offices of the Commissioner and First Deputy Commissioner also provide planning, leadership, technical, and skilled supporting services to accomplish the agency’s goals.
Enforcement and Neighborhood Services
HPD’s Office of Enforcement and Neighborhood Services protects housing by ensuring that building owners comply with the City’s Housing Maintenance Code and the New York State Multiple Dwelling Law. The Office responds to public complaints and plans appropriate, individualized actions to address hazardous conditions in privately owned buildings – conditions may include the presence of lead paint, structural deficiencies, or the lack of heat, hot water, or electricity. Through the Proactive Preservation Initiative and the agency’s Alternative Enforcement, 7A, and Underlying Conditions programs, the Office monitors deteriorating and severely distressed properties and reaches out to owners with tools to educate, assist, or enforce accountability. When warranted, the agency will undertake repairs through the Emergency Repair Program at an owner’s expense. HPD will also bring cases to Housing Court to seek the correction of hazardous conditions, the imposition of civil penalties, and the protection of tenants against claims of harassment.
Financial Management and Tenant Resources
HPD’s Office of Financial Management and Tenant Resources provides a central place for support and consultation on financial issues and includes the Budget Division, the Fiscal Division and the Tenant Resources Division. The Budget Division develops and negotiates the agency’s expense, revenue, and capital budgets and determines how to allocate those resources throughout the agency. The Fiscal Division administers the agency’s accounts payable and accounts receivable functions. Finally, the Tenant Resources Division administers rental assistance programs such as Section 8, which reaches over 39,500 households.
Development
HPD’s Off ice of Development leads the implementation of the Mayor’s Housing Plan in close collaboration with other City and State agencies and with the New York City Housing Development Corporation (HDC). The Office builds a pipeline of affordable housing development on both public and private sites and administers a variety of new construction, rehabilitation, preservation, and homeownership programs.
Additionally, under the Division of Housing Incentives, Development manages the inclusionary housing pipeline and associated transactions—intended to promote economic integration as areas undergo substantial new development—and the tax credits and incentives program.
Neighborhood Strategies
HPD’s Office of Neighborhood Strategies focuses on Planning and Community Partnerships to help the agency adopt a more comprehensive approach to development within the City’s neighborhoods. The Division of Planning and Predevelopment identifies future sites, coordinates neighborhood zoning efforts, and collaborates with other City agencies to develop public properties. The Division of Neighborhood Development and Stabilization leads the agency commitment to strategic preservation and development through engagement with tenants, landlords, community leaders, and neighborhood stakeholders on issues involving the creation of vibrant neighborhoods anchored by affordable housing.
Asset and Property Management
HPD’s Office of Asset and Property Management works to ensure that properties remain financially and physically stable over the long-term. Its programs proactively identify at-risk buildings and help to stabilize mismanaged assets. The Office also manages City-owned residential and commercial properties, as well as Urban Renewal properties, until they can be returned to responsible private ownership. In addition, the agency operates Emergency Housing Services (EHS) and the Homeless Rental Unit to provide emergency shelter and housing relocation services to tenants displaced as a result of fires or vacate orders issued by the Department of Buildings, the Fire Department, or by the agency itself.

Analysis of Agency Budgets Fiscal Year 2018
180
Capital Review
The 2018-2027 Ten-Year Capital Strategy for HPD totals $9.5 billion, including $9.2 billion in City funding and $327 million in Federal funds. The 2018-2021 Four-Year Plan totals $4.1 billion, including $4 billion in City funding and $135 million in Federal funds. The agency will use its City capital resources to leverage State and Federal funds as well as private equity (that does not flow through the City’s capital budget) as part of the agency’s plan to create or preserve 200,000 units of affordable housing by 2024. The Ten-Year Capital Strategy includes $1.9 billion in new funding for HPD between 2018 and 2024 to deepen affordability within the Housing New York Plan. The table below reflects the Four-Year Plan by program area over the 2018 – 2021 period.
Capital Commitments($ in 000’s)
_______________________________________________________________________________________________________________________________________________________________________________________________________________
2018 2019 2020 2021 Plan Plan Plan Plan ________________________________ _____________________________ _________________________________ ________________________________
City All City All City All City All Funds Funds Funds Funds Funds Funds Funds Funds____________________________________________________________________________________________________________________________________________________________________________________________________
New Construction .......................... 516,605 516,605 386,634 386,634 316,771 316,771 290,923 290,923 Other Housing Support .................. 37,036 37,036 12,350 12,350 15,451 15,451 17,193 17,193 Disposition ..................................... 28,631 28,631 36,754 36,754 52,325 52,325 35,462 35,462 Preservation ................................... 407,865 407,865 355,646 355,646 390,119 390,119 416,123 416,123 Special Needs ................................ 104,764 143,680 207,368 239,368 199,401 231,401 176,836 208,836 ____________ _____________ ____________ ____________ ____________ ____________ ____________ ____________
Total ................................................. $1,094,901 $1,133,817 $998,752 $1,030,752 $974,067 $1,006,067 $936,537 $968,537 ========== ============ ============ ============ ============ ============ ============ ===========
_______________________________________________________________________________________________________________________________________________________________________________________________________________
Highlights of the Ten-Year Capital Strategy and Four-Year Plan
Under the Ten-Year Capital Strategy, HPD will generate affordable housing units via preservation, new construction, supportive housing, and the disposition of in rem housing stock. Under the 2018-2021 Four-Year Plan, the City will support production of 20,000 units of affordable housing annually via preservation, new construction, supportive housing, and the disposition of in rem housing stock. Under the Four-Year Plan:
• Funding of $1.6 billion will support activities to preserve existing affordable housing stock while creating long-term affordability by providing moderate to substantial rehabilitation.
• Funding of $1.5 billion will support construction of new units serving various income levels throughout the five boroughs. Initiatives include large-scale developments, as well as funding for various rental and homeownership programs.
• Funding of $823 million (inclusive of $135 million of Federal HOME funds) for supportive housing initiatives funded through various Special Needs Housing loan programs.
• Funding of $153 million will rehabilitate City-owned housing units and return them to responsible private ownership.
• Funding of $82 million will be used in support of
other ancillary housing investments. This primarily encompasses acquisition/demolition, infrastructure for large-scale developments, and Technology and Strategic Development (TSD) projects that will enhance agency operations.
In addition, units are expected to be generated without capital subsidies through various initiatives with agency partners. These units will primarily be created or preserved using bond financing, inclusionary zoning, and tax abatement or exemptions.

Analysis of Agency Budgets Fiscal Year 2018
181
DEPARTMENT OF CITYWIDE ADMINISTRATIVE SERVICES
The Department of Citywide Administrative Services (DCAS) is the principal administrative support agency for the City of New York. DCAS supports other City agencies by making sure they have the critical resources needed to provide the best possible services to the public. DCAS support includes attracting and training a diverse workforce, purchasing goods and services at the lowest prices from local sources where possible, energy and facilities management, and ensuring that public buildings truly serve the public. The following lines of services provide this support: Human Capital, Citywide Diversity and Equal Employment Opportunity, Asset Management, Communications, Energy Management, Office of Citywide Purchasing, and Office of NYC Fleet.
Financial Review
The 2018 Executive Budget for the Department of Citywide Administrative Services provides $1.2 billion, a decrease of $3.3 million below the amount forecasted for 2017. This decrease is predominantly attributable to savings to be achieved from the space management initiative. The $5.7 billion DCAS Ten-Year Capital Plan includes $1.6 billion for the renovation, reconstruction, and outfitting of Public Buildings, $2.7 billion for energy efficiency initiatives, $139.7 million for Real Property, and $1.2 billion for Citywide resiliency and agency facility and operational protective measures.
Revenue Forecast
The Department of Citywide Administrative Services manages the City’s real estate holdings, and receives revenue in the form of rents, mortgage payments, and proceeds from property sales. It also holds auctions for vehicles from the City’s Fleet and collects civil service exam fees. In 2018, the Department of Citywide Administrative Services anticipates collecting $65.8 million in revenue.
Expense Budget Highlights
Budgetary Priorities: Providing Core Services
• The 2018 Executive Budget provides total funds of $1.19 billion for the Department, of which $721.5 million is for goods and services that agencies purchase from DCAS through intra-City agreements, including the following: utilities ($610.3 million), leases ($75.5 million), storehouse supplies ($19.5 million), maintenance and repair of facilities and vehicles ($5.8 million), personnel training ($1.9 million), and other services ($8.4 million).
• The 2018 Executive Budget provides a total of $249.8 million for DCAS Asset Management. Included in this total is $103.8 million for leases and $60.2 million for building maintenance.
• The 2018 Executive Budget provides a total of $132.2 million for DCAS Asset Management – Public Facilities (excluding $103.8 million for leases). Included in the $132.2 million total is $54.4 million in State funding for court facilities. Asset Management – Public Facilities provides overall facilities management, including maintenance and construction services for 55 public buildings including court facilities.
• The 2018 Executive Budget provides a total of $13.8 million for DCAS Asset Management – Real Estate Services. Real Estate Services purchases, sells, and leases real property; and locates space for City agencies.
• The 2018 Executive Budget provides a total of $20.2 million for security services in DCAS-managed buildings.
Restructuring and Streamlining
• To expeditiously provide opportunities for employment and promotion through the use of civil service lists, DCAS has made significant strides in the area of automation. By administering fully automated exams the agency will greatly improve the users’ experience with the examination process and significantly decrease the cycle time from exam administration to list establishment. The plan is being implemented in three phases by DCAS’ Human Capital and IT Lines of Service. The first phase, which allowed for the automation of the Qualifying Incumbent Examination (QIE), was completed in September 2016. Phase 2 focuses on the development of technology solutions that will contribute to shortened cycle times for exams and civil service lists, including the creation of an application portal for candidates and an exams dashboard. The work is expected to be completed by the end of Summer 2017. The work of Phase 3 will allow DCAS to make multiple-choice test content

Analysis of Agency Budgets Fiscal Year 2018
182
portable and provide the agency with the flexibility to offer exams out of any location equipped with computers. The work is scheduled to be completed in June 2018.
• DCAS’ Energy Management Line of Service continues to lead the City’s efforts to reduce greenhouse gas emissions (GHG) by 80 percent by the year 2050 (“80 x 50”), with a near-term goal to reduce GHG emissions from government buildings 35 percent by the year 2025. DCAS continues to develop more opportunities to reduce City facilities’ energy consumption during times of constraint on the electrical grid through its Demand Response (DR) Program. The DR Program provides incentive payments to City agencies that participate in this program by voluntarily reducing their energy consumption during peak times. Over the past year,
the number of facilities enrolled in the DR Program has doubled and has resulted in the shedding of an additional 20 percent of megawatts from the grid. DCAS has also provided more than 200 facilities with new meters to allow building operators to see their energy usage in real-time. Access to real time information will provide the foundation to optimize a building’s energy consumption, not just during times of grid constraint but, every day.
• DCAS’ NYC Fleet Line of Service is leading the implementation of the NYC Clean Fleet Initiative to add 2,000 Electric Vehicles (EVs) to the City’s Fleet by the year 2025, and to reduce transportation GHG emissions by 50 percent. DCAS is expecting to have over 1,000 EVs in operation by the end of calendar year 2017.

Analysis of Agency Budgets Fiscal Year 2018
183
2017 20182016
Actual2017
ForecastPreliminary
BudgetExecutive
Budget Forecast Preliminary
BudgetExpenditures
Salary and Wages ……….. $169,394 $183,693 $188,429 $192,204 $8,511 $3,775Fringe Benefits …………… 1,737 1,931 1,931 1,931 — — OTPS ……………...……… 946,647 1,003,852 943,235 992,072 (11,780) 48,837 Total ……………...……… $1,117,778 $1,189,476 $1,133,595 $1,186,207 ($3,269) $52,612
FundingCity ……………...………… $281,909 $316,691 $279,598 $322,633 $5,942 $43,035Other Categorical Grants … 83,796 80,087 79,314 82,066 1,979 2,752 IFA ……………...………… 952 1,457 1,614 1,395 (62) (219) State ……………...……… 58,146 58,967 55,071 54,933 (4,034) (138) Federal CD ……………...… 1,334 1,845 1,598 1,598 (247) — Federal Other ……………. 1,856 3,551 2,120 2,120 (1,431) — Intra-City Other …………… 689,785 726,878 714,280 721,462 (5,416) 7,182 Total ……………...……… $1,117,778 $1,189,476 $1,133,595 $1,186,207 ($3,269) $52,612
Additional Costs Centrally FundedPersonal Services (PS) Fringe Benefits ………… $49,724 $54,343 $61,193 $59,912 $5,569 ($1,281) Pensions ……………...… 26,302 25,944 30,519 28,544 2,600 (1,975) Other Than Personal Service (OTPS) Debt Service ……………. 594,375 660,976 688,514 722,981 62,005 34,467 Total Additional Costs $670,401 $741,263 $780,226 $811,437 $70,174 $31,211
FundingCity ……………...………… 638,023 709,533 740,991 770,590 61,057 29,599 Non-City ……………...…… 32,378 31,730 39,235 40,847 9,117 1,612
Full Agency Costs (including Central Accounts)Salary and Wages ………… $169,394 $183,693 $188,429 $192,204 $8,511 $3,775Fringe Benefits …………… 51,461 56,274 63,124 61,843 5,569 (1,281) Pensions ……………...…… 26,302 25,944 30,519 28,544 2,600 (1,975) Total PS ……………...…… $247,157 $265,911 $282,072 $282,591 $16,680 $519
OTPS ……………...……… $946,647 $1,003,852 $943,235 $992,072 ($11,780) $48,837Debt Service …………….. 594,375 660,976 688,514 722,981 62,005 34,467 Total OTPS $1,541,022 $1,664,828 $1,631,749 $1,715,053 $50,225 $83,304
Total Agency Costs ……… $1,788,179 $1,930,739 $1,913,821 $1,997,644 $66,905 $83,823Less Intra-City …………… $689,785 $726,878 $714,280 $721,462 ($5,416) $7,182Net Agency Cost ………… $1,098,394 $1,203,861 $1,199,541 $1,276,182 $72,321 $76,641
FundingCity ……………...………… 919,932 1,026,224 1,020,589 1,093,223 66,999 72,634 Non-City ……………...…… 178,462 177,637 178,952 182,959 5,322 4,007
Personnel (includes FTEs at fiscal year-end)City ……………...………… 1,516 1,930 1,923 1,981 51 58 Non-City ……………...…… 663 716 722 714 (2) (8) Total ……………...……… 2,179 2,646 2,645 2,695 49 50
Summary of Agency Financial Data The following table compares 2018 Executive Budget with the 2018 Preliminary Budget, the 2017 forecast and actual expenditures for 2016, including fringe benefits, pensions, and debt service.
2018Increase/(Decrease)($ in 000's)
Standard 4/23/2017 7:59 PMAgency: Department of Citywide Administrative Services

Analysis of Agency Budgets Fiscal Year 2018
184
Programmatic Review and Service Impact
DCAS provides support services through the seven lines of services described below:
Human Capital
Human Capital is responsible for Citywide civil service administration, including the classification of positions and salaries, developing, validating, administering, and rating examinations, creating civil service lists, and certifying those lists to agencies to fill vacancies and replace provisionals. Human Capital also evaluates and administers Citywide personnel policies and programs, and conducts professional development and employee training programs. It also oversees the expansion and maintenance of the New York City Automated Personnel System (NYCAPS), a centralized state-of-the-art automated personnel system for managers and employees to access and manage personnel and benefits information, including Employee Self-Service.
Human Capital administers examinations for City agencies and other organizations such as the New York City Housing Authority. Human Capital will continue to provide sufficient exams to help meet the City’s hiring needs as well as continuing to reduce the number of provisional employees Citywide.
Diversity and Equal Employment Opportunity
Citywide Diversity and EEO (CDEEO) oversees the equal employment opportunity policy and practices of the City, assisting City agencies in developing strategies to achieve compliance with the City’s EEO obligations. This office provides training to agency EEO Officers in implementing the EEO-related provisions of the City Charter, the City’s EEO Policy, and other Federal, State and local laws. The group also monitors agencies’ EEO efforts, including resolving complaints and monitoring employment actions, through quarterly compliance reports and providing statistical reports on the City’s workforce, its demographic composition, and trends in hiring and promotions.
Asset Management
Asset Management is the real estate arm of the City of New York, which oversees City-owned office buildings, court buildings and commercial rental properties, keeping these buildings fully functional and operational. In addition, Asset Management negotiates and administers City leases of private property. Acting as the real estate advisor for City agencies, Asset Management assists agencies with finding suitable and cost effective space for their operations, through purchase or lease of acquired or existing space.
Asset Management actively manages and operates approximately 55 City-owned court and office buildings totaling 15 million square feet throughout the City, which includes City Hall, Manhattan and Brooklyn Municipal Buildings, and each of the five Borough Halls. In addition, Asset Management is responsible for the City’s 21 million square foot leased portfolio.
Communications
The Communications line of service produces the City Record, the official journal of the City of New York mandated by Section 1066 of the New York City Charter. The City Record includes notices about public hearings and meetings, property disposition, procurement (solicitations and awards), agency public hearings, agency rules, and special material, which include changes in personnel.
The City Record is published each weekday except legal holidays along with a searchable version called The City Record Online (CROL). CROL offers vendors the opportunity to view notices and bid documents online at any time. Vendors who register with the site receive notification by e-mail when new solicitations are posted.
Energy Management
DCAS Energy Management (DEM) serves as the hub for energy management for City government operations, from energy procurement to performance tracking, improved operations & maintenance, and building retrofits. DEM is responsible for monitoring and paying the City’s Heat, Light and Power bills. DEM also plays a central role in One City, Built to Last, the initiative to reduce greenhouse gas emissions by 80 percent below 2005 levels by 2050.

Analysis of Agency Budgets Fiscal Year 2018
185
Office of Citywide Purchasing
The Office of Citywide Purchasing (OCP) purchases, inspects and distributes supplies and equipment at the lowest net cost, and assists in the disposal of surplus heavy equipment and goods. Each year DCAS purchases $1.2 billion of goods and services for the City, through approximately 1,000 Citywide requirement contracts and one-time purchases. DCAS leverages the City’s purchasing power to obtain the most competitive pricing for goods and services by aggregating demand and consolidating contracts. DCAS seeks to maximize Minority and Women-Owned Business Enterprise (M/WBE) vendor participation by conducting outreach and regularly representing the City at vendor fairs.
NYC Fleet
NYC Fleet operates 28,000 owned and leased vehicles, the largest municipal fleet in the United States. NYC maintains fleet units at 37 dedicated fleet repair facilities and additional satellite locations, and has over 400 in-house fueling locations. NYC Fleet oversees the vehicle maintenance contracts while managing the City’s fuel, vehicle accidents, defensive driver training and alternative energy programs. DCAS directs efforts to improve fleet management Citywide in areas of safety, sustainability, transparency, and shared services.
Capital Review
The Department is responsible for capital improvements to all DCAS-managed and client agency buildings including office space, warehouses, and courts; oversight and improvements to City-leased properties; the sale, lease, acquisition and rehabilitation of City-owned non-residential waterfront and non-waterfront properties; energy efficiency initiatives; and agency facility and operational protective measures. The capital program includes compliance work for public safety and legal mandates, renovation, rehabilitation, construction, design, and outfitting of various sites, including the purchase of furniture. The Department also purchases vehicles and various communications and technological equipment.
The 2018-2027 Ten-Year Capital Strategy totals $5.7 billion which includes $3.8 billion in the 2018-2021 Four-Year Plan. The table below reflects capital commitments by program area over the FY 2017-2021 period.
Capital Commitments($ in 000’s)
_________________________________________________________________________________________________________________________________ 2016 2017 2018 2019 2020 2021 Actual Plan Plan Plan Plan Plan City All City All City All City All City All City All Funds Funds Funds Funds Funds Funds Funds Funds Funds Funds Funds Funds_________________________________________________________________________________________________________________________________Rehabilitation of City- Owned Space ........................... $51,534 $51,534 $32,731 $32,731 $212,504 $212,504 $155,489 $155,489 $19,542 $19,542 $64,863 $64,863 Renovation of Other City-Owned Facilities .............. 9,633 7,663 2,006 3,976 30,410 30,410 38,398 38,398 — — — — Rehabilitation of Court Buildings .................................. 5,799 — (5,799) — 310 310 — — — — — — Legal Mandates and Correction of Unsafe Conditions ............... 13,809 13,809 71,241 71,700 93,818 93,818 177,849 177,849 132,150 132,609 6,145 6,145 Renovation of Leased Space ........................................ 12,612 12,612 42,809 42,839 101,676 101,676 89,963 89,963 2,226 2,226 — — Equipment and Interagency Services ................ 16,477 16,477 41,728 41,728 28,269 28,269 24,325 24,325 3,006 3,006 3,326 3,326 Communications Equipment ............................... — — — — 782 782 161 161 — — — — Board of Elections ..................... 865 865 1,225 1,225 195 195 — — — — 707 707 Miscellaneous Construction ....... 17,328 17,328 36,175 36,175 25,384 25,384 10,300 10,300 2,201 2,201 2,600 2,600 Acquisition of Real Property ..... 500 500 195 195 32,000 32,000 — — — — — — Energy Efficiency and Sustainability ........................... 97,372 93,151 168,096 169,333 315,048 315,048 261,486 261,486 371,914 371,914 304,649 304,649 Resiliency and Protective Measures ................. 3,968 3,968 79,843 79,843 226,439 226,439 213,318 448,060 308,458 508,458 5,067 5,067 Rehabilitation of Waterfront & Non-Waterfront Properties .. 3,001 3,001 11,029 11,029 30,239 30,239 30,799 30,799 27,695 27,695 26,185 26,185 ____________ ____________ ____________ ____________ ____________ ____________ ____________ ____________ ____________ ____________ ____________ ____________
Total ........................................... $232,898 $220,908 $481,279 $490,774 $1,097,074 $1,097,074 $1,002,088 $1,236,830 $867,192 $1,067,651 $413,542 $413,542 ========== ========== ========== ========== ========== ========== ========== ========== ========== ========== ========== ==========

Analysis of Agency Budgets Fiscal Year 2018
186
Highlights of the Ten- Year Strategy include:
• Reconstruction and rehabilitation of public buildings and City-owned facilities ($506.4 million), including projects at 345 Adams in Brooklyn ($95.3 million), the Brooklyn Municipal Building ($52.6 million), the Manhattan Municipal Building ($44.5 million), 22 Reade in Manhattan ($25.2 million), 1932 Arthur Avenue in the Bronx ($20.5 million), 100 Gold in Manhattan ($19.0 million), a Computerized Testing and Applications Center in the Bronx ($15.0 million), 2 Lafayette in Manhattan ($13.8 million), and Queens Borough Hall ($13.5 million).
• Renovation of leased space ($281.1 million), including expansion of Department of Emergency Management leased space in Brooklyn ($85 million), space for the Department of Investigation in Manhattan ($18.5 million), an infrastructure equipment upgrade for the Department of Information Technology and Telecommunications leased space in Brooklyn ($16.7 million), and space for the Department of Finance in Queens ($8.1 million).
• Energy efficiency measures and building retrofits, Citywide ($2.7 billion), including funding for the Accelerated Conservation and Efficiency (ACE) Program ($110.3 million), Local Law 87 deep retrofits ($69.9 million), Solar panels at Citywide facilities ($86.0 million), and other energy efficiency upgrades for various projects ($2.4 billion). The One City, Built to Last plan will achieve an 80 percent reduction in GHG emissions from 2005 levels by 2050.
• Legal mandates ($545.1 million), including fire/life safety upgrades to ensure Local Law 5 compliance ($287.7 million), fuel tank replacement and remediation ($180.4 million), and façade upgrades to ensure Local Law 11 compliance ($20.4 million).
• Equipment and interagency services ($108.6 million), including the development of a replacement system for the Integrated Property Information System ($9.3 million), installation of security cameras in public buildings ($6.0 million), equipment upgrades for New York City Emergency Management ($3.4 million), and the development of a municipal supplies Inventory Management System ($13.8 million).
• Miscellaneous construction in other facilities ($40.5 million).
• Renovation of other City-owned facilities ($70.1 million), including space for the Taxi and Limousine Commission at its Woodside, Queens facility ($66.4 million).
• Communications equipment ($0.9 million).
• Acquisition of real property ($32.0 million), including parkland for the development of the Staten Island levee ($32.0 million).
• Rehabilitation of court buildings ($0.3 million).
• Rehabilitation of waterfront property ($135.6 million).
• Rehabilitation of non-waterfront property ($4.0 million).
• Citywide agency resiliency and agency facility and operational protective measures ($1.2 billion).
The 2018-2021 Plan provides $3.6 billion and includes:
• Reconstruction and rehabilitation of public buildings and City-owned facilities ($452.4 million), including projects at 345 Adams in Brooklyn ($95.3 million), the Brooklyn Municipal Building ($52.6 million), the Manhattan Municipal Building ($42.9 million), 22 Reade in Manhattan ($25.2 million), 1932 Arthur Avenue in the Bronx ($20.5 million), 100 Gold in Manhattan ($19.0 million), a Computerized Testing and Applications Center in the Bronx ($15.0 million), 2 Lafayette in Manhattan ($13.8 million), and Queens Borough Hall ($13.5 million).
• Renovation of leased space ($193.9 million), including expansion of Department of Emergency Management leased space in Brooklyn ($85 million), space for the Department of Investigation in Manhattan ($18.5 million), an infrastructure equipment upgrade for the Department of Information Technology and Telecommunications leased space in Brooklyn ($16.7 million), and space for the Department of Finance in Queens ($8.1 million).
• Energy efficiency measures and building retrofits, Citywide ($1.3 billion), including funding for the Accelerated Conservation and Efficiency (ACE) Program ($110.3 million), Local Law 87 deep retrofits ($69.9 million), Solar panels at Citywide facilities ($86.0 million), and other energy efficiency

Analysis of Agency Budgets Fiscal Year 2018
187
upgrades for various projects ($982.2 million). The One City, Built to Last plan will achieve an 80 percent reduction in GHG emissions from 2005 levels by 2050.
• Legal mandates ($410.4 million), including fire/life safety upgrades to ensure Local Law 5 compliance ($169.9 million), fuel tank replacement and remediation ($180.4 million), and façade upgrades to ensure Local Law 11 compliance ($20.4 million).
• Equipment and interagency services ($58.9 million), including the development of a replacement system for the Integrated Property Information System ($9.3 million), installation of security cameras in public buildings ($6.0 million), equipment upgrades for New York City Emergency Management ($3.4 million), and the development of a municipal supplies Inventory Management System ($13.8 million).
• Miscellaneous construction in other facilities ($40.5 million).
• Renovation of other City-owned facilities ($68.8 million), including space for the Taxi and Limousine Commission at its Woodside, Queens facility ($66.4 million).
• Communications equipment ($0.9 million).
• Acquisition of real property ($32.0 million), including parkland for the development of the Staten Island levee ($32.0 million).
• Rehabilitation of court buildings ($0.3 million).
• Rehabilitation of waterfront property ($110.9 million).
• Rehabilitation of non-waterfront property ($4.0 million).
• Citywide agency resiliency and agency facility and operational protective measures ($1.2 billion).

Analysis of Agency Budgets Fiscal Year 2018
188
DEPARTMENT OF INFORMATION TECHNOLOGY AND TELECOMMUNICATIONS
The Department of Information Technology and Telecommunications (DoITT) provides Citywide coordination and technical expertise in the development and use of data, voice, and video technologies in City services and operations. DoITT’s Commissioner directs the development of information technology (IT) strategies and deployment. DoITT also provides infrastructure support for data processing and communications services to numerous City agencies, researches and manages IT projects, and administers the City’s cable television and mobile and high-capacity telecommunications franchises. DoITT also provides technology and administrative support to NYC311, the City’s broadcast/cable television and radio stations, the Mayor’s Office of Data Analytics, and the Mayor’s Office of Technology and Innovation.
Financial Review
DoITT’s 2018 Executive Budget provides for an operating budget of $621.7 million, a decrease of $98.1 million over the amount forecasted for 2017. This change is largely attributable to non-city funds that have not yet been rolled into the coming year and intra-city agreements for telecom that have not yet been renewed.
Revenue Forecast
The Department collects revenue from cable television, high capacity and mobile telecommunications franchises, advertising on wireless internet kiosks and international programming fees for use of the City’s NYC TV cable television network. The Department will generate $176.2 million in revenue for 2018.
Expense Budget Highlights
Budgetary Priorities: Providing Core Services
• The Department’s 2018 Executive Budget includes $135.1 million for services that DoITT purchases on behalf of client agencies, including telecommunications, data, and consultant services.
• The Department’s 2018 Executive Budget provides $266.8 million for the Infrastructure Management Division. This Division is responsible for the data center operations and fiber optic network that provide data processing and networking services to over 120 City agencies and entities, 24 hours a day, seven days a week.
• The Department’s 2018 Executive Budget provides $44.2 million for the 311 Citizen Service Center. The Service Center provides the public with continuous access to non-emergency City services through one phone number.
• The Department’s 2018 Executive Budget provides $15.6 million for the administration of the City’s five cable television channels, a broadcast station, and a radio station on the NYC TV Media Group network. The City produces programming designed to inform the public on City affairs.

Analysis of Agency Budgets Fiscal Year 2018
189
2017 20182016
Actual2017
ForecastPreliminary
BudgetExecutive
Budget Forecast Preliminary
BudgetExpenditures
Salary and Wages ……….. $112,118 $125,205 $147,554 $150,747 $25,542 $3,193Fringe Benefits …………… — — 91 — — (91) OTPS ……………...……… 474,891 594,644 455,466 470,987 (123,657) 15,521 Total ……………...……… $587,009 $719,849 $603,111 $621,734 ($98,115) $18,623
FundingCity ……………...………… $401,704 $466,224 $452,707 $460,120 ($6,104) $7,413Other Categorical Grants … 5,667 12,719 3,150 5,022 (7,697) 1,872 IFA ……………...………… 3,059 2,642 — 2,959 317 2,959 State ……………...……… 2,863 50,718 8,668 8,668 (42,050) — Federal CD ……………...… 5,862 15,879 3,387 8,882 (6,997) 5,495 Federal Other ……………. 2,738 7,814 250 916 (6,898) 666 Intra-City Other …………… 165,116 163,853 134,949 135,167 (28,686) 218 Total ……………...……… $587,009 $719,849 $603,111 $621,734 ($98,115) $18,623
Additional Costs Centrally FundedPersonal Services (PS) Fringe Benefits ………… $28,847 $33,913 $38,712 $38,674 $4,761 ($38) Pensions ……………...… 16,186 16,821 19,995 18,701 1,880 (1,294) Other Than Personal Service (OTPS) Debt Service ……………. — — — — — — Total Additional Costs $45,033 $50,734 $58,707 $57,375 $6,641 ($1,332)
FundingCity ……………...………… 40,321 45,806 55,521 52,373 6,567 (3,148) Non-City ……………...…… 4,712 4,928 3,186 5,002 74 1,816
Full Agency Costs (including Central Accounts)Salary and Wages ………… $112,118 $125,205 $147,554 $150,747 $25,542 $3,193Fringe Benefits …………… 28,847 33,913 38,803 38,674 4,761 (129) Pensions ……………...…… 16,186 16,821 19,995 18,701 1,880 (1,294) Total PS ……………...…… $157,151 $175,939 $206,352 $208,122 $32,183 $1,770
OTPS ……………...……… $474,891 $594,644 $455,466 $470,987 ($123,657) $15,521Debt Service …………….. — — — — — — Total OTPS $474,891 $594,644 $455,466 $470,987 ($123,657) $15,521
Total Agency Costs ……… $632,042 $770,583 $661,818 $679,109 ($91,474) $17,291Less Intra-City …………… $165,116 $163,853 $134,949 $135,167 ($28,686) $218Net Agency Cost ………… $466,926 $606,730 $526,869 $543,942 ($62,788) $17,073
FundingCity ……………...………… 442,025 512,030 508,228 512,493 463 4,265 Non-City ……………...…… 24,901 94,700 18,641 31,449 (63,251) 12,808
Personnel (includes FTEs at fiscal year-end)City ……………...………… 1,320 1,711 1,711 1,713 2 2 Non-City ……………...…… 59 66 34 59 (7) 25 Total ……………...……… 1,379 1,777 1,745 1,772 (5) 27
Summary of Agency Financial Data The following table compares 2018 Executive Budget with the 2018 Preliminary Budget, the 2017 forecast and actual expenditures for 2016, including fringe benefits, pensions, and debt service.
2018Increase/(Decrease)($ in 000's)
Standard 4/23/2017 8:00 PMAgency: Department of Info Tech and Telecom

Analysis of Agency Budgets Fiscal Year 2018
190
Programmatic Review and Service Impact
DoITT is committed to leading exponential growth in technology and providing world-class IT services for the City of New York. The Department’s initiatives reflect DoITT’s mission of providing resilient, scalable, and leading IT services, infrastructure, and telecommunications to agency partners, and support the hallmark of the de Blasio Administration: to create a more equitable city for all. To achieve these goals, DoITT works to establish Citywide policies around large-scale technology programs.
Recent efforts to broaden and diversify DoITT’s pool of vendors to include more Minority- and Women-Owned Business Enterprises (M/WBE) and small businesses directly supports the Mayor’s goal to increase total City awards to M/WBEs to $16 billion over the next ten years, and in recognition of the essential nature of broadband, DoITT is working to provide every resident and business access to affordable, reliable, high-speed broadband service by 2025. DoITT continues to support the implementation of WiFi at parks sites and the deployment of LinkNYC, a free, high-speed, citywide Wi-Fi network. Up to 10,000 “Link” kiosks are in the process of replacing aging public payphones across all five boroughs.
DoITT’s state-of-the-art Citywide Data Center allows the City to leverage expertise, IT personnel, and enterprise architecture practice to avoid duplicative efforts across agencies and improve efficiency and effectiveness. DoITT also manages Citynet, the City’s institutional fiber network; NYC.gov, the City’s official website; the New York City Wireless Network (NYCWiN); the Citywide Radio Network (Channel 16); the 800 MHz Radio Network; the Citywide Geographic Information Systems Unit; and provides administrative support to various other initiatives to help streamline agency operations and deliver services to New Yorkers.
Sustainable Broadband Adoption and the Mayor’s Office of technology and Innovation
As part of Mayor de Blasio’s goal of universal broadband access, DoITT’s franchisee installed the first LinkNYC kiosks on Monday, December 28, 2015, growing to more than 700 installed and active by April 2017. DoITT leads NYC Connected Communities, which provides $3.7 million per year to a range of City partners to increase public broadband access, computer literacy, and job readiness training in communities of need.
The Mayor’s Office of Technology and Innovation (MOTI) is leading the efforts to reach affordable, reliable universal broadband for all New Yorkers by 2025. MOTI also helps facilitate citywide coordination and collaboration on technology issues, serves as a catalyst for and advises agencies on innovation, and interacts with the wider New York City technology ecosystem in order to fulfill Mayor de Blasio's vision of making NYC the most innovative, tech-friendly, and equitable big city in the world.
Emergency Communications Transformation Program
The City continues work on Stage 2 of planned upgrades and enhancements to its 9-1-1 Emergency System. The majority of the capital funding for this initiative, known as the Emergency Communications Transformation Program (ECTP), is contained within DoITT’s budget. In December 2011, in collaboration with the Police Department and the Fire Department, the Office of Citywide Emergency Communications completed Stage 1, which included significant upgrades to the call-taking systems and telecommunications infrastructure, as well as co-location of the Police, Fire and EMS call taking and dispatch operations into the Public Safety Answering Center in Brooklyn. ECTP’s work on Stage 2 continues as the City develops a new, consolidated Fire and EMS dispatch system in a second, fully redundant Public Safety Answering Center (PSAC 2) in the Bronx. As previously committed, NYPD call taking operations commenced at PSAC2 in June 2016, and is being followed by continued implementations of public safety systems.
New York City Wireless Network
The New York City Wireless Network (NYCWiN) is a high-speed, mobile data network providing first responders high-speed data access to support large file transfers, including fingerprints, mug shots, City maps, automatic vehicle location, and full-motion streaming video. The network is also leveraged by City agencies to improve service delivery to New Yorkers. This network is relied on for systems such as Automated Water Meter Reading (AMR), Traffic Signal Control, License Plate Reader (LPR) and various other programs.

Analysis of Agency Budgets Fiscal Year 2018
191
Citywide Radio Network & 800 MHz Radio Network
DoITT maintains two distinct mission-critical radio systems – 800 MHz and the Citywide Radio Network (400 MHz) – supporting more than 40 City agencies and some 30,000 radios with internal and interoperable communications among various jurisdictions. There is heavy reliance on these systems by other city agencies as a very dependable means of voice communications. During Hurricane Sandy these systems had 100% uptime and reliability throughout the emergency in areas surrounding the impacted zones. DoITT is currently in the process of upgrading these systems to the Project 25 (P25) standard for the design and manufacture of interoperable, digital two-way wireless communications products, which is the latest standard for interoperable digital two-way wireless communications developed for state, local & federal users.
Geographic Information Systems
DoITT’s Citywide Geographic Information Systems (GIS) Unit provides enterprise-wide support for geospatial applications by developing and hosting interactive maps and geo-referenced data along with associated tools and applications. This includes NYCityMap, a physical base map and planimetrics of the City derived from aerial photography. Leveraging NYCityMap and similar technologies, DoITT works with agencies across the City to launch many interactive websites and applications serving a range of audiences and needs.
NYC311
NYC311 is the nation’s largest and most comprehensive government information and services center. It is available 24 hours a day, 7 days a week. New Yorkers can connect with NYC311 online, chat, mobile app, text, phone, or social media. The agency works continuously to make government services more accessible to non-English speakers, with 311 Online available in more than 50 languages. Since its launch, NYC311 has received more than 220 million calls and has been a clearinghouse for all things New York City government, providing information on more than 5,000 topics, routing details to the appropriate City agencies and providing customers with service request numbers for use in tracking the progress of their inquiry.
NYC.gov
NYC.gov, the official website of the City of New York, is in many ways the City’s digital face to the world. Home to more than 180 NYC.gov websites, representing City agencies, entities, organizations, and initiatives, NYC.gov greets more than 34 million unique visitors who view nearly 275 million pages of content each year. Additionally, NYC.gov serves as a launching point to City government on other digital platforms such as mobile applications, social media, and targeted alerts. Along with the Mayor’s Office of Digital Strategy, DoITT continues to work with agencies across the City to redesign their websites to match the re-launched NYC.gov, which entails major improvements both to the site’s design and accessibility features, and to its back-end technology infrastructure. The site is more user-centric and accessible than before and easily navigated by all users via an intuitive, data-informed interface and comprehensible plain language. From the homepage, users can find important alerts, watch Mayoral announcements live, make a 311 service request, get customized information about their neighborhood, and discover new events and programs.
Mayor’s Office of Media and Entertainment
The New York City Mayor’s Office of Media and Entertainment (MOME) streamlines government communications by making more information accessible, leveraging technology to aid in the transparency of government, and by supporting relevant industries in New York City. MOME consists of the Office of Film, Theatre and Broadcasting, and NYC Media, the official television, radio, and online network of the City of New York.
Streamlining Agency Operations
DoITT will continue to leverage its data centers, fiber optic network, wireless data network, and other resources in order to achieve cost savings for City agencies in need of internet access, data center hosting and management, e-mail, security and firewall solutions, disaster recovery sites, wireless solutions, and remote access. The DoITT Capital Plan for 2018-2021 includes $287.1 million for infrastructure improvements associated with these Citywide initiatives.

Analysis of Agency Budgets Fiscal Year 2018
192
ECONOMIC DEVELOPMENT
Fostering economic development growth in New York City requires a multi-faceted approach, coordinated between multiple agencies. The two main entities responsible for economic development in the City are the Department of Small Business Services (SBS) and the New York City Economic Development Corporation (NYCEDC). SBS makes it easier for businesses in New York City to form, do business and grow by providing direct assistance to business owners, fostering neighborhood development in commercial districts and linking employers to a skilled and qualified workforce. NYCEDC’s mission is to encourage inclusive economic growth throughout the five boroughs of New York City by facilitating investments that create jobs and strengthen neighborhoods. Together, SBS and NYCEDC oversee programming to achieve the City’s economic development goals.
The Department of Small Business Services (SBS)
SBS works to foster a thriving, equitable New York City by connecting people to jobs, creating stronger businesses, and building a fairer economy. SBS operates the City’s NYC Business Solutions Centers, Industrial Business Solutions Provider Network and Workforce1 Career Centers; provides services to support the growth of local economic development organizations throughout the City; and administers the Minority and Women-owned Business Enterprise (MWBE) Program. SBS also contracts with NYCEDC, NYC & Company, the Trust for Governors Island (TGI) and the Brooklyn Navy Yard Development Corporation (BNYDC), to bolster economic development in the five boroughs.
New York City Economic Development Corporation (NYCEDC)
NYCEDC is a not for profit organization under contract with SBS. It manages City-owned properties and invests in major infrastructure upgrades and capital projects; conducts area-wide planning and real estate development; and works to support the City’s major business sectors. NYCEDC addresses challenges faced by industries through analysis of current economic trends, development of strategies and solutions, and implementation of programs that help businesses thrive and grow. Through the New York City Industrial Development Agency (NYCIDA) and Build New York City Resource Corporation (Build NYC), NYCEDC helps eligible businesses meet financing needs for property acquisition, new equipment, renovation and working capital through low-cost tax-exempt bonds and exemptions and abatements of selected City and State taxes to create quality jobs.
Brooklyn Navy Yard Development Corporation (BNYDC) and Trust for Governors Island (TGI)
SBS also contracts with the BNYDC and the TGI for the purposes of economic development and rehabilitating City-owned assets. Since 1981, BNYDC has operated the Brooklyn Navy Yard on behalf of the City and has diversified the types of businesses that operate at the Navy Yard, from a reliance on heavy maritime manufacturers to green and light manufacturers. Currently, over 330 businesses employ over 7,000 people at the Navy Yard’s 300-acre campus.
In 2011, the City of New York assumed responsibility for the development and operations of Governors Island, located in Upper New York Harbor. Since assuming control of the Island, the City has made major investments at the Island to prepare it for future development activities. With these investments, TGI has fortified the Island against natural disasters, rehabilitated the Island’s electrical and water infrastructure, and created new parkland.
Financial Review
The 2018 Executive Budget provides $191.7 million in operating expenses at SBS, inclusive of $58.8 million of Federal Workforce Innovation and Opportunity Act (WIOA) and Community Development Block Grant (CDBG) funds, and City funds totaling $118.5 million. The SBS operating budget includes allocations for NYCEDC, NYC & Company and the TGI. NYCEDC funds the majority of its operating budget through income earned from its management of the City’s real estate portfolio.
City-funded capital commitments of $3 billion are forecast in the 2018-2027 capital plan.
Analysis of Agency Budgets Fiscal Year 2018
193
Expense Budget Highlights
SBS
• The Workforce Development Division helps New Yorkers build careers and connect to jobs. Workforce Development programs are currently budgeted at $51.9 million in 2018.
• The Business Services Division helps businesses to start, operate and grow. The 2017 Executive Budget provides $24.6 million in City and Federal funds.
• The Neighborhood Development Division strengthens commercial neighborhoods and supports the City’s network of 72 Business Improvement Districts. The 2018 Executive Budget provides $6.6 million in City and Federal funds.
• The Division of Economic and Financial Opportunity certifies minority- and women-owned businesses (MWBEs) for government contracts, provides technical assistance to MWBEs, and works to ensure parity in the City’s hiring practices. The 2018 Executive Budget provides $8.0 million in City and Federal funds.
NYCEDC
• NYCEDC is self-sustaining and receives no direct operating funds from the City, deriving revenues primarily from the management of City-owned property, financing fees, and land sale proceeds.
NYC and Co.
• Through a contract with SBS, NYC & Company will receive $21.2 million in City funding in 2018 for its work to promote the City as the country’s premier tourist destination, serve as the City’s official marketing organization, and to provide partnership services.
Trust for Governors Island
• Through a contract with SBS, TGI will receive $17.6 million in City funding towards the management and operations of the Island in 2018, as well as capital funds for investments in infrastructure and the construction of public open space and recreational facilities.
Brooklyn Navy Yard Development Corporation (BNYDC)
• BNYDC is self-sustaining and receives no direct operating funds from the City, deriving revenues primarily from the management of City properties. Through a contract with SBS, BNYDC will receive capital funds for investments in infrastructure.

Analysis of Agency Budgets Fiscal Year 2018
194
2017 20182016
Actual2017
ForecastPreliminary
BudgetExecutive
Budget Forecast Preliminary
BudgetExpenditures
Salary and Wages ……….. $20,581 $25,970 $25,889 $27,320 $1,350 $1,431Fringe Benefits …………… — 3 — — (3) — OTPS ……………...……… 261,886 322,948 133,620 164,388 (158,560) 30,768 Total ……………...……… $282,467 $348,921 $159,509 $191,708 ($157,213) $32,199
FundingCity ……………...………… $131,179 $154,985 $93,657 $118,466 ($36,519) $24,809Other Categorical Grants … 9,169 9,802 — — (9,802) — IFA ……………...………… — — — — — — State ……………...……… 3,326 2,226 2,015 2,015 (211) — Federal CD ……………...… 74,943 85,869 10,905 16,870 (68,999) 5,965 Federal Other ……………. 46,347 69,670 40,427 41,852 (27,818) 1,425 Intra-City Other …………… 17,503 26,369 12,505 12,505 (13,864) — Total ……………...……… $282,467 $348,921 $159,509 $191,708 ($157,213) $32,199
Additional Costs Centrally FundedPersonal Services (PS) Fringe Benefits ………… $6,228 $7,146 $7,660 $7,848 $702 $188 Pensions ……………...… 3,392 3,340 3,670 3,433 93 (237) Other Than Personal Service (OTPS) Debt Service ……………. 171,717 182,520 187,364 199,413 16,893 12,049 Total Additional Costs $181,337 $193,006 $198,694 $210,694 $17,688 $12,000
FundingCity ……………...………… 173,685 184,512 189,707 201,074 16,562 11,367 Non-City ……………...…… 7,652 8,494 8,987 9,620 1,126 633
Full Agency Costs (including Central Accounts)Salary and Wages ………… $20,581 $25,970 $25,889 $27,320 $1,350 $1,431Fringe Benefits …………… 6,228 7,149 7,660 7,848 699 188 Pensions ……………...…… 3,392 3,340 3,670 3,433 93 (237) Total PS ……………...…… $30,201 $36,459 $37,219 $38,601 $2,142 $1,382
OTPS ……………...……… $261,886 $322,948 $133,620 $164,388 ($158,560) $30,768Debt Service …………….. 171,717 182,520 187,364 199,413 16,893 12,049 Total OTPS $433,603 $505,468 $320,984 $363,801 ($141,667) $42,817
Total Agency Costs ……… $463,804 $541,927 $358,203 $402,402 ($139,525) $44,199Less Intra-City …………… $17,503 $26,369 $12,505 $12,505 ($13,864) $—Net Agency Cost ………… $446,301 $515,558 $345,698 $389,897 ($125,661) $44,199
FundingCity ……………...………… 304,864 339,497 283,364 319,540 (19,957) 36,176 Non-City ……………...…… 141,437 176,061 62,334 70,357 (105,704) 8,023
Personnel (includes FTEs at fiscal year-end)City ……………...………… 199 258 242 257 (1) 15 Non-City ……………...…… 103 124 121 114 (10) (7) Total ……………...……… 302 382 363 371 (11) 8
Summary of Agency Financial Data The following table compares 2018 Executive Budget with the 2018 Preliminary Budget, the 2017 forecast and actual expenditures for 2016, including fringe benefits, pensions, and debt service.
2018Increase/(Decrease)($ in 000's)
Standard 4/23/2017 7:55 PMAgency: Economic Development

Analysis of Agency Budgets Fiscal Year 2018
195
Programmatic Review and Service Impact
Department of Small Business Services
SBS works to foster a thriving, equitable economy and promote inclusive growth by connecting New Yorkers to good jobs, creating stronger businesses, and building a fairer economy. It does this by linking employers to a skilled and qualified workforce, providing direct assistance to business owners, reducing the burden of regulation, supporting neighborhood development in commercial districts, and promoting financial and economic opportunity among minority- and women-owned businesses.
Workforce Development Division (WDD)
The Workforce Development Division delivers training and employment services to the City’s workforce, and develops relationships with industry and private partners. In 2016, Workforce1 Career Centers served 104,715 jobseekers, providing workshops, pre-vocational skills training, on-site recruitments and job referral services. Additionally, the Workforce1 system helped to connect New Yorkers to 28,455 jobs, for which they were hired.
Division of Business Services (DBS)
The Division of Business Services helps small businesses start, operate, and thrive by providing free business services through NYC Business Solutions Centers in all five boroughs.
Centers are open in the South Bronx, Upper Manhattan, Queens, Downtown Brooklyn, Washington Heights, Staten Island and Lower Manhattan. In 2016, NYC Business Solutions Centers facilitated over $44.9 million in financing awards for 432 unique clients in partnership with Industrial Business Providers, which serve the industrial sector; provided 5,201 free business education courses to entrepreneurs; and enabled 915 establishments to open and served 5,122 customers.
The Emergency Response Unit, in coordination with the Mayor’s Office of Emergency Management, assists businesses affected by disasters by providing updates on building re-openings, facilitating the resolution of matters affecting day-to-day business operations, and compiling evidence to support business claims for assistance. In 2016, staff provided assistance to 208 businesses.
Neighborhood Development Division (NDD)
NDD supports community-based economic development organizations throughout New York City in order to build neighborhood commercial corridors and to create the conditions under which local businesses thrive and residents enjoy access to a vibrant mix of goods and services. In 2016, through a network of 72 Business Improvement Districts (BIDs), NDD oversaw contracts that led to the provision of more than $134.7 million in supplemental services across 4,108 City blocks.
Division of Economic and Financial Opportunity (DEFO)
SBS works to ensure that the City’s procurement process reflects the great diversity of this City, and that government uses all levers available to strengthen minority and women-owned businesses. The Division of Economic and Financial Opportunity focuses on helping minority and women owned firms certify with the City, and build their capacity so they can compete and win contracts in the public and private sectors. In April of 2015, Mayor de Blasio set an ambitious goal of awarding a minimum of $16 billion over the next ten years to MWBEs certified with the City of New York. During FY 2016, the City awarded over $609 million in prime contracts and $119 million in eligible subcontracts to MWBEs.
New York City Economic Development Corporation
As the City’s primary vehicle for advancing inclusive economic development, NYCEDC coordinates with both the private and public sectors to promote economic development activities across a diverse set of industries and neighborhoods. Over the last 5 years, this work led to over $24.7 billion in private investment in various projects in all five boroughs. To support industrial and commercial development, promote tourism, and improve transportation and waterfront infrastructure, NYCEDC utilizes a combination of City capital funds and NYCEDC revenue to manage the City’s industrial, waterfront and commercial assets.
Asset Management
NYCEDC manages the City’s industrial properties, which include the Brooklyn Army Terminal (BAT). BAT is currently 94 percent occupied, with over 100

Analysis of Agency Budgets Fiscal Year 2018
196
tenants, who employ over 3,700 workers. NYCEDC is currently utilizing $115 million in City capital funds to rehabilitate Building A at the BAT campus to open up 500,000 square feet of new modern industrial space, as well as bring online 55,000 square feet of industrial space focused on food manufacturing facilities at the BAT Annex Building.
Real Estate
NYCEDC helps the City manage and sell its real estate assets. The asset management portfolio includes over 275 City-owned properties, which includes approximately 65 million square feet of largely industrial real estate. NYCEDC also conducts real estate planning and development, disposing of City-owned property, releasing RFPs to develop City assets, and conducting neighborhood-wide planning, throughout the five boroughs.
HireNYC
HireNYC is a free program that connects City economic development projects to local hiring opportunities for New Yorkers, connecting approximately 500 New Yorkers a year with employment opportunities. HireNYC staff members from multiple City Agencies collaborate with real estate developers, the City’s workforce development system, and communities to assess business opportunities and the need for jobs.
Waterfront Development
NYCEDC manages and assists in the redevelopment of City-owned waterfront industrial property. This
includes the Manhattan and Brooklyn Cruise Terminals and the operation of the Citywide Ferry Service. The first three lines of the Citywide Ferry Service will begin operations in 2017, with two additional lines starting operations in 2018.
Industry Support and Small Business Assistance
NYCEDC provides several small business lending, guarantee, and bond programs, as well as a range of sector-based programs and initiatives designed to spur growth and innovation in strategic sectors of the City’s economy. The purpose of these programs is to create jobs, and retain and expand businesses through financial assistance, incubator space or talent development initiatives. NYCEDC has launched a network of 17 business incubators in the five boroughs. Over 1,000 startup businesses and 1,500 employees are currently located at the City-sponsored incubators, which have collectively raised more than $175 million in venture funding.
NYCEDC also oversees the New York City Industrial Development Agency (NYCIDA) and the Build NYC Resource Corporation (Build NYC) to provide financing and tax assistance for capital expansion projects for industrial and commercial companies and not-for-profit organizations. The NYCIDA provides low-cost tax-exempt bonds and exemptions and abatements of selected City and State taxes to create and retain jobs. By working with Build NYC, not-for-profit institutions are able to access triple tax-exempt bonds that can lower the costs of financing their capital needs and free up funds to invest in their programs. IDA had 385 active projects and Build NYC had 103 active projects as of June 30, 2016.

Analysis of Agency Budgets Fiscal Year 2018
197
Capital Review
The primary goal of the Ten Year Capital Plan is to encourage development in order to create and retain jobs in New York City, to bolster the City’s tax base, and to maintain City-owned facilities in a state of good repair. The 2018-2027 Ten Year Capital Plan totals $3.2 billion.
The following chart shows Capital plan commitments by major function over the 2018-2027 period. Actual commitments are provided for 2016.
Capital Commitments($ in 000’s)
__________________________________________________________________________________________________________________________________________ 2016 2017 2018 2019 2020 2021 Actual Plan Plan Plan Plan Plan City All City All City All City All City All City All Funds Funds Funds Funds Funds Funds Funds Funds Funds Funds Funds Funds _______________________________________________________________________________________________________________________________________________________Commercial Development ............ $3,186 $8,478 $93,901 $128,500 $113,149 $113,149 $86,553 $86,553 $64,340 $64,769 $31,854 $31,854 Industrial Development ................. 22,018 22,018 172,915 173,235 154,321 154,321 124,044 124,044 24,399 24,399 16,703 16,703 Market Development..................... 51 51 51,098 51,098 73,589 73,589 – – 1,172 1,172 – – Neighborhood Revitaliz'n ............. 84,014 90,206 313,645 344,800 459,878 459,878 286,688 290,698 309,834 327,834 261,706 261,706 Port Development ......................... 3,261 2,226 9,391 12,316 503 503 – – 1,476 1,476 – – Rail Development ......................... 836 – – – – – – – 193 193 – – Waterfront Development ............... 17,527 16,825 141,357 166,828 136,712 136,712 26,872 26,872 60,433 60,433 23,636 23,636 Cultural Development ................... 3 3 16,427 16,427 2,095 2,095 – – 2,701 2,701 – – Community Development ............. 648 1,325 3,747 4,286 51,742 51,742 50,000 50,000 3,708 3,708 – – Miscellaneous ............................... 41,947 44,358 250,931 370,360 145,289 184,882 42,576 67,576 40,838 106,682 4,000 4,000 ___________ ___________ ___________ ___________ ___________ ___________ ___________ ___________ ___________ ___________ ___________ ___________
Total .............................................. $173,491 $185,490 $1,053,412 $1,267,850 $1,137,278 $1,176,871 $616,733 $645,743 $509,094 $593,367 $337,899 $337,899 ========= ========= =========== =========== ========= ========= ========= ========= ========= ========= ========= =========__________________________________________________________________________________________________________________________________________________________________________________________
Highlights of the 2018-2027 Ten Year Capital Plan (including uncommitted 2017 funds):
• A total of $631 million for the Neighborhood Development Fund to help provide for critical infrastructure work for re-zonings proposed in neighborhood plans developed by the Department of City Planning.
• A total of $506 million for infrastructure work related to planned housing development projects throughout the five boroughs.
• A total of $150 million to support the development of the life sciences industry in New York City.
• A total of $136 million for the development of the Made in New York campus at Bush Terminal.
• A total of $80 million for the rehabilitation of existing structures, public access improvements, and infrastructure upgrades to support future redevelopment at Brooklyn Navy Yard.
• A total of $40 million for the rehabilitation of existing structures, public access improvements, and infrastructure upgrades to support public open space and future redevelopment at Governors Island.

Analysis of Agency Budgets Fiscal Year 2018
198
LIBRARIESThe City of New York funds three independently operated public library systems, each administered by a
separate board of trustees. The Brooklyn Public Library (BPL) oversees the operation of 58 branches and a Central Library. The New York Public Library (NYPL) is made up of four research libraries all located in Manhattan; and 88 neighborhood branches throughout the Bronx (35 branches), Manhattan (40 branches), and Staten Island (13 branches). NYPL’s four research libraries are the Stephen A. Schwarzman Building, the New York Public Library for the Performing Arts, the Schomburg Center for Research in Black Culture, and the Science, Industry and Business Library. The Queens Borough Public Library (QBPL) consists of 62 branches, a Central Library, and two family literacy centers.
Financial Review
The 2018 Executive Budget for the Libraries provides total operating funds of $365.9 million. The Executive Budget also provides for City funded capital commitments of $334.9 million in 2018.
Expense Budget Highlights
Budgetary Priorities: Providing Core Services
• In 2018, the operating subsidy for the Brooklyn Public Library will be $100.7 million.
• In 2018, the operating subsidy for the New York Public Library will be $135.5 million.
• In 2018, the operating subsidy for the New York Public Library’s research libraries will be $27.6 million.
• In 2018, the operating subsidy for the Queens Borough Public Library will be $102.1 million.

Analysis of Agency Budgets Fiscal Year 2018
199
2017 20182016
Actual2017
ForecastPreliminary
BudgetExecutive
Budget ForecastPreliminary
BudgetExpenditures
Salary and Wages ……… $— $— $— $— $— $—Fringe Benefits ………… — — — — — — OTPS …………………… 364,267 370,167 366,096 365,895 (4,272) (201) Total …………………… $364,267 $370,167 $366,096 $365,895 ($4,272) ($201)
FundingCity …………………… $359,112 $366,209 $366,096 $365,895 ($314) ($201)Other Categorical Grants 437 — — — — — IFA ……………………… — — — — — — State …………………… — — — — — — Federal CD ……………… — — — — — — Federal Other …………… — — — — — — Intra-City Other ………… 4,718 3,958 — — (3,958) — Total …………………… $364,267 $370,167 $366,096 $365,895 ($4,272) ($201)
Additional Costs Centrally FundedOther Than Personal Service (OTPS) Fringe Benefits ………… $2,015 $1,976 $2,267 $2,210 $234 ($57) Pensions ……………… 29,935 33,076 33,628 33,628 552 — Debt Service …………… 68,094 74,790 78,281 73,847 (943) (4,434) Total Additional Costs $100,044 $109,842 $114,176 $109,685 ($157) ($4,491)
FundingCity …………………… 97,514 107,265 111,093 106,749 (516) (4,344) Non-City ……………… 2,530 2,577 3,083 2,936 359 (147)
Full Agency Costs (including Central Accounts)Fringe Benefits ………… $2,015 $1,976 $2,267 $2,210 $234 ($57)OTPS …………………… 364,267 370,167 366,096 365,895 (4,272) (201) Pensions ………………… 29,935 33,076 33,628 33,628 552 — Debt Service …………… 68,094 74,790 78,281 73,847 (943) (4,434) Total OTPS …………… $464,311 $480,009 $480,272 $475,580 ($4,429) ($4,692)
Total Agency Costs …… $464,311 $480,009 $480,272 $475,580 ($4,429) ($4,692)Less Intra-City ………… $4,718 $3,958 $— $— ($3,958) $—Net Agency Cost ……… $459,593 $476,051 $480,272 $475,580 ($471) ($4,692)
FundingCity …………………… 456,626 473,474 477,189 472,644 (830) (4,545) Non-City ……………… 2,967 2,577 3,083 2,936 359 (147)
Personnel (includes FTEs at fiscal year-end)City …………………… — — — — — — Non-City ……………… — — — — — — Total …………………… — — — — — —
* The 2018 Executive Budget provides an estimated 4,365 full-time and full-time equivalent positions, which are funded with City subsidies.
Summary of Agency Financial Data
2018Increase/(Decrease)
The following table compares 2018 Executive Budget with the 2018 Preliminary Budget, the 2017 forecast and actual expenditures for 2016, including fringe benefits, pensions, and debt service.
($ in 000's)
Libraries Agency: Libraries 4/23/2017 6:05 PM

Analysis of Agency Budgets Fiscal Year 2018
200
Programmatic Review and Service Impact
The three library systems will continue to provide services throughout the five boroughs at existing branches and at recently opened or rehabilitated libraries including:
• The Woodstock branch will reopen in May 2017 after closing in 2014 for a full interior renovation. The improvements to this Carnegie branch will include expanded programming space, a larger children’s area, a new teen space, technology upgrades, and improved ADA accessibility.
• The third floor of Washington Heights branch in Upper Manhattan is now home to a Teen Zone and Adult Education Center. The 3,750-square-foot space offers a dedicated area for teens, public computers, a large multipurpose room, and class and study rooms for adults.
• The Schomburg Center for Research in Black Culture recently completed work on a new main exhibition space and gift shop, which is now open to the public. This project was part of an ongoing $20 million renovation, which will include an updated façade, auditorium, and several new reading rooms upon its completion in summer 2017.
• The new Elmhurst branch opened in December 2016 and features a comprehensive Adult Learning Center.
• A new Hunters Point branch is under construction and is expected to open in the fall of 2017.
• An expanded Kew Gardens Hills branch is under construction and is expected to open in summer 2017.
• Construction is anticipated to begin in the fall of 2017 for a new Far Rockaway branch.
• The interim library that serves the Brooklyn Heights neighborhood opened in summer 2016, and the Ulmer Park and Brighton Beach branches recently reopened.
The three library systems continue to provide a variety of community programming throughout the five boroughs:
• The Brooklyn Public Library (BPL) offered a wide
variety of programs and services in its library branches, which tallied 8.7 million total visits in 2016. Overall attendance to all programs – including afterschool, financial and health literacy, workforce development, small business, technology training, and others – exceeded 994,000 participants. Due to the baselining of additional operating support, BPL was able to continue to offer at least six days of service in every branch. BPL launched the BKLYN Incubator to support the development of new initiatives by librarians and staff, with training and mentoring on how to design successful programs, build outside partnerships, manage projects, and document outcomes. Hundreds of patrons participated in Incubator-funded projects. BPL staged several artistic and cultural events, including Theater of War, a performance and community conversation about violence, and A Night of Philosophy & Ideas, which drew more than 7,000 attendees to the Central Library. The Summer Reading program served a record number of students and families. In addition, BPL’s outreach team expanded the Telestory program to serve a total of 12 branches, which host virtual story times and other bonding activities for incarcerated parents and their children.
• The New York Public Library (NYPL) continued to expand its essential services and programs to all New Yorkers, especially those in high-need communities – from offering citizenship and immigration assistance to reaching out to those impacted by incarceration. This year NYPL had 18 million visits across its 92 locations, offering 93,341 programs and classes with attendance totaling approximately 1.8 million visitors, the most in NYPL’s history. As an invaluable resource for New York’s diverse immigrant population, NYPL has continued to offer various services. This year, NYPL offered English for Speakers of Other Languages (ESOL) classes to 128,316 attendees. NYPL has also continued its valued partnership with the Mayor’s Office of Immigrant Affairs, maintaining “New Americans Corners” in all of its branches and hosting the NYCitizenship initiative to provide legal and financial help to immigrants. Furthermore, NYPL continues to serve as one of the largest sites for IDNYC enrollment across the City. In an effort to serve incarcerated patrons and their families, NYPL partnered with the City to offer video visitation services. For the first time, families from across the

Analysis of Agency Budgets Fiscal Year 2018
201
City were able to video conference with incarcerated loved ones from any of the five boroughs. Furthering its commitment to incarcerated patrons, NYPL has also embarked on a pilot program to offer ESOL classes to individuals on Rikers Island. NYPL remains committed to advancing key City priorities such as expanding early literacy, bridging the digital divide, and serving those most in need.
• The Queens Borough Public Library (QBPL) continued to meet the rising demand for its resources and programs. It welcomed over 11.2 million customers at its 63 branches and two family literacy centers and offered 68,000 program sessions that drew a record 1.1 million participants. QBPL circulated over 13 million materials, provided more than 3 million computer sessions and connected 477,000 visitors to the Internet. QBPL served 5,500 adult learners, including 1,700 students who participated in a structured 12-week ESOL program across 38 branches. In addition, 865 customers completed job skills training through QBPL’s Jobs
and Business Academy. With the City’s increased investment in 2016 that provided six-day service at every library in all five boroughs, QBPL increased its average weekly operating hours at each location from 40 to 46 hours, and attracted 1.3 million visitors on Saturdays alone. In July 2016, QBPL created an online capital projects tracking tool to update the public on all current and future construction, renovation, and maintenance projects. QBPL also launched a video visitation program at four libraries in 2016, allowing families to spend time with their incarcerated loved ones through a live video feed. In addition, QBPL partnered with Queens Hospital to launch a new web-based application that delivered 200 magazine titles free of charge to smart phones, tablets, laptops.
Days and hours of library branch service remain a priority for all three library systems. In 2017, on average, each branch provides at least 6.1 days of service per week (approximately 48.6 hours per week).
Capital Review
The 2018-2027 Ten-Year Capital Strategy for the Libraries totals $604.4 million. The table below reflects capital commitments by system over the 2016-2021 year period.
Capital Commitments($ in 000’s)
_______________________________________________________________________________________________________________________________________________________________________________________________________________
2016 2017 2018 2019 2020 2021 Actual Plan Plan Plan Plan Plan ________________________ ___________ ____________ ________________________ _______________________ ________________________ _______________________
City All City All City All City All City All City All Funds Funds Funds Funds Funds Funds Funds Funds Funds Funds Funds Funds _______________________________________________________________________________________________________________________________________________________________________________________________________________
Brooklyn Public Library ............. $13,187 $13,187 $86,819 $86,819 $67,491 $67,491 $45,070 $51,328 $24,685 $24,685 $15,684 $15,684New York Public Library ............ 9,620 9,438 139,209 142,479 200,037 200,037 20,862 20,862 20,878 20,878 15,895 15,895NYPL Research Libraries .......... 1,073 915 33,785 36,785 214 214 221 221 221 221 221 221Queens Borough Public Library 18,859 18,859 163,582 167,501 67,185 67,430 21,190 21,190 20,704 20,704 15,717 15,717 ___________ ___________ ___________ ___________ ___________ ___________ ___________ ___________ ___________ ___________ ___________ ___________
Total ............................................... $42,739 $42,399 $423,395 $433,584 $334,927 $335,172 $87,343 $93,601 $66,488 $66,488 $47,517 $47,517 ========= ========= ========= ========= ========= ========= ========= ========= ========= ========= ========= =========
_______________________________________________________________________________________________________________________________________________________________________________________________________________

Analysis of Agency Budgets Fiscal Year 2018
202
Highlights of the Ten-Year Plan include:
Brooklyn Public Library (BPL):
The 2018-2027 Ten-Year Capital Strategy allocates $178.7 million for various renovations and improvements at BPL branches, including:
• Comprehensive renovations of five branches identified as most critical ($98.0 million, in addition to $2.0 million in 2017).
• Interior and exterior rehabilitation of the Borough Park branch ($2.9 million, in addition to $0.4 million in 2017).
• Various upgrades at the Arlington branch ($5.4 million, in addition to $2.4 million in 2017).
New York Public Library (NYPL), which includes projects in the Bronx, Manhattan, and Staten Island:
The 2018-2027 Ten-Year Capital Strategy allocates $280.8 million for various renovations and improvements at NYPL branches and research libraries, including:
• Renovation of the Midtown Campus in Manhattan ($133.3 million, in addition to $17.4 million in 2017).
• Comprehensive renovations of five branches identified as most critical ($90.0 million, in addition to $10.0 million in 2017).
• Upgrades and renovations at the St. George branch in Staten Island ($3.5 million, in addition to $0.1 million in 2017).
• Interior renovation of the Castle Hill branch in the Bronx ($3.3 million, in addition to $1.5 million in 2017).
• Phase two renovations of the Schomburg Center for Research in Black Culture in Manhattan ($13.5 million in 2017).
Queens Borough Public Library (QBPL):
The 2018-2027 Ten-Year Capital Strategy allocates $144.9 million for various renovations and improvements at QBPL branches, including:
• Comprehensive renovations, new construction, and expansion of branches identified as most critical ($90.0 million, in addition to $10.0 million in 2017).
• Construction of an elevator at the Flushing branch ($2.0 million, in addition to $0.2 million in 2017).
• Expansion and furnishing of the Baisley Park branch ($6.5 million, in addition to $0.9 million in 2017).
• Infrastructure, furniture and equipment upgrades at the Hollis branch ($3.0 million, in addition to $0.9 million in 2017).
• Expansion of the Arverne branch ($6.2 million, in addition to $1.4 million in 2017).
• Renovation and furnishing of the North Forest Park branch ($2.6 million, in addition to $0.2 million in 2017).

Analysis of Agency Budgets Fiscal Year 2018
203
THE DEPARTMENT OF CULTURAL AFFAIRS
The Department of Cultural Affairs (DCLA) is responsible for supporting and strengthening the City’s vibrant cultural life through funding, technical assistance, and advocacy for more than 1,200 nonprofit cultural organizations across New York City, including museums, dance companies, theaters, performing arts organizations, botanical gardens, zoos, and a wide array of other cultural organizations.
The City supports operations at the 33 City-owned cultural institutions known as the Cultural Institutions Group (CIG). This group includes diverse organizations such as the American Museum of Natural History, the Bronx Museum of the Arts, the Queens Museum, the Brooklyn Academy of Music, and the Staten Island Historical Society.
DCLA provides support for capital improvements at over 200 cultural organizations throughout the five boroughs. Funding is provided for infrastructure, renovation, expansion, equipment, and public art projects. In 2017, DCLA also provided program grants and support services for more than 945 cultural organizations Citywide, including groups such as the Brooklyn Historical Society, Staten Island Arts, Alpha Workshops, Corona Youth Music Project in Queens, the Seventh Regiment Armory, the Bronx Academy of Arts and Dance (BAAD!), and Studio in a School.
Financial Review
The Department of Cultural Affairs’ 2018 Executive Budget provides for operating expenses of $143.8 million. It also provides for City funded capital commitments of $370.9 million in 2018.
Expense Budget Highlights
Budgetary Priorities: Providing Core Services
• The City’s 33 CIG institutions will receive operating support of $106.5 million, including $41.4 million in energy subsidies.
• In the 2018 Executive Budget, various cultural organizations Citywide will receive program grants totaling $30.5 million, including $1.0 million in energy subsidies.
• The 2018 Executive Budget contains $6.9 million in operating funds for the Department of Cultural Affairs’ staff, rent, supplies, and equipment.

Analysis of Agency Budgets Fiscal Year 2018
204
2017 20182016
Actual2017
ForecastPreliminary
BudgetExecutive
Budget Forecast Preliminary
BudgetExpenditures
Salary and Wages ……….. $4,467 $5,232 $5,140 $5,265 $33 $125Fringe Benefits …………… — — — — — — OTPS ……………...……… 158,638 180,845 138,521 138,536 (42,309) 15 Total ……………...……… $163,105 $186,077 $143,661 $143,801 ($42,276) $140
FundingCity ……………...………… $156,097 $178,272 $142,985 $143,125 ($35,147) $140Other Categorical Grants … 528 — — — — — IFA ……………...………… 200 243 243 243 — — State ……………...……… 48 3 3 3 — — Federal CD ……………...… 225 358 250 250 (108) — Federal Other ……………. 42 — — — — — Intra-City Other …………… 5,965 7,201 180 180 (7,021) — Total ……………...……… $163,105 $186,077 $143,661 $143,801 ($42,276) $140
Additional Costs Centrally FundedPersonal Services (PS) Fringe Benefits ………… $1,220 $1,372 $1,556 $1,517 $145 ($39) Pensions ……………...… 8,686 8,939 9,129 9,077 138 (52) Other Than Personal Service (OTPS) Debt Service ……………. 176,321 162,525 170,114 161,733 (792) (8,381) Total Additional Costs $186,227 $172,836 $180,799 $172,327 ($509) ($8,472)
FundingCity ……………...………… 179,589 167,130 173,997 165,800 (1,330) (8,197) Non-City ……………...…… 6,638 5,706 6,802 6,527 821 (275)
Full Agency Costs (including Central Accounts)Salary and Wages ………… $4,467 $5,232 $5,140 $5,265 $33 $125Fringe Benefits …………… 1,220 1,372 1,556 1,517 145 (39) Pensions ……………...…… 8,686 8,939 9,129 9,077 138 (52) Total PS ……………...…… $14,373 $15,543 $15,825 $15,859 $316 $34
OTPS ……………...……… $158,638 $180,845 $138,521 $138,536 ($42,309) $15Debt Service …………….. 176,321 162,525 170,114 161,733 (792) (8,381) Total OTPS $334,959 $343,370 $308,635 $300,269 ($43,101) ($8,366)
Total Agency Costs ……… $349,332 $358,913 $324,460 $316,128 ($42,785) ($8,332)Less Intra-City …………… $5,965 $7,201 $180 $180 ($7,021) $—Net Agency Cost ………… $343,367 $351,712 $324,280 $315,948 ($35,764) ($8,332)
FundingCity ……………...………… 335,686 345,402 316,982 308,925 (36,477) (8,057) Non-City ……………...…… 7,681 6,310 7,298 7,023 713 (275)
Personnel (includes FTEs at fiscal year-end)City ……………...………… 61 75 66 67 (8) 1 Non-City ……………...…… 6 5 5 5 — — Total ……………...……… 67 80 71 72 (8) 1
*
Summary of Agency Financial Data The following table compares 2018 Executive Budget with the 2018 Preliminary Budget, the 2017 forecast and actual expenditures for 2016, including fringe benefits, pensions, and debt service.
2018Increase/(Decrease)($ in 000's)
The 2018 Executive Budget provides an estimated 1,426 full-time and full-time equivalent positions, which are funded with City subsidies.
Standard 4/23/2017 6:03 PMAgency: Department of Cultural Affairs

Analysis of Agency Budgets Fiscal Year 2018
205
Programmatic Review and Service Impact
• The 2017 Adopted Budget provided a $10.0 million increase for DCLA, in 2017, which supported four specific areas. There was $500 thousand allocated to the new CUNY Cultural Corps., which places CUNY students in paid internship positions at the 33 members of the Cultural Institutions Group (CIG). This new initiative helps build a pipeline into the cultural workforce for the diverse student body of CUNY, addressing one of the major issues highlighted by DCLA’s broader diversity initiative. There was $1.0 million allocated for energy support of non-CIG cultural institutions on City-owned property under DCLA’s jurisdiction; this support will be continued into 2018. These groups serve communities across the city and represent a broad range of disciplines and audiences. There was $4.0 million allocated for additional support to the Cultural Development Fund, which provides program funding through a competitive application process to nearly 900 groups every year. Lastly, there was $4.5 million allocated for additional support to members of the Cultural Institutions Group (CIG) who receive operating and energy subsidies for providing publicly accessible cultural programming to all New Yorkers.
• DCLA launched the public engagement process for CreateNYC in 2017, the City’s first‐ever comprehensive cultural plan. CreateNYC will provide a roadmap for building a more vibrant, inclusive, and equitable cultural sector for all New Yorkers. The plan will examine a number of issues crucial for maintaining New York City’s cultural vibrancy, including affordable artist workspace; access to arts education; and the role of cultural activities in public space. The final draft will be released in July 2017.
• DCLA continued its Public Artists in Residence (PAIR) program, which creates more avenues for artists to work with government agencies. In 2017, Tania Bruguera continued her residency at the Mayor’s Office of Immigrant Affairs; the Lost Collective continued their work with the Administration for Children’s Services; artist Mary Miss partnered with the Department of Design and Construction; and DCLA launched a second partnership between the Department of Veterans’ Services and artist Bryan Doerries/Theater of War Productions.
• DCLA’s Building Community Capacity (BCC) program helped participating communities (East
Brooklyn, Northern Manhattan, South Bronx, and Southeast Queens) establish coalitions of cross-sector stakeholders dedicated to building and implementing a cohesive community-developed vision. The program helped deepen the understanding of both residents’ interests in arts and culture as well as any barriers to cultural access. The BCC program hired four full-time Project Managers, one in each community, which provides emerging and mid-career cultural workers the opportunity to gain leadership experience in arts-based nonprofit management and community coalition building while bringing diversity to the arts leadership pipeline. The 2018 Executive Plan baselines the funding for this program which will enable the Department to continue the program as it expands into additional communities.
• In 2017, 15 commissions for Percent for Art are slated for installation, including Julianne Swartz’s Four Directions from Hunters Point for the Hunters Point Library in Long Island City, and Melissa Calderon’s Para Roberto, a Roberto Clemente memorial for the Roberto Clemente Plaza in the South Bronx. In 2017, Percent for Art also selected four artists for new commissions, and by the end of the summer expects to select eight more artists for new City construction projects, including Atlantic Avenue in Brooklyn, Woodhaven Boulevard in Queens, and the 40th Precinct in the South Bronx.
• In 2017, Section 224 of the New York City Charter, known as the Percent for Art Law, was amended to increase the amount the City of New York can spend on works of art commissioned through the Percent for Art program; clarify who serves on advisory panels for the Percent for Art program; require certain information be posted on DCLA’s website regarding works of art commissioned through the Percent for Art program; and formalize the Department’s outreach and education efforts regarding opportunities for artists to submit for consideration for Percent for Art projects.
• Materials for the Arts (MFTA) remains New York City’s leading municipal reuse center diverting millions of pounds of reusable goods from the landfill. In 2017, MFTA expanded its public engagement through a variety of creative reuse programming. MFTA partnered with the New York City Housing Authority to conduct sustainability
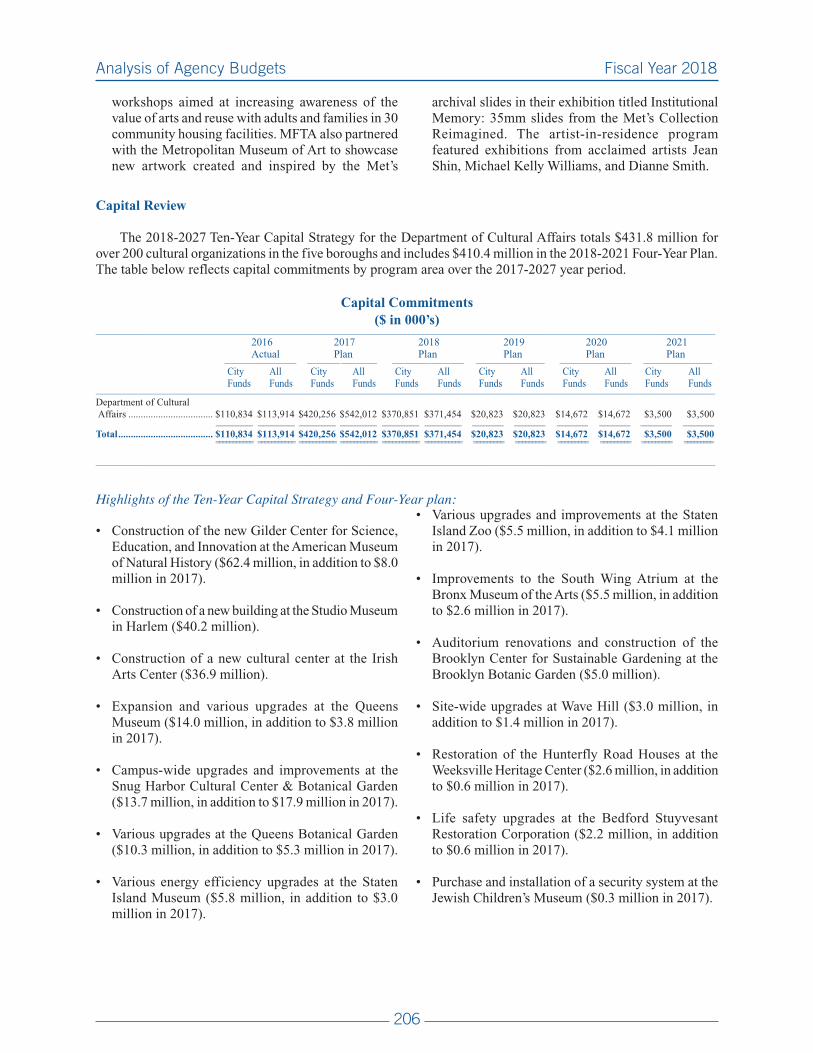
Analysis of Agency Budgets Fiscal Year 2018
206
workshops aimed at increasing awareness of the value of arts and reuse with adults and families in 30 community housing facilities. MFTA also partnered with the Metropolitan Museum of Art to showcase new artwork created and inspired by the Met’s
archival slides in their exhibition titled Institutional Memory: 35mm slides from the Met’s Collection Reimagined. The artist-in-residence program featured exhibitions from acclaimed artists Jean Shin, Michael Kelly Williams, and Dianne Smith.
Capital Review
The 2018-2027 Ten-Year Capital Strategy for the Department of Cultural Affairs totals $431.8 million for over 200 cultural organizations in the five boroughs and includes $410.4 million in the 2018-2021 Four-Year Plan. The table below reflects capital commitments by program area over the 2017-2027 year period.
Capital Commitments($ in 000’s)
_______________________________________________________________________________________________________________________________________________________________________________________________________________
2016 2017 2018 2019 2020 2021 Actual Plan Plan Plan Plan Plan ________________________ ___________ ____________ ________________________ _______________________ ________________________ _______________________
City All City All City All City All City All City All Funds Funds Funds Funds Funds Funds Funds Funds Funds Funds Funds Funds _______________________________________________________________________________________________________________________________________________________________________________________________________________
Department of Cultural Affairs .................................. $110,834 $113,914 $420,256 $542,012 $370,851 $371,454 $20,823 $20,823 $14,672 $14,672 $3,500 $3,500 _____________ _____________ _____________ _____________ _____________ _____________ ___________ ___________ ___________ ___________ ___________ ___________
Total ...................................... $110,834 $113,914 $420,256 $542,012 $370,851 $371,454 $20,823 $20,823 $14,672 $14,672 $3,500 $3,500 =========== =========== =========== =========== =========== =========== ========= ========= ========= ========= ========= =========
_______________________________________________________________________________________________________________________________________________________________________________________________________________
Highlights of the Ten-Year Capital Strategy and Four-Year plan:
• Construction of the new Gilder Center for Science, Education, and Innovation at the American Museum of Natural History ($62.4 million, in addition to $8.0 million in 2017).
• Construction of a new building at the Studio Museum in Harlem ($40.2 million).
• Construction of a new cultural center at the Irish Arts Center ($36.9 million).
• Expansion and various upgrades at the Queens Museum ($14.0 million, in addition to $3.8 million in 2017).
• Campus-wide upgrades and improvements at the Snug Harbor Cultural Center & Botanical Garden ($13.7 million, in addition to $17.9 million in 2017).
• Various upgrades at the Queens Botanical Garden ($10.3 million, in addition to $5.3 million in 2017).
• Various energy efficiency upgrades at the Staten Island Museum ($5.8 million, in addition to $3.0 million in 2017).
• Various upgrades and improvements at the Staten Island Zoo ($5.5 million, in addition to $4.1 million in 2017).
• Improvements to the South Wing Atrium at the Bronx Museum of the Arts ($5.5 million, in addition to $2.6 million in 2017).
• Auditorium renovations and construction of the Brooklyn Center for Sustainable Gardening at the Brooklyn Botanic Garden ($5.0 million).
• Site-wide upgrades at Wave Hill ($3.0 million, in addition to $1.4 million in 2017).
• Restoration of the Hunterfly Road Houses at the Weeksville Heritage Center ($2.6 million, in addition to $0.6 million in 2017).
• Life safety upgrades at the Bedford Stuyvesant Restoration Corporation ($2.2 million, in addition to $0.6 million in 2017).
• Purchase and installation of a security system at the Jewish Children’s Museum ($0.3 million in 2017).

Analysis of Agency Budgets Fiscal Year 2018
207
CITY UNIVERSITY OF NEW YORK
The City University of New York (CUNY) includes eleven senior colleges, seven community colleges, the School of Professional Studies, the Graduate Center, the Graduate School of Journalism, the Macaulay Honors College, the CUNY School of Law, the CUNY Graduate School of Public Health and Health Policy and the CUNY School of Medicine. CUNY also sponsors the Hunter College Campus Schools. The CUNY colleges, some of which date back to the nineteenth century, were federated in 1961. The University is governed by a 17-member Board of Trustees. Ten members are appointed by the Governor with the advice and consent of the New York State Senate, five are appointed by the Mayor, and two (the chairpersons of the Faculty and Student Senates) serve as ex-officio members.
CUNY is the largest municipal university system in the United States and ranks third in number of students among the public university systems in the nation. In 2017, CUNY serves nearly 272,900 students in degree programs with approximately 176,100 in the senior colleges and 96,800 in the community colleges. In addition, CUNY serves approximately 269,100 non-degree students.
Financial Review
The City University of New York’s 2018 Executive Budget totals $1,127.1 million, a net decrease of $76.0 million from the 2017 forecast of $1,203.1 million.
The total budget decrease of $76.0 million is largely due to Intra-City revenue funds decreasing from $91.2 million in 2017 to $12.8 million in 2018. It is offset by growth in State funds of $11.2 million increasing from $285.6 million in 2017 to $296.8 million in 2018 and a
slight increase in funding for Hunter Campus Schools of $0.3 million, totaling $17.3 million in 2017. The Senior College lump sum appropriation of $35 million remains unchanged from 2017.
In addition, higher education related pension and other fringe costs of $85.6 million that are budgeted in separate agencies, brings CUNY’s total 2018 budget to $1,212.7 million.

Analysis of Agency Budgets Fiscal Year 2018
208
Revenue Forecast
COMMUNITY COLLEGE EXPENDITURES BY SOURCE 2012 - 2018
0
200
400
600
800
1,000
1,200
2018201720162015201420132012
Fiscal Year* Funding which supports senior college and Hunter Campus Schools activities is not included here. City tax levy includes pension contributions which are budgeted in the Pension Agency, Medicare Part B and Stabilization Fund contributions which are budgeted in the Miscellaneous Agency. Tuition includes Tuition and Fees, Miscellaneous Revenues and Adult Continuing Education fees. State and Federal dollars and Other Categorical funds are combined and include Community Development funds. The 2017 and 2018 amounts are as per the Executive forecast.
$ in
Mil
lion
s
State, Federal, Other Funds
Tuition
City Tax Levy
In 2018, State, Federal, and Other Categorical funds for two-year colleges increase by $9.6 million from $264.7 million in 2017 to $274.3 million in 2018.
Expense Budget Highlights
Budgetary Priorities: Providing Core Services
• Aligned with the Mayor’s commitment for expanding support to Higher Education, this budget funds $3.9 million in FY18 for application fee waivers for all public school students with financial needs who wish to apply to a CUNY institution and a collaboration with the Mayor’s Office of Criminal Justice, a newly announced program that will serve formerly sentenced inmates providing them access to higher education. In addition the budget continues to support the expansion of Accelerated Study in Associate Programs (ASAP). Efforts will continue to focus on improving college preparation, retention, and graduation rates.
Center for Economic Opportunities and Young Men’s Initiative
• An additional $3.4 million is included for programs such as the Civic Justice Corps, Teacher Paid Recruitment and the Accelerate, Complete and Engage initiative (ACE).
Technical Adjustments
• An additional $64.1 million is funded for initiatives such as leases, energy adjustments, Center for Economic Opportunity (CEO) programs and collective bargaining, which constitute a majority of the allocation ($55.3M in FY18).

Analysis of Agency Budgets Fiscal Year 2018
209
2017 20182016
Actual2017
ForecastPreliminary
BudgetExecutive
Budget Forecast Preliminary
BudgetExpenditures
Salary and Wages ……….. $552,190 $631,749 $602,988 $604,920 ($26,829) $1,932Fringe Benefits …………… 151,112 151,124 179,584 179,584 28,460 — OTPS ……………...……… 315,396 420,241 324,034 342,601 (77,640) 18,567 Total ……………...……… $1,018,698 $1,203,114 $1,106,606 $1,127,105 ($76,009) $20,499
FundingCity ……………...………… $703,360 $810,419 $794,646 $803,247 ($7,172) $8,601Other Categorical Grants … 12,068 14,839 13,541 13,541 (1,298) — IFA ……………...………… — — — — — — State ……………...……… 239,245 285,655 285,655 296,815 11,160 11,160 Federal CD ……………...… 1,165 1,046 — 738 (308) 738 Federal Other ……………. 444 — — — — — Intra-City Other …………… 62,416 91,155 12,764 12,764 (78,391) — Total ……………...……… $1,018,698 $1,203,114 $1,106,606 $1,127,105 ($76,009) $20,499
Additional Costs Centrally FundedPersonal Services (PS) Fringe Benefits ………… $3,023 $2,963 $3,377 $3,290 $327 ($87) Pensions ……………...… 77,822 80,882 82,196 82,266 1,384 70 Other Than Personal Service (OTPS) Debt Service ……………. 61,256 62,926 62,909 55,225 (7,701) (7,684) Total Additional Costs $142,101 $146,771 $148,482 $140,781 ($5,990) ($7,701)
FundingCity ……………...………… 140,656 145,128 146,516 139,103 (6,025) (7,413) Non-City ……………...…… 1,445 1,643 1,966 1,678 35 (288)
Full Agency Costs (including Central Accounts)Salary and Wages ………… $552,190 $631,749 $602,988 $604,920 ($26,829) $1,932Fringe Benefits …………… 154,135 154,087 182,961 182,874 28,787 (87) Pensions ……………...…… 77,822 80,882 82,196 82,266 1,384 70 Total PS ……………...…… $784,147 $866,718 $868,145 $870,060 $3,342 $1,915
OTPS ……………...……… $315,396 $420,241 $324,034 $342,601 ($77,640) $18,567Debt Service …………….. 61,256 62,926 62,909 55,225 (7,701) (7,684) Total OTPS $376,652 $483,167 $386,943 $397,826 ($85,341) $10,883
Total Agency Costs ……… $1,160,799 $1,349,885 $1,255,088 $1,267,886 ($81,999) $12,798Less Intra-City …………… $62,416 $91,155 $12,764 $12,764 ($78,391) $—Net Agency Cost ………… $1,098,383 $1,258,730 $1,242,324 $1,255,122 ($3,608) $12,798
FundingCity ……………...………… 844,016 955,547 941,162 942,350 (13,197) 1,188 Non-City ……………...…… 254,367 303,183 301,162 312,772 9,589 11,610
Personnel (includes FTEs at fiscal year-end)City ……………...………… 8,979 9,741 9,896 9,898 157 2 Non-City ……………...…… — — — — — — Total ……………...……… 8,979 9,741 9,896 9,898 157 2
Summary of Agency Financial Data The following table compares 2018 Executive Budget with the 2018 Preliminary Budget, the 2017 forecast and actual expenditures for 2016, including fringe benefits, pensions, and debt service.
2018Increase/(Decrease)($ in 000's)
Standard 4/23/2017 7:38 PMAgency: City University of New York

Analysis of Agency Budgets Fiscal Year 2018
210
Programmatic Review and Service Impact
The Executive Budget continues City support for CUNY’s efforts to raise and maintain high standards and to create a flagship academic environment. Assisted by revenues generated through enrollment, State aid for the community colleges as well as continuous efforts to promote efficiency from within, CUNY will continue to recruit full-time faculty to improve disciplinary strength and increase the ratio of full-time to adjunct faculty in its schools. Also, CUNY will continue to invest city funding to bolster student-facing programs, such as application fee waivers for public school students and continued support for ASAP.
Program Highlights
• CUNY is expected to engage in numerous independent and collaborative programs with particular focus on increasing college and career readiness aligned with the Mayor’s commitment for expanding support to Higher Education.
These programs include:
Application Fee Waivers for Public School students
This initiative is aligned with the College Access for All initiative.
• This will cover over 33,000 additional waivers for all public school students with a financial need.
Accelerated Study in Associate Programs (ASAP)
The program is designed to help community college students earn their degrees as quickly as possible. Features of ASAP include required full-time study, consolidated course schedules, and academic support. This support includes: monthly Metrocards, textbooks, tuition support for summer courses along with academic advisement and tutoring.
• In FY17, the program impacted a total of 15,400 students and will reach 21,400 in FY18 and beyond.
Summer Tuition
This will allow CUNY to pay summer tuition for students in STEM-related disciplines, which will help them to make significant and timely progress in earning college degrees.
• This initiative will impact 5,000 students in FY17 and beyond.
Academic Advisement
This improves the quality of academic support especially given the complexity of the degree requirements in STEM fields. STEM majors have several prerequisites and these students need to understand the courses that are required to be accepted into the major. Increasing advisors and reducing the advisement caseload will work to improve retention and graduation rates. This aims to improve students’ understanding of the curriculum, the courses they need, and to help them chart a path toward graduation.
• In FY17, 15,110 students benefited from academic advisement and CUNY plans for that number to grow by 5% in each subsequent year.
Other Initiatives
In addition to application fee waivers for public school students and ASAP another initiative that will be funded in the Executive budget is:
Pathway to Higher Education & Peer Navigator Certificate Program
This initiative is aligned with a recently announced program that aims to connect formerly sentenced inmates with access to higher education and career pathways.
• Funding supports outreach, engagement, and enrollment in certificate- or degree-granting CUNY classes for 510 Department of Correction (DOC) releases annually (approximately 10% of medium/high risk city sentenced).
• The program establishes a new forensic peer navigator certification program and career pipeline that will serve 12 Reentry Navigators annually.
Capital Review
The City University of New York’s 2018-2021 Four-Year Capital Plan totals $246.2 million ($245.9 million in City funds and $0.3 million in Non-City funds). Approximately half of CUNY’s capital funds, $297.8 million, reside in the current fiscal year ($288.5 million in City funds and $9.3 million in Non-City funds). CUNY expects a significant portion of these funds to roll into FY 2018.

Analysis of Agency Budgets Fiscal Year 2018
211
Community college critical maintenance and new capital construction projects approved by the City are eligible for an equal amount of State matching funds. The State provides its 50 percent share for such projects through annual State budget capital appropriations. A portion of the State matching funds from annual appropriations are reflected in the City’s capital plan. However, a majority of the State matching funds, provided through the independent sale of New York State Dormitory Authority (DASNY) bonds, are not represented in the City’s capital plan.
The following are on-going major projects and initiatives funded by the City’s FY18-21 Executive Budget:
• A capital initiative to provide for the replacement of the HVAC system for the Borough of Manhattan Community College ($16.5 million).
• A CUNY-wide capital initiative to provide office and administrative space in support of the expansion of the Accelerated Study in Associated Programs (ASAP) ($17.0 million).
• At LaGuardia Community College, construction of the Center 3 Building Façade Replacement is underway ($125.0 million). Also, construction is nearly complete on the Library Expansion project ($15.0 million).
• At Bronx Community College, construction of a new landscaping and site improvement project ($4.5 million) is anticipated to be completed this summer. Construction is underway on the fourth phase of a multi-phase major upgrade of the campus’ outdated utilities ($27.0 million) and construction is also underway on the Alumni Gym Pool renovation ($4.8 million). Additionally, funding was provided for the construction of the new Student Success Center in Meister Hall ($14.0 million).
• At the Borough of Manhattan Community College, construction of a green roof is ongoing ($12.0 million).
• At Kingsborough Community College, construction of a new cooling tower for the campus is underway ($10.0 million).
• At Queensborough Community College, a major upgrade of the campus-wide electrical infrastructure is ongoing ($43.0 million). Construction is nearly complete on phase I of the new cafeteria facility ($12.0 million) and the second phase is in design.
Other major elements of the Four-Year Capital Plan include:
• Ongoing, phased renovations to Hostos Community College’s 500 Grand Concourse Building ($10.0 million) and initial funding for the college’s new Allied Health & Sciences Complex ($5.0 million).
• Renovation of additional space at LaGuardia Community College to alleviate overcrowding ($41.0 million).
• At Kingsborough Community College campus-wide roof replacement and façade repair program ($10.0 million) and structural rehabilitation of the College’s pool facilities ($2.0 million).
• Upgrade of mechanical systems at Hunter College Campus schools ($7.2 million).
• Critical Maintenance and state of good repair ($20.0 million).
In addition to the Four-Year Capital Plan, CUNY’s 2022-2027 capital strategy budget now includes a baseline of $20 million annually for CUNY-wide critical maintenance and state of good repair projects ($120.0 million).
It is anticipated that rolling resources from 2017 into 2018 will fund significant projects that will be accomplished during the next four-year plan period. Highlights of the 2017 commitments include:
• Renovation of the 500 Grand Concourse building at Hostos Community College ($6.0 million).
• Roof replacements for four buildings at Bronx Community College ($6.0 million).
• Cooling Tower improvements at Kingsborough community college ($3.0 million).

Analysis of Agency Budgets Fiscal Year 2018
212
The table below shows the capital commitments by program area over the 2016-2021period.
Capital Commitments
($ in 000’s)_______________________________________________________________________________________________________________________________________________________________________________________________________________
2016 2017 2018 2019 2020 2021 Actual Plan Plan Plan Plan Plan ________________________ _______________________ ________________________ _______________________ ________________________ _______________________
City All City All City All City All City All City All Funds Funds Funds Funds Funds Funds Funds Funds Funds Funds Funds Funds_______________________________________________________________________________________________________________________________________________________________________________________________________________
New School Construction ..... $27,850 $28,044 $27,750 $27,944 $ — $— $— $— $100 $100 $— $—Renovation/Rehabilitation of Roofs, Classrooms, etc ....... 164,489 172,930 230,835 239,080 126,654 126,716 59,456 59,519 23,743 23,807 23,262 23,327 Purchase & Installation of EDP and Other Equipment . 26,998 27,907 27,005 27,914 12,420 12,420 — — 260 260 — —Electrical, Mechanical & HVAC .................................. 4,292 4,292 405 405 — — — — — — — —Other Projects ....................... 2,623 2,623 2,438 2,439 1 1 — — — — — — ___________ ___________ ___________ ___________ ___________ ___________ ___________ ___________ ___________ ___________ ___________ ___________
Total ...................................... $226,252 $235,796 $288,433 $297,782 $139,075 $139,137 $59,456 $59,519 $24,103 $24,167 $23,262 $23,327 ========= ========= ========= ========= ========= ========= ========= ========= ========= ========= ========= =========
_______________________________________________________________________________________________________________________________________________________________________________________________________________

Analysis of Agency Budgets Fiscal Year 2018
213
PENSIONS AND OTHER FRINGE BENEFITS
Pension Overview
The Executive Budget for 2018 includes $9,572 million in expenditures for City pension contributions, an increase of $177 million from the amount expected to be paid in 2017. The City’s pension contribution reflects recent collective bargaining agreements, fiscal year 2016 asset losses, and updates in the mortality assumptions used by the Office of the Actuary for cost projections. Other adjustments include changes in the number of pension members and revised accidental disability retirement benefits for certain Tier 3/6 uniform members. In the table below: (1) $9,480 million in expenditures are for contributions to the City’s five major retirement systems (City Actuarial Systems) that cover City employees and retirees; (2) $91 million in expenditures are for contributions to retirement systems not maintained by the City (Non-City Systems), including the State pension plan that covers employees of City libraries, the Cultural Institutions Retirement System that covers non-City employees of day care centers and certain cultural institutions, and the Teachers’ Insurance and Annuity Association (TIAA) that covers certain CUNY employees and the City’s Voluntary Defined Contribution program; and (3) less than a million in expenditures (Non-Actuarial) are primarily for supplemental benefits for certain retired uniformed members.
Pension Expenditures and Funding Sources($ in 000’s)
__________________________________________________________________________________________________________________________________________________________________________________________ 2018 Increase/(Decrease) ____________________________________________________ _________________________________________________
2016 2017 Preliminary Executive 2017 Preliminary Actual Forecast Budget Budget Forecast Budget__________________________________________________________________________________________________________________________________________________________________________________________
ExpendituresPersonal Service City Actuarial Systems ...... $9,141,243 $9,232,026 $9,654,525 $9,480,253 $248,227 $(174,272) Non-City Systems ............. 76,413 88,664 88,840 91,037 $2,373 $2,197 Non-Actuarial .................... 65,560 74,372 75,213 350 (74,022) (74,863) _______________________ _______________________ _______________________ ______________________ _____________________ _____________________
Total ....................................... $9,283,216 $9,395,062 $9,818,578 $9,571,640 $176,578 $(246,938) ================ ================ ================ ================ ============== ==============
Funding City ....................................... $9,138,937 $9,250,783 $9,674,299 $9,427,361 $176,578 $(246,938) State ....................................... 32,025 32,025 32,025 32,025 — — Federal ................................... — — — — — —Intra-City Other .............................. 112,254 112,254 112,254 112,254 — — _______________________ _______________________ _______________________ ______________________ _____________________ _____________________
Total ....................................... $9,283,216 $9,395,062 $9,818,578 $9,571,640 $176,578 $(246,938) ================ ================ ================ ================ ============== ==============
__________________________________________________________________________________________________________________________________________________________________________________________
The City’s five actuarial retirement systems are the New York City Employees’ Retirement System, the New York City Teachers’ Retirement System, the New York City Police Pension Fund, the New York City Fire Pension Fund, and the Board of Education Retirement System. These systems cover approximately 670,000 employees, retirees and beneficiaries of the City, the
Department of Education, the City University System, and certain independent agencies. Each system is governed by a board of trustees and functions in accordance with applicable state and local laws. Annual pension contributions are made as required by statute based on an actuarial valuation of liabilities and assets.

Analysis of Agency Budgets Fiscal Year 2018
214
Other Fringe Benefits
The City provides a number of fringe benefits to its employees, retirees and eligible dependents. City contribution amounts and terms of coverage are governed by various contractual, legal and collective bargaining provisions. In general, the City’s Miscellaneous Expense Budget contains the budget appropriations for the fringe benefit expenditures on behalf of employees and retirees of the mayoral agencies. Separate allocations are included in the Department of Education, the City University system, the Health and Hospitals Corporation, and the various other covered organizations, libraries and cultural institutions, for the fringe benefit expenditures on behalf of their active and retired employees. These estimates also include the health care savings agreed to in the May 2014 Agreement between the City and the Municipal Labor Committee. The savings amounts agreed to were $400 million, $700 million, $1 billion and $1.3 billion in FY 2015 through FY 2018 respectively. The savings are expected to continue through the financial plan.
The City’s basic health insurance program provides comprehensive major medical and hospitalization benefits to its employees, retirees and eligible dependents. In addition, the City makes annual contributions to union-administered welfare funds, which typically provide supplemental health insurance benefits to their members. Annual City contributions to the various welfare funds conform to collective bargaining and labor agreements.
The City also makes the required employer contributions on behalf of its employees who are covered under federal Social Security. As required by New York State Workers’ Compensation Law, the City pays wage replacement and medical benefits to employees who sustain on-the-job injuries. Under New York State Labor Law, the City provides up to 26 weeks in unemployment benefits (capped at statutory maximums) to eligible employees who lose their jobs due to economic reasons. The City, as required by the Administrative Code, also pays for the medical costs of uniformed employees of the Police, Fire and Sanitation Departments who sustain injuries in the line of duty.
Retiree Health Benefits Trust Fund
The Retiree Health Benefits Trust Fund (the “Trust”) was created in 2006 and is used to receive City deposits and make the annual pay as you go (“PAYGO”) payments required to meet current year health insurance and supplemental welfare benefits expenses for retirees. In 2016, the PAYGO amount paid out of the Trust was approximately $2.2 billion. Assets in the Trust are used to offset the City’s Other Postemployment Benefits (OPEB) obligations. OPEB exclude pensions, and include retiree health insurance premium payments, contributions to retiree welfare funds, and Medicare Part B reimbursements. As of the end of 2016, the City’s reported net OPEB obligation was $89.4 billion. The City is not required to fund OPEB obligations on an actuarial basis, other than to meet its current year PAYGO payment. In 2017, the City is planning to prepay $400 million of the 2018 PAYGO amount.
The following table sets forth the fringe benefit amounts carried in the Miscellaneous Budget for 2017 and 2018.

Analysis of Agency Budgets Fiscal Year 2018
215
Fringe Benefits
($ in 000’s)__________________________________________________________________________________________________________________________________________________________________________________________ 2017 2018 Increase/ Forecast Executive (Decrease)__________________________________________________________________________________________________________________________________________________________________________________________
Workers' Compensation ....................................................... $275,796 $298,196 $22,400 Health Insurance Plans ........................................................ 4,001,365 3,591,516 (409,849)Social Security Contributions .............................................. 1,003,508 1,063,220 59,712 Unemployment Insurance Benefits...................................... 19,654 20,354 700 Supplementary Employee Welfare Benefits ........................ 576,167 611,290 35,123 Workers' Compensation - Other ........................................... 38,300 41,600 3,300 _________________________ _________________________ _________________________
Total ............................................................................. $5,914,790 $5,626,176 $(288,614)
Funding City .............................................................................. $5,190,152 $4,951,331 $(238,821) Other Categorical ......................................................... 202,371 181,742 (20,628) State .............................................................................. 136,316 119,694 (16,622) Interfund Agreements .................................................. 83,329 84,085 756 Intra-City ...................................................................... 84,230 94,298 10,067 Federal .......................................................................... 218,392 195,026 (23,366) • CD ............................................................................. 39,054 35,124 (3,930) • Other ......................................................................... 179,338 159,902 (19,436) _________________________ _________________________ _________________________
Total ............................................................................. $5,914,790 $5,626,176 $(288,614)__________________________________________________________________________________________________________________________________________________________________________________________

Analysis of Agency Budgets Fiscal Year 2018
216
JUDGMENTS AND CLAIMS
The Executive Budget for 2018 includes an appropriation of $692 million for expenditures on Judgments and Claims. These expenditures represent the City’s payments to settle tort and contract liability claims, and are projected to reach $740 million by 2021. Tort expenditures cover both personal injury and property damage claims, and typically represent about 95 percent of total Judgment and Claims expenditures. The projections incorporate a substantial amount of claims expenditures attributed to the Health and Hospitals Corporation for which the Corporation will reimburse the City.
The Office of Management and Budget (OMB) employs various statistical methods and financial models to estimate claims expenses. In addition, OMB consults the Law Department to obtain cost estimates for cases that are expected to settle for $1 million or greater. These are mainly serious personal injury cases that have been in litigation or on appeal for a considerable period of time. These cases represent a
significant portion of total tort expenditures, but their relatively small volumes do not lend themselves to statistical analysis. Historical claim data contained on the Comptroller’s Omnibus Automated Image Storage and Information System (OAISIS) are analyzed to determine annual settlement volumes and average cost per claim. Total expenditures are the product of the volume and average claim cost projections.

Analysis of Agency
Budgets:Covered
Organizations

Covered Organizations Fiscal Year 2018
219
NEW YORK CITY HEALTH + HOSPITALS
NYC Health + Hospitals serves all five boroughs in New York City and provides comprehensive medical, mental health, and substance abuse services to all residents, regardless of immigration status or their ability to pay. The system operates 11 acute care hospitals, five long-term care facilities, six diagnostic and treatment centers, and more than 60 community-based health clinics. In addition, MetroPlus, the system’s wholly-owned health maintenance organization, provides care to more than 500,000 New Yorkers. Health + Hospitals provides health care services to the City’s correctional facilities’ inmate population and conducts mental health evaluations for the family courts in the Bronx, Brooklyn, Queens, and Manhattan.
Health + Hospitals is the nation's largest public hospital system, serving nearly 1.2 million people, of which more than 425,000 are uninsured. In 2016, there were 4.5 million outpatient visits, and approximately 1.2 million emergency room visits, which is approximately 30 percent of the City’s emergency department visits. There were 195,000 patient discharges, including 18,000 newborn deliveries. In total, there are more than 4,700 inpatient beds and 2,000 long term care facility beds across the system.
Financial Review
Health + Hospitals faces major f inancial challenges brought on by higher costs and changes to reimbursement that have yielded a shortfall associated with being the City’s single largest provider of care to Medicaid and uninsured patients. This need is intensified by the budget and policy uncertainty emanating from Washington.
Last year, Health + Hospitals began work to close its 2017 gap through a series of transformation initiatives that sought to improve its budget by $779 million. By the end of the fiscal year, it will close the gap by achieving $661 million in increased revenue, including growing value-based payment arrangements, and increasing MetroPlus revenue, among other initiatives. The system will also achieve $118 million of savings by improving its supply chain management and reducing overtime, use of temporary staff, and other personnel efficiencies.
Driving Quality and Community Health
Health + Hospitals is in the process of implementing a comprehensive plan to transform into a high-performing, competitive, and sustainable community-based system. It is proactively changing its clinical and operational approach to keep patients healthy and conveniently serve them in the communities where they live. Transforming from sick care to health care means ensuring access to routine primary and preventative care. Health + Hospitals is expanding this care as well as providing better care management, population health approaches, and linking patients up to social services to more effectively meet their needs and help to address social determinants of health. Below are highlights of quality improvement initiatives over the past year:
Primary and preventive care appointments
Since January 2015, there has been a 65 percent decrease in wait time for new adult primary care patients, from 55 days in 2015 to 19 days in 2017. Likewise, for new pediatric patients, there’s been a significant decrease in wait times – 57 percent - for this same time period.
Integrating behavioral health and primary care
There has been increased access to depression screening in maternal health, and other at-risk populations. Health + Hospitals has also provided increased mental health support for victims of domestic violence in Family Justice Centers.
Women’s Health Care
Health + Hospitals encouraged women to access the system’s high-quality, affordable, and culturally responsive medical, family planning, and mental health services through a digital media campaign. The goal is to reassure women that Health + Hospitals will maintain access to all, across all five boroughs, regardless of immigration status or ability to pay.
Reducing Opioid Overdose
Health + Hospitals is a key partner in the Mayor’s HealingNYC initiative, which is a comprehensive effort to reduce opioid overdose deaths by 35 percent over the next five years. The initiative will allow an additional 20,000 New Yorkers gain access to medication-assisted treatment by 2022 through the transformation of our substance use care model.
Covered Organizations Fiscal Year 2018
220
Improving Clinical Quality
The Leapfrog Group, the only independent ratings program that focuses solely on how effectively hospitals keep their patients safe, recently awarded the highest grades of A or B to only five hospitals in New York City. Notably, all five hospitals are part of Health + Hospitals.
Centralized Laboratory Services
Health + Hospitals and Northwell Health have begun work to centralize laboratory services. This joint venture will provide a newly built state-of-the-art shared laboratory in Queens and will enhance quality and patient services while reducing costs for both health systems.
Insurance Outreach
Health + Hospitals has worked closely with the Mayor’s initiative, GetCoveredNYC, to encourage and assist New Yorkers in signing up for health coverage. GetCoveredNYC is a partnership between the Mayor’s Office, Health + Hospitals, and other City agencies to proactively engage uninsured New Yorkers who have previously visited one of our patient care sites. This initiative builds on existing programs to screen uninsured patients and to enroll them, if eligible, in health insurance coverage.
Commitment to Our Patients and Communities
Health + Hospitals has expanded its community outreach and involvement. Last fall, the system convened a series of meetings in all five boroughs and across New York City’s diverse communities to help educate more than 300 interested New Yorkers about changes to the City’s health care landscape, and to learn from them about their own community’s health needs and priorities.
During these unsettling times, Health + Hospitals remains staunchly committed to caring for individuals and families regardless of their immigration status or ability to pay. In December, along with the Mayor’s Office of Immigrant Affairs (MOIA), it issued an “Open Letter to Immigrant New Yorkers,” which was translated into 13 languages, to reassure all immigrants that they can receive medical care in any public health care setting without fear.
And recently, the system has partnered with the MOIA, the New York Immigration Coalition, and New
York Legal Assistance to host “Immigrant Health Care Rights” panel discussions to help educate immigrant communities and provide access to information and resources. These forums address a variety of important health care topics affecting immigrants, such as health care rights, access to care, services and programs for immigrants, and privacy concerns regarding immigration status.
Correctional Health Services
Health + Hospitals has made tremendous progress over the last year to improve the care that is provided in New York City jails. Correctional Health Services (CHS) has continued expanding its workforce, enhancing operational efficiencies, extending successful programs and services, and leveraging other Health + Hospitals programs and services to improve care during and after incarceration.
As part of Health + Hospitals, CHS has increased recruitment of highly qualified, mission driven health professionals and is strengthening support for front line clinicians. CHS now has a unified mental health service with clinical supervisors in every mental observation housing unit and a clinical education office to support improvements in clinical practice.
They have improved operational efficiencies by streamlining EMS transport of patients and improving access to care through a pilot program with FDNY, Bellevue, Elmhurst and DOC. CHS is also now part of Health + Hospitals’ supply chain system, giving broader access to medical/surgical supplies and equipment.
CHS is on track to triple the number of patients on hepatitis C treatment compared to last year. Efforts are well underway to open two new PACE units in 2017. Telehealth is now used with five specialty services at Bellevue and more installations are underway. CHS began operating a 24/7 enhanced pre-arraignment screening unit in Manhattan last November and has screened more than 14,400 people and avoided nearly 23 percent being transported to a hospital emergency department.
Beginning in 2017 and baselined in 2018, CHS will receive funding to improve quality and access to care, and strengthen its ability to comply with new and existing mandates. CHS will also enhance substance abuse services as part of the City’s opioid strategy.
CHS has been successful in leveraging Health + Hospital services to improve the care its patients receive
Covered Organizations Fiscal Year 2018
221
both during and after incarceration. CHS has taken over specialty clinic scheduling for Health + Hospitals patients at Bellevue to decrease wait times and improve access to care, and have improved continuity of care by sharing electronic health records with Bellevue and Elmhurst. Working with Coler, one of the system’s long term care facilities, CHS has created new pathways to refer, evaluate, and transfer patients to more clinically appropriate long term care settings. They established a process to expedite health and mental health appointments with Health + Hospitals providers and MetroPlus is present in the Rikers visit center to enroll individuals in an insurance plan.
Capital Review
Health + Hospitals is becoming more energy efficient through a dozen projects at its facilities, including upgrading boilers that are far more efficient and use cleaner fuel oil. Through decreased usage and cost reductions, Health +Hospitals has achieved $21 million in saving. These efforts have had the added benefit of reducing greenhouse gas emissions by 21 percent and Health + Hospitals is on track to meet the goal of reducing greenhouse gases by 50 percent by 2025. Additionally, Health + Hospitals has installed new window and lighting systems in many facilities. As a result of these efforts, over the last fiscal year, Health + Hospitals has seen a decrease in energy use of more that 10 percent system-wide.
In terms of recent updates, work has been completed or is underway on several major projects:
• Elmhurst Hospital is renovating and expanding its adult emergency room. The project is currently in a design phase, and is expected to be completed in 2019.
• The Vanderbilt Avenue clinic on Staten Island will open this fall. The new $28 million, 18,000 square foot ambulatory care facility will offer comprehensive primary, medical, and mental health services for children and adults. The site will also feature an after-hours urgent care center to better accommodate patients’ needs.
• The design phase of Metropolitan’s LGBTQ Family Health Center was completed in February. The project will be completed by January 2018.
• The renovation, expansion, and outfitting of the Roberto Clemente clinic will be completed by May 2017. Patients will now have access to behavioral health programs.
In addition to the aforementioned ongoing capital projects Health + Hospitals continues to work on key projects to rectify the damage caused by Hurricane Sandy and to protect its facilities from future storms. Health + Hospitals has been working closely with the Mayor’s Office of Recovery and Resiliency and the New York City Economic Development Corporation on these initiatives. Projects to relocate and/or protect critical infrastructure equipment including electrical, mechanical, heating and ventilation units as well as projects to mitigate the effects of floods are underway at Bellevue, Coler, Coney Island and Metropolitan.
Critical to Health + Hospitals’ transformation is upgrading its information technology infrastructure to support an integrated patient-focused approach for care delivery and more efficient operations. Last April, Health + Hospitals began installing Epic, the industry leader for advanced, electronic medical record systems. This new system not only helps clinicians to provide safe, high-quality, and efficient care, but also facilitates patients’ secure online access to their medical records and provides convenient online services such as prescription refill requests and allows patients to contact their providers with questions. Epic is now being used at Queens, Elmhurst, and Coney Island hospitals and has already helped to improve the quality of care. In the 2018 Executive Budget, Health + Hospitals received capital funding for the installation of the Epic Revenue Cycle system, a new patient registration and billing system that will integrate with the clinical records system at all sites.

Covered Organizations Fiscal Year 2018
222
NEW YORK CITY TRANSIT
New York City Transit (NYCT) operates the most extensive public transportation system in the nation, which served approximately 2.4 billion subway and bus passengers in calendar year 2016, with over 1.7 billion passengers riding the subway system. NYCT has been a component of the Metropolitan Transportation Authority (MTA) since the Authority’s inception in 1968. The MTA is a New York State public authority responsible for coordinating and implementing a mass transportation program for New York City and the seven adjacent counties. Other components of the MTA primarily serving New York City are the Staten Island Rapid Transit Operating Authority (SIRTOA) and the MTA Bus Company (MTABC). The MTA also includes the Long Island Railroad and the Metro North Railroad.
The NYCT’s subway system operates 24 hours a day, seven days a week, on over 660 miles of mainline track, serving 472 stations throughout the Bronx, Brooklyn, Manhattan, and Queens. The NYCT bus system consists of a fleet of 4,425 buses on 191 local, 13 Select Bus Service, and 31 express routes servicing all five boroughs.
SIRTOA operates a 29-mile rapid transit line which links 21 communities on Staten Island and provides a connection to the Staten Island Ferry. SIRTOA serves approximately 4.6 million passengers per year.
The MTABC operates an extensive public bus transportation system throughout New York City, primarily in the Bronx, Brooklyn, and Queens. Over 126.1 million passengers are carried annually on local and express routes. The MTABC is primarily funded through farebox revenues and City subsidies.
The MTABC currently operates 1,285 buses owned by the City. Service on 46 local, one Select Bus, and 43 express routes is available 24 hours a day, seven days a week. Since beginning operations in 2005, the MTABC has significantly improved service and the City expects the MTABC to continue making improvements to all facets of its operations, ensuring service levels are up to MTA’s standards.
Financial Review
The City’s financial plan includes $304.4 million for NYCT in fiscal year 2018. As NYCT operates on a calendar year (CY) basis, the financial plan below is presented in that format. The plan for CY 2017 incorporates the following key elements:
• CY 2017 fare revenue is projected to be $4.6 billion, a 3.6 percent increase over the CY 2016 total.
• Tax revenues dedicated for NYCT’s use are projected to total $3.7 billion; $1.1 billion from the regional Metropolitan Mass Transportation Operating Assistance Account (MMTOA), $516.5 million from the State “Lock Box” Petroleum Business Tax, and $836.3 million from the Urban Mass Transportation Operating Assistance Account (Urban Account). Additionally, $1.2 billion comes from other State taxes and fees. This includes $781.7 million from the Payroll Mobility Tax, $247.4 million from license, vehicle registration, taxi, and vehicle rental fees, and $197.8 million to replace forgone revenues from exempting school districts and small businesses from the Payroll Mobility Tax.
• The City’s scheduled contribution to NYCT’s operating budget for CY 2017 totals $362.3 million, including $158.1 million in operating assistance as part of the City match to State “18b” aid, $45.0 million for student fare discounts, $142.0 million for the Paratransit program, $13.8 million for elderly and disabled fare discounts, and $3.4 million for Transit Police. In addition, the City contributes $97.8 million directly to the MTA to maintain Long Island Railroad and Metro-North Commuter Railroad stations in the five boroughs and for operating assistance for the commuter railroads as part of the local match of State “18b” aid. The City has also set aside $56.4 million for liabilities related to the Staten Island Rapid Transit Operating Authority.
In addition to the very large indirect contributions the City makes to various MTA revenue sources, the following chart summarizes the City’s direct subsidies to NYCT for CY 2017:

Covered Organizations Fiscal Year 2018
223
City Subsidies to NYCT, CY 2017($ in Millions)
• Elderly and Disabled Subsidy….. ......................................... $13.8 • School Fare Subsidy…. ........................................................ $45.0 • Operating Assistance…. ....................................................... $158.1 • Police Reimbursement…. ..................................................... $3.4 • Paratransit…. ......................................................................... $142.0
============
TOTAL….. ............................................................... $362.3 ============
Based on recent financial reports, NYCT projects that it will close CY 2016 with a cash surplus of $180.3 million. NYCT has projected budget surpluses in CY 2017-2019 of $16.8 million, $18.5 million and $5.1 million, respectively. A future shortfall is projected in CY 2020 of $257.7 million, which is expected to be offset by gap-closing and other government actions including potential tax, fee, and further fare increases.

Covered Organizations Fiscal Year 2018
224
New York City Transit Financial Plan($ in Millions)
__________________________________________________________________________________________________________________________________________________________________________________________
Calendar Years [1]__________________________________________________________________________________________________________________________________________________________________________________________
2016 2017 2018 2019 2020__________________________________________________________________________________________________________________________________________________________________________________________
REVENUES Subway / Bus Fare Revenue ............... $4,412.3 $4,569.8 $4,628.9 $4,643.9 $4,669.3 Other Operating Revenue ................... $170.1 $176.9 $195.2 $204.7 $211.0 Transit Tax and Other Subsidies ........ $3,929.6 $3,699.9 $3,871.3 $3,913.7 $3,934.6 City Subsidies .................................... $347.9 $362.3 $370.9 $386.7 $403.8 State Subsidies ................................... $183.3 $183.3 $183.3 $183.3 $183.3 TBTA Surplus Transfer ...................... $308.6 $287.3 $262.0 $241.8 $225.5 Capital and Other Reimbursements ... $1,198.5 $1,247.1 $1,179.2 $1,181.2 $1,143.3 ________________ _________________ _________________ __________________ _________________
TOTAL REVENUES ................. $10,550.3 $10,526.6 $10,690.8 $10,755.2 $10,770.8
EXPENSES Salaries & Wages ............................... $3,630.6 $3,745.1 $3,825.6 $3,902.4 $3,989.2 Fringes ................................................ $2,377.2 $2,504.1 $2,580.6 $2,703.6 $2,822.9 Reimbursable Overhead ..................... ($255.5) ($255.7) ($241.3) ($241.1) ($235.4) OTPS [2] ............................................ $1,910.9 $1,864.2 $1,578.5 $1,650.1 $1,679.6 Paratransit Expenses .......................... $390.9 $411.3 $435.1 $472.3 $511.3 Capital Reimbursable Expenses ......... $1,198.5 $1,247.1 $1,179.2 $1,181.2 $1,143.3 Transit Police ...................................... $3.6 $3.4 $3.4 $3.4 $3.5 Debt Service ....................................... $1,241.9 $1,307.4 $1,368.4 $1,406.5 $1,451.9 Depreciation [3] ................................. $1,728.1 $1,778.1 $1,828.1 $1,878.1 $1,928.1 Other Post Employment Benefits [3] . $1,443.4 $1,501.1 $1,561.1 $1,623.6 $1,688.5 Environmental Remediation [3] ......... $0.0 $0.0 $0.0 $0.0 $0.0 ________________ _________________ _________________ __________________ _________________
TOTAL EXPENSES .................. $13,669.5 $14,106.1 $14,118.7 $14,580.2 $14,982.8
OTHER ACTIONS Balance before Adjustments .............. ($3,119.2) ($3,579.5) ($3,428.0) ($3,825.0) ($4,212.0) Gap-Closing Actions [4] .................... $8.3 $180.7 $155.2 $438.9 $468.8 Cash Flow Adjustments [5] ................ $2,971.1 $3,235.2 $3,274.5 $3,372.7 $3,480.5 Net Cash from Prior Year ................... $320.2 $180.3 $16.8 $18.5 $5.1 ________________ _________________ _________________ __________________ _________________
SURPLUS/(DEFICIT) ............... $180.3 $16.8 $18.5 $5.1 ($257.7)__________________________________________________________________________________________________________________________________________________________________________________________
[1] All Financial Plan figures were provided by NYCT in February 2017 and represents estimated values. Because the MTA operates on a calendar year basis (January-December) that is not directly comparable to the City's fiscal year (July-June).
[2] Includes Inter-agency Loan, NYCT Charge Back of MTA Bus Debt Service, Forward Energy Contracts and Commitments to Capital.
[3] Since February 2004, NYCT has included depreciation in its financial plan. As of 2007, NYCT also reports other post employment benefits (OPEB) obligations and environmental remediation liabilities.
[4] Includes Below the Line Items and items not yet provided by the MTA. Typically includes increased ridership, fare collection, expense reduction, management initiatives, cash reserve, and other governmental assistance.
[5] Cash flow adjustments include operating, depreciation, environmental remediation and OPEB cash flow adjustments.

Covered Organizations Fiscal Year 2018
225
Capital Review
The City’s 2018-2027 Ten-Year Capital Strategy totals $655.0 million, including $651.2 million for NYCT and $3.8 million for SIRTOA. Funding for the MTA 2015-2019 Capital Program includes the $375.0 million in the Ten-Year Capital Strategy as well as $250.0 million in 2016-2017, and $32.0 million in matching funds to Federal grants supporting the MTA Bus Capital Program. These funds will be used to support MTA’s most essential work: bringing the mass transit system to a state of good repair, maintaining a normal replacement cycle, and helping expand the transit system. City capital funds are used in conjunction with other sources (Federal, State, and Private) towards MTA’s Capital Program. The MTA 2015-2019 Capital Program includes a City contribution of $2.492 billion, consisting of $1.892 billion to be funded with proceeds of City general obligation bonds and $600 million to be funded through alternative non tax levy revenue sources. Additional City funds shall be provided concurrently with additional State funds in accordance with the funding needs of the capital program.
The City’s Ten-Year Capital Strategy for NYCT, SIRTOA, and MTABC includes the following key elements:
• Funds to help provide for various NYCT infrastructure improvements, system enhancements, and bus and subway car upgrades, $301.2 million for 2018-2027 ($271.2 million for 2018-2021).
• Funds for NYCT track work, $350.0 million for 2018-2027 ($140.0 million for 2018-2021).
• Funds for SIRTOA’s track replacement and infrastructure programs, $3.8 million for 2018-2027 ($3.8 million for 2018-2021).
The table below outlines the City’s capital commitments to NYCT, SIRTOA and MTABC for the 2016-2021 period:
Capital Commitments ($ in 000’s)
_______________________________________________________________________________________________________________________________________________________________________________________________________________
2016 2017 2018 2019 2020 2021 Actual Plan Plan Plan Plan Plan ________________________ ___________ ____________ ________________________ _______________________ ________________________ _______________________
City All City All City All City All City All City All Funds Funds Funds Funds Funds Funds Funds Funds Funds Funds Funds Funds_______________________________________________________________________________________________________________________________________________________________________________________________________________
Infrastructure ......................... $177,300 $177,300 $167,450 $167,450 $83,725 $83,725 $83,725 $83,725 $83,725 $83,725 $— $— Trackwork ............................. 35,000 35,000 35,000 35,000 35,000 35,000 35,000 35,000 35,000 35,000 35,000 35,000 Revolving Fund ..................... 5,000 5,000 15,000 15,000 5,000 5,000 5,000 5,000 5,000 5,000 5,000 5,000 SIRTOA ................................. 3,700 3,700 4,050 4,050 1,275 1,275 1,275 1,275 1,275 1,275 — —Miscellaneous ....................... 346 346 40,919 40,919 — — — — — — — —MTABC ................................. 8,005 16,010 22,517 45,034 — — — — — — — — ___________ ___________ ___________ ___________ ___________ ___________ ___________ ___________ ___________ ___________ ___________ ___________
Total ...................................... $229,351 $237,356 $284,936 $307,453 $125,000 $125,000 $125,000 $125,000 $125,000 $125,000 $40,000 $40,000 ========= ========= ========= ========= ========= ========= ========= ========= ========= ========= ========= =========
_______________________________________________________________________________________________________________________________________________________________________________________________________________

Appendix
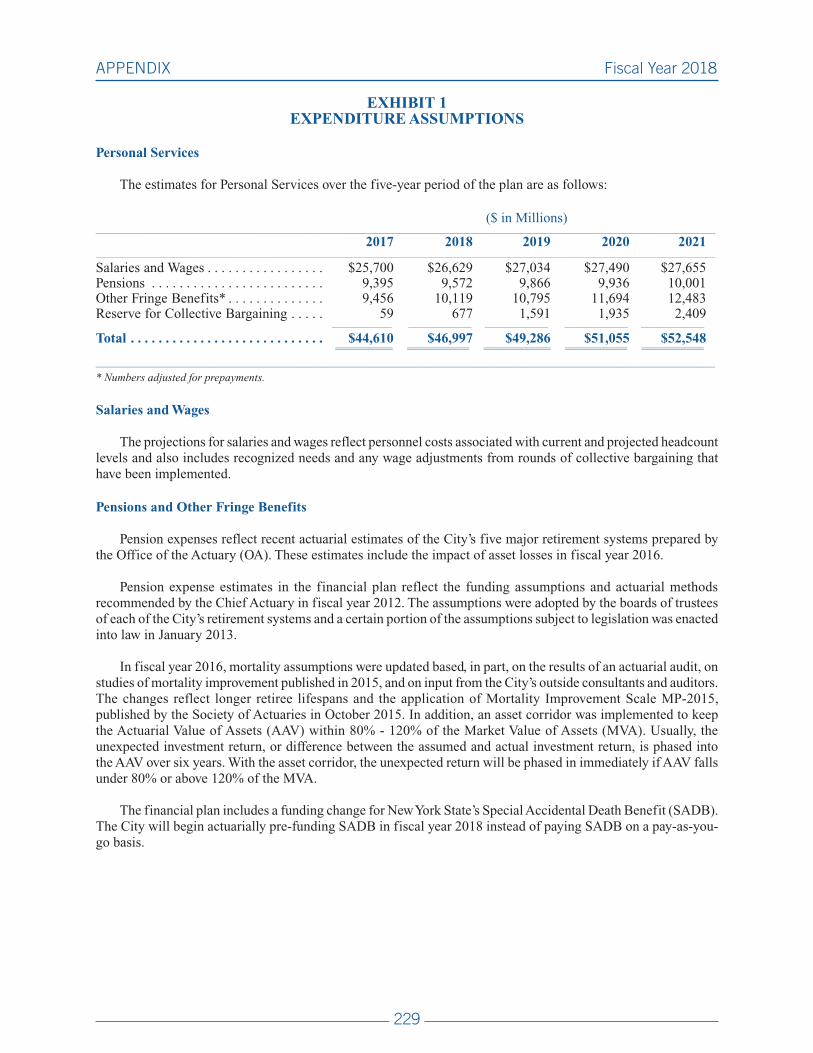
APPENDIX Fiscal Year 2018
229
EXHIBIT 1EXPENDITURE ASSUMPTIONS
Personal Services
The estimates for Personal Services over the five-year period of the plan are as follows:
($ in Millions)_______________________________________________________________________________________________________________________________________________________________________________________________________________
2017 2018 2019 2020 2021_______________________________________________________________________________________________________________________________________________________________________________________________________________
Salaries and Wages . . . . . . . . . . . . . . . . . $25,700 $26,629 $27,034 $27,490 $27,655Pensions . . . . . . . . . . . . . . . . . . . . . . . . . 9,395 9,572 9,866 9,936 10,001Other Fringe Benefits* . . . . . . . . . . . . . . 9,456 10,119 10,795 11,694 12,483Reserve for Collective Bargaining . . . . . 59 677 1,591 1,935 2,409 __________________ ___________________ ___________________ ___________________ ___________________
Total . . . . . . . . . . . . . . . . . . . . . . . . . . . . $44,610 $46,997 $49,286 $51,055 $52,548 ============ ============= ============== ============= =============
_______________________________________________________________________________________________________________________________________________________________________________________________________________
* Numbers adjusted for prepayments.
Salaries and Wages
The projections for salaries and wages reflect personnel costs associated with current and projected headcount levels and also includes recognized needs and any wage adjustments from rounds of collective bargaining that have been implemented.
Pensions and Other Fringe Benefits
Pension expenses reflect recent actuarial estimates of the City’s five major retirement systems prepared by the Office of the Actuary (OA). These estimates include the impact of asset losses in fiscal year 2016.
Pension expense estimates in the financial plan reflect the funding assumptions and actuarial methods recommended by the Chief Actuary in fiscal year 2012. The assumptions were adopted by the boards of trustees of each of the City’s retirement systems and a certain portion of the assumptions subject to legislation was enacted into law in January 2013.
In fiscal year 2016, mortality assumptions were updated based, in part, on the results of an actuarial audit, on studies of mortality improvement published in 2015, and on input from the City’s outside consultants and auditors. The changes reflect longer retiree lifespans and the application of Mortality Improvement Scale MP-2015, published by the Society of Actuaries in October 2015. In addition, an asset corridor was implemented to keep the Actuarial Value of Assets (AAV) within 80% - 120% of the Market Value of Assets (MVA). Usually, the unexpected investment return, or difference between the assumed and actual investment return, is phased into the AAV over six years. With the asset corridor, the unexpected return will be phased in immediately if AAV falls under 80% or above 120% of the MVA.
The financial plan includes a funding change for New York State’s Special Accidental Death Benefit (SADB). The City will begin actuarially pre-funding SADB in fiscal year 2018 instead of paying SADB on a pay-as-you-go basis.

APPENDIX Fiscal Year 2018
230
Other adjustments stemming from changes in the number of active members, wage growth assumptions, and administrative expenses of the retirement systems, have been reflected in the financial plan. This includes employer contributions for enhanced Police Accidental Disability Retirement benefits based on the law that was enacted.
Total pension expenses for the financial plan are shown below:
Total Pension Expenses($ in Millions)
_______________________________________________________________________________________________________________________________________________________________________________________________________________
2017 2018 2019 2020 2021_______________________________________________________________________________________________________________________________________________________________________________________________________________
City Actuarial Systems . . . . . . . . . . . . . . $9,232 $9,480 $9,773 $9,842 $9,904Non-City Systems . . . . . . . . . . . . . . . . . . 89 92 93 94 97 Non-Actuarial* . . . . . . . . . . . . . . . . . . . 74 0 0 0 0 __________________ ___________________ ___________________ ___________________ ___________________
Total . . . . . . . . . . . . . . . . . . . . . . . . . . . . $9,395 $9,572 $9,866 $9,936 $10,001 ============= ============= ============== ============= =============
_______________________________________________________________________________________________________________________________________________________________________________________________________________
* Zeros represent dollar amounts of less than one million.
Other fringe benefits include, primarily, Social Security, Unemployment Insurance, Workers’ Compensation and Health Insurance. Expenditures on fringe benefits include adjustments for expected changes in the City’s planned headcount levels. The Social Security expense estimates reflect the tax rates and earnings caps issued by the Social Security Administration. In calendar year 2017, the combined tax rate is 7.65%. The OASDI tax portion of 6.2% is capped at $127,200 in earnings; the Medicare tax portion of 1.45% is applied to all earnings. Unemployment Insurance expense estimates are consistent with the statutory maximum weekly benefit levels and planned payroll levels. Workers’ Compensation expense estimates are consistent with the compensation rate schedule mandated by State law and the projected growth in medical costs. Health Insurance expense estimates reflect current levels of City enrollee coverage based on the health insurance contract counts and premium data available from the City’s health insurance providers. These estimates also include the health care savings agreed to in the May 2014 Agreement between the City and the Municipal Labor Committee. The savings amounts agreed to were $400 million, $700 million, $1 billion and $1.3 billion in FY 2015 through FY 2018 respectively. The savings are expected to continue through the financial plan.
Reserve for Collective Bargaining
The labor reserve contains funding for the net cost of all of the elements of the United Federation of Teachers (UFT) and AFSCME District Council 37 (DC37) pattern as applied to the remaining unsettled unions. The reserve also contains funding for the restructured payments for those unions that were covered by the UFT nine-year pattern. With the recent PBA deal, the City has now reached settlements with all of the uniformed unions and over 99% of the City workforce through the 2010-2017 round of bargaining.
For the period beyond current round of bargaining, the reserve contains funding for wage increases assumed to be 1% per year following the expiration of the contracts in the 2010-2017 round of collective bargaining.
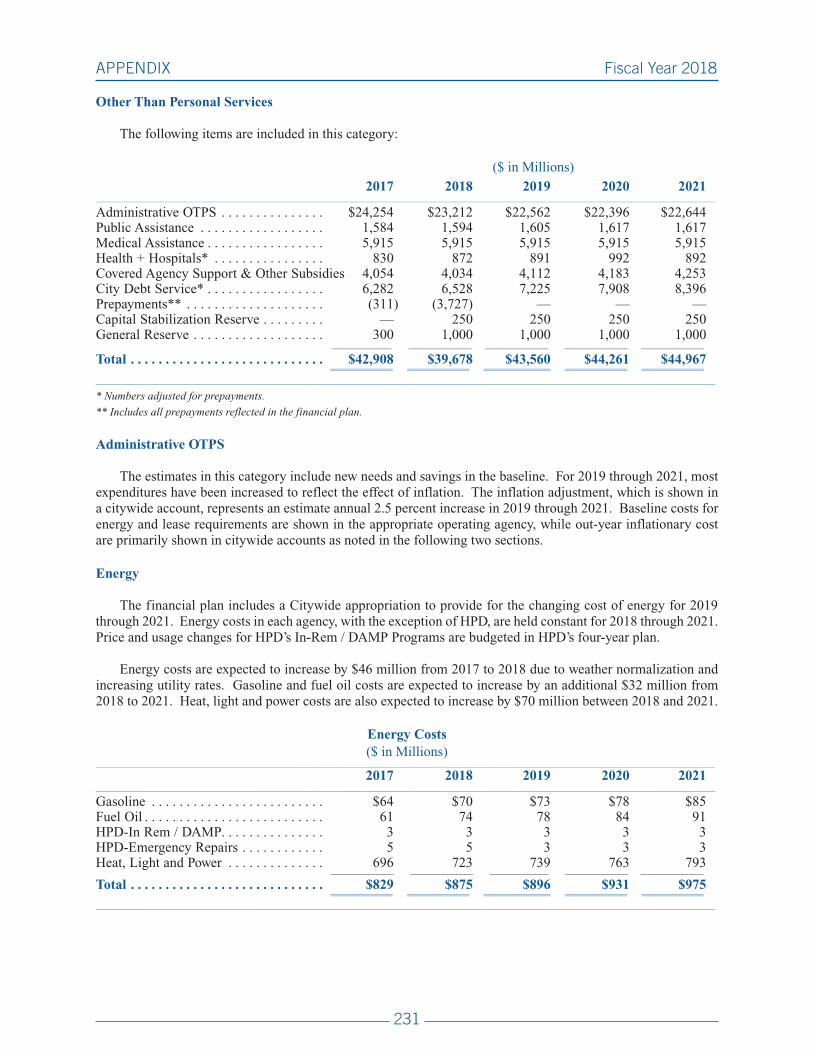
APPENDIX Fiscal Year 2018
231
Other Than Personal Services
The following items are included in this category:
($ in Millions)
2017 2018 2019 2020 2021_______________________________________________________________________________________________________________________________________________________________________________________________________________
Administrative OTPS . . . . . . . . . . . . . . . $24,254 $23,212 $22,562 $22,396 $22,644Public Assistance . . . . . . . . . . . . . . . . . . 1,584 1,594 1,605 1,617 1,617 Medical Assistance . . . . . . . . . . . . . . . . . 5,915 5,915 5,915 5,915 5,915 Health + Hospitals* . . . . . . . . . . . . . . . . 830 872 891 992 892 Covered Agency Support & Other Subsidies 4,054 4,034 4,112 4,183 4,253 City Debt Service* . . . . . . . . . . . . . . . . . 6,282 6,528 7,225 7,908 8,396 Prepayments** . . . . . . . . . . . . . . . . . . . . (311) (3,727) — — —Capital Stabilization Reserve . . . . . . . . . — 250 250 250 250 General Reserve . . . . . . . . . . . . . . . . . . . 300 1,000 1,000 1,000 1,000 __________________ ___________________ ___________________ ___________________ ___________________
Total . . . . . . . . . . . . . . . . . . . . . . . . . . . . $42,908 $39,678 $43,560 $44,261 $44,967 ============= ============= ============== ============= =============_______________________________________________________________________________________________________________________________________________________________________________________________________________
* Numbers adjusted for prepayments.
** Includes all prepayments reflected in the financial plan.
Administrative OTPS
The estimates in this category include new needs and savings in the baseline. For 2019 through 2021, most expenditures have been increased to reflect the effect of inflation. The inflation adjustment, which is shown in a citywide account, represents an estimate annual 2.5 percent increase in 2019 through 2021. Baseline costs for energy and lease requirements are shown in the appropriate operating agency, while out-year inflationary cost are primarily shown in citywide accounts as noted in the following two sections.
Energy
The financial plan includes a Citywide appropriation to provide for the changing cost of energy for 2019 through 2021. Energy costs in each agency, with the exception of HPD, are held constant for 2018 through 2021. Price and usage changes for HPD’s In-Rem / DAMP Programs are budgeted in HPD’s four-year plan.
Energy costs are expected to increase by $46 million from 2017 to 2018 due to weather normalization and increasing utility rates. Gasoline and fuel oil costs are expected to increase by an additional $32 million from 2018 to 2021. Heat, light and power costs are also expected to increase by $70 million between 2018 and 2021.
Energy Costs($ in Millions)
_______________________________________________________________________________________________________________________________________________________________________________________________________________
2017 2018 2019 2020 2021_______________________________________________________________________________________________________________________________________________________________________________________________________________
Gasoline . . . . . . . . . . . . . . . . . . . . . . . . . $64 $70 $73 $78 $85Fuel Oil . . . . . . . . . . . . . . . . . . . . . . . . . . 61 74 78 84 91HPD-In Rem / DAMP. . . . . . . . . . . . . . . 3 3 3 3 3HPD-Emergency Repairs . . . . . . . . . . . . 5 5 3 3 3Heat, Light and Power . . . . . . . . . . . . . . 696 723 739 763 793 _______________ _______________ ______________ _______________ _______________
Total . . . . . . . . . . . . . . . . . . . . . . . . . . . . $829 $875 $896 $931 $975 ============= ============= ============== ============= =============_______________________________________________________________________________________________________________________________________________________________________________________________________________

APPENDIX Fiscal Year 2018
232
Leases
In each agency, the cost of leases is budgeted at a constant level from 2018 through 2021. A citywide adjustment for 2019 through 2021 provides for the increasing cost of leases based on a three percent annual inflator as well as known future leases, where applicable.
In total, the four-year plan includes $1.155 billion for leases in 2018, $1.189 billion in 2019, $1.225 billion in 2020 and $1.262 billion in 2021. Of these amounts, the citywide adjustment is $34 million, $70 million, and $107 million respectively in 2019 through 2021.
Public Assistance
The financial plan for Public Assistance projects 370,984 persons will be on Public Assistance in June 2017 and remain at that level for the balance of the four-year plan.
Medical Assistance
The financial plan for Medical Assistance assumes baselined funds consistent with the New York State enacted budget effective April 1, 2017, in which the State continues to take over Medicaid growth from localities. The financial plan also includes the City share of Disproportionate Share and Upper Payment Limit payments to Health + Hospitals which fall outside of the Medicaid cap.
Health + Hospitals
Revenue and expenditure projections for 2017 through 2021 include assumptions related to actual collections experience, the impact of rates by third party payers, and collections performance through a variety of revenue enhancement efforts. Included in the System’s baseline revenue assumption are the continued receipt of the Disproportionate Share and Upper Payment Limit transactions, as well as a shift from Medicaid Fee for Service to Medicaid Managed Care. Expenditure increases are driven by growth in health insurance costs and wage increases.
Covered Agency Support and Other Subsidies
Included in this category are the contributions made by the City to the Transit Authority, Housing Authority, Libraries and various Cultural Institutions. Also included in this category are the estimated projections for the cost of Judgments and Claims.
General Reserve
The General Reserve is projected at $300 million for 2017 and $1 billion for 2018 through 2021 to provide for uncontrollable increases in expenditures as well as shortfalls in revenue. The General Reserve for 2018 through 2021 has been increased above the required amount as per the City Charter to allow for any further uncertainties that may occur in the future.
Capital Stabilization Reserve
The financial plan includes a capital stabilization reserve of $250 million in fiscal years 2018 through 2021, for a total of $1 billion.

APPENDIX Fiscal Year 2018
233
Debt Service
Debt Service projections cover payments of debt service on currently outstanding City, TFA, and Conduit debt as well as future issuances in accordance with the 2017 through 2021 financing program (See Financing Program). Actual debt service payments in these years will be affected by the timing of bond sales and by market conditions. Estimates of City and TFA debt service costs on debt to be issued are based on estimates of the periods of probable usefulness of the capital assets for which the debt will be issued.
A Budget Stabilization Account has been established for the prepayment of future years’ debt service costs. Funding of $3.327 billion in 2017 has been provided for this purpose.
Below are the detailed estimates for debt service for 2017 through 2021 after prepayments:
($ in Millions)_______________________________________________________________________________________________________________________________________________________________________________________________________________
Total City, Long Short Lease Budget Total City Prepayment Lease and Term Term Purchase Stabilization* and Lease TFA Adjustment TFA___________________________________________________________________________________________________________________________________________________
2017 $2,089 $- $107 $3,327 $5,523 $448 $311 $6,282 2018 2,684 - 224 - $2,908 293 3,327 $6,528 2019 4,177 - 218 - $4,395 2,830 - $7,225 2020 4,520 - 267 - $4,787 3,121 - $7,908 2021 4,707 - 284 - $4,991 3,405 - $8,396 _______________________________________________________________________________________________________________________________________________________________________________________________________________
* Amounts in the Budget Stabilization Account are used to prepay the succeeding year’s debt service.

234
APPENDIX Fiscal Year 2018
FY 2016 8 Month FY 2018Dept. Actual Executive Actuals Executive FY 2019 FY 2020 FY 2021No. Agency Expenditures Budget July - Feb. Forecast Budget Estimate Estimate Estimate
002 Mayoralty……………………………… $109,534 $137,879 $73,561 $131,396 $136,597 $135,220 $127,544 $125,420
003 Board of Elections…………………… 116,671 123,747 96,852 132,123 140,996 95,113 96,564 94,370
004 Campaign Finance Board……………… 7,886 16,176 9,094 16,205 56,656 14,015 14,015 14,015
008 Office of the Actuary………………… 6,694 7,401 4,093 7,193 7,351 7,351 7,351 7,351
010 President,Borough of Manhattan……… 4,661 4,834 2,906 4,837 5,016 4,584 4,584 4,584
011 President,Borough of the Bronx……… 5,064 5,781 3,263 5,794 6,009 5,451 5,451 5,451
012 President,Borough of Brooklyn……… 6,369 6,012 3,929 6,395 6,583 5,695 5,695 5,695
013 President,Borough of Queens………… 5,094 5,274 3,099 5,320 5,580 4,744 4,744 4,744
014 President,Borough of S.I.……………… 4,049 4,409 2,260 4,427 4,531 4,244 4,244 4,244
015 Office of the Comptroller……………… 90,371 96,370 63,750 105,034 105,638 105,644 105,644 105,644
017 Dept. of Emergency Management…… 35,673 44,779 29,463 59,361 59,228 27,303 27,238 28,154
021 Office of Admin. Tax Appeals………… 4,259 5,077 2,911 4,972 5,146 5,061 5,061 5,061
025 Law Department……………………… 194,352 212,778 133,508 221,974 207,668 205,728 207,145 207,145
030 Department of City Planning………… 31,231 43,868 27,450 42,069 49,506 41,108 40,267 40,267
032 Department of Investigation………… 38,368 47,438 33,227 55,584 44,728 41,547 38,590 38,590
035 NY Public Library - Research………… 26,737 25,582 25,493 27,485 27,612 27,612 27,612 27,612
037 New York Public Library……………… 133,792 125,593 130,596 136,470 135,512 135,512 135,512 135,512
038 Brooklyn Public Library……………… 102,042 94,077 66,854 102,194 100,694 100,695 100,695 100,695
039 Queens Borough Public Library……… 101,696 95,739 88,212 104,018 102,077 102,077 102,077 102,077
040 Department of Education……………… 22,421,562 23,072,762 14,062,513 23,406,459 24,277,727 25,652,598 26,322,360 27,010,975
042 City University………………………… 1,018,698 1,030,139 645,989 1,203,114 1,127,105 1,150,466 1,158,243 1,171,396
054 Civilian Complaint Review Bd.……… 14,077 16,665 9,368 16,176 16,713 16,713 16,713 16,713
056 Police Department…………………… 5,328,650 5,150,938 3,486,946 5,684,076 5,568,021 5,541,830 5,505,000 5,473,071
057 Fire Department……………………… 1,974,517 1,936,932 1,312,766 2,063,166 2,020,684 1,987,511 2,006,073 2,005,489
063 Dept. of Veterans' Services…………… — 3,843 1,567 4,064 4,492 4,493 4,493 4,493
068 Admin. for Children Services………… 2,875,119 2,982,028 2,202,545 3,034,342 3,071,389 2,520,742 2,531,157 2,531,157
069 Department of Social Services………… 9,397,990 9,733,153 6,803,979 9,689,844 9,858,614 9,872,844 9,931,137 9,948,190
071 Dept. of Homeless Services…………… 1,400,629 1,295,962 1,255,696 1,752,437 1,609,290 1,632,145 1,643,113 1,643,113
072 Department of Correction…………… 1,307,631 1,368,828 878,599 1,405,265 1,428,326 1,435,590 1,451,021 1,461,594
073 Board of Correction…………………… 1,493 3,065 1,196 2,737 2,997 2,997 2,997 2,997
095 Citywide Pension Contributions……… 9,283,217 9,422,235 6,268,308 9,395,062 9,571,640 9,866,316 9,936,465 10,001,333
098 Miscellaneous………………………… 8,721,490 9,765,492 4,022,930 9,056,610 9,740,457 11,568,057 12,416,325 13,412,881
099 Debt Service…………………………… 5,873,842 3,271,839 1,736,707 5,971,497 3,200,411 7,224,838 7,908,367 8,395,814
101 Public Advocate……………………… 3,312 3,350 2,148 3,599 3,620 3,620 3,620 3,620
102 City Council…………………………… 59,787 64,077 41,595 64,077 64,077 54,200 54,200 54,200
103 City Clerk……………………………… 5,548 5,545 3,764 5,982 5,558 5,558 5,558 5,558
125 Department for the Aging…………… 305,379 295,041 274,660 341,937 310,111 312,667 317,827 317,827
126 Department of Cultural Affairs……… 163,105 144,757 139,289 186,077 143,801 142,801 142,801 142,801
127 Financial Info. Serv. Agency………… 91,390 106,524 77,008 102,805 110,289 110,933 111,576 111,576
131 Office of Payroll Admin.……………… 15,664 17,285 10,264 16,461 16,998 16,999 16,999 16,999
132 Independent Budget Office…………… 3,991 6,871 2,835 5,477 5,513 5,396 5,395 5,130
133 Equal Employment Practices Com…… 764 1,091 537 1,139 1,187 1,187 1,187 1,187
134 Civil Service Commission…………… 781 1,086 655 1,086 1,094 1,092 1,092 1,092
136 Landmarks Preservation Comm.……… 5,251 6,314 3,480 5,885 6,465 6,276 6,266 6,286
156 Taxi & Limousine Commission……… 47,931 72,524 30,151 68,409 56,364 58,067 51,060 51,060
226 Commission on Human Rights……… 8,842 12,122 6,419 12,190 11,457 11,458 11,458 11,458
260 Youth & Community Development…… 664,715 562,438 527,925 747,618 679,819 669,880 684,394 684,327
312 Conflicts of Interest Board…………… 2,381 2,325 1,403 2,561 2,580 2,581 2,581 2,581
313 Office of Collective Barg.…………… 2,198 2,311 1,500 2,418 2,322 2,322 2,322 2,322
EXHIBIT 2
FISCAL YEAR 2018 EXECUTIVE BUDGET AND PROJECTIONS,FISCAL YEAR 2019 THROUGH FISCAL YEAR 2021
($ in thousands)Fiscal Year 2017

235
APPENDIX Fiscal Year 2018
FY 2016 8 Month FY 2018Dept. Actual Executive Actuals Executive FY 2019 FY 2020 FY 2021No. Agency Expenditures Budget July - Feb. Forecast Budget Estimate Estimate Estimate
EXHIBIT 2
FISCAL YEAR 2018 EXECUTIVE BUDGET AND PROJECTIONS,FISCAL YEAR 2019 THROUGH FISCAL YEAR 2021
($ in thousands)Fiscal Year 2017
499 Community Boards (All)……………… $15,759 $17,419 $10,842 $18,174 $17,406 $17,406 $17,406 $17,406
781 Department of Probation……………… 89,048 100,519 65,198 103,069 102,571 101,842 101,380 101,380
801 Dept. Small Business Services………… 282,467 217,714 149,784 348,921 191,708 142,184 133,653 126,872
806 Housing Preservation & Dev.………… 850,033 1,246,934 838,447 1,339,604 1,131,963 838,503 782,264 770,922
810 Department of Buildings……………… 134,724 172,059 104,204 158,915 183,776 164,329 165,599 158,519
816 Dept Health & Mental Hygiene……… 1,450,675 1,488,935 1,204,120 1,678,817 1,566,207 1,606,596 1,634,924 1,634,941
819 Health and Hospitals Corp.…………… 1,359,134 735,312 129,520 429,800 872,204 890,618 992,486 891,870
820 Office Admin Trials & Hearings……… 36,344 39,641 24,471 42,121 50,349 49,922 49,922 49,922
826 Dept of Environmental Prot.………… 1,267,158 1,443,520 1,013,837 1,523,800 1,408,102 1,238,760 1,216,708 1,202,442
827 Department of Sanitation……………… 1,500,677 1,662,616 1,176,488 1,607,682 1,674,029 1,706,945 1,721,028 1,718,653
829 Business Integrity Commission……… 8,093 8,684 6,800 10,180 8,728 8,605 8,605 8,605
836 Department of Finance………………… 258,848 274,562 191,669 278,983 298,523 297,686 297,900 297,925
841 Department of Transportation………… 910,279 947,081 709,076 1,004,870 961,532 961,422 916,688 918,768
846 Dept of Parks and Recreation………… 476,104 480,009 345,485 553,377 493,309 487,452 485,802 484,351
850 Dept. of Design & Construction……… 399,287 478,782 551,881 730,324 351,848 152,992 158,622 145,934
856 Dept of Citywide Admin Srvces……… 1,117,778 1,175,180 931,370 1,189,476 1,186,207 1,136,837 1,137,526 1,138,616
858 D.O.I.T.T.……………………………… 587,009 635,228 435,788 719,849 621,734 596,788 587,619 587,467
860 Dept of Records & Info Serv.………… 7,732 7,516 5,095 8,139 8,298 8,665 8,665 8,665
866 Department of Consumer Affairs……… 36,210 40,713 20,651 38,331 41,129 41,046 41,046 41,046
901 District Attorney - N.Y.……………… 109,626 101,787 83,748 125,980 103,987 104,301 104,306 104,306
902 District Attorney - Bronx……………… 61,576 59,770 42,064 74,610 72,335 72,456 72,454 72,454
903 District Attorney - Kings……………… 97,047 94,354 65,490 100,378 97,081 97,329 97,319 97,319
904 District Attorney - Queens…………… 59,264 58,148 39,039 66,183 63,756 63,990 63,998 63,998
905 District Attorney - Richmond………… 10,705 10,015 7,528 14,650 14,176 14,211 14,212 14,212
906 Off. of Prosec. & Spec. Narc.………… 21,600 22,121 13,238 22,121 22,353 22,453 22,458 22,458
941 Public Administrator - N.Y.…………… 1,599 1,751 1,266 1,785 2,804 2,817 2,817 2,817
942 Public Administrator - Bronx………… 616 655 394 728 692 704 704 704
943 Public Administrator- Brooklyn……… 686 788 493 859 843 855 855 855
944 Public Administrator - Queens………… 503 585 315 612 620 632 632 632
945 Public Administrator -Richmond……… 560 481 318 514 519 531 531 531
989 Prior Payable Adjustment…………… (714,656) — — (400,000) — — — —
991 General Reserve……………………… — 1,000,000 — 300,000 1,000,000 1,000,000 1,000,000 1,000,000
992 Citywide Savings Initiatives………… — — — — — (46,281) (73,531) (98,781)
995 Energy Adjustment…………………… — — — — — 22,099 57,776 101,321
996 Lease Adjustment……………………… — — — — — 34,636 70,311 107,056
998 OTPS Inflation Adjustment…………… — — — — — 55,519 111,038 166,557
TOTAL EXPENDITURES………………… $82,460,982 $83,983,235 $52,781,882 $87,518,273 $86,675,038 $92,845,731 $95,315,556 $97,514,614
LESS: INTRA-CITY EXPENDITURES…… 1,922,462 1,763,302 515,933 2,064,801 1,814,795 1,737,256 1,738,573 1,743,573NET TOTAL EXPENDITURES…………… $80,538,520 $82,219,933 $52,265,949 $85,453,472 $84,860,243 $91,108,475 $93,576,983 $95,771,041
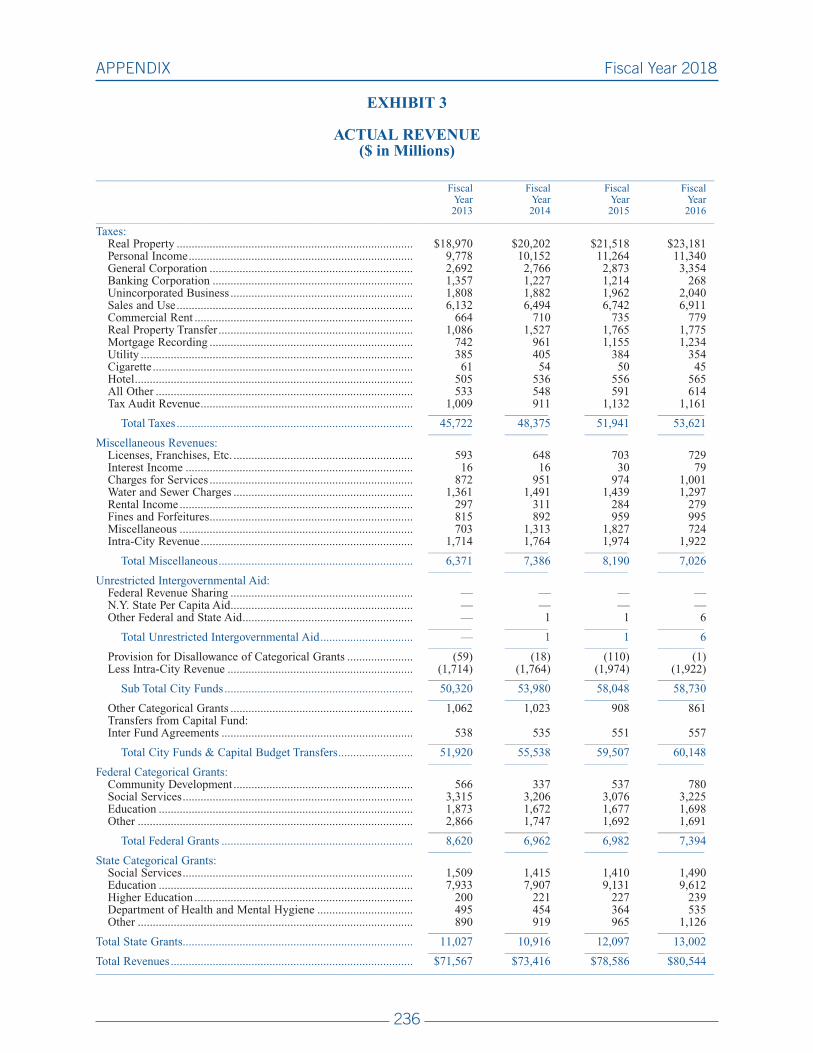
APPENDIX Fiscal Year 2018
236
EXHIBIT 3
ACTUAL REVENUE($ in Millions)
__________________________________________________________________________________________________________________________________________________________________________________________
Fiscal Fiscal Fiscal Fiscal Year Year Year Year 2013 2014 2015 2016__________________________________________________________________________________________________________________________________________________________________________________________
Taxes:Real Property ............................................................................... $18,970 $20,202 $21,518 $23,181 Personal Income ........................................................................... 9,778 10,152 11,264 11,340 General Corporation .................................................................... 2,692 2,766 2,873 3,354 Banking Corporation ................................................................... 1,357 1,227 1,214 268 Unincorporated Business ............................................................. 1,808 1,882 1,962 2,040 Sales and Use ............................................................................... 6,132 6,494 6,742 6,911 Commercial Rent ......................................................................... 664 710 735 779 Real Property Transfer ................................................................. 1,086 1,527 1,765 1,775 Mortgage Recording .................................................................... 742 961 1,155 1,234 Utility ........................................................................................... 385 405 384 354 Cigarette ....................................................................................... 61 54 50 45 Hotel ............................................................................................. 505 536 556 565 All Other ...................................................................................... 533 548 591 614 Tax Audit Revenue ....................................................................... 1,009 911 1,132 1,161
_____________ _____________ _____________ ______________
Total Taxes ............................................................................... 45,722 48,375 51,941 53,621 _____________ _____________ _____________ ______________
Miscellaneous Revenues:Licenses, Franchises, Etc. ............................................................ 593 648 703 729 Interest Income ............................................................................ 16 16 30 79 Charges for Services .................................................................... 872 951 974 1,001 Water and Sewer Charges ............................................................ 1,361 1,491 1,439 1,297 Rental Income .............................................................................. 297 311 284 279 Fines and Forfeitures .................................................................... 815 892 959 995 Miscellaneous .............................................................................. 703 1,313 1,827 724 Intra-City Revenue ....................................................................... 1,714 1,764 1,974 1,922
_____________ _____________ _____________ ______________
Total Miscellaneous ................................................................. 6,371 7,386 8,190 7,026 _____________ _____________ _____________ ______________
Unrestricted Intergovernmental Aid:Federal Revenue Sharing ............................................................. — — — — N.Y. State Per Capita Aid ............................................................. — — — — Other Federal and State Aid ......................................................... — 1 1 6
_____________ _____________ _____________ ______________
Total Unrestricted Intergovernmental Aid ............................... — 1 1 6 _____________ _____________ _____________ ______________
Provision for Disallowance of Categorical Grants ...................... (59) (18) (110) (1)Less Intra-City Revenue .............................................................. (1,714) (1,764) (1,974) (1,922)
_____________ _____________ _____________ ______________
Sub Total City Funds ............................................................... 50,320 53,980 58,048 58,730 _____________ _____________ _____________ ______________
Other Categorical Grants ............................................................. 1,062 1,023 908 861 Transfers from Capital Fund:Inter Fund Agreements ................................................................ 538 535 551 557
_____________ _____________ _____________ ______________
Total City Funds & Capital Budget Transfers ......................... 51,920 55,538 59,507 60,148 _____________ _____________ _____________ ______________
Federal Categorical Grants:Community Development ............................................................ 566 337 537 780 Social Services ............................................................................. 3,315 3,206 3,076 3,225 Education ..................................................................................... 1,873 1,672 1,677 1,698 Other ............................................................................................ 2,866 1,747 1,692 1,691
_____________ _____________ _____________ ______________
Total Federal Grants ................................................................ 8,620 6,962 6,982 7,394 _____________ _____________ _____________ ______________
State Categorical Grants:Social Services ............................................................................. 1,509 1,415 1,410 1,490 Education ..................................................................................... 7,933 7,907 9,131 9,612 Higher Education ......................................................................... 200 221 227 239 Department of Health and Mental Hygiene ................................ 495 454 364 535 Other ............................................................................................ 890 919 965 1,126
_____________ _____________ _____________ ______________
Total State Grants ............................................................................. 11,027 10,916 12,097 13,002 _____________ _____________ _____________ ______________
Total Revenues ................................................................................. $71,567 $73,416 $78,586 $80,544 __________________________________________________________________________________________________________________________________________________________________________________________

APPENDIX Fiscal Year 2018
237
EXHIBIT 4REVENUE ESTIMATES
($ in Millions)_______________________________________________________________________________________________________________________________________________________________________________________________________________
Fiscal Year 2017 Fiscal Fiscal Fiscal Fiscal Fiscal 8 Months Year Year Year Year Year Actuals 2017 2018 2019 2020 2021_______________________________________________________________________________________________________________________________________________________________________________________________________________
Taxes:Real Property ..................... $22,683 $24,402 $25,629 $27,292 $28,618 $29,929 Personal Income ................ 7,203 10,958 11,655 12,073 12,624 13,166 General Corporation .......... 1,718 3,869 3,890 3,982 4,004 4,113 Banking Corporation ......... (66) (75) — — — — Unincorporated Business ... 1,062 2,026 2,137 2,242 2,371 2,502 Sale and Use ...................... 4,514 6,994 7,369 7,881 8,245 8,592 Commercial Rent ............... 405 816 848 884 919 955 Real Property Transfer ....... 938 1,345 1,364 1,400 1,461 1,490 Mortgage Recording .......... 745 1,074 934 959 1,001 1,020 Utility ................................. 213 377 382 387 396 409 Cigarette ............................. 24 44 42 41 40 39 Hotel .................................. 319 571 570 592 599 608 All Other ............................ 306 638 596 596 595 595 Tax Audit Revenue ............ 649 1,251 850 721 721 721 State Tax Relief Program - STAR 109 556 202 200 198 196
__________________ ___________________ ___________________ ____________________ ___________________ ___________________
Total Taxes .................... 40,822 54,846 56,468 59,250 61,792 64,335 __________________ ___________________ ___________________ ____________________ ___________________ ___________________
Miscellaneous Revenue:Licenses, Franchises, Etc. 499 738 674 663 668 662 Interest Income .................. 35 75 110 177 241 246 Charges for Services .......... 575 1,007 989 991 991 991 Water and Sewer Charges .. 1,420 1,389 1,400 1,385 1,371 1,359 Rental Income .................... 159 254 251 250 250 250 Fines and Forfeitures ......... 661 956 908 899 891 875 Miscellaneous .................... 247 527 333 538 703 714 Intra-City Revenue ............ 516 2,065 1,815 1,737 1,739 1,744
__________________ ___________________ ___________________ ____________________ ___________________ ___________________
Total Miscellaneous ...... 4,112 7,011 6,480 6,640 6,854 6,841 __________________ ___________________ ___________________ ____________________ ___________________ ___________________
Unrestricted Intergovernmental Aid:Federal Revenue Sharing ... — — — — — — Other Federal & State Aid . 59 57 — — — —
__________________ ___________________ ___________________ ____________________ ___________________ ___________________
Total Unrestricted Intergovernmental Aid 59 57 — — — — __________________ ___________________ ___________________ ____________________ ___________________ ___________________
Reserve for Disallowance of Categorical Grants ......... — 613 (15) (15) (15) (15)Less: Intra-City Revenue ........ (516) (2,065) (1,815) (1,737) (1,739) (1,744) __________________ ___________________ ___________________ ____________________ ___________________ ___________________
Sub Total City Funds ......... 44,477 60,462 61,118 64,138 66,892 69,417 __________________ ___________________ ___________________ ____________________ ___________________ ___________________
Other Categorical Grants ........ 345 976 880 868 859 856 Inter Fund Agreements ........... 286 641 667 662 599 597 __________________ ___________________ ___________________ ____________________ ___________________ ___________________
Total City Funds & Inter-Fund Revenues . $45,108 $62,079 $62,665 $65,668 $68,350 $70,870 __________________ ___________________ ___________________ ____________________ ___________________ ___________________

APPENDIX Fiscal Year 2018
238
EXHIBIT 4REVENUE ESTIMATES
($ in Millions)_______________________________________________________________________________________________________________________________________________________________________________________________________________
Fiscal Year 2017 Fiscal Fiscal Fiscal Fiscal Fiscal 8 Months Year Year Year Year Year Actuals 2017 2018 2019 2020 2021_______________________________________________________________________________________________________________________________________________________________________________________________________________
Federal Categorical Grants:Community Development .. $248 $1,640 $1,003 $332 $253 $235 Social Services .................. 1,271 3,675 3,548 3,300 3,314 3,318 Education ........................... 179 1,702 1,787 2,033 2,033 2,033 Other .................................. 694 1,920 1,461 1,337 1,297 1,293
_________________ ___________________ ___________________ ___________________ ___________________ ___________________
Total Federal Grants ..... 2,392 8,937 7,799 7,002 6,897 6,879 _________________ ___________________ ___________________ ___________________ ___________________ ___________________
State Categorical Grants:Social Services .................. 586 1,819 1,711 1,716 1,727 1,727 Education ........................... 2,517 10,327 10,683 11,108 11,554 11,879 Higher Education ............... 56 286 297 297 297 297 Department of Health and
Mental Hygiene ............ 211 625 547 539 539 523 Other .................................. 118 1,380 1,158 1,189 1,230 1,276
_________________ ___________________ ___________________ ___________________ ___________________ ___________________
Total State Grants ......... 3,488 14,437 14,396 14,849 15,347 15,702 ============ ============= ============ ============= ============= =============
TOTAL REVENUE ...... $50,988 $85,453 $84,860 $87,519 $90,594 $93,451 ============ ============= ============ ============= ============= =============
_______________________________________________________________________________________________________________________________________________________________________________________________________________

APPENDIX Fiscal Year 2018
239
EXHIBIT 5FULL-TIME and PART-TIME POSITIONS (FTEs)
_______________________________________________________________________________________________________________________________________________________________________________________________________________
6/30/2018 6/30/2019 6/30/2020 6/30/2021 Total City Total City Total City Total City _______________________________________________________________________________________________________________________________________________________________________________________________________________
MAYORAL AGENCIES AND ELECTED OFFICIALS:Uniformed Forces: Police -Uniform . . . . . . . . 35,906 35,906 35,906 35,906 35,906 35,906 35,906 35,906 -Civilian . . . . . . . . 17,931 17,850 17,723 17,703 17,736 17,716 17,736 17,716 Fire -Uniform . . . . . . . . 10,914 10,906 10,946 10,938 10,946 10,938 10,946 10,938 -Civilian . . . . . . . . . 6,122 6,104 6,123 6,105 6,123 6,105 6,122 6,105 Correction -Uniform . . . . . . . . 10,420 10,420 10,459 10,459 10,475 10,475 10,475 10,475 -Civilian . . . . . . . . . 2,243 2,235 2,256 2,248 2,256 2,248 2,256 2,248 Sanitation -Uniform . . . . . . . . 7,517 7,517 7,594 7,594 7,607 7,607 7,607 7,607 -Civilian . . . . . . . . . 2,669 2,611 2,693 2,635 2,693 2,635 2,693 2,635 _____________ ____________ ____________ ____________ ____________ _____________ ____________ ____________
Subtotal . . . . . . . . . . . 93,722 93,549 93,700 93,588 93,742 93,630 93,741 93,630
Health and Welfare: Admin. for Children’s Services . 7,206 7,038 7,023 6,855 7,022 6,855 7,022 6,855 Social Services . . . . . . . . . . . . . 14,696 11,289 14,697 11,290 14,706 11,299 14,706 11,299 Homeless Services . . . . . . . . . . 2,484 2,474 2,484 2,474 2,484 2,474 2,484 2,474 Health & Mental Hygiene . . . . 6,578 5,291 6,541 5,288 6,532 5,285 6,532 5,285 _____________ ____________ ____________ ____________ ____________ _____________ ____________ ____________
Subtotal . . . . . . . . . . . 30,964 26,092 30,745 25,907 30,744 25,913 30,744 25,913
Other Agencies: Housing Preservation and Development . . . . . . . . . 2,550 786 2,518 783 2,514 780 2,509 780 Environmental Protection . . . . 6,408 269 6,400 269 6,371 269 6,442 269 Finance . . . . . . . . . . . . . . . . . . . 2,245 2,233 2,245 2,233 2,245 2,233 2,245 2,233 Transportation . . . . . . . . . . . . . 5,429 2,551 5,396 2,518 5,388 2,529 5,388 2,529 Parks . . . . . . . . . . . . . . . . . . . . . 7,463 6,757 7,455 6,749 7,440 6,734 7,437 6,731 Citywide Administrative Services . 2,695 1,981 2,694 1,980 2,697 1,983 2,697 1,983 All Other . . . . . . . . . . . . . . . . . 21,792 18,405 21,499 18,293 21,486 18,289 21,455 18,287 _____________ ____________ ____________ ____________ ____________ _____________ ____________ ____________
Subtotal . . . . . . . . . . . 48,582 32,982 48,207 32,825 48,141 32,817 48,173 32,812
Education Dept. of Education -Pedagogical . 121,235 92,927 122,252 93,597 122,358 93,824 123,748 93,599 -Civilian . . . . . 24,083 21,478 24,229 21,620 24,247 21,634 24,914 22,120 City University -Pedagogical . 6,533 6,533 6,533 6,533 6,533 6,533 6,533 6,533 -Civilian . . . . . 3,365 3,365 3,568 3,568 3,752 3,752 3,752 3,752 _____________ ____________ ____________ ____________ ____________ _____________ ____________ ____________
Subtotal . . . . . . . . . . . 155,216 124,303 156,582 125,318 156,890 125,743 158,947 126,004 _____________ ____________ ____________ ____________ ____________ _____________ ____________ ____________
Total - Mayoral Agencies and Elected Officials . . . . . . . . . . . . 328,484 276,926 329,234 277,638 329,517 278,103 331,605 278,359 ========== ========= ========= ========= ========= ========= ========= =========
COVERED ORGANIZATIONS1: Health + Hospitals . . . . . . . . . . . . 38,713 38,713 38,713 38,713 38,713 38,713 38,713 38,713 Housing Authority . . . . . . . . . . . . 11,181 — 11,141 — 11,111 — 11,098 — Libraries . . . . . . . . . . . . . . . . . . . . . 4,365 4,365 4,365 4,365 4,365 4,365 4,365 4,365 Cultural Institutions2 . . . . . . . . . . . 1,426 1,426 1,426 1,426 1,426 1,426 1,426 1,426 School Construction Authority . . 840 840 840 840 840 840 840 840 New York City Employees Retirement System . . . . . . . . . . 448 448 448 448 448 448 438 438 Economic Development Corporation . . . . . . . . . . . . . . . . 506 506 506 506 506 506 506 506 Teachers Retirement System . . . . 392 392 392 392 392 392 392 392 Police Pension Fund . . . . . . . . . . . 143 143 143 143 143 143 143 143 All Other3 . . . . . . . . . . . . . . . . . . . . 267 263 268 264 269 265 270 266 _____________ ____________ ____________ ____________ ____________ _____________ ____________ ____________
Total - Covered Organizations . . . 58,281 47,096 58,242 47,097 58,213 47,098 58,191 47,089 _____________ ____________ ____________ ____________ ____________ _____________ ____________ ____________
Grand Total . . . . . . . . . . . . . . . . . . . . . 386,765 324,022 387,476 324,735 387,730 325,201 389,796 325,448 ========== ========= ========= ========= ========= ========= ========= =========___________________________________________________________________________________________________________________________________________________________________________________________________________________
1. Includes non-city employees substantially paid by city subsidies.2. Includes only those employees of the Cultural Institutions Group paid by city fund subsidies.3. Includes Housing Development Corporation, Education Construction Fund, City University Construction Fund, Rent
Guidelines Board and Water Finance Authority.

APPENDIX Fiscal Year 2018
240
EXHIBIT 6FY 2018 EXECUTIVE BUDGET
CITYWIDE SAVINGS PROGRAM - 5 YEAR VALUE(City $ in 000’s)
_______________________________________________________________________________________________________________________________________________________________________________________________________________
FY 2017 FY 2018 FY 2019 FY 2020 FY 2021_______________________________________________________________________________________________________________________________________________________________________________________________________________
Uniformed Forces:Police . . . . . . . . . . . . . . . . . . . . . . . . . . . . . . . $5,081 $15,978 $21,830 $21,815 $21,800 Fire . . . . . . . . . . . . . . . . . . . . . . . . . . . . . . . . 7,452 10,750 10,750 10,750 10,750 Correction . . . . . . . . . . . . . . . . . . . . . . . . . . . 13,563 10,002 — — —Sanitation . . . . . . . . . . . . . . . . . . . . . . . . . . . 91,859 36,089 9,784 9,784 18,784
Health and Welfare:
Admin. for Children’s Services . . . . . . . . . . 147,944 41,629 41,629 41,629 41,629 Social Services . . . . . . . . . . . . . . . . . . . . . . . 137,738 28,540 28,540 28,540 28,540 Homeless Services . . . . . . . . . . . . . . . . . . . . — 2,657 2,657 2,657 2,657 Aging. . . . . . . . . . . . . . . . . . . . . . . . . . . . . . . 2,000 1,000 — — —Youth and Community Dev. . . . . . . . . . . . . . 3,726 1,808 308 308 308 Health and Mental Hygiene . . . . . . . . . . . . . 40,451 18,848 13,968 13,958 13,941
Other Agencies:
Housing Preservation and Dev.. . . . . . . . . . . 1,334 1,641 1,641 1,641 1,641 Finance . . . . . . . . . . . . . . . . . . . . . . . . . . . . . 3,150 2,843 2,843 2,843 2,843 Transportation . . . . . . . . . . . . . . . . . . . . . . . . 16,748 24,926 24,089 16,662 16,912 Parks and Recreation . . . . . . . . . . . . . . . . . . — 2,287 2,367 1,967 1,967 Citywide Administrative Services . . . . . . . . 8,573 7,075 5,175 4,675 3,645 All Other Agencies . . . . . . . . . . . . . . . . . . . . 72,921 61,186 44,396 38,040 36,488
Education:
Education . . . . . . . . . . . . . . . . . . . . . . . . . . . 132,005 166,389 165,708 172,731 172,731 City University . . . . . . . . . . . . . . . . . . . . . . . — 3,100 3,100 3,100 3,100
Other:
Citywide Savings Initiatives . . . . . . . . . . . . . — 30,700 74,000 102,000 124,000 Miscellaneous . . . . . . . . . . . . . . . . . . . . . . . . 555,379 320,064 367,064 402,064 407,064 Debt Service . . . . . . . . . . . . . . . . . . . . . . . . . 295,406 421,134 231,537 206,979 125,031 Procurement Savings . . . . . . . . . . . . . . . . . . — 55,519 55,519 55,519 55,519
_____________________ _____________________ _____________________ _____________________ _____________________
Total Citywide Savings Program . . . . . . . . $1,535,330 $1,264,165 $1,106,905 $1,137,662 $1,089,350 ================== ================= ================= ================= =================_______________________________________________________________________________________________________________________________________________________________________________________________________________
Note: Includes initiatives from the April 26, 2017 Executive Budget, January 24, 2017 Preliminary Budget, and the November 17, 2016 Financial Plan.

APPENDIX Fiscal Year 2018
241
EXHIBIT 6AFY 2018 EXECUTIVE BUDGET
CITYWIDE SAVINGS PROGRAM - 5 YEAR VALUE(City $ in 000’s)
_______________________________________________________________________________________________________________________________________________________________________________________________________________
FY 2017 FY 2018 FY 2019 FY 2020 FY 2021_______________________________________________________________________________________________________________________________________________________________________________________________________________
All Other Agencies:Mayoralty . . . . . . . . . . . . . . . . . . . . . . . . . . . $2,204 $— $— $— $—Actuary . . . . . . . . . . . . . . . . . . . . . . . . . . . . . 54 74 74 74 74Emergency Management . . . . . . . . . . . . . . . 1,352 116 87 58 27 Administrative Tax Appeals . . . . . . . . . . . . . 50 51 51 51 51 Law . . . . . . . . . . . . . . . . . . . . . . . . . . . . . . . . 13,977 2,000 2,000 — — City Planning . . . . . . . . . . . . . . . . . . . . . . . . 1,453 557 246 247 247 Investigation . . . . . . . . . . . . . . . . . . . . . . . . . 22 22 22 22 22 Civilian Complaint Review Board . . . . . . . . 81 251 251 251 251 Board of Correction . . . . . . . . . . . . . . . . . . . 346 77 77 77 77 City Clerk . . . . . . . . . . . . . . . . . . . . . . . . . . . 97 68 68 68 68 Cultural Affairs . . . . . . . . . . . . . . . . . . . . . . . 275 — — — — Financial Info. Services Agency . . . . . . . . . . 3,138 3,190 3,190 3,190 3,190 Payroll Admin. . . . . . . . . . . . . . . . . . . . . . . . 628 704 704 704 704 Equal Employment Practices . . . . . . . . . . . . 10 11 11 11 11 Civil Service . . . . . . . . . . . . . . . . . . . . . . . . . — 11 11 11 11 Landmarks Preservation . . . . . . . . . . . . . . . . 100 100 100 100 100 Taxi and Limousine . . . . . . . . . . . . . . . . . . . 3,459 2,217 397 397 397 Collective Bargaining . . . . . . . . . . . . . . . . . . 3 3 3 3 3 Probation . . . . . . . . . . . . . . . . . . . . . . . . . . . . 2,035 — — — — Small Business Services . . . . . . . . . . . . . . . . 4,657 5,697 5,167 5,119 5,082 Buildings . . . . . . . . . . . . . . . . . . . . . . . . . . . . 3,152 3,260 3,260 3,260 3,260 Administrative Trials and Hearings . . . . . . . 500 — — — — Environmental Protection . . . . . . . . . . . . . . . 19,041 23,905 10,107 6,353 4,869 DOITT . . . . . . . . . . . . . . . . . . . . . . . . . . . . . . 13,784 18,399 18,097 17,571 17,571 Records and Info. Services . . . . . . . . . . . . . . 37 98 98 98 98 Consumer Affairs . . . . . . . . . . . . . . . . . . . . . 2,466 375 375 375 375
_____________________ _____________________ _____________________ _____________________ _____________________
Total All Other Agencies . . . . . . . . . . . . . . . $72,921 $61,186 $44,396 $38,040 $36,488 ================== ================= ================= ================= =================_______________________________________________________________________________________________________________________________________________________________________________________________________________
Note: Includes initiatives from the April 26, 2017 Executive Budget, January 24, 2017 Preliminary Budget and the November 17, 2016 Financial Plan.

APPENDIX Fiscal Year 2018
242
EXHIBIT 6BFY 2018 EXECUTIVE BUDGET
CITYWIDE SAVINGS PROGRAM - BY EXPENSE AND REVENUE(City $ in 000’s)
_______________________________________________________________________________________________________________________________________________________________________________________________________________
Expense Revenue Total
_______________________________________________________________________________________________________________________________________________________________________________________________________________
Uniformed Forces: Police . . . . . . . . . . . . . . . . . . . . . . . . . . . . . . . . . . . . . . . $12,378 $3,600 $15,978 Fire . . . . . . . . . . . . . . . . . . . . . . . . . . . . . . . . . . . . . . . . . 4,418 6,332 10,750 Correction . . . . . . . . . . . . . . . . . . . . . . . . . . . . . . . . . . . 10,002 - 10,002 Sanitation . . . . . . . . . . . . . . . . . . . . . . . . . . . . . . . . . . . . 27,089 9,000 36,089
Health & Welfare: Admin. for Children’s Services . . . . . . . . . . . . . . . . . . 41,629 - 41,629 Social Services . . . . . . . . . . . . . . . . . . . . . . . . . . . . . . . . 28,540 - 28,540 Homeless Services . . . . . . . . . . . . . . . . . . . . . . . . . . . . . 2,657 - 2,657 Aging . . . . . . . . . . . . . . . . . . . . . . . . . . . . . . . . . . . . . . . 1,000 - 1,000 Youth and Community Dev. . . . . . . . . . . . . . . . . . . . . . . 1,808 - 1,808 Health and Mental Hygiene . . . . . . . . . . . . . . . . . . . . . . 18,848 - 18,848
Other Agencies: Housing Preservation and Dev. . . . . . . . . . . . . . . . . . . . 1,641 - 1,641 Finance . . . . . . . . . . . . . . . . . . . . . . . . . . . . . . . . . . . . . . 343 2,500 2,843 Transportation . . . . . . . . . . . . . . . . . . . . . . . . . . . . . . . . 18,221 6,705 24,926 Parks and Recreation . . . . . . . . . . . . . . . . . . . . . . . . . . . 1,900 387 2,287 Citywide Administrative Services . . . . . . . . . . . . . . . . . 3,575 3,500 7,075 All Other Agencies . . . . . . . . . . . . . . . . . . . . . . . . . . . . 57,728 3,458 61,186
Education: Education . . . . . . . . . . . . . . . . . . . . . . . . . . . . . . . . . . . . 166,389 - 166,389 City University . . . . . . . . . . . . . . . . . . . . . . . . . . . . . . . . 3,100 - 3,100
Other: Citywide Savings Initiatives . . . . . . . . . . . . . . . . . . . . . 30,700 - 30,700 Miscellaneous . . . . . . . . . . . . . . . . . . . . . . . . . . . . . . . . 320,064 - 320,064 Debt Service . . . . . . . . . . . . . . . . . . . . . . . . . . . . . . . . . 421,134 - 421,134 Procurement Savings . . . . . . . . . . . . . . . . . . . . . . . . . . . 55,519 - 55,519 ________________ ________________ ________________
Total Citywide Savings Program . . . . . . . . . . . . . . . . . . . . . $1,228,683 $35,482 $1,264,165 ============= ============== ==============_______________________________________________________________________________________________________________________________________________________________________________________________________________
Note: Includes initiatives from the April 26, 2017 Executive Budget, January 24, 2017 Preliminary Budget and the November 17, 2016 Financial Plan.