fy 2013-15 proposed policy budget - City of Oakland
502
-
Upload
khangminh22 -
Category
Documents
-
view
0 -
download
0
Transcript of fy 2013-15 proposed policy budget - City of Oakland


CITY OF OAKLAND
FY 2013-15 PROPOSED POLICY BUDGET
Mayor Jean Quan
Members of the City Council
Patricia Kernighan (District 2) Council President
Larry Reid (District 7) Vice-Mayor
Rebecca Kaplan (At-Large) Libby Schaaf (District 4) Dan Kalb (District 1) Noel Gallo (District 5)
Lynette Gibson McElhaney (District 3) Desley Brooks (District 6)
City Administrator Deanna J. Santana
Prepared by the Budget Office
Donna Hom Osborn Solitei Budget Director Controller
Kirsten LaCasse Assistant Controller
Analytical Staff
Support Staff Debbie Comeaux Lucius Hatcher, Jr.
Additional Analytical Support Provided by Karen Boyd Katano Kasaine Sarah Schlenk Nila Wong Alexandra Orologas
Janelle Montu Andrew Murray
Rina Hernandez Bradley Johnson
Michelle Soares

Elected Officers
Barbara Parker, City Attorney
Courtney Ruby, City Auditor
Administration
Deanna J. Santana, City Administrator
Fred Blackwell, Assistant City Administrator
Scott P. Johnson, Assistant City Administrator
Arturo Sanchez, Deputy City Administrator
Directors
LaTonda Simmons
City Clerk
Community Services
Audree V. Jones-Taylor – Parks & Recreation Sara Bedford – Human Services
Teresa Deloach Reed
Fire Department
Michele Byrd
Housing & Community Development
Gerald Garzon (Interim)
Library
Rachel O’Dwyer Flynn
Planning and Building
Howard A. Jordan
Police Department
Vitaly Troyan
Public Works
Mission Statement
The City of Oakland is committed to the delivery of effective, courteous and responsible service. Citizens and employees are treated with fairness, dignity and respect.
Civic and employee pride are accomplished through constant pursuit of excellence and a workforce that values and reflects the diversity of the Oakland community.

The Government Finance Officers Association of the United States and Canada (GFOA) presented a Distinguished Budget Presentation Award to the City of Oakland for its biannual budget for the fiscal years 2011-12 and 2012-13.
In order to receive this award, a governmental unit must publish a budget document that meets program criteria as a policy document, as an operations guide, as a financial plan and as a communications device.
The award is valid for a period of one budget cycle only. We believe our current budget for fiscal years 2013-14 and 2014-15, continues to conform to program requirements, and we are submitting it to GFOA to determine its eligibility for another award.


CITY OF OAKLAND
O N E F R A N K H . O G A W A P L A Z A 3 R D F L O O R O A K L A N D , C A L I F O R N I A 9 4 6 1 2
Office of the Mayor Honorable Jean Quan Mayor
FAX
(510) 238-3141 (510) 238-4731
Office of the City Administrator Deanna J. Santana City Administrator
FAX
(510) 238-3301 (510) 238-2223
April 17, 2013
HONORABLE CITY COUNCIL & OAKLAND RESIDENTS
On behalf of the City Administration, we are pleased to present the City of Oakland’s Proposed Policy
Budgets for Fiscal Years 2013-14 and 2014-15 for the City Council’s consideration.
This budget represents a crossroads for Oakland. Our economy is on the rise, and we see many
opportunities ahead to realize our vision of success, safety and stability for our city. We have worked to
balance the priorities and needs of everyone in the City, and we believe this is a "fair share" budget for
all. We are investing strongly in public safety and economic development to restore our police force and
build on the economic opportunities before us. Due to growing expenses beyond our control, we are still
forced to propose some cuts and position eliminations, but we have worked hard to minimize them.
Significantly, employee contributions made over two years ago, at the height of the recession, will sunset
starting in July 2013. For several years now, our employees have given contributions that were critical to
stabilizing the City and creating an environment where we can now make thoughtful, though urgent,
decisions about our future. We are grateful to all City employees, whose sacrifices have been essential to
stabilizing the City’s finances and resuming our economic growth. Looking ahead, we will have to make
smart, tough decisions together about how we move forward to tackle our challenges and seize the great
opportunities before us.
While we have weathered fiscal storms and made substantial progress, there are factors beyond our local
control that pose big challenges for balancing this two-year budget in the short term and ensuring our
financial stability in the long term. It is crucial that we prepare now to address anticipated increases in
expenditures. Our recent economic gains have been offset and outpaced by the following factors:
• Unknown federal and state funding cuts;
• Rising health care costs;
• Rapidly growing costs of employee pensions as the CalPERS funding system undergoes
necessary reform;
• Sunsetting of local tax measures; and
• Expiring public safety grants worth millions of dollars.

HONORABLE CITY COUNCIL AND OAKLAND RESIDENTS
Subject: FY 2013-2015 Proposed Policy Budget
Date: April 17, 2013 Page 2
As a result, the Proposed Budget for FY 2013-15 proposes to reduce expenditures by $11.6 million in the
first year (FY 2013-14) and $16.1 million in the second year (FY 2014-15). This will result in the
proposed elimination of 79.5 full-time equivalent (FTE) employees in FY 2013-14 and 86.5 FTEs in
FY 2014-15.
The purpose of this transmittal letter is to lay out the context in which this budget is proposed: the
Administration’s priorities and vision for the City; the collective contributions of our many stakeholders;
the work we have done together to stabilize and build Oakland’s fiscal health and retain public services;
the outside forces we must reconcile with our fiscal operations; the important long-term factors which
require sound planning; and our strategies and values in building this budget.
This budget proposal contains appropriations totaling about $1 billion per year for the next two years
across all funding sources, and budget proposals that both increase and decrease City services. It is a
balanced budget, as required by City Charter.
In building the vision and direction proposed in this budget, we have weighed and tried to fairly balance
the priorities of the Administration, Councilmembers, City employees and, most importantly, the
community we serve. The specific proposed budget-balancing measures are presented in detail in the
Service Impacts tab of this budget document. In brief, here are some of the most significant, concrete
elements of this balanced budget:
Net increases in General Fund appropriations. In the current fiscal year (FY 2012-13), those
appropriations total $409 million. For the proposed two-year budget, General Fund appropriations
total $430 million in FY13-14, and $457 million in FY14-15.
Investment in public safety by funding more police academies. Under this budget, four academies
will graduate over the next two years. The projected sworn staffing level of the department would be
an estimated 697 officers by the end of FY 2014-15, depending on graduation and attrition rates.
Investment in economic development, including job training, business assistance, cultural arts and
marketing, business attraction and affordable housing.
Policy trade-offs will need to be considered. Among these include funding for additional police
academies, housing services, litter and illegal dumping enforcement and clean-up, road repair, graffiti
abatement and Head Start services, which likely face federal cuts.
We have reduced our reliance on one-time sources of revenue for ongoing expenses ($10.8 million
over the next two years, compared to $14.3 million for the current year).
Priorities and Vision
Oakland is a diverse city that is home to a wide array of different communities and individuals. In many
cases, that means our residents and businesses sometimes have differing and even conflicting priorities.
The job of leadership is to serve all of Oakland, and to resolve those differences in a way that best serves
our collective needs and goals. In that spirit, our top priorities for this budget are to:
Invest in public safety;
Create jobs and promote economic development;

HONORABLE CITY COUNCIL AND OAKLAND RESIDENTS
Subject: FY 2013-2015 Proposed Policy Budget
Date: April 17, 2013 Page 3
Bolster job-training services so that Oaklanders are a competitive and thriving workforce;
Build and restore our infrastructure and the physical environment of Oakland;
Achieve long-term fiscal stability for the City; and
Foster Oakland youth and care for our most vulnerable populations.
All these priorities weave a cohesive whole, and by working together we will move Oakland forward. Our
vision for Oakland is to dramatically bring down crime and strongly increase safety for our residents and
businesses. This will encourage new businesses and investors, and bolster the businesses we already have,
which in turn will produce new jobs, increase prosperity in our neighborhoods and create more revenue to
support City services. With greater revenues, we can improve quality of life for everyone in our city, and
better fund services for our most vulnerable residents, making stable, steady progress toward prosperity.
Collective Stakeholder Contributions
The City could not have achieved its state of relative health without three crucial factors: employee
contributions, service reductions, and growing revenues. The first two factors were the result of incredible
dedication, hard work, negotiation and leadership on the part of every City stakeholder, including the
employees themselves and the City Council.
Every City employee has faced the difficulty of losing approximately 9% of their compensation, a
sacrifice that is never easy to make. Mayor Quan cut in her own salary by 25% upon taking office, and
will continue to do so in the coming fiscal year. This was partly an effort to honor the hard work of all
public servants and the sacrifices they were asked to make. In the current fiscal year alone, employee
contributions equal approximately $37 million. These contributions have saved jobs and allowed the City
to sustain vital services for residents.
Weathering the Financial Storm
In addition to employee contributions, we have made great strides over the past several years to stabilize
the City’s finances, which has required significant and in many cases unsustainable service reductions
and/or eliminations:
• Reduced the workforce by 21% over the past 10 years, resulting in the elimination of about 720
positions;
• Closed $318 million in cumulative budget shortfalls ;
• Instituted rolling brown-outs of two fire engine companies;
• Reduced sworn police staffing by 27% (from 837 to 611 officers) and civilian staff by 34% in the last
6 years (from 394 to 261 FTEs), with loss of services in patrol, level of investigations, delayed
response to 911 calls for service, and elimination of the horse-mounted unit and traffic unit;
• Significantly reduced paving and street repairs;
• Reduced code enforcement, development, and planning staff;
• Reduced Cultural Arts programs and grants, and Film Office staffing;
• Significantly reduced various neighborhood improvement and beautification programs, such as:
façade and tenant improvement grants, the Neighborhood Project Initiative Program, graffiti
abatement (private property), blight removal, litter and illegal dumping response, tree trimming,
sidewalk maintenance, and open space maintenance;
• Reduced affordable housing programs and funding for homeless programs;

HONORABLE CITY COUNCIL AND OAKLAND RESIDENTS
Subject: FY 2013-2015 Proposed Policy Budget
Date: April 17, 2013 Page 4
• Reduced park, median and grounds and building maintenance and custodial services.
We have pursued various ways to maximize revenue by: (1) pursuing grants from federal and state
governments as well as foundations and the private sector, (2) aggressively pursuing dollars owed the
City through special revenue collection efforts, (3) developing more public/private partnerships, and (4)
increasing fees to fully recover the costs related to providing services. The results of a growing economy
and aggressive revenue development efforts have proven fruitful.
Over the past five years, the City has made significant strides in stabilizing its financial condition, and the
City Council, residents, and employees have played a major role in getting the City to a stronger fiscal
condition. The following fiscal actions that have strengthened our financial standing:
• Instituted strong fiscal controls and strengthened financial policies;
• Proactively collected revenues and implemented targeted efforts to collect past-due funds;
• Paid down negative fund balances, which have gone from $138 million to about $99 million at the
close of FY 2012-2013 (this is internal debt that comes from inter-fund borrowing);
• Fully funded the General Fund reserve to meet the level mandated by City Council policy for the first
time in five years;
• Reorganized to reduce costs and enhance efficiency; and,
• Planned for anticipated additional fiscal impacts from the dissolution of Redevelopment.
Two years ago this Administration walked in the door to more than $40 million in existing budget
shortfalls, a dramatically reduced police force, high debt, reduced revenues, and high unemployment.
Together, since Mayor Quan took office, we have:
Closed the budget shortfalls
Minimized layoffs and service reductions
Rehired all the laid-off police officers who wanted to return, and awarded a grant for 25 new officers
Funded the first police academy in more than four years and proposed more
Significantly paid down debt
Maintained AA credit ratings through multiple reviews by raters/investors
Supported modest, steady revenue increases
Brought down unemployment from 16.6% to 13.1% in January 2013.
Ready for Growth
The good news is that the economy is showing steady signs of modest recovery, the housing market is red
hot, and key economic indicators are trending in a positive direction: unemployment is down and
revenues are up in most categories (e.g., property tax, sales tax, business tax, real estate tax).
The financial markets are taking notice of Oakland’s judicious approach to address both short-term and
long-term financial challenges: just recently, the credit-rating agencies reaffirmed our AA credit rating
and noted our stable fiscal outlook.

HONORABLE CITY COUNCIL AND OAKLAND RESIDENTS
Subject: FY 2013-2015 Proposed Policy Budget
Date: April 17, 2013 Page 5
Looking forward, we must continue to grow our revenues to restore and enhance services to the
community. We have actively supported long-dormant projects which have recently sprung to life, and
are working to spur progress on other projects to draw investment to Oakland, creating more jobs and
more economic development. Recent progress includes:
Preparing to begin construction at the Oakland Army Base by December 2013, which includes
constructing a new marine terminal and 1 million square feet of trade and logistics space that will
generate approximately 2,000 jobs;
Supporting efforts to break ground in spring 2014 at the Brooklyn Basin Project, which includes 3,100
units of housing, 30 acres of open space, and 200,000 square feet of commercial space, with an
approximate job count of 8,000 over the 6 to 8 year build-out of the project;
Completing the “10K” housing project started a decade ago and strategically positioning Oakland for
“10K” 2.0, which would build housing across all of Oakland's transit corridors;
Continuing to negotiate exciting opportunities for our sports facilities and the world-class potential of
the Coliseum City development project; and
Aggressively pursuing retail projects. Since 2011, more than 1 million square feet of new or improved
leasable retail space have been completed or are in the pipeline.
Factors Outside the City’s Control
Despite the good work we’ve done putting our fiscal house in order, outside financial forces are creating
new challenges going forward. We face some significant losses, and some expenses are rising even faster
than our revenues, but three primary factors affect our fiscal status:
1. Ongoing Impacts of the Global Recession
Oakland continues to be challenged by the lingering impacts of the global recession and the harsh service
impacts which resulted from reducing $318 million in expenditures and losing 720 FTEs in prior years,
while simultaneously planning for additional reductions.
We have begun recovery, but have not yet fully restored our pre-recession revenues. A good example of
these ongoing points of recovery is property tax, a central revenue source for California cities. Although
Oakland property tax revenues are on the rise, they remain $8.7 million short of pre-recession levels.
Although revenues are showing modest, upward trends, continuously rising costs and deferred
expenditures are projected to outpace revenue growth, mostly due to steep increases in health care and
pension costs and critical deferred maintenance to repair City buildings and roads, upgrade technology,
and replace fleet and equipment.
2. Increased Cost of Benefits
CalPERS’ newly adopted actuarial assumptions will have a significant impact on the City’s budget.

HONORABLE CITY COUNCIL AND OAKLAND RESIDENTS
Subject: FY 2013-2015 Proposed Policy Budget
Date: April 17, 2013 Page 6
In the coming year, we face a 21% increase in CalPERS costs, or about $18 million. Over the next five
years, additional increases of about 50% are expected, and anticipated CalPERS reforms could drive costs
even higher.
The City must also prepare to pay increased costs for medical benefits above the estimated $41 million
we now pay. These costs have increased by 39% per civilian employee since FY 06-07, and by 50% for
sworn employees. While CalPERS has not published projected cost increases for 2014, the past increases
are a reasonable indicator of anticipated increases in the coming years.
These rising costs are currently projected to outpace the City’s economic growth and steadily rising
revenues.
3. Dissolution of Redevelopment
Redevelopment was a major tool that Oakland—like other urban centers in California—could use to turn
vacant and underutilized properties into productive, tax revenue-generating and job-producing use. It
served as a catalyst for private investment to breathe life into areas burdened with deteriorated buildings,
environmental contamination, and aging infrastructure that would otherwise lay vacant and
nonproductive.
The elimination of Redevelopment in January 2012 created a $28 million hole in the City’s budget and
eliminated a significant source of ongoing funding for affordable housing and blight abatement, including
resource to combat graffiti and illegal dumping. Redevelopment had also been partly used to help fund
police services in commercial areas slated for revitalization.
Over the past year, the work to wind down former redevelopment agencies has been an enormously
complex process for cities across the state. The California Department of Finance is currently reviewing
the transactions and land sales that took place during that process and has disallowed a number of actions
in other cities. Oakland is preparing for that possibility, and while we have fiscally prepared for these
events, funds set aside to address this fiscal impact are funds that the City could have used for investment
in desperately needed, one-time expenses (e.g., critical deferred maintenance to repair City buildings and
roads, technology upgrades, and replacement of fleet and equipment).
Strategies and Values
We’ve worked to be transparent and collaborative. This is an open, community-focused process with
the books open to anyone who wants to see the data. By letting everyone have unprecedented access to
our budget data we know we can: (1) improve trust in the process, (2) create a budget that truly serves
everyone, and (3) tap into the best ideas available by empowering everyone in Oakland to contribute their
ideas and perspectives.
In recent years, we reorganized to increase efficiency, reduced middle management, and in many cases
cut services to the bone. We now face choices moving forward about rebuilding and restoring a few key
services. While all City service areas require our attention, we have given particular focus to the areas of
public safety and economic development. By building a safer Oakland and growing our economy, we
will create a better foundation on which to restore and grow the City as a whole.
We’re in this together. We will build on union partnerships and collaborate with City Councilmembers
and the community. A series of town hall meetings will be held throughout Oakland to discuss the City’s
fiscal condition and proposed Policy Budget, and the City Council will hold public hearings on the
proposed budget.

HONORABLE CITY COUNCIL AND OAKLAND RESIDENTS
Subject: FY 2013-2015 Proposed Policy Budget
Date: April 17, 2013 Page 7
Balancing priorities. Tough choices lie ahead. Everyone’s priorities are important, and we have made
every effort to respect and champion the collective expectations, needs and goals of the people and
employees of Oakland.
Oakland at a Crossroads
It is clear that the City is at a critical juncture. The decisions we make now are pivotal to our future and to
realizing the full promise of Oakland. The city has won recent international recognition, and with our
economy on the rise, we are well positioned for growth. Great opportunities are before us and we are
within reach of a prosperous, bright future.
However, to get there, we must deal directly with our remaining challenges. The most urgent, immediate
priority is to reduce crime and increase police staffing. This proposed budget will fund the graduation of
four police academies over the next two fiscal years and bring police sworn staffing to 697 by the end of
FY 2014-2015.
As we tackle police staffing shortages in the near term, we must also keep our eyes sharply focused on the
horizon to ensure that our long-term financial issues are addressed without “kicking the can” further down
the road.
For Oakland to truly flourish, we must begin to confront the imbalance between revenues and
expenditures. This will take systematic planning, difficult trade-offs, patience, and will to create
sustainable, long-term solutions that provide relief from the shortfalls predicted for the future, absent a
permanent solution. Among our upcoming challenges are:
Two major tax measures will sunset in the coming years: Measure Y, which largely funds police
officers and community-based violence prevention service, amongst other services, as well as the
Wildfire Prevention Assessment District, which provides for the ongoing safety needs necessary
to preventing another firestorm such as the one Oakland endured in 1991. Renewal of these
measures will require voter approval. As a result, we need to begin problem-solving over the next
fiscal year to stabilize these services and funding should they not be renewed;
Prepare for the reforms that CalPERS will put in place over the next six years that will have a
significant fiscal impact;
Prepare to implement the Affordable Care Act during the term of this proposed budget, with as-
yet unknown fiscal impacts and many unresolved questions;
Still absorbing the impact of the loss of Redevelopment;
Five years of structural deficit is forecasted; and
More than $1 billion of unfunded liabilities and/or deferred capital projects projected.
With labor agreements expiring beginning in July 2013, the proposed Policy Budget does not assume
these savings and, instead, provides a prioritized list of services that we recommend be restored, if
additional contributions are received.
In general, the proposed budget-balancing measures seek to leverage City services by reducing hours
rather than eliminating programs, ensuring that the fees we charge cover the cost of providing the service,
generating additional revenue, and expanding the Oakland Police Department. Examples of proposed
service eliminations, reductions, and reorganizations are presented in detail in the Service Impacts section
of this document.

HONORABLE CITY COUNCIL AND OAKLAND RESIDENTS
Subject: FY 2013-2015 Proposed Policy Budget
Date: April 17, 2013 Page 8
Going forward, we must recognize the vital contribution employees made and the major impacts those
contributions had; while these budgets do not assume the renewal of those contributions, we know that by
working with our employees to secure structural reform to the City's budget and finding long-term
solutions together, we can prepare ourselves for the period of true growth Oakland needs and deserves.
It will also be critical to bolster our dialogue with the broader Oakland community. The dialogue will
have to include the possibility of a modest parcel tax the voters could approve to accelerate the restoration
of staffing our police department. While the City has been prudent and smart in setting its financial house
in order, we do not have a clear path to reach adequate police staffing without voters playing a part in
funding that restoration. We have begun to heal from the devastating effects of the Great Recession, but
that growth is modest and arriving at a pace that does not allow the fast action many residents are
demanding.
Oakland is like many other California cities and cities across the United States that have grappled with
multi-year service reductions and budget shortfalls to a point where there are no longer any discretionary
services left to eliminate. It’s no longer about “doing more with less” or hoping for a full recovery. It is
about acknowledging that we have weathered a very bad fiscal storm, put strong fiscal measures in place
that have shown positive results, and now know what the future holds for our City and what we must plan
for in the very near term.
We are not alone in these challenges; however, we must remember that the progress we have made over
the past five years has been a direct result of this City’s dogged determination to work together, with
resolve and collective passion for the well-being and viability of our community. Through ongoing
collaboration and problem-solving, we will find solutions to the challenges before us, and we are
confident that these decisions will allow Oakland to emerge stronger than ever.
We look forward to formally presenting this Proposed Budget to the City Council on April 30, 2013.
Respectfully submitted,
Jean Quan Deanna J. Santana
Mayor City Administrator
Attachment:
Budget Highlights

ATTACHMENT
FY 2013-2015 BUDGET HIGHLIGHTS Page 1
FY 2013-2015 BUDGET HIGHLIGHTS
I. BUDGET-BALANCING PRINCIPLES
The following budget-balancing principles were used to develop budget proposals and present the City Council
with a proposed Policy Budget: essentially, they guide expenditure priorities and impacts. These budget-
balancing principles are largely the same as presented in the past (January 2012) and have worked to stabilize our
limited public funds and investment in essential services:
1. Develop a budget that balances the City's delivery of the most essential services to the community with the
resources available.
2. Comply with Court rulings and orders, such as the dissolution of Redevelopment and Negotiated Settlement
Agreement.
3. Resolve shortfalls with ongoing revenue to fund ongoing expenditures. Align one-time resources with one-
time costs for programs or projects. To the greatest extent possible, one-time resources should not be used
for ongoing costs.
4. Minimize the negative impact of service reductions/eliminations on Oakland residents, businesses, and
employees.
5. General Purpose Fund revenues shall not be earmarked for any particular purpose, unless required by law or
generally accepted accounting principles (GAAP).
6. All Enterprise Funds shall work to become fully self-supporting from revenues generated by rates, fees and
charges.
7. Ensure that services address the diverse community and preserve efforts that the City Council has put in
place to address social equity and access to quality of life services.
8. Rates, fees and charges should become fully cost recovering and the General Purpose Fund should not
provide subsidies, unless authorized by the City Council and funds are appropriately allocated/appropriated.
9. Ensure that budget-balancing approaches have no negative impact, or minimal impact, on future budgets to
ensure high standards of fiscal integrity and management, along with the goal and interest of preserving the
City’s credit ratings.
10. Focus on services for both the short- and long-term that are unique to what a full-service local government
should offer. As a goal, analyze all existing services and target service consolidations, reductions, or
eliminations in areas where service is less essential.
11. Explore personnel services cost savings, subject to the meet-and-confer process where applicable.
12. Make every effort, if operationally feasible, to eliminate vacant positions, rather than filled positions, to
minimize the number of employee layoffs while at the same time being mindful of the services that the
community demands and/or needs. As programs are consolidated, reduced or eliminated, ensure that
management and administration are reduced as appropriate.
13. Defer any new program commitments and initiatives or program expansions, unless those programs reduce
crime, stimulate the local economy, create jobs, are cost neutral, generate new revenues, are required by law,
have a significant return on investment for the General Purpose Fund, and/or are funded through
redeployment of existing resources.
14. Explore interdepartmental/interagency partnerships to leverage service delivery models.

Page 2 FY 2013-2015 BUDGET HIGHLIGHTS
II. FINANCIAL/ECONOMIC MARKET CONSIDERATIONS
Consistent with national, state, and regional economic market trends, the City of Oakland economy is showing
signs of stabilization and modest growth.
Key Oakland Economic Indicators at a Glance
Recent economic indicators confirm modest economic recoveries for Oakland:
Vacancy rates have decreased across all commercial sectors, with the industrial sector falling to its lowest
ever of 4.7%. Commercial and retail vacancy rates are declining.1
From calendar years 2009 to 2012, retail sales increased 23.1%. In calendar year 2012, the gain in taxable
retail sales from 2011 alone increased by 7.6%.2
In calendar year 2012, the City experienced a net increase of 5.3% (823 net new) Residential and
commercial businesses in Oakland (non-rental businesses).3
Property transfers continue on an upward trend. In 2012, there was an average of 749 transfers per
month for all properties, compared with 712 per month in 2011.4
Employment in Oakland in January 2012 was 175,100; in January 2013, employment grew to 181,500,
for a net gain of 6,400 jobs.5
Housing Market Activity
Oakland’s housing market is complex. The rate of foreclosure activities has significantly decreased in Oakland.
However, there are still many Oakland residents in or at risk for foreclosure and the number of underwater
borrowers is also high. Notices of Default have decreased 64.1% since the prior year, and the rate of short sales has
increased 35% from 2011 to 2012.6 Like state and national trends, the number of short sales in Oakland has
impacted the market. Additionally the significant number of foreclosed home purchases by investors has also
contributed to higher home prices and a larger rental market.
Additionally, newly constructed condominium units that were converted to rental units are now returning to the
sale market. Vacancy rates in rental markets are low, with rents rising. According to the data published by real
estate trends site Realtor.com, the average U.S. home spent 84 days on the market last month. In 10 housing
markets, homes spent 48 days or less on the market before being sold. In Oakland, homes spent just 24 days on the
market. 7
In terms of new housing, construction starts remain slow, but major housing developments proposed in Oakland
are expected to come on line in the next several years. For example, Brooklyn Basin Development (Oak to Ninth
development), along the Embarcadero adjacent to Jack London Square, where construction will begin in spring
2014, will contain 3,100 new units of housing, as well as 30 acres of open space and 200,000 square feet of
commercial space. The City is positioned now for a “10k 2.0” initiative.
1 Colliers International 2012 4
th Quarter Report
2 HdL Companies
3 City of Oakland Business License Office
4 HdL Companies
5 State of California EDD
6 ForeclosureRadar http://www.foreclosureradar.com/california/alameda-county/oakland-foreclosures
7 http://www.foxbusiness.com/industries/2012/07/25/american-cities-where-homes-sell-fastest/

ATTACHMENT
FY 2013-2015 BUDGET HIGHLIGHTS Page 3
Labor Market Activity
Over the past year, 6,400 jobs were created in Oakland compared to 5,000 jobs created in the previous year. 8
The unemployment rate in the Oakland-Fremont-Hayward MD was 8.0% in February 2013, down from 8.6% in
January 2013, and below the year-ago estimate of 9.5%. This compares with an unadjusted unemployment rate of
9.7% for California and 8.1% for the nation during the same period. The unemployment rate was 8.0% in
Alameda County, and 8.1% in Contra Costa County.
Two major development projects are expected to add significantly to employment in the City over the next two
years. The construction of a new marine terminal and one million square feet of trade and logistics space at the
former Oakland Army Base, which will begin in December 2013, is expected to create approximately two
thousand new jobs over the course of its build out. In addition, Brooklyn Basin Development referenced above
will create approximately 8,000 jobs over the six to eight year build out of the project, which will begin in spring
2014. At the same time, the City currently has about 1 million sq. feet of retail development underway which will
have a positive impact on jobs, as reported by the San Francisco Business Times.
Taxable Sales Activity
The country’s major economic recession in 2008 has had a significant impact on retailing, and the sector is still
recovering. In Oakland overall, retail sales had been relatively flat from 2001 to 2004, increased notably from
2004 to 2007, declined in 2008 and 2009, and have been increasing again in 2010 and 2011.
Retail sales activity in 2012 is continuing to show improvement and on an upward trend. Eating and drinking and
convenience retailing have shown the largest increases and strongest recovery, while department and apparel sales
have lagged and have not recovered as quickly. Retail sales are anticipated to continue growing over the next
several years as the economy and consumer confidence continue to recover and grow. Per HdL Economist Jordan
Levine, auto sales activity is a good economic indicator for consumer confidence – in Oakland, auto sales are
strong – all Oakland auto dealerships are part of Oakland’s top 30 sales tax producers. 9
III. OAKLAND WEATHERING ITS FINANCIAL CHALLENGES: 2008-2013
The City of Oakland is steadily emerging from the recession and collapse of the housing market in 2008. Since
then, the City has addressed $318 million in budget shortfalls caused by sharp revenue declines and eliminated 720
full-time equivalent positions.
Workforce and Community Service Reductions
Over the past 10 years, the City’s workforce has shrunk by about 20% to an all-time low of 3,680 employees.
Although the City has tried to sustain service levels despite diminishing staff and resources, the reality is that
losing 20% of our staff has had a significant impact on service delivery. And yet, the demand for services has only
increased as a result of growing community needs that are heightened during a recession. Adding to the challenge,
we have preserved front-line services by dramatically cutting internal service departments such as information
technology, finance, and human resources, which are critical to sustaining quality community services. We must
seek a better balance moving forward between workload capacity and services delivered.
8 State of California, EDD
9 HdL Sales Tax Report 2012

Page 4 FY 2013-2015 BUDGET HIGHLIGHTS
Past Short-Term and Long-Term Cost-Cutting Measures
The City’s sworn and civilian employees have made significant contributions to help bridge multi-million
shortfalls. Pursuant to the collective bargaining agreements, City employee’s wages were reduced and all
employees are now contributing the full employee share of pension costs. Current labor agreements that include
these cost-cutting concessions are set to begin expiring in June 2013. Examples of austerity and cost-cutting
measures to address the $318 million in cumulative shortfalls since July 2008 include the following:
Table 1: Past Short-term and Long-term Cost-Cutting Measures Taken
Short-Term Measures Long-Term Measures
● Employees temporarily contributed 10% of
compensation
● Initiated hiring freeze
● Closed City offices 12 days per year and added floating furlough days
● Deferred maintenance of facilities and streets
● Eliminated two fire engine companies and
implemented rolling brown outs
● Closed branch libraries one day per week
● Reduced hours at recreation centers, branch
libraries, and senior centers
● Eliminated more than 239 vehicles in the fleet
● Significantly reduced tree trimming
● Restricted travel , training, and discretionary spending
● Reduced grants and subsidies to community
organizations
● Sold surplus property and land
● Eliminated 720 full-time equivalent positions
● Increased employee’s retirement contribution
● Implemented new two-tier retirement system
● Reorganized and combined several City
departments to achieve operational efficiencies
● Eliminated façade improvement grants, graffiti
abatement and illegal dumping programs
● Transferred eligible expenditures to restricted
funds, freeing up General Fund dollars
● Increased fees
● Invested in economic development strategies
Maximizing Revenue
The City has pursued ways to maximize revenue. State law limits the City’s ability to levee new taxes, so the only
means of increasing revenues without voter approval is to raise fees associated with certain City services. By law,
these fees can only cover the City’s actual cost to provide the service (e.g., the City cannot make a profit from
basic service fees). To maximize revenue, the City has employed a variety of strategies, which have significantly
yielded results, such as:
Pursued grants from federal and state governments as well as foundations and the private sector;
Aggressively pursued dollars owed the City through special revenue collection efforts;
Developed more public/private partnerships; and,
Increased fees to fully recover the costs related to providing services.

ATTACHMENT
FY 2013-2015 BUDGET HIGHLIGHTS Page 5
Measures Taken During Last Five Years
Over the past five years, the City has made significant strides in stabilizing our finances. We have:
Instituted strong fiscal controls and strengthened financial policies;
Maintained solid credit ratings which reflect strong financial management practices, a deep and diversified
economic base, positive cash flows and liquidity levels, and healthy general fund reserves;
Fully funded the General Fund reserve to meet the level mandated by City Council policy for the first time
in five years;
Paid down 28% of our negative fund balances, which have gone from $138 million to $99 million over a
three-year period (this is internal debt that comes from borrowing between funds); and,
Planned for anticipated additional fiscal impacts from the dissolution of Redevelopment and compliance
costs associated with the Negotiated Settlement Agreement.
IV. BUDGET OVERVIEW
Total City Budget
This FY 2013-15 Budget Proposal contains appropriations totaling about $1 billion per year for the next two years
across all funding sources. The General Purpose Fund accounts for approximately 41% of the City’s total budget.
It pays for essential programs and services such as police and fire protection, libraries, senior centers, recreational
programs, elected offices and municipal business functions. It also includes some restricted funds such as ballot
measure earmarks. For FY 2013-14, the proposed General Fund budget is about $430.16 million (Table 2).
The remainder of the City’s budget is comprised of funds that are restricted for special purposes such as grant
programs, sewer services, bond-funded projects, capital projects and debt payments. Restricted funds come from
grants, fees, bonds, or revenues that are collected for a specific purpose.
Table 2: Proposed Budget: Revenues and Expenditures Summary (in Millions)
FY 2013-14 FY 2014-15
Revenues Expenditures Revenue Expenditures
GPF $
430.16
$
430.16
$
457.40
$
457.40
All-
Funds*
$ 1,052.69 $
1,039.01
$
1,071.70
$
1,060.58
* The revenues in All-Funds exceed the All-Funds expenditures due to Council’s
policy to amortize the repayment to negative funds created in prior years.

Page 6 FY 2013-2015 BUDGET HIGHLIGHTS
General Purpose Fund (GPF)
Despite having addressed budget shortfalls totaling $318 million over the past six years, significant conditions
continue to impact our fiscal condition, such as: rising costs, police staffing shortages, modest revenue growth, and
ongoing recovery from the dissolution of Redevelopment.
In addition, this Proposed Budget takes into account that two special assessments—Measure Y (the Violence
Prevention Act and Public Safety Act of 2004) and the Wildfire Prevention Assessment District—are nearing the
end of their 10-year lifespan; and that employee contributions, which are estimated to save the City $37 million per
year across all funds in FY 2012-13, are set to expire and are subject to meet-and-confer bargaining to continue at
any level after the expiration date. The next year must be used to prepare for the renewal of these initiatives to
further stabilize the City’s fiscal condition in the next years: otherwise, there will be greater adverse impacts than
already anticipated.
Summary of Former Baseline Estimates
Shortly after publishing the FY 2013-18 Five Year Forecast in the fall of 2012, staff developed the FY 2013-15
baseline revenue and expenditure estimates. These former estimates from the FY 2013-15 baseline indicated that
despite modest revenue growth, continuation of the current FY 2012-13 levels of service plus Council approved
augmentations (baseline) would result in a shortfall of $15.64 million in FY 2013-14 and $24.86 million in FY
2014-15, as reflected in the table below:
Table 3: FYs 2013-2015 GPF Revenue & Expenditures Former BASELINE Summary
FY 2013-14 FY 2014-15
Former Baseline GPF Revenues $417.99 million $430.07 million
Former Baseline GPF Expenditures $433.63 million $457.93 million
Former Baseline GPF Shortfall ($15.64 million) ($24.86 million)
Note: Figures modified based on recent data, see Table 4 below.
The baseline shortfall is generally caused by increased costs of providing City services which are outpacing
moderate revenue increases, prior reliance on the use of one-time funds to fund ongoing expenditures, and the
expiration of employee contributions over the past five years (these contributions, for example, saved $37 million
in FY 2012-13 across all funds and $23.6 million in the General Purpose Fund). A primary cost driver the city has
been experiencing has been the growth in employee health and retirement benefits. For example, the City’s
pension costs are projected to grow from $67.3 million in the current year (FY 2012-13) to $85.3 million in FY
2014-15, representing an increase of 26.7% over the two year period; and the employee benefit costs (other than
retirement) are projected to grow from $91.3 million in the current year to $107.3 million in FY 2014-15,
representing a 17.5% increase over the two year period. Another driver of the baseline expenditure growth is
ongoing funding for new police officers from the last three police academies (166, 167 and 168), as approved by
the City Council in FY 2011-13 Policy Budget. In addition, when the City’s Redevelopment Agency was
dissolved due to the State’s action, some of the positions were maintained to complete approved projects. As those
projects are being completed, less funding is available for administrative positions proportionally.

ATTACHMENT
FY 2013-2015 BUDGET HIGHLIGHTS Page 7
Revised Revenue Estimates Based on Actual Trend Data through the 2nd
Quarter of FY 2012-13
Since the development of the baseline budget, new information is available that has been factored into the
proposed policy budget. Table 4 below provides a reconciliation of the projected GPF revenues based on new
trend data and actual results of revenue the City has been experiencing through December 2012 (2nd
qtr. FY 2012-
13 Revenue and Expense Report) information available since the Five Year Forecast was developed that has better
informed and updated our previous baseline revenue projections.
The FY 2013-15 Proposed Policy Budget assumes to use a net of $10.81 million in General Purpose Fund balance
as a balancing proposal to fund on-going operating costs, representing 1.2% of the total two year policy budget. It
also assumes $13.33 million new revenue (above the baseline) in FY 2013-14, of which $0.5 million or .12% is
one-time revenue. For FY 2014-15, $15.37 million in new revenue is assumed (above the baseline). In addition
for FY 2014-15, the budget assumes $6 million or 1.31% from one-time revenue and the use of $11.97 million of
undesignated general fund balance; both of which are proposed to be used to balance the budget for on-going
operations.
Table 4: Summary of Revised GPF Revenue Projections
Reconciliation of Projected GPF Revenue Reconciliation
FY 2013-14 FY 2014-15
Baseline GPF Revenues $417.99M $430.07M
Additional Revenue – Revised Estimates * 11.51M 8.05M
One-time Balancing Revenue (see Table 5) .50M 6.00M
New Fees and Revenues (see below) 1.32M 1.32M
Use of Undesignated General Fund Balance (1.16M) 11.97M
Total Revenue Estimates: $430.16M $457.41M
*The projected GPF baseline revenue in October 2012 was revised in March 2013 based on latest data available in property
tax, sales tax, business license tax, etc. FY 2013-14 projected GPF revenue increased by $11.51 million and $8.05 million
increased for FY 2014-15.
Table 5: One-Time New Revenues Summary
One-Time Revenue
Description FY 2013-14 FY 2014-15
Billboard $ 500,000 $ -
Property Sale $ 4,000,000
Parking Ticket Backlog $ 2,000,000
Total One-Time New Revenue $ 500,000 $ 6,000,000
Total Revenue $ 430,155,612 $ 457,401,684
Percentage of One-Time Revenue .12% 1.31%

Page 8 FY 2013-2015 BUDGET HIGHLIGHTS
Revenue Adjustments
In addition to the revised revenue estimates in March 2013, the proposed General Purpose Fund budget includes
additional revenue increases as follows:
$445,124 increases in service charges and fees each year
Billboard revenue; $500,000 one-time for the first year plus $475,000 each year on-going
$400,000 revenue from former Redevelopment Agency per year due to debt refinancing plan
For FY 2014-15, $2 million one-time revenue from parking ticket backlog by implementing booting
vehicles that have multiple unpaid parking tickets
$4 million property sales - implementation of asset management plan in the second year
Use of $10.81 million (net) from the General Purpose Fund to balance the two-year budget for on-going
operating expenditures
Use of One-Time vs. Ongoing Revenue Sources
While recurring, one-time revenue sources are variable by nature, and to the greatest extent possible should not be
relied upon to meet predictable ongoing expenses. As stated before, as a best practice, our goal is to use one-time
resources or revenues to meet one-time costs for programs or projects. However, as a policy objective, it is
reasonable to assume that each year about 3% of revenues will come from variable, one-time sources, which
should be used to meet one-time expenses (such as large purchases of equipment or technology upgrades).
The charts below summarize revenues and expenditures for the two-year budget, showing the amounts and
percentages of one-time revenues and expenditures vs. ongoing revenues and expenditures. This proposed Policy
Budget reduces the City’s reliance on the use of one-time dollars for on-going expenditures. For example, for FY
2012-2013, the City used approximately $14.3 million of one-time dollars for on-going expenditures; however, for
FYs 2013-2014 and 2014-2015, it is proposed that the City use approximately $10.83 million over both years for
on-going expenditures. To the extent that on-going revenues are generated to cover these costs during the year,
they will be replaced accordingly to further advance this fiscal priority.
On the expenditure side, in FY 2013-14, $5.4 million or 1.26% of the $430.16 million in expenditures are one-time
reductions. In FY 2014-15, $5.90 million or 1.29% of the $457.40 million are one-time reductions (see summary
below).
Table 6: Comparison of Ongoing vs. One Time Revenues and Expenditures
FY 2013-14
$430.16 million Total Revenue: $430.16 million Total Expenditures:
$.5 million one-time revenue (.12% of total) $5.4 million one-time exp. reduction (1.26% of total)
$429.66 million ongoing revenue (99.88% of total) $424.76 million ongoing exp. (98.74% of total)
[Net of $1.16 million of fund balance to be programed
For balancing 2014-15)
FY 2014-15
$457.40 million Total Revenue: $457.40 million Total Expenditures:
$6.0 million one-time revenue (1.31% of total) $5.9 million one-time exp. reduction (1.29% of total)
$11.97 million fund balance (2.62% of total)
$439.44 million ongoing revenue (96.07% of total) $451.50 million ongoing exp. (98.71% of total)

ATTACHMENT
FY 2013-2015 BUDGET HIGHLIGHTS Page 9
Table 7: One-Time Expenditure Summary
One-Time Expenditure Reductions
Descriptions FY 2013-14 FY 2014-15
SAFER Grant $ 3,900,000 $ 3,900,000
IT Equip & Maintenance $ 1,500,000 $ 2,000,000
Total One-Time Exp. Reductions $ 5,400,000 $ 5,900,000
Total Exp. Reductions $ 430,155,612 $ 457,401,684
Percentage of One-Time Exp. Reductions 1.26% 1.29%
V. BALANCING THE FY 2013-15 BUDGET
The Administration used the budget principles to guide its decision-making during the development of this budget
and Table 11 summarizes the proposed budget.
The proposed FY 2013-15 GPF budget contains service level augmentation in some areas and reduction in other
areas, which will be discussed in the later section. The General Purpose Fund shortfall is further increased due to
reductions of other funds. Table 8 below shows the gaps between revenue and expenditure in the proposed FY
2013-15 budget and the related balancing measures proposed for the General Purpose Fund.
Table 8: Summary of Balancing Measures
Balancing Measures
FY 2013-14 FY 2014-15
Revised Projected GPF Revenues $429.50M * $438.12M*
Revised Baseline GPF Expenditures $433.63M $454.93M
Baseline GPF Shortfall ($ 4.13M) ($ 16.81M)
Non-Recovery of OH due to other funds cut ($ 1.13M) ($ 1.26M)
Increase in Expenditures ($ 7.02M) ($17.35M)
Total Shortfall: ($12.27M) ($35.42M)
Expenditure Reductions $11.63M $16.13M
Increase in Revenues $ 1.80M $ 7.32M
Utilized Fund Balance: ($ 1.16M) $11.97M
Net balance: $ -0- $-0-
*The projected GPF revenue in October 2012 was revised in March 2013 based on latest data available in property tax, sales tax, business
license tax, etc. FY 2013-14 projected GPF revenue increased by $11.51 million and $8.05 million increased for FY 2014-15.
Organizational Changes & Service Impacts
This budget makes the following organizational changes to reduce expenditures and administrative layers, and in
an effort to improve the effectiveness of individual programs and services by aligning them closely with other
related functions. In the Service Impacts section of the Proposed Policy Budget, you will find a summary of all of
the proposed changes and related service impacts associated with this proposal.

Page 10 FY 2013-2015 BUDGET HIGHLIGHTS
Other Budget Challenges - Fiscal Uncertainties
Oakland faces uncertainties when it comes to financial planning; these include:
Changes in federal spending (e.g., sequestration);
Changes in state spending;
Measure Y and Wildfire Prevention Assessment District renewal and the impact FYs 2015-17;
Slower than expected economic recovery;
Redevelopment “clawback”;
CalPERS reforms that it will put in place over the next six years;
Affordable Care Act during the term of this proposed budget, with fiscal impacts not yet settled and an
abundance of questions yet to be resolved;
Five years of structural deficit forecasted;
$1B+ of unfunded liabilities and/or deferred capital projects;
Implementation of the Negotiated Settlement Agreement (NSA) and police staffing; and,
Potential liabilities.
General Purpose Fund (Fund Balance as of March 2013)
City Council policy mandates that the City set aside 7.5% of the General Purpose Fund budgeted expenditures into
a General Fund Reserve. Last year, FY 2011-12, was the first time in five years that the reserve fund had been
fully funded at $30.2 million.
As of March 2013, the General Fund Reserve balance was $84.6 million. When accounting for City Council
appropriations and other expenditures made from the fund balance, as detailed below, the net available
“undesignated” fund balance is $32.5 million.
Table 9: General Purpose Fund Reserve/Undesignated Fund Balance
Gross Ending Fund Balance: $84.6 million
Costs related to Redevelopment dissolution, one-time funds to balance
FY 2012-13 budget, carry-forwards and encumbrances - $18 million
Net Fund Balance $66.6 million
7.5% GPF reserve per City Council policy - $30.2 million
Net Available Ending Fund Balance $36.4 million
City Council-approved or recognized revenues/expenditures Dec 2012 – June 2013 - $3.9 million
General Purpose Fund Undesignated Fund Balance $32.5 million
Note: Does not account for anticipated expenditures in FYs 2012-2013 or 2013-2015 (see next section).

ATTACHMENT
FY 2013-2015 BUDGET HIGHLIGHTS Page 11
Other Anticipated Costs in Excess of Reserve Balance
There are number of anticipated costs, currently estimated at least more than $40.3 million, which would eliminate
the surplus fund balance of $32.5 million. These costs are primarily related to the State Department of Finance and
Controller’s Office’s ongoing review of actions related to Redevelopment dissolution, litigation, and police
overtime for FY 2012-13. Below is some detail related to these anticipated expenditures:
Potential State reversal of third-party contracts and City Funding Agreement $ TBD
State/ROPS Review $TBD
Land sale reversals following State review of Redevelopment dissolution $31-35 million
Pending litigation settlement agreements (minimum) $4.3 million
Negotiated Settlement Agreement compliance costs $TBD
Police overtime for FY 2012-13 (net after accounting revenue growth) $1 million
Total $40.3+ million
Budget Concerns in Other Funds
The City has also implemented a number of corrective action plans on non-GPF funds financial challenges. Some
result from historical overspending and/or under collection. Others stem from more recent operational shortfalls.
Currently, approximately $99 million remains in negative fund balances which have been paid down by about $40
million over the past three years. Negative fund balances are a result of overspending or under-recovery of costs.
Historically the City has borrowed from available positive funds to cover shortfalls in negative funds. Most of the
positive funds are restricted, and therefore the City must repay what it has borrowed. The FY 2013-15 Proposed
Budget contains the Council’s policy repayment plan for the City to repay itself, and staff is monitoring this
closely. Continued commitment to repayment, especially while interest rates are low, is needed to ensure the
necessary financial progress.
Table 10: Status of Negative Fund Balance Repayments
Ending Ending Ending Estimated
Fund Balance Fund Balance Fund Balance Fund Balance
FY 2009-10 FY 2010-11 FY 2011-12 FY 2012-13
1 Negative Funds with Repayment Plan (98,175,474) (94,379,909) (78,766,947) (69,755,454)
2 Reimbursable Negative Funds (22,448,746) (13,525,732) (18,692,300) (14,629,751)
3 Non-Reimbursable Negative Funds without Repayment Plan (17,542,656) (13,441,408) (14,031,629) (14,531,629)
(138,166,876)$ (121,347,049)$ (111,490,876)$ (98,916,834)$
FY 2010-10 to FY 2012-13 repayment amount (39,250,042)$
Negative Fund Balance Summary for FY 2010 thru 2013
Total Negative Funds
Negative Fund Category

Page 12 FY 2013-2015 BUDGET HIGHLIGHTS
VI. CAPITAL IMPROVEMENT PROJECTS
A Capital Improvement Program (CIP) represents a major investment in a city's infrastructure and assets. It must
balance repair and replacement of existing assets with delivering new assets where they may be needed. It must
reflect the overall priorities of the City. It has a huge impact on the health and vibrancy of the community.
Capital projects are defined as a long-term investment that builds, replaces or improves an asset (buildings, roads,
parks, sewer and drainage lines, technology systems, etc.) and that has a useful design life of at least ten years and
a minimum cost of $50,000. Oakland's Capital Improvement Program (CIP) is formally reviewed and approved
every two years, as part of the biennial policy budget.
There are limited sources of internal funding available for capital improvements, typically with restrictions on their
use within broad categories, described below. Grants are another source of funding for capital projects. While
often a major source of capital funding, they are even more limited, typically competitive and cyclical in nature.
Internal Sources: The following are the major sources of funding for capital investment in Oakland:
Sewer Service Fund (Fund 3100). Limited to funding maintenance and capital improvements to the
sanitary sewer collection system.
Measure B - Transportation (Fund 2211). Limited to funding transportation and traffic safety
improvements within the public right-of-way.
Measure B - Bicycle and Pedestrian (Fund 2212). Limited to funding bicycle and pedestrian safety and
accessibility improvements within the public right-of-way.
Vehicle Registration Fee (Fund 2215). Limited to funding transportation and traffic safety improvements
within the public right-of-way.
Grant Sources: Additionally, Oakland aggressively pursues grant opportunities for various capital improvements.
While by their nature these grants are only available for specific projects and purposes, they do represent a
significant addition to local funds. They represent the most viable source to fund new improvements and allow
internal funds to be kept available for existing assets.
In the period including the last two fiscal years to date, staff successfully applied for and received a total of $36
million in grants for 29 capital projects. Staff will continue to seek grants when projects are competitive and meet
the City's need to address unfunded priorities.
A total of $87.8 million is recommended for investment in 27 projects, summarized here:
Buildings and Facilities — 7 projects, $1.4 million
Sewers — 12 projects, $29.1 million
Streets, Sidewalks — 10 projects, $19.6 million
Traffic Improvements — 5 projects, 4.5 million
Garage Improvements — 3 projects, $33.2 million (subject to State Approval of Redevelopment
disposition)
Like many older cities, Oakland has an aging infrastructure and a significant backlog of deferred maintenance. The
proposed CIP includes funding for only a small portion of this backlog or need, reflecting the limits of existing
fund sources. Because of this, a strategic approach to prioritizing the remaining unmet needs is needed. Such an
approach will necessarily require an assessment of core City programs, the assets needed to deliver those
programs, a condition assessment of those City's assets, and a long-term funding approach to addressing those
assets considered critical to core functions and future growth.

ATTACHMENT
FY 2013-2015 BUDGET HIGHLIGHTS Page 13
Equipment/Vehicles
The City of Oakland fleet has a current replacement value of $105 million with an average annual capital funding
requirement of $10.2 million in current dollars. Due to the high number of vehicles currently overdue for
replacement, immediate funding needs are high with normal cyclical patterns afterward. In FY 2013-15, the City
will purchase $11.8M in new vehicles.
Information Technology
A Capital Improvement Program (CIP) represents a major investment in a City's Information Technology
infrastructure and services. It must maintain, operate and support existing Information Technology architecture in
order to provide the necessary services for internal and external City customers. It must reflect the overall
priorities of the City. It has a huge impact on public safety, economic development and day to day efficiencies of
City government.
Capital projects are defined as a long-term investment that builds and replaces critical technical infrastructure (911
systems, public safety, telecommunications, payroll, etc.) and has a useful design life of three to five years. Staff
identified 29 critical projects in an amount of $85.23 million in the next five years that are in need of upgrade,
purchase, and maintenance, but they are not funded. Examples are:
Infrastructure Improvements – Includes Citywide email replacement, Document and
Records Management system, Network Security, and End-User computer devices (replacements laptops and
desktops).
Enterprise Application Services – (Oracle Release 12 upgrade) Payroll, Advanced Benefits, Advanced
Collections and Universal Content Management system.
Public Safety Radio System – provides for additional sites which will enhance coverage in the field and within
buildings.
Data Center Improvements – continuity of operations in a major disaster scenario, which requires having a
redundant data center site for preservation of data.
Accela Fire Prevention – Fire plan checks and inspections are currently handled on a separate system from
Accela (CEDA). Implementation of the Accela Fire module will allow for one platform to handle inspections
and permits and provide more transparency by allowing citizens to schedule inspections, apply for a permit
and print out permits from a centralized point online.
Budget Constraints
During the budget development process, consideration was given to the restrictions placed on the use of the City’s
General Purpose Fund. Outside of public safety and mandated services, only a small portion of the expenditures
are discretionary. Nearly three-quarters of the GPF goes to pay for police, fire, voter-approved ballot measure
earmarks, and debt service. Much of the remainder is dedicated to several ballot measures such as Measure Q
(libraries) and Measure K/OO/D (Kids First!). These measures require baseline spending levels, so the funds
cannot be cut without jeopardizing either the revenue they generate or other charter requirements. About 5% of
the GPF pays for revenue-generating staff and charter-mandated positions, such as elected officials.

Page 14 FY 2013-2015 BUDGET HIGHLIGHTS
VII. FIVE-YEAR PLAN TO FISCAL SUSTAINABILITY
The City has demonstrated its resolve in addressing economic challenges; now is the time to strategically plan for
the future in order to preserve essential City services over the long term and increase investment in top community
priorities, while maintaining long-term fiscal stability.
Under current conditions, our expenditures and long-term financial liabilities are expected to outpace our modest
revenue growth. Last fall, the City presented a five-year forecast to establish a clear roadmap of the financial
obligations and challenges ahead. Based on historic trends and conservative assumptions, the forecast includes
estimates on future revenues and long-term obligations, including retiree medical costs, pension costs and about
$100 million annually in critical deferred maintenance for City building and road repairs, technology upgrades and
critical fleet and equipment replacement. Table 11 below illustrates the unfunded and long-term liabilities the City
faces over time.
Table 11: Unfunded and Long-Term Liabilities
Unfunded Amount Description $743M CalPERS California Public Employees Retirement System. 75% funded. $520M OPEB Other Post-Employment Benefits. Retiree medical benefits. $216M PFRS Police and Fire Retirement System. Closed system. City issued bonds to reduce
the liability and made advance payments for five years. No new payments until 2017-18, then GPF payment of $28.5 million/yr. until 2026.
$743K OMERS Oakland Municipal Employees Retirement System. Closed retirement system. $ 99M Negative Projected by June 30, 2013, 54 out of 173 funds have negative balance; $70
million of total on repayment plan after $39 million paid over past 3 years. $29.5M Accrued Estimated amount owed to employees for accrued vacation and leaves.
$1.6 Billion TOTAL
Deferred Capital Expenses
Additionally, the City has deferred various capital expenses over time because funds have not been available to
invest in these critical needs. Below are three categories that illustrated needed levels of investment to keep pace
with the City’s capital needs.
$7.5 million/year Technology upgrades and replacements.
$10.2 million/year Equipment and vehicles.
$100 million/year Deferred maintenance and replacement.
Legislative Activities
In Sacramento, a number of legislative proposals are being developed that pertain to economic development and
local government. These bills seek to fill the void left by the elimination of redevelopment agencies and provide
tools used by local governments to remedy blight, provide affordable housing, and spur local economic
development. Several bills are also being proposed that would change the State Constitution to lower the vote
threshold for ballot measures from 2/3 to 55%. Additionally, the State Department of Housing and Community
Development has proposed major changes to the Enterprise Zone program which would have a negative impact on
Oakland.
The legislative process has just begun. Bills would have to go through the legislative process and reach to the
Governor’s desk to be vetoed or signed into law by October 13.

ATTACHMENT
FY 2013-2015 BUDGET HIGHLIGHTS Page 15
VIII. BUDGET DEVELOPMENT SCHEDULE, ENGAGEMENT
City Administration has planned several opportunities for residents to participate and provide input with respect to
the City’s budget-balancing efforts. Table 12 below illustrates key milestones.
Table 12: Budget Development Schedule and Planned Milestones
Date Planned Milestone
April 2 Council budget workshop held and City Employee Feedback Due
April 15-19 Public Release of Proposed Budget
April 30 Presentation of Proposed Budget to City Council
May Budget Town Hall Meetings Citywide
May 23 Proposed City Council Budget Hearing #1*
June 13 Proposed City Council Budget Hearing #2*
June 27 Proposed Final City Council Budget Hearing/Adoption*
July 1 Implementation of FY 13-15 Adopted Budget *Note: Subject to Rules Committee approval.
Engagement Opportunities for Residents and Employees
City staff has been working hard to open our government to wider public view and increase transparency. This
year, for the first time, we will upload the budget to the newly launched open data platform which will allow
visualization of budget data and community data "hacking." In addition, there are a number of public information
tools and community engagement opportunities underway that will educate and inform the community about the
budget and budget-balancing options. These include:
Fact sheets in English, Spanish and Chinese;
A survey and community engagement opportunities on EngageOakland.com; and,
Updated budget web page with all relevant budget documents and resource materials.

Page 16 FY 2013-2015 BUDGET HIGHLIGHTS
NOTES


i
TABLE OF CONTENTS
LETTER OF TRANSMITTAL
POLICY TRADEOFFS & SERVICE BUYBACKS ........................................................................................................... A-1
BUDGET GUIDE ................................................................................................................................................................. B-1
The Budget Process .................................................................................................................................................................................. B-1
CITY FACTS ......................................................................................................................................................................... C-1
General Information ................................................................................................................................................................................ C-1
Statistical Profile ........................................................................................................................................................................................ C-1
City Government ....................................................................................................................................................................................... C-2
Oakland’s Economic Base ...................................................................................................................................................................... C-2
A Brief History ............................................................................................................................................................................................ C-3
Transportation ........................................................................................................................................................................................... C-4
Infrastructure .............................................................................................................................................................................................. C-4
Human Services .......................................................................................................................................................................................... C-6
Education ...................................................................................................................................................................................................... C-6
Library System ............................................................................................................................................................................................ C-7
Medical Facilities ....................................................................................................................................................................................... C-7
Public Safety ................................................................................................................................................................................................ C-8
Recreation ..................................................................................................................................................................................................... C-9
Other Attractions ....................................................................................................................................................................................... C-9
Key Facts/Accolades ................................................................................................................................................................................ C-11
FINANCIAL SUMMARIES................................................................................................................................................. D-1
Introduction to Financial Summaries .................................................................................................................................. D-1
City Revenue and Expenditure Forecast Methodology ................................................................................................. D-1
Revenue Forecast ........................................................................................................................................................... D-2
Expenditure Forecast .................................................................................................................................................... D-2
Basis of Budgeting ................................................................................................................................................................. D-3
Planning for Two-Year Budget ........................................................................................................................................... D-3
Summary Tables .......................................................................................................................................................................... D-5
Summary of Significant Proposed Budget Reductions and Revenue Enhancements for FY 2013-15 .............. D-7
Fund Sources and Descriptions ........................................................................................................................................................... D-19
FY 2013-14 Proposed Budget Summary by Fund ....................................................................................................................... D-33
FY 2014-15 Proposed Budget Summary by Fund ....................................................................................................................... D-45

ii
Revenue Tables ............................................................................................................................................................................ D-57
All Funds Revenue ................................................................................................................................................................. D-59
General Purpose Fund Revenue ......................................................................................................................................... D-61
Summary of the General Purpose Fund Revenues ......................................................................................................... D-63
Expenditure Tables..................................................................................................................................................................... D-81
All Funds Expenditures ........................................................................................................................................................ D-83
General Purpose Fund Expenditures ................................................................................................................................ D-85
Summary of the General Purpose Fund Expenditures .................................................................................................. D-87
Other budget Information ........................................................................................................................................................ D-93
Negative Funds ....................................................................................................................................................................... D-95
Ten-Year Repayment Plan for Funds with Negative Balances .................................................................................... D-101
Long Term Liabilities .............................................................................................................................................................................. D-103
Updated Five-Year Financial Forecast ............................................................................................................................................. D-107
DEPARTMENTAL SUMMARIES
Organizational Structure .................................................................................................................................................................. E-1
City of Oakland Organization Summary .................................................................................................................. E-1
Summary of Positions by Department FY 2007-08 through FY 2014-15 .......................................................... E-2
Format of Agency and Department Budgets ........................................................................................................... E-3
Mayor ............................................................................................................................................................................. E-5
City Council .................................................................................................................................................................................... E-7
City Administrator ....................................................................................................................................................... E-9
City Attorney ................................................................................................................................................................................. E-13
City Auditor .................................................................................................................................................................................... E-15
City Clerk ....................................................................................................................................................................... E-17
Police Services .............................................................................................................................................................. E-19
Fire Services ................................................................................................................................................................. E-23
Administrative Services ............................................................................................................................................. E-27
Controller’s Office ..................................................................................................................................................................................... E-29
Revenue ........................................................................................................................................................................................................ E-32
Treasury ....................................................................................................................................................................................................... E-35
Human Resources .................................................................................................................................................................................... E-37
Information Technology ......................................................................................................................................................................... E-39
Community Services .................................................................................................................................................... E-43
Neighborhood Services .......................................................................................................................................................................... E-43
Parks and Recreation .............................................................................................................................................................................. E-45
Human Services ......................................................................................................................................................................................... E-48

iii
Library ............................................................................................................................................................................................. E-51
Public Works................................................................................................................................................................. E-53
Housing and Community Development .............................................................................................................................. E-61
Planning and Building ............................................................................................................................................................... E-65
Non-Departmental ....................................................................................................................................................... E-69
Capital Improvement Program ................................................................................................................................. E-71
FINANCIAL POLICIES ....................................................................................................................................................... F-1
LEGISLATION ..................................................................................................................................................................... G-1
GLOSSARY ........................................................................................................................................................................... H-1
INDEX .................................................................................................................................................................................. I-1
SERVICE IMPACTS ............................................................................................................................................................ X-1

iv


POLICY TRADEOFFS & SERVICE BUYBACKS
Restoration of Expenditures Cuts & Policy Decisions on
Possible Expanded Funding of Priority Services RESTORATION OF EXPENDITURE CUTS The FY 2013-15 Proposed Policy Budget includes a number of service and position reductions relative to FY 2012-13, which were required as baseline expenditures are growing faster than baseline revenues. To the extent that the City Council eliminates expenditures included in the FY 2013-15 Proposed Policy Budget or identifies additional revenues, the City Council can use those expenditures or new revenues to restore proposed service reductions in order to maintain existing service levels. Below is a list of key City services and positions that were reduced or excluded in the proposed budget due to fiscal constraints that we would recommend restoring if additional revenue or expenditure reductions is recognized. Labor contracts for miscellaneous bargaining groups, and the significant temporary compensation reductions they include, expire at the end of FY 2012-13. After considering the restoration of these employee compensation contributions in FY 2013-14, a 5% reduction in compensation for the next two fiscal years would equate to cost savings to the City of approximately $5M annually for the General Purpose Fund and $13M annually for all funds. Note that in some cases, the ongoing costs discussed below, which are based on FY 2012-13 or FY 2013-14 values, do not include cost escalation that the City is likely to experience.
CUTS FOR POSSIBLE RESTORATION Fire Prevention Inspector
The civilian Fire Prevention Bureau Inspector position was frozen in prior fiscal years and remains frozen in the proposed budget. The annual cost of salary and benefits to restore the position is $104,024. This position is recommended for restoration to augment services provided from the current level.
TOTAL COST $104,024
Restore all Hours at Recreation Centers
The proposed budget includes the reduction of 3.25 FTE recreation staff, which will result in decreased hours at recreation centers. Fully restoring these positions will require $106,653.
TOTAL COST $106,653 Fully Restore Funding to Cultural and Recreational Organizations
The City provides funding above what is legally required to a number of cultural and recreational organizations. The proposed budget reduces funding beyond the required minimum by approximately 10% to the Chabot Space and Science Center, Oakland Zoo, Hacienda Peralta, Asian Cultural Center, Vietnamese American Community Center, and others. Restoring this 10% reduction would total approximately $100,000.
TOTAL COST $100,000
A - 1

POLICY TRADEOFFS & SERVICE BUYBACKS
Unfreeze or Restore Department Director or Other Administrative Positions
The proposed budget includes freezing or eliminating a number of managerial and general administrative positions, including freezing the Administrative Services Director ($230,000), freezing the Community Services Director ($230,000), and eliminating the Executive Assistant to the Administrative Services Director ($112,000). Unfreezing and filling the director positions would result in improved performance of these functions including increased efficiency and effectiveness and, more importantly, increased capacity of our existing staff. This would also put in place the organizational structure which the City Council, on two occasions has approved and provided the associated funding.
TOTAL COST $572,000
Unfreeze or Restore Finance and Technology Positions
The proposed budget includes freezing or eliminating a number of General Purpose Fund positions that are vacant, e.g., finance positions, and one technology position. Within Treasury, a vacant manager position overseeing retirement functions was eliminated at a savings of approximately $200,000. This workload will be distributed among busy existing staff and its restoration would greatly assist capacity within this critical function. Two vacant Account Clerk II positions were frozen in the Police Department at a savings of approximately $150,000, which will result in delays in billing and collections. A vacant accounting supervisor position in the Controller’s Office was also frozen saving approximately $150,000, which will require distributing this workload among busy existing staff. A vacant Management Intern position in the City Administrator’s Budget Office was eliminated at a savings of approximately $15,000. Finally, a vacant Telecommunications System Engineer position was eliminated for a savings of approximately $140,000, one of the only reductions in that function. Internal service departments have been severely cut over past years and any restoration of these positions would greatly assist with managing workload, preserve service levels help mitigate capacity issues.
TOTAL COST $655,000
Restore Expenditure Reductions in Elected Offices
The proposed budget includes 5% reductions in baseline General Purpose Fund expenditures in FY 2013-14 and 10% total reductions in General Purpose Fund expenditures in FY 2014-15 to all elected offices, including the Mayor, City Council, City Attorney, and City Auditor. These are the same reduction levels requested of all departments in the budget instructions. Restoring these reductions would require approximately $600,000 in FY 2013-14 and $1.2M in FY 2014-15.
TOTAL COST Y1: $600,000/Y2: $1,200,0001
1 Y1 = 2013-2014 and Y2 = 2014-2015
A - 2

POLICY TRADEOFFS & SERVICE BUYBACKS
Illegal Dumping Mitigation
In February 2012, Public Works had a reduction in staff of five full-time positions formerly funded by the former Oakland Redevelopment Agency. These staff responded to community complaints regarding illegal dumping retrieval requests in East and West Oakland. In January 2013, the department experienced a further reduction in service, ending removal of 12 cubic yards of debris daily and the four annual amnesty dumping days, due to the settlement with Waste Management of Alameda County.
With current staffing levels, Public Works crews are not able to respond to the demand for service and this continues to be one of the highest areas of resident complaints. Restoring one crew at a cost of approximately $500,000 annually (one Street Maintenance Leader, one Public Works Maintenance Worker, supplies, and equipment) will restore the response times to service requests to around 78% within 3 days. Restoring two crews at a cost of approximately $1,000,000 annually will restore response times to 85% within 3 days. The City Council might also consider expanding public education and outreach around illegal dumping to change behavior.
TOTAL COST $1,000,000
Litter Mitigation
Since FY 2008-09, Public Works has eliminated all staff that performed regular “hand” cleaning services, which includes removal of small blown litter from medians and major gateways. Currently, the service is only provided on a complaint basis by crews that normally handle illegal dumping. The reductions in force included a full-time supervisor, 10 FTEs serving downtown and West Oakland, and 8 permanent part time (PPT) staff handling other parts of the City. Restoring three crews (6 FTEs total) would cost approximately $600,000 annually, plus a one-time investment of $120,000 for three vehicles. The crews would target major gateways to the City (e.g. 880 and 980 corridors, Coliseum and Oakland Airport access roads, downtown areas under 880, and other major gateways and medians). The City would have less litter on its streets and there would be a direct impact to the aesthetic appearance of the streets that receive this service.
TOTAL COST OT: $120,000/OG: $600,0002 Y1: $720,000/Y2: $600,000
2 OT=one time funds and OG= on going funds
A - 3

POLICY TRADEOFFS & SERVICE BUYBACKS
POLICY TRADEOFFS--FUNDING OF PRIORITY SERVICES Similar to restoring some of the expenditure cuts in the FY 2013-15 Proposed Policy Budget discussed above, the City Council might wish to consider expanding funding for certain key services beyond the levels included in the proposed budget. Since there are no revenues associated with these proposals, they are policy tradeoffs for the City Council to consider against the policies funded in the Proposed Policy Budget. Some prominent service areas for consideration include the following:
1. Head Start Early Childhood Development
2. Graffiti Enforcement and Abatement
3. Street Patching
4. Rainbow Teen Center/Digital Arts and Culinary Academy (DACA) and West Oakland Teen Center Staffing
5. Taxicab Vehicle Permit
6. Affordable Housing
7. Additional Police Sworn Staffing
8. Additional Police Civilian Staff
9. Maintenance of Former Redevelopment Parcels
10. City Attorney Positions
11. Repair and Replacement of City Facilities
12. Additional City Vehicles
13. Additional Information Technology
1) Head Start Early Childhood Development
In FY 2012-13, the City of Oakland's Head Start and Early Head Start programs will serve 1,778 children ages 0 to 5 with high quality early childhood education and comprehensive family support. Research on child development and academic achievement clearly shows the long-term benefits of these services. Due to federal sequestration cuts and rising operational costs staff anticipates reduced funding of $1.7M for FY 2013-14. This will require reducing staff positions, the number of days of service at Head Start and Early Head Start sites, and eliminating 102 half day classroom slots for new families (closing the San Antonio CDC site that serves 68 families and reducing Eastmont Town Center by 34 families, when there are already 396 families on the waiting list for these slots). The FY 2013-2015 budget proposal includes backfilling with the General Purpose Fund $184,000 of lost federal funding, which could sustain one part day classroom at Eastmont Town Center for 34 families ($114,000) and restore one Family Advocate ($70,000) to support the parents and siblings of Head Start children. The City Council could chose to make the following additional restorations: Family Advocate ($70,000); 15 days for Head Start full day sites ($153,000); restore San Antonio CDC site ($421,446); 15 days for Early Head Start services ($58,020); Head Start/Early Head Start mental health and support services contracts ($77,884); Head Start service area coordinator ($105,159); food service worker ($60,000); Early Head Start administrative assistant ($92,000); and miscellaneous other O&M restorations ($480,000).
TOTAL COST $1,516,000
A - 4

POLICY TRADEOFFS & SERVICE BUYBACKS
2) Graffiti Enforcement and Abatement
In January 2013, the City Council adopted an ordinance amending the City’s graffiti enforcement and abatement policies. The proposed FY 2103-15 budget contains two new FTE painters to respond more quickly to graffiti on public property, bringing the total number of painters to abate graffiti on public right-of-ways to 6 FTEs. This will provide adequate abatement for public property. However, graffiti on private property continues to be a significant quality of life issue. Public Works estimates that to fully support the private property enforcement and mitigation policies contained in the recent ordinance, the City would need additional code enforcement and police intervention at an annual cost ranging from a minimum of approximately $165,000 to full funding at $1.0M. (Although the staff report that accompanied the ordinance briefly discussed the potential revenues that may be generated from this program, Public Works believes that the revenues will not cover the full program cost.) Minimum staffing would entail adding a Specialty Combination Inspector to administer code enforcement. Full funding would entail an additional Graffiti Program lead; two police officers to do special operations to identify suspects in violation of the ordinance (which could also be piloted through an Overtime funding allocation); support from the City Attorney’s Office to pursue civil penalties as outlined in the ordinance; two FTEs to administer code enforcement; and public education, murals; and rewards.
TOTAL COST Y1: $1,000,000
3) Street Patching
The City of Oakland has 806 miles of City-maintained streets varying from two-lane to six-lane arterial streets. Due to stagnant gas tax revenues and increased usage, the City’s streets continue to deteriorate and are now on an 85 year repaving cycle. In FY 2013-14 there is only $4.1M available to pave City streets. Without reconstruction of streets, motorist will experience more potholes. A new four-person patch crew could increase the number of block rehabilitated to improve the riding surface, and repair minor and medium defects before major repairs are needed. Patching areas where potholes recur frequently could reduce recurring potholes by several hundred per year. Paving would occur May through November, when hot asphalt mix is available, and base repair, crack sealing, and training would be performed the remaining months. The annual cost for one crew would be approximately $800,000 for one street maintenance leader, three maintenance workers, and asphalt and related supplies. There would also be one-time costs of approximately $725,000 for an asphalt patch truck and a grinder.
TOTAL COST OT: $725,000/OG $800,000 Y1: $1,525,000/Y2: $1,525,000
4) Rainbow Teen Center/Digital Arts and Culinary Academy (DACA) and West Oakland Teen Center Staffing
The capital funds to renovate the Rainbow Teen Center/Digital Arts and Culinary Academy (DACA) and the West Oakland Teen Center were not accompanied by operating funds for City staff to run the facilities. The City Council did approve one-time funding in spring 2012 to support DACA operating expenses, along with some absorbed expenditures. Parks and Recreation estimates that it will cost approximately $150,000 to staff the Rainbow Teen Center/Digital Arts and Culinary Academy (DACA) and $190,000 to staff the West Oakland Teen Center. The Department does not believe it can absorb these costs in its proposed budget, given the additional reductions/eliminations proposed. Alternatively, the City could explore partnerships.
TOTAL COST $340,000
A - 5

POLICY TRADEOFFS & SERVICE BUYBACKS
5) Taxicab Vehicle Permit
The City’s FY 2011-12 Master Fee Schedule and budget increased the Taxi Vehicle Permit Fee from $25 annually to $1,019 per permit. The City Council currently has before it an ordinance proposing to reduce the fee by half, to $510. According to staff, a fee of $510 will not cover the City’s current taxi program costs. The bulk of the City’s cost is for compliance with the state-mandated taxi administration process, which includes the City Administrator’s Office daily handling of inquiries, requests, complaints and allegations of violations from citizens, drivers, City staff, the news media, and taxi companies. If the program is maintained in its current form, it will require a General Purpose Fund subsidy of $143,602 per year.
TOTAL COST $143,602
6) Affordable Housing Until a permanent funding stream of affordable housing funding is identified to replace the 25% Redevelopment Agency Housing set-Aside, Housing’s annual Notice of Funding Availability (NOFA) will focus on preserving the fiscal and structural integrity of the City's affordable housing portfolio. Oakland's affordable housing inventory includes 83 developments comprising more than 4,000 housing units, with an additional 2,000 affordable housing units in the pipeline. Approximate 85% reduced funding for new construction of affordable housing programs, from roughly $13 million to $2 million, due to: dissolution of Redevelopment Agency, operating cost increases, and potential sequestration (impact currently unknown; not yet included in the proposed budget; additional service impacts likely). To maintain the current level of housing program staffing, it is proposed that any one-time dollars received from the City’s claim to the County regarding the extra fee for administering the “triple flip” –a tax transfer resulting in less revenue from vehicle license tax, but more from property taxes—be appropriated for Y1 (2013-14) for supporting affordable housing programs and other quality of life services (e.g., homeless services, graffiti, etc.) and close funding gaps should the Department of Finance deny project management staffing that is currently being disputed through the Recognized Obligation Payment Schedule. The City’s claim for “triple flip” funds paid to the County is about $2.6 million, generally equal to the policy goal of establishing a 20% set aside for affordable housing programs generated through new tax revenue distributed from the dissolution of redevelopment. This policy alternative establishes a funding bridge for the City’s affordable housing needs and allows for more time to establish an on-going program, absent any approved state legislation that may provide funding for this critical need. Alternatively, the City Council could desire to provide an on-going funding stream for affordable housing by designating 20% of future annual tax revenues the City will receive from the distribution of former redevelopment property tax dollars for affordable housing programs. The FY 2013-14 amount is approximately $2.6 million.
TOTAL COST Y1: $2,600,000/Y2: $3,400,000
7) Additional Police Sworn Staffing The proposed budget includes two graduating academies per FY, with the funding for one police academy in FY 2013-14 (168th) and two in FY 2014-15 (169th and 170th). The cost to add a fourth academy to the two-year period would require additional expenditures of approximately $4M for the academy itself and $8M in on-going funding for the officers per year (depending on the timing). Alternatively, the cost of if a lateral academy to add 20 new officers would be approximately $2.5M for pre-academy and some Oakland-specific academy training, as well as approximately $4M on-going funding (not including cost escalation) for the officers per year.
TOTAL COST $TBD/Various Scenarios
A - 6

POLICY TRADEOFFS & SERVICE BUYBACKS
8) Additional Police Civilian Staffing
The OPD recently reported that it needs approximately 56 FTE civilian positions to support critical operating needs to fully utilize the effectiveness and efficiency of our sworn officers and OPD’s service delivery models. The OPD has identified the following positions/classifications needed to implement improved service delivery and achieve better utilization of sworn staff. The Proposed Policy Budget includes 5 Police Communications Dispatcher FTEs and there are various scenarios that the Council could select based on policy tradeoffs. For Y1, the Administration would prioritize the hiring of 5 Police Evidence Technicians and 5 Criminalists. In Y2, additional Dispatchers and Police Records Management staff would greatly improve operations. Any combination of added staff will significantly address the 34% reduction in civilian staff and contribute to efforts to reduce crime, make OPD more efficient, and improve customer services.
Professional Staff (Civilian)
FY 2013-14
Authorized
2012-13 Needs
Assessment
Gap to Fill Need
Field Operations Police Services Technician II 59 59 0
Police Evidence Technician 14 29 15
Records Management Police Records Specialist 54 59 5
Police Records Supervisor 3 4 1
Crime Lab Criminalist II 13 15 2
Criminalist III 3 5 2
Latent Fingerprint Examiner II 4 5 1
Communications (911) Police Communications
Dispatcher 70 87 17
Police Communications Supervisor 4 7 3
Business Intelligence & Crime Analysis
Admin Analyst II 20 30 10
Total 244 300 56
TOTAL COST $TBD/Various Scenarios
A - 7

POLICY TRADEOFFS & SERVICE BUYBACKS
9) Maintenance of Former Redevelopment Parcels
When the former Oakland Redevelopment Agency was dissolved, it transferred a number of vacant parcels to the City. No funding was transferred from the Agency to the City for the ongoing maintenance of the sites, which need continual weed, litter, and graffiti abatement, fencing and lighting maintenance, etc.; nor can these costs be recovered as recognizable obligations of the Agency. The cost for this ongoing maintenance, estimated at approximately $516,464 annually, is not included in the proposed budget. Note that the City’s responsibilities and costs associated with these properties might change depending on State action. In addition, the City will create a comprehensive asset management plan that might impact the City’s ownership and maintenance of these properties.
TOTAL COST $516,464
10) City Attorney Positions
The proposed budget funds three new attorney positions in the City Attorney’s Office. The intention is to have the City conduct more work in house rather than contracting the work out to private law firms that likely have higher costs. The argument is that using private law firms restricts flexibility, capacity, and is a more costly method of obtaining legal services. The City Attorney’s Office has requested an additional eight positions for similar purposes, at a cost of approximately $1,361,972.
TOTAL COST $1,361,972
11) Additional Repair and Replacement of City Facilities
The Proposed Capital Improvement Program identifies specific funding for a limited number of facility and infrastructure projects as well as some critical projects that are deferred for lack of funding. The proposed budget includes an investment of $2.0M annually for critical City facility repairs. The City Council might wish to consider investment in repair and replacement to reduce the total lifecycle cost of ownership of facilities and infrastructure, such as City buildings and roads.
TOTAL COST $TBD/Various Scenarios
12) Additional City Vehicles
The City is in the process of purchasing the replacement of a number of vehicles and other equipment recently approved by City Council. Although this is a step in the right direction as the City has deferred these expenditures in the recent past, it should be noted that subsequent to this purchase the City’s fleet will still have a number of vehicles overdue for replacement, as reported in Public Works’ recent Infrastructure Report: Vehicle and Equipment Fleet. The City Council might wish to consider investment in new vehicles and equipment to reduce the total lifecycle cost of ownership of these items.
TOTAL COST $TBD/Various Scenarios
13) Additional Information Technology
Although the proposed budget funds a number of critical information technology systems and necessary on-going ITD operating costs to begin to address many years of under investment, the updated Capital Improvement Program report indicates that there is still a substantial number of critical projects that are unfunded and that will require investment in the very near term.
TOTAL COST $TBD/Various Scenarios
A - 8


BUDGET GUIDE
Budget Overview
At its core, a local government budget is officially approved revenue and spending plan that authorizes a municipality to use public dollars to provide services. Local governments use their budgets for a variety of additional purposes, including communication, planning, accountability, and evaluation.
The City of Oakland has a two fiscal-year (biennial) budget cycle. For the City of Oakland, the fiscal year begins on July 1 and ends on June 30. The current budget is being proposed for fiscal years (FY) 2013-14 and 20014-15. This same fiscal year calendar is used by the State of California, and most cities, counties, and school districts. The City policy of adopting a two-year budget is intended to improve the City’s long-term planning, enhance funding stability, and to create greater efficiency in the budget development process. While the City’s budget is adopted for a 24-month period, appropriations are divided into two one-year spending plans. During the second year of the two-year cycle, the Mayor and Council conduct a midcycle budget review to address variances in estimated revenues, estimated expenditures, and other changes to the City’s financial condition.
The City of Oakland’s budget presents two principal types of data: projected revenues and planned expenditures. Expenditures can be divided by type (e.g. salaries, retirement contributions, debt service, supplies, capital projects, etc.), and by the department that spends them (e.g. Police, Fire, Library, Public Works, etc.). Revenues are monetary resources that the City anticipates will become available during the fiscal year. City revenues can be categorized by type (e.g. property tax, sales tax, permit fees, etc.). City revenues may also be divided into those that can be expended on general or restricted purposes. For instance, the City’ Measure Q parcel tax revenues can only be used for libraries, whereas the City’s business tax revenues can be used for all governmental purposes.
To ensure that restricted revenues are used only for appropriate expenditures, the City accounts for its financial resources in different “funds.” For instance grants from the federal Department of Transportation for road construction are held in a different fund than are revenues from the City’s Wildfire Prevention Assessment District. The largest City fund is the General Purpose Fund which can be used for all public purposes over which the City has jurisdiction. General Purpose Fund revenues are generally unrestricted and include most taxes. The budget document will present data related to the General Purpose Fund only and to “all funds” (including the General Purpose Fund).
The Budget Process
The budget process is the procedure through which the City formally develops, deliberates and adopts its budget. Through the budget the City Council approves revenue estimates and authorizes expenditures. A budget is a reflection of a city’s priorities and policies. The budget process consists of several important stages: 1) Budget Development, 2) Budget Adoption, and 3) Budget Amendment
.
Budget Development
Oct 2012: Five Year Forecast Report Planning for the FY 2013-15 Budget began with the production and publication
of the City’s Five-Year Financial Forecast in fall 2012, a planning level estimate of revenues and expenditures that surfaces all major budget issues and contextualizes the long-term financial environment.
Nov-Dec 2012: Baseline Budget Development In fall 2012, the Controller’s Office created a “baseline budget,” which is a draft
two-year budget that estimates revenues and expenditures if the City maintains its current staffing, programs, and policies. The baseline budget is the foundation upon which the proposed budget is developed. The Controller’s Office worked in conjunction with departments to create the baseline budget, taking into account the latest economic projections and information on likely expenditures increases,
B - 1

BUDGET GUIDE
such as fringe benefit rates for retirement and health care. The comparison of expected revenues and expenditures in the baseline budget is what defines whether the City will have a surplus or shortfall to address in the proposed budget.
Jan-Mar 2013: Internal Analysis After the development of the baseline budget, the City Administrator’s Office
directs, through “budget instructions,” the departments to submit requests for changes to the baseline budget. Departmental requests can include changes such as new programs, increased appropriations, reduced expenditures, reorganizations, or shifting appropriations from one program or service to another. The Controller’s Office conducts in-depth analysis of each budget request to assess the value and confirm the fiscal feasibility. Based on the analysis, the Controller’s Office provides recommendations to the City Administrator. The City Administrator and key staff hold internal budget hearings with department directors and their staff to discuss proposals. The City Administrator makes preliminary budget decisions based on the internal hearings, additional analysis, and the Mayor’s priorities.
Mar -Apr 2013: Proposed Budget Finalized The City Administrator provides a preliminary budget proposal to the Mayor.
The Mayor weighs options, conducts additional analysis, considers Council, community, and other stakeholder input, and issues a final Proposed Policy Budget in April.
Budget Adoption
Apr-May 2013: Community Input City Council members hold community meetings to obtain input from
constituents on FY 2013-15 budget priorities and to understand questions and concerns pertaining to the Administration’s proposed budget.
May-June 2013: Council Deliberations Upon presentation of the proposed budget, the Mayor and City Council conduct a
series of public hearings to review the FY 2013-15 proposed budget.
June 2013: Council Budget Adoption As required by the City Charter, the City Council will adopt a balanced budget by
June 30, preceding the start of the fiscal year commencing July 1. The adopted budget provides two-year appropriation authority for all funds, and first- and second-year appropriations for the Capital Improvement Program (CIP). The CIP appropriations are outlined in two annual spending plans for FY 2013-15.
Budget Amendment
Apr-June 2014: Midcycle Budget Amendment Toward the end of the first year of the two-year cycle, the Mayor and Council
conduct a mid-cycle budget review to address variances in estimated revenues, estimated expenditures, and other changes to the City’s financial condition. For the FY 2013-15 budget cycle, the mid-cycle review will take place in March-June 2014, and will pertain to revenues and expenditures for FY 2014-15 (i.e. the second year of the biennial budget).
B - 2

BUDGET GUIDE
Year-Round Budget Amendments The Council can make amendments to the budget throughout the two-year
period. Appropriation of new money, or changes to the allocation of appropriations between funds or departments require Council approval. Transfers between divisions within a department, between spending accounts, or between projects may be made at the administrative level. These transfers can be authorized by the City Administrator, Controller’s Office, or department directors, depending on the nature of the transfer.
B - 3

BUDGET GUIDE
NOTES
B - 4


CITY FACTS
GENERAL INFORMATION
The City of Oakland (“City”) is located on the east side of the San Francisco Bay in the County of Alameda. Oakland is bordered by 19 miles of coastline to the west and rolling hills to the east, which provide unparalleled vistas of the Bay and the Pacific Ocean. In between are traditional, well-kept neighborhoods, a progressive downtown, and superior cultural and recreational amenities. Oakland serves as the administrative hub of the County of Alameda, the regional seat for the federal government, the district location of primary state offices, and the center of commerce and international trade for the Bay Area.
Oakland is the eighth largest city in the State of California, with an estimated population of 395,817, and a wealth of resources and opportunities. It is home to the Port of Oakland, which is the fifth busiest maritime port in the U.S. and among the top 25 in the world. Oakland International Airport has undergone a $300 million Terminal Improvement program including construction of a new concourse with seven boarding gates/waiting areas, centralized food/beverage and retail shopping areas, as well as expanded ticketing, security, and baggage claim facilities. The former Oakland Army Base is engaged in a $400 million revitalization and redevelopment process; and $115 million of new construction and improvements have recently been completed in Oakland City Center.
In concert with ongoing economic development efforts, the City strives to maintain a balance between old and new. Historic structures continue to be preserved and revitalized while new buildings are constructed. The City has completed its part in a $350 million revitalization effort to create a multifaceted government center that links major historical landmarks with new developments. Major corporate headquarters include Clorox and Kaiser Permanente, which are in close proximity to many new businesses and various small retail shops that have sprung up in the downtown area.
Oakland is a mature city that has been able to preserve its abundant natural beauty and resources. The City has over 100 parks (totaling over 2,500 acres) within its borders, as well as several recreational areas along its perimeter. Lake Merritt, the largest saltwater lake within a U.S. city, borders the downtown area. Its shoreline is a favorite retreat for joggers, office workers and picnickers. At dusk, the area sparkles as the Lake is lit with the “Necklace of Lights.” Lake Merritt is the oldest officially declared wildlife sanctuary in the United States, dating back to 1870.
Statistical Profile Date of Incorporation May 4, 1852 Form of Government Mayor-Council Population (2011)* 395,817 Land Area 53.8 square miles Lake Area 3.5 square miles Miles of Streets 835.8 miles
*US Census 2011 estimate
C - 1

CITY FACTS
CITY GOVERNMENT
The City of Oakland has a Mayor-Council form of government. The Mayor is elected at-large for a four-year term, and can be re-elected only once. The Mayor is not a member of the City Council; however, he or she has the right to vote as one if the Council members are evenly divided.
The City Council is the legislative body of the City and is comprised of eight Council members. One Council member is elected “at large,” while the other seven Council members represent specific districts. All Council members are elected to serve four-year terms. Each year the Council members elect one member as President of the Council and one member to serve as Vice Mayor.
The City Administrator is appointed by the Mayor and is subject to confirmation by the City Council. The City Administrator is responsible for the day-to-day administrative and fiscal operations of the City.
OAKLAND’S ECONOMIC BASE
Oakland has diversified its economic base significantly in the past few decades. The economy offers a healthy mix of trade, government, financial, medical, information technology, publishing and service-oriented occupations. Industries with the largest growth in jobs in the last two years are professional and business services, education and healthcare, government, leisure and hospitality, traditional and specialty food production, and construction.
Oakland offers abundant resources to its businesses and residents: state-of-the-art transportation, a vibrant dining and entertainment scene, and utility facilities keep the City running smoothly. Several new office and mixed-use buildings, public facilities, hotels, convention facilities, park enhancements and outdoor art have created a cosmopolitan environment in the downtown area. Waterfront restaurants and shops at Jack London Square, as well as the burgeoning Old Oakland and Uptown districts provide lively nighttime attractions. The City’s neighborhood retail areas continue to grow, as evidenced by Oakland’s nine Business Improvement Districts. While manufacturing remains an important segment of the City’s economy, some industrial land has been converted to residential and work/live use.
A variety of incentives are available to companies located in the City’s Enterprise, Foreign Trade, and Recycling Market Development Zones. The Economic Development staff links businesses with the many services available to them throughout the area and serves as an ombudsman for companies dealing with the City. Neighborhood Commercial Specialists work with merchants in each commercial district to promote the district, obtain loans, expedite permits and arrange for City services.
Oakland plays a pivotal role in the East Bay Trade Area; it is a city of rich history, impressive growth and a promising future. Located within one of the nation’s largest metropolitan areas, California’s eighth most populous city is the economic heart of the East Bay. Oakland has the infrastructure and economic base to support and attract a diverse mix of advanced industries and value-oriented retail.
Downtown Oakland offers competitive office space, a fiber-optic infrastructure and the amenities for both traditional and emerging enterprises. The well-maintained freeways, the mass transit systems and the ferry service make getting to and from downtown Oakland a relatively quick and easy process—travel times to San Francisco, San Jose and other Bay Area cities are surprisingly short.
The Oakland Metropolitan Area (Alameda and Contra-Costa counties) is one of the highest spending markets in the nation, with a mean household income of $95,495. In the City of Oakland itself, some 156,790 households earn, on average, $73,975 per year, resulting in over $3.0 billion in annual taxable sales.
City departments take a proactive approach and use streamlined processes to best serve the needs of the business community.
C - 2

CITY FACTS
A BRIEF HISTORY
1200 B.C. Ohlone Indians settle in the area that would become Oakland.
1772 Spanish explorers are the first Europeans to visit the East Bay.
1797 Established in Fremont, Mission de San José extends Spanish jurisdiction over the area that would become Oakland.
1849 During the California Gold Rush, Oakland becomes the mainland staging point for passengers and cargo traveling between the Bay and the Sierra foothills.
1852 Oakland was chartered as a city and almost immediately thereafter, construction of shipping wharves began. Building the large wharves and dredging a shipping channel positioned Oakland as an independent point of destination.
1869 The Central Pacific Railroad selected Oakland as the terminus of the new transcontinental railroad, providing a vital link to the East.
1910 Oakland’s population more than doubles in ten years from 66,960 to over 150,000 as people and businesses relocate from earthquake-ravaged San Francisco. Oakland regains control of the long-lost waterfront by final settlement of litigation, which had lasted over half a century and cost several millions of dollars.
1936 The Oakland-San Francisco Bay Bridge, one of the engineering wonders of the world, opens months before the Golden Gate Bridge.
1942 The Permanente Foundation Hospital is dedicated in Oakland, the first in the chain of Henry J. Kaiser’s health plan hospitals.
1950 Children’s Fairyland opens in Lakeside Park. Swelled by huge numbers of workers who flocked to the city for WWII jobs, the U.S. Census puts Oakland’s population at 384,575. Oakland’s African American population soars from 8,462 in 1940 to 47,562 in 1950. The military makes substantial improvement to the Port’s facilities.
World War II brought tremendous changes to Oakland. Huge numbers of workers moved to the Bay Area to work in local shipyards, and many of these people, as well as large numbers of military personnel who mustered out at Treasure Island and the Oakland Army Base, chose to remain in the Bay Area. As a result, the City’s population increased by nearly one third between 1940 and 1950.
Late 1950s – 1970s Under the Urban Indian Relocation Program, Oakland saw large numbers of Native Americans move to the city.
1970s Following the end of the Vietnam War, Oakland welcomed Cambodians, Vietnamese and Muong from war-torn Southeast Asia.
2010 The U.S. Census ranked Oakland as the eighth largest city in California, with a population of 390,724. According to a University of Wisconsin study, Oakland is the most ethnically diverse city in the United States. There are at least 100 different languages and dialects spoken here.
A new generation of restaurateurs and specialty food producers has fueled an epicurean renaissance. Oakland’s sizzling arts and dining scene is no longer a local secret as national media outlets spread the word on our vibrant city.
Oakland has a rich literary and cultural heritage. Such historical notables as writers Bret Harte, Jack London, Joaquin Miller, Ina Donna Coolbrith, Jessica Mitford, Narman Jayo, Ishmael Reed and Gertrude Stein; architect Julia Morgan; and dancer Isadora Duncan are just a few who have left their cultural mark on the City. It is also the birthplace of the West Coast Blues.
C - 3

CITY FACTS
TRANSPORTATION
Located in the geographic center of the Bay Area, Oakland has been recognized as a vital transportation hub for more than 100 years. Oakland is also the headquarters of the Alameda-Contra Costa Transit District (AC Transit), the Bay Area Rapid Transit (BART) system, and the Metropolitan Transportation Commission that oversees transit and transportation for the Bay Area. The combination of train, bus, marine, aviation, freeway and the Bay Area Rapid Transit (BART) system guarantees ease of travel for local residents and efficient channels of commerce for businesses relying on the City ’s easy access. Oakland’s Port is a primary sea terminal for transporting cargo between the western United States and the Pacific Rim, Latin America and Europe. Access to air cargo services is minutes away at the Oakland International Airport.
AC Transit. Local and transbay bus service is offered by Alameda-Contra Costa (AC) Transit, the third largest public bus system in California serving the East Bay since 1960:
Serves all 13 cities and adjacent unincorporated communities in 364 square miles along the east shore of San Francisco Bay. Annually, AC Transit buses drive 19.2 million service miles.
Serves approximately 200,000 daily riders with a fleet of 689 buses and a network of more than 105 bus lines with approximately 5,600 bus stops. The bus lines connect with nine other public and private bus systems, 21 BART stations, six Amtrak stations, and three ferry terminals.
Bus routes serve the Oakland International Airport, the Amtrak Station and ferry terminal located at Jack London Square, downtown San Francisco and other major Bay Area attractions. All buses are accessible to people with disabilities.
All buses are equipped with bicycle racks.
BART. The Bay Area Rapid Transit (BART) is a 104-mile, computer-automated rapid transit system:
Serving more than 3 million people in the three BART counties of Alameda, Contra Costa, and San Francisco, as well as northern San Mateo County.
Electric-powered trains traveling up to 80 mph connect 44 stations, including 8 stations in Oakland. Travel time between downtown Oakland and downtown San Francisco averages only 11 minutes on BART.
BART carries an average of 366,000 passengers each weekday and recorded more than 110,000,000 station exits in FY 2011-12.
In Oakland, four BART stations – West Oakland, MacArthur, Fruitvale and Coliseum — are catalysts for transit oriented development projects that are in design or construction.
The Oakland Airport Connector (OAC) is a 3.2-mile extension of BART from the Coliseum/Oakland Airport BART Station to Oakland International Airport. OAC will provide a seamless connection with driverless trains that travel the alignment in eight minutes and depart every four minutes. Construction is underway and is scheduled to be complete in late 2013. After several months of systems testing, OAC will open for service in late 2014.
OAK. The Oakland International Airport (OAK) is the second largest San Francisco Bay Area airport offering over 300 daily passenger and cargo flights.
Hosted more than 10 million passengers in 2012.
Handled more than 1.1 billion pounds of air freight.
Served by 11 domestic and international air carriers.
Features 29 board gates in two terminalslAll buses are equipped with
C - 4

CITY FACTS
Roadways, Bicycles, Car Sharing
The Alameda/Oakland Ferry Service that links Oakland with San Francisco, Angel Island and South San Francisco.
Nine major U.S. and California highways pass through Oakland.
Daily service to rail destinations throughout the U.S. is offered at the Oakland Amtrak Station in Jack London Square and service along the Capitol Corridor also stops at the Coliseum Amtrak Station..
Greyhound Bus Lines also offers daily bus service to cities throughout the United States. MegaBus.com offers service between Oakland and Los Angeles.
Car-sharing is offered by City CarShare and Zipcar.
Oakland was one of the first cities to pilot the “sharrow” lane – shared-lane pavement markings to indicate road lanes shared by cyclists and motorists.
INFRASTRUCTURE
The Public Works Agency plans, builds and maintains Oakland’s physical and environmental infrastructure for residents, businesses and visitors, making Oakland a sustainable and desirable place to live, work, invest and visit. Local Streets & Roads
806 miles
90 miles of bike lanes & routes
Sidewalks, Curb Ramps, Stairs & Paths
1,100 miles of sidewalks
17,800 curb ramp locations
232 developed stairs & pathways
Bridges
38 bridges
Traffic Signals & Signs
677 traffic signal intersections
200,000 street signs
Street Lighting
37,000 streetlights (LED Light Conversion program to begin Spring 2013 on 30,000)
Stormwater
400 miles of storm drains
15,000 structures
80+ miles of open creek
Wastewater Collection
919 miles of sewer pipes
7 pump stations
27,000 structures
Public Buildings
300+ public buildings
C - 5

CITY FACTS
Trees 42,600 official street trees
Plus all open space & park trees
Fleet & Equipment
1,489 vehicles & pieces of equipment including fire trucks & police cars
HUMAN SERVICES DHS offers various services to assist Oakland residents including seniors, youth, families and the homeless.
Serves 1,778 low-income children and their families at 25 sites throughout Oakland with comprehensive early childhood education and family support services through the Oakland Head Start & Early Head Start programs.
Over 8,000 seniors enjoy a broad range of classes and special events as well as free or low-cost meals at 4 senior centers operated by the City and 4 contracted centers for monolingual seniors.
Provides over 26,000 trips annually for frail seniors and disabled persons through its Oakland Paratransit for the Elderly and Disabled Program (OPED).
Serves over 390 frail and disabled seniors through its Multipurpose Senior Services Program (MSSP) by helping them live independently in their homes through in-home case management and health services.
Trains and prepares over 240 low income seniors for the workforce today through subsidized training and job placement via the ASSETS Sr. Employment Program.
Provides approximately 68 low-income seniors, who accompany their clients in running daily errands or mentor young children, volunteer stipends through the Senior Companion/Foster Grandparent Program.
Provides 3,500 bags of groceries low-income families and seniors nine times a year at multiple sites citywide through the Community Housing Services which also provides shelter, transitional and supportive housing to many who would otherwise be homeless.
Serves over 100,000 lunches and 80,000 snacks to children and youth through the Summer Food Service Program.
Assists 2,500 children to walk to and from school safely thanks to the Safe Walk to School Program.
Serves more than 28,700 youth through the locally mandated Oakland Children’s Fund (Kids First! Oakland Fund for Children and Youth) and the federally funded grant programs that address the educational, youth development and safety needs of children in Oakland.
Administers approximately $5.2 million in Oakland Unite Measure Y grant funding to 23 community-based organizations and public agencies whose programs are evidence-based and work with youth and young adults who are most affected by violence in the areas of Oakland that are the most violent.
More than 10,000 low-income residents in Oakland and Alameda County are served by the Alameda County-Oakland Community Action Partnership through programs that fight poverty by helping low-income residents become self sufficient and through partnerships that offer free income tax assistance and Individual Development Accounts.
EDUCATION
Elementary, Middle, Special, and Secondary Education
More than 87 public, 40 charter and 43 private schools in Oakland.
Colleges
C - 6

CITY FACTS
Holy Names University – an undergraduate and graduate inter-disciplinary study college.
Mills College – a private women’s liberal arts college founded in 1852, also offering co-ed graduate programs.
Patten University – a private, co-educational Christian college dedicated to providing a liberal arts education with a strong biblical studies emphasis. Also offers some graduate programs.
Samuel Merritt University - offers degrees in nursing, occupational therapy, physical therapy, physician assistant, and podiatric medicine and is the largest source of new registered nurses in California.
California College of the Arts - known for its broad, interdisciplinary programs in art, design, architecture, and writing, it offers studies in 21 undergraduate and 11 graduate.
Merritt College, and Laney College – part of the Peralta Community College District, these colleges offer arts, liberal arts, college preparatory and vocational trade programs.
LIBRARY SYSTEM
1 main library and 16 library branches
Second Start Adult Literacy Program
Tool lending library
African-American Museum and Library
281,553 Registered Borrowers
1,051,933 Books Held
1,268,857 Total Records in Catalog (books etc)
2,535,896 Library Visits
2,670,928 Circulation
291,269 Uses of Public Internet Computers
158,975 Program Attendance of which 130,753 were at Children’s Programs
MEDICAL FACILITIES
Oakland’s medical facilities are among the best in the nation. The medical community provides the latest and most sophisticated medical technology for the diagnosis and treatment of disease. There are now four hospitals providing full service in Oakland. Together, these hospitals are investing more than $2 billion in new construction and seismic upgrades. Children’s Hospital Oakland Research Institute delivers high quality pediatric care for all children through regional primary and subspecialty networks, strong education and teaching program, a diverse workforce, state-of-the-art research programs and facilities and nationally recognized child advocacy efforts. Alta Bates Summit Medical Center offers comprehensive services designed to meet the health care needs of the diverse communities of the greater East Bay. Alameda County Medical Center’s Highland Hospital provides comprehensive, high-quality medical treatment, health promotion, and health maintenance through an integrated system of hospitals, clinics, and health services staffed by individuals who are responsive to the diverse cultural needs of our community. Kaiser Permanente organizes and provides or coordinates members’ care, including preventive care such as well-baby and prenatal care, immunizations, and screening diagnostics; hospital and medical services; and pharmacy services. Kaiser Hospital is the flagship of the national system of hospitals headquartered here along with the nation’s first health maintenance organization (HMO), founded by Henry Kaiser.
C - 7

CITY FACTS
PUBLIC SAFETY
Oakland’s public safety providers actively engage all segments of the City’s diverse residential and business communities in efforts to increase public safety and quality of life. Current police initiatives partner law enforcement agencies with local community-based social service organizations to create / enhance programs that offer ex-offenders services (training and education) and support (substance abuse recovery and mental health counseling), while maintaining strict accountability and supervision of parolees and those on probation.
Oakland’s first responders, committed to proactive emergency preparedness, response, and mitigation, continue to develop and enhance their skills, assess local risks, and prepare strategies to ensure the safety and security of the City’s residential and commercial sectors in the event of a natural disaster or terrorist attack.
Police
665 authorized sworn officers (649 filled as of March 2013)
338 non-sworn employees
Assignments range within comprehensive 24/7 public safety service and response
● Patrol
● Crime analysis
● Administration
● Criminal Investigations
● K-9 Unit
● Communications
● Tactical Operations Teams (S.W.A.T. and Negotiations)
● Traffic Enforcement & Investigations
● Narcotics Enforcement
● Youth or Community Services
● Criminal Intelligence
● Vice
Receives and processes over 600,000 calls for service annually
Handled over 288,000 law enforcement incidents in 2012
Fire
507 authorized uniformed personnel to fill three complete shifts of response personnel
25 Fire Stations which includes equipment and resources such as:
● 24 engine apparatus
● 7 aerial apparatus
● hazardous materials response team
● technical rescue team
● airport rescue company
● water rescue team
● specialized wild land response apparatus
Over 60,000 response calls annually, 80% are calls that include medical service
C - 8

CITY FACTS
RECREATION
The Office of Parks and Recreation (OPR) offers critical quality of life programming in areas of enrichment, cultural arts, prevention and intervention, sports and physical activities, health and wellness, youth violence abatement, and other leisure activities for adults, youth, and children. Programs and Camps at recreation centers, pools and parks are part of the efforts to promote health, stem obesity, and encourage civic participation, personal development, and empowerment. We preserve the best of Oakland and connect communities.
OPR also operates:
30 recreation/cultural arts/boating/science & nature/teen centers
140 parks and playgrounds
66 ball fields
6 swimming pools
44 tennis courts
15 community gardens
10 rental facilities
5 dog play areas
3 public golf courses
2 skate parks
1 Sport Complex and Indoor Water Park; and a host of other public facilities
Oakland is at the heart of the East Bay Regional Park District, a splendid system of 65 parks and 29 regional hiking trails covering more than 100,000 acres in Alameda and Contra Costa Counties.
OTHER ATTRACTIONS
Oakland is home to many world-class and unique attractions for local residents and visitors.
Chabot Space & Science Center – The City of Oakland is home to Chabot Space & Science Center (CSSC), an 86,000 square foot, award-winning facility featuring hands-on science and astronomy exhibits, a state-of-the-art planetarium, a large-format domed screen theater, a simulated space mission experience, and the largest telescopes available for public use in California.
Fox Theater – The newly renovated Fox Theater in downtown Oakland reopened its doors in February 2009 with a run of performances from entertainment’s top acts. The theater’s wrap-around building will also be the permanent home for the Oakland School for the Arts, a tuition-free charter school dedicated to artistic and academic excellence.
Grand Lake Theater - A mainstay of the community since its construction in 1926, this first-run movie theater is graced with a colorful, lighted marquee and a sweeping staircase in the main hall. Look for the ornately decorated walls, brass chandeliers, and faux opera boxes. Prior to curtain on Friday and Saturday nights, an organist serenades the audience on a Wurlitzer.
Lake Merritt – The Lake is the largest lake located within an urban area and is set in Lakeside Park, which is home to the Garden Center, Sailboat House, Rotary Nature Center, Junior Science Center, and a Bonsai Garden. Bordered by a 3.4 mile trail, Lake Merritt is a favorite location for joggers, walkers, and strollers.
Children's Fairyland - Young children will enjoy this enchanting, three-dimensional fantasy world where popular nursery rhymes come to life, set in picturesque Lakeside Park.
Jack London Square – Located along Oakland’s waterfront, Jack London Square is home to Yoshi’s Jazz Club, a Cineplex, numerous restaurants, and other local attractions. Local arts venues extend their evening hours on Third Thursdays Oakland Art Nights, to host exhibitions, artists’ lectures and demonstrations, receptions and other cultural events.
C - 9

CITY FACTS
USS Potomac – Affectionately dubbed the Floating White House by the press, Franklin Delano Roosevelt's presidential yacht is one of the few floating museums in the country. The restored 165-foot vessel, a national historic landmark, is a memorial to FDR and his accomplishments.
Chinatown – Oakland Chinatown dates back to the arrival of Chinese immigrants in the 1850s, making it one of the oldest Chinatowns in North America. Oakland’s Chinatown is bustling with activity. The Asian Branch Library is one of many of Oakland Public Library’s branches and is located in Chinatown’s Pacific Renaissance Plaza.
George P. Scotlan Convention Center - Offering 64,000 square feet of exhibition and meeting space and adjoining the Oakland Marriott City Center, this convention center has an additional 25,000 square feet of flexible meeting space and 483 deluxe guest rooms.
Old Oakland – An historic district with beautiful buildings and a thriving commercial strip. A Farmers’ Market takes place every Friday.
Oakland Museum of California – This is the state’s only museum devoted to the arts, history and natural sciences of California. The Museum provides unique collections, rotating exhibitions and educational opportunities designed to generate a broader and deeper understanding of and interest in California’s environment, history, art and people.
Oakland Zoo – Founded in 1922 by naturalist Henry A. Snow, the Oakland Zoo is an 85 year-old regional treasure. Many of its animals are kept in relatively “natural” habitats, and expanded natural habitats are planned. The Zoo is nationally known for its excellent elephant exhibit and has been praised for allowing its elephants to roam freely.
Paramount Theater -This beautiful Art Deco theater opened in 1931 and was authentically restored in 1973. The theater hosts an impressive variety of popular attractions, including the Oakland East Bay Symphony, Broadway shows, R&B concerts, gospel performers, comedy, and special engagements.
Oakland’s Western Aerospace Museum - Located at the Airport’s North Field, showcases aviation history through special exhibits, multimedia presentations, hands-on displays incorporating 13 vintage airplanes, photographs, replicas and other artifacts, and classes for students of all ages.
Malonga Casquelourd Center for the Arts - This restored 1920s building is a popular multicultural, multidisciplinary performing-arts complex sponsored by the city. The 400-seat theater and five rehearsal and class spaces showcase drama, ballet, and African and contemporary dance. Several long-standing arts organizations-Axis Dance Company, Bay Area Blues Society, CitiCentre Dance Theater, Dimensions Dance Theater, and Oakland Youth Orchestra-call the center home.
The Crucible – Located in West Oakland, this non-profit educational facility fosters a collaboration of Arts, Industry and Community. Through training in the fine and industrial arts, The Crucible promotes creative expression, reuse of materials and innovative design while serving as an accessible arts venue for the general public.
Professional/Amateur Sports - Oakland is a magnet for sports fans of all types. Whatever the season, Oakland pro and amateur games frequently garner large crowds and broad national media coverage. In the last three decades, Oakland’s professional sports teams have won six world championships in three major sports.
Golden State Warriors – The Warriors continue to showcase exciting basket-ball. The most recent season was a season of change with new ownership, coaching and players. The Warriors were one of only seven teams to improve their record from the prior year, making the prospects for a playoff berth highly anticipated for the coming seasons.
Oakland Athletics – The Oakland Athletics have won six American League Championships and four baseball World Series titles.
Oakland Raiders – From dominance in three Super Bowl victories to improbable come-from-behind victories, the Raiders have been involved in some of professional football's most incredible moments.
C - 10

CITY FACTS
Key Facts/Accolades: Oakland, California Oakland Among Top 5 Places to Visit in the World Source: New York Times, January 8, 2012 Ten Best Cities To Have a Dog Source; NerdWallet, March 25, 2013 Oakland Among 5 best markets to sell a home Source: CNN/Money, March 14, 2013 Oakland Among 15 Top Cities for Tech Startups Source: National Venture Capital Association, February 13, 2013 #10 Most Walkable City in America Source: America Walks, February 2013 Oakland Ranked Among Top 12 ArtPlaces in the Nation Source: ArtPlace, January 7, 2013 Gayest Cities in America, 2013 Source: The Advocate, January 2013 Oakland Rises to 7th in Nation in Bicycling Rate with 7,000 Biking Commuters Source; U.S. Census Data, November 5, 2012 Oakland Named Among America's 50 Best Cities Source: Bloomberg Businessweek, September 26, 2012 Uptown named among the Best Hipster Neighborhoods Source: Forbes, September 20, 2012 Oakland named among America's Best Cities on the Rise Source: SmarterTravel.com, August 31, 2012, Oakland Tied as Most Honest City in the U.S. Source: National Honesty Index, August 20, 2012 Oakland top city for fastest selling homes in the nation Source: Realtor.com, August 8, 2012 6th among the 51 largest US cities for percentage of residents that bicycle to work Source: Alliance for Biking & Walking 2012 Benchmarking Report Where the Creative Class Earns the Most Source: The Atlantic Cities, July 2012 #2 US City in Per-Capita Availability of Eco-Friendly Services Source: Thumbtack, July 2012 4th Greenest US City Source: Mother Nature Network, July 2012
C - 11

CITY FACTS
5th Greenest City in America Source: Corporate Knights Magazine, June 2012 The Gardens at Lake Merritt Named Among Top 5 in California Source: Via Magazine, March 2012 Men's Fitness Ranks Oakland the 4th Most Fit City in America Source: Men's Fitness, March 2012 CNN includes Oakland in its 5 must-see film sites Source: CNN, February 23, 2012 California’s 2nd Most Literate City and 15th in the Nation Source: America's Most Literate Cities, 2011 10th Greenest Real Estate Market in U.S. Source: Cushman & Wakefield Green Building Opportunity Index, November 2011 #2 “Can-Do” City Source: Newsweek, September 2011 10th Most Walkable City in the Nation Source: Walk Score, July 2011 9th Most Sustainable City in the U.S. Source: Sustainlane, 2008 4th largest "Nano Metro" Area in the nation Source: Project on Emerging Nanotechnologies, 2007
C - 12


FINANCIAL SUMMARIES
INTRODUCTION TO FINANCIAL SUMMARIES
This section contains tables summarizing revenue and expenditure data for the entire City. Summaries are presented by fund. Tables are also presented on fund balances and fund descriptions.
CITY REVENUE AND EXPENDITURE FORECAST METHODOLOGY
The City prepares revenue and expenditure forecasts for its biennial budget. The forecasts are based on agency input, historical budgetary performance, prevailing general economic conditions and department input. A detailed forecast is prepared for the General Purpose Fund (GPF), and for other funds.
To prepare the forecast, a comprehensive analysis of the components of the City's revenues and expenditures is performed. These major components are projected into the two-to-five-year period on the basis of various relevant assumptions. For example, projections for property tax, the single largest source of revenues for the City's General Purpose Fund (GPF), are done based on the projected growth in the net assessed value of locally assessed property and projected changes to the tax delinquency rate. Similarly, forecast of the expenditures is performed by separately analyzing individual expenditure categories (e.g. salaries, retirement, benefits, utility expenses) based on forecast cost increases (e.g. pay-step increases, PERS retirement rates, benefit cost inflation, energy prices).
Forecasting Techniques
Citywide revenues and expenditures are projected using two forecasting techniques: qualitative analysis, and quantitative analysis.
Qualitative analysis projects future revenues and/or expenditures using non-statistical techniques. These techniques rely on human judgment rather than statistical analysis to arrive at revenue projections. Qualitative forecasting is essential for projecting revenue or expenditure components that are unstable, volatile, or for which there is limited historical information. To facilitate sound qualitative analysis, the City of Oakland seeks input from outside experts in economic forecasting, municipal finance, and other relevant fields. Just two examples of this is the City’s reliance on the League of Cities’ analysis and recommendations relating to legislative issues impacting cities, and the Legislative Analyst Office for their expertise and analysis of the State of California budgetary issues that may potentially affect the City of Oakland.
Quantitative analysis involves looking at data to understand historical trends and causal relationships. One kind of quantitative analysis is time series analysis; it is based on data which have been collected over time and can be shown chronologically on graphs. When using time series techniques, the forecaster is especially interested in the nature of seasonal fluctuations which occur within a year, the nature of multiyear cycles, and the nature of any possible long-run trends. Causal analysis is another type of quantitative analysis; it deals with the historical interrelationships between two or more variables. One or more predictors influence, directly or indirectly, the future revenue or expenditure. The causal forecasting techniques are predicated upon selecting the correct independent variables, correctly defining their interrelationship to the dependent variable, i.e. the projected revenue or expenditure item, and, finally, collecting accurate data.
D - 1

FINANCIAL SUMMARIES
Revenue Forecast
Citywide revenues are projected using dynamic forecasting which anticipates changes in revenues triggered by new economic development, economic growth, changes in the levels of service of departments and agencies, (as approved in the case of Master Fee Schedule changes by the City Council), changes in governmental policies at the state or federal level, and various economic and demographic changes. The purpose of this dynamic forecast is to demonstrate the potential impact of various events and actions on the selected revenue sources. Under this scenario:
Tax Revenues are projected to grow at rates that are responsive to dynamic forces in the economy. Generally, the assumption is the local economy will be affected by national and state trends, with some deviation expected due to specific characteristics of regional business and labor markets.
Fee increases will likely follow the projected inflation and changes in the local population due to increased service costs and changes in demand.
Any known or anticipated changes in revenues as a result of potential changes in state revenue streams and/or legislation are reflected in the analysis.
The revenue forecast takes into consideration a number of economic factors and trends, including changes in economic growth, income, sales and Consumer Price Index (CPI), among other factors. Additionally, anticipated changes in State or local policy are also considered.
Expenditure Forecast
Forecasting the City's expenditures involves analyzing, at the Agency level, and by category
The expenditure forecast begins with the baseline budget, which represents the cost of maintaining the current level of services, while taking into account all unavoidable costs necessary to continue at that current level. Examples of unavoidable costs are pre-negotiated MOU salary levels, as well as health care and retirement costs that the City pays on behalf of its employees.
The baseline budget is then modified to reflect changes to programs and services that the Mayor and the City Administrator decide to include as part of the Proposed Budget. These modifications could include additions or subtractions in any of categories (1) through (3) above. Changes to debt service are less discretionary, and are made based on changes in the Treasury Division's debt payment schedules.
The expenditure forecast follows the guidance of the Government Finance Officers Association (GFOA), which recommends that expenditures be grouped into units of analysis that are meaningful to the organization, such as departments and standard budget categories of expenditures. As such, staff grouped baseline (FY 2013-15) proposed budget expenditures by department and by expenditure category, consistent with the City’s chart of accounts. Future expenditures were forecasted from the FY 2013-15 proposed budget. This forecast generally assumes that expenditures will only grow due to inflationary cost escalation. Though In a small number of cases, costs are also expected to change due to new operating expenditures, which are changes in service or staffing levels, as described below.
• The Police Department will run one police academy per year in FY 2015-16, FY 2016-17, and FY 2017-18 to roughly maintain the number of sworn staff achieved by the FY 2013-15 budget proposal, 697;
• The City will lose Successor Agency project staff as their projects and funding wind down;
• Note that this forecast assumes the same funding level when Measure Y expires on December 31, 2014 and the Wildfire Prevention Assessment District expires on June 30, 2014. The parking revenue for Measure Y will not be collected by January 1, 2015 if the Measure is not renewed while the parcel tax covers until June 30, 2015;
• The City will appropriate $10M in FY 2015-16 and an additional $10M in FY 2016-17 to a reserve for unfunded pension and OPEB liabilities, as directed by City Council.
D - 2

FINANCIAL SUMMARIES
BASIS OF BUDGETING
The City of Oakland’s basis of budgeting for its major fund groups (General Funds, Special Revenue Funds, Enterprise Funds, Internal Service Funds and Capital Project Funds) are the Generally Accepted Accounting Principals (GAAP), and the modified accrual basis of accounting.
Revenues are budgeted according to when they are both measurable and available. Revenues are considered to be available when they are collected within the current year, or soon enough thereafter to pay liabilities of the current period. The City considers property tax revenues to be available for the year levied if they are collected within 60 days of the end of the current fiscal year. All other revenues are considered to be available if they are collected within 120 days of the end of the current fiscal year.
Expenditures are budgeted according to when the liability is incurred, regardless of the timing of related cash flows. The exceptions are debt service, compensated absences, claims and judgments, which are budgeted as expenditures according to when the payments are due.
The City’s basis of budgeting is the same as the basis of accounting used in the City’s audited financial statement, the Comprehensive Annual Financial Report (CAFR).
PLANNING FOR THE CITY OF OAKLAND’S TWO-YEAR BUDGET
Planning for the Two-Year Budget
The City’s budget development process begins over a year in advance of the actual adoption of the two-year budget. During this advance planning process, the City identifies factors (known or anticipated) that may have a significant effect on future revenues, expenditures, or staffing levels. The staff’s two-year budget projections are also aided by p. The analysis is based on actual City revenue and expenditure trends, general and relevant economic trends and outlooks, input from the City Departments who oversee those specific expenditure and revenue streams, and input from outside economists and revenue experts.
Staff’s budget forecast was presented to the City Council at a budget workshop (held for the FY 2013-15 Budget on April 2nd 2013). At the workshop, the Council was provided with information regarding the City’s financial situation, including the five year financial forecast and FY 2012-13 second quarter Revenue& Expenditure report
D - 3

FINANCIAL SUMMARIES
NOTES
D - 4

FINANCIAL SUMMARIES
SUMMARY TABLES
D - 5

FINANCIAL SUMMARIES
NOTES
D - 6

FINANCIAL SUMMARIES
SUMMARY OF SIGNIFICANT PROPOSED BUDGET CHANGES AND REVENUE ENHANCEMENTS
FY 2013-15
GENERAL PURPOSE FUND (GPF) FTE FY 2013-14
Savings
(in millions)
FY 2014-15
Savings
(in millions)
Significant Revenue Changes (continued)
One-time parking citation revenues from proposed booting
inter-governmental partnership
$.00 $2.00
Credit card convenience fee $.25 $.25
RD Pass through $.40 $.40
Increase in Billboard Revenues $.95 $.48
Significant Expenditure Changes (continued)
MAYOR
GPF reduction of 5% in FY2013-14 and 10% in FY2014-15 - ($.10) ($.21)
Add 1.00 FTE Special Assistant to the Mayor 1.00 $.12 $.12
CITY COUNCIL
GPF reduction of 5% in FY2013-14 and 10% in FY2014-15 - ($.19) ($.38)
CITY ADMINISTRATOR (continued)
Add an Assistant to the City Administrator in CAO Administration
and a Program Analyst I in Public Ethics
2.00 $.22 $.22
Downgrade an Administrative Services Manager I in Contracting
and Compliance to an Account Clerk III
- ($.09) ($.09)
Eliminate 0.50 FTE Management Intern, PT in the Budget Office (0.50) ($.01) ($.01)
Transfer 1.00 FTE Compliance Officer in Contracts and
Compliance to fund 5671
(1.00) ($.14) ($.14)
Transfer 1.00 Contract Compliance Office Assistant from Dept of
Energy ARRA Fund (2609)
1.00 $.11 $.11
Transfer 1.00 FTE Urban Economic Analyst II to fund 1610.
Eliminate 0.50 FTE Graphic Design Specialist from the Office of
Neighborhood Investment
(1.50) ($.18) ($.18)
CITY ATTORNEY (continued)
GPF reduction of 5% in FY2013-14 and 10% in FY2014-15 - ($.23) ($.48)
D - 7

FINANCIAL SUMMARIES
SUMMARY OF SIGNIFICANT PROPOSED BUDGET CHANGES AND REVENUE ENHANCEMENTS
FY 2013-15 (continued)
GENERAL PURPOSE FUND (GPF) FTE FY 2013-14
Savings
(in millions)
FY 2014-15
Savings
(in millions)
Significant Expenditure Changes (continued)
CITY AUDITOR
GPF reduction of 5% in FY2013-14 and 10% in FY2014-15 - ($.08) ($.17)
CITY CLERK
Reduction in O&M - ($.08) ($.17)
POLICE SERVICES (continued)
Add 169th and 170th Academy in FY2014-15. Pre Academy costs of the 169th Academy budgeted in FY2013-14
80.00 $1.12 $10.77
Transfer 1.00 FTE Police Officer and 1.00 FTE Police Communications Dispatcher to the False Alarm Fund (2411)
(2.00) ($.29) ($.30)
Transfer 1.00 FTE Public Information Officer to
Telecommunications Reserve Fund (1760)
(1.00) ($.14) ($.15)
Freeze 2.00 FTE Account Clerk II's and 1.00 FTE Animal Control
Officer
(3.00) ($.22) ($.23)
Eliminate 1.00 FTE Accountant II and 1.00 FTE Administrative
Analyst I
(2.00) ($.22) ($.23)
Add 1.00 FTE Payroll Personnel Clerk III and 1.00 FTE Accountant
III
2.00 $.20 $.21
Add 5.00 FTE Police Communications Dispatchers 5.00 $.55 $.57
Realign Internal Service Fund charges to other funds - ($.33) ($.33)
Move 25.00 FTE to 1010 from the Department of Justice COPS
Fund upon expiration of grant funding (6 months in FY 2014-15)
25.00 $.00 $1.83
FIRE SERVICES (continued)
Charge 24 Firefighters to the SAFER Grant - ($3.90) ($3.90)
Freeze 1.00 FTE Fire Prevent Bureau Inspect, Civil (1.00) ($.13) ($.13)
D - 8

FINANCIAL SUMMARIES
SUMMARY OF SIGNIFICANT PROPOSED BUDGET CHANGES AND REVENUE ENHANCEMENTS
FY 2013-15 (continued)
GENERAL PURPOSE FUND (GPF) FTE FY 2013-14
Savings
(in millions)
FY 2014-15
Savings
(in millions)
Significant Expenditure Changes (continued)
ADMINISTRATIVE SERVICES
Administration
Eliminate 1.00 FTE Administrative Services Manager II and 1.00
FTE Executive Assistant to the Agency Director
(2.00) ($.31) ($.32)
Controller's Office
Add 1.00 FTE City Administrator Analyst 1.00 $.12 $.12
Eliminate 1.00 Accountant III (1.00) ($.14) ($.14)
Transfer 1.00 FTE Office Assistant II in fund 4550 to fund 1010 1.00 $.06 $.06
Freeze 1.00 Accounting Supervisor (1.00) ($.14) ($.14)
Revenue
Add O&M for BT Online System, HDL Contract and Hearing
Officers
- $.35 $.19
Treasury
Eliminate 1.00 FTE Human Resources Manager (1.00) ($.20) ($.21)
Reallocate Treasury Manager split funding - net transfer 0.15 FTE
to various funds
(0.15) ($.04) ($.04)
Reduce O&M - ($.04) ($.04)
Human Resources
Transfer 0.30 FTE Director of Personnel Resource Management to
the worker's compensation fund 1150 and the deferred comp
fund 7130.
(0.30) ($.08) ($.08)
Information Technology
Eliminate 1.0 FTE Telecommunications Systems Engineer (1.00) ($.14) ($.14)
COMMUNITY SERVICES
Parks & Recreation
Transfer 5.54 FTE to OPRCA Self-Sustaining Fund (5.54) ($.39) ($.39)
Add 1.00 Student Trainee, PT 1.00 $.02 $.02
D - 9

FINANCIAL SUMMARIES
SUMMARY OF SIGNIFICANT PROPOSED BUDGET CHANGES AND REVENUE ENHANCEMENTS
FY 2013-15 (continued)
GENERAL PURPOSE FUND (GPF) FTE FY 2013-14
Savings(in millions)
FY 2014-15
Savings(in millions)
Significant Expenditure Changes (continued)
COMMUNITY SERVICES
Parks & Recreation (continued)
Reduce 1.62 FTE each of a Recreation Leader I, PT and Recreation
Leader II, PT
(3.24) ($.11) ($.11)
Reduction in 10% of subsidy to Oakland zoo, Chabot Space Center, Hacienda Peralta and Asian Cultural Center
- ($.09) ($.09)
Human Services
Freeze 1.00 FTE Community Services Director (1.00) ($.23) ($.24)
Eliminate 1.00 FTE Program Analyst I (Youth Commission) (1.00) ($.09) ($.10)
Eliminate 0.59 FTE Senior Services Supervisor in FY 2014-15 (0.59) $.00 ($.08)
Reduce & Transfer 0.91 FTE Accountant II (0.91) ($.11) ($.11)
Transfer 0.68 FTE Accountant II from various funds 0.68 $.08 $.08
Transfer 1.00 FTE Family Advocate from the Head Start Fund 1.00 $.06 $.07
Reduce O&M in Senior Centers - ($.01) ($.01)
Reduction of 10% subsidy to OUSD Academies and Vietnamese
Centers
- ($.01) ($.01)
LIBRARY SERVICES (continued)
Transfer 3.00 FTE Librarian II's to fund 2241 (3.00) ($.36) ($.37)
Transfer 1.00 FTE Senior Librarian to fund 2241 in FY2014-15 (1.00) $.00 ($.14)
Transfer 1.00 FTE Librarian Assistant, Senior to fund 2241 in FY2014-15
(1.00) $.00 ($.11)
Transfer 3.00 FTE Librarian Supervisors to fund 2241 (3.00) ($.45) ($.46)
Transfer 3.00 FTE Library Assistant and 1.0 FTE Office Assistant I to fund 2241
(4.00) ($.34) ($.35)
PUBLIC WORKS (continued)
No GPF changes - $.00 $.00
D - 10

FINANCIAL SUMMARIES
SUMMARY OF SIGNIFICANT PROPOSED BUDGET CHANGES AND REVENUE ENHANCEMENTS
FY 2013-15 (continued)
GENERAL PURPOSE FUND (GPF) FTE FY 2013-14 Savings
(in millions)
FY 2014-15 Savings
(in millions)
Significant Expenditure Changes (continued)
HOUSING & COMMUNITY DEVELOPMENT
No GPF Changes - $.00 $.00
PLANNING & BUILDING
No GPF Changes - $.00 $.00
NON-DEPARTMENTAL
Reduction in CSO Recovery from eliminated positions Citywide - $1.13 $1.26
Increase CSO Recovery Waiver for DHS - ($.25) ($.24)
Add funding for Redistricting and Ballot Measure Renewal - $.42 $.02
Add funding for DIT Licensing & Software - $1.50 $1.00
Extend Contract with CHP and Alameda County Sheriff - $2.00 $2.00
Reduce subsidy to Measure Y (Fund 2251) - ($1.00) ($1.00)
Eliminate Day Laborer Program - ($.17) ($.17)
D - 11

D - 12

FINANCIAL SUMMARIES
SUMMARY OF SIGNIFICANT PROPOSED BUDGET CHANGES AND REVENUE ENHANCEMENTS
FY 2013-15
(continued)
ALL OTHER FUNDS FTE FY 2013-14 Savings
(in millions)
FY 2014-15 Savings
(in millions)
Significant Revenue Changes (continued)
One-time PG&E rebates in the Landscaping & Lighting
Assessment District Fund
$1.65 $1.65
Significant Expenditure Changes (continued)
MAYOR
No non-GPF Changes $0.00 $0.00
CITY COUNCIL
No non-GPF Changes $0.00 $0.00
CITY ADMINISTRATOR (continued)
Add 0.50 FTE Program Analyst I to Public Ethics in Measure Y
fund 2251
0.50 $0.05 $0.05
Eliminate I.00 FTE Cable Operations Technician in KTOP in fund
1760
(1.00) ($0.14) ($0.14)
Eliminate 0.50 FTE Administrative Analyst II PPT and 1.00 FTE
Administrative Assistant I in fund 2195 in the Office of
Neighborhood Investment
(1.50) ($0.14) ($0.14)
Eliminate 0.50 FTE Graphic Design Specialist from various funds (0.50) ($0.06) ($0.06)
CITY ATTORNEY (continued)
No non-GPF Changes $0.00 $0.00
CITY AUDITOR
No non-GPF Changes $0.00 $0.00
CITY CLERK
No non-GPF Changes $0.00 $0.00
POLICE SERVICES (continued)
Transfer 1.00 FTE Police Officer and 1.00 FTE Police
Communications Dispatcher from 1010 to the False Alarm Fund
(2411)
2.00 $0.29 $0.30
D - 13

FINANCIAL SUMMARIES
SUMMARY OF SIGNIFICANT PROPOSED BUDGET CHANGES AND REVENUE ENHANCEMENTS
FY 2013-15
(continued)
ALL OTHER FUNDS FTE FY 2013-14 Savings
(in millions)
FY 2014-15 Savings
(in millions)
Significant Expenditure Changes (continued)
POLICE SERVICES (continued)
Realign Internal Service Fund charges to other funds from 1010 - $0.33 $0.33
Freeze 1.00 FTE Grants Coordinator (1.00) ($0.14) ($0.14)
Transfer 1.00 FTE Public Information Officer to
Telecommunications Reserve Fund (1760) from 1010
1.00 $0.14 $0.15
Move 25.00 FTE to 1010 from the Department of Justice COPS
Fund upon expiration of grant funding (6 months in FY 2014-15)
(25.00) $0.00 ($1.83)
FIRE SERVICES (continued)
Charge 24.00 FTE Firefighters to the SAFER Grant Fund (2124) - $3.90 $3.90
ADMINISTRATIVE SERVICES
Administration
No non-GPF Changes $0.00 $0.00
Controller's Office
Eliminate 1.00 FTE Administrative Assistant II and add 1.00 FTE
Buyer in Purchasing Fund (4450)
- $0.01 $0.01
Revenue
No non-GPF Changes $0.00 $0.00
Treasury
Reallocate Treasury Manager split funding - net transfer 0.15 FTE
to various funds
0.15 $0.04 $0.04
Human Resources
Transfer 0.30 FTE Director of Personnel Resource Management to
the Worker's Compensation Fund 1150 and the Deferred Comp
Fund 7130 from 1010
0.30 $0.08 $0.08
Information Technology
Freeze 1.00 FTE Microcomputer Systems Specialist in Measure Q
Fund (2241)
(1.00) ($0.14) ($0.14)
D - 14
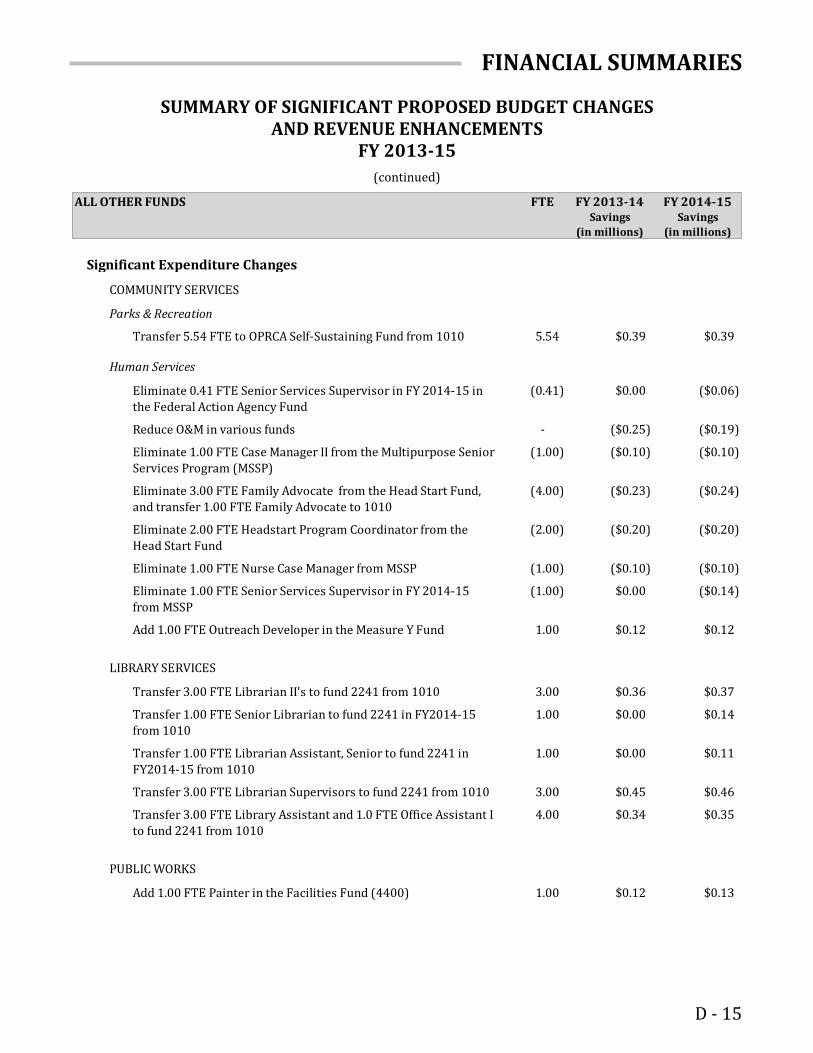
FINANCIAL SUMMARIES
SUMMARY OF SIGNIFICANT PROPOSED BUDGET CHANGES AND REVENUE ENHANCEMENTS
FY 2013-15
(continued)
ALL OTHER FUNDS FTE FY 2013-14 Savings
(in millions)
FY 2014-15 Savings
(in millions)
Significant Expenditure Changes (continued)
COMMUNITY SERVICES
Parks & Recreation
Transfer 5.54 FTE to OPRCA Self-Sustaining Fund from 1010 5.54 $0.39 $0.39
Human Services (continued)
Eliminate 0.41 FTE Senior Services Supervisor in FY 2014-15 in
the Federal Action Agency Fund
(0.41) $0.00 ($0.06)
Reduce O&M in various funds - ($0.25) ($0.19)
Eliminate 1.00 FTE Case Manager II from the Multipurpose Senior
Services Program (MSSP)
(1.00) ($0.10) ($0.10)
Eliminate 3.00 FTE Family Advocate from the Head Start Fund,
and transfer 1.00 FTE Family Advocate to 1010
(4.00) ($0.23) ($0.24)
Eliminate 2.00 FTE Headstart Program Coordinator from the
Head Start Fund
(2.00) ($0.20) ($0.20)
Eliminate 1.00 FTE Nurse Case Manager from MSSP (1.00) ($0.10) ($0.10)
Eliminate 1.00 FTE Senior Services Supervisor in FY 2014-15
from MSSP
(1.00) $0.00 ($0.14)
Add 1.00 FTE Outreach Developer in the Measure Y Fund 1.00 $0.12 $0.12
LIBRARY SERVICES (continued)
Transfer 3.00 FTE Librarian II's to fund 2241 from 1010 3.00 $0.36 $0.37
Transfer 1.00 FTE Senior Librarian to fund 2241 in FY2014-15
from 1010
1.00 $0.00 $0.14
Transfer 1.00 FTE Librarian Assistant, Senior to fund 2241 in
FY2014-15 from 1010
1.00 $0.00 $0.11
Transfer 3.00 FTE Librarian Supervisors to fund 2241 from 1010 3.00 $0.45 $0.46
Transfer 3.00 FTE Library Assistant and 1.0 FTE Office Assistant I
to fund 2241 from 1010
4.00 $0.34 $0.35
PUBLIC WORKS (continued)
Add 1.00 FTE Painter in the Facilities Fund (4400) 1.00 $0.12 $0.13
D - 15

FINANCIAL SUMMARIES
SUMMARY OF SIGNIFICANT PROPOSED BUDGET CHANGES AND REVENUE ENHANCEMENTS
FY 2013-15
(continued)
ALL OTHER FUNDS FTE FY 2013-14 Savings
(in millions)
FY 2014-15 Savings
(in millions)
Significant Expenditure Changes (continued)
PUBLIC WORKS (continued)
Add 2.00 FTE Custodians in the Facilities Fund (4400) 2.00 $0.14 $0.14
Add 2.00 FTE Painters and O&M in the Comprehensive Clean-up
Fund for graffitti abatement team
2.00 $0.55 $0.30
Add 4.00 FTE Maintenance Mechanics in the Facilities Fund
(4400)
4.00 $0.30 $0.31
Add fundng for Minor CIP in the Facilities Fund (4400) - $1.00 $1.25
Add O&M for new facilities in the Facilities Fund (4400) - $0.25 $0.24
Eliminate 0.25 FTE Stationary Engineer in the Facilities Fund
(4400)
(0.25) ($0.03) ($0.03)
Eliminate 0.50 FTE Maintenance Mechanic, PPT in the Facilities
Fund (4400)
(0.50) ($0.05) ($0.05)
Eliminate 1.00 FTE Clean Community Supervisor in the
Comprehensive Clean-up Fund
(1.00) ($0.14) ($0.15)
LED Lighting Conversion Lease Payment in the Landscaping &
Lighting Assesment District Fund
- $1.65 $1.65
LED Lighting Conversion Energy utility savings from lighting
conversion in the Landscaping & Lighting Assesment District
Fund
- ($1.11) ($1.48)
Eliminate 1.00 FTE Recycling Specialist in the Recycling Fund
(partially funded by projects)
(1.00) ($0.10) ($0.11)
Eliminate O&M to off-set cost of positions & O&M added for
maintaining new facilities notpreviously funded
- ($0.89) ($0.89)
Transfer Dept of Infrastructure & Operations group from the
Measure B Fund (2211) to the State Gas Tax Fund (2231)
(17.26) ($2.03) ($2.13)
Transfer Dept of Infrastructure & Operations group to the State
Gas Tax Fund (2231) from the Measure B Fund (2211)
17.26 $2.03 $2.13
HOUSING
Transfer to other funding sources in Y1 and eliminate in Y2 from
SRA projects (Fund 1610):
0.75 FTE Development/Redevleopment Manager (0.75) ($0.13) ($0.13)
D - 16

FINANCIAL SUMMARIES
SUMMARY OF SIGNIFICANT PROPOSED BUDGET CHANGES AND REVENUE ENHANCEMENTS
FY 2013-15
(continued)
ALL OTHER FUNDS FTE FY 2013-14 Savings
(in millions)
FY 2014-15 Savings
(in millions)
Significant Expenditure Changes (continued)
HOUSING (continued)
1.00 FTE Housing Development Coordinator III (1.00) ($0.13) ($0.13)
3.65 FTE Housing Development Coordinator IV (3.65) ($0.56) ($0.57)
1.00 FTE Office Assistant II (1.00) ($0.07) ($0.07)
Reduce O&M and OH - ($0.41) ($0.42)
Elminate 1.00 FTE Development/Redevleopment Manager in the
HUD-Home Fund
(1.00) ($0.20) ($0.20)
Eliminate 2.00 FTE Housing Development Coordinator from SRA
projects (Fund 1610)
(2.00) ($0.22) ($0.23)
Eliminate 1.00 FTE Housing Development Coordinator and 0.50
FTE Student Intern, PT in CA Community Services Fund
(1.50) ($0.12) ($0.13)
Reduce Loan Expenditures in HUD-CDBG Fund - ($0.23) ($0.23)
Reduce Contract Expenditures HUD-CDBG Fund - ($0.68) ($0.68)
PLANNING
Eliminate positions and O&M in the Development Services Fund
(2415):
0.70 FTE Administrative Analyst II (0.70) ($0.08) ($0.09)
1.00 FTE Engineer, Civil (Office) (1.00) ($0.16) ($0.16)
1.00 FTE Account Clerk II (partial Y1) (1.00) ($0.05) ($0.08)
1.00 FTE Business Analyst III (1.00) $0.00 ($0.08)
1.00 FTE Engineer, Civil Supv (Office) (1.00) ($0.17) ($0.17)
1.00 FTE Manager, Building Services (1.00) ($0.11) ($0.12)
2.00 FTE Office Assistant II (partial Y1) (2.00) ($0.09) ($0.12)
1.00 FTE Planner I (1.00) ($0.08) ($0.09)
1.00 FTE Planner II (1.00) ($0.11) ($0.12)
1.00 FTE Process Coordinator II (1.00) ($0.10) ($0.10)
1.00 FTE Public Service Representative (1.00) ($0.08) ($0.08)
1.00 FTE Specialty Combination Insp, Senior (1.00) ($0.13) ($0.13)
D - 17

FINANCIAL SUMMARIES
SUMMARY OF SIGNIFICANT PROPOSED BUDGET CHANGES AND REVENUE ENHANCEMENTS
FY 2013-15
(continued)
ALL OTHER FUNDS FTE FY 2013-14 Savings
(in millions)
FY 2014-15 Savings
(in millions)
Significant Expenditure Changes (continued)
PLANNING (continued)
4.00 FTE Specialty Combination Inspector (4.00) ($0.48) ($0.49)
Reduce Other Refunds - ($0.41) ($0.41)
Reduce Contract Expenditures - ($0.82) ($0.70)
Increase Computer Equipment/Software - $0.27 $0.27
Reduce OH associated with eliminated positions - ($0.28) ($0.28)
NON-DEPARTMENTAL
Increase transfer to Pension Override Tax Revenue Fund - $8.74 $4.13
Add funding for DIT Licensing & Software in the Capital Reserves Fund (5510)
- $1.50 $2.00
D - 18

FINANCIAL SUMMARIES
FUND SOURCES AND DESCRIPTIONS
Fund Fund Description Source of Funds Uses of Funds
1010 General Purpose Fund Revenues from most of the City's
taxes, fees and service charges
Discretion of the City Council Most City
departments receive General Purpose
Fund support
1100 Self-Insurance Liability Transfer of funds from the General
Purpose Fund, Sewer Fund, and
other miscellaneous funds
Self-insurance liability claims and
settlements, outside legal services and
court costs
1150 Workers' Compensation Insurance
Claims
City payroll deductions for Workers'
Compensation Insurance
Workers' Compensation Insurance claims
and administration
1200 Pension Override Tax Revenue Property tax override Payment to the Police and Fire Retirement
System
1610 Oakland Redevelopment Successor
Agency (ORSA)
Redevelopment Property Tax Trust
Fund ("RPTTF")
City staff and other costs related to
Oakland Redevelopment Successor Agency
projects
1700 Mandatory Refuse Collection Assessments on delinquent refuse
collection customers
Collection of delinquent refuse collection
bills
1710 Recycling Program Special surcharge on refuse
collection bills
City's recycling program and related
activities
1720 Comprehensive Clean-Up Special surcharge on refuse
collection bills
Illegal dumping enforcement; street
sweeping, custodial services and other
clean-up related activities
1730 Henry J Kaiser Convention Center Transfers from General Purpose
Fund, in accordance with repayment
plan
Reduce negative fund balance, in
accordance with repayment plan
1740 Hazardous Materials Inspection Fees from inspections by Emergency
Service Hazardous Materials Unit
Hazardous Materials Inspection Program
1750 Multi-Purpose Reserve Fees from City-owned off-street
parking facilities, other revenues at
Council discretion
Off-street parking facilities revenue is
restricted by Council policy to parking
facility construction and operation All
other revenue may be spent at Council
discretion
1760 Telecommunications Reserve Cable television franchise fees Operation of the City's cable television
station (KTOP) and other
telecommunications-related operations
1770 Telecommunications Land Use Fee revenue generated from use of
public property for
telecommunications equipment
Telecommunication projects
D - 19

FINANCIAL SUMMARIES
FUND SOURCES AND DESCRIPTIONS (CONT’D)
Fund Fund Description Source of Funds Uses of Funds
1780 Kids First Oakland Children's Fund Transfer from the General Purpose
Fund (equal to 3.0% of unrestricted
revenues)
Programs for children and youth
1791 Contract Administration Fee Transfers from General Purpose
Fund, in accordance with repayment
plan
Reduce negative fund balance, in
accordance with repayment plan
1820 Office of Parks and Recreation
Cultural Advisory (OPRCA) Self-
Sustaining Revolving Fund
Fees for recreation-related program Supporting parks and recreation programs
1830 Central District Project Area Loans Loan repayments Redevelopment projects within Central
District Project Area
1831 Central City East Project Area
Loans
Loan repayments Redevelopment projects within Central
City East Project Area
1832 Coliseum Project Area Loans Loan repayments Redevelopment projects within Coliseum
Project Area
1880 Low and Moderate Income Housing
Asset Fund (LMIHF) Operation
Loan repayments Low and Moderate Income Housing Asset
Fund (LMIHF) Operating cost
1882 Multi Service Center/Rent Rental income Building maintenance for the Multi Service
Center
1883 2000 Subordinated Housing Set-
aside bonds
Proceeds from 2000 Subordinated
Housing Set-aside Bonds
Development of Low and Moderate
Income Housing projects
1884 2006 Housing Set-aside Bond
Proceeds
Proceeds from 2006 Subordinated
Housing Set-aside Bonds
Development of Low and Moderate
Income Housing projects
1885 2011 Subordinated Housing Set-
aside Bonds
Proceeds from 2011 Subordinated
Housing Set-aside Bonds
Development of Low and Moderate
Income Housing projects
2102 Department of Agriculture U.S. Department of Agriculture Year-round lunch program for school
children offered through City's Department
of Human Services
2103 Department of Housing and Urban
Development (HUD) -- Emergency
Shelter Grant (ESG)/
Supportive Housing Program
(SHP)/
Housing Opportunities for Persons
with AIDS (HOPWA)
U.S. Department of Housing and
Urban Development (HUD)
Emergency shelters, housing for persons
with AIDs, and transitional housing
programs
2104 Department of Commerce U.S. Department of Commerce,
Economic Development
Administration (EDA) grants
Traffic and road improvement for the Del
Monte Cannery Shopping Center projects
D - 20

FINANCIAL SUMMARIES
FUND SOURCES AND DESCRIPTIONS (CONT’D)
Fund Fund Description Source of Funds Uses of Funds
2105 Department of Housing and Urban
Development (HUD) -- Economic
Development Initiative (EDI)
Grants
U.S. Department of Housing and
Urban Development (HUD)
Commercial grants and loans and
associated operational costs to promote
economic development
2107 Department of Housing and Urban
Development (HUD) -- 108
U.S. Department of Housing and
Urban Development (HUD)
Loan guarantees for commercial and
residential loans
2108 Department of Housing and Urban
Development (HUD) -- Community
Development Block Grant (CDBG)
U.S. Department of Housing and
Urban Development (HUD)
Grants to non-profit organizations for
housing and community development in
low- and moderate-income areas
2109 Department of Housing and Urban
Development (HUD) -- HOME
Investment Partnerships (HOME)
U.S. Department of Housing and
Urban Development (HUD)
Support for first-time homebuyers,
housing rehabilitation, and housing
development
2112 Department of Justice US Department of Justice (DOJ) Law enforcement activities, particularly
drug law enforcement
2113 Department of Justice - COPS Hiring US Department of Justice (DOJ) Law enforcement activities, particularly
drug law enforcement
2114 Department of Labor Federal funds administered by
California Employment Development
Department (EDD)
Employment training programs
2116 Department of Transportation State pass-through of Federal Aid for
Urban Systems Act funds
Construction and improvements of streets
and highways
2120 Federal Action Agency Federal Government Various social services programs
2123 US Department of Homeland
Security
Urban Area Security Initiative (UASI)
Grants
Offset city's costs of supporting the newly
established Homeland Security program
2124 Federal Emergency Management
Agency
Federal disaster relieve fund Disaster recovery activities
2125 Environmental Protection Agency Environmental Protection Agency Environmental projects
2127 Dept of Transportation-TIGER II
Grant
Department of Transportation Oakland Army Base projects
2128 Department of Health and Human
Services (DHHS)
Federal funds administered by
California Department of Economic
Opportunity
Various social services programs for low-
income residents such as headstart
2132 California Department of Aging Grants from California Department of
Aging
Health and social case management
services for frail elderly residents
2134 California Parks and Recreation State of California Capital projects related to park and
recreation acquisition and development
D - 21

FINANCIAL SUMMARIES
FUND SOURCES AND DESCRIPTIONS (CONT’D)
Fund Fund Description Source of Funds Uses of Funds
2136 California Water Resource Board State of California Water Resource
Board
Improvement on water quality
2138 California Department of Education State of California grants from
Department of Education
Library programs
2139 California Department of
Conservation
State of California grants from
Department of Conservation
To provide funding for energy efficiency
and conservation programs
2140 California Department of
Transportation
State of California grants from
Department of Transportation
Capital projects related to transportation
2144 California Housing and Community
Development
California Dept. of Housing and
Community Development grants
Provide grants for Emergency Housing
Program and Winter Relief Program
2146 California State Emergency Service State of California Pay for emergency-related services such as
seismic retrofitting of buildings
2148 California Library Services State Public Library Commission and
Foundation
Library operations
2150 California Department of Fish and
Games
California Department of Fish and
Games
To provide funding for programs related to
preservation of wildlife
2152 California Board of Corrections California Board of Corrections Research/evaluate the effectiveness of
narcotics enforcement activities
2154 California Integrated Waste
Management Board
California Integrated Waste
Management Board
To provide funding for used motor oil
recycling and public education programs
2158 5th Year State COPS Grant, AB
1913, Statutes of 2000
State COPS grants Law enforcement activities
2159 State of California Other State of California Miscellaneous programs
2160 County of Alameda Grants County of Alameda Street improvements within the City of
Oakland
2162 Metro Transportation Com: TDA Metropolitan Transportation
Commission
To provide funding for transportation
programs
2163 Metropolitan Transportation
Commission - Transportation
Program Grant
Metropolitan Transportation
Commission
Projects that benefit pedestrians and
bicyclists
2164 Congestion Mitigation & Air Quality
(CMAQ)
County of Alameda Streetscape improvement projects
2165 Prop 1B Nov 2006 CA Trans Bond State of California - Prop. 1B Local street and road repairs
2166 Bay Area Air Quality Management
District
US Department of Commerce
Economic Development
Administration
To provide funding for Broadway Shuttle
programs
D - 22

FINANCIAL SUMMARIES
FUND SOURCES AND DESCRIPTIONS (CONT’D)
Fund Fund Description Source of Funds Uses of Funds
2172 Alameda County Abandoned
Vehicle Abatement Authority
Vehicle registration surcharge Removal of abandoned vehicles from
private or public property
2175 Alameda County: Source Reduction
& Recycling
County of Alameda To provide funding for recycling programs
2185 Oakland Redevelopment Agency
Grants
Oakland Redevelopment Agency Loans to qualified businesses within the
Central District Project Area
2190 Private Grants Corporations and private individuals Restricted to specific programs
2195 Workforce Investment Act US Department of Labor Employment and training services for
Oakland residents; overseen by Oakland
Workforce Investment Board and the
Mayor
2211 Measure B - ACTIA Alameda County Transportation
Improvement Authority (ACTIA) -
1/2 percent Alameda County sales
tax re-authorized by Measure B in
2002
Traffic and transportation projects,
including street and signal construction,
maintenance and repair
2212 Measure B - Bicycle/Pedestrian
Pass-Thru Funds
Alameda County Transportation
Improvement Authority (ACTIA) -
1/2 percent Alameda County sales
tax re-authorized by Measure B in
2002
Bicycle and pedestrian projects
2213 Measure B - Paratransit - ACTIA Alameda County Transportation
Improvement Authority (ACTIA) -
1/2 percent Alameda County sales
tax re-authorized by Measure B in
2002
Paratransit projects
2214 ACTIA Reimbursable Grants Alameda County Transportation
Improvement Authority (ACTIA)
Transportation projects
2215 Measure F - Vehicle Registration
Fee
Vehicle registration fee Local transportation projects defined by
Measure F
2230 State Gas Tax State of California - allocation of
gasoline tax revenues
Uses related to local streets and highways
Includes acquisition of real property,
construction, improvement, repairs and
maintenance of streets and lighting
2231 State Gas Tax-Prop 42 Replacement
Funds
State Proposition 42 For Local street and road rehabilitation
2241 Measure Q - Library Services
Retention-Enhancement
Voter-approved special parcel tax
authorized by Measure Q
Maintenance of library operations
D - 23

FINANCIAL SUMMARIES
FUND SOURCES AND DESCRIPTIONS (CONT’D)
Fund Fund Description Source of Funds Uses of Funds
2242 Measure Q Reserve - Library
Services Retention-Enhancement
Required Reserve from Measure Q Required reserve
2250 Measure N Fund Voter-approved special parcel tax
authorized by Measure N
To provide paramedic services on fire
trucks
2251 Public Safety Act / 2004 Measure Y Special parcel and parking tax Violence prevention through social-
services intervention, long-term crime-
prevention programs, police services, fire-
safety and paramedic support
2260 Measure WW: East Bay Regional
Parks District Local Grant
2008 Measure WW bond proceeds
through East Bay Regional Parks
District
Parks and open space renovation projects
2310 Landscaping & Lighting
Assessment District
Landscape & Lighting Assessments
(assessed on property tax bills)
Operation, construction, maintenance,
repair of street lighting, landscaping, and
related activities
2320 Fire Suppression Assessment
District
Special voter-approved tax Fire suppression programs
2321 Wildland Fire Prevention
Assessment District Fund
Special voter-approved tax Vegetation management services
2330 Werner Court Vegetation
Management District
Special tax from parcels in a
subdivision located in the Oakland
Hills
Vegetation management services in that
area
2331 Wood Street Community Facilities
District
Special tax on Wood Street
Community
Wood street community facilities
maintenance
2410 Link Handipark Surcharge on handicap parking
offenses
Programs for the elderly
2411 False Alarm Reduction Program Alarm Permit Revenue For the False Alarm Reduction Program
2412 Alameda County Emergency
Dispatch Service Supplemental
Assessment
Voter-approved special parcel tax
authorized by Measure M
Emergency-related programs
2413 Rent Adjustment Program Fund Rent program service fee The fees are dedicated for the payment of
services and costs of the Rent Adjustment
Program
2415 Development Service Fund Licenses, fees, and permits from
housing and commercial planning
and construction-related activities
Planning and zoning services; construction
inspections, construction permit
approvals; building code enforcement;
plan checks, engineering services
D - 24

FINANCIAL SUMMARIES
FUND SOURCES AND DESCRIPTIONS (CONT’D)
Fund Fund Description Source of Funds Uses of Funds
2416 Traffic Safety Fund Fines and forfeitures of bail for
violations of the State Vehicle Code
Traffic safety projects including
construction and improvement of streets,
signs and signals
2417 Excess Litter Fee Assessment fees from business Litter and trash clean-up resulting from
businesses
2419 Transient Occupancy Tax (TOT)
Surcharge
Three (3) % Surcharge to the City's
Transient Occupancy Tax (Hotel
Tax)
To provide funding to the Oakland
Convention and Visitors Bureau (OCVB),
the Oakland Zoo, Oakland Museum of
California, Chabot Space & Science Center
and the Cultural Arts Programs and
Fesitivals
2601 Workforce Investment Act (ARRA) Federal stimulus funds administered
through the Workforce Investment
Act
To provide funding for the Youth
Employment programs
2603 HUD-ESG/SHP/HOPWA (ARRA) Federal stimulus funds administered
through HUD
To provide funding for the Homelessness
Prevention and Rapid Re-Housing Program
2605 Dept of Health & Human Services
(ARRA)
Federal stimulus funds administered
through the Department of Health
and Human Services
To provide funding for the Head Start
Program
2606 Metro Transportation Commission
(ARRA)
Federal stimulus funds administered
through Metro Transportation
Commission
To provide funding for street resurfacing,
curb ramp installation and sidewalk repair
2607 Department of Justice-COPS Hiring
Recovery Program (ARRA)
Federal stimulus funds administered
through the Department of Justice
Hiring and/or preserving police officers
2608 Environmental Protection Agency
(ARRA)
Federal stimulus funds administered
through the Environmental
Protection Agency
To provide funding for assessment of
hazardous substances in soil and
groundwater in west Oakland
2609 Dept of Energy-EECBG Program
(ARRA)
Federal stimulus funds administered
through the Department of Energy
To provide funding for energy efficiency
and conservation programs
2610 State Water Control Board-CWSRF
Program (ARRA)
Federal stimulus funds administered
through the State Water Control
Board
To provide funding for removal of
stormwater pollutants at Lake Merritt and
Oakland Estuary
2611 HUD-CDBG (ARRA) Federal stimulus funds administered
through HUD
To provide funding for the community
development block grant program
2612 California Department of
Community Services -
Weatherization Assistance
Program (ARRA)
Federal stimulus funds administered
through The Department of
Community Service and
Development
To provide funding for weatherization
services to low-income residents
D - 25

FINANCIAL SUMMARIES
FUND SOURCES AND DESCRIPTIONS (CONT’D)
Fund Fund Description Source of Funds Uses of Funds
2613 Port Security Grant Program
(ARRA)
Federal stimulus funds administered
Pass-through grant from Port of
Oakland
Port Security Programs
2826 Mortgage Revenue Proceeds from revenue bonds and
repayment of mortgage loans
Multi-Lending mortgage purchase
programs
2910 Federal Asset Forfeiture -
15% Set-Aside
Federal government Uses related to law enforcement
2912 Federal Asset Forfeiture City Share Federal government Uses related to law enforcement
2914 State Asset Forfeiture State of California Uses related to law enforcement
2990 Public Works Grants Various State and Federal grants Public Works projects
2992 Parks and Recreation Grants Proceeds of bonds authorized by
Measure A and other grants
Park and open space acquisition, capital
improvement projects and programs; Year-
Round Lunch Program
2993 Library Grants Library Grants For Library related projects
2994 Social Services Grants Grant from City of Berkeley Temporary winter shelter at Oakland Army
Base
2995 Police Grants Miscellaneous grants or contracts
from other government entities
Various reimbursable police activities
2999 Miscellaneous Grants Various State, Federal and
miscellaneous grants
Restricted to specific activities approved
by the granting source
3100 Sewer Service Fund Sewer service charges (charged on
EBMUD bills)
Acquisition, construction, reconstruction,
relocation, maintenance, operation and
repair of sewer facilities
3150 Sewer Rate Stabilization Fund Transfer from sewer service fund Required reserve
3200 Golf Course City golf course fees and concession
charges
City golf course operations, maintenance
and capital improvements
4100 Equipment Rental Equipment rental charges to
operating departments
Maintenance and replacement of City
vehicles and other motorized equipment
4200 Radio Fund Radio rental charges to operating
departments
Maintenance and replacement of City
radios and other communications
equipment
4210 Telephone Equipment & Software Telephone and software charges to
operating departments
Maintenance and replacement of City
telephones and computer software
4300 Reproduction Reproduction equipment rental and
services charges to operating
departments
Maintenance and replacement of City
reproduction equipment
D - 26

FINANCIAL SUMMARIES
FUND SOURCES AND DESCRIPTIONS (CONT’D)
Fund Fund Description Source of Funds Uses of Funds
4400 City Facilities City facility rental charges to
operating departments
Operation and maintenance of City
facilities, including custodial services
4450 City Facilities Energy Conservation
Loan
California Energy Commission Implement energy conservation capital
projects in city facilities
4500 Central Stores Reimbursements from departments Supplies, materials and equipment for City
operations
4550 Purchasing Fund Purchasing charges to operating
departments
Staffing, operations and maintenance for
Purchasing unit of the Controllers' Office
5055 Piedmont Pines Underground
Assessment District
Bond proceeds from Piedmont Pines
Underground Assessment District
Revenue Bonds
Piedmont Pines area underground projects
5057 2012 Reassessment Project Fund Special property tax assessment
from Reassessment District No 99-1
To refund the 1999 Reassessment Bonds,
including the forms of Fiscal Agent, Escrow
Agreement Deposit and Trust Agreement,
and Bond Purchase Agreement
5130 Rockridge Library Assessment
District
Special property tax assessment Improvements to the Rockridge Library
5200 JPFA Capital Projects: Series 2005 Proceeds from JPA Series 2005
bonds
Seismic retrofit; infrastructure projects,
deferred maintenance and improvements
to public facilities
5311 Measure G: 2006 Zoo, Museum Bond proceeds from Measure G:
Series 2006
Capital Projects: Oakland Zoo, Museum
and Chabot Space & Science Center
improvements
5320 Measure DD: 2003A Clean Water,
Safe Parks & Open Space Trust
Fund for Oakland
Proceeds from General Obligation
bonds authorized by Measure DD in
2003A
Capital projects to improve water quality;
provide educational and recreational
facilities for children; clean up Lake
Merritt; restore Oakland's creeks,
waterfront, and Estuary; and renovate
parks and open space
5321 Measure DD: 2009B Clean Water,
Safe Parks & Open Space Trust
Fund for Oakland
Proceeds from General Obligation
bonds authorized by Measure DD in
2009B
Capital projects to improve water quality;
provide educational and recreational
facilities for children; clean up Lake
Merritt; restore Oakland's creeks,
waterfront, and Estuary; and renovate
parks and open space
5500 Municipal Capital Improvement Bond proceeds Construction, purchase, lease, or
improvements of City capital assets
D - 27

FINANCIAL SUMMARIES
FUND SOURCES AND DESCRIPTIONS (CONT’D)
Fund Fund Description Source of Funds Uses of Funds
5501 Municipal Capital Improvement -
1989 Local Government Funding
Agency (LGFA) Refund
Revenue proceeds from 1989 LGFA
Refund
Construction, purchase, lease, or
improvements of City capital assets
5504 Parking Garage Access
Improvement
Proceeds from lease Garage access improvement project
5505 Municipal Improvement Capital-
Public Art
15% assessment on eligible City's
capital projects
Use for Public Art activities
5510 Capital Reserves One-time revenues, mainly from
bond refinancing / restructuring and
financing deals
Capital projects
5610 Central District Projects Funding Agreement with the Former
Oakland Redevelopment Agency
To provide funding for Central District
redevelopment projects
5611 Central District: TA Bonds Series
2003
Bond proceeds from the Central
District Tax Allocation Bond: Series
2003
To provide funding for Central District
redevelopment projects
5612 Central District: TA Bonds Series
2005
Bond proceeds from the Central
District Tax Allocation Bond: Series
2005
To provide funding for Central District
redevelopment projects
5620 Oak Knoll Projects One-time revenues, mainly from
bond refinancing / restructuring and
financing deals
To provide funding for Oak Knoll Area
redevelopment projects
5630 Broadway/MacArthur/San Pablo
Projects
Funding Agreement with the Former
Oakland Redevelopment Agency
To provide funding for
Broadway/MacArthur/San Pablo area
redevelopment projects
5640 Central City East Projects Funding Agreement with the Former
Oakland Redevelopment Agency
To provide funding for Central City East
Area redevelopment projects
5642 Central City East TA Bonds Series
2006A-TE (Tax Exempt)
Bond proceeds from the Central City
East Tax Allocation Bond: Series
2006A-TE
To provide funding for Central City East
Area redevelopment projects
5643 Central City East TA Bonds Series
2006A-T (Taxable)
Bond proceeds from the Central City
East Tax Allocation Bond: Series
2006A-T
To provide funding for Central City East
Area redevelopment projects
5650 Coliseum Projects Funding Agreement with the Former
Oakland Redevelopment Agency
To provide funding for Coliseum Area
redevelopment projects
5653 Coliseum: TA Bonds Series 2003 Bond proceeds from the Coliseum
Tax Allocation Bond: Series 2003
To provide funding for Coliseum Area
redevelopment projects
5655 Coliseum: TA Bonds Series 2006B-
TE (Tax Exempt)
Bond proceeds from Coliseum Tax
Allocation Bond: Series 2006B-TE
To provide funding for Coliseum Area
redevelopment projects
D - 28
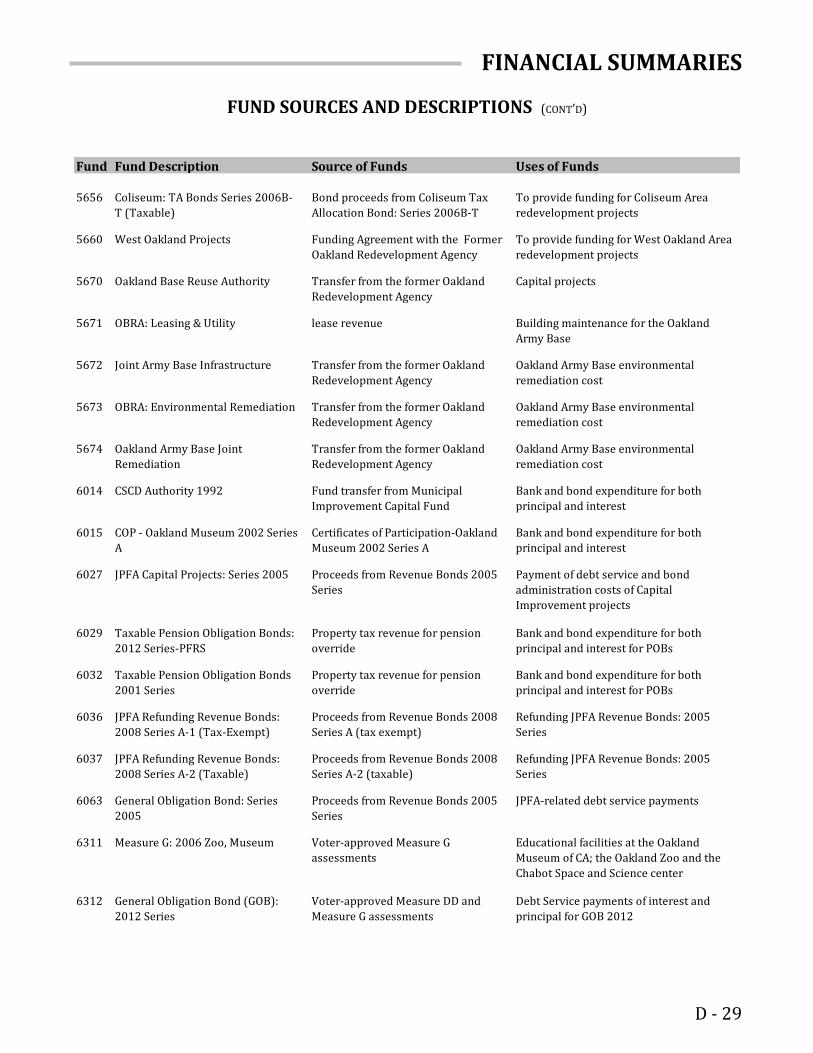
FINANCIAL SUMMARIES
FUND SOURCES AND DESCRIPTIONS (CONT’D)
Fund Fund Description Source of Funds Uses of Funds
5656 Coliseum: TA Bonds Series 2006B-
T (Taxable)
Bond proceeds from Coliseum Tax
Allocation Bond: Series 2006B-T
To provide funding for Coliseum Area
redevelopment projects
5660 West Oakland Projects Funding Agreement with the Former
Oakland Redevelopment Agency
To provide funding for West Oakland Area
redevelopment projects
5670 Oakland Base Reuse Authority Transfer from the former Oakland
Redevelopment Agency
Capital projects
5671 OBRA: Leasing & Utility lease revenue Building maintenance for the Oakland
Army Base
5672 Joint Army Base Infrastructure Transfer from the former Oakland
Redevelopment Agency
Oakland Army Base environmental
remediation cost
5673 OBRA: Environmental Remediation Transfer from the former Oakland
Redevelopment Agency
Oakland Army Base environmental
remediation cost
5674 Oakland Army Base Joint
Remediation
Transfer from the former Oakland
Redevelopment Agency
Oakland Army Base environmental
remediation cost
6014 CSCD Authority 1992 Fund transfer from Municipal
Improvement Capital Fund
Bank and bond expenditure for both
principal and interest
6015 COP - Oakland Museum 2002 Series
A
Certificates of Participation-Oakland
Museum 2002 Series A
Bank and bond expenditure for both
principal and interest
6027 JPFA Capital Projects: Series 2005 Proceeds from Revenue Bonds 2005
Series
Payment of debt service and bond
administration costs of Capital
Improvement projects
6029 Taxable Pension Obligation Bonds:
2012 Series-PFRS
Property tax revenue for pension
override
Bank and bond expenditure for both
principal and interest for POBs
6032 Taxable Pension Obligation Bonds
2001 Series
Property tax revenue for pension
override
Bank and bond expenditure for both
principal and interest for POBs
6036 JPFA Refunding Revenue Bonds:
2008 Series A-1 (Tax-Exempt)
Proceeds from Revenue Bonds 2008
Series A (tax exempt)
Refunding JPFA Revenue Bonds: 2005
Series
6037 JPFA Refunding Revenue Bonds:
2008 Series A-2 (Taxable)
Proceeds from Revenue Bonds 2008
Series A-2 (taxable)
Refunding JPFA Revenue Bonds: 2005
Series
6063 General Obligation Bond: Series
2005
Proceeds from Revenue Bonds 2005
Series
JPFA-related debt service payments
6311 Measure G: 2006 Zoo, Museum Voter-approved Measure G
assessments
Educational facilities at the Oakland
Museum of CA; the Oakland Zoo and the
Chabot Space and Science center
6312 General Obligation Bond (GOB):
2012 Series
Voter-approved Measure DD and
Measure G assessments
Debt Service payments of interest and
principal for GOB 2012
D - 29

FINANCIAL SUMMARIES
FUND SOURCES AND DESCRIPTIONS (CONT’D)
Fund Fund Description Source of Funds Uses of Funds
6321 Measure DD 2009 Debt Srv-Clean
Water, Safe Parks & Open Space
Trust Fund for Oakland
Voter-approved Measure DD
assessments
Principal and interest on long-term debt
6520 Fire Area - Redemption Special Assessments for fire area
utility underground
Pay for fire prevention-related services
6530 Rockridge Area Water District -
Redemption
Special Assessments for Rockridge
district
Pay for street light undergrounding
liability
6540 Skyline Sewer District -
Redemption
Repayment agreement with
homeowners
Pay for street light undergrounding
liability
6555 Piedmont Pines 2010 Utility
Underground Phase I
Special Assessments from Piedmont
Pines district
Debt service payments
6570 1996 JPFA Pooled Assessment
Revenue Bonds - Assessment Fund
Other special assessment districts Principal and interest
6580 1997 JPFA Pooled Assessment
Revenue Bonds - Revenue Fund
Other special assessment districts Principal and interest
6585 1999 JPFA Reassessment District
Debt Service
Other special assessment districts Principal and interest
6587 2012 Refunding Reassessment
Bonds-Debt Service
Special property tax assessment
from Reassessment District No 99-1
Bank and bond expenditure for both
principal and interest
6612 JPFA Lease Revenue Refunding
Bonds (Admin Building)
Proceeds from lease revenue bonds
and other funding sources
Construction of City Administration
Building
7100 Police and Fire Retirement System City Police and Fire Retirement
System contributions
City administrative costs related to the
Police and Fire Retirement System
7120 Oakland Municipal Employees
Retirement System (OMERS)
City Municipal Employees
Retirement System contributions
City administrative costs related to the
Oakland Municipal Employees Retirement
System
7130 Employee Deferred Compensation Employee deferred compensation
contributions
Account for employees' deferred
compensation contributions and
disbursements
7320 Pension Annuity Fund Pension Annuity receipts Transfer to General Purpose Fund to
support accrued pension liability
payments
7420 State Asset Trust Confiscated funds held in the course
of Police activities
Dispensed by order of criminal court
7440 Unclaimed Cash Funds from Police asset forfeitures-
redistributed from State
Transfer to General Fund after holding
period to fund city services
D - 30

FINANCIAL SUMMARIES
FUND SOURCES AND DESCRIPTIONS (CONT’D)
Fund Fund Description Source of Funds Uses of Funds
7540 Oakland Public Library Trust Donations, endowments and
contributions from individuals and
private corporations
Library Programs
7640 Oakland Public Museum Trust Donations and proceeds from fund-
raising activities
Museum programs and improvements
7690 Kerrison Trust for Police
Enhancement
Private, individual donation Uses related to police service
enhancements
7760 Grant Clearing Recoveries of departmental burden
charges to other subordinate
programs within departments
Capital project funding for personnel
expenditures
Administrative costs in departments that
are largely supported by grant and other
restricted funding sources
Personnel costs that are directly supported
by capital projects
7780 Oakland Redevelopment Agency
Projects (ORA)
Former Oakland Redevelopment
Agency
City staff and other costs related to former
Oakland Redevelopment Agency projects
7999 Miscellaneous Trusts Donations and endowments Miscellaneous programs and services
D - 31

FINANCIAL SUMMARIES
NOTES
D - 32

FINANCIAL SUMMARIES
FY 2013-14 PROPOSED BUDGET SUMMARY BY FUND
Fund Description
FY 2012-13
Projected
Ending Fund
Balance
FY 2013-14
Proposed
Revenues
FY 2013-14
Proposed
Expenditures
FY 2013-14
Proposed
Positions
(FTE)
1010 - General Fund: General Purpose 83,600,000 430,155,612 430,155,612 2,091.18
Mayor 2,055,907 9.10
City Council 3,547,574 26.46
City Administrator* 2,735,069 13,537,728 59.61
City Attorney 22,000 4,406,790 25.12
City Auditor 1,556,461 10.00
City Clerk 1,917,527 8.60
Police Department 5,397,408 178,790,549 1,006.70
Fire Department 6,543,824 95,480,831 549.80
Administrative Services 415,763,075 28,132,845 169.13
Community Services 630,839 18,189,843 150.80
Library 732,290 9,060,667 67.61
Public Works 610,709 1,156,776 8.25
Non-Departmental (2,279,602) 72,070,114
Capital Improvement Projects 252,000
1100 - Self Insurance Liability (21,171,561) 22,979,358 20,771,353 18.19
City Attorney 3,256,633 18.19
Police Department 6,576,750
Fire Department 943,902
Community Services 354,607
Public Works 3,524,791 4,524,821
Non-Departmental 19,454,567 5,114,640
1150 - Worker's Compensation Insurance Claims - - 12.81
City Attorney 439,309 1.91
Police Department 281,286 2.00
Fire Department 20,813 0.20
Administrative Services 1,508,585 7.20
Public Works 224,214 1.50
Non-Departmental (2,474,207)
1200 - Pension Override Tax Revenue 61,846,605 63,924,766 63,924,766
Administrative Services 200,000
Non-Departmental 63,724,766 63,924,766
* City Administrator consists of Administration, Budget, CBRB, Contract Compliance, Communications/KTOP, Economic & Workforce Development, Measure Y, Neighborhood Investment, Oaklanders’ Assistance Center and Public Ethics.
D - 33

FINANCIAL SUMMARIES
FY 2013-14 PROPOSED BUDGET SUMMARY BY FUND (CONT’D)
Fund Description
FY 2012-13
Projected
Ending Fund
Balance
FY 2013-14
Proposed
Revenues
FY 2013-14
Proposed
Expenditures
FY 2013-14
Proposed
Positions
(FTE)
1610 - Successor Redevelopment Agency
Reimbursement Fund
- 6,945,868 6,945,868 33.60
City Administrator* 6,945,868 4,702,655 23.02
City Attorney 1,349,968 5.81
City Clerk 49,402 0.40
Administrative Services 829,405 4.17
Library 14,438 0.20
1700 - Mandatory Refuse Program (4,839,314) 2,396,949 2,118,825 14.56
Administrative Services 2,396,949 2,118,825 14.56
1710 - Recycling Program 3,614,774 9,168,523 9,154,369 14.33
City Administrator* 208,871 1.00
City Attorney 294,063 1.50
Fire Department 48,870
Public Works 9,168,523 8,602,565 11.83
1720 - Comprehensive Clean-up 3,992,770 17,958,757 17,958,757 108.30
Fire Department 86,740
Community Services 60,000
Public Works 17,958,757 17,812,017 108.30
1730 - Henry J Kaiser Convention Center (2,910,991) 579,589
Non-Departmental 579,589
1740 - Hazardous Materials Inspections 1,317,080 969,148 969,148 6.10
Fire Department 969,148 969,148 6.10
1750 - Multipurpose Reserve (4,566,712) 4,809,151 4,399,688 8.94
City Administrator* 404,803 0.34
Administrative Services (25,000) 2,219,905 0.40
Public Works 4,834,151 1,774,980 8.20
1760 - Telecommunications Reserve - 1,575,000 1,550,054 10.24
Mayor 100,888 0.50
City Administrator* 196,774 1.30
Police Department 144,721 1.00
Administrative Services 104,406 0.74
Library 1,575,000 1,003,265 6.70
* City Administrator consists of Administration, Budget, CBRB, Contract Compliance, Communications/KTOP, Economic & Workforce Development, Measure Y, Neighborhood Investment, Oaklanders’ Assistance Center and Public Ethics.
D - 34

FINANCIAL SUMMARIES
FY 2013-14 PROPOSED BUDGET SUMMARY BY FUND (CONT’D)
Fund Description
FY 2012-13
Projected
Ending Fund
Balance
FY 2013-14
Proposed
Revenues
FY 2013-14
Proposed
Expenditures
FY 2013-14
Proposed
Positions
(FTE)
1770 - Telecommunications Land Use 641,066 479,259 479,259 2.00
City Administrator* 479,259 479,259 2.00
1780 - Kid's First Oakland Children's Fund 1,314,439 11,763,186 11,763,186 5.90
Community Services 11,763,186 11,763,186 5.90
1791 - Contract Administration Fee (2,363,159) 579,605
Non-Departmental 579,605
1820 - OPRCA Self Sustaining Revolving Fund 870,409 5,353,327 5,353,327 101.55
Community Services 5,353,327 5,353,327 101.55
1884 - 2006 Housing Bond Proceeds 8,392,464 - 5.15
Housing & Community Development - 5.15
2102 - Department of Agriculture (137,459) 1,095,000 1,095,000 6.50
Community Services 1,095,000 1,095,000 6.50
2103 - HUD-ESG/SHP/HOPWA (3,324,975) 6,364,572 6,331,930 0.78
Community Services 6,364,572 6,331,930 0.78
2105 - HUD-EDI Grants 982,591 - 3.00
Housing & Community Development - 3.00
2107 - HUD-108 (202,353) 2,122,000 2,122,000
Housing & Community Development 2,122,000 2,122,000
2108 - HUD-CDBG - 7,455,657 7,455,657 29.20
City Administrator* 311,719 1.75
City Attorney 45,468 0.19
Administrative Services 164,600 1.00
Community Services 919,243 3.89
Housing & Community Development 7,455,657 5,894,865 21.85
Planning & Building 119,762 0.52
2109 - HUD-Home 2,374,789 2,161,467 2,161,467 3.70
Housing & Community Development 2,161,467 2,161,467 3.70
* City Administrator consists of Administration, Budget, CBRB, Contract Compliance, Communications/KTOP, Economic & Workforce Development, Measure Y, Neighborhood Investment, Oaklanders’ Assistance Center and Public Ethics.
D - 35

FINANCIAL SUMMARIES
FY 2013-14 PROPOSED BUDGET SUMMARY BY FUND (CONT’D)
Fund Description
FY 2012-13
Projected
Ending Fund
Balance
FY 2013-14
Proposed
Revenues
FY 2013-14
Proposed
Expenditures
FY 2013-14
Proposed
Positions
(FTE)
2112 - Department of Justice - (10,050) 0.50
Police Department 7,834
Community Services (17,884) 0.50
2113 - Department of Justice - COPS Hiring - - 25.00
Police Department - 25.00
2114 - Department of Labor (38,325) 981,426 981,426 52.85
Community Services 981,426 981,426 52.85
2120 - Federal Action Agency (18,118) 338,693 338,693 1.01
Community Services 338,693 338,693 1.01
2123 - US Dept of Homeland Security - 1,466,257 1,466,257 13.10
Police Department 188,160
Fire Department 1,278,097 1,466,257 13.10
2124 - Federal Emergency Management Agency
(FEMA) (898,403) 936,205 505,549 3.35
Fire Department 936,205 505,549 3.35
2128 - Department of Health and Human Services (642,069) 20,999,741 20,999,741 181.39
Community Services 20,999,741 20,999,741 181.39
2138 - California Department of Education (41,662) 937,485 937,472
Community Services 937,485 937,472
2146 - California State Emergency Services 1,945,519 61,218 61,218 0.25
Fire Department 61,218 61,218 0.25
2148 - California Library Services (563,451) 68,392 64,654 1.08
Library 68,392 64,654 1.08
2159 - State of California Other (877,809) 424,123 411,789 2.54
Police Department 114,123 101,787 1.00
Community Services 310,000 310,002 1.54
2160 - County of Alameda: Grants 2,044,955 1,442,875 1,442,187 2.09
Fire Department 1,011,613 1,010,925 1.00
Community Services 431,262 431,262 1.09
* City Administrator consists of Administration, Budget, CBRB, Contract Compliance, Communications/KTOP, Economic & Workforce Development, Measure Y, Neighborhood Investment, Oaklanders’ Assistance Center and Public Ethics.
D - 36

FINANCIAL SUMMARIES
FY 2013-14 PROPOSED BUDGET SUMMARY BY FUND (CONT’D)
Fund Description
FY 2012-13
Projected
Ending Fund
Balance
FY 2013-14
Proposed
Revenues
FY 2013-14
Proposed
Expenditures
FY 2013-14
Proposed
Positions
(FTE)
2163 - Metro Transportation Com: Program Grant (556,387) 72,719 71,924 0.27
Library 72,719 71,924 0.27
Public Works
Capital Improvement Projects
2172 - Alameda County: Vehicle Abatement
Authority 27,732 400,550 400,550 2.00
Police Department 400,550 400,550 2.00
2190 - Private Grants (382,939) 35,280 24,960 0.20
City Attorney 10,280
Fire Department 25,000 24,960 0.20
2195 - Workforce Investment Act 6,889 5,530,936 5,489,004 9.01
City Administrator* 5,530,936 5,275,111 7.25
Administrative Services 100,011 0.83
Community Services 113,882 0.93
2211 - Measure B: ACTIA 6,313,366 10,350,816 10,350,816 10.98
City Attorney 28,238 0.13
Administrative Services 10,920 32,832 0.25
Public Works 10,339,896 2,744,746 10.60
Capital Improvement Projects 7,545,000
2212 - Measure B: Bicycle/Pedestrian Pass-Thru Funds3,092,152 1,660,000 1,660,000
Public Works 1,660,000 10,000
Capital Improvement Projects 1,650,000
2213 - Measure B: Paratransit - ACTIA 101,818 1,068,580 1,068,580 4.41
Community Services 1,068,580 1,068,580 4.41
2215 - Measure F - Vehicle Registration Fee 1,590,209 1,500,000 1,500,000
Capital Improvement Projects 1,500,000 1,500,000
2230 - State Gas Tax 2,527,772 7,130,723 7,025,033 31.93
Public Works 7,130,723 7,025,033 31.93
* City Administrator consists of Administration, Budget, CBRB, Contract Compliance, Communications/KTOP, Economic & Workforce Development, Measure Y, Neighborhood Investment, Oaklanders’ Assistance Center and Public Ethics.
D - 37

FINANCIAL SUMMARIES
FY 2013-14 PROPOSED BUDGET SUMMARY BY FUND (CONT’D)
Fund Description
FY 2012-13
Projected
Ending Fund
Balance
FY 2013-14
Proposed
Revenues
FY 2013-14
Proposed
Expenditures
FY 2013-14
Proposed
Positions
(FTE)
2231 - State Gas Tax-Prop 42 Replacement Funds 3,924,243 4,823,742 4,562,403 34.62
City Attorney 116,656 0.45
Public Works 4,823,742 4,445,747 34.17
2241 - Measure Q-Library Services Retention &
Enhancement 5,664,259 16,850,879 16,843,379 148.83
City Administrator* 17,930
Administrative Services 231,871 2.00
Library 16,850,879 16,593,578 146.83
2242 - Measure Q Reserve- Library Services
Retention & Enhancement 673,091
Library
2250 - Measure N: Fund 657,671 1,749,630 1,749,630 6.85
City Administrator* 4,579
Fire Department 1,749,630 1,745,051 6.85
2251 - Measure Y: Public Safety Act 2004 5,078,511 23,562,840 23,562,840 74.05
Mayor 80,710 0.40
City Administrator* 529,953 0.80
Police Department 12,327,243 63.00
Fire Department 4,000,000
Administrative Services 23,562,840 22,975
Community Services 6,601,959 9.85
2310 - Lighting and Landscape Assessment
District (800,000) 20,617,346 20,353,939 82.69
City Administrator* 25,531
Administrative Services 18,970,646 42,456 0.40
Community Services 4,110,610 7.29
Public Works 1,646,700 16,175,342 75.00
2321 - Wildland Fire Prevention Assess District 1,627,512 2,127,812 2,127,812 1.00
Fire Department 2,127,812 2,127,812 1.00
2330 - Werner Court Vegetation Mgmt District 16,202 6,200 6,200
Fire Department 6,200 6,200
* City Administrator consists of Administration, Budget, CBRB, Contract Compliance, Communications/KTOP, Economic & Workforce Development, Measure Y, Neighborhood Investment, Oaklanders’ Assistance Center and Public Ethics.
D - 38

FINANCIAL SUMMARIES
FY 2013-14 PROPOSED BUDGET SUMMARY BY FUND (CONT’D)
Fund Description
FY 2012-13
Projected
Ending Fund
Balance
FY 2013-14
Proposed
Revenues
FY 2013-14
Proposed
Expenditures
FY 2013-14
Proposed
Positions
(FTE)
2411 - False Alarm Reduction Program 815,734 1,491,239 1,472,551 8.50
Police Department 1,491,239 1,312,904 7.50
Administrative Services 159,647 1.00
2412 - Alameda County: Emergency Dispatch
Service Supplemental Assessment 1,095 1,913,935 1,913,935 11.10
City Administrator* 4,542
Fire Department 1,913,935 1,909,393 11.10
2413 - Rent Adjustment Program Fund 2,355,407 2,160,782 2,160,782 13.70
City Administrator* 173,336 0.50
City Attorney 348,415 1.90
Administrative Services 277,382 3.00
Housing & Community Development 2,160,782 1,361,649 8.30
2415 - Development Service Fund (1,537,216) 24,316,484 24,316,484 132.64
City Administrator* 255,218 1.58
City Attorney 644,633 3.50
Administrative Services 377,737 2.33
Public Works 1,577,484 1,745,626 11.00
Planning & Building 22,739,000 21,293,270 114.23
2416 - Traffic Safety Fund 757,141 2,790,417 2,790,417 19.53
Police Department 1,263,653 2,360,960 17.65
Public Works 1,526,764 429,457 1.88
2417 - Excess Litter Fee Fund 384,320 440,900 440,900
City Administrator* 440,900
Administrative Services 440,900
2419 - Transient Occupancy Tax (TOT) Surcharge 336,148 2,963,047 2,963,047
City Administrator* 370,381 370,381
Non-Departmental 2,592,666 2,592,666
2826 - Mortgage Revenue 198,699 225,636 225,636 1.75
Housing & Community Development 225,636 225,636 1.75
* City Administrator consists of Administration, Budget, CBRB, Contract Compliance, Communications/KTOP, Economic & Workforce Development, Measure Y, Neighborhood Investment, Oaklanders’ Assistance Center and Public Ethics.
D - 39

FINANCIAL SUMMARIES
FY 2013-14 PROPOSED BUDGET SUMMARY BY FUND (CONT’D)
Fund Description
FY 2012-13
Projected
Ending Fund
Balance
FY 2013-14
Proposed
Revenues
FY 2013-14
Proposed
Expenditures
FY 2013-14
Proposed
Positions
(FTE)
2990 - Public Works Grants (652,723) 280,000 280,000 1.47
Public Works 280,000 280,000 1.47
2993 - Library Grants 50,000 250,000 250,000
Library 250,000 250,000
2994 - Social Services Grants 31,681 76,000 76,000
Community Services 76,000 76,000
2995 - Police Grants 77,240 20,000 20,000
Police Department 20,000 20,000
2996 - Parks and Recreation Grants 2001 25,664 16,847 16,847
Community Services 16,847 16,847
2999 - Miscellaneous Grants 6,987,205 1,300,000 1,300,000 2.50
Police Department 1,300,000 1,300,000
Housing & Community Development - 2.50
3100 - Sewer Service Fund 161,325,975 54,094,500 53,695,519 129.37
City Attorney 640,241 3.80
Fire Department 283,400 2.00
Administrative Services 100,000 3,321,941 1.35
Public Works 53,994,500 24,957,832 122.22
Non-Departmental 9,732,105
Capital Improvement Projects 14,760,000
3150 - Sewer Rate Stabilization Fund 1,001,108 500,000
Public Works 500,000
3200 - Golf Course 3,843,595 895,950 503,165 0.75
City Administrator* 8,450
Community Services 895,950 494,715 0.75
4100 - Equipment (7,059,377) 19,623,320 18,270,840 56.00
Administrative Services (100,000) 5,521
Public Works 19,723,320 18,265,319 56.00
* City Administrator consists of Administration, Budget, CBRB, Contract Compliance, Communications/KTOP, Economic & Workforce Development, Measure Y, Neighborhood Investment, Oaklanders’ Assistance Center and Public Ethics.
D - 40

FINANCIAL SUMMARIES
FY 2013-14 PROPOSED BUDGET SUMMARY BY FUND (CONT’D)
Fund Description
FY 2012-13
Projected
Ending Fund
Balance
FY 2013-14
Proposed
Revenues
FY 2013-14
Proposed
Expenditures
FY 2013-14
Proposed
Positions
(FTE)
4200 - Radio / Telecommunications 2,954,093 3,577,377 3,517,719 9.61
Administrative Services 3,577,377 3,517,719 9.61
4210 - Telephone Equipment and Software 1,885,171 308,530 308,530
Administrative Services 308,530 308,530
4300 - Reproduction (1,115,669) 1,440,745 1,410,937 5.00
Administrative Services 1,440,745 1,410,937 5.00
4400 - City Facilities (22,455,376) 26,530,817 25,272,966 111.68
City Administrator* 2,400
Administrative Services (75,000)
Public Works 26,603,417 25,272,966 111.68
4450 - City Facilities Energy Conservation
Projects 2,385,870 - 0.50
Public Works 86,141 0.50
Planning & Building (86,141)
4500 - Central Stores (4,046,005) 425,838 339,843 2.50
Administrative Services 425,838 339,843 2.50
4550 - Purchasing (445,288) 777,965 777,965 7.00
Administrative Services 777,965 782,813 7.00
Planning & Building (4,848)
5130 - Rockridge: Library Assessment District 500,699 501,887 501,887
City Administrator* 3,387
Administrative Services 501,887
Capital Improvement Projects 498,500
5321 - Measure DD: 2009B Clean Water,Safe Parks
& Open Space Trust Fund for Oakland 26,707,820 - 4.50
City Administrator* - 0.50
Public Works - 4.00
5505 - Municipal Capital Improvement: Public
Arts 613,098 - 1.50
City Administrator* - 1.50
* City Administrator consists of Administration, Budget, CBRB, Contract Compliance, Communications/KTOP, Economic & Workforce Development, Measure Y, Neighborhood Investment, Oaklanders’ Assistance Center and Public Ethics.
D - 41

FINANCIAL SUMMARIES
FY 2013-14 PROPOSED BUDGET SUMMARY BY FUND (CONT’D)
Fund Description
FY 2012-13
Projected
Ending Fund
Balance
FY 2013-14
Proposed
Revenues
FY 2013-14
Proposed
Expenditures
FY 2013-14
Proposed
Positions
(FTE)
5510 - Capital Reserves 563,984 7,250,000 2,950,000
Administrative Services 1,000,000
Non-Departmental 6,250,000 1,700,000
Capital Improvement Projects 1,250,000
5610 - Central District Projects 12,294,325 350,000 350,000
City Administrator* 350,000 350,000
5650 - Coliseum Projects 10,219,561 100,000 100,000
City Administrator* 100,000 100,000
5671 - OBRA: Leasing & Utility 60,615,770 500,000 500,000 5.10
City Administrator* 500,000 - 5.10
Public Works 500,000
6014 - Oakland Convention Center 1992 82,878 14,106,950 14,106,950
Non-Departmental 14,106,950 14,106,950
6027 - JPFA Capital Projects: Series 2005 75,224,665 11,206,500 11,206,500
Non-Departmental 11,206,500 11,206,500
6029 - Taxable Pension Obligation Bonds: 2012
Series-PFRS 1,000 8,965,220 8,965,220
Non-Departmental 8,965,220 8,965,220
6032 - Taxable Pension Obligation: Series 2001 28,003 40,769,001 40,769,001
Non-Departmental 40,769,001 40,769,001
6036 - JPFA Refunding Revenue Bonds: 2008
Series A-1 (Tax-Exempt Bonds) 10,095,544 18,344,750 18,344,750
Non-Departmental 18,344,750 18,344,750
6037 - JPFA Refunding Revenue Bonds: 2008
Series A-2 (Taxable Bonds) 2,076,468 5,470,053 5,470,053
Non-Departmental 5,470,053 5,470,053
6063 - General Obligation Bonds: Series 2005 1,225,181 11,203,665 11,203,665
Non-Departmental 11,203,665 11,203,665
* City Administrator consists of Administration, Budget, CBRB, Contract Compliance, Communications/KTOP, Economic & Workforce Development, Measure Y, Neighborhood Investment, Oaklanders’ Assistance Center and Public Ethics.
D - 42

FINANCIAL SUMMARIES
FY 2013-14 PROPOSED BUDGET SUMMARY BY FUND (CONT’D)
Fund Description
FY 2012-13
Projected
Ending Fund
Balance
FY 2013-14
Proposed
Revenues
FY 2013-14
Proposed
Expenditures
FY 2013-14
Proposed
Positions
(FTE)
6311 - Measure G: 2006 Zoo, Museum 852,316 1,328,363 1,328,363
Non-Departmental 1,328,363 1,328,363
6312 - GOB Series 2012-Refunding Bonds 1,157,522 6,655,475 6,655,475
Non-Departmental 6,655,475 6,655,475
6321 - Measure DD: 2009B Clean Water, Safe
Parks & Open Space Trust Fund for Oakland 205,014 4,616,882 4,616,882
Non-Departmental 4,616,882 4,616,882
6540 - Skyline Sewer District - Redemption 56,523 32,568 24,600
Non-Departmental 32,568 24,600
6555 - Piedmont Pines 2010 Utility Underground
Phase I - Debt Service 145,415 230,007 230,007
Non-Departmental 230,007 230,007
6570 - JPFA Pooled Assessment: 1996 Revenue
Bonds - Assessment (143,909) 21,600 21,600
Non-Departmental 21,600 21,600
6587 - 2012 Refunding Reassessment Bonds-Debt
Service 355,000 432,991 432,991 0.40
Administrative Services 55,971 0.40
Non-Departmental 432,991 377,020
6612 - JPFA Lease Revenue Refunding Bonds
(Admin Building): 2008 Series B 9,111,530 15,322,038 15,322,038
Non-Departmental 15,322,038 15,322,038
6999 - Miscellaneous Debt Service 21,500,000 21,500,000
Non-Departmental 21,500,000 21,500,000
7100 - Police and Fire Retirement System 471,105,257 3,063,640 3,063,640 4.90
City Attorney 95,766 0.40
Administrative Services 479,856 2,967,874 4.50
Non-Departmental 2,583,784
* City Administrator consists of Administration, Budget, CBRB, Contract Compliance, Communications/KTOP, Economic & Workforce Development, Measure Y, Neighborhood Investment, Oaklanders’ Assistance Center and Public Ethics.
D - 43
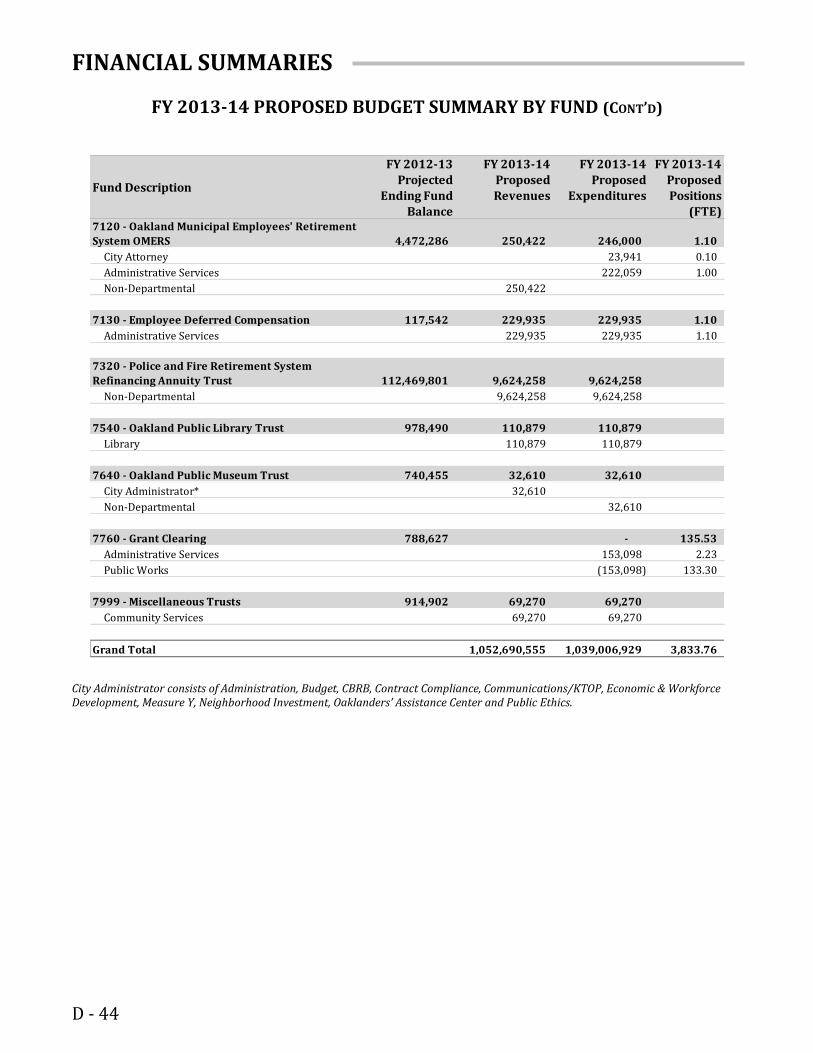
FINANCIAL SUMMARIES
FY 2013-14 PROPOSED BUDGET SUMMARY BY FUND (CONT’D)
Fund Description
FY 2012-13 Projected
Ending Fund Balance
FY 2013-14 Proposed
Revenues
FY 2013-14 Proposed
Expenditures
FY 2013-14 Proposed
Positions (FTE)
7120 - Oakland Municipal Employees' Retirement
System OMERS 4,472,286 250,422 246,000 1.10
City Attorney 23,941 0.10
Administrative Services 222,059 1.00
Non-Departmental 250,422
7130 - Employee Deferred Compensation 117,542 229,935 229,935 1.10
Administrative Services 229,935 229,935 1.10
7320 - Police and Fire Retirement System
Refinancing Annuity Trust 112,469,801 9,624,258 9,624,258
Non-Departmental 9,624,258 9,624,258
7540 - Oakland Public Library Trust 978,490 110,879 110,879
Library 110,879 110,879
7640 - Oakland Public Museum Trust 740,455 32,610 32,610
City Administrator* 32,610
Non-Departmental 32,610
7760 - Grant Clearing 788,627 - 135.53
Administrative Services 153,098 2.23
Public Works (153,098) 133.30
7999 - Miscellaneous Trusts 914,902 69,270 69,270
Community Services 69,270 69,270
Grand Total 1,052,690,555 1,039,006,929 3,833.76
City Administrator consists of Administration, Budget, CBRB, Contract Compliance, Communications/KTOP, Economic & Workforce Development, Measure Y, Neighborhood Investment, Oaklanders’ Assistance Center and Public Ethics.
D - 44

FINANCIAL SUMMARIES
FY 2014-15 PROPOSED BUDGET SUMMARY BY FUND
Fund Description
FY 2014-15
Proposed
Revenues
FY 2014-15
Proposed
Expenditures
FY 2014-15
Proposed
Positions
(FTE)
FY 2014-15
Estimated
Ending Fund
Balance
1010 - General Fund: General Purpose 457,401,684 457,401,684 2,153.95 83,600,000
Mayor 2,002,220 9.10 (4,058,127)
City Council 3,434,472 26.46 (6,982,046)
City Administrator* 2,049,840 13,790,378 59.47 (22,543,197)
City Attorney 22,000 4,289,481 25.12 (8,652,271)
City Auditor 1,510,761 10.00 (3,067,222)
City Clerk 1,873,031 8.60 (3,790,558)
Police Department 9,604,285 192,780,324 1,071.20 ##########
Fire Department 6,548,730 109,836,720 550.80 ##########
Administrative Services 425,850,871 27,111,004 169.13 786,370,097
Community Services 631,172 18,540,187 150.21 (35,468,019)
Library 741,734 9,060,466 65.61 (16,647,109)
Public Works 610,924 1,178,195 8.25 (1,113,338)
Non-Departmental 11,342,128 71,742,445 ##########
Capital Improvement Projects 252,000 (504,000)
-
1100 - Self Insurance Liability 22,979,358 20,849,803 18.19 (16,834,001)
City Attorney 3,335,083 18.19 (6,591,716)
Police Department 6,576,750 (13,153,500)
Fire Department 943,902 (1,887,804)
Community Services 354,607 (709,214)
Public Works 3,524,791 4,524,821 (2,000,060)
Non-Departmental 19,454,567 5,114,640 28,679,854
-
1150 - Worker's Compensation Insurance Claims 0 12.81 -
City Attorney 449,900 1.91 (889,209)
Police Department 287,654 2.00 (568,940)
Fire Department 21,287 0.20 (42,100)
Administrative Services 1,533,283 7.20 (3,041,868)
Public Works 228,585 1.50 (452,799)
Non-Departmental (2,520,709) 4,994,916
-
1200 - Pension Override Tax Revenue 59,311,513 59,311,513 61,846,605
Administrative Services 200,000 400,000
Non-Departmental 59,111,513 59,311,513 (400,000)
-
* City Administrator consists of Administration, Budget, CBRB, Contract Compliance, Communications/KTOP, Economic & Workforce Development, Measure Y, Neighborhood Investment, Oaklanders’ Assistance Center and Public Ethics.
D - 45

FINANCIAL SUMMARIES
FY 2014-15 PROPOSED BUDGET SUMMARY BY FUND (CONT’D)
Fund Description
FY 2014-15
Proposed
Revenues
FY 2014-15
Proposed
Expenditures
FY 2014-15
Proposed
Positions
(FTE)
FY 2014-15
Estimated
Ending Fund
Balance
1610 - Successor Redevelopment Agency
Reimbursement Fund
7,097,334 7,097,334 33.60 -
City Administrator* 7,097,334 4,805,018 23.02 4,535,529
City Attorney 1,382,330 5.81 (2,732,298)
City Clerk 50,588 0.40 (99,990)
Administrative Services 844,620 4.17 (1,674,025)
Library 14,778 0.20 (29,216)
-
1700 - Mandatory Refuse Program 2,396,949 2,172,735 14.56 (4,336,976)
Administrative Services 2,396,949 2,172,735 14.56 502,338
-
1710 - Recycling Program 9,217,398 9,202,967 14.33 3,643,359
City Administrator* 212,086 1.00 (420,957)
City Attorney 301,157 1.50 (595,220)
Fire Department 48,870 (97,740)
Public Works 9,217,398 8,640,854 11.83 1,142,502
-
1720 - Comprehensive Clean-up 17,976,019 17,976,019 108.30 3,992,770
Fire Department 86,740 (173,480)
Community Services 60,000 (120,000)
Public Works 17,976,019 17,829,279 108.30 293,480
-
1730 - Henry J Kaiser Convention Center 579,589 (1,751,813)
Non-Departmental 579,589 1,159,178
-
1740 - Hazardous Materials Inspections 987,798 987,798 6.10 1,317,080
Fire Department 987,798 987,798 6.10 -
-
1750 - Multipurpose Reserve 4,809,151 4,429,307 8.94 (3,777,405)
City Administrator* 405,786 0.34 (810,589)
Administrative Services (25,000) 2,221,180 0.40 (4,491,085)
Public Works 4,834,151 1,802,341 8.20 6,090,981
-
1760 - Telecommunications Reserve 1,581,944 1,581,944 10.24 24,946
Mayor 103,339 0.50 (204,227)
City Administrator* 201,532 1.30 (398,306)
Police Department 148,237 1.00 (292,958)
Administrative Services 106,940 0.74 (211,346)
Library 1,581,944 1,021,896 6.70 1,131,783 * City Administrator consists of Administration, Budget, CBRB, Contract Compliance, Communications/KTOP, Economic & Workforce Development, Measure Y, Neighborhood Investment, Oaklanders’ Assistance Center and Public Ethics.
D - 46

FINANCIAL SUMMARIES
FY 2014-15 PROPOSED BUDGET SUMMARY BY FUND (CONT’D)
Fund Description
FY 2014-15
Proposed
Revenues
FY 2014-15
Proposed
Expenditures
FY 2014-15
Proposed
Positions
(FTE)
FY 2014-15
Estimated
Ending Fund
Balance
1770 - Telecommunications Land Use 513,005 513,005 2.14 641,066
City Administrator* 513,005 513,005 2.14 -
-
1780 - Kid's First Oakland Children's Fund 12,125,533 12,125,533 5.90 1,314,439
Community Services 12,125,533 12,125,533 5.90 -
-
1791 - Contract Administration Fee 579,605 (1,203,949)
Non-Departmental 579,605 1,159,210
-
1820 - OPRCA Self Sustaining Revolving Fund 5,402,771 5,402,771 101.55 870,409
Community Services 5,402,771 5,402,771 101.55 -
-
1884 - 2006 Housing Bond Proceeds 8,392,464
Housing & Community Development -
-
2102 - Department of Agriculture 1,095,000 1,095,000 6.50 (137,459)
Community Services 1,095,000 1,095,000 6.50 -
-
2103 - HUD-ESG/SHP/HOPWA 6,364,572 6,331,131 0.78 (3,258,892)
Community Services 6,364,572 6,331,131 0.78 66,083
-
2105 - HUD-EDI Grants 0 3.00 982,591
Housing & Community Development 0 3.00 -
-
2107 - HUD-108 2,122,000 2,122,000 (202,353)
Housing & Community Development 2,122,000 2,122,000 -
-
2108 - HUD-CDBG 7,455,657 7,455,657 29.20 -
City Administrator* 317,834 1.75 (629,553)
City Attorney 46,564 0.19 (92,032)
Administrative Services 167,741 1.00 (332,341)
Community Services 954,269 3.89 (1,873,512)
Housing & Community Development 7,455,657 5,847,061 21.85 3,169,388
Planning & Building 122,188 0.52 (241,950)
-
2109 - HUD-Home 2,161,467 2,161,467 3.10 2,374,789
Housing & Community Development 2,161,467 2,161,467 3.10 -
-
*City Administrator consists up of Administration, Equal Opportunity Programs, Employee Relations, Budget, and
KTOP Operations
D - 47

FINANCIAL SUMMARIES
FY 2014-15 PROPOSED BUDGET SUMMARY BY FUND (CONT’D)
Fund Description
FY 2014-15
Proposed
Revenues
FY 2014-15
Proposed
Expenditures
FY 2014-15
Proposed
Positions
(FTE)
FY 2014-15
Estimated
Ending Fund
Balance
2112 - Department of Justice (10,050) 0.25 20,100
Police Department 7,834 (15,668)
Community Services (17,884) 0.25 35,768
-
2113 - Department of Justice - COPS Hiring 0 12.50 -
Police Department 0 12.50 -
-
2114 - Department of Labor 981,426 981,426 52.85 (38,325)
Community Services 981,426 981,426 52.85 -
-
2120 - Federal Action Agency 329,801 277,802 0.60 33,881
Community Services 329,801 277,802 0.60 51,999
-
2123 - US Dept of Homeland Security 1,498,069 1,498,069 13.10 -
Police Department 188,160 376,320
Fire Department 1,309,909 1,498,069 13.10 (376,320)
-
2124 - Federal Emergency Management Agency
(FEMA) 944,958 514,302 3.35 (37,091)
Fire Department 944,958 514,302 3.35 861,312
-
2128 - Department of Health and Human Services 20,999,741 20,999,741 181.39 (642,069)
Community Services 20,999,741 20,999,741 181.39 -
-
2138 - California Department of Education 937,485 937,472 (41,636)
Community Services 937,485 937,472 26
-
2146 - California State Emergency Services 62,661 62,661 0.25 1,945,519
Fire Department 62,661 62,661 0.25 -
-
2148 - California Library Services 68,392 64,654 1.08 (555,975)
Library 68,392 64,654 1.08 7,476
-
2159 - State of California Other 424,123 411,789 2.54 (853,141)
Police Department 114,123 101,788 1.00 24,671
Community Services 310,000 310,001 1.54 (3)
-
2160 - County of Alameda: Grants 1,442,875 1,442,187 2.09 2,046,331
Fire Department 1,011,613 1,010,925 1.00 1,376
Community Services 431,262 431,262 1.09 -
- * City Administrator consists of Administration, Budget, CBRB, Contract Compliance, Communications/KTOP, Economic & Workforce Development, Measure Y, Neighborhood Investment, Oaklanders’ Assistance Center and Public Ethics.
D - 48

FINANCIAL SUMMARIES
FY 2014-15 PROPOSED BUDGET SUMMARY BY FUND (CONT’D)
Fund Description
FY 2014-15
Proposed
Revenues
FY 2014-15
Proposed
Expenditures
FY 2014-15
Proposed
Positions
(FTE)
FY 2014-15
Estimated
Ending Fund
Balance
2163 - Metro Transportation Com: Program Grant 3,922,924 3,922,924 0.27 (555,592)
Library 72,719 71,924 0.27 1,590
Public Works 3,850,205 3,850,205
Capital Improvement Projects 3,851,000 (3,851,000)
-
2172 - Alameda County: Vehicle Abatement
Authority 412,615 412,615 2.00 27,732
Police Department 412,615 412,615 2.00 -
-
2190 - Private Grants 35,280 24,960 0.20 (362,299)
City Attorney 10,280 20,560
Fire Department 25,000 24,960 0.20 80
-
2195 - Workforce Investment Act 5,530,936 5,495,156 9.01 84,601
City Administrator* 5,530,936 5,279,141 7.25 507,620
Administrative Services 102,419 0.83 (202,430)
Community Services 113,596 0.93 (227,478)
-
2211 - Measure B: ACTIA 9,837,042 9,837,042 10.98 6,313,366
City Attorney 28,919 0.13 (57,157)
Administrative Services 10,920 33,629 0.25 (44,621)
Public Works 9,826,122 2,779,494 10.60 14,641,778
Capital Improvement Projects 6,995,000 (14,540,000)
-
2212 - Measure B: Bicycle/Pedestrian Pass-Thru Funds 1,103,350 1,010,000 3,185,502
Public Works 1,103,350 10,000 2,743,350
Capital Improvement Projects 1,000,000 (2,650,000)
-
2213 - Measure B: Paratransit - ACTIA 1,068,580 1,068,580 4.41 101,818
Community Services 1,068,580 1,068,580 4.41 -
-
2215 - Measure F - Vehicle Registration Fee 1,500,000 1,500,000 1,590,209
Capital Improvement Projects 1,500,000 1,500,000 -
-
2230 - State Gas Tax 7,250,340 7,142,305 31.89 2,741,497
Public Works 7,250,340 7,142,305 31.89 213,725
-
* City Administrator consists of Administration, Budget, CBRB, Contract Compliance, Communications/KTOP, Economic & Workforce Development, Measure Y, Neighborhood Investment, Oaklanders’ Assistance Center and Public Ethics.
D - 49
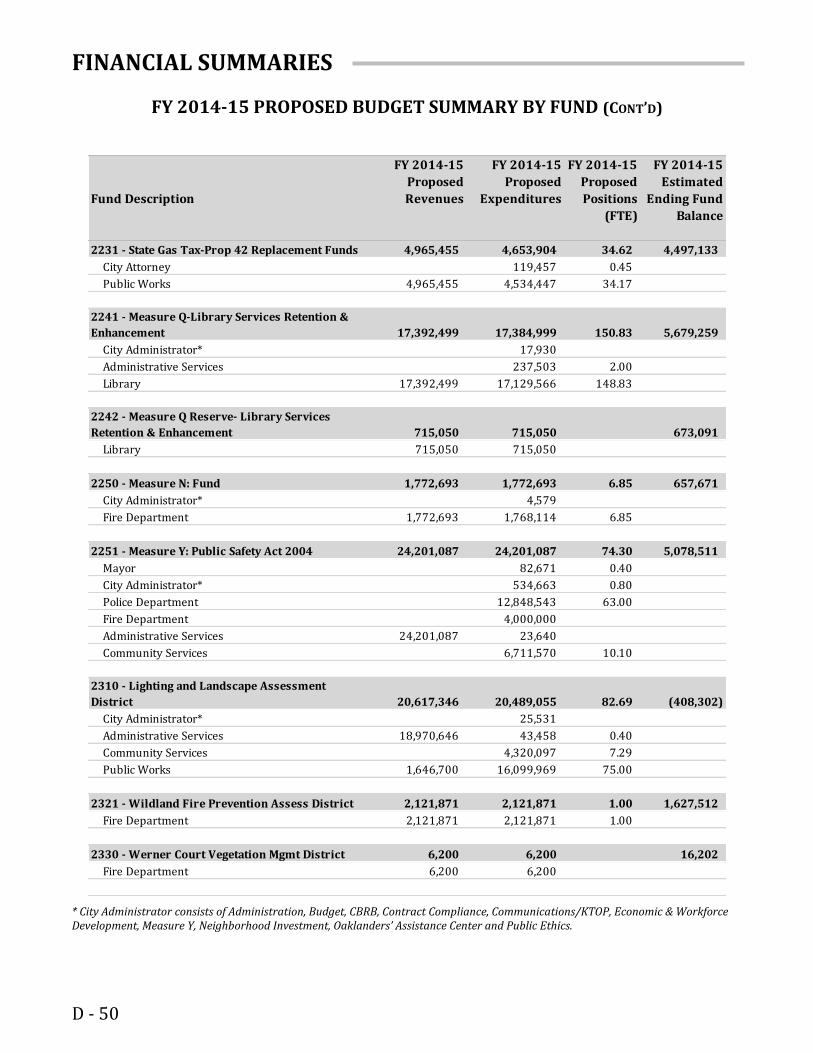
FINANCIAL SUMMARIES
FY 2014-15 PROPOSED BUDGET SUMMARY BY FUND (CONT’D)
Fund Description
FY 2014-15
Proposed
Revenues
FY 2014-15
Proposed
Expenditures
FY 2014-15
Proposed
Positions
(FTE)
FY 2014-15
Estimated
Ending Fund
Balance
2231 - State Gas Tax-Prop 42 Replacement Funds 4,965,455 4,653,904 34.62 4,497,133
City Attorney 119,457 0.45 (236,113)
Public Works 4,965,455 4,534,447 34.17 809,003
-
2241 - Measure Q-Library Services Retention &
Enhancement 17,392,499 17,384,999 150.83 5,679,259
City Administrator* 17,930 (35,860)
Administrative Services 237,503 2.00 (469,374)
Library 17,392,499 17,129,566 148.83 520,234
-
2242 - Measure Q Reserve- Library Services
Retention & Enhancement 715,050 715,050 673,091
Library 715,050 715,050 -
-
2250 - Measure N: Fund 1,772,693 1,772,693 6.85 657,671
City Administrator* 4,579 (9,158)
Fire Department 1,772,693 1,768,114 6.85 9,158
-
2251 - Measure Y: Public Safety Act 2004 24,201,087 24,201,087 74.30 5,078,511
Mayor 82,671 0.40 (163,381)
City Administrator* 534,663 0.80 (1,064,616)
Police Department 12,848,543 63.00 (25,175,786)
Fire Department 4,000,000 (8,000,000)
Administrative Services 24,201,087 23,640 47,717,312
Community Services 6,711,570 10.10 (13,313,529)
-
2310 - Lighting and Landscape Assessment
District 20,617,346 20,489,055 82.69 (408,302)
City Administrator* 25,531 (51,062)
Administrative Services 18,970,646 43,458 0.40 37,855,378
Community Services 4,320,097 7.29 (8,430,707)
Public Works 1,646,700 16,099,969 75.00 (28,981,911)
-
2321 - Wildland Fire Prevention Assess District 2,121,871 2,121,871 1.00 1,627,512
Fire Department 2,121,871 2,121,871 1.00 -
-
2330 - Werner Court Vegetation Mgmt District 6,200 6,200 16,202
Fire Department 6,200 6,200 -
-
* City Administrator consists of Administration, Budget, CBRB, Contract Compliance, Communications/KTOP, Economic & Workforce Development, Measure Y, Neighborhood Investment, Oaklanders’ Assistance Center and Public Ethics.
D - 50
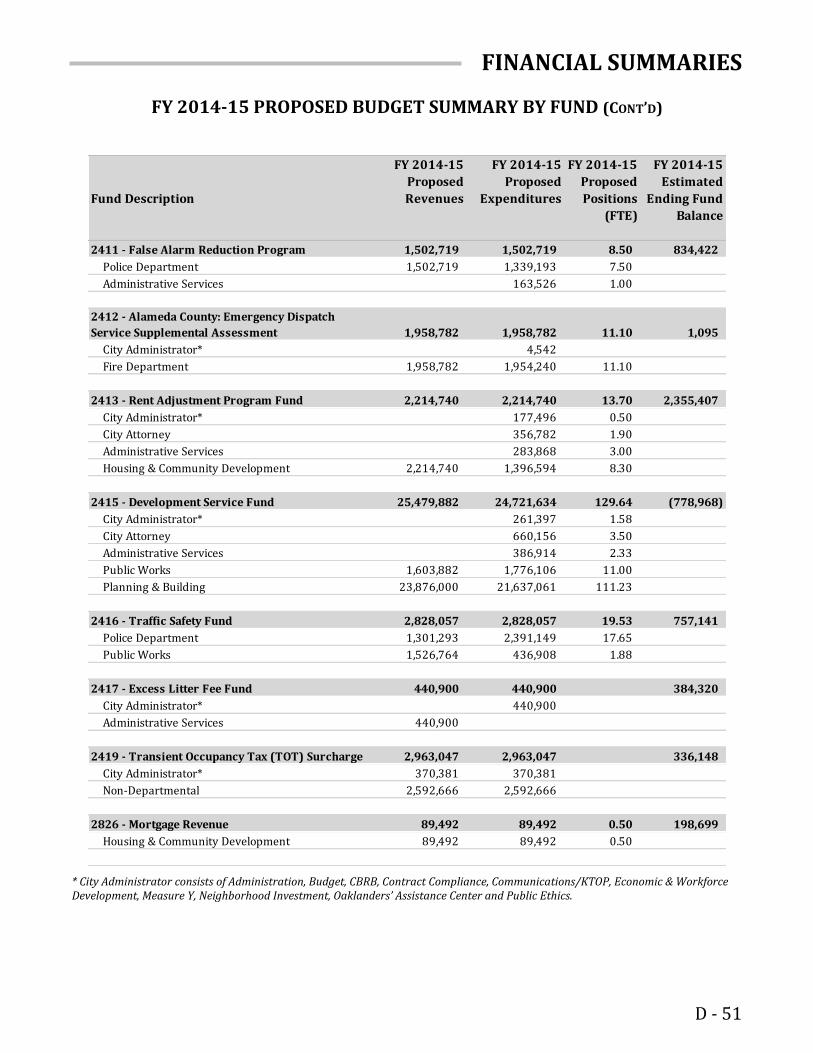
FINANCIAL SUMMARIES
FY 2014-15 PROPOSED BUDGET SUMMARY BY FUND (CONT’D)
Fund Description
FY 2014-15
Proposed
Revenues
FY 2014-15
Proposed
Expenditures
FY 2014-15
Proposed
Positions
(FTE)
FY 2014-15
Estimated
Ending Fund
Balance
2411 - False Alarm Reduction Program 1,502,719 1,502,719 8.50 834,422
Police Department 1,502,719 1,339,193 7.50 341,861
Administrative Services 163,526 1.00 (323,173)
-
2412 - Alameda County: Emergency Dispatch
Service Supplemental Assessment 1,958,782 1,958,782 11.10 1,095
City Administrator* 4,542 (9,084)
Fire Department 1,958,782 1,954,240 11.10 9,084
-
2413 - Rent Adjustment Program Fund 2,214,740 2,214,740 13.70 2,355,407
City Administrator* 177,496 0.50 (350,832)
City Attorney 356,782 1.90 (705,197)
Administrative Services 283,868 3.00 (561,250)
Housing & Community Development 2,214,740 1,396,594 8.30 1,617,279
-
2415 - Development Service Fund 25,479,882 24,721,634 129.64 (778,968)
City Administrator* 261,397 1.58 (516,615)
City Attorney 660,156 3.50 (1,304,789)
Administrative Services 386,914 2.33 (764,651)
Public Works 1,603,882 1,776,106 11.00 (340,366)
Planning & Building 23,876,000 21,637,061 111.23 3,684,669
-
2416 - Traffic Safety Fund 2,828,057 2,828,057 19.53 757,141
Police Department 1,301,293 2,391,149 17.65 (2,187,163)
Public Works 1,526,764 436,908 1.88 2,187,163
-
2417 - Excess Litter Fee Fund 440,900 440,900 384,320
City Administrator* 440,900 (881,800)
Administrative Services 440,900 881,800
-
2419 - Transient Occupancy Tax (TOT) Surcharge 2,963,047 2,963,047 336,148
City Administrator* 370,381 370,381 -
Non-Departmental 2,592,666 2,592,666 -
-
2826 - Mortgage Revenue 89,492 89,492 0.50 198,699
Housing & Community Development 89,492 89,492 0.50 -
-
* City Administrator consists of Administration, Budget, CBRB, Contract Compliance, Communications/KTOP, Economic & Workforce Development, Measure Y, Neighborhood Investment, Oaklanders’ Assistance Center and Public Ethics.
D - 51

FINANCIAL SUMMARIES
FY 2014-15 PROPOSED BUDGET SUMMARY BY FUND (CONT’D)
Fund Description
FY 2014-15
Proposed
Revenues
FY 2014-15
Proposed
Expenditures
FY 2014-15
Proposed
Positions
(FTE)
FY 2014-15
Estimated
Ending Fund
Balance
2990 - Public Works Grants 280,000 280,000 1.47 (652,723)
Public Works 280,000 280,000 1.47 -
-
2993 - Library Grants 250,000 250,000 50,000
Library 250,000 250,000 -
-
2994 - Social Services Grants 76,000 76,000 31,681
Community Services 76,000 76,000 -
-
2995 - Police Grants 20,000 20,000 77,240
Police Department 20,000 20,000 -
-
2996 - Parks and Recreation Grants 2001 16,847 16,847 25,664
Community Services 16,847 16,847 -
-
2999 - Miscellaneous Grants 1,300,000 1,300,000 2.50 6,987,205
Police Department 1,300,000 1,300,000 -
Housing & Community Development 0 2.50 -
-
3100 - Sewer Service Fund 54,257,627 53,832,248 129.41 162,150,335
City Attorney 655,579 3.80 (1,295,820)
Fire Department 289,161 2.00 (572,561)
Administrative Services 100,000 3,497,277 1.35 (6,619,218)
Public Works 54,157,627 25,301,951 122.26 57,892,344
Non-Departmental 9,728,280 (19,460,385)
Capital Improvement Projects 14,360,000 (29,120,000)
-
3150 - Sewer Rate Stabilization Fund 500,000 2,001,108
Public Works 500,000 1,000,000
-
3200 - Golf Course 895,950 505,854 0.75 4,626,476
City Administrator* 8,450 (16,900)
Community Services 895,950 497,404 0.75 799,781
-
4100 - Equipment 19,919,058 18,443,117 56.00 (4,230,956)
Administrative Services (100,000) 5,521 (211,042)
Public Works 20,019,058 18,437,596 56.00 3,039,463
-
* City Administrator consists of Administration, Budget, CBRB, Contract Compliance, Communications/KTOP, Economic & Workforce Development, Measure Y, Neighborhood Investment, Oaklanders’ Assistance Center and Public Ethics.
D - 52

FINANCIAL SUMMARIES
FY 2014-15 PROPOSED BUDGET SUMMARY BY FUND (CONT’D)
Fund Description
FY 2014-15
Proposed
Revenues
FY 2014-15
Proposed
Expenditures
FY 2014-15
Proposed
Positions
(FTE)
FY 2014-15
Estimated
Ending Fund
Balance
4200 - Radio / Telecommunications 3,577,377 3,557,381 9.61 3,033,747
Administrative Services 3,577,377 3,557,381 9.61 79,654
-
4210 - Telephone Equipment and Software 308,530 308,530 1,885,171
Administrative Services 308,530 308,530 -
-
4300 - Reproduction 1,440,745 1,433,684 5.00 (1,078,800)
Administrative Services 1,440,745 1,433,684 5.00 36,869
-
4400 - City Facilities 27,948,274 25,779,478 111.68 (19,028,729)
City Administrator* 2,400 4,800
Administrative Services (75,000) (150,000)
Public Works 28,020,874 25,779,478 111.68 3,571,847
-
4450 - City Facilities Energy Conservation
Projects - 0.50 2,385,870
Public Works 87,832 0.50 (173,973)
Planning & Building (87,832) 173,973
-
4500 - Central Stores 425,838 348,358 2.50 (3,882,530)
Administrative Services 425,838 348,358 2.50 163,475
-
4550 - Purchasing 777,965 777,965 7.00 (445,288)
Administrative Services 777,965 800,643 7.00 (27,526)
Planning & Building (22,678) 27,526
-
5130 - Rockridge: Library Assessment District 134,420 3,387 631,732
City Administrator* 3,387 (6,774)
Administrative Services 134,420 636,307
Capital Improvement Projects (498,500)
-
5321 - Measure DD: 2009B Clean Water,Safe Parks
& Open Space Trust Fund for Oakland - 4.50 26,707,820
City Administrator* - 0.50 -
Public Works - 4.00 -
-
5505 - Municipal Capital Improvement: Public
Arts - 1.50 613,098
City Administrator* - 1.50 -
* City Administrator consists of Administration, Budget, CBRB, Contract Compliance, Communications/KTOP, Economic & Workforce Development, Measure Y, Neighborhood Investment, Oaklanders’ Assistance Center and Public Ethics.
D - 53
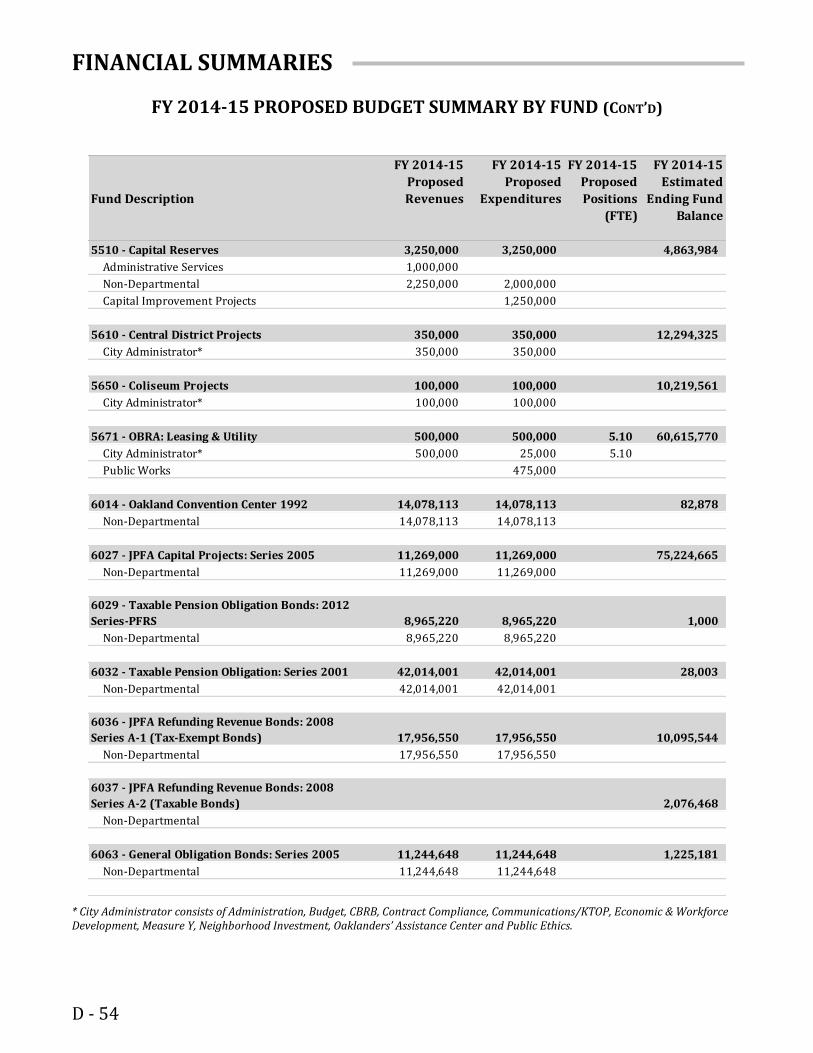
FINANCIAL SUMMARIES
FY 2014-15 PROPOSED BUDGET SUMMARY BY FUND (CONT’D)
Fund Description
FY 2014-15
Proposed
Revenues
FY 2014-15
Proposed
Expenditures
FY 2014-15
Proposed
Positions
(FTE)
FY 2014-15
Estimated
Ending Fund
Balance
5510 - Capital Reserves 3,250,000 3,250,000 4,863,984
Administrative Services 1,000,000 2,000,000
Non-Departmental 2,250,000 2,000,000 4,800,000
Capital Improvement Projects 1,250,000 (2,500,000)
-
5610 - Central District Projects 350,000 350,000 12,294,325
City Administrator* 350,000 350,000 -
-
5650 - Coliseum Projects 100,000 100,000 10,219,561
City Administrator* 100,000 100,000 -
-
5671 - OBRA: Leasing & Utility 500,000 500,000 5.10 60,615,770
City Administrator* 500,000 25,000 5.10 975,000
Public Works 475,000 (975,000)
-
6014 - Oakland Convention Center 1992 14,078,113 14,078,113 82,878
Non-Departmental 14,078,113 14,078,113 -
-
6027 - JPFA Capital Projects: Series 2005 11,269,000 11,269,000 75,224,665
Non-Departmental 11,269,000 11,269,000 -
-
6029 - Taxable Pension Obligation Bonds: 2012
Series-PFRS 8,965,220 8,965,220 1,000
Non-Departmental 8,965,220 8,965,220 -
-
6032 - Taxable Pension Obligation: Series 2001 42,014,001 42,014,001 28,003
Non-Departmental 42,014,001 42,014,001 -
-
6036 - JPFA Refunding Revenue Bonds: 2008
Series A-1 (Tax-Exempt Bonds) 17,956,550 17,956,550 10,095,544
Non-Departmental 17,956,550 17,956,550 -
-
6037 - JPFA Refunding Revenue Bonds: 2008
Series A-2 (Taxable Bonds) 2,076,468
Non-Departmental -
-
6063 - General Obligation Bonds: Series 2005 11,244,648 11,244,648 1,225,181
Non-Departmental 11,244,648 11,244,648 -
-
* City Administrator consists of Administration, Budget, CBRB, Contract Compliance, Communications/KTOP, Economic & Workforce Development, Measure Y, Neighborhood Investment, Oaklanders’ Assistance Center and Public Ethics.
D - 54

FINANCIAL SUMMARIES
FY 2014-15 PROPOSED BUDGET SUMMARY BY FUND (CONT’D)
Fund Description
FY 2014-15
Proposed
Revenues
FY 2014-15
Proposed
Expenditures
FY 2014-15
Proposed
Positions
(FTE)
FY 2014-15
Estimated
Ending Fund
Balance
6311 - Measure G: 2006 Zoo, Museum 1,332,563 1,332,563 852,316
Non-Departmental 1,332,563 1,332,563 -
-
6312 - GOB Series 2012-Refunding Bonds 6,652,225 6,652,225 1,157,522
Non-Departmental 6,652,225 6,652,225 -
-
6321 - Measure DD: 2009B Clean Water, Safe
Parks & Open Space Trust Fund for Oakland 4,617,132 4,617,132 205,014
Non-Departmental 4,617,132 4,617,132 -
-
6540 - Skyline Sewer District - Redemption 34,736 28,600 70,627
Non-Departmental 34,736 28,600 14,104
-
6555 - Piedmont Pines 2010 Utility Underground
Phase I - Debt Service 236,169 236,169 145,415
Non-Departmental 236,169 236,169 -
-
6570 - JPFA Pooled Assessment: 1996 Revenue
Bonds - Assessment 25,600 25,600 (143,909)
Non-Departmental 25,600 25,600 -
-
6587 - 2012 Refunding Reassessment Bonds-Debt
Service 439,051 439,051 0.40 355,000
Administrative Services 57,331 0.40 (113,302)
Non-Departmental 439,051 381,720 113,302
-
6612 - JPFA Lease Revenue Refunding Bonds
(Admin Building): 2008 Series B 11,318,307 11,318,307 9,111,530
Non-Departmental 11,318,307 11,318,307 -
-
6999 - Miscellaneous Debt Service 21,500,000 21,500,000 -
Non-Departmental 21,500,000 21,500,000 -
-
7100 - Police and Fire Retirement System 3,578,493 3,578,493 4.90 471,105,257
City Attorney 98,075 0.40 (193,841)
Administrative Services 971,563 3,480,418 4.50 (4,996,873)
Non-Departmental 2,606,930 5,190,714
-
* City Administrator consists of Administration, Budget, CBRB, Contract Compliance, Communications/KTOP, Economic & Workforce Development, Measure Y, Neighborhood Investment, Oaklanders’ Assistance Center and Public Ethics.
D - 55

FINANCIAL SUMMARIES
FY 2014-15 PROPOSED BUDGET SUMMARY BY FUND (CONT’D)
Fund Description
FY 2014-15
Proposed
Revenues
FY 2014-15
Proposed
Expenditures
FY 2014-15
Proposed
Positions
(FTE)
FY 2014-15
Estimated
Ending Fund
Balance
7120 - Oakland Municipal Employees' Retirement
System OMERS 257,904 250,162 1.10 4,484,450
City Attorney 24,519 0.10 (48,460)
Administrative Services 225,643 1.00 (447,702)
Non-Departmental 257,904 508,326
-
7130 - Employee Deferred Compensation 232,736 232,736 1.10 117,542
Administrative Services 232,736 232,736 1.10 -
-
7320 - Police and Fire Retirement System
Refinancing Annuity Trust 9,624,258 9,624,258 112,469,801
Non-Departmental 9,624,258 9,624,258 -
-
7540 - Oakland Public Library Trust 110,879 110,879 978,490
Library 110,879 110,879 -
-
7640 - Oakland Public Museum Trust 32,610 32,610 740,455
City Administrator* 32,610 65,220
Non-Departmental 32,610 (65,220)
-
7760 - Grant Clearing - 135.53 788,627
Administrative Services 156,788 2.23 (309,886)
Public Works (156,788) 133.30 309,886
-
7999 - Miscellaneous Trusts 69,270 69,270 914,902
Community Services 69,270 69,270 -
-
Grand Total 1,071,696,861 1,060,583,969 3,875.76
* City Administrator consists of Administration, Budget, CBRB, Contract Compliance, Communications/KTOP, Economic & Workforce Development, Measure Y, Neighborhood Investment, Oaklanders’ Assistance Center and Public Ethics.
D - 56

FINANCIAL SUMMARIES
REVENUE TABLES
D - 57

FINANCIAL SUMMARIES
NOTES
D - 58

FINANCIAL SUMMARIES
Revenue TypeFY 2011-12
Actuals
FY 2012-13
Adjusted
Budget
FY 2013-14
Proposed
Budget
FY 2014-15
Proposed
Budget
FY 2015-16
Forecast
FY 2016-17
Forecast
FY 2017-18
Forecast
Property Tax $138,816,699 $125,354,813 $144,637,164 $151,117,089 $154,485,959 $159,955,252 $168,234,449
Sales Tax 55,476,445 53,616,357 57,964,798 59,663,701 $62,050,249 $64,532,259 $67,113,549
Gasoline Tax 5,795,764 6,637,535 6,637,535 6,637,535 $6,637,535 $6,637,535 $6,637,535
Business
License Tax 58,548,809 51,800,000 58,486,270 60,240,858 $62,048,084 $64,530,007 $67,111,207
Utility
Consumption Tax 51,434,031 50,500,000 50,588,732 50,588,732 $50,588,732 $50,588,732 $50,588,732
Real Estate
Transfer Tax 30,546,398 28,490,000 39,453,990 40,637,610 $42,263,114 $43,953,639 $45,711,785
Transient
Occupancy Tax 30,546,398 13,827,549 14,969,363 15,209,489 $15,665,774 $16,135,747 $16,619,819
Parking Tax 15,975,931 14,992,135 15,640,428 15,967,449 $16,446,472 $16,939,867 $17,448,063
Other Local
Taxes 152,572,913 132,207,099 109,945,104 110,170,793 $112,374,209 $114,621,693 $116,914,127
Licenses &
Permits 14,260,718 13,320,000 14,406,356 15,067,488 $15,519,513 $15,985,098 $16,464,651
Fines &
Penalties 27,452,800 30,146,129 28,219,589 27,289,401 $25,039,337 $22,942,687 $22,243,803
Interest Income 10,614,818 5,701,950 904,012 894,012 $894,012 $894,012 $894,012
Service Charges 518,190,174 153,856,654 149,247,715 152,052,708 $154,550,055 $156,943,652 $159,283,491
Internal Service
Charges 48,122,481 46,189,740 52,045,217 53,758,412 $54,833,580 $55,930,252 $57,048,857
Grants &
Subsidies 152,647,545 75,704,081 59,314,176 63,348,963 $63,348,963 $63,348,963 $63,348,963
Miscellaneous* (194,967,319) 470,829,294 41,793,137 45,488,357 $41,488,357 $41,488,357 $41,488,357
Interfund
Tranfers 470,666,394 143,145,048 142,333,740 135,383,060 $135,383,060 $135,383,060 $135,383,060
Subtotal
Revenue$1,586,701,001 $1,416,318,385 $986,587,326 $1,003,515,657 $1,013,617,005 $1,030,810,812 $1,052,534,461
Transfers from
Fund Balance** 40,151,058 66,103,229 68,181,204 - - -
Grand Total $1,586,701,001 $1,456,469,443 $1,052,690,555 $1,071,696,861 $1,013,617,005 $1,030,810,812 $1,052,534,461
ALL FUNDS REVENUE
* Negative Miscellaneous Revenue is due to Port of Oakland Reveue & Expense Clearing
** Tranfers from Fund Balance were previously combined with Interfund Transfers.
D - 59

FINANCIAL SUMMARIES
$-
$200
$400
$600
$800
$1,000
$1,200
$1,400
$1,600
FY 2011-12 Actuals
FY 2012-13 MidcycleBudget
FY 2013-14 Proposed Budget
FY 2014-15 Proposed Budget
Mil
lio
ns
HISTORICAL CHANGES IN ALL FUNDS REVENUE
D - 60

FINANCIAL SUMMARIES
Revenue TypeFY 2011-12
Actuals
FY 2012-13
Midcycle
Budget
FY 2013-14
Proposed
Budget
FY 2014-15
Proposed
Budget
FY 2015-16
Forecast
FY 2016-17
Forecast
FY 2017-18
Forecast
Property Tax $138,796,954 $125,166,501 $144,448,852 $150,928,777 $154,291,998 $159,755,472 $168,026,677
Sales Tax 44,740,906 43,556,223 47,208,326 48,624,575 $50,569,558 $52,592,340 $54,696,034
Business
License Tax 58,548,809 51,800,000 58,486,270 60,240,858 $62,048,084 $64,530,007 $67,111,207
Utility
Consumption Tax 51,434,031 50,500,000 50,588,732 50,588,732 $50,588,732 $50,588,732 $50,588,732
Real Estate
Transfer Tax 30,546,398 28,490,000 39,453,990 40,637,610 $42,263,114 $43,953,639 $45,711,785
Transient
Occupancy Tax 10,713,948 10,864,502 12,006,316 12,246,442 $12,613,835 $12,992,250 $13,382,018
Parking Tax 8,616,474 8,103,857 8,531,028 8,701,649 $8,962,698 $9,231,579 $9,508,527
Licenses &
Permits 1,158,650 925,570 1,386,726 1,413,858 $1,456,274 $1,499,962 $1,544,961
Fines &
Penalties 24,246,700 25,425,535 23,498,995 22,568,807 $20,650,228 $18,862,462 $18,266,540
Interest Income 740,482 800,000 740,482 740,482 $740,482 $740,482 $740,482
Service Charges 45,948,737 43,338,382 43,662,137 43,919,082 $44,396,175 $44,729,301 $44,967,647
Grants &
Subsidies 229,107 160,672 - - - - -
Miscellaneous 32,079,762 2,733,000 1,299,320 4,824,320 $824,320 $824,320 $824,320
Interfund
Transfers 1,718,023 3,200,000 - - - - -
Subtotal
Revenue$449,519,489 $395,064,242 $431,311,174 $445,435,192 $449,405,499 $460,300,547 $475,368,929
Transfers from
Fund Balance* - 14,282,521 (1,155,562) 11,966,492 - - -
Grand Total $449,519,489 $409,346,763 $430,155,612 $457,401,684 $449,405,499 $460,300,547 $475,368,929
* Tranfers from Fund Balance were previously combined with Interfund Transfers.
GENERAL PURPOSE FUND REVENUE
D - 61

FINANCIAL SUMMARIES
$-
$50
$100
$150
$200
$250
$300
$350
$400
$450
FY 2011-12 Actuals
FY 2012-13 MidcycleBudget
FY 2013-14 Proposed Budget
FY 2014-15 Proposed Budget
Mil
lio
ns
HISTORICAL CHANGES IN GPF REVENUE
D - 62

FINANCIAL SUMMARIES
SUMMARY OF THE GENERAL PURPOSE FUND REVENUES Below is a detailed discussion of the individual categories that comprise General Purpose Fund (GPF) revenues. For each category, a brief description is provided, followed by historical data, relevant analysis, key forecast assumptions and then the forecast itself.
Property Tax Property tax is the largest single source of revenue for the GPF. The property tax is ad valorem, which means that the tax paid on a property is proportional to the property’s value. However, Proposition 13, which passed in 1978, introduced two significant caveats: 1) the annual tax owed is a maximum of 1 percent of a property’s assessed value, and 2) the assessed value can only increase a maximum 2 percent each year, unless ownership changes, in which case the prevailing market value assessment is used as the basis for taxation. The one percent assessment is collected by the County and is distributed to various public entities in accordance with a complex formula. The County’s computation results in the City receiving about 26 percent of total collections.
Over the last 10 years, property tax revenue has grown on average, year-over-year, at a steady pace of 9.8 percent, due primarily to robust increases in local housing values. The growth for that period was accelerated by a rapid run-up of housing demand, new construction, and developments that began in FY 2004-05. The rise in FY 2004-05 property tax revenues was also due to a Vehicle License Fee (VLF) “backfill” payment from the State (the difference between the old VLF of 2.0% and new fee of 0.65%) in the form of property tax. The value of rising property tax, which increased more quickly than VLF revenues, brought Oakland additional revenues. Beginning in FY 2004-05, property assessments rose quickly, propelled by high volume of home sales and rising home prices. Driven by economic growth and aggressive lending practices, the housing market accelerated and finally peaked in 2007. After this peak, housing demand and prices eventually declined due to an economic downturn, lack of affordability, tightened credit, and increased foreclosures. The resulting decrease in home sales volume for new and existing homes drove down home prices, which in turn continues to slow Property Tax revenue growth. Taking into consideration the uncertainties brought on by the continuing sluggishness of the housing market, home foreclosures, tightened lending policies, the assumption is that the growth rate for Property Tax revenue will be below the historical trend for the forecast period. The budget assumes a 2% percent increase in FY 2013-14 and in FY 2014-15 consistent with initial assessments from Alameda County’s Assessor of growth in assessed value. In FY 2015-16 through FY 2016-17 Property Tax is forecast to grow at 3% annually. In FY 2017-18 Property Tax is forecast to grow at 4% annually. The anticipated low near-term growth rate of property tax is due to a large number of underwater home owners (owing a mortgage larger than the value of their home), and high recent base year assessments under Proposition 13 yielding limited growth in revenue due to re-assessment at sale.
D - 63
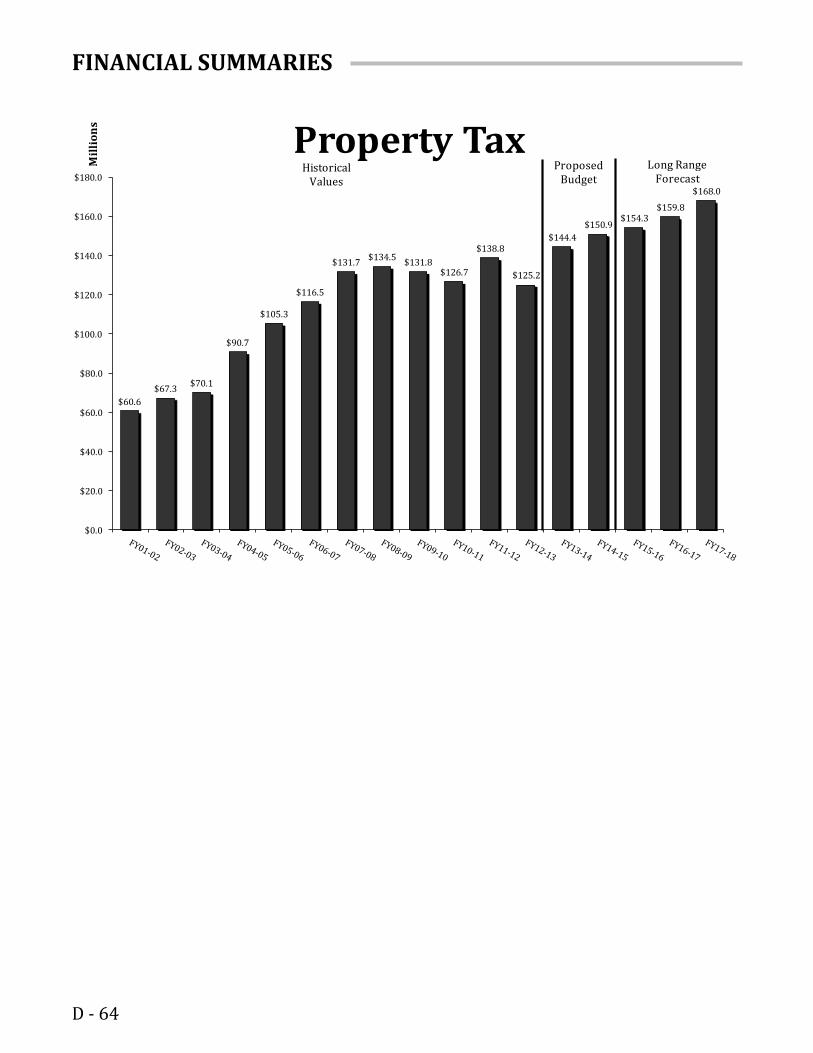
FINANCIAL SUMMARIES
$60.6
$67.3$70.1
$90.7
$105.3
$116.5
$131.7$134.5
$131.8$126.7
$138.8
$125.2
$144.4
$150.9$154.3
$159.8
$168.0
$0.0
$20.0
$40.0
$60.0
$80.0
$100.0
$120.0
$140.0
$160.0
$180.0
Mil
lio
ns
Property TaxHistorical
Values
ProposedBudget
Long RangeForecast
D - 64

FINANCIAL SUMMARIES
Sales & Use Tax Sales and Use Tax applies to the retail sale or use of “tangible personal property.” The recent passage of Proposition 30 brings the total Sales Tax percentage in the City of Oakland to 9.0 percent; meaning on a $1 purchase tax paid is 9 cents. The City receives 1% percent of the total tax, meaning the City receives 1 cent on a $1 purchase. The table below details the general allocation of Sales and Use Tax on purchases in the City of Oakland. Some of the tax revenue receive by the State of California is redistributed to counties to provide health and public safety services.
Receiving Agency Rate
The State of California 6.5%
The City of Oakland 1.0%
The Bay Area Rapid Transit District 0.5%
Alameda County Transportation Improvement Authority 0.5%
Alameda County Essential Health Care Services 0.5%
Total Sales Tax 9.0%
Sales Tax revenue is fairly volatile, varying to a large extent with the overall strength of the local and national economy. During the previous recession, Sales tax revenue declined significantly. Recently Sales Tax revenues have increased to the economic recovery. Increases are also attributable to high gasoline and jet fuel prices. One of the strengths of the Oakland Sales Tax base is its diversity; it comes from seven major business groups. No single group accounts for more than 25 percent of the total. See the chart below.
Fuel21%
Autos/ Transport
16%
Business & Industry
16%
Restaurants & Hotels
15%
Consumer Goods14%
Food and Drugs
9%
Building & Construction
9%
Sales Tax in CY 2012
Sales Tax revenue in FY 2013-14 is projected to be 5.5% higher than its FY 2011-12 level, due to the economic recovery. In the second year of the two-year budget sales tax revenue is expected to increase by roughly 3% annually. In the 3rd, 4th and 5th years of the five-year planning horizon Sales Tax is expected to increase by 4% annually. The annual growth of Sales tax over the prior 25 year period has averaged 3.2% annually.
D - 65

FINANCIAL SUMMARIES
$38.4 $38.2$36.5
$41.7
$44.9$46.7
$53.1
$46.1
$35.9
$41.2
$44.7$43.6
$47.2$48.6
$50.6$52.6
$54.7
$0.0
$10.0
$20.0
$30.0
$40.0
$50.0
$60.0
Mil
lio
ns
Sales TaxHistorical
Values
ProposedBudget
Long RangeForecast
D - 66

FINANCIAL SUMMARIES
Business License Tax The Business License Tax (BLT) is charged annually to Oakland businesses based either gross receipts (60 percent) or rental income (40 percent). The rate on gross receipts varies by type of business, ranging from a low of sixty cents per $1,000 of receipts for grocers to six dollars per $1,000 of receipts for public utilities. The rate on rental income is $13.95 per $1,000. Business License Tax has been a relatively steady and reliable revenue source as shown in the chart below. However, BLT is impacted by the condition of the economy. Recessions slow down business activity, which in turn slows down the number of businesses paying business license taxes and their gross receipts. From FY 2009-10 through FY 2011-12 the City has performed a number of special audit projects which have helped to stabilize revenues bringing businesses into compliance and collecting interest and penalties on previously unpaid taxes. Recovery of the local economy and the implementation of a new business discovery program are expected to help increase revenues in future years. Over the two-year budget and 3rd year of the five-year planning horizon business license tax revenue is expected to increase by roughly 3% annually. In the 4th and 5th years of the five-year planning horizon BLT is expected to increase by 4% annually.
Sales & Transport
17%
Hotels & Recreation
3%
Residential Rental 21%
Commercial Rental 19%
Business Services
30%
Manufacturing
2%
Utilities & Construction
8%
Business Tax in FY 2011-12
D - 67

FINANCIAL SUMMARIES
$42.1 $42.0$44.2 $43.9 $43.8
$50.3$52.5
$54.3 $54.1 $53.1
$58.7
$51.8
$58.5$60.2
$62.0$64.5
$67.1
$0.0
$10.0
$20.0
$30.0
$40.0
$50.0
$60.0
$70.0
$80.0
Mil
lio
ns
Business License TaxHistorical
Values
ProposedBudget
Long RangeForecast
D - 68

FINANCIAL SUMMARIES
Utility Consumption Tax
The Utility Consumption Tax (UCT) is imposed on the use of utilities, primarily electricity, natural gas, cable television, and telephone. The UCT applies to both residential and commercial users. It is collected by utility companies and remitted to the City each month. The tax rate in Oakland has been 7.5 percent since 1993, although there are two significant exceptions: annual payments by manufacturers are capped at $350,000, and low-income residents pay just 5.5 percent on energy use (gas and electricity).
The FY 2011-12 UCT revenue totaled $52.8 million and its composition is shown below. The graph illustrates that in FY 2011-12, energy and telecommunications accounted for a major portion of UCT, at 54 percent and 37 percent, respectively. Cable television accounted for the remaining 9 percent.
Cable TV9%
Energy54%
Telecom37%
UCT Revenues in FY 2011-12
Historical growth in UCT revenue has been due in large part to increases in the tax rate and the prices of energy and services billed to customers. This tax is unpredictable due to industry restructuring, technological change, weather, dynamics of energy markets, price volatility, consumption patterns and energy conservation.
Energy consumption has been negatively impacted by the recession, energy efficiency programs, and by local conservation efforts. Telecommunications accounts for 37% of UCT revenues down from 40% in FY 2009-10. This is due to innovations in technology that have begun to erode the tax base. Services like pre-paid cell phones and voice over internet protocol, combined with decreasing data costs and industry price wars, are placing downward pressure on the consumption of taxable telecommunications services.
D - 69

FINANCIAL SUMMARIES
$49.5
$46.6$48.1
$49.8$48.8
$51.4$52.5 $52.7
$51.1
$53.4$51.4
$50.5 $50.6 $50.6 $50.6 $50.6 $50.6
$0.0
$10.0
$20.0
$30.0
$40.0
$50.0
$60.0
Mil
lio
ns
Utility Consumption TaxHistorical
Values
ProposedBudget
Long RangeForecast
D - 70

FINANCIAL SUMMARIES
Real Estate Transfer Tax (RETT) The RETT rate is 1.61 percent charged to real estate transactions. Oakland’s share is 1.5 percent - Alameda County gets the remaining .11 percent. The tax is triggered by the transfer of property ownership and both the buyer and seller are responsible for ensuring the tax is paid. Up until 2006, RETT revenue had been one of the fastest growing major revenue categories, following significant real estate market growth. As the real estate market cooled in 2007, sales volume significantly declined, and home prices decreased. This resulted from the economic downturn, rising new and existing home inventories, and escalating home foreclosures due to falling home prices and growing number of adjustable rate mortgages and subprime loan defaults. Additionally, new and more stringent lending standards plus reluctance on the part of lenders applied further downward pressure on the housing market. As demand for housing and sales transactions plummeted, RETT revenue took a major hit. In FY 2012-13 the local housing market began to experience a substantial recovery in the average sale price of homes. These price increases have resulted in strong increases in RETT revenues. It should be noted that the volume of home sales has lagged price increased largely due to many homeowners being underwater (owing a mortgage larger than the value of their home) and continued weakness in the national housing market. RETT is often subject to major non-recurring revenues. When certain high value properties are sold they can result in anomalously high revenue. In past years the sale of the downtown City Center complex resulted in nearly $10 million in revenue. These very large transactions cannot be accurately predicted. Over the two-year budget RETT revenue is expected to increase by roughly 3% annually. In the 3rd 4th and 5th years of the five-year planning horizon RETT is expected to increase by 4% annually.
$37.3
$42.1
$55.7
$77.7$79.5
$61.5
$36.2$34.3
$37.0
$31.6 $30.7$28.5
$39.5 $40.6$42.3
$44.0$45.7
$0.0
$10.0
$20.0
$30.0
$40.0
$50.0
$60.0
$70.0
$80.0
$90.0
Mil
lio
ns
Real Estate Transfer TaxHistorical
Values
ProposedBudget
Long RangeForecast
HistoricalValues
ProposedBudget
Long RangeForecast
D - 71

FINANCIAL SUMMARIES
Transient Occupancy Tax (TOT)
The Transient Occupancy Tax (TOT) rate is 14 percent and is paid by lodgers at the City’s hotels who stay thirty days or less; the tax is collected and remitted by hotel operators. The rate was increased from 11 to 14 percent in FY 2008-09 due to the Measure C tax surcharge. Measure C supports various cultural institutions and is booked in a separate fund.
TOT revenue declined by 17% in FY 2008-09 and FY 2009-10 due to the recession’s adverse affects on tourism and travel. This is consistent with the prior recessions. Following the September 11th terrorist attacks and economic slowdown, TOT revenues declined sharply and remained flat for the next four years. In FY 2005-06, TOT rebounded by 9.7 percent, and continued positive growth two years afterward, culminating in a near-record high of $12.2 million in FY 2007-08. In FY 2008-09, TOT was again affected by an unprecedented economic recession. TOT is expected to recover significantly over the two-year budget, reaching $12.0 million in FY 13-14 which is a 42% increase over its recessionary low. TOT is expected to equal its pre-recession high of $2.2 million in FY 2014-15. The recovery in TOT revenues has been principally driven by high average daily hotel room rates rather than by increased numbers of occupied hotel rooms. TOT is expected to grow by 3% annually over the five-year planning horizon.
$10.3$10.6 $10.7
$10.3
$11.3
$11.8$12.2
$10.5
$8.5
$9.5
$10.7 $10.9
$12.0$12.2
$12.6$13.0
$13.4
$0.0
$2.0
$4.0
$6.0
$8.0
$10.0
$12.0
$14.0
$16.0
Mil
lio
ns
Transient Occupancy TaxHistorical
Values
ProposedBudget
Long RangeForecast
D - 72

FINANCIAL SUMMARIES
Parking Tax The Parking Tax is a tax imposed on the occupant of an off-street parking space. The tax rate is 18.5 percent (8.5 percent supports Measure Y activities and is booked in a separate fund), and is collected by parking operators. Approximately half of the City’s Parking Tax revenue is generated from parking at the Oakland International Airport.
The Parking Tax revenues are strongly correlated with passenger volume at the Oakland International Airport. Parking, revenue declined sharply in FY 2008-09, due to aggressive price competition, the economic downturn, and reduced airline travel. Parking Tax revenue is expected to regain levels reached during its pre-recession peak during the FY 2013-14 and FY 2014-15 budgets. Parking tax is expected to continue to grow at a rate of 3% annually through the five-year planning horizon, exceeding its all time high by FY2015-16.
$7.5
$8.2
$8.7
$7.0
$8.5
$8.9
$8.5
$7.7 $7.5
$8.5 $8.6
$8.1
$8.5$8.7
$9.0$9.2
$9.5
$0.0
$1.0
$2.0
$3.0
$4.0
$5.0
$6.0
$7.0
$8.0
$9.0
$10.0
Mil
lio
ns
Parking TaxHistorical
Values
ProposedBudget
Long RangeForecast
D - 73

FINANCIAL SUMMARIES
Licenses & Permits Licenses and Permits revenue primarily includes special Police and Fire permits, traffic, medical cannabis, bingo permits, residential parking permits, and animal licenses. In FY 2006-07, 93 percent of License & Permit revenue related to development and building code enforcement activities were taken out of the General Purpose Fund (GPF) and moved to the new Development Services Fund (2415). Those revenues were specifically associated with a variety of development and enforcement activities, such as land use, permit, and inspection and abatement services. This separation was intended to allow clearer monitoring of these revenues and their related expenditures, as required by state law. As a result of the separation, Licenses and Permits revenue after FY 2006-07 dropped to a new baseline of only 7 percent of the previous amounts. Licenses and Permits are assumed to growth by 3% over the two-year budget and five-year planning horizon.
$11.3
$12.5$13.0
$15.6
$19.0
$1.1$1.6
$1.3$0.7 $0.9 $1.2 $0.9
$1.4 $1.4 $1.5 $1.5 $1.5
$0.0
$2.0
$4.0
$6.0
$8.0
$10.0
$12.0
$14.0
$16.0
$18.0
$20.0
Mil
lio
ns
Licenses & PermitsHistorical
Values
ProposedBudget
Long RangeForecast
D - 74

FINANCIAL SUMMARIES
Fines & Penalties Fines & Penalties consist primarily of parking enforcement fines (roughly 90 percent of the total), penalties, and interest on late property tax payments. Parking citation revenue collected for FY 2013-14 is projected to be roughly 3% below FY 2011-12 actuals. The decline is primarily due to decreased parking citation issuance arising from the implementation of several parking friendliness policies including the five-minute grace period and the park mobile pilot program. Between FY 2013-14 and FY 2014-15 parking citation revenue is expected to decline by 12.5% due to the installation of 1,200 new debt/credit parking meters. In other cities parking citation revenue has fallen by up to 30% due to the installation of similar meters. In future years parking citation revenue is expected to decline by between 7% and 8% per year due to the continuing installation of new debit/credit parking meters at a rate of 600 meters annually.
Parking citations revenue is expected to increase by $2.0 million over its base amount in FY 2014-15 with the implementation of a Car Boot Compliance program in partnership with other local governments. Roughly $200,000 of the revenue is assumed to be ongoing in FY 2015-16 through FY 2017-18.
$16.2$16.9
$28.0
$25.8$24.7
$26.0
$21.9
$25.6
$27.4
$24.3 $24.2
$25.4
$23.5$22.6
$20.7
$18.9$18.3
$0.0
$5.0
$10.0
$15.0
$20.0
$25.0
$30.0
Mil
lio
ns
Fines & PenaltiesHistorical
Values
ProposedBudget
Long RangeForecast
D - 75

FINANCIAL SUMMARIES
Interest Income This revenue category nets interest income from investments against the cost of advances made from the City’s General Purpose Fund to other funds. Interest income is volatile, fluctuating along with short-term interest rate movements. Interest income is estimated at $0.8 million in each of FY 2013-14 and FY 2014-15. The amount reflects the interest income projected to be received from pooled investments.
$1.8
$2.0$1.9
$3.6
$3.2
$4.5
$1.7
$1.1 $1.0
$0.7 $0.8 $0.7 $0.7 $0.7 $0.7 $0.7
$0.0
$0.5
$1.0
$1.5
$2.0
$2.5
$3.0
$3.5
$4.0
$4.5
$5.0
Mil
lio
ns
Interest IncomeHistorical
Values
ProposedBudget
Long RangeForecast
D - 76

FINANCIAL SUMMARIES
Service Charges
Service charges are imposed on the user of a service provided by the City. The charge, or fee, may recover all or part of the cost of providing the service. In FY 2006-07, the composition of this revenue changed significantly, explaining the steep drop in revenue that year. A major change in that year saw $11 million in revenues related to building and construction being permanently moved into the Development Services Fund (2415).
Port Revenue16%
Franchise Fees32%
Parking Meter
Revenue28%
Other Service Charges
17%
Rental Income
7%
Budgeted Service Charges by Category in FY 2013-14
Background information concerning the components of service charges is provided below:
Port Revenue consists of payments for general services, Fire, and other services the City provides to the Port. The City invoices semi-annually, based on actual costs of services. Port revenue is expected to remain constant over the two-year budget and five-year planning horizon.
Franchise Fees apply to four utilities for the use of City rights of way: PG&E for gas and electric; Waste
Management of Alameda County for garbage collection; East Bay Municipal Utility District for water; and Comcast for cable television. Franchise fee revenue is expected to remain constant over the two-year budget and five-year planning horizon.
Parking Meter Revenue consists of charges for parking in metered street stalls. Parking revenue is expected
to grow between 1% and 2% annually over the two-year budget and five-year planning horizon in anticipation of the installation of new debit/credit parking meters.
Other Service Charges is revenue from other fees charged including parks and recreation fees, public works fees, fire inspection fees, and charges for personnel service to provide public safety at events. These revenues are expected to grow by 2% annually over the two-year budget and five-year planning horizon.
Rental Income is rental fees for the City’s facilities and lands, as well as concessions at various locations.
These revenues are expected to grow between 1% and 2% annually over the two-year budget and five-year planning horizon.
D - 77

FINANCIAL SUMMARIES
$34.4
$39.0
$41.5
$56.7
$60.6
$45.4$44.1 $43.9
$45.0 $44.6$45.9
$43.3 $43.7 $43.9 $44.4 $44.7 $45.0
$0.0
$10.0
$20.0
$30.0
$40.0
$50.0
$60.0
$70.0
Mil
lio
ns
Service ChargesHistorical
Values
ProposedBudget
Long RangeForecast
D - 78

FINANCIAL SUMMARIES
Miscellaneous The Miscellaneous category consists largely of one-time items that do not fit well into other categories, such as billboard revenue agreements and land/property sales. The Miscellaneous category has experienced substantial variation from year to year, due to its one-time and unpredictable nature. The peaks in FY 2002-03, FY 2003-04, FY 2006-07 and FY 2008-09 occurred as a result of a large number of land and facility sales in those years. The large peak in FY 2011-12 is also a result of land sales. notably the Henry J. Kaiser Convention Center. In FY 2014-15 $4.0 million is budgeted for sale and rental of city property and assets.
$5.7
$15.4
$19.2
$4.3
$2.8
$12.2
$4.0
$11.4
$8.0
$6.5
$32.1
$2.7
$1.3
$4.8
$0.8 $0.8 $0.8
$0.0
$5.0
$10.0
$15.0
$20.0
$25.0
$30.0
$35.0
Mil
lio
ns
MiscellaneousHistorical
Values
ProposedBudget
Long RangeForecast
D - 79

FINANCIAL SUMMARIES
Interfund Transfers Interfund Transfers are transfers into the GPF from other funds. They can be made for a variety of reasons and have various objectives. These transfers are usually one time payments or scheduled payments for a limited time.
For example, the Sewer Service Fund (3100) has been making fund transfers into GPF to cover the cost of the office space taken up by Sewer Service employees in the City Administration Complex. In FY 2012-13 the GPF is expected to receive only $1.1 million in Interfund Transfers; $400,000 from the Multipurpose Fund and $608,000, one from the Sewer Service Fund. In FYs 13-14 and 14-15 the GPF is not expected to receive Interfund Transfer revenue. The Multipurpose Fund is unable to support a transfer due to an operating deficit and negative fund balance, and the Sewer Service Fund’s transfer is being reclassified as a service charge.
$20.1
$6.7
$10.6
$14.4
$18.9
$29.3
$25.7
$38.7
$21.9
$17.1
$1.7$3.2
$0.0 $0.0 $0.0 $0.0 $0.0$0.0
$5.0
$10.0
$15.0
$20.0
$25.0
$30.0
$35.0
$40.0
$45.0
Mil
lio
ns
Interfund TransfersHistorical
Values
ProposedBudget
Long RangeForecast
D - 80

FINANCIAL SUMMARIES
EXPENDITURE TABLES
D - 81

FINANCIAL SUMMARIES
NOTES
D - 82

FINANCIAL SUMMARIES
Agency / Department
FY 2012-13
Midcycle
Adopted
Budget
FY 2013-14
Proposed
Policy
Budget
FY 2014-15
Proposed
Policy
Budget
Mayor $1,546,515 $2,237,505 $2,188,230
City Council 3,419,414 3,547,574 3,434,472
City Administrator
Administration 16,913,493 7,176,602 7,324,238
Citizens' Police Review Board 1,312,501 2,090,136 2,104,580
Contract Compliance 1,523,489 1,622,317 1,659,977
Economic & Workforce Development 8,287,018 8,337,841 8,384,112
Measure Y 469,282 537,690 543,025
Neighborhood Investment 7,829,790 4,962,975 5,103,403
Public Ethics 200,327 301,047 308,010
Oaklanders' Assistance Center 184,595 202,087 206,915
Other Services1 3,188,135 3,251,450
Revenue 13,710,674
City Attorney 12,058,374 11,690,121 11,748,002
City Auditor 900,535 1,556,461 1,510,761
City Clerk 2,108,852 1,966,929 1,923,619
Police Services 194,952,142 203,624,584 218,214,087
Fire Services 108,509,408 110,691,069 125,175,820
Administative Services
Administration 1,765,474 1,126,910 1,178,508
Controller's Office 4,951,376 5,484,674 5,611,583
Revenue 16,771,814 16,890,606
Treasury 6,260,729 6,631,941 7,217,221
Human Resources 5,132,191 5,454,601 5,562,302
Information Technology 12,799,850 14,169,783 13,076,550
Community Services
Neighborhood Services 236,338 325,514 332,264
Parks and Recreation 22,248,240 23,186,389 23,718,699
Human Services 52,780,189 57,087,808 57,605,719
Library 24,599,505 26,151,702 27,402,539
Public Works 121,211,128 135,880,484 137,188,373
Housing & Community Development 13,312,193 11,765,617 11,616,614
Plannng, Building
& Neighborhood Preservation
20,708,482 21,322,043 21,648,739
Non-Departmental 290,658,010 322,459,076 309,245,551
Subtotal Expenditures $950,590,114 $1,011,551,429 $1,031,375,969
Capital Improvement Projects 33,512,000 27,455,500 29,208,000
Grand Total $984,102,114 $1,039,006,929 $1,060,583,969
1 Other Services consists of Equal Opportunity Programs, Employee Relations, Budget, and KTOP Operations
ALL FUNDS EXPENDITURES
D - 83

FINANCIAL SUMMARIES
D - 84
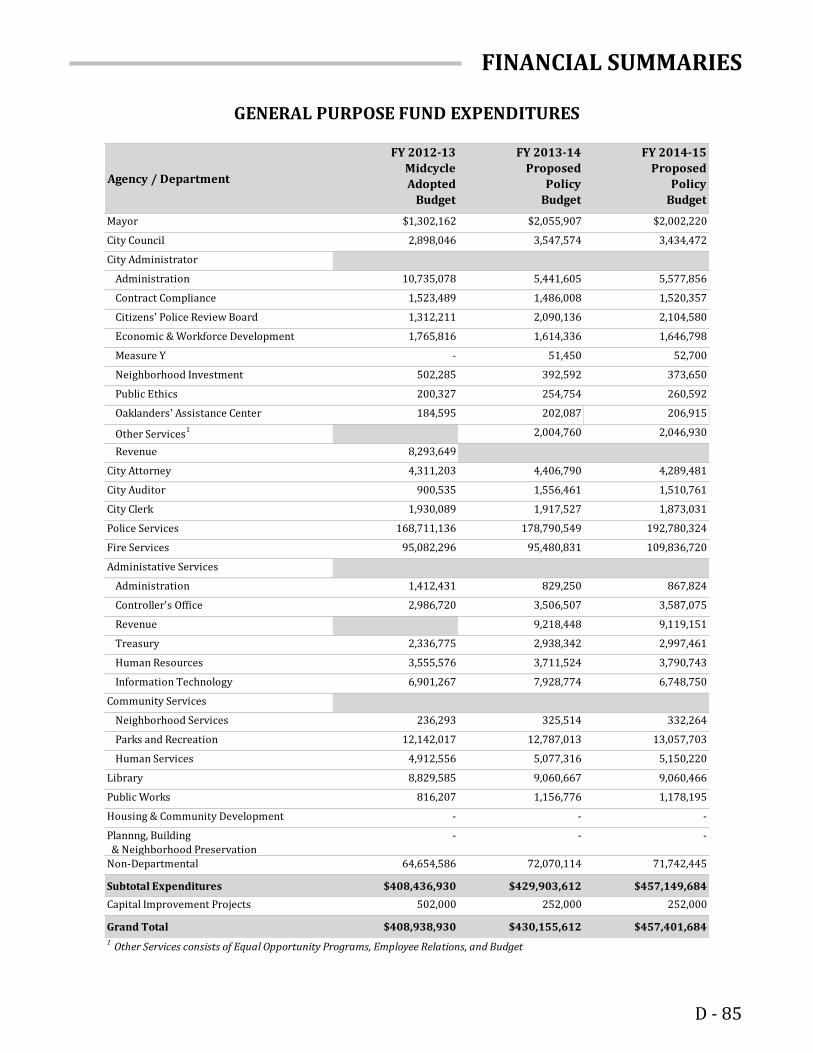
FINANCIAL SUMMARIES
Agency / Department
FY 2012-13
Midcycle
Adopted
Budget
FY 2013-14
Proposed
Policy
Budget
FY 2014-15
Proposed
Policy
Budget
Mayor $1,302,162 $2,055,907 $2,002,220
City Council 2,898,046 3,547,574 3,434,472
City Administrator
Administration 10,735,078 5,441,605 5,577,856
Contract Compliance 1,523,489 1,486,008 1,520,357
Citizens' Police Review Board 1,312,211 2,090,136 2,104,580
Economic & Workforce Development 1,765,816 1,614,336 1,646,798
Measure Y - 51,450 52,700
Neighborhood Investment 502,285 392,592 373,650
Public Ethics 200,327 254,754 260,592
Oaklanders' Assistance Center 184,595 202,087 206,915
Other Services1 2,004,760 2,046,930
Revenue 8,293,649
City Attorney 4,311,203 4,406,790 4,289,481
City Auditor 900,535 1,556,461 1,510,761
City Clerk 1,930,089 1,917,527 1,873,031
Police Services 168,711,136 178,790,549 192,780,324
Fire Services 95,082,296 95,480,831 109,836,720
Administative Services
Administration 1,412,431 829,250 867,824
Controller's Office 2,986,720 3,506,507 3,587,075
Revenue 9,218,448 9,119,151
Treasury 2,336,775 2,938,342 2,997,461
Human Resources 3,555,576 3,711,524 3,790,743
Information Technology 6,901,267 7,928,774 6,748,750
Community Services
Neighborhood Services 236,293 325,514 332,264
Parks and Recreation 12,142,017 12,787,013 13,057,703
Human Services 4,912,556 5,077,316 5,150,220
Library 8,829,585 9,060,667 9,060,466
Public Works 816,207 1,156,776 1,178,195
Housing & Community Development - - -
Plannng, Building
& Neighborhood Preservation
- - -
Non-Departmental 64,654,586 72,070,114 71,742,445
Subtotal Expenditures $408,436,930 $429,903,612 $457,149,684
Capital Improvement Projects 502,000 252,000 252,000
Grand Total $408,938,930 $430,155,612 $457,401,684
1 Other Services consists of Equal Opportunity Programs, Employee Relations, and Budget
GENERAL PURPOSE FUND EXPENDITURES
D - 85
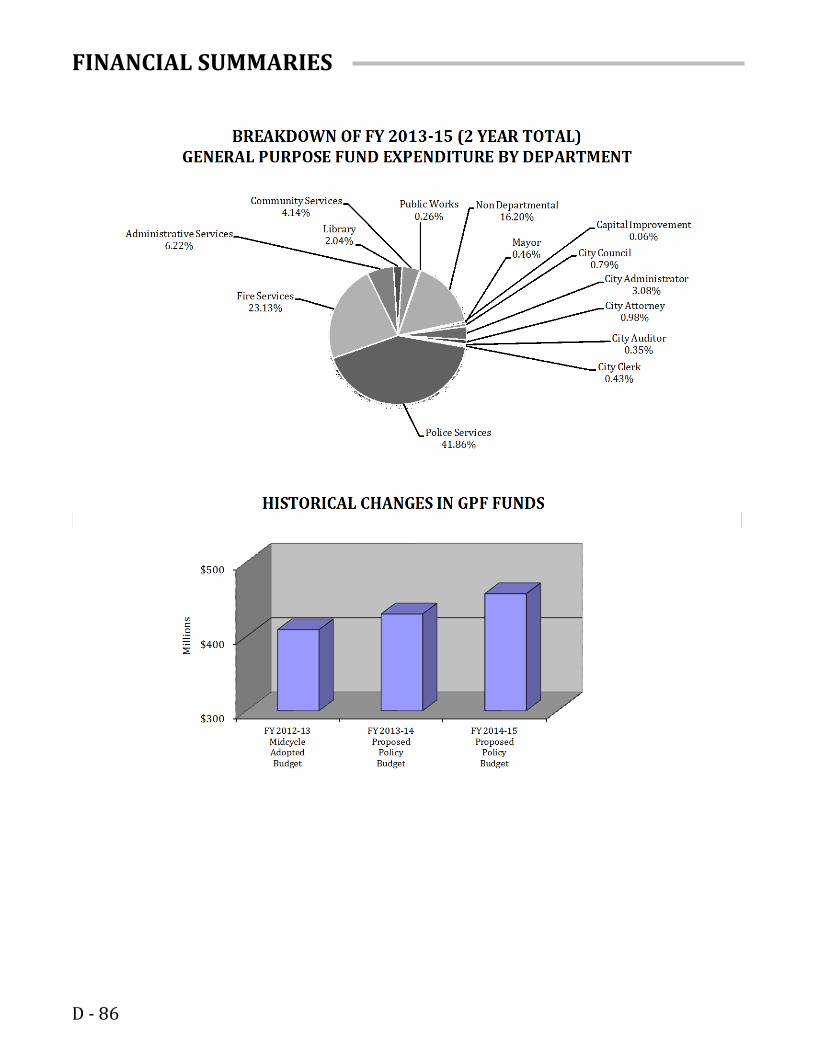
FINANCIAL SUMMARIES
D - 86

FINANCIAL SUMMARIES
SUMMARY OF THE GENERAL PURPOSE FUND EXPENDITURES Below is a detailed discussion of the individual categories that comprise General Purpose Fund (GPF) expenditures. For each category, a brief description is provided, followed by relevant analysis, and key forecast assumptions.
Civilian Salaries
15%
Sworn Salaries30%
Civilian Fringe5%
Sworn Fringe
9%
Civilian Retirement
4%
Sworn Retirement
8%
Debt Service, Transfers & Overhead
O&M16%
GPF Budgeted Expenditures by Category in FY 2013-14
D - 87
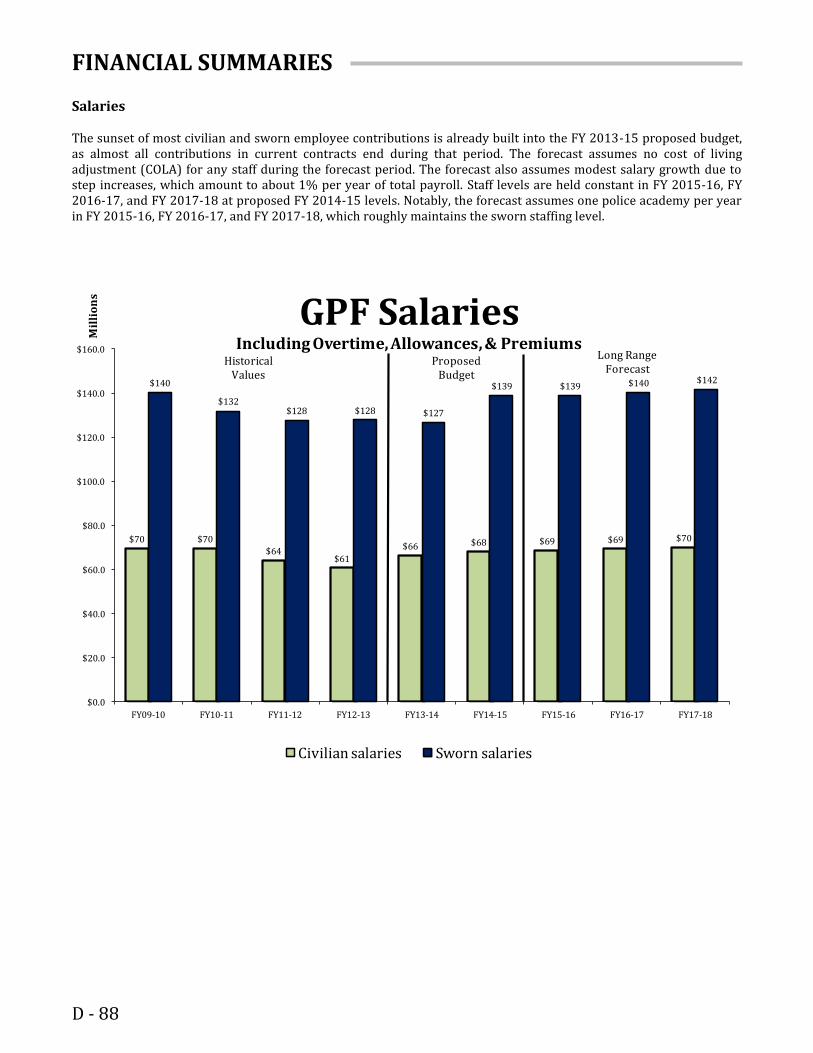
FINANCIAL SUMMARIES
Salaries The sunset of most civilian and sworn employee contributions is already built into the FY 2013-15 proposed budget, as almost all contributions in current contracts end during that period. The forecast assumes no cost of living adjustment (COLA) for any staff during the forecast period. The forecast also assumes modest salary growth due to step increases, which amount to about 1% per year of total payroll. Staff levels are held constant in FY 2015-16, FY 2016-17, and FY 2017-18 at proposed FY 2014-15 levels. Notably, the forecast assumes one police academy per year in FY 2015-16, FY 2016-17, and FY 2017-18, which roughly maintains the sworn staffing level.
$70 $70$64
$61
$66 $68 $69 $69 $70
$140
$132$128 $128 $127
$139 $139 $140 $142
$0.0
$20.0
$40.0
$60.0
$80.0
$100.0
$120.0
$140.0
$160.0
FY09-10 FY10-11 FY11-12 FY12-13 FY13-14 FY14-15 FY15-16 FY16-17 FY17-18
Mil
lio
ns
GPF SalariesIncluding Overtime, Allowances, & Premiums
Civilian salaries Sworn salaries
HistoricalValues
ProposedBudget
Long RangeForecast
D - 88

FINANCIAL SUMMARIES
Fringe Benefits Civilian and sworn fringe benefit expenditures are comprised of many components, including health insurance, workers’ compensation, dental and vision insurance, disability insurance, unemployment insurance, and others. Staff assumed that health insurance costs would grow by 6% per year during the forecast period. Although the City’s health insurance program administrator, California Public Employees Retirement System (CalPERS), will not provide a long-term estimate, this is consistent with a blend of recent history and estimates by experts, notably the City’s actuary, Aon Hewitt, and the City’s health benefits broker. Other fringe benefit expenditures are also projected to growth by an average of 6% per year. Cost sharing between employer and employee on fringe benefits is also a bargained arrangement. For the purpose of the forecast, staff assumed that the arrangement currently in place would continue (e.g., the City fully pays the Kaiser family of four health insurance premium).
$23 $23
$18$20
$22$23
$25$26
$28
$39
$36
$32
$36
$39
$45$47
$50
$53
$0.0
$10.0
$20.0
$30.0
$40.0
$50.0
$60.0
FY09-10 FY10-11 FY11-12 FY12-13 FY13-14 FY14-15 FY15-16 FY16-17 FY17-18
Mil
lio
ns
GPF Fringe Benefits
Civilian fringe Sworn fringe
HistoricalValues
ProposedBudget
Long RangeForecast
D - 89

FINANCIAL SUMMARIES
Retirement Staff assumed that the City’s employer contribution retirement expenditures for current civilian and sworn employees would grow as projected by CalPERS, the City’s retirement program administrator. Based on the most current information available, this is expected to involve a 4.25% per year increase for sworn employees and 5.5% for civilian employees for FY 2015-16, FY 2016-17, and FY 2017-18. Although CalPERS identifies an “employer contribution” and “employee contribution” for retirement deposits, the actual cost sharing between the City and employees is a bargained arrangement codified in Memoranda of Understanding (MOUs) between the City and employee unions. CalPERS is considering a number of changes to its pension funding rules, which could significantly impact the employer contribution cost to participating agencies, so this is an area of substantial uncertainty in the forecast. Although the California Legislature passed a pension reform bill in 2012, we have assumed that the legislation will have no substantial impact on Oakland’s required retirement contributions to CalPERS during the forecast period, particularly as the City is not expecting to add many new employees during the forecast period. Similarly, the forecast assumes that the City’s recently adopted second tier retirement program will not result in any retirement savings to the City during the forecast period.
$12 $12 $11$13
$16$17
$18$20
$22
$39
$36
$30 $31
$36
$41
$44
$47
$51
$0.0
$10.0
$20.0
$30.0
$40.0
$50.0
$60.0
FY09-10 FY10-11 FY11-12 FY12-13 FY13-14 FY14-15 FY15-16 FY16-17 FY17-18
Mil
lio
ns
GPF Retirement
Civilian retirement Sworn retirement
HistoricalValues
ProposedBudget
Long RangeForecast
D - 90

FINANCIAL SUMMARIES
Other Expenditures
Operations and Maintenance Staff forecasted that operations and maintenance (O&M) expenditures would remain in future years at FY 2014-15 levels, consistent with budgeting practices and the City’s actual experience with these expenditures. Historically, operations and maintenance expenditures, which are composed of services and supplies and contracts, have grown very slightly, and therefore 0% growth seems like a prudent estimate. Debt Service, Overhead, and Operating Transfers The City’s Treasury Division estimated the future debt service expenditures based on the repayment schedule of the City’s current debt. Debt service includes principal and interest expenses on bonds and other loans. Staff forecasted that overhead and operating transfers would remain constant at FY 2014-15 levels. The FY 2013-15 proposed budget contains some updates to overhead cost recovery rates relative to past years.
$0.0
$10.0
$20.0
$30.0
$40.0
$50.0
$60.0
$70.0
$80.0
FY09-10 FY10-11 FY11-12 FY12-13 FY13-14 FY14-15 FY15-16 FY16-17 FY17-18
Mil
lio
ns
GPF Other Expenditures
Debt Service, Transfers & Overhead O&M Contributions to PFRS & OPEB
HistoricalValues
ProposedBudget
Long RangeForecast
D - 91

FINANCIAL SUMMARIES
NOTES
D - 92

FINANCIAL SUMMARIES
OTHER BUDGET INFORMATION
D - 93

FINANCIAL SUMMARIES
NOTES
D - 94

FINANCIAL SUMMARIES
NEGATIVE FUNDS
Many non-GPF City funds have negative balances. The poor financial standing of the funds is a result of historical overspending and/or under-recovery, as well as operational shortfalls (cost increases outpacing revenue growth). Funds with significant negatives include: Self-Insurance Liability Fund ($16.5 million projected by the end of FY 2013-15), Mandatory Refuse Program ($4.3 million), Municipal Capital Improvement ($5.9 million projected by the end of FY 2012-13), Kaiser Convention Center Fund ($1.7 million), Equipment Fund ($4.2 million), and Facilities Fund ($19.0 million). These negative balances harm the overall health of the City’s assets by borrowing from the available positive funds, such as the General Purpose Fund, internal pension assets, deferred leave balances, etc. Except for the GPF, these other positive funds are mostly restricted, and funds borrowed from them will require repayment.
D - 95

FINANCIAL SUMMARIES
NEGATIVE FUNDS
Ending Ending Ending Estimated
Fund Balance Fund Balance Fund Balance Fund BalanceFund Fund Description (as of 6/30/10) (as of 6/30/11) (as of 6/30/12) (as of 6/30/13) Explanation of negative fund balance
Negative Funds with Repayment Schedules:
1100
Self Insurance
Liability Budget Office (23,482,665) (28,885,586) (22,980,339) (21,171,561) On repayment plan through 2022
1700
Mandatory Refuse
Program
Administrative
Services (7,401,479) (7,742,916) (5,839,314) (4,839,314)
Rising lien receivables due to non-payments of
garbage fees, and previous multiple transfer to
GPF. Negative Funds should be eliminated over
time as liens are collected through sale of
properties. Additionally the recent increase of
surcharge rate will leave a positive effect on this
fund balance.
1730
Henry J Kaiser
Convention Center Budget Office (4,710,045) (4,062,136) (3,490,580) (2,910,991) On repayment plan through 2018
1750
Multipurpose
Reserve Public Works (4,047,612) (4,599,488) (4,766,712) (4,566,712)
Negative was created due to two $2.1 million
transfer to the GPF and in FY 2005-06 an
additional $800K was transferred to GPF.
Garage rate increases and expenditure
reductions were adopted for FY09-11.
Additionally transportation staff will charge a
percentage of their time directly to capital
projects in other funds where possible which
will reduce personnel costs.
1760
Telecommunications
Reserve City Adminsitrator (1,074,609) (567,646) (197,957) -
The fund was previously on a re-payment plan
but will now be drawn down by surplus
franchise fee revenues.
1791
Contract
Administration Fee
Contracting and
Purchasing (4,131,840) (3,515,594) (2,942,764) (2,363,159) On repayment plan through 2016
2310
Lighting and
Landscape
Assessment District Public Works (4,620,719) (2,516,548) (1,416,293) (416,293)
PWA is working diligently to reduce the
deficit/negative fund balance.
4100 Equipment Public Works (13,224,994) (10,363,365) (7,759,377) (5,425,085) On repayment plan through 2019
4300 Reproduction
Information
Technology (187,543) (441,775) (815,669) (1,115,669) On repayment plan through 2019
4400 City Facilities Public Works (29,088,831) (26,260,574) (23,885,961) (22,455,376) On repayment plan through 2019
4500 Central Stores
Administrative
Services (5,209,132) (4,659,415) (4,146,005) (4,046,005)
On repayment plan through 2019. To reduce the
cost of the fund Central Store section was
eliminated in FY2011-2012 adopted budget.
Agencies/departments will now manage their
supplies on a just-in-time basis.
4550 Purchasing
Contracting and
Purchasing (996,004) (764,866) (525,975) (445,288) On repayment plan through 2019
Total (98,175,474) (94,379,909) (78,766,947) (69,755,454)
Assigned
Department
Reimbursable Negative Funds:
2061
2006 FEMA: 1628
Winter Storm Public Works (235,261) (235,102) (223,546) (223,546)
The City is waiting for FEMA to issue the final
close out report of the disaster, send final
reimbursement and release retention payment.
2062
2006 FEMA: 1646
Spring Storm Public Works (547,880) (547,509) (547,108) (547,108)
The City is waiting for FEMA to issue the final
close out report of the disaster, send final
reimbursement and release retention payment.
2102
Department of
Agriculture Human Services (100,264) (169,913) (137,459) (137,459)
Current negative fund balance is due to lag time
between spending grant funds and receiving
reimbursement from the grantor.
2103
HUD-
ESG/SHP/HOPWA Human Services (4,643,601) (3,346,704) (3,324,975) (3,324,975)
Historical negative balance (pre FY1999-2000)
requires one-time offset of $3.9M. A portion of
this uncollectible amount (approximately $1.2
M) is due to HUD's modified cost
reimbursement methodology.
2105 HUD-EDI Grants Human Services (252,675) (164,752) - -
Current negative fund balance is due to lag time
between spending grant funds and receiving
reimbursement from the grantor.
D - 96

FINANCIAL SUMMARIES
NEGATIVE FUNDS (CONT’D)
Ending Ending Ending Estimated
Fund Balance Fund Balance Fund Balance Fund BalanceFund Fund Description (as of 6/30/10) (as of 6/30/11) (as of 6/30/12) (as of 6/30/13) Explanation of negative fund balance
Reimbursable Negative Funds (Cont'd):
2061
2006 FEMA: 1628
Winter Storm Public Works (235,261) (235,102) (223,546) (223,546)
The City is waiting for FEMA to issue the final
close out report of the disaster, send final
reimbursement and release retention payment.
2062
2006 FEMA: 1646
Spring Storm Public Works (547,880) (547,509) (547,108) (547,108)
The City is waiting for FEMA to issue the final
close out report of the disaster, send final
reimbursement and release retention payment.
2102
Department of
Agriculture Human Services (100,264) (169,913) (137,459) (137,459)
Current negative fund balance is due to lag time
between spending grant funds and receiving
reimbursement from the grantor.
2103
HUD-
ESG/SHP/HOPWA Human Services (4,643,601) (3,346,704) (3,324,975) (3,324,975)
Historical negative balance (pre FY1999-2000)
requires one-time offset of $3.9M. A portion of
this uncollectible amount (approximately $1.2
M) is due to HUD's modified cost
reimbursement methodology.
2105 HUD-EDI Grants Human Services (252,675) (164,752) - -
Current negative fund balance is due to lag time
between spending grant funds and receiving
reimbursement from the grantor.
2107 HUD-108
Housing and
Community
Development (202,353) (202,353)
Current negative fund balance is due to lag time
between spending grant funds and receiving
reimbursement from the grantor.
2112
Department of
Justice Human Services - -
Current negative fund balance is due to lag time
between spending grant funds and receiving
reimbursement from the grantor.
2114 Department of Labor Human Services (106,599) (46,084) (38,325) (38,325)
Current negative fund balance is due to lag time
between spending grant funds and receiving
reimbursement from the grantor
2116
Department of
Transportation Public Works (205,489) -
Current negative fund balance is due to lag time
between spending grant funds and receiving
reimbursement from the grantor
2118
National Foundation
of the Arts and
Humanities
Parks and
Recreation (83,907) - - - Fund closed in FY 2011
2120
Federal Action
Agency Human Services (17,186) (17,134) (18,118) (18,118)
Historical negative balance is due to
accumulated negative interest of $17K. Timing
of drawdown and/or reimbursement.
2123
US Dept of Homeland
Security Fire (2,133,256) (917,713) - -
Current negative fund balance is due to lag time
between spending grant funds and receiving
reimbursement from the grantor.
2124
Federal Emergency
Management Fire (3,721,008) (1,236,157) (898,403) (898,403)
Current negative fund balance is due to lag time
between spending grant funds and receiving
reimbursement from the grantor.
2126
Department of
Education Library (155,263) - - - Fund closed in FY 2011
2128
Dept. of Health and
Human Services Human Services (974,408) (657,620) (642,069) (642,069)
Historical negative balance (pre FY1999-2000)
relates to $255K in accumulated negative
interest and also timing of drawdowns and/or
reimbursements. The fund requires one-time
revenue offset.
2134
California Parks and
Recreation Public Works (369,418) (526,383) (381,120) (381,120)
Historical negative balance (pre FY1999-2000)
requires one-time offset. $107K is related to
SB174 Park Grant Activities, and $109K is
related to non-project related charges. Current
negative fund balance is due to lag time between
spending grant funds and receiving
reimbursement from the grantor.
2138
California
Department of
Education Human Services - - (41,662) (41,662)
Current negative fund balance is due to lag time
between spending grant funds and receiving
reimbursement from the grantor.
2144
California Housing
and Community
Development
Housing and
Community
Development /
Human Services (1,376,467) (21,645) (182,670) (182,670)
Current negative fund balance is due to lag time
between spending grant funds and receiving
reimbursement from the grantor.
Assigned
Department
D - 97

FINANCIAL SUMMARIES
NEGATIVE FUNDS (CONT’D)
Ending Ending Ending Estimated
Fund Balance Fund Balance Fund Balance Fund BalanceFund Fund Description (as of 6/30/10) (as of 6/30/11) (as of 6/30/12) (as of 6/30/13) Explanation of negative fund balance
Reimbursable Negative Funds (Cont'd):
2148
California Library
Services
Library / Public
Works (1,156,376) (594,074) (563,451) (563,451)
Current negative fund balance is due to lag time
between spending grant funds and receiving
reimbursement from the grantor.
2152
California Board of
Corrections Police (49,451) (47,708) (28,846) (28,846)
Current negative fund balance is due to lag time
between spending grant funds and receiving
reimbursement from the grantor.
2154
California Integrated
Waste Management
Board Public Works (317,590) (108,773) (73,475) (73,475)
Current negative fund balance is due to lag time
between spending grant funds and receiving
reimbursement from the grantor.
2159
State of California
Other Public Works (424,599) (366,412) (1,377,809) (877,809)
Current negative fund balance is due to lag time
between spending grant funds and receiving
reimbursement from the grantor.
2162
Metro
Transportation Com:
TD Public Works - (104,670) (171,800) (171,800)
Current negative fund balance is due to lag time
between spending grant funds and receiving
reimbursement from the grantor.
2163
Metro
Transportation Com:
Program Grant Public Works (360,709) (848,470) (556,387) (556,387)
Current negative fund balance is due to lag time
between spending grant funds and receiving
reimbursement from the grantor.
2164
Congestion
Mitigation & Air Public Works (218,576) (218,428) (91,804) (91,804)
Current negative fund balance is due to lag time
between spending grant funds and receiving
reimbursement from the grantor.
2166
Bay Area Air Quality
Management District Public Works (210,974) (566,752) - -
Current negative fund balance is due to lag time
between spending grant funds and receiving
reimbursement from the grantor.
2127
Department of
Transportation -
TIGER II Grant Public Works - - (1,775,518) (775,518)
Current negative fund balance is due to lag time
between spending grant funds and receiving
reimbursement from the grantor.
2185
Oakland
Redevelopment
Agency Grants
Housing and
Community
Development (814,314) - - - Fully reimbursed
2190 Private Grants Various (305,049) (380,107) (382,939) (382,939)
Historical negative balance due to
Neighborhood law project (City Attorney's
Office). This project requires a one-time
revenue offset.
2214
ACTIA Reimbursable
Grants Public Works (100,645) (88,159) (265,410) (265,410)
The remaining deficit balance is from several
streetscape projects Staff is continuing to
review the ability to receive reimbursement for
these projects.
2260
Measure WW: East
Bay Regional Parks
District Local Grant Public Works (698,364) (283,596) (1,653,960) (1,653,960)
Current negative fund balance is due to lag time
between spending grant funds and receiving
reimbursement from the grantor and retention
amount.
2415
Development Service
Fund Planning (607,050) - (2,037,216) (1,537,216)
The fund balance is created by long-term lien
receivables not collected through the County
and restricted Record Management &
Technology Enhancement Fees (PERTS) and
General Planning fees. Planning is working
diligently to reduce the deficit/negative fund ba
2511
Local Law Enforce
Block Grant (LLEBG)
2001 Police (17,130) - - - Fund closed in FY 2011
2513
Local Law Enforce
Block Grant (LLEBG)
2003 Police (239,753) - - - Fund closed in FY 2011
2603
HUD-
ESG/SHP/HOPWA
(ARRA)
Housing and
Community
Development (171) -
Current negative fund balance is due to lag time
between spending grant funds and receiving
reimbursement from the grantor.
Assigned
Department
D - 98

FINANCIAL SUMMARIES
NEGATIVE FUNDS (CONT’D)
Ending Ending Ending Estimated
Fund Balance Fund Balance Fund Balance Fund BalanceFund Fund Description (as of 6/30/10) (as of 6/30/11) (as of 6/30/12) (as of 6/30/13) Explanation of negative fund balance
Reimbursable Negative Funds (Cont'd):
2605
Dept of Health &
Human Services Human Services (139) -
Current negative fund balance is due to lag time
between spending grant funds and receiving
reimbursement from the grantor.
2606
Metro
Transportation
Commiss Public Works (283,138) -
Current negative fund balance is due to lag time
between spending grant funds and receiving
reimbursement from the grantor.
2607
Department of
Justice-COPS Police (1,168,627) -
Current negative fund balance is due to lag time
between spending grant funds and receiving
reimbursement from the grantor.
2608
Environmental
Protection Agency
Housing and
Community
Development (21,438) -
Current negative fund balance is due to lag time
between spending grant funds and receiving
reimbursement from the grantor.
2609
Dept of Energy-
EECBG Program Public Works (187,077) -
Current negative fund balance is due to lag time
between spending grant funds and receiving
reimbursement from the grantor.
2610
State Water Control
Board-CW Public Works (175,264) -
Current negative fund balance is due to lag time
between spending grant funds and receiving
reimbursement from the grantor.
2611 HUD-CDBG (ARRA)
Housing and
Community
Development (5,525) -
Current negative fund balance is due to lag time
between spending grant funds and receiving
reimbursement from the grantor.
2613
Port Security Grant
Program Fire (15,126) -
Current negative fund balance is due to lag time
between spending grant funds and receiving
reimbursement from the grantor.
2822
Title I Loans:
Revolving (30,507) - - - Fund closed in FY 2011
2824
FHA 203k Loan:
Revolving
Housing and
Community
Development (17,853) - - - Fund closed in FY 2011
2990 Public Works Grants Public Works (837,789) (1,062,145) (651,723) (652,723)
PWA staff will be continuing efforts to
coordinate with responsible departments to
move ineligible grant charges to other matching
fund sources. The $886K estimate of
unrecoverable costs is made up of historical
expenditures ($856K) and accumulated negative
interest of $32K.
5008 Emergency
Response: GOB
Series 1992
Public Works (64,006) (155,553) (155,911) (156,911) PWA staff will coordinate with responsible
departments to move ineligible charges to other
funds.
5550 Municipal Capital
Improvement:
Revenue Bonds
Public Works (14,443) (15) - -
Fully reimbursed
5673 OBRA Enviromental
Remediation OSRA
- - (59,787) (59,787)
Balance transferred from ORA
6570 JPFA Pooled
Assessment: 1996
Revenue Bonds
Non-Departmental (143,909) (143,909) Fund balance to be recovered by assessment.
7760 Grant Clearing Public Works (452,558) - - - Fully reimbursed
1610
Oakland Successor
Redevelopment
Agency OSRA - - (2,556) -
Replace fund 7780. Reimbursement of Housing
Agency overhead ended 12/31/2012
7780
Oakland
Redevelopment
Agency Projects OSRA (662,790) (670,573) - -
The fund is currently fully reimbursed after the
AB 1x26 Dissolution Act
(22,317,721) (13,382,153) (18,692,300) (14,629,751)
Assigned
Department
Total
D - 99

FINANCIAL SUMMARIES
NEGATIVE FUNDS (CONT’D)
Ending Ending Ending Estimated
Fund Balance Fund Balance Fund Balance Fund BalanceFund Fund Description (as of 6/30/10) (as of 6/30/11) (as of 6/30/12) (as of 6/30/13) Explanation of negative fund balance
Non-Reimbursable Negative Funds without Repayment Plan:
1600 Underground District
Revolving Fund
Public Works (2,484,901) (886,705) (965,744) (965,744) Fund is no longer being used. This fund was
originally set up as a pass thru for
undergrounding projects. Very little recovery
took place in FY 1999-00 and FY2000-01. The
fund has accumulated negative interest of
$721K and all remaining charges are considered
un-collectable. This fund requires a one-time
revenue off-set.
2992
Parks and Recreation
Grants
Parks and
Recreation (2,578,638) (2,592,622) (2,590,719) (2,590,719)
Historical negative balance (FY1993-1994)
requires one-time offset. $161K is related to
accumulated negative interest. OPR has
confirmed current activity will be reimbursed
on a quarterly basis.
5012 JPFA Admin
Building: Series 1996
Public Works (1,606,363) (1,611,033) (1,614,742) (1,614,742) Historical negative balance (FY2001-2002) is
related Admin building projects (Civic Center
Complex/City Hall) that are uncollectable. This
fund requires a one-time revenue offset.
5500 Municipal Capital
Improvement
Budget Office (5,660,261) (4,969,515) (5,471,106) (5,971,106) Historical negative balance caused by
expenditures exceeding revenues. This fund
requires a one-time revenue offset.
5999 Miscellaneous
Capital Projects
Budget
Office/PWA
(3,979,340) (3,381,533) (3,389,318) (3,389,318) Historical negative balance related to $1.3
million in negative interest and $2.1 million in
various project expenditures (e.g. Y2K
conversion). This fund requires one-time
revenue offset.
6999 Miscellaneous Debt
Service
Non-Departmental (49,642) - - -
Fully reimbursed
7660 Museum
Preservation Trust
Museum (140,902) - - - Fund closed in FY 2011
7752
Rehabilitation Trust:
City Funded
Administrative
Services (1,042,610) - - -
Fund closed in FY 2011
Total (17,542,656) (13,441,408) (14,031,629) (14,531,629)
(138,035,851) (121,203,470) (111,490,876) (98,916,834)
Assigned
Department
Total Negative Funds
D - 100

FINANCIAL SUMMARIES
TEN-YEAR REPAYMENT PLAN FOR FUNDS WITH NEGATIVE BALANCES
Certain funds with negative balances, such as the Kaiser Convention Center Fund and Contract Compliance Fund were put on 10-year repayment schedules during FY 2005-07. The plan involves the GPF amortizing the negative balance in these funds and making annual transfers over a 10-year period.
SELF-INSURANCE FUND (1100) FINANCIAL PROJECTION
Total Total Change in Year- End GPF Non-GPF Change in Increase
Revenues Expenditures Fund Balance Fund Balance Portion Portion Transfer in Subsidy
2013-14 23,129,358 20,771,353 2,358,005 (18,813,556) 19,454,567 3,674,791 2,114,731 10%
2014-15 23,129,358 20,849,803 2,279,555 (16,534,001) 19,454,567 3,674,791 0 0%
2015-16 22,749,422 20,261,247 2,488,175 (14,045,827) 19,337,008 3,412,413 (379,936) -2%
2016-17 23,707,969 21,219,794 2,488,175 (11,557,652) 20,151,773 3,556,195 958,547 4%
2017-18 24,770,056 22,281,881 2,488,175 (9,069,477) 21,054,547 3,715,508 1,062,087 4%
2018-19 25,728,177 23,240,002 2,488,175 (6,581,303) 21,868,950 3,859,226 958,121 4%
2019-20 26,727,497 24,239,322 2,488,175 (4,093,128) 22,718,372 4,009,125 999,320 4%
2020-21 27,769,788 25,281,613 2,488,175 (1,604,953) 23,604,319 4,165,468 1,042,291 4%
2021-22 28,856,897 26,368,722 2,488,175 883,222 24,528,362 4,328,535 1,087,109 4%
KAISER CONVENTION CENTER FUND (1730) FINANCIAL PROJECTION
Total Total Change in Year- End Amount of Change in Increase
Revenues Expenditures Fund Balance Fund Balance Subsidy Subsidy in Subsidy
2013-14 579,589 - 579,589 (2,331,402) 579,589 256,947 80%
2014-15 579,589 - 579,589 (1,751,813) 579,589 - 0%
2015-16 583,937 - 583,937 (1,167,876) 583,937 4,348 1%
2016-17 583,937 - 583,937 (583,939) 583,937 - 0%
2017-18 583,937 - 583,937 (2) 583,937 - -
EQUIPMENT FUND (4100) FINANCIAL PROJECTION
ISF non-ISF Total Total Year- End Impact Rate
Revenues Revenue Revenue Expenditures Non GPF GPF TOTAL Fund Balance on GPF Inc.
2013-14 19,486,990 136,330 19,623,320 18,270,840 662,715 689,765 1,352,480 (5,706,897) 9,826,147 17%
2014-15 19,782,728 136,330 19,919,058 18,443,117 737,971 737,971 1,475,941 (4,230,956) 9,839,829 2%
2015-16 20,376,210 136,330 20,512,540 19,180,842 568,397 484,190 1,331,698 (2,899,258) 10,188,105 3%
2016-17 20,987,496 136,330 21,123,826 19,948,075 540,745 460,635 1,175,751 (1,723,508) 10,493,748 3%
2017-18 21,826,996 136,330 21,963,326 20,745,998 608,476 518,332 1,217,328 (506,180) 10,913,498 4%
2018-19 22,700,076 136,330 22,836,406 21,575,838 733,362 624,715 1,260,568 754,388 11,350,038 4%
Change in Fund Balance
TEN-YEAR NEGATIVE FUND REPAYMENT SCHEDULES
Beginning Amount of Transfer
Fund Deficit
(21,171,561)$
Beginning
Fund Deficit
(2,910,991)$
Beginning
Cash Deficit
(7,059,377)$
D - 101

FINANCIAL SUMMARIES
FACILITIES FUND (4400) FINANCIAL PROJECTION
ISF non-ISF Total Total Year- End Impact Rate
Revenues Revenue Revenue Expenditures Non GPF GPF TOTAL Fund Balance on GPF Inc.
2013-14 25,872,472 658,345 26,530,817 25,272,966 528,297 729,554 1,257,851 (21,197,525) 15,013,075 15%
2014-15 27,289,929 658,345 27,948,274 25,779,478 260,256 1,908,540 2,168,796 (19,028,729) 15,835,345 5%
2015-16 28,927,325 658,345 29,585,670 26,552,862 363,937 2,668,871 3,032,807 (15,995,922) 16,310,197 6%
2016-17 30,662,964 658,345 31,321,309 27,349,448 476,623 3,495,238 3,971,861 (12,024,061) 17,778,114 6%
2017-18 32,809,372 658,345 33,467,717 28,169,932 635,734 4,662,051 5,297,785 (6,726,276) 19,911,488 7%
2018-19 35,106,028 658,345 35,764,373 29,015,030 809,921 5,939,422 6,749,343 23,068 22,300,867 7%
PURCHASING FUND (4550) FINANCIAL PROJECTION
ISF non-ISF Total Total Change in Year- End Impact Rate
Revenues Revenue Revenue Expenditures Fund Balance Fund Balance on GPF Inc.
2013-14 750,403 77,562 777,965 777,965 - (445,288) 254,624 -3%
2014-15 715,504 62,461 777,965 777,965 - (445,288) 74,480 -5%
2015-16 787,054 - 787,054 785,745 1,310 (443,978) 81,928 10%
2016-17 865,760 - 865,760 793,602 72,158 (371,821) 90,121 10%
2017-18 952,336 - 952,336 801,538 150,798 (221,023) 99,133 10%
2018-19 1,057,093 - 1,057,093 809,553 247,539 26,516 110,038 11%
(22,455,376)$
Cash Deficit
(445,288)$
Beginning
Beginning
Cash Deficit
TEN-YEAR NEGATIVE FUND REPAYMENT SCHEDULES (CONT'D)
Change in Fund Balance
D - 102

FINANCIAL SUMMARIES
LONG TERM LIABILITIES
Overview of Long Term Liabilities The City has four defined benefit retirement plans: Oakland Police and Fire Retirement System (PFRS), Oakland Municipal Employees’ Retirement System (OMERS), and the California Public Employees’ Retirement System (PERS) Public Safety Retirement Plan and Miscellaneous Retirement Plan. PFRS and OMERS are closed plans that cover employees hired prior to July 1976 and September 1970, respectively. The City also has programs in place to partially pay health insurance premiums for certain classes of retirees f rom City employment. City retirees are eligible for retiree health benefits if they meet certain requirements relating to age and service. The retiree health benefits are described in the labor agreements between the City and Local Unions and in City resolutions. The table below shows a summary of the long-term liabilities for the City
Unfunded Amount
Descriptions
$743M California Public Employees Retirement System (Cal PERS), 75% funded. Unfunded balance as of June 30, 2011
$216M Police and Fire Retirement System (PFRS), closed retirement system, unfunded balance as of June 30, 2012 was $426M; issued a bond in July 2012, the current unfunded balance is $216M, will start the payment in FY 2017-18, $24.24M
$520M Other Post-Employment Benefits (OPEB) has the unfunded actuarial accrued liability (UAAL) of $520M as of June 30, 2011
$29.5M Accrued leaves are funded at 28.7% level, which leaves approximately $29.5M unfunded as of June 30, 2012 (unaudited)
D - 103

FINANCIAL SUMMARIES
Unfunded Pension Liability for CalPERS – Active Retirement Plan The City has active defined benefit retirement plans for safety and miscellaneous employees with CalPERS. Although the funded ratios of the safety and miscellaneous plan with CalPERS are below 100%, they are within an acceptable range of close to 80% funded, and the City will continue to maintain the required funded ratios through increases in CalPERS’ required contributions from the City, which are already accounted for in the cost escalation of current employees’ retirement contribution in the fringe benefit line.
Unfunded Pension Liability for PFRS and OMERS – Closed Retirement Plans Regarding unfunded pension liability, the City has two close defined benefit retirement plans: the Oakland Police and Fire Retirement System (PFRS), Oakland Municipal Employees’ Retirement System (OMERS) and the safety According to the City’s FY 2010-11 Comprehensive Annual Financial Report (CAFR), PFRS' Unfunded Actuarial Accrued Liability (UAAL) was $426.7M as of July 1, 2011 and OMERS' UAAL was $743,000 as of July 1, 2010. The City recently issued pension obligation bonds to reduce the PFRS UAAL from approximately $426M to $216M. The debt service on the bonds is included in the debt service portion of the forecast. As part of the financing, the City made advanced payments for five years on its obligation to PFRS, and therefore does not need to make any new payment until FY 2017-18. The GPF portion of the UAAL payment beginning in FY 2017-18 is estimated to be $24.2M. The City is required, by Charter, to fully fund this liability by 2026, so the GPF portion of the payment will continue to be an average of approximately $21.5M each year through 2026.
Other Post Employment Benefits (OPEB) Like many municipalities, the City has accrued significant unfunded long-term liabilities, including for other post employment benefits (OPEB) for police, fire, and miscellaneous employees. Public administration and financial management best practices dictate that the City must begin to make deposits to build assets in order to offset these liabilities. In addition, the Governmental Accounting Standards Board (GASB) now requires that municipalities report these liabilities in their CAFR and other appropriate financial reports. According to the most recent report from the City’s actuary, Aon Hewitt, as of September 13, 2011, the annual required contribution (ARC) for a 30-year amortization (the maximum amortization allowed by GASB) of the police, fire, and miscellaneous OPEB Unfunded Actuarial Accrued Liability (UAAL) was $20,941,230, $12,413,116, and $13,303,004 respectively, totaling over $46M per year. The City is currently paying for OPEB benefits for its retirees on a pay-as-you-go basis, through which it pays as much each year as is required for just that year’s expenses (approximately $16M per year). The forecast shows what the fiscal picture would be if the City chose to make a net new investment each year to meet the full ARC, dividing the cost between the GPF and all other funds proportionate to the amount of salary paid from each. The table below shows the City’s current and forecasted pay-as-you-go amount, ARC, and net new expense. Note that the City’s net OPEB obligation increased in FY 2011-12 and will increase again in FY 2012-13 because the City did not make the full ARC payment in those years. As a result, when the City’s net OPEB obligation is next calculated by the actuary, the recalculated ARC will likely be higher than that displayed in the table on the following page.
D - 104

FINANCIAL SUMMARIES
Forecasted OPEB Pay-As-You-Go and ARC Contributions
OPEB Contributions FY 2012-13
Forecast FY 2013-14
Forecast FY 2014-15
Forecast FY 2015-16
Forecast FY 2016-17
Forecast FY 2017-18
Forecast
Misc
Pay as you go $6,989,759 $7,479,042 $7,927,785 $8,403,452 $8,907,659 $9,442,118
ARC $14,000,000 $14,300,000 $14,600,000 $14,900,000 $15,200,000 $15,500,000
Net new to achieve ARC $7,010,241 $6,820,958 $6,672,215 $6,496,548 $6,292,341 $6,057,882
Police
Pay as you go $6,558,564 $7,017,664 $7,438,724 $7,885,047 $8,358,150 $8,859,639
ARC $23,500,000 $24,900,000 $26,300,000 $27,800,000 $29,400,000 $31,000,000
Net new to achieve ARC $16,941,436 $17,882,336 $18,861,276 $19,914,953 $21,041,850 $22,140,361
Fire
Pay as you go $4,935,189 $5,280,652 $5,597,491 $5,933,341 $6,289,341 $6,666,702
ARC $13,700,000 $14,400,000 $15,000,000 $15,800,000 $16,600,000 $17,400,000
Net new to achieve ARC $8,764,811 $9,119,348 $9,402,509 $9,866,659 $10,310,659 $10,733,298
Total
Pay as you go $18,483,512 $19,777,358 $20,963,999 $22,221,839 $23,555,150 $24,968,459
ARC $51,200,000 $53,600,000 $55,900,000 $58,500,000 $61,200,000 $63,900,000
Net new to achieve ARC $32,716,488 $33,822,642 $34,936,001 $36,278,161 $37,644,850 $38,931,541
Note that the City is currently considering using existing fund balance to create a significant OPEB trust using funds restricted for this purpose. If the City does take this step, it will reduce the City’s ARC necessary to fully fund this liability. Staff will be bringing forward a recommendation to City Council later this year to begin to invest in the California Employers’ Retiree Benefit Trust (CERBT) Fund. Staff will be recommending a substantial deposit of funds ($20M to $40M) to fund health and other post-employment benefit costs for City retirees and their beneficiaries. The expenditure forecast related to paying down this liability will be updated in the Five-Year Financial Plan – Service Levels and Budget Strategies report accordingly. Investing in the CERBT will help the City minimize future cost impacts, as the investment returns will pay for the majority of the benefit; it will demonstrate prudent financial management, and bond rating agencies now expect an OPEB plan; and agencies that invest in the CERBT use a higher discount rate, which will lower projected liabilities and the ARC.
Compensated Absences – Accrued Vacation, Sick Leave, and Compensatory Time The City’s policy and its agreements with employee groups permit employees to accumulate earned but unused vested vacation, sick leave and other compensatory time. All earned compensatory time is accrued when incurred in the government-wide financial statements and the proprietary fund financial statements. A liability for these amounts is reported in the governmental funds only if they are due and payable. The estimated current liability is $29.5 million.
D - 105

FINANCIAL SUMMARIES
NOTES
D - 106

FINANCIAL SUMMARIES
UPDATED FIVE-YEAR FINANCIAL FORECAST
The City issued a Five-Year Financial Forecast for FY 2013-14 Through FY 2017-18 in October 2012. Based on the best data available at the time and some assumptions, it forecasted the City’s General Purpose Fund (GPF) and all funds revenues and expenditures over a future five-year period. The October report noted that the City would issue a revised forecast of revenues and expenditures in the spring. This revised forecast, which incorporates recent information, is presented in the revenue and expenditure sections above and further discussed below. Forecast Methodology City staff followed public administration best practices when designing the forecast methodology. Staff conducted research on best practices by reviewing the past financial forecasting work of Oakland, of peer jurisdictions and other leading municipalities, and by reviewing academic and professional materials on the topic. Future revenues and expenditures are impacted by cyclical and irregular changes in the City’s economy and demography. They can be estimated using a number of techniques including qualitative/judgmental analysis; quantitative analysis such as time series and regression analysis; and hybrid techniques. Qualitative forecasting uses non-statistical techniques that rely on human judgment to arrive at projections. Qualitative forecasting is essential for projecting revenue or expenditure components that are unstable, volatile, or for which there is limited historical information. To facilitate sound qualitative analysis, the City of Oakland seeks input from outside experts in economics, municipal finance, and other relevant fields. For example, the City incorporates information from the League of California Cities and the Legislative Analyst’s Office on State legislation’s impact on local government finances. Quantitative analysis involves using quantitative methods, primarily statistical analysis, to understand historical trends and causal relationships in order to forecast future conditions. One kind of quantitative analysis is time series analysis in which chronological data can be used to identify multiyear cycles and the nature of long-run trends. Causal analysis is another type of quantitative analysis dealing with interrelationships between two or more variables. One or more predictors influence, directly or indirectly, future revenue or expenditure. City staff used both qualitative and quantitative analysis as part of this forecast, as described below. Staff conducted an environmental scan and consulted extensively with other City staff to gain their thoughts on events that would impact future revenues and expenditures. Much of the forecast also draws on information provided by outside experts, such as future inflation rates and expected medical insurance premium growth rates. City staff took into account historical experience, as well as the economic uncertainties underlying the revenue and expenditure outlook over the five-year period. The forecast uses revenues and expenditures from the FY 2013-15 proposed budget as the baseline from which future years are projected. Note that the majority of the assumptions in this updated forecast are the same as those in the forecast issued in October 2012. There are three important assumptions that are different, beyond simply using more current growth rates. First, this forecast includes one police academy per year in FY 2015-16, FY 2016-17, and FY 2017-18, whereas the original forecast had included two per year. Second, this forecast assumes that two local revenue measures, the Wildfire Prevention Assessment District and the Violence Prevention and Public Safety Act of 2004 (Measure Y), will be extended by voters. As such, the services those revenues support will not have to be eliminated or backfilled by the General Purpose Fund. Third, salaries are conservatively assumed to grow at 1% of total payroll due to step increases.
D - 107

FINANCIAL SUMMARIES
Revenue Forecast As presented above, the proposed and forecasted General Purpose Fund and all funds revenues are illustrated in the tables below.
Revenue TypeFY 2011-12
Actuals
FY 2012-13
Midcycle
Budget
FY 2013-14
Proposed
Budget
FY 2014-15
Proposed
Budget
FY 2015-16
Forecast
FY 2016-17
Forecast
FY 2017-18
Forecast
Property Tax $138,796,954 $125,166,501 $144,448,852 $150,928,777 $154,291,998 $159,755,472 $168,026,677
Sales Tax 44,740,906 43,556,223 47,208,326 48,624,575 $50,569,558 $52,592,340 $54,696,034
Business
License Tax 58,548,809 51,800,000 58,486,270 60,240,858 $62,048,084 $64,530,007 $67,111,207
Utility
Consumption Tax 51,434,031 50,500,000 50,588,732 50,588,732 $50,588,732 $50,588,732 $50,588,732
Real Estate
Transfer Tax 30,546,398 28,490,000 39,453,990 40,637,610 $42,263,114 $43,953,639 $45,711,785
Transient
Occupancy Tax 10,713,948 10,864,502 12,006,316 12,246,442 $12,613,835 $12,992,250 $13,382,018
Parking Tax 8,616,474 8,103,857 8,531,028 8,701,649 $8,962,698 $9,231,579 $9,508,527
Licenses &
Permits 1,158,650 925,570 1,386,726 1,413,858 $1,456,274 $1,499,962 $1,544,961
Fines &
Penalties 24,246,700 25,425,535 23,498,995 22,568,807 $20,650,228 $18,862,462 $18,266,540
Interest Income 740,482 800,000 740,482 740,482 $740,482 $740,482 $740,482
Service Charges 45,948,737 43,338,382 43,662,137 43,919,082 $44,396,175 $44,729,301 $44,967,647
Grants &
Subsidies 229,107 160,672 - - - - -
Miscellaneous 32,079,762 2,733,000 1,299,320 4,824,320 $824,320 $824,320 $824,320
Interfund
Transfers 1,718,023 3,200,000 - - - - -
Subtotal
Revenue$449,519,489 $395,064,242 $431,311,174 $445,435,192 $449,405,499 $460,300,547 $475,368,929
Transfers from
Fund Balance* - 14,282,521 (1,155,562) 11,966,492 - - -
Grand Total $449,519,489 $409,346,763 $430,155,612 $457,401,684 $449,405,499 $460,300,547 $475,368,929
* Tranfers from Fund Balance were previously combined with Interfund Transfers.
GENERAL PURPOSE FUND REVENUE
D - 108

FINANCIAL SUMMARIES
Revenue TypeFY 2011-12
Actuals
FY 2012-13
Adjusted
Budget
FY 2013-14
Proposed
Budget
FY 2014-15
Proposed
Budget
FY 2015-16
Forecast
FY 2016-17
Forecast
FY 2017-18
Forecast
Property Tax $138,816,699 $125,354,813 $144,637,164 $151,117,089 $154,485,959 $159,955,252 $168,234,449
Sales Tax 55,476,445 53,616,357 57,964,798 59,663,701 $62,050,249 $64,532,259 $67,113,549
Gasoline Tax 5,795,764 6,637,535 6,637,535 6,637,535 $6,637,535 $6,637,535 $6,637,535
Business
License Tax 58,548,809 51,800,000 58,486,270 60,240,858 $62,048,084 $64,530,007 $67,111,207
Utility
Consumption Tax 51,434,031 50,500,000 50,588,732 50,588,732 $50,588,732 $50,588,732 $50,588,732
Real Estate
Transfer Tax 30,546,398 28,490,000 39,453,990 40,637,610 $42,263,114 $43,953,639 $45,711,785
Transient
Occupancy Tax 30,546,398 13,827,549 14,969,363 15,209,489 $15,665,774 $16,135,747 $16,619,819
Parking Tax 15,975,931 14,992,135 15,640,428 15,967,449 $16,446,472 $16,939,867 $17,448,063
Other Local
Taxes 152,572,913 132,207,099 109,945,104 110,170,793 $112,374,209 $114,621,693 $116,914,127
Licenses &
Permits 14,260,718 13,320,000 14,406,356 15,067,488 $15,519,513 $15,985,098 $16,464,651
Fines &
Penalties 27,452,800 30,146,129 28,219,589 27,289,401 $25,039,337 $22,942,687 $22,243,803
Interest Income 10,614,818 5,701,950 904,012 894,012 $894,012 $894,012 $894,012
Service Charges 518,190,174 153,856,654 149,247,715 152,052,708 $154,550,055 $156,943,652 $159,283,491
Internal Service
Charges 48,122,481 46,189,740 52,045,217 53,758,412 $54,833,580 $55,930,252 $57,048,857
Grants &
Subsidies 152,647,545 75,704,081 59,314,176 63,348,963 $63,348,963 $63,348,963 $63,348,963
Miscellaneous* (194,967,319) 470,829,294 41,793,137 45,488,357 $41,488,357 $41,488,357 $41,488,357
Interfund
Tranfers 470,666,394 143,145,048 142,333,740 135,383,060 $135,383,060 $135,383,060 $135,383,060
Subtotal
Revenue$1,586,701,001 $1,416,318,385 $986,587,326 $1,003,515,657 $1,013,617,005 $1,030,810,812 $1,052,534,461
Transfers from
Fund Balance** 40,151,058 66,103,229 68,181,204 - - -
Grand Total $1,586,701,001 $1,456,469,443 $1,052,690,555 $1,071,696,861 $1,013,617,005 $1,030,810,812 $1,052,534,461
ALL FUNDS REVENUE
* Negative Miscellaneous Revenue is due to Port of Oakland Reveue & Expense Clearing
** Tranfers from Fund Balance were previously combined with Interfund Transfers.
D - 109

FINANCIAL SUMMARIES
Expenditure Forecast The proposed and forecasted General Purpose Fund and all funds expenditures are illustrated in the tables below. Recall that the majority of the assumptions in this updated expenditure forecast are the same as those in the forecast issued in October 2012. Three important assumptions are different: one police academy per year in FY 2015-16, FY 2016-17, and FY 2017-18, rather than two per year; the police and fire services supported by Measure Y do not have to be backfilled by the General Purpose Fund; and salaries are assumed to grow at 1% due to step increases. A second police academy per year would add approximately $4M in academy costs per year and $24M per year by FY 2017-18 in start up and ongoing compensation and equipment for 120 new officers. Having to backfill Measure Y police and fire services with the GPF would require approximately $14.5M in additional expenditures per year.
Expenditure CategoriesFY 2013-14
Proposed
FY 2014-15
Proposed
FY 2015-16
Forecast
FY 2016-17
Forecast
FY 2017-18
Forecast
Civilian salaries 66,331,643$ 68,054,143$ 68,600,000$ 69,300,000$ 70,000,000$
Civilian fringe 21,995,075$ 23,177,677$ 24,500,000$ 26,000,000$ 27,500,000$
Civilian retirement 16,053,933$ 17,043,133$ 18,400,000$ 19,900,000$ 21,500,000$
Personnel - Civilian 104,380,651$ 108,274,953$ 111,500,000$ 115,200,000$ 119,000,000$
Sworn salaries 126,734,085$ 138,909,176$ 138,900,000$ 140,300,000$ 141,700,000$
Sworn fringe 39,156,172$ 45,056,939$ 47,000,000$ 49,900,000$ 52,900,000$
Sworn retirement 36,149,911$ 40,766,263$ 43,600,000$ 47,200,000$ 51,100,000$
Personnel - Sworn 202,040,168$ 224,732,378$ 229,600,000$ 237,400,000$ 245,700,000$
Services and supplies 15,616,347$ 14,631,017$ 13,700,000$ 13,700,000$ 13,700,000$
Contract services 19,697,024$ 19,736,539$ 19,600,000$ 19,600,000$ 19,600,000$
Internal service/work order 29,285,594$ 30,132,571$ 30,800,000$ 31,900,000$ 33,400,000$
Other 1,823,994$ 1,824,364$ 1,800,000$ 1,800,000$ 1,800,000$
Operations and maintenance 66,422,959$ 66,324,491$ 65,800,000$ 67,000,000$ 68,500,000$
Debt service 35,413,567$ 35,033,723$ 20,900,000$ 20,900,000$ 20,900,000$
Operating transfers 35,293,535$ 36,237,058$ 37,200,000$ 37,200,000$ 37,200,000$
Overhead (14,278,144)$ (14,083,795)$ (14,100,000)$ (14,100,000)$ (14,100,000)$
Bank, bond, loan, and other expenditures 2,220,252$ 2,220,252$ 2,000,000$ 2,000,000$ 2,000,000$
Other (1,337,376)$ (1,337,376)$ (1,300,000)$ (1,300,000)$ (1,300,000)$
Debt service, operating transfers, other 57,311,834$ 58,069,862$ 44,700,000$ 44,700,000$ 44,700,000$
Deposits to reserve for pension and OPEB liabilities 10,000,000$ 10,000,000$ -$
Required contribution for PFRS -$ -$ 24,200,000$
Pay down long term liabilities - non-defered 10,000,000$ 10,000,000$ 24,200,000$
Subtotal Non-Deferred 430,155,612$ 457,401,684$ 461,600,000$ 474,300,000$ 502,100,000$
Land, buildings, infrastructure, furniture 58,500,000$ 58,500,000$ 58,500,000$
Equipment/vehicles 4,600,000$ 4,600,000$ 4,600,000$
Other fixed assets/computers and software 3,800,000$ 3,800,000$ 3,800,000$
Capital acquisitions - deferred 66,800,000$ 66,800,000$ 66,800,000$
Deposits to GPF reserves -$ -$ -$
Net new negative fund balance repayment 3,000,000$ 3,000,000$ 3,000,000$
OPEB - Net new Police to achieve ARC 17,700,000$ 18,700,000$ 19,700,000$
OPEB - Net new Fire to achieve ARC 9,100,000$ 9,500,000$ 9,900,000$
OPEB - Net new Misc to achieve ARC 2,400,000$ 2,300,000$ 2,300,000$
Pay down long term liabilities - deferred 32,200,000$ 33,600,000$ 34,900,000$
Subtotal Deferred 99,000,000$ 100,400,000$ 101,700,000$
Grand Total Including Deferred 430,155,612$ 457,401,684$ 560,600,000$ 574,700,000$ 603,800,000$
General Purpose Fund Expenditures
D - 110

FINANCIAL SUMMARIES
Expenditure CategoriesFY 2013-14
Proposed
FY 2014-15
Proposed
FY 2015-16
Forecast
FY 2016-17
Forecast
FY 2017-18
Forecast
Civilian salaries 170,226,896$ 170,379,243$ 171,400,000$ 173,100,000$ 174,800,000$
Civilian fringe 56,451,146$ 59,398,702$ 62,700,000$ 66,400,000$ 70,400,000$
Civilian retirement 41,076,011$ 43,525,191$ 46,900,000$ 50,600,000$ 54,700,000$
Personnel - civilian 267,754,053$ 273,303,136$ 280,900,000$ 290,200,000$ 300,000,000$
Sworn salaries 139,551,088$ 153,668,175$ 153,900,000$ 155,500,000$ 157,000,000$
Sworn fringe 42,327,881$ 48,123,543$ 50,300,000$ 53,300,000$ 56,600,000$
Sworn retirement 39,357,670$ 43,845,661$ 47,000,000$ 50,800,000$ 55,000,000$
Personnel - sworn 221,236,639$ 245,637,379$ 251,200,000$ 259,600,000$ 268,600,000$
Services and supplies 70,825,352$ 70,116,230$ 68,700,000$ 68,700,000$ 68,700,000$
Contract services 98,349,106$ 99,317,103$ 99,200,000$ 99,200,000$ 99,200,000$
Internal service/work order 54,290,850$ 55,482,083$ 56,700,000$ 59,000,000$ 62,000,000$
Other 4,367,188$ 4,377,390$ 4,400,000$ 4,400,000$ 4,400,000$
Operations and maintenance 227,832,496$ 229,292,806$ 229,000,000$ 231,300,000$ 234,300,000$
Land, buildings, infrastructure, furniture $24,910,286 $26,512,786 $26,500,000 $26,500,000 $26,500,000
Equipment/vehicles $668,755 $668,755 $700,000 $700,000 $700,000
Other fixed assets/computers and software $800,898 $808,878 $800,000 $800,000 $800,000
Capital acquisitions $26,379,939 $27,990,419 $28,000,000 $28,000,000 $28,000,000
Debt service 178,328,061$ 173,415,117$ 145,200,000$ 145,200,000$ 145,200,000$
Operating transfers 119,138,950$ 112,188,270$ 116,400,000$ 116,400,000$ 116,400,000$
Overhead (1,690,003)$ (1,675,520)$ (1,700,000)$ (1,700,000)$ (1,700,000)$
Overhead - Project Recoveries (13,674,482)$ (14,129,131)$ (14,200,000)$ (14,200,000)$ (14,200,000)$
Bank, bond, loan, and other expenditures 5,329,749$ 5,335,749$ 5,100,000$ 5,100,000$ 5,100,000$
Other 8,371,527$ 9,225,744$ 9,400,000$ 9,400,000$ 9,400,000$
Debt service, operating transfers, other 295,803,802$ 284,360,229$ 260,200,000$ 260,200,000$ 260,200,000$
Deposits to reserve for pension and OPEB liabilities 10,000,000$ 10,000,000$ -$
Required contribution for PFRS -$ -$ 24,200,000$
Pay down long term liabilities - required 10,000,000$ 10,000,000$ 24,200,000$
Subtotal Non-Deferred 1,039,006,929$ 1,060,583,969$ 1,059,300,000$ 1,079,300,000$ 1,115,300,000$
Land, buildings, infrastructure, furniture 78,000,000$ 78,000,000$ 78,000,000$
Equipment/vehicles 10,200,000$ 10,200,000$ 10,200,000$
Other fixed assets/computers and software 7,500,000$ 7,500,000$ 7,500,000$
Capital acquisitions - deferred 95,700,000$ 95,700,000$ 95,700,000$
Deposits to GPF reserves -$ -$ -$
Net new negative fund balance repayment 3,000,000$ 3,000,000$ 3,000,000$
OPEB - Net new Police to achieve ARC 19,900,000$ 21,000,000$ 22,100,000$
OPEB - Net new Fire to achieve ARC 9,900,000$ 10,300,000$ 10,700,000$
OPEB - Net new Misc to achieve ARC 6,500,000$ 6,300,000$ 6,100,000$
Pay down long term liabilities - deferred 39,300,000$ 40,600,000$ 41,900,000$
Subtotal Deferred $135,000,000 $136,300,000 $137,600,000
Grand Total Including Deferred 430,155,612$ 457,401,684$ 560,600,000$ 574,700,000$ 603,800,000$
All Funds Expenditures
D - 111

FINANCIAL SUMMARIES
Imbalance Recall that the October 2012 forecast projected a General Purpose Fund shortfall rising over the years to approximately $48 million in FY 2017-18 for expected expenditures, $152 million when including deferred expenditures. This updated forecast presents comparable figures. Revenues are expected to be modestly higher. Expenditures are expected to be modestly lower, due primarily to the ongoing nature of expenditure reductions proposed for FY 2013-14 and FY 2014-15, the inclusion of just one police academy per year rather than two, and the assumption that the General Purpose Fund will not have to backfill police and fire services currently funded by Measure Y. It continues to paint a similar picture – natural revenue growth is not expected to catch up with expenditure growth, and is certainly not expected to achieve levels that would enable the City to fully fund deferred expenditures.
The updated all funds forecast also projects a future similar to that projected in October 2012. Revenues are expected to be somewhat higher, as are expenditures, resulting in a projected shortfall for expected expenditures of approximately $63 million in FY 2017-18 and of $200 million when including deferred expenditures.
General Purpose Fund FY 2013-14
Proposed
FY 2014-15
Proposed
FY 2015-16
Forecast
FY 2016-17
Forecast
FY 2017-18
Forecast
Revenue 430,155,612$ 457,401,684$ 449,405,499$ 460,300,547$ 475,368,929$
Expenditures 430,155,612$ 457,401,684$ 461,600,000$ 474,300,000$ 502,100,000$
Surplus/(Shortfall) -$ -$ (12,194,501)$ (13,999,453)$ (26,731,071)$
Expenditures - Deferred 99,000,000$ 100,400,000$ 101,700,000$
Surplus/(Shortfall) -$ -$ (111,194,501)$ (114,399,453)$ (128,431,071)$
All Funds FY 2013-14
Proposed
FY 2014-15
Proposed
FY 2015-16
Forecast
FY 2016-17
Forecast
FY 2017-18
Forecast
Revenue 1,052,690,555$ 1,071,696,861$ 1,013,617,005$ 1,030,810,812$ 1,052,534,461$
Expenditures 1,039,006,929$ 1,060,583,969$ 1,059,300,000$ 1,079,300,000$ 1,115,300,000$
Surplus/(Shortfall) 13,683,626$ 11,112,892$ (45,682,995)$ (48,489,188)$ (62,765,539)$
Expenditures - Deferred 135,000,000$ 136,300,000$ 137,600,000$
Surplus/(Shortfall) 13,683,626$ 11,112,892$ (180,682,995)$ (184,789,188)$ (200,365,539)$
D - 112


ORGANIZATIONAL STRUCTURE
CITY OF OAKLAND
ORGANIZATIONAL SUMMARY
* Administrative Services includes Controller’s Office, Revenue, Treasury, Human Resources and Information Technology.
** Community Services includes Neighborhood Services, Parks and Recreation and Human Services.
E - 1

ORGANIZATIONAL STRUCTURE
SUMMARY OF POSITIONS BY AGENCY/DEPARTMENT FY 2007-08 THROUGH FY 2014-15
(In Full Time Equivalents)
Agency/Department
FY 2007-08
Adopted Budget
FTE
FY 2008-09
October Revise Budget
FTE
FY 2009-10
Amended Budget
FTE
FY 2010-11
MidcycleBudget
FTE
FY 2011-12
Adopted Budget
FTE
FY 2012-13
Midcycle Budget
FTE
FY 2013-14
ProposedBudget
FTE
FY 2014-15
ProposedBudget
FTE
Mayor 24.00 23.00 13.50 10.00 9.00 9.00 10.00 10.00
City Council 35.50 35.50 35.50 26.46 26.46 26.46 26.46 26.46
City Administrator 1 84.80 79.30 66.60 61.50 64.30 187.15 113.15 113.15
City Attorney 79.35 77.00 74.00 67.00 61.00 62.00 63.00 63.00
City Auditor 10.00 10.00 10.00 10.00 10.00 10.00 10.00 10.00
City Clerk 13.00 11.50 11.50 11.00 10.00 9.00 9.00 9.00
Contracting & Purchasing 2 28.00 25.00 23.50 22.50
Administrative Services 3 164.50
Information Technology 1 100.00 86.00 80.00 68.00 64.00 67.00 67.00
Finance & Management 4 231.05 228.25 229.30 222.30 215.70
Controller's Office 36.00 36.00
Treasury 27.00 27.00
Revenue 75.00 75.00
Human Resources 4 63.00 58.00 42.00 41.00 37.50 36.70 36.70
Police Service 1,180.13 1,166.13 1,159.13 1,084.13 961.65 1,001.85 1,125.85 1,177.85
Fire Service 596.00 594.75 586.45 588.05 589.95 589.95 594.95 595.95
Museum 5 51.83 44.95 44.95 44.95
Community Services 3 506.69
Neighborhood Services 3.70 3.70
Human Services 286.63 284.27 276.75 273.09 266.06 297.19 296.19
Parks & Recreation 241.32 237.93 220.99 218.49 232.13 230.14 230.14
Library Services 232.24 217.29 211.00 215.04 217.01 215.01 215.79 215.79
Planning, Building &
Neighborhood Preservation 6
127.75 114.75 111.75
Housing & Community
Development 6
48.75 46.25 39.25
Community & Economic
Development Agency 6457.72 464.62 451.60 263.50 257.00
Public Works 686.81 644.03 587.35 723.05 732.83 722.58 731.83 731.83
TOTAL FTE 4,401.38 4,287.52 4,124.12 3,950.06 3,754.59 3,680.69 3,833.76 3,875.76
1 City Administrator assumed the Revenue Division and Parking Revenue Collection from Finance and Management. City Administrator assumed Employee Relations from
HRM. City Administrator assumed Office of Economic and Workforce Development and Office of Neighborhood Investment responsibilities from Community and Economic
Development Agency with dissolution of the Oakland Redevelopment Agency (ORA) in FY 2011-12. In FY 13-15 the Revenue Division moved back into Administrative Services.2 The Department of Contracting and Purchasing and Information Technology were divisions of the Finance and Management Agency through FY 2006-07. The Department
of Contracting and Purchasing functions were absorbed by other departments in FY 2011-12.
3 Administrative Services is created, composed of Information Technology, Finance and Management, and Human Resources Management and Community Services is created
composed of Human Services and Parks and Recreation in FY 2012-13. In FY 13-15 the Revenue Division moved back into Administrative Services.4 Finance and Management transferred Parking Revenue Collection to City Administrator, Parking Enforcement to Police Department, and Repair Operations to Public
Works as part of the restructuring due to the dissolution of the ORA in FY 2011-12. Human Resources was a division of the Finance and Management Agency through the end
of FY 2008-09.
5 City ceased operating the Oakland Museum of California in FY 2011-126 With the dissolution of the ORA in FY 2011-12, the Community and Economic Development Agency was dissolved and new departments, the Department of Planning,
Building & Neighborhood Preservation and the Department of Housing & Community Development are created.
E - 2
ORGANIZATIONAL STRUCTURE
Format of Agency and Department Budgets
The budgets presented for each department of the City have been prepared to provide a large amount of information in a brief and easily understandable format. Adopted budget data reflecting the City Council’s action on June 30, 2013 is presented. This section outlines the information presented by each department.
Mission Statement Each department budget begins with its mission statement and organization chart.
Business Goals The second section lists the departmental goals for FY 2013-15. Typically, these goals represent the business purpose of a department, in support of its mission statement. Each department in the City fulfills particular needs of the community, and this section outlines those responsibilities.
Programs/Divisions Included in the FY 2013-15 Budget This section lists all programs/divisions, along with their descriptions, for each
department.
Appropriations The pages display summary information for revenue, expenditures, and positions -- both historical and FY 2013-15 proposed -- associated with operating the department.
Summary of Historical Expenditure by Fund outlines which funds (i.e., revenue sources) each department uses to carry out its programs. The sources and uses of the City’s various funds are described in the Financial Summaries section.
Summary of Authorized Positions by Program summarizes all positions by program.
Summary of Amended Budget by Program/Division summarizes revenue and expenditures by program or division depending according to department preference.
Significant Changes to Budget A table highlighting major changes to the agency/department’s appropriations included in the FY 2013-15 Proposed Policy Budget. Changes are presented for the General Purpose Fund and other funds.
Organizational Chart This chart presents the departments organizational chart by budget program and includes a count of full time equivalent positions.
E - 3

ORGANIZATIONAL STRUCTURE
NOTES
E - 4

MAYOR
MAYOR
DUTIES AND RESPONSIBILITIES
The Mayor’s Office supports the Mayor in carrying out her City Charter duties to achieve the Mayor’s priorities: providing hope and opportunity for Oakland’s youth; strengthening public safety and reducing crime and violence; fostering sustainable economic growth and development of Oakland and Oakland residents; providing Oakland residents the opportunity to lead a healthy life; and providing city services in an effective and efficient manner.
The Mayor’s Office also works to create public/private partnerships, develop inter-governmental relationships with the County and surrounding jurisdictions; collaborate with the state and federal government on legislative and inter-governmental matters, promote a positive image of Oakland and establish partnerships with non-profit and philanthropic groups for the benefit of Oakland and Oakland’s residents.
PRIORITIES
The Mayor shall be responsible for the submission of an annual budget to the Council which shall be prepared by the City Administrator under the direction of the Mayor and Council. The Mayor shall, at the time of the submission of the budget, submit a general statement of the conditions of the affairs of the City, the goals of the administration and recommendations of such measures as she may deem expedient and proper to accomplish such goals.
The Mayor shall recommend to the Council measures and legislation as she deems necessary and to make such other recommendations to the Council concerning the affairs of the City as she finds desirable.
Expenditures by Fund
FY 2012-13 Midcycle
Budget
FY 2013-14 Proposed
Budget
FY 2014-15 Proposed
Budget
1010 General Purpose Fund (GPF) $1,302,162 $2,055,907 $2,002,220
1610 Successor Redevelopment Agency Reimbursement Fund
94,731 - -
1760 Telecommunications Reserve 70,549 100,888 103,339
2251 Measure Y: Public Safety Act 79,073 80,710 82,671
TOTAL $1,546,515 $2,237,505 $2,188,230
GPF Percent to Total Department 84.2% 91.9% 91.5%
GPF Percent to Citywide GPF Expenditures 0.3% 0.5% 0.4%
SUMMARY OF HISTORICAL EXPENDITURES AND PROPOSED BUDGET BY FUND
AUTHORIZED POSITIONS BY PROGRAM
Program
FY 2012-13
MidcycleAuthorized
FTE
FY 2013-14
ProposedBudget
FTE
FY 2014-15
ProposedBudget
FTE
Mayor's Support 9.00 10.00 10.00
1010 - General Purpose Fund (GPF) 7.70 9.10 9.10
1610 - Successor Redevelopment Agency Reimbursement
Fund
0.40 - -
1760 - Telecommunications Reserve 0.50 0.50 0.50
2251 - Measure Y: Public Safety Act 2004 0.40 0.40 0.40
TOTAL 9.00 10.00 10.00
SUMMARY OF HISTORICAL EXPENDITURES AND PROPOSED BUDGET BY PROGRAM
Revenue
Program
FY 2012-13 Midcycle
Budget
FY 2013-14 Proposed
Budget
FY 2014-15 Proposed
Budget
Mayor's Support $0 $0 $0
TOTAL $0 $0 $0
Expenditure
Program
FY 2012-13 Midcycle
Budget
FY 2013-14 Proposed
Budget
FY 2014-15 Proposed
Budget
Mayor's Support $1,546,515 $2,237,505 $2,188,230
TOTAL $1,546,515 $2,237,505 $2,188,230
General Purpose Fund (GPF) FTE FY 2013-14
ChangesFY 2014-15
Changes
Add 1.00 FTE Special Assistant to the Mayor 1.00 $117,870 $120,733
Reduction target of 5% in FY 2013-14 and 10% in FY 2014-15. - ($102,002) ($209,054)
SIGNIFICANT CHANGES IN BUDGET AND PERFORMANCE
E - 5

MAYOR
PRIORITIES (CONT’D)
The Mayor shall encourage programs for the physical, economic, social and cultural development of the City.
The Mayor shall actively promote economic development to broaden and strengthen the commercial and employment base of the City.
The Mayor shall appoint the City Administrator, subject to confirmation by the City Council, remove the City Administrator and give direction to the City Administrator. The Mayor shall
advise the council before removing the City Administrator.
The Mayor shall serve as ceremonial head of the City.
The Mayor shall represent the City in inter-governmental relations as directed by the Council.
The Mayor shall provide community leadership.
PRIOR REDUCTIONS
Elimination of General Fund Pay Go in FY09-10 has resulted in less capital improvement programs around Oakland.
Staffing in the Mayor’s Office has reduced substantially over the past several years, from 18 FTE’s in FY07-08 (excludes Oaklander’s Assistance Centre) to 9 FTE’s in FY 2012-13. One of the positions managed federal, state and local
government relations that coordinated special projects. Other positions were administrative in nature and also assisted with special projects.
PROGRAM DESCRIPTIONS
MAYOR’S SUPPORT
This program works directly with the Mayor in implementing her goals and responding to queries and concerns of Oakland citizens, businesses, and elected officials.
E - 6

CITY COUNCIL
CITY COUNCIL
DUTIES AND RESPONSIBILITIES
The Oakland City Council consists of eight Councilmembers, with seven nominated and elected from districts and one Citywide (At-Large). All Councilmembers are elected to a term of four years.
The City Council is the governing body of the City. It exercises the corporate powers of the City and, subject to the expressed limitations of the City Charter, is vested with all powers of legislation in municipal affairs adequate to provide a complete system of local government consistent with the Constitution of the State of California. The Council has no administrative powers.
BUSINESS GOALS
Improve efficiency and responsiveness to our residents.
Improve the infrastructure.
Reduce crime and ensure public safety for every Oakland neighborhood.
Develop a sustainable city.
Ensure that all Oakland children through seniors have an opportunity to be successful.
Expand economic development.
PRIOR REDUCTIONS
Elimination of General Fund Pay-Go in FY09-10 has resulted in less capital improvement programs in various districts.
Elimination of 6 FTE Legislative Analyst’s in FY09-10 resulted in dedicated personnel to staff Committees, which reduced the policy analysis and legislative expertise required by Council.
Reduction of 15% in City Council budget in FY 2011-13 led to the reduction in staff hours, additional voluntary furloughs, reductions in O&M and position eliminations.
Expenditures by Fund
FY 2012-13 Midcycle
Budget
FY 2013-14 Proposed
Budget
FY 2014-15 Proposed
Budget
1010 General Purpose Fund (GPF) $2,898,046 $3,547,574 $3,434,472
1610 Successor Redevelopment Agency Reimbursement Fund
521,368 - -
TOTAL $3,419,414 $3,547,574 $3,434,472
GPF Percent to Total Department 84.8% 100.0% 100.0%
GPF Percent to Citywide GPF Expenditures 0.7% 0.8% 0.8%
SUMMARY OF HISTORICAL EXPENDITURES AND PROPOSED BUDGET BY FUND
AUTHORIZED POSITIONS BY PROGRAM
Program
FY 2012-13
Midcycle
Budget FTE
FY 2013-14
Proposed
BudgetFTE
FY 2014-15
Proposed
BudgetFTE
Policy Analysis 26.46 26.46 26.46
1010 - General Purpose Fund (GPF) 23.26 26.46 26.46
1610 - Successor Redevelopment Agency Reimbursement Fund
3.20 - -
TOTAL 26.46 26.46 26.46
Revenue
Program
FY 2012-13 Midcycle
Budget
FY 2013-14 Proposed
Budget
FY 2014-15 Proposed
Budget
Policy Analysis $0
TOTAL $0 $0 $0
Expenditure
Program
FY 2012-13 Midcycle
Budget
FY 2013-14 Proposed
Budget
FY 2014-15 Proposed
Budget
Policy Analysis $3,419,414 $3,547,574 $3,434,472
TOTAL $3,419,414 $3,547,574 $3,434,472
SUMMARY OF HISTORICAL EXPENDITURES AND PROPOSED BUDGET BY PROGRAM
SIGNIFICANT CHANGES IN BUDGET AND PERFORMANCE
General Purpose Fund (GPF) FTE FY 2013-14
Changes
FY 2014-15
Changes
Reduction target of 5% in FY 2013-14 and 10% in FY 2014-15. - ($186,717) ($381,610)
E - 7

CITY COUNCIL
PROGRAM DESCRIPTIONS
POLICY ANALYSIS
This program analyzes new public policy initiatives and ensures that City of Oakland policy objectives are being met. Also, address constituent concerns and handles legislative follow up unique to Councilmembers and/or Council priorities.
E - 8

CITY ADMINISTRATOR
CITY ADMINISTRATOR
MISSION STATEMENT
The Office of the City Administrator provides strategic leadership that supports the Mayor and City Council and motivates and challenges the organization to deliver efficient and effective services to the community.
BUSINESS GOALS
Administer the affairs of the City in an efficient and effective manner.
Conduct necessary reviews of City operations to improve efficiency and accountability of City government.
Manage and coordinate citywide service delivery.
Enforce all applicable laws, ordinances and policies of the City.
Advance the City’s vision and goals and build organizational capacity.
Provide professional expertise and support to the Mayor and City Council in the formulation, interpretation, and application of public policy.
Advance the Mayor’s and City Council’s priorities.
PRIOR REDUCTIONS
SUMMARY OF HISTORICAL EXPENDITURES AND PROPOSED BUDGET BY FUND
Expenditures by Fund
FY 2012-13
Midcycle Budget
FY 2013-14
Proposed Budget
FY 2014-15
Proposed Budget
1010 General Purpose Fund (GPF) $24,517,450 13,537,728 13,790,378
1610 Successor Redevelopment Agency Reimbursement
Fund
6,979,859 4,717,093 4,819,796
1700 Mandatory Refuse Program 1,818,282 - -
1710 Recycling Program 194,178 208,871 212,086
1720 Comprehensive Clean-up 11,859 - -
1750 Multipurpose Reserve 2,569,098 404,803 405,786
1760 Telecommunications Reserve 1,151,543 1,200,039 1,223,428
1770 Telecommunications Land Use 581,383 479,259 513,005
1820 OPRCA Self Sustaining Revolving Fund 10,274 - -
2108 HUD-CDBG 470,348 311,719 317,834
2112 Department of Justice 290 - -
2195 Workforce Investment Act 5,371,837 5,275,111 5,279,141
2241 Measure Q-Library Services Retention & Enhancement 28,204 17,930 17,930
2250 Measure N: Fund 4,579 4,579 4,579
2251 Measure Y: Public Safety Act 516,169 529,953 534,663
2310 Lighting and Landscape Assesment 63,612 25,531 25,531
2412 Measure M: Emergency Dispatch Service 4,542 4,542 4,542
2413 Rent Adjustment Program Fund 440,346 173,336 177,496
2415 Development Service Fund 236,305 255,218 261,397
2417 Excess Litter Fee Fund 440,900 440,900 440,900
2419 Transient Occupancy Tax (TOT) Surcharge 370,381 370,381 370,381
2609 Dept of Energy-EECBG Program (ARRA) 99,414 - -
3100 Sewer Service Fund 1,063,022 - -
3200 Golf Course 8,450 8,450 8,450
5130 Rockridge: Library Assessment 3,387 3,387 3,387
5505 Municipal Capital Improvement: Public Arts 276,526 - -
5610 Central District Projects - 350,000 350,000
5650 Coliseum Projects - 100,000 100,000
5671 OBRA: Leasing & Utility 3,120,001 - 25,000
7640 Oakland Public Museum Trust 32,610 - -
7760 Grant Clearing 46,320 - -
TOTAL * $50,431,169 $28,418,830 $28,885,710
GPF Percent to Total Department 48.6% 47.6% 47.7%
GPF Percent to Citywide GPF Expenditures 6.0% 3.1% 3.0%
* Reduced budget due, in part, to the re-organization of Revenue to Administrative Services.
In the past several years, Equal Employment Opportunity Programs staffing has been reduced by 50%. The unit’s ability to meet required deadlines for discrimination complaint investigations, and the number of reasonable accommodation requests have taken longer to process.
The Citizens Police Review Board budget has been reduced by 60% and staffing by 38% over four years. The time to investigate complaints has doubled for some cases and they are unable to perform mediations and there has been a reduction in the
number of cases brought to evidentiary hearing.
Staffing in the Budget Office has reduced over the past several years. The unit has lost essential analytical positions necessary for the preparation, analysis and monitoring of department budgets.
The position that handled the administration of cabaret, massage parlor and other City wide permits and the Director position in the Neighborhood Services Division were eliminated from CAO Administration. Duties of these positions are now handled by existing staff in the unit.
Both Neighborhood Investment and Economic Development/Marketing have experienced reductions of more than 50 percent over the past several years, not only due to GPF cuts, but also since the dissolution of redevelopment in 2012. Despite these losses, the programs continue to operate by expanding the duties and workload of remaining staff.
E - 9

CITY ADMINISTRATOR
DIVISION DESCRIPTIONS
ADMINISTRATION
This program directs and coordinates all City agencies and departments to ensure the goals and policy directives of the City Council and Mayor are implemented and services are delivered to the community in an efficient and cost effective manner.
BUDGET
The division develops a fiscally responsible budget; develops a budget that meets community priorities; produces accurate and timely analysis of program revenues and expenditures; provides consultative services to ensure programs are efficient and effective; provides thorough legislative analysis to the City Administrator and elected officials to ensure the City remains proactive in its legislative agenda.
CITIZENS POLICE REVIEW BOARD
This program is the civilian police oversight agency for the City of Oakland, established to review complaints of conduct by police officers, conduct fact-finding investigations of these complaints, and thereafter make advisory reports to the City Administrator. Currently, the funding for Office of Inspector General (OIG) and Internal Affair Complaint Intake resides in this unit.
COMMUNICATIONS / KTOP
Facilitates City communications that are timely, accurate, professional, clear, relevant, effective and dependable; manages citywide media relations; oversees development and content of the City web site; and oversees KTOP, the City’s government access cable television station. KTOP provides coverage of City Council, Council Committee, and other City Agency meetings, and broadcasting original and acquired programming that connects and engages viewers with their city government, fellow citizens and the world at large.
AUTHORIZED POSITIONS BY DIVISION (CONT'D)
Program
FY 2012-13Midcycle
Budget
FTE
FY 2013-14Proposed
Budget
FTE
FY 2014-15Proposed
Budget
FTE
Administration 20.45 24.75 24.75
1010 - General Purpose Fund (GPF) 11.80 19.73 19.73
1610 - Successor Redevelopment Agency Reimbursement Fund
4.93 1.30 1.30
1750 - Multipurpose Reserve 0.34 0.34 0.34
1760 - Telecommunications Reserve 1.30 1.30 1.30
2413 - Rent Adjustment Program Fund 0.50 0.50 0.50
2415 - Development Service Fund 1.58 1.58 1.58
Budget 4.50 4.00 4.00
1010 - General Purpose Fund (GPF) 3.70 3.60 3.60
1610 - Successor Redevelopment Agency Reimbursement Fund
0.80 0.40 0.40
Citizens' Police Review Board 4.00 4.00 4.00
1010 - General Purpose Fund (GPF) 4.00 4.00 4.00
Communications / KTOP 7.90 6.90 6.90
1610 - Successor Redevelopment Agency Reimbursement Fund
0.78 0.20 0.20
1760 - Telecommunications Reserve 7.12 6.70 6.70
Contract Compliance 14.00 13.00 13.00
1010 - General Purpose Fund (GPF) 12.60 12.00 12.00
1610 - Successor Redevelopment Agency Reimbursement
Fund
0.40 - -
2609 - Dept of Energy-EECBG Program (ARRA) 1.00 - -
5671 - OBRA: Leasing & Utility - 1.00 1.00
Economic & Workforce Development 22.25 21.50 21.50
1010 - General Purpose Fund (GPF) 10.00 8.50 8.50
1710 - Recycling Program 1.10 1.00 1.00
1720 - Comprehensive Clean-up 0.10 - -
1820 - OPRCA Self Sustaining Revolving Fund 0.10 - -
2108 - HUD-CDBG 1.75 1.75 1.75
2195 - Workforce Investment Act 7.00 7.25 7.25
2241 - Measure Q-Library Services Retention & Enhancement
0.10 - -
5321 - Measure DD: 2009B Clean Water,Safe Parks & Open Space Trust Fund for Oakland
0.50 0.50 0.50
5505 - Municipal Capital Improvement: Public Arts 1.50 1.50 1.50
5671 - OBRA: Leasing & Utility - 1.00 1.00
7760 - Grant Clearing 0.10 - -
Employee Relations / Equal Opportunity 7.00 7.00 7.00
1010 - General Purpose Fund (GPF) 7.00 7.00 7.00
Measure Y 0.30 1.00 1.00
1010 - General Purpose Fund (GPF) - 0.50 0.50
1610 - Successor Redevelopment Agency Reimbursement
Fund
- 0.20 0.20
2251 - Measure Y: Public Safety Act 2004 0.30 0.30 0.30
Neighborhood Investment 26.75 27.00 27.00
1010 - General Purpose Fund (GPF) 0.78 0.78 0.64
1610 - Successor Redevelopment Agency Reimbursement Fund
21.22 21.12 21.12
1770 - Telecommunications Land Use 2.00 2.00 2.14
5671 - OBRA: Leasing & Utility 2.75 3.10 3.10
Oaklanders' Assistance Center 2.00 2.00 2.00
1010 - General Purpose Fund (GPF) 2.00 2.00 2.00
Public Ethics 1.00 2.00 2.00
1010 - General Purpose Fund (GPF) 1.00 1.50 1.50
2251 - Measure Y: Public Safety Act 2004 - 0.50 0.50
Revenue * 77.00 - -
1010 - General Purpose Fund (GPF) 57.21 - -
1700 - Mandatory Refuse Program 15.66 - -
1750 - Multipurpose Reserve 0.40 - -
2310 - Lighting and Landscape Assessment District 0.40 - -
2413 - Rent Adjustment Program Fund 3.00 - -
7760 - Grant Clearing 0.33 - -
TOTAL 187.15 113.15 113.15
* Revenue is proposed to move as a Department within Adinistrative Services.
E - 10

CITY ADMINISTRATOR
DIVISION DESCRIPTIONS
CONTRACT COMPLIANCE
This program supports all compliance policies that ensure social equity in public contracting and maximizes employment opportunities on City construction stability of Oakland's diverse community via contracting, procurement and construction employment opportunities.
ECONOMIC WORKFORCE &
DEVELOPMENT
The Economic Development program helps businesses succeed in Oakland by working with businesses and developers one-on-one and by implementing strategic initiatives to create a business-friendly environment.
The Workforce Development program staffs the City’s Workforce Investment Board and administering more than $5,000,000 in grants for Adult, Dislocated Worker, and Youth Service Providers; supports the Mayor’s Summer Jobs Program, and leading the development and operation of the new West Oakland Job Resource Center.
The Marketing program produces vital marketing tools to attract business, develop business and revitalize neighborhoods. The message: Oakland
SUMMARY OF HISTORICAL EXPENDITURES AND PROPOSED BUDGET BY DIVISION
Revenue
Program
FY 2012-13
Midcycle
Budget
FY 2013-14
Proposed
Budget
FY 2014-15
Proposed
Budget
Administration $13,657,609 $7,801,264 $7,969,763
Citizens' Police Review Board - 734,000 -
Communications / KTOP 1,085,858 1,575,000 1,581,944
Contract Compliance - 79,002 79,002
Economic & Workforce Development 8,287,018 6,444,376 6,476,114
Neighborhood Investment 7,829,790 1,949,741 1,983,487
Revenue 13,710,674 - -
TOTAL * $44,570,949 $18,583,383 $18,090,310
Expenditure
Program
FY 2012-13
Midcycle
Budget
FY 2013-14
Proposed
Budget
FY 2014-15
Proposed
Budget
Administration $13,657,609 $7,176,602 $7,324,238
Budget 962,062 961,437 978,957
Citizens' Police Review Board 1,312,501 2,090,136 2,104,580
Communications / KTOP 1,085,858 1,017,703 1,036,674
Contract Compliance 1,523,489 1,622,317 1,659,977
Economic & Workforce Development 8,287,018 8,337,841 8,384,112
Employee Relations / Equal Opportunity 1,179,077 1,208,995 1,235,819
Measure Y 498,169 537,690 543,025
Neighborhood Investment 7,829,790 4,962,975 5,103,403
Oaklanders' Assistance Center 184,595 202,087 206,915
Public Ethics 200,327 301,047 308,010
Revenue 13,710,674 - -
TOTAL * $50,431,169 $28,418,830 $28,885,710
* Reduced budget due, in part, to the re-organization of Revenue to Administrative Services.
is a premier location for business and investment. This unit also facilitates special events, cultural art grants and public art projects.
EMPLOYEE RELATIONS / EQUAL
OPPORTUNITY
Employee Relations represents the City and provides support to City staff on matters concerning employees who are represented by labor unions; negotiates on behalf of the City to set wages, hours, and other conditions of employment; assists City management staff in the interpretation of labor contracts; and investigates and resolves grievances. Equal Opportunity is mandated by federal, state, and local laws and regulations, performs the following functions: investigates Equal Employment Opportunity (EEO) claims of discrimination and harassment via a
neutral fact finding process; receives and responds to informal EEO mediation and dispute resolution requests from employees; provides and administers an ADA/FEHA workplace accommodations process for City employees and job applicants; develops and submits EEO statistical reports; conducts sexual harassment education and EEO training programs; monitors hiring practices for EEO compliance and conducts outreach to the Oakland community.
MEASURE Y
This program provides approximately $20 million annually for violence prevention and public safety programs managed by the Department of Human Services and the Police Department. Currently, the City Administrator's Office manages the evaluation portion of the program. In addition, the
Department of Human Services contracts with Neighborhood Services to manage the City/County Neighborhood Initiative Program.
NEIGHBORHOOD INVESTMENT
This program is responsible for winding down affairs of the former Oakland Redevelopment Agency (ORA) and ensuring contractual obligations of the former ORA are met, as well as property disposition and management, negotiation of disposition agreements, strengthening established commercial districts and neighborhood infrastructure support.
Real Estate Services provide a variety of services including property transfers, appraisals, leasing program, telecommunication leasing programs, right of way services, and property maintenance.
E - 11
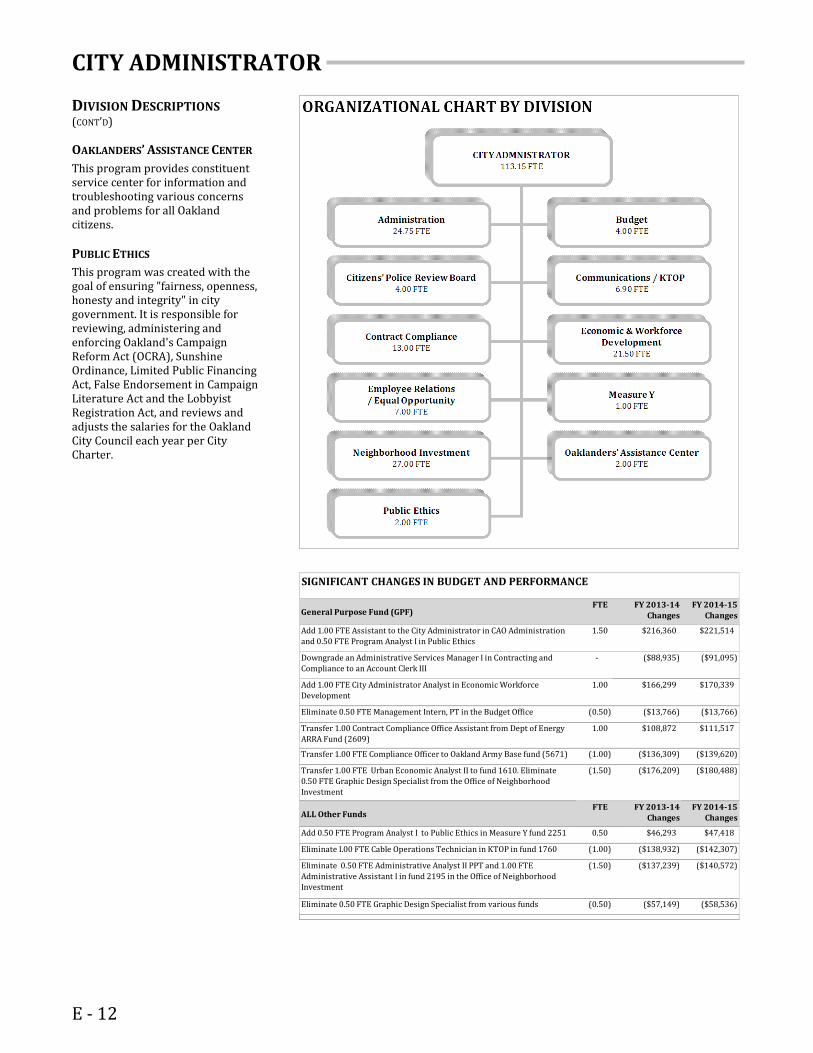
CITY ADMINISTRATOR
DIVISION DESCRIPTIONS (CONT’D)
OAKLANDERS’ ASSISTANCE CENTER
This program provides constituent service center for information and troubleshooting various concerns and problems for all Oakland citizens.
PUBLIC ETHICS
This program was created with the goal of ensuring "fairness, openness, honesty and integrity" in city government. It is responsible for reviewing, administering and enforcing Oakland's Campaign Reform Act (OCRA), Sunshine Ordinance, Limited Public Financing Act, False Endorsement in Campaign Literature Act and the Lobbyist Registration Act, and reviews and adjusts the salaries for the Oakland City Council each year per City Charter.
SIGNIFICANT CHANGES IN BUDGET AND PERFORMANCE
General Purpose Fund (GPF)FTE FY 2013-14
Changes
FY 2014-15
Changes
Add 1.00 FTE Assistant to the City Administrator in CAO Administration and 0.50 FTE Program Analyst I in Public Ethics
1.50 $216,360 $221,514
Downgrade an Administrative Services Manager I in Contracting and
Compliance to an Account Clerk III
- ($88,935) ($91,095)
Add 1.00 FTE City Administrator Analyst in Economic Workforce Development
1.00 $166,299 $170,339
Eliminate 0.50 FTE Management Intern, PT in the Budget Office (0.50) ($13,766) ($13,766)
Transfer 1.00 Contract Compliance Office Assistant from Dept of Energy
ARRA Fund (2609)
1.00 $108,872 $111,517
Transfer 1.00 FTE Compliance Officer to Oakland Army Base fund (5671) (1.00) ($136,309) ($139,620)
Transfer 1.00 FTE Urban Economic Analyst II to fund 1610. Eliminate 0.50 FTE Graphic Design Specialist from the Office of Neighborhood
Investment
(1.50) ($176,209) ($180,488)
ALL Other FundsFTE FY 2013-14
ChangesFY 2014-15
Changes
Add 0.50 FTE Program Analyst I to Public Ethics in Measure Y fund 2251 0.50 $46,293 $47,418
Eliminate I.00 FTE Cable Operations Technician in KTOP in fund 1760 (1.00) ($138,932) ($142,307)
Eliminate 0.50 FTE Administrative Analyst II PPT and 1.00 FTE
Administrative Assistant I in fund 2195 in the Office of Neighborhood Investment
(1.50) ($137,239) ($140,572)
Eliminate 0.50 FTE Graphic Design Specialist from various funds (0.50) ($57,149) ($58,536)
E - 12

CITY ATTORNEY
CITY ATTORNEY
MISSION STATEMENT
The Office of the City Attorney is committed to providing the highest quality legal services to the City of Oakland, its City Council, employees, officers, agencies, departments, boards and commissions; to promoting open government, transparency and accountability to the residents of Oakland in accordance with the letter and spirit of the law; and to apply the law in an innovative and community-oriented manner to improve the quality of life in all Oakland neighborhoods.
TOP PRIORITIES & GOALS
Assist the Mayor, City Council, and City Administrator in achieving their goals for the City by providing sound legal advice.
Respond efficiently to the needs of the City Council, City officials, departments and boards and commissions by negotiating, drafting and reviewing agreements, legislation, regulations, policies and procedures and helping to shape viable, defensible policies for the City.
Aggressively defend Oakland’s interests and resources in court and initiate legal action and other initiatives to protect the rights and interests and enhance the quality of life of our residents and community.
Minimize public liability exposure and reduce claims through effective advocacy, successful risk policies and useful training programs.
Explore and identify ways to provide highest quality, professional legal services in the most efficient and cost-effective manner possible by restoring and maintaining sufficient in-house staff.
Continue with the momentum of the Neighborhood Law Corps program to be responsive to residents and proactive in solving
Expenditures by Fund
FY 2012-13 Midcycle
Budget
FY 2013-14 Proposed
Budget
FY 2014-15 Proposed
Budget
1010 General Purpose Fund (GPF) $4,311,203 $4,406,790 $4,289,481
1100 Self Insurance Liability 3,240,654 3,256,633 3,335,083
1150 Worker's Compensation Insurance 447,665 439,309 449,900
1610 Successor Redevelopment Agency Reimbursement Fund
1,887,213 1,349,968 1,382,330
1710 Recycling Program 295,686 294,063 301,157
2108 HUD-CDBG 46,395 45,468 46,564
2211 Measure B: ACTIA 28,814 28,238 28,919
2231 State Gas Tax-Prop 42 Replacement Funds 111,042 116,656 119,457
2413 Rent Adjustment Program Fund 338,882 348,415 356,782
2415 Development Service Fund 610,651 644,633 660,156
3100 Sewer Service Fund 618,023 640,241 655,579
7100 Police and Fire Retirement System 97,717 95,766 98,075
7120 Oakland Municipal Employees' Retirement System 24,429 23,941 24,519
TOTAL $12,058,374 $11,690,121 $11,748,002
GPF Percent to Total Department 35.8% 37.7% 36.5%
GPF Percent to Citywide GPF Expenditures 1.1% 1.0% 0.9%
SUMMARY OF HISTORICAL EXPENDITURES AND PROPOSED BUDGET BY FUND
AUTHORIZED POSITIONS BY DIVISION
Division
FY 2012-13
Midcycle
Budget
FTE
FY 2013-14
Proposed
Budget
FTE
FY 2014-15
Proposed
Budget
FTE
Advisory 22.00 22.00 22.00
1010 - General Purpose Fund (GPF) 5.23 6.23 6.23
1100 - Self Insurance Liability 4.32 4.32 4.32
1150 - Worker's Compensation Insurance Claims 0.92 0.92 0.92
1610 - Successor Redevelopment Agency Reimbursement
Fund
6.31 5.31 5.31
1710 - Recycling Program 1.00 1.00 1.00
2108 - HUD-CDBG 0.19 0.19 0.19
2211 - Measure B: ACTIA 0.13 0.13 0.13
2231 - State Gas Tax-Prop 42 Replacement Funds 0.25 0.25 0.25
2413 - Rent Adjustment Program Fund 0.90 0.90 0.90
2415 - Development Service Fund 1.15 1.15 1.15
3100 - Sewer Service Fund 1.10 1.10 1.10
7100 - Police and Fire Retirement System 0.40 0.40 0.40
7120 - Oakland Municipal Employees' Retirement System
OMERS
0.10 0.10 0.10
City Attorney: Administration 27.00 28.00 28.00
1010 - General Fund: General Purpose 13.29 15.39 15.39
1100 - Self Insurance Liability 7.07 7.07 7.07
1610 - Successor Redevelopment Agency Reimbursement
Fund
1.60 0.50 0.50
1710 - Recycling Program 0.50 0.50 0.50
2413 - Rent Adjustment Program Fund 1.00 1.00 1.00
2415 - Development Service Fund 1.60 1.60 1.60
3100 - Sewer Service Fund 1.94 1.94 1.94
Litigation 13.00 13.00 13.00
1010 - General Fund: General Purpose 3.00 3.50 3.50
1100 - Self Insurance Liability 6.80 6.80 6.80
1150 - Worker's Compensation Insurance Claims 0.99 0.99 0.99
1610 - Successor Redevelopment Agency Reimbursement
Fund
0.50 - -
2231 - State Gas Tax-Prop 42 Replacement Funds 0.20 0.20 0.20
2415 - Development Service Fund 0.75 0.75 0.75
3100 - Sewer Service Fund 0.76 0.76 0.76
TOTAL 62.00 63.00 63.00
* Three staff are to be added at a cost of $615,652 from fund 1100 and will achieve saving from expenditure on outside counsel.
E - 13

CITY ATTORNEY
TOP PRIORITIES & GOALS
(CONT’D)
chronic neighborhood problems and addressing public nuisances.
Promote open government and accountability to the residents of Oakland in accordance with the letter and spirit of the law.
PRIOR REDUCTIONS
The adopted budget of the Office of the City Attorney for FY 2011-12 is $11.63 million which represents a steady decline ($3.78 million) from the FY 2007-08 budget of $15.41 million. Over the last decade, due to budget cuts, the City Attorney’s office has lost 33 positions (19 attorneys and 14 support staff) which represents more than one-third of the staff.
17 of the positions were eliminated by the start of FY 2009-10, with three more rounds of budget reductions occurring in the 2009-11 budget process. The result was a reduction of nine additional attorney positions and seven support positions during the last three years.
Reductions have required greater reliance on outside counsel for legal advice, litigation support, and transactional work, that could have been performed more efficiently and effectively and at lower cost with in-house counsel.
The time to complete other functions such as document review, legal opinions, and legislation preparation has increased due to the budget cuts.
DIVISION DESCRIPTIONS
ADVISORY SERVICES
Revenue
Division
FY 2012-13 Midcycle
Budget
FY 2013-14 Proposed
Budget
FY 2014-15 Proposed
Budget
Advisory $10,280 $10,280 $10,280
Litigation 8,000 22,000 22,000
TOTAL $18,280 $32,280 $32,280
Expenditure
Division
FY 2012-13 Midcycle
Budget
FY 2013-14 Proposed
Budget
FY 2014-15 Proposed
Budget
Advisory $5,062,085 $5,013,914 $5,133,484
City Attorney: Administration 4,581,771 4,331,063 4,213,625
Litigation 2,414,518 2,345,144 2,400,893
TOTAL $12,058,374 $11,690,121 $11,748,002
SUMMARY OF HISTORICAL EXPENDITURES AND PROPOSED BUDGET BY DIVISION
SIGNIFICANT CHANGES IN BUDGET AND PERFORMANCE
General Purpose Fund (GPF)FTE FY 2013-14
Changes
FY 2014-15
Changes
Reduction target of 5% in FY 2013-14 and 10% in FY 2014-15. - ($231,936) ($476,609)
ALL Other Funds
Planned addition of 1.00 FTE of City Attorney IV, 1.00 FTE of Special Counsel, and 1.00 FTE of Legal Administrative Assistant to
increase staff capacity to address legal and litigation matters from Self-Insurance Fund (1100). As a result, saving for outside
counsel expenditure should be achieved. The total staff level will be 66 FTEs. The effectiveness will be evaluated in FY 2014-15.
The approximate cost to add these positions is $0.62 million, and would result in the recalculation of the repayment to the
negative fund balance.
Provide legal services covering a wide spectrum of municipal affairs, including but not limited to legal advice and counsel, drafting and reviewing and negotiating contracts, and preparing legislation.
LEGAL SUPPORT & OPERATIONS
Manage the budget, personnel and support services of the City Attorney’s Office, including but limited to payroll, information technology, and paralegal and legal assistant services.
LITIGATION SERVICES
Advocate the City's interest in claims and lawsuits filed against and on behalf of the City, its officers, employees and agencies.
E - 14

CITY AUDITOR
CITY AUDITOR
MISSION STATEMENT
The mission of the Office of the City Auditor is to conduct performance audits that return in-depth and meaningful results to the citizens of Oakland by utilizing a risk-based audit approach to identify and audit the areas of government most vulnerable to fraud, waste, abuse and mismanagement.
BUSINESS GOALS
Identify $4 of monetary benefit for every $1 in audit cost.
Conduct performance audits to improve the economy, efficiency, effectiveness and accountability of City Government.
Conduct mandated audits of City expenditures.
Establish an effective whistleblower program to combat fraud, waste, and abuse.
Follow-up on audit recommendations in accordance with the City Charter.
Provide a professional, supportive, and effective environment for staff to excel.
PRIOR REDUCTIONS
Reductions in the Whistleblower Program have resulted in the elimination of all special investigations. The City Auditor’s Office has very limited flexibility within the program for any follow up or investigative work.
Trainings reduced to only those necessary for annual professional requirements.
Expenditures by Fund
FY 2012-13
Midcycle Budget
FY 2013-14
Proposed Budget
FY 2014-15
Proposed Budget
1010 General Purpose Fund (GPF) $900,535 $1,556,461 $1,510,761
TOTAL $900,535 $1,556,461 $1,510,761
GPF Percent to Total Department 100.0% 100.0% 100.0%
GPF Percent to Citywide GPF Expenditures 0.2% 0.4% 0.3%
SUMMARY OF HISTORICAL EXPENDITURES AND PROPOSED BUDGET BY FUND
AUTHORIZED POSITIONS BY PROGRAM
Program
FY 2012-13
Midcycle
Budget FTE
FY 2013-14
Proposed
BudgetFTE
FY 2014-15
Proposed
BudgetFTE
Auditing 10.00 10.00 10.00
1010 - General Purpose Fund (GPF) 10.00 10.00 10.00
TOTAL 10.00 10.00 10.00
Revenue
Program
FY 2012-13 Midcycle
Budget
FY 2013-14 Proposed
Budget
FY 2014-15 Proposed
Budget
Auditing $0 $0 $0
TOTAL $0 $0 $0
Expenditure
Program
FY 2012-13 Midcycle
Budget
FY 2013-14 Proposed
Budget
FY 2014-15 Proposed
Budget
Auditing $900,535 $1,556,461 $1,510,761
TOTAL $900,535 $1,556,461 $1,510,761
SUMMARY OF HISTORICAL EXPENDITURES AND PROPOSED BUDGET BY PROGRAM
SIGNIFICANT CHANGES IN BUDGET AND PERFORMANCE
General Purpose Fund (GPF) FTE FY 2013-14
Changes
FY 20114-15
Changes
Reduction target of 5% in FY 2013-14 and 10% in FY 2014-15. - ($81,919) ($167,862)
E - 15

CITY AUDITOR
PROGRAM DESCRIPTIONS
AUDITING
This program conducts audits of all departments and agencies of the City in accordance with applicable government auditing standards and in conformity with Section 403 of the Oakland City Charter. Audit services will identify ways to increase the economy, efficiency, effectiveness, and accountability of City government.
E - 16

CITY CLERK
CITY CLERK
MISSION STATEMENT
The mission of the Office of the City Clerk is to enable the public to fully participate in the governmental process, by providing accurate information and services in a professional manner, and to assist residents in making informed decisions affecting the quality of their lives.
BUSINESS GOALS
Support the Mayor, City Council, City Administrator, and Department Directors in achieving their goals for the City through accurate recording of legislative activities and retention / retrieval of City records.
Enhancement of City-Wide Records Management program to promote accessibility, retention, and timely destruction.
Continue outreach to encourage citizen participation in government affairs and increase voter participation.
PRIOR REDUCTIONS
The FY 2012-13 baseline budget of the City Clerk’s office reflects a 27.25% reduction in comparison to the adjusted baseline budget for FY 2009-10. The variance to O&M is $789,768. Operational impacts of the reductions include: elimination of full support to City Boards and Commissions, elimination of Passport Services, elimination of hearing room reservations for City Hall hearing rooms, elimination of front desk/receptionist support, and elimination of part time support for elections administration. Additionally balancing measures included reduction of O&M expenses supporting agenda production, elections administration, and general supplies/equipment replacement.
Expenditures by Fund
FY 2012-13 Midcycle
Budget
FY 2013-14 Proposed
Budget
FY 2014-15 Proposed
Budget
1010 General Purpose Fund (GPF) $1,930,089 $1,917,527 $1,873,031
1610 Successor Redevelopment Agency Reimbursement Fund
178,763 49,402 50,588
TOTAL $2,108,852 $1,966,929 $1,923,619
GPF Percent to Total Department 91.5% 97.5% 97.4%
GPF Percent to Citywide GPF Expenditures 0.5% 0.4% 0.4%
SUMMARY OF HISTORICAL EXPENDITURES AND PROPOSED BUDGET BY FUND
AUTHORIZED POSITIONS BY PROGRAM
Program
FY 2012-13Midcycle
Budget FTE
FY 2013-14Proposed
BudgetFTE
FY 2014-15Proposed
BudgetFTE
Agenda Management 4.40 4.00 4.00
1010 - General Purpose Fund (GPF) 3.60 3.70 3.70
1610 - Successor Redevelopment Agency Reimbursement Fund
0.80 0.30 0.30
Customer Services & Public Relations 1.00 1.00 1.00
1010 - General Purpose Fund (GPF) 1.00 1.00 1.00
Elections & Political Compliance 1.20 2.00 2.00
1010 - General Purpose Fund (GPF) 1.00 1.90 1.90
1610 - Successor Redevelopment Agency Reimbursement Fund
0.20 0.10 0.10
Records Management 2.40 2.00 2.00
1010 - General Purpose Fund (GPF) 2.00 2.00 2.00
1610 - Successor Redevelopment Agency Reimbursement Fund
0.40 - -
TOTAL 9.00 9.00 9.00
Revenue
Program
FY 2012-13 Midcycle
Budget
FY 2013-14 Proposed
Budget
FY 2014-15 Proposed
Budget
Agenda Management $1,870 $0 $0
Customer Services & Public Relations 3,840 - -
TOTAL $5,710 $0 $0
Expenditure
Program
FY 2012-13 Midcycle
Budget
FY 2013-14 Proposed
Budget
FY 2014-15 Proposed
Budget
Agenda Management $1,113,529 $1,016,993 $1,047,272
Customer Services & Public Relations 154,244 140,746 143,640
Elections & Political Compliance 468,902 469,957 387,597
Records Management 372,177 339,233 345,110
TOTAL $2,108,852 $1,966,929 $1,923,619
SUMMARY OF HISTORICAL EXPENDITURES AND PROPOSED BUDGET BY PROGRAM
E - 17

CITY CLERK
PROGRAM DESCRIPTIONS
AGENDA MANAGEMENT
Manages and performs processes to prepare and issue City Council legislative agendas and materials in advance to the public, members of the Council, and executive staff; facilitate opportunities for public comment during the meeting; record official actions taken by the Council, the Oakland Redevelopment Successor Agency, JPA, and certain other governing bodies (Legally Mandated).
CUSTOMER SERVICE AND PUBLIC
RELATIONS
Manage general operations for the department: finance, budget, payroll, personnel, workers comp; process Domestic Partnership Registration Applications; coordinate facilities needs; and Equal Access.
ELECTIONS & POLITICAL COMPLIANCE
Administer and Coordinate election services for the selection of City and
SIGNIFICANT CHANGES IN BUDGET AND PERFORMANCE
General Purpose Fund (GPF) FTE FY 2013-14
Changes
FY 2014-15
Changes
Reduce O&M for elections - ($84,509) ($171,565)
OUSD officers, approval of Initiatives, City Measures, Referendums, and Recalls; Serve as Filing Officer and Filing Official for the issuance, filing, review, and audit of required Fair Political Practices Commission (FPPC) Political Reports, i.e. Campaign Disclosure Statements and Statements of Economic Interest (Form 700) (Legally Mandated).
RECORDS MANAGEMENT
Maintain minutes, ordinances, resolutions, motions, and contracts adopted and approved by the City Council; provide ready access to records city-wide; set policy and establish procedures to guide the care,
preservation, retention, and disposition of all city records and information; manage access to and contract for offsite storage facility; coordinate records requests; manages records’ disposition processes; processes discovery requests for litigation requests.
E - 18

POLICE DEPARTMENT
POLICE DEPARTMENT
MISSION STATEMENT
The Mission of the Oakland Police Department is to provide the people of Oakland an environment where they can live, work, play, and thrive free from crime and the fear of crime.
BUSINESS GOALS
Provide effective leadership and administrative support by providing comprehensive oversight of internal operations, maintaining sound fiscal practices, implementing and utilizing up-to-date technology, and providing effective supervision and training.
Promote public trust and confidence through the efficient and effective investigation of complaints involving violations of law or policy against police personnel.
Provide effective and efficient criminal investigation of adult and juvenile crimes through consistent training, intelligent analysis of crime data, the identification of career criminals, prosecution of offenders, and the utilization of advanced forensic evidence analysis.
Provide timely state-of-the-art forensic analytical services and analysis of physical evidence from crimes, while making full, systematic use of forensic science databases and contemporary technologies to solve crimes and apprehend perpetrators.
Effectively address crime and public safety issues by increasing police crimes, while making full, systematic use of forensic science databases and contemporary technologies to solve crimes and apprehend perpetrators.
Effectively address crime and public safety issues by increasing police personnel's capacity to
Expenditures by Fund
FY 2012-13 Midcycle
Budget
FY 2013-14 Proposed
Budget
FY 2014-15 Proposed
Budget
1010 General Purpose Fund (GPF) $168,711,136 $178,790,549 $192,780,324
1100 Self Insurance Liability 7,374,480 6,576,750 6,576,750
1150 Worker's Compensation Insurance 276,057 281,286 287,654
1720 Comprehensive Clean-up 702,702 - -
1760 Telecommunications Reserve - 144,721 148,237
2112 Department of Justice 156,435 7,834 7,834
2159 State of California Other 178,194 101,787 101,788
2172 Alameda County: Vehicle Abatement Authority 352,240 400,550 412,615
2251 Measure Y: Public Safety Act 11,636,551 12,327,243 12,848,543
2411 False Alarm Reduction Program 1,977,532 1,312,904 1,339,193
2416 Traffic Safety Fund 2,266,815 2,360,960 2,391,149
2995 Police Grants 20,000 20,000 20,000
2999 Miscellaneous Grants 1,300,000 1,300,000 1,300,000
TOTAL $194,952,142 $203,624,584 $218,214,087
GPF Percent to Total Department 86.5% 87.8% 88.3%
GPF Percent to Citywide GPF Expenditures 41.2% 41.6% 42.1%
SUMMARY OF HISTORICAL EXPENDITURES AND PROPOSED BUDGET BY FUND
AUTHORIZED POSITIONS BY DIVISION
Division
FY 2012-13
Midcycle
Budget
FTE
FY 2013-14
Proposed
Budget
FTE
FY 2014-15
Proposed
Budget
FTE
Bureau of Field Operations 596.85 710.85 769.85
1010 - General Purpose Fund (GPF) 501.92 627.20 686.20
1720 - Comprehensive Clean-up 12.28 - -
2172 - Alameda County: Vehicle Abatement Authority 2.00 2.00 2.00
2251 - Measure Y: Public Safety Act 2004 63.00 63.00 63.00
2411 - False Alarm Reduction Program - 1.00 1.00
2416 - Traffic Safety Fund 17.65 17.65 17.65
Bureau of Risk Management 79.00 80.00 80.00
1010 - General Purpose Fund (GPF) 79.00 80.00 80.00
Bureau of Services 144.00 147.00 146.00
1010 - General Purpose Fund (GPF) 135.50 138.50 137.50
1150 - Worker's Compensation Insurance Claims 2.00 2.00 2.00
2112 - Department of Justice 1.00 - -
2411 - False Alarm Reduction Program 5.50 6.50 6.50
Criminal Investigation Division 172.00 174.00 168.00
1010 - General Purpose Fund (GPF) 146.00 148.00 154.50
2113 - Department of Justice - COPS Hiring - 25.00 12.50
2159 - State of California Other 1.00 1.00 1.00
2607 - Department of Justice-COPS Hiring Recovery
Program (ARRA)
25.00 - -
Office of the Chief of Police 10.00 14.00 14.00
1010 - General Purpose Fund (GPF) 10.00 13.00 13.00
1760 - Telecommunications Reserve - 1.00 1.00
TOTAL 1,001.85 1,125.85 1,177.85
E - 19

POLICE DEPARTMENT
BUSINESS GOALS (CONT’D)
provide a higher quality of service to the community by providing basic and in-service training to improve their skills and abilities.
Provide targeted investigation of prostitution activity with a priority on intervention with minors and the prosecution of adults involved in human trafficking. Collaborate with the Department of Human Services, Alameda County judges, the District Attorney's Office, and the Alameda County Probation Department to establish a process to place juvenile offenders into a Measure Y Program or Juvenile Hall and to develop system to monitor all referrals and outcomes for juvenile offenders.
Reduce violence caused by career criminals and maintain involvement in youth development.
Improve traffic safety and community safety through enforcement of traffic codes, public education, and the removal of traffic hazards and abandoned vehicles from City streets.
PRIOR REDUCTIONS
Since 2008-09 adopted budget, approximately 225 full time equivalents (FTE) have been eliminated from OPD’s budget. This represents a 24% reduction in sworn staffing and a 20% reduction in professional staff. OPD has reduced spending on employee services (salaries & benefits) by $40 million, since 2008-09 – a 19% reduction. Prior to the adoption of Measure BB, budget reductions had come exclusive from within professional staff positions. For example, in the FY 2003-05 budget, twenty (20) dispatcher positions were eliminated. The impacts of these cuts to service delivery are:
Slower response times for 911 calls for service
Dramatic reduction in investigative staffing, which results in a lower
SUMMARY OF HISTORICAL EXPENDITURES AND PROPOSED BUDGET BY DIVISION
Revenue
Division
FY 2012-13 Midcycle
Budget
FY 2013-14 Proposed
Budget
FY 2014-15 Proposed
Budget
Bureau of Field Operations $7,394,765 $6,843,453 $11,062,379
Bureau of Risk Management 45,000 33,912 33,912
Bureau of Services 3,353,858 1,706,054 1,717,550
Criminal Investigation Division 145,773 154,565 154,565
Office of the Chief of Police 1,914,164 1,437,149 1,474,789
TOTAL $12,853,560 $10,175,133 $14,443,195
Expenditure
Division
FY 2012-13 Midcycle
Budget
FY 2013-14 Proposed
Budget
FY 2014-15 Proposed
Budget
Bureau of Field Operations $101,346,764 $111,557,073 $123,696,186
Bureau of Risk Management 12,513,986 13,549,497 14,045,747
Bureau of Services 19,535,740 19,679,140 19,448,028
Criminal Investigation Division 26,208,348 26,654,440 28,305,699
Office of the Chief of Police 35,347,304 32,184,434 32,718,427
TOTAL $194,952,142 $203,624,584 $218,214,087
E - 20

POLICE DEPARTMENT
PRIOR REDUCTIONS (CONT’D)
clearance rate for identifying suspects in crimes o Increases in violent crime,
notably robberies, in areas where it had not normally occurred in Oakland
o Property crime has become much more pervasive throughout the city, because people are able to commit property crimes with relative impunity
Increased overtime spending to maintain basic service levels
Slower response times to answer queries for records from the public and from other governmental agencies
Administrative work assigned to police officers
DIVISION DESCRIPTIONS
OFFICE OF THE CHIEF OF POLICE The Office of the Chief of Police consists of two areas: The Chief's Immediate Office and the Media Relations Office. The Media Relations Office handles media inquiries and responds to questions and comments from the public.
BUREAU OF FIELD OPERATIONS
This division encompasses Patrol, Special Operations, Traffic, Support Operations, and Animal Services. Police
SIGNIFICANT CHANGES IN BUDGET AND PERFORMANCE
General Purpose Fund (GPF)FTE FY 2013-14
Changes
FY 2014-15
Changes
Add 169th Police Aceademy in FY 2014-15 (pre-academy costs in
FY 2013-14)
40.00 $1,119,983 $4,179,623
Add 170th Police Aceademy in FY 2014-15 (Academy from
December - May. Salaries and benefits for the new officers for the
month of June only).
40.00 - $2,619,813
Add 50.00 FTE Police Officer Trainees for the 169th and 170th
Academy (6 months for each new academy)
50.00 - $3,966,086
Transfer 1.00 FTE Police Officer and 1.00 FTE Police
Communications Dispatcher to the False Alarm Fund (2411)
(2.00) ($290,649) ($302,667)
Transfer 1.00 FTE Public Information Officer to
Telecommunications Reserve Fund (1760)
(1.00) ($144,721) ($148,237)
Freeze 2.00 FTE Account Clerk II's (2.00) ($148,564) ($152,174)
Eliminate 1.00 FTE Accountant II (1.00) ($116,631) ($119,465)
Add 1.00 FTE Payroll Personnel Clerk III 1.00 $79,954 $81,896
Eliminate 1.00 FTE Administrative Analyst I (1.00) ($103,680) ($106,199)
Add 1.00 FTE Accountant III 1.00 $120,267 $123,189
Freeze 1.00 FTE Animal Control Officer (1.00) ($73,777) ($75,569)
Add 5.00 FTE Police Communications Dispatchers 5.00 $553,092 $566,529
Realign Internal Service Fund charges to other funds - ($329,580) ($329,580)
Move 25.00 FTE to 1010 from the Department of Justice COPS
Fund upon expiration of grant funding (6 months in FY 2014-15)
25.00 - $1,832,432
ALL Other FundsFTE FY 2013-14
Changes
FY 2014-15
Changes
Transfer 1.00 FTE Police Officer and 1.00 FTE Police
Communications Dispatcher from 1010 to the False Alarm Fund
(2411)
2.00 $290,649 $302,667
Realign Internal Service Fund charges to other funds from 1010 - $329,580 $329,580
Freeze 1.00 FTE Grants Coordinator (1.00) ($137,557) ($140,899)
Transfer 1.00 FTE Public Information Officer to
Telecommunications Reserve Fund (1760) from 1010
1.00 $144,721 $148,237
Move 25.00 FTE to 1010 from the Department of Justice COPS
Fund upon expiration of grant funding (6 months in FY 2014-15)
(25.00) - ($1,832,432)
patrol provides general investigation, community policing, and crime prevention. The Special Operations unit includes the Helicopter and SWAT teams. The Traffic unit promotes traffic safety, investigates traffic complaints, and enforces traffic and vehicular laws. Support Operations includes school police, neighborhood service coordinators, and reserves.
CRIMINAL INVESTIGATIONS DIVISION
This division investigates criminal activity and develops cases for the prosecution of crimes. This also includes the criminalistics unit that analyzes and documents evidence for the prosecution of crimes as well as analyzing crime statistics and recommending plans for the effective deployment and use of resources.
BUREAU OF RISK MANAGEMENT
The Bureau of Risk Management oversees policy compliance efforts at the top of the organization to ensure that OPD reaches compliance with the NSA memorandum of understanding and policies. The bureau is composed of four divisions: Internal Affairs, Office of Inspector General, Criminalistics Division, PAS Administration Unit, and the Training Section.
BUREAU OF SERVICES
This bureau is made of four functional areas: Communications, Fiscal Services, Personnel, and Records. The Animal This Communications section manages the emergency 911 call system and all calls for service and dispatches appropriate emergency response personnel. Fiscal Services is responsible for providing
administrative support for the Oakland Police Department in the following areas: accounting, accounts payable, accounts receivable, audits, budget, contracting and purchasing, financial reporting, and grants. The Personnel Division is responsible for daily processing of all personnel-related matters, and maintains individual personnel files for everyone who works for OPD. It is divided into four units: Personnel Administration, Medical Unit, Payroll Unit, and Recruiting and Background. The Records Division maintains all non-traffic police crime-related reports and records, answers public record requests, manages the City’s tow contract, performs warrant verification, and inputs data into the Department’s public safety records management software.
E - 21

POLICE DEPARTMENT
NOTES
E - 22

FIRE DEPARTMENT
FIRE DEPARTMENT
MISSION STATEMENT
The proud men and women of the Oakland Fire Department are committed to providing the highest quality and highest level of courteous and responsive services to the citizens of Oakland.
This is accomplished by implementing comprehensive strategies and training in fire prevention, fire suppression, emergency medical services, and all risk mitigation, including: human-caused and natural disasters, emergency preparedness, 9-1-1 services and community-based fire services.
BUSINESS GOALS
Provide leadership to all aspects of the Department's operation, especially strategic planning, fiscal management, personnel management and labor relations.
Deliver high quality services when responding to emergency calls within 7 minutes, 90% of the time - from when dispatch first receives the call to arrival on the scene.
Create 9-1-1 incidents in the Dispatch system within 90 seconds for the annual volume of 60,000 emergency calls; maintain Computer Aided Dispatch/Records Management System (CAD/RMS); complete the Center of Excellence accreditation, which will enable the Oakland Fire Department to compete for Emergency Medical Services (EMS) dispatch contracts.
Provide Citizens of Oakland Respond to Emergencies (CORE) training and public education; continue to implement the National Incident Management System (NIMS) and National Response Plan (NRP); provide basic and advanced training to elected officials, management, and key staff to ensure an effective
Expenditures by Fund
FY 2012-13 Midcycle
Budget
FY 2013-14 Proposed
Budget
FY 2014-15 Proposed
Budget
1010 General Purpose Fund (GPF) $95,082,296 $95,480,831 $109,836,720
1100 Self Insurance Liability 1,491,890 943,902 943,902
1150 Worker's Compensation Insurance 128,051 20,813 21,287
1710 Recycling Program 48,870 48,870 48,870
1720 Comprehensive Clean-up 86,740 86,740 86,740
1740 Hazardous Materials Inspections 817,543 969,148 987,798
2123 US Dept of Homeland Security (72,087) 1,466,257 1,498,069
2124 Federal Emergency Management Agency 429,150 505,549 514,302
2146 California State Emergency Services 55,063 61,218 62,661
2160 County of Alameda: Grants 1,004,205 1,010,925 1,010,925
2190 Private Grants 24,732 24,960 24,960
2250 Measure N: Fund 1,556,334 1,745,051 1,768,114
2251 Measure Y: Public Safety Act 4,000,000 4,000,000 4,000,000
2321 Wildland Fire Prevention Assessment 1,850,518 2,127,812 2,121,871
2330 Werner Court Vegetation Mgmt District 6,200 6,200 6,200
2412 Measure M: Emergency Dispatch Service 1,743,515 1,909,393 1,954,240
3100 Sewer Service Fund 256,388 283,400 289,161
TOTAL $108,509,408 $110,691,069 $125,175,820
GPF Percent to Total Department 87.6% 86.3% 87.7%
GPF Percent to Citywide GPF Expenditures 23.2% 22.2% 24.0%
SUMMARY OF HISTORICAL EXPENDITURES AND PROPOSED BUDGET BY FUND
AUTHORIZED POSITIONS BY DIVISION (CONT'D)
Division
FY 2012-13Midcycle
Budget
FTE
FY 2013-14Proposed
Budget
FTE
FY 2014-15Proposed
Budget
FTE
Fire Chief Office & Fiscal/Administration Services 11.00 12.00 12.00
1010 - General Purpose Fund (GPF) 9.70 11.30 11.30
1150 - Worker's Compensation Insurance Claims 0.80 0.20 0.20
1740 - Hazardous Materials Inspections 0.10 0.10 0.10
2123 - US Dept of Homeland Security 0.10 0.10 0.10
2124 - Federal Emergency Management Agency (FEMA) 0.10 0.10 0.10
2250 - Measure N: Fund 0.10 0.10 0.10
2412 - Alameda County: Emergency Dispatch Service Supplemental Assessment
0.10 0.10 0.10
Field Operations Bureau 500.45 500.45 500.45
1010 - General Purpose Fund (GPF) 498.00 498.00 498.00
2124 - Federal Emergency Management Agency (FEMA) 2.25 2.25 2.25
2190 - Private Grants 0.20 0.20 0.20
Medical Services, Communication & IT Services Division 35.00 35.00 35.00
1010 - General Purpose Fund (GPF) 15.00 15.25 15.25
2124 - Federal Emergency Management Agency (FEMA) 1.00 1.00 1.00
2250 - Measure N: Fund 7.00 6.75 6.75
2412 - Alameda County: Emergency Dispatch Service Supplemental Assessment
11.00 11.00 11.00
3100 - Sewer Service Fund 1.00 1.00 1.00
Emergency Management Services Division 12.00 17.00 17.00
1010 - General Purpose Fund (GPF) 2.75 2.75 2.75
2123 - US Dept of Homeland Security 8.00 13.00 13.00
2146 - California State Emergency Services 0.25 0.25 0.25
2160 - County of Alameda: Grants 1.00 1.00 1.00
Fire Prevention & Support Services Bureau 31.50 30.50 31.50
1010 - General Purpose Fund (GPF) 23.50 22.50 23.50
1740 - Hazardous Materials Inspections 6.00 6.00 6.00
2321 - Wildland Fire Prevention Assess District 1.00 1.00 1.00
3100 - Sewer Service Fund 1.00 1.00 1.00
TOTAL 589.95 594.95 595.95
E - 23

FIRE DEPARTMENT
BUSINESS GOALS (CONT’D)
Emergency Operations Center (EOC).
Review 98-100% of all plans, sprinkler, fire alarm, evacuation, hood and duct (Tenant Improvements (TI), and Tenant Parcel Maps (TPMs) within fifteen business days; ensure public and private buildings are in compliance with the Californian Fire Code; enforce the state-required Certified Unified Program Agency (CUPA) program and hazardous materials regulations; develop and implement online permitting with an online payment option; develop and implement new inspection and billing database.
Continue to maintain an effective and efficient Fiscal and Administration Services Division to ensure minimal vacancies with effective recruitment and exam processes. In addition, ensure employee safety and health, which will result in increased productivity and reduced workers’ compensation claims. Partner with PWA to provide logistical support to the Oakland Fire Department ‘s facilities, apparatus, and equipment, including developing and instituting reasonable maintenance schedules to ensure CAL-OSHA compliance;
Continue to explore revenue opportunities, such as grant funds and cost-recovery fees; streamline the billing process to maximize revenue collection.
Continue to meet all mandated training, exercise and drill requirements needed to respond to emergency incidents related to airport, water rescue, confined space rescue, heavy rescue and hazardous material response, natural and human-made disasters and Urban Search and Rescue.
Improve the entire Oakland Fire Department Recruit Academy training curriculum with established, OFD-specific, time
Revenue
Division
FY 2012-13 Midcycle
Budget
FY 2013-14 Proposed
Budget
FY 2014-15 Proposed
Budget
Fire Chief Office & Fiscal/Administration Services $100,000 $36,119 $36,685
Field Operations Bureau 5,373,311 5,125,276 5,131,587
Medical Services, Communication & IT Services Division 4,422,184 4,857,452 4,927,521
Emergency Management Services Division 112,409 1,384,997 1,417,969
Fire Prevention & Support Services Bureau 5,223,069 5,218,838 5,236,453
TOTAL $15,230,973 $16,622,682 $16,750,215
Expenditure
Division
FY 2012-13 Midcycle
Budget
FY 2013-14 Proposed
Budget
FY 2014-15 Proposed
Budget
Fire Chief Office & Fiscal/Administration Services $3,371,383 $2,222,935 $2,308,319
Field Operations Bureau 88,090,222 87,997,638 101,781,485
Medical Services, Communication & IT Services Division 7,539,217 8,016,431 8,137,527
Emergency Management Services Division 508,538 2,090,777 2,133,877
Fire Prevention & Support Services Bureau 9,000,048 10,363,288 10,814,612
TOTAL $108,509,408 $110,691,069 $125,175,820
SUMMARY OF HISTORICAL EXPENDITURES AND PROPOSED BUDGET BY DIVISION
SIGNIFICANT CHANGES IN BUDGET AND PERFORMANCE
General Purpose Fund (GPF)FTE FY 2013-14
ChangesFY 2014-15
Changes
Charge 24.0 FTE Firefighters to the SAFER Grant fund 2124. - ($3,900,000) ($3,900,000)
Freeze 1.00 FTE Fire Prevent Bureau Inspect, Civil (1.00) ($125,001) ($127,948)
E - 24

FIRE DEPARTMENT
BUSINESS GOALS (CONT’D)
performance standards. Continue to assess the feasibility of the Joint Oakland Fire and Police Department Regional Training Center. Enhance training capacity and efficiency by utilizing online, web-based training.
PRIOR REDUCTIONS
Implemented rotation brown out for two out of thirty-two fire companies daily since July 2012
Deleted one of two Fire Protection Engineers
With the exception of two full time staff, vegetation management staffing was reduced from year-around to seasonal.
All sworn personnel reduced salary pay by 8.85% and vacation allotment by two 48 hours
Civilians took up to 20 furlough days per year or 9% of productive work hours resulting in backlog of apparatus repairs and preventative maintenance
Reduced take-home vehicles
Eliminated the GPF support to the fire boat program, which left $25K annually from the Port of Oakland for minimum fire boat maintenance
DIVISION DESCRIPTIONS
FIRE CHIEF OFFICE &
FISCAL/ADMINISTRATION SERVICES
Responsible for providing effective leadership to the Department’s operations through, strategic planning, financial reporting, performance measures, payroll and benefits, staff development and training; serves as the liaison among citizens, department staff, city management, the Mayor and City Council. Manages entry-level and promotional recruitments, exams, testing, workers’ compensation, grievances, disciplines and labor relations; provides training in labor law and practices to supervisory and executive-level staff; administers contracts and grants.
FIELD OPERATIONS BUREAU
Responsible for emergency medical services, fire suppression, mitigation of disasters, rescue activities and our FEMA sponsored Type 1 Urban Search and Rescue team. Largest division employs 11 Battalion Chiefs and over 430 suppression personnel. The Field Operations Bureau handles over 60,000 emergency incidents a year which includes fire, rescue, medical aid and other calls for service. Manages all major disaster responses and staffs 25 engine companies and seven truck companies. In addition to emergency response, firefighters inspect commercial, multi-residential facilities and vegetation management inspections on an annual basis. Special Operation Division operates under the direction of the Field Operations Bureau and is comprised of four highly trained, specialized response teams; Aircraft Rescue and Firefighting Response Team (ARFF), Hazardous Materials Response Team, Technical Rescue Team and the Water Rescue Response Team. Each team is required to undergo extensive preparatory training and annual refresher training in order to remain certified in their respective specialties.
MEDICAL SERVICES, COMMUNICATION &
IT SERVICES DIVISION
Provides voter-mandated emergency medical services to the citizens, businesses and visitors of Oakland; manages programs related to all 9-1-1 medical emergencies, including continuous paramedic training in accordance with local, state and federal guidelines; provides oversight and management for the Metropolitan Medical Response System (MMRS); maintains inventory of equipment for Basic/Advanced Life Support; develops preventive health programs for the community; provides EMT and Paramedic-related classes, such as CPR, First Aid and Automatic Emergency Defibrillation for citizens and businesses. Dispatch Communication Center provides dispatch service support for emergency calls and maintains all Fire Department communications equipment and media support; coordinates with the Department of Information Technology and Oakland Police Department to
implement and maintain the City’s Integrated Public Safety System (IPSS). EMERGENCY MANAGEMENT SERVICES
DIVISION
Implements and strengthens the City's emergency prevention, mitigation, preparedness, response and recovery efforts in alignment with state and federal emergency management legislation, including California's Standardized Emergency Management System (SEMS), the federal National Incident Management System (NIMS) and the National Response Framework Plan (NPF) or (NRFP); develops and provides community disaster preparedness training and planning, which includes public education and the CORE Program. Maintains and manages the City's Emergency Operations Center (EOC); provides training for City staff to ensure compliance with SEMS, NIMS and to ensure management and staff emergencies; respond for the readiness to respond during major emergencies; responsible for the City's Homeland Security Program.
FIRE PREVENTION & SUPPORT SERVICES
BUREAU
Manages and directs all fire prevention functions to benefit the overall health and safety of the Oakland community through public education, fire investigations, and inspections of public facilities and enforcement of hazardous materials management plans through the Certified Unified Program Agency (CUPA) program. Fire Prevention supports businesses and building development through fire engineering plan check, engineering services, major building development project coordination and consulting services. Support Services manages the timely and cost-effective purchase, acquisition, coordination, maintenance and/or repair of Fire Department facilities, fire apparatus, personal protective safety gear, tool and equipment, while the training division provides training to existing and new recruit personnel that meets or exceeds all city, state and federal mandates.
E - 25

FIRE DEPARTMENT
NOTES
E - 26

ADMINISTRATIVE SERVICES
ADMINISTRATIVE SERVICES The Administrative Services Department provides comprehensive financial services for the City; provides timely and accurate financial reports; maintains integrity of information in the City's financial systems and monitors internal controls; processes payments; processes payroll and maintains inventory of critical supplies (warehousing); collects deposits and records City revenues; procures materials, supplies and services for City departments; manages the City's investments; issues and restructures City's and Redevelopment Successor Agency bond issues and debt; plans, directs and administers all risk management, insurance and safety activities.
The Administrative Services Department includes merging the Finance & Management Agency, Human Resources, and Information Technology to form the following divisions:
Office of the Controller Revenue Management Treasury Human Resources Information Technology
The goal is to establish a single Administrative Unit to ensure uniform processes, procedures, training, and standard protocols for administrative tasks within the department.
DIVISION DESCRIPTIONS
ADMINISTRATION
This division provides administrative support, oversight and leadership to the five divisions in Administrative Services. The Division’s primary responsibility is managing the department’s general operations to ensure efficient and effective service delivery.
OFFICE OF THE CONTROLLER
This division is responsible for financial reporting. This includes timely and accurate financial information and reports to the City Administrator, the
SUMMARY OF HISTORICAL EXPENDITURES AND PROPOSED BUDGET BY FUND
Expenditures by Fund
FY 2012-13
Midcycle
Budget
FY 2013-14
Proposed
Budget
FY 2014-15
Proposed
Budget
1010 General Purpose Fund (GPF) $17,192,769 $28,132,845 $27,111,004
1150 Worker's Compensation Insurance 1,342,754 1,508,585 1,533,283
1610 Successor Redevelopment Agency Reimbursement
Fund
894,200 829,405 844,620
1700 Mandatory Refuse Program 272,477 2,118,825 2,172,735
1750 Multipurpose Reserve 715,045 2,219,905 2,221,180
1760 Telecommunications Reserve 98,934 104,406 106,940
2105 HUD-EDI Grants 99,750 - -
2108 HUD-CDBG 207,570 164,600 167,741
2195 Workforce Investment Act 111,415 100,011 102,419
2211 Measure B: ACTIA 34,969 32,832 33,629
2241 Measure Q-Library Services Retention & Enhancement 363,239 231,871 237,503
2251 Measure Y: Public Safety Act 30,830 22,975 23,640
2310 Lighting and Landscape Assesment - 42,456 43,458
2411 False Alarm Reduction Program 170,026 159,647 163,526
2413 Rent Adjustment Program Fund 220 277,382 283,868
2415 Development Service Fund 343,328 377,737 386,914
3100 Sewer Service Fund 42,313 3,321,941 3,497,277
4100 Equipment 5,521 5,521 5,521
4200 Radio / Telecommunications 3,491,399 3,517,719 3,557,381
4210 Telephone Equipment and Software 87,376 308,530 308,530
4300 Reproduction 1,412,391 1,410,937 1,433,684
4500 Central Stores 309,637 339,843 348,358
4550 Purchasing 777,965 782,813 800,643
6520 Fire Area - Redemption 50,000 - -
6587 2012 Refunding Reassessment Bonds-Debt Service - 55,971 57,331
7100 Police and Fire Retirement System 2,425,498 2,967,874 3,480,418
7120 Oakland Municipal Employees' Retirement System 238,639 222,059 225,643
7130 Employee Deferred Compensation 191,355 229,935 232,736
7760 Grant Clearing - 153,098 156,788
TOTAL 30,909,620 $49,639,723 $49,536,770
GPF Percent to Total Department 55.6% 56.7% 54.7%
GPF Percent to Citywide GPF Expenditures 4.2% 6.5% 5.9%
AUTHORIZED POSITIONS BY DIVISION (CONT'D)
Division
FY 2012-13Midcycle
Budget FTE
FY 2013-14Proposed
BudgetFTE
FY 20114-15Proposed
BudgetFTE
Administration 4.00 - -
Controller's Office 35.00 36.00 36.00
Revenue * - 75.00 75.00
Treasury 26.00 27.00 27.00
Human Resources 37.50 36.70 36.70
Information Technology 62.00 67.00 67.00
TOTAL 164.50 241.70 241.70
* Revenue Division is being moved from the Ciity Administrator's Office.
SIGNIFICANT CHANGES IN BUDGET AND PERFORMANCE (CONT'D)
General Purpose Fund (GPF) FTE FY 2013-14
Changes
FY 2014-15
Changes
Eliminate 1.00 FTE Administrative Services Manager II and 1.00
FTE Executive Assistant to the Agency Director.
(2.00) ($311,605) ($318,993)
E - 27
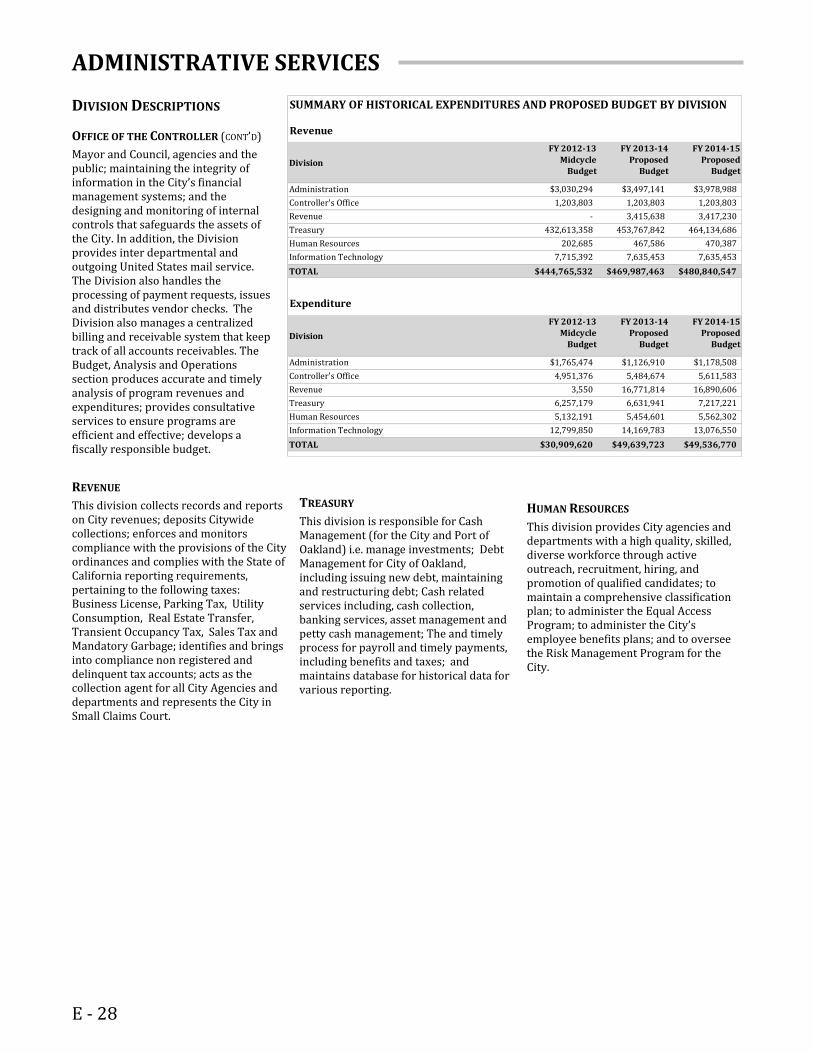
ADMINISTRATIVE SERVICES
DIVISION DESCRIPTIONS
OFFICE OF THE CONTROLLER (CONT’D)
Mayor and Council, agencies and the public; maintaining the integrity of information in the City’s financial management systems; and the designing and monitoring of internal controls that safeguards the assets of the City. In addition, the Division provides inter departmental and outgoing United States mail service. The Division also handles the processing of payment requests, issues and distributes vendor checks. The Division also manages a centralized billing and receivable system that keep track of all accounts receivables. The Budget, Analysis and Operations section produces accurate and timely analysis of program revenues and expenditures; provides consultative services to ensure programs are efficient and effective; develops a fiscally responsible budget.
Revenue
Division
FY 2012-13
Midcycle
Budget
FY 2013-14
Proposed
Budget
FY 2014-15
Proposed
Budget
Administration $3,030,294 $3,497,141 $3,978,988
Controller's Office 1,203,803 1,203,803 1,203,803
Revenue - 3,415,638 3,417,230
Treasury 432,613,358 453,767,842 464,134,686
Human Resources 202,685 467,586 470,387
Information Technology 7,715,392 7,635,453 7,635,453
TOTAL $444,765,532 $469,987,463 $480,840,547
Expenditure
Division
FY 2012-13
Midcycle
Budget
FY 2013-14
Proposed
Budget
FY 2014-15
Proposed
Budget
Administration $1,765,474 $1,126,910 $1,178,508
Controller's Office 4,951,376 5,484,674 5,611,583
Revenue 3,550 16,771,814 16,890,606
Treasury 6,257,179 6,631,941 7,217,221
Human Resources 5,132,191 5,454,601 5,562,302
Information Technology 12,799,850 14,169,783 13,076,550
TOTAL $30,909,620 $49,639,723 $49,536,770
SUMMARY OF HISTORICAL EXPENDITURES AND PROPOSED BUDGET BY DIVISION
REVENUE
This division collects records and reports on City revenues; deposits Citywide collections; enforces and monitors compliance with the provisions of the City ordinances and complies with the State of California reporting requirements, pertaining to the following taxes: Business License, Parking Tax, Utility Consumption, Real Estate Transfer, Transient Occupancy Tax, Sales Tax and Mandatory Garbage; identifies and brings into compliance non registered and delinquent tax accounts; acts as the collection agent for all City Agencies and departments and represents the City in Small Claims Court.
TREASURY
This division is responsible for Cash Management (for the City and Port of Oakland) i.e. manage investments; Debt Management for City of Oakland, including issuing new debt, maintaining and restructuring debt; Cash related services including, cash collection, banking services, asset management and petty cash management; The and timely process for payroll and timely payments, including benefits and taxes; and maintains database for historical data for various reporting.
HUMAN RESOURCES
This division provides City agencies and departments with a high quality, skilled, diverse workforce through active outreach, recruitment, hiring, and promotion of qualified candidates; to maintain a comprehensive classification plan; to administer the Equal Access Program; to administer the City’s employee benefits plans; and to oversee the Risk Management Program for the City.
E - 28

ADMINISTRATIVE SERVICES
CONTROLLER’S OFFICE
MISSION STATEMENT
The mission of the Controller’s Office is to provide timely and accurate financial information that support and enhances the effective, responsive and courteous delivery of services to the citizens and residents of Oakland, businesses, the Mayor, City Administrator, City Agencies and Departments. The Division maintains strong internal controls, ensuring transparency, adhering to established financial policies and procedures and complying with legal fiscal reporting requirements. Services include: financial reporting, budget development, implementation and operational analysis, procurement of goods and services, accounts payable processing, centralized billing and accounts receivable tracking, inter-departmental and outgoing United States mail and parcel service.
BUSINESS GOALS
To safeguard the City’s financial and material assets by maintaining strong internal controls, ensuring equity and transparency in Agency processes, adhering to established financial policies and procedures, and complying with all legal fiscal reporting requirements.
To develop more efficient and effective internal controls for the City
To improve and streamline the City year-end audit process
To improve and streamline the Public Sector Budgeting (PSB) module
To improve and streamline the City procurement process
PRIOR REDUCTIONS
Since July 2008, a total of four positions have been eliminated in the Controller’s Office.
Reductions have resulted in delays in many accounting functions such as
SUMMARY OF HISTORICAL EXPENDITURES AND PROPOSED BUDGET BY FUND
Expenditures by Fund
FY 2012-13 Midcycle
Budget
FY 2013-14 Proposed
Budget
FY 2014-15 Proposed
Budget
1010 General Purpose Fund (GPF) $2,986,720 $3,506,507 $3,587,075
1610 Successor Redevelopment Agency Reimbursement Fund
461,421 319,975 327,714
2108 HUD-CDBG 151,408 164,600 167,741
2195 Workforce Investment Act 111,415 100,011 102,419
2211 Measure B: ACTIA 34,969 32,832 33,629
2251 Measure Y: Public Safety Act 30,000 22,145 22,810
2415 Development Service Fund 60,528 67,333 68,970
3100 Sewer Service Fund 27,313 31,982 32,758
4500 Central Stores 309,637 339,843 348,358
4550 Purchasing 777,965 782,813 800,643
7100 Police and Fire Retirement System - 81,643 83,626
7120 Oakland Municipal Employees' Retirement System - 34,990 35,840
TOTAL $4,951,376 $5,484,674 $5,611,583
GPF Percent to Total Department 60.3% 63.9% 63.9%
GPF Percent to Citywide GPF Expenditures 0.7% 0.8% 0.8%
AUTHORIZED POSITIONS BY DIVISION (CONT'D)
Division
FY 2012-13
Midcycle
Budget
FTE
FY 2013-14
Proposed
Budget
FTE
FY 20114-15
Proposed
Budget
FTE
Accounting Administration 2.00 3.00 3.00
1010 - General Purpose Fund (GPF) 1.80 2.80 2.80
1610 - Successor Redevelopment Agency Reimbursement
Fund
0.20 0.20 0.20
Accounts Payable 4.50 4.50 4.50
1010 - General Purpose Fund (GPF) 4.50 4.50 4.50
Budget Analysis & Operations 6.00 6.00 6.00
1010 - General Purpose Fund (GPF) 5.15 5.35 5.35
1610 - Successor Redevelopment Agency Reimbursement
Fund
0.60 0.40 0.40
2211 - Measure B: ACTIA 0.25 0.25 0.25
General Ledger Accounting 12.00 13.00 13.00
1010 - General Purpose Fund (GPF) 6.55 7.90 7.90
1610 - Successor Redevelopment Agency Reimbursement
Fund
2.70 1.52 1.52
2108 - HUD-CDBG 1.00 1.00 1.00
2195 - Workforce Investment Act 1.00 0.83 0.83
2415 - Development Service Fund 0.50 0.50 0.50
3100 - Sewer Service Fund 0.25 0.25 0.25
7100 - Police and Fire Retirement System - 0.70 0.70
7120 - Oakland Municipal Employees' Retirement System
OMERS
- 0.30 0.30
Mailroom 2.50 2.50 2.50
4500 - Central Stores 2.50 2.50 2.50
Purchasing 8.00 7.00 7.00
4550 - Purchasing 8.00 7.00 7.00
TOTAL 35.00 36.00 36.00
E - 29

ADMINISTRATIVE SERVICES
PRIOR REDUCTIONS (CONT’D)
monthly closing of books, account reconciliations, and year-end audits.
Due to the prompt payment ordinance, delays in payables processing has resulted, thereby incurring interest penalties.
Staffing in the Budget Office has reduced over the past several years. The unit has lost essential analytical positions necessary for the preparation, analysis and monitoring of department budgets.
DIVISION DESCRIPTIONS
ACCOUNTS PAYABLE
This Section processes the City department payables, thereby ensuring that vendors are paid timely and departments are able to procure supplies and services needed to perform their functions and deliver their services in a timely fashion. The Section handles the sales tax reporting to the State Board of Equalization and 1099 Miscellaneous reporting for City vendors to the Internal Revenue Service.
BUDGET, ANALYSIS & OPERATIONS
This Section develops a fiscally responsible budget; develops a budget that meets council priorities and community needs; produces timely and accurate analysis of program revenues and expenditures; provides consultative services to ensure programs are efficient and effective. Compiles and produces the Biennial Proposed Budget and prepares the Adopted Policy Budget.
GENERAL LEDGER / ACCOUNTS RECEIVABLE
This Section provides accounting, fiscal monitoring, and financial and specialized reporting for all City departments, thereby allowing them to perform timely grant draw downs, and securing new grants. Plans and coordinates the year-end audit process and prepares the Comprehensive Annual Financial Report (CAFR), the Single Audit Report and completes several legislative mandated measures year end audits. It completes the State-Mandated Cost Claim Report and the
Revenue
Division
FY 2012-13 Midcycle
Budget
FY 2013-14 Proposed
Budget
FY 2014-15 Proposed
Budget
Mailroom $425,838 $425,838 $425,838
Purchasing 777,965 777,965 777,965
TOTAL $1,203,803 $1,203,803 $1,203,803
Expenditure
Division
FY 2012-13 Midcycle
Budget
FY 2013-14 Proposed
Budget
FY 2014-15 Proposed
Budget
Accounting Administration $508,460 $607,018 $619,391
Accounts Payable 450,826 499,789 511,781
Budget Analysis & Operations 856,306 844,620 863,702
General Ledger / Accounts Receivable 2,048,182 2,411,271 2,468,388
Mailroom 309,637 339,843 348,358
Purchasing 777,965 782,133 799,963
TOTAL $4,951,376 $5,484,674 $5,611,583
SUMMARY OF HISTORICAL EXPENDITURES AND PROPOSED BUDGET BY DIVISION
SIGNIFICANT CHANGES IN BUDGET AND PERFORMANCE (CONT'D)
General Purpose Fund (GPF)FTE FY 2013-14
ChangesFY 2014-15
Changes
Add 1.00 FTE City Administrator Analyst. 1.00 $117,870 $120,733
Eliminate 1.00 FTE Accountant III (1.00) ($137,894) ($141,244)
Freeze 1.00 Accounting Supervisor (1.00) ($136,744) ($140,066)
Transfer 1.00 FTE Office Assistant II in fund 4550 to fund 1010. 1.00 $59,209 $60,649
ALL Other FundsFTE FY 2013-14
ChangesFY 2014-15
Changes
Eliminate 1.00 FTE Administrative Assistant II and Add 1.00 FTE Buyer in Purchasing fund 4450.
- $9,590 $9,822
Transfer 1.00 FTE Office Assistant II in fund 4450 to fund 1010. (1.00) ($59,209) ($60,649)
E - 30

ADMINISTRATIVE SERVICES
DIVISION DESCRIPTIONS
GENERAL LEDGER / ACCOUNTS RECEIVABLE (cont’d)
State Controller’s Report. This Section provides a centralized billing and collection support to City departments, thus enabling the departments to realize their revenues and hence enabling them to maintain a balanced budget.
MAILROOM
This Section receives sorts and distributes incoming mail from the Unites States Postal Service; processes outgoing mail and handles shipping of packages for City departments. Handles the metered postage billing and reconciliation process.
PURCHASING
This Section supports the procurement of materials, equipment and services essential to providing governmental services for the citizens of Oakland. The Section promotes the most effective use of City funds in the acquisition of commodities, procurement of supplies and services for City departments. The Section prepares specifications and requests for formal bids and request for proposals in collaboration with City departments.
E - 31

ADMINISTRATIVE SERVICES
REVENUE
MISSION STATEMENT
The Revenue Division is committed to the delivery of quality, courteous and responsive services, treating all citizens with fairness, dignity and respect. We seek to achieve an optimal level of effectiveness and compliance in the administration and collection of local taxes, fines, and fees, to ensure equity and transparency in the application of applicable laws and policies.
BUSINESS GOALS
General operations to ensure efficient and effective service delivery
Safeguard the City’s financial and material assets by maintaining strong internal controls, ensuring equity and transparency in division’s processes.
Enforces provisions of the California State Vehicle and Oakland Municipal Codes.
PRIOR REDUCTIONS
Since July 2009, the Revenue Division which was formerly under the Finance and Management Agency has incurred approximately -$250,000 in staff reductions of (-3) FTEs, two positions from Parking and one (1) position from Revenue. Reductions have resulted in delays in processing correspondence, collection of parking meters and collection of revenues.
DIVISION DESCRIPTIONS
ADMINISTRATION
The Division’s primary responsibility is collection of local taxes, fines and managing the department’s general operations to ensure efficient and effective service delivery. Preserves the City’s financial and material assets by maintaining strong internal controls, ensuring equity and transparency in division’s processes. Also, it adheres to established financial policies and
SUMMARY OF HISTORICAL EXPENDITURES AND PROPOSED BUDGET BY FUND
Expenditures by Fund
FY 2012-13 Midcycle Budget *
FY 2013-14 Proposed
Budget
FY 2014-15 Proposed
Budget
1010 General Purpose Fund (GPF) $8,293,649 $9,218,448 $9,119,151
1700 Mandatory Refuse Program 1,818,282 1,881,182 1,922,068
1750 Multipurpose Reserve 2,198,100 2,204,860 2,206,135
2310 Lighting and Landscape Assesment 38,081 42,456 43,458
2413 Rent Adjustment Program Fund 263,494 277,162 283,648
3100 Sewer Service Fund 1,063,022 3,108,048 3,275,554
7760 Grant Clearing 36,046 39,658 40,592
TOTAL $13,710,674 $16,771,814 $16,890,606
GPF Percent to Total Department 60.5% 55.0% 54.0%
GPF Percent to Citywide GPF Expenditures 2.0% 2.1% 2.0%
* For comparison only. In FY 012-13 Revenue was part of the Ciity Administrator's Office.
AUTHORIZED POSITIONS BY DIVISION (CONT'D)
Division
FY 2012-13
Midcycle
Budget
FTE*
FY 2013-14
Proposed
Budget
FTE
FY 2014-15
Proposed
Budget
FTE
Administration 5.00 5.00 5.00
1010 - General Purpose Fund (GPF) 3.94 4.34 4.34
1700 - Mandatory Refuse Program 0.66 0.66 0.66
1750 - Multipurpose Reserve 0.40 - -
Audit/Compliance 10.00 13.00 13.00
1010 - General Purpose Fund (GPF) 5.80 10.00 10.00
1700 - Mandatory Refuse Program 2.67 2.00 2.00
2310 - Lighting and Landscape Assessment District 0.20 - -
2413 - Rent Adjustment Program Fund 1.00 1.00 1.00
7760 - Grant Clearing 0.33 - -
Business Tax 15.00 14.00 14.00
1010 - General Purpose Fund (GPF) 9.57 8.30 8.30
1700 - Mandatory Refuse Program 4.43 4.17 4.17
2310 - Lighting and Landscape Assessment District - 0.20 0.20
2413 - Rent Adjustment Program Fund 1.00 1.00 1.00
7760 - Grant Clearing - 0.33 0.33
Collections/Mandatory Garbage 13.00 11.00 11.00
1010 - General Purpose Fund (GPF) 6.90 6.60 6.60
1700 - Mandatory Refuse Program 5.90 4.40 4.40
2310 - Lighting and Landscape Assessment District 0.20 - -
Strategic Support 11.00 8.00 8.00
1010 - General Purpose Fund (GPF) 8.00 3.47 3.47
1700 - Mandatory Refuse Program 2.00 3.33 3.33
2310 - Lighting and Landscape Assessment District - 0.20 0.20
2413 - Rent Adjustment Program Fund 1.00 1.00 1.00
Parking Citation Assistance Center 15.00 16.00 16.00
1010 - General Purpose Fund (GPF) 15.00 15.60 15.60
1750 - Multipurpose Reserve - 0.40 0.40
Parking Meter Collection 8.00 8.00 8.00
1010 - General Purpose Fund (GPF) 8.00 8.00 8.00
TOTAL 77.00 75.00 75.00
* For comparison only. In FY 012-13 Revenue was part of the Ciity Administrator's Office.
E - 32

ADMINISTRATIVE SERVICES
DIVISION DESCRIPTIONS
ADMINISTRATION (CONT’D)
procedures complying with all legal fiscal reporting requirements. Additionally, it directs and enforces provisions of the California State Vehicle and Oakland Municipal Codes. The division’s sections/units include: Business Tax (BT), Audit/Compliance, Collections/Mandatory Garbage, Strategic Support, Parking Citation Assistance Center (PCAC) and Parking Meter collections.
AUDIT / COMPLIANCE
The Revenue Audit Section audits and reviews all the revenue sources such as:
Business Tax Transient Occupancy Tax Parking Tax Utility Consumption Tax Real Property Transfer Tax Sales Tax
The primary function and goal of the Revenue Audit Section is to confirm the taxpayer's accurate filing of tax information and payment of taxes due while ensuring the proper application of respective revenue ordinances by both staff and taxpayers. The Compliance section ensures that all businesses conducting business in Oakland are in compliance with the rules and regulations set forth in Oakland Municipal Code and have current business tax certificates for conducting business in the City.
BUSINESS TAX
Reviews of tax and fee ordinances to ensure equitable and fair application of taxes and fees paid to the City by the residential and commercial community. This section collects, records and reports on all City revenues; enforces and monitors the provisions of the City's ordinances; Complies with the State of California reporting requirements pertaining to the following taxes & Fees:
Business Tax Utility Users’ Tax Real Estate Transfer, Parking Tax Transient Occupancy Tax Rental Adjustment Program (RAP) Excess Liter Fee (ELF) Business Improvement District
(BID)
Revenue
Division
FY 2012-13
Midcycle
Budget *
FY 2013-14
Proposed
Budget
FY 2014-15
Proposed
Budget
Administration $0 $220,020 $221,517
Audit/Compliance 2,406,949 2,424,549 2,424,549
Business Tax - 16,400 16,400
Collections/Mandatory Garbage 158,600 $264,591 $264,591
Strategic Support 440,900 455,300 455,300
Parking Citation Assistance Center - 34,778 34,873
TOTAL $3,006,449 $3,415,638 $3,417,230
Expenditure
Division
FY 2012-13
Midcycle
Budget *
FY 2013-14
Proposed
Budget
FY 2014-15
Proposed
Budget
Administration $2,037,645 $4,282,083 $4,766,133
Audit/Compliance 1,215,129 1,669,019 1,706,779
Business Tax 1,474,694 1,686,308 1,562,327
Collections/Mandatory Garbage 1,408,202 1,337,486 1,366,448
Strategic Support 1,516,768 1,282,586 1,303,027
Parking Citation Assistance Center 2,095,502 2,434,566 2,466,758
Parking Meter Collection 3,962,734 4,079,766 3,719,134
TOTAL $13,710,674 $16,771,814 $16,890,606
* For comparison only. In FY 012-13 Revenue was part of the Ciity Administrator's Office.
SUMMARY OF HISTORICAL EXPENDITURES AND PROPOSED BUDGET BY DIVISION
REVENUE75.00 FTE
Administration 5.00 FTE
Parking CitationAssistance Center
16.00 FTE
Audit / Compliance13.00 FTE
Strategic Support8.00 FTE
Collections/Mandatory Garbage11.00 FTE
Business Tax14.00 FTE
Parking Meter Collection8.00 FTE
E - 33

ADMINISTRATIVE SERVICES
DIVISION DESCRIPTIONS (CONT’D)
COLLECTIONS/MANDATORY GARBAGE
Acts as the collection agent for all City Agencies and departments; represents the City in Small Claims Court, collects on delinquent garbage bills. The primary responsibilities of Mandatory Garbage is to collect delinquent Mandatory Garbage invoices, issue Demand Letters and Release of Lien documents for
SIGNIFICANT CHANGES IN BUDGET AND PERFORMANCE (CONT'D)
General Purpose Fund (GPF) FTE FY 2013-14
ChangesFY 2014-15
Changes
Add O&M for BT Online System - $176,000 $16,000
Add O&M for HDL Contract - $22,000 $22,000
Add O&M for Hearing Officers - $150,000 $150,000
Mandatory Garbage, Business Tax, and Code Enforcement, and bring into compliance delinquent businesses which have not registered according to the provisions of the Business Tax Ordinance.
STRATEGIC SUPPORT
This section of the division supports and maintains the integrity of the Business Tax licensing system. It is responsible for printing & mailing of Business Tax (BT) Renewals, Notice of Determinations (NODs) and BT certificates. It also,
handles and processes lockbox payments for BT, Rental Adjustment Program (RAP), Transient Occupancy Tax (TOT), Utility Users’ Tax (UUT) and Parking Tax (PT). The BT liens for both residential and commercial rental accounts are also handled by this section.
PARKING CITATION ASSISTANCE CENTER
The Parking Citation Assistance Center (PCAC) processes all parking violation citations, and posts various citation payments. The citation payments are handled either by direct cashier services
or through the mail. PCAC staff also provides direct in-person or telephone assistance to citizens regarding various parking related issues including the Residential Permit Parking.
PARKING METER COLLECTIONS
Parking Meter Collections is responsible for collecting parking meter revenue from the on and off-street parking meters. They also perform counting, sorting, bagging of the coins for different coin denominations and Brink’s pick up.
E - 34

ADMINISTRATIVE SERVICES
TREASURY
MISSION STATEMENT
The mission of the Treasury Division is to promote the conditions for fiscal prosperity and stability in Oakland and provide support services to all City departments. Treasury Division services include: financial management and maintenance of the City’s financial and payroll systems, manage portfolio for City, Port and Successor Agency; debt management for City and Successor Agency; and administer the City’s retirement systems.
BUSINESS GOALS
To provide oversight for all City financial interests as Treasurer of the City and the Successor Agency, and Board Member of the Oakland Municipal Employees Retirement System.
To safeguard the City and Successor’s investments by maintaining strong internal controls, ensuring equity and transparency, adhering to established financial policies and procedures (investments and debt policy).
To ensure the stability of City financial resources through effective debt financing, maintenance of the City’s bond ratings that reflect a deep, stable, and diversified economic base with management practices that are considered strong by rating agencies; and effective debt management.
To maintain investor’s relation and attract potential investors by demonstrating strong financial management and condition in order to promote City’s financings to ensure lowest interest costs to the City.
To administer and oversee audits and retirement benefits; ensures compliance; and protect and ensure prudent investing of the pension funds (OMERS and PFRS) for the benefit of the retirees and beneficiaries.
SUMMARY OF HISTORICAL EXPENDITURES AND PROPOSED BUDGET BY FUND
Expenditures by Fund
FY 2012-13 Midcycle
Budget
FY 2013-14 Proposed
Budget
FY 2014-15 Proposed
Budget
1010 General Purpose Fund (GPF) $2,333,225 $2,938,342 $2,997,461
1610 Successor Redevelopment Agency Reimbursement Fund
276,312 468,894 475,387
1750 Multipurpose Reserve 700,000 - -
2105 HUD-EDI Grants 99,750 - -
2108 HUD-CDBG 56,162 - -
2415 Development Service Fund 40,232 44,756 45,843
3100 Sewer Service Fund 15,000 15,000 18,000
4200 Radio / Telecommunications 34,250 38,100 39,026
6520 Fire Area - Redemption 50,000 - -
6587 2012 Refunding Reassessment Bonds-Debt Service - 55,971 57,331
7100 Police and Fire Retirement System 2,414,771 2,884,971 3,395,532
7120 Oakland Municipal Employees' Retirement System 237,477 185,907 188,641
TOTAL $6,257,179 $6,631,941 $7,217,221
GPF Percent to Total Department 37.3% 44.3% 41.5%
GPF Percent to Citywide GPF Expenditures 0.6% 0.7% 0.7%
AUTHORIZED POSITIONS BY DIVISION (CONT'D)
Division
FY 2012-13
Midcycle
Budget
FTE
FY 2013-14
Proposed
Budget
FTE
FY 2014-15
Proposed
Budget
FTE
Administration 1.00 1.60 1.60
1010 - General Purpose Fund (GPF) 0.65 1.50 1.50
1610 - Successor Redevelopment Agency Reimbursement
Fund
0.10 0.10 0.10
2105 - HUD-EDI Grants 0.15 - -
2108 - HUD-CDBG 0.10 - -
Cash & Operations 1.00 1.00 1.00
1010 - General Purpose Fund (GPF) 1.00 1.00 1.00
Debt Issuance & Investment 7.00 6.00 6.00
1010 - General Purpose Fund (GPF) 4.70 4.95 4.95
1610 - Successor Redevelopment Agency Reimbursement
Fund
1.30 0.65 0.65
2105 - HUD-EDI Grants 0.40 - -
2108 - HUD-CDBG 0.20 - -
6520 - Fire Area - Redemption 0.40 - -
6587 - 2012 Refunding Reassessment Bonds-Debt Service - 0.40 0.40
Payroll 12.00 13.00 13.00
1010 - General Purpose Fund (GPF) 10.27 11.17 11.17
1610 - Successor Redevelopment Agency Reimbursement
Fund
0.90 1.00 1.00
2415 - Development Service Fund 0.50 0.50 0.50
4200 - Radio / Telecommunications 0.33 0.33 0.33
Retirement 5.00 5.40 5.40
1010 - General Purpose Fund (GPF) 1.00 0.90 0.90
7100 - Police and Fire Retirement System 3.00 3.80 3.80
7120 - Oakland Municipal Employees' Retirement System
OMERS
1.00 0.70 0.70
TOTAL 26.00 27.00 27.00
E - 35
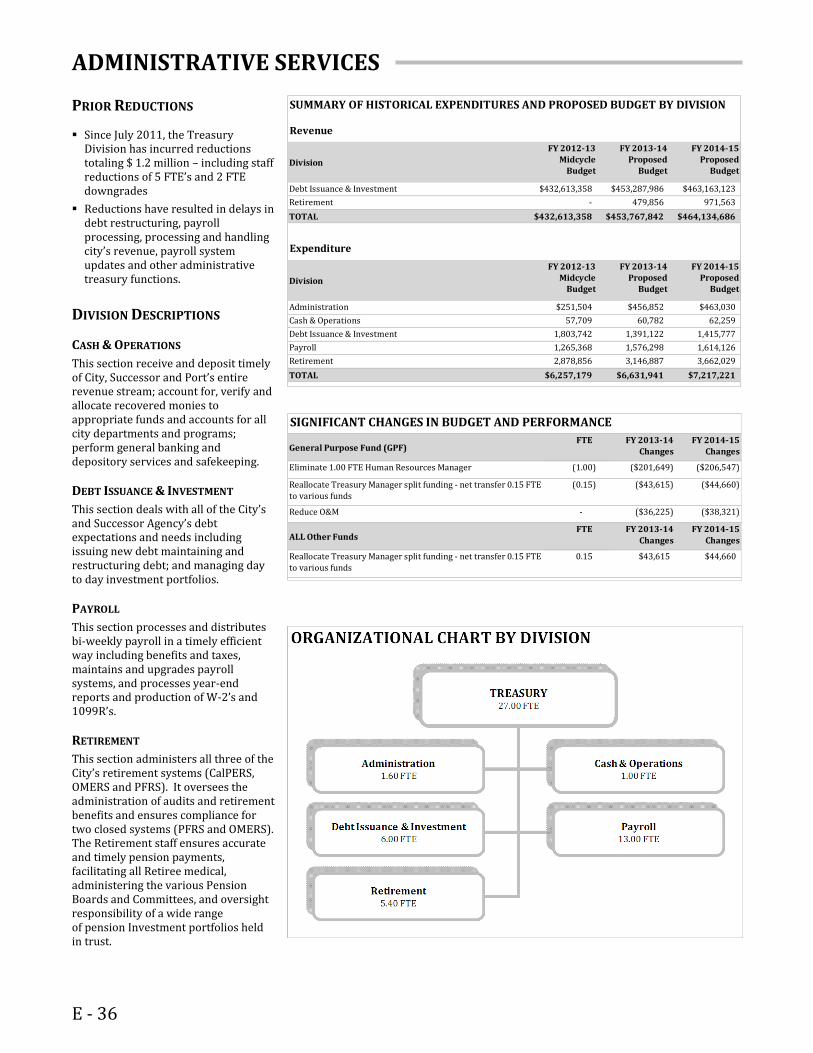
ADMINISTRATIVE SERVICES
PRIOR REDUCTIONS
Since July 2011, the Treasury Division has incurred reductions totaling $ 1.2 million – including staff reductions of 5 FTE’s and 2 FTE downgrades
Reductions have resulted in delays in debt restructuring, payroll processing, processing and handling city’s revenue, payroll system updates and other administrative treasury functions.
DIVISION DESCRIPTIONS
CASH & OPERATIONS
This section receive and deposit timely of City, Successor and Port’s entire revenue stream; account for, verify and allocate recovered monies to appropriate funds and accounts for all city departments and programs; perform general banking and depository services and safekeeping.
DEBT ISSUANCE & INVESTMENT
This section deals with all of the City’s and Successor Agency’s debt expectations and needs including issuing new debt maintaining and restructuring debt; and managing day to day investment portfolios.
PAYROLL
This section processes and distributes bi-weekly payroll in a timely efficient way including benefits and taxes, maintains and upgrades payroll systems, and processes year-end reports and production of W-2’s and 1099R’s.
RETIREMENT
This section administers all three of the City’s retirement systems (CalPERS, OMERS and PFRS). It oversees the administration of audits and retirement benefits and ensures compliance for two closed systems (PFRS and OMERS). The Retirement staff ensures accurate and timely pension payments, facilitating all Retiree medical, administering the various Pension Boards and Committees, and oversight responsibility of a wide range of pension Investment portfolios held in trust.
Revenue
Division
FY 2012-13 Midcycle
Budget
FY 2013-14 Proposed
Budget
FY 2014-15 Proposed
Budget
Debt Issuance & Investment $432,613,358 $453,287,986 $463,163,123
Retirement - 479,856 971,563
TOTAL $432,613,358 $453,767,842 $464,134,686
Expenditure
Division
FY 2012-13 Midcycle
Budget
FY 2013-14 Proposed
Budget
FY 2014-15 Proposed
Budget
Administration $251,504 $456,852 $463,030
Cash & Operations 57,709 60,782 62,259
Debt Issuance & Investment 1,803,742 1,391,122 1,415,777
Payroll 1,265,368 1,576,298 1,614,126
Retirement 2,878,856 3,146,887 3,662,029
TOTAL $6,257,179 $6,631,941 $7,217,221
SUMMARY OF HISTORICAL EXPENDITURES AND PROPOSED BUDGET BY DIVISION
SIGNIFICANT CHANGES IN BUDGET AND PERFORMANCE (CONT'D)
General Purpose Fund (GPF)FTE FY 2013-14
ChangesFY 2014-15
Changes
Eliminate 1.00 FTE Human Resources Manager (1.00) ($201,649) ($206,547)
Reallocate Treasury Manager split funding - net transfer 0.15 FTE to various funds
(0.15) ($43,615) ($44,660)
Reduce O&M - ($36,225) ($38,321)
ALL Other FundsFTE FY 2013-14
ChangesFY 2014-15
Changes
Reallocate Treasury Manager split funding - net transfer 0.15 FTE
to various funds
0.15 $43,615 $44,660
E - 36

ADMINISTRATIVE SERVICES
HUMAN RESOURCES
MISSION STATEMENT
The mission of the Department of Human Resources is to manage a comprehensive personnel system based on merit and to provide City agencies and departments with a competitive workforce through training, active outreach, recruitment, hiring, and the promotion of qualified candidates, particularly Oakland residents.
BUSINESS GOALS
To provide City agencies and departments with a high quality, skilled, diverse workforce through active outreach, recruitment, hiring, and promotion of qualified candidates; to maintain a comprehensive classification plan; to administer the Equal Access Program; to administer the City’s employee benefits plans; and to oversee the Risk Management Program for the City.
PRIOR REDUCTIONS
Since July 2008, the Department of Human Resources Management has incurred staff reductions of 26.50 FTEs (-42%).
Reductions have resulted in delays in recruitments and classification studies, decreased support for customer service activities, and limited oversight of the performance appraisal processes. Currently, recruitments are delayed four weeks and classification studies are delayed three months.
Revisions to the City’s classification plan have been severely reduced and human resource trainings have also been greatly limited.
DIVISION DESCRIPTIONS
ADMINISTRATION
Provides direction and support to all of the Human Resources Management units; advises the Mayor, Council, and City Administrator on Human
Expenditures by Fund
FY 2012-13 Midcycle
Budget
FY 2013-14 Proposed
Budget
FY 2014-15 Proposed
Budget
1010 General Purpose Fund (GPF) $3,555,576 $3,711,524 $3,790,743
1150 Worker's Compensation Insurance 1,298,832 1,464,663 1,489,361
1610 Successor Redevelopment Agency Reimbursement Fund
69,018 40,536 41,519
4100 Equipment 5,521 5,521 5,521
7100 Police and Fire Retirement System 10,727 1,260 1,260
7120 Oakland Municipal Employees' Retirement System 1,162 1,162 1,162
7130 Employee Deferred Compensation 191,355 229,935 232,736
TOTAL $5,132,191 $5,454,601 $5,562,302
GPF Percent to Total Department 69.3% 68.0% 68.2%
GPF Percent to Citywide GPF Expenditures 0.9% 0.9% 0.8%
SUMMARY OF HISTORICAL EXPENDITURES AND PROPOSED BUDGET BY FUND
AUTHORIZED POSITIONS BY DIVISION
Division
FY 2012-13Midcycle
Budget FTE
FY 2013-14Proposed
BudgetFTE
FY 2014-15Proposed
BudgetFTE
Administration 5.00 4.00 4.00
1010 - General Purpose Fund (GPF) 5.00 3.70 3.70
1150 - Worker's Compensation Insurance Claims - 0.20 0.20
7130 - Employee Deferred Compensation - 0.10 0.10
Recruitment & Classification 21.50 22.70 22.70
1010 - General Purpose Fund (GPF) 21.10 22.60 22.60
1610 - Successor Redevelopment Agency Reimbursement Fund
0.40 0.10 0.10
Risk & Benefits 11.00 10.00 10.00
1010 - General Purpose Fund (GPF) 2.70 1.80 1.80
1150 - Worker's Compensation Insurance Claims 7.00 7.00 7.00
1610 - Successor Redevelopment Agency Reimbursement Fund
0.20 0.20 0.20
7100 - Police and Fire Retirement System 0.10 - -
7130 - Employee Deferred Compensation 1.00 1.00 1.00
TOTAL 37.50 36.70 36.70
Revenue
Division
FY 2012-13 Midcycle
Budget
FY 2013-14 Proposed
Budget
FY 2014-15 Proposed
Budget
Administration $202,685 $467,586 $470,387
TOTAL $202,685 $467,586 $470,387
Expenditure
Division
FY 2012-13 Midcycle
Budget
FY 2013-14 Proposed
Budget
FY 2014-15 Proposed
Budget
Administration 750,933 779,098 793,285
Recruitment & Classification 2,713,002 2,965,586 3,028,560
Risk & Benefits $1,668,256 $1,709,917 $1,740,457
TOTAL $5,132,191 $5,454,601 $5,562,302
SUMMARY OF HISTORICAL EXPENDITURES AND PROPOSED BUDGET BY DIVISION
E - 37

ADMINISTRATIVE SERVICES
DIVISION DESCRIPTIONS
ADMINISTRATION (CONT’D)
Resources issues; develops and facilitates the implementation of action plans to address current and future City human resources needs. Department director is the Secretary to the Civil Service Board.
RISK & BENEFITS
Manage all employee benefits programs including the Employee Assistance Program. Provide staff support to the Deferred Compensation Committee and Disability Retirement Board. Administer all protected leave (CFRA, FMLA, and PDL) programs and disability related programs including Workers’ Compensation and FEHA/ADA. Administer Employee Medical Services and programs requiring medical services. Provide Occupational Safety & Health services to departments. Manage the Commercial Insurance and Self-Insurance portfolios and represent City on insurance pool boards and committees. Monitor vendor contracts for Compliance with Risk Management related requirements. Extend other Risk Management and/or employment liability services to departments as needed..
RECRUITMENT & CLASSIFICATION
Responsible for all aspects of recruiting and for retaining the most qualified
candidates for employment. Maintains a competitive classification and compensation system; recruits local, statewide and national candidates who reflect the City’s diversity objectives. Provides staff support to the Civil Service Board. This division also houses the Equal Access Program which seeks to ensure resident access to City services in accordance with the Equal Access to Services Ordinance (Ordinance No.12324 C.M.S.).
SIGNIFICANT CHANGES IN BUDGET AND PERFORMANCE (CONT'D)
General Purpose Fund (GPF)FTE FY 2013-14
ChangesFY 2014-15
Changes
Transfer 0.30 FTE Director of Personnel Resource Management to the worker's compensation fund 1150 and the deferred comp
fund 7130.
(0.30) ($76,889) ($78,725)
ALL Other FundsFTE FY 2013-14
ChangesFY 2014-15
Changes
Transfer 0.30 FTE Director of Personnel Resource Management
from fund 1010 to the worker's compensation fund 1150 and the defferred comp fund 7130.
0.30 $76,889 $78,725
E - 38

ADMINISTRATIVE SERVICES
INFORMATION TECHNOLOGY
MISSION STATEMENT
The Department of Information Technology is committed to providing the timely delivery of strategic, responsive, cost-effective technology solutions and quality services to meet the goals defined by the Mayor, City Council and Oakland's citizens. We are dedicated to maintaining the highest standards of excellence in our technical skills by providing total quality workmanship and expertise; by understanding the needs of the customer to facilitate the accomplishment of common objectives; and by always treating customers and staff with respect and dignity.
BUSINESS GOALS
Improve customer service for internal clients, businesses and the community by providing an overall Information Technology (IT) vision and strategic plan that includes the re-engineering and re-architecting of the City's existing IT environment and associated services.
Install, maintin and support the mission critical public safety applications and infrastructure. Provide technical resources for business needs analysis, technology acquisition, solution designing, contract negotiations, project management, and support services.
Provide a pro-active, stable and highly reliable intra/internet environment that supports and enhances E-Commerce, E-Oakland, Citywide GIS, Crime Watch and migration of City applications to the Web.
Enable and publish City Data for the use of City Agencies and Departments and provide access to this resource to Residents and Businesses.
Expenditures by Fund
FY 2012-13 Midcycle
Budget
FY 2013-14 Proposed
Budget
FY 2014-15 Proposed
Budget
1010 General Purpose Fund (GPF) $6,901,267 $7,928,774 $6,748,750
1610 Successor Redevelopment Agency Reimbursement Fund
66,900 - -
1760 Telecommunications Reserve 98,934 104,406 106,940
2241 Measure Q-Library Services Retention & Enhancement 363,239 231,871 237,503
2411 False Alarm Reduction Program 170,026 159,647 163,526
2415 Development Service Fund 242,568 265,648 272,101
3100 Sewer Service Fund - 166,911 170,965
4200 Radio / Telecommunications 3,457,149 3,479,619 3,518,355
4210 Telephone Equipment and Software 87,376 308,530 308,530
4300 Reproduction 1,412,391 1,410,937 1,433,684
7760 Grant Clearing - 113,440 116,196
TOTAL $12,799,850 $14,169,783 $13,076,550
GPF Percent to Total Department 53.9% 56.0% 51.6%
GPF Percent to Citywide GPF Expenditures 1.7% 1.8% 1.5%
SUMMARY OF HISTORICAL EXPENDITURES AND PROPOSED BUDGET BY FUND
AUTHORIZED POSITIONS BY DIVISION
Division
FY 2012-13
Midcycle
Budget
FTE
FY 2013-14
Proposed
Budget
FTE
FY 2014-15
Proposed
Budget
FTE
Administration & Customer Services 10.00 10.00 10.00
1010 - General Purpose Fund (GPF) 3.40 3.80 3.80
1610 - Successor Redevelopment Agency Reimbursement
Fund
0.40 - -
4200 - Radio / Telecommunications 1.20 1.20 1.20
4300 - Reproduction 5.00 5.00 5.00
Enterprise Application Services 18.00 20.00 20.00
1010 - General Purpose Fund (GPF) 15.50 15.50 15.50
1760 - Telecommunications Reserve 0.34 0.34 0.34
2415 - Development Service Fund 0.33 0.33 0.33
3100 - Sewer Service Fund - 1.10 1.10
4200 - Radio / Telecommunications 1.83 1.83 1.83
7760 - Grant Clearing - 0.90 0.90
Enterprise Network & Computing Services 21.00 22.00 22.00
1010 - General Purpose Fund (GPF) 16.55 18.75 18.75
1610 - Successor Redevelopment Agency Reimbursement
Fund
0.20 - -
2241 - Measure Q-Library Services Retention &
Enhancement
3.00 2.00 2.00
4200 - Radio / Telecommunications 1.25 0.25 0.25
7760 - Grant Clearing - 1.00 1.00
Public Safety Systems Services 13.00 15.00 15.00
1010 - General Purpose Fund (GPF) 5.60 6.60 6.60
1760 - Telecommunications Reserve 0.40 0.40 0.40
2411 - False Alarm Reduction Program 1.00 1.00 1.00
2415 - Development Service Fund 1.00 1.00 1.00
4200 - Radio / Telecommunications 5.00 6.00 6.00
TOTAL 62.00 67.00 67.00
E - 39

ADMINISTRATIVE SERVICES
PRIOR REDUCTIONS (CONT’D)
Provide national standards based Interoperable communications infrastructure to the City's Public Safety Agencies and to surrounding jurisdictions.
Improve the availability, reliability and speed of the City's fixed and wireless network connectivity.
DIVISION DESCRIPTIONS
ADMINISTRATION & CUSTOMER
SERVICES
This division provides general administrative support for the Department of Information Technology as well as: telephone and radio billing, cable television complaints and printing / duplicating services for all City departments.
ENTERPRISE APPLICATION SERVICES
This division maintains and supports enterprise applications and databases, to include Oracle’s Public Sector Budgeting (PSB), Internet Recruitment, Internet Procurement, Internet Supplier, Financials, Payroll, Contract Management, and Internet Sourcing; designs, develops and implements program solutions for enterprise applications; provides support for performance monitoring of enterprise resources and performance capacity planning. It also provides GIS information to users; researches GIS database accuracy and completeness; develops web applications to access various resources; maintains intranet applications including web content management. performance capacity planning. It also provides GIS information to users; researches GIS database accuracy and completeness; develops web applications to access various resources; maintains intranet applications including web content management.
Revenue
Division
FY 2012-13 Midcycle
Budget
FY 2013-14 Proposed
Budget
FY 2014-15 Proposed
Budget
Administration & Customer Services $7,710,642 $7,630,703 $7,630,703
Enterprise Application Services 4,750 4,750 4,750
TOTAL $7,715,392 $7,635,453 $7,635,453
Expenditure
Division
FY 2012-13 Midcycle
Budget
FY 2013-14 Proposed
Budget
FY 2014-15 Proposed
Budget
Administration & Customer Services $4,905,499 $5,140,617 $3,837,555
Enterprise Application Services 3,283,245 3,714,566 3,795,584
Enterprise Network & Computing Services 2,724,852 3,034,796 3,108,489
Public Safety Systems Services 1,886,254 2,279,804 2,334,922
TOTAL $12,799,850 $14,169,783 $13,076,550
SUMMARY OF HISTORICAL EXPENDITURES AND PROPOSED BUDGET BY DIVISION
SIGNIFICANT CHANGES IN BUDGET AND PERFORMANCE
General Purpose Fund (GPF)FTE FY 2013-14
Changes
FY 2014-15
Changes
Eliminate 1.0 FTE Telecommunications Systems Engineer. (1.00) ($137,894) ($141,244)
ALL Other FundsFTE FY 2013-14
Changes
FY 2014-15
Changes
Freeze 1.0 FTE Microcomputer Systems Specialist in fund 2241. (1.00) ($137,501) ($140,842)
E - 40

ADMINISTRATIVE SERVICES
DIVISION DESCRIPTIONS (CONT’D)
ENTERPRISE NETWORK & COMPUTING
SERVICES
This division supports and provides daily maintenance of the citywide area IT Network infrastructure that provides voice and data network/ telecommunications services. This section also provides microcomputer and server support including email support for all Agencies/Departments throughout the City. It prepares short and long range network, server and desktop client strategies, is responsible for the development of the City’s desktop, server and network access
security policies, standards, and technical specifications.
This section also provides microcomputer support (both advice and assistance) for most of the Agencies/Departments throughout the City. The Desktop and Server Support Section is responsible for the development and maintenance of microcomputer hardware and software standards.
PUBLIC SAFETY SYSTEMS SERVICES
This division is the One-Stop Shop for the citywide Public Safety operational
needs and technology initiatives. The program components include support for all the mission critical public safety applications and infrastructure including 911 Computer Aided Dispatch (CAD) system, Records Management System (RMS), OPD Internal Personnel Assessment System (iPAS), Citywide Two-way radio system, Microwave Backbone network, mobile applications, fire station alerting systems and public safety end-users equipment in the police and fire vehicles. This program also includes the on-going maintenance and support of various third-party as well as in-house developed applications and databases.
E - 41

ADMINISTRATIVE SERVICES
NOTES
E - 42

COMMUNITY SERVICES
NEIGHBORHOOD SERVICES
MISSION STATEMENT
The mission of the Neighborhood Services Division is to strive to organize residential & business neighborhoods, work in partnership to problem solve to improve their neighborhood, provide trainings & workshops to educate the community, and strengthen relationships by engaging everyone to host community events i.e. National Night Out.
.
BUSINESS GOALS
The Neighborhood Services Division coordinates fifteen programs, events and functions that involve residents and merchants in the City's community-policing program.
Serves as a liaison between the community, the Police, & other City departments to assist residents in accessing the resources necessary to reduce crime, address issues, and increase the quality of life in their neighborhoods
Provides training and support for grassroots neighborhood leadership as community members work in partnership with the police & other City departments to solve problems. Neighborhood Services fosters resident and merchant participation at three levels: on the block, in the neighborhood and citywide.
PRIOR REDUCTIONS
In 2008 the Division consisted of: 1 Manager, 4 Supervisors, 17 Neighborhood Services Coordinators (NSCs), 5 Police Service Technicians (PSTs), 2 Community Building Coordinators , and 1 Administrative Assistant for a total of 30 FTEs.
Currently the Division consists of: 3 Supervisors (one acting as Manager), 9 NSCs, 2 PSTs, and 1 CBC, with a vacant CBC position to be filled, and part-time student intern, for a total of 15.5 FTEs, totaling a 48% workforce reduction.
Expenditures by Fund
FY 2012-13 Midcycle
Budget
FY 2013-14 Proposed
Budget
FY 2014-15 Proposed
Budget
1010 General Purpose Fund (GPF) $236,293 $325,514 $332,264
2251 Measure Y: Public Safety Act 45 - -
TOTAL $236,338 $325,514 $332,264
GPF Percent to Total Department 100.0% 100.0% 100.0%
GPF Percent to Citywide GPF Expenditures 0.1% 0.1% 0.1%
SUMMARY OF HISTORICAL EXPENDITURES AND PROPOSED BUDGET BY FUND
AUTHORIZED POSITIONS BY DIVISION
Division
FY 2012-13
MidcycleBudget
FTE
FY 2013-14
ProposedBudget
FTE
FY 2014-15
ProposedBudget
FTE
Neighborhood Services Division 3.70 3.70 3.70
1010 - General Purpose Fund (GPF) 1.50 2.00 2.00
2251 - Measure Y: Public Safety Act 2004 2.20 1.70 1.70
TOTAL 3.70 3.70 3.70
Revenue
Program
FY 2012-13 Midcycle
Budget
FY 2013-14 Proposed
Budget
FY 2014-15 Proposed
Budget
Neighorhood Sevices Division $0 $0 $0
TOTAL $0 $0 $0
Expenditure
Program
FY 2012-13 Midcycle
Budget
FY 2013-14 Proposed
Budget
FY 2014-15 Proposed
Budget
Neighorhood Sevices Division $236,338 $325,514 $332,264
TOTAL $236,338 $325,514 $332,264
SUMMARY OF HISTORICAL EXPENDITURES AND PROPOSED BUDGET BY PROGRAM
SIGNIFICANT CHANGES IN BUDGET AND PERFORMANCE
General Purpose Fund (GPF) FTE FY 2013-14
Changes
FY 2014-15
Changes
None
E - 43

COMMUNITY SERVICES
PRIOR REDUCTIONS (CONT’D)
The reductions has increased staff workload with NSCs covering an average of 6-8 Community Policing Beats (versus 3 in 2008), fewer Neighborhood Watch trainings take place, no Spanish Speaking PST is on staff to conduct trainings in Spanish, and all administrative tasks have been absorbed by existing staff.
PROGRAM DESCRIPTIONS
NEIGHBORHOOD WATCH
Residents and merchants are encouraged to form Neighborhood Watch or Merchant Watch groups to meet each other, learn crime prevention techniques, and work together to solve block-level problems. Police Services Technician II (PSTs) provides training to new groups on an ongoing basis. Currently there are over 800 organized Neighborhood Watch Block Groups citywide.
NEIGHBORHOOD CRIME PREVENTION
COUNCILS/NEIGHBORHOOD COUNCILS
45 Neighborhood Crime Prevention Councils are organized by beat for the purpose of bringing everyone together to work in partnership to address community concerns. Everyone is encouraged to participate in their Neighborhood Crime Prevention Council (NCPC). They generally meet monthly, bi-monthly, & quarterly. City representatives including the Oakland Police Department attend NCPC meetings and works with residents to address selected priorities.
CRIME PREVENTION EDUCATION
Businesses, schools, groups and organizations can request special presentations on personal safety and other topics of concern including Senior Safety, Youth Safety, and Home or Business Security. A Police Services Technician II from the Division conducts home and business safety inspections with individual property owners.
THE CITY-COUNTY NEIGHBORHOOD
INITIATIVE (CCNI)
This Measure Y funded program is a partnership with the Alameda County Public Health Department that helps community members work together to solve problems and create a better standard of living for themselves. CCNI works in two targeted neighborhoods: Sobrante Park in East Oakland and the
Hoover Historic District in West Oakland.
CITIZENS’ POLICE ACADEMY AND ALUMNI
ASSOCIATION
This 14-week program provides community members with an overview of the Police Department functions and a forum for police-citizen dialogue. Graduates of the Citizens’ Police Academy continue their association with Police Department through the Citizens’ Police Alumni Association where they participate in special projects such as Officer Appreciation Day and Christmas
Escorts for Oakland shoppers.
COMMUNITY POLICING ADVISORY BOARD
(CPAB)
The role of the Community Policing Advisory Board (CPAB) is to oversee and ensure the successful implementation of Oakland's community policing policy articulated in City Council Resolution No. 72727. The appointed board conducts monthly meetings, provides guidance to the City’s 53 NCPCs and gives input to OPD on issues related to Community Policing efforts by the department. The Division provides staff support to the CPAB.
NEIGHBORHOOD WATCH STEERING
COMMITTEE
This citywide group meets monthly to work with Block Captains and staff to strengthen and build the Neighborhood Watch Program through policy guidance, trainings, and collaboration.
NATIONAL NIGHT OUT (NN0)
National Night Out is held annually on the first Tuesday in August. It is a unique worldwide event that is the nationally night out against crime. National Night Out promotes neighborhood unity & and police-community partnerships. The Neighborhood Services Division coordinates this annual event.
E - 44

COMMUNITY SERVICES
PARKS AND RECREATION
MISSION STATEMENT
The Office of Parks & Recreation is committed and dedicated to offering quality services, activities, and programs open to all Oakland residents and visitors. Our goal is to cultivate awareness about the availability and accessibility of Parks and Recreation services. We offer fun activities in a clean, safe, and healthy environment that provides opportunities for personal growth and skills development. We strive to offer community ownership and launch best practice standards to operate and maintain our facilities, playgrounds, and parks to preserve the beauty and legacy of the City of Oakland.
BUSINESS GOALS
Establish a solid foundation that defines our purpose at every recreation center and ensure all programs are equitable citywide for children, youth, teens, adults and seniors.
Create vibrant and welcoming environments that encourage healthy living and physical play in our parks, on our trails, at our golf courses, recreation centers, ball fields, tennis courts and open space for citizens of all abilities.
Enhance recreation experiences for Oakland residents through the introduction and expansion of water sports for ages 0 and up from progressive learn-to-swim lessons, sailing, kayaking and sailing into science.
Provide specialized enrichment programs that embody character development, health consciousness, art appreciation, life skills, civic duty, and environmental responsibility in every program offering.
Increase OPR’s visibility to be recognized as an essential service and community resource through
Expenditures by Fund
FY 2012-13 Midcycle
Budget
FY 2013-14 Proposed
Budget
FY 2014-15 Proposed
Budget
1010 General Purpose Fund (GPF) $12,142,017 $12,787,013 $13,057,703
1100 Self Insurance Liability 290,170 354,607 354,607
1780 Kid's First Oakland Children's Fund 109,973
1820 OPRCA Self Sustaining Revolving Fund 4,646,270 5,353,327 5,402,771
2310 Lighting and Landscape Assesment 4,091,501 4,110,610 4,320,097
2996 Parks and Recreation Grants 2001 16,847 16,847 16,847
3200 Golf Course 882,192 494,715 497,404
7999 Miscellaneous Trusts 69,270 69,270 69,270
TOTAL $22,248,240 $23,186,389 $23,718,699
GPF Percent to Total Department 54.6% 55.1% 55.1%
GPF Percent to Citywide GPF Expenditures 3.0% 3.0% 2.9%
SUMMARY OF HISTORICAL EXPENDITURES AND PROPOSED BUDGET BY FUND
AUTHORIZED POSITIONS BY PROGRAM
Program
FY 2012-13
Midcycle
Budget
FTE
FY 2013-14
Proposed
Budget
FTE
FY 2014-15
Proposed
Budget
FTE
Adult & Community Sports 25.56 6.23 6.23
1010 - General Purpose Fund (GPF) 5.63 4.14 4.14
1820 - OPRCA Self Sustaining Revolving Fund 19.93 2.09 2.09
After School Programs 16.58 18.83 18.83
1010 - General Purpose Fund (GPF) 15.83 15.08 15.08
1820 - OPRCA Self Sustaining Revolving Fund - 3.00 3.00
3200 - Golf Course 0.75 0.75 0.75
Aquatics Boating 9.68 10.43 10.43
1010 - General Purpose Fund (GPF) 5.75 5.32 5.32
1820 - OPRCA Self Sustaining Revolving Fund 3.93 5.11 5.11
Aquatics Pools 20.93 19.60 19.60
1010 - General Purpose Fund (GPF) 20.23 17.98 17.98
1820 - OPRCA Self Sustaining Revolving Fund 0.70 1.62 1.62
Ball Fields 8.10 8.10 8.10
1010 - General Purpose Fund (GPF) 1.81 1.81 1.81
2310 - Lighting and Landscape Assessment District 6.29 6.29 6.29
Camps 1.00 2.00 2.00
1010 - General Purpose Fund (GPF) 1.00 1.00 1.00
1820 - OPRCA Self Sustaining Revolving Fund - 1.00 1.00
Central Administration 15.38 16.38 16.38
1010 - General Purpose Fund (GPF) 15.38 14.88 14.88
1820 - OPRCA Self Sustaining Revolving Fund - 1.50 1.50
Central Reservations 13.65 11.65 11.65
1010 - General Purpose Fund (GPF) 1.00 - -
1820 - OPRCA Self Sustaining Revolving Fund 12.65 11.65 11.65
Contract Management 3.00 - -
1010 - General Purpose Fund (GPF) 1.00 - -
1820 - OPRCA Self Sustaining Revolving Fund 2.00 - -
Cultural Arts 13.45 13.12 13.12
1010 - General Purpose Fund (GPF) 6.02 5.31 5.31
1820 - OPRCA Self Sustaining Revolving Fund 7.43 7.81 7.81
Davies Tennis & Citywide Tennis 4.28 4.28 4.28
1820 - OPRCA Self Sustaining Revolving Fund 4.28 4.28 4.28
Recreation Programs 98.52 119.52 119.52
1010 - General Purpose Fund (GPF) 55.43 55.03 55.03
1780 - Kid's First Oakland Children's Fund 1.25 - -
1820 - OPRCA Self Sustaining Revolving Fund 40.84 63.49 63.49
2310 - Lighting and Landscape Assessment District 1.00 1.00 1.00
TOTAL 230.13 230.14 230.14
E - 45

COMMUNITY SERVICES
BUSINESS GOALS (CONT’D)
citywide events, such as concerts, creative partnerships, sporting events, and street festivals, with the end result of increasing annual participation in recreation.
Oakland Parks and Recreation aspires to ensure that all citizens have an opportunity to explore the arts. Art forms should include: Drama, Dance, Fine Arts, Crafts, Music, Architecture Drawing, Painting, and Sculpting. OPR intends to reinstitute the Art Exchange program at Malonga to ensure our children and youth at the recreation facilities continue to be exposed to the above art forms.
Provide a minimum of five days a week of consistent recreational services to the community Monday –Friday.
Expand the adult programs/services to become fully self-sustaining through the expansion of leagues and non-traditional programs and classes.
Increase department revenue in self sustaining programs and services including the enterprise centers, through the upgrading and renewing of all contracts that have or are expiring.
Provide ongoing training for OPR employees at all level to ensure we are developing a strong leadership team for the 21st century.
Revenue
Program
FY 2012-13
Midcycle
Budget
FY 2013-14
Proposed
Budget
FY 2014-15
Proposed
Budget
Adult & Community Sports $965,861 $1,094,823 $1,097,948
After School Programs 300,580 300,580 300,580
Aquatics - Boating 227,767 247,922 248,084
Aquatics - Pools 162,140 216,272 216,272
Central Administration 69,270 77,842 78,013
Central Reservations 1,097,721 1,097,721 1,097,721
Contract Management 1,018,000 618,000 618,000
Cultural Arts 528,330 528,330 528,330
Davies Tennis and Citywide Tennis 147,250 150,960 150,960
Recreation Programs 1,833,958 2,356,641 2,402,960
TOTAL $6,350,877 $6,689,091 $6,738,868
Expenditure
Program
FY 2012-13
Midcycle
Budget
FY 2013-14
Proposed
Budget
FY 2014-15
Proposed
Budget
Adult & Community Sports $1,662,123 $819,555 $846,280
After School Programs 759,846 889,176 896,215
Aquatics - Boating 588,042 607,878 615,989
Aquatics - Pools 1,504,031 1,445,369 1,480,859
Ball fields 442,487 471,917 478,224
Camps 107,856 118,257 120,756
Central Administration 4,771,826 3,430,786 3,466,048
Central Reservations 865,098 758,922 773,142
Contract Management 1,425,805 810,690 811,873
Cultural Arts 1,090,101 1,057,701 1,068,975
Davies Tennis and Citywide Tennis 174,114 193,752 195,905
Recreation Programs 8,856,911 12,582,386 12,964,433
TOTAL $22,248,240 $23,186,389 $23,718,699
SUMMARY OF HISTORICAL EXPENDITURES AND PROPOSED BUDGET BY PROGRAM
Administrative staff reductions have impacted monitoring of collections, outstanding payable and program tracking.
Increase the development skills for our Counselors in Training, through onsite assessments, skill/drill training and active participation.
Implement STRIDE (Striving to Redirect Individuals in a Difficult Environment) Job Training program for youth ages 16-21 citywide through leverage services of CDBG, OFCY and Corporate Grants.
PROGRAM DESCRIPTIONS
ADULT & COMMUNITY SPORTS
Provide vibrant and welcoming environments and programs that
encourage healthy living and physical play in our parks, on our trails, at our golf courses, recreation centers, ball fields, tennis courts and open space for citizens of all abilities.
AFTER SCHOOL PROGRAMS
Provide specialized enrichment programs that embody character development, health consciousness, art appreciation, life skills, civic duty, and environmental responsibility in every program offering for elementary, middle school and high school youth within OUSD and at all OPR program offerings.
AQUATICS - BOATING
Provide recreation experiences for Oakland residents through the exposure
of water sports for ages 5 and up from sailing, kayaking, dragon boating, sailing into science education component for 5th graders and tall ships.
AQUATICS - POOLS
Provide recreation experiences for Oakland residents through the introduction of water sports for ages zero and up in progressive learn-to-swim lessons, swim teams, lifeguard training, and lap swim.
BALL FIELDS
Provide for safe, clean and well-maintained ball fields citywide that create a vibrant and welcoming environment encouraging healthy living, and physical play in our ball fields for citizens of all abilities.
E - 46

COMMUNITY SERVICES
PROGRAM DESCRIPTIONS
(CONT’D)
CAMPS
Serve as OPR's “Schools-out Rec's-in” fee base program for OUSD non-instruction days including fall, winter, spring and summer breaks. Camps provide specialized enrichment programs that embody, character development, health consciousness, art appreciation and life skills in an educational environment.
CENTRAL ADMINISTRATION
Serve as the departmental management infrastructure including fiscal oversight, staff training and development that enables OPR to increase visibility to be recognized as an essential service and community resource, with the end result of increasing revenue, public trust and services.
CENTRAL RESERVATIONS
Serve as a critical program in meeting Oaklanders rental space needs while contributing to the department self- sustaining fund through our enterprise centers and rental of parks.
CONTRACT MANAGEMENT
Maintain over 30 contracts with major stakeholders such as the Oakland Zoo, Children's Fairyland, Feather River Camp, , Woodminster Amphitheater, Sequoia Nursery School, Metropolitan Horsemen Association, and OUSD.
CULTURAL ARTS
Provide cultural experiences that ensure all children, youth, adults and seniors have an opportunity to explore the arts. The art forms include: Drama, Dance, Fine Arts, , Crafts, Music, Architecture Drawing, Painting, and Sculpting.
SIGNIFICANT CHANGES IN BUDGET AND PERFORMANCE
General Purpose Fund (GPF)FTE FY 2013-14
ChangesFY 2014-15
Changes
Transfer 5.54 FTE to OPRCA Self-Sustaining Fund (5.54) ($386,612) ($389,111)
Add 1.00 Student Trainee, PT 1.00 $23,679 $23,679
10% reduction in the subsidy for Oakland Zoo, Chabot Space & Science Center, Hacienda Peralta and the Asian Cultural Center
- ($94,025) ($94,025)
Reduce 1.62 FTE each of a Recreation Leader I, PT and Recreation Leader II, PT
(3.24) ($106,653) ($106,653)
ALL Other FundsFTE FY 2013-14
ChangesFY 2014-15
Changes
Transfer 5.54 FTE to OPRCA Self-Sustaining Fund 5.54 $386,612 $389,111
DAVIES TENNIS AND CITYWIDE TENNIS
Offer tennis instruction and tournaments for children, youth, adults and seniors that encourage healthy living and physical play.
RECREATION PROGRAMS
Provide a solid foundation of recreation services that defines our purpose at every open recreation center and
program offering ensuring programs are equitable citywide for children, youth, teens, adults and seniors.
E - 47

COMMUNITY SERVICES
HUMAN SERVICES
MISSION STATEMENT
The Department of Human Services builds strong communities by enriching the quality of life for individuals and families in Oakland.
BUSINESS GOALS
Provide high quality, effective programs for children, youth, families, seniors and other adults through direct services, grant making, and close collaboration and coordination with other public and community based agencies.
Develop new resources and leverage existing resources to maintain and expand programs that promote social equity for Oakland residents.
Develop and support collaborations that improve community health and safety with an emphasis on violence prevention and community building.
Identify, plan and recommend proactive policy and programmatic responses to community needs and social issues that impact the health and well-being of Oakland residents.
Create opportunities for community engagement and education through volunteerism and involvement with Boards, Commissions and community groups.
Sustain the Department’s efficient fiscal and program operations and improve and enhance service accountability through expanded performance monitoring, evaluation and continuous quality improvement.
Foster staff development and acknowledgement.
PRIOR REDUCTIONS
Reduction in support for OUSD Academies has led to 100 fewer high school students annually participating in job training.
Expenditures by Fund
FY 2012-13 Midcycle
Budget
FY 2013-14 Proposed
Budget
FY 2014-15 Proposed
Budget
1010 General Purpose Fund (GPF) $4,912,556 $5,077,316 $5,150,220
1720 Comprehensive Clean-up - 60,000 60,000
1780 Kid's First Oakland Children's Fund 10,756,257 11,763,186 12,125,533
2102 Department of Agriculture 1,079,936 1,095,000 1,095,000
2103 HUD-ESG/SHP/HOPWA 6,041,278 6,331,930 6,331,131
2108 HUD-CDBG 1,049,771 919,243 954,269
2112 Department of Justice - (17,884) (17,884)
2114 Department of Labor 1,197,113 981,426 981,426
2120 Federal Action Agency 322,939 338,693 277,802
2128 Department of Health and Human Services 17,753,149 20,999,741 20,999,741
2138 California Department of Education 1,174,283 937,472 937,472
2159 State of California Other 549,761 310,002 310,001
2160 County of Alameda: Grants 413,835 431,262 431,262
2195 Workforce Investment Act 120,000 113,882 113,596
2213 Measure B: Paratransit - ACTIA 929,860 1,068,580 1,068,580
2251 Measure Y: Public Safety Act 6,423,451 6,601,959 6,711,570
2994 Social Services Grants 56,000 76,000 76,000
TOTAL $52,780,189 $57,087,808 $57,605,719
GPF Percent to Total Department 9.3% 8.9% 8.9%
GPF Percent to Citywide GPF Expenditures 1.2% 1.2% 1.1%
SUMMARY OF HISTORICAL EXPENDITURES AND PROPOSED BUDGET BY FUND
AUTHORIZED POSITIONS BY DIVISION
Division
FY 2012-13Midcycle
Budget FTE
FY 2013-14Proposed
BudgetFTE
FY 2014-15Proposed
BudgetFTE
Empowering Seniors & People with Disabilities 103.20 89.86 89.11
1010 - General Purpose Fund (GPF) 18.65 19.06 18.47
2114 - Department of Labor 63.35 52.85 52.85
2120 - Federal Action Agency 0.78 1.01 0.60
2128 - Department of Health and Human Services 12.10 9.60 9.60
2159 - State of California Other 1.62 0.94 1.19
2160 - County of Alameda: Grants 1.06 1.06 1.06
2195 - Workforce Investment Act 1.23 0.93 0.93
2213 - Measure B: Paratransit - ACTIA 4.41 4.41 4.41
Fostering Safe & Healthy Communities 18.28 16.61 16.11
1010 - General Purpose Fund (GPF) 7.73 6.81 6.81
2103 - HUD-ESG/SHP/HOPWA 0.81 0.78 0.78
2108 - HUD-CDBG 4.71 3.89 3.89
2112 - Department of Justice - 0.50 0.25
2128 - Department of Health and Human Services 4.00 4.00 4.00
2159 - State of California Other 1.00 0.60 0.35
2160 - County of Alameda: Grants 0.03 0.03 0.03
Measure Y-Prevention 6.65 8.15 8.40
2251 - Measure Y: Public Safety Act 2004 6.65 8.15 8.40
Oakland Fund for Children & Youth 6.41 6.21 6.21
1010 - General Purpose Fund (GPF) 0.51 0.31 0.31
1780 - Kid's First Oakland Children's Fund 5.90 5.90 5.90
Strengthening Children, Youth & Their Families 138.32 176.36 176.36
1010 - General Purpose Fund (GPF) 1.72 2.07 2.07
2102 - Department of Agriculture 6.50 6.50 6.50
2128 - Department of Health and Human Services 130.10 167.79 167.79
TOTAL 272.86 297.19 296.19
E - 48
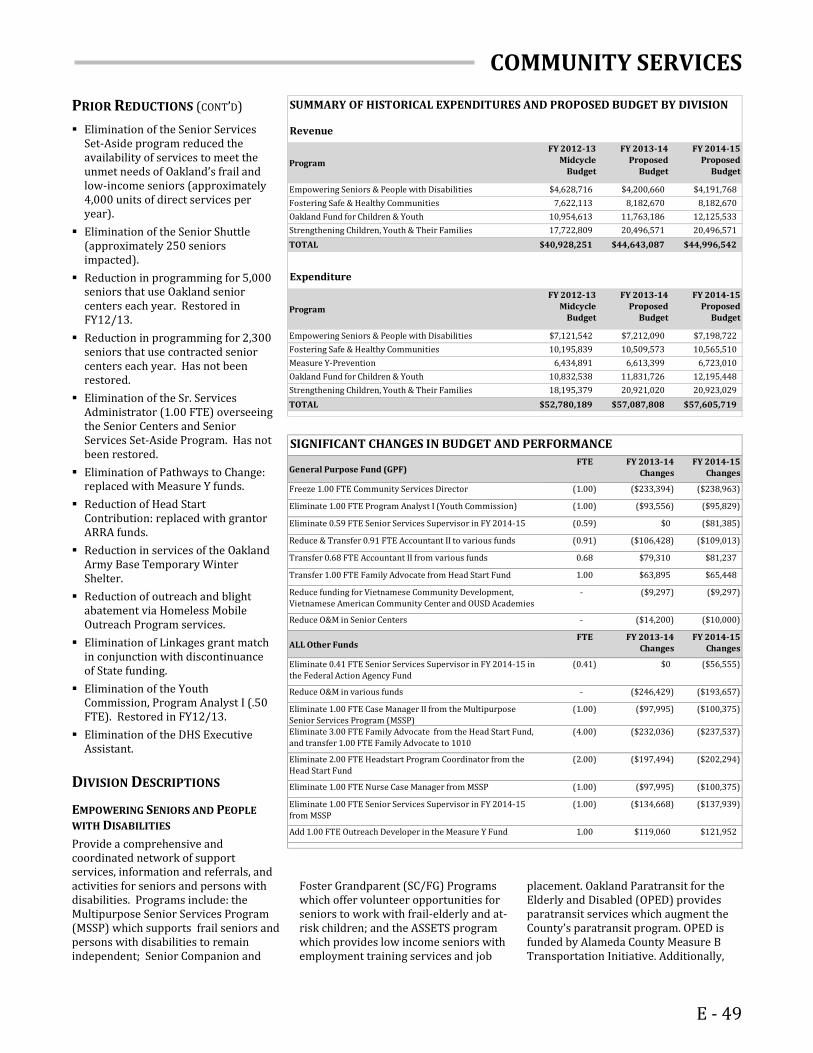
COMMUNITY SERVICES
PRIOR REDUCTIONS (CONT’D)
Elimination of the Senior Services Set-Aside program reduced the availability of services to meet the unmet needs of Oakland’s frail and low-income seniors (approximately 4,000 units of direct services per year).
Elimination of the Senior Shuttle (approximately 250 seniors impacted).
Reduction in programming for 5,000 seniors that use Oakland senior centers each year. Restored in FY12/13.
Reduction in programming for 2,300 seniors that use contracted senior centers each year. Has not been restored.
Elimination of the Sr. Services Administrator (1.00 FTE) overseeing the Senior Centers and Senior Services Set-Aside Program. Has not been restored.
Elimination of Pathways to Change: replaced with Measure Y funds.
Reduction of Head Start Contribution: replaced with grantor ARRA funds.
Reduction in services of the Oakland Army Base Temporary Winter Shelter.
Reduction of outreach and blight abatement via Homeless Mobile Outreach Program services.
Elimination of Linkages grant match in conjunction with discontinuance of State funding.
Elimination of the Youth Commission, Program Analyst I (.50 FTE). Restored in FY12/13.
Elimination of the DHS Executive Assistant.
DIVISION DESCRIPTIONS
EMPOWERING SENIORS AND PEOPLE
WITH DISABILITIES
Provide a comprehensive and coordinated network of support services, information and referrals, and
Revenue
Program
FY 2012-13 Midcycle
Budget
FY 2013-14 Proposed
Budget
FY 2014-15 Proposed
Budget
Empowering Seniors & People with Disabilities $4,628,716 $4,200,660 $4,191,768
Fostering Safe & Healthy Communities 7,622,113 8,182,670 8,182,670
Oakland Fund for Children & Youth 10,954,613 11,763,186 12,125,533
Strengthening Children, Youth & Their Families 17,722,809 20,496,571 20,496,571
TOTAL $40,928,251 $44,643,087 $44,996,542
Expenditure
Program
FY 2012-13 Midcycle
Budget
FY 2013-14 Proposed
Budget
FY 2014-15 Proposed
Budget
Empowering Seniors & People with Disabilities $7,121,542 $7,212,090 $7,198,722
Fostering Safe & Healthy Communities 10,195,839 10,509,573 10,565,510
Measure Y-Prevention 6,434,891 6,613,399 6,723,010
Oakland Fund for Children & Youth 10,832,538 11,831,726 12,195,448
Strengthening Children, Youth & Their Families 18,195,379 20,921,020 20,923,029
TOTAL $52,780,189 $57,087,808 $57,605,719
SUMMARY OF HISTORICAL EXPENDITURES AND PROPOSED BUDGET BY DIVISION
SIGNIFICANT CHANGES IN BUDGET AND PERFORMANCE
General Purpose Fund (GPF)FTE FY 2013-14
Changes
FY 2014-15
Changes
Freeze 1.00 FTE Community Services Director (1.00) ($233,394) ($238,963)
Eliminate 1.00 FTE Program Analyst I (Youth Commission) (1.00) ($93,556) ($95,829)
Eliminate 0.59 FTE Senior Services Supervisor in FY 2014-15 (0.59) $0 ($81,385)
Reduce & Transfer 0.91 FTE Accountant II to various funds (0.91) ($106,428) ($109,013)
Transfer 0.68 FTE Accountant II from various funds 0.68 $79,310 $81,237
Transfer 1.00 FTE Family Advocate from Head Start Fund 1.00 $63,895 $65,448
Reduce funding for Vietnamese Community Development,
Vietnamese American Community Center and OUSD Academies
- ($9,297) ($9,297)
Reduce O&M in Senior Centers - ($14,200) ($10,000)
ALL Other FundsFTE FY 2013-14
Changes
FY 2014-15
Changes
Eliminate 0.41 FTE Senior Services Supervisor in FY 2014-15 in
the Federal Action Agency Fund
(0.41) $0 ($56,555)
Reduce O&M in various funds - ($246,429) ($193,657)
Eliminate 1.00 FTE Case Manager II from the Multipurpose
Senior Services Program (MSSP)
(1.00) ($97,995) ($100,375)
Eliminate 3.00 FTE Family Advocate from the Head Start Fund,
and transfer 1.00 FTE Family Advocate to 1010
(4.00) ($232,036) ($237,537)
Eliminate 2.00 FTE Headstart Program Coordinator from the
Head Start Fund
(2.00) ($197,494) ($202,294)
Eliminate 1.00 FTE Nurse Case Manager from MSSP (1.00) ($97,995) ($100,375)
Eliminate 1.00 FTE Senior Services Supervisor in FY 2014-15
from MSSP
(1.00) ($134,668) ($137,939)
Add 1.00 FTE Outreach Developer in the Measure Y Fund 1.00 $119,060 $121,952
activities for seniors and persons with disabilities. Programs include: the Multipurpose Senior Services Program (MSSP) which supports frail seniors and persons with disabilities to remain independent; Senior Companion and
Foster Grandparent (SC/FG) Programs which offer volunteer opportunities for seniors to work with frail-elderly and at-risk children; and the ASSETS program which provides low income seniors with employment training services and job
placement. Oakland Paratransit for the Elderly and Disabled (OPED) provides paratransit services which augment the County’s paratransit program. OPED is funded by Alameda County Measure B Transportation Initiative. Additionally,
E - 49

COMMUNITY SERVICES
DIVISION DESCRIPTIONS
EMPOWERING SENIORS AND PEOPLE
WITH DISABILITIES (CONT’D)
City-sponsored Senior Centers offer culturally appropriate and accessible social, nutrition, education and wellness programming for seniors throughout the City. Rental of City-owned senior facilities.
FOSTERING SAFE AND HEALTHY
COMMUNITIES
Encompasses DHS services specifically designed to make residents safer and to support individuals and families in key areas such as housing and income supports that contribute to the overall well-being of the Oakland community. Included is A Safe Walk to School program which provides neighborhood monitors at select schools to ensure children travel safely to/from school; the Youth Commission gives youth the opportunity to build leadership skills
and participate in civic activities; Community Housing Services which serves people in Oakland who are homeless, hungry, HIV/AIDS positive, or living on extremely low incomes by providing food and hot meal programs, housing (both emergency and transitional), and support services. The Alameda County – Oakland Community Action Partnership (AC-OCAP) provides funding and staff support to programs designed to eliminate poverty in the community. The OUSD Academies program provides on-the-job work experience for high school students.
MEASURE Y-PREVENTION
Measure Y: the Violence Prevention and Public Safety Act of 2004 provides approximately $6 million annually for violence prevention programs to neighborhoods and youth and young adults most at risk for committing or being victims of violence. The Measure Y funds a variety of services in 4 key areas: 1) outreach, case management, employment and other services for youth who are chronically truant, dropped out or on probation; 2) special services for families experiencing domestic violence and youth exposed to violence including sexually exploited minors; 3) Diversion and reentry services and employment for
youth and young adults on probation and parole; and 4) School-based services including case management, mental health, violence prevention curriculum and peer conflict mediation. The fund also supports special initiatives that address emerging issues such as gang prevention and intervention.
OAKLAND FUND FOR CHILDREN AND
YOUTH
The Oakland Fund for Children & Youth (OFCY) fosters the development of young people ages 0 to 20 by providing grant funds for services and programs that improve Committee provides policy recommendations to the City Counciland oversees strategic planning, evaluation and grant-making through a competitive proposal process. A City Charter amendment (1996 Measure K – Kids First! voter initiative) established OFCY as a mandated set aside of funds calculated at 2.5% of the General Purpose revenues annually with 92% of the funds allocated to private non-profit and public agencies “to help young people become healthy, productive, and honorable adults,” and 8% for administration and evaluation of OFCY. . In November 2008, Oakland voters passed Measure OO, the Kids First 2 initiative, which took effect July 1, 2009. Measure OO changed the required
funding amount from 2.5% of unrestricted General Fund revenues to 1.5% (July 2009 – June 2011) and 2.5% (after July 2011) of revenues, with the funding coming solely from the unrestricted General Fund. Measure D modified Measure OO, which requires a 3% percent set-aside of city unrestricted general fund revenues for children's programs. Legislation requires completion of an OFCY Strategic Plan every four years and a comprehensive evaluation of OFCY annually.
STRENGTHENING CHILDREN, YOUTH AND
THEIR FAMILIES
Provides services that improve the health, development and quality of life for children, youth and their families. Head Start, Early Head Start and Summer Food Service programs offer opportunities for comprehensive early child development and education; parenting support and parent/child interactive literacy activities; healthy nutritious lunches for low income school-aged children during the summer months; and other ancillary services to Food Program, and must comply with applicable federal and state regulations regarding funded activities and facilities.
E - 50

OAKLAND PUBLIC LIBRARY
OAKLAND PUBLIC LIBRARY
MISSION STATEMENT
The Oakland Public Library informs, inspires and delights our diverse community as a resource for information, knowledge, and artistic and literary expression, providing the best in traditional services, new technologies and innovative programs.
BUSINESS GOALS
To increase circulation and in-library usage of library materials and services by providing relevant and popular collections (e-books, best sellers, DVD, etc.) and superior customer service through a well-trained and diverse staff.
To enhance services and programs for children and teens by offering story times for preschool children to encourage early literacy; and teen programming that expands their expectations of libraries through arts, gaming , civic engagement and volunteer opportunities that help develop leadership skills and workplace preparedness.
To increase the public’s ability to access statewide collections by fuller integration of Link+, a new service that makes over 60 libraries' collections, including academic and public, available to Oakland residents for borrowing.
Expenditures by Fund
FY 2012-13 Midcycle
Budget
FY 2013-14 Proposed
Budget
FY 2014-15 Proposed
Budget
1010 General Purpose Fund (GPF) $9,059,989 $9,060,667 $9,060,466
2148 California Library Services 65,421 64,654 64,654
2163 Metro Transportation Com: Program Grant 68,713 71,924 71,924
2241 Measure Q-Library Services Retention & Enhancement 15,044,503 16,593,578 17,129,566
2242 Measure Q Reserve- Library Services Retention & Enhancement
- - 715,050
2993 Library Grants 250,000 250,000 250,000
7540 Oakland Public Library Trust 110,879 110,879 110,879
TOTAL $24,599,505 $26,151,702 $27,402,539
GPF Percent to Total Department 36.8% 34.6% 33.1%
GPF Percent to Citywide GPF Expenditures 3.7% 3.9% 3.7%
SUMMARY OF HISTORICAL EXPENDITURES AND PROPOSED BUDGET BY FUND
AUTHORIZED POSITIONS BY PROGRAM
Program
FY 2012-13Midcycle
Budget FTE
FY 2013-14Proposed
BudgetFTE
FY 2014-15Proposed
BudgetFTE
African American Museum & Library at Oakland 6.40 4.90 4.90
1010 - General Purpose Fund (GPF) 1.00 1.00 1.00
2241 - Measure Q-Library Services Retention & Enhancement 5.40 3.90 3.90
Branch Library Services 98.38 96.86 96.86
1010 - General Purpose Fund (GPF) 36.45 28.45 28.45
2163 - Metro Transportation Com: Program Grant 0.27 0.27 0.27
2241 - Measure Q-Library Services Retention & Enhancement 61.66 68.14 68.14
Library System Wide Support 59.41 66.05 66.05
1010 - General Purpose Fund (GPF) 24.07 28.37 27.37
2241 - Measure Q-Library Services Retention & Enhancement 35.34 37.68 38.68
Literacy Programs 5.08 5.08 5.08
1010 - General Purpose Fund (GPF) 1.00 - -
2148 - California Library Services 1.08 1.08 1.08
2241 - Measure Q-Library Services Retention & Enhancement 3.00 4.00 4.00
Main Library Services 45.74 42.90 42.90
1010 - General Purpose Fund (GPF) 12.20 9.79 8.79
2241 - Measure Q-Library Services Retention & Enhancement 33.54 33.11 34.11
TOTAL 215.01 215.79 215.79
To increase the public’s access to our neighborhood branches by implementing a change in schedules.
To increase access to the Tool Lending Library by expanding from 4-day service to 5-day service.
To develop a public relations strategic plan that markets and brands the Oakland Public Library through a continuously, connected campaign that publicizes the Library’s vast resources to all members of the community.
To provide Oakland residents access to materials and collections of the African American cultural and historical experience in Northern California, along with programs, lectures, films, and exhibits that speak to the social, historical, and political conditions of the African American Diaspora by operating the African American Museum and Library at Oakland (AAMLO).
To further develop new Models of Service (e.g. self-check, online fines payment, floating collections) for the Oakland Public Library that will allow
services to be delivered to the public in a more efficient, customer-friendly manner.
To develop Service Models that allow more of our library staff to perform outreach and develop collaborative partnerships with schools, community organizations and agencies to promote and provide library services to groups unfamiliar with library resources.
To increase the level of support to the Oakland Public Library from volunteers and donors through outreach and stewardship activities.
E - 51

OAKLAND PUBLIC LIBRARY
PRIOR REDUCTIONS
Since FY 2007-09 the Library has reduced Branch Library days from 6 days to 5 days. The Main Library continues to operate 7 days per week. The reduced hours (and city wide furlough shutdown days) have impacted the public’s ability to gather for programs, after school activities, teens and pre-teens gathering time, and increased usage of computers with fewer days. As well, elimination of Bookmobile service and reductions in Second Start Adult Literacy has impacted outreach services to the community provided by OPL.
PROGRAM DESCRIPTIONS
AFRICAN AMERICAN MUSEUM &
LIBRARY AT OAKLAND (AAMLO)
This program represents the public services provided at AAMLO through collections and archives on the culture and history of African Americans in Northern California and the Bay Area.
BRANCH LIBRARY SERVICES
This program represents the public services provided at the 16 Branch Libraries located throughout Oakland, and Branch Administration.
LIBRARY SYSTEM-WIDE SUPPORT
This program represents the system-wide services provided by the Finance and Administrative Unit, Teen Services, Children’s Services, Community Relations, Materials Unit, Computer Services Unit, and the Acquisitions and Cataloging Unit.
LITERACY PROGRAMS
This program represents the Literacy services provided by the Second Start Literacy Center.
MAIN LIBRARY SERVICES
This program represents the public services provided at the Main Library. These include General Reference services, Main Library Administration, the Oakland History Room, Art/History and Literature, Magazines and Newspapers, Science, Business and Sociology, Children’s Room, Computer Center, etc.
Revenue
Program
FY 2012-13 Midcycle
Budget
FY 2013-14 Proposed
Budget
FY 2014-15 Proposed
Budget
Branch Library Services $72,719 $72,719 $72,719
Library System Wide Support 16,587,487 17,944,048 19,210,162
Literacy Programs 68,392 68,392 68,392
TOTAL $16,728,598 $18,085,159 $19,351,273
Expenditure
Program
FY 2012-13 Midcycle
Budget
FY 2013-14 Proposed
Budget
FY 2014-15 Proposed
Budget
African American Museum & Library at Oakland $938,341 $874,462 $902,599
Branch Library Services 9,882,143 10,329,433 10,571,352
Library System Wide Support 9,053,435 10,044,253 10,892,287
Literacy Programs 370,155 397,846 405,503
Main Library Services 4,355,431 4,505,708 4,630,798
TOTAL $24,599,505 $26,151,702 $27,402,539
SUMMARY OF HISTORICAL EXPENDITURES AND PROPOSED BUDGET BY PROGRAM
SIGNIFICANT CHANGES IN BUDGET AND PERFORMANCE
General Purpose Fund (GPF)FTE FY 2013-14
ChangesFY 2014-15
Changes
Transfer 3.00 FTE Librarian II's to fund 2241. (3.00) ($363,424) ($372,037)
Transfer 1.00 FTE Senior Librarian to fund 2241 in FY2014-15. (1.00) - ($137,777)
Transfer 1.00 FTE Librarian Assistant, Senior to fund 2241 in FY2014-15. (1.00) - ($114,383)
Transfer 3.00 FTE Librarian Supervisors to fund 2241. (3.00) ($447,136) ($457,765)
Transfer 3.00 FTE Library Assistant and 1.0 FTE Office Assistant I to fund 2241.
(4.00) ($337,399) ($345,345)
ALL Other FundsFTE FY 2013-14
ChangesFY 2014-15
Changes
Transfer 3.00 FTE Librarian II's to fund 2241 from 1010 3.00 $363,424 $372,037
Transfer 1.00 FTE Senior Librarian to fund 2241 in FY2014-15 from 1010
1.00 - $137,777
Transfer 1.00 FTE Librarian Assistant, Senior to fund 2241 in FY2014-15 from 1010
1.00 - $114,383
Transfer 3.00 FTE Librarian Supervisors to fund 2241 from 1010 3.00 $447,136 $457,765
Transfer 3.00 FTE Library Assistant and 1.0 FTE Office Assistant I to fund 2241 from 1010
4.00 $337,399 $345,345
E - 52
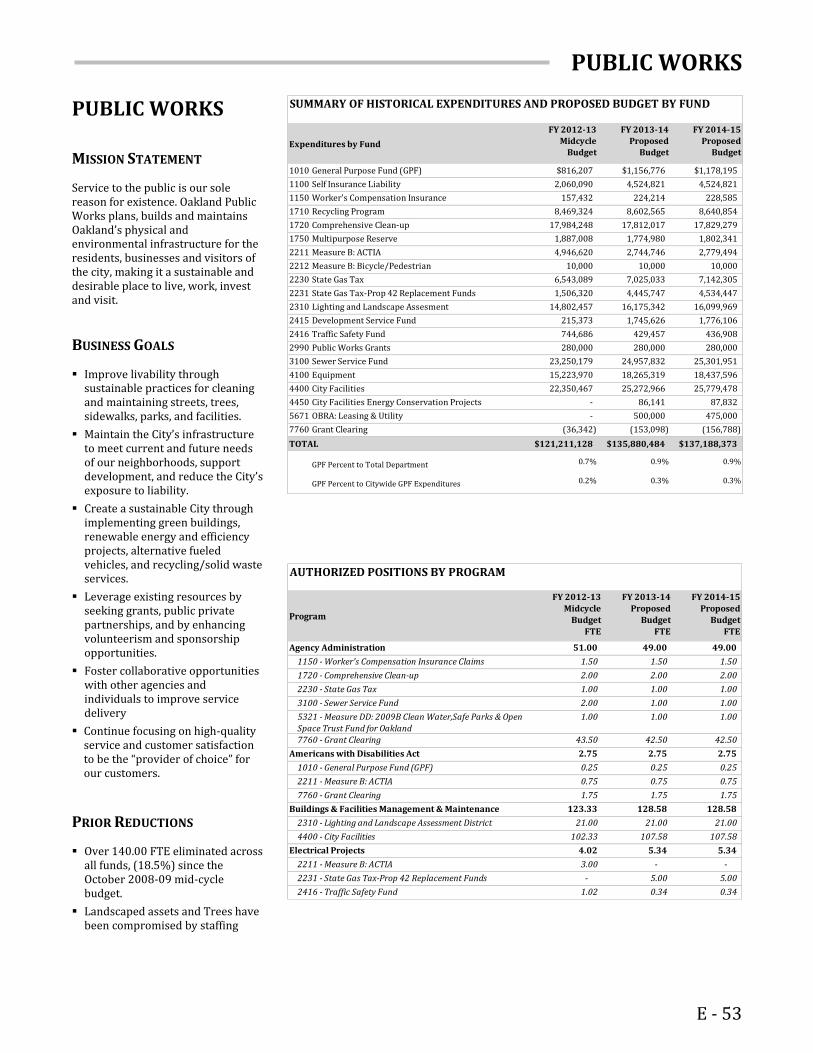
PUBLIC WORKS
PUBLIC WORKS
MISSION STATEMENT
Service to the public is our sole reason for existence. Oakland Public Works plans, builds and maintains Oakland’s physical and environmental infrastructure for the residents, businesses and visitors of the city, making it a sustainable and desirable place to live, work, invest and visit.
BUSINESS GOALS
Improve livability through sustainable practices for cleaning and maintaining streets, trees, sidewalks, parks, and facilities.
Maintain the City’s infrastructure to meet current and future needs of our neighborhoods, support development, and reduce the City’s exposure to liability.
Create a sustainable City through implementing green buildings, renewable energy and efficiency projects, alternative fueled vehicles, and recycling/solid waste services.
Leverage existing resources by seeking grants, public private partnerships, and by enhancing volunteerism and sponsorship opportunities.
Foster collaborative opportunities with other agencies and individuals to improve service delivery
Continue focusing on high-quality service and customer satisfaction to be the “provider of choice” for our customers.
PRIOR REDUCTIONS
Over 140.00 FTE eliminated across all funds, (18.5%) since the October 2008-09 mid-cycle budget.
Landscaped assets and Trees have been compromised by staffing
Expenditures by Fund
FY 2012-13
Midcycle
Budget
FY 2013-14
Proposed
Budget
FY 2014-15
Proposed
Budget
1010 General Purpose Fund (GPF) $816,207 $1,156,776 $1,178,195
1100 Self Insurance Liability 2,060,090 4,524,821 4,524,821
1150 Worker's Compensation Insurance 157,432 224,214 228,585
1710 Recycling Program 8,469,324 8,602,565 8,640,854
1720 Comprehensive Clean-up 17,984,248 17,812,017 17,829,279
1750 Multipurpose Reserve 1,887,008 1,774,980 1,802,341
2211 Measure B: ACTIA 4,946,620 2,744,746 2,779,494
2212 Measure B: Bicycle/Pedestrian 10,000 10,000 10,000
2230 State Gas Tax 6,543,089 7,025,033 7,142,305
2231 State Gas Tax-Prop 42 Replacement Funds 1,506,320 4,445,747 4,534,447
2310 Lighting and Landscape Assesment 14,802,457 16,175,342 16,099,969
2415 Development Service Fund 215,373 1,745,626 1,776,106
2416 Traffic Safety Fund 744,686 429,457 436,908
2990 Public Works Grants 280,000 280,000 280,000
3100 Sewer Service Fund 23,250,179 24,957,832 25,301,951
4100 Equipment 15,223,970 18,265,319 18,437,596
4400 City Facilities 22,350,467 25,272,966 25,779,478
4450 City Facilities Energy Conservation Projects - 86,141 87,832
5671 OBRA: Leasing & Utility - 500,000 475,000
7760 Grant Clearing (36,342) (153,098) (156,788)
TOTAL $121,211,128 $135,880,484 $137,188,373
GPF Percent to Total Department 0.7% 0.9% 0.9%
GPF Percent to Citywide GPF Expenditures 0.2% 0.3% 0.3%
SUMMARY OF HISTORICAL EXPENDITURES AND PROPOSED BUDGET BY FUND
AUTHORIZED POSITIONS BY PROGRAM (CONT'D)
Program
FY 2012-13Midcycle
Budget FTE
FY 2013-14Proposed
BudgetFTE
FY 2014-15Proposed
BudgetFTE
Agency Administration 51.00 49.00 49.00
1150 - Worker's Compensation Insurance Claims 1.50 1.50 1.50
1720 - Comprehensive Clean-up 2.00 2.00 2.00
2230 - State Gas Tax 1.00 1.00 1.00
3100 - Sewer Service Fund 2.00 1.00 1.00
5321 - Measure DD: 2009B Clean Water,Safe Parks & Open Space Trust Fund for Oakland
1.00 1.00 1.00
7760 - Grant Clearing 43.50 42.50 42.50
Americans with Disabilities Act 2.75 2.75 2.75
1010 - General Purpose Fund (GPF) 0.25 0.25 0.25
2211 - Measure B: ACTIA 0.75 0.75 0.75
7760 - Grant Clearing 1.75 1.75 1.75
Buildings & Facilities Management & Maintenance 123.33 128.58 128.58
2310 - Lighting and Landscape Assessment District 21.00 21.00 21.00
4400 - City Facilities 102.33 107.58 107.58
Electrical Projects 4.02 5.34 5.34
2211 - Measure B: ACTIA 3.00 - -
2231 - State Gas Tax-Prop 42 Replacement Funds - 5.00 5.00
2416 - Traffic Safety Fund 1.02 0.34 0.34
E - 53

PUBLIC WORKS
PRIOR REDUCTIONS (CONT’D)
decreases, resulting in increased blight, weeds, litter and a generally unkempt appearance. Tree maintenance is limited to hazardous response only.
The Department currently maintains 805 miles of City streets and major road repairs have been postponed until funding is available.
PROGRAM DESCRIPTIONS
AGENCY ADMINISTRATION
Agency Administration supports the Public Works Agency’s core functions by providing management, administration, fiscal services, human resources support, business and information analysis, safety program, public information and operation of the Public Works Call Center.
AMERICANS WITH DISABILITIES ACT
ADA Programs provides comprehensive access compliance activities to City agencies as well as the disability, business and nonprofit communities, as mandated by Title II of the Americans with Disabilities Act. ADA divides staffing resources between physical and programmatic responsibilities. We support multimillion dollar infrastructure improvement programs, major settlement agreements, and citywide accommodation efforts. We staff the Commission on Persons with Disabilities and Commission on Aging.
BUILDINGS AND FACILITIES
MANAGEMENT AND MAINTENANCE
The Public Works Agency maintains approximately 300 City-owned buildings (estimated 2.5 million square feet) ranging in size from Police Administration Building (147,900 sq. ft) to the FROG Park restroom (40 sq. ft.). In 2006, an assessment of 62 representative buildings showed that the majority were in average condition but that the overall building conditions continue to decline due to chronic
AUTHORIZED POSITIONS BY PROGRAM (CONT'D)
Program
FY 2012-13
Midcycle
Budget
FTE
FY 2013-14
Proposed
Budget
FTE
FY 2014-15
Proposed
Budget
FTE
Engineering Design 58.00 50.55 50.40
2211 - Measure B: ACTIA 4.15 1.55 1.55
2230 - State Gas Tax - 0.04
2415 - Development Service Fund 1.00 10.00 10.00
3100 - Sewer Service Fund 20.30 10.40 10.40
7760 - Grant Clearing 32.55 28.57 28.45
Fleet & Equipment Management & Maintenance 53.00 56.00 56.00
4100 - Equipment 53.00 56.00 56.00
Keep Oakland Clean & Beautiful 73.50 75.50 75.50
1720 - Comprehensive Clean-up 72.30 74.30 74.30
3100 - Sewer Service Fund 1.20 1.20 1.20
Parking Management – Meter Repair 7.00 8.00 8.00
1010 - General Purpose Fund (GPF) 7.00 8.00 8.00
Parks, Grounds & Medians 68.00 69.00 69.00
1720 - Comprehensive Clean-up 29.00 29.00 29.00
2310 - Lighting and Landscape Assessment District 39.00 39.00 39.00
4400 - City Facilities - 1.00 1.00
Project Delivery 46.00 44.10 44.10
2211 - Measure B: ACTIA 0.60 0.60 0.60
3100 - Sewer Service Fund 3.50 3.40 3.40
4400 - City Facilities 0.50 0.50 0.50
5321 - Measure DD: 2009B Clean Water,Safe Parks & Open
Space Trust Fund for Oakland
1.00 1.00 1.00
7760 - Grant Clearing 40.40 38.60 38.60
Recycling & Solid Waste 9.50 9.50 9.50
1710 - Recycling Program 8.00 8.00 8.00
7760 - Grant Clearing 1.50 1.50 1.50
Sanitary Sewer Management & Maintenance 66.50 64.50 64.50
3100 - Sewer Service Fund 66.50 64.50 64.50
Street & Sidewalk Management & Maintenance 40.00 41.00 41.00
2230 - State Gas Tax 11.90 11.90 11.90
2231 - State Gas Tax-Prop 42 Replacement Funds 15.18 15.84 15.84
3100 - Sewer Service Fund 12.92 13.26 13.26
Street Light Management & Maintenance 8.99 7.66 7.66
2211 - Measure B: ACTIA 7.50 - -
2230 - State Gas Tax 1.49 1.16 1.16
2231 - State Gas Tax-Prop 42 Replacement Funds - 6.50 6.50
Sustainable Oakland Program 14.50 14.50 14.50
1710 - Recycling Program 3.83 3.83 3.83
1720 - Comprehensive Clean-up 3.00 3.00 3.00
2990 - Public Works Grants 0.47 0.47 0.47
3100 - Sewer Service Fund 1.40 1.40 1.40
4400 - City Facilities 2.60 2.60 2.60
4450 - City Facilities Energy Conservation Projects - 0.50 0.50
7760 - Grant Clearing 3.20 2.70 2.70
Traffic Signal Management & Maintenance 7.99 8.00 8.00
2211 - Measure B: ACTIA 7.49 - -
2230 - State Gas Tax 0.50 0.83 0.83
2231 - State Gas Tax-Prop 42 Replacement Funds - 6.83 6.83
2416 - Traffic Safety Fund - 0.34 0.34
Traffic Signs & Markings Management & Maintenance 18.00 18.00 18.00
2230 - State Gas Tax 17.00 17.00 17.00
2416 - Traffic Safety Fund 1.00 1.00 1.00
Transportation & Pedestrian Safety 25.00 25.00 25.00
1750 - Multipurpose Reserve 8.20 8.20 8.20
2211 - Measure B: ACTIA 4.70 5.20 5.20
2416 - Traffic Safety Fund 1.70 0.20 0.20
7760 - Grant Clearing 10.40 11.40 11.40
E - 54

PUBLIC WORKS
PROGRAM DESCRIPTIONS
BUILDINGS AND FACILITIES
MANAGEMENT AND MAINTENANCE
(CONT’D)
and constant vandalism, heavy patron usage, and a lack of preventive maintenance and capital repairs. There is currently no funding for capital repairs.
ELECTRICAL PROJECTS
Electrical staff provides design services and electrical engineering review for project development and construction. Utility coordination, planning, design and facilitation of assessment engineering are provided for the utility undergrounding program.
ENGINEERING DESIGN
Engineering Design facilitates program and project management, engineering and inspection services for City activities including sanitary sewer rehabilitation, major street improvement, pavement rehabilitation, bridge rehabilitation, storm drainage, sidewalks and utilities. This program also provides project management services on a wide variety of technical projects in support of other City departments.
FLEET AND EQUIPMENT
MANAGEMENT AND MAINTENANCE
The City of Oakland owns and operates 1,489 vehicles and major pieces of equipment. The City’s fleet has been reduced by 341 vehicles in in the last ten years. A full-time City staff of 53 mechanics, service workers, technicians, and administrative staff keep the City’s aging fleet at an 89% availability rate. The average fleet vehicle is 10.7 years old which is more than twice the 5.2-year replacement age recommended by the National Association of Fleet
AUTHORIZED POSITIONS BY PROGRAM (CONT'D)
Program
FY 2012-13Midcycle
Budget FTE
FY 2013-14Proposed
BudgetFTE
FY 2014-15Proposed
BudgetFTE
Transportation Planning & Funding - 8.38 8.50
2211 - Measure B: ACTIA - 2.50 2.50
2415 - Development Service Fund - 1.00 1.00
7760 - Grant Clearing - 4.88 5.00
Tree Management & Maintenance 15.00 15.00 15.00
2310 - Lighting and Landscape Assessment District 15.00 15.00 15.00
Watershed & Storm Drain Management & Maintenance 30.50 31.46 31.50
2990 - Public Works Grants 1.00 1.00 1.00 3100 - Sewer Service Fund 26.10 27.06 27.10
5321 - Measure DD: 2009B Clean Water,Safe Parks & Open Space Trust Fund for Oakland
2.00 2.00 2.00
7760 - Grant Clearing 1.40 1.40 1.40
TOTAL 722.58 731.83 731.83
SIGNIFICANT CHANGES IN BUDGET AND PERFORMANCE (CONT'D)
General Purpose Fund (GPF)FTE FY 2013-14
Changes
FY 2014-15
Changes
None
ALL Other FundsFTE FY 2013-14
Changes
FY 2014-15
Changes
Add 1.00 FTE Painter in the Facilities Fund 1.00 $124,182 $129,650
Add 2.00 FTE Custodians in the Facilities Fund 2.00 $139,723 $142,451
Add 2.00 FTE Painters and O&M in the Comprehensive Clean-up
Fund for graffitti abatement team
2.00 $551,000 $295,000
Add 4.00 FTE Maintenance Mechanics in the Facilities Fund 4.00 $301,693 $307,503
Add fundng for Minor CIP in the Facilities Fund - $1,000,000 $1,250,000
Add O&M for new facilities maintenance in the Facilities Fund - $248,174 $235,639
Eliminate 0.25 FTE Stationary Engineer in the Facilities Fund
(4400)
(0.25) ($27,187) ($27,849)
Eliminate 0.50 FTE Maintenance Mechanic, PPT in the Facilities
Fund
(0.50) ($52,713) ($53,748)
Eliminate 1.00 FTE Clean Community Supervisor in the
Comprehensive Clean-up Fund
(1.00) ($143,097) ($146,471)
Eliminate 1.00 FTE Recycling Specialist in the Recycling Fund
(partially funded by projects)
(1.00) ($102,901) ($105,401)
Eliminate O&M to off-set cost of positions & O&M added for
maintaining new facilities notpreviously funded
- ($890,487) ($890,487)
LED Lighting Conversion Lease Payment in the Landscaping &
Lighting Assesment District Fund
- $1,647,206 $1,647,206
LED Lighting Conversion Energy utility savings from lighting
conversion in the Landscaping & Lighting Assesment District
Fund
- ($1,110,185) ($1,480,247)
Transfer Dept of Infrastructure & Operations group from the
Measure B Fund (2211) to the State Gas Tax Fund (2231)
(17.26) ($2,032,462) ($2,128,202)
Transfer Dept of Infrastructure & Operations group to the State
Gas Tax Fund (2231) from the Measure B Fund (2211)
17.26 $2,032,462 $2,128,202
Administrators (NAFA). Currently, over 55% of City vehicles are over the NAFA recommended replacement age.
The City can have a better performing fleet and spend less money overall by making capital investments in newer
equipment. The fleet should be smaller, newer and require less maintenance.
KEEP OAKLAND CLEAN AND BEAUTIFUL
The Keep Oakland Clean and Beautiful program maintains and enhances the cleanliness, health, and appearance of
City streets and neighborhoods. Activities include (annually) response to 13,000 complaints for removal of illegal dumping; abatement of 285 homeless encampments; removal of 800,000 sq. ft. of graffiti; support for volunteer cleanup and beautification events; and special
E - 55

PUBLIC WORKS
PROGRAM DESCRIPTIONS
KEEP OAKLAND CLEAN AND
BEAUTIFUL (CONT’D)
events support (Art & Soul, Holiday Parade, Street Fairs, etc.); and street cleaning of 492 controlled routes monthly.
PARKING MANAGEMENT – METER
REPAIR
Oakland has a total of about 7,500 parking spaces. It consists of about (1) 4,000 single parking meter spaces; and (2) 500 multi-space parking meters that control about 2,500 parking spaces. Meters are planned for upgrade to utilize modern technology. Revenue generated from citations goes directly to the general purpose fund.
PARKS, GROUNDS AND MEDIANS
Oakland has 134 parks and public spaces. This includes two region-serving parks, nine community parks, 53 neighborhood parks, 15 special use parks, 26 athletic fields, plus many mini-parks, linear parks, and public grounds. There are another 1,055 acres of Resource Conservation Area (open space) primarily in the Oakland hills. Approximately 100 landscaped medians and streetscapes are also included in the City's park maintenance responsibility along with grounds at City facilities and surface parking lots.
New and renovated parks and plans are being developed primarily funded by voter-supported Measure DD (2002 Oakland Trust for Clean Water & Safe Parks), Measure WW (2008 Preserve Open Space for Recreation and Wildlife Habitat), State Park Bond Funds (2002 California Clean Water, Clean Air, Safe Neighborhood Parks, and Coastal Protection Act) and Redevelopment funds (still funding projects in process). Bonds and former Redevelopment funds are restricted to supporting the creation of a park or other facility, and are not available to fund staff or materials for ongoing maintenance. No funds have been budgeted to maintain these newly constructed parks.
Revenue
Program
FY 2012-13
Midcycle
Budget
FY 2013-14
Proposed
Budget
FY 2014-15
Proposed
Budget
Buildings & Facilities Management & Maintenance $23,178,037 $26,482,472 $27,899,929
Engineering Design 2,508,000 3,685,484 7,562,087
Fleet & Equipment Management & Maintenance 17,186,928 19,734,029 20,029,982
Keep Oakland Clean & Beautiful 18,696,349 17,810,196 17,886,819
Project Delivery 129,200 188,561 129,200
Recycling & Solid Waste 9,316,334 9,167,973 9,216,848
Safety & Liability 1,560,060 3,524,791 3,524,791
Sanitary Sewer Management & Maintenance 55,657,355 53,010,600 53,173,727
Street & Sidewalk Management & Maintenance 6,637,535 11,461,277 11,602,990
Street Light Management & Maintenance 123,350 1,585,850 1,585,850
Sustainable Oakland Program 191,495 191,495 191,495
Traffic Signal Management & Maintenance 123,350 123,350 123,350
Traffic Signs & Markings Management & Maintenance 17,500 17,000 17,000
Transportation & Pedestrian Safety 20,501,628 17,032,899 16,638,742
Transportation Planning & Funding - 1,660,000 1,103,350
Tree Management & Maintenance 17,500 17,500 17,500
Watershed & Storm Drain Management & Maintenance 210,000 210,000 210,000
TOTAL $156,054,621 $165,903,477 $170,913,660
Expenditure
Program
FY 2012-13
Midcycle
Budget
FY 2013-14
Proposed
Budget
FY 2014-15
Proposed
Budget
Agency Administration ($2,294,532) ($3,125,780) ($3,172,211)
Americans with Disabilities Act 436,597 547,655 555,875
Buildings & Facilities Management & Maintenance 23,551,223 26,446,358 26,979,418
Electrical Projects 1,000,097 1,079,026 1,102,905
Engineering Design 6,341,726 6,636,640 6,704,137
Fleet & Equipment Management & Maintenance 15,030,878 17,811,294 17,983,571
Keep Oakland Clean & Beautiful 14,819,674 13,999,577 14,029,219
Parking Management – Meter Repair 795,149 1,127,013 1,147,872
Parks, Grounds & Medians 8,608,450 9,078,427 9,246,942
Project Delivery 2,623,761 2,986,332 2,971,394
Recycling & Solid Waste 7,984,430 8,085,098 8,116,744
Safety & Liability 3,620,150 8,049,612 8,049,612
Sanitary Sewer Management & Maintenance 10,515,168 11,203,590 11,402,660
Street & Sidewalk Management & Maintenance 5,944,854 6,802,215 6,938,227
Street Light Management & Maintenance 4,837,954 5,026,621 4,748,446
Sustainable Oakland Program 2,173,481 2,903,888 2,908,473
Traffic Signal Management & Maintenance 1,723,463 1,695,759 1,723,992
Traffic Signs & Markings Management & Maintenance 2,863,360 3,008,207 3,056,157
Transportation & Pedestrian Safety 3,654,799 $3,699,404 $3,761,487
Transportation Planning & Funding - $1,227,793 $1,230,886
Tree Management & Maintenance 2,497,697 $2,855,246 $2,906,054
Watershed & Storm Drain Management & Maintenance 4,482,749 4,736,509 4,796,513
TOTAL $121,211,128 $135,880,484 $137,188,373
SUMMARY OF HISTORICAL EXPENDITURES AND PROPOSED BUDGET BY PROGRAM
E - 56

PUBLIC WORKS
PROGRAM DESCRIPTIONS
PROJECT DELIVERY
Project Delivery manages and implements capital improvement projects in a professional, comprehensive, efficient, and cost effective manner. These projects serve the community and city employees in the forms of new facilities, expanded facilities, increased comfort, safety, and modernization of facilities, improved access for the disabled, improved storm and sewer services and long-term maintenance, street beautification, and improved traffic and pedestrian safety. The program provides long-term planning for facility and park assets.
RECYCLING AND SOLID WASTE
The Recycling and Solid Waste Disposal Program manages the City’s franchised solid waste, organics and recycling collection services for 161,000 homes, which include weekly collection of recyclables, yard
RECYCLING AND SOLID WASTE
(CONT’D)
trimmings and food scraps, and garbage. The Program oversees garbage and recycling collection services for 5,600 businesses, and City facility recycling improvements.
The Program is currently engaged in procurement of Zero Waste Services that will replace existing agreements for citywide solid waste and recycling services, beginning July 2015. The Program supports and ensures the City’s compliance with state and local mandatory recycling requirements.
The Program ensures the City’s compliance with the State requirements of diverting a minimum 50 percent of solid waste from landfill disposal, works to further reduce the waste disposed to 75 percent consistent with city, county and state policy goals, and to achieve the City goal of Zero Waste by 2020.
Activities include oversight of the implementation of the Construction and Demolition Debris Waste Reduction and Recycling Ordinance, and participation in planning and development of sustainability initiatives. This program also provides the Recycling Hotline 238-SAVE service, and education and public
information in support of all its activities.
SAFETY AND LIABILITY
Serves all Public Works Agency employees and aggressively addresses and improves issues of employee safety and training. Reduces workers compensation claims, increases the number of employees returning to work, and decreasing the amount of exposure and liability to the city. Activities within the program include training in sound safety and health practices, developing and enforcing safety and health rules, and investigating every accident promptly and thoroughly to determine cause and
implement proper measures to prevent recurrence. This program works closely with the City Attorney’s Office, the City’s Risk Management Division and the third party administrator.
SANITARY SEWER MANAGEMENT AND
MAINTENANCE
The City of Oakland has 919 miles of City-maintained sanitary sewer pipes, seven pump stations, and over 27,000 manholes and structures. Most of Oakland’s sewer system is 60 to 70 years old. During storm events, sewer flows are significantly increased due to infiltration and inflow (I/I) of stormwater into the sanitary sewer
E - 57

PUBLIC WORKS
PROGRAM DESCRIPTIONS
SANITARY SEWER MANAGEMENT AND
MAINTENANCE (CONT’D)
system. The Sewer Service Charge that is collected from all properties is now adequate to cover the operating and capital expenses of the program. The sanitary sewer collection system is a network of pipes, manholes, clean-outs, pump stations, and other structures used to collect all wastewater and transport it to the East Bay Municipal Utility (EBMUD) interceptor and treatment plant. The City of Oakland sanitary sewer system is a collection system only. Sewage treatment and disposal occurs at the EBMUD Facility near the Bay Bridge area of West Oakland.
Conditions such as ground movement, tree root intrusion, quality of original pipe material, and other factors can significantly decrease the serviceability of sewer pipes and manholes. In 1987, a long-term capital improvement program was initiated to rehabilitate sewer lines that contributed to wet weather overflows. In 2010, the City started a two-year flow metering and modeling project to evaluate system capacity and plan for the next long-term capital improvements, with an objective to improve pipe conditions and reduce wet-weather flows. It is anticipated that the current level of investment in capital improvements will need to be sustained in order to stay in compliance with regulatory requirements.
STREET AND SIDEWALK MANAGEMENT
AND MAINTENANCE
The City of Oakland has 806 miles of City-maintained streets. Buses use 150 miles of these streets. Bike facilities are designated on 200 miles of streets. The pavement condition is rated by a “Pavement Condition Index” (PCI), created by the Metropolitan Transportation Commission (MTC) which must be used by the City to be eligible for federal, state, and county funds. Oakland is on an 85-year repaving schedule, which means a street that is repaved today won’t be repaved again in 85 years. Maintaining the existing pavement condition on Oakland’s streets would require an estimated $28 million annually, while
our annual funding for this purpose is totally dependent on federal, state, and county allocations which have been less than $6 million in recent years. The total needed to rehabilitate Oakland streets is over $435 million.
The City of Oakland has 1,100 miles of sidewalk, 17,800 curb ramp locations, and 232 developed stairs and pathways. A majority of Oakland’s sidewalks, stairs, and paths are in acceptable condition, while 60% of the curb ramps are non-compliant or non-existing.
STREET LIGHT MANAGEMENT AND
MAINTENANCE
Oakland has approximately 37,000 streetlights covering over 800 miles of roadways and pedestrian passages. Most of the lights are mounted on wooden poles and fed directly overhead from PG&E. 30,000 streetlights are “cobra head” fixtures on tall poles, while about 7,000 are ornamental pedestrian lights. In FY 2011-12, City staff responded to 2,400 street lighting service requests and repaired 3,200 streetlights.
In general, streetlights in Oakland meet the levels in the Street Lighting Warrants approved by City Council; however, there are areas that could benefit from enhanced lighting due to increased pedestrian usage or criminal activities. Oakland’s current standard for streetlights is Light Emitting Diode (LED) fixtures for City projects and as replacements for failed lights.
SUSTAINABLE OAKLAND PROGRAM
The Sustainable Oakland Program leads the protection of Oakland’s natural resources and the health of our community through energy efficiency and increased use of renewable energy sources, pollution prevention, environmental cleanup and promotion of sustainability. The program tracks Oakland’s progress in becoming a more sustainable city, coordinates climate change mitigation and adaptation initiatives, and leads internal sustainability teams.
The program is dedicated to improving the environmental quality of City of Oakland facilities, open spaces, rights-of-way, waterways and development projects through professional environmental assessment and
cleanups, improved energy efficiency, and implementation of best management practices. The Program supports the efforts of citizen volunteers to clean and green Oakland's streets, parks, and creeks through the Adopt a Spot program and major beautification events such as Earth Day and Creek to Bay Day.
The program aggressively seeks grants to support these efforts enabling Oakland to be a top 10 green city in the nation.
TRAFFIC SIGNAL MANAGEMENT AND
MAINTENANCE
Oakland’s streets include 677 signalized intersections (which include 18,000 traffic signals and 4,000 pedestrian walk/don’t walk signals). Signals are reviewed and re-timed on the average of once every five to ten years due to the large number of signals (higher than most cities of comparable size) and few dedicated staff to collect the traffic counts necessary to make signal timing changes (less than one full-time staff employee is assigned to signal timing and 7.5 staff are assigned to traffic signal maintenance). Much of the City’s signal equipment is obsolete and/or not compatible with modern communication systems. Maintenance of traffic signals is provided by City staff.
The City has developed an Intelligent Transportation Systems (ITS) Master Plan to upgrade and manage the signal system along major corridors. Only a small fraction of the system has been built, and most of that in the last year. A Traffic Management Center (TMC) was recently completed and serves as the nerve center for ITS corridors. More arterial corridors which are indentified in the ITS Master Plan would be need to implemented. The estimated total cost of implementing the ITS Master Plan is $123 million in current (2012) dollars.
TRAFFIC SIGNS AND MARKINGS
MANAGEMENT AND MAINTENANCE
There are over 3,500 signal poles, and on average, 100 traffic signal poles have to be replaced each year from damages. Oakland’s streets also include 200,000 traffic signs, 3,600 miles of lane striping, 400,000 linear feet of crosswalks and 6,000 street legends.
E - 58

PUBLIC WORKS
PROGRAM DESCRIPTIONS
TRAFFIC SIGNS AND MARKINGS
MANAGEMENT AND MAINTENANCE (CONT’D)
All signs, striping, and legends are designed using the California Manual of Uniform Traffic Control Devices specifications and standards as dictated by 23 CFR 655.603. These signs, stripes, and legends are maintained daily by City staff, and through the course of yearly paving contracts for streets identified in the Five-Year Paving Plan, as hazards are identified or on a complaint basis.
TRANSPORTATION AND PEDESTRIAN
SAFETY
The Transportation and Pedestrian Safety program advances vehicular and pedestrian safety on City streets and around schools, parks, senior centers and other public places. Activities include designing traffic signals and safety devices, audible pedestrian signal heads, pavement markings, residential blue zones, traffic calming systems and other engineering approaches to making our community safer. This program also promotes alternative modes of transportation such as walking and bicycling.
TRANSPORTATION PLANNING AND
FUNDING
Transportation Planning and Funding coordinates the grant application prioritization and submittal process for transportation projects. Deliverables
include transportation policies and plans, bicycle and pedestrian plans and facilities, the development of a Complete Streets Policy and street network, and citywide parking policy. This is achieved through extensive community outreach, corridor planning, development project review and the update and implementation of the General Plan Circulation Element and TOD and Transit-First policies. The Division coordinates planning and implementation of large-scale transportation projects with AC Transit, BART, Caltrans, and the Port of Oakland.
TREE MANAGEMENT AND
MAINTENANCE
Oakland is known for its green tree covered canopy; the 100-year-old Jack London Oak tree symbolizes this commitment to being a Green City. The urban forest consists of 42,642 street trees per the 2008 Sidewalk Survey plus an unknown number of park trees, median and streetscape trees, and trees found within the street right-of-way. Since the survey, several hundred new trees have been planted by Urban Releaf, Sierra Club, West Oakland Greening Initiative and homeowners.
Major cuts to Tree Services staffing over the past five years (over 50%) have now limited services to emergency tree response. The City ended the tree planting and aesthetic tree pruning program in 2008. Tree staff is also responsible for processing over 200 tree permits annually under the Tree ordinances and the View
ordinance. All permits and hazardous tree requests must be inspected by an Arboricultural Inspector or Tree Supervisor, of which there is only one of each.
WATERSHED AND STORM DRAIN
MANAGEMENT AND MAINTENANCE
The City’s storm water infrastructure includes more than 400 miles of storm drains, 15,000 structures, and over 80 miles of open creek. The majority of the City’s storm water infrastructure was constructed 60 to 80 years ago. Since that time, very little to no upgrading of the system has taken place. Much of the system has long suffered from inadequate resources leading to increasing instances of flooding, erosion, and property damage.
The City of Oakland has no fund source dedicated to managing storm water. Without a dedicated source of funding for ongoing maintenance, capital improvements, and water quality efforts the existing storm water system will continue to deteriorate, damage related to flooding and infrastructure failure will increase and compliance with water quality regulations will be jeopardized. Much of the system is now nearing the end of its useful life and is in need of replacement. An average annual investment of $20 to $25 million is needed for storm water system capital projects and maintenance and for water quality compliance.
E - 59

PUBLIC WORKS
NOTES
E - 60
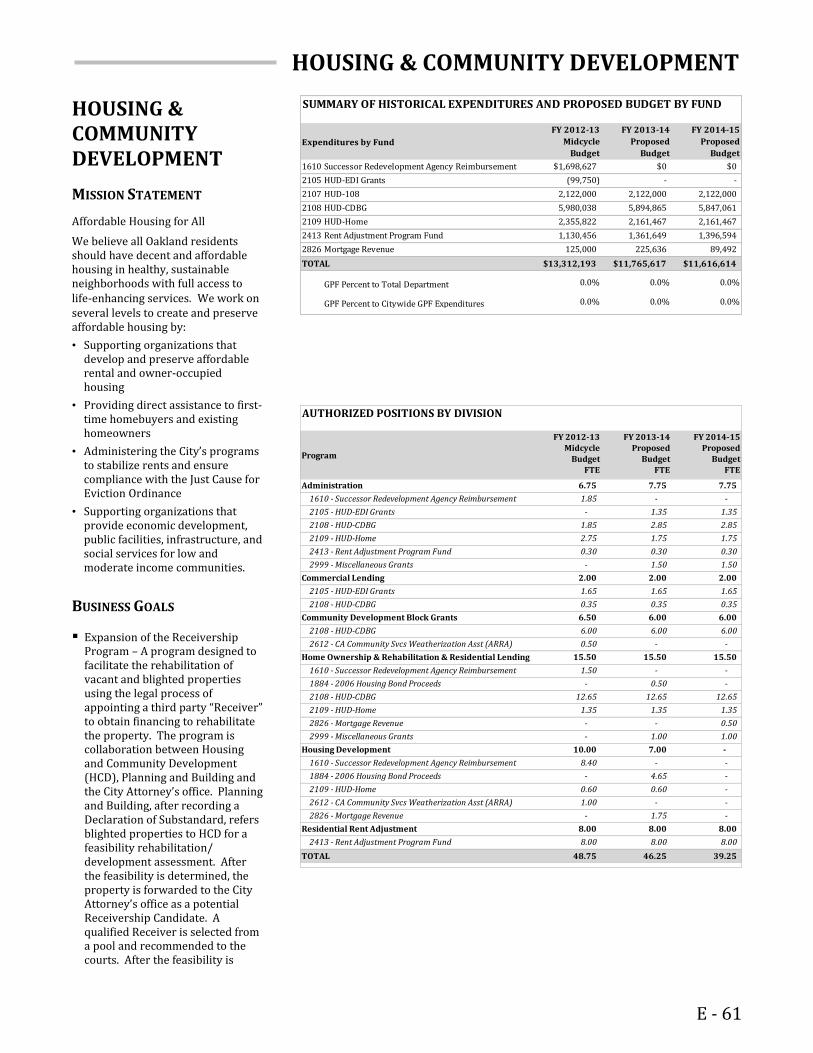
HOUSING & COMMUNITY DEVELOPMENT
HOUSING & COMMUNITY DEVELOPMENT
MISSION STATEMENT
Affordable Housing for All
We believe all Oakland residents should have decent and affordable housing in healthy, sustainable neighborhoods with full access to life-enhancing services.We work on several levels to create and preserve affordable housing by:
• Supporting organizations that develop and preserve affordable rental and owner-occupied housing
• Providing direct assistance to first-time homebuyers and existing homeowners
• Administering the City’s programs to stabilize rents and ensure compliance with the Just Cause for Eviction Ordinance
• Supporting organizations that provide economic development, public facilities, infrastructure, and social services for low and moderate income communities.
BUSINESS GOALS
Expansion of the Receivership Program – A program designed to facilitate the rehabilitation of vacant and blighted properties using the legal process of appointing a third party “Receiver” to obtain financing to rehabilitate the property. The program is collaboration between Housing and Community Development (HCD), Planning and Building and the City Attorney’s office. Planning and Building, after recording a Declaration of Substandard, refers blighted properties to HCD for a feasibility rehabilitation/ development assessment. After the feasibility is determined, the property is forwarded to the City Attorney’s office as a potential Receivership Candidate. A qualified Receiver is selected from a pool and recommended to the courts. After the feasibility is
SUMMARY OF HISTORICAL EXPENDITURES AND PROPOSED BUDGET BY FUND
Expenditures by Fund
FY 2012-13
Midcycle
Budget
FY 2013-14
Proposed
Budget
FY 2014-15
Proposed
Budget
1610 Successor Redevelopment Agency Reimbursement
Fund
$1,698,627 $0 $0
2105 HUD-EDI Grants (99,750) - -
2107 HUD-108 2,122,000 2,122,000 2,122,000
2108 HUD-CDBG 5,980,038 5,894,865 5,847,061
2109 HUD-Home 2,355,822 2,161,467 2,161,467
2413 Rent Adjustment Program Fund 1,130,456 1,361,649 1,396,594
2826 Mortgage Revenue 125,000 225,636 89,492
TOTAL $13,312,193 $11,765,617 $11,616,614
GPF Percent to Total Department 0.0% 0.0% 0.0%
GPF Percent to Citywide GPF Expenditures 0.0% 0.0% 0.0%
AUTHORIZED POSITIONS BY DIVISION
Program
FY 2012-13
Midcycle
Budget
FTE
FY 2013-14
Proposed
Budget
FTE
FY 2014-15
Proposed
Budget
FTE
Administration 6.75 7.75 7.75
1610 - Successor Redevelopment Agency Reimbursement
Fund
1.85 - -
2105 - HUD-EDI Grants - 1.35 1.35
2108 - HUD-CDBG 1.85 2.85 2.85
2109 - HUD-Home 2.75 1.75 1.75
2413 - Rent Adjustment Program Fund 0.30 0.30 0.30
2999 - Miscellaneous Grants - 1.50 1.50
Commercial Lending 2.00 2.00 2.00
2105 - HUD-EDI Grants 1.65 1.65 1.65
2108 - HUD-CDBG 0.35 0.35 0.35
Community Development Block Grants 6.50 6.00 6.00
2108 - HUD-CDBG 6.00 6.00 6.00
2612 - CA Community Svcs Weatherization Asst (ARRA) 0.50 - -
Home Ownership & Rehabilitation & Residential Lending 15.50 15.50 15.50
1610 - Successor Redevelopment Agency Reimbursement
Fund
1.50 - -
1884 - 2006 Housing Bond Proceeds - 0.50 -
2108 - HUD-CDBG 12.65 12.65 12.65
2109 - HUD-Home 1.35 1.35 1.35
2826 - Mortgage Revenue - - 0.50
2999 - Miscellaneous Grants - 1.00 1.00
Housing Development 10.00 7.00 -
1610 - Successor Redevelopment Agency Reimbursement
Fund
8.40 - -
1884 - 2006 Housing Bond Proceeds - 4.65 -
2109 - HUD-Home 0.60 0.60 -
2612 - CA Community Svcs Weatherization Asst (ARRA) 1.00 - -
2826 - Mortgage Revenue - 1.75 -
Residential Rent Adjustment 8.00 8.00 8.00
2413 - Rent Adjustment Program Fund 8.00 8.00 8.00
TOTAL 48.75 46.25 39.25
E - 61

HOUSING & COMMUNITY DEVELOPMENT
BUSINESS GOALS (CONT’D)
determined, the property is forwarded to the City Attorney’s office as a potential Receivership Candidate. A qualified Receiver is selected from a pool and recommended to the courts. After court approval, the receiver obtains private financing to rehabilitate the property and is responsible for the disposition of the property after rehabilitation.
Re-implementation of the Rental Rehabilitation Program – Providing construction loans to property owners to rehabilitate blighted properties for rental housing for seniors, persons with disabilities and low income renters. The program will provide a $75,000 maximum, 6.5% percent deferred, matching funds loan. The loan becomes due and payable in full in 2 years. Loan proceeds would be deposited in a revolving fund to be used to finance additional loans.
Expansion of the Surplus Property Development Partnership with Laney College and local Non-Profit Construction Training Organizations – Providing construction training to students by building one to four unit residential properties using City owned surplus and donated properties.
Implement a New Commercial Loan Program, the Broadway Corridor Revitalization Project, jointly developed by OBDC and the City of Oakland, is supported by a major grant from Citibank and focused on accelerating redevelopment of the City’s urban core. The mission of this new public private partnership will be to streamline support for local small businesses and create needed jobs. It is expected that 10-15 new businesses will be identified and financed through this program in the first year, resulting in the creation of at least 250 new jobs, with more to be added in the second year of the program. In the first three months of the program, $1.6 million have been invested in 10 businesses, creating and retaining 190 jobs.
Revenue
Division
FY 2012-13 Midcycle Budget
FY 2013-14 Proposed
Budget
FY 2014-15 Proposed
Budget
Administration $2,480,822 $2,161,467 $2,161,467
Commercial Lending (2,122,000) 2,122,000 2,122,000
Community Development Block Grants 11,498,122 6,655,657 6,655,657
Home Ownership & Rehabilitation & Residential Lending 500,000 1,025,636 889,492
Residential Rent Adjustment 1,905,303 2,160,782 2,214,740
TOTAL $14,262,247 $14,125,542 $14,043,356
Expenditure
Division
FY 2012-13 Midcycle Budget
FY 2013-14 Proposed
Budget
FY 2014-15 Proposed
Budget
Administration $753,012 $1,144,543 $1,079,896
Commercial Lending 2,263,334 1,908,694 2,071,285
Community Development Block Grants 2,315,410 2,266,159 1,777,427
Home Ownership & Rehabilitation & Residential Lending 2,977,483 2,464,533 2,675,230
Housing Development 3,907,901 2,656,331 2,653,355
Residential Rent Adjustment 1,095,053 1,325,357 1,359,421
TOTAL $13,312,193 $11,765,617 $11,616,614
SUMMARY OF HISTORICAL EXPENDITURES AND PROPOSED BUDGET BY DIVISION
SIGNIFICANT CHANGES IN BUDGET AND PERFORMANCE (CONT'D)
General Purpose Fund (GPF)FTE FY 2013-14
ChangesFY 2014-15
Changes
None
ALL Other FundsFTE FY 2013-14
ChangesFY 2014-15
Changes
Transfer to other funding sources in Y1 and Eliminated in Y2 from SRA projects (Fund 1610):
0.75 FTE Development/Redevleopment Manager (0.75) ($128,536) ($131,582)
1.00 FTE Housing Development Coordinator III (1.00) ($125,719) ($128,773)
3.65 FTE Housing Development Coordinator IV (3.65) ($559,574) ($573,151)
1.00 FTE Office Assistant II (1.00) ($69,074) ($70,752)
Reduce O&M and OH - ($406,746) ($416,513)
Elminate 1.00 FTE Development/Redevleopment Manager in the HUD-Home Fund
(1.00) ($199,722) ($204,472)
Eliminate 2.00 FTE Housing Development Coordinator from SRA projects (Fund 1610)
(2.00) ($221,222) ($226,596)
Eliminate 1.00 FTE Housing Development Coordinator and 0.50 FTE Student Intern, PT in CA Community Services Fund
(1.50) ($122,758) ($125,514)
Reduce Loan Expenditures in HUD-CDBG Fund - ($234,356) ($234,356)
Reduce Contract Expenditures HUD-CDBG Fund - ($678,206) ($680,632)
E - 62

HOUSING & COMMUNITY DEVELOPMENT
BUSINESS GOALS (CONT’D)
The program will target Oakland's Broadway commercial and retail corridor, the heart of business activity in the city. OBDC will assess the market area’s small business needs; inventory and assess available blighted or underutilized properties; recruit qualified entrepreneurs for identified opportunities; and provide funding for the creation of new enterprises in the market area.
Implement the new ROOT Loan Fund. This new loan fund program, Restoring Ownership Opportunities Today, is supported by national and local partners, California Housing Finance Agency, and major lenders. The model re-sets home mortgages to current market values in order to provide sustainable loan modifications for eligible Oakland residents. The Oakland pilot program would serve about 20-25 Oakland about 20-25 Oakland
eligible homeowners and create the foundation for a regional loan fund program.
Revamp the ImageSource Workflow system which provides tracking CDBG Grant Agreements electronically to allow the process to become completely paperless reducing excessive staff time utilized in the past CDBG grant administration process.
Review and realign the use of administration costs for all the HUD entitlement grants. The grants continue to decrease annually while the administration requirements remain the same or increase.
Identify additional/permanent resources to fund affordable housing development and fund rehab projects to ensure long term viability and capacity to generate residual receipts.
Identify strategies to fund administration of affordable housing developments.
Collaborate with City Attorney’s Office to re-write the Relocation Ordinance.
PRIOR REDUCTIONS
In FY 2009-10, the Department of Housing and Community Development did not exist and was established as a result of the dissolution of Redevelopment. Prior to the dissolution of redevelopment, DHCD managed millions of dollars in projects and programs aimed at revitalizing neighborhoods throughout Oakland with the preservation and construction of affordable housing and through the First-time Homebuyer’s Program. Currently, DHCD is acting as the Successor Housing Agency and is tasked with completing all affordable housing projects.
During the past twenty months, DHCD has improved neighborhoods and Oakland’s housing stock through investment in new developments and restoration of deteriorating properties. In response to the foreclosure crisis, DHCD launched a new initiative in partnership with national, state, and local partners to prevent and mitigate against foreclosures.
DIVISION DESCRIPTIONS
ADMINISTRATION
Provides the overall management of the Department of Housing and Community Development including personnel, fiscal, policy and information technology.
Manages strategic initiatives in response to the foreclosure crisis, in partnership with national, state, and local partners to prevent and mitigate foreclosures.
Manages the Housing Assistance Center which streamlines City housing services, as well as provide a central portal to meet the housing needs of Oakland residents.
COMMERCIAL LENDING
Provide tools and resources for Oakland's business owners and entrepreneurs through commercial loans funded by HUD and the Oakland Redevelopment Agency. These resources promote business attraction, retention and expansion leading to the creation of jobs and economic development primarily in Oakland's low
E - 63

HOUSING & COMMUNITY DEVELOPMENT
DIVISION DESCRIPTIONS
COMMERCIAL LENDING (CONT’D)
and moderate income communities and redevelopment areas. These various loan programs contribute to Oakland's economic revitalization by expanding the City's tax base by focusing lending activity in the City's economic development target industries; placing low-moderate income Oakland residents into sustainable jobs created by loan recipients; leveraging private investment through participation loans; and abating blight through financing commercial and mixed-used developments. This program awards professional services contracts to Oakland's small business community and administers several City funded loan programs, lending outreach, servicing of the City's loan portfolio and recruitment for job placement.
COMMUNITY DEVELOPMENT BLOCK
GRANTS
Manages and implements the City of Oakland’s Community Development Block Grant (CDBG) program. The City utilizes CDBG funds to rebuild and revitalize depressed areas and sustain neighborhoods with full access to life enhancing services. CDBG program provides funding for housing, economic development and a variety of neighborhood improvement/public service projects for low and moderate income residents in the seven Community Development areas. Distribution of CDBG funds undergo an extensive citizen participation process resulting in approximately 50 contracts with non-profit organizations and several city departments for the provision of services. The CDBG program staff provides technical assistance to the seven Community Development District Boards and
monitors the contracts and programs funded with CDBG funds.
HOME OWNERSHIP & REHABILITATION
& RESIDENTIAL LENDING
This program provides financial and technical assistance for the purchase of homes and minor-to-substantial rehabilitation to very-low, low and moderate income persons. Counsels and educates owners and first-time homebuyers about refinancing, purchasing and maintaining homes to promote safe, healthy and accessible neighborhoods, to identify and thwart predatory lending practices, as well as, fraudulent home improvement contracting. It promotes collaboration with lenders, general contractors, code enforcement, citizens and other housing agencies to expand opportunities for all homebuyers and to provide rehabilitation construction management services which identify and correct health and safety hazards and code violations in owner-occupied homes. Priority is given to assisting seniors and disabled persons to maintain the independence and security of homeownership. The Residential Lending Program: • Elevate pride of ownership and
sustainability in residential neighborhoods.
• Improvement of the existing housing stock by assisting low-income homeowners.
• Build community and foster livable neighborhoods.
• Systematic restoration of neighborhoods within the City
• Provide the city with a well-organized mechanism for effectively rehabilitating the City’s stock of salvageable housing.
• Prevent neighborhood deterioration • Provide residents with the necessary
financial and technical assistance to improve their individual property
and the overall environment of the Districts.
• Facilitate blight removal, lead-hazard reduction, and building code adherence on all 1-4 unit residential improvement projects.
HOUSING DEVELOPMENT
This program helps implement the City and Redevelopment Agency affordable housing development programs. Staff works with for-profit and non-profit developers to revitalize neighborhoods and increase housing opportunities through new construction, substantial rehabilitation and preservation of rental and ownership housing for very low or low and moderate income households. Staff implements the City’s annual Notice of Funding Availability (NOFA) process to make competitive funding awards for affordable housing projects; and monitors the City and Agency portfolio of over 75 projects to ensure proper management and maintenance and compliance with rent and income limits.
RESIDENTIAL RENT ADJUSTMENT
This program helps maintain decent, safe, affordable, and sanitary residential rental housing in the City of Oakland by limiting rent increases, monitoring removal of rental units from the market, and limiting evictions. Administers the Rent Adjustment Ordinance, the Just Cause for Eviction Ordinance and the Ellis Act Tenant Protection Ordinance. Additional responsibilities include processing appeals of Housing Code citations and appeals of denials of relocation benefits for tenants of buildings vacated by the Code Compliance section of the Building Services Department.
E - 64

PLANNING & BUILDING
PLANNING & BUILDING
MISSION STATEMENT
The Department of Planning and Building is committed to improving the physical and economic environments of Oakland through sustainable development and maintenance of private property that embraces the core principles of quality of life, diversity and equity, engagement and collaboration.
BUSINESS GOALS
Complete and implement the Accela Land Management System and other records management tools to continue the expansion of electronic record keeping and online accessibility for staff, citizenry, and the development community.
Complete work, secure approval, and begin implementation of the various Specific and Area Plans and accompanying Zoning District regulations underway.
Process necessary amendments to the Comprehensive Plan, including the housing Element, the Land Use and Transportation Element, and the Estuary Policy Plan.
Recommend for and assist in the development of affordable housing initiatives.
SUMMARY OF HISTORICAL EXPENDITURES AND PROPOSED BUDGET BY FUND
Expenditures by Fund
FY 2012-13 Midcycle Budget
FY 2013-14 Proposed
Budget
FY 2014-15 Proposed
Budget
1770 Telecommunications Land Use $32,371 $0 $0
2108 HUD-CDBG - 119,762 122,188
2415 Development Service Fund 20,676,111 21,293,270 21,637,061
4450 City Facilities Energy Conservation Projects - (86,141) (87,832)
4550 Purchasing - (4,848) (22,678)
TOTAL $20,708,482 $21,322,043 $21,648,739
GPF Percent to Total Department 0.0% 0.0% 0.0%
GPF Percent to Citywide GPF Expenditures 0.0% 0.0% 0.0%
AUTHORIZED POSITIONS BY PROGRAM
Program
FY 2012-13Midcycle
Budget FTE
FY 2013-14Proposed
BudgetFTE
FY 2014-15Proposed
BudgetFTE
Administration 8.00 7.00 4.00
1770 - Telecommunications Land Use 0.30 - -
2415 - Development Service Fund 7.70 7.00 4.00
Development Permit Inspections 32.00 28.00 28.00
2415 - Development Service Fund 32.00 28.00 28.00
Development Review/Zoning 18.00 18.00 18.00
2415 - Development Service Fund 18.00 18.00 18.00
Engineering & Architectural Plan Approval 27.75 33.75 33.75
2415 - Development Service Fund 27.75 33.75 33.75
General Plan, Zoning Update & Strategic Analysis 15.00 13.00 13.00
2415 - Development Service Fund 14.50 13.00 13.00
4450 - City Facilities Energy Conservation Projects 0.50 - -
Historic Preservation 2.00 2.00 2.00
2415 - Development Service Fund 2.00 2.00 2.00
Livable Neighborhood Code Enforcement Services 25.00 13.00 13.00
2108 - HUD-CDBG - 0.52 0.52
2415 - Development Service Fund 25.00 12.48 12.48
TOTAL 127.75 114.75 111.75
Complete several Zoning Code Amendments to streamline and update sections not included in the main code overhaul of 2011 (such as parking and nonconforming regulations, among others).
Work on initiatives to improve and streamline the environmental review process (CEQA) to assist in the appropriate development of many areas of the City.
Continue to recommend for, develop, and implement development fees for traffic improvements and other infrastructure, such as Traffic Impact Fees and Park Land Dedication fees.
Continue to increase overall effectiveness of code enforcement through establishing clear priorities, fostering better coordination with City departments, and promoting high property maintenance standards with community partners.
Provide internal and external customer service that is responsive, timely, and accurate. Streamline processes to deliver results while including appropriate community involvement. Improve communication with residential and business communities to enhance knowledge of and access to services.
PRIOR REDUCTIONS
Since FY 2009-10, Planning and Building reduced 22.5 positions (16%). Most reductions consisted of inspectors and administrative support within Building Services as private development stalled. Other reductions included major projects and administrative support for Planning and Zoning.
E - 65

PLANNING & BUILDING
PROGRAM DESCRIPTIONS ADMINISTRATION
Provides agency oversight and support services for policy development; human resource planning; management and training; accounting; budget development; fiscal and grants management; information technology systems and support; agenda management and contract administration. Ensures that the department meets its obligations and complies with federal, state, and local laws including labor and public records laws, financial management, and auditing.
DEVELOPMENT PERMIT INSPECTIONS
This program assures conformance with the California Building, Electrical, Plumbing Mechanical Codes, and the Oakland Municipal Code regulating the construction of residential and non-residential buildings and structures, public and private infrastructure, and earthwork; geo-technical remediation, and land use conditions.
DEVELOPMENT REVIEW/ZONING
Provides information on zoning regulations and reviews proposed development applications for approximately 20,000 people seeking information or application sign-offs at the Zoning Counter. Approximately 1,200 development applications are processed each year. Development applications fall into three main categories: 1) major cases, which are reviewed by the Planning Commission - 10%; 2) administrative cases decided by the Zoning Administrator after public notice and comments - 40%; and 3) residential design review cases decided by staff - 50%.
ENGINEERING & ARCHITECTURAL PLAN
APPROVAL
This program assists builders, property owners, architects, engineers, and realtors in understanding and processing appropriate construction permits related to buildings and infrastructure with applicable state health and safety codes, regional environmental regulations, and city development and land subdivision
Revenue
Program
FY 2012-13
Midcycle Budget
FY 2013-14
Proposed
Budget
FY 2014-15
Proposed
Budget
Administration $1,193,004 $1,750,000 $1,844,000
Development Permit Inspections 11,040,951 8,498,000 9,140,000
Development Review/Zoning 2,258,045 2,227,000 2,245,000
Engineering & Architectural Plan Approval 8,741,000 8,447,000 8,783,000
Livable Neighborhood Code Enforcement Services 785,000 1,817,000 1,864,000
TOTAL $24,018,000 $22,739,000 $23,876,000
Expenditure
Program
FY 2012-13
Midcycle Budget
FY 2013-14
Proposed
Budget
FY 2014-15
Proposed
Budget
Administration $2,292,070 $3,184,575 $3,197,432
Development Permit Inspections 5,763,909 5,216,800 5,308,445
Development Review/Zoning 2,270,777 2,518,312 2,565,815
Engineering & Architectural Plan Approval 4,929,476 5,824,677 5,936,518
General Plan, Zoning Update & Strategic Analysis 2,024,778 2,137,195 2,157,539
Historic Preservation 176,730 192,693 195,908
Livable Neighborhood Code Enforcement Services 3,250,742 2,247,791 2,287,082
TOTAL $20,708,482 $21,322,043 $21,648,739
SUMMARY OF HISTORICAL EXPENDITURES AND PROPOSED BUDGET BY PROGRAM
SIGNIFICANT CHANGES IN BUDGET AND PERFORMANCE (CONT'D)
General Purpose Fund (GPF)FTE FY 2013-14
ChangesFY 2014-15
Changes
None
ALL Other FundsFTE FY 2013-14
ChangesFY 2014-15
Changes
Eliminate positions and O&M in the Development Services Fund
(2415):
0.70 FTE Administrative Analyst II (0.70) ($84,024) ($86,065)
1.00 FTE Engineer, Civil (Office) (1.00) ($160,571) ($164,471)
1.00 FTE Account Clerk II (partial Y1) (1.00) ($45,363) ($77,218)
1.00 FTE Business Analyst III (1.00) $0 ($83,772)
1.00 FTE Engineer, Civil Supv (Office) (1.00) ($169,226) ($173,337)
1.00 FTE Manager, Building Services (1.00) ($113,408) ($116,163)
2.00 FTE Office Assistant II (partial Y1) (2.00) ($88,812) ($121,298)
1.00 FTE Planner I (1.00) ($84,652) ($86,708)
1.00 FTE Planner II (1.00) ($114,297) ($117,074)
1.00 FTE Process Coordinator II (1.00) ($102,238) ($104,721)
1.00 FTE Public Service Representative (1.00) ($76,224) ($78,076)
1.00 FTE Specialty Combination Insp, Senior (1.00) ($125,015) ($128,053)
4.00 FTE Specialty Combination Inspector (4.00) ($483,174) ($494,912)
Reduce Other Refunds - ($414,170) ($414,170)
Reduce Contract Expenditures - ($815,022) ($704,472)
Increase Computer Equipment/Software - $266,000 $273,980
Reduce OH associated with eliminated positions - ($279,958) ($279,958)
E - 66
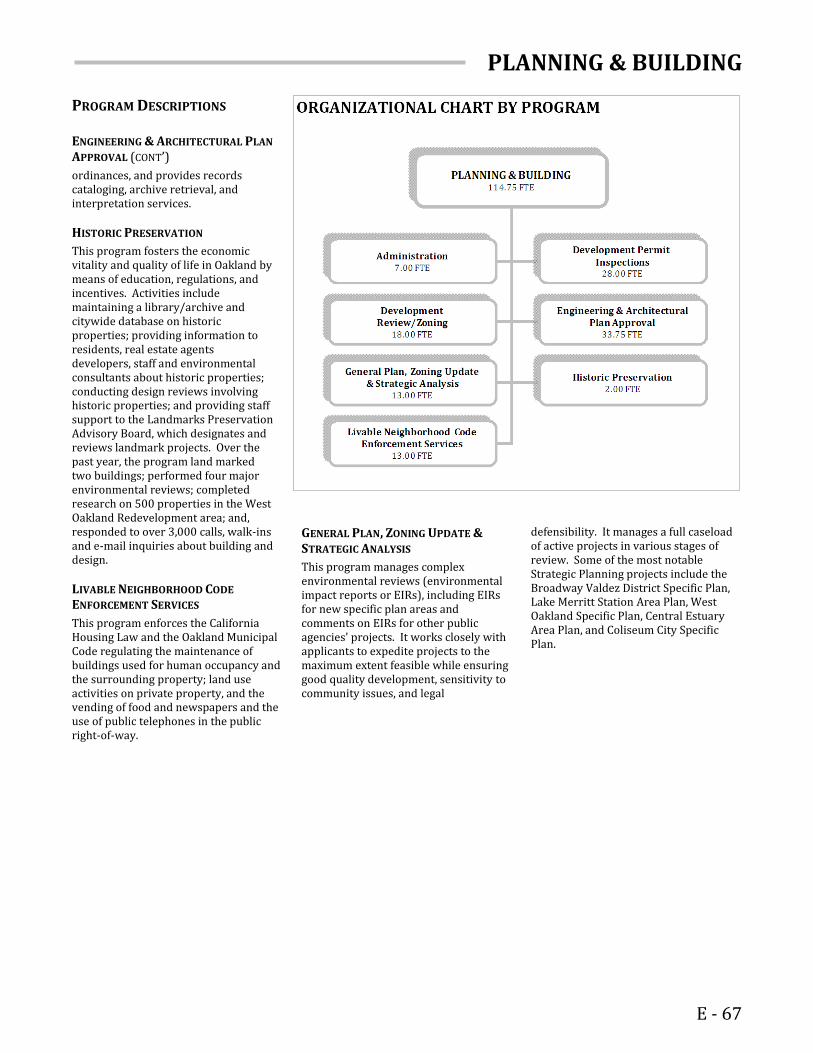
PLANNING & BUILDING
PROGRAM DESCRIPTIONS ENGINEERING & ARCHITECTURAL PLAN
APPROVAL (CONT’)
ordinances, and provides records cataloging, archive retrieval, and interpretation services.
HISTORIC PRESERVATION
This program fosters the economic vitality and quality of life in Oakland by means of education, regulations, and incentives. Activities include maintaining a library/archive and citywide database on historic properties; providing information to residents, real estate agents developers, staff and environmental consultants about historic properties; conducting design reviews involving historic properties; and providing staff support to the Landmarks Preservation Advisory Board, which designates and reviews landmark projects. Over the past year, the program land marked two buildings; performed four major environmental reviews; completed research on 500 properties in the West Oakland Redevelopment area; and,
responded to over 3,000 calls, walk-ins and e-mail inquiries about building and design.
LIVABLE NEIGHBORHOOD CODE
ENFORCEMENT SERVICES
This program enforces the California Housing Law and the Oakland Municipal Code regulating the maintenance of buildings used for human occupancy and the surrounding property; land use activities on private property, and the vending of food and newspapers and the use of public telephones in the public right-of-way.
GENERAL PLAN, ZONING UPDATE &
STRATEGIC ANALYSIS
This program manages complex environmental reviews (environmental impact reports or EIRs), including EIRs for new specific plan areas and comments on EIRs for other public agencies' projects. It works closely with applicants to expedite projects to the maximum extent feasible while ensuring good quality development, sensitivity to community issues, and legal
defensibility. It manages a full caseload of active projects in various stages of review. Some of the most notable Strategic Planning projects include the Broadway Valdez District Specific Plan, Lake Merritt Station Area Plan, West Oakland Specific Plan, Central Estuary Area Plan, and Coliseum City Specific Plan.
E - 67

PLANNING & BUILDING
NOTES
E - 68

NON-DEPARTMENTAL
NON-DEPARTMENTAL Non-Departmental comprises costs, programs, activities, debt and lease payments that are not assignable to a specific department.
PRIOR REDUCTIONS
Grants to local artists and art groups have declined from $1.1 million in FY 2007-08 to $730,000 in FY 2011-12.
During the same period, citywide programs and subsidies have declined from a total of $5.6 million to $2.5 million. This category includes organizations such as:
Symphony in the Schools – decrease from $100,000 to $30,000
Oakland Asian Cultural Center - decrease from $100,000 to $60,000
Hacienda Peralta - decrease from $180,000 to $54,000
Vietnamese Senior Service Center - decrease from $60,000 to $37,000
Women’s Business Initiative - decrease from $150,000 to $45,000
The Oakland Convention and Visitor’s Bureau has declined in funding from $650,000 in FY 2007-08 to receiving no funding in FY 2011-12.
Funding for the training of city staff has declined from $227,000 in FY 2007-08 to $0 in FY 2011-12.
Expenditures by Fund
FY 2012-13
Midcycle Budget
FY 2013-14
Proposed Budget
FY 2014-15
Proposed Budget
1010 General Purpose Fund (GPF) $64,654,586 $72,070,114 $71,742,445
1100 Self Insurance Liability 4,766,820 5,114,640 5,114,640
1150 Worker's Compensation Insurance (2,351,959) (2,474,207) (2,520,709)
1200 Pension Override Tax Revenue 55,185,782 63,924,766 59,311,513
2419 Transient Occupancy Tax (TOT) Surcharge 2,592,666 2,592,666 2,592,666
3100 Sewer Service Fund 10,161,330 9,732,105 9,728,280
5510 Capital Reserves - 1,700,000 2,000,000
6014 Oakland Convention Center 1992 14,126,610 14,106,950 14,078,113
6027 JPFA Capital Projects: Series 2005 11,164,010 11,206,500 11,269,000
6029 Taxable Pension Obligation Bonds: 2012 Series-PFRS - 8,965,220 8,965,220
6032 Taxable Pension Obligation: 2001 Series 39,559,020 40,769,001 42,014,001
6036 JPFA Refunding Revenue Bonds: 2008 Series A-1 19,718,760 18,344,750 17,956,550
6037 JPFA Refunding Revenue Bonds: 2008 Series A-2 5,532,260 5,470,053 -
6063 General Obligation Bonds: Series 2005 11,162,090 11,203,665 11,244,648
6310 Measure G: 2002A Zoo, Museum, Chabot 2,555,010 - -
6311 Measure G: 2006 Zoo, Museum 1,326,370 1,328,363 1,332,563
6312 GOB Series 2012-Refunding Bonds - 6,655,475 6,652,225
6320 Measure DD: 2003A Clean Water 4,430,300 - -
6321 Measure DD: 2009B Clean Water 4,615,490 4,616,882 4,617,132
6520 Fire Area - Redemption 446,080 - -
6530 Rockridge Area Water District 58,039 - -
6540 Skyline Sewer District - Redemption 24,300 24,600 28,600
6555 Piedmont Pines 2010 Utility Underground Phase I - Debt Service
231,528 230,007 236,169
6570 JPFA Pooled Assessment: 1996 22,400 21,600 25,600
6585 JPFA Reassessment District: Debt Service 484,080 - -
6587 2012 Refunding Reassessment Bonds-Debt Service - 377,020 381,720
6612 JPFA Lease Revenue Refunding Bonds 9,068,180 15,322,038 11,318,307
6999 Miscellaneous Debt Service 21,500,000 21,500,000 21,500,000
7320 Police and Fire Retirement System 9,624,258 9,624,258 9,624,258
7640 Oakland Public Museum Trust - 32,610 32,610
TOTAL $290,658,010 $322,459,076 $309,245,551
GPF Percent to Total Department 22.2% 22.4% 23.2%
GPF Percent to Citywide GPF Expenditures 15.8% 16.8% 15.7%
SUMMARY OF HISTORICAL EXPENDITURES AND PROPOSED BUDGET BY FUND (cont'd)
E - 69

NON-DEPARTMENTAL
PROGRAM DESCRIPTIONS
CITYWIDE ACTIVITIES
Includes a wide variety of city-wide costs and programs. The other major component is subsidies to organizations outside City governments. Examples of city-wide programs, and their annual costs, include the Clean Water Program ($410,000); Joint Powers Authority Membership ($150,000); State Lobbyist ($130,000).
Examples of subsidies include City-wide Arts Grants ($730,000); Oakland Zoo ($635,000); Chabot Space and Science Center ($297,000).
DEBT/LEASE PAYMENTS
Include payments for debt related to financing of City administration buildings at Frank Ogawa Plaza ($9 million); Oakland Convention Center ($14 million); and payment for the Oakland-Alameda County Coliseum ($10 million).
FISCAL MANAGEMENT
Fiscal Management includes a variety of fiscal items such as fund transfers, overhead cost recoveries, citywide insurance premiums, and contingency line items. The largest item is a cost recovery into the General Purpose Fund for $14.5 million from other funds. This represents a reimbursement for services provided by General Government departments such as Personnel, the City Administrator, the City Attorney and Finance. Also included in Fiscal Management are payments from the General Purpose Fund to other funds with negative balances.
Revenue
Program
FY 2012-13 Midcycle
Budget
FY 2013-14 Proposed
Budget
FY 2014-15 Proposed
Budget
Citywide Activities $5,017,396 $2,592,666 $2,592,666
Debt\Lease Payments 198,618,472 233,593,227 220,457,226
Fiscal Management 32,392,222 27,418,365 37,070,723
TOTAL $236,028,090 $263,604,258 $260,120,615
Expenditure
Program
FY 2012-13 Midcycle
Budget
FY 2013-14 Proposed
Budget
FY 2014-15 Proposed
Budget
Citywide Activities $11,165,472 $10,047,644 $9,647,644
Debt\Lease Payments 251,700,369 279,803,521 266,639,895
Fiscal Management 27,792,169 32,607,911 32,958,012
TOTAL $290,658,010 $322,459,076 $309,245,551
SUMMARY OF HISTORICAL EXPENDITURES AND PROPOSED BUDGET BY PROGRAM
General Purpose Fund (GPF)FTE FY 2013-14
ChangesFY 2014-15
Changes
Reduction in CSO Recovery from eliminiated positions Citywide - $1,131,855 $1,258,233
Increase CSO Recovery Waiver for DHS - ($253,403) ($240,191)
Add funding for Redistricting and Ballot Measure Renewal - $420,000 $20,000
Add funding for DIT Licensing & Software - $1,500,000 $1,000,000
Extend Contract with CHP and Alameda County Sheriff - $2,000,000 $2,000,000
Reduce subsudy to Measure Y (Fund 2251) - ($1,000,000) ($1,000,000)
Eliminate the Day Laborer Program - ($170,000) ($170,000)
ALL Other FundsFTE FY 2013-14
ChangesFY 2014-15
Changes
Increase transfer to Pension Override Tax Revenue Fund - $8,738,984 $4,125,731
Add funding for DIT Licensing & Software in the Capital Reserves Fund (5510)
- $1,500,000 $2,000,000
SIGNIFICANT CHANGES IN BUDGET AND PERFORMANCE
E - 70

CAPITAL IMPROVEMENT PROGRAM
CAPITAL IMPROVEMENT PROGRAM
DEFINITION
Capital projects are defined as a long-term investment that builds, replaces or improves an asset (buildings, roads, parks, sewer and drainage lines, etc.) and that has a useful design life of at least ten years and a minimum cost of $50,000.
CATEGORIES
The FY 2013-15 Capital Improvement Program budget is organized in the categories listed below.
BUILDINGS AND FACILITIES
This category of projects includes new construction, replacement or improvement of recreation centers, fire stations, community centers, and other City buildings, facilities, and structures.
PARKS AND OPEN SPACE
Projects in this category include improvements to playgrounds and tot lots, park facilities and City swimming pools; and improvements to Oakland’s waterways.
SEWERS AND STORM DRAINS
Projects in this category include reconstruction of sewer mains throughout the City as required by an Administrative Order issued to Oakland and other Bay Area communities by the
CAPITAL IMPROVEMENT PROGRAM FY 2013-15
Summary by Source
Source
FY 2013-14 Proposed
Budget
FY 2014-15 Proposed
Budget
FY 2013-15 Total
Budget
1010 - General Fund: General Purpose $252,000 $252,000 $504,000
2163 - Metro Transportation Com: Program Grant - 3,851,000 3,851,000
2211 - Measure B: ACTIA 7,545,000 6,995,000 14,540,000
2212 - Measure B: Bicycle/Pedestrian Pass-Thru Funds 1,650,000 1,000,000 2,650,000
2215 - Measure F - Vehicle Registration Fee 1,500,000 1,500,000 3,000,000
3100 - Sewer Service Fund 14,760,000 14,360,000 29,120,000
5130 - Rockridge: Library Assessment District 498,500 - 498,500
Total * $26,205,500 $27,958,000 $54,163,500
* Total does not reflect $1,250,000 in miscellaneous expenditures in fund 5510.
1010 - General Fund Purpose
0.9%
2163 - Metro Transportation Com:
Program Grant7.1%
2211 - Measure B: ACTIA26.8%
2212 - Measure B: Bicycle/Pedestrian
Pass-Thru Funds4.9%
2215 - Measure F -Vehicle Registration
Fee5.5%
3100 - Sewer Service Fund
53.8%
5130 - Rockridge: Library Assessment
District0.9%
CAPITAL IMPROVEMENT PROGRAM FY 2013-15Summary by Source - City
$54,163,500
E - 71

CAPITAL IMPROVEMENT PROGRAM
CATEGORIES
SEWERS AND STORM DRAINS
(CONT’D)
United States Environmental Protection Agency and the State of California. The Order requires the City to plan and implement capital repairs and replacements to the aging sewer facilities and implement maintenance practices to prevent sewage discharges into creeks, lakes, and the San Francisco Bay. Funding for emergency repair and replacement of sewer and storm drain facilities is also included.
STREETS AND SIDEWALKS
Projects in this category include street paving and rehabilitation, street safety projects, street lighting, and sidewalk repair, as well as streetscape beautification. These projects are designed to address the maintenance backlog of City streets and sidewalks.
TRAFFIC IMPROVEMENTS
This category includes traffic and transportation-related improvements, including traffic calming, traffic signals, modernization of traffic signals and signal controllers, and signal synchronization. They are intended to improve the safety of all modes of travel: pedestrian, cyclist and automobile.
CAPITAL IMPROVEMENT PROGRAM FY 2013-15
Summary by Category
Category
FY 2013-14 Proposed
Budget
FY 2014-15 Proposed
Budget
FY 2013-15 Total Budget
Buildings and Facilities $750,500 $252,000 $1,002,500
Parks & Open Space - - -
Sewers & Storm Drains 14,760,000 14,360,000 29,120,000
Streets & Sidewalks 8,195,000 11,346,000 19,541,000
Traffic Improvements 2,500,000 2,000,000 4,500,000
Total * $26,205,500 $27,958,000 54,163,500$
* Total does not reflect $1,250,000 in miscellaneous expenditures in fund 5510.
Buildings and Facilities
1.9%
Parks & Open Space0.0%
Sewers & Storm Drains53.8%
Streets & Sidewalks
36.1%
Traffic Improvements
8.3%
CAPITAL IMPROVEMENT PROGRAM FY 2013-15Summary by Category
$54,163,500
E - 72

CAPITAL IMPROVEMENT PROGRAM
CAPITAL IMPROVEMENT PROGRAM FY 2013-15
Projects by Category (Continued)
Category
FY 2013-14
Proposed Budget
FY 2014-15
Proposed Budget
FY 2013-15
Total Budget
Buildings and Facilities
ADA Buildings and Facilities 30-Year Transition Plan $252,000 $252,000 $504,000
Rockridge Library Interior/Exterior Painting $225,000 $0 $225,000
Rockridge Library Light Replacement (Interior) $148,500 $148,500
Rockridge Library Re-Carpet $125,000 $0 $125,000
Buildings & Facilities Total $750,500 $252,000 $1,002,500
Parks & Open Space - - -
Sewers & Storm Drains
Citywide Cyclic Sewer Replacement $3,375,000 $3,375,000 $6,750,000
Rehabilitation of Sanitary Sewer in the Area bounded by 21st Avenue,
17th Street, 24th Avenue, and 27th Avenue (60-06)
$400,000 $0 $400,000
Rehabilitation of Sanitary Sewer in the Area bounded by Campus Drive, Mountain Boulevard, Knoll Avenue, and Access (83-013)
$0 $240,000 $240,000
Rehabilitation of Sanitary Sewer in the Area bounded by Castle Park Wy, Skyline Boulevard, Haverhill Drive, and Scarborough Drive (56-07)
$0 $945,000 $945,000
Rehabilitation of Sanitary Sewer in the Area bounded by Dennison
Street, Embarcadero, King Street, and Federick Street (61-01)
$1,250,000 $0 $1,250,000
Rehabilitation of Sanitary Sewer in the Area Bounded by Hwy 13, Reinhardt Drive, 39th Avenue, and Aliso Avenue (83-501)
$0 $280,000 $280,000
Rehabilitation of Sanitary Sewer in the Area Bounded by Mountain Boulevard, Bernves Ct, Terrabella Way, and Redwood Rd (83-502)
$0 $280,000 $280,000
Rehabilitation of Sanitary Sewer in the Area bounded by Mountain
Boulevard, Joaquin Miller Rd, Skyline Boulevard, and Castle Dr (56-06)
$525,000 $4,200,000 $4,725,000
Rehabilitation of Sanitary Sewer in the Area bounded by Park Boulevard, Hollywood Ave, Sunnyhills Rd, and Brighton Ave (54-16)
$630,000 $5,040,000 $5,670,000
Rehabilitation of Sanitary Sewers in the Area Bounded by Longridge Road, FWY 580, Park Blvd., and Underhills Road (54-12)
$750,000 $0 $750,000
Rehabilitation of Sanitary Sewers in the Area Bounded by MacArthur
Boulevard, Maple Avenue, Barner Avenue, and Frye Street (80-102)
$4,320,000 $0 $4,320,000
Rehabilitation of Sanitary Sewers in West Grand Avenue between Wood Street and San Pablo Avenue
$3,510,000 $0 $3,510,000
Sewers & Storm Drains Total $14,760,000 $14,360,000 $29,120,000
Streets & Sidewalks
ADA Curb Ramp 30-Year Transition Plan $660,000 $660,000 $1,320,000
Bridge Preventive Maintenance $250,000 $250,000 $500,000
Citywide Repair and Rehabilitation of City Paths and Stairs $200,000 $200,000 $400,000
Citywide Sidewalk Repairs $300,000 $300,000 $600,000
Citywide Sidewalk Repairs $250,000 $250,000 $500,000
Citywide Street Rehabilitation / Resurfacing $0 $3,851,000 $3,851,000
Citywide Street Rehabilitation / Resurfacing $3,285,000 $2,585,000 $5,870,000
Citywide Street Rehabilitation / Resurfacing $1,500,000 $1,500,000 $3,000,000
Emergency Roadway Repairs $500,000 $500,000 $1,000,000
Matching Funds for Grant Funded Projects $1,250,000 $1,250,000 $2,500,000
Streets & Sidewalks Total $8,195,000 $11,346,000 $19,541,000
Traffic Improvements
Bicycle Master Plan Implementation $1,000,000 $350,000 $1,350,000
Citywide Traffic Signal Controller Replacement Program $0 $150,000 $150,000
Neighborhood Traffic Calming Program $100,000 $100,000 $200,000
Pedestrian Master Plan Implementation $400,000 $400,000 $800,000
Traffic Signal System Management $1,000,000 $1,000,000 $2,000,000
Traffic Improvements Total 2,500,000 2,000,000 4,500,000
Total $26,205,500 $27,958,000 $54,163,500
E - 73

CAPITAL IMPROVEMENT PROGRAM
NOTES
E - 74


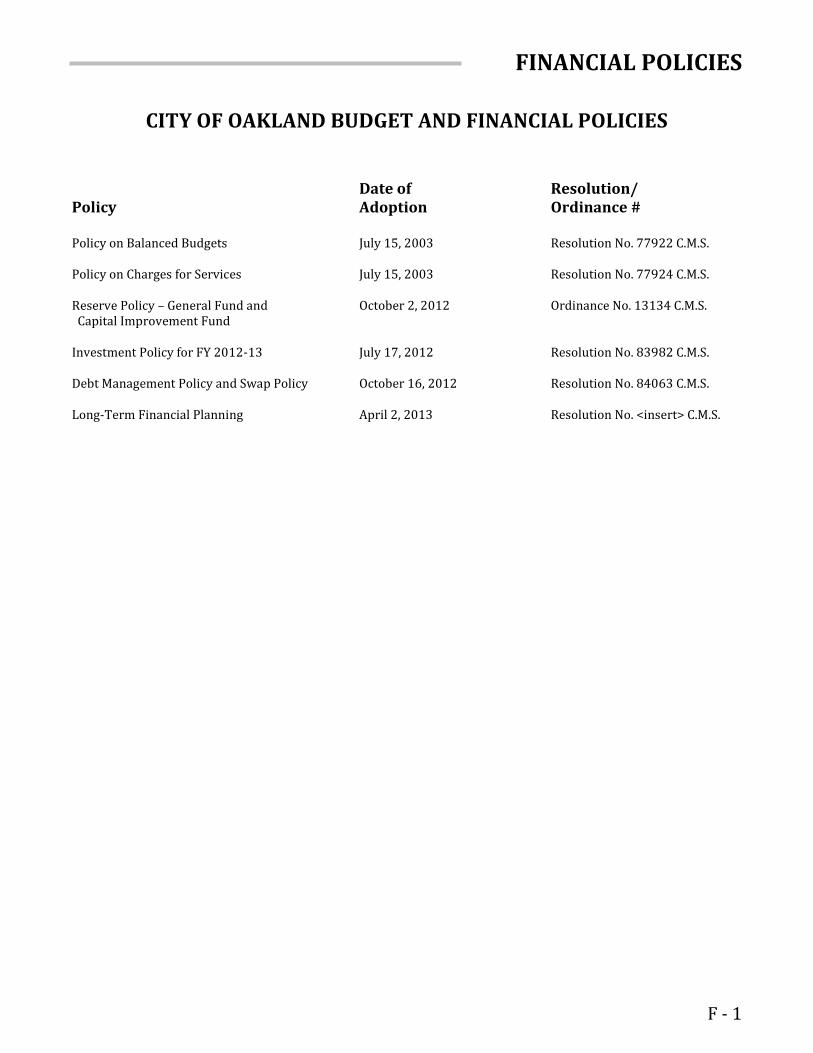
FINANCIAL POLICIES
CITY OF OAKLAND BUDGET AND FINANCIAL POLICIES
Date of Resolution/
Policy Adoption Ordinance # Policy on Balanced Budgets July 15, 2003 Resolution No. 77922 C.M.S. Policy on Charges for Services July 15, 2003 Resolution No. 77924 C.M.S. Reserve Policy – General Fund and October 2, 2012 Ordinance No. 13134 C.M.S. Capital Improvement Fund Investment Policy for FY 2012-13 July 17, 2012 Resolution No. 83982 C.M.S. Debt Management Policy and Swap Policy October 16, 2012 Resolution No. 84063 C.M.S. Long-Term Financial Planning April 2, 2013 Resolution No. <insert> C.M.S.
F - 1

FINANCIAL POLICIES
F - 2

FINANCIAL POLICIES
F - 3

FINANCIAL POLICIES
F - 4

FINANCIAL POLICIES
F - 5

FINANCIAL POLICIES
F - 6

FINANCIAL POLICIES
F - 7

FINANCIAL POLICIES
F - 8

FINANCIAL POLICIES
F - 9

FINANCIAL POLICIES
F - 10

FINANCIAL POLICIES
F - 11

FINANCIAL POLICIES
F - 12

FINANCIAL POLICIES
F - 13

FINANCIAL POLICIES
F - 14

FINANCIAL POLICIES
F - 15

FINANCIAL POLICIES
F - 16

FINANCIAL POLICIES
F - 17

FINANCIAL POLICIES
F - 18

FINANCIAL POLICIES
F - 19

FINANCIAL POLICIES
F - 20

FINANCIAL POLICIES
F - 21

FINANCIAL POLICIES
F - 22

FINANCIAL POLICIES
F - 23

FINANCIAL POLICIES
F - 24
FINANCIAL POLICIES
F - 25

FINANCIAL POLICIES
F - 26

FINANCIAL POLICIES
F - 27

FINANCIAL POLICIES
F - 28

FINANCIAL POLICIES
F - 29

FINANCIAL POLICIES
F - 30

FINANCIAL POLICIES
F - 31

FINANCIAL POLICIES
F - 32

FINANCIAL POLICIES
F - 33

FINANCIAL POLICIES
F - 34

FINANCIAL POLICIES
F - 35

FINANCIAL POLICIES
F - 36

FINANCIAL POLICIES
F - 37

FINANCIAL POLICIES
F - 38

FINANCIAL POLICIES
F - 39

FINANCIAL POLICIES
F - 40

FINANCIAL POLICIES
F - 41

FINANCIAL POLICIES
F - 42

FINANCIAL POLICIES
F - 43

FINANCIAL POLICIES
F - 44

FINANCIAL POLICIES
F - 45

FINANCIAL POLICIES
F - 46

FINANCIAL POLICIES
F - 47

FINANCIAL POLICIES
F - 48

FINANCIAL POLICIES
F - 49

FINANCIAL POLICIES
F - 50

FINANCIAL POLICIES
F - 51

FINANCIAL POLICIES
F - 52

FINANCIAL POLICIES
F - 53

FINANCIAL POLICIES
F - 54
FINANCIAL POLICIES
F - 55

FINANCIAL POLICIES
F - 56

FINANCIAL POLICIES
F - 57

FINANCIAL POLICIES
F - 58

FINANCIAL POLICIES
F - 59

FINANCIAL POLICIES
F - 60

FINANCIAL POLICIES
F - 61

FINANCIAL POLICIES
F - 62

FINANCIAL POLICIES
F - 63

FINANCIAL POLICIES
F - 64

FINANCIAL POLICIES
F - 65

FINANCIAL POLICIES
F - 66

FINANCIAL POLICIES
F - 67

FINANCIAL POLICIES
F - 68


LEGISLATION
FY 2013-15 Proposed Policy Budget Legislation
Legislative Item Anticipated
Approval Date Resolution / Ordinance
FINANCIAL POLICIES
Appropriations Limit for FY 2013-15 June 30, 2013 Resolution No. ______
Budget Adoption and City Council Budget Amendments
June 30, 2013 Resolution No. _____
LOCAL ASSESSMENTS
Landscaping and Lighting Assessment District June 30, 2013 Resolution No. _____
Wildfire Prevention Assessment District June 30, 2013 Resolution No. _____
LOCAL MEASURES
Emergency Medical Services (Measure M) June 30, 2013 Ordinance No. _____
Paramedic Emergency Services (Measure N) June 30, 2013 Ordinance No. _____
Library Services (Measure Q) June 30, 2013 Ordinance No. _____
Violence Prevention & Public Safety (Measure Y)
June 30, 2013 Ordinance No. _____
G - 1

LEGISLATION
G - 2

LEGISLATION
APPROVED AS TO FORM AND LEGALITY
_________________________________
CITY ATTORNEY
OAKLAND CITY COUNCIL
Resolution No. C.M.S.
RESOLUTION ESTABLISHING AN APPROPRIATIONS LIMIT FOR FISCAL
YEAR 2013-2014 PURSUANT TO ARTICLE XIIIB OF THE CALIFORNIA
CONSTITUTION
WHEREAS, Article XIIIB of the California Constitution (Limitation of Government Appropriations) was passed by the California electorate on November 6, 1979, and became effective on July 1, 1980; and
WHEREAS, the Chapter 1205, Statute of 1980, Section 7900 of the Government Code, formally implements methods for governmental entities to establish and define annual appropriations limits, based on annual appropriations for the prior fiscal year, which is fiscal year 2012-13, for fiscal year 2013-14; now therefore be it
RESOLVED: That the annual appropriations limit for the City of Oakland for FY 2013-14 is $XXX,XXX,XXX, as reflected in Exhibit A; and be it
FURTHER RESOLVED: That the growth factors used to calculate the limit are the county population change and the increase in the California per capita income.
IN COUNCIL, OAKLAND, CALIFORNIA, ____________________, 2013
PASSED BY THE FOLLOWING VOTE:
AYES--- BROOKS, GALLO, KALB, KAPLAN, MCELHANEY, REID, SCHAAF, AND PRESIDENT KERNIGHAN
NOES---
ABSENT---
ABSTENTION---
ATTEST: LATONDA SIMMONS City Clerk and Clerk of the Council of the City of Oakland, California
G - 3

LEGISLATION
G - 4

LEGISLATION
APPROVED AS TO FORM AND LEGALITY
INTRODUCED BY COUNCILMEMBER ___________________________ ___________________________
CITY ATTORNEY
OAKLAND CITY COUNCIL
RESOLUTION NO. C. M. S.
RESOLUTION AUTHORIZING THE FY 2013-2015 BIENNIAL BUDGET AND APPROPRIATING CERTAIN FUNDS TO PROVIDE FOR THE EXPENDITURES PROPOSED BY SAID BUDGET
WHEREAS, the City Council has reviewed departmental and non departmental budgets
in public hearings in view of estimated resources available for Fiscal Years 2013-2015; and WHEREAS, the City Council has given careful consideration to the proposed budget for
the use of funds for Fiscal Years 2013-2015 as set forth in the FY 2013-2015 Proposed Policy Budget document; and
WHEREAS, the City Council has agreed on modifications the proposed budget as
shown in exhibit __, which together with the proposed budget constitute the 2013-2015 Adopted Policy Budget; now therefore be it
RESOLVED, that the City Administrator is authorized to expend in accordance with the
laws of the State of California and the City of Oakland on behalf of the City Council new appropriations for departments and activity programs as incorporated in the FY 2012-2015 Adopted Policy Budget attached hereto; and be it
FURTHER RESOLVED, that the City Administrator may transfer operating
appropriations between activity programs during the fiscal year provided that such funds remain within the agency department in which the funds were approved by City Council; and be it
FURTHER RESOLVED, that the City Administrator may transfer capital appropriations
between the Capital Improvement Program and operating departments to the extent that such transfers are necessary to fund capital related activities of the operating departments; and be it
FURTHER RESOLVED, that the City Administrator must obtain approval from the City
Council before (1) substantially or materially altering the relative agency allocations of funding set out in the Adopted Policy Budget, (2) substantially or materially changing the levels of service expressly prioritized and funded by the Adopted Policy Budget including but not limited to layoffs and/or freezes that would substantially or materially (a) change levels of service, or (b) affect programs, or (3) eliminates or suspends entire programs funded by the Adopted Policy Budget; and be it
G - 5

LEGISLATION
FURTHER RESOLVED, that the City Administrator may periodically transfer
unexpended funds from the Unclaimed Cash Fund (Fund 7440) to the General Purpose Fund (Fund 1010); and be it
FURTHER RESOLVED, that this Resolution shall take effect immediately upon its
passage. In Council, Oakland, California, _________________________, 2013
PASSED BY THE FOLLOWING VOTE:
Ayes- BROOKS, GALLO, KALB, KAPLAN, MCELHANEY, REID, SCHAAF, AND
PRESIDENT KERNIGHAN
Noes-
Absent-
Abstention-
Attest:
_________________________________ LaTonda Simmons
City Clerk and Clerk of the Council of the City of Oakland, California
G - 6

LEGISLATION
Approved as to Form and Legality
________________________
Oakland City Attorney’s Office
OAKLAND CITY COUNCIL
Resolution No. ____________________C.M.S.
RESOLUTION CONFIRMING THE INFORMATION IN THE ENGINEER’S REPORT FOR THE CITY OF OAKLAND LANDSCAPING AND LIGHTING ASSESSMENT DISTRICT FOR FISCAL YEAR 2013-14 AND THE LEVYING OF ASSESSMENTS
WHEREAS, pursuant to the California Streets and Highways code, Sections 22500, et seq known as the
Landscaping and Lighting Act of 1972 (Act of 1972), the City Administrator filed with the City Clerk
and presented before Council, on June 4, 2013, reports for the continuation of the Landscape and
Lighting Assessment District in order to raise funds for the installation, maintenance and servicing of
public landscaping and lighting; and
WHEREAS, pursuant to Sections 22500 and following of the Act of 1972, the City took a series of
actions preliminary to ordering the establishment of the Landscape and Lighting Assessment District
(“District”) and did establish such District of June 23, 1989; and
WHEREAS, pursuant to Sections 22500 and following of the Act of 1972, the City has renewed the
District each subsequent year; and
WHEREAS, the voters of the City of Oakland previously approved the continuation of the District, in
accordance with Article XIIID, Section 5, of the California Constitution (Proposition 218); and
WHEREAS, the District Engineer has filed an Engineer’s Report for the District confirming the
applicability of the existing assessment rates for FY 2013-14; and
WHEREAS, Tuesday, June 4, 2013, at the hour of 6:30 p.m. was fixed and properly noticed as the day
and hour for the City Council to hear and pass on said reports, together with any objections or protests
which may be raised by any of the property owners liable to be assessed for the costs of certain public
maintenance and improvements equitably only among those citizens and businesses benefiting from
such city programs; and
WHEREAS, the Engineer’s Report was prepared in accordance with the provisions of Article XIII of
the California Constitution and state law; and
G - 7

LEGISLATION
WHEREAS, the Engineer’s Report, incorporated by this reference, provides for services of particular
benefit to the properties located within the District (as more specifically identified in the Engineer’s
Report); now, therefore be it
RESOLVED by the Council of the City of Oakland, as follows:
1. The City Council finds that the City Clerk gave notice of these proceedings as required by
Government Code Section 53753 and in compliance with, state law, and Article XIII of the
California Constitution, and gave all other notices and took all other actions required by law with
regard thereto.
2. A Public Hearing was held on June 4, 2013, (at 6:30 p.m. in the City Council Chambers in City
Hall, located at 1 Frank H. Ogawa Plaza, Oakland California) to hear all public comments,
protests, and thereafter to take final action as to the annual assessment for the District.
3. At the hearing the testimony of all interested persons for or against the furnishing of the specified
types of improvements or activities, and the imposition of the annual assessment for the District
was heard. All protests, both written and oral, are overruled and denied, and the City Council finds
that there is not a majority protest within the meaning of the law.
4. The City Council finds, determines and declares that the District and each parcel therein is
benefited by the improvements, maintenance, and activities funded by the assessment to be levied,
including all expenses incurred incidentally thereto, upon the lots and parcels of real property in
proportion to the estimated benefits to be received as specified in the Engineer’s Report.
5. The Engineer’s Report for the District and the proposed assessment district boundary description,
assessment roll and map is accepted and approved and the assessments shall be as provided for in the
Engineer’s Report and assessment roll. The reasons for the assessments and the types of
improvements, activities and services proposed to be funded and provided by the levy of assessments
on property in the District and the time period for which the proposed assessments are to be made are
those specified in the Engineer’s Report.
6. The City’s Budget shall annually appropriate funds from non-District funds to pay for a low-
income rebate.
7. The City’s and Successor Agency’s budgets shall annually appropriate funds from non-district
funds to pay for the district’s assessment on City and Agency properties.
8. That the report which the District Engineer filed with the City Clerk and scheduled before Council
on June 4, 2013 at the hour of 6:30 p.m. for the continuation of the Landscape and Lighting
Assessment District for the FY 2013-14, and the diagram and assessment as set forth in the annual
report of the Engineering of Work and each component part of it, including each exhibit
incorporated by reference in the report and the levying of each individual assessment as stated in
the Assessment Roll described therein, as modified to reflect no increases in the assessment, be
and are hereby accepted and confirmed.
G - 8

LEGISLATION
9. That upon approval of the Landscape and Lighting Assessments, the City Administrator shall
present an itemized report to the Alameda County Auditor-Controller Agency, State of California,
to be placed on the FY 2013-14 County Tax Roll, and to take whatever other action necessary to
collect the assessments.
IN COUNCIL, OAKLAND, CALIFORNIA, ___________________________
PASSED BY THE FOLLOWING VOTE:
AYES - BROOKS, GALLO, GIBSON MCELHANEY, KALB, KAPLAN, REID, SCHAAF AND
PRESIDENT KERNIGHAN
NOES –
ABSENT –
ABSTENTION –
ATTEST:
_______________________________
LATONDA SIMMONS
City Clerk and Clerk of the Council of
the City of Oakland, California
G - 9

LEGISLATION
G - 10

LEGISLATION
Approved as to Form and Legality
________________________
Oakland City Attorney’s Office
OAKLAND CITY COUNCIL
Resolution No. ____________________C.M.S.
RESOLUTION CONFIRMING THE INFORMATION IN THE ANNUAL REPORT FOR THE CITY OF OAKLAND WILDFIRE PREVENTION ASSESSMENT DISTRICT FOR FISCAL YEAR 2013-14 AND THE LEVYING OF ASSESSMENTS
WHEREAS, the City of Oakland Wildfire Prevention Assessment District (WPAD) was established on
January 20, 2004 under the authority of the Oakland Fire Suppression, Prevention and Preparedness
District Ordinance of 2003 (Ordinance No. 12556 C.M.S.); and
WHEREAS, pursuant to the Oakland Fire Suppression, Prevention and Preparedness District Ordinance
of 2003 (Ordinance No. 12556 C.M.S.), on May 15, 2012, the City Council adopted the resolution of
intention (Resolution No. 83853 C.M.S.) and accepted the FY 2013-14 Annual Report for the City of
Oakland Wildfire Prevention Assessment District and setting a date for a public hearing; and
WHEREAS, pursuant to the Oakland Fire Suppression, Prevention and Preparedness District Ordinance
of 2003 (Ordinance No. 12556 C.M.S.), the City Administrator has filed with the City Clerk and
presented before the City Council, on June 5, 2012, reports for the continuation of the District in order to
finance the costs and expenses related to fire suppression, prevention and preparedness services and
programs in the Oakland hills; and
WHEREAS, all the area of land to be assessed is located within the City of Oakland, Alameda County;
and
WHEREAS, assessment rates will not exceed the rates established in FY 2004-05; and
WHEREAS, Tuesday, June 4, 2013, at the hour of 6:30 p.m. was fixed and properly noticed as the day
and hour for the City Council to hear and pass on said reports, together with any objections or protests
which may be raised by any of the property owners liable to be assessed for the costs of certain public
maintenance and improvements equitably only among those citizens and businesses benefiting from such
city programs; now, therefore be it
G - 11

LEGISLATION
RESOLVED: That the City Council accepts and confirms the Annual Report filed with the City Clerk
and scheduled before the City Council on June 4, 2013, for the continuation of the Wildfire Prevention
Assessment District; and the diagram and assessment as set forth in the Final Annual Report for FY
2013-14 and each component part of it, including each exhibit incorporated by reference in the report;
and be it
FURTHUR RESOLVED: That the City Council confirms the levying of each individual assessment for
FY 2013-14 as stated in the Assessment Roll prepared by the District Engineer; and be it
FURTHER RESOLVED: That the City Administrator is authorized to direct the District Engineer to
present an itemized report of the FY 2013-14 Wildfire Prevention Assessment District assessments to the
Alameda County Auditor-Controller Agency, State of California, to be placed on the FY 2013-14
property tax roll.
IN COUNCIL, OAKLAND, CALIFORNIA, ___________________________
PASSED BY THE FOLLOWING VOTE:
AYES - BROOKS, GALLO, GIBSON MCELHANEY, KALP, KAPLAN, REID, SCHAAF, and
PRESIDENT KERNIGHAN
NOES –
ABSENT –
ABSTENTION –
ATTEST:
_______________________________
LATONDA SIMMONS
City Clerk and Clerk of the Council of
the City of Oakland, California
G - 12

LEGISLATION
Approved as to Form and Legality
________________________
Oakland City Attorney’s Office
OAKLAND CITY COUNCIL
Ordinance No. ____________________C.M.S.
ORDINANCE AUTHORIZING A FISCAL YEAR 2013-14 INCREASE TO A SPECIAL TAX IMPOSED FOR EMERGENCY MEDICAL SERVICES, IN ACCORDANCE WITH THE CONSUMER PRICE INDEX, AND PURSUANT TO THE EMERGENCY MEDICAL SERVICES RETENTION ACT OF 1997 (MEASURE M)
WHEREAS, in 1997 the voters of Oakland approved Measure M, a special tax to fund
emergency medical services; and
WHEREAS, Measure M imposed a special tax on all parcels in the City of Oakland, except
where the parcels are otherwise exempt from taxation by Section 3 of the Ordinance; and
WHEREAS, Measure M provided that beginning in fiscal year 1998-99 and each fiscal year
thereafter, the Oakland City Council may increase the tax only upon a finding that the cost of living in
the immediate San Francisco Bay Area, as shown by the Consumer Price Index (CPI) for all items, has
increased since the 1997 index year; and
WHEREAS, Measure M provided that any tax rate adjustment imposed by the City Council
pursuant to the ordinance shall not exceed five percent of the tax rate imposed during the immediately
preceding fiscal year; and
WHEREAS, a public hearing on this ordinance to increase the Measure M special parcel tax
was held on June 4, 2013 at 6:30 p.m. in City Hall, One Frank H. Ogawa Plaza, Oakland, California;
now, therefore,
THE COUNCIL OF THE CITY OF OAKLAND DOES ORDAIN AS FOLLOWS:
1. The Oakland City Council hereby finds that the Consumer Price Index for all items in the San
Francisco Bay Area was 233.39 for calendar year 2011 and 239.65 for calendar year 2012.
2. The cost-of-living in the immediate San Francisco Bay Area as shown by the Consumer Price
Index, has increased 2.7 percent from calendar year 2011 and calendar year 2012.
3. The Measure M special tax rate upward adjustment shall be 2.7 percent, effective July 1, 2013.
G - 13

LEGISLATION
4. The following rate structure will be imposed on parcels within the City of Oakland effective July
1, 2013 for FY 2013-14:
PROPOSED MEASURE M TAX INCREASES BY PARCEL TYPE
Parcel Type Current
Parcel Rate
Proposed
Increase FY 2013-14
Parcel Rate
Single Family Residential Parcels $12.64 $0.34 $12.98
Multiple Residential (2 to 4 units) $25.27 $0.68 $25.95
Multiple Residential (5 or more units) $63.18 $1.71 $64.89
Commercial $25.27 $0.68 $25.95
Industrial $50.54 $1.36 $51.90
Rural $12.64 $0.34 $12.98
Institutional $12.64 $0.34 $12.98
IN COUNCIL, OAKLAND, CALIFORNIA, _________________________________ PASSED BY THE FOLLOWING VOTE: AYES- BROOKS, GALLO, GIBSON MCELHANEY, KALB, KAPLAN, REID, SCHAAF, and PRESIDENT KERNIGHAN NOES- ABSENT- ABSTENTION-
ATTEST:
_______________________________
LATONDA SIMMONS
City Clerk and Clerk of the Council of
the City of Oakland, California
G - 14

LEGISLATION
Approved as to Form and Legality
________________________
Oakland City Attorney’s Office
OAKLAND CITY COUNCIL
Ordinance No. ____________________C.M.S.
ORDINANCE AUTHORIZING A FISCAL YEAR 2013-14 INCREASE TO A SPECIAL TAX IMPOSED FOR PARAMEDIC EMERGENCY SERVICES, IN ACCORDANCE WITH THE CONSUMER PRICE INDEX, AND PURSUANT TO THE PARAMEDIC SERVICES ACT OF 1997 (MEASURE N)
WHEREAS, in 1997 the voters of Oakland approved Measure N, a special tax to fund
paramedic emergency services; and
WHEREAS, Measure N imposed a special tax on all parcels in the City of Oakland, except
where the parcels are otherwise exempt from taxation by Section 3 of the Ordinance; and
WHEREAS, Measure N provided that beginning in fiscal year 2000-01 and each fiscal year
thereafter, the Oakland City Council may increase the tax only upon a finding that the cost of living in
the immediate San Francisco Bay Area, as shown by the Consumer Price Index (CPI) for all items, has
increased since the 1997 index year; and
WHEREAS, Measure N provided that any tax rate adjustment imposed by the City Council
pursuant to the ordinance shall not exceed five percent of the tax rate imposed during the immediately
preceding fiscal year; and
WHEREAS, a public hearing on this ordinance to increase the Measure N special parcel tax was
held on June 4, 2013 at 6:30 p.m. in City Hall, One Frank H. Ogawa Plaza, Oakland, California; now,
therefore,
WHEREAS, the Consumer Price Index for all items in the San Francisco Bay Area was 233.39
for calendar year 2011 and 239.65 for calendar year 2012.
G - 15

LEGISLATION
WHEREAS, The cost-of-living in the immediate San Francisco Bay Area as shown by the
Consumer Price Index, has increased 2.7 percent from calendar year 2011 and calendar year 2012.
THE COUNCIL OF THE CITY OF OAKLAND DOES ORDAIN AS FOLLOWS:
1. The Measure N special tax rate upward adjustment shall be 2.7 percent, effective July 1, 2013.
2. The following rate structure will be imposed on parcels within the City of Oakland effective July
1, 2013 for FY 2013-14:
PROPOSED MEASURE N TAX INCREASES BY PARCEL TYPE
Parcel Type Current
Parcel Rate
Proposed
Increase FY 2013-14
Parcel Rate
Single Family Residential Parcels $10.06 $0.27 $10.33
Multiple Residential (2 to 4 units) $20.12 $0.54 $20.66
Multiple Residential (5 or more units) $50.29 $1.36 $51.65
Commercial $20.12 $0.54 $20.66
Industrial $40.23 $1.09 $41.32
Rural $10.06 $0.27 $10.33
Institutional $10.06 $0.27 $10.33
IN COUNCIL, OAKLAND, CALIFORNIA, _________________________________ PASSED BY THE FOLLOWING VOTE: AYES- BROOKS, GALLO, GIBSON MCELHANEY, KALB, KAPLAN, REID, SCHAAF, and PRESIDENT KERNIGHAN NOES- ABSENT- ABSTENTION-
ATTEST:
_______________________________
LATONDA SIMMONS
City Clerk and Clerk of the Council of
the City of Oakland, California
G - 16

LEGISLATION
Approved as to Form and Legality
________________________
Oakland City Attorney’s Office
OAKLAND CITY COUNCIL
Ordinance No. ____________________C.M.S.
ORDINANCE AUTHORIZING A FISCAL YEAR 2013-14 INCREASE TO A SPECIAL TAX IMPOSED FOR LIBRARY SERVICES, IN ACCORDANCE WITH THE CONSUMER PRICE INDEX, AND PURSUANT TO THE LIBRARY SERVICES RETENTION AND ENHANCEMENT ACT OF 2004 (MEASURE Q)
WHEREAS, the voters of Oakland in 2004 approved Measure Q, the Library Services Retention
and Enhancement Act of 2004, which extended the original Measure O Library Services Retention and
Enhancement of 1994, through June 30, 2024; and
WHEREAS, Measure Q continued imposition of this special tax on all parcels in the City of
Oakland, except where the parcels are otherwise exempt from taxation by Section 6 of the ordinance;
and
WHEREAS, the Measure Q legislation allows the City Council to increase the tax annually
upon a finding that the cost of living in the immediate San Francisco Bay Area, as shown on the
Consumer Price Index (CPI) for all items, has increased since the 1994 index year; and
WHEREAS, the Measure Q legislation further provides that any tax rate adjustment imposed by
the City Council pursuant to the ordinance shall not exceed five percent of the tax rate imposed during
the immediately preceding fiscal year; and
WHEREAS, a public hearing on this ordinance to increase the Measure Q special parcel tax was
held on June 4, 2013 at 6:30 p.m. in City Hall, One Frank H. Ogawa Plaza, Oakland, California; now,
therefore,
G - 17

LEGISLATION
THE COUNCIL OF THE CITY OF OAKLAND DOES ORDAIN AS FOLLOWS:
1. The Oakland City Council hereby finds that the Consumer Price Index for all items in the San
Francisco Bay Area was 233.39 for calendar year 2011 and 239.65 for calendar year 2012.
2. The cost-of-living in the immediate San Francisco Bay Area as shown by the Consumer Price
Index, has increased 2.7 percent from calendar year 2011 and calendar year 2012.
3. The Measure Q special tax rate upward adjustment shall be 2.7 percent, effective July 1, 2013.
4. The following rate structure will be imposed on parcels within the City of Oakland effective July
1, 2013 for FY 2013-14:
PROPOSED MEASURE Q TAX INCREASES BY PARCEL TYPE
Parcel Type Current
Parcel Rate
Proposed
Increase FY 2013-14
Parcel Rate
Single Family Residential Parcels $89.13 $2.41 $91.54
Multiple Residential (2 to 4 units) $60.88 $1.64 $62.52
Non-Residential Parcels $45.65 $1.23 $46.88
IN COUNCIL, OAKLAND, CALIFORNIA, _________________________________
PASSED BY THE FOLLOWING VOTE: AYES- BROOKS, GALLO, GIBSON MCELHANEY, KALB, KAPLAN, REID, SCHAAF, and PRESIDENT KERNIGHAN NOES- ABSENT- ABSTENTION-
ATTEST:
_______________________________
LATONDA SIMMONS
City Clerk and Clerk of the Council of
the City of Oakland, California
G - 18

LEGISLATION
Approved as to Form and Legality
________________________
Oakland City Attorney’s Office
OAKLAND CITY COUNCIL
Ordinance No. ____________________C.M.S.
ORDINANCE AUTHORIZING A FISCAL YEAR 2013-14 INCREASE TO A SPECIAL TAX IMPOSED FOR VIOLENCE PREVENTION AND PUBLIC SAFETY SERVICES, IN ACCORDANCE WITH THE CONSUMER PRICE INDEX, AND PURSUANT TO THE VIOLENCE PREVENTION AND PUBLIC SAFETY ACT OF 2004 (MEASURE Y)
WHEREAS, in 2004 the voters of Oakland approved Measure Y, a special tax to fund violence
prevention and public safety services; and
WHEREAS, Measure Y imposes a special tax on all parcels in the City of Oakland, except
where the parcels are otherwise exempt from taxation by Section 3 of the Ordinance; and
WHEREAS, Measure Y provided that beginning in fiscal year 2005-2006 and each fiscal year
thereafter, the Oakland City Council may increase the tax only upon a finding that the cost of living in
the immediate San Francisco Bay Area, as shown by the Consumer Price Index (CPI) for all items, has
increased since the 1997 index year; and
WHEREAS, Measure Y provided that any tax rate adjustment imposed by the City Council
pursuant to the ordinance shall not exceed five percent of the tax rate imposed during the immediately
preceding fiscal year; and
WHEREAS, a public hearing on this ordinance to increase the Measure Y special parcel tax was
held on June 4, 2013 at 6:30 p.m. in City Hall, One Frank H. Ogawa Plaza, Oakland, California; now,
therefore,
G - 19

LEGISLATION
THE COUNCIL OF THE CITY OF OAKLAND DOES ORDAIN AS FOLLOWS:
1. The Oakland City Council hereby finds that the Consumer Price Index for all items in the San
Francisco Bay Area was 233.39 for calendar year 2011 and 239.65 for calendar year 2012.
2. The cost-of-living in the immediate San Francisco Bay Area as shown by the Consumer Price
Index, has increased 2.7 percent from calendar year 2011 and calendar year 2012.
3. The Measure Y special tax rate upward adjustment shall be 2.7 percent, effective July 1, 2013,
pursuant to the Measure Y requirement that the rate increase equal the annual CPI increase for the San
Francisco Bay Area, and at no time may the increase exceed 5.0 percent of the tax rates imposed by the
Ordinance during the immediately preceding fiscal year.
4. The following rate structure will be imposed on parcels within the City of Oakland effective July
1, 2013 for FY 2013-14:
MEASURE Y TAX INCREASES BY PARCEL TYPE
Parcel Type Current
Parcel Rate
Increase FY 2013-14
Parcel Rate
Single Family Residential Parcels $95.05 $2.57 $97.62
Multiple Unit Residential Parcels $64.94 $1.75 $66.69
Non-Residential Parcels $48.68 $1.31 $49.99
IN COUNCIL, OAKLAND, CALIFORNIA, _________________________________
PASSED BY THE FOLLOWING VOTE: AYES- BROOKS, GALLO, GIBSON MCELHANEY, KALB, KAPLAN, REID, SCHAAF, and PRESIDENT KERNIGHAN NOES- ABSENT- ABSTENTION-
ATTEST:
_______________________________
LATONDA SIMMONS
City Clerk and Clerk of the Council of
the City of Oakland, California
G - 20


GLOSSARY
BUDGET TERMINOLOGY
AAMLO African American Museum & Library at Oakland
ABAT Alcohol Beverage Action Team
Accrual Basis Accounting Distinct from cash basis, accrual basis accounting records the financial effects of transactions in the periods in which those transactions occur, regardless of the timing of related cash flows. Revenues are recorded when earned and expenses are recorded at the time liabilities are incurred.
ACS Automated Collection System
ACTC Alameda County Transportation Commission, created in July 2010 by the merger of the Alameda County Congestion Management Agency (ACCMA) and the Alameda County Transportation Improvement Authority (ACTIA).
Actual Actual refers to the expenditures and/or revenues that are actually realized, opposed to those that are forecasted or budgeted.
ADA Americans with Disabilities Act
Adjusted Budget The status of appropriations as of a specific date between July 1 at the beginning of the fiscal period and June 30 at the end of the period. Includes the adopted budget, budget amendments, prior year encumbrances, approved project carryforwards from prior years, and transfers between accounts, divisions and departments.
Adopted Budget Revenues and appropriations (budgeted expenditures) approved by the City Council in June immediately preceding the new fiscal period.
Agency / Department A major unit of the municipal organization which is managed by an Agency / Department Director and comprised of a number of divisions which are functionally related to one another.
Appropriation An authorization made by the City Council that permits the City to incur obligations and to make expenditures of resources.
Appropriation Resolution The official resolution adopted by the City Council to establish legal authority for City officials to obligate and expend funds.
ARRA The American Recovery and Reinvestment Act of 2009 is an economic stimulus package enacted by the 111th United States Congress in February 2009.
BAC Budget Advisory Committee
Balanced Budget
Budgeted revenues are equivalent to budgeted expenditures.
BART Bay Area Rapid Transit
H - 1

GLOSSARY
BUDGET TERMINOLOGY(continued)
Baseline Budget Projected revenue and expenditure budgets created as part of the budget development process based on the assumption that current policies will continue unchanged for the upcoming fiscal period.
BID Business Improvement District
Biennial Budget Budget lasting or enduring for two fiscal years. Bond A form of loan in which the City borrows funds for a defined period of time
at a fixed interest rate. Bonds are used by finance capital projects or long-term obligations.
Bond Rating/Credit Rating A rating given to bonds the City issues that indicates their credit quality, meaning the borrower’s ability to pay the principal and interest in a timely fashion. Private independent rating services include Standard & Poor's, Moody's and Fitch. Bond ratings are expressed as letters ranging from 'AAA', which is the highest grade, to 'C' ("junk"), which is the lowest grade.
Budget A financial plan for a specific fiscal period that documents anticipated revenues and associated authorized expenditures.
Budget Adjustment A procedure governed by accounting controls and City policies through which City staff revises budget appropriations. City staff has the prerogative to adjust expenditures within departmental budgets. Council approval is required for transfers between departments, between funds, and for additional appropriations from fund balance or new revenue sources.
Budget Calendar The schedule of key dates or milestones that the City follows in the preparation, adoption, and administration of the budget.
Budget Document A financial and planning document that reflects the proposed (and later adopted) revenues and appropriations (authorized expenditures) for the City (including operating and capital), historical financial information, and organizational structure and goals.
Budgetary Control The use of controls and monitoring of a governmental unit or enterprise for the purpose of keeping expenditures within the approved limits and achieving revenue targets.
CAFR Comprehensive Annual Financial Report
CalPERS California Public Employees’ Retirement System
Capital Budget A budget for capital expenditures, opposed to operating expenditures.
Capital Improvement Program (CIP)/Capital Plan
A plan that identifies an organization’s capital project needs, prioritizes the projects, estimates costs, and proposes specific revenues, expenditures, and timeline to complete priority capital projects.
H - 2

GLOSSARY
BUDGET TERMINOLOGY(continued)
Capital Project Projects generally costing $50,000 or more designed to upgrade and repair existing facilities and infrastructure; purchase technology-related equipment and service contracts; and purchase equipment.
CAO City Administrator’s Office
Carryforward Appropriations brought forward from a previous fiscal year to continue or complete a specific project, program or activity.
CDBG Community Development Block Grant
CEDA Community and Economic Development Agency
CIP Capital Improvement Program
COIN Caring for Oaklanders in Need
Contingency Reserve An appropriation of funds to cover unforeseen events, such as emergencies, newly required programs, shortfalls in revenue or other unforeseen eventualities. For example, the City Council has set a policy for the General Fund reserve (of 7.5 percent).
Contractual Services Operating expenditures for services provided by outside organizations and businesses, including maintenance contracts, consulting services, etc.
Core Services Key City lines of business.
CORE Citizens of Oakland Respond to Emergencies Program
CPRB Citizen’s Police Review Board
CSO Central Service Overhead, expenditures that are incurred by central service organizations, such as information technology, human resources, legal, accounting, and management, that are recovered through cost allocation to user departments and funds.
Debt Service The expenditure required to pay (“service”) interest and principal on outstanding debt.
Deferred Capital Investments/ Deferred Maintenance
The practice of deferring capital maintenance or renewal activities that would be required to minimize a capital asset’s total cost of ownership in order to reduce short term expenditures.
Deficit/Shortfall The amount by which budgeted or actual expenditures exceed revenues.
Department / Agency A major unit of the municipal organization which is managed by an Agency / Department Director and comprised of a number of divisions which are functionally related to one another.
H - 3

GLOSSARY
BUDGET TERMINOLOGY(continued)
DHS Department of Human Services
Discretionary Funds Funds that are not restricted to specific purposes.
Division A unit of the municipal organization which reports to a department or agency.
EBMUD East Bay Municipal Utilities District
EDI Economic Development Initiative
EEC Enhanced Enterprise Community
EEO Equal Employment Opportunity
EIR Environmental Impact Report
Encumbrance Obligations in the form of purchase orders, contracts or salary commitments,
which are chargeable to an appropriation and for which a part of the appropriation is reserved. They cease to be encumbrances when the obligations are paid or otherwise terminated.
Enterprise Fund A governmental accounting fund in which the services provided are financed
and operated similarly to those of a private business. The rate schedules for these services are established to ensure that the revenues are adequate to meet all necessary expenditures.
EOC Emergency Operations Center
Expenditure The actual expending of financial resources, as recorded in the City’s financial system.
Expenditure Category A basis for distinguishing types of expenditures. The major expenditure categories used by the City of Oakland are personnel services; operations and maintenance; and capital outlay.
FEMA Federal Emergency Management Agency
Fiscal Year A twelve-month time period signifying the beginning and ending period for recording financial transactions. The City of Oakland has specified July 1 through June 30 as its fiscal year.
FMA Finance and Management Agency
FMS Financial Management System (old pre-Oracle)
Forecast An estimate of future conditions, particularly related to financial conditions
H - 4

GLOSSARY
BUDGET TERMINOLOGY(continued)
FSA Fire Services Agency
FTE An FTE or full-time equivalent is defined as a staff year. For example, two employees who work one-half time are considered one full-time equivalent.
Fund An accounting entity that has a set of self-balancing accounts and that records all financial transactions for specific activities or government functions. As required by governmental accounting standards, the City uses different funds to account for expenditures from various revenue sources. Restricted funds may be expended for purposes specified by law or grantor regulations. Discretionary or unrestricted funds may be spent for any lawful purpose designated by the City Council.
Fund Balance The net effect of a fund’s assets less liabilities at any given point in time. The
total fund balance includes a designated / reserved portion, usually for encumbrances, projects, or other prior commitments, as well as an undesignated / unreserved (i.e. “available”) portion.
Fund Group A group of funds with similar restrictions and accounting treatment. The
seven fund groups included in the City’s budget are: general funds; special revenue funds; enterprise funds; internal service funds; capital projects funds; debt service funds; and trust.
GAAP Generally Accepted Accounting Principles
General Fund One of seven groups of funds used by the City to account for financial
resources for different purposes.
General Obligation (GO) Bond A type of bond that is repaid and backed by the City’s full financial resources. These are distinct from revenue bonds, which are repaid using the revenue generated by the specific project the bonds are issued to fund.
General Purpose Fund (GPF) One specific fund within the General Fund group of funds. Revenues from many of the City's taxes, fees and service charges are deposited into the General Purpose Fund. It is the fund from which the City has the most flexibility in making expenditures.
GIS Geographic-based Information System
Grant A contribution by a government, other organization, or a private individual, to support a particular activity. Grants may be classified as either categorical or block, depending upon the amount of discretion allowed the grantee. Grants may be competitive or based on allocation.
HAAB Housing Advisory and Appeals Board
HJKCC Henry J. Kaiser Convention Center
H - 5

GLOSSARY
BUDGET TERMINOLOGY(continued)
HJKCC Henry J. Kaiser Convention Center
HMIP Home Maintenance & Improvement Program
HOPWA
Housing Opportunities for Persons with AIDS
HR
Human Resources
HUD Federal Department of Housing and Urban Development HVAC Heating, Ventilation & Air Conditioning
IAFF International Association of Firefighters
IMMS Integrated Maintenance Management System
ISTEA Intermodal Surface Transportation Efficiency Act
IT Information Technology
ITD Information Technology Division (Finance & Management Agency)
JPA Joint Powers Authority
KTOP TV Channel 10—Oakland’s Government Channel
LAN Local Area Network
LBE Local Business Enterprise
Letter of Transmittal The opening section of the budget, which provides the City Council and the public with a general summary of the most important aspects of the budget, changes from the previous fiscal years, and the views and recommendations of the Mayor and City Administrator.
LLAD Landscaping and Lighting Assessment District
MIC Municipal Improvement Capital Fund
Modified Accrual Basis Modified Accrual Basis accounting recognizes an economic transaction or event as revenues in the operating statement when the revenues are both measurable and available to liquidate liabilities of the current period. Available means collectible in the current period or soon enough thereafter to be used to pay liabilities of the current period. Similarly, expenditures are generally recognized when an event or transaction is expected to draw on current spendable resources.
H - 6

GLOSSARY
BUDGET TERMINOLOGY(continued)
MSSP Multi Purpose Senior Services Program
MSC Municipal Service Center
MTC Metropolitan Transportation Commission
NCR Neighborhood Commercial Revitalization
Negative Fund Balance The situation in which a fund’s balance is negative, meaning that its liabilities exceed its assets.
NEH National Endowment for the Humanities
NSC Neighborhood Service Coordinator
OBRA Oakland Base Reuse Authority OCA Office of the City Attorney
OMCF Oakland Museum of California Foundation
OMERS Oakland Municipal Employees Retirement System
OOB Oakland Oversight Board, consists of representatives from the local taxing entities; exercises oversight functions over ORSA.
OPACT Oakland Police and Clergy Together
Other Post-Employment Benefits (OPEB)
Other Post-Employment Benefits refers to benefits due to retirees that are other than pension/retirement benefits. These are primarily composed of retiree medical benefits, but may also include other retiree benefits.
OPED Oakland Paratransit for the Elderly & Disabled
Operating Budget A financial plan for the provision of direct services and support functions, as distinct from a capital budget.
Operations and Maintenance Expenditures related to operating costs including supplies, commodities, contract services, materials, utilities and educational services.
OPOA Oakland Police Officers’ Association
OPR Office of Parks and Recreation
ORSA Oakland Redevelopment Successor Agency, successor to the former Oakland Redevelopment Agency that is tasked with winding down all former redevelopment obligations.
H - 7

GLOSSARY
BUDGET TERMINOLOGY(continued)
OSCAR Open Space, Conservation and Recreation
OSHA Occupational Safety & Health Administration
OUSD Oakland Unified School District
Overhead Managerial, administrative, and support costs, such as finance, human resources, legal, and others, that are critical to operating the City but that are not associated with a specific direct service provided to the public. These costs are subject to a citywide overhead cost allocation plan to distribute costs on an equitable basis to departments and funds that are the beneficiaries of such activities.
PAL Police Athletic League
Personnel Services Expenditures related to employee compensation including wages and salaries, fringe benefits, retirement, premiums, allowances and special / supplemental pay such as shift differentials.
PFRS Oakland’s Police and Fire Retirement System
POB Pension Obligation Bond
Program Budget Programs, and associated program codes, are created to identify cross division or departmental efforts that have a common purpose. Using program codes, the budget (both revenues and expenditures) can be described in programmatic terms.
PSA Police Services Agency
PSB Public Sector Budgeting, an Oracle module currently used in the City of Oakland to develop the biennial policy budget.
PTS Permit Tracking System
PWA Public Works Agency
ROPS Recognized Obligation Payment Schedule, a schedule every six months of estimated payments of the Oakland Redevelopment Successor Agency that serves as its budget.
Reserve A portion of a fund’s balance or a separate fund that is restricted for a specific purpose and is, therefore, not available for general appropriation.
Restricted Funds Funds that can be spent only for the specific purposes stipulated by external source providers, constitutionally or through enabling legislation. Restrictions may effectively be changed or lifted only with the consent of resource providers. It also includes a legally enforceable requirement that the resources can only be used for specific purposes enumerated in the law.
H - 8

GLOSSARY
BUDGET TERMINOLOGY(continued)
Revenue Funds that the City receives as income. It includes such items as taxes, licenses, user fees / charges for services, fines/penalties, grants, and internal revenue.
RLF Revolving Loan Fund
SBE
Small Business Enterprise
SCDI Sustainable Community Development Initiative
SLBE Small Local Business Enterprise
Special Purpose Funds Funds, exclusive of the General Fund and capital funds, which are separately administered because they are associated with a distinct function or enterprise.
Structural Deficit A situation in which a fund’s expenditures are expected to routinely exceed its revenues, creating a regular shortfall/deficit.
THP Transitional Housing Program
Transfer A movement of budgetary or actual revenues or expenditures between organizational units, accounts, projects, programs or funds. Transfers between funds appear as an expenditure (“transfer out”) in one fund and revenue (“transfer in”) in the other. Transfers between fiscal years represent the carryforward of funds received in previous years to be expended in the new year and appear as a revenue in the new year. Transfers between departments, funds or from one fiscal year to another must be approved by City Council.
UBC Uniform Building Code UCR Uniform Crime Report Unaudited In reference to financial figures, the term unaudited means prior to the
completion of a financial audit of an organization’s financial statements.
Unfunded Liability A liability for which there is not an offsetting asset, often used in reference to OPEB liabilities and other long-term liabilities.
USAR Urban Search and Rescue
VLF
Vehicle License Fee
WIA Workforce Investment Act
H - 9

GLOSSARY
NOTES
H - 10


INDEX
A
Abbreviation Guide - Glossary ................................ H-1 Administrative Services ............................................ E-7
Authorized Positions by Division ............................ E-27, E-29,E-32, E-35, E-37, E-39 Business Goals ................................................................. E-29, 32, 35, 37, 39 Historical Expenditures and Proposed Budget
by Fund (Summary of) .......................................... E-27, 29, 32, 35, 37, 39
Historical Revenue and Expenditures by Division (Summary of) .................................... E-28, 30, 33, 36, 40
Organization Chart by Program ............................... E-30 33, 36, 38, 40 Prior Reductions............................................................ E-29, 32, 36, 37, 40 Division Descriptions ................................................... E-30, 32, 36, 38, 40 Service Impacts ............................................................... X-4 Significant Changes in Budget ................................. E-27, 30, 34, 36, 38, 40
All Funds Expenditures ........................................... D-83 All Funds Revenue....................................................... D-59 Amateur/Professional Sports ................................. C-10 Americans with Disabilities Act ............................. E-54 Arts and Attractions ................................................... C-9 Authorized Positions by Division/Program
Administrative Services…….…………………………..E-27 City Administrator ......................................................... E-9 City Attorney .................................................................... E-13 City Auditor....................................................................... E-15 City Clerk ............................................................................ E-17 City Council ....................................................................... E-7 Community Services…………...…………………………E-43 Fire ........................................................................................ E-23 Housing and Community Development…………..E-61 Library ................................................................................ E-51 Mayor................................................................................... E-5 Planning and Building……………………………...……E-65 Police ................................................................................... E-19 Public Works ................................................................... E-53
B
Balanced Budget Policy ............................................ F-3
Basis of Budgeting ...................................................... D-3
Budget Adoption ......................................................... B-2
Budget Amendment ................................................... B-2
Budget and Financial Policies Balanced Budget (Resolution) ................................. F-3 Charges for Services (Resolution) .......................... F-5 Debt Management Policy FY 2012-13 .................. F-41 Investment Policy FY 2012-13................................. F-15 Long-Term Financial Planning (Resolution) ..... F-67 Reserve Policy (Resolution) ...................................... F-9
Budget by Program Administrative Services…….…………………………..E-30 City Administrator......................................................... E-11 City Attorney .................................................................... E-14 City Auditor ...................................................................... E-15 City Clerk ........................................................................... E-17 City Council ....................................................................... E-7 Community Services…………...……………E-43, 46, 49 Fire ....................................................................................... E-24 Housing and Community Development…………..E-62 Library ................................................................................ E-52 Mayor .................................................................................. E-5 Planning and Building……………………………...……E-66 Police ................................................................................... E-20 Public Works ................................................................... E-55
Budget Development ................................................. B-1 Budget Guide ................................................................ B-1
Budget Adoption ............................................................ B-2 Budget Amendment ...................................................... B-2 Budget Development .................................................... B-1 Budget Process ............................................................... B-2
Budget Process............................................................. B-1 Budget Summary by Fund
FY 2013-14 ....................................................................... D-33 FY 2014-15 ....................................................................... D-45
Budgetary Terminology ........................................... H-1
Business Goals Administrative Services…….……….…E-32 ,35, 37, 39 City Administrator......................................................... E-9 City Attorney .................................................................... E-13
I - 1

INDEX
City Auditor....................................................................... E-15 City Clerk ............................................................................ E-17 City Council ....................................................................... E-7 Community Services…………...……………E-43, 45, 48 Fire ........................................................................................ E-23 Housing and Community Development…………..E-61 Library ................................................................................ E-51 Planning and Building……………………………...……E-65 Police ................................................................................... E-19 Public Works ................................................................... E-53
Business License Tax ................................................. D-63
C
Capital Improvement Program (CIP) ................... E-71 Buildings & Facilities Category ................................ E-73
Categories .......................................................................... E-71 Definition ........................................................................... E-71 Projects by Category ..................................................... E-73 Summary by Category .................................................. E-72 Summary by Category (Graph) ................................ E-72 Summary by Source ...................................................... E-71 Summary by Source – City (Graph) ........................ E-71
Capital Improvement Reserve Fund Policy ....... F-9 Chabot Space & Science Center .............................. C-9
Charges for Services Policy ..................................... F-5
City Administrator ...................................................... E-9
Authorized Positions by Division ............................ E-10 Business Goals ................................................................. E-9 Historical Expenditures and Proposed Budget
by Fund (Summary of) .......................................... E-9 Historical Revenue and Expenditures
by Division (Summary of) .................................... E-11 Mission Statement ......................................................... E-9 Organization Chart by Program ............................... E-12 Prior Reductions ............................................................. E-9 Division Descriptions ................................................... E-10 Significant Changes in Budget ................................. E-12
City Attorney ................................................................. E-13
Authorized Positions by Division ............................ E-13 Business Goals ................................................................. E-13 Division Descriptions ................................................... E-14 Historical Expenditures and Proposed Budget
by Fund (Summary of) .......................................... E-13 Historical Revenue and Expenditures
by Division (Summary of) .................................... E-14 Mission Statement ......................................................... E-13
Organization Chart by Division ............................... E-14 Prior Reductions ............................................................ E-14 Significant Changes in Budget ................................. E-14
City Auditor ................................................................... E-15 Authorized Positions by Program .......................... E-15 Business Goals ................................................................. E-15 Historical Expenditures and Proposed Budget
by Fund (Summary of) ......................................... E-15 Historical Revenue and Expenditures
by Program (Summary of) ................................... E-15 Mission Statement ......................................................... E-15 Organization Chart by Program .............................. E-16 Prior Reductions ............................................................ E-15 Program Descriptions .................................................. E-16 Significant Changes in Budget ................................. E-15
City Clerk ........................................................................ E-17
Authorized Positions by Program .......................... E-17 Business Goals ................................................................. E-17 Historical Expenditures and Proposed Budget
by Fund (Summary of) ......................................... E-17 Historical Revenue and Expenditures
by Program (Summary of) ................................... E-17 Mission Statement ......................................................... E-17 Organization Chart by Program .............................. E-18 Prior Reductions ............................................................ E-17 Program Descriptions .................................................. E-18 Significant Changes in Budget .................................. E-18
City Council .................................................................... E-7 Authorized Positions by Program .......................... E-7 Business Goals ................................................................. E-7 Duties and Responsibilities ....................................... E-7 Historical Expenditures and Proposed Budget
by Fund (Summary of) ......................................... E-7 Historical Revenue and Expenditures
by Program (Summary of) ................................... E-7 Organization Chart by Program .............................. E-8 Prior Reductions ............................................................ E-7 Program Descriptions .................................................. E-8 Significant Changes in Budget ................................. E-7
City Facts ........................................................................ C-1 Arts and Attractions ..................................................... C-9 Chabot Space and Science Center ........................... C-9 Economic Base ................................................................ C-2 Education .......................................................................... C-6 General Information ..................................................... C-1 Government ...................................................................... C-2 Health Care ....................................................................... C-7 History…………………………………………………………C-3 Key Facts ............................................................................ C-11 Oakland International Airport ................................. C-4 Parks and Recreation ................................................... C-9
I - 2

INDEX
Professional/Amateur Sports ................................... C-10 Public Safety ..................................................................... C-8 Transportation and Mass Transit ........................... C-4
D
Debt Management Policy, FY2012-13 .................. F-41 Distinguished Budget Presentation Award ..... Front
E
Economic Base .............................................................. C-2
Economic Development, Service Impacts ........... X-2 Education........................................................................ C-6 Emergency Medical Services Retention Act (Legislation) .................................................................. G-13
Equal Access .................................................................. E-37 Equal Opportunity Programs .................................. E-11
Expenditures, Other GPF .......................................... D-91 Expenditure Tables .................................................... D-81 Expenditures and Proposed Budget by Fund
(Summary of) Administrative Services…….………………………….E-27, 29, 32, 35, 37, 39 City Administrator ......................................................... E-9 City Attorney .................................................................... E-13 City Auditor....................................................................... E-15 City Clerk ............................................................................ E-17 City Council ....................................................................... E-7 Community Services…………...………………………E-43, 45, 48 Fire ........................................................................................ E-23 Housing and Community Development…………..E-61 Library ................................................................................ E-51 Mayor................................................................................... E-5 Planning and Building……………………………...……E-65 Police ................................................................................... E-19 Public Works ................................................................... E-53
F
Financial Policies
Balanced Budget (Resolution) ................................. F-3 Charges for Services (Resolution) .......................... F-5 Debt Management Policy FY 2012-13 .................. F-41 Investment Policy FY 2012-13................................. F-15 Long-Term Financial Planning (Resolution) ..... F-67 Reserve Policy (Resolution) ...................................... F-9
Financial Summaries ................................................. D-1 All Funds Expenditures ............................................... D-83 All Funds Revenue ......................................................... D-59 Basis of Budgeting ......................................................... D-3 Budget Summary by Fund
FY 2013-14 ................................................................ D-33 FY 2014-15 ................................................................ D-45
Expenditure Forecast ................................................... D-2, …………………………………………………………………...D-110 Expenditure Tables ....................................................... D-81 Five Year Financial Forecast………………………..D-107 Forecasting Techniques .............................................. D-1 Fund Sources and Descriptions ............................... D-19 General Purpose Fund Expenditures .................... D-85 General Purpose Fund Revenue .............................. D-61 General Purpose Fund Revenues (Summary of) ............................................................... D-63 Introduction to Financial Summaries ................... D-1 Negative Funds ............................................................... D-95 Other Budget Information ......................................... D-93 Planning for the Two-Year Budget......................... D-3 Revenue & Expenditure Forecast Methodology ................................................................................................ D-1 Revenue Forecast .......................................................... D-2, D-108 Revenue Tables ............................................................... D-57 Significant Expenditure Changes ............................ D-7 Significant Revenue Changes .................................... D-7 Summary Tables ............................................................. D-5 Ten-Year Negative Fund Repayment Schedule …………………………………………………………………..D-101
Fines & Penalties ......................................................... D-75
Fire .................................................................................. E-23
Authorized Positions by Division ........................... E-23 Business Goals ................................................................. E-23 Historical Expenditures and Proposed Budget
by Fund (Summary of) ......................................... E-23 Historical Revenue and Expenditures
by Division (Summary of) .................................... E-24 Mission Statement ......................................................... E-23
I - 3

INDEX
Organization Chart by Division ................................ E-24 Prior Reductions ............................................................. E-25 Division Descriptions .................................................. E-25 Significant Changes in Budget ................................. E-24
Five Year Financial Forecast……………………...…D-107
Forecast Methodology……….……………………...…D-107
Forecasting Techniques ............................................ D-1
Franchise Fees .............................................................. D-77
Fringe Benefits, GPF ................................................... D-89
Fund Sources and Descriptions .............................. D-19
G
General Fund Reserve Policy .................................. F-9 General Information................................................... C-1
General Government, Service Impacts ................ X-4 General Purpose Fund Expenditures ................... D-85
General Purpose Fund Revenue ............................ D-61 General Purpose Fund Revenues (Summary of) ............................................................. D-63
Glossary, Budgetary Terminology ........................ H-1 Government ................................................................... C-2
GPF Fringe Benefits .................................................... D-89
GPF Other Expenditures ........................................... D-91
GPF Retirement ............................................................ D-90
GPF Salaries ................................................................... D-88
H
Health Care (Medical Facilities) ............................. C-7
History of Oakland ...................................................... C-3
Historical Expenditures and Budget by Fund (Summary of)
Administrative Services…….………………………….E-27, 29, 32, 35, 37, 39 City Administrator......................................................... E-9 City Attorney .................................................................... E-13 City Auditor ...................................................................... E-15 City Clerk ........................................................................... E-17 City Council ....................................................................... E-7 Community Services…………...………………………E-43, 45, 48 Fire ....................................................................................... E-23 Housing and Community Development…………..E-61 Library ................................................................................ E-51 Mayor .................................................................................. E-5 Planning and Building……………………………...……E-65 Police ................................................................................... E-19 Public Works ................................................................... E-53
Historical Revenue and Expenditures by
Division/Program (Summary of) Administrative Services…….………………………….E-28, 30, 33, 36, 40 City Administrator......................................................... E-11 City Attorney .................................................................... E-14 City Auditor ...................................................................... E-15 City Clerk ........................................................................... E-17 City Council ....................................................................... E-7 Community Services…………...………………………E-43, 46, 49 Fire ....................................................................................... E-24 Housing and Community Development…………..E-62 Library ................................................................................ E-52 Mayor .................................................................................. E-7 Planning and Building……………………………...……E-66 Police ................................................................................... E-20 Public Works ................................................................... E-56
Housing and Community Development………..…E-61
Authorized Positions by Division ........................... E-61 Business Goals ................................................................. E-61 Division Descriptions ................................................... E-64 Historical Expenditures and Proposed Budget
by Fund (Summary of) ......................................... E-61 Historical Revenue and Expenditures
by Division (Summary of) .................................... E-62 Mission Statement ......................................................... E-61 Organization Chart by Division ............................... E-63 Prior Reductions ............................................................ E-63 Service Impacts ............................................................... X-2 Significant Changes in Budget ................................. E-62
Human Resources ....................................................... E-37 Authorized Positions by Division ........................... E-37
I - 4

INDEX
Business Goals ................................................................. E-37 Division Descriptions ................................................... E-37 Historical Expenditures and Proposed Budget
by Fund (Summary of) .......................................... E-37 Historical Revenue and Expenditures
by Division (Summary of) .................................... E-37 Mission Statement ......................................................... E-37 Organization Chart by Division ................................ E-38 Prior Reductions ............................................................. E-37 Significant Changes in Budget ................................. E-38
Human Services ........................................................... E-48 Authorized Positions by Program .......................... E-48 Business Goals ................................................................. E-48 Historical Expenditures and Proposed Budget
by Fund(Summary of) .......................................... E-48 Historical Revenue and Expenditures
by Program (Summary of) ................................... E-49 Mission Statement ......................................................... E-48 Organization Chart by Program ............................... E-50 Prior Reductions ............................................................. E-48 Program Descriptions .................................................. E-49 Service Impacts ............................................................... X-1 Significant Changes in Budget ................................. E-49
I
Imbalance, Budget……………..……………………...…D-112
Information Technology ........................................... E-39 Authorized Positions by Division ............................ E-39 Business Goals ................................................................. E-39 Division Descriptions ................................................... E-40 Historical Expenditures and Budget
by Fund (Summary of) .......................................... E-39 Historical Revenue and Expenditures
by Division(Summary of) .................................... E-40 Mission Statement ......................................................... E-39 Organization Chart by Division ................................ E-40 Prior Reductions ............................................................. E-40 Significant Changes in Budget .................................. E-40
Interfund Transfers .................................................... D-80 Interest Income ............................................................ D-76
Introduction to Financial Summaries .................. D-1 Investment Policy, City FY 2012-13 ...................... F-15
K
Key Facts ........................................................................ C-11
L
Lake Merritt .................................................................. C-9
Landscape & Lighting Assessment District (Legislation) ................................................................. G-7
Legislation ..................................................................... G-1 Article IIIB Appropriations Limit ........................... G-3 Biennial Budget and Council Amendments ........ G-5 Emergency Medical Services Retention
Act of 1997 (Measure M) ...................................... G-15 Landscape & Lighting Assessment District ........ G-7 Library Services Retention & Enhancement
Act (Measure Q) ....................................................... G-17 Paramedic Services Act of 1997
(Measure N) ............................................................... G-13 Violence Prevention & Public Safety
Act of 2004 (Measure Y) ....................................... G-19 Wildfire Prevention Assessment District ............ G-11
Letter of Transmittal ............................................... Front Library ............................................................................ E-51
Authorized Positions by Program .......................... E-51 Business Goals ................................................................. E-51 Historical Expenditures and Proposed Budget
by Fund (Summary of) ........................................ E-51 Historical Revenue and Expenditures
by Program(Summary of) ................................... E-52 Mission Statement ......................................................... E-51 Organization Chart by Program .............................. E-52 Prior Reductions ............................................................ E-52 Program Descriptions .................................................. E-52 Significant Changes in Budget ................................. E-52
Library Services Retention and Enhancement
Act (Legislation) ...................................................... G-47
Licenses & Permits ..................................................... D-74 Long-Term Financial Planning Policy ................. F-67
Long-Term Liabilities…………………………………D-103
I - 5

INDEX
M
Mayor ............................................................................... E-5 Authorized Positions by Program .......................... E-5 Duties and Responsibilities ....................................... E-5 Historical Expenditures and Proposed Budget
by Fund (Summary of) .......................................... E-5 Historical Revenue and Expenditures
by Program (Summary of) ................................... E-5 Mission Statement ......................................................... E-5 Organization Chart by Program ............................... E-6 Prior Reductions ............................................................. E-6 Program Descriptions .................................................. E-6 Significant Changes in Budget ................................. E-5
Measure M - EMS Retention Act (Legislation) ............................................................ G-15
Measure N - Paramedic Services Act (Legislation) ............................................................ G-13 Measure Q - Library Services Retention &
Enhancement Act (Legislation) ........................ G-17 Measure Y - Violence Prevention & Public
Safety Act (Legislation) ....................................... G-19 Medical Facilities ......................................................... C-7
Miscellaneous Revenue ............................................. D-79
Mission Statement
Administrative Services…….……….…E-32 ,35, 37, 39 City Administrator ......................................................... E-9 City Attorney .................................................................... E-13 City Auditor....................................................................... E-15 City Clerk ............................................................................ E-17 City Council ....................................................................... E-7 Community Services…………...……………E-43, 45, 48 Fire ........................................................................................ E-23 Housing and Community Development…………..E-61 Library ................................................................................ E-51 Planning and Building……………………………...……E-65 Police ................................................................................... E-19 Public Works ................................................................... E-53
N
Negative Funds……………………………………………D-95
Negative Fund Ten-Year Rebalancing Schedule…………………………………………………D-101
Non-Departmental ...................................................... E-69 Historical Expenditures and Proposed Budget by Fund (Summary of) ............................................. E-69 Historical Expenditures and Proposed Budget by Program (Summary of) ...................................... E-70 Prior Reductions ............................................................ E-69 Program Descriptions .................................................. E-70
O
Oakland Army Base .................................................... C-1, C-3 Oakland International Airport C-1, C-4 Organizational Structure ......................................... E-1
Citywide Organizational Chart................................. E-1 Summary of Positions by Agency/Dept
FY 2007-08 through FY 2014-15 ....................... E-2 Other Attractions ........................................................ C-9 Other Budget Information ....................................... D-93
Other Service Charges ............................................... D-77
P
Paramedic Services Act (Legislation) .................. G-13
Parking Revenue ......................................................... D-77
Parking Tax ................................................................... D-73 Parks and Recreation ................................................ E-45
Authorized Positions by Program .......................... E-45 Business Goals ................................................................. E-45 Historical Expenditures and Proposed Budget
by Fund (Summary of) ......................................... E-45 Historical Revenue and Expenditures
by Program (Summary of) ................................... E-46 Mission Statement ......................................................... E-45 Organization Chart by Program .............................. E-47 Program Descriptions .................................................. E-46 Service Impacts ............................................................... X-3 Significant Changes in Budget ................................. E-47
Parks & Recreation (City Facts) ............................. C-9
Planning and Building ............................................... E-65
I - 6
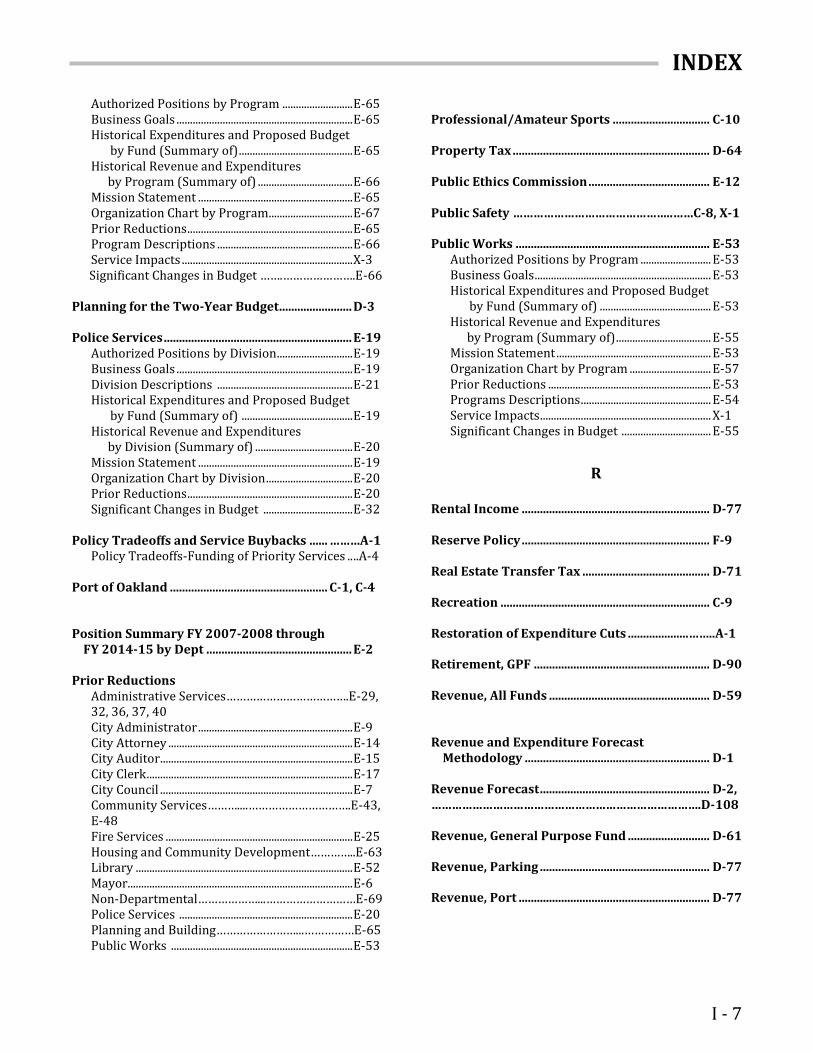
INDEX
Authorized Positions by Program .......................... E-65 Business Goals ................................................................. E-65 Historical Expenditures and Proposed Budget
by Fund (Summary of) .......................................... E-65 Historical Revenue and Expenditures
by Program (Summary of) ................................... E-66 Mission Statement ......................................................... E-65 Organization Chart by Program ............................... E-67 Prior Reductions ............................................................. E-65 Program Descriptions .................................................. E-66 Service Impacts ............................................................... X-3
Significant Changes in Budget …….………………….E-66 Planning for the Two-Year Budget ........................ D-3
Police Services .............................................................. E-19
Authorized Positions by Division ............................ E-19 Business Goals ................................................................. E-19 Division Descriptions .................................................. E-21 Historical Expenditures and Proposed Budget
by Fund (Summary of) ......................................... E-19 Historical Revenue and Expenditures
by Division (Summary of) .................................... E-20 Mission Statement ......................................................... E-19 Organization Chart by Division ................................ E-20 Prior Reductions ............................................................. E-20 Significant Changes in Budget ................................. E-32
Policy Tradeoffs and Service Buybacks ...... ………A-1 Policy Tradeoffs-Funding of Priority Services .. ..A-4
Port of Oakland .................................................... C-1, C-4
Position Summary FY 2007-2008 through FY 2014-15 by Dept ................................................ E-2 Prior Reductions
Administrative Services……………………………….E-29, 32, 36, 37, 40 City Administrator ......................................................... E-9 City Attorney .................................................................... E-14 City Auditor....................................................................... E-15 City Clerk ............................................................................ E-17 City Council ....................................................................... E-7 Community Services………....………………………….E-43, E-48 Fire Services ..................................................................... E-25 Housing and Community Development…………..E-63 Library ................................................................................ E-52 Mayor................................................................................... E-6 Non-Departmental………………...………………………E-69 Police Services ................................................................ E-20 Planning and Building……………………...……………E-65 Public Works ................................................................... E-53
Professional/Amateur Sports ................................ C-10 Property Tax ................................................................. D-64 Public Ethics Commission ........................................ E-12 Public Safety ………………………………………..……C-8, X-1
Public Works ................................................................ E-53
Authorized Positions by Program .......................... E-53 Business Goals ................................................................. E-53 Historical Expenditures and Proposed Budget
by Fund (Summary of) ......................................... E-53 Historical Revenue and Expenditures
by Program (Summary of) ................................... E-55 Mission Statement ......................................................... E-53 Organization Chart by Program .............................. E-57 Prior Reductions ............................................................ E-53 Programs Descriptions ................................................ E-54 Service Impacts ............................................................... X-1 Significant Changes in Budget ................................. E-55
R
Rental Income .............................................................. D-77
Reserve Policy .............................................................. F-9
Real Estate Transfer Tax .......................................... D-71 Recreation ..................................................................... C-9
Restoration of Expenditure Cuts ....................……..A-1
Retirement, GPF .......................................................... D-90 Revenue, All Funds ..................................................... D-59 Revenue and Expenditure Forecast Methodology ............................................................. D-1 Revenue Forecast ........................................................ D-2, …………………………………………………………………….D-108
Revenue, General Purpose Fund ........................... D-61
Revenue, Parking ........................................................ D-77
Revenue, Port ............................................................... D-77
I - 7

INDEX
S
Salaries, GPF .................................................................. D-88 Sales Tax ......................................................................... D-65 Service Charges ............................................................ D-78
Budgeted by Category .................................................. D-77 Other .................................................................................... D-77
Service Impacts .................................................... ……..X-1 Significant Changes in Budget and Performance
Citywide ............................................................................. D-7 Administrative Services…….………………………….E-27, 30, 34, 36, 38, 40 City Administrator ......................................................... E-12 City Attorney .................................................................... E-14 City Auditor....................................................................... E-15 City Clerk ............................................................................ E-18 City Council ....................................................................... E-7 Community Services…………...………………………E-43, 47, 49 Fire ........................................................................................ E-24 Housing and Community Development…………..E-62 Library ................................................................................ E-52 Mayor................................................................................... E-5 Non-Departmental……………………..………………….E-70 Planning and Building……………………………...……E-66 Police ................................................................................... E-21 Public Works ................................................................... E-55
Significant Expenditure Changes ........................... D-7
Significant Revenue Changes .................................. D-7 Sports, Professional/Amateur ................................ C-10
T
Table of Contents ......................................................... i
Transient Occupancy Tax ......................................... D-72
Transportation & Mass Transit ............................. C-4 Two-Year Budget, Planning ..................................... D-3
Ten-Year Negative Fund Rebalancing Schedule…………………………………………………….D-101
U
Utility Consumption Tax .......................................... D-70
V
Violence Prevention and Public Safety Act (Legislation) ............................................................... G-19
W
Wildfire Prevention Assessment District (Legislation) ............................................................... G-11
I - 8


SERVICE IMPACTS
Service Impact Statements
The following provide, in brief, the service impacts anticipated in the FY 2013-2015 Proposed Policy Budget.
Public Safety
Complete four (4) police academies over the next two years (two per fiscal year), bringing the sworn staffing level from the current budgeted staff level of 633 to 665 (by the end of FY 2013-14) and to 697 (by the end of FY 2014-15).
Complete two (2) fire academies in FY 2013-2014, filling approximately 30 vacant firefighter positions (24 funded through the SAFER grant) and hiring approximately 10 paramedics.
Add five (5) Police Communication Dispatchers.
Earmark $2 million for service agreements with outside law enforcement agencies to provide supplemental patrol services, subject to their agreement to provide continued services.
Freeze one (1) vacant Animal Control Officer position, resulting in delayed services.
Restore two (2) fire engines that have been on rotating closures since July 1, 2012.
Begin efforts to streamline Plan Check and Engineering functions among the Fire, Planning & Building, and Public Works departments, which will result in faster reviews, improved efficiency, and reduced redundancy in our permitting process. Increase 1 FTE Fire Plan Check position to improve review time.
Public Works
Invest $82.7 million in infrastructure repairs and improvements: $34.5 million for buildings and facilities, $25.5 million for sewer services, $18.8 million for streets and sidewalks, and $3.8 million for traffic improvements.
Add two (2) positions to begin implementation of the Council-approved Graffiti Abatement Program.
Human Services
Reduce service subsidy contracts with the following organizations by 10 percent: Oakland Unified School District; Family Bridges; Vietnamese Community Development, Inc.; and Vietnamese American Community Center. These agencies would need to determine the types of service impacts resulting from this reduction.
Eliminate one (1) Senior Services Supervisor in FY 2014-2015 and reduce operations/maintenance funds for senior centers.
Head Start--Due to federal sequestration and operating cost increases, reduce the Head Start program by $1.7 million, which will result in the following service impacts:
o Reduce 15 days of service, which still provides 15 days of service above the minimum requirement.
o Close the San Antonio Center and eliminate 13. 47 FTEs positions, of which the budget proposes to add back 3.00 FTEs and save 34 slots.
o Reduce enrollment by 68 slots. Currently there are 1,778 slots, which will be reduced to 1,710.
o Longer waiting lists: With 68 fewer slots, we will only be able to enroll 432 new children next year, instead of 500, and will carry those not registered on an existing waiting list, which currently ranges from 300-400 children.
o Subsidize one Family Advocate and two Early Childhood Instructors to keep the Eastmont Center open
and all Program classes intact. This preserves a full classroom at the Eastmont Center.
X - 1

SERVICE IMPACTS
Housing
Approximate 85% reduced funding for affordable housing programs, from roughly $13 million to $2 million since 2011, due to dissolution of Redevelopment Agency, operating cost increases, and potential sequestration (not yet included in the proposed budget and additional service impacts likely).
o Maintains ROPS staffing level, no filled staff reductions in FY 2013-15, funded at: Y1: $1,740,016; Y2: $1,782,861; but, does eliminate 2 vacant FTE positions. This results in a staffing complement of 9.75 FTEs in FY 2014-2015.
o 55% of the projects are scheduled to be completed by June, 2014 as such the staff will be reduced accordingly.
The budget proposes that any one-time dollars received from the City’s claim to the County regarding the extra fee for administering the “triple flip” –a tax transfer resulting in less revenue from vehicle license tax, but more from property taxes—be appropriated for Y1 (2013-14) for supporting affordable housing programs and other quality of life services (e.g., homeless services, graffiti, etc.) and close funding gaps should the Department of Finance deny project management staffing that is currently being disputed through the Recognized Obligation Payment Schedule. The City’s claim for “triple flip” funds paid to the County is about $2.6 million, generally equal to the policy goal of establishing a 20% set aside for affordable housing programs generated through new tax revenue distributed from the dissolution of redevelopment. The City would use FY 2013-2014 to put in place a sustainable program to set aside, as a goal, 20% of future tax revenues distributed from the dissolution of the redevelopment for affordable housing programs within operating fiscal constraints; but, this begins implementation of the policy goal of an affordable housing set aside in the absence of one established through legislation.1
Sustain the City's partnership with the Oakland Housing Authority to provide project-based subsidy at each affordable housing development funded by the City. This public-partner collaboration ensures the maximum potential for a well-operated and well-maintained affordable housing inventory in the City of Oakland.
Economic Development
Sustain Youth Employment Program (at $1.4M), Adult Employment Training Program (at $1.4M), Dislocated Worker Training Program (at $1.1M); provide limited funding for system administration support.
Start construction at the Army Base by December 2013, which includes constructing a new marine terminal and 1 million square feet of trade and logistics space that will generate approximately 2,000 jobs.
Support efforts to break ground in spring 2014 at the Brooklyn Basin Project, which includes 3,100 units of housing, 30 acres of open space, and 200,000 square feet of commercial space, with an approximate job count of about 8,000 over the 6 to 8 year build-out of the project.
Eliminate the Walking Tour program in FY 2014-2015; other Oakland tours offered by private or non-profit groups minimize the impact.
Stabilize Cultural Arts Programs by transferring some staff costs to Measure C funds.
Maintain funding for festivals and street events and slightly increase the General Fund allocation established by the City Council to $80,000.
1 Until a permanent funding stream to support affordable housing is identified to replace the 25% Redevelopment Agency Housing set-
Aside, Housing’s annual Notice of Funding Availability (NOFA) will focus on preserving the fiscal and structural integrity of the City's affordable housing portfolio. Oakland's affordable housing inventory includes 83 developments comprising more than 4,000 housing units, with an additional 2,000 affordable housing units in the pipeline. Since January 2011, significantly reduced funding for affordable housing has had a two-fold impact: (1) developers are less likely to leverage other loans for affordable housing developments without sufficient local contribution and (2) it further exacerbates the already severe un-met demand for affordable housing. For example, more than 21,000 families are currently on the Oakland Housing Authority (OHA) Section 8 waiting list for affordable housing assistance programs and 121 families sought urgent housing assistance in first two months of operating the new Housing Assistance Center, but could not be served for lack of resources.
X - 2

SERVICE IMPACTS
Economic Development (cont’d)
Add one (1) FTE to add capacity to basic economic development activities related to business recruitment, retention, and development services.
Transfer the Neighborhood Investment unit to the Department of Economic and Workforce Development for increased synergy with economic development activities.
Parks and Recreation Services
Reduce support by 10% for the: Oakland Zoo, Chabot Space and Science Center, Hacienda Peralta, and the Asian Cultural Center.
Eliminate 3.25 FTEs in recreation center staffing, resulting in reductions to the hours of operation for all recreation centers and programs that are supported by the General Purpose Fund.
o The following programs/centers are cost-recovering for staff and material costs, so the hours of operation will not change; however, program offerings may be reduced:
Adult Sports
Central Reservation Unit
Carmen Flores Recreation Center
Davies Tennis
deFremery Recreation Center
Dimond Recreation Center
Discovery Centers (grant funded)
Dunsmuir Hellman Historic Estate
East Oakland Sports Center
Franklin Recreation Center
Ira Jinkins Recreation Center
Lake Merritt Boating
Malonga Casquelourd Center for the Arts
Montclair Recreation Center
Mosswood Recreation Center
Redwood Heights Recreation Center
Studio One Recreation Center
o All other recreation centers and programs will have the flexibility to determine when the reduced hours are implemented, which will limit the negative impacts to their respective communities as long as the reduced-funding target is achieved.
Increased fee at swimming facilities by $1.00.
Negotiations for golf course agreements, including subsidies, are currently underway; however, our focus will be on subsidy reductions subject to operational constraints.
Transfer of funding for various types of services to the Enterprise Fund to sustain current levels of service.
Planning & Building
Eliminate nine (9) currently vacant positions in order to balance the Special Revenue Fund: Planners (2 FTEs), Inspectors (3 FTEs), Engineers (2 FTEs) and Process Coordinator (1 FTE). While these positions are currently vacant, the loss of capacity will double the response time to process and issue permits, as well as complete inspections.
Plan-check review and approval will be delayed by approximately two weeks from current review time.
Slower response times to complaints about blight, illegal dumping, graffiti, etc.
Proceed with implementation of Accela system to improve the effectiveness and efficiency of the permit process, as scheduled.
X - 3

SERVICE IMPACTS
Administrative Services and General Government
Add three (3) FTEs in the City Attorney’s Office to pilot a cost-reduction program that reduces the cost of hiring more expensive, outside legal support by increasing in-house capacity at the cost of $615,652. This assumes that the cost of adding 3 FTEs will be offset by an equivalent reduction in expenditures to hire outside legal support. The pilot program will be evaluated as part of the Mid-Cycle Budget and adjusted accordingly, if necessary. This Pilot Program would be tested in the Self-Insurance Liability Fund.
Consolidate support for Boards & Commissions by adding one (1) FTE to support the Youth Commission and administratively support the Public Ethics Commission and Citizens’ Police Review Board; eliminate the 1 FTE currently assigned only to the Youth Commission.
Reduce General Fund budgets (personnel costs and operations & maintenance) for all elected offices by 5% in FY 2013-14 and 10% in FY 2014-15.
Freeze the Administrative Services Department Director and Community Services Director positions.
Freeze one (1) FTE for information technology and one (1) FTE for accounting supervisor.
Eliminate/Freeze the Human Resource Manager position in Treasury (1 FTEs), an Accountant III and an Accounting Supervisor in Controller’s Office (2 FTEs), an Administrative Services Manager I (1FTEs) in Contract Compliance, Telecommunications System Engineer in Information Technology (1 FTE), a Cable Operations Technician, a Graphic Design Specialist, two Urban Economic Analyst I, an Administrative Assistant, a Program Analyst III, and a part-time Management Intern,City Administration’s Office (11.50 FTEs).
Establish a non-discretionary, one-time Capital Improvement Program Fund for Information Technology at $8.5 million. Propose use of a portion of these funds for: license renewal and critical software upgrades (e.g., Oracle Payroll upgrade), with remaining funds earmarked for critical system upgrades or replacement.
Overall, reductions listed above will result in reduced responsiveness to the general public and internal administrative support services, which have already been significantly impacted.
X - 4

ERRATA #1
X‐1 April 17, 2013
Corrections and Clarification
The following information is provided to correct some misstated or unclear information in other sections of the FY 2013‐15 Proposed Policy Budget.
• Former Redevelopment Transactions: The State is reviewing all of the former Redevelopment Agency’s fiscal and asset transactions, which may be subject to reversal. Fiscal impacts associated with this review will be issued later this spring and will be included when available.
• Negotiated Settlement Agreement (NSA): The Oakland Police Department continues to implement the NSA and a remedial action plan and associated budget are due on May 1, 2013. The actual fiscal impacts are still being determined and will be issued when available.
• Head Start Program: As described in the Policy Tradeoffs and Service Buybacks section and the Service Impacts section, cuts in federal funding necessitate the elimination of 102 Head Start slots and the complete closure of the San Antonio Center. The proposed budget allocates General Purpose Fund dollars to compensate for the lost federal funding, restoring three FTEs for Family Advocates and Early Childhood Instructors and 34 slots for children at Eastmont Town Center.
• Senior Services: The community‐based organization service contracts for senior services will be reduced at the same rate as the City’s own senior center reduction, which is 0.58% and 0.40% in FY 2013‐14 and FY 2014‐15 respectively.
• Housing: Affordable Housing ‐‐ Since 2011, funding for affordable housing has decreased by 85%, from $13 million to $2 million. This was mainly caused by the dissolution of the state redevelopment program. Rising operating costs and the unknown impacts of federal sequestration add to the loss.
To stabilize the housing programs staff, which allows the City to encourage development and leverage state and federal funds, this budget proposes the following:
• The City is expecting up to $2.6M in one‐time revenues from the county. Those one‐time funds can be used in the short term to secure and stabilize housing program staff in year one.
• When boomerang property tax funds stabilize, we can then supplement the one‐time revenues and sustainably fund housing staff by allocating 20% of those funds.
• OUSD Academy: Funding for Oakland Unified School District academy will not be reduced.
• Walking tour: Sustain the walking tour in FY 2013‐14 and seek alternative funding for FY 2014‐15 outside of General Purpose Fund.

California
California


CITYOFOAKLAND
FY2013‐15PROPOSEDCAPITALIMPROVEMENTPROGRAM
MayorJeanQuan
MembersoftheCityCouncil
PatriciaKernighan(District2)CouncilPresident
LarryReid(District7)
Vice‐Mayor
RebeccaKaplan(At‐Large) LibbySchaaf(District4) DanKalb(District1) NoelGallo(District5)
LynetteGibsonMcElhaney(District3) DesleyBrooks(District6)
CityAdministratorDeannaJ.Santana
PreparedbythePublicWorksVitalyB.TroyanP.E.,AgencyDirectorJasonMitchellAgencyManager
MichaelJ.Neary
NilaWong
AdministrativeServicesManager
SupportStaffDavidNgCathyVicentina
RowenaQuindiagan
P.E.,AssistantDirectorDepartmentofEngineering&Construction

ElectedOfficersBarbaraParker,CityAttorneyCourtneyRuby,CityAuditor
AdministrationDeannaJ.Santana,CityAdministrator
FredBlackwell,AssistantCityAdministratorScottP.Johnson,AssistantCityAdministratorArturoSanchez,DeputyCityAdministrator
Directors
LaTondaSimmonsCityClerk
CommunityServices
AudreeV.Jones‐Taylor–Parks&RecreationSaraBedford–HumanServices
TeresaDeloachReed
FireDepartment
MicheleByrd
Housing&CommunityDevelopment
GeraldGarzon(Interim)Library
RachelO’DwyerFlynnPlanningandBuilding
HowardA.JordanPoliceDepartment
VitalyTroyanPublicWorks

MissionStatementTheCityofOakland is committed to thedeliveryof effective, courteousandresponsibleservice.Citizensandemployeesaretreatedwithfairness,dignityandrespect.
Civic and employee pride are accomplished through constant pursuit ofexcellence and a workforce that values and reflects the diversity of theOaklandcommunity.

ProposedCIP
Notes

ProposedCIP Page1
Contents
CAPITAL IMPROVEMENT PROGRAM OVERVIEW ........................................................ 3
I. CAPITAL IMPROVEMENTS - INFRASTRUCTURE ........................................................ 5
Capital Improvement Program - Principles and Development Process ...................................... 5
Key CIP Funding Sources ........................................................................................................... 6
Internal Sources ...................................................................................................................... 6
Grant Sources .......................................................................................................................... 6
CIP Project Categories ................................................................................................................ 6
Funded, Non-Discretionary Projects ....................................................................................... 7
Funded, Discretionary Projects ............................................................................................... 7
Mandated Projects ................................................................................................................... 7
Major Unmet Requests ........................................................................................................... 7
Other Unmet Requests ............................................................................................................ 8
Next Steps - Long Term Planning .............................................................................................. 8
Financial Summaries .................................................................................................................. 11
Definition .............................................................................................................................. 13
Categories ............................................................................................................................. 13
CIP Summary by Source ....................................................................................................... 14
CIP Summary by Category ................................................................................................... 17
Attachment I: Project Description
Buildings and Facilities................................................................................................A-1 Sewers & Storm Drains...............................................................................................B-1 Streets & Sidewalks.....................................................................................................C-1 Traffic Improvements.................................................................................................D-1

ProposedCIP Page2
Attachment II: Mandated Projects
Unfunded Mandatory Priority List by Department.......................................................E-1
Attachment III: Legislation
The Capital Improvement Prioritization Policy (Resolution No. 78747 C.M.S., 2004)...........................................................................F-1
Five Year Pavement Program (Resolution 81039 C.M.S,, 2007) .................................................................................F-5
Sidewalk Prioritization Program (Resolution 81751 C.M.S., 2009)..................................................................................F-7 Park Project Prioritization List (Resolution 81021 C.M.S., 2007) .................................................................................F-10
II. CAPITAL IMPROVEMENT – EQUIPMENT
III. CAPITAL IMPROVEMENT – INFORMATION TECHNOLOGY

ProposedCIP Page3
CAPITALIMPROVEMENTPROGRAMOVERVIEW
A Capital Improvement Program (CIP) represents a major investment in a city's infrastructure and assets. It must balance repair and replacement of existing assets with delivering new assets where they may be needed. It must reflect the overall priorities of the City. It has a huge impact on the health and vibrancy of the community.
This recommended Capital Improvement Program comprises three areas of investment:
Infrastructure
Equipment
Information Technology
Each of these categories is described in detail in this document. Infrastructure projects include projects for which funding is available and are recommended for adoption. Likewise, Equipment includes equipment purchases funded through a Master Lease Agreement. Information Technology investments list all high priority projects, however the funding for these projects may still need to be identified.
Oakland's Capital Improvement Program is formally reviewed and approved every two years, as part of the biennial policy budget.
Capital projects are defined as any long-term investment that builds, replaces or improves an asset (buildings, roads, parks, sewer and drainage lines, etc.) and that has a useful design life of at least ten years and a minimum cost of $50,000.Equipment and Information Technology investments have different useful life due to the nature of the purchase and are more specifically defined in their respective sections below.

ProposedCIP Page4
Notes

ProposedCIP Page5
I.CAPITALIMPROVEMENTS‐INFRASTRUCTURE
Like many older cities, Oakland has an aging infrastructure and a significant backlog of deferred maintenance. Oakland currently has no dedicated source of truly discretionary funding to address overall capital investment needs. The proposed CIP includes funding for only a small portion of this backlog or need, reflecting the limits of existing fund sources. Because of this, a strategic approach to prioritizing the remaining unmet needs is needed. Such an approach will necessarily require an assessment of core City programs, the assets needed to deliver those programs, a condition assessment of those City's assets, and a long-term funding approach to addressing those assets considered critical to core functions and future growth. The steps to begin this process are discussed in more detail below.
CapitalImprovementProgram‐PrinciplesandDevelopmentProcessSeveral policy documents guide the overall preparation of the infrastructure CIP. These include
The Capital Improvement Prioritization Policy adopted by Council in 2004 (Resolution No. 78747 C.M.S.)
Five Year Pavement Program (Resolution 81039 C.M.S,, 2007) Sidewalk Prioritization Program (Resolution 81751 C.M.S., 2009) Park Project Prioritization List (Resolution 83725 C.M.S., 2012)
With these policies as guidance, the Public Works Agency reviewed the previous CIP (FY 2010-2012) and solicited new projects or revisions to existing projects from departments throughout the City organization. This effort was begun in Fall 2012. Public Works Agency staff developed a planning level scope and budget for each requested project, in consultation with client departments. We also reviewed any relevant condition assessments available for various city assets, such as pavement, sidewalks, sanitary sewers, parks and open space and facilities. Finally, a set of objective criteria fitting the prioritization policies listed above was developed to allow projects within categories to be ranked in relative priority. A database was developed to maintain this information.
The projects recommended for appropriation reflect these priority policies and the constraints of existing funding sources. They place a priority on preserving the City's significant investment in existing infrastructure assets.

ProposedCIP Page6
KeyCIPFundingSourcesThere are limited sources of internal funding available for capital improvements, typically with restrictions on their use within broad categories, described below. Grants are another source of funding for capital projects. While often a major source of capital funding, they are even more limited, typically competitive and cyclical in nature.
InternalSources
The following are the major sources of funding for capital investment in Oakland:
Sewer Service Fund (Fund 3100). Limited to funding maintenance and capital improvements to the sanitary sewer collection system.
Measure B - Transportation (Fund 2211). Limited to funding transportation and traffic safety improvements within the public right-of-way.
Measure B - Bicycle and Pedestrian (Fund 2212). Limited to funding bicycle and pedestrian safety and accessibility improvements within the public right-of-way.
Vehicle Registration Fee (Fund 2215). Limited to funding transportation and traffic safety improvements within the public right-of-way.
GrantSources
Additionally, Oakland aggressively pursues grant opportunities for various capital improvements. While by their nature these grants are only available for specific projects and purposes, they do represent a significant addition to local funds. They represent the most viable source to fund new improvements and allow internal funds to be kept available for existing assets.
In the period including the last two fiscal years to date, staff successfully applied for and received a total of $36 million in grants for 29 capital projects. Staff will continue to seek grants when projects are competitive and meet the City's need to address unfunded priorities.
CIPProjectCategoriesThe CIP can be broken into several key categories for consideration. These include:
Funded, non-discretionary projects Funded, discretionary projects Unfunded, mandated projects Unfunded, high priority projects Other unfunded projects
Each is described in more detail below.

ProposedCIP Page7
Funded,Non‐DiscretionaryProjects
These projects are those that are either mandated upon the City by court order or other legislation (e.g., sanitary sewer capital improvements; construction of curb ramps) or where the funding source limits the type of project to be funded. The majority of projects recommended for adoption in the attached CIP fall into this category. A total of $87.8 million is recommended for investment in these projects. A summary of these projects:
Buildings and Facilities, 7 projects, $1.4 million Sewers - 12 projects, $29.1 million Streets, Sidewalks - 10 projects, $19.6 million Traffic Improvements - 5 projects, 4.5 million Garage Improvements – 3 projects, $33.2 million (subject to State Approval of
Redevelopment disposition)
Funded,DiscretionaryProjects
These are projects for which funding is available that are not mandated or are funded through sources such as General Purpose Fund or other funds that do not have limits on their expenditures.
MandatedProjects
These are projects with no available source of funding but which are mandated by federal or state law. Staff carefully analyzed all projects submitted for inclusion in this category and sought confirmation of any relevant legislation. A total of 4 projects representing a needed investment of $1.8 million were identified. Examples of these projects include boiler replacement and elevator upgrades. While no funding source has been identified, these projects are presented for consideration should funding become available.
MajorUnmetRequests
This category includes projects that replace or renovate assets which are either structurally or functionally obsolete or have deferred maintenance issues that negatively value the asset but for which no funding is available. This category includes:
Major projects that improve or replace key assets. Examples include: o Emergency services facilities such as the Police Administration Building and
some fire stations that do not meet the criteria of essential service facilities (fully operational after an earthquake or similar disaster) or have significant deferred maintenance items that impact their operational status.
o Street Resurfacing and sidewalk repairs, to address the backlog throughout the City in assets that must be maintained.

ProposedCIP Page8
Minor Capital Improvements, which would fund repairs or replacement of assets that are not planned but are of an urgent nature, are recommended for funding in the proposed policy operating budget. These include roof repairs and replacement; hot water heater, chiller and boiler replacement; appliance replacement; mold, asbestos and lead paint abatement; HVAC major repair and/or replacement; Fire Station apron replacement; electrical panel upgrades; sewer line/lateral replacements; interior plumbing replacement at aged facilities (e.g. PAB); various facilities –fire and burglar alarm system upgrades; Parks and Recreation Tot Lot surface replacement; Fire Station roll up door replacement; Parks and Recreation swimming pools, pumps, boilers and filters; fencing at a variety of facilities; pathway and parking lot paving at all facilities; Ball field and park lighting. The category is listed here for consideration should funding for this work be removed from the proposed operating budget.
OtherUnmetRequests
This category includes all other department requests for capital projects. These include completion of some or all of the Library Master Plan; improvements to Recreation Centers and Parks; construction of New Fire Stations and upgrades to facilities throughout Oakland.
NextSteps‐LongTermPlanning
Because capital assets are linked directly to services provided by the City organization, any long term capital project planning requires a careful assessment of core services. In seeking input from departments for the preparation of this CIP, it became clear that the requests for capital investment vastly outweigh our capacity to fund them. Oakland maintains a significant inventory of assets, from the street and sidewalk network to buildings, grounds and facilities. Many of our assets have reached the end of their useful life and need replacement. Others have historic value or other intrinsic value to the community. Our inventory also includes facilities that have been abandoned, are no longer used for their original intended purpose or are functionally obsolete. Abandoned assets in particular pose an ongoing maintenance burden and often present liability to the City.
Before any significant investment can be made to these assets, a prioritization must be completed. Such prioritization must take into account the current condition and the current and future need and use. It must include a risk assessment, an analysis of the highest and best use of each asset, and a cost-benefit analysis to maintaining ownership and use. Finally, it should consider all options to deliver the service associated with the asset.

ProposedCIP Page9
Using the data collected to date as part of this CIP process, the City Administrator will convene a committee of key department stakeholders and subject matter experts from Public Works, Finance and other appropriate disciplines to conduct a thorough review of core city services to determine which requested projects should be considered for future funding. A report of this effort will be provided at a future date.

ProposedCIP Page10
Notes

ProposedCIP Page11
FinancialSummaries

ProposedCIP Page12
Notes

ProposedCIP Page13
Definition
Capital projects are defined as a long-term investment that builds, replaces or improves an asset (buildings, roads, parks, sewer and drainage lines, etc.) and that has a useful design life of at least ten years and a minimum cost of $50,000.
Categories
The FY 2013-15 Capital Improvement Program budget is organized in the categories listed below.
BUILDINGSANDFACILITIESThis category of projects includes new construction, replacement or improvement of recreation centers, fire stations, community centers, and other City buildings, facilities, and structures.
PARKSANDOPENSPACEProjects in this category include improvements to playgrounds and tot lots, park facilities and City swimming pools; and improvements to Oakland’s waterways.
SEWERSANDSTORMDRAINSProjects in this category include reconstruction of sewer mains throughout the City as required by an Administrative Order issued to Oakland and other Bay Area communities by the United States Environmental Protection Agency and the State of California. The Order requires the City to plan and implement capital repairs and replacements to the aging sewer facilities and implement maintenance practices to prevent sewage discharges into creeks, lakes, and the San Francisco Bay. Funding for emergency repair and replacement of sewer and storm drain facilities is also included.
STREETSANDSIDEWALKSProjects in this category include street paving and rehabilitation, street safety projects, street lighting, and sidewalk repair, as well as streetscape beautification. These projects are designed to address the maintenance backlog of City streets and sidewalks.
TRAFFICIMPROVEMENTSThis category includes traffic and transportation-related improvements, including traffic calming, traffic signals, modernization of traffic signals and signal controllers, and signal synchronization. They are intended to improve the safety of all modes of travel: pedestrian, cyclist and automobile.

ProposedCIP Page14
CIPSummarybySource
SummarybySource
SourceFY2013‐14ProposedBudget
FY2014‐15ProposedBudget
FY2013‐15Total
Budget
1010‐GENERALPURPOSEGENERALFUND $252,000 $252,000 $504,0002163‐METROTRANSPORTATIONCOM‐PROGRAMGRANT ‐ 3,851,000 3,851,0002211‐MEASUREB‐ACTIA 7,545,000 6,995,000 14,540,0002212‐MEASUREB‐BICYCLE/PEDESTRIANPASS‐THRU 1,650,000 1,000,000 2,650,0002215‐VEHICLEREGISTRATIONFEE 1,500,000 1,500,000 3,000,0003100‐SEWERSERVICEFUND 14,760,000 14,360,000 29,120,0005130‐ROCKRIDGELIBRARYASSESSMENTDISTRICT 498,500 ‐ 498,500
Total $26,205,500 $27,958,000 $54,163,500
1010‐ GeneralFundPurpose
0.9%
2163‐METROTRANSPORTATIONCOM‐
PROGRAMGRANT7.1%
2211‐MEASURE B‐ ACTIA26.8%
2212‐MEASURE B‐BICYCLE/PEDESTRIAN
PASS‐THRU4.9%2215‐VEHICLE
REGISTRATIONFEE5.5%
3100‐SEWERSERVICEFUND53.8%
5130‐ROCKRIDGE LIBRARYASSESSMENTDISTRICT
0.9%
CAPITALIMPROVEMENTPROGRAMFY2013‐15SummarybySource‐ City
$54,163,500

ProposedCIP Page15
ProjectsbySource
FundFY2013‐14ProposedBudget
FY2014‐15ProposedBudget
FY2013‐15Total
Budget1010GeneralPurposeFundADABuildingsandFacilities30‐YearTransitionPlan $252,000 $252,000 $504,0001010GeneralPurposeFundTotal $252,000 $252,000 $504,000
2163‐MetroTransportationCom‐ProgramGrantCitywideStreetRehabilitation/Resurfacing $0 $3,851,000 $3,851,0002163‐MetroTransportationCom‐ProgramGrantTotal $0 $3,851,000 $3,851,000
2211‐MeasureBADACurbRamp30‐YearTransitionPlan $660,000 $660,000 $1,320,000BridgePreventiveMaintenance $250,000 $250,000 $500,000CitywideRepairandRehabilitationofCityPathsandStairs $200,000 $200,000 $400,000CitywideSidewalkRepairs $300,000 $300,000 $600,000CitywideStreetRehabilitation/Resurfacing $3,285,000 $2,585,000 $5,870,000CitywideTrafficSignalControllerReplacementProgram $0 $150,000 $150,000EmergencyRoadwayRepairs $500,000 $500,000 $1,000,000MatchingFundsforGrantFundedProjects $1,250,000 $1,250,000 $2,500,000NeighborhoodTrafficCalmingProgram $100,000 $100,000 $200,000TrafficSignalSystemManagement $1,000,000 $1,000,000 $2,000,0002211‐MeasureBTotal $7,545,000 $6,995,000 $14,540,000
2212‐MeasureB‐Bicycle/PedestricanPass‐ThruBicycleMasterPlanImplementation $1,000,000 $350,000 $1,350,000CitywideSidewalkRepairs $250,000 $250,000 $500,000PedestrianMasterPlanImplementation $400,000 $400,000 $800,0002212‐MeasureB‐Bicycle/PedestricanPass‐ThruTotal $1,650,000 $1,000,000 $2,650,000
2215‐VehicleRegistrationFeeCitywideStreetRehabilitation/Resurfacing $1,500,000 $1,500,000 $3,000,0002215‐VehicleRegistrationFeeTotal $1,500,000 $1,500,000 $3,000,000
3100‐SewerServiceFundCitywideCyclicSewerReplacement $3,375,000 $3,375,000 $6,750,000RehabilitationofSanitarySewerintheAreaboundedby21stAvenue,17thStreet,24thAvenue,and27thAvenue(60‐06)
$400,000 $0 $400,000
RehabilitationofSanitarySewerintheAreaboundedbyCampusDrive,MountainBoulevard,KnollAvenue,andAccess(83‐013)
$0 $240,000 $240,000
RehabilitationofSanitarySewerintheAreaboundedbyCastleParkWy,SkylineBoulevard,HaverhillDrive,andScarboroughDrive(56‐07)
$0 $945,000 $945,000
RehabilitationofSanitarySewerintheAreaboundedbyDennisonStreet,Embarcadero,KingStreet,andFederickStreet(61‐01)
$1,250,000 $0 $1,250,000

ProposedCIP Page16
ProjectsbySource(Continued)
FundFY2013‐14ProposedBudget
FY2014‐15ProposedBudget
FY2013‐15Total
Budget
3100‐SewerServiceFund(Continued)RehabilitationofSanitarySewerintheAreaBoundedbyHwy13,ReinhardtDrive,39thAvenue,andAlisoAvenue(83‐501)
$0 $280,000 $280,000
RehabilitationofSanitarySewerintheAreaBoundedbyMountainBoulevard,BernvesCt,TerrabellaWay,andRedwoodRd(83‐502)
$0 $280,000 $280,000
RehabilitationofSanitarySewerintheAreaboundedbyMountainBoulevard,JoaquinMillerRd,SkylineBoulevard,andCastleDr(56‐06)
$525,000 $4,200,000 $4,725,000
RehabilitationofSanitarySewerintheAreaboundedbyParkBoulevard,HollywoodAve,SunnyhillsRd,andBrightonAve(54‐16)
$630,000 $5,040,000 $5,670,000
RehabilitationofSanitarySewersintheAreaBoundedbyLongridgeRoad,FWY580,ParkBlvd.,andUnderhillsRoad(54‐12)
$750,000 $0 $750,000
RehabilitationofSanitarySewersintheAreaBoundedbyMacArthurBoulevard,MapleAvenue,BarnerAvenue,andFryeStreet(80‐102)
$4,320,000 $0 $4,320,000
RehabilitationofSanitarySewersinWestGrandAvenuebetweenWoodStreetandSanPabloAvenue
$3,510,000 $0 $3,510,000
3100‐SewerServiceFundTotal $14,760,000 $14,360,000 $29,120,000
5130‐RockridgeLibraryAssessmentDistrictRockridgeLibraryInterior/ExteriorPainting $225,000 $0 $225,000RockridgeLibraryLightReplacement(Interior) $148,500 $148,500RockridgeLibraryRe‐Carpet $125,000 $0 $125,0005130‐RockridgeLibraryAssessmentDistrictTotal $498,500 $0 $498,500
Total $26,205,500 $27,958,000 $54,163,500

ProposedCIP Page17
CIPSummarybyCategory
SummarybyCategory
Category
FY2013‐14ProposedBudget
FY2014‐15ProposedBudget
FY2013‐15TotalBudget
BuildingsandFacilities $750,500 $252,000 $1,002,500
Parks&OpenSpace ‐ ‐ ‐
Sewers&StormDrains 14,760,000 14,360,000 29,120,000
Streets&Sidewalks 8,195,000 11,346,000 19,541,000
TrafficImprovements 2,500,000 2,000,000 4,500,000
Total $26,205,500 $27,958,000 54,163,500$
BuildingsandFacilities1.9%
Parks&OpenSpace0.0%
Sewers&Storm Drains53.8%
Streets &Sidewalks36.1%
TrafficImprovements8.3%
CAPITAL IMPROVEMENT PROGRAM FY 2013‐15Summary by Category
$54,163,500

ProposedCIP Page18
ProjectsbyCategory
CategoryFY2013‐14ProposedBudget
FY2014‐15ProposedBudget
FY2013‐15Total
Budget
BuildingsandFacilitiesADABuildingsandFacilities30‐YearTransitionPlan $252,000 $252,000 $504,000RockridgeLibraryInterior/ExteriorPainting $225,000 $0 $225,000RockridgeLibraryLightReplacement(Interior) $148,500 $148,500RockridgeLibraryRe‐Carpet $125,000 $0 $125,000Buildings&FacilitiesTotal $750,500 $252,000 $1,002,500
Parks&OpenSpace ‐ ‐ ‐
Sewers&StormDrainsCitywideCyclicSewerReplacement $3,375,000 $3,375,000 $6,750,000RehabilitationofSanitarySewerintheAreaboundedby21stAvenue,17thStreet,24thAvenue,and27thAvenue(60‐06)
$400,000 $0 $400,000
RehabilitationofSanitarySewerintheAreaboundedbyCampusDrive,MountainBoulevard,KnollAvenue,andAccess(83‐013)
$0 $240,000 $240,000
RehabilitationofSanitarySewerintheAreaboundedbyCastleParkWy,SkylineBoulevard,HaverhillDrive,andScarboroughDrive(56‐07)
$0 $945,000 $945,000
RehabilitationofSanitarySewerintheAreaboundedbyDennisonStreet,Embarcadero,KingStreet,andFederickStreet(61‐01)
$1,250,000 $0 $1,250,000
RehabilitationofSanitarySewerintheAreaBoundedbyHwy13,ReinhardtDrive,39thAvenue,andAlisoAvenue(83‐501)
$0 $280,000 $280,000
RehabilitationofSanitarySewerintheAreaBoundedbyMountainBoulevard,BernvesCt,TerrabellaWay,andRedwoodRd(83‐502)
$0 $280,000 $280,000
RehabilitationofSanitarySewerintheAreaboundedbyMountainBoulevard,JoaquinMillerRd,SkylineBoulevard,andCastleDr(56‐06)
$525,000 $4,200,000 $4,725,000
RehabilitationofSanitarySewerintheAreaboundedbyParkBoulevard,HollywoodAve,SunnyhillsRd,andBrightonAve(54‐16)
$630,000 $5,040,000 $5,670,000
RehabilitationofSanitarySewersintheAreaBoundedbyLongridgeRoad,FWY580,ParkBlvd.,andUnderhillsRoad(54‐12)
$750,000 $0 $750,000
RehabilitationofSanitarySewersintheAreaBoundedbyMacArthurBoulevard,MapleAvenue,BarnerAvenue,andFryeStreet(80‐102)
$4,320,000 $0 $4,320,000
RehabilitationofSanitarySewersinWestGrandAvenuebetweenWoodStreetandSanPabloAvenue
$3,510,000 $0 $3,510,000
Sewers&StormDrainsTotal $14,760,000 $14,360,000 $29,120,000

ProposedCIP Page19
ProjectsbyCategory(Continued)
CategoryFY2013‐14ProposedBudget
FY2014‐15ProposedBudget
FY2013‐15Total
Budget
Streets&SidewalksADACurbRamp30‐YearTransitionPlan $660,000 $660,000 $1,320,000BridgePreventiveMaintenance $250,000 $250,000 $500,000CitywideRepairandRehabilitationofCityPathsandStairs $200,000 $200,000 $400,000CitywideSidewalkRepairs $300,000 $300,000 $600,000CitywideSidewalkRepairs $250,000 $250,000 $500,000CitywideStreetRehabilitation/Resurfacing $0 $3,851,000 $3,851,000CitywideStreetRehabilitation/Resurfacing $3,285,000 $2,585,000 $5,870,000CitywideStreetRehabilitation/Resurfacing $1,500,000 $1,500,000 $3,000,000EmergencyRoadwayRepairs $500,000 $500,000 $1,000,000MatchingFundsforGrantFundedProjects $1,250,000 $1,250,000 $2,500,000
Streets&SidewalksTotal $8,195,000 11,346,000$ 19,541,000$
TrafficImprovementsBicycleMasterPlanImplementation $1,000,000 $350,000 $1,350,000CitywideTrafficSignalControllerReplacementProgram $0 $150,000 $150,000NeighborhoodTrafficCalmingProgram $100,000 $100,000 $200,000PedestrianMasterPlanImplementation $400,000 $400,000 $800,000TrafficSignalSystemManagement $1,000,000 $1,000,000 $2,000,000TrafficImprovementsTotal 2,500,000 2,000,000 4,500,000
Total $26,205,500 27,958,000$ 54,163,500$

ProposedCIP Page20
Notes

Project Description
Proposed 2-Year Budget and 5-Year Plan
Project/CIP Funding Source
Operating Cost Impact Funding Source 2013-14 2014-15 2015-16 2016-17 2017-18
2013-14 2014-15 2015-16 2016-17 2017-18 TOTALS
TOTALS
Contact:
Project Title: ADA Buildings and Facilities 30-Year Transition Plan
Description: This ongoing project removes major architectural barriers identified by the City’s federally mandated ADA Buildings and Facilities Transition Plan or by qualified complainants. Scheduled fiscal year 2011-13 projects included accessibility improvements swimming pools, and the Woodminster Amphitheater (case settlement). Scheduled FY 2013-15 projects include ongoing tot lot rehabilitation, and other listed park and recreation facility improvements.
Justification: Public entities must have a structured and scheduled program for transitioning buildings and facilities to ADA compliance. Over 100 City buildings and facilities remain on the ADA Transition Plan list and an annual budget of $252,000 represents what is minimally required to sustain the transition program through FY 2014-15. This project minimizes public liability exposure and reduces complaints, thus adverting major spendingon litigation. Nevertheless the City is still subject to disability complaints and in some instances such complaints can only be remedied by major building and facility improvements.
Prioritization Factors:
New Facility Existing Facility
Council District: Citywide
Mandated Program
Leverages Outside Funding
ADA
Location: Citywide
Life Safety0
Hazard Elimination 4
Preventive Maintenance4
Project No.: P274210
Department: Public Works Agency
BUILDINGS AND FACILITIESCategory:
252,000 252,000 906,500 906,500 1,398,0001010 General Purpose General Fund 3,715,000
252,000 906,500 906,500 1,398,000TOTAL 252,000 3,715,000
2013-18 CAPITAL IMPROVEMENT PROGRAM
A - 1

Project Description
Proposed 2-Year Budget and 5-Year Plan
Project/CIP Funding Source
Operating Cost Impact Funding Source 2013-14 2014-15 2015-16 2016-17 2017-18
2013-14 2014-15 2015-16 2016-17 2017-18 TOTALS
TOTALS
Contact: Gerry Garzon X6720
Project Title: Rockridge Library Interior/Exterior Painting
Description: Repaint Interior and Exterior of Library
Justification: Funding provided through the Rockridge Assessment District funds in 2013-14
Prioritization Factors:
New Facility Existing Facility
Council District: 1
Mandated Program
Leverages Outside Funding
Location: 5366 College Avenue
Life Safety0
Hazard Elimination 0
Preventive Maintenance0
Project No.:
Department: Library
BUILDINGS AND FACILITIESCategory:
225,000 0 0 0 05130 Rockridge Library Assessment District 225,000
0 0 0 0TOTAL 225,000 225,000
4,065 0 0 0 00000 Undetermined Fund 4,065
4,065 0 0 0 0TOTAL 4,065
2013-18 CAPITAL IMPROVEMENT PROGRAM
A - 2

Project Description
Proposed 2-Year Budget and 5-Year Plan
Project/CIP Funding Source
Operating Cost Impact Funding Source 2013-14 2014-15 2015-16 2016-17 2017-18
2013-14 2014-15 2015-16 2016-17 2017-18 TOTALS
TOTALS
Contact:
Project Title: Rockridge Library Light Replacement (Interior)
Description: Replacement of recessed can light fixtures with energy efficient fixtures requiring less bulb replacement; as an alternative, replace fixture with another type more readily accessible (pendant).
Justification: PWA indicates light fixture is too difficult to service because of the difficultly in accessing the fixtures, the bulbs are often not replaced or fixed. This is a priority project for Library Services, funded through Rockridge Assessment District Funds for FY 2013-14.
Prioritization Factors:
New Facility Existing Facility
Council District: 1
Mandated Program
Leverages Outside Funding
Location: 5366 College Avenue
Life Safety
Hazard Elimination
Preventive Maintenance3
Project No.:
Department: Library
BUILDINGS AND FACILITIESCategory:
148,500 0 0 05130 Rockridge Library Assessment District 148,500
0 0 0 0TOTAL 148,500 148,500
0 0 0 0 00000 Undetermined Fund 0
0 0 0 0 0TOTAL 0
2013-18 CAPITAL IMPROVEMENT PROGRAM
A - 3

Project Description
Proposed 2-Year Budget and 5-Year Plan
Project/CIP Funding Source
Operating Cost Impact Funding Source 2013-14 2014-15 2015-16 2016-17 2017-18
2013-14 2014-15 2015-16 2016-17 2017-18 TOTALS
TOTALS
Contact:
Project Title: Rockridge Library Re-Carpet
Description: Recarpet Library
Justification: Funding provided through the Rockridge Assessment District funds in 2013-14
Prioritization Factors:
New Facility Existing Facility
Council District: 1
Mandated Program
Leverages Outside Funding
Location: 5366 College Avenue
Life Safety
Hazard Elimination
Preventive Maintenance
Project No.:
Department: Library
BUILDINGS AND FACILITIESCategory:
125,000 0 0 0 05130 Rockridge Library Assessment District 125,000
0 0 0 0TOTAL 125,000 125,000
2013-18 CAPITAL IMPROVEMENT PROGRAM
A - 4

Project Description
Adopted 2-Year Budget and 5-Year Plan
Project/CIP Funding Source
Operating Cost Impact Funding Source 2013-14 2014-15 2015-16 2016-17 2017-18
2013-14 2014-15 2015-16 2016-17 2017-18 TOTALS
TOTALS
Contact:
Project Title: Citywide Cyclic Sewer Replacement
Description: Design and construct replacement of deteriorated sanitary sewers.
Justification: The California Regional Water Quality Control Board requires the City to eliminate sewer overflows under a cease and desist order. These project eliminate sewer overflows, a health and safety issue, extend the useful life of the sanitary sewer infrastructure, and reduce operation and maintenance costs.
Prioritization Factors:
New Facility Existing Facility
Council District: Citywide
Mandated Program
Leverages Outside Funding
Cease and Desist Order
Location: Citywide
Life Safety3
Hazard Elimination 3
Preventive Maintenance3
Project No.: C228910
Department: Public Works Agency
SEWERS AND STORM DRAINSCategory:
3,375,000 3,375,000 3,375,000 3,375,000 3,375,0003100 Sewer Service Fund 16,875,000
3,375,000 3,375,000 3,375,000 3,375,000TOTAL 3,375,000 16,875,000
2013-18 CAPITAL IMPROVEMENT PROGRAMB - 1

Project Description
Adopted 2-Year Budget and 5-Year Plan
Project/CIP Funding Source
Operating Cost Impact Funding Source 2013-14 2014-15 2015-16 2016-17 2017-18
2013-14 2014-15 2015-16 2016-17 2017-18 TOTALS
TOTALS
Contact:
Project Title: Rehabilitation of Sanitary Sewer in the Area bounded by 21st Avenue, 17th Street, 24th Avenue, and 27th Avenue (60-06)
Description: This project will rehabilitate the sanitary sewer main lines throughout the area bounded by 21st Avenue, 17th Street, 24th Avenue, and 27th Avenue by various pipeline rehabilitation methods. Building sewer laterals between the main sewer and property line will also be rehabilitated, and clean-outs will be installed on building laterals to provide access for maintenance. (60-06)
Justification: Under a cease and desist order the California Regional Water Quality Control Board requires the City to eliminate the discharge of untreated sewage into local creeks, lakes, and the Bay. The sewers in the subject area have been determined to be cost-effective for rehabilitation. The project will rehabilitate existing sewer pipes in the area, reduce overflows, and is required by the City's Compliance plan with the Regional Board.
Prioritization Factors:
New Facility Existing Facility
Council District: 2, 5
Mandated Program
Leverages Outside Funding
Cease and Desist Order
Location: Area Bounded by 21st Avenue, 17th Street, 24t
Life Safety3
Hazard Elimination 3
Preventive Maintenance3
Project No.:
Department: Public Works Agency
SEWERS AND STORM DRAINSCategory:
400,000 0 2,500,000 0 03100 Sewer Service Fund 2,900,000
0 2,500,000 0 0TOTAL 400,000 2,900,000
2013-18 CAPITAL IMPROVEMENT PROGRAMB - 2

Project Description
Adopted 2-Year Budget and 5-Year Plan
Project/CIP Funding Source
Operating Cost Impact Funding Source 2013-14 2014-15 2015-16 2016-17 2017-18
2013-14 2014-15 2015-16 2016-17 2017-18 TOTALS
TOTALS
Contact:
Project Title: Rehabilitation of Sanitary Sewer in the Area bounded by Campus Drive, Mountain Boulevard, Knoll Avenue, and Access (83-013)
Description: This project will rehabilitate the sanitary sewer main lines throughout the area bounded by Campus Drive, Mountain Boulevard, Knoll Avenue, and Access by various pipeline rehabilitation methods. Building sewer laterals between the main sewer and property line will also be rehabilitated, and clean-outs will be installed on building laterals to provide access for maintenance. (83-013)
Justification: Under a cease and desist order the California Regional Water Quality Control Board requires the City to eliminate the discharge of untreated sewage into local creeks, lakes, and the Bay. The sewers in the subject area have been determined to be cost-effective for rehabilitation. The project will rehabilitate existing sewer pipes in the area, reduce overflows, and is required by the City's Compliance plan with the Regional Board.
Prioritization Factors:
New Facility Existing Facility
Council District: 4, 6
Mandated Program
Leverages Outside Funding
Cease and Desist Order
Location: Area Bounded by Campus Drive, Mountain Bo
Life Safety3
Hazard Elimination 3
Preventive Maintenance3
Project No.:
Department: Public Works Agency
SEWERS AND STORM DRAINSCategory:
0 240,000 1,500,000 0 03100 Sewer Service Fund 1,740,000
240,000 1,500,000 0 0TOTAL 0 1,740,000
2013-18 CAPITAL IMPROVEMENT PROGRAMB - 3

Project Description
Adopted 2-Year Budget and 5-Year Plan
Project/CIP Funding Source
Operating Cost Impact Funding Source 2013-14 2014-15 2015-16 2016-17 2017-18
2013-14 2014-15 2015-16 2016-17 2017-18 TOTALS
TOTALS
Contact:
Project Title: Rehabilitation of Sanitary Sewer in the Area bounded by Castle Park Wy, Skyline Boulevard, Haverhill Drive, and Scarborough Drive (56-07)
Description: This project will rehabilitate the sanitary sewer main lines throughout the area bounded by Castle Park Wy, Skyline Boulevard, Haverhill Drive, and Scarborough Drive by various pipeline rehabilitation methods. Building sewer laterals between the main sewer and property line will also be rehabilitated, and clean-outs will be installed on building laterals to provide access for maintenance. (56-07)
Justification: Under a cease and desist order the California Regional Water Quality Control Board requires the City to eliminate the discharge of untreated sewage into local creeks, lakes, and the Bay. The sewers in the subject area have been determined to be cost-effective for rehabilitation. The project will rehabilitate existing sewer pipes in the area, reduce overflows, and is required by the City's Compliance plan with the Regional Board.
Prioritization Factors:
New Facility Existing Facility
Council District: 4
Mandated Program
Leverages Outside Funding
Cease and Desist Order
Location: Area bounded by Castle Park Wy, Skyline Boul
Life Safety3
Hazard Elimination 3
Preventive Maintenance3
Project No.:
Department: Public Works Agency
SEWERS AND STORM DRAINSCategory:
0 945,000 0 7,560,000 03100 Sewer Service Fund 8,505,000
945,000 0 7,560,000 0TOTAL 0 8,505,000
2013-18 CAPITAL IMPROVEMENT PROGRAMB - 4

Project Description
Adopted 2-Year Budget and 5-Year Plan
Project/CIP Funding Source
Operating Cost Impact Funding Source 2013-14 2014-15 2015-16 2016-17 2017-18
2013-14 2014-15 2015-16 2016-17 2017-18 TOTALS
TOTALS
Contact:
Project Title: Rehabilitation of Sanitary Sewer in the Area bounded by Dennison Street, Embarcadero, King Street, and Federick Street (61-01)
Description: This project will rehabilitate the sanitary sewer main lines throughout the area bounded by Dennison Street, Embarcadero, King Street, and Frederick Street by various pipeline rehabilitation methods. Building sewer laterals between the main sewer and property line will also be rehabilitated, and clean-outs will be installed on building laterals to provide access for maintenance. (61-01).
Justification: Under a cease and desist order the California Regional Water Quality Control Board requires the City to eliminate the discharge of untreated sewage into local creeks, lakes, and the Bay. The sewers in the subject area have been determined to be cost-effective for rehabilitation. The project will rehabilitate existing sewer pipes in the area, reduce overflows, and is required by the City's Compliance plan with the Regional Board.
Prioritization Factors:
New Facility Existing Facility
Council District: 1
Mandated Program
Leverages Outside Funding
Cease and Desist Order
Location: Area bounded by Dennison Street, Embarcade
Life Safety3
Hazard Elimination 3
Preventive Maintenance3
Project No.: C428610
Department: Public Works Agency
SEWERS AND STORM DRAINSCategory:
1,250,000 0 0 0 03100 Sewer Service Fund 1,250,000
0 0 0 0TOTAL 1,250,000 1,250,000
2013-18 CAPITAL IMPROVEMENT PROGRAMB - 5
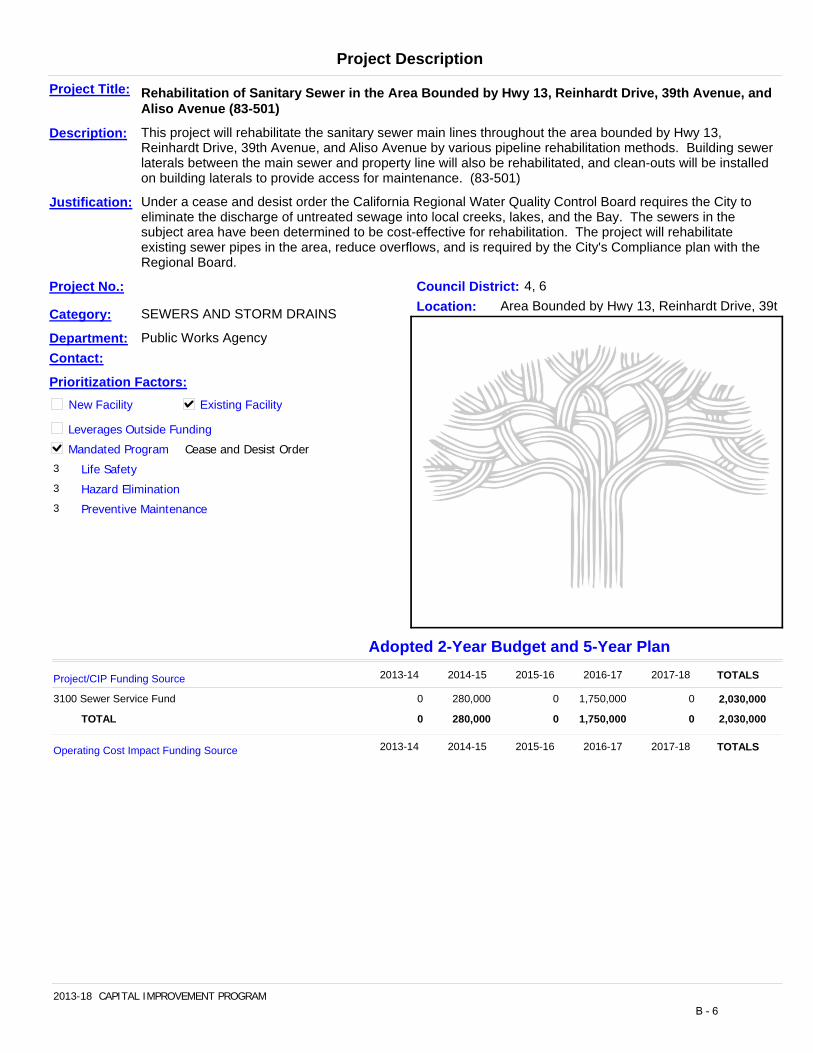
Project Description
Adopted 2-Year Budget and 5-Year Plan
Project/CIP Funding Source
Operating Cost Impact Funding Source 2013-14 2014-15 2015-16 2016-17 2017-18
2013-14 2014-15 2015-16 2016-17 2017-18 TOTALS
TOTALS
Contact:
Project Title: Rehabilitation of Sanitary Sewer in the Area Bounded by Hwy 13, Reinhardt Drive, 39th Avenue, and Aliso Avenue (83-501)
Description: This project will rehabilitate the sanitary sewer main lines throughout the area bounded by Hwy 13, Reinhardt Drive, 39th Avenue, and Aliso Avenue by various pipeline rehabilitation methods. Building sewer laterals between the main sewer and property line will also be rehabilitated, and clean-outs will be installed on building laterals to provide access for maintenance. (83-501)
Justification: Under a cease and desist order the California Regional Water Quality Control Board requires the City to eliminate the discharge of untreated sewage into local creeks, lakes, and the Bay. The sewers in the subject area have been determined to be cost-effective for rehabilitation. The project will rehabilitate existing sewer pipes in the area, reduce overflows, and is required by the City's Compliance plan with the Regional Board.
Prioritization Factors:
New Facility Existing Facility
Council District: 4, 6
Mandated Program
Leverages Outside Funding
Cease and Desist Order
Location: Area Bounded by Hwy 13, Reinhardt Drive, 39t
Life Safety3
Hazard Elimination 3
Preventive Maintenance3
Project No.:
Department: Public Works Agency
SEWERS AND STORM DRAINSCategory:
0 280,000 0 1,750,000 03100 Sewer Service Fund 2,030,000
280,000 0 1,750,000 0TOTAL 0 2,030,000
2013-18 CAPITAL IMPROVEMENT PROGRAMB - 6

Project Description
Adopted 2-Year Budget and 5-Year Plan
Project/CIP Funding Source
Operating Cost Impact Funding Source 2013-14 2014-15 2015-16 2016-17 2017-18
2013-14 2014-15 2015-16 2016-17 2017-18 TOTALS
TOTALS
Contact:
Project Title: Rehabilitation of Sanitary Sewer in the Area Bounded by Mountain Boulevard, Bernves Ct, Terrabella Way, and Redwood Rd (83-502)
Description: This project will rehabilitate the sanitary sewer main lines throughout the area bounded by Mountain Boulevard, Bernves Ct, Terrabella Way, and Redwood Rd by various pipeline rehabilitation methods. Building sewer laterals between the main sewer and property line will also be rehabilitated, and clean-outs will be installed on building laterals to provide access for maintenance. (83-502)
Justification: Under a cease and desist order the California Regional Water Quality Control Board requires the City to eliminate the discharge of untreated sewage into local creeks, lakes, and the Bay. The sewers in the subject area have been determined to be cost-effective for rehabilitation. The project will rehabilitate existing sewer pipes in the area, reduce overflows, and is required by the City's Compliance plan with the Regional Board.
Prioritization Factors:
New Facility Existing Facility
Council District: 7
Mandated Program
Leverages Outside Funding
Cease and Desist Order
Location: Area Bounded by Mountain Boulevard, Bernve
Life Safety3
Hazard Elimination 3
Preventive Maintenance3
Project No.:
Department: Public Works Agency
SEWERS AND STORM DRAINSCategory:
0 280,000 0 0 1,750,0003100 Sewer Service Fund 2,030,000
280,000 0 0 1,750,000TOTAL 0 2,030,000
2013-18 CAPITAL IMPROVEMENT PROGRAMB - 7

Project Description
Adopted 2-Year Budget and 5-Year Plan
Project/CIP Funding Source
Operating Cost Impact Funding Source 2013-14 2014-15 2015-16 2016-17 2017-18
2013-14 2014-15 2015-16 2016-17 2017-18 TOTALS
TOTALS
Contact:
Project Title: Rehabilitation of Sanitary Sewer in the Area bounded by Mountain Boulevard, Joaquin Miller Rd, Skyline Boulevard, and Castle Dr (56-06)
Description: This project will rehabilitate the sanitary sewer main lines throughout the area of 2Mountain Boulevard, Joaquin Miller Rd, Skyline Boulevard, and Castle Dr by various pipeline rehabilitation methods. Building sewer laterals between the main sewer and property line will also be rehabilitated, and clean-outs will be installed on building laterals to provide access for maintenance. (56-06).
Justification: Under a cease and desist order the California Regional Water Quality Control Board requires the City to eliminate the discharge of untreated sewage into local creeks, lakes, and the Bay. The sewers in the subject area have been determined to be cost-effective for rehabilitation. The project will rehabilitate existing sewer pipes in the area, reduce overflows, and is required by the City's Compliance plan with the Regional Board.
Prioritization Factors:
New Facility Existing Facility
Council District: 4
Mandated Program
Leverages Outside Funding
Cease and Desist Order
Location: Area Bounded by Mountain Boulevard, Joaquin
Life Safety3
Hazard Elimination 3
Preventive Maintenance3
Project No.:
Department: Public Works Agency
SEWERS AND STORM DRAINSCategory:
525,000 4,200,000 0 0 03100 Sewer Service Fund 4,725,000
4,200,000 0 0 0TOTAL 525,000 4,725,000
2013-18 CAPITAL IMPROVEMENT PROGRAMB - 8

Project Description
Adopted 2-Year Budget and 5-Year Plan
Project/CIP Funding Source
Operating Cost Impact Funding Source 2013-14 2014-15 2015-16 2016-17 2017-18
2013-14 2014-15 2015-16 2016-17 2017-18 TOTALS
TOTALS
Contact:
Project Title: Rehabilitation of Sanitary Sewer in the Area bounded by Park Boulevard, Hollywood Ave, Sunnyhills Rd, and Brighton Ave (54-16)
Description: This project will rehabilitate the sanitary sewer main lines throughout the area of Park Boulevard, Hollywood Ave, Sunnyhills Rd, and Brighton Ave (54-16). By various pipeline rehabilitation methods. Building sewer laterals between the main sewer and property line will also be rehabilitated, and clean-outs will be installed on building laterals to provide access for maintenance. (54-16).
Justification: Under a cease and desist order the California Regional Water Quality Control Board requires the City to eliminate the discharge of untreated sewage into local creeks, lakes, and the Bay. The sewers in the subject area have been determined to be cost-effective for rehabilitation. The project will rehabilitate existing sewer pipes in the area, reduce overflows, and is required by the City's Compliance plan with the Regional Board.
Prioritization Factors:
New Facility Existing Facility
Council District: 2, 5
Mandated Program
Leverages Outside Funding
Cease and Desist Order
Location: Area Bounded by Park Boulevard, Hollywood A
Life Safety3
Hazard Elimination 3
Preventive Maintenance3
Project No.:
Department: Public Works Agency
SEWERS AND STORM DRAINSCategory:
630,000 5,040,000 0 0 03100 Sewer Service Fund 5,670,000
5,040,000 0 0 0TOTAL 630,000 5,670,000
2013-18 CAPITAL IMPROVEMENT PROGRAMB - 9

Project Description
Adopted 2-Year Budget and 5-Year Plan
Project/CIP Funding Source
Operating Cost Impact Funding Source 2013-14 2014-15 2015-16 2016-17 2017-18
2013-14 2014-15 2015-16 2016-17 2017-18 TOTALS
TOTALS
Contact:
Project Title: Rehabilitation of Sanitary Sewers in the Area Bounded by Longridge Road, FWY 580, Park Blvd., and Underhills Road (54-12)
Description: This project will rehabilitate the sanitary sewer main lines throughout the area bounded by Longridge Road, FWY 580, Park Blvd., and Underhills Road by various pipeline rehabilitation methods. Building sewer laterals between the main sewer and property line will also be rehabilitated, and clean-outs will be installed on building laterals to provide access for maintenance. (54-12).
Justification: Under a cease and desist order the California Regional Water Quality Control Board requires the City to eliminate the discharge of untreated sewage into local creeks, lakes, and the Bay. The sewers in the subject area have been determined to be cost-effective for rehabilitation. The project will rehabilitate existing sewer pipes in the area, reduce overflows, and is required by the City's Compliance plan with the Regional Board.
Prioritization Factors:
New Facility Existing Facility
Council District: 2
Mandated Program
Leverages Outside Funding
Cease and Desist Order
Location: Area Bounded by Longridge Road, FWY 580,
Life Safety3
Hazard Elimination 3
Preventive Maintenance3
Project No.:
Department: Public Works Agency
SEWERS AND STORM DRAINSCategory:
750,000 0 6,000,000 0 03100 Sewer Service Fund 6,750,000
0 6,000,000 0 0TOTAL 750,000 6,750,000
2013-18 CAPITAL IMPROVEMENT PROGRAMB - 10

Project Description
Adopted 2-Year Budget and 5-Year Plan
Project/CIP Funding Source
Operating Cost Impact Funding Source 2013-14 2014-15 2015-16 2016-17 2017-18
2013-14 2014-15 2015-16 2016-17 2017-18 TOTALS
TOTALS
Contact:
Project Title: Rehabilitation of Sanitary Sewers in the Area Bounded by MacArthur Boulevard, Maple Avenue, Barner Avenue, and Frye Street (80-102)
Description: This project will rehabilitate the sanitary sewer main lines throughout the area of MacArthur Boulevard, Maple Avenue, Barner Avenue, and Frye Street by various pipeline rehabilitation methods. Building sewer laterals between the main sewer and property line will also be rehabilitated, and clean-outs will be installed on building laterals to provide access for maintenance. (80-102).
Justification: Under a cease and desist order the California Regional Water Quality Control Board requires the City to eliminate the discharge of untreated sewage into local creeks, lakes, and the Bay. The sewers in the subject area have been determined to be cost-effective for rehabilitation. The project will rehabilitate existing sewer pipes in the area, reduce overflows, and is required by the City's Compliance plan with the Regional Board.
Prioritization Factors:
New Facility Existing Facility
Council District: 4
Mandated Program
Leverages Outside Funding
Cease and Desist Order
Location: Area Bounded by MacArthur Boulevard, Maple
Life Safety3
Hazard Elimination 3
Preventive Maintenance3
Project No.: C428510
Department: Public Works Agency
SEWERS AND STORM DRAINSCategory:
4,320,000 0 0 0 03100 Sewer Service Fund 4,320,000
0 0 0 0TOTAL 4,320,000 4,320,000
2013-18 CAPITAL IMPROVEMENT PROGRAMB - 11

Project Description
Adopted 2-Year Budget and 5-Year Plan
Project/CIP Funding Source
Operating Cost Impact Funding Source 2013-14 2014-15 2015-16 2016-17 2017-18
2013-14 2014-15 2015-16 2016-17 2017-18 TOTALS
TOTALS
Contact:
Project Title: Rehabilitation of Sanitary Sewers in West Grand Avenue between Wood Street and San Pablo Avenue
Description: This project will rehabilitate the sanitary sewer main lines from West Grand Avenue between Wood Street and San Pablo Avenue by various pipeline rehabilitation methods. Building sewer laterals between the mainsewer and property line will also be rehabilitated, and clean-outs will be installed on building laterals to provide access for maintenance.
Justification: Under a cease and desist order the California Regional Water Quality Control Board requires the City to eliminate the discharge of untreated sewage into local creeks, lakes, and the Bay. The sewers in the subject area have been determined to be cost-effective for rehabilitation. The project will rehabilitate existing sewer pipes in the area, reduce overflows, and is required by the City's Compliance plan with the Regional Board.
Prioritization Factors:
New Facility Existing Facility
Council District: 2
Mandated Program
Leverages Outside Funding
Cease and Desist Order
Location: West Grand Avenue between Wood Street and
Life Safety3
Hazard Elimination 3
Preventive Maintenance3
Project No.:
Department: Public Works Agency
SEWERS AND STORM DRAINSCategory:
3,510,000 0 0 0 03100 Sewer Service Fund 3,510,000
0 0 0 0TOTAL 3,510,000 3,510,000
2013-18 CAPITAL IMPROVEMENT PROGRAMB - 12

Project Description
Adopted 2-Year Budget and 5-Year Plan
Project/CIP Funding Source
Operating Cost Impact Funding Source 2013-14 2014-15 2015-16 2016-17 2017-18
2013-14 2014-15 2015-16 2016-17 2017-18 TOTALS
TOTALS
Contact:
Project Title: ADA Curb Ramp 30-Year Transition Plan
Description: On-going construction of curb ramps throughout the City.
Justification: The City ADA Curb Ramp Transition Plan (2009) requires construction / rehabilitation of curb ramps at everystreet corner. The City must install at least 500 curb ramps annually to keep pace with this 30-year transition plan. Infill and on-call programs provide access along prioritized corridors and as needed by individuals with disabilities. The project increases access and safety for older adults and persons with disabilities.
Prioritization Factors:
New Facility Existing Facility
Council District: Citywide
Mandated Program
Leverages Outside Funding
ADA
Location: Citywide
Life Safety0
Hazard Elimination 5
Preventive Maintenance0
Project No.:
Department: Public Works Agency
STREETS AND SIDEWALKSCategory:
660,000 660,000 660,000 660,000 660,0002211 Measure B - ACTIA 3,300,000
660,000 660,000 660,000 660,000TOTAL 660,000 3,300,000
2013-18 CAPITAL IMPROVEMENT PROGRAMC - 1

Project Description
Adopted 2-Year Budget and 5-Year Plan
Project/CIP Funding Source
Operating Cost Impact Funding Source 2013-14 2014-15 2015-16 2016-17 2017-18
2013-14 2014-15 2015-16 2016-17 2017-18 TOTALS
TOTALS
Contact:
Project Title: Bridge Preventive Maintenance
Description: Perform preventive maintenance on the City's bridges, as needed.
Justification: Federal and State mandate shifting bridge maintenance responsibility to the municipal level. This project will provide for bridge maintenance of selected City bridges.
Prioritization Factors:
New Facility Existing Facility
Council District: Citywide
Mandated Program
Leverages Outside Funding
Location: Citywide
Life Safety4
Hazard Elimination 4
Preventive Maintenance4
Project No.:
Department: Public Works Agency
STREETS AND SIDEWALKSCategory:
250,000 250,000 250,000 250,000 250,0002211 Measure B - ACTIA 1,250,000
250,000 250,000 250,000 250,000TOTAL 250,000 1,250,000
2013-18 CAPITAL IMPROVEMENT PROGRAMC - 2

Project Description
Adopted 2-Year Budget and 5-Year Plan
Project/CIP Funding Source
Operating Cost Impact Funding Source 2013-14 2014-15 2015-16 2016-17 2017-18
2013-14 2014-15 2015-16 2016-17 2017-18 TOTALS
TOTALS
Contact:
Project Title: Citywide Repair and Rehabilitation of City Paths and Stairs
Description: There is a significant backlog of public stairs that need reconstruction and renovation. Pedestrian paths and stairs have not generally received the same level of attention and funding for upkeep and maintenance than that of Streets and Sidewalks. With increased attention on pedestrian and alternative modes of transportation, combined with densification of urban population in the Bay Area, it is recommended that funding be set aside for City paths and stairway improvements.
Justification: Economic: Bicycle and pedestrian facilities promote bicycling and walking, the most cost-effective forms of transportation. Bicycle and walking trips tend to be local and thus are more likely to contribute to local economic activity.
Environmental: Bicycling is the most energy efficient form of transportation and both bicycling and walking create no emissions, contributing to the City’s efforts to reduce air pollution and address climate change.
Social Equity: The projects improve accessibility and safety for persons who depend on non- and public transit to access jobs, services, and recreational facilities. Bicycling and walking are inexpensive and broadly accessible forms of transportation.
Prioritization Factors:
New Facility Existing Facility
Council District: Citywide
Mandated Program
Leverages Outside Funding
Location: Citywide
Life Safety3
Hazard Elimination 4
Preventive Maintenance3
Project No.:
Department: Public Works Agency
STREETS AND SIDEWALKSCategory:
200,000 200,000 400,000 400,000 400,0002211 Measure B - ACTIA 1,600,000
200,000 400,000 400,000 400,000TOTAL 200,000 1,600,000
0 0 0 0 00000 Undetermined Fund 0
0 0 0 0 0TOTAL 0
2013-18 CAPITAL IMPROVEMENT PROGRAMC - 3

Project Description
Adopted 2-Year Budget and 5-Year Plan
Project/CIP Funding Source
Operating Cost Impact Funding Source 2013-14 2014-15 2015-16 2016-17 2017-18
2013-14 2014-15 2015-16 2016-17 2017-18 TOTALS
TOTALS
Contact:
Project Title: Citywide Sidewalk Repairs
Description: Repair city tree damaged sidewalks and facilitate private property owner repairs.
Justification: The Council-adopted Sidewalk Prioritization Plan (2008) calls for sidewalk repairs along identified transit corridors; residential sidewalk repairs; and liability reduction programs. This project will increase access compliance, reduce trip and fall liability and respond to citizen sidewalk repair demands.
Prioritization Factors:
New Facility Existing Facility
Council District: Citywide
Mandated Program
Leverages Outside Funding
Location: Citywide
Life Safety3
Hazard Elimination 3
Preventive Maintenance3
Project No.:
Department: Public Works Agency
STREETS AND SIDEWALKSCategory:
300,000 300,000 600,000 600,000 600,0002211 Measure B - ACTIA 2,400,000
250,000 250,000 250,000 250,000 250,0002212 Measure B - Bicycle/Pedestrian Pass-Thru 1,250,000
550,000 850,000 850,000 850,000TOTAL 550,000 3,650,000
2013-18 CAPITAL IMPROVEMENT PROGRAMC - 4

Project Description
Adopted 2-Year Budget and 5-Year Plan
Project/CIP Funding Source
Operating Cost Impact Funding Source 2013-14 2014-15 2015-16 2016-17 2017-18
2013-14 2014-15 2015-16 2016-17 2017-18 TOTALS
TOTALS
Contact:
Project Title: Citywide Street Rehabilitation / Resurfacing
Description: Rehabilitation and resurfacing of City streets will provide a safe road surface. The project work includes rehabilitation and reconstruction of street pavement. This is a minimal level of effort while additional funds are sought to restore street conditions city-wide.
Justification: Funding is needed to maintain the city's 836 centerline miles of paved roadways on a consistent bases. TheCity's current average Pavement Condition Index (PCI) is 56 on a scale of 0 - 100 (100 being the best). The City's current need for street resurfacing program is $28 million per year.
Prioritization Factors:
New Facility Existing Facility
Council District: Citywide
Mandated Program
Leverages Outside Funding
Location: Citywide
Life Safety3
Hazard Elimination 3
Preventive Maintenance3
Project No.:
Department: Public Works Agency
STREETS AND SIDEWALKSCategory:
3,285,000 2,585,000 2,585,000 2,585,000 2,585,0002211 Measure B - ACTIA 13,625,000
0 3,851,000 0 0 02163 Metro Transportation Com-Program Grant 3,851,000
1,500,000 1,500,000 1,500,000 1,500,000 1,500,0002215 Vehicle Registration Fee 7,500,000
7,936,000 4,085,000 4,085,000 4,085,000TOTAL 4,785,000 24,976,000
2013-18 CAPITAL IMPROVEMENT PROGRAMC - 5

Project Description
Adopted 2-Year Budget and 5-Year Plan
Project/CIP Funding Source
Operating Cost Impact Funding Source 2013-14 2014-15 2015-16 2016-17 2017-18
2013-14 2014-15 2015-16 2016-17 2017-18 TOTALS
TOTALS
Contact: Kevin Kashi / Jaime Heredia
Project Title: Emergency Roadway Repairs
Description: Over the last several years, many City roads have been damaged by slides and required repairs. FEMA pays only for repair of pavement, but not stabilization work and only under federally-declared disasters.
Justification: Our records show that emergency roadway restoration capital costs can exceed one million dollars in a typical year. In 2011/2012, PWA spent over a million dollars restoring roadway failures citywide. Since 2005, the total cost of restoring storm-damaged roadways in Oakland is about ten million dollars. This includes disaster restorations that were funded by state and federal agencies declaring the disaster
Prioritization Factors:
New Facility Existing Facility
Council District: Citywide
Mandated Program
Leverages Outside Funding
Location: Citywide
Life Safety4
Hazard Elimination 4
Preventive Maintenance4
Project No.:
Department: Public Works Agency
STREETS AND SIDEWALKSCategory:
500,000 500,000 800,000 800,000 800,0002211 Measure B - ACTIA 3,400,000
500,000 800,000 800,000 800,000TOTAL 500,000 3,400,000
0 0 0 0 00000 Undetermined Fund 0
0 0 0 0 0TOTAL 0
2013-18 CAPITAL IMPROVEMENT PROGRAMC - 6

Project Description
Adopted 2-Year Budget and 5-Year Plan
Project/CIP Funding Source
Operating Cost Impact Funding Source 2013-14 2014-15 2015-16 2016-17 2017-18
2013-14 2014-15 2015-16 2016-17 2017-18 TOTALS
TOTALS
Contact:
Project Title: Matching Funds for Grant Funded Projects
Description: Local matching funds from Measure B need to be provided for federally-funded street improvement projects. Improvements typically include repair/rehabilitation/resurfacing of pavement, signage and striping, traffic signal upgrades, pedestrian improvements, bicycle lanes and bridges seismic retrofits.
Justification: Local matching funds from Measure B need to be provided for federally-funded street improvement projects. Improvements typically include repair/rehabilitation/resurfacing of pavement, signage and striping, traffic signal upgrades, pedestrian improvements, bicycle lanes and bridges seismic retrofits.
Prioritization Factors:
New Facility Existing Facility
Council District: Citywide
Mandated Program
Leverages Outside Funding
Location: Citywide
Life Safety3
Hazard Elimination 3
Preventive Maintenance3
Project No.: C370010
Department: Public Works Agency
STREETS AND SIDEWALKSCategory:
1,250,000 1,250,000 1,250,000 1,250,000 1,250,0002211 Measure B - ACTIA 6,250,000
1,250,000 1,250,000 1,250,000 1,250,000TOTAL 1,250,000 6,250,000
2013-18 CAPITAL IMPROVEMENT PROGRAMC - 7

ProposedCIP
Notes

Project Description
Adopted 2-Year Budget and 5-Year Plan
Project/CIP Funding Source
Operating Cost Impact Funding Source 2013-14 2014-15 2015-16 2016-17 2017-18
2013-14 2014-15 2015-16 2016-17 2017-18 TOTALS
TOTALS
Contact: Jason Patton
Project Title: Bicycle Master Plan Implementation
Description: The program funds implementation of the Bicycle Master Plan. Eligible expenses include: 1) installation and maintenance of bicycle parking; 2) striping, signing, and paving of bikeways; 3) project development for bicycle facilities; 4) local matches for bicycle grants; 5) bicycle safety education classes and equipment; and 6) bicycle encouragement events and materials.
Justification: This program uses 35% (approximately $350,000 per year) from Fund 2212 (Measure B Bicycle/Pedestrian Pass-through fund) that must be used on bicycle and pedestrian improvements.
Prioritization Factors:
New Facility Existing Facility
Council District: Citywide
Mandated Program
Leverages Outside Funding
Measure B
Location: Citywide
Life Safety3
Hazard Elimination 5
Preventive Maintenance4
Project No.: C248410
Department: Public Works Agency
TRAFFIC IMPROVEMENTSCategory:
1,000,000 350,000 350,000 350,000 350,0002212 Measure B - Bicycle/Pedestrian Pass-Thru 2,400,000
350,000 350,000 350,000 350,000TOTAL 1,000,000 2,400,000
0 0 0 0 00000 Undetermined Fund 0
0 0 0 0 0TOTAL 0
2013-18 CAPITAL IMPROVEMENT PROGRAMD - 1

Project Description
Adopted 2-Year Budget and 5-Year Plan
Project/CIP Funding Source
Operating Cost Impact Funding Source 2013-14 2014-15 2015-16 2016-17 2017-18
2013-14 2014-15 2015-16 2016-17 2017-18 TOTALS
TOTALS
Contact: Joseph Hu x5420
Project Title: Citywide Traffic Signal Controller Replacement Program
Description: Replace old 180 type controllers to new 170 type controllers. Work to be carried out by City Staff.
Justification: Over 50% of existing Oakland traffic signal controllers are type 180. These controllers are no longer manufactured/sold. The controllers currently in operation are roughly 20-25 years old. $150K will allow Electrical Services to convert 20 controllers (~5% of our type 180 currently in use).
Prioritization Factors:
New Facility Existing Facility
Council District: Citywide
Mandated Program
Leverages Outside Funding
Location: Citywide signalized intersections
Life Safety
Hazard Elimination 3
Preventive Maintenance5
Project No.:
Department: Public Works Agency
TRAFFIC IMPROVEMENTSCategory:
0 150,000 150,000 150,000 150,0002211 Measure B - ACTIA 600,000
150,000 150,000 150,000 150,000TOTAL 0 600,000
0 0 0 0 00000 Undetermined Fund 0
0 0 0 0 0TOTAL 0
2013-18 CAPITAL IMPROVEMENT PROGRAMD - 2

Project Description
Adopted 2-Year Budget and 5-Year Plan
Project/CIP Funding Source
Operating Cost Impact Funding Source 2013-14 2014-15 2015-16 2016-17 2017-18
2013-14 2014-15 2015-16 2016-17 2017-18 TOTALS
TOTALS
Contact: Joe Wang
Project Title: Neighborhood Traffic Calming Program
Description: The Neighborhood Traffic Calming Program will include tools such as speed bumps and traffic islands that will be installed based on adopted engineering standards and public support.
Justification: The Transportation Services Division received more than 400 requests in the last fiscal year to improve traffic safety, a significant number of which was for traffic calming in residential and commercial neighborhoods. Traffic calming devices such as speed bumps and traffic circles are more effective in reducing automobile speed and volume than conventional traffic control devices such as signs and pavement markings absent police enforcement. Slower and less traffic in neighborhoods enhances public safety and overall quality of life.
Prioritization Factors:
New Facility Existing Facility
Council District: Citywide
Mandated Program
Leverages Outside Funding
Location: Citywide
Life Safety3
Hazard Elimination 3
Preventive Maintenance0
Project No.:
Department: Public Works Agency
TRAFFIC IMPROVEMENTSCategory:
100,000 100,000 200,000 200,000 200,0002211 Measure B - ACTIA 800,000
100,000 200,000 200,000 200,000TOTAL 100,000 800,000
2013-18 CAPITAL IMPROVEMENT PROGRAMD - 3

Project Description
Adopted 2-Year Budget and 5-Year Plan
Project/CIP Funding Source
Operating Cost Impact Funding Source 2013-14 2014-15 2015-16 2016-17 2017-18
2013-14 2014-15 2015-16 2016-17 2017-18 TOTALS
TOTALS
Contact: Jason Patton
Project Title: Pedestrian Master Plan Implementation
Description: The program funds implementation of the Pedestrian Master Plan. Eligible expenses include: 1) capital improvements to improve pedestrian safety and access; 2) pedestrian safety education classes and equipment; and 3) pedestrian encouragement events and materials.
Justification: This program uses 40% (approximately $400,000 per year) from Fund 2212 (Measure B Bicycle/Pedestrian Pass-through fund) that must be used on bicycle and pedestrian improvements.
Prioritization Factors:
New Facility Existing Facility
Council District: Citywide
Mandated Program
Leverages Outside Funding
Measure B
Location: Citywide
Life Safety3
Hazard Elimination 5
Preventive Maintenance3
Project No.: C428310
Department: Public Works Agency
TRAFFIC IMPROVEMENTSCategory:
400,000 400,000 400,000 400,000 400,0002212 Measure B - Bicycle/Pedestrian Pass-Thru 2,000,000
400,000 400,000 400,000 400,000TOTAL 400,000 2,000,000
0 0 0 0 00000 Undetermined Fund 0
0 0 0 0 0TOTAL 0
2013-18 CAPITAL IMPROVEMENT PROGRAMD - 4

Project Description
Adopted 2-Year Budget and 5-Year Plan
Project/CIP Funding Source
Operating Cost Impact Funding Source 2013-14 2014-15 2015-16 2016-17 2017-18
2013-14 2014-15 2015-16 2016-17 2017-18 TOTALS
TOTALS
Contact:
Project Title: Traffic Signal System Management
Description: Upgrade old traffic signal system along key arterial streets, to improve reliability, efficiency, and road safety and to reduce vehicular emissions.Funds will be used to implement City's Intelligent Transportation Systems(ITS) master plan to upgrade and build new signal network using fiber optic technology, live video feeds and communication equipment to facilitate and manage traffic flow, reduce vehicle emissions, improve safety and allow arterial management during emergencies and major events, including real time road users information. Projects will be implemented in coordination with the pavement resurfacing program.
Justification: Project will facilitate traffic efficient flow and improve safety for all users.
Prioritization Factors:
New Facility Existing Facility
Council District: Citywide
Mandated Program
Leverages Outside Funding
Location: Citywide
Life Safety
Hazard Elimination 4
Preventive Maintenance4
Project No.: C427910
Department: Public Works Agency
TRAFFIC IMPROVEMENTSCategory:
1,000,000 1,000,000 1,000,000 1,000,000 1,000,0002211 Measure B - ACTIA 5,000,000
1,000,000 1,000,000 1,000,000 1,000,000TOTAL 1,000,000 5,000,000
0 0 0 0 0 0
0 0 0 0 0TOTAL 0
2013-18 CAPITAL IMPROVEMENT PROGRAMD - 5

ProposedCIP
Notes
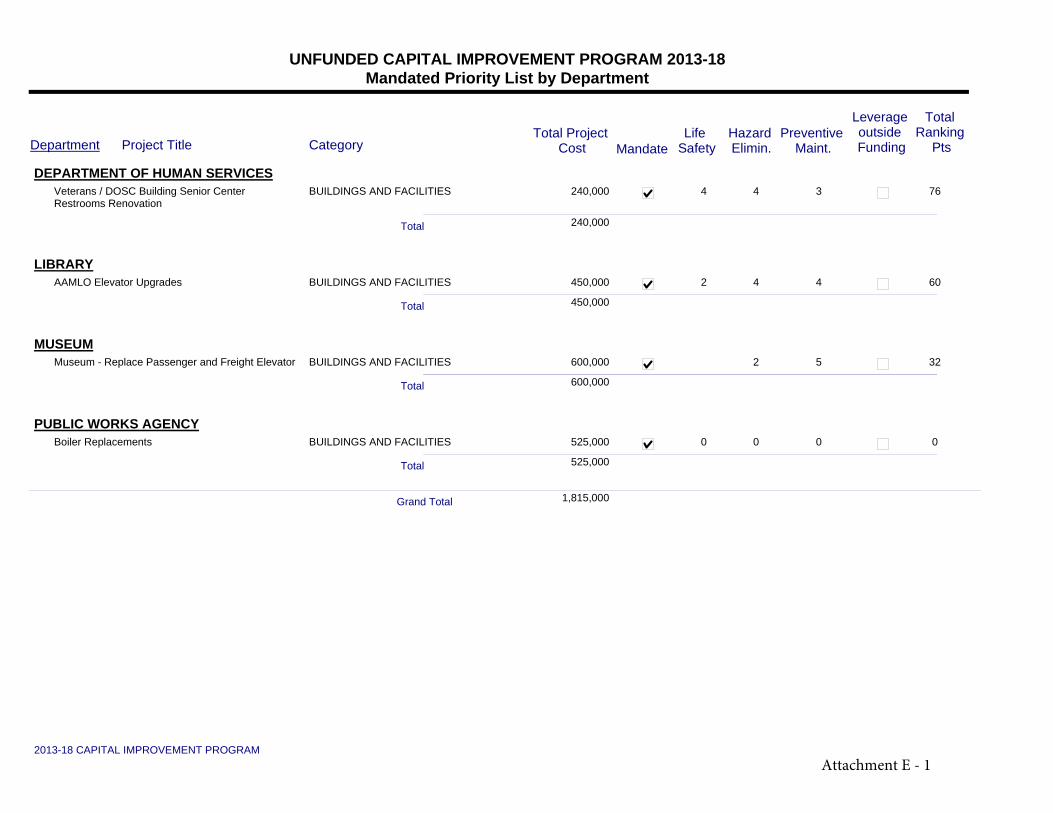
Project TitleDepartmentTotal Project
CostLife
SafetyHazard Elimin.
Preventive Maint.
UNFUNDED CAPITAL IMPROVEMENT PROGRAM 2013-18Mandated Priority List by Department
Total Ranking
PtsCategory
Leverage outside FundingMandate
DEPARTMENT OF HUMAN SERVICESVeterans / DOSC Building Senior Center Restrooms Renovation
240,000 4 4 3 76BUILDINGS AND FACILITIES
240,000Total
LIBRARYAAMLO Elevator Upgrades 450,000 2 4 4 60BUILDINGS AND FACILITIES
450,000Total
MUSEUMMuseum - Replace Passenger and Freight Elevator 600,000 2 5 32BUILDINGS AND FACILITIES
600,000Total
PUBLIC WORKS AGENCYBoiler Replacements 525,000 0 0 0 0BUILDINGS AND FACILITIES
525,000Total
1,815,000Grand Total
2013-18 CAPITAL IMPROVEMENT PROGRAM
Attachnt
- 1 Attachment E - 1

ProposedCIP
Notes

JEVISEIVNCI^ r
OrHCE OF THE Cl,j_V CLERfeESOLUTION NOT " ? 8 ' ^ ' rC.M.S.
OAKLAND CITY COUNCIL I,?;i
RESOLUTION ESTABLISHING PRIORITIZATION METHODS FOR THE CITYOF OAKLAND'S FACILITIES AND STRUCTURES, PARKS AND OPEN
SPACE, SEWERS, STORM DRAINS, STREETS, SIDEWALKS, AND TRAFFICIMPROVEMENT INFRASTRUCTURE NEEDS
WHEREAS, a policy for establishing priorities for the City of Oakland's variousinfrastructure needs does not currently exist; and
WHEREAS, a Public Improvement Project, also referred to as a CapitalImprovement Project, is any defined location, specified public facility, building, utility,street, or any other City right-of-way improvement, capital improvement, park,recreational facility, trail, or environmental improvement that requires the City ofOakland's involvement in its design, site or building acquisition, site preparation,utilities emplacement, installation, construction, or reconstruction; and
WHEREAS, a Capital Maintenance Project is a minor project that does notsignificantly affect the level of service provided to the public, including the repair,renovation, or maintenance of existing public buildings or facilities such as roofing,HVAC improvements, carpeting, or other similar work; and
WHEREAS, On-Going Operations and Maintenance refers to the long-term,continuing costs associated with any location, specified public facility, building, utility,street, City right-of-way, park, recreational facility, trail, or leased space, includingexpenditures required to provide a specified level of service to the public (programfunctions, utilities, custodial) and expenditures required to support the scheduledmaintenance needs of the infrastructure; and
WHEREAS, the City of Oakland has limited financial resources to fund itsinfrastructure needs, including capital and on-going operations and maintenance; and
WHEREAS, the City of Oakland's infrastructure, including facilities andstructures, parks and open space, sewers, storm drains, streets, sidewalks, and trafficimprovements, are considered significant assets to the City and impact the quality oflife for those who live, work, and play in the City; and
WHEREAS, in 2002, the City of Oakland government initiative called "MovingOakland Forward!" made several recommendations, including (1) that the City Councildeliberate on the Capital Improvement Program budget prior to engaging in theoperating budget to ensure that incremental operations and maintenance costsresulting from capital projects are incorporated into the operating budget, and (2) thatall projects proposed to the City Council for consideration contain a comprehensivefinancial timeline for the first five years, including prospective incremental allocationsfor On-Going Operations and Maintenance and that approval of the project should beconsidered a City Council mandate to include the incremental operating andmaintenance costs in the budget, now, therefore be it
F - 1

RESOLVED: That the City Council establishes that the criteria used to prioritizethe City of Oakland's Public Infrastructure Projects by type shall be as follows:
Infrastructure Type
Facilities and Structures
(Capital Maintenance Projects)
Prioritization Method
Prioritize calls for service from high to low using the followingfactors:
High
o Life safety issues, including liability exposure
o Mandated service
o Hazardous situations
o Security breaches
o Preventive maintenance of emergency responsesystems
Medium
o Scheduled preventive maintenance projects
Low
o Deferred maintenance projects
Parks (Park Facilities) and
Open Space
Apply the Open Space Conservation and Recreation (OSCAR)Element of the Oakland General Plan. OSCAR states that inorder to reduce deficiencies in parks and recreational facilitiesresulting from decline and deferred maintenance, outdatedfacilities, and factors such as vandalism and safety, the focusshould be on maintenance, rehabilitation and safetyimprovements. This is cited as currently the highest prioritysince it protects public investment and maximizes the effectivedelivery of park services. (Objective REC-3.)
Criteria to prioritize future infrastructure needs related to parksand open space are:
o Projects that resolve existing health and safety issues,including liability exposure.
o Projects that replace existing deteriorated facilities,fields, tot lots, etc.
o Projects that leverage existing improvements thatare already funded, or in design or construction,particularly those that are approved by Citywidevote.
o Projects that are partially funded and suitable forgrant-funding opportunities.
o Projects that increase access to existing parks forschool children.
As funding is available, there will be an equitable distribution ofthese funds for both maintenance and repair of existingfacilities, as well as for new construction.
Sanitary Sewers Use the Infiltration and Inflow (I/I) Correction Program that hasestablished a 25-year program to rehabilitate 30% of the sewersystem sub-basins based on greatest to least infiltration andinflow of rainwater problems. The program includes a year-by-year prioritization of projects and is expected to be completed
F - 2

by 2013.
Apply the same criteria to plan and prioritize the rehabilitationand replacement of the remaining 70% of the system.
Storm Drainage Use the Storm Drain Master Plan that prioritizes projects usingthe following factors:
o Type of problem (flooding, erosion, etc.)o Location of impact (commercial, public street, private
property, etc.)
o Type of system (City-owned culvert, open channel, etc.)
Streets Prioritize streets proposed for rehabilitation using thePavement Management System based on the PavementCondition Index (PCI), visual inspection, and costeffectiveness. Streets are ranked on scale of 1 - 100 with 100being best.
Sidewalks Prioritize sidewalks using a Sidewalk Management Systembased on the Sidewalk Condition Index (SCI) and a completedsurvey of damaged sidewalks throughout the City.
The Sidewalk Management System uses a combination offactors including distress type and severity and pedestrianusage and location to index the damage locations. Prioritiesare determined by those damaged locations having the lowestranking first.
Traffic Improvements Prioritize traffic signal needs based on criteria established bythe State of California, Department of Transportation(Caltrans) as follows:o Vehicular volumeso Interruption of continuous traffico Pedestrian volumeso Accident data (pedestrian and vehicular accidents)o Other, site specific special condition
In addition, to address pedestrian safety issues, staffmaintains a second, parallel priority list for pedestrian trafficimprovements based upon pedestrian safety criteria.Pedestrian safety improvements include striping and signage,bulbouts and sidewalk improvements, medians and islands, aswell as traffic signals. The programming of pedestrian priorityintersection locations is prioritized based on the followingfactors:o Intersection Pedestrian Accident Historical Datao Other site specific conditions
Prioritize Neighborhood Traffic Safety Program needs throughinput from the community and City Council offices, and an
F - 3

engineering assessment. Requests are prioritized usingcriteria as follows:o Documented accident history (pedestrian and vehicular
accidents)o Field evaluationo Assessment of non-standard or changed conditions
o Citizen complaintso Other, site specific factors
Prioritize Bicycle Program needs using the 1999 BicycleMaster Plan. The plan's criteria for designating prioritybikeways are:o Eliminate gaps in existing bikewayso Overcome significant obstacles and barriers such as
bridges, tunnels, and freeways
o Facilitate regional connections with bikeways inneighboring cities
o Target improvements in corridors with identified safetyconcerns
o Provide facilities in service districts that have no existingbikeways
o Provide direct connection to BART, ferry, or other transitstation
o Provide direct connection to a major employment center
IN COUNCIL, OAKLAND, CALIFORNIA,
PASSED BY THE FOLLOWING VOTE:
AYES-
NOES—
ABSENT—
ABSTENTION-
JUL 2 0 2004, 2004
CEWA FLOYDCity Clerk and Clerk of the tf/incil
of the City of Oakland, Qafifornia
F - 4

OAKLAND CITY COUNCIL
ZC i 7 0
8 3 9 CMS
Approved as to 6riand L alit
r
City Attorney
RESOLUTION ESTABLISHING AFIVEYEARPRIORITIZATION PLANFOR THE CITY OF OAKLANDS STREET PAVEMENTREHABILITATION PROGRAM
WHEREAS the City of Oaklands streets infrastructure is considered a significant asset that
impacts the quality of life for those who live and work in Oakland and
WHEREAS the City of Oakland has upgraded its Pavement Management Program PMP to the
Metropolitan Transportation Commission MTC StreetSaver pavement management softwareand
WHEREAS the City of Oakland completed a citywide pavement distress survey in the spring of2007 to update its Pavement Management Program database and
WHEREAS the City of Oakland is required by MTC to maintain and update aPavementManagement Program in order to remain eligible for federal street rehabilitation funding and
WHEREAS the Pavement Management Program standardizes the optimization and distributionof available funding for street rehabilitation projects and
WHEREAS the City of Oakland has limited financial resources to fund its street rehabilitation
program and
WHEREAS the anticipated annual funding level for street rehabilitation for the City of Oaklandis estimated to be approximately 72million over the next five years and
WHEREAS the City of Oakland has established criteria to be used to prioritize streets proposedfor rehabilitation using the Pavement Management Program based on Pavement Condition IndexPCI visual inspection and cost effectiveness and
WHEREAS the Pavement Management Program is utilized to prioritize and identify candidatestreets for street rehabilitation projects that represents the most optimum use ofavailable
funding and
WHEREAS the City of Oakland coordinates and screens all proposed streets for conflicts withsewer storm drainage gas water electrical cable and fiber optic replacement projects to insurethat all underground rehabilitation work occursprior to scheduled street rehabilitation projectsnow therefore be it
t
RESOLUTION NO
F - 5

RESOLVED That in order to optimize resources to the extent possible the City Council ofthe
City of Oakland adopts and will use its PCI based Pavement Management Program to prioritizestreets for rehabilitation and be it
FURTHER RESOLVED That a target of eighty percent 80 ofavailable street
rehabilitation funds each year will be dedicated to rehabilitating streets that are identified by thePavement Management Program and that the remaining twenty percent 20 of available fundswill be dedicated to rehabilitating selected worst streets
IN COUNCIL OAKLAND CALIFORNIA 20
PASSED BY THE FOLLOWING VOTE
AYES BROOKS BRUNNER CHANG KERNIGHAN NADEL QUAN REID and PRESIDENT DE LA FUENTE
NOES
ABSENT
ABSTENTION
A
LaTonda Simmons
City Clerk and Clerk of the Council
of the City of Oakland California
F - 6

F - 7

F - 8

F - 9

F - 10

F - 11

F - 12

II.CAPITALIMPROVEMENT–EQUIPMENT
The City of Oakland fleet has a current replacement value of $105 million with an average annual capital funding requirement of $10.2 million in current dollars. Due to the high number of vehicles currently overdue for replacement, immediate funding needs are high with normal cyclical patterns afterward. In FY 2013-15, the City will purchase $11.8M in new vehicles. This capital investment is a small step towards addressing the problem. The table below provides an estimated 20-year capital forecast using current year dollars. If the funding obligation is met, over time our vehicle and equipment replacement will be adequate to ensure a cost-effective fleet.
$‐
$5,000,000
$10,000,000
$15,000,000
$20,000,000
$25,000,000
$30,000,000
City of Oakland Fleet Replacement Cost Projection2012 Dollars

ProposedCIP
Notes

CITY OF OAKLAND 2013 FEB 1U PH12: UZ AGENDA REPORT
TO: DEANNA J. SANTANA CITY ADMINISTRATOR
FROM: Vitaly B. Troyan, P.E. Director, Public Works Agency
SUBJECT: Master Lease Purchase Agreement DATE: January 14, 2013
City Administrator Approval
Date
COUNCIL DISTRICT: City-Wide
RECOMMENDATION
Staff recommends that the City Council adopt a resolution authorizing the City Administrator to execute a master lease-purchase agreement in the amount of S11,850,000 to replace approximately 153 vehicles and equipment items and, for items available from local vendors, authorizing the waiver of the Oakland purchasing ordinance's formal advertising and competitive bidding requirements and allowing the City Administrator to solicit bids from three vendors and award contracts for the purchase of the vehicles and equipment without returning to Council and for items not available from local vendors authorize the City Administrator to enter into cooperative purchase agreements with other governmental agencies to purchase the needed vehicles and equipment.
OUTCOME
The following benefits will accrue from adopting this resolution:
1. Replacement of existing vehicles that are past their life expectancy, have excessive maintenance costs and are out of service more frequently than normal.
2. Deployment of well-performing assets critical to delivering services to citizens, maintaining the environment and collecting revenues.
3. Reduced maintenance costs, reduction in the number of spare units and lower lifecycle cost for these vehicles.
4. Reduced environmental impact by using newer equipment that lowers pollution and uses less fuel.
5. Improved protection for City employees by using vehicles that include up-to-date safety features.
Item: Public Works Committee
February 26, 2013

Deanna J . Santana, City Administrator Subject: Master Lease- Purchase Agreement Date: January 14, 2013 Page 2
BACKGROUND/LEGISLATIVE HISTORY
Recent funding for vehicle and equipment replacement has been inadequate to ensure a cost-effective fleet. The Public Works Agency (PWA) provided its last fleet status report to the Finance Committee on September 11, 2012. The report discussed the age of the City's vehicle fleet and the high cost of keeping vehicles in service past their optimum replacement point. The fleet has a current replacement value of $ 105 million. If each item were to be replaced at a reasonable interval for its type, there is an average annual capital funding requirement for $10.2 million in current dollars. Due to the high number of vehicles currently overdue for replacement, immediate funding needs are $25.9 million. This report proposes only to replace the most critical vehicles and those with the greatest excess maintenance cost.
The City Council and the Authority approved resolutions in 2000 and 2002 to allow the City to acquire vehicles and equipment through the use of Equipment Leases. Resolution numbers 75575 C.M.S and 77101 C.M.S. apply.
ANALYSIS
The Public Works Agency is preparing to purchase approximately 153 replacement vehicles and pieces of equipment for the City's fleet that are beyond their economic life or are required to be replaced in order to provide reliable public safety functions. A listing of the vehicles is provided in Attachment A, Project Itemized Cost Estimates.
The following actions are requested of the City Council:
1. Authorize the City Administrator or designee to execute the Master Lease-Purchase Agreement, the Equipment Replacement Schedule, and the Escrow Agreement related to the lease financing of the vehicles and equipment without returning to Council.
2. Authorize the City Administrator or designee to acquire approximately 153 energy efficient vehicles and pieces of equipment on behalf of the City to replace the City's fleet vehicles overdue for replacement.
3. For items available from local vendors, authorize the waiver of the Oakland purchasing ordinance's formal advertising and competitive bidding requirements and allow the City Administrator to solicit bids from three vendors and award contracts for the purchase of the vehicles and equipment without returning to Council.
4. Authorize the City Administrator and/or designee to execute and deliver all City documents and to perform all actions necessary to carry out the equipment lease financing.
Item: Public Works Committee
February 26, 2013

Deanna J . Santana, City Administrator Subject: Master Lease- Purctiase Agreement Date: January 14, 2013 . . . Page 3
A resolution has been prepared that authorizes the City Administrator and/or designee to execute a Master Lease-Purchase Agreement (the "Agreement") for the finance of vehicles and mobile equipment.
Further, the proposed resolution authorizes the City Administrator to acquire approximately 153 replacement vehicles and pieces of equipment for the City's fleet in an amount not to exceed $11,850,000. The acquisition of the equipment will be financed using the Master Lease-Purchase Agreement (the "Agreement") cited above.
KEY ISSUES AND IMPACTS
Lease Transaction - To assist the City with its proposed equipment lease financing, the City will enter into a Master Lease-Purchase Agreement, an Equipment Schedule, and an Escrow Agreement.
Management of Proceeds - The proceeds of the Master Lease-Purchase Agreement will be deposited into an Escrow Fund(s) established pursuant to an Escrow Agreement by the City. City staff will direct the Escrow Agent to make payments directly to each vendor from the appropriate Escrow Fund for the purchase of the necessary vehicles and equipment. The proceeds are also expected to generate interest income.
Lease Payments - Each schedule will have a life equal to the aggregate average usefiil life of the leased equipment. The majority of the equipment has useful lives between 3 years and 10 years, with an aggregate average useful life of approximately seven years. The $11,850,000 equipment lease financing is structured with three- to ten-year maturities, with coupons ranging from 1.42 percent (3 years) to 2.12 percent (10 years). The lease will be paid off over a period often years, with declining semi-annual payments ranging from approximately $3,403,061 to $136,108 per year as shown m Attachment Estimated Repayment Schedule.
Acquisition of Vehicles and Equipment - For items available from local vendors, the proposed resolution authorizes the City Administrator to solicit informal bids and award contracts for the purchase of the needed vehicles and equipment without returning to Council. The reasons for this action are:
1. Soliciting formal bids would take 3-4 months; and 2. Deadlines established by equipment manufacturers for ordering new vehicles and
equipment (e.g., police vehicles and fire trucks) for the current model year cannot be met in many cases if a fornial bid process is utilized.
Item: Public Works Committee
February 26, 2013

Deanna J . Santana, City Administrator Subject: Master Lease- Purcliase Agreement Date: January 14, 2013 Page 4
The City's resolution authorizes the City Administrator to award the vehicle and equipment contracts once informal bids have been received. Local Business Enterprises (LBE) will receive a 2.5 percent preference on their bids and Small Local Business Enterprises (SLBE) will receive an additional 2.5 percent preference in accordance with the City's Local and Small Local Business Enterprise Program for Construction, Professional Services and Purchasing Programs.
In the event the vehicles and equipment are not available through local vendors, the City Administrator will use existing authority to enter into cooperative purchase agreements or use the formal bidding process to obtain the vehicles and equipment to be replaced.
Environmental - In accordance with Council Resolution 77842 C.M.S., The Green Fleet Policy, Equipment Services Division will purchase alternative fuel vehicles for non-emergency fleet requirements whenever possible without exceeding the amount budgeted for vehicle acquisitions.
POLICY ALTERNATIVES
Alternative 1 Take no action, continue to maintain existing vehicles Pros Small incremental cost increases, no debt obligation Cons Vehicles continue to deteriorate and are out of service more
frequently; maintenance costs continue to increase. Service levels decline.
Reason for not recommending
This is a non-sustainable approach.
Alternative 2 Purchase required vehicle and equipment replacements outright Pros No debt obligation or interest cost Cons Insufficient budget available in the current fiscal year Reason for not recommending
This is impractical due to competing priorities for available funding
Alternative 3 Eliminate vehicles and equipment past due for replacement Pros Reduces costs immediately and significantly Cons Severely impacts service level to using departments and public.
Compromises public safety and environmental compliance. Reduces revenue-generating activities.
Reason for not recommending
This would require significant downsizing of services to the public.
PUBLIC OUTREACH/INTEREST
This item did not require any additional public outreach other than the required posting on the City's website.
Item: Public Works Committee
February 26, 2013

Deanna J . Santana, City Administrator Subject: Master Lease- Purchase Agreement Date: January 14, 2013 Page 5
COORDINATION
Information that is the basis of this report has been coordinated with the departments using the vehicles and equipment to be replaced. Treasury, the City Budget Office and the City Attorney's Office.
COST SUMMARY/IMPLICATIONS
Finance the acquisition of approximately 153 replacement vehicles and pieces of equipment through the Equipment Lease. This financing transaction will provide $11,850,000 in new proceeds. The Lease payments will be made from the City's Equipment Fund, which will earn revenues from rates charged to departments using the purchased vehicles and equipment.
The City will remove from service approximately 168 vehicles and pieces of equipment that are costing $2.3 million per year to maintain. More vehicles can be removed from service than are being purchased because the new vehicles will be in commission more frequently, thus providing the same level of service. The maintenance cost of the new vehicles is expected to be $1.1 million per year for a $1.2 million annual savings. Cost savings estimates are detailed on Attachment A.
The City will remarket the vehicles and equipment removed from service for an estimated return of $295,000 which will be deposited to the Equipment Fund to partially offset lease payments.
The internal service Equipment Fund has a negative balance of -$7,205,277 as of the end of F Y l 1-12. The fund is being restored through fleet usage rates charged to using departments and is scheduled to be a positive balance in FY 18-19. The master lease-purchase program will not affect this schedule.
The Equipment Fund will charge using departments amounts to cover the semi-armual principal and interest payments on the master lease-purchase agreement. Impacts to departments are shown in a table at Attachment B. These amounts are accounted for in the F Y l 3-15 baseline budget.
SUSTAINABLE OPPORTUNITIES
Economic: Sound management of the City's fleet reduces overall costs and increases available funding for direct services to citizens. As assets age, their fixed cost is reduced while their operational costs increase. For each type of equipment, there is a point where the total costs rise and the equipment has reached its economic life. Keeping the equipment in service after that point has a greater annualized cost than replacing it with a new asset. The proposed actions will replace approximately 153 vehicles that are past their economic life and will reduce expenditures over the next several years.
Item: Public Works Committee
February 26, 2013

Deanna J. Santana, City Administrator Subject: Master Lease- Purchase Agreement Date: January 14, 2013 Page 6
Environmental: Regular replacement of fleet assets deploys up-to-date technologies that reduce fuel consumption and emissions. For example, the marked police sedans to be purchased are expected to have 30 percent lower fuel consumption than the assets they replace.
Social Equity: There are no known impacts in this area.
For questions regarding this report, please contact Ken Bailey, Equipment Services Manager, at (510)615-5487.
Respectfully submitted.
Y B. TI VITALY B. TROYAN, P.E. Director, Public Works Agency
Reviewed by: David Ferguson, Assistant Director Department of Infrastructure and Operations
Prepared by: Ken Bailey, Equipment Services Manager Equipment Services Division, PWA
Attachments - A , Project Itemized Cost Estimates " B , Estimated Repayment Schedule
Item: Public Works Committee
February 26, 2013

Attachment A, Project Itemized Cost Estimates
Category and Maintenance Class Class Description
Average Replacement
Cost Each
Average Service Life Years
Units to Replace Purchase Cost
Current Maint Cost/Year
Estimated Maint Cost
Savings
Fire Apparatus ISyr
7753 Fire Apparatus, Pumper, Straight Trucks, 26,001- 33,000 GVW $650,000 15 3 $1,950,000 $88,128 $54,005
Fire Apparatus 20yr
7758 Fire Apparatus, Aerial Ladder Truck, Tiller, 26,QQ1- 33,000 GVW $1,100,000 20 1 $1,100,000 $43,452 $26,627
Light Trucks and Vans
1411 Window, General Purpose, Van, < 8500 GVW $40,000 12 2 $ 80,000 $6,120 $3,750
1521 Half Ton, Regular Cab, Pickups, < 8500 GVW $40,000 12 4 $160,000 $11,016 $6,751
1532 3/4 Ton, Extended Cab, Pickups, < 8500 GVW $40,000 12 2 $80,000 $19,584 $12,001
1534 3/4 Ton, Utility Body, Pickups, < 8500 GVW $40,000 12 4 $160,000 $23,256 $14,251
2423 Cargo, Hi-Cube, Van, 8501-10,000 GVW $40,000 12 3 $120,000 $18,360 $11,251
2424 Cargo, Utility, Van, 8501-10,000 GVW $40,000 12 1 $40,000 $6,120 $3,750
2511 One Ton, Regular Cab, Pickups, 8501- 10,000 GVW $40,000 12 1 $40,000 $5,508 $3,375
2512 One Ton, Extended Cab, Pickups, 8501-10,000 GVW $40,000 12 1 $40,000 $3,672 $2,250
2514 One Ton, Utility Bed, Pickups, 8501- 10,000 GVW $40,000 12 3 $120,000 $28,458 $17,439
2712 Genera! Purpose, Dump Bed, Straight Trucks, 8501-10,000 GVW $40,000 12 2 $80,000 $11,628 $7,126
3424 Cargo, Utility, Van, 10, 001-14,000 GVW $40,000 12 2 $80,000 $12,240 $7,501
Marked Law Enforcement
1348M Full Size, Law Enforcement, Automobile, .< 8500 GVW $60,000 7 70 $4,200,000 $706,860 $433,165
1648M Emergency Services, Law Enforcement, Sport Utility, < 8500 GVW $70,000 7 4 $280,000 $23,256 $14,251
Mechanical Sweepers
6771 Public Works, Mechanical Street Sweeper, Straight Trucks, 19,501-26,000 GVW $350,000 5 6 $2,100,000 $918,000 $562,552
Parking Enforcement
1322 Compact, Sedan, Automobile, < 8500 GVW $25,000 8 36 $900,000 $308,448 $189,017
Unmarked LE, Other

Attachment A, Project Itemized Cost Estimates (continued)
Category and Maintenance Class Class Description
Average Replacement
Cost Each
Average Service Life Years
Units to Replace Purchase Cost
Current Maint Cost/Year
Estimated Maint Cost
Savings
1348U Full Size, Law Enforcement, Automobile, < 8500 GVW $40,000 8 8 $320,000 $36,720 $22,502
Vehicle Cost Total 153 $11;850,000 $2,270,826 $1,202,547
Total Project Cost $11,850,000

Attachment B, Estimated Repayment Schedule
Estimated Lease Payments
FY14 FY15 FY16 FY17 FY18 FY19 FY20 FY21 FY22 FY23
$3,403,061 $3,403,061 $3,403,061 $672,323 $672,323 $454,189 $454,189 $136,108 $136,108 $136,108
Estimated Impact to Departments
FY14 FYl 5 FY16 FY17 FY18 FY19 FY20 FY21 FY22 FY23 Public Works $1,338,151 $1,338,151 $1,338,151 $ 264,371 $ 264,371 $ 178,596 $ 178,596 $ 53,520 $ 53,520 $ 53,520
Police $1,287,614 $1,287,614 $1,287,614 $ 254,386 $ 254,386 $ 171,851 $ 171,851 $ 51,499 $ 51,499 $ 51,499
Fire $ 643,139 $ 643,139 $ 643,139 $ 127,061 $ 127,061 $ 85,836 $ 85,836 $ 25,723 $ 25,723 $ 25,723
Other $ 134,157 $ 34,157 $ 134,157 $ 26,505 $ 26,505 $ 17,905 $ 17,905 $ 5,366 $ 5,366 $ 5,366

ProposedCIP
Notes


Proposed CIP Page 1
Contents
III. CAPITAL IMPROVEMENT – INFORMATION TECHNOLOGY ...................................... 3
Overview ..................................................................................................................................... 3
Capital Improvement Program - Principles and Development Process ...................................... 3
Key CIP Funding Sources ........................................................................................................... 4
Internal Sources ...................................................................................................................... 4
Grant Sources .......................................................................................................................... 4
CIP Project Categories ................................................................................................................ 5
Unfunded, Mandated Projects ................................................................................................. 5
Unfunded, High Priority Projects ........................................................................................... 5
Unfunded, Other Projects........................................................................................................ 6
Next Steps - Long Term Planning .............................................................................................. 6
Attachments ................................................................................................................................ 7
Unfunded Projects Summary...............................................................................................A-1
Unfunded Projects Detail ....................................................................................................B-1

Proposed CIP Page 2
Notes

Proposed CIP Page 3
III. CAPITAL IMPROVEMENT – INFORMATION TECHNOLOGY
Overview
This section of the Capital Improvement Program (CIP) includes recommended major
investments in the city's Information Technology infrastructure and services. These investments
are necessary to maintain, operate and support existing Information Technology architecture to
provide the necessary services for internal and external City customers. It must reflect the overall
priorities of the City. It has a huge impact on public safety, economic development and day to
day efficiencies of City government.
Infrastructure investments include long-term investments that build and replace critical technical
infrastructure (911 systems, public safety, telecommunications, payroll, etc.) and that, unlike
infrastructure Capital Improvement Projects, have a useful design life of three to five years.
Many of the projects included in this section are unfunded, reflecting the limits of existing fund
sources. A strategic approach to prioritizing the remaining requested work is needed. Such an
approach will necessarily require a needs assessment of many of the City's assets, and a long-
term funding approach to addressing existing and emerging technologies that are considered
critical to Public Safety, City Services and future growth.
Capital Improvement Program - Principles and Development Process
The Department of Information Technology is committed to providing the timely delivery of
strategic, responsive, cost-effective technology solutions and quality services to meet the goals
defined by the Mayor, City Council and Oakland's citizens. The department has demonstrated
and implemented systems that improve efficiencies and increase the transparency and
accountability of government.
Each year the Department of Information Technology has submitted Capital Improvement
projects considered essential towards the delivery of services to the City of Oakland.
Unfortunately each year most of the requested CIP’s have not been approved. As a result, the
Department of Information Technology has accumulated a backlog of essential projects on
critical systems. This year’s Capital Improvement Projects submission reflects over 5 years of
deferred maintenance and systems replacements. Technology is the underlying pin that ties
multiple departments and agencies together. It remains the basis upon which many of City
processes provide basic services to its constituents. Placing a priority on these CIP projects will
allow the City to continue to provide relevant, efficient services to the City of Oakland.

Proposed CIP Page 4
Given the large listing of Capital Improvements projects, the Department of Information
Technology has reviewed the CIP projects in consultation with client departments and has
developed a planning level scope and budget for each requested project.
The recommended projects place a priority on preserving the City's Public Safety infrastructure
and critical Enterprise level applications.
Key CIP Funding Sources
Internal Sources
Since 2007-2008, the Department of Information Technology has lost 30 FTE. This severe
reduction in staff has jeopardized the department’s ability to maintain and service critical
infrastructure. The implementation of new projects will require that staffing be added to meet
these high priority and mandated projects.
The Department of Information Technology is currently funded via the General Purpose Fund
(Fund 1010) which leads to the inability to properly plan and strategize any new technology
implementations. Looking forward, it is important that an Internal services fund be established
that will provide operational sustainability of existing Telecommunications and Applications
infrastructure.
Grant Sources
The Department of Information Technology aggressively pursues grant opportunities for various
capital improvements. While by their nature these grants are only available for specific projects
and purposes, they do represent an addition to local funds. They represent the most viable source
to fund new improvements and allow internal funds to be kept available for existing assets.
In the period including the last five years to date, staff successfully applied for and received a
total of $10 million in grants for several public safety and infrastructure technology projects.
Staff will continue to seek grants when projects are competitive and meet the City's need to
address unfunded priorities.
Proposed CIP Page 5
CIP Project Categories
The Information Technology requests can be broken into several key categories for
consideration. These include:
Unfunded, mandated projects (DOJ/NSA)
Unfunded, high priority projects (911, Public Safety Network)
Other unfunded projects
Each is described in more detail below.
Unfunded, Mandated Projects
These are projects with no available source of funding but which are mandated by federal or state
law. Staff carefully analyzed all projects submitted for inclusion in this category and sought
confirmation of any relevant legislation. The Department of Information Technology has
identified 3 projects that are unfunded and mandated for a total of $22 million. Examples of
these projects include Public Safety Network replacement, Public Safety 911 Computer Aided
Dispatch, Record Management System, Mobile systems, Field based reporting and Personnel
Assessment system (IPAS).
Unfunded, High Priority Projects
This category includes projects that replace or renovate assets which are either structurally or
functionally obsolete or have deferred maintenance issues that negatively value the asset but for
which no funding is available. This category includes:
Infrastructure Improvements – Includes Citywide Email replacement, Document and
Records Management system, Network Security, and End User computer devices
(replacements laptops and desktops).
Enterprise Application Services – (Oracle Release 12 upgrade) Payroll, Advanced
Benefits, Advanced Collections and Universal Content Management system.
Public Safety Radio System – provides for additional sites which will enhance coverage
in the field and within buildings.

Proposed CIP Page 6
Unfunded, Other Projects
Data Center Improvements – continuity of operations in a major disaster scenario
requires a need to have a redundant data center site for preservation of data.
Accela Fire Prevention – Fire plan checks and inspections are currently handled on a
separate system from Accela (CEDA). Implementation of the Accela Fire module will
allow for one platform to handle inspections and permits and provide more transparency
by allowing citizens to schedule inspections, apply for a permit and print out permits
from a centralized point online.
Oakland 311 – Citizens should have one centralized point of contact for City Services. A
311 system will consolidate Citywide resources into one reference center, and shorten
response times to the Citizens of Oakland.
Next Steps - Long Term Planning
It is well established that the Department of Information Technology supports critical core
functions for all City Departments and Agencies. Long term planning requires a source of
established funding for departmental services via an Internal Services Fund.
The Department of Information Technology is currently working with the City Administrators
Office to establish a Technology Council, populated with all the major stakeholders from each
department and Agency. The guiding principle of the committee is to provide the necessary
support and input required when making technology decisions that affect Citywide resources.
With this input, the Department of Information Technology will be in a better position to provide
robust, essential CIP proposals that will leverage the most results for our funding.

Proposed CIP Page 7
Attachments

Proposed CIP Page 8
Notes

Project TitleCategory 2013-14 2015-16 2016-17 2017-182014-15
2013-18 CAPITAL IMPROVEMENT PROGRAM
Unfunded Requests by Category
Totals
TECHNOLOGY ENHANCEMENTS
Accela Fire Management Automation 250,000 250,000 0 0 0 500,000
Accela Foreclosure Registration/Investor owned property Module
500,000 0 0 0 0 500,000
CAD, RMS, FBR Systems Replacement 2,000,000 3,000,000 2,000,000 0 0 7,000,000
Data Center - Virtualization Energy Efficiency 1,800,000 0 0 0 0 1,800,000
Data Center: 150 FHOP Data Center Relocation 0 0 800,000 0 0 800,000
EDACS System Migration 4,500,000 3,000,000 0 0 0 7,500,000
Emergency Backup Solution for Public Safety Radio Communications
3,000,000 1,500,000 1,000,000 500,000 250,000 6,250,000
GIS Cloud 174,000 150,000 150,000 150,000 150,000 774,000
Internet Connection Upgrade 250,000 0 0 0 0 250,000
IPSS Network Upgrade 1,450,000 450,000 450,000 450,000 450,000 3,250,000
Microsoft Suite / Licensing 1,100,000 800,000 80,000 0 0 1,980,000
Microwave Network Reliability Upgrade 5,000,000 500,000 0 0 0 5,500,000
Oakland 311 CRM 0 217,000 217,000 0 0 434,000
Oracle EDMS Upgrade 500,000 500,000 0 0 0 1,000,000
Oracle Release 12 Upgrades 2,600,000 1,050,000 200,000 100,000 0 3,950,000
P25 Radio Subscriber Unit Replacement 2,000,000 2,000,000 2,000,000 4,000,000 8,000,000 18,000,000
Public Safety – Desktops Virtualization 0 1,500,000 1,500,000 500,000 500,000 4,000,000
Public Safety – Enterprise Backup for mission-critical data
600,000 230,000 230,000 230,000 230,000 1,520,000
Public Safety – IPAS Upgrade (Sharepoint) 1,200,000 1,400,000 0 0 0 2,600,000
Public Safety – Laptop Refresh 700,000 300,000 100,000 100,000 100,000 1,300,000
Public Safety – Servers Virtualization 450,000 300,000 0 0 0 750,000
Public Safety Communication In Building Coverage Enhancements
2,000,000 2,000,000 2,000,000 2,000,000 0 8,000,000
Public Safety Radio Rebanding Reconciliation Project 2,900,000 0 0 0 0 2,900,000
Public Safety Wireless Test Equipment & Tool Upgrade 1,500,000 250,000 250,000 250,000 250,000 2,500,000
Recware Application Replacement 150,000 0 0 0 0 150,000
SalesForce – HelpDesk Software Upgrade 30,000 0 0 0 0 30,000
Security Software Upgrade 300,000 200,000 100,000 0 0 600,000
Server Refresh 585,000 275,000 0 0 0 860,000
Uninterruptable Power Supply (UPS) upgrade and maintenance
15,000 20,000 20,000 20,000 10,000 85,000
Wireless Infrastructure Upgrade 200,000 150,000 100,000 0 0 450,000
35,754,000 20,042,000 11,197,000 8,300,000 9,940,000SubTotals: 85,233,000
35,754,000 20,042,000 11,197,000 8,300,000 9,940,000Grand Totals: 85,233,000
2013-18 CAPITAL IMPROVEMENT PROGRAM A - 1

Project Description
Project Title: Accela Fire Management Automation
Description: Implementation of Accela Fire Module to facilitate and integrate Fire plan checks and inspections within one System.
Justification: Fire plan checks and inspections are currently handled on a separate system from Accela (CEDA). Implementation of the Accela Fire module will allow for one platform to handle inspections and permits and provide more transparency by allowing citizens to schedule inspections, apply for a permit and print out permits from a centralized point online.
Prioritization Factors:
New Facility Existing Facility
Council District Citywide
Mandated Program
Leverages Outside Funding
Location: 150 Frank H. Ogawa Plaza, 7th Floor
Life Safety4
Hazard Elimination 1
Preventive Maintenance
Department: Department of Information Technology
TECHNOLOGY ENHANCEMENTSCategory:
Contact: Damaris Samgajon x6545
Adopted 2-Year Budget and 5-Year Plan
Project/CIP Funding Source
Operating Cost Impact Funding Source 2013-14 2014-15 2015-16 2016-17 2017-18
2013-14 2014-15 2015-16 2016-17 2017-18 TOTALS
TOTALS
250,000 250,000 0 0 00000 Undetermined Fund 500,000
250,000 0 0 0TOTAL 250,000 500,000
110,000 110,000 110,000 110,000 110,0000000 Undetermined Fund 550,000
110,000 110,000 110,000 110,000 110,000TOTAL 550,000
2013-18 CAPITAL IMPROVEMENT PROGRAM B - 1
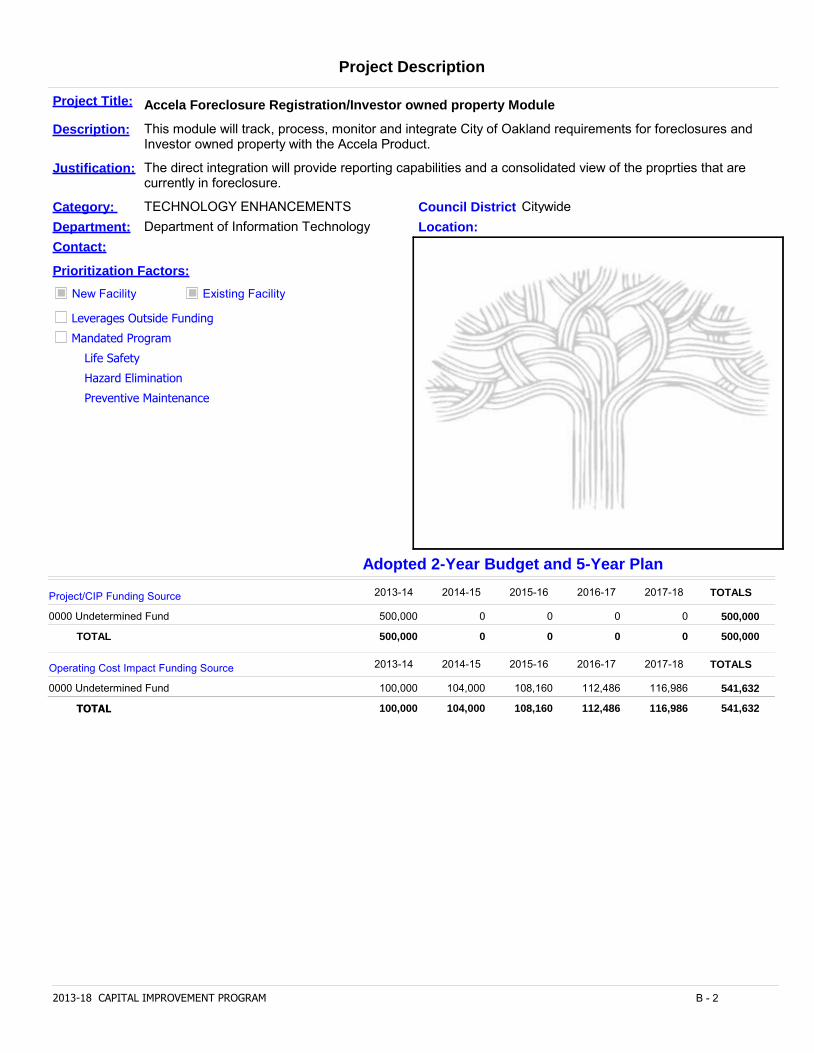
Project Description
Project Title: Accela Foreclosure Registration/Investor owned property Module
Description: This module will track, process, monitor and integrate City of Oakland requirements for foreclosures and Investor owned property with the Accela Product.
Justification: The direct integration will provide reporting capabilities and a consolidated view of the proprties that are currently in foreclosure.
Prioritization Factors:
New Facility Existing Facility
Council District Citywide
Mandated Program
Leverages Outside Funding
Location:
Life Safety
Hazard Elimination
Preventive Maintenance
Department: Department of Information Technology
TECHNOLOGY ENHANCEMENTSCategory:
Contact:
Adopted 2-Year Budget and 5-Year Plan
Project/CIP Funding Source
Operating Cost Impact Funding Source 2013-14 2014-15 2015-16 2016-17 2017-18
2013-14 2014-15 2015-16 2016-17 2017-18 TOTALS
TOTALS
500,000 0 0 0 00000 Undetermined Fund 500,000
0 0 0 0TOTAL 500,000 500,000
100,000 104,000 108,160 112,486 116,9860000 Undetermined Fund 541,632
100,000 104,000 108,160 112,486 116,986TOTAL 541,632
2013-18 CAPITAL IMPROVEMENT PROGRAM B - 2

Project Description
Project Title: CAD, RMS, FBR Systems Replacement
Description: Upgrade and replace the current IPSS system which includes 911 Computer Aided Dispatch (CAD), Records Management System (RMS), mobile and Field Based Reporting (FBR) systems. Current hardware and software modules deployed in IPSS reach end of life.
Justification: Our CAD system is more than 10 years old and requires a major hardware and software upgrade.
Prioritization Factors:
New Facility Existing Facility
Council District Citywide
Mandated Program
Leverages Outside Funding
Location: 911 Center, EOC, PAB, EMM, 150 FHOP
Life Safety5
Hazard Elimination 5
Preventive Maintenance5
Department: Department of Information Technology
TECHNOLOGY ENHANCEMENTSCategory:
Contact: Ahsan Baig x3010
Adopted 2-Year Budget and 5-Year Plan
Project/CIP Funding Source
Operating Cost Impact Funding Source 2013-14 2014-15 2015-16 2016-17 2017-18
2013-14 2014-15 2015-16 2016-17 2017-18 TOTALS
TOTALS
2,000,000 3,000,000 2,000,000 0 00000 Undetermined Fund 7,000,000
3,000,000 2,000,000 0 0TOTAL 2,000,000 7,000,000
1,542,758 1,598,758 1,656,998 1,717,568 1,780,5600000 Undetermined Fund 8,296,642
1,542,758 1,598,758 1,656,998 1,717,568 1,780,560TOTAL 8,296,642
2013-18 CAPITAL IMPROVEMENT PROGRAM B - 3

Project Description
Project Title: Data Center - Virtualization Energy Efficiency
Description: Convert data servers, add control software. Virtualize and consolidate servers in data centers.
Justification: Reduce energy bills by $25,000 to $45,000 per year, reduce greenhouse gas emissions, reduce maintenance cost for equipment replacement. Virtualize and consolidate servers to reduce maintenance cost and improve energy efficiency; to continue modifications to data center airflow to improve heat transfer and energy efficiency.
Prioritization Factors:
New Facility Existing Facility
Council District Citywide
Mandated Program
Leverages Outside Funding
Location: Various Data Centers (150 Frank Ogawa, EOC
Life Safety0
Hazard Elimination 3
Preventive Maintenance5
Department: Department of Information Technology
TECHNOLOGY ENHANCEMENTSCategory:
Contact: Scott Wentworth x3984
Adopted 2-Year Budget and 5-Year Plan
Project/CIP Funding Source
Operating Cost Impact Funding Source 2013-14 2014-15 2015-16 2016-17 2017-18
2013-14 2014-15 2015-16 2016-17 2017-18 TOTALS
TOTALS
1,800,000 0 0 0 00000 Undetermined Fund 1,800,000
0 0 0 0TOTAL 1,800,000 1,800,000
0 136,000 141,440 147,098 152,9820000 Undetermined Fund 577,520
0 136,000 141,440 147,098 152,982TOTAL 577,520
2013-18 CAPITAL IMPROVEMENT PROGRAM B - 4

Project Description
Project Title: Data Center: 150 FHOP Data Center Relocation
Description: Project will move the servers located at the Frank H. Ogawa Plaza Data Center on the 8th Floor to a Data Center capable of providing a robust facility with redundant power, HVAC and elecrical systems.
Justification: The current location of the Data Center at 150 Frank H. Ogawa, 8th Floor is not the most stable and secure location. It si recommended to ensure the Data Center has adequate power backup and cooling.
Prioritization Factors:
New Facility Existing Facility
Council District Citywide
Mandated Program
Leverages Outside Funding
Location:
Life Safety5
Hazard Elimination 0
Preventive Maintenance0
Department: Department of Information Technology
TECHNOLOGY ENHANCEMENTSCategory:
Contact: Ahsan Baig x3010; David Cruise x3917
Adopted 2-Year Budget and 5-Year Plan
Project/CIP Funding Source
Operating Cost Impact Funding Source 2013-14 2014-15 2015-16 2016-17 2017-18
2013-14 2014-15 2015-16 2016-17 2017-18 TOTALS
TOTALS
0 0 800,000 0 00000 Undetermined Fund 800,000
0 800,000 0 0TOTAL 0 800,000
0 0 900,000 936,000 973,4400000 Undetermined Fund 2,809,440
0 0 900,000 936,000 973,440TOTAL 2,809,440
2013-18 CAPITAL IMPROVEMENT PROGRAM B - 5

Project Description
Project Title: EDACS System Migration
Description: Migration of all remaining radio users from the legacy EDACS radio system onto the new P25 standard. This project includes the decommissioning and disposal of the EDACS radio system, migration of all existing users including the PWA 311 Call Center and its radio users onto P25 equipment, migration of the City-Wide Emergency Siren System to another communication source, and the migration of existing channels and FCC frequency coordination.
Justification: Migrating these non-public safety radio users is necessary in order for them to continue utiizing radio communications on either the existing P25, or externally provided radio system as the current subscriber units do have P25 capability and are being used wel past their useful life (excess of 15 years). The EDACS System is manufacturer discontinued and no onger supported. The city has migrated al of the public safety users off the EDACS System and onto the new P25 System. However, all non-pubic safety users and the citywide Emergancy Siren system coninue to be reiant on the EDACS System. This project is vital to ensure the citywide Emergency Siren system continues to operate during an emergency by migrating it to another communicatons source.
Prioritization Factors:
New Facility Existing Facility
Council District Citywide
Mandated Program
Leverages Outside Funding
Location:
Life Safety5
Hazard Elimination 5
Preventive Maintenance5
Department: Department of Information Technology
TECHNOLOGY ENHANCEMENTSCategory:
Contact:
Adopted 2-Year Budget and 5-Year Plan
Project/CIP Funding Source
Operating Cost Impact Funding Source 2013-14 2014-15 2015-16 2016-17 2017-18
2013-14 2014-15 2015-16 2016-17 2017-18 TOTALS
TOTALS
4,500,000 3,000,000 0 0 00000 Undetermined Fund 7,500,000
3,000,000 0 0 0TOTAL 4,500,000 7,500,000
2013-18 CAPITAL IMPROVEMENT PROGRAM B - 6

Project Description
Project Title: Emergency Backup Solution for Public Safety Radio Communications
Description: This project would design and purchase a backup solution to provide emergency communications to the city's first responders in the event our parimary communication system experiences a failure due to a natural disaster or terrorist event. The project would design and build an overlay system to be used in emergency circumstances, as well as provide mobile on-scene communication in the event of a natural disaster or other critical incident which may disable the existing communications system.
Justification: Oakland first responders utilize radio communications as a basic essential service in order to protect life and safety. Unlike other major cities, Oakland does not possess the basic backup systems, or have the ability to restore its existing systems which are necessary to continue to perate basic wireless radio services for its first responders. Building this system is necessary to ensure the city has the ability to recover its own operations due to a catastrophic event and the protection of life and property.
Prioritization Factors:
New Facility Existing Facility
Council District Citywide
Mandated Program
Leverages Outside Funding
Location:
Life Safety5
Hazard Elimination 5
Preventive Maintenance
Department: Department of Information Technology
TECHNOLOGY ENHANCEMENTSCategory:
Contact:
Adopted 2-Year Budget and 5-Year Plan
Project/CIP Funding Source
Operating Cost Impact Funding Source 2013-14 2014-15 2015-16 2016-17 2017-18
2013-14 2014-15 2015-16 2016-17 2017-18 TOTALS
TOTALS
3,000,000 1,500,000 1,000,000 500,000 250,0000000 Undetermined Fund 6,250,000
1,500,000 1,000,000 500,000 250,000TOTAL 3,000,000 6,250,000
625,000 650,000 676,000 703,040 731,1620000 Undetermined Fund 3,385,202
625,000 650,000 676,000 703,040 731,162TOTAL 3,385,202
2013-18 CAPITAL IMPROVEMENT PROGRAM B - 7

Project Description
Project Title: GIS Cloud
Description: Deploy GIS public facing enterprise applications to the cloud computing environment to allow new technology implementations, greater performance, and improved customer satisfaction.
Justification: Database Servers, ArcSDE, Application Servers in the cloud –will reduce over time for maintenance, and provide data redundancy.
Prioritization Factors:
New Facility Existing Facility
Council District Citywide
Mandated Program
Leverages Outside Funding
Location: 150 Frank H. Ogawa Plaza
Life Safety
Hazard Elimination
Preventive Maintenance5
Department: Department of Information Technology
TECHNOLOGY ENHANCEMENTSCategory:
Contact: Ifeoma Olike x7980
Adopted 2-Year Budget and 5-Year Plan
Project/CIP Funding Source
Operating Cost Impact Funding Source 2013-14 2014-15 2015-16 2016-17 2017-18
2013-14 2014-15 2015-16 2016-17 2017-18 TOTALS
TOTALS
174,000 150,000 150,000 150,000 150,0000000 Undetermined Fund 774,000
150,000 150,000 150,000 150,000TOTAL 174,000 774,000
0 0 0 0 00000 Undetermined Fund 0
0 0 0 0 0TOTAL 0
2013-18 CAPITAL IMPROVEMENT PROGRAM B - 8

Project Description
Project Title: Internet Connection Upgrade
Description: Installation of Internet connection at the Emergency Operations Center.
Justification: Currently, there are no Internet Services located in the City's Emergency Operations Center (EOC). All internet email and outside web based content is delivered through a single internet connection, currently located in the 150 Frank H. Ogawa Data Center. A secondary internet connection is proposed for EOC to provide business continuity in the event of an internet service outage.
Prioritization Factors:
New Facility Existing Facility
Council District Citywide
Mandated Program
Leverages Outside Funding
Location: Emergency Operations Center
Life Safety3
Hazard Elimination
Preventive Maintenance5
Department: Department of Information Technology
TECHNOLOGY ENHANCEMENTSCategory:
Contact: Terry Allen x6458
Adopted 2-Year Budget and 5-Year Plan
Project/CIP Funding Source
Operating Cost Impact Funding Source 2013-14 2014-15 2015-16 2016-17 2017-18
2013-14 2014-15 2015-16 2016-17 2017-18 TOTALS
TOTALS
250,000 0 0 0 00000 Undetermined Fund 250,000
0 0 0 0TOTAL 250,000 250,000
184,270 187,270 190,390 193,635 197,0090000 Undetermined Fund 952,574
184,270 187,270 190,390 193,635 197,009TOTAL 952,574
2013-18 CAPITAL IMPROVEMENT PROGRAM B - 9

Project Description
Project Title: IPSS Network Upgrade
Description: The City of Oakland is proposing the replacement and upgrade of the Integrated Public Safety Network (IPSS). This network is a pivotal communications network for the City's first responders and serves multiple sites including the Emergency Operations Center, Police Administration and 911 Operations Center. The proposed replacement network will provide additional capacity needed to support the increased demands of voice/data and rich multimedia applications.
Justification: The currently deployed equipment in the Integrated Public Safety Network is over 10 years old. The equipment manufacturer will no longer offer maintenance, warranties or support for this equipment after November 2012. These conditions have a direct impact on the safety of citizens and first responders.
Prioritization Factors:
New Facility Existing Facility
Council District Citywide
Mandated Program
Leverages Outside Funding
Location: 150 Frank H. Ogawa Plaza
Life Safety5
Hazard Elimination 1
Preventive Maintenance5
Department: Department of Information Technology
TECHNOLOGY ENHANCEMENTSCategory:
Contact:
Adopted 2-Year Budget and 5-Year Plan
Project/CIP Funding Source
Operating Cost Impact Funding Source 2013-14 2014-15 2015-16 2016-17 2017-18
2013-14 2014-15 2015-16 2016-17 2017-18 TOTALS
TOTALS
1,450,000 450,000 450,000 450,000 450,0000000 Undetermined Fund 3,250,000
450,000 450,000 450,000 450,000TOTAL 1,450,000 3,250,000
359,270 369,270 379,670 390,486 401,7350000 Undetermined Fund 1,900,431
359,270 369,270 379,670 390,486 401,735TOTAL 1,900,431
2013-18 CAPITAL IMPROVEMENT PROGRAM B - 10

Project Description
Project Title: Microsoft Suite / Licensing
Description: The project moves the City's email and Microsoft Office Products to a cloud based environment.
Justification: The City's current email system has exceeded its useful life and is therefore at risk of failure. In addition, the City has exceeded its software license entitlement under its current agreement with Microsoft. The implementation of Cloud based email and computing can facilitate a more agile use of technology and provide a more efficient use of staff to support more critical IT functions.
Prioritization Factors:
New Facility Existing Facility
Council District Citywide
Mandated Program
Leverages Outside Funding
Location: 150 Frank Ogawa Plaza
Life Safety2
Hazard Elimination
Preventive Maintenance5
Department: Department of Information Technology
TECHNOLOGY ENHANCEMENTSCategory:
Contact: Terry Allen x6458
Adopted 2-Year Budget and 5-Year Plan
Project/CIP Funding Source
Operating Cost Impact Funding Source 2013-14 2014-15 2015-16 2016-17 2017-18
2013-14 2014-15 2015-16 2016-17 2017-18 TOTALS
TOTALS
1,100,000 800,000 80,000 0 00000 Undetermined Fund 1,980,000
800,000 80,000 0 0TOTAL 1,100,000 1,980,000
1,209,270 1,137,270 909,270 941,270 974,5500000 Undetermined Fund 5,171,630
1,209,270 1,137,270 909,270 941,270 974,550TOTAL 5,171,630
2013-18 CAPITAL IMPROVEMENT PROGRAM B - 11

Project Description
Project Title: Microwave Network Reliability Upgrade
Description: Infrastructure upgrades includiing tower modifications, power generatiors, air conditioning, fire suppression, and other ancillary system upgrades.
Justification: Upgrade of supporting facility infrastructure for the 911 Dispatch/MSC, Oakland EOC, Gwin Radio Site, APL Radio Site, Seneca Radio Site, 150 Frank Ogawa Plaza, and Fire Station 25, which are all integral to ensuring the network maintains high availability in support of mission critical systems including 911 call taking and dispatch operations across the city.
Prioritization Factors:
New Facility Existing Facility
Council District Citywide
Mandated Program
Leverages Outside Funding
Location:
Life Safety5
Hazard Elimination 5
Preventive Maintenance1
Department: Department of Information Technology
TECHNOLOGY ENHANCEMENTSCategory:
Contact:
Adopted 2-Year Budget and 5-Year Plan
Project/CIP Funding Source
Operating Cost Impact Funding Source 2013-14 2014-15 2015-16 2016-17 2017-18
2013-14 2014-15 2015-16 2016-17 2017-18 TOTALS
TOTALS
5,000,000 500,000 0 0 00000 Undetermined Fund 5,500,000
500,000 0 0 0TOTAL 5,000,000 5,500,000
625,000 650,000 676,000 703,040 731,1620000 Undetermined Fund 3,385,202
625,000 650,000 676,000 703,040 731,162TOTAL 3,385,202
2013-18 CAPITAL IMPROVEMENT PROGRAM B - 12
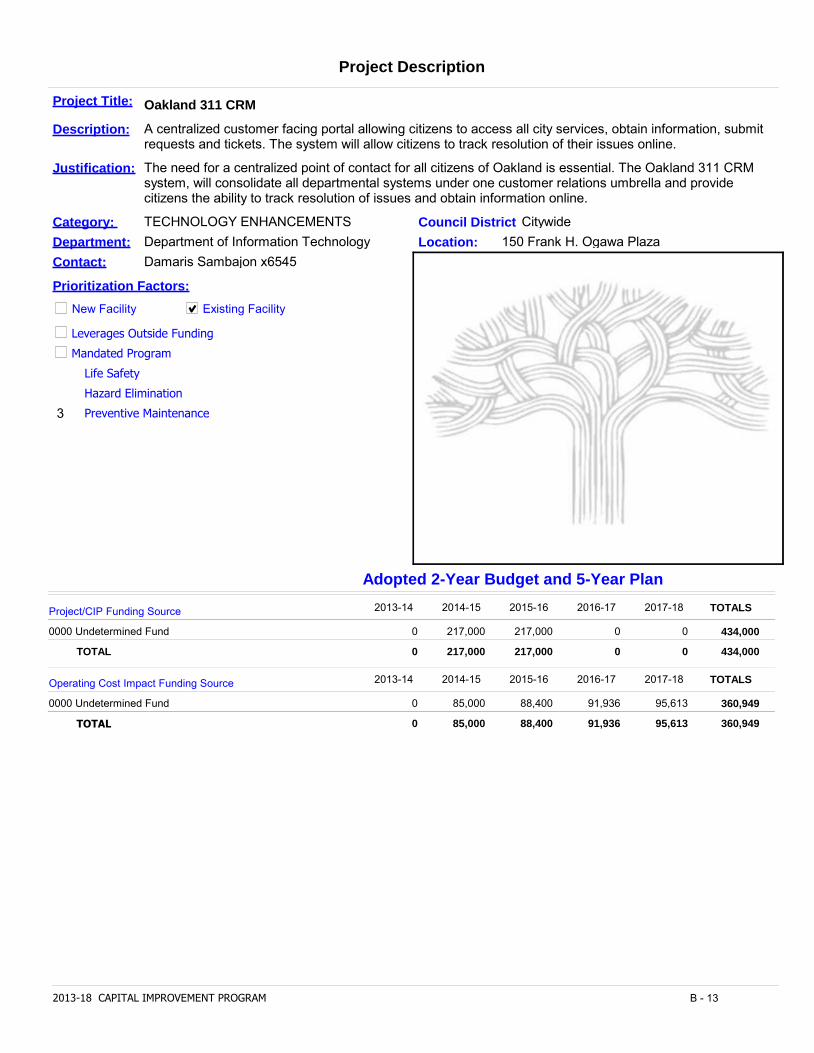
Project Description
Project Title: Oakland 311 CRM
Description: A centralized customer facing portal allowing citizens to access all city services, obtain information, submit requests and tickets. The system will allow citizens to track resolution of their issues online.
Justification: The need for a centralized point of contact for all citizens of Oakland is essential. The Oakland 311 CRM system, will consolidate all departmental systems under one customer relations umbrella and provide citizens the ability to track resolution of issues and obtain information online.
Prioritization Factors:
New Facility Existing Facility
Council District Citywide
Mandated Program
Leverages Outside Funding
Location: 150 Frank H. Ogawa Plaza
Life Safety
Hazard Elimination
Preventive Maintenance3
Department: Department of Information Technology
TECHNOLOGY ENHANCEMENTSCategory:
Contact: Damaris Sambajon x6545
Adopted 2-Year Budget and 5-Year Plan
Project/CIP Funding Source
Operating Cost Impact Funding Source 2013-14 2014-15 2015-16 2016-17 2017-18
2013-14 2014-15 2015-16 2016-17 2017-18 TOTALS
TOTALS
0 217,000 217,000 0 00000 Undetermined Fund 434,000
217,000 217,000 0 0TOTAL 0 434,000
0 85,000 88,400 91,936 95,6130000 Undetermined Fund 360,949
0 85,000 88,400 91,936 95,613TOTAL 360,949
2013-18 CAPITAL IMPROVEMENT PROGRAM B - 13

Project Description
Project Title: Oracle EDMS Upgrade
Description: To consolidate and upgrade the Electronic Document Management System into one platform, providing additional functionality and efficiency.
Justification: The City has two separate electronic document management systems, one of which has not been updated nor maintained. Consolidation and upgrade will provide a stable platform with the necessary support and increased functionality. This document management system will support the city's requirement for long term electronic document storage and retrieval.
Prioritization Factors:
New Facility Existing Facility
Council District Citywide
Mandated Program
Leverages Outside Funding
Location: 150 Frank H. Ogawa Plaza
Life Safety
Hazard Elimination
Preventive Maintenance
Department: Department of Information Technology
TECHNOLOGY ENHANCEMENTSCategory:
Contact: Damaris Sambajon x6545
Adopted 2-Year Budget and 5-Year Plan
Project/CIP Funding Source
Operating Cost Impact Funding Source 2013-14 2014-15 2015-16 2016-17 2017-18
2013-14 2014-15 2015-16 2016-17 2017-18 TOTALS
TOTALS
500,000 500,000 0 0 00000 Undetermined Fund 1,000,000
500,000 0 0 0TOTAL 500,000 1,000,000
328,660 332,860 337,228 341,771 346,4950000 Undetermined Fund 1,687,014
328,660 332,860 337,228 341,771 346,495TOTAL 1,687,014
2013-18 CAPITAL IMPROVEMENT PROGRAM B - 14

Project Description
Project Title: Oracle Release 12 Upgrades
Description: Oracle Enterprise Business Suite of applications Release 12 upgrades to include: upgrade entire eBusiness Suite, perform business process enhancements, implement new features and eliminate customizations; implement new modules – Advanced Benefits, Grants Accounting and Advance Collections; re-implement Project Accounting; perform refresh of Oracle eBusiness Suite hardware platform to include Open Source Operating System (LINUX).
Justification: The Oracle Enterprise Business Suite (EBS) Software Release 11i must be upgraded to Release 12 no later than November 31, 2014 to continue payroll processing. Use of the new features and new software application modules will serve to improve business processes in finance, benefits, debt collections, grants and project accounting management.
Prioritization Factors:
New Facility Existing Facility
Council District Citywide
Mandated Program
Leverages Outside Funding
Location: 150 Frank H. Ogawa Plaza
Life Safety0
Hazard Elimination 0
Preventive Maintenance5
Department: Department of Information Technology
TECHNOLOGY ENHANCEMENTSCategory:
Contact: Ken Gordon x2028
Adopted 2-Year Budget and 5-Year Plan
Project/CIP Funding Source
Operating Cost Impact Funding Source 2013-14 2014-15 2015-16 2016-17 2017-18
2013-14 2014-15 2015-16 2016-17 2017-18 TOTALS
TOTALS
2,600,000 1,050,000 200,000 100,000 00000 Undetermined Fund 3,950,000
1,050,000 200,000 100,000 0TOTAL 2,600,000 3,950,000
1,423,660 1,471,660 1,521,580 1,573,497 1,627,4900000 Undetermined Fund 7,617,887
1,423,660 1,471,660 1,521,580 1,573,497 1,627,490TOTAL 7,617,887
2013-18 CAPITAL IMPROVEMENT PROGRAM B - 15

Project Description
Project Title: P25 Radio Subscriber Unit Replacement
Description: This existing, aging fleet of radios was purchased by Sprint/Nextel as part of the "Rebanding Project" and no city funds were used to deploy them. As part of this replacement, the various public safety users have expressed a strong desire to secure some of their critical communications from public broadcast and wish to deploy a basic level of encryption on a limited number of radio channels used for specialized public safety tasks. This project will, over a period of 5 years, migrate the older fleet of radios into retirement and purchase new radios and supporting accessories as replacements.
Justification: This existing public safety radio subscriber fleet is nearing their end of life and will not be supported by the manufacturer in the near future. The public safety radio subscriber fleet will need replacement over the next five years in order to continue supporting the city's first responders mission critical communication needs.
Prioritization Factors:
New Facility Existing Facility
Council District Citywide
Mandated Program
Leverages Outside Funding
Location:
Life Safety5
Hazard Elimination 5
Preventive Maintenance5
Department: Department of Information Technology
TECHNOLOGY ENHANCEMENTSCategory:
Contact:
Adopted 2-Year Budget and 5-Year Plan
Project/CIP Funding Source
Operating Cost Impact Funding Source 2013-14 2014-15 2015-16 2016-17 2017-18
2013-14 2014-15 2015-16 2016-17 2017-18 TOTALS
TOTALS
2,000,000 2,000,000 2,000,000 4,000,000 8,000,0000000 Undetermined Fund 18,000,000
2,000,000 2,000,000 4,000,000 8,000,000TOTAL 2,000,000 18,000,000
1,250,000 1,300,000 1,352,000 1,406,080 1,462,3230000 Undetermined Fund 6,770,403
1,250,000 1,300,000 1,352,000 1,406,080 1,462,323TOTAL 6,770,403
2013-18 CAPITAL IMPROVEMENT PROGRAM B - 16

Project Description
Project Title: Public Safety – Desktops Virtualization
Description: This project will virtualize all desktop computers in the City on a centralized servers platform. Low cost and easy to deploy desktop computers will be deployed, and all the applications and data will reside in the City private cloud.
Justification: There are more than 3000 desktop computers deployed in the City supporting various applications. Many of these desktop computers consist of outdated hardware and software. With this Desktop Virtualization, end-user productivity will significantly increase and downtime associated with hardware/software problems will be minimized.
Prioritization Factors:
New Facility Existing Facility
Council District Citywide
Mandated Program
Leverages Outside Funding
Location: 911 Center, PAB, EM, FDC, 250 FOP, Fire Sta
Life Safety5
Hazard Elimination 5
Preventive Maintenance5
Department: Department of Information Technology
TECHNOLOGY ENHANCEMENTSCategory:
Contact: Ahsan Baig x3010
Adopted 2-Year Budget and 5-Year Plan
Project/CIP Funding Source
Operating Cost Impact Funding Source 2013-14 2014-15 2015-16 2016-17 2017-18
2013-14 2014-15 2015-16 2016-17 2017-18 TOTALS
TOTALS
0 1,500,000 1,500,000 500,000 500,0000000 Undetermined Fund 4,000,000
1,500,000 1,500,000 500,000 500,000TOTAL 0 4,000,000
0 500,000 520,000 540,800 568,0000000 Undetermined Fund 2,128,800
0 500,000 520,000 540,800 568,000TOTAL 2,128,800
2013-18 CAPITAL IMPROVEMENT PROGRAM B - 17

Project Description
Project Title: Public Safety – Enterprise Backup for mission-critical data
Description: Implement an Enterprise Backup System for mission critical data.
Justification: The primary purpose of having Enterprise Backup system is to quick recover from disasters to ensure business continuity, and restoration and recovery of critical data and systems. We need to ensure that critical data is backed up periodically and copies maintained at an off-site location.
Prioritization Factors:
New Facility Existing Facility
Council District Citywide
Mandated Program
Leverages Outside Funding
Location: PAB, 150 FOP, EOC
Life Safety5
Hazard Elimination 5
Preventive Maintenance5
Department: Department of Information Technology
TECHNOLOGY ENHANCEMENTSCategory:
Contact: Ahsan Baig x3010
Adopted 2-Year Budget and 5-Year Plan
Project/CIP Funding Source
Operating Cost Impact Funding Source 2013-14 2014-15 2015-16 2016-17 2017-18
2013-14 2014-15 2015-16 2016-17 2017-18 TOTALS
TOTALS
600,000 230,000 230,000 230,000 230,0000000 Undetermined Fund 1,520,000
230,000 230,000 230,000 230,000TOTAL 600,000 1,520,000
363,758 372,598 381,792 391,353 401,2970000 Undetermined Fund 1,910,798
363,758 372,598 381,792 391,353 401,297TOTAL 1,910,798
2013-18 CAPITAL IMPROVEMENT PROGRAM B - 18

Project Description
Project Title: Public Safety – IPAS Upgrade (Sharepoint)
Description: The IPAS ver 2 will be designed, developed and deployed by using a new technology platform, to meet the business and operational needs of the Oakland Police Department for enhanced reporting, improved collaboration and supervision.
Justification: The current platform of IPAS is more than 5 years old, and relies on hardware and software, which is not supported by the manufacturers. The current version of IPAS was built to provide an interim solution, and has exceeded the capacity to meet the new business needs of OPD.
Prioritization Factors:
New Facility Existing Facility
Council District Citywide
Mandated Program
Leverages Outside Funding
Location: 911 Center, PAB, EMM, IAD, 250 FOP
Life Safety5
Hazard Elimination 5
Preventive Maintenance5
Department: Department of Information Technology
TECHNOLOGY ENHANCEMENTSCategory:
Contact: Ahsan Baig x3010
Adopted 2-Year Budget and 5-Year Plan
Project/CIP Funding Source
Operating Cost Impact Funding Source 2013-14 2014-15 2015-16 2016-17 2017-18
2013-14 2014-15 2015-16 2016-17 2017-18 TOTALS
TOTALS
1,200,000 1,400,000 0 0 00000 Undetermined Fund 2,600,000
1,400,000 0 0 0TOTAL 1,200,000 2,600,000
422,758 433,958 445,606 457,720 470,3180000 Undetermined Fund 2,230,360
422,758 433,958 445,606 457,720 470,318TOTAL 2,230,360
2013-18 CAPITAL IMPROVEMENT PROGRAM B - 19

Project Description
Project Title: Public Safety – Laptop Refresh
Description: This project will replace the current mobile computers and laptops and outdated OPD & OFD broadband 4G data communication network.
Justification: The current mobile data terminals and laptop computers in police cars are 5 to 7 years old, and mobile data terminals in fire engines are more than 10 years old. The private data network is 15 years old, and there is no maintenance support available from the manufacturer.
Prioritization Factors:
New Facility Existing Facility
Council District Citywide
Mandated Program
Leverages Outside Funding
Location: 911 Center, PAB, EM, FDC, 250 FOP, Fire Sta
Life Safety5
Hazard Elimination 5
Preventive Maintenance5
Department: Department of Information Technology
TECHNOLOGY ENHANCEMENTSCategory:
Contact: Ahsan Baig x3010
Adopted 2-Year Budget and 5-Year Plan
Project/CIP Funding Source
Operating Cost Impact Funding Source 2013-14 2014-15 2015-16 2016-17 2017-18
2013-14 2014-15 2015-16 2016-17 2017-18 TOTALS
TOTALS
700,000 300,000 100,000 100,000 100,0000000 Undetermined Fund 1,300,000
300,000 100,000 100,000 100,000TOTAL 700,000 1,300,000
142,758 142,758 142,758 142,758 142,7580000 Undetermined Fund 713,790
142,758 142,758 142,758 142,758 142,758TOTAL 713,790
2013-18 CAPITAL IMPROVEMENT PROGRAM B - 20

Project Description
Project Title: Public Safety – Servers Virtualization
Description: Server Virtualization will allow DIT to optimize its resources by consolidating 50+ individual servers into 4 blade servers.
Justification: This implementation will prevent the City from mission critical data losses and data breaches by using virtualization technology. In addition, this will enable DIT to address the challenges of limited resources and unsecured data.
Prioritization Factors:
New Facility Existing Facility
Council District Citywide
Mandated Program
Leverages Outside Funding
Location: PAB, 150 FOP, EOC
Life Safety4
Hazard Elimination 4
Preventive Maintenance5
Department: Department of Information Technology
TECHNOLOGY ENHANCEMENTSCategory:
Contact: Ahsan Baig x6010
Adopted 2-Year Budget and 5-Year Plan
Project/CIP Funding Source
Operating Cost Impact Funding Source 2013-14 2014-15 2015-16 2016-17 2017-18
2013-14 2014-15 2015-16 2016-17 2017-18 TOTALS
TOTALS
450,000 300,000 0 0 00000 Undetermined Fund 750,000
300,000 0 0 0TOTAL 450,000 750,000
187,758 189,558 191,430 193,377 195,4020000 Undetermined Fund 957,525
187,758 189,558 191,430 193,377 195,402TOTAL 957,525
2013-18 CAPITAL IMPROVEMENT PROGRAM B - 21

Project Description
Project Title: Public Safety Communication In Building Coverage Enhancements
Description: This project will enhance the public safety wireless communication coverage inside of 50 government owned buildings to ensure first responders can communicate while working inside buildings. This includes hospitals, critical facilities, civic buildings, schools, and public safety facilities.
Justification: This project is critical to ensure first responders from all agencies can communicate while responding to emergencies inside of government owned buildings.
Prioritization Factors:
New Facility Existing Facility
Council District Citywide
Mandated Program
Leverages Outside Funding
Location:
Life Safety5
Hazard Elimination 5
Preventive Maintenance
Department: Department of Information Technology
TECHNOLOGY ENHANCEMENTSCategory:
Contact:
Adopted 2-Year Budget and 5-Year Plan
Project/CIP Funding Source
Operating Cost Impact Funding Source 2013-14 2014-15 2015-16 2016-17 2017-18
2013-14 2014-15 2015-16 2016-17 2017-18 TOTALS
TOTALS
2,000,000 2,000,000 2,000,000 2,000,000 00000 Undetermined Fund 8,000,000
2,000,000 2,000,000 2,000,000 0TOTAL 2,000,000 8,000,000
750,000 780,000 811,200 843,648 877,3940000 Undetermined Fund 4,062,242
750,000 780,000 811,200 843,648 877,394TOTAL 4,062,242
2013-18 CAPITAL IMPROVEMENT PROGRAM B - 22

Project Description
Project Title: Public Safety Radio Rebanding Reconciliation Project
Description: FCC mandated Sprint/Nextel to enter into a Frequency Reconfiguration Agreement (FRA) with City of Oakland. The 800 MHz reconfiguration program is part of the FCC's plan to promote safety and protect the lives of first responders and other emergency personnel by addressing the harmful interference to public safety communication systems operating in the 800 MHz Band. The Actual Cost Reconciliation (ACR) is the project closing process that matches cost support documentation.
Justification: Ciyt needs to start the cost reconsiliation process, and pay for any additional subscriber radio equipment received as part of the rebanding project. It also includes a reconsiliation of any replacement and/or loaner equipment included in the Frequency Reconfiguration Agreement (FRA).
Prioritization Factors:
New Facility Existing Facility
Council District Citywide
Mandated Program
Leverages Outside Funding
Location:
Life Safety3
Hazard Elimination 4
Preventive Maintenance3
Department: Department of Information Technology
TECHNOLOGY ENHANCEMENTSCategory:
Contact:
Adopted 2-Year Budget and 5-Year Plan
Project/CIP Funding Source
Operating Cost Impact Funding Source 2013-14 2014-15 2015-16 2016-17 2017-18
2013-14 2014-15 2015-16 2016-17 2017-18 TOTALS
TOTALS
2,900,000 0 0 0 00000 Undetermined Fund 2,900,000
0 0 0 0TOTAL 2,900,000 2,900,000
2013-18 CAPITAL IMPROVEMENT PROGRAM B - 23

Project Description
Project Title: Public Safety Wireless Test Equipment & Tool Upgrade
Description: This project would purchase and replace the various tools, test equipment, hardware, software and vehicles necessary to support this operation.
Justification: The existing tools and test equipment used by the IT Wireless Division are either antiquated or missing and require immediate replacement in order for this workgroup to continue to support the multitude of mission critical systems utilized across the City. The current workgroup does not have the basic equipment necessary and the City is either renting, borrowing or using outside vendors to provide emergency support as necessary.
Prioritization Factors:
New Facility Existing Facility
Council District Citywide
Mandated Program
Leverages Outside Funding
Location:
Life Safety5
Hazard Elimination 5
Preventive Maintenance5
Department: Department of Information Technology
TECHNOLOGY ENHANCEMENTSCategory:
Contact:
Adopted 2-Year Budget and 5-Year Plan
Project/CIP Funding Source
Operating Cost Impact Funding Source 2013-14 2014-15 2015-16 2016-17 2017-18
2013-14 2014-15 2015-16 2016-17 2017-18 TOTALS
TOTALS
1,500,000 250,000 250,000 250,000 250,0000000 Undetermined Fund 2,500,000
250,000 250,000 250,000 250,000TOTAL 1,500,000 2,500,000
250,000 260,000 270,400 281,216 292,4650000 Undetermined Fund 1,354,081
250,000 260,000 270,400 281,216 292,465TOTAL 1,354,081
2013-18 CAPITAL IMPROVEMENT PROGRAM B - 24

Project Description
Project Title: Recware Application Replacement
Description: The City of Oakland is proposing the replacement and upgrade of the online recreation management and registration application currently used by the Park and Recreation Agency with a cloud based solution.
Justification: The currently deployed online recreation management application is more than 10 years old and does not meet current industry security standards. The Payment Card Industry Standard (PCI) requires the City to protect card holder data processed by this application.The City cannot meet these requirements with the currently deployed solution. Failure to meet PCI eompliance can subject the City to costly fines. This project replaces the existing application with a PCI Compliant cloud based solution.
Prioritization Factors:
New Facility Existing Facility
Council District Citywide
Mandated Program
Leverages Outside Funding
Location:
Life Safety1
Hazard Elimination
Preventive Maintenance
Department: Department of Information Technology
TECHNOLOGY ENHANCEMENTSCategory:
Contact:
Adopted 2-Year Budget and 5-Year Plan
Project/CIP Funding Source
Operating Cost Impact Funding Source 2013-14 2014-15 2015-16 2016-17 2017-18
2013-14 2014-15 2015-16 2016-17 2017-18 TOTALS
TOTALS
150,000 0 0 0 00000 Undetermined Fund 150,000
0 0 0 0TOTAL 150,000 150,000
189,270 192,470 195,798 199,259 202,8590000 Undetermined Fund 979,656
189,270 192,470 195,798 199,259 202,859TOTAL 979,656
2013-18 CAPITAL IMPROVEMENT PROGRAM B - 25

Project Description
Project Title: SalesForce – HelpDesk Software Upgrade
Description: Maintenance, Support and Upgrade of the City’s cloud based Help Desk system.
Justification: Reduces the need for Help Desk application maintenance currently performed by staff.
Prioritization Factors:
New Facility Existing Facility
Council District Citywide
Mandated Program
Leverages Outside Funding
Location: 150 Frank H. Ogawa Plaza
Life Safety0
Hazard Elimination 0
Preventive Maintenance5
Department: Department of Information Technology
TECHNOLOGY ENHANCEMENTSCategory:
Contact: Ifeoma Olike x7980
Adopted 2-Year Budget and 5-Year Plan
Project/CIP Funding Source
Operating Cost Impact Funding Source 2013-14 2014-15 2015-16 2016-17 2017-18
2013-14 2014-15 2015-16 2016-17 2017-18 TOTALS
TOTALS
30,000 0 0 0 00000 Undetermined Fund 30,000
0 0 0 0TOTAL 30,000 30,000
60,000 62,400 64,896 67,492 70,1920000 Undetermined Fund 324,980
60,000 62,400 64,896 67,492 70,192TOTAL 324,980
2013-18 CAPITAL IMPROVEMENT PROGRAM B - 26

Project Description
Project Title: Security Software Upgrade
Description: Project to upgrade and maintain the security of the City’s internal and public facing systems.
Justification: The City of Oakland is the custodian of a wide range of information. The need to safeguard this information is an essential requirement. The implementation of this request will provide the ability to implement and maintain security measures to protect information assets.
Prioritization Factors:
New Facility Existing Facility
Council District Citywide
Mandated Program
Leverages Outside Funding
Location: 150 Frank H. Ogawa Plaza
Life Safety4
Hazard Elimination
Preventive Maintenance5
Department: Department of Information Technology
TECHNOLOGY ENHANCEMENTSCategory:
Contact: Terry Allen x6458
Adopted 2-Year Budget and 5-Year Plan
Project/CIP Funding Source
Operating Cost Impact Funding Source 2013-14 2014-15 2015-16 2016-17 2017-18
2013-14 2014-15 2015-16 2016-17 2017-18 TOTALS
TOTALS
300,000 200,000 100,000 0 00000 Undetermined Fund 600,000
200,000 100,000 0 0TOTAL 300,000 600,000
259,270 265,270 271,510 278,000 284,7490000 Undetermined Fund 1,358,799
259,270 265,270 271,510 278,000 284,749TOTAL 1,358,799
2013-18 CAPITAL IMPROVEMENT PROGRAM B - 27

Project Description
Project Title: Server Refresh
Description: This project will replace obsolete server hardware.
Justification: Technology updates and new applications require server hardware capable of supporting critical business functions. The majority of the City's current server platforms have exceeded their useful life. Warranties have expired and are no longer available on certain platforms.
Prioritization Factors:
New Facility Existing Facility
Council District Citywide
Mandated Program
Leverages Outside Funding
Location: 150 Frank H. Ogawa Plaza
Life Safety0
Hazard Elimination 0
Preventive Maintenance5
Department: Department of Information Technology
TECHNOLOGY ENHANCEMENTSCategory:
Contact: Terry Allen x6458
Adopted 2-Year Budget and 5-Year Plan
Project/CIP Funding Source
Operating Cost Impact Funding Source 2013-14 2014-15 2015-16 2016-17 2017-18
2013-14 2014-15 2015-16 2016-17 2017-18 TOTALS
TOTALS
585,000 275,000 0 0 00000 Undetermined Fund 860,000
275,000 0 0 0TOTAL 585,000 860,000
184,270 187,270 190,390 193,635 197,0090000 Undetermined Fund 952,574
184,270 187,270 190,390 193,635 197,009TOTAL 952,574
2013-18 CAPITAL IMPROVEMENT PROGRAM B - 28

Project Description
Project Title: Uninterruptable Power Supply (UPS) upgrade and maintenance
Description: This project will upgrade and maintain power backup systems for the City's Data Centers.
Justification: The City's Data Centers contain components that provide critical services to internal City staff as well as the citizens of Oakland. Uninterruptable Power Supplies (UPS) provide protection against interruption in electrical services. The UPS will ensure that critical public safety services remain available when there is a power failure.
Prioritization Factors:
New Facility Existing Facility
Council District Citywide
Mandated Program
Leverages Outside Funding
Location: 150 Frank H. Ogawa Plaza
Life Safety5
Hazard Elimination 0
Preventive Maintenance5
Department: Department of Information Technology
TECHNOLOGY ENHANCEMENTSCategory:
Contact: Terry Allen x6458
Adopted 2-Year Budget and 5-Year Plan
Project/CIP Funding Source
Operating Cost Impact Funding Source 2013-14 2014-15 2015-16 2016-17 2017-18
2013-14 2014-15 2015-16 2016-17 2017-18 TOTALS
TOTALS
15,000 20,000 20,000 20,000 10,0000000 Undetermined Fund 85,000
20,000 20,000 20,000 10,000TOTAL 15,000 85,000
139,270 140,470 141,718 143,016 144,3660000 Undetermined Fund 708,840
139,270 140,470 141,718 143,016 144,366TOTAL 708,840
2013-18 CAPITAL IMPROVEMENT PROGRAM B - 29

Project Description
Project Title: Wireless Infrastructure Upgrade
Description: This project will provide increased wireless coverage in City conference rooms and other shared areas.
Justification: The increased use of mobile data technologies and mobile devices are continuously placing new demands on the City's wireless infrastructure. In order to meet increased demands for wireless coverage and bandwidth, the City's wireless infrastructure needs to be upgraded and expanded.
Prioritization Factors:
New Facility Existing Facility
Council District Citywide
Mandated Program
Leverages Outside Funding
Location: 150 Frank Ogawa Plaza
Life Safety1
Hazard Elimination
Preventive Maintenance5
Department: Department of Information Technology
TECHNOLOGY ENHANCEMENTSCategory:
Contact: Terry Allen x6458
Adopted 2-Year Budget and 5-Year Plan
Project/CIP Funding Source
Operating Cost Impact Funding Source 2013-14 2014-15 2015-16 2016-17 2017-18
2013-14 2014-15 2015-16 2016-17 2017-18 TOTALS
TOTALS
200,000 150,000 100,000 0 00000 Undetermined Fund 450,000
150,000 100,000 0 0TOTAL 200,000 450,000
159,270 161,270 163,350 165,513 167,7630000 Undetermined Fund 817,166
159,270 161,270 163,350 165,513 167,763TOTAL 817,166
2013-18 CAPITAL IMPROVEMENT PROGRAM B - 30

ProposedCIP
Notes