fy-2021-operating-budget-summaries.pdf - University of Texas ...
109
AUGUST 2020 The University of Texas at Arlington The University of Texas at Austin The University of Texas at Dallas The University of Texas at El Paso The University of Texas Permian Basin The University of Texas Rio Grande Valley The University of Texas at San Antonio The University of Texas at Tyler The University of Texas Southwestern Medical Center The University of Texas Medical Branch at Galveston The University of Texas Health Science Center at Houston The University of Texas Health Science Center at San Antonio The University of Texas M. D. Anderson Cancer Center The University of Texas Health Science Center at Tyler The University of Texas System Administration T HE U NIVERSITY OF T EXAS S YSTEM OPERATING BUDGET SUMMARIES AND RESERVE ALLOCATIONS FOR LIBRARY, EQUIPMENT, REPAIR AND REHABILITATION AND FACULTY STARS FISCAL YEAR 2021
-
Upload
khangminh22 -
Category
Documents
-
view
0 -
download
0
Transcript of fy-2021-operating-budget-summaries.pdf - University of Texas ...
AUGUST 2020
The University of Texas at Arlington The University of Texas at Austin The University of Texas at Dallas The University of Texas at El Paso The University of Texas Permian Basin The University of Texas Rio Grande Valley The University of Texas at San Antonio The University of Texas at Tyler The University of Texas Southwestern Medical Center The University of Texas Medical Branch at Galveston The University of Texas Health Science Center at Houston The University of Texas Health Science Center at San Antonio The University of Texas M. D. Anderson Cancer Center The University of Texas Health Science Center at Tyler The University of Texas System Administration
THE UNIVERSITY OF TEXAS SYSTEM
OPERATING BUDGET SUMMARIES AND RESERVE ALLOCATIONS FOR
LIBRARY, EQUIPMENT, REPAIR AND REHABILITATION
AND FACULTY STARS
FISCAL YEAR 2021

THE UNIVERSITY OF TEXAS SYSTEM OPERATING BUDGET SUMMARIES AND RESERVE ALLOCATIONS FOR
LIBRARY, EQUIPMENT, REPAIR AND REHABILITATION AND FACULTY STARS
For Fiscal Year Ending August 31, 2021
Table of Contents
TAB 1 – Operating Budget Summaries Page
Operating Budget Highlights (including Background and Glossary of Terms). ............................................................... 1 The University of Texas System - Combined ................................................................................................................. 11 The University of Texas System Academic Institutions - Combined ............................................................................. 13 The University of Texas System Health Related Institutions - Combined .................................................................... 15 The University of Texas System Administration ........................................................................................................... 17 The University of Texas at Arlington ............................................................................................................................. 21 The University of Texas at Austin ................................................................................................................................. 25 The University of Texas at Austin - Application of Available University Fund .............................................................. 29 The University of Texas at Dallas .................................................................................................................................. 37 The University of Texas at El Paso ................................................................................................................................ 41 The University of Texas Permian Basin ......................................................................................................................... 45 The University of Texas Rio Grande Valley ................................................................................................................... 49 The University of Texas at San Antonio ........................................................................................................................ 53 The University of Texas at Tyler .................................................................................................................................... 57 The University of Southwestern Medical Center ......................................................................................................... 61 The University of Texas Medical Branch at Galveston ................................................................................................. 65 The University of Texas Health Science Center at Houston ......................................................................................... 69 The University of Texas Health Science Center at San Antonio.................................................................................... 73 The University of Texas M. D. Anderson Cancer Center ............................................................................................... 77 The University of Texas Health Science Center at Tyler ............................................................................................... 81
TAB 2 – Reserve Allocations for Library, Equipment, Repair and Rehabilitation (LERR) and Faculty Science and Technology Acquisition and Retention (STARs) Program
LERR/Faculty STARs Allocations Summary ................................................................................................................... 85 TAB 3 – Budget Rules and Procedures
Operating Budget Rules and Procedures ...................................................................................................................... 90
Faculty Workload Requirements for Academic Institutions ......................................................................................... 95 Medical, Dental, Nursing, Faculty Services Research and Development Plans, Allied Health Faculty Services Plan and Physicians Referral Service .............................................................................................................. 96
LERR, Faculty STARs and Similar Funded Programs Budget Rules and Procedures ..................................................... 97 LERR, Faculty STARs, and Similar Funded Programs Expenditure Guidelines .............................................................. 99
U. T. System Office of Budget and Planning - 210 Seventh Street - Austin, Texas 78701 - 512.499.4527

THE UN IVERS I T Y OF TEXAS SYS T EM Operating Budget Highlights
For the Year Ending August 31, 2021
INTRODUCTION For more than 130 years, The University of Texas System (the “U. T. System”) has been committed to improving the lives of Texans and people all over the world through education, research and health care. The U. T. System is one of the nation’s largest systems of higher education, with 14 institutions that educate nearly 240,000 students. Each year, U. T. System institutions award more than one‐third of all undergraduate degrees in Texas and more than half of all health professional degrees. The U. T. System is one of the largest employers in the state with about 21,000 faculty – including Nobel laureates and members of the National Academies – and more than 85,000 health care professionals, researchers and support staff. Life‐changing research and invention of new technologies at U. T. System institutions places the U. T. System among the top 10 “World’s Most Innovative Universities,” according to Reuters. The U. T. System ranks fifth in the nation in patent applications, and because of the high caliber of scientific research conducted at U. T. institutions, the U. T. System is ranked No. 1 in Texas and No. 2 in the nation in federal research expenditures. In addition, the U. T. System is home to three of the nation’s National Cancer Institute Designated Cancer Centers – U. T. M. D. Anderson Cancer Center, U. T. Southwestern Medical Center and U. T. Health Science Center at San Antonio – which must meet rigorous criteria for world‐class programs in cancer research. Also, the U. T. System is the only system in the country to have four Clinical and Translational Science Awards from the National Institutes of Health. Transformational initiatives implemented over the past several years have cemented U. T. as a national leader in higher education, including the expansion of educational opportunities in South Texas with the opening of U. T. Rio Grande Valley in 2015. The U. T. System was the only system of higher education in the nation that established not one, but two new medical schools in 2016, at U. T. Austin and U. T. Rio Grande Valley. For FY 2021, changes in the operating budget are largely driven by growth in health care activities primarily related to hospital patient income and professional fees charged by U. T. faculty physicians and contractual arrangements with affiliated hospitals and health care systems. These gains are partially offset by a proposed reduction in general revenue state appropriations at U. T. academic institutions and the impact of the COVID‐19 pandemic on all institutions’ auxiliary activities.
U. T. System Office of Budget and Planning 1
REVENUE $22.1 BILLION
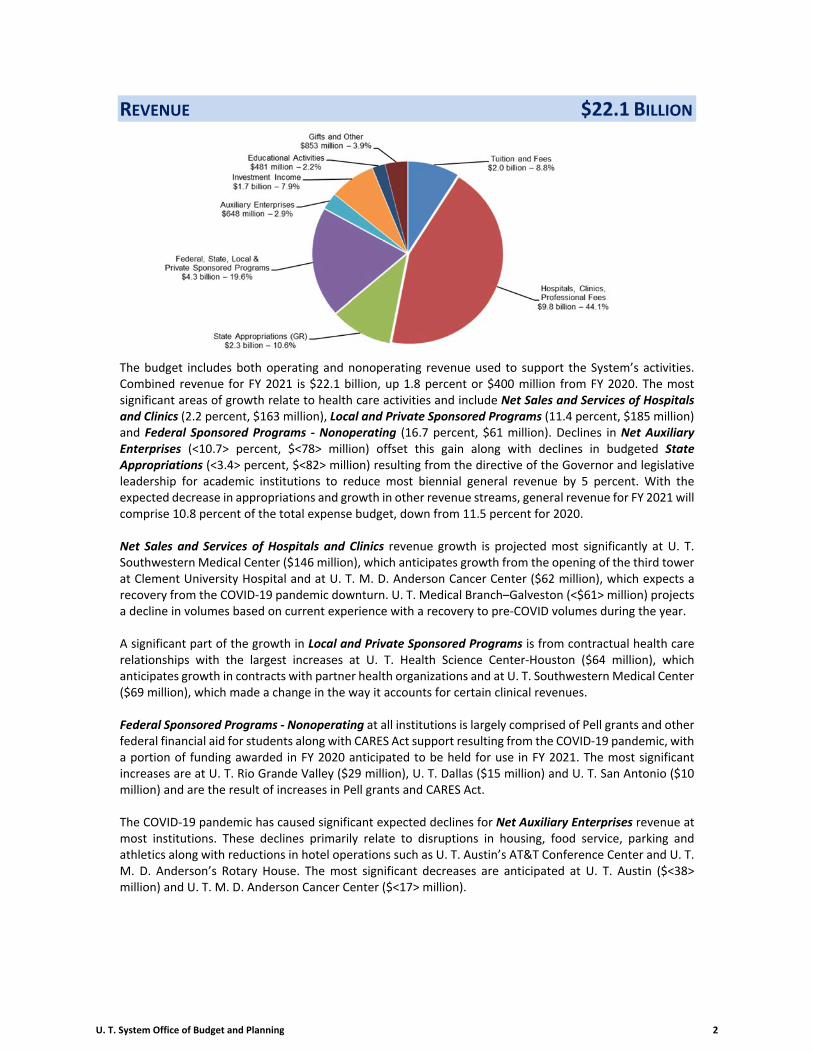
The budget includes both operating and nonoperating revenue used to support the System’s activities. Combined revenue for FY 2021 is $22.1 billion, up 1.8 percent or $400 million from FY 2020. The most significant areas of growth relate to health care activities and include Net Sales and Services of Hospitals and Clinics (2.2 percent, $163 million), Local and Private Sponsored Programs (11.4 percent, $185 million) and Federal Sponsored Programs ‐ Nonoperating (16.7 percent, $61 million). Declines in Net Auxiliary Enterprises (<10.7> percent, $<78> million) offset this gain along with declines in budgeted State Appropriations (<3.4> percent, $<82> million) resulting from the directive of the Governor and legislative leadership for academic institutions to reduce most biennial general revenue by 5 percent. With the expected decrease in appropriations and growth in other revenue streams, general revenue for FY 2021 will comprise 10.8 percent of the total expense budget, down from 11.5 percent for 2020. Net Sales and Services of Hospitals and Clinics revenue growth is projected most significantly at U. T. Southwestern Medical Center ($146 million), which anticipates growth from the opening of the third tower at Clement University Hospital and at U. T. M. D. Anderson Cancer Center ($62 million), which expects a recovery from the COVID‐19 pandemic downturn. U. T. Medical Branch–Galveston (<$61> million) projects a decline in volumes based on current experience with a recovery to pre‐COVID volumes during the year. A significant part of the growth in Local and Private Sponsored Programs is from contractual health care relationships with the largest increases at U. T. Health Science Center‐Houston ($64 million), which anticipates growth in contracts with partner health organizations and at U. T. Southwestern Medical Center ($69 million), which made a change in the way it accounts for certain clinical revenues. Federal Sponsored Programs ‐ Nonoperating at all institutions is largely comprised of Pell grants and other federal financial aid for students along with CARES Act support resulting from the COVID‐19 pandemic, with a portion of funding awarded in FY 2020 anticipated to be held for use in FY 2021. The most significant increases are at U. T. Rio Grande Valley ($29 million), U. T. Dallas ($15 million) and U. T. San Antonio ($10 million) and are the result of increases in Pell grants and CARES Act. The COVID‐19 pandemic has caused significant expected declines for Net Auxiliary Enterprises revenue at most institutions. These declines primarily relate to disruptions in housing, food service, parking and athletics along with reductions in hotel operations such as U. T. Austin’s AT&T Conference Center and U. T. M. D. Anderson’s Rotary House. The most significant decreases are anticipated at U. T. Austin ($<38> million) and U. T. M. D. Anderson Cancer Center ($<17> million).
U. T. System Office of Budget and Planning 2
EXPENSES BY NATURAL CLASSIFICATION $21.7 BILLION
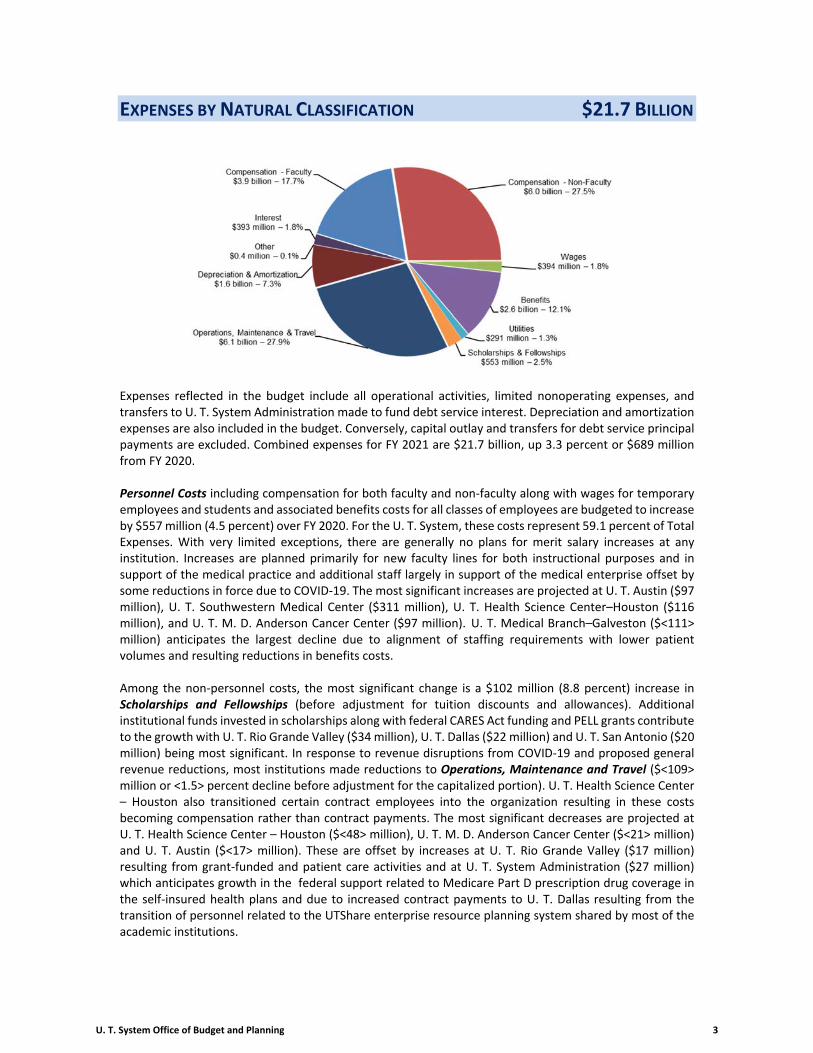
Expenses reflected in the budget include all operational activities, limited nonoperating expenses, and transfers to U. T. System Administration made to fund debt service interest. Depreciation and amortization expenses are also included in the budget. Conversely, capital outlay and transfers for debt service principal payments are excluded. Combined expenses for FY 2021 are $21.7 billion, up 3.3 percent or $689 million from FY 2020. Personnel Costs including compensation for both faculty and non‐faculty along with wages for temporary employees and students and associated benefits costs for all classes of employees are budgeted to increase by $557 million (4.5 percent) over FY 2020. For the U. T. System, these costs represent 59.1 percent of Total Expenses. With very limited exceptions, there are generally no plans for merit salary increases at any institution. Increases are planned primarily for new faculty lines for both instructional purposes and in support of the medical practice and additional staff largely in support of the medical enterprise offset by some reductions in force due to COVID‐19. The most significant increases are projected at U. T. Austin ($97 million), U. T. Southwestern Medical Center ($311 million), U. T. Health Science Center–Houston ($116 million), and U. T. M. D. Anderson Cancer Center ($97 million). U. T. Medical Branch–Galveston ($<111> million) anticipates the largest decline due to alignment of staffing requirements with lower patient volumes and resulting reductions in benefits costs. Among the non‐personnel costs, the most significant change is a $102 million (8.8 percent) increase in Scholarships and Fellowships (before adjustment for tuition discounts and allowances). Additional institutional funds invested in scholarships along with federal CARES Act funding and PELL grants contribute to the growth with U. T. Rio Grande Valley ($34 million), U. T. Dallas ($22 million) and U. T. San Antonio ($20 million) being most significant. In response to revenue disruptions from COVID‐19 and proposed general revenue reductions, most institutions made reductions to Operations, Maintenance and Travel ($<109> million or <1.5> percent decline before adjustment for the capitalized portion). U. T. Health Science Center – Houston also transitioned certain contract employees into the organization resulting in these costs becoming compensation rather than contract payments. The most significant decreases are projected at U. T. Health Science Center – Houston ($<48> million), U. T. M. D. Anderson Cancer Center ($<21> million) and U. T. Austin ($<17> million). These are offset by increases at U. T. Rio Grande Valley ($17 million) resulting from grant‐funded and patient care activities and at U. T. System Administration ($27 million) which anticipates growth in the federal support related to Medicare Part D prescription drug coverage in the self‐insured health plans and due to increased contract payments to U. T. Dallas resulting from the transition of personnel related to the UTShare enterprise resource planning system shared by most of the academic institutions.
U. T. System Office of Budget and Planning 3
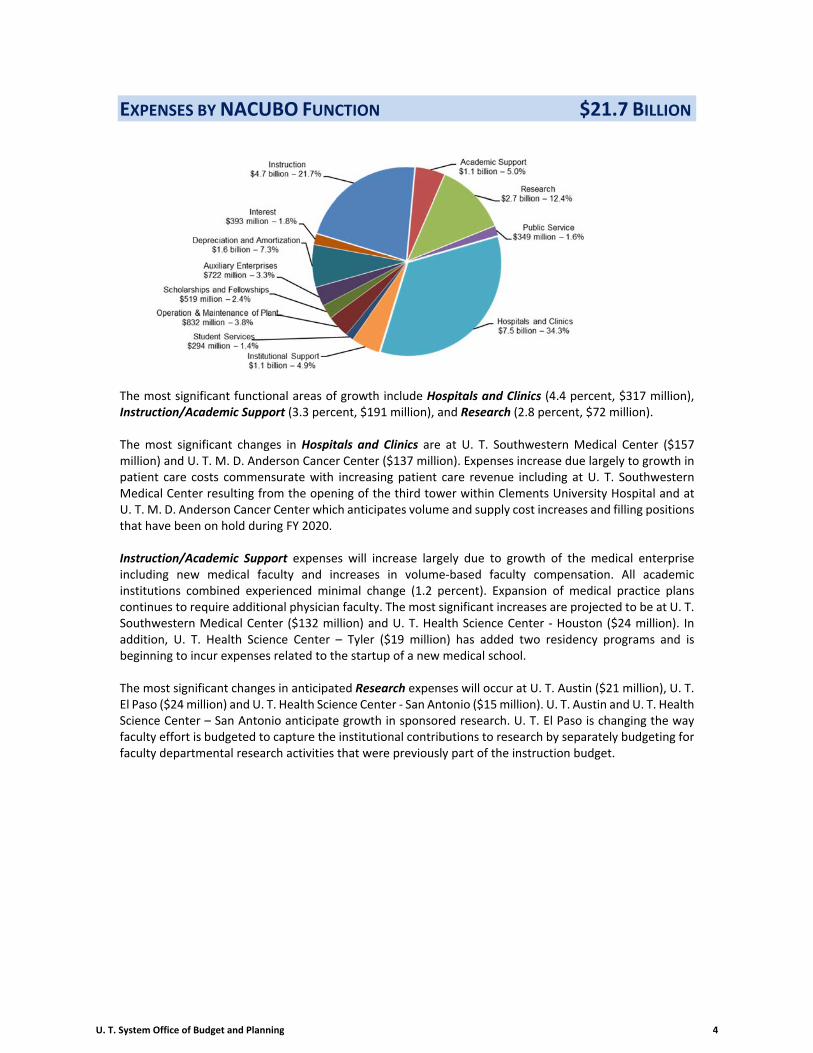
EXPENSES BY NACUBO FUNCTION $21.7 BILLION
The most significant functional areas of growth include Hospitals and Clinics (4.4 percent, $317 million), Instruction/Academic Support (3.3 percent, $191 million), and Research (2.8 percent, $72 million). The most significant changes in Hospitals and Clinics are at U. T. Southwestern Medical Center ($157 million) and U. T. M. D. Anderson Cancer Center ($137 million). Expenses increase due largely to growth in patient care costs commensurate with increasing patient care revenue including at U. T. Southwestern Medical Center resulting from the opening of the third tower within Clements University Hospital and at U. T. M. D. Anderson Cancer Center which anticipates volume and supply cost increases and filling positions that have been on hold during FY 2020. Instruction/Academic Support expenses will increase largely due to growth of the medical enterprise including new medical faculty and increases in volume‐based faculty compensation. All academic institutions combined experienced minimal change (1.2 percent). Expansion of medical practice plans continues to require additional physician faculty. The most significant increases are projected to be at U. T. Southwestern Medical Center ($132 million) and U. T. Health Science Center ‐ Houston ($24 million). In addition, U. T. Health Science Center – Tyler ($19 million) has added two residency programs and is beginning to incur expenses related to the startup of a new medical school. The most significant changes in anticipated Research expenses will occur at U. T. Austin ($21 million), U. T. El Paso ($24 million) and U. T. Health Science Center ‐ San Antonio ($15 million). U. T. Austin and U. T. Health Science Center – San Antonio anticipate growth in sponsored research. U. T. El Paso is changing the way faculty effort is budgeted to capture the institutional contributions to research by separately budgeting for faculty departmental research activities that were previously part of the instruction budget.
U. T. System Office of Budget and Planning 4
BACKGROUND The System reports financial information based on Governmental Accounting Standards Board (GASB) Statement No. 35, Basic Financial Statements – Management’s Discussion and Analysis – for Public Colleges and Universities, as amended by GASB Statements No. 37, Basic Financial Statements – and Management’s Discussion and Analysis – for State and Local Governments: Omnibus, and GASB Statement No. 38, Certain Financial Statement Note Disclosures. These statements establish standards for external financial reporting for public colleges and universities and require that financial statements be presented on a consolidated basis to focus on the entity as a whole. Previously, financial statements focused on the accountability of individual fund groups rather than on the entity as a whole. The U. T. System Annual Operating Budget has historically presented sources and uses of funds in select fund groups rather than on operating results of the entity as a whole. As a result, several significant differences existed between the budget and the financial reporting presentations at year‐end. Beginning in the FY 2007 budget, the underlying operating budget maintains the sources and uses information but allows the focus of the budget to conform more closely to the entity‐wide financial performance measures of the annual financial report through a series of adjustments incorporated into the budget totals. The major differences that have been resolved included the following items: The budget reflects tuition discounting and related scholarship/fellowship activities in a manner
comparable to the GASB Rules for the annual financial report.
Depreciation expense is incorporated into the budgeted expense totals.
Capital outlay from operating funds is eliminated from budgeted expenditure totals.
Debt service principal repayments are eliminated from budgeted expenditure totals. The information presented in this summary document nets budgeted revenues and expenses to arrive at a “Budget Margin (Deficit).” Beginning with this calculated margin, a reconciliation has been included to arrive at a forecasted Change in Net Assets that would be comparable to the Statement of Revenues, Expenses, and Changes in Net Position (SRECNP) included in the U. T. System’s Annual Financial Report. Expenses are reported in the budget by natural classification meaning that expenses are accumulated based on the nature of each type of expense. This contrasts with functional classification which is a presentation method under which expenses are aggregated and reported by the activities for which they were incurred. Reporting of functional classifications is included as supplemental information.
PRESENTATION OF FY 2020 PROJECTED ACTUAL TOTALS All U. T. institutions have prepared a projection of FY 2020 activity in a format comparable to that presented for the FY 2020 adjusted and FY 2021 proposed budgets. This projection was based on activity through May 2020.
RECLASSIFICATION OF FY 2020 BUDGET TOTALS In certain situations, reclassifications have been made between FY 2020 line items to enhance comparability with the FY 2021 presentation.
U. T. System Office of Budget and Planning 5
GLOSSARY OF TERMS Operating Revenues: TUITION AND FEES – All student tuition and fee revenues earned at the U. T. institutions for educational purposes. Tuition is reported gross with an identified offset “Less Discounts and Allowances” to reflect the related scholarship/fellowship discount activities in a manner comparable to the GASB Rules for the annual financial report. SPONSORED PROGRAMS – Funding received from local, state, and federal governments or private agencies, organizations, or individuals. Includes amounts received for services performed on grants, contracts, and agreements from these entities for current operations. This also includes indirect cost recoveries and pass‐through federal and state grants. Contractual relationships with clinical partners such as hospitals are reported as Local and Private Sponsored Programs. NET SALES AND SERVICES OF EDUCATIONAL ACTIVITIES – Revenues related to the conduct of instruction, research, and public service and revenues from activities that exist to provide an instructional and laboratory experience for students that create goods and services that may be sold. Examples include revenues received from activities such as performing arts, continuing education, charter schools, the University Interscholastic League, trademarks programs, and sports camps. NET SALES AND SERVICES OF HOSPITALS AND CLINICS – Revenues (net of discounts, allowances, and bad debt expense) generated from U. T. health institutions’ daily patient care, special or other services, as well as revenues from health clinics that are part of a hospital. NET PROFESSIONAL FEES – Revenues (net of discounts, allowances, and bad debt expense) derived from the fees charged by the professional staffs at U. T. health institutions, U. T. Austin and U. T. Rio Grande Valley as part of the medical, dental, and other practice plans. Examples of such fees include doctor’s fees for clinic visits, medical and dental procedures, professional opinions, and anatomical procedures, such as analysis of specimens after a surgical procedure, etc. NET AUXILIARY ENTERPRISES – Revenues derived from a service to students, faculty, or staff in which a fee is charged that is directly related to, although not necessarily equal to the cost of the service (e.g., bookstores, dormitories, dining halls, snack bars, inter‐collegiate athletic programs, etc.). OTHER OPERATING REVENUES – Other revenues generated from sales or services provided to meet current fiscal year operating expenses, which are not included in the preceding categories. Also included in this category are Delivery System Reform Incentive Payment funds (DSRIP) which are payments made to providers who agree to participate in Medicaid health care quality and delivery system reforms. Operating Expenses: NATURAL CLASSIFICATION ‐ A natural expense classification is a method of grouping expenses according to the type of costs that are incurred. The classifications indicate what was purchased rather than why an expense was incurred. Categories included are Compensation‐Faculty; Compensation‐Non‐Faculty; Wages; Benefits; Utilities; Scholarships and Fellowships; Operations, Maintenance, and Travel; and Depreciation and Amortization. FUNCTIONAL CLASSIFICATION – A presentation method for expenses under which expenses are aggregated and reported by the activities for which they were incurred. The classifications indicate why an expense was incurred rather than what was purchased. Functional classification definitions are set by the National Association of College and University Business Officers (NACUBO).
U. T. System Office of Budget and Planning 6
GLOSSARY OF TERMS (CONTINUED) INSTRUCTION AND ACADEMIC SUPPORT – Expenditures for salaries, wages, and all other costs related to those engaged in the teaching function including operating costs of instructional departments. This would include the salaries of faculty, teaching assistants, lecturers, and teaching equipment. Library materials and related salaries are also included. RESEARCH – Expenditures for salaries and wages and other costs associated with the support of research conducted by faculty members. PUBLIC SERVICE – Expenditures for activities providing noninstructional services beneficial to individuals and groups external to the institution (e.g. conferences, institutes such as the Institute for Texan Cultures, general advisory services, reference bureaus, radio, and television). HOSPITALS AND CLINICS – Expenditures of U. T. health‐related institutions with teaching hospital affiliations for costs associated with providing patient care and operating the entity (i.e., labs, pharmacies, personnel salaries, etc.). INSTITUTIONAL SUPPORT – Expenditures for central executive‐level activities concerned with management and long‐range planning for the entire institution, such as the governing board, planning and programming, and legal services; fiscal operations, including the investment office; administrative data processing; space management; employee personnel and records; logistical activities that provide procurement, storerooms, printing, and transportation services to the institution; support services to faculty and staff that are not operated as auxiliary enterprises; and activities concerned with community and alumni relations, including development and fund raising. STUDENT SERVICES – Expenditures for offices of admissions and of the registrar and activities with the primary purpose of contributing to students’ emotional and physical well‐being and intellectual, cultural, and social development outside the context of the formal instruction program. OPERATION AND MAINTENANCE OF PLANT – Expenditures of current operating funds for the operation and maintenance of the physical plant. This includes all expenditures for operations established to provide services and maintenance related to grounds and facilities. Also included are utilities, fire protection, property insurance, and similar items. Specifically included are: salaries, wages, supplies materials, and other expenses necessary to keep each building in good repair and usable condition. Also includes expenses necessary to keep the buildings in a clean and sanitary condition, provide upkeep of all lands designated as campus proper (improved and unimproved) not occupied by actual buildings. SCHOLARSHIPS AND FELLOWSHIPS – Expenditures for scholarships and fellowships in the form of grants to students resulting from selection by the institution or from an entitlement program. Amounts reported are net of the effects of tuition discounting. AUXILIARY ENTERPRISES – Expenditures of essentially self‐supporting institution enterprises (e.g. bookstores, dormitories, inter‐collegiate athletic programs, etc.). DEPRECIATION AND AMORTIZATION – A noncash expense that reduces the value of a capital asset as a result of wear and tear, age, or obsolescence. Also includes amortization expense, which is the gradual elimination of a liability in regular payments over a specified period of time.
U. T. System Office of Budget and Planning 7
GLOSSARY OF TERMS (CONTINUED) Nonoperating Revenues (Expenses): STATE APPROPRIATIONS – Appropriations from the State of Texas General Revenue Fund, which supplement the U. T. institutional revenue in meeting operating expenses, such as faculty salaries, utilities, and institutional support. Also includes estimated state‐paid fringe benefits costs and funding for debt service on tuition revenue bonds. FEDERAL SPONSORED PROGRAMS ‐ NONOPERATING – Funding received from the federal government for which no exchange of goods or services is perceived to have occurred. This typically includes federal Pell Grants and other miscellaneous awards from the State of Texas. STATE AND LOCAL SPONSORED PROGRAMS ‐ NONOPERATING – Funding received from state or local governments for which no exchange of goods or services is perceived to have occurred. This typically includes Texas Research Incentive Program awards from the State of Texas and funding for the U. T. Austin Medical School provided by the local health care district. GIFTS IN SUPPORT OF OPERATIONS – Consist of public and private gifts used in current operations, excluding gifts for capital acquisition and endowment gifts. NET INVESTMENT INCOME – Interest and dividend income, Long Term Fund and Permanent Health Fund distributions paid from current year income and patent and royalty income. Distributions from the PUF are also included for budget purposes. OTHER NONOPERATING REVENUES (EXPENSES) – Revenues and expenses not directly associated with the primary missions of System institutions and not included in another category. Transfers and Other: AUF TRANSFERS RECEIVED (MADE) – Transfers made from U. T. System Administration’s Available University Fund (AUF) primarily used to finance excellence at U. T. Austin and general administration at U. T. System Administration. AUF Transfers Received are included in budgeted “revenue” at U. T. Austin and U. T. System Administration in order to be incorporated into margin calculations. To allow revenue totals to balance Systemwide, AUF Transfers Made are reported as a contra‐revenue at U. T. System Administration. TRANSFERS FOR DEBT SERVICE ‐ INTEREST – Reflects debt service activity at all U. T. institutions and includes only the interest portion of mandatory debt service transfers under the Revenue Financing System, Tuition Revenue bond and PUF bond programs. Through the REVERSE TRANSFERS FOR DEBT SERVICE (SYSTEM ONLY) line item, these amounts are eliminated for purposes of calculating the Systemwide SRECNP Change in Net Position. This elimination leaves virtually all interest expense for the entire System reflected at U. T. System Administration since most of the System’s debt is issued in the name of the U. T. System Board of Regents. Reconciliation to Change in Net Assets: NET NON‐PROFIT HEALTH CORP ACTIVITY – Reflects the net activity of the non‐profit health corporations affiliated with U. T. health‐related institutions. These organizations function as independent entities and their operations are not directly included in the U. T. System’s operating budget. At year end, these entities are incorporated into the U. T. System’s financial statements in accordance with generally accepted accounting principles.
U. T. System Office of Budget and Planning 8
GLOSSARY OF TERMS (CONTINUED) NET INC./ (DEC.) IN FAIR VALUE OF INVESTMENTS – Unrealized gains or losses on investment assets of the System. INTEREST EXPENSE ON CAPITAL ASSET FINANCINGS – Interest expense associated with bond and note borrowings utilized to finance capital improvement projects. U. T. System Administration reports most interest expense because almost all debt legally belongs to the U. T. System Board of Regents. CAPITAL APPROPRIATIONS, GIFTS AND SPONSORED PROGRAMS – Includes appropriations from the State along with gifts and support for capital projects of the System that are not used for operations. ADDITIONS TO PERMANENT ENDOWMENTS – Gifts and other additions to the corpus of permanent endowments. These funds are not available to be expended for operational purposes. TRANSFERS FOR DEBT SERVICE – PRINCIPAL – Reflects debt service activity at all U. T. institutions and includes only the principal portion of mandatory debt service transfers under the Revenue Financing System, Tuition Revenue bond and PUF bond programs. Through the REVERSE TRANSFERS FOR DEBT SERVICE (SYSTEM ONLY) line item, these amounts are eliminated for purposes of calculating the Systemwide SRECNP Change in Net Position as retirement of principal is a balance sheet transaction and do not impact net position. REVERSE TRANSFERS FOR DEBT SERVICE (SYSTEM ONLY) – This line is used to eliminate the effects of transfers for debt service received by U. T. System Administration on the SRECNP Change in Net Position. TRANSFERS AND OTHER – Includes all interfund transfers and other activity not categorized elsewhere. For U. T. System, this total also includes the income and distribution to Texas A&M University System for their annual one‐third participation in the PUF endowment.
U. T. System Office of Budget and Planning 9

THE UNIVERSITY OF TEXAS SYSTEM
INSTITUTION BUDGET HIGHLIGHTS
AND BUDGET SUMMARIES
U. T. System Office of Budget and Planning 10
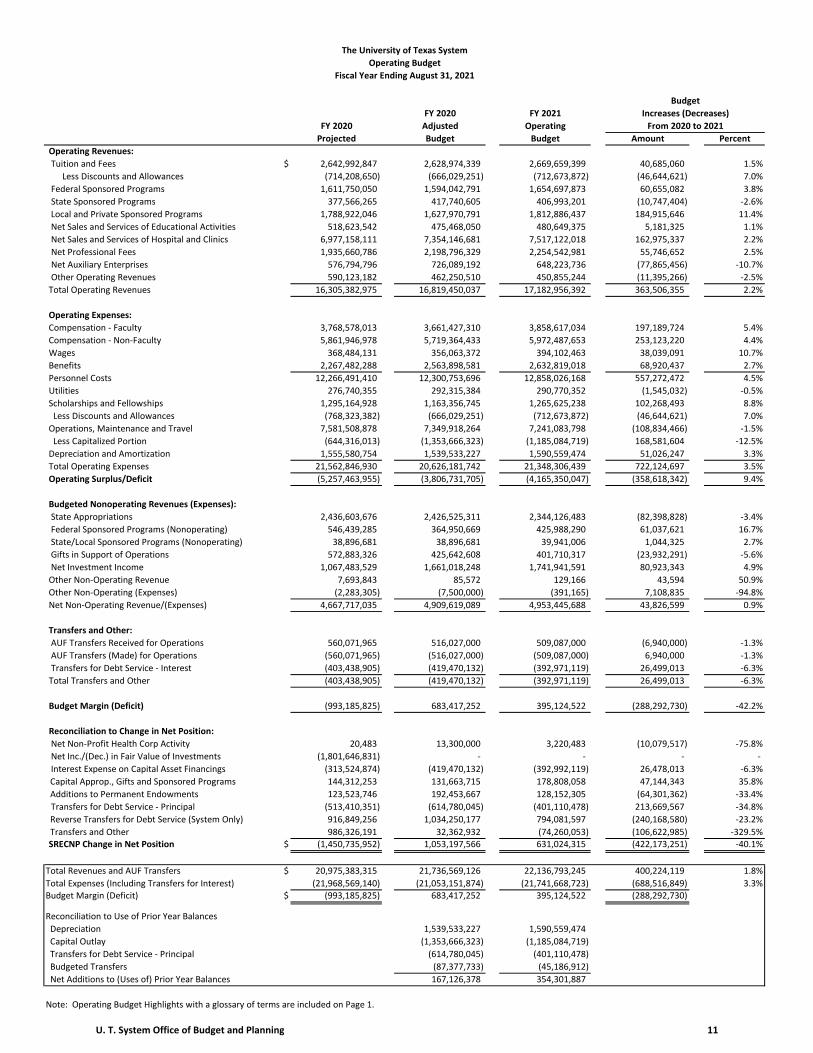
The University of Texas System
Operating Budget
Fiscal Year Ending August 31, 2021
Budget
FY 2020 FY 2021 Increases (Decreases)
FY 2020 Adjusted Operating From 2020 to 2021
Projected Budget Budget Amount Percent
Operating Revenues:
Tuition and Fees $ 2,642,992,847 2,628,974,339 2,669,659,399 40,685,060 1.5%
Less Discounts and Allowances (714,208,650) (666,029,251) (712,673,872) (46,644,621) 7.0%
Federal Sponsored Programs 1,611,750,050 1,594,042,791 1,654,697,873 60,655,082 3.8%
State Sponsored Programs 377,566,265 417,740,605 406,993,201 (10,747,404) ‐2.6%
Local and Private Sponsored Programs 1,788,922,046 1,627,970,791 1,812,886,437 184,915,646 11.4%
Net Sales and Services of Educational Activities 518,623,542 475,468,050 480,649,375 5,181,325 1.1%
Net Sales and Services of Hospital and Clinics 6,977,158,111 7,354,146,681 7,517,122,018 162,975,337 2.2%
Net Professional Fees 1,935,660,786 2,198,796,329 2,254,542,981 55,746,652 2.5%
Net Auxiliary Enterprises 576,794,796 726,089,192 648,223,736 (77,865,456) ‐10.7%
Other Operating Revenues 590,123,182 462,250,510 450,855,244 (11,395,266) ‐2.5%
Total Operating Revenues 16,305,382,975 16,819,450,037 17,182,956,392 363,506,355 2.2%
Operating Expenses:
Compensation ‐ Faculty 3,768,578,013 3,661,427,310 3,858,617,034 197,189,724 5.4%
Compensation ‐ Non‐Faculty 5,861,946,978 5,719,364,433 5,972,487,653 253,123,220 4.4%
Wages 368,484,131 356,063,372 394,102,463 38,039,091 10.7%
Benefits 2,267,482,288 2,563,898,581 2,632,819,018 68,920,437 2.7%
Personnel Costs 12,266,491,410 12,300,753,696 12,858,026,168 557,272,472 4.5%
Utilities 276,740,355 292,315,384 290,770,352 (1,545,032) ‐0.5%
Scholarships and Fellowships 1,295,164,928 1,163,356,745 1,265,625,238 102,268,493 8.8%
Less Discounts and Allowances (768,323,382) (666,029,251) (712,673,872) (46,644,621) 7.0%
Operations, Maintenance and Travel 7,581,508,878 7,349,918,264 7,241,083,798 (108,834,466) ‐1.5%
Less Capitalized Portion (644,316,013) (1,353,666,323) (1,185,084,719) 168,581,604 ‐12.5%
Depreciation and Amortization 1,555,580,754 1,539,533,227 1,590,559,474 51,026,247 3.3%
Total Operating Expenses 21,562,846,930 20,626,181,742 21,348,306,439 722,124,697 3.5%
Operating Surplus/Deficit (5,257,463,955) (3,806,731,705) (4,165,350,047) (358,618,342) 9.4%
Budgeted Nonoperating Revenues (Expenses):
State Appropriations 2,436,603,676 2,426,525,311 2,344,126,483 (82,398,828) ‐3.4%
Federal Sponsored Programs (Nonoperating) 546,439,285 364,950,669 425,988,290 61,037,621 16.7%
State/Local Sponsored Programs (Nonoperating) 38,896,681 38,896,681 39,941,006 1,044,325 2.7%
Gifts in Support of Operations 572,883,326 425,642,608 401,710,317 (23,932,291) ‐5.6%
Net Investment Income 1,067,483,529 1,661,018,248 1,741,941,591 80,923,343 4.9%
Other Non‐Operating Revenue 7,693,843 85,572 129,166 43,594 50.9%
Other Non‐Operating (Expenses) (2,283,305) (7,500,000) (391,165) 7,108,835 ‐94.8%
Net Non‐Operating Revenue/(Expenses) 4,667,717,035 4,909,619,089 4,953,445,688 43,826,599 0.9%
Transfers and Other:
AUF Transfers Received for Operations 560,071,965 516,027,000 509,087,000 (6,940,000) ‐1.3%
AUF Transfers (Made) for Operations (560,071,965) (516,027,000) (509,087,000) 6,940,000 ‐1.3%
Transfers for Debt Service ‐ Interest (403,438,905) (419,470,132) (392,971,119) 26,499,013 ‐6.3%
Total Transfers and Other (403,438,905) (419,470,132) (392,971,119) 26,499,013 ‐6.3%
Budget Margin (Deficit) (993,185,825) 683,417,252 395,124,522 (288,292,730) ‐42.2%
Reconciliation to Change in Net Position:
Net Non‐Profit Health Corp Activity 20,483 13,300,000 3,220,483 (10,079,517) ‐75.8%
Net Inc./(Dec.) in Fair Value of Investments (1,801,646,831) ‐ ‐ ‐ ‐
Interest Expense on Capital Asset Financings (313,524,874) (419,470,132) (392,992,119) 26,478,013 ‐6.3%
Capital Approp., Gifts and Sponsored Programs 144,312,253 131,663,715 178,808,058 47,144,343 35.8%
Additions to Permanent Endowments 123,523,746 192,453,667 128,152,305 (64,301,362) ‐33.4%
Transfers for Debt Service ‐ Principal (513,410,351) (614,780,045) (401,110,478) 213,669,567 ‐34.8%
Reverse Transfers for Debt Service (System Only) 916,849,256 1,034,250,177 794,081,597 (240,168,580) ‐23.2%
Transfers and Other 986,326,191 32,362,932 (74,260,053) (106,622,985) ‐329.5%SRECNP Change in Net Position $ (1,450,735,952) 1,053,197,566 631,024,315 (422,173,251) ‐40.1%
Total Revenues and AUF Transfers $ 20,975,383,315 21,736,569,126 22,136,793,245 400,224,119 1.8%
Total Expenses (Including Transfers for Interest) (21,968,569,140) (21,053,151,874) (21,741,668,723) (688,516,849) 3.3%Budget Margin (Deficit) $ (993,185,825) 683,417,252 395,124,522 (288,292,730)
Reconciliation to Use of Prior Year Balances
Depreciation 1,539,533,227 1,590,559,474
Capital Outlay (1,353,666,323) (1,185,084,719)
Transfers for Debt Service ‐ Principal (614,780,045) (401,110,478)
Budgeted Transfers (87,377,733) (45,186,912)
Net Additions to (Uses of) Prior Year Balances 167,126,378 354,301,887
Note: Operating Budget Highlights with a glossary of terms are included on Page 1.
U. T. System Office of Budget and Planning 11
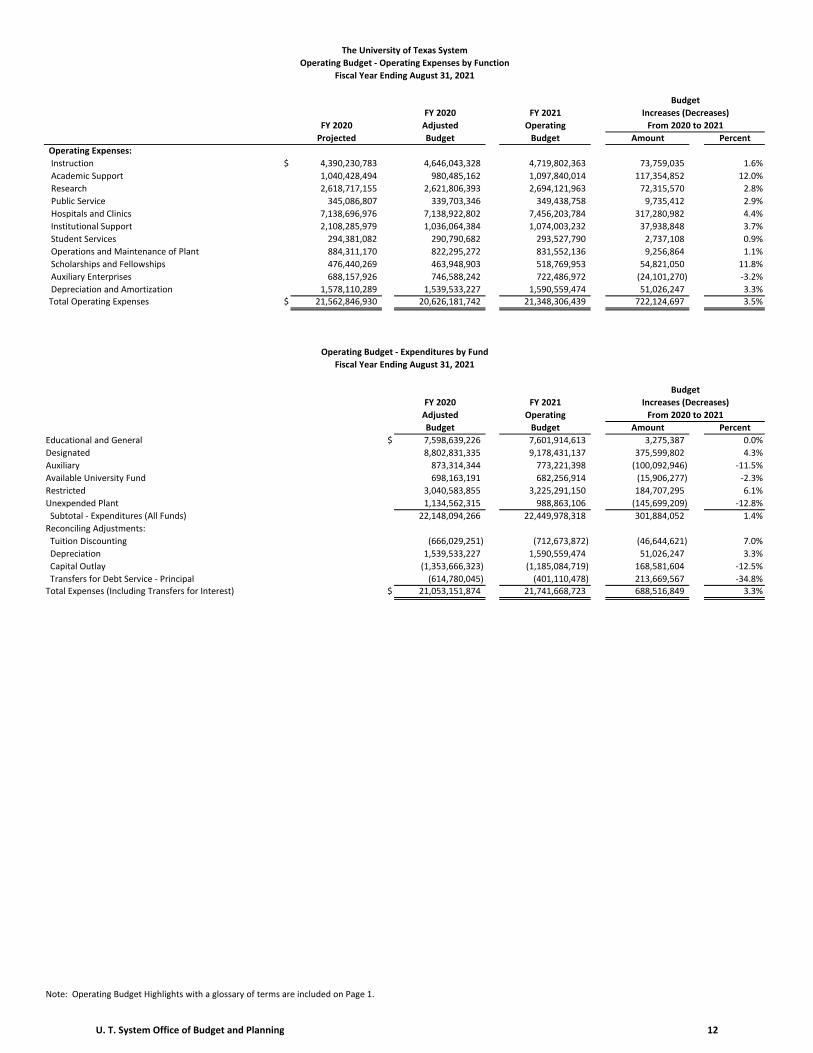
The University of Texas System
Operating Budget ‐ Operating Expenses by Function
Fiscal Year Ending August 31, 2021
Budget
FY 2020 FY 2021 Increases (Decreases)
FY 2020 Adjusted Operating From 2020 to 2021
Projected Budget Budget Amount Percent
Operating Expenses:
Instruction $ 4,390,230,783 4,646,043,328 4,719,802,363 73,759,035 1.6%
Academic Support 1,040,428,494 980,485,162 1,097,840,014 117,354,852 12.0%
Research 2,618,717,155 2,621,806,393 2,694,121,963 72,315,570 2.8%
Public Service 345,086,807 339,703,346 349,438,758 9,735,412 2.9%
Hospitals and Clinics 7,138,696,976 7,138,922,802 7,456,203,784 317,280,982 4.4%
Institutional Support 2,108,285,979 1,036,064,384 1,074,003,232 37,938,848 3.7%
Student Services 294,381,082 290,790,682 293,527,790 2,737,108 0.9%
Operations and Maintenance of Plant 884,311,170 822,295,272 831,552,136 9,256,864 1.1%
Scholarships and Fellowships 476,440,269 463,948,903 518,769,953 54,821,050 11.8%
Auxiliary Enterprises 688,157,926 746,588,242 722,486,972 (24,101,270) ‐3.2%
Depreciation and Amortization 1,578,110,289 1,539,533,227 1,590,559,474 51,026,247 3.3%Total Operating Expenses $ 21,562,846,930 20,626,181,742 21,348,306,439 722,124,697 3.5%
Operating Budget ‐ Expenditures by Fund
Fiscal Year Ending August 31, 2021
Budget
FY 2020 FY 2021 Increases (Decreases)
Adjusted Operating From 2020 to 2021
Budget Budget Amount Percent
Educational and General $ 7,598,639,226 7,601,914,613 3,275,387 0.0%
Designated 8,802,831,335 9,178,431,137 375,599,802 4.3%
Auxiliary 873,314,344 773,221,398 (100,092,946) ‐11.5%
Available University Fund 698,163,191 682,256,914 (15,906,277) ‐2.3%
Restricted 3,040,583,855 3,225,291,150 184,707,295 6.1%
Unexpended Plant 1,134,562,315 988,863,106 (145,699,209) ‐12.8%
Subtotal ‐ Expenditures (All Funds) 22,148,094,266 22,449,978,318 301,884,052 1.4%
Reconciling Adjustments:
Tuition Discounting (666,029,251) (712,673,872) (46,644,621) 7.0%
Depreciation 1,539,533,227 1,590,559,474 51,026,247 3.3%
Capital Outlay (1,353,666,323) (1,185,084,719) 168,581,604 ‐12.5%
Transfers for Debt Service ‐ Principal (614,780,045) (401,110,478) 213,669,567 ‐34.8%Total Expenses (Including Transfers for Interest) $ 21,053,151,874 21,741,668,723 688,516,849 3.3%
Note: Operating Budget Highlights with a glossary of terms are included on Page 1.
U. T. System Office of Budget and Planning 12

The University of Texas Academic Institutions
Operating Budget
Fiscal Year Ending August 31, 2021
Budget
FY 2020 FY 2021 Increases (Decreases)
FY 2020 Adjusted Operating From 2020 to 2021
Projected Budget Budget Amount Percent
Operating Revenues:
Tuition and Fees $ 2,447,062,564 2,437,513,771 2,471,224,261 33,710,490 1.4%
Less Discounts and Allowances (703,710,364) (658,488,638) (704,105,391) (45,616,753) 6.9%
Federal Sponsored Programs 735,978,068 757,183,200 761,509,465 4,326,265 0.6%
State Sponsored Programs 223,782,674 242,514,115 242,965,542 451,427 0.2%
Local and Private Sponsored Programs 231,068,691 206,746,979 238,809,098 32,062,119 15.5%
Net Sales and Services of Educational Activities 405,916,126 392,149,747 394,429,552 2,279,805 0.6%
Net Sales and Services of Hospital and Clinics ‐ ‐ ‐ ‐ ‐
Net Professional Fees 21,580,848 24,186,405 81,653,367 57,466,962 237.6%
Net Auxiliary Enterprises 466,062,680 596,889,079 534,416,313 (62,472,766) ‐10.5%
Other Operating Revenues 46,942,042 30,463,382 36,601,435 6,138,053 20.1%
Total Operating Revenues 3,874,683,329 4,029,158,040 4,057,503,642 28,345,602 0.7%
Operating Expenses:
Compensation ‐ Faculty 1,164,524,528 1,083,094,232 1,111,054,237 27,960,005 2.6%
Compensation ‐ Non‐Faculty 1,577,507,142 1,555,763,993 1,620,515,317 64,751,324 4.2%
Wages 169,966,509 184,472,674 185,841,184 1,368,510 0.7%
Benefits 800,954,196 811,980,966 855,269,331 43,288,365 5.3%
Personnel Costs 3,712,952,375 3,635,311,865 3,772,680,069 137,368,204 3.8%
Utilities 134,248,211 145,257,068 144,773,508 (483,560) ‐0.3%
Scholarships and Fellowships 1,253,329,743 1,128,471,008 1,225,314,006 96,842,998 8.6%
Less Discounts and Allowances (757,825,096) (658,488,638) (704,105,391) (45,616,753) 6.9%
Operations, Maintenance and Travel 1,590,285,859 1,872,748,337 1,845,708,724 (27,039,613) ‐1.4%
Less Capitalized Portion (274,548,341) (169,319,626) (154,074,037) 15,245,589 ‐9.0%
Depreciation and Amortization 649,966,981 627,971,754 655,622,055 27,650,301 4.4%
Total Operating Expenses 6,308,409,732 6,581,951,768 6,785,918,934 203,967,166 3.1%
Operating Surplus/Deficit (2,433,726,403) (2,552,793,728) (2,728,415,292) (175,621,564) 6.9%
Budgeted Nonoperating Revenues (Expenses):
State Appropriations 1,152,193,439 1,145,778,571 1,058,152,796 (87,625,775) ‐7.6%
Federal Sponsored Programs (Nonoperating) 415,499,041 361,368,048 422,186,260 60,818,212 16.8%
State/Local Sponsored Programs (Nonoperating) 38,896,681 38,896,681 39,941,006 1,044,325 2.7%
Gifts in Support of Operations 359,175,205 206,106,960 214,516,603 8,409,643 4.1%
Net Investment Income 408,526,372 339,896,756 380,817,976 40,921,220 12.0%
Other Non‐Operating Revenue 1,126,892 45,000 ‐ (45,000) ‐100.0%
Other Non‐Operating (Expenses) (237,986) ‐ ‐ ‐ ‐
Net Non‐Operating Revenue/(Expenses) 2,375,179,644 2,092,092,016 2,115,614,641 23,522,625 1.1%
Transfers and Other:
AUF Transfers Received for Operations 463,071,965 424,027,000 417,087,000 (6,940,000) ‐1.6%
AUF Transfers (Made) for Operations ‐ ‐ ‐ ‐ ‐
Transfers for Debt Service ‐ Interest (156,840,732) (151,657,563) (142,831,490) 8,826,073 ‐5.8%
Total Transfers and Other 306,231,233 272,369,437 274,255,510 1,886,073 0.7%
Budget Margin (Deficit) 247,684,474 (188,332,275) (338,545,141) (150,212,866) 79.8%
Reconciliation to Change in Net Position:
Net Non‐Profit Health Corp Activity ‐ ‐ ‐ ‐ ‐
Net Inc./(Dec.) in Fair Value of Investments (33,526,964) ‐ ‐ ‐ ‐
Interest Expense on Capital Asset Financings ‐ ‐ (21,000) (21,000) ‐
Capital Approp., Gifts and Sponsored Programs 72,154,864 65,751,000 110,090,000 44,339,000 67.4%
Additions to Permanent Endowments 73,501,930 127,419,667 74,258,000 (53,161,667) ‐41.7%
Transfers for Debt Service ‐ Principal (202,310,350) (195,592,795) (93,846,478) 101,746,317 ‐52.0%
Reverse Transfers for Debt Service (System Only) ‐ ‐ ‐ ‐ ‐
Transfers and Other 886,820,914 216,707,350 151,788,255 (64,919,095) ‐30.0%SRECNP Change in Net Position $ 1,044,324,868 25,952,947 (96,276,364) (122,229,311) ‐471.0%
Total Revenues and AUF Transfers $ 6,713,172,924 6,545,277,056 6,590,205,283 44,928,227 0.7%
Total Expenses (Including Transfers for Interest) (6,465,488,450) (6,733,609,331) (6,928,750,424) (195,141,093) 2.9%Budget Margin (Deficit) $ 247,684,474 (188,332,275) (338,545,141) (150,212,866)
Reconciliation to Use of Prior Year Balances
Depreciation 627,971,754 655,622,055
Capital Outlay (169,319,626) (154,074,037)
Transfers for Debt Service ‐ Principal (195,592,795) (93,846,478)
Budgeted Transfers (83,277,041) (41,533,867)
Net Additions to (Uses of) Prior Year Balances (8,549,983) 27,622,532
Note: Operating Budget Highlights with a glossary of terms are included on Page 1.
U. T. System Office of Budget and Planning 13
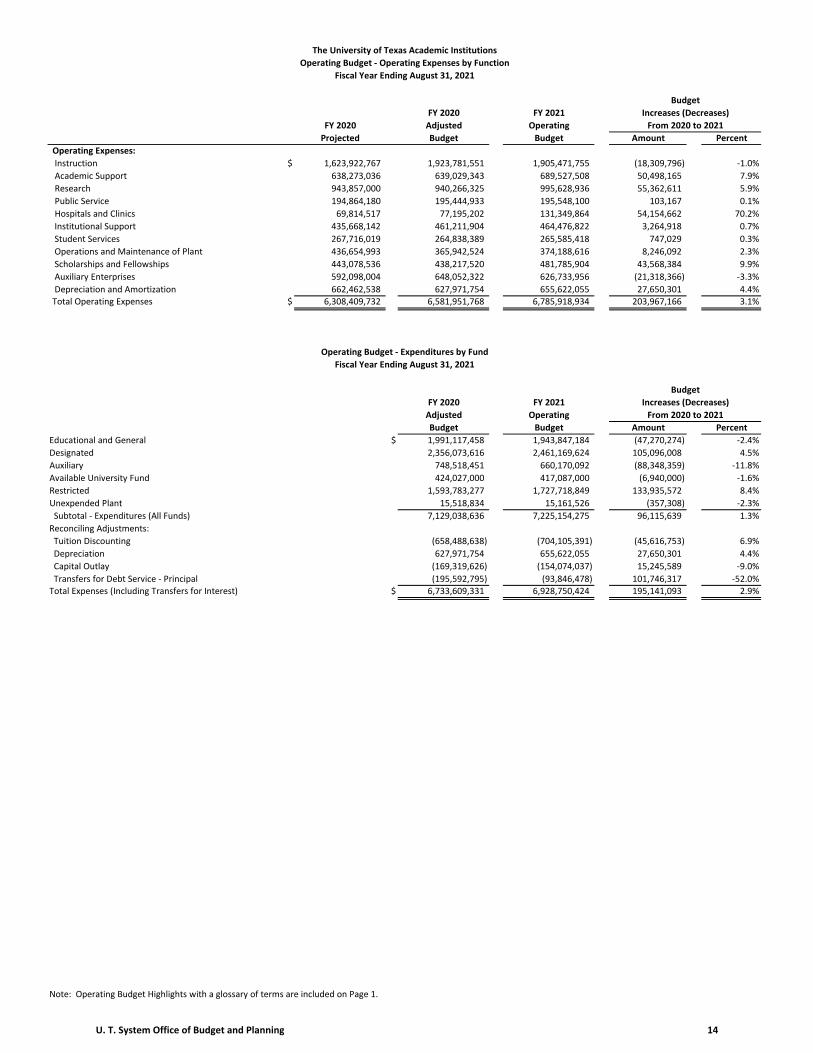
The University of Texas Academic Institutions
Operating Budget ‐ Operating Expenses by Function
Fiscal Year Ending August 31, 2021
Budget
FY 2020 FY 2021 Increases (Decreases)
FY 2020 Adjusted Operating From 2020 to 2021
Projected Budget Budget Amount Percent
Operating Expenses:
Instruction $ 1,623,922,767 1,923,781,551 1,905,471,755 (18,309,796) ‐1.0%
Academic Support 638,273,036 639,029,343 689,527,508 50,498,165 7.9%
Research 943,857,000 940,266,325 995,628,936 55,362,611 5.9%
Public Service 194,864,180 195,444,933 195,548,100 103,167 0.1%
Hospitals and Clinics 69,814,517 77,195,202 131,349,864 54,154,662 70.2%
Institutional Support 435,668,142 461,211,904 464,476,822 3,264,918 0.7%
Student Services 267,716,019 264,838,389 265,585,418 747,029 0.3%
Operations and Maintenance of Plant 436,654,993 365,942,524 374,188,616 8,246,092 2.3%
Scholarships and Fellowships 443,078,536 438,217,520 481,785,904 43,568,384 9.9%
Auxiliary Enterprises 592,098,004 648,052,322 626,733,956 (21,318,366) ‐3.3%
Depreciation and Amortization 662,462,538 627,971,754 655,622,055 27,650,301 4.4%Total Operating Expenses $ 6,308,409,732 6,581,951,768 6,785,918,934 203,967,166 3.1%
Operating Budget ‐ Expenditures by Fund
Fiscal Year Ending August 31, 2021
Budget
FY 2020 FY 2021 Increases (Decreases)
Adjusted Operating From 2020 to 2021
Budget Budget Amount Percent
Educational and General $ 1,991,117,458 1,943,847,184 (47,270,274) ‐2.4%
Designated 2,356,073,616 2,461,169,624 105,096,008 4.5%
Auxiliary 748,518,451 660,170,092 (88,348,359) ‐11.8%
Available University Fund 424,027,000 417,087,000 (6,940,000) ‐1.6%
Restricted 1,593,783,277 1,727,718,849 133,935,572 8.4%
Unexpended Plant 15,518,834 15,161,526 (357,308) ‐2.3%
Subtotal ‐ Expenditures (All Funds) 7,129,038,636 7,225,154,275 96,115,639 1.3%
Reconciling Adjustments:
Tuition Discounting (658,488,638) (704,105,391) (45,616,753) 6.9%
Depreciation 627,971,754 655,622,055 27,650,301 4.4%
Capital Outlay (169,319,626) (154,074,037) 15,245,589 ‐9.0%
Transfers for Debt Service ‐ Principal (195,592,795) (93,846,478) 101,746,317 ‐52.0%Total Expenses (Including Transfers for Interest) $ 6,733,609,331 6,928,750,424 195,141,093 2.9%
Note: Operating Budget Highlights with a glossary of terms are included on Page 1.
U. T. System Office of Budget and Planning 14
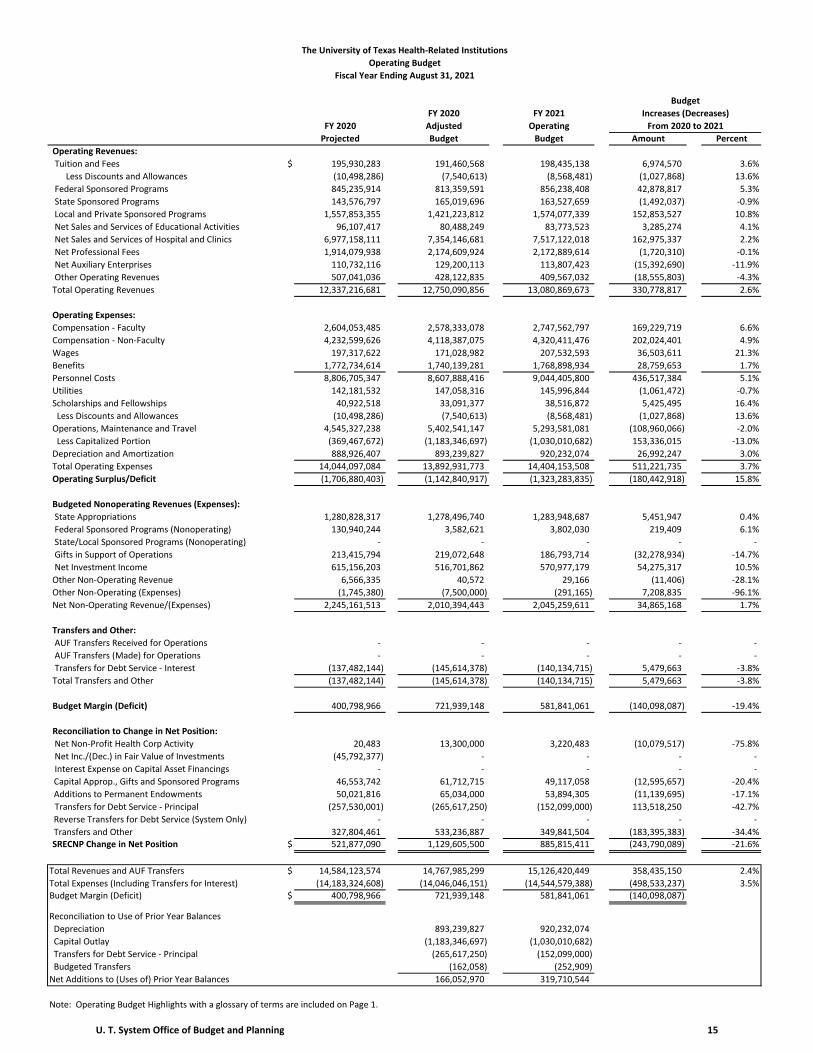
The University of Texas Health‐Related Institutions
Operating Budget
Fiscal Year Ending August 31, 2021
Budget
FY 2020 FY 2021 Increases (Decreases)
FY 2020 Adjusted Operating From 2020 to 2021
Projected Budget Budget Amount Percent
Operating Revenues:
Tuition and Fees $ 195,930,283 191,460,568 198,435,138 6,974,570 3.6%
Less Discounts and Allowances (10,498,286) (7,540,613) (8,568,481) (1,027,868) 13.6%
Federal Sponsored Programs 845,235,914 813,359,591 856,238,408 42,878,817 5.3%
State Sponsored Programs 143,576,797 165,019,696 163,527,659 (1,492,037) ‐0.9%
Local and Private Sponsored Programs 1,557,853,355 1,421,223,812 1,574,077,339 152,853,527 10.8%
Net Sales and Services of Educational Activities 96,107,417 80,488,249 83,773,523 3,285,274 4.1%
Net Sales and Services of Hospital and Clinics 6,977,158,111 7,354,146,681 7,517,122,018 162,975,337 2.2%
Net Professional Fees 1,914,079,938 2,174,609,924 2,172,889,614 (1,720,310) ‐0.1%
Net Auxiliary Enterprises 110,732,116 129,200,113 113,807,423 (15,392,690) ‐11.9%
Other Operating Revenues 507,041,036 428,122,835 409,567,032 (18,555,803) ‐4.3%
Total Operating Revenues 12,337,216,681 12,750,090,856 13,080,869,673 330,778,817 2.6%
Operating Expenses:
Compensation ‐ Faculty 2,604,053,485 2,578,333,078 2,747,562,797 169,229,719 6.6%
Compensation ‐ Non‐Faculty 4,232,599,626 4,118,387,075 4,320,411,476 202,024,401 4.9%
Wages 197,317,622 171,028,982 207,532,593 36,503,611 21.3%
Benefits 1,772,734,614 1,740,139,281 1,768,898,934 28,759,653 1.7%
Personnel Costs 8,806,705,347 8,607,888,416 9,044,405,800 436,517,384 5.1%
Utilities 142,181,532 147,058,316 145,996,844 (1,061,472) ‐0.7%
Scholarships and Fellowships 40,922,518 33,091,377 38,516,872 5,425,495 16.4%
Less Discounts and Allowances (10,498,286) (7,540,613) (8,568,481) (1,027,868) 13.6%
Operations, Maintenance and Travel 4,545,327,238 5,402,541,147 5,293,581,081 (108,960,066) ‐2.0%
Less Capitalized Portion (369,467,672) (1,183,346,697) (1,030,010,682) 153,336,015 ‐13.0%
Depreciation and Amortization 888,926,407 893,239,827 920,232,074 26,992,247 3.0%
Total Operating Expenses 14,044,097,084 13,892,931,773 14,404,153,508 511,221,735 3.7%
Operating Surplus/Deficit (1,706,880,403) (1,142,840,917) (1,323,283,835) (180,442,918) 15.8%
Budgeted Nonoperating Revenues (Expenses):
State Appropriations 1,280,828,317 1,278,496,740 1,283,948,687 5,451,947 0.4%
Federal Sponsored Programs (Nonoperating) 130,940,244 3,582,621 3,802,030 219,409 6.1%
State/Local Sponsored Programs (Nonoperating) ‐ ‐ ‐ ‐ ‐
Gifts in Support of Operations 213,415,794 219,072,648 186,793,714 (32,278,934) ‐14.7%
Net Investment Income 615,156,203 516,701,862 570,977,179 54,275,317 10.5%
Other Non‐Operating Revenue 6,566,335 40,572 29,166 (11,406) ‐28.1%
Other Non‐Operating (Expenses) (1,745,380) (7,500,000) (291,165) 7,208,835 ‐96.1%
Net Non‐Operating Revenue/(Expenses) 2,245,161,513 2,010,394,443 2,045,259,611 34,865,168 1.7%
Transfers and Other:
AUF Transfers Received for Operations ‐ ‐ ‐ ‐ ‐
AUF Transfers (Made) for Operations ‐ ‐ ‐ ‐ ‐
Transfers for Debt Service ‐ Interest (137,482,144) (145,614,378) (140,134,715) 5,479,663 ‐3.8%
Total Transfers and Other (137,482,144) (145,614,378) (140,134,715) 5,479,663 ‐3.8%
Budget Margin (Deficit) 400,798,966 721,939,148 581,841,061 (140,098,087) ‐19.4%
Reconciliation to Change in Net Position:
Net Non‐Profit Health Corp Activity 20,483 13,300,000 3,220,483 (10,079,517) ‐75.8%
Net Inc./(Dec.) in Fair Value of Investments (45,792,377) ‐ ‐ ‐ ‐
Interest Expense on Capital Asset Financings ‐ ‐ ‐ ‐ ‐
Capital Approp., Gifts and Sponsored Programs 46,553,742 61,712,715 49,117,058 (12,595,657) ‐20.4%
Additions to Permanent Endowments 50,021,816 65,034,000 53,894,305 (11,139,695) ‐17.1%
Transfers for Debt Service ‐ Principal (257,530,001) (265,617,250) (152,099,000) 113,518,250 ‐42.7%
Reverse Transfers for Debt Service (System Only) ‐ ‐ ‐ ‐ ‐
Transfers and Other 327,804,461 533,236,887 349,841,504 (183,395,383) ‐34.4%SRECNP Change in Net Position $ 521,877,090 1,129,605,500 885,815,411 (243,790,089) ‐21.6%
Total Revenues and AUF Transfers $ 14,584,123,574 14,767,985,299 15,126,420,449 358,435,150 2.4%
Total Expenses (Including Transfers for Interest) (14,183,324,608) (14,046,046,151) (14,544,579,388) (498,533,237) 3.5%Budget Margin (Deficit) $ 400,798,966 721,939,148 581,841,061 (140,098,087)
Reconciliation to Use of Prior Year Balances
Depreciation 893,239,827 920,232,074
Capital Outlay (1,183,346,697) (1,030,010,682)
Transfers for Debt Service ‐ Principal (265,617,250) (152,099,000)
Budgeted Transfers (162,058) (252,909)
Net Additions to (Uses of) Prior Year Balances 166,052,970 319,710,544
Note: Operating Budget Highlights with a glossary of terms are included on Page 1.
U. T. System Office of Budget and Planning 15

The University of Texas Health‐Related Institutions
Operating Budget ‐ Operating Expenses by Function
Fiscal Year Ending August 31, 2021
Budget
FY 2020 FY 2021 Increases (Decreases)
FY 2020 Adjusted Operating From 2020 to 2021
Projected Budget Budget Amount Percent
Operating Expenses:
Instruction $ 2,766,308,016 2,722,261,777 2,814,330,608 92,068,831 3.4%
Academic Support 391,130,130 333,188,785 400,045,472 66,856,687 20.1%
Research 1,674,860,155 1,681,540,068 1,698,493,027 16,952,959 1.0%
Public Service 146,830,912 142,008,413 151,365,658 9,357,245 6.6%
Hospitals and Clinics 7,068,882,459 7,061,727,600 7,324,853,920 263,126,320 3.7%
Institutional Support 494,211,507 454,187,319 478,584,152 24,396,833 5.4%
Student Services 26,665,063 25,952,293 27,942,372 1,990,079 7.7%
Operations and Maintenance of Plant 447,121,469 456,352,748 457,363,520 1,010,772 0.2%
Scholarships and Fellowships 33,067,066 23,937,023 35,189,689 11,252,666 47.0%
Auxiliary Enterprises 96,059,922 98,535,920 95,753,016 (2,782,904) ‐2.8%
Depreciation and Amortization 898,960,385 893,239,827 920,232,074 26,992,247 3.0%Total Operating Expenses $ 14,044,097,084 13,892,931,773 14,404,153,508 511,221,735 3.7%
Operating Budget ‐ Expenditures by Fund
Fiscal Year Ending August 31, 2021
Budget
FY 2020 FY 2021 Increases (Decreases)
Adjusted Operating From 2020 to 2021
Budget Budget Amount Percent
Educational and General $ 5,509,923,073 5,563,242,429 53,319,356 1.0%
Designated 6,433,644,822 6,705,910,615 272,265,793 4.2%
Auxiliary 124,795,893 113,051,306 (11,744,587) ‐9.4%
Available University Fund ‐ ‐ ‐ ‐
Restricted 1,421,903,615 1,459,119,547 37,215,932 2.6%
Unexpended Plant 1,119,043,481 973,701,580 (145,341,901) ‐13.0%
Subtotal ‐ Expenditures (All Funds) 14,609,310,884 14,815,025,477 205,714,593 1.4%
Reconciling Adjustments:
Tuition Discounting (7,540,613) (8,568,481) (1,027,868) 13.6%
Depreciation 893,239,827 920,232,074 26,992,247 3.0%
Capital Outlay (1,183,346,697) (1,030,010,682) 153,336,015 ‐13.0%
Transfers for Debt Service ‐ Principal (265,617,250) (152,099,000) 113,518,250 ‐42.7%Total Expenses (Including Transfers for Interest) $ 14,046,046,151 14,544,579,388 498,533,237 3.5%
Note: Operating Budget Highlights with a glossary of terms are included on Page 1.
U. T. System Office of Budget and Planning 16
THE UNIVERSITY OF TEXAS
SYSTEM ADMINISTRATION
U. T. System Office of Budget and Planning 17
The University of Texas System Administration Operating Budget Highlights
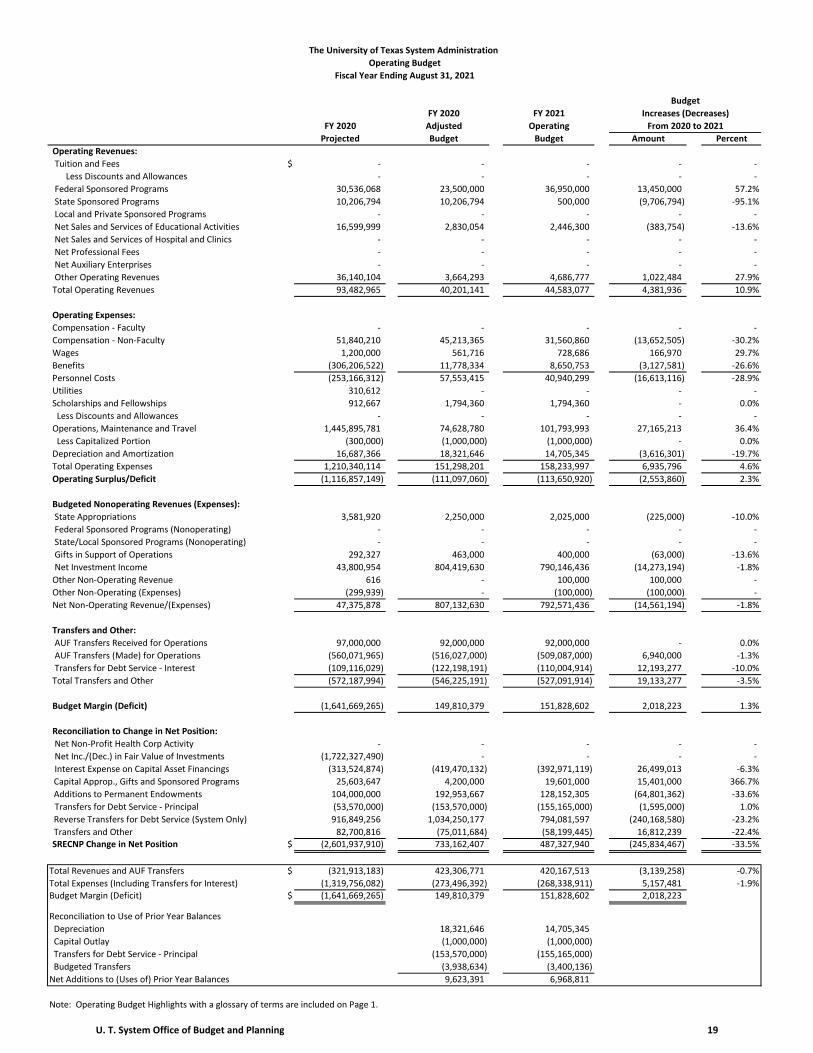
For the Year Ending August 31, 2021 Introduction - Major Goals Addressed by FY 2021 Budget For more than 130 years, The University of Texas System has been committed to improving the lives of Texans and people all over the world through education, research and health care. Under the direction of the U. T. System Board of Regents and the Chancellor, U. T. System Administration supports this commitment by fulfilling the statutory roles of oversight and coordination. The COVID-19 pandemic and the depressed oil market in the Permian Basin have significantly affected the economy of Texas and the operations of the U. T. System. In alignment with the adjustments that U. T. System institutions have made under the current economic conditions, U. T. System Administration has performed a careful review of administrative operations to further reduce costs and staffing levels. The FY 2021 budget is built on a recurring Available University Fund (AUF) requirement of $92.0 million, unchanged from FY 2020. This requires no use of balances to support ongoing U. T. System Administration activities, including direct campus support, and is down from the $3.3 million in balances needed in FY 2020. The current budget reflects a decrease in proposed AUF usage of $48 million (34 percent) since FY 2017. For FY 2021, the total proposed budgeted full-time equivalent employees (FTEs) reflect a 22 percent reduction from FY 2020. Budgeted FTEs have been declining over the past several years in response to the charge by the Board of Regents to reduce overall FTEs and dependence on the AUF. Proposed FY 2021 FTEs represent a reduction in excess of 50 percent as compared to the peak total of FTEs budgeted in FY 2017. The core U. T. System Administration AUF-fund budget for FY 2021 is $50.5 million, reflecting a 3.3 percent decrease from FY 2020. As part of the 2015 plan to offset tuition at the academic campuses other than U. T. Austin, the Board of Regents approved $31.4 million of AUF with the stated understanding that this commitment was expected to increase over time and that it would be incorporated into future U. T. System Administration budgets. This segment of the budget, providing direct campus support, is proposed to utilize approximately $41.5 million of AUF and is down 2.6 percent from FY 2020. Of the 113 Shared Information Services (SIS) FTEs previously included in this support, 109 were transitioned to U. T. Dallas in FY 2020. All associated costs are now part of an ongoing contract with U. T. Dallas and the overall impact of SIS to U. T. System Administration’s AUF direct campus support budget remains unchanged. Revenue Budgeted revenue for U. T. System Administration is $420.2 million, down $3.1 million (0.7 percent). While relatively unchanged overall, individual elements experienced significant fluctuations. Federal Sponsored Programs reflect a $13.5 million increase in anticipated Employee Group Waiver Plan (EGWP) payments related to Medicare Part D retiree prescription drug coverage administered as part of the health insurance program. State Sponsored Programs will experience a $9.7 million reduction related to the Joint Admission Medical Program, which received its full biennial appropriation in FY 2020. Net Investment Income includes the U. T. System’s share of the AUF. While the distribution from the Permanent University Fund (PUF) to the AUF is budgeted to increase, significant declines in AUF surface income and interest earnings on AUF balances held in the state treasury have contributed to an overall decline in AUF available to the U. T. System. This decrease also impacts the amount of AUF transferred to U. T. Austin and contributes to the AUF support provided to U. T. Austin being $6.9 million less than FY 2020. Only the portions of the AUF distributed for PUF bond debt service, for U. T. System Administration operations and any surplus after distributions to U. T. Austin are reflected as revenue in U. T. System Administration’s budget. Expenses Budgeted expenses (including transfers for interest) have decreased $5.2 million (1.9 percent) to $268.3 million. The reduction results primarily from decreased projected PUF bond interest, depreciation and AUF operating costs offset by growth in the expenses associated with the EGWP federal support. The presented operating expenses reflect a significant shift from Personnel Costs to Operations, Maintenance and Travel resulting from the new contractual relationship between U. T. System Administration and U. T. Dallas for the operation of SIS. As part of the review of administrative operations, travel, along with maintenance and operations costs, have been reduced to reflect expected needs under the current and anticipated future economic conditions. Like other U. T. System institutions, U. T. System Administration has chosen to forego a staff merit policy for the current fiscal year.
U. T. System Office of Budget and Planning 18
The University of Texas System Administration
Operating Budget
Fiscal Year Ending August 31, 2021
Budget
FY 2020 FY 2021 Increases (Decreases)
FY 2020 Adjusted Operating From 2020 to 2021
Projected Budget Budget Amount Percent
Operating Revenues:
Tuition and Fees $ ‐ ‐ ‐ ‐ ‐
Less Discounts and Allowances ‐ ‐ ‐ ‐ ‐
Federal Sponsored Programs 30,536,068 23,500,000 36,950,000 13,450,000 57.2%
State Sponsored Programs 10,206,794 10,206,794 500,000 (9,706,794) ‐95.1%
Local and Private Sponsored Programs ‐ ‐ ‐ ‐ ‐
Net Sales and Services of Educational Activities 16,599,999 2,830,054 2,446,300 (383,754) ‐13.6%
Net Sales and Services of Hospital and Clinics ‐ ‐ ‐ ‐ ‐
Net Professional Fees ‐ ‐ ‐ ‐ ‐
Net Auxiliary Enterprises ‐ ‐ ‐ ‐ ‐
Other Operating Revenues 36,140,104 3,664,293 4,686,777 1,022,484 27.9%
Total Operating Revenues 93,482,965 40,201,141 44,583,077 4,381,936 10.9%
Operating Expenses:
Compensation ‐ Faculty ‐ ‐ ‐ ‐ ‐
Compensation ‐ Non‐Faculty 51,840,210 45,213,365 31,560,860 (13,652,505) ‐30.2%
Wages 1,200,000 561,716 728,686 166,970 29.7%
Benefits (306,206,522) 11,778,334 8,650,753 (3,127,581) ‐26.6%
Personnel Costs (253,166,312) 57,553,415 40,940,299 (16,613,116) ‐28.9%
Utilities 310,612 ‐ ‐ ‐ ‐
Scholarships and Fellowships 912,667 1,794,360 1,794,360 ‐ 0.0%
Less Discounts and Allowances ‐ ‐ ‐ ‐ ‐
Operations, Maintenance and Travel 1,445,895,781 74,628,780 101,793,993 27,165,213 36.4%
Less Capitalized Portion (300,000) (1,000,000) (1,000,000) ‐ 0.0%
Depreciation and Amortization 16,687,366 18,321,646 14,705,345 (3,616,301) ‐19.7%
Total Operating Expenses 1,210,340,114 151,298,201 158,233,997 6,935,796 4.6%
Operating Surplus/Deficit (1,116,857,149) (111,097,060) (113,650,920) (2,553,860) 2.3%
Budgeted Nonoperating Revenues (Expenses):
State Appropriations 3,581,920 2,250,000 2,025,000 (225,000) ‐10.0%
Federal Sponsored Programs (Nonoperating) ‐ ‐ ‐ ‐ ‐
State/Local Sponsored Programs (Nonoperating) ‐ ‐ ‐ ‐ ‐
Gifts in Support of Operations 292,327 463,000 400,000 (63,000) ‐13.6%
Net Investment Income 43,800,954 804,419,630 790,146,436 (14,273,194) ‐1.8%
Other Non‐Operating Revenue 616 ‐ 100,000 100,000 ‐
Other Non‐Operating (Expenses) (299,939) ‐ (100,000) (100,000) ‐
Net Non‐Operating Revenue/(Expenses) 47,375,878 807,132,630 792,571,436 (14,561,194) ‐1.8%
Transfers and Other:
AUF Transfers Received for Operations 97,000,000 92,000,000 92,000,000 ‐ 0.0%
AUF Transfers (Made) for Operations (560,071,965) (516,027,000) (509,087,000) 6,940,000 ‐1.3%
Transfers for Debt Service ‐ Interest (109,116,029) (122,198,191) (110,004,914) 12,193,277 ‐10.0%
Total Transfers and Other (572,187,994) (546,225,191) (527,091,914) 19,133,277 ‐3.5%
Budget Margin (Deficit) (1,641,669,265) 149,810,379 151,828,602 2,018,223 1.3%
Reconciliation to Change in Net Position:
Net Non‐Profit Health Corp Activity ‐ ‐ ‐ ‐ ‐
Net Inc./(Dec.) in Fair Value of Investments (1,722,327,490) ‐ ‐ ‐ ‐
Interest Expense on Capital Asset Financings (313,524,874) (419,470,132) (392,971,119) 26,499,013 ‐6.3%
Capital Approp., Gifts and Sponsored Programs 25,603,647 4,200,000 19,601,000 15,401,000 366.7%
Additions to Permanent Endowments 104,000,000 192,953,667 128,152,305 (64,801,362) ‐33.6%
Transfers for Debt Service ‐ Principal (53,570,000) (153,570,000) (155,165,000) (1,595,000) 1.0%
Reverse Transfers for Debt Service (System Only) 916,849,256 1,034,250,177 794,081,597 (240,168,580) ‐23.2%
Transfers and Other 82,700,816 (75,011,684) (58,199,445) 16,812,239 ‐22.4%SRECNP Change in Net Position $ (2,601,937,910) 733,162,407 487,327,940 (245,834,467) ‐33.5%
Total Revenues and AUF Transfers $ (321,913,183) 423,306,771 420,167,513 (3,139,258) ‐0.7%
Total Expenses (Including Transfers for Interest) (1,319,756,082) (273,496,392) (268,338,911) 5,157,481 ‐1.9%Budget Margin (Deficit) $ (1,641,669,265) 149,810,379 151,828,602 2,018,223
Reconciliation to Use of Prior Year Balances
Depreciation 18,321,646 14,705,345
Capital Outlay (1,000,000) (1,000,000)
Transfers for Debt Service ‐ Principal (153,570,000) (155,165,000)
Budgeted Transfers (3,938,634) (3,400,136)
Net Additions to (Uses of) Prior Year Balances 9,623,391 6,968,811
Note: Operating Budget Highlights with a glossary of terms are included on Page 1.
U. T. System Office of Budget and Planning 19
The University of Texas System Administration
Operating Budget ‐ Operating Expenses by Function
Fiscal Year Ending August 31, 2021
Budget
FY 2020 FY 2021 Increases (Decreases)
FY 2020 Adjusted Operating From 2020 to 2021
Projected Budget Budget Amount Percent
Operating Expenses:
Instruction $ ‐ ‐ ‐ ‐ ‐
Academic Support 11,025,328 8,267,034 8,267,034 ‐ 0.0%
Research ‐ ‐ ‐ ‐ ‐
Public Service 3,391,715 2,250,000 2,525,000 275,000 12.2%
Hospitals and Clinics ‐ ‐ ‐ ‐ ‐
Institutional Support 1,178,406,330 120,665,161 130,942,258 10,277,097 8.5%
Student Services ‐ ‐ ‐ ‐ ‐
Operations and Maintenance of Plant 534,708 ‐ ‐ ‐ ‐
Scholarships and Fellowships 294,667 1,794,360 1,794,360 ‐ 0.0%
Auxiliary Enterprises ‐ ‐ ‐ ‐ ‐
Depreciation and Amortization 16,687,366 18,321,646 14,705,345 (3,616,301) ‐19.7%Total Operating Expenses $ 1,210,340,114 151,298,201 158,233,997 6,935,796 4.6%
Operating Budget ‐ Expenditures by Fund
Fiscal Year Ending August 31, 2021
Budget
FY 2020 FY 2021 Increases (Decreases)
Adjusted Operating From 2020 to 2021
Budget Budget Amount Percent
Educational and General $ 97,598,695 94,825,000 (2,773,695) ‐2.8%
Designated 13,112,897 11,350,898 (1,761,999) ‐13.4%
Auxiliary ‐ ‐ ‐ ‐
Available University Fund 274,136,191 265,169,914 (8,966,277) ‐3.3%
Restricted 24,896,963 38,452,754 13,555,791 54.4%
Unexpended Plant ‐ ‐ ‐ ‐
Subtotal ‐ Expenditures (All Funds) 409,744,746 409,798,566 53,820 0.0%
Reconciling Adjustments:
Tuition Discounting ‐ ‐ ‐ ‐
Depreciation 18,321,646 14,705,345 (3,616,301) ‐19.7%
Capital Outlay (1,000,000) (1,000,000) ‐ 0.0%
Transfers for Debt Service ‐ Principal (153,570,000) (155,165,000) (1,595,000) 1.0%Total Expenses (Including Transfers for Interest) $ 273,496,392 268,338,911 (5,157,481) ‐1.9%
Note: Operating Budget Highlights with a glossary of terms are included on Page 1.
U. T. System Office of Budget and Planning 20
THE UNIVERSITY OF TEXAS
AT ARLINGTON
U. T. System Office of Budget and Planning 21
The University of Texas at Arlington Operating Budget Highlights
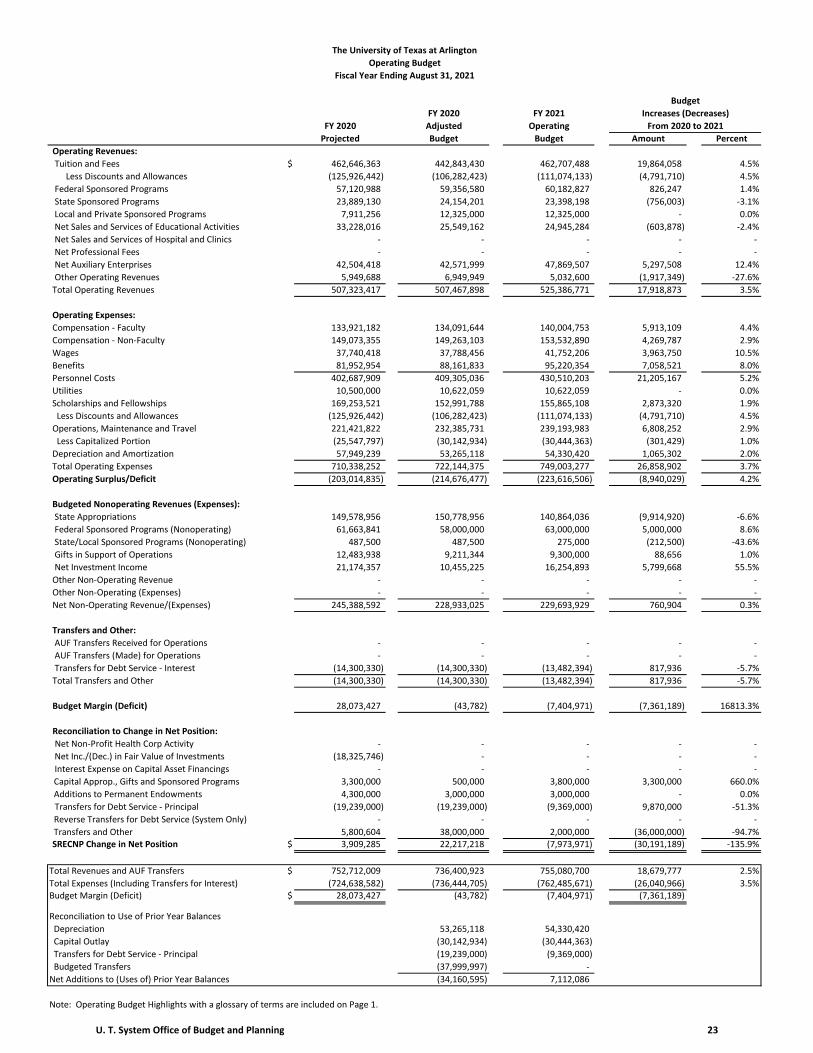
for the Year Ending August 31, 2021 Introduction - Major Goals Addressed by FY 2021 Budget The University of Texas at Arlington, classified by the Carnegie Classification of Institutions of Higher Education in its top list of 131 elite doctoral institutions as an R-1 “very high research activity” institution, is the second-largest campus and one of the most affordable in the U. T. System. The University has received a number of accolades in recent years, such as U.S. News and World Report ranking 20 of its graduate programs among the top in the nation, the National League for Nursing designating its College of Nursing and Health Innovation a Center of Excellence—making the University one of only three in Texas to receive that honor—Military Times naming it the top four-year institution for veterans in the nation, and Washington Monthly ranking it the top four-year university in North Texas for adult learners. U. T. Arlington is also the third largest transfer destination in the country and home to the sixth most diverse student population. By all metrics, including affordability and degree attainment, the University has a national reputation for excellence. The University focuses on ensuring excellence and access at affordable rates to enable all students to get a top-notch education, with the goal of enhancing educational opportunities for students and ensuring that the state has a highly skilled workforce. U. T. Arlington has developed the FY 2021 budget with a focus on balancing the mission and strategic priorities of the University with the challenging economic environment expected over the next year—namely, meeting the objectives of the strategic plan and continuing progress toward Texas Tier 1 status while simultaneously meeting aggressive student success and student support goals. Budget increases are primarily focused on addressing student success initiatives, student support projects, and faculty and staff recruitment and retention. U. T. Arlington has taken steps to control costs and minimize risks of potential economic factors by forgoing merit raises next fiscal year; implementing a strategic hiring freeze; pausing reclassifications and salary increases, except in cases considered mission critical and in direct support of our strategic plan; adopting a more conservative approach to department and unit spending decisions; and limiting expenditures to essential items. With the support of U. T. System, medical insurance rates have been held flat and debt principal payments have been deferred, providing flexibility for the upcoming fiscal year. Revenue Total annual operating revenue is expected to increase by just under 4 percent in FY 2021. An increase in tuition and fees revenue is driven by the tuition rate increases approved by the U. T. System Board of Regents and a one percent increase in enrollment. While the overall enrollment trend remains positive, there has been a shift in student composition over the last three years and we have experienced a decline in non-resident paying students and graduate students. Net tuition and fee revenue is expected to increase 4.5 percent. As the State economy has suffered during the current fiscal year, U. T. Arlington, and most other universities received a significant cut in state appropriations, resulting in a decline of state appropriations of approximately $10 million. Expenses Budget increases are primarily focused on addressing student success initiatives, student support projects, and faculty and staff recruitment and retention. U. T. Arlington has taken steps to control costs and minimize risks of potential economic factors by: forgoing merit raises next fiscal year, implementing a strategic hiring freeze, pausing reclassifications and salary increases, except in cases considered mission critical and in direct support of our strategic plan, adopting a more conservative approach to department and unit spending decisions, and limiting expenditures to essential items. With the support of U. T. System, medical insurance rates have been held flat and debt principal payments have been deferred, providing flexibility for the upcoming fiscal year. U. T. Arlington’s operating expenses are expected to increase by less than four percent in FY 2021 to a total of $750 million. Expenditure increases are predominately related to student success initiatives and academic support related to increased faculty levels, faculty retention initiatives, advising, and increasing costs related to enrollment growth particularly in online learning. Student Support expenditure increases related to counseling, health services, and student success initiatives were part of the tuition increase proposal approved in 2018. U. T. Arlington plans to utilize $4.4 million from prior year reserves to defray the impact of the 5 percent state appropriation reduction.
U. T. System Office of Budget and Planning 22
The University of Texas at Arlington
Operating Budget
Fiscal Year Ending August 31, 2021
Budget
FY 2020 FY 2021 Increases (Decreases)
FY 2020 Adjusted Operating From 2020 to 2021
Projected Budget Budget Amount Percent
Operating Revenues:
Tuition and Fees $ 462,646,363 442,843,430 462,707,488 19,864,058 4.5%
Less Discounts and Allowances (125,926,442) (106,282,423) (111,074,133) (4,791,710) 4.5%
Federal Sponsored Programs 57,120,988 59,356,580 60,182,827 826,247 1.4%
State Sponsored Programs 23,889,130 24,154,201 23,398,198 (756,003) ‐3.1%
Local and Private Sponsored Programs 7,911,256 12,325,000 12,325,000 ‐ 0.0%
Net Sales and Services of Educational Activities 33,228,016 25,549,162 24,945,284 (603,878) ‐2.4%
Net Sales and Services of Hospital and Clinics ‐ ‐ ‐ ‐ ‐
Net Professional Fees ‐ ‐ ‐ ‐ ‐
Net Auxiliary Enterprises 42,504,418 42,571,999 47,869,507 5,297,508 12.4%
Other Operating Revenues 5,949,688 6,949,949 5,032,600 (1,917,349) ‐27.6%
Total Operating Revenues 507,323,417 507,467,898 525,386,771 17,918,873 3.5%
Operating Expenses:
Compensation ‐ Faculty 133,921,182 134,091,644 140,004,753 5,913,109 4.4%
Compensation ‐ Non‐Faculty 149,073,355 149,263,103 153,532,890 4,269,787 2.9%
Wages 37,740,418 37,788,456 41,752,206 3,963,750 10.5%
Benefits 81,952,954 88,161,833 95,220,354 7,058,521 8.0%
Personnel Costs 402,687,909 409,305,036 430,510,203 21,205,167 5.2%
Utilities 10,500,000 10,622,059 10,622,059 ‐ 0.0%
Scholarships and Fellowships 169,253,521 152,991,788 155,865,108 2,873,320 1.9%
Less Discounts and Allowances (125,926,442) (106,282,423) (111,074,133) (4,791,710) 4.5%
Operations, Maintenance and Travel 221,421,822 232,385,731 239,193,983 6,808,252 2.9%
Less Capitalized Portion (25,547,797) (30,142,934) (30,444,363) (301,429) 1.0%
Depreciation and Amortization 57,949,239 53,265,118 54,330,420 1,065,302 2.0%
Total Operating Expenses 710,338,252 722,144,375 749,003,277 26,858,902 3.7%
Operating Surplus/Deficit (203,014,835) (214,676,477) (223,616,506) (8,940,029) 4.2%
Budgeted Nonoperating Revenues (Expenses):
State Appropriations 149,578,956 150,778,956 140,864,036 (9,914,920) ‐6.6%
Federal Sponsored Programs (Nonoperating) 61,663,841 58,000,000 63,000,000 5,000,000 8.6%
State/Local Sponsored Programs (Nonoperating) 487,500 487,500 275,000 (212,500) ‐43.6%
Gifts in Support of Operations 12,483,938 9,211,344 9,300,000 88,656 1.0%
Net Investment Income 21,174,357 10,455,225 16,254,893 5,799,668 55.5%
Other Non‐Operating Revenue ‐ ‐ ‐ ‐ ‐
Other Non‐Operating (Expenses) ‐ ‐ ‐ ‐ ‐
Net Non‐Operating Revenue/(Expenses) 245,388,592 228,933,025 229,693,929 760,904 0.3%
Transfers and Other:
AUF Transfers Received for Operations ‐ ‐ ‐ ‐ ‐
AUF Transfers (Made) for Operations ‐ ‐ ‐ ‐ ‐
Transfers for Debt Service ‐ Interest (14,300,330) (14,300,330) (13,482,394) 817,936 ‐5.7%
Total Transfers and Other (14,300,330) (14,300,330) (13,482,394) 817,936 ‐5.7%
Budget Margin (Deficit) 28,073,427 (43,782) (7,404,971) (7,361,189) 16813.3%
Reconciliation to Change in Net Position:
Net Non‐Profit Health Corp Activity ‐ ‐ ‐ ‐ ‐
Net Inc./(Dec.) in Fair Value of Investments (18,325,746) ‐ ‐ ‐ ‐
Interest Expense on Capital Asset Financings ‐ ‐ ‐ ‐ ‐
Capital Approp., Gifts and Sponsored Programs 3,300,000 500,000 3,800,000 3,300,000 660.0%
Additions to Permanent Endowments 4,300,000 3,000,000 3,000,000 ‐ 0.0%
Transfers for Debt Service ‐ Principal (19,239,000) (19,239,000) (9,369,000) 9,870,000 ‐51.3%
Reverse Transfers for Debt Service (System Only) ‐ ‐ ‐ ‐ ‐
Transfers and Other 5,800,604 38,000,000 2,000,000 (36,000,000) ‐94.7%SRECNP Change in Net Position $ 3,909,285 22,217,218 (7,973,971) (30,191,189) ‐135.9%
Total Revenues and AUF Transfers $ 752,712,009 736,400,923 755,080,700 18,679,777 2.5%
Total Expenses (Including Transfers for Interest) (724,638,582) (736,444,705) (762,485,671) (26,040,966) 3.5%Budget Margin (Deficit) $ 28,073,427 (43,782) (7,404,971) (7,361,189)
Reconciliation to Use of Prior Year Balances
Depreciation 53,265,118 54,330,420
Capital Outlay (30,142,934) (30,444,363)
Transfers for Debt Service ‐ Principal (19,239,000) (9,369,000)
Budgeted Transfers (37,999,997) ‐
Net Additions to (Uses of) Prior Year Balances (34,160,595) 7,112,086
Note: Operating Budget Highlights with a glossary of terms are included on Page 1.
U. T. System Office of Budget and Planning 23

The University of Texas at Arlington
Operating Budget ‐ Operating Expenses by Function
Fiscal Year Ending August 31, 2021
Budget
FY 2020 FY 2021 Increases (Decreases)
FY 2020 Adjusted Operating From 2020 to 2021
Projected Budget Budget Amount Percent
Operating Expenses:
Instruction $ 193,286,165 245,650,180 248,497,158 2,846,978 1.2%
Academic Support 52,521,108 56,137,251 57,708,317 1,571,066 2.8%
Research 100,056,527 75,766,278 80,376,725 4,610,447 6.1%
Public Service 14,995,466 14,403,788 14,831,227 427,439 3.0%
Hospitals and Clinics ‐ ‐ ‐ ‐ ‐
Institutional Support 52,931,175 71,032,786 76,678,673 5,645,887 7.9%
Student Services 96,945,432 92,948,701 92,184,148 (764,553) ‐0.8%
Operations and Maintenance of Plant 37,439,973 25,864,955 27,853,701 1,988,746 7.7%
Scholarships and Fellowships 43,327,079 34,805,178 38,318,579 3,513,401 10.1%
Auxiliary Enterprises 60,886,088 52,270,139 58,224,329 5,954,190 11.4%
Depreciation and Amortization 57,949,239 53,265,118 54,330,420 1,065,302 2.0%Total Operating Expenses $ 710,338,252 722,144,375 749,003,277 26,858,902 3.7%
Operating Budget ‐ Expenditures by Fund
Fiscal Year Ending August 31, 2021
Budget
FY 2020 FY 2021 Increases (Decreases)
Adjusted Operating From 2020 to 2021
Budget Budget Amount Percent
Educational and General $ 271,721,194 260,257,682 (11,463,512) ‐4.2%
Designated 353,322,617 376,609,456 23,286,839 6.6%
Auxiliary 73,790,787 71,334,190 (2,456,597) ‐3.3%
Available University Fund ‐ ‐ ‐ ‐
Restricted 138,164,569 149,056,893 10,892,324 7.9%
Unexpended Plant 1,844,777 1,784,526 (60,251) ‐3.3%
Subtotal ‐ Expenditures (All Funds) 838,843,944 859,042,747 20,198,803 2.4%
Reconciling Adjustments:
Tuition Discounting (106,282,423) (111,074,133) (4,791,710) 4.5%
Depreciation 53,265,118 54,330,420 1,065,302 2.0%
Capital Outlay (30,142,934) (30,444,363) (301,429) 1.0%
Transfers for Debt Service ‐ Principal (19,239,000) (9,369,000) 9,870,000 ‐51.3%Total Expenses (Including Transfers for Interest) $ 736,444,705 762,485,671 26,040,966 3.5%
Note: Operating Budget Highlights with a glossary of terms are included on Page 1.
U. T. System Office of Budget and Planning 24
THE UNIVERSITY OF TEXAS
AT AUSTIN
U. T. System Office of Budget and Planning 25
The University of Texas at Austin Operating Budget Highlights
For the Year Ending August 31, 2021 Introduction - Major Goals Addressed by FY 2021 Budget The University of Texas at Austin’s FY 2021 budget is a statement of resiliency in the face of the unprecedented challenges presented by the COVID-19 pandemic and its economic aftermath. The University’s budget includes projected decreases in auxiliary enterprise revenue and a state funding clawback, reflecting operational uncertainties and a darkening economic picture for FY 2021. However, U. T. Austin’s primary missions remain fully supported in this budget: contributions to the advancement of society through teaching, research, creative activity, scholarly inquiry, and the development and dissemination of new knowledge, including commercialization of University discoveries. Improving the already substantial value of an undergraduate education at U. T. Austin by unlocking the potential of its students is a central priority for the institution. The University continues to improve access and affordability through expansion of the Texas Advance Commitment (TAC). Under TAC, tuition will continue to be covered for Texas resident students with financial need who have family adjusted gross incomes of up to $65,000. However, beginning in fall 2020, new and continuing eligible Texas resident students who are working toward their first undergraduate degree, who have family adjusted gross incomes of up to $125,000, and have financial need will be eligible for financial assistance to support educational success. The University continues to pursue student success initiatives in this budget, which have helped achieve the latest four-year graduation rate of 69.9 percent. U. T. Austin’s increase in graduation rates is one of the largest improvements over such a short period of time in American higher education. Faculty are at the heart of the institution’s education and research mission. In the FY 2021 budget, U. T. Austin continues its strategic investment in the Faculty Investment Initiative. In FY 2020, this investment included preemptive retention salary increases for faculty at greatest risk of being recruited away, enhanced replacement hiring, and 40 additional faculty lines for cluster and interdisciplinary hiring. While the recruitment environment in FY 2021 poses some uncertainties, the University remains committed to faculty investments to bolster our current research capacity, including the continuation of the Cluster and Interdisciplinary Hiring Initiative to recruit the highest quality faculty members in strategic areas for the University Since its creation, the Dell Medical School continues to transform health education and patient care across Central Texas. This continues in the battle against COVID-19, with the medical school performing testing, contact tracing, and coronavirus-related research. The budget includes a significant operational expansion tied to new contracts and extension of existing contracts within the medical school’s clinical practice. New contract revenues involve partnerships with the Seton Medical Center for child neurological and psychology programs, women’s health, gastroenterology, and neurosurgery. Existing professional fee contracts have also expanded in the areas of surgery, cardio surgery, integral care, and ophthalmological clinical services. Revenue The entirety of the five percent reduction of 2020-21 biennial state funding is reflected in the FY 2021 budget, totaling $28.0 million. Additionally, $9.2 million of the state funding decrease from FY 2020 is due to state support for the Darrell K. Royal Texas Alzheimer's Initiative being entirely appropriated in the first year of the biennium. Tuition revenue decreases total $10.9 million, due to projected COVID-related enrollment declines, particularly among nonresident and international students, partially offset by expected gains from the Board approved 2.6 percent tuition increase. The significant increase in net professional fees reflect a projected $41.4 million tied to new contracts and expansion of existing contracts within Dell Medical School’s clinical practice. Net investment income is projected to increase by $31.1 million, due in part to the movement of significant funds from the Intermediate Term Fund to the Long Term Fund, resulting in higher estimated investment income. Additionally, the growth in university endowments contributes to the increase, including $7.6 million in endowment income budgeted for the expanded Texas Advance Commitment. Finally, auxiliary revenues are projected to decrease by $38.1 million, led by budgeted declines at the AT&T Hotel and Conference Center, and Parking and Transportation Services. Expenses Due to the COVID-19 pandemic, in April 2020 the University canceled its plans for an institutionally-funded merit increases for tenured/tenure-track faculty, non-tenured faculty, administrative and professional and classified staff. An increase of 2 percent for teaching assistants and assistant instructors remains funded. Significant increases in hospital and clinic expenditures, including non-faculty compensation and benefits, relate to the additional revenues expected by Dell Medical School’s new and expanded clinical and surgical programs.
U. T. System Office of Budget and Planning 26
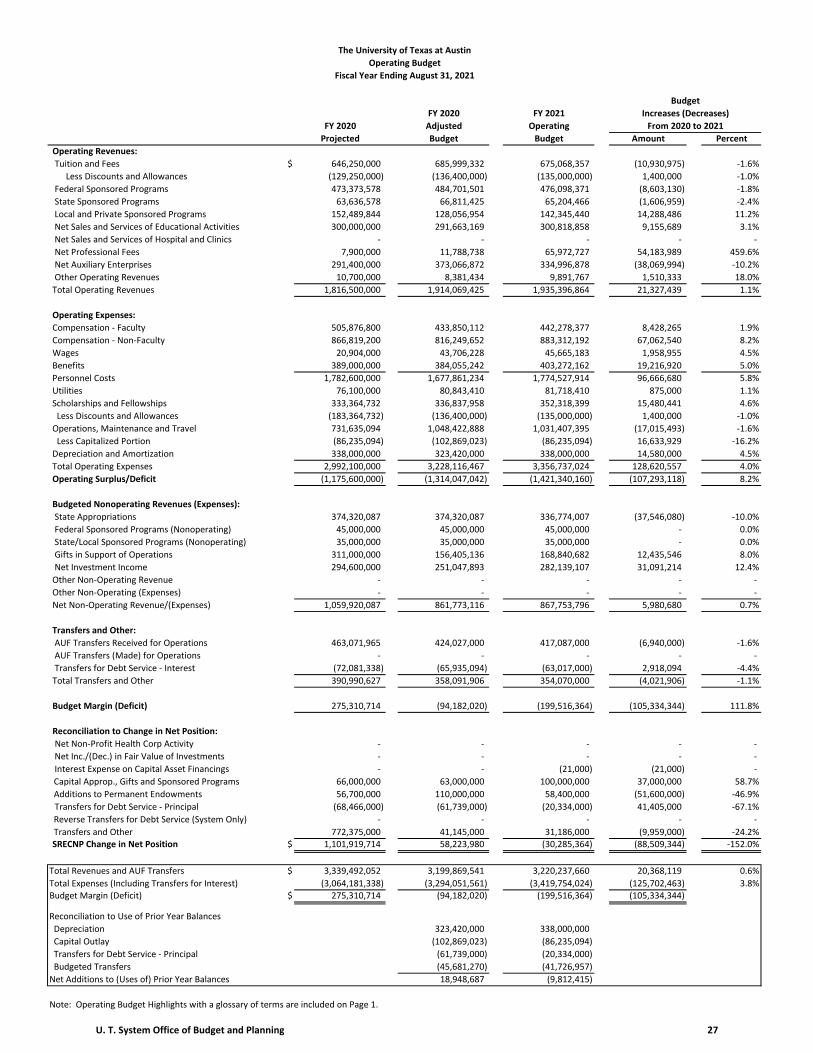
The University of Texas at Austin
Operating Budget
Fiscal Year Ending August 31, 2021
Budget
FY 2020 FY 2021 Increases (Decreases)
FY 2020 Adjusted Operating From 2020 to 2021
Projected Budget Budget Amount Percent
Operating Revenues:
Tuition and Fees $ 646,250,000 685,999,332 675,068,357 (10,930,975) ‐1.6%
Less Discounts and Allowances (129,250,000) (136,400,000) (135,000,000) 1,400,000 ‐1.0%
Federal Sponsored Programs 473,373,578 484,701,501 476,098,371 (8,603,130) ‐1.8%
State Sponsored Programs 63,636,578 66,811,425 65,204,466 (1,606,959) ‐2.4%
Local and Private Sponsored Programs 152,489,844 128,056,954 142,345,440 14,288,486 11.2%
Net Sales and Services of Educational Activities 300,000,000 291,663,169 300,818,858 9,155,689 3.1%
Net Sales and Services of Hospital and Clinics ‐ ‐ ‐ ‐ ‐
Net Professional Fees 7,900,000 11,788,738 65,972,727 54,183,989 459.6%
Net Auxiliary Enterprises 291,400,000 373,066,872 334,996,878 (38,069,994) ‐10.2%
Other Operating Revenues 10,700,000 8,381,434 9,891,767 1,510,333 18.0%
Total Operating Revenues 1,816,500,000 1,914,069,425 1,935,396,864 21,327,439 1.1%
Operating Expenses:
Compensation ‐ Faculty 505,876,800 433,850,112 442,278,377 8,428,265 1.9%
Compensation ‐ Non‐Faculty 866,819,200 816,249,652 883,312,192 67,062,540 8.2%
Wages 20,904,000 43,706,228 45,665,183 1,958,955 4.5%
Benefits 389,000,000 384,055,242 403,272,162 19,216,920 5.0%
Personnel Costs 1,782,600,000 1,677,861,234 1,774,527,914 96,666,680 5.8%
Utilities 76,100,000 80,843,410 81,718,410 875,000 1.1%
Scholarships and Fellowships 333,364,732 336,837,958 352,318,399 15,480,441 4.6%
Less Discounts and Allowances (183,364,732) (136,400,000) (135,000,000) 1,400,000 ‐1.0%
Operations, Maintenance and Travel 731,635,094 1,048,422,888 1,031,407,395 (17,015,493) ‐1.6%
Less Capitalized Portion (86,235,094) (102,869,023) (86,235,094) 16,633,929 ‐16.2%
Depreciation and Amortization 338,000,000 323,420,000 338,000,000 14,580,000 4.5%
Total Operating Expenses 2,992,100,000 3,228,116,467 3,356,737,024 128,620,557 4.0%
Operating Surplus/Deficit (1,175,600,000) (1,314,047,042) (1,421,340,160) (107,293,118) 8.2%
Budgeted Nonoperating Revenues (Expenses):
State Appropriations 374,320,087 374,320,087 336,774,007 (37,546,080) ‐10.0%
Federal Sponsored Programs (Nonoperating) 45,000,000 45,000,000 45,000,000 ‐ 0.0%
State/Local Sponsored Programs (Nonoperating) 35,000,000 35,000,000 35,000,000 ‐ 0.0%
Gifts in Support of Operations 311,000,000 156,405,136 168,840,682 12,435,546 8.0%
Net Investment Income 294,600,000 251,047,893 282,139,107 31,091,214 12.4%
Other Non‐Operating Revenue ‐ ‐ ‐ ‐ ‐
Other Non‐Operating (Expenses) ‐ ‐ ‐ ‐ ‐
Net Non‐Operating Revenue/(Expenses) 1,059,920,087 861,773,116 867,753,796 5,980,680 0.7%
Transfers and Other:
AUF Transfers Received for Operations 463,071,965 424,027,000 417,087,000 (6,940,000) ‐1.6%
AUF Transfers (Made) for Operations ‐ ‐ ‐ ‐ ‐
Transfers for Debt Service ‐ Interest (72,081,338) (65,935,094) (63,017,000) 2,918,094 ‐4.4%
Total Transfers and Other 390,990,627 358,091,906 354,070,000 (4,021,906) ‐1.1%
Budget Margin (Deficit) 275,310,714 (94,182,020) (199,516,364) (105,334,344) 111.8%
Reconciliation to Change in Net Position:
Net Non‐Profit Health Corp Activity ‐ ‐ ‐ ‐ ‐
Net Inc./(Dec.) in Fair Value of Investments ‐ ‐ ‐ ‐ ‐
Interest Expense on Capital Asset Financings ‐ ‐ (21,000) (21,000) ‐
Capital Approp., Gifts and Sponsored Programs 66,000,000 63,000,000 100,000,000 37,000,000 58.7%
Additions to Permanent Endowments 56,700,000 110,000,000 58,400,000 (51,600,000) ‐46.9%
Transfers for Debt Service ‐ Principal (68,466,000) (61,739,000) (20,334,000) 41,405,000 ‐67.1%
Reverse Transfers for Debt Service (System Only) ‐ ‐ ‐ ‐ ‐
Transfers and Other 772,375,000 41,145,000 31,186,000 (9,959,000) ‐24.2%SRECNP Change in Net Position $ 1,101,919,714 58,223,980 (30,285,364) (88,509,344) ‐152.0%
Total Revenues and AUF Transfers $ 3,339,492,052 3,199,869,541 3,220,237,660 20,368,119 0.6%
Total Expenses (Including Transfers for Interest) (3,064,181,338) (3,294,051,561) (3,419,754,024) (125,702,463) 3.8%Budget Margin (Deficit) $ 275,310,714 (94,182,020) (199,516,364) (105,334,344)
Reconciliation to Use of Prior Year Balances
Depreciation 323,420,000 338,000,000
Capital Outlay (102,869,023) (86,235,094)
Transfers for Debt Service ‐ Principal (61,739,000) (20,334,000)
Budgeted Transfers (45,681,270) (41,726,957)
Net Additions to (Uses of) Prior Year Balances 18,948,687 (9,812,415)
Note: Operating Budget Highlights with a glossary of terms are included on Page 1.
U. T. System Office of Budget and Planning 27
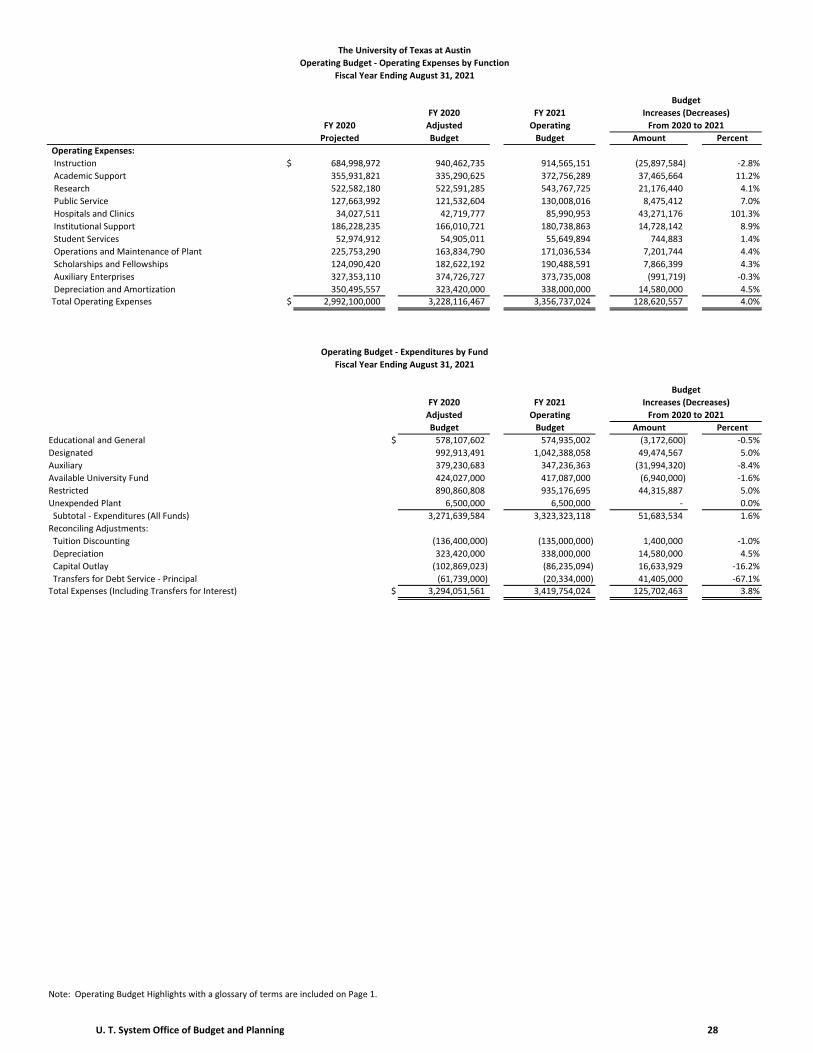
The University of Texas at Austin
Operating Budget ‐ Operating Expenses by Function
Fiscal Year Ending August 31, 2021
Budget
FY 2020 FY 2021 Increases (Decreases)
FY 2020 Adjusted Operating From 2020 to 2021
Projected Budget Budget Amount Percent
Operating Expenses:
Instruction $ 684,998,972 940,462,735 914,565,151 (25,897,584) ‐2.8%
Academic Support 355,931,821 335,290,625 372,756,289 37,465,664 11.2%
Research 522,582,180 522,591,285 543,767,725 21,176,440 4.1%
Public Service 127,663,992 121,532,604 130,008,016 8,475,412 7.0%
Hospitals and Clinics 34,027,511 42,719,777 85,990,953 43,271,176 101.3%
Institutional Support 186,228,235 166,010,721 180,738,863 14,728,142 8.9%
Student Services 52,974,912 54,905,011 55,649,894 744,883 1.4%
Operations and Maintenance of Plant 225,753,290 163,834,790 171,036,534 7,201,744 4.4%
Scholarships and Fellowships 124,090,420 182,622,192 190,488,591 7,866,399 4.3%
Auxiliary Enterprises 327,353,110 374,726,727 373,735,008 (991,719) ‐0.3%
Depreciation and Amortization 350,495,557 323,420,000 338,000,000 14,580,000 4.5%Total Operating Expenses $ 2,992,100,000 3,228,116,467 3,356,737,024 128,620,557 4.0%
Operating Budget ‐ Expenditures by Fund
Fiscal Year Ending August 31, 2021
Budget
FY 2020 FY 2021 Increases (Decreases)
Adjusted Operating From 2020 to 2021
Budget Budget Amount Percent
Educational and General $ 578,107,602 574,935,002 (3,172,600) ‐0.5%
Designated 992,913,491 1,042,388,058 49,474,567 5.0%
Auxiliary 379,230,683 347,236,363 (31,994,320) ‐8.4%
Available University Fund 424,027,000 417,087,000 (6,940,000) ‐1.6%
Restricted 890,860,808 935,176,695 44,315,887 5.0%
Unexpended Plant 6,500,000 6,500,000 ‐ 0.0%
Subtotal ‐ Expenditures (All Funds) 3,271,639,584 3,323,323,118 51,683,534 1.6%
Reconciling Adjustments:
Tuition Discounting (136,400,000) (135,000,000) 1,400,000 ‐1.0%
Depreciation 323,420,000 338,000,000 14,580,000 4.5%
Capital Outlay (102,869,023) (86,235,094) 16,633,929 ‐16.2%
Transfers for Debt Service ‐ Principal (61,739,000) (20,334,000) 41,405,000 ‐67.1%Total Expenses (Including Transfers for Interest) $ 3,294,051,561 3,419,754,024 125,702,463 3.8%
Note: Operating Budget Highlights with a glossary of terms are included on Page 1.
U. T. System Office of Budget and Planning 28
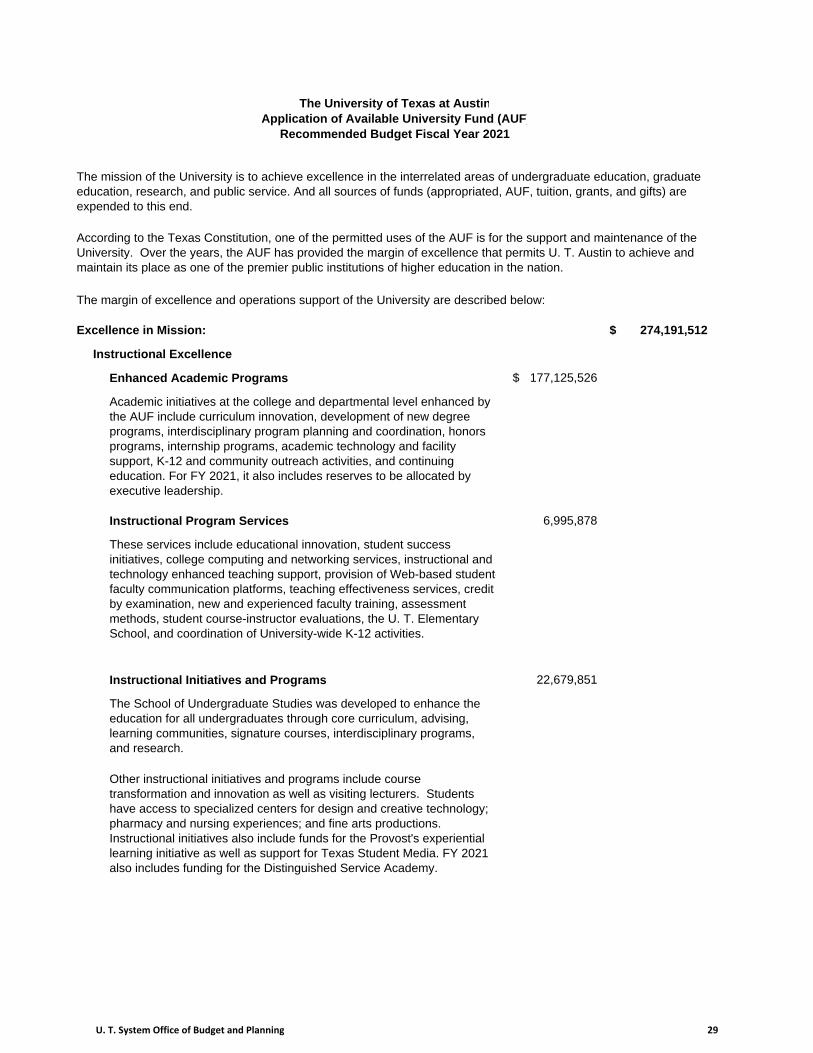
The University of Texas at AustinApplication of Available University Fund (AUF)
Recommended Budget Fiscal Year 2021
Excellence in Mission: 274,191,512$
Instructional Excellence
Enhanced Academic Programs 177,125,526$
Instructional Program Services 6,995,878
Instructional Initiatives and Programs 22,679,851
These services include educational innovation, student success initiatives, college computing and networking services, instructional and technology enhanced teaching support, provision of Web-based student-faculty communication platforms, teaching effectiveness services, credit by examination, new and experienced faculty training, assessment methods, student course-instructor evaluations, the U. T. Elementary School, and coordination of University-wide K-12 activities.
The School of Undergraduate Studies was developed to enhance the education for all undergraduates through core curriculum, advising, learning communities, signature courses, interdisciplinary programs, and research.
Other instructional initiatives and programs include course transformation and innovation as well as visiting lecturers. Students have access to specialized centers for design and creative technology; pharmacy and nursing experiences; and fine arts productions. Instructional initiatives also include funds for the Provost's experiential learning initiative as well as support for Texas Student Media. FY 2021 also includes funding for the Distinguished Service Academy.
The mission of the University is to achieve excellence in the interrelated areas of undergraduate education, graduate education, research, and public service. And all sources of funds (appropriated, AUF, tuition, grants, and gifts) are expended to this end.
According to the Texas Constitution, one of the permitted uses of the AUF is for the support and maintenance of the University. Over the years, the AUF has provided the margin of excellence that permits U. T. Austin to achieve and maintain its place as one of the premier public institutions of higher education in the nation.
The margin of excellence and operations support of the University are described below:
Academic initiatives at the college and departmental level enhanced by the AUF include curriculum innovation, development of new degree programs, interdisciplinary program planning and coordination, honors programs, internship programs, academic technology and facility support, K-12 and community outreach activities, and continuing education. For FY 2021, it also includes reserves to be allocated by executive leadership.
U. T. System Office of Budget and Planning 29
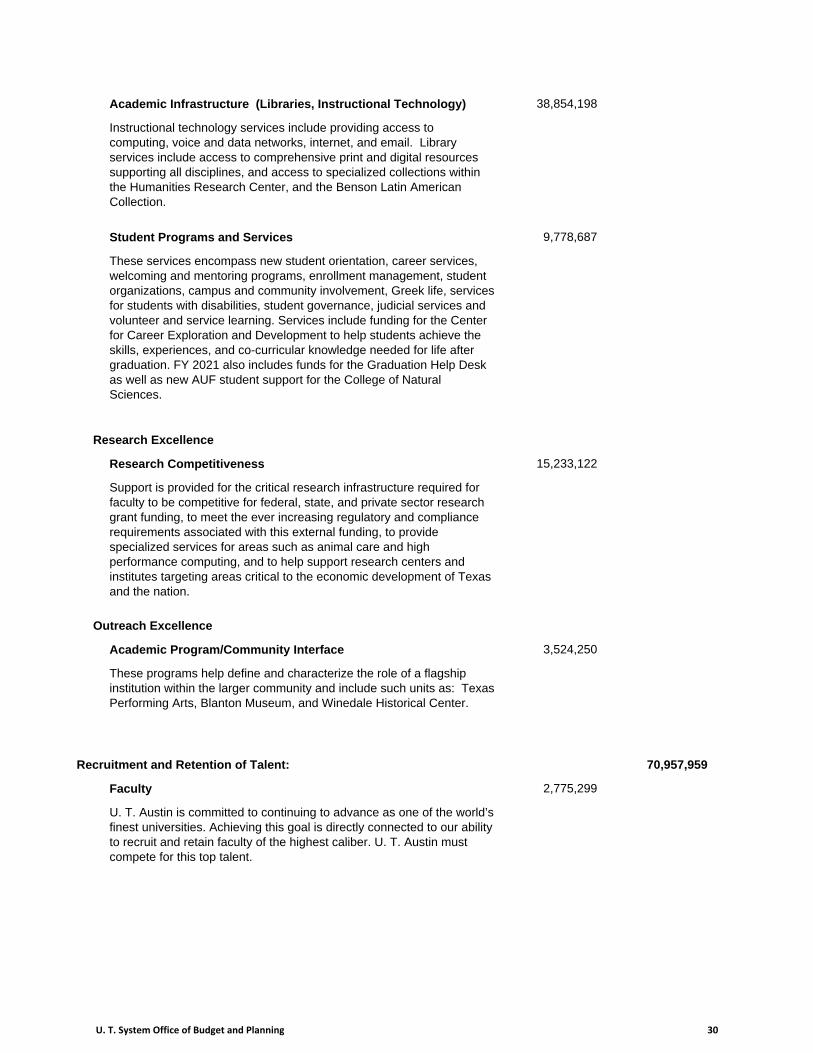
Academic Infrastructure (Libraries, Instructional Technology) 38,854,198
Student Programs and Services 9,778,687
Research Excellence
Research Competitiveness 15,233,122
Outreach Excellence
Academic Program/Community Interface 3,524,250
Recruitment and Retention of Talent: 70,957,959
Faculty 2,775,299
Support is provided for the critical research infrastructure required for faculty to be competitive for federal, state, and private sector research grant funding, to meet the ever increasing regulatory and compliance requirements associated with this external funding, to provide specialized services for areas such as animal care and high performance computing, and to help support research centers and institutes targeting areas critical to the economic development of Texas and the nation.
These programs help define and characterize the role of a flagship institution within the larger community and include such units as: Texas Performing Arts, Blanton Museum, and Winedale Historical Center.
U. T. Austin is committed to continuing to advance as one of the world’s finest universities. Achieving this goal is directly connected to our ability to recruit and retain faculty of the highest caliber. U. T. Austin must compete for this top talent.
Instructional technology services include providing access to computing, voice and data networks, internet, and email. Library services include access to comprehensive print and digital resources supporting all disciplines, and access to specialized collections within the Humanities Research Center, and the Benson Latin American Collection.
These services encompass new student orientation, career services, welcoming and mentoring programs, enrollment management, student organizations, campus and community involvement, Greek life, services for students with disabilities, student governance, judicial services and volunteer and service learning. Services include funding for the Center for Career Exploration and Development to help students achieve the skills, experiences, and co-curricular knowledge needed for life after graduation. FY 2021 also includes funds for the Graduation Help Desk as well as new AUF student support for the College of Natural Sciences.
U. T. System Office of Budget and Planning 30
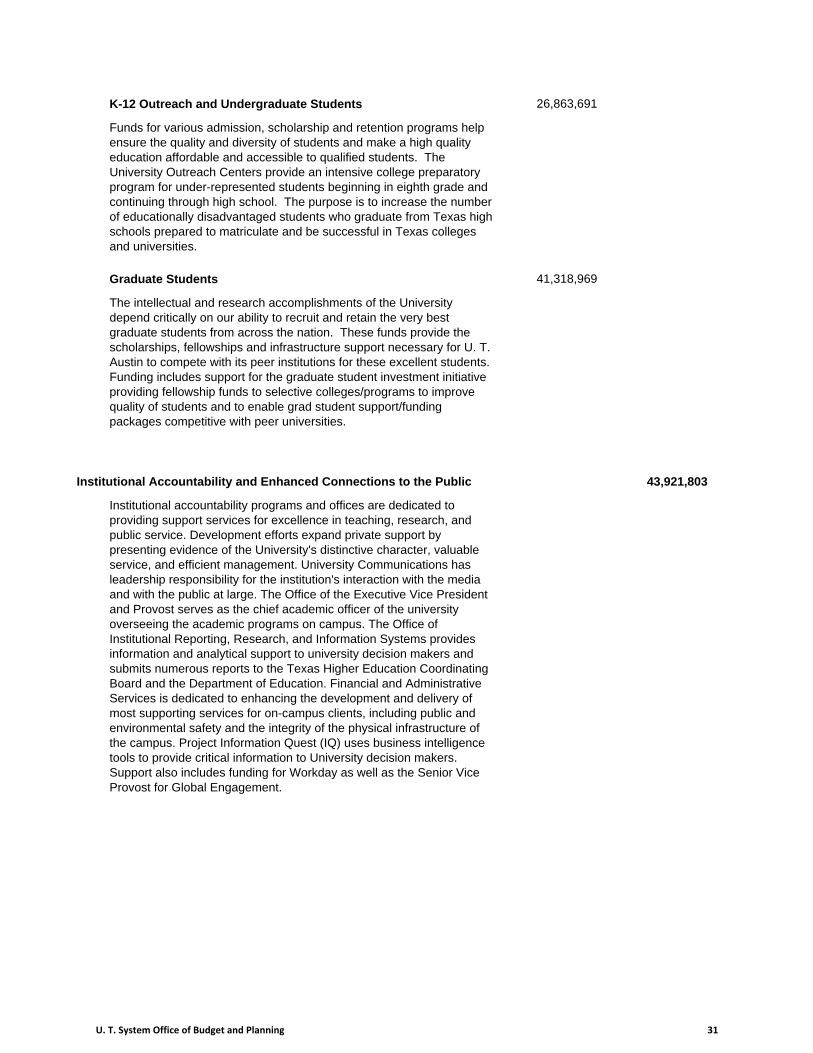
K-12 Outreach and Undergraduate Students 26,863,691
Graduate Students 41,318,969
Institutional Accountability and Enhanced Connections to the Public 43,921,803
Funds for various admission, scholarship and retention programs help ensure the quality and diversity of students and make a high quality education affordable and accessible to qualified students. The University Outreach Centers provide an intensive college preparatory program for under-represented students beginning in eighth grade and continuing through high school. The purpose is to increase the number of educationally disadvantaged students who graduate from Texas high schools prepared to matriculate and be successful in Texas colleges and universities.
The intellectual and research accomplishments of the University depend critically on our ability to recruit and retain the very best graduate students from across the nation. These funds provide the scholarships, fellowships and infrastructure support necessary for U. T. Austin to compete with its peer institutions for these excellent students. Funding includes support for the graduate student investment initiative providing fellowship funds to selective colleges/programs to improve quality of students and to enable grad student support/funding packages competitive with peer universities.
Institutional accountability programs and offices are dedicated to providing support services for excellence in teaching, research, and public service. Development efforts expand private support by presenting evidence of the University's distinctive character, valuable service, and efficient management. University Communications has leadership responsibility for the institution's interaction with the media and with the public at large. The Office of the Executive Vice President and Provost serves as the chief academic officer of the university overseeing the academic programs on campus. The Office of Institutional Reporting, Research, and Information Systems provides information and analytical support to university decision makers and submits numerous reports to the Texas Higher Education Coordinating Board and the Department of Education. Financial and Administrative Services is dedicated to enhancing the development and delivery of most supporting services for on-campus clients, including public and environmental safety and the integrity of the physical infrastructure of the campus. Project Information Quest (IQ) uses business intelligence tools to provide critical information to University decision makers. Support also includes funding for Workday as well as the Senior Vice Provost for Global Engagement.
U. T. System Office of Budget and Planning 31
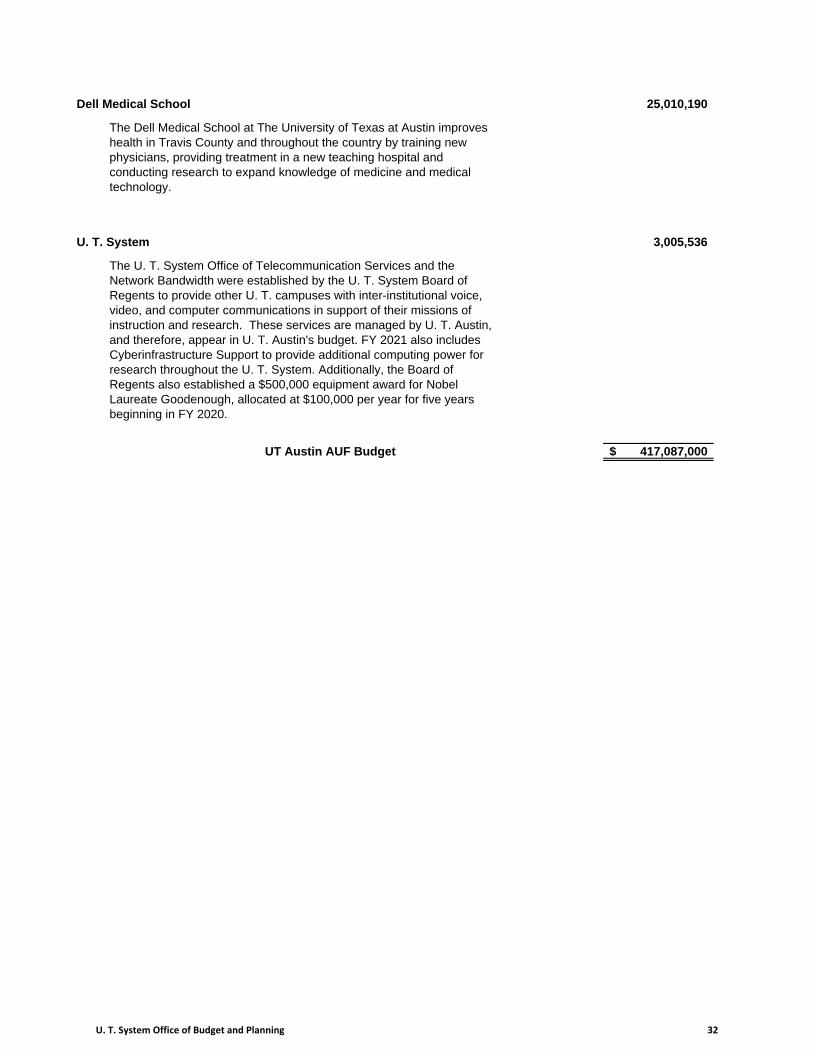
Dell Medical School 25,010,190
U. T. System 3,005,536
UT Austin AUF Budget 417,087,000$
The Dell Medical School at The University of Texas at Austin improves health in Travis County and throughout the country by training new physicians, providing treatment in a new teaching hospital and conducting research to expand knowledge of medicine and medical technology.
The U. T. System Office of Telecommunication Services and the Network Bandwidth were established by the U. T. System Board of Regents to provide other U. T. campuses with inter-institutional voice, video, and computer communications in support of their missions of instruction and research. These services are managed by U. T. Austin, and therefore, appear in U. T. Austin's budget. FY 2021 also includes Cyberinfrastructure Support to provide additional computing power for research throughout the U. T. System. Additionally, the Board of Regents also established a $500,000 equipment award for Nobel Laureate Goodenough, allocated at $100,000 per year for five years beginning in FY 2020.
U. T. System Office of Budget and Planning 32
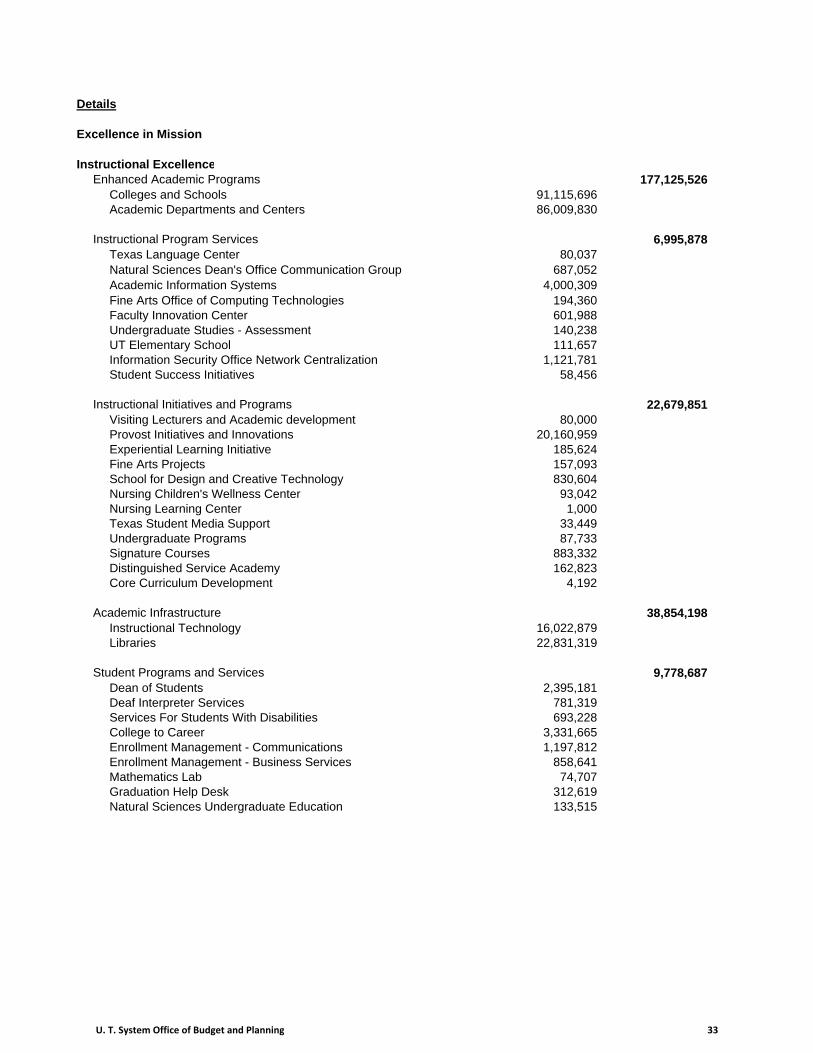
Details
Excellence in Mission
Instructional ExcellenceEnhanced Academic Programs 177,125,526
Colleges and Schools 91,115,696 Academic Departments and Centers 86,009,830
Instructional Program Services 6,995,878 Texas Language Center 80,037 Natural Sciences Dean's Office Communication Group 687,052 Academic Information Systems 4,000,309 Fine Arts Office of Computing Technologies 194,360 Faculty Innovation Center 601,988 Undergraduate Studies - Assessment 140,238 UT Elementary School 111,657 Information Security Office Network Centralization 1,121,781 Student Success Initiatives 58,456
Instructional Initiatives and Programs 22,679,851 Visiting Lecturers and Academic development 80,000 Provost Initiatives and Innovations 20,160,959 Experiential Learning Initiative 185,624 Fine Arts Projects 157,093 School for Design and Creative Technology 830,604 Nursing Children's Wellness Center 93,042 Nursing Learning Center 1,000 Texas Student Media Support 33,449 Undergraduate Programs 87,733 Signature Courses 883,332 Distinguished Service Academy 162,823 Core Curriculum Development 4,192
Academic Infrastructure 38,854,198 Instructional Technology 16,022,879 Libraries 22,831,319
Student Programs and Services 9,778,687 2,395,181
781,319 Services For Students With Disabilities 693,228 College to Career 3,331,665 Enrollment Management - Communications 1,197,812 Enrollment Management - Business Services 858,641
74,707 312,619 133,515 Natural Sciences Undergraduate Education
Dean of StudentsDeaf Interpreter Services
Mathematics LabGraduation Help Desk
U. T. System Office of Budget and Planning 33
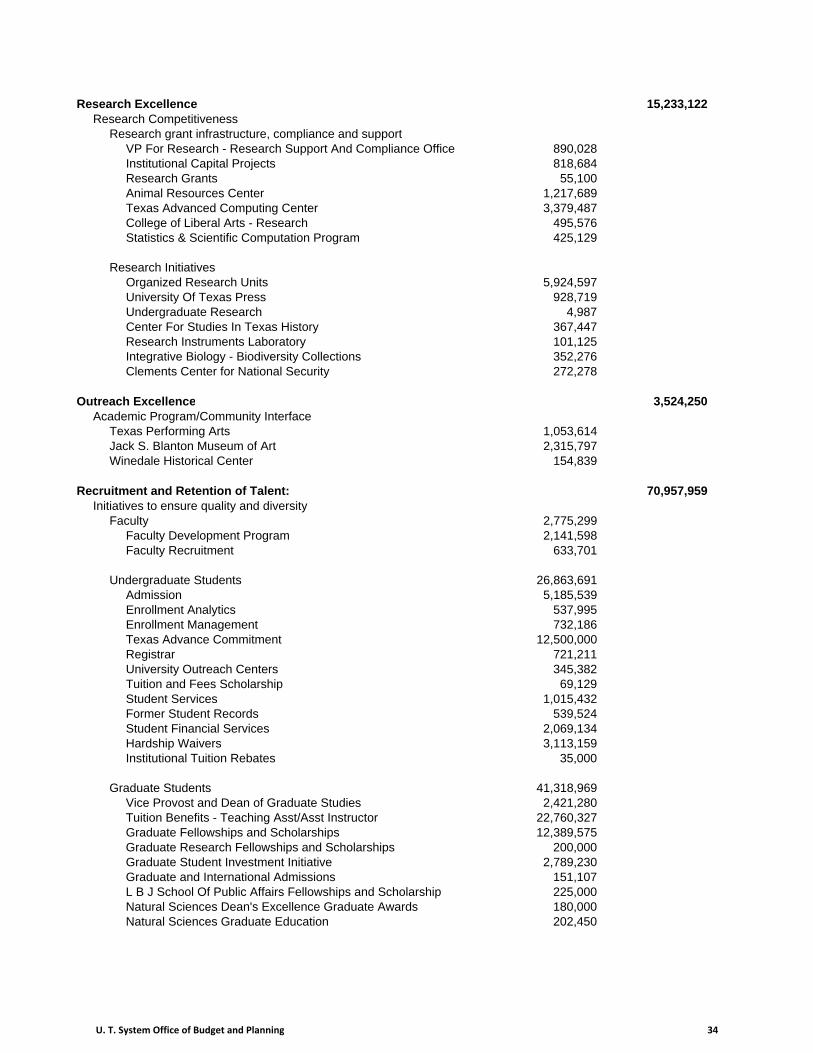
Research Excellence 15,233,122 Research Competitiveness
Research grant infrastructure, compliance and supportVP For Research - Research Support And Compliance Office 890,028 Institutional Capital Projects 818,684 Research Grants 55,100 Animal Resources Center 1,217,689 Texas Advanced Computing Center 3,379,487 College of Liberal Arts - Research 495,576 Statistics & Scientific Computation Program 425,129
Research InitiativesOrganized Research Units 5,924,597 University Of Texas Press 928,719 Undergraduate Research 4,987 Center For Studies In Texas History 367,447 Research Instruments Laboratory 101,125 Integrative Biology - Biodiversity Collections 352,276Clements Center for National Security 272,278
Outreach Excellence 3,524,250 Academic Program/Community Interface
Texas Performing Arts 1,053,614 Jack S. Blanton Museum of Art 2,315,797 Winedale Historical Center 154,839
Recruitment and Retention of Talent: 70,957,959 Initiatives to ensure quality and diversity
Faculty 2,775,299 Faculty Development Program 2,141,598 Faculty Recruitment 633,701
Undergraduate Students 26,863,691 Admission 5,185,539 Enrollment Analytics 537,995 Enrollment Management 732,186 Texas Advance Commitment 12,500,000 Registrar 721,211 University Outreach Centers 345,382 Tuition and Fees Scholarship 69,129 Student Services 1,015,432 Former Student Records 539,524 Student Financial Services 2,069,134 Hardship Waivers 3,113,159 Institutional Tuition Rebates 35,000
Graduate Students 41,318,969 Vice Provost and Dean of Graduate Studies 2,421,280 Tuition Benefits - Teaching Asst/Asst Instructor 22,760,327 Graduate Fellowships and Scholarships 12,389,575 Graduate Research Fellowships and Scholarships 200,000 Graduate Student Investment Initiative 2,789,230 Graduate and International Admissions 151,107 L B J School Of Public Affairs Fellowships and Scholarship 225,000 Natural Sciences Dean's Excellence Graduate Awards 180,000 Natural Sciences Graduate Education 202,450
U. T. System Office of Budget and Planning 34
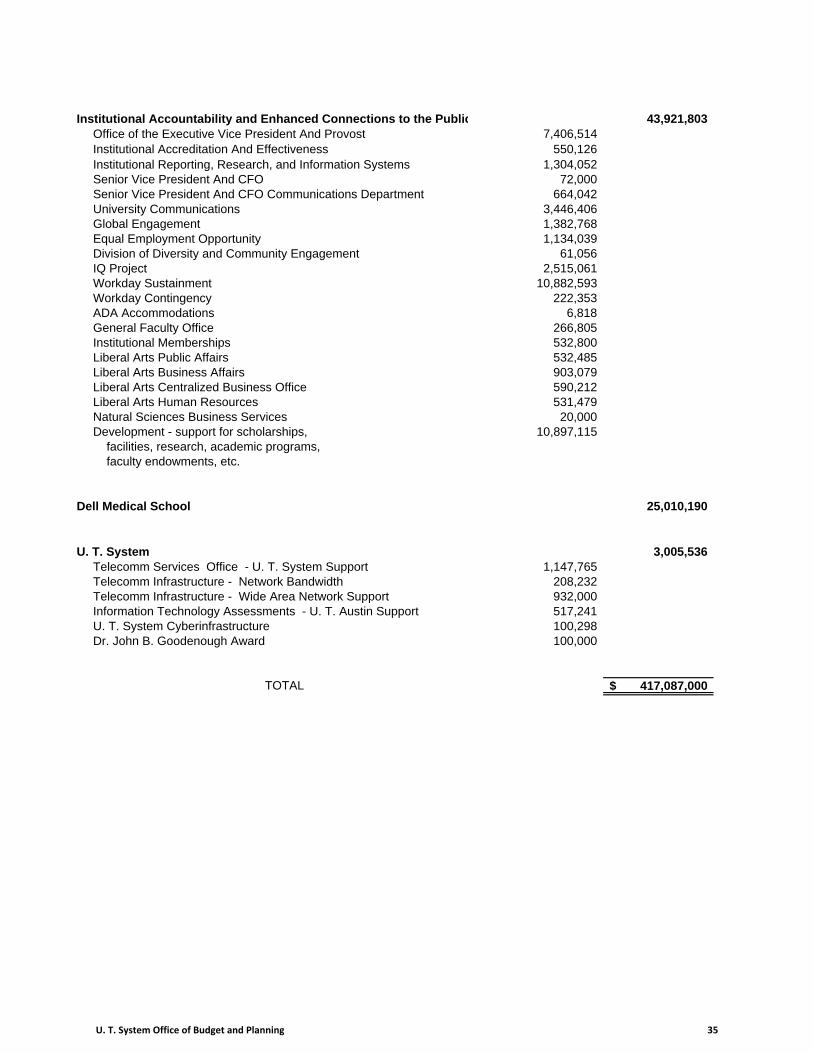
Institutional Accountability and Enhanced Connections to the Public 43,921,803 7,406,514
Institutional Accreditation And Effectiveness 550,126 1,304,052
Senior Vice President And CFO 72,000 Senior Vice President And CFO Communications Department 664,042
3,446,406 Global Engagement 1,382,768
1,134,039 61,056
2,515,061 Workday Sustainment 10,882,593 Workday Contingency 222,353 ADA Accommodations 6,818
266,805 532,800 532,485 903,079 590,212
Liberal Arts Human Resources 531,479Natural Sciences Business Services 20,000
10,897,115
Dell Medical School 25,010,190
U. T. System 3,005,536 1,147,765
208,232 Telecomm Infrastructure - Wide Area Network Support 932,000
517,241 U. T. System Cyberinfrastructure 100,298 Dr. John B. Goodenough Award 100,000
TOTAL 417,087,000$
facilities, research, academic programs, faculty endowments, etc.
Telecomm Services Office - U. T. System SupportTelecomm Infrastructure - Network Bandwidth
Information Technology Assessments - U. T. Austin Support
Development - support for scholarships,
Office of the Executive Vice President And Provost
Institutional Reporting, Research, and Information Systems
University Communications
Equal Employment OpportunityDivision of Diversity and Community EngagementIQ Project
General Faculty OfficeInstitutional MembershipsLiberal Arts Public AffairsLiberal Arts Business AffairsLiberal Arts Centralized Business Office
U. T. System Office of Budget and Planning 35

U. T. System Office of Budget and Planning 36
THE UNIVERSITY OF TEXAS
AT DALLAS
U. T. System Office of Budget and Planning 37
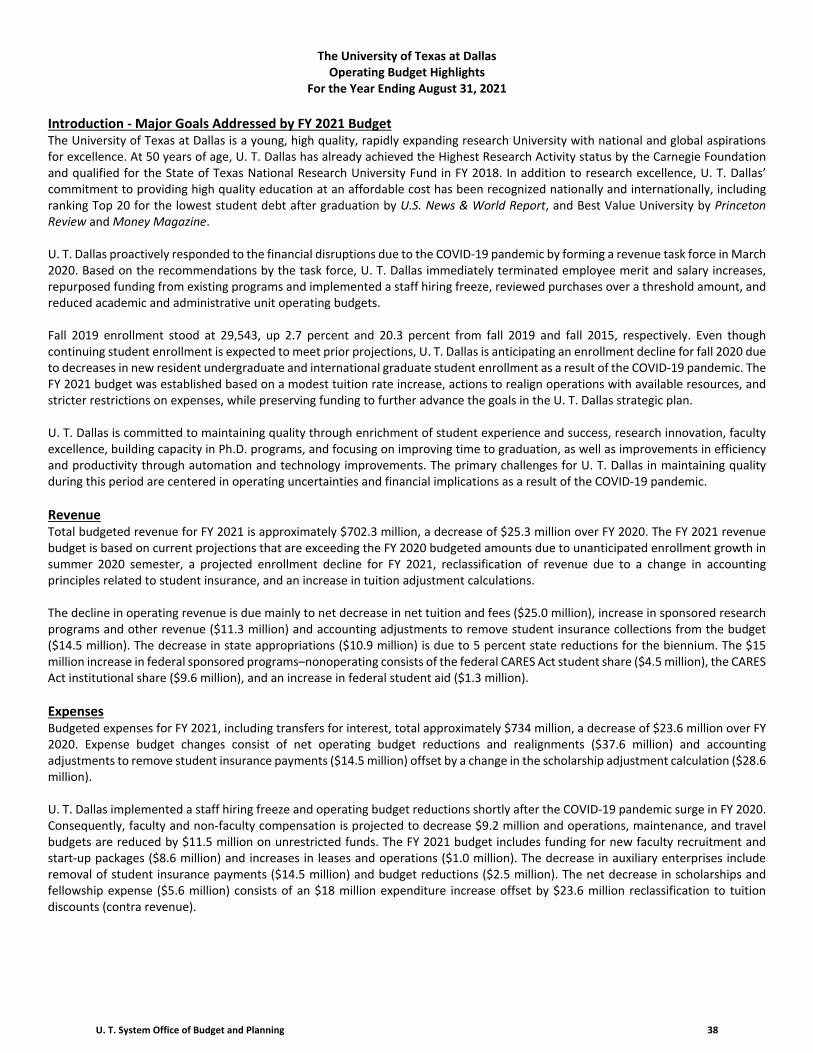
The University of Texas at Dallas Operating Budget Highlights
For the Year Ending August 31, 2021 Introduction - Major Goals Addressed by FY 2021 Budget The University of Texas at Dallas is a young, high quality, rapidly expanding research University with national and global aspirations for excellence. At 50 years of age, U. T. Dallas has already achieved the Highest Research Activity status by the Carnegie Foundation and qualified for the State of Texas National Research University Fund in FY 2018. In addition to research excellence, U. T. Dallas’ commitment to providing high quality education at an affordable cost has been recognized nationally and internationally, including ranking Top 20 for the lowest student debt after graduation by U.S. News & World Report, and Best Value University by Princeton Review and Money Magazine. U. T. Dallas proactively responded to the financial disruptions due to the COVID-19 pandemic by forming a revenue task force in March 2020. Based on the recommendations by the task force, U. T. Dallas immediately terminated employee merit and salary increases, repurposed funding from existing programs and implemented a staff hiring freeze, reviewed purchases over a threshold amount, and reduced academic and administrative unit operating budgets. Fall 2019 enrollment stood at 29,543, up 2.7 percent and 20.3 percent from fall 2019 and fall 2015, respectively. Even though continuing student enrollment is expected to meet prior projections, U. T. Dallas is anticipating an enrollment decline for fall 2020 due to decreases in new resident undergraduate and international graduate student enrollment as a result of the COVID-19 pandemic. The FY 2021 budget was established based on a modest tuition rate increase, actions to realign operations with available resources, and stricter restrictions on expenses, while preserving funding to further advance the goals in the U. T. Dallas strategic plan. U. T. Dallas is committed to maintaining quality through enrichment of student experience and success, research innovation, faculty excellence, building capacity in Ph.D. programs, and focusing on improving time to graduation, as well as improvements in efficiency and productivity through automation and technology improvements. The primary challenges for U. T. Dallas in maintaining quality during this period are centered in operating uncertainties and financial implications as a result of the COVID-19 pandemic. Revenue Total budgeted revenue for FY 2021 is approximately $702.3 million, a decrease of $25.3 million over FY 2020. The FY 2021 revenue budget is based on current projections that are exceeding the FY 2020 budgeted amounts due to unanticipated enrollment growth in summer 2020 semester, a projected enrollment decline for FY 2021, reclassification of revenue due to a change in accounting principles related to student insurance, and an increase in tuition adjustment calculations. The decline in operating revenue is due mainly to net decrease in net tuition and fees ($25.0 million), increase in sponsored research programs and other revenue ($11.3 million) and accounting adjustments to remove student insurance collections from the budget ($14.5 million). The decrease in state appropriations ($10.9 million) is due to 5 percent state reductions for the biennium. The $15 million increase in federal sponsored programs–nonoperating consists of the federal CARES Act student share ($4.5 million), the CARES Act institutional share ($9.6 million), and an increase in federal student aid ($1.3 million). Expenses Budgeted expenses for FY 2021, including transfers for interest, total approximately $734 million, a decrease of $23.6 million over FY 2020. Expense budget changes consist of net operating budget reductions and realignments ($37.6 million) and accounting adjustments to remove student insurance payments ($14.5 million) offset by a change in the scholarship adjustment calculation ($28.6 million). U. T. Dallas implemented a staff hiring freeze and operating budget reductions shortly after the COVID-19 pandemic surge in FY 2020. Consequently, faculty and non-faculty compensation is projected to decrease $9.2 million and operations, maintenance, and travel budgets are reduced by $11.5 million on unrestricted funds. The FY 2021 budget includes funding for new faculty recruitment and start-up packages ($8.6 million) and increases in leases and operations ($1.0 million). The decrease in auxiliary enterprises include removal of student insurance payments ($14.5 million) and budget reductions ($2.5 million). The net decrease in scholarships and fellowship expense ($5.6 million) consists of an $18 million expenditure increase offset by $23.6 million reclassification to tuition discounts (contra revenue).
U. T. System Office of Budget and Planning 38
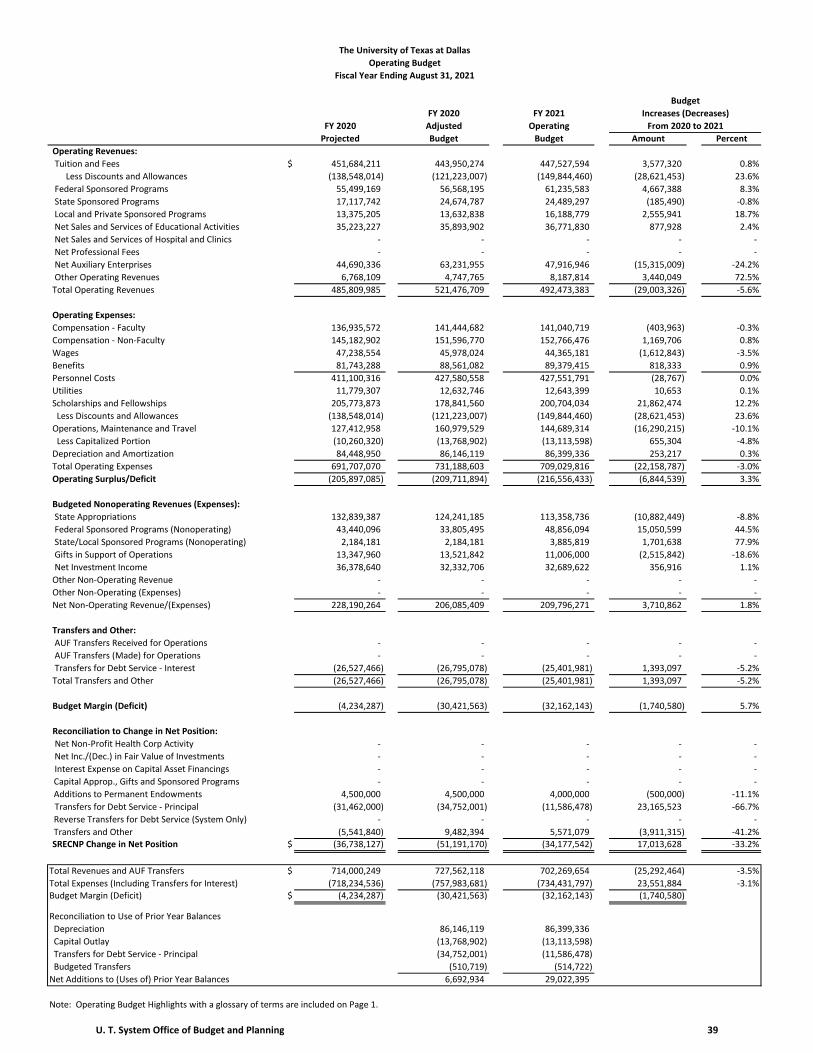
The University of Texas at Dallas
Operating Budget
Fiscal Year Ending August 31, 2021
Budget
FY 2020 FY 2021 Increases (Decreases)
FY 2020 Adjusted Operating From 2020 to 2021
Projected Budget Budget Amount Percent
Operating Revenues:
Tuition and Fees $ 451,684,211 443,950,274 447,527,594 3,577,320 0.8%
Less Discounts and Allowances (138,548,014) (121,223,007) (149,844,460) (28,621,453) 23.6%
Federal Sponsored Programs 55,499,169 56,568,195 61,235,583 4,667,388 8.3%
State Sponsored Programs 17,117,742 24,674,787 24,489,297 (185,490) ‐0.8%
Local and Private Sponsored Programs 13,375,205 13,632,838 16,188,779 2,555,941 18.7%
Net Sales and Services of Educational Activities 35,223,227 35,893,902 36,771,830 877,928 2.4%
Net Sales and Services of Hospital and Clinics ‐ ‐ ‐ ‐ ‐
Net Professional Fees ‐ ‐ ‐ ‐ ‐
Net Auxiliary Enterprises 44,690,336 63,231,955 47,916,946 (15,315,009) ‐24.2%
Other Operating Revenues 6,768,109 4,747,765 8,187,814 3,440,049 72.5%
Total Operating Revenues 485,809,985 521,476,709 492,473,383 (29,003,326) ‐5.6%
Operating Expenses:
Compensation ‐ Faculty 136,935,572 141,444,682 141,040,719 (403,963) ‐0.3%
Compensation ‐ Non‐Faculty 145,182,902 151,596,770 152,766,476 1,169,706 0.8%
Wages 47,238,554 45,978,024 44,365,181 (1,612,843) ‐3.5%
Benefits 81,743,288 88,561,082 89,379,415 818,333 0.9%
Personnel Costs 411,100,316 427,580,558 427,551,791 (28,767) 0.0%
Utilities 11,779,307 12,632,746 12,643,399 10,653 0.1%
Scholarships and Fellowships 205,773,873 178,841,560 200,704,034 21,862,474 12.2%
Less Discounts and Allowances (138,548,014) (121,223,007) (149,844,460) (28,621,453) 23.6%
Operations, Maintenance and Travel 127,412,958 160,979,529 144,689,314 (16,290,215) ‐10.1%
Less Capitalized Portion (10,260,320) (13,768,902) (13,113,598) 655,304 ‐4.8%
Depreciation and Amortization 84,448,950 86,146,119 86,399,336 253,217 0.3%
Total Operating Expenses 691,707,070 731,188,603 709,029,816 (22,158,787) ‐3.0%
Operating Surplus/Deficit (205,897,085) (209,711,894) (216,556,433) (6,844,539) 3.3%
Budgeted Nonoperating Revenues (Expenses):
State Appropriations 132,839,387 124,241,185 113,358,736 (10,882,449) ‐8.8%
Federal Sponsored Programs (Nonoperating) 43,440,096 33,805,495 48,856,094 15,050,599 44.5%
State/Local Sponsored Programs (Nonoperating) 2,184,181 2,184,181 3,885,819 1,701,638 77.9%
Gifts in Support of Operations 13,347,960 13,521,842 11,006,000 (2,515,842) ‐18.6%
Net Investment Income 36,378,640 32,332,706 32,689,622 356,916 1.1%
Other Non‐Operating Revenue ‐ ‐ ‐ ‐ ‐
Other Non‐Operating (Expenses) ‐ ‐ ‐ ‐ ‐
Net Non‐Operating Revenue/(Expenses) 228,190,264 206,085,409 209,796,271 3,710,862 1.8%
Transfers and Other:
AUF Transfers Received for Operations ‐ ‐ ‐ ‐ ‐
AUF Transfers (Made) for Operations ‐ ‐ ‐ ‐ ‐
Transfers for Debt Service ‐ Interest (26,527,466) (26,795,078) (25,401,981) 1,393,097 ‐5.2%
Total Transfers and Other (26,527,466) (26,795,078) (25,401,981) 1,393,097 ‐5.2%
Budget Margin (Deficit) (4,234,287) (30,421,563) (32,162,143) (1,740,580) 5.7%
Reconciliation to Change in Net Position:
Net Non‐Profit Health Corp Activity ‐ ‐ ‐ ‐ ‐
Net Inc./(Dec.) in Fair Value of Investments ‐ ‐ ‐ ‐ ‐
Interest Expense on Capital Asset Financings ‐ ‐ ‐ ‐ ‐
Capital Approp., Gifts and Sponsored Programs ‐ ‐ ‐ ‐ ‐
Additions to Permanent Endowments 4,500,000 4,500,000 4,000,000 (500,000) ‐11.1%
Transfers for Debt Service ‐ Principal (31,462,000) (34,752,001) (11,586,478) 23,165,523 ‐66.7%
Reverse Transfers for Debt Service (System Only) ‐ ‐ ‐ ‐ ‐
Transfers and Other (5,541,840) 9,482,394 5,571,079 (3,911,315) ‐41.2%SRECNP Change in Net Position $ (36,738,127) (51,191,170) (34,177,542) 17,013,628 ‐33.2%
Total Revenues and AUF Transfers $ 714,000,249 727,562,118 702,269,654 (25,292,464) ‐3.5%
Total Expenses (Including Transfers for Interest) (718,234,536) (757,983,681) (734,431,797) 23,551,884 ‐3.1%Budget Margin (Deficit) $ (4,234,287) (30,421,563) (32,162,143) (1,740,580)
Reconciliation to Use of Prior Year Balances
Depreciation 86,146,119 86,399,336
Capital Outlay (13,768,902) (13,113,598)
Transfers for Debt Service ‐ Principal (34,752,001) (11,586,478)
Budgeted Transfers (510,719) (514,722)
Net Additions to (Uses of) Prior Year Balances 6,692,934 29,022,395
Note: Operating Budget Highlights with a glossary of terms are included on Page 1.
U. T. System Office of Budget and Planning 39
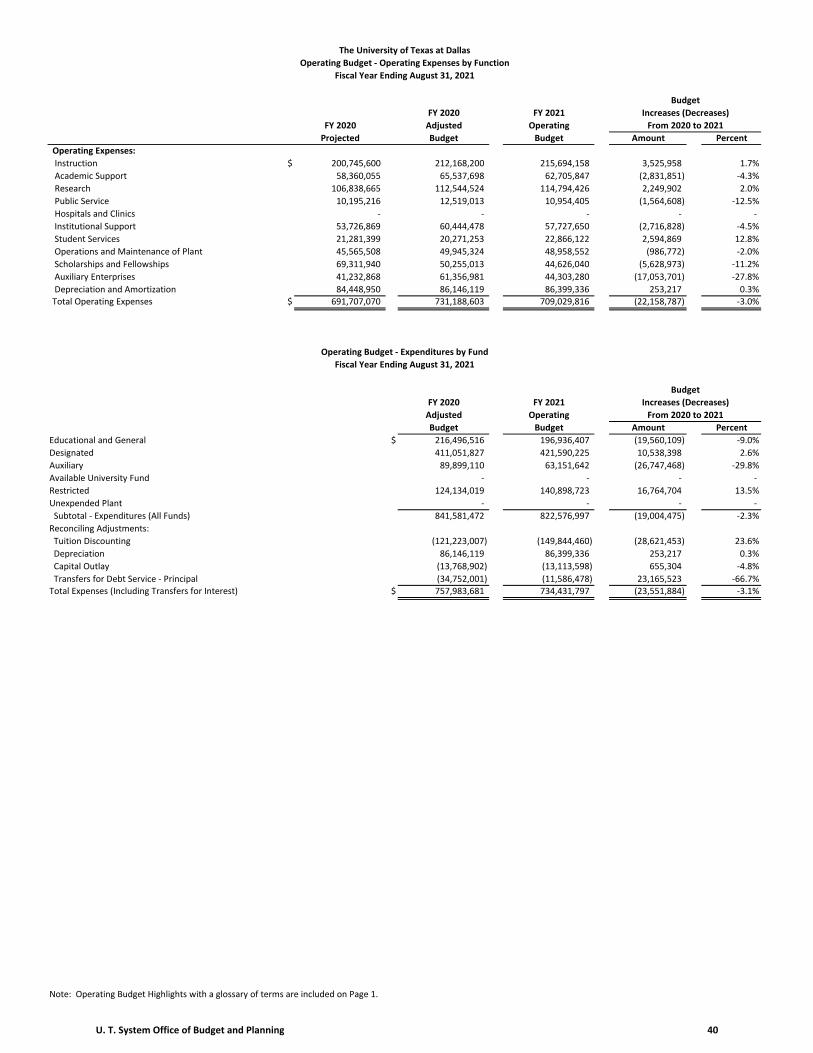
The University of Texas at Dallas
Operating Budget ‐ Operating Expenses by Function
Fiscal Year Ending August 31, 2021
Budget
FY 2020 FY 2021 Increases (Decreases)
FY 2020 Adjusted Operating From 2020 to 2021
Projected Budget Budget Amount Percent
Operating Expenses:
Instruction $ 200,745,600 212,168,200 215,694,158 3,525,958 1.7%
Academic Support 58,360,055 65,537,698 62,705,847 (2,831,851) ‐4.3%
Research 106,838,665 112,544,524 114,794,426 2,249,902 2.0%
Public Service 10,195,216 12,519,013 10,954,405 (1,564,608) ‐12.5%
Hospitals and Clinics ‐ ‐ ‐ ‐ ‐
Institutional Support 53,726,869 60,444,478 57,727,650 (2,716,828) ‐4.5%
Student Services 21,281,399 20,271,253 22,866,122 2,594,869 12.8%
Operations and Maintenance of Plant 45,565,508 49,945,324 48,958,552 (986,772) ‐2.0%
Scholarships and Fellowships 69,311,940 50,255,013 44,626,040 (5,628,973) ‐11.2%
Auxiliary Enterprises 41,232,868 61,356,981 44,303,280 (17,053,701) ‐27.8%
Depreciation and Amortization 84,448,950 86,146,119 86,399,336 253,217 0.3%Total Operating Expenses $ 691,707,070 731,188,603 709,029,816 (22,158,787) ‐3.0%
Operating Budget ‐ Expenditures by Fund
Fiscal Year Ending August 31, 2021
Budget
FY 2020 FY 2021 Increases (Decreases)
Adjusted Operating From 2020 to 2021
Budget Budget Amount Percent
Educational and General $ 216,496,516 196,936,407 (19,560,109) ‐9.0%
Designated 411,051,827 421,590,225 10,538,398 2.6%
Auxiliary 89,899,110 63,151,642 (26,747,468) ‐29.8%
Available University Fund ‐ ‐ ‐ ‐
Restricted 124,134,019 140,898,723 16,764,704 13.5%
Unexpended Plant ‐ ‐ ‐ ‐
Subtotal ‐ Expenditures (All Funds) 841,581,472 822,576,997 (19,004,475) ‐2.3%
Reconciling Adjustments:
Tuition Discounting (121,223,007) (149,844,460) (28,621,453) 23.6%
Depreciation 86,146,119 86,399,336 253,217 0.3%
Capital Outlay (13,768,902) (13,113,598) 655,304 ‐4.8%
Transfers for Debt Service ‐ Principal (34,752,001) (11,586,478) 23,165,523 ‐66.7%Total Expenses (Including Transfers for Interest) $ 757,983,681 734,431,797 (23,551,884) ‐3.1%
Note: Operating Budget Highlights with a glossary of terms are included on Page 1.
U. T. System Office of Budget and Planning 40

THE UNIVERSITY OF TEXAS
AT EL PASO
U. T. System Office of Budget and Planning 41
The University of Texas at El Paso Operating Budget Highlights
For the Year Ending August 31, 2021 Introduction - Major Goals Addressed by FY 2021 Budget The University of Texas at El Paso is a comprehensive public research university that is increasing access to excellent higher education. The University advances discovery of public value and positively impact the health, culture, education, and economy of the community they serve. U. T. El Paso is a national model for Hispanic-serving institutions. Having grown every year for the past 21 years and topped $100 million in research in 2019, U. T. El Paso has over 25,000 students and is ranked in the top 5 percent of research universities in the country. The University has also been recognized as a Carnegie Community Engaged Institution. U. T. El Paso is currently faced with a reduction of $7.5 million in general revenue appropriations for FY 2021. While challenged with this reduction, the FY 2021 operating budget focuses on minimizing the impact of the reductions on teaching, research, and service, while still supporting cost-effective innovations. To meet the $7.5 million reduction target, the University has put in place a flexible hiring freeze and eliminated about 45 positions. While the reduction will have an impact, reductions in costs have been sought in ways that minimize the impact on the mission. The University has slowed other operating expenditures that will continue through FY 2021 as a result of the COVID-19 pandemic. The FY 2021 operating budget maintains and enhances investments in faculty competitiveness, retention, and research. The University remains invested in developing new programs in order to contribute to the region’s economy, increase student success, and expand research of public value that solidifies and builds upon the University’s status as an R1 research university. Revenue Projected revenues for FY 2021 are $471 million, which reflect the full 5 percent biennial state reduction of $7.5 million. Gross tuition and fee revenue increased by $3.4 million resulting from the 2.6 percent tuition rate increase approved by the Board of Regents. The increase in non-operating Federal Sponsored Programs is related to a $1.6 million increase in federal financial aid programs. State sponsored programs are projected to decline by $5 million, due primarily to the reduction in TEXAS Grants appropriations. Net auxiliary enterprise revenue is expected to decrease in the amount of $4.6 million as a direct result of the COVID-19 pandemic. Gifts and investment income are expected to decrease by a combined $1.8 million. Expenses The FY 2021 operating budget projects a reduction of expenses by 1.6 percent to $484.9 million. Auxiliary enterprise expenses reflect a decrease of $2.1 million, largely attributed to the reduction of parking permits, housing rentals, and meal plans. U. T. El Paso has set aside $675,000 for new faculty positions, an increase of $250,000 to cover the benefit costs for Student Health Insurance Premiums, as well as an increase in operating expenditures related to the opening of the new Interdisciplinary Research Building, to include debt service, utilities and maintenance, and repair. A total of $233,000 has been set aside to start new Psychiatric and Neonatal Nurse Practitioner programs, as well as $110,000 for additional coordinators to assist with teacher training partnerships. Restricted funds expenditures are expected to remain relatively flat, with an increase of approximately $1.6 million in federal financial aid.
U. T. System Office of Budget and Planning 42

The University of Texas at El Paso
Operating Budget
Fiscal Year Ending August 31, 2021
Budget
FY 2020 FY 2021 Increases (Decreases)
FY 2020 Adjusted Operating From 2020 to 2021
Projected Budget Budget Amount Percent
Operating Revenues:
Tuition and Fees $ 203,126,313 202,480,432 205,976,686 3,496,254 1.7%
Less Discounts and Allowances (56,875,367) (55,794,724) (58,703,356) (2,908,632) 5.2%
Federal Sponsored Programs 53,202,717 52,327,057 51,629,124 (697,933) ‐1.3%
State Sponsored Programs 25,463,800 30,702,200 25,690,526 (5,011,674) ‐16.3%
Local and Private Sponsored Programs 8,837,951 7,305,737 8,479,848 1,174,111 16.1%
Net Sales and Services of Educational Activities 5,487,568 6,026,125 6,384,561 358,436 5.9%
Net Sales and Services of Hospital and Clinics ‐ ‐ ‐ ‐ ‐
Net Professional Fees ‐ ‐ ‐ ‐ ‐
Net Auxiliary Enterprises 33,556,819 44,404,738 37,744,461 (6,660,277) ‐15.0%
Other Operating Revenues 140,000 60,000 20,000 (40,000) ‐66.7%
Total Operating Revenues 272,939,801 287,511,565 277,221,850 (10,289,715) ‐3.6%
Operating Expenses:
Compensation ‐ Faculty 96,723,263 96,579,738 95,234,037 (1,345,701) ‐1.4%
Compensation ‐ Non‐Faculty 91,589,331 104,806,745 100,787,674 (4,019,071) ‐3.8%
Wages 17,044,651 15,611,412 15,207,691 (403,721) ‐2.6%
Benefits 57,976,362 58,082,044 59,244,069 1,162,025 2.0%
Personnel Costs 263,333,607 275,079,939 270,473,471 (4,606,468) ‐1.7%
Utilities 7,971,630 10,353,955 9,573,691 (780,264) ‐7.5%
Scholarships and Fellowships 135,278,177 113,711,150 112,730,212 (980,938) ‐0.9%
Less Discounts and Allowances (56,875,367) (55,794,724) (58,703,356) (2,908,632) 5.2%
Operations, Maintenance and Travel 99,143,976 112,477,864 112,300,236 (177,628) ‐0.2%
Less Capitalized Portion (4,050,538) (4,055,017) (4,374,582) (319,565) 7.9%
Depreciation and Amortization 32,215,812 32,699,511 33,467,537 768,026 2.3%
Total Operating Expenses 477,017,297 484,472,678 475,467,209 (9,005,469) ‐1.9%
Operating Surplus/Deficit (204,077,496) (196,961,113) (198,245,359) (1,284,246) 0.7%
Budgeted Nonoperating Revenues (Expenses):
State Appropriations 115,170,223 114,645,552 107,058,242 (7,587,310) ‐6.6%
Federal Sponsored Programs (Nonoperating) 69,252,000 64,853,301 66,480,915 1,627,614 2.5%
State/Local Sponsored Programs (Nonoperating) ‐ ‐ ‐ ‐ ‐
Gifts in Support of Operations 4,734,307 8,555,000 6,916,425 (1,638,575) ‐19.2%
Net Investment Income 16,409,721 13,527,500 13,400,500 (127,000) ‐0.9%
Other Non‐Operating Revenue ‐ 45,000 ‐ (45,000) ‐100.0%
Other Non‐Operating (Expenses) ‐ ‐ ‐ ‐ ‐
Net Non‐Operating Revenue/(Expenses) 205,566,251 201,626,353 193,856,082 (7,770,271) ‐3.9%
Transfers and Other:
AUF Transfers Received for Operations ‐ ‐ ‐ ‐ ‐
AUF Transfers (Made) for Operations ‐ ‐ ‐ ‐ ‐
Transfers for Debt Service ‐ Interest (10,058,051) (10,191,879) (9,442,880) 748,999 ‐7.3%
Total Transfers and Other (10,058,051) (10,191,879) (9,442,880) 748,999 ‐7.3%
Budget Margin (Deficit) (8,569,296) (5,526,639) (13,832,157) (8,305,518) 150.3%
Reconciliation to Change in Net Position:
Net Non‐Profit Health Corp Activity ‐ ‐ ‐ ‐ ‐
Net Inc./(Dec.) in Fair Value of Investments (10,892,491) ‐ ‐ ‐ ‐
Interest Expense on Capital Asset Financings ‐ ‐ ‐ ‐ ‐
Capital Approp., Gifts and Sponsored Programs ‐ ‐ ‐ ‐ ‐
Additions to Permanent Endowments 1,446,000 3,017,000 1,518,000 (1,499,000) ‐49.7%
Transfers for Debt Service ‐ Principal (18,045,000) (18,045,000) (9,065,000) 8,980,000 ‐49.8%
Reverse Transfers for Debt Service (System Only) ‐ ‐ ‐ ‐ ‐
Transfers and Other 30,407,850 30,363,850 25,983,799 (4,380,051) ‐14.4%SRECNP Change in Net Position $ (5,652,937) 9,809,211 4,604,642 (5,204,569) ‐53.1%
Total Revenues and AUF Transfers $ 478,506,052 489,137,918 471,077,932 (18,059,986) ‐3.7%
Total Expenses (Including Transfers for Interest) (487,075,348) (494,664,557) (484,910,089) 9,754,468 ‐2.0%Budget Margin (Deficit) $ (8,569,296) (5,526,639) (13,832,157) (8,305,518)
Reconciliation to Use of Prior Year Balances
Depreciation 32,699,511 33,467,537
Capital Outlay (4,055,017) (4,374,582)
Transfers for Debt Service ‐ Principal (18,045,000) (9,065,000)
Budgeted Transfers 13,086 39,000
Net Additions to (Uses of) Prior Year Balances 5,085,941 6,234,798
Note: Operating Budget Highlights with a glossary of terms are included on Page 1.
U. T. System Office of Budget and Planning 43

The University of Texas at El Paso
Operating Budget ‐ Operating Expenses by Function
Fiscal Year Ending August 31, 2021
Budget
FY 2020 FY 2021 Increases (Decreases)
FY 2020 Adjusted Operating From 2020 to 2021
Projected Budget Budget Amount Percent
Operating Expenses:
Instruction $ 119,429,198 140,195,523 115,290,120 (24,905,403) ‐17.8%
Academic Support 25,931,927 28,493,221 28,654,642 161,421 0.6%
Research 91,495,665 73,535,116 97,122,823 23,587,707 32.1%
Public Service 5,826,899 7,416,770 5,644,901 (1,771,869) ‐23.9%
Hospitals and Clinics ‐ ‐ ‐ ‐ ‐
Institutional Support 33,449,072 38,947,200 36,472,140 (2,475,060) ‐6.4%
Student Services 19,348,865 21,338,728 20,270,990 (1,067,738) ‐5.0%
Operations and Maintenance of Plant 30,424,422 31,698,370 32,133,828 435,458 1.4%
Scholarships and Fellowships 62,628,049 57,401,085 56,655,914 (745,171) ‐1.3%
Auxiliary Enterprises 56,267,388 52,747,154 49,754,314 (2,992,840) ‐5.7%
Depreciation and Amortization 32,215,812 32,699,511 33,467,537 768,026 2.3%Total Operating Expenses $ 477,017,297 484,472,678 475,467,209 (9,005,469) ‐1.9%
Operating Budget ‐ Expenditures by Fund
Fiscal Year Ending August 31, 2021
Budget
FY 2020 FY 2021 Increases (Decreases)
Adjusted Operating From 2020 to 2021
Budget Budget Amount Percent
Educational and General $ 225,869,731 218,444,829 (7,424,902) ‐3.3%
Designated 121,436,264 117,963,255 (3,473,009) ‐2.9%
Auxiliary 58,969,925 51,691,555 (7,278,370) ‐12.3%
Available University Fund ‐ ‐ ‐ ‐
Restricted 131,583,867 133,485,851 1,901,984 1.4%
Unexpended Plant 2,000,000 2,000,000 ‐ 0.0%
Subtotal ‐ Expenditures (All Funds) 539,859,787 523,585,490 (16,274,297) ‐3.0%
Reconciling Adjustments:
Tuition Discounting (55,794,724) (58,703,356) (2,908,632) 5.2%
Depreciation 32,699,511 33,467,537 768,026 2.3%
Capital Outlay (4,055,017) (4,374,582) (319,565) 7.9%
Transfers for Debt Service ‐ Principal (18,045,000) (9,065,000) 8,980,000 ‐49.8%Total Expenses (Including Transfers for Interest) $ 494,664,557 484,910,089 (9,754,468) ‐2.0%
Note: Operating Budget Highlights with a glossary of terms are included on Page 1.
U. T. System Office of Budget and Planning 44
THE UNIVERSITY OF TEXAS
PERMIAN BASIN
U. T. System Office of Budget and Planning 45
The University of Texas Permian Basin Operating Budget Highlights
For the Year Ending August 31, 2021 Introduction - Major Goals Addressed by FY 2021 Budget The University of Texas Permian Basin seeks: to provide greater access to higher education for Texans, particularly west Texans; to award degrees of value; to conduct meaningful research; to improve the overall quality of life of the west Texas region; and, to do so while being a good steward of resources entrusted to it. To advance efforts to achieve these goals, U. T. Permian Basin has four strategic pillars in the new strategic plan: 1) Student Success, 2) Serve the Region, 3) Advance creativity and knowledge, and 4) Responsible stewardship. U. T. Permian Basin remains committed to the success of students. Initiatives planned or begun to help students achieve educational and career goals by addressing graduation, retention, and experiential learning efforts are continued in this budget. The University will seek to enhance the campus life and academic experiences for students, and to increase high impact practices that benefit students. It is also critical for the University to recruit and retain high quality faculty to maintain academic excellence. The dramatic effects of adjusting to COVID 19 and the slowdown of the oil industry in west Texas have created financial challenges for U. T. Permian Basin. While not completely stopped, the present Permian Basin economy has significantly slowed down private contributions. The 5 percent general revenue reductions required by state leadership have resulted in a loss of almost $2 million. In addition, uncertainty as to fall enrollment have prompted U. T. Permian Basin to conservatively reduce budgeted tuition and fee revenue for FY 2021 by an additional 5 percent. Meeting the needs of the region will require that the University significantly increase the number of graduates and the strategic plan calls for the number of degrees to double over the next 10 to 12 years. High demand degrees such as engineering, nursing, business, and education are facing the most severe shortages and therefore new faculty have been added in these areas. The FY 2021 budget provides funding for the operation of the new kinesiology facility. Another major goal of the strategic plan is to promote responsible stewardship of resources. U. T. Permian Basin is working with U. T. System staff to develop and implement a five-year plan designed to provide a tool for strategic planning and to help strengthen the financial position of the University. U. T. Permian Basin has taken the necessary steps to produce savings which will help offset the effects of the reduced revenues. These steps include a flexible hiring freeze, a reduction in force which eliminated 19 positions from the FY 2021 budget, temporary pay cuts for all employees ranging from 0 to 2 percent, and travel and operating budget reductions. CARES Act funding will also be utilized strategically and as appropriate. The University has successfully recruited talented individuals in several high impact areas who will significantly impact operations. Revenue Total budgeted revenue for FY 2021 is approximately $92.5 million, a decrease of $4.5 million from the FY 2020 budget or 4.6 percent. This decrease in the overall revenue budget over the prior year is the net effect of increases in tuition and fees applied to a projected enrollment drop of 5 percent, estimated reduction in housing revenues, the reduction in state funding, and an increase in grant and gift funds. Resident undergraduate and graduate tuition rates were increased by 6.4 percent for FY 2021. Because of the uncertainty related to COVID 19, enrollment is conservatively projected at 95 percent of the levels experienced in FY 2020. Auxiliary revenue is projected lower than FY 2020 by 9.7 percent representing the net effect of potential enrollment and campus housing occupancy drops and increases in room and board rates. Expenses Until FY 2020, most faculty and staff at U.T. Permian Basin had not received a pay raise in a number of years. This is believed to be a factor in retaining quality faculty and staff. For FY 2020, the University was able to provide merit increases ranging from 2 to 4 percent. Unfortunately, a temporary pay cut for all employees ranging from 0 to 2 percent in FY 2021 has been budgeted. Budgeted expenses for FY 2021, including transfers for interest on bonds, total approximately $100.2 million, a decrease of $4.9 million from FY 2020. The FY 2021 budgeted depreciation is increased as a result of the kinesiology building coming on line this fall. Critical faculty and staff have been added to provide instruction needed in growing programs or to address needs in operational areas. Transfers for debt service interest decreased by $554,000. Principal payments totaling $2.8 million for FY 2021 have been deferred to future years.
U. T. System Office of Budget and Planning 46
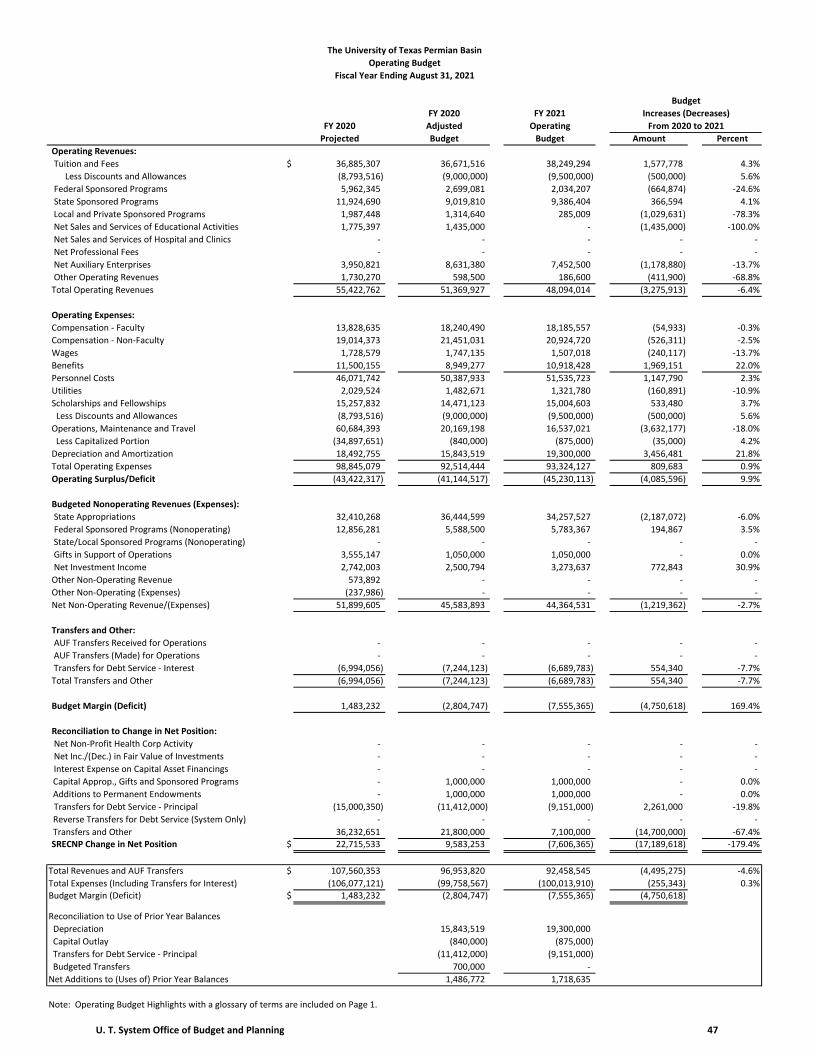
The University of Texas Permian Basin
Operating Budget
Fiscal Year Ending August 31, 2021
Budget
FY 2020 FY 2021 Increases (Decreases)
FY 2020 Adjusted Operating From 2020 to 2021
Projected Budget Budget Amount Percent
Operating Revenues:
Tuition and Fees $ 36,885,307 36,671,516 38,249,294 1,577,778 4.3%
Less Discounts and Allowances (8,793,516) (9,000,000) (9,500,000) (500,000) 5.6%
Federal Sponsored Programs 5,962,345 2,699,081 2,034,207 (664,874) ‐24.6%
State Sponsored Programs 11,924,690 9,019,810 9,386,404 366,594 4.1%
Local and Private Sponsored Programs 1,987,448 1,314,640 285,009 (1,029,631) ‐78.3%
Net Sales and Services of Educational Activities 1,775,397 1,435,000 ‐ (1,435,000) ‐100.0%
Net Sales and Services of Hospital and Clinics ‐ ‐ ‐ ‐ ‐
Net Professional Fees ‐ ‐ ‐ ‐ ‐
Net Auxiliary Enterprises 3,950,821 8,631,380 7,452,500 (1,178,880) ‐13.7%
Other Operating Revenues 1,730,270 598,500 186,600 (411,900) ‐68.8%
Total Operating Revenues 55,422,762 51,369,927 48,094,014 (3,275,913) ‐6.4%
Operating Expenses:
Compensation ‐ Faculty 13,828,635 18,240,490 18,185,557 (54,933) ‐0.3%
Compensation ‐ Non‐Faculty 19,014,373 21,451,031 20,924,720 (526,311) ‐2.5%
Wages 1,728,579 1,747,135 1,507,018 (240,117) ‐13.7%
Benefits 11,500,155 8,949,277 10,918,428 1,969,151 22.0%
Personnel Costs 46,071,742 50,387,933 51,535,723 1,147,790 2.3%
Utilities 2,029,524 1,482,671 1,321,780 (160,891) ‐10.9%
Scholarships and Fellowships 15,257,832 14,471,123 15,004,603 533,480 3.7%
Less Discounts and Allowances (8,793,516) (9,000,000) (9,500,000) (500,000) 5.6%
Operations, Maintenance and Travel 60,684,393 20,169,198 16,537,021 (3,632,177) ‐18.0%
Less Capitalized Portion (34,897,651) (840,000) (875,000) (35,000) 4.2%
Depreciation and Amortization 18,492,755 15,843,519 19,300,000 3,456,481 21.8%
Total Operating Expenses 98,845,079 92,514,444 93,324,127 809,683 0.9%
Operating Surplus/Deficit (43,422,317) (41,144,517) (45,230,113) (4,085,596) 9.9%
Budgeted Nonoperating Revenues (Expenses):
State Appropriations 32,410,268 36,444,599 34,257,527 (2,187,072) ‐6.0%
Federal Sponsored Programs (Nonoperating) 12,856,281 5,588,500 5,783,367 194,867 3.5%
State/Local Sponsored Programs (Nonoperating) ‐ ‐ ‐ ‐ ‐
Gifts in Support of Operations 3,555,147 1,050,000 1,050,000 ‐ 0.0%
Net Investment Income 2,742,003 2,500,794 3,273,637 772,843 30.9%
Other Non‐Operating Revenue 573,892 ‐ ‐ ‐ ‐
Other Non‐Operating (Expenses) (237,986) ‐ ‐ ‐ ‐
Net Non‐Operating Revenue/(Expenses) 51,899,605 45,583,893 44,364,531 (1,219,362) ‐2.7%
Transfers and Other:
AUF Transfers Received for Operations ‐ ‐ ‐ ‐ ‐
AUF Transfers (Made) for Operations ‐ ‐ ‐ ‐ ‐
Transfers for Debt Service ‐ Interest (6,994,056) (7,244,123) (6,689,783) 554,340 ‐7.7%
Total Transfers and Other (6,994,056) (7,244,123) (6,689,783) 554,340 ‐7.7%
Budget Margin (Deficit) 1,483,232 (2,804,747) (7,555,365) (4,750,618) 169.4%
Reconciliation to Change in Net Position:
Net Non‐Profit Health Corp Activity ‐ ‐ ‐ ‐ ‐
Net Inc./(Dec.) in Fair Value of Investments ‐ ‐ ‐ ‐ ‐
Interest Expense on Capital Asset Financings ‐ ‐ ‐ ‐ ‐
Capital Approp., Gifts and Sponsored Programs ‐ 1,000,000 1,000,000 ‐ 0.0%
Additions to Permanent Endowments ‐ 1,000,000 1,000,000 ‐ 0.0%
Transfers for Debt Service ‐ Principal (15,000,350) (11,412,000) (9,151,000) 2,261,000 ‐19.8%
Reverse Transfers for Debt Service (System Only) ‐ ‐ ‐ ‐ ‐
Transfers and Other 36,232,651 21,800,000 7,100,000 (14,700,000) ‐67.4%SRECNP Change in Net Position $ 22,715,533 9,583,253 (7,606,365) (17,189,618) ‐179.4%
Total Revenues and AUF Transfers $ 107,560,353 96,953,820 92,458,545 (4,495,275) ‐4.6%
Total Expenses (Including Transfers for Interest) (106,077,121) (99,758,567) (100,013,910) (255,343) 0.3%Budget Margin (Deficit) $ 1,483,232 (2,804,747) (7,555,365) (4,750,618)
Reconciliation to Use of Prior Year Balances
Depreciation 15,843,519 19,300,000
Capital Outlay (840,000) (875,000)
Transfers for Debt Service ‐ Principal (11,412,000) (9,151,000)
Budgeted Transfers 700,000 ‐
Net Additions to (Uses of) Prior Year Balances 1,486,772 1,718,635
Note: Operating Budget Highlights with a glossary of terms are included on Page 1.
U. T. System Office of Budget and Planning 47
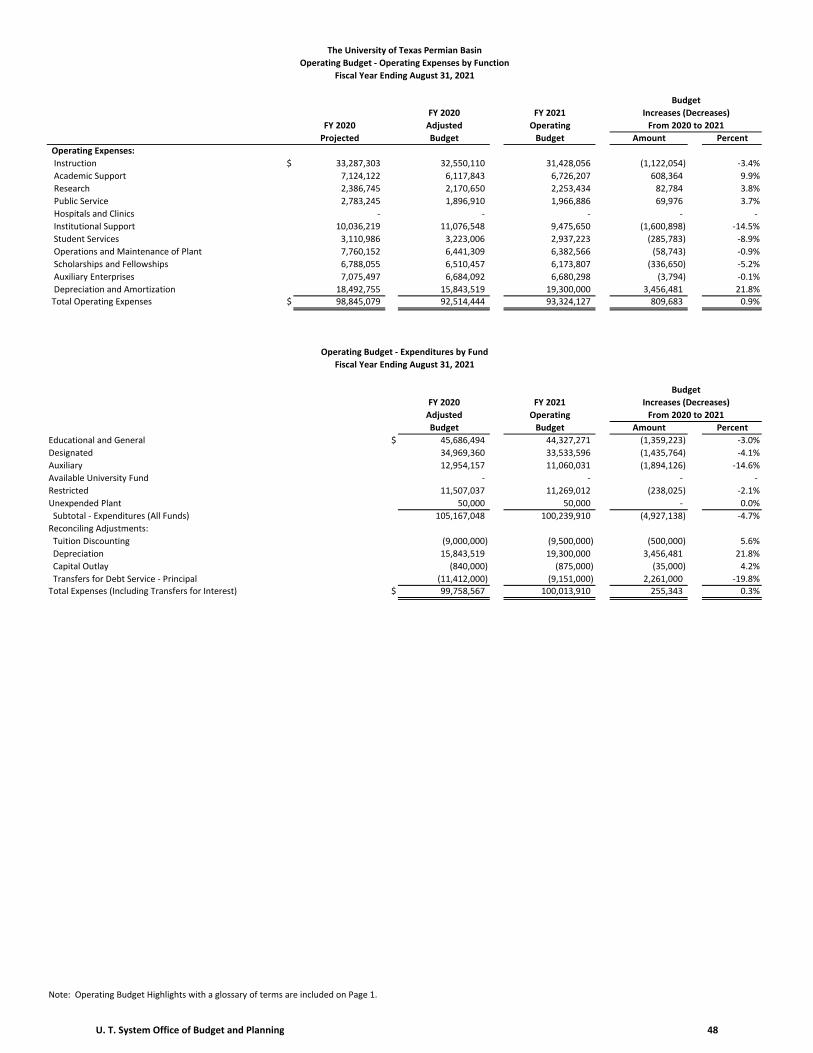
The University of Texas Permian Basin
Operating Budget ‐ Operating Expenses by Function
Fiscal Year Ending August 31, 2021
Budget
FY 2020 FY 2021 Increases (Decreases)
FY 2020 Adjusted Operating From 2020 to 2021
Projected Budget Budget Amount Percent
Operating Expenses:
Instruction $ 33,287,303 32,550,110 31,428,056 (1,122,054) ‐3.4%
Academic Support 7,124,122 6,117,843 6,726,207 608,364 9.9%
Research 2,386,745 2,170,650 2,253,434 82,784 3.8%
Public Service 2,783,245 1,896,910 1,966,886 69,976 3.7%
Hospitals and Clinics ‐ ‐ ‐ ‐ ‐
Institutional Support 10,036,219 11,076,548 9,475,650 (1,600,898) ‐14.5%
Student Services 3,110,986 3,223,006 2,937,223 (285,783) ‐8.9%
Operations and Maintenance of Plant 7,760,152 6,441,309 6,382,566 (58,743) ‐0.9%
Scholarships and Fellowships 6,788,055 6,510,457 6,173,807 (336,650) ‐5.2%
Auxiliary Enterprises 7,075,497 6,684,092 6,680,298 (3,794) ‐0.1%
Depreciation and Amortization 18,492,755 15,843,519 19,300,000 3,456,481 21.8%Total Operating Expenses $ 98,845,079 92,514,444 93,324,127 809,683 0.9%
Operating Budget ‐ Expenditures by Fund
Fiscal Year Ending August 31, 2021
Budget
FY 2020 FY 2021 Increases (Decreases)
Adjusted Operating From 2020 to 2021
Budget Budget Amount Percent
Educational and General $ 45,686,494 44,327,271 (1,359,223) ‐3.0%
Designated 34,969,360 33,533,596 (1,435,764) ‐4.1%
Auxiliary 12,954,157 11,060,031 (1,894,126) ‐14.6%
Available University Fund ‐ ‐ ‐ ‐
Restricted 11,507,037 11,269,012 (238,025) ‐2.1%
Unexpended Plant 50,000 50,000 ‐ 0.0%
Subtotal ‐ Expenditures (All Funds) 105,167,048 100,239,910 (4,927,138) ‐4.7%
Reconciling Adjustments:
Tuition Discounting (9,000,000) (9,500,000) (500,000) 5.6%
Depreciation 15,843,519 19,300,000 3,456,481 21.8%
Capital Outlay (840,000) (875,000) (35,000) 4.2%
Transfers for Debt Service ‐ Principal (11,412,000) (9,151,000) 2,261,000 ‐19.8%Total Expenses (Including Transfers for Interest) $ 99,758,567 100,013,910 255,343 0.3%
Note: Operating Budget Highlights with a glossary of terms are included on Page 1.
U. T. System Office of Budget and Planning 48
THE UNIVERSITY OF TEXAS
RIO GRANDE VALLEY
U. T. System Office of Budget and Planning 49
The University of Texas Rio Grande Valley Operating Budget Highlights
For the Year Ending August 31, 2021 Introduction - Major Goals Addressed by FY 2021 Budget With the FY 2021 operating budget, The University of Texas Rio Grande Valley seeks to sustain enrollment growth and promote student retention while addressing the major challenges posed by the coronavirus pandemic and the State general revenue reduction. Planning began immediately in March 2020 to implement cost saving measures and to set aside funds to help navigate through the difficult times ahead. The savings set aside, along with other reserves, will be strategically deployed to help sustain operations during FY 2021. Notably, the Institution seeks to maintain full employment for faculty and staff. Only vacant positions have been eliminated. A significant aspect of this plan is to fully support enrollment by strategically deploying the full amount of CARES Act funding toward direct student grants in addition to the customary financial aid packages offered. The additional assistance, up to $1,500 for each full-time student attending in the Fall and Spring, can be used to provide the technology needed for online course delivery and to address other cost of attendance expenses. Similar investments to support and grow enrollment in the summer were very successful. Total enrollment for the Fall semester is projected to exceed 30,000 students, an increase of 4.0 percent over Fall 2019. U. T. Rio Grande Valley will also continue its tradition of maintaining access and affordability by increasing its Tuition Advantage income threshold to $95,000. Students with family incomes below this level will face no out-of-pocket costs for tuition and fees. According to the latest available data, the average total academic cost at the institution was the second lowest among Texas public universities. Finally, and as discussed below, the FY 2021 budget reflects the ongoing growth of the School of Medicine which fortunately was spared from the general revenue cuts. Revenue State appropriations of $149.4 million represent a decrease of $8.2 million from FY 2020 and includes the 5 percent general revenue reduction of $7.9 million along with a $263,683 reduction in estimated fringe benefits to be paid by the State. Gross tuition and fee revenues, before discounting, are estimated to increase by $19.1 million primarily due to anticipated enrollment growth of 4.0 percent and the transition of students in expiring guaranteed tuition plans to higher rates. In addition, a 7.0 percent increase in the total academic cost, which is guaranteed for four years, will go into effect for newly enrolled students. Of the increase in private sponsored programs, $9.1 million is for the Transform Health Research in the Valley and Elsewhere project supported by the Valley Baptist Legacy Foundation. Of the increase in State sponsored programs, $5.0 million is due to a medical school contract with the Texas Child Mental Health Care Consortium. The ongoing growth of the medical school practice plans is indicated by the $3.3 million increase in net professional fees due to seven additional clinics and increased patient volume. The $2.4 million increase in other operating revenues is primarily due to growth in clinical and lab revenues. The $28.9 million increase in nonoperating federal sponsored programs is due to $21.9 million in one-time CARES Act funding plus a $7.0 million increase in Pell grants. The adverse impacts of the pandemic are indicated by revenue losses of $3.6 million in auxiliaries and $0.7 million in net sales and services of educational activities. The situation with auxiliaries continues to be under review as the extent of physical student presence on the campuses, including occupancy of campus housing, is highly uncertain at present. Expenses Total expenses are projected at $632.9 million inclusive of noncash adjustments such as depreciation. Included are $4.3 million for 72 academic faculty FTEs, $5.1 million for 19 medical school faculty FTEs, and $2.2 million for 40 medical school resident FTEs. Other labor investments include $657,000 for faculty promotions, $1.0 million for 30 academic advisor FTEs, and $1.4 million for peer mentoring efforts. Information technology and custodial staffing requirements to address the pandemic were funded by reallocation from vacant positions. Also, $2.6 million in travel reductions are being implemented to help offset the cost of the pandemic response. Scholarships, before discounts, are projected at $207.4 million, including $93.0 million in Pell Grants, $39.6 million in TEXAS Grants (assuming no cuts will be made to this item), and $21.9 million in direct student grants from CARES Act funding. An additional $2.3 million is provided for merit-based scholarships, and an additional $2.0 million in financial aid is funded by tuition set-asides. Also included is $8.1 million for exemptions, of which $5.8 million is estimated for Hazlewood recipients. Facilities cost increases include $5.7 million in depreciation related to additional medical school facilities and $1.5 million in lease obligations. Finally, a slight savings in utilities is projected due to transition of classes to online delivery.
U. T. System Office of Budget and Planning 50

The University of Texas Rio Grande Valley
Operating Budget
Fiscal Year Ending August 31, 2021
Budget
FY 2020 FY 2021 Increases (Decreases)
FY 2020 Adjusted Operating From 2020 to 2021
Projected Budget Budget Amount Percent
Operating Revenues:
Tuition and Fees $ 245,617,520 235,155,169 254,209,757 19,054,588 8.1%
Less Discounts and Allowances (118,750,810) (114,468,900) (122,566,700) (8,097,800) 7.1%
Federal Sponsored Programs 38,819,961 39,150,656 45,234,052 6,083,396 15.5%
State Sponsored Programs 46,264,616 46,291,036 53,384,961 7,093,925 15.3%
Local and Private Sponsored Programs 37,819,987 32,462,992 46,627,545 14,164,553 43.6%
Net Sales and Services of Educational Activities 5,847,727 6,319,088 5,606,139 (712,949) ‐11.3%
Net Sales and Services of Hospital and Clinics ‐ ‐ ‐ ‐ ‐
Net Professional Fees 13,680,848 12,397,667 15,680,640 3,282,973 26.5%
Net Auxiliary Enterprises 7,124,526 10,809,161 7,172,302 (3,636,859) ‐33.6%
Other Operating Revenues 17,993,656 8,931,440 11,358,360 2,426,920 27.2%
Total Operating Revenues 294,418,031 277,048,309 316,707,056 39,658,747 14.3%
Operating Expenses:
Compensation ‐ Faculty 123,018,588 115,576,476 126,968,905 11,392,429 9.9%
Compensation ‐ Non‐Faculty 122,032,164 128,978,310 140,834,384 11,856,074 9.2%
Wages 29,038,030 25,576,126 24,150,093 (1,426,033) ‐5.6%
Benefits 80,259,740 82,769,143 89,800,552 7,031,409 8.5%
Personnel Costs 354,348,522 352,900,055 381,753,934 28,853,879 8.2%
Utilities 9,997,353 11,895,109 11,564,623 (330,486) ‐2.8%
Scholarships and Fellowships 196,196,767 173,685,348 207,904,479 34,219,131 19.7%
Less Discounts and Allowances (118,750,810) (114,468,900) (122,566,700) (8,097,800) 7.1%
Operations, Maintenance and Travel 120,540,818 84,274,731 101,626,067 17,351,336 20.6%
Less Capitalized Portion (35,657,416) (8,190,000) (8,710,000) (520,000) 6.3%
Depreciation and Amortization 52,310,826 49,759,894 55,495,525 5,735,631 11.5%
Total Operating Expenses 578,986,060 549,856,237 627,067,928 77,211,691 14.0%
Operating Surplus/Deficit (284,568,029) (272,807,928) (310,360,872) (37,552,944) 13.8%
Budgeted Nonoperating Revenues (Expenses):
State Appropriations 158,318,763 157,572,706 149,392,783 (8,179,923) ‐5.2%
Federal Sponsored Programs (Nonoperating) 104,044,229 86,000,000 114,945,132 28,945,132 33.7%
State/Local Sponsored Programs (Nonoperating) ‐ ‐ ‐ ‐ ‐
Gifts in Support of Operations 3,567,086 6,076,623 4,653,496 (1,423,127) ‐23.4%
Net Investment Income 8,502,509 7,661,140 8,835,694 1,174,554 15.3%
Other Non‐Operating Revenue ‐ ‐ ‐ ‐ ‐
Other Non‐Operating (Expenses) ‐ ‐ ‐ ‐ ‐
Net Non‐Operating Revenue/(Expenses) 274,432,587 257,310,469 277,827,105 20,516,636 8.0%
Transfers and Other:
AUF Transfers Received for Operations ‐ ‐ ‐ ‐ ‐
AUF Transfers (Made) for Operations ‐ ‐ ‐ ‐ ‐
Transfers for Debt Service ‐ Interest (6,594,374) (6,596,631) (5,787,658) 808,973 ‐12.3%
Total Transfers and Other (6,594,374) (6,596,631) (5,787,658) 808,973 ‐12.3%
Budget Margin (Deficit) (16,729,816) (22,094,090) (38,321,425) (16,227,335) 73.4%
Reconciliation to Change in Net Position:
Net Non‐Profit Health Corp Activity ‐ ‐ ‐ ‐ ‐
Net Inc./(Dec.) in Fair Value of Investments (2,316,548) ‐ ‐ ‐ ‐
Interest Expense on Capital Asset Financings ‐ ‐ ‐ ‐ ‐
Capital Approp., Gifts and Sponsored Programs 2,344,864 140,000 1,290,000 1,150,000 821.4%
Additions to Permanent Endowments 2,375,149 930,000 1,640,000 710,000 76.3%
Transfers for Debt Service ‐ Principal (17,441,000) (17,859,000) (14,438,000) 3,421,000 ‐19.2%
Reverse Transfers for Debt Service (System Only) ‐ ‐ ‐ ‐ ‐
Transfers and Other 34,877,559 59,309,942 59,131,110 (178,832) ‐0.3%SRECNP Change in Net Position $ 3,110,208 20,426,852 9,301,685 (11,125,167) ‐54.5%
Total Revenues and AUF Transfers $ 568,850,618 534,358,778 594,534,161 60,175,383 11.3%
Total Expenses (Including Transfers for Interest) (585,580,434) (556,452,868) (632,855,586) (76,402,718) 13.7%Budget Margin (Deficit) $ (16,729,816) (22,094,090) (38,321,425) (16,227,335)
Reconciliation to Use of Prior Year Balances
Depreciation 49,759,894 55,495,525
Capital Outlay (8,190,000) (8,710,000)
Transfers for Debt Service ‐ Principal (17,859,000) (14,438,000)
Budgeted Transfers 107,278 96,838
Net Additions to (Uses of) Prior Year Balances 1,724,082 (5,877,062)
Note: Operating Budget Highlights with a glossary of terms are included on Page 1.
U. T. System Office of Budget and Planning 51
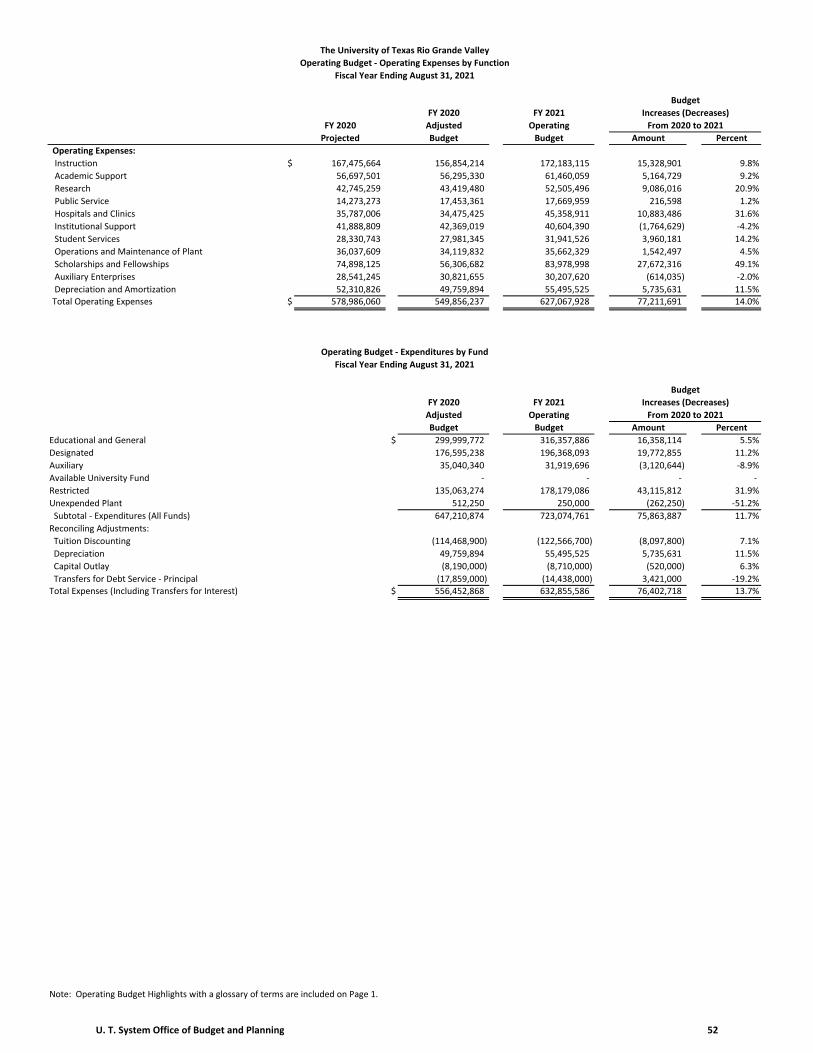
The University of Texas Rio Grande Valley
Operating Budget ‐ Operating Expenses by Function
Fiscal Year Ending August 31, 2021
Budget
FY 2020 FY 2021 Increases (Decreases)
FY 2020 Adjusted Operating From 2020 to 2021
Projected Budget Budget Amount Percent
Operating Expenses:
Instruction $ 167,475,664 156,854,214 172,183,115 15,328,901 9.8%
Academic Support 56,697,501 56,295,330 61,460,059 5,164,729 9.2%
Research 42,745,259 43,419,480 52,505,496 9,086,016 20.9%
Public Service 14,273,273 17,453,361 17,669,959 216,598 1.2%
Hospitals and Clinics 35,787,006 34,475,425 45,358,911 10,883,486 31.6%
Institutional Support 41,888,809 42,369,019 40,604,390 (1,764,629) ‐4.2%
Student Services 28,330,743 27,981,345 31,941,526 3,960,181 14.2%
Operations and Maintenance of Plant 36,037,609 34,119,832 35,662,329 1,542,497 4.5%
Scholarships and Fellowships 74,898,125 56,306,682 83,978,998 27,672,316 49.1%
Auxiliary Enterprises 28,541,245 30,821,655 30,207,620 (614,035) ‐2.0%
Depreciation and Amortization 52,310,826 49,759,894 55,495,525 5,735,631 11.5%Total Operating Expenses $ 578,986,060 549,856,237 627,067,928 77,211,691 14.0%
Operating Budget ‐ Expenditures by Fund
Fiscal Year Ending August 31, 2021
Budget
FY 2020 FY 2021 Increases (Decreases)
Adjusted Operating From 2020 to 2021
Budget Budget Amount Percent
Educational and General $ 299,999,772 316,357,886 16,358,114 5.5%
Designated 176,595,238 196,368,093 19,772,855 11.2%
Auxiliary 35,040,340 31,919,696 (3,120,644) ‐8.9%
Available University Fund ‐ ‐ ‐ ‐
Restricted 135,063,274 178,179,086 43,115,812 31.9%
Unexpended Plant 512,250 250,000 (262,250) ‐51.2%
Subtotal ‐ Expenditures (All Funds) 647,210,874 723,074,761 75,863,887 11.7%
Reconciling Adjustments:
Tuition Discounting (114,468,900) (122,566,700) (8,097,800) 7.1%
Depreciation 49,759,894 55,495,525 5,735,631 11.5%
Capital Outlay (8,190,000) (8,710,000) (520,000) 6.3%
Transfers for Debt Service ‐ Principal (17,859,000) (14,438,000) 3,421,000 ‐19.2%Total Expenses (Including Transfers for Interest) $ 556,452,868 632,855,586 76,402,718 13.7%
Note: Operating Budget Highlights with a glossary of terms are included on Page 1.
U. T. System Office of Budget and Planning 52
THE UNIVERSITY OF TEXAS
AT SAN ANTONIO
U. T. System Office of Budget and Planning 53
The University of Texas at San Antonio Operating Budget Highlights
For the Year Ending August 31, 2021 Introduction - Major Goals Addressed by FY 2021 Budget FY 2020 was the first year of the Incentivized Resource Management (IRM) budget model for The University of Texas at San Antonio. IRM provides an on-going activity-based framework to manage financial resources, particularly as colleges and divisions adjust and align expenses with anticipated revenues. While current events may influence the pace at which the University reaches the shared goals under this model, the creativity and entrepreneurial spirit is undaunted. The core principles allow for adapting budget planning as needed to focus on institutional priorities and core services. The transparency and growth of institutional knowledge on budget matters as part of the IRM implementation has proven invaluable when making decisions related to the COVID-19 pandemic. In the coming months and years, revenue growth and cost effectiveness will be key to success. These are incentivized in the IRM model. Colleges and divisions are encouraged to explore different paths to grow revenue or implement cost-effective efficiencies. To balance the budget for FY 2021 to the lower forecasted revenues and reduced appropriations, a budget reduction of 9 percent for academic colleges and 10 percent for all other division units was required. With the knowledge gained in developing and implementing the IRM model, divisions were able to reduce budgets from an “all-funds” approach, and thus all divisions were able to contribute to the financial health and position of the institution. The budget principles used for the FY 2021 budget process were new and unique due to the pandemic. First and foremost, the budget plan was created to ensure the University was able to advance the institution’s commitments to student success and critical research. Every decision was filtered through U. T. San Antonio’s mission, core values, identity, strategic plans, and destinations. The following principles shaped the overall budgetary planning and decisions: 1) Keeping the health and safety of faculty, staff, and students at the forefront; 2) Retaining jobs, maintaining current salaries/pay rates, and preserving employee benefits to the extent possible; 3) Advancing the continued, uninterrupted educational success of students; 4) Maintaining overall commitments to be a university focused on research excellence and graduate education; 5) Communicating the value and support of faculty and staff, and embracing a spirit of transparency; 6) Leading from a position of strength for the benefit of the city and students; and 7) Acknowledging that one size does not fit all. During the annual budget planning process, reviews were completed of available revenues, expenses, and projections for the coming year. This year, revenues were impacted by numerous uncertainties. It is unknown when students and the workforce will fully return to campus. Fall enrollment projections are widely varied, as are models for instruction, which range from fully on-campus to full online. The national economy has seen substantial disruption. Budget planning was influenced by the reality that the University experienced financial setbacks due to COVID-19 and more revenue losses are expected in the months to come. This is not unique to U. T. San Antonio or fellow institutions of higher education. As part of the University’s next steps, President Eighmy has planned for a new strategic planning exercise focused on the “new normal” that includes input from the various task forces created to see the University through the pandemic. Revenue The FY 2021 budget includes a revenue decrease of $9.7 million in tuition that is offset by a $4.7 million increase for fees as a result of fee increases approved prior to COVID-19. Discounts and allowances are increasing by $1.6 million. Therefore, net tuition and fee decrease is estimated at $6.6 million. This estimation is based on a projected 2.5 percent enrollment decline, a reduction of non-resident students, and an increase in student exemptions. State appropriations overall reflect an $8.7 million decrease due to the 5 percent reduction by the State of Texas for FY 2020 and FY 2021. To avoid negative impacts to programs late in FY 2020, the University will take the majority of the reduction against FY 2021. Sponsored programs are projected to increase by $4.9 million. State sponsored financial aid programs that include TEXAS grants and State work-study are increasing by $400,000. The Federal Pell program is projected at a $10 million increase. The Texas Research Incentive Program is declining by $445,000. Gifts are projected down by $2.3 million. Sales and services for both designated and auxiliary net a $4.7 million decrease due to direct impacts from COVID-19 and the uncertainty of when students will return to campus. Expenses U. T. San Antonio determined that the pandemic’s financial impact necessitated budgeted expense reductions across all areas of the University, including some workforce reductions. Deans, vice-provosts, and vice presidents engaged in a deeply collaborative and transparent process to reduce expenditures by a target of almost $35.8 million. Most of the reductions offset $18.4 million in declines for tuition and fee revenue and state appropriations. The remaining reductions offset expenditure budget increases needed for FY 2021. These increases include keeping institutional financial aid hold harmless, as it typically declines as tuition revenues decline. Increases in utilities due to new buildings, annual rate/usage increases, and housekeeping cost increases required a $1.3 million increase. The majority of budgeted expense reductions occurred in the workforce, which reduced approximately $20 million from the unrestricted budget, affecting 243 filled staff positions and 137 vacant staff positions. In addition, 12 vacant tenure track faculty positions were eliminated and 69 non-tenure track faculty (equivalent to 34.5 full-time employees) will not be renewed for FY 2021. An increase in projected sponsored activity for compensation of $19.4 million offset the unrestricted budget reductions. The University did not budget a merit increase for FY 2021. The result is a net overall increase in expenditures for the University of $1.2 million.
U. T. System Office of Budget and Planning 54

The University of Texas at San Antonio
Operating Budget
Fiscal Year Ending August 31, 2021
Budget
FY 2020 FY 2021 Increases (Decreases)
FY 2020 Adjusted Operating From 2020 to 2021
Projected Budget Budget Amount Percent
Operating Revenues:
Tuition and Fees $ 321,918,154 308,662,798 303,630,200 (5,032,598) ‐1.6%
Less Discounts and Allowances (103,013,809) (91,962,584) (93,518,100) (1,555,516) 1.7%
Federal Sponsored Programs 47,528,156 59,658,973 62,374,144 2,715,171 4.6%
State Sponsored Programs 26,169,094 29,500,315 29,766,834 266,519 0.9%
Local and Private Sponsored Programs 7,316,236 10,824,570 11,733,229 908,659 8.4%
Net Sales and Services of Educational Activities 12,942,250 12,282,849 9,505,856 (2,776,993) ‐22.6%
Net Sales and Services of Hospital and Clinics ‐ ‐ ‐ ‐ ‐
Net Professional Fees ‐ ‐ ‐ ‐ ‐
Net Auxiliary Enterprises 33,685,760 43,538,720 41,833,700 (1,705,020) ‐3.9%
Other Operating Revenues 3,377,746 757,500 1,887,500 1,130,000 149.2%
Total Operating Revenues 349,923,587 373,263,141 367,213,363 (6,049,778) ‐1.6%
Operating Expenses:
Compensation ‐ Faculty 116,955,793 105,836,098 109,998,212 4,162,114 3.9%
Compensation ‐ Non‐Faculty 152,892,182 150,208,923 137,015,152 (13,193,771) ‐8.8%
Wages 11,845,058 11,511,589 10,656,739 (854,850) ‐7.4%
Benefits 77,124,839 77,931,647 85,930,261 7,998,614 10.3%
Personnel Costs 358,817,872 345,488,257 343,600,364 (1,887,893) ‐0.5%
Utilities 13,451,000 13,861,749 14,432,547 570,798 4.1%
Scholarships and Fellowships 166,217,088 125,753,462 145,881,644 20,128,182 16.0%
Less Discounts and Allowances (103,013,809) (91,962,584) (93,518,100) (1,555,516) 1.7%
Operations, Maintenance and Travel 193,193,758 175,728,863 159,792,019 (15,936,844) ‐9.1%
Less Capitalized Portion (77,599,525) (8,883,600) (9,916,400) (1,032,800) 11.6%
Depreciation and Amortization 49,450,276 49,438,534 51,530,114 2,091,580 4.2%
Total Operating Expenses 600,516,660 609,424,681 611,802,188 2,377,507 0.4%
Operating Surplus/Deficit (250,593,073) (236,161,540) (244,588,825) (8,427,285) 3.6%
Budgeted Nonoperating Revenues (Expenses):
State Appropriations 146,448,672 144,668,403 135,974,332 (8,694,071) ‐6.0%
Federal Sponsored Programs (Nonoperating) 67,596,000 56,000,000 66,000,000 10,000,000 17.9%
State/Local Sponsored Programs (Nonoperating) 1,225,000 1,225,000 780,187 (444,813) ‐36.3%
Gifts in Support of Operations 8,000,000 10,000,000 7,750,000 (2,250,000) ‐22.5%
Net Investment Income 21,928,802 15,344,800 17,702,700 2,357,900 15.4%
Other Non‐Operating Revenue ‐ ‐ ‐ ‐ ‐
Other Non‐Operating (Expenses) ‐ ‐ ‐ ‐ ‐
Net Non‐Operating Revenue/(Expenses) 245,198,474 227,238,203 228,207,219 969,016 0.4%
Transfers and Other:
AUF Transfers Received for Operations ‐ ‐ ‐ ‐ ‐
AUF Transfers (Made) for Operations ‐ ‐ ‐ ‐ ‐
Transfers for Debt Service ‐ Interest (13,970,570) (14,279,881) (13,150,356) 1,129,525 ‐7.9%
Total Transfers and Other (13,970,570) (14,279,881) (13,150,356) 1,129,525 ‐7.9%
Budget Margin (Deficit) (19,365,169) (23,203,218) (29,531,962) (6,328,744) 27.3%
Reconciliation to Change in Net Position:
Net Non‐Profit Health Corp Activity ‐ ‐ ‐ ‐ ‐
Net Inc./(Dec.) in Fair Value of Investments (2,242,179) ‐ ‐ ‐ ‐
Interest Expense on Capital Asset Financings ‐ ‐ ‐ ‐ ‐
Capital Approp., Gifts and Sponsored Programs 500,000 1,101,000 500,000 (601,000) ‐54.6%
Additions to Permanent Endowments 3,180,781 3,572,667 3,200,000 (372,667) ‐10.4%
Transfers for Debt Service ‐ Principal (23,113,000) (23,002,794) (12,785,000) 10,217,794 ‐44.4%
Reverse Transfers for Debt Service (System Only) ‐ ‐ ‐ ‐ ‐
Transfers and Other 11,169,090 15,385,267 19,516,267 4,131,000 26.9%SRECNP Change in Net Position $ (29,870,477) (26,147,078) (19,100,695) 7,046,383 ‐26.9%
Total Revenues and AUF Transfers $ 595,122,061 600,501,344 595,420,582 (5,080,762) ‐0.8%
Total Expenses (Including Transfers for Interest) (614,487,230) (623,704,562) (624,952,544) (1,247,982) 0.2%Budget Margin (Deficit) $ (19,365,169) (23,203,218) (29,531,962) (6,328,744)
Reconciliation to Use of Prior Year Balances
Depreciation 49,438,534 51,530,114
Capital Outlay (8,883,600) (9,916,400)
Transfers for Debt Service ‐ Principal (23,002,794) (12,785,000)
Budgeted Transfers 257,317 703,248
Net Additions to (Uses of) Prior Year Balances (5,393,761) ‐
Note: Operating Budget Highlights with a glossary of terms are included on Page 1.
U. T. System Office of Budget and Planning 55

The University of Texas at San Antonio
Operating Budget ‐ Operating Expenses by Function
Fiscal Year Ending August 31, 2021
Budget
FY 2020 FY 2021 Increases (Decreases)
FY 2020 Adjusted Operating From 2020 to 2021
Projected Budget Budget Amount Percent
Operating Expenses:
Instruction $ 166,043,035 134,322,184 145,191,380 10,869,196 8.1%
Academic Support 63,907,001 71,969,591 79,958,188 7,988,597 11.1%
Research 75,602,159 108,919,728 103,447,524 (5,472,204) ‐5.0%
Public Service 18,507,005 19,569,829 13,756,684 (5,813,145) ‐29.7%
Hospitals and Clinics ‐ ‐ ‐ ‐ ‐
Institutional Support 45,014,434 54,955,949 49,240,449 (5,715,500) ‐10.4%
Student Services 31,530,185 31,101,013 27,753,098 (3,347,915) ‐10.8%
Operations and Maintenance of Plant 40,990,441 42,949,214 42,193,372 (755,842) ‐1.8%
Scholarships and Fellowships 52,538,558 41,030,204 50,066,382 9,036,178 22.0%
Auxiliary Enterprises 56,933,566 55,168,435 48,664,997 (6,503,438) ‐11.8%
Depreciation and Amortization 49,450,276 49,438,534 51,530,114 2,091,580 4.2%Total Operating Expenses $ 600,516,660 609,424,681 611,802,188 2,377,507 0.4%
Operating Budget ‐ Expenditures by Fund
Fiscal Year Ending August 31, 2021
Budget
FY 2020 FY 2021 Increases (Decreases)
Adjusted Operating From 2020 to 2021
Budget Budget Amount Percent
Educational and General $ 294,736,082 276,437,475 (18,298,607) ‐6.2%
Designated 176,908,321 186,892,257 9,983,936 5.6%
Auxiliary 79,886,103 66,169,622 (13,716,481) ‐17.2%
Available University Fund ‐ ‐ ‐ ‐
Restricted 142,007,500 155,565,576 13,558,076 9.5%
Unexpended Plant 4,577,000 4,577,000 ‐ 0.0%
Subtotal ‐ Expenditures (All Funds) 698,115,006 689,641,930 (8,473,076) ‐1.2%
Reconciling Adjustments:
Tuition Discounting (91,962,584) (93,518,100) (1,555,516) 1.7%
Depreciation 49,438,534 51,530,114 2,091,580 4.2%
Capital Outlay (8,883,600) (9,916,400) (1,032,800) 11.6%
Transfers for Debt Service ‐ Principal (23,002,794) (12,785,000) 10,217,794 ‐44.4%Total Expenses (Including Transfers for Interest) $ 623,704,562 624,952,544 1,247,982 0.2%
Note: Operating Budget Highlights with a glossary of terms are included on Page 1.
U. T. System Office of Budget and Planning 56

THE UNIVERSITY OF TEXAS
AT TYLER
U. T. System Office of Budget and Planning 57
The University of Texas at Tyler Operating Budget Highlights
For the Year Ending August 31, 2021 Introduction - Major Goals Addressed by FY 2021 Budget The FY 2021 budget reflects The University of Texas at Tyler’s vision to be the primary educational and economic driver of East Texas. U. T. Tyler has a culture of excellence and innovation that also provides a nurturing environment to prepare students to be future problem solvers and leaders. U. T. Tyler remains one of the best values in higher education in Texas. With tuition and fees below the mean among the U. T. System, the State, and regional competitors, U. T. Tyler takes great pride in the tradition of offering quality academic programs, expert faculty, active student life programs, and well-rounded service opportunities. Despite the challenges of the COVID-19 pandemic and the resultant economic uncertainty, including a 5 percent General Revenue reduction, the FY 2021 budget continues to support an investment in the University’s highest priority strategic initiatives. U. T. Tyler’s overall scorecard rating held steady at Aa3 for FY 2019. Operating Revenues for U. T. Tyler have been trending upward mainly due to increases in Investment, gift, and sponsored program income, along with a slight increase in tuition and fees. The Operating Margin decreased from FY 2018 to FY 2019 due to lower than anticipated enrollment and increases in student scholarship and fellowship support programs as well as an increase in depreciation related to the completion of the Soules College of Business. Spendable cash and investments to operating expenses has remained steady year over year, while spendable cash and investments to total debt has increased slightly. Revenue U. T. Tyler’s FY 2021 revenue budget totals $159.1 million and reflects a slight ($1.4 million or less than 1.0 percent) total operating revenue decline over FY 2020. An approximately $2.1 million (2.6 percent) increase in gross tuition ($1.7 million) and selected mandatory fees ($0.4 million) is the result of a modest increase in rates. Overall, FY 2021 enrollment is projected to be flat. However, the Fisch College of Pharmacy self-funded program is projecting a 12.8 percent decrease in enrollment, aligning with national trends. The proposed operating budget reflects an overall $2.6 million reduction in State-appropriated General Revenue in accordance with the State’s 5 percent biennial budget reduction. A $2.6 million decline in program revenue (19.9 percent) is attributed in part to a $1.4 million (12.6 percent) decline in Pharmacy revenue. Additionally, two self-funded programs were eliminated in FY 2020. U. T. Tyler’s involvement in Project Lead the Way, a secondary school training program, concluded in FY 2020 resulting a $0.9 million reduction to the FY 2021 budget. Declining enrollments in the Executive Healthcare Administration program led to its elimination and a $0.3 million budget reduction. Even with the anticipated revenue reduction to the Pharmacy program, the program continues to contribute to supporting campus overhead costs. The $1.2 million decrease in net auxiliary enterprises reflects an expected reduction in student housing revenue ($1 million or 13.0 percent), meal plan commission ($0.1 million or 17 percent), and parking permit sales ($0.1 million or 11.8 percent) due to expected shortened Fall and Spring semester lengths. An increase of gifts in support of operations ($3.7 million or 288 percent) reflects an aggressive plan initiated in FY 2020 to increase philanthropic support over the next five years. Expenses Total expenses, including transfers for interest, are budgeted at $169.3 million, a slight net decrease ($1.2 million or less than 1.0 percent) from the prior year. The budget reflects a reduction in expenditures related to the 5 percent General Revenue reduction ($2.6 million) and the University’s internal overall 4 percent budget reinvestment ($2.5 million). These reductions are centered in a hiring freeze on targeted vacant positions ($4.1 million) as well as reduced travel and other operating expenses ($1 million). The FY 2021 budget includes $4.5 million in new investments centered in the University’s highest strategic priorities: student engagement and student success. A total of $2.4 million has been allocated in support of student scholarships: the third Presidential Fellows merit scholarship cohort ($1.3 million), the second year of athletic scholarship awards ($0.4 million) in accordance with National Collegiate Athletic Association Division II rules, and an addition of a new need-based gap scholarship ($0.7 million). An additional $1.4 million has been invested in new faculty lines in support of new and growing academic programs and $0.8 million has been invested in student support roles. There will be no faculty/staff merit program in FY 2021, only a modest amount ($0.2 million) has been set aside for the faculty tenure and promotion program. An additional $0.5 million has been set aside to accommodate increased operating expenses related to the COVID-19 response, including off-campus space for student quarantine, increased classroom cleaning, and additional protective equipment. All efforts will be made to utilize fully any external funding sources available to offset COVID-19 expenditures.
U. T. System Office of Budget and Planning 58
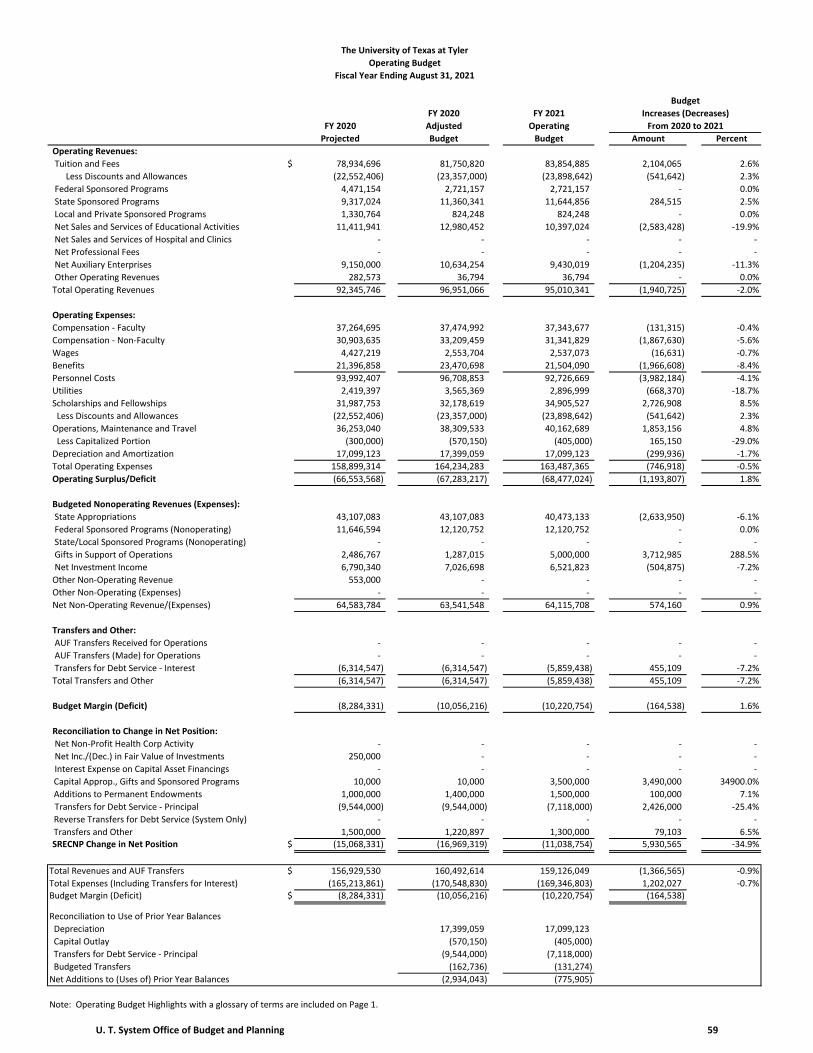
The University of Texas at Tyler
Operating Budget
Fiscal Year Ending August 31, 2021
Budget
FY 2020 FY 2021 Increases (Decreases)
FY 2020 Adjusted Operating From 2020 to 2021
Projected Budget Budget Amount Percent
Operating Revenues:
Tuition and Fees $ 78,934,696 81,750,820 83,854,885 2,104,065 2.6%
Less Discounts and Allowances (22,552,406) (23,357,000) (23,898,642) (541,642) 2.3%
Federal Sponsored Programs 4,471,154 2,721,157 2,721,157 ‐ 0.0%
State Sponsored Programs 9,317,024 11,360,341 11,644,856 284,515 2.5%
Local and Private Sponsored Programs 1,330,764 824,248 824,248 ‐ 0.0%
Net Sales and Services of Educational Activities 11,411,941 12,980,452 10,397,024 (2,583,428) ‐19.9%
Net Sales and Services of Hospital and Clinics ‐ ‐ ‐ ‐ ‐
Net Professional Fees ‐ ‐ ‐ ‐ ‐
Net Auxiliary Enterprises 9,150,000 10,634,254 9,430,019 (1,204,235) ‐11.3%
Other Operating Revenues 282,573 36,794 36,794 ‐ 0.0%
Total Operating Revenues 92,345,746 96,951,066 95,010,341 (1,940,725) ‐2.0%
Operating Expenses:
Compensation ‐ Faculty 37,264,695 37,474,992 37,343,677 (131,315) ‐0.4%
Compensation ‐ Non‐Faculty 30,903,635 33,209,459 31,341,829 (1,867,630) ‐5.6%
Wages 4,427,219 2,553,704 2,537,073 (16,631) ‐0.7%
Benefits 21,396,858 23,470,698 21,504,090 (1,966,608) ‐8.4%
Personnel Costs 93,992,407 96,708,853 92,726,669 (3,982,184) ‐4.1%
Utilities 2,419,397 3,565,369 2,896,999 (668,370) ‐18.7%
Scholarships and Fellowships 31,987,753 32,178,619 34,905,527 2,726,908 8.5%
Less Discounts and Allowances (22,552,406) (23,357,000) (23,898,642) (541,642) 2.3%
Operations, Maintenance and Travel 36,253,040 38,309,533 40,162,689 1,853,156 4.8%
Less Capitalized Portion (300,000) (570,150) (405,000) 165,150 ‐29.0%
Depreciation and Amortization 17,099,123 17,399,059 17,099,123 (299,936) ‐1.7%
Total Operating Expenses 158,899,314 164,234,283 163,487,365 (746,918) ‐0.5%
Operating Surplus/Deficit (66,553,568) (67,283,217) (68,477,024) (1,193,807) 1.8%
Budgeted Nonoperating Revenues (Expenses):
State Appropriations 43,107,083 43,107,083 40,473,133 (2,633,950) ‐6.1%
Federal Sponsored Programs (Nonoperating) 11,646,594 12,120,752 12,120,752 ‐ 0.0%
State/Local Sponsored Programs (Nonoperating) ‐ ‐ ‐ ‐ ‐
Gifts in Support of Operations 2,486,767 1,287,015 5,000,000 3,712,985 288.5%
Net Investment Income 6,790,340 7,026,698 6,521,823 (504,875) ‐7.2%
Other Non‐Operating Revenue 553,000 ‐ ‐ ‐ ‐
Other Non‐Operating (Expenses) ‐ ‐ ‐ ‐ ‐
Net Non‐Operating Revenue/(Expenses) 64,583,784 63,541,548 64,115,708 574,160 0.9%
Transfers and Other:
AUF Transfers Received for Operations ‐ ‐ ‐ ‐ ‐
AUF Transfers (Made) for Operations ‐ ‐ ‐ ‐ ‐
Transfers for Debt Service ‐ Interest (6,314,547) (6,314,547) (5,859,438) 455,109 ‐7.2%
Total Transfers and Other (6,314,547) (6,314,547) (5,859,438) 455,109 ‐7.2%
Budget Margin (Deficit) (8,284,331) (10,056,216) (10,220,754) (164,538) 1.6%
Reconciliation to Change in Net Position:
Net Non‐Profit Health Corp Activity ‐ ‐ ‐ ‐ ‐
Net Inc./(Dec.) in Fair Value of Investments 250,000 ‐ ‐ ‐ ‐
Interest Expense on Capital Asset Financings ‐ ‐ ‐ ‐ ‐
Capital Approp., Gifts and Sponsored Programs 10,000 10,000 3,500,000 3,490,000 34900.0%
Additions to Permanent Endowments 1,000,000 1,400,000 1,500,000 100,000 7.1%
Transfers for Debt Service ‐ Principal (9,544,000) (9,544,000) (7,118,000) 2,426,000 ‐25.4%
Reverse Transfers for Debt Service (System Only) ‐ ‐ ‐ ‐ ‐
Transfers and Other 1,500,000 1,220,897 1,300,000 79,103 6.5%SRECNP Change in Net Position $ (15,068,331) (16,969,319) (11,038,754) 5,930,565 ‐34.9%
Total Revenues and AUF Transfers $ 156,929,530 160,492,614 159,126,049 (1,366,565) ‐0.9%
Total Expenses (Including Transfers for Interest) (165,213,861) (170,548,830) (169,346,803) 1,202,027 ‐0.7%Budget Margin (Deficit) $ (8,284,331) (10,056,216) (10,220,754) (164,538)
Reconciliation to Use of Prior Year Balances
Depreciation 17,399,059 17,099,123
Capital Outlay (570,150) (405,000)
Transfers for Debt Service ‐ Principal (9,544,000) (7,118,000)
Budgeted Transfers (162,736) (131,274)
Net Additions to (Uses of) Prior Year Balances (2,934,043) (775,905)
Note: Operating Budget Highlights with a glossary of terms are included on Page 1.
U. T. System Office of Budget and Planning 59

The University of Texas at Tyler
Operating Budget ‐ Operating Expenses by Function
Fiscal Year Ending August 31, 2021
Budget
FY 2020 FY 2021 Increases (Decreases)
FY 2020 Adjusted Operating From 2020 to 2021
Projected Budget Budget Amount Percent
Operating Expenses:
Instruction $ 58,656,830 61,578,405 62,622,617 1,044,212 1.7%
Academic Support 17,799,501 19,187,784 19,557,959 370,175 1.9%
Research 2,149,800 1,319,264 1,360,783 41,519 3.1%
Public Service 619,084 652,658 716,022 63,364 9.7%
Hospitals and Clinics ‐ ‐ ‐ ‐ ‐
Institutional Support 12,393,329 16,375,203 13,539,007 (2,836,196) ‐17.3%
Student Services 14,193,497 13,069,332 11,982,417 (1,086,915) ‐8.3%
Operations and Maintenance of Plant 12,683,598 11,088,730 9,967,734 (1,120,996) ‐10.1%
Scholarships and Fellowships 9,496,310 9,286,709 11,477,593 2,190,884 23.6%
Auxiliary Enterprises 13,808,242 14,277,139 15,164,110 886,971 6.2%
Depreciation and Amortization 17,099,123 17,399,059 17,099,123 (299,936) ‐1.7%Total Operating Expenses $ 158,899,314 164,234,283 163,487,365 (746,918) ‐0.5%
Operating Budget ‐ Expenditures by Fund
Fiscal Year Ending August 31, 2021
Budget
FY 2020 FY 2021 Increases (Decreases)
Adjusted Operating From 2020 to 2021
Budget Budget Amount Percent
Educational and General $ 58,500,067 56,150,632 (2,349,435) ‐4.0%
Designated 88,876,498 85,824,684 (3,051,814) ‐3.4%
Auxiliary 18,747,346 17,606,993 (1,140,353) ‐6.1%
Available University Fund ‐ ‐ ‐ ‐
Restricted 20,462,203 24,087,013 3,624,810 17.7%
Unexpended Plant 34,807 ‐ (34,807) ‐100.0%
Subtotal ‐ Expenditures (All Funds) 186,620,921 183,669,322 (2,951,599) ‐1.6%
Reconciling Adjustments:
Tuition Discounting (23,357,000) (23,898,642) (541,642) 2.3%
Depreciation 17,399,059 17,099,123 (299,936) ‐1.7%
Capital Outlay (570,150) (405,000) 165,150 ‐29.0%
Transfers for Debt Service ‐ Principal (9,544,000) (7,118,000) 2,426,000 ‐25.4%Total Expenses (Including Transfers for Interest) $ 170,548,830 169,346,803 (1,202,027) ‐0.7%
Note: Operating Budget Highlights with a glossary of terms are included on Page 1.
U. T. System Office of Budget and Planning 60
THE UNIVERSITY OF TEXAS
SOUTHWESTERN MEDICAL CENTER
U. T. System Office of Budget and Planning 61
The University of Texas Southwestern Medical Center Operating Budget Highlights
For the Year Ending August 31, 2021 Introduction - Major Goals Addressed by FY 2021 Budget The University of Texas Southwestern Medical Center, one of the premier academic medical centers in the nation, integrates pioneering biomedical research with exceptional clinical care and education. The mission of U. T. Southwestern Medical Center is to promote health and a healthy society that enables individuals to achieve their full potential in the community, Texas and beyond. This is accomplished through innovation and education, training physicians, scientists and other providers optimally prepared to serve the needs of patients; discovery, conducting high-impact, internationally recognized research that solves for unmet needs by finding better treatments, cures, and prevention with a commitment to ensuring real world application; and healing, delivering the best patient care possible today, with continuous improvement for better care tomorrow. Strategic positioning and programmatic investments are designed to sustain a trajectory of excellence and targeted growth in all these mission areas. U. T. Southwestern Medical Center is dedicated to groundbreaking medical advances and quickly translating science-driven research to new clinical treatments. A notable example is the Peter O’Donnell Jr. Brain Institute, which encompasses both research and clinical programs, including the state-supported Texas Institute for Brain Injury and Repair, which promotes awareness of concussions and other traumatic brain injuries, and the Center for Alzheimer’s and Neurodegenerative Diseases, which is advancing the understanding of the causes of Alzheimer’s disease. With investments from the state and local community and high-profile attention to brain health in sports, the military, and an aging patient population, U. T. Southwestern Medical Center is making significant strides toward enhancing public health. To support expanded research and co-locate the medical specialties, the Institution began construction of a new brain institute and cancer center facility in FY 2019. This expansion also provides the Simmons Comprehensive Cancer Center with the ability to meet increasing patient demands while pursuing the mission of state-of-the-art cancer treatment. In addition to outstanding education and research programs, the Institution is committed to leadership in patient care and continues to gain recognition through national and international clinical awards. Steady growth of patient volume continues to exceed projections. In the fall of 2020, the University will open a 292-bed third tower expansion of Clements University Hospital that will provide additional inpatient capacity. The Institution received Board of Regents approval in FY 2019 to expand the Radiation Oncology facility that originally opened in April 2017. A key driver of clinical growth is Southwestern Health Resources, a partnership with Texas Health Resources (THR) that includes a clinically integrated network of over 3,000 physicians, 27 hospitals, and 300 clinics across 16 counties. It leverages the complementary strengths of U. T. Southwestern Medical Center and THR, enhancing joint initiatives, including significant growth of Accountable Care Organization program offerings with demonstrated improvement in patient outcomes and cost reductions. The Institution has further leveraged the relationship with THR to jointly develop a hospital and medical office building campus that opened in FY 2020 in the rapidly expanding Frisco, Texas market. Additionally, U. T. Southwestern Medical Center’s clinical enterprise recently underwent a comprehensive strategic planning process to optimize the clinical network, further develop destination service lines, enhance value, quality, and patient experience, and leverage outstanding research capabilities in the clinical setting. University leadership remains focused on placing industry leaders in key executive, department chair, and center director positions. Following national searches, several key positions have been filled with individuals who are prominent leaders in their fields. The most recent appointments include Thomas J. Wang, M.D., Chair of the Department of Internal Medicine and Elan D. Louis, M.D., M.S., Chair of the Department of Neurology and Neurotherapeutics. Revenue The FY 2021 revenue budget of $3.69 billion represents a 7.5 percent increase over the FY 2020 projection, primarily driven by recovery from the COVID-19 pandemic coupled with continued strong patient care volumes for university hospitals and clinics, and growth in professional fees from the faculty practice plan. Expenses While the budget assumes a gradual return to full capacity in all missions from the reduced levels of activity dictated by the COVID-19 pandemic, U. T. Southwestern Medical Center continues to identify mitigating cost savings measures, including the difficult decision to forego an annual merit plan, to be able to adjust to an uncertain future. The expenditure budget for FY 2021 is $3.66 billion. Expense growth related to university hospitals, clinical operations, and instruction are proportional to revenue growth for the upcoming fiscal year and include expenditures for the third tower of Clements University Hospital opening in late 2020. The budget includes sufficient funds to cover projected debt service to finance expansion activities and major information resources projects.
U. T. System Office of Budget and Planning 62
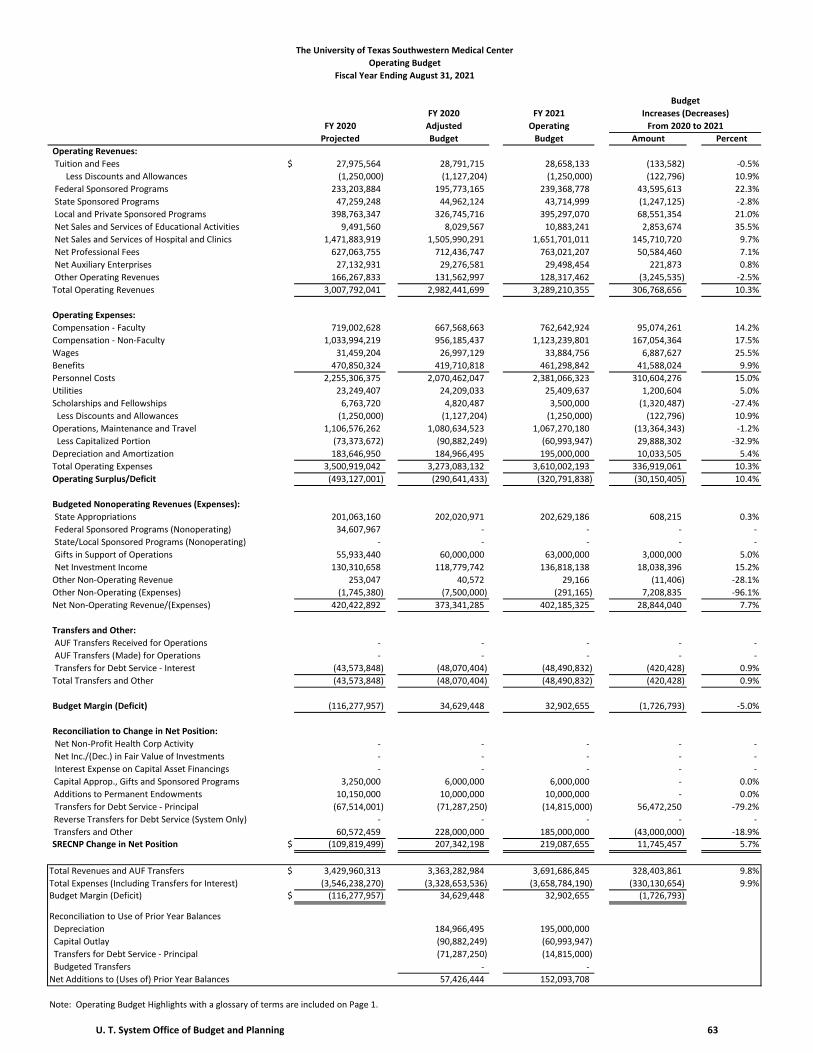
The University of Texas Southwestern Medical Center
Operating Budget
Fiscal Year Ending August 31, 2021
Budget
FY 2020 FY 2021 Increases (Decreases)
FY 2020 Adjusted Operating From 2020 to 2021
Projected Budget Budget Amount Percent
Operating Revenues:
Tuition and Fees $ 27,975,564 28,791,715 28,658,133 (133,582) ‐0.5%
Less Discounts and Allowances (1,250,000) (1,127,204) (1,250,000) (122,796) 10.9%
Federal Sponsored Programs 233,203,884 195,773,165 239,368,778 43,595,613 22.3%
State Sponsored Programs 47,259,248 44,962,124 43,714,999 (1,247,125) ‐2.8%
Local and Private Sponsored Programs 398,763,347 326,745,716 395,297,070 68,551,354 21.0%
Net Sales and Services of Educational Activities 9,491,560 8,029,567 10,883,241 2,853,674 35.5%
Net Sales and Services of Hospital and Clinics 1,471,883,919 1,505,990,291 1,651,701,011 145,710,720 9.7%
Net Professional Fees 627,063,755 712,436,747 763,021,207 50,584,460 7.1%
Net Auxiliary Enterprises 27,132,931 29,276,581 29,498,454 221,873 0.8%
Other Operating Revenues 166,267,833 131,562,997 128,317,462 (3,245,535) ‐2.5%
Total Operating Revenues 3,007,792,041 2,982,441,699 3,289,210,355 306,768,656 10.3%
Operating Expenses:
Compensation ‐ Faculty 719,002,628 667,568,663 762,642,924 95,074,261 14.2%
Compensation ‐ Non‐Faculty 1,033,994,219 956,185,437 1,123,239,801 167,054,364 17.5%
Wages 31,459,204 26,997,129 33,884,756 6,887,627 25.5%
Benefits 470,850,324 419,710,818 461,298,842 41,588,024 9.9%
Personnel Costs 2,255,306,375 2,070,462,047 2,381,066,323 310,604,276 15.0%
Utilities 23,249,407 24,209,033 25,409,637 1,200,604 5.0%
Scholarships and Fellowships 6,763,720 4,820,487 3,500,000 (1,320,487) ‐27.4%
Less Discounts and Allowances (1,250,000) (1,127,204) (1,250,000) (122,796) 10.9%
Operations, Maintenance and Travel 1,106,576,262 1,080,634,523 1,067,270,180 (13,364,343) ‐1.2%
Less Capitalized Portion (73,373,672) (90,882,249) (60,993,947) 29,888,302 ‐32.9%
Depreciation and Amortization 183,646,950 184,966,495 195,000,000 10,033,505 5.4%
Total Operating Expenses 3,500,919,042 3,273,083,132 3,610,002,193 336,919,061 10.3%
Operating Surplus/Deficit (493,127,001) (290,641,433) (320,791,838) (30,150,405) 10.4%
Budgeted Nonoperating Revenues (Expenses):
State Appropriations 201,063,160 202,020,971 202,629,186 608,215 0.3%
Federal Sponsored Programs (Nonoperating) 34,607,967 ‐ ‐ ‐ ‐
State/Local Sponsored Programs (Nonoperating) ‐ ‐ ‐ ‐ ‐
Gifts in Support of Operations 55,933,440 60,000,000 63,000,000 3,000,000 5.0%
Net Investment Income 130,310,658 118,779,742 136,818,138 18,038,396 15.2%
Other Non‐Operating Revenue 253,047 40,572 29,166 (11,406) ‐28.1%
Other Non‐Operating (Expenses) (1,745,380) (7,500,000) (291,165) 7,208,835 ‐96.1%
Net Non‐Operating Revenue/(Expenses) 420,422,892 373,341,285 402,185,325 28,844,040 7.7%
Transfers and Other:
AUF Transfers Received for Operations ‐ ‐ ‐ ‐ ‐
AUF Transfers (Made) for Operations ‐ ‐ ‐ ‐ ‐
Transfers for Debt Service ‐ Interest (43,573,848) (48,070,404) (48,490,832) (420,428) 0.9%
Total Transfers and Other (43,573,848) (48,070,404) (48,490,832) (420,428) 0.9%
Budget Margin (Deficit) (116,277,957) 34,629,448 32,902,655 (1,726,793) ‐5.0%
Reconciliation to Change in Net Position:
Net Non‐Profit Health Corp Activity ‐ ‐ ‐ ‐ ‐
Net Inc./(Dec.) in Fair Value of Investments ‐ ‐ ‐ ‐ ‐
Interest Expense on Capital Asset Financings ‐ ‐ ‐ ‐ ‐
Capital Approp., Gifts and Sponsored Programs 3,250,000 6,000,000 6,000,000 ‐ 0.0%
Additions to Permanent Endowments 10,150,000 10,000,000 10,000,000 ‐ 0.0%
Transfers for Debt Service ‐ Principal (67,514,001) (71,287,250) (14,815,000) 56,472,250 ‐79.2%
Reverse Transfers for Debt Service (System Only) ‐ ‐ ‐ ‐ ‐
Transfers and Other 60,572,459 228,000,000 185,000,000 (43,000,000) ‐18.9%SRECNP Change in Net Position $ (109,819,499) 207,342,198 219,087,655 11,745,457 5.7%
Total Revenues and AUF Transfers $ 3,429,960,313 3,363,282,984 3,691,686,845 328,403,861 9.8%
Total Expenses (Including Transfers for Interest) (3,546,238,270) (3,328,653,536) (3,658,784,190) (330,130,654) 9.9%Budget Margin (Deficit) $ (116,277,957) 34,629,448 32,902,655 (1,726,793)
Reconciliation to Use of Prior Year Balances
Depreciation 184,966,495 195,000,000
Capital Outlay (90,882,249) (60,993,947)
Transfers for Debt Service ‐ Principal (71,287,250) (14,815,000)
Budgeted Transfers ‐ ‐
Net Additions to (Uses of) Prior Year Balances 57,426,444 152,093,708
Note: Operating Budget Highlights with a glossary of terms are included on Page 1.
U. T. System Office of Budget and Planning 63

The University of Texas Southwestern Medical Center
Operating Budget ‐ Operating Expenses by Function
Fiscal Year Ending August 31, 2021
Budget
FY 2020 FY 2021 Increases (Decreases)
FY 2020 Adjusted Operating From 2020 to 2021
Projected Budget Budget Amount Percent
Operating Expenses:
Instruction $ 1,091,369,731 1,029,185,555 1,121,887,876 92,702,321 9.0%
Academic Support 69,142,800 24,464,307 63,790,179 39,325,872 160.7%
Research 393,147,583 372,184,525 379,601,756 7,417,231 2.0%
Public Service 29,816,933 33,102,723 33,439,479 336,756 1.0%
Hospitals and Clinics 1,519,271,226 1,437,345,890 1,593,884,523 156,538,633 10.9%
Institutional Support 85,082,303 75,089,155 91,871,083 16,781,928 22.3%
Student Services 5,814,011 4,038,341 6,241,274 2,202,933 54.6%
Operations and Maintenance of Plant 83,322,538 80,971,520 84,988,258 4,016,738 5.0%
Scholarships and Fellowships 9,161,134 3,750,009 5,150,221 1,400,212 37.3%
Auxiliary Enterprises 31,143,833 27,984,612 34,147,544 6,162,932 22.0%
Depreciation and Amortization 183,646,950 184,966,495 195,000,000 10,033,505 5.4%Total Operating Expenses $ 3,500,919,042 3,273,083,132 3,610,002,193 336,919,061 10.3%
Operating Budget ‐ Expenditures by Fund
Fiscal Year Ending August 31, 2021
Budget
FY 2020 FY 2021 Increases (Decreases)
Adjusted Operating From 2020 to 2021
Budget Budget Amount Percent
Educational and General $ 209,567,110 218,377,981 8,810,871 4.2%
Designated 2,664,380,550 2,892,751,842 228,371,292 8.6%
Auxiliary 37,974,411 37,623,297 (351,114) ‐0.9%
Available University Fund ‐ ‐ ‐ ‐
Restricted 324,023,596 362,090,017 38,066,421 11.7%
Unexpended Plant 71,038,077 30,000,000 (41,038,077) ‐57.8%
Subtotal ‐ Expenditures (All Funds) 3,306,983,744 3,540,843,137 233,859,393 7.1%
Reconciling Adjustments:
Tuition Discounting (1,127,204) (1,250,000) (122,796) 10.9%
Depreciation 184,966,495 195,000,000 10,033,505 5.4%
Capital Outlay (90,882,249) (60,993,947) 29,888,302 ‐32.9%
Transfers for Debt Service ‐ Principal (71,287,250) (14,815,000) 56,472,250 ‐79.2%Total Expenses (Including Transfers for Interest) $ 3,328,653,536 3,658,784,190 330,130,654 9.9%
Note: Operating Budget Highlights with a glossary of terms are included on Page 1.
U. T. System Office of Budget and Planning 64
THE UNIVERSITY OF TEXAS
MEDICAL BRANCH
AT GALVESTON
U. T. System Office of Budget and Planning 65
The University of Texas Medical Branch at Galveston Operating Budget Highlights
For the Year Ending August 31, 2021 Introduction - Major Goals Addressed by FY 2021 Budget The FY 2021 operating budget of The University of Texas Medical Branch at Galveston allocates resources to ensure continued support for the University’s mission, which is to improve health for the people of Texas and around the world by: offering innovative education and training; pursuing cutting edge research; and providing the highest quality patient care. U. T. Medical Branch ‐ Galveston’s strategic plan serves as the blueprint for the University’s annual scope of work, and includes detailed goals and actions, timelines, and leader assignments. In general, the strategic plan focuses on four broad areas of achievement related to people, value, strategic growth, and management and resources. The FY 2021 budget represents the University’s proposed financial plan for the upcoming fiscal year; however, the short and long‐term financial implications that the COVID‐19 pandemic will have on the University’s hospital and clinic operations remain largely unknown. Addressing “people” as an area of focus, the FY 2021 operating budget attempts to consider the impact to faculty, staff, students, and patients due to potential revenue losses associated with COVID‐19. It is clear that the University will need to streamline expenses to align with fluctuations in revenue, which will require close and careful management throughout the year. Regarding strategies related to “value,” U. T. Medical Branch ‐ Galveston intends to streamline systems, improve outcomes, and deliver the best health care and patient support services in FY 2021. Nationally, clinical reimbursement from commercial and governmental payors is expected to remain essentially flat or even decline; therefore, the University will continue to identify and capitalize upon strategies to enhance revenues and reduce expenses so as to meet its budget and maintain an appropriate margin. Advancing the work of U. T. Medical Branch ‐ Galveston as a “High‐Value Practicing Organization” through the Best Care initiative, the University will continue to promote evidence‐based, high‐value approaches to avoid unnecessary expenses. This work includes reducing variations in clinical care such as: antibiotic management, blood product usage, opioid stewardship, length of stay, and supply, device, lab, and imaging utilization. The University’s “growth” strategies in FY 2021 call for strengthening its competitive position in key markets such as League City, Clear Lake, the Bay Area, and the region of Southeast Texas. Clinical strategic priorities for those markets include: Primary Care, Orthopedics, Gastroenterology, Cardiology, Women’s and Children’s services, and Neurosciences as well as the expansion of digital health. Growth initiatives also include increasing utilization of University hospitals and clinics in League City, Clear Lake, and throughout the Bay Area. The University also plans to leverage those assets to advance its educational and research missions. The FY 2021 budget also considers growth opportunities within its established partnerships with The University of Texas M. D. Anderson Cancer Center, The University of Texas Health Science Center at Houston, and the Memorial Hermann Health System. U. T. Medical Branch ‐ Galveston will continue to advance its research strategic plan to ensure maximum utilization of Biosafety level 4 (BSL4) and Galveston National Laboratory resources. The University will also continue to play a leadership role in developing therapeutics and vaccines to mitigate or eradicate the COVID‐19 disease. To that end, U. T. Medical Branch ‐ Galveston was among the first in the state to provide mass testing for the disease with prompt reporting capabilities; at this time, the University has provided testing to patients in approximately two‐thirds of the counties across Texas. Regarding strategies related to “resources,” the FY 2021 operating budget requires significant efficiency gains across all areas. The University will optimize its existing forecasting, decision support, and financial management infrastructure, backed by measurable action plans, to achieve the planned financial results for FY 2021 and future years. Revenue Total budgeted operating revenue for FY 2021 reflects a decrease of $71.0 million (3.5 percent) from the FY 2020 budget, primarily related to the fluid state of healthcare services in response to COVID‐19. Expenses Total budgeted operating expenses for FY 2021 reflect a decrease of $100.2 million (4.1 percent) from the prior year, primarily attributable to efficient management of variable expenses. Increases in depreciation expense are related to the League City Campus expansion and substantial completion of the John Sealy Hospital modernization.
U. T. System Office of Budget and Planning 66

The University of Texas Medical Branch at Galveston
Operating Budget
Fiscal Year Ending August 31, 2021
Budget
FY 2020 FY 2021 Increases (Decreases)
FY 2020 Adjusted Operating From 2020 to 2021
Projected Budget Budget Amount Percent
Operating Revenues:
Tuition and Fees $ 49,497,895 47,037,063 52,706,468 5,669,405 12.1%
Less Discounts and Allowances (3,882,018) (1,532,906) (4,133,660) (2,600,754) 169.7%
Federal Sponsored Programs 125,637,583 125,692,546 123,054,542 (2,638,004) ‐2.1%
State Sponsored Programs 11,759,476 11,764,620 11,630,025 (134,595) ‐1.1%
Local and Private Sponsored Programs 64,574,639 64,602,888 63,863,789 (739,099) ‐1.1%
Net Sales and Services of Educational Activities 14,403,387 14,409,688 14,244,832 (164,856) ‐1.1%
Net Sales and Services of Hospital and Clinics 1,298,697,198 1,443,184,779 1,382,268,646 (60,916,133) ‐4.2%
Net Professional Fees 203,661,962 231,120,297 219,350,010 (11,770,287) ‐5.1%
Net Auxiliary Enterprises 15,951,720 13,709,881 16,821,330 3,111,449 22.7%
Other Operating Revenues 92,690,255 53,199,180 52,389,419 (809,761) ‐1.5%
Total Operating Revenues 1,872,992,097 2,003,188,036 1,932,195,401 (70,992,635) ‐3.5%
Operating Expenses:
Compensation ‐ Faculty 198,501,914 199,562,879 199,562,879 ‐ 0.0%
Compensation ‐ Non‐Faculty 831,981,414 856,238,420 794,533,447 (61,704,973) ‐7.2%
Wages 101,573,308 86,148,419 103,053,009 16,904,590 19.6%
Benefits 315,762,515 364,879,094 298,939,775 (65,939,319) ‐18.1%
Personnel Costs 1,447,819,151 1,506,828,812 1,396,089,110 (110,739,702) ‐7.3%
Utilities 35,552,809 32,019,482 34,540,236 2,520,754 7.9%
Scholarships and Fellowships 9,723,627 6,323,525 10,930,565 4,607,040 72.9%
Less Discounts and Allowances (3,882,018) (1,532,906) (4,133,660) (2,600,754) 169.7%
Operations, Maintenance and Travel 751,337,281 794,041,838 780,274,557 (13,767,281) ‐1.7%
Less Capitalized Portion (57,029,282) (107,512,291) (90,429,318) 17,082,973 ‐15.9%
Depreciation and Amortization 194,600,114 201,323,474 203,992,172 2,668,698 1.3%
Total Operating Expenses 2,378,121,682 2,431,491,934 2,331,263,662 (100,228,272) ‐4.1%
Operating Surplus/Deficit (505,129,585) (428,303,898) (399,068,261) 29,235,637 ‐6.8%
Budgeted Nonoperating Revenues (Expenses):
State Appropriations 384,298,285 380,513,162 383,862,638 3,349,476 0.9%
Federal Sponsored Programs (Nonoperating) 1,004,954 1,004,954 1,200,000 195,046 19.4%
State/Local Sponsored Programs (Nonoperating) ‐ ‐ ‐ ‐ ‐
Gifts in Support of Operations 10,299,337 6,967,744 7,995,668 1,027,924 14.8%
Net Investment Income 63,090,446 63,910,461 58,420,677 (5,489,784) ‐8.6%
Other Non‐Operating Revenue ‐ ‐ ‐ ‐ ‐
Other Non‐Operating (Expenses) ‐ ‐ ‐ ‐ ‐
Net Non‐Operating Revenue/(Expenses) 458,693,022 452,396,321 451,478,983 (917,338) ‐0.2%
Transfers and Other:
AUF Transfers Received for Operations ‐ ‐ ‐ ‐ ‐
AUF Transfers (Made) for Operations ‐ ‐ ‐ ‐ ‐
Transfers for Debt Service ‐ Interest (32,124,249) (33,799,922) (33,704,722) 95,200 ‐0.3%
Total Transfers and Other (32,124,249) (33,799,922) (33,704,722) 95,200 ‐0.3%
Budget Margin (Deficit) (78,560,812) (9,707,499) 18,706,000 28,413,499 ‐292.7%
Reconciliation to Change in Net Position:
Net Non‐Profit Health Corp Activity ‐ ‐ ‐ ‐ ‐
Net Inc./(Dec.) in Fair Value of Investments ‐ ‐ ‐ ‐ ‐
Interest Expense on Capital Asset Financings ‐ ‐ ‐ ‐ ‐
Capital Approp., Gifts and Sponsored Programs 37,625,840 49,412,715 37,339,156 (12,073,559) ‐24.4%
Additions to Permanent Endowments 4,863,412 2,934,000 3,967,000 1,033,000 35.2%
Transfers for Debt Service ‐ Principal (67,411,000) (61,405,000) (15,606,000) 45,799,000 ‐74.6%
Reverse Transfers for Debt Service (System Only) ‐ ‐ ‐ ‐ ‐
Transfers and Other 202,044,547 207,277,618 63,339,723 (143,937,895) ‐69.4%SRECNP Change in Net Position $ 98,561,987 188,511,834 107,745,879 (80,765,955) ‐42.8%
Total Revenues and AUF Transfers $ 2,331,685,119 2,455,584,357 2,383,674,384 (71,909,973) ‐2.9%
Total Expenses (Including Transfers for Interest) (2,410,245,931) (2,465,291,856) (2,364,968,384) 100,323,472 ‐4.1%Budget Margin (Deficit) $ (78,560,812) (9,707,499) 18,706,000 28,413,499
Reconciliation to Use of Prior Year Balances
Depreciation 201,323,474 203,992,172
Capital Outlay (107,512,291) (90,429,318)
Transfers for Debt Service ‐ Principal (61,405,000) (15,606,000)
Budgeted Transfers ‐ ‐
Net Additions to (Uses of) Prior Year Balances 22,698,684 116,662,854
Note: Operating Budget Highlights with a glossary of terms are included on Page 1.
U. T. System Office of Budget and Planning 67

The University of Texas Medical Branch at Galveston
Operating Budget ‐ Operating Expenses by Function
Fiscal Year Ending August 31, 2021
Budget
FY 2020 FY 2021 Increases (Decreases)
FY 2020 Adjusted Operating From 2020 to 2021
Projected Budget Budget Amount Percent
Operating Expenses:
Instruction $ 362,179,337 370,130,313 354,389,099 (15,741,214) ‐4.3%
Academic Support 45,355,284 43,025,701 44,379,722 1,354,021 3.1%
Research 112,750,269 108,024,534 110,325,085 2,300,551 2.1%
Public Service 13,038,557 13,357,200 12,758,106 (599,094) ‐4.5%
Hospitals and Clinics 1,489,450,853 1,529,899,417 1,457,413,752 (72,485,665) ‐4.7%
Institutional Support 72,477,959 79,177,459 70,919,006 (8,258,453) ‐10.4%
Student Services 6,646,079 7,372,489 6,503,126 (869,363) ‐11.8%
Operations and Maintenance of Plant 44,977,240 60,461,082 44,009,809 (16,451,273) ‐27.2%
Scholarships and Fellowships 10,997,274 5,657,842 10,760,732 5,102,890 90.2%
Auxiliary Enterprises 16,256,658 13,062,423 15,813,053 2,750,630 21.1%
Depreciation and Amortization 203,992,172 201,323,474 203,992,172 2,668,698 1.3%Total Operating Expenses $ 2,378,121,682 2,431,491,934 2,331,263,662 (100,228,272) ‐4.1%
Operating Budget ‐ Expenditures by Fund
Fiscal Year Ending August 31, 2021
Budget
FY 2020 FY 2021 Increases (Decreases)
Adjusted Operating From 2020 to 2021
Budget Budget Amount Percent
Educational and General $ 967,620,654 820,865,091 (146,755,563) ‐15.2%
Designated 1,191,302,203 1,192,131,210 829,007 0.1%
Auxiliary 14,565,193 16,412,542 1,847,349 12.7%
Available University Fund ‐ ‐ ‐ ‐
Restricted 161,706,311 159,034,767 (2,671,544) ‐1.7%
Unexpended Plant 99,224,218 82,701,580 (16,522,638) ‐16.7%
Subtotal ‐ Expenditures (All Funds) 2,434,418,579 2,271,145,190 (163,273,389) ‐6.7%
Reconciling Adjustments:
Tuition Discounting (1,532,906) (4,133,660) (2,600,754) 169.7%
Depreciation 201,323,474 203,992,172 2,668,698 1.3%
Capital Outlay (107,512,291) (90,429,318) 17,082,973 ‐15.9%
Transfers for Debt Service ‐ Principal (61,405,000) (15,606,000) 45,799,000 ‐74.6%Total Expenses (Including Transfers for Interest) $ 2,465,291,856 2,364,968,384 (100,323,472) ‐4.1%
Note: Operating Budget Highlights with a glossary of terms are included on Page 1.
U. T. System Office of Budget and Planning 68
THE UNIVERSITY OF TEXAS
HEALTH SCIENCE CENTER
AT HOUSTON
U. T. System Office of Budget and Planning 69
The University of Texas Health Science Center at Houston Operating Budget Highlights
For the Year Ending August 31, 2021 Introduction - Major Goals Addressed by FY 2021 Budget The University of Texas Health Science Center at Houston is Houston’s Health University and Texas’ resource for health care education, innovation, scientific discovery, and excellence in patient care. The most comprehensive academic health center in The University of Texas System and the United States Gulf Coast region, U. T. Health Science Center - Houston is home to schools of biomedical informatics, biomedical sciences, dentistry, public health, the Jane and Robert Cizik School of Nursing, and the John P. and Kathrine G. McGovern Medical School. It also includes The University of Texas Harris County Psychiatric Center (HCPC), as well as the growing clinical practices UT Physicians, UT Dentists, and UT Health Services. The Institution continues the strategy of clinical expansion through key recruitments and acquisitions as a means to support the academic and research mission in FY 2021. Much of the limited budget growth is funded by the additional support of primary hospital partners, Memorial Hermann Healthcare System (MHHS), and the Harris County Hospital District (Harris Health), as well as physician-generated revenue. The FY 2021 budget continues to include the 1115 Waiver’s Uncompensated Care and Delivery System Reform Incentive Payment initiatives and the Network Access Improvement Program, which remain critical funding sources of the Institution’s programs designed to provide quality clinical care to the underserved throughout Greater Houston. The FY 2021 budget takes into consideration an ever-evolving education, research, and clinical landscape due to the COVID-19 pandemic and criteria set at the local, state, and federal levels designed to address this crisis. The U. T. Health Science Center - Houston plans to continue offering online instruction, staffing research labs in a manner to allow appropriate social distancing, and expanding telehealth opportunities in FY 2021. In addition, given the successful shift to remote staffing of many administrative activities, the Institution will be reviewing space requirements with a goal of reducing lease space and maximizing the effectiveness of owned facilities. The financial challenge presented by the pandemic in the current year is also driving clinic consolidation, creating expense savings through economies of scale. U. T. Health Science Center - Houston will continue to enhance information technology infrastructure and facilities in FY 2021. The Institution is currently implementing Epic with a May 2021 targeted go live. This major software project will replace the Institution’s current electronic health record and revenue cycle systems and will enhance the patient experience, all while bringing consistency to clinic operations and providing additional opportunities for improvement in revenue cycle management. Administratively, the Institution will be implementing Coupa, the market leader in procure-to-pay software, intended to drive supply chain savings through increased electronic catalogue procurement. The Institution, along with the Texas Department of Health and Human Services Commission (HHSC), broke ground in late FY 2019 on construction of a $125.0 million Continuum of Care Campus that will be funded by the state, owned by HHSC, and operated by HCPC physicians and staff. It will include short- and long-term care options, residential treatment, and add 240 beds to HCPC’s existing 274 beds to create the largest academic psychiatric hospital in the country. The facility is scheduled to open in late FY 2021. Revenue The FY 2021 $1.9 billion revenue budget includes an increase of $72.7 million, or 4.0 percent, in total operating and non-operating revenues over the FY 2020 budget. This is driven by MHHS and Harris Health contract increases of approximately $56.6 million, and an additional $15.2 million in physician practice plan increased net professional fees associated with acquisitions and recruitment efforts, increased faculty productivity, and revenue cycle optimization. Expenses The FY 2021 operating expense budget is projecting a total increase of $74.3 million or 4.1 percent. Compensation for both faculty and non-faculty positions, and the associated benefits, tied to enhanced clinical activities and the transition of Insperity staff positions onto the U. T. Health Science Center - Houston payroll are the main drivers of the increase. It should also be noted that depreciation expense is on the rise and will continue to increase as facilities are improved, information technology infrastructure is implemented, and new buildings come online.
U. T. System Office of Budget and Planning 70
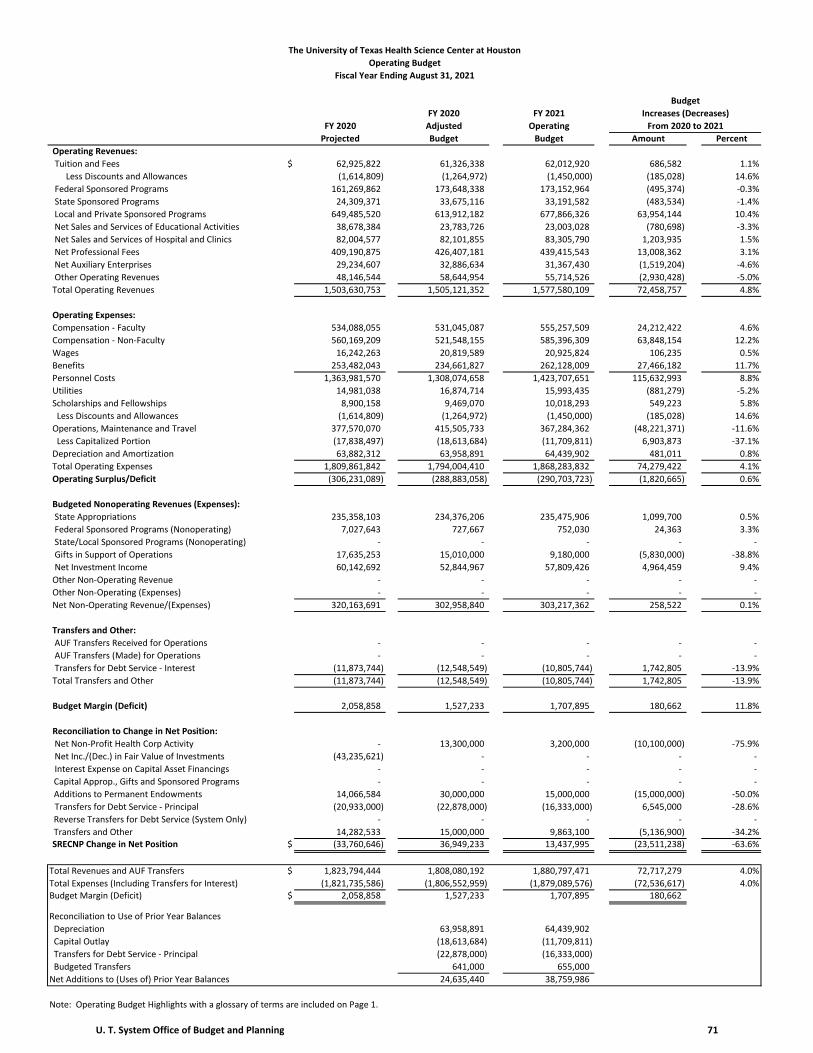
The University of Texas Health Science Center at Houston
Operating Budget
Fiscal Year Ending August 31, 2021
Budget
FY 2020 FY 2021 Increases (Decreases)
FY 2020 Adjusted Operating From 2020 to 2021
Projected Budget Budget Amount Percent
Operating Revenues:
Tuition and Fees $ 62,925,822 61,326,338 62,012,920 686,582 1.1%
Less Discounts and Allowances (1,614,809) (1,264,972) (1,450,000) (185,028) 14.6%
Federal Sponsored Programs 161,269,862 173,648,338 173,152,964 (495,374) ‐0.3%
State Sponsored Programs 24,309,371 33,675,116 33,191,582 (483,534) ‐1.4%
Local and Private Sponsored Programs 649,485,520 613,912,182 677,866,326 63,954,144 10.4%
Net Sales and Services of Educational Activities 38,678,384 23,783,726 23,003,028 (780,698) ‐3.3%
Net Sales and Services of Hospital and Clinics 82,004,577 82,101,855 83,305,790 1,203,935 1.5%
Net Professional Fees 409,190,875 426,407,181 439,415,543 13,008,362 3.1%
Net Auxiliary Enterprises 29,234,607 32,886,634 31,367,430 (1,519,204) ‐4.6%
Other Operating Revenues 48,146,544 58,644,954 55,714,526 (2,930,428) ‐5.0%
Total Operating Revenues 1,503,630,753 1,505,121,352 1,577,580,109 72,458,757 4.8%
Operating Expenses:
Compensation ‐ Faculty 534,088,055 531,045,087 555,257,509 24,212,422 4.6%
Compensation ‐ Non‐Faculty 560,169,209 521,548,155 585,396,309 63,848,154 12.2%
Wages 16,242,263 20,819,589 20,925,824 106,235 0.5%
Benefits 253,482,043 234,661,827 262,128,009 27,466,182 11.7%
Personnel Costs 1,363,981,570 1,308,074,658 1,423,707,651 115,632,993 8.8%
Utilities 14,981,038 16,874,714 15,993,435 (881,279) ‐5.2%
Scholarships and Fellowships 8,900,158 9,469,070 10,018,293 549,223 5.8%
Less Discounts and Allowances (1,614,809) (1,264,972) (1,450,000) (185,028) 14.6%
Operations, Maintenance and Travel 377,570,070 415,505,733 367,284,362 (48,221,371) ‐11.6%
Less Capitalized Portion (17,838,497) (18,613,684) (11,709,811) 6,903,873 ‐37.1%
Depreciation and Amortization 63,882,312 63,958,891 64,439,902 481,011 0.8%
Total Operating Expenses 1,809,861,842 1,794,004,410 1,868,283,832 74,279,422 4.1%
Operating Surplus/Deficit (306,231,089) (288,883,058) (290,703,723) (1,820,665) 0.6%
Budgeted Nonoperating Revenues (Expenses):
State Appropriations 235,358,103 234,376,206 235,475,906 1,099,700 0.5%
Federal Sponsored Programs (Nonoperating) 7,027,643 727,667 752,030 24,363 3.3%
State/Local Sponsored Programs (Nonoperating) ‐ ‐ ‐ ‐ ‐
Gifts in Support of Operations 17,635,253 15,010,000 9,180,000 (5,830,000) ‐38.8%
Net Investment Income 60,142,692 52,844,967 57,809,426 4,964,459 9.4%
Other Non‐Operating Revenue ‐ ‐ ‐ ‐ ‐
Other Non‐Operating (Expenses) ‐ ‐ ‐ ‐ ‐
Net Non‐Operating Revenue/(Expenses) 320,163,691 302,958,840 303,217,362 258,522 0.1%
Transfers and Other:
AUF Transfers Received for Operations ‐ ‐ ‐ ‐ ‐
AUF Transfers (Made) for Operations ‐ ‐ ‐ ‐ ‐
Transfers for Debt Service ‐ Interest (11,873,744) (12,548,549) (10,805,744) 1,742,805 ‐13.9%
Total Transfers and Other (11,873,744) (12,548,549) (10,805,744) 1,742,805 ‐13.9%
Budget Margin (Deficit) 2,058,858 1,527,233 1,707,895 180,662 11.8%
Reconciliation to Change in Net Position:
Net Non‐Profit Health Corp Activity ‐ 13,300,000 3,200,000 (10,100,000) ‐75.9%
Net Inc./(Dec.) in Fair Value of Investments (43,235,621) ‐ ‐ ‐ ‐
Interest Expense on Capital Asset Financings ‐ ‐ ‐ ‐ ‐
Capital Approp., Gifts and Sponsored Programs ‐ ‐ ‐ ‐ ‐
Additions to Permanent Endowments 14,066,584 30,000,000 15,000,000 (15,000,000) ‐50.0%
Transfers for Debt Service ‐ Principal (20,933,000) (22,878,000) (16,333,000) 6,545,000 ‐28.6%
Reverse Transfers for Debt Service (System Only) ‐ ‐ ‐ ‐ ‐
Transfers and Other 14,282,533 15,000,000 9,863,100 (5,136,900) ‐34.2%SRECNP Change in Net Position $ (33,760,646) 36,949,233 13,437,995 (23,511,238) ‐63.6%
Total Revenues and AUF Transfers $ 1,823,794,444 1,808,080,192 1,880,797,471 72,717,279 4.0%
Total Expenses (Including Transfers for Interest) (1,821,735,586) (1,806,552,959) (1,879,089,576) (72,536,617) 4.0%Budget Margin (Deficit) $ 2,058,858 1,527,233 1,707,895 180,662
Reconciliation to Use of Prior Year Balances
Depreciation 63,958,891 64,439,902
Capital Outlay (18,613,684) (11,709,811)
Transfers for Debt Service ‐ Principal (22,878,000) (16,333,000)
Budgeted Transfers 641,000 655,000
Net Additions to (Uses of) Prior Year Balances 24,635,440 38,759,986
Note: Operating Budget Highlights with a glossary of terms are included on Page 1.
U. T. System Office of Budget and Planning 71

The University of Texas Health Science Center at Houston
Operating Budget ‐ Operating Expenses by Function
Fiscal Year Ending August 31, 2021
Budget
FY 2020 FY 2021 Increases (Decreases)
FY 2020 Adjusted Operating From 2020 to 2021
Projected Budget Budget Amount Percent
Operating Expenses:
Instruction $ 798,940,703 791,940,639 814,504,981 22,564,342 2.8%
Academic Support 66,927,477 66,341,080 67,811,703 1,470,623 2.2%
Research 219,302,122 217,380,667 214,934,440 (2,446,227) ‐1.1%
Public Service 40,287,016 39,934,034 39,545,910 (388,124) ‐1.0%
Hospitals and Clinics 457,077,002 453,072,239 509,056,463 55,984,224 12.4%
Institutional Support 84,010,945 83,274,868 83,467,133 192,265 0.2%
Student Services 11,543,641 11,442,499 11,741,840 299,341 2.6%
Operations and Maintenance of Plant 39,508,193 39,162,035 37,147,762 (2,014,273) ‐5.1%
Scholarships and Fellowships 8,276,615 8,204,098 8,568,293 364,195 4.4%
Auxiliary Enterprises 19,463,896 19,293,360 17,065,405 (2,227,955) ‐11.5%
Depreciation and Amortization 64,524,232 63,958,891 64,439,902 481,011 0.8%Total Operating Expenses $ 1,809,861,842 1,794,004,410 1,868,283,832 74,279,422 4.1%
Operating Budget ‐ Expenditures by Fund
Fiscal Year Ending August 31, 2021
Budget
FY 2020 FY 2021 Increases (Decreases)
Adjusted Operating From 2020 to 2021
Budget Budget Amount Percent
Educational and General $ 322,320,695 323,790,609 1,469,914 0.5%
Designated 1,158,097,609 1,224,141,882 66,044,273 5.7%
Auxiliary 24,692,052 20,231,838 (4,460,214) ‐18.1%
Available University Fund ‐ ‐ ‐ ‐
Restricted 280,240,368 275,978,156 (4,262,212) ‐1.5%
Unexpended Plant ‐ ‐ ‐ ‐
Subtotal ‐ Expenditures (All Funds) 1,785,350,724 1,844,142,485 58,791,761 3.3%
Reconciling Adjustments:
Tuition Discounting (1,264,972) (1,450,000) (185,028) 14.6%
Depreciation 63,958,891 64,439,902 481,011 0.8%
Capital Outlay (18,613,684) (11,709,811) 6,903,873 ‐37.1%
Transfers for Debt Service ‐ Principal (22,878,000) (16,333,000) 6,545,000 ‐28.6%Total Expenses (Including Transfers for Interest) $ 1,806,552,959 1,879,089,576 72,536,617 4.0%
Note: Operating Budget Highlights with a glossary of terms are included on Page 1.
U. T. System Office of Budget and Planning 72
THE UNIVERSITY OF TEXAS
HEALTH SCIENCE CENTER
AT SAN ANTONIO
U. T. System Office of Budget and Planning 73
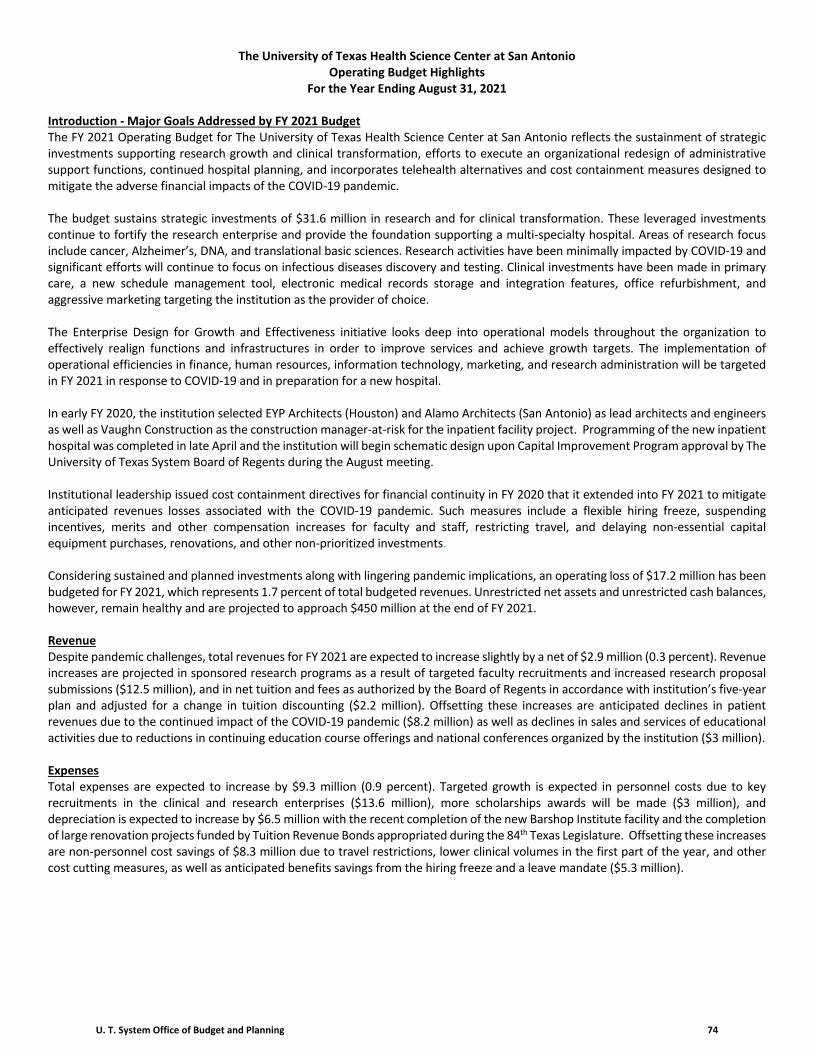
The University of Texas Health Science Center at San Antonio Operating Budget Highlights
For the Year Ending August 31, 2021 Introduction - Major Goals Addressed by FY 2021 Budget The FY 2021 Operating Budget for The University of Texas Health Science Center at San Antonio reflects the sustainment of strategic investments supporting research growth and clinical transformation, efforts to execute an organizational redesign of administrative support functions, continued hospital planning, and incorporates telehealth alternatives and cost containment measures designed to mitigate the adverse financial impacts of the COVID-19 pandemic. The budget sustains strategic investments of $31.6 million in research and for clinical transformation. These leveraged investments continue to fortify the research enterprise and provide the foundation supporting a multi-specialty hospital. Areas of research focus include cancer, Alzheimer’s, DNA, and translational basic sciences. Research activities have been minimally impacted by COVID-19 and significant efforts will continue to focus on infectious diseases discovery and testing. Clinical investments have been made in primary care, a new schedule management tool, electronic medical records storage and integration features, office refurbishment, and aggressive marketing targeting the institution as the provider of choice. The Enterprise Design for Growth and Effectiveness initiative looks deep into operational models throughout the organization to effectively realign functions and infrastructures in order to improve services and achieve growth targets. The implementation of operational efficiencies in finance, human resources, information technology, marketing, and research administration will be targeted in FY 2021 in response to COVID-19 and in preparation for a new hospital. In early FY 2020, the institution selected EYP Architects (Houston) and Alamo Architects (San Antonio) as lead architects and engineers as well as Vaughn Construction as the construction manager-at-risk for the inpatient facility project. Programming of the new inpatient hospital was completed in late April and the institution will begin schematic design upon Capital Improvement Program approval by The University of Texas System Board of Regents during the August meeting. Institutional leadership issued cost containment directives for financial continuity in FY 2020 that it extended into FY 2021 to mitigate anticipated revenues losses associated with the COVID-19 pandemic. Such measures include a flexible hiring freeze, suspending incentives, merits and other compensation increases for faculty and staff, restricting travel, and delaying non-essential capital equipment purchases, renovations, and other non-prioritized investments. Considering sustained and planned investments along with lingering pandemic implications, an operating loss of $17.2 million has been budgeted for FY 2021, which represents 1.7 percent of total budgeted revenues. Unrestricted net assets and unrestricted cash balances, however, remain healthy and are projected to approach $450 million at the end of FY 2021. Revenue Despite pandemic challenges, total revenues for FY 2021 are expected to increase slightly by a net of $2.9 million (0.3 percent). Revenue increases are projected in sponsored research programs as a result of targeted faculty recruitments and increased research proposal submissions ($12.5 million), and in net tuition and fees as authorized by the Board of Regents in accordance with institution’s five-year plan and adjusted for a change in tuition discounting ($2.2 million). Offsetting these increases are anticipated declines in patient revenues due to the continued impact of the COVID-19 pandemic ($8.2 million) as well as declines in sales and services of educational activities due to reductions in continuing education course offerings and national conferences organized by the institution ($3 million). Expenses Total expenses are expected to increase by $9.3 million (0.9 percent). Targeted growth is expected in personnel costs due to key recruitments in the clinical and research enterprises ($13.6 million), more scholarships awards will be made ($3 million), and depreciation is expected to increase by $6.5 million with the recent completion of the new Barshop Institute facility and the completion of large renovation projects funded by Tuition Revenue Bonds appropriated during the 84th Texas Legislature. Offsetting these increases are non-personnel cost savings of $8.3 million due to travel restrictions, lower clinical volumes in the first part of the year, and other cost cutting measures, as well as anticipated benefits savings from the hiring freeze and a leave mandate ($5.3 million).
U. T. System Office of Budget and Planning 74
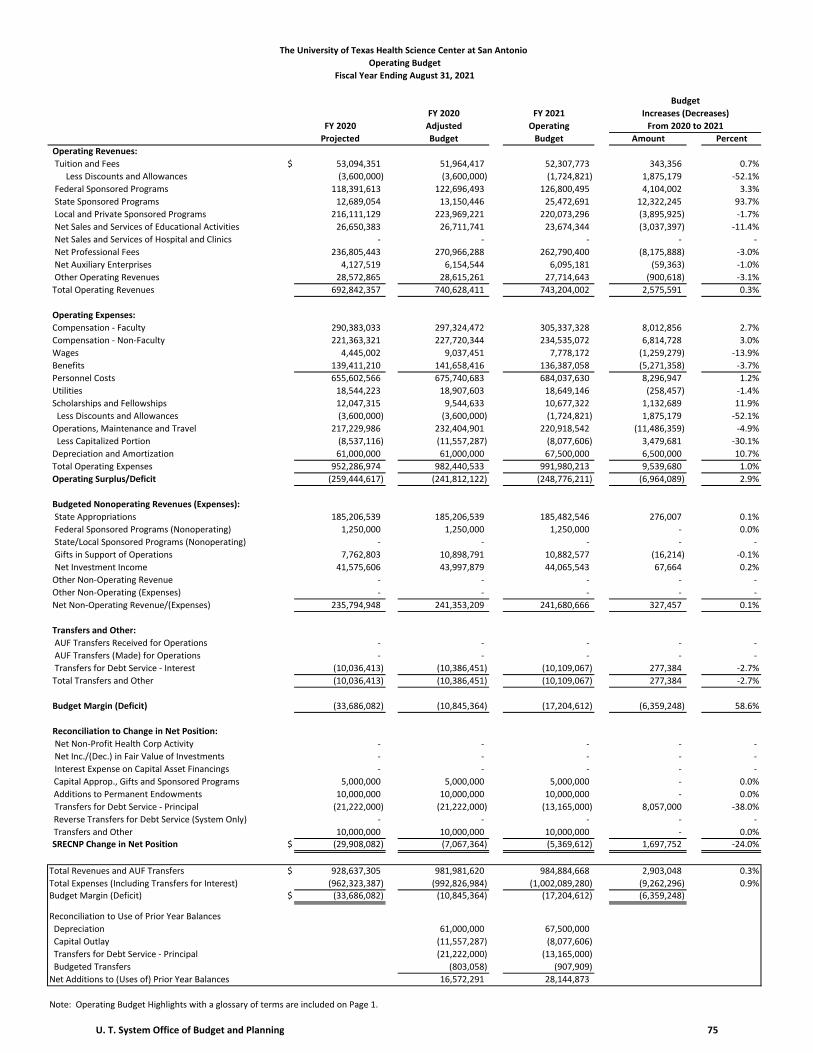
The University of Texas Health Science Center at San Antonio
Operating Budget
Fiscal Year Ending August 31, 2021
Budget
FY 2020 FY 2021 Increases (Decreases)
FY 2020 Adjusted Operating From 2020 to 2021
Projected Budget Budget Amount Percent
Operating Revenues:
Tuition and Fees $ 53,094,351 51,964,417 52,307,773 343,356 0.7%
Less Discounts and Allowances (3,600,000) (3,600,000) (1,724,821) 1,875,179 ‐52.1%
Federal Sponsored Programs 118,391,613 122,696,493 126,800,495 4,104,002 3.3%
State Sponsored Programs 12,689,054 13,150,446 25,472,691 12,322,245 93.7%
Local and Private Sponsored Programs 216,111,129 223,969,221 220,073,296 (3,895,925) ‐1.7%
Net Sales and Services of Educational Activities 26,650,383 26,711,741 23,674,344 (3,037,397) ‐11.4%
Net Sales and Services of Hospital and Clinics ‐ ‐ ‐ ‐ ‐
Net Professional Fees 236,805,443 270,966,288 262,790,400 (8,175,888) ‐3.0%
Net Auxiliary Enterprises 4,127,519 6,154,544 6,095,181 (59,363) ‐1.0%
Other Operating Revenues 28,572,865 28,615,261 27,714,643 (900,618) ‐3.1%
Total Operating Revenues 692,842,357 740,628,411 743,204,002 2,575,591 0.3%
Operating Expenses:
Compensation ‐ Faculty 290,383,033 297,324,472 305,337,328 8,012,856 2.7%
Compensation ‐ Non‐Faculty 221,363,321 227,720,344 234,535,072 6,814,728 3.0%
Wages 4,445,002 9,037,451 7,778,172 (1,259,279) ‐13.9%
Benefits 139,411,210 141,658,416 136,387,058 (5,271,358) ‐3.7%
Personnel Costs 655,602,566 675,740,683 684,037,630 8,296,947 1.2%
Utilities 18,544,223 18,907,603 18,649,146 (258,457) ‐1.4%
Scholarships and Fellowships 12,047,315 9,544,633 10,677,322 1,132,689 11.9%
Less Discounts and Allowances (3,600,000) (3,600,000) (1,724,821) 1,875,179 ‐52.1%
Operations, Maintenance and Travel 217,229,986 232,404,901 220,918,542 (11,486,359) ‐4.9%
Less Capitalized Portion (8,537,116) (11,557,287) (8,077,606) 3,479,681 ‐30.1%
Depreciation and Amortization 61,000,000 61,000,000 67,500,000 6,500,000 10.7%
Total Operating Expenses 952,286,974 982,440,533 991,980,213 9,539,680 1.0%
Operating Surplus/Deficit (259,444,617) (241,812,122) (248,776,211) (6,964,089) 2.9%
Budgeted Nonoperating Revenues (Expenses):
State Appropriations 185,206,539 185,206,539 185,482,546 276,007 0.1%
Federal Sponsored Programs (Nonoperating) 1,250,000 1,250,000 1,250,000 ‐ 0.0%
State/Local Sponsored Programs (Nonoperating) ‐ ‐ ‐ ‐ ‐
Gifts in Support of Operations 7,762,803 10,898,791 10,882,577 (16,214) ‐0.1%
Net Investment Income 41,575,606 43,997,879 44,065,543 67,664 0.2%
Other Non‐Operating Revenue ‐ ‐ ‐ ‐ ‐
Other Non‐Operating (Expenses) ‐ ‐ ‐ ‐ ‐
Net Non‐Operating Revenue/(Expenses) 235,794,948 241,353,209 241,680,666 327,457 0.1%
Transfers and Other:
AUF Transfers Received for Operations ‐ ‐ ‐ ‐ ‐
AUF Transfers (Made) for Operations ‐ ‐ ‐ ‐ ‐
Transfers for Debt Service ‐ Interest (10,036,413) (10,386,451) (10,109,067) 277,384 ‐2.7%
Total Transfers and Other (10,036,413) (10,386,451) (10,109,067) 277,384 ‐2.7%
Budget Margin (Deficit) (33,686,082) (10,845,364) (17,204,612) (6,359,248) 58.6%
Reconciliation to Change in Net Position:
Net Non‐Profit Health Corp Activity ‐ ‐ ‐ ‐ ‐
Net Inc./(Dec.) in Fair Value of Investments ‐ ‐ ‐ ‐ ‐
Interest Expense on Capital Asset Financings ‐ ‐ ‐ ‐ ‐
Capital Approp., Gifts and Sponsored Programs 5,000,000 5,000,000 5,000,000 ‐ 0.0%
Additions to Permanent Endowments 10,000,000 10,000,000 10,000,000 ‐ 0.0%
Transfers for Debt Service ‐ Principal (21,222,000) (21,222,000) (13,165,000) 8,057,000 ‐38.0%
Reverse Transfers for Debt Service (System Only) ‐ ‐ ‐ ‐ ‐
Transfers and Other 10,000,000 10,000,000 10,000,000 ‐ 0.0%SRECNP Change in Net Position $ (29,908,082) (7,067,364) (5,369,612) 1,697,752 ‐24.0%
Total Revenues and AUF Transfers $ 928,637,305 981,981,620 984,884,668 2,903,048 0.3%
Total Expenses (Including Transfers for Interest) (962,323,387) (992,826,984) (1,002,089,280) (9,262,296) 0.9%Budget Margin (Deficit) $ (33,686,082) (10,845,364) (17,204,612) (6,359,248)
Reconciliation to Use of Prior Year Balances
Depreciation 61,000,000 67,500,000
Capital Outlay (11,557,287) (8,077,606)
Transfers for Debt Service ‐ Principal (21,222,000) (13,165,000)
Budgeted Transfers (803,058) (907,909)
Net Additions to (Uses of) Prior Year Balances 16,572,291 28,144,873
Note: Operating Budget Highlights with a glossary of terms are included on Page 1.
U. T. System Office of Budget and Planning 75
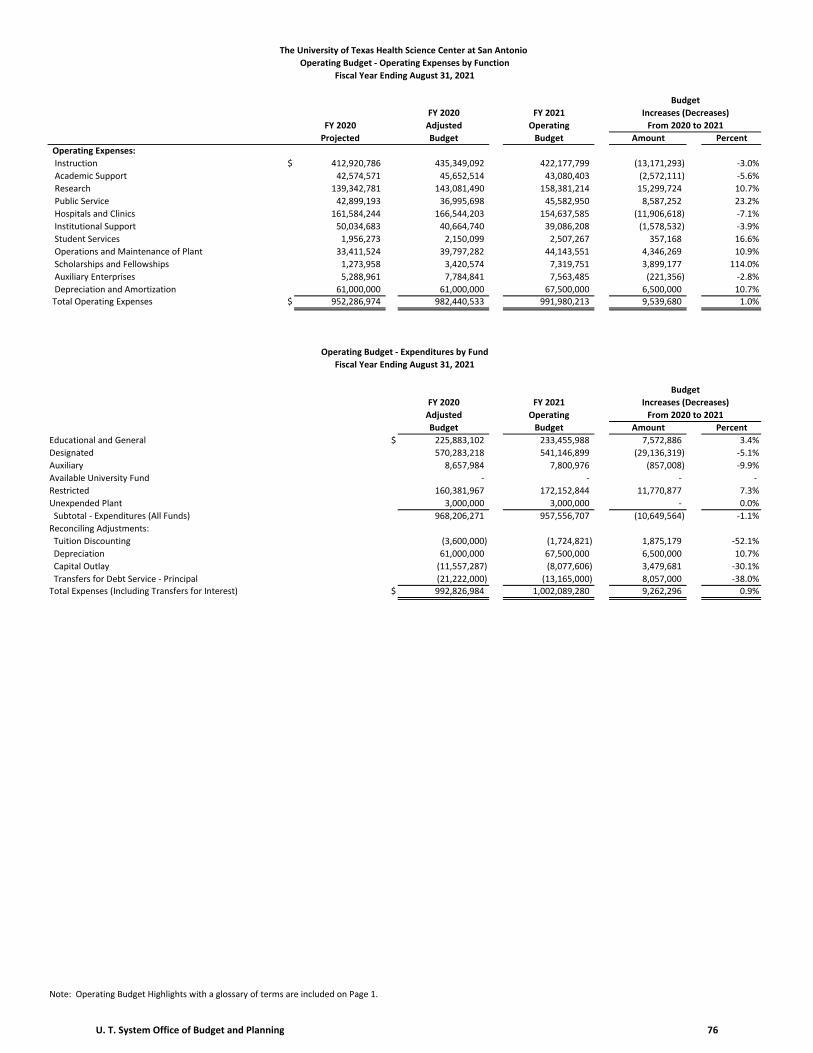
The University of Texas Health Science Center at San Antonio
Operating Budget ‐ Operating Expenses by Function
Fiscal Year Ending August 31, 2021
Budget
FY 2020 FY 2021 Increases (Decreases)
FY 2020 Adjusted Operating From 2020 to 2021
Projected Budget Budget Amount Percent
Operating Expenses:
Instruction $ 412,920,786 435,349,092 422,177,799 (13,171,293) ‐3.0%
Academic Support 42,574,571 45,652,514 43,080,403 (2,572,111) ‐5.6%
Research 139,342,781 143,081,490 158,381,214 15,299,724 10.7%
Public Service 42,899,193 36,995,698 45,582,950 8,587,252 23.2%
Hospitals and Clinics 161,584,244 166,544,203 154,637,585 (11,906,618) ‐7.1%
Institutional Support 50,034,683 40,664,740 39,086,208 (1,578,532) ‐3.9%
Student Services 1,956,273 2,150,099 2,507,267 357,168 16.6%
Operations and Maintenance of Plant 33,411,524 39,797,282 44,143,551 4,346,269 10.9%
Scholarships and Fellowships 1,273,958 3,420,574 7,319,751 3,899,177 114.0%
Auxiliary Enterprises 5,288,961 7,784,841 7,563,485 (221,356) ‐2.8%
Depreciation and Amortization 61,000,000 61,000,000 67,500,000 6,500,000 10.7%Total Operating Expenses $ 952,286,974 982,440,533 991,980,213 9,539,680 1.0%
Operating Budget ‐ Expenditures by Fund
Fiscal Year Ending August 31, 2021
Budget
FY 2020 FY 2021 Increases (Decreases)
Adjusted Operating From 2020 to 2021
Budget Budget Amount Percent
Educational and General $ 225,883,102 233,455,988 7,572,886 3.4%
Designated 570,283,218 541,146,899 (29,136,319) ‐5.1%
Auxiliary 8,657,984 7,800,976 (857,008) ‐9.9%
Available University Fund ‐ ‐ ‐ ‐
Restricted 160,381,967 172,152,844 11,770,877 7.3%
Unexpended Plant 3,000,000 3,000,000 ‐ 0.0%
Subtotal ‐ Expenditures (All Funds) 968,206,271 957,556,707 (10,649,564) ‐1.1%
Reconciling Adjustments:
Tuition Discounting (3,600,000) (1,724,821) 1,875,179 ‐52.1%
Depreciation 61,000,000 67,500,000 6,500,000 10.7%
Capital Outlay (11,557,287) (8,077,606) 3,479,681 ‐30.1%
Transfers for Debt Service ‐ Principal (21,222,000) (13,165,000) 8,057,000 ‐38.0%Total Expenses (Including Transfers for Interest) $ 992,826,984 1,002,089,280 9,262,296 0.9%
Note: Operating Budget Highlights with a glossary of terms are included on Page 1.
U. T. System Office of Budget and Planning 76
THE UNIVERSITY OF TEXAS
M. D. ANDERSON
CANCER CENTER
U. T. System Office of Budget and Planning 77
The University of Texas M. D. Anderson Cancer Center Operating Budget Highlights
For the Year Ending August 31, 2021 Introduction - Major Goals Addressed by FY 2021 Budget Under the leadership of Dr. Peter Pisters and the Executive Leadership Team, The University of Texas M. D. Anderson Cancer Center restored the deemed status with the Centers for Medicare and Medicaid Services, completed a successful accreditation from The Joint Commission, and took unprecedented steps to protect patients, workforce, and community due to the COVID-19 pandemic. The overarching goals during the pandemic have been to: 1) Protect patients by implementing enhanced infection prevention protocols and procedures, creating a protective barrier around clinical areas, further expansion of virtual care platforms and asymptomatic testing, continued screening vigilance at entries, and limitation of on-campus traffic to a subset of employees absolutely needed for patient care. 2) Ensure the health of the workforce by continuing remote work, wherever possible, supporting the physical, mental, emotional, and economic well-being of employees, encouraging them to stay safe by following universal precautions (including handwashing, masking, self-monitoring, and social distancing) and offering testing for all employees upon request. 3) Reduce the impact of COVID-19 on the community by maintaining bed capacity and staff preparedness for an unexpected surge, providing access to rapid testing results for Harris Health System and Texas Division of Emergency Management, offering expert insight to local and state leaders on public health issues, and working with city, county and state officials to advise on response and recovery efforts. The Institution began a phased, data driven approach to safely resume patient care volumes in early May. This initially included the strategic reopening of Lymphoma/Myeloma and Surgery, the flexible recovery of Radiation Oncology, and the targeted reopening of Pediatrics. It subsequently included guidance to all other service lines and to downstream services on the process, timing, and goals of reopening. The goal of the recovery plan is to achieve 100 percent pre-COVID-19 levels by November 1, 2020, by addressing backlogs of deferred patient activity; providing outstanding care for all patients via prevention, treatments, trials; and by optimizing patient and provider experience with virtual tools and other technologies. U. T. M. D. Anderson made the very difficult decision to suspend all laboratory research activities and most clinical trials, except those deemed as essential by department chairs and the chief scientific officer by close of business March 24, 2020. This involved clinical research staff all working remotely, patients continuing on a small number of trials if they were deriving benefit, and limited trials open to new patient enrollment. As the Institution adapts to the endemic COVID-19, the research team is implementing a data-driven approach to gradually resume clinical trials to pre-COVID-19 levels and reopen laboratory research. The patient care and research recovery efforts are proceeding with the understanding that it will closely monitor the number of COVID-19 positive cases in the community and within patient and employee populations that the Institution is committed to protect and that a throttle down or scale-back activity will occur if and when needed, based on certain macro-level metrics that have been identified. For the incoming fall semester, the School of Health Professions will maintain didactic courses via hybrid on-line delivery. The Institution is moving forward to reopen student teaching and both research and student labs, which will be ready by the fall semester. FY 2021 will see the completion of U. T. M. D. Anderson’s strategic plan, with execution commencing in the first quarter. Strategic areas include expanding access or reach of U. T. M. D. Anderson services with particular focus on Houston and the State of Texas, continuing to invest in patient care, education, research, and prevention breakthroughs and preparing for payment disruption by continuing to focus on value, cost efficiency, productivity, and transparency. Capabilities include a focus on workforce and culture, data driven intelligence and partnerships with U. T. System institutions, with initial emphasis on partnership with The University of Texas at Austin. Revenue FY 2021 operating revenue is projected to stay relatively flat over levels budgeted for FY 2020. It includes increases in hospital, practice plan and sponsored program revenues offset with decreases in other operating revenue and Auxiliary Enterprises due to impacts to Dining Services, Parking and Rotary House. State Appropriations were budgeted at FY 2020 levels, made possible by the State’s recent decision to exclude HRIs from the 5 percent reduction in the current biennium, for which the Institution is immensely grateful. Expenses The FY 2021 total budgeted operating expenses are projected to increase by 3.3 percent or $168 million over the level budgeted for FY 2020. It includes increases in medical and drug supplies and filling some positions that have been on hold in FY 2020 to support the increased clinical, research, and educational activities of the Institution. It does not include merit increases for staff and faculty.
U. T. System Office of Budget and Planning 78

The University of Texas M. D. Anderson Cancer Center
Operating Budget
Fiscal Year Ending August 31, 2021
Budget
FY 2020 FY 2021 Increases (Decreases)
FY 2020 Adjusted Operating From 2020 to 2021
Projected Budget Budget Amount Percent
Operating Revenues:
Tuition and Fees $ 1,929,388 1,851,747 1,929,388 77,641 4.2%
Less Discounts and Allowances (10,000) (15,531) (10,000) 5,531 ‐35.6%
Federal Sponsored Programs 197,376,714 184,382,893 183,560,344 (822,549) ‐0.4%
State Sponsored Programs 43,963,236 49,456,203 44,687,648 (4,768,555) ‐9.6%
Local and Private Sponsored Programs 207,282,467 161,958,134 178,481,396 16,523,262 10.2%
Net Sales and Services of Educational Activities 2,500,000 2,239,249 2,300,000 60,751 2.7%
Net Sales and Services of Hospital and Clinics 4,008,183,354 4,216,411,789 4,278,462,376 62,050,587 1.5%
Net Professional Fees 409,479,584 503,148,355 458,237,637 (44,910,718) ‐8.9%
Net Auxiliary Enterprises 34,120,900 47,011,054 29,857,300 (17,153,754) ‐36.5%
Other Operating Revenues 133,675,160 120,893,390 110,241,793 (10,651,597) ‐8.8%
Total Operating Revenues 5,038,500,803 5,287,337,283 5,287,747,882 410,599 0.0%
Operating Expenses:
Compensation ‐ Faculty 810,202,818 822,809,992 853,739,691 30,929,699 3.8%
Compensation ‐ Non‐Faculty 1,519,360,661 1,490,715,249 1,510,505,264 19,790,015 1.3%
Wages 42,778,941 26,996,709 40,867,140 13,870,431 51.4%
Benefits 560,295,054 539,808,461 572,577,627 32,769,166 6.1%
Personnel Costs 2,932,637,474 2,880,330,411 2,977,689,722 97,359,311 3.4%
Utilities 47,505,403 52,450,140 48,829,665 (3,620,475) ‐6.9%
Scholarships and Fellowships 3,283,692 2,830,031 3,310,692 480,661 17.0%
Less Discounts and Allowances (10,000) (15,531) (10,000) 5,531 ‐35.6%
Operations, Maintenance and Travel 1,981,363,445 2,764,711,302 2,743,927,803 (20,783,499) ‐0.8%
Less Capitalized Portion (211,900,000) (945,781,186) (858,000,000) 87,781,186 ‐9.3%
Depreciation and Amortization 368,688,828 365,290,967 372,000,000 6,709,033 1.8%
Total Operating Expenses 5,121,568,842 5,119,816,134 5,287,747,882 167,931,748 3.3%
Operating Surplus/Deficit (83,068,039) 167,521,149 ‐ (167,521,149) ‐100.0%
Budgeted Nonoperating Revenues (Expenses):
State Appropriations 217,542,264 218,310,545 218,310,545 ‐ 0.0%
Federal Sponsored Programs (Nonoperating) 84,563,049 600,000 600,000 ‐ 0.0%
State/Local Sponsored Programs (Nonoperating) ‐ ‐ ‐ ‐ ‐
Gifts in Support of Operations 108,572,255 125,000,000 90,500,000 (34,500,000) ‐27.6%
Net Investment Income 316,405,439 233,063,000 269,579,877 36,516,877 15.7%
Other Non‐Operating Revenue 6,313,288 ‐ ‐ ‐ ‐
Other Non‐Operating (Expenses) ‐ ‐ ‐ ‐ ‐
Net Non‐Operating Revenue/(Expenses) 733,396,295 576,973,545 578,990,422 2,016,877 0.3%
Transfers and Other:
AUF Transfers Received for Operations ‐ ‐ ‐ ‐ ‐
AUF Transfers (Made) for Operations ‐ ‐ ‐ ‐ ‐
Transfers for Debt Service ‐ Interest (38,048,140) (38,734,209) (35,374,812) 3,359,397 ‐8.7%
Total Transfers and Other (38,048,140) (38,734,209) (35,374,812) 3,359,397 ‐8.7%
Budget Margin (Deficit) 612,280,116 705,760,485 543,615,610 (162,144,875) ‐23.0%
Reconciliation to Change in Net Position:
Net Non‐Profit Health Corp Activity ‐ ‐ ‐ ‐ ‐
Net Inc./(Dec.) in Fair Value of Investments ‐ ‐ ‐ ‐ ‐
Interest Expense on Capital Asset Financings ‐ ‐ ‐ ‐ ‐
Capital Approp., Gifts and Sponsored Programs 400,000 1,000,000 500,000 (500,000) ‐50.0%
Additions to Permanent Endowments 10,000,000 12,000,000 10,000,000 (2,000,000) ‐16.7%
Transfers for Debt Service ‐ Principal (73,212,000) (82,295,000) (89,362,000) (7,067,000) 8.6%
Reverse Transfers for Debt Service (System Only) ‐ ‐ ‐ ‐ ‐
Transfers and Other 28,611,861 66,695,532 70,041,646 3,346,114 5.0%SRECNP Change in Net Position $ 578,079,977 703,161,017 534,795,256 (168,365,761) ‐23.9%
Total Revenues and AUF Transfers $ 5,771,897,098 5,864,310,828 5,866,738,304 2,427,476 0.0%
Total Expenses (Including Transfers for Interest) (5,159,616,982) (5,158,550,343) (5,323,122,694) (164,572,351) 3.2%Budget Margin (Deficit) $ 612,280,116 705,760,485 543,615,610 (162,144,875)
Reconciliation to Use of Prior Year Balances
Depreciation 365,290,967 372,000,000
Capital Outlay (945,781,186) (858,000,000)
Transfers for Debt Service ‐ Principal (82,295,000) (89,362,000)
Budgeted Transfers ‐ ‐
Net Additions to (Uses of) Prior Year Balances 42,975,266 (31,746,390)
Note: Operating Budget Highlights with a glossary of terms are included on Page 1.
U. T. System Office of Budget and Planning 79

The University of Texas M. D. Anderson Cancer Center
Operating Budget ‐ Operating Expenses by Function
Fiscal Year Ending August 31, 2021
Budget
FY 2020 FY 2021 Increases (Decreases)
FY 2020 Adjusted Operating From 2020 to 2021
Projected Budget Budget Amount Percent
Operating Expenses:
Instruction $ 80,941,316 83,187,339 83,684,840 497,501 0.6%
Academic Support 165,115,651 151,615,339 165,115,651 13,500,312 8.9%
Research 792,846,791 814,888,301 807,846,791 (7,041,510) ‐0.9%
Public Service 20,789,213 18,618,758 20,039,213 1,420,455 7.6%
Hospitals and Clinics 3,242,002,586 3,261,434,131 3,398,037,607 136,603,476 4.2%
Institutional Support 188,050,408 164,261,641 179,050,408 14,788,767 9.0%
Student Services 705,059 948,865 948,865 ‐ 0.0%
Operations and Maintenance of Plant 235,521,384 226,502,380 236,731,812 10,229,432 4.5%
Scholarships and Fellowships 3,283,692 2,814,500 3,310,692 496,192 17.6%
Auxiliary Enterprises 23,623,914 30,253,913 20,982,003 (9,271,910) ‐30.6%
Depreciation and Amortization 368,688,828 365,290,967 372,000,000 6,709,033 1.8%Total Operating Expenses $ 5,121,568,842 5,119,816,134 5,287,747,882 167,931,748 3.3%
Operating Budget ‐ Expenditures by Fund
Fiscal Year Ending August 31, 2021
Budget
FY 2020 FY 2021 Increases (Decreases)
Adjusted Operating From 2020 to 2021
Budget Budget Amount Percent
Educational and General $ 3,576,781,153 3,762,770,458 185,989,305 5.2%
Designated 782,599,717 780,360,276 (2,239,441) ‐0.3%
Auxiliary 38,749,482 30,801,127 (7,948,355) ‐20.5%
Available University Fund ‐ ‐ ‐ ‐
Restricted 477,439,555 466,562,833 (10,876,722) ‐2.3%
Unexpended Plant 945,781,186 858,000,000 (87,781,186) ‐9.3%
Subtotal ‐ Expenditures (All Funds) 5,821,351,093 5,898,494,694 77,143,601 1.3%
Reconciling Adjustments:
Tuition Discounting (15,531) (10,000) 5,531 ‐35.6%
Depreciation 365,290,967 372,000,000 6,709,033 1.8%
Capital Outlay (945,781,186) (858,000,000) 87,781,186 ‐9.3%
Transfers for Debt Service ‐ Principal (82,295,000) (89,362,000) (7,067,000) 8.6%Total Expenses (Including Transfers for Interest) $ 5,158,550,343 5,323,122,694 164,572,351 3.2%
Note: Operating Budget Highlights with a glossary of terms are included on Page 1.
U. T. System Office of Budget and Planning 80

THE UNIVERSITY OF TEXAS
HEALTH SCIENCE CENTER
AT TYLER
U. T. System Office of Budget and Planning 81
The University of Texas Health Science Center at Tyler Operating Budget Highlights
For the Year Ending August 31, 2021 Introduction - Major Goals Addressed by FY 2021 Budget The University of Texas Health Science Center at Tyler is in the midst of an ambitious five-year strategic plan that prioritizes growth that will result in greater capacity to meet the health and educational needs of the East Texas region. This plan includes five priorities toward accomplishing the Institution’s mission: 1) integrate the academic and administrative structure of U. T. Health Science Center - Tyler and The University of Texas at Tyler; 2) launch a new medical school; 3) continue to grow Graduate Medical Education (GME) programs throughout the UT Health East Texas System; 4) build a critical mass of faculty physicians, particularly in specialty areas; and 5) continue to grow philanthropic giving necessary to support the mission. The groundbreaking public-private partnership between U. T. Health Science Center - Tyler and Ardent Health Services to form UT Health East Texas continues to strengthen, and the Institution continues to benefit from the joint venture. U. T. Health Science Center - Tyler has experienced a 95.6 percent improvement in the year-to-date financial performance through June 2020 in comparison to the same period a year ago. As a result of the UT Health East Texas joint venture, U. T. Health Science Center - Tyler has increased the scope of services and footprint from a standalone organization with annual revenues in the $190 million - $200 million range, to a 30 percent partner of close to a $1 billion enterprise, a greater than 500 percent increase in size and scope. This partnership has allowed the Institution to expand the mission and geographic reach and to refocus efforts in the research and education space, especially in the critical area of graduate medical education. Faculty and staff from U. T. Health Science Center - Tyler and U. T. Tyler have made great strides toward implementing Board of Regents’ direction to integrate the two campuses under one administrative structure. This realignment entered the critical accreditation process following notice given to the Southern Association of Colleges and Schools Commission on Colleges and is proceeding on schedule with a targeted implementation date of January 1, 2021. Achieving successful accreditation and implementation of this realignment will be directly supported by the FY 2021 operating budget of each institution. The FY 2021 operating budget will also support the Board of Regents’ approved proposal to establish a medical school in Tyler. While U. T. Health Science Center - Tyler has marshalled unprecedented amounts of philanthropy toward this endeavor, support of the FY 2021 operating budget will still be crucial toward successful completion. This need is especially significant in light of the state’s projected fiscal condition in the wake of COVID-19. In response, U. T. Health Science Center - Tyler will not seek start-up funding support from the 87th Legislature. East Texas is the only region of the state without a medical school and one of the most medically underserved regions of Texas. Thus, the impact of the work supported toward this goal under the FY 2021 operating budget will be felt for generations to come. These and other strategies serve the mission, vision, and values of U. T. Health Science Center - Tyler, thereby allowing the Institution to continue to provide high quality patient care, education, and research and to retain world-class faculty, students, staff, and administrators. Revenue U. T. Health Science Center – Tyler’s budgeted total revenues and transfers for FY 2021 are approximately 8.1 percent higher than the FY 2020 operating budget. This increase is driven primarily by four initiatives – continued clinical growth, expansion of the residency programs and GME programs, growth of the Physician Master Services Agreement to establish U. T. Health Science Center – Tyler as the predominant employer of UT Health East Texas’s physicians, and increased operating gifts related to the medical school and for critical care and nursing support initiatives. Expenses The Institution’s budgeted total expenses and transfers for FY 2021 are approximately 7.6 percent higher than the FY 2020 operating budget. This increase reflects the investment in five initiatives - growth of the residency programs and GME programs, ongoing expansion of the Physician MSA to establish U. T. Health Science Center - Tyler as the predominant employer of UT Health East Texas’s physicians, implementation of EPIC as the patient information system, establishing a medical school, and integrating U. T. Health Science Center - Tyler and U. T. Tyler into one administrative structure. The Institution continues to invest in the School of Community and Rural Health, as well as ongoing outlays to improve the quality of and access to healthcare, increase behavioral health clinical capacity and workforce training, expand educational and residency programs and opportunities, maintain and improve infrastructure, and invest in and develop the Institution’s human capital.
U. T. System Office of Budget and Planning 82

The University of Texas Health Science Center at Tyler
Operating Budget
Fiscal Year Ending August 31, 2021
Budget
FY 2020 FY 2021 Increases (Decreases)
FY 2020 Adjusted Operating From 2020 to 2021
Projected Budget Budget Amount Percent
Operating Revenues:
Tuition and Fees $ 507,263 489,288 820,456 331,168 67.7%
Less Discounts and Allowances (141,459) ‐ ‐ ‐ ‐
Federal Sponsored Programs 9,356,258 11,166,156 10,301,285 (864,871) ‐7.7%
State Sponsored Programs 3,596,412 12,011,187 4,830,714 (7,180,473) ‐59.8%
Local and Private Sponsored Programs 21,636,253 30,035,671 38,495,462 8,459,791 28.2%
Net Sales and Services of Educational Activities 4,383,703 5,314,278 9,668,078 4,353,800 81.9%
Net Sales and Services of Hospital and Clinics 116,389,063 106,457,967 121,384,195 14,926,228 14.0%
Net Professional Fees 27,878,319 30,531,056 30,074,817 (456,239) ‐1.5%
Net Auxiliary Enterprises 164,439 161,419 167,728 6,309 3.9%
Other Operating Revenues 37,688,379 35,207,053 35,189,189 (17,864) ‐0.1%
Total Operating Revenues 221,458,630 231,374,075 250,931,924 19,557,849 8.5%
Operating Expenses:
Compensation ‐ Faculty 51,875,037 60,021,985 71,022,466 11,000,481 18.3%
Compensation ‐ Non‐Faculty 65,730,802 65,979,470 72,201,583 6,222,113 9.4%
Wages 818,904 1,029,685 1,023,692 (5,993) ‐0.6%
Benefits 32,933,468 39,420,665 37,567,623 (1,853,042) ‐4.7%
Personnel Costs 151,358,211 166,451,805 181,815,364 15,363,559 9.2%
Utilities 2,348,652 2,597,344 2,574,725 (22,619) ‐0.9%
Scholarships and Fellowships 204,006 103,631 80,000 (23,631) ‐22.8%
Less Discounts and Allowances (141,459) ‐ ‐ ‐ ‐
Operations, Maintenance and Travel 111,250,194 115,242,850 113,905,637 (1,337,213) ‐1.2%
Less Capitalized Portion (789,105) (9,000,000) (800,000) 8,200,000 ‐91.1%
Depreciation and Amortization 17,108,203 16,700,000 17,300,000 600,000 3.6%
Total Operating Expenses 281,338,702 292,095,630 314,875,726 22,780,096 7.8%
Operating Surplus/Deficit (59,880,072) (60,721,555) (63,943,802) (3,222,247) 5.3%
Budgeted Nonoperating Revenues (Expenses):
State Appropriations 57,359,966 58,069,317 58,187,866 118,549 0.2%
Federal Sponsored Programs (Nonoperating) 2,486,631 ‐ ‐ ‐ ‐
State/Local Sponsored Programs (Nonoperating) ‐ ‐ ‐ ‐ ‐
Gifts in Support of Operations 13,212,706 1,196,113 5,235,469 4,039,356 337.7%
Net Investment Income 3,631,362 4,105,813 4,283,518 177,705 4.3%
Other Non‐Operating Revenue ‐ ‐ ‐ ‐ ‐
Other Non‐Operating (Expenses) ‐ ‐ ‐ ‐ ‐
Net Non‐Operating Revenue/(Expenses) 76,690,665 63,371,243 67,706,853 4,335,610 6.8%
Transfers and Other:
AUF Transfers Received for Operations ‐ ‐ ‐ ‐ ‐
AUF Transfers (Made) for Operations ‐ ‐ ‐ ‐ ‐
Transfers for Debt Service ‐ Interest (1,825,750) (2,074,843) (1,649,538) 425,305 ‐20.5%
Total Transfers and Other (1,825,750) (2,074,843) (1,649,538) 425,305 ‐20.5%
Budget Margin (Deficit) 14,984,843 574,845 2,113,513 1,538,668 267.7%
Reconciliation to Change in Net Position:
Net Non‐Profit Health Corp Activity 20,483 ‐ 20,483 20,483 ‐
Net Inc./(Dec.) in Fair Value of Investments (2,556,756) ‐ ‐ ‐ ‐
Interest Expense on Capital Asset Financings ‐ ‐ ‐ ‐ ‐
Capital Approp., Gifts and Sponsored Programs 277,902 300,000 277,902 (22,098) ‐7.4%
Additions to Permanent Endowments 941,820 100,000 4,927,305 4,827,305 4827.3%
Transfers for Debt Service ‐ Principal (7,238,000) (6,530,000) (2,818,000) 3,712,000 ‐56.8%
Reverse Transfers for Debt Service (System Only) ‐ ‐ ‐ ‐ ‐
Transfers and Other 12,293,061 6,263,737 11,597,035 5,333,298 85.1%SRECNP Change in Net Position $ 18,723,353 708,582 16,118,238 15,409,656 2174.7%
Total Revenues and AUF Transfers $ 298,149,295 294,745,318 318,638,777 23,893,459 8.1%
Total Expenses (Including Transfers for Interest) (283,164,452) (294,170,473) (316,525,264) (22,354,791) 7.6%Budget Margin (Deficit) $ 14,984,843 574,845 2,113,513 1,538,668
Reconciliation to Use of Prior Year Balances
Depreciation 16,700,000 17,300,000
Capital Outlay (9,000,000) (800,000)
Transfers for Debt Service ‐ Principal (6,530,000) (2,818,000)
Budgeted Transfers ‐ ‐
Net Additions to (Uses of) Prior Year Balances 1,744,845 15,795,513
Note: Operating Budget Highlights with a glossary of terms are included on Page 1.
U. T. System Office of Budget and Planning 83
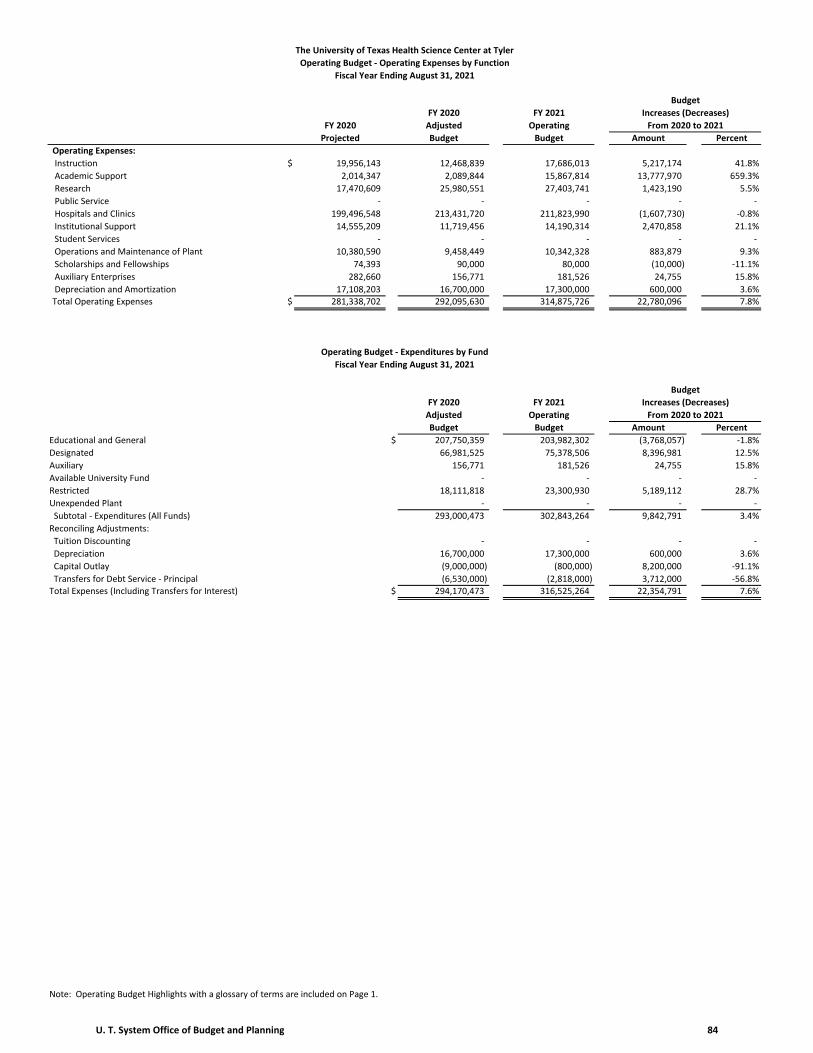
The University of Texas Health Science Center at Tyler
Operating Budget ‐ Operating Expenses by Function
Fiscal Year Ending August 31, 2021
Budget
FY 2020 FY 2021 Increases (Decreases)
FY 2020 Adjusted Operating From 2020 to 2021
Projected Budget Budget Amount Percent
Operating Expenses:
Instruction $ 19,956,143 12,468,839 17,686,013 5,217,174 41.8%
Academic Support 2,014,347 2,089,844 15,867,814 13,777,970 659.3%
Research 17,470,609 25,980,551 27,403,741 1,423,190 5.5%
Public Service ‐ ‐ ‐ ‐ ‐
Hospitals and Clinics 199,496,548 213,431,720 211,823,990 (1,607,730) ‐0.8%
Institutional Support 14,555,209 11,719,456 14,190,314 2,470,858 21.1%
Student Services ‐ ‐ ‐ ‐ ‐
Operations and Maintenance of Plant 10,380,590 9,458,449 10,342,328 883,879 9.3%
Scholarships and Fellowships 74,393 90,000 80,000 (10,000) ‐11.1%
Auxiliary Enterprises 282,660 156,771 181,526 24,755 15.8%
Depreciation and Amortization 17,108,203 16,700,000 17,300,000 600,000 3.6%Total Operating Expenses $ 281,338,702 292,095,630 314,875,726 22,780,096 7.8%
Operating Budget ‐ Expenditures by Fund
Fiscal Year Ending August 31, 2021
Budget
FY 2020 FY 2021 Increases (Decreases)
Adjusted Operating From 2020 to 2021
Budget Budget Amount Percent
Educational and General $ 207,750,359 203,982,302 (3,768,057) ‐1.8%
Designated 66,981,525 75,378,506 8,396,981 12.5%
Auxiliary 156,771 181,526 24,755 15.8%
Available University Fund ‐ ‐ ‐ ‐
Restricted 18,111,818 23,300,930 5,189,112 28.7%
Unexpended Plant ‐ ‐ ‐ ‐
Subtotal ‐ Expenditures (All Funds) 293,000,473 302,843,264 9,842,791 3.4%
Reconciling Adjustments:
Tuition Discounting ‐ ‐ ‐ ‐
Depreciation 16,700,000 17,300,000 600,000 3.6%
Capital Outlay (9,000,000) (800,000) 8,200,000 ‐91.1%
Transfers for Debt Service ‐ Principal (6,530,000) (2,818,000) 3,712,000 ‐56.8%Total Expenses (Including Transfers for Interest) $ 294,170,473 316,525,264 22,354,791 7.6%
Note: Operating Budget Highlights with a glossary of terms are included on Page 1.
U. T. System Office of Budget and Planning 84

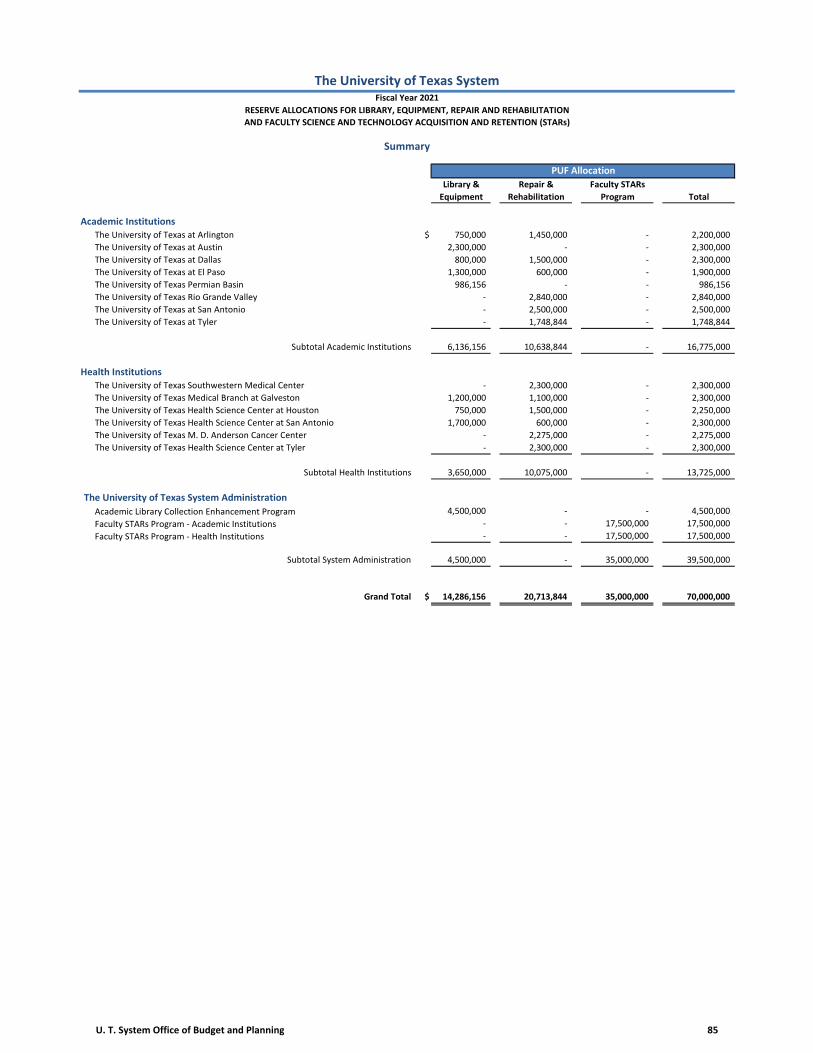
PUF Allocation
Library & Repair & Faculty STARs
Equipment Rehabilitation Program Total
The University of Texas at Arlington $ 750,000 1,450,000 ‐ 2,200,000
The University of Texas at Austin 2,300,000 ‐ ‐ 2,300,000
The University of Texas at Dallas 800,000 1,500,000 ‐ 2,300,000
The University of Texas at El Paso 1,300,000 600,000 ‐ 1,900,000
The University of Texas Permian Basin 986,156 ‐ ‐ 986,156
The University of Texas Rio Grande Valley ‐ 2,840,000 ‐ 2,840,000
The University of Texas at San Antonio ‐ 2,500,000 ‐ 2,500,000
The University of Texas at Tyler ‐ 1,748,844 ‐ 1,748,844
Subtotal Academic Institutions 6,136,156 10,638,844 ‐ 16,775,000
The University of Texas Southwestern Medical Center ‐ 2,300,000 ‐ 2,300,000
The University of Texas Medical Branch at Galveston 1,200,000 1,100,000 ‐ 2,300,000
The University of Texas Health Science Center at Houston 750,000 1,500,000 ‐ 2,250,000
The University of Texas Health Science Center at San Antonio 1,700,000 600,000 ‐ 2,300,000
The University of Texas M. D. Anderson Cancer Center ‐ 2,275,000 ‐ 2,275,000
The University of Texas Health Science Center at Tyler ‐ 2,300,000 ‐ 2,300,000
Subtotal Health Institutions 3,650,000 10,075,000 ‐ 13,725,000
Academic Library Collection Enhancement Program 4,500,000 ‐ ‐ 4,500,000
Faculty STARs Program ‐ Academic Institutions ‐ ‐ 17,500,000 17,500,000
Faculty STARs Program ‐ Health Institutions ‐ ‐ 17,500,000 17,500,000
Subtotal System Administration 4,500,000 ‐ 35,000,000 39,500,000
Grand Total $ 14,286,156 20,713,844 35,000,000 70,000,000
The University of Texas System Administration
Health Institutions
Academic Institutions
The University of Texas SystemFiscal Year 2021
RESERVE ALLOCATIONS FOR LIBRARY, EQUIPMENT, REPAIR AND REHABILITATION
Summary
AND FACULTY SCIENCE AND TECHNOLOGY ACQUISITION AND RETENTION (STARs)
U. T. System Office of Budget and Planning 85
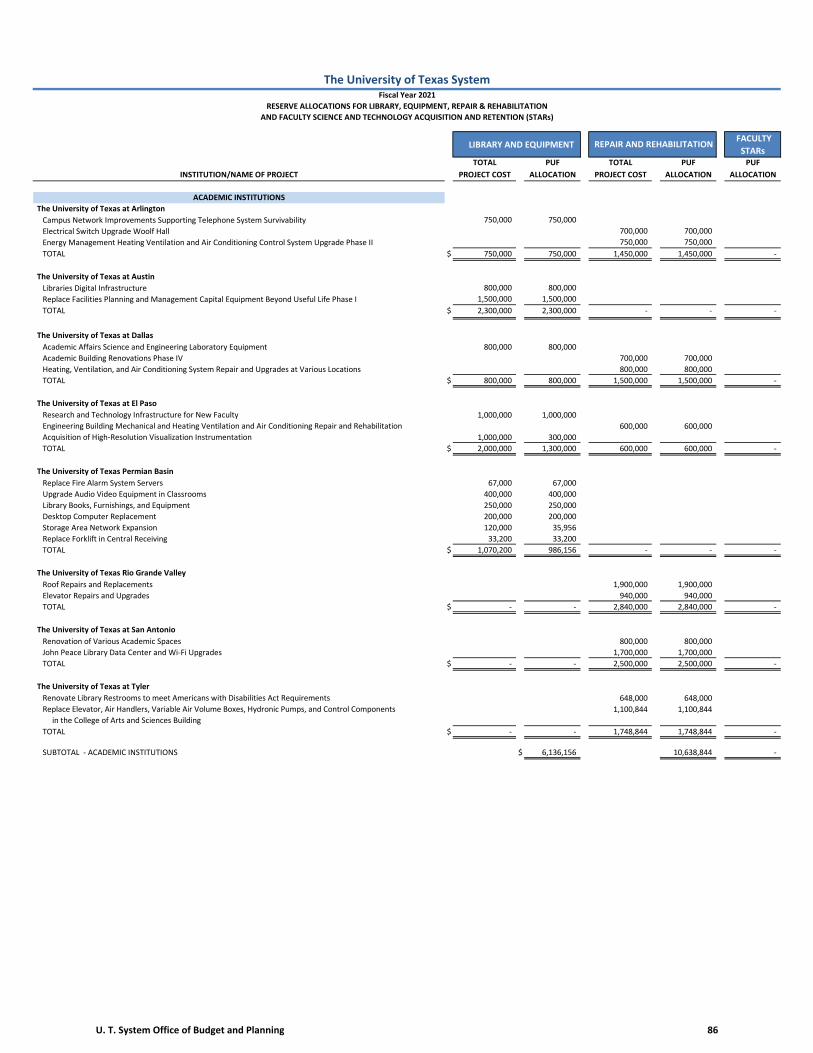
LIBRARY AND EQUIPMENT FACULTY
STARs TOTAL PUF TOTAL PUF PUF
INSTITUTION/NAME OF PROJECT PROJECT COST ALLOCATION PROJECT COST ALLOCATION ALLOCATION
ACADEMIC INSTITUTIONS
The University of Texas at Arlington
Campus Network Improvements Supporting Telephone System Survivability 750,000 750,000
Electrical Switch Upgrade Woolf Hall 700,000 700,000
Energy Management Heating Ventilation and Air Conditioning Control System Upgrade Phase II 750,000 750,000
TOTAL $ 750,000 750,000 1,450,000 1,450,000 ‐
The University of Texas at Austin
Libraries Digital Infrastructure 800,000 800,000
Replace Facilities Planning and Management Capital Equipment Beyond Useful Life Phase I 1,500,000 1,500,000
TOTAL $ 2,300,000 2,300,000 ‐ ‐ ‐
The University of Texas at Dallas
Academic Affairs Science and Engineering Laboratory Equipment 800,000 800,000
Academic Building Renovations Phase IV 700,000 700,000
Heating, Ventilation, and Air Conditioning System Repair and Upgrades at Various Locations 800,000 800,000
TOTAL $ 800,000 800,000 1,500,000 1,500,000 ‐
The University of Texas at El Paso
Research and Technology Infrastructure for New Faculty 1,000,000 1,000,000
Engineering Building Mechanical and Heating Ventilation and Air Conditioning Repair and Rehabilitation 600,000 600,000
Acquisition of High‐Resolution Visualization Instrumentation 1,000,000 300,000
TOTAL $ 2,000,000 1,300,000 600,000 600,000 ‐
The University of Texas Permian Basin
Replace Fire Alarm System Servers 67,000 67,000
Upgrade Audio Video Equipment in Classrooms 400,000 400,000
Library Books, Furnishings, and Equipment 250,000 250,000
Desktop Computer Replacement 200,000 200,000
Storage Area Network Expansion 120,000 35,956
Replace Forklift in Central Receiving 33,200 33,200
TOTAL $ 1,070,200 986,156 ‐ ‐ ‐
The University of Texas Rio Grande Valley
Roof Repairs and Replacements 1,900,000 1,900,000
Elevator Repairs and Upgrades 940,000 940,000
TOTAL $ ‐ ‐ 2,840,000 2,840,000 ‐
The University of Texas at San Antonio
Renovation of Various Academic Spaces 800,000 800,000
John Peace Library Data Center and Wi‐Fi Upgrades 1,700,000 1,700,000
TOTAL $ ‐ ‐ 2,500,000 2,500,000 ‐
The University of Texas at Tyler
Renovate Library Restrooms to meet Americans with Disabilities Act Requirements 648,000 648,000
Replace Elevator, Air Handlers, Variable Air Volume Boxes, Hydronic Pumps, and Control Components 1,100,844 1,100,844
in the College of Arts and Sciences Building
TOTAL $ ‐ ‐ 1,748,844 1,748,844 ‐
SUBTOTAL ‐ ACADEMIC INSTITUTIONS $ 6,136,156 10,638,844 ‐
REPAIR AND REHABILITATION
The University of Texas SystemFiscal Year 2021
RESERVE ALLOCATIONS FOR LIBRARY, EQUIPMENT, REPAIR & REHABILITATION
AND FACULTY SCIENCE AND TECHNOLOGY ACQUISITION AND RETENTION (STARs)
U. T. System Office of Budget and Planning 86
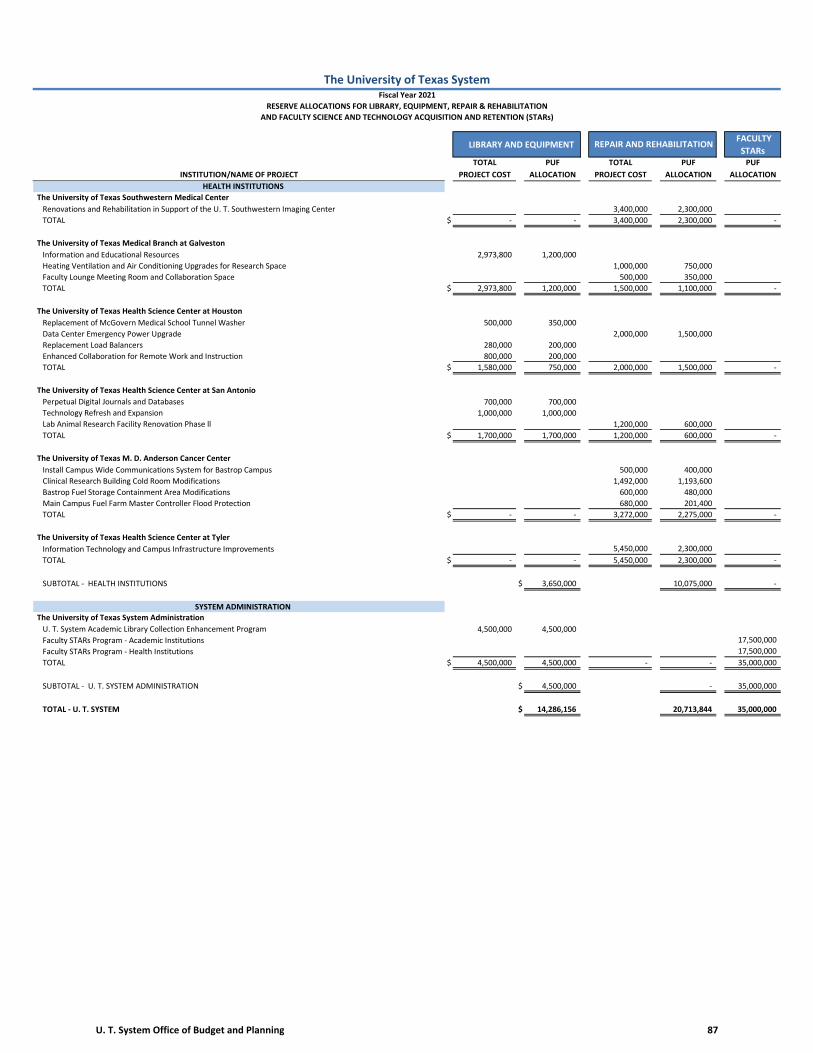
LIBRARY AND EQUIPMENT FACULTY
STARs TOTAL PUF TOTAL PUF PUF
INSTITUTION/NAME OF PROJECT PROJECT COST ALLOCATION PROJECT COST ALLOCATION ALLOCATION
REPAIR AND REHABILITATION
The University of Texas SystemFiscal Year 2021
RESERVE ALLOCATIONS FOR LIBRARY, EQUIPMENT, REPAIR & REHABILITATION
AND FACULTY SCIENCE AND TECHNOLOGY ACQUISITION AND RETENTION (STARs)
HEALTH INSTITUTIONS
The University of Texas Southwestern Medical Center
Renovations and Rehabilitation in Support of the U. T. Southwestern Imaging Center 3,400,000 2,300,000
TOTAL $ ‐ ‐ 3,400,000 2,300,000 ‐
The University of Texas Medical Branch at Galveston
Information and Educational Resources 2,973,800 1,200,000
Heating Ventilation and Air Conditioning Upgrades for Research Space 1,000,000 750,000
Faculty Lounge Meeting Room and Collaboration Space 500,000 350,000
TOTAL $ 2,973,800 1,200,000 1,500,000 1,100,000 ‐
The University of Texas Health Science Center at Houston
Replacement of McGovern Medical School Tunnel Washer 500,000 350,000
Data Center Emergency Power Upgrade 2,000,000 1,500,000
Replacement Load Balancers 280,000 200,000
Enhanced Collaboration for Remote Work and Instruction 800,000 200,000
TOTAL $ 1,580,000 750,000 2,000,000 1,500,000 ‐
The University of Texas Health Science Center at San Antonio
Perpetual Digital Journals and Databases 700,000 700,000
Technology Refresh and Expansion 1,000,000 1,000,000
Lab Animal Research Facility Renovation Phase ll 1,200,000 600,000
TOTAL $ 1,700,000 1,700,000 1,200,000 600,000 ‐
The University of Texas M. D. Anderson Cancer Center
Install Campus Wide Communications System for Bastrop Campus 500,000 400,000
Clinical Research Building Cold Room Modifications 1,492,000 1,193,600
Bastrop Fuel Storage Containment Area Modifications 600,000 480,000
Main Campus Fuel Farm Master Controller Flood Protection 680,000 201,400
TOTAL $ ‐ ‐ 3,272,000 2,275,000 ‐
The University of Texas Health Science Center at Tyler
Information Technology and Campus Infrastructure Improvements 5,450,000 2,300,000
TOTAL $ ‐ ‐ 5,450,000 2,300,000 ‐
SUBTOTAL ‐ HEALTH INSTITUTIONS $ 3,650,000 10,075,000 ‐
SYSTEM ADMINISTRATIONThe University of Texas System Administration
U. T. System Academic Library Collection Enhancement Program 4,500,000 4,500,000
Faculty STARs Program ‐ Academic Institutions 17,500,000
Faculty STARs Program ‐ Health Institutions 17,500,000
TOTAL $ 4,500,000 4,500,000 ‐ ‐ 35,000,000
SUBTOTAL ‐ U. T. SYSTEM ADMINISTRATION $ 4,500,000 ‐ 35,000,000
TOTAL ‐ U. T. SYSTEM $ 14,286,156 20,713,844 35,000,000
U. T. System Office of Budget and Planning 87

U. T. System Office of Budget and Planning 88
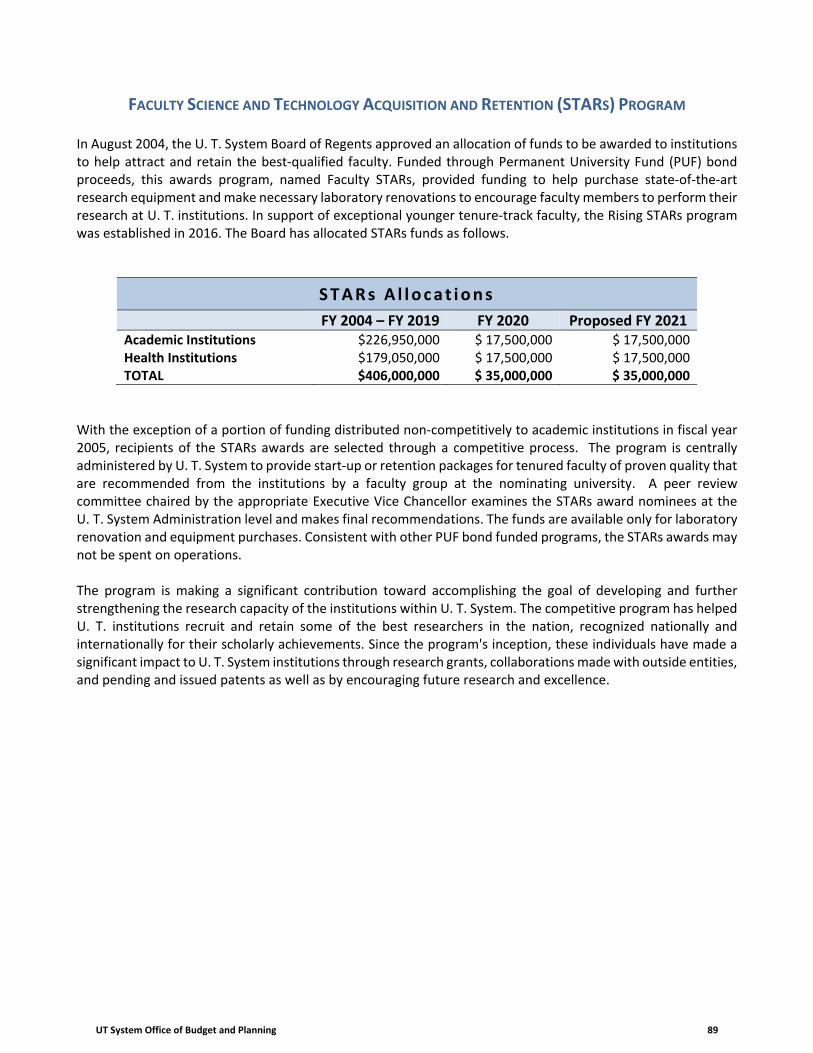
FACULTY SCIENCE AND TECHNOLOGY ACQUISITION AND RETENTION (STARS) PROGRAM
In August 2004, the U. T. System Board of Regents approved an allocation of funds to be awarded to institutions to help attract and retain the best‐qualified faculty. Funded through Permanent University Fund (PUF) bond proceeds, this awards program, named Faculty STARs, provided funding to help purchase state‐of‐the‐art research equipment and make necessary laboratory renovations to encourage faculty members to perform their research at U. T. institutions. In support of exceptional younger tenure‐track faculty, the Rising STARs program was established in 2016. The Board has allocated STARs funds as follows.
STARs Al loca t ions
FY 2004 – FY 2019 FY 2020 Proposed FY 2021 Academic Institutions $226,950,000 $ 17,500,000 $ 17,500,000 Health Institutions $179,050,000 $ 17,500,000 $ 17,500,000 TOTAL $406,000,000 $ 35,000,000 $ 35,000,000
With the exception of a portion of funding distributed non‐competitively to academic institutions in fiscal year 2005, recipients of the STARs awards are selected through a competitive process. The program is centrally administered by U. T. System to provide start‐up or retention packages for tenured faculty of proven quality that are recommended from the institutions by a faculty group at the nominating university. A peer review committee chaired by the appropriate Executive Vice Chancellor examines the STARs award nominees at the U. T. System Administration level and makes final recommendations. The funds are available only for laboratory renovation and equipment purchases. Consistent with other PUF bond funded programs, the STARs awards may not be spent on operations.
The program is making a significant contribution toward accomplishing the goal of developing and further strengthening the research capacity of the institutions within U. T. System. The competitive program has helped U. T. institutions recruit and retain some of the best researchers in the nation, recognized nationally and internationally for their scholarly achievements. Since the program's inception, these individuals have made a significant impact to U. T. System institutions through research grants, collaborations made with outside entities, and pending and issued patents as well as by encouraging future research and excellence.
UT System Office of Budget and Planning 89

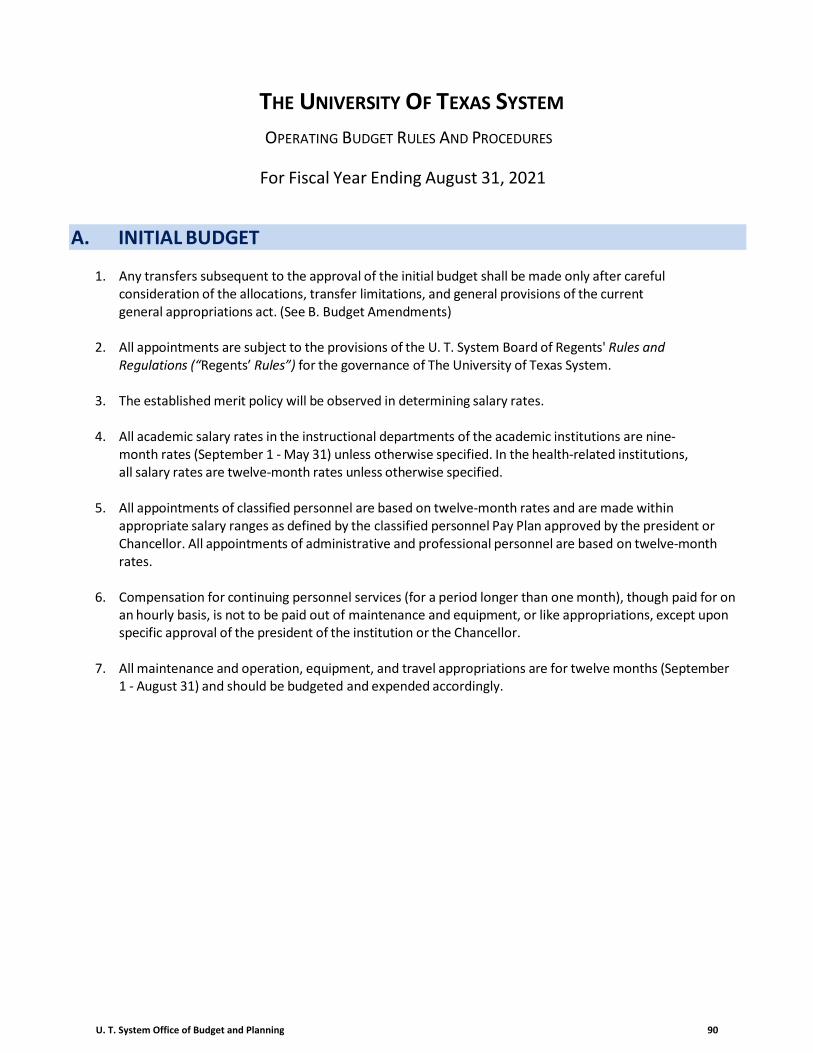
THE UNIVERSITY OF TEXAS SYSTEM
OPERATING BUDGET RULES AND PROCEDURES
For Fiscal Year Ending August 31, 2021
A. INITIAL BUDGET
1. Any transfers subsequent to the approval of the initial budget shall be made only after carefulconsideration of the allocations, transfer limitations, and general provisions of the currentgeneral appropriations act. (See B. Budget Amendments)
2. All appointments are subject to the provisions of the U. T. System Board of Regents' Rules andRegulations (“Regents’ Rules”) for the governance of The University of Texas System.
3. The established merit policy will be observed in determining salary rates.
4. All academic salary rates in the instructional departments of the academic institutions are nine‐month rates (September 1 ‐ May 31) unless otherwise specified. In the health‐related institutions,all salary rates are twelve‐month rates unless otherwise specified.
5. All appointments of classified personnel are based on twelve‐month rates and are made withinappropriate salary ranges as defined by the classified personnel Pay Plan approved by the president orChancellor. All appointments of administrative and professional personnel are based on twelve‐monthrates.
6. Compensation for continuing personnel services (for a period longer than one month), though paid for onan hourly basis, is not to be paid out of maintenance and equipment, or like appropriations, except uponspecific approval of the president of the institution or the Chancellor.
7. All maintenance and operation, equipment, and travel appropriations are for twelve months (September1 ‐ August 31) and should be budgeted and expended accordingly.
U. T. System Office of Budget and Planning 90
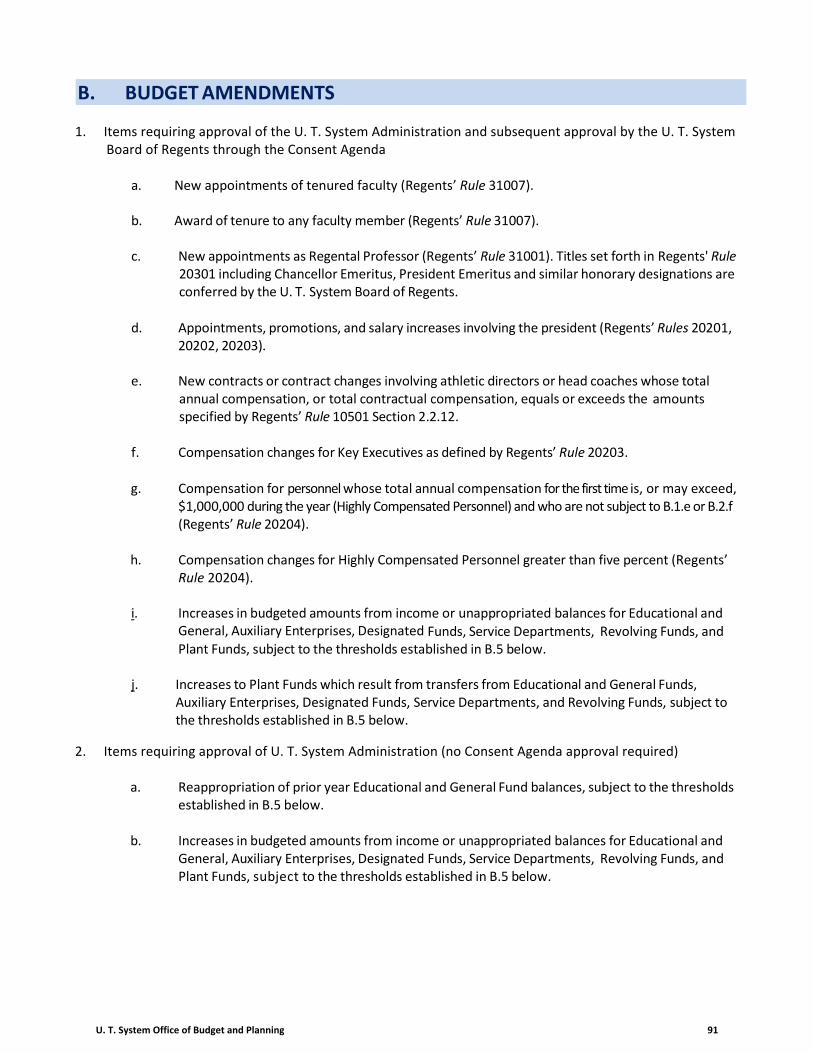
B. BUDGET AMENDMENTS 1. Items requiring approval of the U. T. System Administration and subsequent approval by the U. T. System
Board of Regents through the Consent Agenda
a. New appointments of tenured faculty (Regents’ Rule 31007).
b. Award of tenure to any faculty member (Regents’ Rule 31007).
c. New appointments as Regental Professor (Regents’ Rule 31001). Titles set forth in Regents' Rule 20301 including Chancellor Emeritus, President Emeritus and similar honorary designations are conferred by the U. T. System Board of Regents.
d. Appointments, promotions, and salary increases involving the president (Regents’ Rules 20201,
20202, 20203).
e. New contracts or contract changes involving athletic directors or head coaches whose total annual compensation, or total contractual compensation, equals or exceeds the amounts specified by Regents’ Rule 10501 Section 2.2.12.
f. Compensation changes for Key Executives as defined by Regents’ Rule 20203.
g. Compensation for personnel whose total annual compensation for the first time is, or may exceed,
$1,000,000 during the year (Highly Compensated Personnel) and who are not subject to B.1.e or B.2.f (Regents’ Rule 20204).
h. Compensation changes for Highly Compensated Personnel greater than five percent (Regents’
Rule 20204). i. Increases in budgeted amounts from income or unappropriated balances for Educational and
General, Auxiliary Enterprises, Designated Funds, Service Departments, Revolving Funds, and Plant Funds, subject to the thresholds established in B.5 below.
j. Increases to Plant Funds which result from transfers from Educational and General Funds,
Auxiliary Enterprises, Designated Funds, Service Departments, and Revolving Funds, subject to the thresholds established in B.5 below.
2. Items requiring approval of U. T. System Administration (no Consent Agenda approval required)
a. Reappropriation of prior year Educational and General Fund balances, subject to the thresholds
established in B.5 below.
b. Increases in budgeted amounts from income or unappropriated balances for Educational and General, Auxiliary Enterprises, Designated Funds, Service Departments, Revolving Funds, and Plant Funds, subject to the thresholds established in B.5 below.
U. T. System Office of Budget and Planning 91
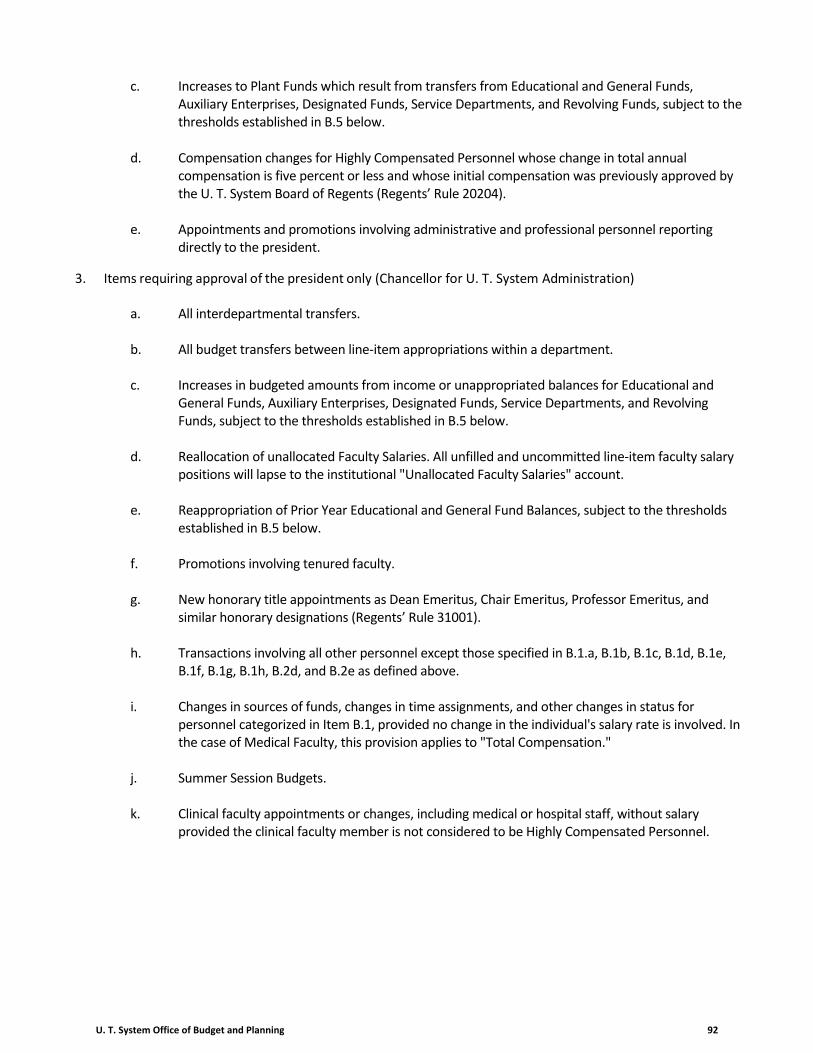
c. Increases to Plant Funds which result from transfers from Educational and General Funds, Auxiliary Enterprises, Designated Funds, Service Departments, and Revolving Funds, subject to the thresholds established in B.5 below.
d. Compensation changes for Highly Compensated Personnel whose change in total annual
compensation is five percent or less and whose initial compensation was previously approved by the U. T. System Board of Regents (Regents’ Rule 20204).
e. Appointments and promotions involving administrative and professional personnel reporting
directly to the president. 3. Items requiring approval of the president only (Chancellor for U. T. System Administration)
a. All interdepartmental transfers. b. All budget transfers between line‐item appropriations within a department. c. Increases in budgeted amounts from income or unappropriated balances for Educational and
General Funds, Auxiliary Enterprises, Designated Funds, Service Departments, and Revolving Funds, subject to the thresholds established in B.5 below.
d. Reallocation of unallocated Faculty Salaries. All unfilled and uncommitted line‐item faculty salary
positions will lapse to the institutional "Unallocated Faculty Salaries" account. e. Reappropriation of Prior Year Educational and General Fund Balances, subject to the thresholds
established in B.5 below.
f. Promotions involving tenured faculty.
g. New honorary title appointments as Dean Emeritus, Chair Emeritus, Professor Emeritus, and similar honorary designations (Regents’ Rule 31001).
h. Transactions involving all other personnel except those specified in B.1.a, B.1b, B.1c, B.1d, B.1e,
B.1f, B.1g, B.1h, B.2d, and B.2e as defined above.
i. Changes in sources of funds, changes in time assignments, and other changes in status for personnel categorized in Item B.1, provided no change in the individual's salary rate is involved. In the case of Medical Faculty, this provision applies to "Total Compensation."
j. Summer Session Budgets. k. Clinical faculty appointments or changes, including medical or hospital staff, without salary
provided the clinical faculty member is not considered to be Highly Compensated Personnel.
U. T. System Office of Budget and Planning 92
4. Effective date of appointments and compensation increases
a. Any increase in approved compensation for the current fiscal year without a change in classification or position is not to be effective prior to the first day of the month in which the required final approval of the rate change is obtained.
b. A compensation increase resulting from an appointment to another classification or to a
position involving new and different duties may be made effective to the time of the first performance of duties under the new appointment.
c. The effective date of an appointment is the date on which the individual is first to perform
service for the institution under that appointment. d. The original appointment during a fiscal year of a person not in a budget for that year or not
under an existing appointment for that year may relate back to the first performance of duties during the fiscal year although such person may have been employed in a previous fiscal year and although increased compensation for the same classification or position is involved.
5. Budget amendment criteria
a. Institutions other than U. T. System Administration with budgeted revenue, including
transfers from the Available University Fund, of $1 billion or more will have a threshold of: i. For B.1h and B.1i – Equal to or greater than $5,000,000 (budget increase approval on
Consent Agenda) ii. For B.2a – Equal to or greater than $2,000,000 (reappropriation of E&G balances approval
by U. T. System Administration) iii. For B.2b and B.2c – Equal to or greater than $2,000,000 and less than $5,000,000 (budget
increase approval by U. T. System Administration) iv. For B.3c and B.3e – Less than $2,000,000 (approval by president)
b. Institutions other than U. T. System Administration with budgeted revenue, including
transfers from the Available University Fund, between $250 million and $1 billion will have a threshold of:
i. For B.1h and B.1i – Equal to or greater than $2,500,000 (budget increase approval on Consent Agenda)
ii. For B.2a – Equal to or greater than $1,000,000 (reappropriation of E&G balances approval by U. T. System Administration)
iii. For B.2b and B.2c – Equal to or greater than $1,000,000 and less than $2,500,000 (budget increase approval by U. T. System Administration)
iv. For B.3c and B.3e – Less than $1,000,000 (approval by president)
U. T. System Office of Budget and Planning 93
c. Institutions other than U. T. System Administration with budgeted revenue, including transfers from the Available University Fund, less than $250 million will have a threshold of: i. For B.1h and B.1i – Equal to or greater than $1,000,000 (budget increase approval on
Consent Agenda) ii. For B.2a – Equal to or greater than $250,000 (reappropriation of E&G balances approval by
U. T. System Administration) iii. For B.2b and B.2c – Equal to or greater than $250,000 and less than $1,000,000 (budget
increase approval by U. T. System Administration) iv. For B.3c and B.3e – Less than $250,000 (approval by president)
d. U. T. System Administration will have a threshold of: i. For B.1h and B.1i – Equal to or greater than $1,000,000 (budget increase approval on
Consent Agenda) ii. For B.2a and B.3e – All amounts may be approved by the Chancellor (reappropriation of E&G
balances) iii. For B.2b, B.2c, and B.3c – All amounts less than $1,000,000 may be approved by the
Chancellor (budget increase approval) iv. Notwithstanding i., ii., and iii., the Chancellor may authorize any budget amendment in the
U. T. System revolving insurance funds without limitation.
C. OTHER CONSIDERATIONS
1. All appropriations not actually expended or encumbered by August 31 will automatically lapse to the Unappropriated Balance Account except for those reallocated pursuant to Item B.2a and Item B.3e.
2. Compensation indicated as "MSRDP Funds," "DSRDP Funds," "PRS Funds," “FSRDP Funds, “Allied
Health Faculty Services Plan” or “Nursing Clinical Enterprise Health Services, Research and Development Plan” is contingent upon its being earned or available in accordance with the regulations applicable to the appropriate Medical Service Research and Development Plan, Dental Service Research and Development Plan, Physicians Referral Service Plan, Faculty Services Research and Development Plan, Allied Health Faculty Services Plan, or Nursing Clinical Enterprise Health Services Research and Development Plan.
3. Budgeted expenditures authorized from sources of funds other than Educational and General Funds
are contingent upon receipt of such funds. Appointments from such fund sources will not become an obligation of the institution in the event the supplemental or grant funds are not realized.
4. Leaves of Absence may be granted only in accordance with provisions contained in Regents' Rule 30201.
5. In these Rules, Compensation means total annual compensation as defined by Regents’ Rule 20204 or
total compensation under a multiyear contract.
6. Appropriations of the Available University Fund are subject to the appropriation limitations and notice requirements found in the General Appropriations Act.
U. T. System Office of Budget and Planning 94
THE UNIVERSITY OF TEXAS SYSTEM
FACULTY WORKLOAD REQUIREMENTS FOR ACADEMIC INSTITUTIONS
For Fiscal Year Ending August 31, 2021
FACULTY WORKLOAD REQUIREMENTS FOR ACADEMIC INSTITUTIONS
The general workload policy for faculty employed at U. T. System academic institutions is set forth in Regents' Rule 31006. Through established shared governance processes, each academic institution has been authorized by the U. T. System Board of Regents to establish a faculty workload policy that adheres to the provisions and reporting requirements of Rule 31006. As required by Texas Education Code Section 51.402 and Rule 31006, each academic institution has included their faculty workload policy in this operating budget.
U. T. System Office of Budget and Planning 95

THE UNIVERSITY OF TEXAS SYSTEM
MEDICAL, DENTAL, NURSING, FACULTY SERVICES RESEARCH AND DEVELOPMENT PLANS, ALLIED HEALTH FACULTY SERVICES PLAN AND PHYSICIANS REFERRAL SERVICE
For Fiscal Year Ending August 31, 2021
RULES AND PROCEDURES
1. These Rules and Procedures are to be used for the Medical, Dental, Nursing, and Faculty Services Research and Development Plans, the Allied Health Faculty Services Plan and Physicians Referral Service (“the Plans”) Budgets in conjunction with the Rules and Procedures for the General Operating Budget.
2. Budgeted expenditures authorized from the Plans are contingent upon receipt of such funds. Appointments and other budget transactions from such fund sources shall not become an obligation of any institution in the event the funds are not realized.
3. All income for professional services earned by members of the plans, except royalties, payments for editing scientific publications, and consultation fees as a regional or national consultant to any branch of the U.S. Government as approved by the U. T. System Board of Regents shall be deposited in the appropriate institution’s institutional Trust Fund Account.
4. Administration, operation, and disbursement of funds shall be in accordance with each institutional plan approved by U. T. System Administration and the U. T. System Board of Regents.
5. At U. T. M. D. Anderson Cancer Center, associate members’ earnings will be contingent upon the earned income of the member in accordance with the services rendered to the patient assigned to the member’s specialty by the chief of the major service. All payments will be approved by the Executive Council of the Physicians Referral Service.
6. Budgeted funds can be used for staff retirement and insurance benefits, for actual travel or supplemental travel expenses for attending meetings for the benefit of any institution, for memberships and dues in medical organizations, for official entertainment, and for such other disbursements as may be authorized by the president consistent with the policies approved by the U. T. System Board of Regents and the U. T. System Administration. These expenditures must be in the best interests of the research, educational and patient care activities of any institution and in the best interest of maintaining a distinguished scientific staff for such purposes and activities.
U. T. System Office of Budget and Planning 96
THE UNIVERSITY OF TEXAS SYSTEM
PERMANENT UNIVERSITY FUND (PUF) BOND PROCEEDS FOR LIBRARY, EQUIPMENT, REPAIR AND REHABILITATION (LERR)
AND FACULTY SCIENCE AND TECHNOLOGY ACQUISITION AND RETENTION (STARS) AND SIMILAR FUNDED PROGRAMS BUDGET RULES AND PROCEDURES
For Fiscal Year Ending August 31, 2021
A. INITIAL BUDGET
1. U. T. System institutions are authorized to purchase approved Library and Equipment items and to contract for Repair and Rehabilitation projects following standard purchasing and contracting procedures. This includes expenditures for Faculty STARs or similar funded programs.
2. Transfers by the U. T. System Administration of allocated funds to institutional control or to vendors will
coincide with vendor payment requirements.
3. Final approval of specific Repair and Rehabilitation projects will be in accordance with U. T. System Board of Regents established procedures for construction projects.
4. All expenditures are subject to the provisions of the Constitution of the State of Texas and the U. T. System Board of Regents' Rules and Regulations for the governance of The University of Texas System.
B. BUDGET AMENDMENTS
1. Items requiring approval of the U. T. System Administration and subsequent approval by the U. T. System Board of Regents through the Consent Agenda
a. Substitute Library and Equipment purchases in excess of $1 million that are not on the approved list.
b. Funding for new Repair and Rehabilitation projects in excess of $1 million that are not on the approved list.
2. Items requiring approval of U. T. System Administration (no Consent Agenda approval required)
a. Substitute Library and Equipment purchases of $1 million or less that are not on the approved list.
b. Funding for new Repair and Rehabilitation projects of $1 million or less that are not on the
approved list. c. Transfers of appropriated funds between approved Library and Equipment items.
d. Transfers of appropriated funds between Repair and Rehabilitation items.
U. T. System Office of Budget and Planning 97
e. Transfers of funds for approved Library and Equipment purchases to fund approved Repair and Rehabilitation projects and vice versa.
f. All transfers of funds are subject to the requirements of the UTS 168 Capital Expenditure Policy. g. Transfer of STARs funding between the Faculty STARs program and the Rising STARs program.
C. OTHER CONSIDERATIONS
1. All Library and Equipment or Repair and Rehabilitation appropriations must be expended within 36 months from the date of the award or the appropriation will lapse and be made available for future Systemwide reallocation.
2. All Faculty STARs or similar program appropriations must be expended within 36 months from the time the faculty member arrives on campus or the appropriation will lapse and be made available for future Systemwide reallocation.
3. Notwithstanding the limitations adopted at the time LERR, Faculty STARs, or other similar funding was authorized, these Budget Rules and Procedures apply to all previously authorized LERR, Faculty STARs and similar funding.
4. In accordance with the UTS 168 Capital Expenditure Policy, LERR and Faculty STARs funding that is incorporated into a Major Project will be defined as PUF and will be subject to rules applicable to all Major Projects. Major Projects are defined by Regents’ Rule 80301.
U. T. System Office of Budget and Planning 98
THE UNIVERSITY OF TEXAS SYSTEM
PERMANENT UNIVERSITY FUND (PUF) BOND PROCEEDS FOR LIBRARY, EQUIPMENT, REPAIR AND REHABILITATION (LERR)
AND FACULTY SCIENCE AND TECHNOLOGY ACQUISITION AND RETENTION (STARS) AND SIMILAR FUNDED PROGRAMS EXPENDITURE GUIDELINES
For Fiscal Year Ending August 31, 2021
A. AUTHORIZATION OF PUF BOND PROCEEDS FOR LERR, STARs, OR SIMILAR FUNDED PROGRAMS
Article VII, Section 18 (b) of the Texas Constitution authorizes the U. T. System Board of Regents to issue bonds and notes secured by the U. T. System’s interest in the Permanent University Fund for the purpose of:
• acquiring land, with or without permanent improvements; • constructing and equipping buildings or other permanent improvements; • major repair and rehabilitation of buildings and other permanent improvements; • acquiring capital equipment; and • acquiring library books and library materials.
It is for the last three purposes noted above that the U. T. System Board of Regents has established the LERR, Faculty STARs, and similar funded programs.
B. RETENTION OF RECORDS The Internal Revenue Service requires that invoice documentation supporting capital expenditures, including LERR, Faculty STARs and similar programs funded with proceeds of tax‐exempt bonds, be maintained for a period ending three (3) years after the complete extinguishment of the bonds. Pursuant to the Texas Constitution, PUF bonds may be structured with a maximum maturity of 30 years. In order to comply with the IRS requirement and UTS 181 Policy for Post Bond Issuance Federal Tax Compliance, U. T. institutions shall maintain invoice documentation for 35 years for any capital expenditures funded with tax‐exempt proceeds.
C. ELIGIBILITY FOR PROGRAM FUNDS Eligibility for LERR, STARs, or other similar funded programs is the same as eligibility for PUF bond proceeds as set forth in the Constitution.
U. T. System Office of Budget and Planning 99
D. GENERAL GUIDELINES FOR USE OF PROGRAM FUNDS In addition to meeting the constitutional requirements outlined above, the general guideline to determine whether an item is eligible for LERR, Faculty STARs, or similar funded programs, is that it must have a useful life of at least one year. The following sections are provided to assist with that determination. These guidelines are not intended to be exhaustive and any questions regarding LERR, Faculty STARs, or similar funded program eligibility should be directed to the U. T. System Administration Office of Budget and Planning. Repair and Rehabilitation of Buildings or Other Permanent Improvements Major repairs or rehabilitation of buildings or other permanent improvements include, but are not limited to, repairs, renovations, replacements, or betterments that are normally expected to extend the useful life, improve operating efficiency, eliminate health and safety hazards, correct structural or mechanical defects, upgrade the quality of existing facilities, or convert these assets to more useful functions, but that are not considered routine maintenance. The cost of major repairs or rehabilitation of buildings or other improvements can include the contract price or cost of construction and other costs that would be applicable to make the building or improvement suitable for its intended use. Acquisition of Capital Equipment Capital equipment is generally regarded as nonexpendable, tangible personal property having a useful life of more than one year. The acquisition cost for equipment includes the net invoice price, including any modifications, attachments, accessories, or auxiliary apparatus necessary to make it usable for the purpose for which it is acquired. In addition, taxes, duty, in‐transit insurance, freight, and installation charges are also included as part of the acquisition cost. Capital equipment, including software, that will be used Systemwide, or between and among U. T. institutions and System Administration, is eligible for LERR, Faculty STARs, or similar program funds. Warranties and Similar Service Features
The cost of warranties and similar service features related to a purchase of capital equipment (such as maintenance agreements and loaner programs) are not eligible for LERR, Faculty STARs, or similar program funds as these are considered operating expenses. This ineligibility also applies to warranty and similar service feature costs separately identified during original purchase. For example, a warranty agreement charge that is separately identified on a Laptop purchase is not allowed. Software
Any capitalized costs associated with the development or implementation of software, including personnel costs (salaries), are eligible for LERR, Faculty STARs, or similar funded programs if they are incurred in the Application Development Stage. This principle applies whether the salaries are paid to employees of the institution or to outside parties. See UTS 142.13 Accounting and Financial Reporting for Intangible Assets at https://www.utsystem.edu/sites/policy‐library/policies/uts‐14213‐accounting‐and‐financial‐reporting‐intangible‐assets. Training costs related to software usage are discussed below.
U. T. System Office of Budget and Planning 100
The purchase of bundled software included as part of the initial acquisition of computer hardware is capitalizable regardless of threshold and therefore eligible for LERR, Faculty STARs, or similar program funds. Software maintenance costs are considered operating expenses and therefore are not eligible for LERR, Faculty STARs, or similar program funds as these are considered operating expense. Costs for software licenses with a useful life extending beyond one year that will be owned are eligible for LERR, Faculty STARs, or similar program funds. Leased or licensed software that requires the payment of an annual fee (i.e., does not have a useful life extending beyond one year) and that will not be owned when the license expires is not eligible for LERR, Faculty STARs, or similar program funds.
Employee Training and Travel Costs Employee training and travel costs are not eligible for LERR or STARs program funds as these are considered operating expenses. Operating Expenses Consumables, which generally include those items that have an expected useful life of less than one year, are not eligible for LERR or STARs program funds as these are considered operating expenses. Some examples include, but are not limited to: chemicals, gases, paper, staplers and other office supplies, toner cartridges, medical supplies, disposal services, and laboratory supplies. Examples of other operating expenses that are not eligible for LERR or STARs program funds include, but are not limited to: monthly telephone services, animals, software maintenance cost, and routine maintenance.
Acquisition of Library Books and Library Materials The acquisition of library books and library materials is eligible for LERR. A library book is generally defined as a literary composition bound into a separate volume and identifiable as a separate copyrighted unit. Library materials are information sources other than books, including journals, periodicals, microforms, audio/visual media, computer‐based information, manuscripts, maps, documents, and similar items that provide information essential to the learning process or enhance the quality of university library programs. A purchase of a license for library materials is allowable if the license period is in excess of one year. Annual license subscriptions and payments are not eligible for LERR. The acquisition cost of library books and library materials can include the invoice price, freight‐in, handling and insurance, binding, electronic access charges, reproduction and other like costs required to put these assets in place, except for library salaries. Prohibition for Student Housing, Athletics, and Auxiliary Enterprises Article VII, Section 18 (d) of the Constitution prohibits the use of PUF bond proceeds, and therefore the use of LERR, Faculty STARs, and similar program funds, for student housing, intercollegiate athletics, or auxiliary enterprises.
U. T. System Office of Budget and Planning 101
E. SPECIAL PROGRAM FUNDING Faculty STARs Program The Faculty STARs program funded by PUF bond proceeds supports the recruitment and retention of the best‐qualified faculty at both academic and health institutions by providing additional resources to build and enhance research infrastructure. Because the STARs program is funded in the same manner as LERR, the same guidelines apply and each item must have a useful life of more than one year. STARs funds are available for laboratory renovation and equipment purchases; however, faculty and other staff salaries cannot be paid from STARs funds. There are three related program goals that form the basis of the STARs program:
• recruit senior faculty with national prominence; and • improve the quality of new faculty and research capacity of the institutions by augmenting the start‐up
packages for tenure and tenure‐track faculty; and • retain high quality faculty who have had offers from another research institution or have the potential to
leave because of limited access to quality equipment or laboratories. Rising STARs Program The Rising STARs program makes up to $250,000 available for recruitment of promising faculty members who are recruited in a tenure track position at any academic level, i.e. assistant, associate or full professor. Rising STARs funding is limited to the same equipment and renovation expenditure restrictions as Faculty STARs.
U. T. System Office of Budget and Planning 102